UNITED STATES
SECURITIES AND EXCHANGE COMMISSION
Washington, D.C. 20549
FORM N-CSR
CERTIFIED SHAREHOLDER REPORT OF REGISTERED
MANAGEMENT INVESTMENT COMPANIES
Investment Company Act file number | 811-08274 |
|
MassMutual Select Funds |
(Exact name of registrant as specified in charter) |
|
1295 State Street, Springfield, MA | | 01111 |
(Address of principal executive offices) | | (Zip code) |
|
Frederick C. Castellani 1295 State Street, Springfield, MA 01111 |
(Name and address of agent for service) |
|
Registrant’s telephone number, including area code: | 413-788-8411 | |
|
Date of fiscal year end: | 12/31/2005 | |
|
Date of reporting period: | 6/30/2005 | |
| | | | | | | | |
Item 1. Reports to Stockholders.
Table of Contents
| Letter to Shareholders | | | 1 | | |
|
| Portfolio Manager Reports | | | 3 | | |
|
| Portfolio of Investments | | | |
|
| MassMutual Select Strategic Bond Fund | | | 72 | | |
|
| MassMutual Select Strategic Balanced Fund | | | 77 | | |
|
| MassMutual Select Diversified Value Fund | | | 84 | | |
|
| MassMutual Select Fundamental Value Fund | | | 87 | | |
|
| MassMutual Select Value Equity Fund | | | 90 | | |
|
| MassMutual Select Large Cap Value Fund | | | 94 | | |
|
| MassMutual Select Indexed Equity Fund | | | 97 | | |
|
| MassMutual Select Blue Chip Growth Fund | | | 103 | | |
|
| MassMutual Select Large Cap Growth Fund | | | 106 | | |
|
| MassMutual Select Growth Equity Fund | | | 108 | | |
|
| MassMutual Select Aggressive Growth Fund | | | 112 | | |
|
| MassMutual Select OTC 100 Fund | | | 114 | | |
|
| MassMutual Select Focused Value Fund | | | 117 | | |
|
| MassMutual Select Small Company Value Fund | | | 120 | | |
|
| MassMutual Select Mid Cap Growth Equity Fund | | | 125 | | |
|
| MassMutual Select Mid Cap Growth Equity II Fund | | | 128 | | |
|
| MassMutual Select Small Cap Growth Equity Fund | | | 134 | | |
|
| MassMutual Select Small Company Growth Fund | | | 138 | | |
|
| MassMutual Select Emerging Growth Fund | | | 142 | | |
|
| MassMutual Select Overseas Fund | | | 146 | | |
|
| MassMutual Select Destination Retirement Income Fund | | | 150 | | |
|
| MassMutual Select Destination Retirement 2010 Fund | | | 151 | | |
|
| MassMutual Select Destination Retirement 2020 Fund | | | 152 | | |
|
| MassMutual Select Destination Retirement 2030 Fund | | | 153 | | |
|
| MassMutual Select Destination Retirement 2040 Fund | | | 154 | | |
|
| Statement of Assets and Liabilities | | | 156 | | |
|
| Statement of Operations | | | 168 | | |
|
| Statement of Changes in Net Assets | | | 174 | | |
|
| Financial Highlights | | | 186 | | |
|
| Notes to Financial Statements | | | 259 | | |
|
| Other Information (Unaudited) | | | 299 | | |
|
This material must be preceded or accompanied by a current prospectus for the MassMutual Select Funds. Investors should consider a Fund's investment objective, risks and charges and expenses carefully before investing. This and other information about the investment company is available in the prospectus. Read it carefully before investing.
[This page is intentionally left blank.]
MassMutual Select Funds – Letter to Shareholders

Frederick C. Castellani
"MassMutual believes there are a number of favorable factors at work in the current economic environment. Despite the general underperformance of the markets so far in 2005, we continue to believe it's important for investors to stay diversified across a variety of asset classes, to keep a long-term focus and to maintain a financial plan that's in line with their retirement goals, needs and risk tolerance levels."
A Six-Month Snapshot of the Markets
The first half of 2005 was not without its challenges – for both the equity and fixed income markets. The first quarter saw the broader U.S. stock averages struggle unsuccessfully to remain above the break-even mark in the midst of widespread expectations for slower growth by the nation's economy and a reduction in corporate profits.
On the fixed income front, bond yields fell and prices rose in January, but fears of rising inflation – especially resurgent crude oil prices – took center stage during the remainder of the quarter and reversed much of the earlier advance. Also putting pressure on bond prices was a surprisingly strong report on fourth quarter Gross Domestic Product (GDP), released at the end of February, which pegged the nation's estimated growth rate at 3.8%, up sharply from the previous estimate of 3.1%. Additionally, there were two 0.25% hikes in short-term interest rates by the Federal Reserve Board (Fed) during the first three months of 2005.
Turning to the second quarter, U.S. stocks traded indecisively, as moderately positive news on the economy and corporate earnings was tempered by high crude oil prices, rising short-term interest rates and concerns about slowing economic growth.
In the bond market, Treasuries outperformed other fixed income asset classes, while investment-grade bonds outpaced high-yield securities in the corporate sector. Debt downgrades to financially troubled automakers General Motors and Ford from investment-grade to high-yield status drew bond investors' attention and contributed to a general flight to quality. The yield curve, a graphical representation of the yields of comparable securities with different maturities, flattened further, partly in response to two more hikes in short-term interest rates by the Fed.
In this challenging investment environment, blue chips, as represented by the Dow Jones Industrial AverageSM (DJIASM)*, returned –4.71% for the six months ended June 30, 2005. The S&P 500® Index fared better, with a –0.81% return. The technology-focused Nasdaq Composite® Index and the small-cap Russell 2000® Index were also in negative territory for the period, returning –5.45% and –1.25%, respectively. Despite a strengthening of the U.S. dollar, foreign stocks outperformed most of their U.S. counterparts, as measured by the –1.17% return of the MSCI® EAFE® Index. For the same six-month period, only the fixed income market ended on positive ground, as underscored by the Lehman Brothers® Aggregate Bond Index's return of 2.51%.
The Impact of Higher Oil Prices
Late in June, crude oil prices hit a high of approximately $60 per barrel. With the price of crude oil continuing to increase, it's worth taking a closer look at some of the factors driving this market and the potential implications.
Crude oil is refined into a number of products consumers depend on for transportation, heating and other purposes. In the past few years, the commodity's price has risen sharply, as demand from Asia – particularly China – has accelerated markedly. Even the refinement process has played a role in the current situation, since underinvestment in refineries in recent years has resulted in refining capacity
* Indexes are unmanaged, do not incur fees or expenses and cannot be purchased directly for investment.
(Continued)
1
MassMutual Select Funds – Letter to Shareholders (Continued)
that is now barely adequate to meet existing needs. Finally, persistent speculator buying has been exacerbating the situation. Because crude oil futures have rewarded investors over the past few years, traders keep buying when prices dip and driving them back up.
High oil prices can act like a tax on consumers, limiting their purchases in other areas. Furthermore, because crude oil products drive so many businesses across the spectrum of industries, persistently high oil prices could act as a brake on economic growth at the same time that rising interest rates are having a similar effect.
Despite these challenges, the crude oil situation offers some reasons for optimism. Indeed, while prices are high, they do not approach their all-time highs in inflation-adjusted terms, so the overall negative impact is not as great as it might appear. Additionally, global economies appear to be taking the recent price increases in stride, perhaps because higher prices have been driven by gradually increasing demand rather than an abrupt event, such as an oil embargo. Finally, China's oil imports declined slightly in the first five months of 2005, as that nation's torrid growth rate cooled somewhat.
Outlook
Stock prices have held up remarkably well against the dual threats of rising interest rates and high crude oil prices. MassMutual believes there are a number of favorable factors at work in the current economic environment, including a reasonably healthy U.S. economy. Other positive influences include fairly robust consumer confidence, along with interest rates and inflation that are still low by historical standards.
Given the difficulty of predicting market movements, we believe it's important for investors to stay diversified across a variety of asset classes, to keep a long-term focus and to maintain a financial plan that's in line with their retirement goals, needs and risk tolerance levels.
Sincerely,

Frederick C. Castellani
President
The opinions expressed herein are those of MassMutual as of July 1, 2005 and are subject to change without notice. This information is not to be construed as tax, legal or investment advice.
2
MassMutual Select Strategic Bond Fund – Portfolio Manager Report
What is the investment objective of the MassMutual Select Strategic Bond Fund?
This Fund seeks a superior total rate of return by investing in fixed income instruments.
How did the Fund perform during the six months ended June 30, 2005?
For the six months ended June 30, 2005, the Fund's Class S shares returned 2.20%, underperforming the 2.51% return of the Lehman Brothers Aggregate Bond Index, an index of fixed income securities primarily from the Treasury, mortgage-backed, and corporate asset classes.
What was the investment background during the period?
During the six-month period ending June 30, 2005, short-term rates rose, led by four 25 basis-point hikes in the federal funds rate. Most bond yields fell, however. While it is true that long-term rates rarely fall when the Federal Reserve (Fed) is raising short-term rates, it is noteworthy for bond yields to decline at a time when most measures of inflation are rising. The Consumer Price Index has risen from a low of 1% in 2002 to 2.8% as of June 30, and the Producer Price Index has risen from –3% to 3.5% over the same period. Core rates of inflation are u p by less, but energy prices have been in a sustained rise for the past three years, so neglecting energy may not be appropriate at this time.
The dollar rose against most currencies in the year-to-date period, as the market regained confidence in the Fed's ability to keep inflation contained, while the faltering European and Japanese economies weakened demand for their currencies. Commodity prices generally softened, but crude oil surged from $43 to as high as $60 per barrel. Investors largely turned to favor higher-quality bonds on news that GM and Ford debt was downgraded to junk status, and the ripple effects were felt throughout the investment-grade, high-yield and emerging markets sectors, as credit spreads widened as lower-quality bonds declined in price. Credit spreads are the difference in yields between nearly identical bonds with comparable maturities with different quality ratings.
What factors contributed to the Fund's performance?
During the first quarter, the Fund's investment strategies produced mixed results. Overweight exposure to Treasury-Inflation Protected Securities (TIPS) contributed to returns as they outperformed their nominal counterparts. Moderate non-dollar exposure added significantly to returns, as international bonds performed well. Moderately overweight exposure to BAA, high-yield and emerging market debt detracted significantly from returns, as their prices declined and yields rose. Bond prices move in the opposite direction to interest rates (or yields); when yields rise, the pric es of existing bonds fall – and vice versa.
In the second quarter, a modest overweight exposure to lower-quality corporate bonds detracted somewhat from performance as their prices declined. Prices on emerging market and high-yield bonds also benefited, as the differences in their yields were relatively unchanged for the period. Our underweight duration exposure was a negative, since most yields fell, and our positioning with regard to different maturities alone had little impact on performance, as gains from a decline in the yields of longer-term bonds were largely offset by losses from rising short-term rates. Duration is a measure of a bond fund's sensitivity to interest rates, with each year of duration generally indicating greater vulnerability to interest rate movements. For example, if a bond fund has a duration of five years and interest rates fall by 1%, the fund will generally gain 5% in value. Conversely, a 1% increase will generally crea te a decline of 5%.
A moderate exposure to intermediate-maturity TIPS detracted from performance, as TIPS underperformed their Treasury counterparts, although they received a 2% inflation adjustment during the quarter. Non-dollar bond exposure benefited, as our focus on Eurobonds outperformed their Treasury counterparts. The Fund's underweight exposure to the mortgage-backed sector had a modest negative impact on performance as these bonds performed better than expected.
3
MassMutual Select Strategic Bond Fund – Portfolio Manager Report (Continued)
What is your outlook? With market assumptions on the optimistic side and little margin for error, and with economic fundamentals likely to remain relatively healthy, this is not a time to take outsized risks – nor is it a time to be unduly defensive. We continue to believe that a neutral to underweight duration stance is appropriate, coupled with tactical shifts within this duration range as market conditions change.
MassMutual Select Strategic Bond Fund
Quality Structure
(% of Net Assets) on 6/30/05
| U.S. Governments, Aaa/AAA | | | 79.0 | % | |
| Aa/AA | | | 1.6 | % | |
| A | | | 2.9 | % | |
| Baa/BBB | | | 9.2 | % | |
| Ba/BB | | | 7.4 | % | |
| B | | | 1.5 | % | |
| Forward Currency Contracts | | | 0.4 | % | |
| Purchased Options | | | 0.1 | % | |
| Futures | | | (0.0 | %) | |
| Written Options | | | (0.3 | %) | |
Short-Term Investments and
Other Assets and Liabilities | | | (1.7 | %) | |
| Total | | | 100.0 | % | |
4
MassMutual Select Strategic Bond Fund – Portfolio Manager Report (Continued)
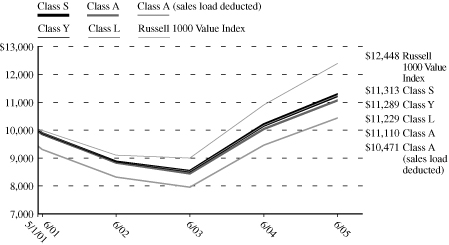
Growth of a $10,000 Investment
Hypothetical Investments in MassMutual Select Strategic Bond Fund Class S, Class A, Class A (sales load deducted), Class Y, Class L and the Lehman Brothers Aggregate Bond Index.
MassMutual Select Strategic Bond Fund
Total Return
| | | Year to Date
1/1/05 - 6/30/05 | | Since Inception
12/31/04 - 6/30/05 | |
| Class S | | | 2.20 | % | | | 2.20 | % | |
| Class A | | | 2.00 | % | | | 2.00 | % | |
| Class A (sales load deducted)* | | | –2.85 | % | | | –2.85 | % | |
| Class Y | | | 2.20 | % | | | 2.20 | % | |
| Class L | | | 2.20 | % | | | 2.20 | % | |
| Lehman Aggregate Bond Index | | | 2.51 | % | | | 2.71 | % | |
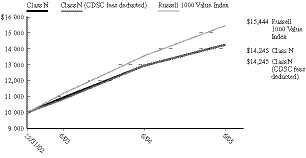
Hypothetical Investments in MassMutual Select Strategic Bond Fund Class N, Class N (CDSC fees deducted) and the Lehman Brothers Aggregate Bond Index.
MassMutual Select Strategic Bond Fund
Total Return
| | | Year to Date
1/1/05 - 6/30/05 | | Since Inception
12/31/04 - 6/30/05 | |
| Class N | | | 1.90 | % | | | 1.90 | % | |
| Class N (CDSC fees deducted)* | | | 0.90 | % | | | 0.90 | % | |
| Lehman Aggregate Bond Index | | | 2.51 | % | | | 2.71 | % | |
GROWTH OF A $10,000 INVESTMENT SINCE INCEPTION
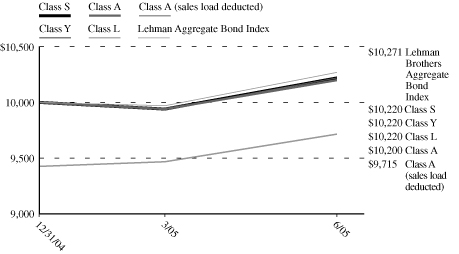
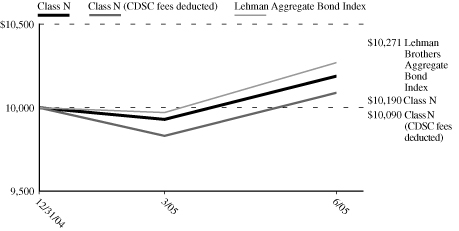
* Class A (sales load deducted) returns include the 4.75% maximum sales charge and Class N (CDSC fees deducted) returns include the 1.00% maximum contingent deferred sales charge.
Performance data quoted represents past performance; past performance is not predictive of future results. The investment return and principal value of shares of the Fund will fluctuate with market conditions so that shares of the Fund, when redeemed, may be worth more or less than their original cost. Current performance of the Fund may be lower or higher than the performance quoted. Performance data current to the most recent month end may be obtained by calling 1-888-309-3539.
Investors should note that the Fund is a professionally managed mutual fund, while the Lehman Brothers Aggregate Bond Index is unmanaged and does not incur expenses, and cannot be purchased directly by investors. Investors should read the Fund's prospectus with regard to the Fund's investment objective, risks and charges and expenses in conjunction with these financial statements. Employee retirement benefit plans that invest plan assets in the Separate Investment Accounts (SIAs) may be subject to certain charges as set forth in their respective Plan Documents. Total return figures would be lower for the periods presented if they reflected these charges. The performance tables and charts do not reflect the deduction of taxes that a shareholder would pay on the fund distributions or the redemption of the fund shares.
5
MassMutual Select Strategic Balanced Fund – Portfolio Manager Report
What is the investment objective of the MassMutual Select Strategic Balanced Fund?
This Fund seeks long-term capital growth, consistent with preservation of capital and balanced by current income.
How did the Fund perform during the six months ended June 30, 2005?
For the six months ended June 30, 2005, the Fund's Class S shares returned –0.19%, trailing the 0.49% return of the Lipper Balanced Fund Index, an unmanaged index of stock and bond portfolios.
What was the investment background during the period?
The first quarter saw the broader U.S. stock averages struggle unsuccessfully to remain above the break-even mark in the midst of widespread expectations for slower growth by the nation's economy and a reduction in corporate profits. On the fixed income front, bond yields fell and prices rose in January, but fears of rising inflation – especially resurgent crude oil prices – took center stage during the remainder of the quarter and reversed much of the earlier advance. Also putting pressure on bond prices was a surprisingly strong report on fourth quarter Gross Domestic Product (GDP), released at the end of February, which pegged the nation's estimated growth rate at 3.8%, up sharply from the previous estimate of 3.1%. Additionally, there were two 0.25% hikes in short-term interest rates by the Federal Reserve Board (Fed) during the first three months of 2005.
Turning to the second quarter, U.S. stocks traded indecisively, as moderately positive news on the economy and corporate earnings was tempered by high crude oil prices, rising short-term interest rates and concerns about slowing economic growth. In the bond market, Treasuries outperformed other fixed income asset classes, while investment-grade bonds outpaced high-yield securities in the corporate sector. Debt downgrades to financially troubled automakers General Motors and Ford from investment-grade to high-yield status drew bond investors' attention and contributed to an environment favoring higher-quality bonds.
What factors contributed to the Fund's performance – and how have you positioned the Fund as a result?
During the six-month period ending June 30, 2005, sectors such as energy and information technology were substantial contributors to relative performance, whereas the consumer discretionary, financials and utilities sectors were the most significant detractors from performance.
In consumer discretionary, the Fund held an overweight position relative to its benchmark in media companies, which we believe are selling at very attractive valuation levels. The performance of media stocks, such as Time Warner, News Corp. and Disney, was a principal reason for the underperformance of the Fund's consumer discretionary holdings.
The Fund was underweight in financials, because we believed the lack of higher bond coupon rates in longer-term bonds will adversely impact the earnings power of many companies in this sector. Two segments, REITs and smaller banks, make up approximately 11% of the Fund's benchmark, and we have virtually no representation. REITs now sell at a 15% premium to underlying asset values and a number of smaller banks due to high prices in these areas command prices of three to five times book value – a level not seen in the last 25 years.
During the first six months of this year, interest rates remained low and the 10-year U.S. Treasury yield actually declined from the first of the year. In this environment, many stocks in the financials sector extended their gains from what we felt were lofty levels. We continue to believe our underweight position is justified by what we believe are stretched valuations.
Finally, utilities are usually considered interest sensitive and often carry high valuations. Consequently, the Fund is underweight here as well.
6
MassMutual Select Strategic Balanced Fund – Portfolio Manager Report (Continued)
What is your outlook?
The stock market has been facing the twin headwinds of rising energy prices and rising short-term interest rates, both of which can hinder company earnings. Historically, when these conditions have been present simultaneously, the stock market has been choppy or in a correction mode. To a large extent, prospects for stocks will be dependent on how these trends play out in the coming months.
We believe oil prices may correct meaningfully from here, based on higher inventories and the fact that high oil prices usually produce a conservation effect. Most likely, the critical variable for stocks will be the direction that interest rates take. Since early 2004, the Fed has raised interest rates nine times, bringing the federal funds rate from 1% to 3.25%. We believe we are in the final stages of these increases.
MassMutual Select Strategic
Balanced Fund
Asset Allocation
(% of Net Assets) on 06/30/05
| Equities | | | 55.9 | % | |
| Bonds & Notes | | | 42.1 | % | |
| Purchased Options | | | 0.1 | % | |
| Forward Currency Contracts | | | 0.2 | % | |
| Futures | | | (0.1 | %) | |
| Swaps | | | (0.1 | %) | |
| Written Options | | | (0.2 | %) | |
Short-Term Investments and
Other Assets and Liabilities | | | 2.1 | % | |
| | | | 100.0 | % | |
MassMutual Select Strategic
Balanced Fund
Largest Stock Holdings (06/30/05)
Murphy Oil Corp.
The PMI Group, Inc.
Johnson & Johnson
Microsoft Corp.
Raytheon Co.
Chubb Corp.
Time Warner, Inc.
Abbott Laboratories
American Express Co.
JP Morgan Chase & Co.
7
MassMutual Select Strategic Balanced Fund – Portfolio Manager Report (Continued)
Growth of a $10,000 Investment
Hypothetical Investments in MassMutual Select Strategic Balanced Fund Class S, Class A, Class A (sales load deducted), Class Y, the Lipper Balanced Fund Index, the Lehman Brothers Aggregate Bond Index and the Russell 3000 Index.
MassMutual Select Strategic Balanced Fund
Total Return
| | | Year to Date
1/1/05 - 6/30/05 | | One Year
7/1/04 - 6/30/05 | | Since Inception
12/31/03 - 6/30/05 | |
| Class S | | | –0.19 | % | | | 3.69 | % | | | 3.67 | % | |
| Class A | | | –0.48 | % | | | 3.19 | % | | | 3.20 | % | |
Class A (sales
load deducted)* | | | –6.20 | % | | | –2.75 | % | | | –0.79 | % | |
| Class Y | | | –0.29 | % | | | 3.57 | % | | | 3.59 | % | |
| Lipper Balanced | | | 0.49 | % | | | 7.11 | % | | | 6.26 | % | |
| Lehman Aggregate | | | 2.51 | % | | | 6.80 | % | | | 4.65 | % | |
| Russell 3000 | | | –0.01 | % | | | 8.05 | % | | | 7.84 | % | |
Hypothetical Investments in MassMutual Select Strategic Balanced Fund Class L, Class N, Class N (CDSC fees deducted), the Lipper Balanced Fund Index, the Lehman Brothers Aggregate Bond Index and the Russell 3000 Index.
MassMutual Select Strategic Balanced Fund
Total Return
| | | Year to Date
1/1/05 - 6/30/05 | | One Year
7/1/04 - 6/30/05 | | Since Inception
12/31/03 - 6/30/05 | |
| Class L | | | –0.38 | % | | | 3.46 | % | | | 3.45 | % | |
| Class N | | | –0.57 | % | | | 2.88 | % | | | 2.92 | % | |
Class N (CDSC
fees deducted)* | | | –1.57 | % | | | 1.88 | % | | | 2.92 | % | |
| Lipper Balanced | | | 0.49 | % | | | 7.11 | % | | | 6.26 | % | |
| Lehman Aggregate | | | 2.51 | % | | | 6.80 | % | | | 4.65 | % | |
| Russell 3000 | | | –0.01 | % | | | 8.05 | % | | | 7.84 | % | |
GROWTH OF A $10,000 INVESTMENT SINCE INCEPTION
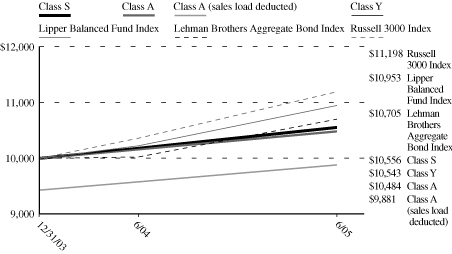
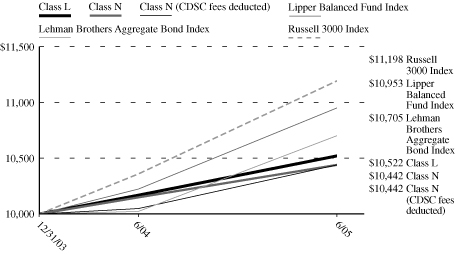
* Class A (sales load deducted) returns include the 5.75% maximum sales charge and Class N (CDSC fees deducted) returns include the 1.00% maximum contingent deferred sales charge for the 18 months shown.
Performance data quoted represents past performance; past performance is not predictive of future results. The investment return and principal value of shares of the Fund will fluctuate with market conditions so that shares of the Fund, when redeemed, may be worth more or less than their original cost. Current performance of the Fund may be lower or higher than the performance quoted. Performance data current to the most recent month end may be obtained by calling 1-888-309-3539.
Investors should note that the Fund is a professionally managed mutual fund, while the Lipper Balanced Fund Index, the Lehman Brothers Aggregate Bond Index and the Russell 3000 Index are unmanaged and do not incur expenses, and cannot be purchased directly by investors. Investors should read the Fund's prospectus with regard to the Fund's investment objective, risks and charges and expenses in conjunction with these financial statements. Employee retirement benefit plans that invest plan assets in the Separate Investment Accounts (SIAs) may be subject to certain charges as set forth in their respective Plan Documents. Total return figures would be lower for the periods presented if they reflected these charges. The performance tables and charts do not reflect the deduction of taxes that a shareholder would pay on the fund distributions or the redemption of the fund shares.
8
MassMutual Select Diversified Value Fund – Portfolio Manager Report
What is the investment objective of the MassMutual Select Diversified Value Fund?
This Fund seeks to achieve long-term growth of capital and income by investing primarily in a diversified portfolio of equity securities of larger, well-established companies.
How did the Fund perform during the six months ended June 30, 2005?
For the six months ended June 30, 2005, the Fund's Class S shares returned 1.01%, underperforming the 1.76% return of the Russell 1000® Value Index, an unmanaged index representative of stocks with a greater than average value orientation among the stocks of the largest 1000 U.S. companies based on capitalization.
What was the investment background during the period?
Domestic equity markets were weak in the first quarter, as a renewed spike in oil prices fueled ongoing concerns about inflation and interest rates. Energy shares led the market, gaining nearly 20%, while technology and financial stocks lagged. Energy shares now comprise a larger portion of the value domain than they do the broad market or its growth subset and technology shares make up a smaller portion of the value domain than they do the broad market or its growth subset. In this environment, value stocks outperformed both their growth counterparts and the broad market , as measured by the S&P 500 Index.
Turning to the second quarter, U.S. stocks traded indecisively, as moderately positive news on the economy and corporate earnings was tempered by high crude oil prices, rising short-term interest rates and concerns about slowing economic growth. In the bond market, Treasuries outperformed other fixed income asset classes, while investment-grade bonds outpaced high-yield securities in the corporate sector. Debt downgrades to financially troubled automakers General Motors and Ford from investment-grade to high-yield status drew bond investors' attention and contributed to an environment favoring higher-quality bonds.
What factors contributed to the Fund's performance?
In the three months ended March 31, 2005, the largest detractor from performance was the technology sector. Technology shares trailed the market during the period, and the Fund's overweight position in the sector relative to its benchmark merely amplified the problem. In addition, several of our holdings declined and diminished returns, including Solectron, Ingram Micro and Sanmina. On the positive side, several of our investments in the capital equipment and consumer growth sectors contributed to relative returns in the first quarter.
Performance in the second quarter was hampered by stock selection in the industrial resources and financial sectors. In the financial sector, Wachovia's stock fell after Bank of America won the bid for MBNA and investors speculated Wachovia would rush into a deal and possibly overpay. On the plus side, positive stock selections in the technology sector included Tellabs, Corning and ADC Telecommunications. Tellabs rose in June after posting strong first quarter financial performance driven by robust revenue growth across all its product lines. Corning continued to benefit from strong demand for LCD monitors and televisions, and strong pricing for LCD glass. ADC Telecommunications rose after management announced strong second quarter numbers. Our underweight in IBM also added to returns, as IBM's first quarter earnings and full-year guidance declined as a result of greater-than-anticipated pension retur n shortfall costs.
What is your outlook?
The value opportunity remains low. With the market currently offering little incremental compensation for taking risk, our active deviations from benchmark sector weights are conservative and our exposure to other risk factors is quite muted as well. We continue to believe that the best approach in the current environment is to keep our tracking error low and to use our fundamental research to uncover the opportunities available on a stock-specific basis. Moreover, when the value opportunity warrants it, we likely will begin to take more active positions in the portfolio.
9
MassMutual Select Diversified Value Fund – Portfolio Manager Report (Continued)
MassMutual Select Diversified Value Fund
Industry Table
(% of Net Assets) on 6/30/05
| Banking, Savings & Loans | | | 21.3 | % | |
| Energy | | | 14.3 | % | |
| Insurance | | | 7.4 | % | |
| Financial Services | | | 5.2 | % | |
| Pharmaceuticals | | | 5.1 | % | |
Electrical Equipment &
Electronics | | | 4.7 | % | |
| Electric Utilities | | | 4.6 | % | |
| Telephone Utilities | | | 3.2 | % | |
| Automotive & Parts | | | 3.1 | % | |
| Tobacco | | | 2.7 | % | |
Broadcasting, Publishing &
Printing | | | 2.5 | % | |
Computers & Office
Equipment | | | 2.3 | % | |
| Industrial – Diversified | | | 2.2 | % | |
| Transportation | | | 2.2 | % | |
| Retail | | | 1.9 | % | |
| Communications | | | 1.8 | % | |
| Household Products | | | 1.8 | % | |
| Foods | | | 1.8 | % | |
| Aerospace & Defense | | | 1.5 | % | |
| Chemicals | | | 1.2 | % | |
| Metals & Mining | | | 1.2 | % | |
| Restaurants | | | 1.1 | % | |
| Forest Products & Paper | | | 1.0 | % | |
Building Materials &
Construction | | | 0.9 | % | |
| Apparel, Textiles & Shoes | | | 0.9 | % | |
| Computers & Information | | | 0.9 | % | |
| Prepackaged Software | | | 0.6 | % | |
| Advertising | | | 0.5 | % | |
| Healthcare | | | 0.4 | % | |
| Computer Related Services | | | 0.3 | % | |
| Containers | | | 0.3 | % | |
Home Construction,
Furnishings & Appliances | | | 0.2 | % | |
| Entertainment & Leisure | | | 0.1 | % | |
Short-Term Investments and
Other Assets and Liabilities | | | 0.8 | % | |
| | | | 100.0 | % | |
MassMutual Select Diversified Value Fund
Largest Holdings
Largest Stock Holdings (6/30/05)
General Electric Co.
Exxon Mobil Corp.
Citigroup, Inc.
Bank of America Corp.
JP Morgan Chase & Co.
Altria Group, Inc.
ChevronTexaco Corp.
Time Warner, Inc.
Wachovia Corp.
Hewlett-Packard Co.
10
MassMutual Select Diversified Value Fund – Portfolio Manager Report (Continued)
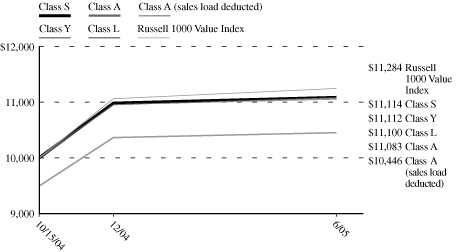
Growth of a $10,000 Investment
Hypothetical Investments in MassMutual Select Diversified Value Fund Class S, Class A, Class A (sales load deducted), Class Y, Class L and the Russell 1000 Value Index.
MassMutual Select Diversified Value Fund
Total Return
| | | Year to Date
1/1/05 - 6/30/05 | | Since Inception
10/15/04 - 6/30/05 | |
| Class S | | | 1.01 | % | | | 11.14 | % | |
| Class A | | | 0.91 | % | | | 10.83 | % | |
| Class A (sales load deducted)* | | | –4.89 | % | | | 4.46 | % | |
| Class Y | | | 1.10 | % | | | 11.12 | % | |
| Class L | | | 0.91 | % | | | 11.00 | % | |
| Russell 1000 Value Index | | | 1.76 | % | | | 12.84 | % | |
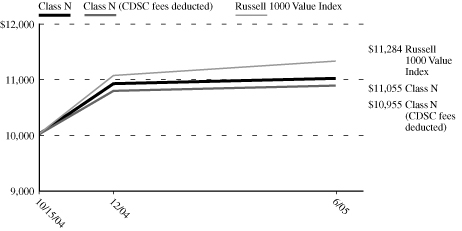
Hypothetical Investments in MassMutual Select Diversified Value Fund Class N, Class N (CDSC fees deducted) and the Russell 1000 Value Index.
MassMutual Select Diversified Value Fund
Total Return
| | | Year to Date
1/1/05 - 6/30/05 | | Since Inception
10/15/04 - 6/30/05 | |
| Class N | | | 0.64 | % | | | 10.55 | % | |
| Class N (CDSC fees deducted)* | | | –0.36 | % | | | 9.55 | % | |
| Russell 1000 Value Index | | | 1.76 | % | | | 12.84 | % | |
GROWTH OF A $10,000 INVESTMENT SINCE INCEPTION
* Class A (sales load deducted) returns include the 5.75% maximum sales charge and Class N (CDSC fees deducted) returns include the 1.00% maximum contingent deferred sales charge.
Performance data quoted represents past performance; past performance is not predictive of future results. The investment return and principal value of shares of the Fund will fluctuate with market conditions so that shares of the Fund, when redeemed, may be worth more or less than their original cost. Current performance of the Fund may be lower or higher than the performance quoted. Performance data current to the most recent month end may be obtained by calling 1-888-309-3539.
Investors should note that the Fund is a professionally managed mutual fund, while the Russell 1000 Value Index is unmanaged and does not incur expenses, and cannot be purchased directly by investors. Investors should read the Fund's prospectus with regard to the Fund's investment objective, risks and charges and expenses in conjunction with these financial statements. Employee retirement benefit plans that invest plan assets in the Separate Investment Accounts (SIAs) may be subject to certain charges as set forth in their respective Plan Documents. Total return figures would be lower for the periods presented if they reflected these charges. The performance tables and charts do not reflect the deduction of taxes that a shareholder would pay on the fund distributions or the redemption of the fund shares.
11
MassMutual Select Fundamental Value Fund – Portfolio Manager Report
What is the investment objective of the MassMutual Select Fundamental Value Fund?
The Fund seeks long-term total return by, under normal conditions, investing at least 80% of its assets in equity securities, with a focus on companies with large capitalizations.
How did the Fund perform during the six months ended June 30, 2005?
For the six months ended June 30, 2005, the Fund's Class S shares returned 0.74%, exceeding the –0.81% return of the S&P 500 Index, a market-capitalization-weighted, unmanaged index of 500 common stocks.
What was the investment backdrop during the period?
The first quarter saw the broader U.S. stock averages struggle unsuccessfully to remain above the break-even mark in the midst of widespread expectations for slower growth by the nation's economy and a reduction in corporate profits. On the fixed income front, bond yields fell and prices rose in January, but fears of rising inflation – especially resurgent crude oil prices – took center stage during the remainder of the quarter and reversed much of the earlier advance. Also putting pressure on bond prices was a surprisingly strong report on fourth quarter Gross Do mestic Product (GDP), released at the end of February, which pegged the nation's estimated growth rate at 3.8%, up sharply from the previous estimate of 3.1%. Additionally, there were two 0.25% hikes in short-term interest rates by the Federal Reserve Board (Fed) during the first three months of 2005.
Turning to the second quarter, U.S. stocks traded indecisively, as moderately positive news on the economy and corporate earnings was tempered by high crude oil prices, rising short-term interest rates and concerns about slowing economic growth. In the bond market, Treasuries outperformed other fixed income asset classes, while investment-grade bonds outpaced high-yield securities in the corporate sector. Debt downgrades to financially troubled automakers General Motors and Ford from investment-grade to high-yield status drew bond investors' attention and contributed to an environment favoring higher-quality bonds.
What factors contributed to the Fund's performance – and how have you responded?
In the first quarter, underweight positions in financials and telecommunication services and positive stock selection in utilities were unable to offset weaker results from the Fund's energy, consumer discretionary and health care holdings. We made investment choices in four of ten broad industry sectors that helped performance in the first quarter. Throughout the period, we reduced our holdings in companies that hadn't made progress in their business plans in our view.
In the second quarter, a negative bias toward financials and an overweight position relative to the Fund's benchmark in the negatively performing materials sector offset the gains realized through positive stock selection in the consumer staples, information technology and energy sectors – and an overweight allocation to the strong health care and utilities sectors. Stock selection in five of ten broad industry sectors was beneficial to the portfolio's benchmark-relative performance in the second quarter. Purchases during the period primarily reflected special situations, while sales consisted of companies that had achieved our price targets or whose fundamentals had deteriorated.
What is your outlook?
We expect economic growth to decelerate during the remainder of 2005, as positive forces such as favorable monetary policy, federal tax stimulus and real estate appreciation become less stimulative. Although the growth rate likely will moderate, there seems to be no end to the build in global imbalances. We generally expect Gross Domestic Product (GDP) growth over the next 12 months, both in the U.S. and abroad.
12
MassMutual Select Fundamental Value Fund – Portfolio Manager Report (Continued)
MassMutual Select Fundamental Value Fund
Industry Table
(% of Net Assets) on 6/30/05
| Banking, Savings & Loans | | | 17.2 | % | |
| Energy | | | 10.7 | % | |
| Electric Utilities | | | 9.5 | % | |
| Insurance | | | 7.5 | % | |
| Pharmaceuticals | | | 4.7 | % | |
| Metals & Mining | | | 4.7 | % | |
| Chemicals | | | 3.8 | % | |
| Machinery & Components | | | 3.7 | % | |
Broadcasting, Publishing &
Printing | | | 3.7 | % | |
Electrical Equipment &
Electronics | | | 3.1 | % | |
| Financial Services | | | 2.8 | % | |
| Retail | | | 2.8 | % | |
| Telephone Utilities | | | 2.8 | % | |
| Medical Supplies | | | 2.2 | % | |
| Communications | | | 2.0 | % | |
| Transportation | | | 1.8 | % | |
| Restaurants | | | 1.8 | % | |
| Industrial – Diversified | | | 1.7 | % | |
| Air Transportation | | | 1.7 | % | |
| Aerospace & Defense | | | 1.7 | % | |
| Manufacturing | | | 1.6 | % | |
| Beverages | | | 1.3 | % | |
| Apparel, Textiles & Shoes | | | 1.2 | % | |
| Cosmetics & Personal Care | | | 1.1 | % | |
| Foods | | | 1.0 | % | |
Computer Integrated Systems
Design | | | 0.6 | % | |
| Commercial Services | | | 0.4 | % | |
| Real Estate | | | 0.2 | % | |
Short-Term Investments and
Other Assets and Liabilities | | | 2.7 | % | |
| | | | 100.0 | % | |
MassMutual Select Fundamental
Value Fund
Largest Stock Holdings (6/30/05)
Alcoa, Inc.
Bank of America Corp.
Caterpillar, Inc.
Citigroup, Inc.
ConocoPhillips
Exelon Corp.
Exxon Mobil Corp.
GlobalSantaFe Corp.
JP Morgan Chase & Co.
WellPoint, Inc.
13
MassMutual Select Fundamental Value Fund – Portfolio Manager Report (Continued)
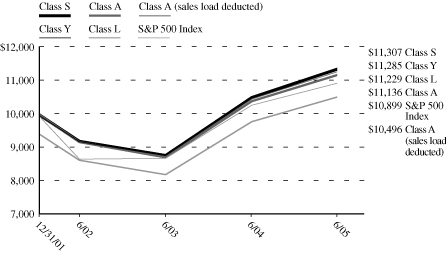
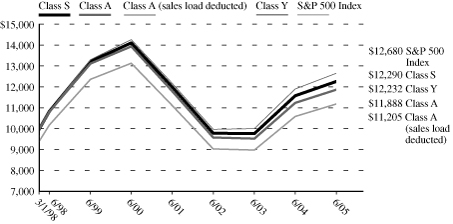
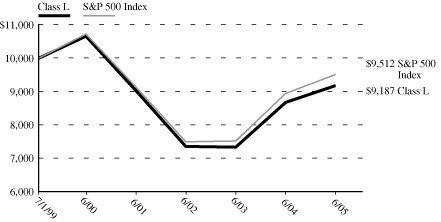
Growth of a $10,000 Investment
Hypothetical Investments in MassMutual Select Fundamental Value Fund Class S, Class A, Class A (sales load deducted), Class Y, Class L and the S&P 500 Index.
MassMutual Select Fundamental Value Fund
Total Return
| | | Year to Date
1/1/05 - 6/30/05 | | One Year
7/1/04 - 6/30/05 | | Since Inception
Average Annual
12/31/01 - 6/30/05 | |
| Class S | | | 0.74 | % | | | 7.93 | % | | | 3.57 | % | |
| Class A | | | 0.47 | % | | | 7.38 | % | | | 3.12 | % | |
Class A (sales
load deducted)* | | | –5.31 | % | | | 1.21 | % | | | 1.39 | % | |
| Class Y | | | 0.74 | % | | | 7.91 | % | | | 3.51 | % | |
| Class L | | | 0.56 | % | | | 7.69 | % | | | 3.37 | % | |
| S&P 500 Index | | | –0.81 | % | | | 6.32 | % | | | 2.49 | % | |
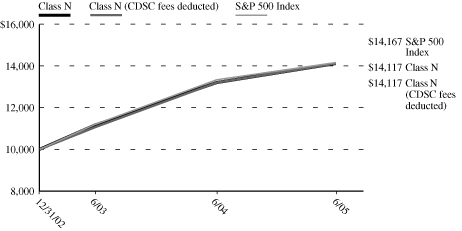
Hypothetical Investments in MassMutual Select Fundamental Value Fund Class N, Class N (CDSC fees deducted) and the S&P 500 Index.
MassMutual Select Fundamental Value Fund
Total Return
| | | Year to Date
1/1/05 - 6/30/05 | | One Year
7/1/04 - 6/30/05 | | Since Inception
Average Annual
12/31/02 - 6/30/05 | |
| Class N | | | 0.28 | % | | | 7.04 | % | | | 14.80 | % | |
Class N (CDSC
fees deducted)* | | | –0.72 | % | | | 6.04 | % | | | 14.80 | % | |
| S&P 500 Index | | | –0.81 | % | | | 6.32 | % | | | 14.96 | % | |
GROWTH OF A $10,000 INVESTMENT SINCE INCEPTION
* Class A (sales load deducted) returns include the 5.75% maximum sales charge and Class N (CDSC fees deducted) returns include the 1.00% maximum contingent deferred sales charge for the first 18 months shown.
Performance data quoted represents past performance; past performance is not predictive of future results. The investment return and principal value of shares of the Fund will fluctuate with market conditions so that shares of the Fund, when redeemed, may be worth more or less than their original cost. Current performance of the Fund may be lower or higher than the performance quoted. Performance data current to the most recent month end may be obtained by calling 1-888-309-3539.
Investors should note that the Fund is a professionally managed mutual fund, while the S&P 500 Index is unmanaged and does not incur expenses, and cannot be purchased directly by investors. Investors should read the Fund's prospectus with regard to the Fund's investment objective, risks and charges and expenses in conjunction with these financial statements. Employee retirement benefit plans that invest plan assets in the Separate Investment Accounts (SIAs) may be subject to certain charges as set forth in their respective Plan Documents. Total return figures would be lower for the periods presented if they reflected these charges. The performance tables and charts do not reflect the deduction of taxes that a shareholder would pay on the fund distributions or the redemption of the fund shares.
14
MassMutual Select Value Equity Fund – Portfolio Manager Report
What is the investment objective of the MassMutual Select Value Equity Fund?
The Fund seeks long-term growth of capital by investing in securities of companies that the Fund's sub-adviser believes are undervalued in the marketplace in relation to factors such as the company's assets, sales, earnings, growth potential, or cash flow, or in relation to securities of other companies in the same industry.
How did the Fund perform during the six months ended June 30, 2005?
For the six months ended June 30, 2005, the Fund's Class S shares returned 0.95%, trailing the 1.76% return of the Russell 1000 Value Index, an unmanaged index representative of stocks with a greater than average value orientation among stocks of the largest 1,000 U.S. companies based on capitalization.
What was the investment background during the period?
Stocks returns were mixed during the first quarter of 2005. The broader market, as measured by the S&P 500 Index, declined due to concerns about the continued increase in energy prices, rising interest rates and inflation. However, strong corporate earnings and a flurry of mergers and acquisitions lifted parts of the market. The top-performing sectors were those that tend to be more defensive or those that typically benefit from rising oil prices, such as energy stocks and utilities. Sectors that can be more sensitive to rising interest rates – such as finan cial, technology and consumer discretionary stocks – declined. The defensive preference of investors also was apparent in the outperformance of the large-cap Russell 1000 Index over the small-cap Russell 2000 and of the Russell 1000 Value over the Russell 1000 Growth.
U.S. stocks posted modest gains during the second quarter of 2005. The U.S. economy appeared healthy during the quarter, but higher oil prices and concerns about decelerating global economic growth kept stock market returns in check. As expected, the Federal Reserve Board (Fed) continued to raise short-term interest rates, and these actions appeared to ease inflationary pressures. However, defying expectations, longer-term interest rates declined, moving corporate and home buyer borrowing costs below their already low levels. The top-performing sectors during the period were those that tend to benefit from lower interest rates, including utilities and financials, while sectors that are more sensitive to global economic growth declined, including materials and industrials. During the quarter, investors seemed to abandon some of the defensive posturing they undertook in the first quarter, as the small-cap Ru ssell 2000 Index outperformed the large-cap Russell 1000, and the Russell 1000 Growth topped the Russell 1000 Value Index.
What factors contributed to the Fund's performance?
In the first quarter, the Fund was hurt by poor security selection, particularly within the health care sector, where the Fund's holdings in the pharmaceuticals and health care equipment industries lagged the rest of the market. Also detracting from performance was top-ten holding American International Group. The insurance industry leader declined during the period due to allegations that the company improperly accounted for a number of offshore accounts for which it might have to restate earnings. Contributing to performance were underweighted positions in the financials and consumer discretionary sectors. Financial stocks underperformed, due to concerns about recent increases in interest rates as well as concerns that the Fed might continue to raise the short-term federal funds rate.
Turning to the second quarter, the Fund was hurt by poor market selection, particularly an underweighting of the strong-performing utilities and financials sectors, both of which received a boost from lower long-term interest rates. Also hampering performance was an overweighting of the poor-performing materials sector, particularly some of the Fund's chemicals and paper packaging holdings. As a group, materials stocks were hampered by lowered expectations for global economic growth. Conversely, fueling performance during the quarter was strong security selection within the energy and telecommunications sectors. Within energy, the Fund benefited from overweighting energy equipment and services stocks and underweighting the weaker-performing, large integrated oil companies. In the telecommunications sector, the Fund received a boost from its wireless holdings, which benefited from industry consolidation and strong fundamentals.
15
MassMutual Select Value Equity Fund – Portfolio Manager Report (Continued)
What is your outlook?
Stock prices have held up remarkably well against the dual threats of rising interest rates and high crude oil prices, both of which can negatively impact company earnings. We believe there are a number of favorable factors at work in the current investment environment, including a reasonably healthy U.S. economy. Other positive influences include fairly robust consumer confidence, along with interest rates and inflation that are still low by historical standards.
MassMutual Select Value Equity Fund
Industry Table
(% of Net Assets) on 6/30/05
| Energy | | | 14.1 | % | |
| Banking, Savings & Loans | | | 10.3 | % | |
| Insurance | | | 7.2 | % | |
Electrical Equipment &
Electronics | | | 7.0 | % | |
| Medical Supplies | | | 5.1 | % | |
| Aerospace & Defense | | | 4.7 | % | |
| Pharmaceuticals | | | 4.7 | % | |
| Chemicals | | | 4.4 | % | |
| Financial Services | | | 4.0 | % | |
| Communications | | | 3.9 | % | |
| Commercial Services | | | 2.6 | % | |
| Industrial – Diversified | | | 2.5 | % | |
Broadcasting, Publishing &
Printing | | | 2.2 | % | |
| Prepackaged Software | | | 2.1 | % | |
| Retail | | | 1.7 | % | |
| Electric Utilities | | | 1.7 | % | |
| Telephone Utilities | | | 1.5 | % | |
| Tobacco | | | 1.4 | % | |
| Computers & Information | | | 1.3 | % | |
Information Retrieval
Services | | | 1.2 | % | |
Home Construction,
Furnishings & Appliances | | | 1.2 | % | |
| Foods | | | 1.1 | % | |
| Machinery & Components | | | 1.1 | % | |
| Cosmetics & Personal Care | | | 1.1 | % | |
| Beverages | | | 1.0 | % | |
Photography Equipment/
Supplies | | | 1.0 | % | |
| Containers | | | 1.0 | % | |
| Transportation | | | 1.0 | % | |
Computers & Office
Equipment | | | 0.9 | % | |
| Metals & Mining | | | 0.8 | % | |
| Advertising | | | 0.8 | % | |
| Entertainment & Leisure | | | 0.7 | % | |
| Healthcare | | | 0.6 | % | |
| Air Transportation | | | 0.6 | % | |
| Automotive & Parts | | | 0.4 | % | |
Building Materials &
Construction | | | 0.4 | % | |
| Computer & Data Processing Services | | | 0.3 | % | |
| Data Processing & Preparation | | | 0.3 | % | |
| Internet Software | | | 0.3 | % | |
| Forest Products & Paper | | | 0.2 | % | |
| Household Products | | | 0.2 | % | |
| Restaurants | | | 0.2 | % | |
| Communications Equipment | | | 0.2 | % | |
| Apparel, Textiles & Shoes | | | 0.2 | % | |
Computer Programming
Services | | | 0.2 | % | |
| Internet Content | | | 0.1 | % | |
| Heavy Construction | | | 0.1 | % | |
Computer Integrated Systems
Design | | | 0.0 | % | |
Short-Term Investments and
Other Assets and Liabilities | | | 0.4 | % | |
| | | | 100.0 | % | |
MassMutual Select Value Equity Fund
Largest Stock Holdings (6/30/05)
General Electric Co.
American International Group, Inc.
Exxon Mobil Corp.
Honeywell International, Inc.
Bank of America Corp.
Baxter International, Inc.
SBC Communications, Inc.
Tyco International Limited
Altria Group, Inc.
JP Morgan Chase & Co.
16
MassMutual Select Value Equity Fund – Portfolio Manager Report (Continued)
Growth of a $10,000 Investment
Hypothetical Investments in MassMutual Select Value Equity Fund Class S, Class A, Class A (sales load deducted), Class Y, Class L and the Russell 1000 Value Index.
MassMutual Select Value Equity Fund
Total Return
| | | Year to Date
1/1/05 - 6/30/05 | | One Year
7/1/04 - 6/30/05 | | Since Inception
Average Annual
5/1/01 - 6/30/05 | |
| Class S | | | 0.95 | % | | | 10.92 | % | | | 3.00 | % | |
| Class A | | | 0.76 | % | | | 10.53 | % | | | 2.56 | % | |
Class A (sales
load deducted)* | | | –5.03 | % | | | 4.18 | % | | | 1.11 | % | |
| Class Y | | | 0.85 | % | | | 10.85 | % | | | 2.95 | % | |
| Class L | | | 0.86 | % | | | 10.77 | % | | | 2.82 | % | |
Russell 1000
Value Index | | | 1.76 | % | | | 14.06 | % | | | 5.40 | % | |
Hypothetical Investments in MassMutual Select Value Equity Fund, Class N, Class N (CDSC fees deducted) and the Russell 1000 Value Index.
MassMutual Select Value Equity Fund
Total Return
| | | Year to Date
1/1/05 - 6/30/05 | | One Year
7/1/04 - 6/30/05 | | Since Inception
Average Annual
12/31/02 - 6/30/05 | |
| Class N | | | 0.57 | % | | | 10.15 | % | | | 15.21 | % | |
Class N (CDSC
fees deducted)* | | | –0.43 | % | | | 9.15 | % | | | 15.21 | % | |
Russell 1000
Value Index | | | 1.76 | % | | | 14.06 | % | | | 19.00 | % | |
GROWTH OF A $10,000 INVESTMENT SINCE INCEPTION
* Class A (sales load deducted) returns include the 5.75% maximum sales charge and Class N (CDSC fees deducted) returns include the 1.00% maximum contingent deferred sales charge for the first 18 months shown.
Performance data quoted represents past performance; past performance is not predictive of future results. The investment return and principal value of shares of the Fund will fluctuate with market conditions so that shares of the Fund, when redeemed, may be worth more or less than their original cost. Current performance of the Fund may be lower or higher than the performance quoted. Performance data current to the most recent month end may be obtained by calling 1-888-309-3539.
Investors should note that the Fund is a professionally managed mutual fund, while the Russell 1000 Value Index is unmanaged and does not incur expenses, and cannot be purchased directly by investors. Investors should read the Fund's prospectus with regard to the Fund's investment objective, risks and charges and expenses in conjunction with these financial statements. Employee retirement benefit plans that invest plan assets in the Separate Investment Accounts (SIAs) may be subject to certain charges as set forth in their respective Plan Documents. Total return figures would be lower for the periods presented if they reflected these charges. The performance tables and charts do not reflect the deduction of taxes that a shareholder would pay on the fund distributions or the redemption of the fund shares.
17
MassMutual Select Large Cap Value Fund – Portfolio Manager Report
What is the investment objective of the MassMutual Select Large Cap Value Fund?
This Fund seeks both capital growth and income by selecting high quality, large capitalization companies primarily in the S&P 500 Index.
How did the Fund perform during the six months ended June 30, 2005?
For the six months ended June 30, 2005, the Fund's Class S shares returned 1.34%, outpacing the –0.81% return of the S&P 500 Index, a market-capitalization-weighted, unmanaged index of 500 common stocks.
What was the investment backdrop during the period?
The first quarter saw the broader U.S. stock averages struggle unsuccessfully to remain above the break-even mark in the midst of widespread expectations for slower growth by the nation's economy and a reduction in corporate profits. On the fixed income front, bond yields fell and prices rose in January, but fears of rising inflation – especially resurgent crude oil prices – took center stage during the remainder of the quarter and reversed much of the earlier advance. Also putting pressure on bond prices was a surprisingly strong report on fourth quarter Gross Do mestic Product (GDP), released at the end of February, which pegged the nation's estimated growth rate at 3.8%, up sharply from the previous estimate of 3.1%. Additionally, there were two 0.25% hikes in short-term interest rates by the Federal Reserve Board (Fed) during the first three months of 2005.
Turning to the second quarter, U.S. stocks traded indecisively, as moderately positive news on the economy and corporate earnings was tempered by high crude oil prices, rising short-term interest rates and concerns about slowing economic growth. In the bond market, Treasuries outperformed other fixed income asset classes, while investment-grade bonds outpaced high-yield securities in the corporate sector. Debt downgrades to financially troubled automakers General Motors and Ford from investment-grade to high-yield status drew bond investors' attention and contributed to an environment that favored higher-quality bonds.
What factors contributed to the Fund's performance – and how did you respond?
During the first quarter, energy and select holdings in health care and consumer products contributed positively to the Fund's results, offset by weaker results in financials. Top-performing positions included ConcocoPhillips, EOG Resources, HCA Inc., Devon Energy and Occidental Petroleum. Detractors from performance during the period included Centerpoint Properties Trust, Costco Wholesale, JPMorgan Chase, American Express and American International Group. We did not make any notable changes to the portfolio during the first quarter.
Turning to the second quarter, contributors to performance were largely stock specific. Notable standouts included EOG Resources, American International Group, H&R Block, American Express and Progressive Corp. The list of detractors included Berkshire Hathaway, Transatlantic Holdings, Lexmark International, Comcast and Tyco. Toward the end of June, the Fund initiated a position in Harley-Davidson, the well-known U.S.-based motorcycle manufacturer.
What is your outlook?
We believe that the major averages are likely to remain in a trading range and will not necessarily experience large sustained gains or declines for the foreseeable future. If this unfolds, prudent stock selection will be the key to generating favorable results.
18
MassMutual Select Large Cap Value Fund – Portfolio Manager Report (Continued)
MassMutual Select Large Cap Value Fund
Industry Table
(% of Net Assets) on 6/30/05
| Banking, Savings & Loans | | | 18.3 | % | |
| Insurance | | | 13.6 | % | |
| Financial Services | | | 12.3 | % | |
| Energy | | | 10.4 | % | |
| Commercial Services | | | 5.5 | % | |
Broadcasting, Publishing &
Printing | | | 5.2 | % | |
| Tobacco | | | 5.0 | % | |
| Retail | | | 4.6 | % | |
| Industrial – Diversified | | | 4.3 | % | |
| Containers | | | 2.5 | % | |
| Pharmaceuticals | | | 2.3 | % | |
| Beverages | | | 2.0 | % | |
| Healthcare | | | 1.7 | % | |
Building Materials &
Construction | | | 1.6 | % | |
| Computers & Information | | | 1.2 | % | |
| Transportation | | | 1.0 | % | |
| Foods | | | 1.0 | % | |
| Prepackaged Software | | | 0.9 | % | |
| Automotive & Parts | | | 0.7 | % | |
| Communications | | | 0.7 | % | |
| Diversified Financial | | | 0.6 | % | |
Computers & Office
Equipment | | | 0.6 | % | |
| Advertising | | | 0.3 | % | |
| Cosmetics & Personal Care | | | 0.2 | % | |
| Household Products | | | 0.2 | % | |
Short-Term Investments and
Other Assets and Liabilities | | | 3.3 | % | |
| | | | 100.0 | % | |
MassMutual Select Large Cap
Value Fund
Largest Stock Holdings (6/30/05)
Altria Group, Inc.
American Express Co.
American International Group, Inc.
Berkshire Hathaway, Inc. Cl. A
Comcast Corp. Special, Class A
Costco Wholesale Corp.
Golden West Financial Corp.
JP Morgan Chase & Co.
Progressive Corp.
Tyco International Limited
19
MassMutual Select Large Cap Value Fund – Portfolio Manager Report (Continued)
Growth of a $10,000 Investment
Hypothetical Investments in MassMutual Select Large Cap Value Fund Class S, Class A, Class A (sales load deducted), Class Y, Class L and the S&P 500 Index.
MassMutual Select Large Cap Value Fund
Total Return
| | | Year to Date
1/1/05 -
6/30/05 | | One Year
7/1/04 -
6/30/05 | | Five Year
Average
Annual
7/1/00 -
6/30/05 | | Since
Inception
Average
Annual
5/1/00 -
6/30/05 | |
| Class S | | | 1.34 | % | | | 8.64 | % | | | 2.28 | % | | | 1.79 | % | |
| Class A | | | 1.06 | % | | | 7.99 | % | | | 1.78 | % | | | 1.29 | % | |
Class A (sales
load deducted)* | | | –4.75 | % | | | 1.78 | % | | | 0.58 | % | | | 0.13 | % | |
| Class Y | | | 1.15 | % | | | 8.38 | % | | | 2.17 | % | | | 1.68 | % | |
| Class L | | | 1.05 | % | | | 8.27 | % | | | 2.02 | % | | | 1.51 | % | |
| S&P 500 Index | | | –0.81 | % | | | 6.32 | % | | | –2.37 | % | | | –2.23 | % | |
Hypothetical Investments in MassMutual Select Large Cap Value Fund Class N, Class N (CDSC fees deducted) and the S&P 500 Index.
MassMutual Select Large Cap Value Fund
Total Return
| | | Year to Date
1/1/05 - 6/30/05 | | One Year
7/1/04 - 6/30/05 | | Since Inception
Average Annual
12/31/02 - 6/30/05 | |
| Class N | | | 0.87 | % | | | 7.68 | % | | | 16.15 | % | |
Class N (CDSC
fees deducted)* | | | –0.13 | % | | | 6.68 | % | | | 16.15 | % | |
| S&P 500 Index | | | –0.81 | % | | | 6.32 | % | | | 14.96 | % | |
GROWTH OF A $10,000 INVESTMENT SINCE INCEPTION


* Class A (sales load deducted) returns include the 5.75% maximum sales charge and Class N (CDSC fees deducted) returns include the 1.00% maximum contingent deferred sales charge for the first 18 months shown.
Performance data quoted represents past performance; past performance is not predictive of future results. The investment return and principal value of shares of the Fund will fluctuate with market conditions so that shares of the Fund, when redeemed, may be worth more or less than their original cost. Current performance of the Fund may be lower or higher than the performance quoted. Performance data current to the most recent month end may be obtained by calling 1-888-309-3539.
Investors should note that the Fund is a professionally managed mutual fund, while the S&P 500 Index is unmanaged and does not incur expenses, and cannot be purchased directly by investors. Investors should read the Fund's prospectus with regard to the Fund's investment objective, risks and charges and expenses in conjunction with these financial statements. Employee retirement benefit plans that invest plan assets in the Separate Investment Accounts (SIAs) may be subject to certain charges as set forth in their respective Plan Documents. Total return figures would be lower for the periods presented if they reflected these charges. The performance tables and charts do not reflect the deduction of taxes that a shareholder would pay on the fund distributions or the redemption of the fund shares.
20
MassMutual Select Indexed Equity Fund – Portfolio Manager Report
What is the investment objective of the MassMutual Select Indexed Equity Fund?
The Fund seeks to approximate as closely as practicable (before fees and expenses) the capitalization-weighted total rate of return of that portion of the U.S. market for publicly traded common stocks composed of larger-capitalized companies. The Fund pursues this objective by investing at least 80% of its assets in the equity securities of companies that make up the S&P 500 Index.
How did the Fund perform during the six months ended June 30, 2005?
For the six months ended June 30, 2005, the Fund's Class S shares returned –0.97%, lagging the –0.81% return of the S&P 500 Index, a market-capitalization-weighted, unmanaged index of 500 common stocks.
What was the investment backdrop during the period?
The first quarter saw the broader U.S. stock averages struggle unsuccessfully to remain above the break-even mark in the midst of widespread expectations for slower growth by the nation's economy and a reduction in corporate profits. On the fixed income front, bond yields fell and prices rose in January, but fears of rising inflation – especially resurgent crude oil prices – took center stage during the remainder of the quarter and reversed much of the earlier advance. Also putting pressure on bond prices was a surprisingly strong report on fourth quarter Gross Do mestic Product (GDP), released at the end of February, which pegged the nation's estimated growth rate at 3.8%, up sharply from the previous estimate of 3.1%. Additionally, there were two 0.25% hikes in short-term interest rates by the Federal Reserve Board (Fed) during the first three months of 2005.
Turning to the second quarter, U.S. stocks traded indecisively, as moderately positive news on the economy and corporate earnings was tempered by high crude oil prices, rising short-term interest rates and concerns about slowing economic growth. In the bond market, Treasuries outperformed other fixed income asset classes, while investment-grade bonds outpaced high-yield securities in the corporate sector. Debt downgrades to financially troubled automakers General Motors and Ford from investment-grade to high-yield status drew bond investors' attention and contributed to an environment favoring higher-quality bonds.
What factors contributed to the Fund's performance?
In the first quarter, growth stocks outpaced value issues, and small and mid cap securities ended the period in negative territory. On a sector basis, the energy and utilities sectors posted the best performance, up 17.58% and 5.42%, respectively. However, the strong performance of these sectors was not enough to bring the S&P 500 Index into positive territory, since energy stocks account for only 8.03% of the S&P 500 Index, and utilities, just 3.06%. The two largest sectors in the S&P 500 ended the quarter with sharp losses. The financial sector, representing 20.42% of the S&P 500 Index, lost 6.38% and information technology, at 15.44% of the S&P 500 Index, dropped 7.33%. The worst-performing sector for the period was telecommunications services, down 7.78%. Against the backdrop of high oil prices and two interest hikes by the Fed, the vast majority of U.S. equity indexes posted negative returns during the period.
In the second quarter, value stocks outpaced their growth counterparts, and small and mid cap securities posted positive returns. From a sector perspective, utilities and financials sectors posted the best performance, up 9.31% and 4.33%, respectively. The health care sector, which comprises 13.49% of the S&P 500 Index, was also positive for the period, posting a return of 4.13%. The increase in the energy sector continued through the second quarter, as that sector, which represents 8.56% of the S&P 500 Index, advanced 1.99%. The worst-performing sector for the second quarter was materials, which fell 9.47%.
What is your outlook?
Stock prices have held up remarkably well against the dual threats of rising interest rates and high crude oil prices, both of which can negatively impact company earnings. We believe there are a number of favorable factors at work in the current investment environment, including a reasonably healthy U.S. economy. Other positive influences include fairly robust consumer confidence, along with interest rates and inflation that are still low by historical standards.
21
MassMutual Select Indexed Equity Fund – Portfolio Manager Report (Continued)
MassMutual Select Indexed Equity Fund
Industry Table
(% of Net Assets) on 6/30/05
| Banking, Savings & Loans | | | 11.3 | % | |
| Pharmaceuticals | | | 8.8 | % | |
| Energy | | | 8.7 | % | |
Electrical Equipment &
Electronics | | | 6.8 | % | |
| Retail | | | 5.5 | % | |
| Insurance | | | 5.2 | % | |
| Computers & Information | | | 4.0 | % | |
| Financial Services | | | 3.8 | % | |
| Prepackaged Software | | | 3.8 | % | |
| Electric Utilities | | | 3.1 | % | |
Broadcasting, Publishing &
Printing | | | 2.5 | % | |
| Cosmetics & Personal Care | | | 2.4 | % | |
| Medical Supplies | | | 2.3 | % | |
| Beverages | | | 2.2 | % | |
| Aerospace & Defense | | | 2.2 | % | |
| Telephone Utilities | | | 2.1 | % | |
| Communications | | | 2.0 | % | |
| Foods | | | 1.8 | % | |
| Transportation | | | 1.7 | % | |
| Industrial – Diversified | | | 1.7 | % | |
| Commercial Services | | | 1.6 | % | |
| Chemicals | | | 1.5 | % | |
| Tobacco | | | 1.4 | % | |
| Healthcare | | | 1.3 | % | |
| Entertainment & Leisure | | | 1.0 | % | |
Computers & Office
Equipment | | | 0.9 | % | |
| Machinery & Components | | | 0.9 | % | |
| Automotive & Parts | | | 0.8 | % | |
Data Processing &
Preparation | | | 0.8 | % | |
| Apparel, Textiles & Shoes | | | 0.7 | % | |
| Metals & Mining | | | 0.6 | % | |
| Household Products | | | 0.6 | % | |
| Restaurants | | | 0.6 | % | |
| Forest Products & Paper | | | 0.5 | % | |
Information Retrieval
Services | | | 0.4 | % | |
| Communications Equipment | | | 0.4 | % | |
| Manufacturing | | | 0.4 | % | |
Home Construction,
Furnishings & Appliances | | | 0.3 | % | |
| Lodging | | | 0.3 | % | |
Computer Integrated
Systems Design | | | 0.3 | % | |
| Real Estate | | | 0.2 | % | |
| Advertising | | | 0.2 | % | |
Building Materials &
Construction | | | 0.2 | % | |
| Containers | | | 0.2 | % | |
| Air Transportation | | | 0.1 | % | |
| Toys, Games | | | 0.1 | % | |
Photography Equipment/
Supplies | | | 0.1 | % | |
| Retail – Grocery | | | 0.1 | % | |
| Industrial – Distribution | | | 0.1 | % | |
Computer Programming
Services | | | 0.0 | % | |
| Travel | | | 0.0 | % | |
Short-Term Investments and
Other Assets and Liabilities | | | 1.5 | % | |
| | | | 100.0 | % | |
MassMutual Select Indexed
Equity Fund
Largest Stock Holdings (6/30/05)
General Electric Co.
Exxon Mobil Corp.
Microsoft Corp.
Citigroup, Inc.
Pfizer, Inc.
Johnson & Johnson
Bank of America Corp.
Wal-Mart Stores, Inc.
Intel Corp.
American International Group, Inc.
22
MassMutual Select Indexed Equity Fund – Portfolio Manager Report (Continued)
Growth of a $10,000 Investment
Hypothetical Investments in MassMutual Select Indexed Equity Fund Class S, Class A, Class A (sales load deducted), Class Y and the S&P 500 Index.
MassMutual Select Indexed Equity Fund
Total Return
| | | Year to Date
1/1/05 -
6/30/05 | | One Year
7/1/04 -
6/30/05 | | Five Year
Average
Annual
7/1/00 -
6/30/05 | | Since
Inception
Average
Annual
3/1/98 -
6/30/05 | |
| Class S | | | –0.97 | % | | | 5.95 | % | | | –2.78 | % | | | 2.85 | % | |
| Class A | | | –1.17 | % | | | 5.63 | % | | | –3.18 | % | | | 2.39 | % | |
Class A (sales
load deducted)* | | | –6.85 | % | | | –0.44 | % | | | –4.32 | % | | | 1.56 | % | |
| Class Y | | | –0.98 | % | | | 5.93 | % | | | –2.83 | % | | | 2.78 | % | |
| S&P 500 Index | | | –0.81 | % | | | 6.32 | % | | | –2.37 | % | | | 3.29 | % | |
Hypothetical Investments in MassMutual Select Indexed Equity Fund Class L and the S&P 500 Index.
MassMutual Select Indexed Equity Fund
Total Return
| | | Year to Date
1/1/05 -
6/30/05 | | One Year
7/1/04 -
6/30/05 | | Five Year
Average
Annual
7/1/00 -
6/30/05 | | Since
Inception
Average
Annual
7/1/99 -
6/30/05 | |
| Class L | | | –0.99 | % | | | 5.86 | % | | | –2.93 | % | | | –1.40 | % | |
| S&P 500 Index | | | –0.81 | % | | | 6.32 | % | | | –2.37 | % | | | –0.83 | % | |
GROWTH OF A $10,000 INVESTMENT SINCE INCEPTION
* Class A (sales load deducted) returns include the 5.75% maximum sales charge.
Performance data quoted represents past performance; past performance is not predictive of future results. The investment return and principal value of shares of the Fund will fluctuate with market conditions so that shares of the Fund, when redeemed, may be worth more or less than their original cost. Current performance of the Fund may be lower or higher than the performance quoted. Performance data current to the most recent month end may be obtained by calling 1-888-309-3539.
Investors should note that the Fund is a professionally managed mutual fund, while the S&P 500 Index is unmanaged and does not incur expenses, and cannot be purchased directly by investors. Investors should read the Fund's prospectus with regard to the Fund's investment objective, risks and charges and expenses in conjunction with these financial statements. Employee retirement benefit plans that invest plan assets in the Separate Investment Accounts (SIAs) may be subject to certain charges as set forth in their respective Plan Documents. Total return figures would be lower for the periods presented if they reflected these charges. The performance tables and charts do not reflect the deduction of taxes that a shareholder would pay on the fund distributions or the redemption of the fund shares.
23
MassMutual Select Indexed Equity Fund – Portfolio Manager Report (Continued)
Growth of a $10,000 Investment
Hypothetical Investments in MassMutual Select Indexed Equity Fund Class Z and the S&P 500 Index.
MassMutual Select Indexed Equity Fund
Total Return
| | | Year to Date
1/1/05 - 6/30/05 | | One Year
7/1/04 - 6/30/05 | | Since Inception
Average Annual
5/1/01 - 6/30/05 | |
| Class Z | | | –0.88 | % | | | 6.22 | % | | | 0.36 | % | |
| S&P 500 Index | | | –0.81 | % | | | 6.32 | % | | | 0.54 | % | |
Hypothetical Investments in MassMutual Select Indexed Equity Fund Class N, Class N (CDSC fees deducted) and the S&P 500 Index.
MassMutual Select Indexed Equity Fund
Total Return
| | | Year to Date
1/1/05 - 6/30/05 | | One Year
7/1/04 - 6/30/05 | | Since Inception
Average Annual
12/31/02 - 6/30/05 | |
| Class N | | | –1.27 | % | | | 5.29 | % | | | 13.68 | % | |
Class N (CDSC
fees deducted)* | | | –2.26 | % | | | 5.49 | % | | | 13.68 | % | |
| S&P 500 Index | | | –0.81 | % | | | 6.32 | % | | | 14.96 | % | |
GROWTH OF A $10,000 INVESTMENT SINCE INCEPTION


* Class N (CDSC fees deducted) returns include the 1.00% maximum contingent deferred sales charge for the first 18 months shown.
Performance data quoted represents past performance; past performance is not predictive of future results. The investment return and principal value of shares of the Fund will fluctuate with market conditions so that shares of the Fund, when redeemed, may be worth more or less than their original cost. Current performance of the Fund may be lower or higher than the performance quoted. Performance data current to the most recent month end may be obtained by calling 1-888-309-3539.
Investors should note that the Fund is a professionally managed mutual fund, while the S&P 500 Index is unmanaged and does not incur expenses, and cannot be purchased directly by investors. Investors should read the Fund's prospectus with regard to the Fund's investment objective, risks and charges and expenses in conjunction with these financial statements. Employee retirement benefit plans that invest plan assets in the Separate Investment Accounts (SIAs) may be subject to certain charges as set forth in their respective Plan Documents. Total return figures would be lower for the periods presented if they reflected these charges. The performance tables and charts do not reflect the deduction of taxes that a shareholder would pay on the fund distributions or the redemption of the fund shares.
24
MassMutual Select Blue Chip Growth Fund – Portfolio Manager Report
What is the investment objective of the MassMutual Select Blue Chip Growth Fund?
This Fund seeks growth of capital over the long term by normally investing at least 80% of assets in blue chip companies. Blue chip companies include companies whose stock is included in the Standard & Poor's 500 Index or the Dow Jones Industrial Average, and companies with market capitalizations of at least $1 billion if not included in either index. (A company's market capitalization is based on its current market capitalization or its market capitalization at the time of the Fund's investment.)
How did the Fund perform during the six months ended June 30, 2005?
For the six months ended June 30, 2005, the Fund's Class S shares returned –2.15%, lagging the –0.81% return of the S&P 500 Index, a market-capitalization-weighted, unmanaged index of 500 common stocks.
What was the investment background during the period?
The consistent theme throughout the first quarter of 2005 was rising crude oil prices. The potential for these increases to reverberate throughout the economy and ignite inflation helped to undermine investor confidence. Furthering investor unease was higher borrowing costs resulting from two interest rate increases by the Federal Reserve (Fed). Looking at the S&P 500 Index from an industry perspective, energy stocks were the best-performing industry, while the telecommunications and information technology industries posted the lowest returns. From a capitalizati on viewpoint, energy stocks helped large-capitalization value stocks perform best – albeit with a relatively flat return – while small-capitalization growth stocks had the poorest results as a group.
Equity markets enjoyed a favorable second quarter. While all style categories posted positive results, small-capitalization value stocks generated the highest returns. From a sector perspective, utilities stocks – which offer attractive dividend yields – were the strongest performers. Energy shares finished second, with crude oil at $60.95 per barrel by the end of June. The Fed, assured that U.S. economic growth remained on track while citing continued upward pressure on inflation, raised the federal funds target rate further during the quarter – bringing it to 3.25% at the end of June, up from 1.25% on June 30, 2004. While short-term interest rates rose, long-term yields did not follow suit, as is typically seen, remaining flat if not lower. Relatively low long-term rates helped further stimulate demand for home mortgages and led to higher housing prices.
What factors contributed to the Fund's performance?
An underweighting in energy stocks detracted from relative results in the first quarter, as integrated energy companies and exploration and production companies posted strong gains. The Fund held an overweight position relative to the benchmark in information technology stocks. Within that space, companies in the communications and networking equipment industries generally detracted from performance, whereas computer hardware and semiconductor companies contributed. Merger and acquisition activity in the consumer staples group contributed to the Fund's performance, as a lar ge personal and household products company in the portfolio appreciated due to its acceptance of a takeover bid.
Turning to the second quarter, strong stock selection in the pharmaceutical and biotechnology industry helped performance. In the software services group, a growing Internet search company helped fuel returns, as it continued to benefit from exploiting its impressive Internet advertising model. Offsetting this favorable performance was the Fund's relative underweighting in the strong-performing utility sector. Elsewhere, rising interest rates and high energy prices detracted from consumers' disposable income. This environment created challenges for holdings such as Wal-Mart, which was already struggling due to its increasingly competitive environment and investors' growing doubts about the company's future leadership role in the retail industry.
What is your outlook?
Stock prices have held up remarkably well against the dual threats of rising interest rates and high crude oil prices. We believe there are a number of favorable factors at work in the current investment environment, including a reasonably healthy U.S. economy. Other positive influences include fairly robust consumer confidence, along with interest rates and inflation that are still low by historical standards.
25
MassMutual Select Blue Chip Growth Fund – Portfolio Manager Report (Continued)
MassMutual Select Blue Chip Growth Fund
Industry Table
(% of Net Assets) on 6/30/05
| Pharmaceuticals | | | 13.4 | % | |
Electrical Equipment &
Electronics | | | 10.3 | % | |
| Retail | | | 6.9 | % | |
| Banking, Savings & Loans | | | 6.3 | % | |
| Prepackaged Software | | | 6.2 | % | |
| Computers & Information | | | 5.8 | % | |
| Energy | | | 5.5 | % | |
| Insurance | | | 4.9 | % | |
| Medical Supplies | | | 4.7 | % | |
| Cosmetics & Personal Care | | | 3.6 | % | |
| Financial Services | | | 2.7 | % | |
| Commercial Services | | | 2.6 | % | |
| Aerospace & Defense | | | 2.3 | % | |
| Healthcare | | | 2.1 | % | |
| Communications | | | 2.1 | % | |
| Industrial – Diversified | | | 2.1 | % | |
Information Retrieval
Services | | | 1.9 | % | |
| Beverages | | | 1.6 | % | |
| Chemicals | | | 1.6 | % | |
| Transportation | | | 1.5 | % | |
| Entertainment & Leisure | | | 1.4 | % | |
| Machinery & Components | | | 1.3 | % | |
| Tobacco | | | 1.0 | % | |
| Restaurants | | | 0.9 | % | |
| Manufacturing | | | 0.8 | % | |
| Apparel, Textiles & Shoes | | | 0.8 | % | |
Broadcasting, Publishing &
Printing | | | 0.7 | % | |
| Foods | | | 0.7 | % | |
Data Processing &
Preparation | | | 0.7 | % | |
| Advertising | | | 0.6 | % | |
Building Materials &
Construction | | | 0.3 | % | |
| Telephone Utilities | | | 0.3 | % | |
| Air Transportation | | | 0.3 | % | |
Computer Integrated Systems
Design | | | 0.2 | % | |
| Internet Content | | | 0.2 | % | |
| Containers | | | 0.1 | % | |
Short-Term Investments and
Other Assets and Liabilities | | | 1.6 | % | |
| | | | 100.0 | % | |
MassMutual Select Blue Chip Growth Fund
Largest Stock Holdings (6/30/05)
Microsoft Corp.
General Electric Co.
Johnson & Johnson
Intel Corp.
Pfizer, Inc.
American International Group, Inc.
The Procter & Gamble Co.
Wal-Mart Stores, Inc.
Dell, Inc.
Cisco Systems, Inc.
26
MassMutual Select Blue Chip Growth Fund – Portfolio Manager Report (Continued)
Growth of a $10,000 Investment
Hypothetical Investments in MassMutual Select Blue Chip Growth Fund Class S, Class A, Class A (sales load deducted), Class Y, Class L and the S&P 500 Index.
MassMutual Select Blue Chip Growth Fund
Total Return
| | | Year to Date
1/1/05 - 6/30/05 | | One Year
7/1/04 - 6/30/05 | | Since Inception
Average Annual
6/1/01 - 6/30/05 | |
| Class S | | | –2.15 | % | | | 1.12 | % | | | –3.21 | % | |
| Class A | | | –2.52 | % | | | 0.50 | % | | | –3.73 | % | |
Class A (sales
load deducted)* | | | –8.12 | % | | | –5.28 | % | | | –5.12 | % | |
| Class Y | | | –2.27 | % | | | 0.91 | % | | | –3.34 | % | |
| Class L | | | –2.38 | % | | | 0.78 | % | | | –3.47 | % | |
| S&P 500 Index | | | –0.81 | % | | | 6.32 | % | | | 0.39 | % | |
Hypothetical Investments in MassMutual Select Blue Chip Growth Fund Class N, Class N (CDSC fees deducted) and the S&P 500 Index.
MassMutual Select Blue Chip Growth Fund
Total Return
| | | Year to Date
1/1/05 - 6/30/05 | | One Year
7/1/04 - 6/30/05 | | Since Inception
Average Annual
12/31/02 - 6/30/05 | |
| Class N | | | –2.65 | % | | | 0.20 | % | | | 9.84 | % | |
Class N (CDSC
fees deducted)* | | | –3.62 | % | | | –0.80 | % | | | 9.84 | % | |
| S&P 500 Index | | | –0.81 | % | | | 6.32 | % | | | 14.96 | % | |
GROWTH OF A $10,000 INVESTMENT SINCE INCEPTION
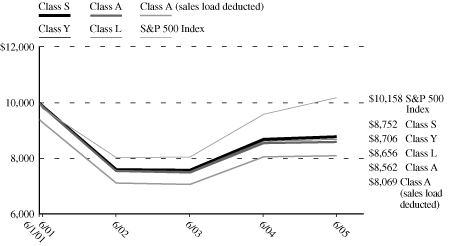

* Class A (sales load deducted) returns include the 5.75% maximum sales charge and Class N (CDSC fees deducted) returns include the 1.00% maximum contingent deferred sales charge for the first 18 months shown.
Performance data quoted represents past performance; past performance is not predictive of future results. The investment return and principal value of shares of the Fund will fluctuate with market conditions so that shares of the Fund, when redeemed, may be worth more or less than their original cost. Current performance of the Fund may be lower or higher than the performance quoted. Performance data current to the most recent month end may be obtained by calling 1-888-309-3539.
Investors should note that the Fund is a professionally managed mutual fund, while the S&P 500 Index is unmanaged and does not incur expenses, and cannot be purchased directly by investors. Investors should read the Fund's prospectus with regard to the Fund's investment objective, risks and charges and expenses in conjunction with these financial statements. Employee retirement benefit plans that invest plan assets in the Separate Investment Accounts (SIAs) may be subject to certain charges as set forth in their respective Plan Documents. Total return figures would be lower for the periods presented if they reflected these charges. The performance tables and charts do not reflect the deduction of taxes that a shareholder would pay on the fund distributions or the redemption of the fund shares.
27
MassMutual Select Large Cap Growth Fund – Portfolio Manager Report
What is the investment objective of the MassMutual Select Large Cap Growth Fund?
The Fund seeks long-term growth of capital and future income by normally investing at least 80% of its assets in the common stocks and securities convertible into common stocks of companies the Fund's sub-adviser believes offer prospects for long-term growth and that, at the time of purchase, have market capitalizations of at least $10 billion.
How did the Fund perform during the six months ended June 30, 2005?
For the six months ended June 30, 2005, the Fund's Class S shares returned –0.88%, slightly underperforming the –0.81% return of the S&P 500 Index, a market-capitalization-weighted, unmanaged index of 500 common stocks.
What was the investment background during the period?
The first quarter saw the broader U.S. stock averages struggle unsuccessfully to remain above the break-even mark in the midst of widespread expectations for slower growth by the nation's economy and a reduction in corporate profits. On the fixed income front, bond yields fell and prices rose in January, but fears of rising inflation – especially resurgent crude oil prices – took center stage during the remainder of the quarter and reversed much of the earlier advance. Also putting pressure on bond prices was a surprisingly strong report on fourth quarter Gross Domestic Product (GDP), released at the end of February, which pegged the nation's estimated growth rate at 3.8%, up sharply from the previous estimate of 3.1%. Additionally, there were two 0.25% hikes in short-term interest rates by the Federal Reserve Board (Fed) during the first three months of 2005.
For the second quarter of 2005, the S&P 500 Index was up 1.4%. Reversing the trend of the past few years, growth modestly outperformed value, as the Russell 1000 Growth Index gained 2.5%, while the Russell 1000 Value Index was up 1.7%. Small capitalization stocks outpaced large capitalization stocks, as the Russell 2000 Index gained 4.3% during the quarter. The technology-heavy NASDAQ 100 was up 0.7%. Investors remained skeptical that consumer spending, which is approximately two-thirds of GDP, can stay strong in the face of rising interest rates and high energy prices.
What factors contributed to the Fund's relative performance?
During the first quarter, the Fund experienced weakness in technology and Internet-related consumer discretionary stocks. Furthermore, our stock selection in the consumer discretionary sector, which generally underperformed, was the largest detractor from performance for the quarter. The Fund's substantial positions in eBay and Electronic Arts detracted significantly. On the positive side, however, stock selection in the producer durables sector contributed to the Fund's performance.
In the second quarter, strong stock selection in the health care, consumer discretionary and technology sectors helped to drive performance. Mid-sized positions in Alcon (+23.7%) and St. Jude Medical (+21.1%) accounted for much of the portfolio's outperformance in the health care sector. A good-sized position in Google (+63.0%) accounted for all of the outperformance in the consumer discretionary sector – and a mid-sized position in Corning (+49.3%) contributed the most to the portfolio's return in the technology sector.
What is your outlook?
Stock prices have held up remarkably well against the dual threats of rising interest rates and high crude oil prices. We believe there are a number of favorable factors at work in the current investment environment, including a reasonably healthy U.S. economy. Other positive influences include fairly robust consumer confidence, along with interest rates and inflation that are still low by historical standards.
While we may have seen the end of the longest – at nearly five years – and largest value cycle since the inception of the Russell Indexes in 1979, the portfolio is well positioned for a market that may be poised to favor growth stocks.
28
MassMutual Select Large Cap Growth Fund – Portfolio Manager Report (Continued)
MassMutual Select Large Cap Growth Fund
Industry Table
(% of Net Assets) on 6/30/05
| Pharmaceuticals | | | 11.5 | % | |
Information Retrieval
Services | | | 11.5 | % | |
| Computers & Information | | | 7.4 | % | |
Electrical Equipment &
Electronics | | | 7.3 | % | |
| Financial Services | | | 7.1 | % | |
| Medical Supplies | | | 6.6 | % | |
| Prepackaged Software | | | 5.2 | % | |
| Retail | | | 5.1 | % | |
| Cosmetics & Personal Care | | | 4.8 | % | |
| Energy | | | 4.4 | % | |
| Insurance | | | 4.3 | % | |
| Communications | | | 4.1 | % | |
| Healthcare | | | 3.9 | % | |
Broadcasting, Publishing &
Printing | | | 3.5 | % | |
| Commercial Services | | | 3.0 | % | |
| Banking, Savings & Loans | | | 1.9 | % | |
| Household Products | | | 1.7 | % | |
| Transportation | | | 1.4 | % | |
Home Construction,
Furnishings & Appliances | | | 1.2 | % | |
| Foods | | | 1.2 | % | |
| Manufacturing | | | 0.8 | % | |
| Retail – Grocery | | | 0.6 | % | |
Computer Programming
Services | | | 0.3 | % | |
Short-Term Investments and
Other Assets and Liabilities | | | 1.2 | % | |
| | | | 100.0 | % | |
MassMutual Select Large Cap
Growth Fund
Largest Stock Holdings (6/30/05)
Yahoo!, Inc.
Google, Inc. Cl. A
Dell, Inc.
General Electric Co.
St. Jude Medical, Inc.
Qualcomm, Inc.
Juniper Networks, Inc.
eBay, Inc.
Electronic Arts, Inc.
Lowe's Companies, Inc.
29
MassMutual Select Large Cap Growth Fund – Portfolio Manager Report (Continued)
Growth of a $10,000 Investment
Hypothetical Investments in MassMutual Select Large Cap Growth Fund Class S, Class A, Class A (sales load deducted), Class Y, Class L and the S&P 500 Index.
MassMutual Select Large Cap Growth Fund
Total Return
| | | Year to Date
1/1/05 - 6/30/05 | | One Year
7/1/04 - 6/30/05 | | Since Inception
Average Annual
12/31/01 - 6/30/05 | |
| Class S | | | –0.88 | % | | | 3.24 | % | | | –2.72 | % | |
| Class A | | | –1.11 | % | | | 2.64 | % | | | –3.18 | % | |
Class A (sales
load deducted)* | | | –6.79 | % | | | –3.26 | % | | | –4.81 | % | |
| Class Y | | | –0.88 | % | | | 3.14 | % | | | –2.82 | % | |
| Class L | | | 0.44 | % | | | 4.38 | % | | | –2.56 | % | |
| S&P 500 Index | | | –0.81 | % | | | 6.32 | % | | | 2.49 | % | |
Hypothetical Investments in MassMutual Select Large Cap Growth Fund Class N, Class N (CDSC fees deducted) and the S&P 500 Index.
MassMutual Select Large Cap Growth Fund
Total Return
| | | Year to Date
1/1/05 - 6/30/05 | | One Year
7/1/04 - 6/30/05 | | Since Inception
Average Annual
12/31/02 - 6/30/05 | |
| Class N | | | –1.21 | % | | | 3.94 | % | | | 10.70 | % | |
Class N (CDSC
fees deducted)* | | | –2.20 | % | | | 2.94 | % | | | 10.70 | % | |
| S&P 500 Index | | | –0.81 | % | | | 6.32 | % | | | 14.96 | % | |
GROWTH OF A $10,000 INVESTMENT SINCE INCEPTION
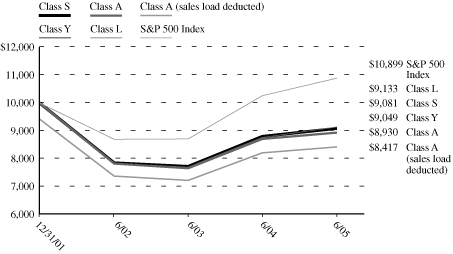

* Class A (sales load deducted) returns include the 5.75% maximum sales charge and Class N (CDSC fees deducted) returns include the 1.00% maximum contingent deferred sales charge for the first 18 months shown.
Performance data quoted represents past performance; past performance is not predictive of future results. The investment return and principal value of shares of the Fund will fluctuate with market conditions so that shares of the Fund, when redeemed, may be worth more or less than their original cost. Current performance of the Fund may be lower or higher than the performance quoted. Performance data current to the most recent month end may be obtained by calling 1-888-309-3539.
Investors should note that the Fund is a professionally managed mutual fund, while the S&P 500 Index is unmanaged and does not incur expenses, and cannot be purchased directly by investors. Investors should read the Fund's prospectus with regard to the Fund's investment objective, risks and charges and expenses in conjunction with these financial statements. Employee retirement benefit plans that invest plan assets in the Separate Investment Accounts (SIAs) may be subject to certain charges as set forth in their respective Plan Documents. Total return figures would be lower for the periods presented if they reflected these charges. The performance tables and charts do not reflect the deduction of taxes that a shareholder would pay on the fund distributions or the redemption of the fund shares.
30
MassMutual Select Growth Equity Fund – Portfolio Manager Report
What is the investment objective of the MassMutual Select Growth Equity Fund?
This Fund seeks long-term growth of capital and future income by normally investing at least 80% of its assets in the common stocks and securities convertible into common stocks of companies the Fund's sub-adviser believes offer prospects for long-term growth.
How did the Fund perform during the six months ended June 30, 2005?
For the six months ended June 30, 2005, the Fund's Class S shares returned 0.00%, exceeding the –0.81% return of the S&P 500 Index, a market-capitalization-weighted, unmanaged index of 500 common stocks.
What was the investment background during the period?
The first quarter of 2005 saw the majority of U.S. equity markets in the red, spurred in large part by mixed economic data, rising oil prices and concerns over inflation. Both large and small cap stocks produced negative returns for the period, although the large cap universe slightly outpaced its small cap counterpart. Within large and small caps, value stocks led growth stocks.
Oil futures were central to U.S. and global markets for the quarter, as prices repeatedly climbed, then stabilized. The dollar shrugged off disappointing U.S. job creation data for March, as well as reports of soft U.S. manufacturing activity, and edged higher against the euro at the tail-end of the period. Meanwhile, the U.S. Labor Department announced that payrolls rose to only 110,000 in March, which was less than half of the expected increase of 225,000.
In a turnaround from the first quarter, most U.S. equity markets ended the second quarter in positive territory, with the exception of the Dow Jones Industrial Average, which returned –1.6%. Both large and small cap stocks produced positive returns for the period, although the small cap universe slightly outpaced its large cap counterpart in a reversal from the first quarter. Within large and small caps, there was little disparity between value and growth stocks.
During the second quarter, the Federal Reserve (Fed) raised the federal funds rate by an additional two 0.25% increases, to end the period at 3.25%. This marked nine increases since June 2004. Turning to commodities, the markets kept a wary eye on oil prices during the period, as they repeatedly spiked and then leveled out. In June, oil futures contracts closed above $60 per barrel – a first for crude – as traders continued to worry about the potential imbalance of supply and demand.
What factors contributed to the Fund's performance?
During the first quarter, sector selection was positive, aided considerably by an overweight position relative to the Fund's benchmark in oil and gas. An underweight position in the financial sector also contributed to the portfolio's relative performance. Conversely, underweight positions in both health care and food/beverages detracted from relative returns – but not enough to offset the Fund's overall positive performance for the period.
In the second quarter, sector selection was flat relative to the benchmark. The portfolio benefited from a sector underweight position in manufacturing and an overweight position in oil/gas. This positive performance, however, was offset by overweight positions in the primary process industry and automotive spaces, which underperformed as groups.
What is your outlook?
We continue to believe that a tilt towards higher-quality stocks is worthwhile for U.S. investors, as these stocks have remained cheap relative to their historical averages. While lower-quality stocks once again outpaced their high-quality counterparts, our market outlook for the remainder of 2005 continues to be for a moderate, yet sustained, bear market. We believe that the key to success lies in a focus on quality.
31
MassMutual Select Growth Equity Fund – Portfolio Manager Report (Continued)
MassMutual Select Growth Equity Fund
Industry Table
(% of Net Assets) on 6/30/05
| Pharmaceuticals | | | 15.0 | % | |
| Retail | | | 14.2 | % | |
| Energy | | | 7.9 | % | |
| Computers & Information | | | 7.6 | % | |
| Healthcare | | | 6.5 | % | |
| Tobacco | | | 4.8 | % | |
Electrical Equipment &
Electronics | | | 4.5 | % | |
| Insurance | | | 2.8 | % | |
| Apparel, Textiles & Shoes | | | 2.7 | % | |
| Prepackaged Software | | | 2.4 | % | |
| Banking, Savings & Loans | | | 2.2 | % | |
Data Processing &
Preparation | | | 2.1 | % | |
| Aerospace & Defense | | | 2.0 | % | |
| Lodging | | | 1.8 | % | |
| Financial Services | | | 1.8 | % | |
| Chemicals | | | 1.6 | % | |
| Communications | | | 1.5 | % | |
| Transportation | | | 1.4 | % | |
Information Retrieval
Services | | | 1.3 | % | |
| Automotive & Parts | | | 1.3 | % | |
| Commercial Services | | | 1.2 | % | |
| Restaurants | | | 1.2 | % | |
| Machinery & Components | | | 1.1 | % | |
Home Construction,
Furnishings & Appliances | | | 1.1 | % | |
| Cosmetics & Personal Care | | | 1.0 | % | |
| Foods | | | 0.9 | % | |
| Medical Supplies | | | 0.9 | % | |
| Electric Utilities | | | 0.9 | % | |
Computer Integrated
Systems Design | | | 0.8 | % | |
| Telephone Utilities | | | 0.7 | % | |
| Household Products | | | 0.5 | % | |
| Metals & Mining | | | 0.5 | % | |
Broadcasting, Publishing &
Printing | | | 0.4 | % | |
| Real Estate | | | 0.4 | % | |
| Industrial – Distribution | | | 0.3 | % | |
| Communications Equipment | | | 0.2 | % | |
| Manufacturing | | | 0.2 | % | |
Computer Programming
Services | | | 0.2 | % | |
| Advertising | | | 0.2 | % | |
| Industrial – Diversified | | | 0.1 | % | |
| Containers | | | 0.1 | % | |
| Entertainment & Leisure | | | 0.1 | % | |
Building Materials &
Construction | | | 0.1 | % | |
| Retail – Grocery | | | 0.0 | % | |
Short-Term Investments and
Other Assets and Liabilities | | | 1.5 | % | |
| | | | 100.0 | % | |
MassMutual Select Growth Equity Fund
Largest Stock Holdings (6/30/05)
| Johnson & Johnson | |
| Dell, Inc. | |
| Exxon Mobil Corp. | |
| UnitedHealth Group, Inc. | |
| The Home Depot, Inc. | |
| Altria Group, Inc. | |
| Pfizer, Inc. | |
| Intel Corp. | |
| Lowe's Companies, Inc. | |
| Fannie Mae | |
32
MassMutual Select Growth Equity Fund – Portfolio Manager Report (Continued)
Growth of a $10,000 Investment
Hypothetical Investments in MassMutual Select Growth Equity Fund Class S, Class A, Class A (sales load deducted), Class Y, Class L and the S&P 500 Index.
MassMutual Select Growth Equity Fund
Total Return
| | | Year to Date
1/1/05 -
6/30/05 | | One Year
7/1/04 -
6/30/05 | | Five Year
Average
Annual
7/1/00 -
6/30/05 | | Since
Inception
Average
Annual
5/3/99 -
6/30/05 | |
| Class S | | | 0.00 | % | | | 2.52 | % | | | –8.69 | % | | | –2.47 | % | |
| Class A | | | –0.39 | % | | | 1.99 | % | | | –9.13 | % | | | –2.91 | % | |
Class A (sales
load deducted)* | | | –6.12 | % | | | –3.88 | % | | | –10.20 | % | | | –3.84 | % | |
| Class Y | | | –0.13 | % | | | 2.48 | % | | | –8.76 | % | | | –2.54 | % | |
| Class L | | | –0.13 | % | | | 2.36 | % | | | –8.88 | % | | | –2.65 | % | |
| S&P 500 Index | | | –0.81 | % | | | 6.32 | % | | | –2.37 | % | | | –0.32 | % | |
Hypothetical Investments in MassMutual Select Growth Equity Fund Class N, Class N (CDSC fees deducted) and the S&P 500 Index.
MassMutual Select Growth Equity Fund
Total Return
| | | Year to Date
1/1/05 - 6/30/05 | | One Year
7/1/04 - 6/30/05 | | Since Inception
Average Annual
12/31/02-6/30/05 | |
| Class N | | | –0.39 | % | | | 1.87 | % | | | 9.97 | % | |
Class N (CDSC
fees deducted)* | | | –1.39 | % | | | 0.87 | % | | | 9.97 | % | |
| S&P 500 Index | | | –0.81 | % | | | 6.32 | % | | | 14.96 | % | |
GROWTH OF A $10,000 INVESTMENT SINCE INCEPTION
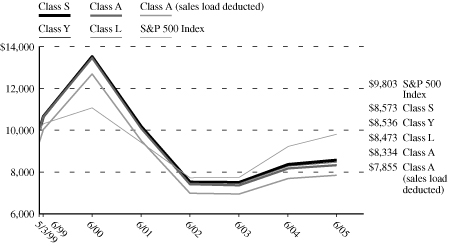
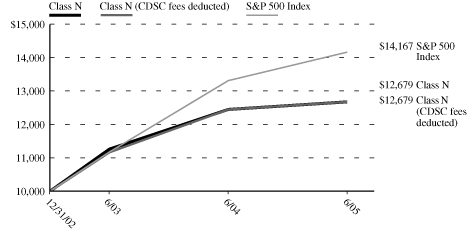
* Class A (sales load deducted) returns include the 5.75% maximum sales charge and Class N (CDSC fees deducted) returns include the 1.00% maximum contingent deferred sales charge for the first 18 months shown.
Performance data quoted represents past performance; past performance is not predictive of future results. The investment return and principal value of shares of the Fund will fluctuate with market conditions so that shares of the Fund, when redeemed, may be worth more or less than their original cost. Current performance of the Fund may be lower or higher than the performance quoted. Performance data current to the most recent month end may be obtained by calling 1-888-309-3539.
Investors should note that the Fund is a professionally managed mutual fund, while the S&P 500 Index is unmanaged and does not incur expenses, and cannot be purchased directly by investors. Investors should read the Fund's prospectus with regard to the Fund's investment objective, risks and charges and expenses in conjunction with these financial statements. Employee retirement benefit plans that invest plan assets in the Separate Investment Accounts (SIAs) may be subject to certain charges as set forth in their respective Plan Documents. Total return figures would be lower for the periods presented if they reflected these charges. The performance tables and charts do not reflect the deduction of taxes that a shareholder would pay on the fund distributions or the redemption of the fund shares.
33
MassMutual Select Aggressive Growth Fund – Portfolio Manager Report
What is the investment objective of the MassMutual Select Aggressive Growth Fund?
This Fund seeks long-term capital appreciation by investing primarily in U.S. common stocks and other equity securities.
How did the Fund perform during the six months ended June 30, 2005?
For the six months ended June 30, 2005, the Fund's Class S shares returned –1.99%, trailing the –0.81% return of the S&P 500 Index, a market-capitalization-weighted, unmanaged index of 500 common stocks.
What was the investment backdrop during the period?
The first quarter saw the broader U.S. stock averages struggle unsuccessfully to remain above the break-even mark in the midst of widespread expectations for slower growth by the nation's economy and a reduction in corporate profits. On the fixed income front, bond yields fell and prices rose in January, but fears of rising inflation – especially resurgent crude oil prices – took center stage during the remainder of the quarter and reversed much of the earlier advance. Also putting pressure on bond prices was a surprisingly strong report on fourth quarter Gross Do mestic Product (GDP), released at the end of February, which pegged the nation's estimated growth rate at 3.8%, up sharply from the previous estimate of 3.1%. Additionally, there were two 0.25% hikes in short-term interest rates by the Federal Reserve Board (Fed) during the first three months of 2005.
Turning to the second quarter, U.S. stocks traded indecisively, as moderately positive news on the economy and corporate earnings was tempered by high crude oil prices, rising short-term interest rates and concerns about slowing economic growth. In the bond market, Treasuries outperformed other fixed income asset classes, while investment-grade bonds outpaced high-yield securities in the corporate sector. Debt downgrades to financially troubled automakers General Motors and Ford from investment-grade to high-yield status drew bond investors' attention and contributed to an environment favoring higher-quality bonds.
What factors contributed to the Fund's performance during the period?
Despite increased corporate profits, low inflation, low interest rates and solid economic growth, investors continued to view the markets with a high degree of skepticism in the first quarter. Like the broader equity markets, the Fund's portfolio exhibited the same disconnect between stock performance and company performance. The standout businesses for the period were primarily in the consumer discretionary sector. On a weighted basis, these companies posted year-over-year revenue and earnings growth of 35% and 35%, respectively. Health care was seco nd, with 28% and 31% revenue and earnings growth, year-over-year, respectively. Information technology companies in the portfolio posted 18% and 23% respective revenue and earnings growth, year-over-year. All of these results were above average. Detracting from performance was the financial services sector, with revenue and earnings growth of 8% and –5%, respectively. This decline in earnings growth was primarily the result of one of the portfolio companies making significant investments in future growth.
Turning to the second quarter, all sectors in the Fund's portfolio had positive returns. On a weighted basis, the health care sector contributed the most to absolute performance. The smallest contribution to absolute performance came from the information technology sector.
More importantly, and consistent with our fundamental, company-based approach to investing, most of the portfolio's holdings returned solid business results for the period. The weighted average year-over-year sales and earnings growth for our portfolio companies was 29% and 36%, respectively. No one sector dominated, with balanced earnings growth across all represented sectors. Earnings were up 50% year-over-year in the consumer discretionary sector, 27% year-over-year in financial services, 28% year-over-year in health care and 34% year-over-year in information technology.
What is your outlook?
Going forward, we continue to expect the companies in the Fund's portfolio to generate above-average growth by capitalizing on the sustainable, long-term advantages they have created. Our experience has proven that it is high-quality, leading companies in growing business spaces that are best positioned to deliver consistent, growing earnings. As a result, we are content to own these types of "business enterprises," regardless of their short-term performance, as long as th e companies continue to meet our criteria.
34
MassMutual Select Aggressive Growth Fund – Portfolio Manager Report (Continued)
MassMutual Select Aggressive Growth Fund
Industry Table
(% of Net Assets) on 6/30/05
| Pharmaceuticals | | | 19.6 | % | |
| Commercial Services | | | 17.1 | % | |
| Medical Supplies | | | 13.7 | % | |
| Retail | | | 12.6 | % | |
| Computers & Information | | | 9.3 | % | |
Information Retrieval
Services | | | 6.9 | % | |
| Foods | | | 6.3 | % | |
Banking, Savings &
Loans | | | 5.6 | % | |
| Communications | | | 3.4 | % | |
| Prepackaged Software | | | 1.4 | % | |
Short-Term Investments and
Other Assets and Liabilities | | | 4.1 | % | |
| | | | 100.0 | % | |
MassMutual Select Aggressive
Growth Fund
Largest Stock Holdings (6/30/05)
| Genentech, Inc. | |
| Google, Inc. Cl. A | |
| Apollo Group, Inc. Cl. A | |
| eBay, Inc. | |
| Starbucks Corp. | |
| Capital One Financial Corp. | |
| Dell, Inc. | |
| Lowe's Companies, Inc. | |
| Teva Pharmaceutical Sponsored ADR (Israel) | |
| Genzyme Corp. | |
35
MassMutual Select Aggressive Growth Fund – Portfolio Manager Report (Continued)
Growth of a $10,000 Investment
Hypothetical Investments in MassMutual Select Aggressive Growth Fund Class S, Class A, Class A (sales load deducted), Class Y, Class L and the S&P 500 Index.
MassMutual Select Aggressive Growth Fund
Total Return
| | | Year to Date
1/1/05 -
6/30/05 | | One Year
7/1/04 -
6/30/05 | | Five Year
Average
Annual
7/1/00 -
6/30/05 | | Since
Inception
Average
Annual
5/1/00 -
6/30/05 | |
| Class S | | | –1.99 | % | | | 4.97 | % | | | –9.52 | % | | | –9.62 | % | |
| Class A | | | –2.21 | % | | | 4.35 | % | | | –9.99 | % | | | –10.09 | % | |
Class A (sales
load deducted)* | | | –7.83 | % | | | –1.65 | % | | | –11.05 | % | | | –11.11 | % | |
| Class Y | | | –2.00 | % | | | 4.81 | % | | | –9.60 | % | | | –9.71 | % | |
| Class L | | | –2.18 | % | | | 4.66 | % | | | –9.75 | % | | | –9.84 | % | |
| S&P 500 Index | | | –0.81 | % | | | 6.32 | % | | | –2.37 | % | | | –2.23 | % | |
Hypothetical Investments in MassMutual Select Aggressive Growth Fund Class N, Class N (CDSC fees deducted) and the S&P 500 Index.
MassMutual Select Aggressive Growth Fund
Total Return
| | | Year to Date
1/1/05 - 6/30/05 | | One Year
7/1/04 - 6/30/05 | | Since Inception
Average Annual
12/31/02 - 6/30/05 | |
| Class N | | | –2.40 | % | | | 4.21 | % | | | 17.91 | % | |
Class N (CDSC
fees deducted)* | | | –3.38 | % | | | 3.21 | % | | | 17.91 | % | |
| S&P 500 Index | | | –0.81 | % | | | 6.32 | % | | | 14.96 | % | |
GROWTH OF A $10,000 INVESTMENT SINCE INCEPTION
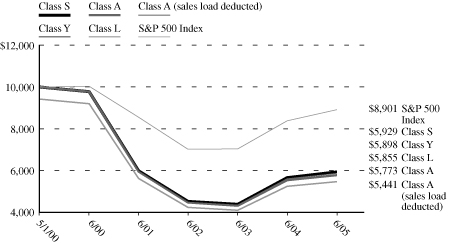

* Class A (sales load deducted) returns include the 5.75% maximum sales charge and Class N (CDSC fees deducted) returns include the 1.00% maximum contingent deferred sales charge for the first 18 months shown.
Performance data quoted represents past performance; past performance is not predictive of future results. The investment return and principal value of shares of the Fund will fluctuate with market conditions so that shares of the Fund, when redeemed, may be worth more or less than their original cost. Current performance of the Fund may be lower or higher than the performance quoted. Performance data current to the most recent month end may be obtained by calling 1-888-309-3539.
Investors should note that the Fund is a professionally managed mutual fund, while the S&P 500 Index is unmanaged and does not incur expenses, and cannot be purchased directly by investors. Investors should read the Fund's prospectus with regard to the Fund's investment objective, risks and charges and expenses in conjunction with these financial statements. Employee retirement benefit plans that invest plan assets in the Separate Investment Accounts (SIAs) may be subject to certain charges as set forth in their respective Plan Documents. Total return figures would be lower for the periods presented if they reflected these charges. The performance tables and charts do not reflect the deduction of taxes that a shareholder would pay on the fund distributions or the redemption of the fund shares.
36
MassMutual Select OTC 100 Fund – Portfolio Manager Report
What is the investment objective of the MassMutual Select OTC 100 Fund?
This Fund seeks to approximate, as closely as practicable (before fees and expenses) the total return of the 100 largest publicly traded over-the-counter common stocks. The Fund pursues this objective by investing at least 80% of its assets in the equity securities of companies included in the NASDAQ 100 Index®, which is generally recognized as representative of the over-the-counter market.
How did the Fund perform during the six months ended June 30, 2005?
For the six months ended June 30, 2005, the Fund's Class S shares returned –7.91%, moderately lagging the –7.87% return of the NASDAQ 100 Index.
The NASDAQ 100 Index represents 100 of the largest non-financial U.S. and non-U.S. companies listed on the National Tier of the NASDAQ stock market. It is a modified capitalization-weighted index that is designed to limit domination by a few large stocks while generally retaining the ranking of companies by capitalization.
What was the investment backdrop during the period?
The first quarter saw the broader U.S. stock averages struggle unsuccessfully to remain above the break-even mark in the midst of widespread expectations for slower growth by the nation's economy and a reduction in corporate profits. On the fixed income front, bond yields fell and prices rose in January, but fears of rising inflation – especially resurgent crude oil prices – took center stage during the remainder of the quarter and reversed much of the earlier advance. Also putting pressure on bond prices was a surprisingly strong report on fourth quarter Gross Do mestic Product (GDP), released at the end of February, which pegged the nation's estimated growth rate at 3.8%, up sharply from the previous estimate of 3.1%. Additionally, there were two 0.25% hikes in short-term interest rates by the Federal Reserve Board (Fed) during the first three months of 2005.
Turning to the second quarter, U.S. stocks traded indecisively, as moderately positive news on the economy and corporate earnings was tempered by high crude oil prices, rising short-term interest rates and concerns about slowing economic growth. In the bond market, Treasuries outperformed other fixed income asset classes, while investment-grade bonds outpaced high-yield securities in the corporate sector. Debt downgrades to financially troubled automakers General Motors and Ford from investment-grade to high-yield status drew bond investors' attention and contributed to an environment favoring higher-quality bonds.
What factors contributed to the Fund's performance?
During the first quarter, all of the NASDAQ 100 Index's sectors posted negative returns. The information technology sector, which accounts for over half of the NASDAQ 100 Index, returned –6.60% for the quarter. Consumer discretionary, which is the second-largest sector at 18.98% of the NASDAQ 100 Index, was also down for the quarter with a return of –14.75%. Against the backdrop of high oil prices and two interest hikes by the Fed, the vast majority of U.S. equity indexes posted negative returns during the period.
Turning to the second quarter, the telecommunications services sector advanced impressively with a gain of 11.42%. The information technology sector, which accounts for over half of the NASDAQ 100 Index, returned –0.09%. Consumer discretionary, which is the second-largest sector at 19.82% of the NASDAQ 100 Index, was also down for the period, with a return of –0.14%.
What is your outlook?
Stock prices have held up remarkably well against the dual threats of rising interest rates and high crude oil prices, both of which can negatively impact company earnings. We believe there are a number of favorable factors at work in the current investment environment, including a reasonably healthy U.S. economy. Other positive influences include fairly robust consumer confidence, along with interest rates and inflation that are still low by historical standards.
37
MassMutual Select OTC 100 Fund – Portfolio Manager Report (Continued)
MassMutual Select OTC 100 Fund
Industry Table
(% of Net Assets) on 6/30/05
| Prepackaged Software | | | 16.7 | % | |
Electrical Equipment &
Electronics | | | 14.6 | % | |
| Communications | | | 13.3 | % | |
| Computers & Information | | | 10.8 | % | |
| Pharmaceuticals | | | 10.2 | % | |
| Retail | | | 6.4 | % | |
| Commercial Services | | | 6.0 | % | |
Broadcasting, Publishing &
Printing | | | 4.3 | % | |
Information Retrieval
Services | | | 2.6 | % | |
| Foods | | | 2.2 | % | |
| Medical Supplies | | | 1.7 | % | |
| Manufacturing | | | 1.4 | % | |
Computer Programming
Services | | | 1.4 | % | |
Computer Integrated
Systems Design | | | 1.3 | % | |
| Automotive & Parts | | | 1.1 | % | |
| Healthcare | | | 0.8 | % | |
| Telephone Utilities | | | 0.8 | % | |
Data Processing &
Preparation | | | 0.8 | % | |
| Transportation | | | 0.8 | % | |
| Retail – Grocery | | | 0.6 | % | |
| Lodging | | | 0.4 | % | |
| Apparel, Textiles & Shoes | | | 0.3 | % | |
| Communications Equipment | | | 0.3 | % | |
| Advertising | | | 0.3 | % | |
| Internet Content | | | 0.3 | % | |
| Containers | | | 0.2 | % | |
| Miscellaneous | | | 0.0 | % | |
Short-Term Investments and
Other Assets and Liabilities | | | 0.4 | % | |
| | | | 100.0 | % | |
MassMutual Select OTC 100 Fund
Largest Stock Holdings (6/30/05)
| Amgen, Inc. | |
| Apple Computer, Inc. | |
| Cisco Systems, Inc. | |
| Comcast Corp. Cl. A | |
| Dell, Inc. | |
| eBay, Inc. | |
| Intel Corp. | |
| Microsoft Corp. | |
| Nextel Communications, Inc. Cl. A | |
| Qualcomm, Inc. | |
38
MassMutual Select OTC 100 Fund – Portfolio Manager Report (Continued)
Growth of a $10,000 Investment
Hypothetical Investments in MassMutual Select OTC 100 Fund Class S, Class A, Class A (sales load deducted), Class Y, Class L and the NASDAQ 100 Index.
MassMutual Select OTC 100 Fund
Total Return
| | | Year to Date
1/1/05 -
6/30/05 | | One Year
7/1/04 -
6/30/05 | | Five Year
Average
Annual
7/1/00 -
6/30/05 | | Since
Inception
Average
Annual
5/1/00 -
6/30/05 | |
| Class S | | | –7.91 | % | | | –1.80 | % | | | –17.04 | % | | | –16.83 | % | |
| Class A | | | –8.31 | % | | | –2.24 | % | | | –17.50 | % | | | –17.27 | % | |
Class A (sales
load deducted)* | | | –13.59 | % | | | –7.86 | % | | | –18.47 | % | | | –18.21 | % | |
| Class Y | | | –8.19 | % | | | –2.13 | % | | | –17.18 | % | | | –16.96 | % | |
| Class L | | | –8.23 | % | | | –2.08 | % | | | –17.30 | % | | | –17.08 | % | |
| NASDAQ 100 Index | | | –7.87 | % | | | –1.52 | % | | | –16.88 | % | | | –16.42 | % | |
Hypothetical Investments in MassMutual Select OTC 100 Fund Class N, Class N (CDSC fees deducted) and the NASDAQ 100 Index.
MassMutual Select OTC 100 Fund
Total Return
| | | Year to Date
1/1/05 - 6/30/05 | | One Year
7/1/04 - 6/30/05 | | Since Inception
Average Annual
12/31/02 - 6/30/05 | |
| Class N | | | –8.40 | % | | | –2.55 | % | | | 16.59 | % | |
Class N (CDSC
fees deducted)* | | | –9.31 | % | | | –3.52 | % | | | 16.59 | % | |
| NASDAQ 100 Index | | | –7.87 | % | | | –1.52 | % | | | 17.89 | % | |
GROWTH OF A $10,000 INVESTMENT SINCE INCEPTION
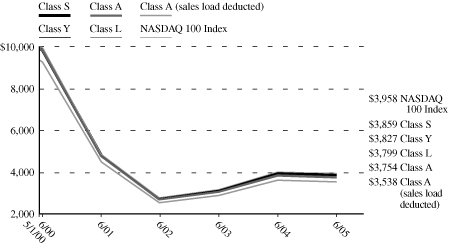
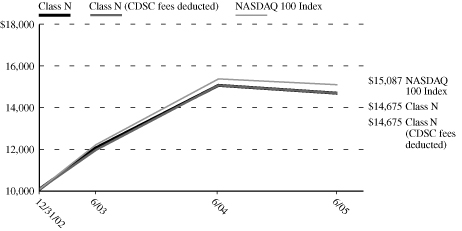
* Class A (sales load deducted) returns include the 5.75% maximum sales charge and Class N (CDSC fees deducted) returns include the 1.00% maximum contingent deferred sales charge for the first 18 months shown.
Performance data quoted represents past performance; past performance is not predictive of future results. The investment return and principal value of shares of the Fund will fluctuate with market conditions so that shares of the Fund, when redeemed, may be worth more or less than their original cost. Current performance of the Fund may be lower or higher than the performance quoted. Performance data current to the most recent month end may be obtained by calling 1-888-309-3539.
Investors note that the Fund is a professionally managed mutual fund, while the NASDAQ 100 Index is unmanaged and does not incur expenses, and cannot be purchased directly by investors. Investors should read the Fund's prospectus with regard to the Fund's investment objective, risks and charges and expenses in conjunction with these financial statements. Employee retirement benefit plans that invest plan assets in the Separate Investment Accounts (SIAs) may be subject to certain charges as set forth in their respective Plan Documents. Total return figures would be lower for the periods presented if they reflected these charges. The performance tables and charts do not reflect the deduction of taxes that a shareholder would pay on the fund distributions or the redemption of the fund shares.
39
MassMutual Select Focused Value Fund – Portfolio Manager Report
What is the investment objective of the MassMutual Select Focused Value Fund?
This Fund seeks growth of capital over the long term by investing primarily in a non-diversified portfolio of U.S. equity securities. As a non-diversified fund, the Fund is not limited in the percentage of its assets that it may invest in any one company. (This means that the Fund may hold larger positions in a smaller number of stocks than a diversified fund. As a result, an increase or decrease in value of a single stock could have a greater impact on the Fund's net asset value and its total return.)
How did the Fund perform during the six months ended June 30, 2005?
For the six months ended June 30, 2005, the Fund's Class S shares returned 1.43%, outpacing the 1.24% return of the Russell 2500® Index, a broadly based, unmanaged index of 2500 medium- and small-capitalization common stocks.
What was the investment background during the period?
The first quarter saw the broader U.S. stock averages struggle unsuccessfully to remain above the break-even mark in the midst of widespread expectations for slower growth by the nation's economy and a reduction in corporate profits. On the fixed income front, bond yields fell and prices rose in January, but fears of rising inflation – especially resurgent crude oil prices – took center stage during the remainder of the quarter and reversed much of the earlier advance. Also putting pressure on bond prices was a surprisingly strong report on fourth quarter Gross Domestic Product (GDP), released at the end of February, which pegged the nation's estimated growth rate at 3.8%, up sharply from the previous estimate of 3.1%. Additionally, there were two 0.25% hikes in short-term interest rates by the Federal Reserve Board (Fed) during the first three months of 2005.
Turning to the second quarter, U.S. stocks traded indecisively, as moderately positive news on the economy and corporate earnings was tempered by high crude oil prices, rising short-term interest rates and concerns about slowing economic growth. In the bond market, Treasuries outperformed other fixed income asset classes, while investment-grade bonds outpaced high-yield securities in the corporate sector. Debt downgrades to financially troubled automakers General Motors and Ford from investment-grade to high-yield status drew bond investors' attention and contributed to an environment favoring higher-quality bonds.
What factors contributed to the Fund's performance?
During the first quarter, our stock selection in health care was outstanding, with all three of our best-performing stocks – Medco, Haemonetics and Universal Health – coming from that sector. On a stock-specific basis, Cablevision Systems Corporation, Yum! Brands, and Tiffany & Company had the most significant positive impact on performance during the period.
Underperformers came from a variety of sectors, including technology, finance and industrials. With respect to individual holdings, Time Warner, Costco Wholesale Corporation and Carnival provided the greatest hindrance to performance during the quarter.
In the second quarter, performance leadership was weighted toward our technology stocks, such as ADC Telecom and Parametric. Our laggards, on the other hand, tended to be companies with some exposure to the economic cycle, such as Hubbell and Mettler-Toledo. With respect to individual holdings, Hospira Inc., Cablevision Systems Corporation and National Semiconductor Corporation were performance drivers during the period. Conversely, McDonald's Corporation, Gap Inc., and Time Warner Inc. provided the greatest hindrance to performance during the second quarter.
What is your outlook?
We see no evidence of a recession, and the companies we talk to suggest the overall demand environment remains healthy. Nevertheless, some caution is warranted and we continue to emphasize business quality in our stock selection process.
40
MassMutual Select Focused Value Fund – Portfolio Manager Report (Continued)
MassMutual Select Focused Value Fund
Industry Table
(% of Net Assets) on 6/30/05
Broadcasting, Publishing &
Printing | | | 14.8 | % | |
| Banking, Savings & Loans | | | 11.8 | % | |
| Restaurants | | | 9.6 | % | |
| Retail | | | 8.6 | % | |
| Commercial Services | | | 6.5 | % | |
| Medical Supplies | | | 6.4 | % | |
| Apparel, Textiles & Shoes | | | 4.9 | % | |
| Beverages | | | 4.8 | % | |
Electrical Equipment &
Electronics | | | 4.6 | % | |
| Pharmaceuticals | | | 4.2 | % | |
| Transportation | | | 3.1 | % | |
Computers & Office
Equipment | | | 1.7 | % | |
| Insurance | | | 1.6 | % | |
| Machinery & Components | | | 1.3 | % | |
| Chemicals | | | 1.0 | % | |
| Industrial – Diversified | | | 0.9 | % | |
| Automotive & Parts | | | 0.8 | % | |
Computer Integrated
Systems Design | | | 0.8 | % | |
| Advertising | | | 0.7 | % | |
| Healthcare | | | 0.6 | % | |
| Foods | | | 0.6 | % | |
Data Processing &
Preparation | | | 0.5 | % | |
| Toys, Games | | | 0.5 | % | |
Home Construction,
Furnishings & Appliances | | | 0.4 | % | |
| Communications | | | 0.3 | % | |
Short-Term Investments and
Other Assets and Liabilities | | | 9.0 | % | |
| | | | 100.0 | % | |
MassMutual Select Focused Value Fund
Largest Stock Holdings (6/30/05)
| Cablevision Systems Corp. Cl. A | |
| Yum! Brands, Inc. | |
| Baxter International, Inc. | |
| Sovereign Bancorp, Inc. | |
| The Pepsi Bottling Group, Inc. | |
| Time Warner, Inc. | |
| The Gap, Inc. | |
| McDonald's Corp. | |
| JP Morgan Chase & Co. | |
| Liberty Media Corp. Cl. A | |
41
MassMutual Select Focused Value Fund – Portfolio Manager Report (Continued)
Growth of a $10,000 Investment
Hypothetical Investments in MassMutual Select Focused Value Fund Class S, Class A, Class A (sales load deducted), Class Y, Class L and the Russell 2500 Index.
MassMutual Select Focused Value Fund
Total Return
| | | Year to Date
1/1/05 -
6/30/05 | | One Year
7/1/04 -
6/30/05 | | Five Year
Average
Annual
7/1/00 -
6/30/05 | | Since
Inception
Average
Annual
5/1/00 -
6/30/05 | |
| Class S | | | 1.43 | % | | | 8.70 | % | | | 17.12 | % | | | 15.25 | % | |
| Class A | | | 1.24 | % | | | 8.17 | % | | | 16.55 | % | | | 14.68 | % | |
Class A (sales
load deducted)* | | | –4.58 | % | | | 1.95 | % | | | 15.17 | % | | | 13.38 | % | |
| Class Y | | | 1.44 | % | | | 8.57 | % | | | 17.02 | % | | | 15.13 | % | |
| Class L | | | 1.33 | % | | | 8.44 | % | | | 16.83 | % | | | 14.96 | % | |
| Russell 2500 Index | | | 1.24 | % | | | 12.73 | % | | | 7.42 | % | | | 7.47 | % | |
Hypothetical Investments in MassMutual Select Focused Value Fund Class N, Class N (CDSC fees deducted) and the Russell 2500 Index.
MassMutual Select Focused Value Fund
Total Return
| | | Year to Date
1/1/05 - 6/30/05 | | One Year
7/1/04 - 6/30/05 | | Since Inception
Average Annual
12/31/02 - 6/30/05 | |
| Class N | | | 1.02 | % | | | 7.82 | % | | | 21.93 | % | |
Class N (CDSC
fees deducted)* | | | 0.02 | % | | | 6.82 | % | | | 21.93 | % | |
| Russell 2500 Index | | | 1.24 | % | | | 12.73 | % | | | 25.13 | % | |
GROWTH OF A $10,000 INVESTMENT SINCE INCEPTION
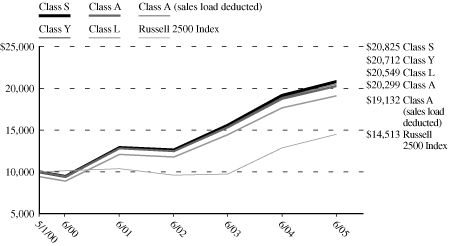

* Class A (sales load deducted) returns include the 5.75% maximum sales charge and Class N (CDSC fees deducted) returns include the 1.00% maximum contingent deferred sales charge for the first 18 months shown.
Performance data quoted represents past performance; past performance is not predictive of future results. The investment return and principal value of shares of the Fund will fluctuate with market conditions so that shares of the Fund, when redeemed, may be worth more or less than their original cost. Current performance of the Fund may be lower or higher than the performance quoted. Performance data current to the most recent month end may be obtained by calling 1-888-309-3539.
Investors should note that the Fund is a professionally managed mutual fund, while the Russell 2500 Index is unmanaged and does not incur expenses, and cannot be purchased directly by investors. Investors should read the Fund's prospectus with regard to the Fund's investment objective, risks and charges and expenses in conjunction with these financial statements. Employee retirement benefit plans that invest plan assets in the Separate Investment Accounts (SIAs) may be subject to certain charges as set forth in their respective Plan Documents. Total return figures would be lower for the periods presented if they reflected these charges. The performance tables and charts do not reflect the deduction of taxes that a shareholder would pay on the fund distributions or the redemption of the fund shares.
42
MassMutual Select Small Company Value Fund – Portfolio Manager Report
What is the investment objective of the MassMutual Select Small Company Value Fund?
The Fund seeks to achieve long-term growth of capital by investing primarily in a diversified portfolio of equity securities of smaller companies.
How did the Fund perform during the six months ended June 30, 2005?
For the six months ended June 30, 2005, the Fund's Class S shares returned –1.04%, outperforming the –1.25% return of the Russell 2000 Index, a broadly based, unmanaged index of 2000 small-capitalization common stocks.
What was the investment background during the period?
The major U.S. stock indexes declined in the first quarter of 2005 as the specter of rising inflation – sparked by a 30% increase in the price of oil during the quarter – and higher interest rates threatened to dampen the economy and corporate profit growth. Small-cap stocks trailed their mid- and large-cap counterparts, while value stocks outpaced growth in the small-cap universe.
In a turnaround in the second quarter, small-cap stocks led the market's advance, as moderating, but solid, economic growth and tame inflation boosted investor confidence. Brisk merger activity and generally favorable corporate earnings news also provided support for stock prices. Small and mid cap stocks posted the best results, while value stocks continued to outperform growth among small cap stocks. In addition, Gross Domestic Product (GDP) was revised upwards to +3.8%, signaling a healthy overall economy. Employment reports in June also came in stronger than expected, with U.S. non-farm payrolls growing by 352,000 jobs in April and May, slightly ahead of consensus forecasts. Existing home re-sales, new home sales and median new home sales prices all soared and finally, the U.S. trade deficit narrowed versus consensus expectations.
What factors contributed to the Fund's performance?
In the first quarter, the portfolio's overweight position in energy stocks provided a lift to relative performance, as did stock selection in the sector. Stock picks in the information technology sector, particularly among software and Internet services stocks, also aided results relative to the benchmark. Relative performance was also driven by stock selection in the consumer discretionary and consumer staples sectors. On the downside, stock selection in the materials sector hampered performance, as many of the portfolio's chemicals and paper products stocks were hurt by higher energy costs. Stock selection in the industrial sector also detracted from relative results.
Turning to the second quarter, the Fund's overweight position in health care stocks, which were among the quarter's best performers, proved beneficial, as did stock selection in the sector. Although materials stocks declined during the quarter, our stock picking in this sector aided relative performance. Utilities and health care stocks were strong performers during the quarter, and stock selection in the information technology and consumer discretionary sectors contributed. On the downside, an underweight in financial stocks, especially in the top-performing real estate industry, weighed on relative results. The energy sector continued to perform well, but our stock selection in the sector hampered relative results. Stock selection in the industrials space also provided some headwind, hindering performance.
What is your outlook?
Given the outperformance of small cap value stocks in recent years and the current deceleration in corporate earnings growth, we are cautious in our outlook for this segment of the market. Although it has become more challenging to find attractive investment opportunities among small cap names, we expect our research to continue to generate good value ideas on an ongoing basis.
43
MassMutual Select Small Company Value Fund – Portfolio Manager Report (Continued)
MassMutual Select Small Company Value Fund
Industry Table
(% of Net Assets) on 6/30/05
| Financial Services | | | 11.5 | % | |
| Energy | | | 8.6 | % | |
| Commercial Services | | | 7.8 | % | |
| Insurance | | | 7.2 | % | |
Electrical Equipment &
Electronics | | | 6.8 | % | |
| Banking, Savings & Loans | | | 5.8 | % | |
| Transportation | | | 4.9 | % | |
| Electric Utilities | | | 4.3 | % | |
| Retail | | | 3.7 | % | |
| Machinery & Components | | | 3.2 | % | |
| Metals & Mining | | | 2.4 | % | |
Broadcasting, Publishing &
Printing | | | 2.3 | % | |
| Prepackaged Software | | | 2.3 | % | |
| Pharmaceuticals | | | 2.1 | % | |
| Healthcare | | | 1.9 | % | |
| Apparel, Textiles & Shoes | | | 1.8 | % | |
| Automotive & Parts | | | 1.7 | % | |
| Chemicals | | | 1.6 | % | |
| Medical Supplies | | | 1.5 | % | |
Building Materials &
Construction | | | 1.3 | % | |
| Entertainment & Leisure | | | 1.2 | % | |
| Forest Products & Paper | | | 1.2 | % | |
| Manufacturing | | | 1.2 | % | |
| Restaurants | | | 1.2 | % | |
| Containers | | | 1.1 | % | |
| Real Estate | | | 1.1 | % | |
| Foods | | | 1.0 | % | |
| Industrial – Diversified | | | 0.9 | % | |
| Computer Related Services | | | 0.8 | % | |
Home Construction,
Furnishings & Appliances | | | 0.6 | % | |
| Communications | | | 0.6 | % | |
| Information Retrieval Services | | | 0.6 | % | |
| Telephone Utilities | | | 0.6 | % | |
Computer Integrated
Systems Design | | | 0.5 | % | |
| Air Transportation | | | 0.5 | % | |
Computer Programming
Services | | | 0.4 | % | |
| Heavy Machinery | | | 0.3 | % | |
| Household Products | | | 0.3 | % | |
Data Processing &
Preparation | | | 0.2 | % | |
| Aerospace & Defense | | | 0.2 | % | |
| Heavy Construction | | | 0.1 | % | |
| Lodging | | | 0.1 | % | |
Short-Term Investments and
Other Assets and Liabilities | | | 2.6 | % | |
| | | | 100.0 | % | |
MassMutual Select
Small Company Value Fund
Largest Stock Holdings (6/30/05)
| ProAssurance Corp. | |
| Landstar System, Inc. | |
| FelCor Lodging Trust, Inc. | |
| Aaron Rents, Inc. | |
| Dollar Thrifty Automotive Group, Inc. | |
| Texas Regional Bancshares, Inc. | |
| CMS Energy Corp. | |
| SVB Financial Group | |
| First Republic Bank | |
| Stein Mart, Inc. | |
44
MassMutual Select Small Company Value Fund – Portfolio Manager Report (Continued)
Growth of a $10,000 Investment
Hypothetical Investments in MassMutual Select Small Company Value Fund Class S, Class A, Class A (sales load deducted), Class Y, Class L and the Russell 2000 Index.
MassMutual Select Small Company Value Fund
Total Return
| | | Year to Date
1/1/05 - 6/30/05 | | One Year
7/1/04 - 6/30/05 | | Since Inception
Average Annual
12/31/01 - 6/30/05 | |
| Class S | | | –1.04 | % | | | 9.79 | % | | | 11.76 | % | |
| Class A | | | –1.19 | % | | | 9.33 | % | | | 11.28 | % | |
Class A (sales
load deducted)* | | | –6.87 | % | | | 3.04 | % | | | 9.41 | % | |
| Class Y | | | –1.05 | % | | | 9.71 | % | | | 11.69 | % | |
| Class L | | | –1.12 | % | | | 9.58 | % | | | 11.52 | % | |
| Russell 2000 Index | | | –1.25 | % | | | 9.45 | % | | | 9.05 | % | |
Hypothetical Investments in MassMutual Select Small Company Value Fund Class N, Class N (CDSC fees deducted) and the Russell 2000 Index.
MassMutual Select Small Company Value Fund
Total Return
| | | Year to Date
1/1/05 - 6/30/05 | | One Year
7/1/04 - 6/30/05 | | Since Inception
Average Annual
12/31/02 - 6/30/05 | |
| Class N | | | –1.34 | % | | | 9.01 | % | | | 22.78 | % | |
Class N (CDSC
fees deducted)* | | | –2.33 | % | | | 8.01 | % | | | 22.78 | % | |
| Russell 2000 Index | | | –1.25 | % | | | 9.45 | % | | | 24.37 | % | |
GROWTH OF A $10,000 INVESTMENT SINCE INCEPTION

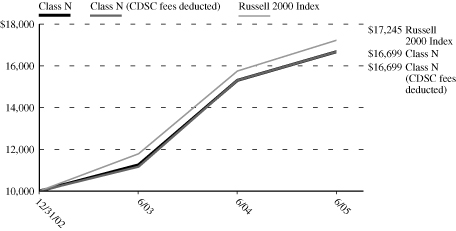
* Class A (sales load deducted) returns include the 5.75% maximum sales charge and Class N (CDSC fees deducted) returns include the 1.00% maximum contingent deferred sales charge for the first 18 months shown.
Performance data quoted represents past performance; past performance is not predictive of future results. The investment return and principal value of shares of the Fund will fluctuate with market conditions so that shares of the Fund, when redeemed, may be worth more or less than their original cost. Current performance of the Fund may be lower or higher than the performance quoted. Performance data current to the most recent month end may be obtained by calling 1-888-309-3539.
Investors should note that the Fund is a professionally managed mutual fund, while the Russell 2000 Index is unmanaged and does not incur expenses, and cannot be purchased directly by investors. Investors should read the Fund's prospectus with regard to the Fund's investment objective, risks and charges and expenses in conjunction with these financial statements. Employee retirement benefit plans that invest plan assets in the Separate Investment Accounts (SIAs) may be subject to certain charges as set forth in their respective Plan Documents. Total return figures would be lower for the periods presented if they reflected these charges. The performance tables and charts do not reflect the deduction of taxes that a shareholder would pay on the fund distributions or the redemption of the fund shares.
45
MassMutual Select Mid Cap Growth Equity Fund – Portfolio Manager Report
What is the investment objective of the MassMutual Select Mid Cap Growth Equity Fund?
This Fund seeks long-term capital growth by investing, under normal conditions, at least 80% of its assets in stocks of companies with market capitalizations, at the time of purchase, that fall within the range of companies in either the S&P® MidCap 400 Index or the Russell MidCap® Growth Index (as of January 31, 2005, between $351.5 million and $31.1 billion).
How did the Fund perform during the six months ended June 30, 2005?
For the six months ended June 30, 2005, the Fund's Class S shares advanced 2.79%, outperforming the 1.24% return of the Russell 2500 Index, a broadly based, unmanaged index of 2500 medium- and small-capitalization common stocks.
What was the investment background during the period?
During a very difficult first quarter, in which nearly every major equity index produced negative returns, many investors fled the markets. Their concerns ranged from the outlook for inflation, the possibility of a more aggressive Federal Reserve, decelerating corporate profits and spiraling oil prices. In addition, investors were worried that the emerging economies of China, India, Latin America and Southeast Asia would increasingly put inf lationary pressure on key economic drivers. As a result, the overall stock market finished the first quarter down, despite the fact that there were pockets of strength, predominantly found in commodity stocks and those stocks with superior fundamentals.
At the start of the second quarter, investor psychology was once again strained, as fears of stagflation and the pending impacts of rising oil and gasoline prices kept investors cautious. In addition, economic statistics failed to indicate a clear direction and only served to further cloud the horizon for investors as they surveyed the landscape. Yet, despite these concerns, the quarter was positive for mid-cap stocks. As an asset class, mid-cap stocks continued to dominate both their small- and large-cap counterparts based on the first six months of 2005.
What factors contributed to the Fund's performance – and how did you respond?
During the first quarter, stock selection in the energy, health care and consumer discretionary sectors contributed the most to the portfolio's momentum. Overall, stock selection was the main driver of positive relative outperformance, with sector allocation also making a significant contribution. Conversely, the technology and industrial services sectors did not perform as expected.
Turning to the second quarter, stock selection in the finance, consumer discretionary and utilities sectors contributed the most to the Fund's results, although our allocation weighting among sectors resulted in negative relative performance. We did not significantly reduce the portfolio's exposure to any specific sector, but we did add to the health care and energy sectors. Presently, the three sectors where the Fund is currently most overweight relative to the Fund's benchmark, the Russell 2500 Index, are health care, consumer staples and technology. Our greatest underweight sectors are finance, transportation and durables.
What is your outlook?
Stock prices have held up remarkably well against the dual threats of rising interest rates and high crude oil prices, both of which can negatively impact company earnings. We believe there are a number of favorable factors at work in the current investment environment, including a reasonably healthy U.S. economy. Other positive influences include fairly robust consumer confidence, along with interest rates and inflation that are still low by historical standards.
Given the continued strength in the mid-cap asset class, we are optimistic about the Fund's outlook. Moreover, we adjusted the Fund's fundamental quantitative stock selection model slightly during the second quarter by notably increasing its emphasis on sales growth. We also replaced one variable, historical earnings growth, with operating margin. As such, we believe we are well positioned moving forward.
46
MassMutual Select Mid Cap Growth Equity Fund – Portfolio Manager Report (Continued)
MassMutual Select Mid Cap Growth Equity Fund
Industry Table
(% of Net Assets) on 6/30/05
| Healthcare | | | 10.5 | % | |
| Apparel, Textiles & Shoes | | | 7.6 | % | |
| Energy | | | 6.3 | % | |
| Medical Supplies | | | 5.8 | % | |
Electrical Equipment &
Electronics | | | 5.5 | % | |
| Telephone Utilities | | | 5.0 | % | |
| Lodging | | | 4.6 | % | |
| Communications | | | 4.2 | % | |
Computer Programming
Services | | | 4.1 | % | |
| Commercial Services | | | 3.6 | % | |
| Prepackaged Software | | | 3.6 | % | |
| Metals & Mining | | | 3.6 | % | |
| Pharmaceuticals | | | 3.2 | % | |
| Foods | | | 2.6 | % | |
| Restaurants | | | 2.5 | % | |
Computer Integrated
Systems Design | | | 2.4 | % | |
| Household Products | | | 2.3 | % | |
| Insurance | | | 2.2 | % | |
| Beverages | | | 1.9 | % | |
Data Processing &
Preparation | | | 1.8 | % | |
| Manufacturing | | | 1.7 | % | |
| Financial Services | | | 1.7 | % | |
| Machinery & Components | | | 1.4 | % | |
| Retail | | | 1.4 | % | |
| Industrial – Diversified | | | 1.4 | % | |
Home Construction,
Furnishings & Appliances | | | 1.1 | % | |
| Aerospace & Defense | | | 1.0 | % | |
| Computers & Information | | | 0.9 | % | |
Broadcasting, Publishing &
Printing | | | 0.8 | % | |
| Entertainment & Leisure | | | 0.6 | % | |
Short-Term Investments and
Other Assets and Liabilities | | | 4.7 | % | |
| | | | 100.0 | % | |
MassMutual Select Mid Cap
Growth Equity Fund
Largest Stock Holdings (6/30/05)
| Aetna, Inc. | |
| Nextel Partners, Inc. Cl. A | |
| Rockwell Automation, Inc. | |
| Sunoco, Inc. | |
| Constellation Brands, Inc. | |
| Kerr-McGee Corp. | |
| NCR Corp. | |
| Nordstrom, Inc. | |
| Pentair, Inc. | |
| Autodesk, Inc. | |
47
MassMutual Select Mid Cap Growth Equity Fund – Portfolio Manager Report (Continued)
Growth of a $10,000 Investment
Hypothetical Investments in MassMutual Select Mid Cap Growth Equity Fund Class S, Class A, Class A (sales load deducted), Class Y, Class L and the Russell 2500 Index.
MassMutual Select Mid Cap Growth Equity Fund
Total Return
| | | Year to Date
1/1/05 -
6/30/05 | | One Year
7/1/04 -
6/30/05 | | Five Year
Average
Annual
7/1/00 -
6/30/05 | | Since
Inception
Average
Annual
5/3/99 -
6/30/05 | |
| Class S | | | 2.79 | % | | | 16.86 | % | | | –7.04 | % | | | 0.28 | % | |
| Class A | | | 2.63 | % | | | 16.34 | % | | | –7.49 | % | | | –0.18 | % | |
Class A (sales
load deducted)* | | | –3.27 | % | | | 9.65 | % | | | –8.58 | % | | | –1.13 | % | |
| Class Y | | | 2.80 | % | | | 16.77 | % | | | –7.13 | % | | | 0.21 | % | |
| Class L | | | 2.82 | % | | | 16.62 | % | | | –7.24 | % | | | 0.09 | % | |
| Russell 2500 Index | | | 1.24 | % | | | 12.73 | % | | | 7.42 | % | | | 10.08 | % | |
Hypothetical Investments in MassMutual Select Mid Cap Growth Equity Fund Class N, Class N (CDSC fees deducted) and the Russell 2500 Index.
MassMutual Select Mid Cap Growth Equity Fund
Total Return
| | | Year to Date
1/1/05 - 6/30/05 | | One Year
7/1/04 - 6/30/05 | | Since Inception
Average Annual
12/31/02 - 6/30/05 | |
| Class N | | | 2.42 | % | | | 16.08 | % | | | 18.10 | % | |
Class N (CDSC
fees deducted)* | | | 1.42 | % | | | 15.08 | % | | | 18.10 | % | |
| Russell 2500 Index | | | 1.24 | % | | | 12.73 | % | | | 25.13 | % | |
GROWTH OF A $10,000 INVESTMENT SINCE INCEPTION
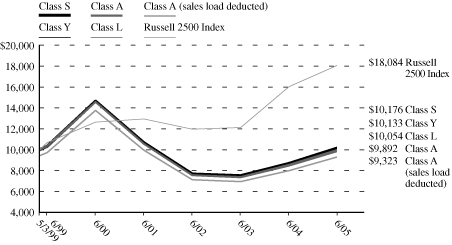
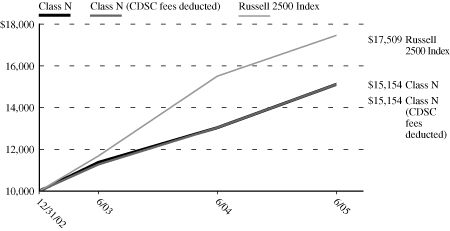
* Class A (sales load deducted) returns include the 5.75% maximum sales charge and Class N (CDSC fees deducted) returns include the 1.00% maximum contingent deferred sales charge for the first 18 months shown.
Performance data quoted represents past performance; past performance is not predictive of future results. The investment return and principal value of shares of the Fund will fluctuate with market conditions so that shares of the Fund, when redeemed, may be worth more or less than their original cost. Current performance of the Fund may be lower or higher than the performance quoted. Performance data current to the most recent month end may be obtained by calling 1-888-309-3539.
Investors should note that the Fund is a professionally managed mutual fund, while the Russell 2500 Index is unmanaged and does not incur expenses, and cannot be purchased directly by investors. Investors should read the Fund's prospectus with regard to the Fund's investment objective, risks and charges and expenses in conjunction with these financial statements. Employee retirement benefit plans that invest plan assets in the Separate Investment Accounts (SIAs) may be subject to certain charges as set forth in their respective Plan Documents. Total return figures would be lower for the periods presented if they reflected these charges. The performance tables and charts do not reflect the deduction of taxes that a shareholder would pay on the fund distributions or the redemption of the fund shares.
48
MassMutual Select Mid Cap Growth Equity II Fund – Portfolio Manager Report
What is the investment objective of the MassMutual Select Mid Cap Growth Equity II Fund?
This Fund seeks growth of capital over the long term by investing, under normal conditions, at least 80% of its assets in a broadly diversified portfolio of common stocks of mid-cap companies whose earnings the Fund's sub-adviser expects to grow at a faster rate than the average company. Mid-cap companies are defined as those whose market capitalizations, at the time of purchase, fall within the range of companies in either the S&P MidCap 400 Index or the Russell MidCap Growth Index (as of January 31, 2005, between $35 1.5 million and $31.1 billion).
How did the Fund perform during the six months ended June 30, 2005?
For the six months ended June 30, 2005, the Fund's Class S shares returned 0.97%, trailing both the 3.85% return of the S&P MidCap 400 Index, a market-capitalization-weighted, unmanaged index of 400 medium-capitalization common stocks, and the 1.70% return of the Russell MidCap Growth Index, an unmanaged index which tracks the performance of mid-cap growth stocks.
What was the investment background during the period?
The first quarter saw the broader U.S. stock averages struggle unsuccessfully to remain above the break-even mark in the midst of widespread expectations for slower growth by the nation's economy and a reduction in corporate profits. Fears of rising inflation – especially resurgent crude oil prices – took center stage with investors during the period and a surprisingly strong report on fourth quarter Gross Domestic Product (GDP), released at the end of February, also raised concern. Additionally, there were two 0.25% hikes in short-term interest rates by the Fed eral Reserve Board (Fed) during the first three months of 2005. For the first quarter, mid-cap stocks outperformed their small- and large-cap brethren; value stocks outpaced growth issues across all market capitalizations.
Turning to the second quarter, U.S. stocks traded indecisively, as moderately positive news on the economy and corporate earnings was tempered by high crude oil prices, rising short-term interest rates and concerns about slowing economic growth. During this time frame, small- and mid-cap stocks outpaced large caps; value stocks were better performers than growth stocks for the quarter.
What factors contributed to the Fund's performance?
The upward march in oil prices sent energy stocks higher in the first quarter of 2005, and the Fund's allocation to the group benefited relative performance. Telecommunications services stocks were solid performers, and our positioning in wireless services providers yielded favorable relative results. Conversely, stock selection in the health care sector was the main source of relative weakness, as negative product news weighed on several biotechnology and pharmaceutical positions. In the consumer discretionary sector, our retail holdings detracted from relative performance . In addition, our information technology stocks lost ground, but good stock selection in semiconductors, communications equipment and electronic equipment names helped to fuel relative performance.
In the second quarter, technology stocks lagged the market overall, but our communications equipment, Internet and IT services holdings were the key drivers of the portfolio's relative strength in the sector. Biotechnology aided relative performance in health care. Wireless services provided relative strength in the telecommunications sector, as continued subscriber growth and industry consolidation benefited our holdings.
The Fund's poor relative performance in consumer discretionary was largely due to weakness in our household durables and retail positions. High gas prices have hurt lower-income consumers; consequently, this impacted some of our retail holdings. Our financial holdings were solid gainers, largely due to stock selection and lack of exposure to real estate. Our oil and gas producer holdings performed well, but weak stock selection in energy equipment and services names hindered relative results.
What is your outlook?
Mid-cap earnings remain strong and are the primary reason for the asset class' strong results versus large caps. Growth stocks appear attractively valued, given the significant outperformance by value in recent years. We generally expect companies with consistent earnings and cash flow growth to be rewarded as the economic recovery matures.
49
MassMutual Select Mid Cap Growth Equity II Fund – Portfolio Manager Report (Continued)
MassMutual Select Mid Cap Growth Equity II Fund
Industry Table
(% of Net Assets) on 6/30/05
Electrical Equipment &
Electronics | | | 9.1 | % | |
| Pharmaceuticals | | | 9.0 | % | |
| Commercial Services | | | 7.1 | % | |
| Financial Services | | | 6.0 | % | |
| Retail | | | 5.8 | % | |
| Prepackaged Software | | | 4.8 | % | |
| Energy | | | 4.8 | % | |
| Healthcare | | | 4.6 | % | |
| Communications | | | 3.6 | % | |
| Medical Supplies | | | 3.4 | % | |
| Insurance | | | 3.3 | % | |
| Machinery & Components | | | 3.0 | % | |
| Computers & Information | | | 2.6 | % | |
| Aerospace & Defense | | | 2.6 | % | |
Broadcasting, Publishing &
Printing | | | 2.5 | % | |
Computer Programming
Services | | | 2.2 | % | |
| Telephone Utilities | | | 2.0 | % | |
| Lodging | | | 1.9 | % | |
| Advertising | | | 1.7 | % | |
| Banking, Savings & Loans | | | 1.6 | % | |
Information Retrieval
Services | | | 1.4 | % | |
| Entertainment & Leisure | | | 1.4 | % | |
Computer Integrated
Systems Design | | | 1.3 | % | |
| Industrial – Diversified | | | 1.3 | % | |
| Automotive & Parts | | | 1.2 | % | |
| Transportation | | | 1.1 | % | |
| Air Transportation | | | 1.1 | % | |
| Restaurants | | | 1.0 | % | |
Home Construction,
Furnishings & Appliances | | | 1.0 | % | |
| Computer Related Services | | | 0.8 | % | |
| Manufacturing | | | 0.7 | % | |
| Apparel, Textiles & Shoes | | | 0.7 | % | |
| Metals & Mining | | | 0.5 | % | |
| Beverages | | | 0.5 | % | |
Building Materials &
Construction | | | 0.5 | % | |
Data Processing &
Preparation | | | 0.4 | % | |
| Retail – Grocery | | | 0.3 | % | |
| Chemicals | | | 0.3 | % | |
| Foods | | | 0.2 | % | |
| Household Products | | | 0.1 | % | |
| Agribusiness | | | 0.1 | % | |
| Toys, Games | | | 0.0 | % | |
| Internet Software | | | 0.0 | % | |
| Containers | | | 0.0 | % | |
| Travel | | | 0.0 | % | |
Short-Term Investments and
Other Assets and Liabilities | | | 2.5 | % | |
| | | | 100.0 | % | |
MassMutual Select Mid Cap
Growth Equity II Fund
Largest Stock Holdings (6/30/05)
| Rockwell Collins, Inc. | |
| Omnicare, Inc. | |
| Murphy Oil Corp. | |
| BJ Services Co. | |
| Roper Industries, Inc. | |
| Medimmune, Inc. | |
| Smith International, Inc. | |
| XTO Energy, Inc. | |
| Ameritrade Holding Corp. | |
| Nextel Partners, Inc. Cl. A | |
50
MassMutual Select Mid Cap Growth Equity II Fund – Portfolio Manager Report (Continued)
Growth of a $10,000 Investment
Hypothetical Investments in MassMutual Select Mid Cap Growth Equity II Fund Class S, Class A, Class A (sales load deducted), Class Y, Class L and the S&P Mid Cap 400 Index.
MassMutual Select Mid Cap Growth Equity II Fund
Total Return
| | | Year to Date
1/1/05 -
6/30/05 | | One Year
7/1/04 -
6/30/05 | | Five Year
Average
Annual
7/1/00 -
6/30/05 | | Since
Inception
Average
Annual
6/1/00 -
6/30/05 | |
| Class S | | | 0.97 | % | | | 10.66 | % | | | 5.55 | % | | | 6.15 | % | |
| Class A | | | 0.69 | % | | | 10.13 | % | | | 5.01 | % | | | 5.62 | % | |
Class A (sales
load deducted)* | | | –5.10 | % | | | 3.80 | % | | | 3.78 | % | | | 4.40 | % | |
| Class Y | | | 0.90 | % | | | 10.62 | % | | | 5.47 | % | | | 6.08 | % | |
| Class L | | | 0.83 | % | | | 10.35 | % | | | 5.28 | % | | | 5.89 | % | |
S&P MidCap
400 Index | | | 3.85 | % | | | 14.02 | % | | | 8.49 | % | | | 8.65 | % | |
Hypothetical Investments in MassMutual Select Mid Cap Growth Equity II Fund Class N, Class N (CDSC fees deducted) and the S&P Mid Cap 400 Index.
MassMutual Select Mid Cap Growth Equity II Fund
Total Return
| | | Year to Date
1/1/05 - 6/30/05 | | One Year
7/1/04 - 6/30/05 | | Since Inception
Average Annual
12/31/02 - 6/30/05 | |
| Class N | | | 0.54 | % | | | 9.79 | % | | | 21.39 | % | |
Class N (CDSC
fees deducted)* | | | –0.46 | % | | | 8.79 | % | | | 21.39 | % | |
| S&P MidCap 400 Index | | | 3.85 | % | | | 14.02 | % | | | 22.14 | % | |
GROWTH OF A $10,000 INVESTMENT SINCE INCEPTION
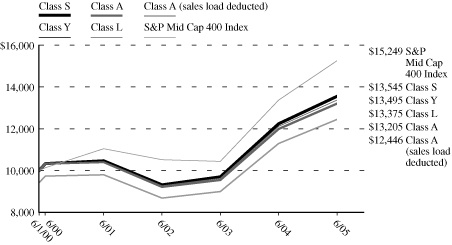

* Class A (sales load deducted) returns include the 5.75% maximum sales charge and Class N (CDSC fees deducted) returns include the 1.00% maximum contingent deferred sales charge for the first 18 months shown.
Performance data quoted represents past performance; past performance is not predictive of future results. The investment return and principal value of shares of the Fund will fluctuate with market conditions so that shares of the Fund, when redeemed, may be worth more or less than their original cost. Current performance of the Fund may be lower or higher than the performance quoted. Performance data current to the most recent month end may be obtained by calling 1-888-309-3539.
Investors should note that the Fund is a professionally managed mutual fund, while the S&P Mid Cap 400 Index is unmanaged and does not incur expenses, and cannot be purchased directly by investors. Investors should read the Fund's prospectus with regard to the Fund's investment objective, risks and charges and expenses in conjunction with these financial statements. Employee retirement benefit plans that invest plan assets in the Separate Investment Accounts (SIAs) may be subject to certain charges as set forth in their respective Plan Documents. Total return figures would be lower for the periods presented if they reflected these charges. The performance tables and charts do not reflect the deduction of taxes that a shareholder would pay on the fund distributions or the redemption of the fund shares.
51
MassMutual Select Small Cap Growth Equity Fund – Portfolio Manager Report
What is the investment objective of the MassMutual Select Small Cap Growth Equity Fund?
This Fund seeks long-term capital appreciation by investing primarily in common stocks and equity securities of smaller companies the managers believe offer potential for long-term growth.
How did the Fund perform during the six months ended June 30, 2005?
For the six months ended June 30, 2005, the Fund's Class S shares returned 0.82%, outpacing the –1.25% return of the Russell 2000 Index, a broadly based, unmanaged index of 2000 small capitalization common stocks, and the –3.58% return of the Russell 2000 Growth Index, which tracks the performance of stocks in the Russell 2000 Index sharing characteristics common to the growth universe. However, the performance of the Fund's shares lagged the 1.79% return of the S&P SmallCap 600 Index, a market-capitalization- weighted index that measures the performance of 600 domestic small cap stocks chosen for market size, liquidity and industry group representation.
What was the investment background during the period?
After registering positive returns in 2004, equity markets generally retreated in the first quarter of 2005 on concerns of rising interest rates, high oil prices, and slowing earnings growth. For the quarter, value performed better than growth, and large cap stocks outperformed their small cap counterparts. Within the Russell 2000 Index, energy was by far the best-performing sector, while information technology and telecommunication services were the worst.
In the second quarter, the market remained surprisingly resilient in the face of rising short-term interest rates, high energy prices and a slowing economy. Another surprise was the strength of the small cap cycle, as small cap stocks led the market's advance.
What factors contributed to the Fund's performance – and how have you positioned the Fund as a result?
2004's trend continued into the first quarter. Mainstream strategies outperformed their speculative counterparts, as investors moved away from lower-quality companies, defined by their negative earnings and smaller size. As a result, market capitalization and quality mattered. Micro-cap stocks with market caps below $250 million underperformed stocks with market capitalizations over $1 billion by greater than 9%. Companies with negative earnings also lagged, with an average –7.9% return. Nowhere did this exem plify itself more than in the technology sector, which closed down almost 12% during the first quarter. The opposite remained true in the energy sector, as oil-related stocks maintained their outperformance on the tailwind of rapidly rising oil prices. The energy group's first quarter return of 14.6% again topped all sectors. We were underweight in these two volatile and cyclical sectors, which held back performance somewhat. The opportunistic feature of these groups just does not fit within our larger emphasis on high and stable profitability. Our greater concentration was in the health care, finance and consumer discretionary sectors. During the first quarter, the portfolio had favorable stock selection in the health care sector; conversely, the consumer discretionary sector provided some headwinds to overall performance.
Turning to the second quarter, positive contributions came from the financials sector. Outside of financials, health insurer Humana and business integration software provider SeeBeyond Technology were also standouts. On the other hand, unfavorable stock selection in the consumer discretionary and information technology sectors hampered the Fund's returns.
What is your outlook?
Thus far, the economy has successfully weathered the storm of Federal Reserve (Fed) tightening and various inflationary pressures. Now that the Fed-induced slowdown has passed, we are cautiously optimistic about global Gross Domestic Product (GDP) growth for the next 12 months. We foresee modest economic expansion, but plenty of attractive investment opportunities in small, growing companies.
52
MassMutual Select Small Cap Growth Equity Fund – Portfolio Manager Report (Continued)
MassMutual Select Small Cap Growth Equity Fund
Industry Table
(% of Net Assets) on 6/30/05
| Healthcare | | | 9.2 | % | |
| Prepackaged Software | | | 9.2 | % | |
| Commercial Services | | | 7.6 | % | |
Electrical Equipment &
Electronics | | | 4.9 | % | |
| Energy | | | 4.4 | % | |
| Banking, Savings & Loans | | | 4.2 | % | |
| Retail | | | 4.2 | % | |
| Medical Supplies | | | 3.4 | % | |
| Pharmaceuticals | | | 3.4 | % | |
| Transportation | | | 3.1 | % | |
| Computer Related Services | | | 3.0 | % | |
| Financial Services | | | 2.4 | % | |
Computer Integrated
Systems Design | | | 2.3 | % | |
Data Processing &
Preparation | | | 2.3 | % | |
| Lodging | | | 2.3 | % | |
| Chemicals | | | 2.3 | % | |
| Advertising | | | 2.1 | % | |
Information Retrieval
Services | | | 1.9 | % | |
| Foods | | | 1.8 | % | |
Home Construction,
Furnishings & Appliances | | | 1.8 | % | |
| Computers & Information | | | 1.7 | % | |
| Machinery & Components | | | 1.7 | % | |
| Automotive & Parts | | | 1.5 | % | |
Broadcasting, Publishing &
Printing | | | 1.3 | % | |
| Telephone Utilities | | | 1.1 | % | |
| Insurance | | | 1.0 | % | |
| Communications | | | 0.9 | % | |
| Metals & Mining | | | 0.8 | % | |
| Air Transportation | | | 0.7 | % | |
| Restaurants | | | 0.6 | % | |
Computer Programming
Services | | | 0.5 | % | |
| Heavy Machinery | | | 0.5 | % | |
| Manufacturing | | | 0.5 | % | |
| Household Products | | | 0.5 | % | |
Building Materials &
Construction | | | 0.5 | % | |
| Entertainment & Leisure | | | 0.4 | % | |
| Containers | | | 0.4 | % | |
| Apparel, Textiles & Shoes | | | 0.4 | % | |
| Cosmetics & Personal Care | | | 0.4 | % | |
Computer Maintenance &
Repair | | | 0.3 | % | |
Investment Management
Services | | | 0.2 | % | |
| Real Estate | | | 0.1 | % | |
| Beverages | | | 0.1 | % | |
Short-Term Investments and
Other Assets and Liabilities | | | 8.1 | % | |
| | | | 100.0 | % | |
MassMutual Select Small Cap Growth
Equity Fund
Largest Stock Holdings (6/30/05)
The Corporate Executive Board Co.
Checkfree Corp.
ITT Educational Services, Inc.
Cerner Corp.
Factset Research Systems, Inc.
Take-Two Interactive Software, Inc.
American Healthways, Inc.
Getty Images, Inc.
Newfield Exploration Co.
AmSurg Corp.
53
MassMutual Select Small Cap Growth Equity Fund – Portfolio Manager Report (Continued)
Growth of a $10,000 Investment
Hypothetical Investments in MassMutual Select Small Cap Growth Equity Fund Class S, Class A, Class A (sales load deducted), Class Y, Class L and the Russell 2000 Index.
MassMutual Select Small Cap Growth Equity Fund
Total Return
| | | Year to Date
1/1/05 -
6/30/05 | | One Year
7/1/04 -
6/30/05 | | Five Year
Average
Annual
7/1/00 -
6/30/05 | | Since
Inception
Average
Annual
5/3/99 -
6/30/05 | |
| Class S | | | 0.82 | % | | | 10.75 | % | | | –2.22 | % | | | 7.12 | % | |
| Class A | | | 0.56 | % | | | 10.17 | % | | | –2.74 | % | | | 6.55 | % | |
Class A (sales
load deducted)* | | | –5.22 | % | | | 3.83 | % | | | –3.89 | % | | | 5.53 | % | |
| Class Y | | | 0.69 | % | | | 10.59 | % | | | –2.36 | % | | | 6.97 | % | |
| Class L | | | 0.62 | % | | | 10.43 | % | | | –2.50 | % | | | 6.81 | % | |
| Russell 2000 Index | | | –1.25 | % | | | 9.45 | % | | | 5.71 | % | | | 7.92 | % | |
Hypothetical Investments in MassMutual Select Small Cap Growth Equity Fund Class N, Class N (CDSC fees deducted) and the Russell 2000 Index.
MassMutual Select Small Cap Growth Equity Fund
Total Return
| | | Year to Date
1/1/05 - 6/30/05 | | One Year
7/1/04 - 6/30/05 | | Since Inception
Average Annual
12/31/02 - 6/30/05 | |
| Class N | | | 0.43 | % | | | 9.88 | % | | | 21.53 | % | |
Class N (CDSC
fees deducted)* | | | –0.57 | % | | | 8.88 | % | | | 21.53 | % | |
| Russell 2000 Index | | | –1.25 | % | | | 9.45 | % | | | 24.37 | % | |
GROWTH OF A $10,000 INVESTMENT SINCE INCEPTION
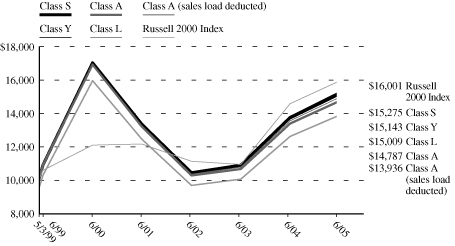

* Class A (sales load deducted) returns include the 5.75% maximum sales charge and Class N (CDSC fees deducted) returns include the 1.00% maximum contingent deferred sales charge for the first 18 months shown.
Performance data quoted represents past performance; past performance is not predictive of future results. The investment return and principal value of shares of the Fund will fluctuate with market conditions so that shares of the Fund, when redeemed, may be worth more or less than their original cost. Current performance of the Fund may be lower or higher than the performance quoted. Performance data current to the most recent month end may be obtained by calling 1-888-309-3539.
Investors should note that the Fund is a professionally managed mutual fund, while the Russell 2000 Index is unmanaged and does not incur expenses, and cannot be purchased directly by investors. Investors should read the Fund's prospectus with regard to the Fund's investment objective, risks and charges and expenses in conjunction with these financial statements. Employee retirement benefit plans that invest plan assets in the Separate Investment Accounts (SIAs) may be subject to certain charges as set forth in their respective Plan Documents. Total return figures would be lower for the periods presented if they reflected these charges. The performance tables and charts do not reflect the deduction of taxes that a shareholder would pay on the fund distributions or the redemption of the fund shares.
54
MassMutual Select Small Company Growth Fund – Portfolio Manager Report
What is the investment objective of the MassMutual Select Small Company Growth Fund?
The Fund seeks long-term capital appreciation by investing primarily in common stocks and equity securities of smaller companies the Fund's sub-advisers believe offer potential for long-term growth.
How did the Fund perform during the six months ended June 30, 2005?
For the six months ended June 30, 2005, the Fund's Class S shares returned –7.15%, underperforming the –1.25% return of the Russell 2000 Index, a broadly based, unmanaged index of 2000 small-capitalization common stocks.
What was the investment background during the period?
The first quarter saw the broader U.S. stock averages struggle unsuccessfully to remain above the break-even mark, as oil prices took center stage again with the price per barrel surpassing $55. For investors, this renewed fears that inflation would disrupt the growing economy and the Federal Reserve (Fed) would take more aggressive monetary action. Not surprisingly, oil-related stocks were up significantly and outperformed all other industry groups during the quart er, as they had last year, while the rest of the stock market was down on average. At the same time, the U.S. economy continued to grow at a stable pace, with no significant signs of letting up. Annualized Gross Domestic Product (GDP) growth turned out to be 3.8% for the first quarter; the job market was healthy and growing; core inflation remained under control; oil prices, while high, were still 25% below real 1981 prices; and, while interest rates were on the rise, they remained low by historical standards.
The stock market rebounded in the second quarter, as the strength of the U.S. economy impressed investors enough to put aside fears that rising oil prices and higher interest rates would bring an end to the current economic expansion. The unemployment rate dropped to 5%, its lowest level since September 2001, and consumer confidence reached a three-year high. On the last day of the second quarter, the Fed raised interest rates for the ninth time in 12 months. The total tightening during the period added 2.25% – taking the federal funds rate from 1.00% to 3.25% – since June 2004. Furthermore, the Central Bank gave no indication that its campaign to raise interest rates was nearing an end. According to the Fed, monetary policy remained "accommodative" and was still stimulating the economy. It also said that it expected to continue raising rates at a "measured pace."
What factors contributed to the Fund's performance?
In the first quarter, top-performing sectors included materials and processing, and energy. In the energy sector, the Fund held a slightly overweight position and outperformed the benchmark, as strong oil and natural gas demand pushed commodity prices upward. The Fund's underweight position in the health care sector also helped the portfolio, although our emphasis on biotech and emerging pharmaceuticals detracted. Security selection in the consumer discretio nary sector contributed strongly to returns, despite the sector as a whole posting negative returns. On the downside, the Fund's overweight position relative to the benchmark in financial services detracted, as investors reacted to two more interest rate hikes and the strong likelihood of increases throughout the year. Technology was another lagging sector during the period.
In the second quarter, the portfolio's top-performing sectors were consumer discretionary and producer durables. In the consumer discretionary sector, the Fund outperformed the benchmark due to strong stock selection in household furnishings, commercial services and casinos and gambling. Conversely, the materials and processing sector lagged, due in large part to poor returns from several holdings. The Fund also underperformed relative to the benchmark in health care, although did have positive absolute returns in the sector.
What is your outlook?
High energy prices and rising deficits have the potential to lead to a stagflation environment. We continue to expect slow growth with gradually rising interest rates. We believe a cautious approach is necessary.
55
MassMutual Select Small Company Growth Fund – Portfolio Manager Report (Continued)
MassMutual Select Small Company Growth Fund
Industry Table
(% of Net Assets) on 6/30/05
Electrical Equipment &
Electronics | | | 13.1 | % | |
| Pharmaceuticals | | | 8.8 | % | |
| Medical Supplies | | | 8.5 | % | |
| Commercial Services | | | 7.8 | % | |
| Retail | | | 5.2 | % | |
| Energy | | | 4.8 | % | |
| Prepackaged Software | | | 3.8 | % | |
| Entertainment & Leisure | | | 3.7 | % | |
| Metals & Mining | | | 3.6 | % | |
| Banking, Savings & Loans | | | 3.5 | % | |
| Financial Services | | | 3.5 | % | |
Computer Integrated
Systems Design | | | 3.3 | % | |
| Healthcare | | | 3.1 | % | |
| Communications | | | 3.1 | % | |
| Computers & Information | | | 2.4 | % | |
Home Construction,
Furnishings & Appliances | | | 2.2 | % | |
Data Processing &
Preparation | | | 2.0 | % | |
| Chemicals | | | 1.9 | % | |
| Advertising | | | 1.7 | % | |
| Machinery & Components | | | 1.7 | % | |
| Apparel, Textiles & Shoes | | | 1.7 | % | |
| Insurance | | | 1.6 | % | |
| Heavy Machinery | | | 1.2 | % | |
| Computer Related Services | | | 1.2 | % | |
| Agribusiness | | | 1.1 | % | |
| Transportation | | | 0.9 | % | |
| Restaurants | | | 0.8 | % | |
Computer & Data Processing
Services | | | 0.5 | % | |
Broadcasting, Publishing &
Printing | | | 0.3 | % | |
| Real Estate | | | 0.3 | % | |
| Foods | | | 0.2 | % | |
| Lodging | | | 0.1 | % | |
Computer Programming
Services | | | 0.1 | % | |
Information Retrieval
Services | | | 0.1 | % | |
Short-Term Investments and
Other Assets and Liabilities | | | 2.2 | % | |
| | | | 100.0 | % | |
MassMutual Select Small Company
Growth Fund
Largest Stock Holdings (6/30/05)
Cephalon, Inc.
Unit Corp.
E Trade Financial Corp.
Waste Connections, Inc.
Respironics, Inc.
Aleris International, Inc.
Genesco, Inc.
Polycom, Inc.
RadiSys Corp.
Factset Research Systems, Inc.
56
MassMutual Select Small Company Growth Fund – Portfolio Manager Report (Continued)
Growth of a $10,000 Investment
Hypothetical Investments in MassMutual Select Small Company Growth Fund Class S, Class A, Class A (sales load deducted), Class Y, Class L and the Russell 2000 Index.
MassMutual Select Small Company Growth Fund
Total Return
| | | Year to Date
1/1/05 - 6/30/05 | | One Year
7/1/04 - 6/30/05 | | Since Inception
Average Annual
12/31/01 - 6/30/05 | |
| Class S | | | –7.15 | % | | | –4.44 | % | | | 2.01 | % | |
| Class A | | | –7.27 | % | | | –4.89 | % | | | 1.54 | % | |
Class A (sales
load deducted)* | | | –12.60 | % | | | –10.36 | % | | | –0.17 | % | |
| Class Y | | | –7.07 | % | | | –4.54 | % | | | 1.96 | % | |
| Class L | | | –7.20 | % | | | –4.66 | % | | | 1.82 | % | |
| Russell 2000 Index | | | –1.25 | % | | | 9.45 | % | | | 9.05 | % | |
Hypothetical Investments in MassMutual Select Small Company Growth Fund Class N, Class N (CDSC fees deducted) and the Russell 2000 Index.
MassMutual Select Small Company Growth Fund
Total Return
| | | Year to Date
1/1/05 - 6/30/05 | | One Year
7/1/04 - 6/30/05 | | Since Inception
Average Annual
12/31/02 - 6/30/05 | |
| Class N | | | –7.36 | % | | | –5.14 | % | | | 17.95 | % | |
Class N (CDSC
fees deducted)* | | | –8.29 | % | | | –6.02 | % | | | 17.95 | % | |
| Russell 2000 Index | | | –1.25 | % | | | 9.45 | % | | | 24.37 | % | |
GROWTH OF A $10,000 INVESTMENT SINCE INCEPTION
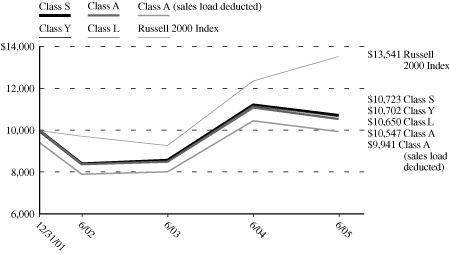
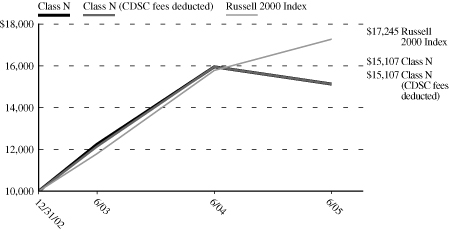
* Class A (sales load deducted) returns include the 5.75% maximum sales charge and Class N (CDSC fees deducted) returns include the 1.00% maximum contingent deferred sales charge for the first 18 months shown.
Performance data quoted represents past performance; past performance is not predictive of future results. The investment return and principal value of shares of the Fund will fluctuate with market conditions so that shares of the Fund, when redeemed, may be worth more or less than their original cost. Current performance of the Fund may be lower or higher than the performance quoted. Performance data current to the most recent month end may be obtained by calling 1-888-309-3539.
Investors should note that the Fund is a professionally managed mutual fund, while the Russell 2000 Index is unmanaged and does not incur expenses, and cannot be purchased directly by investors. Investors should read the Fund's prospectus with regard to the Fund's investment objective, risks and charges and expenses in conjunction with these financial statements. Employee retirement benefit plans that invest plan assets in the Separate Investment Accounts (SIAs) may be subject to certain charges as set forth in their respective Plan Documents. Total return figures would be lower for the periods presented if they reflected these charges. The performance tables and charts do not reflect the deduction of taxes that a shareholder would pay on the fund distributions or the redemption of the fund shares.
57
MassMutual Select Emerging Growth Fund – Portfolio Manager Report
What is the investment objective of the MassMutual Select Emerging Growth Fund?
This Fund seeks capital appreciation by investing primarily in smaller, rapidly growing emerging companies – generally in industry segments experiencing rapid growth, and often including technology and technology-related concerns.
How did the Fund perform during the six months ended June 30, 2005?
For the six months ended June 30, 2005, the Fund's Class S shares returned –5.14%, which underperformed the –1.25% return of the Russell 2000 Index, a broadly based, unmanaged index of 2000 small-capitalization common stocks.
What was the investment backdrop during the period?
The first quarter saw the broader U.S. stock averages struggle unsuccessfully to remain above the break-even mark in the midst of widespread expectations for slower growth by the nation's economy and a reduction in corporate profits. On the fixed income front, bond yields fell and prices rose in January, but fears of rising inflation – especially resurgent crude oil prices – took center stage during the remainder of the quarter and reversed much of the earlier advance. Also putting pressure on bond prices was a surprisingly strong report on fourth quarter Gross Do mestic Product (GDP), released at the end of February, which pegged the nation's estimated growth rate at 3.8%, up sharply from the previous estimate of 3.1%. Additionally, there were two 0.25% hikes in short-term interest rates by the Federal Reserve Board (Fed) during the first three months of 2005.
Turning to the second quarter, U.S. stocks traded indecisively, as moderately positive news on the economy and corporate earnings was tempered by high crude oil prices, rising short-term interest rates and concerns about slowing economic growth. In the bond market, Treasuries outperformed other fixed income asset classes, while investment-grade bonds outpaced high-yield securities in the corporate sector. Debt downgrades to financially troubled automakers General Motors and Ford from investment-grade to high-yield status drew bond investors' attention and contributed to an environment favoring higher-quality bonds.
What factors contributed to the Fund's performance?
In the first quarter, the Fund's underperformance primarily came from sector corrections in biotechnology, Internet, and technology. Our largest underperforming positions included holdings in emerging industries ranging from biotech to voice-over-IP to Internet advertising and wireless networking. Conversely, our better-performing stocks came from broader sectors of the economy – such as retail, energy, medical devices, consumer, software and health care services.
In the second quarter, favorable stock selection drove the Fund's performance. The Fund benefited from a number of software positions and acquisition activity, as Adobe Software acquired long-held Macromedia, Inc. Although our retail positions turned in decent performance, the portfolio encountered challenges in several services positions, and performance weakness in some Internet positions. Returns from our Internet holdings were mixed in the second quarter. Health care proved to be another productive area for the portfolio in the quarter, with biotechnology holdings providing some of the best returns.
What is your outlook?
Our portfolio remains more aggressively positioned than our benchmark because we expect Internet, technology, medical products and various consumer segments to grow faster than the more cyclical sectors, which have grown to a much bigger percentage of the benchmark than in years past. Higher energy prices may keep a lid on any sustained valuation expansion. Our focus remains on discovering the emerging sectors of the economy, which should exhibit firms with faster earnings growth. We remain resolutely positive on the long-term opportunities we believe Internet advertising and commerce offer. Online adve rtising adoption is just reaching a tipping point as Fortune 1000 companies recognize that online presence is essential – and our belief is that online advertising may continue to grow.
58
MassMutual Select Emerging Growth Fund – Portfolio Manager Report (Continued)
MassMutual Select Emerging Growth Fund
Industry Table
(% of Net Assets) on 6/30/05
| Commercial Services | | | 11.1 | % | |
| Pharmaceuticals | | | 9.1 | % | |
Electrical Equipment &
Electronics | | | 8.0 | % | |
| Medical Supplies | | | 6.9 | % | |
| Prepackaged Software | | | 4.3 | % | |
| Healthcare | | | 4.2 | % | |
| Computers & Information | | | 3.9 | % | |
| Communications | | | 3.8 | % | |
| Retail | | | 3.7 | % | |
| Lodging | | | 3.1 | % | |
| Financial Services | | | 2.8 | % | |
| Insurance | | | 2.6 | % | |
| Banking, Savings & Loans | | | 2.5 | % | |
| Restaurants | | | 2.4 | % | |
| Energy | | | 2.3 | % | |
| Advertising | | | 2.1 | % | |
| Telephone Utilities | | | 2.1 | % | |
Computer Integrated
Systems Design | | | 2.1 | % | |
Building Materials &
Construction | | | 1.9 | % | |
Computer Programming
Services | | | 1.7 | % | |
| Apparel, Textiles & Shoes | | | 1.6 | % | |
| Internet Software | | | 1.4 | % | |
| Machinery & Components | | | 1.2 | % | |
Information Retrieval
Services | | | 1.2 | % | |
| Aerospace & Defense | | | 1.0 | % | |
| Computer Related Services | | | 1.0 | % | |
| Foods | | | 1.0 | % | |
| Transportation | | | 0.9 | % | |
Home Construction,
Furnishings & Appliances | | | 0.6 | % | |
Data Processing &
Preparation | | | 0.4 | % | |
Photography Equipment/
Supplies | | | 0.4 | % | |
| Metals & Mining | | | 0.3 | % | |
| Real Estate | | | 0.3 | % | |
| Heavy Machinery | | | 0.0 | % | |
Short-Term Investments and
Other Assets and Liabilities | | | 8.1 | % | |
| | | | 100.0 | % | |
MassMutual Select Emerging Growth Fund
Largest Stock Holdings (6/30/05)
Alexion Pharmaceuticals, Inc.
bebe stores, inc.
Bright Horizons Family Solutions, Inc.
Emulex Corp.
Ixia
Lifeline Systems, Inc.
Matria Healthcare, Inc.
Rigel Pharmaceuticals, Inc.
Valueclick, Inc.
WebEx Communications, Inc.
59
MassMutual Select Emerging Growth Fund – Portfolio Manager Report (Continued)
Growth of a $10,000 Investment
Hypothetical Investments in MassMutual Select Emerging Growth Fund Class S, Class A, Class A (sales load deducted), Class Y, Class L and the Russell 2000 Index.
MassMutual Select Emerging Growth Fund
Total Return
| | | Year to Date
1/1/05 -
6/30/05 | | One Year
7/1/04 -
6/30/05 | | Five Year
Average
Annual
7/1/00 -
6/30/05 | | Since
Inception
Average
Annual
5/1/00 -
6/30/05 | |
| Class S | | | –5.14 | % | | | 4.76 | % | | | –11.87 | % | | | –10.25 | % | |
| Class A | | | –5.44 | % | | | 4.12 | % | | | –12.37 | % | | | –10.74 | % | |
Class A (sales
load deducted)* | | | –10.88 | % | | | –1.87 | % | | | –13.40 | % | | | –11.76 | % | |
| Class Y | | | –5.18 | % | | | 4.60 | % | | | –12.00 | % | | | –10.37 | % | |
| Class L | | | –5.22 | % | | | 4.45 | % | | | –12.15 | % | | | –10.52 | % | |
| Russell 2000 Index | | | –1.25 | % | | | 9.45 | % | | | 5.71 | % | | | 6.00 | % | |
Hypothetical Investments in MassMutual Select Emerging Growth Fund Class N, Class N (CDSC fees deducted) and the Russell 2000 Index.
MassMutual Select Emerging Growth Fund
Total Return
| | | Year to Date
1/1/05 - 6/30/05 | | One Year
7/1/04 - 6/30/05 | | Since Inception
Average Annual
12/31/02 - 6/30/05 | |
| Class N | | | –5.67 | % | | | 3.78 | % | | | 19.74 | % | |
Class N (CDSC
fees deducted)* | | | –6.61 | % | | | 2.78 | % | | | 19.74 | % | |
| Russell 2000 Index | | | –1.25 | % | | | 9.45 | % | | | 24.37 | % | |
GROWTH OF A $10,000 INVESTMENT SINCE INCEPTION
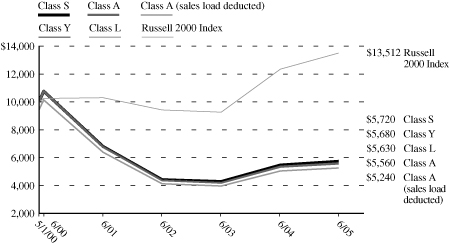
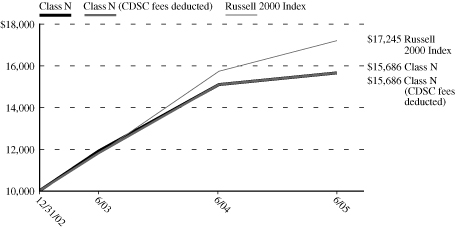
* Class A (sales load deducted) returns include the 5.75% maximum sales charge and Class N (CDSC fees deducted) returns include the 1.00% maximum contingent deferred sales charge for the first 18 months shown.
Performance data quoted represents past performance; past performance is not predictive of future results. The investment return and principal value of shares of the Fund will fluctuate with market conditions so that shares of the Fund, when redeemed, may be worth more or less than their original cost. Current performance of the Fund may be lower or higher than the performance quoted. Performance data current to the most recent month end may be obtained by calling 1-888-309-3539.
Investors should note that the Fund is a professionally managed mutual fund, while the Russell 2000 Index is unmanaged and does not incur expenses, and cannot be purchased directly by investors. Investors should read the Fund's prospectus with regard to the Fund's investment objective, risks and charges and expenses in conjunction with these financial statements. Employee retirement benefit plans that invest plan assets in the Separate Investment Accounts (SIAs) may be subject to certain charges as set forth in their respective Plan Documents. Total return figures would be lower for the periods presented if they reflected these charges. The performance tables and charts do not reflect the deduction of taxes that a shareholder would pay on the fund distributions or the redemption of the fund shares.
60
MassMutual Select Overseas Fund – Portfolio Manager Report
What is the investment objective of the MassMutual Select Overseas Fund?
The Fund seeks growth of capital over the long term by investing in both foreign and domestic equity securities. The Fund seeks to achieve this objective by investing at least 80% of its assets in stocks of foreign companies, including companies located in Europe, Latin America and Asia.
How did the Fund perform during the six months ended June 30, 2005?
For the six months ended June 30, 2005, the Fund's Class S shares returned –0.36%, outpacing the –1.17% return of the Morgan Stanley Capital International Europe, Australasia, Far East (MSCI EAFE) Index, a market-capitalization-weighted, unmanaged index of over 1,000 foreign stocks.
What was the investment background during the period?
On the world economic stage, equity markets were stifled during the first quarter, as high prices for commodities, especially oil, raised fears that inflation might accelerate, leading to higher interest rates, slower economic growth and lower corporate profits. Crude oil futures rose every month during the quarter, settling at $55.40 a barrel on March 31, up 28% for the year-to-date period.
Turning to the second quarter, many of the world's equity markets were restrained, as they struggled to overcome concerns that rising commodity prices – particularly oil's spike above $60 a barrel – posed a threat to global economic growth and corporate profits.
What factors contributed to the Fund's performance?
During the first quarter, the energy sector contributed most to the Fund's return, as gains were led by the portfolio's oil and gas companies, such as France's Total and the United Kingdom's BP. On a relative basis, the financial sector, the portfolio's largest stake during the period, registered the best performance versus the Fund's benchmark, the MSCI EAFE Index, due partly to a lighter weighting in some commercial banks, and a complete lack of exposure to others that declined during the quarter. The absence of any real estate companies in the portfolio also proved benef icial, as the industry pulled back. Conversely, health care detracted most from the portfolio's relative performance, with Switzerland's Roche Holdings leading the retreat. Roche, the world's largest maker of cancer medicines and diagnostic tests, declined after reporting profits in the second half of 2004 that declined due to higher spending on research and marketing and waning demand for some older products. The portfolio's overweight stake in the health care equipment and supplies industry also hampered the Fund's progress. On a country basis, France, Canada and Australia made the largest contribution to the portfolio; stock selection in Germany and the Netherlands was also positive. Conversely, Japan, the UK, Switzerland and France were detractors.
In the second quarter, the Fund's overweight position relative to its benchmark in health care companies and industrials contributed most to the portfolio's return. In health care, the United Kingdom's GlaxoSmithKline and AstraZeneca were among the companies making the largest contributions. A Swiss drug maker led the advance among the portfolio's pharmaceutical holdings. Industrials also benefited the portfolio, as companies in two industries – transportation infrastructure and construction and engineering – were performance standouts. On a relative basis, the portfolio's holdings in the consumer discretionary sector delivered the best relative performance for the period, due mostly to effective security selection among media companies. Currency also played a role during the quarter, as the upward movement of the dollar versus other currencies hampered the portfolio's return. From a country pers pective, investments in Japan, France and Switzerland provided the most tailwind on a relative basis. Additionally, contributions came from stock selection in Germany and the Netherlands. Offsetting these favorable returns were stock selection in the UK, France, the Netherlands, Finland and Hong Kong.
61
MassMutual Select Overseas Fund – Portfolio Manager Report (Continued)
What is your outlook?
Much negative news has come from Europe lately, casting doubt on true European economic unification. First, France and Germany prevented liberalization of EU Services. This news seems minor in comparison to the French and Dutch voters' rejection of the new EU Constitution. These setbacks reflect a great deal of soul-searching in Europe. Old Europe, unable to adapt to any type of effective free market reforms, is being smothered by low growth and double-digit unemployment. Because the economic environment in Western Europe is dire, it has created an environment of declining blue chip share prices. Many f irms, though based in Old Europe, have revenues from all over the world, and they can provide excellent value. This is how we, as bottom up, value-oriented investors, can profit from patience. Bottom-up investing means making investment choices on a company-by-company basis, rather than buying by sector or country. We use this bottom-up approach as we search for stocks of individual companies that have been discounted by the market, but in which we see strong potential for price growth.
MassMutual Select Overseas Fund
Country Weightings
(% of Net Assets) on 6/30/05
| United Kingdom | | | 23.8 | % | |
| Japan | | | 14.2 | % | |
| France | | | 11.7 | % | |
| Switzerland | | | 11.4 | % | |
| Germany | | | 7.1 | % | |
| Netherlands | | | 4.6 | % | |
| Australia | | | 3.8 | % | |
| South Korea | | | 3.3 | % | |
| Ireland | | | 3.2 | % | |
| Italy | | | 2.7 | % | |
| Spain | | | 1.8 | % | |
| Greece | | | 1.1 | % | |
| Mexico | | | 1.0 | % | |
| Canada | | | 0.9 | % | |
| Netherlands | | | 0.8 | % | |
| Hong Kong | | | 0.8 | % | |
| Norway | | | 0.8 | % | |
| Singapore | | | 0.7 | % | |
| Germany | | | 0.6 | % | |
| Belgium | | | 0.5 | % | |
| Austria | | | 0.5 | % | |
| Denmark | | | 0.3 | % | |
| United States | | | 0.2 | % | |
| Israel | | | 0.1 | % | |
| Forward Currency Contracts | | | 0.7 | % | |
Short-Term Investments and
Other Assets and Liabilities | | | 3.4 | % | |
| | | | 100.0 | % | |
MassMutual Select Overseas Fund
Largest Stock Holdings (6/30/05)
GlaxoSmithKline PLC
Diageo PLC
Novartis AG
Nestle SA
BP PLC
Bank of Ireland (GBP)
Bayerische Motoren Werke AG
Vodafone Group PLC
SK Telecom Co. Limited
Takeda Pharmaceutical Co. Limited
62
MassMutual Select Overseas Fund – Portfolio Manager Report (Continued)
Growth of a $10,000 Investment
Hypothetical Investments in MassMutual Select Overseas Fund Class S, Class A, Class A (sales load deducted), Class Y, Class L and the MSCI EAFE Index.
MassMutual Select Overseas Fund
Total Return
| | | Year to Date
1/1/05 - 6/30/05 | | One Year
7/1/04 - 6/30/05 | | Since Inception
Average Annual
5/1/01 - 6/30/05 | |
| Class S | | | –0.36 | % | | | 12.08 | % | | | 3.16 | % | |
| Class A | | | –0.64 | % | | | 11.64 | % | | | 2.70 | % | |
Class A (sales
load deducted)* | | | –6.35 | % | | | 5.22 | % | | | 1.25 | % | |
| Class Y | | | –0.36 | % | | | 12.05 | % | | | 3.10 | % | |
| Class L | | | –0.46 | % | | | 11.98 | % | | | 2.96 | % | |
| MSCI EAFE | | | –1.17 | % | | | 13.65 | % | | | 4.02 | % | |
Hypothetical Investments in MassMutual Select Overseas Fund Class N, Class N (CDSC fees deducted) and the MSCI EAFE Index.
MassMutual Select Overseas Fund
Total Return
| | | Year to Date
1/1/05 - 6/30/05 | | One Year
7/1/04 - 6/30/05 | | Since Inception
Average Annual
12/31/02 - 6/30/05 | |
| Class N | | | –0.74 | % | | | 11.33 | % | | | 18.41 | % | |
Class N (CDSC
fees deducted)* | | | –1.73 | % | | | 10.33 | % | | | 18.41 | % | |
| MSCI EAFE | | | –1.17 | % | | | 13.65 | % | | | 22.47 | % | |
GROWTH OF A $10,000 INVESTMENT SINCE INCEPTION

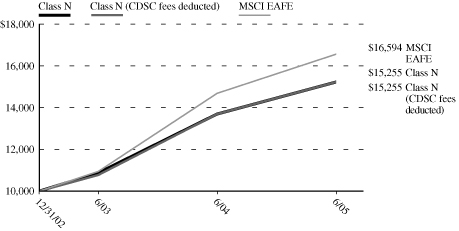
* Class A (sales load deducted) returns include the 5.75% maximum sales charge and Class N (CDSC fees deducted) returns include the 1.00% maximum contingent deferred sales charge for the first 18 months shown.
Performance data quoted represents past performance; past performance is not predictive of future results. The investment return and principal value of shares of the Fund will fluctuate with market conditions so that shares of the Fund, when redeemed, may be worth more or less than their original cost. Current performance of the Fund may be lower or higher than the performance quoted. Performance data current to the most recent month end may be obtained by calling 1-888-309-3539.
Investors should note that the Fund is a professionally managed mutual fund, while the MSCI EAFE Index is unmanaged and does not incur expenses, and cannot be purchased directly by investors. Investors should read the Fund's prospectus with regard to the Fund's investment objective, risks and charges and expenses in conjunction with these financial statements. Employee retirement benefit plans that invest plan assets in the Separate Investment Accounts (SIAs) may be subject to certain charges as set forth in their respective Plan Documents. Total return figures would be lower for the periods presented if they reflected these charges. The performance tables and charts do not reflect the deduction of taxes that a shareholder would pay on the fund distributions or the redemption of the fund shares.
63
MassMutual Select Destination Retirement Series – Portfolio Manager Report
What are the investment objectives of the Funds that comprise the MassMutual Select Destination Retirement Series?
• Destination Retirement Income Fund: This Fund seeks to achieve high current income and, as a secondary objective, capital appreciation, by investing in a combination of MassMutual equity, fixed income and money market funds using an asset allocation strategy designed for investors already in retirement.
• Destination Retirement 2010 / 2020 / 2030 / 2040 Funds: Each of these Funds seeks to achieve as high a total rate of return on an annual basis as is considered consistent with prudent investment risk and the preservation of capital by investing in a combination of MassMutual equity, fixed income and money market funds using an asset allocation strategy designed for investors expecting to retire around the year 2010, 2020, 2030, or 2040, respectively.
How did the Funds perform during the six months ended June 30, 2005?
For the six months ended June 30, 2005, each Fund's Class S return, along with the return of its custom benchmark and the Lipper Balanced Fund Index, an unmanaged index of stock and bond portfolios, was as follows:
| Destination Retirement Income Fund | | Custom
Benchmark | | Lipper Balanced
Fund Index | |
| | 1.45 | % | | | 1.64 | % | | | 0.49 | % | |
|
| Destination Retirement 2010 Fund | | | | | |
| | 1.14 | % | | | 1.37 | % | | | 0.49 | % | |
|
| Destination Retirement 2020 Fund | | | | | |
| | 0.74 | % | | | 0.91 | % | | | 0.49 | % | |
|
| Destination Retirement 2030 Fund | | | | | |
| | 0.09 | % | | | 0.24 | % | | | 0.49 | % | |
|
| Destination Retirement 2040 Fund | | | | | |
| | –0.27 | % | | | –0.16 | % | | | 0.49 | % | |
|
The Destination Retirement Income Fund, Destination Retirement 2010 Fund and Destination Retirement 2020 Fund underperformed their respective custom benchmarks, but outperformed the Lipper Balanced Fund Index for the first six months of 2005. The Destination Retirement 2030 Fund and Destination Retirement 2040 Fund both underperformed their respective custom benchmarks and the Lipper Balanced Fund Index for the six-month period ended June 30, 2005.
See the description of each custom benchmark below:
The Custom Destination Income Index comprises the MSCI EAFE, Dow Jones Wilshire 5000 (full cap), Lehman Brothers Aggregate Bond and T-Bill indexes. The weightings of each index can vary depending on the weightings of the underlying mutual funds that compose the Destination Retirement Income Fund.
The Custom Destination 2010 Index comprises the MSCI EAFE, Dow Jones Wilshire 5000 (full cap), Lehman Brothers Aggregate Bond and T-Bill indexes. The weightings of each index can vary depending on the weightings of the underlying mutual funds that compose the Destination Retirement 2010 Fund.
The Custom Destination 2020 Index comprises the MSCI EAFE, Dow Jones Wilshire 5000 (full cap) and Lehman Brothers Aggregate Bond indexes. The weightings of each index can vary depending on the weightings of the underlying mutual funds that compose the Destination Retirement 2020 Fund.
The Custom Destination 2030 Index comprises the MSCI EAFE, Dow Jones Wilshire 5000 (full cap) and Lehman Brothers Aggregate Bond indexes. The weightings of each index can vary depending on the weightings of the underlying mutual funds that compose the Destination Retirement 2030 Fund.
64
MassMutual Select Destination Retirement Series – Portfolio Manager Report (Continued)
The Custom Destination 2040 Index comprises the MSCI EAFE and Dow Jones Wilshire 5000 (full cap) indexes. The weightings of each index can vary depending on the weightings of the underlying mutual funds that compose the Destination Retirement 2040 Fund.
What was the investment backdrop during the period?
The first quarter saw the broader U.S. stock averages struggle unsuccessfully to remain above the break-even mark in the midst of widespread expectations for slower growth by the nation's economy and a reduction in corporate profits. On the fixed income front, bond yields fell and prices rose in January, but fears of rising inflation – especially resurgent crude oil prices – took center stage during the remainder of the quarter and reversed much of the earlier advance. Also putting pressure on bond prices was a surprisingly strong report on fourth quarter Gross Do mestic Product (GDP), released at the end of February, which pegged the nation's estimated growth rate at 3.8%, up sharply from the previous estimate of 3.1%. Additionally, there were two 0.25% hikes in short-term interest rates by the Federal Reserve Board (Fed) during the first three months of 2005.
Turning to the second quarter, U.S. stocks traded indecisively, as moderately positive news on the economy and corporate earnings was tempered by high crude oil prices, rising short-term interest rates and concerns about slowing economic growth. In the bond market, Treasuries outperformed other fixed income asset classes, while investment-grade bonds outpaced high-yield securities in the corporate sector. Debt downgrades to financially troubled automakers General Motors and Ford from investment-grade to high-yield status drew bond investors' attention and contributed to an environment favoring higher-quality bonds.
What factors contributed to the Funds' performance?
Each Select Destination Retirement Fund is made up of a number of underlying funds. In the first quarter, underlying equity fund performance was disappointing on an absolute basis, but not on a relative one. Select Large Cap Value Fund, Select Fundamental Value Fund and Select Mid Cap Growth Equity II Fund performed in line with their respective benchmarks. Select Aggressive Growth Fund was hurt by stock selection, particularly eBay. Select Growth Equity Fund did well by owning large positions in the winners – including Exxon Mobil and Johnson & Johnson – and by not owning the biggest losers – AIG, eBay and Microsoft. Select Emerging Growth Fund was hurt by large allocations to the biotechnology, Internet and technology sectors.
In the fixed income arena, investment-grade securities outperformed their below-investment-grade counterparts during the first quarter. The underlying bond funds performed in line with their respective indexes and peer groups, posting slightly negative absolute returns. The small allocation to high-yield securities in the Premier Diversified Bond Fund, which aided performance throughout 2004, hindered it somewhat in the first quarter.
In the second quarter, each of the Select Destination Retirement Funds gained at least 2.00% and performed in line with expectations, as those funds with higher stock exposure (Select Destination Retirement 2020, 2030 and 2040) underperformed those funds with greater bond exposure (Select Destination Retirement Income and 2010). During the period, among the stronger performers were the bond funds, including Premier Core Bond Fund and Premier Short-Duration Bond Fund. In addition, Select Aggressive Growth Fund had a very strong quarter of absolute performance, while Select Overseas Fund posted slightly negative returns that nonetheless beat its benchmark.
What is your outlook?
Stock prices have held up remarkably well against the dual threats of rising interest rates and record-high crude oil prices, both of which can negatively impact company earnings. We believe there are a number of favorable factors at work in the current investment environment, including a reasonably healthy U.S. economy. Other positive influences include fairly robust consumer confidence, along with interest rates and inflation that are still low by historical standards.
65
MassMutual Select Destination Retirement Series – Portfolio Manager Report (Continued)
MassMutual Select Destination
Retirement Income Fund
Asset Allocation
(% of Net Assets) on 6/30/05
| Mutual Fund | | | 100.0 | % | |
Short-Term Investments and
Other Assets and Liabilities | | | (0.0 | )% | |
| | | | 100.0 | % | |
MassMutual Select Destination
Retirement 2010 Fund
Asset Allocation
(% of Net Assets) on 6/30/05
| Mutual Fund | | | 100.0 | % | |
Short-Term Investments and
Other Assets and Liabilities | | | (0.0 | )% | |
| | | | 100.0 | % | |
MassMutual Select Destination
Retirement 2020 Fund
Asset Allocation
(% of Net Assets) on 6/30/05
| Mutual Fund | | | 100.0 | % | |
Short-Term Investments and
Other Assets and Liabilities | | | (0.0 | )% | |
| | | | 100.0 | % | |
MassMutual Select Destination
Retirement 2030 Fund
Asset Allocation
(% of Net Assets) on 6/30/05
| Mutual Fund | | | 100.0 | % | |
Short-Term Investments and
Other Assets and Liabilities | | | (0.0 | )% | |
| | | | 100.0 | % | |
MassMutual Select Destination
Retirement 2040 Fund
Asset Allocation
(% of Net Assets) on 6/30/05
| Mutual Fund | | | 100.0 | % | |
Short-Term Investments and
Other Assets and Liabilities | | | (0.0 | )% | |
| | | | 100.0 | % | |
66
MassMutual Select Destination Retirement Series – Portfolio Manager Report (Continued)
Growth of a $10,000 Investment
Hypothetical Investments in MassMutual Select Destination Retirement Income Fund Class S, Class A, Class A (sales load deducted), Class Y, the Custom Destination Income Index, the Lipper Balanced Fund Index, the Lehman Brothers Aggregate Bond Index and the S&P 500 Index.
MassMutual Select Destination Retirement Income Fund
Total Return
| | | Year to Date
1/1/05 - 6/30/05 | | One Year
7/1/04 - 6/30/05 | | Since Inception
12/31/03 - 6/30/05 | |
| Class S | | | 1.45 | % | | | 6.66 | % | | | 5.43 | % | |
| Class A | | | 1.26 | % | | | 6.20 | % | | | 5.06 | % | |
Class A (sales
load deducted)** | | | –4.56 | % | | | 0.10 | % | | | 1.00 | % | |
| Class Y | | | 1.35 | % | | | 6.54 | % | | | 5.42 | % | |
| S&P 500 Index | | | –0.81 | % | | | 6.32 | % | | | 6.69 | % | |
Lipper Balanced
Fund Index | | | 0.49 | % | | | 7.11 | % | | | 6.26 | % | |
Lehman Aggregate
Bond Index | | | 2.51 | % | | | 6.80 | % | | | 4.65 | % | |
Custom Destination
Income Index | | | 1.64 | % | | | 7.58 | % | | | 5.82 | % | |
Hypothetical Investments in MassMutual Select Destination Retirement Income Fund Class L, Class N, Class N (CDSC fees deducted), the Custom Destination Income Index, the Lipper Balanced Fund Index, the Lehman Brothers Aggregate Bond Index and the S&P 500 Index.
MassMutual Select Destination Retirement Income Fund
Total Return
| | | Year to Date
1/1/05 - 6/30/05 | | One Year
7/1/04 - 6/30/05 | | Since Inception
12/31/03 - 6/30/05 | |
| Class L | | | 1.35 | % | | | 6.47 | % | | | 5.30 | % | |
| Class N | | | 1.06 | % | | | 5.88 | % | | | 4.71 | % | |
Class N (CDSC
fees deducted)** | | | 0.06 | % | | | 4.88 | % | | | 4.71 | % | |
| S&P 500 Index | | | –0.81 | % | | | 6.32 | % | | | 6.69 | % | |
Lipper Balanced
Fund Index | | | 0.49 | % | | | 7.11 | % | | | 6.26 | % | |
Lehman Aggregate
Bond Index | | | 2.51 | % | | | 6.80 | % | | | 4.65 | % | |
Custom Destination
Income Index | | | 1.64 | % | | | 7.58 | % | | | 5.82 | % | |
GROWTH OF A $10,000 INVESTMENT SINCE INCEPTION*
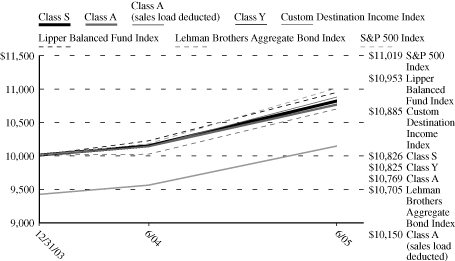
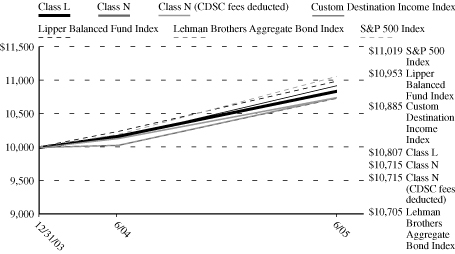
* The custom benchmark $10,000 growth chart values commence on 1/1/04.
** Class A (sales load deducted) returns include the 5.75% maximum sales charge and Class N (CDSC fees deducted) returns include the 1.00% maximum contingent deferred sales charge for the 18 months shown.
Performance data quoted represents past performance; past performance is not predictive of future results. The investment return and principal value of shares of the Fund will fluctuate with market conditions so that shares of the Fund, when redeemed, may be worth more or less than their original cost. Current performance of the Fund may be lower or higher than the performance quoted. Performance data current to the most recent month end may be obtained by calling 1-888-309-3539.
Investors should note that the Fund is a professionally managed mutual fund, while the Custom Destination Income Index, the Lipper Balanced Fund Index, the Lehman Brothers Aggregate Bond Index and the S&P 500 Index are unmanaged and do not incur expenses, and cannot be purchased directly by investors. Investors should read the Fund's prospectus with regard to the Fund's investment objective, risks and charges and expenses in conjunction with these financial statements. Employee retirement benefit plans that invest plan assets in the Separate Investment Accounts (SIAs) may be subject to certain charges as set forth in their respective Plan Documents. Total return figures would be lower for the periods presented if they reflected these charges. The performance tables and charts do not reflect the deduction of taxes that a shareholder would pay on the fund distributions or the redemption of the fund shares.
67
MassMutual Select Destination Retirement Series – Portfolio Manager Report (Continued)
Growth of a $10,000 Investment
Hypothetical Investments in MassMutual Select Destination Retirement 2010 Fund Class S, Class A, Class A (sales load deducted), Class Y, the Custom Destination 2010 Index, the Lipper Balanced Fund Index, the Lehman Brothers Aggregate Bond Index and the S&P 500 Index.
MassMutual Select Destination Retirement 2010 Fund
Total Return
| | | Year to Date
1/1/05 - 6/30/05 | | One Year
7/1/04 - 6/30/05 | | Since Inception
12/31/03 - 6/30/05 | |
| Class S | | | 1.14 | % | | | 6.88 | % | | | 5.92 | % | |
| Class A | | | 0.95 | % | | | 6.47 | % | | | 5.51 | % | |
Class A (sales
load deducted)** | | | –4.86 | % | | | 0.34 | % | | | 1.43 | % | |
| Class Y | | | 1.14 | % | | | 6.88 | % | | | 5.85 | % | |
| S&P 500 Index | | | –0.81 | % | | | 6.32 | % | | | 6.69 | % | |
Lipper Balanced
Fund Index | | | 0.49 | % | | | 7.11 | % | | | 6.26 | % | |
Lehman Aggregate
Bond Index | | | 2.51 | % | | | 6.80 | % | | | 4.65 | % | |
Custom Destination
2010 Index | | | 1.37 | % | | | 7.94 | % | | | 6.28 | % | |
Hypothetical Investments in MassMutual Select Destination Retirement 2010 Fund Class L, Class N, Class N (CDSC fees deducted), the Custom Destination 2010 Index, the Lipper Balanced Fund Index, the Lehman Brothers Aggregate Bond Index and the S&P 500 Index.
MassMutual Select Destination Retirement 2010 Fund
Total Return
| | | Year to Date
1/1/05 - 6/30/05 | | One Year
7/1/04 - 6/30/05 | | Since Inception
12/31/03 - 6/30/05 | |
| Class L | | | 1.04 | % | | | 6.78 | % | | | 5.78 | % | |
| Class N | | | 0.85 | % | | | 6.19 | % | | | 5.19 | % | |
Class N (CDSC
fees deducted)** | | | –0.15 | % | | | 5.19 | % | | | 5.19 | % | |
| S&P 500 Index | | | –0.81 | % | | | 6.32 | % | | | 6.69 | % | |
Lipper Balanced
Fund Index | | | 0.49 | % | | | 7.11 | % | | | 6.26 | % | |
Lehman Aggregate
Bond Index | | | 2.51 | % | | | 6.80 | % | | | 4.65 | % | |
Custom Destination
2010 Index | | | 1.37 | % | | | 7.94 | % | | | 6.28 | % | |
GROWTH OF A $10,000 INVESTMENT SINCE INCEPTION*
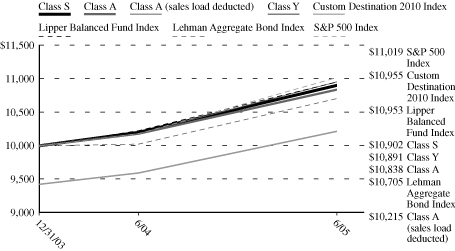
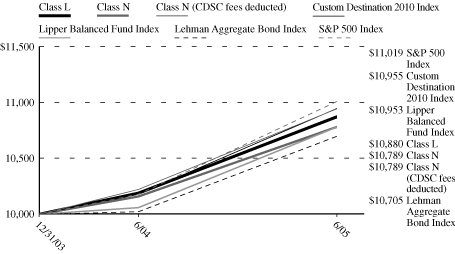
* The custom benchmark $10,000 growth chart values commence on 1/1/04.
** Class A (sales load deducted) returns include the 5.75% maximum sales charge and Class N (CDSC fees deducted) returns include the 1.00% maximum contingent deferred sales charge for the 18 months shown.
Performance data quoted represents past performance; past performance is not predictive of future results. The investment return and principal value of shares of the Fund will fluctuate with market conditions so that shares of the Fund, when redeemed, may be worth more or less than their original cost. Current performance of the Fund may be lower or higher than the performance quoted. Performance data current to the most recent month end may be obtained by calling 1-888-309-3539.
Investors should note that the Fund is a professionally managed mutual fund, while the Custom Destination 2010 Index, the Lipper Balanced Fund Index, the Lehman Brothers Aggregate Bond Index and the S&P 500 Index are unmanaged and do not incur expenses, and cannot be purchased directly by investors. Investors should read the Fund's prospectus with regard to the Fund's investment objective, risks and charges and expenses in conjunction with these financial statements. Employee retirement benefit plans that invest plan assets in the Separate Investment Accounts (SIAs) may be subject to certain charges as set forth in their respective Plan Documents. Total return figures would be lower for the periods presented if they reflected these charges. The performance tables and charts do not reflect the deduction of taxes that a shareholder would pay on the fund distributions or the redemption of th e fund shares.
68
MassMutual Select Destination Retirement Series – Portfolio Manager Report (Continued)
Growth of a $10,000 Investment
Hypothetical Investments in MassMutual Select Destination Retirement 2020 Fund Class S, Class A, Class A (sales load deducted), Class Y, the Custom Destination 2020 Index, the Lipper Balanced Fund Index, the Lehman Brothers Aggregate Bond Index and the S&P 500 Index.
MassMutual Select Destination Retirement 2020 Fund
Total Return
| | | Year to Date
1/1/05 - 6/30/05 | | One Year
7/1/04 - 6/30/05 | | Since Inception
12/31/03 - 6/30/05 | |
| Class S | | | 0.74 | % | | | 7.35 | % | | | 7.20 | % | |
| Class A | | | 0.56 | % | | | 6.95 | % | | | 6.79 | % | |
Class A (sales
load deducted)** | | | –5.22 | % | | | 0.80 | % | | | 2.66 | % | |
| Class Y | | | 0.74 | % | | | 7.24 | % | | | 7.13 | % | |
| S&P 500 Index | | | –0.81 | % | | | 6.32 | % | | | 6.69 | % | |
Lipper Balanced
Fund Index | | | 0.49 | % | | | 7.11 | % | | | 6.26 | % | |
Lehman Aggregate
Bond Index | | | 2.51 | % | | | 6.80 | % | | | 4.65 | % | |
Custom Destination
2020 Index | | | 0.91 | % | | | 8.80 | % | | | 7.22 | % | |
Hypothetical Investments in MassMutual Select Destination Retirement 2020 Fund Class L, Class N, Class N (CDSC fees deducted), the Custom Destination 2020 Index, the Lipper Balanced Fund Index, the Lehman Brothers Aggregate Bond Index and the S&P 500 Index.
MassMutual Select Destination Retirement 2020 Fund
Total Return
| | | Year to Date
1/1/05 - 6/30/05 | | One Year
7/1/04 - 6/30/05 | | Since Inception
12/31/03 - 6/30/05 | |
| Class L | | | 0.65 | % | | | 7.24 | % | | | 7.06 | % | |
| Class N | | | 0.46 | % | | | 6.69 | % | | | 6.49 | % | |
Class N (CDSC
fees deducted)** | | | –0.54 | % | | | 5.69 | % | | | 6.49 | % | |
| S&P 500 Index | | | –0.81 | % | | | 6.32 | % | | | 6.69 | % | |
Lipper Balanced
Fund Index | | | 0.49 | % | | | 7.11 | % | | | 6.26 | % | |
Lehman Aggregate
Bond Index | | | 2.51 | % | | | 6.80 | % | | | 4.65 | % | |
Custom Destination
2020 Index | | | 0.91 | % | | | 8.80 | % | | | 7.22 | % | |
GROWTH OF A $10,000 INVESTMENT SINCE INCEPTION*
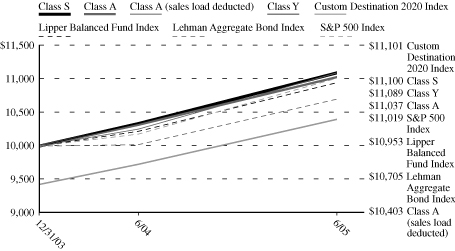

* The custom benchmark $10,000 growth chart values commence on 1/1/04.
** Class A (sales load deducted) returns include the 5.75% maximum sales charge and Class N (CDSC fees deducted) returns include the 1.00% maximum contingent deferred sales charge for the 18 months shown.
Performance data quoted represents past performance; past performance is not predictive of future results. The investment return and principal value of shares of the Fund will fluctuate with market conditions so that shares of the Fund, when redeemed, may be worth more or less than their original cost. Current performance of the Fund may be lower or higher than the performance quoted. Performance data current to the most recent month end may be obtained by calling 1-888-309-3539.
Investors should note that the Fund is a professionally managed mutual fund, while the Custom Destination 2020 Index, the Lipper Balanced Fund Index, the Lehman Brothers Aggregate Bond Index and the S&P 500 Index are unmanaged and do not incur expenses, and cannot be purchased directly by investors. Investors should read the Fund's prospectus with regard to the Fund's investment objective, risks and charges and expenses in conjunction with these financial statements. Employee retirement benefit plans that invest plan assets in the Separate Investment Accounts (SIAs) may be subject to certain charges as set forth in their respective Plan Documents. Total return figures would be lower for the periods presented if they reflected these charges. The performance tables and charts do not reflect the deduction of taxes that a shareholder would pay on the fund distributions or the redemption of th e fund shares.
69
MassMutual Select Destination Retirement Series – Portfolio Manager Report (Continued)
Growth of a $10,000 Investment
Hypothetical Investments in MassMutual Select Destination Retirement 2030 Fund Class S, Class A, Class A (sales load deducted), Class Y, the Custom Destination 2030 Index, the Lipper Balanced Fund Index, the Lehman Brothers Aggregate Bond Index and the S&P 500 Index.
MassMutual Select Destination Retirement 2030 Fund
Total Return
| | | Year to Date
1/1/05 - 6/30/05 | | One Year
7/1/04 - 6/30/05 | | Since Inception
12/31/03 - 6/30/05 | |
| Class S | | | 0.09 | % | | | 7.65 | % | | | 8.36 | % | |
| Class A | | | –0.09 | % | | | 7.21 | % | | | 7.93 | % | |
Class A (sales
load deducted)** | | | –5.83 | % | | | 1.04 | % | | | 3.76 | % | |
| Class Y | | | 0.09 | % | | | 7.54 | % | | | 8.29 | % | |
| S&P 500 Index | | | –0.81 | % | | | 6.32 | % | | | 6.69 | % | |
Lipper Balanced
Fund Index | | | 0.49 | % | | | 7.11 | % | | | 6.26 | % | |
Lehman Aggregate
Bond Index | | | 2.51 | % | | | 6.80 | % | | | 4.65 | % | |
Custom Destination
2030 Index | | | 0.24 | % | | | 9.64 | % | | | 8.26 | % | |
Hypothetical Investments in MassMutual Select Destination Retirement 2030 Fund Class L, Class N, Class N (CDSC fees deducted), the Custom Destination 2030 Index, the Lipper Balanced Fund Index, the Lehman Brothers Aggregate Bond Index and the S&P 500 Index.
MassMutual Select Destination Retirement 2030 Fund
Total Return
| | | Year to Date
1/1/05 - 6/30/05 | | One Year
7/1/04 - 6/30/05 | | Since Inception
12/31/03 - 6/30/05 | |
| Class L | | | 0.09 | % | | | 7.54 | % | | | 8.22 | % | |
| Class N | | | –0.27 | % | | | 6.89 | % | | | 7.58 | % | |
Class N (CDSC
fees deducted)** | | | –1.27 | % | | | 5.89 | % | | | 7.58 | % | |
| S&P 500 Index | | | –0.81 | % | | | 6.32 | % | | | 6.69 | % | |
Lipper Balanced
Fund Index | | | 0.49 | % | | | 7.11 | % | | | 6.26 | % | |
Lehman Aggregate
Bond Index | | | 2.51 | % | | | 6.80 | % | | | 4.65 | % | |
Custom Destination
2030 Index | | | 0.24 | % | | | 9.64 | % | | | 8.26 | % | |
GROWTH OF A $10,000 INVESTMENT SINCE INCEPTION*
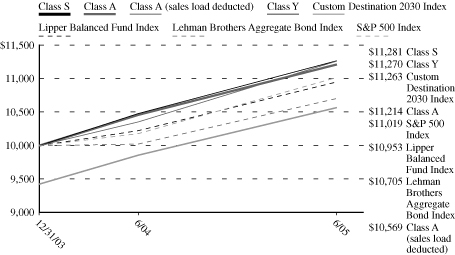
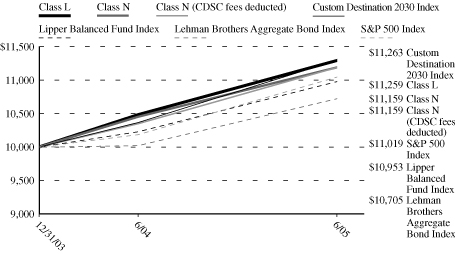
* The custom benchmark $10,000 growth chart values commence on 1/1/04.
** Class A (sales load deducted) returns include the 5.75% maximum sales charge and Class N (CDSC fees deducted) returns include the 1.00% maximum contingent deferred sales charge for the 18 months shown.
Performance data quoted represents past performance; past performance is not predictive of future results. The investment return and principal value of shares of the Fund will fluctuate with market conditions so that shares of the Fund, when redeemed, may be worth more or less than their original cost. Current performance of the Fund may be lower or higher than the performance quoted. Performance data current to the most recent month end may be obtained by calling 1-888-309-3539.
Investors should note that the Fund is a professionally managed mutual fund, while the Custom Destination 2030 Index, the Lipper Balanced Fund Index, the Lehman Brothers Aggregate Bond Index and the S&P 500 Index are unmanaged and do not incur expenses, and cannot be purchased directly by investors. Investors should read the Fund's prospectus with regard to the Fund's investment objective, risks and charges and expenses in conjunction with these financial statements. Employee retirement benefit plans that invest plan assets in the Separate Investment Accounts (SIAs) may be subject to certain charges as set forth in their respective Plan Documents. Total return figures would be lower for the periods presented if they reflected these charges. The performance tables and charts do not reflect the deduction of taxes that a shareholder would pay on the fund distributions or the redemption of th e fund shares.
70
MassMutual Select Destination Retirement Series – Portfolio Manager Report (Continued)
Growth of a $10,000 Investment
Hypothetical Investments in MassMutual Select Destination Retirement 2040 Fund Class S, Class A, Class A (sales load deducted), Class Y, the Custom Destination 2040 Index, the Lipper Balanced Fund Index, the Lehman Brothers Aggregate Bond Index and the S&P 500 Index.
MassMutual Select Destination Retirement 2040 Fund
Total Return
| | | Year to Date
1/1/05 - 6/30/05 | | One Year
7/1/04 - 6/30/05 | | Since Inception
12/31/03 - 6/30/05 | |
| Class S | | | –0.27 | % | | | 7.54 | % | | | 8.77 | % | |
| Class A | | | –0.53 | % | | | 7.11 | % | | | 8.34 | % | |
Class A (sales
load deducted)** | | | –6.25 | % | | | 0.95 | % | | | 4.15 | % | |
| Class Y | | | –0.27 | % | | | 7.52 | % | | | 8.76 | % | |
| S&P 500 Index | | | –0.81 | % | | | 6.32 | % | | | 6.69 | % | |
Lipper Balanced
Fund Index | | | 0.49 | % | | | 7.11 | % | | | 6.26 | % | |
Lehman Aggregate
Bond Index | | | 2.51 | % | | | 6.80 | % | | | 4.65 | % | |
Custom Destination
2040 Index | | | –0.16 | % | | | 10.13 | % | | | 8.85 | % | |
Hypothetical Investments in MassMutual Select Destination Retirement 2040 Fund Class L, Class N, Class N (CDSC fees deducted), the Custom Destination 2040 Index, the Lipper Balanced Fund Index, the Lehman Brothers Aggregate Bond Index and the S&P 500 Index.
MassMutual Select Destination Retirement 2040 Fund
Total Return
| | | Year to Date
1/1/05 - 6/30/05 | | One Year
7/1/04 - 6/30/05 | | Since Inception
12/31/03 - 6/30/05 | |
| Class L | | | –0.35 | % | | | 7.33 | % | | | 8.63 | % | |
| Class N | | | –0.62 | % | | | 6.78 | % | | | 8.05 | % | |
Class N (CDSC
fees deducted)** | | | –1.61 | % | | | 5.78 | % | | | 8.05 | % | |
| S&P 500 Index | | | –0.81 | % | | | 6.32 | % | | | 6.69 | % | |
Lipper Balanced
Fund Index | | | 0.49 | % | | | 7.11 | % | | | 6.26 | % | |
Lehman Aggregate
Bond Index | | | 2.51 | % | | | 6.80 | % | | | 4.65 | % | |
Custom Destination
2040 Index | | | –0.16 | % | | | 10.13 | % | | | 8.85 | % | |
GROWTH OF A $10,000 INVESTMENT SINCE INCEPTION*
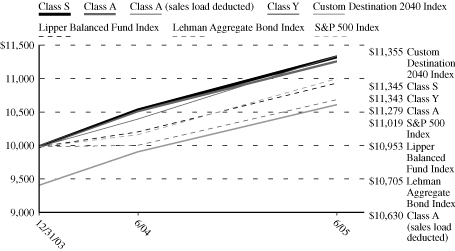
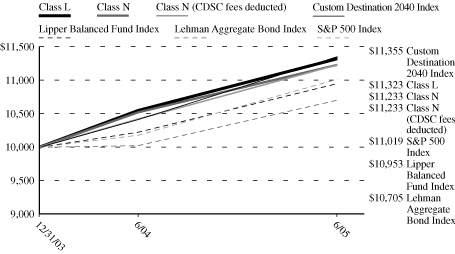
* The custom benchmark $10,000 growth chart values commence on 1/1/04.
** Class A (sales load deducted) returns include the 5.75% maximum sales charge and Class N (CDSC fees deducted) returns include the 1.00% maximum contingent deferred sales charge for the 18 months shown.
Performance data quoted represents past performance; past performance is not predictive of future results. The investment return and principal value of shares of the Fund will fluctuate with market conditions so that shares of the Fund, when redeemed, may be worth more or less than their original cost. Current performance of the Fund may be lower or higher than the performance quoted. Performance data current to the most recent month end may be obtained by calling 1-888-309-3539.
Investors should note that the Fund is a professionally managed mutual fund, while the Custom Destination 2040 Index, the Lipper Balanced Fund Index, the Lehman Brothers Aggregate Bond Index and the S&P 500 Index are unmanaged and do not incur expenses, and cannot be purchased directly by investors. Investors should read the Fund's prospectus with regard to the Fund's investment objective, risks and charges and expenses in conjunction with these financial statements. Employee retirement benefit plans that invest plan assets in the Separate Investment Accounts (SIAs) may be subject to certain charges as set forth in their respective Plan Documents. Total return figures would be lower for the periods presented if they reflected these charges. The performance tables and charts do not reflect the deduction of taxes that a shareholder would pay on the fund distributions or the redemption of th e fund shares.
71
MassMutual Select Strategic Bond Fund – Portfolio of Investments
June 30, 2005 (Unaudited)
| | | Number of
Shares | | Market
Value | |
| EQUITIES - 0.2% | |
| Automotive & Parts | |
General Motors Corp.,
Series B, Convertible
Preferred Stock | | | 6,200 | | | $ | 115,072 | | |
TOTAL EQUITIES
(Cost $111,379) | | | | | | | 115,072 | | |
| | | Principal
Amount | |
| |
| BONDS & NOTES - 101.4% | |
| CORPORATE DEBT - 17.8% | |
AES Corp.
7.750% 03/01/2014 | | $ | 280,000 | | | | 303,800 | | |
AES Corp.
8.875% 02/15/2011 | | | 10,000 | | | | 11,175 | | |
Altria Group, Inc.
7.000% 11/04/2013 | | | 185,000 | | | | 207,033 | | |
Amerada Hess Corp.
7.300% 08/15/2031 | | | 190,000 | | | | 229,248 | | |
Anheuser-Busch Cos., Inc.
4.950% 01/15/2014 | | | 70,000 | | | | 72,711 | | |
AOL Time Warner, Inc.
6.875% 05/01/2012 | | | 215,000 | | | | 242,611 | | |
AOL Time Warner, Inc.
7.700% 05/01/2032 | | | 95,000 | | | | 120,177 | | |
Apache Finance
Canada Corp.
4.375% 05/15/2015 | | | 155,000 | | | | 154,685 | | |
ASIF Global Financng(b)
4.900% 01/17/2013 | | | 30,000 | | | | 30,442 | | |
Bank of America Corp.
3.875% 01/15/2008 | | | 225,000 | | | | 224,115 | | |
Banque Paribas - New York
6.875% 03/01/2009 | | | 110,000 | | | | 119,581 | | |
ChevronTexaco
Capital Co.
3.500% 09/17/2007 | | | 150,000 | | | | 148,547 | | |
Citigroup, Inc.
4.125% 02/22/2010 | | | 240,000 | | | | 239,148 | | |
Clear Channel
Communications, Inc.
4.250% 05/15/2009 | | | 50,000 | | | | 48,183 | | |
Clear Channel
Communications, Inc.
5.500% 09/15/2014 | | | 150,000 | | | | 142,269 | | |
Comcast Corp.
6.500% 01/15/2015 | | | 245,000 | | | | 273,087 | | |
| | | Principal
Amount | | Market
Value | |
Conoco, Inc.
6.950% 04/15/2029 | | $ | 145,000 | | | $ | 182,166 | | |
Cox Communications, Inc.
3.875% 10/01/2008 | | | 75,000 | | | | 73,420 | | |
Credit Suisse
First Boston USA, Inc.
4.625% 01/15/2008 | | | 100,000 | | | | 101,081 | | |
DaimlerChrysler
North American
Holding Corp.
4.050% 06/04/2008 | | | 150,000 | | | | 147,703 | | |
Deutsche Telekom
International Finance BV
5.250% 07/22/2013 | | | 50,000 | | | | 51,911 | | |
Devon Energy Corp.
7.950% 04/15/2032 | | | 105,000 | | | | 138,113 | | |
Dominion Resources, Inc.
4.750% 12/15/2010 | | | 30,000 | | | | 30,182 | | |
Dominion Resources, Inc.
5.700% 09/17/2012 | | | 100,000 | | | | 105,452 | | |
Duke Energy Corp.
5.625% 11/30/2012 | | | 145,000 | | | | 153,815 | | |
Eastman Kodak Co.
3.625% 05/15/2008 | | | 60,000 | | | | 57,720 | | |
Eastman Kodak Co.
7.250% 11/15/2013 | | | 80,000 | | | | 84,108 | | |
El Paso Corp.
7.800% 08/01/2031 | | | 12,000 | | | | 11,670 | | |
El Paso Natural Gas Co.
8.375% 06/15/2032 | | | 79,000 | | | | 91,877 | | |
FirstEnergy Corp., Series B
6.450% 11/15/2011 | | | 70,000 | | | | 76,484 | | |
FirstEnergy Corp., Series C
7.375% 11/15/2031 | | | 175,000 | | | | 213,916 | | |
Ford Motor Co.
7.450% 07/16/2031 | | | 160,000 | | | | 133,571 | | |
Ford Motor Credit Co.
4.950% 01/15/2008 | | | 110,000 | | | | 104,931 | | |
Ford Motor Credit Co.(a)
6.625% 06/16/2008 | | | 100,000 | | | | 98,765 | | |
Ford Motor Credit Co.
7.250% 10/25/2011 | | | 80,000 | | | | 76,981 | | |
Ford Motor Credit Co.
7.375% 10/28/2009 | | | 615,000 | | | | 600,970 | | |
Ford Motor Credit Co.
7.375% 02/01/2011 | | | 130,000 | | | | 126,634 | | |
General Electric
Capital Corp.
4.250% 01/15/2008 | | | 185,000 | | | | 185,715 | | |
| | | Principal
Amount | | Market
Value | |
General Motors
Acceptance Corp.
5.625% 05/15/2009 | | $ | 430,000 | | | $ | 402,692 | | |
General Motors
Acceptance Corp.
6.125% 02/01/2007 | | | 30,000 | | | | 29,794 | | |
General Motors
Acceptance Corp.
6.125% 08/28/2007 | | | 160,000 | | | | 158,355 | | |
General Motors
Acceptance Corp.
6.125% 09/15/2006 | | | 30,000 | | | | 30,021 | | |
General Motors
Acceptance Corp.
6.150% 04/05/2007 | | | 30,000 | | | | 29,844 | | |
General Motors
Acceptance Corp.
6.311% 11/30/2007 | | | 50,000 | | | | 48,434 | | |
General Motors
Acceptance Corp.
7.750% 01/19/2010 | | | 70,000 | | | | 68,428 | | |
General Motors Corp.
8.250% 07/15/2023 | | | 80,000 | | | | 66,200 | | |
General Motors Corp.
8.375% 07/05/2033 | | | 40,000 | | | | 39,663 | | |
General Motors Corp.(a)
8.375% 07/15/2033 | | | 120,000 | | | | 100,200 | | |
Goldman Sachs
Group, Inc.
4.125% 01/15/2008 | | | 115,000 | | | | 114,934 | | |
Goldman Sachs
Group, Inc.
4.500% 06/15/2010 | | | 60,000 | | | | 60,194 | | |
HCA, Inc.
5.750% 03/15/2014 | | | 30,000 | | | | 29,868 | | |
HCA, Inc.
6.250% 02/15/2013 | | | 80,000 | | | | 81,769 | | |
HCA, Inc.
6.375% 01/15/2015 | | | 170,000 | | | | 176,393 | | |
Household Finance Corp.
Series MTN
4.125% 11/16/2009 | | | 245,000 | | | | 242,352 | | |
International Paper Co.
5.500% 01/15/2014 | | | 75,000 | | | | 76,584 | | |
Kerr - McGee Corp.
7.875% 09/15/2031 | | | 180,000 | | | | 204,968 | | |
Kraft Foods, Inc.
5.625% 11/01/2011 | | | 140,000 | | | | 148,515 | | |
Lehman Brothers
Holdings, Inc.
4.000% 01/22/2008 | | | 125,000 | | | | 124,553 | | |
(Continued)
The accompanying notes are an integral part of the financial statements.
72
MassMutual Select Strategic Bond Fund – Portfolio of Investments (Continued)
| | | Principal
Amount | | Market
Value | |
Liberty Media Corp.
5.700% 05/15/2013 | | $ | 20,000 | | | $ | 18,602 | | |
Morgan Stanley
3.625% 04/01/2008 | | | 200,000 | | | | 196,899 | | |
News America, Inc.
6.200% 12/15/2034 | | | 50,000 | | | | 52,475 | | |
OAO Gazprom(b)
9.625% 03/01/2013 | | | 20,000 | | | | 24,525 | | |
Oncor Electric Delivery Co.
6.375% 01/15/2015 | | | 45,000 | | | | 49,880 | | |
Pacific Gas & Electric Co.
6.050% 03/01/2034 | | | 110,000 | | | | 121,230 | | |
Rabobank Capital
Fund II(b)
5.260% 12/31/2049 | | | 10,000 | | | | 10,287 | | |
Rabobank Capital
Funding Trust(b)
5.254% 12/31/2049 | | | 20,000 | | | | 20,515 | | |
Sprint Capital Corp.
6.000% 01/15/2007 | | | 310,000 | | | | 317,671 | | |
Sprint Capital Corp.
8.375% 03/15/2012 | | | 30,000 | | | | 36,085 | | |
Tenet Healthcare Corp.(b)
9.250% 02/01/2015 | | | 244,000 | | | | 253,150 | | |
Tennessee Valley Authority
4.650% 06/15/2035 | | | 60,000 | | | | 60,105 | | |
TXU Corp.(b)
6.550% 11/15/2034 | | | 160,000 | | | | 157,140 | | |
Tyco International
Group SA
6.000% 11/15/2013 | | | 230,000 | | | | 250,124 | | |
Tyco International
Group SA
6.375% 10/15/2011 | | | 115,000 | | | | 126,305 | | |
Tyco International
Group SA
6.875% 01/15/2029 | | | 70,000 | | | | 83,555 | | |
Verizon Global
Funding Corp.
7.375% 09/01/2012 | | | 170,000 | | | | 198,644 | | |
Waste Management, Inc.
6.375% 11/15/2012 | | | 115,000 | | | | 125,565 | | |
Waste Management, Inc.
6.500% 11/15/2008 | | | 60,000 | | | | 63,735 | | |
Wells Fargo & Co.
4.200% 01/15/2010 | | | 115,000 | | | | 114,939 | | |
Weyerhaeuser Co.
6.750% 03/15/2012 | | | 245,000 | | | | 269,559 | | |
Williams Cos., Inc.
7.750% 06/15/2031 | | | 210,000 | | | | 231,525 | | |
XTO Energy, Inc.
6.250% 04/15/2013 | | | 115,000 | | | | 124,457 | | |
TOTAL CORPORATE DEBT
(Cost $10,491,220) | | | | | | | 10,554,730 | | |
| | | Principal
Amount | | Market
Value | |
NON-U.S. GOVERNMENT AGENCY
OBLIGATIONS - 5.6% | |
| Collateralized Mortgage Obligations | |
AAA Trust,
Series 2005-2,
Class A1(b)
3.414% 11/26/2035 | | $ | 698,014 | | | $ | 697,959 | | |
Countrywide Alternative
Loan Trust,
Series 2005-24,
Class 4A1
3.490% 07/20/2035 | | | 498,657 | | | | 498,603 | | |
Delta Funding Home
Equity Loan Trust,
Series 1998-1,
Class A6F
6.340% 12/15/2028 | | | 221,337 | | | | 223,516 | | |
Equifirst Mortgage
Loan Trust,
Series 2005-1,
Class A1
3.374% 04/25/2035 | | | 451,979 | | | | 451,767 | | |
GS Mortgage
Securities Corp. II,
Series 2005-GG4,
Class AABA
4.680% 07/10/2039 | | | 200,000 | | | | 202,423 | | |
GSAA Trust,
Series 2005-7,
Class AV1
3.436% 07/25/2035 | | | 500,000 | | | | 499,940 | | |
LB-UBS Commercial
Mortgage Trust,
Series 2005-C3,
Class A5
4.739% 07/15/2030 | | | 140,000 | | | | 141,838 | | |
LB-UBS Commercial
Mortgage Trust,
Series 2005-C3,
Class AAB
4.664% 07/15/2030 | | | 100,000 | | | | 101,156 | | |
MSDWCC Heloc Trust,
Series 2005-1, Class A
3.504% 07/25/2017 | | | 67,487 | | | | 67,518 | | |
Washington Mutual, Inc.,
Series 2005-AR8,
Class 1A1A(c)
0.000% 07/25/2045 | | | 400,000 | | | | 399,948 | | |
TOTAL NON-U.S. GOVERNMENT
AGENCY OBLIGATIONS
(Cost $3,282,143) | | | | | | | 3,284,668 | | |
| | | Principal
Amount | | Market
Value | |
| SOVEREIGN DEBT OBLIGATIONS - 9.7% | | | |
Bundesobligation
3.250% 04/17/2009 | | EUR | 1,100,000 | | | $ | 1,371,393 | | |
Canada Government
4.000% 12/01/2031 | | CAD | 128,351 | | | | 149,838 | | |
Commonwealth of
Australia
5.250% 08/15/2010 | | AUD | 340,000 | | | | 260,137 | | |
French Republic
3.000% 07/25/2009 | | EUR | 332,700 | | | | 441,556 | | |
Republic of Brazil
4.313% 04/15/2012 | | | 49,412 | | | | 47,530 | | |
Republic of Brazil
8.000% 04/15/2014 | | | 116,104 | | | | 118,925 | | |
Republic of Brazil
10.125% 05/15/2027 | | | 130,000 | | | | 150,605 | | |
Republic of Brazil
11.000% 08/17/2040 | | | 80,000 | | | | 96,240 | | |
Republic of Brazil
14.500% 10/15/2009 | | | 170,000 | | | | 221,000 | | |
Republic of Bulgaria(b)
8.250% 01/15/2015 | | | 110,000 | | | | 138,188 | | |
Republic of Colombia
10.500% 07/09/2010 | | | 30,000 | | | | 35,700 | | |
Republic of Colombia
11.750% 02/25/2020 | | | 70,000 | | | | 92,050 | | |
Republic of Germany
4.250% 01/04/2014 | | EUR | 460,000 | | | | 607,048 | | |
Republic of Hungary
8.250% 10/12/2009 | | HUF | 42,960,000 | | | | 223,086 | | |
Republic of Panama
9.625% 02/08/2011 | | | 20,000 | | | | 23,900 | | |
Republic of Panama
10.750% 05/15/2020 | | | 80,000 | | | | 108,400 | | |
Republic of Peru
5.000% 03/07/2017 | | | 51,000 | | | | 48,578 | | |
Republic of Peru
8.750% 11/21/2033 | | | 50,000 | | | | 56,375 | | |
Russian Federation
5.000% 03/31/2030 | | | 560,000 | | | | 625,184 | | |
United Mexican States
7.500% 04/08/2033 | | | 480,000 | | | | 550,800 | | |
United Mexican States
8.300% 08/15/2031 | | | 100,000 | | | | 124,500 | | |
United Mexican States
8.375% 01/14/2011 | | | 190,000 | | | | 221,160 | | |
TOTAL SOVEREIGN DEBT
OBLIGATIONS
(Cost $5,789,882) | | | | | | | 5,712,193 | | |
(Continued)
The accompanying notes are an integral part of the financial statements.
73
MassMutual Select Strategic Bond Fund – Portfolio of Investments (Continued)
| | | Principal
Amount | | Market
Value | |
U.S. GOVERNMENT AGENCY
OBLIGATIONS - 22.1% | |
| Federal Home Loan Mortgage Corporation (FHLMC) - 0.9% | |
| Pass-Through Securities | |
Federal Home Loan Bank
4.125% 04/18/2008 | | $ | 50,000 | | | $ | 50,146 | | |
Federal Home Loan Bank
4.375% 03/17/2010 | | | 60,000 | | | | 60,603 | | |
FHLMC Gold TBA(c)
5.000% 07/01/2019 | | | 400,000 | | | | 404,438 | | |
Total Pass-Through
Securities | | | | | | | 515,187 | | |
Federal National Mortgage Association
(FNMA) - 11.6% | |
| Pass-Through Securities | |
FNMA
3.310% 01/26/2007 | | | 110,000 | | | | 109,041 | | |
FNMA
3.875% 07/15/2008 | | | 120,000 | | | | 119,569 | | |
FNMA
4.610% 10/10/2013 | | | 260,000 | | | | 255,237 | | |
FNMA(c)
5.500% 07/01/2019 | | | 200,000 | | | | 205,250 | | |
FNMA TBA(c)
5.000% 07/01/2034 | | | 2,200,000 | | | | 2,199,828 | | |
FNMA TBA(c)
5.500% 08/01/2019-
07/01/2034 | | | 1,300,000 | | | | 1,318,821 | | |
FNMA TBA(c)
6.000% 07/01/2035 | | | 1,300,000 | | | | 1,332,805 | | |
FNMA TBA(c)
6.500% 07/01/2035 | | | 1,300,000 | | | | 1,345,297 | | |
Total Pass-Through
Securities | | | | | | | 6,885,848 | | |
| Government National Mortgage Association (GNMA) - 9.6% | |
| Pass-Through Securities | |
GNMA(c)
5.000% 07/01/2034 | | | 1,500,000 | | | | 1,511,367 | | |
GNMA(c)
5.500% 07/01/2034 | | | 400,000 | | | | 408,406 | | |
GNMA TBA(c)
6.000% 07/01/2034 | | | 2,700,000 | | | | 2,784,164 | | |
GNMA TBA(c)
6.500% 07/01/2034 | | | 900,000 | | | | 939,797 | | |
| Total Pass-Through Securities | | | | | | | 5,643,734 | | |
TOTAL U.S. GOVERNMENT
AGENCY OBLIGATIONS
(Cost $13,025,079) | | | | | | | 13,044,769 | | |
| | | Principal
Amount | | Market
Value | |
| U.S. TREASURY OBLIGATIONS - 46.2% | | | |
| U.S. Treasury Bonds - 10.3% | | | |
U.S. Treasury Bond
4.000% 02/15/2015 | | $ | 320,000 | | | $ | 321,200 | | |
U.S. Treasury Bond(a)
4.125% 05/15/2015 | | | 810,000 | | | | 822,023 | | |
U.S. Treasury Bond
5.250% 02/15/2029 | | | 30,000 | | | | 34,317 | | |
U.S. Treasury Bond(a)
5.375% 02/15/2031 | | | 1,790,000 | | | | 2,112,200 | | |
U.S. Treasury Bond(d)
6.250% 05/15/2030 | | | 1,000,000 | | | | 1,302,813 | | |
U.S. Treasury
Inflation Index
1.625% 01/15/2015 | | | 10,595 | | | | 10,553 | | |
U.S. Treasury
Inflation Index
2.375% 01/15/2025 | | | 1,300,509 | | | | 1,430,966 | | |
U.S. Treasury
Inflation Index
3.875% 04/15/2029 | | | 35,504 | | | | 50,033 | | |
| Total U.S. Treasury Bonds | | | | | | | 6,084,105 | | |
| U.S. Treasury Notes - 35.4% | | | |
U.S. Treasury
Inflation Index
0.875% 04/15/2010 | | | 2,568,742 | | | | 2,506,731 | | |
U.S. Treasury
Inflation Index
3.375% 01/15/2007 | | | 196,478 | | | | 202,864 | | |
U.S. Treasury
Inflation Index
3.625% 01/15/2008 | | | 156,556 | | | | 165,742 | | |
U.S. Treasury
Inflation Index
3.875% 01/15/2009 | | | 59,316 | | | | 64,566 | | |
U.S. Treasury Note
1.875% 12/31/2005 | | | 50,000 | | | | 49,625 | | |
U.S. Treasury Note(d)
2.500% 09/30/2006 | | | 9,720,000 | | | | 9,590,907 | | |
U.S. Treasury Note
3.000% 12/31/2006 | | | 720,000 | | | | 713,419 | | |
U.S. Treasury Note
3.000% 02/15/2008 | | | 10,000 | | | | 9,838 | | |
U.S. Treasury Note
3.125% 01/31/2007 | | | 120,000 | | | | 119,053 | | |
U.S. Treasury Note(a)
3.500% 12/15/2009 | | | 600,000 | | | | 594,469 | | |
U.S. Treasury Note
3.625% 04/30/2007 | | | 110,000 | | | | 109,940 | | |
U.S. Treasury Note
3.625% 01/15/2010 | | | 490,000 | | | | 487,703 | | |
| | | Principal
Amount | | Market
Value | |
U.S. Treasury Note
3.625% 06/15/2010 | | $ | 370,000 | | | $ | 368,786 | | |
U.S. Treasury Note(a)
3.875% 05/15/2010 | | | 5,910,000 | | | | 5,944,629 | | |
| Total U.S. Treasury Notes | | | | | | | 20,928,272 | | |
| U.S. Treasury Strips - 0.5% | |
U.S. Treasury Strips
0.000% 11/15/2021 | | | 640,000 | | | | 315,615 | | |
U.S. Treasury Strips
0.000% 11/15/2027 | | | 60,000 | | | | 22,867 | | |
| Total U.S. Treasury Strips | | | | | | | 338,482 | | |
TOTAL U.S. TREASURY
OBLIGATIONS
(Cost $27,066,940) | | | | | | | 27,350,859 | | |
TOTAL BONDS & NOTES
(Cost $59,655,264) | | | | | | | 59,947,219 | | |
| OPTIONS - 0.1% | |
1 Year
Eurodollar Futures,
September 2005 Call,
Expires 9/16/2005,
Strike 96.25 | | | 10,000 | | | | 750 | | |
90 Day
Eurodollar Futures,
September 2005 Call,
Expires 9/19/2005,
Strike 96 | | | 47,500 | | | | 7,719 | | |
90 Day
Eurodollar Futures,
September 2005 Call,
Expires 9/19/2005,
Strike 96.25 | | | 2,500 | | | | 94 | | |
90 Day
Eurodollar Futures,
September 2005 Call,
Expires 9/19/2005,
Strike 96.50 | | | 10,000 | | | | 75 | | |
90 Day
Eurodollar Futures,
September 2005 Put,
Expires 9/19/2005,
Srtike 95.00 | | | 2,500 | | | | 6 | | |
Eurodollar Future Options,
June 2006 Put,
Expires 6/19/2006,
Strike 94 | | | 7,500 | | | | 19 | | |
(Continued)
The accompanying notes are an integral part of the financial statements.
74
MassMutual Select Strategic Bond Fund – Portfolio of Investments (Continued)
| | | Principal
Amount | | Market
Value | |
Eurodollar Future Options,
March 2006 Call,
Expires 3/13/2006,
Strike 95 | | $ | 25,000 | | | $ | 25,250 | | |
Eurodollar Future Options,
March 2006 Put,
Expires 3/13/2006,
Strike 96 | | | 20,000 | | | | 4,100 | | |
Eurodollar Future Options,
September 2005 Call,
Expires 9/19/2005,
Strike 95.75 | | | 7,500 | | | | 3,000 | | |
Eurodollar Option,
March 2006 Call,
Expires 3/13/2006,
Strike 96.25 | | | 20,000 | | | | 2,250 | | |
OTC Call, Exp: 7/7/2005,
Strike 101.45 | | | 120,000 | | | | 240 | | |
U.S. 10 Year Future Options,
September 2005 Put,
Expires 8/26/2005,
Strike 113 | | | 10,000 | | | | 7,031 | | |
U.S. 5 Year Future Options,
September 2005 Put,
Expires 8/26/2005,
Strike 104 | | | 47,000 | | | | 734 | | |
U.S. Bond Future Options,
September 2005 Call,
Expires 8/26/2005,
Strike 116 | | | 1,000 | | | | 3,266 | | |
U.S. Bond Future Options,
September 2005 Call,
Expires 8/26/2005,
Strike 118 | | | 2,000 | | | | 3,812 | | |
TOTAL OPTIONS
(Cost $69,680) | | | | | | | 58,346 | | |
TOTAL LONG TERM INVESTMENTS
(Cost $59,836,323) | | | | | | | 60,120,637 | | |
| SHORT-TERM INVESTMENTS - 17.0% | | | |
| Cash Equivalents - 5.7%(f) | | | |
ABN Amro Bank NV
Eurodollar Time Deposit
3.250% 08/05/2005 | | | 35,860 | | | | 35,860 | | |
American Beacon Money
Market Fund | | | 96,805 | | | | 96,805 | | |
Bank of America Bank Note
3.270% 07/18/2005 | | | 49,635 | | | | 49,635 | | |
Bank of America Bank Note
3.270% 08/30/2005 | | | 92,179 | | | | 92,179 | | |
| | | Principal
Amount | | Market
Value | |
Bank of Montreal
Eurodollar Time Deposit
3.010% 07/01/2005 | | $ | 136,530 | | | $ | 136,530 | | |
Barclays
Eurodollar Time Deposit
3.160% 07/14/2005 | | | 70,907 | | | | 70,907 | | |
Barclays
Eurodollar Time Deposit
3.250% 07/26/2005 | | | 71,443 | | | | 71,443 | | |
BGI Institutional Money
Market Fund | | | 278,289 | | | | 278,289 | | |
BNP Paribas
Eurodollar Time Deposit
3.000% 07/01/2005 | | | 49,635 | | | | 49,635 | | |
Calyon
Eurodollar Time Deposit
3.310% 07/01/2005 | | | 42,544 | | | | 42,544 | | |
Citigroup
Eurodollar Time Deposit
3.085% 07/22/2005 | | | 42,544 | | | | 42,544 | | |
Citigroup
Eurodollar Time Deposit
3.100% 07/25/2005 | | | 98,547 | | | | 98,547 | | |
Dexia Group
Eurodollar Time Deposit
3.205% 07/20/2005 | | | 35,454 | | | | 35,454 | | |
Dexia Group
Eurodollar Time Deposit
3.240% 07/21/2005 | | | 35,454 | | | | 35,454 | | |
Federal Home Loan
Bank Discount Note
2.977% 07/01/2005 | | | 87,560 | | | | 87,560 | | |
First Tennessee
National Corporation
Eurodollar Time Deposit
3.220% 08/09/2005 | | | 12,778 | | | | 12,778 | | |
Fortis Bank
Eurodollar Time Deposit
3.110% 07/05/2005 | | | 49,331 | | | | 49,331 | | |
Fortis Bank
Eurodollar Time Deposit
3.250% 07/25/2005 | | | 50,049 | | | | 50,049 | | |
Fortis Bank
Eurodollar Time Deposit
3.250% 08/04/2005 | | | 70,907 | | | | 70,907 | | |
Fortis Bank
Eurodollar Time Deposit
3.270% 07/07/2005 | | | 56,726 | | | | 56,726 | | |
Freddie Mac Discount Note
3.208% 07/26/2005 | | | 34,955 | | | | 34,955 | | |
Freddie Mac Discount Note
3.244% 08/16/2005 | | | 85,088 | | | | 85,088 | | |
General Electric Capital Corp
3.252% 07/06/2005 | | | 70,907 | | | | 70,907 | | |
| | | Principal
Amount | | Market
Value | |
General Electric Capital Corp
3.253% 07/08/2005 | | $ | 56,726 | | | $ | 56,726 | | |
Goldman Sachs Financial
Square Prime Obligations
Money Market Fund | | | 64,747 | | | | 64,747 | | |
Harris Trust & Savings Bank
3.295% 11/04/2005 | | | 67,911 | | | | 67,911 | | |
HBOS Halifax
Bank of Scotland
Eurodollar Time Deposit
3.150% 08/08/2005 | | | 35,454 | | | | 35,454 | | |
HSBC Banking/Holdings PLC
Eurodollar Time Deposit
3.250% 08/05/2005 | | | 42,544 | | | | 42,544 | | |
JP Morgan Chase & Co.
Eurodollar Time Deposit
3.200% 07/20/2005 | | | 70,907 | | | | 70,907 | | |
Merrimac Cash Fund,
Premium Class | | | 112,421 | | | | 112,421 | | |
Morgan Stanley
Dean Witter & Co.
3.518% 07/19/2005 | | | 141,814 | | | | 141,814 | | |
National Australia Bank
Eurodollar Time Deposit
3.260% 07/06/2005 | | | 28,363 | | | | 28,363 | | |
National Australia Bank
Eurodollar Time Deposit
3.375% 07/01/2005 | | | 85,088 | | | | 85,088 | | |
Nordea Bank Finland
PLC (NY Branch)
Eurodollar Time Deposit
3.165% 08/09/2005 | | | 55,060 | | | | 55,060 | | |
Nordea Bank Finland
PLC (NY Branch)
Eurodollar Time Deposit
3.240% 08/03/2005 | | | 25,527 | | | | 25,527 | | |
Rabobank Nederland
Eurodollar Time Deposit
3.170% 07/18/2005 | | | 70,907 | | | | 70,907 | | |
Rabobank Nederland
Eurodollar Time Deposit
3.350% 07/01/2005 | | | 57,372 | | | | 57,372 | | |
Royal Bank of Canada
Eurodollar Time Deposit
3.250% 07/07/2005 | | | 42,544 | | | | 42,544 | | |
Royal Bank of Canada
Eurodollar Time Deposit
3.260% 07/28/2005 | | | 70,907 | | | | 70,907 | | |
Royal Bank of Scotland
Eurodollar Time Deposit
3.240% 08/08/2005 | | | 77,998 | | | | 77,998 | | |
Royal Bank of Scotland
Eurodollar Time Deposit
3.250% 08/04/2005 | | | 56,726 | | | | 56,726 | | |
(Continued)
The accompanying notes are an integral part of the financial statements.
75
MassMutual Select Strategic Bond Fund – Portfolio of Investments (Continued)
| | | Principal
Amount | | Market
Value | |
Royal Bank of Scotland
Eurodollar Time Deposit
3.270% 07/29/2005 | | $ | 56,726 | | | $ | 56,726 | | |
Societe Generale
Eurodollar Time Deposit
3.200% 08/08/2005 | | | 28,363 | | | | 28,363 | | |
Societe Generale
Eurodollar Time Deposit
3.240% 08/09/2005 | | | 46,932 | | | | 46,932 | | |
Societe Generale
Eurodollar Time Deposit
3.280% 08/01/2005 | | | 70,907 | | | | 70,907 | | |
Svenska Handlesbanken
Eurodollar Time Deposit
3.220% 08/05/2005 | | | 70,907 | | | | 70,907 | | |
The Bank of the West
Eurodollar Time Deposit
3.270% 07/27/2005 | | | 21,272 | | | | 21,272 | | |
Toronto Dominion Bank
Eurodollar Time Deposit
3.250% 08/02/2005 | | | 70,907 | | | | 70,907 | | |
UBS AG
Eurodollar Time Deposit
3.250% 08/09/2005 | | | 35,454 | | | | 35,454 | | |
Wells Fargo
Eurodollar Time Deposit
3.270% 07/21/2005 | | | 70,907 | | | | 70,907 | | |
Wells Fargo
Eurodollar Time Deposit
3.270% 08/01/2005 | | | 70,907 | | | | 70,907 | | |
| | | | 3,360,425 | | |
| Commercial Paper - 0.5% | | | |
FNMA Discount Note(e)
3.390% 12/05/2005 | | | 315,000 | | | | 310,343 | | |
| Repurchase Agreement - 10.8% | |
Investors Bank & Trust
Company Repurchase
Agreement, dated
06/30/2005, 2.01%,
due 07/01/2005(a) | | | 6,396,599 | | | | 6,396,599 | | |
TOTAL SHORT-TERM
INVESTMENTS
(At Amortized Cost) | | | | | | | 10,067,367 | | |
TOTAL INVESTMENTS - 118.7%
(Cost $69,903,690)(h) | | | | | | | 70,188,004 | | |
Other Assets/
(Liabilities) - (18.7%) | | | | | | | (11,035,853 | ) | |
| NET ASSETS - 100.0% | | | | | | $ | 59,152,151 | | |
Notes to Portfolio of Investments
AUD - Australian Dollar
CAD - Canadian Dollar
EUR - Euro
HUF - Hungarian Forint
MTN - Medium Term Note
TBA - To be announced
(a) Denotes all or a portion of security on loan.
(b) Securities exempt from registration under rule 144A of the Securities Act of 1933. These securities may be resold in transactions exempt from registration, normally to qualified institutional buyers. At June 30, 2005, these securities amounted to a value of $1,332,206 or 2.3% of net assets.
(c) A portion of this security is purchased on a forward commitment basis (Note 2).
(d) All or a portion of this security is segregated to cover forward purchase commitments. (Note 2).
(e) This security is held as collateral for open futures contracts. (Note 2).
(f) Represents investments of security lending collateral. (Note 2).
(g) Maturity value $6,396,957. Collateralized by U.S. Government Agency obligations with rates of 3.814% - 5.875%, maturity dates of 09/25/2023 - 10/25/2032, and an aggregate market value, including accrued interest, of $6,716,430.
(h) See Note 6 for aggregate cost for Federal tax purposes.
The accompanying notes are an integral part of the financial statements.
76
MassMutual Select Strategic Balanced Fund – Portfolio of Investments
June 30, 2005 (Unaudited)
| | | Number of
Shares | | Market
Value | |
| EQUITIES - 56.0% | |
| Advertising - 0.3% | |
Interpublic Group of
Companies, Inc.(a) | | | 60,000 | | | $ | 730,800 | | |
| Aerospace & Defense - 2.3% | |
| Boeing Co. | | | 24,900 | | | | 1,643,400 | | |
Honeywell
International, Inc. | | | 38,800 | | | | 1,421,244 | | |
| Raytheon Co. | | | 65,500 | | | | 2,562,360 | | |
| | | | 5,627,004 | | |
| Air Transportation - 0.8% | | | |
| Southwest Airlines Co. | | | 139,000 | | | | 1,936,270 | | |
US Airways Group, Inc.
Aircraft Statutory Trust
Certificates of Beneficial
Interest 1989(a) | | | 30,000 | | | | 12,600 | | |
US Airways Group, Inc.
Aircraft Statutory Trust
Certificates of Beneficial
Interest 1993(a) | | | 100,000 | | | | 40,000 | | |
| | | | 1,988,870 | | |
| Automotive & Parts - 0.3% | | | |
| BorgWarner, Inc.(b) | | | 12,500 | | | | 670,875 | | |
General Motors Corp.,
Series B, Convertible
Preferred Stock | | | 4,200 | | | | 77,952 | | |
| | | | 748,827 | | |
| Banking, Savings & Loans - 2.7% | | | |
| Bank of New York Co., Inc. | | | 30,000 | | | | 863,400 | | |
Fannie Mae,
Preferred Stock | | | 4,600 | | | | 255,530 | | |
Fannie Mae, Convertible
Preferred Stock | | | 2 | | | | 194,811 | | |
| JP Morgan Chase & Co. | | | 67,440 | | | | 2,381,981 | | |
Mitsubishi Tokyo
Financial Group, Inc. | | | 216 | | | | 1,837,176 | | |
| State Street Corp. | | | 23,300 | | | | 1,124,225 | | |
| | | | 6,657,123 | | |
| Beverages - 0.7% | | | |
Molson Coors Brewing
Co., Class B | | | 4,700 | | | | 291,400 | | |
| PepsiCo, Inc. | | | 26,300 | | | | 1,418,359 | | |
| | | | 1,709,759 | | |
| Broadcasting, Publishing & Printing - 3.4% | | | |
Clear Channel
Communications, Inc. | | | 21,200 | | | | 655,716 | | |
| | | Number of
Shares | | Market
Value | |
Comcast Corp. Special,
Class A(a) | | | 57,400 | | | $ | 1,719,130 | | |
| IAC/InterActiveCorp(a) (b) | | | 25,300 | | | | 608,465 | | |
| Pearson PLC | | | 60,500 | | | | 714,072 | | |
| Time Warner, Inc.(a) | | | 147,200 | | | | 2,459,712 | | |
| Viacom, Inc., Class B | | | 66,400 | | | | 2,126,128 | | |
| | | | 8,283,223 | | |
| Chemicals - 2.0% | | | |
| Dow Chemical Co. | | | 42,400 | | | | 1,888,072 | | |
Du Pont (E.I.) de
Nemours & Co. | | | 30,100 | | | | 1,294,601 | | |
| Engelhard Corp. | | | 58,100 | | | | 1,658,755 | | |
WGI Heavy
Minerals, Inc.(a) | | | 32,500 | | | | 57,525 | | |
| | | | 4,898,953 | | |
| Commercial Services - 0.1% | | | |
| Ikon Office Solutions, Inc. | | | 37,400 | | | | 355,674 | | |
| Communications - 1.7% | |
Lucent
Technologies, Inc.(a) | | | 585,000 | | | | 1,702,350 | | |
Nokia Oyj Sponsored
ADR (Finland) | | | 74,200 | | | | 1,234,688 | | |
| SBC Communications, Inc. | | | 55,900 | | | | 1,327,625 | | |
| | | | 4,264,663 | | |
| Communications Equipment - 0.7% | | | |
| Motorola, Inc. | | | 96,400 | | | | 1,760,264 | | |
| Computer Maintenance & Repair - 0.4% | |
Electronics for
Imaging, Inc.(a) (b) | | | 42,000 | | | | 883,680 | | |
| Computer Programming Services - 0.1% | |
| RealNetworks, Inc.(a) | | | 29,300 | | | | 145,621 | | |
| Computers & Information - 1.8% | |
| Cisco Systems, Inc.(a) | | | 61,700 | | | | 1,179,087 | | |
International Business
Machines Corp. | | | 16,400 | | | | 1,216,880 | | |
| Solectron Corp.(a) | | | 514,319 | | | | 1,949,269 | | |
| | | | 4,345,236 | | |
| Electrical Equipment & Electronics - 2.6% | | | |
Maxwell
Technologies, Inc.(a) | | | 21,700 | | | | 264,523 | | |
| Novellus Systems, Inc.(a) | | | 17,800 | | | | 439,838 | | |
Samsung Electronics Co.
Limited GDR (Korea)(c) | | | 7,000 | | | | 1,672,956 | | |
Taiwan Semiconductor
Manufacturing Co.
Limited Sponsored
ADR (Taiwan) | | | 245,051 | | | | 2,234,866 | | |
| | | Number of
Shares | | Market
Value | |
| Texas Instruments, Inc. | | | 62,400 | | | $ | 1,751,568 | | |
| | | | 6,363,751 | | |
| Energy - 7.3% | | | |
Anadarko
Petroleum Corp. | | | 26,900 | | | | 2,209,835 | | |
BP PLC Sponsored ADR
(United Kingdom) | | | 6,400 | | | | 399,232 | | |
Canadian Natural
Resources Limited | | | 30,000 | | | | 1,091,400 | | |
| Chevron Corp. | | | 39,500 | | | | 2,208,840 | | |
| ConocoPhillips | | | 8,200 | | | | 471,418 | | |
| Dynegy, Inc., Class A(a) | | | 13,200 | | | | 64,152 | | |
| Exxon Mobil Corp. | | | 19,200 | | | | 1,103,424 | | |
| GlobalSantaFe Corp. | | | 64,000 | | | | 2,611,200 | | |
| Halliburton Co. | | | 45,500 | | | | 2,175,810 | | |
| Murphy Oil Corp.(b) | | | 72,800 | | | | 3,802,344 | | |
The Williams
Companies, Inc. | | | 93,000 | | | | 1,767,000 | | |
| | | | 17,904,655 | | |
| Entertainment & Leisure - 1.6% | | | |
News Corp., Inc.,
Class B(b) | | | 129,800 | | | | 2,188,428 | | |
| The Walt Disney Co. | | | 67,500 | | | | 1,699,650 | | |
| | | | 3,888,078 | | |
| Financial Services - 3.2% | | | |
| American Express Co. | | | 45,000 | | | | 2,395,350 | | |
Digital Realty Trust,
Inc. REIT | | | 29,600 | | | | 514,448 | | |
| MBNA Corp. | | | 75,400 | | | | 1,972,464 | | |
| Merrill Lynch & Co., Inc. | | | 30,400 | | | | 1,672,304 | | |
| Morgan Stanley | | | 26,900 | | | | 1,411,443 | | |
| | | | 7,966,009 | | |
| Foods - 1.7% | | | |
| Safeway, Inc.(b) | | | 83,500 | | | | 1,886,265 | | |
| Unilever PLC | | | 91,100 | | | | 880,634 | | |
Unilever PLC, Sponsored
ADR (United Kingdom) | | | 38,000 | | | | 1,476,300 | | |
| | | | 4,243,199 | | |
| Forest Products & Paper - 0.7% | | | |
| Weyerhaeuser Co. | | | 27,500 | | | | 1,750,375 | | |
| Healthcare - 1.2% | |
Enzo
Biochem, Inc.(a) (b) | | | 58,380 | | | | 1,046,753 | | |
GlaxoSmithKline PLC
ADR (United Kingdom) | | | 41,200 | | | | 1,998,612 | | |
| | | | 3,045,365 | | |
(Continued)
The accompanying notes are an integral part of the financial statements.
77
MassMutual Select Strategic Balanced Fund – Portfolio of Investments (Continued)
| | | Number of
Shares | | Market
Value | |
| Industrial – Diversified - 0.6% | |
| Tyco International Limited | | | 48,400 | | | $ | 1,413,280 | | |
| Insurance - 4.9% | |
Ambac Financial
Group, Inc. | | | 21,200 | | | | 1,478,912 | | |
American International
Group, Inc. | | | 27,700 | | | | 1,609,370 | | |
| Chubb Corp. | | | 29,500 | | | | 2,525,495 | | |
The Hartford Financial
Services Group, Inc.(b) | | | 25,400 | | | | 1,899,412 | | |
| MGIC Investment Corp. | | | 26,400 | | | | 1,721,808 | | |
| The PMI Group, Inc. | | | 72,200 | | | | 2,814,356 | | |
United American
Healthcare Corp.(a) | | | 700 | | | | 1,540 | | |
| | | | 12,050,893 | | |
| Machinery & Components - 1.5% | | | |
| Baker Hughes, Inc. | | | 32,300 | | | | 1,652,468 | | |
| Caterpillar, Inc. | | | 21,600 | | | | 2,058,696 | | |
| | | | 3,711,164 | | |
| Manufacturing - 0.6% | | | |
| Applied Materials, Inc. | | | 89,200 | | | | 1,443,256 | | |
| Medical Supplies - 0.7% | |
Agilent Technologies,
Inc.(a) (b) | | | 66,100 | | | | 1,521,622 | | |
| Boston Scientific Corp.(a) | | | 7,700 | | | | 207,900 | | |
| | | | 1,729,522 | | |
| Metals & Mining - 2.1% | | | |
| Alcoa, Inc. | | | 79,100 | | | | 2,066,883 | | |
Allegheny
Technologies, Inc. | | | 15,300 | | | | 337,518 | | |
| Newmont Mining Corp. | | | 38,400 | | | | 1,498,752 | | |
RTI International
Metals, Inc.(a) | | | 36,510 | | | | 1,146,779 | | |
| | | | 5,049,932 | | |
| Pharmaceuticals - 4.9% | | | |
| Abbott Laboratories | | | 49,000 | | | | 2,401,490 | | |
| Amgen, Inc.(a) | | | 12,100 | | | | 731,566 | | |
| Aphton Corp.(a) (b) | | | 109,400 | | | | 80,956 | | |
Bentley
Pharmaceuticals, Inc.(a) | | | 24,300 | | | | 266,085 | | |
| Eli Lilly & Co. | | | 6,400 | | | | 356,544 | | |
| Johnson & Johnson | | | 42,200 | | | | 2,743,000 | | |
Novartis AG ADR
(Switzerland) | | | 29,100 | | | | 1,380,504 | | |
| Pfizer, Inc. | | | 71,000 | | | | 1,958,180 | | |
| Wyeth | | | 48,200 | | | | 2,144,900 | | |
| | | | 12,063,225 | | |
| | | Number of
Shares | | Market
Value | |
| Prepackaged Software - 1.4% | | | |
| Micromuse, Inc.(a) | | | 118,900 | | | $ | 672,974 | | |
| Microsoft Corp. | | | 108,100 | | | | 2,685,204 | | |
| | | | 3,358,178 | | |
| Retail - 1.0% | | | |
| Costco Wholesale Corp. | | | 15,500 | | | | 694,710 | | |
| The Home Depot, Inc. | | | 43,000 | | | | 1,672,700 | | |
| | | | 2,367,410 | | |
| Telephone Utilities - 0.8% | | | |
Vodafone Group PLC
Sponsored ADR
(United Kingdom) | | | 84,500 | | | | 2,055,040 | | |
| Toys, Games - 1.2% | | | |
| Hasbro, Inc. | | | 81,000 | | | | 1,683,990 | | |
| Mattel, Inc. | | | 75,300 | | | | 1,377,990 | | |
| | | | 3,061,980 | | |
| Transportation - 0.7% | | | |
| Carnival Corp. | | | 32,100 | | | | 1,751,055 | | |
TOTAL EQUITIES
(Cost $132,462,475) | | | | | | | 137,616,064 | | |
| | | Principal
Amount | |
| |
| BONDS & NOTES - 42.1% | | | |
| ASSET BACKED SECURITIES - 0.5% | | | |
Credit-Based Asset Servicing
and Securitization,
Series 2004-RP1,
Class A2(c)
3.464% 05/25/2050 | | $ | 206,737 | | | | 206,857 | | |
MBNA Master Credit
Card Trust,
Series 2002-3A,
Class A
3.460% 09/15/2014 | | | 260,000 | | | | 262,600 | | |
Nissan Auto Receivables
Owner Trust,
Series 2002-B,
Class A4
4.600% 09/17/2007 | | | 301,565 | | | | 302,178 | | |
Wachovia Asset
Securitization, Inc.,
Series 2002-HE1,
Class A
3.684% 09/27/2032 | | | 433,667 | | | | 434,310 | | |
TOTAL ASSET BACKED
SECURITIES
(Cost $1,212,342) | | | | | | | 1,205,945 | | |
| | | Principal
Amount | | Market
Value | |
| CORPORATE DEBT - 7.9% | |
AES Corp.
7.750% 03/01/2014 | | $ | 520,000 | | | $ | 564,200 | | |
AES Corp.
8.875% 02/15/2011 | | | 10,000 | | | | 11,175 | | |
Altria Group, Inc.
7.000% 11/04/2013 | | | 325,000 | | | | 363,707 | | |
Amerada Hess Corp.(b)
7.300% 08/15/2031 | | | 330,000 | | | | 398,167 | | |
Anadarko Finance Co.
6.750% 05/01/2011 | | | 205,000 | | | | 227,777 | | |
Anheuser-Busch Cos., Inc.
4.950% 01/15/2014 | | | 265,000 | | | | 275,265 | | |
AOL Time Warner, Inc.
6.875% 05/01/2012 | | | 355,000 | | | | 400,589 | | |
AOL Time Warner, Inc.
7.700% 05/01/2032 | | | 185,000 | | | | 234,029 | | |
ASIF Global Financng(c)
4.900% 01/17/2013 | | | 50,000 | | | | 50,737 | | |
Bank of America Corp.
3.875% 01/15/2008 | | | 345,000 | | | | 343,643 | | |
Bank One Corp.
2.625% 06/30/2008 | | | 545,000 | | | | 521,312 | | |
Bank One Corp.
6.500% 02/01/2006 | | | 370,000 | | | | 375,659 | | |
Banque Paribas -
New York
6.875% 03/01/2009 | | | 170,000 | | | | 184,807 | | |
BellSouth Corp.
4.750% 11/15/2012 | | | 50,000 | | | | 50,262 | | |
British Telecom PLC
8.125% 12/15/2010 | | | 160,000 | | | | 189,438 | | |
ChevronTexaco Capital Co.
3.500% 09/17/2007 | | | 230,000 | | | | 227,771 | | |
Citigroup, Inc.
4.125% 02/22/2010 | | | 370,000 | | | | 368,687 | | |
Clear Channel
Communications, Inc.
4.250% 05/15/2009 | | | 50,000 | | | | 48,183 | | |
Clear Channel
Communications, Inc.
5.500% 09/15/2014 | | | 230,000 | | | | 218,145 | | |
The Cleveland Electric
Illuminating Co.
5.650% 12/15/2013 | | | 40,000 | | | | 42,069 | | |
Comcast Corp.
6.500% 01/15/2015 | | | 395,000 | | | | 440,283 | | |
Conoco Funding Co.
6.350% 10/15/2011 | | | 40,000 | | | | 44,292 | | |
Conoco, Inc.
6.950% 04/15/2029 | | | 235,000 | | | | 295,234 | | |
ConocoPhillips Co.
4.750% 10/15/2012 | | | 150,000 | | | | 153,500 | | |
(Continued)
The accompanying notes are an integral part of the financial statements.
78
MassMutual Select Strategic Balanced Fund – Portfolio of Investments (Continued)
| | | Principal
Amount | | Market
Value | |
Corporacion Nacional
del Cobre(c)
4.750% 10/15/2014 | | $ | 100,000 | | | $ | 98,856 | | |
Cox Communications, Inc.
3.875% 10/01/2008 | | | 120,000 | | | | 117,473 | | |
DaimlerChrysler NA
Holding Corp.
7.200% 09/01/2009 | | | 80,000 | | | | 87,082 | | |
DaimlerChrysler North
American Holding Corp.
4.050% 06/04/2008 | | | 155,000 | | | | 152,626 | | |
Deutsche Telekom
International Finance BV
5.250% 07/22/2013 | | | 75,000 | | | | 77,867 | | |
Devon Energy Corp.
7.950% 04/15/2032 | | | 190,000 | | | | 249,919 | | |
Dominion Resources, Inc.
4.750% 12/15/2010 | | | 40,000 | | | | 40,243 | | |
Dominion Resources, Inc.
5.700% 09/17/2012 | | | 165,000 | | | | 173,996 | | |
Duke Energy Corp.
5.625% 11/30/2012 | | | 225,000 | | | | 238,678 | | |
Dynegy Holdings, Inc.
8.750% 02/15/2012 | | | 20,000 | | | | 21,800 | | |
Eastman Kodak Co.
3.625% 05/15/2008 | | | 130,000 | | | | 125,060 | | |
Eastman Kodak Co.
7.250% 11/15/2013 | | | 160,000 | | | | 168,216 | | |
El Paso Corp.
7.750% 01/15/2032 | | | 40,000 | | | | 39,000 | | |
El Paso Corp.
7.800% 08/01/2031 | | | 96,000 | | | | 93,360 | | |
El Paso Natural Gas Co.
8.375% 06/15/2032 | | | 168,000 | | | | 195,384 | | |
Export-Import
Bank of Korea(c)
5.250% 02/10/2014 | | | 5,000 | | | | 5,177 | | |
FirstEnergy Corp.,
Series B
6.450% 11/15/2011 | | | 60,000 | | | | 65,558 | | |
FirstEnergy Corp.,
Series C
7.375% 11/15/2031 | | | 315,000 | | | | 385,049 | | |
Ford Motor Co.
7.450% 07/16/2031 | | | 190,000 | | | | 158,615 | | |
Ford Motor Credit Co.
4.950% 01/15/2008 | | | 150,000 | | | | 143,088 | | |
Ford Motor Credit Co.
6.625% 06/16/2008 | | | 685,000 | | | | 676,539 | | |
Ford Motor Credit Co.
7.375% 10/28/2009 | | | 500,000 | | | | 488,593 | | |
Ford Motor Credit Co.
7.375% 02/01/2011 | | | 120,000 | | | | 116,892 | | |
| | | Principal
Amount | | Market
Value | |
General Electric
Capital Corp.
4.250% 01/15/2008 | | $ | 290,000 | | | $ | 291,121 | | |
General Electric
Capital Corp., Series A
3.670% 09/15/2014 | | | 380,000 | | | | 382,138 | | |
General Motors
Acceptance Corp.
5.625% 05/15/2009 | | | 610,000 | | | | 571,261 | | |
General Motors
Acceptance Corp.
6.125% 02/01/2007 | | | 10,000 | | | | 9,931 | | |
General Motors
Acceptance Corp.
6.125% 08/28/2007 | | | 180,000 | | | | 178,149 | | |
General Motors
Acceptance Corp.
6.150% 04/05/2007 | | | 80,000 | | | | 79,584 | | |
General Motors
Acceptance Corp.
6.311% 11/30/2007 | | | 80,000 | | | | 77,494 | | |
General Motors
Acceptance Corp.
7.750% 01/19/2010 | | | 140,000 | | | | 136,856 | | |
General Motors Corp.
8.375% 07/05/2033 | | | 90,000 | | | | 89,241 | | |
General Motors Corp.(b)
8.375% 07/15/2033 | | | 260,000 | | | | 217,100 | | |
Goldman Sachs
Group, Inc.
4.125% 01/15/2008 | | | 165,000 | | | | 164,905 | | |
Goldman Sachs
Group, Inc.
4.500% 06/15/2010 | | | 100,000 | | | | 100,323 | | |
HCA, Inc.
5.750% 03/15/2014 | | | 60,000 | | | | 59,735 | | |
HCA, Inc.
6.250% 02/15/2013 | | | 150,000 | | | | 153,317 | | |
HCA, Inc.
6.375% 01/15/2015 | | | 320,000 | | | | 332,035 | | |
HCA, Inc., Note
7.690% 06/15/2025 | | | 10,000 | | | | 10,714 | | |
Household Finance Corp.
Series MTN
4.125% 11/16/2009 | | | 375,000 | | | | 370,947 | | |
Intelsat Limited
6.500% 11/01/2013 | | | 30,000 | | | | 24,300 | | |
International Paper Co.
5.500% 01/15/2014 | | | 115,000 | | | | 117,429 | | |
Kerr - McGee Corp.
7.875% 09/15/2031 | | | 160,000 | | | | 182,193 | | |
Kraft Foods, Inc.
5.625% 11/01/2011 | | | 210,000 | | | | 222,773 | | |
| | | Principal
Amount | | Market
Value | |
Lehman Brothers
Holdings, Inc.
4.000% 01/22/2008 | | $ | 190,000 | | | $ | 189,321 | | |
Liberty Media Corp.
5.700% 05/15/2013 | | | 30,000 | | | | 27,903 | | |
Morgan Stanley
3.625% 04/01/2008 | | | 310,000 | | | | 305,194 | | |
News America, Inc.
6.200% 12/15/2034 | | | 50,000 | | | | 52,475 | | |
Northrop Grumman Corp.
4.079% 11/16/2006 | | | 80,000 | | | | 79,769 | | |
OAO Gazprom(c)
9.625% 03/01/2013 | | | 30,000 | | | | 36,788 | | |
OAO Gazprom
Registered Shares
9.625% 03/01/2013 | | | 10,000 | | | | 12,240 | | |
Oncor Electric Delivery Co.
6.375% 01/15/2015 | | | 70,000 | | | | 77,592 | | |
Pacific Gas & Electric Co.
3.820% 04/03/2006 | | | 1,000 | | | | 1,000 | | |
Pacific Gas & Electric Co.
6.050% 03/01/2034 | | | 220,000 | | | | 242,460 | | |
Philip Morris Cos., Inc.
7.750% 01/15/2027 | | | 10,000 | | | | 12,008 | | |
Qwest Capital
Funding, Inc.
7.250% 02/15/2011 | | | 20,000 | | | | 19,150 | | |
Qwest Capital
Funding, Inc.(b)
7.750% 02/15/2031 | | | 30,000 | | | | 25,875 | | |
Qwest Communications
International, Inc.,
Series B(c)
7.500% 02/15/2014 | | | 20,000 | | | | 18,925 | | |
Qwest Corp.
8.875% 03/15/2012 | | | 10,000 | | | | 10,875 | | |
Rabobank Capital
Fund II(c)
5.260% 12/31/2049 | | | 10,000 | | | | 10,287 | | |
Rabobank Capital
Funding Trust(c)
5.254% 12/31/2049 | | | 120,000 | | | | 123,089 | | |
SBC Communications, Inc.
5.100% 09/15/2014 | | | 110,000 | | | | 112,471 | | |
SLM Corp.
4.270% 04/01/2009 | | | 10,000 | | | | 9,830 | | |
Sprint Capital Corp.
4.780% 08/17/2006 | | | 65,000 | | | | 65,474 | | |
Sprint Capital Corp.
6.000% 01/15/2007 | | | 480,000 | | | | 491,878 | | |
Sprint Capital Corp.
8.375% 03/15/2012 | | | 50,000 | | | | 60,141 | | |
Target Corp.
5.400% 10/01/2008 | | | 255,000 | | | | 265,163 | | |
(Continued)
The accompanying notes are an integral part of the financial statements.
79
MassMutual Select Strategic Balanced Fund – Portfolio of Investments (Continued)
| | | Principal
Amount | | Market
Value | |
Telecom Italia
Capital SA(c)
4.950% 09/30/2014 | | $ | 120,000 | | | $ | 118,817 | | |
Tenet Healthcare Corp.(c)
9.250% 02/01/2015 | | | 496,000 | | | | 514,600 | | |
Tennessee Valley Authority
4.650% 06/15/2035 | | | 110,000 | | | | 110,192 | | |
TXU Corp.(c)
6.550% 11/15/2034 | | | 270,000 | | | | 265,173 | | |
TXU Energy Co. LLC
3.920% 01/17/2006 | | | 40,000 | | | | 39,989 | | |
Tyco International
Group SA(b)
6.375% 10/15/2011 | | | 180,000 | | | | 197,695 | | |
Tyco International
Group SA
6.875% 01/15/2029 | | | 500,000 | | | | 596,819 | | |
U.S. West
Communications, Inc.
5.625% 11/15/2008 | | | 30,000 | | | | 29,475 | | |
Verizon Global
Funding Corp.
7.375% 09/01/2012 | | | 50,000 | | | | 58,425 | | |
Wal-Mart Stores, Inc.
3.375% 10/01/2008 | | | 315,000 | | | | 308,817 | | |
Waste Management, Inc.
6.375% 11/15/2012 | | | 175,000 | | | | 191,078 | | |
Waste Management, Inc.
6.500% 11/15/2008 | | | 110,000 | | | | 116,847 | | |
Wells Fargo & Co.
4.200% 01/15/2010 | | | 180,000 | | | | 179,905 | | |
Weyerhaeuser Co.
6.750% 03/15/2012 | | | 385,000 | | | | 423,592 | | |
Williams Cos., Inc.
Series A
7.500% 01/15/2031 | | | 290,000 | | | | 313,925 | | |
XTO Energy, Inc.
6.250% 04/15/2013 | | | 30,000 | | | | 32,467 | | |
XTO Energy, Inc.
7.500% 04/15/2012 | | | 50,000 | | | | 57,507 | | |
TOTAL CORPORATE DEBT
(Cost $19,261,733) | | | | | | | 19,524,779 | | |
NON-U.S. GOVERNMENT AGENCY
OBLIGATIONS - 1.6% | |
| Collateralized Mortgage Obligations | |
Amresco Residential
Securities Mortgage
Loan Trust,
Series 1997-3, Class M1A
3.869% 09/25/2027 | | | 80,320 | | | | 80,324 | | |
| | | Principal
Amount | | Market
Value | |
Bear Stearns Adjustable
Rate Mortgage Trust,
Series 2004-4, Class A6
3.515% 06/25/2034 | | $ | 400,000 | | | $ | 388,539 | | |
Chase Commercial
Mortgage Securities
Corp., Series 2000-FL1,
Class A(c)
3.490% 12/12/2013 | | | 47,895 | | | | 47,887 | | |
CRIIMI MAE Commercial
Mortgage Trust,
Series 1998-C1,
Class A2(c)
7.000% 06/02/2033 | | | 200,000 | | | | 209,427 | | |
GS Mortgage Securities
Corp. II,
Series 2005-GG4,
Class AABA
4.680% 07/10/2039 | | | 300,000 | | | | 303,635 | | |
Household Home Equity
Loan Trust,
Series 2002-4, Class A
3.810% 10/20/2032 | | | 80,151 | | | | 80,255 | | |
LB-UBS Commercial
Mortgage Trust,
Series 2005-C3, Class A5
4.739% 07/15/2030 | | | 210,000 | | | | 210,687 | | |
LB-UBS Commercial
Mortgage Trust,
Series 2005-C3,
Class AAB
4.664% 07/15/2030 | | | 200,000 | | | | 200,720 | | |
Mach One Trust
Commercial
Mortgage-Backed,
Series 2004-1A,
Class X IO(c)
1.627% 05/28/2040 | | | 2,588,317 | | | | 159,673 | | |
MASTR Adjustable Rate
Mortgages Trust,
Series 2005-1,
Class 1A3(c)
7.000% 08/25/2034 | | | 454,843 | | | | 478,718 | | |
MLCC Mortgage
Investors, Inc.,
Series 2004-B,
Class A3
4.670% 05/25/2029 | | | 594,084 | | | | 602,958 | | |
MSDWCC Heloc Trust,
Series 2005-1, Class A
3.504% 07/25/2017 | | | 141,127 | | | | 141,193 | | |
Mutual Fund Fee Trust,
Series 2000-3
9.070% 07/01/2008 | | | 687,435 | | | | 184,088 | | |
| | | Principal
Amount | | Market
Value | |
Residential Asset Mortgage
Products, Inc.,
Series 2002-RS4,
Class A11
3.634% 08/25/2032 | | $ | 62,754 | | | $ | 62,813 | | |
Residential Asset Mortgage
Products, Inc.,
Series 2004-RP1,
Class A2A
2.233% 11/25/2042 | | | 276,965 | | | | 277,493 | | |
UCFC Home Equity Loan,
Series 1998-D, Cl. MF1
6.905% 04/15/2030 | | | 178,137 | | | | 181,201 | | |
Washington Mutual MSC
Mortgage Pass-Through
Certificates,
Series 2004-RA1,
Class 2A
7.000% 03/25/2034 | | | 340,817 | | | | 348,924 | | |
TOTAL NON-U.S. GOVERNMENT
AGENCY OBLIGATIONS
(Cost $4,046,594) | | | | | | | 3,958,535 | | |
| SOVEREIGN DEBT OBLIGATIONS - 3.9% | |
Canada Government
4.000% 12/01/2031 | | CAD | 233,366 | | | | 272,432 | | |
Commonwealth of Australia
5.250% 08/15/2010 | | AUD | 630,000 | | | | 482,019 | | |
French Republic
3.000% 07/25/2009 | | EUR | 1,375,160 | | | | 1,825,099 | | |
Kingdom of the
Netherlands
4.250% 07/15/2013 | | EUR | 910,000 | | | | 1,197,292 | | |
Republic of Brazil
4.313% 04/15/2012 | | | 115,296 | | | | 110,903 | | |
Republic of Brazil
8.000% 04/15/2014 | | | 211,099 | | | | 216,228 | | |
Republic of Brazil
10.125% 05/15/2027 | | | 150,000 | | | | 173,775 | | |
Republic of Brazil
11.000% 08/17/2040 | | | 160,000 | | | | 192,480 | | |
Republic of Brazil
14.500% 10/15/2009 | | | 330,000 | | | | 429,000 | | |
Republic of Bulgaria
8.250% 01/15/2015 | | | 230,000 | | | | 289,251 | | |
Republic of Colombia
10.500% 07/09/2010 | | | 60,000 | | | | 71,400 | | |
Republic of Colombia
11.750% 02/25/2020 | | | 100,000 | | | | 131,500 | | |
Republic of Germany
4.250% 01/04/2014 | | EUR | 200,000 | | | | 263,934 | | |
Republic of Germany
5.000% 01/04/2012 | | EUR | 270,000 | | | | 368,775 | | |
(Continued)
The accompanying notes are an integral part of the financial statements.
80
MassMutual Select Strategic Balanced Fund – Portfolio of Investments (Continued)
| | | Principal
Amount | | Market
Value | |
Republic of Panama
9.375% 01/16/2023 | | $ | 40,000 | | | $ | 49,400 | | |
Republic of Panama
9.625% 02/08/2011 | | | 50,000 | | | | 59,750 | | |
Republic of Panama
10.750% 05/15/2020 | | | 80,000 | | | | 108,400 | | |
Republic of Peru
5.000% 03/07/2017 | | | 102,000 | | | | 97,155 | | |
Republic of Peru
8.750% 11/21/2033 | | | 130,000 | | | | 146,575 | | |
Russian Federation
5.000% 03/31/2030 | | | 1,150,000 | | | | 1,283,860 | | |
United Mexican States
7.500% 04/08/2033 | | | 570,000 | | | | 654,075 | | |
United Mexican States
8.300% 08/15/2031 | | | 120,000 | | | | 149,400 | | |
United Mexican States
8.375% 01/14/2011 | | | 330,000 | | | | 384,120 | | |
United Mexican States
11.500% 05/15/2026 | | | 340,000 | | | | 545,700 | | |
TOTAL SOVEREIGN DEBT
OBLIGATIONS
(Cost $9,252,708) | | | | | | | 9,502,523 | | |
U.S. GOVERNMENT AGENCY
OBLIGATIONS - 10.4% | | | |
| Federal Home Loan Mortgage Corporation (FHLMC) - 1.2% | | | |
| Pass-Through Securities | | | |
Federal Home Loan Bank
2.750% 05/15/2006 | | | 220,000 | | | | 217,970 | | |
Federal Home Loan Bank
3.003% 10/05/2005 | | | 910,000 | | | | 910,050 | | |
Federal Home Loan Bank
4.125% 04/18/2008 | | | 110,000 | | | | 110,322 | | |
Federal Home Loan Bank
4.375% 03/17/2010 | | | 120,000 | | | | 121,207 | | |
FHLMC TBA(d)
5.000% 07/01/2019 | | | 1,600,000 | | | | 1,617,750 | | |
| Total Pass-Through Securities | | | | | | | 2,977,299 | | |
| Federal National Mortgage Association (FNMA) - 5.8% | | | |
| Pass-Through Securities | | | |
FNMA
2.800% 03/01/2019 | | | 20,000 | | | | 19,893 | | |
FNMA
3.000% 04/26/2019 | | | 440,000 | | | | 437,561 | | |
FNMA
3.310% 01/26/2007 | | | 220,000 | | | | 218,082 | | |
FNMA
3.875% 07/15/2008 | | | 210,000 | | | | 209,246 | | |
FNMA
4.610% 10/10/2013 | | | 500,000 | | | | 490,841 | | |
| | | Principal
Amount | | Market
Value | |
FNMA TBA(d)
5.000% 07/01/2034 | | $ | 3,800,000 | | | $ | 3,799,703 | | |
FNMA TBA(d)
5.500% 07/01/2034 | | | 2,400,000 | | | | 2,432,625 | | |
FNMA TBA(d)
6.000% 07/01/2035 | | | 3,800,000 | | | | 3,895,891 | | |
FNMA TBA(d)
6.500% 07/01/2035 | | | 2,700,000 | | | | 2,794,078 | | |
| Total Pass-Through Securities | | | | | | | 14,297,920 | | |
| Government National Mortgage Association (GNMA) - 3.4% | | | |
| Pass-Through Securities | | | |
GNMA
5.000% 05/15/2034 | | | 3,748,462 | | | | 3,789,021 | | |
GNMA
6.000% 02/15/2032-
03/15/2033 | | | 1,693,737 | | | | 1,750,953 | | |
GNMA TBA(d)
6.000% 07/01/2034 | | | 2,000,000 | | | | 2,062,344 | | |
GNMA TBA(d)
6.500% 07/01/2034 | | | 600,000 | | | | 626,531 | | |
| Total Pass-Through Securities | | | | | | | 8,228,849 | | |
TOTAL U.S. GOVERNMENT
AGENCY OBLIGATIONS
(Cost $25,325,009) | | | | | | | 25,504,068 | | |
| U.S. TREASURY OBLIGATIONS - 17.7% | | | |
| U.S. Treasury Bonds - 4.1% | | | |
U.S. Treasury Bond
4.000% 02/15/2015 | | | 1,650,000 | | | | 1,656,188 | | |
U.S. Treasury Bond
4.125% 05/15/2015 | | | 1,350,000 | | | | 1,370,039 | | |
U.S. Treasury Bond
5.250% 02/15/2029 | | | 230,000 | | | | 263,098 | | |
U.S. Treasury Bond(b) (e)
5.375% 02/15/2031 | | | 2,490,000 | | | | 2,938,200 | | |
U.S. Treasury Bond
6.250% 08/15/2023 | | | 20,000 | | | | 24,931 | | |
U.S. Treasury Bond
6.250% 05/15/2030 | | | 2,070,000 | | | | 2,696,822 | | |
U.S. Treasury
Inflation Index
1.625% 01/15/2015 | | | 142,647 | | | | 142,090 | | |
U.S. Treasury
Inflation Index(e)
2.375% 01/15/2025 | | | 939,257 | | | | 1,033,476 | | |
U.S. Treasury
Inflation Index
3.875% 04/15/2029 | | | 82,844 | | | | 116,745 | | |
| Total U.S. Treasury Bonds | | | | | | | 10,241,589 | | |
| | | Principal
Amount | | Market
Value | |
| U.S. Treasury Notes - 13.0% | | | |
U.S. Treasury
Inflation Index
0.875% 04/15/2010 | | $ | 2,156,761 | | | $ | 2,154,809 | | |
U.S. Treasury
Inflation Index
2.000% 01/15/2014 | | | 694,940 | | | | 716,006 | | |
U.S. Treasury
Inflation Index
3.375% 01/15/2007 | | | 1,940,224 | | | | 2,003,281 | | |
U.S. Treasury
Inflation Index
3.625% 01/15/2008 | | | 289,027 | | | | 305,985 | | |
U.S. Treasury
Inflation Index
3.875% 01/15/2009 | | | 166,085 | | | | 180,786 | | |
U.S. Treasury Note(b)
1.875% 12/31/2005 | | | 110,000 | | | | 109,175 | | |
U.S. Treasury Note(e)
2.625% 03/15/2009 | | | 5,800,000 | | | | 5,589,297 | | |
U.S. Treasury Note(e)
2.875% 11/30/2006 | | | 1,230,000 | | | | 1,217,412 | | |
U.S. Treasury Note
3.000% 12/31/2006 | | | 130,000 | | | | 128,812 | | |
U.S. Treasury Note
3.000% 02/15/2008 | | | 720,000 | | | | 708,356 | | |
U.S. Treasury Note
3.125% 01/31/2007 | | | 570,000 | | | | 565,502 | | |
U.S. Treasury Note
3.125% 05/15/2007 | | | 10,000 | | | | 9,905 | | |
U.S. Treasury Note
3.375% 10/15/2009 | | | 390,000 | | | | 384,485 | | |
U.S. Treasury Note
3.500% 08/15/2009 | | | 535,000 | | | | 530,444 | | |
U.S. Treasury Note(b)
3.500% 12/15/2009 | | | 3,410,000 | | | | 3,378,564 | | |
U.S. Treasury Note
3.625% 04/30/2007 | | | 200,000 | | | | 199,891 | | |
U.S. Treasury Note(e)
3.625% 07/15/2009 | | | 6,390,000 | | | | 6,369,532 | | |
U.S. Treasury Note
3.625% 01/15/2010 | | | 280,000 | | | | 278,688 | | |
U.S. Treasury Note
3.625% 06/15/2010 | | | 610,000 | | | | 607,998 | | |
U.S. Treasury Note
3.750% 05/15/2008 | | | 400,000 | | | | 400,875 | | |
U.S. Treasury Note(b) (e)
3.875% 05/15/2010 | | | 5,225,000 | | | | 5,255,615 | | |
U.S. Treasury Note
4.000% 04/15/2010 | | | 880,000 | | | | 889,831 | | |
| Total U.S. Treasury Notes | | | | | | | 31,985,249 | | |
(Continued)
The accompanying notes are an integral part of the financial statements.
81
MassMutual Select Strategic Balanced Fund – Portfolio of Investments (Continued)
| | | Principal
Amount | | Market
Value | |
| U.S. Treasury Strips - 0.6% | | | |
U.S. Treasury Strips(e)
0.000% 11/15/2021 | | $ | 2,770,000 | | | $ | 1,366,023 | | |
U.S. Treasury Strips
0.000% 11/15/2027 | | | 150,000 | | | | 57,169 | | |
| Total U.S. Treasury Strips | | | | | | | 1,423,192 | | |
TOTAL U.S. TREASURY
OBLIGATIONS
(Cost $43,296,348) | | | | | | | 43,650,030 | | |
TOTAL BONDS & NOTES
(Cost $102,394,734) | | | | | | | 103,345,880 | | |
| OPTIONS - 0.1% | | | |
1 Year Eurodollar Futures,
September 2005 Call,
Expires 9/16/2005,
Strike 96.25 | | | 17,500 | | | | 1,312 | | |
90 Day Eurodollar Futures,
September 2005 Call,
Expires 9/19/2005,
Strike 95.50 | | | 20,000 | | | | 13,000 | | |
90 Day Eurodollar Futures,
September 2005 Call,
Expires 9/19/2005,
Strike 96 | | | 197,500 | | | | 32,094 | | |
90 Day Eurodollar Futures,
September 2005 Call,
Expires 9/19/2005,
Strike 96.50 | | | 17,500 | | | | 131 | | |
90 Day Eurodollar Futures,
September 2005 Put,
Expires 9/19/2005,
Srtike 95.00 | | | 172,500 | | | | 431 | | |
90 Day Eurodollar Futures,
September 2005 Put,
Expires 9/19/2005,
Strike 96.50 | | | 7,500 | | | | 2,662 | | |
90 Day Sterling LIBOR
Futures, September 2005
Call, Expires 9/21/2005,
Strike 93.25 | | | 46,250 | | | | 186,804 | | |
Eurodollar Future Options,
June 2006 Put,
Expires 6/19/2006,
Strike 94 | | | 15,000 | | | | 38 | | |
Eurodollar Future Options,
March 2006 Call,
Expires 3/13/2006,
Strike 95 | | | 50,000 | | | | 50,500 | | |
Eurodollar Future Options,
March 2006 Put,
Expires 3/13/2006,
Strike 96 | | | 35,000 | | | | 7,175 | | |
| | | Principal
Amount | | Market
Value | |
Eurodollar Future Options,
September 2005 Call,
Expires 9/19/2005,
Strike 95.75 | | $ | 17,500 | | | $ | 7,000 | | |
Eurodollar Option,
March 2006 Call,
Expires 3/13/2006,
Strike 96.25 | | | 35,000 | | | | 3,938 | | |
OTC Call, Exp: 7/7/05,
Strike 101.45 | | | 210,000 | | | | 630 | | |
U.S. 10 Year Future
Options, September 2005
Put, Expires 8/26/2005,
Strike 113 | | | 19,000 | | | | 13,359 | | |
U.S. Bond Future Options,
September 2005 Call,
Expires 8/26/2005,
Strike 116 | | | 2,000 | | | | 6,531 | | |
U.S. Bond Future Options,
September 2005 Call,
Expires 8/26/2005,
Strike 118 | | | 3,000 | | | | 5,719 | | |
TOTAL OPTIONS
(Cost $341,883) | | | | | | | 331,324 | | |
TOTAL LONG TERM INVESTMENTS
(Cost $235,199,092) | | | | | | | 241,293,268 | | |
| SHORT-TERM INVESTMENTS - 17.9% | |
| Cash Equivalents - 9.2%(g) | |
ABN Amro Bank NV
Eurodollar Time Deposit
3.250% 08/05/2005 | | | 241,704 | | | | 241,704 | | |
American Beacon Money
Market Fund | | | 652,502 | | | | 652,502 | | |
Bank of America
Bank Note
3.270% 07/18/2005 | | | 334,551 | | | | 334,551 | | |
Bank of America
Bank Note
3.270% 08/30/2005 | | | 621,310 | | | | 621,310 | | |
Bank of Montreal
Eurodollar Time Deposit
3.010% 07/01/2005 | | | 920,249 | | | | 920,249 | | |
Barclays
Eurodollar Time Deposit
3.160% 07/14/2005 | | | 477,931 | | | | 477,931 | | |
Barclays
Eurodollar Time Deposit
3.250% 07/26/2005 | | | 481,541 | | | | 481,541 | | |
BGI Institutional Money
Market Fund | | | 1,875,735 | | | | 1,875,735 | | |
| | | Principal
Amount | | Market
Value | |
BNP Paribas
Eurodollar Time Deposit
3.000% 07/01/2005 | | $ | 334,551 | | | $ | 334,551 | | |
Calyon
Eurodollar Time Deposit
3.310% 07/01/2005 | | | 286,758 | | | | 286,758 | | |
Citigroup
Eurodollar Time Deposit
3.085% 07/22/2005 | | | 286,758 | | | | 286,758 | | |
Citigroup
Eurodollar Time Deposit
3.100% 07/25/2005 | | | 664,234 | | | | 664,234 | | |
Dexia Group
Eurodollar Time Deposit
3.205% 07/20/2005 | | | 238,965 | | | | 238,965 | | |
Dexia Group
Eurodollar Time Deposit
3.240% 07/21/2005 | | | 238,965 | | | | 238,965 | | |
Federal Home Loan Bank
Discount Note
2.977% 07/01/2005 | | | 590,175 | | | | 590,175 | | |
First Tennessee National
Corporation
Eurodollar Time Deposit
3.220% 08/09/2005 | | | 86,127 | | | | 86,127 | | |
Fortis Bank
Eurodollar Time Deposit
3.110% 07/05/2005 | | | 332,504 | | | | 332,504 | | |
Fortis Bank
Eurodollar Time Deposit
3.250% 07/25/2005 | | | 337,343 | | | | 337,343 | | |
Fortis Bank
Eurodollar Time Deposit
3.250% 08/04/2005 | | | 477,931 | | | | 477,931 | | |
Fortis Bank
Eurodollar Time Deposit
3.270% 07/07/2005 | | | 382,345 | | | | 382,345 | | |
Freddie Mac
Discount Note
3.208% 07/26/2005 | | | 235,602 | | | | 235,602 | | |
Freddie Mac
Discount Note
3.244% 08/16/2005 | | | 573,517 | | | | 573,517 | | |
General Electric
Capital Corp
3.252% 07/06/2005 | | | 477,931 | | | | 477,931 | | |
General Electric
Capital Corp
3.253% 07/08/2005 | | | 382,345 | | | | 382,345 | | |
Goldman Sachs
Financial Square
Prime Obligations
Money Market Fund | | | 436,409 | | | | 436,409 | | |
(Continued)
The accompanying notes are an integral part of the financial statements.
82
MassMutual Select Strategic Balanced Fund – Portfolio of Investments (Continued)
| | | Principal
Amount | | Market
Value | |
Harris Trust &
Savings Bank
3.295% 11/04/2005 | | $ | 457,735 | | | $ | 457,735 | | |
HBOS Halifax
Bank of Scotland
Eurodollar Time Deposit
3.150% 08/08/2005 | | | 238,965 | | | | 238,965 | | |
HSBC Banking/
Holdings PLC
Eurodollar Time Deposit
3.250% 08/05/2005 | | | 286,758 | | | | 286,758 | | |
JP Morgan Chase & Co.
Eurodollar Time Deposit
3.200% 07/20/2005 | | | 477,931 | | | | 477,931 | | |
Merrimac Cash Fund,
Premium Class | | | 757,743 | | | | 757,743 | | |
Morgan Stanley
Dean Witter & Co.
3.518% 07/19/2005 | | | 955,862 | | | | 955,862 | | |
National Australia Bank
Eurodollar Time Deposit
3.260% 07/06/2005 | | | 191,173 | | | | 191,173 | | |
National Australia Bank
Eurodollar Time Deposit
3.375% 07/01/2005 | | | 573,517 | | | | 573,517 | | |
Nordea Bank Finland PLC
(NY Branch)
Eurodollar Time Deposit
3.165% 08/09/2005 | | | 371,118 | | | | 371,118 | | |
Nordea Bank Finland PLC
(NY Branch)
Eurodollar Time Deposit
3.240% 08/03/2005 | | | 172,055 | | | | 172,055 | | |
Rabobank Nederland
Eurodollar Time Deposit
3.170% 07/18/2005 | | | 477,931 | | | | 477,931 | | |
Rabobank Nederland
Eurodollar Time Deposit
3.350% 07/01/2005 | | | 386,701 | | | | 386,701 | | |
Royal Bank of Canada
Eurodollar Time Deposit
3.250% 07/07/2005 | | | 286,758 | | | | 286,758 | | |
Royal Bank of Canada
Eurodollar Time Deposit
3.260% 07/28/2005 | | | 477,931 | | | | 477,931 | | |
Royal Bank of Scotland
Eurodollar Time Deposit
3.240% 08/08/2005 | | | 525,724 | | | | 525,724 | | |
Royal Bank of Scotland
Eurodollar Time Deposit
3.250% 08/04/2005 | | | 382,345 | | | | 382,345 | | |
Royal Bank of Scotland
Eurodollar Time Deposit
3.270% 07/29/2005 | | | 382,345 | | | | 382,345 | | |
| | | Principal
Amount | | Market
Value | |
Societe Generale
Eurodollar Time Deposit
3.200% 08/08/2005 | | $ | 191,173 | | | $ | 191,173 | | |
Societe Generale
Eurodollar Time Deposit
3.240% 08/09/2005 | | | 316,337 | | | | 316,337 | | |
Societe Generale
Eurodollar Time Deposit
3.280% 08/01/2005 | | | 477,931 | | | | 477,931 | | |
Svenska Handlesbanken
Eurodollar Time Deposit
3.220% 08/05/2005 | | | 477,931 | | | | 477,931 | | |
The Bank of the West
Eurodollar Time Deposit
3.270% 07/27/2005 | | | 143,380 | | | | 143,380 | | |
Toronto Dominion Bank
Eurodollar Time Deposit
3.250% 08/02/2005 | | | 477,931 | | | | 477,931 | | |
UBS AG
Eurodollar Time Deposit
3.250% 08/09/2005 | | | 238,965 | | | | 238,965 | | |
Wells Fargo
Eurodollar Time Deposit
3.270% 07/21/2005 | | | 477,931 | | | | 477,931 | | |
Wells Fargo
Eurodollar Time Deposit
3.270% 08/01/2005 | | | 477,931 | | | | 477,931 | | |
| | | | 22,650,085 | | |
| Discount Notes - 0.2% | | | |
FNMA Discount Note(f)
3.390% 12/05/2005 | | | 640,000 | | | | 630,539 | | |
| Time Deposit - 0.0% | | | |
Goldman Sachs Group, Inc.
3.43%, due 07/01/2005(h) | | | 300,000 | | | | 300,000 | | |
| Repurchase Agreement - 8.5% | | | |
Investors Bank &
Trust Company
Repurchase Agreement,
dated 06/30/2005, 2.01%,
due 07/01/2005(i) | | | 20,513,710 | | | | 20,513,710 | | |
| | | | 20,813,710 | | |
TOTAL SHORT-TERM
INVESTMENTS
(At Amortized Cost) | | | | | | | 44,094,334 | | |
TOTAL INVESTMENTS - 116.0%
(Cost $279,293,426)(j) | | | | | | | 285,387,602 | | |
Other Assets/
(Liabilities) - (16.0%) | | | | | | | (39,327,620 | ) | |
| NET ASSETS - 100.0% | | | | | | $ | 246,059,982 | | |
Notes to Portfolio of Investments
ADR - American Depository Receipt.
AUD - Australian Dollar
CAD - Canadian Dollar
EUR - Euro
GDR - Global Depository Receipt.
MTN - Medium Term Note
REIT - Real Estate Investment Trust
TBA - To be announced
(a) Non-income producing security.
(b) Denotes all or a portion of security on loan.
(c) Securities exempt from registration under rule 144A of the Securities Act of 1933. These securities may be resold in transactions exempt from registration, normally to qualified institutional buyers.
(d) A portion of this security is purchased on a forward commitment basis (Note 2).
(e) All or a portion of this security is segregated to cover forward purchase commitments. (Note 2).
(f) This security is held as collateral for open futures contracts. (Note 2).
(g) Represents investments of security lending collateral. (Note 2).
(h) This security is collateral for swap agreements.
(i) Maturity value of $20,514,855. Collaterized by U.S. Government Agency obligations with a rate of 3.650%, maturity date of 04/01/2035, and an aggregate market value, including accrued interest, of $21,539,395.
(j) See Note 6 for aggregrate cost for Federal tax purposes.
The accompanying notes are an integral part of the financial statements.
83
MassMutual Select Diversified Value Fund – Portfolio of Investments
June 30, 2005 (Unaudited)
| | | Number of
Shares | | Market
Value | |
| EQUITIES - 99.2% | |
| Advertising - 0.5% | |
Interpublic Group of
Companies, Inc.(a) | | | 85,100 | | | $ | 1,036,518 | | |
| Aerospace & Defense - 1.5% | |
| Boeing Co. | | | 25,000 | | | | 1,650,000 | | |
| Goodrich Corp. | | | 33,900 | | | | 1,388,544 | | |
| | | | 3,038,544 | | |
| Apparel, Textiles & Shoes - 0.9% | | | |
| Limited Brands | | | 49,500 | | | | 1,060,290 | | |
| Nordstrom, Inc.(b) | | | 11,100 | | | | 754,467 | | |
| | | | 1,814,757 | | |
| Automotive & Parts - 3.1% | | | |
American
Axle & Manufacturing
Holdings, Inc.(b) | | | 15,700 | | | | 396,739 | | |
| Autoliv, Inc. | | | 32,300 | | | | 1,414,740 | | |
| BorgWarner, Inc.(b) | | | 16,200 | | | | 869,454 | | |
Cooper Tire &
Rubber Co.(b) | | | 20,600 | | | | 382,542 | | |
| Dana Corp. | | | 39,600 | | | | 594,396 | | |
| Lear Corp.(b) | | | 21,800 | | | | 793,084 | | |
Magna International,
Inc. Cl. A | | | 11,800 | | | | 830,012 | | |
| SPX Corp. | | | 22,100 | | | | 1,016,158 | | |
| | | | 6,297,125 | | |
| Banking, Savings & Loans - 21.3% | | | |
| Bank of America Corp. | | | 161,000 | | | | 7,343,210 | | |
| Citigroup, Inc. | | | 200,500 | | | | 9,269,115 | | |
| Comerica, Inc. | | | 22,600 | | | | 1,306,280 | | |
| Fannie Mae | | | 49,100 | | | | 2,867,440 | | |
| Freddie Mac | | | 32,900 | | | | 2,146,067 | | |
| JP Morgan Chase & Co. | | | 150,688 | | | | 5,322,300 | | |
| KeyCorp | | | 43,000 | | | | 1,425,450 | | |
| National City Corp. | | | 43,600 | | | | 1,487,632 | | |
| SunTrust Banks, Inc. | | | 24,500 | | | | 1,769,880 | | |
| U.S. Bancorp | | | 92,900 | | | | 2,712,680 | | |
| Wachovia Corp. | | | 63,200 | | | | 3,134,720 | | |
| Washington Mutual, Inc.(b) | | | 54,500 | | | | 2,217,605 | | |
| Wells Fargo & Co. | | | 44,600 | | | | 2,746,468 | | |
| | | | 43,748,847 | | |
| Broadcasting, Publishing & Printing - 2.5% | | | |
| Comcast Corp. Cl. A(a) | | | 61,700 | | | | 1,894,190 | | |
| Time Warner, Inc.(a) | | | 172,425 | | | | 2,881,222 | | |
| Viacom, Inc., Class B | | | 9,800 | | | | 313,796 | | |
| | | | 5,089,208 | | |
| | | Number of
Shares | | Market
Value | |
| Building Materials & Construction - 0.9% | |
Martin Marietta
Materials, Inc. | | | 8,500 | | | $ | 587,520 | | |
| Masco Corp.(b) | | | 23,100 | | | | 733,656 | | |
| Vulcan Materials Co.(b) | | | 9,700 | | | | 630,403 | | |
| | | | 1,951,579 | | |
| Chemicals - 1.2% | | | |
Du Pont (E.I.) de
Nemours & Co. | | | 12,400 | | | | 533,324 | | |
| Hercules, Inc.(a) | | | 32,500 | | | | 459,875 | | |
| Monsanto Co. | | | 8,500 | | | | 534,395 | | |
| PPG Industries, Inc. | | | 15,900 | | | | 997,884 | | |
| | | | 2,525,478 | | |
| Communications - 1.8% | | | |
ADC
Telecommunications, Inc.(a) | | | 35,200 | | | | 766,304 | | |
| Nortel Networks Corp.(a) | | | 180,400 | | | | 470,844 | | |
| SBC Communications, Inc. | | | 64,900 | | | | 1,541,375 | | |
| Tellabs, Inc.(a) | | | 111,800 | | | | 972,660 | | |
| | | | 3,751,183 | | |
| Computer Related Services - 0.3% | | | |
| Ingram Micro, Inc. Cl. A(a) | | | 40,500 | | | | 634,230 | | |
| Computers & Information - 0.9% | |
International Business
Machines Corp. | | | 8,000 | | | | 593,600 | | |
| Solectron Corp.(a) | | | 146,275 | | | | 554,382 | | |
| Tech Data Corp.(a) | | | 17,200 | | | | 629,692 | | |
| | | | 1,777,674 | | |
| Computers & Office Equipment - 2.3% | | | |
Electronic Data
Systems Corp. | | | 60,400 | | | | 1,162,700 | | |
| Hewlett-Packard Co. | | | 150,752 | | | | 3,544,180 | | |
| | | | 4,706,880 | | |
| Containers - 0.3% | | | |
Smurfit-Stone
Container Corp. | | | 52,900 | | | | 537,993 | | |
| Electric Utilities - 4.6% | |
| Alliant Energy Corp. | | | 9,700 | | | | 273,055 | | |
| American Electric Power Co. | | | 40,500 | | | | 1,493,235 | | |
Constellation Energy
Group, Inc. | | | 32,300 | | | | 1,863,387 | | |
| Edison International | | | 49,100 | | | | 1,991,005 | | |
| Entergy Corp. | | | 20,700 | | | | 1,563,885 | | |
| Northeast Utilities | | | 40,600 | | | | 846,916 | | |
| PPL Corp. | | | 24,400 | | | | 1,448,872 | | |
| | | | 9,480,355 | | |
| | | Number of
Shares | | Market
Value | |
| Electrical Equipment & Electronics - 4.7% | | | |
| Agere Systems, Inc.(a) | | | 21,500 | | | $ | 258,000 | | |
Arrow
Electronics, Inc.(a) (b) | | | 34,100 | | | | 926,156 | | |
| Celestica, Inc.(a) | | | 55,700 | | | | 746,380 | | |
Flextronics International
Limited(a) (b) | | | 92,200 | | | | 1,217,962 | | |
| General Electric Co. | | | 140,800 | | | | 4,878,720 | | |
| Hubbell, Inc. Cl. B(b) | | | 16,300 | | | | 718,830 | | |
| Sanmina-SCI Corp.(a) (b) | | | 170,700 | | | | 933,729 | | |
| | | | 9,679,777 | | |
| Energy - 14.3% | | | |
BP PLC Sponsored ADR
(United Kingdom) | | | 16,900 | | | | 1,054,222 | | |
| Chevron Corp. | | | 86,200 | | | | 4,820,304 | | |
| ConocoPhillips | | | 70,494 | | | | 4,052,700 | | |
Diamond Offshore
Drilling, Inc.(b) | | | 18,000 | | | | 961,740 | | |
| Exxon Mobil Corp. | | | 198,500 | | | | 11,407,795 | | |
| GlobalSantaFe Corp. | | | 28,400 | | | | 1,158,720 | | |
| Marathon Oil Corp. | | | 42,700 | | | | 2,278,899 | | |
| Occidental Petroleum Corp. | | | 25,250 | | | | 1,942,482 | | |
| Sempra Energy | | | 31,800 | | | | 1,313,658 | | |
| Xcel Energy, Inc.(b) | | | 19,900 | | | | 388,448 | | |
| | | | 29,378,968 | | |
| Entertainment & Leisure - 0.1% | | | |
| The Walt Disney Co. | | | 11,900 | | | | 299,642 | | |
| Financial Services - 5.2% | | | |
Bear Stearns
Companies, Inc. | | | 11,500 | | | | 1,195,310 | | |
Countrywide
Financial Corp. | | | 47,600 | | | | 1,837,836 | | |
The Goldman Sachs
Group, Inc. | | | 15,600 | | | | 1,591,512 | | |
Huntington
Bancshares, Inc.(b) | | | 50,800 | | | | 1,226,312 | | |
Lehman Brothers
Holdings, Inc.(b) | | | 18,200 | | | | 1,806,896 | | |
| Merrill Lynch & Co., Inc. | | | 23,200 | | | | 1,276,232 | | |
| Morgan Stanley | | | 32,300 | | | | 1,694,781 | | |
| | | | 10,628,879 | | |
| Foods - 1.8% | | | |
| Archer-Daniels-Midland Co. | | | 72,700 | | | | 1,554,326 | | |
| The Kroger Co.(a) | | | 69,400 | | | | 1,320,682 | | |
| Safeway, Inc.(b) | | | 34,100 | | | | 770,319 | | |
| | | | 3,645,327 | | |
(Continued)
The accompanying notes are an integral part of the financial statements.
84
MassMutual Select Diversified Value Fund – Portfolio of Investments (Continued)
| | | Number of
Shares | | Market
Value | |
| Forest Products & Paper - 1.0% | |
| Georgia-Pacific Corp. | | | 26,200 | | | $ | 833,160 | | |
| International Paper Co. | | | 42,200 | | | | 1,274,862 | | |
| | | | 2,108,022 | | |
| Healthcare - 0.4% | | | |
GlaxoSmithKline PLC ADR
(United Kingdom) | | | 18,700 | | | | 907,137 | | |
Home Construction, Furnishings &
Appliances - 0.2% | | | |
| Leggett & Platt, Inc. | | | 17,600 | | | | 467,808 | | |
| Household Products - 1.8% | |
| Corning, Inc.(a) | | | 79,050 | | | | 1,313,811 | | |
| Newell Rubbermaid, Inc. | | | 56,700 | | | | 1,351,728 | | |
Unilever NV NY Shares
(Netherlands) | | | 16,200 | | | | 1,050,246 | | |
| | | | 3,715,785 | | |
| Industrial – Diversified - 2.2% | | | |
Cooper Industries
Limited Cl. A | | | 17,200 | | | | 1,099,080 | | |
| Eaton Corp. | | | 23,600 | | | | 1,413,640 | | |
| Textron, Inc.(b) | | | 21,000 | | | | 1,592,850 | | |
| Tyco International Limited | | | 17,200 | | | | 502,240 | | |
| | | | 4,607,810 | | |
| Insurance - 7.4% | | | |
| ACE Limited | | | 11,000 | | | | 493,350 | | |
| Allstate Corp. | | | 29,400 | | | | 1,756,650 | | |
American International
Group, Inc. | | | 32,300 | | | | 1,876,630 | | |
| Chubb Corp. | | | 16,200 | | | | 1,386,882 | | |
Genworth Financial,
Inc. Cl. A(b) | | | 28,600 | | | | 864,578 | | |
The Hartford Financial
Services Group, Inc.(b) | | | 25,600 | | | | 1,914,368 | | |
| Metlife, Inc. | | | 33,300 | | | | 1,496,502 | | |
| MGIC Investment Corp. | | | 13,700 | | | | 893,514 | | |
| PartnerRe Limited | | | 6,500 | | | | 418,730 | | |
| Prudential Financial, Inc. | | | 24,900 | | | | 1,634,934 | | |
RenaissanceRe
Holdings Limited | | | 3,400 | | | | 167,416 | | |
St. Paul
Travelers Companies | | | 33,024 | | | | 1,305,439 | | |
| XL Capital Limited Cl. A(b) | | | 13,700 | | | | 1,019,554 | | |
| | | | 15,228,547 | | |
| Metals & Mining - 1.2% | | | |
| Alcoa, Inc. | | | 10,300 | | | | 269,139 | | |
| Crane Co. | | | 16,500 | | | | 433,950 | | |
| Nucor Corp.(b) | | | 12,500 | | | | 570,250 | | |
| United States Steel Corp. | | | 33,900 | | | | 1,165,143 | | |
| | | | 2,438,482 | | |
| | | Number of
Shares | | Market
Value | |
| Pharmaceuticals - 5.1% | | | |
| Abbott Laboratories | | | 4,800 | | | $ | 235,248 | | |
| Bristol-Myers Squibb Co.(b) | | | 22,300 | | | | 557,054 | | |
| Eli Lilly & Co. | | | 20,700 | | | | 1,153,197 | | |
Medco Health
Solutions, Inc.(a) | | | 35,000 | | | | 1,867,600 | | |
| Merck & Co., Inc. | | | 32,600 | | | | 1,004,080 | | |
| Pfizer, Inc. | | | 207,900 | | | | 5,733,882 | | |
| | | | 10,551,061 | | |
| Prepackaged Software - 0.6% | | | |
| Microsoft Corp. | | | 49,100 | | | | 1,219,644 | | |
| Restaurants - 1.1% | | | |
| McDonald's Corp. | | | 78,000 | | | | 2,164,500 | | |
| Retail - 1.9% | | | |
Federated Department
Stores, Inc.(b) | | | 23,600 | | | | 1,729,408 | | |
| Office Depot, Inc.(a) | | | 50,800 | | | | 1,160,272 | | |
| Target Corp. | | | 19,700 | | | | 1,071,877 | | |
| | | | 3,961,557 | | |
| Telephone Utilities - 3.2% | | | |
| BellSouth Corp.(b) | | | 22,800 | | | | 605,796 | | |
Sprint Corp.
(FON Group)(b) | | | 108,250 | | | | 2,715,992 | | |
Verizon
Communications, Inc. | | | 92,900 | | | | 3,209,695 | | |
| | | | 6,531,483 | | |
| Tobacco - 2.7% | | | |
| Altria Group, Inc. | | | 65,900 | | | | 4,261,094 | | |
| UST, Inc.(b) | | | 27,900 | | | | 1,273,914 | | |
| | | | 5,535,008 | | |
| Transportation - 2.2% | | | |
Burlington Northern
Santa Fe Corp. | | | 38,600 | | | | 1,817,288 | | |
| CSX Corp. | | | 30,400 | | | | 1,296,864 | | |
| Norfolk Southern Corp. | | | 45,500 | | | | 1,408,680 | | |
| | | | 4,522,832 | | |
TOTAL EQUITIES
(Cost $168,494,182) | | | | | | | 203,982,640 | | |
| | | Principal
Amount | |
| |
| SHORT-TERM INVESTMENTS - 14.6% | | | |
| Cash Equivalents - 12.8%(c) | | | |
ABN Amro Bank NV
Eurodollar Time Deposit
3.250% 08/05/2005 | | $ | 281,053 | | | | 281,053 | | |
American Beacon Money
Market Fund | | | 758,726 | | | | 758,726 | | |
| | | Principal
Amount | | Market
Value | |
Bank of America
Bank Note
3.270% 07/18/2005 | | $ | 389,015 | | | $ | 389,015 | | |
Bank of America
Bank Note
3.270% 08/30/2005 | | | 722,457 | | | | 722,457 | | |
Bank of Montreal
Eurodollar Time Deposit
3.010% 07/01/2005 | | | 1,070,062 | | | | 1,070,062 | | |
Barclays
Eurodollar Time Deposit
3.160% 07/14/2005 | | | 555,736 | | | | 555,736 | | |
Barclays
Eurodollar Time Deposit
3.250% 07/26/2005 | | | 559,934 | | | | 559,934 | | |
BGI Institutional Money
Market Fund | | | 2,181,098 | | | | 2,181,098 | | |
BNP Paribas
Eurodollar Time Deposit
3.000% 07/01/2005 | | | 389,015 | | | | 389,015 | | |
Calyon
Eurodollar Time Deposit
3.310% 07/01/2005 | | | 333,442 | | | | 333,442 | | |
Citigroup
Eurodollar Time Deposit
3.085% 07/22/2005 | | | 333,442 | | | | 333,442 | | |
Citigroup
Eurodollar Time Deposit
3.100% 07/25/2005 | | | 772,369 | | | | 772,369 | | |
Dexia Group
Eurodollar Time Deposit
3.205% 07/20/2005 | | | 277,868 | | | | 277,868 | | |
Dexia Group
Eurodollar Time Deposit
3.240% 07/21/2005 | | | 277,868 | | | | 277,868 | | |
Federal Home Loan Bank
Discount Note
2.977% 07/01/2005 | | | 686,253 | | | | 686,253 | | |
First Tennessee
National Corporation
Eurodollar Time Deposit
3.220% 08/09/2005 | | | 100,148 | | | | 100,148 | | |
Fortis Bank
Eurodollar Time Deposit
3.110% 07/05/2005 | | | 386,634 | | | | 386,634 | | |
Fortis Bank
Eurodollar Time Deposit
3.250% 07/25/2005 | | | 392,260 | | | | 392,260 | | |
Fortis Bank
Eurodollar Time Deposit
3.250% 08/04/2005 | | | 555,736 | | | | 555,736 | | |
Fortis Bank
Eurodollar Time Deposit
3.270% 07/07/2005 | | | 444,589 | | | | 444,589 | | |
(Continued)
The accompanying notes are an integral part of the financial statements.
85
MassMutual Select Diversified Value Fund – Portfolio of Investments (Continued)
| | | Principal
Amount | | Market
Value | |
Freddie Mac
Discount Note
3.208% 07/26/2005 | | $ | 273,957 | | | $ | 273,957 | | |
Freddie Mac
Discount Note
3.244% 08/16/2005 | | | 666,883 | | | | 666,883 | | |
General Electric
Capital Corp
3.252% 07/06/2005 | | | 555,736 | | | | 555,736 | | |
General Electric
Capital Corp
3.253% 07/08/2005 | | | 444,589 | | | | 444,589 | | |
Goldman Sachs
Financial Square
Prime Obligations
Money Market Fund | | | 507,455 | | | | 507,455 | | |
Harris Trust &
Savings Bank
3.295% 11/04/2005 | | | 532,254 | | | | 532,254 | | |
HBOS Halifax
Bank of Scotland
Eurodollar Time Deposit
3.150% 08/08/2005 | | | 277,868 | | | | 277,868 | | |
HSBC Banking/
Holdings PLC
Eurodollar Time Deposit
3.250% 08/05/2005 | | | 333,442 | | | | 333,442 | | |
JP Morgan Chase & Co.
Eurodollar Time Deposit
3.200% 07/20/2005 | | | 555,736 | | | | 555,736 | | |
Merrimac Cash Fund,
Premium Class | | | 881,101 | | | | 881,101 | | |
Morgan Stanley
Dean Witter & Co.
3.518% 07/19/2005 | | | 1,111,472 | | | | 1,111,472 | | |
National Australia Bank
Eurodollar Time Deposit
3.260% 07/06/2005 | | | 222,294 | | | | 222,294 | | |
National Australia Bank
Eurodollar Time Deposit
3.375% 07/01/2005 | | | 666,883 | | | | 666,883 | | |
Nordea Bank Finland PLC
(NY Branch)
Eurodollar Time Deposit
3.165% 08/09/2005 | | | 431,535 | | | | 431,535 | | |
Nordea Bank Finland PLC
(NY Branch)
Eurodollar Time Deposit
3.240% 08/03/2005 | | | 200,065 | | | | 200,065 | | |
| | | Principal
Amount | | Market
Value | |
Rabobank Nederland
Eurodollar Time Deposit
3.170% 07/18/2005 | | $ | 555,736 | | | $ | 555,736 | | |
Rabobank Nederland
Eurodollar Time Deposit
3.350% 07/01/2005 | | | 449,655 | | | | 449,655 | | |
Royal Bank of Canada
Eurodollar Time Deposit
3.250% 07/07/2005 | | | 333,442 | | | | 333,442 | | |
Royal Bank of Canada
Eurodollar Time Deposit
3.260% 07/28/2005 | | | 555,736 | | | | 555,736 | | |
Royal Bank of Scotland
Eurodollar Time Deposit
3.240% 08/08/2005 | | | 611,310 | | | | 611,310 | | |
Royal Bank of Scotland
Eurodollar Time Deposit
3.250% 08/04/2005 | | | 444,589 | | | | 444,589 | | |
Royal Bank of Scotland
Eurodollar Time Deposit
3.270% 07/29/2005 | | | 444,589 | | | | 444,589 | | |
Societe Generale
Eurodollar Time Deposit
3.200% 08/08/2005 | | | 222,294 | | | | 222,294 | | |
Societe Generale
Eurodollar Time Deposit
3.240% 08/09/2005 | | | 367,835 | | | | 367,835 | | |
Societe Generale
Eurodollar Time Deposit
3.280% 08/01/2005 | | | 555,736 | | | | 555,736 | | |
Svenska Handlesbanken
Eurodollar Time Deposit
3.220% 08/05/2005 | | | 555,736 | | | | 555,736 | | |
The Bank of the West
Eurodollar Time Deposit
3.270% 07/27/2005 | | | 166,721 | | | | 166,721 | | |
Toronto Dominion Bank
Eurodollar Time Deposit
3.250% 08/02/2005 | | | 555,736 | | | | 555,736 | | |
UBS AG
Eurodollar Time Deposit
3.250% 08/09/2005 | | | 277,868 | | | | 277,868 | | |
Wells Fargo
Eurodollar Time Deposit
3.270% 07/21/2005 | | | 555,736 | | | | 555,736 | | |
Wells Fargo
Eurodollar Time Deposit
3.270% 08/01/2005 | | | 555,736 | | | | 555,736 | | |
| | | | 26,337,430 | | |
| | | Principal
Amount | | Market
Value | |
| Repurchase Agreement - 1.8% | | | |
Investors Bank & Trust
Company Repurchase
Agreement, dated
06/30/2005, 2.01%,
due 07/01/2005(d) | | $ | 3,674,083 | | | $ | 3,674,083 | | |
TOTAL SHORT-TERM
INVESTMENTS
(At Amortized Cost) | | | | | 30,011,513 | | |
TOTAL INVESTMENTS - 113.8%
(Cost $198,505,695)(e) | | | | | 233,994,153 | | |
Other Assets/
(Liabilities) - (13.8%) | | | | | (28,413,176 | ) | |
| NET ASSETS - 100.0% | | | | $ | 205,580,977 | | |
Notes to Portfolio of Investments
ADR - American Depository Receipt.
(a) Non-income producing security.
(b) Denotes all or a portion of security on loan.
(c) Represents investments of security lending collateral. (Note 2).
(d) Maturity value of $3,674,288. Collaterized by U.S. Government Agency obligation with a rate of 3.864%, maturity date of 01/25/2033, and aggregate market value, including accrued interest, of $3,857,787.
(e) See Note 6 for aggregate cost for Federal tax purposes.
The accompanying notes are an integral part of the financial statements.
86
MassMutual Select Fundamental Value Fund – Portfolio of Investments
June 30, 2005 (Unaudited)
| | | Number of
Shares | | Market
Value | |
| EQUITIES - 97.3% | | | |
| Aerospace & Defense - 1.7% | | | |
| General Dynamics Corp. | | | 142,000 | | | $ | 15,554,680 | | |
| Air Transportation - 1.7% | | | |
| Southwest Airlines Co. | | | 1,134,400 | | | | 15,802,192 | | |
| Apparel, Textiles & Shoes - 1.2% | | | |
| Nike, Inc. Cl. B | | | 126,400 | | | | 10,946,240 | | |
| Banking, Savings & Loans - 17.2% | | | |
| Bank of America Corp. | | | 731,500 | | | | 33,363,715 | | |
| Citigroup, Inc. | | | 872,100 | | | | 40,317,183 | | |
Golden West
Financial Corp.(a) | | | 263,000 | | | | 16,931,940 | | |
| JP Morgan Chase & Co. | | | 694,336 | | | | 24,523,948 | | |
| National City Corp. | | | 497,700 | | | | 16,981,524 | | |
| SunTrust Banks, Inc. | | | 124,200 | | | | 8,972,208 | | |
| Washington Mutual, Inc. | | | 107,300 | | | | 4,366,037 | | |
| Wells Fargo & Co. | | | 216,600 | | | | 13,338,228 | | |
| | | | 158,794,783 | | |
| Beverages - 1.3% | | | |
| PepsiCo, Inc. | | | 220,300 | | | | 11,880,779 | | |
| Broadcasting, Publishing & Printing - 3.7% | | | |
| Comcast Corp. Cl. A(b) | | | 441,200 | | | | 13,544,840 | | |
| Gannett Co., Inc. | | | 97,900 | | | | 6,963,627 | | |
| Time Warner, Inc.(b) | | | 845,700 | | | | 14,131,647 | | |
| | | | 34,640,114 | | |
| Chemicals - 3.8% | | | |
| Dow Chemical Co. | | | 299,300 | | | | 13,327,829 | | |
Du Pont (E.I.) de
Nemours & Co. | | | 375,700 | | | | 16,158,857 | | |
| Huntsman Corp.(a) (b) | | | 274,100 | | | | 5,556,007 | | |
| | | | 35,042,693 | | |
| Commercial Services - 0.4% | | | |
| Manpower, Inc. | | | 103,400 | | | | 4,113,252 | | |
| Communications - 2.0% | | | |
Nokia Oyj Sponsored
ADR (Finland) | | | 553,900 | | | | 9,216,896 | | |
| SBC Communications, Inc. | | | 377,300 | | | | 8,960,875 | | |
| | | | 18,177,771 | | |
| Computer Integrated Systems Design - 0.6% | | | |
| Teradyne, Inc.(a) (b) | | | 474,200 | | | | 5,676,174 | | |
| Cosmetics & Personal Care - 1.1% | | | |
| Kimberly-Clark Corp. | | | 162,200 | | | | 10,152,098 | | |
| | | Number of
Shares | | Market
Value | |
| Electric Utilities - 9.5% | | | |
Consolidated
Edison, Inc.(a) | | | 205,500 | | | $ | 9,625,620 | | |
Constellation Energy
Group, Inc. | | | 91,600 | | | | 5,284,404 | | |
Dominion
Resources, Inc.(a) | | | 176,750 | | | | 12,971,682 | | |
| Entergy Corp. | | | 154,400 | | | | 11,664,920 | | |
| Exelon Corp.(a) | | | 469,500 | | | | 24,099,435 | | |
| PPL Corp. | | | 162,600 | | | | 9,655,188 | | |
| Progress Energy, Inc. | | | 87,100 | | | | 3,940,404 | | |
| SCANA Corp. | | | 97,500 | | | | 4,164,225 | | |
| TXU Corp. | | | 81,200 | | | | 6,746,908 | | |
| | | | 88,152,786 | | |
| Electrical Equipment & Electronics - 3.1% | | | |
| Emerson Electric Co. | | | 154,800 | | | | 9,695,124 | | |
| Intel Corp. | | | 373,900 | | | | 9,743,834 | | |
| Rockwell Automation, Inc. | | | 194,800 | | | | 9,488,708 | | |
| | | | 28,927,666 | | |
| Energy - 10.7% | | | |
| ConocoPhillips | | | 431,500 | | | | 24,806,935 | | |
| Exxon Mobil Corp. | | | 817,000 | | | | 46,952,990 | | |
| GlobalSantaFe Corp.(a) | | | 568,700 | | | | 23,202,960 | | |
| Occidental Petroleum Corp. | | | 59,100 | | | | 4,546,563 | | |
| | | | 99,509,448 | | |
| Financial Services - 2.8% | | | |
The Goldman Sachs
Group, Inc. | | | 173,800 | | | | 17,731,076 | | |
PNC Financial Services
Group, Inc. | | | 154,200 | | | | 8,397,732 | | |
| | | | 26,128,808 | | |
| Foods - 1.0% | | | |
| Kellogg Co. | | | 211,400 | | | | 9,394,616 | | |
| Industrial – Diversified - 1.7% | | | |
| Illinois Tool Works, Inc. | | | 111,100 | | | | 8,852,448 | | |
| Tyco International Limited | | | 244,900 | | | | 7,151,080 | | |
| | | | 16,003,528 | | |
| Insurance - 7.5% | | | |
| ACE Limited | | | 170,100 | | | | 7,628,985 | | |
American International
Group, Inc. | | | 205,400 | | | | 11,933,740 | | |
| Chubb Corp. | | | 165,400 | | | | 14,159,894 | | |
Principal Financial
Group, Inc. | | | 233,800 | | | | 9,796,220 | | |
| WellPoint, Inc.(b) | | | 375,600 | | | | 26,156,784 | | |
| | | | 69,675,623 | | |
| | | Number of
Shares | | Market
Value | |
| Machinery & Components - 3.7% | |
| Caterpillar, Inc.(a) | | | 304,600 | | | $ | 29,031,426 | | |
| Parker-Hannifin Corp. | | | 90,900 | | | | 5,636,709 | | |
| | | | 34,668,135 | | |
| Manufacturing - 1.6% | | | |
| Applied Materials, Inc. | | | 496,300 | | | | 8,030,134 | | |
| Lam Research Corp.(a) (b) | | | 232,400 | | | | 6,725,656 | | |
| | | | 14,755,790 | | |
| Medical Supplies - 2.2% | | | |
| Baxter International, Inc. | | | 339,200 | | | | 12,584,320 | | |
| Beckman Coulter, Inc. | | | 121,800 | | | | 7,742,826 | | |
| | | | 20,327,146 | | |
| Metals & Mining - 4.7% | | | |
| Alcoa, Inc. | | | 825,800 | | | | 21,578,154 | | |
| Cameco Corp.(a) | | | 267,100 | | | | 11,952,725 | | |
| Precision Castparts Corp. | | | 127,500 | | | | 9,932,250 | | |
| | | | 43,463,129 | | |
| Pharmaceuticals - 4.7% | | | |
| Pfizer, Inc. | | | 592,620 | | | | 16,344,460 | | |
Watson
Pharmaceutical, Inc.(b) | | | 313,600 | | | | 9,270,016 | | |
| Wyeth | | | 403,000 | | | | 17,933,500 | | |
| | | | 43,547,976 | | |
| Real Estate - 0.2% | | | |
CB Richard Ellis Group,
Inc. Cl. A(b) | | | 45,800 | | | | 2,008,788 | | |
| Restaurants - 1.8% | |
| McDonald's Corp. | | | 582,400 | | | | 16,161,600 | | |
| Retail - 2.8% | |
| CVS Corp. | | | 594,300 | | | | 17,276,301 | | |
| Dollar General Corp. | | | 430,100 | | | | 8,756,836 | | |
| | | | 26,033,137 | | |
| Telephone Utilities - 2.8% | | | |
| AT&T Corp. | | | 194,200 | | | | 3,697,568 | | |
| BellSouth Corp.(a) | | | 338,100 | | | | 8,983,317 | | |
Sprint Corp.
(FON Group)(a) | | | 509,000 | | | | 12,770,810 | | |
| | | | 25,451,695 | | |
| Transportation - 1.8% | | | |
| CSX Corp. | | | 385,700 | | | | 16,453,962 | | |
TOTAL EQUITIES
(Cost $785,463,557) | | | | | | | 901,444,609 | | |
(Continued)
The accompanying notes are an integral part of the financial statements.
87
MassMutual Select Fundamental Value Fund – Portfolio of Investments (Continued)
| | | Principal
Amount | | Market
Value | |
| SHORT-TERM INVESTMENTS - 10.2% | | | |
| Cash Equivalents - 9.4%(c) | | | |
ABN Amro Bank NV
Eurodollar Time Deposit
3.250% 08/05/2005 | | $ | 924,300 | | | $ | 924,300 | | |
American Beacon Money
Market Fund | | | 2,495,217 | | | | 2,495,217 | | |
Bank of America
Bank Note
3.270% 07/18/2005 | | | 1,279,351 | | | | 1,279,351 | | |
Bank of America
Bank Note
3.270% 08/30/2005 | | | 2,375,937 | | | | 2,375,937 | | |
Bank of Montreal
Eurodollar Time Deposit
3.010% 07/01/2005 | | | 3,519,102 | | | | 3,519,102 | | |
Barclays
Eurodollar Time Deposit
3.160% 07/14/2005 | | | 1,827,644 | | | | 1,827,644 | | |
Barclays
Eurodollar Time Deposit
3.250% 07/26/2005 | | | 1,841,450 | | | | 1,841,450 | | |
BGI Institutional Money
Market Fund | | | 7,172,956 | | | | 7,172,956 | | |
BNP Paribas
Eurodollar Time Deposit
3.000% 07/01/2005 | | | 1,279,351 | | | | 1,279,351 | | |
Calyon
Eurodollar Time Deposit
3.310% 07/01/2005 | | | 1,096,586 | | | | 1,096,586 | | |
Citigroup
Eurodollar Time Deposit
3.085% 07/22/2005 | | | 1,096,586 | | | | 1,096,586 | | |
Citigroup
Eurodollar Time Deposit
3.100% 07/25/2005 | | | 2,540,083 | | | | 2,540,083 | | |
Dexia Group
Eurodollar Time Deposit
3.205% 07/20/2005 | | | 913,822 | | | | 913,822 | | |
Dexia Group
Eurodollar Time Deposit
3.240% 07/21/2005 | | | 913,822 | | | | 913,822 | | |
Federal Home Loan Bank
Discount Note
2.977% 07/01/2005 | | | 2,256,875 | | | | 2,256,875 | | |
First Tennessee
National Corporation
Eurodollar Time Deposit
3.220% 08/09/2005 | | | 329,356 | | | | 329,356 | | |
Fortis Bank
Eurodollar Time Deposit
3.110% 07/05/2005 | | | 1,271,521 | | | | 1,271,521 | | |
| | | Principal
Amount | | Market
Value | |
Fortis Bank
Eurodollar Time Deposit
3.250% 07/25/2005 | | $ | 1,290,023 | | | $ | 1,290,023 | | |
Fortis Bank
Eurodollar Time Deposit
3.250% 08/04/2005 | | | 1,827,644 | | | | 1,827,644 | | |
Fortis Bank
Eurodollar Time Deposit
3.270% 07/07/2005 | | | 1,462,115 | | | | 1,462,115 | | |
Freddie Mac
Discount Note
3.208% 07/26/2005 | | | 900,960 | | | | 900,960 | | |
Freddie Mac
Discount Note
3.244% 08/16/2005 | | | 2,193,173 | | | | 2,193,173 | | |
General Electric
Capital Corp
3.252% 07/06/2005 | | | 1,827,644 | | | | 1,827,644 | | |
General Electric
Capital Corp
3.253% 07/08/2005 | | | 1,462,115 | | | | 1,462,115 | | |
Goldman Sachs
Financial Square
Prime Obligations
Money Market Fund | | | 1,668,864 | | | | 1,668,864 | | |
Harris Trust &
Savings Bank
3.295% 11/04/2005 | | | 1,750,418 | | | | 1,750,418 | | |
HBOS Halifax
Bank of Scotland
Eurodollar Time Deposit
3.150% 08/08/2005 | | | 913,822 | | | | 913,822 | | |
HSBC Banking/
Holdings PLC
Eurodollar Time Deposit
3.250% 08/05/2005 | | | 1,096,586 | | | | 1,096,586 | | |
JP Morgan Chase & Co.
Eurodollar Time Deposit
3.200% 07/20/2005 | | | 1,827,644 | | | | 1,827,644 | | |
Merrimac Cash Fund,
Premium Class | | | 2,897,667 | | | | 2,897,667 | | |
Morgan Stanley
Dean Witter & Co.
3.518% 07/19/2005 | | | 3,655,288 | | | | 3,655,288 | | |
National Australia Bank
Eurodollar Time Deposit
3.260% 07/06/2005 | | | 731,058 | | | | 731,058 | | |
National Australia Bank
Eurodollar Time Deposit
3.375% 07/01/2005 | | | 2,193,173 | | | | 2,193,173 | | |
Nordea Bank Finland PLC
(NY Branch)
Eurodollar Time Deposit
3.165% 08/09/2005 | | | 1,419,185 | | | | 1,419,185 | | |
| | | Principal
Amount | | Market
Value | |
Nordea Bank Finland PLC
(NY Branch)
Eurodollar Time Deposit
3.240% 08/03/2005 | | $ | 657,952 | | | $ | 657,952 | | |
Rabobank Nederland
Eurodollar Time Deposit
3.170% 07/18/2005 | | | 1,827,644 | | | | 1,827,644 | | |
Rabobank Nederland
Eurodollar Time Deposit
3.350% 07/01/2005 | | | 1,478,778 | | | | 1,478,778 | | |
Royal Bank of Canada
Eurodollar Time Deposit
3.250% 07/07/2005 | | | 1,096,586 | | | | 1,096,586 | | |
Royal Bank of Canada
Eurodollar Time Deposit
3.260% 07/28/2005 | | | 1,827,644 | | | | 1,827,644 | | |
Royal Bank of Scotland
Eurodollar Time Deposit
3.240% 08/08/2005 | | | 2,010,409 | | | | 2,010,409 | | |
Royal Bank of Scotland
Eurodollar Time Deposit
3.250% 08/04/2005 | | | 1,462,115 | | | | 1,462,115 | | |
Royal Bank of Scotland
Eurodollar Time Deposit
3.270% 07/29/2005 | | | 1,462,115 | | | | 1,462,115 | | |
Societe Generale
Eurodollar Time Deposit
3.200% 08/08/2005 | | | 731,058 | | | | 731,058 | | |
Societe Generale
Eurodollar Time Deposit
3.240% 08/09/2005 | | | 1,209,695 | | | | 1,209,695 | | |
Societe Generale
Eurodollar Time Deposit
3.280% 08/01/2005 | | | 1,827,644 | | | | 1,827,644 | | |
Svenska Handlesbanken
Eurodollar Time Deposit
3.220% 08/05/2005 | | | 1,827,644 | | | | 1,827,644 | | |
The Bank of the West
Eurodollar Time Deposit
3.270% 07/27/2005 | | | 548,293 | | | | 548,293 | | |
Toronto Dominion Bank
Eurodollar Time Deposit
3.250% 08/02/2005 | | | 1,827,644 | | | | 1,827,644 | | |
UBS AG
Eurodollar Time Deposit
3.250% 08/09/2005 | | | 913,822 | | | | 913,822 | | |
Wells Fargo
Eurodollar Time Deposit
3.270% 07/21/2005 | | | 1,827,644 | | | | 1,827,644 | | |
Wells Fargo
Eurodollar Time Deposit
3.270% 08/01/2005 | | | 1,827,644 | | | | 1,827,644 | | |
| | | | 86,615,669 | | |
(Continued)
The accompanying notes are an integral part of the financial statements.
88
MassMutual Select Fundamental Value Fund – Portfolio of Investments (Continued)
| | | Principal
Amount | | Market
Value | |
| Repurchase Agreement - 0.8% | | | |
Investors Bank & Trust
Company Repurchase
Agreement, dated
06/30/2005, 2.01%,
due 07/01/2005(d) | | $ | 7,563,709 | | | $ | 7,563,709 | | |
TOTAL SHORT-TERM
INVESTMENTS
(At Amortized Cost) | | | | | 94,179,378 | | |
TOTAL INVESTMENTS - 107.5%
(Cost $879,642,935)(e) | | | | | 995,623,987 | | |
Other Assets/
(Liabilities) - (7.5%) | | | | | (69,416,794 | ) | |
| NET ASSETS - 100.0% | | | | $ | 926,207,193 | | |
Notes to Portfolio of Investments
ADR - American Depository Receipt.
(a) Denotes all or a portion of security on loan.
(b) Non-income producing security.
(c) Represents investments of security lending collateral. (Note 2).
(d) Maturity value of $7,564,131. Collaterized by U.S. Government Agency obligations with rates of 6.145% - 6.875%, maturity dates of 10/25/2017 - 06/25/2024, and an aggregate market value, including accrued interest, of $7,941,894.
(e) See Note 6 for aggregate cost for Federal tax purposes.
The remainder of this page is intentionally left blank.
The accompanying notes are an integral part of the financial statements.
89
MassMutual Select Value Equity Fund – Portfolio of Investments
June 30, 2005 (Unaudited)
| | | Number of
Shares | | Market
Value | |
| EQUITIES - 99.6% | | | |
| Advertising - 0.8% | | | |
| Lamar Advertising Co.(a) | | | 12,900 | | | $ | 551,733 | | |
| Omnicom Group, Inc. | | | 1,700 | | | | 135,762 | | |
| | | | 687,495 | | |
| Aerospace & Defense - 4.7% | | | |
| Boeing Co. | | | 5,100 | | | | 336,600 | | |
Honeywell
International, Inc. | | | 86,900 | | | | 3,183,147 | | |
| Lockheed Martin Corp. | | | 2,100 | | | | 136,227 | | |
| Raytheon Co. | | | 13,100 | | | | 512,472 | | |
| | | | 4,168,446 | | |
| Air Transportation - 0.6% | | | |
ACE Aviation Holdings,
Inc., Cl. A | | | 5,000 | | | | 161,644 | | |
Airtran
Holdings, Inc.(a) (b) | | | 7,200 | | | | 66,456 | | |
JetBlue
Airways Corp.(a) (b) | | | 5,500 | | | | 112,420 | | |
Northwest
Airlines Corp.(a) | | | 8,600 | | | | 39,216 | | |
| Southwest Airlines Co. | | | 8,700 | | | | 121,191 | | |
| | | | 500,927 | | |
| Apparel, Textiles & Shoes - 0.2% | | | |
| Nordstrom, Inc. | | | 2,000 | | | | 135,940 | | |
| Automotive & Parts - 0.4% | | | |
| Delphi Corp. | | | 19,100 | | | | 88,815 | | |
| Lear Corp.(b) | | | 8,300 | | | | 301,954 | | |
| | | | 390,769 | | |
| Banking, Savings & Loans - 10.3% | | | |
Banco Bradesco SA,
Sponsored
ADR (Brazil)(b) | | | 8,300 | | | | 293,737 | | |
| Bank of America Corp. | | | 51,158 | | | | 2,333,316 | | |
| Capital One Financial Corp. | | | 2,300 | | | | 184,023 | | |
| Citigroup, Inc. | | | 24,200 | | | | 1,118,766 | | |
| Fannie Mae | | | 14,800 | | | | 864,320 | | |
| Freddie Mac | | | 5,800 | | | | 378,334 | | |
Golden West
Financial Corp. | | | 2,300 | | | | 148,074 | | |
| JP Morgan Chase & Co. | | | 33,556 | | | | 1,185,198 | | |
| Korea Exchange Bank | | | 25,790 | | | | 226,980 | | |
New York Community
Bancorp, Inc.(b) | | | 4,866 | | | | 88,172 | | |
Sovereign
Bancorp, Inc.(b) | | | 14,700 | | | | 328,398 | | |
| State Street Corp. | | | 2,600 | | | | 125,450 | | |
| | | Number of
Shares | | Market
Value | |
| UBS AG | | | 2,800 | | | $ | 217,980 | | |
| UCBH Holdings, Inc. | | | 12,948 | | | | 210,275 | | |
| W Holding Co., Inc. | | | 6,885 | | | | 70,365 | | |
| Wachovia Corp. | | | 19,457 | | | | 965,067 | | |
| Wells Fargo & Co. | | | 6,300 | | | | 387,954 | | |
| | | | 9,126,409 | | |
| Beverages - 1.0% | | | |
| The Coca-Cola Co. | | | 8,900 | | | | 371,575 | | |
Coca-Cola
Enterprises, Inc. | | | 17,500 | | | | 385,175 | | |
| PepsiCo, Inc. | | | 2,800 | | | | 151,004 | | |
| | | | 907,754 | | |
| Broadcasting, Publishing & Printing - 2.2% | | | |
Clear Channel
Communications, Inc. | | | 7,600 | | | | 235,068 | | |
Grupo Televisa SA
Sponsored ADR
(Mexico) | | | 2,200 | | | | 136,598 | | |
| IAC/InterActiveCorp(a) (b) | | | 6,900 | | | | 165,945 | | |
| Time Warner, Inc.(a) | | | 25,800 | | | | 431,118 | | |
Univision Communications,
Inc. Cl. A(a) (b) | | | 27,500 | | | | 757,625 | | |
| Viacom, Inc., Class B | | | 6,179 | | | | 197,851 | | |
| | | | 1,924,205 | | |
| Building Materials & Construction - 0.4% | | | |
Martin Marietta
Materials, Inc. | | | 1,500 | | | | 103,680 | | |
| Masco Corp. | | | 8,100 | | | | 257,256 | | |
| | | | 360,936 | | |
| Chemicals - 4.4% | | | |
| Ashland, Inc. | | | 1,300 | | | | 93,431 | | |
Cabot Microelectronics
Corp.(a) (b) | | | 6,800 | | | | 197,132 | | |
| Cytec Industries, Inc. | | | 1,500 | | | | 59,700 | | |
| Dow Chemical Co. | | | 6,100 | | | | 271,633 | | |
Du Pont (E.I.) de
Nemours & Co. | | | 25,700 | | | | 1,105,357 | | |
| Georgia Gulf Corp. | | | 3,000 | | | | 93,150 | | |
| Lyondell Chemical Co.(b) | | | 42,805 | | | | 1,130,908 | | |
| Monsanto Co. | | | 6,700 | | | | 421,229 | | |
| The Mosaic Co.(a) | | | 13,700 | | | | 213,172 | | |
| Praxair, Inc. | | | 3,700 | | | | 172,420 | | |
| Rohm & Haas Co. | | | 2,500 | | | | 115,850 | | |
| | | | 3,873,982 | | |
| Commercial Services - 2.6% | | | |
ABB, Limited, Sponsored
ADR (Switzerland)(b) | | | 12,100 | | | | 78,287 | | |
| | | Number of
Shares | | Market
Value | |
Akamai
Technologies, Inc.(a) (b) | | | 8,900 | | | $ | 116,857 | | |
Apollo Group,
Inc. Cl. A(a) (b) | | | 1,200 | | | | 93,864 | | |
| eBay, Inc.(a) | | | 13,600 | | | | 448,936 | | |
| Fluor Corp. | | | 8,900 | | | | 512,551 | | |
Jacobs Engineering
Group, Inc.(a) | | | 5,200 | | | | 292,552 | | |
| PerkinElmer, Inc. | | | 9,700 | | | | 183,330 | | |
Robert Half
International, Inc.(b) | | | 13,770 | | | | 343,837 | | |
| Service Corp. International | | | 23,800 | | | | 190,876 | | |
| | | | 2,261,090 | | |
| Communications - 3.9% | | | |
American Tower
Corp. Cl. A(a) (b) | | | 12,000 | | | | 252,240 | | |
| Avaya, Inc.(a) | | | 12,500 | | | | 104,000 | | |
EchoStar Communications
Corp. Cl. A | | | 5,600 | | | | 168,840 | | |
Nextel
Communications,
Inc. Cl. A(a) | | | 25,500 | | | | 823,905 | | |
Nokia Oyj Sponsored
ADR (Finland) | | | 25,300 | | | | 420,992 | | |
SBC
Communications, Inc. | | | 65,600 | | | | 1,558,000 | | |
| Ulticom, Inc.(a) | | | 9,100 | | | | 96,551 | | |
| | | | 3,424,528 | | |
| Communications Equipment - 0.2% | | | |
| Motorola, Inc. | | | 8,700 | | | | 158,862 | | |
| Computer & Data Processing Services - 0.3% | |
Anteon
International Corp.(a) | | | 5,800 | | | | 264,596 | | |
| Computer Integrated Systems Design - 0.0% | |
Enterasys
Networks, Inc.(a) | | | 690 | | | | 621 | | |
| Computer Programming Services - 0.2% | |
| Ceridian Corp.(a) | | | 6,900 | | | | 134,412 | | |
| Computers & Information - 1.3% | |
Comverse
Technology, Inc.(a) | | | 9,200 | | | | 217,580 | | |
| Dell, Inc.(a) | | | 2,000 | | | | 79,020 | | |
| EMC Corp.(a) | | | 14,700 | | | | 201,537 | | |
International Business
Machines Corp. | | | 1,500 | | | | 111,300 | | |
| Maxtor Corp.(a) | | | 22,200 | | | | 115,440 | | |
(Continued)
The accompanying notes are an integral part of the financial statements.
90
MassMutual Select Value Equity Fund – Portfolio of Investments (Continued)
| | | Number of
Shares | | Market
Value | |
| Symbol Technologies, Inc. | | | 23,100 | | | $ | 227,997 | | |
| Western Digital Corp.(a) | | | 12,500 | | | | 167,750 | | |
| | | | 1,120,624 | | |
| Computers & Office Equipment - 0.9% | | | |
| Hewlett-Packard Co. | | | 28,300 | | | | 665,333 | | |
| Xerox Corp.(a) | | | 7,300 | | | | 100,667 | | |
| | | | 766,000 | | |
| Containers - 1.0% | | | |
| Crown Holdings, Inc.(a) | | | 7,300 | | | | 103,879 | | |
| Owens-Illinois, Inc.(a) | | | 15,200 | | | | 380,760 | | |
Smurfit-Stone
Container Corp. | | | 36,025 | | | | 366,374 | | |
| | | | 851,013 | | |
| Cosmetics & Personal Care - 1.1% | | | |
| Colgate-Palmolive Co. | | | 13,700 | | | | 683,767 | | |
| The Gillette Co. | | | 6,300 | | | | 318,969 | | |
| | | | 1,002,736 | | |
| Data Processing & Preparation - 0.3% | | | |
Affiliated Computer
Services, Inc. Cl. A(a) (b) | | | 4,600 | | | | 235,060 | | |
| Electric Utilities - 1.7% | | | |
| AES Corp.(a) | | | 5,700 | | | | 93,366 | | |
| CMS Energy Corp.(a) (b) | | | 17,700 | | | | 266,562 | | |
| Entergy Corp.(b) | | | 5,300 | | | | 400,415 | | |
| PG&E Corp. | | | 8,400 | | | | 315,336 | | |
| PPL Corp. | | | 3,300 | | | | 195,954 | | |
Public Service Enterprise
Group, Inc. | | | 1,300 | | | | 79,066 | | |
| Southern Co. | | | 1,500 | | | | 52,005 | | |
| TXU Corp. | | | 800 | | | | 66,472 | | |
| | | | 1,469,176 | | |
| Electrical Equipment & Electronics - 7.0% | | | |
| Amphenol Corp. Cl. A | | | 4,700 | | | | 188,799 | | |
| Analog Devices, Inc.(b) | | | 4,700 | | | | 175,357 | | |
| ATI Technologies, Inc.(a) | | | 3,000 | | | | 35,550 | | |
Freescale Semiconductor,
Inc. Cl. A(a) | | | 16,600 | | | | 348,766 | | |
| General Electric Co. | | | 107,900 | | | | 3,738,735 | | |
| Hexcel Corp.(a) | | | 10,800 | | | | 182,736 | | |
| Intel Corp. | | | 22,900 | | | | 596,774 | | |
Maxim Integrated
Products, Inc. | | | 4,800 | | | | 183,408 | | |
| PMC-Sierra, Inc.(a) | | | 7,300 | | | | 68,109 | | |
Samsung Electronics
Co., Ltd. | | | 250 | | | | 119,505 | | |
Sony Corp. Sponsored
ADR (Japan) | | | 9,900 | | | | 340,956 | | |
| | | Number of
Shares | | Market
Value | |
Wesco
International, Inc.(a) | | | 6,400 | | | $ | 200,832 | | |
| | | | 6,179,527 | | |
| Energy - 14.1% | | | |
| Apache Corp. | | | 3,200 | | | | 206,720 | | |
| BJ Services Co.(b) | | | 8,100 | | | | 425,088 | | |
| Burlington Resources, Inc. | | | 8,500 | | | | 469,540 | | |
| Chevron Corp. | | | 18,616 | | | | 1,041,007 | | |
| ConocoPhillips | | | 5,890 | | | | 338,616 | | |
| El Paso Corp.(b) | | | 19,200 | | | | 221,184 | | |
| Encore Acquisition Co.(a) | | | 4,000 | | | | 164,000 | | |
| Ensco International, Inc. | | | 5,700 | | | | 203,775 | | |
| Exxon Mobil Corp. | | | 56,100 | | | | 3,224,067 | | |
| GlobalSantaFe Corp. | | | 10,300 | | | | 420,240 | | |
| Halliburton Co. | | | 22,200 | | | | 1,061,604 | | |
National Oilwell
Varco, Inc.(a) | | | 16,002 | | | | 760,735 | | |
| Occidental Petroleum Corp. | | | 5,200 | | | | 400,036 | | |
Pride
International, Inc.(a) (b) | | | 16,300 | | | | 418,910 | | |
Quicksilver
Resources, Inc.(a) (b) | | | 11,000 | | | | 703,230 | | |
| Schlumberger Limited | | | 8,200 | | | | 622,708 | | |
Shell Transport & Trading
Co. PLC | | | 1,600 | | | | 92,896 | | |
| Transocean, Inc.(a) | | | 9,300 | | | | 501,921 | | |
| Valero Energy Corp.(b) | | | 8,600 | | | | 680,346 | | |
Weatherford International
Limited(a) | | | 8,300 | | | | 481,234 | | |
| | | | 12,437,857 | | |
| Entertainment & Leisure - 0.7% | | | |
| Macrovision Corp.(a) | | | 1,700 | | | | 38,318 | | |
| News Corp., Inc. Cl. A | | | 2,982 | | | | 48,249 | | |
| The Walt Disney Co. | | | 21,200 | | | | 533,816 | | |
| | | | 620,383 | | |
| Financial Services - 4.0% | | | |
Apartment Investment &
Management Co. Cl. A(b) | | | 6,790 | | | | 277,847 | | |
Bear Stearns
Companies, Inc. | | | 1,800 | | | | 187,092 | | |
| Doral Financial Corp. | | | 9,600 | | | | 158,784 | | |
Equity Lifestyle Properties,
Inc. REIT | | | 2,300 | | | | 91,448 | | |
General Growth
Properties, Inc. REIT | | | 7,430 | | | | 305,299 | | |
| iStar Financial, Inc. | | | 3,300 | | | | 137,247 | | |
Lehman Brothers
Holdings, Inc.(b) | | | 2,800 | | | | 277,984 | | |
| Merrill Lynch & Co., Inc. | | | 12,000 | | | | 660,120 | | |
| Morgan Stanley | | | 16,600 | | | | 871,002 | | |
| | | Number of
Shares | | Market
Value | |
Nuveen Investments,
Inc. Cl. A(b) | | | 6,300 | | | $ | 237,006 | | |
| Telewest Global, Inc.(a) | | | 15,700 | | | | 357,646 | | |
| | | | 3,561,475 | | |
| Foods - 1.1% | | | |
Corn Products
International, Inc. | | | 5,500 | | | | 130,680 | | |
| The Kroger Co.(a) | | | 8,100 | | | | 154,143 | | |
| Nestle SA | | | 805 | | | | 205,119 | | |
| Safeway, Inc.(b) | | | 15,700 | | | | 354,663 | | |
| Tyson Foods, Inc. Cl. A | | | 9,600 | | | | 170,880 | | |
| | | | 1,015,485 | | |
| Forest Products & Paper - 0.2% | | | |
Packaging Corp.
of America(b) | | | 10,000 | | | | 210,500 | | |
| Healthcare - 0.6% | |
Sierra Health
Services, Inc.(a) (b) | | | 2,600 | | | | 185,796 | | |
| UnitedHealth Group, Inc. | | | 6,400 | | | | 333,696 | | |
| | | | 519,492 | | |
| Heavy Construction - 0.1% | | | |
Foster Wheeler,
Limited(b) | | | 4,600 | | | | 90,436 | | |
Home Construction, Furnishings &
Appliances - 1.2% | | | |
| Centex Corp. | | | 4,900 | | | | 346,283 | | |
| KB Home(b) | | | 4,900 | | | | 373,527 | | |
| Toll Brothers, Inc.(a) (b) | | | 3,000 | | | | 304,650 | | |
| | | | 1,024,460 | | |
| Household Products - 0.2% | | | |
| Ferro Corp. | | | 10,100 | | | | 200,586 | | |
| Industrial – Diversified - 2.5% | |
| 3M Co. | | | 2,300 | | | | 166,290 | | |
Cooper Industries
Limited Cl. A | | | 1,500 | | | | 95,850 | | |
| ITT Industries, Inc. | | | 4,200 | | | | 410,046 | | |
| Tyco International Limited | | | 52,900 | | | | 1,544,680 | | |
| | | | 2,216,866 | | |
| Information Retrieval Services - 1.2% | | | |
| Google, Inc. Cl. A(a) (b) | | | 1,700 | | | | 500,055 | | |
| Juniper Networks, Inc.(a) | | | 10,400 | | | | 261,872 | | |
| Yahoo!, Inc.(a) | | | 9,600 | | | | 332,640 | | |
| | | | 1,094,567 | | |
| Insurance - 7.2% | | | |
| ACE Limited | | | 12,100 | | | | 542,685 | | |
Ambac Financial
Group, Inc. | | | 1,300 | | | | 90,688 | | |
(Continued)
The accompanying notes are an integral part of the financial statements.
91
MassMutual Select Value Equity Fund – Portfolio of Investments (Continued)
| | | Number of
Shares | | Market
Value | |
American International
Group, Inc. | | | 60,200 | | | $ | 3,497,620 | | |
| Berkley (W.R.) Corp. | | | 11,900 | | | | 424,592 | | |
| Chubb Corp. | | | 1,600 | | | | 136,976 | | |
The Hartford Financial
Services Group, Inc.(b) | | | 7,600 | | | | 568,328 | | |
| Hilb, Rogal & Hobbs Co. | | | 6,900 | | | | 237,360 | | |
| Metlife, Inc. | | | 5,100 | | | | 229,194 | | |
| PartnerRe Limited | | | 7,800 | | | | 502,476 | | |
Scottish Re Group
Limited(b) | | | 4,700 | | | | 113,928 | | |
| | | | 6,343,847 | | |
| Internet Content - 0.1% | | | |
| BEA Systems, Inc.(a) | | | 13,400 | | | | 117,652 | | |
| Internet Software - 0.3% | | | |
Covad Communications
Group, Inc.(a) (b) | | | 159,000 | | | | 222,600 | | |
| Machinery & Components - 1.1% | | | |
| Baker Hughes, Inc. | | | 2,100 | | | | 107,436 | | |
Chicago Bridge &
Iron Co. NV | | | 12,600 | | | | 288,036 | | |
| FMC Technologies, Inc.(a) | | | 9,900 | | | | 316,503 | | |
| Smith International, Inc.(b) | | | 4,700 | | | | 299,390 | | |
| | | | 1,011,365 | | |
| Medical Supplies - 5.1% | | | |
Agilent Technologies,
Inc.(a) (b) | | | 23,200 | | | | 534,064 | | |
| Allergan, Inc. | | | 2,800 | | | | 238,672 | | |
| Baxter International, Inc. | | | 43,900 | | | | 1,628,690 | | |
| CONMED Corp.(a) | | | 3,200 | | | | 98,464 | | |
| Cooper Cos., Inc. | | | 3,000 | | | | 182,580 | | |
Dade Behring
Holdings, Inc.(a) | | | 1,600 | | | | 104,016 | | |
| Medtronic, Inc. | | | 16,200 | | | | 838,998 | | |
| Thermo Electron Corp.(a) | | | 5,000 | | | | 134,350 | | |
| Varian, Inc.(a) | | | 2,400 | | | | 90,696 | | |
| Waters Corp.(a) | | | 17,400 | | | | 646,758 | | |
| | | | 4,497,288 | | |
| Metals & Mining - 0.8% | | | |
| Alcoa, Inc. | | | 12,700 | | | | 331,851 | | |
Freeport-McMoRan Copper &
Gold, Inc. Cl. B | | | 2,800 | | | | 104,832 | | |
| Newmont Mining Corp. | | | 4,900 | | | | 191,247 | | |
| Precision Castparts Corp. | | | 1,400 | | | | 109,060 | | |
| | | | 736,990 | | |
| Pharmaceuticals - 4.7% | | | |
| Amgen, Inc.(a) | | | 2,600 | | | | 157,196 | | |
BioMarin
Pharmaceuticals, Inc.(a) | | | 21,800 | | | | 163,282 | | |
| Cephalon, Inc.(a) (b) | | | 5,600 | | | | 222,936 | | |
| | | Number of
Shares | | Market
Value | |
| Connetics Corp.(a) | | | 1,900 | | | $ | 33,516 | | |
| Eli Lilly & Co. | | | 3,000 | | | | 167,130 | | |
| Genentech, Inc.(a) | | | 1,900 | | | | 152,532 | | |
| McKesson Corp. | | | 3,600 | | | | 161,244 | | |
| Medimmune, Inc.(a) | | | 12,300 | | | | 328,656 | | |
| Merck & Co., Inc.(b) | | | 5,000 | | | | 154,000 | | |
| Pfizer, Inc. | | | 34,000 | | | | 937,720 | | |
| Schering-Plough Corp.(b) | | | 47,600 | | | | 907,256 | | |
| Wyeth | | | 16,500 | | | | 734,250 | | |
| | | | 4,119,718 | | |
| Photography Equipment/Supplies - 1.0% | | | |
| Eastman Kodak Co.(b) | | | 31,800 | | | | 853,830 | | |
| Prepackaged Software - 2.1% | | | |
| Electronic Arts, Inc.(a) (b) | | | 3,900 | | | | 220,779 | | |
| Microsoft Corp. | | | 38,600 | | | | 958,824 | | |
| Oracle Corp.(a) | | | 7,000 | | | | 92,400 | | |
| PalmSource, Inc.(a) (b) | | | 1,500 | | | | 12,750 | | |
| Siebel Systems, Inc. | | | 9,700 | | | | 86,330 | | |
| Symantec Corp.(a) | | | 14,300 | | | | 310,882 | | |
| Tibco Software, Inc.(a) | | | 10,100 | | | | 66,054 | | |
| TradeStation Group, Inc.(a) | | | 14,000 | | | | 120,120 | | |
| | | | 1,868,139 | | |
| Restaurants - 0.2% | | | |
| McDonald's Corp. | | | 6,000 | | | | 166,500 | | |
| Retail - 1.7% | | | |
| 99 Cents Only Stores(a) | | | 10,200 | | | | 129,642 | | |
Federated Department
Stores, Inc.(b) | | | 2,700 | | | | 197,856 | | |
| The Home Depot, Inc. | | | 3,500 | | | | 136,150 | | |
| J.C. Penney Co., Inc. | | | 3,700 | | | | 194,546 | | |
| Kohl's Corp.(a) | | | 4,200 | | | | 234,822 | | |
| Rite Aid Corp.(a) | | | 9,100 | | | | 38,038 | | |
| Walgreen Co. | | | 3,800 | | | | 174,762 | | |
| Wal-Mart Stores, Inc. | | | 8,400 | | | | 404,880 | | |
| | | | 1,510,696 | | |
| Telephone Utilities - 1.5% | | | |
| Alltel Corp.(b) | | | 2,000 | | | | 124,560 | | |
Leap Wireless
International, Inc.(a) | | | 3,700 | | | | 102,675 | | |
| Mastec, Inc.(a) | | | 15,200 | | | | 133,760 | | |
Nextel Partners,
Inc. Cl. A(a) (b) | | | 16,900 | | | | 425,373 | | |
Verizon
Communications, Inc.(b) | | | 16,600 | | | | 573,530 | | |
| | | | 1,359,898 | | |
| Tobacco - 1.4% | | | |
| Altria Group, Inc. | | | 19,700 | | | | 1,273,802 | | |
| Transportation - 1.0% | | | |
| EGL, Inc.(a) | | | 7,600 | | | | 154,432 | | |
| | | Number of
Shares | | Market
Value | |
Hornbeck Offshore
Services, Inc.(a) | | | 6,700 | | | $ | 181,503 | | |
| Norfolk Southern Corp. | | | 12,600 | | | | 390,096 | | |
| OMI Corp. | | | 6,100 | | | | 115,961 | | |
| | | | 841,992 | | |
TOTAL EQUITIES
(Cost $80,442,206) | | | | | | | 87,861,532 | | |
| | | Principal
Amount | |
| |
| SHORT-TERM INVESTMENTS - 15.9% | | | |
| Cash Equivalents - 15.2%(c) | | | |
ABN Amro Bank NV
Eurodollar Time Deposit
3.250% 08/05/2005 | | $ | 142,498 | | | | 142,498 | | |
American Beacon Money
Market Fund | | | 384,699 | | | | 384,699 | | |
Bank of America
Bank Note
3.270% 07/18/2005 | | | 197,243 | | | | 197,243 | | |
Bank of America
Bank Note
3.270% 08/30/2005 | | | 366,309 | | | | 366,309 | | |
Bank of Montreal
Eurodollar Time Deposit
3.010% 07/01/2005 | | | 542,556 | | | | 542,556 | | |
Barclays
Eurodollar Time Deposit
3.160% 07/14/2005 | | | 281,776 | | | | 281,776 | | |
Barclays
Eurodollar Time Deposit
3.250% 07/26/2005 | | | 283,905 | | | | 283,905 | | |
BGI Institutional Money
Market Fund | | | 1,105,886 | | | | 1,105,886 | | |
BNP Paribas
Eurodollar Time Deposit
3.000% 07/01/2005 | | | 197,243 | | | | 197,243 | | |
Calyon
Eurodollar Time Deposit
3.310% 07/01/2005 | | | 169,066 | | | | 169,066 | | |
Citigroup
Eurodollar Time Deposit
3.085% 07/22/2005 | | | 169,066 | | | | 169,066 | | |
Citigroup
Eurodollar Time Deposit
3.100% 07/25/2005 | | | 391,616 | | | | 391,616 | | |
Dexia Group
Eurodollar Time Deposit
3.205% 07/20/2005 | | | 140,888 | | | | 140,888 | | |
Dexia Group
Eurodollar Time Deposit
3.240% 07/21/2005 | | | 140,888 | | | | 140,888 | | |
(Continued)
The accompanying notes are an integral part of the financial statements.
92
MassMutual Select Value Equity Fund – Portfolio of Investments (Continued)
| | | Principal
Amount | | Market
Value | |
Federal Home Loan Bank
Discount Note
2.977% 07/01/2005 | | $ | 347,952 | | | $ | 347,952 | | |
First Tennessee
National Corporation
Eurodollar Time Deposit
3.220% 08/09/2005 | | | 50,778 | | | | 50,778 | | |
Fortis Bank
Eurodollar Time Deposit
3.110% 07/05/2005 | | | 196,036 | | | | 196,036 | | |
Fortis Bank
Eurodollar Time Deposit
3.250% 07/25/2005 | | | 198,889 | | | | 198,889 | | |
Fortis Bank
Eurodollar Time Deposit
3.250% 08/04/2005 | | | 281,776 | | | | 281,776 | | |
Fortis Bank
Eurodollar Time Deposit
3.270% 07/07/2005 | | | 225,421 | | | | 225,421 | | |
Freddie Mac Discount Note
3.208% 07/26/2005 | | | 138,905 | | | | 138,905 | | |
Freddie Mac Discount Note
3.244% 08/16/2005 | | | 338,131 | | | | 338,131 | | |
General Electric
Capital Corp
3.252% 07/06/2005 | | | 281,776 | | | | 281,776 | | |
General Electric
Capital Corp
3.253% 07/08/2005 | | | 225,421 | | | | 225,421 | | |
Goldman Sachs
Financial Square
Prime Obligations
Money Market Fund | | | 257,296 | | | | 257,296 | | |
Harris Trust &
Savings Bank
3.295% 11/04/2005 | | | 269,870 | | | | 269,870 | | |
HBOS Halifax Bank of
Scotland
Eurodollar Time Deposit
3.150% 08/08/2005 | | | 140,888 | | | | 140,888 | | |
HSBC Banking/
Holdings PLC
Eurodollar Time Deposit
3.250% 08/05/2005 | | | 169,066 | | | | 169,066 | | |
JP Morgan Chase & Co.
Eurodollar Time Deposit
3.200% 07/20/2005 | | | 281,776 | | | | 281,776 | | |
Merrimac Cash Fund,
Premium Class | | | 446,746 | | | | 446,746 | | |
Morgan Stanley
Dean Witter & Co.
3.518% 07/19/2005 | | | 563,552 | | | | 563,552 | | |
| | | Principal
Amount | | Market
Value | |
National Australia Bank
Eurodollar Time Deposit
3.260% 07/06/2005 | | $ | 112,710 | | | $ | 112,710 | | |
National Australia Bank
Eurodollar Time Deposit
3.375% 07/01/2005 | | | 338,131 | | | | 338,131 | | |
Nordea Bank Finland PLC
(NY Branch)
Eurodollar Time Deposit
3.165% 08/09/2005 | | | 218,802 | | | | 218,802 | | |
Nordea Bank Finland PLC
(NY Branch)
Eurodollar Time Deposit
3.240% 08/03/2005 | | | 101,439 | | | | 101,439 | | |
Rabobank Nederland
Eurodollar Time Deposit
3.170% 07/18/2005 | | | 281,776 | | | | 281,776 | | |
Rabobank Nederland
Eurodollar Time Deposit
3.350% 07/01/2005 | | | 227,990 | | | | 227,990 | | |
Royal Bank of Canada
Eurodollar Time Deposit
3.250% 07/07/2005 | | | 169,066 | | | | 169,066 | | |
Royal Bank of Canada
Eurodollar Time Deposit
3.260% 07/28/2005 | | | 281,776 | | | | 281,776 | | |
Royal Bank of Scotland
Eurodollar Time Deposit
3.240% 08/08/2005 | | | 309,954 | | | | 309,954 | | |
Royal Bank of Scotland
Eurodollar Time Deposit
3.250% 08/04/2005 | | | 225,421 | | | | 225,421 | | |
Royal Bank of Scotland
Eurodollar Time Deposit
3.270% 07/29/2005 | | | 225,421 | | | | 225,421 | | |
Societe Generale
Eurodollar Time Deposit
3.200% 08/08/2005 | | | 112,710 | | | | 112,710 | | |
Societe Generale
Eurodollar Time Deposit
3.240% 08/09/2005 | | | 186,504 | | | | 186,504 | | |
Societe Generale
Eurodollar Time Deposit
3.280% 08/01/2005 | | | 281,776 | | | | 281,776 | | |
Svenska Handlesbanken
Eurodollar Time Deposit
3.220% 08/05/2005 | | | 281,776 | | | | 281,776 | | |
The Bank of the West
Eurodollar Time Deposit
3.270% 07/27/2005 | | | 84,533 | | | | 84,533 | | |
Toronto Dominion Bank
Eurodollar Time Deposit
3.250% 08/02/2005 | | | 281,776 | | | | 281,776 | | |
| | | Principal
Amount | | Market
Value | |
UBS AG
Eurodollar Time Deposit
3.250% 08/09/2005 | | $ | 140,888 | | | $ | 140,888 | | |
Wells Fargo
Eurodollar Time Deposit
3.270% 07/21/2005 | | | 281,776 | | | | 281,776 | | |
Wells Fargo
Eurodollar Time Deposit
3.270% 08/01/2005 | | | 281,776 | | | | 281,776 | | |
| | | | 13,353,919 | | |
| Repurchase Agreement - 0.7% | | | |
Investors Bank & Trust
Company Repurchase
Agreement, dated
06/30/2005, 2.01%,
due 07/01/2005(d) | | | 624,996 | | | | 624,996 | | |
TOTAL SHORT-TERM
INVESTMENTS
(At Amortized Cost) | | | | | | | 13,978,915 | | |
TOTAL INVESTMENTS - 115.5%
(Cost $94,421,121)(e) | | | | | | | 101,840,447 | | |
Other Assets/
(Liabilities) - (15.5%) | | | | | | | (13,669,502 | ) | |
| NET ASSETS - 100.0% | | | | | | $ | 88,170,945 | | |
Notes to Portfolio of Investments
ADR - American Depository Receipt.
REIT - Real Estate Investment Trust
(a) Non-income producing security.
(b) Denotes all or a portion of security on loan.
(c) Represents investments of security lending collateral. (Note 2).
(d) Maturity value of $625,031. Collateralized by U.S. Government Agency obligation with a rate of 4.830%, maturity date of 07/01/2035, and an aggregate market value, including accrued interest, of $656,246.
(e) See Note 6 for aggregate cost for Federal tax purposes.
The accompanying notes are an integral part of the financial statements.
93
MassMutual Select Large Cap Value Fund – Portfolio of Investments
June 30, 2005 (Unaudited)
| | | Number of
Shares | | Market
Value | |
| EQUITIES - 96.7% | | | |
| Advertising - 0.3% | | | |
WPP Group PLC Sponsored
ADR (United Kingdom) | | | 72,900 | | | $ | 3,721,545 | | |
| Automotive & Parts - 0.7% | | | |
| Harley-Davidson, Inc. | | | 194,900 | | | | 9,667,040 | | |
| Banking, Savings & Loans - 18.3% | | | |
| Citigroup, Inc. | | | 775,300 | | | | 35,842,119 | | |
| Fifth Third Bancorp | | | 303,300 | | | | 12,498,993 | | |
Golden West
Financial Corp.(a) | | | 673,700 | | | | 43,372,806 | | |
| HSBC Holdings PLC | | | 2,483,909 | | | | 39,663,884 | | |
| JP Morgan Chase & Co. | | | 1,480,288 | | | | 52,283,772 | | |
Lloyds TSB Group PLC
Sponsored ADR
(United Kingdom)(a) | | | 260,800 | | | | 8,880,240 | | |
Providian
Financial Corp.(b) | | | 253,400 | | | | 4,467,442 | | |
| State Street Corp. | | | 55,500 | | | | 2,677,875 | | |
| Wells Fargo & Co. | | | 604,300 | | | | 37,212,794 | | |
| | | | 236,899,925 | | |
| Beverages - 2.0% | | | |
Diageo PLC Sponsored ADR
(United Kingdom)(a) | | | 292,200 | | | | 17,327,460 | | |
| Heineken Holding NV Cl. A | | | 327,550 | | | | 9,161,574 | | |
| | | | 26,489,034 | | |
| Broadcasting, Publishing & Printing - 5.2% | | | |
Comcast Corp.
Special, Class A(b) | | | 1,462,400 | | | | 43,798,880 | | |
| Gannett Co., Inc. | | | 81,600 | | | | 5,804,208 | | |
| IAC/InterActiveCorp(a) (b) | | | 237,900 | | | | 5,721,495 | | |
| Lagardere S.C.A. SA(a) | | | 170,000 | | | | 12,491,021 | | |
| | | | 67,815,604 | | |
| Building Materials & Construction - 1.6% | | | |
Martin Marietta
Materials, Inc. | | | 152,200 | | | | 10,520,064 | | |
| Vulcan Materials Co.(a) | | | 156,700 | | | | 10,183,933 | | |
| | | | 20,703,997 | | |
| Commercial Services - 5.5% | | | |
| Block (H&R), Inc.(a) | | | 429,500 | | | | 25,061,325 | | |
| Cosco Pacific, Limited | | | 1,910,000 | | | | 3,698,059 | | |
| Dun & Bradstreet Corp.(b) | | | 143,050 | | | | 8,819,033 | | |
| Iron Mountain, Inc.(a) (b) | | | 579,600 | | | | 17,979,192 | | |
| Moody's Corp.(a) | | | 354,400 | | | | 15,933,824 | | |
| | | | 71,491,433 | | |
| | | Number of
Shares | | Market
Value | |
| Communications - 0.7% | |
Nokia Oyj Sponsored
ADR (Finland) | | | 219,200 | | | $ | 3,647,488 | | |
| NTL, Inc.(a) (b) | | | 11,600 | | | | 793,672 | | |
SK Telecom Co. Limited
ADR (South Korea)(a) | | | 248,800 | | | | 5,075,520 | | |
| | | | 9,516,680 | | |
| Computers & Information - 1.2% | | | |
Lexmark
International, Inc.(b) | | | 234,300 | | | | 15,189,669 | | |
| Computers & Office Equipment - 0.6% | |
| Hewlett-Packard Co. | | | 306,300 | | | | 7,201,113 | | |
| Containers - 2.5% | |
| Sealed Air Corp.(b) | | | 647,900 | | | | 32,258,941 | | |
| Cosmetics & Personal Care - 0.2% | |
| Avon Products, Inc. | | | 86,700 | | | | 3,281,595 | | |
| Diversified Financial - 0.6% | |
| Takefuji Corp. | | | 119,200 | | | | 8,067,365 | | |
| Energy - 10.4% | |
| ConocoPhillips | | | 599,892 | | | | 34,487,791 | | |
| Devon Energy Corp. | | | 575,000 | | | | 29,141,000 | | |
| EOG Resources, Inc.(a) | | | 504,600 | | | | 28,661,280 | | |
| Occidental Petroleum Corp. | | | 407,800 | | | | 31,372,054 | | |
| Transocean, Inc.(b) | | | 199,700 | | | | 10,777,809 | | |
| | | | 134,439,934 | | |
| Financial Services - 12.3% | | | |
| American Express Co. | | | 1,438,500 | | | | 76,571,355 | | |
Berkshire Hathaway,
Inc. Cl. A(b) | | | 599 | | | | 50,016,500 | | |
Centerpoint
Properties Corp.(a) | | | 472,098 | | | | 19,969,745 | | |
| Morgan Stanley | | | 173,900 | | | | 9,124,533 | | |
| Telewest Global, Inc.(b) | | | 145,500 | | | | 3,314,490 | | |
| | | | 158,996,623 | | |
| Foods - 1.0% | | | |
| The Hershey Co.(a) | | | 207,600 | | | | 12,891,960 | | |
| Healthcare - 1.7% | |
| Caremark Rx, Inc.(b) | | | 26,600 | | | | 1,184,232 | | |
| HCA, Inc.(a) | | | 379,100 | | | | 21,483,597 | | |
| | | | 22,667,829 | | |
| Household Products - 0.2% | | | |
| Hunter Douglas NV(a) | | | 40,400 | | | | 2,005,794 | | |
| Industrial – Diversified - 4.3% | |
| Tyco International Limited | | | 1,898,324 | | | | 55,431,061 | | |
| | | Number of
Shares | | Market
Value | |
| Insurance - 13.6% | |
American International
Group, Inc. | | | 1,120,500 | | | $ | 65,101,050 | | |
| Aon Corp.(a) | | | 352,300 | | | | 8,821,592 | | |
| Chubb Corp. | | | 49,100 | | | | 4,203,451 | | |
| Loews Corp. | | | 304,600 | | | | 23,606,500 | | |
| Markel Corp.(b) | | | 3,500 | | | | 1,186,500 | | |
Marsh & McLennan
Companies, Inc. | | | 377,000 | | | | 10,442,900 | | |
Principal Financial
Group, Inc. | | | 108,600 | | | | 4,550,340 | | |
| Progressive Corp. | | | 419,500 | | | | 41,450,795 | | |
| Sun Life Financial, Inc.(a) | | | 66,900 | | | | 2,254,530 | | |
| Transatlantic Holdings, Inc. | | | 255,462 | | | | 14,259,889 | | |
| | | | 175,877,547 | | |
| Pharmaceuticals - 2.3% | | | |
| Cardinal Health, Inc. | | | 263,000 | | | | 15,143,540 | | |
| Eli Lilly & Co. | | | 193,000 | | | | 10,752,030 | | |
| Novartis AG | | | 85,000 | | | | 4,025,304 | | |
| | | | 29,920,874 | | |
| Prepackaged Software - 0.9% | | | |
| Microsoft Corp. | | | 453,900 | | | | 11,274,876 | | |
| Retail - 4.6% | |
| AutoZone, Inc.(b) | | | 115,100 | | | | 10,642,146 | | |
Costco
Wholesale Corp.(a) | | | 944,600 | | | | 42,336,972 | | |
| Wal-Mart Stores, Inc. | | | 135,000 | | | | 6,507,000 | | |
| | | | 59,486,118 | | |
| Tobacco - 5.0% | | | |
| Altria Group, Inc. | | | 1,009,200 | | | | 65,254,872 | | |
| Transportation - 1.0% | |
China Merchants Holdings
International Co., Ltd. | | | 2,250,000 | | | | 4,363,206 | | |
Kuehne & Nagel
International AG | | | 3,000 | | | | 633,345 | | |
United Parcel Service,
Inc. Cl. B | | | 123,800 | | | | 8,562,008 | | |
| | | | 13,558,559 | | |
TOTAL EQUITIES
(Cost $1,035,734,440) | | | | | | | 1,254,109,988 | | |
(Continued)
The accompanying notes are an integral part of the financial statements.
94
MassMutual Select Large Cap Value Fund – Portfolio of Investments (Continued)
| | | Principal
Amount | | Market
Value | |
| SHORT-TERM INVESTMENTS - 18.3% | |
| Cash Equivalents - 14.9%(c) | |
ABN Amro Bank NV
Eurodollar Time Deposit
3.250% 08/05/2005 | | $ | 2,065,776 | | | $ | 2,065,776 | | |
American Beacon Money
Market Fund | | | 5,576,746 | | | | 5,576,746 | | |
Bank of America
Bank Note
3.270% 07/18/2005 | | | 2,859,317 | | | | 2,859,317 | | |
Bank of America
Bank Note
3.270% 08/30/2005 | | | 5,310,160 | | | | 5,310,160 | | |
Bank of Montreal
Eurodollar Time Deposit
3.010% 07/01/2005 | | | 7,865,104 | | | | 7,865,104 | | |
Barclays
Eurodollar Time Deposit
3.160% 07/14/2005 | | | 4,084,738 | | | | 4,084,738 | | |
Barclays
Eurodollar Time Deposit
3.250% 07/26/2005 | | | 4,115,595 | | | | 4,115,595 | | |
BGI Institutional Money
Market Fund | | | 16,031,374 | | | | 16,031,374 | | |
BNP Paribas
Eurodollar Time Deposit
3.000% 07/01/2005 | | | 2,859,317 | | | | 2,859,317 | | |
Calyon
Eurodollar Time Deposit
3.310% 07/01/2005 | | | 2,450,843 | | | | 2,450,843 | | |
Citigroup
Eurodollar Time Deposit
3.085% 07/22/2005 | | | 2,450,843 | | | | 2,450,843 | | |
Citigroup
Eurodollar Time Deposit
3.100% 07/25/2005 | | | 5,677,020 | | | | 5,677,020 | | |
Dexia Group
Eurodollar Time Deposit
3.205% 07/20/2005 | | | 2,042,369 | | | | 2,042,369 | | |
Dexia Group
Eurodollar Time Deposit
3.240% 07/21/2005 | | | 2,042,369 | | | | 2,042,369 | | |
Federal Home Loan Bank
Discount Note
2.977% 07/01/2005 | | | 5,044,058 | | | | 5,044,058 | | |
First Tennessee
National Corporation
Eurodollar Time Deposit
3.220% 08/09/2005 | | | 736,102 | | | | 736,102 | | |
Fortis Bank
Eurodollar Time Deposit
3.110% 07/05/2005 | | | 2,841,818 | | | | 2,841,818 | | |
| | | Principal
Amount | | Market
Value | |
Fortis Bank
Eurodollar Time Deposit
3.250% 07/25/2005 | | $ | 2,883,169 | | | $ | 2,883,169 | | |
Fortis Bank
Eurodollar Time Deposit
3.250% 08/04/2005 | | | 4,084,738 | | | | 4,084,738 | | |
Fortis Bank
Eurodollar Time Deposit
3.270% 07/07/2005 | | | 3,267,790 | | | | 3,267,790 | | |
Freddie Mac
Discount Note
3.208% 07/26/2005 | | | 2,013,622 | | | | 2,013,622 | | |
Freddie Mac
Discount Note
3.244% 08/16/2005 | | | 4,901,686 | | | | 4,901,686 | | |
General Electric
Capital Corp
3.252% 07/06/2005 | | | 4,084,738 | | | | 4,084,738 | | |
General Electric
Capital Corp
3.253% 07/08/2005 | | | 3,267,790 | | | | 3,267,790 | | |
Goldman Sachs
Financial Square
Prime Obligations
Money Market Fund | | | 3,729,868 | | | | 3,729,868 | | |
Harris Trust &
Savings Bank
3.295% 11/04/2005 | | | 3,912,139 | | | | 3,912,139 | | |
HBOS Halifax
Bank of Scotland
Eurodollar Time Deposit
3.150% 08/08/2005 | | | 2,042,369 | | | | 2,042,369 | | |
HSBC Banking/
Holdings PLC
Eurodollar Time Deposit
3.250% 08/05/2005 | | | 2,450,843 | | | | 2,450,843 | | |
JP Morgan Chase & Co.
Eurodollar Time Deposit
3.200% 07/20/2005 | | | 4,084,738 | | | | 4,084,738 | | |
Merrimac Cash Fund,
Premium Class | | | 6,476,213 | | | | 6,476,213 | | |
Morgan Stanley
Dean Witter & Co.
3.518% 07/19/2005 | | | 8,169,476 | | | | 8,169,476 | | |
National Australia Bank
Eurodollar Time Deposit
3.260% 07/06/2005 | | | 1,633,895 | | | | 1,633,895 | | |
National Australia Bank
Eurodollar Time Deposit
3.375% 07/01/2005 | | | 4,901,686 | | | | 4,901,686 | | |
Nordea Bank Finland PLC
(NY Branch)
Eurodollar Time Deposit
3.165% 08/09/2005 | | | 3,171,841 | | | | 3,171,841 | | |
| | | Principal
Amount | | Market
Value | |
Nordea Bank Finland PLC
(NY Branch)
Eurodollar Time Deposit
3.240% 08/03/2005 | | $ | 1,470,506 | | | $ | 1,470,506 | | |
Rabobank Nederland
Eurodollar Time Deposit
3.170% 07/18/2005 | | | 4,084,738 | | | | 4,084,738 | | |
Rabobank Nederland
Eurodollar Time Deposit
3.350% 07/01/2005 | | | 3,305,031 | | | | 3,305,031 | | |
Royal Bank of Canada
Eurodollar Time Deposit
3.250% 07/07/2005 | | | 2,450,843 | | | | 2,450,843 | | |
Royal Bank of Canada
Eurodollar Time Deposit
3.260% 07/28/2005 | | | 4,084,738 | | | | 4,084,738 | | |
Royal Bank of Scotland
Eurodollar Time Deposit
3.240% 08/08/2005 | | | 4,493,212 | | | | 4,493,212 | | |
Royal Bank of Scotland
Eurodollar Time Deposit
3.250% 08/04/2005 | | | 3,267,790 | | | | 3,267,790 | | |
Royal Bank of Scotland
Eurodollar Time Deposit
3.270% 07/29/2005 | | | 3,267,790 | | | | 3,267,790 | | |
Societe Generale
Eurodollar Time Deposit
3.200% 08/08/2005 | | | 1,633,895 | | | | 1,633,895 | | |
Societe Generale
Eurodollar Time Deposit
3.240% 08/09/2005 | | | 2,703,637 | | | | 2,703,637 | | |
Societe Generale
Eurodollar Time Deposit
3.280% 08/01/2005 | | | 4,084,738 | | | | 4,084,738 | | |
Svenska Handlesbanken
Eurodollar Time Deposit
3.220% 08/05/2005 | | | 4,084,738 | | | | 4,084,738 | | |
The Bank of the West
Eurodollar Time Deposit
3.270% 07/27/2005 | | | 1,225,421 | | | | 1,225,421 | | |
Toronto Dominion Bank
Eurodollar Time Deposit
3.250% 08/02/2005 | | | 4,084,738 | | | | 4,084,738 | | |
UBS AG
Eurodollar Time Deposit
3.250% 08/09/2005 | | | 2,042,369 | | | | 2,042,369 | | |
Wells Fargo
Eurodollar Time Deposit
3.270% 07/21/2005 | | | 4,084,738 | | | | 4,084,738 | | |
Wells Fargo
Eurodollar Time Deposit
3.270% 08/01/2005 | | | 4,084,738 | | | | 4,084,738 | | |
| | | | 193,583,810 | | |
(Continued)
The accompanying notes are an integral part of the financial statements.
95
MassMutual Select Large Cap Value Fund – Portfolio of Investments (Continued)
| | | Principal
Amount | | Market
Value | |
| Repurchase Agreement - 3.4% | | | |
Investors Bank & Trust
Company Repurchase
Agreement, dated
06/30/2005, 2.01%,
due 07/01/2005(d) | | $ | 43,245,664 | | | $ | 43,245,664 | | |
TOTAL SHORT-TERM
INVESTMENTS
(At Amortized Cost) | | | | | 236,829,474 | | |
TOTAL INVESTMENTS - 115.0%
(Cost $1,272,563,914)(e) | | | | | 1,490,939,462 | | |
Other Assets/
(Liabilities) - (15.0%) | | | | | (194,130,632 | ) | |
| NET ASSETS - 100.0% | | | | $ | 1,296,808,830 | | |
Notes to Portfolio of Investments
ADR - American Depository Receipt.
(a) Denotes all or a portion of security on loan.
(b) Non-income producing security.
(c) Represents investments of security lending collateral. (Note 2).
(d) Maturity value of $43,248,079. Collateralized by U.S. Government Agency obligations with rates of 3.770% - 5.875%, maturity dates of 10/25/2022 - 08/25/2033, and an aggregate market value, including accrued interest, of $45,407,947.
(e) See Note 6 for aggregate cost for Federal tax purposes.
The remainder of this page is intentionally left blank.
The accompanying notes are an integral part of the financial statements.
96
MassMutual Select Indexed Equity Fund – Portfolio of Investments
June 30, 2005 (Unaudited)
| | | Number of
Shares | | Market
Value | |
| EQUITIES - 98.5% | | | |
| Advertising - 0.2% | | | |
Interpublic Group of
Companies, Inc.(a) | | | 69,133 | | | $ | 842,039 | | |
| Monster Worldwide, Inc.(a) | | | 19,318 | | | | 554,040 | | |
| Omnicom Group, Inc. | | | 30,014 | | | | 2,396,918 | | |
| | | | 3,792,997 | | |
| Aerospace & Defense - 2.2% | | | |
| Boeing Co. | | | 139,640 | | | | 9,216,240 | | |
| General Dynamics Corp. | | | 33,854 | | | | 3,708,367 | | |
| Goodrich Corp. | | | 21,290 | | | | 872,038 | | |
Honeywell
International, Inc. | | | 141,110 | | | | 5,168,859 | | |
| Lockheed Martin Corp. | | | 67,107 | | | | 4,353,231 | | |
| Northrop Grumman Corp. | | | 58,078 | | | | 3,208,809 | | |
| Raytheon Co. | | | 73,100 | | | | 2,859,672 | | |
| Rockwell Collins, Inc. | | | 28,032 | | | | 1,336,566 | | |
| United Technologies Corp. | | | 170,662 | | | | 8,763,494 | | |
| | | | 39,487,276 | | |
| Air Transportation - 0.1% | | | |
| Delta Air Lines, Inc.(a) (b) | | | 19,716 | | | | 74,132 | | |
| Southwest Airlines Co. | | | 126,965 | | | | 1,768,622 | | |
| | | | 1,842,754 | | |
| Apparel, Textiles & Shoes - 0.7% | | | |
| Coach, Inc.(a) | | | 59,800 | | | | 2,007,486 | | |
| The Gap, Inc. | | | 133,203 | | | | 2,630,759 | | |
| Jones Apparel Group, Inc. | | | 18,189 | | | | 564,587 | | |
| Limited Brands | | | 62,959 | | | | 1,348,582 | | |
| Liz Claiborne, Inc. | | | 17,292 | | | | 687,530 | | |
| Nike, Inc. Cl. B | | | 38,983 | | | | 3,375,928 | | |
| Nordstrom, Inc. | | | 22,038 | | | | 1,497,923 | | |
Reebok International
Limited | | | 9,900 | | | | 414,117 | | |
| VF Corp. | | | 18,002 | | | | 1,030,074 | | |
| | | | 13,556,986 | | |
| Automotive & Parts - 0.8% | | | |
| AutoNation, Inc.(a) | | | 36,400 | | | | 746,928 | | |
Cooper Tire &
Rubber Co.(b) | | | 12,730 | | | | 236,396 | | |
| Dana Corp. | | | 29,069 | | | | 436,326 | | |
| Delphi Corp. | | | 100,694 | | | | 468,227 | | |
| Ford Motor Co. | | | 295,814 | | | | 3,029,135 | | |
| General Motors Corp.(b) | | | 91,045 | | | | 3,095,530 | | |
| Genuine Parts Co. | | | 26,112 | | | | 1,072,942 | | |
The Goodyear Tire &
Rubber Co.(a) (b) | | | 28,776 | | | | 428,762 | | |
| Harley-Davidson, Inc. | | | 48,236 | | | | 2,392,506 | | |
| | | Number of
Shares | | Market
Value | |
Navistar
International Corp.(a) | | | 10,309 | | | $ | 329,888 | | |
| Paccar, Inc. | | | 28,804 | | | | 1,958,672 | | |
| Visteon Corp.(b) | | | 23,653 | | | | 142,628 | | |
| | | | 14,337,940 | | |
| Banking, Savings & Loans - 11.3% | | | |
| AmSouth Bancorporation | | | 52,694 | | | | 1,370,044 | | |
| Bank of America Corp. | | | 669,414 | | | | 30,531,973 | | |
| Bank of New York Co., Inc. | | | 131,403 | | | | 3,781,778 | | |
| BB&T Corp. | | | 90,416 | | | | 3,613,928 | | |
Capital One
Financial Corp.(b) | | | 41,046 | | | | 3,284,090 | | |
| Citigroup, Inc. | | | 863,741 | | | | 39,930,746 | | |
| Comerica, Inc. | | | 30,576 | | | | 1,767,293 | | |
| Compass Bancshares, Inc. | | | 23,000 | | | | 1,035,000 | | |
| Fannie Mae | | | 161,079 | | | | 9,407,014 | | |
| Fifth Third Bancorp | | | 87,688 | | | | 3,613,622 | | |
First Horizon
National Corp. | | | 23,000 | | | | 970,600 | | |
| Freddie Mac | | | 115,428 | | | | 7,529,368 | | |
Golden West
Financial Corp. | | | 47,458 | | | | 3,055,346 | | |
| JP Morgan Chase & Co. | | | 587,348 | | | | 20,745,131 | | |
| KeyCorp | | | 65,068 | | | | 2,157,004 | | |
| M&T Bank Corp.(b) | | | 16,700 | | | | 1,756,172 | | |
| Marshall and Ilsley Corp. | | | 30,900 | | | | 1,373,505 | | |
| Mellon Financial Corp. | | | 68,468 | | | | 1,964,347 | | |
| National City Corp. | | | 99,571 | | | | 3,397,363 | | |
North Fork
Bancorporation, Inc. | | | 81,900 | | | | 2,300,571 | | |
| Northern Trust Corp. | | | 30,893 | | | | 1,408,412 | | |
Providian
Financial Corp.(a) | | | 50,804 | | | | 895,675 | | |
| Regions Financial Corp. | | | 72,242 | | | | 2,447,559 | | |
| SLM Corp. | | | 70,431 | | | | 3,577,895 | | |
| Sovereign Bancorp, Inc. | | | 54,690 | | | | 1,221,775 | | |
| State Street Corp. | | | 51,868 | | | | 2,502,631 | | |
| SunTrust Banks, Inc. | | | 58,034 | | | | 4,192,376 | | |
| Synovus Financial Corp. | | | 45,599 | | | | 1,307,323 | | |
| U.S. Bancorp | | | 311,734 | | | | 9,102,633 | | |
| Wachovia Corp. | | | 265,415 | | | | 13,164,584 | | |
| Washington Mutual, Inc.(b) | | | 144,652 | | | | 5,885,890 | | |
| Wells Fargo & Co. | | | 279,137 | | | | 17,189,256 | | |
| Zions Bancorp | | | 15,500 | | | | 1,139,715 | | |
| | | | 207,620,619 | | |
| Beverages - 2.2% | | | |
Anheuser-Busch
Companies, Inc. | | | 128,796 | | | | 5,892,417 | | |
| Brown-Forman Corp. Cl. B | | | 14,942 | | | | 903,393 | | |
| | | Number of
Shares | | Market
Value | |
| The Coca-Cola Co. | | | 374,072 | | | $ | 15,617,506 | | |
| Coca-Cola Enterprises, Inc. | | | 60,743 | | | | 1,336,953 | | |
Molson Coors Brewing
Co., Class B | | | 12,065 | | | | 748,030 | | |
The Pepsi Bottling
Group, Inc. | | | 35,382 | | | | 1,012,279 | | |
| PepsiCo, Inc. | | | 280,566 | | | | 15,130,924 | | |
| | | | 40,641,502 | | |
| Broadcasting, Publishing & Printing - 2.5% | | | |
Clear Channel
Communications, Inc. | | | 87,321 | | | | 2,700,839 | | |
| Comcast Corp. Cl. A(a) | | | 368,896 | | | | 11,325,107 | | |
| Dow Jones & Co., Inc.(b) | | | 14,157 | | | | 501,866 | | |
| Gannett Co., Inc. | | | 40,471 | | | | 2,878,702 | | |
| Knight Ridder, Inc. | | | 13,537 | | | | 830,360 | | |
The McGraw-Hill
Companies, Inc. | | | 65,488 | | | | 2,897,844 | | |
| Meredith Corp. | | | 5,689 | | | | 279,102 | | |
New York Times
Co. Cl. A(b) | | | 20,800 | | | | 647,920 | | |
| Time Warner, Inc.(a) | | | 759,394 | | | | 12,689,474 | | |
| Tribune Co.(b) | | | 49,395 | �� | | | 1,737,716 | | |
Univision Communications,
Inc. Cl. A(a) | | | 47,100 | | | | 1,297,605 | | |
| Viacom, Inc., Class B | | | 264,318 | | | | 8,463,462 | | |
| | | | 46,249,997 | | |
| Building Materials & Construction - 0.2% | | | |
| Louisiana-Pacific Corp.(b) | | | 18,184 | | | | 446,963 | | |
| Masco Corp.(b) | | | 75,792 | | | | 2,407,154 | | |
| Vulcan Materials Co.(b) | | | 14,378 | | | | 934,426 | | |
| | | | 3,788,543 | | |
| Chemicals - 1.5% | | | |
Air Products &
Chemicals, Inc. | | | 38,505 | | | | 2,321,851 | | |
| Ashland, Inc. | | | 11,025 | | | | 792,367 | | |
| Dow Chemical Co. | | | 158,220 | | | | 7,045,537 | | |
Du Pont (E.I.) de
Nemours & Co. | | | 163,650 | | | | 7,038,587 | | |
| Eastman Chemical Co. | | | 14,135 | | | | 779,545 | | |
| Engelhard Corp. | | | 15,025 | | | | 428,964 | | |
| Great Lakes Chemical Corp. | | | 10,196 | | | | 320,868 | | |
| Hercules, Inc.(a) | | | 12,889 | | | | 182,379 | | |
International Flavors &
Fragrances, Inc. | | | 14,182 | | | | 513,672 | | |
| Monsanto Co. | | | 44,624 | | | | 2,805,511 | | |
| PPG Industries, Inc. | | | 26,908 | | | | 1,688,746 | | |
| Praxair, Inc. | | | 51,656 | | | | 2,407,170 | | |
| Rohm & Haas Co. | | | 33,284 | | | | 1,542,381 | | |
| | | | 27,867,578 | | |
(Continued)
The accompanying notes are an integral part of the financial statements.
97
MassMutual Select Indexed Equity Fund – Portfolio of Investments (Continued)
| | | Number of
Shares | | Market
Value | |
| Commercial Services - 1.6% | |
Allied Waste
Industries, Inc.(a) (b) | | | 42,934 | | | $ | 340,467 | | |
| Apollo Group, Inc. Cl. A(a) | | | 28,200 | | | | 2,205,804 | | |
| Block (H&R), Inc.(b) | | | 26,648 | | | | 1,554,911 | | |
| Cendant Corp. | | | 177,144 | | | | 3,962,711 | | |
| Cintas Corp.(b) | | | 23,900 | | | | 922,540 | | |
| Convergys Corp.(a) | | | 20,871 | | | | 296,786 | | |
| Donnelley (R.R.) & Sons Co. | | | 32,615 | | | | 1,125,544 | | |
| eBay, Inc.(a) | | | 199,200 | | | | 6,575,592 | | |
| Ecolab, Inc.(b) | | | 36,158 | | | | 1,170,073 | | |
| Equifax, Inc.(b) | | | 23,249 | | | | 830,222 | | |
| Fluor Corp.(b) | | | 13,735 | | | | 790,999 | | |
| Moody's Corp. | | | 44,172 | | | | 1,985,973 | | |
| Paychex, Inc. | | | 62,106 | | | | 2,020,929 | | |
| PerkinElmer, Inc. | | | 16,174 | | | | 305,689 | | |
| Quest Diagnostics, Inc.(b) | | | 29,370 | | | | 1,564,540 | | |
Robert Half
International, Inc.(b) | | | 27,900 | | | | 696,663 | | |
| Ryder System, Inc. | | | 10,705 | | | | 391,803 | | |
| Waste Management, Inc. | | | 96,397 | | | | 2,731,891 | | |
| | | | 29,473,137 | | |
| Communications - 2.0% | | | |
ADC
Telecommunications, Inc.(a) | | | 21,270 | | | | 463,048 | | |
| Andrew Corp.(a) (b) | | | 23,442 | | | | 299,120 | | |
| Avaya, Inc.(a) | | | 74,675 | | | | 621,296 | | |
| Ciena Corp.(a) | | | 93,100 | | | | 194,579 | | |
Citizens
Communications Co.(b) | | | 54,100 | | | | 727,104 | | |
L-3 Communications
Holdings, Inc. | | | 16,700 | | | | 1,278,886 | | |
Lucent
Technologies, Inc.(a) (b) | | | 711,352 | | | | 2,070,034 | | |
Network
Appliance, Inc.(a) (b) | | | 60,138 | | | | 1,700,101 | | |
Nextel Communications,
Inc. Cl. A(a) (b) | | | 189,039 | | | | 6,107,850 | | |
| Qualcomm, Inc. | | | 274,818 | | | | 9,071,742 | | |
| SBC Communications, Inc. | | | 543,509 | | | | 12,908,339 | | |
| Scientific-Atlanta, Inc. | | | 26,681 | | | | 887,677 | | |
| Tellabs, Inc.(a) | | | 81,423 | | | | 708,380 | | |
| | | | 37,038,156 | | |
| Communications Equipment - 0.4% | | | |
| Motorola, Inc. | | | 403,802 | | | | 7,373,425 | | |
| Computer Integrated Systems Design - 0.3% | |
| Autodesk, Inc. | | | 39,012 | | | | 1,340,842 | | |
| Computer Sciences Corp.(a) | | | 31,696 | | | | 1,385,115 | | |
Parametric
Technology Corp.(a) | | | 43,688 | | | | 278,729 | | |
| Sun Microsystems, Inc.(a) | | | 563,004 | | | | 2,100,005 | | |
| Teradyne, Inc.(a) (b) | | | 32,606 | | | | 390,294 | | |
| | | Number of
Shares | | Market
Value | |
| Unisys Corp.(a) | | | 43,051 | | | $ | 272,513 | | |
| | | | 5,767,498 | | |
| Computer Programming Services - 0.0% | | | |
Mercury
Interactive Corp.(a) | | | 14,740 | | | | 565,426 | | |
| Computers & Information - 4.0% | | | |
| Apple Computer, Inc.(a) | | | 133,450 | | | | 4,912,294 | | |
| Cisco Systems, Inc.(a) | | | 1,075,387 | | | | 20,550,646 | | |
Comverse
Technology, Inc.(a) | | | 33,129 | | | | 783,501 | | |
| Dell, Inc.(a) | | | 409,548 | | | | 16,181,241 | | |
| EMC Corp.(a) | | | 402,833 | | | | 5,522,840 | | |
| Gateway, Inc.(a) | | | 48,768 | | | | 160,934 | | |
International Business
Machines Corp. | | | 269,702 | | | | 20,011,888 | | |
International
Game Technology | | | 58,156 | | | | 1,637,091 | | |
| Jabil Circuit, Inc.(a) | | | 29,600 | | | | 909,608 | | |
Lexmark
International, Inc.(a) | | | 21,128 | | | | 1,369,728 | | |
| Solectron Corp.(a) | | | 151,153 | | | | 572,870 | | |
| Symbol Technologies, Inc. | | | 40,400 | | | | 398,748 | | |
| | | | 73,011,389 | | |
| Computers & Office Equipment - 0.9% | | | |
Electronic Data
Systems Corp.(b) | | | 86,523 | | | | 1,665,568 | | |
| Hewlett-Packard Co. | | | 483,352 | | | | 11,363,606 | | |
| Pitney Bowes, Inc. | | | 34,255 | | | | 1,491,805 | | |
| Xerox Corp.(a) | | | 158,177 | | | | 2,181,261 | | |
| | | | 16,702,240 | | |
| Containers - 0.2% | | | |
| Ball Corp. | | | 17,608 | | | | 633,184 | | |
| Bemis Co., Inc. | | | 12,988 | | | | 344,702 | | |
| Pactiv Corp.(a) | | | 19,198 | | | | 414,293 | | |
| Sealed Air Corp.(a) | | | 13,948 | | | | 694,471 | | |
| Temple-Inland, Inc. | | | 20,186 | | | | 749,910 | | |
| | | | 2,836,560 | | |
| Cosmetics & Personal Care - 2.4% | | | |
| Alberto-Culver Co. | | | 12,847 | | | | 556,661 | | |
| Avon Products, Inc. | | | 78,538 | | | | 2,972,663 | | |
| Colgate-Palmolive Co. | | | 89,119 | | | | 4,447,929 | | |
| The Gillette Co. | | | 166,344 | | | | 8,421,997 | | |
| Kimberly-Clark Corp. | | | 81,881 | | | | 5,124,932 | | |
| The Procter & Gamble Co. | | | 415,998 | | | | 21,943,894 | | |
| | | | 43,468,076 | | |
| Data Processing & Preparation - 0.8% | | | |
Affiliated Computer
Services, Inc. Cl. A(a) | | | 19,100 | | | | 976,010 | | |
Automatic Data
Processing, Inc. | | | 96,708 | | | | 4,058,835 | | |
| | | Number of
Shares | | Market
Value | |
| First Data Corp. | | | 134,151 | | | $ | 5,384,821 | | |
| Fiserv, Inc.(a) | | | 34,001 | | | | 1,460,343 | | |
| IMS Health, Inc. | | | 33,625 | | | | 832,891 | | |
| NCR Corp.(a) | | | 28,936 | | | | 1,016,232 | | |
| | | | 13,729,132 | | |
| Electric Utilities - 3.1% | | | |
| AES Corp.(a) | | | 108,153 | | | | 1,771,546 | | |
| Allegheny Energy, Inc.(a) | | | 22,300 | | | | 562,406 | | |
| Ameren Corp. | | | 28,842 | | | | 1,594,963 | | |
| American Electric Power Co. | | | 66,108 | | | | 2,437,402 | | |
| Calpine Corp.(a) (b) | | | 73,879 | | | | 251,189 | | |
| CenterPoint Energy, Inc.(b) | | | 56,522 | | | | 746,656 | | |
| Cinergy Corp. | | | 34,981 | | | | 1,567,848 | | |
| CMS Energy Corp.(a) (b) | | | 35,854 | | | | 539,961 | | |
| Consolidated Edison, Inc.(b) | | | 42,274 | | | | 1,980,114 | | |
Constellation Energy
Group, Inc. | | | 26,664 | | | | 1,538,246 | | |
| Dominion Resources, Inc.(b) | | | 57,220 | | | | 4,199,376 | | |
| DTE Energy Co.(b) | | | 28,452 | | | | 1,330,700 | | |
| Duke Energy Corp.(b) | | | 157,898 | | | | 4,694,308 | | |
| Edison International | | | 54,887 | | | | 2,225,668 | | |
| Entergy Corp. | | | 37,206 | | | | 2,810,913 | | |
| Exelon Corp. | | | 111,648 | | | | 5,730,892 | | |
| FirstEnergy Corp. | | | 56,487 | | | | 2,717,590 | | |
| FPL Group, Inc. | | | 65,030 | | | | 2,735,162 | | |
| NiSource, Inc. | | | 37,485 | | | | 927,004 | | |
| PG&E Corp.(b) | | | 61,781 | | | | 2,319,259 | | |
| Pinnacle West Capital Corp. | | | 11,750 | | | | 522,287 | | |
| PPL Corp. | | | 29,455 | | | | 1,749,038 | | |
| Progress Energy, Inc. | | | 39,821 | | | | 1,801,502 | | |
Public Service Enterprise
Group, Inc. | | | 39,282 | | | | 2,389,131 | | |
| Southern Co. | | | 124,846 | | | | 4,328,411 | | |
| Teco Energy, Inc.(b) | | | 28,200 | | | | 533,262 | | |
| TXU Corp. | | | 38,366 | | | | 3,187,831 | | |
| | | | 57,192,665 | | |
| Electrical Equipment & Electronics - 6.8% | | | |
Advanced Micro
Devices, Inc.(a) | | | 62,742 | | | | 1,087,946 | | |
| Altera Corp.(a) (b) | | | 64,804 | | | | 1,284,415 | | |
American Power
Conversion Corp. | | | 28,942 | | | | 682,742 | | |
| Analog Devices, Inc.(b) | | | 57,425 | | | | 2,142,527 | | |
Applied Micro
Circuits Corp.(a) | | | 48,600 | | | | 124,416 | | |
| Broadcom Corp. Cl. A(a) | | | 49,600 | | | | 1,761,296 | | |
| Emerson Electric Co. | | | 68,154 | | | | 4,268,485 | | |
Freescale Semiconductor,
Inc. Cl. B(a) | | | 61,609 | | | | 1,304,879 | | |
| General Electric Co. | | | 1,753,975 | | | | 60,775,234 | | |
| Intel Corp. | | | 1,028,732 | | | | 26,808,756 | | |
(Continued)
The accompanying notes are an integral part of the financial statements.
98
MassMutual Select Indexed Equity Fund – Portfolio of Investments (Continued)
| | | Number of
Shares | | Market
Value | |
| JDS Uniphase Corp.(a) | | | 220,876 | | | $ | 335,732 | | |
| Johnson Controls, Inc. | | | 31,902 | | | | 1,797,040 | | |
| Kla-Tencor Corp. | | | 33,328 | | | | 1,456,434 | | |
| Linear Technology Corp. | | | 52,649 | | | | 1,931,692 | | |
| LSI Logic Corp.(a) | | | 63,842 | | | | 542,019 | | |
Maxim Integrated
Products, Inc. | | | 55,599 | | | | 2,124,438 | | |
Micron
Technology, Inc.(a) (b) | | | 100,880 | | | | 1,029,985 | | |
| Molex, Inc.(b) | | | 30,447 | | | | 792,840 | | |
National
Semiconductor Corp.(b) | | | 60,024 | | | | 1,322,329 | | |
| Novellus Systems, Inc.(a) | | | 23,831 | | | | 588,864 | | |
| Nvidia Corp.(a) | | | 26,800 | | | | 716,096 | | |
| PMC-Sierra, Inc.(a) | | | 25,779 | | | | 240,518 | | |
| Qlogic Corp.(a) | | | 14,100 | | | | 435,267 | | |
| Rockwell Automation, Inc. | | | 30,032 | | | | 1,462,859 | | |
| Sanmina-SCI Corp.(a) (b) | | | 82,324 | | | | 450,312 | | |
| Texas Instruments, Inc. | | | 283,669 | | | | 7,962,589 | | |
| Xilinx, Inc. | | | 59,568 | | | | 1,518,984 | | |
| | | | 124,948,694 | | |
| Energy - 8.7% | | | |
| Amerada Hess Corp. | | | 13,960 | | | | 1,486,880 | | |
| Anadarko Petroleum Corp. | | | 39,154 | | | | 3,216,501 | | |
| Apache Corp. | | | 55,156 | | | | 3,563,078 | | |
| BJ Services Co.(b) | | | 26,900 | | | | 1,411,712 | | |
| Burlington Resources, Inc. | | | 65,160 | | | | 3,599,438 | | |
| Chevron Corp.(b) | | | 347,658 | | | | 19,441,035 | | |
| ConocoPhillips | | | 232,910 | | | | 13,389,996 | | |
| Devon Energy Corp. | | | 80,000 | | | | 4,054,400 | | |
| Dynegy, Inc., Class A(a) | | | 48,037 | | | | 233,460 | | |
| El Paso Corp. | | | 98,335 | | | | 1,132,819 | | |
| EOG Resources, Inc. | | | 39,400 | | | | 2,237,920 | | |
| Exxon Mobil Corp. | | | 1,056,498 | | | | 60,716,940 | | |
| Halliburton Co. | | | 80,684 | | | | 3,858,309 | | |
| Kerr-McGee Corp. | | | 18,093 | | | | 1,380,677 | | |
| KeySpan Corp.(b) | | | 32,000 | | | | 1,302,400 | | |
| Kinder Morgan, Inc.(b) | | | 19,300 | | | | 1,605,760 | | |
| Marathon Oil Corp. | | | 58,551 | | | | 3,124,867 | | |
Nabors Industries
Limited(a) | | | 24,369 | | | | 1,477,249 | | |
National Oilwell
Varco, Inc.(a) | | | 28,500 | | | | 1,354,890 | | |
| Nicor, Inc.(b) | | | 5,282 | | | | 217,460 | | |
| Noble Corp. | | | 24,200 | | | | 1,488,542 | | |
| Occidental Petroleum Corp. | | | 67,451 | | | | 5,189,005 | | |
| Peoples Energy Corp. | | | 4,262 | | | | 185,227 | | |
| Rowan Companies, Inc. | | | 18,366 | | | | 545,654 | | |
| Schlumberger Limited | | | 94,905 | | | | 7,207,086 | | |
| Sempra Energy | | | 40,861 | | | | 1,687,968 | | |
| Sunoco, Inc. | | | 11,356 | | | | 1,290,950 | | |
| Transocean, Inc.(a) | | | 51,772 | | | | 2,794,135 | | |
| Unocal Corp. | | | 43,629 | | | | 2,838,066 | | |
| | | Number of
Shares | | Market
Value | |
| Valero Energy Corp. | | | 41,200 | | | $ | 3,259,332 | | |
The Williams
Companies, Inc. | | | 95,191 | | | | 1,808,629 | | |
| Xcel Energy, Inc.(b) | | | 57,387 | | | | 1,120,194 | | |
| XTO Energy, Inc. | | | 53,866 | | | | 1,830,905 | | |
| | | | 160,051,484 | | |
| Entertainment & Leisure - 1.0% | | | |
| Brunswick Corp. | | | 16,555 | | | | 717,163 | | |
| Harrah's Entertainment, Inc. | | | 30,016 | | | | 2,163,253 | | |
| News Corp., Inc. Cl. A | | | 475,600 | | | | 7,695,208 | | |
| The Walt Disney Co. | | | 335,970 | | | | 8,459,725 | | |
| | | | 19,035,349 | | |
| Financial Services - 3.8% | | | |
| American Express Co. | | | 196,560 | | | | 10,462,889 | | |
Apartment Investment &
Management Co. Cl. A(b) | | | 18,000 | | | | 736,560 | | |
| Archstone-Smith Trust REIT | | | 28,900 | | | | 1,116,118 | | |
Bear Stearns
Companies, Inc. | | | 17,795 | | | | 1,849,612 | | |
| CIT Group, Inc. | | | 36,100 | | | | 1,551,217 | | |
| Countrywide Financial Corp. | | | 94,298 | | | | 3,640,846 | | |
| E Trade Financial Corp.(a) | | | 65,900 | | | | 921,941 | | |
Federated Investors,
Inc. Cl. B | | | 13,400 | | | | 402,134 | | |
| Franklin Resources, Inc. | | | 33,730 | | | | 2,596,535 | | |
The Goldman Sachs
Group, Inc. | | | 72,800 | | | | 7,427,056 | | |
Huntington
Bancshares, Inc.(b) | | | 41,121 | | | | 992,661 | | |
Janus Capital
Group, Inc.(b) | | | 43,294 | | | | 651,142 | | |
Lehman Brothers
Holdings, Inc.(b) | | | 44,418 | | | | 4,409,819 | | |
| MBNA Corp. | | | 210,746 | | | | 5,513,115 | | |
| Merrill Lynch & Co., Inc. | | | 154,270 | | | | 8,486,393 | | |
| Morgan Stanley | | | 186,299 | | | | 9,775,109 | | |
PNC Financial Services
Group, Inc. | | | 49,313 | | | | 2,685,586 | | |
| Price (T. Rowe) Group, Inc. | | | 22,013 | | | | 1,378,014 | | |
| ProLogis Trust REIT | | | 26,300 | | | | 1,058,312 | | |
The Schwab
(Charles) Corp. | | | 191,105 | | | | 2,155,664 | | |
Simon Property Group,
Inc. REIT(b) | | | 37,400 | | | | 2,711,126 | | |
| | | | 70,521,849 | | |
| Foods - 1.8% | | | |
Archer-Daniels-
Midland Co.(b) | | | 103,279 | | | | 2,208,105 | | |
| Campbell Soup Co. | | | 52,546 | | | | 1,616,840 | | |
| ConAgra Foods, Inc. | | | 81,769 | | | | 1,893,770 | | |
| General Mills, Inc. | | | 61,751 | | | | 2,889,329 | | |
| | | Number of
Shares | | Market
Value | |
| Heinz (H. J.) Co. | | | 57,522 | | | $ | 2,037,429 | | |
| The Hershey Co.(b) | | | 34,984 | | | | 2,172,506 | | |
| Kellogg Co. | | | 56,216 | | | | 2,498,239 | | |
| The Kroger Co.(a) (b) | | | 118,775 | | | | 2,260,288 | | |
| McCormick & Co., Inc. | | | 19,200 | | | | 627,456 | | |
| Safeway, Inc.(b) | | | 72,777 | | | | 1,644,032 | | |
| Sara Lee Corp. | | | 127,336 | | | | 2,522,526 | | |
| Starbucks Corp.(a) | | | 66,148 | | | | 3,417,206 | | |
| SuperValu, Inc. | | | 23,532 | | | | 767,379 | | |
| Sysco Corp. | | | 106,278 | | | | 3,846,201 | | |
| Wrigley (Wm.) Jr. Co. | | | 31,704 | | | | 2,182,503 | | |
| | | | 32,583,809 | | |
| Forest Products & Paper - 0.5% | | | |
| Georgia-Pacific Corp. | | | 42,172 | | | | 1,341,070 | | |
| International Paper Co. | | | 79,051 | | | | 2,388,131 | | |
| MeadWestvaco Corp. | | | 33,250 | | | | 932,330 | | |
| OfficeMax, Inc.(b) | | | 14,701 | | | | 437,649 | | |
Plum Creek Timber Co.,
Inc. REIT | | | 25,300 | | | | 918,390 | | |
| Weyerhaeuser Co. | | | 42,011 | | | | 2,674,000 | | |
| | | | 8,691,570 | | |
| Healthcare - 1.3% | | | |
| Caremark Rx, Inc.(a) | | | 76,100 | | | | 3,387,972 | | |
| Express Scripts, Inc.(a) (b) | | | 26,600 | | | | 1,329,468 | | |
| HCA, Inc. | | | 67,885 | | | | 3,847,043 | | |
Health Management
Associates, Inc. Cl. A(b) | | | 40,700 | | | | 1,065,526 | | |
| Humana, Inc.(a) (b) | | | 27,796 | | | | 1,104,613 | | |
Laboratory Corp. of
America Holdings(a) | | | 21,800 | | | | 1,087,820 | | |
| Manor Care, Inc. | | | 15,581 | | | | 619,033 | | |
| Tenet Healthcare Corp.(a) | | | 73,728 | | | | 902,431 | | |
| UnitedHealth Group, Inc. | | | 212,896 | | | | 11,100,397 | | |
| | | | 24,444,303 | | |
Home Construction, Furnishings &
Appliances - 0.3% | | | | | | | |
| Centex Corp.(b) | | | 20,510 | | | | 1,449,442 | | |
| KB Home(b) | | | 14,770 | | | | 1,125,917 | | |
| Leggett & Platt, Inc. | | | 30,747 | | | | 817,255 | | |
| Maytag Corp.(b) | | | 13,938 | | | | 218,269 | | |
| Pulte Homes, Inc.(b) | | | 18,746 | | | | 1,579,350 | | |
| Whirlpool Corp.(b) | | | 11,029 | | | | 773,243 | | |
| | | | 5,963,476 | | |
| Household Products - 0.6% | | | |
| Black & Decker Corp.(b) | | | 12,950 | | | | 1,163,557 | | |
| The Clorox Co. | | | 23,615 | | | | 1,315,828 | | |
| Corning, Inc.(a) | | | 234,761 | | | | 3,901,728 | | |
| Fortune Brands, Inc. | | | 22,580 | | | | 2,005,104 | | |
| Newell Rubbermaid, Inc.(b) | | | 48,471 | | | | 1,155,549 | | |
| Sherwin-Williams Co. | | | 23,289 | | | | 1,096,679 | | |
| Snap-On, Inc. | | | 6,903 | | | | 236,773 | | |
(Continued)
The accompanying notes are an integral part of the financial statements.
99
MassMutual Select Indexed Equity Fund – Portfolio of Investments (Continued)
| | | Number of
Shares | | Market
Value | |
| The Stanley Works | | | 15,455 | | | $ | 703,821 | | |
| | | | 11,579,039 | | |
| Industrial – Distribution - 0.1% | | | |
| Grainger (W.W.), Inc. | | | 15,466 | | | | 847,382 | | |
| Industrial – Diversified - 1.7% | |
| 3M Co. | | | 126,698 | | | | 9,160,265 | | |
Cooper Industries
Limited Cl. A | | | 14,965 | | | | 956,263 | | |
| Danaher Corp.(b) | | | 46,200 | | | | 2,418,108 | | |
| Eaton Corp. | | | 25,256 | | | | 1,512,834 | | |
| Illinois Tool Works, Inc. | | | 46,233 | | | | 3,683,845 | | |
| ITT Industries, Inc. | | | 16,255 | | | | 1,586,976 | | |
| Textron, Inc.(b) | | | 21,955 | | | | 1,665,287 | | |
| Tyco International Limited | | | 336,254 | | | | 9,818,617 | | |
| | | | 30,802,195 | | |
| Information Retrieval Services - 0.4% | | | |
| Yahoo!, Inc.(a) | | | 217,920 | | | | 7,550,928 | | |
| Insurance - 5.2% | |
| ACE Limited | | | 46,900 | | | | 2,103,465 | | |
| Aetna, Inc. | | | 47,498 | | | | 3,933,784 | | |
| AFLAC, Inc. | | | 82,338 | | | | 3,563,589 | | |
| Allstate Corp. | | | 114,715 | | | | 6,854,221 | | |
Ambac Financial
Group, Inc. | | | 18,900 | | | | 1,318,464 | | |
American International
Group, Inc. | | | 430,308 | | | | 25,000,895 | | |
| Aon Corp. | | | 54,552 | | | | 1,365,982 | | |
| Chubb Corp. | | | 30,909 | | | | 2,646,119 | | |
| Cigna Corp. | | | 20,788 | | | | 2,224,940 | | |
| Cincinnati Financial Corp. | | | 25,885 | | | | 1,024,011 | | |
The Hartford Financial
Services Group, Inc. | | | 50,434 | | | | 3,771,455 | | |
| Jefferson-Pilot Corp. | | | 21,673 | | | | 1,092,753 | | |
| Lincoln National Corp. | | | 31,739 | | | | 1,489,194 | | |
| Loews Corp. | | | 26,848 | | | | 2,080,720 | | |
Marsh & McLennan
Companies, Inc. | | | 86,652 | | | | 2,400,260 | | |
| MBIA, Inc.(b) | | | 24,811 | | | | 1,471,540 | | |
| Metlife, Inc. | | | 122,800 | | | | 5,518,632 | | |
| MGIC Investment Corp. | | | 14,787 | | | | 964,408 | | |
Principal Financial
Group, Inc. | | | 46,100 | | | | 1,931,590 | | |
| Progressive Corp. | | | 32,387 | | | | 3,200,159 | | |
| Prudential Financial, Inc. | | | 87,500 | | | | 5,745,250 | | |
| Safeco Corp. | | | 23,025 | | | | 1,251,179 | | |
St. Paul
Travelers Companies | | | 112,259 | | | | 4,437,598 | | |
| Torchmark Corp. | | | 18,026 | | | | 940,957 | | |
| UnumProvident Corp.(b) | | | 46,725 | | | | 856,002 | | |
| WellPoint, Inc.(a) | | | 100,040 | | | | 6,966,786 | | |
| XL Capital Limited Cl. A(b) | | | 21,100 | | | | 1,570,262 | | |
| | | | 95,724,215 | | |
| | | Number of
Shares | | Market
Value | |
| Lodging - 0.3% | | | |
| Hilton Hotels Corp. | | | 59,651 | | | $ | 1,422,676 | | |
Marriott International,
Inc. Cl. A | | | 34,623 | | | | 2,361,981 | | |
Starwood Hotels & Resorts
Worldwide, Inc. | | | 34,327 | | | | 2,010,532 | | |
| | | | 5,795,189 | | |
| Machinery & Components - 0.9% | | | |
| Baker Hughes, Inc. | | | 56,683 | | | | 2,899,902 | | |
| Caterpillar, Inc. | | | 55,316 | | | | 5,272,168 | | |
| Cummins, Inc.(b) | | | 7,473 | | | | 557,561 | | |
| Deere & Co.(b) | | | 41,513 | | | | 2,718,686 | | |
| Dover Corp. | | | 30,959 | | | | 1,126,288 | | |
| Ingersoll-Rand Co. Cl. A | | | 29,386 | | | | 2,096,691 | | |
| Pall Corp. | | | 14,618 | | | | 443,802 | | |
| Parker-Hannifin Corp. | | | 20,698 | | | | 1,283,483 | | |
| | | | 16,398,581 | | |
| Manufacturing - 0.4% | | | |
American Standard
Companies, Inc. | | | 29,300 | | | | 1,228,256 | | |
| Applied Materials, Inc. | | | 277,952 | | | | 4,497,263 | | |
| Avery Dennison Corp. | | | 14,398 | | | | 762,518 | | |
| Millipore Corp.(a) | | | 7,781 | | | | 441,416 | | |
| | | | 6,929,453 | | |
| Medical Supplies - 2.3% | | | |
| Agilent Technologies, Inc.(a) | | | 72,005 | | | | 1,657,555 | | |
| Allergan, Inc. | | | 22,529 | | | | 1,920,372 | | |
Applied Biosystems Group-
Applera Corp. | | | 32,168 | | | | 632,745 | | |
| Bard (C.R.), Inc. | | | 15,878 | | | | 1,056,046 | | |
| Bausch & Lomb, Inc. | | | 9,994 | | | | 829,502 | | |
| Baxter International, Inc. | | | 103,826 | | | | 3,851,945 | | |
| Becton, Dickinson & Co. | | | 42,846 | | | | 2,248,130 | | |
| Biomet, Inc.(b) | | | 42,994 | | | | 1,489,312 | | |
| Boston Scientific Corp.(a) | | | 128,440 | | | | 3,467,880 | | |
Fisher Scientific
International(a) | | | 18,300 | | | | 1,187,670 | | |
| Guidant Corp. | | | 54,141 | | | | 3,643,689 | | |
| Medtronic, Inc. | | | 200,914 | | | | 10,405,336 | | |
| St. Jude Medical, Inc.(a) | | | 57,092 | | | | 2,489,782 | | |
| Stryker Corp. | | | 62,802 | | | | 2,986,863 | | |
| Tektronix, Inc. | | | 17,070 | | | | 397,219 | | |
| Thermo Electron Corp.(a) | | | 24,075 | | | | 646,895 | | |
| Waters Corp.(a) | | | 19,500 | | | | 724,815 | | |
| Zimmer Holdings, Inc.(a) | | | 39,778 | | | | 3,029,890 | | |
| | | | 42,665,646 | | |
| Metals & Mining - 0.6% | | | |
| Alcoa, Inc. | | | 145,066 | | | | 3,790,575 | | |
| Allegheny Technologies, Inc. | | | 16,347 | | | | 360,615 | | |
Freeport-McMoRan
Copper & Gold, Inc. Cl. B | | | 31,083 | | | | 1,163,748 | | |
| | | Number of
Shares | | Market
Value | |
| Newmont Mining Corp. | | | 74,897 | | | $ | 2,923,230 | | |
| Nucor Corp.(b) | | | 26,500 | | | | 1,208,930 | | |
| Phelps Dodge Corp.(b) | | | 16,339 | | | | 1,511,358 | | |
| United States Steel Corp.(b) | | | 18,856 | | | | 648,081 | | |
| | | | 11,606,537 | | |
| Pharmaceuticals - 8.8% | | | |
| Abbott Laboratories | | | 260,737 | | | | 12,778,720 | | |
| AmerisourceBergen Corp.(b) | | | 15,916 | | | | 1,100,591 | | |
| Amgen, Inc.(a) | | | 207,490 | | | | 12,544,845 | | |
| Biogen Idec, Inc.(a) | | | 56,391 | | | | 1,942,670 | | |
| Bristol-Myers Squibb Co.(b) | | | 327,684 | | | | 8,185,546 | | |
| Cardinal Health, Inc. | | | 70,479 | | | | 4,058,181 | | |
| Chiron Corp.(a) | | | 25,700 | | | | 896,673 | | |
| Eli Lilly & Co. | | | 189,295 | | | | 10,545,624 | | |
| Forest Laboratories, Inc.(a) | | | 56,900 | | | | 2,210,565 | | |
| Genzyme Corp.(a) | | | 41,400 | | | | 2,487,726 | | |
| Gilead Sciences, Inc.(a) | | | 73,438 | | | | 3,230,538 | | |
| Hospira, Inc.(a) | | | 22,493 | | | | 877,227 | | |
| Johnson & Johnson | | | 491,200 | | | | 31,928,000 | | |
King
Pharmaceuticals, Inc.(a) | | | 38,148 | | | | 397,502 | | |
| McKesson Corp. | | | 50,398 | | | | 2,257,326 | | |
Medco Health
Solutions, Inc.(a) | | | 46,041 | | | | 2,456,748 | | |
| Medimmune, Inc.(a) | | | 41,569 | | | | 1,110,724 | | |
| Merck & Co., Inc. | | | 364,862 | | | | 11,237,750 | | |
| Mylan Laboratories, Inc.(b) | | | 43,800 | | | | 842,712 | | |
| Pfizer, Inc. | | | 1,234,321 | | | | 34,042,573 | | |
| Schering-Plough Corp. | | | 243,486 | | | | 4,640,843 | | |
| Sigma-Aldrich Corp. | | | 13,351 | | | | 748,190 | | |
Watson
Pharmaceutical, Inc.(a) | | | 18,371 | | | | 543,047 | | |
| Wyeth | | | 221,404 | | | | 9,852,478 | | |
| | | | 160,916,799 | | |
| Photography Equipment/Supplies - 0.1% | | | |
| Eastman Kodak Co.(b) | | | 48,647 | | | | 1,306,172 | | |
| Prepackaged Software - 3.8% | | | |
| Adobe Systems, Inc. | | | 80,044 | | | | 2,290,859 | | |
| BMC Software, Inc.(a) | | | 34,531 | | | | 619,831 | | |
| Citrix Systems, Inc.(a) | | | 29,127 | | | | 630,891 | | |
Computer Associates
International, Inc. | | | 87,139 | | | | 2,394,580 | | |
| Compuware Corp.(a) | | | 58,837 | | | | 423,038 | | |
| Electronic Arts, Inc.(a) | | | 50,900 | | | | 2,881,449 | | |
| Intuit, Inc.(a) | | | 30,200 | | | | 1,362,322 | | |
| Microsoft Corp. | | | 1,674,190 | | | | 41,586,880 | | |
| Novell, Inc.(a) (b) | | | 68,182 | | | | 422,728 | | |
| Oracle Corp.(a) | | | 750,028 | | | | 9,900,370 | | |
| Siebel Systems, Inc. | | | 88,762 | | | | 789,982 | | |
SunGard Data
Systems, Inc.(a) | | | 48,400 | | | | 1,702,228 | | |
| Symantec Corp.(a) | | | 116,100 | | | | 2,524,014 | | |
(Continued)
The accompanying notes are an integral part of the financial statements.
100
MassMutual Select Indexed Equity Fund – Portfolio of Investments (Continued)
| | | Number of
Shares | | Market
Value | |
| Veritas Software Corp.(a) | | | 70,790 | | | $ | 1,727,276 | | |
| | | | 69,256,448 | | |
| Real Estate - 0.2% | | | |
Equity Office Properties
Trust REIT | | | 69,700 | | | | 2,307,070 | | |
| Equity Residential REIT | | | 49,800 | | | | 1,833,636 | | |
| | | | 4,140,706 | | |
| Restaurants - 0.6% | | | |
| Darden Restaurants, Inc. | | | 24,728 | | | | 815,529 | | |
| McDonald's Corp. | | | 211,360 | | | | 5,865,240 | | |
| Wendy's International, Inc. | | | 19,701 | | | | 938,753 | | |
| Yum! Brands, Inc. | | | 47,420 | | | | 2,469,634 | | |
| | | | 10,089,156 | | |
| Retail - 5.5% | | | |
| AutoZone, Inc.(a) | | | 11,836 | | | | 1,094,357 | | |
| Bed Bath & Beyond, Inc.(a) | | | 50,696 | | | | 2,118,079 | | |
| Best Buy Co., Inc. | | | 48,741 | | | | 3,341,196 | | |
| Big Lots, Inc.(a) (b) | | | 22,596 | | | | 299,171 | | |
| Circuit City Stores, Inc. | | | 31,959 | | | | 552,571 | | |
| Costco Wholesale Corp. | | | 78,789 | | | | 3,531,323 | | |
| CVS Corp. | | | 126,778 | | | | 3,685,436 | | |
| Dillards, Inc. Cl. A | | | 11,365 | | | | 266,168 | | |
| Dollar General Corp. | | | 48,231 | | | | 981,983 | | |
| Family Dollar Stores, Inc. | | | 30,424 | | | | 794,066 | | |
Federated Department
Stores, Inc. | | | 27,178 | | | | 1,991,604 | | |
| The Home Depot, Inc. | | | 360,087 | | | | 14,007,384 | | |
| J.C. Penney Co., Inc. | | | 45,461 | | | | 2,390,339 | | |
| Kohl's Corp.(a) | | | 52,776 | | | | 2,950,706 | | |
| Lowe's Companies, Inc.(b) | | | 129,650 | | | | 7,548,223 | | |
The May Department
Stores Co. | | | 48,487 | | | | 1,947,238 | | |
| Office Depot, Inc.(a) | | | 52,859 | | | | 1,207,300 | | |
| RadioShack Corp. | | | 25,530 | | | | 591,530 | | |
| Sears Holdings Corp.(a) | | | 15,898 | | | | 2,382,633 | | |
| Staples, Inc. | | | 122,484 | | | | 2,611,359 | | |
| Target Corp. | | | 148,810 | | | | 8,096,752 | | |
| Tiffany & Co. | | | 24,156 | | | | 791,351 | | |
| TJX Companies, Inc. | | | 82,560 | | | | 2,010,336 | | |
| Toys R Us, Inc.(a) | | | 37,482 | | | | 992,523 | | |
| Walgreen Co. | | | 168,580 | | | | 7,752,994 | | |
| Wal-Mart Stores, Inc. | | | 559,273 | | | | 26,956,959 | | |
| | | | 100,893,581 | | |
| Retail – Grocery - 0.1% | | | |
| Albertson's, Inc.(b) | | | 61,848 | | | | 1,279,017 | | |
| Telephone Utilities - 2.1% | | | |
| Alltel Corp.(b) | | | 55,657 | | | | 3,466,318 | | |
| AT&T Corp. | | | 129,033 | | | | 2,456,788 | | |
| BellSouth Corp. | | | 302,923 | | | | 8,048,664 | | |
| CenturyTel, Inc. | | | 21,848 | | | | 756,596 | | |
| | | Number of
Shares | | Market
Value | |
Qwest Communications
International, Inc.(a) | | | 287,021 | | | $ | 1,064,848 | | |
Sprint Corp.
(FON Group)(b) | | | 248,306 | | | | 6,229,998 | | |
Verizon
Communications, Inc.(b) | | | 455,783 | | | | 15,747,303 | | |
| | | | 37,770,515 | | |
| Tobacco - 1.4% | | | |
| Altria Group, Inc. | | | 344,639 | | | | 22,284,358 | | |
| Reynolds American, Inc.(b) | | | 18,600 | | | | 1,465,680 | | |
| UST, Inc. | | | 27,887 | | | | 1,273,320 | | |
| | | | 25,023,358 | | |
| Toys, Games - 0.1% | | | |
| Hasbro, Inc. | | | 26,804 | | | | 557,255 | | |
| Mattel, Inc. | | | 65,752 | | | | 1,203,262 | | |
| | | | 1,760,517 | | |
| Transportation - 1.7% | | | |
Burlington Northern
Santa Fe Corp. | | | 62,556 | | | | 2,945,136 | | |
| Carnival Corp. | | | 87,768 | | | | 4,787,744 | | |
| CSX Corp. | | | 34,686 | | | | 1,479,705 | | |
| FedEx Corp. | | | 49,412 | | | | 4,002,866 | | |
| Norfolk Southern Corp. | | | 68,777 | | | | 2,129,336 | | |
| Union Pacific Corp. | | | 42,838 | | | | 2,775,902 | | |
United Parcel Service,
Inc. Cl. B | | | 186,900 | | | | 12,926,004 | | |
| | | | 31,046,693 | | |
| Travel - 0.0% | | | |
| Sabre Holdings Corp. | | | 23,928 | | | | 477,364 | | |
TOTAL EQUITIES
(Cost $1,731,721,725) | | | | | | | 1,806,443,921 | | |
| | | Principal
Amount | |
| |
| SHORT-TERM INVESTMENTS - 9.3% | | | |
| Cash Equivalents - 7.9%(d) | | | |
ABN Amro Bank NV
Eurodollar Time Deposit
3.250% 08/05/2005 | | $ | 1,547,378 | | | | 1,547,378 | | |
American Beacon Money
Market Fund | | | 4,177,285 | | | | 4,177,285 | | |
Bank of America
Bank Note
3.270% 07/18/2005 | | | 2,141,782 | | | | 2,141,782 | | |
Bank of America
Bank Note
3.270% 08/30/2005 | | | 3,977,595 | | | | 3,977,595 | | |
| | | Principal
Amount | | Market
Value | |
Bank of Montreal
Eurodollar Time Deposit
3.010% 07/01/2005 | | $ | 5,891,386 | | | $ | 5,891,386 | | |
Barclays
Eurodollar Time Deposit
3.160% 07/14/2005 | | | 3,059,688 | | | | 3,059,688 | | |
Barclays
Eurodollar Time Deposit
3.250% 07/26/2005 | | | 3,082,802 | | | | 3,082,802 | | |
BGI Institutional Money
Market Fund | | | 12,008,361 | | | | 12,008,361 | | |
BNP Paribas
Eurodollar Time Deposit
3.000% 07/01/2005 | | | 2,141,782 | | | | 2,141,782 | | |
Calyon
Eurodollar Time Deposit
3.310% 07/01/2005 | | | 1,835,813 | | | | 1,835,813 | | |
Citigroup
Eurodollar Time Deposit
3.085% 07/22/2005 | | | 1,835,813 | | | | 1,835,813 | | |
Citigroup
Eurodollar Time Deposit
3.100% 07/25/2005 | | | 4,252,393 | | | | 4,252,393 | | |
Dexia Group
Eurodollar Time Deposit
3.205% 07/20/2005 | | | 1,529,844 | | | | 1,529,844 | | |
Dexia Group
Eurodollar Time Deposit
3.240% 07/21/2005 | | | 1,529,844 | | | | 1,529,844 | | |
Federal Home Loan Bank
Discount Note
2.977% 07/01/2005 | | | 3,778,271 | | | | 3,778,271 | | |
First Tennessee National
Corporation
Eurodollar Time Deposit
3.220% 08/09/2005 | | | 551,380 | | | | 551,380 | | |
Fortis Bank
Eurodollar Time Deposit
3.110% 07/05/2005 | | | 2,128,674 | | | | 2,128,674 | | |
Fortis Bank
Eurodollar Time Deposit
3.250% 07/25/2005 | | | 2,159,648 | | | | 2,159,648 | | |
Fortis Bank
Eurodollar Time Deposit
3.250% 08/04/2005 | | | 3,059,688 | | | | 3,059,688 | | |
Fortis Bank
Eurodollar Time Deposit
3.270% 07/07/2005 | | | 2,447,751 | | | | 2,447,751 | | |
Freddie Mac Discount Note
3.208% 07/26/2005 | | | 1,508,311 | | | | 1,508,311 | | |
Freddie Mac Discount Note
3.244% 08/16/2005 | | | 3,671,626 | | | | 3,671,626 | | |
General Electric
Capital Corp
3.252% 07/06/2005 | | | 3,059,688 | | | | 3,059,688 | | |
(Continued)
The accompanying notes are an integral part of the financial statements.
101
MassMutual Select Indexed Equity Fund – Portfolio of Investments (Continued)
| | | Principal
Amount | | Market
Value | |
General Electric
Capital Corp
3.253% 07/08/2005 | | $ | 2,447,751 | | | $ | 2,447,751 | | |
Goldman Sachs
Financial Square
Prime Obligations
Money Market Fund | | | 2,793,872 | | | | 2,793,872 | | |
Harris Trust &
Savings Bank
3.295% 11/04/2005 | | | 2,930,402 | | | | 2,930,402 | | |
HBOS Halifax Bank
of Scotland
Eurodollar Time Deposit
3.150% 08/08/2005 | | | 1,529,844 | | | | 1,529,844 | | |
HSBC Banking/
Holdings PLC
Eurodollar Time Deposit
3.250% 08/05/2005 | | | 1,835,813 | | | | 1,835,813 | | |
JP Morgan Chase & Co.
Eurodollar Time Deposit
3.200% 07/20/2005 | | | 3,059,688 | | | | 3,059,688 | | |
Merrimac Cash Fund,
Premium Class | | | 4,851,031 | | | | 4,851,031 | | |
Morgan Stanley
Dean Witter & Co.
3.518% 07/19/2005 | | | 6,119,377 | | | | 6,119,377 | | |
National Australia Bank
Eurodollar Time Deposit
3.260% 07/06/2005 | | | 1,223,875 | | | | 1,223,875 | | |
National Australia Bank
Eurodollar Time Deposit
3.375% 07/01/2005 | | | 3,671,626 | | | | 3,671,626 | | |
Nordea Bank Finland PLC
(NY Branch)
Eurodollar Time Deposit
3.165% 08/09/2005 | | | 2,375,880 | | | | 2,375,880 | | |
Nordea Bank Finland PLC
(NY Branch)
Eurodollar Time Deposit
3.240% 08/03/2005 | | | 1,101,488 | | | | 1,101,488 | | |
Rabobank Nederland
Eurodollar Time Deposit
3.170% 07/18/2005 | | | 3,059,688 | | | | 3,059,688 | | |
Rabobank Nederland
Eurodollar Time Deposit
3.350% 07/01/2005 | | | 2,475,646 | | | | 2,475,646 | | |
Royal Bank of Canada
Eurodollar Time Deposit
3.250% 07/07/2005 | | | 1,835,813 | | | | 1,835,813 | | |
Royal Bank of Canada
Eurodollar Time Deposit
3.260% 07/28/2005 | | | 3,059,688 | | | | 3,059,688 | | |
Royal Bank of Scotland
Eurodollar Time Deposit
3.240% 08/08/2005 | | | 3,365,657 | | | | 3,365,657 | | |
| | | Principal
Amount | | Market
Value | |
Royal Bank of Scotland
Eurodollar Time Deposit
3.250% 08/04/2005 | | $ | 2,447,751 | | | $ | 2,447,751 | | |
Royal Bank of Scotland
Eurodollar Time Deposit
3.270% 07/29/2005 | | | 2,447,751 | | | | 2,447,751 | | |
Societe Generale
Eurodollar Time Deposit
3.200% 08/08/2005 | | | 1,223,875 | | | | 1,223,875 | | |
Societe Generale
Eurodollar Time Deposit
3.240% 08/09/2005 | | | 2,025,169 | | | | 2,025,169 | | |
Societe Generale
Eurodollar Time Deposit
3.280% 08/01/2005 | | | 3,059,688 | | | | 3,059,688 | | |
Svenska Handlesbanken
Eurodollar Time Deposit
3.220% 08/05/2005 | | | 3,059,688 | | | | 3,059,688 | | |
The Bank of the West
Eurodollar Time Deposit
3.270% 07/27/2005 | | | 917,907 | | | | 917,907 | | |
Toronto Dominion Bank
Eurodollar Time Deposit
3.250% 08/02/2005 | | | 3,059,688 | | | | 3,059,688 | | |
UBS AG
Eurodollar Time Deposit
3.250% 08/09/2005 | | | 1,529,844 | | | | 1,529,844 | | |
Wells Fargo
Eurodollar Time Deposit
3.270% 07/21/2005 | | | 3,059,688 | | | | 3,059,688 | | |
Wells Fargo
Eurodollar Time Deposit
3.270% 08/01/2005 | | | 3,059,688 | | | | 3,059,688 | | |
| | | | 145,004,679 | | |
| Repurchase Agreement - 1.3% | | | |
Investors Bank & Trust
Company Repurchase
Agreement, dated
06/30/2005, 2.01%,
due 07/01/2005(e) | | | 23,085,887 | | | | 23,085,887 | | |
| U.S. Treasury Bills - 0.1% | | | |
U.S. Treasury Bill(c)
2.805% 07/14/2005 | | | 2,740,000 | | | | 2,737,225 | | |
TOTAL SHORT-TERM
INVESTMENTS
(At Amortized Cost) | | | | | | | 170,827,791 | | |
TOTAL INVESTMENTS - 107.8%
(Cost $1,902,549,516)(f) | | | | | | | 1,977,271,712 | | |
Other Assets/
(Liabilities) - (7.8%) | | | | | | | (143,502,801 | ) | |
| NET ASSETS - 100.0% | | | | | | $ | 1,833,768,911 | | |
Notes to Portfolio of Investments
REIT - Real Estate Investment Trust
(a) Non-income producing security.
(b) Denotes all or a portion of security on loan.
(c) This security is held as collateral for open futures contracts. (Note 2).
(d) Represents investments of security lending collateral. (Note 2).
(e) Maturity value of $23,087,447. Collateralized by U.S. Government Agency obligations with rates of 3.764% - 6.125%, maturity dates of 11/25/2015 - 12/01/2035, and an aggregate market value, including accrued interest, of $24,240,466.
(f) See Note 6 for aggregate cost for Federal tax purposes.
The accompanying notes are an integral part of the financial statements.
102
MassMutual Select Blue Chip Growth Fund – Portfolio of Investments
June 30, 2005 (Unaudited)
| | | Number of
Shares | | Market
Value | |
| EQUITIES - 98.4% | |
| Advertising - 0.6% | |
| Omnicom Group, Inc. | | | 30,800 | | | $ | 2,459,688 | | |
| Aerospace & Defense - 2.3% | |
| Boeing Co. | | | 57,200 | | | | 3,775,200 | | |
Honeywell
International, Inc. | | | 47,400 | | | | 1,736,262 | | |
| Northrop Grumman Corp. | | | 39,100 | | | | 2,160,275 | | |
| United Technologies Corp. | | | 25,400 | | | | 1,304,290 | | |
| | | | 8,976,027 | | |
| Air Transportation - 0.3% | | | |
| Southwest Airlines Co. | | | 83,800 | | | | 1,167,334 | | |
| Apparel, Textiles & Shoes - 0.8% | |
| Nike, Inc. Cl. B | | | 22,600 | | | | 1,957,160 | | |
| Ross Stores, Inc. | | | 37,200 | | | | 1,075,452 | | |
| | | | 3,032,612 | | |
| Banking, Savings & Loans - 6.3% | | | |
| Bank of America Corp. | | | 97,400 | | | | 4,442,414 | | |
Capital One
Financial Corp.(a) | | | 17,100 | | | | 1,368,171 | | |
| Citigroup, Inc. | | | 96,900 | | | | 4,479,687 | | |
| Fannie Mae | | | 80,300 | | | | 4,689,520 | | |
| Freddie Mac | | | 4,800 | | | | 313,104 | | |
Golden West
Financial Corp.(a) | | | 33,800 | | | | 2,176,044 | | |
| SLM Corp. | | | 39,100 | | | | 1,986,280 | | |
| State Street Corp. | | | 16,700 | | | | 805,775 | | |
| Wachovia Corp. | | | 41,600 | | | | 2,063,360 | | |
| Wells Fargo & Co. | | | 34,300 | | | | 2,112,194 | | |
| | | | 24,436,549 | | |
| Beverages - 1.6% | | | |
| The Coca-Cola Co. | | | 3,600 | | | | 150,300 | | |
| PepsiCo, Inc. | | | 114,820 | | | | 6,192,242 | | |
| | | | 6,342,542 | | |
| Broadcasting, Publishing & Printing - 0.7% | | | |
Clear Channel
Communications, Inc. | | | 4,700 | | | | 145,371 | | |
| Time Warner, Inc.(b) | | | 55,500 | | | | 927,405 | | |
Univision Communications,
Inc. Cl. A(a) (b) | | | 61,900 | | | | 1,705,345 | | |
| | | | 2,778,121 | | |
| Building Materials & Construction - 0.3% | | | |
| Cytyc Corp.(b) | | | 59,600 | | | | 1,314,776 | | |
| Chemicals - 1.6% | |
| Monsanto Co. | | | 31,800 | | | | 1,999,266 | | |
| | | Number of
Shares | | Market
Value | |
Potash Corp. of
Saskatchewan(a) | | | 14,300 | | | $ | 1,366,794 | | |
| Praxair, Inc. | | | 58,400 | | | | 2,721,440 | | |
| | | | 6,087,500 | | |
| Commercial Services - 2.6% | | | |
| Apollo Group, Inc. Cl. A(b) | | | 13,900 | | | | 1,087,258 | | |
| Career Education Corp.(b) | | | 17,900 | | | | 655,319 | | |
| Cintas Corp.(a) | | | 23,100 | | | | 891,660 | | |
| eBay, Inc.(b) | | | 72,200 | | | | 2,383,322 | | |
| Fluor Corp.(a) | | | 24,600 | | | | 1,416,714 | | |
| Paychex, Inc. | | | 37,566 | | | | 1,222,398 | | |
| Quest Diagnostics, Inc.(a) | | | 24,400 | | | | 1,299,788 | | |
Robert Half
International, Inc.(a) | | | 46,100 | | | | 1,151,117 | | |
| | | | 10,107,576 | | |
| Communications - 2.1% | | | |
EchoStar Communications
Corp. Cl. A | | | 29,100 | | | | 877,365 | | |
Nextel Communications,
Inc. Cl. A(b) | | | 80,100 | | | | 2,588,031 | | |
| Qualcomm, Inc. | | | 109,500 | | | | 3,614,595 | | |
XM Satellite Radio Holdings,
Inc. Cl. A(a) (b) | | | 32,557 | | | | 1,095,869 | | |
| | | | 8,175,860 | | |
| Computer Integrated Systems Design - 0.2% | | | |
| Synopsys, Inc.(b) | | | 23,858 | | | | 397,713 | | |
| Teradyne, Inc.(a) (b) | | | 31,700 | | | | 379,449 | | |
| | | | 777,162 | | |
| Computers & Information - 5.8% | | | |
| CDW Corp.(a) | | | 20,600 | | | | 1,176,054 | | |
| Cisco Systems, Inc.(b) | | | 331,600 | | | | 6,336,876 | | |
| Dell, Inc.(b) | | | 183,400 | | | | 7,246,134 | | |
| EMC Corp.(b) | | | 194,540 | | | | 2,667,143 | | |
International Business
Machines Corp. | | | 70,500 | | | | 5,231,100 | | |
| | | | 22,657,307 | | |
| Containers - 0.1% | | | |
Smurfit-Stone
Container Corp. | | | 52,704 | | | | 536,000 | | |
| Cosmetics & Personal Care - 3.6% | | | |
| Colgate-Palmolive Co. | | | 41,100 | | | | 2,051,301 | | |
| The Gillette Co. | | | 85,900 | | | | 4,349,117 | | |
The Procter &
Gamble Co. | | | 143,100 | | | | 7,548,525 | | |
| | | | 13,948,943 | | |
| | | Number of
Shares | | Market
Value | |
| Data Processing & Preparation - 0.7% | |
Affiliated Computer
Services, Inc. Cl. A(b) | | | 27,000 | | | $ | 1,379,700 | | |
Automatic Data
Processing, Inc. | | | 1,900 | | | | 79,743 | | |
| First Data Corp. | | | 26,400 | | | | 1,059,696 | | |
| | | | 2,519,139 | | |
| Electrical Equipment & Electronics - 10.3% | | | |
| Altera Corp.(a) (b) | | | 60,700 | | | | 1,203,074 | | |
| Analog Devices, Inc. | | | 55,500 | | | | 2,070,705 | | |
Flextronics International
Limited(a) (b) | | | 110,500 | | | | 1,459,705 | | |
| General Electric Co. | | | 425,700 | | | | 14,750,505 | | |
| Intel Corp.(a) | | | 420,900 | | | | 10,968,654 | | |
| Intersil Corp. Cl. A | | | 48,700 | | | | 914,099 | | |
| Kla-Tencor Corp.(a) | | | 38,000 | | | | 1,660,600 | | |
| Linear Technology Corp. | | | 28,000 | | | | 1,027,320 | | |
Marvell Technology Group
Limited(b) | | | 31,500 | | | | 1,198,260 | | |
| Microchip Technology, Inc. | | | 15,200 | | | | 450,224 | | |
| PMC-Sierra, Inc.(b) | | | 60,000 | | | | 559,800 | | |
| Texas Instruments, Inc. | | | 106,500 | | | | 2,989,455 | | |
| Xilinx, Inc. | | | 41,200 | | | | 1,050,600 | | |
| | | | 40,303,001 | | |
| Energy - 5.5% | | | |
| BJ Services Co.(a) | | | 34,000 | | | | 1,784,320 | | |
| Chevron Corp.(a) | | | 32,800 | | | | 1,834,176 | | |
| Exxon Mobil Corp. | | | 59,800 | | | | 3,436,706 | | |
| Halliburton Co. | | | 62,700 | | | | 2,998,314 | | |
Nabors Industries
Limited(b) | | | 33,100 | | | | 2,006,522 | | |
| Schlumberger Limited | | | 51,600 | | | | 3,918,504 | | |
| Total SA | | | 10,300 | | | | 2,402,897 | | |
| Transocean, Inc.(b) | | | 31,700 | | | | 1,710,849 | | |
Weatherford International
Limited(a) (b) | | | 23,000 | | | | 1,333,540 | | |
| | | | 21,425,828 | | |
| Entertainment & Leisure - 1.4% | | | |
| News Corp., Inc. Cl. A | | | 67,911 | | | | 1,098,800 | | |
| News Corp., Inc. Cl. B(a) | | | 90,600 | | | | 1,527,516 | | |
| The Walt Disney Co. | | | 116,200 | | | | 2,925,916 | | |
| | | | 5,552,232 | | |
| Financial Services - 2.7% | | | |
| American Express Co. | | | 87,900 | | | | 4,678,917 | | |
The Goldman Sachs
Group, Inc. | | | 7,800 | | | | 795,756 | | |
(Continued)
The accompanying notes are an integral part of the financial statements.
103
MassMutual Select Blue Chip Growth Fund – Portfolio of Investments (Continued)
| | | Number of
Shares | | Market
Value | |
Lehman Brothers
Holdings, Inc.(a) | | | 21,000 | | | $ | 2,084,880 | | |
| MBNA Corp. | | | 42,750 | | | | 1,118,340 | | |
| Merrill Lynch & Co., Inc. | | | 34,400 | | | | 1,892,344 | | |
| | | | 10,570,237 | | |
| Foods - 0.7% | | | |
| Bunge Limited(a) | | | 22,610 | | | | 1,433,474 | | |
| Sysco Corp. | | | 36,000 | | | | 1,302,840 | | |
| | | | 2,736,314 | | |
| Healthcare - 2.1% | | | |
Health Management
Associates, Inc. Cl. A(a) | | | 22,900 | | | | 599,522 | | |
Laboratory Corp. of
America Holdings(b) | | | 23,800 | | | | 1,187,620 | | |
| UnitedHealth Group, Inc. | | | 124,200 | | | | 6,475,788 | | |
| | | | 8,262,930 | | |
| Industrial – Diversified - 2.1% | | | |
| 3M Co. | | | 50,200 | | | | 3,629,460 | | |
| Danaher Corp.(a) | | | 25,100 | | | | 1,313,734 | | |
| Tyco International Limited | | | 107,300 | | | | 3,133,160 | | |
| | | | 8,076,354 | | |
| Information Retrieval Services - 1.9% | | | |
| Google, Inc. Cl. A(a) (b) | | | 7,300 | | | | 2,147,295 | | |
| Juniper Networks, Inc.(b) | | | 55,400 | | | | 1,394,972 | | |
| Yahoo!, Inc.(b) | | | 109,806 | | | | 3,804,778 | | |
| | | | 7,347,045 | | |
| Insurance - 4.9% | | | |
| Aetna, Inc. | | | 6,700 | | | | 554,894 | | |
| AFLAC, Inc. | | | 28,200 | | | | 1,220,496 | | |
| Ambac Financial Group, Inc. | | | 26,100 | | | | 1,820,736 | | |
American International
Group, Inc. | | | 168,000 | | | | 9,760,800 | | |
| MBIA, Inc.(a) | | | 21,200 | | | | 1,257,372 | | |
| Prudential Financial, Inc. | | | 25,600 | | | | 1,680,896 | | |
| WellPoint, Inc.(b) | | | 39,500 | | | | 2,750,780 | | |
| | | | 19,045,974 | | |
| Internet Content - 0.2% | | | |
| BEA Systems, Inc.(b) | | | 67,700 | | | | 594,406 | | |
| Machinery & Components - 1.3% | | | |
| Baker Hughes, Inc.(a) | | | 63,500 | | | | 3,248,660 | | |
| Ingersoll-Rand Co. Cl. A | | | 11,100 | | | | 791,985 | | |
| Roper Industries, Inc. | | | 14,500 | | | | 1,034,865 | | |
| | | | 5,075,510 | | |
| Manufacturing - 0.8% | | | |
| Applied Materials, Inc. | | | 85,800 | | | | 1,388,244 | | |
| Lam Research Corp.(a) (b) | | | 24,300 | | | | 703,242 | | |
| Millipore Corp.(b) | | | 21,200 | | | | 1,202,676 | | |
| | | | 3,294,162 | | |
| | | Number of
Shares | | Market
Value | |
| Medical Supplies - 4.7% | |
| Allergan, Inc. | | | 27,400 | | | $ | 2,335,576 | | |
| Baxter International, Inc. | | | 57,000 | | | | 2,114,700 | | |
| Becton, Dickinson & Co. | | | 29,100 | | | | 1,526,877 | | |
Fisher Scientific
International(b) | | | 24,200 | | | | 1,570,580 | | |
| Guidant Corp. | | | 24,200 | | | | 1,628,660 | | |
| Medtronic, Inc. | | | 99,100 | | | | 5,132,389 | | |
| St. Jude Medical, Inc.(b) | | | 59,200 | | | | 2,581,712 | | |
| Waters Corp.(b) | | | 39,600 | | | | 1,471,932 | | |
| | | | 18,362,426 | | |
| Pharmaceuticals - 13.4% | | | |
| Abbott Laboratories | | | 89,700 | | | | 4,396,197 | | |
| Alkermes, Inc.(a) (b) | | | 12,000 | | | | 158,640 | | |
| Amgen, Inc.(b) | | | 60,800 | | | | 3,675,968 | | |
Barr
Pharmaceuticals(a) (b) | | | 28,700 | | | | 1,398,838 | | |
| Biogen Idec, Inc.(b) | | | 36,225 | | | | 1,247,951 | | |
| Cardinal Health, Inc. | | | 25,700 | | | | 1,479,806 | | |
| Cephalon, Inc.(a) (b) | | | 15,900 | | | | 632,979 | | |
| Eli Lilly & Co. | | | 49,300 | | | | 2,746,503 | | |
| Genentech, Inc.(b) | | | 78,200 | | | | 6,277,896 | | |
| Gilead Sciences, Inc.(b) | | | 35,600 | | | | 1,566,044 | | |
| Johnson & Johnson | | | 166,326 | | | | 10,811,190 | | |
| Merck & Co., Inc. | | | 41,400 | | | | 1,275,120 | | |
| Pfizer, Inc. | | | 273,480 | | | | 7,542,578 | | |
Protein Design
Labs, Inc.(b) | | | 16,000 | | | | 323,360 | | |
| Schering-Plough Corp. | | | 157,400 | | | | 3,000,044 | | |
| Wyeth | | | 128,300 | | | | 5,709,350 | | |
| | | | 52,242,464 | | |
| Prepackaged Software - 6.2% | | | |
| Adobe Systems, Inc. | | | 29,000 | | | | 829,980 | | |
| Citrix Systems, Inc.(b) | | | 31,500 | | | | 682,290 | | |
| DST Systems, Inc.(b) | | | 27,800 | | | | 1,301,040 | | |
| McAfee, Inc.(b) | | | 38,800 | | | | 1,015,784 | | |
| Microsoft Corp. | | | 645,400 | | | | 16,031,736 | | |
| Oracle Corp.(b) | | | 175,100 | | | | 2,311,320 | | |
| Siebel Systems, Inc. | | | 35,700 | | | | 317,730 | | |
| Symantec Corp.(b) | | | 34,200 | | | | 743,508 | | |
| Veritas Software Corp.(b) | | | 40,700 | | | | 993,080 | | |
| | | | 24,226,468 | | |
| Restaurants - 0.9% | | | |
Brinker
International, Inc.(a) (b) | | | 39,800 | | | | 1,593,990 | | |
| McDonald's Corp. | | | 61,600 | | | | 1,709,400 | | |
| | | | 3,303,390 | | |
| Retail - 6.9% | | | |
| Costco Wholesale Corp. | | | 8,600 | | | | 385,452 | | |
| CVS Corp. | | | 54,800 | | | | 1,593,036 | | |
| The Home Depot, Inc. | | | 153,900 | | | | 5,986,710 | | |
| Kohl's Corp.(b) | | | 15,900 | | | | 888,969 | | |
| | | Number of
Shares | | Market
Value | |
| Lowe's Companies, Inc.(a) | | | 28,860 | | | $ | 1,680,229 | | |
| Staples, Inc. | | | 95,450 | | | | 2,034,994 | | |
| Target Corp. | | | 89,900 | | | | 4,891,459 | | |
| Walgreen Co. | | | 57,600 | | | | 2,649,024 | | |
| Wal-Mart Stores, Inc. | | | 144,500 | | | | 6,964,900 | | |
| | | | 27,074,773 | | |
| Telephone Utilities - 0.3% | | | |
Verizon
Communications, Inc. | | | 37,200 | | | | 1,285,260 | | |
| Tobacco - 1.0% | | | |
| Altria Group, Inc. | | | 59,800 | | | | 3,866,668 | | |
| Transportation - 1.5% | | | |
| Carnival Corp. | | | 48,300 | | | | 2,634,765 | | |
| FedEx Corp. | | | 7,800 | | | | 631,878 | | |
Royal Caribbean Cruises
Limited(a) | | | 30,600 | | | | 1,479,816 | | |
United Parcel Service,
Inc. Cl. B | | | 16,000 | | | | 1,106,560 | | |
| | | | 5,853,019 | | |
TOTAL EQUITIES
(Cost $365,016,122) | | | | | | | 383,815,597 | | |
| | | Principal
Amount | |
| |
| SHORT-TERM INVESTMENTS - 11.6% | | | |
| Cash Equivalents - 9.9%(c) | | | |
ABN Amro Bank NV
Eurodollar Time Deposit
3.250% 08/05/2005 | | $ | 410,479 | | | | 410,479 | | |
American Beacon Money
Market Fund | | | 1,108,106 | | | | 1,108,106 | | |
Bank of America
Bank Note
3.270% 07/18/2005 | | | 568,150 | | | | 568,150 | | |
Bank of America
Bank Note
3.270% 08/30/2005 | | | 1,055,135 | | | | 1,055,135 | | |
Bank of Montreal
Eurodollar Time Deposit
3.010% 07/01/2005 | | | 1,562,806 | | | | 1,562,806 | | |
Barclays
Eurodollar Time Deposit
3.160% 07/14/2005 | | | 811,642 | | | | 811,642 | | |
Barclays
Eurodollar Time Deposit
3.250% 07/26/2005 | | | 817,774 | | | | 817,774 | | |
BGI Institutional Money
Market Fund | | | 3,185,454 | | | | 3,185,454 | | |
(Continued)
The accompanying notes are an integral part of the financial statements.
104
MassMutual Select Blue Chip Growth Fund – Portfolio of Investments (Continued)
| | | Principal
Amount | | Market
Value | |
BNP Paribas
Eurodollar Time Deposit
3.000% 07/01/2005 | | $ | 568,150 | | | $ | 568,150 | | |
Calyon
Eurodollar Time Deposit
3.310% 07/01/2005 | | | 486,985 | | | | 486,985 | | |
Citigroup
Eurodollar Time Deposit
3.085% 07/22/2005 | | | 486,985 | | | | 486,985 | | |
Citigroup
Eurodollar Time Deposit
3.100% 07/25/2005 | | | 1,128,031 | | | | 1,128,031 | | |
Dexia Group
Eurodollar Time Deposit
3.205% 07/20/2005 | | | 405,821 | | | | 405,821 | | |
Dexia Group
Eurodollar Time Deposit
3.240% 07/21/2005 | | | 405,821 | | | | 405,821 | | |
Federal Home Loan Bank
Discount Note
2.977% 07/01/2005 | | | 1,002,260 | | | | 1,002,260 | | |
First Tennessee
National Corporation
Eurodollar Time Deposit
3.220% 08/09/2005 | | | 146,264 | | | | 146,264 | | |
Fortis Bank
Eurodollar Time Deposit
3.110% 07/05/2005 | | | 564,673 | | | | 564,673 | | |
Fortis Bank
Eurodollar Time Deposit
3.250% 07/25/2005 | | | 572,889 | | | | 572,889 | | |
Fortis Bank
Eurodollar Time Deposit
3.250% 08/04/2005 | | | 811,642 | | | | 811,642 | | |
Fortis Bank
Eurodollar Time Deposit
3.270% 07/07/2005 | | | 649,314 | | | | 649,314 | | |
Freddie Mac Discount Note
3.208% 07/26/2005 | | | 400,109 | | | | 400,109 | | |
Freddie Mac Discount Note
3.244% 08/16/2005 | | | 973,971 | | | | 973,971 | | |
General Electric
Capital Corp
3.252% 07/06/2005 | | | 811,642 | | | | 811,642 | | |
General Electric
Capital Corp
3.253% 07/08/2005 | | | 649,314 | | | | 649,314 | | |
Goldman Sachs
Financial Square
Prime Obligations
Money Market Fund | | | 741,129 | | | | 741,129 | | |
Harris Trust & Savings Bank
3.295% 11/04/2005 | | | 777,347 | | | | 777,347 | | |
HBOS Halifax
Bank of Scotland
Eurodollar Time Deposit
3.150% 08/08/2005 | | | 405,821 | | | | 405,821 | | |
| | | Principal
Amount | | Market
Value | |
HSBC Banking/
Holdings PLC
Eurodollar Time Deposit
3.250% 08/05/2005 | | $ | 486,985 | | | $ | 486,985 | | |
JP Morgan Chase & Co.
Eurodollar Time Deposit
3.200% 07/20/2005 | | | 811,642 | | | | 811,642 | | |
Merrimac Cash Fund,
Premium Class | | | 1,286,831 | | | | 1,286,831 | | |
Morgan Stanley
Dean Witter & Co.
3.518% 07/19/2005 | | | 1,623,285 | | | | 1,623,285 | | |
National Australia Bank
Eurodollar Time Deposit
3.260% 07/06/2005 | | | 324,657 | | | | 324,657 | | |
National Australia Bank
Eurodollar Time Deposit
3.375% 07/01/2005 | | | 973,971 | | | | 973,971 | | |
Nordea Bank Finland PLC
(NY Branch)
Eurodollar Time Deposit
3.165% 08/09/2005 | | | 630,249 | | | | 630,249 | | |
Nordea Bank Finland PLC
(NY Branch)
Eurodollar Time Deposit
3.240% 08/03/2005 | | | 292,191 | | | | 292,191 | | |
Rabobank Nederland
Eurodollar Time Deposit
3.170% 07/18/2005 | | | 811,642 | | | | 811,642 | | |
Rabobank Nederland
Eurodollar Time Deposit
3.350% 07/01/2005 | | | 656,714 | | | | 656,714 | | |
Royal Bank of Canada
Eurodollar Time Deposit
3.250% 07/07/2005 | | | 486,985 | | | | 486,985 | | |
Royal Bank of Canada
Eurodollar Time Deposit
3.260% 07/28/2005 | | | 811,642 | | | | 811,642 | | |
Royal Bank of Scotland
Eurodollar Time Deposit
3.240% 08/08/2005 | | | 892,807 | | | | 892,807 | | |
Royal Bank of Scotland
Eurodollar Time Deposit
3.250% 08/04/2005 | | | 649,314 | | | | 649,314 | | |
Royal Bank of Scotland
Eurodollar Time Deposit
3.270% 07/29/2005 | | | 649,314 | | | | 649,314 | | |
Societe Generale
Eurodollar Time Deposit
3.200% 08/08/2005 | | | 324,657 | | | | 324,657 | | |
Societe Generale
Eurodollar Time Deposit
3.240% 08/09/2005 | | | 537,216 | | | | 537,216 | | |
| | | Principal
Amount | | Market
Value | |
Societe Generale
Eurodollar Time Deposit
3.280% 08/01/2005 | | $ | 811,642 | | | $ | 811,642 | | |
Svenska Handlesbanken
Eurodollar Time Deposit
3.220% 08/05/2005 | | | 811,642 | | | | 811,642 | | |
The Bank of the West
Eurodollar Time Deposit
3.270% 07/27/2005 | | | 243,493 | | | | 243,493 | | |
Toronto Dominion Bank
Eurodollar Time Deposit
3.250% 08/02/2005 | | | 811,642 | | | | 811,642 | | |
UBS AG
Eurodollar Time Deposit
3.250% 08/09/2005 | | | 405,821 | | | | 405,821 | | |
Wells Fargo
Eurodollar Time Deposit
3.270% 07/21/2005 | | | 811,642 | | | | 811,642 | | |
Wells Fargo
Eurodollar Time Deposit
3.270% 08/01/2005 | | | 811,642 | | | | 811,642 | | |
| | | | 38,465,340 | | |
| Repurchase Agreement - 1.7% | | | |
Investors Bank & Trust
Company Repurchase
Agreement, dated
06/30/2005, 2.01%,
due 07/01/2005(d) | | | 6,486,551 | | | | 6,486,551 | | |
TOTAL SHORT-TERM
INVESTMENTS
(At Amortized Cost) | | | | | | | 44,951,891 | | |
TOTAL INVESTMENTS - 110.0%
(Cost $409,968,013)(e) | | | | | | | 428,767,488 | | |
Other Assets/
(Liabilities) - (10.0%) | | | | | | | (38,817,598 | ) | |
| NET ASSETS - 100.0% | | | | | | $ | 389,949,890 | | |
Notes to Portfolio of Investments
(a) Denotes all or a portion of security on loan.
(b) Non-income producing security.
(c) Represents investments of security lending collateral. (Note 2).
(d) Maturity value of $6,486,913. Collaterized by U.S. Government Agency obligations with a rate of 5.375% - 6.375%, maturity dates 11/25/2015 - 05/28/2028, and an aggregate market value, including accrued interest, of $6,810,878.
(e) See Note 6 for aggregate cost for Federal tax purposes.
The accompanying notes are an integral part of the financial statements.
105
MassMutual Select Large Cap Growth Fund – Portfolio of Investments
June 30, 2005 (Unaudited)
| | | Number of
Shares | | Market
Value | |
| EQUITIES - 98.8% | |
| Banking, Savings & Loans - 1.9% | |
| Citigroup, Inc. | | | 12,400 | | | $ | 573,252 | | |
| Broadcasting, Publishing & Printing - 3.5% | |
| The Scripps (E.W.) Co.(a) | | | 12,030 | | | | 587,064 | | |
| Time Warner, Inc.(b) | | | 27,150 | | | | 453,676 | | |
| | | | 1,040,740 | | |
| Commercial Services - 3.0% | | | |
| eBay, Inc.(b) | | | 27,420 | | | | 905,134 | | |
| Communications - 4.1% | |
Network
Appliance, Inc.(a) (b) | | | 10,100 | | | | 285,527 | | |
| Qualcomm, Inc. | | | 28,450 | | | | 939,134 | | |
| | | | 1,224,661 | | |
| Computer Programming Services - 0.3% | | | |
SAP AG Sponsored
ADR (Germany)(a) | | | 2,150 | | | | 93,095 | | |
| Computers & Information - 7.4% | |
| Apple Computer, Inc.(b) | | | 21,150 | | | | 778,531 | | |
| Dell, Inc.(b) | | | 29,150 | | | | 1,151,716 | | |
| EMC Corp.(b) | | | 19,950 | | | | 273,514 | | |
| | | | 2,203,761 | | |
| Cosmetics & Personal Care - 4.8% | | | |
| Avon Products, Inc. | | | 17,050 | | | | 645,342 | | |
The Procter��&
Gamble Co.(a) | | | 14,800 | | | | 780,700 | | |
| | | | 1,426,042 | | |
| Electrical Equipment & Electronics - 7.3% | | | |
| Broadcom Corp. Cl. A(b) | | | 16,230 | | | | 576,327 | | |
| General Electric Co. | | | 32,590 | | | | 1,129,243 | | |
Marvell Technology
Group Limited(b) | | | 12,570 | | | | 478,163 | | |
| | | | 2,183,733 | | |
| Energy - 4.4% | | | |
| Halliburton Co. | | | 10,850 | | | | 518,847 | | |
Nabors Industries
Limited(b) | | | 7,100 | | | | 430,402 | | |
| Schlumberger Limited | | | 4,770 | | | | 362,234 | | |
| | | | 1,311,483 | | |
| Financial Services - 7.1% | | | |
| Franklin Resources, Inc. | | | 6,050 | | | | 465,729 | | |
The Goldman Sachs
Group, Inc. | | | 5,480 | | | | 559,070 | | |
| MBNA Corp. | | | 18,450 | | | | 482,652 | | |
| Merrill Lynch & Co., Inc. | | | 8,250 | | | | 453,832 | | |
| The Schwab (Charles) Corp. | | | 12,850 | | | | 144,948 | | |
| | | | 2,106,231 | | |
| | | Number of
Shares | | Market
Value | |
| Foods - 1.2% | |
| Starbucks Corp.(b) | | | 7,180 | | | $ | 370,919 | | |
| Healthcare - 3.9% | |
| Caremark Rx, Inc.(b) | | | 8,650 | | | | 385,098 | | |
| UnitedHealth Group, Inc. | | | 14,700 | | | | 766,458 | | |
| | | | 1,151,556 | | |
Home Construction, Furnishings &
Appliances - 1.2% | | | | | | | |
| Pulte Homes, Inc. | | | 4,430 | | | | 373,228 | | |
| Household Products - 1.7% | |
| Corning, Inc.(b) | | | 31,150 | | | | 517,713 | | |
| Information Retrieval Services - 11.5% | |
| Google, Inc. Cl. A(a) (b) | | | 4,150 | | | | 1,220,723 | | |
Juniper
Networks, Inc.(a) (b) | | | 36,730 | | | | 924,861 | | |
| Yahoo!, Inc.(b) | | | 36,750 | | | | 1,273,388 | | |
| | | | 3,418,972 | | |
| Insurance - 4.3% | | | |
| AFLAC, Inc. | | | 3,500 | | | | 151,480 | | |
American International
Group, Inc. | | | 12,300 | | | | 714,630 | | |
| WellPoint, Inc.(b) | | | 5,880 | | | | 409,483 | | |
| | | | 1,275,593 | | |
| Manufacturing - 0.8% | | | |
| Applied Materials, Inc. | | | 14,100 | | | | 228,138 | | |
| Medical Supplies - 6.6% | |
Boston
Scientific Corp.(a) (b) | | | 10,340 | | | | 279,180 | | |
| St. Jude Medical, Inc.(b) | | | 23,500 | | | | 1,024,835 | | |
| Zimmer Holdings, Inc.(b) | | | 8,770 | | | | 668,011 | | |
| | | | 1,972,026 | | |
| Pharmaceuticals - 11.5% | | | |
| Alcon, Inc. | | | 6,550 | | | | 716,243 | | |
| Amgen, Inc.(b) | | | 10,900 | | | | 659,014 | | |
| Eli Lilly & Co. | | | 6,550 | | | | 364,901 | | |
| Genentech, Inc.(b) | | | 8,500 | | | | 682,380 | | |
| Gilead Sciences, Inc.(b) | | | 9,800 | | | | 431,102 | | |
Teva Pharmaceutical
Sponsored ADR
(Israel)(a) | | | 18,350 | | | | 571,419 | | |
| | | | 3,425,059 | | |
| Prepackaged Software - 5.2% | | | |
| Electronic Arts, Inc.(b) | | | 14,360 | | | | 812,920 | | |
| Microsoft Corp. | | | 29,200 | | | | 725,328 | | |
| | | | 1,538,248 | | |
| | | Number of
Shares | | Market
Value | |
| Retail - 5.1% | |
| Lowe's Companies, Inc.(a) | | | 13,550 | | | $ | 788,881 | | |
| Target Corp. | | | 13,450 | | | | 731,815 | | |
| | | | 1,520,696 | | |
| Retail – Grocery - 0.6% | | | |
| Whole Foods Market, Inc. | | | 1,520 | | | | 179,816 | | |
| Transportation - 1.4% | |
| Carnival Corp.(a) | | | 7,750 | | | | 422,763 | | |
TOTAL EQUITIES
(Cost $26,238,227) | | | | | | | 29,462,859 | | |
| | | Principal
Amount | |
| |
| SHORT-TERM INVESTMENTS - 20.2% | |
| Cash Equivalents - 18.9%(c) | |
ABN Amro Bank NV
Eurodollar Time Deposit
3.250% 08/05/2005 | | $ | 60,199 | | | | 60,199 | | |
American Beacon Money
Market Fund | | | 162,511 | | | | 162,511 | | |
Bank of America
Bank Note
3.270% 07/18/2005 | | | 83,323 | | | | 83,323 | | |
Bank of America
Bank Note
3.270% 08/30/2005 | | | 154,743 | | | | 154,743 | | |
Bank of Montreal
Eurodollar Time Deposit
3.010% 07/01/2005 | | | 229,196 | | | | 229,196 | | |
Barclays
Eurodollar Time Deposit
3.160% 07/14/2005 | | | 119,033 | | | | 119,033 | | |
Barclays
Eurodollar Time Deposit
3.250% 07/26/2005 | | | 119,932 | | | | 119,932 | | |
BGI Institutional Money
Market Fund | | | 467,168 | | | | 467,168 | | |
BNP Paribas
Eurodollar Time Deposit
3.000% 07/01/2005 | | | 83,323 | | | | 83,323 | | |
Calyon
Eurodollar Time Deposit
3.310% 07/01/2005 | | | 71,420 | | | | 71,420 | | |
Citigroup
Eurodollar Time Deposit
3.085% 07/22/2005 | | | 71,420 | | | | 71,420 | | |
(Continued)
The accompanying notes are an integral part of the financial statements.
106
MassMutual Select Large Cap Growth Fund – Portfolio of Investments (Continued)
| | | Principal
Amount | | Market
Value | |
Citigroup
Eurodollar Time Deposit
3.100% 07/25/2005 | | $ | 165,433 | | | $ | 165,433 | | |
Dexia Group
Eurodollar Time Deposit
3.205% 07/20/2005 | | | 59,516 | | | | 59,516 | | |
Dexia Group
Eurodollar Time Deposit
3.240% 07/21/2005 | | | 59,516 | | | | 59,516 | | |
Federal Home Loan
Bank Discount Note
2.977% 07/01/2005 | | | 146,988 | | | | 146,988 | | |
First Tennessee
National Corporation
Eurodollar Time Deposit
3.220% 08/09/2005 | | | 21,451 | | | | 21,451 | | |
Fortis Bank
Eurodollar Time Deposit
3.110% 07/05/2005 | | | 82,813 | | | | 82,813 | | |
Fortis Bank
Eurodollar Time Deposit
3.250% 07/25/2005 | | | 84,018 | | | | 84,018 | | |
Fortis Bank
Eurodollar Time Deposit
3.250% 08/04/2005 | | | 119,033 | | | | 119,033 | | |
Fortis Bank
Eurodollar Time Deposit
3.270% 07/07/2005 | | | 95,226 | | | | 95,226 | | |
Freddie Mac Discount Note
3.208% 07/26/2005 | | | 58,679 | | | | 58,679 | | |
Freddie Mac Discount Note
3.244% 08/16/2005 | | | 142,839 | | | | 142,839 | | |
General Electric
Capital Corp
3.252% 07/06/2005 | | | 119,033 | | | | 119,033 | | |
General Electric
Capital Corp
3.253% 07/08/2005 | | | 95,226 | | | | 95,226 | | |
Goldman Sachs
Financial Square
Prime Obligations
Money Market Fund | | | 108,692 | | | | 108,692 | | |
Harris Trust & Savings Bank
3.295% 11/04/2005 | | | 114,003 | | | | 114,003 | | |
HBOS Halifax
Bank of Scotland
Eurodollar Time Deposit
3.150% 08/08/2005 | | | 59,516 | | | | 59,516 | | |
HSBC Banking/
Holdings PLC
Eurodollar Time Deposit
3.250% 08/05/2005 | | | 71,420 | | | | 71,420 | | |
JP Morgan Chase & Co.
Eurodollar Time Deposit
3.200% 07/20/2005 | | | 119,033 | | | | 119,033 | | |
| | | Principal
Amount | | Market
Value | |
Merrimac Cash Fund,
Premium Class | | $ | 188,722 | | | $ | 188,722 | | |
Morgan Stanley
Dean Witter & Co.
3.518% 07/19/2005 | | | 238,066 | | | | 238,066 | | |
National Australia Bank
Eurodollar Time Deposit
3.260% 07/06/2005 | | | 47,613 | | | | 47,613 | | |
National Australia Bank
Eurodollar Time Deposit
3.375% 07/01/2005 | | | 142,839 | | | | 142,839 | | |
Nordea Bank Finland PLC
(NY Branch)
Eurodollar Time Deposit
3.165% 08/09/2005 | | | 92,430 | | | | 92,430 | | |
Nordea Bank Finland PLC
(NY Branch)
Eurodollar Time Deposit
3.240% 08/03/2005 | | | 42,852 | | | | 42,852 | | |
Rabobank Nederland
Eurodollar Time Deposit
3.170% 07/18/2005 | | | 119,033 | | | | 119,033 | | |
Rabobank Nederland
Eurodollar Time Deposit
3.350% 07/01/2005 | | | 96,312 | | | | 96,312 | | |
Royal Bank of Canada
Eurodollar Time Deposit
3.250% 07/07/2005 | | | 71,420 | | | | 71,420 | | |
Royal Bank of Canada
Eurodollar Time Deposit
3.260% 07/28/2005 | | | 119,033 | | | | 119,033 | | |
Royal Bank of Scotland
Eurodollar Time Deposit
3.240% 08/08/2005 | | | 130,936 | | | | 130,936 | | |
Royal Bank of Scotland
Eurodollar Time Deposit
3.250% 08/04/2005 | | | 95,226 | | | | 95,226 | | |
Royal Bank of Scotland
Eurodollar Time Deposit
3.270% 07/29/2005 | | | 95,226 | | | | 95,226 | | |
Societe Generale
Eurodollar Time Deposit
3.200% 08/08/2005 | | | 47,613 | | | | 47,613 | | |
Societe Generale
Eurodollar Time Deposit
3.240% 08/09/2005 | | | 78,786 | | | | 78,786 | | |
Societe Generale
Eurodollar Time Deposit
3.280% 08/01/2005 | | | 119,033 | | | | 119,033 | | |
Svenska Handlesbanken
Eurodollar Time Deposit
3.220% 08/05/2005 | | | 119,033 | | | | 119,033 | | |
| | | Principal
Amount | | Market
Value | |
The Bank of the West
Eurodollar Time Deposit
3.270% 07/27/2005 | | $ | 35,710 | | | $ | 35,710 | | |
Toronto Dominion Bank
Eurodollar Time Deposit
3.250% 08/02/2005 | | | 119,033 | | | | 119,033 | | |
UBS AG
Eurodollar Time Deposit
3.250% 08/09/2005 | | | 59,516 | | | | 59,516 | | |
Wells Fargo
Eurodollar Time Deposit
3.270% 07/21/2005 | | | 119,033 | | | | 119,033 | | |
Wells Fargo
Eurodollar Time Deposit
3.270% 08/01/2005 | | | 119,033 | | | | 119,033 | | |
| | | | 5,641,201 | | |
| Repurchase Agreement - 1.3% | | | |
Investors Bank & Trust
Company Repurchase
Agreement, dated
06/30/2005, 2.01%,
due 07/01/2005(d) | | | 375,860 | | | | 375,860 | | |
TOTAL SHORT-TERM
INVESTMENTS
(At Amortized Cost) | | | | | | | 6,017,061 | | |
TOTAL INVESTMENTS - 119.0%
(Cost $32,255,288)(e) | | | | | | | 35,479,920 | | |
Other Assets/
(Liabilities) - (19.0%) | | | | | | | (5,668,401 | ) | |
| NET ASSETS - 100.0% | | | | | | $ | 29,811,519 | | |
Notes to Portfolio of Investments
ADR - American Depository Receipt.
(a) Denotes all or a portion of security on loan.
(b) Non-income producing security.
(c) Represents investments of security lending collateral. (Note 2).
(d) Maturity value of $375,881. Collateralized by U.S. Government Agency obligations with a rate of 3.664%, maturity date of 05/25/2034, and an aggregate market value, including accrued interest, of $394,653.
(e) See Note 6 for aggregate cost for Federal tax purposes.
The accompanying notes are an integral part of the financial statements.
107
MassMutual Select Growth Equity Fund – Portfolio of Investments
June 30, 2005 (Unaudited)
| | | Number of
Shares | | Market
Value | |
| EQUITIES - 98.5% | | | |
| Advertising - 0.2% | | | |
| Getty Images, Inc.(a) (b) | | | 18,400 | | | $ | 1,366,384 | | |
| Aerospace & Defense - 2.0% | | | |
Engineered Support
Systems, Inc.(b) | | | 9,549 | | | | 342,141 | | |
| General Dynamics Corp. | | | 6,000 | | | | 657,240 | | |
| Lockheed Martin Corp.(b) | | | 218,400 | | | | 14,167,608 | | |
| Rockwell Collins, Inc. | | | 38,200 | | | | 1,821,376 | | |
| | | | 16,988,365 | | |
| Apparel, Textiles & Shoes - 2.7% | | | |
Abercrombie & Fitch
Co. Cl. A(b) | | | 22,800 | | | | 1,566,360 | | |
American Eagle
Outfitters, Inc. | | | 218,000 | | | | 6,681,700 | | |
| bebe stores, inc.(b) | | | 56,500 | | | | 1,495,555 | | |
| Chico's FAS, Inc.(a) (b) | | | 32,100 | | | | 1,100,388 | | |
| Coach, Inc.(a) | | | 100,400 | | | | 3,370,428 | | |
Columbia
Sportswear Co.(a) (b) | | | 18,100 | | | | 893,959 | | |
| Nike, Inc. Cl. B | | | 33,500 | | | | 2,901,100 | | |
| Nordstrom, Inc. | | | 29,300 | | | | 1,991,521 | | |
Urban
Outfitters, Inc.(a) (b) | | | 53,700 | | | | 3,044,253 | | |
| | | | 23,045,264 | | |
| Automotive & Parts - 1.3% | | | |
| Copart, Inc.(a) | | | 20,300 | | | | 483,140 | | |
| Harley-Davidson, Inc. | | | 131,100 | | | | 6,502,560 | | |
| Oshkosh Truck Corp. | | | 1,200 | | | | 93,936 | | |
| Paccar, Inc. | | | 55,400 | | | | 3,767,200 | | |
| | | | 10,846,836 | | |
| Banking, Savings & Loans - 2.2% | | | |
| Fannie Mae | | | 324,500 | | | | 18,950,800 | | |
The First
Marblehead Corp.(a) (b) | | | 6,100 | | | | 213,866 | | |
| | | | 19,164,666 | | |
| Broadcasting, Publishing & Printing - 0.4% | | | |
Cablevision Systems
Corp. Cl. A(a) | | | 55,200 | | | | 1,777,440 | | |
The McGraw-Hill
Companies, Inc. | | | 39,800 | | | | 1,761,150 | | |
| | | | 3,538,590 | | |
| Building Materials & Construction - 0.1% | | | |
| Kinetic Concepts, Inc.(a) | | | 11,700 | | | | 702,000 | | |
| | | Number of
Shares | | Market
Value | |
| Chemicals - 1.6% | |
| Dow Chemical Co. | | | 276,400 | | | $ | 12,308,092 | | |
| Eastman Chemical Co. | | | 12,700 | | | | 700,405 | | |
| Georgia Gulf Corp. | | | 25,700 | | | | 797,985 | | |
| | | | 13,806,482 | | |
| Commercial Services - 1.2% | | | |
| Ecolab, Inc.(b) | | | 45,600 | | | | 1,475,616 | | |
| Fluor Corp.(b) | | | 25,200 | | | | 1,451,268 | | |
| Global Payments, Inc.(b) | | | 10,700 | | | | 725,460 | | |
Jacobs Engineering
Group, Inc.(a) | | | 7,500 | | | | 421,950 | | |
| Moody's Corp. | | | 26,000 | | | | 1,168,960 | | |
Pharmaceutical Product
Development, Inc.(a) | | | 42,300 | | | | 1,982,178 | | |
| Regis Corp. | | | 11,300 | | | | 441,604 | | |
| Rent-A-Center, Inc.(a) | | | 73,500 | | | | 1,711,815 | | |
Robert Half
International, Inc.(b) | | | 18,500 | | | | 461,945 | | |
| Ryder System, Inc. | | | 24,300 | | | | 889,380 | | |
| | | | 10,730,176 | | |
| Communications - 1.5% | | | |
| Harris Corp. | | | 70,300 | | | | 2,194,063 | | |
Network
Appliance, Inc.(a) (b) | | | 228,300 | | | | 6,454,041 | | |
| Qualcomm, Inc. | | | 116,700 | | | | 3,852,267 | | |
| Titan Corp.(a) | | | 34,700 | | | | 789,078 | | |
| | | | 13,289,449 | | |
| Communications Equipment - 0.2% | | | |
| Motorola, Inc. | | | 116,700 | | | | 2,130,942 | | |
| Computer Integrated Systems Design - 0.8% | |
| Autodesk, Inc. | | | 185,400 | | | | 6,372,198 | | |
| F5 Networks, Inc.(a) | | | 15,500 | | | | 732,142 | | |
| | | | 7,104,340 | | |
| Computer Programming Services - 0.2% | | | |
Cognizant Technology
Solutions Corp.(a) | | | 13,700 | | | | 645,681 | | |
| VeriSign, Inc.(a) | | | 41,500 | | | | 1,193,540 | | |
| | | | 1,839,221 | | |
| Computers & Information - 7.6% | | | |
| Apple Computer, Inc.(a) | | | 175,300 | | | | 6,452,793 | | |
| Cisco Systems, Inc.(a) | | | 65,500 | | | | 1,251,705 | | |
| Dell, Inc.(a) | | | 1,125,200 | | | | 44,456,652 | | |
| EMC Corp.(a) | | | 136,500 | | | | 1,871,415 | | |
International Business
Machines Corp. | | | 103,800 | | | | 7,701,960 | | |
| | | Number of
Shares | | Market
Value | |
Lexmark
International, Inc.(a) | | | 22,200 | | | $ | 1,439,226 | | |
| Western Digital Corp.(a) | | | 158,200 | | | | 2,123,044 | | |
| | | | 65,296,795 | | |
| Containers - 0.1% | | | |
| Crown Holdings, Inc.(a) | | | 76,100 | | | | 1,082,903 | | |
| Cosmetics & Personal Care - 1.0% | | | |
| The Gillette Co. | | | 68,100 | | | | 3,447,903 | | |
| The Procter & Gamble Co. | | | 95,000 | | | | 5,011,250 | | |
| | | | 8,459,153 | | |
| Data Processing & Preparation - 2.1% | | | |
Affiliated Computer
Services, Inc. Cl. A(a) | | | 23,200 | | | | 1,185,520 | | |
Alliance Data
Systems Corp.(a) | | | 21,200 | | | | 859,872 | | |
Factset Research
Systems, Inc.(b) | | | 2,000 | | | | 71,680 | | |
| First Data Corp. | | | 254,800 | | | | 10,227,672 | | |
| Fiserv, Inc.(a) | | | 56,500 | | | | 2,426,675 | | |
| NCR Corp.(a) | | | 64,400 | | | | 2,261,728 | | |
Total System
Services, Inc.(b) | | | 38,100 | | | | 918,210 | | |
| | | | 17,951,357 | | |
| Electric Utilities - 0.9% | | | |
| Exelon Corp. | | | 108,100 | | | | 5,548,773 | | |
| TXU Corp. | | | 22,800 | | | | 1,894,452 | | |
| | | | 7,443,225 | | |
| Electrical Equipment & Electronics - 4.5% | | | |
American Power
Conversion Corp. | | | 15,000 | | | | 353,850 | | |
| Amphenol Corp. Cl. A | | | 31,600 | | | | 1,269,372 | | |
| Cree, Inc.(a) (b) | | | 77,800 | | | | 1,981,566 | | |
| General Electric Co. | | | 113,200 | | | | 3,922,380 | | |
| Intel Corp. | | | 932,700 | | | | 24,306,162 | | |
| Qlogic Corp.(a) | | | 43,200 | | | | 1,333,584 | | |
| Rockwell Automation, Inc. | | | 106,600 | | | | 5,192,486 | | |
| Texas Instruments, Inc. | | | 17,400 | | | | 488,418 | | |
| | | | 38,847,818 | | |
| Energy - 7.9% | | | |
| Burlington Resources, Inc. | | | 69,400 | | | | 3,833,656 | | |
CAL Dive
International, Inc.(a) | | | 31,700 | | | | 1,660,129 | | |
| EOG Resources, Inc. | | | 150,700 | | | | 8,559,760 | | |
| Exxon Mobil Corp. | | | 742,100 | | | | 42,648,487 | | |
| Halliburton Co. | | | 62,800 | | | | 3,003,096 | | |
| Kinder Morgan, Inc. | | | 40,300 | | | | 3,352,960 | | |
| Murphy Oil Corp. | | | 24,200 | | | | 1,263,966 | | |
(Continued)
The accompanying notes are an integral part of the financial statements.
108
MassMutual Select Growth Equity Fund – Portfolio of Investments (Continued)
| | | Number of
Shares | | Market
Value | |
National Oilwell
Varco, Inc.(a) | | | 1,100 | | | $ | 52,294 | | |
| Patterson-UTI Energy, Inc. | | | 52,300 | | | | 1,455,509 | | |
Pride
International, Inc.(a) (b) | | | 84,900 | | | | 2,181,930 | | |
| XTO Energy, Inc. | | | 10,500 | | | | 356,895 | | |
| | | | 68,368,682 | | |
| Entertainment & Leisure - 0.1% | | | |
| Blockbuster, Inc. Cl. A(b) | | | 79,600 | | | | 725,952 | | |
| Financial Services - 1.8% | | | |
The Chicago
Mercantile Exchange | | | 3,700 | | | | 1,093,350 | | |
| Eaton Vance Corp. | | | 21,600 | | | | 516,456 | | |
| Franklin Resources, Inc. | | | 61,700 | | | | 4,749,666 | | |
| MBNA Corp. | | | 303,300 | | | | 7,934,328 | | |
| Regency Centers Corp. | | | 26,100 | | | | 1,492,920 | | |
| | | | 15,786,720 | | |
| Foods - 0.9% | | | |
| 7-Eleven, Inc.(a) | | | 20,800 | | | | 628,992 | | |
| The Hershey Co. | | | 10,600 | | | | 658,260 | | |
Panera Bread
Co. Cl. A(a) (b) | | | 13,200 | | | | 819,522 | | |
| Starbucks Corp.(a) | | | 118,400 | | | | 6,116,544 | | |
| | | | 8,223,318 | | |
| Healthcare - 6.5% | | | |
| Caremark Rx, Inc.(a) | | | 32,600 | | | | 1,451,352 | | |
| Covance, Inc.(a) | | | 8,700 | | | | 390,369 | | |
Coventry Health
Care, Inc.(a) | | | 11,653 | | | | 824,450 | | |
Express
Scripts, Inc.(a) (b) | | | 90,600 | | | | 4,528,188 | | |
| HCA, Inc. | | | 36,500 | | | | 2,068,455 | | |
Lincare
Holdings, Inc.(a) (b) | | | 98,100 | | | | 4,006,404 | | |
| UnitedHealth Group, Inc. | | | 815,352 | | | | 42,512,453 | | |
| | | | 55,781,671 | | |
Home Construction, Furnishings &
Appliances - 1.1% | | | | | | | |
| D.R. Horton, Inc. | | | 7,400 | | | | 278,314 | | |
Harman
International Industries | | | 19,800 | | | | 1,610,928 | | |
| Maytag Corp.(b) | | | 36,900 | | | | 577,854 | | |
Mohawk
Industries, Inc.(a) (b) | | | 31,400 | | | | 2,590,500 | | |
| The Ryland Group, Inc. | | | 9,100 | | | | 690,417 | | |
Tempur-Pedic
International, Inc.(a) (b) | | | 36,800 | | | | 816,224 | | |
| Toll Brothers, Inc.(a) (b) | | | 27,700 | | | | 2,812,935 | | |
| | | | 9,377,172 | | |
| | | Number of
Shares | | Market
Value | |
| Household Products - 0.5% | |
| Black & Decker Corp.(b) | | | 41,300 | | | $ | 3,710,805 | | |
| Fortune Brands, Inc. | | | 7,600 | | | | 674,880 | | |
| | | | 4,385,685 | | |
| Industrial – Distribution - 0.3% | | | |
| Grainger (W.W.), Inc. | | | 41,600 | | | | 2,279,264 | | |
| Industrial – Diversified - 0.1% | |
| Danaher Corp.(b) | | | 21,400 | | | | 1,120,076 | | |
| Information Retrieval Services - 1.3% | |
| Google, Inc. Cl. A(a) (b) | | | 26,400 | | | | 7,765,560 | | |
| Yahoo!, Inc.(a) | | | 94,400 | | | | 3,270,960 | | |
| | | | 11,036,520 | | |
| Insurance - 2.8% | | | |
| Aetna, Inc. | | | 111,200 | | | | 9,209,584 | | |
| AFLAC, Inc. | | | 149,000 | | | | 6,448,720 | | |
Ambac Financial
Group, Inc. | | | 27,900 | | | | 1,946,304 | | |
American International
Group, Inc. | | | 27,200 | | | | 1,580,320 | | |
| AMERIGROUP Corp.(a) | | | 8,100 | | | | 325,620 | | |
Marsh & McLennan
Companies, Inc. | | | 40,000 | | | | 1,108,000 | | |
| Radian Group, Inc. | | | 28,400 | | | | 1,341,048 | | |
| WellChoice, Inc.(a) | | | 2,100 | | | | 145,887 | | |
| WellPoint, Inc.(a) | | | 30,600 | | | | 2,130,984 | | |
| | | | 24,236,467 | | |
| Lodging - 1.8% | | | |
| Boyd Gaming Corp. | | | 12,800 | | | | 654,464 | | |
Marriott
International, Inc. Cl. A | | | 118,700 | | | | 8,097,714 | | |
| MGM Mirage(a) | | | 119,900 | | | | 4,745,642 | | |
Starwood Hotels & Resorts
Worldwide, Inc. | | | 42,200 | | | | 2,471,654 | | |
| | | | 15,969,474 | | |
| Machinery & Components - 1.1% | | | |
| Baker Hughes, Inc. | | | 37,400 | | | | 1,913,384 | | |
| Caterpillar, Inc. | | | 51,200 | | | | 4,879,872 | | |
| FMC Technologies, Inc.(a) | | | 29,500 | | | | 943,115 | | |
| Graco, Inc. | | | 20,600 | | | | 701,842 | | |
| Grant Prideco, Inc.(a) | | | 26,700 | | | | 706,215 | | |
| Joy Global, Inc. | | | 19,500 | | | | 655,005 | | |
| | | | 9,799,433 | | |
| Manufacturing - 0.2% | | | |
American Standard
Companies, Inc. | | | 44,700 | | | | 1,873,824 | | |
| Medical Supplies - 0.9% | |
| Bard (C.R.), Inc. | | | 29,200 | | | | 1,942,092 | | |
| Bausch & Lomb, Inc. | | | 9,000 | | | | 747,000 | | |
| | | Number of
Shares | | Market
Value | |
| Becton, Dickinson & Co. | | | 13,400 | | | $ | 703,098 | | |
| Mine Safety Appliances Co. | | | 12,000 | | | | 554,400 | | |
| Zimmer Holdings, Inc.(a) | | | 46,700 | | | | 3,557,139 | | |
| | | | 7,503,729 | | |
| Metals & Mining - 0.5% | | | |
| Nucor Corp.(b) | | | 77,800 | | | | 3,549,236 | | |
| Precision Castparts Corp. | | | 6,100 | | | | 475,190 | | |
Worthington
Industries, Inc. | | | 18,300 | | | | 289,140 | | |
| | | | 4,313,566 | | |
| Pharmaceuticals - 15.0% | | | |
| Abbott Laboratories | | | 118,700 | | | | 5,817,487 | | |
AmerisourceBergen
Corp.(b) | | | 44,400 | | | | 3,070,260 | | |
| Barr Pharmaceuticals(a) | | | 31,900 | | | | 1,554,806 | | |
| Cardinal Health, Inc. | | | 130,000 | | | | 7,485,400 | | |
Charles River Laboratories
International, Inc.(a) | | | 6,000 | | | | 289,500 | | |
| Genentech, Inc.(a) | | | 34,300 | | | | 2,753,604 | | |
| Hospira, Inc.(a) | | | 20,400 | | | | 795,600 | | |
| Johnson & Johnson | | | 846,900 | | | | 55,048,500 | | |
| McKesson Corp. | | | 122,200 | | | | 5,473,338 | | |
Medco Health
Solutions, Inc.(a) | | | 42,500 | | | | 2,267,800 | | |
| Merck & Co., Inc. | | | 573,800 | | | | 17,673,040 | | |
| Pfizer, Inc. | | | 951,100 | | | | 26,231,338 | | |
| Wyeth | | | 30,700 | | | | 1,366,150 | | |
| | | | 129,826,823 | | |
| Prepackaged Software - 2.4% | | | |
| Adobe Systems, Inc. | | | 316,300 | | | | 9,052,506 | | |
| Microsoft Corp. | | | 117,200 | | | | 2,911,248 | | |
| Oracle Corp.(a) | | | 495,600 | | | | 6,541,920 | | |
| Symantec Corp.(a) | | | 87,600 | | | | 1,904,424 | | |
| | | | 20,410,098 | | |
| Real Estate - 0.4% | | | |
| The St. Joe Co.(b) | | | 39,300 | | | | 3,204,522 | | |
| Restaurants - 1.2% | | | |
Applebee's
International, Inc. | | | 54,150 | | | | 1,434,434 | | |
Brinker
International, Inc.(a) (b) | | | 35,200 | | | | 1,409,760 | | |
| Darden Restaurants, Inc. | | | 77,800 | | | | 2,565,844 | | |
| McDonald's Corp. | | | 25,100 | | | | 696,525 | | |
| Outback Steakhouse, Inc. | | | 31,700 | | | | 1,434,108 | | |
| Sonic Corp.(a) | | | 25,100 | | | | 766,303 | | |
| Yum! Brands, Inc. | | | 45,100 | | | | 2,348,808 | | |
| | | | 10,655,782 | | |
(Continued)
The accompanying notes are an integral part of the financial statements.
109
MassMutual Select Growth Equity Fund – Portfolio of Investments (Continued)
| | | Number of
Shares | | Market
Value | |
| Retail - 14.2% | | | |
Bed Bath &
Beyond, Inc.(a) | | | 168,400 | | | $ | 7,035,752 | | |
| Dollar General Corp. | | | 120,300 | | | | 2,449,308 | | |
Dollar Tree
Stores, Inc.(a) (b) | | | 98,700 | | | | 2,368,800 | | |
Family Dollar
Stores, Inc. | | | 32,900 | | | | 858,690 | | |
| The Home Depot, Inc. | | | 1,079,000 | | | | 41,973,100 | | |
| Lowe's Companies, Inc. | | | 371,200 | | | | 21,611,264 | | |
| Michaels Stores, Inc. | | | 89,600 | | | | 3,706,752 | | |
MSC Industrial
Direct Co. Cl. A | | | 11,000 | | | | 371,250 | | |
O'Reilly
Automotive, Inc.(a) | | | 23,200 | | | | 691,592 | | |
| Pier 1 Imports, Inc.(b) | | | 16,400 | | | | 232,716 | | |
| Staples, Inc. | | | 90,400 | | | | 1,927,328 | | |
| Target Corp. | | | 195,100 | | | | 10,615,391 | | |
| TJX Companies, Inc. | | | 182,800 | | | | 4,451,180 | | |
| Walgreen Co. | | | 263,700 | | | | 12,127,563 | | |
| Wal-Mart Stores, Inc. | | | 250,800 | | | | 12,088,560 | | |
| | | | 122,509,246 | | |
| Retail – Grocery - 0.0% | | | |
| Weis Markets, Inc. | | | 9,500 | | | | 368,505 | | |
| Telephone Utilities - 0.7% | | | |
Nextel
Partners, Inc. Cl. A(a) | | | 98,500 | | | | 2,479,245 | | |
NII
Holdings, Inc. Cl. B(a) | | | 7,100 | | | | 453,974 | | |
Verizon
Communications, Inc. | | | 85,400 | | | | 2,950,570 | | |
| | | | 5,883,789 | | |
| Tobacco - 4.8% | | | |
| Altria Group, Inc. | | | 640,700 | | | | 41,427,662 | | |
| Transportation - 1.4% | | | |
| CNF, Inc. | | | 34,700 | | | | 1,558,030 | | |
Expeditors International
of Washington, Inc.(b) | | | 59,900 | | | | 2,983,619 | | |
| FedEx Corp. | | | 18,800 | | | | 1,522,988 | | |
J.B. Hunt Transport
Services, Inc.(b) | | | 108,200 | | | | 2,088,260 | | |
| Landstar System, Inc.(a) | | | 54,000 | | | | 1,626,480 | | |
Robinson (C.H.)
Worldwide, Inc. | | | 36,900 | | | | 2,147,580 | | |
| | | | 11,926,957 | | |
TOTAL EQUITIES
(Cost $802,668,646) | | | | | | | 850,628,903 | | |
| | | Number of
Shares | | Market
Value | |
| RIGHTS - 0.0% | |
| Computers & Information | |
| Seagate Technology(a) (c) | | | 66,000 | | | $ | - | | |
TOTAL RIGHTS
(Cost $0) | | | | | | | - | | |
TOTAL LONG TERM INVESTMENTS
(Cost $802,668,646) | | | | | | $ | 850,628,903 | | |
| | | Principal
Amount | | | |
| SHORT-TERM INVESTMENTS - 8.8% | |
| Cash Equivalents - 6.6%(d) | |
ABN Amro Bank NV
Eurodollar Time Deposit
3.250% 08/05/2005 | | $ | 610,061 | | | | 610,061 | | |
American Beacon Money
Market Fund | | | 1,646,914 | | | | 1,646,914 | | |
Bank of America
Bank Note
3.270% 07/18/2005 | | | 844,408 | | | | 844,408 | | |
Bank of America
Bank Note
3.270% 08/30/2005 | | | 1,568,186 | | | | 1,568,186 | | |
Bank of Montreal
Eurodollar Time Deposit
3.010% 07/01/2005 | | | 2,322,707 | | | | 2,322,707 | | |
Barclays
Eurodollar Time Deposit
3.160% 07/14/2005 | | | 1,206,297 | | | | 1,206,297 | | |
Barclays
Eurodollar Time Deposit
3.250% 07/26/2005 | | | 1,215,410 | | | | 1,215,410 | | |
BGI Institutional Money
Market Fund | | | 4,734,355 | | | | 4,734,355 | | |
BNP Paribas
Eurodollar Time Deposit
3.000% 07/01/2005 | | | 844,408 | | | | 844,408 | | |
Calyon
Eurodollar Time Deposit
3.310% 07/01/2005 | | | 723,778 | | | | 723,778 | | |
Citigroup
Eurodollar Time Deposit
3.085% 07/22/2005 | | | 723,778 | | | | 723,778 | | |
Citigroup
Eurodollar Time Deposit
3.100% 07/25/2005 | | | 1,676,527 | | | | 1,676,527 | | |
Dexia Group
Eurodollar Time Deposit
3.205% 07/20/2005 | | | 603,149 | | | | 603,149 | | |
| | | Principal
Amount | | Market
Value | |
Dexia Group
Eurodollar Time Deposit
3.240% 07/21/2005 | | $ | 603,149 | | | $ | 603,149 | | |
Federal Home Loan Bank
Discount Note
2.977% 07/01/2005 | | | 1,489,602 | | | | 1,489,602 | | |
First Tennessee National
Corporation
Eurodollar Time Deposit
3.220% 08/09/2005 | | | 217,384 | | | | 217,384 | | |
Fortis Bank
Eurodollar Time Deposit
3.110% 07/05/2005 | | | 839,240 | | | | 839,240 | | |
Fortis Bank
Eurodollar Time Deposit
3.250% 07/25/2005 | | | 851,452 | | | | 851,452 | | |
Fortis Bank
Eurodollar Time Deposit
3.250% 08/04/2005 | | | 1,206,297 | | | | 1,206,297 | | |
Fortis Bank
Eurodollar Time Deposit
3.270% 07/07/2005 | | | 965,038 | | | | 965,038 | | |
Freddie Mac
Discount Note
3.208% 07/26/2005 | | | 594,659 | | | | 594,659 | | |
Freddie Mac
Discount Note
3.244% 08/16/2005 | | | 1,447,556 | | | | 1,447,556 | | |
General Electric
Capital Corp
3.252% 07/06/2005 | | | 1,206,297 | | | | 1,206,297 | | |
General Electric
Capital Corp
3.253% 07/08/2005 | | | 965,038 | | | | 965,038 | | |
Goldman Sachs
Financial Square
Prime Obligations
Money Market Fund | | | 1,101,498 | | | | 1,101,498 | | |
Harris Trust &
Savings Bank
3.295% 11/04/2005 | | | 1,155,325 | | | | 1,155,325 | | |
HBOS Halifax
Bank of Scotland
Eurodollar Time Deposit
3.150% 08/08/2005 | | | 603,149 | | | | 603,149 | | |
HSBC Banking/
Holdings PLC
Eurodollar Time Deposit
3.250% 08/05/2005 | | | 723,778 | | | | 723,778 | | |
JP Morgan Chase & Co.
Eurodollar Time Deposit
3.200% 07/20/2005 | | | 1,206,297 | | | | 1,206,297 | | |
(Continued)
The accompanying notes are an integral part of the financial statements.
110
MassMutual Select Growth Equity Fund – Portfolio of Investments (Continued)
| | | Principal
Amount | | Market
Value | |
Merrimac Cash Fund,
Premium Class | | $ | 1,912,543 | | | $ | 1,912,543 | | |
Morgan Stanley
Dean Witter & Co.
3.518% 07/19/2005 | | | 2,412,594 | | | | 2,412,594 | | |
National Australia Bank
Eurodollar Time Deposit
3.260% 07/06/2005 | | | 482,519 | | | | 482,519 | | |
National Australia Bank
Eurodollar Time Deposit
3.375% 07/01/2005 | | | 1,447,556 | | | | 1,447,556 | | |
Nordea Bank Finland PLC
(NY Branch)
Eurodollar Time Deposit
3.165% 08/09/2005 | | | 936,702 | | | | 936,702 | | |
Nordea Bank Finland PLC
(NY Branch)
Eurodollar Time Deposit
3.240% 08/03/2005 | | | 434,267 | | | | 434,267 | | |
Rabobank Nederland
Eurodollar Time Deposit
3.170% 07/18/2005 | | | 1,206,297 | | | | 1,206,297 | | |
Rabobank Nederland
Eurodollar Time Deposit
3.350% 07/01/2005 | | | 976,035 | | | | 976,035 | | |
Royal Bank of Canada
Eurodollar Time Deposit
3.250% 07/07/2005 | | | 723,778 | | | | 723,778 | | |
Royal Bank of Canada
Eurodollar Time Deposit
3.260% 07/28/2005 | | | 1,206,297 | | | | 1,206,297 | | |
Royal Bank of Scotland
Eurodollar Time Deposit
3.240% 08/08/2005 | | | 1,326,927 | | | | 1,326,927 | | |
Royal Bank of Scotland
Eurodollar Time Deposit
3.250% 08/04/2005 | | | 965,038 | | | | 965,038 | | |
Royal Bank of Scotland
Eurodollar Time Deposit
3.270% 07/29/2005 | | | 965,038 | | | | 965,038 | | |
Societe Generale
Eurodollar Time Deposit
3.200% 08/08/2005 | | | 482,519 | | | | 482,519 | | |
Societe Generale
Eurodollar Time Deposit
3.240% 08/09/2005 | | | 798,433 | | | | 798,433 | | |
Societe Generale
Eurodollar Time Deposit
3.280% 08/01/2005 | | | 1,206,297 | | | | 1,206,297 | | |
Svenska Handlesbanken
Eurodollar Time Deposit
3.220% 08/05/2005 | | | 1,206,297 | | | | 1,206,297 | | |
| | | Principal
Amount | | Market
Value | |
The Bank of the West
Eurodollar Time Deposit
3.270% 07/27/2005 | | $ | 361,889 | | | $ | 361,889 | | |
Toronto Dominion Bank
Eurodollar Time Deposit
3.250% 08/02/2005 | | | 1,206,297 | | | | 1,206,297 | | |
UBS AG
Eurodollar Time Deposit
3.250% 08/09/2005 | | | 603,149 | | | | 603,149 | | |
Wells Fargo
Eurodollar Time Deposit
3.270% 07/21/2005 | | | 1,206,294 | | | | 1,206,294 | | |
Wells Fargo
Eurodollar Time Deposit
3.270% 08/01/2005 | | | 1,206,297 | | | | 1,206,297 | | |
| | | | 57,168,800 | | |
| Repurchase Agreement - 2.2% | | | |
Investors Bank & Trust
Company Repurchase
Agreement, dated
06/30/2005, 2.01%,
due 07/01/2005(e) | | | 18,999,285 | | | | 18,999,285 | | |
TOTAL SHORT-TERM
INVESTMENTS
(At Amortized Cost) | | | | | | | 76,168,085 | | |
TOTAL INVESTMENTS - 107.3%
(Cost $878,836,731)(f) | | | | | | | 926,796,988 | | |
Other Assets/
(Liabilities) - (7.3%) | | | | | | | (63,033,816 | ) | |
| NET ASSETS - 100.0% | | | | | | $ | 863,763,172 | | |
Notes to Portfolio of Investments
(a) Non-income producing security.
(b) Denotes all or a portion of security on loan.
(c) This security is valued in good faith under procedures established by the board of trustees.
(d) Represents investments of security lending collateral. (Note 2).
(e) Maturity value of $19,000,346. Collateralized by U.S. Government Agency obligation with a rate of 6.625%, maturity date of 06/25/2016, and an aggregate market value, including accrued interest, of $19,949,249.
(f) See Note 6 for aggregate cost for Federal tax purposes.
The accompanying notes are an integral part of the financial statements.
111
MassMutual Select Aggressive Growth Fund – Portfolio of Investments
June 30, 2005 (Unaudited)
| | | Number of
Shares | | Market
Value | |
| EQUITIES - 95.9% | | | |
| Banking, Savings & Loans - 5.6% | | | |
Capital One
Financial Corp.(a) | | | 342,450 | | | $ | 27,399,424 | | |
| Commercial Services - 17.1% | | | |
Apollo
Group, Inc. Cl. A(a) (b) | | | 425,150 | | | | 33,255,233 | | |
| eBay, Inc.(b) | | | 967,950 | | | | 31,952,029 | | |
| Iron Mountain, Inc.(b) | | | 160,500 | | | | 4,978,710 | | |
| Moody's Corp.(a) | | | 309,300 | | | | 13,906,128 | | |
| | | | 84,092,100 | | |
| Communications - 3.4% | | | |
| Qualcomm, Inc. | | | 499,050 | | | | 16,473,640 | | |
| Computers & Information - 9.3% | | | |
| Cisco Systems, Inc.(b) | | | 965,950 | | | | 18,459,304 | | |
| Dell, Inc.(a) (b) | | | 687,800 | | | | 27,174,978 | | |
| | | | 45,634,282 | | |
| Foods - 6.3% | | | |
| Starbucks Corp.(b) | | | 603,650 | | | | 31,184,559 | | |
| Information Retrieval Services - 6.9% | | | |
| Google, Inc. Cl. A(a) (b) | | | 114,750 | | | | 33,753,713 | | |
| Medical Supplies - 13.7% | | | |
| Allergan, Inc.(a) | | | 196,950 | | | | 16,788,018 | | |
| Medtronic, Inc. | | | 345,350 | | | | 17,885,677 | | |
| Patterson Cos., Inc.(b) | | | 193,550 | | | | 8,725,234 | | |
| Stryker Corp. | | | 279,150 | | | | 13,276,374 | | |
| Zimmer Holdings, Inc.(b) | | | 136,150 | | | | 10,370,546 | | |
| | | | 67,045,849 | | |
| Pharmaceuticals - 19.6% | | | |
| Amgen, Inc.(b) | | | 235,900 | | | | 14,262,514 | | |
| Genentech, Inc.(b) | | | 527,250 | | | | 42,327,630 | | |
| Genzyme Corp.(b) | | | 314,700 | | | | 18,910,323 | | |
Teva Pharmaceutical
Sponsored ADR
(Israel)(a) | | | 660,050 | | | | 20,553,957 | | |
| | | | 96,054,424 | | |
| Prepackaged Software - 1.4% | | | |
| Red Hat, Inc.(a) (b) | | | 518,450 | | | | 6,791,695 | | |
| Retail - 12.6% | | | |
Bed Bath &
Beyond, Inc.(b) | | | 298,600 | | | | 12,475,508 | | |
| Kohl's Corp.(b) | | | 243,700 | | | | 13,625,267 | | |
| | | Number of
Shares | | Market
Value | |
Lowe's
Companies, Inc.(a) | | | 385,700 | | | $ | 22,455,454 | | |
| Walgreen Co. | | | 292,350 | | | | 13,445,177 | | |
| | | | 62,001,406 | | |
TOTAL EQUITIES
(Cost $411,877,753) | | | | | | | 470,431,092 | | |
| | | Principal
Amount | | | |
| SHORT-TERM INVESTMENTS - 22.7% | | | |
| Cash Equivalents - 18.8%(c) | | | |
ABN Amro Bank NV
Eurodollar Time Deposit
3.250% 08/05/2005 | | $ | 983,315 | | | | 983,315 | | |
American Beacon Money
Market Fund | | | 2,654,524 | | | | 2,654,524 | | |
Bank of America
Bank Note
3.270% 07/18/2005 | | | 1,361,031 | | | | 1,361,031 | | |
Bank of America
Bank Note
3.270% 08/30/2005 | | | 2,527,629 | | | | 2,527,629 | | |
Bank of Montreal
Eurodollar Time Deposit
3.010% 07/01/2005 | | | 3,743,780 | | | | 3,743,780 | | |
Barclays
Eurodollar Time Deposit
3.160% 07/14/2005 | | | 1,944,330 | | | | 1,944,330 | | |
Barclays
Eurodollar Time Deposit
3.250% 07/26/2005 | | | 1,959,018 | | | | 1,959,018 | | |
BGI Institutional Money
Market Fund | | | 7,630,914 | | | | 7,630,914 | | |
BNP Paribas
Eurodollar Time Deposit
3.000% 07/01/2005 | | | 1,361,031 | | | | 1,361,031 | | |
Calyon
Eurodollar Time Deposit
3.310% 07/01/2005 | | | 1,166,598 | | | | 1,166,598 | | |
Citigroup
Eurodollar Time Deposit
3.085% 07/22/2005 | | | 1,166,598 | | | | 1,166,598 | | |
Citigroup
Eurodollar Time Deposit
3.100% 07/25/2005 | | | 2,702,255 | | | | 2,702,255 | | |
Dexia Group
Eurodollar Time Deposit
3.205% 07/20/2005 | | | 972,165 | | | | 972,165 | | |
| | | Principal
Amount | | Market
Value | |
Dexia Group
Eurodollar Time Deposit
3.240% 07/21/2005 | | $ | 972,165 | | | $ | 972,165 | | |
Federal Home Loan Bank
Discount Note
2.977% 07/01/2005 | | | 2,400,965 | | | | 2,400,965 | | |
First Tennessee National
Corporation
Eurodollar Time Deposit
3.220% 08/09/2005 | | | 350,384 | | | | 350,384 | | |
Fortis Bank
Eurodollar Time Deposit
3.110% 07/05/2005 | | | 1,352,702 | | | | 1,352,702 | | |
Fortis Bank
Eurodollar Time Deposit
3.250% 07/25/2005 | | | 1,372,385 | | | | 1,372,385 | | |
Fortis Bank
Eurodollar Time Deposit
3.250% 08/04/2005 | | | 1,944,330 | | | | 1,944,330 | | |
Fortis Bank
Eurodollar Time Deposit
3.270% 07/07/2005 | | | 1,555,464 | | | | 1,555,464 | | |
Freddie Mac
Discount Note
3.208% 07/26/2005 | | | 958,482 | | | | 958,482 | | |
Freddie Mac
Discount Note
3.244% 08/16/2005 | | | 2,333,196 | | | | 2,333,196 | | |
General Electric
Capital Corp
3.252% 07/06/2005 | | | 1,944,330 | | | | 1,944,330 | | |
General Electric
Capital Corp
3.253% 07/08/2005 | | | 1,555,464 | | | | 1,555,464 | | |
Goldman Sachs
Financial Square
Prime Obligations
Money Market Fund | | | 1,775,413 | | | | 1,775,413 | | |
Harris Trust &
Savings Bank
3.295% 11/04/2005 | | | 1,862,173 | | | | 1,862,173 | | |
HBOS Halifax
Bank of Scotland
Eurodollar Time Deposit
3.150% 08/08/2005 | | | 972,165 | | | | 972,165 | | |
HSBC Banking/
Holdings PLC
Eurodollar Time Deposit
3.250% 08/05/2005 | | | 1,166,598 | | | | 1,166,598 | | |
(Continued)
The accompanying notes are an integral part of the financial statements.
112
MassMutual Select Aggressive Growth Fund – Portfolio of Investments (Continued)
| | | Principal
Amount | | Market
Value | |
JP Morgan Chase & Co.
Eurodollar Time Deposit
3.200% 07/20/2005 | | $ | 1,944,330 | | | $ | 1,944,330 | | |
Merrimac Cash Fund,
Premium Class | | | 3,082,669 | | | | 3,082,669 | | |
Morgan Stanley
Dean Witter & Co.
3.518% 07/19/2005 | | | 3,888,661 | | | | 3,888,661 | | |
National Australia Bank
Eurodollar Time Deposit
3.260% 07/06/2005 | | | 777,732 | | | | 777,732 | | |
National Australia Bank
Eurodollar Time Deposit
3.375% 07/01/2005 | | | 2,333,196 | | | | 2,333,196 | | |
Nordea Bank Finland PLC
(NY Branch)
Eurodollar Time Deposit
3.165% 08/09/2005 | | | 1,509,793 | | | | 1,509,793 | | |
Nordea Bank Finland PLC
(NY Branch)
Eurodollar Time Deposit
3.240% 08/03/2005 | | | 699,959 | | | | 699,959 | | |
Rabobank Nederland
Eurodollar Time Deposit
3.170% 07/18/2005 | | | 1,944,330 | | | | 1,944,330 | | |
Rabobank Nederland
Eurodollar Time Deposit
3.350% 07/01/2005 | | | 1,573,191 | | | | 1,573,191 | | |
Royal Bank of Canada
Eurodollar Time Deposit
3.250% 07/07/2005 | | | 1,166,598 | | | | 1,166,598 | | |
Royal Bank of Canada
Eurodollar Time Deposit
3.260% 07/28/2005 | | | 1,944,330 | | | | 1,944,330 | | |
Royal Bank of Scotland
Eurodollar Time Deposit
3.240% 08/08/2005 | | | 2,138,763 | | | | 2,138,763 | | |
Royal Bank of Scotland
Eurodollar Time Deposit
3.250% 08/04/2005 | | | 1,555,464 | | | | 1,555,464 | | |
Royal Bank of Scotland
Eurodollar Time Deposit
3.270% 07/29/2005 | | | 1,555,464 | | | | 1,555,464 | | |
Societe Generale
Eurodollar Time Deposit
3.200% 08/08/2005 | | | 777,732 | | | | 777,732 | | |
Societe Generale
Eurodollar Time Deposit
3.240% 08/09/2005 | | | 1,286,928 | | | | 1,286,928 | | |
Societe Generale
Eurodollar Time Deposit
3.280% 08/01/2005 | | | 1,944,330 | | | | 1,944,330 | | |
| | | Principal
Amount | | Market
Value | |
Svenska Handlesbanken
Eurodollar Time Deposit
3.220% 08/05/2005 | | $ | 1,944,330 | | | $ | 1,944,330 | | |
The Bank of the West
Eurodollar Time Deposit
3.270% 07/27/2005 | | | 583,299 | | | | 583,299 | | |
Toronto Dominion Bank
Eurodollar Time Deposit
3.250% 08/02/2005 | | | 1,944,330 | | | | 1,944,330 | | |
UBS AG
Eurodollar Time Deposit
3.250% 08/09/2005 | | | 972,165 | | | | 972,165 | | |
Wells Fargo
Eurodollar Time Deposit
3.270% 07/21/2005 | | | 1,944,330 | | | | 1,944,330 | | |
Wells Fargo
Eurodollar Time Deposit
3.270% 08/01/2005 | | | 1,944,330 | | | | 1,944,330 | | |
| | | | 92,145,658 | | |
| Repurchase Agreement - 3.9% | | | |
Investors Bank & Trust
Company Repurchase
Agreement, dated
06/30/2005, 2.01%,
due 07/01/2005(d) | | | 19,292,397 | | | | 19,292,397 | | |
TOTAL SHORT-TERM
INVESTMENTS
(At Amortized Cost) | | | | | | | 111,438,055 | | |
TOTAL INVESTMENTS - 118.6%
(Cost $523,315,808)(e) | | | | | | | 581,869,147 | | |
Other Assets/
(Liabilities) - (18.6%) | | | | | | | (91,071,633 | ) | |
| NET ASSETS - 100.0% | | | | | | $ | 490,797,514 | | |
Notes to Portfolio of Investments
ADR - American Depository Receipt.
(a) Denotes all or a portion of security on loan.
(b) Non-income producing security.
(c) Represents investments of security lending collateral. (Note 2).
(d) Maturity value of $19,293,474. Collaterized by U.S. Government Agency obligations with rates of 3.650% - 6.375%, maturity dates of 08/25/2014 - 04/01/2035, and an aggregate market value, including accrued interest, of $20,257,017.
(e) See Note 6 for aggregate cost for Federal tax purposes.
The accompanying notes are an integral part of the financial statements.
113
MassMutual Select OTC 100 Fund – Portfolio of Investments
June 30, 2005 (Unaudited)
| | | Number of
Shares | | Market
Value | |
| EQUITIES - 99.6% | | | |
| Advertising - 0.3% | | | |
| Lamar Advertising Co.(a) | | | 4,191 | | | $ | 179,249 | | |
| Apparel, Textiles & Shoes - 0.3% | | | |
| Ross Stores, Inc. | | | 7,076 | | | | 204,567 | | |
| Automotive & Parts - 1.1% | | | |
| Paccar, Inc. | | | 9,478 | | | | 644,504 | | |
| Broadcasting, Publishing & Printing - 4.3% | | | |
| Comcast Corp. Cl. A(a) | | | 46,363 | | | | 1,423,344 | | |
| IAC/InterActiveCorp(a) (b) | | | 33,297 | | | | 800,793 | | |
| Liberty Global, Inc. Cl. A(a) | | | 8,464 | | | | 395,015 | | |
| | | | 2,619,152 | | |
| Commercial Services - 6.0% | | | |
Apollo
Group, Inc. Cl. A(a) (b) | | | 8,935 | | | | 698,896 | | |
| Career Education Corp.(a) | | | 5,082 | | | | 186,052 | | |
| Cintas Corp.(b) | | | 10,043 | | | | 387,660 | | |
| eBay, Inc.(a) | | | 48,966 | | | | 1,616,368 | | |
| Fastenal Co.(b) | | | 3,528 | | | | 216,125 | | |
| Paychex, Inc. | | | 17,464 | | | | 568,279 | | |
| | | | 3,673,380 | | |
| Communications - 13.3% | | | |
EchoStar
Communications
Corp. Cl. A(b) | | | 10,815 | | | | 326,072 | | |
Network
Appliance, Inc.(a) (b) | | | 18,622 | | | | 526,444 | | |
Nextel
Communications,
Inc. Cl. A(a) (b) | | | 68,639 | | | | 2,217,726 | | |
| NTL, Inc.(a) | | | 4,494 | | | | 307,479 | | |
| Qualcomm, Inc. | | | 95,833 | | | | 3,163,447 | | |
Research In
Motion Limited(a) | | | 9,250 | | | | 682,187 | | |
Sirius Satellite
Radio, Inc.(a) (b) | | | 69,726 | | | | 451,824 | | |
| Tellabs, Inc.(a) | | | 12,428 | | | | 108,124 | | |
XM Satellite Radio
Holdings,
Inc. Cl. A(a) (b) | | | 10,624 | | | | 357,604 | | |
| | | | 8,140,907 | | |
| Communications Equipment - 0.3% | | | |
Ericsson (LM) Cl. B
Sponsored ADR
(Sweden)(b) | | | 6,223 | | | | 198,825 | | |
| | | Number of
Shares | | Market
Value | |
| Computer Integrated Systems Design - 1.3% | | | |
| Autodesk, Inc. | | | 11,587 | | | $ | 398,245 | | |
| Sun Microsystems, Inc.(a) | | | 72,068 | | | | 268,814 | | |
| Synopsys, Inc.(a) | | | 6,445 | | | | 107,438 | | |
| | | | 774,497 | | |
| Computer Programming Services - 1.4% | | | |
Cognizant Technology
Solutions Corp.(a) | | | 6,418 | | | | 302,480 | | |
Mercury
Interactive Corp.(a) | | | 4,485 | | | | 172,045 | | |
| VeriSign, Inc.(a) (b) | | | 12,131 | | | | 348,888 | | |
| | | | 823,413 | | |
| Computers & Information - 10.8% | | | |
| Apple Computer, Inc.(a) | | | 55,898 | | | | 2,057,605 | | |
| CDW Corp. | | | 4,125 | | | | 235,496 | | |
| Cisco Systems, Inc.(a) | | | 111,055 | | | | 2,122,261 | | |
Comverse
Technology, Inc.(a) | | | 10,113 | | | | 239,172 | | |
| Dell, Inc.(a) | | | 43,323 | | | | 1,711,692 | | |
| Sandisk Corp.(a) | | | 8,084 | | | | 191,833 | | |
| | | | 6,558,059 | | |
| Containers - 0.2% | | | |
Smurfit-Stone
Container Corp. | | | 12,107 | | | | 123,128 | | |
| Data Processing & Preparation - 0.8% | | | |
| Fiserv, Inc.(a) | | | 11,639 | | | | 499,895 | | |
| Electrical Equipment & Electronics - 14.6% | | | |
| Altera Corp.(a) (b) | | | 25,421 | | | | 503,844 | | |
American Power
Conversion Corp. | | | 9,432 | | | | 222,501 | | |
| ATI Technologies, Inc.(a) | | | 12,069 | | | | 143,018 | | |
| Broadcom Corp. Cl. A(a) | | | 12,293 | | | | 436,524 | | |
Flextronics International
Limited(a) | | | 29,840 | | | | 394,186 | | |
| Garmin Limited(b) | | | 4,892 | | | | 209,133 | | |
| Intel Corp. | | | 105,142 | | | | 2,740,001 | | |
| Intersil Corp. Cl. A | | | 7,506 | | | | 140,888 | | |
| JDS Uniphase Corp.(a) | | | 80,229 | | | | 121,948 | | |
| Kla-Tencor Corp. | | | 11,605 | | | | 507,138 | | |
Linear
Technology Corp.(b) | | | 19,893 | | | | 729,874 | | |
Marvell Technology
Group Limited(a) | | | 12,969 | | | | 493,341 | | |
Maxim Integrated
Products, Inc. | | | 22,354 | | | | 854,146 | | |
| Microchip Technology, Inc. | | | 8,431 | | | | 249,726 | | |
| Molex, Inc.(b) | | | 4,812 | | | | 125,304 | | |
| Novellus Systems, Inc.(a) | | | 6,848 | | | | 169,214 | | |
| | | Number of
Shares | | Market
Value | |
| Qlogic Corp.(a) | | | 4,554 | | | $ | 140,582 | | |
| Sanmina-SCI Corp.(a) (b) | | | 27,288 | | | | 149,265 | | |
| Xilinx, Inc. | | | 22,637 | | | | 577,244 | | |
| | | | 8,907,877 | | |
| Foods - 2.2% | | | |
| Starbucks Corp.(a) | | | 26,361 | | | | 1,361,809 | | |
| Healthcare - 0.8% | |
Express
Scripts, Inc.(a) (b) | | | 6,440 | | | | 321,871 | | |
| Lincare Holdings, Inc.(a) | | | 4,646 | | | | 189,743 | | |
| | | | 511,614 | | |
| Information Retrieval Services - 2.6% | | | |
Juniper
Networks, Inc.(a) (b) | | | 17,421 | | | | 438,661 | | |
| Yahoo!, Inc.(a) | | | 32,652 | | | | 1,131,392 | | |
| | | | 1,570,053 | | |
| Internet Content - 0.3% | | | |
| BEA Systems, Inc.(a) | | | 17,675 | | | | 155,187 | | |
| Lodging - 0.4% | |
Wynn Resorts
Limited(a) (b) | | | 5,275 | | | | 249,349 | | |
| Manufacturing - 1.4% | |
| Applied Materials, Inc. | | | 41,353 | | | | 669,092 | | |
| Lam Research Corp.(a) | | | 6,962 | | | | 201,480 | | |
| | | | 870,572 | | |
| Medical Supplies - 1.7% | | | |
| Biomet, Inc. | | | 16,496 | | | | 571,421 | | |
Dentsply
International, Inc. | | | 3,753 | | | | 202,662 | | |
| Patterson Cos., Inc.(a) | | | 6,410 | | | | 288,963 | | |
| | | | 1,063,046 | | |
| Miscellaneous - 0.0% | | | |
Nasdaq-100 Index
Tracking Stock | | | 221 | | | | 8,131 | | |
| Pharmaceuticals - 10.2% | |
| Amgen, Inc.(a) | | | 28,055 | | | | 1,696,205 | | |
| Biogen Idec, Inc.(a) | | | 18,222 | | | | 627,748 | | |
| Chiron Corp.(a) | | | 12,752 | | | | 444,917 | | |
| Genzyme Corp.(a) | | | 15,384 | | | | 924,425 | | |
| Gilead Sciences, Inc.(a) | | | 21,642 | | | | 952,032 | | |
| Invitrogen Corp.(a) | | | 2,371 | | | | 197,481 | | |
| Medimmune, Inc.(a) | | | 12,896 | | | | 344,581 | | |
Millennium
Pharmaceuticals, Inc.(a) | | | 16,406 | | | | 152,084 | | |
(Continued)
The accompanying notes are an integral part of the financial statements.
114
MassMutual Select OTC 100 Fund – Portfolio of Investments (Continued)
| | | Number of
Shares | | Market
Value | |
| Sigma-Aldrich Corp. | | | 3,217 | | | $ | 180,281 | | |
Teva Pharmaceutical
Sponsored ADR (Israel) | | | 22,611 | | | | 704,107 | | |
| | | | 6,223,861 | | |
| Prepackaged Software - 16.7% | | | |
| Adobe Systems, Inc.(b) | | | 23,282 | | | | 666,331 | | |
Check Point Software
Technologies Limited(a) | | | 11,926 | | | | 236,135 | | |
| Citrix Systems, Inc.(a) | | | 9,782 | | | | 211,878 | | |
| Electronic Arts, Inc.(a) | | | 15,030 | | | | 850,848 | | |
| Intuit, Inc.(a) | | | 11,105 | | | | 500,947 | | |
| Microsoft Corp. | | | 180,868 | | | | 4,492,761 | | |
| Oracle Corp.(a) | | | 104,274 | | | | 1,376,417 | | |
| Pixar, Inc.(a) | | | 5,780 | | | | 289,289 | | |
| Siebel Systems, Inc. | | | 29,438 | | | | 261,998 | | |
| Symantec Corp.(a) | | | 36,180 | | | | 786,553 | | |
| Veritas Software Corp.(a) | | | 21,246 | | | | 518,402 | | |
| | | | 10,191,559 | | |
| Retail - 6.4% | | | |
| Amazon.Com, Inc.(a) (b) | | | 13,270 | | | | 438,972 | | |
| Bed Bath & Beyond, Inc.(a) | | | 19,325 | | | | 807,399 | | |
| Costco Wholesale Corp. | | | 12,238 | | | | 548,507 | | |
| Dollar Tree Stores, Inc.(a) | | | 5,102 | | | | 122,448 | | |
| Petsmart, Inc.(b) | | | 6,893 | | | | 209,203 | | |
Sears
Holdings Corp.(a) (b) | | | 8,389 | | | | 1,257,259 | | |
| Staples, Inc. | | | 24,068 | | | | 513,130 | | |
| | | | 3,896,918 | | |
| Retail – Grocery - 0.6% | | | |
| Whole Foods Market, Inc. | | | 3,117 | | | | 368,741 | | |
| Telephone Utilities - 0.8% | | | |
Level 3 Communications,
Inc.(a) (b) | | | 33,358 | | | | 67,717 | | |
| MCI, Inc.(b) | | | 17,226 | | | | 442,880 | | |
| | | | 510,597 | | |
| Transportation - 0.8% | | | |
Expeditors International of
Washington, Inc. | | | 5,093 | | | | 253,682 | | |
Robinson (C.H.)
Worldwide, Inc. | | | 4,076 | | | | 237,223 | | |
| | | | 490,905 | | |
TOTAL EQUITIES
(Cost $56,956,941) | | | | | | | 60,819,795 | | |
| | | Principal
Amount | | Market
Value | |
| SHORT-TERM INVESTMENTS - 14.3% | | | |
| Cash Equivalents - 13.8%(c) | | | |
ABN Amro Bank NV
Eurodollar Time Deposit
3.250% 08/05/2005 | | $ | 90,120 | | | $ | 90,120 | | |
American Beacon Money
Market Fund | | | 243,293 | | | | 243,293 | | |
Bank of America
Bank Note
3.270% 07/18/2005 | | | 124,741 | | | | 124,741 | | |
Bank of America
Bank Note
3.270% 08/30/2005 | | | 231,662 | | | | 231,662 | | |
Bank of Montreal
Eurodollar Time Deposit
3.010% 07/01/2005 | | | 343,125 | | | | 343,125 | | |
Barclays
Eurodollar Time Deposit
3.160% 07/14/2005 | | | 178,202 | | | | 178,202 | | |
Barclays
Eurodollar Time Deposit
3.250% 07/26/2005 | | | 179,548 | | | | 179,548 | | |
BGI Institutional Money
Market Fund | | | 699,389 | | | | 699,389 | | |
BNP Paribas
Eurodollar Time Deposit
3.000% 07/01/2005 | | | 124,741 | | | | 124,741 | | |
Calyon
Eurodollar Time Deposit
3.310% 07/01/2005 | | | 106,921 | | | | 106,921 | | |
Citigroup
Eurodollar Time Deposit
3.085% 07/22/2005 | | | 106,921 | | | | 106,921 | | |
Citigroup
Eurodollar Time Deposit
3.100% 07/25/2005 | | | 247,667 | | | | 247,667 | | |
Dexia Group
Eurodollar Time Deposit
3.205% 07/20/2005 | | | 89,101 | | | | 89,101 | | |
Dexia Group
Eurodollar Time Deposit
3.240% 07/21/2005 | | | 89,101 | | | | 89,101 | | |
Federal Home Loan Bank
Discount Note
2.977% 07/01/2005 | | | 220,053 | | | | 220,053 | | |
First Tennessee
National Corporation
Eurodollar Time Deposit
3.220% 08/09/2005 | | | 32,113 | | | | 32,113 | | |
Fortis Bank
Eurodollar Time Deposit
3.110% 07/05/2005 | | | 123,978 | | | | 123,978 | | |
| | | Principal
Amount | | Market
Value | |
Fortis Bank
Eurodollar Time Deposit
3.250% 07/25/2005 | | $ | 125,782 | | | $ | 125,782 | | |
Fortis Bank
Eurodollar Time Deposit
3.250% 08/04/2005 | | | 178,202 | | | | 178,202 | | |
Fortis Bank
Eurodollar Time Deposit
3.270% 07/07/2005 | | | 142,561 | | | | 142,561 | | |
Freddie Mac
Discount Note
3.208% 07/26/2005 | | | 87,847 | | | | 87,847 | | |
Freddie Mac
Discount Note
3.244% 08/16/2005 | | | 213,842 | | | | 213,842 | | |
General Electric
Capital Corp
3.252% 07/06/2005 | | | 178,202 | | | | 178,202 | | |
General Electric
Capital Corp
3.253% 07/08/2005 | | | 142,561 | | | | 142,561 | | |
Goldman Sachs
Financial Square
Prime Obligations
Money Market Fund | | | 162,720 | | | | 162,720 | | |
Harris Trust &
Savings Bank
3.295% 11/04/2005 | | | 170,672 | | | | 170,672 | | |
HBOS Halifax
Bank of Scotland
Eurodollar Time Deposit
3.150% 08/08/2005 | | | 89,101 | | | | 89,101 | | |
HSBC Banking/
Holdings PLC
Eurodollar Time Deposit
3.250% 08/05/2005 | | | 106,921 | | | | 106,921 | | |
JP Morgan Chase & Co.
Eurodollar Time Deposit
3.200% 07/20/2005 | | | 178,202 | | | | 178,202 | | |
Merrimac Cash Fund,
Premium Class | | | 282,533 | | | | 282,533 | | |
Morgan Stanley
Dean Witter & Co.
3.518% 07/19/2005 | | | 356,404 | | | | 356,404 | | |
National Australia Bank
Eurodollar Time Deposit
3.260% 07/06/2005 | | | 71,281 | | | | 71,281 | | |
National Australia Bank
Eurodollar Time Deposit
3.375% 07/01/2005 | | | 213,842 | | | | 213,842 | | |
Nordea Bank Finland PLC
(NY Branch)
Eurodollar Time Deposit
3.165% 08/09/2005 | | | 138,376 | | | | 138,376 | | |
(Continued)
The accompanying notes are an integral part of the financial statements.
115
MassMutual Select OTC 100 Fund – Portfolio of Investments (Continued)
| | | Principal
Amount | | Market
Value | |
Nordea Bank Finland PLC
(NY Branch)
Eurodollar Time Deposit
3.240% 08/03/2005 | | $ | 64,153 | | | $ | 64,153 | | |
Rabobank Nederland
Eurodollar Time Deposit
3.170% 07/18/2005 | | | 178,202 | | | | 178,202 | | |
Rabobank Nederland
Eurodollar Time Deposit
3.350% 07/01/2005 | | | 144,186 | | | | 144,186 | | |
Royal Bank of Canada
Eurodollar Time Deposit
3.250% 07/07/2005 | | | 106,921 | | | | 106,921 | | |
Royal Bank of Canada
Eurodollar Time Deposit
3.260% 07/28/2005 | | | 178,202 | | | | 178,202 | | |
Royal Bank of Scotland
Eurodollar Time Deposit
3.240% 08/08/2005 | | | 196,022 | | | | 196,022 | | |
Royal Bank of Scotland
Eurodollar Time Deposit
3.250% 08/04/2005 | | | 142,561 | | | | 142,561 | | |
Royal Bank of Scotland
Eurodollar Time Deposit
3.270% 07/29/2005 | | | 142,561 | | | | 142,561 | | |
Societe Generale
Eurodollar Time Deposit
3.200% 08/08/2005 | | | 71,281 | | | | 71,281 | | |
Societe Generale
Eurodollar Time Deposit
3.240% 08/09/2005 | | | 117,950 | | | | 117,950 | | |
Societe Generale
Eurodollar Time Deposit
3.280% 08/01/2005 | | | 178,202 | | | | 178,202 | | |
Svenska Handlesbanken
Eurodollar Time Deposit
3.220% 08/05/2005 | | | 178,202 | | | | 178,202 | | |
The Bank of the West
Eurodollar Time Deposit
3.270% 07/27/2005 | | | 53,461 | | | | 53,461 | | |
Toronto Dominion Bank
Eurodollar Time Deposit
3.250% 08/02/2005 | | | 178,202 | | | | 178,202 | | |
UBS AG
Eurodollar Time Deposit
3.250% 08/09/2005 | | | 89,101 | | | | 89,101 | | |
Wells Fargo
Eurodollar Time Deposit
3.270% 07/21/2005 | | | 178,202 | | | | 178,202 | | |
Wells Fargo
Eurodollar Time Deposit
3.270% 08/01/2005 | | | 178,202 | | | | 178,202 | | |
| | | | 8,445,336 | | |
| | | Principal
Amount | | Market
Value | |
| Repurchase Agreement - 0.1% | |
Investors Bank & Trust
Company Repurchase
Agreement, dated
06/30/2005, 2.01%,
due 07/01/2005(d) | | $ | 37,981 | | | $ | 37,981 | | |
| U.S. Treasury Bills - 0.4% | |
U.S. Treasury Bill(c)
2.715% 07/14/2005 | | | 30,000 | | | | 29,970 | | |
U.S. Treasury Bill(c)
2.805% 07/14/2005 | | | 185,000 | | | | 184,813 | | |
| | | | 214,783 | | |
TOTAL SHORT-TERM
INVESTMENTS
(At Amortized Cost) | | | | | | | 8,698,100 | | |
TOTAL INVESTMENTS - 113.9%
(Cost $65,655,041)(e) | | | | | | | 69,517,895 | | |
Other Assets/
(Liabilities) - (13.9%) | | | | | | | (8,476,678 | ) | |
| NET ASSETS - 100.0% | | | | | | $ | 61,041,217 | | |
Notes to Portfolio of Investments
ADR - American Depository Receipt.
(a) Non-income producing security.
(b) Denotes all or a portion of security on loan.
(c) This security is held as collateral for open futures contracts. (Note 2).
(c) Represents investments of security lending collateral. (Note 2).
(d) Maturity value of $37,983. Collateralized by a U.S. Government Agency obligation with a rate of 6.125%, maturity date of 04/25/2016 and an aggregate market value, including accrued interest, of $39,880.
(e) See Note 6 for agrregate cost for Federal tax purposes.
The accompanying notes are an integral part of the financial statements.
116
MassMutual Select Focused Value Fund – Portfolio of Investments
June 30, 2005 (Unaudited)
| | | Number of
Shares | | Market
Value | |
| EQUITIES - 91.0% | | | |
| Advertising - 0.7% | | | |
Catalina
Marketing Corp.(a) | | | 113,700 | | | $ | 2,889,117 | | |
| Harte-Hanks, Inc. | | | 96,200 | | | | 2,860,026 | | |
| | | | 5,749,143 | | |
| Apparel, Textiles & Shoes - 4.9% | | | |
| The Gap, Inc.(a) | | | 1,800,000 | | | | 35,550,000 | | |
| Jones Apparel Group, Inc. | | | 95,300 | | | | 2,958,112 | | |
| Tommy Hilfiger Corp.(b) | | | 282,900 | | | | 3,892,704 | | |
| | | | 42,400,816 | | |
| Automotive & Parts - 0.8% | | | |
| Federal Signal Corp.(a) | | | 253,600 | | | | 3,956,160 | | |
Superior Industries
International, Inc.(a) | | | 114,700 | | | | 2,718,390 | | |
| | | | 6,674,550 | | |
| Banking, Savings & Loans - 11.8% | | | |
| JP Morgan Chase & Co. | | | 950,000 | | | | 33,554,000 | | |
The South Financial
Group, Inc. | | | 34,000 | | | | 966,280 | | |
Sovereign
Bancorp, Inc.(a) | | | 1,800,000 | | | | 40,212,000 | | |
| Washington Mutual, Inc. | | | 700,000 | | | | 28,483,000 | | |
| | | | 103,215,280 | | |
| Beverages - 4.8% | | | |
The Pepsi Bottling
Group, Inc.(a) | | | 1,400,000 | | | | 40,054,000 | | |
| PepsiAmericas, Inc. | | | 74,200 | | | | 1,903,972 | | |
| | | | 41,957,972 | | |
| Broadcasting, Publishing & Printing - 14.8% | | | |
Cablevision
Systems Corp. Cl. A(b) | | | 1,586,500 | | | | 51,085,300 | | |
Liberty
Global, Inc. Cl. A(b) | | | 192,000 | | | | 8,960,640 | | |
Liberty
Media Corp. Cl. A(b) | | | 3,200,000 | | | | 32,608,000 | | |
| Time Warner, Inc.(b) | | | 2,200,000 | | | | 36,762,000 | | |
| | | | 129,415,940 | | |
| Chemicals - 1.0% | | | |
| Albemarle Corp. | | | 101,400 | | | | 3,698,058 | | |
| The Valspar Corp.(a) | | | 96,100 | | | | 4,640,669 | | |
| | | | 8,338,727 | | |
| Commercial Services - 6.5% | | | |
| ARAMARK Corp. Cl. B | | | 97,700 | | | | 2,579,280 | | |
| Cendant Corp. | | | 1,000,000 | | | | 22,370,000 | | |
| | | Number of
Shares | | Market
Value | |
| Equifax, Inc. | | | 64,100 | | | $ | 2,289,011 | | |
MoneyGram
International, Inc. | | | 273,000 | | | | 5,219,760 | | |
| Viad Corp.(a) | | | 54,100 | | | | 1,533,194 | | |
| Waste Management, Inc. | | | 800,000 | | | | 22,672,000 | | |
| | | | 56,663,245 | | |
| Communications - 0.3% | | | |
ADC
Telecommunications, Inc.(b) | | | 135,000 | | | | 2,938,950 | | |
| Computer Integrated Systems Design - 0.8% | |
Parametric
Technology Corp.(b) | | | 1,039,100 | | | | 6,629,458 | | |
| Computers & Office Equipment - 1.7% | |
| Hewlett-Packard Co. | | | 650,000 | | | | 15,281,500 | | |
| Data Processing & Preparation - 0.5% | |
| IMS Health, Inc. | | | 181,100 | | | | 4,485,847 | | |
| Electrical Equipment & Electronics - 4.6% | |
| AVX Corp.(a) | | | 167,700 | | | | 2,032,524 | | |
| Entegris, Inc.(b) | | | 459,500 | | | | 4,549,050 | | |
Flextronics International
Limited(b) | | | 146,300 | | | | 1,932,623 | | |
| Hubbell, Inc. Cl. B(a) | | | 132,400 | | | | 5,838,840 | | |
| Mykrolis Corp.(b) | | | 295,400 | | | | 4,197,634 | | |
National
Semiconductor Corp. | | | 1,000,000 | | | | 22,030,000 | | |
| | | | 40,580,671 | | |
| Foods - 0.6% | | | |
Hain Celestial
Group, Inc.(b) | | | 251,300 | | | | 4,900,350 | | |
| Healthcare - 0.6% | |
Universal Health
Services Cl. B | | | 89,700 | | | | 5,577,546 | | |
Home Construction, Furnishings &
Appliances - 0.4% | | | |
| Steelcase, Inc. | | | 261,100 | | | | 3,616,235 | | |
| Industrial – Diversified - 0.9% | |
| Carlisle Companies, Inc. | | | 80,600 | | | | 5,531,578 | | |
| Nordson Corp. | | | 58,000 | | | | 1,988,240 | | |
| | | | 7,519,818 | | |
| Insurance - 1.6% | | | |
Ambac Financial
Group, Inc. | | | 28,150 | | | | 1,963,744 | | |
| MBIA, Inc.(a) | | | 79,550 | | | | 4,718,110 | | |
| | | Number of
Shares | | Market
Value | |
Principal Financial
Group, Inc. | | | 73,900 | | | $ | 3,096,410 | | |
| UnumProvident Corp.(a) | | | 244,500 | | | | 4,479,240 | | |
| | | | 14,257,504 | | |
| Machinery & Components - 1.3% | | | |
| Dover Corp. | | | 126,000 | | | | 4,583,880 | | |
| Pall Corp. | | | 229,500 | | | | 6,967,620 | | |
| | | | 11,551,500 | | |
| Medical Supplies - 6.4% | | | |
| Baxter International, Inc. | | | 1,100,000 | | | | 40,810,000 | | |
| Haemonetics Corp.(b) | | | 146,300 | | | | 5,945,632 | | |
| Itron, Inc.(b) | | | 57,219 | | | | 2,556,545 | | |
Mettler-Toledo
International, Inc.(b) | | | 142,000 | | | | 6,614,360 | | |
| | | | 55,926,537 | | |
| Pharmaceuticals - 4.2% | | | |
| Hospira, Inc.(b) | | | 800,000 | | | | 31,200,000 | | |
Medco Health
Solutions, Inc.(a) (b) | | | 96,200 | | | | 5,133,232 | | |
| | | | 36,333,232 | | |
| Restaurants - 9.6% | | | |
| CBRL Group, Inc.(a) | | | 154,550 | | | | 6,005,813 | | |
| McDonald's Corp. | | | 1,250,000 | | | | 34,687,500 | | |
Wendy's
International, Inc.(a) | | | 38,600 | | | | 1,839,290 | | |
| Yum! Brands, Inc. | | | 800,000 | | | | 41,664,000 | | |
| | | | 84,196,603 | | |
| Retail - 8.6% | | | |
| Big Lots, Inc.(a) (b) | | | 639,400 | | | | 8,465,656 | | |
| Costco Wholesale Corp. | | | 700,000 | | | | 31,374,000 | | |
| Dollar General Corp. | | | 80,100 | | | | 1,630,836 | | |
| Tiffany & Co.(a) | | | 800,000 | | | | 26,208,000 | | |
| Zale Corp.(b) | | | 234,000 | | | | 7,415,460 | | |
| | | | 75,093,952 | | |
| Toys, Games - 0.5% | | | |
| Hasbro, Inc. | | | 195,400 | | | | 4,062,366 | | |
| Transportation - 3.1% | |
| Carnival Corp. | | | 500,000 | | | | 27,275,000 | | |
TOTAL EQUITIES
(Cost $643,192,940) | | | | | | | 794,642,742 | | |
(Continued)
The accompanying notes are an integral part of the financial statements.
117
MassMutual Select Focused Value Fund – Portfolio of Investments (Continued)
| | | Principal
Amount | | Market
Value | |
| SHORT-TERM INVESTMENTS - 18.5% | | | |
| Cash Equivalents - 10.7%(c) | | | |
ABN Amro Bank NV
Eurodollar Time Deposit
3.250% 08/05/2005 | | $ | 1,000,243 | | | $ | 1,000,243 | | |
American Beacon Money
Market Fund | | | 2,700,257 | | | | 2,700,257 | | |
Bank of America
Bank Note
3.270% 07/18/2005 | | | 1,384,479 | | | | 1,384,479 | | |
Bank of America
Bank Note
3.270% 08/30/2005 | | | 2,571,176 | | | | 2,571,176 | | |
Bank of Montreal
Eurodollar Time Deposit
3.010% 07/01/2005 | | | 3,808,278 | | | | 3,808,278 | | |
Barclays
Eurodollar Time Deposit
3.160% 07/14/2005 | | | 1,977,828 | | | | 1,977,828 | | |
Barclays
Eurodollar Time Deposit
3.250% 07/26/2005 | | | 1,992,768 | | | | 1,992,768 | | |
BGI Institutional Money
Market Fund | | | 7,762,380 | | | | 7,762,380 | | |
BNP Paribas
Eurodollar Time Deposit
3.000% 07/01/2005 | | | 1,384,479 | | | | 1,384,479 | | |
Calyon
Eurodollar Time Deposit
3.310% 07/01/2005 | | | 1,186,697 | | | | 1,186,697 | | |
Citigroup
Eurodollar Time Deposit
3.085% 07/22/2005 | | | 1,186,697 | | | | 1,186,697 | | |
Citigroup
Eurodollar Time Deposit
3.100% 07/25/2005 | | | 2,748,810 | | | | 2,748,810 | | |
Dexia Group
Eurodollar Time Deposit
3.205% 07/20/2005 | | | 988,913 | | | | 988,913 | | |
Dexia Group
Eurodollar Time Deposit
3.240% 07/21/2005 | | | 988,913 | | | | 988,913 | | |
Federal Home Loan Bank
Discount Note
2.977% 07/01/2005 | | | 2,442,330 | | | | 2,442,330 | | |
First Tennessee
National Corporation
Eurodollar Time Deposit
3.220% 08/09/2005 | | | 356,420 | | | | 356,420 | | |
Fortis Bank
Eurodollar Time Deposit
3.110% 07/05/2005 | | | 1,376,006 | | | | 1,376,006 | | |
| | | Principal
Amount | | Market
Value | |
Fortis Bank
Eurodollar Time Deposit
3.250% 07/25/2005 | | $ | 1,396,028 | | | $ | 1,396,028 | | |
Fortis Bank
Eurodollar Time Deposit
3.250% 08/04/2005 | | | 1,977,828 | | | | 1,977,828 | | |
Fortis Bank
Eurodollar Time Deposit
3.270% 07/07/2005 | | | 1,582,262 | | | | 1,582,262 | | |
Freddie Mac
Discount Note
3.208% 07/26/2005 | | | 974,995 | | | | 974,995 | | |
Freddie Mac
Discount Note
3.244% 08/16/2005 | | | 2,373,392 | | | | 2,373,392 | | |
General Electric
Capital Corp
3.252% 07/06/2005 | | | 1,977,828 | | | | 1,977,828 | | |
General Electric
Capital Corp
3.253% 07/08/2005 | | | 1,582,262 | | | | 1,582,262 | | |
Goldman Sachs
Financial Square
Prime Obligations
Money Market Fund | | | 1,806,000 | | | | 1,806,000 | | |
Harris Trust &
Savings Bank
3.295% 11/04/2005 | | | 1,894,255 | | | | 1,894,255 | | |
HBOS Halifax
Bank of Scotland
Eurodollar Time Deposit
3.150% 08/08/2005 | | | 988,913 | | | | 988,913 | | |
HSBC Banking/
Holdings PLC
Eurodollar Time Deposit
3.250% 08/05/2005 | | | 1,186,697 | | | | 1,186,697 | | |
JP Morgan Chase & Co.
Eurodollar Time Deposit
3.200% 07/20/2005 | | | 1,977,828 | | | | 1,977,828 | | |
Merrimac Cash Fund,
Premium Class | | | 3,135,777 | | | | 3,135,777 | | |
Morgan Stanley
Dean Witter & Co.
3.518% 07/19/2005 | | | 3,955,655 | | | | 3,955,655 | | |
National Australia Bank
Eurodollar Time Deposit
3.260% 07/06/2005 | | | 791,131 | | | | 791,131 | | |
National Australia Bank
Eurodollar Time Deposit
3.375% 07/01/2005 | | | 2,373,392 | | | | 2,373,392 | | |
Nordea Bank Finland PLC
(NY Branch)
Eurodollar Time Deposit
3.165% 08/09/2005 | | | 1,535,804 | | | | 1,535,804 | | |
| | | Principal
Amount | | Market
Value | |
Nordea Bank Finland PLC
(NY Branch)
Eurodollar Time Deposit
3.240% 08/03/2005 | | $ | 712,017 | | | $ | 712,017 | | |
Rabobank Nederland
Eurodollar Time Deposit
3.170% 07/18/2005 | | | 1,977,828 | | | | 1,977,828 | | |
Rabobank Nederland
Eurodollar Time Deposit
3.350% 07/01/2005 | | | 1,600,294 | | | | 1,600,294 | | |
Royal Bank of Canada
Eurodollar Time Deposit
3.250% 07/07/2005 | | | 1,186,697 | | | | 1,186,697 | | |
Royal Bank of Canada
Eurodollar Time Deposit
3.260% 07/28/2005 | | | 1,977,828 | | | | 1,977,828 | | |
Royal Bank of Scotland
Eurodollar Time Deposit
3.240% 08/08/2005 | | | 2,175,610 | | | | 2,175,610 | | |
Royal Bank of Scotland
Eurodollar Time Deposit
3.250% 08/04/2005 | | | 1,582,262 | | | | 1,582,262 | | |
Royal Bank of Scotland
Eurodollar Time Deposit
3.270% 07/29/2005 | | | 1,582,262 | | | | 1,582,262 | | |
Societe Generale
Eurodollar Time Deposit
3.200% 08/08/2005 | | | 791,131 | | | | 791,131 | | |
Societe Generale
Eurodollar Time Deposit
3.240% 08/09/2005 | | | 1,309,099 | | | | 1,309,099 | | |
Societe Generale
Eurodollar Time Deposit
3.280% 08/01/2005 | | | 1,977,828 | | | | 1,977,828 | | |
Svenska Handlesbanken
Eurodollar Time Deposit
3.220% 08/05/2005 | | | 1,977,828 | | | | 1,977,828 | | |
The Bank of the West
Eurodollar Time Deposit
3.270% 07/27/2005 | | | 593,348 | | | | 593,348 | | |
Toronto Dominion Bank
Eurodollar Time Deposit
3.250% 08/02/2005 | | | 1,977,828 | | | | 1,977,828 | | |
UBS AG
Eurodollar Time Deposit
3.250% 08/09/2005 | | | 988,913 | | | | 988,913 | | |
Wells Fargo
Eurodollar Time Deposit
3.270% 07/21/2005 | | | 1,977,828 | | | | 1,977,828 | | |
Wells Fargo
Eurodollar Time Deposit
3.270% 08/01/2005 | | | 1,977,828 | | | | 1,977,828 | | |
| | | | 93,733,150 | | |
(Continued)
The accompanying notes are an integral part of the financial statements.
118
MassMutual Select Focused Value Fund – Portfolio of Investments (Continued)
| | | Principal
Amount | | Market
Value | |
| Repurchase Agreement - 7.8% | |
Investors Bank & Trust
Company Repurchase
Agreement, dated
06/30/2005, 2.01%,
due 07/01/2005(d) | | $ | 67,932,842 | | | $ | 67,932,842 | | |
TOTAL SHORT-TERM
INVESTMENTS
(At Amortized Cost) | | | | | 161,665,992 | | |
TOTAL INVESTMENTS - 109.5%
(Cost $804,858,932)(e) | | | | | 956,308,734 | | |
Other Assets/
(Liabilities) - (9.5%) | | | | | (82,988,979 | ) | |
| NET ASSETS - 100.0% | | | | $ | 873,319,755 | | |
Notes to Portfolio of Investments
(a) Denotes all or a portion of security on loan.
(b) Non-income producing security.
(c) Represents investments of security lending collateral. (Note 2).
(d) Maturity value of $67,936,635. Collaterized by U.S. Government Agency obligations with rates of 4.000% - 5.625%, maturity dates of 11/25/2027 - 08/01/2034, and an aggregate market value, including accrued interest, of $71,329,484.
(e) See Note 6 for aggregate cost for Federal tax purposes.
The remainder of this page is intentionally left blank.
The accompanying notes are an integral part of the financial statements.
119
MassMutual Select Small Company Value Fund – Portfolio of Investments
June 30, 2005 (Unaudited)
| | | Number of
Shares | | Market
Value | |
| EQUITIES - 97.0% | | | |
| Aerospace & Defense - 0.2% | | | |
| AAR Corp. | | | 54,500 | | | $ | 856,195 | | |
| Air Transportation - 0.5% | | | |
MAIR
Holdings, Inc.(a) (b) | | | 116,900 | | | | 1,033,396 | | |
Mesa Air
Group, Inc.(a) (b) | | | 265,675 | | | | 1,782,679 | | |
| | | | 2,816,075 | | |
| Apparel, Textiles & Shoes - 1.8% | | | |
Charlotte Russe
Holding, Inc.(a) | | | 99,700 | | | | 1,242,262 | | |
| Culp, Inc.(a) | | | 53,900 | | | | 237,160 | | |
| HOT Topic, Inc.(a) | | | 122,750 | | | | 2,346,980 | | |
Payless
Shoesource, Inc.(a) | | | 75,850 | | | | 1,456,320 | | |
Phillips-Van
Heusen Corp. | | | 14,600 | | | | 477,274 | | |
Reebok International
Limited | | | 52,200 | | | | 2,183,526 | | |
| Timberland Co. Cl. A(a) | | | 36,000 | | | | 1,393,920 | | |
| | | | 9,337,442 | | |
| Automotive & Parts - 1.7% | | | |
| Accuride Corp. | | | 16,100 | | | | 171,143 | | |
Commercial Vehicle
Group, Inc. | | | 40,200 | | | | 713,550 | | |
| JLG Industries, Inc. | | | 146,000 | | | | 4,012,080 | | |
| Myers Industries, Inc. | | | 77,960 | | | | 974,500 | | |
| TBC Corp.(a) | | | 108,900 | | | | 2,954,457 | | |
Winnebago
Industries, Inc. | | | 5,400 | | | | 176,850 | | |
| | | | 9,002,580 | | |
| Banking, Savings & Loans - 5.8% | | | |
| Advanta Corp. Cl. B | | | 54,550 | | | | 1,536,128 | | |
| Astoria Financial Corp. | | | 12,850 | | | | 365,839 | | |
Bankunited Financial
Corp. Cl. A(a) | | | 5,400 | | | | 146,016 | | |
The Colonial
BancGroup, Inc. | | | 177,175 | | | | 3,908,480 | | |
| First Republic Bank | | | 122,850 | | | | 4,340,290 | | |
| Metris Companies, Inc.(a) | | | 113,925 | | | | 1,647,355 | | |
| NetBank, Inc. | | | 106,100 | | | | 988,852 | | |
| Northwest Bancorp, Inc. | | | 49,150 | | | | 1,044,929 | | |
Oriental Financial
Group, Inc. | | | 8,100 | | | | 123,606 | | |
| PFF Bancorp, Inc. | | | 102,275 | | | | 3,097,910 | | |
Providian
Financial Corp.(a) | | | 101,900 | | | | 1,796,497 | | |
| | | Number of
Shares | | Market
Value | |
Sterling
Financial Corp.(a) | | | 36,015 | | | $ | 1,346,961 | | |
| Student Loan Corp. | | | 1,300 | | | | 285,740 | | |
SVB Financial
Group(a) (b) | | | 92,400 | | | | 4,425,960 | | |
Texas Regional
Bancshares, Inc. | | | 162,300 | | | | 4,946,904 | | |
| West Coast Bancorp | | | 27,950 | | | | 682,259 | | |
| | | | 30,683,726 | | |
| Broadcasting, Publishing & Printing - 2.3% | | | |
| CSS Industries, Inc. | | | 59,600 | | | | 2,016,864 | | |
Cumulus Media,
Inc. Cl. A(a) | | | 162,800 | | | | 1,917,784 | | |
Entravision
Communications
Corp. Cl. A(a) | | | 256,475 | | | | 1,997,940 | | |
| Journal Register Co.(a) | | | 93,600 | | | | 1,638,936 | | |
Saga Communications,
Inc. Cl. A(a) | | | 111,400 | | | | 1,559,600 | | |
| Scholastic Corp.(a) | | | 72,950 | | | | 2,812,222 | | |
Sinclair Broadcast Group,
Inc. Cl. A | | | 10,000 | | | | 90,800 | | |
| | | | 12,034,146 | | |
| Building Materials & Construction - 1.3% | | | |
| ElkCorp | | | 68,300 | | | | 1,949,965 | | |
| Emcor Group, Inc. | | | 25,000 | | | | 1,222,500 | | |
Florida Rock
Industries, Inc. | | | 51,600 | | | | 3,784,860 | | |
| | | | 6,957,325 | | |
| Chemicals - 1.6% | | | |
| Airgas, Inc.(b) | | | 90,800 | | | | 2,240,036 | | |
| Arch Chemicals, Inc. | | | 100,650 | | | | 2,512,224 | | |
| Georgia Gulf Corp. | | | 29,250 | | | | 908,212 | | |
| MacDermid, Inc. | | | 36,800 | | | | 1,146,688 | | |
The Scotts
Miracle-Gro Co.(a) | | | 3,500 | | | | 249,235 | | |
Symyx
Technologies, Inc.(a) | | | 51,800 | | | | 1,449,364 | | |
| The Valspar Corp. | | | 2,400 | | | | 115,896 | | |
| | | | 8,621,655 | | |
| Commercial Services - 7.8% | | | |
| Aaron Rents, Inc. | | | 200,600 | | | | 4,992,934 | | |
| Aaron Rents, Inc. Cl. A | | | 12,425 | | | | 282,669 | | |
| Administaff, Inc. | | | 5,600 | | | | 133,056 | | |
Allied Waste
Industries, Inc.(a) | | | 15,300 | | | | 121,329 | | |
Casella Waste Systems,
Inc. Cl. A(a) | | | 140,200 | | | | 1,682,400 | | |
| | | Number of
Shares | | Market
Value | |
| CRA International, Inc. | | | 14,200 | | | $ | 764,670 | | |
| Diversa Corp.(a) | | | 145,000 | | | | 755,450 | | |
Dollar Thrifty Automotive
Group, Inc.(a) | | | 130,400 | | | | 4,952,592 | | |
| Equifax, Inc. | | | 21,200 | | | | 757,052 | | |
| Exelixis, Inc.(a) | | | 114,200 | | | | 848,506 | | |
| FTI Consulting, Inc.(a) (b) | | | 112,000 | | | | 2,340,800 | | |
| G&K Services, Inc. Cl. A | | | 61,600 | | | | 2,324,168 | | |
| Global Payments, Inc. | | | 4,400 | | | | 298,320 | | |
| Kelly Services, Inc. Cl. A | | | 5,300 | | | | 151,792 | | |
| Landauer, Inc. | | | 30,700 | | | | 1,593,637 | | |
| Lexicon Genetics, Inc.(a) | | | 168,900 | | | | 834,366 | | |
Macquarie Infrastructure
Co. Trust(a) | | | 43,800 | | | | 1,243,044 | | |
| McGrath Rentcorp | | | 122,800 | | | | 2,910,360 | | |
| Monro Muffler, Inc. | | | 47,000 | | | | 1,386,970 | | |
| MPS Group, Inc.(a) | | | 225,700 | | | | 2,126,094 | | |
Pharmaceutical Product
Development, Inc.(a) | | | 9,300 | | | | 435,798 | | |
Quanta
Services, Inc.(a) (b) | | | 81,100 | | | | 713,680 | | |
| Startek, Inc. | | | 49,200 | | | | 807,864 | | |
| Steiner Leisure Limited(a) | | | 48,000 | | | | 1,779,360 | | |
| Synagro Technologies, Inc. | | | 86,800 | | | | 419,244 | | |
| United Rentals, Inc.(a) | | | 110,725 | | | | 2,237,752 | | |
Washington Group
International, Inc.(a) | | | 20,000 | | | | 1,022,400 | | |
Waste
Connections, Inc.(a) (b) | | | 51,100 | | | | 1,905,519 | | |
| Wireless Facilities, Inc.(a) | | | 215,800 | | | | 1,366,014 | | |
| | | | 41,187,840 | | |
| Communications - 0.6% | | | |
American Tower
Corp. Cl. A(a) | | | 17,800 | | | | 374,156 | | |
| Nice Systems Limited(a) | | | 69,975 | | | | 2,761,913 | | |
| | | | 3,136,069 | | |
| Computer Integrated Systems Design - 0.5% | | | |
| Websense, Inc.(a) (b) | | | 59,000 | | | | 2,834,950 | | |
| Computer Programming Services - 0.4% | | | |
| Ciber, Inc.(a) | | | 207,475 | | | | 1,655,650 | | |
Innovative Solutions &
Support, Inc.(a) | | | 20,800 | | | | 698,256 | | |
| | | | 2,353,906 | | |
| Computer Related Services - 0.8% | | | |
| Carreker Corp.(a) | | | 127,925 | | | | 701,029 | | |
Checkpoint
Systems, Inc.(a) | | | 85,025 | | | | 1,504,942 | | |
| Electro Rent Corp.(a) | | | 127,800 | | | | 1,858,212 | | |
| | | | 4,064,183 | | |
(Continued)
The accompanying notes are an integral part of the financial statements.
120
MassMutual Select Small Company Value Fund – Portfolio of Investments (Continued)
| | | Number of
Shares | | Market
Value | |
| Containers - 1.1% | |
| Chesapeake Corp. | | | 30,100 | | | $ | 630,294 | | |
| Crown Holdings, Inc.(a) | | | 94,800 | | | | 1,349,004 | | |
| Owens-Illinois, Inc.(a) | | | 162,625 | | | | 4,073,756 | | |
| | | | 6,053,054 | | |
| Data Processing & Preparation - 0.2% | | | |
| eFunds Corp.(a) | | | 47,675 | | | | 857,673 | | |
| Electric Utilities - 4.3% | |
Allegheny
Energy, Inc.(a) (b) | | | 40,000 | | | | 1,008,800 | | |
| Black Hills Corp. | | | 60,800 | | | | 2,240,480 | | |
| CenterPoint Energy, Inc. | | | 97,000 | | | | 1,281,370 | | |
| Cleco Corp. | | | 68,750 | | | | 1,482,937 | | |
| CMS Energy Corp.(a) (b) | | | 322,600 | | | | 4,858,356 | | |
| El Paso Electric Co.(a) | | | 162,350 | | | | 3,320,057 | | |
| NorthWestern Corp.(b) | | | 33,000 | | | | 1,040,160 | | |
| NRG Energy, Inc.(a) (b) | | | 42,000 | | | | 1,579,200 | | |
| Otter Tail Corp. | | | 38,700 | | | | 1,057,671 | | |
| PNM Resources, Inc. | | | 10,300 | | | | 296,743 | | |
Reliant
Energy, Inc.(a) (b) | | | 183,000 | | | | 2,265,540 | | |
Sierra Pacific
Resources(a) (b) | | | 79,000 | | | | 983,550 | | |
| Unisource Energy Corp. | | | 40,000 | | | | 1,230,000 | | |
| | | | 22,644,864 | | |
| Electrical Equipment & Electronics - 6.8% | | | |
| Analogic Corp. | | | 20,100 | | | | 1,011,432 | | |
| ATMI, Inc.(a) (b) | | | 53,400 | | | | 1,549,134 | | |
| Belden CDT, Inc.(b) | | | 88,150 | | | | 1,868,780 | | |
| C&D Technologies, Inc. | | | 81,200 | | | | 746,228 | | |
| Cymer, Inc.(a) (b) | | | 42,500 | | | | 1,119,875 | | |
| EDO Corp. | | | 42,000 | | | | 1,256,220 | | |
Energizer
Holdings, Inc.(a) (b) | | | 21,000 | | | | 1,305,570 | | |
| ESS Technology, Inc.(a) | | | 94,600 | | | | 398,266 | | |
| Exar Corp.(a) | | | 203,725 | | | | 3,033,465 | | |
Fairchild Semiconductor
International,
Inc. Cl. A(a) | | | 133,000 | | | | 1,961,750 | | |
| FLIR Systems, Inc.(a) | | | 19,900 | | | | 593,816 | | |
| Franklin Electric Co., Inc. | | | 88,700 | | | | 3,428,255 | | |
| Genlyte Group, Inc.(a) | | | 31,700 | | | | 1,545,058 | | |
Integrated Silicon
Solution, Inc.(a) (b) | | | 238,975 | | | | 1,770,805 | | |
| IXYS Corp.(a) | | | 126,525 | | | | 1,794,124 | | |
| Littelfuse, Inc.(a) (b) | | | 64,800 | | | | 1,804,680 | | |
| LSI Logic Corp.(a) | | | 215,900 | | | | 1,832,991 | | |
| Magnetek, Inc.(a) | | | 192,675 | | | | 495,175 | | |
| Methode Electronics, Inc. | | | 71,200 | | | | 845,144 | | |
| Moog, Inc. Cl. A(a) | | | 34,350 | | | | 1,081,681 | | |
| Mykrolis Corp.(a) | | | 128,800 | | | | 1,830,248 | | |
| Sanmina-SCI Corp.(a) | | | 20,900 | | | | 114,323 | | |
| | | Number of
Shares | | Market
Value | |
| Spectrum Brands, Inc. | | | 55,400 | | | $ | 1,828,200 | | |
| Teleflex, Inc. | | | 25,000 | | | | 1,484,250 | | |
| Zoran Corp.(a) | | | 109,600 | | | | 1,456,584 | | |
| | | | 36,156,054 | | |
| Energy - 8.6% | | | |
| Atwood Oceanics, Inc.(a) | | | 30,800 | | | | 1,896,048 | | |
Cabot Oil & Gas
Corp. Cl. A | | | 97,550 | | | | 3,384,985 | | |
| CARBO Ceramics, Inc. | | | 31,100 | | | | 2,455,656 | | |
| Chesapeake Energy Corp. | | | 20,900 | | | | 476,520 | | |
| Cimarex Energy Co.(a) | | | 37,350 | | | | 1,453,289 | | |
Denbury
Resources, Inc.(a) | | | 47,000 | | | | 1,869,190 | | |
Encore
Acquisition Co.(a) (b) | | | 65,325 | | | | 2,678,325 | | |
| Forest Oil Corp.(a) (b) | | | 85,200 | | | | 3,578,400 | | |
| Giant Industries, Inc. | | | 40,000 | | | | 1,440,000 | | |
| Grey Wolf, Inc.(a) (b) | | | 231,175 | | | | 1,713,007 | | |
| Headwaters, Inc.(a) | | | 9,000 | | | | 309,420 | | |
| Helmerich & Payne, Inc. | | | 38,300 | | | | 1,797,036 | | |
Oceaneering
International, Inc. | | | 3,400 | | | | 131,410 | | |
| Oneok, Inc. | | | 7,100 | | | | 231,815 | | |
| Penn Virginia Corp. | | | 82,500 | | | | 3,685,275 | | |
| SEACOR Holdings, Inc.(a) | | | 16,000 | | | | 1,028,800 | | |
| SEMCO Energy, Inc.(b) | | | 158,825 | | | | 951,362 | | |
| Southern Union Co.(a) | | | 79,000 | | | | 1,939,450 | | |
| Swift Energy Co.(a) | | | 8,400 | | | | 300,888 | | |
| Tesoro Corp.(a) | | | 29,000 | | | | 1,349,080 | | |
TETRA
Technologies, Inc.(a) | | | 89,600 | | | | 2,853,760 | | |
| Todco Cl. A(a) | | | 121,900 | | | | 3,129,173 | | |
| Vectren Corp. | | | 49,400 | | | | 1,419,262 | | |
W-H Energy
Services, Inc.(a) | | | 55,200 | | | | 1,376,136 | | |
Whiting
Petroleum Corp.(a) | | | 108,400 | | | | 3,936,004 | | |
| | | | 45,384,291 | | |
| Entertainment & Leisure - 1.2% | | | |
| Callaway Golf Co. | | | 125,500 | | | | 1,936,465 | | |
Pinnacle
Entertainment, Inc.(a) | | | 68,000 | | | | 1,330,080 | | |
| SCP Pool Corp. | | | 91,200 | | | | 3,200,208 | | |
| | | | 6,466,753 | | |
| Financial Services - 11.1% | | | |
Accredited Home
Lenders Holding Co.(a) | | | 7,700 | | | | 338,800 | | |
| AG Edwards, Inc. | | | 19,825 | | | | 895,099 | | |
| Allied Capital Corp.(b) | | | 80,600 | | | | 2,346,266 | | |
American Capital
Strategies Limited(b) | | | 33,300 | | | | 1,202,463 | | |
| | | Number of
Shares | | Market
Value | |
American Financial
Realty Trust | | | 174,575 | | | $ | 2,684,963 | | |
| AmeriCredit Corp.(a) (b) | | | 144,600 | | | | 3,687,300 | | |
BankAtlantic
Bancorp, Inc. Cl. A | | | 57,450 | | | | 1,088,677 | | |
Bedford Property
Investors | | | 62,800 | | | | 1,445,656 | | |
CBL & Associates
Properties, Inc. REIT(b) | | | 30,450 | | | | 1,311,482 | | |
Columbia Equity Trust,
Inc. REIT | | | 32,500 | | | | 498,875 | | |
| East West Bancorp, Inc. | | | 118,600 | | | | 3,983,774 | | |
| Eaton Vance Corp. | | | 12,200 | | | | 291,702 | | |
Entertainment Properties
Trust REIT | | | 6,400 | | | | 294,400 | | |
FelCor Lodging
Trust, Inc.(a) (b) | | | 375,375 | | | | 5,435,430 | | |
Glenborough Realty
Trust, Inc. | | | 47,600 | | | | 980,084 | | |
| Home Properties, Inc. | | | 52,475 | | | | 2,257,475 | | |
| HRPT Properties Trust | | | 164,175 | | | | 2,040,695 | | |
| Innkeepers USA Trust | | | 70,600 | | | | 1,054,764 | | |
| Jefferies Group, Inc. | | | 11,100 | | | | 420,579 | | |
| Kilroy Realty Corp. | | | 76,900 | | | | 3,651,981 | | |
| LaSalle Hotel Properties | | | 76,500 | | | | 2,509,965 | | |
| LTC Properties, Inc. | | | 111,025 | | | | 2,298,218 | | |
Meristar Hospitality
Corp. REIT(a) | | | 164,875 | | | | 1,417,925 | | |
Mid-America Apartment
Communities, Inc. REIT | | | 7,100 | | | | 322,482 | | |
| Mills Corp. REIT(b) | | | 26,450 | | | | 1,607,896 | | |
New Century Financial
Corp. REIT(b) | | | 14,000 | | | | 720,300 | | |
Raymond James
Financial, Inc. | | | 10,900 | | | | 307,925 | | |
Reckson Associates
Realty Corp. | | | 64,000 | | | | 2,147,200 | | |
| SL Green Realty Corp. | | | 3,400 | | | | 219,300 | | |
Strategic Hotel Capital,
Inc. REIT | | | 214,350 | | | | 3,858,300 | | |
| Sun Communities, Inc. | | | 56,500 | | | | 2,101,235 | | |
Trizec Properties,
Inc. REIT | | | 61,850 | | | | 1,272,255 | | |
Trustreet Properties,
Inc. REIT | | | 112,800 | | | | 1,873,608 | | |
Washington Real Estate
Investment Trust | | | 58,200 | | | | 1,815,840 | | |
| | | | 58,382,914 | | |
| Foods - 1.0% | | | |
Chiquita Brands
International, Inc. | | | 65,550 | | | | 1,800,003 | | |
| Nash Finch Co.(b) | | | 69,000 | | | | 2,535,060 | | |
(Continued)
The accompanying notes are an integral part of the financial statements.
121
MassMutual Select Small Company Value Fund – Portfolio of Investments (Continued)
| | | Number of
Shares | | Market
Value | |
Wild Oats
Markets, Inc.(a) (b) | | | 65,300 | | | $ | 747,685 | | |
| | | | 5,082,748 | | |
| Forest Products & Paper - 1.2% | | | |
| Deltic Timber Corp. | | | 51,300 | | | | 1,950,939 | | |
| Playtex Products, Inc.(a) | | | 238,625 | | | | 2,567,605 | | |
| School Specialty, Inc.(a) | | | 5,600 | | | | 260,400 | | |
| Wausau Paper Corp. | | | 136,600 | | | | 1,636,468 | | |
| | | | 6,415,412 | | |
| Healthcare - 1.9% | | | |
American
Healthways, Inc.(a) | | | 13,100 | | | | 553,737 | | |
Community Health
Systems, Inc.(a) | | | 49,500 | | | | 1,870,605 | | |
| Covance, Inc.(a) | | | 8,200 | | | | 367,934 | | |
Kindred
Healthcare, Inc.(a) | | | 43,300 | | | | 1,715,113 | | |
Lincare
Holdings, Inc.(a) (b) | | | 43,000 | | | | 1,756,120 | | |
Sunrise Senior
Living, Inc.(a) | | | 2,500 | | | | 134,950 | | |
| Triad Hospitals, Inc.(a) | | | 44,625 | | | | 2,438,310 | | |
Universal Health
Services Cl. B(b) | | | 16,500 | | | | 1,025,970 | | |
| | | | 9,862,739 | | |
| Heavy Construction - 0.1% | | | |
Hovnanian K.
Enterprises, Inc.(a) | | | 12,200 | | | | 795,440 | | |
| Heavy Machinery - 0.3% | | | |
| Aviall, Inc. | | | 23,300 | | | | 736,047 | | |
Bucyrus
International, Inc. Cl. A | | | 4,300 | | | | 163,314 | | |
| Milacron, Inc.(a) | | | 469,858 | | | | 888,032 | | |
| | | | 1,787,393 | | |
Home Construction, Furnishings &
Appliances - 0.6% | | | | | | | |
Harman International
Industries | | | 4,600 | | | | 374,256 | | |
| Meritage Homes Corp.(a) | | | 7,400 | | | | 588,300 | | |
| Standard-Pacific Corp. | | | 5,100 | | | | 448,545 | | |
| Stanley Furniture Co., Inc. | | | 81,400 | | | | 1,999,184 | | |
| | | | 3,410,285 | | |
| Household Products - 0.3% | | | |
| RPM, Inc. | | | 81,875 | | | | 1,495,038 | | |
| Snap-On, Inc. | | | 8,500 | | | | 291,550 | | |
| | | | 1,786,588 | | |
| Industrial – Diversified - 0.9% | | | |
| Ameron International Corp. | | | 33,800 | | | | 1,264,120 | | |
| Harsco Corp. | | | 4,300 | | | | 234,565 | | |
| | | Number of
Shares | | Market
Value | |
| Nordson Corp. | | | 69,900 | | | $ | 2,396,172 | | |
| Tredegar Corp. | | | 54,875 | | | | 856,050 | | |
| | | | 4,750,907 | | |
| Information Retrieval Services - 0.6% | | | |
| Ask Jeeves, Inc.(a) (b) | | | 36,000 | | | | 1,086,840 | | |
| Autobytel, Inc.(a) | | | 210,000 | | | | 1,014,300 | | |
| Infospace, Inc.(a) | | | 29,000 | | | | 954,970 | | |
| | | | 3,056,110 | | |
| Insurance - 7.2% | | | |
Allmerica
Financial Corp.(a) | | | 50,725 | | | | 1,881,390 | | |
| AMERIGROUP Corp.(a) | | | 8,100 | | | | 325,620 | | |
| AmerUs Group Co.(b) | | | 49,150 | | | | 2,361,658 | | |
Arch Capital Group
Limited(a) | | | 16,500 | | | | 743,325 | | |
Aspen Insurance
Holdings Limited | | | 26,500 | | | | 730,340 | | |
| Brown & Brown, Inc. | | | 5,000 | | | | 224,700 | | |
| Centene Corp.(a) | | | 40,000 | | | | 1,343,200 | | |
The Commerce
Group, Inc. | | | 6,100 | | | | 378,871 | | |
Delphi Financial
Group, Inc. Cl. A | | | 6,200 | | | | 273,730 | | |
FPIC Insurance
Group, Inc.(a) (b) | | | 40,700 | | | | 1,193,731 | | |
HCC Insurance
Holdings, Inc. | | | 40,650 | | | | 1,539,416 | | |
| Markel Corp.(a) | | | 8,000 | | | | 2,712,000 | | |
| The Midland Co. | | | 55,900 | | | | 1,967,121 | | |
| Molina Healthcare, Inc. | | | 32,000 | | | | 1,416,320 | | |
| Ohio Casualty Corp.(a) | | | 99,725 | | | | 2,411,351 | | |
Philadelphia Consolidated
Holding Corp.(a) | | | 7,700 | | | | 652,652 | | |
ProAssurance
Corp.(a) (b) | | | 147,575 | | | | 6,162,732 | | |
| Protective Life Corp. | | | 3,000 | | | | 126,660 | | |
Scottish Re Group
Limited(b) | | | 168,350 | | | | 4,080,804 | | |
| Selective Insurance Group | | | 30,500 | | | | 1,511,275 | | |
| Triad Guaranty, Inc.(a) | | | 83,250 | | | | 4,194,968 | | |
United America Indemnity
Limited Cl. A(a) | | | 87,543 | | | | 1,504,864 | | |
| United Fire & Casualty Co. | | | 2,200 | | | | 97,724 | | |
| | | | 37,834,452 | | |
| Lodging - 0.1% | | | |
Isle of Capri
Casinos, Inc.(a) | | | 23,000 | | | | 602,600 | | |
| Machinery & Components - 3.2% | | | |
| Brooks Automation, Inc.(a) | | | 98,500 | | | | 1,462,725 | | |
| Flowserve Corp.(a) | | | 53,450 | | | | 1,617,397 | | |
| Gardner Denver, Inc.(a) | | | 19,400 | | | | 680,552 | | |
| | | Number of
Shares | | Market
Value | |
Helix
Technology Corp.(b) | | | 108,200 | | | $ | 1,436,896 | | |
| IDEX Corp. | | | 72,450 | | | | 2,797,295 | | |
Insituform Technologies,
Inc. Cl. A(a) (b) | | | 117,400 | | | | 1,881,922 | | |
| Joy Global, Inc. | | | 6,200 | | | | 208,258 | | |
Lone Star
Technologies, Inc.(a) | | | 40,700 | | | | 1,851,850 | | |
| Thomas Industries, Inc. | | | 72,100 | | | | 2,881,116 | | |
| Watsco, Inc. | | | 8,100 | | | | 345,060 | | |
| Woodward Governor Co. | | | 20,400 | | | | 1,714,212 | | |
| | | | 16,877,283 | | |
| Manufacturing - 1.2% | | | |
| AptarGroup, Inc. | | | 59,500 | | | | 3,022,600 | | |
Stewart & Stevenson
Services Corp. | | | 87,250 | | | | 1,977,085 | | |
| Terex Corp.(a) | | | 32,675 | | | | 1,287,395 | | |
| | | | 6,287,080 | | |
| Medical Supplies - 1.5% | | | |
| Arrow International, Inc. | | | 52,000 | | | | 1,658,800 | | |
| Cooper Cos., Inc. | | | 8,500 | | | | 517,310 | | |
| Owens & Minor, Inc. | | | 121,500 | | | | 3,930,525 | | |
| Viasys Healthcare, Inc.(a) | | | 76,400 | | | | 1,725,876 | | |
| | | | 7,832,511 | | |
| Metals & Mining - 2.4% | | | |
| Carpenter Technology | | | 47,700 | | | | 2,470,860 | | |
| Circor International, Inc. | | | 23,125 | | | | 570,494 | | |
| Gibraltar Industries, Inc. | | | 110,300 | | | | 2,044,962 | | |
Matthews
International Corp. | | | 108,000 | | | | 4,207,680 | | |
Meridian
Gold, Inc.(a) (b) | | | 84,900 | | | | 1,528,200 | | |
Reliance Steel &
Aluminum Co. | | | 19,775 | | | | 733,059 | | |
| The Shaw Group, Inc.(a) | | | 34,000 | | | | 731,340 | | |
| Wolverine Tube, Inc.(a) | | | 76,375 | | | | 448,321 | | |
| | | | 12,734,916 | | |
| Pharmaceuticals - 2.1% | | | |
| Barr Pharmaceuticals(a) | | | 4,000 | | | | 194,960 | | |
Bone Care
International, Inc.(a) | | | 75,200 | | | | 2,479,344 | | |
K-V Pharmaceutical
Co. Cl. A(a) | | | 4,500 | | | | 75,375 | | |
Molecular
Devices Corp.(a) | | | 23,250 | | | | 502,898 | | |
| Myriad Genetics, Inc.(b) | | | 101,500 | | | | 1,588,475 | | |
Nabi
Biopharmaceuticals(a) | | | 20,100 | | | | 306,123 | | |
Natures Sunshine
Products, Inc. | | | 91,225 | | | | 1,590,964 | | |
| NBTY, Inc.(a) | | | 85,225 | | | | 2,210,737 | | |
(Continued)
The accompanying notes are an integral part of the financial statements.
122
MassMutual Select Small Company Value Fund – Portfolio of Investments (Continued)
| | | Number of
Shares | | Market
Value | |
| Serologicals Corp.(a) | | | 11,000 | | | $ | 233,750 | | |
United Therapeutics
Corp.(a) (b) | | | 37,000 | | | | 1,783,400 | | |
| | | | 10,966,026 | | |
| Prepackaged Software - 2.3% | | | |
| Activision, Inc.(a) | | | 100,133 | | | | 1,654,197 | | |
| Packeteer, Inc.(a) (b) | | | 277,200 | | | | 3,908,520 | | |
Progress
Software Corp.(a) | | | 95,500 | | | | 2,879,325 | | |
| SPSS, Inc.(a) | | | 84,750 | | | | 1,628,048 | | |
| THQ, Inc.(a) (b) | | | 62,600 | | | | 1,832,302 | | |
| | | | 11,902,392 | | |
| Real Estate - 1.1% | | | |
Alderwoods
Group, Inc.(a) | | | 144,900 | | | | 2,082,213 | | |
CB Richard Ellis Group,
Inc. Cl. A(a) | | | 36,625 | | | | 1,606,373 | | |
| Jones Lang Lasalle, Inc.(a) | | | 14,000 | | | | 619,220 | | |
| Trammell Crow Co. | | | 39,375 | | | | 954,450 | | |
| WCI Communities, Inc.(a) | | | 23,500 | | | | 752,705 | | |
| | | | 6,014,961 | | |
| Restaurants - 1.2% | | | |
Brinker
International, Inc.(a) | | | 6,300 | | | | 252,315 | | |
CEC
Entertainment, Inc.(a) | | | 6,500 | | | | 273,585 | | |
| Centerplate, Inc. | | | 49,600 | | | | 632,400 | | |
RARE Hospitality
International, Inc.(a) | | | 114,600 | | | | 3,491,862 | | |
| Ruby Tuesday, Inc.(b) | | | 48,100 | | | | 1,245,790 | | |
| Sonic Corp.(a) | | | 8,200 | | | | 250,346 | | |
| | | | 6,146,298 | | |
| Retail - 3.7% | | | |
| Blue Nile, Inc.(a) (b) | | | 52,900 | | | | 1,729,301 | | |
Casey's General
Stores, Inc. | | | 117,700 | | | | 2,332,814 | | |
| CSK Auto Corp.(a) | | | 13,600 | | | | 226,848 | | |
| Dillards, Inc. Cl. A | | | 96,600 | | | | 2,262,372 | | |
| Fred's, Inc.(b) | | | 78,950 | | | | 1,308,991 | | |
| Hancock Fabrics, Inc. | | | 80,000 | | | | 531,200 | | |
Haverty Furniture
Companies, Inc. | | | 135,300 | | | | 1,999,734 | | |
Kenneth Cole
Productions, Inc. Cl. A | | | 43,700 | | | | 1,359,944 | | |
Marvel
Enterprises, Inc.(a) (b) | | | 57,000 | | | | 1,124,040 | | |
Men's
Wearhouse, Inc.(a) (b) | | | 70,112 | | | | 2,413,956 | | |
| Stein Mart, Inc.(a) | | | 193,600 | | | | 4,259,200 | | |
| | | | 19,548,400 | | |
| | | Number of
Shares | | Market
Value | |
| Telephone Utilities - 0.6% | |
| Brightpoint, Inc.(a) | | | 83,000 | | | $ | 1,841,770 | | |
| West Corp.(a) | | | 20,300 | | | | 779,520 | | |
Yak
Communications, Inc.(a) | | | 89,275 | | | | 432,984 | | |
| | | | 3,054,274 | | |
| Transportation - 4.9% | | | |
| Celadon Group, Inc.(a) | | | 23,400 | | | | 398,736 | | |
| CNF, Inc. | | | 28,100 | | | | 1,261,690 | | |
| GATX Corp.(b) | | | 22,200 | | | | 765,900 | | |
Genesee & Wyoming,
Inc. Cl. A(a) (b) | | | 63,700 | | | | 1,733,277 | | |
| Hub Group, Inc. Cl. A(a) | | | 28,200 | | | | 706,410 | | |
| Kirby Corp.(a) | | | 66,700 | | | | 3,008,170 | | |
Laidlaw
International, Inc.(a) | | | 61,000 | | | | 1,470,100 | | |
| Landstar System, Inc.(a) | | | 203,100 | | | | 6,117,372 | | |
Pacer
International, Inc.(a) | | | 76,000 | | | | 1,656,040 | | |
Pegasus
Solutions, Inc.(a) | | | 123,775 | | | | 1,380,091 | | |
| Skyline Corp. | | | 41,200 | | | | 1,645,116 | | |
US Xpress Enterprises,
Inc. Cl. A(a) | | | 62,000 | | | | 738,420 | | |
| UTI Worldwide, Inc. | | | 48,200 | | | | 3,355,684 | | |
| Yellow Roadway Corp.(a) | | | 28,000 | | | | 1,422,400 | | |
| | | | 25,659,406 | | |
TOTAL EQUITIES
(Cost $435,924,540) | | | | | | | 512,239,916 | | |
| MUTUAL FUNDS - 0.4% | |
| Financial Services | |
| First Financial Fund(b) | | | 102,900 | | | | 1,865,577 | | |
Government Reserve
Investment Fund | | | 231,461 | | | | 231,461 | | |
| | | | 2,097,038 | | |
TOTAL MUTUAL FUNDS
(Cost $2,037,015) | | | | | | | 2,097,038 | | |
TOTAL LONG TERM INVESTMENTS
(Cost $437,961,555) | | | | | | | 514,336,954 | | |
| | | Principal
Amount | |
| |
| SHORT-TERM INVESTMENTS - 17.6% | |
| Cash Equivalents - 15.1%(c) | |
ABN Amro Bank NV
Eurodollar Time Deposit
3.250% 08/05/2005 | | $ | 850,053 | | | | 850,053 | | |
| | | Principal
Amount | | Market
Value | |
American Beacon Money
Market Fund | | $ | 2,294,793 | | | $ | 2,294,793 | | |
Bank of America
Bank Note
3.270% 07/18/2005 | | | 1,176,590 | | | | 1,176,590 | | |
Bank of America
Bank Note
3.270% 08/30/2005 | | | 2,185,095 | | | | 2,185,095 | | |
Bank of Montreal
Eurodollar Time Deposit
3.010% 07/01/2005 | | | 3,236,437 | | | | 3,236,437 | | |
Barclays
Eurodollar Time Deposit
3.160% 07/14/2005 | | | 1,680,842 | | | | 1,680,842 | | |
Barclays
Eurodollar Time Deposit
3.250% 07/26/2005 | | | 1,693,539 | | | | 1,693,539 | | |
BGI Institutional Money
Market Fund | | | 6,596,803 | | | | 6,596,803 | | |
BNP Paribas
Eurodollar Time Deposit
3.000% 07/01/2005 | | | 1,176,590 | | | | 1,176,590 | | |
Calyon
Eurodollar Time Deposit
3.310% 07/01/2005 | | | 1,008,505 | | | | 1,008,505 | | |
Citigroup
Eurodollar Time Deposit
3.085% 07/22/2005 | | | 1,008,505 | | | | 1,008,505 | | |
Citigroup
Eurodollar Time Deposit
3.100% 07/25/2005 | | | 2,336,056 | | | | 2,336,056 | | |
Dexia Group
Eurodollar Time Deposit
3.205% 07/20/2005 | | | 840,421 | | | | 840,421 | | |
Dexia Group
Eurodollar Time Deposit
3.240% 07/21/2005 | | | 840,421 | | | | 840,421 | | |
Federal Home Loan Bank
Discount Note
2.977% 07/01/2005 | | | 2,075,596 | | | | 2,075,596 | | |
First Tennessee
National Corporation
Eurodollar Time Deposit
3.220% 08/09/2005 | | | 302,901 | | | | 302,901 | | |
Fortis Bank
Eurodollar Time Deposit
3.110% 07/05/2005 | | | 1,169,389 | | | | 1,169,389 | | |
Fortis Bank
Eurodollar Time Deposit
3.250% 07/25/2005 | | | 1,186,405 | | | | 1,186,405 | | |
Fortis Bank
Eurodollar Time Deposit
3.250% 08/04/2005 | | | 1,680,842 | | | | 1,680,842 | | |
(Continued)
The accompanying notes are an integral part of the financial statements.
123
MassMutual Select Small Company Value Fund – Portfolio of Investments (Continued)
| | | Principal
Amount | | Market
Value | |
Fortis Bank
Eurodollar Time Deposit
3.270% 07/07/2005 | | $ | 1,344,674 | | | $ | 1,344,674 | | |
Freddie Mac
Discount Note
3.208% 07/26/2005 | | | 828,592 | | | | 828,592 | | |
Freddie Mac
Discount Note
3.244% 08/16/2005 | | | 2,017,011 | | | | 2,017,011 | | |
General Electric
Capital Corp
3.252% 07/06/2005 | | | 1,680,842 | | | | 1,680,842 | | |
General Electric
Capital Corp
3.253% 07/08/2005 | | | 1,344,674 | | | | 1,344,674 | | |
Goldman Sachs
Financial Square
Prime Obligations
Money Market Fund | | | 1,534,816 | | | | 1,534,816 | | |
Harris Trust &
Savings Bank
3.295% 11/04/2005 | | | 1,609,818 | | | | 1,609,818 | | |
HBOS Halifax
Bank of Scotland
Eurodollar Time Deposit
3.150% 08/08/2005 | | | 840,421 | | | | 840,421 | | |
HSBC Banking/
Holdings PLC
Eurodollar Time Deposit
3.250% 08/05/2005 | | | 1,008,505 | | | | 1,008,505 | | |
JP Morgan Chase & Co.
Eurodollar Time Deposit
3.200% 07/20/2005 | | | 1,680,842 | | | | 1,680,842 | | |
Merrimac Cash Fund,
Premium Class | | | 2,664,918 | | | | 2,664,918 | | |
Morgan Stanley
Dean Witter & Co.
3.518% 07/19/2005 | | | 3,361,684 | | | | 3,361,684 | | |
National Australia Bank
Eurodollar Time Deposit
3.260% 07/06/2005 | | | 672,337 | | | | 672,337 | | |
National Australia Bank
Eurodollar Time Deposit
3.375% 07/01/2005 | | | 2,017,011 | | | | 2,017,011 | | |
Nordea Bank Finland PLC
(NY Branch)
Eurodollar Time Deposit
3.165% 08/09/2005 | | | 1,305,192 | | | | 1,305,192 | | |
Nordea Bank Finland PLC
(NY Branch)
Eurodollar Time Deposit
3.240% 08/03/2005 | | | 605,103 | | | | 605,103 | | |
| | | Principal
Amount | | Market
Value | |
Rabobank Nederland
Eurodollar Time Deposit
3.170% 07/18/2005 | | $ | 1,680,842 | | | $ | 1,680,842 | | |
Rabobank Nederland
Eurodollar Time Deposit
3.350% 07/01/2005 | | | 1,359,998 | | | | 1,359,998 | | |
Royal Bank of Canada
Eurodollar Time Deposit
3.250% 07/07/2005 | | | 1,008,505 | | | | 1,008,505 | | |
Royal Bank of Canada
Eurodollar Time Deposit
3.260% 07/28/2005 | | | 1,680,842 | | | | 1,680,842 | | |
Royal Bank of Scotland
Eurodollar Time Deposit
3.240% 08/08/2005 | | | 1,848,926 | | | | 1,848,926 | | |
Royal Bank of Scotland
Eurodollar Time Deposit
3.250% 08/04/2005 | | | 1,344,674 | | | | 1,344,674 | | |
Royal Bank of Scotland
Eurodollar Time Deposit
3.270% 07/29/2005 | | | 1,344,674 | | | | 1,344,674 | | |
Societe Generale
Eurodollar Time Deposit
3.200% 08/08/2005 | | | 672,337 | | | | 672,337 | | |
Societe Generale
Eurodollar Time Deposit
3.240% 08/09/2005 | | | 1,112,528 | | | | 1,112,528 | | |
Societe Generale
Eurodollar Time Deposit
3.280% 08/01/2005 | | | 1,680,842 | | | | 1,680,842 | | |
Svenska Handlesbanken
Eurodollar Time Deposit
3.220% 08/05/2005 | | | 1,680,842 | | | | 1,680,842 | | |
The Bank of the West
Eurodollar Time Deposit
3.270% 07/27/2005 | | | 504,253 | | | | 504,253 | | |
Toronto Dominion Bank
Eurodollar Time Deposit
3.250% 08/02/2005 | | | 1,680,842 | | | | 1,680,842 | | |
UBS AG
Eurodollar Time Deposit
3.250% 08/09/2005 | | | 840,421 | | | | 840,421 | | |
Wells Fargo
Eurodollar Time Deposit
3.270% 07/21/2005 | | | 1,680,851 | | | | 1,680,851 | | |
Wells Fargo
Eurodollar Time Deposit
3.270% 08/01/2005 | | | 1,680,842 | | | | 1,680,842 | | |
| | | | 79,658,442 | | |
| | | Principal
Amount | | Market
Value | |
| Repurchase Agreement - 2.5% | |
Investors Bank & Trust
Company Repurchase
Agreement, dated
06/30/2005, 2.01%,
due 07/01/2005(d) | | $ | 12,916,529 | | | $ | 12,916,529 | | |
TOTAL SHORT-TERM
INVESTMENTS
(At Amortized Cost) | | | | | 92,574,971 | | |
TOTAL INVESTMENTS - 115.0%
(Cost $530,536,526)(e) | | | | | 606,911,925 | | |
Other Assets/
(Liabilities) - (15.0%) | | | | | (78,935,320 | ) | |
| NET ASSETS - 100.0% | | | | $ | 527,976,605 | | |
Notes to Portfolio of Investments
REIT - Real Estate Investment Trust
(a) Non-income producing security.
(b) Denotes all or a portion of security on loan.
(c) Represents investments of security lending collateral. (Note 2).
(d) Maturity value of $12,917,250. Collaterized by U.S. Government Agency obligations with rates of 3.764% - 4.127%, maturity dates of 02/01/2033 - 10/25/2033, and an aggregate market value, including accrued interest, of $13,562,355.
(e) See Note 6 for aggregate cost for Federal tax purposes.
The accompanying notes are an integral part of the financial statements.
124
MassMutual Select Mid Cap Growth Equity Fund – Portfolio of Investments
June 30, 2005 (Unaudited)
| | | Number of
Shares | | Market
Value | |
| EQUITIES - 95.3% | |
| Aerospace & Defense - 1.0% | |
| Rockwell Collins, Inc. | | | 30,600 | | | $ | 1,459,008 | | |
| Apparel, Textiles & Shoes - 7.6% | |
Abercrombie &
Fitch Co. Cl. A | | | 25,800 | | | | 1,772,460 | | |
American Eagle
Outfitters, Inc. | | | 80,900 | | | | 2,479,585 | | |
| Coach, Inc.(a) | | | 59,000 | | | | 1,980,630 | | |
| Nordstrom, Inc.(b) | | | 37,700 | | | | 2,562,469 | | |
Urban
Outfitters, Inc.(a) (b) | | | 44,200 | | | | 2,505,698 | | |
| | | | 11,300,842 | | |
| Beverages - 1.9% | | | |
Constellation
Brands, Inc.(a) | | | 95,600 | | | | 2,820,200 | | |
| Broadcasting, Publishing & Printing - 0.8% | |
| John Wiley & Sons Cl. A | | | 31,500 | | | | 1,251,495 | | |
| Commercial Services - 3.6% | |
| Affymetrix, Inc.(a) (b) | | | 37,400 | | | | 2,016,982 | | |
Pharmaceutical Product
Development, Inc.(a) | | | 39,900 | | | | 1,869,714 | | |
| Quest Diagnostics, Inc.(b) | | | 27,000 | | | | 1,438,290 | | |
| | | | 5,324,986 | | |
| Communications - 4.2% | | | |
| Harris Corp. | | | 60,600 | | | | 1,891,326 | | |
L-3 Communications
Holdings, Inc. | | | 20,800 | | | | 1,592,864 | | |
Research In Motion
Limited(a) (b) | | | 19,200 | | | | 1,416,000 | | |
| Spectrasite, Inc.(a) | | | 18,000 | | | | 1,339,740 | | |
| | | | 6,239,930 | | |
| Computer Integrated Systems Design - 2.4% | | | |
| Autodesk, Inc. | | | 73,700 | | | | 2,533,069 | | |
Avid
Technology, Inc.(a) (b) | | | 19,600 | | | | 1,044,288 | | |
| | | | 3,577,357 | | |
| Computer Programming Services - 4.1% | | | |
Cognizant Technology
Solutions Corp.(a) | | | 53,100 | | | | 2,502,603 | | |
| Macromedia, Inc.(a) | | | 60,800 | | | | 2,323,776 | | |
| VeriSign, Inc.(a) | | | 41,500 | | | | 1,193,540 | | |
| | | | 6,019,919 | | |
| Computers & Information - 0.9% | | | |
| Western Digital Corp.(a) | | | 95,700 | | | | 1,284,294 | | |
| | | Number of
Shares | | Market
Value | |
| Data Processing & Preparation - 1.8% | | | |
| NCR Corp.(a) | | | 76,400 | | | $ | 2,683,168 | | |
| Electrical Equipment & Electronics - 5.5% | | | |
| Ametek, Inc. | | | 39,400 | | | | 1,648,890 | | |
Energizer
Holdings, Inc.(a) (b) | | | 23,200 | | | | 1,442,344 | | |
Marvell Technology
Group Limited(a) | | | 59,100 | | | | 2,248,164 | | |
| Rockwell Automation, Inc. | | | 59,100 | | | | 2,878,761 | | |
| | | | 8,218,159 | | |
| Energy - 6.3% | | | |
Diamond Offshore
Drilling, Inc. | | | 27,800 | | | | 1,485,354 | | |
| EOG Resources, Inc. | | | 39,400 | | | | 2,237,920 | | |
| Kerr-McGee Corp. | | | 36,748 | | | | 2,804,240 | | |
| Sunoco, Inc. | | | 25,000 | | | | 2,842,000 | | |
| | | | 9,369,514 | | |
| Entertainment & Leisure - 0.6% | | | |
Regal Entertainment
Group Cl. A(b) | | | 50,300 | | | | 949,664 | | |
| Financial Services - 1.7% | | | |
The Chicago Mercantile
Exchange(b) | | | 8,400 | | | | 2,482,200 | | |
| Foods - 2.6% | | | |
| 7-Eleven, Inc.(a) | | | 71,900 | | | | 2,174,256 | | |
| The Hershey Co.(b) | | | 26,600 | | | | 1,651,860 | | |
| | | | 3,826,116 | | |
| Healthcare - 10.5% | | | |
Community Health
Systems, Inc.(a) | | | 39,200 | | | | 1,481,368 | | |
| Covance, Inc.(a) | | | 31,200 | | | | 1,399,944 | | |
Coventry
Health Care, Inc.(a) | | | 30,300 | | | | 2,143,725 | | |
| DaVita, Inc.(a) | | | 42,100 | | | | 1,914,708 | | |
Lincare
Holdings, Inc.(a) (b) | | | 24,400 | | | | 996,496 | | |
| Renal Care Group, Inc.(a) | | | 47,300 | | | | 2,180,530 | | |
| Triad Hospitals, Inc.(a) | | | 41,100 | | | | 2,245,704 | | |
Universal Health
Services Cl. B(b) | | | 31,300 | | | | 1,946,234 | | |
| VCA Antech, Inc.(a) (b) | | | 53,000 | | | | 1,285,250 | | |
| | | | 15,593,959 | | |
Home Construction, Furnishings &
Appliances - 1.1% | | | | | | | |
| Toll Brothers, Inc.(a) | | | 15,300 | | | | 1,553,715 | | |
| | | Number of
Shares | | Market
Value | |
| Household Products - 2.3% | |
| Black & Decker Corp.(b) | | | 24,200 | | | $ | 2,174,370 | | |
| The Clorox Co. | | | 23,000 | | | | 1,281,560 | | |
| | | | 3,455,930 | | |
| Industrial – Diversified - 1.4% | | | |
| ITT Industries, Inc. | | | 21,100 | | | | 2,059,993 | | |
| Insurance - 2.2% | |
| Aetna, Inc. | | | 39,300 | | | | 3,254,826 | | |
| Lodging - 4.6% | |
Choice Hotels
International, Inc.(b) | | | 23,600 | | | | 1,550,520 | | |
| MGM Mirage(a) | | | 37,000 | | | | 1,464,460 | | |
Starwood Hotels & Resorts
Worldwide, Inc. | | | 29,500 | | | | 1,727,815 | | |
| Station Casinos, Inc. | | | 30,900 | | | | 2,051,760 | | |
| | | | 6,794,555 | | |
| Machinery & Components - 1.4% | | | |
| Graco, Inc. | | | 62,600 | | | | 2,132,782 | | |
| Manufacturing - 1.7% | |
| Pentair, Inc. | | | 59,200 | | | | 2,534,352 | | |
| Medical Supplies - 5.8% | |
| Bard (C.R.), Inc. | | | 21,200 | | | | 1,410,012 | | |
| Beckman Coulter, Inc. | | | 22,200 | | | | 1,411,254 | | |
Dade Behring
Holdings, Inc.(a) | | | 37,200 | | | | 2,418,372 | | |
Edwards
Lifesciences Corp.(a) (b) | | | 42,500 | | | | 1,828,350 | | |
| Patterson Cos., Inc.(a) | | | 35,100 | | | | 1,582,308 | | |
| | | | 8,650,296 | | |
| Metals & Mining - 3.6% | | | |
Allegheny
Technologies, Inc. | | | 53,800 | | | | 1,186,828 | | |
| Cameco Corp.(b) | | | 33,100 | | | | 1,481,225 | | |
| Nucor Corp.(b) | | | 25,600 | | | | 1,167,872 | | |
| Precision Castparts Corp. | | | 18,300 | | | | 1,425,570 | | |
| | | | 5,261,495 | | |
| Pharmaceuticals - 3.2% | | | |
Barr
Pharmaceuticals(a) (b) | | | 34,700 | | | | 1,691,278 | | |
| Celgene Corp.(a) (b) | | | 38,000 | | | | 1,549,260 | | |
Medco Health
Solutions, Inc.(a) | | | 28,700 | | | | 1,531,432 | | |
| | | | 4,771,970 | | |
| Prepackaged Software - 3.6% | | | |
| Adobe Systems, Inc. | | | 88,400 | | | | 2,530,008 | | |
(Continued)
The accompanying notes are an integral part of the financial statements.
125
MassMutual Select Mid Cap Growth Equity Fund – Portfolio of Investments (Continued)
| | | Number of
Shares | | Market
Value | |
| McAfee, Inc.(a) | | | 52,300 | | | $ | 1,369,214 | | |
| Pixar, Inc.(a) | | | 28,000 | | | | 1,401,400 | | |
| | | | 5,300,622 | | |
| Restaurants - 2.5% | | | |
| Darden Restaurants, Inc. | | | 67,000 | | | | 2,209,660 | | |
| Yum! Brands, Inc. | | | 29,800 | | | | 1,551,984 | | |
| | | | 3,761,644 | | |
| Retail - 1.4% | | | |
| Michaels Stores, Inc. | | | 49,800 | | | | 2,060,226 | | |
| Telephone Utilities - 5.0% | | | |
Nextel Partners,
Inc. Cl. A(a) (b) | | | 128,500 | | | | 3,234,345 | | |
NII Holdings,
Inc. Cl. B(a) (b) | | | 35,900 | | | | 2,295,446 | | |
| US Cellular Corp.(a) | | | 36,800 | | | | 1,837,792 | | |
| | | | 7,367,583 | | |
TOTAL EQUITIES
(Cost $113,166,207) | | | | | | | 141,360,800 | | |
| | | Principal
Amount | | | |
| SHORT-TERM INVESTMENTS - 25.2% | | | |
| Cash Equivalents - 19.5%(c) | | | |
ABN Amro Bank NV
Eurodollar Time Deposit
3.250% 08/05/2005 | | $ | 308,771 | | | | 308,771 | | |
American Beacon Money
Market Fund | | | 833,555 | | | | 833,555 | | |
Bank of America
Bank Note
3.270% 07/18/2005 | | | 427,381 | | | | 427,381 | | |
Bank of America
Bank Note
3.270% 08/30/2005 | | | 793,708 | | | | 793,708 | | |
Bank of Montreal
Eurodollar Time Deposit
3.010% 07/01/2005 | | | 1,175,595 | | | | 1,175,595 | | |
Barclays
Eurodollar Time Deposit
3.160% 07/14/2005 | | | 610,545 | | | | 610,545 | | |
Barclays
Eurodollar Time Deposit
3.250% 07/26/2005 | | | 615,157 | | | | 615,157 | | |
BGI Institutional Money
Market Fund | | | 2,396,205 | | | | 2,396,205 | | |
BNP Paribas
Eurodollar Time Deposit
3.000% 07/01/2005 | | | 427,381 | | | | 427,381 | | |
| | | Principal
Amount | | Market
Value | |
Calyon
Eurodollar Time Deposit
3.310% 07/01/2005 | | $ | 366,327 | | | $ | 366,327 | | |
Citigroup
Eurodollar Time Deposit
3.085% 07/22/2005 | | | 366,327 | | | | 366,327 | | |
Citigroup
Eurodollar Time Deposit
3.100% 07/25/2005 | | | 848,543 | | | | 848,543 | | |
Dexia Group
Eurodollar Time Deposit
3.205% 07/20/2005 | | | 305,272 | | | | 305,272 | | |
Dexia Group
Eurodollar Time Deposit
3.240% 07/21/2005 | | | 305,272 | | | | 305,272 | | |
Federal Home Loan Bank
Discount Note
2.977% 07/01/2005 | | | 753,934 | | | | 753,934 | | |
First Tennessee
National Corporation
Eurodollar Time Deposit
3.220% 08/09/2005 | | | 110,025 | | | | 110,025 | | |
Fortis Bank
Eurodollar Time Deposit
3.110% 07/05/2005 | | | 424,766 | | | | 424,766 | | |
Fortis Bank
Eurodollar Time Deposit
3.250% 07/25/2005 | | | 430,946 | | | | 430,946 | | |
Fortis Bank
Eurodollar Time Deposit
3.250% 08/04/2005 | | | 610,545 | | | | 610,545 | | |
Fortis Bank
Eurodollar Time Deposit
3.270% 07/07/2005 | | | 488,434 | | | | 488,434 | | |
Freddie Mac
Discount Note
3.208% 07/26/2005 | | | 300,976 | | | | 300,976 | | |
Freddie Mac
Discount Note
3.244% 08/16/2005 | | | 732,654 | | | | 732,654 | | |
General Electric
Capital Corp
3.252% 07/06/2005 | | | 610,545 | | | | 610,545 | | |
General Electric
Capital Corp
3.253% 07/08/2005 | | | 488,436 | | | | 488,436 | | |
Goldman Sachs
Financial Square
Prime Obligations
Money Market Fund | | | 557,502 | | | | 557,502 | | |
Harris Trust &
Savings Bank
3.295% 11/04/2005 | | | 584,746 | | | | 584,746 | | |
| | | Principal
Amount | | Market
Value | |
HBOS Halifax
Bank of Scotland
Eurodollar Time Deposit
3.150% 08/08/2005 | | $ | 305,272 | | | $ | 305,272 | | |
HSBC Banking/
Holdings PLC
Eurodollar Time Deposit
3.250% 08/05/2005 | | | 366,327 | | | | 366,327 | | |
JP Morgan Chase & Co.
Eurodollar Time Deposit
3.200% 07/20/2005 | | | 610,545 | | | | 610,545 | | |
Merrimac Cash Fund,
Premium Class | | | 967,998 | | | | 967,998 | | |
Morgan Stanley
Dean Witter & Co.
3.518% 07/19/2005 | | | 1,221,089 | | | | 1,221,089 | | |
National Australia Bank
Eurodollar Time Deposit
3.260% 07/06/2005 | | | 244,218 | | | | 244,218 | | |
National Australia Bank
Eurodollar Time Deposit
3.375% 07/01/2005 | | | 732,654 | | | | 732,654 | | |
Nordea Bank Finland
PLC (NY Branch)
Eurodollar Time Deposit
3.165% 08/09/2005 | | | 474,094 | | | | 474,094 | | |
Nordea Bank Finland
PLC (NY Branch)
Eurodollar Time Deposit
3.240% 08/03/2005 | | | 219,796 | | | | 219,796 | | |
Rabobank Nederland
Eurodollar Time Deposit
3.170% 07/18/2005 | | | 610,545 | | | | 610,545 | | |
Rabobank Nederland
Eurodollar Time Deposit
3.350% 07/01/2005 | | | 494,002 | | | | 494,002 | | |
Royal Bank of Canada
Eurodollar Time Deposit
3.250% 07/07/2005 | | | 366,327 | | | | 366,327 | | |
Royal Bank of Canada
Eurodollar Time Deposit
3.260% 07/28/2005 | | | 610,545 | | | | 610,545 | | |
Royal Bank of Scotland
Eurodollar Time Deposit
3.240% 08/08/2005 | | | 671,599 | | | | 671,599 | | |
Royal Bank of Scotland
Eurodollar Time Deposit
3.250% 08/04/2005 | | | 488,436 | | | | 488,436 | | |
Royal Bank of Scotland
Eurodollar Time Deposit
3.270% 07/29/2005 | | | 488,436 | | | | 488,436 | | |
Societe Generale
Eurodollar Time Deposit
3.200% 08/08/2005 | | | 244,218 | | | | 244,218 | | |
(Continued)
The accompanying notes are an integral part of the financial statements.
126
MassMutual Select Mid Cap Growth Equity Fund – Portfolio of Investments (Continued)
| | | Principal
Amount | | Market
Value | |
Societe Generale
Eurodollar Time Deposit
3.240% 08/09/2005 | | $ | 404,112 | | | $ | 404,112 | | |
Societe Generale
Eurodollar Time Deposit
3.280% 08/01/2005 | | | 610,545 | | | | 610,545 | | |
Svenska Handlesbanken
Eurodollar Time Deposit
3.220% 08/05/2005 | | | 610,545 | | | | 610,545 | | |
The Bank of the West
Eurodollar Time Deposit
3.270% 07/27/2005 | | | 183,163 | | | | 183,163 | | |
Toronto Dominion Bank
Eurodollar Time Deposit
3.250% 08/02/2005 | | | 610,545 | | | | 610,545 | | |
UBS AG
Eurodollar Time Deposit
3.250% 08/09/2005 | | | 305,272 | | | | 305,272 | | |
Wells Fargo
Eurodollar Time Deposit
3.270% 07/21/2005 | | | 610,545 | | | | 610,545 | | |
Wells Fargo
Eurodollar Time Deposit
3.270% 08/01/2005 | | | 610,545 | | | | 610,545 | | |
| | | | 28,934,921 | | |
| Repurchase Agreement - 5.7% | | | |
Investors Bank & Trust
Company Repurchase
Agreement, dated
06/30/2005, 2.01%,
due 07/01/2005(d) | | | 8,383,158 | | | | 8,383,158 | | |
TOTAL SHORT-TERM
INVESTMENTS
(At Amortized Cost) | | | | | | | 37,318,079 | | |
TOTAL INVESTMENTS - 120.5%
(Cost $150,484,286)(e) | | | | | | | 178,678,879 | | |
Other Assets/
(Liabilities) - (20.5%) | | | | | | | (30,387,619 | ) | |
| NET ASSETS - 100.0% | | | | | | $ | 148,291,260 | | |
Notes to Portfolio of Investments
(a) Non-income producing security.
(b) Denotes all or a portion of security on loan.
(c) Represents investments of security lending collateral. (Note 2).
(d) Maturity value of $8,383,626. Collateralized by U.S. Government Agency obligations with a rate of 6.575%, maturity date of 09/25/2015, and an aggregate market value, including accrued interest, of $8,802,315.
(e) See Note 6 for aggregate cost for Federal tax purposes.
The remainder of this page is intentionally left blank.
The accompanying notes are an integral part of the financial statements.
127
MassMutual Select Mid Cap Growth Equity II Fund – Portfolio of Investments
June 30, 2005 (Unaudited)
| | | Number of
Shares | | Market
Value | |
| EQUITIES - 96.7% | | | |
| Advertising - 1.7% | | | |
Catalina
Marketing Corp.(a) | | | 143,000 | | | $ | 3,633,630 | | |
| Getty Images, Inc.(a) (b) | | | 50,100 | | | | 3,720,426 | | |
| Harte-Hanks, Inc. | | | 15,900 | | | | 472,707 | | |
| Lamar Advertising Co.(b) | | | 14,500 | | | | 620,165 | | |
Monster
Worldwide, Inc.(b) | | | 209,100 | | | | 5,996,988 | | |
| Omnicom Group, Inc.(a) | | | 17,000 | | | | 1,357,620 | | |
WPP Group PLC
Sponsored ADR
(United Kingdom) | | | 19,700 | | | | 1,005,685 | | |
| | | | 16,807,221 | | |
| Aerospace & Defense - 2.6% | | | |
Alliant
Techsystems, Inc.(b) | | | 117,000 | | | | 8,260,200 | | |
Empresa
Brasileira de
Aeronautica SA,
ADR (Brazil)(a) | | | 33,100 | | | | 1,094,617 | | |
| Goodrich Corp. | | | 85,000 | | | | 3,481,600 | | |
| Rockwell Collins, Inc. | | | 251,400 | | | | 11,986,752 | | |
| | | | 24,823,169 | | |
| Agribusiness - 0.1% | | | |
| Delta & Pine Land Co. | | | 18,400 | | | | 461,104 | | |
| Air Transportation - 1.1% | | | |
JetBlue Airways
Corp.(a) (b) | | | 158,000 | | | | 3,229,520 | | |
| SkyWest, Inc. | | | 31,000 | | | | 563,580 | | |
| Southwest Airlines Co. | | | 455,900 | | | | 6,350,687 | | |
| | | | 10,143,787 | | |
| Apparel, Textiles & Shoes - 0.7% | | | |
| Coach, Inc.(b) | | | 29,000 | | | | 973,530 | | |
| Ross Stores, Inc. | | | 190,100 | | | | 5,495,791 | | |
| | | | 6,469,321 | | |
| Automotive & Parts - 1.2% | | | |
| Harley-Davidson, Inc. | | | 7,000 | | | | 347,200 | | |
| Oshkosh Truck Corp. | | | 86,000 | | | | 6,732,080 | | |
TRW Automotive
Holdings Corp. | | | 169,000 | | | | 4,142,190 | | |
Winnebago
Industries, Inc.(a) | | | 14,700 | | | | 481,425 | | |
| | | | 11,702,895 | | |
| Banking, Savings & Loans - 1.6% | | | |
| City National Corp. | | | 6,200 | | | | 444,602 | | |
| | | Number of
Shares | | Market
Value | |
First Horizon
National Corp. | | | 8,600 | | | $ | 362,920 | | |
The First
Marblehead Corp.(a) (b) | | | 17,600 | | | | 617,056 | | |
Investors Financial
Services Corp. | | | 61,100 | | | | 2,310,802 | | |
| Mellon Financial Corp. | | | 51,100 | | | | 1,466,059 | | |
North Fork
Bancorporation, Inc. | | | 22,500 | | | | 632,025 | | |
| Northern Trust Corp. | | | 55,300 | | | | 2,521,127 | | |
| State Street Corp. | | | 55,400 | | | | 2,673,050 | | |
SVB Financial
Group(a) (b) | | | 43,900 | | | | 2,102,810 | | |
| Synovus Financial Corp. | | | 48,400 | | | | 1,387,628 | | |
| UCBH Holdings, Inc. | | | 30,000 | | | | 487,200 | | |
| | | | 15,005,279 | | |
| Beverages - 0.5% | | | |
| Cott Corp.(a) (b) | | | 217,500 | | | | 4,748,025 | | |
| Broadcasting, Publishing & Printing - 2.5% | | | |
Citadel Broadcasting
Corp.(a) (b) | | | 426,600 | | | | 4,884,570 | | |
| Cox Radio, Inc. Cl. A(b) | | | 167,000 | | | | 2,630,250 | | |
Cumulus Media,
Inc. Cl. A(b) | | | 27,300 | | | | 321,594 | | |
Entercom
Communications Corp.(b) | | | 59,800 | | | | 1,990,742 | | |
The McGraw-Hill
Companies, Inc. | | | 14,200 | | | | 628,350 | | |
| Meredith Corp. | | | 16,900 | | | | 829,114 | | |
| New York Times Co. Cl. A | | | 14,200 | | | | 442,330 | | |
| Radio One, Inc. Cl. D(b) | | | 47,600 | | | | 607,852 | | |
Regent
Communications, Inc.(b) | | | 68,700 | | | | 403,269 | | |
Salem Communications
Corp. Cl. A(b) | | | 35,200 | | | | 698,368 | | |
| Scholastic Corp.(b) | | | 56,000 | | | | 2,158,800 | | |
| The Scripps (E.W.) Co. | | | 14,600 | | | | 712,480 | | |
Spanish Broadcasting
System, Inc. Cl. A(b) | | | 40,600 | | | | 405,594 | | |
Univision Communications,
Inc. Cl. A(a) (b) | | | 221,200 | | | | 6,094,060 | | |
| Washington Post Co. Cl. B | | | 900 | | | | 751,527 | | |
| Westwood One, Inc.(a) (b) | | | 23,100 | | | | 471,933 | | |
| | | | 24,030,833 | | |
| Building Materials & Construction - 0.5% | | | |
| Kinetic Concepts, Inc.(b) | | | 77,000 | | | | 4,620,000 | | |
| | | Number of
Shares | | Market
Value | |
| Chemicals - 0.3% | |
| Engelhard Corp. | | | 14,000 | | | $ | 399,700 | | |
| Monsanto Co. | | | 12,500 | | | | 785,875 | | |
| Praxair, Inc. | | | 11,000 | | | | 512,600 | | |
Symyx
Technologies, Inc.(b) | | | 15,600 | | | | 436,488 | | |
| The Valspar Corp. | | | 16,200 | | | | 782,298 | | |
| | | | 2,916,961 | | |
| Commercial Services - 7.1% | | | |
Apollo Group,
Inc. Cl. A(a) (b) | | | 56,706 | | | | 4,435,543 | | |
| ARAMARK Corp. Cl. B | | | 15,100 | | | | 398,640 | | |
| Block (H&R), Inc. | | | 8,900 | | | | 519,315 | | |
Career
Education Corp.(b) | | | 20,100 | | | | 735,861 | | |
| Certegy, Inc. | | | 237,100 | | | | 9,061,962 | | |
| Cintas Corp.(a) | | | 29,500 | | | | 1,138,700 | | |
The Corporate Executive
Board Co. | | | 11,800 | | | | 924,294 | | |
Decode
Genetics, Inc.(a) (b) | | | 61,700 | | | | 579,363 | | |
| DeVry, Inc.(a) (b) | | | 21,400 | | | | 425,860 | | |
| Diversa Corp.(b) | | | 50,300 | | | | 262,063 | | |
| Dun & Bradstreet Corp.(b) | | | 13,700 | | | | 844,605 | | |
| Ecolab, Inc. | | | 13,900 | | | | 449,804 | | |
Education
Management Corp.(b) | | | 166,500 | | | | 5,616,045 | | |
| Equifax, Inc. | | | 17,800 | | | | 635,638 | | |
| Gen-Probe, Inc.(b) | | | 75,300 | | | | 2,728,119 | | |
| Global Payments, Inc. | | | 78,900 | | | | 5,349,420 | | |
| Iron Mountain, Inc.(b) | | | 238,950 | | | | 7,412,229 | | |
ITT Educational
Services, Inc.(a) (b) | | | 14,200 | | | | 758,564 | | |
| LECG Corp.(b) | | | 28,000 | | | | 595,280 | | |
| Manpower, Inc. | | | 170,700 | | | | 6,790,446 | | |
MoneyGram
International, Inc. | | | 283,600 | | | | 5,422,432 | | |
| Moody's Corp. | | | 51,600 | | | | 2,319,936 | | |
| Paychex, Inc. | | | 48,700 | | | | 1,584,698 | | |
| QIAGEN NV(a) (b) | | | 59,100 | | | | 682,014 | | |
| Quest Diagnostics, Inc. | | | 37,800 | | | | 2,013,606 | | |
Robert Half
International, Inc.(a) | | | 170,300 | | | | 4,252,391 | | |
| Stericycle, Inc.(a) (b) | | | 17,900 | | | | 900,728 | | |
Universal Technical
Institute, Inc.(a) (b) | | | 15,500 | | | | 514,600 | | |
| Viad Corp. | | | 65,000 | | | | 1,842,100 | | |
| | | | 69,194,256 | | |
(Continued)
The accompanying notes are an integral part of the financial statements.
128
MassMutual Select Mid Cap Growth Equity II Fund – Portfolio of Investments (Continued)
| | | Number of
Shares | | Market
Value | |
| Communications - 3.6% | | | |
American Tower
Corp. Cl. A(a) (b) | | | 119,500 | | | $ | 2,511,890 | | |
Crown Castle
International Corp.(b) | | | 435,000 | | | | 8,839,200 | | |
| Harris Corp. | | | 288,000 | | | | 8,988,480 | | |
Network
Appliance, Inc.(a) (b) | | | 13,100 | | | | 370,337 | | |
| Plantronics, Inc.(a) | | | 10,100 | | | | 367,236 | | |
Research In Motion
Limited(b) | | | 39,600 | | | | 2,920,500 | | |
Rogers Communications,
Inc. Cl. B(a) | | | 252,175 | | | | 8,291,514 | | |
XM Satellite Radio
Holdings,
Inc. Cl. A(a) (b) | | | 74,000 | | | | 2,490,840 | | |
| | | | 34,779,997 | | |
| Computer Integrated Systems Design - 1.3% | | | |
Cadence Design
Systems, Inc.(a) (b) | | | 397,800 | | | | 5,433,948 | | |
| Cogent, Inc.(b) | | | 50,600 | | | | 1,444,630 | | |
| F5 Networks, Inc.(b) | | | 12,200 | | | | 576,267 | | |
| FileNET Corp.(b) | | | 18,700 | | | | 470,118 | | |
Jack Henry &
Associates, Inc. | | | 184,500 | | | | 3,378,195 | | |
Mercury Computer
Systems, Inc.(b) | | | 14,500 | | | | 396,865 | | |
National
Instruments Corp. | | | 15,500 | | | | 328,600 | | |
| Synopsys, Inc.(b) | | | 23,500 | | | | 391,745 | | |
| Websense, Inc.(a) (b) | | | 11,600 | | | | 557,380 | | |
| | | | 12,977,748 | | |
| Computer Programming Services - 2.2% | | | |
CACI International,
Inc. Cl. A(b) | | | 82,000 | | | | 5,179,120 | | |
Cognizant Technology
Solutions Corp.(b) | | | 31,800 | | | | 1,498,734 | | |
| Macromedia, Inc.(b) | | | 35,000 | | | | 1,337,700 | | |
Mercury
Interactive Corp.(b) | | | 121,900 | | | | 4,676,084 | | |
| VeriSign, Inc.(b) | | | 308,700 | | | | 8,878,212 | | |
| | | | 21,569,850 | | |
| Computer Related Services - 0.8% | | | |
| Checkfree Corp.(a) (b) | | | 103,000 | | | | 3,508,180 | | |
CNET
Networks, Inc.(a) (b) | | | 323,000 | | | | 3,792,020 | | |
| | | | 7,300,200 | | |
| Computers & Information - 2.6% | | | |
| CDW Corp. | | | 108,500 | | | | 6,194,265 | | |
| Cognos, Inc.(b) | | | 26,800 | | | | 914,952 | | |
| | | Number of
Shares | | Market
Value | |
Comverse
Technology, Inc.(b) | | | 101,000 | | | $ | 2,388,650 | | |
| Diebold, Inc. | | | 91,000 | | | | 4,105,010 | | |
International Game
Technology | | | 48,500 | | | | 1,365,275 | | |
| Jabil Circuit, Inc.(a) (b) | | | 248,500 | | | | 7,636,405 | | |
Lexmark
International, Inc.(b) | | | 24,500 | | | | 1,588,335 | | |
| Symbol Technologies, Inc. | | | 48,900 | | | | 482,643 | | |
Zebra Technologies
Corp. Cl. A(b) | | | 22,000 | | | | 963,380 | | |
| | �� | | 25,638,915 | | |
| Containers - 0.0% | | | |
| Sealed Air Corp.(b) | | | 7,500 | | | | 373,425 | | |
| Data Processing & Preparation - 0.4% | |
Affiliated Computer
Services, Inc. Cl. A(b) | | | 13,600 | | | | 694,960 | | |
Factset Research
Systems, Inc.(a) | | | 17,700 | | | | 634,368 | | |
| Fiserv, Inc.(b) | | | 23,300 | | | | 1,000,735 | | |
| IMS Health, Inc. | | | 38,000 | | | | 941,260 | | |
| SEI Investments Co. | | | 11,200 | | | | 418,320 | | |
| | | | 3,689,643 | | |
| Electrical Equipment & Electronics - 9.1% | | | |
| Altera Corp.(a) (b) | | | 117,700 | | | | 2,332,814 | | |
| Ametek, Inc. | | | 9,300 | | | | 389,205 | | |
| AMIS Holdings, Inc.(b) | | | 180,400 | | | | 2,406,536 | | |
| Analog Devices, Inc. | | | 62,700 | | | | 2,339,337 | | |
| Broadcom Corp. Cl. A(b) | | | 23,700 | | | | 841,587 | | |
| Cymer, Inc.(b) | | | 15,000 | | | | 395,250 | | |
Dolby Laboratories,
Inc. Cl. A(b) | | | 146,800 | | | | 3,238,408 | | |
Flextronics International
Limited(b) | | | 452,000 | | | | 5,970,920 | | |
| FLIR Systems, Inc.(a) (b) | | | 183,800 | | | | 5,484,592 | | |
| Garmin Limited(a) | | | 92,000 | | | | 3,933,000 | | |
| Gentex Corp.(a) | | | 358,600 | | | | 6,526,520 | | |
Integrated Circuit
Systems, Inc.(b) | | | 158,100 | | | | 3,263,184 | | |
| Intersil Corp. Cl. A | | | 318,200 | | | | 5,972,614 | | |
| Kla-Tencor Corp. | | | 20,300 | | | | 887,110 | | |
| Linear Technology Corp. | | | 64,400 | | | | 2,362,836 | | |
| Littelfuse, Inc.(b) | | | 11,500 | | | | 320,275 | | |
Marvell Technology
Group Limited(b) | | | 74,000 | | | | 2,814,960 | | |
Maxim Integrated
Products, Inc. | | | 63,400 | | | | 2,422,514 | | |
Microchip
Technology, Inc. | | | 289,900 | | | | 8,586,838 | | |
| Molex, Inc. Cl. A | | | 34,000 | | | | 798,320 | | |
| | | Number of
Shares | | Market
Value | |
National
Semiconductor Corp. | | | 114,900 | | | $ | 2,531,247 | | |
| Novellus Systems, Inc.(b) | | | 222,800 | | | | 5,505,388 | | |
| PMC-Sierra, Inc.(a) (b) | | | 230,000 | | | | 2,145,900 | | |
| Qlogic Corp.(b) | | | 17,700 | | | | 546,399 | | |
| Semtech Corp.(b) | | | 146,000 | | | | 2,430,900 | | |
Silicon
Laboratories, Inc.(a) (b) | | | 40,300 | | | | 1,056,263 | | |
| Teleflex, Inc. | | | 91,000 | | | | 5,402,670 | | |
| Xilinx, Inc. | | | 270,800 | | | | 6,905,400 | | |
| | | | 87,810,987 | | |
| Energy - 4.8% | | | |
| BJ Services Co.(a) | | | 205,100 | | | | 10,763,648 | | |
| EOG Resources, Inc. | | | 147,000 | | | | 8,349,600 | | |
| Murphy Oil Corp. | | | 213,400 | | | | 11,145,882 | | |
Weatherford International
Limited(b) | | | 31,400 | | | | 1,820,572 | | |
Western Gas
Resources, Inc. | | | 128,000 | | | | 4,467,200 | | |
| XTO Energy, Inc. | | | 278,067 | | | | 9,451,497 | | |
| | | | 45,998,399 | | |
| Entertainment & Leisure - 1.4% | | | |
| Brunswick Corp. | | | 177,600 | | | | 7,693,632 | | |
DreamWorks Animation
SKG, Inc. Cl. A(b) | | | 104,600 | | | | 2,740,520 | | |
Harrah's
Entertainment, Inc. | | | 22,800 | | | | 1,643,196 | | |
Shuffle
Master, Inc.(a) (b) | | | 31,950 | | | | 895,559 | | |
WMS
Industries, Inc.(a) (b) | | | 11,400 | | | | 384,750 | | |
| | | | 13,357,657 | | |
| Financial Services - 5.2% | | | |
| AG Edwards, Inc. | | | 11,800 | | | | 532,770 | | |
Ameritrade
Holding Corp.(b) | | | 492,000 | | | | 9,146,280 | | |
AMVESCAP PLC
Sponsored ADR
(United Kingdom) | | | 38,900 | | | | 467,189 | | |
Boston Private Financial
Holdings, Inc. | | | 16,400 | | | | 413,280 | | |
| CapitalSource, Inc.(a) (b) | | | 179,000 | | | | 3,513,770 | | |
| E Trade Financial Corp.(b) | | | 299,000 | | | | 4,183,010 | | |
| East West Bancorp, Inc. | | | 15,800 | | | | 530,722 | | |
| Eaton Vance Corp. | | | 284,100 | | | | 6,792,831 | | |
Federated
Investors, Inc. Cl. B | | | 91,900 | | | | 2,757,919 | | |
| Franklin Resources, Inc. | | | 32,200 | | | | 2,478,756 | | |
| Lazard, Limited Cl. A(a) | | | 37,100 | | | | 862,575 | | |
| Legg Mason, Inc.(a) | | | 76,950 | | | | 8,011,265 | | |
(Continued)
The accompanying notes are an integral part of the financial statements.
129
MassMutual Select Mid Cap Growth Equity II Fund – Portfolio of Investments (Continued)
| | | Number of
Shares | | Market
Value | |
Nuveen Investments,
Inc. Cl. A(a) | | | 128,900 | | | $ | 4,849,218 | | |
Raymond James
Financial, Inc. | | | 15,700 | | | | 443,525 | | |
The Schwab
(Charles) Corp. | | | 116,600 | | | | 1,315,248 | | |
Waddell & Reed
Financial, Inc. Cl. A | | | 210,000 | | | | 3,885,000 | | |
| | | | 50,183,358 | | |
| Foods - 0.2% | | | |
| The Hershey Co.(a) | | | 9,100 | | | | 565,110 | | |
| McCormick & Co., Inc. | | | 16,000 | | | | 522,880 | | |
Tootsie Roll
Industries, Inc. | | | 17,304 | | | | 506,142 | | |
| Wrigley (Wm.) Jr. Co. | | | 6,500 | | | | 447,460 | | |
| | | | 2,041,592 | | |
| Healthcare - 4.6% | | | |
| Caremark Rx, Inc.(b) | | | 28,800 | | | | 1,282,176 | | |
Community Health
Systems, Inc.(b) | | | 114,000 | | | | 4,308,060 | | |
Coventry
Health Care, Inc.(b) | | | 78,500 | | | | 5,553,875 | | |
| DaVita, Inc.(b) | | | 65,750 | | | | 2,990,310 | | |
Elan Corp. PLC
Sponsored ADR
(Ireland)(a) (b) | | | 325,300 | | | | 2,218,546 | | |
Express
Scripts, Inc.(a) (b) | | | 26,200 | | | | 1,309,476 | | |
Health Management
Associates, Inc. Cl. A(a) | | | 257,600 | | | | 6,743,968 | | |
Human Genome
Sciences, Inc.(b) | | | 161,900 | | | | 1,874,802 | | |
Laboratory Corp. of
America Holdings(a) (b) | | | 167,000 | | | | 8,333,300 | | |
Lincare
Holdings, Inc.(a) (b) | | | 23,900 | | | | 976,076 | | |
| Manor Care, Inc. | | | 227,300 | | | | 9,030,629 | | |
| | | | 44,621,218 | | |
Home Construction, Furnishings &
Appliances - 1.0% | | | | | | | |
| Centex Corp. | | | 7,700 | | | | 544,159 | | |
Harman International
Industries | | | 68,000 | | | | 5,532,480 | | |
| HNI Corp. | | | 17,400 | | | | 890,010 | | |
| KB Home | | | 7,200 | | | | 548,856 | | |
| Lennar Corp.(a) | | | 8,300 | | | | 526,635 | | |
| Pulte Homes, Inc. | | | 6,300 | | | | 530,775 | | |
| Toll Brothers, Inc.(a) (b) | | | 5,900 | | | | 599,145 | | |
| | | | 9,172,060 | | |
| | | Number of
Shares | | Market
Value | |
| Household Products - 0.1% | | | |
| Corning, Inc.(b) | | | 54,200 | | | $ | 900,804 | | |
| Trex Company, Inc.(a) (b) | | | 8,200 | | | | 210,740 | | |
| | | | 1,111,544 | | |
| Industrial – Diversified - 1.3% | | | |
| Danaher Corp.(a) | | | 99,600 | | | | 5,213,064 | | |
| ITT Industries, Inc. | | | 74,500 | | | | 7,273,435 | | |
| | | | 12,486,499 | | |
| Information Retrieval Services - 1.4% | | | |
| ChoicePoint, Inc.(b) | | | 213,800 | | | | 8,562,690 | | |
Juniper
Networks, Inc.(a) (b) | | | 161,300 | | | | 4,061,534 | | |
| Sina Corp.(a) (b) | | | 27,900 | | | | 778,410 | | |
| | | | 13,402,634 | | |
| Insurance - 3.3% | | | |
Ambac Financial
Group, Inc. | | | 11,300 | | | | 788,288 | | |
Arch Capital Group
Limited(b) | | | 14,500 | | | | 653,225 | | |
| Assurant, Inc. | | | 205,000 | | | | 7,400,500 | | |
Axis Capital Holdings
Limited | | | 118,800 | | | | 3,362,040 | | |
| Brown & Brown, Inc. | | | 11,600 | | | | 521,304 | | |
Gallagher
(Arthur J.) & Co. | | | 24,000 | | | | 651,120 | | |
| Markel Corp.(b) | | | 1,300 | | | | 440,700 | | |
Marsh & McLennan
Companies, Inc. | | | 25,800 | | | | 714,660 | | |
| MBIA, Inc.(a) | | | 13,500 | | | | 800,685 | | |
| MGIC Investment Corp. | | | 5,100 | | | | 332,622 | | |
Principal Financial
Group, Inc. | | | 110,000 | | | | 4,609,000 | | |
| Protective Life Corp. | | | 51,000 | | | | 2,153,220 | | |
| Radian Group, Inc. | | | 6,700 | | | | 316,374 | | |
RenaissanceRe Holdings
Limited | | | 8,600 | | | | 423,464 | | |
| Triad Guaranty, Inc.(b) | | | 7,100 | | | | 357,769 | | |
| WellChoice, Inc.(b) | | | 35,200 | | | | 2,445,344 | | |
| WellPoint, Inc.(b) | | | 24,800 | | | | 1,727,072 | | |
Willis Group Holdings
Limited | | | 142,300 | | | | 4,656,056 | | |
| | | | 32,353,443 | | |
| Internet Software - 0.0% | | | |
| MatrixOne, Inc.(b) | | | 75,600 | | | | 378,000 | | |
| Lodging - 1.9% | | | |
| Boyd Gaming Corp. | | | 33,200 | | | | 1,697,516 | | |
Choice Hotels
International, Inc. | | | 25,600 | | | | 1,681,920 | | |
Fairmont Hotels &
Resorts, Inc.(a) | | | 247,700 | | | | 8,627,391 | | |
| | | Number of
Shares | | Market
Value | |
| Hilton Hotels Corp. | | | 28,500 | | | $ | 679,725 | | |
Marriott
International, Inc. Cl. A | | | 37,000 | | | | 2,524,140 | | |
| Station Casinos, Inc. | | | 38,500 | | | | 2,556,400 | | |
Wynn Resorts
Limited(a) (b) | | | 22,800 | | | | 1,077,756 | | |
| | | | 18,844,848 | | |
| Machinery & Components - 3.0% | | | |
| Baker Hughes, Inc. | | | 25,300 | | | | 1,294,348 | | |
| Cooper Cameron Corp.(b) | | | 29,300 | | | | 1,818,065 | | |
| FMC Technologies, Inc.(b) | | | 148,000 | | | | 4,731,560 | | |
| IDEX Corp. | | | 10,850 | | | | 418,919 | | |
| Pall Corp. | | | 26,300 | | | | 798,468 | | |
| Roper Industries, Inc. | | | 147,900 | | | | 10,555,623 | | |
| Smith International, Inc. | | | 148,500 | | | | 9,459,450 | | |
| | | | 29,076,433 | | |
| Manufacturing - 0.7% | | | |
American Standard
Companies, Inc. | | | 129,000 | | | | 5,407,680 | | |
| Avery Dennison Corp. | | | 6,600 | | | | 349,536 | | |
| Lam Research Corp.(b) | | | 15,500 | | | | 448,570 | | |
| Millipore Corp.(b) | | | 13,900 | | | | 788,547 | | |
| | | | 6,994,333 | | |
| Medical Supplies - 3.4% | | | |
| Allergan, Inc. | | | 8,200 | | | | 698,968 | | |
Applied Biosystems
Group - Applera Corp. | | | 24,000 | | | | 472,080 | | |
| ArthoCare Corp.(b) | | | 14,400 | | | | 503,136 | | |
| Bard (C.R.), Inc. | | | 20,200 | | | | 1,343,502 | | |
| Bausch & Lomb, Inc. | | | 42,000 | | | | 3,486,000 | | |
| Beckman Coulter, Inc. | | | 9,200 | | | | 584,844 | | |
| Becton, Dickinson & Co. | | | 14,400 | | | | 755,568 | | |
| Biomet, Inc. | | | 45,100 | | | | 1,562,264 | | |
| Cooper Cos., Inc.(a) | | | 10,800 | | | | 657,288 | | |
Dentsply
International, Inc.(a) | | | 17,400 | | | | 939,600 | | |
Edwards
Lifesciences Corp.(b) | | | 120,300 | | | | 5,175,306 | | |
| II-VI, Inc.(b) | | | 16,000 | | | | 294,240 | | |
| Inamed Corp.(b) | | | 34,600 | | | | 2,317,162 | | |
Integra LifeSciences
Holdings Corp.(b) | | | 12,200 | | | | 356,240 | | |
| Kyphon, Inc.(a) (b) | | | 25,700 | | | | 894,103 | | |
Mettler-Toledo
International, Inc.(b) | | | 6,300 | | | | 293,454 | | |
| Patterson Cos., Inc.(b) | | | 16,000 | | | | 721,280 | | |
| Resmed, Inc.(b) | | | 9,300 | | | | 613,707 | | |
| Respironics, Inc.(b) | | | 18,800 | | | | 678,868 | | |
Smith & Nephew PLC
ADR (United Kingdom) | | | 13,100 | | | | 647,271 | | |
| St. Jude Medical, Inc.(b) | | | 15,300 | | | | 667,233 | | |
(Continued)
The accompanying notes are an integral part of the financial statements.
130
MassMutual Select Mid Cap Growth Equity II Fund – Portfolio of Investments (Continued)
| | | Number of
Shares | | Market
Value | |
Sybron Dental
Specialties, Inc.(b) | | | 14,000 | | | $ | 526,680 | | |
| Techne Corp.(a) (b) | | | 18,400 | | | | 844,744 | | |
Varian Medical
Systems, Inc.(b) | | | 80,600 | | | | 3,008,798 | | |
| Waters Corp.(b) | | | 99,100 | | | | 3,683,547 | | |
Wright Medical
Group, Inc.(b) | | | 24,100 | | | | 643,470 | | |
Zimmer
Holdings, Inc.(a) (b) | | | 5,900 | | | | 449,403 | | |
| | | | 32,818,756 | | |
| Metals & Mining - 0.5% | | | |
| Newmont Mining Corp. | | | 104,000 | | | | 4,059,120 | | |
| Precision Castparts Corp. | | | 11,000 | | | | 856,900 | | |
| | | | 4,916,020 | | |
| Pharmaceuticals - 9.0% | | | |
| Abgenix, Inc.(a) (b) | | | 153,700 | | | | 1,318,746 | | |
| Alkermes, Inc.(a) (b) | | | 170,000 | | | | 2,247,400 | | |
Amylin Pharmaceuticals,
Inc.(a) (b) | | | 100,100 | | | | 2,095,093 | | |
| Andrx Corp.(a) (b) | | | 127,000 | | | | 2,579,370 | | |
| Atherogenics, Inc.(a) (b) | | | 25,400 | | | | 405,892 | | |
Barr
Pharmaceuticals(a) (b) | | | 128,000 | | | | 6,238,720 | | |
| Celgene Corp.(b) | | | 94,000 | | | | 3,832,380 | | |
| Cephalon, Inc.(a) (b) | | | 127,900 | | | | 5,091,699 | | |
Charles River Laboratories
International, Inc.(b) | | | 15,300 | | | | 738,225 | | |
| Genzyme Corp.(b) | | | 9,100 | | | | 546,819 | | |
| Gilead Sciences, Inc.(b) | | | 196,100 | | | | 8,626,439 | | |
| Henry Schein, Inc.(b) | | | 29,600 | | | | 1,228,992 | | |
| Invitrogen Corp.(b) | | | 9,900 | | | | 824,571 | | |
| IVAX Corp.(b) | | | 364,600 | | | | 7,838,900 | | |
Martek
Biosciences Corp.(a) (b) | | | 20,700 | | | | 785,565 | | |
Medco Health
Solutions, Inc.(b) | | | 23,400 | | | | 1,248,624 | | |
| The Medicines Co.(a) (b) | | | 15,800 | | | | 369,562 | | |
| Medimmune, Inc.(a) (b) | | | 366,300 | | | | 9,787,536 | | |
Millennium
Pharmaceuticals, Inc.(b) | | | 35,900 | | | | 332,793 | | |
| Nektar Therapeutics(b) | | | 19,600 | | | | 330,064 | | |
Neurocrine
Biosciences, Inc.(b) | | | 78,900 | | | | 3,318,534 | | |
| Omnicare, Inc. | | | 271,700 | | | | 11,528,231 | | |
OSI
Pharmaceuticals, Inc.(b) | | | 38,300 | | | | 1,565,321 | | |
Protein
Design Labs, Inc.(b) | | | 143,100 | | | | 2,892,051 | | |
| Sepracor, Inc.(a) (b) | | | 82,300 | | | | 4,938,823 | | |
| Sigma-Aldrich Corp. | | | 8,500 | | | | 476,340 | | |
Taro Pharmaceutical
Industries Limited(b) | | | 63,000 | | | | 1,831,410 | | |
| | | Number of
Shares | | Market
Value | |
Valeant Pharmaceuticals
International | | | 90,000 | | | $ | 1,586,700 | | |
Vertex
Pharmaceuticals, Inc.(b) | | | 163,600 | | | | 2,755,024 | | |
| | | | 87,359,824 | | |
| Prepackaged Software - 4.8% | | | |
| Activision, Inc.(b) | | | 225,733 | | | | 3,729,109 | | |
| Adobe Systems, Inc. | | | 139,000 | | | | 3,978,180 | | |
Check Point Software
Technologies Limited(b) | | | 37,400 | | | | 740,520 | | |
| Citrix Systems, Inc.(b) | | | 24,700 | | | | 535,002 | | |
| DST Systems, Inc.(b) | | | 168,600 | | | | 7,890,480 | | |
| Electronic Arts, Inc.(b) | | | 12,100 | | | | 684,981 | | |
| Fair Isaac Corp. | | | 14,500 | | | | 529,250 | | |
Hyperion
Solutions Corp.(b) | | | 13,800 | | | | 555,312 | | |
Internet Security
Systems, Inc.(b) | | | 16,600 | | | | 336,814 | | |
| Intuit, Inc.(a) (b) | | | 76,000 | | | | 3,428,360 | | |
| McAfee, Inc.(b) | | | 288,000 | | | | 7,539,840 | | |
| NAVTEQ Corp.(b) | | | 170,000 | | | | 6,320,600 | | |
| Novell, Inc.(a) (b) | | | 69,700 | | | | 432,140 | | |
| Red Hat, Inc.(a) (b) | | | 280,100 | | | | 3,669,310 | | |
| Salesforce.com, Inc.(b) | | | 42,700 | | | | 874,496 | | |
SunGard Data
Systems, Inc.(b) | | | 81,000 | | | | 2,848,770 | | |
| THQ, Inc.(b) | | | 12,000 | | | | 351,240 | | |
| Veritas Software Corp.(b) | | | 75,400 | | | | 1,839,760 | | |
| | | | 46,284,164 | | |
| Restaurants - 1.0% | | | |
The Cheesecake
Factory(a) (b) | | | 159,500 | | | | 5,539,435 | | |
| Outback Steakhouse, Inc. | | | 10,300 | | | | 465,972 | | |
P.F. Chang's China
Bistro, Inc.(a) (b) | | | 52,000 | | | | 3,066,960 | | |
| Ruby Tuesday, Inc. | | | 20,600 | | | | 533,540 | | |
| | | | 9,605,907 | | |
| Retail - 5.8% | | | |
| Amazon.com, Inc.(a) (b) | | | 136,900 | | | | 4,528,652 | | |
Bed Bath &
Beyond, Inc.(b) | | | 33,500 | | | | 1,399,630 | | |
| Best Buy Co., Inc. | | | 129,000 | | | | 8,842,950 | | |
| Carmax, Inc.(b) | | | 100,000 | | | | 2,665,000 | | |
| Dollar General Corp. | | | 257,400 | | | | 5,240,664 | | |
| Dollar Tree Stores, Inc.(b) | | | 15,600 | | | | 374,400 | | |
| Family Dollar Stores, Inc. | | | 258,800 | | | | 6,754,680 | | |
| Fred's, Inc.(a) | | | 25,000 | | | | 414,500 | | |
Men's
Wearhouse, Inc.(a) (b) | | | 17,400 | | | | 599,082 | | |
MSC Industrial
Direct Co. Cl. A | | | 22,000 | | | | 742,500 | | |
O'Reilly
Automotive, Inc.(b) | | | 207,800 | | | | 6,194,518 | | |
| Petsmart, Inc.(a) | | | 219,800 | | | | 6,670,930 | | |
| | | Number of
Shares | | Market
Value | |
Shoppers
Drug Mart Corp. (CAD) | | | 16,000 | | | $ | 551,657 | | |
Shoppers Drug
Mart Corp. (CAD)(c) | | | 38,000 | | | | 1,310,185 | | |
Shoppers Drug
Mart Corp. (USD) | | | 23,000 | | | | 793,007 | | |
| Staples, Inc. | | | 41,550 | | | | 885,846 | | |
| Tiffany & Co.(a) | | | 45,100 | | | | 1,477,476 | | |
| TJX Companies, Inc. | | | 66,800 | | | | 1,626,580 | | |
| Williams-Sonoma, Inc.(b) | | | 136,400 | | | | 5,397,348 | | |
| | | | 56,469,605 | | |
| Retail – Grocery - 0.3% | | | |
| Whole Foods Market, Inc. | | | 25,000 | | | | 2,957,500 | | |
| Telephone Utilities - 2.0% | | | |
| Adtran, Inc. | | | 221,700 | | | | 5,495,943 | | |
| NeuStar, Inc. Cl. A(b) | | | 13,800 | | | | 353,280 | | |
Nextel Partners,
Inc. Cl. A(a) (b) | | | 360,600 | | | | 9,076,302 | | |
| TELUS Corp. (CAD) | | | 130,700 | | | | 4,565,726 | | |
| TELUS Corp. (CAD) | | | 6,300 | | | | 220,077 | | |
| | | | 19,711,328 | | |
| Toys, Games - 0.0% | | | |
| Mattel, Inc. | | | 23,600 | | | | 431,880 | | |
| Transportation - 1.1% | | | |
Expeditors International
of Washington, Inc. | | | 50,500 | | | | 2,515,405 | | |
| Landstar System, Inc.(b) | | | 24,600 | | | | 740,952 | | |
Robinson (C.H.)
Worldwide, Inc.(a) | | | 87,100 | | | | 5,069,220 | | |
Royal Caribbean Cruises
Limited | | | 35,200 | | | | 1,702,272 | | |
| Thor Industries, Inc. | | | 20,100 | | | | 631,743 | | |
| UTI Worldwide, Inc. | | | 6,300 | | | | 438,606 | | |
| | | | 11,098,198 | | |
| Travel - 0.0% | | | |
| Sabre Holdings Corp. | | | 17,400 | | | | 347,130 | | |
TOTAL EQUITIES
(Cost $764,226,735) | | | | | | | 937,085,946 | | |
| MUTUAL FUND - 0.8% | | | |
| Financial Services | | | |
Government Reserve
Investment Fund | | | 7,962,485 | | | | 7,962,485 | | |
TOTAL MUTUAL FUND
(Cost $7,962,486) | | | | | | | 7,962,485 | | |
TOTAL LONG TERM INVESTMENTS
(Cost $772,189,221) | | | | | | | 945,048,431 | | |
(Continued)
The accompanying notes are an integral part of the financial statements.
131
MassMutual Select Mid Cap Growth Equity II Fund – Portfolio of Investments (Continued)
| | | Principal
Amount | | Market
Value | |
| SHORT-TERM INVESTMENTS - 16.5% | |
| Cash Equivalents - 13.9%(d) | |
ABN Amro Bank NV
Eurodollar Time Deposit
3.250% 08/05/2005 | | $ | 1,438,227 | | | $ | 1,438,227 | | |
American Beacon Money
Market Fund | | | 3,882,620 | | | | 3,882,620 | | |
Bank of America
Bank Note
3.270% 07/18/2005 | | | 1,990,702 | | | | 1,990,702 | | |
Bank of America
Bank Note
3.270% 08/30/2005 | | | 3,697,019 | | | | 3,697,019 | | |
Bank of Montreal
Eurodollar Time Deposit
3.010% 07/01/2005 | | | 5,475,812 | | | | 5,475,812 | | |
Barclays
Eurodollar Time Deposit
3.160% 07/14/2005 | | | 2,843,861 | | | | 2,843,861 | | |
Barclays
Eurodollar Time Deposit
3.250% 07/26/2005 | | | 2,865,343 | | | | 2,865,343 | | |
BGI Institutional Money
Market Fund | | | 11,161,301 | | | | 11,161,301 | | |
BNP Paribas
Eurodollar Time Deposit
3.000% 07/01/2005 | | | 1,990,702 | | | | 1,990,702 | | |
Calyon
Eurodollar Time Deposit
3.310% 07/01/2005 | | | 1,706,316 | | | | 1,706,316 | | |
Citigroup
Eurodollar Time Deposit
3.085% 07/22/2005 | | | 1,706,316 | | | | 1,706,316 | | |
Citigroup
Eurodollar Time Deposit
3.100% 07/25/2005 | | | 3,952,433 | | | | 3,952,433 | | |
Dexia Group
Eurodollar Time Deposit
3.205% 07/20/2005 | | | 1,421,930 | | | | 1,421,930 | | |
Dexia Group
Eurodollar Time Deposit
3.240% 07/21/2005 | | | 1,421,930 | | | | 1,421,930 | | |
Federal Home Loan Bank
Discount Note
2.977% 07/01/2005 | | | 3,511,755 | | | | 3,511,755 | | |
First Tennessee
National Corporation
Eurodollar Time Deposit
3.220% 08/09/2005 | | | 512,486 | | | | 512,486 | | |
Fortis Bank
Eurodollar Time Deposit
3.110% 07/05/2005 | | | 1,978,519 | | | | 1,978,519 | | |
| | | Principal
Amount | | Market
Value | |
Fortis Bank
Eurodollar Time Deposit
3.250% 07/25/2005 | | $ | 2,007,309 | | | $ | 2,007,309 | | |
Fortis Bank
Eurodollar Time Deposit
3.250% 08/04/2005 | | | 2,843,861 | | | | 2,843,861 | | |
Fortis Bank
Eurodollar Time Deposit
3.270% 07/07/2005 | | | 2,275,088 | | | | 2,275,088 | | |
Freddie Mac
Discount Note
3.208% 07/26/2005 | | | 1,401,916 | | | | 1,401,916 | | |
Freddie Mac
Discount Note
3.244% 08/16/2005 | | | 3,412,633 | | | | 3,412,633 | | |
General Electric
Capital Corp
3.252% 07/06/2005 | | | 2,843,861 | | | | 2,843,861 | | |
General Electric
Capital Corp
3.253% 07/08/2005 | | | 2,275,088 | | | | 2,275,088 | | |
Goldman Sachs
Financial Square
Prime Obligations
Money Market Fund | | | 2,596,794 | | | | 2,596,794 | | |
Harris Trust &
Savings Bank
3.295% 11/04/2005 | | | 2,723,694 | | | | 2,723,694 | | |
HBOS Halifax
Bank of Scotland
Eurodollar Time Deposit
3.150% 08/08/2005 | | | 1,421,930 | | | | 1,421,930 | | |
HSBC Banking/
Holdings PLC
Eurodollar Time Deposit
3.250% 08/05/2005 | | | 1,706,316 | | | | 1,706,316 | | |
JP Morgan Chase & Co.
Eurodollar Time Deposit
3.200% 07/20/2005 | | | 2,843,861 | | | | 2,843,861 | | |
Merrimac Cash Fund,
Premium Class | | | 4,508,844 | | | | 4,508,844 | | |
Morgan Stanley
Dean Witter & Co.
3.518% 07/19/2005 | | | 5,687,721 | | | | 5,687,721 | | |
National Australia Bank
Eurodollar Time Deposit
3.260% 07/06/2005 | | | 1,137,544 | | | | 1,137,544 | | |
National Australia Bank
Eurodollar Time Deposit
3.375% 07/01/2005 | | | 3,412,633 | | | | 3,412,633 | | |
Nordea Bank Finland PLC
(NY Branch)
Eurodollar Time Deposit
3.165% 08/09/2005 | | | 2,208,287 | | | | 2,208,287 | | |
| | | Principal
Amount | | Market
Value | |
Nordea Bank Finland PLC
(NY Branch)
Eurodollar Time Deposit
3.240% 08/03/2005 | | $ | 1,023,790 | | | $ | 1,023,790 | | |
Rabobank Nederland
Eurodollar Time Deposit
3.170% 07/18/2005 | | | 2,843,861 | | | | 2,843,861 | | |
Rabobank Nederland
Eurodollar Time Deposit
3.350% 07/01/2005 | | | 2,301,016 | | | | 2,301,016 | | |
Royal Bank of Canada
Eurodollar Time Deposit
3.250% 07/07/2005 | | | 1,706,316 | | | | 1,706,316 | | |
Royal Bank of Canada
Eurodollar Time Deposit
3.260% 07/28/2005 | | | 2,843,861 | | | | 2,843,861 | | |
Royal Bank of Scotland
Eurodollar Time Deposit
3.240% 08/08/2005 | | | 3,128,247 | | | | 3,128,247 | | |
Royal Bank of Scotland
Eurodollar Time Deposit
3.250% 08/04/2005 | | | 2,275,088 | | | | 2,275,088 | | |
Royal Bank of Scotland
Eurodollar Time Deposit
3.270% 07/29/2005 | | | 2,275,088 | | | | 2,275,088 | | |
Societe Generale
Eurodollar Time Deposit
3.200% 08/08/2005 | | | 1,137,544 | | | | 1,137,544 | | |
Societe Generale
Eurodollar Time Deposit
3.240% 08/09/2005 | | | 1,882,316 | | | | 1,882,316 | | |
Societe Generale
Eurodollar Time Deposit
3.280% 08/01/2005 | | | 2,843,861 | | | | 2,843,861 | | |
Svenska Handlesbanken
Eurodollar Time Deposit
3.220% 08/05/2005 | | | 2,843,861 | | | | 2,843,861 | | |
The Bank of the West
Eurodollar Time Deposit
3.270% 07/27/2005 | | | 853,158 | | | | 853,158 | | |
Toronto Dominion Bank
Eurodollar Time Deposit
3.250% 08/02/2005 | | | 2,843,861 | | | | 2,843,861 | | |
UBS AG
Eurodollar Time Deposit
3.250% 08/09/2005 | | | 1,421,930 | | | | 1,421,930 | | |
Wells Fargo
Eurodollar Time Deposit
3.270% 07/21/2005 | | | 2,843,861 | | | | 2,843,861 | | |
Wells Fargo
Eurodollar Time Deposit
3.270% 08/01/2005 | | | 2,843,861 | | | | 2,843,861 | | |
| | | | 134,776,172 | | |
(Continued)
The accompanying notes are an integral part of the financial statements.
132
MassMutual Select Mid Cap Growth Equity II Fund – Portfolio of Investments (Continued)
| | | Principal
Amount | | Market
Value | |
| Repurchase Agreement - 2.6% | |
Investors Bank & Trust
Company Repurchase
Agreement, dated
06/30/2005, 2.01%,
due 07/01/2005(e) | | $ | 25,690,567 | | | $ | 25,690,567 | | |
TOTAL SHORT-TERM
INVESTMENTS
(At Amortized Cost) | | | | | 160,466,739 | | |
TOTAL INVESTMENTS - 114.0%
(Cost $932,655,960)(f) | | | | | 1,105,515,170 | | |
Other Assets/
(Liabilities) - (14.0%) | | | | | (136,094,833 | ) | |
| NET ASSETS - 100.0% | | | | $ | 969,420,337 | | |
Notes to Portfolio of Investments
ADR - American Depository Receipt.
(a) Denotes all or a portion of security on loan.
(b) Non-income producing security.
(c) Securities exempt from registration under rule 144A of the Securities Act of 1933. These securities may be resold in transactions exempt from registration, normally to qualified institutional buyers. At June 30, 2005, these securities amounted to a value of $1,310,185 or 0.14% of net assets.
(d) Represents investments of security lending collateral. (Note 2).
(e) Maturity value of $25,692,002. Collateralized by U.S. Government Agency obligations with rates of 4.625% - 6.625%, maturity dates of 1/25/2017 - 1/20/2034, and an aggregate market value, including accrued interest, of $26,975,095.
(f) See Note 6 for aggregate cost for Federal tax purposes.
The remainder of this page is intentionally left blank.
The accompanying notes are an integral part of the financial statements.
133
MassMutual Select Small Cap Growth Equity Fund – Portfolio of Investments
June 30, 2005 (Unaudited)
| | | Number of
Shares | | Market
Value | |
| EQUITIES - 91.7% | |
| Advertising - 2.1% | |
| Aquantive, Inc.(a) | | | 30,430 | | | $ | 539,220 | | |
| Catalina Marketing Corp.(b) | | | 79,500 | | | | 2,020,095 | | |
| Getty Images, Inc.(a) (b) | | | 110,150 | | | | 8,179,739 | | |
| | | | 10,739,054 | | |
| Air Transportation - 0.7% | | | |
Airtran
Holdings, Inc.(a) (b) | | | 185,700 | | | | 1,714,011 | | |
| AMR Corp.(a) (b) | | | 102,900 | | | | 1,246,119 | | |
| Forward Air Corp. | | | 8,405 | | | | 237,609 | | |
Gol Linhas Aereas
Inteligentes SA
ADR (Brazil)(b) | | | 14,670 | | | | 440,980 | | |
| | | | 3,638,719 | | |
| Apparel, Textiles & Shoes - 0.4% | | | |
| Aeropostale, Inc.(a) | | | 6,600 | | | | 221,760 | | |
| Candie's, Inc.(a) | | | 31,170 | | | | 207,592 | | |
| DSW, Inc. Cl. A(a) | | | 11,400 | | | | 284,430 | | |
Skechers U.S.A.,
Inc. Cl. A(a) | | | 89,900 | | | | 1,281,974 | | |
| | | | 1,995,756 | | |
| Automotive & Parts - 1.5% | | | |
American Axle &
Manufacturing
Holdings, Inc.(b) | | | 71,700 | | | | 1,811,859 | | |
| LKQ Corp.(a) | | | 173,439 | | | | 4,708,869 | | |
| United Auto Group, Inc. | | | 31,200 | | | | 929,760 | | |
| | | | 7,450,488 | | |
| Banking, Savings & Loans - 4.2% | | | |
| Advanta Corp. Cl. B | | | 108,000 | | | | 3,041,280 | | |
| Amcore Financial, Inc. | | | 61,500 | | | | 1,837,620 | | |
| City National Corp. | | | 42,200 | | | | 3,026,162 | | |
| Financial Federal Corp. | | | 135,350 | | | | 5,229,924 | | |
| Hancock Holding Co. | | | 41,800 | | | | 1,437,920 | | |
| Providian Financial Corp.(a) | | | 154,800 | | | | 2,729,124 | | |
| Signature Bank(a) | | | 11,590 | | | | 282,796 | | |
| UMB Financial Corp. | | | 23,600 | | | | 1,345,908 | | |
| Westcorp | | | 46,400 | | | | 2,432,288 | | |
| | | | 21,363,022 | | |
| Beverages - 0.1% | | | |
Peet's Coffee &
Tea, Inc.(a) (b) | | | 12,310 | | | | 406,722 | | |
| Broadcasting, Publishing & Printing - 1.3% | |
Central European
Media Enterprises,
Limited(a) (b) | | | 7,140 | | | | 345,433 | | |
| | | Number of
Shares | | Market
Value | |
Charter Communications,
Inc. Cl. A(a) (b) | | | 932,300 | | | $ | 1,100,114 | | |
LodgeNet
Entertainment Corp.(a) | | | 99,300 | | | | 1,647,387 | | |
Playboy Enterprises,
Inc. Cl. B(a) (b) | | | 151,000 | | | | 1,953,940 | | |
| TiVo, Inc.(a) (b) | | | 198,400 | | | | 1,325,312 | | |
| | | | 6,372,186 | | |
| Building Materials & Construction - 0.5% | | | |
Beacon Roofing
Supply, Inc.(a) | | | 75,700 | | | | 1,990,910 | | |
| Eagle Materials, Inc. | | | 5,210 | | | | 482,394 | | |
| | | | 2,473,304 | | |
| Chemicals - 2.3% | | | |
| Cytec Industries, Inc. | | | 45,800 | | | | 1,822,840 | | |
| Hercules, Inc.(a) | | | 202,080 | | | | 2,859,432 | | |
| Minerals Technologies, Inc. | | | 26,800 | | | | 1,650,880 | | |
The Scotts
Miracle-Gro Co.(a) | | | 74,100 | | | | 5,276,661 | | |
| | | | 11,609,813 | | |
| Commercial Services - 7.6% | | | |
| The Advisory Board Co.(a) | | | 15,330 | | | | 747,184 | | |
| ADVO, Inc. | | | 62,150 | | | | 1,979,478 | | |
The Corporate
Executive Board Co. | | | 129,210 | | | | 10,121,019 | | |
Corrections Corp.
of America(a) | | | 12,360 | | | | 485,130 | | |
DiamondCluster
International, Inc. Cl. A(a) | | | 43,300 | | | | 489,290 | | |
| Exelixis, Inc.(a) | | | 187,400 | | | | 1,392,382 | | |
| Harris Interactive, Inc.(a) | | | 265,700 | | | | 1,293,959 | | |
| Incyte Corp.(a) (b) | | | 219,800 | | | | 1,571,570 | | |
ITT Educational
Services, Inc.(a) (b) | | | 173,600 | | | | 9,273,712 | | |
Jacobs Engineering
Group, Inc.(a) (b) | | | 7,250 | | | | 407,885 | | |
| LECG Corp.(a) | | | 18,790 | | | | 399,475 | | |
Lincoln Educational
Services Corp.(a) (b) | | | 150,000 | | | | 3,037,500 | | |
| Navigant Consulting, Inc.(a) | | | 6,090 | | | | 107,549 | | |
| Opsware, Inc.(a) (b) | | | 330,320 | | | | 1,691,238 | | |
Pharmaceutical Product
Development, Inc.(a) | | | 8,340 | | | | 390,812 | | |
| Stericycle, Inc.(a) (b) | | | 12,610 | | | | 634,535 | | |
| Vertrue, Inc.(a) (b) | | | 66,100 | | | | 2,575,256 | | |
Washington Group
International, Inc.(a) (b) | | | 37,400 | | | | 1,911,888 | | |
| Wireless Facilities, Inc.(a) | | | 37,940 | | | | 240,160 | | |
| | | | 38,750,022 | | |
| | | Number of
Shares | | Market
Value | |
| Communications - 0.9% | | | |
AudioCodes
Limited(a) (b) | | | 17,850 | | | $ | 177,608 | | |
Crown Castle
International Corp.(a) | | | 36,830 | | | | 748,386 | | |
| EFJ, Inc.(a) | | | 23,250 | | | | 156,938 | | |
Powerwave
Technologies, Inc.(a) | | | 55,200 | | | | 564,144 | | |
SBA
Communications Corp.(a) | | | 45,500 | | | | 614,250 | | |
Westell Technologies,
Inc. Cl. A(a) | | | 407,400 | | | | 2,436,252 | | |
| | | | 4,697,578 | | |
| Computer Integrated Systems Design - 2.3% | | | |
| Avid Technology, Inc.(a) (b) | | | 108,450 | | | | 5,778,216 | | |
| Cogent, Inc.(a) | | | 109,800 | | | | 3,134,790 | | |
| Enterasys Networks, Inc.(a) | | | 7,658 | | | | 6,892 | | |
| F5 Networks, Inc.(a) | | | 11,520 | | | | 544,147 | | |
| IDX Systems Corp.(a) | | | 64,100 | | | | 1,931,974 | | |
| Websense, Inc.(a) (b) | | | 10,480 | | | | 503,564 | | |
| | | | 11,899,583 | | |
| Computer Maintenance & Repair - 0.3% | | | |
Electronics for
Imaging, Inc.(a) | | | 61,200 | | | | 1,287,648 | | |
| Computer Programming Services - 0.5% | | | |
| Jamdat Mobile, Inc.(a) (b) | | | 97,300 | | | | 2,693,264 | | |
| Computer Related Services - 3.0% | | | |
| Acxiom Corp. | | | 102,900 | | | | 2,148,552 | | |
| Checkfree Corp.(a) (b) | | | 277,149 | | | | 9,439,695 | | |
Ingram Micro,
Inc. Cl. A(a) | | | 145,600 | | | | 2,280,096 | | |
| NetFlix, Inc.(a) (b) | | | 69,900 | | | | 1,147,059 | | |
| | | | 15,015,402 | | |
| Computers & Information - 1.7% | | | |
| Extreme Networks, Inc.(a) | | | 320,200 | | | | 1,312,820 | | |
Logitech International SA
ADR (Switzerland)(a) (b) | | | 9,970 | | | | 635,887 | | |
Scientific Games
Corp. Cl. A(a) | | | 232,800 | | | | 6,269,304 | | |
SRA International,
Inc. Cl. A(a) | | | 3,600 | | | | 124,992 | | |
| VeriFone Holdings, Inc.(a) | | | 33,790 | | | | 549,088 | | |
| | | | 8,892,091 | | |
| Containers - 0.4% | | | |
| Pactiv Corp.(a) (b) | | | 92,600 | | | | 1,998,308 | | |
(Continued)
The accompanying notes are an integral part of the financial statements.
134
MassMutual Select Small Cap Growth Equity Fund – Portfolio of Investments (Continued)
| | | Number of
Shares | | Market
Value | |
| Cosmetics & Personal Care - 0.4% | | | |
Nu Skin Enterprises,
Inc. Cl. A(b) | | | 82,000 | | | $ | 1,910,600 | | |
| Data Processing & Preparation - 2.3% | | | |
| The BISYS Group, Inc.(a) | | | 131,700 | | | | 1,967,598 | | |
CSG Systems
International, Inc.(a) | | | 28,990 | | | | 550,230 | | |
Factset Research
Systems, Inc.(b) | | | 258,124 | | | | 9,251,164 | | |
| | | | 11,768,992 | | |
| Electrical Equipment & Electronics - 4.9% | | | |
| Agere Systems, Inc.(a) | | | 163,240 | | | | 1,958,880 | | |
Benchmark
Electronics, Inc.(a) | | | 55,800 | | | | 1,697,436 | | |
| Cree, Inc.(a) (b) | | | 274,250 | | | | 6,985,148 | | |
| Evergreen Solar, Inc.(a) (b) | | | 32,670 | | | | 210,068 | | |
| FuelCell Energy, Inc.(a) (b) | | | 145,200 | | | | 1,482,492 | | |
| Gentex Corp. | | | 370,880 | | | | 6,750,016 | | |
MEMC Electronic
Materials, Inc.(a) | | | 33,470 | | | | 527,822 | | |
| Microsemi Corp.(a) | | | 23,660 | | | | 444,808 | | |
| Moog, Inc. Cl. A(a) (b) | | | 74,315 | | | | 2,340,179 | | |
| ON Semiconductor Corp.(a) | | | 523,200 | | | | 2,406,720 | | |
| Semtech Corp.(a) | | | 20,710 | | | | 344,822 | | |
SiRF Technology
Holdings, Inc.(a) | | | 1,600 | | | | 28,288 | | |
| | | | 25,176,679 | | |
| Energy - 4.4% | | | |
| Arch Coal, Inc.(b) | | | 10,660 | | | | 580,650 | | |
| Cabot Oil & Gas Corp. Cl. A | | | 10,750 | | | | 373,025 | | |
CAL Dive
International, Inc.(a) | | | 24,700 | | | | 1,293,539 | | |
Comstock
Resources, Inc.(a) | | | 82,700 | | | | 2,091,483 | | |
| Grey Wolf, Inc.(a) (b) | | | 295,800 | | | | 2,191,878 | | |
| Newfield Exploration Co.(a) | | | 203,300 | | | | 8,109,637 | | |
Pride
International, Inc.(a) (b) | | | 16,440 | | | | 422,508 | | |
| Range Resources Corp. | | | 15,530 | | | | 417,757 | | |
Stolt Offshore SA
Sponsored ADR
(United Kingdom)(a) | | | 70,610 | | | | 640,433 | | |
| TETRA Technologies, Inc.(a) | | | 81,700 | | | | 2,602,145 | | |
| UGI Corp. | | | 57,800 | | | | 1,612,620 | | |
| Vintage Petroleum, Inc. | | | 72,200 | | | | 2,199,934 | | |
| | | | 22,535,609 | | |
| Entertainment & Leisure - 0.4% | | | |
| Churchill Downs, Inc. | | | 43,200 | | | | 1,835,568 | | |
| WMS Industries, Inc.(a) (b) | | | 8,500 | | | | 286,875 | | |
| | | | 2,122,443 | | |
| | | Number of
Shares | | Market
Value | |
| Financial Services - 2.4% | | | |
Affiliated Managers
Group, Inc.(a) (b) | | | 24,309 | | | $ | 1,661,034 | | |
| America West, Inc. | | | 93,500 | | | | 1,542,750 | | |
| IndyMac Bancorp, Inc. | | | 48,100 | | | | 1,959,113 | | |
Investment Technology
Group, Inc.(a) | | | 118,400 | | | | 2,488,768 | | |
The Nasdaq Stock
Market Inc.(a) | | | 126,340 | | | | 2,382,772 | | |
| Ventas, Inc. | | | 66,100 | | | | 1,996,220 | | |
| | | | 12,030,657 | | |
| Foods - 1.8% | | | |
Chiquita Brands
International, Inc. | | | 9,490 | | | | 260,595 | | |
| The J.M. Smucker Co.(b) | | | 117,900 | | | | 5,534,226 | | |
Provide
Commerce, Inc.(a) (b) | | | 151,000 | | | | 3,260,090 | | |
| | | | 9,054,911 | | |
| Healthcare - 9.2% | | | |
Allscripts Healthcare
Solutions, Inc.(a) (b) | | | 473,147 | | | | 7,858,972 | | |
American
Healthways, Inc.(a) (b) | | | 201,650 | | | | 8,523,746 | | |
| AmSurg Corp.(a) (b) | | | 288,300 | | | | 7,983,027 | | |
| Genesis HealthCare Corp.(a) | | | 84,680 | | | | 3,918,990 | | |
Human Genome
Sciences, Inc.(a) (b) | | | 187,600 | | | | 2,172,408 | | |
| Humana, Inc.(a) (b) | | | 48,900 | | | | 1,943,286 | | |
| Manor Care, Inc. | | | 80,600 | | | | 3,202,238 | | |
| Matria Healthcare, Inc.(a) | | | 84,150 | | | | 2,712,155 | | |
| Symbion, Inc.(a) | | | 19,490 | | | | 464,837 | | |
| Triad Hospitals, Inc.(a) | | | 52,500 | | | | 2,868,600 | | |
| VCA Antech, Inc.(a) | | | 222,300 | | | | 5,390,775 | | |
| | | | 47,039,034 | | |
| Heavy Machinery - 0.5% | | | |
Bucyrus International,
Inc. Cl. A | | | 69,500 | | | | 2,639,610 | | |
Home Construction, Furnishings &
Appliances - 1.8% | | | | | | | |
Ethan Allen
Interiors, Inc.(b) | | | 29,300 | | | | 981,843 | | |
| Fossil, Inc.(a) | | | 219,600 | | | | 4,984,920 | | |
Furniture Brands
International, Inc.(b) | | | 92,050 | | | | 1,989,201 | | |
| Standard-Pacific Corp.(b) | | | 4,680 | | | | 411,606 | | |
Tempur-Pedic
International, Inc.(a) (b) | | | 30,130 | | | | 668,283 | | |
| | | | 9,035,853 | | |
| | | Number of
Shares | | Market
Value | |
| Household Products - 0.5% | | | |
| Ferro Corp. | | | 101,800 | | | $ | 2,021,748 | | |
| Jarden Corp.(a) (b) | | | 9,670 | | | | 521,406 | | |
| | | | 2,543,154 | | |
| Information Retrieval Services - 1.9% | | | |
| Agile Software Corp.(a) | | | 180,140 | | | | 1,134,882 | | |
| CoStar Group, Inc.(a) (b) | | | 152,600 | | | | 6,653,360 | | |
| Intergraph Corp.(a) (b) | | | 55,600 | | | | 1,915,976 | | |
| | | | 9,704,218 | | |
| Insurance - 1.0% | | | |
Arch Capital Group
Limited(a) | | | 12,690 | | | | 571,685 | | |
Aspen Insurance
Holdings Limited | | | 75,600 | | | | 2,083,536 | | |
| HealthExtras, Inc.(a) | | | 20,450 | | | | 410,432 | | |
| ProAssurance Corp.(a) | | | 4,200 | | | | 175,392 | | |
Reinsurance Group of
America, Inc. | | | 42,000 | | | | 1,953,420 | | |
| | | | 5,194,465 | | |
| Lodging - 2.3% | | | |
| Aztar Corp.(a) | | | 66,100 | | | | 2,263,925 | | |
| La Quinta Corp.(a) | | | 300,260 | | | | 2,801,426 | | |
| Vail Resorts, Inc.(a) | | | 233,580 | | | | 6,563,598 | | |
| | | | 11,628,949 | | |
| Machinery & Components - 1.7% | | | |
| Agco Corp.(a) (b) | | | 63,900 | | | | 1,221,768 | | |
Chicago Bridge &
Iron Co. NV | | | 236,198 | | | | 5,399,486 | | |
Global Power Equipment
Group, Inc.(a) | | | 210,600 | | | | 1,674,270 | | |
| Woodward Governor Co. | | | 2,530 | | | | 212,596 | | |
| | | | 8,508,120 | | |
| Manufacturing - 0.5% | | | |
Stewart & Stevenson
Services Corp. | | | 115,920 | | | | 2,626,747 | | |
| Medical Supplies - 3.4% | | | |
Advanced Medical
Optics, Inc.(a) (b) | | | 134,522 | | | | 5,347,250 | | |
| Arrow International, Inc. | | | 67,270 | | | | 2,145,913 | | |
| CONMED Corp.(a) | | | 30,400 | | | | 935,408 | | |
Foxhollow
Technologies, Inc.(a) (b) | | | 4,030 | | | | 154,228 | | |
| HealthTronics, Inc.(a) | | | 23,160 | | | | 300,848 | | |
| Hologic, Inc.(a) | | | 16,320 | | | | 648,720 | | |
| Itron, Inc.(a) | | | 3,400 | | | | 151,912 | | |
| Kensey Nash Corp.(a) (b) | | | 85,000 | | | | 2,570,400 | | |
| Kyphon, Inc.(a) | | | 83,900 | | | | 2,918,881 | | |
| PSS World Medical, Inc.(a) | | | 155,000 | | | | 1,929,750 | | |
| | | | 17,103,310 | | |
(Continued)
The accompanying notes are an integral part of the financial statements.
135
MassMutual Select Small Cap Growth Equity Fund – Portfolio of Investments (Continued)
| | | Number of
Shares | | Market
Value | |
| Metals & Mining - 0.8% | |
| Carpenter Technology | | | 33,500 | | | $ | 1,735,300 | | |
Century
Aluminum Co.(a) (b) | | | 80,560 | | | | 1,643,424 | | |
| Precision Castparts Corp. | | | 11,900 | | | | 927,010 | | |
| | | | 4,305,734 | | |
| Pharmaceuticals - 3.4% | | | |
| Abgenix, Inc.(a) (b) | | | 185,630 | | | | 1,592,705 | | |
| Alkermes, Inc.(a) (b) | | | 139,950 | | | | 1,850,139 | | |
Amylin
Pharmaceuticals, Inc.(a) (b) | | | 127,820 | | | | 2,675,273 | | |
Angiotech
Pharmaceuticals, Inc.(a) | | | 18,611 | | | | 257,949 | | |
| Atherogenics, Inc.(a) (b) | | | 10,230 | | | | 163,475 | | |
Encysive
Pharmaceuticals, Inc.(a) | | | 28,230 | | | | 305,166 | | |
| ICOS Corp.(a) | | | 11,460 | | | | 242,608 | | |
Impax
Laboratories, Inc.(a) (b) | | | 24,150 | | | | 379,155 | | |
Martek
Biosciences Corp.(a) (b) | | | 145,400 | | | | 5,517,930 | | |
| The Medicines Co.(a) (b) | | | 80,350 | | | | 1,879,387 | | |
| MGI Pharma, Inc.(a) (b) | | | 64,000 | | | | 1,392,640 | | |
| NPS Pharmaceuticals, Inc.(a) | | | 12,470 | | | | 141,535 | | |
| OSI Pharmaceuticals, Inc.(a) | | | 7,300 | | | | 298,351 | | |
Salix Pharmaceuticals
Limited(a) | | | 11,485 | | | | 202,825 | | |
Vertex
Pharmaceuticals, Inc.(a) | | | 10,230 | | | | 172,273 | | |
| | | | 17,071,411 | | |
| Prepackaged Software - 9.2% | | | |
| Blackboard, Inc.(a) (b) | | | 205,100 | | | | 4,905,992 | | |
| Cerner Corp.(a) (b) | | | 136,400 | | | | 9,271,108 | | |
Dendrite
International, Inc.(a) | | | 436,300 | | | | 6,020,940 | | |
| Emageon, Inc.(a) | | | 22,400 | | | | 313,824 | | |
| EPIQ Systems, Inc.(a) (b) | | | 145,129 | | | | 2,374,310 | | |
Hyperion
Solutions Corp.(a) | | | 35,600 | | | | 1,432,544 | | |
MicroStrategy,
Inc. Cl. A(a) (b) | | | 77,436 | | | | 4,107,205 | | |
| Motive, Inc.(a) | | | 132,500 | | | | 1,315,725 | | |
| NAVTEQ Corp.(a) | | | 5,430 | | | | 201,887 | | |
| Red Hat, Inc.(a) (b) | | | 324,450 | | | | 4,250,295 | | |
| Salesforce.com, Inc.(a) | | | 26,730 | | | | 547,430 | | |
Seebeyond
Technology Corp.(a) | | | 200,000 | | | | 836,000 | | |
| Serena Software, Inc.(a) | | | 74,000 | | | | 1,428,200 | | |
Take-Two Interactive
Software, Inc.(a) (b) | | | 357,698 | | | | 9,103,414 | | |
| THQ, Inc.(a) | | | 13,160 | | | | 385,193 | | |
| Verint Systems, Inc.(a) | | | 14,360 | | | | 461,818 | | |
| | | | 46,955,885 | | |
| | | Number of
Shares | | Market
Value | |
| Real Estate - 0.1% | |
CB Richard Ellis
Group, Inc. Cl. A(a) | | | 16,630 | | | $ | 729,392 | | |
| Restaurants - 0.6% | |
RARE Hospitality
International, Inc.(a) | | | 77,750 | | | | 2,369,043 | | |
Red Robin Gourmet
Burgers, Inc.(a) | | | 10,920 | | | | 676,822 | | |
| | | | 3,045,865 | | |
| Retail - 4.2% | | | |
A.C. Moore Arts &
Crafts, Inc.(a) | | | 8,990 | | | | 284,174 | | |
| Borders Group, Inc. | | | 86,600 | | | | 2,191,846 | | |
| Cabela's, Inc. Cl. A(a) (b) | | | 132,000 | | | | 2,819,520 | | |
Dick's Sporting
Goods, Inc.(a) | | | 6,800 | | | | 262,412 | | |
Electronics Boutique
Holdings Corp.(a) (b) | | | 6,910 | | | | 438,716 | | |
| Foot Locker, Inc. | | | 139,700 | | | | 3,802,634 | | |
| GameStop Corp.(a) (b) | | | 21,620 | | | | 707,190 | | |
| GameStop Corp. Cl. B(a) | | | 21,120 | | | | 631,488 | | |
| Insight Enterprises, Inc.(a) | | | 24,140 | | | | 487,145 | | |
Men's
Wearhouse, Inc.(a) (b) | | | 23,445 | | | | 807,211 | | |
| O'Reilly Automotive, Inc.(a) | | | 201,220 | | | | 5,998,368 | | |
| Priceline.com, Inc.(a) (b) | | | 17,870 | | | | 416,907 | | |
| Stamps.com, Inc.(a) (b) | | | 90,300 | | | | 1,693,125 | | |
| Stride Rite Corp. | | | 18,420 | | | | 254,012 | | |
| Zumiez, Inc.(a) | | | 14,400 | | | | 419,760 | | |
| | | | 21,214,508 | | |
| Telephone Utilities - 1.1% | | | |
Fairpoint
Communications, Inc. | | | 73,200 | | | | 1,182,180 | | |
General Communication,
Inc. Cl. A(a) | | | 213,800 | | | | 2,110,206 | | |
| NeuStar, Inc. Cl. A(a) | | | 11,100 | | | | 284,160 | | |
| Ubiquitel, Inc.(a) | | | 265,800 | | | | 2,168,928 | | |
| | | | 5,745,474 | | |
| Transportation - 3.1% | | | |
Central Freight
Lines, Inc.(a) | | | 246,200 | | | | 640,120 | | |
| CNF, Inc. | | | 41,700 | | | | 1,872,330 | | |
J.B. Hunt Transport
Services, Inc.(b) | | | 366,800 | | | | 7,079,240 | | |
| Kansas City Southern(a) (b) | | | 305,950 | | | | 6,174,071 | | |
| Knight Transportation, Inc. | | | 3,700 | | | | 90,021 | | |
| | | | 15,855,782 | | |
TOTAL EQUITIES
(Cost $368,201,840) | | | | | | | 466,830,362 | | |
| | | Number of
Shares | | Market
Value | |
| MUTUAL FUNDS - 0.2% | | | |
| Investment Management Services | | | |
iShares Russell 2000
Growth Index Fund(b) | | | 9,560 | | | $ | 619,010 | | |
| Oil Service HOLDRs Trust | | | 4,870 | | | | 496,594 | | |
| | | | 1,115,604 | | |
TOTAL MUTUAL FUNDS
(Cost $1,069,494) | | | | | | | 1,115,604 | | |
TOTAL LONG TERM INVESTMENTS
(Cost $369,271,334) | | | | | | | 467,945,966 | | |
| | | Principal
Amount | | | |
| SHORT-TERM INVESTMENTS - 35.9% | | | |
| Cash Equivalents - 27.9%(c) | | | |
ABN Amro Bank NV
Eurodollar Time Deposit
3.250% 08/05/2005 | | $ | 1,514,387 | | | | 1,514,387 | | |
American Beacon Money
Market Fund | | | 4,088,222 | | | | 4,088,222 | | |
Bank of America
Bank Note
3.270% 07/18/2005 | | | 2,096,119 | | | | 2,096,119 | | |
Bank of America
Bank Note
3.270% 08/30/2005 | | | 3,892,793 | | | | 3,892,793 | | |
Bank of Montreal
Eurodollar Time Deposit
3.010% 07/01/2005 | | | 5,765,781 | | | | 5,765,781 | | |
Barclays
Eurodollar Time Deposit
3.160% 07/14/2005 | | | 2,994,456 | | | | 2,994,456 | | |
Barclays
Eurodollar Time Deposit
3.250% 07/26/2005 | | | 3,017,075 | | | | 3,017,075 | | |
BGI Institutional Money
Market Fund | | | 11,752,342 | | | | 11,752,342 | | |
BNP Paribas
Eurodollar Time Deposit
3.000% 07/01/2005 | | | 2,096,119 | | | | 2,096,119 | | |
Calyon
Eurodollar Time Deposit
3.310% 07/01/2005 | | | 1,796,674 | | | | 1,796,674 | | |
Citigroup
Eurodollar Time Deposit
3.085% 07/22/2005 | | | 1,796,674 | | | | 1,796,674 | | |
Citigroup
Eurodollar Time Deposit
3.100% 07/25/2005 | | | 4,161,732 | | | | 4,161,732 | | |
(Continued)
The accompanying notes are an integral part of the financial statements.
136
MassMutual Select Small Cap Growth Equity Fund – Portfolio of Investments (Continued)
| | | Principal
Amount | | Market
Value | |
Dexia Group
Eurodollar Time Deposit
3.205% 07/20/2005 | | $ | 1,497,227 | | | $ | 1,497,227 | | |
Dexia Group
Eurodollar Time Deposit
3.240% 07/21/2005 | | | 1,497,227 | | | | 1,497,227 | | |
Federal Home Loan
Bank Discount Note
2.977% 07/01/2005 | | | 3,697,717 | | | | 3,697,717 | | |
First Tennessee
National Corporation
Eurodollar Time Deposit
3.220% 08/09/2005 | | | 539,624 | | | | 539,624 | | |
Fortis Bank
Eurodollar Time Deposit
3.110% 07/05/2005 | | | 2,083,291 | | | | 2,083,291 | | |
Fortis Bank
Eurodollar Time Deposit
3.250% 07/25/2005 | | | 2,113,604 | | | | 2,113,604 | | |
Fortis Bank
Eurodollar Time Deposit
3.250% 08/04/2005 | | | 2,994,456 | | | | 2,994,456 | | |
Fortis Bank
Eurodollar Time Deposit
3.270% 07/07/2005 | | | 2,395,564 | | | | 2,395,564 | | |
Freddie Mac
Discount Note
3.208% 07/26/2005 | | | 1,476,154 | | | | 1,476,154 | | |
Freddie Mac
Discount Note
3.244% 08/16/2005 | | | 3,593,347 | | | | 3,593,347 | | |
General Electric
Capital Corp
3.252% 07/06/2005 | | | 2,994,456 | | | | 2,994,456 | | |
General Electric
Capital Corp
3.253% 07/08/2005 | | | 2,395,564 | | | | 2,395,564 | | |
Goldman Sachs
Financial Square
Prime Obligations
Money Market Fund | | | 2,734,306 | | | | 2,734,306 | | |
Harris Trust &
Savings Bank
3.295% 11/04/2005 | | | 2,867,926 | | | | 2,867,926 | | |
HBOS Halifax
Bank of Scotland
Eurodollar Time Deposit
3.150% 08/08/2005 | | | 1,497,227 | | | | 1,497,227 | | |
HSBC Banking/
Holdings PLC
Eurodollar Time Deposit
3.250% 08/05/2005 | | | 1,796,674 | | | | 1,796,674 | | |
| | | Principal
Amount | | Market
Value | |
JP Morgan Chase & Co.
Eurodollar Time Deposit
3.200% 07/20/2005 | | $ | 2,994,456 | | | $ | 2,994,456 | | |
Merrimac Cash Fund,
Premium Class | | | 4,747,607 | | | | 4,747,607 | | |
Morgan Stanley
Dean Witter & Co.
3.518% 07/19/2005 | | | 5,988,911 | | | | 5,988,911 | | |
National Australia Bank
Eurodollar Time Deposit
3.260% 07/06/2005 | | | 1,197,783 | | | | 1,197,783 | | |
National Australia Bank
Eurodollar Time Deposit
3.375% 07/01/2005 | | | 3,593,347 | | | | 3,593,347 | | |
Nordea Bank Finland PLC
(NY Branch)
Eurodollar Time Deposit
3.165% 08/09/2005 | | | 2,325,226 | | | | 2,325,226 | | |
Nordea Bank Finland PLC
(NY Branch)
Eurodollar Time Deposit
3.240% 08/03/2005 | | | 1,078,005 | | | | 1,078,005 | | |
Rabobank Nederland
Eurodollar Time Deposit
3.170% 07/18/2005 | | | 2,994,456 | | | | 2,994,456 | | |
Rabobank Nederland
Eurodollar Time Deposit
3.350% 07/01/2005 | | | 2,422,865 | | | | 2,422,865 | | |
Royal Bank of Canada
Eurodollar Time Deposit
3.250% 07/07/2005 | | | 1,796,674 | | | | 1,796,674 | | |
Royal Bank of Canada
Eurodollar Time Deposit
3.260% 07/28/2005 | | | 2,994,456 | | | | 2,994,456 | | |
Royal Bank of Scotland
Eurodollar Time Deposit
3.240% 08/08/2005 | | | 3,293,901 | | | | 3,293,901 | | |
Royal Bank of Scotland
Eurodollar Time Deposit
3.250% 08/04/2005 | | | 2,395,564 | | | | 2,395,564 | | |
Royal Bank of Scotland
Eurodollar Time Deposit
3.270% 07/29/2005 | | | 2,395,564 | | | | 2,395,564 | | |
Societe Generale
Eurodollar Time Deposit
3.200% 08/08/2005 | | | 1,197,783 | | | | 1,197,783 | | |
Societe Generale
Eurodollar Time Deposit
3.240% 08/09/2005 | | | 1,981,993 | | | | 1,981,993 | | |
Societe Generale
Eurodollar Time Deposit
3.280% 08/01/2005 | | | 2,994,456 | | | | 2,994,456 | | |
| | | Principal
Amount | | Market
Value | |
Svenska Handlesbanken
Eurodollar Time Deposit
3.220% 08/05/2005 | | $ | 2,994,456 | | | $ | 2,994,456 | | |
The Bank of the West
Eurodollar Time Deposit
3.270% 07/27/2005 | | | 898,336 | | | | 898,336 | | |
Toronto Dominion Bank
Eurodollar Time Deposit
3.250% 08/02/2005 | | | 2,994,456 | | | | 2,994,456 | | |
UBS AG
Eurodollar Time Deposit
3.250% 08/09/2005 | | | 1,497,227 | | | | 1,497,227 | | |
Wells Fargo
Eurodollar Time Deposit
3.270% 07/21/2005 | | | 2,994,456 | | | | 2,994,456 | | |
Wells Fargo
Eurodollar Time Deposit
3.270% 08/01/2005 | | | 2,994,457 | | | | 2,994,457 | | |
| | | | 141,913,173 | | |
| Repurchase Agreement - 8.0% | | | |
Investors Bank & Trust
Company Repurchase
Agreement, dated
06/30/2005, 2.01%,
due 07/01/2005(d) | | | 40,480,913 | | | | 40,480,913 | | |
TOTAL SHORT-TERM
INVESTMENTS
(At Amortized Cost) | | | | | | | 182,394,086 | | |
TOTAL INVESTMENTS - 127.8%
(Cost $551,665,420)(e) | | | | | | | 650,340,052 | | |
Other Assets/
(Liabilities) - (27.8%) | | | | | | | (141,488,331 | ) | |
| NET ASSETS - 100.0% | | | | | | $ | 508,851,721 | | |
Notes to Portfolio of Investments
ADR - American Depository Receipt.
(a) Non-income producing security.
(b) Denotes all or a portion of security on loan.
(c) Represents investments of security lending collateral. (Note 2).
(d) Maturity value of $40,483,173. Collaterized by U.S. Government Agency obligations with rates of 3.720% - 6.375%, maturity dates of 05/25/2027 - 06/15/2034, and an aggregate market value, including accrued interest, of $42,504,958.
(e) See Note 6 for aggregate cost for Federal tax purposes.
The accompanying notes are an integral part of the financial statements.
137
MassMutual Select Small Company Growth Fund – Portfolio of Investments
June 30, 2005 (Unaudited)
| | | Number of
Shares | | Market
Value | |
| EQUITIES - 97.8% | | | |
| Advertising - 1.7% | | | |
| Aquantive, Inc.(a) | | | 60,300 | | | $ | 1,068,516 | | |
| Jupitermedia Corp.(a) (b) | | | 44,000 | | | | 753,720 | | |
| Marchex, Inc. Cl. B(a) (b) | | | 45,500 | | | | 684,320 | | |
| | | | 2,506,556 | | |
| Agribusiness - 1.1% | | | |
| Delta & Pine Land Co. | | | 61,700 | | | | 1,546,202 | | |
| Apparel, Textiles & Shoes - 1.7% | | | |
| Christopher & Banks Corp. | | | 19,600 | | | | 357,896 | | |
| HOT Topic, Inc.(a) | | | 42,500 | | | | 812,600 | | |
| Quiksilver, Inc.(a) | | | 18,100 | | | | 289,238 | | |
| Too, Inc.(a) | | | 34,100 | | | | 796,917 | | |
| Volcom, Inc.(a) | | | 6,000 | | | | 160,620 | | |
| | | | 2,417,271 | | |
| Banking, Savings & Loans - 3.5% | | | |
| Bank of the Ozarks, Inc. | | | 4,200 | | | | 137,928 | | |
| Cascade Bancorp | | | 13,375 | | | | 281,410 | | |
Commercial Capital
Bancorp, Inc.(b) | | | 79,932 | | | | 1,335,664 | | |
Encore Capital
Group, Inc.(a) | | | 28,900 | | | | 491,300 | | |
| Euronet Worldwide, Inc.(a) | | | 16,300 | | | | 473,841 | | |
| Glacier Bancorp, Inc. | | | 10,035 | | | | 262,215 | | |
Harbor Florida
Bancshares, Inc. | | | 1,900 | | | | 71,136 | | |
| Sterling Financial Corp.(a) | | | 9,921 | | | | 371,045 | | |
| SVB Financial Group(a) (b) | | | 28,300 | | | | 1,355,570 | | |
United PanAm
Financial Corp.(a) | | | 9,300 | | | | 254,913 | | |
| | | | 5,035,022 | | |
| Broadcasting, Publishing & Printing - 0.3% | | | |
Outdoor Channel
Holdings, Inc.(a) | | | 31,000 | | | | 426,560 | | |
| Chemicals - 1.9% | | | |
| Applied Films Corp.(a) | | | 54,250 | | | | 1,388,800 | | |
Cabot
Microelectronics Corp.(a) (b) | | | 5,700 | | | | 165,243 | | |
| Symyx Technologies, Inc.(a) | | | 41,300 | | | | 1,155,574 | | |
| | | | 2,709,617 | | |
| Commercial Services - 7.8% | | | |
| American Ecology Corp. | | | 15,600 | | | | 279,240 | | |
Corrections Corp.
of America(a) | | | 31,900 | | | | 1,252,075 | | |
Decode
Genetics, Inc.(a) (b) | | | 101,100 | | | | 949,329 | | |
| Duratek, Inc.(a) | | | 58,475 | | | | 1,355,450 | | |
| | | Number of
Shares | | Market
Value | |
| Exact Sciences Corp.(a) | | | 50,600 | | | $ | 115,368 | | |
| Global Payments, Inc. | | | 21,300 | | | | 1,444,140 | | |
Internet Capital
Group, Inc.(a) | | | 118,850 | | | | 871,170 | | |
| iPayment, Inc.(a) | | | 6,900 | | | | 251,988 | | |
| Kosan Biosciences, Inc.(a) | | | 50,000 | | | | 264,000 | | |
| Labor Ready, Inc.(a) | | | 20,200 | | | | 470,862 | | |
Lionbridge
Technologies, Inc.(a) | | | 66,600 | | | | 451,548 | | |
| Navigant Consulting, Inc.(a) | | | 16,000 | | | | 282,560 | | |
| Online Resources Corp.(a) | | | 16,300 | | | | 184,353 | | |
| Strayer Education, Inc. | | | 7,800 | | | | 672,828 | | |
Waste
Connections, Inc.(a) (b) | | | 63,500 | | | | 2,367,915 | | |
| Wind River Systems, Inc.(a) | | | 6,300 | | | | 98,784 | | |
| | | | 11,311,610 | | |
| Communications - 3.1% | | | |
| C-COR, Inc.(a) | | | 93,400 | | | | 639,790 | | |
| Harmonic, Inc.(a) | | | 95,300 | | | | 460,299 | | |
| Polycom, Inc.(a) | | | 147,700 | | | | 2,202,207 | | |
| Tekelec(a) | | | 69,350 | | | | 1,165,080 | | |
| | | | 4,467,376 | | |
| Computer & Data Processing Services - 0.5% | | | |
| Digimarc Corp.(a) | | | 121,800 | | | | 666,246 | | |
| Computer Integrated Systems Design - 3.3% | | | |
| Eclipsys Corp.(a) | | | 83,400 | | | | 1,173,438 | | |
Jack Henry &
Associates, Inc. | | | 43,100 | | | | 789,161 | | |
Mentor
Graphics Corp.(a) (b) | | | 66,600 | | | | 682,650 | | |
| RadiSys Corp.(a) (b) | | | 131,700 | | | | 2,126,955 | | |
| | | | 4,772,204 | | |
| Computer Programming Services - 0.1% | | | |
| Jamdat Mobile, Inc.(a) (b) | | | 5,400 | | | | 149,472 | | |
| Computer Related Services - 1.2% | | | |
| Corillian Corp.(a) | | | 133,889 | | | | 415,056 | | |
| eCollege.com, Inc.(a) (b) | | | 36,900 | | | | 439,110 | | |
| Identix, Inc.(a) | | | 53,400 | | | | 268,602 | | |
| LivePerson, Inc.(a) | | | 51,900 | | | | 161,928 | | |
| Secure Computing Corp.(a) | | | 35,600 | | | | 387,328 | | |
| | | | 1,672,024 | | |
| Computers & Information - 2.4% | | | |
| Emulex Corp.(a) | | | 41,900 | | | | 765,094 | | |
| Immersion Corp.(a) (b) | | | 182,700 | | | | 973,791 | | |
| Komag, Inc.(a) | | | 23,500 | | | | 666,695 | | |
| Western Digital Corp.(a) | | | 76,000 | | | | 1,019,920 | | |
| | | | 3,425,500 | | |
| | | Number of
Shares | | Market
Value | |
| Data Processing & Preparation - 2.0% | |
Factset Research
Systems, Inc.(b) | | | 54,900 | | | $ | 1,967,616 | | |
| HomeStore, Inc.(a) | | | 219,500 | | | | 445,585 | | |
Netsmart
Technologies, Inc.(a) | | | 62,300 | | | | 560,700 | | |
| | | | 2,973,901 | | |
| Electrical Equipment & Electronics - 13.1% | | | |
| Active Power, Inc.(a) | | | 43,700 | | | | 142,025 | | |
| Altera Corp.(a) (b) | | | 71,400 | | | | 1,415,148 | | |
| Cognex Corp. | | | 5,400 | | | | 141,426 | | |
| Credence Systems Corp.(a) | | | 155,500 | | | | 1,407,275 | | |
| Cymer, Inc.(a) (b) | | | 20,500 | | | | 540,175 | | |
| EMS Technologies, Inc.(a) | | | 68,200 | | | | 1,019,590 | | |
| FuelCell Energy, Inc.(a) (b) | | | 21,325 | | | | 217,728 | | |
| Genesis Microchip, Inc.(a) | | | 69,300 | | | | 1,279,278 | | |
| Gentex Corp.(b) | | | 24,400 | | | | 444,080 | | |
Integrated Circuit
Systems, Inc.(a) | | | 15,700 | | | | 324,048 | | |
Integrated Device
Technology, Inc.(a) (b) | | | 119,500 | | | | 1,284,625 | | |
Lattice
Semiconductor Corp.(a) | | | 394,900 | | | | 1,753,356 | | |
| Littelfuse, Inc.(a) | | | 11,935 | | | | 332,390 | | |
| Mykrolis Corp.(a) | | | 55,800 | | | | 792,918 | | |
| Photon Dynamics, Inc.(a) | | | 21,150 | | | | 435,901 | | |
| Pixelworks, Inc.(a) | | | 188,100 | | | | 1,613,898 | | |
| PLX Technology, Inc.(a) | | | 77,800 | | | | 790,448 | | |
Rudolph
Technologies, Inc.(a) (b) | | | 51,900 | | | | 743,727 | | |
| Skyworks Solutions, Inc.(a) | | | 138,700 | | | | 1,022,219 | | |
STATS ChipPAC Limited
ADR (Singapore)(a) (b) | | | 66,326 | | | | 472,241 | | |
Triquint
Semiconductor, Inc.(a) | | | 281,000 | | | | 935,730 | | |
| Ultra Clean Holdings(a) | | | 52,500 | | | | 391,125 | | |
Universal
Display Corp.(a) (b) | | | 5,400 | | | | 55,512 | | |
Universal
Electronics, Inc.(a) | | | 86,575 | | | | 1,436,279 | | |
| | | | 18,991,142 | | |
| Energy - 4.8% | | | |
| Atwood Oceanics, Inc.(a) | | | 2,700 | | | | 166,212 | | |
| Core Laboratories NV(a) | | | 19,425 | | | | 520,978 | | |
| Headwaters, Inc.(a) | | | 33,400 | | | | 1,148,292 | | |
| KCS Energy, Inc.(a) | | | 22,900 | | | | 397,773 | | |
| Patterson-UTI Energy, Inc. | | | 48,950 | | | | 1,362,278 | | |
| Range Resources Corp. | | | 18,500 | | | | 497,650 | | |
| TETRA Technologies, Inc.(a) | | | 11,875 | | | | 378,219 | | |
| Unit Corp.(a) | | | 57,400 | | | | 2,526,174 | | |
| | | | 6,997,576 | | |
(Continued)
The accompanying notes are an integral part of the financial statements.
138
MassMutual Select Small Company Growth Fund – Portfolio of Investments (Continued)
| | | Number of
Shares | | Market
Value | |
| Entertainment & Leisure - 3.7% | |
Lions Gate
Entertainment Corp.(a) (b) | | | 116,200 | | | $ | 1,192,212 | | |
| Macrovision Corp.(a) | | | 36,200 | | | | 815,948 | | |
Nevada Gold &
Casinos, Inc.(a) | | | 28,200 | | | | 305,970 | | |
| SCP Pool Corp. | | | 34,800 | | | | 1,221,132 | | |
| Shuffle Master, Inc.(a) (b) | | | 62,950 | | | | 1,764,488 | | |
| | | | 5,299,750 | | |
| Financial Services - 3.5% | | | |
BankAtlantic
Bancorp, Inc. Cl. A | | | 14,900 | | | | 282,355 | | |
| E Trade Financial Corp.(a) | | | 173,000 | | | | 2,420,270 | | |
| Greenhill & Co., Inc.(b) | | | 17,800 | | | | 721,078 | | |
| Morningstar Inc.(a) | | | 6,000 | | | | 168,900 | | |
Mortgageit Holdings
Inc. REIT | | | 13,900 | | | | 253,675 | | |
NorthStar Realty Finance
Corp. REIT | | | 30,700 | | | | 322,043 | | |
| Primus Guaranty, Ltd.(a) | | | 28,460 | | | | 412,101 | | |
| Redwood Trust, Inc.(b) | | | 3,600 | | | | 185,760 | | |
| Saxon REIT, Inc. REIT | | | 15,400 | | | | 262,878 | | |
| | | | 5,029,060 | | |
| Foods - 0.2% | | | |
Provide
Commerce, Inc.(a) (b) | | | 13,600 | | | | 293,624 | | |
| Healthcare - 3.1% | |
| Alliance Imaging, Inc.(a) | | | 40,700 | | | | 425,722 | | |
American
Healthways, Inc.(a) (b) | | | 33,100 | | | | 1,399,137 | | |
Apria Healthcare
Group, Inc.(a) (b) | | | 4,100 | | | | 142,024 | | |
| Horizon Health Corp.(a) | | | 65,200 | | | | 1,525,028 | | |
| LifePoint Hospitals, Inc.(a) | | | 17,700 | | | | 894,204 | | |
| PainCare Holdings, Inc.(a) | | | 39,200 | | | | 169,736 | | |
| | | | 4,555,851 | | |
| Heavy Machinery - 1.2% | | | |
| Hydril(a) | | | 6,300 | | | | 342,405 | | |
| UNOVA, Inc.(a) (b) | | | 52,200 | | | | 1,390,086 | | |
| | | | 1,732,491 | | |
Home Construction, Furnishings &
Appliances - 2.2% | | | |
Meritage
Homes Corp.(a) (b) | | | 9,600 | | | | 763,200 | | |
| Select Comfort Corp.(a) | | | 30,400 | | | | 651,472 | | |
Tempur-Pedic
International, Inc.(a) (b) | | | 81,800 | | | | 1,814,324 | | |
| | | | 3,228,996 | | |
| | | Number of
Shares | | Market
Value | |
| Information Retrieval Services - 0.1% | |
| RADWARE Limited(a) | | | 8,207 | | | $ | 148,383 | | |
| Insurance - 1.6% | |
| Centene Corp.(a) | | | 24,300 | | | | 815,994 | | |
Philadelphia Consolidated
Holding Corp.(a) | | | 18,400 | | | | 1,559,584 | | |
| | | | 2,375,578 | | |
| Lodging - 0.1% | | | |
| Great Wolf Resorts Inc.(a) | | | 7,400 | | | | 151,256 | | |
| Machinery & Components - 1.7% | |
| Actuant Corp. Cl. A(a) | | | 24,000 | | | | 1,150,560 | | |
| Brooks Automation, Inc.(a) | | | 91,000 | | | | 1,351,350 | | |
| | | | 2,501,910 | | |
| Medical Supplies - 8.5% | | | |
Advanced Medical
Optics, Inc.(a) (b) | | | 11,000 | | | | 437,250 | | |
American Medical Systems
Holdings, Inc.(a) | | | 84,800 | | | | 1,751,120 | | |
| Arrow International, Inc. | | | 28,250 | | | | 901,175 | | |
| ArthoCare Corp.(a) | | | 15,700 | | | | 548,558 | | |
| Cooper Cos., Inc.(b) | | | 10,000 | | | | 608,600 | | |
| DJ Orthopedics, Inc.(a) | | | 34,200 | | | | 938,106 | | |
| FEI Co.(a) (b) | | | 56,400 | | | | 1,286,484 | | |
| Inamed Corp.(a) | | | 21,450 | | | | 1,436,507 | | |
| Ista Pharmaceuticals, Inc.(a) | | | 23,200 | | | | 193,024 | | |
| Langer Inc.(a) | | | 32,000 | | | | 208,000 | | |
| Oyo Geospace Corp.(a) | | | 21,500 | | | | 451,070 | | |
| PSS World Medical, Inc.(a) | | | 71,800 | | | | 893,910 | | |
| Respironics, Inc.(a) | | | 62,400 | | | | 2,253,264 | | |
| Thoratec Corp.(a) | | | 24,975 | | | | 383,117 | | |
| | | | 12,290,185 | | |
| Metals & Mining - 3.6% | | | |
| Aleris International, Inc.(a) | | | 98,500 | | | | 2,221,175 | | |
| General Cable Corp.(a) | | | 81,500 | | | | 1,208,645 | | |
| Maverick Tube Corp.(a) (b) | | | 28,100 | | | | 837,380 | | |
| NS Group, Inc.(a) | | | 27,100 | | | | 881,021 | | |
| Oregon Steel Mills, Inc.(a) | | | 8,400 | | | | 144,564 | | |
| | | | 5,292,785 | | |
| Pharmaceuticals - 8.8% | | | |
| Alkermes, Inc.(a) (b) | | | 57,600 | | | | 761,472 | | |
| BioScrip, Inc.(a) | | | 38,900 | | | | 233,400 | | |
| Cell Genesys, Inc.(a) (b) | | | 151,100 | | | | 808,385 | | |
| Cephalon, Inc.(a) (b) | | | 68,100 | | | | 2,711,061 | | |
| Corixa Corp.(a) | | | 63,600 | | | | 278,568 | | |
Cubist
Pharmaceuticals, Inc.(a) | | | 90,200 | | | | 1,187,934 | | |
| Dendreon Corp.(a) (b) | | | 55,525 | | | | 290,396 | | |
Guilford
Pharmaceuticals, Inc.(a) (b) | | | 96,500 | | | | 219,055 | | |
| | | Number of
Shares | | Market
Value | |
Isis
Pharmaceuticals, Inc.(a) (b) | | | 130,100 | | | $ | 508,691 | | |
| Medarex, Inc.(a) (b) | | | 144,700 | | | | 1,205,351 | | |
Medicis Pharmaceutical
Corp. Cl. A(b) | | | 24,575 | | | | 779,765 | | |
| Neose Technologies, Inc.(a) | | | 79,300 | | | | 249,795 | | |
OraSure
Technologies, Inc.(a) | | | 54,300 | | | | 542,457 | | |
| Pain Therapeutics, Inc.(a) | | | 32,000 | | | | 216,000 | | |
Par Pharmaceutical
Cos., Inc.(a) (b) | | | 5,700 | | | | 181,317 | | |
Salix Pharmaceuticals
Limited(a) (b) | | | 14,800 | | | | 261,368 | | |
Taro Pharmaceutical
Industries Limited(a) (b) | | | 16,000 | | | | 465,120 | | |
| Telik, Inc.(a) | | | 58,200 | | | | 946,332 | | |
Third Wave
Technologies, Inc.(a) | | | 147,400 | | | | 579,282 | | |
| Transgenomic, Inc.(a) | | | 130,800 | | | | 88,944 | | |
| Vasogen, Inc.(a) (b) | | | 58,800 | | | | 288,708 | | |
| | | | 12,803,401 | | |
| Prepackaged Software - 3.8% | | | |
| Ansys, Inc.(a) | | | 42,300 | | | | 1,502,073 | | |
| Atari, Inc.(a) | | | 107,000 | | | | 297,460 | | |
| Datastream Systems, Inc.(a) | | | 167,525 | | | | 1,219,582 | | |
| Epicor Software Corp.(a) | | | 4,800 | | | | 63,360 | | |
| Motive, Inc.(a) | | | 52,800 | | | | 524,304 | | |
| Onyx Software Corp.(a) | | | 29,950 | | | | 107,820 | | |
| Open Solutions, Inc.(a) | | | 17,500 | | | | 355,425 | | |
| Quest Software, Inc.(a) | | | 5,400 | | | | 73,602 | | |
| Red Hat, Inc.(a) (b) | | | 62,300 | | | | 816,130 | | |
| TradeStation Group, Inc.(a) | | | 63,600 | | | | 545,688 | | |
| | | | 5,505,444 | | |
| Real Estate - 0.3% | | | |
WCI
Communities, Inc.(a) (b) | | | 11,800 | | | | 377,954 | | |
| Restaurants - 0.8% | | | |
Buffalo Wild
Wings, Inc.(a) (b) | | | 12,100 | | | | 377,520 | | |
Red Robin Gourmet
Burgers, Inc.(a) | | | 13,300 | | | | 824,334 | | |
| | | | 1,201,854 | | |
| Retail - 5.2% | | | |
| Blue Nile, Inc.(a) (b) | | | 30,250 | | | | 988,873 | | |
Build-A-Bear
Workshop, Inc.(a) (b) | | | 43,050 | | | | 1,009,523 | | |
| Cabela's, Inc. Cl. A(a) (b) | | | 52,000 | | | | 1,110,720 | | |
Cash America
International, Inc. | | | 31,675 | | | | 637,301 | | |
| Cost Plus, Inc.(a) | | | 15,700 | | | | 391,558 | | |
| Genesco, Inc.(a) | | | 59,000 | | | | 2,188,310 | | |
(Continued)
The accompanying notes are an integral part of the financial statements.
139
MassMutual Select Small Company Growth Fund – Portfolio of Investments (Continued)
| | | Number of
Shares | | Market
Value | |
| Knoll, Inc. | | | 47,000 | | | $ | 804,170 | | |
Marvel
Enterprises, Inc.(a) (b) | | | 22,650 | | | | 446,658 | | |
| | | | 7,577,113 | | |
| Transportation - 0.9% | | | |
| OMI Corp.(b) | | | 65,600 | | | | 1,247,056 | | |
TOTAL EQUITIES
(Cost $141,962,877) | | | | | | | 141,680,970 | | |
| | | Principal
Amount | |
| |
| SHORT-TERM INVESTMENTS - 31.8% | | | |
| Cash Equivalents - 29.4%(c) | | | |
ABN Amro Bank NV
Eurodollar Time Deposit
3.250% 08/05/2005 | | $ | 454,396 | | | | 454,396 | | |
American Beacon Money
Market Fund | | | 1,226,664 | | | | 1,226,664 | | |
Bank of America
Bank Note
3.270% 07/18/2005 | | | 628,937 | | | | 628,937 | | |
Bank of America
Bank Note
3.270% 08/30/2005 | | | 1,168,026 | | | | 1,168,026 | | |
Bank of Montreal
Eurodollar Time Deposit
3.010% 07/01/2005 | | | 1,730,013 | | | | 1,730,013 | | |
Barclays
Eurodollar Time Deposit
3.160% 07/14/2005 | | | 898,481 | | | | 898,481 | | |
Barclays
Eurodollar Time Deposit
3.250% 07/26/2005 | | | 905,269 | | | | 905,269 | | |
BGI Institutional Money
Market Fund | | | 3,526,271 | | | | 3,526,271 | | |
BNP Paribas
Eurodollar Time Deposit
3.000% 07/01/2005 | | | 628,937 | | | | 628,937 | | |
Calyon
Eurodollar Time Deposit
3.310% 07/01/2005 | | | 539,089 | | | | 539,089 | | |
Citigroup
Eurodollar Time Deposit
3.085% 07/22/2005 | | | 539,089 | | | | 539,089 | | |
Citigroup
Eurodollar Time Deposit
3.100% 07/25/2005 | | | 1,248,721 | | | | 1,248,721 | | |
Dexia Group
Eurodollar Time Deposit
3.205% 07/20/2005 | | | 449,241 | | | | 449,241 | | |
| | | Principal
Amount | | Market
Value | |
Dexia Group
Eurodollar Time Deposit
3.240% 07/21/2005 | | $ | 449,241 | | | $ | 449,241 | | |
Federal Home Loan
Bank Discount Note
2.977% 07/01/2005 | | | 1,109,494 | | | | 1,109,494 | | |
First Tennessee
National Corporation
Eurodollar Time Deposit
3.220% 08/09/2005 | | | 161,913 | | | | 161,913 | | |
Fortis Bank
Eurodollar Time Deposit
3.110% 07/05/2005 | | | 625,088 | | | | 625,088 | | |
Fortis Bank
Eurodollar Time Deposit
3.250% 07/25/2005 | | | 634,184 | | | | 634,184 | | |
Fortis Bank
Eurodollar Time Deposit
3.250% 08/04/2005 | | | 898,481 | | | | 898,481 | | |
Fortis Bank
Eurodollar Time Deposit
3.270% 07/07/2005 | | | 718,785 | | | | 718,785 | | |
Freddie Mac
Discount Note
3.208% 07/26/2005 | | | 442,918 | | | | 442,918 | | |
Freddie Mac
Discount Note
3.244% 08/16/2005 | | | 1,078,177 | | | | 1,078,177 | | |
General Electric
Capital Corp
3.252% 07/06/2005 | | | 898,481 | | | | 898,481 | | |
General Electric
Capital Corp
3.253% 07/08/2005 | | | 718,785 | | | | 718,785 | | |
Goldman Sachs Financial
Square Prime Obligations
Money Market Fund | | | 820,424 | | | | 820,424 | | |
Harris Trust & Savings Bank
3.295% 11/04/2005 | | | 860,517 | | | | 860,517 | | |
HBOS Halifax
Bank of Scotland
Eurodollar Time Deposit
3.150% 08/08/2005 | | | 449,241 | | | | 449,241 | | |
HSBC Banking/
Holdings PLC
Eurodollar Time Deposit
3.250% 08/05/2005 | | | 539,089 | | | | 539,089 | | |
JP Morgan Chase & Co.
Eurodollar Time Deposit
3.200% 07/20/2005 | | | 898,481 | | | | 898,481 | | |
Merrimac Cash Fund,
Premium Class | | | 1,424,511 | | | | 1,424,511 | | |
| | | Principal
Amount | | Market
Value | |
Morgan Stanley
Dean Witter & Co.
3.518% 07/19/2005 | | $ | 1,796,962 | | | $ | 1,796,962 | | |
National Australia Bank
Eurodollar Time Deposit
3.260% 07/06/2005 | | | 359,392 | | | | 359,392 | | |
National Australia Bank
Eurodollar Time Deposit
3.375% 07/01/2005 | | | 1,078,177 | | | | 1,078,177 | | |
Nordea Bank Finland PLC
(NY Branch)
Eurodollar Time Deposit
3.165% 08/09/2005 | | | 697,680 | | | | 697,680 | | |
Nordea Bank Finland PLC
(NY Branch)
Eurodollar Time Deposit
3.240% 08/03/2005 | | | 323,453 | | | | 323,453 | | |
Rabobank Nederland
Eurodollar Time Deposit
3.170% 07/18/2005 | | | 898,481 | | | | 898,481 | | |
Rabobank Nederland
Eurodollar Time Deposit
3.350% 07/01/2005 | | | 726,977 | | | | 726,977 | | |
Royal Bank of Canada
Eurodollar Time Deposit
3.250% 07/07/2005 | | | 539,089 | | | | 539,089 | | |
Royal Bank of Canada
Eurodollar Time Deposit
3.260% 07/28/2005 | | | 898,481 | | | | 898,481 | | |
Royal Bank of Scotland
Eurodollar Time Deposit
3.240% 08/08/2005 | | | 988,329 | | | | 988,329 | | |
Royal Bank of Scotland
Eurodollar Time Deposit
3.250% 08/04/2005 | | | 718,785 | | | | 718,785 | | |
Royal Bank of Scotland
Eurodollar Time Deposit
3.270% 07/29/2005 | | | 718,785 | | | | 718,785 | | |
Societe Generale
Eurodollar Time Deposit
3.200% 08/08/2005 | | | 359,392 | | | | 359,392 | | |
Societe Generale
Eurodollar Time Deposit
3.240% 08/09/2005 | | | 594,694 | | | | 594,694 | | |
Societe Generale
Eurodollar Time Deposit
3.280% 08/01/2005 | | | 898,481 | | | | 898,481 | | |
Svenska Handlesbanken
Eurodollar Time Deposit
3.220% 08/05/2005 | | | 898,481 | | | | 898,481 | | |
The Bank of the West
Eurodollar Time Deposit
3.270% 07/27/2005 | | | 269,544 | | | | 269,544 | | |
(Continued)
The accompanying notes are an integral part of the financial statements.
140
MassMutual Select Small Company Growth Fund – Portfolio of Investments (Continued)
| | | Principal
Amount | | Market
Value | |
Toronto Dominion Bank
Eurodollar Time Deposit
3.250% 08/02/2005 | | $ | 898,481 | | | $ | 898,481 | | |
UBS AG
Eurodollar Time Deposit
3.250% 08/09/2005 | | | 449,241 | | | | 449,241 | | |
Wells Fargo
Eurodollar Time Deposit
3.270% 07/21/2005 | | | 898,481 | | | | 898,481 | | |
Wells Fargo
Eurodollar Time Deposit
3.270% 08/01/2005 | | | 898,481 | | | | 898,481 | | |
| | | | 42,580,811 | | |
| Repurchase Agreement - 2.4% | | | |
Investors Bank & Trust
Company Repurchase
Agreement, dated
06/30/2005, 2.01%,
due 07/01/2005(d) | | | 3,500,953 | | | | 3,500,953 | | |
TOTAL SHORT-TERM
INVESTMENTS
(At Amortized Cost) | | | | | | | 46,081,764 | | |
TOTAL INVESTMENTS - 129.6%
(Cost $188,044,641)(e) | | | | | | | 187,762,734 | | |
Other Assets/
(Liabilities) - (29.6%) | | | | | | | (42,908,166 | ) | |
| NET ASSETS - 100.0% | | | | | | $ | 144,854,568 | | |
Notes to Portfolio of Investments
ADR - American Depository Receipt.
REIT - Real Estate Investment Trust
(a) Non-income producing security.
(b) Denotes all or a portion of security on loan.
(c) Represents investments of security lending collateral. (Note 2).
(d) Maturity value of $3,501,149. Collateralized by U.S. Government Agency Obligation with a rate of 6.375%, maturity date of 05/25/2015, and an aggregate market value, including accrued interest, of $3,676,001.
(e) See Note 6 for aggregate cost for Federal tax purposes.
The remainder of this page is intentionally left blank.
The accompanying notes are an integral part of the financial statements.
141
MassMutual Select Emerging Growth Fund – Portfolio of Investments
June 30, 2005 (Unaudited)
| | | Number of
Shares | | Market
Value | |
| EQUITIES - 91.9% | |
| Advertising - 2.1% | |
| Aquantive, Inc.(a) | | | 31,990 | | | $ | 566,863 | | |
| Fastclick(a) | | | 4,100 | | | | 37,310 | | |
| Marchex, Inc. Cl. B(a) (b) | | | 36,850 | | | | 554,224 | | |
| Valueclick, Inc.(a) (b) | | | 126,710 | | | | 1,562,334 | | |
| | | | 2,720,731 | | |
| Aerospace & Defense - 1.0% | | | |
| ARGON ST, Inc.(a) | | | 13,680 | | | | 485,640 | | |
Engineered Support
Systems, Inc. | | | 24,295 | | | | 870,490 | | |
| | | | 1,356,130 | | |
| Apparel, Textiles & Shoes - 1.6% | | | |
| bebe stores, inc.(b) | | | 58,990 | | | | 1,561,465 | | |
Jos. A. Bank
Clothiers, Inc.(a) (b) | | | 3,080 | | | | 133,364 | | |
| Urban Outfitters, Inc.(a) | | | 5,830 | | | | 330,503 | | |
| Volcom, Inc.(a) | | | 1,900 | | | | 50,863 | | |
| | | | 2,076,195 | | |
| Banking, Savings & Loans - 2.5% | | | |
Euronet
Worldwide, Inc.(a) | | | 28,290 | | | | 822,390 | | |
| PrivateBancorp, Inc. | | | 37,101 | | | | 1,312,633 | | |
SVB
Financial Group(a) (b) | | | 24,140 | | | | 1,156,306 | | |
| | | | 3,291,329 | | |
| Building Materials & Construction - 1.9% | | | |
| Chemed Corp. | | | 33,210 | | | | 1,357,625 | | |
Merge
Technologies, Inc.(a) (b) | | | 56,920 | | | | 1,067,250 | | |
| | | | 2,424,875 | | |
| Commercial Services - 11.1% | | | |
| The Advisory Board Co.(a) | | | 20,121 | | | | 980,698 | | |
AMN Healthcare
Services, Inc.(a) | | | 68,400 | | | | 1,028,052 | | |
Bright Horizons
Family Solutions, Inc.(a) | | | 48,720 | | | | 1,983,878 | | |
DiamondCluster
International, Inc. Cl. A(a) | | | 19,890 | | | | 224,757 | | |
eResearch
Technology, Inc.(a) (b) | | | 53,880 | | | | 721,453 | | |
| Global Payments, Inc. | | | 19,470 | | | | 1,320,066 | | |
Greenfield
Online, Inc.(a) (b) | | | 38,250 | | | | 464,737 | | |
Heidrick & Struggles
International, Inc.(a) | | | 31,460 | | | | 820,477 | | |
| | | Number of
Shares | | Market
Value | |
Huron Consulting
Group, Inc.(a) | | | 23,112 | | | $ | 544,288 | | |
| Laureate Education, Inc.(a) | | | 8,140 | | | | 389,580 | | |
Magellan Health
Services, Inc.(a) | | | 16,720 | | | | 590,383 | | |
| MPS Group, Inc.(a) | | | 101,870 | | | | 959,615 | | |
| Navigant Consulting, Inc.(a) | | | 48,810 | | | | 861,985 | | |
Portfolio Recovery
Associates, Inc.(a) | | | 19,720 | | | | 828,634 | | |
Resources
Connection, Inc.(a) | | | 38,480 | | | | 893,890 | | |
Universal Technical
Institute, Inc.(a) (b) | | | 36,760 | | | | 1,220,432 | | |
Wind River
Systems, Inc.(a) (b) | | | 42,600 | | | | 667,968 | | |
| | | | 14,500,893 | | |
| Communications - 3.8% | | | |
| AudioCodes Limited(a) (b) | | | 84,750 | | | | 843,262 | | |
| Lifeline Systems, Inc.(a) | | | 44,536 | | | | 1,430,496 | | |
| Nice Systems Limited(a) | | | 20,110 | | | | 793,742 | | |
Openwave
Systems, Inc.(a) (b) | | | 81,680 | | | | 1,339,552 | | |
| PowerDsine Limited(a) | | | 49,230 | | | | 492,300 | | |
| | | | 4,899,352 | | |
| Computer Integrated Systems Design - 2.1% | | | |
| F5 Networks, Inc.(a) | | | 13,400 | | | | 632,949 | | |
Mercury Computer
Systems, Inc.(a) | | | 45,234 | | | | 1,238,055 | | |
| Optimal Robotics Corp.(a) | | | 23,690 | | | | 382,593 | | |
| SafeNet, Inc.(a) | | | 12,380 | | | | 421,663 | | |
| | | | 2,675,260 | | |
| Computer Programming Services - 1.7% | | | |
CACI International,
Inc. Cl. A(a) | | | 13,290 | | | | 839,396 | | |
| Jamdat Mobile, Inc.(a) (b) | | | 27,620 | | | | 764,522 | | |
Shanda Interactive
Entertainment Limited
ADR (Cayman
Islands)(a) (b) | | | 18,100 | | | | 665,899 | | |
| | | | 2,269,817 | | |
| Computer Related Services - 1.0% | | | |
| Checkfree Corp.(a) (b) | | | 25,560 | | | | 870,574 | | |
| CNET Networks, Inc.(a) (b) | | | 40,210 | | | | 472,065 | | |
| | | | 1,342,639 | | |
| Computers & Information - 3.9% | | | |
| Emulex Corp.(a) | | | 91,398 | | | | 1,668,927 | | |
| Micros Systems, Inc.(a) | | | 19,667 | | | | 880,098 | | |
| | | Number of
Shares | | Market
Value | |
M-Systems Flash
Disk Pioneers
Limited(a) (b) | | | 68,480 | | | $ | 1,312,762 | | |
Scientific Games
Corp. Cl. A(a) | | | 27,320 | | | | 735,728 | | |
SRA International,
Inc. Cl. A(a) (b) | | | 12,520 | | | | 434,694 | | |
| | | | 5,032,209 | | |
| Data Processing & Preparation - 0.4% | | | |
Factset Research
Systems, Inc.(b) | | | 15,680 | | | | 561,971 | | |
| Electrical Equipment & Electronics - 8.0% | |
| Credence Systems Corp.(a) | | | 77,640 | | | | 702,642 | | |
| DRS Technologies, Inc. | | | 19,890 | | | | 1,019,959 | | |
| Ixia(a) | | | 92,712 | | | | 1,802,321 | | |
O2Micro International
Limited(a) | | | 58,450 | | | | 821,222 | | |
| Photon Dynamics, Inc.(a) | | | 48,670 | | | | 1,003,089 | | |
| PLX Technology, Inc.(a) | | | 45,710 | | | | 464,414 | | |
SiRF Technology
Holdings, Inc.(a) | | | 30,670 | | | | 542,246 | | |
Tessera
Technologies, Inc.(a) | | | 34,972 | | | | 1,168,415 | | |
Varian
Semiconductor Equipment
Associates, Inc.(a) | | | 31,470 | | | | 1,164,390 | | |
| Virage Logic Corp.(a) | | | 77,680 | | | | 800,104 | | |
Volterra
Semiconductor Corp.(a) (b) | | | 61,840 | | | | 920,798 | | |
| | | | 10,409,600 | | |
| Energy - 2.3% | | | |
CAL Dive
International, Inc.(a) | | | 4,580 | | | | 239,855 | | |
Denbury
Resources, Inc.(a) | | | 19,990 | | | | 795,002 | | |
| Headwaters, Inc.(a) | | | 9,065 | | | | 311,655 | | |
Superior Energy
Services, Inc.(a) | | | 24,520 | | | | 436,456 | | |
| Unit Corp.(a) | | | 28,590 | | | | 1,258,246 | | |
| | | | 3,041,214 | | |
| Financial Services - 2.8% | | | |
Affiliated Managers
Group, Inc.(a) (b) | | | 18,750 | | | | 1,281,187 | | |
Boston Private Financial
Holdings, Inc. | | | 46,910 | | | | 1,182,132 | | |
| East West Bancorp, Inc. | | | 17,351 | | | | 582,820 | | |
First Cash Financial
Services, Inc.(a) | | | 8,189 | | | | 174,999 | | |
(Continued)
The accompanying notes are an integral part of the financial statements.
142
MassMutual Select Emerging Growth Fund – Portfolio of Investments (Continued)
| | | Number of
Shares | | Market
Value | |
| GFI Group, Inc.(a) | | | 1,300 | | | $ | 46,280 | | |
International Securities
Exchange, Inc.(a) | | | 3,100 | | | | 77,841 | | |
KKR Financial
Corp. REIT(a) | | | 12,150 | | | | 303,750 | | |
| | | | 3,649,009 | | |
| Foods - 1.0% | | | |
Provide
Commerce, Inc.(a) (b) | | | 16,830 | | | | 363,360 | | |
United Natural
Foods, Inc.(a) (b) | | | 29,020 | | | | 881,337 | | |
| | | | 1,244,697 | | |
| Healthcare - 4.2% | | | |
Allscripts Healthcare
Solutions, Inc.(a) (b) | | | 13,000 | | | | 215,930 | | |
American
Healthways, Inc.(a) (b) | | | 19,870 | | | | 839,905 | | |
| Matria Healthcare, Inc.(a) | | | 44,475 | | | | 1,433,429 | | |
| Option Care, Inc.(b) | | | 77,285 | | | | 1,089,718 | | |
United Surgical Partners
International, Inc.(a) | | | 26,300 | | | | 1,369,704 | | |
| VCA Antech, Inc.(a) | | | 20,780 | | | | 503,915 | | |
| | | | 5,452,601 | | |
| Heavy Machinery - 0.0% | | | |
| Hydril(a) | | | 700 | | | | 38,045 | | |
Home Construction, Furnishings &
Appliances - 0.6% | |
| Miller (Herman), Inc. | | | 23,900 | | | | 737,076 | | |
| Information Retrieval Services - 1.2% | |
| Bankrate, Inc.(a) (b) | | | 11,860 | | | | 238,860 | | |
| Infospace, Inc.(a) | | | 40,517 | | | | 1,334,225 | | |
| | | | 1,573,085 | | |
| Insurance - 2.6% | | | |
| AMERIGROUP Corp.(a) | | | 19,240 | | | | 773,448 | | |
| Centene Corp.(a) | | | 23,710 | | | | 796,182 | | |
| HealthExtras, Inc.(a) | | | 45,370 | | | | 910,576 | | |
| Tower Group, Inc. | | | 61,147 | | | | 955,728 | | |
| | | | 3,435,934 | | |
| Internet Software - 1.4% | | | |
WebEx
Communications, Inc.(a) (b) | | | 69,286 | | | | 1,829,843 | | |
| Lodging - 3.1% | |
Four Seasons
Hotels, Inc.(b) | | | 18,080 | | | | 1,195,088 | | |
Kerzner
International, Ltd.(a) | | | 13,062 | | | | 743,881 | | |
Orient-Express
Hotels Limited Cl. A | | | 30,830 | | | | 976,386 | | |
| | | Number of
Shares | | Market
Value | |
| Station Casinos, Inc. | | | 16,600 | | | $ | 1,102,240 | | |
| | | | 4,017,595 | | |
| Machinery & Components - 1.2% | | | |
| Grant Prideco, Inc.(a) | | | 35,720 | | | | 944,794 | | |
| Ultratech, Inc.(a) | | | 36,560 | | | | 669,048 | | |
| | | | 1,613,842 | | |
| Medical Supplies - 6.9% | | | |
Advanced Neuromodulation
Systems, Inc.(a) (b) | | | 7,600 | | | | 301,568 | | |
American Medical Systems
Holdings, Inc.(a) | | | 40,490 | | | | 836,119 | | |
| BEI Technologies, Inc. | | | 30,675 | | | | 818,409 | | |
Foxhollow
Technologies, Inc.(a) (b) | | �� | 6,500 | | | | 248,755 | | |
| Hologic, Inc.(a) | | | 10,610 | | | | 421,748 | | |
| I-Flow Corp.(a) | | | 28,910 | | | | 481,062 | | |
| Illumina, Inc.(a) | | | 21,280 | | | | 256,850 | | |
| Intralase Corp.(a) (b) | | | 29,300 | | | | 574,866 | | |
| Intuitive Surgical, Inc.(a) | | | 18,800 | | | | 876,832 | | |
| Laserscope(a) (b) | | | 27,330 | | | | 1,132,555 | | |
| SonoSite, Inc.(a) | | | 21,050 | | | | 653,392 | | |
| Symmetry Medical, Inc.(a) | | | 20,320 | | | | 478,333 | | |
Syneron Medical
Limited(a) (b) | | | 33,380 | | | | 1,221,374 | | |
Ventana Medical
Systems, Inc.(a) | | | 18,130 | | | | 729,370 | | |
| | | | 9,031,233 | | |
| Metals & Mining - 0.3% | | | |
| Maverick Tube Corp.(a) | | | 14,340 | | | | 427,332 | | |
| Pharmaceuticals - 9.1% | | | |
Alexion
Pharmaceuticals, Inc.(a) (b) | | | 60,640 | | | | 1,397,146 | | |
Angiotech
Pharmaceuticals, Inc.(a) | | | 73,200 | | | | 1,014,552 | | |
| Atherogenics, Inc.(a) (b) | | | 65,515 | | | | 1,046,930 | | |
| CV Therapeutics, Inc.(a) (b) | | | 24,370 | | | | 546,375 | | |
| Cypress Bioscience, Inc.(a) | | | 26,040 | | | | 343,728 | | |
Discovery
Laboratories, Inc.(a) (b) | | | 97,050 | | | | 707,495 | | |
First Horizon
Pharmaceuticals, Inc.(a) (b) | | | 52,450 | | | | 998,648 | | |
Inspire
Pharmaceuticals, Inc.(a) | | | 64,820 | | | | 545,784 | | |
| Nabi Biopharmaceuticals(a) | | | 86,860 | | | | 1,322,878 | | |
| NitroMed, Inc.(a) (b) | | | 13,180 | | | | 256,351 | | |
Priority Healthcare
Corp. Cl. B(a) | | | 33,000 | | | | 836,880 | | |
| QLT, Inc.(a) | | | 25,020 | | | | 260,708 | | |
Rigel
Pharmaceuticals, Inc.(a) | | | 75,140 | | | | 1,496,789 | | |
| | | Number of
Shares | | Market
Value | |
Salix Pharmaceuticals
Limited(a) | | | 58,010 | | | $ | 1,024,457 | | |
| | | | 11,798,721 | | |
| Photography Equipment/Supplies - 0.4% | | | |
| Sonic Solutions, Inc.(a) (b) | | | 29,360 | | | | 546,096 | | |
| Prepackaged Software - 4.3% | | | |
| Blackboard, Inc.(a) (b) | | | 38,164 | | | | 912,883 | | |
Dendrite
International, Inc.(a) | | | 40,880 | | | | 564,144 | | |
| Epicor Software Corp.(a) | | | 52,360 | | | | 691,152 | | |
MicroStrategy,
Inc. Cl. A(a) (b) | | | 20,740 | | | | 1,100,050 | | |
| Open Solutions, Inc.(a) | | | 38,540 | | | | 782,747 | | |
| Quest Software, Inc.(a) | | | 78,680 | | | | 1,072,408 | | |
Ultimate Software
Group, Inc.(a) | | | 5,000 | | | | 82,000 | | |
| Witness Systems, Inc.(a) | | | 20,650 | | | | 376,450 | | |
| | | | 5,581,834 | | |
| Real Estate - 0.3% | | | |
| ZipRealty, Inc.(a) (b) | | | 25,560 | | | | 328,190 | | |
| Restaurants - 2.4% | | | |
California Pizza
Kitchen, Inc.(a) | | | 45,128 | | | | 1,230,641 | | |
P.F. Chang's China
Bistro, Inc.(a) (b) | | | 12,938 | | | | 763,083 | | |
RARE Hospitality
International, Inc.(a) | | | 39,060 | | | | 1,190,158 | | |
| | | | 3,183,882 | | |
| Retail - 3.7% | | | |
| Central Garden & Pet Co.(a) | | | 13,370 | | | | 656,734 | | |
| GSI Commerce, Inc.(a) (b) | | | 66,278 | | | | 1,110,157 | | |
| Guitar Center, Inc.(a) | | | 3,883 | | | | 226,651 | | |
Hibbett Sporting
Goods, Inc.(a) | | | 25,192 | | | | 953,265 | | |
Kenneth Cole Productions,
Inc. Cl. A | | | 25,040 | | | | 779,245 | | |
| Priceline.com, Inc.(a) (b) | | | 49,626 | | | | 1,157,775 | | |
| | | | 4,883,827 | | |
| Telephone Utilities - 2.1% | | | |
| Equinix, Inc.(a) (b) | | | 23,250 | | | | 1,007,655 | | |
j2 Global
Communications, Inc.(a) (b) | | | 37,306 | | | | 1,284,819 | | |
| Novatel Wireless, Inc.(a) (b) | | | 32,430 | | | | 404,402 | | |
| | | | 2,696,876 | | |
| Transportation - 0.9% | | | |
| UTI Worldwide, Inc. | | | 17,356 | | | | 1,208,325 | | |
TOTAL EQUITIES
(Cost $109,145,372) | | | | | | | 119,880,258 | | |
(Continued)
The accompanying notes are an integral part of the financial statements.
143
MassMutual Select Emerging Growth Fund – Portfolio of Investments (Continued)
| | | Principal
Amount | | Market
Value | |
| SHORT-TERM INVESTMENTS - 35.6% | | | |
| Cash Equivalents - 28.5%(c) | | | |
ABN Amro Bank NV
Eurodollar Time Deposit
3.250% 08/05/2005 | | $ | 396,812 | | | $ | 396,812 | | |
American Beacon Money
Market Fund | | | 1,071,229 | | | | 1,071,229 | | |
Bank of America
Bank Note
3.270% 07/18/2005 | | | 549,242 | | | | 549,242 | | |
Bank of America
Bank Note
3.270% 08/30/2005 | | | 1,020,020 | | | | 1,020,020 | | |
Bank of Montreal
Eurodollar Time Deposit
3.010% 07/01/2005 | | | 1,510,796 | | | | 1,510,796 | | |
Barclays
Eurodollar Time Deposit
3.160% 07/14/2005 | | | 784,631 | | | | 784,631 | | |
Barclays
Eurodollar Time Deposit
3.250% 07/26/2005 | | | 790,558 | | | | 790,558 | | |
BGI Institutional Money
Market Fund | | | 3,079,441 | | | | 3,079,441 | | |
BNP Paribas
Eurodollar Time Deposit
3.000% 07/01/2005 | | | 549,242 | | | | 549,242 | | |
Calyon
Eurodollar Time Deposit
3.310% 07/01/2005 | | | 470,779 | | | | 470,779 | | |
Citigroup
Eurodollar Time Deposit
3.085% 07/22/2005 | | | 470,779 | | | | 470,779 | | |
Citigroup
Eurodollar Time Deposit
3.100% 07/25/2005 | | | 1,090,490 | | | | 1,090,490 | | |
Dexia Group
Eurodollar Time Deposit
3.205% 07/20/2005 | | | 392,316 | | | | 392,316 | | |
Dexia Group
Eurodollar Time Deposit
3.240% 07/21/2005 | | | 392,316 | | | | 392,316 | | |
Federal Home Loan
Bank Discount Note
2.977% 07/01/2005 | | | 968,905 | | | | 968,905 | | |
First Tennessee
National Corporation
Eurodollar Time Deposit
3.220% 08/09/2005 | | | 141,397 | | | | 141,397 | | |
Fortis Bank
Eurodollar Time Deposit
3.110% 07/05/2005 | | | 545,880 | | | | 545,880 | | |
| | | Principal
Amount | | Market
Value | |
Fortis Bank
Eurodollar Time Deposit
3.250% 07/25/2005 | | $ | 553,823 | | | $ | 553,823 | | |
Fortis Bank
Eurodollar Time Deposit
3.250% 08/04/2005 | | | 784,631 | | | | 784,631 | | |
Fortis Bank
Eurodollar Time Deposit
3.270% 07/07/2005 | | | 627,705 | | | | 627,705 | | |
Freddie Mac
Discount Note
3.208% 07/26/2005 | | | 386,794 | | | | 386,794 | | |
Freddie Mac
Discount Note
3.244% 08/16/2005 | | | 941,557 | | | | 941,557 | | |
General Electric
Capital Corp
3.252% 07/06/2005 | | | 784,631 | | | | 784,631 | | |
General Electric
Capital Corp
3.253% 07/08/2005 | | | 627,705 | | | | 627,705 | | |
Goldman Sachs Financial
Square Prime Obligations
Money Market Fund | | | 716,465 | | | | 716,465 | | |
Harris Trust &
Savings Bank
3.295% 11/04/2005 | | | 751,477 | | | | 751,477 | | |
HBOS Halifax
Bank of Scotland
Eurodollar Time Deposit
3.150% 08/08/2005 | | | 392,316 | | | | 392,316 | | |
HSBC Banking/
Holdings PLC
Eurodollar Time Deposit
3.250% 08/05/2005 | | | 470,779 | | | | 470,779 | | |
JP Morgan Chase & Co.
Eurodollar Time Deposit
3.200% 07/20/2005 | | | 784,631 | | | | 784,631 | | |
Merrimac Cash Fund,
Premium Class | | | 1,244,006 | | | | 1,244,006 | | |
Morgan Stanley
Dean Witter & Co.
3.518% 07/19/2005 | | | 1,569,262 | | | | 1,569,262 | | |
National Australia Bank
Eurodollar Time Deposit
3.260% 07/06/2005 | | | 313,852 | | | | 313,852 | | |
National Australia Bank
Eurodollar Time Deposit
3.375% 07/01/2005 | | | 941,557 | | | | 941,557 | | |
Nordea Bank Finland PLC
(NY Branch)
Eurodollar Time Deposit
3.165% 08/09/2005 | | | 609,274 | | | | 609,274 | | |
| | | Principal
Amount | | Market
Value | |
Nordea Bank Finland PLC
(NY Branch)
Eurodollar Time Deposit
3.240% 08/03/2005 | | $ | 282,467 | | | $ | 282,467 | | |
Rabobank Nederland
Eurodollar Time Deposit
3.170% 07/18/2005 | | | 784,631 | | | | 784,631 | | |
Rabobank Nederland
Eurodollar Time Deposit
3.350% 07/01/2005 | | | 634,858 | | | | 634,858 | | |
Royal Bank of Canada
Eurodollar Time Deposit
3.250% 07/07/2005 | | | 470,779 | | | | 470,779 | | |
Royal Bank of Canada
Eurodollar Time Deposit
3.260% 07/28/2005 | | | 784,631 | | | | 784,631 | | |
Royal Bank of Scotland
Eurodollar Time Deposit
3.240% 08/08/2005 | | | 863,094 | | | | 863,094 | | |
Royal Bank of Scotland
Eurodollar Time Deposit
3.250% 08/04/2005 | | | 627,705 | | | | 627,705 | | |
Royal Bank of Scotland
Eurodollar Time Deposit
3.270% 07/29/2005 | | | 627,705 | | | | 627,705 | | |
Societe Generale
Eurodollar Time Deposit
3.200% 08/08/2005 | | | 313,852 | | | | 313,852 | | |
Societe Generale
Eurodollar Time Deposit
3.240% 08/09/2005 | | | 519,338 | | | | 519,338 | | |
Societe Generale
Eurodollar Time Deposit
3.280% 08/01/2005 | | | 784,631 | | | | 784,631 | | |
Svenska Handlesbanken
Eurodollar Time Deposit
3.220% 08/05/2005 | | | 784,631 | | | | 784,631 | | |
The Bank of the West
Eurodollar Time Deposit
3.270% 07/27/2005 | | | 235,389 | | | | 235,389 | | |
Toronto Dominion Bank
Eurodollar Time Deposit
3.250% 08/02/2005 | | | 784,631 | | | | 784,631 | | |
UBS AG
Eurodollar Time Deposit
3.250% 08/09/2005 | | | 392,316 | | | | 392,316 | | |
Wells Fargo
Eurodollar Time Deposit
3.270% 07/21/2005 | | | 784,631 | | | | 784,631 | | |
Wells Fargo
Eurodollar Time Deposit
3.270% 08/01/2005 | | | 784,631 | | | | 784,631 | | |
| | | | 37,185,218 | | |
(Continued)
The accompanying notes are an integral part of the financial statements.
144
MassMutual Select Emerging Growth Fund – Portfolio of Investments (Continued)
| | | Principal
Amount | | Market
Value | |
| Repurchase Agreement - 7.1% | | | |
Investors Bank & Trust
Company Repurchase
Agreement, dated
06/30/2005, 2.01%,
due 07/01/2005(d) | | $ | 9,290,270 | | | $ | 9,290,270 | | |
TOTAL SHORT-TERM
INVESTMENTS
(At Amortized Cost) | | | | | 46,475,488 | | |
TOTAL INVESTMENTS - 127.5%
(Cost $155,620,860)(e) | | | | | 166,355,746 | | |
Other Assets/
(Liabilities) - (27.5%) | | | | | (35,914,830 | ) | |
| NET ASSETS - 100.0% | | | | $ | 130,440,916 | | |
Notes to Portfolio of Investments
(a) Non-income producing security.
(b) Denotes all or a portion of security on loan.
(c) Represents investments of security lending collateral. (Note 2).
(d) Maturity value of $9,290,788. Collateralized by U.S. Government Agency obligations with rates of 3.764 - 7.125%, maturity dates of 08/25/2015 - 12/01/2035, and an aggregate market value, including accrued interest, of $9,754,783.
(e) See Note 6 for aggregate cost for Federal tax purposes.
The remainder of this page is intentionally left blank.
The accompanying notes are an integral part of the financial statements.
145
MassMutual Select Overseas Fund – Portfolio of Investments
June 30, 2005 (Unaudited)
| | | Number of
Shares | | Market
Value | |
| EQUITIES - 95.7% | |
| Advertising - 2.2% | |
| Aegis Group PLC | | | 2,915,000 | | | $ | 5,181,497 | | |
| Publicis Groupe(a) | | | 332,000 | | | | 9,730,859 | | |
| | | | 14,912,356 | | |
| Air Transportation - 0.4% | | | |
Ryanair Holdings
PLC Sponsored
ADR (Ireland)(a) (b) | | | 65,184 | | | | 2,922,851 | | |
| Apparel, Textiles & Shoes - 1.4% | |
| Adidas-Salomon AG | | | 9,340 | | | | 1,552,172 | | |
| Ansell Limited | | | 91,736 | | | | 696,136 | | |
| Chargeurs SA | | | 18,058 | | | | 608,314 | | |
Giordano International
Limited | | | 3,404,000 | | | | 2,337,518 | | |
| Next PLC | | | 107,380 | | | | 2,897,545 | | |
| Toray Industries, Inc. | | | 314,000 | | | | 1,487,118 | | |
| | | | 9,578,803 | | |
| Automotive & Parts - 4.3% | | | |
Bayerische Motoren
Werke AG(a) | | | 273,400 | | | | 12,392,013 | | |
| Continental AG | | | 42,600 | | | | 3,050,810 | | |
| Honda Motor Co. Limited | | | 197,200 | | | | 9,724,809 | | |
| Lafarge SA | | | 32,022 | | | | 2,894,813 | | |
| Toyota Motor Corp. | | | 34,400 | | | | 1,232,940 | | |
| | | | 29,295,385 | | |
| Banking, Savings & Loans - 14.9% | | | |
Anglo Irish Bank
Corp. PLC | | | 311,030 | | | | 3,841,838 | | |
Australia & New Zealand
Banking Group Limited | | | 483,300 | | | | 7,960,598 | | |
Banco Popolare di Verona
e Novara Scrl | | | 355,400 | | | | 6,027,551 | | |
| Banco Popular Espanol | | | 290,940 | | | | 3,495,263 | | |
| Bank of Ireland | | | 96,000 | | | | 1,549,803 | | |
| Bank of Ireland (GBP) | | | 816,450 | | | | 13,076,069 | | |
| BNP Paribas SA | | | 80,800 | | | | 5,503,199 | | |
Commonwealth
Bank of Australia | | | 49,920 | | | | 1,436,410 | | |
| Credit Suisse Group | | | 210,200 | | | | 8,222,393 | | |
| DnB Nor ASA(a) | | | 309,710 | | | | 3,201,646 | | |
Erste Bank der
oesterreichischen
Sparkassen AG | | | 66,102 | | | | 3,293,719 | | |
| HSBC Holdings PLC | | | 21,780 | | | | 347,790 | | |
| KBC Bankverzekeringsholding | | | 42,250 | | | | 3,316,926 | | |
| Kookmin Bank | | | 166,000 | | | | 7,622,757 | | |
| Lloyds TSB Group PLC | | | 862,000 | | | | 7,300,108 | | |
| | | Number of
Shares | | Market
Value | |
Mitsubishi Tokyo
Financial Group, Inc. | | | 90 | | | $ | 761,609 | | |
| National Australia Bank | | | 88,410 | | | | 2,062,086 | | |
National Bank of
Greece SA | | | 118,610 | | | | 3,999,124 | | |
Royal Bank of
Scotland Group PLC | | | 157,791 | | | | 4,760,742 | | |
| Sanpaolo IMI SpA | | | 140,900 | | | | 1,919,670 | | |
| UniCredito Italiano SpA(a) | | | 970,000 | | | | 5,084,056 | | |
United Overseas
Bank Limited | | | 561,000 | | | | 4,720,851 | | |
| Yokohama Bank Limited | | | 244,000 | | | | 1,405,281 | | |
| | | | 100,909,489 | | |
| Beverages - 4.6% | | | |
| Diageo PLC | | | 1,165,650 | | | | 17,161,014 | | |
Heineken
Holding NV Cl. A | | | 196,250 | | | | 5,489,113 | | |
| Heineken NV | | | 32,250 | | | | 989,768 | | |
Lotte Chilsung Beverage
Co. Limited | | | 4,130 | | | | 3,604,463 | | |
| Pernod-Ricard SA(a) | | | 25,215 | | | | 4,007,209 | | |
| | | | 31,251,567 | | |
| Broadcasting, Publishing & Printing - 3.8% | | | |
British Sky Broadcasting
Group PLC | | | 470,000 | | | | 4,437,763 | | |
Grupo Televisa SA
Sponsored ADR (Mexico) | | | 82,500 | | | | 5,122,425 | | |
| Reed Elsevier PLC | | | 422,550 | | | | 4,041,916 | | |
| Thomson Corp. (The)(a) | | | 77,980 | | | | 2,595,010 | | |
| Vivendi Universal SA(a) | | | 307,110 | | | | 9,580,913 | | |
| | | | 25,778,027 | | |
| Chemicals - 4.5% | | | |
| Akzo Nobel, Inc. | | | 208,500 | | | | 8,151,672 | | |
| BASF AG | | | 26,280 | | | | 1,735,210 | | |
| Givaudan SA Registered | | | 10,600 | | | | 6,138,402 | | |
| Lonza Group AG Registered | | | 125,500 | | | | 6,908,953 | | |
Shin-Etsu Chemical
Co. Limited | | | 33,500 | | | | 1,269,184 | | |
| Syngenta AG(b) | | | 62,000 | | | | 6,331,652 | | |
| | | | 30,535,073 | | |
| Commercial Services - 0.8% | | | |
Michael Page
International PLC | | | 980,800 | | | | 3,544,611 | | |
| Taisei Corp. | | | 651,000 | | | | 2,195,053 | | |
| | | | 5,739,664 | | |
| | | Number of
Shares | | Market
Value | |
| Communications - 5.6% | |
America Movil SA de CV
Sponsored ADR
Series L (Mexico) | | | 29,950 | | | $ | 1,785,320 | | |
| Deutsche Telekom AG | | | 220,390 | | | | 4,057,454 | | |
| France Telecom SA(a) | | | 80,380 | | | | 2,326,301 | | |
| KDDI Corp. | | | 390 | | | | 1,803,892 | | |
| SK Telecom Co. Limited | | | 63,730 | | | | 11,302,822 | | |
| Telefonica SA | | | 210,012 | | | | 3,415,979 | | |
| Telenor ASA | | | 236,680 | | | | 1,872,273 | | |
| Vodafone Group PLC | | | 4,683,860 | | | | 11,402,957 | | |
| | | | 37,966,998 | | |
| Computer Related Services - 0.7% | | | |
| Meitec Corp. | | | 148,700 | | | | 4,574,355 | | |
| Consumer Services - 0.1% | |
| Veolia Environment | | | 8,650 | | | | 323,997 | | |
| Containers - 0.5% | |
| Amcor Limited | | | 609,260 | | | | 3,087,215 | | |
| Cosmetics & Personal Care - 2.3% | |
| L'Oreal SA(a) | | | 77,000 | | | | 5,502,077 | | |
| Reckitt Benckiser PLC | | | 165,663 | | | | 4,876,737 | | |
| Uni-Charm Corp. | | | 130,000 | | | | 5,234,802 | | |
| | | | 15,613,616 | | |
| Diversified Financial - 0.3% | | | |
| Takefuji Corp. | | | 30,700 | | | | 2,077,753 | | |
| Electric Utilities - 1.3% | |
| CLP Holdings, Limited | | | 523,500 | | | | 3,004,209 | | |
| E.ON AG | | | 28,750 | | | | 2,542,716 | | |
| National Grid Transco PLC | | | 327,940 | | | | 3,177,205 | | |
| | | | 8,724,130 | | |
| Electrical Equipment & Electronics - 1.1% | | | |
Koninklijke Philips
Electronics NV | | | 137,000 | | | | 3,431,932 | | |
| Omron Corp. | | | 86,100 | | | | 1,901,616 | | |
| Schneider Electric SA | | | 29,920 | | | | 2,240,301 | | |
| | | | 7,573,849 | | |
| Electronics - 1.0% | | | |
| Rohm Co. Limited | | | 72,500 | | | | 6,972,957 | | |
| Energy - 5.0% | |
| BG Group PLC | | | 292,680 | | | | 2,403,142 | | |
| BP PLC | | | 1,290,120 | | | | 13,441,093 | | |
| ENI SpA(a) | | | 127,410 | | | | 3,258,639 | | |
| Osaka Gas Co., Limited | | | 1,003,000 | | | | 3,168,679 | | |
| Saipem SpA | | | 148,920 | | | | 1,994,185 | | |
| Total SA | | | 41,130 | | | | 9,595,256 | | |
| | | | 33,860,994 | | |
(Continued)
The accompanying notes are an integral part of the financial statements.
146
MassMutual Select Overseas Fund – Portfolio of Investments (Continued)
| | | Number of
Shares | | Market
Value | |
| Entertainment & Leisure - 0.8% | | | |
Fuji Photo Film
Co. Limited | | | 94,600 | | | $ | 3,085,253 | | |
| OPAP SA | | | 86,720 | | | | 2,494,900 | | |
| | | | 5,580,153 | | |
| Financial Services - 6.6% | | | |
Daiwa Securities
Group, Inc. | | | 732,000 | | | | 4,512,996 | | |
| Deutsche Boerse AG(a) | | | 128,600 | | | | 10,004,919 | | |
| Euronext | | | 303,600 | | | | 10,206,301 | | |
| ING Groep NV | | | 111,500 | | | | 3,124,952 | | |
Macquarie
Infrastructure Group | �� | | 1,063,400 | | | | 3,351,443 | | |
| Man Group PLC | | | 76,670 | | | | 1,984,922 | | |
| ORIX Corp. | | | 23,200 | | | | 3,477,663 | | |
| Societe Generale Cl. A | | | 42,580 | | | | 4,296,657 | | |
| UBS AG Registered | | | 47,270 | | | | 3,667,836 | | |
| | | | 44,627,689 | | |
| Food Retailers - 0.0% | | | |
| J Sainsbury PLC | | | 641,000 | | | | 6,410 | | |
| Foods - 6.2% | | | |
| Ajinomoto Co., Inc. | | | 199,000 | | | | 2,211,321 | | |
| Cadbury Schweppes PLC | | | 969,600 | | | | 9,247,543 | | |
| Groupe Danone | | | 25,200 | | | | 2,201,074 | | |
| Nestle SA | | | 61,170 | | | | 15,586,496 | | |
| Royal Numico NV(a) (b) | | | 94,920 | | | | 3,771,120 | | |
| Tesco PLC | | | 882,840 | | | | 5,038,163 | | |
| Unilever PLC | | | 433,100 | | | | 4,170,528 | | |
| | | | 42,226,245 | | |
| Healthcare - 0.4% | | | |
Fresenius Medical
Care AG(a) | | | 32,636 | | | | 2,775,396 | | |
| Healthcare/Drugs - 1.2% | | | |
| Astellas Pharma, Inc. | | | 109,400 | | | | 3,742,701 | | |
| Eisai Co. Limited | | | 70,300 | | | | 2,360,388 | | |
| Novo Nordisk A/S | | | 42,850 | | | | 2,172,909 | | |
| | | | 8,275,998 | | |
| Heavy Construction - 1.1% | | | |
| Grupo Ferrovial SA | | | 54,851 | | | | 3,510,124 | | |
| Vinci SA | | | 46,514 | | | | 3,854,617 | | |
| | | | 7,364,741 | | |
| Heavy Machinery - 0.6% | | | |
| Daikin Industries Limited | | | 113,500 | | | | 2,832,658 | | |
| Komatsu Limited | | | 125,000 | | | | 967,454 | | |
| | | | 3,800,112 | | |
| | | Number of
Shares | | Market
Value | |
Home Construction, Furnishings &
Appliances - 0.5% | | | |
Matsushita Electric
Industrial Co. Limited | | | 228,000 | | | $ | 3,468,142 | | |
| Household Products - 1.4% | | | |
| Henkel KGaA | | | 98,100 | | | | 8,213,723 | | |
| Kao Corp. | | | 57,000 | | | | 1,346,306 | | |
| | | | 9,560,029 | | |
| Industrial – Diversified - 0.2% | | | |
| Enodis PLC(b) | | | 777,300 | | | | 1,603,167 | | |
| Industrial Services - 0.5% | | | |
| BAA PLC | | | 297,390 | | | | 3,303,832 | | |
| Insurance - 2.0% | | | |
| Aegon NV | | | 98,840 | | | | 1,276,162 | | |
| AXA SA | | | 123,209 | | | | 3,052,481 | | |
Hannover
Rueckversicherungs AG(a) | | | 106,000 | | | | 3,985,127 | | |
Legal & General
Group PLC | | | 1,084,990 | | | | 2,233,097 | | |
QBE Insurance
Group Limited(a) | | | 219,040 | | | | 2,661,747 | | |
| | | | 13,208,614 | | |
| Lodging - 0.4% | | | |
| Accor SA | | | 62,100 | | | | 2,889,585 | | |
| Medical Supplies - 1.3% | | | |
Cie Generale D'Optique
Essilor International SA | | | 42,880 | | | | 2,909,846 | | |
| Hoya Corp. | | | 12,900 | | | | 1,485,617 | | |
| Orbotech Limited(b) | | | 39,100 | | | | 840,259 | | |
| Smith & Nephew PLC | | | 328,400 | | | | 3,238,475 | | |
| | | | 8,474,197 | | |
| Metals & Mining - 0.7% | | | |
| BHP Billiton Limited | | | 332,370 | | | | 4,539,278 | | |
| Pharmaceuticals - 9.5% | | | |
| AstraZeneca PLC | | | 125,090 | | | | 5,178,948 | | |
| GlaxoSmithKline PLC | | | 911,530 | | | | 22,034,877 | | |
| Haw Par Corp. Limited | | | 1,349 | | | | 4,117 | | |
| Novartis AG | | | 351,800 | | | | 16,660,025 | | |
| Roche Holding AG | | | 31,899 | | | | 4,010,872 | | |
| Sanofi-Aventis(a) | | | 79,768 | | | | 6,505,647 | | |
Takeda Pharmaceutical
Co. Limited | | | 206,700 | | | | 10,245,060 | | |
| | | | 64,639,546 | | |
| Public Facilities - 0.3% | | | |
Cintra Concesiones de
Infraestructuras de
Transporte SA(b) | | | 148,722 | | | | 1,734,411 | | |
| | | Number of
Shares | | Market
Value | |
| Real Estate - 0.0% | | | |
United Overseas
Land Limited | | | 56,100 | | | $ | 75,885 | | |
| Retail - 4.5% | | | |
Compagnie Financiere
Richemont AG, A Units | | | 67,410 | | | | 2,252,866 | | |
| Metro AG | | | 32,730 | | | | 1,613,974 | | |
| PPR SA | | | 15,800 | | | | 1,617,282 | | |
Shoppers Drug Mart
Corp. (CAD) | | | 97,894 | | | | 3,375,244 | | |
| Signet Group PLC | | | 4,474,000 | | | | 8,703,756 | | |
| The Swatch Group AG Cl. B | | | 55,300 | | | | 7,725,661 | | |
| Wolseley PLC | | | 103,170 | | | | 2,165,080 | | |
| Yamada Denki Co. Limited | | | 55,300 | | | | 3,172,076 | | |
| | | | 30,625,939 | | |
| Telecommunications - 1.0% | | | |
| NTT DoCoMo, Inc. | | | 4,600 | | | | 6,779,004 | | |
| Telephone Utilities - 0.1% | | | |
Hellenic Telecommunications
Organization SA (OTE)(b) | | | 50,430 | | | | 975,162 | | |
| Tobacco - 0.1% | | | |
British American
Tobacco PLC | | | 32,980 | | | | 637,020 | | |
| Transportation - 1.5% | | | |
Associated British Ports
Holdings PLC | | | 782,200 | | | | 6,885,365 | | |
| East Japan Railway Co. | | | 610 | | | | 3,134,935 | | |
| | | | 10,020,300 | | |
TOTAL EQUITIES
(Cost $573,504,962) | | | | | | | 648,889,934 | | |
| MUTUAL FUND - 0.2% | | | |
| Financial Services | | | |
iShares MSCI EAFE
Index Fund | | | 20,000 | | | | 1,046,200 | | |
TOTAL MUTUAL FUND
(Cost $1,042,766) | | | | | | | 1,046,200 | | |
TOTAL LONG TERM INVESTMENTS
(Cost $574,547,728) | | | | | | | 649,936,134 | | |
(Continued)
The accompanying notes are an integral part of the financial statements.
147
MassMutual Select Overseas Fund – Portfolio of Investments (Continued)
| | | Principal
Amount | | Market
Value | |
| SHORT-TERM INVESTMENTS - 10.7% | |
| Cash Equivalents - 7.9%(c) | |
ABN Amro Bank NV
Eurodollar Time Deposit
3.250% 08/05/2005 | | $ | 576,509 | | | $ | 576,509 | | |
American Beacon Money
Market Fund | | | 1,556,352 | | | | 1,556,352 | | |
Bank of America
Bank Note
3.270% 07/18/2005 | | | 797,975 | | | | 797,975 | | |
Bank of America
Bank Note
3.270% 08/30/2005 | | | 1,481,953 | | | | 1,481,953 | | |
Bank of Montreal
Eurodollar Time Deposit
3.010% 07/01/2005 | | | 2,194,984 | | | | 2,194,984 | | |
Barclays
Eurodollar Time Deposit
3.160% 07/14/2005 | | | 1,139,964 | | | | 1,139,964 | | |
Barclays
Eurodollar Time Deposit
3.250% 07/26/2005 | | | 1,148,576 | | | | 1,148,576 | | |
BGI Institutional Money
Market Fund | | | 4,474,018 | | | | 4,474,018 | | |
BNP Paribas
Eurodollar Time Deposit
3.000% 07/01/2005 | | | 797,975 | | | | 797,975 | | |
Calyon
Eurodollar Time Deposit
3.310% 07/01/2005 | | | 683,979 | | | | 683,979 | | |
Citigroup
Eurodollar Time Deposit
3.085% 07/22/2005 | | | 683,979 | | | | 683,979 | | |
Citigroup
Eurodollar Time Deposit
3.100% 07/25/2005 | | | 1,584,336 | | | | 1,584,336 | | |
Dexia Group
Eurodollar Time Deposit
3.205% 07/20/2005 | | | 569,982 | | | | 569,982 | | |
Dexia Group
Eurodollar Time Deposit
3.240% 07/21/2005 | | | 569,982 | | | | 569,982 | | |
Federal Home Loan
Bank Discount Note
2.977% 07/01/2005 | | | 1,407,690 | | | | 1,407,690 | | |
First Tennessee
National Corporation
Eurodollar Time Deposit
3.220% 08/09/2005 | | | 205,431 | | | | 205,431 | | |
Fortis Bank
Eurodollar Time Deposit
3.110% 07/05/2005 | | | 793,091 | | | | 793,091 | | |
| | | Principal
Amount | | Market
Value | |
Fortis Bank
Eurodollar Time Deposit
3.250% 07/25/2005 | | $ | 804,632 | | | $ | 804,632 | | |
Fortis Bank
Eurodollar Time Deposit
3.250% 08/04/2005 | | | 1,139,964 | | | | 1,139,964 | | |
Fortis Bank
Eurodollar Time Deposit
3.270% 07/07/2005 | | | 911,971 | | | | 911,971 | | |
Freddie Mac
Discount Note
3.208% 07/26/2005 | | | 561,960 | | | | 561,960 | | |
Freddie Mac
Discount Note
3.244% 08/16/2005 | | | 1,367,957 | | | | 1,367,957 | | |
General Electric
Capital Corp
3.252% 07/06/2005 | | | 1,139,964 | | | | 1,139,964 | | |
General Electric
Capital Corp
3.253% 07/08/2005 | | | 911,971 | | | | 911,971 | | |
Goldman Sachs Financial
Square Prime Obligations
Money Market Fund | | | 1,040,927 | | | | 1,040,927 | | |
Harris Trust &
Savings Bank
3.295% 11/04/2005 | | | 1,091,795 | | | | 1,091,795 | | |
HBOS Halifax
Bank of Scotland
Eurodollar Time Deposit
3.150% 08/08/2005 | | | 569,982 | | | | 569,982 | | |
HSBC Banking/
Holdings PLC
Eurodollar Time Deposit
3.250% 08/05/2005 | | | 683,979 | | | | 683,979 | | |
JP Morgan Chase & Co.
Eurodollar Time Deposit
3.200% 07/20/2005 | | | 1,139,964 | | | | 1,139,964 | | |
Merrimac Cash Fund,
Premium Class | | | 1,807,374 | | | | 1,807,374 | | |
Morgan Stanley
Dean Witter & Co.
3.518% 07/19/2005 | | | 2,279,928 | | | | 2,279,928 | | |
National Australia Bank
Eurodollar Time Deposit
3.260% 07/06/2005 | | | 455,986 | | | | 455,986 | | |
National Australia Bank
Eurodollar Time Deposit
3.375% 07/01/2005 | | | 1,367,957 | | | | 1,367,957 | | |
Nordea Bank Finland PLC
(NY Branch)
Eurodollar Time Deposit
3.165% 08/09/2005 | | | 885,193 | | | | 885,193 | | |
| | | Principal
Amount | | Market
Value | |
Nordea Bank Finland PLC
(NY Branch)
Eurodollar Time Deposit
3.240% 08/03/2005 | | $ | 410,387 | | | $ | 410,387 | | |
Rabobank Nederland
Eurodollar Time Deposit
3.170% 07/18/2005 | | | 1,139,964 | | | | 1,139,964 | | |
Rabobank Nederland
Eurodollar Time Deposit
3.350% 07/01/2005 | | | 922,364 | | | | 922,364 | | |
Royal Bank of Canada
Eurodollar Time Deposit
3.250% 07/07/2005 | | | 683,979 | | | | 683,979 | | |
Royal Bank of Canada
Eurodollar Time Deposit
3.260% 07/28/2005 | | | 1,139,964 | | | | 1,139,964 | | |
Royal Bank of Scotland
Eurodollar Time Deposit
3.240% 08/08/2005 | | | 1,253,961 | | | | 1,253,961 | | |
Royal Bank of Scotland
Eurodollar Time Deposit
3.250% 08/04/2005 | | | 911,971 | | | | 911,971 | | |
Royal Bank of Scotland
Eurodollar Time Deposit
3.270% 07/29/2005 | | | 911,971 | | | | 911,971 | | |
Societe Generale
Eurodollar Time Deposit
3.200% 08/08/2005 | | | 455,986 | | | | 455,986 | | |
Societe Generale
Eurodollar Time Deposit
3.240% 08/09/2005 | | | 754,527 | | | | 754,527 | | |
Societe Generale
Eurodollar Time Deposit
3.280% 08/01/2005 | | | 1,139,964 | | | | 1,139,964 | | |
Svenska Handlesbanken
Eurodollar Time Deposit
3.220% 08/05/2005 | | | 1,139,964 | | | | 1,139,964 | | |
The Bank of the West
Eurodollar Time Deposit
3.270% 07/27/2005 | | | 341,989 | | | | 341,989 | | |
Toronto Dominion Bank
Eurodollar Time Deposit
3.250% 08/02/2005 | | | 1,139,964 | | | | 1,139,964 | | |
UBS AG
Eurodollar Time Deposit
3.250% 08/09/2005 | | | 569,982 | | | | 569,982 | | |
Wells Fargo
Eurodollar Time Deposit
3.270% 07/21/2005 | | | 1,139,964 | | | | 1,139,964 | | |
Wells Fargo
Eurodollar Time Deposit
3.270% 08/01/2005 | | | 1,139,964 | | | | 1,139,964 | | |
| | | | 54,025,145 | | |
(Continued)
The accompanying notes are an integral part of the financial statements.
148
MassMutual Select Overseas Fund – Portfolio of Investments (Continued)
| | | Principal
Amount | | Market
Value | |
| Repurchase Agreement - 2.8% | | | |
Investors Bank & Trust
Company Repurchase
Agreement, dated
06/30/2005, 2.01%,
due 07/01/2005(d) | | $ | 18,871,818 | | | $ | 18,871,818 | | |
TOTAL SHORT-TERM
INVESTMENTS
(At Amortized Cost) | | | | | 72,896,963 | | |
TOTAL INVESTMENTS - 106.6%
(Cost $647,444,691)(e) | | | | | 722,833,097 | | |
Other Assets/
(Liabilities) - (6.6%) | | | | | (44,519,686 | ) | |
| NET ASSETS - 100.0% | | | | $ | 678,313,411 | | |
Notes to Portfolio of Investments
ADR - American Depository Receipt.
(a) Denotes all or a portion of security on loan.
(b) Non-income producing security.
(c) Represents investments of security lending collateral. (Note 2).
(d) Maturity value of $18,872,872. Collateralized by U.S. Government Agency obligations with rates of 3.740% - 4.397%, maturity dates of 08/18/2031 - 01/01/2034, and an aggregate market value, including accrued interest, of $19,815,409.
(e) See Note 6 for aggregate cost for Federal tax purposes.
The remainder of this page is intentionally left blank.
The accompanying notes are an integral part of the financial statements.
149
MassMutual Select Destination Retirement Income Fund – Portfolio of Investments
June 30, 2005 (Unaudited)
| | | Number of
Shares | | Market
Value | |
| MUTUAL FUNDS - 100.0% | |
| Financial Services | |
MassMutual Premier
Core Bond Fund,
Class S | | | 3,613,345 | | | $ | 40,505,598 | | |
MassMutual Premier
Diversified Bond Fund,
Class S | | | 3,702,678 | | | | 40,507,303 | | |
MassMutual Premier
Inflation Protected Bond,
Class S | | | 3,959,137 | | | | 42,758,677 | | |
MassMutual Premier
Money Market Fund
Class S | | | 11,232,398 | | | | 11,232,398 | | |
MassMutual Premier
Short-Duration Bond,
Class S | | | 3,258,772 | | | | 33,728,291 | | |
MassMutual Premier
Small Company
Opportunities Fund,
Class S | | | 802,946 | | | | 13,425,253 | | |
MassMutual Select
Growth Equity Fund,
Class S | | | 2,027,743 | | | | 16,019,169 | | |
MassMutual Select
Large Cap Value Fund,
Class S | | | 1,478,202 | | | | 15,668,943 | | |
MassMutual Select
Overseas Fund, Class S | | | 972,641 | | | | 10,689,319 | | |
| | | | 224,534,951 | | |
TOTAL MUTUAL FUNDS
(Cost $219,752,516)(a) | | | | | | | 224,534,951 | | |
| TOTAL INVESTMENTS - 100.0% | | | | | | | | | |
Other Assets/
(Liabilities) - 0.0% | | | | | | | (63,392 | ) | |
| NET ASSETS - 100.0% | | | | | | $ | 224,471,559 | | |
Notes to Portfolio of Investments
(a) See Note 6 for aggregate cost for Federal tax purposes.
The remainder of this page is intentionally left blank.
The accompanying notes are an integral part of the financial statements.
150
MassMutual Select Destination Retirement 2010 Fund – Portfolio of Investments
June 30, 2005 (Unaudited)
| | | Number of
Shares | | Market
Value | |
| MUTUAL FUNDS - 100.0% | | | |
| Financial Services | | | |
MassMutual Premier
Core Bond Fund,
Class S | | | 1,042,536 | | | $ | 11,686,827 | | |
MassMutual Premier
Diversified Bond Fund,
Class S | | | 1,068,301 | | | | 11,687,216 | | |
MassMutual Premier
Inflation Protected Bond,
Class S | | | 1,082,169 | | | | 11,687,424 | | |
MassMutual Premier
Money Market Fund
Class S | | | 3,890,381 | | | | 3,890,381 | | |
MassMutual Premier
Short-Duration Bond,
Class S | | | 752,311 | | | | 7,786,420 | | |
MassMutual Premier
Small Company
Opportunities Fund,
Class S | | | 278,339 | | | | 4,653,823 | | |
MassMutual Select
Fundamental Value Fund,
Class S | | | 355,609 | | | | 3,869,029 | | |
MassMutual Select
Growth Equity Fund,
Class S | | | 1,079,293 | | | | 8,526,418 | | |
MassMutual Select
Large Cap Value Fund,
Class S | | | 439,176 | | | | 4,655,261 | | |
MassMutual Select
Mid Cap Growth
Equity II Fund,
Class S(a) | | | 286,953 | | | | 3,879,603 | | |
MassMutual Select
Overseas Fund, Class S | | | 494,576 | | | | 5,435,385 | | |
| | | | 77,757,787 | | |
TOTAL MUTUAL FUNDS
(Cost $76,934,774)(b) | | | | | | | 77,757,787 | | |
| TOTAL INVESTMENTS - 100.0% | | | | | | | | | |
Other Assets/
(Liabilities) - 0.0% | | | | | | | (36,289 | ) | |
| NET ASSETS - 100.0% | | | | | | $ | 77,721,498 | | |
Notes to Portfolio of Investments
(a) Non-income producing security.
(b) See Note 6 for aggregate cost for Federal tax purposes.
The remainder of this page is intentionally left blank.
The accompanying notes are an integral part of the financial statements.
151
MassMutual Select Destination Retirement 2020 Fund – Portfolio of Investments
June 30, 2005 (Unaudited)
| | | Number of
Shares | | Market
Value | |
| MUTUAL FUNDS - 100.0% | |
| Financial Services | |
MassMutual Premier
Core Bond Fund,
Class S | | | 3,556,677 | | | $ | 39,870,353 | | |
MassMutual Premier
Diversified Bond Fund,
Class S | | | 3,340,891 | | | | 36,549,349 | | |
MassMutual Premier
Inflation Protected Bond,
Class S | | | 3,691,936 | | | | 39,872,914 | | |
MassMutual Premier
Short-Duration Bond,
Class S | | | 1,603,843 | | | | 16,599,770 | | |
MassMutual Premier
Small Company
Opportunities Fund,
Class S | | | 987,986 | | | | 16,519,131 | | |
MassMutual Select
Aggressive Growth Fund,
Class S(a) | | | 5,051,143 | | | | 29,852,255 | | |
MassMutual Select
Focused Value Fund,
Class S(a) | | | 895,246 | | | | 16,508,332 | | |
MassMutual Select
Fundamental Value Fund,
Class S | | | 2,724,814 | | | | 29,645,978 | | |
MassMutual Select
Growth Equity Fund,
Class S | | | 3,760,745 | | | | 29,709,888 | | |
MassMutual Select
Large Cap Value Fund,
Class S | | | 2,806,228 | | | | 29,746,015 | | |
MassMutual Select
Mid Cap Growth
Equity II Fund,
Class S(a) | | | 1,222,392 | | | | 16,526,738 | | |
MassMutual Select
Overseas Fund, Class S | | | 2,709,311 | | | | 29,775,323 | | |
| | | | 331,176,046 | | |
TOTAL MUTUAL FUNDS
(Cost $319,115,362)(b) | | | | | | | 331,176,046 | | |
| TOTAL INVESTMENTS - 100.0% | | | | | | | | | |
Other Assets/
(Liabilities) - 0.0% | | | | | | | (105,624 | ) | |
| NET ASSETS - 100.0% | | | | | | $ | 331,070,422 | | |
Notes to Portfolio of Investments
(a) Non-income producing security.
(b) See Note 6 for aggregate cost for Federal tax purposes.
The remainder of this page is intentionally left blank.
The accompanying notes are an integral part of the financial statements.
152
MassMutual Select Destination Retirement 2030 Fund – Portfolio of Investments
June 30, 2005 (Unaudited)
| | | Number of
Shares | | Market
Value | |
| MUTUAL FUNDS - 100.0% | | | |
| Financial Services | | | |
MassMutual Premier
Diversified Bond Fund,
Class S | | | 1,458,117 | | | $ | 15,951,805 | | |
MassMutual Premier
Inflation Protected Bond,
Class S | | | 1,688,060 | | | | 18,231,052 | | |
MassMutual Select
Aggressive Growth Fund,
Class S(a) | | | 4,618,893 | | | | 27,297,657 | | |
MassMutual Select
Emerging Growth Fund,
Class S(a) | | | 2,386,159 | | | | 13,648,829 | | |
MassMutual Select
Focused Value Fund,
Class S(a) | | | 613,919 | | | | 11,320,660 | | |
MassMutual Select
Fundamental Value Fund,
Class S | | | 2,698,893 | | | | 29,363,951 | | |
MassMutual Select
Growth Equity Fund,
Class S | | | 3,725,133 | | | | 29,428,552 | | |
MassMutual Select
Large Cap Value Fund,
Class S | | | 2,565,899 | | | | 27,198,527 | | |
MassMutual Select
Mid Cap Growth
Equity II Fund,
Class S(a) | | | 838,280 | | | | 11,333,541 | | |
MassMutual
Select Overseas Fund,
Class S | | | 2,683,776 | | | | 29,494,696 | | |
MassMutual Select
Small Company Value
Fund, Class S | | | 955,892 | | | | 13,611,898 | | |
| | | | 226,881,168 | | |
TOTAL MUTUAL FUNDS
(Cost $214,356,984)(b) | | | | | | | 226,881,168 | | |
| TOTAL INVESTMENTS - 100.0% | | | | | | | | | |
Other Assets/
(Liabilities) - 0.0% | | | | | | | (81,429 | ) | |
| NET ASSETS - 100.0% | | | | | | $ | 226,799,739 | | |
Notes to Portfolio of Investments
(a) Non-income producing security.
(b) See Note 6 for aggregate cost for Federal tax purposes.
The remainder of this page is intentionally left blank.
The accompanying notes are an integral part of the financial statements.
153
MassMutual Select Destination Retirement 2040 Fund – Portfolio of Investments
June 30, 2005 (Unaudited)
| | | Number of
Shares | | Market
Value | |
| MUTUAL FUNDS - 100.0% | | | |
| Financial Services | | | |
MassMutual Select
Aggressive Growth Fund,
Class S(a) | | | 3,158,581 | | | $ | 18,667,212 | | |
MassMutual Select
Emerging Growth Fund,
Class S(a) | | | 1,305,399 | | | | 7,466,885 | | |
MassMutual Select
Focused Value Fund,
Class S(a) | | | 402,977 | | | | 7,430,890 | | |
MassMutual Select
Fundamental Value Fund,
Class S | | | 1,703,307 | | | | 18,531,978 | | |
MassMutual Select
Growth Equity Fund,
Class S | | | 2,351,124 | | | | 18,573,876 | | |
MassMutual Select
Large Cap Value Fund,
Class S | | | 1,754,487 | | | | 18,597,561 | | |
MassMutual Select
Mid Cap Growth
Equity II Fund,
Class S(a) | | | 550,265 | | | | 7,439,579 | | |
MassMutual Select
Overseas Fund, Class S | | | 1,693,974 | | | | 18,616,775 | | |
MassMutual Select Small
Company Value Fund,
Class S | | | 610,052 | | | | 8,687,147 | | |
| | | | 124,011,903 | | |
TOTAL MUTUAL FUNDS
(Cost $116,101,041)(b) | | | | | | | 124,011,903 | | |
| TOTAL INVESTMENTS - 100.0% | | | | | | | | | |
Other Assets/
(Liabilities) - 0.0% | | | | | | | (51,530 | ) | |
| NET ASSETS - 100.0% | | | | | | $ | 123,960,373 | | |
Notes to Portfolio of Investments
(a) Non-income producing security.
(b) See Note 6 for aggregate cost for Federal tax purposes.
The remainder of this page is intentionally left blank.
The accompanying notes are an integral part of the financial statements.
154
[This page is intentionally left blank.]
MassMutual Select Funds – Financial Statements
Statement of Assets and Liabilities
June 30, 2005 (Unaudited)
| | | MassMutual
Select
Strategic Bond
Fund | | MassMutual
Select
Strategic Balanced
Fund | | MassMutual
Select
Diversified Value
Fund | | MassMutual
Select
Fundamental Value
Fund | |
| Assets: | | | |
| Investments, at value (Note 2)(a) | | $ | 60,120,637 | | | $ | 241,293,268 | | | $ | 203,982,640 | | | $ | 901,444,609 | | |
| Short-term investments, at value (Note 2)(b) | | | 10,067,367 | | | | 44,094,334 | | | | 30,011,513 | | | | 94,179,378 | | |
| Total Investments(c) | | | 70,188,004 | | | | 285,387,602 | | | | 233,994,153 | | | | 995,623,987 | | |
| Cash | | | 4,772,895 | | | | - | | | | - | | | | - | | |
| Foreign currency, at value(d) | | | 126,432 | | | | 80,462 | | | | - | | | | - | | |
| Net receivable for open swap contracts (Note 2) | | | 870 | | | | - | | | | - | | | | - | | |
| Receivables from: | |
| Investments sold | | | 544,124 | | | | 2,204,301 | | | | 3,373,616 | | | | 18,092,171 | | |
| Open forward foreign currency contracts (Note 2) | | | 224,636 | | | | 402,887 | | | | - | | | | - | | |
| Investment adviser (Note 3) | | | 3,574 | | | | 2,189 | | | | - | | | | - | | |
| Fund shares sold | | | 111,815 | | | | 205,765 | | | | 126,145 | | | | 4,362,414 | | |
| Interest and dividends | | | 472,017 | | | | 1,378,881 | | | | 395,078 | | | | 904,241 | | |
| Variation margin on open futures contracts (Note 2) | | | - | | | | 22,856 | | | | - | | | | - | | |
| Foreign taxes withheld | | | - | | | | 146 | | | | - | | | | 1,301 | | |
| Total assets | | | 76,444,367 | | | | 289,685,089 | | | | 237,888,992 | | | | 1,018,984,114 | | |
| Liabilities: | | | |
| Payables for: | |
| Investments purchased | | | 13,670,537 | | | | 2,622,164 | | | | 5,743,721 | | | | 4,644,965 | | |
Written options outstanding, at value (premium $$151,595
and $295,486, respectively) (Note 2) | | | 200,934 | | | | 402,113 | | | | - | | | | - | | |
| Open forward foreign currency contracts (Note 2) | | | - | | | | - | | | | - | | | | - | | |
| Fund shares repurchased | | | 16,572 | | | | 194,294 | | | | 91,708 | | | | 671,435 | | |
| Variation margin on open futures contracts (Note 2) | | | 6,982 | | | | - | | | | - | | | | - | | |
| Securities on loan (Note 2) | | | 3,360,425 | | | | 22,650,085 | | | | 26,337,430 | | | | 86,615,669 | | |
| Settlement of investments purchased on a when issued basis (Note 2) | | | - | | | | 17,229,033 | | | | - | | | | - | | |
| Periodic payments from open swap agreements | | | - | | | | 247,942 | | | | - | | | | - | | |
| Directors' fees and expenses (Note 3) | | | 317 | | | | 3,718 | | | | 3,470 | | | | 17,338 | | |
| Affiliates (Note 3): | |
| Investment management fees | | | 26,192 | | | | 121,476 | | | | 84,692 | | | | 495,098 | | |
| Administration fees | | | 2,690 | | | | 52,261 | | | | 16,459 | | | | 166,768 | | |
| Service fees | | | 1,896 | | | | 22,008 | | | | 7,521 | | | | 141,727 | | |
| Distribution fees | | | 63 | | | | 243 | | | | 116 | | | | 1,136 | | |
| Due to custodian | | | - | | | | 53,402 | | | | - | | | | - | | |
| Accrued expenses and other liabilities | | | 5,608 | | | | 26,368 | | | | 22,898 | | | | 22,785 | | |
| Total liabilities | | | 17,292,216 | | | | 43,625,107 | | | | 32,308,015 | | | | 92,776,921 | | |
| Net assets | | $ | 59,152,151 | | | $ | 246,059,982 | | | $ | 205,580,977 | | | $ | 926,207,193 | | |
| Net assets consist of: | | | |
| Paid-in capital | | $ | 57,999,253 | | | $ | 239,578,705 | | | $ | 165,042,088 | | | $ | 799,259,637 | | |
| Undistributed net investment income | | | 757,166 | | | | 1,968,299 | | | | 1,691,741 | | | | 5,323,408 | | |
| Accumulated net realized gain (loss) on investments | | | (40,885 | ) | | | (1,485,969 | ) | | | 3,358,690 | | | | 5,643,096 | | |
| Net unrealized appreciation on investments | | | 436,617 | | | | 5,998,947 | | | | 35,488,458 | | | | 115,981,052 | | |
| | | $ | 59,152,151 | | | $ | 246,059,982 | | | $ | 205,580,977 | | | $ | 926,207,193 | | |
| (a) Cost of investments: | | $ | 59,836,323 | | | $ | 235,199,092 | | | $ | 168,494,182 | | | $ | 785,463,557 | | |
| (b) Cost of short-term investments: | | $ | 10,067,367 | | | $ | 44,094,334 | | | $ | 30,011,513 | | | $ | 94,179,378 | | |
| (c) Securities on loan with market value of: | | $ | 3,274,222 | | | $ | 21,744,888 | | | $ | 25,451,689 | | | $ | 83,865,392 | | |
| (d) Cost of foreign currency: | | $ | 123,568 | | | $ | 86,036 | | | $ | - | | | $ | - | | |
| | | MassMutual
Select
Value Equity
Fund | | MassMutual
Select
Large Cap Value
Fund | | MassMutual
Select
Indexed Equity
Fund | | MassMutual
Select
Blue Chip Growth
Fund | |
| Assets: | |
| Investments, at value (Note 2)(a) | | $ | 87,861,532 | | | $ | 1,254,109,988 | | | $ | 1,806,443,921 | | | $ | 383,815,597 | | |
| Short-term investments, at value (Note 2)(b) | | | 13,978,915 | | | | 236,829,474 | | | | 170,827,791 | | | | 44,951,891 | | |
| Total Investments(c) | | | 101,840,447 | | | | 1,490,939,462 | | | | 1,977,271,712 | | | | 428,767,488 | | |
| Cash | | | - | | | | - | | | | 12,101 | | | | - | | |
| Foreign currency, at value(d) | | | - | | | | 145,337 | | | | - | | | | - | | |
| Net receivable for open swap contracts (Note 2) | | | - | | | | - | | | | - | | | | - | | |
| Receivables from: | |
| Investments sold | | | 869,784 | | | | 10,024,704 | | | | - | | | | 244,859 | | |
| Open forward foreign currency contracts (Note 2) | | | - | | | | - | | | | - | | | | - | | |
| Investment adviser (Note 3) | | | - | | | | - | | | | - | | | | - | | |
| Fund shares sold | | | 24,503 | | | | 5,629,889 | | | | 1,606,253 | | | | 372,098 | | |
| Interest and dividends | | | 116,339 | | | | 2,040,338 | | | | 2,502,780 | | | | 300,497 | | |
| Variation margin on open futures contracts (Note 2) | | | - | | | | - | | | | - | | | | - | | |
| Foreign taxes withheld | | | 98 | | | | 5,137 | | | | - | | | | - | | |
| Total assets | | | 102,851,171 | | | | 1,508,784,867 | | | | 1,981,392,846 | | | | 429,684,942 | | |
| Liabilities: | |
| Payables for: | |
| Investments purchased | | | 1,128,719 | | | | 16,372,101 | | | | - | | | | 50,909 | | |
Written options outstanding, at value (premium $$151,595
and $295,486, respectively) (Note 2) | | | - | | | | - | | | | - | | | | - | | |
| Open forward foreign currency contracts (Note 2) | | | - | | | | 599 | | | | - | | | | - | | |
| Fund shares repurchased | | | 96,021 | | | | 845,774 | | | | 1,545,481 | | | | 811,029 | | |
| Variation margin on open futures contracts (Note 2) | | | - | | | | - | | | | 174,612 | | | | - | | |
| Securities on loan (Note 2) | | | 13,353,919 | | | | 193,583,810 | | | | 145,004,679 | | | | 38,465,340 | | |
| Settlement of investments purchased on a when issued basis (Note 2) | | | - | | | | - | | | | - | | | | - | | |
| Periodic payments from open swap agreements | | | - | | | | - | | | | - | | | | - | | |
| Directors' fees and expenses (Note 3) | | | 3,114 | | | | 29,549 | | | | 49,410 | | | | 14,634 | | |
| Affiliates (Note 3): | |
| Investment management fees | | | 50,893 | | | | 691,090 | | | | 152,168 | | | | 228,249 | | |
| Administration fees | | | 11,468 | | | | 229,670 | | | | 477,871 | | | | 117,793 | | |
| Service fees | | | 15,878 | | | | 192,072 | | | | 186,299 | | | | 23,799 | | |
| Distribution fees | | | 174 | | | | 1,577 | | | | 2,594 | | | | 1,305 | | |
| Due to custodian | | | - | | | | - | | | | - | | | | - | | |
| Accrued expenses and other liabilities | | | 20,040 | | | | 29,795 | | | | 30,821 | | | | 21,994 | | |
| Total liabilities | | | 14,680,226 | | | | 211,976,037 | | | | 147,623,935 | | | | 39,735,052 | | |
| Net assets | | $ | 88,170,945 | | | $ | 1,296,808,830 | | | $ | 1,833,768,911 | | | $ | 389,949,890 | | |
| Net assets consist of: | |
| Paid-in capital | | $ | 75,539,256 | | | $ | 1,161,472,166 | | | $ | 1,795,566,181 | | | $ | 458,150,578 | | |
| Undistributed net investment income | | | 292,510 | | | | 4,631,185 | | | | 12,070,215 | | | | 242,667 | | |
| Accumulated net realized gain (loss) on investments | | | 4,919,853 | | | | (87,669,917 | ) | | | (48,309,642 | ) | | | (87,242,830 | ) | |
| Net unrealized appreciation on investments | | | 7,419,326 | | | | 218,375,396 | | | | 74,442,157 | | | | 18,799,475 | | |
| | | $ | 88,170,945 | | | $ | 1,296,808,830 | | | $ | 1,833,768,911 | | | $ | 389,949,890 | | |
| (a) Cost of investments: | | $ | 80,442,206 | | | $ | 1,035,734,440 | | | $ | 1,731,721,725 | | | $ | 365,016,122 | | |
| (b) Cost of short-term investments: | | $ | 13,978,915 | | | $ | 236,829,474 | | | $ | 170,827,791 | | | $ | 44,951,891 | | |
| (c) Securities on loan with market value of: | | $ | 12,799,023 | | | $ | 187,904,093 | | | $ | 140,418,284 | | | $ | 37,191,240 | | |
| (d) Cost of foreign currency: | | $ | - | | | $ | 146,351 | | | $ | - | | | $ | - | | |
The accompanying notes are an integral part of the financial statements.
156
157
MassMutual Select Funds – Financial Statements (Continued)
Statement of Assets and Liabilities
June 30, 2005 (Unaudited)
| | | MassMutual
Select
Strategic Bond
Fund | | MassMutual
Select
Strategic Balanced
Fund | | MassMutual
Select
Diversified Value
Fund | | MassMutual
Select
Fundamental Value
Fund | |
| Class A shares: | |
| Net assets | | $ | 3,275,502 | | | $ | 34,464,509 | | | $ | 13,009,524 | | | $ | 226,540,301 | | |
| Shares outstanding | | | 321,026 | | | | 3,312,111 | | | | 1,180,046 | | | | 20,977,948 | | |
| Net asset value and redemption price per share | | $ | 10.20 | | | $ | 10.41 | | | $ | 11.02 | | | $ | 10.80 | | |
Offering price per share
(100/[100-maximum sales charge] of net asset value) | | $ | 10.71 | | | $ | 11.05 | | | $ | 11.69 | | | $ | 11.46 | | |
| Class L shares: | |
| Net assets | | $ | 309,542 | | | $ | 102,486,180 | | | $ | 21,599,037 | | | $ | 209,662,172 | | |
| Shares outstanding | | | 30,294 | | | | 9,812,293 | | | | 1,956,562 | | | | 19,337,314 | | |
| Net asset value, offering price and redemption price per share | | $ | 10.22 | | | $ | 10.44 | | | $ | 11.04 | | | $ | 10.84 | | |
| Class Y shares: | |
| Net assets | | $ | 4,789,457 | | | $ | 94,672,545 | | | $ | 2,445,332 | | | $ | 128,267,795 | | |
| Shares outstanding | | | 468,883 | | | | 9,056,004 | | | | 221,386 | | | | 11,813,035 | | |
| Net asset value, offering price and redemption price per share | | $ | 10.21 | | | $ | 10.45 | | | $ | 11.05 | | | $ | 10.86 | | |
| Class S shares: | |
| Net assets | | $ | 50,674,660 | | | $ | 14,035,986 | | | $ | 168,338,364 | | | $ | 359,893,855 | | |
| Shares outstanding | | | 4,959,934 | | | | 1,341,405 | | | | 15,232,788 | | | | 33,094,153 | | |
| Net asset value, offering price and redemption price per share | | $ | 10.22 | | | $ | 10.46 | | | $ | 11.05 | | | $ | 10.87 | | |
| Class Z shares: | |
| Net assets | | $ | - | | | $ | - | | | $ | - | | | $ | - | | |
| Shares outstanding | | | - | | | | - | | | | - | | | | - | | |
| Net asset value, offering price and redemption price per share | | $ | - | | | $ | - | | | $ | - | | | $ | - | | |
| Class N shares: | |
| Net assets | | $ | 102,990 | | | $ | 400,762 | | | $ | 188,720 | | | $ | 1,843,070 | | |
| Shares outstanding | | | 10,110 | | | | 38,532 | | | | 17,145 | | | | 171,886 | | |
| Net asset value, offering price and redemption price per share | | $ | 10.19 | | | $ | 10.40 | | | $ | 11.01 | | | $ | 10.72 | | |
| | | MassMutual
Select
Value Equity
Fund | | MassMutual
Select
Large Cap Value
Fund | | MassMutual
Select
Indexed Equity
Fund | | MassMutual
Select
Blue Chip Growth
Fund | |
| Class A shares: | |
| Net assets | | $ | 25,793,247 | | | $ | 314,557,151 | | | $ | 298,339,782 | | | $ | 36,508,370 | | |
| Shares outstanding | | | 2,443,006 | | | | 29,959,698 | | | | 27,147,896 | | | | 4,282,924 | | |
| Net asset value and redemption price per share | | $ | 10.56 | | | $ | 10.50 | | | $ | 10.99 | | | $ | 8.52 | | |
Offering price per share
(100/[100-maximum sales charge] of net asset value) | | $ | 11.20 | | | $ | 11.14 | | | $ | 11.66 | | | $ | 9.04 | | |
| Class L shares: | |
| Net assets | | $ | 7,927,935 | | | $ | 335,618,298 | | | $ | 231,709,113 | | | $ | 275,459,999 | | |
| Shares outstanding | | | 748,952 | | | | 31,829,754 | | | | 20,974,816 | | | | 32,016,092 | | |
| Net asset value, offering price and redemption price per share | | $ | 10.59 | | | $ | 10.54 | | | $ | 11.05 | | | $ | 8.60 | | |
| Class Y shares: | |
| Net assets | | $ | 3,847,171 | | | $ | 148,796,350 | | | $ | 463,742,195 | | | $ | 4,425,387 | | |
| Shares outstanding | | | 361,812 | | | | 14,071,329 | | | | 41,859,090 | | | | 513,532 | | |
| Net asset value, offering price and redemption price per share | | $ | 10.63 | | | $ | 10.57 | | | $ | 11.08 | | | $ | 8.62 | | |
| Class S shares: | |
| Net assets | | $ | 50,317,790 | | | $ | 495,331,846 | | | $ | 645,300,823 | | | $ | 71,417,893 | | |
| Shares outstanding | | | 4,736,941 | | | | 46,751,850 | | | | 57,685,245 | | | | 8,259,004 | | |
| Net asset value, offering price and redemption price per share | | $ | 10.62 | | | $ | 10.59 | | | $ | 11.19 | | | $ | 8.65 | | |
| Class Z shares: | |
| Net assets | | $ | - | | | $ | - | | | $ | 190,435,632 | | | $ | - | | |
| Shares outstanding | | | - | | | | - | | | | 17,001,067 | | | | - | | |
| Net asset value, offering price and redemption price per share | | $ | - | | | $ | - | | | $ | 11.20 | | | $ | - | | |
| Class N shares: | |
| Net assets | | $ | 284,802 | | | $ | 2,505,185 | | | $ | 4,241,366 | | | $ | 2,138,241 | | |
| Shares outstanding | | | 26,964 | | | | 241,316 | | | | 389,830 | | | | 252,922 | | |
| Net asset value, offering price and redemption price per share | | $ | 10.56 | | | $ | 10.38 | | | $ | 10.88 | | | $ | 8.45 | | |
The accompanying notes are an integral part of the financial statements.
158
159
MassMutual Select Funds – Financial Statements (Continued)
Statement of Assets and Liabilities
June 30, 2005 (Unaudited)
| | | MassMutual
Select
Large Cap Growth
Fund | | MassMutual
Select
Growth Equity
Fund | | MassMutual
Select
Aggressive Growth
Fund | | MassMutual
Select
OTC 100
Fund | | MassMutual
Select
Focused Value
Fund | | MassMutual
Select Small
Company Value
Fund | | MassMutual
Select Mid Cap
Growth Equity
Fund | | MassMutual
Select Mid Cap
Growth Equity II
Fund | |
| Assets: | | | |
| Investments, at value (Note 2)(a) | | $ | 29,462,859 | | | $ | 850,628,903 | | | $ | 470,431,092 | | | $ | 60,819,795 | | | $ | 794,642,742 | | | $ | 514,336,954 | | | $ | 141,360,800 | | | $ | 945,048,431 | | |
| Short-term investments, at value (Note 2)(b) | | | 6,017,061 | | | | 76,168,085 | | | | 111,438,055 | | | | 8,698,100 | | | | 161,665,992 | | | | 92,574,971 | | | | 37,318,079 | | | | 160,466,739 | | |
| Total Investments(c) | | | 35,479,920 | | | | 926,796,988 | | | | 581,869,147 | | | | 69,517,895 | | | | 956,308,734 | | | | 606,911,925 | | | | 178,678,879 | | | | 1,105,515,170 | | |
| Cash | | | - | | | | 3,874 | | | | 3,677 | | | | 1,209 | | | | 3,971,769 | | | | - | | | | - | | | | - | | |
| Receivables from: | |
| Investments sold | | | 41,847 | | | | 28,283,880 | | | | - | | | | - | | | | 5,244,818 | | | | 2,026,330 | | | | 801,991 | | | | 524,320 | | |
| Fund shares sold | | | 10,147 | | | | 7,997,254 | | | | 3,017,788 | | | | 190,636 | | | | 2,603,826 | | | | 1,150,139 | | | | 536,037 | | | | 4,073,739 | | |
| Interest and dividends | | | 12,299 | | | | 1,062,504 | | | | 41,938 | | | | 4,179 | | | | 593,442 | | | | 555,468 | | | | 32,891 | | | | 487,388 | | |
| Foreign taxes withheld | | | 1,268 | | | | 98 | | | | - | | | | - | | | | - | | | | - | | | | 161 | | | | 5,357 | | |
| Total assets | | | 35,545,481 | | | | 964,144,598 | | | | 584,932,550 | | | | 69,713,919 | | | | 968,722,589 | | | | 610,643,862 | | | | 180,049,959 | | | | 1,110,605,974 | | |
| Liabilities: | | | |
| Payables for: | |
| Investments purchased | | | 30,951 | | | | 41,644,719 | | | | 732,362 | | | | - | | | | - | | | | 1,961,911 | | | | 1,863,174 | | | | 4,812,020 | | |
| Fund shares repurchased | | | 19,692 | | | | 742,031 | | | | 713,599 | | | | 150,991 | | | | 829,936 | | | | 462,064 | | | | 807,599 | | | | 615,449 | | |
| Variation margin on open futures contracts (Note 2) | | | - | | | | - | | | | - | | | | 738 | | | | - | | | | - | | | | - | | | | - | | |
| Securities on loan (Note 2) | | | 5,641,201 | | | | 57,168,800 | | | | 92,145,658 | | | | 8,445,336 | | | | 93,733,150 | | | | 79,658,442 | | | | 28,934,921 | | | | 134,776,172 | | |
| Directors' fees and expenses (Note 3) | | | 1,166 | | | | 24,636 | | | | 11,501 | | | | 2,922 | | | | 19,503 | | | | 8,464 | | | | 6,450 | | | | 19,239 | | |
| Affiliates (Note 3): | |
| Investment management fees | | | 16,101 | | | | 481,988 | | | | 263,298 | | | | 7,814 | | | | 491,341 | | | | 365,317 | | | | 84,355 | | | | 591,568 | | |
| Administration fees | | | 4,757 | | | | 154,729 | | | | 97,169 | | | | 28,002 | | | | 154,804 | | | | 113,281 | | | | 24,058 | | | | 201,477 | | |
| Service fees | | | 1,324 | | | | 140,484 | | | | 70,181 | | | | 16,588 | | | | 150,298 | | | | 74,641 | | | | 18,140 | | | | 143,954 | | |
| Distribution fees | | | 2 | | | | 902 | | | | 522 | | | | 240 | | | | 1,107 | | | | 668 | | | | 93 | | | | 759 | | |
| Accrued expenses and other liabilities | | | 18,768 | | | | 23,137 | | | | 100,746 | | | | 20,071 | | | | 22,695 | | | | 22,469 | | | | 19,909 | | | | 24,999 | | |
| Total liabilities | | | 5,733,962 | | | | 100,381,426 | | | | 94,135,036 | | | | 8,672,702 | | | | 95,402,834 | | | | 82,667,257 | | | | 31,758,699 | | | | 141,185,637 | | |
| Net assets | | $ | 29,811,519 | | | $ | 863,763,172 | | | $ | 490,797,514 | | | $ | 61,041,217 | | | $ | 873,319,755 | | | $ | 527,976,605 | | | $ | 148,291,260 | | | $ | 969,420,337 | | |
| Net assets consist of: | | | |
| Paid-in capital | | $ | 29,758,874 | | | $ | 987,080,610 | | | $ | 512,651,591 | | | $ | 86,796,048 | | | $ | 671,784,159 | | | $ | 436,197,228 | | | $ | 221,305,398 | | | $ | 768,573,520 | | |
Undistributed net investment income
(distributions in excess of net investment income) | | | (30,201 | ) | | | 1,451,166 | | | | (1,662,518 | ) | | | (124,379 | ) | | | (105,406 | ) | | | 100,354 | | | | (198,294 | ) | | | (2,314,367 | ) | |
| Accumulated net realized loss on investments | | | (3,141,786 | ) | | | (172,728,862 | ) | | | (78,744,898 | ) | | | (29,486,992 | ) | | | 50,191,200 | | | | 15,303,624 | | | | (101,010,437 | ) | | | 30,301,593 | | |
| Net unrealized appreciation on investments | | | 3,224,632 | | | | 47,960,258 | | | | 58,553,339 | | | | 3,856,540 | | | | 151,449,802 | | | | 76,375,399 | | | | 28,194,593 | | | | 172,859,591 | | |
| | | $ | 29,811,519 | | | $ | 863,763,172 | | | $ | 490,797,514 | | | $ | 61,041,217 | | | $ | 873,319,755 | | | $ | 527,976,605 | | | $ | 148,291,260 | | | $ | 969,420,337 | | |
| (a) Cost of investments: | | $ | 26,238,227 | | | $ | 802,668,646 | | | $ | 411,877,753 | | | $ | 56,956,941 | | | $ | 643,192,940 | | | $ | 437,961,555 | | | $ | 113,166,207 | | | $ | 772,189,221 | | |
| (b) Cost of short-term investments: | | $ | 6,017,061 | | | $ | 76,168,085 | | | $ | 111,438,055 | | | $ | 8,698,100 | | | $ | 161,665,992 | | | $ | 92,574,971 | | | $ | 37,318,079 | | | $ | 160,466,739 | | |
| (c) Securities on loan with market value of: | | $ | 5,476,129 | | | $ | 55,522,682 | | | $ | 89,169,216 | | | $ | 8,052,334 | | | $ | 90,707,623 | | | $ | 76,114,711 | | | $ | 28,088,877 | | | $ | 130,537,773 | | |
The accompanying notes are an integral part of the financial statements.
160
161
MassMutual Select Funds – Financial Statements (Continued)
Statement of Assets and Liabilities
June 30, 2005 (Unaudited)
| | | MassMutual
Select
Large Cap Growth
Fund | | MassMutual
Select
Growth Equity
Fund | | MassMutual
Select
Aggressive Growth
Fund | | MassMutual
Select
OTC 100
Fund | |
| Class A shares: | |
| Net assets | | $ | 2,296,009 | | | $ | 223,587,888 | | | $ | 115,334,403 | | | $ | 24,980,759 | | |
| Shares outstanding | | | 257,079 | | | | 28,996,026 | | | | 20,024,664 | | | | 6,656,993 | | |
| Net asset value and redemption price per share | | $ | 8.93 | | | $ | 7.71 | | | $ | 5.76 | | | $ | 3.75 | | |
Offering price per share
(100/[100-maximum sales charge] of net asset value) | | $ | 9.47 | | | $ | 8.18 | | | $ | 6.11 | | | $ | 3.98 | | |
| Class L shares: | |
| Net assets | | $ | 338,060 | | | $ | 273,587,872 | | | $ | 154,489,376 | | | $ | 13,471,836 | | |
| Shares outstanding | | | 37,047 | | | | 35,017,991 | | | | 26,466,450 | | | | 3,551,736 | | |
| Net asset value, offering price and redemption price per share | | $ | 9.13 | | | $ | 7.81 | | | $ | 5.84 | | | $ | 3.79 | | |
| Class Y shares: | |
| Net assets | | $ | 9,525,754 | | | $ | 115,562,241 | | | $ | 29,496,504 | | | $ | 2,499,935 | | |
| Shares outstanding | | | 1,056,049 | | | | 14,694,114 | | | | 5,020,992 | | | | 655,700 | | |
| Net asset value, offering price and redemption price per share | | $ | 9.02 | | | $ | 7.86 | | | $ | 5.87 | | | $ | 3.81 | | |
| Class S shares: | |
| Net assets | | $ | 17,647,698 | | | $ | 249,553,276 | | | $ | 190,667,451 | | | $ | 19,696,756 | | |
| Shares outstanding | | | 1,948,385 | | | | 31,612,937 | | | | 32,283,246 | | �� | | 5,131,641 | | |
| Net asset value, offering price and redemption price per share | | $ | 9.06 | | | $ | 7.89 | | | $ | 5.91 | | | $ | 3.84 | | |
| Class N shares: | |
| Net assets | | $ | 3,998 | | | $ | 1,471,895 | | | $ | 809,780 | | | $ | 391,931 | | |
| Shares outstanding | | | 446 | | | | 193,319 | | | | 142,444 | | | | 105,637 | | |
| Net asset value, offering price and redemption price per share | | $ | 8.96 | | | $ | 7.61 | | | $ | 5.68 | | | $ | 3.71 | | |
| | | MassMutual
Select
Focused Value
Fund | | MassMutual
Select Small
Company Value
Fund | | MassMutual
Select Mid Cap
Growth Equity
Fund | | MassMutual
Select Mid Cap
Growth Equity II
Fund | |
| Class A shares: | |
| Net assets | | $ | 246,276,249 | | | $ | 122,867,117 | | | $ | 29,643,103 | | | $ | 240,393,962 | | |
| Shares outstanding | | | 13,685,468 | | | | 8,708,291 | | | | 3,303,425 | | | | 18,235,640 | | |
| Net asset value and redemption price per share | | $ | 18.00 | | | $ | 14.11 | | | $ | 8.97 | | | $ | 13.18 | | |
Offering price per share
(100/[100-maximum sales charge] of net asset value) | | $ | 19.10 | | | $ | 14.97 | | | $ | 9.52 | | | $ | 13.98 | | |
| Class L shares: | |
| Net assets | | $ | 172,214,150 | | | $ | 116,483,622 | | | $ | 39,586,690 | | | $ | 405,147,540 | | |
| Shares outstanding | | | 9,451,408 | | | | 8,232,511 | | | | 4,341,374 | | | | 30,337,190 | | |
| Net asset value, offering price and redemption price per share | | $ | 18.22 | | | $ | 14.15 | | | $ | 9.12 | | | $ | 13.35 | | |
| Class Y shares: | |
| Net assets | | $ | 110,336,989 | | | $ | 101,625,758 | | | $ | 18,999,148 | | | $ | 113,773,261 | | |
| Shares outstanding | | | 6,016,336 | | | | 7,155,616 | | | | 2,067,007 | | | | 8,447,102 | | |
| Net asset value, offering price and redemption price per share | | $ | 18.34 | | | $ | 14.20 | | | $ | 9.19 | | | $ | 13.47 | | |
| Class S shares: | |
| Net assets | | $ | 342,640,400 | | | $ | 185,903,792 | | | $ | 59,910,012 | | | $ | 208,840,360 | | |
| Shares outstanding | | | 18,578,230 | | | | 13,053,046 | | | | 6,495,876 | | | | 15,449,678 | | |
| Net asset value, offering price and redemption price per share | | $ | 18.44 | | | $ | 14.24 | | | $ | 9.22 | | | $ | 13.52 | | |
| Class N shares: | |
| Net assets | | $ | 1,851,967 | | | $ | 1,096,316 | | | $ | 152,307 | | | $ | 1,265,214 | | |
| Shares outstanding | | | 104,083 | | | | 78,475 | | | | 17,151 | | | | 97,024 | | |
| Net asset value, offering price and redemption price per share | | $ | 17.79 | | | $ | 13.97 | | | $ | 8.88 | | | $ | 13.04 | | |
The accompanying notes are an integral part of the financial statements.
162
163
MassMutual Select Funds – Financial Statements (Continued)
Statement of Assets and Liabilities
June 30, 2005 (Unaudited)
| | | MassMutual
Select Small Cap
Growth Equity
Fund | | MassMutual
Select Small
Company Growth
Fund | | MassMutual
Select
Emerging Growth
Fund | | MassMutual
Select
Overseas
Fund | | MassMutual
Select Destination
Retirement Income | | MassMutual
Select Destination
Retirement 2010
Fund | | MassMutual
Select Destination
Retirement 2020
Fund | | MassMutual
Select Destination
Retirement 2030
Fund | | MassMutual
Select Destination
Retirement 2040
Fund | |
| Assets: | | | |
Investments, at value (Note 2)
Unaffiliated issuers(a) | | $ | 467,945,966 | | | $ | 141,680,970 | | | $ | 119,880,258 | | | $ | 649,936,134 | | | $ | - | | | $ | - | | | $ | - | | | $ | - | | | $ | - | | |
| Affiliated issuers(b) | | | - | | | | - | | | | - | | | | - | | | | 224,534,951 | | | | 77,757,787 | | | | 331,176,046 | | | | 226,881,168 | | | | 124,011,903 | | |
| Short-term investments, at value (Note 2)(c) | | | 182,394,086 | | | | 46,081,764 | | | | 46,475,488 | | | | 72,896,963 | | | | - | | | | - | | | | - | | | | - | | | | - | | |
| Total Investments(d) | | | 650,340,052 | | | | 187,762,734 | | | | 166,355,746 | | | | 722,833,097 | | | | 224,534,951 | | | | 77,757,787 | | | | 331,176,046 | | | | 226,881,168 | | | | 124,011,903 | | |
| Cash | | | - | | | | 9,327 | | | | - | | | | 107,615 | | | | - | | | | - | | | | - | | | | - | | | | - | | |
| Foreign currency, at value(e) | | | - | | | | - | | | | - | | | | 324,865 | | | | - | | | | - | | | | - | | | | - | | | | - | | |
| Receivables from: | |
| Investments sold | | | 5,040,704 | | | | 1,483,987 | | | | 1,762,209 | | | | 15,797,983 | | | | - | | | | - | | | | - | | | | - | | | | - | | |
| Open forward foreign currency contracts (Note 2) | | | - | | | | - | | | | - | | | | 4,926,650 | | | | - | | | | - | | | | - | | | | - | | | | - | | |
| Investment adviser (Note 3) | | | - | | | | - | | | | - | | | | - | | | | - | | | | 2,787 | | | | - | | | | 26 | | | | 236 | | |
| Fund shares sold | | | 757,578 | | | | 270,371 | | | | 812,159 | | | | 5,214,261 | | | | 10,403,892 | | | | 19,382,620 | | | | 17,922,838 | | | | 8,109,277 | | | | 1,119,869 | | |
| Interest and dividends | | | 124,552 | | | | 27,321 | | | | 20,852 | | | | 2,272,535 | | | | - | | | | - | | | | - | | | | - | | | | - | | |
| Foreign taxes withheld | | | 709 | | | | - | | | | 81 | | | | 323,953 | | | | - | | | | - | | | | - | | | | - | | | | - | | |
| Total assets | | | 656,263,595 | | | | 189,553,740 | | | | 168,951,047 | | | | 751,800,959 | | | | 234,938,843 | | | | 97,143,194 | | | | 349,098,884 | | | | 234,990,471 | | | | 125,132,008 | | |
| Liabilities: | | | |
| Payables for: | |
| Investments purchased | | | 2,823,859 | | | | 1,820,962 | | | | 1,052,792 | | | | 17,767,134 | | | | 10,277,985 | | | | 19,303,426 | | | | 17,692,803 | | | | 7,741,965 | | | | 934,166 | | |
| Fund shares repurchased | | | 606,065 | | | | 95,700 | | | | 118,514 | | | | 864,310 | | | | 124,668 | | | | 78,029 | | | | 228,755 | | | | 366,072 | | | | 184,506 | | |
| Securities on loan (Note 2) | | | 141,913,173 | | | | 42,580,811 | | | | 37,185,218 | | | | 54,025,145 | | | | - | | | | - | | | | - | | | | - | | | | - | | |
Settlement of investments purchased on a
when issued basis (Note 2) | | | 1,542,750 | | | | - | | | | - | | | | - | | | | - | | | | - | | | | - | | | | - | | | | - | | |
| Directors' fees and expenses (Note 3) | | | 15,590 | | | | 3,783 | | | | 4,859 | | | | 11,091 | | | | 2,702 | | | | 352 | | | | 3,607 | | | | 2,789 | | | | 1,634 | | |
| Affiliates (Note 3): | |
| Investment management fees | | | 337,343 | | | | 100,378 | | | | 83,542 | | | | 556,063 | | | | 8,742 | | | | 2,340 | | | | 12,772 | | | | 8,963 | | | | 5,040 | | |
| Administration fees | | | 99,132 | | | | 34,170 | | | | 26,740 | | | | 84,658 | | | | 18,478 | | | | 6,669 | | | | 40,264 | | | | 29,560 | | | | 15,558 | | |
| Service fees | | | 46,591 | | | | 37,897 | | | | 14,349 | | | | 99,420 | | | | 13,217 | | | | 8,737 | | | | 27,943 | | | | 19,863 | | | | 9,132 | | |
| Distribution fees | | | 482 | | | | 621 | | | | 94 | | | | 893 | | | | 65 | | | | 73 | | | | 115 | | | | 79 | | | | 70 | | |
| Investment advisor | | | - | | | | - | | | | - | | | | - | | | | 110 | | | | - | | | | - | | | | - | | | | - | | |
| Accrued expenses and other liabilities | | | 26,889 | | | | 24,850 | | | | 24,023 | | | | 78,834 | | | | 21,317 | | | | 22,070 | | | | 22,203 | | | | 21,441 | | | | 21,529 | | |
| Total liabilities | | | 147,411,874 | | | | 44,699,172 | | | | 38,510,131 | | | | 73,487,548 | | | | 10,467,284 | | | | 19,421,696 | | | | 18,028,462 | | | | 8,190,732 | | | | 1,171,635 | | |
| Net assets | | $ | 508,851,721 | | | $ | 144,854,568 | | | $ | 130,440,916 | | | $ | 678,313,411 | | | $ | 224,471,559 | | | $ | 77,721,498 | | | $ | 331,070,422 | | | $ | 226,799,739 | | | $ | 123,960,373 | | |
| Net assets consist of: | | | |
| Paid-in capital | | $ | 451,010,491 | | | $ | 146,134,400 | | | $ | 173,163,521 | | | $ | 558,941,831 | | | $ | 218,806,217 | | | $ | 76,758,137 | | | $ | 317,635,170 | | | $ | 212,518,964 | | | $ | 114,650,101 | | |
Undistributed net investment income (distributions
in excess of net investment income) | | | (1,351,591 | ) | | | (718,195 | ) | | | (532,115 | ) | | | 6,129,156 | | | | (109,725 | ) | | | (46,954 | ) | | | (384,548 | ) | | | (285,876 | ) | | | (158,518 | ) | |
| Accumulated net realized gain (loss) on investments | | | (39,481,811 | ) | | | (279,728 | ) | | | (52,925,376 | ) | | | 32,985,604 | | | | 992,632 | | | | 187,302 | | | | 1,759,116 | | | | 2,042,467 | | | | 1,557,928 | | |
Net unrealized appreciation (depreciation)
on investments | | | 98,674,632 | | | | (281,909 | ) | | | 10,734,886 | | | | 80,256,820 | | | | 4,782,435 | | | | 823,013 | | | | 12,060,684 | | | | 12,524,184 | | | | 7,910,862 | | |
| | | $ | 508,851,721 | | | $ | 144,854,568 | | | $ | 130,440,916 | | | $ | 678,313,411 | | | $ | 224,471,559 | | | $ | 77,721,498 | | | $ | 331,070,422 | | | $ | 226,799,739 | | | $ | 123,960,373 | | |
| (a) Cost of investments - unaffiliated issuers: | | $ | 369,271,334 | | | $ | 141,962,877 | | | $ | 109,145,372 | | | $ | 574,547,728 | | | $ | - | | | $ | - | | | $ | - | | | $ | - | | | $ | - | | |
| (b) Cost of investments - affiliated issuers: | | $ | - | | | $ | - | | | $ | - | | | $ | - | | | $ | 219,752,516 | | | $ | 76,934,774 | | | $ | 319,115,362 | | | $ | 214,356,984 | | | $ | 116,101,041 | | |
| (c) Cost of short-term investments: | | $ | 182,394,086 | | | $ | 46,081,764 | | | $ | 46,475,488 | | | $ | 72,896,963 | | | $ | - | | | $ | - | | | $ | - | | | $ | - | | | $ | - | | |
| (d) Securities on loan with market value of: | | $ | 135,791,603 | | | $ | 40,466,925 | | | $ | 35,660,755 | | | $ | 50,906,949 | | | $ | - | | | $ | - | | | $ | - | | | $ | - | | | $ | - | | |
| (e) Cost of foreign currency: | | $ | - | | | $ | - | | | $ | - | | | $ | 334,566 | | | $ | - | | | $ | - | | | $ | - | | | $ | - | | | $ | - | | |
The accompanying notes are an integral part of the financial statements.
164
165
MassMutual Select Funds – Financial Statements (Continued)
Statement of Assets and Liabilities
June 30, 2005 (Unaudited)
| | | MassMutual
Select Small Cap
Growth Equity
Fund | | MassMutual
Select Small
Company Growth
Fund | | MassMutual
Select
Emerging Growth
Fund | | MassMutual
Select
Overseas
Fund | | MassMutual
Select Destination
Retirement Income | |
| Class A shares: | |
| Net assets | | $ | 75,825,068 | | | $ | 62,056,603 | | | $ | 23,830,305 | | | $ | 157,788,664 | | | $ | 22,737,829 | | |
| Shares outstanding | | | 5,303,978 | | | | 6,664,448 | | | | 4,285,900 | | | | 14,508,966 | | | | 2,177,532 | | |
| Net asset value and redemption price per share | | $ | 14.30 | | | $ | 9.31 | | | $ | 5.56 | | | $ | 10.88 | | | $ | 10.44 | | |
Offering price per share
(100/[100-maximum sales charge] of net asset value) | | $ | 15.17 | | | $ | 9.88 | | | $ | 5.90 | | | $ | 11.54 | | | $ | 11.08 | | |
| Class L shares: | |
| Net assets | | $ | 90,290,171 | | | $ | 29,974,722 | | | $ | 61,731,359 | | | $ | 180,070,210 | | | $ | 106,050,966 | | |
| Shares outstanding | | | 6,226,601 | | | | 3,183,966 | | | | 10,965,044 | | | | 16,464,770 | | | | 10,122,780 | | |
Net asset value, offering price and redemption price
per share | | $ | 14.50 | | | $ | 9.41 | | | $ | 5.63 | | | $ | 10.94 | | | $ | 10.48 | | |
| Class Y shares: | |
| Net assets | | $ | 103,132,705 | | | $ | 28,460,134 | | | $ | 5,235,711 | | | $ | 97,792,232 | | | $ | 93,181,771 | | |
| Shares outstanding | | | 7,053,024 | | | | 3,007,770 | | | | 922,102 | | | | 8,912,824 | | | | 8,888,710 | | |
Net asset value, offering price and redemption price
per share | | $ | 14.62 | | | $ | 9.46 | | | $ | 5.68 | | | $ | 10.97 | | | $ | 10.48 | | |
| Class S shares: | |
| Net assets | | $ | 238,776,165 | | | $ | 23,322,954 | | | $ | 39,484,988 | | | $ | 241,218,288 | | | $ | 2,395,628 | | |
| Shares outstanding | | | 16,210,262 | | | | 2,459,407 | | | | 6,906,903 | | | | 21,945,223 | | | | 228,532 | | |
Net asset value, offering price and redemption price
per share | | $ | 14.73 | | | $ | 9.48 | | | $ | 5.72 | | | $ | 10.99 | | | $ | 10.48 | | |
| Class N shares: | |
| Net assets | | $ | 827,612 | | | $ | 1,040,155 | | | $ | 158,553 | | | $ | 1,444,017 | | | $ | 105,365 | | |
| Shares outstanding | | | 58,587 | | | | 113,235 | | | | 28,857 | | | | 133,930 | | | | 10,089 | | |
Net asset value, offering price and redemption price
per share | | $ | 14.13 | | | $ | 9.19 | | | $ | 5.49 | | | $ | 10.78 | | | $ | 10.44 | | |
| | | MassMutual
Select Destination
Retirement 2010
Fund | | MassMutual
Select Destination
Retirement 2020
Fund | | MassMutual
Select Destination
Retirement 2030
Fund | | MassMutual
Select Destination
Retirement 2040
Fund | |
| Class A shares: | |
| Net assets | | $ | 15,841,600 | | | $ | 48,696,578 | | | $ | 34,471,176 | | | $ | 15,578,014 | | |
| Shares outstanding | | | 1,488,936 | | | | 4,503,307 | | | | 3,106,161 | | | | 1,390,502 | | |
| Net asset value and redemption price per share | | $ | 10.64 | | | $ | 10.81 | | | $ | 11.10 | | | $ | 11.20 | | |
Offering price per share
(100/[100-maximum sales charge] of net asset value) | | $ | 11.29 | | | $ | 11.47 | | | $ | 11.78 | | | $ | 11.88 | | |
| Class L shares: | |
| Net assets | | $ | 29,404,170 | | | $ | 216,733,187 | | | $ | 169,643,978 | | | $ | 100,534,110 | | |
| Shares outstanding | | | 2,754,839 | | | | 19,973,345 | | | | 15,230,361 | | | | 8,942,825 | | |
Net asset value, offering price and redemption price
per share | | $ | 10.67 | | | $ | 10.85 | | | $ | 11.14 | | | $ | 11.24 | | |
| Class Y shares: | |
| Net assets | | $ | 27,256,329 | | | $ | 44,718,244 | | | $ | 14,596,067 | | | $ | 3,003,110 | | |
| Shares outstanding | | | 2,553,271 | | | | 4,122,767 | | | | 1,312,081 | | | | 267,273 | | |
Net asset value, offering price and redemption price
per share | | $ | 10.68 | | | $ | 10.85 | | | $ | 11.12 | | | $ | 11.24 | | |
| Class S shares: | |
| Net assets | | $ | 5,098,302 | | | $ | 20,729,055 | | | $ | 7,954,396 | | | $ | 4,730,435 | | |
| Shares outstanding | | | 476,888 | | | | 1,908,446 | | | | 713,512 | | | | 420,357 | | |
Net asset value, offering price and redemption price
per share | | $ | 10.69 | | | $ | 10.86 | | | $ | 11.15 | | | $ | 11.25 | | |
| Class N shares: | |
| Net assets | | $ | 121,097 | | | $ | 193,358 | | | $ | 134,122 | | | $ | 114,704 | | |
| Shares outstanding | | | 11,371 | | | | 17,872 | | | | 12,079 | | | | 10,235 | | |
Net asset value, offering price and redemption price
per share | | $ | 10.65 | | | $ | 10.82 | | | $ | 11.10 | | | $ | 11.21 | | |
The accompanying notes are an integral part of the financial statements.
166
167
MassMutual Select Funds – Financial Statements (Continued)
Statement of Operations
For the Six Months Ended June 30, 2005 (Unaudited)
| | | MassMutual
Select
Strategic Bond
Fund | | MassMutual
Select
Strategic Balanced
Fund | | MassMutual
Select
Diversified Value
Fund | | MassMutual
Select
Fundamental Value
Fund | |
| Investment income (Note 2): | |
| Dividends(a) | | $ | - | | | $ | 1,035,194 | | | $ | 2,316,291 | | | $ | 9,472,592 | | |
| Interest(b) | | | 939,509 | | | | 2,010,152 | | | | 9,768 | | | | 166,456 | | |
| Total investment income | | | 939,509 | | | | 3,045,346 | | | | 2,326,059 | | | | 9,639,048 | | |
| Expenses (Note 2): | |
| Investment management fees (Note 3) | | | 140,904 | | | | 732,781 | | | | 498,052 | | | | 2,940,541 | | |
| Custody fees | | | 17,060 | | | | 37,308 | | | | 9,358 | | | | 38,370 | | |
| Trustee reporting | | | 3,525 | | | | 3,525 | | | | 3,526 | | | | 3,525 | | |
| Audit and legal fees | | | 11,411 | | | | 12,092 | | | | 11,552 | | | | 13,699 | | |
| Proxy fees | | | 550 | | | | 550 | | | | 550 | | | | 467 | | |
| Shareholder reporting fees | | | 6,973 | | | | 4,126 | | | | 3,319 | | | | 14,870 | | |
| Directors' fees (Note 3) | | | 686 | | | | 3,275 | | | | 2,585 | | | | 11,922 | | |
| | | | 181,109 | | | | 793,657 | | | | 528,942 | | | | 3,023,394 | | |
| Administration fees (Note 3): | |
| Class A | | | 835 | | | | 55,727 | | | | 14,426 | | | | 345,353 | | |
| Class L | | | 62 | | | | 164,884 | | | | 27,077 | | | | 344,673 | | |
| Class Y | | | 358 | | | | 84,542 | | | | 1,130 | | | | 101,318 | | |
| Class S | | | 12,158 | | | | 8,515 | | | | 48,991 | | | | 207,440 | | |
| Class Z | | | - | | | | - | | | | - | | | | - | | |
| Class N | | | 73 | | | | 739 | | | | 340 | | | | 3,196 | | |
| Distribution fees (Note 3): | |
| Class N | | | 124 | | | | 490 | | | | 231 | | | | 2,202 | | |
| Service fees (Note 3): | |
| Class A | | | 2,086 | | | | 42,605 | | | | 11,698 | | | | 275,929 | | |
| Class N | | | 124 | | | | 490 | | | | 231 | | | | 2,202 | | |
| Total expenses | | | 196,929 | | | | 1,151,649 | | | | 633,066 | | | | 4,305,707 | | |
| Expenses waived (Note 3) | | | (14,586 | ) | | | (20,572 | ) | | | - | | | | - | | |
| Class A Administration fees waived (Note 3) | | | - | | | | - | | | | - | | | | - | | |
| Class L Administration fees waived (Note 3) | | | - | | | | - | | | | - | | | | - | | |
| Class N Administration fees waived (Note 3) | | | - | | | | - | | | | - | | | | - | | |
| Net expenses | | | 182,343 | | | | 1,131,077 | | | | 633,066 | | | | 4,305,707 | | |
| Net investment income | | | 757,166 | | | | 1,914,269 | | | | 1,692,993 | | | | 5,333,341 | | |
| Realized and unrealized gain (loss): | |
| Net realized gain (loss) on: | |
| Investment transactions | | | (94,424 | ) | | | (299,391 | ) | | | 2,722,862 | | | | 7,801,529 | | |
| Closed futures contracts | | | (57,551 | ) | | | (523,325 | ) | | | - | | | | - | | |
| Written options | | | 27,290 | | | | 316,536 | | | | - | | | | - | | |
| Closed swap contracts | | | 16,563 | | | | 666,938 | | | | - | | | | - | | |
| Foreign currency transactions | | | 67,237 | | | | (242,061 | ) | | | (92 | ) | | | - | | |
| Net realized gain (loss) | | | (40,885 | ) | | | (81,303 | ) | | | 2,722,770 | | | | 7,801,529 | | |
| Net change in unrealized appreciation (depreciation) on: | |
| Investments | | | 284,314 | | | | (3,074,007 | ) | | | (2,466,884 | ) | | | (7,136,419 | ) | |
| Open futures contracts | | | (20,483 | ) | | | 14,812 | | | | - | | | | - | | |
| Written options | | | (49,339 | ) | | | (241,545 | ) | | | - | | | | - | | |
| Open swap contracts | | | - | | | | (374,096 | ) | | | - | | | | - | | |
| Translation of assets and liabilities in foreign currencies | | | 222,125 | | | | 890,586 | | | | 119 | | | | - | | |
| Net unrealized gain (loss) | | | 436,617 | | | | (2,784,250 | ) | | | (2,466,765 | ) | | | (7,136,419 | ) | |
| Net realized and unrealized gain (loss) | | | 395,732 | | | | (2,865,553 | ) | | | 256,005 | | | | 665,110 | | |
| Net increase (decrease) in net assets resulting from operations | | $ | 1,152,898 | | | $ | (951,284 | ) | | $ | 1,948,998 | | | $ | 5,998,451 | | |
| (a) Net of withholding tax of: | | $ | - | | | $ | 26,940 | | | $ | 7,498 | | | $ | 40,065 | | |
| (b) Including securities lending income of: | | $ | 6,623 | | | $ | 35,061 | | | $ | 10,351 | | | $ | 55,321 | | |
| | | MassMutual
Select
Value Equity
Fund | | MassMutual
Select
Large Cap Value
Fund | | MassMutual
Select
Indexed Equity
Fund | | MassMutual
Select
Blue Chip Growth
Fund | |
| Investment income (Note 2): | |
| Dividends(a) | | $ | 719,520 | | | $ | 10,096,821 | | | $ | 15,946,639 | | | $ | 2,383,229 | | |
| Interest(b) | | | 12,916 | | | | 632,410 | | | | 315,646 | | | | 48,204 | | |
| Total investment income | | | 732,436 | | | | 10,729,231 | | | | 16,262,285 | | | | 2,431,433 | | |
| Expenses (Note 2): | |
| Investment management fees (Note 3) | | | 306,369 | | | | 3,966,699 | | | | 886,098 | | | | 1,385,812 | | |
| Custody fees | | | 12,960 | | | | 87,446 | | | | 79,844 | | | | 21,465 | | |
| Trustee reporting | | | 3,525 | | | | 3,527 | | | | 3,525 | | | | 3,525 | | |
| Audit and legal fees | | | 11,126 | | | | 14,839 | | | | 17,031 | | | | 12,130 | | |
| Proxy fees | | | 612 | | | | 488 | | | | 457 | | | | 612 | | |
| Shareholder reporting fees | | | 1,487 | | | | 19,249 | | | | 29,200 | | | | 6,878 | | |
| Directors' fees (Note 3) | | | 1,163 | | | | 15,360 | | | | 23,255 | | | | 5,363 | | |
| | | | 337,242 | | | | 4,107,608 | | | | 1,039,410 | | | | 1,435,785 | | |
| Administration fees (Note 3): | |
| Class A | | | 34,904 | | | | 475,888 | | | | 692,025 | | | | 73,403 | | |
| Class L | | | 10,707 | | | | 513,135 | | | | 522,425 | | | | 570,915 | | |
| Class Y | | | 2,217 | | | | 124,263 | | | | 715,465 | | | | 6,487 | | |
| Class S | | | 20,037 | | | | 196,435 | | | | 1,037,569 | | | | 58,564 | | |
| Class Z | | | - | | | | - | | | | 57,888 | | | | - | | |
| Class N | | | 459 | | | | 5,200 | | | | 10,677 | | | | 4,804 | | |
| Distribution fees (Note 3): | |
| Class N | | | 349 | | | | 3,472 | | | | 5,039 | | | | 2,619 | | |
| Service fees (Note 3): | |
| Class A | | | 31,332 | | | | 366,745 | | | | 360,655 | | | | 44,922 | | |
| Class N | | | 349 | | | | 3,472 | | | | 5,039 | | | | 2,619 | | |
| Total expenses | | | 437,596 | | | | 5,796,218 | | | | 4,446,192 | | | | 2,200,118 | | |
| Expenses waived (Note 3) | | | - | | | | - | | | | - | | | | - | | |
| Class A Administration fees waived (Note 3) | | | - | | | | - | | | | (144,262 | ) | | | - | | |
| Class L Administration fees waived (Note 3) | | | - | | | | - | | | | (108,907 | ) | | | - | | |
| Class N Administration fees waived (Note 3) | | | - | | | | - | | | | (2,016 | ) | | | - | | |
| Net expenses | | | 437,596 | | | | 5,796,218 | | | | 4,191,007 | | | | 2,200,118 | | |
| Net investment income | | | 294,840 | | | | 4,933,013 | | | | 12,071,278 | | | | 231,315 | | |
| Realized and unrealized gain (loss): | |
| Net realized gain (loss) on: | |
| Investment transactions | | | 4,337,321 | | | | (2,108,382 | ) | | | 380,261 | | | | (1,193,170 | ) | |
| Closed futures contracts | | | - | | | | - | | | | (164,258 | ) | | | - | | |
| Written options | | | - | | | | - | | | | - | | | | - | | |
| Closed swap contracts | | | - | | | | - | | | | - | | | | - | | |
| Foreign currency transactions | | | 2,868 | | | | (14,373 | ) | | | - | | | | (1,501 | ) | |
| Net realized gain (loss) | | | 4,340,189 | | | | (2,122,755 | ) | | | 216,003 | | | | (1,194,671 | ) | |
| Net change in unrealized appreciation (depreciation) on: | |
| Investments | | | (4,033,708 | ) | | | 12,403,032 | | | | (29,422,658 | ) | | | (9,081,461 | ) | |
| Open futures contracts | | | - | | | | - | | | | (280,039 | ) | | | - | | |
| Written options | | | - | | | | - | | | | - | | | | - | | |
| Open swap contracts | | | - | | | | - | | | | - | | | | - | | |
| Translation of assets and liabilities in foreign currencies | | | - | | | | (152 | ) | | | - | | | | - | | |
| Net unrealized gain (loss) | | | (4,033,708 | ) | | | 12,402,880 | | | | (29,702,697 | ) | | | (9,081,461 | ) | |
| Net realized and unrealized gain (loss) | | | 306,481 | | | | 10,280,125 | | | | (29,486,694 | ) | | | (10,276,132 | ) | |
| Net increase (decrease) in net assets resulting from operations | | $ | 601,321 | | | $ | 15,213,138 | | | $ | (17,415,416 | ) | | $ | (10,044,817 | ) | |
| (a) Net of withholding tax of: | | $ | 3,587 | | | $ | 19,202 | | | $ | - | | | $ | 6,587 | | |
| (b) Including securities lending income of: | | $ | 10,911 | | | $ | 68,826 | | | $ | 61,437 | | | $ | 15,008 | | |
The accompanying notes are an integral part of the financial statements.
168
169
MassMutual Select Funds – Financial Statements (Continued)
Statement of Operations
For the Six Months Ended June 30, 2005 (Unaudited)
| | | MassMutual
Select
Large Cap Growth
Fund | | MassMutual
Select
Growth Equity
Fund | | MassMutual
Select
Aggressive Growth
Fund | | MassMutual
Select
OTC 100
Fund | |
| Investment income (Note 2): | |
| Dividends(a) | | $ | 105,241 | | | $ | 5,459,233 | | | $ | 486,216 | | | $ | 123,467 | | |
| Interest(b) | | | 4,516 | | | | 95,968 | | | | 73,148 | | | | 16,883 | | |
| Total investment income | | | 109,757 | | | | 5,555,201 | | | | 559,364 | | | | 140,350 | | |
| Expenses (Note 2): | |
| Investment management fees (Note 3) | | | 98,926 | | | | 2,844,548 | | | | 1,709,422 | | | | 47,745 | | |
| Custody fees | | | 2,827 | | | | 47,251 | | | | 25,295 | | | | 10,709 | | |
| Trustee reporting | | | 3,525 | | | | 3,525 | | | | 3,525 | | | | 3,525 | | |
| Audit and legal fees | | | 10,773 | | | | 13,567 | | | | 12,519 | | | | 11,410 | | |
| Proxy fees | | | 467 | | | | 488 | | | | 921 | | | | 457 | | |
| Shareholder reporting fees | | | 599 | | | | 14,004 | | | | 8,056 | | | | 1,125 | | |
| Directors' fees (Note 3) | | | 467 | | | | 10,995 | | | | 6,336 | | | | 878 | | |
| | | | 117,584 | | | | 2,934,378 | | | | 1,766,074 | | | | 75,849 | | |
| Administration fees (Note 3): | |
| Class A | | | 3,625 | | | | 331,262 | | | | 190,813 | | | | 83,702 | | |
| Class L | | | 3,291 | | | | 396,448 | | | | 251,682 | | | | 37,946 | | |
| Class Y | | | 9,087 | | | | 84,120 | | | | 27,434 | | | | 6,824 | | |
| Class S | | | 14,301 | | | | 101,463 | | | | 85,994 | | | | 40,117 | | |
| Class N | | | 8 | | | | 2,499 | | | | 1,882 | | | | 1,311 | | |
| Distribution fees (Note 3): | |
| Class N | | | 5 | | | | 1,798 | | | | 1,193 | | | | 486 | | |
| Service fees (Note 3): | |
| Class A | | | 2,568 | | | | 278,371 | | | | 138,511 | | | | 33,513 | | |
| Class N | | | 5 | | | | 1,798 | | | | 1,193 | | | | 486 | | |
| Total expenses | | | 150,474 | | | | 4,132,137 | | | | 2,464,776 | | | | 280,234 | | |
| Expenses waived (Note 3) | | | (10,175 | ) | | | - | | | | (187,334 | ) | | | - | | |
| Net expenses | | | 140,299 | | | | 4,132,137 | | | | 2,277,442 | | | | 280,234 | | |
| Net investment income (loss) | | | (30,542 | ) | | | 1,423,064 | | | | (1,718,078 | ) | | | (139,884 | ) | |
| Realized and unrealized gain (loss): | |
| Net realized gain (loss) on: | |
| Investment transactions | | | 1,149,390 | | | | 10,599,543 | | | | 3,265,893 | | | | 2,050,351 | | |
| Closed futures contracts | | | - | | | | - | | | | - | | | | (57,518 | ) | |
| Foreign currency transactions | | | - | | | | - | | | | - | | | | - | | |
| Net realized gain | | | 1,149,390 | | | | 10,599,543 | | | | 3,265,893 | | | | 1,992,833 | | |
| Net change in unrealized appreciation (depreciation) on: | |
| Investments | | | (1,756,245 | ) | | | (13,374,706 | ) | | | (13,660,709 | ) | | | (7,806,053 | ) | |
| Open futures contracts | | | - | | | | - | | | | - | | | | (6,314 | ) | |
| Translation of assets and liabilities in foreign currencies | | | - | | | | (14 | ) | | | - | | | | - | | |
| Net unrealized loss | | | (1,756,245 | ) | | | (13,374,720 | ) | | | (13,660,709 | ) | | | (7,812,367 | ) | |
| Net realized and unrealized loss | | | (606,855 | ) | | | (2,775,177 | ) | | | (10,394,816 | ) | | | (5,819,534 | ) | |
| Net increase (decrease) in net assets resulting from operations | | $ | (637,397 | ) | | $ | (1,352,113 | ) | | $ | (12,112,894 | ) | | $ | (5,959,418 | ) | |
| (a) Net of withholding tax of: | | $ | 1,508 | | | $ | - | | | $ | 16,772 | | | $ | 1,030 | | |
| (b) Including securities lending income of: | | $ | 1,559 | | | $ | 18,882 | | | $ | 21,595 | | | $ | 10,058 | | |
| | | MassMutual
Select
Focused Value
Fund | | MassMutual
Select Small
Company Value
Fund | | MassMutual
Select Mid Cap
Growth Equity
Fund | | MassMutual
Select Mid Cap
Growth Equity II
Fund | |
| Investment income (Note 2): | |
| Dividends(a) | | $ | 3,379,317 | | | $ | 2,561,253 | | | $ | 345,206 | | | $ | 2,360,064 | | |
| Interest(b) | | | 656,309 | | | | 250,439 | | | | 138,010 | | | | 319,066 | | |
| Total investment income | | | 4,035,626 | | | | 2,811,692 | | | | 483,216 | | | | 2,679,130 | | |
| Expenses (Note 2): | |
| Investment management fees (Note 3) | | | 2,847,756 | | | | 2,179,331 | | | | 470,918 | | | | 3,433,242 | | |
| Custody fees | | | 50,477 | | | | 41,332 | | | | 14,024 | | | | 53,558 | | |
| Trustee reporting | | | 3,525 | | | | 3,525 | | | | 3,525 | | | | 3,525 | | |
| Audit and legal fees | | | 13,522 | | | | 12,545 | | | | 11,272 | | | | 14,061 | | |
| Proxy fees | | | 488 | | | | 860 | | | | 550 | | | | 488 | | |
| Shareholder reporting fees | | | 13,472 | | | | 8,539 | | | | 2,255 | | | | 15,077 | | |
| Directors' fees (Note 3) | | | 10,746 | | | | 6,801 | | | | 1,733 | | | | 12,216 | | |
| | | | 2,939,986 | | | | 2,252,933 | | | | 504,277 | | | | 3,532,167 | | |
| Administration fees (Note 3): | |
| Class A | | | 391,293 | | | | 211,460 | | | | 43,843 | | | | 359,749 | | |
| Class L | | | 262,870 | | | | 201,818 | | | | 55,626 | | | | 631,323 | | |
| Class Y | | | 95,974 | | | | 102,742 | | | | 12,917 | | | | 90,391 | | |
| Class S | | | 138,618 | | | | 155,342 | | | | 23,320 | | | | 84,267 | | |
| Class N | | | 3,112 | | | | 2,148 | | | | 263 | | | | 2,190 | | |
| Distribution fees (Note 3): | |
| Class N | | | 2,024 | | | | 1,312 | | | | 184 | | | | 1,462 | | |
| Service fees (Note 3): | |
| Class A | | | 292,534 | | | | 147,134 | | | | 35,645 | | | | 277,242 | | |
| Class N | | | 2,024 | | | | 1,312 | | | | 184 | | | | 1,462 | | |
| Total expenses | | | 4,128,435 | | | | 3,076,201 | | | | 676,259 | | | | 4,980,253 | | |
| Expenses waived (Note 3) | | | - | | | | - | | | | - | | | | - | | |
| Net expenses | | | 4,128,435 | | | | 3,076,201 | | | | 676,259 | | | | 4,980,253 | | |
| Net investment income (loss) | | | (92,809 | ) | | | (264,509 | ) | | | (193,043 | ) | | | (2,301,123 | ) | |
| Realized and unrealized gain (loss): | |
| Net realized gain (loss) on: | |
| Investment transactions | | | 37,553,481 | | | | 12,564,059 | | | | 7,075,323 | | | | 27,080,085 | | |
| Closed futures contracts | | | - | | | | - | | | | - | | | | - | | |
| Foreign currency transactions | | | - | | | | - | | | | (74 | ) | | | (4,786 | ) | |
| Net realized gain | | | 37,553,481 | | | | 12,564,059 | | | | 7,075,249 | | | | 27,075,299 | | |
| Net change in unrealized appreciation (depreciation) on: | |
| Investments | | | (25,183,485 | ) | | | (17,982,944 | ) | | | (3,612,957 | ) | | | (15,636,332 | ) | |
| Open futures contracts | | | - | | | | - | | | | - | | | | - | | |
| Translation of assets and liabilities in foreign currencies | | | - | | | | - | | | | - | | | | 4,494 | | |
| Net unrealized loss | | | (25,183,485 | ) | | | (17,982,944 | ) | | | (3,612,957 | ) | | | (15,631,838 | ) | |
| Net realized and unrealized loss | | | 12,369,996 | | | | (5,418,885 | ) | | | 3,462,292 | | | | 11,443,461 | | |
| Net increase (decrease) in net assets resulting from operations | | $ | 12,277,187 | | | $ | (5,683,394 | ) | | $ | 3,269,249 | | | $ | 9,142,338 | | |
| (a) Net of withholding tax of: | | $ | - | | | $ | 113 | | | $ | 641 | | | $ | 14,480 | | |
| (b) Including securities lending income of: | | $ | 53,383 | | | $ | 130,699 | | | $ | 69,802 | | | $ | 132,013 | | |
The accompanying notes are an integral part of the financial statements.
170
171
MassMutual Select Funds – Financial Statements (Continued)
Statement of Operations
For the Six Months Ended June 30, 2005 (Unaudited)
| | | MassMutual
Select Small Cap
Growth Equity
Fund | | MassMutual
Select Small
Company Growth
Fund | | MassMutual
Select
Emerging Growth
Fund | | MassMutual
Select
Overseas
Fund | | MassMutual
Select Destination
Retirement Income | | MassMutual
Select Destination
Retirement 2010
Fund | | MassMutual
Select Destination
Retirement 2020
Fund | | MassMutual
Select Destination
Retirement 2030
Fund | | MassMutual
Select Destination
Retirement 2040
Fund | |
| Investment income (Note 2): | |
| Dividends(a) | | $ | 839,422 | | | $ | 149,961 | | | $ | 63,344 | | | $ | 10,626,638 | | | $ | 103,903 | | | $ | 22,799 | | | $ | - | | | $ | - | | | $ | - | | |
| Interest(b) | | | 570,899 | | | | 101,801 | | | | 147,083 | | | | 474,932 | | | | - | | | | - | | | | - | | | | - | | | | - | | |
| Total investment income | | | 1,410,321 | | | | 251,762 | | | | 210,427 | | | | 11,101,570 | | | | 103,903 | | | | 22,799 | | | | - | | | | - | | | | - | | |
| Expenses (Note 2): | |
| Investment management fees (Note 3) | | | 1,989,148 | | | | 635,919 | | | | 495,143 | | | | 3,263,593 | | | | 50,921 | | | | 12,040 | | | | 70,312 | | | | 51,076 | | | | 28,845 | | |
| Custody fees | | | 51,846 | | | | 51,634 | | | | 35,789 | | | | 375,285 | | | | 9,540 | | | | 11,660 | | | | 12,720 | | | | 11,660 | | | | 9,540 | | |
| Trustee reporting | | | 3,525 | | | | 3,525 | | | | 3,525 | | | | 3,525 | | | | 3,525 | | | | 3,525 | | | | 3,525 | | | | 3,525 | | | | 3,525 | | |
| Audit and legal fees | | | 12,424 | | | | 11,194 | | | | 11,270 | | | | 13,182 | | | | 10,633 | | | | 10,076 | | | | 10,883 | | | | 10,637 | | | | 10,320 | | |
| Proxy fees | | | 529 | | | | 673 | | | | 612 | | | | 612 | | | | 425 | | | | 425 | | | | 425 | | | | 425 | | | | 425 | | |
| Shareholder reporting fees | | | 8,249 | | | | 2,834 | | | | 2,198 | | | | 10,277 | | | | 3,148 | | | | 644 | | | | 4,269 | | | | 3,238 | | | | 1,848 | | |
| Directors' fees (Note 3) | | | 6,492 | | | | 2,185 | | | | 1,716 | | | | 8,323 | | | | 2,533 | | | | 546 | | | | 3,455 | | | | 2,581 | | | | 1,469 | | |
| | | | 2,072,213 | | | | 707,964 | | | | 550,253 | | | | 3,674,797 | | | | 80,725 | | | | 38,916 | | | | 105,589 | | | | 83,142 | | | | 55,972 | | |
| Administration fees (Note 3): | |
| Class A | | | 151,062 | | | | 106,239 | | | | 39,229 | | | | 182,539 | | | | 14,330 | | | | 10,467 | | | | 36,282 | | | | 25,427 | | | | 10,970 | | |
| Class L | | | 169,919 | | | | 58,857 | | | | 99,040 | | | | 218,859 | | | | 73,924 | | | | 21,300 | | | | 182,620 | | | | 141,287 | | | | 77,888 | | |
| Class Y | | | 127,112 | | | | 30,374 | | | | 4,402 | | | | 45,177 | | | | 18,499 | | | | 2,360 | | | | 5,541 | | | | 1,806 | | | | 406 | | |
| Class S | | | 134,024 | | | | 18,730 | | | | 15,922 | | | | 50,281 | | | | 200 | | | | 373 | | | | 2,250 | | | | 799 | | | | 231 | | |
| Class N | | | 1,753 | | | | 1,970 | | | | 294 | | | | 1,895 | | | | 101 | | | | 123 | | | | 175 | | | | 133 | | | | 117 | | |
| Distribution fees (Note 3): | |
| Class N | | | 958 | | | | 1,234 | | | | 191 | | | | 1,609 | | | | 129 | | | | 140 | | | | 193 | | | | 149 | | | | 138 | | |
| Service fees (Note 3): | |
| Class A | | | 92,676 | | | | 76,081 | | | | 29,328 | | | | 186,798 | | | | 24,554 | | | | 15,429 | | | | 51,595 | | | | 36,680 | | | | 16,971 | | |
| Class N | | | 958 | | | | 1,234 | | | | 191 | | | | 1,609 | | | | 129 | | | | 140 | | | | 193 | | | | 149 | | | | 138 | | |
| Total expenses | | | 2,750,675 | | | | 1,002,683 | | | | 738,850 | | | | 4,363,564 | | | | 212,591 | | | | 89,248 | | | | 384,438 | | | | 289,572 | | | | 162,831 | | |
| Expenses waived (Note 3) | | | - | | | | (35,014 | ) | | | - | | | | - | | | | - | | | | (19,554 | ) | | | (1,273 | ) | | | (4,791 | ) | | | (4,973 | ) | |
| Net expenses | | | 2,750,675 | | | | 967,669 | | | | 738,850 | | | | 4,363,564 | | | | 212,591 | | | | 69,694 | | | | 383,165 | | | | 284,781 | | | | 157,858 | | |
| Net investment income (loss) | | | (1,340,354 | ) | | | (715,907 | ) | | | (528,423 | ) | | | 6,738,006 | | | | (108,688 | ) | | | (46,895 | ) | | | (383,165 | ) | | | (284,781 | ) | | | (157,858 | ) | |
| Realized and unrealized gain (loss): | |
| Net realized gain (loss) on: | |
| Investment transactions(d) | | | 22,259,586 | | | | (1,135,064 | ) | | | 3,390,141 | | | | 31,361,000 | | | | 220,983 | | | | 127,294 | | | | 979,049 | | | | 917,915 | | | | 712,161 | | |
| Foreign currency transactions | | | - | | | | - | | | | - | | | | (149,892 | ) | | | - | | | | - | | | | - | | | | - | | | | - | | |
| Net realized gain (loss) | | | 22,259,586 | | | | (1,135,064 | ) | | | 3,390,141 | | | | 31,211,108 | | | | 220,983 | | | | 127,294 | | | | 979,049 | | | | 917,915 | | | | 712,161 | | |
| Net change in unrealized appreciation (depreciation) on: | |
| Investments | | | (17,273,652 | ) | | | (11,714,479 | ) | | | (9,996,043 | ) | | | (45,899,028 | ) | | | 2,568,409 | | | | 616,389 | | | | 2,012,113 | | | | (269,691 | ) | | | (787,192 | ) | |
| Translation of assets and liabilities in foreign currencies | | | - | | | | - | | | | - | | | | 4,868,414 | | | | - | | | | - | | | | - | | | | - | | | | - | | |
| Net unrealized (gain) loss | | | (17,273,652 | ) | | | (11,714,479 | ) | | | (9,996,043 | ) | | | (41,030,614 | ) | | | 2,568,409 | | | | 616,389 | | | | 2,012,113 | | | | (269,691 | ) | | | (787,192 | ) | |
| Net realized and unrealized gain (loss) | | | 4,985,934 | | | | (12,849,543 | ) | | | (6,605,902 | ) | | | (9,819,506 | ) | | | 2,789,392 | | | | 743,683 | | | | 2,991,162 | | | | 648,224 | | | | (75,031 | ) | |
| Net increase (decrease) in net assets resulting from operations | | $ | 3,645,580 | | | $ | (13,565,450 | ) | | $ | (7,134,325 | ) | | $ | (3,081,500 | ) | | $ | 2,680,704 | | | $ | 696,788 | | | $ | 2,607,997 | | | $ | 363,443 | | | $ | (232,889 | ) | |
| (a) Net of withholding tax of: | | $ | 2,893 | | | $ | (103 | ) | | $ | 121 | | | $ | 1,146,961 | | | $ | - | | | $ | - | | | $ | - | | | $ | - | | | $ | - | | |
| (b) Including securities lending income of: | | $ | 173,009 | | | $ | 63,754 | | | $ | 67,544 | | | $ | 256,144 | | | $ | - | | | $ | - | | | $ | - | | | $ | - | | | $ | - | | |
| (c) Includes income earned from affiliated issuers (Note 2) | | | | | | | | | | | | | | | | | | | | | | | | | | | | | | | | | | | | | |
| (d) Includes realized gain(loss) from affiliated issuers (Note 2) | | | | | | | | | | | | | | | | | | | | | | | | | | | | | | | | | | | | | |
The accompanying notes are an integral part of the financial statements.
172
173
MassMutual Select Funds – Financial Statements (Continued)
Statements of Changes in Net Assets
| | | MassMutual
Select Strategic Bond Fund | | MassMutual
Select Strategic Balanced Fund | | MassMutual
Select Diversified Value Fund | | MassMutual
Select Fundamental Value Fund | |
| | | Six Months
Ended
June 30, 2005
(Unaudited) | | Year
Ended
December 31, 2004 | | Six Months
Ended
June 30, 2005
(Unaudited) | | Year
Ended
December 31, 2004 | | Six Months
Ended
June 30, 2005
(Unaudited) | | Year
Ended
December 31, 2004 | | Six Months
Ended
June 30, 2005
(Unaudited) | | Year
Ended
December 31, 2004 | |
| Increase (Decrease) in Net Assets: | | | |
| Operations: | | | |
| Net investment income | | $ | 757,166 | | | $ | - | | | $ | 1,914,269 | | | $ | 2,293,506 | | | $ | 1,692,993 | | | $ | 974,323 | | | $ | 5,333,341 | | | $ | 9,219,026 | | |
| Net realized gain (loss) on investment transactions | | | (40,885 | ) | | | - | | | | (81,303 | ) | | | (1,548,605 | ) | | | 2,722,770 | | | | 821,137 | | | | 7,801,529 | | | | 19,127,212 | | |
| Net change in unrealized appreciation (depreciation) on investments | | | 436,617 | | | | - | | | | (2,784,250 | ) | | | 8,783,197 | | | | (2,466,765 | ) | | | 16,722,400 | | | | (7,136,419 | ) | | | 47,742,792 | | |
| Net increase (decrease) in net assets resulting from operations | | | 1,152,898 | | | | - | | | | (951,284 | ) | | | 9,528,098 | | | | 1,948,998 | | | | 18,517,860 | | | | 5,998,451 | | | | 76,089,030 | | |
| Distributions to shareholders (Note 2): | | | |
| From net investment income: | |
| Class A | | | - | | | | - | | | | - | | | | (264,227 | ) | | | - | | | | (19,944 | ) | | | - | | | | (1,710,918 | ) | |
| Class L | | | - | | | | - | | | | - | | | | (838,631 | ) | | | - | | | | (92,059 | ) | | | - | | | | (2,381,317 | ) | |
| Class Y | | | - | | | | - | | | | - | | | | (878,160 | ) | | | - | | | | (6,418 | ) | | | - | | | | (1,338,446 | ) | |
| Class S | | | - | | | | - | | | | - | | | | (120,263 | ) | | | - | | | | (856,567 | ) | | | - | | | | (3,792,393 | ) | |
| Class N | | | - | | | | - | | | | - | | | | (1,688 | ) | | | - | | | | (587 | ) | | | - | | | | (7,072 | ) | |
| Total distributions from net investment income | | | - | | | | - | | | | - | | | | (2,102,969 | ) | | | - | | | | (975,575 | ) | | | - | | | | (9,230,146 | ) | |
| From net realized gains: | |
| Class A | | | - | | | | - | | | | - | | | | - | | | | - | | | | (4,654 | ) | | | - | | | | (2,110,500 | ) | |
| Class L | | | - | | | | - | | | | - | | | | - | | | | - | | | | (18,800 | ) | | | - | | | | (2,318,723 | ) | |
| Class Y | | | - | | | | - | | | | - | | | | - | | | | - | | | | (1,253 | ) | | | - | | | | (1,164,108 | ) | |
| Class S | | | - | | | | - | | | | - | | | | - | | | | - | | | | (160,339 | ) | | | - | | | | (3,211,343 | ) | |
| Class N | | | - | | | | - | | | | - | | | | - | | | | - | | | | (171 | ) | | | - | | | | (16,326 | ) | |
| Total distributions from net realized gains | | | - | | | | - | | | | - | | | | - | | | | - | | | | (185,217 | ) | | | - | | | | (8,821,000 | ) | |
| Net fund share transactions (Note 5): | | | |
| Class A | | | 3,105,898 | | | | 101,100 | | | | 1,651,190 | | | | 32,439,167 | | | | 7,846,677 | | | | 4,568,123 | | | | 10,599,127 | | | | 71,630,668 | | |
| Class L | | | 205,920 | | | | 101,100 | | | | (2,102,453 | ) | | | 101,780,685 | | | | 927,651 | | | | 18,730,816 | | | | (28,658,084 | ) | | | 88,486,427 | | |
| Class Y | | | 4,683,700 | | | | 101,100 | | | | (4,226,705 | ) | | | 96,175,171 | | | | 1,174,728 | | | | 1,154,693 | | | | 6,753,625 | | | | 29,903,504 | | |
| Class S | | | 3,235 | | | | 49,596,100 | | | | 898,768 | | | | 2,583,995 | | | | (6,596,855 | ) | | | 158,299,209 | | | | 31,738,039 | | | | 75,728,530 | | |
| Class N | | | - | | | | 101,100 | | | | (18,926 | ) | | | 402,745 | | | | 357 | | | | 169,512 | | | | 192,537 | | | | (425,545 | ) | |
| Increase (decrease) in net assets from net fund share transactions | | | 7,998,753 | | | | 50,000,500 | | | | (3,798,126 | ) | | | 233,381,763 | | | | 3,352,558 | | | | 182,922,353 | | | | 20,625,244 | | | | 265,323,584 | | |
| Total increase (decrease) in net assets | | | 9,151,651 | | | | 50,000,500 | | | | (4,749,410 | ) | | | 240,806,892 | | | | 5,301,556 | | | | 200,279,421 | | | | 26,623,695 | | | | 323,361,468 | | |
| Net assets: | | | |
| Beginning of period | | | 50,000,500 | | | | - | | | | 250,809,392 | | | | 10,002,500 | | | | 200,279,421 | | | | - | | | | 899,583,498 | | | | 576,222,030 | | |
| End of period | | $ | 59,152,151 | | | $ | 50,000,500 | | | $ | 246,059,982 | | | $ | 250,809,392 | | | $ | 205,580,977 | | | $ | 200,279,421 | | | $ | 926,207,193 | | | $ | 899,583,498 | | |
Undistributed net investment income (distributions in excess of net investment
income) included in net assets at end of the period | | $ | 757,166 | | | $ | - | | | $ | 1,968,299 | | | $ | 54,030 | | | $ | 1,691,741 | | | $ | (1,252 | ) | | $ | 5,323,408 | | | $ | (9,933 | ) | |
The accompanying notes are an integral part of the financial statements.
174
175
MassMutual Select Funds – Financial Statements (Continued)
Statements of Changes in Net Assets
| | | MassMutual
Select Value Equity Fund | | MassMutual
Select Large Cap Value Fund | | MassMutual
Select Indexed Equity Fund | | MassMutual
Select Blue Chip Growth Fund | |
| | | Six Months
Ended
June 30, 2005
(Unaudited) | | Year
Ended
December 31, 2004 | | Six Months
Ended
June 30, 2005
(Unaudited) | | Year
Ended
December 31, 2004 | | Six Months
Ended
June 30, 2005
(Unaudited) | | Year
Ended
December 31, 2004 | | Six Months
Ended
June 30, 2005
(Unaudited) | | Year
Ended
December 31, 2004 | |
| Increase (Decrease) in Net Assets: | | | |
| Operations: | | | |
| Net investment income | | $ | 294,840 | | | $ | 846,484 | | | $ | 4,933,013 | | | $ | 6,620,803 | | | $ | 12,071,278 | | | $ | 24,496,308 | | | $ | 231,315 | | | $ | 2,417,700 | | |
| Net realized gain (loss) on investment transactions | | | 4,340,189 | | | | 11,222,033 | | | | (2,122,755 | ) | | | (6,108,167 | ) | | | 216,003 | | | | 3,424,579 | | | | (1,194,671 | ) | | | (2,091,838 | ) | |
| Net change in unrealized appreciation (depreciation) on investments | | | (4,033,708 | ) | | | (1,049,842 | ) | | | 12,402,880 | | | | 111,250,921 | | | | (29,702,697 | ) | | | 134,405,169 | | | | (9,081,461 | ) | | | 22,612,059 | | |
| Net increase (decrease) in net assets resulting from operations | | | 601,321 | | | | 11,018,675 | | | | 15,213,138 | | | | 111,763,557 | | | | (17,415,416 | ) | | | 162,326,056 | | | | (10,044,817 | ) | | | 22,937,921 | | |
| Distributions to shareholders (Note 2): | | | |
| From net investment income: | |
| Class A | | | - | | | | (169,472 | ) | | | - | | | | (1,014,178 | ) | | | - | | | | (3,299,472 | ) | | | - | | | | (142,003 | ) | |
| Class L | | | - | | | | (67,639 | ) | | | - | | | | (1,790,921 | ) | | | - | | | | (2,926,007 | ) | | | - | | | | (1,637,449 | ) | |
| Class Y | | | - | | | | (28,935 | ) | | | - | | | | (875,693 | ) | | | - | | | | (5,973,344 | ) | | | - | | | | (28,937 | ) | |
| Class S | | | - | | | | (584,018 | ) | | | - | | | | (3,246,587 | ) | | | - | | | | (10,142,244 | ) | | | - | | | | (619,898 | ) | |
| Class Z | | | - | | | | - | | | | - | | | | - | | | | - | | | | (2,131,169 | ) | | | - | | | | - | | |
| Class N | | | - | | | | (635 | ) | | | - | | | | - | | | | - | | | | (34,299 | ) | | | - | | | | (1,828 | ) | |
| Total distributions from net investment income | | | - | | | | (850,699 | ) | | | - | | | | (6,927,379 | ) | | | - | | | | (24,506,535 | ) | | | - | | | | (2,430,115 | ) | |
| From net realized gains: | |
| Class A | | | - | | | | (548,537 | ) | | | - | | | | - | | | | - | | | | - | | | | - | | | | - | | |
| Class L | | | - | | | | (161,465 | ) | | | - | | | | - | | | | - | | | | - | | | | - | | | | - | | |
| Class Y | | | - | | | | (61,060 | ) | | | - | | | | - | | | | - | | | | - | | | | - | | | | - | | |
| Class S | | | - | | | | (1,174,202 | ) | | | - | | | | - | | | | - | | | | - | | | | - | | | | - | | |
| Class N | | | - | | | | (6,158 | ) | | | - | | | | - | | | | - | | | | - | | | | - | | | | - | | |
| Total distributions from net realized gains | | | - | | | | (1,951,422 | ) | | | - | | | | - | | | | - | | | | - | | | | - | | | | - | | |
| Net fund share transactions (Note 5): | | | |
| Class A | | | 111,035 | | | | 1,933,564 | | | | 44,615,103 | | | | 89,506,909 | | | | 25,537,664 | | | | 95,380,016 | | | | 47,290 | | | | 8,673,863 | | |
| Class L | | | 414,478 | | | | 507,956 | | | | 15,226,192 | | | | 81,571,309 | | | | 15,337,909 | | | | 25,351,775 | | | | (19,047,705 | ) | | | (14,982,343 | ) | |
| Class Y | | | 940,964 | | | | (756,928 | ) | | | 19,526,573 | | | | 37,215,759 | | | | 48,419,564 | | | | 87,665,292 | | | | 204,292 | | | | 506,476 | | |
| Class S | | | (1,995,597 | ) | | | (20,621,701 | ) | | | 51,943,071 | | | | 56,014,593 | | | | (73,001,925 | ) | | | (49,166,471 | ) | | | (5,919,233 | ) | | | (16,632,777 | ) | |
| Class Z | | | - | | | | - | | | | - | | | | - | | | | 61,784,813 | | | | 82,019,664 | | | | - | | | | - | | |
| Class N | | | 1,045 | | | | (64,668 | ) | | | (426,433 | ) | | | (305,561 | ) | | | 577,581 | | | | 944,964 | | | | 11,203 | | | | 585,488 | | |
| Increase (decrease) in net assets from net fund share transactions | | | (528,075 | ) | | | (19,001,777 | ) | | | 130,884,506 | | | | 264,003,009 | | | | 78,655,606 | | | | 242,195,240 | | | | (24,704,153 | ) | | | (21,849,293 | ) | |
| Total increase (decrease) in net assets | | | 73,246 | | | | (10,785,223 | ) | | | 146,097,644 | | | | 368,839,187 | | | | 61,240,190 | | | | 380,014,761 | | | | (34,748,970 | ) | | | (1,341,487 | ) | |
| Net assets: | | | |
| Beginning of period | | | 88,097,699 | | | | 98,882,922 | | | | 1,150,711,186 | | | | 781,871,999 | | | | 1,772,528,721 | | | | 1,392,513,960 | | | | 424,698,860 | | | | 426,040,347 | | |
| End of period | | $ | 88,170,945 | | | $ | 88,097,699 | | | $ | 1,296,808,830 | | | $ | 1,150,711,186 | | | $ | 1,833,768,911 | | | $ | 1,772,528,721 | | | $ | 389,949,890 | | | $ | 424,698,860 | | |
Undistributed net investment income (distributions in excess of net investment
income) included in net assets at end of the period | | $ | 292,510 | | | $ | (2,330 | ) | | $ | 4,631,185 | | | $ | (301,828 | ) | | $ | 12,070,215 | | | $ | (1,063 | ) | | $ | 242,667 | | | $ | 11,352 | | |
The accompanying notes are an integral part of the financial statements.
176
177
MassMutual Select Funds – Financial Statements (Continued)
Statements of Changes in Net Assets
| | | MassMutual
Select Large Cap Growth Fund | | MassMutual
Select Growth Equity Fund | | MassMutual
Select Aggressive Growth Fund | | MassMutual
Select OTC 100 Fund | |
| | | Six Months
Ended
June 30, 2005
(Unaudited) | | Year
Ended
December 31, 2004 | | Six Months
Ended
June 30, 2005
(Unaudited) | | Year
Ended
December 31, 2004 | | Six Months
Ended
June 30, 2005
(Unaudited) | | Year
Ended
December 31, 2004 | | Six Months
Ended
June 30, 2005
(Unaudited) | | Year
Ended
December 31, 2004 | |
| Increase (Decrease) in Net Assets: | |
| Operations: | |
| Net investment income (loss) | | $ | (30,542 | ) | | $ | 48,938 | | | $ | 1,423,064 | | | $ | 2,232,131 | | | $ | (1,718,078 | ) | | $ | (1,410,701 | ) | | $ | (139,884 | ) | | $ | 187,039 | | |
| Net realized gain on investment transactions | | | 1,149,390 | | | | 2,786,120 | | | | 10,599,543 | | | | 10,926,294 | | | | 3,265,893 | | | | 34,983,602 | | | | 1,992,833 | | | | 6,800,537 | | |
| Net change in unrealized appreciation (depreciation) on investments | | | (1,756,245 | ) | | | (473,757 | ) | | | (13,374,720 | ) | | | 24,899,090 | | | | (13,660,709 | ) | | | 33,728,140 | | | | (7,812,367 | ) | | | (1,056,231 | ) | |
| Net increase (decrease) in net assets resulting from operations | | | (637,397 | ) | | | 2,361,301 | | | | (1,352,113 | ) | | | 38,057,515 | | | | (12,112,894 | ) | | | 67,301,041 | | | | (5,959,418 | ) | | | 5,931,345 | | |
| Distributions to shareholders (Note 2): | |
| From net investment income: | |
| Class A | | | - | | | | - | | | | - | | | | (7,167 | ) | | | - | | | | - | | | | - | | | | (34,400 | ) | |
| Class L | | | - | | | | (2,882 | ) | | | - | | | | (742,148 | ) | | | - | | | | - | | | | - | | | | (32,945 | ) | |
| Class Y | | | - | | | | (15,470 | ) | | | - | | | | (445,656 | ) | | | - | | | | - | | | | - | | | | (16,612 | ) | |
| Class S | | | - | | | | (30,738 | ) | | | - | | | | (1,053,447 | ) | | | - | | | | - | | | | - | | | | (102,326 | ) | |
| Class N | | | - | | | | - | | | | - | | | | - | | | | - | | | | - | | | | - | | | | (333 | ) | |
| Total distributions from net investment income | | | - | | | | (49,090 | ) | | | - | | | | (2,248,418 | ) | | | - | | | | - | | | | - | | | | (186,616 | ) | |
| Net fund share transactions (Note 5): | |
| Class A | | | 309,756 | | | | 507,683 | | | | (707,540 | ) | | | 9,637,983 | | | | 1,129,333 | | | | 36,845,762 | | | | (4,694,118 | ) | | | (1,044,680 | ) | |
| Class L | | | (8,564,849 | ) | | | 1,064,822 | | | | (2,112,558 | ) | | | 63,516,138 | | | | 5,289,508 | | | | 55,437,611 | | | | 1,496,281 | | | | (3,506,426 | ) | |
| Class Y | | | 523,119 | | | | 778,372 | | | | 3,048,001 | | | | 5,768,798 | | | | (1,815,567 | ) | | | 10,589,845 | | | | (1,001,638 | ) | | | (369,348 | ) | |
| Class S | | | (935,258 | ) | | | (16,038,353 | ) | | | 19,932,643 | | | | 1,632,500 | | | | (2,700,113 | ) | | | 63,375,701 | | | | (4,162,426 | ) | | | (1,954,147 | ) | |
| Class N | | | (700 | ) | | | (117,795 | ) | | | 7,579 | | | | (244,526 | ) | | | (282,240 | ) | | | 357,179 | | | | (3,560 | ) | | | 237,348 | | |
| Increase (decrease) in net assets from net fund share transactions | | | (8,667,932 | ) | | | (13,805,271 | ) | | | 20,168,125 | | | | 80,310,893 | | | | 1,620,921 | | | | 166,606,098 | | | | (8,365,461 | ) | | | (6,637,253 | ) | |
| Total increase (decrease) in net assets | | | (9,305,329 | ) | | | (11,493,060 | ) | | | 18,816,012 | | | | 116,119,990 | | | | (10,491,973 | ) | | | 233,907,139 | | | | (14,324,879 | ) | | | (892,524 | ) | |
| Net assets: | |
| Beginning of period | | | 39,116,848 | | | | 50,609,908 | | | | 844,947,160 | | | | 728,827,170 | | | | 501,289,487 | | | | 267,382,348 | | | | 75,366,096 | | | | 76,258,620 | | |
| End of period | | $ | 29,811,519 | | | $ | 39,116,848 | | | $ | 863,763,172 | | | $ | 844,947,160 | | | $ | 490,797,514 | | | $ | 501,289,487 | | | $ | 61,041,217 | | | $ | 75,366,096 | | |
Undistributed net investment income (distributions in excess of net investment
income) included in net assets at end of the period | | $ | (30,201 | ) | | $ | 341 | | | $ | 1,451,166 | | | $ | 28,102 | | | $ | (1,662,518 | ) | | $ | 55,560 | | | $ | (124,379 | ) | | $ | 15,505 | | |
The accompanying notes are an integral part of the financial statements.
178
179
MassMutual Select Funds – Financial Statements (Continued)
Statements of Changes in Net Assets
| | | MassMutual
Select Focused Value Fund | | MassMutual
Select Small Company Value Fund | | MassMutual
Select Mid Cap Growth Equity Fund | | MassMutual
Select Mid Cap Growth Equity II Fund | |
| | | Six Months
Ended
June 30, 2005
(Unaudited) | | Year
Ended
December 31, 2004 | | Six Months
Ended
June 30, 2005
(Unaudited) | | Year
Ended
December 31, 2004 | | Six Months
Ended
June 30, 2005
(Unaudited) | | Year
Ended
December 31, 2004 | | Six Months
Ended
June 30, 2005
(Unaudited) | | Year
Ended
December 31, 2004 | |
| Increase (Decrease) in Net Assets: | | | |
| Operations: | | | |
| Net investment income (loss) | | $ | (92,809 | ) | | $ | (774,089 | ) | | $ | (264,509 | ) | | $ | 890,314 | | | $ | (193,043 | ) | | $ | (548,330 | ) | | $ | (2,301,123 | ) | | $ | (4,176,803 | ) | |
| Net realized gain on investment transactions | | | 37,553,481 | | | | 50,067,377 | | | | 12,564,059 | | | | 12,283,382 | | | | 7,075,249 | | | | 15,203,589 | | | | 27,075,299 | | | | 29,582,064 | | |
| Net change in unrealized appreciation (depreciation) on investments | | | (25,183,485 | ) | | | 32,026,952 | | | | (17,982,944 | ) | | | 63,995,876 | | | | (3,612,957 | ) | | | 3,311,984 | | | | (15,631,838 | ) | | | 95,802,002 | | |
| Net increase (decrease) in net assets resulting from operations | | | 12,277,187 | | | | 81,320,240 | | | | (5,683,394 | ) | | | 77,169,572 | | | | 3,269,249 | | | | 17,967,243 | | | | 9,142,338 | | | | 121,207,263 | | |
| Distributions to shareholders (Note 2): | | | |
| From net investment income: | |
| Class L | | | - | | | | - | | | | - | | | | (120,262 | ) | | | - | | | | - | | | | - | | | | - | | |
| Class Y | | | - | | | | - | | | | - | | | | (175,961 | ) | | | - | | | | - | | | | - | | | | - | | |
| Class S | | | - | | | | - | | | | - | | | | (372,985 | ) | | | - | | | | - | | | | - | | | | - | | |
| Total distributions from net investment income | | | - | | | | - | | | | - | | | | (669,208 | ) | | | - | | | | - | | | | - | | | | - | | |
| From net realized gains: | |
| Class A | | | - | | | | (12,506,688 | ) | | | - | | | | (2,473,119 | ) | | | - | | | | - | | | | - | | | | (393,064 | ) | |
| Class L | | | - | | | | (8,907,603 | ) | | | - | | | | (2,470,417 | ) | | | - | | | | - | | | | - | | | | (760,234 | ) | |
| Class Y | | | - | | | | (5,220,816 | ) | | | - | | | | (2,216,292 | ) | | | - | | | | - | | | | - | | | | (180,956 | ) | |
| Class S | | | - | | | | (17,778,703 | ) | | | - | | | | (4,054,763 | ) | | | - | | | | - | | | | - | | | | (377,653 | ) | |
| Class N | | | - | | | | (56,883 | ) | | | - | | | | (21,083 | ) | | | - | | | | - | | | | - | | | | (2,391 | ) | |
| Total distributions from net realized gains | | | - | | | | (44,470,693 | ) | | | - | | | | (11,235,674 | ) | | | - | | | | - | | | | - | | | | (1,714,298 | ) | |
| Net fund share transactions (Note 5): | | | |
| Class A | | | 14,100,717 | | | | 60,655,442 | | | | 8,382,160 | | | | 56,861,822 | | | | (672,179 | ) | | | (12,540,756 | ) | | | 29,433,159 | | | | 88,713,877 | | |
| Class L | | | 6,336,313 | | | | 41,948,491 | | | | 1,331,285 | | | | 65,541,509 | | | | (837,098 | ) | | | (1,149,282 | ) | | | (1,888,760 | ) | | | 126,641,847 | | |
| Class Y | | | 14,063,598 | | | | 11,539,086 | | | | 2,253,155 | | | | 40,788,162 | | | | 2,809,478 | | | | (2,526,657 | ) | | | 13,268,402 | | | | 35,097,209 | | |
| Class S | | | 11,126,123 | | | | 16,626,363 | | | | (936,351 | ) | | | 83,597,462 | | | | 8,433,856 | | | | (24,942,672 | ) | | | (29,619 | ) | | | 52,462,525 | | |
| Class N | | | 813,967 | | | | 59,900 | | | | 190,615 | | | | 221,328 | | | | 4 | | | | (6,261 | ) | | | 157,232 | | | | 316,996 | | |
| Increase (decrease) in net assets from net fund share transactions | | | 46,440,718 | | | | 130,829,282 | | | | 11,220,864 | | | | 247,010,283 | | | | 9,734,061 | | | | (41,165,628 | ) | | | 40,940,414 | | | | 303,232,454 | | |
| Total increase (decrease) in net assets | | | 58,717,905 | | | | 167,678,829 | | | | 5,537,470 | | | | 312,274,973 | | | | 13,003,310 | | | | (23,198,385 | ) | | | 50,082,752 | | | | 422,725,419 | | |
| Net assets: | | | |
| Beginning of period | | | 814,601,850 | | | | 646,923,021 | | | | 522,439,135 | | | | 210,164,162 | | | | 135,287,950 | | | | 158,486,335 | | | | 919,337,585 | | | | 496,612,166 | | |
| End of period | | $ | 873,319,755 | | | $ | 814,601,850 | | | $ | 527,976,605 | | | $ | 522,439,135 | | | $ | 148,291,260 | | | $ | 135,287,950 | | | $ | 969,420,337 | | | $ | 919,337,585 | | |
Undistributed net investment income (distributions in excess of net investment
income) included in net assets at end of the period | | $ | (105,406 | ) | | $ | (12,597 | ) | | $ | 100,354 | | | $ | 364,863 | | | $ | (198,294 | ) | | $ | (5,251 | ) | | $ | (2,314,367 | ) | | $ | (13,244 | ) | |
The accompanying notes are an integral part of the financial statements.
180
181
MassMutual Select Funds – Financial Statements (Continued)
Statements of Changes in Net Assets
| | | MassMutual Select
Small Cap Growth Equity Fund | | MassMutual Select
Small Company Growth Fund | | MassMutual
Select Emerging Growth Fund | | MassMutual
Select Overseas Fund | |
| | | Six Months
Ended
June 30, 2005
(Unaudited) | | Year
Ended
December 31, 2004 | | Six Months
Ended
June 30, 2005
(Unaudited) | | Year
Ended
December 31, 2004 | | Six Months
Ended
June 30, 2005
(Unaudited) | | Year
Ended
December 31, 2004 | | Six Months
Ended
June 30, 2005
(Unaudited) | | Year
Ended
December 31, 2004 | |
| Increase (Decrease) in Net Assets: | | | |
| Operations: | | | |
| Net investment income (loss) | | $ | (1,340,354 | ) | | $ | (3,002,532 | ) | | $ | (715,907 | ) | | $ | (978,349 | ) | | $ | (528,423 | ) | | $ | (1,332,186 | ) | | $ | 6,738,006 | | | $ | 3,756,159 | | |
| Net realized gain (loss) on investment transactions | | | 22,259,586 | | | | 32,814,904 | | | | (1,135,064 | ) | | | 9,768,850 | | | | 3,390,141 | | | | 9,902,293 | | | | 31,211,108 | | | | 18,501,585 | | |
| Net change in unrealized appreciation (depreciation) on investments | | | (17,273,652 | ) | | | 28,656,659 | | | | (11,714,479 | ) | | | (10,061,006 | ) | | | (9,996,043 | ) | | | 7,850,762 | | | | (41,030,614 | ) | | | 63,293,994 | | |
| Net increase (decrease) in net assets resulting from operations | | | 3,645,580 | | | | 58,469,031 | | | | (13,565,450 | ) | | | (1,270,505 | ) | | | (7,134,325 | ) | | | 16,420,869 | | | | (3,081,500 | ) | | | 85,551,738 | | |
| Distributions to shareholders (Note 2): | | | |
| From net investment income: | |
| Class A | | | - | | | | - | | | | - | | | | - | | | | - | | | | - | | | | - | | | | (695,223 | ) | |
| Class L | | | - | | | | - | | | | - | | | | - | | | | - | | | | - | | | | - | | | | (1,215,227 | ) | |
| Class Y | | | - | | | | - | | | | - | | | | - | | | | - | | | | - | | | | - | | | | (728,998 | ) | |
| Class S | | | - | | | | - | | | | - | | | | - | | | | - | | | | - | | | | - | | | | (1,746,765 | ) | |
| Class N | | | - | | | | - | | | | - | | | | - | | | | - | | | | - | | | | - | | | | (3,216 | ) | |
| Total distributions from net investment income | | | - | | | | - | | | | - | | | | - | | | | - | | | | - | | | | - | | | | (4,389,429 | ) | |
| From net realized gains: | |
| Class A | | | - | | | | - | | | | - | | | | (4,527,130 | ) | | | - | | | | - | | | | - | | | | (2,691,500 | ) | |
| Class L | | | - | | | | - | | | | - | | | | (3,083,946 | ) | | | - | | | | - | | | | - | | | | (3,510,346 | ) | |
| Class Y | | | - | | | | - | | | | - | | | | (2,770,556 | ) | | | - | | | | - | | | | - | | | | (1,854,997 | ) | |
| Class S | | | - | | | | - | | | | - | | | | (2,007,123 | ) | | | - | | | | - | | | | - | | | | (4,183,823 | ) | |
| Class N | | | - | | | | - | | | | - | | | | (65,559 | ) | | | - | | | | - | | | | - | | | | (17,902 | ) | |
| Total distributions from net realized gains | | | - | | | | - | | | | - | | | | (12,454,314 | ) | | | - | | | | - | | | | - | | | | (12,258,568 | ) | |
| Net fund share transactions (Note 5): | | | |
| Class A | | | (2,278,527 | ) | | | 1,264,399 | | | | 15,291 | | | | 17,706,604 | | | | (1,725,735 | ) | | | (2,011,276 | ) | | | 23,901,012 | | | | 55,925,449 | | |
| Class L | | | (1,225,743 | ) | | | (5,334,295 | ) | | | (9,569,209 | ) | | | 9,969,512 | | | | (186,821 | ) | | | 7,819,542 | | | | 5,436,842 | | | | 74,933,172 | | |
| Class Y | | | 9,297,897 | | | | (5,799,059 | ) | | | (9,451,966 | ) | | | 5,761,512 | | | | 1,031,899 | | | | 858,840 | | | | 4,532,962 | | | | 9,097,215 | | |
| Class S | | | (4,578,478 | ) | | | (30,621,653 | ) | | | (2,749,236 | ) | | | 1,388,648 | | | | 1,655,653 | | | | (6,075,814 | ) | | | 30,160,851 | | | | 52,977,634 | | |
| Class N | | | 9,149 | | | | 574,453 | | | | 200,482 | | | | 24,121 | | | | 4 | | | | - | | | | 565,968 | | | | 536,759 | | |
| Increase (decrease) in net assets from net fund share transactions | | | 1,224,298 | | | | (39,916,155 | ) | | | (21,554,638 | ) | | | 34,850,397 | | | | 775,000 | | | | 591,292 | | | | 64,597,635 | | | | 193,470,229 | | |
| Total increase (decrease) in net assets | | | 4,869,878 | | | | 18,552,876 | | | | (35,120,088 | ) | | | 21,125,578 | | | | (6,359,325 | ) | | | 17,012,161 | | | | 61,516,135 | | | | 262,373,970 | | |
| Net assets: | | | |
| Beginning of period | | | 503,981,843 | | | | 485,428,967 | | | | 179,974,656 | | | | 158,849,078 | | | | 136,800,241 | | | | 119,788,080 | | | | 616,797,276 | | | | 354,423,306 | | |
| End of period | | $ | 508,851,721 | | | $ | 503,981,843 | | | $ | 144,854,568 | | | $ | 179,974,656 | | | $ | 130,440,916 | | | $ | 136,800,241 | | | $ | 678,313,411 | | | $ | 616,797,276 | | |
Undistributed net investment income (distributions in excess of net investment
income) included in net assets at end of the period | | $ | (1,351,591 | ) | | $ | (11,237 | ) | | $ | (718,195 | ) | | $ | (2,288 | ) | | $ | (532,115 | ) | | $ | (3,692 | ) | | $ | 6,129,156 | | | $ | (608,850 | ) | |
The accompanying notes are an integral part of the financial statements.
182
183
MassMutual Select Funds – Financial Statements (Continued)
Statements of Changes in Net Assets
| | | MassMutual Select
Destination Retirement Income Fund | | MassMutual Select
Destination Retirement 2010 Fund | | MassMutual Select
Destination Retirement 2020 Fund | |
| | | Six Months
Ended
June 30, 2005
(Unaudited) | | Year
Ended
December 31, 2004 | | Six Months
Ended
June 30, 2005
(Unaudited) | | Year
Ended
December 31, 2004 | | Six Months
Ended
June 30, 2005
(Unaudited) | | Year
Ended
December 31, 2004 | |
| Increase (Decrease) in Net Assets: | | | |
| Operations: | | | |
| Net investment income (loss) | | $ | (108,688 | ) | | $ | 4,573,963 | | | $ | (46,895 | ) | | $ | 581,347 | | | $ | (383,165 | ) | | $ | 3,685,629 | | |
Net realized gain on investment
transactions | | | 220,983 | | | | 2,031,405 | | | | 127,294 | | | | 184,040 | | | | 979,049 | | | | 2,413,077 | | |
Net change in unrealized appreciation
(depreciation) on investments | | | 2,568,409 | | | | 2,214,026 | | | | 616,389 | | | | 206,624 | | | | 2,012,113 | | | | 10,048,571 | | |
Net increase (decrease) in net assets
resulting from operations | | | 2,680,704 | | | | 8,819,394 | | | | 696,788 | | | | 972,011 | | | | 2,607,997 | | | | 16,147,277 | | |
| Distributions to shareholders (Note 2): | | | |
| From net investment income: | |
| Class A | | | - | | | | (303,340 | ) | | | - | | | | (120,040 | ) | | | - | | | | (373,935 | ) | |
| Class L | | | - | | | | (2,590,845 | ) | | | - | | | | (384,032 | ) | | | - | | | | (3,708,404 | ) | |
| Class Y | | | - | | | | (2,166,399 | ) | | | - | | | | (94,844 | ) | | | - | | | | (186,861 | ) | |
| Class S | | | - | | | | (31,499 | ) | | | - | | | | (41,211 | ) | | | - | | | | (226,188 | ) | |
| Class N | | | - | | | | (2,221 | ) | | | - | | | | (1,210 | ) | | | - | | | | (1,403 | ) | |
Total distributions from net
investment income | | | - | | | | (5,094,304 | ) | | | - | | | | (641,337 | ) | | | - | | | | (4,496,791 | ) | |
| From net realized gains: | |
| Class A | | | - | | | | (45,719 | ) | | | - | | | | (12,643 | ) | | | - | | | | (68,979 | ) | |
| Class L | | | - | | | | (380,246 | ) | | | - | | | | (37,888 | ) | | | - | | | | (682,191 | ) | |
| Class Y | | | - | | | | (309,594 | ) | | | - | | | | (9,341 | ) | | | - | | | | (32,535 | ) | |
| Class S | | | - | | | | (4,479 | ) | | | - | | | | (4,039 | ) | | | - | | | | (39,156 | ) | |
| Class N | | | - | | | | (414 | ) | | | - | | | | (190 | ) | | | - | | | | (370 | ) | |
Total distributions from net
realized gains | | | - | | | | (740,452 | ) | | | - | | | | (64,101 | ) | | | - | | | | (823,231 | ) | |
| Net fund share transactions (Note 5): | | | |
| Class A | | | 10,597,491 | | | | 11,433,428 | | | | 8,368,390 | | | | 6,982,968 | | | | 26,464,215 | | | | 20,664,735 | | |
| Class L | | | 6,941,804 | | | | 97,132,419 | | | | 6,175,902 | | | | 22,890,852 | | | | 3,073,444 | | | | 203,035,431 | | |
| Class Y | | | 11,515,758 | | | | 78,444,733 | | | | 21,566,650 | | | | 5,378,974 | | | | 34,331,630 | | | | 9,752,817 | | |
| Class S | | | 1,168,952 | | | | 568,729 | | | | 2,718,384 | | | | 1,659,571 | | | | 8,091,245 | | | | 11,135,664 | | |
| Class N | | | 337 | | | | 66 | | | | 12,918 | | | | 1,028 | | | | 78,368 | | | | 5,121 | | |
Increase in net assets from net fund
share transactions | | | 30,224,342 | | | | 187,579,375 | | | | 38,842,244 | | | | 36,913,393 | | | | 72,038,902 | | | | 244,593,768 | | |
| Total increase in net assets | | | 32,905,046 | | | | 190,564,013 | | | | 39,539,032 | | | | 37,179,966 | | | | 74,646,899 | | | | 255,421,023 | | |
| Net assets: | | | |
| Beginning of period | | | 191,566,513 | | | | 1,002,500 | | | | 38,182,466 | | | | 1,002,500 | | | | 256,423,523 | | | | 1,002,500 | | |
| End of period | | $ | 224,471,559 | | | $ | 191,566,513 | | | $ | 77,721,498 | | | $ | 38,182,466 | | | $ | 331,070,422 | | | $ | 256,423,523 | | |
Distributions in excess of net investment
income included in net assets at end
of the period | | $ | (109,725 | ) | | $ | (1,037 | ) | | $ | (46,954 | ) | | $ | (59 | ) | | $ | (384,548 | ) | | $ | (1,383 | ) | |
| | | MassMutual Select
Destination Retirement 2030 Fund | | MassMutual Select
Destination Retirement 2040 Fund | |
| | | Six Months
Ended
June 30, 2005
(Unaudited) | | Year
Ended
December 31, 2004 | | Six Months
Ended
June 30, 2005
(Unaudited) | | Year
Ended
December 31, 2004 | |
| Increase (Decrease) in Net Assets: | |
| Operations: | |
| Net investment income (loss) | | $ | (284,781 | ) | | $ | 1,348,692 | | | $ | (157,858 | ) | | $ | 352,784 | | |
Net realized gain on investment
transactions | | | 917,915 | | | | 1,851,099 | | | | 712,161 | | | | 1,314,493 | | |
Net change in unrealized appreciation
(depreciation) on investments | | | (269,691 | ) | | | 12,793,875 | | | | (787,192 | ) | | | 8,698,054 | | |
Net increase (decrease) in net assets
resulting from operations | | | 363,443 | | | | 15,993,666 | | | | (232,889 | ) | | | 10,365,331 | | |
| Distributions to shareholders (Note 2): | |
| From net investment income: | |
| Class A | | | - | | | | (197,990 | ) | | | - | | | | (36,253 | ) | |
| Class L | | | - | | | | (1,623,799 | ) | | | - | | | | (620,919 | ) | |
| Class Y | | | - | | | | (34,111 | ) | | | - | | | | (4,145 | ) | |
| Class S | | | - | | | | (35,648 | ) | | | - | | | | (9,699 | ) | |
| Class N | | | - | | | | (494 | ) | | | - | | | | (77 | ) | |
Total distributions from net
investment income | | | - | | | | (1,892,042 | ) | | | - | | | | (671,093 | ) | |
| From net realized gains: | |
| Class A | | | - | | | | (20,168 | ) | | | - | | | | (8,701 | ) | |
| Class L | | | - | | | | (157,884 | ) | | | - | | | | (139,558 | ) | |
| Class Y | | | - | | | | (3,018 | ) | | | - | | | | (809 | ) | |
| Class S | | | - | | | | (3,114 | ) | | | - | | | | (1,856 | ) | |
| Class N | | | - | | | | (108 | ) | | | - | | | | (154 | ) | |
Total distributions from net
realized gains | | | - | | | | (184,292 | ) | | | - | | | | (151,078 | ) | |
| Net fund share transactions (Note 5): | |
| Class A | | | 12,759,816 | | | | 19,915,421 | | | | 9,018,932 | | | | 5,857,174 | | |
| Class L | | | 1,533,629 | | | | 156,011,775 | | | | (494,644 | ) | | | 92,497,247 | | |
| Class Y | | | 11,383,050 | | | | 2,843,958 | | | | 2,388,517 | | | | 446,989 | | |
| Class S | | | 3,622,078 | | | | 3,424,692 | | | | 2,926,574 | | | | 1,004,758 | | |
| Class N | | | 20,481 | | | | 1,564 | | | | 1,855 | | | | 200 | | |
Increase in net assets from net fund
share transactions | | | 29,319,054 | | | | 182,197,410 | | | | 13,841,234 | | | | 99,806,368 | | |
| Total increase in net assets | | | 29,682,497 | | | | 196,114,742 | | | | 13,608,345 | | | | 109,349,528 | | |
| Net assets: | |
| Beginning of period | | | 197,117,242 | | | | 1,002,500 | | | | 110,352,028 | | | | 1,002,500 | | |
| End of period | | $ | 226,799,739 | | | $ | 197,117,242 | | | $ | 123,960,373 | | | $ | 110,352,028 | | |
Distributions in excess of net investment
income included in net assets at end
of the period | | $ | (285,876 | ) | | $ | (1,095 | ) | | $ | (158,518 | ) | | $ | (660 | ) | |
The accompanying notes are an integral part of the financial statements.
184
185
MassMutual Select Strategic Bond Fund – Financial Statements (Continued)
Financial Highlights (For a share outstanding throughout each period)
| | | Class A | | Class L | |
| | | Six months
ended
6/30/05
(Unaudited) | | Period ended
12/31/04+ | | Six months
ended
6/30/05
(Unaudited) | | Period ended
12/31/04+ | |
| Net asset value, beginning of period | | $ | 10.00 | | | $ | 10.00 | | | $ | 10.00 | | | $ | 10.00 | | |
| Income (loss) from investment operations: | |
| Net investment income | | | 0.15 | *** | | | - | | | | 0.15 | *** | | | - | | |
| Net realized and unrealized gain on investments | | | 0.05 | | | | - | | | | 0.07 | | | | - | | |
| Total income from investment operations | | | 0.20 | | | | - | | | | 0.22 | | | | - | | |
| Net asset value, end of period | | $ | 10.20 | | | $ | 10.00 | | | $ | 10.22 | | | $ | 10.00 | | |
| | | | | | | | | | | | | | | | | | |
| Total Return(a) | | | 2.00 | %(b)** | | | - | ‡ | | | 2.20 | %** | | | - | ‡ | |
| Ratios / Supplemental Data: | |
| Net assets, end of period (000's) | | $ | 3,276 | | | $ | 101 | | | $ | 310 | | | $ | 101 | | |
| Ratio of expenses to average daily net assets: | |
| Before expense waiver | | | 1.21 | %* | | | - | ‡ | | | 0.96 | %* | | | - | ‡ | |
| After expense waiver# | | | 1.00 | %* | | | - | ‡ | | | 0.75 | %* | | | - | ‡ | |
| Net investment income to average daily net assets | | | 3.02 | %* | | | - | ‡ | | | 3.06 | %* | | | - | ‡ | |
| Portfolio turnover rate | | | 300 | %** | | | N/A | | | | 300 | %** | | | N/A | | |
| | | Class Y | | Class S | |
| | | Six months
ended
6/30/05
(Unaudited) | | Period ended
12/31/04+ | | Six months
ended
6/30/05
(Unaudited) | | Period ended
12/31/04+ | |
| Net asset value, beginning of period | | $ | 10.00 | | | $ | 10.00 | | | $ | 10.00 | | | $ | 10.00 | | |
| Income (loss) from investment operations: | |
| Net investment income | | | 0.15 | *** | | | - | | | | 0.15 | ** | | | - | | |
| Net realized and unrealized gain on investments | | | 0.06 | | | | - | | | | 0.07 | | | | - | | |
| Total income from investment operations | | | 0.21 | | | | - | | | | 0.22 | | | | - | | |
| Net asset value, end of period | | $ | 10.21 | | | $ | 10.00 | | | $ | 10.22 | | | $ | 10.00 | | |
| | | | | | | | | | | | | | | | | | |
| Total Return(a) | | | 2.20 | %** | | | - | ‡ | | | 2.20 | %** | | | - | ‡ | |
| Ratios / Supplemental Data: | |
| Net assets, end of period (000's) | | $ | 4,789 | | | $ | 101 | | | $ | 50,675 | | | $ | 49,596 | | |
| Ratio of expenses to average daily net assets: | |
| Before expense waiver | | | 0.81 | %* | | | - | ‡ | | | 0.76 | %* | | | - | ‡ | |
| After expense waiver# | | | 0.75 | %* | | | - | ‡ | | | 0.70 | %* | | | - | ‡ | |
| Net investment income to average daily net assets | | | 3.28 | %* | | | - | ‡ | | | 2.95 | %* | | | - | ‡ | |
| Portfolio turnover rate | | | 300 | %** | | | N/A | | | | 300 | %** | | | N/A | | |
* Annualized.
** Percentage represents results for the period and are not annualized.
*** Per share amount calculated on the average shares method.
+ The Fund commenced operations on December 31, 2004.
‡ Amounts are de minimus due to the short period of operations.
# Computed after giving effect to an agreement by MassMutual to waive certain fees and expenses of the Fund for the six months ended June 30, 2005.
(a) Employee retirement benefit plans that invest plan assets in the Separate Investment Accounts (SIAs) may be subject to certain charges as set forth in their respective Plan Documents. Total return figures would be lower for the period presented if they reflected these charges.
(b) Total Return excludes a front-end sales charge and would be lower for the period presented if it reflected these charges.
The accompanying notes are an integral part of the financial statements.
186
MassMutual Select Strategic Bond Fund – Financial Statements (Continued)
Financial Highlights (For a share outstanding throughout each period)
| | | Class N | |
| | | Six months
ended
6/30/05
(Unaudited) | |
Period ended
12/31/04+ | |
| Net asset value, beginning of period | | $ | 10.00 | | | $ | 10.00 | | |
| Income (loss) from investment operations: | | | |
| Net investment income | | | 0.15 | ** | | | - | | |
| Net realized and unrealized gain on investments | | | 0.04 | | | | - | | |
| Total income from investment operations | | | 0.19 | | | | - | | |
| Net asset value, end of period | | $ | 10.19 | | | $ | 10.00 | | |
| | | | | | | | | | |
| Total Return(a) | | | 1.90 | %(b)** | | | - | ‡ | |
| Ratios / Supplemental Data: | | | |
| Net assets, end of period (000's) | | $ | 103 | | | $ | 101 | | |
| Ratio of expenses to average daily net assets: | |
| Before expense waiver | | | 1.51 | %* | | | - | ‡ | |
| After expense waiver# | | | 1.30 | %* | | | - | ‡ | |
| Net investment income to average daily net assets | | | 2.37 | %* | | | - | ‡ | |
| Portfolio turnover rate | | | 300 | %** | | | N/A | | |
* Annualized.
** Percentage represents results for the period and are not annualized.
*** Per share amount calculated on the average shares method.
+ The Fund commenced operations on December 31, 2004.
‡ Amounts are de minimus due to the short period of operations.
# Computed after giving effect to an agreement by MassMutual to waive certain fees and expenses of the Fund for the six months ended June 30, 2005.
(a) Employee retirement benefit plans that invest plan assets in the Separate Investment Accounts (SIAs) may be subject to certain charges as set forth in their respective Plan Documents. Total return figures would be lower for the period presented if they reflected these charges.
(b) Total Return excludes a contingent deferred sales charge and would be lower for the period presented if it reflected these charges.
The accompanying notes are an integral part of the financial statements.
187
MassMutual Select Strategic Balanced Fund – Financial Statements (Continued)
Financial Highlights (For a share outstanding throughout each period)
| | | Class A | |
| | | Six months
ended
6/30/05
(Unaudited)† | | Year ended
12/31/04 | | Period ended
12/31/03+ | |
| Net asset value, beginning of period | | $ | 10.45 | | | $ | 10.00 | | | $ | 10.00 | | |
| Income (loss) from investment operations: | | | |
| Net investment income | | | 0.07 | *** | | | 0.11 | *** | | | - | | |
| Net realized and unrealized gain (loss) on investments | | | (0.11 | ) | | | 0.42 | | | | - | | |
| Total income (loss) from investment operations | | | (0.04 | ) | | | 0.53 | | | | - | | |
| Less distributions to shareholders: | | | |
| From net investment income | | | - | | | | (0.08 | ) | | | - | | |
| Net asset value, end of period | | $ | 10.41 | | | $ | 10.45 | | | $ | 10.00 | | |
| Total Return(a) | | | (0.48 | )% (b)** | | | 5.34 | % (b) | | | - | ‡ | |
| Ratios / Supplemental Data: | | | |
| Net assets, end of period (000's) | | $ | 34,465 | | | $ | 32,987 | | | $ | 1 | | |
| Ratio of expenses to average daily net assets: | |
| Before expense waiver | | | 1.23 | % * | | | 1.24 | % | | | - | ‡ | |
| After expense waiver# | | | 1.21 | % * | | | 1.21 | % (c) | | | - | ‡ | |
| Net investment income to average daily net assets | | | 1.29 | % * | | | 1.10 | % | | | - | ‡ | |
| Portfolio turnover rate | | | 97 | % ** | | | 129 | % | | | N/A | | |
| | | Class L | |
| | | Six months
ended
6/30/05
(Unaudited)† | | Year ended
12/31/04 | | Period ended
12/31/03+ | |
| Net asset value, beginning of period | | $ | 10.48 | | | $ | 10.00 | | | $ | 10.00 | | |
| Income (loss) from investment operations: | | | |
| Net investment income | | | 0.08 | *** | | | 0.13 | *** | | | - | | |
| Net realized and unrealized gain (loss) on investments | | | (0.12 | ) | | | 0.43 | | | | - | | |
| Total income (loss) from investment operations | | | (0.04 | ) | | | 0.56 | | | | - | | |
| Less distributions to shareholders: | | | |
| From net investment income | | | - | | | | (0.08 | ) | | | - | | |
| Net asset value, end of period | | $ | 10.44 | | | $ | 10.48 | | | $ | 10.00 | | |
| | | | | | | | | | | | | | |
| Total Return(a) | | | (0.38 | )% ** | | | 5.62 | % | | | - | ‡ | |
| Ratios / Supplemental Data: | | | |
| Net assets, end of period (000's) | | $ | 102,486 | | | $ | 104,995 | | | $ | 1 | | |
| Ratio of expenses to average daily net assets: | |
| Before expense waiver | | | 0.98 | % * | | | 0.98 | % | | | - | ‡ | |
| After expense waiver# | | | 0.96 | % * | | | 0.96 | % (c) | | | - | ‡ | |
| Net investment income to average daily net assets | | | 1.53 | % * | | | 1.28 | % | | | - | ‡ | |
| Portfolio turnover rate | | | 97 | % ** | | | 129 | % | | | N/A | | |
* Annualized.
** Percentages represent results for the period and are not annualized.
*** Per share amount calculated on the average share method.
† Effective January 1, 2005, brokerage commissions are included with realized gain or loss on investment transactions. Prior to January 1, 2005, these amounts were presented as a reduction of expenses. Prior year amounts have not been restated to reflect this change due to immateriality. (See Note 3).
+ The Fund commenced operations on December 31, 2003.
‡ Amounts are de minimis due to the short period of operations.
# Computed after giving effect to an agreement by MassMutual to waive certain fees and expenses of the Fund for the years ended December 31, 2003 and 2004 and the six months ended June 30, 2005.
(a) Employee retirement benefit plans that invest plan assets in the Separate Investment Accounts (SIAs) may be subject to certain charges as set forth in their respective Plan Documents. Total return figures would be lower for the periods presented if they reflected these charges.
(b) Total Return excludes a front-end sales charge and would be lower for the period presented if it reflected these charges.
(c) The Fund has entered into an agreement with certain brokers to rebate a portion of brokerage commissions. The rebated commissions are used to reduce operating expenses of the Fund.
The accompanying notes are an integral part of the financial statements.
188
MassMutual Select Strategic Balanced Fund – Financial Statements (Continued)
Financial Highlights (For a share outstanding throughout each period)
| | | Class Y | |
| | | Six months
ended
6/30/05
(Unaudited)† | | Year ended
12/31/04 | | Period ended
12/31/03+ | |
| Net asset value, beginning of period | | $ | 10.48 | | | $ | 10.00 | | | $ | 10.00 | | |
| Income (loss) from investment operations: | | | |
| Net investment income | | | 0.09 | *** | | | 0.14 | *** | | | - | | |
| Net realized and unrealized gain (loss) on investments | | | (0.12 | ) | | | 0.43 | | | | - | | |
| Total income (loss) from investment operations | | | (0.03 | ) | | | 0.57 | | | | - | | |
| Less distributions to shareholders: | | | |
| From net investment income | | | - | | | | (0.09 | ) | | | - | | |
| Net asset value, end of period | | $ | 10.45 | | | $ | 10.48 | | | $ | 10.00 | | |
| | | | | | | | | | | | | | |
| Total Return(a) | | | (0.29 | )% ** | | | 5.74 | % | | | - | ‡ | |
| Ratios / Supplemental Data: | | | |
| Net assets, end of period (000's) | | $ | 94,673 | | | $ | 99,246 | | | $ | 1 | | |
| Ratio of expenses to average daily net assets: | |
| Before expense waiver | | | 0.83 | % * | | | 0.83 | % | | | - | ‡ | |
| After expense waiver# | | | 0.81 | % * | | | 0.81 | % (b) | | | - | ‡ | |
| Net investment income to average daily net assets | | | 1.68 | % * | | | 1.41 | % | | | - | ‡ | |
| Portfolio turnover rate | | | 97 | % ** | | | 129 | % | | | N/A | | |
| | | Class S | |
| | | Six months
ended
6/30/05
(Unaudited)† | | Year ended
12/31/04 | | Period ended
12/31/03+ | |
| Net asset value, beginning of period | | $ | 10.49 | | | $ | 10.00 | | | $ | 10.00 | | |
| Income (loss) from investment operations: | | | |
| Net investment income | | | 0.09 | *** | | | 0.12 | *** | | | - | | |
| Net realized and unrealized gain (loss) on investments | | | (0.12 | ) | | | 0.47 | | | | - | | |
| Total income (loss) from investment operations | | | (0.03 | ) | | | 0.59 | | | | - | | |
| Less distributions to shareholders: | | | |
| From net investment income | | | - | | | | (0.10 | ) | | | - | | |
| Net asset value, end of period | | $ | 10.46 | | | $ | 10.49 | | | $ | 10.00 | | |
| | | | | | | | | | | | | | |
| Total Return(a) | | | (0.19 | )% ** | | | 5.76 | % | | | - | ‡ | |
| Ratios / Supplemental Data: | | | |
| Net assets, end of period (000's) | | $ | 14,036 | | | $ | 13,159 | | | $ | 10,001 | | |
| Ratio of expenses to average daily net assets: | |
| Before expense waiver | | | 0.78 | % * | | | 0.84 | % | | | - | ‡ | |
| After expense waiver# | | | 0.76 | % * | | | 0.76 | % (b) | | | - | ‡ | |
| Net investment income to average daily net assets | | | 1.75 | % * | | | 1.18 | % | | | - | ‡ | |
| Portfolio turnover rate | | | 97 | % ** | | | 129 | % | | | N/A | | |
* Annualized.
** Percentages represent results for the period and are not annualized.
*** Per share amount calculated on the average share method.
† Effective January 1, 2005, brokerage commissions are included with realized gain or loss on investment transactions. Prior to January 1, 2005, these amounts were presented as a reduction of expenses. Prior year amounts have not been restated to reflect this change due to immateriality. (See Note 3).
+ The Fund commenced operations on December 31, 2003.
‡ Amounts are de minimis due to the short period of operations.
# Computed after giving effect to an agreement by MassMutual to waive certain fees and expenses of the Fund for the years ended December 31, 2003 and 2004 and the six months ended June 30, 2005.
(a) Employee retirement benefit plans that invest plan assets in the Separate Investment Accounts (SIAs) may be subject to certain charges as set forth in their respective Plan Documents. Total return figures would be lower for the periods presented if they reflected these charges.
(b) The Fund has entered into an agreement with certain brokers to rebate a portion of brokerage commissions. The rebated commissions are used to reduce operating expenses of the Fund.
The accompanying notes are an integral part of the financial statements.
189
MassMutual Select Strategic Balanced Fund – Financial Statements (Continued)
Financial Highlights (For a share outstanding throughout each period)
| | | Class N | |
| | | Six months
ended
6/30/05
(Unaudited)† | | Year ended
12/31/04 | | Period ended
12/31/03+ | |
| Net asset value, beginning of period | | $ | 10.46 | | | $ | 10.00 | | | $ | 10.00 | | |
| Income (loss) from investment operations: | |
| Net investment income | | | 0.05 | *** | | | 0.08 | *** | | | - | | |
| Net realized and unrealized gain (loss) on investments | | | (0.11 | ) | | | 0.42 | | | | - | | |
| Total income (loss) from investment operations | | | (0.06 | ) | | | 0.50 | | | | - | | |
| Less distributions to shareholders: | |
| From net investment income | | | - | | | | (0.04 | ) | | | - | | |
| Net asset value, end of period | | $ | 10.40 | | | $ | 10.46 | | | $ | 10.00 | | |
| | | | | | | | | | | | | | |
| Total Return(a) | | | (0.57 | )% (b)** | | | 5.02 | % (b) | | | - | ‡ | |
| Ratios / Supplemental Data: | |
| Net assets, end of period (000's) | | $ | 401 | | | $ | 422 | | | $ | 1 | | |
| Ratio of expenses to average daily net assets: | |
| Before expense waiver | | | 1.53 | % * | | | 1.55 | % | | | - | ‡ | |
| After expense waiver# | | | 1.51 | % * | | | 1.51 | % (c) | | | - | ‡ | |
| Net investment income to average daily net assets | | | 0.98 | % * | | | 0.78 | % | | | - | ‡ | |
| Portfolio turnover rate | | | 97 | % ** | | | 129 | % | | | N/A | | |
* Annualized.
** Percentages represent results for the period and are not annualized.
*** Per share amount calculated on the average share method.
† Effective January 1, 2005, brokerage commissions are included with realized gain or loss on investment transactions. Prior to January 1, 2005, these amounts were presented as a reduction of expenses. Prior year amounts have not been restated to reflect this change due to immateriality. (See Note 3).
+ The Fund commenced operations on December 31, 2003.
‡ Amounts are de minimis due to the short period of operations.
# Computed after giving effect to an agreement by MassMutual to waive certain fees and expenses of the Fund for the years ended December 31, 2003 and 2004 and the six months ended June 30, 2005.
(a) Employee retirement benefit plans that invest plan assets in the Separate Investment Accounts (SIAs) may be subject to certain charges as set forth in their respective Plan Documents. Total return figures would be lower for the periods presented if they reflected these charges.
(b) Total Return excludes a contingent deferred sales charge and would be lower for the period presented if it reflected these charges.
(c) The Fund has entered into an agreement with certain brokers to rebate a portion of brokerage commissions. The rebated commissions are used to reduce operating expenses of the Fund.
The accompanying notes are an integral part of the financial statements.
190
MassMutual Select Diversified Value Fund – Financial Statements (Continued)
Financial Highlights (For a share outstanding throughout each period)
| | | Class A | | Class L | |
| | | Six months
ended
6/30/05
(Unaudited) | | Period ended
12/31/04† | | Six months
ended
6/30/05
(Unaudited) | | Period ended
12/31/04† | |
| Net asset value, beginning of period | | $ | 10.93 | | | $ | 10.00 | | | $ | 10.93 | | | $ | 10.00 | | |
| Income (loss) from investment operations: | | | |
| Net investment income | | | 0.07 | *** | | | 0.04 | *** | | | 0.08 | *** | | | 0.05 | *** | |
| Net realized and unrealized gain on investments | | | 0.02 | | | | 0.94 | | | | 0.03 | | | | 0.94 | | |
| Total income from investment operations | | | 0.09 | | | | 0.98 | | | | 0.11 | | | | 0.99 | | |
| Less distributions to shareholders: | | | |
| From net investment income | | | - | | | | (0.04 | ) | | | - | | | | (0.05 | ) | |
| From net realized gains | | | - | | | | (0.01 | ) | | | - | | | | (0.01 | ) | |
| Total distributions | | | - | | | | (0.05 | ) | | | - | | | | (0.06 | ) | |
| Net asset value, end of period | | $ | 11.02 | | | $ | 10.93 | | | $ | 11.04 | | | $ | 10.93 | | |
| | | | | | | | | | | | | | | | | | |
| Total Return(a) | | | 0.91 | %**(b) | | | 9.83 | % **(b) | | | 0.91 | %** | | | 9.99 | % ** | |
| Ratios / Supplemental Data: | | | |
| Net assets, end of period (000's) | | $ | 13,010 | | | $ | 4,998 | | | $ | 21,599 | | | $ | 20,480 | | |
| Ratio of expenses to average daily net assets: | |
| Before expense waiver | | | 1.09 | %* | | | 1.15 | % * | | | 0.80 | %* | | | 0.86 | % * | |
| After expense waiver# | | | N/A | | | | 1.09 | % * | | | N/A | | | | 0.80 | % * | |
| Net investment income to average daily net assets | | | 1.26 | %* | | | 1.99 | % * | | | 1.54 | %* | | | 2.28 | % * | |
| Portfolio turnover rate | | | 12 | %** | | | 5 | % ** | | | 12 | %** | | | 5 | % ** | |
| | | Class Y | | Class S | |
| | | Six months
ended
6/30/05
(Unaudited) | | Period ended
12/31/04† | | Six months
ended
6/30/05
(Unaudited) | | Period ended
12/31/04† | |
| Net asset value, beginning of period | | $ | 10.93 | | | $ | 10.00 | | | $ | 10.94 | | | $ | 10.00 | | |
| Income (loss) from investment operations: | | | |
| Net investment income | | | 0.09 | *** | | | 0.05 | *** | | | 0.09 | *** | | | 0.06 | *** | |
| Net realized and unrealized gain on investments | | | 0.03 | | | | 0.94 | | | | 0.02 | | | | 0.94 | | |
| Total income from investment operations | | | 0.12 | | | | 0.99 | | | | 0.11 | | | | 1.00 | | |
| Less distributions to shareholders: | | | |
| From net investment income | | | - | | | | (0.05 | ) | | | - | | | | (0.05 | ) | |
| From net realized gains | | | - | | | | (0.01 | ) | | | - | | | | (0.01 | ) | |
| Total distributions | | | - | | | | (0.06 | ) | | | - | | | | (0.06 | ) | |
| Net asset value, end of period | | $ | 11.05 | | | $ | 10.93 | | | $ | 11.05 | | | $ | 10.94 | | |
| | | | | | | | | | | | | | | | | | |
| Total Return(a) | | | 1.10 | %** | | | 9.91 | % ** | | | 1.01 | %** | | | 10.03 | % ** | |
| Ratios / Supplemental Data: | | | |
| Net assets, end of period (000's) | | $ | 2,445 | | | $ | 1,273 | | | $ | 168,338 | | | $ | 173,341 | | |
| Ratio of expenses to average daily net assets: | |
| Before expense waiver | | | 0.69 | %* | | | 0.75 | % * | | | 0.59 | %* | | | 0.65 | % * | |
| After expense waiver# | | | N/A | | | | 0.69 | % * | | | N/A | | | | 0.59 | % * | |
| Net investment income to average daily net assets | | | 1.61 | %* | | | 2.39 | % * | | | 1.75 | %* | | | 2.49 | % * | |
| Portfolio turnover rate | | | 12 | %** | | | 5 | % ** | | | 12 | %** | | | 5 | % ** | |
* Annualized.
** Percentages represent results for the period and are not annualized.
*** Per share amount calculated on the average share method.
† For the period from October 15, 2004 (commencement of operations) through December 31, 2004.
# Computed after giving effect to an agreement by MassMutual to waive certain fees and expense of the Fund for the period October 15, 2004 through December 31, 2004.
(a) Employee retirement benefit plans that invest plan assets in the Separate Investment Accounts (SIAs) may be subject to certain charges as set forth in their respective Plan Documents. Total return figures would be lower for the period presented if they reflected these charges.
(b) Total return excludes a front end sales charge for Class A and a contingent deferred sales charge for Class N and would be lower for the period presented if they reflected these charges.
The accompanying notes are an integral part of the financial statements.
191
MassMutual Select Diversified Value Fund – Financial Statements (Continued)
Financial Highlights (For a share outstanding throughout each period)
| | | Class N | |
| | | Six months
ended
6/30/05
(Unaudited) | |
Period ended
12/31/04† | |
| Net asset value, beginning of period | | $ | 10.94 | | | $ | 10.00 | | |
| Income (loss) from investment operations: | | | |
| Net investment income | | | 0.05 | *** | | | 0.04 | *** | |
| Net realized and unrealized gain on investments | | | 0.02 | | | | 0.94 | | |
| Total income from investment operations | | | 0.07 | | | | 0.98 | | |
| Less distributions to shareholders: | | | |
| From net investment income | | | - | | | | (0.03 | ) | |
| From net realized gains | | | - | | | | (0.01 | ) | |
| Total distributions | | | - | | | | (0.04 | ) | |
| Net asset value, end of period | | $ | 11.01 | | | $ | 10.94 | | |
| Total Return(a) | | | 0.64 | %**(b) | | | 9.84 | % **(b) | |
| Ratios / Supplemental Data: | | | |
| Net assets, end of period (000's) | | $ | 189 | | | $ | 187 | | |
| Ratio of expenses to average daily net assets: | |
| Before expense waiver | | | 1.40 | %* | | | 1.46 | % * | |
| After expense waiver# | | | N/A | | | | 1.40 | % * | |
| Net investment income to average daily net assets | | | 0.94 | %* | | | 1.63 | % * | |
| Portfolio turnover rate | | | 12 | %** | | | 5 | % ** | |
* Annualized.
** Percentages represent results for the period and are not annualized.
*** Per share amount calculated on the average share method.
† For the period from October 15, 2004 (commencement of operations) through December 31, 2004.
# Computed after giving effect to an agreement by MassMutual to waive certain fees and expenses of the Fund for the period October 15, 2004 through December 31, 2004.
(a) Employee retirement benefit plans that invest plan assets in the Separate Investment Accounts (SIAs) may be subject to certain charges as set forth in their respective Plan Documents. Total return figures would be lower for the period presented if they reflected these charges.
(b) Total return excludes a front end sales charge for Class A and a contingent deferred sales charge for Class N and would be lower for the period presented if they reflected these charges.
The accompanying notes are an integral part of the financial statements.
192
MassMutual Select Fundamental Value Fund – Financial Statements (Continued)
Financial Highlights (For a share outstanding throughout each period)
| | | Class A | |
| | | Six months
ended
6/30/05
(Unaudited)† | | Year ended
12/31/04 | | Year ended
12/31/03 | | Year ended
12/31/02 | | Period ended
12/31/01+ | |
| Net asset value, beginning of period | | $ | 10.75 | | | $ | 10.01 | | | $ | 7.79 | | | $ | 10.00 | | | $ | 10.00 | | |
| Income (loss) from investment operations: | | | |
| Net investment income | | | 0.05 | *** | | | 0.10 | *** | | | 0.10 | *** | | | 0.08 | *** | | | - | | |
| Net realized and unrealized gain (loss) on investments | | | 0.00 | †† | | | 0.84 | | | | 2.19 | | | | (2.25 | ) | | | - | | |
| Total income (loss) from investment operations | | | 0.05 | | | | 0.94 | | | | 2.29 | | | | (2.17 | ) | | | - | | |
| Less distributions to shareholders: | | | |
| From net investment income | | | - | | | | (0.09 | ) | | | (0.07 | ) | | | (0.04 | ) | | | - | | |
| From net realized gains | | | - | | | | (0.11 | ) | | | - | | | | - | | | | - | | |
| Total distributions | | | - | | | | (0.20 | ) | | | (0.07 | ) | | | (0.04 | ) | | | - | | |
| Net asset value, end of period | | $ | 10.80 | | | $ | 10.75 | | | $ | 10.01 | | | $ | 7.79 | | | $ | 10.00 | | |
| Total Return(a) | | | 0.47 | %**(c) | | | 9.34 | % (c) | | | 29.43 | % | | | (21.67 | )% | | | - | | |
| Ratios / Supplemental Data: | | | |
| Net assets, end of period (000's) | | $ | 226,540 | | | $ | 214,886 | | | $ | 129,552 | | | $ | 37,973 | | | $ | 1 | | |
| Ratio of expenses to average daily net assets: | |
| Before expense waiver | | | 1.23 | %* | | | 1.23 | % | | | 1.24 | % | | | 1.27 | % | | | - | | |
| After expense waiver# | | | N/A | | | | 1.22 | % (b) | | | 1.22 | % (b) | | | 1.20 | % (b) | | | - | | |
| Net investment income to average daily net assets | | | 0.90 | %* | | | 0.96 | % | | | 1.18 | % | | | 1.00 | % | | | - | | |
| Portfolio turnover rate | | | 16 | %** | | | 31 | % | | | 28 | % | | | 38 | % | | | N/A | | |
| | | Class L | |
| | | Six months
ended
6/30/05
(Unaudited)† | | Year ended
12/31/04 | | Year ended
12/31/03 | | Year ended
12/31/02 | | Period ended
12/31/01+ | |
| Net asset value, beginning of period | | $ | 10.78 | | | $ | 10.03 | | | $ | 7.81 | | | $ | 10.00 | | | $ | 10.00 | | |
| Income (loss) from investment operations: | | | |
| Net investment income | | | 0.06 | *** | | | 0.12 | *** | | | 0.13 | *** | | | 0.10 | *** | | | - | | |
| Net realized and unrealized gain (loss) on investments | | | 0.00 | †† | | | 0.85 | | | | 2.18 | | | | (2.24 | ) | | | - | | |
| Total income (loss) from investment operations | | | 0.06 | | | | 0.97 | | | | 2.31 | | | | (2.14 | ) | | | - | | |
| Less distributions to shareholders: | | | |
| From net investment income | | | - | | | | (0.11 | ) | | | (0.09 | ) | | | (0.05 | ) | | | - | | |
| From net realized gains | | | - | | | | (0.11 | ) | | | - | | | | - | | | | - | | |
| Total distributions | | | - | | | | (0.22 | ) | | | (0.09 | ) | | | (0.05 | ) | | | - | | |
| Net asset value, end of period | | $ | 10.84 | | | $ | 10.78 | | | $ | 10.03 | | | $ | 7.81 | | | $ | 10.00 | | |
| Total Return(a) | | | 0.56 | %** | | | 9.65 | % | | | 29.56 | % | | | (21.40 | )% | | | - | | |
| Ratios / Supplemental Data: | | | |
| Net assets, end of period (000's) | | $ | 209,662 | | | $ | 236,583 | | | $ | 133,178 | | | $ | 44,235 | | | $ | 1 | | |
| Ratio of expenses to average daily net assets: | |
| Before expense waiver | | | 0.98 | %* | | | 0.98 | % | | | 0.99 | % | | | 1.02 | % | | | - | | |
| After expense waiver# | | | N/A | | | | 0.97 | % (b) | | | 0.97 | % (b) | | | 0.95 | % (b) | | | - | | |
| Net investment income to average daily net assets | | | 1.17 | %* | | | 1.21 | % | | | 1.44 | % | | | 1.24 | % | | | - | | |
| Portfolio turnover rate | | | 16 | %** | | | 31 | % | | | 28 | % | | | 38 | % | | | N/A | | |
* Annualized.
** Percentages represent results for the period and are not annualized.
*** Per share amount calculated on the average shares method.
† Effective January 1, 2005, brokerage commissions are included with realized gain or loss on investment transactions. Prior to January 1, 2005, these amounts were presented as a reduction of expenses. Prior year amounts have not been restated to reflect this change due to immateriality. (see Note 3)
†† Net realized and unrealized gain on investments is less than $.01 per share.
+ The Fund commenced operations on December 31, 2001.
# Computed after giving effect to an agreement by MassMutual to waive certain fees and expenses of the Fund for the year ended December 31, 2002.
(a) Employee benefit plans that invest plan assets in the Separate Investment Accounts (SIAs) may be subject to certain charges as set forth in their respective Plan Documents. Total return figures would be lower for the periods presented if they reflected these charges.
(b) The Fund has entered into an agreement with certain brokers to rebate a portion of brokerage commissions. The rebated commissions are used to reduce operating expenses of the Fund.
(c) Total Return excludes a front-end sales charge and would be lower for the periods presented if it reflected these charges.
The accompanying notes are an integral part of the financial statements.
193
MassMutual Select Fundamental Value Fund – Financial Statements (Continued)
Financial Highlights (For a share outstanding throughout each period)
| | | Class Y | |
| | | Six months
ended
6/30/05
(Unaudited)† | | Year ended
12/31/04 | | Year ended
12/31/03 | | Year ended
12/31/02 | | Period ended
12/31/01+ | |
| Net asset value, beginning of period | | $ | 10.78 | | | $ | 10.03 | | | $ | 7.80 | | | $ | 10.00 | | | $ | 10.00 | | |
| Income (loss) from investment operations: | | | |
| Net investment income | | | 0.07 | *** | | | 0.14 | *** | | | 0.14 | *** | | | 0.12 | *** | | | - | | |
| Net realized and unrealized gain (loss) on investments | | | 0.01 | | | | 0.84 | | | | 2.19 | | | | (2.26 | ) | | | - | | |
| Total income (loss) from investment operations | | | 0.08 | | | | 0.98 | | | | 2.33 | | | | (2.14 | ) | | | - | | |
| Less distributions to shareholders: | | | |
| From net investment income | | | - | | | | (0.12 | ) | | | (0.10 | ) | | | (0.06 | ) | | | - | | |
| From net realized gains | | | - | | | | (0.11 | ) | | | - | | | | - | | | | - | | |
| Total distributions | | | - | | | | (0.23 | ) | | | (0.10 | ) | | | (0.06 | ) | | | - | | |
| Net asset value, end of period | | $ | 10.86 | | | $ | 10.78 | | | $ | 10.03 | | | $ | 7.80 | | | $ | 10.00 | | |
| Total Return(a) | | | 0.74 | %** | | | 9.78 | % | | | 29.82 | % | | | (21.41 | )% | | | - | | |
| Ratios / Supplemental Data: | | | |
| Net assets, end of period (000's) | | $ | 128,268 | | | $ | 120,769 | | | $ | 82,989 | | | $ | 40,511 | | | $ | 1 | | |
| Ratio of expenses to average daily net assets: | |
| Before expense waiver | | | 0.83 | %* | | | 0.83 | % | | | 0.84 | % | | | 0.87 | % | | | - | | |
| After expense waiver# | | | N/A | | | | 0.82 | % (b) | | | 0.82 | % (b) | | | 0.81 | % (b) | | | - | | |
| Net investment income to average daily net assets | | | 1.29 | %* | | | 1.35 | % | | | 1.60 | % | | | 1.44 | % | | | - | | |
| Portfolio turnover rate | | | 16 | %** | | | 31 | % | | | 28 | % | | | 38 | % | | | N/A | | |
| | | Class S | |
| | | Six months
ended
6/30/05
(Unaudited)† | | Year ended
12/31/04 | | Year ended
12/31/03 | | Year ended
12/31/02 | | Period ended
12/31/01+ | |
| Net asset value, beginning of period | | $ | 10.80 | | | $ | 10.05 | | | $ | 7.81 | | | $ | 10.00 | | | $ | 10.00 | | |
| Income (loss) from investment operations: | | | |
| Net investment income | | | 0.07 | *** | | | 0.14 | *** | | | 0.14 | *** | | | 0.12 | *** | | | - | | |
| Net realized and unrealized gain (loss) on investments | | | 0.00 | †† | | | 0.85 | | | | 2.20 | | | | (2.25 | ) | | | - | | |
| Total income (loss) from investment operations | | | 0.07 | | | | 0.99 | | | | 2.34 | | | | (2.13 | ) | | | - | | |
| Less distributions to shareholders: | | | |
| From net investment income | | | - | | | | (0.13 | ) | | | (0.10 | ) | | | (0.06 | ) | | | - | | |
| From net realized gains | | | - | | | | (0.11 | ) | | | - | | | | - | | | | - | | |
| Total distributions | | | - | | | | (0.24 | ) | | | (0.10 | ) | | | (0.06 | ) | | | - | | |
| Net asset value, end of period | | $ | 10.87 | | | $ | 10.80 | | | $ | 10.05 | | | $ | 7.81 | | | $ | 10.00 | | |
| Total Return(a) | | | 0.74 | %** | | | 9.80 | % | | | 29.97 | % | | | (21.35 | )% | | | - | | |
| Ratios / Supplemental Data: | | | |
| Net assets, end of period (000's) | | $ | 359,894 | | | $ | 325,701 | | | $ | 228,535 | | | $ | 101,228 | | | $ | 10,001 | | |
| Ratio of expenses to average daily net assets: | |
| Before expense waiver | | | 0.79 | %* | | | 0.79 | % | | | 0.80 | % | | | 0.83 | % | | | - | | |
| After expense waiver# | | | N/A | | | | 0.78 | % (b) | | | 0.78 | % (b) | | | 0.77 | % (b) | | | - | | |
| Net investment income to average daily net assets | | | 1.33 | %* | | | 1.40 | % | | | 1.63 | % | | | 1.36 | % | | | - | | |
| Portfolio turnover rate | | | 16 | %** | | | 31 | % | | | 28 | % | | | 38 | % | | | N/A | | |
* Annualized
** Percentages represent results for the period and are not annualized.
*** Per share amount calculated on the average shares method.
† Effective January 1, 2005, brokerage commissions are included with realized gain or loss on investment transactions. Prior to January 1, 2005, these amounts were presented as a reduction of expenses. Prior year amounts have not been restated to reflect this change due to immateriality. (see Note 3)
†† Net realized and unrealized gain on investments is less than $.01 per share.
+ The Fund commenced operations on December 31, 2001.
# Computed after giving effect to an agreement by MassMutual to waive certain fees and expenses of the Fund for the year ended December 31, 2002.
(a) Employee benefit plans that invest plan assets in the Separate Investment Accounts (SIAs) may be subject to certain charges as set forth in their respective Plan Documents. Total return figures would be lower for the periods presented if they reflected these charges.
(b) The Fund has entered into an agreement with certain brokers to rebate a portion of brokerage commissions. The rebated commissions are used to reduce operating expenses of the Fund.
The accompanying notes are an integral part of the financial statements.
194
MassMutual Select Fundamental Value Fund – Financial Statements (Continued)
Financial Highlights (For a share outstanding throughout each period)
| | | Class N | |
| | | Six months
ended
6/30/05
(Unaudited)† | | Year ended
12/31/04 | | Year ended
12/31/03 | | Period ended
12/31/02++ | |
| Net asset value, beginning of period | | $ | 10.69 | | | $ | 9.94 | | | $ | 7.76 | | | $ | 7.76 | | |
| Income (loss) from investment operations: | |
| Net investment income (loss) | | | 0.03 | *** | | | 0.07 | *** | | | 0.08 | *** | | | (0.00 | )***†† | |
| Net realized and unrealized gain (loss) on investments | | | 0.00 | †† | | | 0.84 | | | | 2.17 | | | | (0.00 | )†† | |
| Total income (loss) from investment operations | | | 0.03 | | | | 0.91 | | | | 2.25 | | | | (0.00 | ) | |
| Less distributions to shareholders: | |
| From net investment income | | | - | | | | (0.05 | ) | | | (0.07 | ) | | | - | | |
| From net realized gains | | | - | | | | (0.11 | ) | | | - | | | | - | | |
| Total distributions | | | - | | | | (0.16 | ) | | | (0.07 | ) | | | - | | |
| Net asset value, end of period | | $ | 10.72 | | | $ | 10.69 | | | $ | 9.94 | | | $ | 7.76 | | |
| | | | | | | | | | | | | | | | | | |
| Total Return(a) | | | 0.28 | %**(c) | | | 9.10 | % (c) | | | 29.03 | % (c) | | | - | ‡ | |
| Ratios / Supplemental Data: | |
| Net assets, end of period (000's) | | $ | 1,843 | | | $ | 1,644 | | | $ | 1,968 | | | $ | 101 | | |
| Ratio of expenses to average daily net assets: | |
| Before expense waiver | | | 1.53 | %* | | | 1.53 | % | | | 1.54 | % | | | - | ‡ | |
| After expense waiver | | | N/A | | | | 1.52 | % (b) | | | 1.52 | % (b) | | | - | ‡ | |
| Net investment income to average daily net assets | | | 0.59 | %* | | | 0.65 | % | | | 0.83 | % | | | - | ‡ | |
| Portfolio turnover rate | | | 16 | %** | | | 31 | % | | | 28 | % | | | 38 | % | |
* Annualized
** Percentages represent results for the period and are not annualized.
*** Per share amount calculated on the average shares method.
† Effective January 1, 2005, brokerage commissions are included with realized gain or loss on investment transactions. Prior to January 1, 2005, these amounts were presented as a reduction of expenses. Prior year amounts have not been restated to reflect this change due to immateriality. (see Note 3)
†† Net investment loss and net realized and unrealized gain(loss) on investments are less than $0.01 per share.
++ Class N commenced operations on December 31, 2002.
‡ Amounts are de minimis due to the short period of operations.
(a) Employee benefit plans that invest plan assets in the Separate Investment Accounts (SIAs) may be subject to certain charges as set forth in their respective Plan Documents. Total return figures would be lower for the periods presented if they reflected these charges.
(b) The Fund has entered into an agreement with certain brokers to rebate a portion of brokerage commissions. The rebated commissions are used to reduce operating expenses of the Fund.
(c) Total Return excludes contingent deferred sales charge and would be lower for the periods presented if they reflected these charges.
The accompanying notes are an integral part of the financial statements.
195
MassMutual Select Value Equity Fund – Financial Statements (Continued)
Financial Highlights (For a share outstanding throughout each period)
| | | Class A | |
| | | Six months
ended
6/30/05
(Unaudited)† | | Year ended
12/31/04 | | Year ended
12/31/03 | | Year ended
12/31/02 | | Period ended
12/31/01+ | |
| Net asset value, beginning of period | | $ | 10.48 | | | $ | 9.55 | | | $ | 7.66 | | | $ | 9.34 | | | $ | 10.00 | | |
| Income (loss) from investment operations: | | | |
| Net investment income | | | 0.02 | *** | | | 0.07 | *** | | | 0.08 | *** | | | 0.07 | *** | | | 0.04 | *** | |
| Net realized and unrealized gain (loss) on investments | | | 0.06 | | | | 1.16 | | | | 1.91 | | | | (1.68 | ) | | | (0.67 | ) | |
| Total income (loss) from investment operations | | | 0.08 | | | | 1.23 | | | | 1.99 | | | | (1.61 | ) | | | (0.63 | ) | |
| Less distributions to shareholders: | | | |
| From net investment income | | | - | | | | (0.07 | ) | | | (0.10 | ) | | | (0.07 | ) | | | (0.03 | ) | |
| From net realized gains | | | - | | | | (0.23 | ) | | | - | | | | - | | | | - | | |
| Total distributions | | | - | | | | (0.30 | ) | | | (0.10 | ) | | | (0.07 | ) | | | (0.03 | ) | |
| Net asset value, end of period | | $ | 10.56 | | | $ | 10.48 | | | $ | 9.55 | | | $ | 7.66 | | | $ | 9.34 | | |
| | | | | | | | | | | | | | | | | | | | | | |
| Total Return(a) | | | 0.76 | %(c)** | | | 12.91 | % (c) | | | 25.96 | % | | | (17.28 | )% | | | (6.29 | )% ** | |
| Ratios / Supplemental Data: | | | |
| Net assets, end of period (000's) | | $ | 25,793 | | | $ | 25,523 | | | $ | 21,341 | | | $ | 15,852 | | | $ | 8,881 | | |
| Ratio of expenses to average daily net assets: | |
| Before expense waiver | | | 1.30 | %* | | | 1.33 | % | | | 1.29 | % | | | 1.30 | % | | | 1.29 | % * | |
| After expense waiver# | | | N/A | | | | 1.29 | % (b) | | | 1.27 | % (b) | | | 1.29 | % | | | 1.29 | % * | |
| Net investment income to average daily net assets | | | 0.38 | %* | | | 0.69 | % | | | 0.99 | % | | | 0.79 | % | | | 0.65 | % * | |
| Portfolio turnover rate | | | 51 | %** | | | 161 | % | | | 66 | % | | | 105 | % | | | 62 | % ** | |
| | | Class L | |
| | | Six months
ended
6/30/05
(Unaudited)† | | Year ended
12/31/04 | | Year ended
12/31/03 | | Year ended
12/31/02 | | Period ended
12/31/01+ | |
| Net asset value, beginning of period | | $ | 10.50 | | | $ | 9.57 | | | $ | 7.67 | | | $ | 9.34 | | | $ | 10.00 | | |
| Income (loss) from investment operations: | | | |
| Net investment income | | | 0.03 | *** | | | 0.09 | *** | | | 0.10 | *** | | | 0.09 | *** | | | 0.05 | *** | |
| Net realized and unrealized gain (loss) on investments | | | 0.06 | | | | 1.17 | | | | 1.92 | | | | (1.67 | ) | | | (0.67 | ) | |
| Total income (loss) from investment operations | | | 0.09 | | | | 1.26 | | | | 2.02 | | | | (1.58 | ) | | | (0.62 | ) | |
| Less distributions to shareholders: | | | |
| From net investment income | | | - | | | | (0.10 | ) | | | (0.12 | ) | | | (0.09 | ) | | | (0.04 | ) | |
| From net realized gains | | | - | | | | (0.23 | ) | | | - | | | | - | | | | - | | |
| Total distributions | | | - | | | | (0.33 | ) | | | (0.12 | ) | | | (0.09 | ) | | | (0.04 | ) | |
| Net asset value, end of period | | $ | 10.59 | | | $ | 10.50 | | | $ | 9.57 | | | $ | 7.67 | | | $ | 9.34 | | |
| | | | | | | | | | | | | | | | | | | | | | |
| Total Return(a) | | | 0.86 | %** | | | 13.16 | % | | | 26.34 | % | | | (16.97 | )% | | | (6.21 | )% ** | |
| Ratios / Supplemental Data: | | | |
| Net assets, end of period (000's) | | $ | 7,928 | | | $ | 7,461 | | | $ | 6,313 | | | $ | 4,727 | | | $ | 2,658 | | |
| Ratio of expenses to average daily net assets: | |
| Before expense waiver | | | 1.05 | %* | | | 1.08 | % | | | 1.04 | % | | | 1.05 | % | | | 1.05 | % * | |
| After expense waiver# | | | N/A | | | | 1.04 | % (b) | | | 1.02 | % (b) | | | 1.04 | % | | | 1.04 | % * | |
| Net investment income to average daily net assets | | | 0.63 | %* | | | 0.94 | % | | | 1.24 | % | | | 1.07 | % | | | 0.87 | % * | |
| Portfolio turnover rate | | | 51 | %** | | | 161 | % | | | 66 | % | | | 105 | % | | | 62 | % ** | |
* Annualized.
** Percentages represent results for the period and are not annualized.
*** Per share amount calculated on the average shares method.
† Effective January 1, 2005, brokerage commissions are included with realized gain or loss on investment transactions. Prior to January 1, 2005, these amounts were presented as a reduction of expenses. Prior year amounts have not been restated to reflect this change due to immateriality. (See Note 3)
+ For the period from May 1, 2001 (commencement of operations) through December 31, 2001.
# Computed after giving effect to an agreement by MassMutual to waive certain fees and expenses of the Fund for the period October 1, 2001 through December 31, 2001 and for the year ended December 31, 2002.
(a) Employee retirement benefit plans that invest plan assets in the Separate Investment Accounts (SIAs) may be subject to certain charges as set forth in their Plan Documents. Total return figures would be lower for the periods presented if they reflected these charges.
(b) The Fund has entered into an agreement with certain brokers to rebate a portion of brokerage commissions. The rebated commissions are used to reduce operating expenses of the Fund.
(c) Total Return excludes a front-end sales charge and would be lower for the periods presented if it reflected these charges.
The accompanying notes are an integral part of the financial statements.
196
MassMutual Select Value Equity Fund – Financial Statements (Continued)
Financial Highlights (For a share outstanding throughout each period)
| | | Class Y | |
| | | Six months
ended
6/30/05
(Unaudited)† | | Year ended
12/31/04 | | Year ended
12/31/03 | | Year ended
12/31/02 | | Period ended
12/31/01+ | |
| Net asset value, beginning of period | | $ | 10.54 | | | $ | 9.59 | | | $ | 7.68 | | | $ | 9.35 | | | $ | 10.00 | | |
| Income (loss) from investment operations: | |
| Net investment income | | | 0.04 | *** | | | 0.10 | *** | | | 0.12 | *** | | | 0.10 | *** | | | 0.06 | *** | |
| Net realized and unrealized gain (loss) on investments | | | 0.05 | | | | 1.19 | | | | 1.91 | | | | (1.67 | ) | | | (0.67 | ) | |
| Total income (loss) from investment operations | | | 0.09 | | | | 1.29 | | | | 2.03 | | | | (1.57 | ) | | | (0.61 | ) | |
| Less distributions to shareholders: | |
| From net investment income | | | - | | | | (0.11 | ) | | | (0.12 | ) | | | (0.10 | ) | | | (0.04 | ) | |
| From net realized gains | | | - | | | | (0.23 | ) | | | - | | | | - | | | | - | | |
| Total distributions | | | - | | | | (0.34 | ) | | | (0.12 | ) | | | (0.10 | ) | | | (0.04 | ) | |
| Net asset value, end of period | | $ | 10.63 | | | $ | 10.54 | | | $ | 9.59 | | | $ | 7.68 | | | $ | 9.35 | | |
| | | | | | | | | | | | | | | | | | | | | | |
| Total Return(a) | | | 0.85 | %** | | | 13.47 | % | | | 26.40 | % | | | (16.87 | )% | | | (6.12 | )% ** | |
| Ratios / Supplemental Data: | |
| Net assets, end of period (000's) | | $ | 3,847 | | | $ | 2,891 | | | $ | 3,378 | | | $ | 7,543 | | | $ | 5,977 | | |
| Ratio of expenses to average daily net assets: | |
| Before expense waiver | | | 0.90 | %* | | | 0.93 | % | | | 0.88 | % | | | 0.90 | % | | | 0.90 | % * | |
| After expense waiver# | | | N/A | | | | 0.88 | % (b) | | | 0.86 | % (b) | | | 0.89 | % | | | 0.90 | % * | |
| Net investment income to average daily net assets | | | 0.77 | %* | | | 1.06 | % | | | 1.42 | % | | | 1.18 | % | | | 0.93 | % * | |
| Portfolio turnover rate | | | 51 | %** | | | 161 | % | | | 66 | % | | | 105 | % | | | 62 | % ** | |
| | | Class S | |
| | | Six months
ended
6/30/05
(Unaudited)† | | Year ended
12/31/04 | | Year ended
12/31/03 | | Year ended
12/31/02 | | Period ended
12/31/01+ | |
| Net asset value, beginning of period | | $ | 10.52 | | | $ | 9.59 | | | $ | 7.68 | | | $ | 9.35 | | | $ | 10.00 | | |
| Income (loss) from investment operations: | |
| Net investment income | | | 0.04 | *** | | | 0.11 | *** | | | 0.12 | *** | | | 0.10 | *** | | | 0.07 | *** | |
| Net realized and unrealized gain (loss) on investments | | | 0.06 | | | | 1.17 | | | | 1.92 | | | | (1.68 | ) | | | (0.68 | ) | |
| Total income (loss) from investment operations | | | 0.10 | | | | 1.28 | | | | 2.04 | | | | (1.58 | ) | | | (0.61 | ) | |
| Less distributions to shareholders: | |
| From net investment income | | | - | | | | (0.12 | ) | | | (0.13 | ) | | | (0.09 | ) | | | (0.04 | ) | |
| From net realized gains | | | - | | | | (0.23 | ) | | | - | | | | - | | | | - | | |
| Total distributions | | | - | | | | (0.35 | ) | | | (0.13 | ) | | | (0.09 | ) | | | (0.04 | ) | |
| Net asset value, end of period | | $ | 10.62 | | | $ | 10.52 | | | $ | 9.59 | | | $ | 7.68 | | | $ | 9.35 | | |
| | | | | | | | | | | | | | | | | | | | | | |
| Total Return(a) | | | 0.95 | %** | | | 13.31 | % | | | 26.63 | % | | | (16.83 | )% | | | (6.09 | )% ** | |
| Ratios / Supplemental Data: | |
| Net assets, end of period (000's) | | $ | 50,318 | | | $ | 51,940 | | | $ | 67,536 | | | $ | 60,499 | | | $ | 51,604 | | |
| Ratio of expenses to average daily net assets: | |
| Before expense waiver | | | 0.85 | %* | | | 0.88 | % | | | 0.84 | % | | | 0.85 | % | | | 0.87 | % * | |
| After expense waiver# | | | N/A | | | | 0.84 | % (b) | | | 0.82 | % (b) | | | 0.84 | % | | | 0.86 | % * | |
| Net investment income to average daily net assets | | | 0.82 | %* | | | 1.12 | % | | | 1.45 | % | | | 1.22 | % | | | 1.05 | % * | |
| Portfolio turnover rate | | | 51 | %** | | | 161 | % | | | 66 | % | | | 105 | % | | | 62 | % ** | |
* Annualized.
** Percentages represent results for the period and are not annualized.
*** Per share amount calculated on the average shares method.
† Effective January 1, 2005, brokerage commissions are included with realized gain or loss on investment transactions. Prior to January 1, 2005, these amounts were presented as a reduction of expenses. Prior year amounts have not been restated to reflect this change due to immateriality. (See Note 3)
+ For the period from May 1, 2001 (commencement of operations) through December 31, 2001.
# Computed after giving effect to an agreement by MassMutual to waive certain fees and expenses of the Fund for the period October 1, 2001 through December 31, 2001 and for the year ended December 31, 2002.
(a) Employee retirement benefit plans that invest plan assets in the Separate Investment Accounts (SIAs) may be subject to certain charges as set forth in their Plan Documents. Total return figures would be lower for the periods presented if they reflected these charges.
(b) The Fund has entered into an agreement with certain brokers to rebate a portion of brokerage commissions. The rebated commissions are used to reduce operating expenses of the Fund.
The accompanying notes are an integral part of the financial statements.
197
MassMutual Select Value Equity Fund – Financial Statements (Continued)
Financial Highlights (For a share outstanding throughout each period)
| | | Class N | |
| | | Six months
ended
6/30/05
(Unaudited)† | |
Year ended
12/31/04 | |
Year ended
12/31/03 | |
Year ended
12/31/02++ | |
| Net asset value, beginning of period | | $ | 10.50 | | | $ | 9.56 | | | $ | 7.63 | | | $ | 7.62 | | |
| Income (loss) from investment operations: | | | |
| Net investment income | | | 0.00 | ***†† | | | 0.04 | *** | | | 0.06 | *** | | | 0.00 | ***†† | |
| Net realized and unrealized gain on investments | | | 0.06 | | | | 1.15 | | | | 1.90 | | | | 0.01 | | |
| Total income from investment operations | | | 0.06 | | | | 1.19 | | | | 1.96 | | | | 0.01 | | |
| Less distributions to shareholders: | | | |
| From net investment income | | | - | | | | (0.02 | ) | | | (0.03 | ) | | | - | | |
| From net realized gains | | | - | | | | (0.23 | ) | | | - | | | | - | | |
| Total distributions | | | - | | | | (0.25 | ) | | | (0.03 | ) | | | - | | |
| Net asset value, end of period | | $ | 10.56 | | | $ | 10.50 | | | $ | 9.56 | | | $ | 7.63 | | |
| | | | | | | | | | | | | | | | | | |
| Total Return(a) | | | 0.57 | %(c)** | | | 12.51 | % (c) | | | 25.73 | % (c) | | | - | ‡ | |
| Ratios / Supplemental Data: | | | |
| Net assets, end of period (000's) | | $ | 285 | | | $ | 282 | | | $ | 315 | | | $ | 101 | | |
| Ratio of expenses to average daily net assets: | | | | | | | | | | | | | | | | | |
| Before expense waiver | | | 1.60 | %* | | | 1.63 | % | | | 1.58 | % | | | - | ‡ | |
| After expense waiver | | | N/A | | | | 1.58 | % (b) | | | 1.56 | % (b) | | | - | ‡ | |
| Net investment income to average daily net assets | | | 0.08 | %* | | | 0.39 | % | | | 0.70 | % | | | - | ‡ | |
| Portfolio turnover rate | | | 51 | %** | | | 161 | % | | | 66 | % | | | 105 | % | |
* Annualized.
** Percentages represent results for the period and are not annualized.
*** Per share amount calculated on the average shares method.
† Effective January 1, 2005, brokerage commissions are included with realized gain or loss on investment transactions. Prior to January 1, 2005, these amounts were presented as a reduction of expenses. Prior year amounts have not been restated to reflect this change due to immateriality. (See Note 3)
†† Net investment income is less than $0.01 per share.
++ Class N commenced operations on December 31, 2002.
‡ Amounts are de minimis due to the short period of operations.
(a) Employee retirement benefit plans that invest plan assets in the Separate Investment Accounts (SIAs) may be subject to certain charges as set forth in their Plan Documents. Total return figures would be lower for the periods presented if they reflected these charges.
(b) The Fund has entered into an agreement with certain brokers to rebate a portion of brokerage commissions. The rebated commissions are used to reduce operating expenses of the Fund.
(c) Total Return excludes contingent deferred sales charge and would be lower for the periods presented if they reflected these charges.
The accompanying notes are an integral part of the financial statements.
198
MassMutual Select Large Cap Value Fund – Financial Statements (Continued)
Financial Highlights (For a share outstanding throughout each period)
| | | Class A | |
| | | Six months
ended
6/30/05
(Unaudited)† | | Year ended
12/31/04 | | Year ended
12/31/03 | | Year ended
12/31/02 | | Year ended
12/31/01 | | Period ended
12/31/00+ | |
| Net asset value, beginning of period | | $ | 10.39 | | | $ | 9.35 | | | $ | 7.24 | | | $ | 8.74 | | | $ | 9.92 | | | $ | 10.00 | | |
| Income (loss) from investment operations: | |
| Net investment income | | | 0.03 | *** | | | 0.04 | *** | | | 0.04 | *** | | | 0.02 | *** | | | 0.01 | *** | | | 0.03 | *** | |
Net realized and unrealized gain (loss)
on investments | | | 0.08 | | | | 1.04 | | | | 2.10 | | | | (1.49 | ) | | | (1.18 | ) | | | (0.06 | ) | |
Total income (loss) from
investment operations | | | 0.11 | | | | 1.08 | | | | 2.14 | | | | (1.47 | ) | | | (1.17 | ) | | | (0.03 | ) | |
| Less distributions to shareholders: | |
| From net investment income | | | - | | | | (0.04 | ) | | | (0.03 | ) | | | (0.03 | ) | | | (0.01 | ) | | | (0.04 | ) | |
| From net realized gains | | | - | | | | - | | | | - | | | | - | | | | - | | | | (0.01 | ) | |
| Total distributions | | | - | | | | (0.04 | ) | | | (0.03 | ) | | | (0.03 | ) | | | (0.01 | ) | | | (0.05 | ) | |
| Net asset value, end of period | | $ | 10.50 | | | $ | 10.39 | | | $ | 9.35 | | | $ | 7.24 | | | $ | 8.74 | | | $ | 9.92 | | |
| Total Return(a) | | | 1.06 | %**(c) | | | 11.55 | % (c) | | | 29.61 | % | | | (16.86 | )% | | | (11.75 | )% | | | (0.36 | )% ** | |
| Ratios / Supplemental Data: | |
| Net assets, end of period (000's) | | $ | 314,557 | | | $ | 266,753 | | | $ | 153,918 | | | $ | 92,001 | | | $ | 73,431 | | | $ | 15,926 | | |
| Ratio of expenses to average daily net assets: | |
| Before expense waiver | | | 1.25 | %* | | | 1.25 | % | | | 1.25 | % | | | 1.24 | % | | | 1.25 | % | | | 1.25 | % * | |
| After expense waiver# | | | N/A | | | | 1.25 | % (b) | | | 1.24 | % (b) | | | 1.23 | % (b) | | | 1.24 | % | | | N/A | | |
Net investment income to average daily
net assets | | | 0.51 | %* | | | 0.41 | % | | | 0.45 | % | | | 0.29 | % | | | 0.12 | % | | | 0.53 | % * | |
| Portfolio turnover rate | | | 0 | %** | | | 3 | % | | | 7 | % | | | 25 | % | | | 20 | % | | | 11 | % ** | |
| | | Class L | |
| | | Six months
ended
6/30/05
(Unaudited)† | | Year ended
12/31/04 | | Year ended
12/31/03 | | Year ended
12/31/02 | | Year ended
12/31/01 | | Period ended
12/31/00+ | |
| Net asset value, beginning of period | | $ | 10.43 | | | $ | 9.37 | | | $ | 7.26 | | | $ | 8.76 | | | $ | 9.93 | | | $ | 10.00 | | |
| Income (loss) from investment operations: | |
| Net investment income | | | 0.04 | *** | | | 0.06 | *** | | | 0.06 | *** | | | 0.04 | *** | | | 0.03 | *** | | | 0.05 | *** | |
Net realized and unrealized gain (loss)
on investments | | | 0.07 | | | | 1.06 | | | | 2.10 | | | | (1.50 | ) | | | (1.17 | ) | | | (0.07 | ) | |
Total income (loss) from
investment operations | | | 0.11 | | | | 1.12 | | | | 2.16 | | | | (1.46 | ) | | | (1.14 | ) | | | (0.02 | ) | |
| Less distributions to shareholders: | |
| From net investment income | | | - | | | | (0.06 | ) | | | (0.05 | ) | | | (0.04 | ) | | | (0.03 | ) | | | (0.04 | ) | |
| From net realized gains | | | - | | | | - | | | | - | | | | - | | | | - | | | | (0.01 | ) | |
| Total distributions | | | - | | | | (0.06 | ) | | | (0.05 | ) | | | (0.04 | ) | | | (0.03 | ) | | | (0.05 | ) | |
| Net asset value, end of period | | $ | 10.54 | | | $ | 10.43 | | | $ | 9.37 | | | $ | 7.26 | | | $ | 8.76 | | | $ | 9.93 | | |
| Total Return(a) | | | 1.05 | %** | | | 11.94 | % | | | 29.79 | % | | | (16.64 | )% | | | (11.47 | )% | | | (0.26 | )% ** | |
| Ratios / Supplemental Data: | |
| Net assets, end of period (000's) | | $ | 335,618 | | | $ | 316,841 | | | $ | 207,025 | | | $ | 114,417 | | | $ | 105,322 | | | $ | 44,167 | | |
| Ratio of expenses to average daily net assets: | |
| Before expense waiver | | | 1.00 | %* | | | 1.00 | % | | | 1.00 | % | | | 1.00 | % | | | 1.00 | % | | | 1.00 | % * | |
| After expense waiver# | | | N/A | | | | 1.00 | % (b) | | | 0.99 | % (b) | | | 0.98 | % (b) | | | 0.99 | % | | | N/A | | |
Net investment income to average daily
net assets | | | 0.76 | %* | | | 0.65 | % | | | 0.70 | % | | | 0.53 | % | | | 0.37 | % | | | 0.72 | % * | |
| Portfolio turnover rate | | | 0 | %** | | | 3 | % | | | 7 | % | | | 25 | % | | | 20 | % | | | 11 | % ** | |
* Annualized.
** Percentage represents results for the period and are not annualized.
*** Per share amount calculated on the average shares method.
† Effective January 1, 2005, brokerage commissions are included with realized gain or loss on investment transactions. Prior to January 1, 2005, these amounts were presented as a reduction of expenses. Prior year amounts have not been restated to reflect this change. (see note 3)
+ For the period May 1, 2000 (commencement of operations) through December 31, 2000.
# Computed after giving effect to an agreement by MassMutual to waive certain fees and expenses of the Fund for the periods May 1, 2001 through December 31, 2001 and January 1, 2002 through April 30, 2002.
(a) Employee retirement benefit plans that invest plan assets in the Separate Investment Accounts (SIAs) may be subject to certain charges as set forth by their respective Plan Documents. Total return figures would be lower for the periods presented if they reflected these charges.
(b) The Fund has entered into agreements with certain brokers to rebate a portion of brokerage commissions. The rebated commissions are used to reduce operating expenses of the Fund.
(c) Total Return excludes a front-end sales charge and would be lower for the period presented if it reflected these charges.
The accompanying notes are an integral part of the financial statements.
199
MassMutual Select Large Cap Value Fund – Financial Statements (Continued)
Financial Highlights (For a share outstanding throughout each period)
| | | Class Y | |
| | | Six months
ended
6/30/05
(Unaudited)† | | Year ended
12/31/04 | | Year ended
12/31/03 | | Year ended
12/31/02 | | Year ended
12/31/01 | | Period ended
12/31/00+ | |
| Net asset value, beginning of period | | $ | 10.45 | | | $ | 9.39 | | | $ | 7.27 | | | $ | 8.77 | | | $ | 9.94 | | | $ | 10.00 | | |
| Income (loss) from investment operations: | |
| Net investment income | | | 0.05 | *** | | | 0.08 | *** | | | 0.07 | *** | | | 0.05 | *** | | | 0.05 | *** | | | 0.06 | *** | |
Net realized and unrealized gain (loss)
on investments | | | 0.07 | | | | 1.05 | | | | 2.11 | | | | (1.50 | ) | | | (1.18 | ) | | | (0.07 | ) | |
Total income (loss) from
investment operations | | | 0.12 | | | | 1.13 | | | | 2.18 | | | | (1.45 | ) | | | (1.13 | ) | | | (0.01 | ) | |
| Less distributions to shareholders: | |
| From net investment income | | | - | | | | (0.07 | ) | | | (0.06 | ) | | | (0.05 | ) | | | (0.04 | ) | | | (0.04 | ) | |
| From net realized gains | | | - | | | | - | | | | - | | | | - | | | | - | | | | (0.01 | ) | |
| Total distributions | | | - | | | | (0.07 | ) | | | (0.06 | ) | | | (0.05 | ) | | | (0.04 | ) | | | (0.05 | ) | |
| Net asset value, end of period | | $ | 10.57 | | | $ | 10.45 | | | $ | 9.39 | | | $ | 7.27 | | | $ | 8.77 | | | $ | 9.94 | | |
| Total Return(a) | | | 1.15 | %** | | | 12.06 | % | | | 30.04 | % | | | (16.52 | )% | | | (11.34 | )% | | | (0.08 | )% ** | |
| Ratios / Supplemental Data: | |
| Net assets, end of period (000's) | | $ | 148,796 | | | $ | 127,223 | | | $ | 78,751 | | | $ | 39,762 | | | $ | 52,286 | | | $ | 10,076 | | |
| Ratio of expenses to average daily net assets: | |
| Before expense waiver | | | 0.85 | %* | | | 0.85 | % | | | 0.85 | % | | | 0.84 | % | | | 0.85 | % | | | 0.84 | % * | |
| After expense waiver# | | | N/A | | | | 0.85 | % (b) | | | 0.84 | % (b) | | | 0.83 | % (b) | | | 0.84 | % | | | N/A | | |
Net investment income to average daily
net assets | | | 0.91 | %* | | | 0.81 | % | | | 0.85 | % | | | 0.66 | % | | | 0.52 | % | | | 0.93 | % * | |
| Portfolio turnover rate | | | 0 | %** | | | 3 | % | | | 7 | % | | | 25 | % | | | 20 | % | | | 11 | % ** | |
| | | Class S | |
| | | Six months
ended
6/30/05
(Unaudited)† | | Year ended
12/31/04 | | Year ended
12/31/03 | | Year ended
12/31/02 | | Year ended
12/31/01 | | Period ended
12/31/00+ | |
| Net asset value, beginning of period | | $ | 10.46 | | | $ | 9.40 | | | $ | 7.27 | | | $ | 8.78 | | | $ | 9.94 | | | $ | 10.00 | | |
| Income (loss) from investment operations: | |
| Net investment income | | | 0.05 | *** | | | 0.09 | *** | | | 0.08 | *** | | | 0.06 | *** | | | 0.06 | *** | | | 0.06 | *** | |
Net realized and unrealized gain (loss)
on investments | | | 0.08 | | | | 1.05 | | | | 2.12 | | | | (1.51 | ) | | | (1.17 | ) | | | (0.07 | ) | |
Total income (loss) from
investment operations | | | 0.13 | | | | 1.14 | | | | 2.20 | | | | (1.45 | ) | | | (1.11 | ) | | | (0.01 | ) | |
| Less distributions to shareholders: | |
| From net investment income | | | - | | | | (0.08 | ) | | | (0.07 | ) | | | (0.06 | ) | | | (0.05 | ) | | | (0.04 | ) | |
| From net realized gains | | | - | | | | - | | | | - | | | | - | | | | - | | | | (0.01 | ) | |
| Total distributions | | | - | | | | (0.08 | ) | | | (0.07 | ) | | | (0.06 | ) | | | (0.05 | ) | | | (0.05 | ) | |
| Net asset value, end of period | | $ | 10.59 | | | $ | 10.46 | | | $ | 9.40 | | | $ | 7.27 | | | $ | 8.78 | | | $ | 9.94 | | |
| Total Return(a) | | | 1.34 | %** | | | 12.11 | % | | | 30.24 | % | | | (16.53 | )% | | | (11.20 | )% | | | (0.08 | )% ** | |
| Ratios / Supplemental Data: | |
| Net assets, end of period (000's) | | $ | 495,332 | | | $ | 436,983 | | | $ | 339,287 | | | $ | 233,510 | | | $ | 277,873 | | | $ | 225,913 | | |
| Ratio of expenses to average daily net assets: | |
| Before expense waiver | | | 0.76 | %* | | | 0.76 | % | | | 0.76 | % | | | 0.75 | % | | | 0.76 | % | | | 0.76 | % * | |
| After expense waiver# | | | N/A | | | | 0.76 | % (b) | | | 0.75 | % (b) | | | 0.74 | % (b) | | | 0.75 | % | | | N/A | | |
Net investment income to average daily
net assets | | | 1.00 | %* | | | 0.88 | % | | | 0.94 | % | | | 0.76 | % | | | 0.62 | % | | | 0.91 | % * | |
| Portfolio turnover rate | | | 0 | %** | | | 3 | % | | | 7 | % | | | 25 | % | | | 20 | % | | | 11 | % ** | |
* Annualized.
** Percentage represents results for the period and are not annualized.
*** Per share amount calculated on the average shares method.
† Effective January 1, 2005, brokerage commissions are included with realized gain or loss on investment transactions. Prior to January 1, 2005, these amounts were presented as a reduction of expenses. Prior year amounts have not been restated to reflect this change. (see note 3)
+ For the period May 1, 2000 (commencement of operations) through December 31, 2000.
# Computed after giving effect to an agreement by MassMutual to waive certain fees and expenses of the Fund for the periods May 1, 2001 through December 31, 2001 and January 1, 2002 through April 30, 2002.
(a) Employee retirement benefit plans that invest plan assets in the Separate Investment Accounts (SIAs) may be subject to certain charges as set forth by their respective Plan Documents. Total return figures would be lower for the periods presented if they reflected these charges.
(b) The Fund has entered into agreements with certain brokers to rebate a portion of brokerage commissions. The rebated commissions are used to reduce operating expenses of the Fund.
The accompanying notes are an integral part of the financial statements.
200
MassMutual Select Large Cap Value Fund – Financial Statements (Continued)
Financial Highlights (For a share outstanding throughout each period)
| | | Class N | |
| | | Six months
ended
6/30/05
(Unaudited)† | |
Year ended
12/31/04 | |
Year ended
12/31/03 | |
Period ended
12/31/02++ | |
| Net asset value, beginning of period | | $ | 10.29 | | | $ | 9.25 | | | $ | 7.21 | | | $ | 7.19 | | |
| Income (loss) from investment operations: | |
| Net investment income | | | 0.01 | *** | | | 0.01 | *** | | | 0.03 | *** | | | 0.00 | ***†† | |
| Net realized and unrealized gain on investments | | | 0.08 | | | | 1.03 | | | | 2.07 | | | | 0.02 | | |
| Total income from investment operations | | | 0.09 | | | | 1.04 | | | | 2.10 | | | | 0.02 | | |
| Less distributions to shareholders: | |
| From net investment income | | | - | | | | - | | | | (0.06 | ) | | | - | | |
| Net asset value, end of period | | $ | 10.38 | | | $ | 10.29 | | | $ | 9.25 | | | $ | 7.21 | | |
| | | | | | | | | | | | | | | | | | |
| Total Return(a) | | | 0.87 | %**(c) | | | 11.24 | %(c) | | | 29.18 | % (c) | | | - | ‡ | |
| Ratios / Supplemental Data: | |
| Net assets, end of period (000's) | | $ | 2,505 | | | $ | 2,911 | | | $ | 2,891 | | | $ | 101 | | |
| Ratio of expenses to average daily net assets: | |
| Before expense waiver | | | 1.55 | %* | | | 1.55 | % | | | 1.57 | % | | | - | ‡ | |
| After expense waiver | | | N/A | | | | 1.55 | % | | | 1.56 | % (b) | | | N/A‡ | | |
| Net investment income to average daily net assets | | | 0.23 | %* | | | 0.08 | % | | | 0.33 | % | | | 0.00 | %‡ | |
| Portfolio turnover rate | | | 0 | %** | | | 3 | % | | | 7 | % | | | 25 | % | |
* Annualized.
** Percentage represents results for the period and are not annualized.
*** Per share amount calculated on the average shares method.
† Effective January 1, 2005, brokerage commissions are included with realized gain or loss on investment transactions. Prior to January 1, 2005, these amounts were presented as a reduction of expenses. Prior year amounts have not been restated to reflect this change. (see note 3)
†† Net investment income is less than $0.01 per share.
++ Class N commenced operations on December 31, 2002.
‡ Amounts are de minimis due to the short period of operations.
(a) Employee retirement benefit plans that invest plan assets in the Separate Investment Accounts (SIAs) may be subject to certain charges as set forth by their respective Plan Documents. Total return figures would be lower for the periods presented if they reflected these charges.
(b) The Fund has entered into agreements with certain brokers to rebate a portion of brokerage commissions. The rebated commissions are used to reduce operating expenses of the Fund.
(c) Total Return excludes contingent deferred sales charge and would be lower for the periods presented if they reflected these charges.
The accompanying notes are an integral part of the financial statements.
201
MassMutual Select Indexed Equity Fund – Financial Statements (Continued)
Financial Highlights (For a share outstanding throughout each period)
| | | Class A | |
| | | Six months
ended
6/30/05
(Unaudited) | |
Year ended
12/31/04 | |
Year ended
12/31/03 | |
Year ended
12/31/02 | |
Year ended
12/31/01 | |
Year ended
12/31/00 | |
| Net asset value, beginning of period | | $ | 11.12 | | | $ | 10.23 | | | $ | 8.09 | | | $ | 10.55 | | | $ | 12.17 | | | $ | 13.81 | | |
| Income (loss) from investment operations: | |
| Net investment income | | | 0.06 | *** | | | 0.13 | *** | | | 0.08 | *** | | | 0.07 | *** | | | 0.06 | *** | | | 0.05 | *** | |
Net realized and unrealized gain (loss)
on investments | | | (0.19 | ) | | | 0.89 | | | | 2.14 | | | | (2.47 | ) | | | (1.60 | ) | | | (1.40 | ) | |
Total income (loss) from
investment operations | | | (0.13 | ) | | | 1.02 | | | | 2.22 | | | | (2.40 | ) | | | (1.54 | ) | | | (1.35 | ) | |
| Less distributions to shareholders: | |
| From net investment income | | | - | | | | (0.13 | ) | | | (0.08 | ) | | | (0.06 | ) | | | (0.08 | ) | | | (0.10 | ) | |
| From net realized gains | | | - | | | | - | | | | - | | | | - | | | | - | | | | (0.19 | ) | |
| Total distributions | | | - | | | | (0.13 | ) | | | (0.08 | ) | | | (0.06 | ) | | | (0.08 | ) | | | (0.29 | ) | |
| Net asset value, end of period | | $ | 10.99 | | | $ | 11.12 | | | $ | 10.23 | | | $ | 8.09 | | | $ | 10.55 | | | $ | 12.17 | | |
| Total Return(a) | | | (1.17 | )% (b)** | | | 10.01 | % (b) | | | 27.49 | % | | | (22.74 | )% | | | (12.69 | )% | | | (9.88 | )% | |
| Ratios / Supplemental Data: | |
| Net assets, end of period (000's) | | $ | 298,340 | | | $ | 275,920 | | | $ | 160,470 | | | $ | 70,695 | | | $ | 81,682 | | | $ | 41,829 | | |
| Ratio of expenses to average daily net assets: | |
| Before expense waiver | | | 0.85 | % * | | | 0.85 | % | | | 0.85 | % | | | 0.85 | % | | | 0.86 | % | | | 0.84 | % | |
| After expense waiver# | | | 0.75 | % * | | | 0.78 | % | | | N/A | | | | N/A | | | | N/A | | | | N/A | | |
Net investment income to average daily
net assets | | | 1.09 | % * | | | 1.32 | % | | | 0.94 | % | | | 0.78 | % | | | 0.52 | % | | | 0.41 | % | |
| Portfolio turnover rate | | | 3 | % ** | | | 3 | % | | | 2 | % | | | 5 | % | | | 4 | % | | | 10 | % | |
| | | Class L | |
| | | Six months
ended
6/30/05
(Unaudited) | | Year ended
12/31/04 | | Year ended
12/31/03 | | Year ended
12/31/02 | | Year ended
12/31/01 | | Year ended
12/31/00 | |
| Net asset value, beginning of period | | $ | 11.16 | | | $ | 10.26 | | | $ | 8.11 | | | $ | 10.58 | | | $ | 12.18 | | | $ | 13.80 | | |
| Income (loss) from investment operations: | |
| Net investment income | | | 0.07 | *** | | | 0.16 | *** | | | 0.11 | *** | | | 0.10 | *** | | | 0.08 | *** | | | 0.09 | *** | |
Net realized and unrealized gain (loss)
on investments | | | (0.18 | ) | | | 0.89 | | | | 2.15 | | | | (2.48 | ) | | | (1.60 | ) | | | (1.41 | ) | |
Total income (loss) from
investment operations | | | (0.11 | ) | | | 1.05 | | | | 2.26 | | | | (2.38 | ) | | | (1.52 | ) | | | (1.32 | ) | |
| Less distributions to shareholders: | |
| From net investment income | | | - | | | | (0.15 | ) | | | (0.11 | ) | | | (0.09 | ) | | | (0.08 | ) | | | (0.11 | ) | |
| From net realized gains | | | - | | | | - | | | | - | | | | - | | | | - | | | | (0.19 | ) | |
| Total distributions | | | - | | | | (0.15 | ) | | | (0.11 | ) | | | (0.09 | ) | | | (0.08 | ) | | | (0.30 | ) | |
| Net asset value, end of period | | $ | 11.05 | | | $ | 11.16 | | | $ | 10.26 | | | $ | 8.11 | | | $ | 10.58 | | | $ | 12.18 | | |
| Total Return(a) | | | (0.99 | )% ** | | | 10.25 | % | | | 27.88 | % | | | (22.53 | )% | | | (12.46 | )% | | | (9.61 | )% | |
| Ratios / Supplemental Data: | |
| Net assets, end of period (000's) | | $ | 231,709 | | | $ | 218,755 | | | $ | 176,247 | | | $ | 54,756 | | | $ | 40,420 | | | $ | 28,623 | | |
| Ratio of expenses to average daily net assets: | |
| Before expense waiver | | | 0.60 | % * | | | 0.60 | % | | | 0.60 | % | | | 0.60 | % | | | 0.60 | % | | | 0.59 | % | |
| After expense waiver# | | | 0.50 | % * | | | 0.53 | % | | | N/A | | | | N/A | | | | N/A | | | | N/A | | |
Net investment income to average daily
net assets | | | 1.33 | % * | | | 1.52 | % | | | 1.21 | % | | | 1.05 | % | | | 0.75 | % | | | 0.64 | % | |
| Portfolio turnover rate | | | 3 | % ** | | | 3 | % | | | 2 | % | | | 5 | % | | | 4 | % | | | 10 | % | |
* Annualized.
** Percentages represent results for the period and are not annualized.
*** Per share amount calculated on the average shares method.
# Computed after giving effect to an agreement by MassMutual to waive certain fees and expenses of the Fund for the year ended December 31, 2004 and the six months ended June 30,2005.
(a) Employee retirement benefit plans that invest plan assets in the Separate Investment Accounts (SIAs) may be subject to certain charges as set forth in their respective Plan Documents. Total return figures would be lower for the periods presented if they reflected these charges.
(b) Total Return excludes a front-end sales charge and would be lower for the periods presented if it reflected these charges.
The accompanying notes are an integral part of the financial statements.
202
MassMutual Select Indexed Equity Fund – Financial Statements (Continued)
Financial Highlights (For a share outstanding throughout each period)
| | | Class Y | |
| | | Six months
ended
6/30/05
(Unaudited) | |
Year ended
12/31/04 | |
Year ended
12/31/03 | |
Year ended
12/31/02 | |
Year ended
12/31/01 | |
Year ended
12/31/00 | |
| Net asset value, beginning of period | | $ | 11.19 | | | $ | 10.29 | | | $ | 8.12 | | | $ | 10.60 | | | $ | 12.21 | | | $ | 13.81 | | |
| Income (loss) from investment operations: | | | |
| Net investment income | | | 0.08 | *** | | | 0.17 | *** | | | 0.12 | *** | | | 0.11 | *** | | | 0.10 | *** | | | 0.11 | *** | |
Net realized and unrealized gain (loss)
on investments | | | (0.19 | ) | | | 0.89 | | | | 2.16 | | | | (2.49 | ) | | | (1.61 | ) | | | (1.41 | ) | |
Total income (loss) from
investment operations | | | (0.11 | ) | | | 1.06 | | | | 2.28 | | | | (2.38 | ) | | | (1.51 | ) | | | (1.30 | ) | |
| Less distributions to shareholders: | | | |
| From net investment income | | | - | | | | (0.16 | ) | | | (0.11 | ) | | | (0.10 | ) | | | (0.10 | ) | | | (0.11 | ) | |
| From net realized gains | | | - | | | | - | | | | - | | | | - | | | | - | | | | (0.19 | ) | |
| Total distributions | | | - | | | | (0.16 | ) | | | (0.11 | ) | | | (0.10 | ) | | | (0.10 | ) | | | (0.30 | ) | |
| Net asset value, end of period | | $ | 11.08 | | | $ | 11.19 | | | $ | 10.29 | | | $ | 8.12 | | | $ | 10.60 | | | $ | 12.21 | | |
| Total Return(a) | | | (0.98 | )% ** | | | 10.31 | % | | | 28.10 | % | | | (22.47 | )% | | | (12.37 | )% | | | (9.46 | )% | |
| Ratios / Supplemental Data: | | | |
| Net assets, end of period (000's) | | $ | 463,742 | | | $ | 419,366 | | | $ | 299,713 | | | $ | 198,240 | | | $ | 172,244 | | | $ | 115,648 | | |
| Net expenses to average daily net assets | | | 0.45 | % * | | | 0.45 | % | | | 0.45 | % | | | 0.45 | % | | | 0.45 | % | | | 0.44 | % | |
Net investment income to average daily
net assets | | | 1.39 | % * | | | 1.63 | % | | | 1.34 | % | | | 1.18 | % | | | 0.90 | % | | | 0.80 | % | |
| Portfolio turnover rate | | | 3 | % ** | | | 3 | % | | | 2 | % | | | 5 | % | | | 4 | % | | | 10 | % | |
| | | Class S | |
| | | Six months
ended
6/30/05
(Unaudited) | |
Year ended
12/31/04 | |
Year ended
12/31/03 | |
Year ended
12/31/02 | |
Year ended
12/31/01 | |
Year ended
12/31/00 | |
| Net asset value, beginning of period | | $ | 11.30 | | | $ | 10.38 | | | $ | 8.19 | | | $ | 10.68 | | | $ | 12.29 | | | $ | 13.88 | | |
| Income (loss) from investment operations: | | | |
| Net investment income | | | 0.08 | *** | | | 0.17 | *** | | | 0.12 | *** | | | 0.11 | *** | | | 0.11 | *** | | | 0.11 | *** | |
Net realized and unrealized gain (loss)
on investments | | | (0.19 | ) | | | 0.91 | | | | 2.18 | | | | (2.50 | ) | | | (1.62 | ) | | | (1.42 | ) | |
Total income (loss) from
investment operations | | | (0.11 | ) | | | 1.08 | | | | 2.30 | | | | (2.39 | ) | | | (1.51 | ) | | | (1.31 | ) | |
| Less distributions to shareholders: | | | |
| From net investment income | | | - | | | | (0.16 | ) | | | (0.11 | ) | | | (0.10 | ) | | | (0.10 | ) | | | (0.09 | ) | |
| From net realized gains | | | - | | | | - | | | | - | | | | - | | | | - | | | | (0.19 | ) | |
| Total distributions | | | - | | | | (0.16 | ) | | | (0.11 | ) | | | (0.10 | ) | | | (0.10 | ) | | | (0.28 | ) | |
| Net asset value, end of period | | $ | 11.19 | | | $ | 11.30 | | | $ | 10.38 | | | $ | 8.19 | | | $ | 10.68 | | | $ | 12.29 | | |
| Total Return(a) | | | (0.97 | )% ** | | | 10.39 | % | | | 28.10 | % | | | (22.41 | )% | | | (12.33 | )% | | | (9.47 | )% | |
| Ratios / Supplemental Data: | | | |
| Net assets, end of period (000's) | | $ | 645,301 | | | $ | 724,614 | | | $ | 710,691 | | | $ | 567,426 | | | $ | 642,799 | | | $ | 761,008 | | |
| Net expenses to average daily net assets | | | 0.42 | % * | | | 0.42 | % | | | 0.42 | % | | | 0.42 | % | | | 0.42 | % | | | 0.42 | % | |
Net investment income to average daily
net assets | | | 1.42 | % * | | | 1.62 | % | | | 1.37 | % | | | 1.20 | % | | | 0.92 | % | | | 0.83 | % | |
| Portfolio turnover rate | | | 3 | % ** | | | 3 | % | | | 2 | % | | | 5 | % | | | 4 | % | | | 10 | % | |
* Annualized.
** Percentages represent results for the period and are not annualized.
*** Per share amount calculated on the average shares method.
(a) Employee retirement benefit plans that invest plan assets in the Separate Investment Accounts (SIAs) may be subject to certain charges as set forth in their respective Plan Documents. Total return figures would be lower for the periods presented if they reflected these charges.
The accompanying notes are an integral part of the financial statements.
203
MassMutual Select Indexed Equity Fund – Financial Statements (Continued)
Financial Highlights (For a share outstanding throughout each period)
| | | Class Z | |
| | | Six months
ended
6/30/05
(Unaudited) | |
Year ended
12/31/04 | |
Year ended
12/31/03 | |
Year ended
12/31/02 | |
Period ended
12/31/01+ | |
| Net asset value, beginning of period | | $ | 11.30 | | | $ | 10.38 | | | $ | 8.19 | | | $ | 10.68 | | | $ | 11.66 | | |
| Income (loss) from investment operations: | | | |
| Net investment income | | | 0.09 | *** | | | 0.21 | *** | | | 0.15 | *** | | | 0.13 | *** | | | 0.09 | *** | |
| Net realized and unrealized gain (loss) on investments | | | (0.19 | ) | | | 0.90 | | | | 2.17 | | | | (2.50 | ) | | | (0.95 | ) | |
| Total income (loss) from investment operations | | | (0.10 | ) | | | 1.11 | | | | 2.32 | | | | (2.37 | ) | | | (0.86 | ) | |
| Less distributions to shareholders: | | | |
| From net investment income | | | - | | | | (0.19 | ) | | | (0.13 | ) | | | (0.12 | ) | | | (0.12 | ) | |
| Net asset value, end of period | | $ | 11.20 | | | $ | 11.30 | | | $ | 10.38 | | | $ | 8.19 | | | $ | 10.68 | | |
| | | | | | | | | | | | | | | | | | | | | | |
| Total Return(a) | | | (0.88 | )% ** | | | 10.68 | % | | | 28.39 | % | | | (22.23 | )% | | | (7.33 | )% ** | |
| Ratios / Supplemental Data: | | | |
| Net assets, end of period (000's) | | $ | 190,436 | | | $ | 130,164 | | | $ | 42,906 | | | $ | 16,821 | | | $ | 95 | | |
| Net expenses to average daily net assets | | | 0.20 | % * | | | 0.20 | % | | | 0.21 | % | | | 0.20 | % | | | 0.21 | % * | |
| Net investment income to average daily net assets | | | 1.64 | % * | | | 1.93 | % | | | 1.59 | % | | | 1.42 | % | | | 1.20 | % * | |
| Portfolio turnover rate | | | 3 | % ** | | | 3 | % | | | 2 | % | | | 5 | % | | | 4 | % ** | |
| | | Class N | |
| | | Six months
ended
6/30/05
(Unaudited) | |
Year ended
12/31/04 | |
Year ended
12/31/03 | |
Period ended
12/31/02++ | |
| Net asset value, beginning of period | | $ | 11.02 | | | $ | 10.15 | | | $ | 8.05 | | | $ | 8.05 | | |
| Income (loss) from investment operations: | | | |
| Net investment income | | | 0.04 | *** | | | 0.10 | *** | | | 0.06 | *** | | | 0.00 | † | |
| Net realized and unrealized gain (loss) on investments | | | (0.18 | ) | | | 0.87 | | | | 2.14 | | | | (0.00 | )† | |
| Total income (loss) from investment operations | | | (0.14 | ) | | | 0.97 | | | | 2.20 | | | | 0.00 | | |
| Less distributions to shareholders: | | | |
| From net investment income | | | - | | | | (0.10 | ) | | | (0.10 | ) | | | - | | |
| Net asset value, end of period | | $ | 10.88 | | | $ | 11.02 | | | $ | 10.15 | | | $ | 8.05 | | |
| | | | | | | | | | | | | | | | | | |
| Total Return(a) | | | (1.27 | )% (b)** | | | 9.59 | % (b) | | | 27.34 | % (b) | | | 0.00 | % ‡ | |
| Ratios / Supplemental Data: | | | |
| Net assets, end of period (000's) | | $ | 4,241 | | | $ | 3,710 | | | $ | 2,487 | | | $ | 101 | | |
| Ratio of expenses to average daily net assets: | |
| Before expense waiver | | | 1.15 | % * | | | 1.15 | % | | | 1.15 | % | | | - | ‡ | |
| After expense waiver# | | | 1.05 | % * | | | 1.07 | % | | | N/A | | | | N/A | | |
| Net investment income to average daily net assets | | | 0.80 | % * | | | 1.00 | % | | | 0.64 | % | | | 0.00 | % ‡ | |
| Portfolio turnover rate | | | 3 | % ** | | | 3 | % | | | 2 | % | | | 5 | % | |
* Annualized.
** Percentages represent results for the period and are not annualized.
*** Per share amount calculated on the average shares method.
† Net investment income and net realized and unrealized loss on investments are less than $0.01 per share.
†† Net investment income and net realized and unrealized loss on investments are less than $0.01 per share.
+ For the period from May 1, 2001 (commencement of operations) through December 31, 2001.
++ Class N shares commenced operations on December 31, 2002.
‡ Amounts are de minimis due to the short period of operations.
# Computed after giving effect to an agreement by MassMutual to waive certain fees and expenses of the Fund for the year ended December 31, 2004 and the six months ended June 2005.
(a) Employee retirement benefit plans that invest plan assets in the Separate Investment Accounts (SIAs) may be subject to certain charges as set forth in their respective Plan Documents. Total return figures would be lower for the periods presented if they reflected these charges.
(b) Total Return excludes contingent deferred sales charge and would be lower for the periods presented if they reflected these charges.
The accompanying notes are an integral part of the financial statements.
204
MassMutual Select Blue Chip Growth Fund – Financial Statements (Continued)
Financial Highlights (For a share outstanding throughout each period)
| | | Class A | |
| | | Six months
ended
6/30/05
(Unaudited)††† | | Year ended
12/31/04 | | Year ended
12/31/03 | | Year ended
12/31/02 | | Period ended
12/31/01+ | |
| Net asset value, beginning of period | | $ | 8.74 | | | $ | 8.33 | | | $ | 6.72 | | | $ | 9.07 | | | $ | 10.00 | | |
| Income (loss) from investment operations: | | | |
| Net investment income (loss) | | | (0.01 | )*** | | | 0.03 | *** | | | (0.01 | )*** | | | (0.01 | )*** | | | (0.02 | )*** | |
| Net realized and unrealized gain (loss) on investments | | | (0.21 | ) | | | 0.41 | | | | 1.63 | | | | (2.34 | ) | | | (0.91 | ) | |
| Total income (loss) from investment operations | | | (0.22 | ) | | | 0.44 | | | | 1.62 | | | | (2.35 | ) | | | (0.93 | ) | |
| Less distributions to shareholders: | | | |
| From net investment income | | | - | | | | (0.03 | ) | | | (0.01 | ) | | | (0.00 | )†† | | | - | | |
| Net asset value, end of period | | $ | 8.52 | | | $ | 8.74 | | | $ | 8.33 | | | $ | 6.72 | | | $ | 9.07 | | |
| | | | | | | | | | | | | | | | | | | | | | |
| Total Return(a) | | | (2.52 | )% (c)** | | | 5.32 | % (c) | | | 24.09 | % | | | (25.91 | )% | | | (9.30 | )% ** | |
| Ratios / Supplemental Data: | | | |
| Net assets, end of period (000's) | | $ | 36,508 | | | $ | 37,377 | | | $ | 26,955 | | | $ | 4,914 | | | $ | 1,006 | | |
| Ratio of expenses to average daily net assets: | |
| Before expense waiver | | | 1.38 | % * | | | 1.38 | % | | | 1.39 | % | | | 1.38 | % | | | 1.39 | % * | |
| After expense waiver# | | | N/A | | | | 1.38 | % (b) | | | 1.38 | % (b) | | | 1.38 | % | | | 1.39 | % * | |
| Net investment income (loss) to average daily net assets | | | (0.15 | )% * | | | 0.37 | % | | | (0.13 | )% | | | (0.20 | )% | | | (0.39 | )% * | |
| Portfolio turnover rate | | | 7 | % ** | | | 22 | % | | | 23 | % | | | 30 | % | | | 27 | % ** | |
| | | Class L | |
| | | Six months
ended
6/30/05
(Unaudited)††† | | Year ended
12/31/04 | | Year ended
12/31/03 | | Year ended
12/31/02 | | Period ended
12/31/01+ | |
| Net asset value, beginning of period | | $ | 8.81 | | | $ | 8.39 | | | $ | 6.76 | | | $ | 9.09 | | | $ | 10.00 | | |
| Income (loss) from investment operations: | | | |
| Net investment income (loss) | | | 0.00 | ***† | | | 0.05 | *** | | | 0.01 | *** | | | (0.00 | )***† | | | (0.01 | )*** | |
| Net realized and unrealized gain (loss) on investments | | | (0.21 | ) | | | 0.42 | | | | 1.63 | | | | (2.33 | ) | | | (0.90 | ) | |
| Total income (loss) from investment operations | | | (0.21 | ) | | | 0.47 | | | | 1.64 | | | | (2.33 | ) | | | (0.91 | ) | |
| Less distributions to shareholders: | | | |
| From net investment income | | | - | | | | (0.05 | ) | | | (0.01 | ) | | | - | | | | - | | |
| Net asset value, end of period | | $ | 8.60 | | | $ | 8.81 | | | $ | 8.39 | | | $ | 6.76 | | | $ | 9.09 | | |
| | | | | | | | | | | | | | | | | | | | | | |
| Total Return(a) | | | (2.38 | )% ** | | | 5.58 | % | | | 24.25 | % | | | (25.63 | )% | | | (9.10 | )% ** | |
| Ratios / Supplemental Data: | | | |
| Net assets, end of period (000's) | | $ | 275,460 | | | $ | 301,734 | | | $ | 302,292 | | | $ | 217,427 | | | $ | 314,290 | | |
| Ratio of expenses to average daily net assets: | |
| Before expense waiver | | | 1.13 | % * | | | 1.13 | % | | | 1.13 | % | | | 1.13 | % | | | 1.14 | % * | |
| After expense waiver# | | | N/A | | | | 1.13 | % (b) | | | 1.12 | % (b) | | | 1.13 | % | | | 1.14 | % * | |
| Net investment income (loss) to average daily net assets | | | 0.09 | % * | | | 0.54 | % | | | 0.14 | % | | | (0.05 | )% | | | (0.18 | )% * | |
| Portfolio turnover rate | | | 7 | % ** | | | 22 | % | | | 23 | % | | | 30 | % | | | 27 | % ** | |
* Annualized.
** Percentages represent results for the period and are not annualized.
*** Per share amount calculated on the average shares method.
† Net investment income (loss) is less than $0.01 per share.
†† Distributions from net investment income is less than $0.01 per share.
††† Effective January 1, 2005, brokerage commissions are included with realized gain or loss on investment transactions. Prior to January 1, 2005, these amounts were presented as a reduction of expenses. Prior year amounts have not been restated to reflect this change due to immateriality. (See Note 3).
+ For the period from June 1, 2001 (commencement of operations) through December 31, 2001.
# Computed after giving effect to an agreement by MassMutual to waive certain fees and expenses of the Fund for the period October 1, 2001 through December 31, 2001, the year ended December 31, 2002 and the period January 1, 2003 through April 30, 2003.
(a) Employee retirement benefit plans that invest plan assets in the Separate Investment Accounts (SIAs) may be subject to certain charges as set forth in their respective Plan Documents. Total return figures would be lower for the periods presented if they reflected these charges.
(b) The Fund has entered into agreements with certain brokers to rebate a portion of brokerage commissions. The rebated commissions are used to reduce operating expenses of the Fund.
(c) Total Return excludes a front-end sales charge and would be lower for the periods presented if it reflected these charges.
The accompanying notes are an integral part of the financial statements.
MassMutual Select Blue Chip Growth Fund – Financial Statements (Continued)
Financial Highlights (For a share outstanding throughout each period)
| | | Class Y | |
| | | Six months
ended
6/30/05
(Unaudited)††† | | Year ended
12/31/04 | | Year ended
12/31/03 | | Year ended
12/31/02 | | Period ended
12/31/01+ | |
| Net asset value, beginning of period | | $ | 8.82 | | | $ | 8.39 | | | $ | 6.77 | | | $ | 9.10 | | | $ | 10.00 | | |
| Income (loss) from investment operations: | | | |
| Net investment income (loss) | | | 0.01 | *** | | | 0.06 | *** | | | 0.02 | *** | | | 0.01 | *** | | | (0.00 | )***† | |
| Net realized and unrealized gain (loss) on investments | | | (0.21 | ) | | | 0.43 | | | | 1.62 | | | | (2.34 | ) | | | (0.90 | ) | |
| Total income (loss) from investment operations | | | (0.20 | ) | | | 0.49 | | | | 1.64 | | | | (2.33 | ) | | | (0.90 | ) | |
| Less distributions to shareholders: | | | |
| From net investment income | | | - | | | | (0.06 | ) | | | (0.02 | ) | | | (0.00 | )** | | | - | | |
| Net asset value, end of period | | $ | 8.62 | | | $ | 8.82 | | | $ | 8.39 | | | $ | 6.77 | | | $ | 9.10 | | |
| | | | | | | | | | | | | | | | | | | | | | |
| Total Return(a) | | | (2.27 | )% ** | | | 5.83 | % | | | 24.26 | % | | | (25.56 | )% | | | (9.00 | )% ** | |
| Ratios / Supplemental Data: | | | |
| Net assets, end of period (000's) | | $ | 4,425 | | | $ | 4,331 | | | $ | 3,626 | | | $ | 827 | | | $ | 617 | | |
| Ratio of expenses to average daily net assets: | |
| Before expense waiver | | | 1.01 | % * | | | 1.01 | % | | | 1.01 | % | | | 1.01 | % | | | 1.02 | % * | |
| After expense waiver# | | | N/A | | | | 1.01 | % (b) | | | 1.01 | % (b) | | | 1.01 | % | | | 1.01 | % * | |
| Net investment income (loss) to average daily net assets | | | 0.22 | % * | | | 0.68 | % | | | 0.26 | % | | | 0.12 | % | | | (0.02 | )% * | |
| Portfolio turnover rate | | | 7 | % ** | | | 22 | % | | | 23 | % | | | 30 | % | | | 27 | % ** | |
| | | Class S | |
| | | Six months
ended
6/30/05
(Unaudited)††† | | Year ended
12/31/04 | | Year ended
12/31/03 | | Year ended
12/31/02 | | Period ended
12/31/01+ | |
| Net asset value, beginning of period | | $ | 8.84 | | | $ | 8.42 | | | $ | 6.78 | | | $ | 9.10 | | | $ | 10.00 | | |
| Income (loss) from investment operations: | | | |
| Net investment income | | | 0.01 | *** | | | 0.07 | *** | | | 0.03 | *** | | | 0.02 | *** | | | 0.00 | ***† | |
| Net realized and unrealized gain (loss) on investments | | | (0.20 | ) | | | 0.42 | | | | 1.64 | | | | (2.33 | ) | | | (0.90 | ) | |
| Total income (loss) from investment operations | | | (0.19 | ) | | | 0.49 | | | | 1.67 | | | | (2.31 | ) | | | (0.90 | ) | |
| Less distributions to shareholders: | | | |
| From net investment income | | | - | | | | (0.07 | ) | | | (0.03 | ) | | | (0.01 | ) | | | - | | |
| Net asset value, end of period | | $ | 8.65 | | | $ | 8.84 | | | $ | 8.42 | | | $ | 6.78 | | | $ | 9.10 | | |
| | | | | | | | | | | | | | | | | | | | | | |
| Total Return(a) | | | (2.15 | )% ** | | | 5.80 | % | | | 24.58 | % | | | (25.43 | )% | | | (9.00 | )% ** | |
| Ratios / Supplemental Data: | | | |
| Net assets, end of period (000's) | | $ | 71,418 | | | $ | 79,072 | | | $ | 91,674 | | | $ | 72,210 | | | $ | 113,011 | | |
| Ratio of expenses to average daily net assets: | |
| Before expense waiver | | | 0.88 | % * | | | 0.88 | % | | | 0.88 | % | | | 0.88 | % | | | 0.89 | % * | |
| After expense waiver# | | | N/A | | | | 0.87 | % (b) | | | 0.87 | % (b) | | | 0.88 | % | | | 0.89 | % * | |
| Net investment income to average daily net assets | | | 0.35 | % * | | | 0.77 | % | | | 0.39 | % | | | 0.20 | % | | | 0.07 | % * | |
| Portfolio turnover rate | | | 7 | % ** | | | 22 | % | | | 23 | % | | | 30 | % | | | 27 | % ** | |
* Annualized.
** Percentages represent results for the period and are not annualized.
*** Per share amount calculated on the average shares method.
† Net investment income (loss) is less than $0.01 per share.
†† Distibutions from net investment income is less than $0.01 per share.
††† Effective January 1, 2005, brokerage commissions are included with realized gain or loss on investment transactions. Prior to January 1, 2005, these amounts were presented as a reduction of expenses. Prior year amounts have not been restated to reflect this change due to immateriality. (See Note 3).
+ For the period from June 1, 2001 (commencement of operations) through December 31, 2001.
# Computed after giving effect to an agreement by MassMutual to waive certain fees and expenses of the Fund for the period October 1, 2001 through December 31, 2001, the year ended December 31, 2002 and the period January 1, 2003 through April 30, 2003.
(a) Employee retirement benefit plans that invest plan assets in the Separate Investment Accounts (SIAs) may be subject to certain charges as set forth in their respective Plan Documents. Total return figures would be lower for the periods presented if they reflected these charges.
(b) The Fund has entered into agreements with certain brokers to rebate a portion of brokerage commissions. The rebated commissions are used to reduce operating expenses of the Fund.
The accompanying notes are an integral part of the financial statements.
206
MassMutual Select Blue Chip Growth Fund – Financial Statements (Continued)
Financial Highlights (For a share outstanding throughout each period)
| | | Class N | |
| | | Six months
ended
6/30/05
(Unaudited)††† | | Year ended
12/31/04 | | Year ended
12/31/03 | | Period ended
12/31/02++ | |
| Net asset value, beginning of period | | $ | 8.68 | | | $ | 8.27 | | | $ | 6.69 | | | $ | 6.69 | | |
| Income (loss) from investment operations: | |
| Net investment income (loss) | | | (0.02 | )*** | | | 0.01 | *** | | | (0.03 | )*** | | | 0.00 | ***† | |
| Net realized and unrealized gain (loss) on investments | | | (0.21 | ) | | | 0.41 | | | | 1.61 | | | | (0.00 | )† | |
| Total income from investment operations | | | (0.23 | ) | | | 0.42 | | | | 1.58 | | | | 0.00 | | |
| Less distributions to shareholders: | |
| From net investment income | | | - | | | | (0.01 | ) | | | (0.00 | )†† | | | - | | |
| Net asset value, end of period | | $ | 8.45 | | | $ | 8.68 | | | $ | 8.27 | | | $ | 6.69 | | |
| | | | | | | | | | | | | | | | | | |
| Total Return(a) | | | (2.65 | )% (c)** | | | 5.05 | % (c) | | | 23.64 | % (c) | | | 0.00 | % ‡ | |
| Ratios / Supplemental Data: | |
| Net assets, end of period (000's) | | $ | 2,138 | | | $ | 2,185 | | | $ | 1,493 | | | $ | 101 | | |
| Ratio of expenses to average daily net assets: | |
| Before expense waiver | | | 1.68 | % * | | | 1.68 | % | | | 1.69 | % | | | - | ‡ | |
| After expense waiver# | | | N/A | | | | 1.68 | % (b) | | | 1.69 | % (b) | | | N/A ‡ | | |
| Net investment income (loss) to average daily net assets | | | (0.45 | )% * | | | 0.08 | % | | | (0.45 | )% | | | 0.00 | % ‡ | |
| Portfolio turnover rate | | | 7 | % ** | | | 22 | % | | | 23 | % | | | 30 | % | |
* Annualized.
** Percentages represent results for the period and are not annualized.
*** Per share amount calculated on the average shares method.
† Net investment income and net realized and unrealized loss on investments are less than $0.01 per share.
†† Distibutions from net investment income is less than $0.01 per share.
††† Effective January 1, 2005, brokerage commissions are included with realized gain or loss on investment transactions. Prior to January 1, 2005, these amounts were presented as a reduction of expenses. Prior year amounts have not been restated to reflect this change due to immateriality. (See Note 3).
++ Class N commenced operations on December 31, 2002.
‡ Amounts are de minimis due to the short period of operations.
# Computed after giving effect to an agreement by MassMutual to waive certain fees and expenses of the Fund for the period January 1, 2003 through April 30, 2003.
(a) Employee retirement benefit plans that invest plan assets in the Separate Investment Accounts (SIAs) may be subject to certain charges as set forth in their respective Plan Documents. Total return figures would be lower for the periods presented if they reflected these charges.
(b) The Fund has entered into agreements with certain brokers to rebate a portion of brokerage commissions. The rebated commissions are used to reduce operating expenses of the Fund.
(c) Total Return excludes contingent deferred sales charge and would be lower for the periods presented if they reflected these charges.
The accompanying notes are an integral part of the financial statements.
207
MassMutual Select Large Cap Growth Fund – Financial Statements (Continued)
Financial Highlights (For a share outstanding throughout each period)
| | | Class A | |
| | | Six months
ended
6/30/05
(Unaudited)†† | | Year ended
12/31/04 | | Year ended
12/31/03 | | Year ended
12/31/02 | | Period ended
12/31/01+ | |
| Net asset value, beginning of period | | $ | 9.03 | | | $ | 8.48 | | | $ | 6.97 | | | $ | 10.00 | | | $ | 10.00 | | |
| Income (loss) from investment operations: | |
| Net investment loss | | | (0.02 | )*** | | | (0.02 | )*** | | | (0.03 | )*** | | | (0.04 | )*** | | | - | | |
| Net realized and unrealized gain (loss) on investments | | | (0.08 | ) | | | 0.57 | | | | 1.54 | | | | (2.99 | ) | | | - | | |
| Total income (loss) from investment operations | | | (0.10 | ) | | | 0.55 | | | | 1.51 | | | | (3.03 | ) | | | 0.00 | | |
| Net asset value, end of period | | $ | 8.93 | | | $ | 9.03 | | | $ | 8.48 | | | $ | 6.97 | | | $ | 10.00 | | |
| | | | | | | | | | | | | | | | | | | | | | |
| Total Return(a) | | | (1.11 | )% (c)** | | | 6.49 | % (c) | | | 21.66 | % | | | (30.30 | )% | | | - | | |
| Ratios / Supplemental Data: | |
| Net assets, end of period (000's) | | $ | 2,296 | | | $ | 1,997 | | | $ | 1,374 | | | $ | 826 | | | $ | 1 | | |
| Ratio of expenses to average daily net assets: | |
| Before expense waiver | | | 1.38 | % * | | | 1.37 | % | | | 1.34 | % | | | 1.40 | % | | | - | | |
| After expense waiver# | | | 1.31 | % * | | | 1.25 | % (b) | | | 1.25 | % (b) | | | 1.22 | % (b) | | | - | | |
| Net investment loss to average daily net assets | | | (0.57 | )% * | | | (0.20 | )% | | | (0.34 | )% | | | (0.48 | )% | | | - | | |
| Portfolio turnover rate | | | 29 | % ** | | | 68 | % | | | 47 | % | | | 56 | % | | | - | | |
| | | Class L | |
| | | Six months
ended
6/30/05
(Unaudited)†† | | Year ended
12/31/04 | | Year ended
12/31/03 | | Year ended
12/31/02 | | Period ended
12/31/01+ | |
| Net asset value, beginning of period | | $ | 9.09 | | | $ | 8.52 | | | $ | 6.99 | | | $ | 10.00 | | | $ | 10.00 | | |
| Income (loss) from investment operations: | |
| Net investment income (loss) | | | (0.03 | )*** | | | 0.00 | *** | | | (0.01 | )*** | | | (0.01 | )*** | | | - | | |
| Net realized and unrealized gain (loss) on investments | | | 0.07 | | | | 0.57 | | | | 1.54 | | | | (3.00 | ) | | | - | | |
| Total income (loss) from investment operations | | | 0.04 | | | | 0.57 | | | | 1.53 | | | | (3.01 | ) | | | 0.00 | | |
| Less distributions to shareholders: | |
| From net investment income | | | - | | | | (0.00 | )† | | | - | | | | - | | | | - | | |
| Net asset value, end of period | | $ | 9.13 | | | $ | 9.09 | | | $ | 8.52 | | | $ | 6.99 | | | $ | 10.00 | | |
| | | | | | | | | | | | | | | | | | | | | | |
| Total Return(a) | | | 0.44 | % ** | | | 6.72 | % | | | 21.89 | % | | | (30.10 | )% | | | - | | |
| Ratios / Supplemental Data: | |
| Net assets, end of period (000's) | | $ | 338 | | | $ | 9,272 | | | $ | 7,628 | | | $ | 3,883 | | | $ | 1 | | |
| Ratio of expenses to average daily net assets: | |
| Before expense waiver | | | 1.10 | % * | | | 1.12 | % | | | 1.09 | % | | | 1.15 | % | | | - | | |
| After expense waiver# | | | 1.04 | % * | | | 1.00 | % (b) | | | 1.00 | % (b) | | | 0.98 | % (b) | | | - | | |
| Net investment income (loss) to average daily net assets | | | (0.63 | )% * | | | 0.04 | % | | | (0.08 | )% | | | (0.20 | )% | | | - | | |
| Portfolio turnover rate | | | 29 | % ** | | | 68 | % | | | 47 | % | | | 56 | % | | | - | | |
* Annualized.
** Percentages represent results for the period and are not annualized.
*** Per share amount calculated on the average shares method.
† Distributions from net investment income was less than $0.01 per share.
†† Effective January 1, 2005, brokerage commissions are included with realized gain or loss on investment transactions. Prior to January 1, 2005, these amounts were presented as a reduction of expenses. Prior year amounts have not been restated to reflect this change due to immateriality. (See Note 3).
+ The Fund commenced operations on December 31, 2001.
# Computed after giving effect to an agreement by MassMutual to waive certain fees and expenses of the Fund for the years ended December 31, 2002, 2003 and 2004 and January 1, 2005 through April 30, 2005.
(a) Employee retirement benefit plans that invest plan assets in the Separate Investment Accounts (SIAs) may be subject to certain charges as set forth by their respective Plan Documents. Total return figures would be lower for the periods presented if they reflected these charges.
(b) The Fund has entered into agreements with certain brokers to rebate a portion of brokerage commissions. The rebated commissions are used to reduce operating expenses of the Fund.
(c) Total Return excludes a front-end sales charge and would be lower for the period presented if it reflected these charges.
The accompanying notes are an integral part of the financial statements.
208
MassMutual Select Large Cap Growth Fund – Financial Statements (Continued)
Financial Highlights (For a share outstanding throughout each period)
| | | Class Y | |
| | | Six months
ended
6/30/05
(Unaudited)†† | | Year ended
12/31/04 | | Year ended
12/31/03 | | Year ended
12/31/02 | | Period ended
12/31/01+ | |
| Net asset value, beginning of period | | $ | 9.10 | | | $ | 8.53 | | | $ | 7.00 | | | $ | 10.00 | | | $ | 10.00 | | |
| Income (loss) from investment operations: | |
| Net investment income (loss) | | | (0.01 | )*** | | | 0.02 | *** | | | 0.01 | *** | | | (0.01 | )*** | | | - | | |
| Net realized and unrealized gain (loss) on investments | | | (0.07 | ) | | | 0.57 | | | | 1.53 | | | | (2.99 | ) | | | - | | |
| Total income (loss) from investment operations | | | (0.08 | ) | | | 0.59 | | | | 1.54 | | | | (3.00 | ) | | | 0.00 | | |
| Less distributions to shareholders: | |
| From net investment income | | | - | | | | (0.02 | ) | | | (0.01 | ) | | | - | | | | - | | |
| Net asset value, end of period | | $ | 9.02 | | | $ | 9.10 | | | $ | 8.53 | | | $ | 7.00 | | | $ | 10.00 | | |
| | | | | | | | | | | | | | | | | | | | | | |
| Total Return(a) | | | (0.88 | )% ** | | | 6.86 | % | | | 22.04 | % | | | (30.00 | )% | | | - | | |
| Ratios / Supplemental Data: | |
| Net assets, end of period (000's) | | $ | 9,526 | | | $ | 9,052 | | | $ | 7,697 | | | $ | 78 | | | $ | 1 | | |
| Ratio of expenses to average daily net assets: | |
| Before expense waiver | | | 0.98 | % * | | | 0.97 | % | | | 0.94 | % | | | 1.00 | % | | | - | | |
| After expense waiver# | | | 0.91 | % * | | | 0.85 | % (b) | | | 0.86 | % (b) | | | 0.82 | % (b) | | | - | | |
| Net investment income (loss) to average daily net assets | | | (0.17 | )% * | | | 0.19 | % | | | 0.08 | % | | | (0.11 | )% | | | - | | |
| Portfolio turnover rate | | | 29 | % ** | | | 68 | % | | | 47 | % | | | 56 | % | | | - | | |
| | | Class S | |
| | | Six months
ended
6/30/05
(Unaudited)†† | | Year ended
12/31/04 | | Year ended
12/31/03 | | Year ended
12/31/02 | | Period ended
12/31/01+ | |
| Net asset value, beginning of period | | $ | 9.14 | | | $ | 8.55 | | | $ | 7.01 | | | $ | 10.00 | | | $ | 10.00 | | |
| Income (loss) from investment operations: | |
| Net investment income (loss) | | | (0.01 | )*** | | | 0.01 | *** | | | 0.01 | *** | | | (0.00 | )***† | | | - | | |
| Net realized and unrealized gain (loss) on investments | | | (0.07 | ) | | | 0.59 | | | | 1.54 | | | | (2.99 | ) | | | - | | |
| Total income (loss) from investment operations | | | (0.08 | ) | | | 0.60 | | | | 1.55 | | | | (2.99 | ) | | | 0.00 | | |
| Less distributions to shareholders: | |
| From net investment income | | | - | | | | (0.01 | ) | | | (0.01 | ) | | | - | | | | - | | |
| Net asset value, end of period | | $ | 9.06 | | | $ | 9.14 | | | $ | 8.55 | | | $ | 7.01 | | | $ | 10.00 | | |
| | | | | | | | | | | | | | | | | | | | | | |
| Total Return(a) | | | (0.88 | )% ** | | | 7.08 | % | | | 22.05 | % | | | (29.90 | )% | | | - | | |
| Ratios / Supplemental Data: | |
| Net assets, end of period (000's) | | $ | 17,648 | | | $ | 18,791 | | | $ | 33,787 | | | $ | 28,029 | | | $ | 10,001 | | |
| Ratio of expenses to average daily net assets: | |
| Before expense waiver | | | 0.94 | % * | | | 0.93 | % | | | 0.90 | % | | | 0.96 | % | | | - | | |
| After expense waiver# | | | 0.87 | % * | | | 0.81 | % (b) | | | 0.81 | % (b) | | | 0.77 | % (b) | | | - | | |
| Net investment income (loss) to average daily net assets | | | (0.13 | )% * | | | 0.16 | % | | | 0.11 | % | | | (0.05 | )% | | | - | | |
| Portfolio turnover rate | | | 29 | % ** | | | 68 | % | | | 47 | % | | | 56 | % | | | - | | |
* Annualized.
** Percentages represent results for the period and are not annualized.
*** Per share amount calculated on the average shares method.
† Net investment loss is less than $0.01 per share.
†† Effective January 1, 2005, brokerage commissions are included with realized gain or loss on investment transactions. Prior to January 1, 2005, these amounts were presented as a reduction of expenses. Prior year amounts have not been restated to reflect this change due to immateriality. (See Note 3).
+ The Fund commenced operations on December 31, 2001.
# Computed after giving effect to an agreement by MassMutual to waive certain fees and expenses of the Fund for the years ended December 31, 2002, 2003 and 2004 and January 1, 2005 through April 30, 2005.
(a) Employee retirement benefit plans that invest plan assets in the Separate Investment Accounts (SIAs) may be subject to certain charges as set forth by their respective Plan Documents. Total return figures would be lower for the periods presented if they reflected these charges.
(b) The Fund has entered into agreements with certain brokers to rebate a portion of brokerage commissions. The rebated commissions are used to reduce operating expenses of the Fund.
The accompanying notes are an integral part of the financial statements.
209
MassMutual Select Large Cap Growth Fund – Financial Statements (Continued)
Financial Highlights (For a share outstanding throughout each period)
| | | Class N | |
| | | Six months
ended
6/30/05
(Unaudited)†† | | Year ended
12/31/04 | | Year ended
12/31/03 | | Period ended
12/31/02++ | |
| Net asset value, beginning of period | | $ | 9.07 | | | $ | 8.42 | | | $ | 6.94 | | | $ | 6.95 | | |
| Income (loss) from investment operations: | |
| Net investment income (loss) | | | (0.04 | )*** | | | (0.07 | )*** | | | (0.05 | )*** | | | (0.00 | )***† | |
| Net realized and unrealized gain (loss) on investments | | | (0.07 | ) | | | 0.72 | | | | 1.53 | | | | (0.01 | ) | |
| Total income from investment operations | | | (0.11 | ) | | | 0.65 | | | | 1.48 | | | | (0.01 | ) | |
| Net asset value, end of period | | $ | 8.96 | | | $ | 9.07 | | | $ | 8.42 | | | $ | 6.94 | | |
| Total Return(a) | | | (1.21 | )% (c)** | | | 7.72 | % (c) | | | 21.33 | % (c) | | | - | ‡ | |
| Ratios / Supplemental Data: | |
| Net assets, end of period (000's) | | $ | 4 | | | $ | 5 | | | $ | 125 | | | $ | 101 | | |
| Ratio of expenses to average daily net assets: | |
| Before expense waiver | | | 1.68 | % * | | | 1.67 | % | | | 1.64 | % | | | - | ‡ | |
| After expense waiver# | | | 1.61 | % * | | | 1.56 | % (b) | | | 1.55 | % | | | - | ‡ | |
| Net investment loss to average daily net assets | | | (0.87 | )% * | | | (0.83 | )% | | | (0.63 | )% | | | - | ‡ | |
| Portfolio turnover rate | | | 29 | % ** | | | 68 | % | | | 47 | % | | | 56 | % | |
* Annualized.
** Percentages represent results for the period and are not annualized.
*** Per share amount calculated on the average shares method.
† Net investment loss is less than $0.01 per share.
†† Effective January 1, 2005, brokerage commissions are included with realized gain or loss on investment transactions. Prior to January 1, 2005, these amounts were presented as a reduction of expenses. Prior year amounts have not been restated to reflect this change due to immateriality. (See Note 3).
++ Class N commenced operations on December 31, 2002.
‡ Amounts are de minimis due to the short period of operations.
# Computed after giving effect to an agreement by MassMutual to waive certain fees and expenses of the Fund for the years ended December 31, 2002, 2003 and 2004 and January 1, 2005 through April 30, 2005.
(a) Employee retirement benefit plans that invest plan assets in the Separate Investment Accounts (SIAs) may be subject to certain charges as set forth by their respective Plan Documents. Total return figures would be lower for the periods presented if they reflected these charges.
(b) The Fund has entered into agreements with certain brokers to rebate a portion of brokerage commissions. The rebated commissions are used to reduce operating expenses of the Fund.
(c) Total Return excludes contingent deferred sales charge and would be lower for the periods presented if they reflected these charges.
The accompanying notes are an integral part of the financial statements.
210
MassMutual Select Growth Equity Fund – Financial Statements (Continued)
Financial Highlights (For a share outstanding throughout each period)
| | | Class A | |
| | | Six months
ended
6/30/05
(Unaudited)† | | Year ended
12/31/04 | | Year ended
12/31/03 | | Year ended
12/31/02 | | Year ended
12/31/01 | | Year ended
12/31/00 | |
| Net asset value, beginning of period | | $ | 7.74 | | | $ | 7.40 | | | $ | 6.04 | | | $ | 8.39 | | | $ | 11.24 | | | $ | 12.90 | | |
| Income (loss) from investment operations: | |
| Net investment income (loss) | | | 0.00 | ***†† | | | 0.00 | ***†† | | | (0.02 | )*** | | | (0.03 | )*** | | | (0.03 | )*** | | | (0.05 | )*** | |
Net realized and unrealized gain (loss)
on investments | | | (0.03 | ) | | | 0.34 | | | | 1.38 | | | | (2.32 | ) | | | (2.82 | ) | | | (0.70 | ) | |
Total income (loss) from
investment operations | | | (0.03 | ) | | | 0.34 | | | | 1.36 | | | | (2.35 | ) | | | (2.85 | ) | | | (0.75 | ) | |
| Less distributions to shareholders: | |
| From net investment income | | | (0.00 | )†††† | | | (0.00 | )†††† | | | - | | | | - | | | | - | | | | - | | |
| Tax return of capital | | | - | | | | - | | | | - | | | | - | | | | - | | | | (0.00 | )††† | |
| From net realized gains | | | - | | | | - | | | | - | | | | - | | | | - | | | | (0.91 | ) | |
| Total distributions | | | (0.00 | ) | | | (0.00 | ) | | | - | | | | - | | | | - | | | | (0.91 | ) | |
| Net asset value, end of period | | $ | 7.71 | | | $ | 7.74 | | | $ | 7.40 | | | $ | 6.04 | | | $ | 8.39 | | | $ | 11.24 | | |
| Total Return(a) | | | (0.39 | )% (c)** | | | 4.60 | % (c) | | | 22.52 | % | | | (28.01 | )% | | | (25.36 | )% | | | (6.01 | )% | |
| Ratios / Supplemental Data: | |
| Net assets, end of period (000's) | | $ | 223,588 | | | $ | 224,998 | | | $ | 206,097 | | | $ | 79,267 | | | $ | 75,186 | | | $ | 44,905 | | |
| Ratio of expenses to average daily net assets: | |
| Before expense waiver | | | 1.25 | % * | | | 1.26 | % | | | 1.26 | % | | | 1.26 | % | | | 1.27 | % | | | 1.29 | % | |
| After expense waiver# | | | N/A | | | | 1.24 | % (b) | | | 1.18 | % (b) | | | 1.22 | % (b) | | | 1.24 | % | | | 1.25 | % | |
Net investment income (loss) to average
daily net assets | | | 0.08 | % * | | | 0.01 | % | | | (0.31 | )% | | | (0.41 | )% | | | (0.36 | )% | | | (0.35 | )% | |
| Portfolio turnover rate | | | 54 | % ** | | | 181 | % | | | 260 | % | | | 224 | % | | | 279 | % | | | 264 | % | |
| | | Class L | |
| | | Six months
ended
6/30/05
(Unaudited)† | | Year ended
12/31/04 | | Year ended
12/31/03 | | Year ended
12/31/02 | | Year ended
12/31/01 | | Year ended
12/31/00 | |
| Net asset value, beginning of period | | $ | 7.83 | | | $ | 7.49 | | | $ | 6.10 | | | $ | 8.45 | | | $ | 11.29 | | | $ | 12.93 | | |
| Income (loss) from investment operations: | |
| Net investment income (loss) | | | 0.01 | *** | | | 0.02 | *** | | | (0.00 | )***†† | | | (0 | .01)*** | | | (0.01 | )*** | | | (0.01 | )*** | |
Net realized and unrealized gain (loss)
on investments | | | (0.03 | ) | | | 0.34 | | | | 1.39 | | | | (2.34 | ) | | | (2.83 | ) | | | (0.72 | ) | |
Total income (loss) from
investment operations | | | (0.02 | ) | | | 0.36 | | | | 1.39 | | | | (2.35 | ) | | | (2.84 | ) | | | (0.73 | ) | |
| Less distributions to shareholders: | |
| From net investment income | | | - | | | | (0.02 | ) | | | - | | | | - | | | | - | | | | - | | |
| Tax return of capital | | | - | | | | - | | | | - | | | | - | | | | - | | | | (0.00 | )††† | |
| From net realized gains | | | - | | | | - | | | | - | | | | - | | | | - | | | | (0.91 | ) | |
| Total distributions | | | - | | | | (0.02 | ) | | | - | | | | - | | | | - | | | | (0.91 | ) | |
| Net asset value, end of period | | $ | 7.81 | | | $ | 7.83 | | | $ | 7.49 | | | $ | 6.10 | | | $ | 8.45 | | | $ | 11.29 | | |
| Total Return(a) | | | (0.13 | )% ** | | | 4.82 | % | | | 22.79 | % | | | (27.81 | )% | | | (25.15 | )% | | | (5.84 | )% | |
| Ratios / Supplemental Data: | |
| Net assets, end of period (000's) | | $ | 273,588 | | | $ | 276,387 | | | $ | 201,623 | | | $ | 99,882 | | | $ | 112,901 | | | $ | 69,163 | | |
| Ratio of expenses to average daily net assets: | |
| Before expense waiver | | | 1.00 | % * | | | 1.01 | % | | | 1.01 | % | | | 1.01 | % | | | 1.02 | % | | | 1.04 | % | |
| After expense waiver# | | | N/A | | | | 0.99 | % (b) | | | 0.92 | % (b) | | | 0.97 | % (b) | | | 0.99 | % | | | 1.00 | % | |
Net investment income (loss) to average
daily net assets | | | 0.33 | % * | | | 0.29 | % | | | (0.05 | )% | | | (0.17 | )% | | | (0.11 | )% | | | (0.11 | )% | |
| Portfolio turnover rate | | | 54 | % ** | | | 181 | % | | | 260 | % | | | 224 | % | | | 279 | % | | | 264 | % | |
* Annualized
** Percentages represent results for the period and are not annualized.
*** Per share amount calculated on the average shares method.
† Effective January 1, 2005, brokerage commissions are included with realized gain or loss on investment transactions. Prior to January 1, 2005, these amounts were presented as a reduction of expenses. Prior year amounts have not been restated to reflect this change due to immateriality. (See Note 3)
†† Net investment loss is less than $0.01 per share.
††† Tax return of capital is less than $.01 per share.
†††† Distribution from net investment income is less than $0.01 per share.
# Computed after giving effect to an agreement by MassMutual to waive certain fees and expenses of the Fund for the period May 1, 2000 through December 31, 2000, the year ended December 31, 2001 and the period January 1, 2002 through April 30, 2002.
(a) Employee retirement benefit plans that invest plan assets in the Separate Investment Accounts (SIAs) may be subject to certain charges as set forth in their respective Plan Documents. Total return figures would be lower for all periods shown if they reflected these charges.
(b) The Fund has entered into agreements with certain brokers to rebate a portion of brokerage commissions. The rebated commissions are used to reduce operating expenses of the Fund.
(c) Total Return excludes a front-end sales charge and would be lower for the periods presented if they reflected these charges.
The accompanying notes are an integral part of the financial statements.
211
MassMutual Select Growth Equity Fund – Financial Statements (Continued)
Financial Highlights (For a share outstanding throughout each period)
| | | Class Y | |
| | | Six months
ended
6/30/05
(Unaudited)† | | Year ended
12/31/04 | | Year ended
12/31/03 | | Year ended
12/31/02 | | Year ended
12/31/01 | | Year ended
12/31/00 | |
| Net asset value, beginning of period | | $ | 7.88 | | | $ | 7.54 | | | $ | 6.12 | | | $ | 8.47 | | | $ | 11.31 | | | $ | 12.93 | | |
| Income (loss) from investment operations: | |
| Net investment income (loss) | | | 0.02 | *** | | | 0.03 | *** | | | 0.01 | *** | | | (0.00 | )***†† | | | 0.00 | ***†† | | | 0.00 | ***†† | |
Net realized and unrealized gain (loss)
on investments | | | (0.04 | ) | | | 0.34 | | | | 1.41 | | | | (2.35 | ) | | | (2.84 | ) | | | (0.71 | ) | |
Total income (loss) from
investment operations | | | (0.02 | ) | | | 0.37 | | | | 1.42 | | | | (2.35 | ) | | | (2.84 | ) | | | (0.71 | ) | |
| Less distributions to shareholders: | |
| From net investment income | | | - | | | | (0.03 | ) | | | - | | | | - | | | | - | | | | - | | |
| Tax return of capital | | | - | | | | - | | | | - | | | | - | | | | - | | | | (0.00 | )††† | |
| From net realized gains | | | - | | | | - | | | | - | | | | - | | | | - | | | | (0.91 | ) | |
| Total distributions | | | - | | | | (0.03 | ) | | | - | | | | - | | | | - | | | | (0.91 | ) | |
| Net asset value, end of period | | $ | 7.86 | | | $ | 7.88 | | | $ | 7.54 | | | $ | 6.12 | | | $ | 8.47 | | | $ | 11.31 | | |
| Total Return(a) | | | (0.13 | )% ** | | | 4.92 | % | | | 23.20 | % | | | (27.75 | )% | | | (25.11 | )% | | | (5.69 | )% | |
| Ratios / Supplemental Data: | |
| Net assets, end of period (000's) | | $ | 115,562 | | | $ | 112,683 | | | $ | 101,937 | | | $ | 70,469 | | | $ | 81,552 | | | $ | 49,165 | | |
| Ratio of expenses to average daily net assets: | |
| Before expense waiver | | | 0.85 | % * | | | 0.86 | % | | | 0.86 | % | | | 0.86 | % | | | 0.87 | % | | | 0.89 | % | |
| After expense waiver# | | | N/A | | | | 0.84 | % (b) | | | 0.77 | %(b) | | | 0.82 | % (b) | | | 0.84 | % | | | 0.87 | % | |
Net investment income (loss) to average
daily net assets | | | 0.48 | % * | | | 0.42 | % | | | 0.10 | % | | | (0.03 | )% | | | 0.04 | % | | | 0.01 | % | |
| Portfolio turnover rate | | | 54 | % ** | | | 181 | % | | | 260 | % | | | 224 | % | | | 279 | % | | | 264 | % | |
| | | Class S | |
| | | Six months
ended
6/30/05
(Unaudited)† | | Year ended
12/31/04 | | Year ended
12/31/03 | | Year ended
12/31/02 | | Year ended
12/31/01 | | Year ended
12/31/00 | |
| Net asset value, beginning of period | | $ | 7.90 | | | $ | 7.56 | | | $ | 6.14 | | | $ | 8.49 | | | $ | 11.32 | | | $ | 12.93 | | |
| Income (loss) from investment operations: | |
| Net investment income | | | 0.02 | *** | | | 0.04 | *** | | | 0.01 | *** | | | 0.00 | ***†† | | | 0.01 | *** | | | 0.01 | *** | |
Net realized and unrealized gain (loss)
on investments | | | (0.03 | ) | | | 0.34 | | | | 1.41 | | | | (2.35 | ) | | | (2.84 | ) | | | (0.71 | ) | |
Total income (loss) from
investment operations | | | (0.01 | ) | | | 0.38 | | | | 1.42 | | | | (2.35 | ) | | | (2.83 | ) | | | (0.70 | ) | |
| Less distributions to shareholders: | |
| From net investment income | | | - | | | | (0.04 | ) | | | - | | | | - | | | | - | | | | - | | |
| Tax return of capital | | | - | | | | - | | | | - | | | | - | | | | - | | | | (0.00 | )††† | |
| From net realized gains | | | - | | | | - | | | | - | | | | - | | | | - | | | | (0.91 | ) | |
| Total distributions | | | - | | | | (0.04 | ) | | | - | | | | - | | | | - | | | | (0.91 | ) | |
| Net asset value, end of period | | $ | 7.89 | | | $ | 7.90 | | | $ | 7.56 | | | $ | 6.14 | | | $ | 8.49 | | | $ | 11.32 | | |
| Total Return(a) | | | 0.00 | % ** | | | 4.96 | % | | | 23.13 | % | | | (27.68 | )% | | | (25.00 | )% | | | (5.61 | )% | |
| Ratios / Supplemental Data: | |
| Net assets, end of period (000's) | | $ | 249,553 | | | $ | 229,407 | | | $ | 217,508 | | | $ | 130,165 | | | $ | 174,610 | | | $ | 165,480 | | |
| Ratio of expenses to average daily net assets: | |
| Before expense waiver | | | 0.79 | % * | | | 0.80 | % | | | 0.80 | % | | | 0.80 | % | | | 0.81 | % | | | 0.83 | % | |
| After expense waiver# | | | N/A | | | | 0.78 | % (b) | | | 0.71 | %(b) | | | 0.76 | % (b) | | | 0.78 | % | | | 0.80 | % | |
Net investment income (loss) to average
daily net assets | | | 0.54 | % * | | | 0.48 | % | | | 0.16 | % | | | 0.04 | % | | | 0.10 | % | | | 0.07 | % | |
| Portfolio turnover rate | | | 54 | % ** | | | 181 | % | | | 260 | % | | | 224 | % | | | 279 | % | | | 264 | % | |
* Annualized
** Percentages represent results for the period and are not annualized.
*** Per share amount calculated on the average shares method.
† Effective January 1, 2005, brokerage commissions are included with realized gain or loss on investment transactions. Prior to January 1, 2005, these amounts were presented as a reduction of expenses. Prior year amounts have not been restated to reflect this change due to immateriality. (See Note 3)
†† Net investment income (loss) is less than $0.01 per share.
††† Tax return of capital is less than $.01 per share.
# Computed after giving effect to an agreement by MassMutual to waive certain fees and expenses of the Fund for the period May 1, 2000 through December 31, 2000, the year ended December 31, 2001 and the period January 1, 2002 through April 30, 2002.
(a) Employee retirement benefit plans that invest plan assets in the Separate Investment Accounts (SIAs) may be subject to certain charges as set forth in their respective Plan Documents. Total return figures would be lower for all periods shown if they reflected these charges.
(b) The Fund has entered into agreements with certain brokers to rebate a portion of brokerage commissions. The rebated commissions are used to reduce operating expenses of the Fund.
The accompanying notes are an integral part of the financial statements.
212
MassMutual Select Growth Equity Fund – Financial Statements (Continued)
Financial Highlights (For a share outstanding throughout each period)
| | | Class N | |
| | | Six months
ended
6/30/05
(Unaudited)† | | Year ended
12/31/04 | | Year ended
12/31/03 | | Period ended
12/31/02++ | |
| Net asset value, beginning of period | | $ | 7.65 | | | $ | 7.34 | | | $ | 6.01 | | | $ | 6.01 | | |
| Income (loss) from investment operations: | |
| Net investment income (loss) | | | (0.01 | )*** | | | (0.02 | )*** | | | (0.05 | )*** | | | 0.00 | ***†† | |
| Net realized and unrealized gain on investments | | | (0.03 | ) | | | 0.33 | | | | 1.38 | | | | (0.00 | )†† | |
| Total income from investment operations | | | (0.04 | ) | | | 0.31 | | | | 1.33 | | | | 0.00 | | |
| Net asset value, end of period | | $ | 7.61 | | | $ | 7.65 | | | $ | 7.34 | | | $ | 6.01 | | |
| | | | | | | | | | | | | | | | | | |
| Total Return(a) | | | (0.39 | )% (c)** | | | 4.22 | % (c) | | | 22.13 | % (c) | | | - | ‡ | |
| Ratios / Supplemental Data: | |
| Net assets, end of period (000's) | | $ | 1,472 | | | $ | 1,472 | | | $ | 1,661 | | | $ | 101 | | |
| Ratio of expenses to average daily net assets: | |
| Before expense waiver | | | 1.55 | % * | | | 1.56 | % | | | 1.57 | % | | | - | ‡ | |
| After expense waiver | | | N/A | | | | 1.54 | % (b) | | | 1.52 | % (b) | | | - | ‡ | |
| Net investment income to average daily net assets | | | (0.22 | )% * | | | (0.31 | )% | | | (0.65 | )% | | | - | ‡ | |
| Portfolio turnover rate | | | 54 | % ** | | | 181 | % | | | 260 | % | | | 224 | % | |
* Annualized
** Percentages represent results for the period and are not annualized.
*** Per share amount calculated on the average shares method.
† Effective January 1, 2005, brokerage commissions are included with realized gain or loss on investment transactions. Prior to January 1, 2005, these amounts were presented as a reduction of expenses. Prior year amounts have not been restated to reflect this change due to immateriality. (See Note 3)
†† Net investment income and net realized and unrealized loss on investments are less than $.01 per share.
++ Class N commenced operations on December 31,2002.
‡ Amounts are de minimis due to short period of operations.
(a) Employee retirement benefit plans that invest plan assets in the Separate Investment Accounts (SIAs) may be subject to certain charges as set forth in their respective Plan Documents. Total return figures would be lower for all periods shown if they reflected these charges.
(b) The Fund has entered into agreements with certain brokers to rebate a portion of brokerage commissions. The rebated commissions are used to reduce operating expenses of the Fund.
(c) Total Return excludes a front-end sales charge and would be lower for the periods presented if they reflected these charges.
The accompanying notes are an integral part of the financial statements.
213
MassMutual Select Aggressive Growth Fund – Financial Statements (Continued)
Financial Highlights (For a share outstanding throughout each period)
| | | Class A | |
| | | Six months
ended
6/30/05
(Unaudited)††† | | Year ended
12/31/04 | | Year ended
12/31/03 | | Year ended
12/31/02 | | Year ended
12/31/01(d) | | Period ended
12/31/00+ | |
| Net asset value, beginning of period | | $ | 5.89 | | | $ | 4.96 | | | $ | 3.80 | | | $ | 5.28 | | | $ | 7.75 | | | $ | 10.00 | | |
| Income (loss) from investment operations: | |
| Net investment income (loss) | | | (0.03 | )*** | | | (0.04 | )*** | | | (0.02 | )*** | | | (0.02 | )*** | | | (0.02 | )*** | | | 0.01 | *** | |
Net realized and unrealized gain (loss)
on investments | | | (0.10 | ) | | | 0.97 | | | | 1.18 | | | | (1.46 | ) | | | (2.45 | ) | | | (2.24 | ) | |
Total income (loss) from
investment operations | | | (0.13 | ) | | | 0.93 | | | | 1.16 | | | | (1.48 | ) | | | (2.47 | ) | | | (2.23 | ) | |
| Less distributions to shareholders: | |
| From net investment income | | | - | | | | - | | | | - | | | | - | | | | - | | | | (0.02 | ) | |
| Tax return of capital | | | - | | | | - | | | | - | | | | - | | | | - | | | | (0.00 | )†† | |
| Total distributions | | | - | | | | - | | | | - | | | | - | | | | - | | | | (0.02 | ) | |
| Net asset value, end of period | | $ | 5.76 | | | $ | 5.89 | | | $ | 4.96 | | | $ | 3.80 | | | $ | 5.28 | | | $ | 7.75 | | |
| Total Return(a) | | | (2.21 | )% (c)** | | | 18.75 | % (c) | | | 30.53 | % | | | (28.03 | )% | | | (31.87 | )% | | | (22.32 | )% ** | |
| Ratios / Supplemental Data: | |
| Net assets, end of period (000's) | | $ | 115,334 | | | $ | 117,232 | | | $ | 65,012 | | | $ | 37,203 | | | $ | 34,747 | | | $ | 32,257 | | |
Ratio of expenses to average daily
net assets: | | | |
| Before expense waiver | | | 1.35 | % * | | | 1.36 | % | | | 1.37 | % | | | 1.37 | % | | | 1.36 | % | | | 1.35 | % * | |
| After expense waiver# | | | 1.27 | % * | | | 1.30 | % (b) | | | 1.33 | % (b) | | | 1.34 | % (b) | | | 1.35 | % | | | N/A | | |
Net investment income (loss) to average
daily net assets | | | (1.04 | )% * | | | (0.67 | )% | | | (0.56 | )% | | | (0.56 | )% | | | (0.33 | )% | | | 0.14 | % * | |
| Portfolio turnover rate | | | 12 | % ** | | | 85 | % | | | 93 | % | | | 112 | % | | | 112 | % | | | 48 | % ** | |
| | | Class L | |
| | | Six months
ended
6/30/05
(Unaudited)††† | | Year ended
12/31/04 | | Year ended
12/31/03 | | Year ended
12/31/02 | | Year ended
12/31/01(d) | | Period ended
12/31/00+ | |
| Net asset value, beginning of period | | $ | 5.97 | | | $ | 5.01 | | | $ | 3.82 | | | $ | 5.31 | | | $ | 7.77 | | | $ | 10.00 | | |
| Income (loss) from investment operations: | |
| Net investment income (loss) | | | (0.02 | )*** | | | (0.02 | )*** | | | (0.01 | )*** | | | (0.01 | )*** | | | (0.00 | )***† | | | 0.03 | *** | |
Net realized and unrealized gain (loss)
on investments | | | (0.11 | ) | | | 0.98 | | | | 1.20 | | | | (1.48 | ) | | | (2.46 | ) | | | (2.24 | ) | |
Total income (loss) from
investment operations | | | (0.13 | ) | | | 0.96 | | | | 1.19 | | | | (1.49 | ) | | | (2.46 | ) | | | (2.21 | ) | |
| Less distributions to shareholders: | |
| From net investment income | | | - | | | | - | | | | - | | | | - | | | | - | | | | (0.02 | ) | |
| Tax return of capital | | | - | | | | - | | | | - | | | | - | | | | - | | | | (0.00 | )†† | |
| Total distributions | | | - | | | | - | | | | - | | | | - | | | | - | | | | (0.02 | ) | |
| Net asset value, end of period | | $ | 5.84 | | | $ | 5.97 | | | $ | 5.01 | | | $ | 3.82 | | | $ | 5.31 | | | $ | 7.77 | | |
| Total Return(a) | | | (2.18 | )% ** | | | 19.19 | % | | | 31.15 | % | | | (28.06 | )% | | | (31.66 | )% | | | (22.10 | )% ** | |
| Ratios / Supplemental Data: | |
| Net assets, end of period (000's) | | $ | 154,489 | | | $ | 152,518 | | | $ | 76,120 | | | $ | 31,012 | | | $ | 27,980 | | | $ | 21,017 | | |
Ratio of expenses to average daily
net assets: | | | |
| Before expense waiver | | | 1.10 | % * | | | 1.11 | % | | | 1.12 | % | | | 1.12 | % | | | 1.11 | % | | | 1.12 | % * | |
| After expense waiver# | | | 1.02 | % * | | | 1.05 | % (b) | | | 1.08 | % (b) | | | 1.09 | % (b) | | | 1.10 | % | | | N/A | | |
Net investment income (loss) to average
daily net assets | | | (0.78 | )% * | | | (0.42 | )% | | | (0.32 | )% | | | (0.31 | )% | | | (0.08 | )% | | | 0.43 | % * | |
| Portfolio turnover rate | | | 12 | % ** | | | 85 | % | | | 93 | % | | | 112 | % | | | 112 | % | | | 48 | % ** | |
* Annualized.
** Percentages represent results for the period and are not annualized.
*** Per share amount calculated on the average shares method.
† Net investment loss is less than $0.01 per share.
†† Tax return of capital is less than $0.01 per share.
††† Effective January 1, 2005, brokerage commissions are included with realized gain or loss on investment transactions. Prior to January 1, 2005, these amounts were presented as a reduction of expenses. Prior year amounts have not been restated to reflect this change due to immateriality. (See Note 3)
+ For the period from May 1, 2000 (commencement of operations) through December 31, 2000.
# Computed after giving effect to an agreement by MassMutual to waive certain fees and expenses of the Fund for the periods May 1, 2001 through December 31, 2001, January 1, 2002 through April 30, 2002, the year ended December 31, 2004 and the six months ended June 30, 2005.
(a) Employee retirement benefit plans that invest plan assets in the Separate Investment Accounts (SIAs) may be subject to certain charges as set forth by their respective Plan Documents. Total return figures would be lower for the periods presented if they reflected these charges.
(b) The Fund has entered into agreements with certain brokers to rebate a portion of brokerage commissions. The rebated commissions are used to reduce operating expenses of the Fund.
(c) Total Return excludes a front-end sales charge and would be lower for the periods presented if it reflected these charges.
(d) The Fund has adopted the provisions of the AICPA Audit and Accounting Guide for Investment Companies and began amortizing premiums and discounts on debt securities. The effect of this change for the year ended December 31, 2001 was an increase to net investment loss per share of less than $0.01, a decrease to net realized and unrealized gains and losses per share of less than $0.01 and an increase in the ratio of net investment loss to average net assets of 0.02%. Per share data and ratios/supplemental data for periods prior to January 1, 2001 have not been restated to reflect this change in presentation.
The accompanying notes are an integral part of the financial statements.
214
MassMutual Select Aggressive Growth Fund – Financial Statements (Continued)
Financial Highlights (For a share outstanding throughout each period)
| | | Class Y | |
| | | Six months
ended
6/30/05
(Unaudited)††† | | Year ended
12/31/04 | | Year ended
12/31/03 | | Year ended
12/31/02 | | Year ended
12/31/01(c) | | Period ended
12/31/00+ | |
| Net asset value, beginning of period | | $ | 6.00 | | | $ | 5.03 | | | $ | 3.83 | | | $ | 5.31 | | | $ | 7.77 | | | $ | 10.00 | | |
| Income (loss) from investment operations: | | | |
| Net investment income (loss) | | | (0.02 | )*** | | | (0.01 | )*** | | | (0.01 | )*** | | | (0.01 | )*** | | | (0.00 | )***† | | | 0.03 | *** | |
Net realized and unrealized gain (loss)
on investments | | | (0.11 | ) | | | 0.98 | | | | 1.21 | | | | (1.47 | ) | | | (2.46 | ) | | | (2.24 | ) | |
Total income (loss) from
investment operations | | | (0.13 | ) | | | 0.97 | | | | 1.20 | | | | (1.48 | ) | | | (2.46 | ) | | | (2.21 | ) | |
| Less distributions to shareholders: | | | |
| From net investment income | | | - | | | | - | | | | - | | | | - | | | | - | | | | (0.02 | ) | |
| Tax return of capital | | | - | | | | - | | | | - | | | | - | | | | - | | | | (0.00 | )†† | |
| Total distributions | | | - | | | | - | | | | - | | | | - | | | | - | | | | (0.02 | ) | |
| Net asset value, end of period | | $ | 5.87 | | | $ | 6.00 | | | $ | 5.03 | | | $ | 3.83 | | | $ | 5.31 | | | $ | 7.77 | | |
| Total Return(a) | | | (2.00 | )% ** | | | 19.28 | % | | | 31.33 | % | | | (27.87 | )% | | | (31.66 | )% | | | (22.06 | )% ** | |
| Ratios / Supplemental Data: | | | |
| Net assets, end of period (000's) | | $ | 29,497 | | | $ | 32,242 | | | $ | 17,333 | | | $ | 10,145 | | | $ | 12,095 | | | $ | 2,295 | | |
Ratio of expenses to average daily
net assets: | | | |
| Before expense waiver | | | 0.95 | % * | | | 0.96 | % | | | 0.97 | % | | | 0.97 | % | | | 0.96 | % | | | 0.95 | % * | |
| After expense waiver# | | | 0.87 | % * | | | 0.90 | % (b) | | | 0.93 | % (b) | | | 0.94 | % (b) | | | 0.94 | % | | | N/A | | |
Net investment income (loss) to average
daily net assets | | | (0.63 | )% * | | | (0.27 | )% | | | (0.16 | )% | | | (0.16 | )% | | | (0.02 | )% | | | 0.52 | % * | |
| Portfolio turnover rate | | | 12 | % ** | | | 85 | % | | | 93 | % | | | 112 | % | | | 112 | % | | | 48 | % ** | |
| | | Class S | |
| | | Six months
ended
6/30/05
(Unaudited)††† | | Year ended
12/31/04 | | Year ended
12/31/03 | | Year ended
12/31/02 | | Year ended
12/31/01(c) | | Period ended
12/31/00+ | |
| Net asset value, beginning of period | | $ | 6.03 | | | $ | 5.05 | | | $ | 3.84 | | | $ | 5.32 | | | $ | 7.77 | | | $ | 10.00 | | |
| Income (loss) from investment operations: | | | |
| Net investment income (loss) | | | (0.01 | )*** | | | (0.01 | )*** | | | (0.00 | )***† | | | (0.01 | )*** | | | 0.01 | *** | | | 0.04 | *** | |
Net realized and unrealized gain (loss)
on investments | | | (0.11 | ) | | | 0.99 | | | | 1.21 | | | | (1.47 | ) | | | (2.46 | ) | | | (2.24 | ) | |
Total income (loss) from
investment operations | | | (0.12 | ) | | | 0.98 | | | | 1.21 | | | | (1.48 | ) | | | (2.45 | ) | | | (2.20 | ) | |
| Less distributions to shareholders: | | | |
| From net investment income | | | - | | | | - | | | | - | | | | - | | | | - | | | | (0.03 | ) | |
| Tax return of capital | | | - | | | | - | | | | - | | | | - | | | | - | | | | (0.00 | )†† | |
| Total distributions | | | - | | | | - | | | | - | | | | - | | | | - | | | | (0.03 | ) | |
| Net asset value, end of period | | $ | 5.91 | | | $ | 6.03 | | | $ | 5.05 | | | $ | 3.84 | | | $ | 5.32 | | | $ | 7.77 | | |
| Total Return(a) | | | (1.99 | )% ** | | | 19.41 | % | | | 31.51 | % | | | (27.82 | )% | | | (31.53 | )% | | | (22.05 | )% ** | |
| Ratios / Supplemental Data: | | | |
| Net assets, end of period (000's) | | $ | 190,667 | | | $ | 198,154 | | | $ | 108,281 | | | $ | 46,026 | | | $ | 76,724 | | | $ | 75,412 | | |
Ratio of expenses to average daily
net assets: | | | |
| Before expense waiver | | | 0.85 | % * | | | 0.86 | % | | | 0.87 | % | | | 0.87 | % | | | 0.86 | % | | | 0.87 | % * | |
| After expense waiver# | | | 0.77 | % * | | | 0.80 | % (b) | | | 0.83 | % (b) | | | 0.84 | % (b) | | | 0.85 | % | | | N/A | | |
Net investment income (loss) to average
daily net assets | | | (0.52 | )% * | | | (0.17 | )% | | | (0.06 | )% | | | (0.07 | )% | | | 0.17 | % | | | 0.70 | % * | |
| Portfolio turnover rate | | | 12 | % ** | | | 85 | % | | | 93 | % | | | 112 | % | | | 112 | % | | | 48 | % ** | |
* Annualized.
** Percentages represent results for the period and are not annualized.
*** Per share amount calculated on the average shares method.
† Net investment loss is less than $0.01 per share.
†† Tax return of capital is less than $0.01 per share.
††† Effective January 1, 2005, brokerage commissions are included with realized gain or loss on investment transactions. Prior to January 1, 2005, these amounts were presented as a reduction of expenses. Prior year amounts have not been restated to reflect this change due to immateriality. (See Note 3)
+ For the period from May 1, 2000 (commencement of operations) through December 31, 2000.
# Computed after giving effect to an agreement by MassMutual to waive certain fees and expenses of the Fund for the periods May 1, 2001 through December 31, 2001, January 1, 2002 through April 30, 2002, the year ended December 31, 2004 and the six months ended June 30, 2005.
(a) Employee retirement benefit plans that invest plan assets in the Separate Investment Accounts (SIAs) may be subject to certain charges as set forth by their respective Plan Documents. Total return figures would be lower for the periods presented if they reflected these charges.
(b) The Fund has entered into agreements with certain brokers to rebate a portion of brokerage commissions. The rebated commissions are used to reduce operating expenses of the Fund.
(c) The Fund has adopted the provisions of the AICPA Audit and Accounting Guide for Investment Companies and began amortizing premiums and discounts on debt securities. The effect of this change for the year ended December 31, 2001 was an increase to net investment loss per share of less than $0.01, a decrease to net realized and unrealized gains and losses per share of less than $0.01 and an increase in the ratio of net investment loss to average net assets of 0.02%. Per share data and ratios/supplemental data for periods prior to January 1, 2001 have not been restated to reflect this change in presentation.
The accompanying notes are an integral part of the financial statements.
215
MassMutual Select Aggressive Growth Fund – Financial Statements (Continued)
Financial Highlights (For a share outstanding throughout each period)
| | | Class N | |
| | | Six months
ended
6/30/05
(Unaudited)†† | | Year ended
12/31/04 | | Year ended
12/31/03 | | Period ended
12/31/02++ | |
| Net asset value, beginning of period | | $ | 5.83 | | | $ | 4.92 | | | $ | 3.77 | | | $ | 3.77 | | |
| Income (loss) from investment operations: | | | |
| Net investment income (loss) | | | (0.04 | )*** | | | (0.05 | )*** | | | (0.04 | )*** | | | 0.00 | ***† | |
| Net realized and unrealized gain on investments | | | (0.11 | ) | | | 0.96 | | | | 1.19 | | | | (0.00 | )† | |
| Total income from investment operations | | | (0.15 | ) | | | 0.91 | | | | 1.15 | | | | 0.00 | | |
| Net asset value, end of period | | $ | 5.68 | | | $ | 5.83 | | | $ | 4.92 | | | $ | 3.77 | | |
| | | | | | | | | | | | | | | | | | |
| Total Return(a) | | | (2.40 | )% (c)** | | | 18.50 | % (c) | | | 30.50 | % (c) | | | - | ‡ | |
| Ratios / Supplemental Data: | | | |
| Net assets, end of period (000's) | | $ | 810 | | | $ | 1,144 | | | $ | 636 | | | $ | 101 | | |
| Ratio of expenses to average daily net assets: | |
| Before expense waiver | | | 1.65 | % * | | | 1.66 | % | | | 1.68 | % | | | - | ‡ | |
| After expense waiver# | | | 1.57 | % * | | | 1.59 | % (b) | | | 1.64 | % (b) | | | - | ‡ | |
| Net investment loss to average daily net assets | | | (1.33 | )% * | | | (0.99 | )% | | | (0.91 | )% | | | - | ‡ | |
| Portfolio turnover rate | | | 12 | % ** | | | 85 | % | | | 93 | % | | | 112 | % | |
* Annualized.
** Percentages represent results for the period and are not annualized.
*** Per share amount calculated on the average shares method.
† Net investment income and net realized and unrealized losses on investments are less than $0.01 per share.
†† Effective January 1, 2005, brokerage commissions are included with realized gain or loss on investment transactions. Prior to January 1, 2005, these amounts were presented as a reduction of expenses. Prior year amounts have not been restated to reflect this change due to immateriality. (See Note 3)
++ Class N commenced operations on December 31, 2002.
‡ Amounts are de minimis due to the short period of operations.
# Computed after giving effect to an agreement by MassMutual to waive certain fees and expenses of the Fund for the year ended December 31, 2004 and the six months ended June 30,2005.
(a) Employee retirement benefit plans that invest plan assets in the Separate Investment Accounts (SIAs) may be subject to certain charges as set forth by their respective Plan Documents. Total return figures excludes contingent deferred sales charge and would be lower for the periods presented if they reflected these charges.
(b) The Fund has entered into agreements with certain brokers to rebate a portion of brokerage commissions. The rebated commissions are used to reduce operating expenses of the Fund.
(c) Total Return excludes contingent deferred sales charge and would be lower for the periods presented if they reflected these charges.
The accompanying notes are an integral part of the financial statements.
216
MassMutual Select OTC 100 Fund – Financial Statements (Continued)
Financial Highlights (For a share outstanding throughout each period)
| | | Class A | |
| | | Six months
ended
6/30/05
(Unaudited) | | Year ended
12/31/04 | | Year ended
12/31/03 | | Year ended
12/31/02 | | Year ended
12/31/01 | | Period ended
12/31/00+ | |
| Net asset value, beginning of period | | $ | 4.09 | | | $ | 3.74 | | | $ | 2.53 | | | $ | 4.08 | | | $ | 6.08 | | | $ | 10.00 | | |
| Income (loss) from investment operations: | | | |
| Net investment income (loss) | | | (0.01 | )*** | | | 0.00 | ***† | | | (0.03 | )*** | | | (0.03 | )*** | | | (0.04 | )*** | | | (0.05 | )*** | |
Net realized and unrealized gain (loss)
on investments | | | (0.33 | ) | | | 0.35 | | | | 1.24 | | | | (1.52 | ) | | | (1.96 | ) | | | (3.87 | ) | |
Total income (loss) from
investment operations | | | (0.34 | ) | | | 0.35 | | | | 1.21 | | | | (1.55 | ) | | | (2.00 | ) | | | (3.92 | ) | |
| Less distributions to shareholders: | | | |
| From net investment income | | | - | | | | (0.00 | )† | | | - | | | | - | | | | - | | | | - | | |
| Net asset value, end of period | | $ | 3.75 | | | $ | 4.09 | | | $ | 3.74 | | | $ | 2.53 | | | $ | 4.08 | | | $ | 6.08 | | |
| Total Return(a) | | | (8.31 | )% (b)** | | | 9.47 | % (b) | | | 47.83 | % | | | (37.99 | )% | | | (33.00 | )% | | | (39.10 | )% ** | |
| Ratios / Supplemental Data: | | | |
| Net assets, end of period (000's) | | $ | 24,981 | | | $ | 32,176 | | | $ | 30,349 | | | $ | 11,644 | | | $ | 12,472 | | | $ | 4,411 | | |
Ratio of expenses to average daily
net assets: | | | |
| Before expense waiver | | | 1.11 | % * | | | 1.12 | % | | | 1.17 | % | | | 1.18 | % | | | 1.11 | % | | | 1.11 | % * | |
| After expense waiver# | | | N/A | | | | N/A | | | | 1.12 | % | | | 1.04 | % | | | 1.07 | % | | | N/A | | |
Net investment income (loss) to average
daily net assets | | | (0.67 | )% * | | | 0.12 | % | | | (0.86 | )% | | | (0.90 | )% | | | (0.90 | )% | | | (0.91 | )% * | |
| Portfolio turnover rate | | | 3 | % ** | | | 30 | % | | | 66 | % | | | 65 | % | | | 45 | % | | | 30 | % ** | |
| | | Class L | |
| | | Six months
ended
6/30/05
(Unaudited) | | Year ended
12/31/04 | | Year ended
12/31/03 | | Year ended
12/31/02 | | Year ended
12/31/01 | | Period ended
12/31/00+ | |
| Net asset value, beginning of period | | $ | 4.13 | | | $ | 3.77 | | | $ | 2.54 | | | $ | 4.10 | | | $ | 6.09 | | | $ | 10.00 | | |
| Income (loss) from investment operations: | | | |
| Net investment income (loss) | | | (0.01 | )*** | | | 0.01 | *** | | | (0.02 | )*** | | | (0.02 | )*** | | | (0.03 | )*** | | | (0.04 | )*** | |
Net realized and unrealized gain (loss)
on investments | | | (0.33 | ) | | | 0.36 | | | | 1.25 | | | | (1.54 | ) | | | (1.96 | ) | | | (3.87 | ) | |
Total income (loss) from
investment operations | | | (0.34 | ) | | | 0.37 | | | | 1.23 | | | | (1.56 | ) | | | (1.99 | ) | | | (3.91 | ) | |
| Less distributions to shareholders: | | | |
| From net investment income | | | - | | | | (0.01 | ) | | | - | | | | - | | | | - | | | | - | | |
| Net asset value, end of period | | $ | 3.79 | | | $ | 4.13 | | | $ | 3.77 | | | $ | 2.54 | | | $ | 4.10 | | | $ | 6.09 | | |
| Total Return(a) | | | (8.23 | )% ** | | | 9.82 | % | | | 48.43 | % | | | (38.05 | )% | | | (32.68 | )% | | | (39.10 | )% ** | |
| Ratios / Supplemental Data: | | | |
| Net assets, end of period (000's) | | $ | 13,472 | | | $ | 13,101 | | | $ | 15,508 | | | $ | 6,389 | | | $ | 8,225 | | | $ | 2,360 | | |
Ratio of expenses to average daily
net assets: | | | |
| Before expense waiver | | | 0.86 | % * | | | 0.87 | % | | | 0.91 | % | | | 0.93 | % | | | 0.86 | % | | | 0.86 | % * | |
| After expense waiver# | | | N/A | | | | N/A | | | | 0.87 | % | | | 0.79 | % | | | 0.82 | % | | | N/A | | |
Net investment income (loss) to average
daily net assets | | | (0.43 | )% * | | | 0.26 | % | | | (0.61 | )% | | | (0.65 | )% | | | (0.65 | )% | | | (0.65 | )% * | |
| Portfolio turnover rate | | | 3 | % ** | | | 30 | % | | | 66 | % | | | 65 | % | | | 45 | % | | | 30 | % ** | |
* Annualized.
** Percentages represent results for the period and are not annualized.
*** Per share amount calculated on the average shares method.
+ For the period May 1, 2000 (commencement of operations) through December 31, 2000.
† Net investment income and distributions from net investment income are less than $0.01 per share.
# Computed after giving effect to an agreement by MassMutual to waive certain fees and expenses of the Fund for the period May 1, 2001 through December 31, 2001, and the years ended December 31, 2002 and 2003.
(a) Employee retirement benefit plans that invest plan assets in the Separate Investment Accounts (SIAs) may be subject to certain charges as set forth in their respective Plan Documents. Total return figures would be lower for the periods presented if they reflected these charges.
(b) Total Return excludes a front-end sales charge and would be lower for the periods presented if it reflected these charges.
The accompanying notes are an integral part of the financial statements.
217
MassMutual Select OTC 100 Fund – Financial Statements (Continued)
Financial Highlights (For a share outstanding throughout each period)
| | | Class Y | |
| | | Six months
ended
6/30/05
(Unaudited) | | Year ended
12/31/04 | | Year ended
12/31/03 | | Year ended
12/31/02 | | Year ended
12/31/01 | | Period ended
12/31/00+ | |
| Net asset value, beginning of period | | $ | 4.15 | | | $ | 3.79 | | | $ | 2.54 | | | $ | 4.11 | | | $ | 6.10 | | | $ | 10.00 | | |
| Income (loss) from investment operations: | |
| Net investment income (loss) | | | (0.01 | )*** | | | 0.02 | *** | | | (0.01 | )*** | | | (0.01 | )*** | | | (0.02 | )*** | | | (0.03 | )*** | |
Net realized and unrealized gain (loss)
on investments | | | (0.33 | ) | | | 0.36 | | | | 1.26 | | | | (1.56 | ) | | | (1.97 | ) | | | (3.87 | ) | |
Total income (loss) from
investment operations | | | (0.34 | ) | | | 0.38 | | | | 1.25 | | | | (1.57 | ) | | | (1.99 | ) | | | (3.90 | ) | |
| Less distributions to shareholders: | |
| From net investment income | | | - | | | | (0.02 | ) | | | - | | | | - | | | | - | | | | - | | |
| Net asset value, end of period | | $ | 3.81 | | | $ | 4.15 | | | $ | 3.79 | | | $ | 2.54 | | | $ | 4.11 | | | $ | 6.10 | | |
| Total Return(a) | | | (8.19 | )% ** | | | 9.98 | % | | | 48.63 | % | | | (37.96 | )% | | | (32.62 | )% | | | (39.00 | )% ** | |
| Ratios / Supplemental Data: | |
| Net assets, end of period (000's) | | $ | 2,500 | | | $ | 3,777 | | | $ | 3,827 | | | $ | 998 | | | $ | 350 | | | $ | 121 | | |
Ratio of expenses to average daily
net assets: | | | |
| Before expense waiver | | | 0.71 | % * | | | 0.72 | % | | | 0.77 | % | | | 0.78 | % | | | 0.71 | % | | | 0.80 | % * | |
| After expense waiver# | | | N/A | | | | N/A | | | | 0.73 | % | | | 0.64 | % | | | 0.67 | % | | | N/A | | |
Net investment income (loss) to average
daily net assets | | | (0.28 | )% * | | | 0.49 | % | | | (0.45 | )% | | | (0.50 | )% | | | (0.50 | )% | | | (0.54 | )% * | |
| Portfolio turnover rate | | | 3 | % ** | | | 30 | % | | | 66 | % | | | 65 | % | | | 45 | % | | | 30 | % ** | |
| | | Class S | |
| | | Six months
ended
6/30/05
(Unaudited) | | Year ended
12/31/04 | | Year ended
12/31/03 | | Year ended
12/31/02 | | Year ended
12/31/01 | | Period ended
12/31/00+ | |
| Net asset value, beginning of period | | $ | 4.17 | | | $ | 3.81 | | | $ | 2.56 | | | $ | 4.12 | | | $ | 6.10 | | | $ | 10.00 | | |
| Income (loss) from investment operations: | |
| Net investment income (loss) | | | (0.00 | )***† | | | 0.02 | *** | | | (0.01 | )*** | | | (0.01 | )*** | | | (0.02 | )*** | | | (0.02 | )*** | |
Net realized and unrealized gain (loss)
on investments | | | (0.33 | ) | | | 0.36 | | | | 1.26 | | | | (1.55 | ) | | | (1.96 | ) | | | (3.88 | ) | |
Total income (loss) from
investment operations | | | (0.33 | ) | | | 0.38 | | | | 1.25 | | | | (1.56 | ) | | | (1.98 | ) | | | (3.90 | ) | |
| Less distributions to shareholders: | |
| From net investment income | | | - | | | | (0.02 | ) | | | - | | | | - | | | | - | | | | - | | |
| Net asset value, end of period | | $ | 3.84 | | | $ | 4.17 | | | $ | 3.81 | | | $ | 2.56 | | | $ | 4.12 | | | $ | 6.10 | | |
| Total Return(a) | | | (7.91 | )% ** | | | 10.00 | % | | | 48.83 | % | | | (37.71 | )% | | | (32.62 | )% | | | (39.00 | )% ** | |
| Ratios / Supplemental Data: | |
| Net assets, end of period (000's) | | $ | 19,697 | | | $ | 25,880 | | | $ | 26,424 | | | $ | 7,211 | | | $ | 19,602 | | | $ | 20,466 | | |
Ratio of expenses to average daily
net assets: | | | |
| Before expense waiver | | | 0.61 | % * | | | 0.62 | % | | | 0.67 | % | | | 0.68 | % | | | 0.62 | % | | | 0.69 | % * | |
| After expense waiver# | | | N/A | | | | N/A | | | | 0.63 | % | | | 0.54 | % | | | 0.58 | % | | | N/A | | |
Net investment income (loss) to average
daily net assets | | | (0.17 | )% * | | | 0.45 | % | | | (0.36 | )% | | | (0.41 | )% | | | (0.39 | )% | | | (0.39 | )% * | |
| Portfolio turnover rate | | | 3 | % ** | | | 30 | % | | | 66 | % | | | 65 | % | | | 45 | % | | | 30 | % ** | |
* Annualized.
** Percentages represent results for the period and are not annualized.
*** Per share amount calculated on the average shares method.
† Net investment loss is less than $0.01 per share.
+ For the period May 1, 2000 (commencement of operations) through December 31, 2000.
# Computed after giving effect to an agreement by MassMutual to waive certain fees and expenses of the Fund for the period May 1, 2001 through December 31, 2001, and the years ended December 31, 2002 and 2003.
(a) Employee retirement benefit plans that invest plan assets in the Separate Investment Accounts (SIAs) may be subject to certain charges as set forth in their respective Plan Documents. Total return figures would be lower for the periods presented if they reflected these charges.
The accompanying notes are an integral part of the financial statements.
218
MassMutual Select OTC 100 Fund – Financial Statements (Continued)
Financial Highlights (For a share outstanding throughout each period)
| | | Class N | |
| | | Six months
ended
6/30/05
(Unaudited) | | Year ended
12/31/04 | | Year ended
12/31/03 | | Period ended
12/31/02++ | |
| Net asset value, beginning of period | | $ | 4.05 | | | $ | 3.71 | | | $ | 2.52 | | | $ | 2.53 | | |
| Income (loss) from investment operations: | |
| Net investment income (loss) | | | (0.02 | )*** | | | 0.00 | ***† | | | (0.04 | )*** | | | (0.00 | )***† | |
| Net realized and unrealized gain on investments | | | (0.32 | ) | | | 0.34 | | | | 1.23 | | | | (0.01 | ) | |
| Total income from investment operations | | | (0.34 | ) | | | 0.34 | | | | 1.19 | | | | (0.01 | ) | |
| Less distributions to shareholders: | |
| From net investment income | | | - | | | | (0.00 | )†† | | | - | | | | - | | |
| Net asset value, end of period | | $ | 3.71 | | | $ | 4.05 | | | $ | 3.71 | | | $ | 2.52 | | |
| | | | | | | | | | | | | | | | | | |
| Total Return | | | (8.40 | )% (b)** | | | 9.25 | % (b) | | | 47.22 | % (b) | | | - | ‡ | |
| Ratios / Supplemental Data: | |
| Net assets, end of period (000's) | | $ | 392 | | | $ | 432 | | | $ | 150 | | | $ | 100 | | |
| Ratio of expenses to average daily net assets: | |
| Before expense waiver | | | 1.41 | % * | | | 1.41 | % | | | 1.46 | % | | | - | ‡ | |
| After expense waiver | | | N/A | | | | N/A | | | | 1.42 | % | | | - | ‡ | |
| Net investment income (loss) to average daily net assets | | | (0.97 | )% * | | | 0.11 | % | | | (1.15 | )% | | | - | ‡ | |
| Portfolio turnover rate | | | 3 | % ** | | | 30 | % | | | 66 | % | | | 65 | % | |
* Annualized.
** Percentages represent results for the period and are not annualized.
*** Per share amount calculated on the average shares method.
† Net investment income (loss) is less than $0.01 per share.
†† Distributions from net investment income are less than $0.01 per share.
++ Class N commenced operations on December 31, 2002.
‡ Amounts are de minimis due to the short period of operations.
# Computed after giving effect to an agreement by MassMutual to waive certain fees and expenses of the Fund for the period May 1, 2001 through December 31, 2001, and the years ended December 31, 2002 and 2003.
(a) Employee retirement benefit plans that invest plan assets in the Separate Investment Accounts (SIAs) may be subject to certain charges as set forth in their respective Plan Documents. Total return figures would be lower for the periods presented if they reflected these charges.
(b) Total Return excludes contingent deferred sales charge and would be lower for the periods presented if they reflected these charges.
The accompanying notes are an integral part of the financial statements.
219
MassMutual Select Focused Value Fund – Financial Statements (Continued)
Financial Highlights (For a share outstanding throughout each period)
| | | Class A | |
| | | Six months
ended
6/30/05
(Unaudited)††† | | Year ended
12/31/04 | | Year ended
12/31/03 | | Year ended
12/31/02 | | Year ended
12/31/01 | | Period ended
12/31/00+ | |
| Net asset value, beginning of period | | $ | 17.78 | | | $ | 16.92 | | | $ | 11.94 | | | $ | 13.41 | | | $ | 10.51 | | | $ | 10.00 | | |
| Income (loss) from investment operations: | | | |
| Net investment income (loss) | | | (0.03 | )*** | | | (0.07 | )*** | | | (0.06 | )*** | | | (0.04 | )*** | | | (0.04 | )*** | | | 0.02 | *** | |
Net realized and unrealized gain (loss)
on investments | | | 0.25 | | | | 1.96 | | | | 5.45 | | | | (1.33 | ) | | | 3.30 | | | | 0.52 | | |
Total income (loss) from
investment operations | | | 0.22 | | | | 1.89 | | | | 5.39 | | | | (1.37 | ) | | | 3.26 | | | | 0.54 | | |
| Less distributions to shareholders: | | | |
| From net investment income | | | - | | | | - | | | | (0.00 | )† | | | - | | | | (0.00 | )† | | | (0.03 | ) | |
| From net realized gains | | | - | | | | (1.03 | ) | | | (0.41 | ) | | | (0.10 | ) | | | (0.36 | ) | | | - | | |
| Total distributions | | | - | | | | (1.03 | ) | | | (0.41 | ) | | | (0.10 | ) | | | (0.36 | ) | | | (0.03 | ) | |
| Net asset value, end of period | | $ | 18.00 | | | $ | 17.78 | | | $ | 16.92 | | | $ | 11.94 | | | $ | 13.41 | | | $ | 10.51 | | |
| Total Return(a) | | | 1.24 | % (c)** | | | 11.33 | % (c) | | | 45.13 | % | | | (10.18 | )% | | | 31.08 | % | | | 5.41 | % ** | |
| Ratios / Supplemental Data: | | | |
| Net assets, end of period (000's) | | $ | 246,276 | | | $ | 228,871 | | | $ | 158,981 | | | $ | 54,319 | | | $ | 24,562 | | | $ | 753 | | |
Ratio of expenses to average daily
net assets: | | | |
| Before expense waiver | | | 1.30 | % * | | | 1.30 | % | | | 1.30 | % | | | 1.30 | % | | | 1.29 | % | | | 1.31 | % * | |
| After expense waiver# | | | N/A | | | | 1.28 | % (b) | | | 1.29 | % (b) | | | 1.30 | % (b) | | | 1.29 | % | | | N/A | | |
Net investment income (loss) to average
daily net assets | | | (0.32 | )% * | | | (0.40 | )% | | | (0.40 | )% | | | (0.33 | )% | | | (0.30 | )% | | | 0.33 | % * | |
| Portfolio turnover rate | | | 14 | % ** | | | 32 | % | | | 31 | % | | | 78 | % | | | 53 | % | | | 22 | % ** | |
| | | Class L | |
| | | Six months
ended
6/30/05
(Unaudited)††† | | Year ended
12/31/04 | | Year ended
12/31/03 | | Year ended
12/31/02 | | Year ended
12/31/01 | | Period ended
12/31/00+ | |
| Net asset value, beginning of period | | $ | 17.98 | | | $ | 17.05 | | | $ | 12.00 | | | $ | 13.45 | | | $ | 10.51 | | | $ | 10.00 | | |
| Income (loss) from investment operations: | | | |
| Net investment income (loss) | | | (0.01 | )*** | | | (0.03 | )*** | | | (0.02 | )*** | | | (0.01 | )*** | | | 0.00 | ***† | | | 0.04 | *** | |
Net realized and unrealized gain (loss)
on investments | | | 0.25 | | | | 1.99 | | | | 5.48 | | | | (1.34 | ) | | | 3.31 | | | | 0.51 | | |
Total income (loss) from
investment operations | | | 0.24 | | | | 1.96 | | | | 5.46 | | | | (1.35 | ) | | | 3.31 | | | | 0.55 | | |
| Less distributions to shareholders: | | | |
| From net investment income | | | - | | | | - | | | | (0.00 | )† | | | - | | | | (0.01 | ) | | | (0.04 | ) | |
| From net realized gains | | | - | | | | (1.03 | ) | | | (0.41 | ) | | | (0.10 | ) | | | (0.36 | ) | | | - | | |
| Total distributions | | | - | | | | (1.03 | ) | | | (0.41 | ) | | | (0.10 | ) | | | (0.37 | ) | | | (0.04 | ) | |
| Net asset value, end of period | | $ | 18.22 | | | $ | 17.98 | | | $ | 17.05 | | | $ | 12.00 | | | $ | 13.45 | | | $ | 10.51 | | |
| Total Return(a) | | | 1.33 | % ** | | | 11.65 | % | | | 45.49 | % | | | (10.00 | )% | | | 31.50 | % | | | 5.48 | % ** | |
| Ratios / Supplemental Data: | | | |
| Net assets, end of period (000's) | | $ | 172,214 | | | $ | 163,742 | | | $ | 114,730 | | | $ | 39,942 | | | $ | 25,594 | | | $ | 5,432 | | |
Ratio of expenses to average daily
net assets: | | | |
| Before expense waiver | | | 1.05 | % * | | | 1.05 | % | | | 1.05 | % | | | 1.05 | % | | | 1.04 | % | | | 1.05 | % * | |
| After expense waiver# | | | N/A | | | | 1.03 | % (b) | | | 1.04 | % (b) | | | 1.05 | % (b) | | | 1.04 | % | | | N/A | | |
Net investment income (loss) to average
daily net assets | | | (0.07 | )% * | | | (0.16 | )% | | | (0.16 | )% | | | (0.11 | )% | | | 0.00 | % †† | | | 0.59 | % * | |
| Portfolio turnover rate | | | 14 | % ** | | | 32 | % | | | 31 | % | | | 78 | % | | | 53 | % | | | 22 | % ** | |
* Annualized.
** Percentages represent results for the period and are not annualized.
*** Per share amount calculated on the average shares method.
† Net investment income and distributions from net investment income are less than $0.01 per share.
†† The ratio of net investment income to average daily net assets is less than 0.01%.
††† Effective January 1, 2005, brokerage commissions are included with realized gain or loss on investment transactions. Prior to January 1, 2005, these amounts were presented as a reduction of expenses. Prior year amounts have not been restated to reflect this change due to immateriality. (See Note 3).
+ For the period from May 1, 2000 (commencement of operations) through December 31, 2000.
# Computed after giving effect to an agreement by MassMutual to waive certain fees and expenses of the Fund for the periods May 1, 2001 through December 31, 2001 and January 1, 2002 through April 30, 2002.
(a) Employee retirement benefit plans that invest plan assets in the Separate Investment Accounts (SIAs) may be subject to certain charges as set forth in their respective Plan Documents. Total return figures would be lower for the periods presented if they reflected these charges.
(b) The Fund has entered into agreements with certain brokers to rebate a portion of brokerage commissions. The rebated commissions are used to reduce operating expense of the Fund.
(c) Total Return excludes a front-end sales charge and would be lower for the period presented if it reflected these charges.
The accompanying notes are an integral part of the financial statements.
220
MassMutual Select Focused Value Fund – Financial Statements (Continued)
Financial Highlights (For a share outstanding throughout each period)
| | | Class Y | |
| | | Six months
ended
6/30/05
(Unaudited)†† | | Year ended
12/31/04 | | Year ended
12/31/03 | | Year ended
12/31/02 | | Year ended
12/31/01 | | Period ended
12/31/00+ | |
| Net asset value, beginning of period | | $ | 18.08 | | | $ | 17.12 | | | $ | 12.03 | | | $ | 13.46 | | | $ | 10.52 | | | $ | 10.00 | | |
| Income (loss) from investment operations: | |
| Net investment income (loss) | | | 0.01 | *** | | | (0.00 | )***† | | | (0.00 | )***† | | | 0.03 | *** | | | 0.02 | *** | | | 0.05 | *** | |
Net realized and unrealized gain (loss)
on investments | | | 0.25 | | | | 1.99 | | | | 5.50 | | | | (1.36 | ) | | | 3.30 | | | | 0.52 | | |
Total income (loss) from
investment operations | | | 0.26 | | | | 1.99 | | | | 5.50 | | | | (1.33 | ) | | | 3.32 | | | | 0.57 | | |
| Less distributions to shareholders: | |
| From net investment income | | | - | | | | - | | | | (0.00 | )† | | | - | | | | (0.02 | ) | | | (0.05 | ) | |
| From net realized gains | | | - | | | | (1.03 | ) | | | (0.41 | ) | | | (0.10 | ) | | | (0.36 | ) | | | - | | |
| Total distributions | | | - | | | | (1.03 | ) | | | (0.41 | ) | | | (0.10 | ) | | | (0.38 | ) | | | (0.05 | ) | |
| Net asset value, end of period | | $ | 18.34 | | | $ | 18.08 | | | $ | 17.12 | | | $ | 12.03 | | | $ | 13.46 | | | $ | 10.52 | | |
| Total Return(a) | | | 1.44 | %** | | | 11.78 | % | | | 45.71 | % | | | (9.85 | )% | | | 31.60 | % | | | 5.66 | % ** | |
| Ratios / Supplemental Data: | |
| Net assets, end of period (000's) | | $ | 110,337 | | | $ | 94,538 | | | $ | 78,549 | | | $ | 45,302 | | | $ | 10,137 | | | $ | 502 | | |
Ratio of expenses to average daily
net assets: | | | |
| Before expense waiver | | | 0.90 | %* | | | 0.90 | % | | | 0.89 | % | | | 0.90 | % | | | 0.89 | % | | | 0.91 | % * | |
| After expense waiver# | | | N/A | | | | 0.88 | % (b) | | | 0.89 | % (b) | | | 0.90 | % (b) | | | 0.89 | % | | | N/A | | |
Net investment income (loss) to average
daily net assets | | | 0.08 | %* | | | (0.01 | )% | | | (0.01 | )% | | | 0.24 | % | | | 0.14 | % | | | 0.75 | % * | |
| Portfolio turnover rate | | | 14 | %** | | | 32 | % | | | 31 | % | | | 78 | % | | | 53 | % | | | 22 | % ** | |
| | | Class S | |
| | | Six months
ended
6/30/05
(Unaudited)†† | | Year ended
12/31/04 | | Year ended
12/31/03 | | Year ended
12/31/02 | | Year ended
12/31/01 | | Period ended
12/31/00+ | |
| Net asset value, beginning of period | | $ | 18.18 | | | $ | 17.19 | | | $ | 12.06 | | | $ | 13.48 | | | $ | 10.53 | | | $ | 10.00 | | |
| Income (loss) from investment operations: | |
| Net investment income | | | 0.02 | *** | | | 0.01 | *** | | | 0.01 | *** | | | 0.02 | *** | | | 0.03 | *** | | | 0.06 | *** | |
Net realized and unrealized gain (loss)
on investments | | | 0.24 | | | | 2.01 | | | | 5.53 | | | | (1.34 | ) | | | 3.31 | | | | 0.52 | | |
Total income (loss) from
investment operations | | | 0.26 | | | | 2.02 | | | | 5.54 | | | | (1.32 | ) | | | 3.34 | | | | 0.58 | | |
| Less distributions to shareholders: | |
| From net investment income | | | - | | | | - | | | | (0.00 | )† | | | - | | | | (0.03 | ) | | | (0.05 | ) | |
| From net realized gains | | | - | | | | (1.03 | ) | | | (0.41 | ) | | | (0.10 | ) | | | (0.36 | ) | | | - | | |
| Total distributions | | | - | | | | (1.03 | ) | | | (0.41 | ) | | | (0.10 | ) | | | (0.39 | ) | | | (0.05 | ) | |
| Net asset value, end of period | | $ | 18.44 | | | $ | 18.18 | | | $ | 17.19 | | | $ | 12.06 | | | $ | 13.48 | | | $ | 10.53 | | |
| Total Return(a) | | | 1.43 | %** | | | 11.91 | % | | | 45.94 | % | | | (9.76 | )% | | | 31.70 | % | | | 5.77 | % ** | |
| Ratios / Supplemental Data: | |
| Net assets, end of period (000's) | | $ | 342,640 | | | $ | 326,445 | | | $ | 293,759 | | | $ | 114,178 | | | $ | 110,092 | | | $ | 53,628 | | |
Ratio of expenses to average daily
net assets: | | | |
| Before expense waiver | | | 0.80 | %* | | | 0.80 | % | | | 0.80 | % | | | 0.80 | % | | | 0.79 | % | | | 0.83 | % * | |
| After expense waiver# | | | N/A | | | | 0.78 | % (b) | | | 0.79 | % (b) | | | 0.80 | % (b) | | | 0.79 | % | | | N/A | | |
Net investment income to average
daily net assets | | | 0.18 | %* | | | 0.08 | % | | | 0.09 | % | | | 0.13 | % | | | 0.28 | % | | | 0.95 | % * | |
| Portfolio turnover rate | | | 14 | %** | | | 32 | % | | | 31 | % | | | 78 | % | | | 53 | % | | | 22 | % ** | |
* Annualized.
** Percentages represent results for the period and are not annualized.
*** Per share amount calculated on the average shares method.
† Net investment income (loss) and distributions from net investment income are less than $0.01 per share.
†† Effective January 1, 2005, brokerage commissions are included with realized gain or loss on investment transactions. Prior to January 1, 2005, these amounts were presented as a reduction of expenses. Prior year amounts have not been restated to reflect this change due to immateriality. (See Note 3).
+ For the period from May 1, 2000 (commencement of operations) through December 31, 2000.
# Computed after giving effect to an agreement by MassMutual to waive certain fees and expenses of the Fund for the periods May 1, 2001 through December 31, 2001 and January 1, 2002 through April 30, 2002.
(a) Employee retirement benefit plans that invest plan assets in the Separate Investment Accounts (SIAs) may be subject to certain charges as set forth in their respective Plan Documents. Total return figures would be lower for the periods presented if they reflected these charges.
(b) The Fund has entered into agreements with certain brokers to rebate a portion of brokerage commissions. The rebated commissions are used to reduce operating expense of the Fund.
The accompanying notes are an integral part of the financial statements.
221
MassMutual Select Focused Value Fund – Financial Statements (Continued)
Financial Highlights (For a share outstanding throughout each period)
| | | Class N | |
| | | Six months
ended
6/30/05
(Unaudited)†† | | Year ended
12/31/04 | | Year ended
12/31/03 | | Period ended
12/31/02++ | |
| Net asset value, beginning of period | | $ | 17.60 | | | $ | 16.81 | | | $ | 11.90 | | | $ | 11.77 | | |
| Income (loss) from investment operations: | | | |
| Net investment loss | | | (0.05 | )*** | | | (0.12 | )*** | | | (0.11 | )*** | | | (0.00 | )***† | |
| Net realized and unrealized gain on investments | | | 0.24 | | | | 1.94 | | | | 5.43 | | | | 0.13 | | |
| Total income from investment operations | | | 0.19 | | | | 1.82 | | | | 5.32 | | | | 0.13 | | |
| Less distributions to shareholders: | | | |
| From net investment income | | | - | | | | - | | | | (0.00 | )† | | | - | | |
| Tax return of capital | | | - | | | | - | | | | (0.41 | ) | | | - | | |
| From net realized gains | | | - | | | | (1.03 | ) | | | - | | | | - | | |
| Total distributions | | | - | | | | (1.03 | ) | | | (0.41 | ) | | | - | | |
| Net asset value, end of period | | $ | 17.79 | | | $ | 17.60 | | | $ | 16.81 | | | $ | 11.90 | | |
| | | | | | | | | | | | | | | | | | |
| Total Return(a) | | | 1.02 | % (c)** | | | 11.05 | % (c) | | | 44.70 | % (c) | | | - | ‡ | |
| Ratios / Supplemental Data: | | | |
| Net assets, end of period (000's) | | $ | 1,852 | | | $ | 1,006 | | | $ | 904 | | | $ | 102 | | |
| Ratio of expenses to average daily net assets: | |
| Before expense waiver | | | 1.60 | % * | | | 1.60 | % | | | 1.61 | % | | | - | ‡ | |
| After expense waiver# | | | N/A | | | | 1.58 | % (b) | | | 1.60 | % (b) | | | - | ‡ | |
| Net investment loss to average daily net assets | | | (0.60 | )% * | | | (0.72 | )% | | | (0.70 | )% | | | - | ‡ | |
| Portfolio turnover rate | | | 14 | % ** | | | 32 | % | | | 31 | % | | | 78 | % | |
* Annualized.
** Percentages represent results for the period and are not annualized.
*** Per share amount calculated on the average shares method.
† Net investment loss and distributions from net investment income are less than $0.01 per share.
†† Effective January 1, 2005, brokerage commissions are included with realized gain or loss on investment transactions. Prior to January 1, 2005, these amounts were presented as a reduction of expenses. Prior year amounts have not been restated to reflect this change due to immateriality. (See Note 3).
++ Class N commenced operations on December 31, 2002.
‡ Amounts are de minimis due to the short period of operations.
(a) Employee retirement benefit plans that invest plan assets in the Separate Investment Accounts (SIAs) may be subject to certain charges as set forth in their respective Plan Documents. Total return figures would be lower for the periods presented if they reflected these charges.
(b) The Fund has entered into agreements with certain brokers to rebate a portion of brokerage commissions. The rebated commissions are used to reduce operating expense of the Fund.
(c) Total Return excludes contingent deferred sales charge and would be lower for the periods presented if they reflected these charges.
The accompanying notes are an integral part of the financial statements.
222
MassMutual Select Small Company Value Fund – Financial Statements (Continued)
Financial Highlights (For a share outstanding throughout each period)
| | | Class A | |
| | | Six months
ended
6/30/05
(Unaudited)† | | Year ended
12/31/04 | | Year ended
12/31/03 | | Year ended
12/31/02 | | Period ended
12/31/01+ | |
| Net asset value, beginning of period | | $ | 14.28 | | | $ | 11.96 | | | $ | 8.66 | | | $ | 10.00 | | | $ | 10.00 | | |
| Income (loss) from investment operations: | | | |
| Net investment income (loss) | | | (0.03 | )*** | | | 0.00 | ***†† | | | 0.02 | *** | | | 0.05 | *** | | | - | | |
| Net realized and unrealized gain (loss) on investments | | | (0.14 | ) | | | 2.65 | | | | 3.31 | | | | (1.37 | ) | | | - | | |
| Total income (loss) from investment operations | | | (0.17 | ) | | | 2.65 | | | | 3.33 | | | | (1.32 | ) | | | 0.00 | | |
| Less distributions to shareholders: | | | |
| From net investment income | | | - | | | | - | | | | (0.01 | ) | | | (0.02 | ) | | | - | | |
| From net realized gains | | | - | | | | (0.33 | ) | | | (0.02 | ) | | | - | | | | - | | |
| Total distributions | | | - | | | | (0.33 | ) | | | (0.03 | ) | | | (0.02 | ) | | | - | | |
| Net asset value, end of period | | $ | 14.11 | | | $ | 14.28 | | | $ | 11.96 | | | $ | 8.66 | | | $ | 10.00 | | |
| | | | | | | | | | | | | | | | | | | | | | |
| Total Return(a) | | | (1.19 | )% (c)** | | | 22.30 | % (c) | | | 38.66 | % | | | (13.27 | )% | | | - | | |
| Ratios / Supplemental Data: | | | |
| Net assets, end of period (000's) | | $ | 122,867 | | | $ | 115,807 | | | $ | 44,754 | | | $ | 8,602 | | | $ | 1 | | |
| Ratio of expenses to average daily net assets: | |
| Before expense waiver | | | 1.49 | % * | | | 1.49 | % | | | 1.51 | % | | | 1.64 | % | | | - | | |
| After expense waiver# | | | N/A | | | | 1.44 | % (b) | | | 1.41 | % (b) | | | 1.37 | % (b) | | | - | | |
| Net investment income (loss) to average daily net assets | | | (0.39 | )% * | | | (0.02 | )% | | | 0.17 | % | | | 0.52 | % | | | - | | |
| Portfolio turnover rate | | | 29 | % ** | | | 36 | % | | | 58 | % | | | 69 | % | | | N/A | | |
| | | Class L | |
| | | Six months
ended
6/30/05
(Unaudited)† | | Year ended
12/31/04 | | Year ended
12/31/03 | | Year ended
12/31/02 | | Period ended
12/31/01+ | |
| Net asset value, beginning of period | | $ | 14.31 | | | $ | 11.96 | | | $ | 8.65 | | | $ | 10.00 | | | $ | 10.00 | | |
| Income (loss) from investment operations: | | | |
| Net investment income (loss) | | | (0.01 | )*** | | | 0.03 | *** | | | 0.05 | *** | | | 0.08 | *** | | | - | | |
| Net realized and unrealized gain (loss) on investments | | | (0.15 | ) | | | 2.67 | | | | 3.31 | | | | (1.39 | ) | | | - | | |
| Total income (loss) from investment operations | | | (0.16 | ) | | | 2.70 | | | | 3.36 | | | | (1.31 | ) | | | 0.00 | | |
| Less distributions to shareholders: | | | |
| From net investment income | | | - | | | | (0.02 | ) | | | (0.03 | ) | | | (0.04 | ) | | | - | | |
| From net realized gains | | | - | | | | (0.33 | ) | | | (0.02 | ) | | | - | | | | - | | |
| Total distributions | | | - | | | | (0.35 | ) | | | (0.05 | ) | | | (0.04 | ) | | | - | | |
| Net asset value, end of period | | $ | 14.15 | | | $ | 14.31 | | | $ | 11.96 | | | $ | 8.65 | | | $ | 10.00 | | |
| | | | | | | | | | | | | | | | | | | | | | |
| Total Return(a) | | | (1.12 | )% ** | | | 22.68 | % | | | 38.92 | % | | | (13.10 | )% | | | - | | |
| Ratios / Supplemental Data: | | | |
| Net assets, end of period (000's) | | $ | 116,484 | | | $ | 116,485 | | | $ | 37,776 | | | $ | 3,252 | | | $ | 1 | | |
| Ratio of expenses to average daily net assets: | |
| Before expense waiver | | | 1.24 | % * | | | 1.24 | % | | | 1.26 | % | | | 1.39 | % | | | - | | |
| After expense waiver# | | | N/A | | | | 1.19 | % (b) | | | 1.17 | % (b) | | | 1.11 | % (b) | | | - | | |
| Net investment income (loss) to average daily net assets | | | (0.14 | )% * | | | 0.24 | % | | | 0.45 | % | | | 0.86 | % | | | - | | |
| Portfolio turnover rate | | | 29 | % ** | | | 36 | % | | | 58 | % | | | 69 | % | | | N/A | | |
* Annualized.
** Percentages represent results for the period and are not annualized.
*** Per share amount calculated on the average shares method.
† Effective January 1, 2005, brokerage commissions are included with realized gain or loss on investment transactions. Prior to January 1, 2005, these amounts were presented as a reduction of expenses. Prior year amounts have not been restated to reflect this change due to immateriality. (See Note 3).
†† Net investment income is less than $0.01 per share.
+ The Fund commenced operations on December 31, 2001.
# Computed after giving effect to an agreement by MassMutual to waive certain fees and expenses of the Fund for the years ended December 31, 2002, 2003 and 2004.
(a) Employee retirement benefit plans that invest plan assets in the Separate Investment Accounts (SIAs) may be subject to certain charges as set forth in their respective Plan Documents. Total return figures would be lower for the period presented if they reflected these charges.
(b) The Fund has entered into an agreement with certain brokers to rebate a portion of brokerage commissions. The rebated commissions are used to reduce operating expenses of the Fund.
(c) Total Return excludes a front-end sales charge and would be lower for the periods presented if it reflected these charges.
The accompanying notes are an integral part of the financial statements.
223
MassMutual Select Small Company Value Fund – Financial Statements (Continued)
Financial Highlights (For a share outstanding throughout each period)
| | | Class Y | |
| | | Six months
ended
6/30/05
(Unaudited)† | | Year ended
12/31/04 | | Year ended
12/31/03 | | Year ended
12/31/02 | | Period ended
12/31/01+ | |
| Net asset value, beginning of period | | $ | 14.35 | | | $ | 11.99 | | | $ | 8.66 | | | $ | 10.00 | | | $ | 10.00 | | |
| Income (loss) from investment operations: | | | |
| Net investment income | | | 0.00 | ***†† | | | 0.05 | *** | | | 0.06 | *** | | | 0.11 | *** | | | - | | |
| Net realized and unrealized gain (loss) on investments | | | (0.15 | ) | | | 2.67 | | | | 3.33 | | | | (1.40 | ) | | | - | | |
| Total income (loss) from investment operations | | | (0.15 | ) | | | 2.72 | | | | 3.39 | | | | (1.29 | ) | | | 0.00 | | |
| Less distributions to shareholders: | | | |
| From net investment income | | | - | | | | (0.03 | ) | | | (0.04 | ) | | | (0.05 | ) | | | - | | |
| From net realized gains | | | - | | | | (0.33 | ) | | | (0.02 | ) | | | - | | | | - | | |
| Total distributions | | | - | | | | (0.36 | ) | | | (0.06 | ) | | | (0.05 | ) | | | - | | |
| Net asset value, end of period | | $ | 14.20 | | | $ | 14.35 | | | $ | 11.99 | | | $ | 8.66 | | | $ | 10.00 | | |
| | | | | | | | | | | | | | | | | | | | | | |
| Total Return(a) | | | (1.05 | )% ** | | | 22.80 | % | | | 39.16 | % | | | (12.92 | )% | | | - | | |
| Ratios / Supplemental Data: | | | |
| Net assets, end of period (000's) | | $ | 101,626 | | | $ | 100,488 | | | $ | 46,409 | | | $ | 19,708 | | | $ | 1 | | |
| Ratio of expenses to average daily net assets: | |
| Before expense waiver | | | 1.09 | % * | | | 1.09 | % | | | 1.11 | % | | | 1.24 | % | | | - | | |
| After expense waiver# | | | N/A | | | | 1.04 | % (b) | | | 1.01 | % (b) | | | 0.92 | % (b) | | | - | | |
| Net investment income to average daily net assets | | | 0.01 | % * | | | 0.37 | % | | | 0.58 | % | | | 1.32 | % | | | - | | |
| Portfolio turnover rate | | | 29 | % ** | | | 36 | % | | | 58 | % | | | 69 | % | | | N/A | | |
| | | Class S | |
| | | Six months
ended
6/30/05
(Unaudited)† | | Year ended
12/31/04 | | Year ended
12/31/03 | | Year ended
12/31/02 | | Period ended
12/31/01+ | |
| Net asset value, beginning of period | | $ | 14.39 | | | $ | 12.02 | | | $ | 8.67 | | | $ | 10.00 | | | $ | 10.00 | | |
| Income (loss) from investment operations: | | | |
| Net investment income | | | 0.00 | ***†† | | | 0.05 | *** | | | 0.06 | *** | | | 0.07 | *** | | | - | | |
| Net realized and unrealized gain (loss) on investments | | | (0.15 | ) | | | 2.68 | | | | 3.35 | | | | (1.36 | ) | | | - | | |
| Total income (loss) from investment operations | | | (0.15 | ) | | | 2.73 | | | | 3.41 | | | | (1.29 | ) | | | 0.00 | | |
| Less distributions to shareholders: | | | |
| From net investment income | | | - | | | | (0.03 | ) | | | (0.04 | ) | | | (0.04 | ) | | | - | | |
| From net realized gains | | | - | | | | (0.33 | ) | | | (0.02 | ) | | | - | | | | - | | |
| Total distributions | | | - | | | | (0.36 | ) | | | (0.06 | ) | | | (0.04 | ) | | | - | | |
| Net asset value, end of period | | $ | 14.24 | | | $ | 14.39 | | | $ | 12.02 | | | $ | 8.67 | | | $ | 10.00 | | |
| | | | | | | | | | | | | | | | | | | | | | |
| Total Return(a) | | | (1.04 | )% ** | | | 22.86 | % | | | 39.37 | % | | | (12.92 | )% | | | - | | |
| Ratios / Supplemental Data: | | | |
| Net assets, end of period (000's) | | $ | 185,904 | | | $ | 188,743 | | | $ | 80,661 | | | $ | 44,356 | | | $ | 10,001 | | |
| Ratio of expenses to average daily net assets: | |
| Before expense waiver | | | 1.05 | % * | | | 1.05 | % | | | 1.07 | % | | | 1.20 | % | | | - | | |
| After expense waiver# | | | N/A | | | | 1.00 | % (b) | | | 0.97 | % (b) | | | 0.96 | % (b) | | | - | | |
| Net investment income to average daily net assets | | | 0.05 | % * | | | 0.40 | % | | | 0.58 | % | | | 0.76 | % | | | - | | |
| Portfolio turnover rate | | | 29 | % ** | | | 36 | % | | | 58 | % | | | 69 | % | | | N/A | | |
* Annualized.
** Percentage represents results for the period and are not annualized.
*** Per share amount calculated on the average shares method.
† Effective January 1, 2005, brokerage commissions are included with realized gain or loss on investment transactions. Prior to January 1, 2005, these amounts were presented as a reduction of expenses. Prior year amounts have not been restated to reflect this change due to immateriality. (See Note 3).
†† Net investment income is less than $0.01 per share.
+ The Fund commenced operations on December 31, 2001.
# Computed after giving effect to an agreement by MassMutual to waive certain fees and expenses of the Fund for the years ended December 31, 2002, 2003 and 2004.
(a) Employee retirement benefit plans that invest plan assets in the Separate Investment Accounts (SIAs) may be subject to certain charges as set forth in their respective Plan Documents. Total return figures would be lower for the period presented if they reflected these charges.
(b) The Fund has entered into an agreement with certain brokers to rebate a portion of brokerage commissions. The rebated commissions are used to reduce operating expenses of the Fund.
The accompanying notes are an integral part of the financial statements.
224
MassMutual Select Small Company Value Fund – Financial Statements (Continued)
Financial Highlights (For a share outstanding throughout each period)
| | | Class N | |
| | | Six months
ended
6/30/05
(Unaudited)† | | Year ended
12/31/04 | | Year ended
12/31/03 | | Period ended
12/31/02+ | |
| Net asset value, beginning of period | | $ | 14.16 | | | $ | 11.90 | | | $ | 8.63 | | | $ | 8.59 | | |
| Income (loss) from investment operations: | |
| Net investment income (loss) | | | (0.05 | )*** | | | (0.05 | )*** | | | (0.01 | )*** | | | 0.00 | ***†† | |
| Net realized and unrealized gain (loss) on investments | | | (0.14 | ) | | | 2.64 | | | | 3.30 | | | | 0.04 | | |
| Total income (loss) from investment operations | | | (0.19 | ) | | | 2.59 | | | | 3.29 | | | | 0.04 | | |
| Less distributions to shareholders: | |
| From net investment income | | | - | | | | - | | | | (0.00 | )††† | | | - | | |
| From net realized gains | | | - | | | | (0.33 | ) | | | (0.02 | ) | | | - | | |
| Total distributions | | | - | | | | (0.33 | ) | | | (0.02 | ) | | | - | | |
| Net asset value, end of period | | $ | 13.97 | | | $ | 14.16 | | | $ | 11.90 | | | $ | 8.63 | | |
| | | | | | | | | | | | | | | | | | |
| Total Return(a) | | | (1.34 | )% (c)** | | | 21.91 | % (c) | | | 38.20 | % (c) | | | - | ‡ | |
| Ratios / Supplemental Data: | |
| Net assets, end of period (000's) | | $ | 1,096 | | | $ | 916 | | | $ | 564 | | | $ | 101 | | |
| Ratio of expenses to average daily net assets: | |
| Before expense waiver | | | 1.79 | % * | | | 1.79 | % | | | 1.81 | % | | | - | ‡ | |
| After expense waiver# | | | N/A | | | | 1.74 | % (b) | | | 1.72 | % (b) | | | - | ‡ | |
| Net investment loss to average daily net assets | | | (0.68 | )% * | | | (0.37 | )% | | | (0.08 | )% | | | - | ‡ | |
| Portfolio turnover rate | | | 29 | % ** | | | 36 | % | | | 58 | % | | | 69 | % | |
* Annualized.
** Percentage represents results for the period and are not annualized.
*** Per share amount calculated on the average shares method.
† Effective January 1, 2005, brokerage commissions are included with realized gain or loss on investment transactions. Prior to January 1, 2005, these amounts were presented as a reduction of expenses. Prior year amounts have not been restated to reflect this change due to immateriality. (See Note 3).
†† Net investment income is less than $0.01 per share.
††† Distributions from net investment income are less than $0.01 per share.
+ Class N commenced operations on December 31, 2002.
‡ Amounts are de minimis due to the short period of operations.
# Computed after giving effect to an agreement by MassMutual to waive certain fees and expenses of the Fund for the years ended December 31, 2002, 2003 and 2004.
(a) Employee retirement benefit plans that invest plan assets in the Separate Investment Accounts (SIAs) may be subject to certain charges as set forth in their respective Plan Documents. Total return figures would be lower for the period presented if they reflected these charges.
(b) The Fund has entered into an agreement with certain brokers to rebate a portion of brokerage commissions. The rebated commissions are used to reduce operating expenses of the Fund.
(c) Total Return excludes contingent deferred sales charge and would be lower for the periods presented if it reflected these charges.
The accompanying notes are an integral part of the financial statements.
225
MassMutual Select Mid Cap Growth Equity Fund – Financial Statements (Continued)
Financial Highlights (For a share outstanding throughout each period)
| | | Class A | |
| | | Six months
ended
6/30/05
(Unaudited)† | | Year ended
12/31/04 | | Year ended
12/31/03 | | Year ended
12/31/02 | | Year ended
12/31/01 | | Year ended
12/31/00 | |
| Net asset value, beginning of period | | $ | 8.74 | | | $ | 7.64 | | | $ | 5.87 | | | $ | 8.18 | | | $ | 11.66 | | | $ | 13.90 | | |
| Income (loss) from investment operations: | | | |
| Net investment loss | | | (0.03 | )*** | | | (0.05 | )*** | | | (0.05 | )*** | | | (0.06 | )*** | | | (0.08 | )*** | | | (0.13 | )*** | |
Net realized and unrealized gain (loss)
on investments | | | 0.26 | | | | 1.15 | | | | 1.82 | | | | (2.25 | ) | | | (3.40 | ) | | | (0.84 | ) | |
Total income (loss) from
investment operations | | | 0.23 | | | | 1.10 | | | | 1.77 | | | | (2.31 | ) | | | (3.48 | ) | | | (0.97 | ) | |
| Less distributions to shareholders: | | | |
| Tax return of capital | | | - | | | | - | | | | - | | | | - | | | | - | | | | (0.01 | ) | |
| From net realized gains | | | - | | | | - | | | | - | | | | - | | | | - | | | | (1.26 | ) | |
| Total distributions | | | - | | | | - | | | | - | | | | - | | | | - | | | | (1.27 | ) | |
| Net asset value, end of period | | $ | 8.97 | | | $ | 8.74 | | | $ | 7.64 | | | $ | 5.87 | | | $ | 8.18 | | | $ | 11.66 | | |
| Total Return(a) | | | 2.63 | % **(c) | | | 14.40 | % (c) | | | 30.15 | % | | | (28.24 | )% | | | (29.85 | )% | | | (7.49 | )% | |
| Ratios / Supplemental Data: | | | |
| Net assets, end of period (000's) | | $ | 29,643 | | | $ | 29,642 | | | $ | 37,976 | | | $ | 23,351 | | | $ | 27,226 | | | $ | 25,239 | | |
| Ratio of expenses to average daily net assets: | |
| Before expense waiver | | | 1.31 | % * | | | 1.30 | % | | | 1.30 | % | | | 1.30 | % | | | 1.30 | % | | | 1.33 | % | |
| After expense waiver# | | | N/A | | | | 1.27 | % (b) | | | 1.26 | % (b) | | | 1.29 | % | | | 1.27 | % | | | 1.28 | % | |
| Net investment loss to average daily net assets | | | (0.59 | )% * | | | (0.68 | )% | | | (0.78 | )% | | | (0.90 | )% | | | (0.86 | )% | | | (0.91 | )% | |
| Portfolio turnover rate | | | 52 | % ** | | | 93 | % | | | 128 | % | | | 284 | % | | | 160 | % | | | 153 | % | |
| | | Class L | |
| | | Six months
ended
6/30/05
(Unaudited)† | | Year ended
12/31/04 | | Year ended
12/31/03 | | Year ended
12/31/02 | | Year ended
12/31/01 | | Year ended
12/31/00 | |
| Net asset value, beginning of period | | $ | 8.87 | | | $ | 7.73 | | | $ | 5.93 | | | $ | 8.24 | | | $ | 11.72 | | | $ | 13.93 | | |
| Income (loss) from investment operations: | | | |
| Net investment loss | | | (0.01 | )*** | | | (0.03 | )*** | | | (0.04 | )*** | | | (0.04 | )*** | | | (0.05 | )*** | | | (0.09 | )*** | |
Net realized and unrealized gain (loss)
on investments | | | 0.26 | | | | 1.17 | | | | 1.84 | | | | (2.27 | ) | | | (3.43 | ) | | | (0.85 | ) | |
Total income (loss) from
investment operations | | | 0.25 | | | | 1.14 | | | | 1.80 | | | | (2.31 | ) | | | (3.48 | ) | | | (0.94 | ) | |
| Less distributions to shareholders: | | | |
| From net investment income | | | - | | | | - | | | | - | | | | - | | | | (0.00 | )†† | | | - | | |
| Tax return of capital | | | - | | | | - | | | | - | | | | - | | | | - | | | | (0.01 | ) | |
| From net realized gains | | | - | | | | - | | | | - | | | | - | | | | - | | | | (1.26 | ) | |
| Total distributions | | | - | | | | - | | | | - | | | | - | | | | (0.00 | ) | | | (1.27 | ) | |
| Net asset value, end of period | | $ | 9.12 | | | $ | 8.87 | | | $ | 7.73 | | | $ | 5.93 | | | $ | 8.24 | | | $ | 11.72 | | |
| Total Return(a) | | | 2.82 | % ** | | | 14.75 | % | | | 30.35 | % | | | (28.03 | )% | | | (29.68 | )% | | | (7.26 | )% | |
| Ratios / Supplemental Data: | | | |
| Net assets, end of period (000's) | | $ | 39,587 | | | $ | 39,546 | | | $ | 35,668 | | | $ | 24,204 | | | $ | 28,351 | | | $ | 27,061 | | |
| Ratio of expenses to average daily net assets: | |
| Before expense waiver | | | 1.06 | % * | | | 1.06 | % | | | 1.05 | % | | | 1.05 | % | | | 1.05 | % | | | 1.08 | % | |
| After expense waiver# | | | N/A | | | | 1.02 | % (b) | | | 1.01 | % (b) | | | 1.04 | % | | | 1.02 | % | | | 1.03 | % | |
| Net investment loss to average daily net assets | | | (0.34 | )% * | | | (0.44 | )% | | | (0.54 | )% | | | (0.65 | )% | | | (0.61 | )% | | | (0.65 | )% | |
| Portfolio turnover rate | | | 52 | % ** | | | 93 | % | | | 128 | % | | | 284 | % | | | 160 | % | | | 153 | % | |
* Annualized.
** Percentages represent results for the period and are not annualized.
*** Per share amount calculated on the average shares method.
† Effective January 1, 2005, brokerage commissions are included with realized gain or loss on investment transactions. Prior to January 1, 2005, these amounts were presented as a reduction of expenses. Prior year amounts have not been restated to reflect this change due to immateriality. (See Note 3).
†† Distributions from net investment income is less than $0.01 per share.
# Computed after giving effect to an agreement by MassMutual to waive certain fees and expenses of the Fund for the period May 1, 2000 through December 31, 2000, the year ended December 31, 2001 and the period January 1, 2002 through April 30, 2002.
(a) Employee retirement benefit plans that invest plan assets in the Separate Investment Accounts (SIAs) may be subject to certain charges as set forth in their respective Plan Documents. Total return figures would be lower for the periods presented if they reflected these charges.
(b) The Fund has entered into an agreement with certain brokers to rebate a portion of brokerage commissions. The rebated commissions are used to reduce the operating expenses of the Fund.
(c) Total Return excludes a front-end sales charge and would be lower for the period presented if it reflected these charges.
The accompanying notes are an integral part of the financial statements.
226
MassMutual Select Mid Cap Growth Equity Fund – Financial Statements (Continued)
Financial Highlights (For a share outstanding throughout each period)
| | | Class Y | |
| | | Six months
ended
6/30/05
(Unaudited)† | | Year ended
12/31/04 | | Year ended
12/31/03 | | Year ended
12/31/02 | | Year ended
12/31/01 | | Year ended
12/31/00 | |
| Net asset value, beginning of period | | $ | 8.94 | | | $ | 7.78 | | | $ | 5.95 | | | $ | 8.26 | | | $ | 11.75 | | | $ | 13.94 | | |
| Income (loss) from investment operations: | |
| Net investment loss | | | (0.01 | )*** | | | (0.02 | )*** | | | (0.03 | )*** | | | (0.03 | )*** | | | (0.05 | )*** | | | (0.07 | )*** | |
Net realized and unrealized gain (loss)
on investments | | | 0.26 | | | | 1.18 | | | | 1.86 | | | | (2.28 | ) | | | (3.44 | ) | | | (0.85 | ) | |
Total income (loss) from
investment operations | | | 0.25 | | | | 1.16 | | | | 1.83 | | | | (2.31 | ) | | | (3.49 | ) | | | (0.92 | ) | |
| Less distributions to shareholders: | |
| From net investment income | | | - | | | | - | | | | - | | | | - | | | | (0.00 | )†† | | | - | | |
| Tax return of capital | | | - | | | | - | | | | - | | | | - | | | | - | | | | (0.01 | ) | |
| From net realized gains | | | - | | | | - | | | | - | | | | - | | | | - | | | | (1.26 | ) | |
| Total distributions | | | - | | | | - | | | | - | | | | - | | | | (0.00 | ) | | | (1.27 | ) | |
| Net asset value, end of period | | $ | 9.19 | | | $ | 8.94 | | | $ | 7.78 | | | $ | 5.95 | | | $ | 8.26 | | | $ | 11.75 | | |
| Total Return(a) | | | 2.80 | % ** | | | 14.91 | % | | | 30.76 | % | | | (27.97 | )% | | | (29.67 | )% | | | (7.11 | )% | |
| Ratios / Supplemental Data: | |
| Net assets, end of period (000's) | | $ | 18,999 | | | $ | 15,791 | | | $ | 16,202 | | | $ | 9,379 | | | $ | 12,490 | | | $ | 48,079 | | |
| Ratio of expenses to average daily net assets: | |
| Before expense waiver | | | 0.91 | % * | | | 0.90 | % | | | 0.90 | % | | | 0.90 | % | | | 0.90 | % | | | 0.92 | % | |
| After expense waiver# | | | N/A | | | | 0.87 | % (b) | | | 0.86 | % (b) | | | 0.89 | % | | | 0.87 | % | | | 0.88 | % | |
| Net investment loss to average daily net assets | | | (0.19 | )% * | | | (0.29 | )% | | | (0.38 | )% | | | (0.50 | )% | | | (0.49 | )% | | | (0.50 | )% | |
| Portfolio turnover rate | | | 52 | % ** | | | 93 | % | | | 128 | % | | | 284 | % | | | 160 | % | | | 153 | % | |
| | | Class S | |
| | | Six months
ended
6/30/05
(Unaudited)† | | Year ended
12/31/04 | | Year ended
12/31/03 | | Year ended
12/31/02 | | Year ended
12/31/01 | | Year ended
12/31/00 | |
| Net asset value, beginning of period | | $ | 8.97 | | | $ | 7.79 | | | $ | 5.96 | | | $ | 8.27 | | | $ | 11.75 | | | $ | 13.94 | | |
| Income (loss) from investment operations: | |
| Net investment loss | | | (0.01 | )*** | | | (0.02 | )*** | | | (0.02 | )*** | | | (0.03 | )*** | | | (0.04 | )*** | | | (0.06 | )*** | |
Net realized and unrealized gain (loss)
on investments | | | 0.26 | | | | 1.20 | | | | 1.85 | | | | (2.28 | ) | | | (3.43 | ) | | | (0.86 | ) | |
Total income (loss) from
investment operations | | | 0.25 | | | | 1.18 | | | | 1.83 | | | | (2.31 | ) | | | (3.47 | ) | | | (0.92 | ) | |
| Less distributions to shareholders: | |
| From net investment income | | | - | | | | - | | | | - | | | | - | | | | (0.01 | ) | | | - | | |
| Tax return of capital | | | - | | | | - | | | | - | | | | - | | | | - | | | | (0.01 | ) | |
| From net realized gains | | | - | | | | - | | | | - | | | | - | | | | - | | | | (1.26 | ) | |
| Total distributions | | | - | | | | - | | | | - | | | | - | | | | (0.01 | ) | | | (1.27 | ) | |
| Net asset value, end of period | | $ | 9.22 | | | $ | 8.97 | | | $ | 7.79 | | | $ | 5.96 | | | $ | 8.27 | | | $ | 11.75 | | |
| Total Return(a) | | | 2.79 | % ** | | | 15.15 | % | | | 30.70 | % | | | (27.93 | )% | | | (29.52 | )% | | | (7.11 | )% | |
| Ratios / Supplemental Data: | |
| Net assets, end of period (000's) | | $ | 59,910 | | | $ | 50,160 | | | $ | 68,504 | | | $ | 47,443 | | | $ | 81,248 | | | $ | 120,207 | | |
| Ratio of expenses to average daily net assets: | |
| Before expense waiver | | | 0.84 | % * | | | 0.83 | % | | | 0.83 | % | | | 0.83 | % | | | 0.83 | % | | | 0.85 | % | |
| After expense waiver# | | | N/A | | | | 0.80 | % (b) | | | 0.79 | % (b) | | | 0.82 | % | | | 0.80 | % | | | 0.81 | % | |
| Net investment loss to average daily net assets | | | (0.12 | )% * | | | (0.22 | )% | | | (0.32 | )% | | | (0.43 | )% | | | (0.40 | )% | | | (0.43 | )% | |
| Portfolio turnover rate | | | 52 | % ** | | | 93 | % | | | 128 | % | | | 284 | % | | | 160 | % | | | 153 | % | |
* Annualized.
** Percentages represent results for the period and are not annualized.
*** Per share amount calculated on the average shares method.
† Effective January 1, 2005, brokerage commissions are included with realized gain or loss on investment transactions. Prior to January 1, 2005, these amounts were presented as a reduction of expenses. Prior year amounts have not been restated to reflect this change due to immateriality. (See Note 3).
†† Distributions from net investment income is less than $0.01 per share.
# Computed after giving effect to an agreement by MassMutual to waive certain fees and expenses of the Fund for the period May 1, 2000 through December 31, 2000, the year ended December 31, 2001 and the period January 1, 2002 through April 30, 2002.
(a) Employee retirement benefit plans that invest plan assets in the Separate Investment Accounts (SIAs) may be subject to certain charges as set forth in their respective Plan Documents. Total return figures would be lower for the periods presented if they reflected these charges.
(b) The Fund has entered into an agreement with certain brokers to rebate a portion of brokerage commissions. The rebated commissions are used to reduce the operating expenses of the Fund.
The accompanying notes are an integral part of the financial statements.
227
MassMutual Select Mid Cap Growth Equity Fund – Financial Statements (Continued)
Financial Highlights (For a share outstanding throughout each period)
| | | Class N | |
| | | Six months
ended
6/30/05
(Unaudited)† | | Year ended
12/31/04 | | Year ended
12/31/03 | | Period ended
12/31/02++ | |
| Net asset value, beginning of period | | $ | 8.67 | | | $ | 7.59 | | | $ | 5.85 | | | $ | 5.86 | | |
| Income (loss) from investment operations: | |
| Net investment loss | | | (0.04 | )*** | | | (0.08 | )*** | | | (0.07 | )*** | | | (0.00 | )***†† | |
| Net realized and unrealized gain (loss) on investments | | | 0.25 | | | | 1.16 | | | | 1.81 | | | | (0.01 | ) | |
| Total income (loss) from investment operations | | | 0.21 | | | | 1.08 | | | | 1.74 | | | | (0.01 | ) | |
| Net asset value, end of period | | $ | 8.88 | | | $ | 8.67 | | | $ | 7.59 | | | $ | 5.85 | | |
| | | | | | | | | | | | | | | | | | |
| Total Return(a) | | | 2.42 | % **(c) | | | 14.23 | % (c) | | | 29.74 | % (c) | | | - | ‡ | |
| Ratios / Supplemental Data: | |
| Net assets, end of period (000's) | | $ | 152 | | | $ | 149 | | | $ | 137 | | | $ | 100 | | |
| Ratio of expenses to average daily net assets: | |
| Before expense waiver | | | 1.61 | % * | | | 1.60 | % | | | 1.60 | % | | | - | ‡ | |
| After expense waiver | | | N/A | | | | 1.57 | % (b) | | | 1.56 | % (b) | | | - | ‡ | |
| Net investment loss to average daily net assets | | | (0.89 | )% * | | | (0.99 | )% | | | (1.09 | )% | | | - | ‡ | |
| Portfolio turnover rate | | | 52 | % ** | | | 93 | % | | | 128 | % | | | 284 | % | |
* Annualized.
** Percentages represent results for the period and are not annualized.
*** Per share amount calculated on the average shares method.
† Effective January 1, 2005, brokerage commissions are included with realized gain or loss on investment transactions. Prior to January 1, 2005, these amounts were presented as a reduction of expenses. Prior year amounts have not been restated to reflect this change due to immateriality. (See Note 3).
†† Net investment loss is less than $0.01 per share.
++ Class N commenced operations on December 31, 2002.
‡ Amounts are de minimis due to the short period of operations.
(a) Employee retirement benefit plans that invest plan assets in the Separate Investment Accounts (SIAs) may be subject to certain charges as set forth in their respective Plan Documents. Total return figures would be lower for the periods presented if they reflected these charges.
(b) The Fund has entered into an agreement with certain brokers to rebate a portion of brokerage commissions. The rebated commissions are used to reduce the operating expenses of the Fund.
(c) Total Return excludes contingent deferred sales charge and would be lower for the periods presented if they reflected these charges.
The accompanying notes are an integral part of the financial statements.
228
MassMutual Select Mid Cap Growth Equity II Fund – Financial Statements (Continued)
Financial Highlights (For a share outstanding throughout each period)
| | | Class A | |
| | | Six months
ended
6/30/05
(Unaudited)† | | Year ended
12/31/04 | | Year ended
12/31/03 | | Year ended
12/31/02 | | Year ended
12/31/01 | | Period ended
12/31/00+ | |
| Net asset value, beginning of period | | $ | 13.09 | | | $ | 11.17 | | | $ | 8.12 | | | $ | 10.33 | | | $ | 10.48 | | | $ | 10.00 | | |
| Income (loss) from investment operations: | | | |
| Net investment loss | | | (0.05 | )*** | | | (0.10 | )*** | | | (0.09 | )*** | | | (0.08 | )*** | | | (0.09 | )*** | | | (0.02 | )*** | |
Net realized and unrealized gain (loss)
on investments | | | 0.14 | | | | 2.04 | | | | 3.14 | | | | (2.13 | ) | | | (0.06 | ) | | | 0.50 | | |
Total income (loss) from
investment operations | | | 0.09 | | | | 1.94 | | | | 3.05 | | | | (2.21 | ) | | | (0.15 | ) | | | 0.48 | | |
| Less distributions to shareholders: | | | |
| From net realized gains | | | - | | | | (0.02 | ) | | | - | | | | - | | | | - | | | | - | | |
| Net asset value, end of period | | $ | 13.18 | | | $ | 13.09 | | | $ | 11.17 | | | $ | 8.12 | | | $ | 10.33 | | | $ | 10.48 | | |
| Total Return(a) | | | 0.69 | % (c)** | | | 17.41 | % (c) | | | 37.56 | % | | | (21.39 | )% | | | (1.43 | )% | | | 4.80 | % ** | |
| Ratios / Supplemental Data: | | | |
| Net assets, end of period (000's) | | $ | 240,394 | | | $ | 208,278 | | | $ | 93,526 | | | $ | 30,968 | | | $ | 14,113 | | | $ | 2,861 | | |
| Ratio of expenses to average daily net assets: | |
| Before expense waiver | | | 1.35 | % * | | | 1.35 | % | | | 1.35 | % | | | 1.36 | % | | | 1.35 | % | | | 1.37 | % * | |
| After expense waiver# | | | N/A | | | | 1.34 | % (b) | | | 1.34 | % (b) | | | 1.35 | % (b) | | | 1.35 | % | | | N/A | | |
| Net investment loss to average daily net assets | | | (0.76 | )% * | | | (0.89 | )% | | | (0.93 | )% | | | (0.96 | )% | | | (0.89 | )% | | | (0.40 | )% * | |
| Portfolio turnover rate | | | 12 | % ** | | | 42 | % | | | 54 | % | | | 61 | % | | | 49 | % | | | 37 | % ** | |
| | | Class L | |
| | | Six months
ended
6/30/05
(Unaudited)† | | Year ended
12/31/04 | | Year ended
12/31/03 | | Year ended
12/31/02 | | Year ended
12/31/01 | | Period ended
12/31/00+ | |
| Net asset value, beginning of period | | $ | 13.24 | | | $ | 11.27 | | | $ | 8.17 | | | $ | 10.37 | | | $ | 10.50 | | | $ | 10.00 | | |
| Income (loss) from investment operations: | | | |
| Net investment loss | | | (0.03 | )*** | | | (0.08 | )*** | | | (0.07 | )*** | | | (0.07 | )*** | | | (0.06 | )*** | | | (0.02 | )*** | |
Net realized and unrealized gain (loss)
on investments | | | 0.14 | | | | 2.07 | | | | 3.17 | | | | (2.13 | ) | | | (0.07 | ) | | | 0.52 | | |
Total income (loss) from
investment operations | | | 0.11 | | | | 1.99 | | | | 3.10 | | | | (2.20 | ) | | | (0.13 | ) | | | 0.50 | | |
| Less distributions to shareholders: | | | |
| From net realized gains | | | - | | | | (0.02 | ) | | | - | | | | - | | | | - | | | | - | | |
| Net asset value, end of period | | $ | 13.35 | | | $ | 13.24 | | | $ | 11.27 | | | $ | 8.17 | | | $ | 10.37 | | | $ | 10.50 | | |
| Total Return(a) | | | 0.83 | % ** | | | 17.70 | % | | | 37.94 | % | | | (21.22 | )% | | | (1.24 | )% | | | 5.00 | % ** | |
| Ratios / Supplemental Data: | | | |
| Net assets, end of period (000's) | | $ | 405,148 | | | $ | 403,972 | | | $ | 225,279 | | | $ | 116,835 | | | $ | 136,206 | | | $ | 126,876 | | |
| Ratio of expenses to average daily net assets: | |
| Before expense waiver | | | 1.10 | % * | | | 1.10 | % | | | 1.10 | % | | | 1.11 | % | | | 1.10 | % | | | 1.12 | % * | |
| After expense waiver# | | | N/A | | | | 1.09 | % (b) | | | 1.09 | % (b) | | | 1.09 | % (b) | | | 1.10 | % | | | N/A | | |
| Net investment loss to average daily net assets | | | (0.51 | )% * | | | (0.65 | )% | | | (0.68 | )% | | | (0.72 | )% | | | (0.59 | )% | | | (0.25 | )% * | |
| Portfolio turnover rate | | | 12 | % ** | | | 42 | % | | | 54 | % | | | 61 | % | | | 49 | % | | | 37 | % ** | |
* Annualized.
** Percentages represent results for the period and are not annualized.
*** Per share amount calculated on the average shares method.
† Effective January 1, 2005, brokerage commissions are included with realized gain or loss on investment transactions. Prior to January 1, 2005, these amounts were presented as a reduction of expenses. Prior year amounts have not been restated to reflect this change due to immateriality. (See Note 3).
+ For the period June 1, 2000 (commencement of operations) through December 31, 2000.
# Computed after giving effect to an agreement by MassMutual to waive certain fees and expenses of the Fund for the periods May 1, 2001 through December 31, 2001 and January 1, 2002 through April 30, 2002.
(a) Employee retirement benefit plans that invest plan assets in the Separate Investment Accounts (SIAs) may be subject to certain charges as set forth in their respective Plan Documents. Total return figures would be lower for the periods presented if they reflected these charges.
(b) The Fund has entered into an agreement with the certain brokers to rebate a portion of brokerage commissions. The rebated commissions are used to reduce operating expenses of the Fund.
(c) Total Return excludes a front-end sales charge and would be lower for the periods presented if it reflected these charges.
The accompanying notes are an integral part of the financial statements.
229
MassMutual Select Mid Cap Growth Equity II Fund – Financial Statements (Continued)
Financial Highlights (For a share outstanding throughout each period)
| | | Class Y | |
| | | Six months
ended
6/30/05
(Unaudited)† | | Year ended
12/31/04 | | Year ended
12/31/03 | | Year ended
12/31/02 | | Year ended
12/31/01 | | Period ended
12/31/00+ | |
| Net asset value, beginning of period | | $ | 13.35 | | | $ | 11.34 | | | $ | 8.21 | | | $ | 10.40 | | | $ | 10.51 | | | $ | 10.00 | | |
| Income (loss) from investment operations: | | | |
| Net investment loss | | | (0.02 | )*** | | | (0.06 | )*** | | | (0.05 | )*** | | | (0.04 | )*** | | | (0.05 | )*** | | | (0.00 | )***†† | |
Net realized and unrealized gain (loss)
on investments | | | 0.14 | | | | 2.09 | | | | 3.18 | | | | (2.15 | ) | | | (0.06 | ) | | | 0.51 | | |
Total income (loss) from
investment operations | | | 0.12 | | | | 2.03 | | | | 3.13 | | | | (2.19 | ) | | | (0.11 | ) | | | 0.51 | | |
| Less distributions to shareholders: | | | |
| From net realized gains | | | - | | | | (0.02 | ) | | | - | | | | - | | | | - | | | | - | | |
| Net asset value, end of period | | $ | 13.47 | | | $ | 13.35 | | | $ | 11.34 | | | $ | 8.21 | | | $ | 10.40 | | | $ | 10.51 | | |
| Total Return(a) | | | 0.90 | % ** | | | 17.94 | % | | | 38.12 | % | | | (21.06 | )% | | | (1.05 | )% | | | 5.10 | % ** | |
| Ratios / Supplemental Data: | | | |
| Net assets, end of period (000's) | | $ | 113,773 | | | $ | 99,126 | | | $ | 51,284 | | | $ | 27,835 | | | $ | 622 | | | $ | 267 | | |
| Ratio of expenses to average daily net assets: | |
| Before expense waiver | | | 0.95 | % * | | | 0.95 | % | | | 0.95 | % | | | 0.98 | % | | | 0.95 | % | | | 0.97 | % * | |
| After expense waiver# | | | N/A | | | | 0.94 | % (b) | | | 0.94 | % (b) | | | 0.96 | % (b) | | | 0.95 | % | | | N/A | | |
Net investment loss to average daily
net assets | | | (0.36 | )% * | | | (0.49 | )% | | | (0.53 | )% | | | (0.51 | )% | | | (0.48 | )% | | | (0.07 | )% * | |
| Portfolio turnover rate | | | 12 | % ** | | | 42 | % | | | 54 | % | | | 61 | % | | | 49 | % | | | 37 | % ** | |
| | | Class S | |
| | | Six months
ended
6/30/05
(Unaudited)† | | Year ended
12/31/04 | | Year ended
12/31/03 | | Year ended
12/31/02 | | Year ended
12/31/01 | | Period ended
12/31/00+ | |
| Net asset value, beginning of period | | $ | 13.39 | | | $ | 11.37 | | | $ | 8.22 | | | $ | 10.41 | | | $ | 10.51 | | | $ | 10.00 | | |
| Income (loss) from investment operations: | | | |
| Net investment loss | | | (0.02 | )*** | | | (0.05 | )*** | | | (0.04 | )*** | | | (0.04 | )*** | | | (0.03 | )*** | | | (0.00 | )***†† | |
Net realized and unrealized gain (loss)
on investments | | | 0.15 | | | | 2.09 | | | | 3.19 | | | | (2.15 | ) | | | (0.07 | ) | | | 0.51 | | |
Total income (loss) from
investment operations | | | 0.13 | | | | 2.04 | | | | 3.15 | | | | (2.19 | ) | | | (0.10 | ) | | | 0.51 | | |
| Less distributions to shareholders: | | | |
| From net realized gains | | | - | | | | (0.02 | ) | | | - | | | | - | | | | - | | | | - | | |
| Net asset value, end of period | | $ | 13.52 | | | $ | 13.39 | | | $ | 11.37 | | | $ | 8.22 | | | $ | 10.41 | | | $ | 10.51 | | |
| Total Return(a) | | | 0.97 | % ** | | | 17.98 | % | | | 38.32 | % | | | (21.04 | )% | | | (0.95 | )% | | | 5.10 | % ** | |
| Ratios / Supplemental Data: | | | |
| Net assets, end of period (000's) | | $ | 208,840 | | | $ | 206,865 | | | $ | 125,907 | | | $ | 72,595 | | | $ | 88,921 | | | $ | 90,248 | | |
| Ratio of expenses to average daily net assets: | |
| Before expense waiver | | | 0.86 | % * | | | 0.86 | % | | | 0.86 | % | | | 0.87 | % | | | 0.86 | % | | | 0.88 | % * | |
| After expense waiver# | | | N/A | | | | 0.85 | % (b) | | | 0.85 | % (b) | | | 0.85 | % (b) | | | 0.86 | % | | | N/A | | |
Net investment loss to average daily
net assets | | | (0.27 | )% * | | | (0.41 | )% | | | (0.44 | )% | | | (0.48 | )% | | | (0.34 | )% | | | (0.01 | )% * | |
| Portfolio turnover rate | | | 12 | % ** | | | 42 | % | | | 54 | % | | | 61 | % | | | 49 | % | | | 37 | % ** | |
* Annualized.
** Percentages represent results for the period and are not annualized.
*** Per share amount calculated on the average shares method.
† Effective January 1, 2005, brokerage commissions are included with realized gain or loss on investment transactions. Prior to January 1, 2005, these amounts were presented as a reduction of expenses. Prior year amounts have not been restated to reflect this change due to immateriality. (See Note 3).
†† Net investment loss is less than $0.01 per share.
+ For the period June 1, 2000 (commencement of operations) through December 31, 2000.
# Computed after giving effect to an agreement by MassMutual to waive certain fees and expenses of the Fund for the periods May 1, 2001 through December 31, 2001 and January 1, 2002 through April 30, 2002.
(a) Employee retirement benefit plans that invest plan assets in the Separate Investment Accounts (SIAs) may be subject to certain charges as set forth in their respective Plan Documents. Total return figures would be lower for the periods presented if they reflected these charges.
(b) The Fund has entered into an agreement with the certain brokers to rebate a portion of brokerage commissions. The rebated commissions are used to reduce operating expenses of the Fund.
The accompanying notes are an integral part of the financial statements.
230
MassMutual Select Mid Cap Growth Equity II Fund – Financial Statements (Continued)
Financial Highlights (For a share outstanding throughout each period)
| | | Class N | |
| | | Six months
ended
6/30/05
(Unaudited)† | | Year ended
12/31/04 | | Year ended
12/31/03 | | Period ended
12/31/02++ | |
| Net asset value, beginning of period | | $ | 12.97 | | | $ | 11.10 | | | $ | 8.09 | | | $ | 8.05 | | |
| Income (loss) from investment operations: | |
| Net investment loss | | | (0.07 | )*** | | | (0.14 | )*** | | | (0.12 | )*** | | | (0.00 | )***†† | |
| Net realized and unrealized gain on investments | | | 0.14 | | | | 2.03 | | | | 3.13 | | | | 0.04 | | |
| Total income from investment operations | | | 0.07 | | | | 1.89 | | | | 3.01 | | | | 0.04 | | |
| Less distributions to shareholders: | |
| From net realized gains | | | - | | | | (0.02 | ) | | | - | | | | - | | |
| Net asset value, end of period | | $ | 13.04 | | | $ | 12.97 | | | $ | 11.10 | | | $ | 8.09 | | |
| | | | | | | | | | | | | | | | | | |
| Total Return(a) | | | 0.54 | % (c)** | | | 17.07 | % (c) | | | 37.21 | % (c) | | | - | ‡ | |
| Ratios / Supplemental Data: | |
| Net assets, end of period (000's) | | $ | 1,265 | | | $ | 1,096 | | | $ | 617 | | | $ | 101 | | |
| Ratio of expenses to average daily net assets: | |
| Before expense waiver | | | 1.65 | % * | | | 1.65 | % | | | 1.66 | % | | | - | ‡ | |
| After expense waiver | | | N/A | | | | 1.64 | % (b) | | | 1.65 | % (b) | | | - | ‡ | |
| Net investment loss to average daily net assets | | | (1.06 | )% * | | | (1.19 | )% | | | (1.22 | )% | | | - | ‡ | |
| Portfolio turnover rate | | | 12 | % ** | | | 42 | % | | | 54 | % | | | 61 | % | |
* Annualized.
** Percentages represent results for the period and are not annualized.
*** Per share amount calculated on the average shares mehod.
† Effective January 1, 2005, brokerage commissions are included with realized gain or loss on investment transactions. Prior to January 1, 2005, these amounts were presented as a reduction of expenses. Prior year amounts have not been restated to reflect this change due to immateriality. (See Note 3).
†† Net investment loss is less than $0.01 per share.
‡ Amounts are de minimis due to the short period of operations.
++ Class N commenced operations on December 31, 2002.
(a) Employee retirement benefit plans that invest plan assets in the Separate Investment Accounts (SIAs) may be subject to certain charges as set forth in their respective Plan Documents. Total return figures would be lower for the periods presented if they reflected these charges.
(b) The Fund has entered into an agreement with certain brokers to rebate a portion of brokerage commissions. The rebated commissions are used to reduce operating expenses of the Fund.
(c) Total Return excludes contingent deferred sales charge and would be lower for the peiods presented if they reflected these charges.
The accompanying notes are an integral part of the financial statements.
231
MassMutual Select Small Cap Growth Equity Fund – Financial Statements (Continued)
Financial Highlights (For a share outstanding throughout each period)
| | | Class A | |
| | | Six months
ended
6/30/05
(Unaudited)†† | | Year ended
12/31/04 | | Year ended
12/31/03 | | Year ended
12/31/02 | | Year ended
12/31/01 | | Year ended
12/31/00 | |
| Net asset value, beginning of period | | $ | 14.22 | | | $ | 12.56 | | | $ | 8.76 | | | $ | 11.79 | | | $ | 13.37 | | | $ | 15.86 | | |
| Income (loss) from investment operations: | | | |
| Net investment loss | | | (0.06 | )*** | | | (0.13 | )*** | | | (0.12 | )*** | | | (0.11 | )*** | | | (0.08 | )*** | | | (0.04 | )*** | |
Net realized and unrealized gain (loss)
on investments | | | 0.14 | | | | 1.79 | | | | 3.92 | | | | (2.92 | ) | | | (1.50 | ) | | | (2.08 | ) | |
Total income (loss) from
investment operations | | | 0.08 | | | | 1.66 | | | | 3.80 | | | | (3.03 | ) | | | (1.58 | ) | | | (2.12 | ) | |
| Less distributions to shareholders: | | | |
| From net investment income | | | - | | | | - | | | | - | | | | - | | | | - | | | | (0.00 | )† | |
| Tax return of capital | | | - | | | | - | | | | - | | | | - | | | | - | | | | (0.00 | )† | |
| From net realized gains | | | - | | | | - | | | | - | | | | - | | | | - | | | | (0.37 | ) | |
| Total distributions | | | - | | | | - | | | | - | | | | - | | | | - | | | | (0.37 | ) | |
| Net asset value, end of period | | $ | 14.30 | | | $ | 14.22 | | | $ | 12.56 | | | $ | 8.76 | | | $ | 11.79 | | | $ | 13.37 | | |
| Total Return(a) | | | 0.56 | % **(c) | | | 13.22 | % (c) | | | 43.38 | % | | | (25.70 | )% | | | (11.82 | )% | | | (13.82 | )% | |
| Ratios / Supplemental Data: | | | |
| Net assets, end of period (000's) | | $ | 75,825 | | | $ | 77,739 | | | $ | 67,686 | | | $ | 35,509 | | | $ | 32,095 | | | $ | 15,854 | | |
| Ratio of expenses to average daily net assets: | |
| Before expense waiver | | | 1.51 | % * | | | 1.52 | % | | | 1.51 | % | | | 1.51 | % | | | 1.51 | % | | | 1.53 | % | |
| After expense waiver# | | | N/A | | | | 1.48 | % (b) | | | 1.49 | % (b) | | | 1.50 | % (b) | | | 1.49 | % | | | 1.50 | % | |
| Net investment loss to average daily net assets | | | (0.93 | )% * | | | (1.01 | )% | | | (1.11 | )% | | | (1.08 | )% | | | (0.67 | )% | | | (0.28 | )% | |
| Portfolio turnover rate | | | 29 | % ** | | | 64 | % | | | 56 | % | | | 51 | % | | | 114 | % | | | 97 | % | |
| | | Class L | |
| | | Six months
ended
6/30/05
(Unaudited)†† | | Year ended
12/31/04 | | Year ended
12/31/03 | | Year ended
12/31/02 | | Year ended
12/31/01 | | Year ended
12/31/00 | |
| Net asset value, beginning of period | | $ | 14.41 | | | $ | 12.70 | | | $ | 8.83 | | | $ | 11.85 | | | $ | 13.41 | | | $ | 15.88 | | |
| Income (loss) from investment operations: | | | |
| Net investment loss | | | (0.05 | )*** | | | (0.10 | )*** | | | (0.09 | )*** | | | (0.08 | )*** | | | (0.05 | )*** | | | (0.01 | )*** | |
Net realized and unrealized gain (loss)
on investments | | | 0.14 | | | | 1.81 | | | | 3.96 | | | | (2.94 | ) | | | (1.51 | ) | | | (2.08 | ) | |
Total income (loss) from
investment operations | | | 0.09 | | | | 1.71 | | | | 3.87 | | | | (3.02 | ) | | | (1.56 | ) | | | (2.09 | ) | |
| Less distributions to shareholders: | | | |
| From net investment income | | | - | | | | - | | | | - | | | | - | | | | - | | | | (0.01 | ) | |
| Tax return of capital | | | - | | | | - | | | | - | | | | - | | | | - | | | | (0.00 | )† | |
| From net realized gains | | | - | | | | - | | | | - | | | | - | | | | - | | | | (0.37 | ) | |
| Total distributions | | | - | | | | - | | | | - | | | | - | | | | - | | | | (0.38 | ) | |
| Net asset value, end of period | | $ | 14.50 | | | $ | 14.41 | | | $ | 12.70 | | | $ | 8.83 | | | $ | 11.85 | | | $ | 13.41 | | |
| Total Return(a) | | | 0.62 | % ** | | | 13.46 | % | | | 43.83 | % | | | (25.49 | )% | | | (11.63 | )% | | | (13.54 | )% | |
| Ratios / Supplemental Data: | | | |
| Net assets, end of period (000's) | | $ | 90,290 | | | $ | 90,941 | | | $ | 85,885 | | | $ | 44,419 | | | $ | 43,839 | | | $ | 21,000 | | |
| Ratio of expenses to average daily net assets: | |
| Before expense waiver | | | 1.26 | % * | | | 1.26 | % | | | 1.26 | % | | | 1.26 | % | | | 1.26 | % | | | 1.28 | % | |
| After expense waiver# | | | N/A | | | | 1.23 | % (b) | | | 1.24 | % (b) | | | 1.25 | % (b) | | | 1.24 | % | | | 1.25 | % | |
| Net investment loss to average daily net assets | | | (0.68 | )% * | | | (0.76 | )% | | | (0.86 | )% | | | (0.83 | )% | | | (0.40 | )% | | | (0.03 | )% | |
| Portfolio turnover rate | | | 29 | % ** | | | 64 | % | | | 56 | % | | | 51 | % | | | 114 | % | | | 97 | % | |
* Annualized.
** Percentages represent results from the period and are not annualized.
*** Per share amount calculated on the average shares method.
† Distributions from net investment income and tax return of capital are less than $0.01 per share.
†† Effective January 1, 2005, brokerage commissions are included with realized gain or loss on investment transactions. Prior to January 1, 2005, these amounts were presented as a reduction of expenses. Prior year amounts have not been restated to reflect this change due to immateriality. (See Note 3).
# Computed after giving effect to an agreement by MassMutual to waive certain fees and expenses of the Fund for the period May 1, 2000 through December 31, 2000, the year ended December 31, 2001 and the period January 1, 2002 through April 30, 2002.
(a) Employee retirement benefit plans that invest plan assets in the Separate Investment Account (SIAs) may be subject to certain charges as set forth in their respective Plan Documents. Total return figured would be lower for the period presented if they reflected these charges.
(b) The Fund has entered into an agreement with certain brokers to rebate a portion of brokerage commissions. The rebated commissions are used to reduce operating expenses of the Fund.
(c) Total Return excludes a front-end sales charge and would be lower for the period presented if it reflected these charges.
The accompanying notes are an integral part of the financial statements.
232
MassMutual Select Small Cap Growth Equity Fund – Financial Statements (Continued)
Financial Highlights (For a share outstanding throughout each period)
| | | Class Y | |
| | | Six months
ended
6/30/05
(Unaudited)†† | | Year ended
12/31/04 | | Year ended
12/31/03 | | Year ended
12/31/02 | | Year ended
12/31/01 | | Year ended
12/31/00 | |
| Net asset value, beginning of period | | $ | 14.52 | | | $ | 12.77 | | | $ | 8.87 | | | $ | 11.89 | | | $ | 13.43 | | | $ | 15.90 | | |
| Income (loss) from investment operations: | | | |
| Net investment income (loss) | | | (0.04 | )*** | | | (0.08 | )*** | | | (0.08 | )*** | | | (0.07 | )*** | | | (0.03 | )*** | | | 0.02 | *** | |
Net realized and unrealized gain (loss)
on investments | | | 0.14 | | | | 1.83 | | | | 3.98 | | | | (2.95 | ) | | | (1.51 | ) | | | (2.10 | ) | |
Total income (loss) from
investment operations | | | 0.10 | | | | 1.75 | | | | 3.90 | | | | (3.02 | ) | | | (1.54 | ) | | | (2.08 | ) | |
| Less distributions to shareholders: | | | |
| From net investment income | | | - | | | | - | | | | - | | | | - | | | | - | | | | (0.02 | ) | |
| Tax return of capital | | | - | | | | - | | | | - | | | | - | | | | - | | | | (0.00 | )† | |
| From net realized gains | | | - | | | | - | | | | - | | | | - | | | | - | | | | (0.37 | ) | |
| Total distributions | | | - | | | | - | | | | - | | | | - | | | | - | | | | (0.39 | ) | |
| Net asset value, end of period | | $ | 14.62 | | | $ | 14.52 | | | $ | 12.77 | | | $ | 8.87 | | | $ | 11.89 | | | $ | 13.43 | | |
| Total Return(a) | | | 0.69 | % ** | | | 13.70 | % | | | 43.97 | % | | | (25.40 | )% | | | (11.47 | )% | | | (13.44 | )% | |
| Ratios / Supplemental Data: | | | |
| Net assets, end of period (000's) | | $ | 103,133 | | | $ | 92,812 | | | $ | 87,801 | | | $ | 43,123 | | | $ | 44,759 | | | $ | 35,864 | | |
| Ratio of expenses to average daily net assets: | |
| Before expense waiver | | | 1.11 | % * | | | 1.12 | % | | | 1.11 | % | | | 1.11 | % | | | 1.11 | % | | | 1.13 | % | |
| After expense waiver# | | | N/A | | | | 1.08 | % (b) | | | 1.09 | % (b) | | | 1.10 | % (b) | | | 1.09 | % | | | 1.10 | % | |
Net investment income (loss) to average
daily net assets | | | (0.53 | )% * | | | (0.61 | )% | | | (0.71 | )% | | | (0.68 | )% | | | (0.25 | )% | | | 0.11 | % | |
| Portfolio turnover rate | | | 29 | % ** | | | 64 | % | | | 56 | % | | | 51 | % | | | 114 | % | | | 97 | % | |
| | | Class S | |
| | | Six months
ended
6/30/05
(Unaudited)†† | | Year ended
12/31/04 | | Year ended
12/31/03 | | Year ended
12/31/02 | | Year ended
12/31/01 | | Year ended
12/31/00 | |
| Net asset value, beginning of period | | $ | 14.61 | | | $ | 12.84 | | | $ | 8.91 | | | $ | 11.92 | | | $ | 13.45 | | | $ | 15.91 | | |
| Income (loss) from investment operations: | | | |
| Net investment income (loss) | | | (0.03 | )*** | | | (0.06 | )*** | | | (0.06 | )*** | | | (0.06 | )*** | | | (0.01 | )*** | | | 0.04 | *** | |
Net realized and unrealized gain (loss)
on investments | | | 0.15 | | | | 1.83 | | | | 3.99 | | | | (2.95 | ) | | | (1.52 | ) | | | (2.10 | ) | |
Total income (loss) from
investment operations | | | 0.12 | | | | 1.77 | | | | 3.93 | | | | (3.01 | ) | | | (1.53 | ) | | | (2.06 | ) | |
| Less distributions to shareholders: | | | |
| From net investment income | | | - | | | | - | | | | - | | | | - | | | | - | | | | (0.03 | ) | |
| Tax return of capital | | | - | | | | - | | | | - | | | | - | | | | - | | | | (0.00 | )† | |
| From net realized gains | | | - | | | | - | | | | - | | | | - | | | | - | | | | (0.37 | ) | |
| Total distributions | | | - | | | | - | | | | - | | | | - | | | | - | | | | (0.40 | ) | |
| Net asset value, end of period | | $ | 14.73 | | | $ | 14.61 | | | $ | 12.84 | | | $ | 8.91 | | | $ | 11.92 | | | $ | 13.45 | | |
| Total Return(a) | | | 0.82 | % ** | | | 13.79 | % | | | 44.11 | % | | | (25.25 | )% | | | (11.38 | )% | | | (13.32 | )% | |
| Ratios / Supplemental Data: | | | |
| Net assets, end of period (000's) | | $ | 238,776 | | | $ | 241,673 | | | $ | 243,909 | | | $ | 123,762 | | | $ | 156,565 | | | $ | 147,368 | | |
| Ratio of expenses to average daily net assets: | |
| Before expense waiver | | | 0.97 | % * | | | 0.97 | % | | | 0.97 | % | | | 0.97 | % | | | 0.97 | % | | | 0.99 | % | |
| After expense waiver# | | | N/A | | | | 0.94 | % (b) | | | 0.95 | % (b) | | | 0.96 | % (b) | | | 0.95 | % | | | 0.97 | % | |
Net investment income (loss) to average
daily net assets | | | (0.39 | )% * | | | (0.47 | )% | | | (0.57 | )% | | | (0.54 | )% | | | (0.09 | )% | | | 0.26 | % | |
| Portfolio turnover rate | | | 29 | % ** | | | 64 | % | | | 56 | % | | | 51 | % | | | 114 | % | | | 97 | % | |
* Annualized.
** Percentages represent results from the period and are not annualized.
*** Per share amount calculated on the average shares method.
† Tax return of capital is less than $0.01 per share.
†† Effective January 1, 2005, brokerage commissions are included with realized gain or loss on investments transactions. Prior to January 1, 2005, these amounts were presented as a reduction of expenses. Prior year amounts have not been restated to reflect this change due to immateriality. (See Note 3).
# Computed after giving effect to an agreement by MassMutual to waive certain fees and expenses of the Fund for the period May 1, 2000 through December 31, 2000, the year ended December 31, 2001 and the period January 1, 2002 through April 30, 2002.
(a) Employee retirement benefit plans that invest plan assets in the Separate Investment Accounts (SIAs) may be subject to certain charges as set forth in their respective Plan Documents. Total return figures would be lower for the period presented if they reflected these charges.
(b) The Fund enetered into an agreement with certain brokers to rebate a portion of brokerage commissions. The rebated commissions are used to reduce operating expenses of the Fund.
The accompanying notes are an integral part of the financial statements.
233
MassMutual Select Small Cap Growth Equity Fund – Financial Statements (Continued)
Financial Highlights (For a share outstanding throughout each period)
| | | Class N | |
| | | Six months
ended
6/30/05
(Unaudited)†† | | Year ended
12/31/04 | | Year ended
12/31/03 | | Period ended
12/31/02+ | |
| Net asset value, beginning of period | | $ | 14.07 | | | $ | 12.47 | | | $ | 8.72 | | | $ | 8.68 | | |
| Income (loss) from investment operations: | | | |
| Net investment loss | | | (0.08 | ) | | | (0.16 | ) | | | (0.15 | )*** | | | (0.00 | )***† | |
| Net realized and unrealized gain on investments | | | 0.14 | | | | 1.76 | | | | 3.90 | | | | 0.04 | | |
| Total income from investment operations | | | 0.06 | | | | 1.60 | | | | 3.75 | | | | 0.04 | | |
| Net asset value, end of period | | $ | 14.13 | | | $ | 14.07 | | | $ | 12.47 | | | $ | 8.72 | | |
| | | | | | | | | | | | | | | | | | |
| Total Return(a) | | | 0.43 | % (c) ** | | | 12.83 | % (c) | | | 43.00 | % (c) | | | - | ‡ | |
| Ratios / Supplemental Data: | | | |
| Net assets, end of period (000's) | | $ | 828 | | | $ | 816 | | | $ | 149 | | | $ | 101 | | |
| Ratio of expenses to average daily net assets: | |
| Before expense waiver | | | 1.81 | % * | | | 1.82 | % | | | 1.81 | % | | | - | ‡ | |
| After expense waiver | | | N/A | | | | 1.78 | % (b) | | | 1.79 | % (b) | | | - | ‡ | |
| Net investment loss to average daily net assets | | | (1.23 | )% * | | | (1.31 | )% | | | (1.41 | )% | | | - | ‡ | |
| Portfolio turnover rate | | | 29 | % ** | | | 64 | % | | | 56 | % | | | 51 | % | |
* Annualized.
** Percentage represents results from the period and are not annualized.
*** Per share amount calculated on the average shares method.
† Net investment loss is less than $0.01 per share.
†† Effective January 1, 2005, brokerage commissions are included with realized gain or loss on investment transactions. Prior to January 1, 2005, these amounts were presented as a reduction of expenses. Prior year amounts have not been restated to reflect this change due to immateriality. (See Note 3).
+ Class N commenced operations on December 31, 2002.
‡ Amounts are de minimis due to the short period of operations.
(a) Employee retirement benefit plans that invest plan assets in the Separate Investment Account (SIAs) may be subject to certain charges set forth in their respective Plan Documents. Total return figures would be lower for the period presented if they reflected these charges.
(b) The Fund has entered into an agreement with certain brokers to rebate a portion of brokerage commissions. The rebated commissions are used to reduce operating expenses of the Fund.
(c) Total Return excludes contingent deferred sales charge and would be lower for the periods presented if they reflected these changes.
The accompanying notes are an integral part of the financial statements.
234
MassMutual Select Small Company Growth Fund – Financial Statements (Continued)
Financial Highlights (For a share outstanding throughout each period)
| | | Class A | |
| | | Six months
ended
6/30/05
(Unaudited)†† | | Year ended
12/31/04 | | Year ended
12/31/03 | | Year ended
12/31/02 | | Period ended
12/31/01+ | |
| Net asset value, beginning of period | | $ | 10.05 | | | $ | 10.67 | | | $ | 6.99 | | | $ | 10.00 | | | $ | 10.00 | | |
| Income (loss) from investment operations: | | | |
| Net investment loss | | | (0.05 | )*** | | | (0.08 | )*** | | | (0.10 | )*** | | | (0.06 | )*** | | | - | | |
| Net realized and unrealized gain (loss) on investments | | | (0.69 | ) | | | 0.20 | † | | | 4.30 | | | | (2.95 | ) | | | - | | |
| Total income (loss) from investment operations | | | (0.74 | ) | | | 0.12 | | | | 4.20 | | | | (3.01 | ) | | | 0.00 | | |
| Less distributions to shareholders: | | | |
| From net realized gains | | | - | | | | (0.74 | ) | | | (0.52 | ) | | | - | | | | - | | |
| Net asset value, end of period | | $ | 9.31 | | | $ | 10.05 | | | $ | 10.67 | | | $ | 6.99 | | | $ | 10.00 | | |
| | | | | | | | | | | | | | | | | | | | | | |
| Total Return(a) | | | (7.27 | )% (c)** | | | 1.70 | % (c) | | | 60.01 | % | | | (30.10 | )% | | | - | | |
| Ratios / Supplemental Data: | | | |
| Net assets, end of period (000's) | | $ | 62,057 | | | $ | 66,985 | | | $ | 54,038 | | | $ | 5,038 | | | $ | 1 | | |
| Ratio of expenses to average daily net assets: | |
| Before expense waiver | | | 1.55 | % * | | | 1.52 | % | | | 1.58 | % | | | 1.83 | % | | | - | | |
| After expense waiver# | | | 1.50 | % * | | | 1.35 | % (b) | | | 1.37 | % (b) | | | 1.16 | % (b) | | | - | | |
| Net investment loss to average daily net assets | | | (1.18 | )% * | | | (0.77 | )% | | | (1.00 | )% | | | (0.80 | )% | | | - | | |
| Portfolio turnover rate | | | 113 | % ** | | | 220 | % | | | 141 | % | | | 150 | % | | | - | | |
| | | Class L | |
| | | Six months
ended
6/30/05
(Unaudited)†† | | Year ended
12/31/04 | | Year ended
12/31/03 | | Year ended
12/31/02 | | Period ended
12/31/01+ | |
| Net asset value, beginning of period | | $ | 10.14 | | | $ | 10.74 | | | $ | 7.01 | | | $ | 10.00 | | | $ | 10.00 | | |
| Income (loss) from investment operations: | | | |
| Net investment loss | | | (0.04 | )*** | | | (0.05 | )*** | | | (0.07 | )*** | | | (0.04 | )*** | | | - | | |
| Net realized and unrealized gain (loss) on investments | | | (0.69 | ) | | | 0.19 | † | | | 4.32 | | | | (2.95 | ) | | | - | | |
| Total income (loss) from investment operations | | | (0.73 | ) | | | 0.14 | | | | 4.25 | | | | (2.99 | ) | | | 0.00 | | |
| Less distributions to shareholders: | | | |
| From net realized gains | | | - | | | | (0.74 | ) | | | (0.52 | ) | | | - | | | | - | | |
| Net asset value, end of period | | $ | 9.41 | | | $ | 10.14 | | | $ | 10.74 | | | $ | 7.01 | | | $ | 10.00 | | |
| | | | | | | | | | | | | | | | | | | | | | |
| Total Return(a) | | | (7.20 | )% ** | | | 1.97 | % | | | 60.55 | % | | | (29.90 | )% | | | - | | |
| Ratios / Supplemental Data: | | | |
| Net assets, end of period (000's) | | $ | 29,975 | | | $ | 43,008 | | | $ | 35,948 | | | $ | 10,319 | | | $ | 1 | | |
| Ratio of expenses to average daily net assets: | |
| Before expense waiver | | | 1.29 | % * | | | 1.27 | % | | | 1.33 | % | | | 1.58 | % | | | - | | |
| After expense waiver# | | | 1.25 | % * | | | 1.10 | % (b) | | | 1.10 | % (b) | | | 0.92 | % (b) | | | - | | |
| Net investment loss to average daily net assets | | | (0.89 | )% * | | | (0.54 | )% | | | (0.72 | )% | | | (0.59 | )% | | | - | | |
| Portfolio turnover rate | | | 113 | % ** | | | 220 | % | | | 141 | % | | | 150 | % | | | - | | |
* Annualized.
** Percentages represent results for the period and are not annualized.
*** Per share amount calculated on the average shares method.
† The amount shown for a share outstanding does not correspond with the aggregate net realized and unrealized gain (loss) for the period due to the timing of purchases and redemptions of Fund shares in relation to the fluctuating market values of the Fund.
†† Effective January 1, 2005, brokerage commissions are included with realized gain or loss on investment transactions. Prior to January 1, 2005, these amounts were presented as a reduction of expenses. Prior year amounts have not been restated to reflect this change due to immateriality. (See Note 3).
+ The Fund commenced operations on December 31, 2001.
# Computed after giving effect to an agreement by MassMutual to waive certain fees and expenses of the Fund for the years ended December 31, 2002, 2003 and 2004 and the period January 1, 2005 through April 30, 2005.
(a) Employee retirement benefit plans that invest plan assets in the Separate Investment Accounts (SIAs) may be subject to certain charges as set forth in their respective Plan Documents. Total return figures would be lower for the periods presented if they reflected these charges.
(b) The Fund has entered into an agreement with certain brokers to rebate a portion of brokerage commissions. The rebated commissions are used to reduce operating expenses of the Fund.
(c) Total Return excludes a front-end sales charge and would be lower for the periods presented if it reflected these charges.
The accompanying notes are an integral part of the financial statements.
235
MassMutual Select Small Company Growth Fund – Financial Statements (Continued)
Financial Highlights (For a share outstanding throughout each period)
| | | Class Y | |
| | | Six months
ended
6/30/05
(Unaudited)†† | | Year ended
12/31/04 | | Year ended
12/31/03 | | Year ended
12/31/02 | | Period ended
12/31/01+ | |
| Net asset value, beginning of period | | $ | 10.19 | | | $ | 10.77 | | | $ | 7.02 | | | $ | 10.00 | | | $ | 10.00 | | |
| Income (loss) from investment operations: | | | |
| Net investment loss | | | (0.03 | )*** | | | (0.04 | )*** | | | (0.05 | )*** | | | (0.04 | )*** | | | - | | |
| Net realized and unrealized gain (loss) on investments | | | (0.70 | ) | | | 0.20 | † | | | 4.32 | | | | (2.94 | ) | | | - | | |
| Total income (loss) from investment operations | | | (0.73 | ) | | | 0.16 | | | | 4.27 | | | | (2.98 | ) | | | 0.00 | | |
| Less distributions to shareholders: | | | |
| From net realized gains | | | - | | | | (0.74 | ) | | | (0.52 | ) | | | - | | | | - | | |
| Net asset value, end of period | | $ | 9.46 | | | $ | 10.19 | | | $ | 10.77 | | | $ | 7.02 | | | $ | 10.00 | | |
| Total Return(a) | | | (7.07 | )% ** | | | 2.06 | % | | | 60.75 | % | | | (29.80 | )% | | | - | | |
| Ratios / Supplemental Data: | | | |
| Net assets, end of period (000's) | | $ | 28,460 | | | $ | 40,990 | | | $ | 37,730 | | | $ | 10,545 | | | $ | 1 | | |
| Ratio of expenses to average daily net assets: | |
| Before expense waiver | | | 1.15 | % * | | | 1.12 | % | | | 1.18 | % | | | 1.43 | % | | | - | | |
| After expense waiver# | | | 1.10 | % * | | | 0.95 | % (b) | | | 0.95 | % (b) | | | 0.83 | % (b) | | | - | | |
| Net investment loss to average daily net assets | | | (0.75 | )% * | | | (0.40 | )% | | | (0.60 | )% | | | (0.52 | )% | | | - | | |
| Portfolio turnover rate | | | 113 | % ** | | | 220 | % | | | 141 | % | | | 150 | % | | | - | | |
| | | Class S | |
| | | Six months
ended
6/30/05
(Unaudited)†† | | Year ended
12/31/04 | | Year ended
12/31/03 | | Year ended
12/31/02 | | Period ended
12/31/01+ | |
| Net asset value, beginning of period | | $ | 10.21 | | | $ | 10.78 | | | $ | 7.02 | | | $ | 10.00 | | | $ | 10.00 | | |
| Income (loss) from investment operations: | | | |
| Net investment loss | | | (0.03 | )*** | | | (0.04 | )*** | | | (0.05 | )*** | | | (0.03 | )*** | | | - | | |
| Net realized and unrealized gain (loss) on investments | | | (0.70 | ) | | | 0.21 | † | | | 4.33 | | | | (2.95 | ) | | | - | | |
| Total income (loss) from investment operations | | | (0.73 | ) | | | 0.17 | | | | 4.28 | | | | (2.98 | ) | | | 0.00 | | |
| Less distributions to shareholders: | | | |
| From net realized gains | | | - | | | | (0.74 | ) | | | (0.52 | ) | | | - | | | | - | | |
| Net asset value, end of period | | $ | 9.48 | | | $ | 10.21 | | | $ | 10.78 | | | $ | 7.02 | | | $ | 10.00 | | |
| | | | | | | | | | | | | | | | | | | | | | |
| Total Return(a) | | | (7.15 | )% ** | | | 2.25 | % | | | 60.66 | % | | | (29.70 | )% | | | - | | |
| Ratios / Supplemental Data: | | | |
| Net assets, end of period (000's) | | $ | 23,323 | | | $ | 28,081 | | | $ | 30,181 | | | $ | 8,763 | | | $ | 10,001 | | |
| Ratio of expenses to average daily net assets: | |
| Before expense waiver | | | 1.11 | % * | | | 1.08 | % | | | 1.14 | % | | | 1.39 | % | | | - | | |
| After expense waiver# | | | 1.06 | % * | | | 0.92 | % (b) | | | 0.92 | % (b) | | | 0.80 | % (b) | | | - | | |
| Net investment loss to average daily net assets | | | (0.73 | )% * | | | (0.34 | )% | | | (0.55 | )% | | | (0.41 | )% | | | - | | |
| Portfolio turnover rate | | | 113 | % ** | | | 220 | % | | | 141 | % | | | 150 | % | | | - | | |
* Annualized.
** Percentages represent results for the period and are not annualized.
*** Per share amount calculated on the average shares method.
† The amount shown for a share outstanding does not correspond with the aggregate net realized and unrealized gain (loss) for the period due to the timing of purchases and redemptions of Fund shares in relation to the fluctuating market values of the Fund.
†† Effective January 1, 2005, brokerage commissions are included with realized gain or loss on investment transactions. Prior to January 1, 2005, these amounts were presented as a reduction of expenses. Prior year amounts have not been restated to reflect this change due to immateriality. (See Note 3).
+ The Fund commenced operations on December 31, 2001.
# Computed after giving effect to an agreement by MassMutual to waive certain fees and expenses of the Fund for the years ended December 31, 2002, 2003 and 2004 and the period January 1, 2005 through April 30, 2005.
(a) Employee retirement benefit plans that invest plan assets in the Separate Investment Accounts (SIAs) may be subject to certain charges as set forth in their respective Plan Documents. Total return figures would be lower for the periods presented if they reflected these charges.
(b) The Fund has entered into an agreement with certain brokers to rebate a portion of brokerage commissions. The rebated commissions are used to reduce operating expenses of the Fund.
The accompanying notes are an integral part of the financial statements.
236
MassMutual Select Small Company Growth Fund – Financial Statements (Continued)
Financial Highlights (For a share outstanding throughout each period)
| | | Class N | |
| | | Six months
ended
6/30/05
(Unaudited)††† | | Year ended
12/31/04 | | Year ended
12/31/03 | | Period ended
12/31/02++ | |
| Net asset value, beginning of period | | $ | 9.93 | | | $ | 10.59 | | | $ | 6.95 | | | $ | 6.90 | | |
| Income (loss) from investment operations: | | | |
| Net investment income (loss) | | | (0.06 | )*** | | | (0.11 | )*** | | | (0.13 | )*** | | | 0.00 | ***†† | |
| Net realized and unrealized gain (loss) on investments | | | (0.68 | ) | | | 0.19 | † | | | 4.29 | | | | 0.05 | | |
| Total income (loss) from investment operations | | | (0.74 | ) | | | 0.08 | | | | 4.16 | | | | 0.05 | | |
| Less distributions to shareholders: | | | |
| From net realized gains | | | - | | | | (0.74 | ) | | | (0.52 | ) | | | - | | |
| Net asset value, end of period | | $ | 9.19 | | | $ | 9.93 | | | $ | 10.59 | | | $ | 6.95 | | |
| | | | | | | | | | | | | | | | | | |
| Total Return(a) | | | (7.36 | )% (c)** | | | 1.33 | % (c) | | | 59.78 | % (c) | | | - | ‡ | |
| Ratios / Supplemental Data: | | | |
| Net assets, end of period (000's) | | $ | 1,040 | | | $ | 910 | | | $ | 953 | | | $ | 101 | | |
| Ratio of expenses to average daily net assets: | |
| Before expense waiver | | | 1.85 | % * | | | 1.82 | % | | | 1.88 | % | | | - | ‡ | |
| After expense waiver# | | | 1.80 | % * | | | 1.65 | % (b) | | | 1.68 | % (b) | | | - | ‡ | |
| Net investment loss to average daily net assets | | | (1.49 | )% * | | | (1.06 | )% | | | (1.31 | )% | | | - | ‡ | |
| Portfolio turnover rate | | | 113 | % ** | | | 220 | % | | | 141 | % | | | 150 | % | |
* Annualized.
** Percentages represent results for the period and are not annualized.
*** Per share amount calculated on the average shares method.
† The amount shown for a share outstanding does not correspond with the aggregate net realized and unrealized gain (loss) for the period due to the timing of purchases and redemptions of Fund shares in relation to the fluctuating market values of the Fund.
†† Net investment income is less than $0.01 per share.
††† Effective January 1, 2005, brokerage commissions are included with realized gain or loss on investment transactions. Prior to January 1, 2005, these amounts were presented as a reduction of expenses. Prior year amounts have not been restated to reflect this change due to immateriality. (See Note 3).
++ Class N commenced operations on December 31, 2002.
‡ Amounts are de minimis due to the short period of operations.
# Computed after giving effect to an agreement by MassMutual to waive certain fees and expenses of the Fund for the year ended December 31, 2003 and 2004 and the period January 1, 2005 through April 30, 2005.
(a) Employee retirement benefit plans that invest plan assets in the Separate Investment Accounts (SIAs) may be subject to certain charges as set forth in their respective Plan Documents. Total return figures would be lower for the periods presented if they reflected these charges.
(b) The Fund has entered into an agreement with certain brokers to rebate a portion of brokerage commissions. The rebated commissions are used to reduce operating expenses of the Fund.
(c) Total Return excludes contingent deferred sales charge and would be lower for the periods presented if they reflected these charges.
The accompanying notes are an integral part of the financial statements.
237
MassMutual Select Emerging Growth Fund – Financial Statements (Continued)
Financial Highlights (For a share outstanding throughout each period)
| | | Class A | |
| | | Six months
ended
6/30/05
(Unaudited) | | Year ended
12/31/04 | | Year ended
12/31/03 | | Year ended
12/31/02 | | Year ended
12/31/01 | | Period ended
12/31/00+ | |
| Net asset value, beginning of period | | $ | 5.88 | | | $ | 5.13 | | | $ | 3.53 | | | $ | 6.11 | | | $ | 7.31 | | | $ | 10.00 | | |
| Income (loss) from investment operations: | | | |
| Net investment loss | | | (0.03 | )*** | | | (0.07 | )*** | | | (0.06 | )*** | | | (0.05 | )*** | | | (0.06 | )*** | | | (0.05 | )*** | |
Net realized and unrealized gain (loss)
on investments | | | (0.29 | ) | | | 0.82 | | | | 1.66 | | | | (2.53 | ) | | | (1.14 | ) | | | (2.64 | ) | |
Total income (loss) from
investment operations | | | (0.32 | ) | | | 0.75 | | | | 1.60 | | | | (2.58 | ) | | | (1.20 | ) | | | (2.69 | ) | |
| Net asset value, end of period | | $ | 5.56 | | | $ | 5.88 | | | $ | 5.13 | | | $ | 3.53 | | | $ | 6.11 | | | $ | 7.31 | | |
| Total Return(a) | | | 0.00 | % (b)** | | | 14.62 | % (b) | | | 45.33 | % | | | (42.23 | )% | | | (16.53 | )% | | | (26.80 | )% ** | |
| Ratios / Supplemental Data: | | | |
| Net assets, end of period (000's) | | $ | 23,830 | | | $ | 27,052 | | | $ | 26,130 | | | $ | 10,153 | | | $ | 12,760 | | | $ | 5,197 | | |
| Ratio of expenses to average daily net assets: | |
| Before expense waiver | | | 1.46 | % * | | | 1.47 | % | | | 1.48 | % | | | 1.46 | % | | | 1.44 | % | | | 1.48 | % * | |
| After expense waiver# | | | 1.46 | % | | | N/A | | | | 1.45 | % | | | 1.39 | % | | | 1.41 | % | | | N/A | | |
| Net investment loss to average daily net assets | | | (0.56 | )% * | | | (1.32 | )% | | | (1.32 | )% | | | (1.23 | )% | | | (0.96 | )% | | | (0.82 | )% * | |
| Portfolio turnover rate | | | 56 | % ** | | | 176 | % | | | 198 | % | | | 175 | % | | | 139 | % | | | 132 | % ** | |
| | | Class L | |
| | | Six months
ended
6/30/05
(Unaudited) | | Year ended
12/31/04 | | Year ended
12/31/03 | | Year ended
12/31/02 | | Year ended
12/31/01 | | Period ended
12/31/00+ | |
| Net asset value, beginning of period | | $ | 5.94 | | | $ | 5.18 | | | $ | 3.55 | | | $ | 6.13 | | | $ | 7.31 | | | $ | 10.00 | | |
| Income (loss) from investment operations: | | | |
| Net investment loss | | | (0.02 | )*** | | | (0.06 | )*** | | | (0.05 | )*** | | | (0.04 | )*** | | | (0.04 | )*** | | | (0.03 | )*** | |
Net realized and unrealized gain (loss)
on investments | | | (0.29 | ) | | | 0.82 | | | | 1.68 | | | | (2.54 | ) | | | (1.14 | ) | | | (2.66 | ) | |
Total income (loss) from
investment operations | | | (0.31 | ) | | | 0.76 | | | | 1.63 | | | | (2.58 | ) | | | (1.18 | ) | | | (2.69 | ) | |
| Net asset value, end of period | | $ | 5.63 | | | $ | 5.94 | | | $ | 5.18 | | | $ | 3.55 | | | $ | 6.13 | | | $ | 7.31 | | |
| Total Return(a) | | | 0.00 | % ** | | | 14.67 | % | | | 45.92 | % | | | (42.09 | )% | | | (16.37 | )% | | | (26.70 | )% ** | |
| Ratios / Supplemental Data: | | | |
| Net assets, end of period (000's) | | $ | 61,731 | | | $ | 65,342 | | | $ | 49,424 | | | $ | 20,924 | | | $ | 26,106 | | | $ | 12,753 | | |
| Ratio of expenses to average daily net assets: | |
| Before expense waiver | | | 1.21 | % * | | | 1.22 | % | | | 1.23 | % | | | 1.21 | % | | | 1.18 | % | | | 1.23 | % * | |
| After expense waiver# | | | 1.21 | % | | | N/A | | | | 1.20 | % | | | 1.14 | % | | | 1.16 | % | | | N/A | | |
| Net investment loss to average daily net assets | | | (0.43 | )% * | | | (1.06 | )% | | | (1.07 | )% | | | (0.98 | )% | | | (0.71 | )% | | | (0.54 | )% * | |
| Portfolio turnover rate | | | 56 | % ** | | | 176 | % | | | 198 | % | | | 175 | % | | | 139 | % | | | 132 | % ** | |
* Annualized.
** Percentages represent results for the period and are not annualized.
*** Per share amount calculated on the average shares method.
+ For the period May 1, 2000 (commencement of operations) through December 31, 2000.
# Computed after giving effect to an agreement by MassMutual to waive certain fees and expenses of the Fund for the period May 1, 2001 through December 31, 2001 and the years ended December 31, 2002 and 2003.
(a) Employee retirement benefit plans that invest assets in the Separate Investment Accounts (SIAs) may be subject to certain charges as set forth by their respective Plan Documents. Total return figures would be lower for the periods presented if they reflected these charges.
(b) Total Return excludes a front-end sales charge and would be lower for the periods presented if it reflected these charges.
The accompanying notes are an integral part of the financial statements.
238
MassMutual Select Emerging Growth Fund – Financial Statements (Continued)
Financial Highlights (For a share outstanding throughout each period)
| | | Class Y | |
| | | Six months
ended
6/30/05
(Unaudited) | | Year ended
12/31/04 | | Year ended
12/31/03 | | Year ended
12/31/02 | | Year ended
12/31/01 | | Period ended
12/31/00+ | |
| Net asset value, beginning of period | | $ | 5.99 | | | $ | 5.21 | | | $ | 3.57 | | | $ | 6.15 | | | $ | 7.32 | | | $ | 10.00 | | |
| Income (loss) from investment operations: | |
| Net investment loss | | | (0.02 | )*** | | | (0.05 | )*** | | | (0.04 | )*** | | | (0.04 | )*** | | | (0.03 | )*** | | | (0.02 | )*** | |
Net realized and unrealized gain (loss)
on investments | | | (0.29 | ) | | | 0.83 | | | | 1.68 | | | | (2.54 | ) | | | (1.14 | ) | | | (2.66 | ) | |
Total income (loss) from
investment operations | | | (0.31 | ) | | | 0.78 | | | | 1.64 | | | | (2.58 | ) | | | (1.17 | ) | | | (2.68 | ) | |
| Net asset value, end of period | | $ | 5.68 | | | $ | 5.99 | | | $ | 5.21 | | | $ | 3.57 | | | $ | 6.15 | | | $ | 7.32 | | |
| Total Return(a) | | | 0.00 | % ** | | | 14.97 | % | | | 45.94 | % | | | (41.95 | )% | | | (16.10 | )% | | | (26.70 | )% ** | |
| Ratios / Supplemental Data: | |
| Net assets, end of period (000's) | | $ | 5,236 | | | $ | 4,427 | | | $ | 3,051 | | | $ | 1,664 | | | $ | 3,309 | | | $ | 3,222 | | |
| Ratio of expenses to average daily net assets: | |
| Before expense waiver | | | 1.06 | % * | | | 1.07 | % | | | 1.08 | % | | | 1.06 | % | | | 1.04 | % | | | 1.06 | % * | |
| After expense waiver# | | | 1.06 | % | | | N/A | | | | 1.04 | % | | | 0.99 | % | | | 1.01 | % | | | N/A | | |
| Net investment loss to average daily net assets | | | (0.36 | )% * | | | (0.91 | )% | | | (0.91 | )% | | | (0.83 | )% | | | (0.55 | )% | | | (0.35 | )% * | |
| Portfolio turnover rate | | | 56 | % ** | | | 176 | % | | | 198 | % | | | 175 | % | | | 139 | % | | | 132 | % ** | |
| | | Class S | |
| | | Six months
ended
6/30/05
(Unaudited) | | Year ended
12/31/04 | | Year ended
12/31/03 | | Year ended
12/31/02 | | Year ended
12/31/01 | | Period ended
12/31/00+ | |
| Net asset value, beginning of period | | $ | 6.03 | | | $ | 5.24 | | | $ | 3.58 | | | $ | 6.15 | | | $ | 7.32 | | | $ | 10.00 | | |
| Income (loss) from investment operations: | |
| Net investment loss | | | (0.02 | )*** | | | (0.04 | )*** | | | (0.04 | )*** | | | (0.03 | )*** | | | (0.03 | )*** | | | (0.02 | )*** | |
Net realized and unrealized gain (loss)
on investments | | | (0.29 | ) | | | 0.83 | | | | 1.70 | | | | (2.54 | ) | | | (1.14 | ) | | | (2.66 | ) | |
Total income (loss) from
investment operations | | | (0.31 | ) | | | 0.79 | | | | 1.66 | | | | (2.57 | ) | | | (1.17 | ) | | | (2.68 | ) | |
| Net asset value, end of period | | $ | 5.72 | | | $ | 6.03 | | | $ | 5.24 | | | $ | 3.58 | | | $ | 6.15 | | | $ | 7.32 | | |
| Total Return(a) | | | 0.00 | % ** | | | 15.08 | % | | | 46.37 | % | | | (41.79 | )% | | | (16.10 | )% | | | (26.70 | )% ** | |
| Ratios / Supplemental Data: | |
| Net assets, end of period (000's) | | $ | 39,485 | | | $ | 39,812 | | | $ | 41,306 | | | $ | 24,658 | | | $ | 56,195 | | | $ | 58,872 | | |
| Ratio of expenses to average daily net assets: | |
| Before expense waiver | | | 0.96 | % * | | | 0.97 | % | | | 0.98 | % | | | 0.96 | % | | | 0.94 | % | | | 0.98 | % * | |
| After expense waiver# | | | 0.96 | % | | | N/A | | | | 0.94 | % | | | 0.89 | % | | | 0.91 | % | | | N/A | | |
Net investment income (loss) to average daily
net assets | | | (0.31 | )% * | | | 0.81 | % | | | (0.81 | )% | | | (0.73 | )% | | | (0.45 | )% | | | (0.29 | )% * | |
| Portfolio turnover rate | | | 56 | % ** | | | 176 | % | | | 198 | % | | | 175 | % | | | 139 | % | | | 132 | % ** | |
* Annualized.
** Percentages represent results for the period and are not annualized.
*** Per share amount calculated on the average shares method.
+ For the period May 1, 2000 (commencement of operations) through December 31, 2000.
# Computed after giving effect to an agreement by MassMutual to waive certain fees and expenses of the Fund for the period May 1, 2001 through December 31, 2001 and the years ended December 31, 2002 and 2003.
(a) Employee retirement benefit plans that invest assets in the Separate Investment Accounts (SIAs) may be subject to certain charges as set forth by their respective Plan Documents. Total return figures would be lower for the periods presented if they reflected these charges.
The accompanying notes are an integral part of the financial statements.
239
MassMutual Select Emerging Growth Fund – Financial Statements (Continued)
Financial Highlights (For a share outstanding throughout each period)
| | | Class N | |
| | | Six months
ended
6/30/05
(Unaudited) | | Year ended
12/31/04 | | Year ended
12/31/03 | | Period ended
12/31/02++ | |
| Net asset value, beginning of period | | $ | 5.82 | | | $ | 5.09 | | | $ | 3.51 | | | $ | 3.50 | | |
| Income (loss) from investment operations: | | | |
| Net investment loss | | | (0.04 | )*** | | | (0.08 | )*** | | | (0.07 | )*** | | | (0.00 | )***† | |
| Net realized and unrealized gain on investments | | | (0.29 | ) | | | 0.81 | | | | 1.65 | | | | 0.01 | | |
| Total income from investment operations | | | (0.33 | ) | | | 0.73 | | | | 1.58 | | | | 0.01 | | |
| Net asset value, end of period | | $ | 5.49 | | | $ | 5.82 | | | $ | 5.09 | | | $ | 3.51 | | |
| | | | | | | | | | | | | | | | | | |
| Total Return(a) | | | 0.00 | % (b)** | | | 14.34 | % (b) | | | 45.01 | % (b) | | | - | ‡ | |
| Ratios / Supplemental Data: | | | |
| Net assets, end of period (000's) | | $ | 159 | | | $ | 168 | | | $ | 147 | | | $ | 101 | | |
| Ratio of expenses to average daily net assets: | |
| Before expense waiver | | | 1.76 | % * | | | 1.77 | % | | | 1.78 | % | | | - | ‡ | |
| After expense waiver# | | | 1.76 | % | | | N/A | | | | 1.74 | % | | | - | ‡ | |
| Net investment loss to average daily net assets | | | (0.71 | )% * | | | (1.61 | )% | | | (1.61 | )% | | | - | ‡ | |
| Portfolio turnover rate | | | 56 | % ** | | | 176 | % | | | 198 | % | | | 175 | % | |
* Annualized.
** Percentages represent results for the period and are not annualized.
*** Per share amount calculated on the average shares method.
† Net investment loss is less than $0.01 per share.
++ Class N commenced operations on December 31, 2002.
‡ Amounts are de minimis due to the short period of operations.
# Computed after giving effect to an agreement by MassMutual to waive certain fees and expenses of the Fund for the period ended December 31,2002 and year ended 2003.
(a) Employee retirement benefit plans that invest assets in the Separate Investment Accounts (SIAs) may be subject to certain charges as set forth by their respective Plan Documents. Total return figures would be lower for the periods presented if they reflected these charges.
(b) Total Return excludes contingent deferred sales charge and would be lower for the periods presented if they reflected these charges.
The accompanying notes are an integral part of the financial statements.
240
MassMutual Select Overseas Fund – Financial Statements (Continued)
Financial Highlights (For a share outstanding throughout each period)
| | | Class A | |
| | | Six months
ended
6/30/05
(Unaudited)†† | | Year ended
12/31/04 | | Year ended
12/31/03 | | Year ended
12/31/02 | | Period ended
12/31/01+ | |
| Net asset value, beginning of period | | $ | 10.94 | | | $ | 9.55 | | | $ | 7.36 | | | $ | 8.41 | | | $ | 10.00 | | |
| Income (loss) from investment operations: | |
| Net investment income (loss) | | | 0.10 | *** | | | 0.05 | *** | | | 0.02 | *** | | | 0.01 | *** | | | (0.05 | )*** | |
| Net realized and unrealized gain (loss) on investments | | | (0.16 | ) | | | 1.63 | | | | 2.18 | | | | (1.05 | ) | | | (1.54 | ) | |
| Total income (loss) from investment operations | | | (0.06 | ) | | | 1.68 | | | | 2.20 | | | | (1.04 | ) | | | (1.59 | ) | |
| Less distributions to shareholders: | |
| From net investment income | | | - | | | | (0.06 | ) | | | (0.01 | ) | | | (0.01 | ) | | | - | | |
| From net realized gains | | | - | | | | (0.23 | ) | | | - | | | | - | | | | - | | |
| Tax return of capital | | | - | | | | - | | | | - | | | | (0.00 | )† | | | - | | |
| Total distributions | | | - | | | | (0.29 | ) | | | (0.01 | ) | | | (0.01 | ) | | | - | | |
| Net asset value, end of period | | $ | 10.88 | | | $ | 10.94 | | | $ | 9.55 | | | $ | 7.36 | | | $ | 8.41 | | |
| Total Return(a) | | | (0.64 | )% (c)** | | | 17.53 | % (c) | | | 30.27 | % | | | (12.66 | )% | | | (15.90 | )% ** | |
| Ratios / Supplemental Data: | |
| Net assets, end of period (000's) | | $ | 157,789 | | | $ | 134,927 | | | $ | 65,012 | | | $ | 18,674 | | | $ | 1,159 | | |
| Ratio of expenses to average daily net assets: | |
| Before expense waiver | | | 1.62 | % * | | | 1.64 | % | | | 1.74 | % | | | 2.13 | % | | | 1.95 | % * | |
| After expense waiver# | | | N/A | | | | 1.63 | % (b) | | | 1.64 | % (b) | | | 1.63 | % (b) | | | 1.73 | % * | |
| Net investment income (loss) to average daily net assets | | | 1.84 | % * | | | 0.49 | % | | | 0.22 | % | | | 0.09 | % | | | (0.91 | )% * | |
| Portfolio turnover rate | | | 33 | % ** | | | 66 | % | | | 92 | % | | | 138 | % | | | 111 | % ** | |
| | | Class L | |
| | | Six months
ended
6/30/05
(Unaudited)†† | | Year ended
12/31/04 | | Year ended
12/31/03 | | Year ended
12/31/02 | | Period ended
12/31/01+ | |
| Net asset value, beginning of period | | $ | 10.99 | | | $ | 9.59 | | | $ | 7.35 | | | $ | 8.42 | | | $ | 10.00 | | |
| Income (loss) from investment operations: | |
| Net investment income (loss) | | | 0.11 | *** | | | 0.08 | *** | | | 0.04 | *** | | | 0.02 | *** | | | (0.03 | )*** | |
| Net realized and unrealized gain (loss) on investments | | | (0.16 | ) | | | 1.63 | | | | 2.23 | | | | (1.08 | ) | | | (1.55 | ) | |
| Total income (loss) from investment operations | | | (0.05 | ) | | | 1.71 | | | | 2.27 | | | | (1.06 | ) | | | (1.58 | ) | |
| Less distributions to shareholders: | |
| From net investment income | | | - | | | | (0.08 | ) | | | (0.03 | ) | | | (0.01 | ) | | | - | | |
| From net realized gains | | | - | | | | (0.23 | ) | | | - | | | | - | | | | - | | |
| Tax return of capital | | | - | | | | - | | | | - | | | | (0.00 | )† | | | - | | |
| Total distributions | | | - | | | | (0.31 | ) | | | (0.03 | ) | | | (0.01 | ) | | | - | | |
| Net asset value, end of period | | $ | 10.94 | | | $ | 10.99 | | | $ | 9.59 | | | $ | 7.35 | | | $ | 8.42 | | |
| Total Return(a) | | | (0.46 | )% ** | | | 17.77 | % | | | 30.68 | % | | | (12.44 | )% | | | (15.80 | )% ** | |
| Ratios / Supplemental Data: | |
| Net assets, end of period (000's) | | $ | 180,070 | | | $ | 175,493 | | | $ | 81,542 | | | $ | 19,236 | | | $ | 899 | | |
| Ratio of expenses to average daily net assets: | |
| Before expense waiver | | | 1.37 | % * | | | 1.39 | % | | | 1.49 | % | | | 1.88 | % | | | 1.78 | % * | |
| After expense waiver# | | | N/A | | | | 1.38 | % (b) | | | 1.39 | % (b) | | | 1.37 | % (b) | | | 1.56 | % * | |
| Net investment income (loss) to average daily net assets | | | 1.99 | % * | | | 0.75 | % | | | 0.44 | % | | | 0.20 | % | | | (0.59 | )% * | |
| Portfolio turnover rate | | | 33 | % ** | | | 66 | % | | | 92 | % | | | 138 | % | | | 111 | % ** | |
* Annualized.
** Percentages represent the results for the period and are not annualized.
*** Per share amount calculated on the average shares method.
† Tax return of capital is less than $0.01 per share.
†† Effective January 1, 2005, brokerage commissions are included with realized gain or loss on investment transactions. Prior to January 1, 2005, these amounts were presented as a reduction of expenses. Prior year amounts have not been restated to reflect this change due to immateriality. (See Note 3).
+ For the period May 1, 2001 (commencement of operations) through December 31, 2001.
# Computed after giving effect to an agreement by MassMutual to waive certain fees and expenses of the Fund for the period October 1, 2001 through December 31, 2001, the years ended December 31, 2002, 2003 and 2004.
(a) Employee retirement benefit plans that invest plan assets in the Separate Investment Accounts (SIAs) may be subject to certain charges as set forth in their respective Plan Documents. Total return figures would be lower for the periods presented if they reflected these charges.
(b) The Fund has entered into agreements with certain brokers to rebate a portion of brokerage commissions. The rebated commissions are used to reduce operating expenses of the Fund.
(c) Total Return excludes a front-end sales charge and would be lower for the periods presented if it reflected these charges.
The accompanying notes are an integral part of the financial statements.
241
MassMutual Select Overseas Fund – Financial Statements (Continued)
Financial Highlights (For a share outstanding throughout each period)
| | | Class Y | |
| | | Six months
ended
6/30/05
(Unaudited)†† | | Year ended
12/31/04 | | Year ended
12/31/03 | | Year ended
12/31/02 | | Period ended
12/31/01+ | |
| Net asset value, beginning of period | | $ | 11.01 | | | $ | 9.61 | | | $ | 7.36 | | | $ | 8.43 | | | $ | 10.00 | | |
| Income (loss) from investment operations: | | | |
| Net investment income (loss) | | | 0.12 | *** | | | 0.09 | *** | | | 0.04 | *** | | | (0.00 | )***† | | | 0.00 | ***† | |
| Net realized and unrealized gain (loss) on investments | | | (0.16 | ) | | | 1.63 | | | | 2.25 | | | | (1.05 | ) | | | (1.57 | ) | |
| Total income (loss) from investment operations | | | (0.04 | ) | | | 1.72 | | | | 2.29 | | | | (1.05 | ) | | | (1.57 | ) | |
| Less distributions to shareholders: | | | |
| From net investment income | | | - | | | | (0.09 | ) | | | (0.04 | ) | | | (0.02 | ) | | | - | | |
| From net realized gains | | | - | | | | (0.23 | ) | | | - | | | | - | | | | - | | |
| Tax return of capital | | | - | | | | - | | | | - | | | | (0.00 | )† | | | - | | |
| Total distributions | | | - | | | | (0.32 | ) | | | (0.04 | ) | | | (0.02 | ) | | | - | | |
| Net asset value, end of period | | $ | 10.97 | | | $ | 11.01 | | | $ | 9.61 | | | $ | 7.36 | | | $ | 8.43 | | |
| Total Return(a) | | | (0.36 | )% ** | | | 17.84 | % | | | 30.88 | % | | | (12.34 | )% | | | (15.70 | )% ** | |
| Ratios / Supplemental Data: | | | |
| Net assets, end of period (000's) | | $ | 97,792 | | | $ | 93,675 | | | $ | 72,650 | | | $ | 19,204 | | | $ | 88 | | |
| Ratio of expenses to average daily net assets: | |
| Before expense waiver | | | 1.22 | % * | | | 1.24 | % | | | 1.34 | % | | | 1.73 | % | | | 1.90 | % * | |
| After expense waiver# | | | N/A | | | | 1.23 | % (b) | | | 1.24 | % (b) | | | 1.22 | % (b) | | | 1.69 | % * | |
| Net investment income (loss) to average daily net assets | | | 2.17 | % * | | | 0.91 | % | | | 0.50 | % | | | (0.02 | )% | | | 0.08 | % * | |
| Portfolio turnover rate | | | 33 | % ** | | | 66 | % | | | 92 | % | | | 138 | % | | | 111 | % ** | |
| | | Class S | |
| | | Six months
ended
6/30/05
(Unaudited)†† | | Year ended
12/31/04 | | Year ended
12/31/03 | | Year ended
12/31/02 | | Period ended
12/31/01+ | |
| Net asset value, beginning of period | | $ | 11.03 | | | $ | 9.62 | | | $ | 7.37 | | | $ | 8.43 | | | $ | 10.00 | | |
| Income (loss) from investment operations: | | | |
| Net investment income | | | 0.12 | *** | | | 0.10 | *** | | | 0.06 | *** | | | 0.05 | *** | | | 0.01 | *** | |
| Net realized and unrealized gain (loss) on investments | | | (0.16 | ) | | | 1.63 | | | | 2.23 | | | | (1.09 | ) | | | (1.58 | ) | |
| Total income (loss) from investment operations | | | (0.04 | ) | | | 1.73 | | | | 2.29 | | | | (1.04 | ) | | | (1.57 | ) | |
| Less distributions to shareholders: | | | |
| From net investment income | | | - | | | | (0.09 | ) | | | (0.04 | ) | | | (0.02 | ) | | | - | | |
| From net realized gains | | | - | | | | (0.23 | ) | | | - | | | | - | | | | - | | |
| Tax return of capital | | | - | | | | - | | | | - | | | | (0.00 | )† | | | - | | |
| Total distributions | | | - | | | | (0.32 | ) | | | (0.04 | ) | | | (0.02 | ) | | | - | | |
| Net asset value, end of period | | $ | 10.99 | | | $ | 11.03 | | | $ | 9.62 | | | $ | 7.37 | | | $ | 8.43 | | |
| Total Return(a) | | | (0.36 | )% ** | | | 17.98 | % | | | 30.87 | % | | | (12.23 | )% | | | (15.70 | )% ** | |
| Ratios / Supplemental Data: | | | |
| Net assets, end of period (000's) | | $ | 241,218 | | | $ | 211,818 | | | $ | 134,965 | | | $ | 54,437 | | | $ | 20,893 | | |
| Ratio of expenses to average daily net assets: | |
| Before expense waiver | | | 1.17 | % * | | | 1.19 | % | | | 1.29 | % | | | 1.68 | % | | | 1.85 | % * | |
| After expense waiver# | | | N/A | | | | 1.18 | % (b) | | | 1.19 | % (b) | | | 1.18 | % (b) | | | 1.63 | % * | |
| Net investment income to average daily net assets | | | 2.23 | % * | | | 0.96 | % | | | 0.69 | % | | | 0.68 | % | | | 0.14 | % * | |
| Portfolio turnover rate | | | 33 | % ** | | | 66 | % | | | 92 | % | | | 138 | % | | | 111 | % ** | |
* Annualized.
** Percentages represent the results for the period and are not annualized.
*** Per share amount calculated on the average shares method.
† Net investment income (loss) and tax return of capital are less than $0.01 per share.
†† Effective January 1, 2005, brokerage commissions are included with realized gain or loss on investment transactions. Prior to January 1, 2005, these amounts were presented as a reduction of expenses. Prior year amounts have not been restated to reflect this change due to immateriality. (See Note 3).
+ For the period May 1, 2001 (commencement of operations) through December 31, 2001.
# Computed after giving effect to an agreement by MassMutual to waive certain fees and expenses of the Fund for the period October 1, 2001 through December 31, 2001, the years ended December 31, 2002, 2003 and 2004.
(a) Employee retirement benefit plans that invest plan assets in the Separate Investment Accounts (SIAs) may be subject to certain charges as set forth in their respective Plan Documents. Total return figures would be lower for the periods presented if they reflected these charges.
(b) The Fund has entered into agreements with certain brokers to rebate a portion of brokerage commissions. The rebated commissions are used to reduce operating expenses of the Fund.
The accompanying notes are an integral part of the financial statements.
242
MassMutual Select Overseas Fund – Financial Statements (Continued)
Financial Highlights (For a share outstanding throughout each period)
| | | Class N | |
| | | Six months
ended
6/30/05
(Unaudited)†† | | Year ended
12/31/04 | | Year ended
12/31/03 | | Period ended
12/31/02++ | |
| Net asset value, beginning of period | | $ | 10.86 | | | $ | 9.50 | | | $ | 7.31 | | | $ | 7.24 | | |
| Income (loss) from investment operations: | |
| Net investment income (loss) | | | 0.09 | *** | | | 0.02 | *** | | | (0.02 | )*** | | | (0.00 | )***† | |
| Net realized and unrealized gain (loss) on investments | | | (0.17 | ) | | | 1.61 | | | | 2.21 | | | | 0.07 | | |
| Total income (loss) from investment operations | | | (0.08 | ) | | | 1.63 | | | | 2.19 | | | | 0.07 | | |
| Less distributions to shareholders: | |
| From net investment income | | | - | | | | (0.04 | ) | | | - | | | | - | | |
| From net realized gains | | | - | | | | (0.23 | ) | | | - | | | | - | | |
| Total distributions | | | - | | | | (0.27 | ) | | | - | | | | - | | |
| Net asset value, end of period | | $ | 10.78 | | | $ | 10.86 | | | $ | 9.50 | | | $ | 7.31 | | |
| | | | | | | | | | | | | | | | | | |
| Total Return(a) | | | (0.74 | )% (c)** | | | 17.12 | % (c) | | | 29.96 | % (c) | | | - | ‡ | |
| Ratios / Supplemental Data: | |
| Net assets, end of period (000's) | | $ | 1,444 | | | $ | 884 | | | $ | 255 | | | $ | 102 | | |
| Ratio of expenses to average daily net assets: | |
| Before expense waiver | | | 1.92 | % * | | | 1.94 | % | | | 2.04 | % | | | - | ‡ | |
| After expense waiver# | | | N/A | | | | 1.93 | % (b) | | | 1.94 | % (b) | | | - | ‡ | |
| Net investment income (loss) to average daily net assets | | | 1.68 | % * | | | 0.17 | % | | | (0.22 | )% | | | - | ‡ | |
| Portfolio turnover rate | | | 33 | % ** | | | 66 | % | | | 92 | % | | | 138 | % | |
* Annualized.
** Percentages represent the results for the period and are not annualized.
*** Per share amount calculated on the average shares method.
† Net investment loss is less than $0.01 per share.
†† Effective January 1, 2005, brokerage commissions are included with realized gain or loss on investment transactions. Prior to January 1, 2005, these amounts were presented as a reduction of expenses. Prior year amounts have not been restated to reflect this change due to immateriality. (See Note 3).
++ Class N commenced operations on December 31, 2002.
‡ Amounts are de minimis due to the short period of operations.
# Computed after giving effect to an agreement by MassMutual to waive certain fees and expenses of the Fund for the years ended December 31, 2003 and 2004.
(a) Employee retirement benefit plans that invest plan assets in the Separate Investment Accounts (SIAs) may be subject to certain charges as set forth in their respective Plan Documents. Total return figures would be lower for the periods presented if they reflected these charges.
(b) The Fund has entered into agreement with certain brokers to rebate a portions of brokerage commissions. The rebated commissions are used to reduce operating expenses of the Fund.
(c) Total Return excludes contingent deferred sales charge and would be lower for the periods presented if they reflected these charges.
The accompanying notes are an integral part of the financial statements.
243
MassMutual Select Destination Retirement Income Fund – Financial Statements (Continued)
Financial Highlights (For a share outstanding throughout each period)
| | | Class A | |
| | | Six months
ended
6/30/05
(Unaudited) | | Year ended
12/31/04 | | Period ended
12/31/03+ | |
| Net asset value, beginning of period | | $ | 10.32 | | | $ | 10.00 | | | $ | 10.00 | | |
| Income (loss) from investment operations: | | | |
| Net investment income (loss) | | | (0.02 | )*** | | | 0.62 | *** | | | 0.00 | | |
| Net realized and unrealized gain on investments | | | 0.14 | | | | 0.01 | | | | 0.00 | | |
| Total income from investment operations | | | 0.12 | | | | 0.63 | | | | 0.00 | | |
| Less distributions to shareholders: | | | |
| From net investment income | | | - | | | | (0.27 | ) | | | - | | |
| From net realized gains | | | - | | | | (0.04 | ) | | | - | | |
| Total distributions | | | - | | | | (0.31 | ) | | | - | | |
| Net asset value, end of period | | $ | 10.44 | | | $ | 10.32 | | | $ | 10.00 | | |
| Total Return(a) | | | 1.26 | % (b)** | | | 6.35 | % (b) | | | - | ‡ | |
| Ratios / Supplemental Data: | | | |
| Net assets, end of period (000's) | | $ | 22,738 | | | $ | 11,819 | | | $ | 101 | | |
| Ratio of expenses to average daily net assets: | |
| Before expense waiver | | | 0.48 | % * | | | 0.50 | % | | | - | ‡ | |
| After expense waiver# | | | N/A | | | | 0.50 | % | | | - | ‡ | |
| Net investment income (loss) to average daily net assets | | | (0.37 | )% * | | | 6.00 | % | | | - | ‡ | |
| Portfolio turnover rate | | | 8 | % ** | | | 33 | % | | | N/A | | |
| | | Class L | |
| | | Six months
ended
6/30/05
(Unaudited) | | Year ended
12/31/04 | | Period ended
12/31/03+ | |
| Net asset value, beginning of period | | $ | 10.34 | | | $ | 10.00 | | | $ | 10.00 | | |
| Income (loss) from investment operations: | | | |
| Net investment income (loss) | | | (0.01 | )*** | | | 0.34 | *** | | | 0.00 | | |
| Net realized and unrealized gain on investments | | | 0.15 | | | | 0.32 | | | | 0.00 | | |
| Total income from investment operations | | | 0.14 | | | | 0.66 | | | | 0.00 | | |
| Less distributions to shareholders: | | | |
| From net investment income | | | - | | | | (0.28 | ) | | | - | | |
| From net realized gains | | | - | | | | (0.04 | ) | | | - | | |
| Total distributions | | | - | | | | (0.32 | ) | | | - | | |
| Net asset value, end of period | | $ | 10.48 | | | $ | 10.34 | | | $ | 10.00 | | |
| | | | | | | | | | | | | | |
| Total Return(a) | | | 1.35 | % ** | | | 6.62 | % | | | - | ‡ | |
| Ratios / Supplemental Data: | | | |
| Net assets, end of period (000's) | | $ | 106,051 | | | $ | 97,859 | | | $ | 101 | | |
| Ratio of expenses to average daily net assets: | |
| Before expense waiver | | | 0.23 | % * | | | 0.23 | % | | | - | ‡ | |
| After expense waiver# | | | N/A | | | | 0.23 | % | | | - | ‡ | |
| Net investment income (loss) to average daily net assets | | | (0.12 | )% * | | | 3.36 | % | | | - | ‡ | |
| Portfolio turnover rate | | | 8 | % ** | | | 33 | % | | | N/A | | |
* Annualized.
** Percentages represent results for the period and are not annualized.
*** Per share amount calculated on the average shares method.
† Net investment income (loss) is less than $0.01 per share.
†† Net investment income is less than 0.01%.
+ The Fund commenced operations on December 31, 2003.
‡ Amounts are de minimus due to the short period of operations.
# Computed after giving effect to an agreement by MassMutual to waive certain fees and expenses of the Fund for the periods ended December 31, 2003 and 2004.
(a) Employee retirement benefit plans that invest plan assets in the Separate Investment Accounts (SIAs) may be subject to certain charges as set forth in their respective Plan Documents. Total return figures would be lower for the periods presented if they reflected these charges.
(b) Total Return excludes a front-end sales charge for Class A and a contingent deferred sales charge for Class N and would be lower for the periods presented if they reflected these charges.
The accompanying notes are an integral part of the financial statements.
244
MassMutual Select Destination Retirement Income Fund – Financial Statements (Continued)
Financial Highlights (For a share outstanding throughout each period)
| | | Class Y | |
| | | Six months
ended
6/30/05
(Unaudited) | | Year ended
12/31/04 | | Period ended
12/31/03+ | |
| Net asset value, beginning of period | | $ | 10.35 | | | $ | 10.00 | | | $ | 10.00 | | |
| Income (loss) from investment operations: | | | |
| Net investment income (loss) | | | (0.00 | )***† | | | 0.45 | *** | | | 0.00 | | |
| Net realized and unrealized gain on investments | | | 0.13 | | | | 0.23 | | | | 0.00 | | |
| Total income from investment operations | | | 0.13 | | | | 0.68 | | | | 0.00 | | |
| Less distributions to shareholders: | | | |
| From net investment income | | | - | | | | (0.29 | ) | | | - | | |
| From net realized gains | | | - | | | | (0.04 | ) | | | - | | |
| Total distributions | | | - | | | | (0.33 | ) | | | - | | |
| Net asset value, end of period | | $ | 10.48 | | | $ | 10.35 | | | $ | 10.00 | | |
| Total Return(a) | | | 1.35 | %** | | | 6.80 | % | | | - | ‡ | |
| Ratios / Supplemental Data: | | | |
| Net assets, end of period (000's) | | $ | 93,182 | | | $ | 80,590 | | | $ | 101 | | |
| Ratio of expenses to average daily net assets: | |
| Before expense waiver | | | 0.13 | % * | | | 0.13 | % | | | - | ‡ | |
| After expense waiver# | | | N/A | | | | 0.13 | % | | | - | ‡ | |
| Net investment income (loss) to average daily net assets | | | (0.02 | )% * | | | 4.38 | % | | | - | ‡ | |
| Portfolio turnover rate | | | 8 | % ** | | | 33 | % | | | N/A | | |
| | | Class S | |
| | | Six months
ended
6/30/05
(Unaudited) | | Year ended
12/31/04 | | Period ended
12/31/03+ | |
| Net asset value, beginning of period | | $ | 10.34 | | | $ | 10.00 | | | $ | 10.00 | | |
| Income (loss) from investment operations: | | | |
| Net investment income | | | 0.00 | ***† | | | 0.37 | *** | | | 0.00 | | |
| Net realized and unrealized gain on investments | | | 0.14 | | | | 0.30 | | | | 0.00 | | |
| Total income from investment operations | | | 0.14 | | | | 0.67 | | | | 0.00 | | |
| Less distributions to shareholders: | | | |
| From net investment income | | | - | | | | (0.29 | ) | | | - | | |
| From net realized gains | | | - | | | | (0.04 | ) | | | - | | |
| Total distributions | | | - | | | | (0.33 | ) | | | - | | |
| Net asset value, end of period | | $ | 10.48 | | | $ | 10.34 | | | $ | 10.00 | | |
| | | | | | | | | | | | | | |
| Total Return(a) | | | 1.45 | % ** | | | 6.71 | % | | | - | ‡ | |
| Ratios / Supplemental Data: | | | |
| Net assets, end of period (000's) | | $ | 2,396 | | | $ | 1,195 | | | $ | 601 | | |
| Ratio of expenses to average daily net assets: | |
| Before expense waiver | | | 0.10 | % * | | | 0.71 | % | | | - | ‡ | |
| After expense waiver# | | | N/A | | | | 0.12 | % | | | - | ‡ | |
| Net investment income to average daily net assets | | | 0.00 | % *†† | | | 3.64 | % | | | - | ‡ | |
| Portfolio turnover rate | | | 8 | % ** | | | 33 | % | | | N/A | | |
* Annualized.
** Percentages represent results for the period and are not annualized.
*** Per share amount calculated on the average shares method.
† Net investment income (loss) is less than $0.01 per share.
†† Net investment income is less than 0.01%.
+ The Fund commenced operations on December 31, 2003.
‡ Amounts are de minimus due to the short period of operations.
# Computed after giving effect to an agreement by MassMutual to waive certain fees and expenses of the Fund for the periods ended December 31, 2003 and 2004.
(a) Employee retirement benefit plans that invest plan assets in the Separate Investment Accounts (SIAs) may be subject to certain charges as set forth in their respective Plan Documents. Total return figures would be lower for the periods presented if they reflected these charges.
The accompanying notes are an integral part of the financial statements.
245
MassMutual Select Destination Retirement Income Fund – Financial Statements (Continued)
Financial Highlights (For a share outstanding throughout each period)
| | | Class N | |
| | | Six months
ended
6/30/05
(Unaudited) | | Year ended
12/31/04 | | Period ended
12/31/03+ | |
| Net asset value, beginning of period | | $ | 10.34 | | | $ | 10.00 | | | $ | 10.00 | | |
| Income (loss) from investment operations: | |
| Net investment income (loss) | | | (0.03 | )*** | | | 0.15 | *** | | | 0.00 | | |
| Net realized and unrealized gain on investments | | | 0.13 | | | | 0.45 | | | | 0.00 | | |
| Total income from investment operations | | | 0.10 | | | | 0.60 | | | | 0.00 | | |
| Less distributions to shareholders: | |
| From net investment income | | | - | | | | (0.22 | ) | | | - | | |
| From net realized gains | | | - | | | | (0.04 | ) | | | - | | |
| Total distributions | | | - | | | | (0.26 | ) | | | - | | |
| Net asset value, end of period | | $ | 10.44 | | | $ | 10.34 | | | $ | 10.00 | | |
| Total Return(a) | | | 1.06 | % (b)** | | | 6.02 | % (b) | | | 0.00 | %‡ | |
| Ratios / Supplemental Data: | |
| Net assets, end of period (000's) | | $ | 105 | | | $ | 104 | | | $ | 101 | | |
| Ratio of expenses to average daily net assets: | |
| Before expense waiver | | | 0.78 | % * | | | 1.53 | % | | | - | ‡ | |
| After expense waiver# | | | N/A | | | | 0.80 | % | | | N/A‡ | | |
| Net investment income (loss) to average daily net assets | | | (0.68 | )% * | | | 1.52 | % | | | 0.00 | %‡ | |
| Portfolio turnover rate | | | 8 | % ** | | | 33 | % | | | N/A | | |
* Annualized.
** Percentages represent results for the period and are not annualized.
*** Per share amount calculated on the average shares method.
+ The Fund commenced operations on December 31, 2003.
‡ Amounts are de minimus due to the short period of operations.
# Computed after giving effect to an agreement by MassMutual to waive certain fees and expenses of the Fund for the periods ended December 31, 2003 and 2004.
(a) Employee retirement benefit plans that invest plan assets in the Separate Investment Accounts (SIAs) may be subject to certain charges as set forth in their respective Plan Documents. Total return figures would be lower for the periods presented if they reflected these charges.
(b) Total Return excludes a front-end sales charge for Class A and a contingent deferred sales charge for Class N and would be lower for the periods presented if they reflected these charges.
The accompanying notes are an integral part of the financial statements.
246
MassMutual Select Destination Retirement 2010 Fund – Financial Statements (Continued)
Financial Highlights (For a share outstanding throughout each period)
| | | Class A | |
| | | Six months
ended
6/30/05
(Unaudited) | | Year ended
12/31/04 | | Period ended
12/31/03+ | |
| Net asset value, beginning of period | | $ | 10.54 | | | $ | 10.00 | | | $ | 10.00 | | |
| Income (loss) from investment operations: | |
| Net investment income (loss) | | | (0.02 | )*** | | | 0.56 | *** | | | 0.00 | | |
| Net realized and unrealized gain on investments | | | 0.12 | | | | 0.18 | | | | 0.00 | | |
| Total income from investment operations | | | 0.10 | | | | 0.74 | | | | 0.00 | | |
| Less distributions to shareholders: | |
| From net investment income | | | - | | | | (0.18 | ) | | | - | | |
| From net realized gains | | | - | | | | (0.02 | ) | | | - | | |
| Total distributions | | | - | | | | (0.20 | ) | | | - | | |
| Net asset value, end of period | | $ | 10.64 | | | $ | 10.54 | | | $ | 10.00 | | |
| | | | | | | | | | | | | | |
| Total Return(a) | | | 0.95 | % (b)** | | | 7.36 | % (b) | | | - | ‡ | |
| Ratios / Supplemental Data: | |
| Net assets, end of period (000's) | | $ | 15,842 | | | $ | 7,272 | | | $ | 101 | | |
| Ratio of expenses to average daily net assets: | |
| Before expense waiver | | | 0.58 | % * | | | 1.13 | % | | | - | ‡ | |
| After expense waiver# | | | 0.50 | % * | | | 0.50 | % | | | - | ‡ | |
| Net investment income (loss) to average daily net assets | | | (0.41 | )% * | | | 5.34 | % | | | - | ‡ | |
| Portfolio turnover rate | | | 7 | % ** | | | 28 | % | | | N/A | | |
| | | Class L | |
| | | Six months
ended
6/30/05
(Unaudited) | | Year ended
12/31/04 | | Period ended
12/31/03+ | |
| Net asset value, beginning of period | | $ | 10.56 | | | $ | 10.00 | | | $ | 10.00 | | |
| Income (loss) from investment operations: | |
| Net investment income (loss) | | | (0.01 | )*** | | | 1.25 | *** | | | 0.00 | | |
| Net realized and unrealized gain (loss) on investments | | | 0.12 | | | | (0.48 | ) | | | 0.00 | | |
| Total income from investment operations | | | 0.11 | | | | 0.77 | | | | 0.00 | | |
| Less distributions to shareholders: | |
| From net investment income | | | - | | | | (0.19 | ) | | | - | | |
| From net realized gains | | | - | | | | (0.02 | ) | | | - | | |
| Total distributions | | | - | | | | (0.21 | ) | | | - | | |
| Net asset value, end of period | | $ | 10.67 | | | $ | 10.56 | | | $ | 10.00 | | |
| | | | | | | | | | | | | | |
| Total Return(a) | | | 1.04 | % ** | | | 7.68 | % | | | 0.00 | %‡ | |
| Ratios / Supplemental Data: | |
| Net assets, end of period (000's) | | $ | 29,404 | | | $ | 22,880 | | | $ | 101 | | |
| Ratio of expenses to average daily net assets: | |
| Before expense waiver | | | 0.33 | % * | | | 0.88 | % | | | - | ‡ | |
| After expense waiver# | | | 0.25 | % * | | | 0.25 | % | | | - | ‡ | |
| Net investment income (loss) to average daily net assets | | | (0.15 | )% * | | | 12.10 | % | | | - | ‡ | |
| Portfolio turnover rate | | | 7 | % ** | | | 28 | % | | | N/A | | |
* Annualized.
** Percentages represent results for the period and are not annualized.
*** Per share amount calculated on the average shares method.
+ The Fund commenced operations on December 31, 2003.
‡ Amounts are de minimis due to the short period of operations.
# Computed after giving effect to an agreement by MassMutual to waive certain fees and expenses of the Fund for the years ended December 31, 2003 and 2004 and the six months ended June 30, 2005.
(a) Employee retirement benefit plans that invest plan assets in the Separate Investment Accounts (SIAs) may be subject to certain charges as set forth in their respective Plan Documents. Total return figures would be lower for the period presented if they reflected these charges.
(b) Total Return excludes a front-end sales charge for Class A and a contingent deferred sales charge for Class N and would be lower for the periods presented if they reflected these charges.
The accompanying notes are an integral part of the financial statements.
247
MassMutual Select Destination Retirement 2010 Fund – Financial Statements (Continued)
Financial Highlights (For a share outstanding throughout each period)
| | | Class Y | |
| | | Six months
ended
6/30/05
(Unaudited) | | Year ended
12/31/04 | | Period ended
12/31/03+ | |
| Net asset value, beginning of period | | $ | 10.56 | | | $ | 10.00 | | | $ | 10.00 | | |
| Income (loss) from investment operations: | |
| Net investment income (loss) | | | (0.00 | )***† | | | 0.85 | *** | | | 0.00 | | |
| Net realized and unrealized gain (loss) on investments | | | 0.12 | | | | (0.08 | ) | | | 0.00 | | |
| Total income from investment operations | | | 0.12 | | | | 0.77 | | | | 0.00 | | |
| Less distributions to shareholders: | |
| From net investment income | | | - | | | | (0.19 | ) | | | - | | |
| From net realized gains | | | - | | | | (0.02 | ) | | | - | | |
| Total distributions | | | - | | | | (0.21 | ) | | | - | | |
| Net asset value, end of period | | $ | 10.68 | | | $ | 10.56 | | | $ | 10.00 | | |
| | | | | | | | | | | | | | |
| Total Return(a) | | | 1.14 | % ** | | | 7.69 | % | | | - | ‡ | |
| Ratios / Supplemental Data: | |
| Net assets, end of period (000's) | | $ | 27,256 | | | $ | 5,605 | | | $ | 101 | | |
| Ratio of expenses to average daily net assets: | |
| Before expense waiver | | | 0.23 | % * | | | 0.78 | % | | | - | ‡ | |
| After expense waiver# | | | 0.15 | % * | | | 0.15 | % | | | - | ‡ | |
| Net investment income (loss) to average daily net assets | | | (0.07 | )% * | | | 8.17 | % | | | - | ‡ | |
| Portfolio turnover rate | | | 7 | % ** | | | 28 | % | | | N/A | | |
| | | Class S | |
| | | Six months
ended
6/30/05
(Unaudited) | | Year ended
12/31/04 | | Period ended
12/31/03+ | |
| Net asset value, beginning of period | | $ | 10.57 | | | $ | 10.00 | | | $ | 10.00 | | |
| Income (loss) from investment operations: | |
| Net investment income (loss) | | | (0.00 | )***† | | | 0.36 | *** | | | 0.00 | | |
| Net realized and unrealized gain on investments | | | 0.12 | | | | 0.42 | | | | 0.00 | | |
| Total income from investment operations | | | 0.12 | | | | 0.78 | | | | 0.00 | | |
| Less distributions to shareholders: | |
| From net investment income | | | - | | | | (0.19 | ) | | | - | | |
| From net realized gains | | | - | | | | (0.02 | ) | | | - | | |
| Total distributions | | | - | | | | (0.21 | ) | | | - | | |
| Net asset value, end of period | | $ | 10.69 | | | $ | 10.57 | | | $ | 10.00 | | |
| | | | | | | | | | | | | | |
| Total Return(a) | | | 1.14 | % ** | | | 7.80 | % | | | - | ‡ | |
| Ratios / Supplemental Data: | |
| Net assets, end of period (000's) | | $ | 5,098 | | | $ | 2,319 | | | $ | 601 | | |
| Ratio of expenses to average daily net assets: | |
| Before expense waiver | | | 0.18 | % * | | | 0.73 | % | | | - | ‡ | |
| After expense waiver# | | | 0.10 | % * | | | 0.10 | % | | | - | ‡ | |
| Net investment income (loss) to average daily net assets | | | (0.01 | )% * | | | 3.49 | % | | | - | ‡ | |
| Portfolio turnover rate | | | 7 | % ** | | | 28 | % | | | N/A | | |
* Annualized.
** Percentages represent results from the period and are not annualized.
*** Per share amount calculated on the average shares method.
† Net investment loss is less than $0.01 per share.
+ The Fund commenced operations on December 31, 2003.
‡ Amounts are de minimis due to the short period of operations.
# Computed after giving effect to an agreement by MassMutual to waive certain fees and expenses of the Fund for the years ended December 31, 2003 and 2004 and the six months ended June 30, 2005.
(a) Employee retirement benefit plans that invest plan assets in the Separate Investment Accounts (SIAs) may be subject to certain charges as set forth in their respective Plan Documents. Total return figures would be lower for the period presented if they reflected these charges.
The accompanying notes are an integral part of the financial statements.
248
MassMutual Select Destination Retirement 2010 Fund – Financial Statements (Continued)
Financial Highlights (For a share outstanding throughout each period)
| | | Class N | |
| | | Six months
ended
6/30/05
(Unaudited) | | Year ended
12/31/04 | | Year ended
12/31/03+ | |
| Net asset value, beginning of period | | $ | 10.56 | | | $ | 10.00 | | | $ | 10.00 | | |
| Income (loss) from investment operations: | | | |
| Net investment income (loss) | | | (0.04 | )*** | | | (0.00 | )† | | | 0.00 | | |
| Net realized and unrealized gain on investments | | | 0.13 | | | | 0.70 | | | | 0.00 | | |
| Total income from investment operations | | | 0.09 | | | | 0.70 | | | | 0.00 | | |
| Less distributions to shareholders: | | | |
| From net investment income | | | - | | | | (0.12 | ) | | | - | | |
| From net realized gains | | | - | | | | (0.02 | ) | | | - | | |
| Total distributions | | | - | | | | (0.14 | ) | | | - | | |
| Net asset value, end of period | | $ | 10.65 | | | $ | 10.56 | | | $ | 10.00 | | |
| Total Return(a) | | | 0.85 | % (b)** | | | 6.98 | % (b) | | | 0.00 | % | |
| Ratios / Supplemental Data: | | | |
| Net assets, end of period (000's) | | $ | 121 | | | $ | 107 | | | $ | - | | |
| Ratio of expenses to average daily net assets: | |
| Before expense waiver | | | 0.88 | % * | | | 1.43 | % | | | - | ‡ | |
| After expense waiver# | | | 0.80 | % * | | | 0.80 | % | | | N/A‡ | | |
| Net investment income (loss) to average daily net assets | | | (0.71 | )% * | | | 0.02 | % | | | 0.00 | %‡ | |
| Portfolio turnover rate | | | 7 | % ** | | | 28 | % | | | N/A | | |
* Annualized.
** Percentages represent results for the period and are not annualized.
*** Per share amount calculated on the average shares method.
† Net investment loss is less than $0.01 per share.
+ The Fund commenced operations on December 31, 2003.
‡ Amounts are de minimis due to the short period of operations.
# Computed after giving effect to an agreement by MassMutual to waive certain fees and expenses of the Fund for the years ended December 31, 2003 and 2004 and the six months ended June 30, 2005.
(a) Employee retirement benefit plans that invest plan assets in the Separate Investment Accounts (SIAs) may be subject to certain charges as set forth in their respective Plan Documents. Total return figures would be lower for the period presented if they reflected these charges.
(b) Total Return excludes a front-end sales charge for Class A and a contingent deferred sales charge for Class N and would be lower for the periods presented if they reflected these charges.
The accompanying notes are an integral part of the financial statements.
249
MassMutual Select Destination Retirement 2020 Fund – Financial Statements (Continued)
Financial Highlights (For a share outstanding throughout each period)
| | | Class A | |
| | | Six months
ended
6/30/05
(Unaudited) | | Year ended
12/31/04 | | Period ended
12/31/03+ | |
| Net asset value, beginning of period | | $ | 10.75 | | | $ | 10.00 | | | $ | 10.00 | | |
| Income (loss) from investment operations: | |
| Net investment income (loss) | | | (0.03 | )*** | | | 0.64 | *** | | | 0.00 | | |
| Net realized and unrealized gain on investments | | | 0.09 | | | | 0.34 | | | | 0.00 | | |
| Total income from investment operations | | | 0.06 | | | | 0.98 | | | | 0.00 | | |
| Less distributions to shareholders: | |
| From net investment income | | | - | | | | (0.19 | ) | | | - | | |
| From net realized gains | | | - | | | | (0.04 | ) | | | - | | |
| Total distributions | | | - | | | | (0.23 | ) | | | - | | |
| Net asset value, end of period | | $ | 10.81 | | | $ | 10.75 | | | $ | 10.00 | | |
| | | | | | | | | | | | | | |
| Total Return(a) | | | 0.56 | % (b)** | | | 9.76 | % (b) | | | - | ‡ | |
| Ratios / Supplemental Data: | |
| Net assets, end of period (000's) | | $ | 48,697 | | | $ | 21,577 | | | $ | 101 | | |
| Ratio of expenses to average daily net assets: | |
| Before expense waiver | | | 0.50 | % * | | | 0.52 | % | | | - | ‡ | |
| After expense waiver# | | | 0.50 | % * | | | 0.50 | % | | | - | ‡ | |
| Net investment income (loss) to average daily net assets | | | (0.50 | )% * | | | 6.11 | % | | | - | ‡ | |
| Portfolio turnover rate | | | 7 | % ** | | | 19 | % | | | N/A | | |
| | | Class L | |
| | | Six months
ended
6/30/05
(Unaudited) | | Year ended
12/31/04 | | Period ended
12/31/03+ | |
| Net asset value, beginning of period | | $ | 10.77 | | | $ | 10.00 | | | $ | 10.00 | | |
| Income (loss) from investment operations: | |
| Net investment income (loss) | | | (0.01 | )*** | | | 0.21 | *** | | | 0.00 | | |
| Net realized and unrealized gain on investments | | | 0.09 | | | | 0.79 | | | | 0.00 | | |
| Total income from investment operations | | | 0.08 | | | | 1.00 | | | | 0.00 | | |
| Less distributions to shareholders: | |
| From net investment income | | | - | | | | (0.19 | ) | | | - | | |
| From net realized gains | | | - | | | | (0.04 | ) | | | - | | |
| Total distributions | | | - | | | | (0.23 | ) | | | - | | |
| Net asset value, end of period | | $ | 10.85 | | | $ | 10.77 | | | $ | 10.00 | | |
| | | | | | | | | | | | | | |
| Total Return(a) | | | 0.65 | % ** | | | 10.07 | % | | | - | ‡ | |
| Ratios / Supplemental Data: | |
| Net assets, end of period (000's) | | $ | 216,733 | | | $ | 212,094 | | | $ | 101 | | |
| Ratio of expenses to average daily net assets: | |
| Before expense waiver | | | 0.25 | % * | | | 0.26 | % | | | - | ‡ | |
| After expense waiver# | | | 0.25 | % * | | | 0.25 | % | | | - | ‡ | |
| Net investment income (loss) to average daily net assets | | | (0.25 | )% * | | | 1.99 | % | | | - | ‡ | |
| Portfolio turnover rate | | | 7 | % ** | | | 19 | % | | | N/A | | |
* Annualized.
** Percentages represent results for the period and are not annualized.
*** Per share amount calculated on the average shares method.
+ The Fund commenced operations on December 31, 2003.
‡ Amounts are de minimis due to the short period of operations.
# Computed after giving effect to an agreement by MassMutual to waive certain fees and expenses of the Fund for the year ended December 31, 2004 and the six months ended June 30, 2005.
(a) Employee retirement benefit plans that invest assets in the Separate Investment Accounts (SIAs) may be subject to certain charges as set forth in their respective Plan Documents. Total return would be lower for the periods presented if they reflected these charges.
(b) Total return excludes a front-end sales charge for Class A and a contingent deferred sales charge for Class N and would be lower for the periods presented if they reflected these charges.
The accompanying notes are an integral part of the financial statements.
250
MassMutual Select Destination Retirement 2020 Fund – Financial Statements (Continued)
Financial Highlights (For a share outstanding throughout each period)
| | | Class Y | |
| | | Six months
ended
6/30/05
(Unaudited) | | Year ended
12/31/04 | | Period ended
12/31/03+ | |
| Net asset value, beginning of period | | $ | 10.77 | | | $ | 10.00 | | | $ | 10.00 | | |
| Income (loss) from investment operations: | |
| Net investment income (loss) | | | (0.01 | )*** | | | 0.81 | *** | | | 0.00 | | |
| Net realized and unrealized gain on investments | | | 0.09 | | | | 0.20 | | | | 0.00 | | |
| Total income from investment operations | | | 0.08 | | | | 1.01 | | | | 0.00 | | |
| Less distributions to shareholders: | |
| From net investment income | | | - | | | | (0.20 | ) | | | - | | |
| From net realized gains | | | - | | | | (0.04 | ) | | | - | | |
| Total distributions | | | - | | | | (0.24 | ) | | | - | | |
| Net asset value, end of period | | $ | 10.85 | | | $ | 10.77 | | | $ | 10.00 | | |
| | | | | | | | | | | | | | |
| Total Return(a) | | | 0.74 | % ** | | | 10.07 | % | | | - | ‡ | |
| Ratios / Supplemental Data: | |
| Net assets, end of period (000's) | | $ | 44,718 | | | $ | 10,249 | | | $ | 101 | | |
| Ratio of expenses to average daily net assets: | |
| Before expense waiver | | | 0.15 | % * | | | 0.19 | % | | | - | ‡ | |
| After expense waiver# | | | 0.15 | % * | | | 0.15 | % | | | - | ‡ | |
| Net investment income (loss) to average daily net assets | | | (0.15 | )% * | | | 7.69 | % | | | - | ‡ | |
| Portfolio turnover rate | | | 7 | % ** | | | 19 | % | | | N/A | | |
| | | Class S | |
| | | Six months
ended
6/30/05
(Unaudited) | | Year ended
12/31/04 | | Period ended
12/31/03+ | |
| Net asset value, beginning of period | | $ | 10.78 | | | $ | 10.00 | | | $ | 10.00 | | |
| Income (loss) from investment operations: | |
| Net investment income (loss) | | | (0.01 | )*** | | | 0.52 | *** | | | 0.00 | | |
| Net realized and unrealized gain on investments | | | 0.09 | | | | 0.50 | | | | 0.00 | | |
| Total income from investment operations | | | 0.08 | | | | 1.02 | | | | 0.00 | | |
| Less distributions to shareholders: | |
| From net investment income | | | - | | | | (0.20 | ) | | | - | | |
| From net realized gains | | | - | | | | (0.04 | ) | | | - | | |
| Total distributions | | | - | | | | (0.24 | ) | | | - | | |
| Net asset value, end of period | | $ | 10.86 | | | $ | 10.78 | | | $ | 10.00 | | |
| | | | | | | | | | | | | | |
| Total Return(a) | | | 0.74 | % ** | | | 10.19 | % | | | - | ‡ | |
| Ratios / Supplemental Data: | |
| Net assets, end of period (000's) | | $ | 20,729 | | | $ | 12,389 | | | $ | 601 | | |
| Ratio of expenses to average daily net assets: | |
| Before expense waiver | | | 0.10 | % * | | | 0.21 | % | | | - | ‡ | |
| After expense waiver# | | | 0.10 | % * | | | 0.10 | % | | | - | ‡ | |
| Net investment income (loss) to average daily net assets | | | (0.10 | )% * | | | 5.00 | % | | | - | ‡ | |
| Portfolio turnover rate | | | 7 | % ** | | | 19 | % | | | N/A | | |
* Annualized.
** Percentages represent results for the period and are not annualized.
*** Per share amount calculated on the average shares method.
+ The Fund commenced operations on December 31, 2003.
‡ Amounts are de minimis due to the short period of operations.
# Computed after giving effect to an agreement by MassMutual to waive certain fees and expenses of the Fund for the year ended December 31, 2004 and the six months ended June 30, 2005.
(a) Employee retirement benefit plans that invest assets in the Separate Investment Accounts (SIAs) may be subject to certain charges as set forth in their respective Plan Documents. Total return would be lower for the periods presented if they reflected these charges.
The accompanying notes are an integral part of the financial statements.
251
MassMutual Select Destination Retirement 2020 Fund – Financial Statements (Continued)
Financial Highlights (For a share outstanding throughout each period)
| | | Class N | |
| | | Six months
ended
6/30/05
(Unaudited) | | Year ended
12/31/04 | | Period ended
12/31/03+ | |
| Net asset value, beginning of period | | $ | 10.77 | | | $ | 10.00 | | | $ | 10.00 | | |
| Income (loss) from investment operations: | |
| Net investment income | | | (0.04 | )*** | | | 0.06 | *** | | | 0.00 | | |
| Net realized and unrealized gain on investments | | | 0.09 | | | | 0.88 | | | | 0.00 | | |
| Total income from investment operations | | | 0.05 | | | | 0.94 | | | | 0.00 | | |
| Less distributions to shareholders: | |
| From net investment income | | | - | | | | (0.13 | ) | | | - | | |
| From net realized gains | | | - | | | | (0.04 | ) | | | - | | |
| Total distributions | | | - | | | | (0.17 | ) | | | - | | |
| Net asset value, end of period | | $ | 10.82 | | | $ | 10.77 | | | $ | 10.00 | | |
| | | | | | | | | | | | | | |
| Total Return(a) | | | 0.46 | % (b)** | | | 9.39 | % (b) | | | 0.00 | %‡ | |
| Ratios / Supplemental Data: | |
| Net assets, end of period (000's) | | $ | 193 | | | $ | 113 | | | $ | 101 | | |
| Ratio of expenses to average daily net assets: | |
| Before expense waiver | | | 0.80 | % * | | | 1.57 | % | | | - | ‡ | |
| After expense waiver# | | | 0.80 | % * | | | 0.80 | % | | | N/A‡ | | |
| Net investment income to average daily net assets | | | (0.80 | )% * | | | 0.55 | % | | | 0.00 | %‡ | |
| Portfolio turnover rate | | | 7 | % ** | | | 19 | % | | | N/A | | |
* Annualized.
** Percentages represent results for the period and are not annualized.
*** Per share amount calculated on the average shares method.
+ The Fund commenced operations on December 31, 2003.
‡ Amounts are de minimis due to the short period of operations.
# Computed after giving effect to an agreement by MassMutual to waive certain fees and expenses of the Fund for the year ended December 31, 2004 and the six months ended June 30, 2005.
(a) Employee retirement benefit plans that invest assets in the Separate Investment Accounts (SIAs) may be subject to certain charges as set forth in their respective Plan Documents. Total return would be lower for the periods presented if they reflected these charges.
(b) Total return excludes a front-end sales charge for Class A and a contingent deferred sales charge for Class N and would be lower for the periods presented if they reflected these charges.
The accompanying notes are an integral part of the financial statements.
252
MassMutual Select Destination Retirement 2030 Fund – Financial Statements (Continued)
Financial Highlights (For a share outstanding throughout each period)
| | | Class A | |
| | | Six months
ended
6/30/05
(Unaudited) | | Year ended
12/31/04 | | Period ended
12/31/03+ | |
| Net asset value, beginning of period | | $ | 11.11 | | | $ | 10.00 | | | $ | 10.00 | | |
| Income (loss) from investment operations: | |
| Net investment income (loss) | | | (0.03 | )*** | | | 0.27 | *** | | | - | | |
| Net realized and unrealized gain on investments | | | 0.02 | | | | 0.95 | | | | - | | |
| Total income (loss) from investment operations | | | (0.01 | ) | | | 1.22 | | | | 0.00 | | |
| Less distributions to shareholders: | |
| From net investment income | | | - | | | | (0.10 | ) | | | - | | |
| From net realized gains | | | - | | | | (0.01 | ) | | | - | | |
| Total distributions | | | - | | | | (0.11 | ) | | | - | | |
| Net asset value, end of period | | $ | 11.10 | | | $ | 11.11 | | | $ | 10.00 | | |
| | | | | | | | | | | | | | |
| Total Return(a) | | | (0.09 | )% (b)** | | | 12.24 | % (b) | | | - | ‡ | |
| Ratios / Supplemental Data: | |
| Net assets, end of period (000's) | | $ | 34,471 | | | $ | 21,459 | | | $ | 101 | | |
| Ratio of expenses to average daily net assets: | |
| Before expense waiver | | | 0.50 | % * | | | 0.52 | % | | | - | ‡ | |
| After expense waiver# | | | 0.50 | % * | | | 0.50 | % | | | N/A‡ | | |
| Net investment income (loss) to average daily net assets | | | (0.50 | )% * | | | 2.58 | % | | | 0.00 | %‡ | |
| Portfolio turnover rate | | | 8 | % ** | | | 10 | % | | | N/A | | |
| | | Class L | |
| | | Six months
ended
6/30/05
(Unaudited) | | Year ended
12/31/04 | | Period ended
12/31/03+ | |
| Net asset value, beginning of period | | $ | 11.13 | | | $ | 10.00 | | | $ | 10.00 | | |
| Income (loss) from investment operations: | |
| Net investment income (loss) | | | (0.01 | )*** | | | 0.10 | *** | | | - | | |
| Net realized and unrealized gain on investments | | | 0.02 | | | | 1.15 | | | | - | | |
| Total income from investment operations | | | 0.01 | | | | 1.25 | | | | 0.00 | | |
| Less distributions to shareholders: | |
| From net investment income | | | - | | | | (0.11 | ) | | | - | | |
| From net realized gains | | | - | | | | (0.01 | ) | | | - | | |
| Total distributions | | | - | | | | (0.12 | ) | | | - | | |
| Net asset value, end of period | | $ | 11.14 | | | $ | 11.13 | | | $ | 10.00 | | |
| | | | | | | | | | | | | | |
| Total Return(a) | | | 0.09 | % ** | | | 12.49 | % | | | - | ‡ | |
| Ratios / Supplemental Data: | |
| Net assets, end of period (000's) | | $ | 169,644 | | | $ | 168,132 | | | $ | 101 | | |
| Ratio of expenses to average daily net assets: | |
| Before expense waiver | | | 0.25 | % * | | | 0.26 | % | | | - | ‡ | |
| After expense waiver# | | | 0.25 | % * | | | 0.25 | % | | | N/A‡ | | |
| Net investment income (loss) to average daily net assets | | | (0.25 | )% * | | | 0.95 | % | | | 0.00 | %‡ | |
| Portfolio turnover rate | | | 8 | % ** | | | 10 | % | | | N/A | | |
* Annualized.
** Percentages represent results for the period and are not annualized.
*** Per share amount calculated on the average share method.
+ The Fund commenced operations on December 31, 2003.
‡ Amounts are de minimis due to the short period of operations.
# Computed after giving effect to an agreement by MassMutual to waive certain fees and expenses of the Fund for the years ended December 31, 2003 and 2004 and the six months ended June 30, 2005.
(a) Employee retirement benefit plans that invest plan assets in the Separate Investment Accounts (SIAs) may be subject to certain charges as set forth in their respective Plan Documents. Total return figures would be lower for the period presented if they reflected these charges.
(b) Total return excludes a front-end sales charge for Class A and a contingent deferred sales charge for Class N and would be lower for the periods presented if they reflected these charges.
The accompanying notes are an integral part of the financial statements.
253
MassMutual Select Destination Retirement 2030 Fund – Financial Statements (Continued)
Financial Highlights (For a share outstanding throughout each period)
| | | Class Y | |
| | | Six months
ended
6/30/05
(Unaudited) | | Year ended
12/31/04 | | Period ended
12/31/03+ | |
| Net asset value, beginning of period | | $ | 11.13 | | | $ | 10.00 | | | $ | 10.00 | | |
| Income (loss) from investment operations: | |
| Net investment income (loss) | | | (0.01 | )*** | | | 0.43 | *** | | | - | | |
| Net realized and unrealized gain (loss) on investments | | | (0.00 | ) | | | 0.83 | | | | - | | |
| Total income (loss) from investment operations | | | (0.01 | ) | | | 1.26 | | | | 0.00 | | |
| Less distributions to shareholders: | |
| From net investment income | | | - | | | | (0.12 | ) | | | - | | |
| From net realized gains | | | - | | | | (0.01 | ) | | | - | | |
| Total distributions | | | - | | | | (0.13 | ) | | | - | | |
| Net asset value, end of period | | $ | 11.12 | | | $ | 11.13 | | | $ | 10.00 | | |
| | | | | | | | | | | | | | |
| Total Return(a) | | | 0.09 | % ** | | | 12.60 | % | | | - | ‡ | |
| Ratios / Supplemental Data: | |
| Net assets, end of period (000's) | | $ | 14,596 | | | $ | 3,169 | | | $ | 101 | | |
| Ratio of expenses to average daily net assets: | |
| Before expense waiver | | | 0.15 | % * | | | 0.23 | % | | | - | ‡ | |
| After expense waiver# | | | 0.15 | % * | | | 0.15 | % | | | N/A‡ | | |
| Net investment income (loss) to average daily net assets | | | (0.15 | )% * | | | 4.02 | % | | | 0.00 | %‡ | |
| Portfolio turnover rate | | | 8 | % ** | | | 10 | % | | | N/A | | |
| | | Class S | |
| | | Six months
ended
6/30/05
(Unaudited) | | Year ended
12/31/04 | | Period ended
12/31/03+ | |
| Net asset value, beginning of period | | $ | 11.14 | | | $ | 10.00 | | | $ | 10.00 | | |
| Income (loss) from investment operations: | |
| Net investment income (loss) | | | (0.01 | )*** | | | 0.33 | *** | | | - | | |
| Net realized and unrealized gain on investments | | | 0.02 | | | | 0.94 | | | | - | | |
| Total income from investment operations | | | 0.01 | | | | 1.27 | | | | 0.00 | | |
| Less distributions to shareholders: | |
| From net investment income | | | - | | | | (0.12 | ) | | | - | | |
| From net realized gains | | | - | | | | (0.01 | ) | | | - | | |
| Total distributions | | | - | | | | (0.13 | ) | | | - | | |
| Net asset value, end of period | | $ | 11.15 | | | $ | 11.14 | | | $ | 10.00 | | |
| Total Return(a) | | | 0.09 | % ** | | | 12.71 | % | | | - | ‡ | |
| Ratios / Supplemental Data: | |
| Net assets, end of period (000's) | | $ | 7,954 | | | $ | 4,245 | | | $ | 601 | | |
| Ratio of expenses to average daily net assets: | |
| Before expense waiver | | | 0.10 | % * | | | 0.45 | % | | | - | ‡ | |
| After expense waiver# | | | 0.10 | % * | | | 0.10 | % | | | N/A‡ | | |
| Net investment income (loss) to average daily net assets | | | (0.10 | )% * | | | 3.18 | % | | | 0.00 | %‡ | |
| Portfolio turnover rate | | | 8 | % ** | | | 10 | % | | | N/A | | |
* Annualized.
** Percentages represent results for the period and are not annualized.
*** Per share amount calculated on the average share method.
+ The Fund commenced operations on December 31, 2003.
‡ Amounts are de minimis due to the short period of operations.
# Computed after giving effect to an agreement by MassMutual to waive certain fees and expenses of the Fund for the years ended December 31, 2003 and 2004 and the six months ended June 30, 2005.
(a) Employee retirement benefit plans that invest plan assets in the Separate Investment Accounts (SIAs) may be subject to certain charges as set forth in their respective Plan Documents. Total return figures would be lower for the period presented if they reflected these charges.
The accompanying notes are an integral part of the financial statements.
254
MassMutual Select Destination Retirement 2030 Fund – Financial Statements (Continued)
Financial Highlights (For a share outstanding throughout each period)
| | | Class N | |
| | | Six months
ended
6/30/05
(Unaudited) | | Year ended
12/31/04 | | Period ended
12/31/03+ | |
| Net asset value, beginning of period | | $ | 11.13 | | | $ | 10.00 | | | $ | 10.00 | | |
| Income (loss) from investment operations: | |
| Net investment income | | | (0.04 | )*** | | | (0.02 | )*** | | | 0.00 | | |
| Net realized and unrealized gain on investments | | | 0.01 | | | | 1.21 | | | | 0.00 | | |
| Total income from investment operations | | | (0.03 | ) | | | 1.19 | | | | 0.00 | | |
| Less distributions to shareholders: | |
| From net investment income | | | - | | | | (0.05 | ) | | | - | | |
| From net realized gains | | | - | | | | (0.01 | ) | | | - | | |
| Total distributions | | | - | | | | (0.06 | ) | | | - | | |
| Net asset value, end of period | | $ | 11.10 | | | $ | 11.13 | | | $ | 10.00 | | |
| | | | | | | | | | | | | | |
| Total Return(a) | | | (0.27 | )% (b)** | | | 11.89 | % (b) | | | 0.00 | %‡ | |
| Ratios / Supplemental Data: | |
| Net assets, end of period (000's) | | $ | 134 | | | $ | 113 | | | $ | 101 | | |
| Ratio of expenses to average daily net assets: | |
| Before expense waiver | | | 0.80 | % * | | | 1.47 | % | | | - | ‡ | |
| After expense waiver# | | | 0.80 | % * | | | 0.80 | % | | | N/A‡ | | |
| Net investment income to average daily net assets | | | (0.80 | )% * | | | (0.18 | )% | | | 0.00 | %‡ | |
| Portfolio turnover rate | | | 8 | % ** | | | 10 | % | | | N/A | | |
* Annualized.
** Percentages represent results for the period and are not annualized.
*** Per share amount calculated on the average share method.
+ The Fund commenced operations on December 31, 2003.
‡ Amounts are de minimis due to the short period of operations.
# Computed after giving effect to an agreement by MassMutual to waive certain fees and expenses of the Fund for the years ended December 31, 2003 and 2004 and the six months ended June 30, 2005.
(a) Employee retirement benefit plans that invest plan assets in the Separate Investment Accounts (SIAs) may be subject to certain charges as set forth in their respective Plan Documents. Total return figures would be lower for the period presented if theey reflected these charges.
(b) Total Return excludes contingent deferred sales charge and would be lower for the periods presented if they reflected these charges.
The accompanying notes are an integral part of the financial statements.
255
MassMutual Select Destination Retirement 2040 Fund – Financial Statements (Continued)
Financial Highlights (For a share outstanding throughout each period)
| | | Class A | |
| | | Six months
ended
6/30/05
(Unaudited) | | Year ended
12/31/04 | | Period ended
12/31/03+ | |
| Net asset value, beginning of period | | $ | 11.26 | | | $ | 10.00 | | | $ | 10.00 | | |
| Income (loss) from investment operations: | |
| Net investment income (loss) | | | (0.03 | )*** | | | 0.20 | *** | | | 0.00 | | |
| Net realized and unrealized gain (loss) on investments | | | (0.03 | ) | | | 1.14 | | | | 0.00 | | |
| Total income (loss) from investment operations | | | (0.06 | ) | | | 1.34 | | | | 0.00 | | |
| Less distributions to shareholders: | |
| From net investment income | | | - | | | | (0.06 | ) | | | - | | |
| From net realized gains | | | - | | | | (0.02 | ) | | | - | | |
| Total distributions | | | - | | | | (0.08 | ) | | | - | | |
| Net asset value, end of period | | $ | 11.20 | | | $ | 11.26 | | | $ | 10.00 | | |
| Total Return(a) | | | (0.53 | )% (b)** | | | 13.39 | % (b) | | | - | ‡ | |
| Ratios / Supplemental Data: | |
| Net assets, end of period (000's) | | $ | 15,578 | | | $ | 6,414 | | | $ | 101 | | |
| Ratio of expenses to average daily net assets: | |
| Before expense waiver | | | 0.51 | % * | | | 0.55 | % | | | - | ‡ | |
| After expense waiver# | | | 0.50 | % * | | | 0.50 | % | | | - | ‡ | |
| Net investment income (loss) to average daily net assets | | | (0.50 | )% * | | | 1.92 | % | | | - | ‡ | |
| Portfolio turnover rate | | | 9 | % ** | | | 13 | % | | | N/A | | |
| | | Class L | |
| | | Six months
ended
6/30/05
(Unaudited) | | Year ended
12/31/04 | | Period ended
12/31/03+ | |
| Net asset value, beginning of period | | $ | 11.28 | | | $ | 10.00 | | | $ | 10.00 | | |
| Income (loss) from investment operations: | |
| Net investment income (loss) | | | (0.01 | )*** | | | 0.04 | *** | | | 0.00 | | |
| Net realized and unrealized gain (loss) on investments | | | (0.03 | ) | | | 1.33 | | | | 0.00 | | |
| Total income (loss) from investment operations | | | (0.04 | ) | | | 1.37 | | | | 0.00 | | |
| Less distributions to shareholders: | |
| From net investment income | | | - | | | | (0.07 | ) | | | - | | |
| From net realized gains | | | - | | | | (0.02 | ) | | | - | | |
| Total distributions | | | - | | | | (0.09 | ) | | | - | | |
| Net asset value, end of period | | $ | 11.24 | | | $ | 11.28 | | | $ | 10.00 | | |
| Total Return(a) | | | (0.35 | )% ** | | | 13.63 | % | | | - | ‡ | |
| Ratios / Supplemental Data: | |
| Net assets, end of period (000's) | | $ | 100,534 | | | $ | 101,487 | | | $ | 101 | | |
| Ratio of expenses to average daily net assets: | |
| Before expense waiver | | | 0.26 | % * | | | 0.27 | % | | | - | ‡ | |
| After expense waiver# | | | 0.25 | % * | | | 0.25 | % | | | - | ‡ | |
| Net investment income (loss) to average daily net assets | | | (0.25 | )% * | | | 0.41 | % | | | - | ‡ | |
| Portfolio turnover rate | | | 9 | % ** | | | 13 | % | | | N/A | | |
* Annualized.
** Percentages represent results for the period and are not annualized.
*** Per share amount calculated on the average shares method.
+ The Fund commenced operations on December 31, 2003.
‡ Amounts are de minimis due to the short period of operations.
# Computed after giving effect to an agreement by MassMutual to waive certain fees and expenses of the Fund for the years ended December 31, 2003 and 2004 and the six months ended June 30, 2005.
(a) Employee retirement benefit plans that invest plan assets in the Separate Investment Accounts (SIAs) may be subject to certain charges as set forth in their respective Plan Documents. Total return figures would be lower for the period presented if they reflected these charges.
(b) Total Return excludes a front-end sales charge for Class A and a contingent deferred sales charge for Class N and would be lower for the periods presented if they reflected these charges.
The accompanying notes are an integral part of the financial statements.
256
MassMutual Select Destination Retirement 2040 Fund – Financial Statements (Continued)
Financial Highlights (For a share outstanding throughout each period)
| | | Class Y | |
| | | Six months
ended
6/30/05
(Unaudited) | | Year ended
12/31/04 | | Period ended
12/31/03+ | |
| Net asset value, beginning of period | | $ | 11.28 | | | $ | 10.00 | | | $ | 10.00 | | |
| Income (loss) from investment operations: | | | |
| Net investment income (loss) | | | (0.01 | )*** | | | 0.27 | *** | | | 0.00 | | |
| Net realized and unrealized gain (loss) on investments | | | (0.03 | ) | | | 1.11 | | | | 0.00 | | |
| Total income (loss) from investment operations | | | (0.04 | ) | | | 1.38 | | | | 0.00 | | |
| Less distributions to shareholders: | | | |
| From net investment income | | | - | | | | (0.08 | ) | | | - | | |
| From net realized gains | | | - | | | | (0.02 | ) | | | - | | |
| Total distributions | | | - | | | | (0.10 | ) | | | - | | |
| Net asset value, end of period | | $ | 11.24 | | | $ | 11.28 | | | $ | 10.00 | | |
| | | | | | | | | | | | | | |
| Total Return(a) | | | (0.27 | )% ** | | | 13.74 | % | | | - | ‡ | |
| Ratios / Supplemental Data: | | | |
| Net assets, end of period (000's) | | $ | 3,003 | | | $ | 596 | | | $ | 101 | | |
| Ratio of expenses to average daily net assets: | |
| Before expense waiver | | | 0.16 | % * | | | 0.54 | % | | | - | ‡ | |
| After expense waiver# | | | 0.15 | % * | | | 0.15 | % | | | - | ‡ | |
| Net investment income (loss) to average daily net assets | | | (0.15 | )% * | | | 2.55 | % | | | - | ‡ | |
| Portfolio turnover rate | | | 9 | % ** | | | 13 | % | | | N/A | | |
| | | Class S | |
| | | Six months
ended
6/30/05
(Unaudited) | | Year ended
12/31/04 | | Period ended
12/31/03+ | |
| Net asset value, beginning of period | | $ | 11.28 | | | $ | 10.00 | | | $ | 10.00 | | |
| Income (loss) from investment operations: | | | |
| Net investment income (loss) | | | (0.01 | )*** | | | 0.09 | *** | | | 0.00 | | |
| Net realized and unrealized gain (loss) on investments | | | (0.02 | ) | | | 1.29 | | | | 0.00 | | |
| Total income (loss) from investment operations | | | (0.03 | ) | | | 1.38 | | | | 0.00 | | |
| Less distributions to shareholders: | | | |
| From net investment income | | | - | | | | (0.08 | ) | | | - | | |
| From net realized gains | | | - | | | | (0.02 | ) | | | - | | |
| Total distributions | | | - | | | | (0.10 | ) | | | - | | |
| Net asset value, end of period | | $ | 11.25 | | | $ | 11.28 | | | $ | 10.00 | | |
| | | | | | | | | | | | | | |
| Total Return(a) | | | (0.27 | )% ** | | | 13.75 | % | | | - | ‡ | |
| Ratios / Supplemental Data: | | | |
| Net assets, end of period (000's) | | $ | 4,730 | | | $ | 1,741 | | | $ | 601 | | |
| Ratio of expenses to average daily net assets: | |
| Before expense waiver | | | 0.11 | % * | | | 0.66 | % | | | - | ‡ | |
| After expense waiver# | | | 0.10 | % * | | | 0.10 | % | | | - | ‡ | |
| Net investment income (loss) to average daily net assets | | | (0.10 | )% * | | | 0.85 | % | | | - | ‡ | |
| Portfolio turnover rate | | | 9 | % ** | | | 13 | % | | | N/A | | |
* Annualized.
** Percentages represent results for the period and are not annualized.
*** Per share amount calculated on the average shares method.
+ The Fund commenced operations on December 31, 2003.
‡ Amounts are de minimis due to the short period of operations.
# Computed after giving effect to an agreement by MassMutual to waive certain fees and expenses of the Fund for the years ended December 31, 2003 and 2004 and the six months ended June 30, 2005.
(a) Employee retirement benefit plans that invest plan assets in the Separate Investment Accounts (SIAs) may be subject to certain charges as set forth in their respective Plan Documents. Total return figures would be lower for the period presented if they reflected these charges.
The accompanying notes are an integral part of the financial statements.
257
MassMutual Select Destination Retirement 2040 Fund – Financial Statements (Continued)
Financial Highlights (For a share outstanding throughout each period)
| | | Class N | |
| | | Six months
ended
6/30/05
(Unaudited) | | Year ended
12/31/04 | | Period ended
12/31/03+ | |
| Net asset value, beginning of period | | $ | 11.28 | | | $ | 10.00 | | | $ | 10.00 | | |
| Income (loss) from investment operations: | | | |
| Net investment income (loss) | | | (0.04 | )*** | | | (0.07 | )*** | | | 0.00 | | |
| Net realized and unrealized gain (loss) on investments | | | (0.03 | ) | | | 1.38 | | | | 0.00 | | |
| Total income (loss) from investment operations | | | (0.07 | ) | | | 1.31 | | | | 0.00 | | |
| Less distributions to shareholders: | | | |
| From net investment income | | | - | | | | (0.01 | ) | | | - | | |
| From net realized gains | | | - | | | | (0.02 | ) | | | - | | |
| Total distributions | | | - | | | | (0.03 | ) | | | - | | |
| Net asset value, end of period | | $ | 11.21 | | | $ | 11.28 | | | $ | 10.00 | | |
| | | | | | | | | | | | | | |
| Total Return(a) | | | (0.62 | )% (b)** | | | 13.03 | % (b) | | | 0.00 | % | |
| Ratios / Supplemental Data: | | | |
| Net assets, end of period (000's) | | $ | 115 | | | $ | 114 | | | $ | 101 | | |
| Ratio of expenses to average daily net assets: | |
| Before expense waiver | | | 0.81 | % * | | | 1.54 | % | | | - | ‡ | |
| After expense waiver# | | | 0.80 | % * | | | 0.80 | % | | | - | ‡ | |
| Net investment income (loss) to average daily net assets | | | (0.80 | )% * | | | (0.63 | )% | | | - | ‡ | |
| Portfolio turnover rate | | | 9 | % ** | | | 13 | % | | | N/A | | |
* Annualized.
** Percentages represent results for period and are not annualized.
*** Per share amount calculated on the average shares method.
+ The Fund commenced operations on December 31, 2003.
‡ Amounts are de minimis due to the short period of operations.
# Computed after giving effect to an agreement by MassMutual to waive certain fees and expenses of the Fund for the years ended December 31, 2003 and 2004 and the six months ended June 30, 2005.
(a) Employee retirement benefit plans that invest plan assets in the Separate Investment Accounts (SIAs) may be subject to certain charges as set forth in their respective Plan Documents. Total return figures would be lower for the period presented if they reflected these charges.
(b) Total Return excludes a front-end sales charge for Class A and a contingent deferred sales charge for Class N and would be lower for the periods presented if they reflected these charges.
The accompanying notes are an integral part of the financial statements.
258
Notes to Financial Statements (Unaudited)
1. The Fund
MassMutual Select Funds (the "Trust") is registered under the Investment Company Act of 1940, as amended (the "1940 Act"), as an open-end, management investment company. The Trust is organized under the laws of the Commonwealth of Massachusetts as a Massachusetts business trust pursuant to an Agreement and Declaration of Trust dated May 28, 1993, as amended. The Trust consists of the following series (each individually referred to as a "Fund" or collectively as the "Funds"): MassMutual Select Strategic Bond Fund ("Strategic Bond Fund"), MassMutual Select Strategic Balanced Fund ("Strategic Balanced Fund"), MassMutual S elect Diversified Value Fund ("Diversified Value Fund"), MassMutual Select Fundamental Value Fund ("Fundamental Value Fund"), MassMutual Select Value Equity Fund ("Value Equity Fund"), MassMutual Select Large Cap Value Fund ("Large Cap Value Fund"), MassMutual Select Indexed Equity Fund ("Indexed Equity Fund"), MassMutual Select Blue Chip Growth Fund ("Blue Chip Growth Fund"), MassMutual Select Large Cap Growth Fund ("Large Cap Growth Fund"), MassMutual Select Growth Equity Fund ("Growth Equity Fund"), MassMutual Select Aggressive Growth Fund ("Aggressive Growth Fund"), MassMutual Select OTC 100 Fund ("OTC 100 Fund"), MassMutual Select Focused Value Fund ("Focused Value Fund"), MassMutual Select Small Company Value Fund ("Small Company Value Fund"), MassMutual Select Mid Cap Growth Equity Fund ("Mid Cap Growth Equity Fund"), MassMutual Select Mid Cap Growth Equity II Fund ("Mid Cap Growth Equity II Fund"), MassMutual Select Small Cap Growth Equity Fund ("Small Cap Growth Equity Fund"), MassMutual Select Smal l Company Growth Fund ("Small Company Growth Fund"), MassMutual Select Emerging Growth Fund ("Emerging Growth Fund"), MassMutual Select Overseas Fund ("Overseas Fund"), MassMutual Select Destination Retirement Income Fund ("Destination Retirement Income Fund"), MassMutual Select Destination Retirement 2010 Fund ("Destination Retirement 2010 Fund"), MassMutual Select Destination Retirement 2020 Fund ("Destination Retirement 2020 Fund"), MassMutual Select Destination Retirement 2030 Fund ("Destination Retirement 2030 Fund") and MassMutual Select Destination Retirement 2040 Fund ("Destination Retirement 2040 Fund").
During the reporting period, each Fund had five classes of shares: Class A, Class L, Class Y, Class S and Class N. Additionally, the Indexed Equity Fund had a sixth class of shares: Class Z. The principal economic difference among the classes is the level of service and administration fees borne by the classes. The classes of shares are offered to different types of investors, as outlined in the Trust's Prospectus.
2. Significant Accounting Policies
The following is a summary of significant accounting policies followed consistently by each Fund in the preparation of the financial statements in conformity with accounting principles generally accepted in the United States of America ("generally accepted accounting principles"). The preparation of the financial statements in accordance with generally accepted accounting principles requires management to make estimates and assumptions that affect the reported amounts and disclosur es in the financial statements. Actual results could differ from those estimates.
Investment Valuation
Equity securities are valued on the basis of valuations furnished by a pricing service, authorized by the Trustees, which provides the last reported sale price for securities listed on a national securities exchange or the official closing price on the NASDAQ National Market System, or in the case of over-the-counter securities not so listed, the last reported bid price. Debt securities (other than short-term obligations with a remaining maturity of sixty days or less) are valued on the basis of valuations furnished by a pricing service, authorized by the Trustees, which determines valuations taking into account appropriate f actors such as institutional-size trading in similar groups of securities, yield, quality, coupon rate, maturity, type of issue, trading characteristics and other market data. Short-term securities with a remaining maturity of sixty days or less are valued at either amortized cost or at original cost plus accrued interest, whichever approximates current market value. Shares of other funds of the Trust are valued at their net asset value as reported on each business day. All other securities and other assets, including debt securities for which the prices supplied by a pricing agent are deemed by the Trustees not to be representative of market values, including restricted securities and securities for which no market quotation is available, are valued at fair value in accordance with procedures approved by and determined in good faith by the Trustees, although the actual calculation may be done by others. Securities are typically valued on the basis of valuations furnished by a primary pricing service or, if no such valuation is available, from a secondary pricing
259
Notes to Financial Statements (Unaudited) (Continued)
service. However, valuation methods approved by the Trust's Board of Trustees which are intended to reflect fair value may be used when pricing service information is not readily available or when a security's value is believed to have been materially affected by a significant event, such as a natural disaster, an economic event like a bankruptcy filing, or a substantial fluctuation in domestic or foreign markets, that has occurred after the close of the exchange or market on which the security is principally traded (for example, a foreign exchange or market). In such a case, a Fund's value for a security is likely to be different from the last quoted market price or pricing service information. In addition, for each of the Trust's foreign funds, a fair value pricing service is used to assist in the pricing of foreign securities. Due to the subjective and variable nature of fair value pricing, it is possib le that the value determined for a particular asset may be materially different from the value realized upon such asset's sale.
Portfolio securities traded on more than one national securities exchange are valued at the last price on the business day as of which such value is being determined at the close of the exchange representing the principal market for such securities. All assets and liabilities expressed in foreign currencies are converted into U.S. dollars at the mean between the buying and selling rates of such currencies against U.S. dollars last quoted by any major bank. If such quotations are not available, the rate of exchange is determined in accordance with policies established by the Trustees.
Securities Lending
Each Fund may lend its securities to qualified brokers; however, securities lending cannot exceed 33% of the total assets of the Funds taken at current value. The loans are collateralized at all times with cash or securities with a market value at least equal to 100% of the market value of the securities on loan. The market value of the loaned securities is determined at the close of business of the Fund and any additional collateral is delivered to the Fund the next business day. As with other extensions of credit, the Funds may bear the risk of delay in recovery or even loss of rights in the collateral should the borrower of the securities fail financially. The Funds receive compensation for lending their securities. At June 30, 2005, the Funds loaned securities having the following market values, collateralized by cash, which was invested in short-term instruments in the following amounts:
| | | Securities on Loan | | Collateral | |
| Strategic Bond Fund | | $ | 3,274,222 | | | $ | 3,360,425 | | |
| Strategic Balanced Fund | | | 21,744,888 | | | | 22,650,085 | | |
| Diversified Value Fund | | | 25,451,689 | | | | 26,337,430 | | |
| Fundamental Value Fund | | | 83,865,392 | | | | 86,615,669 | | |
| Value Equity Fund | | | 12,799,023 | | | | 13,353,919 | | |
| Large Cap Value Fund | | | 187,904,093 | | | | 193,583,810 | | |
| Indexed Equity Fund | | | 140,418,284 | | | | 145,004,679 | | |
| Blue Chip Growth Fund | | | 37,191,240 | | | | 38,465,340 | | |
| Large Cap Growth Fund | | | 5,476,129 | | | | 5,641,201 | | |
| Growth Equity Fund | | | 55,522,682 | | | | 57,168,800 | | |
| Aggressive Growth Fund | | | 89,169,216 | | | | 92,145,658 | | |
| OTC 100 Fund | | | 8,052,334 | | | | 8,445,336 | | |
| Focused Value Fund | | | 90,707,623 | | | | 93,733,150 | | |
| Small Company Value Fund | | | 76,114,711 | | | | 79,658,442 | | |
| Mid Cap Growth Equity Fund | | | 28,088,877 | | | | 28,934,921 | | |
| Mid Cap Growth Equity II Fund | | | 130,537,773 | | | | 134,776,172 | | |
| Small Cap Growth Equity Fund | | | 135,791,603 | | | | 141,913,173 | | |
| Small Company Growth Fund | | | 40,466,925 | | | | 42,580,811 | | |
| Emerging Growth Fund | | | 35,660,755 | | | | 37,185,218 | | |
| Overseas Fund | | | 50,906,949 | | | | 54,025,145 | | |
260
Notes to Financial Statements (Unaudited) (Continued)
As securities lending agent, the Trust receives, as fees, a share of the income earned on investment of the cash collateral received for the loan of securities. For the six months ended June 30, 2005, the Trust earned securities lending agent fees as follows:
| | | Securities
Lending
Gross Income | | Securities
Lending
Fees and
Expenses | | Securities
Lending
Net Income | |
| Strategic Bond Fund | | $ | 77,574 | | | $ | (70,951 | ) | | $ | 6,623 | | |
| Strategic Balanced Fund | | | 450,913 | | | | (415,852 | ) | | | 35,061 | | |
| Diversified Value Fund | | | 346,081 | | | | (335,731 | ) | | | 10,351 | | |
| Fundamental Value Fund | | | 1,222,222 | | | | (1,166,901 | ) | | | 55,321 | | |
| Value Equity Fund | | | 152,721 | | | | (141,810 | ) | | | 10,911 | | |
| Large Cap Value Fund | | | 1,728,046 | | | | (1,659,220 | ) | | | 68,826 | | |
| Indexed Equity Fund | | | 1,749,502 | | | | (1,688,065 | ) | | | 61,437 | | |
| Blue Chip Growth Fund | | | 514,739 | | | | (499,731 | ) | | | 15,008 | | |
| Large Cap Growth Fund | | | 59,348 | | | | (57,789 | ) | | | 1,559 | | |
| Growth Equity Fund | | | 657,191 | | | | (638,309 | ) | | | 18,882 | | |
| Aggressive Growth Fund | | | 890,640 | | | | (869,045 | ) | | | 21,595 | | |
| OTC 100 Fund | | | 16,716 | | | | (6,658 | ) | | | 10,058 | | |
| Focused Value Fund | | | 1,556,435 | | | | (1,503,052 | ) | | | 53,383 | | |
| Small Company Value Fund | | | 1,162,634 | | | | (1,031,935 | ) | | | 130,699 | | |
| Mid Cap Growth Equity Fund | | | 351,105 | | | | (281,303 | ) | | | 69,802 | | |
| Mid Cap Growth Equity II Fund | | | 1,785,295 | | | | (1,653,282 | ) | | | 132,013 | | |
| Small Cap Growth Equity Fund | | | 1,714,873 | | | | (1,541,864 | ) | | | 173,009 | | |
| Small Company Growth Fund | | | 445,874 | | | | (382,120 | ) | | | 63,754 | | |
| Emerging Growth Fund | | | 479,162 | | | | (411,618 | ) | | | 67,544 | | |
| Overseas Fund | | | 1,066,239 | | | | (810,095 | ) | | | 256,144 | | |
Repurchase Agreements
Each Fund may enter into repurchase agreements with certain banks and broker/dealers whereby a Fund acquires a security for cash and obtains a simultaneous commitment from the seller to repurchase the security at an agreed upon price and date. The Funds, through their custodian, take possession of the securities collateralizing the repurchase agreement. The collateral is marked to market daily to ensure that the market value of the underlying assets remains sufficient to protect the Funds in the event of default by the seller. Collateral for certain tri-party repurchase agreements is held at the counterparty's custodian in a segregated account for the benefit of the Funds and the counterparty. In connection with transactions in repurchase agreements, if the seller defaults and the value of the collateral declines or if the seller enters insolvency proceedings, realization of collateral by the Funds may be delayed or limited.
Accounting for Investments
Investment transactions are accounted for on the trade date. Realized gains and losses on sales of investments and unrealized appreciation and depreciation of investments are computed on the specific identification cost method. Interest income, adjusted for amortization of discounts and premiums on debt securities, is earned from the settlement date and is recorded on the accrual basis. Dividend income is recorded on the ex-dividend date.
Federal Income Tax
It is each Fund's intent to continue to comply with the provisions of subchapter M of the Internal Revenue Code of 1986, as amended (the "Code"), applicable to a regulated investment company. Under such provisions, the Funds will not be subject to federal income taxes on their ordinary income and net realized capital gains to the extent they are distributed or deemed to have been distributed to their shareholders. Therefore, no Federal income tax provision is required.
261
Notes to Financial Statements (Unaudited) (Continued)
Dividends and Distributions to Shareholders
Dividends from net investment income of each Fund are declared and paid annually and at other times as may be required to satisfy tax or regulatory requirements. Distributions of any net realized capital gains of each Fund are declared and paid annually and at other times as may be required to satisfy tax or regulatory requirements. Distributions to shareholders are recorded on the ex-dividend date. Income and capital gain distributions are determined in accordance with income tax regulations, which may differ from generally accepted accounting principles. These differences are primarily due to investme nts in forward contracts, passive foreign investment companies, the deferral of wash sale losses, and paydowns on certain mortgage-backed securities. As a result, net investment income and net realized gain on investment transactions for a reporting period may differ significantly from distributions during such period.
Accordingly, the Funds may periodically make reclassifications among certain of their capital accounts without impacting the net asset value of the Funds.
Foreign Currency Translation
The books and records of the Funds are maintained in U.S. dollars. The market values of foreign currencies, foreign securities and other assets and liabilities denominated in foreign currencies are translated into U.S. dollars at the mean of the buying and selling rates of such currencies against the U.S. dollar at the end of each business day. Purchases and sales of foreign securities and income and expense items are translated at the rates of exchange prevailing on the respective dates of such transactions. The Funds do not isolate that portion of the results of operations arising from changes in the exchange rates from that portion arising from changes in the market prices of securities.
Net realized foreign currency gains and losses resulting from changes in exchange rates include foreign currency gains and losses between trade date and settlement date on investment securities transactions, foreign currency transactions and the difference between the amounts of dividends recorded on the books of the Funds and the amount actually received.
Forward Foreign Currency Contracts
Each Fund may enter into forward foreign currency contracts in order to hedge the effect of currency movements of foreign denominated securities or obligations. A forward foreign currency contract is an agreement between two parties to buy and sell a currency at a set price on a future date. The market value of a forward foreign currency contract fluctuates with changes in foreign currency exchange and interest rates. Forward foreign currency contracts are marked to market daily and the change in their value is recorded by the Funds as an unrealized gain or loss. When a forward foreign currency contract is extin guished, through delivery or offset by entering into another forward foreign currency contract, the Funds record a realized gain or loss equal to the difference between the value of the contract at the time it was opened and the value of the contract at the time it was extinguished or offset.
Forward foreign currency contracts involve a risk of loss from the potential inability of counterparties to meet the terms of their contracts and from unanticipated movements in foreign currency values and interest rates.
The notional or contractual amounts of these instruments represent the investments the Funds have in particular classes of financial instruments and do not necessarily represent the amounts potentially subject to risk. The measurement of the risk associated with these instruments is meaningful only when all related and offsetting transactions are considered.
262
Notes to Financial Statements (Unaudited) (Continued)
A summary of the obligations for the Strategic Bond Fund, the Strategic Balanced Fund and the Overseas Fund under these forward foreign currency contracts at June 30, 2005 is as follows:
| Settlement Date | | Contracts to
Deliver/Receive | | Units of
Currency | | In Exchange
for U.S.
Dollars | | Contracts at
Value | | Unrealized
Appreciation
(Depreciation) | |
| Strategic Bond Fund | |
| BUYS | |
| 08/10/05 | | Euro Dollar | | | 662,033 | | | $ | 819,063 | | | $ | 802,177 | | | $ | (16,886 | ) | |
| | | $ | (16,886 | ) | |
| SELLS | |
| 08/10/05 | | Australian Dollar | | | 316,848 | | | | 244,923 | | | | 240,815 | | | | 4,108 | | |
| 08/10/05 | | Canadian Dollar | | | 307,386 | | | | 247,892 | | | | 250,977 | | | | (3,084 | ) | |
| 07/05/05 | | Euro Dollar | | | 267,070 | | | | 322,674 | | | | 321,966 | | | | 705 | | |
| 08/10/05 | | Euro Dollar | | | 2,612,299 | | | | 3,405,079 | | | | 3,165,290 | | | | 239,789 | | |
| | | $ | 241,518 | | |
| Strategic Balanced Fund | |
| BUYS | |
| 08/10/05 | | Canadian Dollar | | | 306,575 | | | | 243,894 | | | | 250,494 | | | | 6,600 | | |
| 08/10/05 | | Euro Dollar | | | 2,542,341 | | | | 3,187,605 | | | | 3,078,231 | | | | (109,374 | ) | |
| | | $ | (102,774 | ) | |
| SELLS | |
| 08/10/05 | | Australian Dollar | | | 623,795 | | | | 482,193 | | | | 474,100 | | | | 8,093 | | |
| 07/01/05 | | Canadian Dollar | | | 4,653 | | | | 3,772 | | | | 3,775 | | | | (3 | ) | |
| 08/10/05 | | Canadian Dollar | | | 614,773 | | | | 495,785 | | | | 502,313 | | | | (6,528 | ) | |
| 07/05/05 | | Euro Dollar | | | 1,346,478 | | | | 1,626,815 | | | | 1,623,247 | | | | 3,568 | | |
| 08/10/05 | | Euro Dollar | | | 5,620,440 | | | | 7,305,680 | | | | 6,805,149 | | | | 500,531 | | |
| | | $ | 505,661 | | |
| Overseas Fund | |
| SELLS | |
| 07/05/05 | | Swiss Franc | | | 411,245 | | | | 320,609 | | | | 319,960 | | | | 649 | | |
| 11/16/05 | | Swiss Franc | | | 19,800,000 | | | | 17,077,799 | | | | 15,608,694 | | | | 1,469,105 | | |
| 11/17/05 | | Swiss Franc | | | 11,400,000 | | | | 9,857,328 | | | | 8,987,592 | | | | 869,736 | | |
| 11/22/05 | | Swiss Franc | | | 8,500,000 | | | | 7,419,045 | | | | 6,704,142 | | | | 714,903 | | |
| 07/13/05 | | British Pound Sterling | | | 8,400,000 | | | | 15,117,480 | | | | 15,071,515 | | | | 45,965 | | |
| 07/14/05 | | British Pound Sterling | | | 8,300,000 | | | | 15,020,510 | | | | 14,891,181 | | | | 129,329 | | |
| 11/28/05 | | British Pound Sterling | | | 4,200,000 | | | | 7,748,160 | | | | 7,506,789 | | | | 241,371 | | |
| 12/07/05 | | British Pound Sterling | | | 4,100,000 | | | | 7,791,640 | | | | 7,327,011 | | | | 464,629 | | |
| 12/12/05 | | British Pound Sterling | | | 3,400,000 | | | | 6,454,900 | | | | 6,075,576 | | | | 379,324 | | |
| | | $ | 4,315,011 | | |
Delayed Delivery Transactions,
When Issued Securities, and Forward Commitments
Each Fund may purchase or sell securities on a "when issued" or delayed delivery or on a forward commitment basis. The Funds use forward commitments to manage interest rate exposure or as a temporary substitute for purchasing or selling particular debt securities. Payment and delivery may take place after the customary settlement period for that security. The price of the underlying securities and the date when the securities will be delivered and paid for are fixed at the time the transaction is negotiated. These securities are valued on the basis of valuations fur nished by a pricing service, authorized by the Trustees, which determines valuations taking into account appropriate factors such as institutional-size trading in similar groups of securities, yield, quality, coupon rate, maturity, type of issue, trading characteristics and other market data. Securities for which no market quotation is available, are valued at fair value in accordance with procedures approved by and determined in good
263
Notes to Financial Statements (Unaudited) (Continued)
faith by the Trustees, although the actual calculation may be done by others. The Funds record on a daily basis the unrealized appreciation (depreciation) based upon changes in the value of these securities. When a forward commitment contract is closed or the when-issued or delayed delivery security is received, the Funds record a realized gain or loss equal to the difference between the value of the contract or security at the time it was opened or purchased and the value of the contract or the security at the time it was extinguished or received. Losses may arise due to changes in the value of the underlying securities or if the counterparty does not perform under the contract, or if the issuer does not issue the securities due to political, economic, or other factors. Funds monitor exposure to ensure counterparties are creditworthy and concentration of exposure is minimized.
At June 30, 2005, the Strategic Balanced Fund had the following open when issued securities:
When Issued
Contracts to Buy | | Shares | | Cost | | Market
Value | | Unrealized
Appreciation
(Depreciation) | |
| FNMA TBA | | | 3,800,000 | | | $ | 3,900,423 | | | $ | 3,895,892 | | | $ | (4,531 | ) | |
| FNMA TBA | | | 3,800,000 | | | | 3,800,508 | | | | 3,799,703 | | | | (805 | ) | |
| FNMA TBA | | | 2,700,000 | | | | 2,803,254 | | | | 2,794,078 | | | | (9,176 | ) | |
| FNMA TBA | | | 2,400,000 | | | | 2,431,848 | | | | 2,432,625 | | | | 777 | | |
| GNMA TBA | | | 2,000,000 | | | | 2,056,563 | | | | 2,062,344 | | | | 5,781 | | |
| GNMA TBA | | | 600,000 | | | | 626,437 | | | | 626,531 | | | | 94 | | |
| FHLMC TBA | | | 1,600,000 | | | | 1,610,000 | | | | 1,617,750 | | | | 7,750 | | |
| Totals | | | 16,900,000 | | | $ | 17,229,033 | | | $ | 17,228,923 | | | $ | (110 | ) | |
Financial Futures Contracts
The Funds may purchase or sell financial futures contracts and options on such futures contracts for the purpose of hedging the market risk on existing securities or as a substitute for the purchase of securities. Futures contracts are contracts for delayed delivery of securities at a specific future date and at a specific price or yield. Upon entering into a contract, the Funds deposit and maintain as collateral such initial margin as required by the exchange on which the transaction is effected. Pursuant to the contract, the Fund agrees to receive from or pay to the broker an amount of cash equal to the daily fluctua tion in value of the contract. Such receipts or payments are known as variation margin and are recorded by the Funds as unrealized gains or losses. When the contract is closed, each Fund records a realized gain or loss equal to the difference between the value of the contract at the time it was opened and the value at the time it was closed. Futures contracts are valued at the settlement price established each day by the board of trade or exchange on which they are traded.
A summary of open futures contracts for the Strategic Bond Fund, the Strategic Balanced Fund, the Indexed Equity Fund and the OTC 100 Fund at June 30, 2005, is as follows:
Number of
Contracts | | Type | | Expiration Date | | Notional
Contract
Value | | Net Unrealized
Appreciation/
Depreciation | |
| | Strategic Bond Fund | | | | | | | | | | | | | | |
| | BUYS | | | | | | | | | | | | | | |
| | 2 | | | 90 Day Euro | | 03/13/06 | | $ | 479,474 | | | $ | 152 | | |
| | 32 | | | 90 Day Euro | | 06/19/06 | | | 7,669,999 | | | | 22,452 | | |
| | 56 | | | 90 Day Euro | | 09/19/05 | | | 13,456,100 | | | | (34,580 | ) | |
| | 4 | | | 90 Day Euro | | 12/19/05 | | | 959,300 | | | | (3,132 | ) | |
| | 80 | | | U.S. Treasury Note 5 year | | 09/30/05 | | | 8,675,000 | | | | (5,150 | ) | |
| | | $ | (20,258 | ) | |
| | SELL | | | | | | | | | | | | | | |
| | 13 | | | U.S. Treasury Note 10 year | | 09/30/05 | | | 1,456,750 | | | | 4,201 | | |
| | 32 | | | U.S. Long Bond | | 09/30/05 | | | 3,764,000 | | | | (4,426 | ) | |
| | | $ | (225 | ) | |
264
Notes to Financial Statements (Unaudited) (Continued)
Number of
Contracts | | Type | | Expiration Date | | Notional
Contract
Value | | Net Unrealized
Appreciation/
Depreciation | |
| | Strategic Balanced Fund | | | | | | | | | | | | | | |
| | BUYS | | | | | | | | | | | | | | |
| | 140 | | | 90 Day Euro | | 09/19/05 | | $ | 33,640,249 | | | $ | (123,901 | ) | |
| | 10 | | | 90 Day Euro | | 12/19/05 | | | 2,398,250 | | | | (9,125 | ) | |
| | 13 | | | 90 Day Euro | | 03/13/06 | | | 3,116,587 | | | | (6,328 | ) | |
| | 55 | | | 90 Day Euro | | 06/19/06 | | | 13,182,809 | | | | 29,725 | | |
| | | $ | (109,629 | ) | |
| | SELL | | | | | | | | | | | | | | |
| | 1 | | | 90 Day Euro | | 09/18/06 | | | 239,662 | | | | 557 | | |
| | 37 | | | 90 Day Libor | | 09/21/05 | | | 4,416,411 | | | | (36,810 | ) | |
| | 58 | | | U.S. Long Bond | | 09/30/05 | | | 6,822,250 | | | | (2,399 | ) | |
| | 39 | | | U.S. Treasury Note 10 year | | 09/30/05 | | | 4,397,250 | | | | 18,743 | | |
| | 1 | | | U.S. Treasury Note 5 year | | 09/30/05 | | | 108,437 | | | | 308 | | |
| | | $ | (19,601 | ) | |
| | Indexed Equity Fund | | | | | | | | | | | | | | |
| | BUYS | | | | | | | | | | | | | | |
| | 94 | | | S&P 500 Index | | 09/15/05 | | | 28,094,250 | | | | (280,039 | ) | |
| | OTC 100 Fund | | | | | | | | | | | | | | |
| | BUYS | | | | | | | | | | | | | | |
| | 8 | | | NASDAQ 100 Index | | 09/16/05 | | | 240,480 | | | | (6,314 | ) | |
Options
The Fund may purchase put and call options. By purchasing a put option, a Fund obtains the right (but not the obligation) to sell the instrument underlying the option at a fixed strike price. In return for this right, a Fund pays the current market price for the option (known as the option premium). Options have various types of underlying instruments, including specific securities, indexes of securities, indexes of security prices, indexes of interest rates and futures contracts. A Fund may terminate its position in a put option it has purchased by allowing it to expire or by exercising the option. A Fund may also close out a put option position by entering into an offsetting transaction, if a liquid market exists. If the option is allowed to expire, a Fund will lose the entire premium it paid. Premiums paid for purchasing options which expire are treated as realized losses. If a Fund exercises a put option on a security, it will sell the instrument underlying the option at the strike price. If a Fund exercises an option on an index, settlement is in cash and does not involve the actual sale of securities.
The buyer of a typical put option can expect to realize a gain if the price of the underlying instrument falls substantially. However, if the price of the instrument underlying the option does not fall enough to offset the cost of purchasing the option, a put buyer can expect to suffer a loss (limited to the amount of the premium paid, plus related transaction costs).
The features of call options are essentially the same as those of put options, except that the purchaser of a call option obtains the right to purchase, rather than sell, the instrument underlying the option at the option's strike price. A call buyer typically attempts to participate in potential price increases of the instrument underlying the option with risk limited to the cost of the option if security prices fall. At the same time, the buyer can expect to suffer a loss if security prices do not rise sufficiently to offset the cost of the option. See the Schedule of Investments of the Strategic Bond Fund and the Strategic Balanced Fund for open purchased option contracts as of June 30, 2005.
The Funds may also "write" put and call options. When a Fund writes a put option, it takes the opposite side of the transaction from the option's purchaser. In return for receipt of the premium, a Fund assumes the obligation to pay the strike price for the instrument underlying the option if the other party to the option chooses to exercise it. A fund may seek to terminate its position in a put option it writes before exercise by purchasing an offsetting option in the market at its current price. If the market is not liquid for a put option a Fund has written, however, a Fund must continue to be prepared to pay the strike price while the option is outstanding, regardless of price changes, and must continue to post margin as discussed below.
265
Notes to Financial Statements (Unaudited) (Continued)
If the price of the underlying instrument rises, a put writer would generally expect to profit, although its gain would be limited to the amount of the premium it received. If security prices remain the same over time, it is likely that the writer will also profit, because it should be able to close out the option at a lower price. If security prices fall, the put writer would expect to suffer a loss. This loss should be less than the loss from purchasing and holding the underlying instrument directly, however, because the premium received for writing the option should offset a portion of the decline.
Writing a call option obligates a Fund to sell or deliver the option's underlying instrument in return for the strike price upon exercise of the option. The characteristics of writing call options are similar to those of writing put options, except that writing calls generally is a profitable strategy if prices remain the same or fall. Through receipt of the option premium a call writer offsets part of the effect of a price increase. At the same time, because a call writer must be prepared to deliver the underlying instrument in return for the strike price, even if its current value is greater, a call writer gives up some ability to participate in security price increases.
The writer of an exchange traded put or call option on a security, an index of securities or a futures contract is required to deposit cash or securities or a letter of credit as margin and to make mark to market payments of variation margin as the position becomes unprofitable. When a Fund writes a call or put option, an amount equal to the premium received is recorded as a liability. Premiums received from writing options which expire are treated as realized gains. Premiums received from writing options which are exercised or closed are added to the proceeds or offset against the amount paid on the underlying investments to determine the realized gain or loss.
A summary of open written option contracts for the Strategic Bond Fund and the Strategic Balanced Fund at June 30, 2005, is as follows:
Strategic Bond Fund
| Notional Amount | | Expiration
Date | |
Description | |
Premiums | | Market
Value | |
| | $400,000
| | | 7/31/05
| | Call - OTC Credit Default Swap - Agreement
with Citigroup to receive 0.258% per year times
the notional amount. The Fund makes payment
only upon a default event of FNMA Debt, 5.5%,
due 7/14/05. | | | $1,031
| | | | $200
| | |
| | 9,000 | | | 8/26/05 | | Put - 5 Year U.S. Treasury Note Future | | | 4,939 | | | | 1,406 | | |
| | 17,000 | | | 8/26/05 | | Put - 5 Year U.S. Treasury Note Future | | | 9,368 | | | | 6,906 | | |
| | 7,000 | | | 7/22/05 | | Call - 10 Year U.S. Treasury Note Future | | | 3,824 | | | | 2,297 | | |
| | 26,000 | | | 8/26/05 | | Call - 10 Year U.S. Treasury Note Future | | | 19,464 | | | | 69,469 | | |
| | 22,000 | | | 8/26/05 | | Call - 10 Year U.S. Treasury Note Future | | | 21,468 | | | | 40,906 | | |
| | 11,000 | | | 8/26/05 | | Call - 10 Year U.S. Treasury Note Future | | | 9,633 | | | | 12,891 | | |
| | 19,000 | | | 8/26/05 | | Call - 10 Year U.S. Treasury Note Future | | | 11,530 | | | | 12,469 | | |
| | 20,000 | | | 8/26/05 | | Call - 10 Year U.S. Treasury Note Future | | | 10,369 | | | | 6,562 | | |
| | 1,000 | | | 8/26/05 | | Put - 10 Year U.S. Treasury Note Future | | | 511 | | | | 16 | | |
| | 5,000 | | | 8/26/05 | | Put - 10 Year U.S. Treasury Note Future | | | 2,100 | | | | 78 | | |
| | 4,000 | | | 8/26/05 | | Put - 10 Year U.S. Treasury Note Future | | | 1,730 | | | | 187 | | |
| | 4,000 | | | 11/22/05 | | Put - 10 Year U.S. Treasury Note Future | | | 3,449 | | | | 3,187 | | |
| | 3,000 | | | 8/26/05 | | Call - U.S. Treasury Bond Future | | | 2,188 | | | | 12,234 | | |
| | 2,000 | | | 8/26/05 | | Call - U.S. Treasury Bond Future | | | 3,537 | | | | 13,625 | | |
| | 8,000 | | | 8/26/05 | | Call - U.S. Treasury Bond Future | | | 9,148 | | | | 7,625 | | |
| | 6,000 | | | 8/26/05 | | Put - U.S. Treasury Bond Future | | | 6,064 | | | | 187 | | |
| | 14,000 | | | 8/26/05 | | Put - U.S. Treasury Bond Future | | | 11,664 | | | | 875 | | |
| | 7,000 | | | 8/26/05 | | Put - U.S. Treasury Bond Future | | | 5,262 | | | | 1,094 | | |
| | 3,000 | | | 8/26/05 | | Put - U.S. Treasury Bond Future | | | 3,266 | | | | 2,392 | | |
| | 12,000 | | | 8/26/05 | | Put - U.S. Treasury Bond Future | | | 8,862 | | | | 4,312 | | |
| | 3,000 | | | 8/26/05 | | Put - U.S. Treasury Bond Future | | | 2,188 | | | | 2,016 | | |
| | | $ | 151,595 | | | $ | 200,934 | | |
266
Notes to Financial Statements (Unaudited) (Continued)
Transactions in options written during the six months ended June 30, 2005 were as follows:
| | | Number of
Contracts | | Premiums
Received | |
| Options outstanding at December 31, 2004 | | | - | | | $ | - | | |
| Options written | | | 400,351 | | | | 248,816 | | |
| Options terminated in closing purchase transactions | | | (149 | ) | | | (97,221 | ) | |
| Options outstanding at June 30, 2005 | | | 400,202 | | | $ | 151,595 | | |
Strategic Balanced Fund
| Notional Amount | | Expiration
Date | | Description | | Premiums | | Market
Value | |
| $ | 1,600,000 | | | 8/8/05 | | Call - OTC Interest Rate Swap - Agreement
with JP Morgan Chase & Co. to receive the
notional amount multiplied by 3.943% and to
pay the notional amount multiplied by the
3 month LIBOR. | | | $6,480
| | | | $4,960
| | |
| | 700,000 | | | 7/7/05 | | Call - OTC Credit Default Swap - Agreement
with Citigroup to receive 0.258% per year times
the notional amount. The Fund makes payment
only upon a default event of FNMA Debt, 5.5%,
due 7/14/05. | | | 1,805
| | | | 700
| | |
| | 18,000 | | | 8/26/05 | | Put - 5 Year U.S. Treasury Note Future | | | 9,880 | | | | 2,812 | | |
| | 33,000 | | | 8/26/05 | | Put - 5 Year U.S. Treasury Note Future | | | 18,116 | | | | 13,406 | | |
| | 12,000 | | | 7/22/05 | | Call - 10 Year U.S. Treasury Note Future | | | 6,564 | | | | 3,937 | | |
| | 53,000 | | | 8/26/05 | | Call - 10 Year U.S. Treasury Note Future | | | 39,329 | | | | 141,609 | | |
| | 45,000 | | | 8/26/05 | | Call - 10 Year U.S. Treasury Note Future | | | 43,619 | | | | 83,672 | | |
| | 21,000 | | | 8/26/05 | | Call - 10 Year U.S. Treasury Note Future | | | 18,504 | | | | 24,609 | | |
| | 34,000 | | | 8/26/05 | | Call - 10 Year U.S. Treasury Note Future | | | 21,033 | | | | 22,312 | | |
| | 40,000 | | | 8/26/05 | | Call - 10 Year U.S. Treasury Note Future | | | 20,738 | | | | 13,125 | | |
| | 2,000 | | | 8/26/05 | | Put - 10 Year U.S. Treasury Note Future | | | 1,021 | | | | 35 | | |
| | 10,000 | | | 8/26/05 | | Put - 10 Year U.S. Treasury Note Future | | | 4,200 | | | | 156 | | |
| | 8,000 | | | 8/26/05 | | Put - 10 Year U.S. Treasury Note Future | | | 3,460 | | | | 375 | | |
| | 7,000 | | | 11/22/05 | | Put - 10 Year U.S. Treasury Note Future | | | 6,027 | | | | 5,578 | | |
| | 7,000 | | | 8/26/05 | | Call - U.S. Treasury Bond Future | | | 5,043 | | | | 28,547 | | |
| | 3,000 | | | 8/26/05 | | Call - U.S. Treasury Bond Future | | | 5,298 | | | | 20,437 | | |
| | 16,000 | | | 8/26/05 | | Call - U.S. Treasury Bond Future | | | 18,295 | | | | 15,250 | | |
| | 11,000 | | | 8/26/05 | | Put - U.S. Treasury Bond Future | | | 11,758 | | | | 344 | | |
| | 19,000 | | | 8/26/05 | | Put - U.S. Treasury Bond Future | | | 15,639 | | | | 1,187 | | |
| | 15,000 | | | 8/26/05 | | Put - U.S. Treasury Bond Future | | | 11,300 | | | | 2,344 | | |
| | 6,000 | | | 8/26/05 | | Put - U.S. Treasury Bond Future | | | 6,532 | | | | 4,781 | | |
| | 22,000 | | | 8/26/05 | | Put - U.S. Treasury Bond Future | | | 16,453 | | | | 7,906 | | |
| | 6,000 | | | 11/22/05 | | Put - U.S. Treasury Bond Future | | | 4,392 | | | | 4,031 | | |
| | | $ | 295,486 | | | $ | 402,113 | | |
Transactions in options written during the six months ended June 30, 2005 were as follows:
| | | Number of
Contracts | | Premiums
Received | |
| Options outstanding at December 31, 2004 | | | 282 | | | $ | 246,107 | | |
| Options written | | | 2,300,676 | | | | 516,401 | | |
| Options terminated in closing purchase transactions | | | (570 | ) | | | (467,022 | ) | |
| Options outstanding at June 30, 2005 | | | 2,300,388 | | | $ | 295,486 | | |
267
Notes to Financial Statements (Unaudited) (Continued)
Exchange traded options are valued at the last sale price, or if no sales are reported, the last bid price for purchased options and the last ask price for written options. Options traded over-the-counter are valued using prices supplied by a primary pricing source chosen by the Trust.
Swaps
The Funds may engage in swap transactions, including, but not limited to, interest rate, currency, credit default, indices, basket, specific security and commodity swaps, interest rate caps, floors and collars and options on swaps (collectively defined as "swap transactions").
Each Fund may enter into swap transactions for any legal purpose consistent with its investment objective and policies, such as for the purpose of attempting to obtain or preserve a particular return or spread at a lower cost than obtaining that return or spread through purchases and/or sales of instruments in cash markets, to protect against currency fluctuation, as a duration management technique, to protect against any increase in the price of securities a Fund anticipates purchasing at a later date, or to gain exposure to certain markets in the most economical way possible. A Fund will not sell interest rate caps, floors or collars if it does not own securities with coupons which provide the interest that a Fund may be required to pay.
Swap agreements are two-party contracts entered into primarily by institutional counterparties for periods ranging from a few weeks to several years. In a standard swap transaction, two parties agree to exchange the returns (or differentials in rates of return) that would be earned or realized on specified notional investments or instruments. The gross returns to be exchanged or "swapped" between the parties are calculated by reference to a "notional amount," i.e., the return on or increase in value of a particular dollar amount invested at a particular interest rate, in a particular foreign currency or commodity, or in a "basket" of securities representing a particular index. The purchaser of an interest rate cap or floor, upon payment of a fee, has the right to receive payments (and the seller of the cap is obligated to make payments) to the extent a specified interest rate exceeds (in the case of a cap) or is less than (in the case of a floor) a specified level over a specified period of time or at specified dates. The purchase of an interest rate collar, upon payment of a fee, has the right to receive payments (and the seller of the collar is obligated to make payments) to the extent that a specified interest rate falls outside an agreed upon range over a specified period of time or at specified dates. The purchase of an option on an interest rate swap, upon payment of a fee (either at the time of purchase or in the form of higher payments or lower receipts within an interest rate swap transaction) has the right, but not the obligation, to initiate a new swap transaction of a pre-specified notional amount with pre-specified terms with the seller of the option as the counterparty.
The amount of a Fund's potential gain or loss on any swap transaction is not subject to any fixed limit. Nor is there any fixed limit on a Fund's potential loss if it sells a cap or collar. If the Fund buys a cap, floor or collar, however, the Fund's potential loss is limited to the amount of the fee that it has paid. When measured against the initial amount of cash required to initiate the transaction, which is typically zero in the case of most conventional swap transactions, swaps, caps, floors and collars tend to be more volatile than many other types of instruments.
The Funds will maintain cash or liquid assets in an amount sufficient at all times to cover its current obligations under its swap transactions, caps, floors and collars. If a Fund enters into a swap agreement on a net basis, it will segregate assets with a daily value at least equal to the excess, if any, of a Fund's accrued obligations under the swap agreement over the accrued amount a Fund is entitled to receive under the agreement. If a Fund enters into a swap agreement on other than a net basis, or sells a cap, floor or collar, it will segregate assets with a daily value at least equal to the full amount of a Fund's accrued obligation under the agreement.
During the term of a swap, cap, floor or collar, changes in the value of the instrument are recognized as unrealized gains or losses by marking to market to reflect the market value of the instrument. When the instrument is terminated, a Fund will record a realized gain or loss equal to the difference, if any, between the proceeds from (or cost of) the closing transaction and a Fund's basis in the contract.
268
Notes to Financial Statements (Unaudited) (Continued)
A summary of open swap agreements for the Strategic Balanced Fund at June 30, 2005, is as follows:
Notional
Amount | | Expiration
Date | | Description | | Net Unrealized
Appreciation
(Depreciation) | |
| | Credit Default
Swaps | | | | | | | | | | |
$180,000
| | 3/20/15
| | Agreement with Deutsche Bank AG dated 1/12/05
to receive 0.36% per year times the notional amount.
The Fund makes payment only upon a default event
of Apache Corp., 6.25%, due 4/15/12. | | $(1,083)
| |
100,000
| | 12/20/09
| | Agreement with Deutsche Bank AG dated 1/31/05
to receive 2.93% per year times the notional amount.
The Fund makes payment only upon a default event
of Ford Motor Company Debt Obligation, 7.45%,
due 7/16/31. | | (16,636)
| |
100,000
| | 3/20/15
| | Agreement with Deutsche Bank AG dated 1/31/05
to receive 3.51% per year times the notional amount.
The Fund makes payment only upon a default event
of General Motors Debt Obligation, 8.375%,
due 7/15/33. | | (18,775)
| |
400,000
| | 12/20/09
| | Agreement with Deutsche Bank AG dated 11/01/04
to receive 0.215% per year times the notional amount.
The Fund makes payment only upon a default event
of FNMA Senior Debt, 6.00%, due 5/15/2011. | | (737)
| |
45,000
| | 2/25/35
| | Agreement with Deutsche Bank AG dated 2/18/05
to pay 1.25% per year times the notional amount.
The Fund receives payment only upon a default event
of Fremont Home Loan Trust, Series 2005-A,
Class M8. | | (14)
| |
45,000
| | 2/25/35
| | Agreement with Deutsche Bank AG dated 2/18/05
to pay 1.25% per year times the notional amount.
The Fund receives payment only upon a default event
of Long Beach Mortgage Loan Trust, Series 2005-1,
Class M8. | | (10)
| |
45,000
| | 12/25/34
| | Agreement with Deutsche Bank AG dated 2/18/05
to pay 1.25% per year times the notional amount.
The Fund receives payment only upon a default event
of MASTR Asset Backed Securities, Series 2005-NC1,
Class M8. | | (69)
| |
45,000
| | 2/25/35
| | Agreement with Deutsche Bank AG dated 2/18/05
to pay 1.30% per year times the notional amount.
The Fund receives payment only upon a default event
of ACE Securities Corp., Series 2005-HE1, Class M8. | | (212)
| |
45,000
| | 9/25/35
| | Agreement with Deutsche Bank AG dated 2/18/05
to pay 1.30% per year times the notional amount.
The Fund receives payment only upon a default event
of Merrill Lynch Mortgage Investors, Inc.,
Series 2005-WMC1, Class B2. | | (292)
| |
45,000
| | 10/25/35
| | Agreement with Deutsche Bank AG dated 2/18/05
to pay 1.30% per year times the notional amount.
The Fund receives payment only upon a default event
of Merrill Lynch Mortgage Investors, Series 2005-NC1,
Class B2. | | (212)
| |
45,000
| | 1/25/35
| | Agreement with Deutsche Bank AG dated 2/18/05
to pay 1.30% per year times the notional amount.
The Fund receives payment only upon a default event
of Morgan Stanley Capital I Trust, Series 2005-WMC1,
Class B2. | | (273)
| |
269
Notes to Financial Statements (Unaudited) (Continued)
Notional
Amount | | Expiration
Date | | Description | | Net Unrealized
Appreciation
(Depreciation) | |
$45,000
| | 3/25/35
| | Agreement with Deutsche Bank AG dated 2/18/05
to pay 1.30% per year times the notional amount.
The Fund receives payment only upon a default event
of New Century Home Equity Loan Trust,
Series 2005-1, Class M8. | | $(151)
| |
45,000
| | 6/25/35
| | Agreement with Deutsche Bank AG dated 2/18/05
to pay 1.35% per year times the notional amount.
The Fund receives payment only upon a default event
of Novastar Home Equity Loan Trust, Series 2005-1,
Class B2. | | (162)
| |
45,000
| | 1/25/36
| | Agreement with Deutsche Bank AG dated 2/18/05
to pay 1.35% per year times the notional amount.
The Fund receives payment only upon a default event
of Park Place Securities, Inc., Series 2005-WCH1,
Class M8. | | (257)
| |
45,000
| | 11/25/34
| | Agreement with Deutsche Bank AG dated 2/18/05
to pay 1.40% per year times the notional amount.
The Fund receives payment only upon a default event
of Argent Securities, Inc., Series 2004-W11, Class M9. | | (14)
| |
45,000
| | 11/25/34
| | Agreement with Deutsche Bank AG dated 2/18/05
to pay 1.40% per year times the notional amount.
The Fund receives payment only upon a default event
of Finance America Mortgage Loan, Series 2004-3,
Class M8. | | (14)
| |
45,000
| | 1/25/35
| | Agreement with Deutsche Bank AG dated 2/18/05
to pay 1.40% per year times the notional amount.
The Fund receives payment only upon a default event
of People's Choice Home Loan Securities Trust,
Series 2005-1, Class B2. | | (222)
| |
45,000
| | 4/25/35
| | Agreement with Deutsche Bank AG dated 2/18/05
to pay 1.45% per year times the notional amount.
The Fund receives payment only upon a default event
of Aames Mortgage Investment Trust, Series 2005-1,
Class M8. | | (15)
| |
45,000
| | 3/25/35
| | Agreement with Deutsche Bank AG dated 2/18/05
to pay 1.45% per year times the notional amount.
The Fund receives payment only upon a default event
of Aegis Asset Backed Securities Trust, Series 2005-1,
Class B2. | | (679)
| |
45,000
| | 2/25/35
| | Agreement with Deutsche Bank AG dated 2/18/05
to pay 2.20% per year times the notional amount.
The Fund receives payment only upon a default event
of ACE Securities Corp., Series 2005-HE1, Class M9. | | (906)
| |
45,000
| | 2/25/35
| | Agreement with Deutsche Bank AG dated 2/18/05
to pay 2.20% per year times the notional amount.
The Fund receives payment only upon a default event
of Fremont Home Loan Trust, Series 2005-A,
Class M9. | | (20)
| |
45,000
| | 12/25/34
| | Agreement with Deutsche Bank AG dated 2/18/05
to pay 2.20% per year times the notional amount.
The Fund receives payment only upon a default event
of MASTR Asset Backed Securities, Series 2005-NC1,
Class M9. | | (651)
| |
270
Notes to Financial Statements (Unaudited) (Continued)
Notional
Amount | | Expiration
Date | | Description | | Net Unrealized
Appreciation
(Depreciation) | |
$45,000
| | 4/25/35
| | Agreement with Deutsche Bank AG dated 2/18/05
to pay 2.25% per year times the notional amount.
The Fund receives payment only upon a default event
of Aames Mortgage Investment Trust, Series 2005-1,
Class M9. | | $(21)
| |
45,000
| | 3/25/35
| | Agreement with Deutsche Bank AG dated 2/18/05
to pay 2.25% per year times the notional amount.
The Fund receives payment only upon a default event
of Aegis Asset Backed Securities Trust, Series 2005-1,
Class B3. | | (1,029)
| |
45,000
| | 11/25/34
| | Agreement with Deutsche Bank AG dated 2/18/05
to pay 2.25% per year times the notional amount.
The Fund receives payment only upon a default event
of Argent Securities, Inc., Series 2004-W11,
Class M10. | | (20)
| |
45,000
| | 11/25/34
| | Agreement with Deutsche Bank AG dated 2/18/05
to pay 2.25% per year times the notional amount.
The Fund receives payment only upon a default event
of Finance America Mortgage Loan, Series 2004-3,
Class M9. | | (21)
| |
45,000
| | 2/25/35
| | Agreement with Deutsche Bank AG dated 2/18/05
to pay 2.25% per year times the notional amount.
The Fund receives payment only upon a default event
of Long Beach Mortgage Loan Trust, Series 2005-1,
Class M9. | | (456)
| |
45,000
| | 10/25/35
| | Agreement with Deutsche Bank AG dated 2/18/05
to pay 2.25% per year times the notional amount.
The Fund receives payment only upon a default event
of Merrill Lynch Mortgage Investors, Series 2005-NC1,
Class B3. | | (785)
| |
45,000
| | 9/25/35
| | Agreement with Deutsche Bank AG dated 2/18/05
to pay 2.25% per year times the notional amount.
The Fund receives payment only upon a default event
of Merrill Lynch Mortgage Investors,
Series 2005-WMC1, Class B3. | | (913)
| |
45,000
| | 1/25/35
| | Agreement with Deutsche Bank AG dated 2/18/05
to pay 2.25% per year times the notional amount.
The Fund receives payment only upon a default event
of Morgan Stanley Capital I, Series 2005-WMC1,
Class B3. | | (21)
| |
45,000
| | 3/25/35
| | Agreement with Deutsche Bank AG dated 2/18/05
to pay 2.25% per year times the notional amount.
The Fund receives payment only upon a default event
of New Century Home Equity Loan Trust,
Series 2005-1, Class M9. | | (963)
| |
45,000
| | 6/25/35
| | Agreement with Deutsche Bank AG dated 2/18/05
to pay 2.25% per year times the notional amount.
The Fund receives payment only upon a default event
of Novastar Home Equity Loan Trust, Series 2005-1,
Class B3. | | (921)
| |
45,000
| | 1/25/36
| | Agreement with Deutsche Bank AG dated 2/18/05
to pay 2.25% per year times the notional amount.
The Fund receives payment only upon a default event
of Park Place Securities, Inc., Series 2005-WCH1,
Class M9. | | (518)
| |
271
Notes to Financial Statements (Unaudited) (Continued)
Notional
Amount | | Expiration
Date | | Description | | Net Unrealized
Appreciation
(Depreciation) | |
$45,000
| | 1/25/35
| | Agreement with Deutsche Bank AG dated 2/18/05
to pay 2.25% per year times the notional amount.
The Fund receives payment only upon a default event
of People's Choice Home Loan Securities Trust,
Series 2005-1, Class B3. | | $(516)
| |
100,000
| | 3/20/10
| | Agreement with Deutsche Bank AG dated 2/2/05
to receive 1.25% per year times the notional amount.
The Fund makes payment only upon a default event
of Eastman Kodak Co. Debt Obligation, 7.25%,
due 11/15/13. | | (1,523)
| |
200,000
| | 12/20/05
| | Agreement with Deutsche Bank AG dated 3/18/05
to receive 1.00% per year times the notional amount.
The Fund makes payment only upon a default event
of General Motors Acceptance Corp., 6.75%,
due 12/1/14. | | 603
| |
300,000
| | 12/20/09
| | Agreement with Goldman Sachs dated 10/14/04
to receive 1.03% per year times the notional amount.
The Fund makes payment only upon a default event
of an entity within the Dow Jones CDX.NA.
HY.3 B Index. | | 3,000
| |
200,000
| | 3/20/10
| | Agreement with Goldman Sachs dated 10/18/04
to receive 0.45% per year times the notional amount.
The Fund makes payment only upon a default event
of an entity within the Dow Jones CDX.NA.IG
FIN.3 IBOXX Index. | | 1,242
| |
200,000
| | 3/20/15
| | Agreement with Goldman Sachs dated 10/18/04
to receive 0.60% per year times the notional amount.
The Fund makes payment only upon a default event
of an entity within the Dow Jones CDX.NA.IG
FIN.3 IBOXX Index. | | 3,094
| |
100,000
| | 12/20/09
| | Agreement with Goldman Sachs dated 10/20/04
to receive 0.99% per year times the notional amount.
The Fund makes payment only upon a default event
of an entity within the Dow Jones CDX.NA.
HY.3 B IBOXX Index. | | 1,000
| |
200,000
| | 12/20/05
| | Agreement with Goldman Sachs dated 4/06/05
to receive 1.014% per year times the notional amount.
The Fund makes payment only upon a default event
of an entity within the Dow Jones CDX.NA.
HY.3 B IBOXX Index. | | 2,000
| |
200,000
| | 3/20/10
| | Agreement with Goldman Sachs dated 4/13/05
to receive 1.15% per year times the notional amount.
The Fund makes payment only upon a default event
of an entity within the Dow Jones CDX.NA.IG
HVOL.3 B Index. | | (2,414)
| |
100,000
| | 6/20/10
| | Agreement with Goldman Sachs dated 4/14/05
to receive 0.975% per year times the notional amount.
The Fund makes payment only upon a default event
of an entity within the Dow Jones CDX.NA.
HY.4 Index. | | (1,312)
| |
100,000
| | 6/20/10
| | Agreement with Goldman Sachs dated 4/14/05
to receive 0.986% per year times the notional amount.
The Fund makes payment only upon a default event
of an entity within the Dow Jones CDX.NA.
HY.4 B Index. | | 94
| |
272
Notes to Financial Statements (Unaudited) (Continued)
Notional
Amount | | Expiration
Date | | Description | | Net Unrealized
Appreciation
(Depreciation) | |
$100,000
| | 6/20/10
| | Agreement with Goldman Sachs dated 4/15/05
to receive 0.98% per year times the notional amount.
The Fund makes payment only upon a default event
of an entity within the Dow Jones CDX.NA.
HY.4 B Index. | | $94
| |
2,000,000
| | 6/20/10
| | Agreement with Goldman Sachs dated 4/19/05
to receive 0.97% per year times the notional amount.
The Fund makes payment only upon a default event
of an entity within the Dow Jones CDX.NA.
HY.4 Index. | | (26,250)
| |
100,000
| | 6/20/10
| | Agreement with Goldman Sachs dated 4/28/05
to receive 0.964% per year times the notional amount.
The Fund makes payment only upon a default event
of an entity within the Dow Jones CDX.NA.
HY.4 Index. | | (1,312)
| |
100,000
| | 6/20/10
| | Agreement with Goldman Sachs dated 4/28/05
to receive 0.983% per year times the notional amount.
The Fund makes payment only upon a default event
of an entity within the Dow Jones CDX.NA.
HY.4 B Index. | | 94
| |
900,000
| | 3/20/10
| | Agreement with Goldman Sachs dated 4/28/05
to receive 1.463% per year times the notional amount.
The Fund makes payment only upon a default event
of an entity within the Dow Jones CDX.NA.IG
HVOL.3 Index. | | (10,861)
| |
100,000
| | 6/20/10
| | Agreement with Goldman Sachs dated 5/03/05
to receive 1.00% per year times the notional amount.
The Fund makes payment only upon a default event
of Ford Motor Credit Company, 7.00%, due 10/01/13. | | 2,413
| |
100,000
| | 6/20/10
| | Agreement with Goldman Sachs dated 5/03/05 to
receive 1.385% per year times the notional amount.
The Fund makes payment only upon a default event
of an entity within the Dow Jones CDX.NA.IG.
HVOL.4 Index. | | (1,639)
| |
920,000
| | 6/20/10
| | Agreement with Goldman Sachs dated 5/09/05 to
receive 1.417% per year times the notional amount.
The Fund makes payment only upon a default event
of an entity within the Dow Jones CDX.NA.IG.
HVOL.4 Index. | | (15,081)
| |
900,000
| | 6/20/10
| | Agreement with Goldman Sachs dated 5/10/05 to
receive 1.50% per year times the notional amount.
The Fund makes payment only upon a default event
of an entity within the Dow Jones CDX.NA.IG.
HVOL.4 Index. | | (14,754)
| |
920,000
| | 6/20/10
| | Agreement with Goldman Sachs dated 5/11/05 to
receive 0.707% per year times the notional amount.
The Fund makes payment only upon a default event
of an entity within the Dow Jones CDX.NA.IG.4 Index. | | (8,168)
| |
600,000
| | 6/20/10
| | Agreement with Goldman Sachs dated 5/11/05 to
receive 0.75% per year times the notional amount.
The Fund makes payment only upon a default event
of an entity within the Dow Jones CDX.NA.IG.4 Index. | | (5,327)
| |
273
Notes to Financial Statements (Unaudited) (Continued)
Notional
Amount | | Expiration
Date | | Description | | Net Unrealized
Appreciation
(Depreciation) | |
$900,000
| | 6/20/10
| | Agreement with Goldman Sachs dated 5/11/05
to receive 0.955% per year times the notional amount.
The Fund makes payment only upon a default event
of an entity within the Dow Jones CDX.NA.
HY.4 Index. | | $(11,812)
| |
100,000
| | 6/20/10
| | Agreement with Goldman Sachs dated 5/12/05
to receive 0.985% per year times the notional amount.
The Fund makes payment only upon a default event
of an entity within the Dow Jones CDX.NA.
HY.4 B Index. | | 94
| |
1,200,000
| | 6/20/10
| | Agreement with Goldman Sachs dated 5/13/05 to
receive 0.745% per year times the notional amount.
The Fund makes payment only upon a default event
of an entity within the Dow Jones CDX.NA.IG.4 Index. | | (10,654)
| |
100,000
| | 6/20/10
| | Agreement with Goldman Sachs dated 5/13/05 to
receive 0.977% per year times the notional amount.
The Fund makes payment only upon a default event
of an entity within the Dow Jones CDX.NA.
HY.4 B Index. | | 94
| |
2,300,000
| | 6/20/10
| | Agreement with Goldman Sachs dated 6/14/05 to
receive 1.175% per year times the notional amount.
The Fund makes payment only upon a default event
of an entity within the Dow Jones CDX.NA.IG.
HVOL.4 Index. | | (37,703)
| |
100,000
| | 6/20/10
| | Agreement with Goldman Sachs dated 6/27/05 to
receive 1.38% per year times the notional amount.
The Fund makes payment only upon a default event
of an entity within the Dow Jones CDX.NA.IG.
HVOL.4 Index. | | (1,639)
| |
| | Interest Rate
Swaps | | | | | | | | | | |
4,170,000 USD
| | 1/10/08
| | Agreement with Deutsche Bank AG dated 1/06/05
to receive the notional amount multiplied by 3.754%
and to pay the notional amount multiplied by the
3 month Floating Rate LIBOR. | | (31,820)
| |
4,820,000 USD
| | 1/14/07
| | Agreement with Deutsche Bank AG dated 1/12/05
to receive the notional amount multiplied by 3.571%
and to pay the notional amount multiplied by the
3 month Floating Rate LIBOR. | | (25,665)
| |
2,510,000 USD
| | 6/17/10
| | Agreement with Deutsche Bank AG dated 6/15/05
to receive the notional amount multiplied by 3.313%
and to pay the notional amount multiplied by the
3 month Floating Rate LIBOR. | | (13,365)
| |
1,200,000 USD
| | 10/18/14
| | Agreement with Goldman Sachs dated 10/14/04 to
pay the notional amount multiplied by 4.4915% and
to receive the notional amount multiplied by the
3 month Floating Rate LIBOR. | | 7,217
| |
| | | $ | (247,848 | ) | |
Allocation of Operating Activity
In maintaining the records for the Funds, the income and expense accounts are allocated to each class of shares. Investment income, unrealized and realized gains or losses are prorated among the classes of shares based on the relative net assets of each. Expenses are allocated to each class of shares depending on the nature of the expenditures. Administration and service fees, which are directly attributable to a class of shares, are charged to that class' operations. Expenses of the Fund not directly attributable to
274
Notes to Financial Statements (Unaudited) (Continued)
the operations of any class of shares or Fund are prorated among the Funds and classes to which the expense relates based on the relative net assets of each.
In addition, the Destination Retirement Income Fund, Destination Retirement 2010 Fund, Destination Retirement 2020 Fund, Destination Retirement 2030 Fund and Destination Retirement 2040 Fund will also incur certain fees and expenses indirectly as a shareholder in the underlying funds. Because the underlying funds have varied expense and fee levels and each Fund may own different proportions of underlying funds at different times, the amount of fees and expenses indirectly incurred by each Fund will vary.
Foreign
Securities
The Overseas Fund invests substantially all of its assets in foreign securities. The other Funds may also invest in foreign securities, subject to certain percentage restrictions. Investing in securities of foreign companies and foreign governments involves special risks and considerations not typically associated with investing in securities of U.S. companies and the U.S. Government. These risks include revaluation of currencies and future adverse political and economic developments. Moreover, securities of many foreign companies and foreign governments and their markets may be less liquid and their prices more volatile th an those of securities of comparable U.S. companies and the U.S. Government.
3. Management
Fees and Other
Transactions
Investment Management Fees
Under agreements between the Trust and Massachusetts Mutual Life Insurance Company ("MassMutual") on behalf of each Fund, MassMutual is responsible for providing investment management services for each Fund. In return for this service, MassMutual receives advisory fees monthly based upon each Fund's average daily net assets at the following annual rates:
| Strategic Bond Fund | | | 0.55 | % | | Small Company Value Fund | | | 0.85 | % | |
|
| Strategic Balanced Fund | | | 0.60 | % | | Mid Cap Growth Equity Fund | | | 0.70 | % | |
|
| Diversified Value Fund | | | 0.50 | % | | Mid Cap Growth Equity II Fund | | | 0.75 | % | |
|
| Fundamental Value Fund | | | 0.65 | % | | Small Cap Growth Equity Fund | | | 0.82 | % | |
|
| Value Equity Fund | | | 0.70 | % | | Small Company Growth Fund | | | 0.85 | % | |
|
| Large Cap Value Fund | | | 0.65 | % | | Emerging Growth Fund | | | 0.79 | % | |
|
| Indexed Equity Fund | | | 0.10 | % | | Overseas Fund | | | 1.00 | % | |
|
| Blue Chip Growth Fund | | | 0.70 | % | | Destination Retirement Income Fund | | | 0.05 | % | |
|
| Large Cap Growth Fund | | | 0.65 | % | | Destination Retirement 2010 Fund | | | 0.05 | % | |
|
| Growth Equity Fund | | | 0.68 | % | | Destination Retirement 2020 Fund | | | 0.05 | % | |
|
| Aggressive Growth Fund | | | 0.73 | % | | Destination Retirement 2030 Fund | | | 0.05 | % | |
|
| OTC 100 Fund | | | 0.15 | % | | Destination Retirement 2040 Fund | | | 0.05 | % | |
|
| Focused Value Fund | | | 0.69 | % | | | | | | | |
|
MassMutual has also entered into investment sub-advisory agreements with the following unaffiliated investment sub-advisers: Alliance Capital Management L.P. for the Diversified Value Fund and the Large Cap Growth Fund; Wellington Management Company, LLP for the Fundamental Value Fund and a portion of the Small Cap Growth Equity Fund; Fidelity Management & Research Company for the Value Equity Fund and the Blue Chip Growth Fund; Davis Selected Advisers, L.P. for the Large Cap Value Fund; Northern Trust Investments, N.A. for the Indexed Equity Fund and the OTC 100 Fund; Grantham, Mayo, Van Otterloo & Co. LLC for the Growth Equity Fund; Sands Capital Management, Inc. for the Aggressive Growth Fund; Cooke & Bieler, L.P. for a portion of the Focused Value Fund; Harris Associates, L.P. for a portion of the Focused Value Fund and a portion of the Overseas Fund; Clover Capital Managemen t, Inc. for a portion of the Small Company Value Fund; EARNEST Partners, LLC for a portion of the Small Company Value Fund; Navellier & Associates, Inc. for the Mid Cap Growth Equity Fund; T. Rowe Price Associates, Inc. for the Mid Cap Growth Equity II Fund and a portion of the Small Company Value Fund; Waddell & Reed Investment Management Company for a
275
Notes to Financial Statements (Unaudited) (Continued)
portion of the Small Cap Growth Equity Fund; Mazama Capital Management, Inc. for a portion of the Small Company Growth Fund; Eagle Asset Management, Inc. for a portion of the Small Company Growth Fund; RS Investment Management, L.P. for the Emerging Growth Fund; American Century Global Investment Management, Inc. for a portion of the Overseas Fund; Western Asset Management Company for the Strategic Bond Fund and a portion of the Strategic Balanced Fund; and Salomon Brothers Asset Management Inc for a portion of the Strategic Balanced Fund. Prior to February 17, 2005, MTB Investment Advisers, Inc. managed the investment and reinvestment of a portion of the Small Company Growth Fund. MassMutual pays a sub-advisory fee to each of these sub-advisers based upon the aggregate net assets under management which include (1) the average daily net assets of the specified Fund which it manages, and (2) the average daily net assets of all other funds or accounts of MassMutual or its affiliates for which the sub-adviser provides sub-advisory services and which have substantially the same investment objective, policies and investment strategies.
Administration Fees
Under separate administrative and shareholder services agreements between each Fund and MassMutual, MassMutual provides certain administrative and shareholder services and bears some class specific administrative expenses. In return for these services, MassMutual receives an administrative services fee monthly based upon the average daily net assets of the applicable class of shares of the Fund at the following annual rates:
| | | Class A | | Class L | | Class Y | | Class S | | Class Z | | Class N | |
| Strategic Bond Fund | | | 0.2500 | % | | | 0.2500 | % | | | 0.1000 | % | | | 0.0500 | % | | N/A | | | 0.3000 | % | |
| Strategic Balanced Fund | | | 0.3270 | % | | | 0.3270 | % | | | 0.1770 | % | | | 0.1270 | % | | N/A | | | 0.3770 | % | |
| Diversified Value Fund | | | 0.3083 | % | | | 0.2683 | % | | | 0.1583 | % | | | 0.0583 | % | | N/A | | | 0.3683 | % | |
| Fundamental Value Fund | | | 0.3129 | % | | | 0.3129 | % | | | 0.1629 | % | | | 0.1229 | % | | N/A | | | 0.3629 | % | |
| Value Equity Fund | | | 0.2785 | % | | | 0.2785 | % | | | 0.1285 | % | | | 0.0785 | % | | N/A | | | 0.3285 | % | |
| Large Cap Value Fund | | | 0.3244 | % | | | 0.3244 | % | | | 0.1744 | % | | | 0.0844 | % | | N/A | | | 0.3744 | % | |
| Indexed Equity Fund | | | 0.4797 | % | | | 0.4797 | % | | | 0.3297 | % | | | 0.2997 | % | | | 0.0855 | % | | | 0.5297 | % | |
| Blue Chip Growth Fund | | | 0.4085 | % | | | 0.4085 | % | | | 0.2885 | % | | | 0.1585 | % | | N/A | | | 0.4585 | % | |
| Large Cap Growth Fund | | | 0.3529 | % | | | 0.3529 | % | | | 0.2029 | % | | | 0.1629 | % | | N/A | | | 0.4029 | % | |
| Growth Equity Fund | | | 0.2975 | % | | | 0.2975 | % | | | 0.1475 | % | | | 0.0875 | % | | N/A | | | 0.3475 | % | |
| Aggressive Growth Fund | | | 0.3444 | % | | | 0.3444 | % | | | 0.1944 | % | | | 0.0944 | % | | N/A | | | 0.3944 | % | |
| OTC 100 Fund | | | 0.6244 | % | | | 0.6244 | % | | | 0.4744 | % | | | 0.3744 | % | | N/A | | | 0.6744 | % | |
| Focused Value Fund | | | 0.3344 | % | | | 0.3344 | % | | | 0.1844 | % | | | 0.0844 | % | | N/A | | | 0.3844 | % | |
| Small Company Value Fund | | | 0.3593 | % | | | 0.3593 | % | | | 0.2093 | % | | | 0.1693 | % | | N/A | | | 0.4093 | % | |
| Mid Cap Growth Equity Fund | | | 0.3075 | % | | | 0.3075 | % | | | 0.1575 | % | | | 0.0875 | % | | N/A | | | 0.3575 | % | |
| Mid Cap Growth Equity II Fund | | | 0.3244 | % | | | 0.3244 | % | | | 0.1744 | % | | | 0.0844 | % | | N/A | | | 0.3744 | % | |
| Small Cap Growth Equity Fund | | | 0.4075 | % | | | 0.4075 | % | | | 0.2575 | % | | | 0.1175 | % | | N/A | | | 0.4575 | % | |
| Small Company Growth Fund | | | 0.3491 | % | | | 0.3491 | % | | | 0.1991 | % | | | 0.1591 | % | | N/A | | | 0.3991 | % | |
| Emerging Growth Fund | | | 0.3344 | % | | | 0.3344 | % | | | 0.1844 | % | | | 0.0844 | % | | N/A | | | 0.3844 | % | |
| Overseas Fund | | | 0.2443 | % | | | 0.2443 | % | | | 0.0943 | % | | | 0.0443 | % | | N/A | | | 0.2943 | % | |
Destination Retirement
Income Fund | | | 0.1459 | % | | | 0.1459 | % | | | 0.0459 | % | | | 0.0200 | % | | N/A | | | 0.1959 | % | |
| Destination Retirement 2010 Fund | | | 0.1696 | % | | | 0.1696 | % | | | 0.0696 | % | | | 0.0196 | % | | N/A | | | 0.2196 | % | |
| Destination Retirement 2020 Fund | | | 0.1758 | % | | | 0.1758 | % | | | 0.0758 | % | | | 0.0258 | % | | N/A | | | 0.2258 | % | |
| Destination Retirement 2030 Fund | | | 0.1733 | % | | | 0.1733 | % | | | 0.0733 | % | | | 0.0233 | % | | N/A | | | 0.2233 | % | |
| Destination Retirement 2040 Fund | | | 0.1616 | % | | | 0.1616 | % | | | 0.0616 | % | | | 0.0116 | % | | N/A | | | 0.2116 | % | |
Distribution and Service Fees
MML Distributors, LLC (the "Distributor") acts as distributor to each Fund. Pursuant to separate 12b-1 Plans adopted by the Funds, Class A shares of each fund pay a fee of 0.25% of the average daily net asset value of the Fund to: (i) the Distributor for services provided and expenses incurred by its connection with the distribution of Class A shares of the Fund; and (ii) MassMutual for services provided and expenses incurred by it for purposes of maintaining or providing personal services to Class A shareholders. Pursuant to separate 12b-1 Plans adopted by the Funds, Class N shares of e ach fund pay a fee of 0.50% of the average daily net asset value of the Fund as follows: 0.25% of the average daily net asset value of the Fund to the Distributor for services provided and expenses incurred by it in
276
Notes to Financial Statements (Unaudited) (Continued)
connection with the distribution of Class N shares of the Fund; and 0.25% of the average daily net asset value of the Fund to MassMutual for services provided and expenses incurred by it for purposes of maintaining or providing personal services to Class N shareholders. The Distribution fee may be spent by the Distributor on any activities or expenses primarily intended to result in the sale of Class A or Class N shares of the Fund. The Servicing Fee may be spent by MassMutual on personal services rendered to Class A or Class N shareholders of a Fund and/or maintenance of Class A or Class N shareholder accounts. The Distributor is a majority owned subsidiary of MassMutual. In addition, OppenheimerFunds Distributor, Inc. (the "Sub-Distributor") acts as a sub-distributor to each Fund. The Sub-Distributor is an affiliate of the Distributor and an indirect majority owned subsidiary of MassMutual.
Indirect Expenses
The Destination Retirement Income Fund, Destination Retirement 2010 Fund, Destination Retirement 2020 Fund, Destination Retirement 2030 Fund and Destination Retirement 2040 Fund incur fees and expenses indirectly as shareholders in the underlying funds. For the six months ended June 30, 2005, these expenses were as follows:
| | | Indirect
Operating
Expenses | |
| Destination Retirement Income Fund | | | 0.65 | % | |
| Destination Retirement 2010 Fund | | | 0.69 | % | |
| Destination Retirement 2020 Fund | | | 0.74 | % | |
| Destination Retirement 2030 Fund | | | 0.84 | % | |
| Destination Retirement 2040 Fund | | | 0.87 | % | |
Expense Caps and Waivers
MassMutual agreed to cap the fees and expenses of the following Funds through December 31, 2006, unless otherwise noted, as follows:
| | | Class A | | Class L | | Class Y | | Class S | | Class N | |
| Strategic Bond Fund* | | | 1.00 | % | | | 0.75 | % | | | 0.75 | % | | | 0.70 | % | | | 1.30 | % | |
| Strategic Balanced Fund | | | 1.21 | % | | | 0.96 | % | | | 0.81 | % | | | 0.76 | % | | | 1.51 | % | |
| Diversified Value Fund** | | | 1.09 | % | | | 0.80 | % | | | 0.69 | % | | | 0.59 | % | | | 1.40 | % | |
| Destination Retirement Income Fund | | | 0.50 | % | | | 0.25 | % | | | 0.15 | % | | | 0.12 | % | | | 0.80 | % | |
| Destination Retirement 2010 Fund | | | 0.50 | % | | | 0.25 | % | | | 0.15 | % | | | 0.10 | % | | | 0.80 | % | |
| Destination Retirement 2020 Fund | | | 0.50 | % | | | 0.25 | % | | | 0.15 | % | | | 0.10 | % | | | 0.80 | % | |
| Destination Retirement 2030 Fund | | | 0.50 | % | | | 0.25 | % | | | 0.15 | % | | | 0.10 | % | | | 0.80 | % | |
| Destination Retirement 2040 Fund | | | 0.50 | % | | | 0.25 | % | | | 0.15 | % | | | 0.10 | % | | | 0.80 | % | |
* Expense caps in effect through March 31, 2006.
** Expense caps in effect through April 30, 2006.
Effective May 1, 2005, MassMutual has agreed to voluntarily waive, through March 31, 2006, 0.10% of the Administration fees for Classes A, L and N of the Indexed Equity Fund. MassMutual has also agreed to voluntarily waive, through March 31, 2006, 0.08% of the management fee of all classes of the Aggressive Growth Fund.
Brokerage Commissions
The Strategic Balanced Fund, Fundamental Value Fund, Value Equity Fund, Large Cap Value Fund, Blue Chip Growth Fund, Large Cap Growth Fund, Growth Equity Fund, Aggressive Growth Fund, Focused Value Fund, Small Company Value Fund, Mid Cap Growth Equity Fund, Mid Cap Growth Equity II Fund, Small Cap Growth Equity Fund, Small Company Growth Fund, Emerging Growth Fund and Overseas Fund have entered into agreements with certain brokers whereby the brokers will rebate, in cash, a portion of brokerage commissions. Effective January 1, 2005, amounts earned by the Funds under such agreements are included with realized gain or lo ss on investment transactions presented in the statement of operations. Prior to January 1, 2005, amounts earned by the Funds under such agreements were presented as a reduction of expenses. Prior year amounts have not been restated to
277
Notes to Financial Statements (Unaudited) (Continued)
reflect this change due to immateriality. For the six months ended June 30, 2005, brokerage commissions under these agreements are as follows:
| | | Commissions | |
| Strategic Balanced Fund | | $ | 10,197 | | |
| Fundamental Value Fund | | | 30,003 | | |
| Value Equity Fund | | | 17,381 | | |
| Blue Chip Growth Fund | | | 18,618 | | |
| Large Cap Growth Fund | | | 6,295 | | |
| Aggressive Growth Fund | | | 17,482 | | |
| Focused Value Fund | | | 53,788 | | |
| Small Company Value Fund | | | 48,229 | | |
| Mid Cap Growth Equity Fund | | | 27,908 | | |
| Mid Cap Growth Equity II Fund | | | 16,095 | | |
| Small Cap Growth Equity Fund | | | 79,202 | | |
| Small Company Growth Fund | | | 68,314 | | |
| Overseas Fund | | | 6,456 | | |
Other
Certain officers and trustees of the Funds are also officers of MassMutual. The compensation of each trustee who is not an officer of MassMutual is borne by the Funds.
The following table shows certain concentrations of principal shareholders of each Fund with record or beneficial ownership as of June 30, 2005. Investment activities of these shareholders could have a material effect on the respective Fund.
| | | Shareholders
Holding in Excess of
10% of Fund's
Outstanding Shares
("Principal Shareholders") | | Total % owned
by Principal
Shareholders | | Total %
Ownership by
Related Party | |
| Strategic Bond Fund | | | 1 | | | | 85.7 | % | | | 85.7 | % | |
| Strategic Balanced Fund | | | 3 | | | | 86.7 | % | | | 86.7 | % | |
| Diversified Value Fund | | | 1 | | | | 74.4 | % | | | 74.4 | % | |
| Fundamental Value Fund | | | 4 | | | | 75.8 | % | | | 75.8 | % | |
| Value Equity Fund | | | 2 | | | | 81.4 | % | | | 81.4 | % | |
| Large Cap Value Fund | | | 3 | | | | 62.3 | % | | | 62.3 | % | |
| Indexed Equity Fund | | | 4 | | | | 82.2 | % | | | 82.2 | % | |
| Blue Chip Growth Fund | | | 2 | | | | 88.5 | % | | | 88.5 | % | |
| Large Cap Growth Fund | | | 4 | | | | 91.1 | % | | | 91.1 | % | |
| Growth Equity Fund | | | 4 | | | | 70.4 | % | | | 70.4 | % | |
| Aggressive Growth Fund | | | 3 | | | | 57.3 | % | | | 57.3 | % | |
| OTC 100 Fund | | | 3 | | | | 91.2 | % | | | 91.2 | % | |
| Focused Value Fund | | | 4 | | | | 83.5 | % | | | 83.5 | % | |
| Small Company Value Fund | | | 4 | | | | 78.1 | % | | | 78.1 | % | |
| Mid Cap Growth Equity Fund | | | 4 | | | | 90.0 | % | | | 90.0 | % | |
| Mid Cap Growth Equity II Fund | | | 3 | | | | 70.2 | % | | | 70.2 | % | |
| Small Cap Growth Equity Fund | | | 4 | | | | 95.5 | % | | | 95.5 | % | |
| Small Company Growth Fund | | | 3 | | | | 77.7 | % | | | 77.7 | % | |
| Emerging Growth Fund | | | 3 | | | | 83.5 | % | | | 83.5 | % | |
| Overseas Fund | | | 4 | | | | 69.4 | % | | | 69.4 | % | |
| Destination Retirement Income Fund | | | 2 | | | | 83.6 | % | | | 46.7 | % | |
| Destination Retirement 2010 Fund | | | 3 | | | | 76.2 | % | | | 76.2 | % | |
| Destination Retirement 2020 Fund | | | 2 | | | | 74.3 | % | | | 74.3 | % | |
| Destination Retirement 2030 Fund | | | 1 | | | | 70.5 | % | | | 70.5 | % | |
| Destination Retirement 2040 Fund | | | 1 | | | | 76.0 | % | | | 76.0 | % | |
Deferred Compensation
Trustees of the Funds that are not employees of MassMutual or its subsidiaries may elect to defer receipt of their annual fees in accordance with terms of the Non-Qualified Deferred Compensation Plan. Any amounts deferred shall accrue interest at a rate equal to eight percent (8%) per annum.
For the six months ended June 30, 2005, no significant amounts have been deferred.
278
Notes to Financial Statements (Unaudited) (Continued)
4. Purchases and Sales of Investments
Cost of purchases and proceeds from sales of investment securities (excluding short-term investments) for the six months ended June 30, 2005, were as follows:
| | | | | Long-Term U.S.
Government Securities | | Other Long-Term
Securities | |
| Purchases | | Strategic Bond Fund | | $ | 186,671,482 | | | $ | 26,970,584 | | |
| | | Strategic Balanced Fund | | | 190,911,516 | | | | 51,817,399 | | |
| | | Diversified Value Fund | | | - | | | | 25,869,747 | | |
| | | Fundamental Value Fund | | | - | | | | 154,955,302 | | |
| | | Value Equity Fund | | | - | | | | 44,520,119 | | |
| | | Large Cap Value Fund | | | - | | | | 176,035,887 | | |
| | | Indexed Equity Fund | | | - | | | | 129,117,346 | | |
| | | Blue Chip Growth Fund | | | - | | | | 29,318,766 | | |
| | | Large Cap Growth Fund | | | - | | | | 8,850,998 | | |
| | | Growth Equity Fund | | | - | | | | 451,425,222 | | |
| | | Aggressive Growth Fund | | | - | | | | 53,513,182 | | |
| | | OTC 100 Fund | | | - | | | | 2,153,327 | | |
| | | Focused Value Fund | | | - | | | | 143,739,197 | | |
| | | Small Company Value Fund | | | - | | | | 157,667,490 | | |
| | | Mid Cap Growth Equity Fund | | | - | | | | 69,980,104 | | |
| | | Mid Cap Growth Equity II Fund | | | - | | | | 142,842,968 | | |
| | | Small Cap Growth Equity Fund | | | - | | | | 131,453,339 | | |
| | | Small Company Growth Fund | | | - | | | | 167,033,155 | | |
| | | Emerging Growth Fund | | | - | | | | 65,910,160 | | |
| | | Overseas Fund | | | - | | | | 276,892,964 | | |
| | | Destination Retirement Income Fund | | | - | | | | 46,964,503 | | |
| | | Destination Retirement 2010 Fund | | | - | | | | 42,015,934 | | |
| | | Destination Retirement 2020 Fund | | | - | | | | 92,315,140 | | |
| | | Destination Retirement 2030 Fund | | | - | | | | 44,645,500 | | |
| | | Destination Retirement 2040 Fund | | | - | | | | 24,451,353 | | |
| Sales | | Strategic Bond Fund | | $ | 146,662,925 | | | $ | 7,120,739 | | |
| | | Strategic Balanced Fund | | | 174,316,723 | | | | 49,685,719 | | |
| | | Diversified Value Fund | | | - | | | | 23,373,599 | | |
| | | Fundamental Value Fund | | | - | | | | 143,722,222 | | |
| | | Value Equity Fund | | | - | | | | 44,375,696 | | |
| | | Large Cap Value Fund | | | - | | | | 1,267,517 | | |
| | | Indexed Equity Fund | | | - | | | | 47,758,053 | | |
| | | Blue Chip Growth Fund | | | - | | | | 52,882,944 | | |
| | | Large Cap Growth Fund | | | - | | | | 17,451,709 | | |
| | | Growth Equity Fund | | | - | | | | 449,102,067 | | |
| | | Aggressive Growth Fund | | | - | | | | 60,237,869 | | |
| | | OTC 100 Fund | | | - | | | | 10,199,612 | | |
| | | Focused Value Fund | | | - | | | | 108,077,706 | | |
| | | Small Company Value Fund | | | - | | | | 146,403,697 | | |
| | | Mid Cap Growth Equity Fund | | | - | | | | 69,255,450 | | |
| | | Mid Cap Growth Equity II Fund | | | - | | | | 111,531,092 | | |
| | | Small Cap Growth Equity Fund | | | - | | | | 143,907,034 | | |
| | | Small Company Growth Fund | | | - | | | | 186,449,655 | | |
| | | Emerging Growth Fund | | | - | | | | 71,430,134 | | |
| | | Overseas Fund | | | - | | | | 206,661,028 | | |
| | | Destination Retirement Income Fund | | | - | | | | 16,859,824 | | |
| | | Destination Retirement 2010 Fund | | | - | | | | 3,217,045 | | |
| | | Destination Retirement 2020 Fund | | | - | | | | 20,637,587 | | |
| | | Destination Retirement 2030 Fund | | | - | | | | 15,604,611 | | |
| | | Destination Retirement 2040 Fund | | | - | | | | 10,766,678 | | |
279
Notes to Financial Statements (Unaudited) (Continued)
5. Capital Share Transactions
The Funds are authorized to issue an unlimited number of shares, with no par value in each class of shares. Changes in shares outstanding for each Fund are as follows:
| | | Class A | |
| | | Six months ended June 30, 2005 | | Year ended December 31, 2004 | |
| | | Shares | | Amount | | Shares | | Amount | |
| Strategic Bond Fund* | |
| Sold | | | 328,309 | | | $ | 3,282,020 | | | | 10,110 | | | $ | 101,100 | | |
| Issued as reinvestment of dividends | | | - | | | | - | | | | - | | | | - | | |
| Redeemed | | | (17,393 | ) | | | (176,122 | ) | | | - | | | | - | | |
| Net increase (decrease) | | | 310,916 | | | $ | 3,105,898 | | | | 10,110 | | | $ | 101,100 | | |
| Strategic Balanced Fund** | |
| Sold | | | 794,435 | | | $ | 8,197,669 | | | | 4,347,100 | | | $ | 44,481,343 | | |
| Issued as reinvestment of dividends | | | - | | | | - | | | | 25,309 | | | | 264,227 | | |
| Redeemed | | | (637,945 | ) | | | (6,546,479 | ) | | | (1,216,838 | ) | | | (12,306,403 | ) | |
| Net increase (decrease) | | | 156,490 | | | $ | 1,651,190 | | | | 3,155,571 | | | $ | 32,439,167 | | |
| Diversified Value Fund*** | |
| Sold | | | 799,205 | | | $ | 8,669,779 | | | | 474,995 | | | $ | 4,759,387 | | |
| Issued as reinvestment of dividends | | | - | | | | - | | | | 2,198 | | | | 24,069 | | |
| Redeemed | | | (76,245 | ) | | | (823,102 | ) | | | (20,106 | ) | | | (215,333 | ) | |
| Net increase (decrease) | | | 722,960 | | | $ | 7,846,677 | | | | 457,087 | | | $ | 4,568,123 | | |
| Fundamental Value Fund | |
| Sold | | | 3,405,556 | | | $ | 36,564,849 | | | | 10,101,513 | | | $ | 102,295,460 | | |
| Issued as reinvestment of dividends | | | - | | | | - | | | | 355,266 | | | | 3,819,101 | | |
| Redeemed | | | (2,423,242 | ) | | | (25,965,722 | ) | | | (3,408,103 | ) | | | (34,483,893 | ) | |
| Net increase (decrease) | | | 982,314 | | | $ | 10,599,127 | | | | 7,048,676 | | | $ | 71,630,668 | | |
| Value Equity Fund | |
| Sold | | | 268,391 | | | $ | 2,818,676 | | | | 633,332 | | | $ | 6,156,310 | | |
| Issued as reinvestment of dividends | | | - | | | | - | | | | 68,382 | | | | 718,009 | | |
| Redeemed | | | (260,027 | ) | | | (2,707,641 | ) | | | (500,712 | ) | | | (4,940,755 | ) | |
| Net increase (decrease) | | | 8,364 | | | $ | 111,035 | | | | 201,002 | | | $ | 1,933,564 | | |
| Large Cap Value Fund | |
| Sold | | | 7,637,932 | | | $ | 79,259,761 | | | | 14,602,712 | | | $ | 141,882,911 | | |
| Issued as reinvestment of dividends | | | - | | | | - | | | | 97,517 | | | | 1,014,178 | | |
| Redeemed | | | (3,343,346 | ) | | | (34,644,658 | ) | | | (5,494,055 | ) | | | (53,390,180 | ) | |
| Net increase (decrease) | | | 4,294,586 | | | $ | 44,615,103 | | | | 9,206,174 | | | $ | 89,506,909 | | |
| Indexed Equity Fund | |
| Sold | | | 6,193,016 | | | $ | 67,616,087 | | | | 14,160,139 | | | $ | 147,697,978 | | |
| Issued as reinvestment of dividends | | | - | | | | - | | | | 296,443 | | | | 3,299,407 | | |
| Redeemed | | | (3,864,173 | ) | | | (42,078,423 | ) | | | (5,325,151 | ) | | | (55,617,369 | ) | |
| Net increase (decrease) | | | 2,328,843 | | | $ | 25,537,664 | | | | 9,131,431 | | | $ | 95,380,016 | | |
| Blue Chip Growth Fund | |
| Sold | | | 590,305 | | | $ | 5,000,345 | | | | 2,206,472 | | | $ | 18,447,440 | | |
| Issued as reinvestment of dividends | | | - | | | | - | | | | 16,207 | | | | 141,976 | | |
| Redeemed | | | (583,620 | ) | | | (4,953,055 | ) | | | (1,184,189 | ) | | | (9,915,553 | ) | |
| Net increase (decrease) | | | 6,685 | | | $ | 47,290 | | | | 1,038,490 | | | $ | 8,673,863 | | |
| Large Cap Growth Fund | |
| Sold | | | 73,521 | | | $ | 635,416 | | | | 102,024 | | | $ | 869,344 | | |
| Issued as reinvestment of dividends | | | - | | | | - | | | | - | | | | - | | |
| Redeemed | | | (37,631 | ) | | | (325,660 | ) | | | (42,834 | ) | | | (361,661 | ) | |
| Net increase (decrease) | | | 35,890 | | | $ | 309,756 | | | | 59,190 | | | $ | 507,683 | | |
| Growth Equity Fund | |
| Sold | | | 4,149,506 | | | $ | 31,590,412 | | | | 11,259,470 | | | $ | 83,671,299 | | |
| Issued as reinvestment of dividends | | | - | | | | - | | | | 924 | | | | 7,165 | | |
| Redeemed | | | (4,232,836 | ) | | | (32,297,952 | ) | | | (10,020,028 | ) | | | (74,040,481 | ) | |
| Net increase (decrease) | | | (83,330 | ) | | $ | (707,540 | ) | | | 1,240,366 | | | $ | 9,637,983 | | |
| Aggressive Growth Fund | |
| Sold | | | 5,643,585 | | | $ | 31,534,599 | | | | 12,670,749 | | | $ | 68,296,802 | | |
| Issued as reinvestment of dividends | | | - | | | | - | | | | - | | | | - | | |
| Redeemed | | | (5,506,289 | ) | | | (30,405,266 | ) | | | (5,880,715 | ) | | | (31,451,040 | ) | |
| Net increase (decrease) | | | 137,296 | | | $ | 1,129,333 | | | | 6,790,034 | | | $ | 36,845,762 | | |
280
Notes to Financial Statements (Unaudited) (Continued)
| | | Class A | |
| | | Six months ended June 30, 2005 | | Year ended December 31, 2004 | |
| | | Shares | | Amount | | Shares | | Amount | |
| OTC 100 Fund | |
| Sold | | | 898,413 | | | $ | 3,392,749 | | | | 4,343,845 | | | $ | 15,990,404 | | |
| Issued as reinvestment of dividends | | | - | | | | - | | | | 8,389 | | | | 34,394 | | |
| Redeemed | | | (2,111,034 | ) | | | (8,086,867 | ) | | | (4,603,193 | ) | | | (17,069,478 | ) | |
| Net increase (decrease) | | | (1,212,621 | ) | | $ | (4,694,118 | ) | | | (250,959 | ) | | $ | (1,044,680 | ) | |
| Focused Value Fund | |
| Sold | | | 3,032,540 | | | $ | 53,198,797 | | | | 6,553,097 | | | $ | 113,674,184 | | |
| Issued as reinvestment of dividends | | | - | | | | - | | | | 712,728 | | | | 12,491,353 | | |
| Redeemed | | | (2,220,953 | ) | | | (39,098,080 | ) | | | (3,790,100 | ) | | | (65,510,095 | ) | |
| Net increase (decrease) | | | 811,587 | | | $ | 14,100,717 | | | | 3,475,725 | | | $ | 60,655,442 | | |
| Small Company Value Fund | |
| Sold | | | 2,114,221 | | | $ | 29,114,425 | | | | 5,595,642 | | | $ | 72,432,152 | | |
| Issued as reinvestment of dividends | | | - | | | | - | | | | 178,292 | | | | 2,471,109 | | |
| Redeemed | | | (1,513,355 | ) | | | (20,732,265 | ) | | | (1,408,482 | ) | | | (18,041,439 | ) | |
| Net increase (decrease) | | | 600,866 | | | $ | 8,382,160 | | | | 4,365,452 | | | $ | 56,861,822 | | |
| Mid Cap Growth Equity Fund | |
| Sold | | | 1,003,193 | | | $ | 8,854,459 | | | | 1,234,045 | | | $ | 9,556,818 | | |
| Issued as reinvestment of dividends | | | - | | | | - | | | | - | | | | - | | |
| Redeemed | | | (1,089,858 | ) | | | (9,526,638 | ) | | | (2,817,040 | ) | | | (22,097,574 | ) | |
| Net increase (decrease) | | | (86,665 | ) | | $ | (672,179 | ) | | | (1,582,995 | ) | | $ | (12,540,756 | ) | |
| Mid Cap Growth Equity II Fund | |
| Sold | | | 4,805,497 | | | $ | 61,114,628 | | | | 10,730,952 | | | $ | 125,916,081 | | |
| Issued as reinvestment of dividends | | | - | | | | - | | | | 30,010 | | | | 392,828 | | |
| Redeemed | | | (2,483,761 | ) | | | (31,681,469 | ) | | | (3,223,057 | ) | | | (37,595,032 | ) | |
| Net increase (decrease) | | | 2,321,736 | | | $ | 29,433,159 | | | | 7,537,905 | | | $ | 88,713,877 | | |
| Small Cap Growth Equity Fund | |
| Sold | | | 1,008,161 | | | $ | 13,861,179 | | | | 2,664,227 | | | $ | 34,012,429 | | |
| Issued as reinvestment of dividends | | | - | | | | - | | | | - | | | | - | | |
| Redeemed | | | (1,170,886 | ) | | | (16,139,706 | ) | | | (2,584,448 | ) | | | (32,748,030 | ) | |
| Net increase (decrease) | | | (162,725 | ) | | $ | (2,278,527 | ) | | | 79,779 | | | $ | 1,264,399 | | |
| Small Company Growth Fund | |
| Sold | | | 1,346,567 | | | $ | 12,347,850 | | | | 5,285,106 | | | $ | 55,209,938 | | |
| Issued as reinvestment of dividends | | | - | | | | - | | | | 485,345 | | | | 4,522,855 | | |
| Redeemed | | | (1,350,593 | ) | | | (12,332,559 | ) | | | (4,165,687 | ) | | | (42,026,189 | ) | |
| Net increase (decrease) | | | (4,026 | ) | | $ | 15,291 | | | | 1,604,764 | | | $ | 17,706,604 | | |
| Emerging Growth Fund | |
| Sold | | | 935,282 | | | $ | 5,061,845 | | | | 3,061,673 | | | $ | 16,306,761 | | |
| Issued as reinvestment of dividends | | | - | | | | - | | | | - | | | | - | | |
| Redeemed | | | (1,251,781 | ) | | | (6,787,580 | ) | | | (3,552,451 | ) | | | (18,318,037 | ) | |
| Net increase (decrease) | | | (316,499 | ) | | $ | (1,725,735 | ) | | | (490,778 | ) | | $ | (2,011,276 | ) | |
| Overseas Fund | |
| Sold | | | 4,119,420 | | | $ | 45,053,772 | | | | 7,478,352 | | | $ | 74,872,152 | | |
| Issued as reinvestment of dividends | | | - | | | | - | | | | 310,690 | | | | 3,386,527 | | |
| Redeemed | | | (1,946,098 | ) | | | (21,152,760 | ) | | | (2,257,804 | ) | | | (22,333,230 | ) | |
| Net increase (decrease) | | | 2,173,322 | | | $ | 23,901,012 | | | | 5,531,238 | | | $ | 55,925,449 | | |
| Destination Retirement Income Fund** | |
| Sold | | | 1,760,089 | | | $ | 18,064,037 | | | | 1,231,400 | | | $ | 12,431,552 | | |
| Issued as reinvestment of dividends | | | - | | | | - | | | | 33,091 | | | | 341,172 | | |
| Redeemed | | | (727,485 | ) | | | (7,466,546 | ) | | | (129,613 | ) | | | (1,339,296 | ) | |
| Net increase (decrease) | | | 1,032,604 | | | $ | 10,597,491 | | | | 1,134,878 | | | $ | 11,433,428 | | |
| Destination Retirement 2010 Fund** | |
| Sold | | | 1,085,209 | | | $ | 11,364,541 | | | | 761,458 | | | $ | 7,820,608 | | |
| Issued as reinvestment of dividends | | | - | | | | - | | | | 12,492 | | | | 131,543 | | |
| Redeemed | | | (286,371 | ) | | | (2,996,151 | ) | | | (93,902 | ) | | | (969,183 | ) | |
| Net increase (decrease) | | | 798,838 | | | $ | 8,368,390 | | | | 680,048 | | | $ | 6,982,968 | | |
| Destination Retirement 2020 Fund** | |
| Sold | | | 3,750,194 | | | $ | 39,748,487 | | | | 2,123,721 | | | $ | 21,973,878 | | |
| Issued as reinvestment of dividends | | | - | | | | - | | | | 41,201 | | | | 442,914 | | |
| Redeemed | | | (1,253,896 | ) | | | (13,284,272 | ) | | | (167,963 | ) | | | (1,752,057 | ) | |
| Net increase (decrease) | | | 2,496,298 | | | $ | 26,464,215 | | | | 1,996,959 | | | $ | 20,664,735 | | |
281
Notes to Financial Statements (Unaudited) (Continued)
| | | Class A | |
| | | Six months ended June 30, 2005 | | Year ended December 31, 2004 | |
| | | Shares | | Amount | | Shares | | Amount | |
| Destination Retirement 2030 Fund** | |
| Sold | | | 1,612,336 | | | $ | 17,531,110 | | | | 2,141,149 | | | $ | 22,206,378 | | |
| Issued as reinvestment of dividends | | | - | | | | - | | | | 19,636 | | | | 218,158 | | |
| Redeemed | | | (438,137 | ) | | | (4,771,294 | ) | | | (238,873 | ) | | | (2,509,115 | ) | |
| Net increase (decrease) | | | 1,174,199 | | | $ | 12,759,816 | | | | 1,921,912 | | | $ | 19,915,421 | | |
| Destination Retirement 2040 Fund** | |
| Sold | | | 1,234,519 | | | $ | 13,557,523 | | | | 638,526 | | | $ | 6,675,110 | | |
| Issued as reinvestment of dividends | | | - | | | | - | | | | 3,993 | | | | 44,954 | | |
| Redeemed | | | (413,890 | ) | | | (4,538,591 | ) | | | (82,696 | ) | | | (862,890 | ) | |
| Net increase (decrease) | | | 820,629 | | | $ | 9,018,932 | | | | 559,823 | | | $ | 5,857,174 | | |
| | | Class L | |
| | | Six months ended June 30, 2005 | | Year ended December 31, 2004 | |
| | | Shares | | Amount | | Shares | | Amount | |
| Strategic Bond Fund* | |
| Sold | | | 20,365 | | | $ | 207,765 | | | | 10,110 | | | $ | 101,100 | | |
| Issued as reinvestment of dividends | | | - | | | | - | | | | - | | | | - | | |
| Redeemed | | | (181 | ) | | | (1,845 | ) | | | - | | | | - | | |
| Net increase (decrease) | | | 20,184 | | | $ | 205,920 | | | | 10,110 | | | $ | 101,100 | | |
| Strategic Balanced Fund** | |
| Sold | | | 1,267,634 | | | $ | 13,094,819 | | | | 13,219,946 | | | $ | 134,087,075 | | |
| Issued as reinvestment of dividends | | | - | | | | - | | | | 80,175 | | | | 838,631 | | |
| Redeemed | | | (1,474,434 | ) | | | (15,197,272 | ) | | | (3,281,078 | ) | | | (33,145,021 | ) | |
| Net increase (decrease) | | | (206,800 | ) | | $ | (2,102,453 | ) | | | 10,019,043 | | | $ | 101,780,685 | | |
| Diversified Value Fund*** | |
| Sold | | | 114,774 | | | $ | 1,264,610 | | | | 1,877,620 | | | $ | 18,781,884 | | |
| Issued as reinvestment of dividends | | | - | | | | - | | | | 10,070 | | | | 110,268 | | |
| Redeemed | | | (31,116 | ) | | | (336,959 | ) | | | (14,787 | ) | | | (161,336 | ) | |
| Net increase (decrease) | | | 83,658 | | | $ | 927,651 | | | | 1,872,903 | | | $ | 18,730,816 | | |
| Fundamental Value Fund | |
| Sold | | | 2,718,791 | | | $ | 29,243,863 | | | | 12,833,995 | | | $ | 130,634,844 | | |
| Issued as reinvestment of dividends | | | - | | | | - | | | | 435,996 | | | | 4,700,040 | | |
| Redeemed | | | (5,334,420 | ) | | | (57,901,947 | ) | | | (4,595,194 | ) | | | (46,848,457 | ) | |
| Net increase (decrease) | | | (2,615,629 | ) | | $ | (28,658,084 | ) | | | 8,674,797 | | | $ | 88,486,427 | | |
| Value Equity Fund | |
| Sold | | | 86,524 | | | $ | 914,894 | | | | 142,665 | | | $ | 1,399,163 | | |
| Issued as reinvestment of dividends | | | - | | | | - | | | | 21,799 | | | | 229,104 | | |
| Redeemed | | | (48,322 | ) | | | (500,416 | ) | | | (113,714 | ) | | | (1,120,311 | ) | |
| Net increase (decrease) | | | 38,202 | | | $ | 414,478 | | | | 50,750 | | | $ | 507,956 | | |
| Large Cap Value Fund | |
| Sold | | | 5,589,095 | | | $ | 58,180,119 | | | | 14,250,637 | | | $ | 140,284,839 | | |
| Issued as reinvestment of dividends | | | - | | | | - | | | | 171,544 | | | | 1,790,921 | | |
| Redeemed | | | (4,151,555 | ) | | | (42,953,927 | ) | | | (6,115,088 | ) | | | (60,504,451 | ) | |
| Net increase (decrease) | | | 1,437,540 | | | $ | 15,226,192 | | | | 8,307,093 | | | $ | 81,571,309 | | |
| Indexed Equity Fund | |
| Sold | | | 3,842,807 | | | $ | 42,395,884 | | | | 7,036,225 | | | $ | 73,511,288 | | |
| Issued as reinvestment of dividends | | | - | | | | - | | | | 261,718 | | | | 2,926,007 | | |
| Redeemed | | | (2,466,947 | ) | | | (27,057,975 | ) | | | (4,877,671 | ) | | | (51,085,520 | ) | |
| Net increase (decrease) | | | 1,375,860 | | | $ | 15,337,909 | | | | 2,420,272 | | | $ | 25,351,775 | | |
| Blue Chip Growth Fund | |
| Sold | | | 4,171,263 | | | $ | 35,644,938 | | | | 11,238,006 | | | $ | 94,950,789 | | |
| Issued as reinvestment of dividends | | | - | | | | - | | | | 185,442 | | | | 1,637,449 | | |
| Redeemed | | | (6,399,850 | ) | | | (54,692,643 | ) | | | (13,227,473 | ) | | | (111,570,581 | ) | |
| Net increase (decrease) | | | (2,228,587 | ) | | $ | (19,047,705 | ) | | | (1,804,025 | ) | | $ | (14,982,343 | ) | |
| Large Cap Growth Fund | |
| Sold | | | 27,193 | | | $ | 238,888 | | | | 386,723 | | | $ | 3,294,383 | | |
| Issued as reinvestment of dividends | | | - | | | | - | | | | 316 | | | | 2,882 | | |
| Redeemed | | | (1,010,383 | ) | | | (8,803,737 | ) | | | (262,426 | ) | | | (2,232,443 | ) | |
| Net increase (decrease) | | | (983,190 | ) | | $ | (8,564,849 | ) | | | 124,613 | | | $ | 1,064,822 | | |
282
Notes to Financial Statements (Unaudited) (Continued)
| | | Class L | |
| | | Six months ended June 30, 2005 | | Year ended December 31, 2004 | |
| | | Shares | | Amount | | Shares | | Amount | |
| Growth Equity Fund | |
| Sold | | | 3,733,999 | | | $ | 28,742,211 | | | | 17,579,200 | | | $ | 133,564,752 | | |
| Issued as reinvestment of dividends | | | - | | | | - | | | | 94,541 | | | | 742,148 | | |
| Redeemed | | | (4,014,801 | ) | | | (30,854,769 | ) | | | (9,283,717 | ) | | | (70,790,762 | ) | |
| Net increase (decrease) | | | (280,802 | ) | | $ | (2,112,558 | ) | | | 8,390,024 | | | $ | 63,516,138 | | |
| Aggressive Growth Fund | |
| Sold | | | 4,016,848 | | | $ | 22,663,679 | | | | 16,057,982 | | | $ | 86,646,393 | | |
| Issued as reinvestment of dividends | | | - | | | | - | | | | - | | | | - | | |
| Redeemed | | | (3,110,645 | ) | | | (17,374,171 | ) | | | (5,685,771 | ) | | | (31,208,782 | ) | |
| Net increase (decrease) | | | 906,203 | | | $ | 5,289,508 | | | | 10,372,211 | | | $ | 55,437,611 | | |
| OTC 100 Fund | |
| Sold | | | 957,746 | | | $ | 3,714,202 | | | | 1,814,901 | | | $ | 6,857,084 | | |
| Issued as reinvestment of dividends | | | - | | | | - | | | | 7,958 | | | | 32,945 | | |
| Redeemed | | | (580,489 | ) | | | (2,217,921 | ) | | | (2,762,565 | ) | | | (10,396,455 | ) | |
| Net increase (decrease) | | | 377,257 | | | $ | 1,496,281 | | | | (939,706 | ) | | $ | (3,506,426 | ) | |
| Focused Value Fund | |
| Sold | | | 1,893,597 | | | $ | 33,814,039 | | | | 4,229,003 | | | $ | 74,091,977 | | |
| Issued as reinvestment of dividends | | | - | | | | - | | | | 502,933 | | | | 8,907,603 | | |
| Redeemed | | | (1,549,793 | ) | | | (27,477,726 | ) | | | (2,351,801 | ) | | | (41,051,089 | ) | |
| Net increase (decrease) | | | 343,804 | | | $ | 6,336,313 | | | | 2,380,135 | | | $ | 41,948,491 | | |
| Small Company Value Fund | |
| Sold | | | 1,532,818 | | | $ | 21,179,809 | | | | 8,151,461 | | | $ | 107,591,499 | | |
| Issued as reinvestment of dividends | | | - | | | | - | | | | 186,122 | | | | 2,590,679 | | |
| Redeemed | | | (1,442,209 | ) | | | (19,848,524 | ) | | | (3,353,832 | ) | | | (44,640,669 | ) | |
| Net increase (decrease) | | | 90,609 | | | $ | 1,331,285 | | | | 4,983,751 | | | $ | 65,541,509 | | |
| Mid Cap Growth Equity Fund | |
| Sold | | | 881,757 | | | $ | 7,931,861 | | | | 896,480 | | | $ | 7,067,781 | | |
| Issued as reinvestment of dividends | | | - | | | | - | | | | - | | | | - | | |
| Redeemed | | | (996,930 | ) | | | (8,768,959 | ) | | | (1,053,939 | ) | | | (8,217,063 | ) | |
| Net increase (decrease) | | | (115,173 | ) | | $ | (837,098 | ) | | | (157,459 | ) | | $ | (1,149,282 | ) | |
| Mid Cap Growth Equity II Fund | |
| Sold | | | 5,348,570 | | | $ | 69,116,960 | | | | 20,723,308 | | | $ | 247,947,740 | | |
| Issued as reinvestment of dividends | | | - | | | | - | | | | 57,376 | | | | 760,234 | | |
| Redeemed | | | (5,516,840 | ) | | | (71,005,720 | ) | | | (10,265,105 | ) | | | (122,066,127 | ) | |
| Net increase (decrease) | | | (168,270 | ) | | $ | (1,888,760 | ) | | | 10,515,579 | | | $ | 126,641,847 | | |
| Small Cap Growth Equity Fund | |
| Sold | | | 1,117,387 | | | $ | 15,544,717 | | | | 2,321,511 | | | $ | 30,021,702 | | |
| Issued as reinvestment of dividends | | | - | | | | - | | | | - | | | | - | | |
| Redeemed | | | (1,203,337 | ) | | | (16,770,460 | ) | | | (2,773,073 | ) | | | (35,355,997 | ) | |
| Net increase (decrease) | | | (85,950 | ) | | $ | (1,225,743 | ) | | | (451,562 | ) | | $ | (5,334,295 | ) | |
| Small Company Growth Fund | |
| Sold | | | 428,333 | | | $ | 3,946,190 | | | | 2,771,167 | | | $ | 28,958,161 | | |
| Issued as reinvestment of dividends | | | - | | | | - | | | | 329,844 | | | | 3,083,946 | | |
| Redeemed | | | (1,484,920 | ) | | | (13,515,399 | ) | | | (2,207,367 | ) | | | (22,072,595 | ) | |
| Net increase (decrease) | | | (1,056,587 | ) | | $ | (9,569,209 | ) | | | 893,644 | | | $ | 9,969,512 | | |
| Emerging Growth Fund | |
| Sold | | | 891,448 | | | $ | 4,890,891 | | | | 4,070,900 | | | $ | 21,784,186 | | |
| Issued as reinvestment of dividends | | | - | | | | - | | | | - | | | | - | | |
| Redeemed | | | (919,469 | ) | | | (5,077,712 | ) | | | (2,627,951 | ) | | | (13,964,644 | ) | |
| Net increase (decrease) | | | (28,021 | ) | | $ | (186,821 | ) | | | 1,442,949 | | | $ | 7,819,542 | | |
| Overseas Fund | |
| Sold | | | 4,014,245 | | | $ | 44,209,724 | | | | 10,489,269 | | | $ | 105,030,029 | | |
| Issued as reinvestment of dividends | | | - | | | | - | | | | 431,560 | | | | 4,725,573 | | |
| Redeemed | | | (3,523,496 | ) | | | (38,772,882 | ) | | | (3,451,068 | ) | | | (34,822,430 | ) | |
| Net increase (decrease) | | | 490,749 | | | $ | 5,436,842 | | | | 7,469,761 | | | $ | 74,933,172 | | |
| Destination Retirement Income Fund** | |
| Sold | | | 2,782,318 | | | $ | 28,788,704 | | | | 11,850,113 | | | $ | 121,638,909 | | |
| Issued as reinvestment of dividends | | | - | | | | - | | | | 287,618 | | | | 2,971,092 | | |
| Redeemed | | | (2,119,219 | ) | | | (21,846,900 | ) | | | (2,688,100 | ) | | | (27,477,582 | ) | |
| Net increase (decrease) | | | 663,099 | | | $ | 6,941,804 | | | | 9,449,631 | | | $ | 97,132,419 | | |
283
Notes to Financial Statements (Unaudited) (Continued)
| | | Class L | |
| | | Six months ended June 30, 2005 | | Year ended December 31, 2004 | |
| | | Shares | | Amount | | Shares | | Amount | |
| Destination Retirement 2010 Fund** | |
| Sold | | | 805,902 | | | $ | 8,468,775 | | | | 2,244,801 | | | $ | 23,790,832 | | |
| Issued as reinvestment of dividends | | | - | | | | - | | | | 39,992 | | | | 421,920 | | |
| Redeemed | | | (218,256 | ) | | | (2,292,873 | ) | | | (127,650 | ) | | | (1,321,900 | ) | |
| Net increase (decrease) | | | 587,646 | | | $ | 6,175,902 | | | | 2,157,143 | | | $ | 22,890,852 | | |
| Destination Retirement 2020 Fund** | |
| Sold | | | 3,842,880 | | | $ | 40,859,633 | | | | 24,187,042 | | | $ | 249,399,080 | | |
| Issued as reinvestment of dividends | | | - | | | | - | | | | 407,668 | | | | 4,390,594 | | |
| Redeemed | | | (3,553,501 | ) | | | (37,786,189 | ) | | | (4,920,794 | ) | | | (50,754,243 | ) | |
| Net increase (decrease) | | | 289,379 | | | $ | 3,073,444 | | | | 19,673,916 | | | $ | 203,035,431 | | |
| Destination Retirement 2030 Fund** | |
| Sold | | | 3,164,301 | | | $ | 34,577,925 | | | | 18,626,424 | | | $ | 192,674,101 | | |
| Issued as reinvestment of dividends | | | - | | | | - | | | | 159,936 | | | | 1,781,683 | | |
| Redeemed | | | (3,033,441 | ) | | | (33,044,296 | ) | | | (3,696,909 | ) | | | (38,444,009 | ) | |
| Net increase (decrease) | | | 130,860 | | | $ | 1,533,629 | | | | 15,089,451 | | | $ | 156,011,775 | | |
| Destination Retirement 2040 Fund** | |
| Sold | | | 2,271,981 | | | $ | 25,082,580 | | | | 11,458,179 | | | $ | 118,281,908 | | |
| Issued as reinvestment of dividends | | | - | | | | - | | | | 67,358 | | | | 760,477 | | |
| Redeemed | | | (2,325,728 | ) | | | (25,577,224 | ) | | | (2,539,015 | ) | | | (26,545,138 | ) | |
| Net increase (decrease) | | | (53,747 | ) | | $ | (494,644 | ) | | | 8,986,522 | | | $ | 92,497,247 | | |
| | | Class Y | |
| | | Six months ended June 30, 2005 | | Year ended December 31, 2004 | |
| | | Shares | | Amount | | Shares | | Amount | |
| Strategic Bond Fund* | |
| Sold | | | 460,368 | | | $ | 4,700,000 | | | | 10,110 | | | $ | 101,100 | | |
| Issued as reinvestment of dividends | | | - | | | | - | | | | - | | | | - | | |
| Redeemed | | | (1,595 | ) | | | (16,300 | ) | | | - | | | | - | | |
| Net increase (decrease) | | | 458,773 | | | $ | 4,683,700 | | | | 10,110 | | | $ | 101,100 | | |
| Strategic Balanced Fund** | |
| Sold | | | 1,360,398 | | | $ | 14,080,981 | | | | 11,877,606 | | | $ | 120,568,240 | | |
| Issued as reinvestment of dividends | | | - | | | | - | | | | 83,874 | | | | 878,160 | | |
| Redeemed | | | (1,773,569 | ) | | | (18,307,686 | ) | | | (2,492,355 | ) | | | (25,271,229 | ) | |
| Net increase (decrease) | | | (413,171 | ) | | $ | (4,226,705 | ) | | | 9,469,125 | | | $ | 96,175,171 | | |
| Diversified Value Fund*** | |
| Sold | | | 124,504 | | | $ | 1,386,009 | | | | 135,386 | | | $ | 1,360,337 | | |
| Issued as reinvestment of dividends | | | - | | | | - | | | | 644 | | | | 7,058 | | |
| Redeemed | | | (19,537 | ) | | | (211,281 | ) | | | (19,612 | ) | | | (212,702 | ) | |
| Net increase (decrease) | | | 104,967 | | | $ | 1,174,728 | | | | 116,418 | | | $ | 1,154,693 | | |
| Fundamental Value Fund | |
| Sold | | | 2,525,129 | | | $ | 27,204,097 | | | | 4,467,641 | | | $ | 45,379,836 | | |
| Issued as reinvestment of dividends | | | - | | | | - | | | | 231,933 | | | | 2,502,554 | | |
| Redeemed | | | (1,910,717 | ) | | | (20,450,472 | ) | | | (1,771,906 | ) | | | (17,978,886 | ) | |
| Net increase (decrease) | | | 614,412 | | | $ | 6,753,625 | | | | 2,927,668 | | | $ | 29,903,504 | | |
| Value Equity Fund | |
| Sold | | | 132,358 | | | $ | 1,409,911 | | | | 225,359 | | | $ | 2,194,783 | | |
| Issued as reinvestment of dividends | | | - | | | | - | | | | 8,531 | | | | 89,995 | | |
| Redeemed | | | (44,904 | ) | | | (468,947 | ) | | | (311,699 | ) | | | (3,041,706 | ) | |
| Net increase (decrease) | | | 87,454 | | | $ | 940,964 | | | | (77,809 | ) | | $ | (756,928 | ) | |
| Large Cap Value Fund | |
| Sold | | | 3,483,314 | | | $ | 36,055,502 | | | | 5,816,465 | | | $ | 56,900,285 | | |
| Issued as reinvestment of dividends | | | - | | | | - | | | | 83,718 | | | | 875,693 | | |
| Redeemed | | | (1,589,182 | ) | | | (16,528,929 | ) | | | (2,107,941 | ) | | | (20,560,219 | ) | |
| Net increase (decrease) | | | 1,894,132 | | | $ | 19,526,573 | | | | 3,792,242 | | | $ | 37,215,759 | | |
| Indexed Equity Fund | |
| Sold | | | 9,333,121 | | | $ | 102,655,824 | | | | 16,730,617 | | | $ | 175,934,975 | | |
| Issued as reinvestment of dividends | | | - | | | | - | | | | 532,859 | | | | 5,973,344 | | |
| Redeemed | | | (4,947,778 | ) | | | (54,236,260 | ) | | | (8,925,948 | ) | | | (94,243,027 | ) | |
| Net increase (decrease) | | | 4,385,343 | | | $ | 48,419,564 | | | | 8,337,528 | | | $ | 87,665,292 | | |
284
Notes to Financial Statements (Unaudited) (Continued)
| | | Class Y | |
| | | Six months ended June 30, 2005 | | Year ended December 31, 2004 | |
| | | Shares | | Amount | | Shares | | Amount | |
| Blue Chip Growth Fund | |
| Sold | | | 130,328 | | | $ | 1,126,880 | | | | 164,037 | | | $ | 1,392,050 | | |
| Issued as reinvestment of dividends | | | - | | | | - | | | | 3,277 | | | | 28,937 | | |
| Redeemed | | | (107,830 | ) | | | (922,588 | ) | | | (108,197 | ) | | | (914,511 | ) | |
| Net increase (decrease) | | | 22,498 | | | $ | 204,292 | | | | 59,117 | | | $ | 506,476 | | |
| Large Cap Growth Fund | |
| Sold | | | 61,520 | | | $ | 525,160 | | | | 101,054 | | | $ | 852,261 | | |
| Issued as reinvestment of dividends | | | - | | | | - | | | | 1,696 | | | | 15,470 | | |
| Redeemed | | | (238 | ) | | | (2,041 | ) | | | (10,615 | ) | | | (89,359 | ) | |
| Net increase (decrease) | | | 61,282 | | | $ | 523,119 | | | | 92,135 | | | $ | 778,372 | | |
| Growth Equity Fund | |
| Sold | | | 1,879,730 | | | $ | 14,586,809 | | | | 3,139,732 | | | $ | 23,654,100 | | |
| Issued as reinvestment of dividends | | | - | | | | - | | | | 56,485 | | | | 445,656 | | |
| Redeemed | | | (1,492,064 | ) | | | (11,538,808 | ) | | | (2,417,698 | ) | | | (18,330,958 | ) | |
| Net increase (decrease) | | | 387,666 | | | $ | 3,048,001 | | | | 778,519 | | | $ | 5,768,798 | | |
| Aggressive Growth Fund | |
| Sold | | | 1,059,771 | | | $ | 6,057,991 | | | | 3,230,688 | | | $ | 17,620,416 | | |
| Issued as reinvestment of dividends | | | - | | | | - | | | | - | | | | - | | |
| Redeemed | | | (1,411,500 | ) | | | (7,873,558 | ) | | | (1,301,823 | ) | | | (7,030,571 | ) | |
| Net increase (decrease) | | | (351,729 | ) | | $ | (1,815,567 | ) | | | 1,928,865 | | | $ | 10,589,845 | | |
| OTC 100 Fund | |
| Sold | | | 361,019 | | | $ | 1,344,432 | | | | 562,288 | | | $ | 2,117,814 | | |
| Issued as reinvestment of dividends | | | - | | | | - | | | | 3,993 | | | | 16,612 | | |
| Redeemed | | | (615,918 | ) | | | (2,346,070 | ) | | | (665,667 | ) | | | (2,503,774 | ) | |
| Net increase (decrease) | | | (254,899 | ) | | $ | (1,001,638 | ) | | | (99,386 | ) | | $ | (369,348 | ) | |
| Focused Value Fund | |
| Sold | | | 2,169,375 | | | $ | 38,710,457 | | | | 2,602,820 | | | $ | 45,713,400 | | |
| Issued as reinvestment of dividends | | | - | | | | - | | | | 293,324 | | | | 5,220,816 | | |
| Redeemed | | | (1,381,317 | ) | | | (24,646,859 | ) | | | (2,255,841 | ) | | | (39,395,130 | ) | |
| Net increase (decrease) | | | 788,058 | | | $ | 14,063,598 | | | | 640,303 | | | $ | 11,539,086 | | |
| Small Company Value Fund | |
| Sold | | | 1,480,947 | | | $ | 20,535,194 | | | | 4,383,938 | | | $ | 56,817,210 | | |
| Issued as reinvestment of dividends | | | - | | | | - | | | | 172,137 | | | | 2,392,253 | | |
| Redeemed | | | (1,327,990 | ) | | | (18,282,039 | ) | | | (1,424,746 | ) | | | (18,421,301 | ) | |
| Net increase (decrease) | | | 152,957 | | | $ | 2,253,155 | | | | 3,131,329 | | | $ | 40,788,162 | | |
| Mid Cap Growth Equity Fund | |
| Sold | | | 782,907 | | | $ | 7,101,242 | | | | 754,765 | | | $ | 5,975,967 | | |
| Issued as reinvestment of dividends | | | - | | | | - | | | | - | | | | - | | |
| Redeemed | | | (482,372 | ) | | | (4,291,764 | ) | | | (1,071,814 | ) | | | (8,502,624 | ) | |
| Net increase (decrease) | | | 300,535 | | | $ | 2,809,478 | | | | (317,049 | ) | | $ | (2,526,657 | ) | |
| Mid Cap Growth Equity II Fund | |
| Sold | | | 1,882,400 | | | $ | 24,481,754 | | | | 4,068,903 | | | $ | 48,857,900 | | |
| Issued as reinvestment of dividends | | | - | | | | - | | | | 13,555 | | | | 180,956 | | |
| Redeemed | | | (862,979 | ) | | | (11,213,352 | ) | | | (1,176,886 | ) | | | (13,941,647 | ) | |
| Net increase (decrease) | | | 1,019,421 | | | $ | 13,268,402 | | | | 2,905,572 | | | $ | 35,097,209 | | |
| Small Cap Growth Equity Fund | |
| Sold | | | 1,964,548 | | | $ | 27,574,180 | | | | 2,692,460 | | | $ | 34,900,142 | | |
| Issued as reinvestment of dividends | | | - | | | | - | | | | - | | | | - | | |
| Redeemed | | | (1,304,972 | ) | | | (18,276,283 | ) | | | (3,172,040 | ) | | | (40,699,201 | ) | |
| Net increase (decrease) | | | 659,576 | | | $ | 9,297,897 | | | | (479,580 | ) | | $ | (5,799,059 | ) | |
| Small Company Growth Fund | |
| Sold | | | 349,521 | | | $ | 3,238,759 | | | | 1,552,489 | | | $ | 16,502,001 | | |
| Issued as reinvestment of dividends | | | - | | | | - | | | | 293,717 | | | | 2,770,556 | | |
| Redeemed | | | (1,365,732 | ) | | | (12,690,725 | ) | | | (1,326,119 | ) | | | (13,511,045 | ) | |
| Net increase (decrease) | | | (1,016,211 | ) | | $ | (9,451,966 | ) | | | 520,087 | | | $ | 5,761,512 | | |
| Emerging Growth Fund | |
| Sold | | | 425,898 | | | $ | 2,329,365 | | | | 309,721 | | | $ | 1,670,265 | | |
| Issued as reinvestment of dividends | | | - | | | | - | | | | - | | | | - | | |
| Redeemed | | | (242,868 | ) | | | (1,297,466 | ) | | | (156,462 | ) | | | (811,425 | ) | |
| Net increase (decrease) | | | 183,030 | | | $ | 1,031,899 | | | | 153,259 | | | $ | 858,840 | | |
285
Notes to Financial Statements (Unaudited) (Continued)
| | | Class Y | |
| | | Six months ended June 30, 2005 | | Year ended December 31, 2004 | |
| | | Shares | | Amount | | Shares | | Amount | |
| Overseas Fund | |
| Sold | | | 1,240,972 | | | $ | 13,682,102 | | | | 2,900,296 | | | $ | 29,328,745 | | |
| Issued as reinvestment of dividends | | | - | | | | - | | | | 235,336 | | | | 2,583,995 | | |
| Redeemed | | | (833,858 | ) | | | (9,149,140 | ) | | | (2,192,861 | ) | | | (22,815,525 | ) | |
| Net increase (decrease) | | | 407,114 | | | $ | 4,532,962 | | | | 942,771 | | | $ | 9,097,215 | | |
| Destination Retirement Income Fund** | |
| Sold | | | 1,392,563 | | | $ | 14,545,808 | | | | 8,067,040 | | | $ | 81,352,155 | | |
| Issued as reinvestment of dividends | | | - | | | | - | | | | 239,689 | | | | 2,475,992 | | |
| Redeemed | | | (292,791 | ) | | | (3,030,050 | ) | | | (527,841 | ) | | | (5,383,414 | ) | |
| Net increase (decrease) | | | 1,099,772 | | | $ | 11,515,758 | | | | 7,778,888 | | | $ | 78,444,733 | | |
| Destination Retirement 2010 Fund** | |
| Sold | | | 2,096,882 | | | $ | 22,353,165 | | | | 530,705 | | | $ | 5,483,429 | | |
| Issued as reinvestment of dividends | | | - | | | | - | | | | 9,678 | | | | 102,102 | | |
| Redeemed | | | (74,458 | ) | | | (786,515 | ) | | | (19,586 | ) | | | (206,557 | ) | |
| Net increase (decrease) | | | 2,022,424 | | | $ | 21,566,650 | | | | 520,797 | | | $ | 5,378,974 | | |
| Destination Retirement 2020 Fund** | |
| Sold | | | 3,255,810 | | | $ | 35,233,409 | | | | 961,141 | | | $ | 9,957,098 | | |
| Issued as reinvestment of dividends | | | - | | | | - | | | | 20,371 | | | | 219,396 | | |
| Redeemed | | | (84,363 | ) | | | (901,779 | ) | | | (40,242 | ) | | | (423,677 | ) | |
| Net increase (decrease) | | | 3,171,447 | | | $ | 34,331,630 | | | | 941,270 | | | $ | 9,752,817 | | |
| Destination Retirement 2030 Fund** | |
| Sold | | | 1,067,435 | | | $ | 11,821,599 | | | | 295,765 | | | $ | 3,069,519 | | |
| Issued as reinvestment of dividends | | | - | | | | - | | | | 3,219 | | | | 35,833 | | |
| Redeemed | | | (40,017 | ) | | | (438,549 | ) | | | (24,371 | ) | | | (261,394 | ) | |
| Net increase (decrease) | | | 1,027,418 | | | $ | 11,383,050 | | | | 274,613 | | | $ | 2,843,958 | | |
| Destination Retirement 2040 Fund** | |
| Sold | | | 232,485 | | | $ | 2,587,705 | | | | 50,006 | | | $ | 524,724 | | |
| Issued as reinvestment of dividends | | | - | | | | - | | | | 356 | | | | 4,016 | | |
| Redeemed | | | (18,080 | ) | | | (199,188 | ) | | | (7,544 | ) | | | (81,751 | ) | |
| Net increase (decrease) | | | 214,405 | | | $ | 2,388,517 | | | | 42,818 | | | $ | 446,989 | | |
| | | Class S | |
| | | Six months ended June 30, 2005 | | Year ended December 31, 2004 | |
| | | Shares | | Amount | | Shares | | Amount | |
| Strategic Bond Fund* | |
| Sold | | | 325 | | | $ | 3,243 | | | | 4,959,610 | | | $ | 49,596,100 | | |
| Issued as reinvestment of dividends | | | - | | | | - | | | | - | | | | - | | |
| Redeemed | | | (1 | ) | | | (8 | ) | | | - | | | | - | | |
| Net increase (decrease) | | | 324 | | | $ | 3,235 | | | | 4,959,610 | | | $ | 49,596,100 | | |
| Strategic Balanced Fund** | |
| Sold | | | 114,287 | | | $ | 1,183,817 | | | | 371,541 | | | $ | 3,778,455 | | |
| Issued as reinvestment of dividends | | | - | | | | - | | | | 2,669 | | | | 27,942 | | |
| Redeemed | | | (27,570 | ) | | | (285,049 | ) | | | (119,572 | ) | | | (1,222,402 | ) | |
| Net increase (decrease) | | | 86,717 | | | $ | 898,768 | | | | 254,638 | | | $ | 2,583,995 | | |
| Diversified Value Fund*** | |
| Sold | | | 638,192 | | | $ | 6,993,524 | | | | 16,371,932 | | | $ | 163,819,461 | | |
| Issued as reinvestment of dividends | | | - | | | | - | | | | 92,810 | | | | 1,016,271 | | |
| Redeemed | | | (1,257,194 | ) | | | (13,590,379 | ) | | | (612,953 | ) | | | (6,536,523 | ) | |
| Net increase (decrease) | | | (619,002 | ) | | $ | (6,596,855 | ) | | | 15,851,789 | | | $ | 158,299,209 | | |
| Fundamental Value Fund | |
| Sold | | | 5,379,497 | | | $ | 58,148,289 | | | | 17,639,272 | | | $ | 179,242,561 | | |
| Issued as reinvestment of dividends | | | - | | | | - | | | | 648,494 | | | | 7,003,736 | | |
| Redeemed | | | (2,444,100 | ) | | | (26,410,250 | ) | | | (10,874,862 | ) | | | (110,517,767 | ) | |
| Net increase (decrease) | | | 2,935,397 | | | $ | 31,738,039 | | | | 7,412,904 | | | $ | 75,728,530 | | |
| Value Equity Fund | |
| Sold | | | 507,401 | | | $ | 5,352,626 | | | | 1,329,444 | | | $ | 13,017,993 | | |
| Issued as reinvestment of dividends | | | - | | | | - | | | | 166,814 | | | | 1,758,220 | | |
| Redeemed | | | (705,973 | ) | | | (7,348,223 | ) | | | (3,606,466 | ) | | | (35,397,914 | ) | |
| Net increase (decrease) | | | (198,572 | ) | | $ | (1,995,597 | ) | | | (2,110,208 | ) | | $ | (20,621,701 | ) | |
286
Notes to Financial Statements (Unaudited) (Continued)
| | | Class S | |
| | | Six months ended June 30, 2005 | | Year ended December 31, 2004 | |
| | | Shares | | Amount | | Shares | | Amount | |
| Large Cap Value Fund | |
| Sold | | | 9,230,370 | | | $ | 96,216,128 | | | | 19,894,965 | | | $ | 194,413,730 | | |
| Issued as reinvestment of dividends | | | - | | | | - | | | | 310,085 | | | | 3,246,587 | | |
| Redeemed | | | (4,242,258 | ) | | | (44,273,057 | ) | | | (14,526,540 | ) | | | (141,645,724 | ) | |
| Net increase (decrease) | | | 4,988,112 | | | $ | 51,943,071 | | | | 5,678,510 | | | $ | 56,014,593 | | |
| Indexed Equity Fund | |
| Sold | | | 7,714,478 | | | $ | 85,155,151 | | | | 18,568,838 | | | $ | 196,456,807 | | |
| Issued as reinvestment of dividends | | | - | | | | - | | | | 896,750 | | | | 10,142,244 | | |
| Redeemed | | | (14,165,545 | ) | | | (158,157,076 | ) | | | (23,806,406 | ) | | | (255,765,522 | ) | |
| Net increase (decrease) | | | (6,451,067 | ) | | $ | (73,001,925 | ) | | | (4,340,818 | ) | | $ | (49,166,471 | ) | |
| Blue Chip Growth Fund | |
| Sold | | | 795,496 | | | $ | 6,777,086 | | | | 2,708,131 | | | $ | 22,995,599 | | |
| Issued as reinvestment of dividends | | | - | | | | - | | | | 69,966 | | | | 619,898 | | |
| Redeemed | | | (1,476,398 | ) | | | (12,696,319 | ) | | | (4,731,108 | ) | | | (40,248,274 | ) | |
| Net increase (decrease) | | | (680,902 | ) | | $ | (5,919,233 | ) | | | (1,953,011 | ) | | $ | (16,632,777 | ) | |
| Large Cap Growth Fund | |
| Sold | | | 88,375 | | | $ | 770,799 | | | | 286,165 | | | $ | 2,442,183 | | |
| Issued as reinvestment of dividends | | | - | | | | - | | | | 2,505 | | | | 22,946 | | |
| Redeemed | | | (196,836 | ) | | | (1,706,057 | ) | | | (2,182,163 | ) | | | (18,503,482 | ) | |
| Net increase (decrease) | | | (108,461 | ) | | $ | (935,258 | ) | | | (1,893,493 | ) | | $ | (16,038,353 | ) | |
| Growth Equity Fund | |
| Sold | | | 5,292,662 | | | $ | 41,095,179 | | | | 17,166,717 | | | $ | 130,579,944 | | |
| Issued as reinvestment of dividends | | | - | | | | - | | | | 133,011 | | | | 1,053,451 | | |
| Redeemed | | | (2,703,368 | ) | | | (21,162,536 | ) | | | (17,040,695 | ) | | | (130,000,895 | ) | |
| Net increase (decrease) | | | 2,589,294 | | | $ | 19,932,643 | | | | 259,033 | | | $ | 1,632,500 | | |
| Aggressive Growth Fund | |
| Sold | | | 7,365,503 | | | $ | 42,171,968 | | | | 28,767,144 | | | $ | 156,609,566 | | |
| Issued as reinvestment of dividends | | | - | | | | - | | | | - | | | | - | | |
| Redeemed | | | (7,945,997 | ) | | | (44,872,081 | ) | | | (17,339,077 | ) | | | (93,233,865 | ) | |
| Net increase (decrease) | | | (580,494 | ) | | $ | (2,700,113 | ) | | | 11,428,067 | | | $ | 63,375,701 | | |
| OTC 100 Fund | |
| Sold | | | 1,417,434 | | | $ | 5,484,593 | | | | 11,919,751 | | | $ | 45,959,137 | | |
| Issued as reinvestment of dividends | | | - | | | | - | | | | 24,480 | | | | 102,326 | | |
| Redeemed | | | (2,489,124 | ) | | | (9,647,019 | ) | | | (12,678,318 | ) | | | (48,015,610 | ) | |
| Net increase (decrease) | | | (1,071,690 | ) | | $ | (4,162,426 | ) | | | (734,087 | ) | | $ | (1,954,147 | ) | |
| Focused Value Fund | |
| Sold | | | 3,378,457 | | | $ | 60,706,508 | | | | 9,257,285 | | | $ | 163,535,917 | | |
| Issued as reinvestment of dividends | | | - | | | | - | | | | 993,993 | | | | 17,778,703 | | |
| Redeemed | | | (2,760,914 | ) | | | (49,580,385 | ) | | | (9,382,302 | ) | | | (164,688,257 | ) | |
| Net increase (decrease) | | | 617,543 | | | $ | 11,126,123 | | | | 868,976 | | | $ | 16,626,363 | | |
| Small Company Value Fund | |
| Sold | | | 2,626,337 | | | $ | 36,258,609 | | | | 10,791,611 | | | $ | 139,439,685 | | |
| Issued as reinvestment of dividends | | | - | | | | - | | | | 317,202 | | | | 4,427,748 | | |
| Redeemed | | | (2,691,901 | ) | | | (37,194,960 | ) | | | (4,703,420 | ) | | | (60,269,971 | ) | |
| Net increase (decrease) | | | (65,564 | ) | | $ | (936,351 | ) | | | 6,405,393 | | | $ | 83,597,462 | | |
| Mid Cap Growth Equity Fund | |
| Sold | | | 2,513,428 | | | $ | 22,817,748 | | | | 2,872,743 | | | $ | 22,965,599 | | |
| Issued as reinvestment of dividends | | | - | | | | - | | | | - | | | | - | | |
| Redeemed | | | (1,612,285 | ) | | | (14,383,892 | ) | | | (6,068,060 | ) | | | (47,908,271 | ) | |
| Net increase (decrease) | | | 901,143 | | | $ | 8,433,856 | | | | (3,195,317 | ) | | $ | (24,942,672 | ) | |
| Mid Cap Growth Equity II Fund | |
| Sold | | | 2,642,129 | | | $ | 34,440,485 | | | | 10,070,441 | | | $ | 119,671,367 | | |
| Issued as reinvestment of dividends | | | - | | | | - | | | | 28,204 | | | | 377,653 | | |
| Redeemed | | | (2,643,870 | ) | | | (34,470,104 | ) | | | (5,724,850 | ) | | | (67,586,495 | ) | |
| Net increase (decrease) | | | (1,741 | ) | | $ | (29,619 | ) | | | 4,373,795 | | | $ | 52,462,525 | | |
| Small Cap Growth Equity Fund | |
| Sold | | | 2,322,312 | | | $ | 32,899,802 | | | | 7,202,292 | | | $ | 94,618,695 | | |
| Issued as reinvestment of dividends | | | - | | | | - | | | | - | | | | - | | |
| Redeemed | | | (2,649,588 | ) | | | (37,478,280 | ) | | | (9,657,903 | ) | | | (125,240,348 | ) | |
| Net increase (decrease) | | | (327,276 | ) | | $ | (4,578,478 | ) | | | (2,455,611 | ) | | $ | (30,621,653 | ) | |
287
Notes to Financial Statements (Unaudited) (Continued)
| | | Class S | |
| | | Six months ended June 30, 2005 | | Year ended December 31, 2004 | |
| | | Shares | | Amount | | Shares | | Amount | |
| Small Company Growth Fund | |
| Sold | | | 211,647 | | | $ | 1,958,763 | | | | 2,818,604 | | | $ | 30,896,633 | | |
| Issued as reinvestment of dividends | | | - | | | | - | | | | 133,668 | | | | 1,258,924 | | |
| Redeemed | | | (503,210 | ) | | | (4,707,999 | ) | | | (2,999,939 | ) | | | (30,766,909 | ) | |
| Net increase (decrease) | | | (291,563 | ) | | $ | (2,749,236 | ) | | | (47,667 | ) | | $ | 1,388,648 | | |
| Emerging Growth Fund | |
| Sold | | | 1,310,808 | | | $ | 7,274,654 | | | | 5,342,673 | | | $ | 29,089,188 | | |
| Issued as reinvestment of dividends | | | - | | | | - | | | | - | | | | - | | |
| Redeemed | | | (1,007,984 | ) | | | (5,619,001 | ) | | | (6,575,661 | ) | | | (35,165,002 | ) | |
| Net increase (decrease) | | | 302,824 | | | $ | 1,655,653 | | | | (1,232,988 | ) | | $ | (6,075,814 | ) | |
| Overseas Fund | |
| Sold | | | 5,247,535 | | | $ | 57,695,651 | | | | 15,744,056 | | | $ | 157,638,482 | | |
| Issued as reinvestment of dividends | | | - | | | | - | | | | 539,145 | | | | 5,930,588 | | |
| Redeemed | | | (2,504,840 | ) | | | (27,534,800 | ) | | | (11,109,060 | ) | | | (110,591,436 | ) | |
| Net increase (decrease) | | | 2,742,695 | | | $ | 30,160,851 | | | | 5,174,141 | | | $ | 52,977,634 | | |
| Destination Retirement Income Fund** | |
| Sold | | | 126,758 | | | $ | 1,310,669 | | | | 55,974 | | | $ | 574,688 | | |
| Issued as reinvestment of dividends | | | - | | | | - | | | | 1,560 | | | | 16,112 | | |
| Redeemed | | | (13,724 | ) | | | (141,717 | ) | | | (2,086 | ) | | | (22,071 | ) | |
| Net increase (decrease) | | | 113,034 | | | $ | 1,168,952 | | | | 55,448 | | | $ | 568,729 | | |
| Destination Retirement 2010 Fund** | |
| Sold | | | 333,899 | | | $ | 3,523,903 | | | | 272,080 | | | $ | 2,828,011 | | |
| Issued as reinvestment of dividends | | | - | | | | - | | | | 3,095 | | | | 32,686 | | |
| Redeemed | | | (76,447 | ) | | | (805,519 | ) | | | (115,789 | ) | | | (1,201,126 | ) | |
| Net increase (decrease) | | | 257,452 | | | $ | 2,718,384 | | | | 159,386 | | | $ | 1,659,571 | | �� |
| Destination Retirement 2020 Fund** | |
| Sold | | | 932,341 | | | $ | 9,944,189 | | | | 1,253,247 | | | $ | 12,837,280 | | |
| Issued as reinvestment of dividends | | | - | | | | - | | | | 24,637 | | | | 265,344 | | |
| Redeemed | | | (173,444 | ) | | | (1,852,944 | ) | | | (188,385 | ) | | | (1,966,960 | ) | |
| Net increase (decrease) | | | 758,897 | | | $ | 8,091,245 | | | | 1,089,499 | | | $ | 11,135,664 | | |
| Destination Retirement 2030 Fund** | |
| Sold | | | 370,012 | | | $ | 4,036,160 | | | | 332,476 | | | $ | 3,538,326 | | |
| Issued as reinvestment of dividends | | | - | | | | - | | | | 2,773 | | | | 30,890 | | |
| Redeemed | | | (37,668 | ) | | | (414,082 | ) | | | (14,131 | ) | | | (144,524 | ) | |
| Net increase (decrease) | | | 332,344 | | | $ | 3,622,078 | | | | 321,118 | | | $ | 3,424,692 | | |
| Destination Retirement 2040 Fund** | |
| Sold | | | 284,136 | | | $ | 3,127,244 | | | | 138,415 | | | $ | 1,465,812 | | |
| Issued as reinvestment of dividends | | | - | | | | - | | | | 517 | | | | 5,838 | | |
| Redeemed | | | (18,109 | ) | | | (200,670 | ) | | | (44,652 | ) | | | (466,892 | ) | |
| Net increase (decrease) | | | 266,027 | | | $ | 2,926,574 | | | | 94,280 | | | $ | 1,004,758 | | |
| | | Class Z | |
| | | Six months ended June 30, 2005 | | Year ended December 31, 2004 | |
| | | Shares | | Amount | | Shares | | Amount | |
| Indexed Equity Fund | |
| Sold | | | 8,486,327 | | | $ | 95,099,589 | | | | 9,313,290 | | | $ | 102,583,756 | | |
| Issued as reinvestment of dividends | | | - | | | | - | | | | 188,432 | | | | 2,131,169 | | |
| Redeemed | | | (3,005,220 | ) | | | (33,314,776 | ) | | | (2,113,972 | ) | | | (22,695,261 | ) | |
| Net increase (decrease) | | | 5,481,107 | | | $ | 61,784,813 | | | | 7,387,750 | | | $ | 82,019,664 | | |
| | | Class N | |
| | | Six months ended June 30, 2005 | | Year ended December 31, 2004 | |
| | | Shares | | Amount | | Shares | | Amount | |
| Strategic Bond Fund* | |
| Sold | | | - | | | $ | - | | | | 10,110 | | | $ | 101,100 | | |
| Issued as reinvestment of dividends | | | - | | | | - | | | | - | | | | - | | |
| Redeemed | | | - | | | | - | | | | - | | | | - | | |
| Net increase (decrease) | | | - | | | $ | - | | | | 10,110 | | | $ | 101,100 | | |
288
Notes to Financial Statements (Unaudited) (Continued)
| | | Class N | |
| | | Six months ended June 30, 2005 | | Year ended December 31, 2004 | |
| | | Shares | | Amount | | Shares | | Amount | |
| Strategic Balanced Fund** | |
| Sold | | | 1,805 | | | $ | 18,558 | | | | 45,704 | | | $ | 456,152 | | |
| Issued as reinvestment of dividends | | | - | | | | - | | | | 122 | | | | 1,271 | | |
| Redeemed | | | (3,650 | ) | | | (37,484 | ) | | | (5,499 | ) | | | (54,678 | ) | |
| Net increase (decrease) | | | (1,845 | ) | | $ | (18,926 | ) | | | 40,327 | | | $ | 402,745 | | |
| Diversified Value Fund*** | |
| Sold | | | 39 | | | $ | 422 | | | | 19,296 | | | $ | 192,964 | | |
| Issued as reinvestment of dividends | | | - | | | | - | | | | 17 | | | | 182 | | |
| Redeemed | | | (6 | ) | | | (65 | ) | | | (2,201 | ) | | | (23,634 | ) | |
| Net increase (decrease) | | | 33 | | | $ | 357 | | | | 17,112 | | | $ | 169,512 | | |
| Fundamental Value Fund | |
| Sold | | | 24,940 | | | $ | 265,681 | | | | 58,836 | | | $ | 604,415 | | |
| Issued as reinvestment of dividends | | | - | | | | - | | | | 2,189 | | | | 23,398 | | |
| Redeemed | | | (6,887 | ) | | | (73,144 | ) | | | (105,141 | ) | | | (1,053,358 | ) | |
| Net increase (decrease) | | | 18,053 | | | $ | 192,537 | | | | (44,116 | ) | | $ | (425,545 | ) | |
| Value Equity Fund | |
| Sold | | | 271 | | | $ | 2,825 | | | | 597 | | | $ | 5,791 | | |
| Issued as reinvestment of dividends | | | - | | | | - | | | | 325 | | | | 3,422 | | |
| Redeemed | | | (171 | ) | | | (1,780 | ) | | | (7,043 | ) | | | (73,881 | ) | |
| Net increase (decrease) | | | 100 | | | $ | 1,045 | | | | (6,121 | ) | | $ | (64,668 | ) | |
| Large Cap Value Fund | |
| Sold | | | 44,797 | | | $ | 456,651 | | | | 10,756 | | | $ | 103,125 | | |
| Issued as reinvestment of dividends | | | - | | | | - | | | | - | | | | - | | |
| Redeemed | | | (86,290 | ) | | | (883,084 | ) | | | (40,347 | ) | | | (408,686 | ) | |
| Net increase (decrease) | | | (41,493 | ) | | $ | (426,433 | ) | | | (29,591 | ) | | $ | (305,561 | ) | |
| Indexed Equity Fund | |
| Sold | | | 77,112 | | | $ | 835,020 | | | | 136,088 | | | $ | 1,402,331 | | |
| Issued as reinvestment of dividends | | | - | | | | - | | | | 3,107 | | | | 34,299 | | |
| Redeemed | | | (23,871 | ) | | | (257,439 | ) | | | (47,689 | ) | | | (491,666 | ) | |
| Net increase (decrease) | | | 53,241 | | | $ | 577,581 | | | | 91,506 | | | $ | 944,964 | | |
| Blue Chip Growth Fund | |
| Sold | | | 16,131 | | | $ | 135,777 | | | | 131,652 | | | $ | 1,091,361 | | |
| Issued as reinvestment of dividends | | | - | | | | - | | | | 210 | | | | 1,828 | | |
| Redeemed | | | (14,871 | ) | | | (124,574 | ) | | | (60,758 | ) | | | (507,701 | ) | |
| Net increase (decrease) | | | 1,260 | | | $ | 11,203 | | | | 71,104 | | | $ | 585,488 | | |
| Large Cap Growth Fund | |
| Sold | | | 48 | | | $ | 421 | | | | 75 | | | $ | 626 | | |
| Issued as reinvestment of dividends | | | - | | | | - | | | | - | | | | - | | |
| Redeemed | | | (134 | ) | | | (1,121 | ) | | | (14,389 | ) | | | (118,421 | ) | |
| Net increase (decrease) | | | (86 | ) | | $ | (700 | ) | | | (14,314 | ) | | $ | (117,795 | ) | |
| Growth Equity Fund | |
| Sold | | | 3,745 | | | $ | 28,250 | | | | 50,257 | | | $ | 380,276 | | |
| Issued as reinvestment of dividends | | | - | | | | - | | | | - | | | | - | | |
| Redeemed | | | (2,844 | ) | | | (20,671 | ) | | | (84,028 | ) | | | (624,802 | ) | |
| Net increase (decrease) | | | 901 | | | $ | 7,579 | | | | (33,771 | ) | | $ | (244,526 | ) | |
| Aggressive Growth Fund | |
| Sold | | | 22,718 | | | $ | 123,609 | | | | 108,571 | | | $ | 577,010 | | |
| Issued as reinvestment of dividends | | | - | | | | - | | | | - | | | | - | | |
| Redeemed | | | (76,668 | ) | | | (405,849 | ) | | | (41,362 | ) | | | (219,831 | ) | |
| Net increase (decrease) | | | (53,950 | ) | | $ | (282,240 | ) | | | 67,209 | | | $ | 357,179 | | |
| OTC 100 Fund | |
| Sold | | | 5,687 | | | $ | 21,388 | | | | 80,680 | | | $ | 289,743 | | |
| Issued as reinvestment of dividends | | | - | | | | - | | | | 52 | | | | 209 | | |
| Redeemed | | | (6,649 | ) | | | (24,948 | ) | | | (14,683 | ) | | | (52,604 | ) | |
| Net increase (decrease) | | | (962 | ) | | $ | (3,560 | ) | | | 66,049 | | | $ | 237,348 | | |
| Focused Value Fund | |
| Sold | | | 58,978 | | | $ | 1,021,746 | | | | 20,781 | | | $ | 363,187 | | |
| Issued as reinvestment of dividends | | | - | | | | - | | | | 2,765 | | | | 47,908 | | |
| Redeemed | | | (12,027 | ) | | | (207,779 | ) | | | (20,212 | ) | | | (351,195 | ) | |
| Net increase (decrease) | | | 46,951 | | | $ | 813,967 | | | | 3,334 | | | $ | 59,900 | | |
| Small Company Value Fund | |
| Sold | | | 29,224 | | | $ | 401,906 | | | | 37,712 | | | $ | 483,482 | | |
| Issued as reinvestment of dividends | | | - | | | | - | | | | 1,259 | | | | 17,197 | | |
| Redeemed | | | (15,442 | ) | | | (211,291 | ) | | | (21,702 | ) | | | (279,351 | ) | |
| Net increase (decrease) | | | 13,782 | | | $ | 190,615 | | | | 17,269 | | | $ | 221,328 | | |
289
Notes to Financial Statements (Unaudited) (Continued)
| | | Class N | |
| | | Six months ended June 30, 2005 | | Year ended December 31, 2004 | |
| | | Shares | | Amount | | Shares | | Amount | |
| Mid Cap Growth Equity Fund | |
| Sold | | | 1 | | | $ | 5 | | | | 1,055 | | | $ | 8,309 | | |
| Issued as reinvestment of dividends | | | - | | | | - | | | | - | | | | - | | |
| Redeemed | | | - | | | | (1 | ) | | | (1,914 | ) | | | (14,570 | ) | |
| Net increase (decrease) | | | 1 | | | $ | 4 | | | | (859 | ) | | $ | (6,261 | ) | |
| Mid Cap Growth Equity II Fund | |
| Sold | | | 22,379 | | | $ | 282,265 | | | | 56,954 | | | $ | 658,756 | | |
| Issued as reinvestment of dividends | | | - | | | | - | | | | 161 | | | | 2,083 | | |
| Redeemed | | | (9,916 | ) | | | (125,033 | ) | | | (28,184 | ) | | | (343,843 | ) | |
| Net increase (decrease) | | | 12,463 | | | $ | 157,232 | | | | 28,931 | | | $ | 316,996 | | |
| Small Cap Growth Equity Fund | |
| Sold | | | 5,972 | | | $ | 81,308 | | | | 51,215 | | | $ | 639,340 | | |
| Issued as reinvestment of dividends | | | - | | | | - | | | | - | | | | - | | |
| Redeemed | | | (5,351 | ) | | | (72,159 | ) | | | (5,196 | ) | | | (64,887 | ) | |
| Net increase (decrease) | | | 621 | | | $ | 9,149 | | | | 46,019 | | | $ | 574,453 | | |
| Small Company Growth Fund | |
| Sold | | | 35,454 | | | $ | 325,414 | | | | 20,744 | | | $ | 226,349 | | |
| Issued as reinvestment of dividends | | | - | | | | - | | | | 5,921 | | | | 54,377 | | |
| Redeemed | | | (13,941 | ) | | | (124,932 | ) | | | (24,945 | ) | | | (256,605 | ) | |
| Net increase (decrease) | | | 21,513 | | | $ | 200,482 | | | | 1,720 | | | $ | 24,121 | | |
| Emerging Growth Fund | |
| Sold | | | 1 | | | $ | 5 | | | | - | | | $ | - | | |
| Issued as reinvestment of dividends | | | - | | | | - | | | | - | | | | - | | |
| Redeemed | | | - | | | | (1 | ) | | | - | | | | - | | |
| Net increase (decrease) | | | 1 | | | $ | 4 | | | | - | | | $ | - | | |
| Overseas Fund | |
| Sold | | | 62,615 | | | $ | 674,549 | | | | 54,905 | | | $ | 539,302 | | |
| Issued as reinvestment of dividends | | | - | | | | - | | | | 1,611 | | | | 17,450 | | |
| Redeemed | | | (10,078 | ) | | | (108,581 | ) | | | (1,978 | ) | | | (19,993 | ) | |
| Net increase (decrease) | | | 52,537 | | | $ | 565,968 | | | | 54,538 | | | $ | 536,759 | | |
| Destination Retirement Income Fund** | |
| Sold | | | 39 | | | $ | 403 | | | | 5 | | | $ | 52 | | |
| Issued as reinvestment of dividends | | | - | | | | - | | | | 1 | | | | 14 | | |
| Redeemed | | | (6 | ) | | | (66 | ) | | | - | | | | - | | |
| Net increase (decrease) | | | 33 | | | $ | 337 | | | | 6 | | | $ | 66 | | |
| Destination Retirement 2010 Fund** | |
| Sold | | | 1,224 | | | $ | 12,920 | | | | 95 | | | $ | 1,008 | | |
| Issued as reinvestment of dividends | | | - | | | | - | | | | 2 | | | | 20 | | |
| Redeemed | | | - | | | | (2 | ) | | | - | | | | - | | |
| Net increase (decrease) | | | 1,224 | | | $ | 12,918 | | | | 97 | | | $ | 1,028 | | |
| Destination Retirement 2020 Fund** | |
| Sold | | | 7,606 | | | $ | 81,088 | | | | 466 | | | $ | 5,034 | | |
| Issued as reinvestment of dividends | | | - | | | | - | | | | 8 | | | | 87 | | |
| Redeemed | | | (258 | ) | | | (2,720 | ) | | | - | | | | - | | |
| Net increase (decrease) | | | 7,348 | | | $ | 78,368 | | | | 474 | | | $ | 5,121 | | |
| Destination Retirement 2030 Fund** | |
| Sold | | | 1,897 | | | $ | 20,587 | | | | 141 | | | $ | 1,553 | | |
| Issued as reinvestment of dividends | | | - | | | | - | | | | 1 | | | | 11 | | |
| Redeemed | | | (10 | ) | | | (106 | ) | | | - | | | | - | | |
| Net increase (decrease) | | | 1,887 | | | $ | 20,481 | | | | 142 | | | $ | 1,564 | | |
| Destination Retirement 2040 Fund** | |
| Sold | | | 238 | | | $ | 2,603 | | | | 18 | | | $ | 200 | | |
| Issued as reinvestment of dividends | | | - | | | | - | | | | - | | | | - | | |
| Redeemed | | | (71 | ) | | | (748 | ) | | | - | | | | - | | |
| Net increase (decrease) | | | 167 | | | $ | 1,855 | | | | 18 | | | $ | 200 | | |
* Fund commenced operations on December 31, 2004.
** Fund commenced operations on December 31, 2003.
*** Fund commenced operations on October 15, 2004.
290
Notes to Financial Statements (Unaudited) (Continued)
Redemptions or exchanges of Class N made within eighteen months of purchase are subject to a contingent deferred sales charge of 1% of the amount redeemed. The distributor receives all contingent deferred sales charges. Contingent deferred sales charges imposed during the six months ended June 30, 2005 were all waived.
6. Federal Income Tax Information At June 30, 2005, the cost of securities and the unrealized appreciation (depreciation) in the value of investments owned by the Funds, as computed on a Federal income tax basis, were as follows:
| | | Federal
Income Tax
Cost | | Tax Basis
Unrealized
Appreciation | | Tax Basis
Unrealized
Depreciation | | Net Unrealized
Appreciation/
(Depreciation) | |
| Strategic Bond Fund | | $ | 69,903,690 | | | $ | 683,294 | | | $ | (398,980 | ) | | $ | 284,314 | | |
| Strategic Balanced Fund | | | 279,293,426 | | | | 15,143,425 | | | | (9,049,249 | ) | | | 6,094,176 | | |
| Diversified Value Fund | | | 198,505,695 | | | | 41,836,859 | | | | (6,348,401 | ) | | | 35,488,458 | | |
| Fundamental Value Fund | | | 879,642,935 | | | | 132,756,666 | | | | (16,775,614 | ) | | | 115,981,052 | | |
| Value Equity Fund | | | 94,421,121 | | | | 9,153,734 | | | | (1,734,408 | ) | | | 7,419,326 | | |
| Large Cap Value Fund | | | 1,272,563,914 | | | | 244,836,339 | | | | (26,460,791 | ) | | | 218,375,548 | | |
| Indexed Equity Fund | | | 1,902,549,516 | | | | 313,409,235 | | | | (238,687,039 | ) | | | 74,722,196 | | |
| Blue Chip Growth Fund | | | 409,968,013 | | | | 49,022,345 | | | | (30,222,870 | ) | | | 18,799,475 | | |
| Large Cap Growth Fund | | | 32,255,288 | | | | 3,829,380 | | | | (604,748 | ) | | | 3,224,632 | | |
| Growth Equity Fund | | | 878,836,731 | | | | 71,461,101 | | | | (23,500,844 | ) | | | 47,960,257 | | |
| Aggressive Growth Fund | | | 523,315,808 | | | | 65,920,936 | | | | (7,367,597 | ) | | | 58,553,339 | | |
| OTC 100 Fund | | | 65,655,041 | | | | 7,911,869 | | | | (4,049,015 | ) | | | 3,862,854 | | |
| Focused Value Fund | | | 804,858,932 | | | | 157,046,441 | | | | (5,596,639 | ) | | | 151,449,802 | | |
| Small Company Value Fund | | | 530,536,526 | | | | 88,959,279 | | | | (12,583,880 | ) | | | 76,375,399 | | |
| Mid Cap Growth Equity Fund | | | 150,484,286 | | | | 30,022,695 | | | | (1,828,102 | ) | | | 28,194,593 | | |
| Mid Cap Growth Equity II Fund | | | 932,655,960 | | | | 201,210,314 | | | | (28,351,104 | ) | | | 172,859,210 | | |
| Small Cap Growth Equity Fund | | | 551,665,420 | | | | 111,703,270 | | | | (13,028,638 | ) | | | 98,674,632 | | |
| Small Company Growth Fund | | | 188,044,641 | | | | 11,722,894 | | | | (12,004,801 | ) | | | (281,907 | ) | |
| Emerging Growth Fund | | | 155,620,860 | | | | 15,210,996 | | | | (4,476,110 | ) | | | 10,734,886 | | |
| Overseas Fund | | | 647,444,691 | | | | 81,970,503 | | | | (6,582,097 | ) | | | 75,388,406 | | |
| Destination Retirement Income Fund | | | 219,752,516 | | | | 4,983,616 | | | | (201,181 | ) | | | 4,782,435 | | |
| Destination Retirement 2010 Fund | | | 76,934,774 | | | | 850,263 | | | | (27,250 | ) | | | 823,013 | | |
| Destination Retirement 2020 Fund | | | 319,115,362 | | | | 12,194,505 | | | | (133,821 | ) | | | 12,060,684 | | |
| Destination Retirement 2030 Fund | | | 214,356,984 | | | | 12,524,184 | | | | - | | | | 12,524,184 | | |
| Destination Retirement 2040 Fund | | | 116,101,041 | | | | 7,910,862 | | | | - | | | | 7,910,862 | | |
At December 31, 2004, the following Funds had available, for Federal income tax purposes, unused capital losses:
| | | Expiring
2009 | | Expiring
2010 | | Expiring
2011 | | Expiring
2012 | |
| Strategic Balanced Fund | | $ | - | | | $ | - | | | $ | - | | | $ | 884,676 | | |
| Large Cap Value Fund | | | 22,553,575 | | | | 38,862,582 | | | | 10,621,856 | | | | 9,443,094 | | |
| Indexed Equity Fund | | | - | | | | 32,615,009 | | | | - | | | | - | | |
| Blue Chip Growth Fund | | | 17,582,488 | | | | 42,088,672 | | | | 16,672,836 | | | | 4,152,321 | | |
| Large Cap Growth Fund | | | - | | | | 1,049,665 | | | | 2,883,177 | | | | - | | |
| Growth Equity Fund | | | 82,533,323 | | | | 98,921,181 | | | | - | | | | - | | |
| Aggressive Growth Fund | | | 41,500,727 | | | | 39,256,002 | | | | - | | | | - | | |
| OTC 100 Fund | | | 2,229,926 | | | | 5,742,042 | | | | 13,741,961 | | | | 7,702,832 | | |
| Mid Cap Growth Equity Fund | | | 71,132,190 | | | | 35,977,324 | | | | 976,172 | | | | - | | |
| Small Cap Growth Equity Fund | | | 6,237,521 | | | | 49,322,723 | | | | 4,198,095 | | | | - | | |
| Emerging Growth Fund | | | 27,011,885 | | | | 28,322,542 | | | | - | | | | - | | |
Net Capital loss carryforwards may be applied against any net realized taxable gains in each succeeding year, or until their respective expiration dates, whichever occurs first.
291
Notes to Financial Statements (Unaudited) (Continued)
Certain differences exist from the amounts reflected in the Statement of Changes in Net Assets primarily due to the character of short-term capital gains treated as ordinary income for tax purposes. The tax character of distributions paid during the year ended December 31, 2004 was as follows:
| | | Ordinary
Income | | Long Term
Capital Gain | | Return of
Capital | |
| Strategic Balanced Fund | | $ | 2,102,969 | | | $ | - | | | $ | - | | |
| Diversified Value Fund | | | 980,229 | | | | 180,563 | | | | - | | |
| Fundamental Value Fund | | | 9,230,146 | | | | 8,821,000 | | | | - | | |
| Value Equity Fund | | | 850,699 | | | | 1,951,422 | | | | - | | |
| Large Cap Value Fund | | | 6,927,379 | | | | - | | | | - | | |
| Indexed Equity Fund | | | 24,506,535 | | | | - | | | | - | | |
| Blue Chip Growth Fund | | | 2,430,115 | | | | - | | | | - | | |
| Large Cap Growth Fund | | | 49,090 | | | | - | | | | - | | |
| Growth Equity Fund | | | 2,248,418 | | | | - | | | | - | | |
| Aggressive Growth Fund | | | - | | | | - | | | | - | | |
| OTC 100 Fund | | | 186,616 | | | | - | | | | - | | |
| Focused Value Fund | | | 22,662,250 | | | | 21,808,443 | | | | - | | |
| Small Company Value Fund | | | 5,361,515 | | | | 6,543,367 | | | | - | | |
| Mid Cap Growth Equity II Fund | | | - | | | | 1,714,298 | | | | - | | |
| Small Company Growth Fund | | | 6,254,063 | | | | 6,200,251 | | | | - | | |
| Emerging Growth Fund | | | - | | | | - | | | | - | | |
| Overseas Fund | | | 6,402,902 | | | | 10,425,095 | | | | - | | |
| Destination Retirement Income Fund | | | 5,155,878 | | | | 678,878 | | | | - | | |
| Destination Retirement 2010 Fund | | | 658,017 | | | | 47,421 | | | | - | | |
| Destination Retirement 2020 Fund | | | 4,612,068 | | | | 707,954 | | | | - | | |
| Destination Retirement 2030 Fund | | | 1,985,729 | | | | 90,605 | | | | - | | |
| Destination Retirement 2040 Fund | | | 757,526 | | | | 64,645 | | | | - | | |
At December 31, 2004, the components of distributable earnings on a tax basis were as follows:
| | | Undistributed
Ordinary
Income | | Undistributed
Long Term
Capital Gain/
(Capital Loss
Carryover) | | Other
Temporary
Differences | | Unrealized
Appreciation
(Depreciation) | |
| Strategic Balanced Fund | | $ | 3,662 | | | $ | (884,676 | ) | | $ | (583,042 | ) | | $ | 8,596,617 | | |
| Diversified Value Fund | | | 46,094 | | | | 590,244 | | | | (1,670 | ) | | | 37,955,223 | | |
| Fundamental Value Fund | | | - | | | | - | | | | (749,114 | ) | | | 121,698,219 | | |
| Value Equity Fund | | | - | | | | 1,606,816 | | | | (2,330 | ) | | | 10,425,882 | | |
| Large Cap Value Fund | | | 410,694 | | | | (81,481,107 | ) | | | (3,104,712 | ) | | | 204,298,651 | | |
| Indexed Equity Fund | | | 3,075 | | | | (32,615,009 | ) | | | (470,851 | ) | | | 88,700,931 | | |
| Blue Chip Growth Fund | | | - | | | | (80,496,317 | ) | | | (2,770,213 | ) | | | 25,110,659 | | |
| Large Cap Growth Fund | | | - | | | | (3,932,842 | ) | | | (38,940 | ) | | | 4,661,824 | | |
| Growth Equity Fund | | | - | | | | (181,454,504 | ) | | | (17,195 | ) | | | 59,506,374 | | |
| Aggressive Growth Fund | | | - | | | | (80,756,729 | ) | | | (850,270 | ) | | | 71,865,816 | | |
| OTC 100 Fund | | | - | | | | (29,416,761 | ) | | | (3,983 | ) | | | 9,625,331 | | |
| Focused Value Fund | | | 700,047 | | | | 11,997,245 | | | | (12,597 | ) | | | 176,573,714 | | |
| Small Company Value Fund | | | 1,143,987 | | | | 2,751,421 | | | | (4,085 | ) | | | 93,571,448 | | |
| Mid Cap Growth Equity Fund | | | - | | | | (108,085,686 | ) | | | (5,251 | ) | | | 31,807,550 | | |
292
Notes to Financial Statements (Unaudited) (Continued)
| | | Undistributed
Ordinary
Income | | Undistributed
Long Term
Capital Gain/
(Capital Loss
Carryover) | | Other
Temporary
Differences | | Unrealized
Appreciation
(Depreciation) | |
| Mid Cap Growth Equity II Fund | | $ | 2,369,895 | | | $ | 2,695,398 | | | $ | (13,244 | ) | | $ | 186,652,430 | | |
| Small Cap Growth Equity Fund | | | - | | | | (59,758,339 | ) | | | (11,237 | ) | | | 113,965,226 | | |
| Small Company Growth Fund | | | 3,125,101 | | | | 257,333 | | | | (2,288 | ) | | | 8,905,472 | | |
| Emerging Growth Fund | | | - | | | | (55,334,427 | ) | | | (3,692 | ) | | | 19,749,839 | | |
| Overseas Fund | | | 1,905,598 | | | | 2,358,621 | | | | (58,742 | ) | | | 118,247,603 | | |
| Destination Retirement Income Fund | | | 667,879 | | | | 259,422 | | | | (1,037 | ) | | | 2,058,374 | | |
| Destination Retirement 2010 Fund | | | 2,784 | | | | 64,644 | | | | (59 | ) | | | 199,204 | | |
| Destination Retirement 2020 Fund | | | - | | | | 941,584 | | | | (1,383 | ) | | | 9,887,054 | | |
| Destination Retirement 2030 Fund | | | 216,168 | | | | 1,034,656 | | | | (1,095 | ) | | | 12,667,603 | | |
| Destination Retirement 2040 Fund | | | 283,616 | | | | 680,711 | | | | (662 | ) | | | 8,579,496 | | |
The following Funds have elected to defer to January 1, 2005 post-October losses:
| | | Amount | |
| Strategic Balanced Fund | | $ | 338,056 | | |
| Fundamental Value Fund | | | 739,181 | | |
| Large Cap Value Fund | | | 3,084,816 | | |
| Blue Chip Growth Fund | | | 2,759,301 | | |
| Large Cap Growth Fund | | | 38,105 | | |
| Aggressive Growth Fund | | | 840,110 | | |
The following Funds have elected to defer to January 1, 2005 post-October currency losses:
| | | Amount | |
| Strategic Balanced Fund | | $ | 444,870 | | |
| Diversified Value Fund | | | 119 | | |
| Mid Cap Growth Equity II Fund | | | 1,085 | | |
| Overseas Fund | | | 2,825,187 | | |
7. Investment in Affiliated Issuers A summary of the Fund's transactions in the securities of these issuers during the six months ended June 30, 2005, is as follows:
| | | Value,
beginning
of period | | Purchases | | Sales
Proceeds | | Value,
end of
period | | Dividend
Income | | Realized
Gains
Distributions | |
Destination Retirement
Income Fund | | | | | | | | | | | | | | | | | | | | | | | | | |
Core Bond Fund,
Class S | | $ | 34,451,963 | | | $ | 7,872,060 | | | $ | 2,684,463 | | | $ | 40,505,598 | | | $ | - | | | $ | - | | |
Diversified Bond
Fund, Class S | | | 34,451,875 | | | | 7,860,288 | | | | 2,590,193 | | | | 40,507,303 | | | | - | | | | - | | |
Growth Equity Fund,
Class S | | | 13,468,033 | | | | 4,013,972 | | | | 1,913,227 | | | | 16,019,169 | | | | - | | | | - | | |
Inflation-Protected Bond
Fund, Class S | | | 36,182,203 | | | | 8,449,480 | | | | 2,914,574 | | | | 42,758,677 | | | | - | | | | - | | |
Large Cap Value Fund,
Class S | | | 13,479,934 | | | | 3,444,692 | | | | 1,480,933 | | | | 15,668,943 | | | | - | | | | - | | |
Money Market Fund,
Class S | | | 9,581,726 | | | | 2,363,124 | | | | 689,616 | | | | 11,232,398 | | | | 103,903 | | | | - | | |
| Overseas Fund, Class S | | | 9,798,316 | | | | 2,381,231 | | | | 964,409 | | | | 10,689,319 | | | | - | | | | - | | |
Short-Duration Bond Fund,
Class S | | | 28,725,042 | | | | 6,678,103 | | | | 2,095,755 | | | | 33,728,291 | | | | - | | | | - | | |
Small Company
Opportunities Fund,
Class S | | | 11,501,994 | | | | 3,924,389 | | | | 1,526,653 | | | | 13,425,253 | | | | - | | | | - | | |
| Totals | | $ | 191,641,086 | | | $ | 46,987,339 | | | $ | 16,859,823 | | | $ | 224,534,951 | | | $ | 103,903 | | | $ | - | | |
293
Notes to Financial Statements (Unaudited) (Continued)
| | | Value,
beginning
of period | | Purchases | | Sales
Proceeds | | Value,
end of
period | | Dividend
Income | | Realized
Gains
Distributions | |
Destination Retirement
2010 Fund | | | | | | | | | | | | | | | | | | | | | | | | | |
| Core Bond Fund, Class S | | $ | 5,642,168 | | | $ | 6,230,680 | | | $ | 373,368 | | | $ | 11,686,827 | | | $ | - | | | $ | - | | |
Diversified Bond Fund,
Class S | | | 5,653,289 | | | | 6,226,453 | | | | 363,610 | | | | 11,687,216 | | | | - | | | | - | | |
Fundamental Value Fund,
Class S | | | 1,938,331 | | | | 2,085,188 | | | | 183,198 | | | | 3,869,029 | | | | - | | | | - | | |
Growth Equity Fund,
Class S | | | 4,205,878 | | | | 4,781,192 | | | | 513,826 | | | | 8,526,418 | | | | - | | | | - | | |
Inflation-Protected Bond
Fund, Class S | | | 5,692,847 | | | | 6,253,581 | | | | 473,803 | | | | 11,687,424 | | | | - | | | | - | | |
Large Cap Value Fund,
Class S | | | 2,318,390 | | | | 2,490,110 | | | | 206,316 | | | | 4,655,261 | | | | - | | | | - | | |
Mid Cap Growth Equity II
Fund, Class S | | | 1,975,558 | | | | 2,089,152 | | | | 245,976 | | | | 3,879,603 | | | | - | | | | - | | |
Money Market Fund,
Class S | | | 1,865,372 | | | | 2,153,028 | | | | 121,899 | | | | 3,890,381 | | | | 22,799 | | | | - | | |
| Overseas Fund, Class S | | | 2,791,585 | | | | 2,902,276 | | | | 250,450 | | | | 5,435,385 | | | | - | | | | - | | |
Short-Duration Bond Fund,
Class S | | | 3,748,042 | | | | 4,193,985 | | | | 229,964 | | | | 7,786,420 | | | | - | | | | - | | |
Small Company
Opportunities Fund,
Class S | | | 2,383,755 | | | | 2,616,410 | | | | 254,635 | | | | 4,653,823 | | | | - | | | | - | | |
| Totals | | $ | 38,215,215 | | | $ | 42,022,055 | | | $ | 3,217,045 | | | $ | 77,757,787 | | | $ | 22,799 | | | $ | - | | |
| | | Value,
beginning
of period | | Purchases | | Sales
Proceeds | | Value,
end of
period | | Dividend
Income | | Realized
Gains
Distributions | |
Destination Retirement
2020 Fund | | | | | | | | | | | | | | | | | | | | | | | | | |
Aggressive Growth Fund,
Class S | | $ | 24,069,988 | | | $ | 8,408,605 | | | $ | 2,291,144 | | | $ | 29,852,255 | | | $ | - | | | $ | - | | |
| Core Bond Fund, Class S | | | 29,341,764 | | | | 11,541,510 | | | | 1,827,975 | | | | 39,870,353 | | | | - | | | | - | | |
Diversified Bond Fund,
Class S | | | 27,052,746 | | | | 10,443,922 | | | | 1,628,518 | | | | 36,549,349 | | | | - | | | | - | | |
| Focused Value Fund, Class S | | | 12,998,250 | | | | 4,236,769 | | | | 992,475 | | | | 16,508,332 | | | | - | | | | - | | |
Fundamental Value Fund,
Class S | | | 23,410,772 | | | | 7,676,006 | | | | 1,703,239 | | | | 29,645,978 | | | | - | | | | - | | |
| Growth Equity Fund, Class S | | | 22,517,743 | | | | 9,027,544 | | | | 2,004,618 | | | | 29,709,888 | | | | - | | | | - | | |
Inflation-Protected Bond
Fund, Class S | | | 29,641,480 | | | | 11,531,051 | | | | 2,223,851 | | | | 39,872,914 | | | | - | | | | - | | |
Large Cap Value Fund,
Class S | | | 23,317,509 | | | | 7,607,937 | | | | 1,596,600 | | | | 29,746,015 | | | | - | | | | - | | |
Mid Cap Growth Equity II
Fund, Class S | | | 13,686,368 | | | | 4,283,547 | | | | 1,667,362 | | | | 16,526,738 | | | | - | | | | - | | |
| Overseas Fund, Class S | | | 24,650,114 | | | | 7,739,420 | | | | 2,540,494 | | | | 29,775,323 | | | | - | | | | - | | |
Short-Duration Bond Fund,
Class S | | | 12,127,741 | | | | 5,010,446 | | | | 737,649 | | | | 16,599,770 | | | | - | | | | - | | |
Small Company
Opportunities Fund,
Class S | | | 13,692,849 | | | | 4,808,383 | | | | 1,423,662 | | | | 16,519,131 | | | | - | | | | - | | |
| Totals | | $ | 256,507,324 | | | $ | 92,315,140 | | | $ | 20,637,587 | | | $ | 331,176,046 | | | $ | - | | | $ | - | | |
294
Notes to Financial Statements (Unaudited) (Continued)
| | | Value,
beginning
of period | | Purchases | | Sales
Proceeds | | Value,
end of
period | | Dividend
Income | | Realized
Gains
Distributions | |
Destination Retirement
2030 Fund | | | | | | | | | | | | | | | | | | | | | | | | | |
Aggressive Growth Fund,
Class S | | $ | 24,196,233 | | | $ | 5,800,875 | | | $ | 2,334,243 | | | $ | 27,297,657 | | | $ | - | | | $ | - | | |
Diversified Bond Fund,
Class S | | | 12,995,343 | | | | 3,681,600 | | | | 1,034,460 | | | | 15,951,805 | | | | - | | | | - | | |
Emerging Growth Fund,
Class S | | | 12,060,216 | | | | 3,106,381 | | | | 982,488 | | | | 13,648,829 | | | | - | | | | - | | |
| Focused Value Fund, Class S | | | 9,796,857 | | | | 1,914,917 | | | | 560,316 | | | | 11,320,660 | | | | - | | | | - | | |
Fundamental Value Fund,
Class S | | | 25,519,312 | | | | 5,115,887 | | | | 1,497,222 | | | | 29,363,951 | | | | - | | | | - | | |
| Growth Equity Fund, Class S | | | 24,481,204 | | | | 6,529,294 | | | | 1,704,924 | | | | 29,428,552 | | | | - | | | | - | | |
Inflation-Protected Bond
Fund, Class S | | | 14,913,400 | | | | 4,292,407 | | | | 1,421,407 | | | | 18,231,052 | | | | - | | | | - | | |
Large Cap Value Fund,
Class S | | | 23,463,713 | | | | 4,529,827 | | | | 1,148,630 | | | | 27,198,527 | | | | - | | | | - | | |
Mid Cap Growth Equity II
Fund, Class S | | | 10,334,083 | | | | 1,862,031 | | | | 987,693 | | | | 11,333,541 | | | | - | | | | - | | |
| Overseas Fund, Class S | | | 26,887,171 | | | | 5,236,063 | | | | 2,504,757 | | | | 29,494,696 | | | | - | | | | - | | |
Small Company Value Fund,
Class S | | | 12,543,108 | | | | 2,576,218 | | | | 1,428,471 | | | | 13,611,898 | | | | - | | | | - | | |
| Totals | | $ | 197,190,640 | | | $ | 44,645,500 | | | $ | 15,604,611 | | | $ | 226,881,168 | | | $ | - | | | $ | - | | |
| | | Value,
beginning
of period | | Purchases | | Sales
Proceeds | | Value,
end of
period | | Dividend
Income | | Realized
Gains
Distributions | |
Destination Retirement
2040 Fund | | | | | | | | | | | | | | | | | | | | | | | | | |
Aggressive Growth Fund,
Class S | | $ | 16,807,065 | | | $ | 4,180,788 | | | $ | 2,040,342 | | | $ | 18,667,212 | | | $ | - | | | $ | - | | |
Emerging Growth Fund,
Class S | | | 6,654,415 | | | | 1,765,536 | | | | 649,929 | | | | 7,466,885 | | | | - | | | | - | | |
| Focused Value Fund, Class S | | | 6,508,216 | | | | 1,290,643 | | | | 479,151 | | | | 7,430,890 | | | | - | | | | - | | |
Fundamental Value Fund,
Class S | | | 16,313,290 | | | | 3,464,848 | | | | 1,388,329 | | | | 18,531,978 | | | | - | | | | - | | |
| Growth Equity Fund, Class S | | | 15,598,924 | | | | 4,197,917 | | | | 1,291,751 | | | | 18,573,876 | | | | - | | | | - | | |
Large Cap Value Fund,
Class S | | | 16,253,923 | | | | 3,253,255 | | | | 1,152,363 | | | | 18,597,561 | | | | - | | | | - | | |
Mid Cap Growth Equity II
Fund, Class S | | | 6,893,672 | | | | 1,196,684 | | | | 732,158 | | | | 7,439,579 | | | | - | | | | - | | |
| Overseas Fund, Class S | | | 17,231,868 | | | | 3,488,451 | | | | 2,021,434 | | | | 18,616,775 | | | | - | | | | - | | |
Small Company Value Fund,
Class S | | | 8,140,886 | | | | 1,613,231 | | | | 1,011,221 | | | | 8,687,147 | | | | - | | | | - | | |
| Totals | | $ | 110,402,259 | | | $ | 24,451,353 | | | $ | 10,766,678 | | | $ | 124,011,903 | | | $ | - | | | $ | - | | |
8. Proxy Voting (Unaudited)
A description of the policies and procedures that each Fund's investment adviser and sub-advisers use to vote proxies relating to the Fund's portfolio securities is available, without charge, upon request, by calling 1-888-309-3539, and on the Securities and Exchange Commission's website at http://www.sec.gov.
Information regarding how the Funds voted proxies relating to portfolio securities during the most recent 12-month period ended June 30 is available, without charge, upon request, on the MassMutual website at http://www.massmutual.com/retire and on the Securities and Exchange Commission's website at http://www.sec.gov.
295
Notes to Financial Statements (Unaudited) (Continued)
9. Quarterly Reporting (Unaudited)
The Funds file their complete schedule of portfolio holdings with the SEC for the first and third quarters of each fiscal year on Form N-Q. The Funds' Forms N-Q are available on the SEC website at http://www.sec.gov. The Funds' Forms N-Q may be reviewed and copied at the SEC's Public Reference Room in Washington D.C. Information on the operation of the SEC's Public Reference Room may be obtained by calling 1-800-SEC-0330.
10. Trustees' Approval of Investment Advisory Contracts (Unaudited)
At a meeting held on February 7, 2005, the Board of Trustees of the Trust, including the Trustees who are not "interested persons" (as such term is defined in the 1940 Act) of the Trust, the Adviser or Sub-Advisers (the "Independent Trustees"), approved the existing Advisory Agreements and Sub-Advisory Agreements for each of the Strategic Balanced Fund, Fundamental Value Fund, Value Equity Fund, Large Cap Value Fund, Indexed Equity Fund, Blue Chip Growth Fund, Large Cap Growth Fund, Growth Equity Fund, Aggressive Growth Fund, OTC 100 Fund, Focused Value Fund, Smal l Company Value Fund, Mid Cap Growth Equity Fund, Mid Cap Growth Equity II Fund, Small Cap Growth Equity Fund, Small Company Growth Fund, Emerging Growth Fund, Overseas Fund, Destination Retirement Income Fund, Destination Retirement 2010 Fund, Destination Retirement 2020 Fund, Destination Retirement 2030 Fund and Destination Retirement 2040 Fund (each a "Fund" and collectively, the "Funds"). In preparation for the meeting, the Trustees requested, and the Adviser and Sub-Advisers provided in advance of the meeting, certain materials relevant to the consideration of the Advisory Agreements and Sub-Advisory Agreements. The Trustees also requested, and received in advance of the meeting, a fee study report with respect to each Fund prepared by an independent third-party vendor (the "Third-Party Report"). The Third-Party Report presented information concerning advisory fees, total expense ratios and investment performance that compared the Funds to a peer group identified by the third-party vendor. The Trustees also received in board materials in advance of the meeting memoranda prepared by Fund counsel and by counsel to the Independent Trustees addressing their duties and responsibilities in approving the Advisory Agreements and Sub-Advisory Agreements, including identification of types of information relevant to such consideration.
Representatives of the third-party vendor preparing the Third-Party Report requested by the Trustees were present for a portion of the meeting and made a presentation to the Trustees with respect to this Report. Such representatives also addressed questions posed by the Trustees concerning the Report. At the meeting, representatives of the Adviser made an extensive presentation concerning the Adviser's operations and capabilities as well as the investment strategy to be pursued by each Fund and each Sub-Adviser's capabilities in managing such a strategy.
In approving the Advisory Agreements, the Trustees took note of the fact that the Adviser would delegate substantially all responsibility for furnishing a continuous investment program for the Funds, and making investment decisions with respect to a Fund's assets, to the relevant Sub-Advisers. The Trustees examined the Adviser's ability to provide investment oversight, administrative and shareholder services to the Funds. The Trustees also considered the experience and qualifications of the personnel of the Adviser that would be performing, or overseeing the performance of, the services to be provided to the Funds and the needs of the Funds for administrative and shareholder services. Based on the above, the Trustees concluded that the resources to be devoted by the Adviser were appropriate to fulfill effectively its duties under the Advisory Agreements.
The Trustees considered a number of factors they believed to be relevant to the interests of shareholders of the Funds. Such factors included (i) the ability of the Adviser to monitor the operations and performance of each Fund's Sub-Adviser, (ii) the financial condition, stability and business strategy of the Adviser, (iii) the ability of the Adviser with respect to regulatory compliance and the ability to monitor compliance with the investment policies of the Funds, (iv) possible economies of scale, and (v) any conditions affecting the Adviser's future provision of high quality services to the Funds. The Trustees concluded that the anticipated scope and quality of the services to be provided by the Adviser were satisfactory, in light of market conditions, the resources to be dedicated by the Adviser and its integrity, personnel, and financial resources, to merit appro val of the Advisory Agreements.
296
Notes to Financial Statements (Unaudited) (Continued)
The Trustees took into account not only the actual dollar amount of fees to be paid by the Funds to the Adviser, but also took into account the estimated profitability of the Funds to the Adviser and the so-called "fallout benefits" to the Adviser, such as any reputational value derived from serving as investment adviser to the Funds. The Trustees considered the fact that the advisory fees did not contain breakpoints due to the Adviser choosing to price for the long-term. The Trustees also reviewed the performance of each Fund for the past one, three and five-year periods, as applicable.
Based on the foregoing, the Trustees concluded that the fees to be paid to the Adviser under the Advisory Agreements and the Funds' total expenses were fair and reasonable, given the anticipated scope and quality of the services to be rendered by the Adviser.
In approving the Sub-Advisory Agreements with respect to the Funds, the Trustees considered a wide range of information about, among other things: each Sub-Adviser and its personnel with responsibilities for providing services to the respective Fund; the terms of the Sub-Advisory Agreements; the scope and quality of services to be provided to each Fund under the Sub-Advisory Agreements; and the fees payable to each Sub-Adviser by the Adviser. The Trustees did not generally review the profitability of the Sub-Advisers based on the fact that the sub-advisory fees were paid by the Adviser and on the conclusion that, accordingly, the sub-advisory fees were being negotiated at arm's length. The Trustees were also informed that each Sub-Adviser may receive research services from brokers in connection with portfolio securities transactions for the Funds and that research services furnished by brokers through which the Funds effect securities transactions may be used by each Sub-Adviser in advising other accounts that it advises. Conversely, research services furnished to each Sub-Adviser in connection with other accounts each Sub-Adviser advises may be used by a Sub-Adviser in advising the Funds.
Based on the foregoing, the Trustees concluded that the investment processes, research capabilities and philosophies of each Sub-Adviser would be well suited to each Fund, given their investment objectives and policies.
Following their review, the Trustees determined that the terms of the Advisory Agreements and Sub-Advisory Agreements were fair and reasonable with respect to each Fund and were in the best interests of each Fund's shareholders. After carefully considering the information summarized above, the Trustees, including the Independent Trustees voting separately, unanimously voted to approve the Advisory Agreements and the Sub-Advisory Agreements.
Prior to the votes being taken to approve the Advisory Agreements and Sub-Advisory Agreements, the Independent Trustees met separately in executive session to discuss the appropriateness of such contracts. In their deliberations with respect to these matters, the Independent Trustees were advised by their independent legal counsel. The Independent Trustees weighed the foregoing matters in light of the advice given to them by their independent legal counsel as to the law applicable to the review of investment advisory contracts. In arriving at a decision, the Trustees, including the Independent Trustees, did not identify any single matter as all-important or controlling. The foregoing summary does not detail all of the matters considered.
After the annual approval of the existing Sub-Advisory Agreements, the Trustees were later presented with, and approved, the termination of the Sub-Advisory Agreement with MTB Investment Advisors, Inc. ("MTB") and the approval of a new Sub-Advisory Agreement with Eagle Asset Management, Inc. ("Eagle") for the Small Company Growth Fund. In addition, the Trustees later approved a new Sub-Advisory Agreement to add EARNEST Partners, LLC ("Earnest Partners") as an additional Sub-Adviser to the Small Company Value Fund.
After arriving at the decision to replace MTB as a Sub-Adviser of the Small Company Growth Fund, the Trustees determined that it would be appropriate to find another Sub-Adviser who would fulfill the growth investment mandate of the Fund. After careful consideration, the Trustees determined that
297
Notes to Financial Statements (Unaudited) (Continued)
Eagle's successful and consistent application of their approach to small cap growth investing provided the best opportunity for the Fund.
In arriving at the decision to add Earnest Partners as an additional Sub-Adviser to the Small Company Value Fund, the Trustees were presented by the Adviser with several options to deal with constraints identified by Clover Capital Management, Inc. ("Clover") in managing the Fund's portfolio given the aggregate assets under Clover's management. These options included: 1) closing the Fund and creating a new fund with similar capitalization and growth characteristics; 2) keeping the Fund open but hiring a third co-Sub-Adviser (in addition to Clover and T. Rowe Price Associates, Inc. ("T. Rowe Price")) to manage future cash flows; 3) keeping the Fund open and allowing Clover to change strategy by investing in companies with larger market capitalizations; and 4) keeping the Fund open by replacing Clover with a new co-Sub-Adviser.
After careful consideration, including input from the Adviser as to the benefits and drawbacks of the options noted above, the Trustees determined that option (2) would be the best solution to address the capacity constraints identified by Clover. The Trustees concluded that the addition of a third Sub-Adviser would avoid undermining Clover's investment approach while at the same time allowing plan sponsors and participants to continue to invest their contributions in this Fund. After coming to this decision, the Trustees then considered possible candidates to assume the role of new co-Sub-Adviser to the Fund. After considering information provided by the Adviser, the Trustees determined that Earnest Partners' investment style would best complement Clover and T. Rowe Price.
In coming to each of these recommendations, the Trustees considered a wide range of information of the type they regularly consider when determining whether to continue a Fund's Sub-Advisory Agreement as in effect from year to year. The Trustees considered information about, among other things: each Sub-Adviser and its personnel (including particularly those personnel with responsibilities for providing services to each Fund), resources and investment process; the terms of the Sub-Advisory Agreements; the scope and quality of services to be provided to each Fund under the Sub-Advisory Agreements; the investment performance of the Sub-Advisers in managing similar strategies; the fees payable to each Sub-Adviser by the Adviser and by other funds and client accounts managed or sub-advised by the Sub-Adviser, and payable by similar funds managed by other Advisers; and each Sub-Adviser's practices r egarding the selection and compensation of brokers and dealers that execute portfolio transactions for the Funds, and the brokers' and dealers' provision of brokerage and research services to the Sub-Adviser. The Trustees did not generally review the profitability of the Sub-Advisers based on the fact that the sub-advisory fees were paid by the Adviser and on the conclusion that, accordingly, the sub-advisory fees were being negotiated at arm's length.
Based on the foregoing, the Trustees concluded that the investment processes, research capabilities and philosophies of Eagle and Earnest Partners would be well suited to the Small Company Growth Fund and Small Company Value Fund, respectively, given their investment objectives and policies.
Following their review, the Trustees determined that the terms of the Sub-Advisory Agreements were fair and reasonable with respect to the Funds and were in the best interests of each Fund's shareholders. After carefully considering the information summarized above, the Trustees, including the Independent Trustees voting separately, unanimously voted to approve these Sub-Advisory Agreements.
In their deliberations with respect to these matters, the Independent Trustees were advised by their independent legal counsel. The Independent Trustees weighed the foregoing matters in light of the advice given to them by their independent legal counsel as to the law applicable to the review of investment advisory contracts. In arriving at a decision, the Trustees, including the Independent Trustees, did not identify any single matter as all-important or controlling. The foregoing summary does not detail all of the matters considered.
298
Other Information (Unaudited)
Fund Expenses
June 30, 2005 (Unaudited)
Expense Examples
| | The following information is in regards to expenses for the six month period ended June 30, 2005:
As a shareholder of the Funds, you may incur two types of costs: (1) transaction costs, including sales charges (loads) on purchase payments or redemptions; and (2) ongoing costs, including management fees, distribution and/or service (12b-1) fees; and other Fund expenses. These examples are intended to help you understand your ongoing costs (in dollars) of investing in the Funds and to compare these costs with the ongoing costs of investing in other mutual funds.
These examples are based on an investment of $1,000 invested for the six month period ended June 30, 2005. | |
|
Actual Expenses
| | The first line of each table on the following pages provides information about actual account values and actual expenses. You may use the information in this line, together with the amount you invested, to estimate the expenses that you paid over the period. Simply divide your account value by $1,000 (for example, an $8,600 account value divided by $1,000 = 8.6), then multiply the result by the number in the first line under the heading entitled "Operating Expenses Incurred" to estimate the expenses you paid on your account during this period. | |
|
Hypothetical Example for Comparison Purposes
| | The second line of each table on the following pages provides information about hypothetical account values and hypothetical expenses based on the Fund's actual expense ratio and an assumed rate of return of 5% per year before expenses, which is not the Fund's actual return. The hypothetical account values and expenses may not be used to estimate the actual ending account balance or expenses you paid for the period. You may use this information to compare the ongoing costs of investing in the Fund and other funds. To do so, compare this 5% hypothetical example with the 5% hypothetical examples that appear in the shareholder reports of the other funds.
Please note that the expenses shown in the tables are meant to highlight your ongoing costs only and do not reflect any transactional costs, such as sa les charges (loads). Therefore, the second line of the table is useful in comparing ongoing costs only, and will not help you determine the relative total costs of owning different funds. In addition, if these transactional costs were included, your costs would have been higher. | |
|
299
Other Information (Unaudited) (Continued)
| The Funds incur ongoing operating expenses during the normal course of business, such as management fees, shareholder service fees and other expenses. The following tables, assuming a $1,000 investment in a class of shares, disclose the ending account value and operating expenses incurred for the six months ended June 30, 2005, based on, (1) the classes' actual return and actual expenses, and (2) a hypothetical annualized 5% return and the classes' actual expenses: | |
|
| Strategic Bond Fund | |
| Class A | |
| | | Beginning
Value | | Ending
Value | | Operating
Expense
Incurred* | |
| 1) Actual | | $ | 1,000.00 | | | $ | 1,020.00 | | | $ | 5.01 | | |
| 2) Hypothetical | | | 1,000.00 | | | | 1,019.84 | | | | 5.01 | | |
* Expenses are calculated using the annualized expense ratio for the six months ended June 30, 2005 of 1.00%, multiplied by the average account value over the period, multiplied by the number of days in the period, divided by the number of days in the year.
| Class L | |
| | | Beginning
Value | | Ending
Value | | Operating
Expense
Incurred* | |
| 1) Actual | | $ | 1,000.00 | | | $ | 1,022.00 | | | $ | 3.76 | | |
| 2) Hypothetical | | | 1,000.00 | | | | 1,021.08 | | | | 3.76 | | |
* Expenses are calculated using the annualized expense ratio for the six months ended June 30, 2005 of 0.75%, multiplied by the average account value over the period, multiplied by the number of days in the period, divided by the number of days in the year.
| Class Y | |
| | | Beginning
Value | | Ending
Value | | Operating
Expense
Incurred* | |
| 1) Actual | | $ | 1,000.00 | | | $ | 1,022.00 | | | $ | 3.76 | | |
| 2) Hypothetical | | | 1,000.00 | | | | 1,021.08 | | | | 3.76 | | |
* Expenses are calculated using the annualized expense ratio for the six months ended June 30, 2005 of 0.75%, multiplied by the average account value over the period, multiplied by the number of days in the period, divided by the number of days in the year.
| Class S | |
| | | Beginning
Value | | Ending
Value | | Operating
Expense
Incurred* | |
| 1) Actual | | $ | 1,000.00 | | | $ | 1,022.00 | | | $ | 3.51 | | |
| 2) Hypothetical | | | 1,000.00 | | | | 1,021.32 | | | | 3.51 | | |
* Expenses are calculated using the annualized expense ratio for the six months ended June 30, 2005 of 0.70%, multiplied by the average account value over the period, multiplied by the number of days in the period, divided by the number of days in the year.
300
Other Information (Unaudited) (Continued)
| Class N | |
| | | Beginning
Value | | Ending
Value | | Operating
Expense
Incurred* | |
| 1) Actual | | $ | 1,000.00 | | | $ | 1,019.00 | | | $ | 6.51 | | |
| 2) Hypothetical | | | 1,000.00 | | | | 1,018.35 | | | | 6.51 | | |
* Expenses are calculated using the annualized expense ratio for the six months ended June 30, 2005 of 1.30%, multiplied by the average account value over the period, multiplied by the number of days in the period, divided by the number of days in the year.
| Strategic Balanced Fund | |
| Class A | |
| | | Beginning
Value | | Ending
Value | | Operating
Expense
Incurred* | |
| 1) Actual | | $ | 1,000.00 | | | $ | 995.20 | | | $ | 5.99 | | |
| 2) Hypothetical | | | 1,000.00 | | | | 1,018.79 | | | | 6.06 | | |
* Expenses are calculated using the annualized expense ratio for the six months ended June 30, 2005 of 1.21%, multiplied by the average account value over the period, multiplied by the number of days in the period, divided by the number of days in the year.
| Class L | |
| | | Beginning
Value | | Ending
Value | | Operating
Expense
Incurred* | |
| 1) Actual | | $ | 1,000.00 | | | $ | 996.20 | | | $ | 4.75 | | |
| 2) Hypothetical | | | 1,000.00 | | | | 1,020.03 | | | | 4.81 | | |
* Expenses are calculated using the annualized expense ratio for the six months ended June 30, 2005 of 0.96%, multiplied by the average account value over the period, multiplied by the number of days in the period, divided by the number of days in the year.
| Class Y | |
| | | Beginning
Value | | Ending
Value | | Operating
Expense
Incurred* | |
| 1) Actual | | $ | 1,000.00 | | | $ | 997.10 | | | $ | 4.01 | | |
| 2) Hypothetical | | | 1,000.00 | | | | 1,020.78 | | | | 4.06 | | |
* Expenses are calculated using the annualized expense ratio for the six months ended June 30, 2005 of 0.81%, multiplied by the average account value over the period, multiplied by the number of days in the period, divided by the number of days in the year.
| Class S | |
| | | Beginning
Value | | Ending
Value | | Operating
Expense
Incurred* | |
| 1) Actual | | $ | 1,000.00 | | | $ | 998.10 | | | $ | 3.77 | | |
| 2) Hypothetical | | | 1,000.00 | | | | 1,021.03 | | | | 3.81 | | |
* Expenses are calculated using the annualized expense ratio for the six months ended June 30, 2005 of 0.76%, multiplied by the average account value over the period, multiplied by the number of days in the period, divided by the number of days in the year.
301
Other Information (Unaudited) (Continued)
| Class N | |
| | | Beginning
Value | | Ending
Value | | Operating
Expense
Incurred* | |
| 1) Actual | | $ | 1,000.00 | | | $ | 994.30 | | | $ | 7.47 | | |
| 2) Hypothetical | | | 1,000.00 | | | | 1,017.31 | | | | 7.55 | | |
* Expenses are calculated using the annualized expense ratio for the six months ended June 30, 2005 of 1.51%, multiplied by the average account value over the period, multiplied by the number of days in the period, divided by the number of days in the year.
| Diversified Value Fund | |
| Class A | |
| | | Beginning
Value | | Ending
Value | | Operating
Expense
Incurred* | |
| 1) Actual | | $ | 1,000.00 | | | $ | 1,009.10 | | | $ | 5.43 | | |
| 2) Hypothetical | | | 1,000.00 | | | | 1,019.39 | | | | 5.46 | | |
* Expenses are calculated using the annualized expense ratio for the six months ended June 30, 2005 of 1.09%, multiplied by the average account value over the period, multiplied by the number of days in the period, divided by the number of days in the year.
| Class L | |
| | | Beginning
Value | | Ending
Value | | Operating
Expense
Incurred* | |
| 1) Actual | | $ | 1,000.00 | | | $ | 1,009.10 | | | $ | 3.99 | | |
| 2) Hypothetical | | | 1,000.00 | | | | 1,020.83 | | | | 4.01 | | |
* Expenses are calculated using the annualized expense ratio for the six months ended June 30, 2005 of 0.80%, multiplied by the average account value over the period, multiplied by the number of days in the period, divided by the number of days in the year.
| Class Y | |
| | | Beginning
Value | | Ending
Value | | Operating
Expense
Incurred* | |
| 1) Actual | | $ | 1,000.00 | | | $ | 1,011.00 | | | $ | 3.44 | | |
| 2) Hypothetical | | | 1,000.00 | | | | 1,021.37 | | | | 3.46 | | |
* Expenses are calculated using the annualized expense ratio for the six months ended June 30, 2005 of 0.69%, multiplied by the average account value over the period, multiplied by the number of days in the period, divided by the number of days in the year.
| Class S | |
| | | Beginning
Value | | Ending
Value | | Operating
Expense
Incurred* | |
| 1) Actual | | $ | 1,000.00 | | | $ | 1,010.10 | | | $ | 2.94 | | |
| 2) Hypothetical | | | 1,000.00 | | | | 1,021.87 | | | | 2.96 | | |
* Expenses are calculated using the annualized expense ratio for the six months ended June 30, 2005 of 0.59%, multiplied by the average account value over the period, multiplied by the number of days in the period, divided by the number of days in the year.
302
Other Information (Unaudited) (Continued)
| Class N | |
| | | Beginning
Value | | Ending
Value | | Operating
Expense
Incurred* | |
| 1) Actual | | $ | 1,000.00 | | | $ | 1,006.40 | | | $ | 6.96 | | |
| 2) Hypothetical | | | 1,000.00 | | | | 1,017.85 | | | | 7.00 | | |
* Expenses are calculated using the annualized expense ratio for the six months ended June 30, 2005 of 1.40%, multiplied by the average account value over the period, multiplied by the number of days in the period, divided by the number of days in the year.
| Fundamental Value Fund | |
| Class A | |
| | | Beginning
Value | | Ending
Value | | Operating
Expense
Incurred* | |
| 1) Actual | | $ | 1,000.00 | | | $ | 1,004.70 | | | $ | 6.11 | | |
| 2) Hypothetical | | | 1,000.00 | | | | 1,018.70 | | | | 6.16 | | |
* Expenses are calculated using the annualized expense ratio for the six months ended June 30, 2005 of 1.23%, multiplied by the average account value over the period, multiplied by the number of days in the period, divided by the number of days in the year.
| Class L | |
| | | Beginning
Value | | Ending
Value | | Operating
Expense
Incurred* | |
| 1) Actual | | $ | 1,000.00 | | | $ | 1,005.60 | | | $ | 4.87 | | |
| 2) Hypothetical | | | 1,000.00 | | | | 1,019.93 | | | | 4.91 | | |
* Expenses are calculated using the annualized expense ratio for the six months ended June 30, 2005 of 0.98%, multiplied by the average account value over the period, multiplied by the number of days in the period, divided by the number of days in the year.
| Class Y | |
| | | Beginning
Value | | Ending
Value | | Operating
Expense
Incurred* | |
| 1) Actual | | $ | 1,000.00 | | | $ | 1,007.40 | | | $ | 4.13 | | |
| 2) Hypothetical | | | 1,000.00 | | | | 1,020.68 | | | | 4.16 | | |
* Expenses are calculated using the annualized expense ratio for the six months ended June 30, 2005 of 0.83%, multiplied by the average account value over the period, multiplied by the number of days in the period, divided by the number of days in the year.
| Class S | |
| | | Beginning
Value | | Ending
Value | | Operating
Expense
Incurred* | |
| 1) Actual | | $ | 1,000.00 | | | $ | 1,007.40 | | | $ | 3.93 | | |
| 2) Hypothetical | | | 1,000.00 | | | | 1,020.88 | | | | 3.96 | | |
* Expenses are calculated using the annualized expense ratio for the six months ended June 30, 2005 of 0.79%, multiplied by the average account value over the period, multiplied by the number of days in the period, divided by the number of days in the year.
303
Other Information (Unaudited) (Continued)
| Class N | |
| | | Beginning
Value | | Ending
Value | | Operating
Expense
Incurred* | |
| 1) Actual | | $ | 1,000.00 | | | $ | 1,002.80 | | | $ | 7.60 | | |
| 2) Hypothetical | | | 1,000.00 | | | | 1,017.21 | | | | 7.65 | | |
* Expenses are calculated using the annualized expense ratio for the six months ended June 30, 2005 of 1.53%, multiplied by the average account value over the period, multiplied by the number of days in the period, divided by the number of days in the year.
| Value Equity Fund | |
| Class A | |
| | | Beginning
Value | | Ending
Value | | Operating
Expense
Incurred* | |
| 1) Actual | | $ | 1,000.00 | | | $ | 1,007.60 | | | $ | 6.47 | | |
| 2) Hypothetical | | | 1,000.00 | | | | 1,018.35 | | | | 6.51 | | |
* Expenses are calculated using the annualized expense ratio for the six months ended June 30, 2005 of 1.30%, multiplied by the average account value over the period, multiplied by the number of days in the period, divided by the number of days in the year.
| Class L | |
| | | Beginning
Value | | Ending
Value | | Operating
Expense
Incurred* | |
| 1) Actual | | $ | 1,000.00 | | | $ | 1,008.60 | | | $ | 5.23 | | |
| 2) Hypothetical | | | 1,000.00 | | | | 1,019.59 | | | | 5.26 | | |
* Expenses are calculated using the annualized expense ratio for the six months ended June 30, 2005 of 1.05%, multiplied by the average account value over the period, multiplied by the number of days in the period, divided by the number of days in the year.
| Class Y | |
| | | Beginning
Value | | Ending
Value | | Operating
Expense
Incurred* | |
| 1) Actual | | $ | 1,000.00 | | | $ | 1,008.50 | | | $ | 4.48 | | |
| 2) Hypothetical | | | 1,000.00 | | | | 1,020.33 | | | | 4.51 | | |
* Expenses are calculated using the annualized expense ratio for the six months ended June 30, 2005 of 0.90%, multiplied by the average account value over the period, multiplied by the number of days in the period, divided by the number of days in the year.
| Class S | |
| | | Beginning
Value | | Ending
Value | | Operating
Expense
Incurred* | |
| 1) Actual | | $ | 1,000.00 | | | $ | 1,009.50 | | | $ | 4.24 | | |
| 2) Hypothetical | | | 1,000.00 | | | | 1,020.58 | | | | 4.26 | | |
* Expenses are calculated using the annualized expense ratio for the six months ended June 30, 2005 of 0.85%, multiplied by the average account value over the period, multiplied by the number of days in the period, divided by the number of days in the year.
304
Other Information (Unaudited) (Continued)
| Class N | |
| | | Beginning
Value | | Ending
Value | | Operating
Expense
Incurred* | |
| 1) Actual | | $ | 1,000.00 | | | $ | 1,005.70 | | | $ | 7.96 | | |
| 2) Hypothetical | | | 1,000.00 | | | | 1,016.86 | | | | 8.00 | | |
* Expenses are calculated using the annualized expense ratio for the six months ended June 30, 2005 of 1.60%, multiplied by the average account value over the period, multiplied by the number of days in the period, divided by the number of days in the year.
| Large Cap Value Fund | |
| Class A | |
| | | Beginning
Value | | Ending
Value | | Operating
Expense
Incurred* | |
| 1) Actual | | $ | 1,000.00 | | | $ | 1,010.60 | | | $ | 6.23 | | |
| 2) Hypothetical | | | 1,000.00 | | | | 1,018.60 | | | | 6.26 | | |
* Expenses are calculated using the annualized expense ratio for the six months ended June 30, 2005 of 1.25%, multiplied by the average account value over the period, multiplied by the number of days in the period, divided by the number of days in the year.
| Class L | |
| | | Beginning
Value | | Ending
Value | | Operating
Expense
Incurred* | |
| 1) Actual | | $ | 1,000.00 | | | $ | 1,010.50 | | | $ | 4.98 | | |
| 2) Hypothetical | | | 1,000.00 | | | | 1,019.84 | | | | 5.01 | | |
* Expenses are calculated using the annualized expense ratio for the six months ended June 30, 2005 of 1.00%, multiplied by the average account value over the period, multiplied by the number of days in the period, divided by the number of days in the year.
| Class Y | |
| | | Beginning
Value | | Ending
Value | | Operating
Expense
Incurred* | |
| 1) Actual | | $ | 1,000.00 | | | $ | 1,011.50 | | | $ | 4.24 | | |
| 2) Hypothetical | | | 1,000.00 | | | | 1,020.58 | | | | 4.26 | | |
* Expenses are calculated using the annualized expense ratio for the six months ended June 30, 2005 of 0.85%, multiplied by the average account value over the period, multiplied by the number of days in the period, divided by the number of days in the year.
| Class S | |
| | | Beginning
Value | | Ending
Value | | Operating
Expense
Incurred* | |
| 1) Actual | | $ | 1,000.00 | | | $ | 1,013.40 | | | $ | 3.79 | | |
| 2) Hypothetical | | | 1,000.00 | | | | 1,021.03 | | | | 3.81 | | |
* Expenses are calculated using the annualized expense ratio for the six months ended June 30, 2005 of 0.76%, multiplied by the average account value over the period, multiplied by the number of days in the period, divided by the number of days in the year.
305
Other Information (Unaudited) (Continued)
| Class N | |
| | | Beginning
Value | | Ending
Value | | Operating
Expense
Incurred* | |
| 1) Actual | | $ | 1,000.00 | | | $ | 1,008.70 | | | $ | 7.72 | | |
| 2) Hypothetical | | | 1,000.00 | | | | 1,017.11 | | | | 7.75 | | |
* Expenses are calculated using the annualized expense ratio for the six months ended June 30, 2005 of 1.55%, multiplied by the average account value over the period, multiplied by the number of days in the period, divided by the number of days in the year.
| Indexed Equity Fund | |
| Class A | |
| | | Beginning
Value | | Ending
Value | | Operating
Expense
Incurred* | |
| 1) Actual | | $ | 1,000.00 | | | $ | 988.30 | | | $ | 3.70 | | |
| 2) Hypothetical | | | 1,000.00 | | | | 1,021.08 | | | | 3.76 | | |
* Expenses are calculated using the annualized expense ratio for the six months ended June 30, 2005 of 0.75%, multiplied by the average account value over the period, multiplied by the number of days in the period, divided by the number of days in the year.
| Class L | |
| | | Beginning
Value | | Ending
Value | | Operating
Expense
Incurred* | |
| 1) Actual | | $ | 1,000.00 | | | $ | 990.10 | | | $ | 2.47 | | |
| 2) Hypothetical | | | 1,000.00 | | | | 1,022.32 | | | | 2.51 | | |
* Expenses are calculated using the annualized expense ratio for the six months ended June 30, 2005 of 0.50%, multiplied by the average account value over the period, multiplied by the number of days in the period, divided by the number of days in the year.
| Class Y | |
| | | Beginning
Value | | Ending
Value | | Operating
Expense
Incurred* | |
| 1) Actual | | $ | 1,000.00 | | | $ | 990.20 | | | $ | 2.22 | | |
| 2) Hypothetical | | | 1,000.00 | | | | 1,022.56 | | | | 2.26 | | |
* Expenses are calculated using the annualized expense ratio for the six months ended June 30, 2005 of 0.45%, multiplied by the average account value over the period, multiplied by the number of days in the period, divided by the number of days in the year.
| Class S | |
| | | Beginning
Value | | Ending
Value | | Operating
Expense
Incurred* | |
| 1) Actual | | $ | 1,000.00 | | | $ | 990.30 | | | $ | 2.07 | | |
| 2) Hypothetical | | | 1,000.00 | | | | 1,022.71 | | | | 2.11 | | |
* Expenses are calculated using the annualized expense ratio for the six months ended June 30, 2005 of 0.42%, multiplied by the average account value over the period, multiplied by the number of days in the period, divided by the number of days in the year.
306
Other Information (Unaudited) (Continued)
| Class Z | |
| | | Beginning
Value | | Ending
Value | | Operating
Expense
Incurred* | |
| 1) Actual | | $ | 1,000.00 | | | $ | 991.20 | | | $ | 0.99 | | |
| 2) Hypothetical | | | 1,000.00 | | | | 1,023.80 | | | | 1.00 | | |
* Expenses are calculated using the annualized expense ratio for the six months ended June 30, 2005 of 0.20%, multiplied by the average account value over the period, multiplied by the number of days in the period, divided by the number of days in the year.
| Class N | |
| | | Beginning
Value | | Ending
Value | | Operating
Expense
Incurred* | |
| 1) Actual | | $ | 1,000.00 | | | $ | 987.30 | | | $ | 5.17 | | |
| 2) Hypothetical | | | 1,000.00 | | | | 1,019.59 | | | | 5.26 | | |
* Expenses are calculated using the annualized expense ratio for the six months ended June 30, 2005 of 1.05%, multiplied by the average account value over the period, multiplied by the number of days in the period, divided by the number of days in the year.
| Blue Chip Growth Fund | |
| Class A | |
| | | Beginning
Value | | Ending
Value | | Operating
Expense
Incurred* | |
| 1) Actual | | $ | 1,000.00 | | | $ | 974.80 | | | $ | 6.76 | | |
| 2) Hypothetical | | | 1,000.00 | | | | 1,017.95 | | | | 6.90 | | |
* Expenses are calculated using the annualized expense ratio for the six months ended June 30, 2005 of 1.38%, multiplied by the average account value over the period, multiplied by the number of days in the period, divided by the number of days in the year.
| Class L | |
| | | Beginning
Value | | Ending
Value | | Operating
Expense
Incurred* | |
| 1) Actual | | $ | 1,000.00 | | | $ | 976.20 | | | $ | 5.54 | | |
| 2) Hypothetical | | | 1,000.00 | | | | 1,019.19 | | | | 5.66 | | |
* Expenses are calculated using the annualized expense ratio for the six months ended June 30, 2005 of 1.13%, multiplied by the average account value over the period, multiplied by the number of days in the period, divided by the number of days in the year.
| Class Y | |
| | | Beginning
Value | | Ending
Value | | Operating
Expense
Incurred* | |
| 1) Actual | | $ | 1,000.00 | | | $ | 977.30 | | | $ | 4.95 | | |
| 2) Hypothetical | | | 1,000.00 | | | | 1,019.79 | | | | 5.06 | | |
* Expenses are calculated using the annualized expense ratio for the six months ended June 30, 2005 of 1.01%, multiplied by the average account value over the period, multiplied by the number of days in the period, divided by the number of days in the year.
307
Other Information (Unaudited) (Continued)
| Class S | |
| | | Beginning
Value | | Ending
Value | | Operating
Expense
Incurred* | |
| 1) Actual | | $ | 1,000.00 | | | $ | 978.50 | | | $ | 4.32 | | |
| 2) Hypothetical | | | 1,000.00 | | | | 1,020.43 | | | | 4.41 | | |
* Expenses are calculated using the annualized expense ratio for the six months ended June 30, 2005 of 0.88%, multiplied by the average account value over the period, multiplied by the number of days in the period, divided by the number of days in the year.
| Class N | |
| | | Beginning
Value | | Ending
Value | | Operating
Expense
Incurred* | |
| 1) Actual | | $ | 1,000.00 | | | $ | 973.50 | | | $ | 8.22 | | |
| 2) Hypothetical | | | 1,000.00 | | | | 1,016.46 | | | | 8.40 | | |
* Expenses are calculated using the annualized expense ratio for the six months ended June 30, 2005 of 1.68%, multiplied by the average account value over the period, multiplied by the number of days in the period, divided by the number of days in the year.
| Large Cap Growth Fund | |
| Class A | |
| | | Beginning
Value | | Ending
Value | | Operating
Expense
Incurred* | |
| 1) Actual | | $ | 1,000.00 | | | $ | 988.90 | | | $ | 6.46 | | |
| 2) Hypothetical | | | 1,000.00 | | | | 1,018.30 | | | | 6.56 | | |
* Expenses are calculated using the annualized expense ratio for the six months ended June 30, 2005 of 1.31%, multiplied by the average account value over the period, multiplied by the number of days in the period, divided by the number of days in the year.
| Class L | |
| | | Beginning
Value | | Ending
Value | | Operating
Expense
Incurred* | |
| 1) Actual | | $ | 1,000.00 | | | $ | 1,004.40 | | | $ | 5.17 | | |
| 2) Hypothetical | | | 1,000.00 | | | | 1,019.64 | | | | 5.21 | | |
* Expenses are calculated using the annualized expense ratio for the six months ended June 30, 2005 of 1.04%, multiplied by the average account value over the period, multiplied by the number of days in the period, divided by the number of days in the year.
| Class Y | |
| | | Beginning
Value | | Ending
Value | | Operating
Expense
Incurred* | |
| 1) Actual | | $ | 1,000.00 | | | $ | 991.20 | | | $ | 4.49 | | |
| 2) Hypothetical | | | 1,000.00 | | | | 1,020.28 | | | | 4.56 | | |
* Expenses are calculated using the annualized expense ratio for the six months ended June 30, 2005 of 0.91%, multiplied by the average account value over the period, multiplied by the number of days in the period, divided by the number of days in the year.
308
Other Information (Unaudited) (Continued)
| Class S | |
| | | Beginning
Value | | Ending
Value | | Operating
Expense
Incurred* | |
| 1) Actual | | $ | 1,000.00 | | | $ | 991.20 | | | $ | 4.30 | | |
| 2) Hypothetical | | | 1,000.00 | | | | 1,020.48 | | | | 4.36 | | |
* Expenses are calculated using the annualized expense ratio for the six months ended June 30, 2005 of 0.87%, multiplied by the average account value over the period, multiplied by the number of days in the period, divided by the number of days in the year.
| Class N | |
| | | Beginning
Value | | Ending
Value | | Operating
Expense
Incurred* | |
| 1) Actual | | $ | 1,000.00 | | | $ | 987.90 | | | $ | 7.94 | | |
| 2) Hypothetical | | | 1,000.00 | | | | 1,016.81 | | | | 8.05 | | |
* Expenses are calculated using the annualized expense ratio for the six months ended June 30, 2005 of 1.61%, multiplied by the average account value over the period, multiplied by the number of days in the period, divided by the number of days in the year.
| Growth Equity Fund | |
| Class A | |
| | | Beginning
Value | | Ending
Value | | Operating
Expense
Incurred* | |
| 1) Actual | | $ | 1,000.00 | | | $ | 996.10 | | | $ | 6.19 | | |
| 2) Hypothetical | | | 1,000.00 | | | | 1,018.60 | | | | 6.26 | | |
* Expenses are calculated using the annualized expense ratio for the six months ended June 30, 2005 of 1.25%, multiplied by the average account value over the period, multiplied by the number of days in the period, divided by the number of days in the year.
| Class L | |
| | | Beginning
Value | | Ending
Value | | Operating
Expense
Incurred* | |
| 1) Actual | | $ | 1,000.00 | | | $ | 998.70 | | | $ | 4.96 | | |
| 2) Hypothetical | | | 1,000.00 | | | | 1,019.84 | | | | 5.01 | | |
* Expenses are calculated using the annualized expense ratio for the six months ended June 30, 2005 of 1.00%, multiplied by the average account value over the period, multiplied by the number of days in the period, divided by the number of days in the year.
| Class Y | |
| | | Beginning
Value | | Ending
Value | | Operating
Expense
Incurred* | |
| 1) Actual | | $ | 1,000.00 | | | $ | 998.70 | | | $ | 4.21 | | |
| 2) Hypothetical | | | 1,000.00 | | | | 1,020.58 | | | | 4.26 | | |
* Expenses are calculated using the annualized expense ratio for the six months ended June 30, 2005 of 0.85%, multiplied by the average account value over the period, multiplied by the number of days in the period, divided by the number of days in the year.
309
Other Information (Unaudited) (Continued)
| Class S | |
| | | Beginning
Value | | Ending
Value | | Operating
Expense
Incurred* | |
| 1) Actual | | $ | 1,000.00 | | | $ | 1,000.00 | | | $ | 3.92 | | |
| 2) Hypothetical | | | 1,000.00 | | | | 1,020.88 | | | | 3.96 | | |
* Expenses are calculated using the annualized expense ratio for the six months ended June 30, 2005 of 0.79%, multiplied by the average account value over the period, multiplied by the number of days in the period, divided by the number of days in the year.
| Class N | |
| | | Beginning
Value | | Ending
Value | | Operating
Expense
Incurred* | |
| 1) Actual | | $ | 1,000.00 | | | $ | 996.10 | | | $ | 7.67 | | |
| 2) Hypothetical | | | 1,000.00 | | | | 1,017.11 | | | | 7.75 | | |
* Expenses are calculated using the annualized expense ratio for the six months ended June 30, 2005 of 1.55%, multiplied by the average account value over the period, multiplied by the number of days in the period, divided by the number of days in the year.
| Aggressive Growth Fund | |
| Class A | |
| | | Beginning
Value | | Ending
Value | | Operating
Expense
Incurred* | |
| 1) Actual | | $ | 1,000.00 | | | $ | 977.90 | | | $ | 6.23 | | |
| 2) Hypothetical | | | 1,000.00 | | | | 1,018.50 | | | | 6.36 | | |
* Expenses are calculated using the annualized expense ratio for the six months ended June 30, 2005 of 1.27%, multiplied by the average account value over the period, multiplied by the number of days in the period, divided by the number of days in the year.
| Class L | |
| | | Beginning
Value | | Ending
Value | | Operating
Expense
Incurred* | |
| 1) Actual | | $ | 1,000.00 | | | $ | 978.20 | | | $ | 5.00 | | |
| 2) Hypothetical | | | 1,000.00 | | | | 1,019.74 | | | | 5.11 | | |
* Expenses are calculated using the annualized expense ratio for the six months ended June 30, 2005 of 1.02%, multiplied by the average account value over the period, multiplied by the number of days in the period, divided by the number of days in the year.
| Class Y | |
| | | Beginning
Value | | Ending
Value | | Operating
Expense
Incurred* | |
| 1) Actual | | $ | 1,000.00 | | | $ | 980.00 | | | $ | 4.27 | | |
| 2) Hypothetical | | | 1,000.00 | | | | 1,020.48 | | | | 4.36 | | |
* Expenses are calculated using the annualized expense ratio for the six months ended June 30, 2005 of 0.87%, multiplied by the average account value over the period, multiplied by the number of days in the period, divided by the number of days in the year.
310
Other Information (Unaudited) (Continued)
| Class S | |
| | | Beginning
Value | | Ending
Value | | Operating
Expense
Incurred* | |
| 1) Actual | | $ | 1,000.00 | | | $ | 980.10 | | | $ | 3.78 | | |
| 2) Hypothetical | | | 1,000.00 | | | | 1,020.98 | | | | 3.86 | | |
* Expenses are calculated using the annualized expense ratio for the six months ended June 30, 2005 of 0.77%, multiplied by the average account value over the period, multiplied by the number of days in the period, divided by the number of days in the year.
| Class N | |
| | | Beginning
Value | | Ending
Value | | Operating
Expense
Incurred* | |
| 1) Actual | | $ | 1,000.00 | | | $ | 976.00 | | | $ | 7.69 | | |
| 2) Hypothetical | | | 1,000.00 | | | | 1,017.01 | | | | 7.85 | | |
* Expenses are calculated using the annualized expense ratio for the six months ended June 30, 2005 of 1.57%, multiplied by the average account value over the period, multiplied by the number of days in the period, divided by the number of days in the year.
| OTC 100 Fund | |
| Class A | |
| | | Beginning
Value | | Ending
Value | | Operating
Expense
Incurred* | |
| 1) Actual | | $ | 1,000.00 | | | $ | 916.90 | | | $ | 5.28 | | |
| 2) Hypothetical | | | 1,000.00 | | | | 1,019.29 | | | | 5.56 | | |
* Expenses are calculated using the annualized expense ratio for the six months ended June 30, 2005 of 1.11%, multiplied by the average account value over the period, multiplied by the number of days in the period, divided by the number of days in the year.
| Class L | |
| | | Beginning
Value | | Ending
Value | | Operating
Expense
Incurred* | |
| 1) Actual | | $ | 1,000.00 | | | $ | 917.70 | | | $ | 4.09 | | |
| 2) Hypothetical | | | 1,000.00 | | | | 1,020.53 | | | | 4.31 | | |
* Expenses are calculated using the annualized expense ratio for the six months ended June 30, 2005 of 0.86%, multiplied by the average account value over the period, multiplied by the number of days in the period, divided by the number of days in the year.
| Class Y | |
| | | Beginning
Value | | Ending
Value | | Operating
Expense
Incurred* | |
| 1) Actual | | $ | 1,000.00 | | | $ | 918.10 | | | $ | 3.38 | | |
| 2) Hypothetical | | | 1,000.00 | | | | 1,021.27 | | | | 3.56 | | |
* Expenses are calculated using the annualized expense ratio for the six months ended June 30, 2005 of 0.71%, multiplied by the average account value over the period, multiplied by the number of days in the period, divided by the number of days in the year.
311
Other Information (Unaudited) (Continued)
| Class S | |
| | | Beginning
Value | | Ending
Value | | Operating
Expense
Incurred* | |
| 1) Actual | | $ | 1,000.00 | | | $ | 920.90 | | | $ | 2.91 | | |
| 2) Hypothetical | | | 1,000.00 | | | | 1,021.77 | | | | 3.06 | | |
* Expenses are calculated using the annualized expense ratio for the six months ended June 30, 2005 of 0.61%, multiplied by the average account value over the period, multiplied by the number of days in the period, divided by the number of days in the year.
| Class N | |
| | | Beginning
Value | | Ending
Value | | Operating
Expense
Incurred* | |
| 1) Actual | | $ | 1,000.00 | | | $ | 916.00 | | | $ | 6.70 | | |
| 2) Hypothetical | | | 1,000.00 | | | | 1,017.80 | | | | 7.05 | | |
* Expenses are calculated using the annualized expense ratio for the six months ended June 30, 2005 of 1.41%, multiplied by the average account value over the period, multiplied by the number of days in the period, divided by the number of days in the year.
| Focused Value Fund | |
| Class A | |
| | | Beginning
Value | | Ending
Value | | Operating
Expense
Incurred* | |
| 1) Actual | | $ | 1,000.00 | | | $ | 1,012.40 | | | $ | 6.49 | | |
| 2) Hypothetical | | | 1,000.00 | | | | 1,018.35 | | | | 6.51 | | |
* Expenses are calculated using the annualized expense ratio for the six months ended June 30, 2005 of 1.30%, multiplied by the average account value over the period, multiplied by the number of days in the period, divided by the number of days in the year.
| Class L | |
| | | Beginning
Value | | Ending
Value | | Operating
Expense
Incurred* | |
| 1) Actual | | $ | 1,000.00 | | | $ | 1,013.30 | | | $ | 5.24 | | |
| 2) Hypothetical | | | 1,000.00 | | | | 1,019.59 | | | | 5.26 | | |
* Expenses are calculated using the annualized expense ratio for the six months ended June 30, 2005 of 1.05.%, multiplied by the average account value over the period, multiplied by the number of days in the period, divided by the number of days in the year.
| Class Y | |
| | | Beginning
Value | | Ending
Value | | Operating
Expense
Incurred* | |
| 1) Actual | | $ | 1,000.00 | | | $ | 1,014.40 | | | $ | 4.50 | | |
| 2) Hypothetical | | | 1,000.00 | | | | 1,020.33 | | | | 4.51 | | |
* Expenses are calculated using the annualized expense ratio for the six months ended June 30, 2005 of 0.90%, multiplied by the average account value over the period, multiplied by the number of days in the period, divided by the number of days in the year.
312
Other Information (Unaudited) (Continued)
| Class S | |
| | | Beginning
Value | | Ending
Value | | Operating
Expense
Incurred* | |
| 1) Actual | | $ | 1,000.00 | | | $ | 1,014.30 | | | $ | 4.00 | | |
| 2) Hypothetical | | | 1,000.00 | | | | 1,020.83 | | | | 4.01 | | |
* Expenses are calculated using the annualized expense ratio for the six months ended June 30, 2005 of 0.80%, multiplied by the average account value over the period, multiplied by the number of days in the period, divided by the number of days in the year.
| Class N | |
| | | Beginning
Value | | Ending
Value | | Operating
Expense
Incurred* | |
| 1) Actual | | $ | 1,000.00 | | | $ | 1,010.20 | | | $ | 7.97 | | |
| 2) Hypothetical | | | 1,000.00 | | | | 1,016.86 | | | | 8.00 | | |
* Expenses are calculated using the annualized expense ratio for the six months ended June 30, 2005 of 1.60%, multiplied by the average account value over the period, multiplied by the number of days in the period, divided by the number of days in the year.
| Small Company Value Fund | |
| Class A | |
| | | Beginning
Value | | Ending
Value | | Operating
Expense
Incurred* | |
| 1) Actual | | $ | 1,000.00 | | | $ | 988.10 | | | $ | 7.34 | | |
| 2) Hypothetical | | | 1,000.00 | | | | 1,017.41 | | | | 7.45 | | |
* Expenses are calculated using the annualized expense ratio for the six months ended June 30, 2005 of 1.49%, multiplied by the average account value over the period, multiplied by the number of days in the period, divided by the number of days in the year.
| Class L | |
| | | Beginning
Value | | Ending
Value | | Operating
Expense
Incurred* | |
| 1) Actual | | $ | 1,000.00 | | | $ | 988.80 | | | $ | 6.11 | | |
| 2) Hypothetical | | | 1,000.00 | | | | 1,018.65 | | | | 6.21 | | |
* Expenses are calculated using the annualized expense ratio for the six months ended June 30, 2005 of 1.24%, multiplied by the average account value over the period, multiplied by the number of days in the period, divided by the number of days in the year.
| Class Y | |
| | | Beginning
Value | | Ending
Value | | Operating
Expense
Incurred* | |
| 1) Actual | | $ | 1,000.00 | | | $ | 989.50 | | | $ | 5.38 | | |
| 2) Hypothetical | | | 1,000.00 | | | | 1,019.39 | | | | 5.46 | | |
* Expenses are calculated using the annualized expense ratio for the six months ended June 30, 2005 of 1.09%, multiplied by the average account value over the period, multiplied by the number of days in the period, divided by the number of days in the year.
313
Other Information (Unaudited) (Continued)
| Class S | |
| | | Beginning
Value | | Ending
Value | | Operating
Expense
Incurred* | |
| 1) Actual | | $ | 1,000.00 | | | $ | 989.60 | | | $ | 5.18 | | |
| 2) Hypothetical | | | 1,000.00 | | | | 1,019.59 | | | | 5.26 | | |
* Expenses are calculated using the annualized expense ratio for the six months ended June 30, 2005 of 1.05%, multiplied by the average account value over the period, multiplied by the number of days in the period, divided by the number of days in the year.
| Class N | |
| | | Beginning
Value | | Ending
Value | | Operating
Expense
Incurred* | |
| 1) Actual | | $ | 1,000.00 | | | $ | 986.60 | | | $ | 8.82 | | |
| 2) Hypothetical | | | 1,000.00 | | | | 1,015.92 | | | | 8.95 | | |
* Expenses are calculated using the annualized expense ratio for the six months ended June 30, 2005 of 1.79%, multiplied by the average account value over the period, multiplied by the number of days in the period, divided by the number of days in the year.
| Mid Cap Growth Equity Fund | |
| Class A | |
| | | Beginning
Value | | Ending
Value | | Operating
Expense
Incurred* | |
| 1) Actual | | $ | 1,000.00 | | | $ | 1,026.30 | | | $ | 6.58 | | |
| 2) Hypothetical | | | 1,000.00 | | | | 1,018.30 | | | | 6.56 | | |
* Expenses are calculated using the annualized expense ratio for the six months ended June 30, 2005 of 1.31%, multiplied by the average account value over the period, multiplied by the number of days in the period, divided by the number of days in the year.
| Class L | |
| | | Beginning
Value | | Ending
Value | | Operating
Expense
Incurred* | |
| 1) Actual | | $ | 1,000.00 | | | $ | 1,028.20 | | | $ | 5.33 | | |
| 2) Hypothetical | | | 1,000.00 | | | | 1,019.54 | | | | 5.31 | | |
* Expenses are calculated using the annualized expense ratio for the six months ended June 30, 2005 of 1.06%, multiplied by the average account value over the period, multiplied by the number of days in the period, divided by the number of days in the year.
| Class Y | |
| | | Beginning
Value | | Ending
Value | | Operating
Expense
Incurred* | |
| 1) Actual | | $ | 1,000.00 | | | $ | 1,028.00 | | | $ | 4.58 | | |
| 2) Hypothetical | | | 1,000.00 | | | | 1,020.28 | | | | 4.56 | | |
* Expenses are calculated using the annualized expense ratio for the six months ended June 30, 2005 of 0.91%, multiplied by the average account value over the period, multiplied by the number of days in the period, divided by the number of days in the year.
314
Other Information (Unaudited) (Continued)
| Class S | |
| | | Beginning
Value | | Ending
Value | | Operating
Expense
Incurred* | |
| 1) Actual | | $ | 1,000.00 | | | $ | 1,027.90 | | | $ | 4.22 | | |
| 2) Hypothetical | | | 1,000.00 | | | | 1,020.63 | | | | 4.21 | | |
* Expenses are calculated using the annualized expense ratio for the six months ended June 30, 2005 of 0.84%, multiplied by the average account value over the period, multiplied by the number of days in the period, divided by the number of days in the year.
| Class N | |
| | | Beginning
Value | | Ending
Value | | Operating
Expense
Incurred* | |
| 1) Actual | | $ | 1,000.00 | | | $ | 1,024.20 | | | $ | 8.08 | | |
| 2) Hypothetical | | | 1,000.00 | | | | 1,016.81 | | | | 8.05 | | |
* Expenses are calculated using the annualized expense ratio for the six months ended June 30, 2005 of 1.61%, multiplied by the average account value over the period, multiplied by the number of days in the period, divided by the number of days in the year.
| Mid Cap Growth Equity II Fund | |
| Class A | |
| | | Beginning
Value | | Ending
Value | | Operating
Expense
Incurred* | |
| 1) Actual | | $ | 1,000.00 | | | $ | 1,006.90 | | | $ | 6.72 | | |
| 2) Hypothetical | | | 1,000.00 | | | | 1,018.10 | | | | 6.76 | | |
* Expenses are calculated using the annualized expense ratio for the six months ended June 30, 2005 of 1.35%, multiplied by the average account value over the period, multiplied by the number of days in the period, divided by the number of days in the year.
| Class L | |
| | | Beginning
Value | | Ending
Value | | Operating
Expense
Incurred* | |
| 1) Actual | | $ | 1,000.00 | | | $ | 1,008.30 | | | $ | 5.48 | | |
| 2) Hypothetical | | | 1,000.00 | | | | 1,019.34 | | | | 5.51 | | |
* Expenses are calculated using the annualized expense ratio for the six months ended June 30, 2005 of 1.10%, multiplied by the average account value over the period, multiplied by the number of days in the period, divided by the number of days in the year.
| Class Y | |
| | | Beginning
Value | | Ending
Value | | Operating
Expense
Incurred* | |
| 1) Actual | | $ | 1,000.00 | | | $ | 1,009.00 | | | $ | 4.73 | | |
| 2) Hypothetical | | | 1,000.00 | | | | 1,020.08 | | | | 4.76 | | |
* Expenses are calculated using the annualized expense ratio for the six months ended June 30, 2005 of 0.95%, multiplied by the average account value over the period, multiplied by the number of days in the period, divided by the number of days in the year.
315
Other Information (Unaudited) (Continued)
| Class S | |
| | | Beginning
Value | | Ending
Value | | Operating
Expense
Incurred* | |
| 1) Actual | | $ | 1,000.00 | | | $ | 1,009.70 | | | $ | 4.29 | | |
| 2) Hypothetical | | | 1,000.00 | | | | 1,020.53 | | | | 4.31 | | |
* Expenses are calculated using the annualized expense ratio for the six months ended June 30, 2005 of 0.86%, multiplied by the average account value over the period, multiplied by the number of days in the period, divided by the number of days in the year.
| Class N | |
| | | Beginning
Value | | Ending
Value | | Operating
Expense
Incurred* | |
| 1) Actual | | $ | 1,000.00 | | | $ | 1,005.40 | | | $ | 8.20 | | |
| 2) Hypothetical | | | 1,000.00 | | | | 1,016.61 | | | | 8.25 | | |
* Expenses are calculated using the annualized expense ratio for the six months ended June 30, 2005 of 1.65%, multiplied by the average account value over the period, multiplied by the number of days in the period, divided by the number of days in the year.
| Small Cap Growth Equity Fund | |
| Class A | |
| | | Beginning
Value | | Ending
Value | | Operating
Expense
Incurred* | |
| 1) Actual | | $ | 1,000.00 | | | $ | 1,005.60 | | | $ | 7.51 | | |
| 2) Hypothetical | | | 1,000.00 | | | | 1,017.31 | | | | 7.55 | | |
* Expenses are calculated using the annualized expense ratio for the six months ended June 30, 2005 of 1.51%, multiplied by the average account value over the period, multiplied by the number of days in the period, divided by the number of days in the year.
| Class L | |
| | | Beginning
Value | | Ending
Value | | Operating
Expense
Incurred* | |
| 1) Actual | | $ | 1,000.00 | | | $ | 1,006.20 | | | $ | 6.27 | | |
| 2) Hypothetical | | | 1,000.00 | | | | 1,018.55 | | | | 6.31 | | |
* Expenses are calculated using the annualized expense ratio for the six months ended June 30, 2005 of 1.26%, multiplied by the average account value over the period, multiplied by the number of days in the period, divided by the number of days in the year.
| Class Y | |
| | | Beginning
Value | | Ending
Value | | Operating
Expense
Incurred* | |
| 1) Actual | | $ | 1,000.00 | | | $ | 1,006.90 | | | $ | 5.52 | | |
| 2) Hypothetical | | | 1,000.00 | | | | 1,019.29 | | | | 5.56 | | |
* Expenses are calculated using the annualized expense ratio for the six months ended June 30, 2005 of 1.11%, multiplied by the average account value over the period, multiplied by the number of days in the period, divided by the number of days in the year.
316
Other Information (Unaudited) (Continued)
| Class S | |
| | | Beginning
Value | | Ending
Value | | Operating
Expense
Incurred* | |
| 1) Actual | | $ | 1,000.00 | | | $ | 1,008.20 | | | $ | 4.83 | | |
| 2) Hypothetical | | | 1,000.00 | | | | 1,019.98 | | | | 4.86 | | |
* Expenses are calculated using the annualized expense ratio for the six months ended June 30, 2005 of 0.97%, multiplied by the average account value over the period, multiplied by the number of days in the period, divided by the number of days in the year.
| Class N | |
| | | Beginning
Value | | Ending
Value | | Operating
Expense
Incurred* | |
| 1) Actual | | $ | 1,000.00 | | | $ | 1,004.30 | | | $ | 8.99 | | |
| 2) Hypothetical | | | 1,000.00 | | | | 1,015.82 | | | | 9.05 | | |
* Expenses are calculated using the annualized expense ratio for the six months ended June 30, 2005 of 1.81%, multiplied by the average account value over the period, multiplied by the number of days in the period, divided by the number of days in the year.
| Small Company Growth Fund | |
| Class A | |
| | | Beginning
Value | | Ending
Value | | Operating
Expense
Incurred* | |
| 1) Actual | | $ | 1,000.00 | | | $ | 927.30 | | | $ | 7.17 | | |
| 2) Hypothetical | | | 1,000.00 | | | | 1,017.36 | | | | 7.50 | | |
* Expenses are calculated using the annualized expense ratio for the six months ended June 30, 2005 of 1.50%, multiplied by the average account value over the period, multiplied by the number of days in the period, divided by the number of days in the year.
| Class L | |
| | | Beginning
Value | | Ending
Value | | Operating
Expense
Incurred* | |
| 1) Actual | | $ | 1,000.00 | | | $ | 928.00 | | | $ | 5.98 | | |
| 2) Hypothetical | | | 1,000.00 | | | | 1,018.60 | | | | 6.26 | | |
* Expenses are calculated using the annualized expense ratio for the six months ended June 30, 2005 of 1.25%, multiplied by the average account value over the period, multiplied by the number of days in the period, divided by the number of days in the year.
| Class Y | |
| | | Beginning
Value | | Ending
Value | | Operating
Expense
Incurred* | |
| 1) Actual | | $ | 1,000.00 | | | $ | 929.30 | | | $ | 5.26 | | |
| 2) Hypothetical | | | 1,000.00 | | | | 1,019.34 | | | | 5.51 | | |
* Expenses are calculated using the annualized expense ratio for the six months ended June 30, 2005 of 1.10%, multiplied by the average account value over the period, multiplied by the number of days in the period, divided by the number of days in the year.
317
Other Information (Unaudited) (Continued)
| Class S | |
| | | Beginning
Value | | Ending
Value | | Operating
Expense
Incurred* | |
| 1) Actual | | $ | 1,000.00 | | | $ | 928.50 | | | $ | 5.07 | | |
| 2) Hypothetical | | | 1,000.00 | | | | 1,019.54 | | | | 5.31 | | |
* Expenses are calculated using the annualized expense ratio for the six months ended June 30, 2005 of 1.06%, multiplied by the average account value over the period, multiplied by the number of days in the period, divided by the number of days in the year.
| Class N | |
| | | Beginning
Value | | Ending
Value | | Operating
Expense
Incurred* | |
| 1) Actual | | $ | 1,000.00 | | | $ | 926.40 | | | $ | 8.60 | | |
| 2) Hypothetical | | | 1,000.00 | | | | 1,015.87 | | | | 9.00 | | |
* Expenses are calculated using the annualized expense ratio for the six months ended June 30, 2005 of 1.80%, multiplied by the average account value over the period, multiplied by the number of days in the period, divided by the number of days in the year.
| Emerging Growth Fund | |
| Class A | |
| | | Beginning
Value | | Ending
Value | | Operating
Expense
Incurred* | |
| 1) Actual | | $ | 1,000.00 | | | $ | 945.60 | | | $ | 7.04 | | |
| 2) Hypothetical | | | 1,000.00 | | | | 1,017.55 | | | | 7.30 | | |
* Expenses are calculated using the annualized expense ratio for the six months ended June 30, 2005 of 1.46%, multiplied by the average account value over the period, multiplied by the number of days in the period, divided by the number of days in the year.
| Class L | |
| | | Beginning
Value | | Ending
Value | | Operating
Expense
Incurred* | |
| 1) Actual | | $ | 1,000.00 | | | $ | 947.80 | | | $ | 5.84 | | |
| 2) Hypothetical | | | 1,000.00 | | | | 1,018.79 | | | | 6.06 | | |
* Expenses are calculated using the annualized expense ratio for the six months ended June 30, 2005 of 1.21%, multiplied by the average account value over the period, multiplied by the number of days in the period, divided by the number of days in the year.
| Class Y | |
| | | Beginning
Value | | Ending
Value | | Operating
Expense
Incurred* | |
| 1) Actual | | $ | 1,000.00 | | | $ | 1,046.00 | | | $ | 5.38 | | |
| 2) Hypothetical | | | 1,000.00 | | | | 1,019.54 | | | | 5.31 | | |
* Expenses are calculated using the annualized expense ratio for the six months ended June 30, 2005 of 1.06%, multiplied by the average account value over the period, multiplied by the number of days in the period, divided by the number of days in the year.
318
Other Information (Unaudited) (Continued)
| Class S | |
| | | Beginning
Value | | Ending
Value | | Operating
Expense
Incurred* | |
| 1) Actual | | $ | 1,000.00 | | | $ | 948.60 | | | $ | 4.64 | | |
| 2) Hypothetical | | | 1,000.00 | | | | 1,020.03 | | | | 4.81 | | |
* Expenses are calculated using the annualized expense ratio for the six months ended June 30, 2005 of 0.96%, multiplied by the average account value over the period, multiplied by the number of days in the period, divided by the number of days in the year.
| Class N | |
| | | Beginning
Value | | Ending
Value | | Operating
Expense
Incurred* | |
| 1) Actual | | $ | 1,000.00 | | | $ | 943.30 | | | $ | 8.48 | | |
| 2) Hypothetical | | | 1,000.00 | | | | 1,016.07 | | | | 8.80 | | |
* Expenses are calculated using the annualized expense ratio for the six months ended June 30, 2005 of 1.76%, multiplied by the average account value over the period, multiplied by the number of days in the period, divided by the number of days in the year.
| Overseas Fund | |
| Class A | |
| | | Beginning
Value | | Ending
Value | | Operating
Expense
Incurred* | |
| 1) Actual | | $ | 1,000.00 | | | $ | 993.60 | | | $ | 8.01 | | |
| 2) Hypothetical | | | 1,000.00 | | | | 1,016.76 | | | | 8.10 | | |
* Expenses are calculated using the annualized expense ratio for the six months ended June 30, 2005 of 1.62%, multiplied by the average account value over the period, multiplied by the number of days in the period, divided by the number of days in the year.
| Class L | |
| | | Beginning
Value | | Ending
Value | | Operating
Expense
Incurred* | |
| 1) Actual | | $ | 1,000.00 | | | $ | 995.40 | | | $ | 6.78 | | |
| 2) Hypothetical | | | 1,000.00 | | | | 1,018.00 | | | | 6.85 | | |
* Expenses are calculated using the annualized expense ratio for the six months ended June 30, 2005 of 1.37%, multiplied by the average account value over the period, multiplied by the number of days in the period, divided by the number of days in the year.
| Class Y | |
| | | Beginning
Value | | Ending
Value | | Operating
Expense
Incurred* | |
| 1) Actual | | $ | 1,000.00 | | | $ | 996.40 | | | $ | 6.04 | | |
| 2) Hypothetical | | | 1,000.00 | | | | 1,018.74 | | | | 6.11 | | |
* Expenses are calculated using the annualized expense ratio for the six months ended June 30, 2005 of 1.22%, multiplied by the average account value over the period, multiplied by the number of days in the period, divided by the number of days in the year.
319
Other Information (Unaudited) (Continued)
| Class S | |
| | | Beginning
Value | | Ending
Value | | Operating
Expense
Incurred* | |
| 1) Actual | | $ | 1,000.00 | | | $ | 996.40 | | | $ | 5.79 | | |
| 2) Hypothetical | | | 1,000.00 | | | | 1,018.99 | | | | 5.86 | | |
* Expenses are calculated using the annualized expense ratio for the six months ended June 30, 2005 of 1.17%, multiplied by the average account value over the period, multiplied by the number of days in the period, divided by the number of days in the year.
| Class N | |
| | | Beginning
Value | | Ending
Value | | Operating
Expense
Incurred* | |
| 1) Actual | | $ | 1,000.00 | | | $ | 992.60 | | | $ | 9.49 | | |
| 2) Hypothetical | | | 1,000.00 | | | | 1,015.27 | | | | 9.59 | | |
* Expenses are calculated using the annualized expense ratio for the six months ended June 30, 2005 of 1.92%, multiplied by the average account value over the period, multiplied by the number of days in the period, divided by the number of days in the year.
| Destination Retirement Income Fund | |
| Class A | |
| | | Beginning
Value | | Ending
Value | | Operating
Expense
Incurred* | |
| 1) Actual | | $ | 1,000.00 | | | $ | 1,012.60 | | | $ | 2.40 | | |
| 2) Hypothetical | | | 1,000.00 | | | | 1,022.41 | | | | 2.41 | | |
* Expenses are calculated using the annualized expense ratio for the six months ended June 30, 2005 of 0.48%, multiplied by the average account value over the period, multiplied by the number of days in the period, divided by the number of days in the year.
| Class L | |
| | | Beginning
Value | | Ending
Value | | Operating
Expense
Incurred* | |
| 1) Actual | | $ | 1,000.00 | | | $ | 1,013.50 | | | $ | 1.15 | | |
| 2) Hypothetical | | | 1,000.00 | | | | 1,023.65 | | | | 1.15 | | |
* Expenses are calculated using the annualized expense ratio for the six months ended June 30, 2005 of 0.23%, multiplied by the average account value over the period, multiplied by the number of days in the period, divided by the number of days in the year.
| Class Y | |
| | | Beginning
Value | | Ending
Value | | Operating
Expense
Incurred* | |
| 1) Actual | | $ | 1,000.00 | | | $ | 1,013.50 | | | $ | 0.65 | | |
| 2) Hypothetical | | | 1,000.00 | | | | 1,024.15 | | | | 0.65 | | |
* Expenses are calculated using the annualized expense ratio for the six months ended June 30, 2005 of 0.13%, multiplied by the average account value over the period, multiplied by the number of days in the period, divided by the number of days in the year.
320
Other Information (Unaudited) (Continued)
| Class S | |
| | | Beginning
Value | | Ending
Value | | Operating
Expense
Incurred* | |
| 1) Actual | | $ | 1,000.00 | | | $ | 1,014.50 | | | $ | 0.50 | | |
| 2) Hypothetical | | | 1,000.00 | | | | 1,024.30 | | | | 0.50 | | |
* Expenses are calculated using the annualized expense ratio for the six months ended June 30, 2005 of 0.10%, multiplied by the average account value over the period, multiplied by the number of days in the period, divided by the number of days in the year.
| Class N | |
| | | Beginning
Value | | Ending
Value | | Operating
Expense
Incurred* | |
| 1) Actual | | $ | 1,000.00 | | | $ | 1,010.60 | | | $ | 3.89 | | |
| 2) Hypothetical | | | 1,000.00 | | | | 1,020.93 | | | | 3.91 | | |
* Expenses are calculated using the annualized expense ratio for the six months ended June 30, 2005 of 0.78%, multiplied by the average account value over the period, multiplied by the number of days in the period, divided by the number of days in the year.
| Destination Retirement 2010 Fund | |
| Class A | |
| | | Beginning
Value | | Ending
Value | | Operating
Expense
Incurred* | |
| 1) Actual | | $ | 1,000.00 | | | $ | 1,009.50 | | | $ | 2.49 | | |
| 2) Hypothetical | | | 1,000.00 | | | | 1,022.32 | | | | 2.51 | | |
* Expenses are calculated using the annualized expense ratio for the six months ended June 30, 2005 of 0.50%, multiplied by the average account value over the period, multiplied by the number of days in the period, divided by the number of days in the year.
| Class L | |
| | | Beginning
Value | | Ending
Value | | Operating
Expense
Incurred* | |
| 1) Actual | | $ | 1,000.00 | | | $ | 1,010.40 | | | $ | 1.25 | | |
| 2) Hypothetical | | | 1,000.00 | | | | 1,023.55 | | | | 1.25 | | |
* Expenses are calculated using the annualized expense ratio for the six months ended June 30, 2005 of 0.25%, multiplied by the average account value over the period, multiplied by the number of days in the period, divided by the number of days in the year.
| Class Y | |
| | | Beginning
Value | | Ending
Value | | Operating
Expense
Incurred* | |
| 1) Actual | | $ | 1,000.00 | | | $ | 1,011.40 | | | $ | 0.75 | | |
| 2) Hypothetical | | | 1,000.00 | | | | 1,024.05 | | | | 0.75 | | |
* Expenses are calculated using the annualized expense ratio for the six months ended June 30, 2005 of 0.15%, multiplied by the average account value over the period, multiplied by the number of days in the period, divided by the number of days in the year.
321
Other Information (Unaudited) (Continued)
| Class S | |
| | | Beginning
Value | | Ending
Value | | Operating
Expense
Incurred* | |
| 1) Actual | | $ | 1,000.00 | | | $ | 1,011.40 | | | $ | 0.50 | | |
| 2) Hypothetical | | | 1,000.00 | | | | 1,024.30 | | | | 0.50 | | |
* Expenses are calculated using the annualized expense ratio for the six months ended June 30, 2005 of 0.10%, multiplied by the average account value over the period, multiplied by the number of days in the period, divided by the number of days in the year.
| Class N | |
| | | Beginning
Value | | Ending
Value | | Operating
Expense
Incurred* | |
| 1) Actual | | $ | 1,000.00 | | | $ | 1,008.50 | | | $ | 3.98 | | |
| 2) Hypothetical | | | 1,000.00 | | | | 1,020.83 | | | | 4.01 | | |
* Expenses are calculated using the annualized expense ratio for the six months ended June 30, 2005 of 0.80%, multiplied by the average account value over the period, multiplied by the number of days in the period, divided by the number of days in the year.
| Destination Retirement 2020 Fund | |
| Class A | |
| | | Beginning
Value | | Ending
Value | | Operating
Expense
Incurred* | |
| 1) Actual | | $ | 1,000.00 | | | $ | 1,005.60 | | | $ | 2.49 | | |
| 2) Hypothetical | | | 1,000.00 | | | | 1,022.32 | | | | 2.51 | | |
* Expenses are calculated using the annualized expense ratio for the six months ended June 30, 2005 of 0.50%, multiplied by the average account value over the period, multiplied by the number of days in the period, divided by the number of days in the year.
| Class L | |
| | | Beginning
Value | | Ending
Value | | Operating
Expense
Incurred* | |
| 1) Actual | | $ | 1,000.00 | | | $ | 1,006.50 | | | $ | 1.24 | | |
| 2) Hypothetical | | | 1,000.00 | | | | 1,023.55 | | | | 1.25 | | |
* Expenses are calculated using the annualized expense ratio for the six months ended June 30, 2005 of 0.25%, multiplied by the average account value over the period, multiplied by the number of days in the period, divided by the number of days in the year.
| Class Y | |
| | | Beginning
Value | | Ending
Value | | Operating
Expense
Incurred* | |
| 1) Actual | | $ | 1,000.00 | | | $ | 1,007.40 | | | $ | 0.75 | | |
| 2) Hypothetical | | | 1,000.00 | | | | 1,024.05 | | | | 0.75 | | |
* Expenses are calculated using the annualized expense ratio for the six months ended June 30, 2005 of 0.15%, multiplied by the average account value over the period, multiplied by the number of days in the period, divided by the number of days in the year.
322
Other Information (Unaudited) (Continued)
| Class S | |
| | | Beginning
Value | | Ending
Value | | Operating
Expense
Incurred* | |
| 1) Actual | | $ | 1,000.00 | | | $ | 1,007.40 | | | $ | 0.50 | | |
| 2) Hypothetical | | | 1,000.00 | | | | 1,024.30 | | | | 0.50 | | |
* Expenses are calculated using the annualized expense ratio for the six months ended June 30, 2005 of 0.10%, multiplied by the average account value over the period, multiplied by the number of days in the period, divided by the number of days in the year.
| Class N | |
| | | Beginning
Value | | Ending
Value | | Operating
Expense
Incurred* | |
| 1) Actual | | $ | 1,000.00 | | | $ | 1,004.60 | | | $ | 3.98 | | |
| 2) Hypothetical | | | 1,000.00 | | | | 1,020.83 | | | | 4.01 | | |
* Expenses are calculated using the annualized expense ratio for the six months ended June 30, 2005 of 0.80%, multiplied by the average account value over the period, multiplied by the number of days in the period, divided by the number of days in the year.
| Destination Retirement 2030 Fund | |
| Class A | |
| | | Beginning
Value | | Ending
Value | | Operating
Expense
Incurred* | |
| 1) Actual | | $ | 1,000.00 | | | $ | 999.10 | | | $ | 2.48 | | |
| 2) Hypothetical | | | 1,000.00 | | | | 1,022.32 | | | | 2.51 | | |
* Expenses are calculated using the annualized expense ratio for the six months ended June 30, 2005 of 0.50%, multiplied by the average account value over the period, multiplied by the number of days in the period, divided by the number of days in the year.
| Class L | |
| | | Beginning
Value | | Ending
Value | | Operating
Expense
Incurred* | |
| 1) Actual | | $ | 1,000.00 | | | $ | 1,000.90 | | | $ | 1.24 | | |
| 2) Hypothetical | | | 1,000.00 | | | | 1,023.55 | | | | 1.25 | | |
* Expenses are calculated using the annualized expense ratio for the six months ended June 30, 2005 of 0.25%, multiplied by the average account value over the period, multiplied by the number of days in the period, divided by the number of days in the year.
| Class Y | |
| | | Beginning
Value | | Ending
Value | | Operating
Expense
Incurred* | |
| 1) Actual | | $ | 1,000.00 | | | $ | 1,000.90 | | | $ | 0.74 | | |
| 2) Hypothetical | | | 1,000.00 | | | | 1,024.05 | | | | 0.75 | | |
* Expenses are calculated using the annualized expense ratio for the six months ended June 30, 2005 of 0.15%, multiplied by the average account value over the period, multiplied by the number of days in the period, divided by the number of days in the year.
323
Other Information (Unaudited) (Continued)
| Class S | |
| | | Beginning
Value | | Ending
Value | | Operating
Expense
Incurred* | |
| 1) Actual | | $ | 1,000.00 | | | $ | 1,000.90 | | | $ | 0.50 | | |
| 2) Hypothetical | | | 1,000.00 | | | | 1,024.30 | | | | 0.50 | | |
* Expenses are calculated using the annualized expense ratio for the six months ended June 30, 2005 of 0.10%, multiplied by the average account value over the period, multiplied by the number of days in the period, divided by the number of days in the year.
| Class N | |
| | | Beginning
Value | | Ending
Value | | Operating
Expense
Incurred* | |
| 1) Actual | | $ | 1,000.00 | | | $ | 997.30 | | | $ | 3.96 | | |
| 2) Hypothetical | | | 1,000.00 | | | | 1,020.83 | | | | 4.01 | | |
* Expenses are calculated using the annualized expense ratio for the six months ended June 30, 2005 of 0.80%, multiplied by the average account value over the period, multiplied by the number of days in the period, divided by the number of days in the year.
| Destination Retirement 2040 Fund | |
| Class A | |
| | | Beginning
Value | | Ending
Value | | Operating
Expense
Incurred* | |
| 1) Actual | | $ | 1,000.00 | | | $ | 994.70 | | | $ | 2.47 | | |
| 2) Hypothetical | | | 1,000.00 | | | | 1,022.32 | | | | 2.51 | | |
* Expenses are calculated using the annualized expense ratio for the six months ended June 30, 2005 of 0.50%, multiplied by the average account value over the period, multiplied by the number of days in the period, divided by the number of days in the year.
| Class L | |
| | | Beginning
Value | | Ending
Value | | Operating
Expense
Incurred* | |
| 1) Actual | | $ | 1,000.00 | | | $ | 996.50 | | | $ | 1.24 | | |
| 2) Hypothetical | | | 1,000.00 | | | | 1,023.55 | | | | 1.25 | | |
* Expenses are calculated using the annualized expense ratio for the six months ended June 30, 2005 of 0.25%, multiplied by the average account value over the period, multiplied by the number of days in the period, divided by the number of days in the year.
| Class Y | |
| | | Beginning
Value | | Ending
Value | | Operating
Expense
Incurred* | |
| 1) Actual | | $ | 1,000.00 | | | $ | 997.30 | | | $ | 0.74 | | |
| 2) Hypothetical | | | 1,000.00 | | | | 1,024.05 | | | | 0.75 | | |
* Expenses are calculated using the annualized expense ratio for the six months ended June 30, 2005 of 0.15%, multiplied by the average account value over the period, multiplied by the number of days in the period, divided by the number of days in the year.
324
Other Information (Unaudited) (Continued)
| Class S | |
| | | Beginning
Value | | Ending
Value | | Operating
Expense
Incurred* | |
| 1) Actual | | $ | 1,000.00 | | | $ | 997.30 | | | $ | 0.50 | | |
| 2) Hypothetical | | | 1,000.00 | | | | 1,024.30 | | | | 0.50 | | |
* Expenses are calculated using the annualized expense ratio for the six months ended June 30, 2005 of 0.10%, multiplied by the average account value over the period, multiplied by the number of days in the period, divided by the number of days in the year.
| Class N | |
| | | Beginning
Value | | Ending
Value | | Operating
Expense
Incurred* | |
| 1) Actual | | $ | 1,000.00 | | | $ | 993.80 | | | $ | 3.95 | | |
| 2) Hypothetical | | | 1,000.00 | | | | 1,020.83 | | | | 4.01 | | |
* Expenses are calculated using the annualized expense ratio for the six months ended June 30, 2005 of 0.80%, multiplied by the average account value over the period, multiplied by the number of days in the period, divided by the number of days in the year.
325
[This page is intentionally left blank.]
Item 2. Code of Ethics. (annual only)
Not applicable to this filing.
Item 3. Audit Committee Financial Expert. (annual only)
Not applicable to this filing.
Item 4. Principal Accountant Fees and Services. (annual only)
Not applicable to this filing.
Items 5. Audit Committee of Listed Registrants. (annual only)
Not applicable to this filing.
Item 6. Schedule of Investments.
Not applicable to this filing.
Item 7. Disclosure of Proxy Voting Policies and Procedures for Closed-End Management Investment Companies.
Not applicable to this filing.
Item 8. Purchases of Equity Securities by Closed-End Management Investment Company and Affiliated Purchasers.
Not applicable to this filing.
Item 9. Submission of Matters to a Vote of Security Holders.
Not applicable to this filing.
Item 10. Controls and Procedures.
(a) The Registrant’s Principal Executive Officer and Principal Financial Officer concluded that the Registrant’s disclosure controls and procedures (as defined in Rule 30a-3(c) under the Investment Company Act of 1940) were effective as of a date within 90 days prior to the filing date of this report (the “Evaluation Date”), based on their evaluation of the effectiveness of the Registrant’s disclosure controls and procedures as of the Evaluation Date.
(b) There were no changes in the Registrant’s internal control over financial reporting (as defined in Rule 30a-3(d) under the 1940 Act (17 CFR 270.30a-3(d)) that occurred during the Registrant’s most recent fiscal quarter that has materially affected, or is reasonably likely to materially affect, the Registrant’s internal control over financial reporting.
Item 11. Exhibits.
(a)(1) Code of Ethics (Item 2) is not applicable to this filing.
(a)(2) Certifications of the Principal Executive Officer and Principal Financial Officer of the Registrant as required by Rule 30a-2(a) under the Investment Company Act of 1940 (17 CFR 270.30a-2(a)) are attached hereto as Exhibit 99CERT.
(a)(3) Not applicable to this filing.
(b) Certifications pursuant to Section 906 of the Sarbanes-Oxley Act of 2002 as required by Rule 30a-2(b), under the Investment Company Act of 1940 (17 CFR 270.30a-2(b)), Rule 15d-14(b) under the Securities Exchange Act of 1934 (17 CFR 240.15d-14(b)) and Section 1350 of Chapter 63 of Title 18 of the United States Code (18 U.S.C. 1350) are attached hereto as Exhibit 99.906CERT.
SIGNATURES
Pursuant to the requirements of the Securities Exchange Act of 1934 and the Investment Company Act of 1940, the registrant has duly caused this report to be signed on its behalf by the undersigned, thereunto duly authorized.
(Registrant) | | MassMutual Select Funds |
By (Signature and Title) | | /s/ Frederick C. Castellani |
| | Frederick C. Castellani, President and Principal Executive Officer |
Pursuant to the requirements of the Securities Exchange Act of 1934 and the Investment Company Act of 1940, this report has been signed below by the following persons on behalf of the registrant and in the capacities and on the dates indicated.
By (Signature and Title) | | /s/ Frederick C. Castellani |
| | Frederick C. Castellani, President and Principal Executive Officer |
By (Signature and Title) | | /s/ James S. Collins |
| | James S. Collins, Treasurer and Principal Financial Officer |