UNITED STATES
SECURITIES AND EXCHANGE COMMISSION
Washington, D.C. 20549
FORM N-CSR
CERTIFIED SHAREHOLDER REPORT OF REGISTERED
MANAGEMENT INVESTMENT COMPANIES
Investment Company Act file number | 811-08274 |
|
MassMutual Select Funds |
(Exact name of registrant as specified in charter) |
|
1295 State Street, Springfield, MA | | 01111 |
(Address of principal executive offices) | | (Zip code) |
|
Frederick C. Castellani 1295 State Street, Springfield, MA 01111 |
(Name and address of agent for service) |
|
Registrant’s telephone number, including area code: | 413-788-8411 | |
|
Date of fiscal year end: | 12/31/2007 | |
|
Date of reporting period: | 6/30/2007 | |
| | | | | | | | |
Item 1. Reports to Stockholders.
MassMutual
Select Funds
Semi-annual Report
June 30, 2007
insure invest retire

Retirement Services
Table of Contents
| Letter to Shareholders | | | 1 | | |
|
| Portfolio Manager Reports | | | 3 | | |
|
| Portfolio of Investments | |
|
| MassMutual Select Strategic Bond Fund | | | 87 | | |
|
| MassMutual Select Strategic Balanced Fund | | | 96 | | |
|
| MassMutual Select Diversified Value Fund | | | 105 | | |
|
| MassMutual Select Fundamental Value Fund | | | 108 | | |
|
| MassMutual Select Value Equity Fund | | | 111 | | |
|
| MassMutual Select Large Cap Value Fund | | | 114 | | |
|
| MassMutual Select Indexed Equity Fund | | | 117 | | |
|
| MassMutual Select Core Opportunities Fund | | | 123 | | |
|
| MassMutual Select Blue Chip Growth Fund | | | 125 | | |
|
| MassMutual Select Large Cap Growth Fund | | | 128 | | |
|
| MassMutual Select Growth Equity Fund | | | 131 | | |
|
| MassMutual Select Aggressive Growth Fund | | | 135 | | |
|
| MassMutual Select OTC 100 Fund | | | 137 | | |
|
| MassMutual Select Focused Value Fund | | | 140 | | |
|
| MassMutual Select Mid-Cap Value Fund | | | 143 | | |
|
| MassMutual Select Small Cap Value Equity Fund | | | 145 | | |
|
| MassMutual Select Small Company Value Fund | | | 151 | | |
|
| MassMutual Select Small Cap Core Equity Fund | | | 156 | | |
|
| MassMutual Select Mid Cap Growth Equity Fund | | | 160 | | |
|
| MassMutual Select Mid Cap Growth Equity II Fund | | | 163 | | |
|
| MassMutual Select Small Cap Growth Equity Fund | | | 169 | | |
|
| MassMutual Select Small Company Growth Fund | | | 174 | | |
|
| MassMutual Select Emerging Growth Fund | | | 178 | | |
|
| MassMutual Select Diversified International Fund | | | 181 | | |
|
| MassMutual Select Overseas Fund | | | 184 | | |
|
| MassMutual Select Destination Retirement Income Fund | | | 187 | | |
|
| MassMutual Select Destination Retirement 2010 Fund | | | 188 | | |
|
| MassMutual Select Destination Retirement 2020 Fund | | | 189 | | |
|
| MassMutual Select Destination Retirement 2030 Fund | | | 190 | | |
|
| MassMutual Select Destination Retirement 2040 Fund | | | 191 | | |
|
| Statement of Assets and Liabilities | | | 192 | | |
|
| Statement of Operations | | | 208 | | |
|
| Statement of Changes in Net Assets | | | 216 | | |
|
| Financial Highlights | | | 232 | | |
|
| Notes to Financial Statements | | | 313 | | |
|
| Other Information (Unaudited) | | | 365 | | |
|
This material must be preceded or accompanied by a current prospectus for the MassMutual Select Funds. Investors should consider a Fund's investment objective, risks and charges and expenses carefully before investing. This and other information about the investment company is available in the prospectus. Read it carefully before investing.
MassMutual Select Funds – President's Letter to Shareholders
To Our Shareholders
June 30, 2007

Frederick C. Castellani
The stock market's impressive performance during the second quarter serves as a reminder of how difficult it can be to forecast stock market performance. Because the direction of the equity markets is constantly subject to change, MassMutual recommends that investors should generally avoid basing their investment activities on market forecasts – and instead adopt a buy-and-hold approach that employs thoughtful asset allocation.
Stocks continue to outperform bonds in first half of 2007
For the six-month period ended June 30, 2007, equities once again fared better than their fixed-income counterparts, as bonds continued to face numerous challenges. The Dow Jones Industrial AverageSM (the Dow), which tracks the progress of blue-chip stock activity, returned 7.59% for the six months ended June 30, 2007. The Nasdaq Composite® Index (Nasdaq) gained 7.78%, outpacing the S&P 500® Index, a measure of U.S. large-cap stock performance, which advanced 6.96%. Continuing the trend from 2006, a leader in worldwide equity markets for this period was once again the MSCI® EAFE® Index – a benchmark for foreign stocks that advanced 10.74%.*
The fixed-income market did not fare nearly as well in the first half of 2007, as the Lehman Brothers® Aggregate Bond Index, a broad measure of the U.S. investment-grade bond markets, gained just 0.97%.*
Domestic stocks showed little change during the first quarter of 2007, despite a significant increase in volatility across the board. Although the Dow notched a new closing high in February, the blue-chip benchmark declined slightly for the three months ended March 31, 2007. The S&P 500 Index finished with a small advance, as did the Nasdaq Index, which barely managed to post a gain for the period. A depreciating U.S. dollar supported the returns of foreign stocks, helping the MSCI EAFE Index outperform its U.S. counterparts for the quarter.
Bond yields rose and prices fell early in 2007, reflecting expectations that the economy would achieve a "soft landing" – that is, a mild slowdown without recession. However, as concerns intensified about the weak housing market and problems with sub-prime lenders made headlines, bond yields eased and prices rallied. Overall, most Treasury securities ended the first quarter with modest price gains, and the Lehman Brothers Aggregate Bond Index closed out the period with a modest advance.
Most U.S. stock indexes advanced in the second quarter, with some setting records along the way. Stocks rode a wave of optimism over corporate earnings early in the quarter and later overcame short periods of increased volatility associated with investor concerns about soft retail sales, rising interest rates, inflation, the housing market and sub-prime mortgages. During the period, the housing market remained depressed, and long-term interest rates moved decisively higher. Crude oil surged to close the quarter near $70 per barrel.
Higher Treasury yields and widening premiums for corporate and mortgage-backed securities reflected rising interest rates in the second quarter. The Treasury yield curve, representing yields across a range of maturities, went from slightly inverted – with yields on short-term bonds higher than those of longer-term bonds – to nearly flat, with longer yields marginally higher than short ones. Also of note, the 10-year bond yield topped the 5% level in its first excursion above that mark since the summer of 2006. Performance was mixed among fixed-income groups, but investors favored shorter-term issues, such as the 13-week U.S. Treasury Bill. High-yield bonds barely managed a positive return for the quarter, despite moderately favorable corporate earnings and low default rates on corporate high-yield securities.
* Indexes are unmanaged, do not incur fees or expenses and cannot be purchased directly for investment.
(Continued)
1
MassMutual Select Funds – President's Letter to Shareholders (Continued)
Long-term interest rates jump
Interest rates have made headlines during the past few years, often in response to adjustments in short-term rates made by the Federal Reserve Board (Fed). The Fed uses short-term rates as a tool to help keep the economy on a healthy growth track while controlling inflation. Consequently, when the economy hit a rough patch earlier in this decade, the Fed cut short-term rates to stimulate growth. Over the last few years, an economic recovery and concerns about a potential resurgence of inflation prompted the Fed to boost short-term rates from 1.00% to the current level of 5.25% (reached in June 2006).
Despite the Fed's rate hikes, long-term interest rates remained relatively low for the most part. Unlike the federal funds rate – the overnight bank lending rate that the Fed controls by buying and selling securities – long-term rates fluctuate according to market forces and are very sensitive to investors' expectations for inflation. Because inflation erodes the value of fixed-income investments, investors generally demand a higher yield for investing in bonds if they believe inflation is on the rise. Typically, short- and long-term rates move in tandem, although this is not always the case.
As of the end of the second quarter, long-term rates were once again on the rise, although historically, they still were not high. So why did the increase generate so much attention? For one thing, the rise was relatively swift – for instance, the average 30-year fixed-rate mortgage (which is based on longer term interest rates) spiked to 6.74% for the week ending June 14, 2007, from 6.53% the previous week. With the housing market already reeling from a spate of sub-prime mortgage defaults, burgeoning inventories of unsold homes and soft prices, there was concern that sharply higher mortgage rates could further hamper the industry. The housing market aside, long-term rates have also risen in sectors such as Treasuries and corporate securities, suggesting that a fundamental shift in perceptions about inflation might be occurring.
Outlook
The stock market's impressive performance during the second quarter – against the challenging backdrop of tepid economic growth, a weak housing market, high energy prices and rising long-term interest rates – serves as a reminder of how difficult it can be to forecast stock market performance. Going forward, any number of scenarios could develop that would negatively affect the equity markets. Conversely, the strength of the global economy, corporate earnings and continued low interest rates may keep investors and consumers optimistic. For this reason, MassMutual recommends that investors should generally avoid basing their investment activities on market forecasts – and instead adopt a buy-and-hold approach that employs thoughtful asset allocation.

Frederick C. Castellani
President
The information provided is the opinion of MassMutual Retirement Services Investments Marketing as of 7/2/07 and is subject to change without notice. It is not to be construed as tax, legal or investment advice. Of course, past performance does not guarantee future results.
2
MassMutual Select Strategic Bond Fund – Portfolio Manager Report
What is the investment objective of the MassMutual Select Strategic Bond Fund – and who are the Fund's sub-advisers? The Fund seeks a superior total rate of return by investing in fixed-income instruments. The Fund normally invests at least 80% of its net assets in U.S. dollar-denominated, fixed-income securities and other debt instruments of domestic and foreign entities, including corporate bonds, securities issued or guaranteed by the U.S. government, its agencies or instrumentalities, mortgage-backed securities and money market instruments. The Fund's sub-advisers are Western Asset Management Company Limited (WAML) and Western Asset Management Company (Western Asset). WAML manages the non-U.S. dollar denominated investments of the Fund.
How did the Fund perform during the six months ended June 30, 2007? The Fund's Class S shares returned 0.10%, trailing the 0.97% return of the Lehman Brothers® Aggregate Bond Index, an unmanaged index of fixed-rate investment-grade securities with at least one year to maturity, combining the Lehman Brothers U.S. Government/Credit Index and the Lehman Brothers Mortgage-Backed Securities Index.
What was the investment background during the period? In the fixed-income markets, short- and intermediate-term interest rates fell in the first quarter, as the economy proved to be somewhat weaker than expected, while long-term interest rates edged higher as inflation expectations rose. The Federal Reserve ("Fed") kept its target funds rate unchanged at 5.25%, and the central banks of Australia and Canada also kept their rates steady. The Bank of England raised rates, as did the Bank of Japan and the European Central Bank. The sudden sell-off in February in the Chinese equity market rattled markets worldwide, as did the rising delinquencies and bankruptcies associated with sub-prime lending. The yield disparities ("spreads") between corporate bonds and other non-Treasuries ("credits") and U.S. Treasuries jumped during the quarter, but lower-qual ity bonds and emerging market debt generally outperformed.
Interest rates moved up significantly in the second quarter, as the economy proved stronger than anticipated and expectations of future Fed easing were largely reversed. Short-term rates rose more than long-term rates as the market recalibrated its expectations of future Fed policy, leaving the yield curve almost flat with a modestly positive slope. (The yield curve is a graphical representation of bond yields with very short maturities to the longest available, with the curve indicating whether short-term rates are higher or lower than long-term rates.)
What factors contributed to the Fund's performance? During the first quarter, the portfolio's overweight position in the mortgage-backed securities sector added to returns, as spreads stabilized and volatility subsided. The Fund's underweight exposure to investment-grade credits was also a plus, as that sector underperformed. On the other hand, an overweight to lower-quality credits hampered returns, since they underperformed as spreads widened.
Yield spreads widened significantly in the second quarter; consequently, the Fund's overweight exposure in the mortgage-backed securities sector proved to be a major drag on performance. Underweight exposure to investment-grade credits also detracted a bit, as that sector outperformed. However, spreads remained relatively stable – so the Fund's overweight exposure to lower-quality credits contributed to returns.
What is your outlook? Despite a list of concerns that includes recession, inflation, a plunging U.S. housing market, a soaring U.S. current account deficit, the collapse of sub-prime lending, and a surge in leveraged buyouts, the global financial environment has been healthy and relatively calm. Leaving headlines aside, there have been no real major threats to growth. The bottom line is that regardless of the various factors that have the potential to affect the fixed-income markets, we are confident that the Fund is positioned to navigate the variety of market conditions that may arise throughout the remainder of this year.
3
MassMutual Select Strategic Bond Fund – Portfolio Manager Report (Continued)
Select Strategic Bond Fund
Quality Structure
(% of Net Assets) on 6/30/07 | |
| U.S. Government, Aaa/AAA | | | 72.1 | % | |
| Aa/AA | | | 3.3 | % | |
| A | | | 2.8 | % | |
| Baa/BBB | | | 8.7 | % | |
| Ba/BB | | | 4.6 | % | |
| B and Below | | | 3.0 | % | |
| Equities | | | 0.1 | % | |
| Total Long-Term Investments | | | 94.6 | % | |
Short-Term Investments and
Other Assets and Liabilities | | | 5.4 | % | |
| | | | 100.0 | % | |
4
MassMutual Select Strategic Bond Fund – Portfolio Manager Report (Continued)
Growth of a $10,000 Investment
Hypothetical Investments in MassMutual Select Strategic Bond Fund Class S, Class A, Class A (sales load deducted), Class Y, Class L, Class N, Class N (CDSC fees deducted) and the Lehman Brothers Aggregate Bond Index.
MassMutual Select Strategic Bond Fund
Total Return
| | | Year-to-Date
1/1/07 - 6/30/07 | | One Year
7/1/06 - 6/30/07 | | Since Inception
Average Annual
12/31/04 - 6/30/07 | |
| Class S | | | 0.10 | % | | | 5.90 | % | | | 2.41 | % | |
| Class A | | | –0.10 | % | | | 5.47 | % | | | 2.09 | % | |
Class A
(sales load
deducted)* | | | –4.85 | % | | | 0.46 | % | | | 0.12 | % | |
| Class Y | | | 0.00 | % | | | 5.75 | % | | | 2.36 | % | |
| Class L | | | 0.00 | % | | | 5.69 | % | | | 2.34 | % | |
| Class N | | | –0.30 | % | | | 5.21 | % | | | 1.75 | % | |
Class N
(CDSC fees
deducted)* | | | –1.30 | % | | | 4.21 | % | | | 1.75 | % | |
Lehman Brothers
Aggregate Bond
Index | | | 0.97 | % | | | 6.11 | % | | | 3.18 | % | |
GROWTH OF $10,000 INVESTMENT SINCE INCEPTION
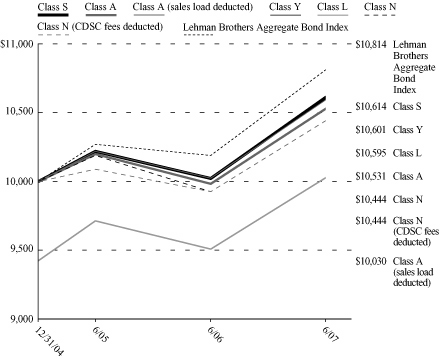
* Class A (sales load deducted) returns include the 4.75% maximum sales charge and Class N (CDSC fees deducted) returns include the 1.00% maximum contingent deferred sales charge for the first 18 months shown.
Performance data quoted represents past performance; past performance is not predictive of future results. The investment return and principal value of shares of the Fund will fluctuate with market conditions so that shares of the Fund, when redeemed, may be worth more or less than their original cost. Current performance of the Fund may be lower or higher than the performance quoted. Performance data current to the most recent month end may be obtained by calling 1-888-309-3539.
Investors should note that the Fund is a professionally managed mutual fund, while the Lehman Brothers Aggregate Bond Index is unmanaged, does not incur expenses, and cannot be purchased directly by investors. Investors should read the Fund's prospectus with regard to the Fund's investment objective, risks and charges and expenses in conjunction with these financial statements. Employee retirement benefit plans that invest plan assets in the Separate Investment Accounts (SIAs) may be subject to certain charges as set forth in their respective Plan Documents. Total return figures would be lower for the periods presented if they reflected these charges. The performance tables and charts do not reflect the deduction of taxes that a shareholder would pay on the Fund distributions or the redemption of the Fund shares.
5
MassMutual Select Strategic Balanced Fund – Portfolio Manager Report
What is the investment objective of the MassMutual Select Strategic Balanced Fund – and who are the Fund's sub-advisers? The Fund seeks long-term capital growth, consistent with preservation of capital and balanced by current income. Three sub-advisers each manage their own portion of the Fund's assets. ClearBridge Advisors, LLC (ClearBridge) manages the equity component and Western Asset Management Company Limited (WAML) and Western Asset Management Company (Western Asset) manage the fixed-income component. WAML manages the non-U.S. dollar denominated investments of the Fund.
How did the Fund perform during the six months ended June 30, 2007? The Fund's Class S shares returned 3.84%, behind the 5.73% return of the Lipper Balanced Fund Index, an unmanaged, equally weighted index of the 30 largest mutual funds within the Lipper Balanced Category. Conversely, the Fund's 3.84% advance outperformed the 0.97% return of the Lehman Brothers® Aggregate Bond Index, an unmanaged index of fixed-rate investment-grade securities with at least one year to maturity, combining the Lehman Brothers U.S. Government/Credit Index and the Lehman Brothers Mortgage-Backed Securities Index – but trailed the 7.11% return of the Russell 3000® Index, which measures the performance of the 3,000 largest U.S. companies based on total market capitalization.
What was the investment background during the period? Domestic stocks showed little change during the first quarter of 2007, despite a significant increase in volatility across the board. Although the Dow Jones Industrial AverageSM ("the Dow") notched a new closing high in February, the blue-chip benchmark declined slightly for the three months ended March 31, 2007. The S&P 500® Index finished with a small advance, as did the Nasdaq Composite® Index ("Nasdaq"), which barely managed to post a gain for the period.
In the fixed-income markets, short- and intermediate-term interest rates fell in the first quarter, as the economy proved to be somewhat weaker than expected, while long-term interest rates edged higher as inflation expectations rose. The Federal Reserve ("Fed") kept its target funds rate unchanged at 5.25%, and the central banks of Australia and Canada also kept their rates steady. The Bank of England raised rates, as did the Bank of Japan and the European Central Bank. The sudden sell-off in February in the Chinese equity market rattled markets worldwide, as did the rising delinquencies and bankruptcies associated with sub-prime lending. The yield disparities ("spreads") between corporate bonds and other non-Treasuries ("credits") and U.S. Treasuries jumped during the quarter, but lower-quality bonds and emerging market debt generally outperformed.
Most U.S. stock indexes advanced in the second quarter, with some setting records along the way. Stocks rode a wave of optimism over corporate earnings early in the quarter and later overcame short periods of increased volatility associated with investor concerns about soft retail sales, rising interest rates, inflation, the housing market and sub-prime mortgages. During the period, the housing market remained depressed, and long-term interest rates moved decisively higher. Crude oil surged to close the quarter near $70 per barrel.
Interest rates moved up significantly in the second quarter, as the economy proved stronger than anticipated and expectations of future Fed easing were largely reversed. Short-term rates rose more than long-term rates as the market recalibrated its expectations of future Fed policy, leaving the yield curve almost flat with a modestly positive slope. (The yield curve is a graphical representation of bond yields with very short maturities to the longest available, with the curve indicating whether short-term rates are higher or lower than long-term rates.)
What factors contributed to the Fund's performance with respect to its stock portfolio? Although the Fund trailed the Lipper Balanced Fund Index for the six months ended June 30, 2007, during this time frame, portfolio holdings in the energy and industrials sectors were substantial contributors to its relative performance. Conversely, the portfolio's investments in the financials and consumer discretionary sectors contributed the least to returns. On a stock-specific basis, the five best performers were Honeywell International Inc., Vodafone Group PLC (ADS), Alcoa Inc., Schlumberger Ltd. and Caterpillar Inc. The five largest detractors were Merrill Lynch & Co. Inc., Motorola Inc., Novellus Systems Inc., Bank of America Corp. and Interpublic Group of Cos.
6
MassMutual Select Strategic Balanced Fund – Portfolio Manager Report (Continued)
What factors contributed to the Fund's performance with respect to its bond portfolio? During the first quarter, the portfolio's overweight position in the mortgage-backed securities sector added to returns, as spreads stabilized and volatility subsided. The Fund's underweight exposure to investment-grade credits was also a plus, as that sector underperformed. On the other hand, an overweight to lower-quality credits hampered returns, since they underperformed as spreads widened.
Yield spreads widened significantly in the second quarter; consequently, the Fund's overweight exposure in the mortgage-backed securities sector proved to be a major drag on performance. Underweight exposure to investment-grade credits also detracted a bit, as that sector outperformed. However, spreads remained relatively stable – so the Fund's overweight exposure to lower-quality credits contributed to returns.
What is your outlook? Despite a list of concerns that includes recession, inflation, a plunging U.S. housing market, a soaring U.S. current account deficit, the collapse of sub-prime lending and a surge in leveraged buyouts, the global financial environment has been healthy and relatively calm. Leaving headlines aside, there have been no real major threats to growth. The bottom line is that regardless of the various factors that have the potential to affect the equity and fixed-income markets, we are confident that the Fund is positioned to navigate the variety of market conditions that may arise throughout the remainder of this year.
MassMutual Select Strategic
Balanced Fund
Asset Allocation
(% of Net Assets) on 6/30/07 | |
| Equities | | | 59.7 | % | |
| Bonds & Notes | | | 35.3 | % | |
| Purchased Options | | | 0.1 | % | |
Total Long-Term
Investments | | | 95.1 | % | |
Short-Term Investments
and Other Assets and
Liabilities | | | 4.9 | % | |
| | | | 100.0 | % | |
MassMutual Select Strategic
Balanced Fund
Largest Stock Holdings
(% of Net Assets) on 6/30/07 | |
| News Corp., Inc. Cl. B | | | 1.8 | % | |
| JP Morgan Chase & Co. | | | 1.6 | % | |
| Pearson PLC | | | 1.5 | % | |
| Bank of America Corp. | | | 1.5 | % | |
| Raytheon Co. | | | 1.5 | % | |
| Wyeth | | | 1.4 | % | |
| Abbott Laboratories | | | 1.4 | % | |
Vodafone Group PLC Sponsored
ADR (United Kingdom) | | | 1.4 | % | |
| Merrill Lynch & Co., Inc. | | | 1.4 | % | |
| Texas Instruments, Inc. | | | 1.3 | % | |
7
MassMutual Select Strategic Balanced Fund – Portfolio Manager Report (Continued)
Growth of a $10,000 Investment
Hypothetical Investments in MassMutual Select Strategic Balanced Fund Class S, Class A, Class A (sales load deducted), Class Y, Class L, Class N, Class N (CDSC fees deducted), the Lipper Balanced Fund Index, the Lehman Brothers Aggregate Bond Index and the Russell 3000 Index.
MassMutual Select Strategic Balanced Fund
Total Return
| | | Year-to-Date
1/1/07 - 6/30/07 | | One Year
7/1/06 - 6/30/07 | | Since Inception
Average Annual
12/31/03 - 6/30/07 | |
| Class S | | | 3.84 | % | | | 14.01 | % | | | 7.24 | % | |
| Class A | | | 3.59 | % | | | 13.50 | % | | | 6.77 | % | |
Class A
(sales load
deducted)* | | | –2.37 | % | | | 6.98 | % | | | 4.98 | % | |
| Class Y | | | 3.84 | % | | | 14.04 | % | | | 7.18 | % | |
| Class L | | | 3.67 | % | | | 13.78 | % | | | 7.01 | % | |
| Class N | | | 3.42 | % | | | 13.18 | % | | | 6.44 | % | |
Class N
(CDSC fees
deducted)* | | | 2.42 | % | | | 12.18 | % | | | 6.44 | % | |
Lipper Balanced
Fund Index | | | 5.73 | % | | | 15.39 | % | | | 9.04 | % | |
Lehman Brothers
Aggregate Bond
Index | | | 0.97 | % | | | 6.11 | % | | | 3.48 | % | |
| Russell 3000 Index | | | 7.11 | % | | | 20.07 | % | | | 11.70 | % | |
GROWTH OF $10,000 INVESTMENT SINCE INCEPTION

* Class A (sales load deducted) returns include the 5.75% maximum sales charge and Class N (CDSC fees deducted) returns include the 1.00% maximum contingent deferred sales charge for the first 18 months shown.
Performance data quoted represents past performance; past performance is not predictive of future results. The investment return and principal value of shares of the Fund will fluctuate with market conditions so that shares of the Fund, when redeemed, may be worth more or less than their original cost. Current performance of the Fund may be lower or higher than the performance quoted. Performance data current to the most recent month end may be obtained by calling 1-888-309-3539.
Investors should note that the Fund is a professionally managed mutual fund, while the Lipper Balanced Fund Index, the Lehman Brothers Aggregate Bond Index and the Russell 3000 Index are unmanaged, do not incur expenses, and cannot be purchased directly by investors. Investors should read the Fund's prospectus with regard to the Fund's investment objective, risks and charges and expenses in conjunction with these financial statements. Employee retirement benefit plans that invest plan assets in the Separate Investment Accounts (SIAs) may be subject to certain charges as set forth in their respective Plan Documents. Total return figures would be lower for the periods presented if they reflected these charges. The performance tables and charts do not reflect the deduction of taxes that a shareholder would pay on the Fund distributions or the redemption of the Fund shares.
8
MassMutual Select Diversified Value Fund – Portfolio Manager Report
What is the investment objective of the MassMutual Select Diversified Value Fund – and who is the Fund's sub-adviser? The Fund seeks to achieve long-term growth of capital and income by investing primarily in a diversified portfolio of equity securities of larger, well-established companies. The Fund's sub-adviser is AllianceBernstein L.P. (AllianceBernstein).
How did the Fund perform during the six months ended June 30, 2007? The Fund's Class S shares returned 6.24%, in line with the 6.23% return of the Russell 1000® Value Index, an unmanaged index representative of stocks with a greater than average value orientation among the stocks of the largest 1000 U.S. companies based on capitalization.
What was the investment background during the period? Domestic stocks showed little change during the first quarter of 2007, despite a significant increase in volatility across the board. Equity markets around the world plunged in late February and remained volatile through most of March, rocked by events ranging from a sharp sell-off in Chinese stocks to troubles in the U.S. sub-prime mortgage market. Lulled into complacency by years of solid economic and corporate-profit growth and steadily rising stocks prices, investors were suddenly reminded that market conditions can turn on a dime – and financial markets are not without risk. By quarter-end, however, equity markets had regained their composure, reassured by statements from the U.S. Federal Reserve about the outlook for economic growth and inflation, and by the ongoing merger and acqui sition boom.
After climbing to new records through May on stronger-than-expected corporate-profit news, U.S. equities retreated in June, as investors grew nervous about rising bond yields, a deepening housing slump and losses from hedge funds invested in securities linked to sub-prime mortgages. Nevertheless, the S&P 500® Index finished the second quarter up 6.3%.
What factors contributed to the Fund's performance? The Fund's relative performance in the first quarter was hurt by our financial holdings – notably Freddie Mac, Countrywide Financial and Merrill Lynch, which underperformed amid the indiscriminate sell-off in reaction to turmoil in the sub-prime mortgage sector. Among the key contributors to the Fund's returns during the first quarter were positions in steel maker Arcelor Mittal, DaimlerChrysler and Owens-Illinois, the world's largest maker of glass bottles.
In the second quarter, the portfolio's relative returns were helped by the Fund's investments in diesel-engine maker Cummins and Owens Illinois. Conversely, relative performance was hurt by Macy's (formerly known as Federated Department Stores), Office Depot and National City.
What is your outlook? Stock valuation spreads remain compressed, limiting the value opportunity as we measure it. Since a central tenet underpinning our investment process is to keep portfolio risk proportional to the value opportunity, the portfolio's tracking error remains low versus the broad market and the Russell 1000 Value Index. Despite this environment, our extensive bottom-up research effort continues to uncover what we believe are attractive value opportunities across diverse industries.
9
MassMutual Select Diversified Value Fund – Portfolio Manager Report (Continued)
MassMutual Select Diversified Value Fund
Industry Table
(% of Net Assets) on 6/30/07 | |
| Oil & Gas | | | 12.3 | % | |
| Diversified Financial | | | 11.8 | % | |
| Insurance | | | 10.4 | % | |
| Banks | | | 8.7 | % | |
| Telecommunications | | | 8.1 | % | |
| Pharmaceuticals | | | 5.5 | % | |
| Manufacturing | | | 5.0 | % | |
| Retail | | | 4.1 | % | |
| Foods | | | 3.8 | % | |
| Media | | | 3.5 | % | |
| Electric | | | 2.8 | % | |
| Chemicals | | | 2.7 | % | |
Cosmetics & Personal
Care | | | 2.0 | % | |
| Agriculture | | | 1.9 | % | |
| Computers | | | 1.5 | % | |
| Beverages | | | 1.3 | % | |
| Automotive & Parts | | | 1.2 | % | |
| Savings & Loans | | | 1.2 | % | |
| Iron & Steel | | | 1.1 | % | |
| Household Products | | | 1.0 | % | |
| Aerospace & Defense | | | 0.9 | % | |
| Packaging & Containers | | | 0.9 | % | |
| Electronics | | | 0.9 | % | |
| Forest Products & Paper | | | 0.8 | % | |
| Apparel | | | 0.8 | % | |
| Commercial Services | | | 0.8 | % | |
| Home Builders | | | 0.7 | % | |
| Machinery — Diversified | | | 0.5 | % | |
| Health Care — Products | | | 0.5 | % | |
| Software | | | 0.4 | % | |
| Hand & Machine Tools | | | 0.4 | % | |
| Auto Manufacturers | | | 0.3 | % | |
| Housewares | | | 0.3 | % | |
| Advertising | | | 0.2 | % | |
| Toys, Games & Hobbies | | | 0.2 | % | |
| Health Care — Services | | | 0.1 | % | |
| Computers & Information | | | 0.1 | % | |
| Mining | | | 0.1 | % | |
Total Long-Term
Investments | | | 98.8 | % | |
Short-Term Investments
and Other Assets
and Liabilities | | | 1.2 | % | |
| | | | 100.0 | % | |
MassMutual Select Diversified
Value Fund
Largest Stock Holdings
(% of Net Assets) on 6/30/07 | |
| Exxon Mobil Corp. | | | 5.7 | % | |
| Citigroup, Inc. | | | 3.7 | % | |
| General Electric Co. | | | 3.5 | % | |
| Bank of America Corp. | | | 3.4 | % | |
| Pfizer, Inc. | | | 3.0 | % | |
| Chevron Corp. | | | 2.9 | % | |
| AT&T, Inc. | | | 2.9 | % | |
| JP Morgan Chase & Co. | | | 2.6 | % | |
| American International Group, Inc. | | | 2.2 | % | |
| Verizon Communications, Inc. | | | 2.1 | % | |
10
MassMutual Select Diversified Value Fund – Portfolio Manager Report (Continued)
Growth of a $10,000 Investment
Hypothetical Investments in MassMutual Select Diversified Value Fund Class S, Class A, Class A (sales load deducted), Class Y, Class L, Class N, Class N (CDSC fees deducted) and the Russell 1000 Value Index.
MassMutual Select Diversified Value Fund
Total Return
| | | Year-to-Date
1/1/07 - 6/30/07 | | One Year
7/1/06 - 6/30/07 | | Since Inception
Average Annual
10/15/04 - 6/30/07 | |
| Class S | | | 6.24 | % | | | 22.43 | % | | | 16.74 | % | |
| Class A | | | 5.96 | % | | | 21.83 | % | | | 16.17 | % | |
Class A
(sales load
deducted)* | | | –0.13 | % | | | 14.83 | % | | | 13.66 | % | |
| Class Y | | | 6.17 | % | | | 22.29 | % | | | 16.62 | % | |
| Class L | | | 6.02 | % | | | 22.11 | % | | | 16.47 | % | |
| Class N | | | 5.73 | % | | | 21.37 | % | | | 15.79 | % | |
Class N
(CDSC fees
deducted)* | | | 4.73 | % | | | 20.37 | % | | | 15.79 | % | |
Russell 1000
Value Index | | | 6.23 | % | | | 21.86 | % | | | 17.32 | % | |
GROWTH OF $10,000 INVESTMENT SINCE INCEPTION
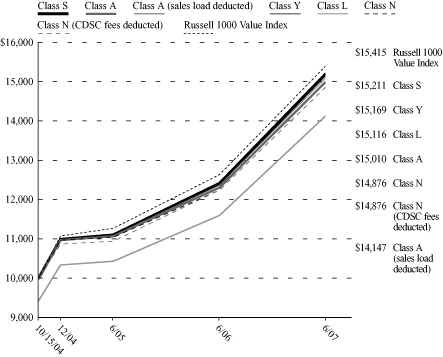
* Class A (sales load deducted) returns include the 5.75% maximum sales charge and Class N (CDSC fees deducted) returns include the 1.00% maximum contingent deferred sales charge for the first 18 months shown.
Performance data quoted represents past performance; past performance is not predictive of future results. The investment return and principal value of shares of the Fund will fluctuate with market conditions so that shares of the Fund, when redeemed, may be worth more or less than their original cost. Current performance of the Fund may be lower or higher than the performance quoted. Performance data current to the most recent month end may be obtained by calling 1-888-309-3539.
Investors should note that the Fund is a professionally managed mutual fund, while the Russell 1000 Value Index is unmanaged, does not incur expenses, and cannot be purchased directly by investors. Investors should read the Fund's prospectus with regard to the Fund's investment objective, risks and charges and expenses in conjunction with these financial statements. Employee retirement benefit plans that invest plan assets in the Separate Investment Accounts (SIAs) may be subject to certain charges as set forth in their respective Plan Documents. Total return figures would be lower for the periods presented if they reflected these charges. The performance tables and charts do not reflect the deduction of taxes that a shareholder would pay on the Fund distributions or the redemption of the Fund shares.
11
MassMutual Select Fundamental Value Fund – Portfolio Manager Report
What is the investment objective of the MassMutual Select Fundamental Value Fund – and who is the Fund's sub-adviser? The Fund seeks long-term total return by investing at least 80% of its net assets in equity securities, with a focus on companies with large capitalizations (generally having market capitalizations above $2 billion). The Fund's sub-adviser is Wellington Management Company, LLP (Wellington Management).
How did the Fund perform during the six months ended June 30, 2007? The Fund's Class S shares returned 8.66%, outpacing the 6.96% return of the S&P 500® Index, a widely recognized, unmanaged index representative of common stocks of larger capitalized U.S. companies. The Fund also outperformed the 6.23% return of the Russell 1000® Value Index, an unmanaged index representative of stocks with a greater than average value orientation among the stocks of the largest 1000 U.S. companies based on capitalization.
Going forward, the Fund's performance will be compared to the Russell 1000 Value Index rather than the S&P 500 Index because the Russell 1000 Value Index more closely represents the Fund's investment strategy.
What was the investment background during the period? Domestic stocks showed little change during the first quarter of 2007, despite a significant increase in volatility across the board. Although the Dow Jones Industrial AverageSM ("the Dow") notched a new closing high in February, the blue-chip benchmark declined slightly for the three months ended March 31, 2007. The S&P 500 Index finished with a small advance, as did the Nasdaq Composite® Index ("Nasdaq"), which barely managed to post a gain for the period. A depreciating U.S. dollar supported the returns of foreign stocks, helping the MSCI® EAFE® Index outperform its U.S. counterparts for the quarter.
Most U.S. stock indexes advanced in the second quarter, with some setting records along the way. Stocks rode a wave of optimism over corporate earnings early in the quarter and later overcame short periods of increased volatility associated with investor concerns about soft retail sales, rising interest rates, inflation, the housing market and sub-prime mortgages. During the period, the housing market remained depressed, and long-term interest rates moved decisively higher. Crude oil surged to close the quarter near $70 per barrel.
What factors contributed to the Fund's performance? Stock selection was additive to benchmark-relative performance in seven of the 10 broad sectors in the first quarter of 2007. In aggregate, sector allocation aided performance, especially our underweight position in financials. Within consumer staples, we benefited from strong results from CVS/Caremark, Tyson Foods, Safeway and Supervalu. Within financials, Host Hotels & Resorts performed well, while the Fund benefited from avoiding Countrywide Financial, Fannie Mae and Washington Mutual, all of which were down significantly. Conversely, the Fund's holdings in the consumer discretionary sector detracted from relative performance. In addition, despite strong absolute returns, the portfolio's positioning in utilities detracted from performance.
In the second quarter, the Fund's stock selection contributed to performance in eight of the 10 broad sectors. Overall, sector allocation aided performance, especially the Fund's strategic positioning in financials and industrials. Within information technology, the Fund's positions in EMC and Nokia provided double-digit returns, as did Corning and Hewlett-Packard. Within financials, portfolio holdings in Nuveen Investments and ACE were both up significantly. Meanwhile, the Fund's positioning in the REIT (real estate investment trust) sector was a positive, as REITs were down on an absolute basis. Hampering the Fund's performance was the fact that its industrials holdings lagged the market's. In addition, in a turnaround from the first quarter, Host Hotels & Resorts lost value – as did Sun Microsystems and Macy's.
12
MassMutual Select Fundamental Value Fund – Portfolio Manager Report (Continued)
What is your outlook? In our view, economic strength is sufficient to support global corporate profit growth, although we expect a deceleration to the single digits. While commodity inflation is real and sustainable, we believe that overall inflation will remain in the 2% to 3% range. In our view, the market seems overly obsessed with capital market losses, such as in the sub-prime sector. As the market restores risk premiums toward a normalized level, these events will likely rotate through one sub-sector at a time. However, we do not expect global growth to be derailed.
MassMutual Select Fundamental Value Fund
Industry Table
(% of Net Assets) on 6/30/07 | |
| Oil & Gas | | | 13.5 | % | |
| Banks | | | 10.1 | % | |
| Telecommunications | | | 9.8 | % | |
| Diversified Financial | | | 9.5 | % | |
| Foods | | | 5.9 | % | |
| Insurance | | | 5.3 | % | |
| Retail | | | 4.9 | % | |
| Manufacturing | | | 3.9 | % | |
| Electric | | | 3.7 | % | |
| Aerospace & Defense | | | 3.6 | % | |
| Chemicals | | | 3.4 | % | |
| Pharmaceuticals | | | 3.3 | % | |
| Computers | | | 3.3 | % | |
| Media | | | 2.3 | % | |
| Health Care — Services | | | 1.9 | % | |
| Building Materials | | | 1.6 | % | |
| Health Care — Products | | | 1.6 | % | |
Real Estate Investment
Trusts (REITS) | | | 1.6 | % | |
| Machinery — Diversified | | | 1.5 | % | |
| Mining | | | 1.4 | % | |
| Beverages | | | 1.4 | % | |
| Agriculture | | | 1.2 | % | |
| Semiconductors | | | 1.0 | % | |
Cosmetics & Personal
Care | | | 0.9 | % | |
| Office Equipment/Supplies | | | 0.8 | % | |
| Household Products | | | 0.8 | % | |
| Forest Products & Paper | | | 0.3 | % | |
Total Long-Term
Investments | | | 98.5 | % | |
Short-Term Investments
and Other Assets
and Liabilities | | | 1.5 | % | |
| | | | 100.0 | % | |
MassMutual Select Fundamental
Value Fund
Largest Stock Holdings
(% of Net Assets) on 6/30/07 | |
| Exxon Mobil Corp. | | | 4.8 | % | |
| Bank of America Corp. | | | 3.7 | % | |
| AT&T, Inc. | | | 3.6 | % | |
| Citigroup, Inc. | | | 3.5 | % | |
| General Electric Co. | | | 3.0 | % | |
| Verizon Communications, Inc. | | | 2.5 | % | |
| JP Morgan Chase & Co. | | | 2.5 | % | |
| CVS Caremark Corp. | | | 2.1 | % | |
| American International Group, Inc. | | | 2.0 | % | |
| General Dynamics Corp. | | | 1.9 | % | |
13
MassMutual Select Fundamental Value Fund – Portfolio Manager Report (Continued)
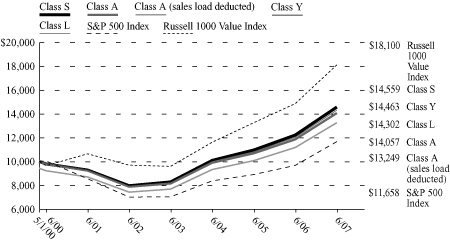
Growth of a $10,000 Investment
Hypothetical Investments in MassMutual Select Fundamental Value Fund Class S, Class A, Class A (sales load deducted), Class Y, Class L, the S&P 500 Index and the Russell 1000 Value Index.
MassMutual Select Fundamental Value Fund
Total Return
| | | Year-
to-Date
1/1/07 -
6/30/07 | | One
Year
7/1/06 -
6/30/07 | | Five
Year
Average
Annual
7/1/02 -
6/30/07 | | Since
Inception
Average
Annual
12/31/01 -
6/30/07 | |
| Class S | | | 8.66 | % | | | 22.77 | % | | | 11.54 | % | | | 8.78 | % | |
| Class A | | | 8.39 | % | | | 22.20 | % | | | 11.05 | % | | | 8.30 | % | |
Class A
(sales load
deducted)* | | | 2.16 | % | | | 15.17 | % | | | 9.75 | % | | | 7.14 | % | |
| Class Y | | | 8.58 | % | | | 22.67 | % | | | 11.50 | % | | | 8.72 | % | |
| Class L | | | 8.52 | % | | | 22.43 | % | | | 11.33 | % | | | 8.57 | % | |
| S&P 500 Index | | | 6.96 | % | | | 20.57 | % | | | 10.70 | % | | | 6.69 | % | |
Russell 1000
Value Index | | | 6.23 | % | | | 21.86 | % | | | 13.31 | % | | | 10.90 | % | |
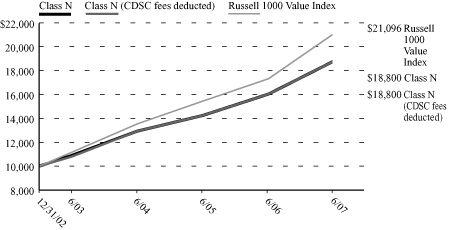
Hypothetical Investments in MassMutual Select Fundamental Value Fund Class N, Class N (CDSC fees deducted), the S&P 500 Index and the Russell 1000 Value Index.
MassMutual Select Fundamental Value Fund
Total Return
| | | Year-to-Date
1/1/07 - 6/30/07 | | One Year
7/1/06 - 6/30/07 | | Since Inception
Average Annual
12/31/02 - 6/30/07 | |
| Class N | | | 8.28 | % | | | 21.88 | % | | | 16.06 | % | |
Class N
(CDSC fees
deducted)* | | | 7.28 | % | | | 20.88 | % | | | 16.06 | % | |
| S&P 500 Index | | | 6.96 | % | | | 20.57 | % | | | 14.72 | % | |
Russell 1000
Value Index | | | 6.23 | % | | | 21.86 | % | | | 18.05 | % | |
GROWTH OF $10,000 INVESTMENT SINCE INCEPTION
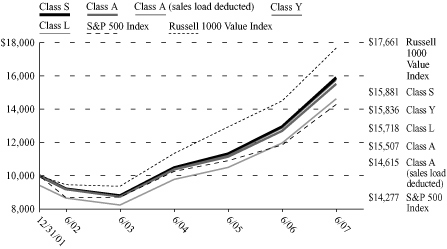

* Class A (sales load deducted) returns include the 5.75% maximum sales charge and Class N (CDSC fees deducted) returns include the 1.00% maximum contingent deferred sales charge for the first 18 months shown.
Performance data quoted represents past performance; past performance is not predictive of future results. The investment return and principal value of shares of the Fund will fluctuate with market conditions so that shares of the Fund, when redeemed, may be worth more or less than their original cost. Current performance of the Fund may be lower or higher than the performance quoted. Performance data current to the most recent month end may be obtained by calling 1-888-309-3539.
Investors should note that the Fund is a professionally managed mutual fund, while the S&P 500 Index and the Russell 1000 Value Index are unmanaged, do not incur expenses, and cannot be purchased directly by investors. Investors should read the Fund's prospectus with regard to the Fund's investment objective, risks and charges and expenses in conjunction with these financial statements. Employee retirement benefit plans that invest plan assets in the Separate Investment Accounts (SIAs) may be subject to certain charges as set forth in their respective Plan Documents. Total return figures would be lower for the periods presented if they reflected these charges. The performance tables and charts do not reflect the deduction of taxes that a shareholder would pay on the Fund distributions or the redemption of the Fund shares.
14
MassMutual Select Value Equity Fund – Portfolio Manager Report
What is the investment objective of the MassMutual Select Value Equity Fund – and who is the Fund's sub-adviser? The Fund seeks long-term growth of capital by investing in securities of companies that Fund management believes are undervalued in the marketplace relative to factors such as the company's assets, sales, earnings, growth potential, or cash flow – or relative to securities of other companies in the same industry. The Fund's sub-adviser is Fidelity Management & Research Company (Fidelity).
How did the Fund perform during the six months ended June 30, 2007? The Fund's Class S shares returned 7.70%, outpacing the 6.23% return of the Russell 1000® Value Index, an unmanaged index representative of stocks with a greater-than-average value orientation among the stocks of the largest 1000 U.S. companies based on capitalization.
What was the investment background during the period? Domestic stocks showed little change during the first quarter of 2007, despite a significant increase in volatility across the board. Markets were roiled by a mid-quarter sell-off prompted by declines in Asian markets and worries over sub-prime mortgage defaults. The broad market, as measured by the S&P 500® Index, declined nearly 6% from high levels achieved in late February, but regained ground to finish up 0.6% for the quarter. The Federal Reserve ("Fed") continued to hold short-term interest rates steady, while emphasizing that inflation remained a concern. Major commodity prices generally rose during the quarter. Existing home sales rose nearly 4% in February relative to January but remained down almost 4% from the same period in 2006, while median sales prices declined more than 1% versus the same period a year ago. In this environment, mid-cap stocks handily outperformed small- and large-cap stocks.
During the second quarter, virtually all major domestic equity indexes turned in positive returns. The Fed continued to hold short-term interest rates steady, while emphasizing that inflation remained a threat. Long-term Treasury yields spiked more than 0.30% during the quarter, as investors feared that faster economic growth and an increase in inflation could push up interest rates globally. Instead, tamer inflation readings and attempted terrorist activity in London and Scotland pushed long-term yields downward at the end of June. Major commodity price trends were mixed: oil and copper prices advanced; gold and corn prices dropped. The downturn in the housing market continued, with both existing and new home sales and median sales prices slipping again. Home sales continued to be impacted by tighter lending standards due to sub-prime mortgage market problems and a lack of buyer confidence in the housing market. In this environment, large-c ap stocks tended to outperform their small- and mid-cap counterparts.
What factors contributed to the Fund's performance? During the first quarter of 2007, the utilities, materials and telecommunications services sectors were the best performers. Also aiding results was active stock selection in the energy, consumer staples and materials sectors – which contributed the most to the Fund's performance relative to the Russell 1000 Value Index. Conversely, the Fund's holdings in the information technology sector detracted from returns.
In the second quarter of 2007, active stock selection in the financials, utilities and energy sectors contributed the most to relative performance. The portfolio's overweight position in mortgage finance firm Fannie Mae was the greatest portfolio contributor. Fannie Mae shares gained nearly 21% when the company filed its 2005 financial reports with the SEC and reinstated its dividend payment. On the other hand, the Fund's holdings in the consumer discretionary and materials sectors detracted from performance. Specifically, an overweight position in department store Macy's was the largest hindrance, as that company's shares fell 11% on weaker-than-expected first-quarter earnings.
15
MassMutual Select Value Equity Fund – Portfolio Manager Report (Continued)
What is your outlook? The portfolio comprises stocks that are trading at material discounts to our assessment of their worth. As the third quarter began, the Fund had an overweight position in insurance companies, as we believe that their valuations were attractive relative to other financials – and that insurers will be less impacted in a flat yield curve environment. (The yield curve is a graphical representation of bond yields with very short maturities to the longest available, with the curve indicating whether short-term rates are higher or lower than long-term rates.) The portfolio also held an overweight position in selected independent power producers, which we believed were trading at less than replacement cost and have been recovering from a long period of overcapacity. Lastly, within financials, the portfolio held an underweight p osition in REITs (real estate investment trusts) and commercial banks. Our belief is that this positioning makes sense for the near future, given our view of what may occur.
MassMutual Select Value Equity Fund
Industry Table
(% of Net Assets) on 6/30/07 | |
| Insurance | | | 14.7 | % | |
| Oil & Gas | | | 13.9 | % | |
| Diversified Financial | | | 13.4 | % | |
| Telecommunications | | | 6.5 | % | |
| Banks | | | 5.2 | % | |
| Electric | | | 5.0 | % | |
| Retail | | | 3.8 | % | |
| Pharmaceuticals | | | 3.4 | % | |
| Manufacturing | | | 3.0 | % | |
| Health Care — Services | | | 3.0 | % | |
| Iron & Steel | | | 3.0 | % | |
| Transportation | | | 2.6 | % | |
| Agriculture | | | 2.5 | % | |
Cosmetics & Personal
Care | | | 2.1 | % | |
| Media | | | 2.0 | % | |
| Machinery — Diversified | | | 1.8 | % | |
| Aerospace & Defense | | | 1.7 | % | |
| Computers | | | 1.6 | % | |
| Foods | | | 1.6 | % | |
| Electronics | | | 0.9 | % | |
| Semiconductors | | | 0.9 | % | |
| Home Builders | | | 0.9 | % | |
| Airlines | | | 0.8 | % | |
Metal Fabricate &
Hardware | | | 0.8 | % | |
Machinery —
Construction & Mining | | | 0.8 | % | |
| Commercial Services | | | 0.8 | % | |
| Automotive & Parts | | | 0.6 | % | |
| Savings & Loans | | | 0.6 | % | |
| Beverages | | | 0.5 | % | |
| Gas | | | 0.5 | % | |
| Computer Related Services | | | 0.0 | % | |
Total Long-Term
Investments | | | 98.9 | % | |
Short-Term Investments
and Other Assets
and Liabilities | | | 1.1 | % | |
| | | | 100.0 | % | |
MassMutual Select Value Equity Fund
Largest Stock Holdings
(% of Net Assets) on 6/30/07 | |
| AT&T, Inc. | | | 4.3 | % | |
| Exxon Mobil Corp. | | | 4.3 | % | |
| Bank of America Corp. | | | 4.1 | % | |
| Pfizer, Inc. | | | 3.4 | % | |
| General Electric Co. | | | 3.1 | % | |
| JP Morgan Chase & Co. | | | 3.0 | % | |
| Fannie Mae | | | 2.6 | % | |
| Altria Group, Inc. | | | 2.5 | % | |
| Citigroup, Inc. | | | 2.4 | % | |
| Marathon Oil Corp. | | | 2.2 | % | |
16
MassMutual Select Value Equity Fund – Portfolio Manager Report (Continued)
Growth of a $10,000 Investment
Hypothetical Investments in MassMutual Select Value Equity Fund Class S, Class A, Class A (sales load deducted), Class Y, Class L and the Russell 1000 Value Index.
MassMutual Select Value Equity Fund
Total Return
| | | Year-
to-Date
1/1/07 -
6/30/07 | | One
Year
7/1/06 -
6/30/07 | | Five
Year
Average
Annual
7/1/02 -
6/30/07 | | Since
Inception
Average
Annual
5/1/01 -
6/30/07 | |
| Class S | | | 7.70 | % | | | 18.21 | % | | | 11.30 | % | | | 6.96 | % | |
| Class A | | | 7.55 | % | | | 17.65 | % | | | 10.79 | % | | | 6.49 | % | |
Class A
(sales load
deducted)* | | | 1.36 | % | | | 10.88 | % | | | 9.49 | % | | | 5.47 | % | |
| Class Y | | | 7.79 | % | | | 18.13 | % | | | 11.25 | % | | | 6.92 | % | |
| Class L | | | 7.74 | % | | | 17.99 | % | | | 11.07 | % | | | 6.76 | % | |
Russell 1000
Value Index | | | 6.23 | % | | | 21.86 | % | | | 13.31 | % | | | 8.99 | % | |
Hypothetical Investments in MassMutual Select Value Equity Fund Class N, Class N (CDSC fees deducted) and the Russell 1000 Value Index.
MassMutual Select Value Equity Fund
Total Return
| | | Year-to-Date
1/1/07 - 6/30/07 | | One Year
7/1/06 - 6/30/07 | | Since Inception
Average Annual
12/31/02 - 6/30/07 | |
| Class N | | | 7.33 | % | | | 17.27 | % | | | 15.06 | % | |
Class N
(CDSC fees
deducted)* | | | 6.33 | % | | | 16.27 | % | | | 15.06 | % | |
Russell 1000
Value Index | | | 6.23 | % | | | 21.86 | % | | | 18.05 | % | |
GROWTH OF $10,000 INVESTMENT SINCE INCEPTION

* Class A (sales load deducted) returns include the 5.75% maximum sales charge and Class N (CDSC fees deducted) returns include the 1.00% maximum contingent deferred sales charge for the first 18 months shown.
Performance data quoted represents past performance; past performance is not predictive of future results. The investment return and principal value of shares of the Fund will fluctuate with market conditions so that shares of the Fund, when redeemed, may be worth more or less than their original cost. Current performance of the Fund may be lower or higher than the performance quoted. Performance data current to the most recent month end may be obtained by calling 1-888-309-3539.
Investors should note that the Fund is a professionally managed mutual fund, while the Russell 1000 Value Index is unmanaged, does not incur expenses, and cannot be purchased directly by investors. Investors should read the Fund's prospectus with regard to the Fund's investment objective, risks and charges and expenses in conjunction with these financial statements. Employee retirement benefit plans that invest plan assets in the Separate Investment Accounts (SIAs) may be subject to certain charges as set forth in their respective Plan Documents. Total return figures would be lower for the periods presented if they reflected these charges. The performance tables and charts do not reflect the deduction of taxes that a shareholder would pay on the Fund distributions or the redemption of the Fund shares.
17
MassMutual Select Large Cap Value Fund – Portfolio Manager Report
What is the investment objective of the MassMutual Select Large Cap Value Fund – and who is the Fund's sub-adviser? The Fund seeks both capital growth and income by selecting businesses that possess characteristics that the Fund's sub-adviser, Davis Selected Advisers, L.P. (Davis), believes foster the creation of long-term value – such as proven management, a durable franchise and business model, and sustainable competitive advantages.
How did the Fund perform during the six months ended June 30, 2007? The Fund's Class S shares returned 7.12%, outpacing the 6.96% return of the S&P 500® Index, a widely recognized, unmanaged index representative of common stocks of larger capitalized U.S. companies. The Fund also outperformed the 6.23% return of the Russell 1000® Value Index, an unmanaged index representative of stocks with a greater-than-average value orientation among the stocks of the largest 1000 U.S. companies based on capitalization.
What was the investment background during the period? Domestic stocks showed little change during the first quarter of 2007, despite a significant increase in volatility across the board. Although the Dow Jones Industrial AverageSM ("the Dow") notched a new closing high in February, the blue-chip benchmark declined slightly for the three months ended March 31, 2007. The S&P 500 Index finished with a small advance, as did the Nasdaq Composite® Index ("Nasdaq"), which barely managed to post a gain for the period. A depreciating U.S. dollar supported the returns of foreign stocks, helping the MSCI® EAFE® Index outperform its U.S. counterparts for the quarter.
Most U.S. stock indexes advanced in the second quarter, with some setting records along the way. Stocks rode a wave of optimism over corporate earnings early in the quarter and later overcame short periods of increased volatility associated with investor concerns about soft retail sales, rising interest rates, inflation, the housing market and sub-prime mortgages. During the period, the housing market remained depressed, and long-term interest rates moved decisively higher. Crude oil surged to close the quarter near $70 per barrel.
What factors contributed to the Fund's performance? In the first three months of 2007, the Fund's allocations to the health care and materials sectors fueled its performance – and helped to balance the results from other sectors, which were flat to modestly negative. Individual contributors during the period included Martin Marietta, EOG Resources, Vulcan Materials, Loews Corp. and CVS/Caremark (formed out of the merger between CVS and Caremark Rx in March). Conversely, the stocks that detracted most from the Fund's return in the first quarter included Harley-Davidson, American Express, Comcast, American International Group and Progressive Corp.
In the second quarter, the Fund's allocations to the financials, energy, consumer discretionary and consumer staples sectors contributed to its performance, while detractors were largely stock specific. The top individual contributors included ConocoPhillips, Amazon, American Express, Occidental Petroleum and Costco. On the downside, News Corp, Wachovia Corp., Bed Bath & Beyond, Hershey Foods and UnitedHealth Group hampered the Fund's progress the most during this period.
What is your outlook? Whatever happens in the remainder of this year and whatever styles, industries or market capitalizations move into or out of favor, we feel that the Fund's investment approach of buying durable businesses at value prices and holding them for the long term is a perennial and sensible approach for building and preserving capital.
18
MassMutual Select Large Cap Value Fund – Portfolio Manager Report (Continued)
MassMutual Select Large Cap Value Fund
Industry Table
(% of Net Assets) on 6/30/07 | |
| Insurance | | | 15.4 | % | |
| Oil & Gas | | | 12.3 | % | |
| Diversified Financial | | | 12.2 | % | |
| Banks | | | 8.8 | % | |
| Retail | | | 8.3 | % | |
| Media | | | 6.0 | % | |
| Manufacturing | | | 4.2 | % | |
| Commercial Services | | | 3.7 | % | |
| Agriculture | | | 3.2 | % | |
| Software | | | 3.0 | % | |
| Telecommunications | | | 2.3 | % | |
| Beverages | | | 2.1 | % | |
| Packaging & Containers | | | 1.9 | % | |
| Computers | | | 1.8 | % | |
| Internet | | | 1.6 | % | |
| Leisure Time | | | 1.5 | % | |
| Mining | | | 1.4 | % | |
| Pharmaceuticals | | | 1.4 | % | |
| Cosmetics & Personal Care | | | 1.3 | % | |
| Building Materials | | | 1.2 | % | |
| Transportation | | | 1.1 | % | |
| Health Care — Services | | | 0.9 | % | |
Holding Company —
Diversified | | | 0.8 | % | |
| Coal | | | 0.6 | % | |
| Foods | | | 0.5 | % | |
| Electronics | | | 0.5 | % | |
| Advertising | | | 0.3 | % | |
| Housewares | | | 0.3 | % | |
| Real Estate | | | 0.1 | % | |
Total Long-Term
Investments | | | 98.7 | % | |
Short-Term Investments
and Other Assets
and Liabilities | | | 1.3 | % | |
| | | | 100.0 | % | |
MassMutual Select Large Cap Value Fund
Largest Stock Holdings
(% of Net Assets) on 6/30/07 | |
| American Express Co. | | | 4.5 | % | |
| ConocoPhillips Co. | | | 4.5 | % | |
| Tyco International Ltd. | | | 4.2 | % | |
| American International Group, Inc. | | | 4.1 | % | |
| Costco Wholesale Corp. | | | 3.8 | % | |
| JP Morgan Chase & Co. | | | 3.8 | % | |
| Altria Group, Inc. | | | 3.3 | % | |
| Berkshire Hathaway, Inc. Cl. A | | | 3.2 | % | |
| Comcast Corp. Special, Cl. A | | | 3.1 | % | |
| HSBC Holdings PLC | | | 2.6 | % | |
19
MassMutual Select Large Cap Value Fund – Portfolio Manager Report (Continued)
Growth of a $10,000 Investment
Hypothetical Investments in MassMutual Select Large Cap Value Fund Class S, Class A, Class A (sales load deducted), Class Y, Class L, the S&P 500 Index and the Russell 1000 Value Index.
MassMutual Select Large Cap Value Fund
Total Return
| | | Year-
to-Date
1/1/07 -
6/30/07 | | One
Year
7/1/06 -
6/30/07 | | Five
Year
Average
Annual
7/1/02 -
6/30/07 | | Since
Inception
Average
Annual
5/1/00 -
6/30/07 | |
| Class S | | | 7.12 | % | | | 19.20 | % | | | 12.82 | % | | | 5.38 | % | |
| Class A | | | 6.78 | % | | | 18.59 | % | | | 12.28 | % | | | 4.87 | % | |
Class A
(sales load
deducted)* | | | 0.64 | % | | | 11.77 | % | | | 10.96 | % | | | 4.00 | % | |
| Class Y | | | 7.05 | % | | | 19.05 | % | | | 12.72 | % | | | 5.28 | % | |
| Class L | | | 6.99 | % | | | 18.95 | % | | | 12.54 | % | | | 5.12 | % | |
| S&P 500 Index | | | 6.96 | % | | | 20.57 | % | | | 10.70 | % | | | 2.16 | % | |
Russell 1000
Value Index | | | 6.23 | % | | | 21.86 | % | | | 13.31 | % | | | 8.63 | % | |
Hypothetical Investments in MassMutual Select Large Cap Value Fund Class N, Class N (CDSC fees deducted), the S&P 500 Index and the Russell 1000 Value Index.
MassMutual Select Large Cap Value Fund
Total Return
| | | Year-to-Date
1/1/07 - 6/30/07 | | One Year
7/1/06 - 6/30/07 | | Since Inception
Average Annual
12/31/02 - 6/30/07 | |
| Class N | | | 6.69 | % | | | 18.20 | % | | | 15.37 | % | |
Class N
(CDSC fees
deducted)* | | | 5.69 | % | | | 17.20 | % | | | 15.37 | % | |
| S&P 500 Index | | | 6.96 | % | | | 20.57 | % | | | 14.72 | % | |
Russell 1000
Value Index | | | 6.23 | % | | | 21.86 | % | | | 18.05 | % | |
GROWTH OF $10,000 INVESTMENT SINCE INCEPTION

* Class A (sales load deducted) returns include the 5.75% maximum sales charge and Class N (CDSC fees deducted) returns include the 1.00% maximum contingent deferred sales charge for the first 18 months shown.
Performance data quoted represents past performance; past performance is not predictive of future results. The investment return and principal value of shares of the Fund will fluctuate with market conditions so that shares of the Fund, when redeemed, may be worth more or less than their original cost. Current performance of the Fund may be lower or higher than the performance quoted. Performance data current to the most recent month end may be obtained by calling 1-888-309-3539.
Investors should note that the Fund is a professionally managed mutual fund, while the S&P 500 Index and the Russell 1000 Value Index are unmanaged, do not incur expenses, and cannot be purchased directly by investors. Investors should read the Fund's prospectus with regard to the Fund's investment objective, risks and charges and expenses in conjunction with these financial statements. Employee retirement benefit plans that invest plan assets in the Separate Investment Accounts (SIAs) may be subject to certain charges as set forth in their respective Plan Documents. Total return figures would be lower for the periods presented if they reflected these charges. The performance tables and charts do not reflect the deduction of taxes that a shareholder would pay on the Fund distributions or the redemption of the Fund shares.
20
MassMutual Select Indexed Equity Fund – Portfolio Manager Report
What is the investment objective of the MassMutual Select Indexed Equity Fund – and who is the Fund's sub-adviser?
The Fund seeks to approximate as closely as practicable (before fees and expenses) the capitalization – weighted total rate of return of that portion of the U.S. market for publicly traded common stocks composed of larger-capitalized companies. The Fund pursues this objective by investing at least 80% of its net assets in the equity securities of companies that make up the S&P 500® Index ("the Index"). The Fund's sub-adviser is Northern Trust Investments, N.A. (Northern).
How did the Fund perform during the six months ended June 30, 2007?
The Fund's Class S shares returned 6.72%, trailing the 6.96% return of the S&P 500 Index, a widely recognized, unmanaged index representative of common stocks of larger capitalized U.S. companies.
What was the investment background during the period?
Overcoming a dip in the market in February, U.S. equity markets posted positive numbers for the first half of 2007, despite negative pressures surrounding sub-prime loan defaults, rising interest rates and geopolitical conflicts in the Middle East and Asia. The S&P 500 Index closed at an all-time high in May. Ongoing merger and acquisition activity, takeover announcements and strong earnings reports also contributed to the markets' performance in the first quarter.
On January 18, 2007, crude oil prices dropped to $51 a barrel on higher-than-expected supply news. This retreat was short-lived, as oil closed higher at the end of the second quarter at around $70 per barrel. The Federal Reserve ("Fed") kept the federal funds rate unchanged at 5.25% during the second quarter. However, Federal Open Market Committee minutes pointed to inflationary pressures that have the potential to prompt the Fed to increase rates later in the year.
What factors contributed to the Fund's performance?
All but three sectors of the S&P 500 Index posted positive results for the first quarter of 2007. The utilities sector was the top performer, followed by the materials sector. The primary detractors had the heaviest weights and the lowest returns. The financials sector, which represented a significant position in the portfolio, ended the quarter in negative territory. In addition, the information technology sector, another large Index component, posted a slightly negative return. At the close of business on March 30, 2007, we incorporated into the portfolio the Index's quarterly share changes. There were 10 additions and deletions to the Index during the quarter, and we incorporated these changes into the portfolio to maintain proper tracking.
For the year-to-date period ended June 30, 2007, financials and information technology constituted the Fund's largest sector positions. During this period, the best-performing sector in the S&P 500 Index was energy, which posted a double-digit return. Conversely, the worst-performing sector, financials, ended the quarter with a slightly negative return. On June 15, 2007, quarterly share changes were incorporated into the Index. There were a total of 19 additions and deletions to the Index during the year-to-date period.
What is your outlook?
Despite the direction in which the equity markets may head throughout the remainder of the year – and the effects that certain factors, such as the price of oil, inflation, geopolitical unrest and Fed policy, may have on the markets – we believe that the Fund is positioned to strive for returns that are consistent with those of the S&P 500 Index.
21
MassMutual Select Indexed Equity Fund – Portfolio Manager Report (Continued)
MassMutual Select Indexed Equity Fund
Industry Table
(% of Net Assets) on 6/30/07 | |
| Oil & Gas | | | 8.6 | % | |
| Diversified Financial | | | 8.0 | % | |
| Telecommunications | | | 6.3 | % | |
| Banks | | | 6.3 | % | |
| Pharmaceuticals | | | 5.7 | % | |
| Retail | | | 5.5 | % | |
| Manufacturing | | | 5.3 | % | |
| Insurance | | | 4.9 | % | |
| Computers | | | 4.2 | % | |
| Software | | | 3.8 | % | |
| Electric | | | 3.2 | % | |
| Media | | | 3.2 | % | |
| Health Care — Products | | | 3.0 | % | |
| Semiconductors | | | 2.7 | % | |
| Aerospace & Defense | | | 2.2 | % | |
| Beverages | | | 2.0 | % | |
| Cosmetics & Personal Care | | | 1.8 | % | |
| Foods | | | 1.8 | % | |
| Internet | | | 1.8 | % | |
| Transportation | | | 1.7 | % | |
| Chemicals | | | 1.6 | % | |
| Oil & Gas Services | | | 1.6 | % | |
| Agriculture | | | 1.4 | % | |
| Health Care — Services | | | 1.4 | % | |
Real Estate Investment
Trusts (REITS) | | | 1.2 | % | |
| Biotechnology | | | 0.9 | % | |
| Mining | | | 0.7 | % | |
| Commercial Services | | | 0.7 | % | |
| Lodging | | | 0.5 | % | |
| Electronics | | | 0.5 | % | |
| Auto Manufacturers | | | 0.4 | % | |
| Apparel | | | 0.4 | % | |
Machinery —
Construction & Mining | | | 0.4 | % | |
| Household Products | | | 0.4 | % | |
| Pipelines | | | 0.4 | % | |
| Savings & Loans | | | 0.4 | % | |
| Machinery — Diversified | | | 0.4 | % | |
| Forest Products & Paper | | | 0.3 | % | |
Electrical Components &
Equipment | | | 0.3 | % | |
| Iron & Steel | | | 0.3 | % | |
| Leisure Time | | | 0.3 | % | |
| Automotive & Parts | | | 0.3 | % | |
| Gas | | | 0.2 | % | |
| Office Equipment/Supplies | | | 0.2 | % | |
| Environmental Controls | | | 0.2 | % | |
| Home Builders | | | 0.2 | % | |
| Advertising | | | 0.2 | % | |
| Building Materials | | | 0.2 | % | |
| Coal | | | 0.2 | % | |
| Packaging & Containers | | | 0.1 | % | |
| Metal Fabricate & Hardware | | | 0.1 | % | |
| Home Furnishing | | | 0.1 | % | |
| Toys, Games & Hobbies | | | 0.1 | % | |
| Hand & Machine Tools | | | 0.1 | % | |
| Entertainment | | | 0.1 | % | |
| Airlines | | | 0.1 | % | |
| Engineering & Construction | | | 0.1 | % | |
| Housewares | | | 0.1 | % | |
| Industrial — Distribution | | | 0.0 | % | |
| Real Estate | | | 0.0 | % | |
Total Long-Term
Investments | | | 99.1 | % | |
Short-Term Investments
and Other Assets and
Liabilities | | | 0.9 | % | |
| | | | 100.0 | % | |
MassMutual Select Indexed
Equity Fund
Largest Stock Holdings
(% of Net Assets) on 6/30/07 | |
| Exxon Mobil Corp. | | | 3.5 | % | |
| General Electric Co. | | | 2.9 | % | |
| AT&T, Inc. | | | 1.9 | % | |
| Citigroup, Inc. | | | 1.9 | % | |
| Microsoft Corp. | | | 1.8 | % | |
| Bank of America Corp. | | | 1.6 | % | |
| The Procter & Gamble Co. | | | 1.4 | % | |
| American International Group, Inc. | | | 1.3 | % | |
| Chevron Corp. | | | 1.3 | % | |
| Pfizer, Inc. | | | 1.3 | % | |
22
MassMutual Select Indexed Equity Fund – Portfolio Manager Report (Continued)
Growth of a $10,000 Investment
Hypothetical Investments in MassMutual Select Indexed Equity Fund Class S, Class A, Class A (sales load deducted), Class Y and the S&P 500 Index.
MassMutual Select Indexed Equity Fund
Total Return
| | | Year-
to-Date
1/1/07 -
6/30/07 | | One
Year
7/1/06 -
6/30/07 | | Five
Year
Average
Annual
7/1/02 -
6/30/07 | | Since
Inception
Average
Annual
3/1/98 -
6/30/07 | |
| Class S | | | 6.72 | % | | | 20.10 | % | | | 10.25 | % | | | 5.14 | % | |
| Class A | | | 6.60 | % | | | 19.72 | % | | | 9.86 | % | | | 4.70 | % | |
Class A
(sales load
deducted)* | | | 0.47 | % | | | 12.84 | % | | | 8.56 | % | | | 4.04 | % | |
| Class Y | | | 6.71 | % | | | 20.08 | % | | | 10.21 | % | | | 5.08 | % | |
| S&P 500 Index | | | 6.96 | % | | | 20.57 | % | | | 10.70 | % | | | 5.59 | % | |
Hypothetical Investments in MassMutual Select Indexed Equity Fund Class L and the S&P 500 Index.
MassMutual Select Indexed Equity Fund
Total Return
| | | Year-
to-Date
1/1/07 -
6/30/07 | | One
Year
7/1/06 -
6/30/07 | | Five
Year
Average
Annual
7/1/02 -
6/30/07 | | Since
Inception
Average
Annual
7/1/99 -
6/30/07 | |
| Class L | | | 6.81 | % | | | 20.10 | % | | | 10.15 | % | | | 2.23 | % | |
| S&P 500 Index | | | 6.96 | % | | | 20.57 | % | | | 10.70 | % | | | 2.79 | % | |
GROWTH OF $10,000 INVESTMENT SINCE INCEPTION


* Class A (sales load deducted) returns include the 5.75% maximum sales charge.
Performance data quoted represents past performance; past performance is not predictive of future results. The investment return and principal value of shares of the Fund will fluctuate with market conditions so that shares of the Fund, when redeemed, may be worth more or less than their original cost. Current performance of the Fund may be lower or higher than the performance quoted. Performance data current to the most recent month end may be obtained by calling 1-888-309-3539.
Investors should note that the Fund is a professionally managed mutual fund, while the S&P 500 Index is unmanaged, does not incur expenses, and cannot be purchased directly by investors. Investors should read the Fund's prospectus with regard to the Fund's investment objective, risks and charges and expenses in conjunction with these financial statements. Employee retirement benefit plans that invest plan assets in the Separate Investment Accounts (SIAs) may be subject to certain charges as set forth in their respective Plan Documents. Total return figures would be lower for the periods presented if they reflected these charges. The performance tables and charts do not reflect the deduction of taxes that a shareholder would pay on the Fund distributions or the redemption of the Fund shares.
23
MassMutual Select Indexed Equity Fund – Portfolio Manager Report (Continued)
Growth of a $10,000 Investment
Hypothetical Investments in MassMutual Select Indexed Equity Fund Class Z and the S&P 500 Index.
MassMutual Select Indexed Equity Fund
Total Return
| | | Year-
to-Date
1/1/07 -
6/30/07 | | One
Year
7/1/06 -
6/30/07 | | Five
Year
Average
Annual
7/1/02 -
6/30/07 | | Since
Inception
Average
Annual
5/1/01 -
6/30/07 | |
| Class Z | | | 6.87 | % | | | 20.33 | % | | | 10.52 | % | | | 4.66 | % | |
| S&P 500 Index | | | 6.96 | % | | | 20.57 | % | | | 10.70 | % | | | 4.85 | % | |
Hypothetical Investments in MassMutual Select Indexed Equity Fund Class N, Class N (CDSC fees deducted) and the S&P 500 Index.
MassMutual Select Indexed Equity Fund
Total Return
| | | Year-to-Date
1/1/07 - 6/30/07 | | One Year
7/1/06 - 6/30/07 | | Since Inception
Average Annual
12/31/02 - 6/30/07 | |
| Class N | | | 6.51 | % | | | 19.50 | % | | | 13.53 | % | |
Class N
(CDSC fees
deducted)* | | | 5.51 | % | | | 18.50 | % | | | 13.53 | % | |
| S&P 500 Index | | | 6.96 | % | | | 20.57 | % | | | 14.72 | % | |
GROWTH OF $10,000 INVESTMENT SINCE INCEPTION
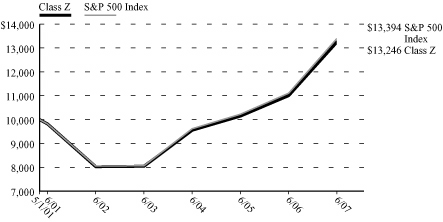
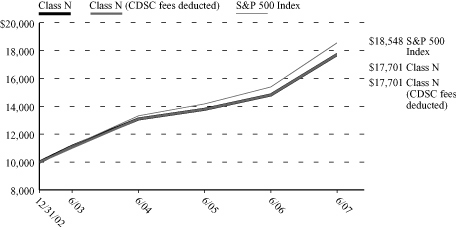
* Class N (CDSC fees deducted) returns include the 1.00% maximum contingent deferred sales charge for the first 18 months shown.
Performance data quoted represents past performance; past performance is not predictive of future results. The investment return and principal value of shares of the Fund will fluctuate with market conditions so that shares of the Fund, when redeemed, may be worth more or less than their original cost. Current performance of the Fund may be lower or higher than the performance quoted. Performance data current to the most recent month end may be obtained by calling 1-888-309-3539.
Investors should note that the Fund is a professionally managed mutual fund, while the S&P 500 Index is unmanaged, does not incur expenses, and cannot be purchased directly by investors. Investors should read the Fund's prospectus with regard to the Fund's investment objective, risks and charges and expenses in conjunction with these financial statements. Employee retirement benefit plans that invest plan assets in the Separate Investment Accounts (SIAs) may be subject to certain charges as set forth in their respective Plan Documents. Total return figures would be lower for the periods presented if they reflected these charges. The performance tables and charts do not reflect the deduction of taxes that a shareholder would pay on the Fund distributions or the redemption of the Fund shares.
24
MassMutual Select Core Opportunities Fund – Portfolio Manager Report
What is the investment objective of the MassMutual Select Core Opportunities Fund – and who is the Fund's sub-adviser? The Fund seeks long-term growth of capital by normally investing at least 80% of its net assets in equity securities and securities convertible into common stocks traded on U.S. exchanges and issued by large, established companies. The Fund's sub-adviser, Victory Capital Management Inc. (Victory), seeks to invest in both growth and value securities.
How did the Fund perform during the six months ended June 30, 2007? The Fund's Class S shares returned 8.38%, outpacing the 6.96% return of the S&P 500® Index ("the Index"), a widely recognized, unmanaged index representative of common stocks of larger capitalized U.S. companies.
What was the investment background during the period? Domestic stocks showed little change during the first quarter of 2007, despite a significant increase in volatility across the board. Although the Dow Jones Industrial AverageSM ("the Dow") notched a new closing high in February, the blue-chip benchmark declined slightly for the three months ended March 31, 2007. The S&P 500 Index finished with a small advance, as did the Nasdaq Composite® Index ("Nasdaq"), which barely managed to post a gain for the period. A depreciating U.S. dollar supported the returns of foreign stocks, helping the MSCI® EAFE® Index outperform its U.S. counterparts for the quarter.
Most U.S. stock indexes advanced in the second quarter, with some setting records along the way. Stocks rode a wave of optimism over corporate earnings early in the quarter and later overcame short periods of increased volatility associated with investor concerns about soft retail sales, rising interest rates, inflation, the housing market and sub-prime mortgages. During the period, the housing market remained depressed, and long-term interest rates moved decisively higher. Crude oil surged to close the quarter near $70 per barrel.
What factors contributed to the Fund's performance? Capital goods was the best-performing sector within the portfolio during the first quarter, both on an absolute basis and relative to the S&P 500 Index – as well-publicized weakness within the U.S. residential construction market was offset by strength in non-residential construction. Outside of sector attribution, the most notable performance differential was capitalization. Mega-capitalization companies (those with a market capitalization of more than $50 billion) significantly underperformed the rest of the market. Despite having an underweight position relative to the S&P 500 Index, the portfolio's mega-capitalization stocks declined more than the Index, and detracted from returns. This was due in part to company-specific issues, and in part to the market's affection for mid- t o large-market capitalization companies which have exhibited better earnings growth and interest from private equity/activist shareholders.
Capital goods was once again the portfolio's best-performing sector relative to the S&P 500 Index in the second quarter. This sector has been a long-term focus for the portfolio, evidenced by the portfolio's overweight position since the fourth quarter of 2005. Since then, it has been the second-largest contributor to outperformance. Capital spending on global infrastructure, energy and mining has been extremely healthy, fueled by a higher commodity price environment, robust emerging market growth, and steady growth in developed markets. The financials sector was the worst performer during the quarter, but due to an underweight position there, an emphasis on asset managers and a private equity takeout of a large holding, the portfolio's financial securities performed much better than the Index. The Fund's preference for asset managers over banks also proved beneficial.
What is your outlook?
Despite the crosscurrents, we remain optimistic and believe the portfolio is positioned for further equity appreciation. Higher-quality and larger-capitalization companies with stellar balance sheets remain attractive and, given the strong relative earnings growth these companies provided in the first-quarter earnings season, sentiment appears to have just begun to shift in their favor. Economically sensitive sectors, such as energy and capital goods, are still a focus for the Fund and we continue to find opportunities in growth stocks, which have underperformed value for the past seven years. As corporate profits decelerate, we believe investors may be willing to pay a higher multiple for companies that can exhibit above-average earni ngs growth over the next 12 months.
25
MassMutual Select Core Opportunities Fund – Portfolio Manager Report (Continued)
MassMutual Select Core Opportunities Fund
Industry Table
(% of Net Assets) on 6/30/07 | |
| Semiconductors | | | 10.3 | % | |
| Diversified Financial | | | 7.7 | % | |
| Oil & Gas Services | | | 7.4 | % | |
| Pharmaceuticals | | | 7.2 | % | |
| Beverages | | | 6.8 | % | |
| Oil & Gas | | | 5.9 | % | |
| Manufacturing | | | 5.8 | % | |
| Insurance | | | 4.2 | % | |
| Internet | | | 4.1 | % | |
| Computers | | | 4.0 | % | |
Machinery —
Construction & Mining | | | 3.4 | % | |
| Transportation | | | 3.1 | % | |
| Aerospace & Defense | | | 2.7 | % | |
| Retail | | | 2.4 | % | |
| Cosmetics & Personal Care | | | 2.3 | % | |
| Chemicals | | | 2.2 | % | |
| Engineering & Construction | | | 1.7 | % | |
| Telecommunications | | | 1.7 | % | |
| Environmental Controls | | | 1.6 | % | |
| Mining | | | 1.6 | % | |
| Banks | | | 1.5 | % | |
| Auto Manufacturers | | | 1.4 | % | |
| Machinery — Diversified | | | 1.4 | % | |
| Coal | | | 1.3 | % | |
| Media | | | 1.3 | % | |
| Electric | | | 1.2 | % | |
| Health Care — Products | | | 1.2 | % | |
| Building Materials | | | 1.1 | % | |
| Home Builders | | | 0.7 | % | |
| Commercial Services | | | 0.3 | % | |
| Foods | | | 0.2 | % | |
Total Long-Term
Investments | | | 97.7 | % | |
Short-Term Investments
and Other Assets
and Liabilities | | | 2.3 | % | |
| | | | 100.0 | % | |
MassMutual Select Core
Opportunities Fund
Largest Stock Holdings
(% of Net Assets) on 6/30/07 | |
| Intel Corp. | | | 4.6 | % | |
| General Electric Co. | | | 4.5 | % | |
| Transocean, Inc. | | | 4.1 | % | |
| Schlumberger Ltd. | | | 3.5 | % | |
| Caterpillar, Inc. | | | 3.4 | % | |
| United Parcel Service, Inc. Cl. B | | | 3.2 | % | |
| Halliburton Co. | | | 3.1 | % | |
| The Charles Schwab Corp. | | | 2.9 | % | |
| The Coca-Cola Co. | | | 2.9 | % | |
| United Technologies Corp. | | | 2.7 | % | |
26
MassMutual Select Core Opportunities Fund – Portfolio Manager Report (Continued)
Growth of a $10,000 Investment
Hypothetical Investments in MassMutual Select Core Opportunities Fund Class S, Class A, Class A (sales load deducted), Class Y, Class L, Class N, Class N (CDSC fees deducted) and the S&P 500 Index.
MassMutual Select Core Opportunities Fund
Total Return
| | | Year-to-Date
1/1/07 - 6/30/07 | | One Year
7/1/06 - 6/30/07 | | Since Inception
3/31/06 - 6/30/07 | |
| Class S | | | 8.38 | % | | | 21.43 | % | | | 13.31 | % | |
| Class A | | | 8.12 | % | | | 20.87 | % | | | 12.80 | % | |
Class A (sales load
deducted)* | | | 1.90 | % | | | 13.92 | % | | | 7.59 | % | |
| Class Y | | | 8.29 | % | | | 21.29 | % | | | 13.20 | % | |
| Class L | | | 8.20 | % | | | 21.08 | % | | | 13.05 | % | |
| Class N | | | 7.94 | % | | | 20.42 | % | | | 12.47 | % | |
Class N (CDSC
fees deducted)* | | | 6.94 | % | | | 19.42 | % | | | 11.69 | % | |
| S&P 500 Index | | | 6.96 | % | | | 20.57 | % | | | 14.42 | % | |
GROWTH OF $10,000 INVESTMENT SINCE INCEPTION
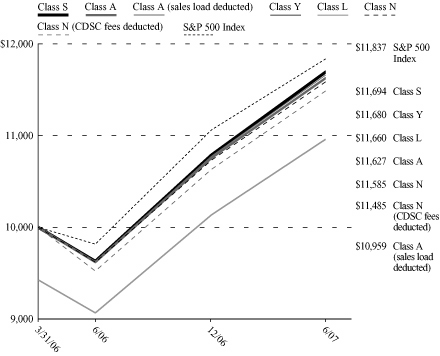
* Class A (sales load deducted) returns include the 5.75% maximum sales charge and Class N (CDSC fees deducted) returns include the 1.00% maximum contingent deferred sales charge.
Performance data quoted represents past performance; past performance is not predictive of future results. The investment return and principal value of shares of the Fund will fluctuate with market conditions so that shares of the Fund, when redeemed, may be worth more or less than their original cost. Current performance of the Fund may be lower or higher than the performance quoted. Performance data current to the most recent month end may be obtained by calling 1-888-309-3539.
Investors should note that the Fund is a professionally managed mutual fund, while the S&P 500 Index is unmanaged, does not incur expenses, and cannot be purchased directly by investors. Investors should read the Fund's prospectus with regard to the Fund's investment objective, risks and charges and expenses in conjunction with these financial statements. Employee retirement benefit plans that invest plan assets in the Separate Investment Accounts (SIAs) may be subject to certain charges as set forth in their respective Plan Documents. Total return figures would be lower for the periods presented if they reflected these charges. The performance tables and charts do not reflect the deduction of taxes that a shareholder would pay on the Fund distributions or the redemption of the Fund shares.
27
MassMutual Select Blue Chip Growth Fund – Portfolio Manager Report
What is the investment objective of the MassMutual Select Blue Chip Growth Fund – and who is the Fund's sub-adviser?
The Fund seeks growth of capital over the long term by normally investing at least 80% of its net assets in the common stocks of large and medium-sized blue chip growth companies. The Fund's sub-adviser is T. Rowe Price Associates, Inc. (T. Rowe Price).
How did the Fund perform during the six months ended June 30, 2007?
The Fund's Class S shares returned 8.78%, exceeding the 6.96% return of the S&P 500® Index, a widely recognized, unmanaged index representative of common stocks of larger capitalized U.S. companies. The Fund also outpaced the 8.13% return of the Russell 1000® Growth Index, an unmanaged index consisting of those Russell 1000 securities (representing the 1000 largest U.S. companies based on market capitalization) with greater-than-average growth orientation that tend to exhibit higher price-to-book ratios and forecasted growth values than securities in the value universe.
Going forward, the Fund's performance will be compared to the Russell 1000 Growth Index rather than the S&P 500 Index because the Russell 1000 Growth Index more closely represents the Fund's investment strategy. The Fund will retain the S&P 500 Index as its supplemental benchmark for performance comparisons.
What was the investment background during the period?
Domestic stocks showed little change during the first quarter of 2007, despite a significant increase in volatility across the board. Although the Dow Jones Industrial AverageSM ("the Dow") notched a new closing high in February, the blue-chip benchmark declined slightly for the three months ended March 31, 2007. The S&P 500 Index finished with a small advance, as did the Nasdaq Composite® Index ("Nasdaq"), which barely managed to post a gain for the period. A depreciating U.S. dollar supported the returns of foreign stocks, helping the MSCI® EAFE® Index outperform its U.S. counterparts for the quarter.
U.S. stocks produced robust gains in the second quarter and moved into positive territory, as several major indexes reached record highs. Better-than-expected first quarter earnings, especially among multi-national firms, combined with signs of an economic uplift and substantial merger and acquisition activity to boost the market. The Federal Reserve's ("Fed's") steady monetary policy also benefited investor confidence. Large- and mid-cap shares outperformed small caps. Growth stocks decisively surpassed value across all market capitalizations. Energy stocks far outpaced other sectors as fuel prices soared.
What factors contributed to the Fund's performance?
For the six-month period ended June 30, 2007, the consumer discretionary sector produced the greatest relative contribution behind stock selection. Returns in this sector were slightly positive, but performance was mixed, as consumers battled high gasoline prices, higher interest rates and housing weakness. Stock selection and an overweight position in the strong-performing energy sector (compared to the benchmark Russell 1000 Growth Index) combined to contribute to the Fund's relative outperformance – as oil prices topped $70 a barrel and natural gas prices rebounded after inventory concerns in 2006 dissipated. Portfolio strength was centered in energy equipment and services companies, such as Smith International and Schlumberger, which were both top overall portfolio contributors.
Underweight positions and stock selection in the industrials and business services sectors detracted from the Fund's relative results for the year-to-date period. Machinery was the largest source of weakness. During this time frame, the Fund selectively added to positions in the industrials and business services sectors, notably in the aerospace/defense and the construction/engineering industries. The Fund's large overweight position in financials also hurt relative performance, offsetting positive stock selection within that sector. Finally, avoiding the utilities sector and holding an underweight allocation to the materials sector also hurt the portfolio's relative performance, as these were among the top-performing sectors in the benchmark for the six-month period.
28
MassMutual Select Blue Chip Growth Fund – Portfolio Manager Report (Continued)
What is your outlook?
Investors remain concerned about the decline in housing prices, higher energy costs, geopolitical turmoil, and the Fed's future course on interest rates. Weighing these risks, we believe the housing correction may be stubborn, but manageable, in its effects on Gross Domestic Product ("GDP") growth. We do not expect any dramatic changes in interest rates by the Fed in the near term. The prospects for corporate earnings growth and relatively stable interest rates are favorable, although valuations are not as supportive as they were last year. High-quality, consistent-growth companies, in our opinion, continue to appear attractive.
MassMutual Select Blue Chip Growth Fund
Industry Table
(% of Net Assets) on 6/30/07 | |
| Diversified Financial | | | 12.8 | % | |
| Telecommunications | | | 8.8 | % | |
| Pharmaceuticals | | | 7.7 | % | |
| Software | | | 6.8 | % | |
| Retail | | | 6.5 | % | |
| Manufacturing | | | 6.3 | % | |
| Semiconductors | | | 5.4 | % | |
| Oil & Gas Services | | | 5.3 | % | |
| Internet | | | 5.2 | % | |
| Health Care — Services | | | 3.8 | % | |
| Banks | | | 3.8 | % | |
| Health Care — Products | | | 3.2 | % | |
| Insurance | | | 3.1 | % | |
| Computers | | | 3.0 | % | |
| Oil & Gas | | | 2.9 | % | |
| Biotechnology | | | 2.0 | % | |
| Media | | | 1.9 | % | |
| Aerospace & Defense | | | 1.7 | % | |
| Lodging | | | 1.5 | % | |
| Cosmetics & Personal Care | | | 1.2 | % | |
| Chemicals | | | 0.9 | % | |
| Engineering & Construction | | | 0.8 | % | |
| Home Furnishing | | | 0.8 | % | |
| Commercial Services | | | 0.6 | % | |
| Apparel | | | 0.6 | % | |
| Beverages | | | 0.5 | % | |
| Entertainment | | | 0.5 | % | |
| Transportation | | | 0.4 | % | |
| Advertising | | | 0.4 | % | |
| Mining | | | 0.3 | % | |
| Machinery — Construction & Mining | | | 0.3 | % | |
| Foods | | | 0.2 | % | |
| Electronics | | | 0.2 | % | |
| Household Products | | | 0.0 | % | |
Total Long-Term
Investments | | | 99.4 | % | |
Short-Term Investments
and Other Assets and
Liabilities | | | 0.6 | % | |
| | | | 100.0 | % | |
MassMutual Select Blue Chip
Growth Fund
Largest Stock Holdings
(% of Net Assets) on 6/30/07 | |
| General Electric Co. | | | 3.6 | % | |
| Microsoft Corp. | | | 2.5 | % | |
| Google, Inc. Cl. A | | | 2.5 | % | |
| Schlumberger Ltd. | | | 2.4 | % | |
| Danaher Corp. | | | 2.3 | % | |
| State Street Corp. | | | 1.8 | % | |
| Cisco Systems, Inc. | | | 1.8 | % | |
| CVS Caremark Corp. | | | 1.8 | % | |
| Amazon.com, Inc. | | | 1.7 | % | |
| Kohl's Corp. | | | 1.7 | % | |
29
MassMutual Select Blue Chip Growth Fund – Portfolio Manager Report (Continued)
Growth of a $10,000 Investment
Hypothetical Investments in MassMutual Select Blue Chip Growth Fund Class S, Class A, Class A (sales load deducted), Class Y, Class L, the S&P 500 Index and the Russell 1000 Growth Index.
MassMutual Select Blue Chip Growth Fund
Total Return
| | | Year-to-Date
1/1/07 -
6/30/07 | | One Year
7/1/06 -
6/30/07 | | Five Year
Average
Annual
7/1/02 -
6/30/07 | | Since
Inception
Average
Annual
6/1/01 -
6/30/07 | |
| Class S | | | 8.78 | % | | | 20.52 | % | | | 7.70 | % | | | 1.53 | % | |
| Class A | | | 8.51 | % | | | 19.95 | % | | | 7.17 | % | | | 1.01 | % | |
Class A (sales
load deducted)* | | | 2.27 | % | | | 13.06 | % | | | 5.91 | % | | | 0.03 | % | |
| Class Y | | | 8.71 | % | | | 20.35 | % | | | 7.56 | % | | | 1.40 | % | |
| Class L | | | 8.61 | % | | | 20.25 | % | | | 7.42 | % | | | 1.27 | % | |
| S&P 500 Index | | | 6.96 | % | | | 20.57 | % | | | 10.70 | % | | | 4.81 | % | |
Russell 1000
Growth Index | | | 8.13 | % | | | 19.04 | % | | | 9.28 | % | | | 1.87 | % | |
Hypothetical Investments in MassMutual Select Blue Chip Growth Fund Class N, Class N (CDSC fees deducted), the S&P 500 Index and the Russell 1000 Growth Index.
MassMutual Select Blue Chip Growth Fund
Total Return
| | | Year-to-Date
1/1/07 - 6/30/07 | | One Year
7/1/06 - 6/30/07 | | Since Inception
Average Annual
12/31/02 - 6/30/07 | |
| Class N | | | 8.31 | % | | | 19.61 | % | | | 10.40 | % | |
Class N (CDSC
fees deducted)* | | | 7.31 | % | | | 18.61 | % | | | 10.40 | % | |
| S&P 500 Index | | | 6.96 | % | | | 20.57 | % | | | 14.72 | % | |
Russell 1000
Growth Index | | | 8.13 | % | | | 19.04 | % | | | 12.70 | % | |
GROWTH OF $10,000 INVESTMENT SINCE INCEPTION


* Class A (sales load deducted) returns include the 5.75% maximum sales charge and Class N (CDSC fees deducted) returns include the 1.00% maximum contingent deferred sales charge for the first 18 months shown.
Performance data quoted represents past performance; past performance is not predictive of future results. The investment return and principal value of shares of the Fund will fluctuate with market conditions so that shares of the Fund, when redeemed, may be worth more or less than their original cost. Current performance of the Fund may be lower or higher than the performance quoted. Performance data current to the most recent month end may be obtained by calling 1-888-309-3539.
Investors should note that the Fund is a professionally managed mutual fund, while the S&P 500 Index and the Russell 1000 Growth Index are unmanaged, do not incur expenses, and cannot be purchased directly by investors. Investors should read the Fund's prospectus with regard to the Fund's investment objective, risks and charges and expenses in conjunction with these financial statements. Employee retirement benefit plans that invest plan assets in the Separate Investment Accounts (SIAs) may be subject to certain charges as set forth in their respective Plan Documents. Total return figures would be lower for the periods presented if they reflected these charges. The performance tables and charts do not reflect the deduction of taxes that a shareholder would pay on the Fund distributions or the redemption of the Fund shares.
30
MassMutual Select Large Cap Growth Fund – Portfolio Manager Report
What is the investment objective of the MassMutual Select Large Cap Growth Fund – and who is the Fund's sub-adviser?
The Fund seeks long-term growth of capital and future income by normally investing at least 80% of its net assets in the common stocks and securities convertible into common stocks of companies which the Fund's sub-adviser believes offer prospects for long-term growth and which, at the time of purchase, have market capitalizations of at least approximately $10 billion. The Fund's sub-adviser is AllianceBernstein L.P. (AllianceBernstein).
How did the Fund perform during the six months ended June 30, 2007?
The Fund's Class S shares returned 7.04%, moderately outperforming the 6.96% return of the S&P 500® Index, a widely recognized, unmanaged index representative of common stocks of larger capitalized U.S. companies. In addition, the Fund lagged the 8.13% return of the Russell 1000® Growth Index, an unmanaged index consisting of those Russell 1000 securities (representing the 1000 largest U.S. companies based on market capitalization) with greater-than-average growth orientation that tend to exhibit higher price-to-book ratios and forecasted growth values than securities in the value universe.
Going forward, the Fund's performance will be compared to the Russell 1000 Growth Index rather than the S&P 500 Index because the Russell 1000 Growth Index more closely represents the Fund's investment strategy.
What was the investment background during the period? Domestic stocks showed little change during the first quarter of 2007, despite a significant increase in volatility across the board. Although the Dow Jones Industrial AverageSM ("the Dow") notched a new closing high in February, the blue-chip benchmark declined slightly for the three months ended March 31, 2007. The S&P 500 Index finished with a small advance, as did the Nasdaq Composite® Index ("Nasdaq"), which barely managed to post a gain for the period. A depreciating U.S. dollar supported the returns of foreign stocks, helping the MSCI® EAFE® Index outperform its U.S. counterparts for the quarter.
The U.S. stock market was inconsistent in the second quarter, with gains in April and May being partially offset by a pullback in June. Nevertheless, most major indexes ended solidly ahead for the time frame. Market moves were driven largely by economic indicators that suggested U.S. Gross Domestic Product ("GDP") growth, which appeared to have bottomed out in the first quarter, would show renewed strength in the second quarter. At first the market seemed heartened by the news of the economy's resilience, as corporate earnings held up better than expected. However, continued signs of strength prompted fears that the U.S. Federal Reserve might resume its tightening and add to the pressure on earnings growth – instead of starting to cut interest rates as previously expected.
What factors contributed to the Fund's performance? During the first quarter, the Fund benefited from strong stock selection in the health care sector – specifically, portfolio holdings in Alcon and Gilead. On the other hand, stock selection within the consumer discretionary and consumer staples sectors was the largest detractor from performance, as the Fund's positions in Comcast, Time Warner and Procter & Gamble hampered its progress. Sector allocation was a slight detractor from the Fund's returns in the first quarter. Specifically, the portfolio's overweight position in the financials sector, which was the worst performer, and a small underweight position in the strong-performing utilities sector, hindered the Fund.
In the second quarter, weak stock selection in the information technology sector detracted from returns, as the Fund's investments in Network Appliance, Broadcom and Sun Microsystems disappointed. On the positive side, stock selection within the materials and industrials sectors proved the largest contributor to second-quarter results, as the Fund's positions in agricultural product manufacturer Monsanto and industrial contractor Fluor contributed to relative performance. While the information technology sector as a whole was a detractor, Apple and Google contributed to performance. The portfolio also received a boost from its underweight allocation to the consumer staples sector, which was one of the worst-performing sectors for the period.
31
MassMutual Select Large Cap Growth Fund – Portfolio Manager Report (Continued)
What is your outlook? While we have been seeing a steady progression toward growth leadership for a number of quarters, what has been missing is investor willingness to reward, to the usual degree, those companies outpacing consensus expectations. But upside earnings surprise, which has been unusually plentiful in recent years, is unlikely to remain so. We therefore expect that companies that are able to continue to outpace earnings will be more richly rewarded.
MassMutual Select Large Cap Growth Fund
Industry Table
(% of Net Assets) on 6/30/07 | |
| Diversified Financial | | | 17.3 | % | |
| Computers | | | 10.4 | % | |
| Pharmaceuticals | | | 9.4 | % | |
| Internet | | | 7.8 | % | |
| Telecommunications | | | 5.5 | % | |
| Aerospace & Defense | | | 4.7 | % | |
| Retail | | | 4.4 | % | |
| Health Care — Services | | | 4.3 | % | |
| Oil & Gas Services | | | 3.9 | % | |
| Lodging | | | 3.6 | % | |
| Media | | | 3.6 | % | |
| Cosmetics & Personal Care | | | 3.6 | % | |
| Software | | | 3.4 | % | |
| Biotechnology | | | 3.3 | % | |
| Chemicals | | | 2.9 | % | |
| Health Care — Products | | | 2.4 | % | |
| Semiconductors | | | 2.2 | % | |
| Manufacturing | | | 1.2 | % | |
| Apparel | | | 1.2 | % | |
| Insurance | | | 1.1 | % | |
| Beverages | | | 1.1 | % | |
| Engineering & Construction | | | 0.7 | % | |
| Transportation | | | 0.5 | % | |
| Commercial Services | | | 0.5 | % | |
| Foods | | | 0.4 | % | |
| Machinery — Diversified | | | 0.3 | % | |
Total Long-Term
Investments | | | 99.7 | % | |
Short-Term Investments
and Other Assets and
Liabilities | | | 0.3 | % | |
| | | | 100.0 | % | |
MassMutual Select Large Cap
Growth Fund
Largest Stock Holdings
(% of Net Assets) on 6/30/07 | |
| Google, Inc. Cl. A | | | 5.6 | % | |
| Apple, Inc. | | | 5.1 | % | |
| WellPoint, Inc. | | | 4.3 | % | |
| Cisco Systems, Inc. | | | 3.9 | % | |
Chicago Mercantile Exchange
Holdings, Inc. | | | 3.5 | % | |
| Comcast Corp. Special, Cl. A | | | 3.3 | % | |
| Boeing Co. | | | 3.3 | % | |
| Hewlett-Packard Co. | | | 3.1 | % | |
| Franklin Resources, Inc. | | | 3.0 | % | |
| Gilead Sciences, Inc. | | | 2.9 | % | |
32
MassMutual Select Large Cap Growth Fund – Portfolio Manager Report (Continued)
Growth of a $10,000 Investment
Hypothetical Investments in MassMutual Select Large Cap Growth Fund Class S, Class A, Class A (sales load deducted), Class Y, Class L, the S&P 500 Index and the Russell 1000 Growth Index.
MassMutual Select Large Cap Growth Fund
Total Return
| | | Year-to-Date
1/1/07 -
6/30/07 | | One Year
7/1/06 -
6/30/07 | | Five Year
Average
Annual
7/1/02 -
6/30/07 | | Since
Inception
Average
Annual
12/31/01 -
6/30/07 | |
| Class S | | | 7.04 | % | | | 15.72 | % | | | 7.51 | % | | | 2.19 | % | |
| Class A | | | 6.78 | % | | | 15.27 | % | | | 7.06 | % | | | 1.72 | % | |
Class A (sales
load deducted)* | | | 0.64 | % | | | 8.64 | % | | | 5.80 | % | | | 0.63 | % | |
| Class Y | | | 6.87 | % | | | 15.70 | % | | | 7.45 | % | | | 2.10 | % | |
| Class L | | | 6.80 | % | | | 15.43 | % | | | 7.58 | % | | | 2.20 | % | |
| S&P 500 Index | | | 6.96 | % | | | 20.57 | % | | | 10.70 | % | | | 6.69 | % | |
Russell 1000
Growth Index | | | 8.13 | % | | | 19.04 | % | | | 9.28 | % | | | 3.62 | % | |
Hypothetical Investments in MassMutual Select Large Cap Growth Fund Class N, Class N (CDSC fees deducted), the S&P 500 Index and the Russell 1000 Growth Index.
MassMutual Select Large Cap Growth Fund
Total Return
| | | Year-to-Date
1/1/07 - 6/30/07 | | One Year
7/1/06 - 6/30/07 | | Since Inception
Average Annual
12/31/02 - 6/30/07 | |
| Class N | | | 6.59 | % | | | 14.85 | % | | | 10.62 | % | |
Class N (CDSC
fees deducted)* | | | 5.59 | % | | | 13.85 | % | | | 10.62 | % | |
| S&P 500 Index | | | 6.96 | % | | | 20.57 | % | | | 14.72 | % | |
Russell 1000
Growth Index | | | 8.13 | % | | | 19.04 | % | | | 12.70 | % | |
GROWTH OF $10,000 INVESTMENT SINCE INCEPTION
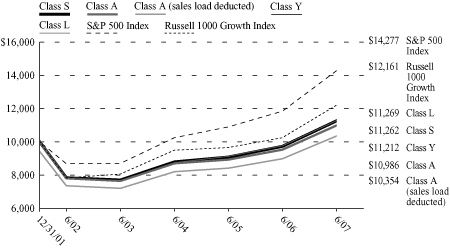
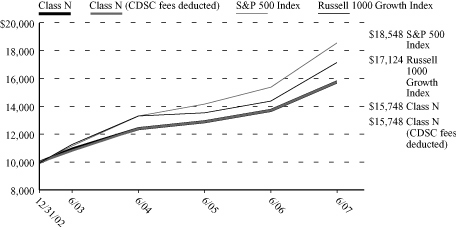
* Class A (sales load deducted) returns include the 5.75% maximum sales charge and Class N (CDSC fees deducted) returns include the 1.00% maximum contingent deferred sales charge for the first 18 months shown.
Performance data quoted represents past performance; past performance is not predictive of future results. The investment return and principal value of shares of the Fund will fluctuate with market conditions so that shares of the Fund, when redeemed, may be worth more or less than their original cost. Current performance of the Fund may be lower or higher than the performance quoted. Performance data current to the most recent month end may be obtained by calling 1-888-309-3539.
Investors should note that the Fund is a professionally managed mutual fund, while the S&P 500 Index and the Russell 1000 Growth Index are unmanaged, do not incur expenses, and cannot be purchased directly by investors. Investors should read the Fund's prospectus with regard to the Fund's investment objective, risks and charges and expenses in conjunction with these financial statements. Employee retirement benefit plans that invest plan assets in the Separate Investment Accounts (SIAs) may be subject to certain charges as set forth in their respective Plan Documents. Total return figures would be lower for the periods presented if they reflected these charges. The performance tables and charts do not reflect the deduction of taxes that a shareholder would pay on the Fund distributions or the redemption of the Fund shares.
33
MassMutual Select Growth Equity Fund – Portfolio Manager Report
What is the investment objective of the MassMutual Select Growth Equity Fund – and who is the Fund's sub-adviser? This Fund seeks long-term growth of capital and future income by normally investing at least 80% of its net assets in the common stocks and securities convertible into common stocks of companies which the Fund's sub-adviser, Grantham, Mayo, Van Otterloo & Co. LLC (GMO), believes offer prospects for long-term growth.
How did the Fund perform during the six months ended June 30, 2007? The Fund's Class S shares returned 5.19%, lagging the 6.96% return of the S&P 500® Index, a widely recognized, unmanaged index representative of common stocks of larger capitalized U.S. companies. The Fund also lagged the 8.13% return of the Russell 1000® Growth Index, an unmanaged index consisting of those Russell 1000 securities (representing the 1000 largest U.S. companies based on market capitalization) with greater-than-average growth orientation that tend to exhibit higher price-to-book ratios and forecasted growth values than securities in the value universe.
Going forward, the Fund's performance will be compared to the Russell 1000 Growth Index rather than the S&P 500 Index because the Russell 1000 Growth Index more closely represents the Fund's investment strategy.
What was the investment background during the period? Domestic stocks showed little change during the first quarter of 2007, despite a significant increase in volatility across the board. Although the Dow Jones Industrial AverageSM ("the Dow") notched a new closing high in February, the blue-chip benchmark declined slightly for the three months ended March 31, 2007. The S&P 500 Index finished with a small advance, as did the Nasdaq Composite® Index ("Nasdaq"), which barely managed to post a gain for the period. A depreciating U.S. dollar supported the returns of foreign stocks, helping the MSCI® EAFE® Index outperform its U.S. counterparts for the quarter.
Most U.S. stock indexes advanced in the second quarter, with some setting records along the way. Stocks rode a wave of optimism over corporate earnings early in the quarter and later overcame short periods of increased volatility associated with investor concerns about soft retail sales, rising interest rates, inflation, the housing market and sub-prime mortgages. During the period, the housing market remained depressed, and long-term interest rates moved decisively higher. Crude oil surged to close the quarter near $70 per barrel.
What factors contributed to the Fund's performance? The portfolio's concentration in high-quality stocks – at the expense of their low-quality counterparts – detracted from returns in the first quarter of 2007. Of the portfolio's investment disciplines (valuation and momentum), momentum benefited performance during the period, whereas valuation detracted. The majority of the negative performance in the valuation discipline came in March, as investors regrouped following the market's late-February decline and once again turned their attention to low-quality, high-volatility stocks. Conversely, the momentum portfolio added to the Fund's returns, since the broad market was rising in January and most of February. After hindering the Fund's progress in the late-February decline, momentum resumed its favorable performance in March, with a pos itive finish for the first quarter. Sector selection was a positive influence on results, aided by the Fund's positions in the oil/gas and retail stores sectors and de-emphasis of technology. The Fund's relative positions in the machinery, services and utility sectors all detracted from performance.
The Fund's valuation discipline fared particularly poorly in April before stabilizing somewhat in May and June. On the other hand, the momentum portfolio declined steadily throughout the period. Sector selection detracted from the portfolio's returns, although holdings in the oil/gas, construction and automotive sectors contributed to returns. On the downside, the strategy's overall positioning in retail stores, technology and machinery detracted from the Fund's performance. In addition, stock selection provided mixed results for the quarter: Selections in the services and construction sectors added to returns, while the Fund's holdings in technology, retail stores and financials were among those detracting.
What is your outlook? Quarterly earnings announcements gave the market a boost in the second quarter, but it remains to be seen whether this scenario will be repeated. While the bullish bias in market sentiment has proven difficult to break thus far, the continued run has stretched current conditions to even greater extremes. The third quarter will tell if the June decline is the beginning of something larger—or if the bulls can regain the upper hand.
34
MassMutual Select Growth Equity Fund – Portfolio Manager Report (Continued)
MassMutual Select Growth Equity Fund
Industry Table
(% of Net Assets) on 6/30/07 | |
| Retail | | | 18.1 | % | |
| Computers | | | 8.4 | % | |
| Pharmaceuticals | | | 7.9 | % | |
| Software | | | 7.5 | % | |
| Health Care — Products | | | 6.2 | % | |
| Oil & Gas | | | 5.6 | % | |
| Telecommunications | | | 4.6 | % | |
| Media | | | 3.9 | % | |
| Insurance | | | 3.3 | % | |
| Diversified Financial | | | 2.7 | % | |
| Health Care — Services | | | 2.4 | % | |
| Apparel | | | 2.4 | % | |
| Foods | | | 2.0 | % | |
| Beverages | | | 1.7 | % | |
| Manufacturing | | | 1.7 | % | |
| Aerospace & Defense | | | 1.6 | % | |
| Leisure Time | | | 1.2 | % | |
| Chemicals | | | 1.2 | % | |
| Semiconductors | | | 1.2 | % | |
| Auto Manufacturers | | | 1.1 | % | |
| Commercial Services | | | 1.1 | % | |
| Lodging | | | 1.1 | % | |
| Transportation | | | 1.0 | % | |
| Electric | | | 0.9 | % | |
| Agriculture | | | 0.9 | % | |
| Electronics | | | 0.8 | % | |
| Household Products | | | 0.8 | % | |
Electrical Components &
Equipment | | | 0.8 | % | |
| Internet | | | 0.7 | % | |
| Toys, Games & Hobbies | | | 0.6 | % | |
| Building Materials | | | 0.6 | % | |
| Cosmetics & Personal Care | | | 0.4 | % | |
| Computers & Information | | | 0.4 | % | |
| Metal Fabricate & Hardware | | | 0.3 | % | |
| Home Builders | | | 0.3 | % | |
| Packaging & Containers | | | 0.3 | % | |
| Automotive & Parts | | | 0.3 | % | |
| Machinery — Diversified | | | 0.3 | % | |
| Advertising | | | 0.2 | % | |
| Environmental Controls | | | 0.2 | % | |
| Banks | | | 0.2 | % | |
| Office Equipment/Supplies | | | 0.1 | % | |
| Industrial — Distribution | | | 0.1 | % | |
| Mining | | | 0.1 | % | |
| Hand & Machine Tools | | | 0.1 | % | |
| Home Furnishing | | | 0.1 | % | |
| Iron & Steel | | | 0.1 | % | |
| Biotechnology | | | 0.1 | % | |
| Gas | | | 0.0 | % | |
| Investment Companies | | | 0.0 | % | |
| Computer Related Services | | | 0.0 | % | |
| Textiles | | | 0.0 | % | |
Total Long-Term
Investments | | | 97.6 | % | |
Short-Term Investments
and Other Assets and
Liabilities | | | 2.4 | % | |
| | | | 100.0 | % | |
MassMutual Select Growth
Equity Fund
Largest Stock Holdings
(% of Net Assets) on 6/30/07 | |
| Microsoft Corp. | | | 3.7 | % | |
| Exxon Mobil Corp. | | | 3.3 | % | |
| Merck & Co., Inc. | | | 3.3 | % | |
| Cisco Systems, Inc. | | | 3.2 | % | |
International Business Machines
Corp. | | | 3.1 | % | |
| Johnson & Johnson | | | 2.6 | % | |
| The Home Depot, Inc. | | | 2.6 | % | |
| Wal-Mart Stores, Inc. | | | 2.6 | % | |
| Oracle Corp. | | | 2.0 | % | |
| Dell, Inc. | | | 1.9 | % | |
35
MassMutual Select Growth Equity Fund – Portfolio Manager Report (Continued)
Growth of a $10,000 Investment
Hypothetical Investments in MassMutual Select Growth Equity Fund Class S, Class A, Class A (sales load deducted), Class Y, Class L, the S&P 500 Index and the Russell 1000 Growth Index.
MassMutual Select Growth Equity Fund
Total Return
| | | Year-to-Date
1/1/07 -
6/30/07 | | One Year
7/1/06 -
6/30/07 | | Five Year
Average
Annual
7/1/02 -
6/30/07 | | Since
Inception
Average
Annual
5/3/99 -
6/30/07 | |
| Class S | | | 5.19 | % | | | 13.11 | % | | | 4.91 | % | | | -0.55 | % | |
| Class A | | | 4.93 | % | | | 12.56 | % | | | 4.44 | % | | | -1.00 | % | |
Class A (sales
load deducted)* | | | -1.11 | % | | | 6.08 | % | | | 3.21 | % | | | -1.72 | % | |
| Class Y | | | 5.21 | % | | | 13.03 | % | | | 4.85 | % | | | -0.62 | % | |
| Class L | | | 5.12 | % | | | 12.88 | % | | | 4.70 | % | | | -0.75 | % | |
| S&P 500 Index | | | 6.96 | % | | | 20.57 | % | | | 10.70 | % | | | 3.11 | % | |
Russell 1000
Growth Index | | | 8.13 | % | | | 19.04 | % | | | 9.28 | % | | | -0.59 | % | |
Hypothetical Investments in MassMutual Select Growth Equity Fund Class N, Class N (CDSC fees deducted), the S&P 500 Index and the Russell 1000 Growth Index.
MassMutual Select Growth Equity Fund
Total Return
| | | Year-to-Date
1/1/07 - 6/30/07 | | One Year
7/1/06 - 6/30/07 | | Since Inception
Average Annual
12/31/02 - 6/30/07 | |
| Class N | | | 4.88 | % | | | 12.33 | % | | | 7.67 | % | |
Class N (CDSC
fees deducted)* | | | 3.88 | % | | | 11.33 | % | | | 7.67 | % | |
| S&P 500 Index | | | 6.96 | % | | | 20.57 | % | | | 14.72 | % | |
Russell 1000
Growth Index | | | 8.13 | % | | | 19.04 | % | | | 12.70 | % | |
GROWTH OF $10,000 INVESTMENT SINCE INCEPTION
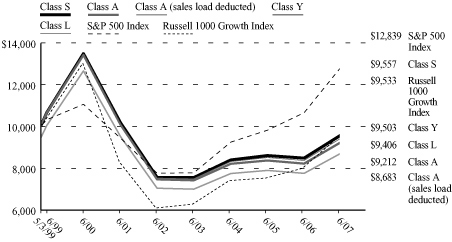
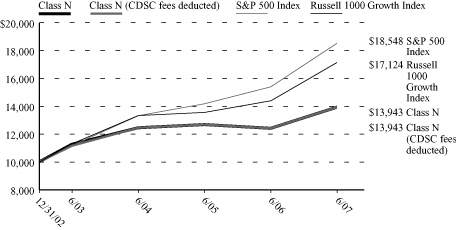
* Class A (sales load deducted) returns include the 5.75% maximum sales charge and Class N (CDSC fees deducted) returns include the 1.00% maximum contingent deferred sales charge for the first 18 months shown.
Performance data quoted represents past performance; past performance is not predictive of future results. The investment return and principal value of shares of the Fund will fluctuate with market conditions so that shares of the Fund, when redeemed, may be worth more or less than their original cost. Current performance of the Fund may be lower or higher than the performance quoted. Performance data current to the most recent month end may be obtained by calling 1-888-309-3539.
Investors should note that the Fund is a professionally managed mutual fund, while the S&P 500 Index and the Russell 1000 Growth Index are unmanaged, do not incur expenses, and cannot be purchased directly by investors. Investors should read the Fund's prospectus with regard to the Fund's investment objective, risks and charges and expenses in conjunction with these financial statements. Employee retirement benefit plans that invest plan assets in the Separate Investment Accounts (SIAs) may be subject to certain charges as set forth in their respective Plan Documents. Total return figures would be lower for the periods presented if they reflected these charges. The performance tables and charts do not reflect the deduction of taxes that a shareholder would pay on the Fund distributions or the redemption of the Fund shares.
36
MassMutual Select Aggressive Growth Fund – Portfolio Manager Report
What is the investment objective of the MassMutual Select Aggressive Growth Fund – and who are the Fund's sub-advisers? The Fund seeks long-term capital appreciation by investing primarily in U.S. common stocks and other equity securities. The Fund's sub-advisers are Sands Capital Management, LLC (Sands Capital) and Delaware Management Company (Delaware). Each sub-adviser is responsible for a portion of the portfolio, but not necessarily equal weighted.
How did the Fund perform during the six months ended June 30, 2007? The Fund's Class S shares returned 6.87%, moderately underperforming the 6.96% return of the S&P 500® Index, a widely recognized, unmanaged index representative of common stocks of larger capitalized U.S. companies. The Fund also lagged the 8.13% return of the Russell 1000® Growth Index, an unmanaged index consisting of those Russell 1000 securities (representing the 1000 largest U.S. companies based on market capitalization) with greater-than-average growth orientation that tend to exhibit higher price-to-book ratios and forecasted growth values than securities in the value universe.
Going forward, the Fund's performance will be compared to the Russell 1000 Growth Index rather than the S&P 500 Index because the Russell 1000 Growth Index more closely represents the Fund's investment strategy.
What was the investment background during the period? U.S. stocks finished practically flat through the end of the first quarter of 2007, after suffering significant volatility that had been missing during the steady run-up of late 2006. On February 27, the S&P 500 Index fell 3.5%, triggered partially by a steep decline in the Chinese market earlier that day. With sub-prime lender troubles making headlines, many investors appeared to fear the onset of a credit crunch and a general shift away from risky assets like emerging markets and high-yield debt. At the end of the quarter, the full effects of a faltering sub-prime mortgage industry remained unknown, but the stock market had recovered from its March 5 lows.
Most U.S. stock indexes advanced in the second quarter, with some setting records along the way. Stocks rode a wave of optimism over corporate earnings early in the quarter and later overcame short periods of increased volatility associated with investor concerns about soft retail sales, rising interest rates, inflation, the housing market and sub-prime mortgages. During this time frame, the housing market remained depressed, and long-term interest rates moved decisively higher. Crude oil surged to close the quarter near $70 per barrel. Despite gains by the major domestic averages, the now almost five-year-old bull market in stocks did begin to show signs of weakness when risks related to mortgage-lending practices became news and performance turned volatile in June.
What factors contributed to the Fund's performance? In a continuation from 2006, cyclical sectors, such as utilities and energy, were among the leading performers of the Russell 1000 Growth Index during the first quarter. The Fund doesn't generally invest in businesses where commodity pricing drives most of the economics and upside of a company. This ordinarily precludes purchases in stocks such as those in the utilities and energy sectors. Where the Fund did find value during the first quarter was from certain holdings in the health care, consumer discretionary, information technology and financial services sectors. Conversely, specific holdings in the consumer discretionary, financial services and health care sectors hampered the Fund's performance in the first quarter.
The second quarter also continued a trend that began last summer, when some of the Index's best-performing sectors were traditional cyclical sectors, such as energy, materials and integrated oils. While they comprise a relatively small percentage of the Index, those sectors had outsized returns relative to the Russell 1000 Growth benchmark – in some cases, almost double the Index return. The Fund generally avoids investing in stocks in those sectors where the direction and magnitude of an economic cycle is the key driver of the company's results. Conversely, the Fund tends to own businesses that have a unique, sustainable competitive advantage that helps them to navigate through various economic cycles and whose returns are not subject to the cyclical swings in an underlying
37
MassMutual Select Aggressive Growth Fund – Portfolio Manager Report (Continued)
commodity price. Consequently, the Fund had difficulty keeping up with the Index for the quarter, despite having solid first-quarter earnings results from its portfolio holdings. Performance drivers in the second quarter were on a stock-specific level. Holdings in the information technology, consumer discretionary, utilities, energy and financial services sectors contributed to the Fund's results. Laggards for the period came from certain of the Fund's investments in consumer discretionary, health care and information technology.
What is your outlook? We will continue to keep a watchful eye on the various factors that have had a strong influence over the markets in recent cycles – specifically, housing and oil prices, inflation, geopolitical actions and Federal Reserve policy. While no one can be sure precisely how these factors will affect the equity markets in 2007, we are confident that the Fund is positioned to handle the wide array of market conditions that investors could face throughout the remainder of the year.
MassMutual Select Aggressive Growth Fund
Industry Table
(% of Net Assets) on 6/30/07 | |
| Internet | | | 12.2 | % | |
| Retail | | | 11.8 | % | |
| Diversified Financial | | | 10.0 | % | |
| Telecommunications | | | 9.0 | % | |
| Biotechnology | | | 8.7 | % | |
| Health Care — Products | | | 8.4 | % | |
| Computers | | | 7.3 | % | |
| Pharmaceuticals | | | 6.7 | % | |
| Oil & Gas Services | | | 6.3 | % | |
| Commercial Services | | | 4.6 | % | |
| Software | | | 4.1 | % | |
| Transportation | | | 3.1 | % | |
| Semiconductors | | | 2.8 | % | |
| Health Care — Services | | | 0.9 | % | |
| Cosmetics & Personal Care | | | 0.8 | % | |
| Chemicals | | | 0.8 | % | |
| Lodging | | | 0.7 | % | |
| Entertainment | | | 0.7 | % | |
Total Long-Term
Investments | | | 98.9 | % | |
Short-Term Investments
and Other Assets and
Liabilities | | | 1.1 | % | |
| | | | 100.0 | % | |
MassMutual Select Aggressive
Growth Fund
Largest Stock Holdings
(% of Net Assets) on 6/30/07 | |
| Google, Inc. Cl. A | | | 9.0 | % | |
| Genentech, Inc. | | | 5.2 | % | |
| IntercontinentalExchange, Inc. | | | 5.2 | % | |
| Apple, Inc. | | | 5.1 | % | |
Chicago Mercantile Exchange
Holdings, Inc. | | | 4.8 | % | |
| Qualcomm, Inc. | | | 4.6 | % | |
| Allergan, Inc. | | | 4.4 | % | |
| Starbucks Corp. | | | 4.4 | % | |
| Schlumberger Ltd. | | | 4.2 | % | |
America Movil SAB de CV
Sponsored ADR (Mexico) | | | 4.1 | % | |
38
MassMutual Select Aggressive Growth Fund – Portfolio Manager Report (Continued)
Growth of a $10,000 Investment
Hypothetical Investments in MassMutual Select Aggressive Growth Fund Class S, Class A, Class A (sales load deducted), Class Y, Class L, the S&P 500 Index and the Russell 1000 Growth Index.
MassMutual Select Aggressive Growth Fund
Total Return
| | | Year-to-Date
1/1/07 -
6/30/07 | | One Year
7/1/06 -
6/30/07 | | Five Year
Average
Annual
7/1/02 -
6/30/07 | | Since
Inception
Average
Annual
5/1/00 -
6/30/07 | |
| Class S | | | 6.87 | % | | | 10.95 | % | | | 8.30 | % | | | –5.41 | % | |
| Class A | | | 6.60 | % | | | 10.43 | % | | | 7.74 | % | | | –5.88 | % | |
Class A (sales
load deducted)* | | | 0.47 | % | | | 4.08 | % | | | 6.47 | % | | | –6.66 | % | |
| Class Y | | | 6.75 | % | | | 10.85 | % | | | 8.19 | % | | | –5.51 | % | |
| Class L | | | 6.65 | % | | | 10.77 | % | | | 8.04 | % | | | –5.64 | % | |
| S&P 500 Index | | | 6.96 | % | | | 20.57 | % | | | 10.70 | % | | | 2.16 | % | |
Russell 1000
Growth Index | | | 8.13 | % | | | 19.04 | % | | | 9.28 | % | | | -3.99 | % | |
Hypothetical Investments in MassMutual Select Aggressive Growth Fund Class N, Class N (CDSC fees deducted), the S&P 500 Index and the Russell 1000 Growth Index.
MassMutual Select Aggressive Growth Fund
Total Return
| | | Year-to-Date
1/1/07 - 6/30/07 | | One Year
7/1/06 - 6/30/07 | | Since Inception
Average Annual
12/31/02 - 6/30/07 | |
| Class N | | | 6.21 | % | | | 9.90 | % | | | 12.21 | % | |
Class N (CDSC
fees deducted)* | | | 5.21 | % | | | 8.90 | % | | | 12.21 | % | |
| S&P 500 Index | | | 6.96 | % | | | 20.57 | % | | | 14.72 | % | |
Russell 1000
Growth Index | | | 8.13 | % | | | 19.04 | % | | | 12.70 | % | |
GROWTH OF $10,000 INVESTMENT SINCE INCEPTION
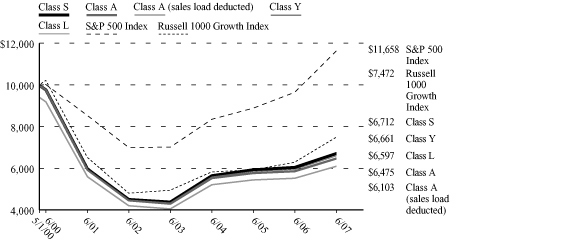

* Class A (sales load deducted) returns include the 5.75% maximum sales charge and Class N (CDSC fees deducted) returns include the 1.00% maximum contingent deferred sales charge for the first 18 months shown.
Performance data quoted represents past performance; past performance is not predictive of future results. The investment return and principal value of shares of the Fund will fluctuate with market conditions so that shares of the Fund, when redeemed, may be worth more or less than their original cost. Current performance of the Fund may be lower or higher than the performance quoted. Performance data current to the most recent month end may be obtained by calling 1-888-309-3539.
Investors should note that the Fund is a professionally managed mutual fund, while the S&P 500 Index and the Russell 1000 Growth Index are unmanaged, do not incur expenses, and cannot be purchased directly by investors. Investors should read the Fund's prospectus with regard to the Fund's investment objective, risks and charges and expenses in conjunction with these financial statements. Employee retirement benefit plans that invest plan assets in the Separate Investment Accounts (SIAs) may be subject to certain charges as set forth in their respective Plan Documents. Total return figures would be lower for the periods presented if they reflected these charges. The performance tables and charts do not reflect the deduction of taxes that a shareholder would pay on the Fund distributions or the redemption of the Fund shares.
39
MassMutual Select OTC 100 Fund – Portfolio Manager Report
What is the investment objective of the MassMutual Select OTC 100 Fund – and who is the Fund's sub-adviser? The Fund seeks to approximate, as closely as practicable (before fees and expenses), the total return of the 100 largest publicly traded over-the-counter common stocks. The Fund pursues this objective by investing at least 80% of its net assets in the equity securities of companies included in the NASDAQ 100 Index® ("the Index"), which is generally recognized as representative of the over-the-counter market. The Fund's sub-adviser is Northern Trust Investments, N.A. (Northern).
How did the Fund perform during the six months ended June 30, 2007? The Fund's Class S shares returned 9.98%, modestly underperforming the 10.09% return of the NASDAQ 100 Index. The NASDAQ 100 Index is a modified capitalization-weighted index composed of the 100 largest non-financial companies listed on the National Association of Securities Dealers Automated Quotations System (NASDAQ).
What was the investment background during the period? Overcoming a dip in the market in February, U.S. equity markets posted positive numbers for the first half of 2007, despite negative pressures surrounding sub-prime loan defaults, rising interest rates and geopolitical conflicts in the Middle East and Asia. The S&P 500® Index closed at an all-time high in May. Ongoing merger and acquisition activity, takeover announcements and strong earnings reports also contributed to the markets' performance in the first quarter.
On January 18, 2007, crude oil prices dropped to $51 a barrel on higher-than-expected supply news. This retreat was short-lived, as oil closed higher at the end of the second quarter at around $70 per barrel. The Federal Reserve ("Fed") kept the federal funds rate unchanged at 5.25% during the second quarter. However, Federal Open Market Committee minutes pointed to inflationary pressures that have the potential to prompt the Fed to increase rates later in the year.
What factors contributed to the Fund's performance? In the first quarter of 2007, the telecommunication services sector (which represents a small position in the Index) turned in the strongest performance for the quarter. Another notable contribution came from the industrials sector. The Index's largest sector position, information technology, posted a very small return.
No individual sectors detracted from the Fund's total return in the second quarter, but the portfolio's underperforming stocks included Starbucks, Yahoo!, Network Appliance and Cognizant Technology.
For the overall year-to-date period ended June 30, 2007, information technology, which represented more than 60% of the Index, turned in a double-digit advance. Consumer Discretionary and Health Care, with a combined weight of 28% in the Index, lagged other sectors, negatively affecting the performance of the Index and the Fund.
What is your outlook? Numerous forces will continue to influence the direction that the market takes throughout the remainder of 2007. These include the price of oil, inflation, geopolitical unrest and Fed policy. We believe, however, that the Fund continues to be positioned to pursue returns that are consistent with those of the NASDAQ 100 Index.
40
MassMutual Select OTC 100 Fund – Portfolio Manager Report (Continued)
MassMutual Select OTC 100 Fund
Industry Table
(% of Net Assets) on 6/30/07 | |
| Computers | | | 15.6 | % | |
| Software | | | 15.0 | % | |
| Internet | | | 13.1 | % | |
| Telecommunications | | | 12.3 | % | |
| Semiconductors | | | 10.5 | % | |
| Retail | | | 6.1 | % | |
| Biotechnology | | | 5.8 | % | |
| Pharmaceuticals | | | 5.2 | % | |
| Media | | | 4.3 | % | |
| Health Care — Products | | | 1.9 | % | |
| Auto Manufacturers | | | 1.5 | % | |
| Electronics | | | 1.3 | % | |
| Commercial Services | | | 1.3 | % | |
| Transportation | | | 1.0 | % | |
| Lodging | | | 0.6 | % | |
| Airlines | | | 0.5 | % | |
| Textiles | | | 0.5 | % | |
| Computers & Information | | | 0.4 | % | |
Machinery —
Construction & Mining | | | 0.4 | % | |
| Chemicals | | | 0.3 | % | |
| Foods | | | 0.3 | % | |
| Advertising | | | 0.3 | % | |
| Oil & Gas | | | 0.3 | % | |
Total Long-Term
Investments | | | 98.5 | % | |
Short-Term Investments
and Other Assets
and Liabilities | | | 1.5 | % | |
| | | | 100.0 | % | |
MassMutual Select
OTC 100 Fund
Largest Stock Holdings
(% of Net Assets) on 6/30/07 | |
| Apple, Inc. | | | 8.8 | % | |
| Microsoft Corp. | | | 5.8 | % | |
| Qualcomm, Inc. | | | 5.2 | % | |
| Google, Inc. Cl. A | | | 4.4 | % | |
| Cisco Systems, Inc. | | | 3.6 | % | |
| Intel Corp. | | | 2.9 | % | |
| Oracle Corp. | | | 2.5 | % | |
| Comcast Corp. Cl. A | | | 2.4 | % | |
| Research In Motion Ltd. | | | 2.2 | % | |
| Gilead Sciences, Inc. | | | 2.1 | % | |
41
MassMutual Select OTC 100 Fund – Portfolio Manager Report (Continued)
Growth of a $10,000 Investment
Hypothetical Investments in MassMutual Select OTC 100 Fund Class S, Class A, Class A (sales load deducted), Class Y, Class L and the NASDAQ 100 Index.
MassMutual Select OTC 100 Fund
Total Return
| | | Year-
to-Date
1/1/07 -
6/30/07 | | One
Year
7/1/06 -
6/30/07 | | Five
Year
Average
Annual
7/1/02 -
6/30/07 | | Since
Inception
Average
Annual
5/1/00 -
6/30/07 | |
| Class S | | | 9.98 | % | | | 22.77 | % | | | 12.88 | % | | | –9.26 | % | |
| Class A | | | 9.59 | % | | | 22.14 | % | | | 12.22 | % | | | –9.72 | % | |
Class A
(sales load
deducted)* | | | 3.29 | % | | | 15.11 | % | | | 10.90 | % | | | –10.46 | % | |
| Class Y | | | 10.07 | % | | | 22.69 | % | | | 12.68 | % | | | –9.37 | % | |
| Class L | | | 9.91 | % | | | 22.61 | % | | | 12.54 | % | | | –9.49 | % | |
NASDAQ 100
Index | | | 10.09 | % | | | 22.78 | % | | | 12.96 | % | | | –8.90 | % | |
Hypothetical Investments in MassMutual Select OTC 100 Fund Class N, Class N (CDSC fees deducted) and the NASDAQ 100 Index.
MassMutual Select OTC 100 Fund
Total Return
| | | Year-to-Date
1/1/07 - 6/30/07 | | One Year
7/1/06 - 6/30/07 | | Since Inception
Average Annual
12/31/02 - 6/30/07 | |
| Class N | | | 9.51 | % | | | 21.65 | % | | | 14.89 | % | |
Class N (CDSC
fees deducted)* | | | 8.51 | % | | | 20.65 | % | | | 14.89 | % | |
| NASDAQ 100 Index | | | 10.09 | % | | | 22.78 | % | | | 16.21 | % | |
GROWTH OF A $10,000 INVESTMENT SINCE INCEPTION
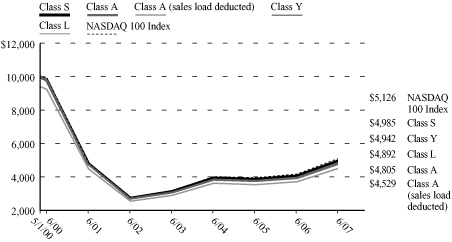

* Class A (sales load deducted) returns include the 5.75% maximum sales charge and Class N (CDSC fees deducted) returns include the 1.00% maximum contingent deferred sales charge for the first 18 months shown.
Performance data quoted represents past performance; past performance is not predictive of future results. The investment return and principal value of shares of the Fund will fluctuate with market conditions so that shares of the Fund, when redeemed, may be worth more or less than their original cost. Current performance of the Fund may be lower or higher than the performance quoted. Performance data current to the most recent month end may be obtained by calling 1-888-309-3539.
Investors should note that the Fund is a professionally managed mutual fund, while the NASDAQ 100 Index is unmanaged, does not incur expenses, and cannot be purchased directly by investors. Investors should read the Fund's prospectus with regard to the Fund's investment objective, risks and charges and expenses in conjunction with these financial statements. Employee retirement benefit plans that invest plan assets in the Separate Investment Accounts (SIAs) may be subject to certain charges as set forth in their respective Plan Documents. Total return figures would be lower for the periods presented if they reflected these charges. The performance tables and charts do not reflect the deduction of taxes that a shareholder would pay on the Fund distributions or the redemption of the Fund shares.
42
MassMutual Select Focused Value Fund – Portfolio Manager Report
What is the investment objective of the MassMutual Select Focused Value Fund – and who are the Fund's sub-advisers? The Fund seeks growth of capital over the long term by investing primarily in a non-diversified portfolio of U.S. equity securities. As a non-diversified fund, the Fund is not limited in the percentage of its assets that it may invest in any one company. (This means that the Fund may hold larger positions in a smaller number of stocks than a diversified fund. As a result, an increase or decrease in value of a single stock could have a greater impact on the Fund's net asset value and its total return.)
The Fund is managed by two sub-advisers, each being responsible for a portion of the portfolio, but not necessarily equal weighted. The sub-advisers are Harris Associates L.P. (Harris) and Cooke & Bieler, L.P. (Cooke & Bieler).
How did the Fund perform during the six months ended June 30, 2007? The Fund's Class S shares returned 11.08%, outpacing the 8.68% return of the Russell 2500TM Index, a widely recognized, unmanaged index representative of common stocks of mid-capitalized U.S. companies. The Fund also outperformed the 7.18% return of the Russell 1000® Index, a widely recognized, unmanaged index representing the performance of common stocks of larger capitalized U.S. companies.
Going forward, the Fund's performance will be compared to the Russell 1000 Index rather than the Russell 2500 Index because the Russell 1000 Index more closely represents the Fund's investment strategy.
What was the investment background during the period? Domestic stocks showed little change during the first quarter of 2007, despite a significant increase in volatility across the board. Although the Dow Jones Industrial AverageSM ("the Dow") notched a new closing high in February, the blue-chip benchmark declined slightly for the three months ended March 31, 2007. The S&P 500® Index finished with a small advance, as did the Nasdaq Composite® Index ("Nasdaq"), which barely managed to post a gain for the period.
Most U.S. stock indexes advanced in the second quarter, with some setting records along the way. Stocks rode a wave of optimism over corporate earnings early in the quarter and later overcame short periods of increased volatility associated with investor concerns about soft retail sales, rising interest rates, inflation, the housing market and sub-prime mortgages. During the period, the housing market remained depressed, and long-term interest rates moved decisively higher. Crude oil surged to close the quarter near $70 per barrel.
What factors contributed to the Fund's performance? There is no question that the Fund benefited from takeover activity in the first quarter of 2007. Two holdings, American Power Conversion and Aramark, were eliminated from the portfolio after their acquisitions, which were announced in 2006, had been consummated. In addition, two other portfolio holdings, Dollar General and Catalina Marketing, announced that they, too, would be acquired – sending both stocks higher and placing them among the portfolio's top contributors to performance for the quarter. Other holdings that added to the Fund's bottom line were Tiffany, Discovery Holding and Sprint Nextel. On the downside, Lennar, Time Warner and Dell had a negative impact on the Fund's performance during the period.
In the second quarter, two more portfolio holdings, CDW Corporation and Guitar Centers, became the subject of takeovers. Consequently, these two stocks were top contributors to the Fund's results. In addition, in a departure from recent trends, the Fund's sector weights contributed significantly to its outperformance. Specifically, the portfolio's underweighted positions in utilities and REITs (real estate investment trusts) helped to drive results, as these interest-sensitive sectors performed poorly. In addition, an overweight position in industrials was a noteworthy contributor to the Fund's positive results. Conversely, the portfolio experienced a modest drag from its underweight position in the energy sector. The Fund's holdings in Hain Celestial, Zale Corporation, Lennar and Virgin Media also detracted from performance.
43
MassMutual Select Focused Value Fund – Portfolio Manager Report (Continued)
What is your outlook? While we recognize that further upheaval in the bond markets could spread to equity markets, we believe that investors could potentially view U.S. equities as the attractive asset class once again – because balance sheets, cash flow, dividends and buyback activity all remain favorable.
MassMutual Select Focused Value Fund
Industry Table
(% of Net Assets) on 6/30/07 | |
| Retail | | | 14.3 | % | |
| Semiconductors | | | 11.7 | % | |
| Media | | | 10.8 | % | |
| Computers | | | 9.4 | % | |
| Telecommunications | | | 7.6 | % | |
| Diversified Financial | | | 7.4 | % | |
| Chemicals | | | 4.5 | % | |
| Banks | | | 4.4 | % | |
| Leisure Time | | | 3.6 | % | |
| Insurance | | | 2.6 | % | |
| Transportation | | | 2.3 | % | |
| Home Builders | | | 2.3 | % | |
| Software | | | 1.7 | % | |
| Manufacturing | | | 1.6 | % | |
| Electronics | | | 1.2 | % | |
| Foods | | | 1.2 | % | |
| Advertising | | | 1.0 | % | |
| Commercial Services | | | 1.0 | % | |
| Machinery — Diversified | | | 1.0 | % | |
Electrical Components &
Equipment | | | 0.9 | % | |
| Health Care — Services | | | 0.8 | % | |
Real Estate Investment
Trusts (REITS) | | | 0.6 | % | |
| Computers & Information | | | 0.5 | % | |
| Textiles | | | 0.5 | % | |
| Office Furnishings | | | 0.5 | % | |
| Apparel | | | 0.4 | % | |
| Entertainment | | | 0.3 | % | |
| Beverages | | | 0.3 | % | |
| Pharmaceuticals | | | 0.3 | % | |
| Oil & Gas | | | 0.3 | % | |
Total Long-Term
Investments | | | 95.0 | % | |
Short-Term Investments
and Other Assets
and Liabilities | | | 5.0 | % | |
| | | | 100.0 | % | |
MassMutual Select Focused
Value Fund
Largest Stock Holdings
(% of Net Assets) on 6/30/07 | |
| Intel Corp. | | | 4.7 | % | |
| McDonald's Corp. | | | 4.5 | % | |
| Hewlett-Packard Co. | | | 4.4 | % | |
| Dell, Inc. | | | 4.3 | % | |
| Yum! Brands, Inc. | | | 4.2 | % | |
| Tiffany & Co. | | | 4.2 | % | |
| Mellon Financial Corp. | | | 3.9 | % | |
| National Semiconductor Corp. | | | 3.9 | % | |
| Sprint Nextel Corp. | | | 3.9 | % | |
| JP Morgan Chase & Co. | | | 3.8 | % | |
44
MassMutual Select Focused Value Fund – Portfolio Manager Report (Continued)
Growth of a $10,000 Investment
Hypothetical Investments in MassMutual Select Focused Value Fund Class S, Class A, Class A (sales load deducted), Class Y, Class L, the Russell 2500 Index and the Russell 1000 Index.
MassMutual Select Focused Value Fund
Total Return
| | | Year-
to-Date
1/1/07 -
6/30/07 | | One
Year
7/1/06 -
6/30/07 | | Five
Year
Average
Annual
7/1/02 -
6/30/07 | | Since
Inception
Average
Annual
5/1/00 -
6/30/07 | |
| Class S | | | 11.08 | % | | | 30.49 | % | | | 17.56 | % | | | 15.67 | % | |
| Class A | | | 10.79 | % | | | 29.84 | % | | | 16.97 | % | | | 15.08 | % | |
Class A
(sales load
deducted)* | | | 4.42 | % | | | 22.37 | % | | | 15.60 | % | | | 14.14 | % | |
| Class Y | | | 10.99 | % | | | 30.33 | % | | | 17.44 | % | | | 15.54 | % | |
| Class L | | | 10.91 | % | | | 30.10 | % | | | 17.27 | % | | | 15.37 | % | |
| Russell 2500 Index | | | 8.68 | % | | | 18.75 | % | | | 15.30 | % | | | 9.82 | % | |
| Russell 1000 Index | | | 7.18 | % | | | 20.43 | % | | | 11.33 | % | | | 2.49 | % | |
Hypothetical Investments in MassMutual Select Focused Value Fund Class N, Class N (CDSC fees deducted), the Russell 2500 Index and the Russell 1000 Index.
MassMutual Select Focused Value Fund
Total Return
| | | Year-to-Date
1/1/07 - 6/30/07 | | One Year
7/1/06 - 6/30/07 | | Since Inception
Average Annual
12/31/02 - 6/30/07 | |
| Class N | | | 10.57 | % | | | 29.38 | % | | | 19.16 | % | |
Class N (CDSC
fees deducted)* | | | 9.57 | % | | | 28.38 | % | | | 19.16 | % | |
| Russell 2500 Index | | | 8.68 | % | | | 18.75 | % | | | 21.04 | % | |
| Russell 1000 Index | | | 7.18 | % | | | 20.43 | % | | | 15.40 | % | |
GROWTH OF A $10,000 INVESTMENT SINCE INCEPTION
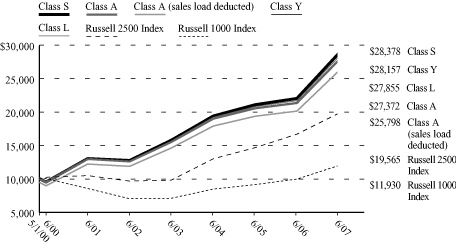
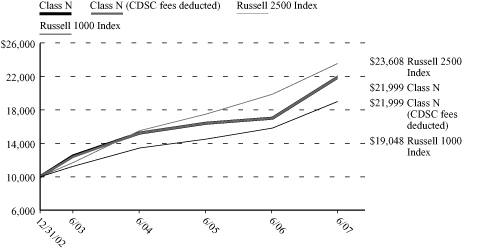
* Class A (sales load deducted) returns include the 5.75% maximum sales charge and Class N (CDSC fees deducted) returns include the 1.00% maximum contingent deferred sales charge for the first 18 months shown.
Performance data quoted represents past performance; past performance is not predictive of future results. The investment return and principal value of shares of the Fund will fluctuate with market conditions so that shares of the Fund, when redeemed, may be worth more or less than their original cost. Current performance of the Fund may be lower or higher than the performance quoted. Performance data current to the most recent month end may be obtained by calling 1-888-309-3539.
Investors should note that the Fund is a professionally managed mutual fund, while the Russell 2500 Index and the Russell 1000 Index are unmanaged, do not incur expenses, and cannot be purchased directly by investors. Investors should read the Fund's prospectus with regard to the Fund's investment objective, risks and charges and expenses in conjunction with these financial statements. Employee retirement benefit plans that invest plan assets in the Separate Investment Accounts (SIAs) may be subject to certain charges as set forth in their respective Plan Documents. Total return figures would be lower for the periods presented if they reflected these charges. The performance tables and charts do not reflect the deduction of taxes that a shareholder would pay on the Fund distributions or the redemption of the Fund shares.
45
MassMutual Select Mid-Cap Value Fund – Portfolio Manager Report
What is the investment objective of the MassMutual Select Mid-Cap Value Fund – and who is the Fund's sub-adviser? The Fund seeks growth of capital over the long term by investing, under normal conditions, at least 80% of its net assets in the stocks of mid-cap companies. The Fund's sub-adviser is Cooke & Bieler, L.P. (Cooke & Bieler).
How did the Fund perform during the six months ended June 30, 2007? The Fund's Class S shares returned 9.98%, outperforming the 8.68% return of Russell Midcap® Value Index, an unmanaged index that measures the performance of those companies in the Russell Midcap Index with lower price-to-book ratios and lower forecasted growth values. The Russell Midcap Index measures the performance of the 800 smallest companies in the Russell 1000® Index, a capitalization-weighted index of the 1,000 U.S. companies with the largest market capitalization.
What was the investment background during the period? Domestic stocks showed little change during the first quarter of 2007, despite a significant increase in volatility across the board. Although the Dow Jones Industrial AverageSM ("the Dow") notched a new closing high in February, the blue-chip benchmark declined slightly for the three months ended March 31, 2007. The S&P 500® Index finished with a small advance, as did the Nasdaq Composite® Index ("Nasdaq"), which barely managed to post a gain for the period.
Most U.S. stock indexes advanced in the second quarter, with some setting records along the way. Stocks rode a wave of optimism over corporate earnings early in the quarter and later overcame short periods of increased volatility associated with investor concerns about soft retail sales, rising interest rates, inflation, the housing market and sub-prime mortgages. During the period, the housing market remained depressed, and long-term interest rates moved decisively higher. Crude oil surged to close the quarter near $70 per barrel.
What factors contributed to the Fund's performance? There is no question that the Fund benefited from takeover activity in the first quarter of 2007. Two holdings, American Power Conversion and Aramark, were eliminated from the portfolio after their acquisitions, which were announced in 2006, had been consummated. In addition, two other portfolio holdings, Dollar General and Catalina Marketing, announced that they, too, would be acquired. This sent both stocks higher and placed them among the portfolio's top five contributors to performance for the quarter. The Fund's laggards, on the other hand, were not very noteworthy. There were a lot of slight underperformers spread across a variety of stocks. Examples included stocks like Hain Celestial and Moneygram – previous winners that simply gave back some of their recent gains.
In the second quarter, two more portfolio holdings, CDW Corporation and Guitar Centers, became the subject of takeovers. Consequently, these two stocks were top contributors to the Fund's results. In addition, in a departure from recent trends, the Fund's sector weights contributed significantly to its outperformance. Specifically, the portfolio's underweighted positions in utilities and REITs (real estate investment trusts) helped to drive results, as these interest-sensitive sectors performed poorly. In addition, an overweight position in industrials was a noteworthy contributor to the Fund's positive results. Conversely, the portfolio experienced a modest drag from its underweight position in the energy sector. The Fund's holdings in Hain Celestial and Zale Corporation also detracted from performance.
What is your outlook? Of course, the current pace of buyout activity will not last indefinitely. And history would argue that the recent run-ups in stock prices cannot continue either. But regardless of the market environment – including any change in the level of merger and acquisition activity – we believe that we have positioned the Fund to continue to pursue good progress throughout the remainder of the year.
46
MassMutual Select Mid-Cap Value Fund – Portfolio Manager Report (Continued)
MassMutual Select Mid-Cap Value Fund
Industry Table
(% of Net Assets) on 6/30/07 | |
| Insurance | | | 12.0 | % | |
| Software | | | 7.7 | % | |
| Manufacturing | | | 7.4 | % | |
| Retail | | | 6.2 | % | |
| Electronics | | | 6.0 | % | |
| Foods | | | 5.5 | % | |
| Chemicals | | | 5.3 | % | |
| Commercial Services | | | 4.7 | % | |
| Machinery — Diversified | | | 4.5 | % | |
| Advertising | | | 4.4 | % | |
Electrical Components &
Equipment | | | 4.3 | % | |
| Health Care — Services | | | 3.6 | % | |
| Semiconductors | | | 3.6 | % | |
| Computers | | | 3.3 | % | |
Real Estate Investment
Trusts (REITS) | | | 2.6 | % | |
| Computers & Information | | | 2.4 | % | |
| Textiles | | | 2.4 | % | |
| Office Furnishings | | | 2.2 | % | |
| Banks | | | 2.1 | % | |
| Apparel | | | 1.8 | % | |
| Entertainment | | | 1.6 | % | |
| Oil & Gas | | | 1.3 | % | |
| Beverages | | | 1.3 | % | |
| Pharmaceuticals | | | 1.3 | % | |
Total Long-Term
Investments | | | 97.5 | % | |
Short-Term Investments
and Other Assets
and Liabilities | | | 2.5 | % | |
| | | | 100.0 | % | |
MassMutual Select Mid-Cap
Value Fund
Largest Stock Holdings
(% of Net Assets) on 6/30/07 | |
| Corinthian Colleges, Inc. | | | 4.7 | % | |
| Entegris, Inc. | | | 3.6 | % | |
| Diebold, Inc. | | | 3.3 | % | |
International Flavors &
Fragrances, Inc. | | | 3.2 | % | |
| MoneyGram International, Inc. | | | 3.0 | % | |
| Hain Celestial Group, Inc. | | | 2.9 | % | |
| Cymer, Inc. | | | 2.9 | % | |
| Guitar Center, Inc. | | | 2.8 | % | |
| Quest Diagnostics, Inc. | | | 2.8 | % | |
| Dover Corp. | | | 2.7 | % | |
47
MassMutual Select Mid-Cap Value Fund – Portfolio Manager Report (Continued)
Growth of a $10,000 Investment
Hypothetical Investments in MassMutual Select Mid-Cap Value Fund Class S, Class A, Class A (sales load deducted), Class Y, Class L, Class N, Class N (CDSC fees deducted) and the Russell Midcap Value Index.
MassMutual Select Mid-Cap Value Fund
Total Return
| | | Year-to-Date
1/1/07 - 6/30/07 | | Since Inception
8/29/06 - 6/30/07 | |
| Class S | | | 9.98 | % | | | 25.94 | % | |
| Class A | | | 9.74 | % | | | 25.40 | % | |
Class A
(sales load deducted)* | | | 3.43 | % | | | 18.19 | % | |
| Class Y | | | 9.89 | % | | | 25.73 | % | |
| Class L | | | 9.81 | % | | | 25.69 | % | |
| Class N | | | 9.82 | % | | | 25.43 | % | |
Class N
(CDSC fees deducted)* | | | 8.82 | % | | | 24.43 | % | |
| Russell Midcap Value Index | | | 8.68 | % | | | 20.38 | % | |
GROWTH OF A $10,000 INVESTMENT SINCE INCEPTION

* Class A (sales load deducted) returns include the 5.75% maximum sales charge and Class N (CDSC fees deducted) returns include the 1.00% maximum contingent deferred sales charge.
Performance data quoted represents past performance; past performance is not predictive of future results. The investment return and principal value of shares of the Fund will fluctuate with market conditions so that shares of the Fund, when redeemed, may be worth more or less than their original cost. Current performance of the Fund may be lower or higher than the performance quoted. Performance data current to the most recent month end may be obtained by calling 1-888-309-3539.
Investors should note that the Fund is a professionally managed mutual fund, while the Russell Midcap Value Index is unmanaged, does not incur expenses, and cannot be purchased directly by investors. Investors should read the Fund's prospectus with regard to the Fund's investment objective, risks and charges and expenses in conjunction with these financial statements. Employee retirement benefit plans that invest plan assets in the Separate Investment Accounts (SIAs) may be subject to certain charges as set forth in their respective Plan Documents. Total return figures would be lower for the periods presented if they reflected these charges. The performance tables and charts do not reflect the deduction of taxes that a shareholder would pay on the Fund distributions or the redemption of the Fund shares.
48
MassMutual Select Small Cap Value Equity Fund – Portfolio Manager Report
What is the investment objective of the MassMutual Select Small Cap Value Equity Fund – and who is the Fund's sub-adviser? This Fund seeks to maximize total return through investment primarily in small-capitalization equity securities. The Fund's sub-adviser is SSgA Funds Management, Inc. (SSgA).
How did the Fund perform during the six months ended June 30, 2007? The Fund's Class S shares returned 4.30%, outpacing the 3.80% return of the Russell 2000® Value Index, a widely recognized, unmanaged index that measures the performance of those Russell 2000® Index Companies with lower price-to-book ratios and lower forecasted growth rates.
What was the investment background during the period? After a burst of volatility hurt global markets at the end of February, equity investors finished the first quarter of 2007 with more optimism. Interest rate tightening policy in non-U.S. regions heightened concerns that favorable financial conditions might have run their course, while the gloom in the U.S. housing market reinforced worries. But U.S. employment trends remained friendly, wage growth solid, and income resilient. As investors considered the idea that mortgage dislocations alone might not be enough to derail the U.S. economy, most equity averages recovered losses to finish even or slightly ahead for the quarter.
Signs of stress in the fixed-income markets brought a cautious end to the first half of 2007, with U.S. stocks and bonds both slipping in June. Risk aversion tended to increase in choppy fashion throughout the second quarter, especially after hopes for an official interest rate cut eroded through May. The second quarter did bring record highs for both the Dow Jones Industrial AverageSM ("the Dow") and the S&P 500® Index, but after peaking in early June, major equity averages explored a lower trading range and closed the period with modest losses for the month, but still ahead for the second quarter and the first half of the year.
What factors contributed to the Fund's performance? The Fund's stock selection model's assessment of value demonstrated the strongest predictive power during the first three months of the year. Within the value model, the free cash flow yield factor was an exceptionally strong differentiator of stocks within the universe, as small-cap investors supported those firms generating the best free cash flow. The model's analysis of corporate insider stock purchases also worked well – companies whose insiders were purchasing their own shares witnessed strong stock performance. The strategy's growth model also produced positive results, as investors favored those small-cap firms that had experienced accelerating earnings growth over previous quarters. Conversely, the Fund's market sentiment model did not add value during the quarter. Small-cap stocks exhibiting a combination of high trading volume and positive price momentum leading into the quarter performed the best over the period. While Fund management favors positive price momentum in the process, they do not favor small-cap stocks trading on high volume. These high-volume issues are often bid up by bullish investors, and tend to underperform low-volume small-cap stocks over time.
The Fund's stock selection model's assessment of growth struggled during the second quarter. In its evaluation of growth, the Fund favors companies that have experienced accelerating earnings growth over the past year, as these stocks tend to outperform going forward. Unfortunately, factors that analyze the historical growth of small-cap companies did not perform well, particularly in the early part of the quarter. Fund management also looks at factors that incorporate a company's growth prospects (as opposed to historical growth), interpreting information from analyst price targets and changes in analyst recommendations. While these "expected growth" factors produced marginally positive results, the overall growth model did not perform well. The strategy's price momentum factor worked well during the quarter, but the overall sentiment model's power was muted as a result of the trading volume component.
49
MassMutual Select Small Cap Value Equity Fund – Portfolio Manager Report (Continued)
What is your outlook? Globalization continues to increase sovereign wealth, but there may be too much money allocated to bonds. Equity has typically offered much better protection from inflation and currency risk than fixed income. Investors may have a lot of difficult financial news to deal with through the summer, as U.S. housing will likely continue to struggle and difficulties may accelerate for many aggressive borrowers. The record levels of short interest and a healthy global economy, however, suggest that equities may still work their way higher in the second half of 2007.
MassMutual Select Small Cap Value Equity Fund
Industry Table
(% of Net Assets) on 6/30/07 | |
| Banks | | | 10.9 | % | |
Real Estate Investment
Trusts (REITS) | | | 8.6 | % | |
| Insurance | | | 7.6 | % | |
| Commercial Services | | | 5.5 | % | |
| Retail | | | 4.5 | % | |
| Telecommunications | | | 3.9 | % | |
| Chemicals | | | 3.4 | % | |
| Manufacturing | | | 2.9 | % | |
| Semiconductors | | | 2.9 | % | |
| Electric | | | 2.6 | % | |
| Computers | | | 2.4 | % | |
| Media | | | 2.2 | % | |
| Internet | | | 2.2 | % | |
| Electronics | | | 2.2 | % | |
| Savings & Loans | | | 2.0 | % | |
| Household Products | | | 2.0 | % | |
| Oil & Gas | | | 1.9 | % | |
| Apparel | | | 1.8 | % | |
| Transportation | | | 1.8 | % | |
| Gas | | | 1.8 | % | |
| Automotive & Parts | | | 1.8 | % | |
| Engineering & Construction | | | 1.7 | % | |
| Diversified Financial | | | 1.6 | % | |
| Foods | | | 1.5 | % | |
| Investment Companies | | | 1.4 | % | |
| Forest Products & Paper | | | 1.2 | % | |
| Health Care — Products | | | 1.2 | % | |
| Health Care — Services | | | 1.1 | % | |
| Oil & Gas Services | | | 0.9 | % | |
| Environmental Controls | | | 0.9 | % | |
| Machinery — Diversified | | | 0.9 | % | |
| Metal Fabricate & Hardware | | | 0.8 | % | |
| Pharmaceuticals | | | 0.7 | % | |
| Leisure Time | | | 0.6 | % | |
| Toys, Games & Hobbies | | | 0.6 | % | |
| Airlines | | | 0.6 | % | |
| Energy — Alternate Sources | | | 0.5 | % | |
| Real Estate | | | 0.5 | % | |
Home Construction,
Furnishings & Appliances | | | 0.5 | % | |
| Packaging & Containers | | | 0.5 | % | |
| Mining | | | 0.5 | % | |
Electrical Components &
Equipment | | | 0.5 | % | |
| Iron & Steel | | | 0.4 | % | |
| Software | | | 0.4 | % | |
| Agriculture | | | 0.4 | % | |
| Aerospace & Defense | | | 0.3 | % | |
| Consumer Services | | | 0.3 | % | |
| Building Materials | | | 0.2 | % | |
| Biotechnology | | | 0.2 | % | |
| Home Builders | | | 0.2 | % | |
| Office Furnishings | | | 0.2 | % | |
| Lodging | | | 0.2 | % | |
| Energy | | | 0.2 | % | |
| Office Equipment/Supplies | | | 0.2 | % | |
| Home Furnishing | | | 0.1 | % | |
| Entertainment | | | 0.1 | % | |
| Banking, Savings & Loans | | | 0.1 | % | |
| Cosmetics & Personal Care | | | 0.1 | % | |
Computer Integrated
Systems Design | | | 0.0 | % | |
| Entertainment & Leisure | | | 0.0 | % | |
Total Long-Term
Investments | | | 97.2 | % | |
Short-Term Investments
and Other Assets
and Liabilities | | | 2.8 | % | |
| | | | 100.0 | % | |
MassMutual Select Small Cap
Value Equity Fund
Largest Stock Holdings
(% of Net Assets) on 6/30/07 | |
| Aspen Insurance Holdings Ltd. | | | 0.8 | % | |
| Emcor Group, Inc. | | | 0.8 | % | |
| AptarGroup, Inc. | | | 0.7 | % | |
| The Commerce Group, Inc. | | | 0.7 | % | |
| Sunstone Hotel Investors, Inc. | | | 0.7 | % | |
| Deluxe Corp. | | | 0.7 | % | |
| Rockwood Holdings, Inc. | | | 0.7 | % | |
| Westar Energy, Inc. | | | 0.6 | % | |
| ArvinMeritor, Inc. | | | 0.6 | % | |
| FirstMerit Corp. | | | 0.6 | % | |
50
MassMutual Select Small Cap Value Equity Fund – Portfolio Manager Report (Continued)
Growth of a $10,000 Investment
Hypothetical Investments in MassMutual Select Small Cap Value Equity Fund Class S, Class A, Class A (sales load deducted), Class Y, Class L, Class N, Class N (CDSC fees deducted) and the Russell 2000 Value Index.
MassMutual Small Cap Value Equity Fund
Total Return
| | | Year-to-Date
1/1/07 - 6/30/07 | | One Year
7/1/06 - 6/30/07 | | Since Inception
3/31/06 - 6/30/07 | |
| Class S | | | 4.30 | % | | | 16.92 | % | | | 11.39 | % | |
| Class A | | | 4.13 | % | | | 16.40 | % | | | 10.91 | % | |
Class A (sales load
deducted)* | | | –1.86 | % | | | 9.71 | % | | | 5.78 | % | |
| Class Y | | | 4.31 | % | | | 16.79 | % | | | 11.29 | % | |
| Class L | | | 4.22 | % | | | 16.80 | % | | | 11.21 | % | |
| Class N | | | 4.03 | % | | | 16.17 | % | | | 10.64 | % | |
Class N (CDSC
fees deducted)* | | | 3.03 | % | | | 15.17 | % | | | 9.86 | % | |
Russell 2000 Value
Index | | | 3.80 | % | | | 16.06 | % | | | 10.46 | % | |
GROWTH OF A $10,000 INVESTMENT SINCE INCEPTION
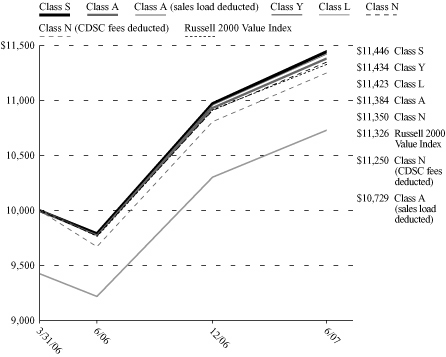
* Class A (sales load deducted) returns include the 5.75% maximum sales charge and Class N (CDSC fees deducted) returns include the 1.00% maximum contingent deferred sales charge.
Performance data quoted represents past performance; past performance is not predictive of future results. The investment return and principal value of shares of the Fund will fluctuate with market conditions so that shares of the Fund, when redeemed, may be worth more or less than their original cost. Current performance of the Fund may be lower or higher than the performance quoted. Performance data current to the most recent month end may be obtained by calling 1-888-309-3539.
Investors should note that the Fund is a professionally managed mutual fund, while the Russell 2000 Value Index is unmanaged, does not incur expenses, and cannot be purchased directly by investors. Investors should read the Fund's prospectus with regard to the Fund's investment objective, risks and charges and expenses in conjunction with these financial statements. Employee retirement benefit plans that invest plan assets in the Separate Investment Accounts (SIAs) may be subject to certain charges as set forth in their respective Plan Documents. Total return figures would be lower for the periods presented if they reflected these charges. The performance tables and charts do not reflect the deduction of taxes that a shareholder would pay on the Fund distributions or the redemption of the Fund shares.
51
MassMutual Select Small Company Value Fund – Portfolio Manager Report
What is the investment objective of the MassMutual Select Small Company Value Fund – and who are the Fund's sub-advisers? The Fund seeks to achieve long-term growth of capital by investing primarily in a diversified portfolio of equity securities of smaller companies. The Fund is managed by three sub-advisers, each being responsible for a portion of the portfolio, but not necessarily equal weighted. The Fund's sub-advisers include Clover Capital Management, Inc. (Clover), T. Rowe Price Associates, Inc. (T. Rowe Price) and EARNEST Partners, LLC (Earnest Partners).
How did the Fund perform during the six months ended June 30, 2007? The Fund's Class S shares returned 6.29%, moderately underperforming the 6.46% return of the Russell 2000® Index, a widely recognized, unmanaged index representative of common stocks of smaller capitalized U.S. companies. Conversely, the Fund outperformed the 3.80% return of the Russell 2000® Value Index, a widely recognized, unmanaged index that measures the performance of those Russell 2000® Index Companies with lower price-to-book ratios and lower forecasted growth rates.
Going forward, the Fund's performance will be compared to the Russell 2000 Value Index rather than the Russell 2000 Index because the Russell 2000 Value Index more closely represents the Fund's investment strategy. The Fund will retain the Russell 2000 Index as its supplemental benchmark for performance comparisons.
What was the investment background during the period? The first quarter of 2007 began with a continuation of the optimism which characterized the second half of 2006. Unfortunately, this optimism was not sustained through the full quarter. At the end of February, the Chinese stock markets dropped precipitously and the ripple effects were felt around the world. In addition, investors began to discount the threat of a decelerating economy, weakening credit quality in segments of the mortgage market and continued headwinds in residential housing. Despite the variable market conditions in the quarter, major indexes delivered nearly flat to positive returns. Small stocks continued to defy consensus expectations by outperforming their large-cap counterparts.
During the second quarter of 2007, equity markets extended gains that began during the first quarter. Performance was uniformly positive across all major indexes, as investors balanced both positive and negative data points as they drove stocks higher. On the negative side of the ledger, continued housing market deterioration, spreading suspicions about credit quality in the mortgage market and higher interest rates weighed heavily. However, these concerns were more than offset by several positive developments, including a vibrant merger and acquisition (M&A) environment and a surprisingly resilient economy.
What factors contributed to the Fund's performance? In the first quarter, the Fund's performance benefited from stock selection in the information technology and financials sectors. The strength in these sectors was partially offset, however, by weakness in the health care and materials sectors, where a scattering of stocks was impacted by company-specific events. The first quarter was also a very active period for M&A activity, which also served to boost the Fund's returns. Specifically, five portfolio holdings received bids, most at significant premiums to their prior trading prices.
Turning to the second quarter of the year, stock selection in the industrials, financials, information technology and health care sectors helped to drive the Fund's performance. Within industrials, companies related to power generation, engineering and construction, and mining equipment were particularly strong. In addition, performance was aided by continuing M&A activity, with an additional five portfolio holdings either receiving bids or being acquired during the quarter – bringing the year-to-date total to 10. These strengths were partially offset by weakness in the consumer discretionary and staples sectors, and under-representation in the telecommunications services sector.
What is your outlook? We expect 2007 may be a decent year for equities, although stocks will have to swim against the currents of a gradually slowing economy and moderating profit margins. Should profits increase at a slower pace, investors would have to rely on expanding multiples, or increasing price-to-earnings or price-to-book ratios, for any major increase in stock prices. We expect a slowing economy, which has traditionally favored the stocks of larger growth companies that are not as reliant on good economic growth as more cyclical companies. Overall, stocks appear attractive relative to bonds, barring any unexpected increase in interest rates.
52
MassMutual Select Small Company Value Fund – Portfolio Manager Report (Continued)
MassMutual Select Small Company Value Fund
Industry Table
(% of Net Assets) on 6/30/07 | |
| Banks | | | 6.7 | % | |
| Commercial Services | | | 6.2 | % | |
| Insurance | | | 5.9 | % | |
Real Estate Investment
Trusts (REITS) | | | 5.7 | % | |
| Oil & Gas | | | 5.3 | % | |
| Retail | | | 4.7 | % | |
| Electronics | | | 3.3 | % | |
| Manufacturing | | | 3.3 | % | |
| Diversified Financial | | | 2.9 | % | |
| Software | | | 2.9 | % | |
| Transportation | | | 2.9 | % | |
| Chemicals | | | 2.5 | % | |
| Electric | | | 2.5 | % | |
| Health Care — Services | | | 2.0 | % | |
| Environmental Controls | | | 1.9 | % | |
Electrical Components &
Equipment | | | 1.8 | % | |
| Semiconductors | | | 1.7 | % | |
| Building Materials | | | 1.7 | % | |
| Telecommunications | | | 1.6 | % | |
| Engineering & Construction | | | 1.6 | % | |
| Apparel | | | 1.6 | % | |
| Oil & Gas Services | | | 1.4 | % | |
| Home Builders | | | 1.4 | % | |
| Machinery — Diversified | | | 1.3 | % | |
| Internet | | | 1.3 | % | |
Machinery —
Construction & Mining | | | 1.3 | % | |
| Foods | | | 1.2 | % | |
| Investment Companies | | | 1.2 | % | |
| Aerospace & Defense | | | 1.2 | % | |
| Forest Products & Paper | | | 1.1 | % | |
| Iron & Steel | | | 1.1 | % | |
| Health Care — Products | | | 1.1 | % | |
| Computers | | | 1.1 | % | |
| Pharmaceuticals | | | 1.0 | % | |
| Gas | | | 0.9 | % | |
| Household Products | | | 0.9 | % | |
| Automotive & Parts | | | 0.9 | % | |
| Metal Fabricate & Hardware | | | 0.9 | % | |
| Savings & Loans | | | 0.8 | % | |
| Hand & Machine Tools | | | 0.7 | % | |
| Airlines | | | 0.7 | % | |
| Biotechnology | | | 0.7 | % | |
| Media | | | 0.7 | % | |
| Mining | | | 0.6 | % | |
| Medical Supplies | | | 0.6 | % | |
| Agriculture | | | 0.5 | % | |
| Pipelines | | | 0.5 | % | |
| Coal | | | 0.5 | % | |
| Consumer Products | | | 0.5 | % | |
| Textiles | | | 0.4 | % | |
| Home Furnishing | | | 0.4 | % | |
| Cosmetics & Personal Care | | | 0.3 | % | |
| Energy — Alternate Sources | | | 0.3 | % | |
| Entertainment | | | 0.3 | % | |
| Packaging & Containers | | | 0.2 | % | |
| Machinery & Components | | | 0.2 | % | |
Building Materials &
Construction | | | 0.2 | % | |
| Leisure Time | | | 0.1 | % | |
| Financial Services | | | 0.0 | % | |
Total Long-Term
Investments | | | 97.2 | % | |
Short-Term Investments
and Other Assets
and Liabilities | | | 2.8 | % | |
| | | | 100.0 | % | |
MassMutual Select Small Company
Value Fund
Largest Stock Holdings
(% of Net Assets) on 6/30/07 | |
| Cabot Oil & Gas Corp. | | | 1.2 | % | |
| Bucyrus International, Inc. Cl. A | | | 1.1 | % | |
| Aaron Rents, Inc. | | | 1.0 | % | |
| Landstar System, Inc. | | | 1.0 | % | |
| Forest Oil Corp. | | | 0.9 | % | |
| Phillips-Van Heusen Corp. | | | 0.8 | % | |
| First Republic Bank | | | 0.8 | % | |
| Penn Virginia Corp. | | | 0.8 | % | |
| ProAssurance Corp. | | | 0.7 | % | |
| Innospec, Inc. | | | 0.7 | % | |
53
MassMutual Select Small Company Value Fund – Portfolio Manager Report (Continued)
Growth of a $10,000 Investment
Hypothetical Investments in MassMutual Select Small Company Value Fund Class S, Class A, Class A (sales load deducted), Class Y, Class L, the Russell 2000 Index and the Russell 2000 Value Index.
MassMutual Select Small Company Value Fund
Total Return
| | | Year-
to-Date
1/1/07 -
6/30/07 | | One
Year
7/1/06 -
6/30/07 | | Five
Year
Average
Annual
7/01/02 -
6/30/07 | | Since
Inception
Average
Annual
12/31/01 -
6/30/07 | |
| Class S | | | 6.29 | % | | | 11.97 | % | | | 13.01 | % | | | 12.52 | % | |
| Class A | | | 6.14 | % | | | 11.49 | % | | | 12.52 | % | | | 12.04 | % | |
Class A
(sales load
deducted)* | | | 0.03 | % | | | 5.08 | % | | | 11.19 | % | | | 10.84 | % | |
| Class Y | | | 6.31 | % | | | 11.93 | % | | | 12.95 | % | | | 12.47 | % | |
| Class L | | | 6.29 | % | | | 11.75 | % | | | 12.78 | % | | | 12.30 | % | |
| Russell 2000 Index | | | 6.46 | % | | | 16.44 | % | | | 13.88 | % | | | 11.35 | % | |
Russell 2000
Value Index | | | 3.80 | % | | | 16.06 | % | | | 14.62 | % | | | 14.47 | % | |
Hypothetical Investments in MassMutual Select Small Company Value Fund Class N, Class N (CDSC fees deducted), the Russell 2000 Index and the Russell 2000 Value Index.
MassMutual Select Small Company Value Fund
Total Return
| | | Year-to-Date
1/1/07 - 6/30/07 | | One Year
7/1/06 - 6/30/07 | | Since Inception
Average Annual
12/31/02 - 6/30/07 | |
| Class N | | | 5.97 | % | | | 11.18 | % | | | 18.35 | % | |
Class N (CDSC fees
deducted)* | | | 4.97 | % | | | 10.18 | % | | | 18.35 | % | |
| Russell 2000 Index | | | 6.46 | % | | | 16.44 | % | | | 20.35 | % | |
Russell 2000
Value Index | | | 3.80 | % | | | 16.06 | % | | | 21.51 | % | |
GROWTH OF A $10,000 INVESTMENT SINCE INCEPTION

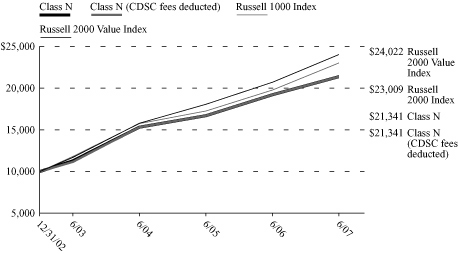
* Class A (sales load deducted) returns include the 5.75% maximum sales charge and Class N (CDSC fees deducted) returns include the 1.00% maximum contingent deferred sales charge for the first 18 months shown.
Performance data quoted represents past performance; past performance is not predictive of future results. The investment return and principal value of shares of the Fund will fluctuate with market conditions so that shares of the Fund, when redeemed, may be worth more or less than their original cost. Current performance of the Fund may be lower or higher than the performance quoted. Performance data current to the most recent month end may be obtained by calling 1-888-309-3539.
Investors should note that the Fund is a professionally managed mutual fund, while the Russell 2000 Index and the Russell 2000 Value Index are unmanaged, do not incur expenses, and cannot be purchased directly by investors. Investors should read the Fund's prospectus with regard to the Fund's investment objective, risks and charges and expenses in conjunction with these financial statements. Employee retirement benefit plans that invest plan assets in the Separate Investment Accounts (SIAs) may be subject to certain charges as set forth in their respective Plan Documents. Total return figures would be lower for the periods presented if they reflected these charges. The performance tables and charts do not reflect the deduction of taxes that a shareholder would pay on the Fund distributions or the redemption of the Fund shares.
54
MassMutual Select Small Cap Core Equity Fund – Portfolio Manager Report
What is the investment objective of the MassMutual Select Small Cap Core Equity Fund – and who is the Fund's sub-adviser? The Fund seeks long-term growth of capital through investment primarily in small capitalization equity securities. The Fund's sub-adviser is Goldman Sachs Asset Management, L.P. (GSAM).
How did the Fund perform during the six months ended June 30, 2007? The Fund's Class S shares returned 2.42%, trailing the 6.46% return of the Russell 2000® Index, a widely recognized, unmanaged index representative of common stocks of smaller capitalized U.S. companies.
What was the investment background during the period? Domestic stocks showed little change during the first quarter of 2007, despite a significant increase in volatility across the board. Although the Dow Jones Industrial AverageSM ("the Dow") notched a new closing high in February, the blue-chip benchmark declined slightly for the three months ended March 31. The S&P 500® Index finished with a small advance, as did the Nasdaq Composite® Index ("Nasdaq"), which barely managed to post a gain for the period. A depreciating U.S. dollar supported the returns of foreign stocks, helping the MSCI® EAFE® Index outperform its U.S. counterparts for the quarter.
Most U.S. stock indexes advanced in the second quarter, with some setting records along the way. Stocks rode a wave of optimism over corporate earnings early in the quarter and later overcame short periods of increased volatility associated with investor concerns about soft retail sales, rising interest rates, inflation, the housing market and sub-prime mortgages. During the period, the housing market remained depressed, and long-term interest rates moved decisively higher. Crude oil surged to close the quarter near $70 per barrel.
What factors contributed to the Fund's performance? In the first quarter of 2007, from a sector perspective, the Fund's stock selection within information technology, consumer discretionary and health care detracted from its performance. Compared to the fourth quarter of 2006, when stock selection was negative in most sectors, the shortfall in the first quarter of this year was concentrated in these three sectors. On the other hand, the Fund's stock selection was slightly negative to somewhat positive in all other sectors, in which the best results came from the Fund's industrials and consumer staples holdings. With respect to investment themes, the Fund's underperformance in the first quarter was largely the result of a drawdown in the momentum factor in the first few weeks of February – the period leading up to the market decline at the en d of that month. Other factors also experienced drawdowns over this period, although not quite as dramatic as momentum. Later in March, when momentum had returned to a more normal pattern of return, the Fund's profitability and valuation themes began to falter.
Turning to the second quarter, overall stock selection was less than favorable. The Fund's holdings in the information technology and financials sectors were the least successful relative to their peers in the Russell 2000 Index. On the upside, stock picks in the utilities and consumer discretionary sectors contributed the most to the Fund's relative performance. Returns to the investment themes were mixed for this period. Analyst sentiment contributed the most to relative performance, followed by valuation and management impact. Conversely, earnings quality detracted from excess returns, while profitability and momentum were flat for the period. Despite good results for the themes, most of the Fund's second-quarter shortfall was the result of stock-specific factors.
What is your outlook? Looking ahead, we continue to believe that cheaper stocks will likely outpace more expensive ones and good momentum stocks will likely do better than poor momentum stocks. We also prefer companies about which fundamental research analysts are becoming more positive, and firms that are profitable, have sustainable earnings and use their capital to enhance shareholder value. As such, we anticipate remaining fully invested and expect that the value we add over time may be due to stock selection rather than sector or size (market capitalization) allocations.
55
MassMutual Select Small Cap Core Equity Fund – Portfolio Manager Report (Continued)
MassMutual Select Small Cap Core Equity Fund
Industry Table
(% of Net Assets) on 6/30/07 | |
| Commercial Services | | | 9.6 | % | |
Real Estate Investment
Trusts (REITS) | | | 6.2 | % | |
| Telecommunications | | | 5.5 | % | |
| Retail | | | 5.3 | % | |
| Internet | | | 4.9 | % | |
| Banks | | | 4.5 | % | |
| Transportation | | | 3.7 | % | |
| Chemicals | | | 3.7 | % | |
| Pharmaceuticals | | | 3.5 | % | |
| Automotive & Parts | | | 2.8 | % | |
| Biotechnology | | | 2.7 | % | |
| Health Care — Products | | | 2.7 | % | |
| Insurance | | | 2.6 | % | |
| Foods | | | 2.5 | % | |
| Savings & Loans | | | 2.5 | % | |
Electrical Components &
Equipment | | | 2.4 | % | |
| Apparel | | | 2.3 | % | |
| Oil & Gas | | | 2.3 | % | |
| Health Care — Services | | | 2.3 | % | |
| Mining | | | 2.1 | % | |
| Diversified Financial | | | 2.0 | % | |
| Semiconductors | | | 1.9 | % | |
| Computers | | | 1.8 | % | |
| Electronics | | | 1.7 | % | |
| Iron & Steel | | | 1.7 | % | |
| Manufacturing | | | 1.6 | % | |
| Software | | | 1.4 | % | |
| Communications | | | 1.3 | % | |
| Electric | | | 1.2 | % | |
| Forest Products & Paper | | | 1.2 | % | |
| Engineering & Construction | | | 1.2 | % | |
| Machinery — Diversified | | | 1.1 | % | |
| Agriculture | | | 0.9 | % | |
| Oil & Gas Services | | | 0.8 | % | |
| Media | | | 0.6 | % | |
| Hand & Machine Tools | | | 0.5 | % | |
| Real Estate | | | 0.5 | % | |
| Investment Companies | | | 0.4 | % | |
| Computers & Information | | | 0.4 | % | |
| Office Equipment/Supplies | | | 0.3 | % | |
| Household Products | | | 0.3 | % | |
| Airlines | | | 0.3 | % | |
| Home Furnishing | | | 0.3 | % | |
| Computer Related Services | | | 0.3 | % | |
| Medical Supplies | | | 0.2 | % | |
| Aerospace & Defense | | | 0.2 | % | |
| Auto Manufacturers | | | 0.2 | % | |
| Pipelines | | | 0.1 | % | |
| Home Builders | | | 0.1 | % | |
| Leisure Time | | | 0.0 | % | |
| Beverages | | | 0.0 | % | |
Total Long-Term
Investments | | | 98.6 | % | |
Short-Term Investments
and Other Assets
and Liabilities | | | 1.4 | % | |
| | | | 100.0 | % | |
MassMutual Select Small Cap Core
Equity Fund
Largest Stock Holdings
(% of Net Assets) on 6/30/07 | |
| CF Industries Holdings, Inc. | | | 1.9 | % | |
| Usec, Inc. | | | 1.9 | % | |
| Umpqua Holdings Corp. | | | 1.6 | % | |
| Novatel Wireless, Inc. | | | 1.6 | % | |
| Cooper Tire & Rubber Co. | | | 1.4 | % | |
| Andrew Corp. | | | 1.3 | % | |
| Cleveland-Cliffs, Inc. | | | 1.2 | % | |
| Reliant Energy, Inc. | | | 1.2 | % | |
| TeleTech Holdings, Inc. | | | 1.2 | % | |
| Provident Financial Services, Inc. | | | 1.2 | % | |
56
MassMutual Select Small Cap Core Equity Fund – Portfolio Manager Report (Continued)
Growth of a $10,000 Investment
Hypothetical Investments in MassMutual Select Small Cap Core Equity Fund Class S, Class A, Class A (sales load deducted), Class Y, Class L, Class N, Class N (CDSC fees deducted) and the Russell 2000 Index.
MassMutual Select Small Cap Core Equity Fund
Total Return | |
| | | Year-to-Date
1/1/07 - 6/30/07 | | One Year
7/1/06 - 6/30/07 | | Since Inception
3/31/06 - 12/31/06 | |
| Class S | | | 2.42 | % | | | 11.69 | % | | | 4.93 | % | |
| Class A | | | 2.13 | % | | | 11.13 | % | | | 4.43 | % | |
Class A (sales load
deducted)* | | | –3.74 | % | | | 4.74 | % | | | –0.40 | % | |
| Class Y | | | 2.32 | % | | | 11.54 | % | | | 4.91 | % | |
| Class L | | | 2.32 | % | | | 11.43 | % | | | 4.74 | % | |
| Class N | | | 1.94 | % | | | 10.85 | % | | | 4.13 | % | |
Class N (CDSC fees
deducted)* | | | 0.94 | % | | | 9.85 | % | | | 3.34 | % | |
| Russell 2000 Index | | | 6.46 | % | | | 16.44 | % | | | 8.66 | % | |
GROWTH OF $10,000 INVESTMENT SINCE INCEPTION

* Class A (sales load deducted) returns include the 5.75% maximum sales charge and Class N (CDSC fees deducted) returns include the 1.00% maximum contingent deferred sales charge.
Performance data quoted represents past performance; past performance is not predictive of future results. The investment return and principal value of shares of the Fund will fluctuate with market conditions so that shares of the Fund, when redeemed, may be worth more or less than their original cost. Current performance of the Fund may be lower or higher than the performance quoted. Performance data current to the most recent month end may be obtained by calling 1-888-309-3539.
Investors should note that the Fund is a professionally managed mutual fund, while the Russell 2000 Index is unmanaged, does not incur expenses, and cannot be purchased directly by investors. Investors should read the Fund's prospectus with regard to the Fund's investment objective, risks and charges and expenses in conjunction with these financial statements. Employee retirement benefit plans that invest plan assets in the Separate Investment Accounts (SIAs) may be subject to certain charges as set forth in their respective Plan Documents. Total return figures would be lower for the periods presented if they reflected these charges. The performance tables and charts do not reflect the deduction of taxes that a shareholder would pay on the Fund distributions or the redemption of the Fund shares.
57
MassMutual Select Mid Cap Growth Equity Fund – Portfolio Manager Report
What is the investment objective of the MassMutual Select Mid Cap Growth Equity Fund – and who is the Fund's sub-adviser? The Fund seeks long-term capital growth by investing primarily, under normal conditions, at least 80% of its net assets in stocks of companies with market capitalizations, at the time of purchase, that fall within the range of companies in either the S&P MidCap 400® Index or the Russell Midcap® Growth Index (as of January 31, 2007, between $597.69 million and $21.76 billion). The Fund's sub-adviser is Navellier & Associates, Inc. (Navellier).
How did the Fund perform during the six months ended June 30, 2007? The Fund's Class S shares returned 7.89%, underperforming the 8.68% return of the Russell 2500TM Index, a widely recognized, unmanaged index representative of common stocks of mid-capitalized U.S. companies. The Fund also trailed the 10.97% return of the Russell Midcap Growth Index, a widely recognized, unmanaged index that measures the performance of those Russell Midcap companies (representing mid-capitalization U.S. common stocks) with higher price-to-book ratios and higher forecasted growth rates.
Going forward, the Fund's performance will be compared to the Russell Midcap Growth Index rather than the Russell 2500 Index because the Russell Midcap Growth Index more closely represents the Fund's investment strategy.
What was the investment background during the period? Domestic stocks showed little change during the first quarter of 2007, despite a significant increase in volatility across the board. Although the Dow Jones Industrial AverageSM ("the Dow") notched a new closing high in February, the blue-chip benchmark declined slightly for the three months ended March 31, 2007. The S&P 500® Index finished with a small advance, as did the Nasdaq Composite® Index ("Nasdaq"), which barely managed to post a gain for the period. A depreciating U.S. dollar supported the returns of foreign stocks, helping the MSCI® EAFE® Index outperform its U.S. counterparts for the quarter.
Most U.S. stock indexes advanced in the second quarter, with some setting records along the way. Stocks rode a wave of optimism over corporate earnings early in the quarter and later overcame short periods of increased volatility associated with investor concerns about soft retail sales, rising interest rates, inflation, the housing market and sub-prime mortgages. During the period, the housing market remained depressed, and long-term interest rates moved decisively higher. Crude oil surged to close the quarter near $70 per barrel.
What factors contributed to the Fund's performance? During the first quarter of 2007, the sectors that helped to drive the portfolio's performance included technology, consumer staples and health care. On the other hand, the consumer discretionary, energy and transportation sectors detracted the most from relative performance. Stock selection was the foundation of positive portfolio returns, as the market began to focus on stocks with healthier fundamental characteristics, such as sales and earnings growth prospects. In terms of sector weighting, the three sectors in which the portfolio held the largest overweight positions were utilities, consumer staples and technology. The Fund's three largest underweight positions were in the energy, consumer discretionary and transportation sectors.
In a turnaround in the second quarter, stock selection was the key detractor from relative portfolio performance, as the market began to gravitate toward stocks that had not appreciated during the first quarter. The sectors that aided the Fund's performance were materials and transportation. Conversely, the technology and consumer discretionary sectors provided the greatest drag on the Fund's relative performance. In terms of sector weightings, the Fund held its largest overweight positions in health care, utilities and materials. Finally, the three sectors in which the portfolio had the largest underweight allocations were energy, durables and transportation.
What is your outlook? It appears to us that, due to the rising volatility associated with value stocks, especially financials, the exodus out of value stocks into growth may be accelerating. The recent annual rebalancing of the Russell indexes also clearly helped boost the institutional ownership stake in many of our portfolio holdings. As the second-quarter earnings announcement season unfolds, we remain confident that the portfolio is positioned in stocks that have the potential to produce strong earnings and price appreciation.
58
MassMutual Select Mid Cap Growth Equity Fund – Portfolio Manager Report (Continued)
MassMutual Select Mid Cap Growth Equity Fund
Industry Table
(% of Net Assets) on 6/30/07 | |
| Commercial Services | | | 8.6 | % | |
| Health Care — Services | | | 6.9 | % | |
| Retail | | | 6.2 | % | |
| Diversified Financial | | | 6.0 | % | |
| Computers | | | 6.0 | % | |
| Telecommunications | | | 5.8 | % | |
| Electronics | | | 3.9 | % | |
| Semiconductors | | | 3.5 | % | |
| Apparel | | | 3.4 | % | |
| Health Care — Products | | | 3.1 | % | |
| Iron & Steel | | | 3.0 | % | |
| Machinery — Diversified | | | 2.9 | % | |
| Electric | | | 2.8 | % | |
| Insurance | | | 2.6 | % | |
| Toys, Games & Hobbies | | | 2.4 | % | |
| Lodging | | | 2.4 | % | |
| Oil & Gas Services | | | 2.2 | % | |
| Foods | | | 2.2 | % | |
| Oil & Gas | | | 2.2 | % | |
| Environmental Controls | | | 2.1 | % | |
| Cosmetics & Personal Care | | | 1.9 | % | |
| Electrical Components & Equipment | | | 1.7 | % | |
| Internet | | | 1.6 | % | |
| Software | | | 1.6 | % | |
| Packaging & Containers | | | 1.6 | % | |
| Biotechnology | | | 1.5 | % | |
| Auto Manufacturers | | | 1.5 | % | |
| Automotive & Parts | | | 1.4 | % | |
| Real Estate | | | 1.4 | % | |
| Household Products | | | 1.3 | % | |
| Metal Fabricate & Hardware | | | 1.2 | % | |
| Chemicals | | | 1.2 | % | |
| Aerospace & Defense | | | 1.0 | % | |
| Media | | | 1.0 | % | |
Real Estate Investment
Trusts (REITS) | | | 0.9 | % | |
| Pharmaceuticals | | | 0.9 | % | |
Total Long-Term
Investments | | | 99.9 | % | |
Short-Term Investments
and Other Assets
and Liabilities | | | 0.1 | % | |
| | | | 100.0 | % | |
MassMutual Select Mid Cap Growth
Equity Fund
Largest Stock Holdings
(% of Net Assets) on 6/30/07 | |
| The Kroger Co. | | | 2.2 | % | |
| Holly Corp. | | | 2.2 | % | |
| WellCare Health Plans, Inc. | | | 2.2 | % | |
| Stericycle, Inc. | | | 2.1 | % | |
| Corrections Corp. of America | | | 2.1 | % | |
| Quanta Services, Inc. | | | 2.0 | % | |
| The Manitowoc Co., Inc. | | | 1.9 | % | |
| Alberto-Culver Co. | | | 1.9 | % | |
| Juniper Networks, Inc. | | | 1.9 | % | |
| Nvidia Corp. | | | 1.9 | % | |
59
MassMutual Select Mid Cap Growth Equity Fund – Portfolio Manager Report (Continued)
Growth of a $10,000 Investment
Hypothetical Investments in MassMutual Select Mid Cap Growth Equity Fund Class S, Class A, Class A (sales load deducted), Class Y, Class L, the Russell 2500 Index and the Russell Midcap Growth Index.
MassMutual Select Mid Cap Growth Equity Fund
Total Return
| | | Year-
to-Date
1/1/07 -
6/30/07 | | One
Year
7/1/06 -
6/30/07 | | Five
Year
Average
Annual
7/1/02 -
6/30/07 | | Since
Inception
Average
Annual
5/3/99 -
6/30/07 | |
| Class S | | | 7.89 | % | | | 7.43 | % | | | 10.67 | % | | | 3.04 | % | |
| Class A | | | 7.63 | % | | | 6.99 | % | | | 10.19 | % | | | 2.57 | % | |
Class A
(sales load
deducted)* | | | 1.44 | % | | | 0.83 | % | | | 8.89 | % | | | 1.83 | % | |
| Class Y | | | 7.82 | % | | | 7.36 | % | | | 10.60 | % | | | 2.97 | % | |
| Class L | | | 7.69 | % | | | 7.22 | % | | | 10.44 | % | | | 2.83 | % | |
| Russell 2500 Index | | | 8.68 | % | | | 18.75 | % | | | 15.30 | % | | | 11.53 | % | |
Russell Midcap
Growth Index | | | 10.97 | % | | | 19.73 | % | | | 15.45 | % | | | 6.11 | % | |
Hypothetical Investments in MassMutual Select Mid Cap Growth Equity Fund Class N, Class N (CDSC fees deducted), the Russell 2500 Index and the Russell Midcap Growth Index.
MassMutual Select Mid Cap Growth Equity Fund
Total Return
| | | Year-to-Date
1/1/07 - 6/30/07 | | One Year
7/1/06 - 6/30/07 | | Since Inception
Average Annual
12/31/02 - 6/30/07 | |
| Class N | | | 7.44 | % | | | 6.61 | % | | | 14.96 | % | |
Class N (CDSC fees
deducted)* | | | 6.44 | % | | | 5.61 | % | | | 14.96 | % | |
| Russell 2500 Index | | | 8.68 | % | | | 18.75 | % | | | 21.04 | % | |
Russell Midcap
Growth Index | | | 10.97 | % | | | 19.73 | % | | | 20.06 | % | |
GROWTH OF $10,000 INVESTMENT SINCE INCEPTION
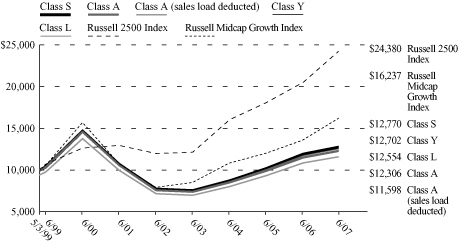
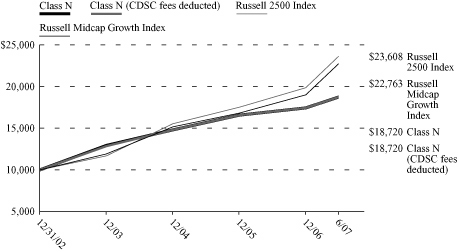
* Class A (sales load deducted) returns include the 5.75% maximum sales charge and Class N (CDSC fees deducted) returns include the 1.00% maximum contingent deferred sales charge for the first 18 months shown.
Performance data quoted represents past performance; past performance is not predictive of future results. The investment return and principal value of shares of the Fund will fluctuate with market conditions so that shares of the Fund, when redeemed, may be worth more or less than their original cost. Current performance of the Fund may be lower or higher than the performance quoted. Performance data current to the most recent month end may be obtained by calling 1-888-309-3539.
Investors should note that the Fund is a professionally managed mutual fund, while the Russell 2500 Index and the Russell Midcap Growth Index are unmanaged, do not incur expenses, and cannot be purchased directly by investors. Investors should read the Fund's prospectus with regard to the Fund's investment objective, risks and charges and expenses in conjunction with these financial statements. Employee retirement benefit plans that invest plan assets in the Separate Investment Accounts (SIAs) may be subject to certain charges as set forth in their respective Plan Documents. Total return figures would be lower for the periods presented if they reflected these charges. The performance tables and charts do not reflect the deduction of taxes that a shareholder would pay on the fund distributions or the redemption of the fund shares.
60
MassMutual Select Mid Cap Growth Equity II Fund – Portfolio Manager Report
What is the investment objective of the MassMutual Select Mid Cap Growth Equity II Fund – and who is the Fund's sub-adviser? The Fund seeks growth of capital over the long term by investing, under normal conditions, at least 80% of its net assets in a broadly diversified portfolio of common stocks of mid-cap companies whose earnings the Fund's sub-adviser, T. Rowe Price Associates, Inc. (T. Rowe Price), expects to grow at a faster rate than the average company. Mid-cap companies are defined as those whose market capitalizations, at the time of purchase, fall within the range of companies in either the S&P MidCap 400® Index or the Russell Midcap® Growth Index (as of January 31, 2007, between $597.69 million and $21.76 billion).
How did the Fund perform during the six months ended June 30, 2007? The Fund's Class S shares returned 13.93%, exceeding the 11.97% return of the S&P MidCap 400 Index, a widely recognized, unmanaged index representative of common stocks of mid-capitalized U.S. companies. The Fund also outperformed the 10.97% return of the Russell Midcap Growth Index, a widely recognized, unmanaged index that measures the performance of those Russell Midcap companies (representing mid-capitalization U.S. common stocks) with higher price-to-book ratios and higher forecasted growth rates.
Going forward, the Fund's performance will be compared to the Russell Midcap Growth Index rather than the S&P MidCap 400 Index because the Russell Midcap Growth Index more closely represents the Fund's investment strategy. The Fund will retain the S&P MidCap 400 Index as its supplemental benchmark for performance comparisons.
What was the investment background during the period? Domestic stocks showed little change during the first quarter of 2007, despite a significant increase in volatility across the board. Although the Dow Jones Industrial AverageSM ("the Dow") notched a new closing high in February, the blue-chip benchmark declined slightly for the three months ended March 31, 2007. The S&P 500® Index finished with a small advance, as did the Nasdaq Composite® Index ("Nasdaq"), which barely managed to post a gain for the period. A depreciating U.S. dollar supported the returns of foreign stocks, helping the MSCI® EAFE® Index outperform its U.S. counterparts for the quarter.
Most U.S. stock indexes advanced in the second quarter, with some setting records along the way. Stocks rode a wave of optimism over corporate earnings early in the quarter and later overcame short periods of increased volatility associated with investor concerns about soft retail sales, rising interest rates, inflation, the housing market and sub-prime mortgages. During the period, the housing market remained depressed, and long-term interest rates moved decisively higher.
What factors contributed to the Fund's performance? In the six-month period ended June 30, 2007, the Fund's stock selection was particularly strong in electronic equipment and instruments, as several alternative energy positions performed exceedingly well. The portfolio's outperformance in the financials sector was driven by an underweight position and stock selection decisions in capital markets and insurance companies. The financial services sector has been under pressure from sub-prime lending weakness and a flat yield curve, which only recently has returned to a more normal upward-sloping curve. (The yield curve is a graphical representation of bond yields with very short maturities to the longest available, with the curve indicating whether short-term rates are higher or lower than long-term rates.)
Stock selection in health care aided relative performance, particularly stock selection in biotechnology and pharmaceuticals. Meanwhile, the portfolio's overweight position in energy helped performance, but was not enough to offset less-than-favorable stock selection decisions. The price of oil increased to around $70 a barrel, while natural gas prices also rebounded after inventory concerns during the second half of 2006 dissipated.
Finally, the Fund's stock selection in the industrials and business service sector detracted from returns for the first half of 2007. Although several of the Fund's top holdings performed well on an absolute basis, relative to their peer group, their performance was weak; aerospace and defense company Rockwell Collins is one such example.
61
MassMutual Select Mid Cap Growth Equity II Fund – Portfolio Manager Report (Continued)
What is your outlook? Our outlook remains generally favorable, but we continue to watch the economy closely as it enters a seventh year of expansion. Consumers are likely to feel a greater pinch as the housing sector continues the process of unwinding from its largest expansion cycle since World War II. We believe the developing environment could continue to bode well for growth stocks.
MassMutual Select Mid Cap Growth Equity II Fund
Industry Table
(% of Net Assets) on 6/30/07 | |
| Telecommunications | | | 7.5 | % | |
| Retail | | | 6.6 | % | |
| Semiconductors | | | 6.5 | % | |
| Commercial Services | | | 5.9 | % | |
| Software | | | 5.5 | % | |
| Pharmaceuticals | | | 5.5 | % | |
| Oil & Gas Services | | | 4.6 | % | |
| Internet | | | 4.4 | % | |
| Diversified Financial | | | 3.7 | % | |
| Health Care — Services | | | 3.6 | % | |
| Health Care — Products | | | 3.2 | % | |
| Oil & Gas | | | 3.0 | % | |
| Computers | | | 2.9 | % | |
| Advertising | | | 2.6 | % | |
| Electronics | | | 2.5 | % | |
| Media | | | 2.4 | % | |
| Manufacturing | | | 2.3 | % | |
| Aerospace & Defense | | | 2.2 | % | |
| Insurance | | | 2.1 | % | |
| Biotechnology | | | 2.0 | % | |
| Coal | | | 1.5 | % | |
| Lodging | | | 1.4 | % | |
| Entertainment | | | 1.4 | % | |
| Home Furnishing | | | 1.1 | % | |
| Transportation | | | 1.0 | % | |
Electrical Components &
Equipment | | | 1.0 | % | |
| Airlines | | | 0.8 | % | |
| Banks | | | 0.8 | % | |
| Energy — Alternate Sources | | | 0.7 | % | |
| Foods | | | 0.7 | % | |
| Engineering & Construction | | | 0.7 | % | |
| Mining | | | 0.7 | % | |
| Auto Manufacturers | | | 0.6 | % | |
| Building Materials | | | 0.6 | % | |
| Electric | | | 0.5 | % | |
| Home Builders | | | 0.4 | % | |
| Beverages | | | 0.4 | % | |
| Leisure Time | | | 0.3 | % | |
| Machinery — Diversified | | | 0.3 | % | |
| Metal Fabricate & Hardware | | | 0.3 | % | |
| Environmental Controls | | | 0.3 | % | |
| Apparel | | | 0.3 | % | |
| Iron & Steel | | | 0.3 | % | |
| Chemicals | | | 0.2 | % | |
| Pipelines | | | 0.2 | % | |
| Cosmetics & Personal Care | | | 0.2 | % | |
| Household Products | | | 0.2 | % | |
| Machinery — Construction & Mining | | | 0.2 | % | |
| Industrial — Distribution | | | 0.1 | % | |
| Packaging & Containers | | | 0.1 | % | |
| Textiles | | | 0.1 | % | |
| Office Furnishings | | | 0.0 | % | |
| Financial Services | | | 0.0 | % | |
Total Long-Term
Investments | | | 96.4 | % | |
Short-Term Investments
and Other Assets
and Liabilities | | | 3.6 | % | |
| | | | 100.0 | % | |
MassMutual Select Mid Cap Growth
Equity II Fund
Largest Stock Holdings
(% of Net Assets) on 6/30/07 | |
| Amazon.com, Inc. | | | 1.4 | % | |
| Smith International, Inc. | | | 1.3 | % | |
| Rockwell Collins, Inc. | | | 1.3 | % | |
| Roper Industries, Inc. | | | 1.3 | % | |
| Cephalon, Inc. | | | 1.1 | % | |
| Crown Castle International Corp. | | | 1.1 | % | |
| Lamar Advertising Co. Cl. A | | | 1.1 | % | |
| Harman International Industries, Inc. | | | 1.1 | % | |
| Manor Care, Inc. | | | 1.0 | % | |
| VeriSign, Inc. | | | 1.0 | % | |
62
MassMutual Select Mid Cap Growth Equity II Fund – Portfolio Manager Report (Continued)
Growth of a $10,000 Investment
Hypothetical Investments in MassMutual Select Mid Cap Growth Equity II Fund Class S, Class A, Class A (sales load deducted), Class Y, Class L, the S&P MidCap 400 Index and the Russell Midcap Growth Index.
MassMutual Select Mid Cap Growth Equity II Fund
Total Return
| | | Year-
to-Date
1/1/07 -
6/30/07 | | One
Year
7/1/06 -
6/30/07 | | Five
Year
Average
Annual
7/1/02 -
6/30/07 | | Since
Inception
Average
Annual
6/1/00 -
6/30/07 | |
| Class S | | | 13.93 | % | | | 20.87 | % | | | 14.80 | % | | | 9.16 | % | |
| Class A | | | 13.67 | % | | | 20.23 | % | | | 14.24 | % | | | 8.62 | % | |
Class A
(sales load
deducted)* | | | 7.13 | % | | | 13.32 | % | | | 12.90 | % | | | 7.72 | % | |
| Class Y | | | 13.86 | % | | | 20.76 | % | | | 14.72 | % | | | 9.07 | % | |
| Class L | | | 13.80 | % | | | 20.56 | % | | | 14.53 | % | | | 8.90 | % | |
S&P MidCap 400
Index | | | 11.97 | % | | | 18.50 | % | | | 14.16 | % | | | 10.60 | % | |
Russell Midcap
Growth Index | | | 10.97 | % | | | 19.73 | % | | | 15.45 | % | | | 1.92 | % | |
Hypothetical Investments in MassMutual Select Mid Cap Growth Equity II Fund Class N, Class N (CDSC fees deducted), the S&P MidCap 400 Index and the Russell Midcap Growth Index.
MassMutual Select Mid Cap Growth Equity II Fund
Total Return
| | | Year-to-Date
1/1/07 - 6/30/07 | | One Year
7/1/06 - 6/30/07 | | Since Inception
Average Annual
12/31/02 - 6/30/07 | |
| Class N | | | 13.44 | % | | | 19.81 | % | | | 19.08 | % | |
Class N (CDSC fees
deducted)* | | | 12.44 | % | | | 18.81 | % | | | 19.08 | % | |
S&P MidCap 400
Index | | | 11.97 | % | | | 18.50 | % | | | 19.26 | % | |
Russell Midcap
Growth Index | | | 10.97 | % | | | 19.73 | % | | | 20.06 | % | |
GROWTH OF $10,000 INVESTMENT SINCE INCEPTION


* Class A (sales load deducted) returns include the 5.75% maximum sales charge and Class N (CDSC fees deducted) returns include the 1.00% maximum contingent deferred sales charge for the first 18 months shown.
Performance data quoted represents past performance; past performance is not predictive of future results. The investment return and principal value of shares of the Fund will fluctuate with market conditions so that shares of the Fund, when redeemed, may be worth more or less than their original cost. Current performance of the Fund may be lower or higher than the performance quoted. Performance data current to the most recent month end may be obtained by calling 1-888-309-3539.
Investors should note that the Fund is a professionally managed mutual fund, while the S&P MidCap 400 Index and the Russell Midcap Growth Index are unmanaged, do not incur expenses, and cannot be purchased directly by investors. Investors should read the Fund's prospectus with regard to the Fund's investment objective, risks and charges and expenses in conjunction with these financial statements. Employee retirement benefit plans that invest plan assets in the Separate Investment Accounts (SIAs) may be subject to certain charges as set forth in their respective Plan Documents. Total return figures would be lower for the periods presented if they reflected these charges. The performance tables and charts do not reflect the deduction of taxes that a shareholder would pay on the Fund distributions or the redemption of the Fund shares.
63
MassMutual Select Small Cap Growth Equity Fund – Portfolio Manager Report
What is the investment objective of the MassMutual Select Small Cap Growth Equity Fund – and who are the Fund's sub-advisers? This Fund seeks long-term capital appreciation by investing primarily in common stocks and equity securities of smaller companies that the Fund's sub-advisers believe offer potential for long-term growth. The Fund's sub-advisers are Wellington Management Company, LLP (Wellington) and Waddell & Reed Investment Management Company (Waddell & Reed). Each sub-adviser is responsible for a portion of the portfolio, but not necessarily equal weighted.
How did the Fund perform during the six months ended June 30, 2007? The Fund's Class S shares returned 10.87%, outpacing the 6.46% return of the Russell 2000® Index, a widely recognized, unmanaged index representative of common stocks of smaller capitalized U.S. companies. The Fund also outperformed the 9.34% return of the Russell 2000® Growth Index, a widely recognized, unmanaged index that measures the performance of those Russell 2000 Index companies (representing small-capitalization U.S. common stocks) with higher price-to-book ratios and forecasted growth rates.
Going forward, the Fund's performance will be compared to the Russell 2000 Growth Index rather than the Russell 2000 Index because the Russell 2000 Growth Index more closely represents the Fund's investment strategy. The Fund will retain the Russell 2000 Index as its supplemental benchmark for performance comparisons.
What was the investment background during the period? U.S. equity markets rose in the first quarter of 2007, as solid corporate earnings and continued merger and acquisition activity offset concerns of a weakening housing and credit environment. Despite the fact that most major indexes posted positive results, first-quarter returns were marked by extreme volatility. The markets were roiled by the sub-prime shakeout, a slowing U.S. economy and sentiment swings in emerging markets. For the period, small-cap stocks led large caps, but trailed their mid-cap counterparts.
In the second quarter of 2007, equity markets generally rose, as better-than-expected corporate earnings and views of solidifying economic growth outweighed concerns of both rising interest rates and a continuing U.S. housing slump. For the quarter, small-cap stocks trailed both large- and mid-cap issues.
What factors contributed to the Fund's performance? Broad-based, positive results in the consumer discretionary sector aided the Fund's relative performance in the first quarter, as did portfolio holdings in the financials sector. Strong stock selection in the industrials, materials and producer durables sectors also proved beneficial. Within energy, lower realized energy prices and rising costs hurt two of the Fund's holdings. Certain telecommunications positions also underperformed. Overall, sector allocation was favorable due in large part to the portfolio's underweight of the poor-performing financials sector. On the downside, poor results from the portfolio's information technology stocks detracted. In the health care sector, two of the Fund's holdings were pressured by sub-par results from important clinical trials.
In the second quarter of the year, the portfolio benefited from strong stock selection in the health care, financials and consumer discretionary sectors. Poor results from information technology stocks VeriFone and Mentor Graphics and telecommunications stock InPhonic detracted from returns – although strong stock selection overall in the information technology sector fueled the portfolio's performance. Stock selection in consumer staples and telecommunication services hampered performance. Within the materials sector, three of the Fund's holdings posted double-digit gains. Finally, the Fund's performance was also aided by its underweight position in the poor-performing financials sector.
What is your outlook? Overall, we remain optimistic about the portfolio's prospects, even as we are somewhat guarded about the economic environment. We will continue to utilize the same techniques for finding the types of reasonably priced growth stocks that have served us well in the past.
64
MassMutual Select Small Cap Growth Equity Fund – Portfolio Manager Report (Continued)
MassMutual Select Small Cap Growth Equity Fund
Industry Table
(% of Net Assets) on 6/30/07 | |
| Software | | | 10.0 | % | |
| Commercial Services | | | 8.6 | % | |
| Internet | | | 6.5 | % | |
| Computers | | | 5.9 | % | |
| Retail | | | 5.0 | % | |
| Transportation | | | 4.6 | % | |
| Health Care — Products | | | 4.4 | % | |
| Oil & Gas | | | 3.7 | % | |
| Investment Companies | | | 3.4 | % | |
| Entertainment | | | 3.3 | % | |
| Health Care — Services | | | 3.0 | % | |
| Insurance | | | 2.7 | % | |
| Diversified Financial | | | 2.5 | % | |
| Telecommunications | | | 2.3 | % | |
| Chemicals | | | 2.2 | % | |
| Pharmaceuticals | | | 2.1 | % | |
| Automotive & Parts | | | 2.0 | % | |
| Lodging | | | 1.9 | % | |
| Engineering & Construction | | | 1.8 | % | |
Machinery —
Construction & Mining | | | 1.8 | % | |
| Semiconductors | | | 1.7 | % | |
| Aerospace & Defense | | | 1.5 | % | |
| Apparel | | | 1.3 | % | |
| Media | | | 1.1 | % | |
| Oil & Gas Services | | | 0.9 | % | |
| Biotechnology | | | 0.8 | % | |
| Storage & Warehousing | | | 0.8 | % | |
| Cosmetics & Personal Care | | | 0.8 | % | |
| Household Products | | | 0.7 | % | |
| Home Furnishing | | | 0.6 | % | |
Real Estate Investment
Trusts (REITS) | | | 0.6 | % | |
| Advertising | | | 0.6 | % | |
| Environmental Controls | | | 0.6 | % | |
| Trucking & Leasing | | | 0.6 | % | |
| Banks | | | 0.6 | % | |
| Machinery — Diversified | | | 0.5 | % | |
| Packaging & Containers | | | 0.5 | % | |
| Building Materials | | | 0.5 | % | |
| Energy — Alternate Sources | | | 0.5 | % | |
| Foods | | | 0.4 | % | |
| Coal | | | 0.4 | % | |
| Computer Related Services | | | 0.4 | % | |
| Manufacturing | | | 0.3 | % | |
| Airlines | | | 0.2 | % | |
| Gas | | | 0.2 | % | |
| Electric | | | 0.2 | % | |
| Electronics | | | 0.2 | % | |
Building Materials &
Construction | | | 0.2 | % | |
| Apparel, Textiles & Shoes | | | 0.2 | % | |
| Toys, Games & Hobbies | | | 0.2 | % | |
Holding Company —
Diversified | | | 0.1 | % | |
| Mining | | | 0.1 | % | |
| Beverages | | | 0.1 | % | |
Total Long-Term
Investments | | | 96.1 | % | |
Short-Term Investments
and Other Assets
and Liabilities | | | 3.9 | % | |
| | | | 100.0 | % | |
MassMutual Select Small Cap Growth
Equity Fund
Largest Stock Holdings
(% of Net Assets) on 6/30/07 | |
iShares Russell 2000
Growth Index Fund | | | 3.3 | % | |
| ITT Educational Services, Inc. | | | 2.2 | % | |
| FactSet Research Systems, Inc. | | | 1.9 | % | |
| Gaylord Entertainment Co. | | | 1.9 | % | |
| Bucyrus International, Inc. Cl. A | | | 1.8 | % | |
| Kansas City Southern | | | 1.7 | % | |
| Blackbaud, Inc. | | | 1.6 | % | |
| Blackboard, Inc. | | | 1.6 | % | |
| Allscripts Healthcare Solutions, Inc. | | | 1.6 | % | |
| J.B. Hunt Transport Services, Inc. | | | 1.5 | % | |
65
MassMutual Select Small Cap Growth Equity Fund – Portfolio Manager Report (Continued)
Growth of a $10,000 Investment
Hypothetical Investments in MassMutual Select Small Cap Growth Equity Fund Class S, Class A, Class A (sales load deducted), Class Y, Class L, the Russell 2000 Index and the Russell 2000 Growth Index.
MassMutual Select Small Cap Growth Equity Fund
Total Return
| | | Year-
to-Date
1/1/07 -
6/30/07 | | One
Year
7/1/06 -
6/30/07 | | Five
Year
Average
Annual
7/1/02 -
6/30/07 | | Since
Inception
Average
Annual
5/3/99 -
6/30/07 | |
| Class S | | | 10.87 | % | | | 16.38 | % | | | 14.35 | % | | | 9.17 | % | |
| Class A | | | 10.64 | % | | | 15.72 | % | | | 13.74 | % | | | 8.59 | % | |
Class A (sales load
deducted)* | | | 4.28 | % | | | 9.06 | % | | | 12.40 | % | | | 7.80 | % | |
| Class Y | | | 10.86 | % | | | 16.22 | % | | | 14.22 | % | | | 9.02 | % | |
| Class L | | | 10.80 | % | | | 16.08 | % | | | 14.03 | % | | | 8.86 | % | |
| Russell 2000 Index | | | 6.46 | % | | | 16.44 | % | | | 13.88 | % | | | 9.73 | % | |
Russell 2000
Growth Index | | | 9.34 | % | | | 16.84 | % | | | 13.08 | % | | | 4.56 | % | |
Hypothetical Investments in MassMutual Select Small Cap Growth Equity Fund Class N, Class N (CDSC fees deducted), the Russell 2000 Index and the Russell 2000 Growth Index.
MassMutual Select Small Cap Growth Equity Fund
Total Return
| | | Year-to-Date
1/1/07 - 6/30/07 | | One Year
7/1/06 - 6/30/07 | | Since Inception
Average Annual
12/31/02 - 6/30/07 | |
| Class N | | | 10.51 | % | | | 15.46 | % | | | 18.48 | % | |
Class N (CDSC fees
deducted)* | | | 9.51 | % | | | 14.46 | % | | | 18.48 | % | |
| Russell 2000 Index | | | 6.46 | % | | | 16.44 | % | | | 20.35 | % | |
Russell 2000
Growth Index | | | 9.34 | % | | | 16.84 | % | | | 19.10 | % | |
GROWTH OF $10,000 INVESTMENT SINCE INCEPTION


* Class A (sales load deducted) returns include the 5.75% maximum sales charge and Class N (CDSC fees deducted) returns include the 1.00% maximum contingent deferred sales charge for the first 18 months shown.
Performance data quoted represents past performance; past performance is not predictive of future results. The investment return and principal value of shares of the Fund will fluctuate with market conditions so that shares of the Fund, when redeemed, may be worth more or less than their original cost. Current performance of the Fund may be lower or higher than the performance quoted. Performance data current to the most recent month end may be obtained by calling 1-888-309-3539.
Investors should note that the Fund is a professionally managed mutual fund, while the Russell 2000 Index and the Russell 2000 Growth Index are unmanaged, do not incur expenses, and cannot be purchased directly by investors. Investors should read the Fund's prospectus with regard to the Fund's investment objective, risks and charges and expenses in conjunction with these financial statements. Employee retirement benefit plans that invest plan assets in the Separate Investment Accounts (SIAs) may be subject to certain charges as set forth in their respective Plan Documents. Total return figures would be lower for the periods presented if they reflected these charges. The performance tables and charts do not reflect the deduction of taxes that a shareholder would pay on the Fund distributions or the redemption of the Fund shares.
66
MassMutual Select Small Company Growth Fund – Portfolio Manager Report
What is the investment objective of the MassMutual Select Small Company Growth Fund – and who are the Fund's sub-advisers? The Fund seeks long-term capital appreciation by investing primarily in common stocks and equity securities of smaller companies that the Fund's sub-advisers believe offer potential for long-term growth. The Fund is managed by two sub-advisers, each being responsible for a portion of the portfolio, but not necessarily equal weighted. The sub-advisers are Mazama Capital Management, Inc. (Mazama) and Eagle Asset Management, Inc. (Eagle).
How did the Fund perform during the six months ended June 30, 2007? The Fund's Class S shares returned 12.44%, ahead of the 6.46% return of the Russell 2000® Index, a widely recognized, unmanaged index representative of common stocks of smaller capitalized U.S. companies. In addition, the Fund exceeded the 9.34% return of the Russell 2000® Growth Index, a widely recognized, unmanaged index that measures the performance of those Russell 2000 Index companies (representing small-capitalization U.S. common stocks) with higher price-to-book ratios and forecasted growth rates.
Going forward, the Fund's performance will be compared to the Russell 2000 Growth Index rather than the Russell 2000 Index because the Russell 2000 Growth Index more closely represents the Fund's investment strategy.
What was the investment background during the period? The first quarter witnessed increased volatility in the equity markets – due to investor reaction to a drop in the Chinese stock market, rising energy costs and mounting fears that troubles in the sub-prime mortgage market could spill over into other segments of the economy. Nevertheless, most major indexes finished the quarter near even or in positive territory. Strong employment and wage growth, continued flows into private equity funds and a rally in the bond market seemed to have helped mitigate some of the negative market sentiment.
During the second quarter, a continued favorable rate environment more than offset the news about the sub-prime meltdown and the rising cost of energy. The bond market experienced an unexpected rate increase during this period, but the rates later pulled back, somewhat reducing the impact on borrowing costs. The yield curve also returned to its pre-2006 non-inverted state. (The yield curve is a graphical representation of bond yields with very short maturities to the longest available, with the curve indicating whether short-term rates are higher or lower than long-term rates.) Additionally, this time frame marked the second consecutive quarter in which growth stocks outperformed value stocks in the small-cap segment since the first quarter of 2006 – indicating, perhaps, that growth investing was back in style. Another positive driver for the small-cap markets was the continued spate of merger and acquisition activity.
What factors contributed to the Fund's performance? During the quarter, the sectors that contributed the most to the Fund's absolute and relative performance were materials and consumer discretionary. Conversely, the financials sector hampered the Fund's results on both an absolute and a relative basis. During this period, the Fund's portfolio held overweight positions in the technology and producer durables sectors, as Fund management continued to invest in companies with strong financial models that were well positioned for the ongoing telecommunications build-out around the globe; the accelerating consumption of consumer electronics worldwide; and the long-awaited enterprise upgrade cycle in the U.S.
Turning to the second quarter, most major sectors in the Fund had positive absolute returns – with energy, industrials, materials and consumer discretionary each posting double-digit advances. During this time frame, the Fund's top-contributing sectors were consumer discretionary and industrials, with materials, energy and financials also positively contributing to returns. Also driving the Fund's performance during the quarter was the fact that 11 acquisitions were announced for holdings within the Fund's portfolio. On the downside, the Fund lagged the benchmark in the information technology and health care sectors.
67
MassMutual Select Small Company Growth Fund – Portfolio Manager Report (Continued)
What is your outlook? Overall, our optimism remains for continued growth in the small-cap equity markets throughout the remainder of the year. We believe there are ample opportunities for equity investors, as several sectors have produced – and are expected to continue to produce – solid returns. We expect the strong gains of the first half of the year in the energy, information technology, industrials and materials sectors may continue for the duration of 2007.
MassMutual Select Small Company Growth Fund
Industry Table
(% of Net Assets) on 6/30/07 | |
| Software | | | 8.3 | % | |
| Pharmaceuticals | | | 7.3 | % | |
| Diversified Financial | | | 6.3 | % | |
| Apparel | | | 5.9 | % | |
| Internet | | | 5.8 | % | |
| Health Care — Products | | | 5.4 | % | |
| Telecommunications | | | 5.1 | % | |
| Retail | | | 5.1 | % | |
| Electronics | | | 4.4 | % | |
| Commercial Services | | | 3.6 | % | |
| Oil & Gas Services | | | 3.3 | % | |
| Semiconductors | | | 3.3 | % | |
| Chemicals | | | 2.9 | % | |
| Health Care — Services | | | 2.8 | % | |
| Biotechnology | | | 2.4 | % | |
| Oil & Gas | | | 2.1 | % | |
Electrical Components &
Equipment | | | 1.8 | % | |
| Home Furnishing | | | 1.8 | % | |
| Banks | | | 1.7 | % | |
| Advertising | | | 1.6 | % | |
| Media | | | 1.6 | % | |
| Machinery — Construction & Mining | | | 1.5 | % | |
| Environmental Controls | | | 1.3 | % | |
| Computers | | | 1.2 | % | |
| Automotive & Parts | | | 1.2 | % | |
| Metal Fabricate & Hardware | | | 1.2 | % | |
| Insurance | | | 1.2 | % | |
| Engineering & Construction | | | 0.9 | % | |
| Manufacturing | | | 0.9 | % | |
| Building Materials | | | 0.9 | % | |
| Cosmetics & Personal Care | | | 0.8 | % | |
| Entertainment | | | 0.8 | % | |
| Real Estate | | | 0.5 | % | |
| Office Furnishings | | | 0.5 | % | |
| Electric | | | 0.5 | % | |
| Iron & Steel | | | 0.4 | % | |
| Energy — Alternate Sources | | | 0.4 | % | |
| Machinery — Diversified | | | 0.4 | % | |
| Consumer Products | | | 0.4 | % | |
| Industrial — Distribution | | | 0.3 | % | |
| Toys, Games & Hobbies | | | 0.2 | % | |
| Home Builders | | | 0.2 | % | |
| Transportation | | | 0.1 | % | |
| Foods | | | 0.1 | % | |
| Household Products | | | 0.1 | % | |
| Beverages | | | 0.0 | % | |
Total Long-Term
Investments | | | 98.5 | % | |
Short-Term Investments
and Other Assets
and Liabilities | | | 1.5 | % | |
| | | | 100.0 | % | |
MassMutual Select Small Company
Growth Fund
Largest Stock Holdings
(% of Net Assets) on 6/30/07 | |
| Red Hat, Inc. | | | 2.2 | % | |
| Cephalon, Inc. | | | 2.1 | % | |
| Terra Industries, Inc. | | | 1.9 | % | |
| Quiksilver, Inc. | | | 1.9 | % | |
| Universal Electronics, Inc. | | | 1.8 | % | |
| Crocs, Inc. | | | 1.8 | % | |
| Volcom, Inc. | | | 1.6 | % | |
| Polycom, Inc. | | | 1.6 | % | |
| Oyo Geospace Corp. | | | 1.5 | % | |
| Bucyrus International, Inc. Cl. A | | | 1.5 | % | |
68
MassMutual Select Small Company Growth Fund – Portfolio Manager Report (Continued)
Growth of a $10,000 Investment
Hypothetical Investments in MassMutual Select Small Company Growth Fund Class S, Class A, Class A (sales load deducted), Class Y, Class L, the Russell 2000 Index and the Russell 2000 Growth Index.
MassMutual Select Small Company Growth Fund
Total Return
| | | Year-
to-Date
1/1/07 -
6/30/07 | | One
Year
7/1/06 -
6/30/07 | | Five
Year
Average
Annual
7/1/02 -
6/30/07 | | Since
Inception
Average
Annual
12/31/01 -
6/30/07 | |
| Class S | | | 12.44 | % | | | 24.64 | % | | | 12.13 | % | | | 7.51 | % | |
| Class A | | | 12.21 | % | | | 24.12 | % | | | 11.61 | % | | | 7.01 | % | |
Class A (sales load
deducted)* | | | 5.76 | % | | | 16.98 | % | | | 10.29 | % | | | 5.86 | % | |
| Class Y | | | 12.49 | % | | | 24.62 | % | | | 12.07 | % | | | 7.45 | % | |
| Class L | | | 12.39 | % | | | 24.49 | % | | | 11.90 | % | | | 7.31 | % | |
| Russell 2000 Index | | | 6.46 | % | | | 16.44 | % | | | 13.88 | % | | | 11.35 | % | |
Russell 2000
Growth Index | | | 9.34 | % | | | 16.84 | % | | | 13.08 | % | | | 7.79 | % | |
Hypothetical Investments in MassMutual Select Small Company Growth Fund Class N, Class N (CDSC fees deducted), the Russell 2000 Index and the Russell 2000 Growth Index.
MassMutual Select Small Company Growth Fund
Total Return
| | | Year-to-Date
1/1/07 - 6/30/07 | | One Year
7/1/06 - 6/30/07 | | Since Inception
Average Annual
12/31/02 - 6/30/07 | |
| Class N | | | 12.06 | % | | | 23.82 | % | | | 17.50 | % | |
Class N (CDSC fees
deducted)* | | | 11.06 | % | | | 22.82 | % | | | 17.50 | % | |
| Russell 2000 Index | | | 6.46 | % | | | 16.44 | % | | | 20.35 | % | |
Russell 2000
Growth Index | | | 9.34 | % | | | 16.84 | % | | | 19.10 | % | |
GROWTH OF $10,000 INVESTMENT SINCE INCEPTION
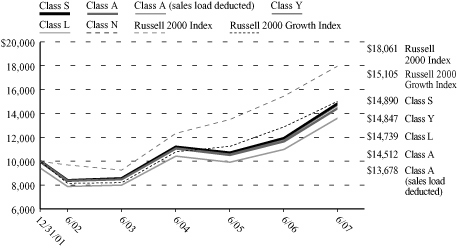
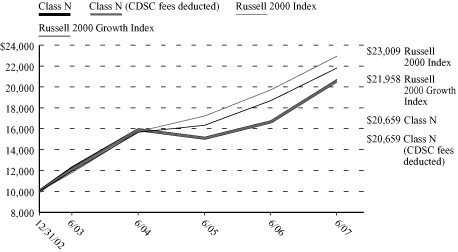
* Class A (sales load deducted) returns include the 5.75% maximum sales charge and Class N (CDSC fees deducted) returns include the 1.00% maximum contingent deferred sales charge for the first 18 months shown.
Performance data quoted represents past performance; past performance is not predictive of future results. The investment return and principal value of shares of the Fund will fluctuate with market conditions so that shares of the Fund, when redeemed, may be worth more or less than their original cost. Current performance of the Fund may be lower or higher than the performance quoted. Performance data current to the most recent month end may be obtained by calling 1-888-309-3539.
Investors should note that the Fund is a professionally managed mutual fund, while the Russell 2000 Index and the Russell 2000 Growth Index are unmanaged, do not incur expenses, and cannot be purchased directly by investors. Investors should read the Fund's prospectus with regard to the Fund's investment objective, risks and charges and expenses in conjunction with these financial statements. Employee retirement benefit plans that invest plan assets in the Separate Investment Accounts (SIAs) may be subject to certain charges as set forth in their respective Plan Documents. Total return figures would be lower for the periods presented if they reflected these charges. The performance tables and charts do not reflect the deduction of taxes that a shareholder would pay on the Fund distributions or the redemption of the Fund shares.
69
MassMutual Select Emerging Growth Fund – Portfolio Manager Report
What is the investment objective of the MassMutual Select Emerging Growth Fund – and who are the Fund's sub-advisers? The Fund seeks capital appreciation by investing primarily in smaller, rapidly growing emerging companies – generally in industry segments experiencing rapid growth, and often including technology and technology-related stocks. The Fund will normally invest at least 80% of its net assets in equity securities (primarily common stocks) of these emerging growth companies in both the U.S. and abroad. The Fund's sub-advisers are Delaware Management Company (Delaware) and Insight Capital Research & Management, Inc. (Insight).
How did the Fund perform during the six months ended June 30, 2007? The Fund's Class S shares returned 13.95%, exceeding the 6.46% return of the Russell 2000® Index, a widely recognized, unmanaged index representative of common stocks of smaller capitalized U.S. companies. The Fund also outpaced the 9.34% return of the Russell 2000® Growth Index, a widely recognized, unmanaged index that measures the performance of those Russell 2000 Index companies (representing small-capitalization U.S. common stocks) with higher price-to-book ratios and forecasted growth rates.
Going forward, the Fund's performance will be compared to the Russell 2000 Growth Index rather than the Russell 2000 Index because the Russell 2000 Growth Index more closely represents the Fund's investment strategy.
What was the investment backdrop during the period? The strength of corporate profit growth and heightened deal activity in the first quarter of 2007 extended the market rally that began in August 2006, but not before the market took a major hit in February. Rising fears about contagion spreading from the sub-prime lending market, relatively weak economic growth data and announcements from Chinese authorities about their intent to curb market speculation all converged to cause a major sell-off late in the month. Over the ensuing weeks, many of these concerns abated, and the markets rebounded. For the quarter, all but the largest stocks posted positive returns, with mid-cap stocks leading the way. Among small-cap stocks, growth outperformed value and gains were widespread, with nearly every sector of the Russell 2000 Growth Index in the black. The exception was the financials sector, which fell, in part, due to the negative sentiment emanating from the sub-prime lending industry.
Investors bought stocks with conviction during the second quarter, as the major indexes advanced throughout the period. Growth and value both performed well; likewise, small, mid and large companies all gained ground. From a leadership perspective, growth stocks asserted dominance over the marketplace, as all the Russell growth indexes beat their value counterparts during the quarter and year-to-date periods.
What factors contributed to the Fund's performance? In the first quarter, overall stock selection was positive, with the top contributors coming from the consumer nondurables, materials, health care and basic industry/capital goods sectors. Conversely, weakness in the information technology, industrials and consumer services sectors hindered the Fund's relative performance. From an industry standpoint, stocks from the commercial services and airline industries proved beneficial to the Fund's results, while Internet software and services and household durable positions were detrimental.
In the second quarter, a slightly negative impact from sector allocation was more than overcome by superior stock selection. Leading the way with strong performance were the Fund's holdings in the business services, consumer services and health care sectors.
What is your outlook? As we enter the second half of the year, it appears that positive momentum for further stock appreciation remains. Whereas overall economic conditions also still appear to be favorable, the potential for higher energy prices and interest rates are potential roadblocks that may preclude recent price gains from continuing. We are optimistic, however, that companies that demonstrate the ability to deliver strong earnings and sales growth will be rewarded and we will continue to seek out and hold on to companies that demonstrate these characteristics.
70
MassMutual Select Emerging Growth Fund – Portfolio Manager Report (Continued)
MassMutual Select Emerging Growth Fund
Industry Table
(% of Net Assets) on 6/30/07 | |
| Internet | | | 9.3 | % | |
| Commercial Services | | | 7.7 | % | |
| Apparel | | | 6.4 | % | |
| Telecommunications | | | 6.2 | % | |
| Retail | | | 4.7 | % | |
| Semiconductors | | | 4.7 | % | |
| Transportation | | | 4.0 | % | |
| Oil & Gas Services | | | 3.6 | % | |
| Health Care — Products | | | 3.3 | % | |
| Software | | | 3.0 | % | |
| Insurance | | | 2.9 | % | |
| Engineering & Construction | | | 2.4 | % | |
| Foods | | | 2.3 | % | |
Metal Fabricate &
Hardware | | | 2.3 | % | |
| Health Care — Services | | | 2.3 | % | |
| Pharmaceuticals | | | 2.2 | % | |
| Machinery — Diversified | | | 2.2 | % | |
| Forest Products & Paper | | | 2.1 | % | |
Computer Programming
Services | | | 1.9 | % | |
| Entertainment | | | 1.8 | % | |
| Manufacturing | | | 1.7 | % | |
| Computers | | | 1.6 | % | |
| Airlines | | | 1.5 | % | |
| Biotechnology | | | 1.3 | % | |
| Chemicals | | | 1.3 | % | |
| Automotive & Parts | | | 1.3 | % | |
| Leisure Time | | | 1.2 | % | |
Electrical Components &
Equipment | | | 1.2 | % | |
| Computer Related Services | | | 1.2 | % | |
Energy —
Alternate Sources | | | 1.1 | % | |
| Banks | | | 1.0 | % | |
| Environmental Controls | | | 1.0 | % | |
| Hand & Machine Tools | | | 1.0 | % | |
| Medical Supplies | | | 0.9 | % | |
| Diversified Financial | | | 0.8 | % | |
| Home Builders | | | 0.7 | % | |
| Media | | | 0.5 | % | |
| Cosmetics & Personal Care | | | 0.4 | % | |
Real Estate Investment
Trusts (REITS) | | | 0.4 | % | |
| Advertising | | | 0.4 | % | |
Total Long-Term
Investments | | | 95.8 | % | |
Short-Term Investments
and Other Assets and
Liabilities | | | 4.2 | % | |
| | | | 100.0 | % | |
MassMutual Select Emerging
Growth Fund
Largest Stock Holdings
(% of Net Assets) on 6/30/07 | |
| Crocs, Inc. | | | 3.0 | % | |
| Priceline.com, Inc. | | | 2.7 | % | |
| Huron Consulting Group, Inc. | | | 2.7 | % | |
| Align Technology, Inc. | | | 2.5 | % | |
| Sanderson Farms, Inc. | | | 2.3 | % | |
| Rock-Tenn Co. Cl. A | | | 2.1 | % | |
| Blue Coat Systems, Inc. | | | 2.0 | % | |
Shanda Interactive Entertainment
Limited ADR (Cayman Islands) | | | 1.9 | % | |
Silicon Motion Technology Corp.
ADR (Taiwan) | | | 1.6 | % | |
| Perini Corp. | | | 1.6 | % | |
71
MassMutual Select Emerging Growth Fund – Portfolio Manager Report (Continued)
Growth of a $10,000 Investment
Hypothetical Investments in MassMutual Select Emerging Growth Fund Class S, Class A, Class A (sales load deducted), Class Y, Class L, the Russell 2000 Index and the Russell 2000 Growth Index.
MassMutual Select Emerging Growth Fund
Total Return
| | | Year-
to-Date
1/1/07 -
6/30/07 | | One Year
7/1/06 -
6/30/07 | | Five Year
Average
Annual
7/1/02 -
6/30/07 | | Since
Inception
Average
Annual
5/1/00 -
6/30/07 | |
| Class S | | | 13.95 | % | | | 16.67 | % | | | 10.81 | % | | | –4.20 | % | |
| Class A | | | 13.83 | % | | | 16.26 | % | | | 10.18 | % | | | –4.70 | % | |
Class A (sales
load deducted)* | | | 7.28 | % | | | 9.57 | % | | | 8.88 | % | | | –5.49 | % | |
| Class Y | | | 13.88 | % | | | 16.80 | % | | | 10.66 | % | | | –4.30 | % | |
| Class L | | | 13.92 | % | | | 16.32 | % | | | 10.45 | % | | | –4.48 | % | |
| Russell 2000 Index | | | 6.46 | % | | | 16.44 | % | | | 13.88 | % | | | 8.57 | % | |
Russell 2000
Growth Index | | | 9.34 | % | | | 16.84 | % | | | 13.08 | % | | | 1.28 | % | |
Hypothetical Investments in MassMutual Select Emerging Growth Fund Class N, Class N (CDSC fees deducted), the Russell 2000 Index and the Russell 2000 Growth Index.
MassMutual Select Emerging Growth Fund
Total Return
| | | Year-to-Date
1/1/07 - 6/30/07 | | One Year
7/1/06 - 6/30/07 | | Since Inception
Average Annual
12/31/02 - 6/30/07 | |
| Class N | | | 13.73 | % | | | 16.00 | % | | | 16.51 | % | |
Class N (CDSC
fees deducted)* | | | 12.73 | % | | | 15.00 | % | | | 16.51 | % | |
| Russell 2000 Index | | | 6.46 | % | | | 16.44 | % | | | 20.35 | % | |
Russell 2000
Growth Index | | | 9.34 | % | | | 16.84 | % | | | 19.10 | % | |
GROWTH OF $10,000 INVESTMENT SINCE INCEPTION
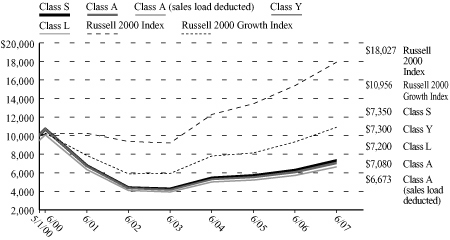
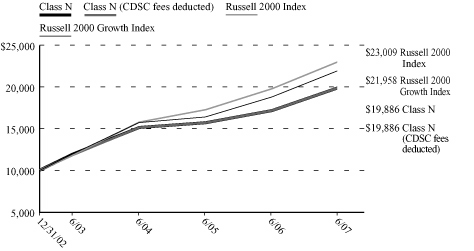
* Class A (sales load deducted) returns include the 5.75% maximum sales charge and Class N (CDSC fees deducted) returns include the 1.00% maximum contingent deferred sales charge for the first 18 months shown.
Performance data quoted represents past performance; past performance is not predictive of future results. The investment return and principal value of shares of the Fund will fluctuate with market conditions so that shares of the Fund, when redeemed, may be worth more or less than their original cost. Current performance of the Fund may be lower or higher than the performance quoted. Performance data current to the most recent month end may be obtained by calling 1-888-309-3539.
Investors should note that the Fund is a professionally managed mutual fund, while the Russell 2000 Index and the Russell 2000 Growth Index are unmanaged, do not incur expenses, and cannot be purchased directly by investors. Investors should read the Fund's prospectus with regard to the Fund's investment objective, risks and charges and expenses in conjunction with these financial statements. Employee retirement benefit plans that invest plan assets in the Separate Investment Accounts (SIAs) may be subject to certain charges as set forth in their respective Plan Documents. Total return figures would be lower for the periods presented if they reflected these charges. The performance tables and charts do not reflect the deduction of taxes that a shareholder would pay on the Fund distributions or the redemption of the Fund shares.
72
MassMutual Select Diversified International Fund – Portfolio Manager Report
What is the investment objective of the MassMutual Select Diversified International Fund – and who is the Fund's sub-adviser? The Fund seeks growth of capital over the long term by investing primarily in a diversified portfolio of equity securities of established companies selected from more than 40 industries and more than 40 developed and emerging market countries. The Fund normally invests in companies in at least three countries other than the United States. The Fund's sub-adviser is AllianceBernstein L.P. (AllianceBernstein).
How did the Fund perform during the six months ended June 30, 2007? The Fund's Class S shares returned 14.12%, outperforming the 12.25% return of the Morgan Stanley Capital International All Country World Index (MSCI® ACWI®) ex-U.S., an unmanaged index representative of stocks domiciled in global developed and emerging markets, excluding the United States.
What was the investment background during the period? International equity markets took investors for a bumpy ride in the first quarter. After continuing to trend gently upwards at the start of the year, a sell-off in Chinese equities and jitters about rising defaults on sub-prime mortgages in the U.S. sent markets around the world plunging in late February and into early March. By quarter-end, however, equity markets had regained their composure, reassured by the U.S. Federal Reserve's outlook for growth and inflation in the world's largest economy, and booming global merger and acquisition activity. Most regions gained modestly over the quarter, though sector returns were more mixed. Industrial commodities did particularly well, but technology, finance and medical companies lagged.
During the second quarter, international equity markets advanced once again, as stocks were generally supported by better-than-expected corporate earnings and robust merger and acquisition activity. Nevertheless, investors continued to worry about the sub-prime mortgage market throughout the quarter. Furthermore, equity markets retreated slightly in June amid increased fears of global inflation and national security concerns in the UK. Most sectors gained during the three-month period, led by energy shares, which rose on a rebound in oil prices. The industrial commodities sector was also strong due to robust demand for metals. On the other hand, the construction and housing sector underperformed. Among currencies, the U.S. dollar depreciated versus the euro and sterling, but appreciated against the yen.
What factors contributed to the Fund's performance? Top contributors to portfolio performance in the first quarter included steel companies Arcelor Mittal and JFE Holdings. Elsewhere, portfolio returns were strengthened by sustained market share gains from Sainsbury, which showed that the UK supermarket operator's plans to boost sales remained on track. Chief detractors from portfolio performance in the first quarter were concentrated within the financials sector and included ORIX, Sumitomo Mitsui Financial and ING Groep. French carmaker Renault also detracted from returns, as its 44% stake in Nissan suffered when Nissan failed to reach its profit forecast for the first time in four years.
In the second quarter, an overweight position in the industrial commodities sector contributed to performance, as did an underweight position in the construction/housing and consumer cyclicals sectors. An overweight allocation to the financials sector detracted. In a reversal from the first quarter, one of the portfolio's leading second-quarter contributors was Renault – which moved higher following positive market reaction to its new Laguna model and on investors' reassessment of the company's prospects following restructuring efforts at Nissan, which reported a 3.2% increase in U.S. vehicle sales in May. Chief detractors from performance in the second quarter included BAE Systems, Fortis and HBOS.
What is your outlook? We continue to believe that global equity markets are reasonably valued and that these valuations are supported by the prospect of continued – if more moderate – economic and profit growth. The overall value opportunity is lower than average, but our fundamental research continues to uncover interesting value investments on a stock-by-stock basis.
73
MassMutual Select Diversified International Fund – Portfolio Manager Report (Continued)
MassMutual Select Diversified International Fund
Country Weightings
(% of Net Assets) on 6/30/07 | |
| Japan | | | 19.5 | % | |
| United Kingdom | | | 13.6 | % | |
| France | | | 10.6 | % | |
| Germany | | | 9.5 | % | |
| Canada | | | 5.1 | % | |
| South Korea | | | 4.6 | % | |
| Taiwan | | | 4.2 | % | |
| Holland | | | 3.5 | % | |
| Brazil | | | 3.5 | % | |
| Switzerland | | | 2.9 | % | |
| Italy | | | 2.8 | % | |
| Netherlands | | | 2.7 | % | |
| Australia | | | 2.0 | % | |
| China | | | 1.5 | % | |
| Belgium | | | 1.1 | % | |
| Austria | | | 1.1 | % | |
| Spain | | | 1.1 | % | |
| South Africa | | | 0.9 | % | |
| Sweden | | | 0.9 | % | |
| Hong Kong | | | 0.7 | % | |
| Finland | | | 0.7 | % | |
| Thailand | | | 0.7 | % | |
| Philippine Islands | | | 0.5 | % | |
| Hungary | | | 0.5 | % | |
| Israel | | | 0.5 | % | |
| Denmark | | | 0.4 | % | |
| Singapore | | | 0.4 | % | |
| Greece | | | 0.3 | % | |
Total Long-Term
Investments | | | 95.8 | % | |
Short-Term Investments
and Other Assets and
Liabilities | | | 4.2 | % | |
| | | | 100.0 | % | |
MassMutual Select Diversified
International Fund
Largest Stock Holdings
(% of Net Assets) on 6/30/07 | |
| Allianz AG | | | 2.0 | % | |
| Renault SA | | | 2.0 | % | |
| ING Groep NV | | | 1.8 | % | |
| Total SA (France) | | | 1.8 | % | |
| Vodafone Group PLC | | | 1.8 | % | |
| Royal Dutch Shell PLC | | | 1.7 | % | |
| BASF AG | | | 1.7 | % | |
| E.ON AG | | | 1.7 | % | |
| Royal Bank of Scotland Group PLC | | | 1.7 | % | |
| ENI SpA | | | 1.6 | % | |
74
MassMutual Select Diversified International Fund – Portfolio Manager Report (Continued)
Growth of a $10,000 Investment
Hypothetical Investments in MassMutual Select Diversified International Fund Class S, Class A, Class A (sales load deducted), Class Y, Class L, Class N, Class N (CDSC fees deducted) and the MSCI ACWI ex US.
MassMutual Select Diversified International Fund
Total Return
| | | Year-to-Date
1/1/07 - 6/30/07 | | Since Inception
12/14/06 - 6/30/07 | |
| Class S | | | 14.12 | % | | | 14.92 | % | |
| Class A | | | 13.92 | % | | | 14.69 | % | |
Class A (sales
load deducted)* | | | 7.37 | % | | | 8.10 | % | |
| Class Y | | | 14.02 | % | | | 14.81 | % | |
| Class L | | | 14.02 | % | | | 14.81 | % | |
| Class N | | | 13.72 | % | | | 14.48 | % | |
Class N (CDSC
fees deducted)* | | | 12.72 | % | | | 13.48 | % | |
| MSCI ACWI ex US | | | 12.25 | % | | | 13.89 | % | |
GROWTH OF $10,000 INVESTMENT SINCE INCEPTION
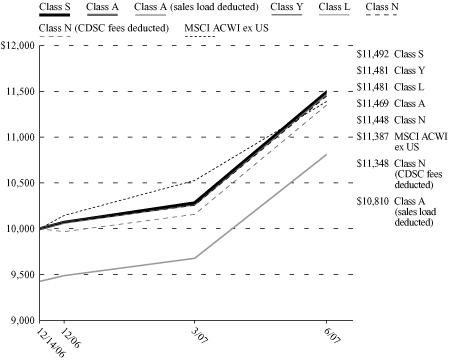
* Class A (sales load deducted) returns include the 5.75% maximum sales charge and Class N (CDSC fees deducted) returns include the 1.00% maximum contingent deferred sales charge.
Performance data quoted represents past performance; past performance is not predictive of future results. The investment return and principal value of shares of the Fund will fluctuate with market conditions so that shares of the Fund, when redeemed, may be worth more or less than their original cost. Current performance of the Fund may be lower or higher than the performance quoted. Performance data current to the most recent month end may be obtained by calling 1-888-309-3539.
Investors should note that the Fund is a professionally managed mutual fund, while the MSCI ACWI ex US is unmanaged, does not incur expenses, and cannot be purchased directly by investors. Investors should read the Fund's prospectus with regard to the Fund's investment objective, risks and charges and expenses in conjunction with these financial statements. Employee retirement benefit plans that invest plan assets in the Separate Investment Accounts (SIAs) may be subject to certain charges as set forth in their respective Plan Documents. Total return figures would be lower for the periods presented if they reflected these charges. The performance tables and charts do not reflect the deduction of taxes that a shareholder would pay on the Fund distributions or the redemption of the Fund shares.
75
MassMutual Select Overseas Fund – Portfolio Manager Report
What is the investment objective of the MassMutual Select Overseas Fund – and who are the Fund's sub-advisers? The Fund seeks growth of capital over the long term by investing in both foreign and domestic equity securities. The Fund invests at least 80% of its net assets in stocks of foreign companies – including companies located in Europe, Latin America and Asia. The Fund's two sub-advisers, Massachusetts Financial Services Company (MFS) and Harris Associates L.P. (Harris), are each responsible for a portion of the portfolio, but not necessarily equal weighted.
How did the Fund perform during the six months ended June 30, 2007? The Fund's Class S shares returned 8.42%, trailing the 10.74% return of the Morgan Stanley Capital International Europe, Australasia, Far East (MSCI® EAFE®) Index, a widely recognized, unmanaged index representative of foreign securities in the major non-U.S. markets of Europe, Australia and the Far East.
What was the investment background during the period? Domestic stocks showed little change during the first quarter of 2007, despite a significant increase in volatility across the board. Although the Dow Jones Industrial AverageSM ("the Dow") notched a new closing high in February, the blue-chip benchmark declined slightly for the three months ended March 31. The S&P 500® Index finished with a small advance, as did the Nasdaq Composite® Index ("Nasdaq"), which barely managed to post a gain for the period. A depreciating U.S. dollar supported the returns of foreign stocks, helping the MSCI EAFE Index outperform its U.S. counterparts for the quarter.
Most U.S. stock indexes advanced in the second quarter, with some setting records along the way. Stocks rode a wave of optimism over corporate earnings early in the quarter and later overcame short periods of increased volatility associated with investor concerns about soft retail sales, rising interest rates, inflation, the housing market and sub-prime mortgages. During the period, the housing market remained depressed, and long-term interest rates moved decisively higher. Crude oil surged to close the quarter near $70 per barrel.
What factors contributed to the Fund's performance? In the first quarter of 2007, numerous factors hindered the Fund's performance. From a sector perspective, the portfolio's underweight position in special products/services detracted from returns, as did an overweight position in health care. In addition, stock selection in the autos, housing, technology and health care sectors hurt the Fund's results. Conversely, overweight positions in consumer staples and retailing and an underweight allocation in financial services helped to drive the Fund's performance. Stock selection in consumer staples and retailing also fueled the Fund's progress. From a geographic perspective, the greatest contributors to performance for the quarter were the Fund's positions in the UK, Japan and Germany. The greatest detractors from relative performance included an ove rweight allocation to South Korea and the Fund's positions in Switzerland.
The Fund's overweight position in consumer staples and underweight allocations to basic materials and special products/services hampered the Fund's progress in the second quarter, as did stock selection in the consumer staples and basic materials sectors. Conversely, contributing to the Fund's performance was its underweight position in the struggling financial services sector and stock selection in financial services, utilities/communications and industrial goods/services. On a stock-specific basis, the five stocks that added the most to the Fund's performance during the quarter were Adecco S.A., British Sky Broadcasting Group, DaimlerChrysler, BMW and SK Telecom Co. Ltd.
What is your outlook? Equity market valuation levels appear reasonable, although investors' recent concerns over slowing growth in the U.S., and sub-prime lending in particular, have resulted in increased volatility in equity markets worldwide. After strong relative performance, many stocks with small capitalizations, those domiciled in emerging markets or operating in more cyclical areas of the economy are trading at high valuations versus their history. Given peak corporate profit margins and recent increases in global interest rates, the risk to profit estimates would seem to be rising, particularly in these areas. In this environment, we are finding a number of stocks that, in our opinion, will be able to generate above-average earnings growth with little volatility and are trading at more attractive valuations than normal.
76
MassMutual Select Overseas Fund – Portfolio Manager Report (Continued)
MassMutual Select Overseas Fund
Industry Table
(% of Net Assets) on 6/30/07 | |
| Diversified Financial | | | 11.6 | % | |
| Banks | | | 10.8 | % | |
| Pharmaceuticals | | | 7.8 | % | |
| Media | | | 7.1 | % | |
| Auto Manufacturers | | | 5.3 | % | |
| Beverages | | | 4.5 | % | |
| Foods | | | 4.5 | % | |
| Semiconductors | | | 4.4 | % | |
| Insurance | | | 4.2 | % | |
| Chemicals | | | 3.9 | % | |
| Telecommunications | | | 3.0 | % | |
| Electronics | | | 2.7 | % | |
| Oil & Gas | | | 2.6 | % | |
| Retail | | | 2.3 | % | |
Electrical Components &
Equipment | | | 2.0 | % | |
| Cosmetics & Personal Care | | | 2.0 | % | |
| Office Equipment/Supplies | | | 1.9 | % | |
| Commercial Services | | | 1.9 | % | |
| Advertising | | | 1.9 | % | |
Holding Company —
Diversified | | | 1.8 | % | |
| Household Products | | | 1.5 | % | |
| Entertainment | | | 1.4 | % | |
| Electric | | | 1.3 | % | |
| Transportation | | | 1.2 | % | |
Building Materials &
Construction | | | 0.9 | % | |
| Automotive & Parts | | | 0.8 | % | |
| Gas | | | 0.8 | % | |
| Manufacturing | | | 0.7 | % | |
| Food Services | | | 0.7 | % | |
| Building Materials | | | 0.6 | % | |
| Mining | | | 0.4 | % | |
| Toys, Games & Hobbies | | | 0.4 | % | |
| Health Care — Products | | | 0.3 | % | |
Electrical Equipment &
Electronics | | | 0.0 | % | |
Total Long-Term
Investments | | | 97.2 | % | |
Short-Term Investments
and Other Assets and
Liabilities | | | 2.8 | % | |
| | | | 100.0 | % | |
MassMutual Select Overseas Fund
Largest Stock Holdings
(% of Net Assets) on 6/30/07 | |
| UBS AG Registered | | | 3.5 | % | |
| GlaxoSmithKline PLC | | | 3.3 | % | |
| Nestle SA | | | 3.0 | % | |
| Diageo PLC | | | 2.6 | % | |
| Samsung Electronics Co., Ltd. | | | 2.4 | % | |
| HSBC Holdings PLC | | | 2.3 | % | |
| Bayerische Motoren Werke AG | | | 2.0 | % | |
LVMH Moet Hennessy
Louis Vuitton SA | | | 1.8 | % | |
| Roche Holding AG | | | 1.7 | % | |
| Credit Suisse Group | | | 1.7 | % | |
77
MassMutual Select Overseas Fund – Portfolio Manager Report (Continued)
Growth of a $10,000 Investment
Hypothetical Investments in MassMutual Select Overseas Fund Class S, Class A, Class A (sales load deducted), Class Y, Class L and the MSCI EAFE Index.
MassMutual Select Overseas Fund
Total Return
| | | Year-
to-Date
1/1/07 -
6/30/07 | | One
Year
7/1/06 -
6/30/07 | | Five
Year
Average
Annual
1/1/02 -
6/30/07 | | Since
Inception
Average
Annual
5/1/01 -
6/30/07 | |
| Class S | | | 8.42 | % | | | 24.77 | % | | | 15.19 | % | | | 9.68 | % | |
| Class A | | | 8.13 | % | | | 24.33 | % | | | 14.71 | % | | | 9.21 | % | |
Class A (sales
load deducted)* | | | 1.91 | % | | | 17.18 | % | | | 13.36 | % | | | 8.17 | % | |
| Class Y | | | 8.37 | % | | | 24.69 | % | | | 15.12 | % | | | 9.61 | % | |
| Class L | | | 8.31 | % | | | 24.68 | % | | | 15.01 | % | | | 9.48 | % | |
| MSCI EAFE Index | | | 10.74 | % | | | 27.00 | % | | | 17.73 | % | | | 10.91 | % | |
Hypothetical Investments in MassMutual Select Overseas Fund Class N, Class N (CDSC fees deducted) and the MSCI EAFE Index.
MassMutual Short-Duration Bond Fund
Total Return
| | | Year-to-Date
1/1/07 - 6/30/07 | | One Year
7/1/06 - 6/30/07 | | Since Inception
Average Annual
12/31/02 - 6/30/07 | |
| Class N | | | 8.05 | % | | | 23.99 | % | | | 20.76 | % | |
Class N (CDSC
fees deducted)* | | | 7.05 | % | | | 22.99 | % | | | 20.76 | % | |
| MSCI EAFE Index | | | 10.74 | % | | | 27.00 | % | | | 24.37 | % | |
GROWTH OF $10,000 INVESTMENT SINCE INCEPTION

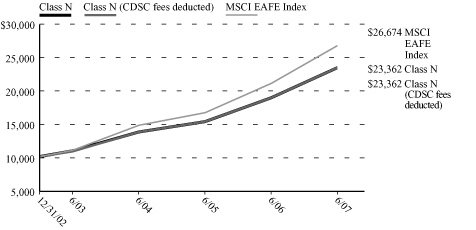
* Class A (sales load deducted) returns include the 5.75% maximum sales charge and Class N (CDSC fees deducted) returns include the 1.00% maximum contingent deferred sales charge for the first 18 months shown.
Performance data quoted represents past performance; past performance is not predictive of future results. The investment return and principal value of shares of the Fund will fluctuate with market conditions so that shares of the Fund, when redeemed, may be worth more or less than their original cost. Current performance of the Fund may be lower or higher than the performance quoted. Performance data current to the most recent month end may be obtained by calling 1-888-309-3539.
Investors should note that the Fund is a professionally managed mutual fund, while the MSCI EAFE Index is unmanaged, does not incur expenses, and cannot be purchased directly by investors. Investors should read the Fund's prospectus with regard to the Fund's investment objective, risks and charges and expenses in conjunction with these financial statements. Employee retirement benefit plans that invest plan assets in the Separate Investment Accounts (SIAs) may be subject to certain charges as set forth in their respective Plan Documents. Total return figures would be lower for the periods presented if they reflected these charges. The performance tables and charts do not reflect the deduction of taxes that a shareholder would pay on the Fund distributions or the redemption of the Fund shares.
78
MassMutual Select Destination Retirement Series – Portfolio Manager Report
What are the investment objectives of the Funds that comprise the MassMutual Select Destination Retirement Series? Destination Retirement Income Fund: This Fund seeks to achieve high current income and, as a secondary objective, capital appreciation, by investing in a combination of MassMutual equity, fixed-income and money market funds using an asset allocation strategy designed for investors already in retirement.
Destination Retirement 2010 / 2020 / 2030 / 2040 Funds: Each of these Funds seeks to achieve as high a total rate of return on an annual basis as is considered consistent with prudent investment risk and the preservation of capital by investing in a combination of MassMutual equity, fixed-income and money market funds. Each Fund uses an asset allocation strategy designed for investors expecting to retire around the year 2010, 2020, 2030, or 2040, respectively.
How did the Funds perform during the six months ended June 30, 2007? For the six months ended June 30, 2007, each Fund's return appears below. Also shown are the returns of each Fund's custom benchmark; the Lipper Balanced Fund Index, an unmanaged, equally weighted index of the 30 largest mutual funds within the Lipper Balanced Category; the Lehman Brothers® Aggregate Bond Index, an unmanaged index of fixed-rate investment-grade securities with at least one year to maturity combining the Lehman Brothers Government/Credit Index and the Lehman Brothers Mortgage-Backed Securities Index; and the S&P 500® Index, a widely recognized, unmanaged index representative of common stocks of larger capitalized U.S. companies.
Destination Retirement
Income Fund | | Custom
Benchmark | | Lipper Balanced
Fund Index | | Lehman Brothers
Aggregate Bond Index | | S&P 500
Index | |
| | 3.12 | % | | | 2.86 | % | | | 5.73 | % | | | 0.97 | % | | | 6.96 | % | |
Destination Retirement
2010 Fund | |
| | 3.97 | % | | | 3.72 | % | | | 5.73 | % | | | 0.97 | % | | | 6.96 | % | |
Destination Retirement
2020 Fund | |
| | 5.42 | % | | | 4.97 | % | | | 5.73 | % | | | 0.97 | % | | | 6.96 | % | |
Destination Retirement
2030 Fund | |
| | 7.34 | % | | | 6.66 | % | | | 5.73 | % | | | 0.97 | % | | | 6.96 | % | |
Destination Retirement
2040 Fund | |
| | 8.51 | % | | | 7.85 | % | | | 5.73 | % | | | 0.97 | % | | | 6.96 | % | |
All of the Destination Retirement Funds outperformed their respective custom benchmarks for the six-month period. With respect to the Lipper Balanced Fund Index, only the Destination Retirement 2030 and 2040 Funds outperformed that benchmark. Those same two Funds also outpaced the S&P 500 Index. Conversely, all of the Destination Retirement Funds (each of which has a stock component) outperformed the Lehman Brothers Aggregate Bond Index for the six-month time frame.
Destination Retirement Custom Benchmarks
• The Custom Destination Income Index comprises the MSCI® EAFE®, Dow Jones Wilshire 5000 (full cap), Lehman Brothers Aggregate Bond and T-Bill Indexes. The weightings of each Index can vary, depending on the weightings of the underlying mutual funds that comprise the Destination Retirement Income Fund.
• The Custom Destination 2010 Index comprises the MSCI EAFE, Dow Jones Wilshire 5000 (full cap), Lehman Brothers Aggregate Bond and T-Bill Indexes. The weightings of each Index can vary, depending on the weightings of the underlying mutual funds that comprise the Destination Retirement 2010 Fund.
• The Custom Destination 2020 Index comprises the MSCI EAFE, Dow Jones Wilshire 5000 (full cap) and Lehman Brothers Aggregate Bond Indexes. The weightings of each Index can vary, depending on the weightings of the underlying mutual funds that comprise the Destination Retirement 2020 Fund.
79
MassMutual Select Destination Retirement Series – Portfolio Manager Report (Continued)
• The Custom Destination 2030 Index comprises the MSCI EAFE, Dow Jones Wilshire 5000 (full cap) and Lehman Brothers Aggregate Bond Indexes. The weightings of each Index can vary, depending on the weightings of the underlying mutual funds that comprise the Destination Retirement 2030 Fund.
• The Custom Destination 2040 Index comprises the MSCI EAFE and Dow Jones Wilshire 5000 (full cap) Indexes. The weightings of each Index can vary, depending on the weightings of the underlying mutual funds that comprise the Destination Retirement 2040 Fund.
What was the investment background during the period? Domestic stocks showed little change during the first quarter of 2007, despite a significant increase in volatility across the board. Although the Dow Jones Industrial AverageSM ("the Dow") notched a new closing high in February, the blue-chip benchmark declined slightly for the three months ended March 31. The S&P 500 Index finished with a small advance, as did the Nasdaq Composite® Index ("Nasdaq"). A depreciating U.S. dollar supported the returns of foreign stocks, helping the MSCI EAFE Index outperform its U.S. counterparts for the quarter.
Bond yields rose and prices fell early in 2007. However, as concerns intensified about the weak housing market and problems with sub-prime lenders made headlines, bond yields eased and prices rallied. Overall, most Treasury securities ended the first quarter with modest price gains, and the Lehman Brothers Aggregate Bond Index posted a modest advance.
Most U.S. stock indexes advanced in the second quarter, with some setting records along the way. During the period, the housing market remained depressed, and long-term interest rates moved decisively higher. Crude oil surged to close the quarter near $70 per barrel.
Higher Treasury yields and widening premiums for corporate and mortgage-backed securities reflected rising interest rates in the second quarter. The Treasury yield curve, representing yields across a range of maturities, went from slightly inverted – with yields on short-term bonds higher than those of longer-term bonds – to nearly flat, with longer yields marginally higher than short ones. High-yield bonds barely managed a positive return for the quarter.
What factors contributed to the Fund's performance? Performance of the portfolios' asset classes varied during the first quarter of 2007. Within equities, the portfolios benefited from exposure to small-cap and international stocks. On the fixed-income side, the portfolios benefited from exposure to Treasury inflation-protected securities ("TIPS") due to their investment in Premier Inflation-Protected Bond Fund. During this time frame, we completed a large number of changes to the Destination portfolios as part of our goal to increase the diversification of the underlying funds held by these investment options. Each Destination portfolio was reallocated to hold a larger number of investment options. Among the underlying funds, some of the top relative performers were Premier Strategic Income Fund, Premier Value Fund, Premier Main Street Small Cap Fund, Select Overseas Fund, Premier Short-Duration Bond Fund and Select Mid Cap Growth Equity II Fund. Among the laggards relative to their respective indexes were Premier Enhanced Index Value Fund, Select Large Cap Value Fund, Select Growth Equity Fund, Select Blue Chip Growth Fund and Select Small Cap Core Equity Fund.
During the second quarter of 2007, the portfolios benefited from exposure to large-cap growth and international stocks. On the fixed-income side, in a turnaround from the first quarter, the portfolios' exposure to TIPS through Premier Inflation-Protected Bond Fund hampered the portfolios' performance, as that Fund ended the quarter in negative territory. Conversely, Premier Strategic Income Fund posted a slight gain, largely due to its exposure to foreign bonds of both emerging markets and developed countries, as these markets benefited from attractive yields and strong currency gains relative to the U.S. dollar. Both Premier Core Bond Fund and Premier Diversified Bond Fund were down in absolute returns and trailed the Lehman Brothers Aggregate Bond Index for the period. During the second quarter, we continued to adjust the Destination portfolios as part of our goal to improve the diversification of the underlying funds held by these investm ent options and provide the appropriate risk profile for each fund. Having portfolios diversified with a wide number of investment managers was beneficial in many ways during the second quarter, since some of the top relative performers included funds that we added as part of our readjustment process – such as Select
80
MassMutual Select Destination Retirement Series – Portfolio Manager Report (Continued)
Blue Chip Growth Fund, Premier International Equity Fund, Select Diversified International Fund, Premier Value Fund and Select Emerging Growth Fund. On the other hand, the underlying funds which detracted from performance included Select Growth Equity Fund, Select Aggressive Growth Fund, Select Overseas Fund and Select Small Cap Core Equity Fund.
What is your outlook? Our goal for the Destination Retirement Series is to build portfolios that are appropriate for investors seeking easy-to-use, long-term investment solutions that deliver consistent results without taking excessive risk. As part of this mandate, we seek to balance opportunities for return with their risks. Portfolios are widely diversified by security and style. Our approach seeks to utilize both those investment managers that seek to deliver a level of tracking to their respective asset classes along with more highly active managers. In addition, the interaction of their respective strategies is managed with the goal of delivering the optimal mix of market exposure and active management. We believe that this process delivers a long-term solution for participants and plan sponsors that will help manage volatility while delive ring the benefits of our investment program's core strengths: identifying, delivering and monitoring a multitude of strategies from a diverse group of investment managers.
MassMutual Select Destination
Retirement Income Fund
Asset Allocation
(% of Net Assets) on 6/30/07 | |
| Equity Funds | | | 34.1 | % | |
| Fixed Income Funds | | | 65.9 | % | |
Short-Term Investments and
Other Assets and Liabilities | | | (0.0 | )% | |
| | | | 100.0 | % | |
MassMutual Select Destination
Retirement 2010 Fund
Asset Allocation
(% of Net Assets) on 6/30/07 | |
| Equity Funds | | | 41.9 | % | |
| Fixed Income Funds | | | 58.1 | % | |
Short-Term Investments and
Other Assets and Liabilities | | | (0.0 | )% | |
| | | | 100.0 | % | |
MassMutual Select Destination
Retirement 2020 Fund
Asset Allocation
(% of Net Assets) on 6/30/07 | |
| Equity Funds | | | 63.9 | % | |
| Fixed Income Funds | | | 36.1 | % | |
Short-Term Investments and
Other Assets and Liabilities | | | (0.0 | )% | |
| | | | 100.0 | % | |
MassMutual Select Destination
Retirement 2030 Fund
Asset Allocation
(% of Net Assets) on 6/30/07 | |
| Equity Funds | | | 85.1 | % | |
| Fixed Income Funds | | | 14.9 | % | |
Short-Term Investments and
Other Assets and Liabilities | | | (0.0 | )% | |
| | | | 100.0 | % | |
MassMutual Select Destination
Retirement 2040 Fund
Asset Allocation
(% of Net Assets) on 6/30/07 | |
| Equity Funds | | | 97.2 | % | |
| Fixed Income Funds | | | 2.8 | % | |
Short-Term Investments and
Other Assets and Liabilities | | | (0.0 | )% | |
| | | | 100.0 | % | |
81
MassMutual Select Destination Retirement Series – Portfolio Manager Report (Continued)
Growth of a $10,000 Investment
Hypothetical Investments in MassMutual Select Destination Retirement Income Fund Class S, Class A, Class A (sales load deducted), Class Y, Class L, Class N, Class N (CDSC fees deducted) and the Custom Destination Income Index, the Lipper Balanced Fund Index, the Lehman Brothers Aggregate Bond Index and the S&P 500 Index.
MassMutual Select Destination Retirement Income Fund
Total Return
| | | Year-to-Date
1/1/07 - 6/30/07 | | One Year
7/1/06 - 6/30/07 | | Since Inception
Annual Average
12/31/03 - 6/30/07 | |
| Class S | | | 3.12 | % | | | 8.55 | % | | | 5.31 | % | |
| Class A | | | 2.93 | % | | | 8.11 | % | | | 4.94 | % | |
Class A (sales
load deducted)** | | | -2.99 | % | | | 1.90 | % | | | 3.18 | % | |
| Class Y | | | 3.12 | % | | | 8.42 | % | | | 5.30 | % | |
| Class L | | | 3.12 | % | | | 8.41 | % | | | 5.21 | % | |
| Class N | | | 2.73 | % | | | 7.69 | % | | | 4.59 | % | |
Class N (CDSC
fees deducted)** | | | 1.73 | % | | | 6.69 | % | | | 4.59 | % | |
Custom Destination
Income Index | | | 2.86 | % | | | 9.87 | % | | | 6.12 | % | |
Lipper Balanced
Fund Index | | | 5.73 | % | | | 15.39 | % | | | 9.04 | % | |
Lehman Brothers
Aggregate Bond Index | | | 0.97 | % | | | 6.11 | % | | | 3.48 | % | |
| S&P 500 Index | | | 6.96 | % | | | 20.57 | % | | | 11.06 | % | |
GROWTH OF $10,000 INVESTMENT SINCE INCEPTION*

* The custom benchmark $10,000 growth chart values commence on 1/1/04.
** Class A (sales load deducted) returns include the 5.75% maximum sales charge and Class N (CDSC fees deducted) returns include the 1.00% maximum contingent deferred sales charge for the first 18 months shown.
Performance data quoted represents past performance; past performance is not predictive of future results. The investment return and principal value of shares of the Fund will fluctuate with market conditions so that shares of the Fund, when redeemed, may be worth more or less than their original cost. Current performance of the Fund may be lower or higher than the performance quoted. Performance data current to the most recent month end may be obtained by calling 1-888-309-3539.
Investors should note that the Fund is a professionally managed mutual fund, while the Custom Destination Income Index, the Lipper Balanced Fund Index, the Lehman Brothers Aggregate Bond Index and the S&P 500 Index are unmanaged, do not incur expenses, and cannot be purchased directly by investors. Investors should read the Fund's prospectus with regard to the Fund's investment objective, risks and charges and expenses in conjunction with these financial statements. Employee retirement benefit plans that invest plan assets in the Separate Investment Accounts (SIAs) may be subject to certain charges as set forth in their respective Plan Documents. Total return figures would be lower for the periods presented if they reflected these charges. The performance tables and charts do not reflect the deduction of taxes that a shareholder would pay on the Fund distributions or the redemption of the Fund shares.
82
MassMutual Select Destination Retirement Series – Portfolio Manager Report (Continued)
Growth of a $10,000 Investment
Hypothetical Investments in MassMutual Select Destination Retirement 2010 Fund Class S, Class A, Class A (sales load deducted), Class Y, Class L, Class N, Class N (CDSC fees deducted) and the Custom Destination 2010 Index, the Lipper Balanced Fund Index, the Lehman Brothers Aggregate Bond Index and the S&P 500 Index.
MassMutual Select Destination Retirement 2010 Fund
Total Return
| | | Year-to-Date
1/1/07 - 6/30/07 | | One Year
7/1/06 - 6/30/07 | | Since Inception
Average Annual
12/31/03 - 6/30/07 | |
| Class S | | | 3.97 | % | | | 10.32 | % | | | 6.53 | % | |
| Class A | | | 3.71 | % | | | 9.83 | % | | | 6.09 | % | |
Class A (sales
load deducted)** | | | -2.25 | % | | | 3.51 | % | | | 4.31 | % | |
| Class Y | | | 3.88 | % | | | 10.19 | % | | | 6.45 | % | |
| Class L | | | 3.89 | % | | | 10.10 | % | | | 6.37 | % | |
| Class N | | | 3.61 | % | | | 9.56 | % | | | 5.79 | % | |
Class N (CDSC
fees deducted)** | | | 2.61 | % | | | 8.56 | % | | | 5.79 | % | |
Custom Destination
2010 Index | | | 3.72 | % | | | 11.70 | % | | | 7.36 | % | |
Lipper Balanced
Fund Index | | | 5.73 | % | | | 15.39 | % | | | 9.04 | % | |
Lehman Brothers
Aggregate Bond Index | | | 0.97 | % | | | 6.11 | % | | | 3.48 | % | |
| S&P 500 Index | | | 6.96 | % | | | 20.57 | % | | | 11.06 | % | |
GROWTH OF $10,000 INVESTMENT SINCE INCEPTION*

* The custom benchmark $10,000 growth chart values commence on 1/1/04.
** Class A (sales load deducted) returns include the 5.75% maximum sales charge and Class N (CDSC fees deducted) returns include the 1.00% maximum contingent deferred sales charge for the first 18 months shown.
Performance data quoted represents past performance; past performance is not predictive of future results. The investment return and principal value of shares of the Fund will fluctuate with market conditions so that shares of the Fund, when redeemed, may be worth more or less than their original cost. Current performance of the Fund may be lower or higher than the performance quoted. Performance data current to the most recent month end may be obtained by calling 1-888-309-3539.
Investors should note that the Fund is a professionally managed mutual fund, while the Custom Destination 2010 Index, the Lipper Balanced Fund Index, the Lehman Brothers Aggregate Bond Index and the S&P 500 Index are unmanaged, do not incur expenses, and cannot be purchased directly by investors. Investors should read the Fund's prospectus with regard to the Fund's investment objective, risks and charges and expenses in conjunction with these financial statements. Employee retirement benefit plans that invest plan assets in the Separate Investment Accounts (SIAs) may be subject to certain charges as set forth in their respective Plan Documents. Total return figures would be lower for the periods presented if they reflected these charges. The performance tables and charts do not reflect the deduction of taxes that a shareholder would pay on the Fund distributions or the redemption of the Fund shares.
83
MassMutual Select Destination Retirement Series – Portfolio Manager Report (Continued)
Growth of a $10,000 Investment
Hypothetical Investments in MassMutual Select Destination Retirement 2020 Fund Class S, Class A, Class A (sales load deducted), Class Y, Class L, Class N, Class N (CDSC fees deducted) and the Custom Destination 2020 Index, the Lipper Balanced Fund Index, the Lehman Brothers Aggregate Bond Index and the S&P 500 Index.
MassMutual Select Destination Retirement 2020 Fund
Total Return
| | | Year-to-Date
1/1/07 - 6/30/07 | | One Year
7/1/06 - 6/30/07 | | Since Inception
Average Annual
12/31/03 - 6/30/07 | |
| Class S | | | 5.42 | % | | | 13.25 | % | | | 8.41 | % | |
| Class A | | | 5.18 | % | | | 12.78 | % | | | 7.98 | % | |
Class A (sales
load deducted)** | | | -0.87 | % | | | 6.30 | % | | | 6.17 | % | |
| Class Y | | | 5.33 | % | | | 13.12 | % | | | 8.34 | % | |
| Class L | | | 5.42 | % | | | 13.10 | % | | | 8.26 | % | |
| Class N | | | 5.08 | % | | | 12.45 | % | | | 7.66 | % | |
Class N (CDSC
fees deducted)** | | | 4.08 | % | | | 11.45 | % | | | 7.66 | % | |
Custom Destination
2020 Index | | | 4.97 | % | | | 14.60 | % | | | 9.21 | % | |
Lipper Balanced
Fund Index | | | 5.73 | % | | | 15.39 | % | | | 9.04 | % | |
Lehman Brothers
Aggregate Bond Index | | | 0.97 | % | | | 6.11 | % | | | 3.48 | % | |
| S&P 500 Index | | | 6.96 | % | | | 20.57 | % | | | 11.06 | % | |
GROWTH OF $10,000 INVESTMENT SINCE INCEPTION*

* The custom benchmark $10,000 growth chart values commence on 1/1/04.
** Class A (sales load deducted) returns include the 5.75% maximum sales charge and Class N (CDSC fees deducted) returns include the 1.00% maximum contingent deferred sales charge for the first 18 months shown.
Performance data quoted represents past performance; past performance is not predictive of future results. The investment return and principal value of shares of the Fund will fluctuate with market conditions so that shares of the Fund, when redeemed, may be worth more or less than their original cost. Current performance of the Fund may be lower or higher than the performance quoted. Performance data current to the most recent month end may be obtained by calling 1-888-309-3539.
Investors should note that the Fund is a professionally managed mutual fund, while the Custom Destination 2020 Index, the Lipper Balanced Fund Index, the Lehman Brothers Aggregate Bond Index and the S&P 500 Index are unmanaged, do not incur expenses, and cannot be purchased directly by investors. Investors should read the Fund's prospectus with regard to the Fund's investment objective, risks and charges and expenses in conjunction with these financial statements. Employee retirement benefit plans that invest plan assets in the Separate Investment Accounts (SIAs) may be subject to certain charges as set forth in their respective Plan Documents. Total return figures would be lower for the periods presented if they reflected these charges. The performance tables and charts do not reflect the deduction of taxes that a shareholder would pay on the Fund distributions or the redemption of the Fund shares.
84
MassMutual Select Destination Retirement Series – Portfolio Manager Report (Continued)
Growth of a $10,000 Investment
Hypothetical Investments in MassMutual Select Destination Retirement 2030 Fund Class S, Class A, Class A (sales load deducted), Class Y, Class L, Class N, Class N (CDSC fees deducted) and the Custom Destination 2030 Index, the Lipper Balanced Fund Index, the Lehman Brothers Aggregate Bond Index and the S&P 500 Index.
MassMutual Select Destination Retirement 2030 Fund
Total Return
| | | Year-to-Date
1/1/07 - 6/30/07 | | One Year
7/1/06 - 6/30/07 | | Since Inception
Average Annual
12/31/03 - 6/30/07 | |
| Class S | | | 7.34 | % | | | 16.65 | % | | | 10.67 | % | |
| Class A | | | 7.14 | % | | | 16.12 | % | | | 10.22 | % | |
Class A (sales
load deducted)** | | | 0.98 | % | | | 9.44 | % | | | 8.37 | % | |
| Class Y | | | 7.36 | % | | | 16.53 | % | | | 10.60 | % | |
| Class L | | | 7.27 | % | | | 16.41 | % | | | 10.49 | % | |
| Class N | | | 7.04 | % | | | 15.78 | % | | | 9.89 | % | |
Class N (CDSC
fees deducted)** | | | 6.04 | % | | | 14.78 | % | | | 9.89 | % | |
Custom Destination
2030 Index | | | 6.66 | % | | | 18.30 | % | | | 11.63 | % | |
Lipper Balanced
Fund Index | | | 5.73 | % | | | 15.39 | % | | | 9.04 | % | |
Lehman Brothers
Aggregate Bond Index | | | 0.97 | % | | | 6.11 | % | | | 3.48 | % | |
| S&P 500 Index | | | 6.96 | % | | | 20.57 | % | | | 11.06 | % | |
GROWTH OF $10,000 INVESTMENT SINCE INCEPTION*

* The custom benchmark $10,000 growth chart values commence on 1/1/04.
** Class A (sales load deducted) returns include the 5.75% maximum sales charge and Class N (CDSC fees deducted) returns include the 1.00% maximum contingent deferred sales charge for the first 18 months shown.
Performance data quoted represents past performance; past performance is not predictive of future results. The investment return and principal value of shares of the Fund will fluctuate with market conditions so that shares of the Fund, when redeemed, may be worth more or less than their original cost. Current performance of the Fund may be lower or higher than the performance quoted. Performance data current to the most recent month end may be obtained by calling 1-888-309-3539.
Investors should note that the Fund is a professionally managed mutual fund, while the Custom Destination 2030 Index, the Lipper Balanced Fund Index, the Lehman Brothers Aggregate Bond Index and the S&P 500 Index are unmanaged, do not incur expenses, and cannot be purchased directly by investors. Investors should read the Fund's prospectus with regard to the Fund's investment objective, risks and charges and expenses in conjunction with these financial statements. Employee retirement benefit plans that invest plan assets in the Separate Investment Accounts (SIAs) may be subject to certain charges as set forth in their respective Plan Documents. Total return figures would be lower for the periods presented if they reflected these charges. The performance tables and charts do not reflect the deduction of taxes that a shareholder would pay on the Fund distributions or the redemption of the Fund shares.
85
MassMutual Select Destination Retirement Series – Portfolio Manager Report (Continued)
Growth of a $10,000 Investment
Hypothetical Investments in MassMutual Select Destination Retirement 2040 Fund Class S, Class A, Class A (sales load deducted), Class Y, Class L, Class N, Class N (CDSC fees deducted) and the Custom Destination 2040 Index, the Lipper Balanced Fund Index, the Lehman Brothers Aggregate Bond Index and the S&P 500 Index.
MassMutual Select Destination Retirement 2040 Fund
Total Return
| | | Year-to-Date
1/1/07 - 6/30/07 | | One Year
7/1/06 - 6/30/07 | | Since Inception
Average Annual
12/31/03 - 6/30/07 | |
| Class S | | | 8.51 | % | | | 18.82 | % | | | 12.02 | % | |
| Class A | | | 8.23 | % | | | 18.31 | % | | | 11.58 | % | |
Class A (sales
load deducted)** | | | 2.01 | % | | | 11.51 | % | | | 9.71 | % | |
| Class Y | | | 8.44 | % | | | 18.71 | % | | | 11.95 | % | |
| Class L | | | 8.35 | % | | | 18.59 | % | | | 11.85 | % | |
| Class N | | | 8.14 | % | | | 18.04 | % | | | 11.24 | % | |
Class N (CDSC
fees deducted)** | | | 7.14 | % | | | 17.04 | % | | | 11.24 | % | |
Custom Destination
2040 Index | | | 7.85 | % | | | 20.99 | % | | | 13.18 | % | |
Lipper Balanced
Fund Index | | | 5.73 | % | | | 15.39 | % | | | 9.04 | % | |
Lehman Brothers
Aggregate Bond Index | | | 0.97 | % | | | 6.11 | % | | | 3.48 | % | |
| S&P 500 Index | | | 6.96 | % | | | 20.57 | % | | | 11.06 | % | |
GROWTH OF $10,000 INVESTMENT SINCE INCEPTION*

* The custom benchmark $10,000 growth chart values commence on 1/1/04.
** Class A (sales load deducted) returns include the 5.75% maximum sales charge and Class N (CDSC fees deducted) returns include the 1.00% maximum contingent deferred sales charge for the first 18 months shown.
Performance data quoted represents past performance; past performance is not predictive of future results. The investment return and principal value of shares of the Fund will fluctuate with market conditions so that shares of the Fund, when redeemed, may be worth more or less than their original cost. Current performance of the Fund may be lower or higher than the performance quoted. Performance data current to the most recent month end may be obtained by calling 1-888-309-3539.
Investors should note that the Fund is a professionally managed mutual fund, while the Custom Destination 2040 Index, the Lipper Balanced Fund Index, the Lehman Brothers Aggregate Bond Index and the S&P 500 Index are unmanaged, do not incur expenses, and cannot be purchased directly by investors. Investors should read the Fund's prospectus with regard to the Fund's investment objective, risks and charges and expenses in conjunction with these financial statements. Employee retirement benefit plans that invest plan assets in the Separate Investment Accounts (SIAs) may be subject to certain charges as set forth in their respective Plan Documents. Total return figures would be lower for the periods presented if they reflected these charges. The performance tables and charts do not reflect the deduction of taxes that a shareholder would pay on the Fund distributions or the redemption of the Fund shares.
86
MassMutual Select Strategic Bond Fund – Portfolio of Investments
June 30, 2007 (Unaudited)
| | | Number of
Shares | | Market
Value | |
| EQUITIES — 0.1% | |
| PREFERRED STOCK — 0.1% | |
| Auto Manufacturers | |
| General Motors Corp. | | | 5,000 | | | $ | 97,800 | | |
General Motors Corp.,
Series C | | | 5,375 | | | | 135,047 | | |
TOTAL PREFERRED STOCK
(Cost $194,564) | | | | | | | 232,847 | | |
TOTAL EQUITIES
(Cost $194,564) | | | | | | | 232,847 | | |
| | | Principal
Amount | | | |
| BONDS & NOTES — 94.5% | |
| ASSET BACKED SECURITIES — 3.3% | |
| Commercial MBS — 1.1% | |
Banc of America
Commercial
Mortgage, Inc.,
Series 2005-5, Class A4
5.115% 09/10/2015 | | $ | 280,000 | | | | 266,724 | | |
Banc of America
Commercial Mortgage,
Inc., Series 2005-6,
Class A4 VRN
5.353% 09/10/2047 | | | 840,000 | | | | 807,487 | | |
GE Capital Commercial
Mortgage Corp.,
Series 2005-C4,
Class A4 VRN
5.512% 11/10/2045 | | | 350,000 | | | | 339,972 | | |
Merrill Lynch Mortgage
Trust, Series 2006-C1,
Class A4 VRN
5.659% 05/12/2039 | | | 610,000 | | | | 605,261 | | |
Morgan Stanley Capital I,
Series 2005-HQ6,
Class A4A
4.989% 08/13/2042 | | | 240,000 | | | | 226,848 | | |
Morgan Stanley Capital I,
Series 2007-IQ14,
Class A4
5.692% 04/15/2049 | | | 1,100,000 | | | | 1,081,825 | | |
| | | | 3,328,117 | | |
| | | Principal
Amount | | Market
Value | |
| Home Equity ABS — 1.2% | |
Delta Funding Home
Equity Loan Trust,
Series 1999-1, Class A6F
6.340% 12/15/2028 | | $ | 20,117 | | | $ | 19,963 | | |
GSAA Trust, Series 2005-7,
Class AV1 FRN
5.430% 05/25/2035 | | | 75,747 | | | | 75,759 | | |
Irwin Home Equity,
Series 2006-1,
Class 2A1 FRN
5.470% 09/25/2035 | | | 481,499 | | | | 481,158 | | |
IXIS Real Estate Capital
Trust, Series 2006-HE1,
Class A1 FRN
5.410% 03/25/2036 | | | 239,483 | | | | 239,483 | | |
Renaissance Home Equity
Loan Trust, Series 2007-2,
Class AF6
5.879% 06/25/2037 | | | 2,100,000 | | | | 2,089,164 | | |
Residential Funding
Mortgage Securities II,
Inc., Series 2005-HSA1,
Class AI1 FRN
5.440% 12/25/2035 | | | 508,737 | | | | 508,816 | | |
Structured Asset Securities
Corp., Series 2002-AL1,
Class A3
3.450% 02/25/2032 | | | 206,502 | | | | 182,496 | | |
| | | | 3,596,839 | | |
| Other ABS — 1.0% | |
Bear Stearns Asset
Backed Securities, Inc.,
Series 2005-AQ2,
Class A1 FRN
5.480% 09/25/2035 | | | 219,829 | | | | 219,932 | | |
Bear Stearns Asset
Backed Securities,
Inc., Series 2005-AQ2,
Class A2 FRN
5.590% 09/25/2035 | | | 900,000 | | | | 902,250 | | |
Bear Stearns Asset
Backed Securities, Inc.,
Series 2005-AQ2,
Class A3 FRN
5.680% 09/25/2035 | | | 900,000 | | | | 898,528 | | |
| | | Principal
Amount | | Market
Value | |
Bear Stearns Asset
Backed Securities, Inc.,
Series 2005-SD4,
Class 2A1 FRN
5.720% 12/25/2042 | | $ | 453,512 | | | $ | 455,142 | | |
Countrywide Asset
Backed Certificates,
Series 2005-17,
Class 1AF1 FRN
5.520% 05/25/2036 | | | 336,321 | | | | 336,336 | | |
Credit-Based Asset
Servicing and
Securitization,
Series 2004-CB8,
Class AV1 FRN
5.580% 12/25/2035 | | | 30,960 | | | | 30,965 | | |
First Franklin Mortgage
Loan Asset Backed
Certificates,
Series 2004-FF10,
Class A2 FRN
5.720% 12/25/2032 | | | 72,387 | | | | 72,478 | | |
Lehman XS Trust,
Series 2005-5N,
Class 1A1 FRN
5.620% 11/25/2035 | | | 361,888 | | | | 362,680 | | |
| | | | 3,278,311 | | |
TOTAL ASSET BACKED
SECURITIES
(Cost $10,323,514) | | | | | | | 10,203,267 | | |
| CORPORATE DEBT — 23.8% | |
| Advertising — 0.0% | |
Lamar Media Corp.
6.625% 08/15/2015 | | | 90,000 | | | | 85,275 | | |
| Aerospace & Defense — 0.0% | |
DRS Technologies, Inc.
6.625% 02/01/2016 | | | 55,000 | | | | 53,075 | | |
| Agriculture — 0.3% | |
Altria Group, Inc.
7.000% 11/04/2013 | | | 580,000 | | | | 615,176 | | |
Reynolds American, Inc.
6.750% 06/15/2017 | | | 215,000 | | | | 216,825 | | |
| | | | 832,001 | | |
(Continued)
The accompanying notes are an integral part of the financial statements.
87
MassMutual Select Strategic Bond Fund – Portfolio of Investments (Continued)
| | | Principal
Amount | | Market
Value | |
| Apparel — 0.0% | |
Oxford Industries, Inc.
8.875% 06/01/2011 | | $ | 45,000 | | | $ | 46,462 | | |
| Auto Manufacturers — 0.7% | |
DaimlerChrysler NA Holding
5.750% 05/18/2009 | | | 140,000 | | | | 140,365 | | |
DaimlerChrysler NA Holding
5.875% 03/15/2011 | | | 380,000 | | | | 381,940 | | |
DaimlerChrysler NA Holding
7.200% 09/01/2009 | | | 65,000 | | | | 67,086 | | |
Ford Motor Co.
4.250% 12/15/2036 | | | 150,000 | | | | 187,875 | | |
Ford Motor Co.
6.625% 10/01/2028 | | | 40,000 | | | | 29,900 | | |
Ford Motor Co.(a)
7.450% 07/16/2031 | | | 190,000 | | | | 151,762 | | |
General Motors Corp.
8.250% 07/15/2023 | | | 80,000 | | | | 72,900 | | |
General Motors Corp.(a)
8.375% 07/15/2033 | | | 1,130,000 | | | | 1,031,125 | | |
General Motors
Corp. EUR(b)
8.375% 07/05/2033 | | | 40,000 | | | | 51,114 | | |
| | | | 2,114,067 | | |
| Automotive & Parts — 0.1% | |
Visteon Corp.
8.250% 08/01/2010 | | | 150,000 | | | | 148,875 | | |
| Banks — 2.5% | |
Bank of America Corp.
5.375% 08/15/2011 | | | 770,000 | | | | 766,635 | | |
Bank One Corp.
2.625% 06/30/2008 | | | 205,000 | | | | 199,444 | | |
Glitnir Banki HF(c)
6.330% 07/28/2011 | | | 290,000 | | | | 295,165 | | |
Glitnir Banki HF VRN(c)
6.693% 06/15/2011 | | | 420,000 | | | | 432,589 | | |
Hypothekenbank in
Essen(c)
5.000% 01/20/2012 | | | 100,000 | | | | 98,682 | | |
ICICI Bank Ltd. VRN(a) (c)
6.375% 04/30/2022 | | | 428,000 | | | | 406,704 | | |
Landsbanki Islands HF(c)
6.100% 08/25/2011 | | | 670,000 | | | | 678,471 | | |
Rabobank Capital
Fund II VRN(c)
5.260% 12/31/2049 | | | 10,000 | | | | 9,590 | | |
Rabobank Capital Funding
Trust III VRN(c)
5.254% 12/31/2016 | | | 95,000 | | | | 88,950 | | |
RSHB Capital SA for OJSC
Russian Agricultural
Bank(c)
6.299% 05/15/2017 | | | 790,000 | | | | 773,252 | | |
| | | Principal
Amount | | Market
Value | |
Shinsei Finance Cayman
Ltd. VRN(c)
6.418% 07/20/2016 | | $ | 300,000 | | | $ | 291,691 | | |
Turanalem Finance BV(c)
8.250% 01/22/2037 | | | 1,170,000 | | | | 1,126,125 | | |
Wachovia Capital
Trust III VRN
5.800% 03/15/2042 | | | 230,000 | | | | 228,998 | | |
Wachovia Corp.
5.250% 08/01/2014 | | | 990,000 | | | | 961,672 | | |
Wachovia Corp.
5.625% 10/15/2016 | | | 330,000 | | | | 321,419 | | |
Wells Fargo & Co.
5.300% 08/26/2011 | | | 1,070,000 | | | | 1,062,245 | | |
Wells Fargo Capital
5.950% 12/15/2036 | | | 100,000 | | | | 93,276 | | |
| | | | 7,834,908 | | |
| Chemicals — 0.0% | |
Georgia Gulf Corp.
9.500% 10/15/2014 | | | 40,000 | | | | 39,800 | | |
Lyondell Chemical Co.
8.000% 09/15/2014 | | | 25,000 | | | | 25,687 | | |
Lyondell Chemical Co.
8.250% 09/15/2016 | | | 15,000 | | | | 15,675 | | |
Westlake Chemicals
6.625% 01/15/2016 | | | 40,000 | | | | 37,900 | | |
| | | | 119,062 | | |
| Coal — 0.0% | |
Peabody Energy Corp.
6.875% 03/15/2013 | | | 40,000 | | | | 39,800 | | |
| Commercial Services — 0.1% | |
Ashtead Capital, Inc.(c)
9.000% 08/15/2016 | | | 31,000 | | | | 32,472 | | |
Di Finance/Dyncorp
International, Series B
9.500% 02/15/2013 | | | 45,000 | | | | 47,869 | | |
Hertz Corp.
8.875% 01/01/2014 | | | 80,000 | | | | 83,400 | | |
Service Corp.
International(c)
7.500% 04/01/2027 | | | 135,000 | | | | 127,237 | | |
Service Corp. International
7.625% 10/01/2018 | | | 10,000 | | | | 10,125 | | |
Service Corp.
International, US
6.750% 04/01/2016 | | | 30,000 | | | | 28,425 | | |
| | | | 329,528 | | |
| Computers — 0.2% | |
Electronic Data
Systems Corp.
7.125% 10/15/2009 | | | 620,000 | | | | 638,070 | | |
| | | Principal
Amount | | Market
Value | |
Sungard Data Systems, Inc.
9.125% 08/15/2013 | | $ | 50,000 | | | $ | 51,187 | | |
Sungard Data
Systems, Inc.(a)
10.250% 08/15/2015 | | | 35,000 | | | | 37,012 | | |
| | | | 726,269 | | |
| Diversified Financial — 8.0% | |
AAC Group Holding
Corp. FRN
0.000% 10/01/2008 | | | 40,000 | | | | 36,000 | | |
Aiful Corp.(c)
5.000% 08/10/2010 | | | 320,000 | | | | 311,910 | | |
American Express Co. VRN
6.800% 09/01/2016 | | | 190,000 | | | | 195,913 | | |
Banque Paribas - New York
6.875% 03/01/2009 | | | 110,000 | | | | 112,510 | | |
Citigroup, Inc.
4.125% 02/22/2010 | | | 445,000 | | | | 431,684 | | |
Citigroup, Inc.
5.100% 09/29/2011 | | | 860,000 | | | | 846,758 | | |
Credit Suisse Guernsey,
Ltd. VRN
5.860% 05/15/2017 | | | 200,000 | | | | 192,692 | | |
E*TRADE Financial Corp.
7.375% 09/15/2013 | | | 40,000 | | | | 40,600 | | |
El Paso
Performance-Linked
Trust(c)
7.750% 07/15/2011 | | | 650,000 | | | | 669,500 | | |
Ford Motor Credit Co.
4.950% 01/15/2008 | | | 110,000 | | | | 109,176 | | |
Ford Motor Credit Co.
7.250% 10/25/2011 | | | 80,000 | | | | 76,995 | | |
Ford Motor Credit Co.
7.375% 10/28/2009 | | | 3,075,000 | | | | 3,052,417 | | |
Ford Motor Credit Co.
7.375% 02/01/2011 | | | 130,000 | | | | 127,004 | | |
Ford Motor Credit Co.,
Series WI FRN
10.610% 06/15/2011 | | | 298,000 | | | | 321,912 | | |
General Electric
Capital Corp.
4.125% 09/01/2009 | | | 1,100,000 | | | | 1,073,368 | | |
General Electric
Capital Corp.
4.250% 01/15/2008 | | | 230,000 | | | | 228,690 | | |
General Motors
Acceptance Corp.
4.375% 12/10/2007 | | | 140,000 | | | | 138,991 | | |
General Motors
Acceptance Corp.
5.125% 05/09/2008 | | | 200,000 | | | | 197,502 | | |
(Continued)
The accompanying notes are an integral part of the financial statements.
88
MassMutual Select Strategic Bond Fund – Portfolio of Investments (Continued)
| | | Principal
Amount | | Market
Value | |
General Motors
Acceptance Corp.
5.625% 05/15/2009 | | $ | 420,000 | | | $ | 410,648 | | |
General Motors
Acceptance Corp.
5.850% 01/14/2009 | | | 240,000 | | | | 236,529 | | |
General Motors
Acceptance Corp.
6.125% 08/28/2007 | | | 1,320,000 | | | | 1,320,899 | | |
General Motors
Acceptance Corp.
6.311% 11/30/2007 | | | 50,000 | | | | 49,880 | | |
General Motors
Acceptance Corp.
8.000% 11/01/2031 | | | 3,150,000 | | | | 3,221,130 | | |
GMAC LLC
0.000% 06/15/2015 | | | 10,000 | | | | 5,563 | | |
Goldman Sachs Group, Inc.
4.500% 06/15/2010 | | | 430,000 | | | | 419,246 | | |
Goldman Sachs Group, Inc.
5.000% 01/15/2011 | | | 100,000 | | | | 98,152 | | |
Household Finance Corp.
4.625% 01/15/2008 | | | 560,000 | | | | 557,832 | | |
Household Finance
Corp. Series
4.125% 11/16/2009 | | | 300,000 | | | | 291,313 | | |
HSBC Finance Corp.
4.625% 09/15/2010 | | | 460,000 | | | | 447,665 | | |
Idearc, Inc.
8.000% 11/15/2016 | | | 225,000 | | | | 227,250 | | |
ILFC E-Capital
Trust II VRN(c)
6.250% 12/21/2015 | | | 10,000 | | | | 9,753 | | |
JP Morgan Chase & Co.
5.125% 09/15/2014 | | | 1,160,000 | | | | 1,113,902 | | |
JP Morgan Chase & Co.
5.150% 10/01/2015 | | | 600,000 | | | | 570,537 | | |
Kaupthing Bank(c)
5.750% 10/04/2011 | | | 100,000 | | | | 99,655 | | |
Kaupthing Bank
(Iceland)(c)
7.125% 05/19/2016 | | | 375,000 | | | | 396,136 | | |
Kaupthing Bank FRN(c)
6.045% 04/12/2011 | | | 690,000 | | | | 695,349 | | |
Lehman Brothers Holdings
5.250% 02/06/2012 | | | 415,000 | | | | 407,916 | | |
Lehman Brothers
Holdings, Inc.
5.500% 04/04/2016 | | | 240,000 | | | | 233,016 | | |
Morgan Stanley
3.625% 04/01/2008 | | | 110,000 | | | | 108,496 | | |
Morgan Stanley
5.625% 01/09/2012 | | | 660,000 | | | | 658,576 | | |
| | | Principal
Amount | | Market
Value | |
MUFG Capital
Finance 1 Ltd. VRN
6.346% 07/25/2016 | | $ | 180,000 | | | $ | 176,864 | | |
Residential Capital Corp.
6.000% 02/22/2011 | | | 720,000 | | | | 696,698 | | |
Residential Capital LLC
6.500% 06/01/2012 | | | 230,000 | | | | 224,432 | | |
Resona Preferred Global
Securities VRN(c)
7.191% 07/30/2015 | | | 455,000 | | | | 465,242 | | |
Sigma Finance, Inc. VRN(c)
8.000% 06/22/2009 | | | 890,000 | | | | 890,000 | | |
SLM Corp.
5.000% 10/01/2013 | | | 510,000 | | | | 435,139 | | |
SLM Corp.
5.000% 04/15/2015 | | | 20,000 | | | | 16,435 | | |
SLM Corp.
5.050% 11/14/2014 | | | 120,000 | | | | 99,789 | | |
SLM Corp.
5.375% 05/15/2014 | | | 1,070,000 | | | | 916,916 | | |
SLM Corp.
5.625% 08/01/2033 | | | 90,000 | | | | 70,177 | | |
SLM Corp., Series X FRN(c)
5.330% 04/18/2008 | | | 770,000 | | | | 765,381 | | |
TNK-BP Finance SA(c)
6.625% 03/20/2017 | | | 200,000 | | | | 193,760 | | |
TNK-BP Finance SA(c)
7.500% 07/18/2016 | | | 400,000 | | | | 412,400 | | |
| | | | 25,106,298 | | |
| Electric — 2.0% | |
AES Corp.
7.750% 03/01/2014 | | | 328,000 | | | | 328,820 | | |
AES Corp.
8.875% 02/15/2011 | | | 10,000 | | | | 10,537 | | |
CE Electric UK
Funding Co.(c)
6.995% 12/30/2007 | | | 1,000,000 | | | | 1,006,862 | | |
The Cleveland Electric
Illuminating Co.
5.700% 04/01/2017 | | | 20,000 | | | | 19,296 | | |
Dominion Resources, Inc.
4.750% 12/15/2010 | | | 30,000 | | | | 29,299 | | |
Dominion Resources, Inc.
5.700% 09/17/2012 | | | 600,000 | | | | 600,476 | | |
Duke Energy Corp.
5.625% 11/30/2012 | | | 705,000 | | | | 704,795 | | |
Duke Energy Corp.
6.250% 01/15/2012 | | | 50,000 | | | | 51,323 | | |
Edison Mission Energy(c)
7.000% 05/15/2017 | | | 150,000 | | | | 141,375 | | |
Edison Mission Energy(c)
7.200% 05/15/2019 | | | 200,000 | | | | 188,000 | | |
| | | Principal
Amount | | Market
Value | |
Edison Mission Energy(c)
7.625% 05/15/2027 | | $ | 70,000 | | | $ | 66,150 | | |
Exelon Corp.
5.625% 06/15/2035 | | | 530,000 | | | | 473,499 | | |
FirstEnergy Corp., Series B
6.450% 11/15/2011 | | | 230,000 | | | | 235,845 | | |
FirstEnergy Corp., Series C
7.375% 11/15/2031 | | | 620,000 | | | | 671,181 | | |
NRG Energy, Inc.
7.375% 02/01/2016 | | | 80,000 | | | | 80,200 | | |
NRG Energy, Inc.
7.375% 01/15/2017 | | | 150,000 | | | | 150,562 | | |
Pacific Gas & Electric Co.
5.800% 03/01/2037 | | | 130,000 | | | | 121,260 | | |
Pacific Gas & Electric Co.
6.050% 03/01/2034 | | | 375,000 | | | | 363,258 | | |
TXU Corp., Series P
5.550% 11/15/2014 | | | 230,000 | | | | 195,253 | | |
TXU Corp., Series Q
6.500% 11/15/2024 | | | 60,000 | | | | 49,611 | | |
TXU Corp., Series R
6.550% 11/15/2034 | | | 845,000 | | | | 683,452 | | |
| | | | 6,171,054 | | |
| Electronics — 0.0% | |
NXP BV / NXP Funding LLC
7.875% 10/15/2014 | | | 15,000 | | | | 14,775 | | |
| Entertainment — 0.0% | |
AMC Entertainment, Inc.(a)
11.000% 02/01/2016 | | | 30,000 | | | | 33,150 | | |
| Environmental Controls — 0.2% | |
Waste Management, Inc.
6.375% 11/15/2012 | | | 400,000 | | | | 409,097 | | |
Waste Management, Inc.
6.500% 11/15/2008 | | | 90,000 | | | | 91,016 | | |
| | | | 500,113 | | |
| Financial Services — 0.2% | |
XX, Note
7.110% 07/01/2012 | | | 600,000 | | | | 599,982 | | |
| Forest Products & Paper — 0.2% | |
Weyerhaeuser Co.
6.750% 03/15/2012 | | | 475,000 | | | | 491,462 | | |
| Gas — 0.2% | |
Intergas Finance BV(c)
6.375% 05/14/2017 | | | 790,000 | | | | 756,425 | | |
| Health Care – Products — 0.0% | |
Fresenius Medical Care
Capital Trust II
7.875% 02/01/2008 | | | 42,000 | | | | 42,210 | | |
(Continued)
The accompanying notes are an integral part of the financial statements.
89
MassMutual Select Strategic Bond Fund – Portfolio of Investments (Continued)
| | | Principal
Amount | | Market
Value | |
| Health Care – Services — 0.4% | |
Community Health
Systems, Inc.(c)
8.875% 07/15/2015 | | $ | 190,000 | | | $ | 192,612 | | |
DaVita, Inc.(c)
6.625% 03/15/2013 | | | 160,000 | | | | 156,200 | | |
HCA, Inc.
5.750% 03/15/2014 | | | 84,000 | | | | 71,085 | | |
HCA, Inc.
6.250% 02/15/2013 | | | 169,000 | | | | 152,522 | | |
HCA, Inc.
6.375% 01/15/2015 | | | 170,000 | | | | 144,500 | | |
HCA, Inc.
6.500% 02/15/2016 | | | 8,000 | | | | 6,770 | | |
HCA, Inc.(c)
9.125% 11/15/2014 | | | 30,000 | | | | 31,537 | | |
HCA, Inc.(c)
9.250% 11/15/2016 | | | 230,000 | | | | 244,950 | | |
HCA, Inc.(c)
9.625% 11/15/2016 | | | 125,000 | | | | 134,375 | | |
Tenet Healthcare Corp.
9.250% 02/01/2015 | | | 174,000 | | | | 165,300 | | |
| | | | 1,299,851 | | |
| Insurance — 0.2% | |
American International
Group, Inc.
6.250% 03/15/2037 | | | 670,000 | | | | 633,494 | | |
ASIF Global Financing(c)
4.900% 01/17/2013 | | | 20,000 | | | | 19,385 | | |
| | | | 652,879 | | |
| Investment Companies — 0.3% | |
Gaz Capital SA(c)(a)
6.212% 11/22/2016 | | | 960,000 | | | | 935,040 | | |
| Iron & Steel — 0.0% | |
Steel Dynamics, Inc.(c)
6.750% 04/01/2015 | | | 140,000 | | | | 137,200 | | |
| Lodging — 0.2% | |
Boyd Gaming Corp.
7.125% 02/01/2016 | | | 50,000 | | | | 48,500 | | |
Inn of the Mountain Gods
Resort & Casino
12.000% 11/15/2010 | | | 50,000 | | | | 53,625 | | |
MGM Mirage
6.750% 09/01/2012 | | | 10,000 | | | | 9,550 | | |
MGM Mirage
7.625% 01/15/2017 | | | 245,000 | | | | 233,056 | | |
MGM Mirage
8.375% 02/01/2011 | | | 95,000 | | | | 97,137 | | |
Station Casinos, Inc.
7.750% 08/15/2016 | | | 200,000 | | | | 198,000 | | |
| | | | 639,868 | | |
| | | Principal
Amount | | Market
Value | |
| Manufacturing — 0.6% | |
Eastman Kodak Co.
3.625% 05/15/2008 | | $ | 120,000 | | | $ | 116,700 | | |
Eastman Kodak Co.
7.250% 11/15/2013 | | | 290,000 | | | | 290,000 | | |
Tyco International Group SA
6.000% 11/15/2013 | | | 310,000 | | | | 318,319 | | |
Tyco International Group SA
6.125% 11/01/2008 | | | 40,000 | | | | 40,357 | | |
Tyco International Group SA
6.125% 01/15/2009 | | | 10,000 | | | | 10,127 | | |
Tyco International Group SA
6.375% 10/15/2011 | | | 470,000 | | | | 484,176 | | |
Tyco International Group SA
6.750% 02/15/2011 | | | 80,000 | | | | 83,840 | | |
Tyco International Group SA
6.875% 01/15/2029 | | | 340,000 | | | | 392,425 | | |
| | | | 1,735,944 | | |
| Media — 1.7% | |
AOL Time Warner, Inc.
6.875% 05/01/2012 | | | 600,000 | | | | 625,962 | | |
AOL Time Warner, Inc.
7.700% 05/01/2032 | | | 60,000 | | | | 64,881 | | |
CCH I LLC
11.000% 10/01/2015 | | | 130,000 | | | | 135,687 | | |
Clear Channel
Communications, Inc.
4.250% 05/15/2009 | | | 50,000 | | | | 48,324 | | |
Clear Channel
Communications, Inc.
4.625% 01/15/2008 | | | 10,000 | | | | 9,915 | | |
Clear Channel
Communications, Inc.
5.500% 09/15/2014 | | | 570,000 | | | | 487,101 | | |
Clear Channel
Communications, Inc.
6.250% 03/15/2011 | | | 10,000 | | | | 9,623 | | |
Comcast Corp.
6.500% 01/15/2015 | | | 1,405,000 | | | | 1,440,614 | | |
Comcast Corp.
6.500% 01/15/2017 | | | 390,000 | | | | 398,173 | | |
Cox Communications, Inc.
3.875% 10/01/2008 | | | 75,000 | | | | 73,454 | | |
CSC Holdings, Inc.
7.625% 07/15/2018 | | | 55,000 | | | | 52,250 | | |
CSC Holdings, Inc.
7.875% 02/15/2018 | | | 5,000 | | | | 4,825 | | |
DirecTV Holdings
LLC/DirecTV
Financing Co.
8.375% 03/15/2013 | | | 55,000 | | | | 57,544 | | |
Echostar DBS Corp.
6.625% 10/01/2014 | | | 45,000 | | | | 42,975 | | |
| | | Principal
Amount | | Market
Value | |
Echostar DBS Corp.
7.000% 10/01/2013 | | $ | 95,000 | | | $ | 93,575 | | |
Echostar DBS Corp.
7.125% 02/01/2016 | | | 40,000 | | | | 39,100 | | |
Liberty Media Corp.
7.875% 07/15/2009 | | | 1,240,000 | | | | 1,286,250 | | |
News America, Inc.
6.200% 12/15/2034 | | | 20,000 | | | | 18,644 | | |
Rogers Cable, Inc.
6.750% 03/15/2015 | | | 40,000 | | | | 41,239 | | |
Shaw Communications, Inc.
7.250% 04/06/2011 | | | 20,000 | | | | 20,600 | | |
Sun Media Corp.
7.625% 02/15/2013 | | | 25,000 | | | | 25,125 | | |
Time Warner
Entertainment Co., LP
8.375% 07/15/2033 | | | 60,000 | | | | 69,632 | | |
TL Acquisitions, Inc.(c)
10.500% 01/15/2015 | | | 80,000 | | | | 79,517 | | |
Umbella Acquistion, Inc.(c)
9.750% 03/15/2015 | | | 70,000 | | | | 69,125 | | |
| | | | 5,194,135 | | |
| Medical Supplies — 0.1% | |
FMC Finance III SA(c)
6.875% 07/15/2017 | | | 240,000 | | | | 235,200 | | |
| Mining — 0.3% | |
Freeport-McMoran
Copper & Gold, Inc.
8.375% 04/01/2017 | | | 250,000 | | | | 266,875 | | |
Vale Overseas Ltd.
6.875% 11/21/2036 | | | 741,000 | | | | 744,843 | | |
| | | | 1,011,718 | | |
| Multi-National — 0.6% | |
International Finance Corp.
4.750% 04/25/2012 | | | 2,000,000 | | | | 1,964,856 | | |
| Office Equipment/Supplies — 0.0% | |
Xerox Corp.
6.750% 02/01/2017 | | | 30,000 | | | | 30,773 | | |
| Oil & Gas — 1.9% | |
Amerada Hess Corp.
7.300% 08/15/2031 | | | 655,000 | | | | 702,434 | | |
Amerada Hess Corp.
7.875% 10/01/2029 | | | 90,000 | | | | 101,446 | | |
Anadarko Finance Co.,
Series B
7.500% 05/01/2031 | | | 230,000 | | | | 247,122 | | |
Anadarko Petroleum Corp.
6.450% 09/15/2036 | | | 290,000 | | | | 278,930 | | |
Anadarko Petroleum
Corp. FRN
5.760% 09/15/2009 | | | 480,000 | | | | 480,427 | | |
(Continued)
The accompanying notes are an integral part of the financial statements.
90
MassMutual Select Strategic Bond Fund – Portfolio of Investments (Continued)
| | | Principal
Amount | | Market
Value | |
Chesapeake Energy Corp.
6.375% 06/15/2015 | | $ | 40,000 | | | $ | 38,150 | | |
Chesapeake Energy Corp.
6.500% 08/15/2017 | | | 40,000 | | | | 37,900 | | |
ChevronTexaco Capital Co.
3.500% 09/17/2007 | | | 150,000 | | | | 149,488 | | |
Conoco, Inc.
6.950% 04/15/2029 | | | 145,000 | | | | 158,248 | | |
Gaz Capital SA(c)
6.510% 03/07/2022 | | | 340,000 | | | | 335,580 | | |
Kerr-McGee Corp.
6.950% 07/01/2024 | | | 290,000 | | | | 300,875 | | |
Kerr-McGee Corp.
7.875% 09/15/2031 | | | 650,000 | | | | 751,116 | | |
OPTI Canada, Inc.(c)
7.875% 12/15/2014 | | | 200,000 | | | | 200,000 | | |
Opti Cananda, Inc.(c)
8.250% 12/15/2014 | | | 75,000 | | | | 76,125 | | |
Pemex Project Funding
Master Trust
6.625% 06/15/2035 | | | 550,000 | | | | 558,250 | | |
Petrobras International
Finance Co.
6.125% 10/06/2016 | | | 550,000 | | | | 539,000 | | |
Pogo Producing Co.
6.625% 03/15/2015 | | | 100,000 | | | | 99,000 | | |
Pogo Producing Co.
6.875% 10/01/2017 | | | 15,000 | | | | 14,888 | | |
Pride International, Inc.
7.375% 07/15/2014 | | | 40,000 | | | | 40,100 | | |
Western Oil Sands, Inc.
8.375% 05/01/2012 | | | 70,000 | | | | 76,563 | | |
XTO Energy, Inc.
7.500% 04/15/2012 | | | 600,000 | | | | 645,060 | | |
| | | | 5,830,702 | | |
| Oil & Gas Services — 0.1% | |
Compagnie Generale de
Geophysique-Veritas
7.500% 05/15/2015 | | | 35,000 | | | | 35,000 | | |
Compagnie Generale de
Geophysique-Veritas
7.750% 05/15/2017 | | | 195,000 | | | | 197,438 | | |
Complete Production
Services, Inc.(c)
8.000% 12/15/2016 | | | 170,000 | | | | 171,700 | | |
| | | | 404,138 | | |
| Packaging & Containers — 0.1% | |
Graham Packaging Co.(a)
9.875% 10/15/2014 | | | 55,000 | | | | 55,619 | | |
Graham Packaging Co., Inc.
8.500% 10/15/2012 | | | 110,000 | | | | 110,688 | | |
| | | | 166,307 | | |
| | | Principal
Amount | | Market
Value | |
| Pharmaceuticals — 0.1% | |
Wyeth
5.950% 04/01/2037 | | $ | 460,000 | | | $ | 439,614 | | |
| Pipelines — 1.0% | |
Dynegy Holdings, Inc.(c)
7.750% 06/01/2019 | | | 260,000 | | | | 241,800 | | |
El Paso Corp.
7.000% 06/15/2017 | | | 680,000 | | | | 672,550 | | |
El Paso Corp.(a)
7.750% 01/15/2032 | | | 84,000 | | | | 84,614 | | |
El Paso Corp.
7.800% 08/01/2031 | | | 19,000 | | | | 19,240 | | |
El Paso Natural Gas Co.
8.375% 06/15/2032 | | | 349,000 | | | | 409,237 | | |
Kinder Morgan Energy
Partners LP
5.000% 12/15/2013 | | | 100,000 | | | | 94,625 | | |
Kinder Morgan Energy
Partners LP
6.000% 02/01/2017 | | | 400,000 | | | | 391,448 | | |
Kinder Morgan Energy
Partners LP
6.300% 02/01/2009 | | | 60,000 | | | | 60,644 | | |
Kinder Morgan Energy
Partners LP
6.750% 03/15/2011 | | | 60,000 | | | | 62,092 | | |
Kinder Morgan Energy
Partners LP
7.125% 03/15/2012 | | | 20,000 | | | | 21,040 | | |
Pacific Energy Partners,
LP/Pacific Energy
Finance Corp.
7.125% 06/15/2014 | | | 20,000 | | | | 20,692 | | |
Semgroup LP(c)
8.750% 11/15/2015 | | | 35,000 | | | | 35,175 | | |
Southern Natural Gas Co.
8.000% 03/01/2032 | | | 5,000 | | | | 5,671 | | |
Tennessee Gas Pipeline
7.625% 04/01/2037 | | | 50,000 | | | | 54,865 | | |
Williams Cos., Inc.
7.750% 06/15/2031 | | | 210,000 | | | | 222,338 | | |
Williams Cos., Inc. Series A(a)
7.500% 01/15/2031 | | | 645,000 | | | | 667,575 | | |
| | | | 3,063,606 | | |
| Real Estate — 0.0% | |
Forest City Enterprises, Inc.
7.625% 06/01/2015 | | | 35,000 | | | | 35,263 | | |
| Real Estate Investment Trusts (REITS) — 0.0% | |
Ventas Realty Corp. REIT
6.500% 06/01/2016 | | | 35,000 | | | | 34,125 | | |
Ventas Realty LP
Capital Corp.
6.750% 04/01/2017 | | | 30,000 | | | | 29,625 | | |
| | | | 63,750 | | |
| | | Principal
Amount | | Market
Value | |
| Retail — 0.1% | |
Amerigas Partners, LP
7.250% 05/20/2015 | | $ | 30,000 | | | $ | 29,700 | | |
CVS Corp.(c)
5.298% 01/11/2027 | | | 17,675 | | | | 16,414 | | |
Suburban Propane
Partners
6.875% 12/15/2013 | | | 80,000 | | | | 77,200 | | |
Wal-Mart Stores, Inc.
3.375% 10/01/2008 | | | 255,000 | | | | 248,771 | | |
| | | | 372,085 | | |
| Semiconductors — 0.0% | |
Freescale
Semiconductor, Inc.(c)
8.875% 12/15/2014 | | | 45,000 | | | | 42,975 | | |
| Telecommunications — 1.4% | |
BellSouth Corp.
4.750% 11/15/2012 | | | 10,000 | | | | 9,557 | | |
British Telecom PLC FRN
8.625% 12/15/2010 | | | 130,000 | | | | 142,060 | | |
Cincinnati Bell, Inc.
7.000% 02/15/2015 | | | 60,000 | | | | 58,800 | | |
Citizens
Communications Co.
7.125% 03/15/2019 | | | 65,000 | | | | 61,425 | | |
Citizens
Communications Co.
7.875% 01/15/2027 | | | 95,000 | | | | 92,388 | | |
Deutsche Telekom
International
Finance BV
5.750% 03/23/2016 | | | 390,000 | | | | 380,450 | | |
Intelsat Bermuda, Ltd.
9.250% 06/15/2016 | | | 40,000 | | | | 42,500 | | |
Koninklijke KPN NV
8.000% 10/01/2010 | | | 715,000 | | | | 765,247 | | |
Koninklijke KPN NV
8.375% 10/01/2030 | | | 200,000 | | | | 224,262 | | |
Level 3 Financing, Inc.(c)
8.750% 02/15/2017 | | | 45,000 | | | | 44,494 | | |
Level 3 Financing, Inc.
9.250% 11/01/2014 | | | 50,000 | | | | 50,500 | | |
Qwest Communications
International, Inc.
7.500% 02/15/2014 | | | 35,000 | | | | 35,438 | | |
Qwest Communications
International, Inc. FRN
8.860% 02/15/2009 | | | 10,000 | | | | 10,100 | | |
Qwest Corp.
6.875% 09/15/2033 | | | 130,000 | | | | 121,875 | | |
Qwest Corp.
7.500% 10/01/2014 | | | 55,000 | | | | 56,375 | | |
SBC Communications, Inc.
5.100% 09/15/2014 | | | 230,000 | | | | 219,383 | | |
(Continued)
The accompanying notes are an integral part of the financial statements.
91
MassMutual Select Strategic Bond Fund – Portfolio of Investments (Continued)
| | | Principal
Amount | | Market
Value | |
Sprint Capital
8.750% 03/15/2032 | | $ | 260,000 | | | $ | 292,014 | | |
Sprint Capital Corp.
8.375% 03/15/2012 | | | 30,000 | | | | 32,682 | | |
Sprint Nextel Corp.
6.000% 12/01/2016 | | | 980,000 | | | | 929,682 | | |
Telecom Italia Capital SA
4.950% 09/30/2014 | | | 100,000 | | | | 92,653 | | |
Telecom Italia Capital SA
5.250% 10/01/2015 | | | 310,000 | | | | 288,258 | | |
Verizon Global
Funding Corp.
7.375% 09/01/2012 | | | 220,000 | | | | 236,949 | | |
Windsream Corp.
8.625% 08/01/2016 | | | 160,000 | | | | 169,200 | | |
| | | | 4,356,292 | | |
| Transportation — 0.0% | |
Gulfmark Offshore, Inc.
7.750% 07/15/2014 | | | 20,000 | | | | 20,200 | | |
Horizon Lines LLC
9.000% 11/01/2012 | | | 65,000 | | | | 68,738 | | |
| | | | 88,938 | | |
TOTAL CORPORATE DEBT
(Cost $76,159,807) | | | | | | | 74,745,925 | | |
NON-U.S. GOVERNMENT
AGENCY OBLIGATIONS — 7.6% | |
| Collateralized Mortgage Obligations — 7.4% | |
American Home Mortgage
Investment Trust,
Series 2005-4,
Class 1A1 FRN
5.610% 11/25/2045 | | | 464,667 | | | | 466,048 | | |
Countrywide Alternative
Loan Trust,
Series 2005-24,
Class 4A1 FRN
5.550% 07/20/2035 | | | 202,232 | | | | 202,187 | | |
Countrywide Alternative
Loan Trust,
Series 2005-38,
Class A3 FRN
5.670% 09/25/2035 | | | 129,601 | | | | 129,821 | | |
Countrywide Alternative
Loan Trust,
Series 2005-44,
Class 1A1 FRN
5.650% 10/25/2035 | | | 339,571 | | | | 339,864 | | |
Countrywide Alternative
Loan Trust,
Series 2005-59,
Class 1A1 FRN
5.649% 11/20/2035 | | | 574,709 | | | | 575,262 | | |
| | | Principal
Amount | | Market
Value | |
Countrywide Alternative
Loan Trust,
Series 2005-J12,
Class 2A1 FRN
5.590% 08/25/2035 | | $ | 551,727 | | | $ | 551,962 | | |
Countrywide Home Equity
Loan Trust,
Series 2005-G,
Class 2A FRN
5.550% 12/15/2035 | | | 293,106 | | | | 293,341 | | |
Countrywide Home Loan
Mortgage Pass Through
Trust, Series 2005-R3,
Class AF FRN(c)
5.720% 09/25/2035 | | | 792,639 | | | | 795,541 | | |
GS Mortgage Securities
Corp. II, Series 2005-GG4,
Class AABA
4.680% 07/10/2039 | | | 200,000 | | | | 190,798 | | |
GSMPS Mortgage Loan
Trust, Series 2005-RP3,
Class 1AF FRN
5.670% 09/25/2035 | | | 539,270 | | | | 540,203 | | |
GSR Mortgage Loan Trust,
Series 2005-AR5,
Class 2A3 VRN
5.182% 10/25/2035 | | | 678,375 | | | | 670,697 | | |
Harborview Mortgage
Loan Trust,
Series 2006-2,
Class 1A VRN
5.441% 02/25/2036 | | | 468,331 | | | | 465,823 | | |
HSI Asset
Securitization Corp.
Trust, Series 2005-I1,
Class 2A4 FRN
5.710% 11/25/2035 | | | 1,400,000 | | | | 1,396,424 | | |
Impac Secured Assets
Corp., Series 2005-2,
Class A1 FRN
5.640% 03/25/2036 | | | 897,545 | | | | 898,924 | | |
Indymac Index Mortgage
Loan Trust,
Series 2004-AR12,
Class A1 FRN
5.710% 12/25/2034 | | | 131,375 | | | | 132,007 | | |
JP Morgan Chase
Commercial Mortgage
Securities Corp.,
Series 2005-CB12,
Class A4
4.895% 09/12/2037 | | | 500,000 | | | | 469,612 | | |
JP Morgan Chase
Commercial Mortgage
Securities Corp.,
Series 2005-CB13,
Class A4 VRN
5.472% 01/12/2043 | | | 100,000 | | | | 96,740 | | |
| | | Principal
Amount | | Market
Value | |
JP Morgan Chase
Commercial Mortgage
Securities Corp.,
Series 2007-LDPX,
Class A3
5.420% 01/15/2049 | | $ | 1,110,000 | | | $ | 1,070,069 | | |
Keycorp Student Loan
Trust, Series 2005-A,
Class 1A1 FRN
5.378% 12/27/2019 | | | 53,959 | | | | 53,934 | | |
LB-UBS Commercial
Mortgage Trust,
Series 2005-C3, Class A5
4.739% 07/15/2030 | | | 140,000 | | | | 130,364 | | |
LB-UBS Commercial
Mortgage Trust,
Series 2005-C3,
Class AAB
4.664% 07/15/2030 | | | 100,000 | | | | 95,257 | | |
LB-UBS Commercial
Mortgage Trust,
Series 2005-C5, Class A4
4.954% 09/15/2040 | | | 100,000 | | | | 94,442 | | |
Lehman XS Trust,
Series 2006-2N,
Class 1A1 FRN
5.580% 02/25/2046 | | | 1,023,796 | | | | 1,025,236 | | |
MASTR Adjustable Rate
Mortgages Trust,
Series 2006-2,
Class 3A1 VRN
4.848% 01/25/2036 | | | 804,304 | | | | 790,641 | | |
MASTR Reperforming
Loan Trust,
Series 2005-2,
Class 1A1F FRN(c)
5.670% 05/25/2035 | | | 535,561 | | | | 536,462 | | |
Merrill Lynch/Countrywide
Commercial Mortgage
Trust, Series 2007-6,
Class A4 VRN
5.485% 03/12/2051 | | | 700,000 | | | | 678,213 | | |
Morgan Stanley Mortgage
Loan Trust,
Series 2006-3AR,
Class 2A3 VRN
5.893% 03/25/2036 | | | 466,841 | | | | 466,209 | | |
MSDWCC Heloc Trust,
Series 2005-1,
Class A FRN
5.510% 07/25/2017 | | | 21,972 | | | | 22,003 | | |
Origen Manufactured
Housing, Series 2005-B,
Class A3
5.605% 05/15/2022 | | | 3,000,000 | | | | 2,906,721 | | |
(Continued)
The accompanying notes are an integral part of the financial statements.
92
MassMutual Select Strategic Bond Fund – Portfolio of Investments (Continued)
| | | Principal
Amount | | Market
Value | |
Prime Mortgage Trust,
Series 2006-DR1,
Class 1A1(c)
5.500% 05/25/2035 | | $ | 994,716 | | | $ | 972,437 | | |
Prime Mortgage Trust,
Series 2006-DR1,
Class 1A2(c)
6.000% 05/25/2035 | | | 435,178 | | | | 434,448 | | |
Prime Mortgage Trust,
Series 2006-DR1,
Class 2A2(c)
6.000% 05/25/2035 | | | 2,161,503 | | | | 2,123,339 | | |
Washington Mutual, Inc.,
Series 2005-AR11,
Class A1A FRN
5.640% 08/25/2045 | | | 593,999 | | | | 594,437 | | |
Washington Mutual, Inc.,
Series 2005-AR13,
Class A1A1 FRN
5.610% 10/25/2045 | | | 373,308 | | | | 373,702 | | |
Washington Mutual, Inc.,
Series 2005-AR15,
Class A1A1 FRN
5.580% 11/25/2045 | | | 496,037 | | | | 494,770 | | |
Washington Mutual, Inc.,
Series 2005-AR15,
Class A1A2 FRN
5.600% 11/25/2045 | | | 496,037 | | | | 493,575 | | |
Washington Mutual, Inc.,
Series 2005-AR19,
Class A1A1 FRN
5.590% 12/25/2045 | | | 529,978 | | | | 530,058 | | |
Washington Mutual, Inc.,
Series 2005-AR19,
Class A1A2 FRN
5.610% 12/25/2045 | | | 662,473 | | | | 662,356 | | |
Washington Mutual, Inc.,
Series 2005-AR8,
Class 1A1A FRN
5.590% 07/25/2045 | | | 119,298 | | | | 119,377 | | |
Washington Mutual, Inc.,
Series 2005-AR9,
Class A1A FRN
5.640% 07/25/2045 | | | 413,511 | | | | 414,209 | | |
| | | | 23,297,513 | | |
| Pass-Through Securities — 0.2% | |
CVS Corp. Lease.
Pass Through(c)
5.880% 01/10/2028 | | | 155,234 | | | | 148,713 | | |
CVS Corp. Lease.
Pass Through(c)
6.036% 12/10/2028 | | | 178,375 | | | | 172,595 | | |
| | | Principal
Amount | | Market
Value | |
CVS Corp. Lease.
Pass Through(c)
9.350% 01/10/2023 | | $ | 240,000 | | | $ | 290,294 | | |
| | | | 611,602 | | |
TOTAL NON-U.S. GOVERNMENT
AGENCY OBLIGATIONS
(Cost $24,201,656) | | | | | | | 23,909,115 | | |
| SOVEREIGN DEBT OBLIGATIONS — 1.0% | |
| Sovereign | |
Bundesrepub
Deutschland EUR(b)
3.750% 01/04/2015 | | | 710,000 | | | | 908,796 | | |
Republic of Brazil
8.875% 04/15/2024 | | | 20,000 | | | | 24,900 | | |
Republic of Brazil
10.125% 05/15/2027 | | | 95,000 | | | | 133,950 | | |
Republic of Brazil(a)
11.000% 08/17/2040 | | | 624,000 | | | | 818,376 | | |
Russian Federation FRN
7.500% 03/31/2030 | | | 292,325 | | | | 321,996 | | |
United Mexican States
6.750% 09/27/2034 | | | 847,000 | | | | 903,326 | | |
| | | | 3,111,344 | | |
TOTAL SOVEREIGN DEBT
OBLIGATIONS
(Cost $3,072,509) | | | | | | | 3,111,344 | | |
U.S. GOVERNMENT AGENCY
OBLIGATIONS — 48.8% | |
| U.S. Government Agencies | |
| Pass-Through Securities | |
Federal Home Loan Bank
4.875% 11/18/2011-
05/17/2017 | | | 1,070,000 | | | | 1,040,492 | | |
Federal Home Loan Bank
5.125% 06/13/2008 | | | 50,000 | | | | 49,896 | | |
Federal Home Loan Bank
5.375% 08/19/2011 | | | 50,000 | | | | 50,233 | | |
FHLMC
4.375% 11/16/2007 | | | 220,000 | | | | 219,330 | | |
FHLMC
4.650% 10/10/2013 | | | 700,000 | | | | 668,051 | | |
FHLMC
4.750% 01/18/2011-
03/05/2012 | | | 820,000 | | | | 803,075 | | |
FHLMC
5.125% 04/18/2011 | | | 340,000 | | | | 338,398 | | |
FHLMC
5.250% 02/24/2011 | | | 1,060,000 | | | | 1,052,410 | | |
FHLMC
5.300% 05/12/2020 | | | 970,000 | | | | 920,393 | | |
| | | Principal
Amount | | Market
Value | |
FHLMC
5.625% 03/15/2011-
11/23/2035 | | $ | 210,000 | | | $ | 200,405 | | |
FHLMC
6.750% 09/15/2029 | | | 50,000 | | | | 57,114 | | |
FHLMC FRN
5.942% 10/01/2036 | | | 1,397,494 | | | | 1,401,004 | | |
FHLMC FRN
6.331% 03/01/2037 | | | 1,377,658 | | | | 1,390,133 | | |
FNMA
4.610% 10/10/2013 | | | 510,000 | | | | 485,870 | | |
FNMA
5.000% 11/01/2021-
08/01/2034 | | | 55,991,324 | | | | 52,961,382 | | |
FNMA
5.200% 11/08/2010 | | | 440,000 | | | | 437,660 | | |
FNMA
5.500% 01/01/2021-
06/01/2037 | | | 41,810,724 | | | | 40,572,262 | | |
FNMA
5.625% 05/19/2011 | | | 770,000 | | | | 770,714 | | |
FNMA
6.000% 10/01/2035-
04/01/2037 | | | 24,593,528 | | | | 24,336,743 | | |
FNMA
6.500% 09/01/2035-
06/01/2037 | | | 10,263,003 | | | | 10,367,574 | | |
FNMA
6.625% 09/15/2009 | | | 490,000 | | | | 504,420 | | |
FNMA FRN
6.723% 03/01/2036 | | | 899,422 | | | | 913,554 | | |
FNMA TBA(d)
6.000% 07/01/2037 | | | 10,000,000 | | | | 9,889,844 | | |
GNMA
6.000% 04/15/2029-
05/15/2037 | | | 3,740,140 | | | | 3,724,079 | | |
TOTAL U.S. GOVERNMENT
AGENCY OBLIGATIONS
(Cost $155,946,762) | | | | | | | 153,155,036 | | |
| U.S. TREASURY OBLIGATIONS — 10.0% | |
| U.S. Government Agencies | |
U.S. Treasury Bond(a)
4.500% 02/15/2036 | | | 1,905,000 | | | | 1,725,216 | | |
U.S. Treasury Bond
4.750% 02/15/2037 | | | 150,000 | | | | 141,445 | | |
U.S. Treasury
Inflation Index
1.875% 07/15/2015 | | | 616,041 | | | | 582,174 | | |
U.S. Treasury
Inflation Index
2.000% 01/15/2014 | | | 961,575 | | | | 924,091 | | |
U.S. Treasury
Inflation Index
2.000% 01/15/2016 | | | 1,686,274 | | | | 1,601,686 | | |
(Continued)
The accompanying notes are an integral part of the financial statements.
93
MassMutual Select Strategic Bond Fund – Portfolio of Investments (Continued)
| | | Principal
Amount | | Market
Value | |
U.S. Treasury
Inflation Index
2.000% 01/15/2026 | | $ | 1,394,819 | | | $ | 1,262,346 | | |
U.S. Treasury
Inflation Index
2.375% 01/15/2017 | | | 1,085,928 | | | | 1,060,405 | | |
U.S. Treasury
Inflation Index
2.375% 01/15/2025 | | | 3,594,946 | | | | 3,455,012 | | |
U.S. Treasury
Inflation Index
2.375% 01/15/2027 | | | 4,702,271 | | | | 4,514,181 | | |
U.S. Treasury
Inflation Index
3.375% 04/15/2032 | | | 244,425 | | | | 281,341 | | |
U.S. Treasury
Inflation Index
3.875% 01/15/2009 | | | 113,377 | | | | 115,171 | | |
U.S. Treasury
Inflation Index
3.875% 04/15/2029 | | | 2,312,365 | | | | 2,789,218 | | |
U.S. Treasury Note
3.000% 02/15/2008 | | | 10,000 | | | | 9,878 | | |
U.S. Treasury Note
3.750% 05/15/2008 | | | 70,000 | | | | 69,234 | | |
U.S. Treasury Note
4.500% 03/31/2009 | | | 130,000 | | | | 129,086 | | |
U.S. Treasury Note
4.500% 05/15/2010 | | | 440,000 | | | | 435,325 | | |
U.S. Treasury Note
4.500% 09/30/2011 | | | 1,370,000 | | | | 1,347,845 | | |
U.S. Treasury Note(a)
4.500% 03/31/2012 | | | 7,540,000 | | | | 7,401,570 | | |
U.S. Treasury Note(a)
4.500% 04/30/2012 | | | 2,660,000 | | | | 2,610,956 | | |
U.S. Treasury Note(a)
4.625% 10/31/2011 | | | 390,000 | | | | 385,399 | | |
U.S. Treasury Note
4.750% 02/15/2010 | | | 370,000 | | | | 368,584 | | |
U.S. Treasury Note
4.750% 03/31/2011 | | | 40,000 | | | | 39,788 | | |
U.S. Treasury Note
5.125% 05/15/2016 | | | 1,000 | | | | 1,005 | | |
U.S. Treasury Note
6.000% 08/15/2009 | | | 100,000 | | | | 102,172 | | |
U.S. Treasury
Principal Strips
0.000% 05/15/2030 | | | 430,000 | | | | 133,585 | | |
| | | | 31,486,713 | | |
TOTAL U.S. TREASURY
OBLIGATIONS
(Cost $32,101,609) | | | | | | | 31,486,713 | | |
TOTAL BONDS & NOTES
(Cost $301,805,857) | | | | | | | 296,611,400 | | |
| | | Principal
Amount | | Market
Value | |
| OPTIONS — 0.2% | |
90 Day
Eurodollar Futures,
December 2007 Call,
Expires 12/17/2007,
Strike 94 | | $ | 95,000 | | | $ | 67,925 | | |
Eurodollar Future Options,
September 2007 Call,
Expires 9/17/07,
Strike 94 | | | 582,500 | | | | 390,275 | | |
Eurodollar Future Options,
September 2007 Call,
Expires 9/17/07,
Strike 94.5 | | | 97,500 | | | | 16,819 | | |
Eurodollar Future Options,
September 2007 Call,
Expires 9/17/07,
Strike 94.75 | | | 195,000 | | | | 4,387 | | |
Eurodollar Future Options,
September 2007 Put,
Expires 9/17/07,
Strike 94 | | | 32,500 | | | | 81 | | |
U.S. 4 Year Treasury
Note (CBT) Futures,
September 2007 Call,
Expires 0824/2007,
Strike 103 | | | 78,000 | | | | 95,063 | | |
U.S. 5 Year Treasury
Note (CBT) Futures,
September 2007 Call,
Expires 08/24/2007,
Strike 104.5 | | | 17,000 | | | | 5,578 | | |
TOTAL OPTIONS
(Cost $844,124) | | | | | | | 580,128 | | |
TOTAL LONG TERM INVESTMENTS
(Cost $302,844,545) | | | | | | | 297,424,375 | | |
| SHORT-TERM INVESTMENTS — 12.5% | |
| Cash Equivalents — 5.1%(g) | |
Abbey National PLC
Eurodollar Time Deposit
5.280% 07/05/2007 | | | 207,952 | | | | 207,952 | | |
Abbey National PLC
Eurodollar Time Deposit
5.285% 07/09/2007 | | | 519,864 | | | | 519,864 | | |
American Beacon Money
Market Fund(e) | | | 583,264 | | | | 583,264 | | |
Banco Bilbao Vizcaya
Argentaria SA
Eurodollar Time Deposit
5.300% 08/10/2007 | | | 389,898 | | | | 389,898 | | |
Bank of America
5.270% 07/06/2007 | | | 519,864 | | | | 519,864 | | |
| | | Principal
Amount | | Market
Value | |
Bank of America
5.270% 07/16/2007 | | $ | 103,973 | | | $ | 103,973 | | |
Bank of America
5.270% 08/17/2007 | | | 129,966 | | | | 129,966 | | |
Bank of America
5.300% 09/17/2007 | | | 259,932 | | | | 259,932 | | |
Bank of Ireland
Eurodollar Time Deposit
5.300% 08/13/2007 | | | 519,864 | | | | 519,864 | | |
Bank of Montreal
Eurodollar Time Deposit
5.280% 07/03/2007 | | | 129,966 | | | | 129,966 | | |
Bank of Montreal
Eurodollar Time Deposit
5.290% 07/02/2007 | | | 103,973 | | | | 103,973 | | |
Bank of Montreal
Eurodollar Time Deposit
5.310% 08/14/2007 | | | 77,980 | | | | 77,980 | | |
Bank of Nova Scotia
Eurodollar Time Deposit
5.280% 07/09/2007 | | | 493,871 | | | | 493,871 | | |
Bank Of Nova Scotia
Eurodollar Time Deposit
5.285% 07/11/2007 | | | 285,925 | | | | 285,925 | | |
Barclays
Eurodollar Time Deposit
5.290% 07/06/2007 | | | 519,864 | | | | 519,864 | | |
Barclays
Eurodollar Time Deposit
5.295% 07/16/2007 | | | 103,973 | | | | 103,973 | | |
Barclays
Eurodollar Time Deposit
5.320% 09/04/2007 | | | 259,932 | | | | 259,932 | | |
Bear Stearns & Co
Commercial Paper
5.435% 07/10/2007 | | | 77,980 | | | | 77,980 | | |
BGI Institutional Money
Market Fund(e) | | | 337,912 | | | | 337,912 | | |
BNP Paribas
Eurodollar Time Deposit
5.350% 07/02/2007 | | | 779,796 | | | | 779,796 | | |
Calyon
Eurodollar Time Deposit
5.290% 07/17/2007 | | | 259,932 | | | | 259,932 | | |
Calyon
Eurodollar Time Deposit
5.380% 07/02/2007 | | | 779,796 | | | | 779,796 | | |
Canadian Imperial
Bank of Commerce
Eurodollar Time Deposit
5.300% 07/30/2007 | | | 519,864 | | | | 519,864 | | |
Dexia Group
Eurodollar Time Deposit
5.290% 08/08/2007 | | | 519,864 | | | | 519,864 | | |
(Continued)
The accompanying notes are an integral part of the financial statements.
94
MassMutual Select Strategic Bond Fund – Portfolio of Investments (Continued)
| | | Principal
Amount | | Market
Value | |
Dreyfus Institutional Cash
Advantage Money
Market Fund(e) | | $ | 155,959 | | | $ | 155,959 | | |
Federal Home Loan Bank
Discount Note
5.174% 07/20/2007 | | | 38,557 | | | | 38,557 | | |
First Tennessee
National Corp.
Eurodollar Time Deposit
5.300% 07/18/2007 | | | 129,966 | | | | 129,966 | | |
Fortis Bank
Eurodollar Time Deposit
5.290% 07/06/2007 | | | 129,966 | | | | 129,966 | | |
Fortis Bank
Eurodollar Time Deposit
5.290% 07/09/2007 | | | 181,952 | | | | 181,952 | | |
Fortis Bank
Eurodollar Time Deposit
5.300% 07/20/2007 | | | 129,966 | | | | 129,966 | | |
Fortis Bank
Eurodollar Time Deposit
5.300% 07/26/2007 | | | 103,973 | | | | 103,973 | | |
Fortis Bank
Eurodollar Time Deposit
5.350% 07/05/2007 | | | 259,932 | | | | 259,932 | | |
Freddie Mac Discount Note
5.155% 07/16/2007 | | | 49,083 | | | | 49,083 | | |
Freddie Mac Discount Note
5.185% 07/09/2007 | | | 25,624 | | | | 25,624 | | |
Morgan Stanley & Co
Commercial Paper
5.445% 08/01/2007 | | | 233,939 | | | | 233,939 | | |
National Australia Bank
Eurodollar Time Deposit
5.320% 07/02/2007 | | | 259,932 | | | | 259,932 | | |
Nationwide Building
Society Commercial Paper
5.301% 07/09/2007 | | | 259,397 | | | | 259,397 | | |
Rabobank Nederland
Eurodollar Time Deposit
5.280% 07/05/2007 | | | 389,898 | | | | 389,898 | | |
Rabobank Nederland
Eurodollar Time Deposit
5.290% 07/16/2007 | | | 519,864 | | | | 519,864 | | |
Rabobank Nederland
Eurodollar Time Deposit
5.330% 07/02/2007 | | | 779,796 | | | | 779,796 | | |
Reserve Primary Money
Market Fund(e) | | | 516,089 | | | | 516,089 | | |
Royal Bank of Canada
Eurodollar Time Deposit
5.305% 08/30/2007 | | | 519,864 | | | | 519,864 | | |
Royal Bank of Scotland
Eurodollar Time Deposit
5.270% 07/11/2007 | | | 129,966 | | | | 129,966 | | |
| | | Principal
Amount | | Market
Value | |
Skandinaviska Enskilda
Banken AB
Eurodollar Time Deposit
5.290% 07/13/2007 | | $ | 519,864 | | | $ | 519,864 | | |
Skandinaviska Enskilda
Banken AB
Eurodollar Time Deposit
5.290% 07/19/2007 | | | 77,980 | | | | 77,980 | | |
Svenska Handlesbanken
Eurodollar Time Deposit
5.300% 07/02/2007 | | | 87,325 | | | | 87,325 | | |
UBS AG
Eurodollar Time Deposit
5.277% 07/05/2007 | | | 363,905 | | | | 363,905 | | |
UBS AG
Eurodollar Time Deposit
5.285% 07/05/2007 | | | 519,864 | | | | 519,864 | | |
Vanguard Prime Money
Market Fund(e) | | | 259,932 | | | | 259,932 | | |
Wells Fargo
Eurodollar Time Deposit
5.260% 07/02/2007 | | | 140,363 | | | | 140,363 | | |
Wells Fargo
Eurodollar Time Deposit
5.280% 07/11/2007 | | | 519,864 | | | | 519,864 | | |
Wells Fargo
Eurodollar Time Deposit
5.280% 07/12/2007 | | | 259,932 | | | | 259,932 | | |
| | | | 16,047,957 | | |
| Repurchase Agreements — 7.2% | |
Investors Bank & Trust
Company Repurchase
Agreement, dated
6/29/2007, 3.50%,
due 7/02/2007(h) | | | 22,522,943 | | | | 22,522,944 | | |
| U.S. Government Agencies — 0.2% | |
FNMA(f)
5.010% 03/17/2008 | | | 750,000 | | | | 722,862 | | |
TOTAL SHORT-TERM
INVESTMENTS
(Cost $39,293,763) | | | | | | | 39,293,763 | | |
TOTAL INVESTMENTS — 107.3%
(Cost $342,138,308)(i) | | | | | | | 336,718,138 | | |
Other Assets/
(Liabilities) — (7.3%) | | | | | | | (22,952,313 | ) | |
| NET ASSETS — 100.0% | | | | | | $ | 313,765,825 | | |
Notes to Portfolio of Investments
EUR - Euro
FRN - Floating Rate Note
TBA - To be announced
VRN - Variable Rate Note
(a) Denotes all or a portion of security on loan. (Note 2).
(b) The principal amount of the security is in foreign currency. The market value is in U.S. dollars.
(c) Securities exempt from registration under rule 144A of the Securities Act of 1933. These securities may be resold in transactions exempt from registration, normally to qualified institutional buyers. At June 30, 2007, these securities amounted to a value of $20,302,059 or 6.5% of net assets.
(d) A portion of this security is purchased on a forward commitment basis. (Note 2).
(e) Amount represents shares owned of the fund.
(f) This security is held as collateral for open futures contracts. (Note 2).
(g) Represents investments of security lending collateral. (Note 2).
(h) Maturity value $22,529,514. Collateralized by a U.S. Government Agency obligation with a rate of 5.82%, maturity date of 11/15/2033, and an aggregate market value, including accrued interest, of $23,649,092.
(i) See Note 6 for aggregate cost for Federal tax purposes.
The accompanying notes are an integral part of the financial statements.
95
MassMutual Select Strategic Balanced Fund – Portfolio of Investments
June 30, 2007 (Unaudited)
| | | Number of
Shares | | Market
Value | |
| EQUITIES — 59.7% | |
| COMMON STOCK — 59.6% | |
| Advertising — 1.0% | |
Interpublic Group of
Companies, Inc.(a) (b) | | | 211,600 | | | $ | 2,412,240 | | |
| Aerospace & Defense — 2.4% | |
| Boeing Co. | | | 23,300 | | | | 2,281,091 | | |
| Raytheon Co. | | | 64,200 | | | | 3,459,738 | | |
| | | | 5,740,829 | | |
| Automotive & Parts — 0.1% | |
Magna International,
Inc. Cl. A(b) | | | 1,590 | | | | 144,674 | | |
| Banks — 2.7% | |
| Bank of America Corp. | | | 71,820 | | | | 3,511,280 | | |
| State Street Corp.(b) | | | 43,100 | | | | 2,948,040 | | |
| | | | 6,459,320 | | |
| Biotechnology — 0.4% | |
| Enzo Biochem, Inc.(a) (b) | | | 56,745 | | | | 848,338 | | |
| Building Materials — 0.2% | |
Simpson Manufacturing
Co., Inc.(b) | | | 13,700 | | | | 462,238 | | |
| Chemicals — 1.6% | |
| The Dow Chemical Co. | | | 36,100 | | | | 1,596,342 | | |
Du Pont (E.I.) de
Nemours & Co. | | | 44,500 | | | | 2,262,380 | | |
| | | | 3,858,722 | | |
| Computers — 1.0% | |
International Business
Machines Corp. | | | 20,300 | | | | 2,136,575 | | |
Socket
Communications, Inc.(a) | | | 800 | | | | 695 | | |
Wave Systems
Corp. Cl. A(a) (b) | | | 72,067 | | | | 149,899 | | |
| | | | 2,287,169 | | |
| Diversified Financial — 4.6% | |
| American Express Co. | | | 43,800 | | | | 2,679,684 | | |
Blackstone
Group (The), LP(a) | | | 300 | | | | 8,781 | | |
| Franklin Resources, Inc. | | | 4,600 | | | | 609,362 | | |
| JP Morgan Chase & Co. | | | 78,140 | | | | 3,785,883 | | |
| Merrill Lynch & Co., Inc. | | | 38,600 | | | | 3,226,188 | | |
Nuveen
Investments, Inc. Cl. A | | | 9,788 | | | | 608,324 | | |
| | | | 10,918,222 | | |
| | | Number of
Shares | | Market
Value | |
| Electronics — 0.6% | |
Agilent
Technologies, Inc.(a) | | | 40,500 | | | $ | 1,556,820 | | |
| Foods — 2.0% | |
| Kraft Foods, Inc. Cl. A | | | 41,461 | | | | 1,461,500 | | |
| Smithfield Foods, Inc.(a) | | | 8,500 | | | | 261,715 | | |
| Unilever PLC GBP(c) | | | 32,555 | | | | 1,048,359 | | |
Unilever PLC, Sponsored
ADR (United Kingdom) | | | 65,680 | | | | 2,118,837 | | |
| | | | 4,890,411 | | |
| Forest Products & Paper — 0.8% | |
| Weyerhaeuser Co. | | | 25,200 | | | | 1,989,036 | | |
| Health Care – Products — 1.1% | |
| Johnson & Johnson | | | 41,500 | | | | 2,557,230 | | |
| Household Products — 0.8% | |
| Kimberly-Clark Corp. | | | 28,800 | | | | 1,926,432 | | |
| Insurance — 4.8% | |
Allied World Assurance
Holdings Ltd. | | | 17,530 | | | | 898,412 | | |
American International
Group, Inc. | | | 25,500 | | | | 1,785,765 | | |
| Chubb Corp. | | | 47,800 | | | | 2,587,892 | | |
The Hartford Financial
Services Group, Inc. | | | 15,000 | | | | 1,477,650 | | |
| MGIC Investment Corp.(b) | | | 30,600 | | | | 1,739,916 | �� | |
| The PMI Group, Inc. | | | 66,800 | | | | 2,983,956 | | |
| | | | 11,473,591 | | |
| Internet — 0.9% | |
| Bridgeline Software, Inc. | | | 6,400 | | | | 32,000 | | |
| eBay, Inc.(a) | | | 28,300 | | | | 910,694 | | |
| VeriSign, Inc.(a) (b) | | | 35,100 | | | | 1,113,723 | | |
| | | | 2,056,417 | | |
| Machinery – Construction & Mining — 1.0% | |
| Caterpillar, Inc. | | | 30,300 | | | | 2,372,490 | | |
| Manufacturing — 2.9% | |
| Dover Corp. | | | 15,200 | | | | 777,480 | | |
| General Electric Co. | | | 80,000 | | | | 3,062,400 | | |
| Honeywell International, Inc. | | | 56,400 | | | | 3,174,192 | | |
| | | | 7,014,072 | | |
| Media — 5.8% | |
| News Corp., Inc., Cl. B(b) | | | 189,200 | | | | 4,340,248 | | |
| Pearson PLC GBP | | | 213,600 | | | | 3,589,869 | | |
| Time Warner, Inc. | | | 130,500 | | | | 2,745,720 | | |
| The Walt Disney Co. | | | 93,900 | | | | 3,205,746 | | |
| | | | 13,881,583 | | |
| | | Number of
Shares | | Market
Value | |
| Mining — 1.0% | |
| Alcoa, Inc. | | | 54,800 | | | $ | 2,221,044 | | |
AngloGold Ashanti,
Ltd. ADR(b) | | | 1,800 | | | | 68,076 | | |
| Newmont Mining Corp. | | | 1,700 | | | | 66,402 | | |
| | | | 2,355,522 | | |
| Oil & Gas — 2.8% | |
| Anadarko Petroleum Corp. | | | 31,500 | | | | 1,637,685 | | |
| Chevron Corp. | | | 17,600 | | | | 1,482,624 | | |
| ConocoPhillips | | | 8,800 | | | | 690,800 | | |
| Exxon Mobil Corp. | | | 14,000 | | | | 1,174,320 | | |
| GlobalSantaFe Corp. | | | 23,300 | | | | 1,683,425 | | |
| | | | 6,668,854 | | |
| Oil & Gas Services — 2.0% | |
| Baker Hughes, Inc. | | | 13,300 | | | | 1,118,929 | | |
| BJ Services Co. | | | 30,600 | | | | 870,264 | | |
| Halliburton Co. | | | 35,100 | | | | 1,210,950 | | |
| Schlumberger Ltd. | | | 18,700 | | | | 1,588,378 | | |
| | | | 4,788,521 | | |
| Pharmaceuticals — 6.1% | |
| Abbott Laboratories | | | 61,900 | | | | 3,314,745 | | |
Bentley
Pharmaceuticals, Inc.(a) | | | 24,920 | | | | 302,529 | | |
| Eli Lilly & Co. | | | 23,500 | | | | 1,313,180 | | |
GlaxoSmithKline PLC
ADR (United Kingdom) | | | 40,600 | | | | 2,126,222 | | |
Novartis
AG ADR (Switzerland) | | | 26,800 | | | | 1,502,676 | | |
| Pfizer, Inc. | | | 103,600 | | | | 2,649,052 | | |
| Wyeth | | | 57,900 | | | | 3,319,986 | | |
| | | | 14,528,390 | | |
| Pipelines — 0.6% | |
| The Williams Cos., Inc. | | | 43,700 | | | | 1,381,794 | | |
| Retail — 3.1% | |
| The Gap, Inc. | | | 85,400 | | | | 1,631,140 | | |
| The Home Depot, Inc. | | | 58,500 | | | | 2,301,975 | | |
| Wal-Mart Stores, Inc. | | | 57,600 | | | | 2,771,136 | | |
| Williams-Sonoma, Inc.(b) | | | 20,580 | | | | 649,916 | | |
| | | | 7,354,167 | | |
| Semiconductors — 4.7% | |
| Applied Materials, Inc. | | | 154,700 | | | | 3,073,889 | | |
| Novellus Systems, Inc.(a) | | | 39,200 | | | | 1,112,104 | | |
Samsung Electronics Co.
Ltd. GDR (Korea)(d) | | | 5,000 | | | | 1,531,551 | | |
Taiwan Semiconductor
Manufacturing Co. Ltd.
Sponsored ADR (Taiwan) | | | 179,664 | | | | 1,999,657 | | |
(Continued)
The accompanying notes are an integral part of the financial statements.
96
MassMutual Select Strategic Balanced Fund – Portfolio of Investments (Continued)
| | | Number of
Shares | | Market
Value | |
| Texas Instruments, Inc. | | | 83,700 | | | $ | 3,149,631 | | |
| Verigy Ltd.(a) | | | 11,179 | | | | 319,831 | | |
| | | | 11,186,663 | | |
| Software — 1.2% | |
| Microsoft Corp. | | | 98,800 | | | | 2,911,636 | | |
| Telecommunications — 3.4% | |
| Cisco Systems, Inc.(a) | | | 76,800 | | | | 2,138,880 | | |
| Motorola, Inc. | | | 148,900 | | | | 2,635,530 | | |
Vodafone Group PLC
Sponsored ADR
(United Kingdom) | | | 97,012 | | | | 3,262,514 | | |
| | | | 8,036,924 | | |
TOTAL COMMON STOCK
(Cost $115,246,491) | | | | | | | 142,062,305 | | |
| PREFERRED STOCK — 0.1% | |
| Auto Manufacturers | |
General Motors
Corp., Series C | | | 4,150 | | | | 104,269 | | |
TOTAL PREFERRED STOCK
(Cost $94,916) | | | | | | | 104,269 | | |
TOTAL EQUITIES
(Cost $115,341,407) | | | | | | | 142,166,574 | | |
| | | Principal
Amount | | | |
| BONDS & NOTES — 35.3% | |
| ASSET BACKED SECURITIES — 0.1% | |
| Home Equity ABS — 0.1% | |
Wachovia Asset
Securitization, Inc.,
Series 2002-HE1,
Class A FRN
5.690% 09/27/2032 | | $ | 163,929 | | | | 164,518 | | |
| Other ABS — 0.0% | |
First Franklin Mortgage
Loan Asset Backed
Certificates,
Series 2004-FF10,
Class A2 FRN
5.720% 12/25/2032 | | | 81,436 | | | | 81,538 | | |
TOTAL ASSET BACKED
SECURITIES
(Cost $246,466) | | | | | | | 246,056 | | |
| CORPORATE DEBT — 11.2% | |
| Advertising — 0.0% | |
Lamar Media Corp.
6.625% 08/15/2015 | | | 40,000 | | | | 37,900 | | |
| | | Principal
Amount | | Market
Value | |
| Aerospace & Defense — 0.0% | |
DRS Technologies, Inc.
6.625% 02/01/2016 | | $ | 20,000 | | | $ | 19,300 | | |
| Agriculture — 0.1% | |
Altria Group, Inc.
7.000% 11/04/2013 | | | 225,000 | | | | 238,646 | | |
Reynolds American, Inc.
6.750% 06/15/2017 | | | 65,000 | | | | 65,912 | | |
| | | | 304,558 | | |
| Airlines — 0.1% | |
Delta Air Lines, Inc.,
Series 2000-1, Class A2
7.570% 11/18/2010 | | | 200,000 | | | | 207,542 | | |
| Apparel — 0.0% | |
Oxford Industries, Inc.
8.875% 06/01/2011 | | | 15,000 | | | | 15,487 | | |
| Auto Manufacturers — 0.6% | |
DaimlerChrysler NA Holding
4.050% 06/04/2008 | | | 55,000 | | | | 54,228 | | |
DaimlerChrysler NA Holding
5.750% 05/18/2009 | | | 60,000 | | | | 60,156 | | |
DaimlerChrysler NA Holding
5.875% 03/15/2011 | | | 100,000 | | | | 100,510 | | |
DaimlerChrysler NA Holding
7.200% 09/01/2009 | | | 80,000 | | | | 82,568 | | |
Ford Motor Co.
4.250% 12/15/2036 | | | 60,000 | | | | 75,150 | | |
Ford Motor Co.
6.625% 10/01/2028 | | | 50,000 | | | | 37,375 | | |
Ford Motor Co.(b)
7.450% 07/16/2031 | | | 150,000 | | | | 119,812 | | |
General Motors Corp.(b)
8.375% 07/15/2033 | | | 740,000 | | | | 675,250 | | |
General Motors
Corp. EUR(c)
8.375% 07/05/2033 | | | 90,000 | | | | 115,006 | | |
| | | | 1,320,055 | | |
| Automotive & Parts — 0.0% | |
Visteon Corp.
8.250% 08/01/2010 | | | 50,000 | | | | 49,625 | | |
| Banks — 1.1% | |
Bank of America Corp.
5.375% 08/15/2011 | | | 280,000 | | | | 278,776 | | |
Bank One Corp.
2.625% 06/30/2008 | | | 545,000 | | | | 530,230 | | |
Glitnir Banki HF(d)
6.330% 07/28/2011 | | | 160,000 | | | | 162,850 | | |
Glitnir Banki HF VRN(d)
6.693% 06/15/2011 | | | 140,000 | | | | 144,196 | | |
Hypothekenbank
in Essen(d)
5.000% 01/20/2012 | | | 20,000 | | | | 19,736 | | |
| | | Principal
Amount | | Market
Value | |
ICICI Bank Ltd. VRN(d)
6.375% 04/30/2022 | | $ | 136,000 | | | $ | 129,233 | | |
ICICI Bank, Ltd. VRN
6.375% 04/30/2017 | | | 100,000 | | | | 94,900 | | |
Landsbanki Islands HF(d)
6.100% 08/25/2011 | | | 280,000 | | | | 283,540 | | |
Rabobank Capital Funding
Trust III VRN(d)
5.254% 12/31/2016 | | | 20,000 | | | | 18,726 | | |
RSHB Capital SA for
OJSC Russian
Agricultural Bank(d)
6.299% 05/15/2017 | | | 200,000 | | | | 195,760 | | |
Shinsei Finance
Cayman Ltd. VRN(d)
6.418% 07/20/2016 | | | 100,000 | | | | 97,230 | | |
TuranAlem Finance
8.250% 01/22/2037 | | | 100,000 | | | | 96,000 | | |
Turanalem Finance BV(d)
8.250% 01/22/2037 | | | 360,000 | | | | 346,500 | | |
Wachovia Capital
Trust III VRN
5.800% 03/15/2042 | | | 120,000 | | | | 119,477 | | |
Wells Fargo & Co.
5.300% 08/26/2011 | | | 15,000 | | | | 14,891 | | |
Wells Fargo Capital
5.950% 12/15/2036 | | | 100,000 | | | | 93,276 | | |
| | | | 2,625,321 | | |
| Chemicals — 0.0% | |
Georgia Gulf Corp.
9.500% 10/15/2014 | | | 10,000 | | | | 9,950 | | |
Lyondell Chemical Co.
8.000% 09/15/2014 | | | 10,000 | | | | 10,275 | | |
Lyondell Chemical Co.
8.250% 09/15/2016 | | | 5,000 | | | | 5,225 | | |
Westlake Chemicals
6.625% 01/15/2016 | | | 15,000 | | | | 14,212 | | |
| | | | 39,662 | | |
| Coal — 0.0% | |
Peabody Energy Corp.
6.875% 03/15/2013 | | | 15,000 | | | | 14,925 | | |
| Commercial Services — 0.0% | |
Ashtead Capital, Inc.(d)
9.000% 08/15/2016 | | | 16,000 | | | | 16,760 | | |
Di Finance/Dyncorp
International, Series B
9.500% 02/15/2013 | | | 15,000 | | | | 15,956 | | |
Hertz Corp.
8.875% 01/01/2014 | | | 30,000 | | | | 31,275 | | |
Service Corp.
International(d)
7.500% 04/01/2027 | | | 35,000 | | | | 32,987 | | |
(Continued)
The accompanying notes are an integral part of the financial statements.
97
MassMutual Select Strategic Balanced Fund – Portfolio of Investments (Continued)
| | | Principal
Amount | | Market
Value | |
Service Corp.
International, US
6.750% 04/01/2016 | | $ | 15,000 | | | $ | 14,212 | | |
| | | | 111,190 | | |
| Computers — 0.0% | |
Electronic Data
Systems Corp.
7.125% 10/15/2009 | | | 10,000 | | | | 10,291 | | |
Sungard Data Systems, Inc.
9.125% 08/15/2013 | | | 10,000 | | | | 10,237 | | |
Sungard Data
Systems, Inc.(b)
10.250% 08/15/2015 | | | 15,000 | | | | 15,862 | | |
| | | | 36,390 | | |
| Diversified Financial — 3.5% | |
AAC Group
Holding Corp. FRN
0.000% 10/01/2008 | | | 15,000 | | | | 13,500 | | |
Aiful Corp.(d)
5.000% 08/10/2010 | | | 100,000 | | | | 97,472 | | |
American Express Co. VRN
6.800% 09/01/2016 | | | 65,000 | | | | 67,023 | | |
Banque Paribas - New York
6.875% 03/01/2009 | | | 170,000 | | | | 173,880 | | |
Citigroup, Inc.
5.100% 09/29/2011 | | | 370,000 | | | | 364,303 | | |
E*TRADE Financial Corp.
7.375% 09/15/2013 | | | 20,000 | | | | 20,300 | | |
El Paso
Performance-Linked
Trust(d)
7.750% 07/15/2011 | | | 270,000 | | | | 278,100 | | |
Ford Motor Credit Co.
7.375% 10/28/2009 | | | 730,000 | | | | 724,639 | | |
Ford Motor Credit Co.
7.375% 02/01/2011 | | | 120,000 | | | | 117,235 | | |
Ford Motor Credit Co.
8.000% 12/15/2016 | | | 280,000 | | | | 268,197 | | |
Ford Motor Credit Co.,
Series WI FRN
10.610% 06/15/2011 | | | 551,000 | | | | 595,214 | | |
General Electric
Capital Corp.
4.125% 09/01/2009 | | | 150,000 | | | | 146,368 | | |
General Electric
Capital Corp.
4.250% 01/15/2008 | | | 110,000 | | | | 109,374 | | |
General Electric Capital
Corp., Series A FRN
5.620% 09/15/2014 | | | 380,000 | | | | 382,222 | | |
General Motors
Acceptance Corp.
4.375% 12/10/2007 | | | 90,000 | | | | 89,351 | | |
| | | Principal
Amount | | Market
Value | |
General Motors
Acceptance Corp.
5.125% 05/09/2008 | | $ | 120,000 | | | $ | 118,501 | | |
General Motors
Acceptance Corp.
5.850% 01/14/2009 | | | 130,000 | | | | 128,120 | | |
General Motors
Acceptance Corp.
6.125% 08/28/2007 | | | 240,000 | | | | 240,163 | | |
General Motors
Acceptance Corp.
6.311% 11/30/2007 | | | 80,000 | | | | 79,808 | | |
General Motors
Acceptance Corp.
8.000% 11/01/2031 | | | 1,070,000 | | | | 1,094,162 | | |
Goldman Sachs Group, Inc.
4.500% 06/15/2010 | | | 110,000 | | | | 107,249 | | |
Goldman Sachs Group, Inc.
5.000% 01/15/2011 | | | 80,000 | | | | 78,521 | | |
Household
Finance Corp. Series
4.125% 11/16/2009 | | | 375,000 | | | | 364,141 | | |
Idearc, Inc.
8.000% 11/15/2016 | | | 70,000 | | | | 70,700 | | |
ILFC E-Capital
Trust II VRN(d)
6.250% 12/21/2015 | | | 190,000 | | | | 185,315 | | |
Kaupthing
Bank (Iceland)(d)
7.125% 05/19/2016 | | | 100,000 | | | | 105,636 | | |
Kaupthing Bank FRN(d)
6.045% 04/12/2011 | | | 320,000 | | | | 322,481 | | |
Lehman Brothers Holdings
5.250% 02/06/2012 | | | 190,000 | | | | 186,757 | | |
Morgan Stanley
3.625% 04/01/2008 | | | 50,000 | | | | 49,316 | | |
Morgan Stanley
5.625% 01/09/2012 | | | 190,000 | | | | 189,590 | | |
MUFG Capital
Finance 1 Ltd. VRN
6.346% 07/25/2016 | | | 100,000 | | | | 98,258 | | |
Residential Capital Corp.
6.000% 02/22/2011 | | | 70,000 | | | | 67,735 | | |
Residential Capital LLC
6.500% 06/01/2012 | | | 20,000 | | | | 19,516 | | |
Resona Preferred Global
Securities VRN(d)
7.191% 07/30/2015 | | | 155,000 | | | | 158,489 | | |
Sigma Finance, Inc. VRN(d)
8.000% 06/22/2009 | | | 280,000 | | | | 280,000 | | |
SLM Corp.
5.000% 10/01/2013 | | | 180,000 | | | | 153,579 | | |
SLM Corp.
5.000% 04/15/2015 | | | 10,000 | | | | 8,218 | | |
| | | Principal
Amount | | Market
Value | |
SLM Corp.
5.050% 11/14/2014 | | $ | 40,000 | | | $ | 33,263 | | |
SLM Corp.
5.375% 05/15/2014 | | | 285,000 | | | | 244,225 | | |
SLM Corp.
5.625% 08/01/2033 | | | 40,000 | | | | 31,190 | | |
SLM Corp. FRN
3.900% 04/01/2009 | | | 20,000 | | | | 18,728 | | |
SLM Corp.,
Series X FRN(d)
5.330% 04/18/2008 | | | 240,000 | | | | 238,560 | | |
TNK-BP Finance SA(d)
7.500% 07/18/2016 | | | 170,000 | | | | 175,270 | | |
| | | | 8,294,669 | | |
| Electric — 0.9% | |
AES Corp.
7.750% 03/01/2014 | | | 652,000 | | | | 653,630 | | |
AES Corp.
8.875% 02/15/2011 | | | 10,000 | | | | 10,537 | | |
The Cleveland Electric
Illuminating Co.
5.700% 04/01/2017 | | | 5,000 | | | | 4,824 | | |
Dominion Resources, Inc.
4.750% 12/15/2010 | | | 40,000 | | | | 39,065 | | |
Dominion
Resources, Inc.(b)
5.700% 09/17/2012 | | | 165,000 | | | | 165,131 | | |
Duke Energy Corp.
5.625% 11/30/2012 | | | 145,000 | | | | 144,958 | | |
Duke Energy Corp.
6.250% 01/15/2012 | | | 80,000 | | | | 82,117 | | |
Edison Mission Energy(d)
7.000% 05/15/2017 | | | 50,000 | | | | 47,125 | | |
Edison Mission Energy(d)
7.200% 05/15/2019 | | | 60,000 | | | | 56,400 | | |
Edison Mission Energy(d)
7.625% 05/15/2027 | | | 20,000 | | | | 18,900 | | |
Exelon Corp.
5.625% 06/15/2035 | | | 30,000 | | | | 26,802 | | |
FirstEnergy Corp., Series B
6.450% 11/15/2011 | | | 60,000 | | | | 61,525 | | |
FirstEnergy Corp., Series C
7.375% 11/15/2031 | | | 240,000 | | | | 259,812 | | |
NRG Energy, Inc.
7.250% 02/01/2014 | | | 10,000 | | | | 10,025 | | |
NRG Energy, Inc.
7.375% 02/01/2016 | | | 20,000 | | | | 20,050 | | |
NRG Energy, Inc.
7.375% 01/15/2017 | | | 40,000 | | | | 40,150 | | |
Pacific Gas & Electric Co.
5.800% 03/01/2037 | | | 10,000 | | | | 9,328 | | |
Pacific Gas & Electric Co.
6.050% 03/01/2034 | | | 160,000 | | | | 154,990 | | |
TXU Corp., Series P
5.550% 11/15/2014 | | | 60,000 | | | | 50,936 | | |
(Continued)
The accompanying notes are an integral part of the financial statements.
98
MassMutual Select Strategic Balanced Fund – Portfolio of Investments (Continued)
| | | Principal
Amount | | Market
Value | |
TXU Corp., Series Q
6.500% 11/15/2024 | | $ | 140,000 | | | $ | 115,760 | | |
TXU Corp., Series R
6.550% 11/15/2034 | | | 290,000 | | | | 234,558 | | |
| | | | 2,206,623 | | |
| Electronics — 0.0% | |
NXP BV / NXP Funding LLC
7.875% 10/15/2014 | | | 5,000 | | | | 4,925 | | |
| Entertainment — 0.0% | |
AMC Entertainment, Inc.(b)
11.000% 02/01/2016 | | | 15,000 | | | | 16,575 | | |
| Environmental Controls — 0.1% | |
Waste Management, Inc.
6.375% 11/15/2012 | | | 115,000 | | | | 117,615 | | |
Waste Management, Inc.
6.500% 11/15/2008 | | | 30,000 | | | | 30,339 | | |
| | | | 147,954 | | |
| Forest Products & Paper — 0.1% | |
Weyerhaeuser Co.
6.750% 03/15/2012 | | | 175,000 | | | | 181,065 | | |
| Gas — 0.1% | |
Intergas Finance BV(d)
6.375% 05/14/2017 | | | 240,000 | | | | 229,800 | | |
| Health Care – Products — 0.0% | |
Fresenius Medical Care
Capital Trust II
7.875% 02/01/2008 | | | 16,000 | | | | 16,080 | | |
| Health Care – Services — 0.4% | |
Community Health
Systems, Inc.(d)
8.875% 07/15/2015 | | | 60,000 | | | | 60,825 | | |
DaVita, Inc.(d)
6.625% 03/15/2013 | | | 60,000 | | | | 58,575 | | |
HCA, Inc.
6.250% 02/15/2013 | | | 132,000 | | | | 119,130 | | |
HCA, Inc.
6.375% 01/15/2015 | | | 320,000 | | | | 272,000 | | |
HCA, Inc.
6.500% 02/15/2016 | | | 34,000 | | | | 28,772 | | |
HCA, Inc.
7.500% 11/06/2033 | | | 20,000 | | | | 16,950 | | |
HCA, Inc.
7.690% 06/15/2025 | | | 10,000 | | | | 8,698 | | |
HCA, Inc.(d)
9.125% 11/15/2014 | | | 10,000 | | | | 10,512 | | |
HCA, Inc.(d)
9.250% 11/15/2016 | | | 90,000 | | | | 95,850 | | |
HCA, Inc.(d)
9.625% 11/15/2016 | | | 30,000 | | | | 32,250 | | |
| | | Principal
Amount | | Market
Value | |
Tenet Healthcare Corp.
9.250% 02/01/2015 | | $ | 318,000 | | | $ | 302,100 | | |
| | | | 1,005,662 | | |
| Insurance — 0.0% | |
ASIF Global Financing(d)
4.900% 01/17/2013 | | | 20,000 | | | | 19,385 | | |
| Investment Companies — 0.2% | |
Gaz Capital SA(b) (d)
6.212% 11/22/2016 | | | 400,000 | | | | 389,600 | | |
| Iron & Steel — 0.0% | |
Steel Dynamics, Inc.(d)
6.750% 04/01/2015 | | | 45,000 | | | | 44,100 | | |
| Lodging — 0.1% | |
Boyd Gaming Corp.
7.125% 02/01/2016 | | | 20,000 | | | | 19,400 | | |
Inn of the Mountain Gods
Resort & Casino
12.000% 11/15/2010 | | | 20,000 | | | | 21,450 | | |
MGM Mirage
6.625% 07/15/2015 | | | 5,000 | | | | 4,544 | | |
MGM Mirage
7.625% 01/15/2017 | | | 55,000 | | | | 52,319 | | |
MGM Mirage
8.375% 02/01/2011 | | | 40,000 | | | | 40,900 | | |
Station Casinos, Inc.
7.750% 08/15/2016 | | | 55,000 | | | | 54,450 | | |
| | | | 193,063 | | |
| Manufacturing — 0.3% | |
Eastman Kodak Co.
3.625% 05/15/2008 | | | 140,000 | | | | 136,150 | | |
Eastman Kodak Co.
7.250% 11/15/2013 | | | 240,000 | | | | 240,000 | | |
Tyco International Group SA
6.125% 11/01/2008 | | | 10,000 | | | | 10,089 | | |
Tyco International Group SA
6.375% 10/15/2011 | | | 220,000 | | | | 226,635 | | |
Tyco International Group SA
6.750% 02/15/2011 | | | 30,000 | | | | 31,440 | | |
Tyco International Group SA
6.875% 01/15/2029 | | | 160,000 | | | | 184,671 | | |
| | | | 828,985 | | |
| Media — 1.0% | |
AOL Time Warner, Inc.
6.875% 05/01/2012 | | | 355,000 | | | | 370,361 | | |
CCH I LLC
11.000% 10/01/2015 | | | 40,000 | | | | 41,750 | | |
Clear Channel
Communications, Inc.
4.250% 05/15/2009 | | | 50,000 | | | | 48,324 | | |
| | | Principal
Amount | | Market
Value | |
Clear Channel
Communications, Inc.
4.625% 01/15/2008 | | $ | 10,000 | | | $ | 9,915 | | |
Clear Channel
Communications, Inc.
5.500% 09/15/2014 | | | 150,000 | | | | 128,185 | | |
Comcast Corp.
6.500% 01/15/2015 | | | 255,000 | | | | 261,464 | | |
Comcast Corp.
6.500% 01/15/2017 | | | 140,000 | | | | 142,934 | | |
Cox Communications, Inc.
3.875% 10/01/2008 | | | 120,000 | | | | 117,526 | | |
CSC Holdings, Inc.
7.625% 07/15/2018 | | | 25,000 | | | | 23,750 | | |
DirecTV Holdings
LLC/DirecTV Financing Co.
8.375% 03/15/2013 | | | 25,000 | | | | 26,156 | | |
Echostar DBS Corp.
6.625% 10/01/2014 | | | 20,000 | | | | 19,100 | | |
Echostar DBS Corp.
7.000% 10/01/2013 | | | 20,000 | | | | 19,700 | | |
Echostar DBS Corp.
7.125% 02/01/2016 | | | 15,000 | | | | 14,662 | | |
Liberty Media Corp.
7.875% 07/15/2009 | | | 1,000,000 | | | | 1,037,298 | | |
Rogers Cable, Inc.
6.750% 03/15/2015 | | | 20,000 | | | | 20,620 | | |
Shaw Communications, Inc.
7.200% 12/15/2011 | | | 10,000 | | | | 10,350 | | |
Sun Media Corp.
7.625% 02/15/2013 | | | 10,000 | | | | 10,050 | | |
TL Acquisitions, Inc.(d)
10.500% 01/15/2015 | | | 30,000 | | | | 29,819 | | |
Umbella Acquistion, Inc.(d)
9.750% 03/15/2015 | | | 20,000 | | | | 19,750 | | |
| | | | 2,351,714 | | |
| Medical Supplies — 0.0% | |
FMC Finance III SA(d)
6.875% 07/15/2017 | | | 70,000 | | | | 68,600 | | |
| Mining — 0.1% | |
Freeport-McMoran
Copper & Gold, Inc.
8.375% 04/01/2017 | | | 70,000 | | | | 74,725 | | |
Vale Overseas Ltd.
6.875% 11/21/2036 | | | 230,000 | | | | 231,193 | | |
| | | | 305,918 | | |
| Multi-National — 0.4% | |
International Finance Corp.
4.750% 04/25/2012 | | | 1,000,000 | | | | 982,428 | | |
| Office Equipment/Supplies — 0.0% | |
Xerox Corp.
6.750% 02/01/2017 | | | 10,000 | | | | 10,258 | | |
(Continued)
The accompanying notes are an integral part of the financial statements.
99
MassMutual Select Strategic Balanced Fund – Portfolio of Investments (Continued)
| | | Principal
Amount | | Market
Value | |
| Oil & Gas — 0.8% | |
Amerada Hess Corp.
7.300% 08/15/2031 | | $ | 190,000 | | | $ | 203,760 | | |
Amerada Hess Corp.
7.875% 10/01/2029 | | | 30,000 | | | | 33,815 | | |
Anadarko Finance Co.
6.750% 05/01/2011 | | | 35,000 | | | | 36,137 | | |
Anadarko Finance Co.,
Series B
7.500% 05/01/2031 | | | 10,000 | | | | 10,744 | | |
Anadarko Petroleum Corp.
6.450% 09/15/2036 | | | 140,000 | | | | 134,656 | | |
Anadarko Petroleum
Corp. FRN
5.760% 09/15/2009 | | | 200,000 | | | | 200,178 | | |
Chesapeake Energy Corp.
6.375% 06/15/2015 | | | 5,000 | | | | 4,769 | | |
Chesapeake Energy Corp.
6.500% 08/15/2017 | | | 20,000 | | | | 18,950 | | |
Conoco Funding Co.
6.350% 10/15/2011 | | | 40,000 | | | | 41,245 | | |
Conoco, Inc.
6.950% 04/15/2029 | | | 50,000 | | | | 54,568 | | |
ConocoPhillips Co.
4.750% 10/15/2012 | | | 150,000 | | | | 145,335 | | |
Gaz Capital SA(d)
6.510% 03/07/2022 | | | 110,000 | | | | 108,570 | | |
Kerr-McGee Corp.
6.950% 07/01/2024 | | | 20,000 | | | | 20,750 | | |
Kerr-McGee Corp.
7.875% 09/15/2031 | | | 265,000 | | | | 306,224 | | |
OPTI Canada, Inc.(d)
7.875% 12/15/2014 | | | 70,000 | | | | 70,000 | | |
Opti Cananda, Inc.(d)
8.250% 12/15/2014 | | | 20,000 | | | | 20,300 | | |
Pemex Project Funding
Master Trust
6.625% 06/15/2035 | | | 100,000 | | | | 101,500 | | |
Petrobras International
Finance Co.
6.125% 10/06/2016 | | | 160,000 | | | | 156,800 | | |
Pogo Producing Co.
6.625% 03/15/2015 | | | 30,000 | | | | 29,700 | | |
Pogo Producing Co.(b)
6.875% 10/01/2017 | | | 5,000 | | | | 4,962 | | |
Pride International, Inc.
7.375% 07/15/2014 | | | 15,000 | | | | 15,038 | | |
Western Oil Sands, Inc.
8.375% 05/01/2012 | | | 25,000 | | | | 27,344 | | |
XTO Energy, Inc.
7.500% 04/15/2012 | | | 50,000 | | | | 53,755 | | |
| | | | 1,799,100 | | |
| Oil & Gas Services — 0.1% | |
Compagnie Generale de
Geophysique-Veritas
7.500% 05/15/2015 | | | 10,000 | | | | 10,000 | | |
| | | Principal
Amount | | Market
Value | |
Compagnie Generale de
Geophysique-Veritas
7.750% 05/15/2017 | | $ | 60,000 | | | $ | 60,750 | | |
Complete Production
Services, Inc.(d)
8.000% 12/15/2016 | | | 50,000 | | | | 50,500 | | |
| | | | 121,250 | | |
| Packaging & Containers — 0.0% | |
Graham Packaging Co.(b)
9.875% 10/15/2014 | | | 20,000 | | | | 20,225 | | |
Graham Packaging Co., Inc.
8.500% 10/15/2012 | | | 30,000 | | | | 30,188 | | |
| | | | 50,413 | | |
| Pharmaceuticals — 0.1% | |
Wyeth
5.950% 04/01/2037 | | | 130,000 | | | | 124,239 | | |
| Pipelines — 0.4% | |
Dynegy Holdings, Inc.(d)
7.750% 06/01/2019 | | | 80,000 | | | | 74,400 | | |
El Paso Corp.
7.000% 06/15/2017 | | | 210,000 | | | | 207,699 | | |
El Paso Corp.
7.750% 01/15/2032 | | | 15,000 | | | | 15,110 | | |
El Paso Corp.
7.800% 08/01/2031 | | | 57,000 | | | | 57,721 | | |
El Paso Natural Gas Co.
8.375% 06/15/2032 | | | 168,000 | | | | 196,996 | | |
Kinder Morgan Energy
Partners LP
5.000% 12/15/2013 | | | 30,000 | | | | 28,388 | | |
Kinder Morgan Energy
Partners LP
6.000% 02/01/2017 | | | 40,000 | | | | 39,145 | | |
Kinder Morgan Energy
Partners LP
6.300% 02/01/2009 | | | 30,000 | | | | 30,322 | | |
Kinder Morgan Energy
Partners LP
6.750% 03/15/2011 | | | 40,000 | | | | 41,395 | | |
Pacific Energy Partners,
LP/Pacific Energy
Finance Corp.
7.125% 06/15/2014 | | | 5,000 | | | | 5,173 | | |
Semgroup LP(d)
8.750% 11/15/2015 | | | 10,000 | | | | 10,050 | | |
Southern Natural Gas Co.
8.000% 03/01/2032 | | | 10,000 | | | | 11,341 | | |
Tennessee Gas Pipeline
7.625% 04/01/2037 | | | 30,000 | | | | 32,919 | | |
Williams Cos., Inc.
Series A(b)
7.500% 01/15/2031 | | | 220,000 | | | | 227,700 | | |
| | | | 978,359 | | |
| | | Principal
Amount | | Market
Value | |
| Real Estate — 0.0% | |
Forest City Enterprises, Inc.
7.625% 06/01/2015 | | $ | 15,000 | | | $ | 15,113 | | |
Real Estate Investment Trusts
(REITS) — 0.0% | |
Ventas Realty Corp. REIT
6.500% 06/01/2016 | | | 15,000 | | | | 14,625 | | |
Ventas Realty LP
Capital Corp.
6.750% 04/01/2017 | | | 10,000 | | | | 9,875 | | |
| | | | 24,500 | | |
| Retail — 0.0% | |
Amerigas Partners, LP
7.250% 05/20/2015 | | | 10,000 | | | | 9,900 | | |
Suburban Propane Partners
6.875% 12/15/2013 | | | 35,000 | | | | 33,775 | | |
| | | | 43,675 | | |
| Semiconductors — 0.0% | |
Freescale
Semiconductor, Inc.(d)
8.875% 12/15/2014 | | | 15,000 | | | | 14,325 | | |
| Sovereign — 0.0% | |
Export-Import
Bank of Korea(d)
5.250% 02/10/2014 | | | 5,000 | | | | 4,857 | | |
| Telecommunications — 0.6% | |
BellSouth Corp.
4.750% 11/15/2012 | | | 10,000 | | | | 9,557 | | |
British Telecom PLC FRN
8.625% 12/15/2010 | | | 160,000 | | | | 174,843 | | |
Cincinnati Bell, Inc.
7.000% 02/15/2015 | | | 25,000 | | | | 24,500 | | |
Citizens Communications Co.
7.125% 03/15/2019 | | | 20,000 | | | | 18,900 | | |
Citizens Communications Co.
7.875% 01/15/2027 | | | 25,000 | | | | 24,313 | | |
Deutsche Telekom
International Finance BV
5.750% 03/23/2016 | | | 75,000 | | | | 73,163 | | |
Intelsat Bermuda, Ltd.
9.250% 06/15/2016 | | | 15,000 | | | | 15,938 | | |
Koninklijke KPN NV
8.000% 10/01/2010 | | | 180,000 | | | | 192,650 | | |
Koninklijke KPN NV
8.375% 10/01/2030 | | | 125,000 | | | | 140,164 | | |
Level 3 Financing, Inc.(d)
8.750% 02/15/2017 | | | 15,000 | | | | 14,831 | | |
Level 3 Financing, Inc.
9.250% 11/01/2014 | | | 20,000 | | | | 20,200 | | |
Qwest Communications
International, Inc.
7.500% 02/15/2014 | | | 30,000 | | | | 30,375 | | |
(Continued)
The accompanying notes are an integral part of the financial statements.
100
MassMutual Select Strategic Balanced Fund – Portfolio of Investments (Continued)
| | | Principal
Amount | | Market
Value | |
Qwest Corp.
6.875% 09/15/2033 | | $ | 10,000 | | | $ | 9,375 | | |
SBC Communications, Inc.
5.100% 09/15/2014 | | | 120,000 | | | | 114,461 | | |
Sprint Capital
8.750% 03/15/2032 | | | 120,000 | | | | 134,776 | | |
Sprint Capital Corp.
8.375% 03/15/2012 | | | 50,000 | | | | 54,470 | | |
Telecom Italia Capital SA
4.950% 09/30/2014 | | | 120,000 | | | | 111,183 | | |
U.S. West
Communications, Inc.
5.625% 11/15/2008 | | | 30,000 | | | | 29,888 | | |
Verizon Global Funding Corp.
7.375% 09/01/2012 | | | 60,000 | | | | 64,623 | | |
Windsream Corp.
8.625% 08/01/2016 | | | 45,000 | | | | 47,588 | | |
| | | | 1,305,798 | | |
| Transportation — 0.0% | |
Gulfmark Offshore, Inc.
7.750% 07/15/2014 | | | 10,000 | | | | 10,100 | | |
Horizon Lines LLC
9.000% 11/01/2012 | | | 25,000 | | | | 26,438 | | |
| | | | 36,538 | | |
TOTAL CORPORATE DEBT
(Cost $27,020,159) | | | | | | | 26,597,526 | | |
NON-U.S. GOVERNMENT AGENCY
OBLIGATIONS — 2.9% | |
| Collateralized Mortgage Obligations — 2.8% | |
Amresco Residential
Securities Mortgage
Loan Trust,
Series 1997-3,
Class M1A FRN
5.875% 09/25/2027 | | | 64,181 | | | | 64,198 | | |
Bear Stearns Adjustable
Rate Mortgage Trust,
Series 2004-4,
Class A6 VRN
3.516% 06/25/2034 | | | 400,000 | | | | 389,115 | | |
Countrywide Home Equity
Loan Trust,
Series 2005-G,
Class 2A FRN
5.550% 12/15/2035 | | | 329,744 | | | | 330,009 | | |
CRIIMI MAE Commercial
Mortgage Trust,
Series 1998-C1,
Class A2(d)
7.000% 06/02/2033 | | | 67,653 | | | | 67,907 | | |
Greenpoint Mortgage
Funding Trust,
Series 2005-HE4,
Class 2A1A FRN
5.540% 07/25/2030 | | | 117,492 | | | | 117,657 | | |
| | | Principal
Amount | | Market
Value | |
GS Mortgage Securities
Corp. II,
Series 2005-GG4,
Class AABA
4.680% 07/10/2039 | | $ | 300,000 | | | $ | 286,197 | | |
Harborview Mortgage
Loan Trust,
Series 2006-2,
Class 1A VRN
5.441% 02/25/2036 | | | 156,110 | | | | 155,274 | | |
Indymac Index Mortgage
Loan Trust,
Series 2005-AR15,
Class A2 VRN
5.099% 09/25/2035 | | | 137,094 | | | | 133,502 | | |
JP Morgan Chase
Commercial Mortgage
Securities Corp.,
Series 2005-CB12,
Class A4
4.895% 09/12/2037 | | | 600,000 | | | | 563,535 | | |
JP Morgan Chase
Commercial Mortgage
Securities Corp.,
Series 2007-LDPX,
Class A3
5.420% 01/15/2049 | | | 300,000 | | | | 289,208 | | |
Keycorp Student Loan
Trust, Series 2005-A,
Class 1A1 FRN
5.378% 12/27/2019 | | | 356,960 | | | | 356,793 | | |
LB-UBS Commercial
Mortgage Trust,
Series 2005-C3, Class A5
4.739% 07/15/2030 | | | 210,000 | | | | 195,546 | | |
LB-UBS Commercial
Mortgage Trust,
Series 2005-C3,
Class AAB
4.664% 07/15/2030 | | | 200,000 | | | | 190,514 | | |
LB-UBS Commercial
Mortgage Trust,
Series 2005-C5, Class A4
4.954% 09/15/2040 | | | 200,000 | | | | 188,885 | | |
Mach One Trust
Commercial
Mortgage-Backed,
Series 2004-1A,
Class X, IO VRN(d)
1.623% 05/28/2040 | | | 2,344,691 | | | | 79,157 | | |
MASTR Adjustable Rate
Mortgages Trust,
Series 2005-1,
Class 1A3(d)
7.000% 08/25/2034 | | | 276,518 | | | | 281,945 | | |
| | | Principal
Amount | | Market
Value | |
Merrill Lynch/Countrywide
Commercial
Mortgage Trust,
Series 2007-6,
Class A4 VRN
5.485% 03/12/2051 | | $ | 200,000 | | | $ | 193,775 | | |
MLCC Mortgage
Investors, Inc.,
Series 2004-B,
Class A3 FRN
7.068% 05/25/2029 | | | 143,314 | | | | 144,692 | | |
Morgan Stanley Mortgage
Loan Trust,
Series 2007-11AR,
Class 2A3
6.639% 06/25/2037 | | | 400,000 | | | | 404,544 | | |
MSDWCC Heloc Trust,
Series 2005-1,
Class A FRN
5.510% 07/25/2017 | | | 364,103 | | | | 364,615 | | |
Mutual Fund Fee Trust,
Series 2000-3
9.070% 07/01/2008 | | | 657,437 | | | | 47,993 | | |
Option One Mortgage
Loan Trust,
Series 2003-3,
Class A1 FRN
5.610% 06/25/2033 | | | 377,989 | | | | 378,461 | | |
Prime Mortgage Trust,
Series 2006-DR1,
Class 1A1(d)
5.500% 05/25/2035 | | | 361,715 | | | | 353,614 | | |
Prime Mortgage Trust,
Series 2006-DR1,
Class 1A2(d)
6.000% 05/25/2035 | | | 174,071 | | | | 173,779 | | |
Prime Mortgage Trust,
Series 2006-DR1,
Class 2A2(d)
6.000% 05/25/2035 | | | 563,870 | | | | 553,915 | | |
Residential Asset Mortgage
Products, Inc.,
Series 2002-RS4,
Class A11 FRN
5.640% 08/25/2032 | | | 7,340 | | | | 7,342 | | |
Terwin Mortgage Trust,
Series 2006-10SL,
Class A1
4.750% 10/25/2037 | | | 149,983 | | | | 146,530 | | |
UCFC Home Equity Loan,
Series 1998-D, Class MF1
6.905% 04/15/2030 | | | 74,862 | | | | 74,686 | | |
(Continued)
The accompanying notes are an integral part of the financial statements.
101
MassMutual Select Strategic Balanced Fund – Portfolio of Investments (Continued)
| | | Principal
Amount | | Market
Value | |
Washington Mutual MSC
Mortgage Pass-Through
Certificates,
Series 2004-RA1, Class 2A
7.000% 03/25/2034 | | $ | 173,655 | | | $ | 175,026 | | |
| | | | 6,708,414 | | |
| Pass-Through Securities — 0.1% | |
CVS Corp. Lease.
Pass Through(d)
5.880% 01/10/2028 | | | 32,017 | | | | 30,672 | | |
CVS Corp. Lease.
Pass Through(d)
6.036% 12/10/2028 | | | 36,655 | | | | 35,468 | | |
CVS Corp. Lease.
Pass Through(d)
9.350% 01/10/2023 | | | 100,000 | | | | 120,956 | | |
| | | | 187,096 | | |
TOTAL NON-U.S. GOVERNMENT
AGENCY OBLIGATIONS
(Cost $7,319,393) | | | | | | | 6,895,510 | | |
| SOVEREIGN DEBT OBLIGATIONS — 0.5% | |
| Sovereign | |
Bundesrepub
Deutschland EUR(c)
3.750% 01/04/2015 | | | 320,000 | | | | 409,598 | | |
Canada Government CAD(c)
4.000% 12/01/2031 | | | 73,253 | | | | 94,522 | | |
Republic of Brazil
10.125% 05/15/2027 | | | 15,000 | | | | 21,150 | | |
Republic of Brazil(b)
11.000% 08/17/2040 | | | 206,000 | | | | 270,169 | | |
Russian Federation FRN
7.500% 03/31/2030 | | | 42,018 | | | | 46,282 | | |
United Mexican States(b)
6.750% 09/27/2034 | | | 329,000 | | | | 350,879 | | |
| | | | 1,192,600 | | |
TOTAL SOVEREIGN DEBT
OBLIGATIONS
(Cost $1,107,230) | | | | | | | 1,192,600 | | |
U.S. GOVERNMENT AGENCY
OBLIGATIONS — 17.6% | |
| Pass-Through Securities | |
Federal Home Loan Bank
5.125% 06/13/2008 | | | 110,000 | | | | 109,770 | | |
FHLMC
4.650% 10/10/2013 | | | 760,000 | | | | 725,312 | | |
FHLMC
5.625% 11/23/2035 | | | 140,000 | | | | 131,678 | | |
FHLMC
5.920% 04/01/2037 | | | 903,852 | | | | 904,928 | | |
| | | Principal
Amount | | Market
Value | |
FHLMC
6.750% 09/15/2029 | | $ | 100,000 | | | $ | 114,227 | | |
FNMA
5.000% 09/01/2021-
02/01/2036 | | | 16,715,996 | | | | 15,810,003 | | |
FNMA
5.500% 08/01/2021-
02/01/2037 | | | 12,992,749 | | | | 12,599,388 | | |
FNMA
6.000% 08/01/2031-
03/01/2037 | | | 6,711,281 | | | | 6,644,689 | | |
FNMA
6.500% 06/01/2036-
06/01/2037 | | | 3,171,365 | | | | 3,204,805 | | |
FNMA, FRN
7.024% 11/01/2035 | | | 72,432 | | | | 73,766 | | |
FNMA, FRN
7.026% 11/01/2035 | | | 138,966 | | | | 141,526 | | |
FNMA, FRN
7.028% 11/01/2035 | | | 144,563 | | | | 147,223 | | |
FNMA, FRN
7.036% 11/01/2035 | | | 144,477 | | | | 147,137 | | |
FNMA, FRN
7.038% 11/01/2035 | | | 138,847 | | | | 141,428 | | |
GNMA
6.000% 01/15/2032-
03/15/2033 | | | 1,075,320 | | | | 1,073,277 | | |
GNMA
6.500% 10/15/2032 | | | 68,280 | | | | 69,795 | | |
TOTAL U.S. GOVERNMENT
AGENCY OBLIGATIONS
(Cost $42,908,940) | | | | | | | 42,038,952 | | |
| U.S. TREASURY OBLIGATIONS — 3.0% | |
| U.S. Government Agencies | |
U.S. Treasury Bond(b)
4.500% 02/15/2036 | | | 685,000 | | | | 620,353 | | |
U.S. Treasury Bond(b)
4.750% 02/15/2037 | | | 230,000 | | | | 216,883 | | |
U.S. Treasury Inflation Index
1.875% 07/15/2015 | | | 201,807 | | | | 190,712 | | |
U.S. Treasury Inflation Index
2.000% 01/15/2014 | | | 614,961 | | | | 590,989 | | |
U.S. Treasury Inflation Index
2.000% 01/15/2016 | | | 166,546 | | | | 158,191 | | |
U.S. Treasury Inflation Index
2.000% 01/15/2026 | | | 458,000 | | | | 414,502 | | |
U.S. Treasury Inflation Index
2.375% 01/15/2017 | | | 348,316 | | | | 340,130 | | |
U.S. Treasury Inflation Index
2.375% 01/15/2025 | | | 964,498 | | | | 926,955 | | |
U.S. Treasury Inflation Index
2.375% 01/15/2027 | | | 1,434,244 | | | | 1,376,874 | | |
| | | Principal
Amount | | Market
Value | |
U.S. Treasury Inflation Index
3.375% 04/15/2032 | | $ | 81,475 | | | $ | 93,780 | | |
U.S. Treasury Inflation Index
3.875% 01/15/2009 | | | 37,792 | | | | 38,390 | | |
U.S. Treasury Inflation Index
3.875% 04/15/2029 | | | 879,704 | | | | 1,061,116 | | |
U.S. Treasury Note(b)
4.375% 11/15/2008 | | | 60,000 | | | | 59,522 | | |
U.S. Treasury Note
4.500% 03/31/2009 | | | 70,000 | | | | 69,508 | | |
U.S. Treasury Note
4.500% 11/30/2011 | | | 40,000 | | | | 39,331 | | |
U.S. Treasury Note(b)
4.500% 03/31/2012 | | | 50,000 | | | | 49,082 | | |
U.S. Treasury Note(b)
4.500% 04/30/2012 | | | 70,000 | | | | 68,709 | | |
U.S. Treasury Note
4.500% 05/15/2017 | | | 10,000 | | | | 9,589 | | |
U.S. Treasury Note
4.625% 12/31/2011 | | | 740,000 | | | | 730,981 | | |
U.S. Treasury Note
4.750% 02/15/2010 | | | 140,000 | | | | 139,464 | | |
U.S. Treasury Note
6.000% 08/15/2009 | | | 50,000 | | | | 51,086 | | |
U.S. Treasury Strips
0.000% 05/15/2030 | | | 130,000 | | | | 40,386 | | |
| | | | 7,286,533 | | |
TOTAL U.S. TREASURY
OBLIGATIONS
(Cost $7,503,894) | | | | | | | 7,286,533 | | |
TOTAL BONDS & NOTES
(Cost $86,106,081) | | | | | | | 84,257,177 | | |
| OPTIONS — 0.1% | |
Eurodollar Future Options,
September 2007 Call,
Expires 9/17/07,
Strike 94 | | | 192,500 | | | | 128,975 | | |
Eurodollar Future Options,
September 2007 Call,
Expires 9/17/07,
Strike 94.5 | | | 45,000 | | | | 7,762 | | |
Eurodollar Future Options,
September 2007 Call,
Expires 9/17/07,
Strike 94.75 | | | 45,000 | | | | 1,012 | | |
Eurodollar Future Options,
September 2007 Put,
Expires 9/17/07,
Strike 94 | | | 5,000 | | | | 13 | | |
TOTAL OPTIONS
(Cost $179,450) | | | | | | | 137,762 | | |
TOTAL LONG TERM INVESTMENTS
(Cost $201,626,938) | | | | | | | 226,561,513 | | |
(Continued)
The accompanying notes are an integral part of the financial statements.
102
MassMutual Select Strategic Balanced Fund – Portfolio of Investments (Continued)
| | | Principal
Amount | | Market
Value | |
| SHORT-TERM INVESTMENTS — 8.6% | |
| Cash Equivalents — 5.6%(h) | |
Abbey National PLC
Eurodollar Time Deposit
5.280% 07/05/2007 | | $ | 172,685 | | | $ | 172,685 | | |
Abbey National PLC
Eurodollar Time Deposit
5.285% 07/09/2007 | | | 431,703 | | | | 431,703 | | |
American Beacon
Money Market Fund(e) | | | 484,351 | | | | 484,351 | | |
Banco Bilbao Vizcaya
Argentaria SA
Eurodollar Time Deposit
5.300% 08/10/2007 | | | 323,778 | | | | 323,778 | | |
Bank of America
5.270% 07/06/2007 | | | 431,703 | | | | 431,703 | | |
Bank of America
5.270% 07/16/2007 | | | 86,340 | | | | 86,340 | | |
Bank of America
5.270% 08/17/2007 | | | 107,926 | | | | 107,926 | | |
Bank of America
5.300% 09/17/2007 | | | 215,852 | | | | 215,852 | | |
Bank of Ireland
Eurodollar Time Deposit
5.300% 08/13/2007 | | | 431,703 | | | | 431,703 | | |
Bank of Montreal
Eurodollar Time Deposit
5.280% 07/03/2007 | | | 107,926 | | | | 107,926 | | |
Bank of Montreal
Eurodollar Time Deposit
5.290% 07/02/2007 | | | 86,340 | | | | 86,340 | | |
Bank of Montreal
Eurodollar Time Deposit
5.310% 08/14/2007 | | | 64,755 | | | | 64,755 | | |
Bank of Nova Scotia
Eurodollar Time Deposit
5.280% 07/09/2007 | | | 410,118 | | | | 410,118 | | |
Bank Of Nova Scotia
Eurodollar Time Deposit
5.285% 07/11/2007 | | | 237,437 | | | | 237,437 | | |
Barclays
Eurodollar Time Deposit
5.290% 07/06/2007 | | | 431,703 | | | | 431,703 | | |
Barclays
Eurodollar Time Deposit
5.295% 07/16/2007 | | | 86,340 | | | | 86,340 | | |
Barclays
Eurodollar Time Deposit
5.320% 09/04/2007 | | | 215,852 | | | | 215,852 | | |
Bear Stearns & Co
Commercial Paper
5.435% 07/10/2007 | | | 64,755 | | | | 64,755 | | |
BGI Institutional
Money Market Fund(e) | | | 280,608 | | | | 280,608 | | |
| | | Principal
Amount | | Market
Value | |
BNP Paribas
Eurodollar Time Deposit
5.350% 07/02/2007 | | $ | 647,555 | | | $ | 647,555 | | |
Calyon
Eurodollar Time Deposit
5.290% 07/17/2007 | | | 215,852 | | | | 215,852 | | |
Calyon
Eurodollar Time Deposit
5.380% 07/02/2007 | | | 647,555 | | | | 647,555 | | |
Canadian Imperial
Bank of Commerce
Eurodollar Time Deposit
5.300% 07/30/2007 | | | 431,703 | | | | 431,703 | | |
Dexia Group
Eurodollar Time Deposit
5.290% 08/08/2007 | | | 431,703 | | | | 431,703 | | |
Dreyfus Institutional
Cash Advantage
Money Market Fund(e) | | | 129,511 | | | | 129,511 | | |
Federal Home Loan Bank
Discount Note
5.174% 07/20/2007 | | | 32,018 | | | | 32,018 | | |
First Tennessee
National Corp.
Eurodollar Time Deposit
5.300% 07/18/2007 | | | 107,926 | | | | 107,926 | | |
Fortis Bank
Eurodollar Time Deposit
5.290% 07/06/2007 | | | 107,926 | | | | 107,926 | | |
Fortis Bank
Eurodollar Time Deposit
5.290% 07/09/2007 | | | 151,096 | | | | 151,096 | | |
Fortis Bank
Eurodollar Time Deposit
5.300% 07/20/2007 | | | 107,926 | | | | 107,926 | | |
Fortis Bank
Eurodollar Time Deposit
5.300% 07/26/2007 | | | 86,340 | | | | 86,340 | | |
Fortis Bank
Eurodollar Time Deposit
5.350% 07/05/2007 | | | 215,852 | | | | 215,852 | | |
Freddie Mac Discount Note
5.155% 07/16/2007 | | | 40,759 | | | | 40,759 | | |
Freddie Mac Discount Note
5.185% 07/09/2007 | | | 21,279 | | | | 21,279 | | |
Morgan Stanley & Co
Commercial Paper
5.445% 08/01/2007 | | | 194,266 | | | | 194,266 | | |
National Australia Bank
Eurodollar Time Deposit
5.320% 07/02/2007 | | | 215,852 | | | | 215,852 | | |
Nationwide Building
Society Commercial Paper
5.301% 07/09/2007 | | | 215,408 | | | | 215,408 | | |
| | | Principal
Amount | | Market
Value | |
Rabobank Nederland
Eurodollar Time Deposit
5.280% 07/05/2007 | | $ | 323,778 | | | $ | 323,778 | | |
Rabobank Nederland
Eurodollar Time Deposit
5.290% 07/16/2007 | | | 431,703 | | | | 431,703 | | |
Rabobank Nederland
Eurodollar Time Deposit
5.330% 07/02/2007 | | | 647,555 | | | | 647,555 | | |
Reserve Primary
Money Market Fund(e) | | | 428,568 | | | | 428,568 | | |
Royal Bank of Canada
Eurodollar Time Deposit
5.305% 08/30/2007 | | | 431,703 | | | | 431,703 | | |
Royal Bank of Scotland
Eurodollar Time Deposit
5.270% 07/11/2007 | | | 107,926 | | | | 107,926 | | |
Skandinaviska Enskilda
Banken AB
Eurodollar Time Deposit
5.290% 07/13/2007 | | | 431,703 | | | | 431,703 | | |
Skandinaviska Enskilda
Banken AB
Eurodollar Time Deposit
5.290% 07/19/2007 | | | 64,755 | | | | 64,755 | | |
Svenska Handlesbanken
Eurodollar Time Deposit
5.300% 07/02/2007 | | | 72,516 | | | | 72,516 | | |
UBS AG
Eurodollar Time Deposit
5.277% 07/05/2007 | | | 302,193 | | | | 302,193 | | |
UBS AG
Eurodollar Time Deposit
5.285% 07/05/2007 | | | 431,703 | | | | 431,703 | | |
Vanguard Prime
Money Market Fund(e) | | | 215,852 | | | | 215,852 | | |
Wells Fargo
Eurodollar Time Deposit
5.260% 07/02/2007 | | | 116,560 | | | | 116,560 | | |
Wells Fargo
Eurodollar Time Deposit
5.280% 07/11/2007 | | | 431,703 | | | | 431,703 | | |
Wells Fargo
Eurodollar Time Deposit
5.280% 07/12/2007 | | | 215,852 | | | | 215,852 | | |
| | | | 13,326,472 | | |
| Certificates of Deposit — 0.1% | |
Deutsche Bank AG CD
5.500% 07/02/2007 | | | 300,000 | | | | 300,000 | | |
| Repurchase Agreements — 2.8% | |
Investors Bank & Trust
Company Repurchase
Agreement, dated
6/29/2007, 3.50%,
due 7/02/2007(g) | | | 6,708,940 | | | | 6,708,940 | | |
(Continued)
The accompanying notes are an integral part of the financial statements.
103
MassMutual Select Strategic Balanced Fund – Portfolio of Investments (Continued)
| | | Principal
Amount | | Market
Value | |
| U.S. Government Agencies — 0.1% | |
FNMA(f)
5.000% 03/17/2008 | | $ | 20,000 | | | $ | 19,269 | | |
FNMA(f)
5.010% 03/17/2008 | | | 125,000 | | | | 120,373 | | |
| | | | 139,642 | | |
TOTAL SHORT-TERM
INVESTMENTS
(Cost $20,475,054) | | | | | 20,475,054 | | |
TOTAL INVESTMENTS — 103.7%
(Cost $222,101,992)(i) | | | | | 247,036,567 | | |
Other Assets/
(Liabilities) — (3.7%) | | | | | (8,726,475 | ) | |
| NET ASSETS — 100.0% | | | | $ | 238,310,092 | | |
Notes to Portfolio of Investments
ADR - American Depository Receipt
CAD - Canadian Dollar
EUR - Euro
FRN - Floating Rate Note
GBP - British Pound
GDR - Global Depository Receipt
VRN - Variable Rate Note
(a) Non-income producing security.
(b) Denotes all or a portion of security on loan. (Note 2).
(c) The principal amount of the security is in foreign currency. The market value is in U.S. dollars.
(d) Securities exempt from registration under rule 144A of the Securities Act of 1933. These securities may be resold in transactions exempt from registration, normally to qualified institutional buyers. At June 30, 2007, these securities amounted to a value of $8,067,129 or 3.4% of net assets.
(e) Amount represents shares owned of the fund.
(f) This security is held as collateral for open futures contracts. (Note 2).
(g) Maturity value of $6,710,896. Collaterized by a U.S. Government Agency obligation with a rate of 7.875%, maturity date of 2/25/2030, and an aggregate market value, including accrued interest, of $7,044,387.
(h) Represents investments of security lending collateral. (Note 2).
(i) See Note 6 for aggregate cost for Federal tax purposes.
The remainder of this page is intentionally left blank.
The accompanying notes are an integral part of the financial statements.
104
MassMutual Select Diversified Value Fund – Portfolio of Investments
June 30, 2007 (Unaudited)
| | | Number of
Shares | | Market
Value | |
| EQUITIES — 98.8% | |
| COMMON STOCK — 98.8% | |
| Advertising — 0.2% | |
Interpublic Group of
Companies, Inc.(a) (b) | | | 117,700 | | | $ | 1,341,780 | | |
| Aerospace & Defense — 0.9% | |
| Boeing Co. | | | 25,000 | | | | 2,404,000 | | |
| Northrop Grumman Corp. | | | 50,200 | | | | 3,909,075 | | |
| | | | 6,313,075 | | |
| Agriculture — 1.9% | |
| Altria Group, Inc. | | | 149,200 | | | | 10,464,888 | | |
| Bunge Ltd.(b) | | | 10,500 | | | | 887,250 | | |
| UST, Inc. | | | 27,900 | | | | 1,498,509 | | |
| | | | 12,850,647 | | |
| Apparel — 0.8% | |
| Jones Apparel Group, Inc. | | | 64,500 | | | | 1,822,125 | | |
| VF Corp. | | | 38,700 | | | | 3,544,146 | | |
| | | | 5,366,271 | | |
| Auto Manufacturers — 0.3% | |
| General Motors Corp. | | | 50,200 | | | | 1,897,560 | | |
| Automotive & Parts — 1.2% | |
| Autoliv, Inc. | | | 52,400 | | | | 2,979,988 | | |
| BorgWarner, Inc. | | | 27,100 | | | | 2,331,684 | | |
Magna International,
Inc. Cl. A(b) | | | 32,400 | | | | 2,948,076 | | |
| | | | 8,259,748 | | |
| Banks — 8.7% | |
| Bank of America Corp. | | | 464,800 | | | | 22,724,072 | | |
| Comerica, Inc. | | | 67,000 | | | | 3,984,490 | | |
| Fifth Third Bancorp | | | 85,400 | | | | 3,396,358 | | |
| KeyCorp(b) | | | 76,000 | | | | 2,609,080 | | |
| National City Corp.(b) | | | 145,300 | | | | 4,841,396 | | |
| Regions Financial Corp. | | | 50,900 | | | | 1,684,790 | | |
| SunTrust Banks, Inc. | | | 56,900 | | | | 4,878,606 | | |
| U.S. Bancorp(b) | | | 162,200 | | | | 5,344,490 | | |
| Wachovia Corp. | | | 71,900 | | | | 3,684,875 | | |
| Wells Fargo & Co. | | | 163,500 | | | | 5,750,295 | | |
| | | | 58,898,452 | | |
| Beverages — 1.3% | |
| The Coca-Cola Co. | | | 12,400 | | | | 648,644 | | |
| Coca-Cola Enterprises, Inc. | | | 117,300 | | | | 2,815,200 | | |
Molson Coors
Brewing Co. Cl. B | | | 41,600 | | | | 3,846,336 | | |
| PepsiCo, Inc. | | | 27,200 | | | | 1,763,920 | | |
| | | | 9,074,100 | | |
| | | Number of
Shares | | Market
Value | |
| Chemicals — 2.7% | |
| Ashland, Inc. | | | 29,600 | | | $ | 1,892,920 | | |
| The Dow Chemical Co. | | | 147,000 | | | | 6,500,340 | | |
Du Pont (E.I.) de
Nemours & Co. | | | 104,600 | | | | 5,317,864 | | |
| The Lubrizol Corp. | | | 33,400 | | | | 2,155,970 | | |
| PPG Industries, Inc. | | | 35,000 | | | | 2,663,850 | | |
| | | | 18,530,944 | | |
| Commercial Services — 0.8% | |
| Accenture Ltd. Cl. A | | | 35,900 | | | | 1,539,751 | | |
| McKesson Corp. | | | 62,300 | | | | 3,715,572 | | |
| | | | 5,255,323 | | |
| Computers — 1.5% | |
| Dell, Inc.(a) | | | 28,800 | | | | 822,240 | | |
Electronic Data
Systems Corp. | | | 90,300 | | | | 2,504,019 | | |
International Business
Machines Corp. | | | 41,900 | | | | 4,409,975 | | |
Lexmark International,
Inc. Cl. A(a) | | | 50,100 | | | | 2,470,431 | | |
| | | | 10,206,665 | | |
| Computers & Information — 0.1% | |
| Tech Data Corp.(a) | | | 17,200 | | | | 661,512 | | |
| Cosmetics & Personal Care — 2.0% | |
| Colgate-Palmolive Co. | | | 37,600 | | | | 2,438,360 | | |
| The Procter & Gamble Co. | | | 179,800 | | | | 11,001,962 | | |
| | | | 13,440,322 | | |
| Diversified Financial — 11.8% | |
| Ameriprise Financial, Inc. | | | 25,900 | | | | 1,646,463 | | |
| CIT Group, Inc. | | | 23,100 | | | | 1,266,573 | | |
| Citigroup, Inc. | | | 483,300 | | | | 24,788,457 | | |
| Countrywide Financial Corp. | | | 139,200 | | | | 5,059,920 | | |
| Fannie Mae | | | 136,400 | | | | 8,911,012 | | |
| Freddie Mac | | | 81,200 | | | | 4,928,840 | | |
The Goldman Sachs
Group, Inc. | | | 6,100 | | | | 1,322,175 | | |
| JP Morgan Chase & Co. | | | 361,900 | | | | 17,534,055 | | |
| Janus Capital Group, Inc.(b) | | | 102,000 | | | | 2,839,680 | | |
| Merrill Lynch & Co., Inc. | | | 83,800 | | | | 7,004,004 | | |
| Morgan Stanley | | | 42,400 | | | | 3,556,512 | | |
Waddell & Reed Financial,
Inc. Cl. A(b) | | | 40,600 | | | | 1,056,006 | | |
| | | | 79,913,697 | | |
| Electric — 2.8% | |
| Allegheny Energy, Inc.(a) | | | 62,400 | | | | 3,228,576 | | |
American Electric
Power Co., Inc. | | | 109,200 | | | | 4,918,368 | | |
| | | Number of
Shares | | Market
Value | |
Constellation Energy
Group, Inc. | | | 32,300 | | | $ | 2,815,591 | | |
| Dominion Resources, Inc. | | | 42,600 | | | | 3,676,806 | | |
| Entergy Corp. | | | 30,700 | | | | 3,295,645 | | |
| Pinnacle West Capital Corp. | | | 20,700 | | | | 824,895 | | |
| | | | 18,759,881 | | |
| Electronics — 0.9% | |
| Arrow Electronics, Inc.(a) | | | 34,100 | | | | 1,310,463 | | |
| Celestica, Inc.(a) | | | 28,200 | | | | 176,250 | | |
Flextronics
International Ltd.(a) (b) | | | 275,500 | | | | 2,975,400 | | |
| Sanmina-SCI Corp.(a) | | | 154,500 | | | | 483,585 | | |
| Solectron Corp.(a) | | | 287,375 | | | | 1,057,540 | | |
| | | | 6,003,238 | | |
| Foods — 3.8% | |
| ConAgra Foods, Inc. | | | 78,000 | | | | 2,095,080 | | |
| General Mills, Inc. | | | 47,700 | | | | 2,786,634 | | |
| Kellogg Co. | | | 57,200 | | | | 2,962,388 | | |
| Kraft Foods, Inc. Cl. A | | | 197,947 | | | | 6,977,631 | | |
| The Kroger Co. | | | 101,200 | | | | 2,846,756 | | |
| Safeway, Inc. | | | 123,200 | | | | 4,192,496 | | |
| Sara Lee Corp. | | | 217,700 | | | | 3,787,980 | | |
| | | | 25,648,965 | | |
| Forest Products & Paper — 0.8% | |
Smurfit-Stone
Container Corp.(a) | | | 138,900 | | | | 1,848,759 | | |
| Temple-Inland, Inc. | | | 61,400 | | | | 3,777,942 | | |
| | | | 5,626,701 | | |
| Hand & Machine Tools — 0.4% | |
| The Black & Decker Corp. | | | 28,500 | | | | 2,516,835 | | |
| Health Care – Products — 0.5% | |
| Johnson & Johnson | | | 50,000 | | | | 3,081,000 | | |
| Health Care – Services — 0.1% | |
Tenet
Healthcare Corp.(a) (b) | | | 135,100 | | | | 879,501 | | |
| Home Builders — 0.7% | |
| Centex Corp.(b) | | | 35,400 | | | | 1,419,540 | | |
| KB Home | | | 61,300 | | | | 2,413,381 | | |
| Pulte Homes, Inc. | | | 50,900 | | | | 1,142,705 | | |
| | | | 4,975,626 | | |
| Household Products — 1.0% | |
| Avery Dennison Corp. | | | 34,300 | | | | 2,280,264 | | |
| The Clorox Co. | | | 32,900 | | | | 2,043,090 | | |
| Kimberly-Clark Corp. | | | 37,300 | | | | 2,494,997 | | |
| | | | 6,818,351 | | |
(Continued)
The accompanying notes are an integral part of the financial statements.
105
MassMutual Select Diversified Value Fund – Portfolio of Investments (Continued)
| | | Number of
Shares | | Market
Value | |
| Housewares — 0.3% | |
| Newell Rubbermaid, Inc. | | | 56,700 | | | $ | 1,668,681 | | |
| Insurance — 10.4% | |
| ACE Ltd. | | | 18,000 | | | | 1,125,360 | | |
| Allstate Corp. | | | 49,100 | | | | 3,020,141 | | |
| Ambac Financial Group, Inc. | | | 30,600 | | | | 2,668,014 | | |
American International
Group, Inc. | | | 210,700 | | | | 14,755,321 | | |
| Aon Corp. | | | 50,900 | | | | 2,168,849 | | |
| Chubb Corp. | | | 32,400 | | | | 1,754,136 | | |
Fidelity National
Financial, Inc. | | | 140,400 | | | | 3,327,480 | | |
Genworth Financial,
Inc. Cl. A | | | 124,200 | | | | 4,272,480 | | |
The Hartford Financial
Services Group, Inc. | | | 58,800 | | | | 5,792,388 | | |
| MBIA, Inc.(b) | | | 48,700 | | | | 3,030,114 | | |
| Metlife, Inc. | | | 84,400 | | | | 5,442,112 | | |
| MGIC Investment Corp.(b) | | | 46,100 | | | | 2,621,246 | | |
Old Republic
International Corp. | | | 147,600 | | | | 3,137,976 | | |
| PartnerRe Ltd.(b) | | | 18,100 | | | | 1,402,750 | | |
| Prudential Financial, Inc. | | | 18,100 | | | | 1,759,863 | | |
RenaissanceRe
Holdings Ltd. | | | 21,000 | | | | 1,301,790 | | |
| Torchmark Corp. | | | 17,500 | | | | 1,172,500 | | |
| St. Paul Travelers Companies | | | 122,900 | | | | 6,575,150 | | |
| Unum Group | | | 78,600 | | | | 2,052,246 | | |
| XL Capital Ltd. Cl. A | | | 29,700 | | | | 2,503,413 | | |
| | | | 69,883,329 | | |
| Iron & Steel — 1.1% | |
| Arcelor Mittal Cl. A(b) | | | 59,200 | | | | 3,694,080 | | |
| United States Steel Corp. | | | 33,900 | | | | 3,686,625 | | |
| | | | 7,380,705 | | |
| Machinery – Diversified — 0.5% | |
| Cummins, Inc. | | | 35,400 | | | | 3,582,834 | | |
| Manufacturing — 5.0% | |
| Cooper Industries Ltd. Cl. A | | | 28,380 | | | | 1,620,214 | | |
| Eaton Corp. | | | 23,600 | | | | 2,194,800 | | |
| General Electric Co. | | | 614,910 | | | | 23,538,755 | | |
| SPX Corp. | | | 29,400 | | | | 2,581,614 | | |
| Tyco International Ltd. | | | 102,200 | | | | 3,453,338 | | |
| | | | 33,388,721 | | |
| Media — 3.5% | |
| CBS Corp. Cl. B | | | 152,100 | | | | 5,067,972 | | |
| Citadel Broadcasting Corp. | | | 4,891 | | | | 31,547 | | |
| Comcast Corp. Cl. A(a) | | | 235,950 | | | | 6,634,914 | | |
| Gannett Co., Inc. | | | 9,800 | | | | 538,510 | | |
| Time Warner, Inc. | | | 307,125 | | | | 6,461,910 | | |
| Tribune Co. | | | 20,172 | | | | 593,057 | | |
| | | Number of
Shares | | Market
Value | |
| Viacom, Inc. Cl. B(a) | | | 77,900 | | | $ | 3,242,977 | | |
| The Walt Disney Co. | | | 31,700 | | | | 1,082,238 | | |
| | | | 23,653,125 | | |
| Mining — 0.1% | |
| Alcoa, Inc. | | | 10,300 | | | | 417,459 | | |
| Oil & Gas — 12.3% | |
BP PLC, Sponsored ADR
(United Kingdom) | | | 44,600 | | | | 3,217,444 | | |
| Chevron Corp. | | | 235,500 | | | | 19,838,520 | | |
| ConocoPhillips | | | 83,200 | | | | 6,531,200 | | |
| Exxon Mobil Corp. | | | 457,000 | | | | 38,333,160 | | |
| Marathon Oil Corp. | | | 123,200 | | | | 7,387,072 | | |
Occidental
Petroleum Corp. | | | 14,400 | | | | 833,472 | | |
Royal Dutch Shell PLC
Sponsored ADR
(United Kingdom) | | | 42,300 | | | | 3,434,760 | | |
Total SA Sponsored
ADR (France) | | | 41,200 | | | | 3,336,376 | | |
| | | | 82,912,004 | | |
| Packaging & Containers — 0.9% | |
| Bemis Co., Inc. | | | 14,800 | | | | 491,064 | | |
| Crown Holdings, Inc.(a) | | | 90,700 | | | | 2,264,779 | | |
| Owens-Illinois, Inc.(a) | | | 64,000 | | | | 2,240,000 | | |
| Sonoco Products Co. | | | 27,400 | | | | 1,172,994 | | |
| | | | 6,168,837 | | |
| Pharmaceuticals — 5.5% | |
| AmerisourceBergen Corp. | | | 34,700 | | | | 1,716,609 | | |
| Eli Lilly & Co. | | | 78,200 | | | | 4,369,816 | | |
| Merck & Co., Inc. | | | 129,700 | | | | 6,459,060 | | |
| Pfizer, Inc. | | | 794,400 | | | | 20,312,808 | | |
| Schering-Plough Corp. | | | 127,800 | | | | 3,890,232 | | |
| | | | 36,748,525 | | |
| Retail — 4.1% | |
| Dillards, Inc. Cl. A | | | 30,000 | | | | 1,077,900 | | |
| Dollar Tree Stores, Inc.(a) | | | 38,900 | | | | 1,694,095 | | |
| Family Dollar Stores, Inc. | | | 18,000 | | | | 617,760 | | |
| The Gap, Inc. | | | 176,200 | | | | 3,365,420 | | |
| The Home Depot, Inc. | | | 35,000 | | | | 1,377,250 | | |
| Limited Brands, Inc. | | | 61,800 | | | | 1,696,410 | | |
| Macy's, Inc. | | | 111,200 | | | | 4,423,536 | | |
| McDonald's Corp. | | | 168,800 | | | | 8,568,288 | | |
| Office Depot, Inc.(a) | | | 60,700 | | | | 1,839,210 | | |
| Saks, Inc. | | | 68,900 | | | | 1,471,015 | | |
| Wal-Mart Stores, Inc. | | | 27,000 | | | | 1,298,970 | | |
| | | | 27,429,854 | | |
| Savings & Loans — 1.2% | |
| Astoria Financial Corp. | | | 61,500 | | | | 1,539,960 | | |
| Washington Mutual, Inc.(b) | | | 153,100 | | | | 6,528,184 | | |
| | | | 8,068,144 | | |
| | | Number of
Shares | | Market
Value | |
| Software — 0.4% | |
| Microsoft Corp. | | | 93,300 | | | $ | 2,749,551 | | |
| Telecommunications — 8.1% | |
American Tower
Corp. Cl. A(a) | | | 31,000 | | | | 1,302,000 | | |
| AT&T, Inc. | | | 472,300 | | | | 19,600,450 | | |
| Cisco Systems, Inc.(a) | | | 88,400 | | | | 2,461,940 | | |
| Embarq Corp. | | | 47,900 | | | | 3,035,423 | | |
Nokia Oyj Sponsored
ADR (Finland) | | | 102,700 | | | | 2,886,897 | | |
| Sprint Nextel Corp. | | | 358,400 | | | | 7,422,464 | | |
Verizon
Communications, Inc. | | | 342,700 | | | | 14,108,959 | | |
Vodafone Group PLC
Sponsored
ADR (United Kingdom) | | | 114,500 | | | | 3,850,635 | | |
| | | | 54,668,768 | | |
| Toys, Games & Hobbies — 0.2% | |
| Mattel, Inc. | | | 47,100 | | | | 1,191,159 | | |
TOTAL EQUITIES
(Cost $550,194,277) | | | | | | | 666,231,890 | | |
| | | Principal
Amount | | | |
| SHORT-TERM INVESTMENTS — 7.0% | |
| Cash Equivalents — 6.1%(d) | |
Abbey National PLC
Eurodollar Time Deposit
5.280% 07/05/2007 | | $ | 537,006 | | | | 537,006 | | |
Abbey National PLC
Eurodollar Time Deposit
5.285% 07/09/2007 | | | 1,342,517 | | | | 1,342,517 | | |
American Beacon
Money Market Fund(c) | | | 1,506,242 | | | | 1,506,242 | | |
Banco Bilbao Vizcaya
Argentaria SA
Eurodollar Time Deposit
5.300% 08/10/2007 | | | 1,006,888 | | | | 1,006,888 | | |
Bank of America
5.270% 07/06/2007 | | | 1,342,517 | | | | 1,342,517 | | |
Bank of America
5.270% 07/16/2007 | | | 268,503 | | | | 268,503 | | |
Bank of America
5.270% 08/17/2007 | | | 335,629 | | | | 335,629 | | |
Bank of America
5.300% 09/17/2007 | | | 671,258 | | | | 671,258 | | |
Bank of Ireland
Eurodollar Time Deposit
5.300% 08/13/2007 | | | 1,342,517 | | | | 1,342,517 | | |
Bank of Montreal
Eurodollar Time Deposit
5.280% 07/03/2007 | | | 335,629 | | | | 335,629 | | |
(Continued)
The accompanying notes are an integral part of the financial statements.
106
MassMutual Select Diversified Value Fund – Portfolio of Investments (Continued)
| | | Principal
Amount | | Market
Value | |
Bank of Montreal
Eurodollar Time Deposit
5.290% 07/02/2007 | | $ | 268,503 | | | $ | 268,503 | | |
Bank of Montreal
Eurodollar Time Deposit
5.310% 08/14/2007 | | | 201,378 | | | | 201,378 | | |
Bank of Nova Scotia
Eurodollar Time Deposit
5.280% 07/09/2007 | | | 1,275,391 | | | | 1,275,391 | | |
Bank Of Nova Scotia
Eurodollar Time Deposit
5.285% 07/11/2007 | | | 738,384 | | | | 738,384 | | |
Barclays
Eurodollar Time Deposit
5.290% 07/06/2007 | | | 1,342,517 | | | | 1,342,517 | | |
Barclays
Eurodollar Time Deposit
5.295% 07/16/2007 | | | 268,503 | | | | 268,503 | | |
Barclays
Eurodollar Time Deposit
5.320% 09/04/2007 | | | 671,258 | | | | 671,258 | | |
Bear Stearns & Co
Commercial Paper
5.435% 07/10/2007 | | | 201,378 | | | | 201,378 | | |
BGI Institutional
Money Market Fund(c) | | | 872,636 | | | | 872,636 | | |
BNP Paribas
Eurodollar Time Deposit
5.350% 07/02/2007 | | | 2,013,775 | | | | 2,013,775 | | |
Calyon
Eurodollar Time Deposit
5.290% 07/17/2007 | | | 671,258 | | | | 671,258 | | |
Calyon
Eurodollar Time Deposit
5.380% 07/02/2007 | | | 2,013,775 | | | | 2,013,775 | | |
Canadian Imperial
Bank of Commerce
Eurodollar Time Deposit
5.300% 07/30/2007 | | | 1,342,517 | | | | 1,342,517 | | |
Dexia Group
Eurodollar Time Deposit
5.290% 08/08/2007 | | | 1,342,517 | | | | 1,342,517 | | |
Dreyfus Institutional Cash
Advantage
Money Market Fund(c) | | | 402,755 | | | | 402,755 | | |
Federal Home Loan Bank
Discount Note
5.174% 07/20/2007 | | | 99,570 | | | | 99,570 | | |
First Tennessee
National Corp.
Eurodollar Time Deposit
5.300% 07/18/2007 | | | 335,629 | | | | 335,629 | | |
Fortis Bank
Eurodollar Time Deposit
5.290% 07/06/2007 | | | 335,629 | | | | 335,629 | | |
| | | Principal
Amount | | Market
Value | |
Fortis Bank
Eurodollar Time Deposit
5.290% 07/09/2007 | | $ | 469,881 | | | $ | 469,881 | | |
Fortis Bank
Eurodollar Time Deposit
5.300% 07/20/2007 | | | 335,629 | | | | 335,629 | | |
Fortis Bank
Eurodollar Time Deposit
5.300% 07/26/2007 | | | 268,503 | | | | 268,503 | | |
Fortis Bank
Eurodollar Time Deposit
5.350% 07/05/2007 | | | 671,258 | | | | 671,258 | | |
Freddie Mac Discount Note
5.155% 07/16/2007 | | | 126,754 | | | | 126,754 | | |
Freddie Mac Discount Note
5.185% 07/09/2007 | | | 66,173 | | | | 66,173 | | |
Morgan Stanley & Co
Commercial Paper
5.445% 08/01/2007 | | | 604,133 | | | | 604,133 | | |
National Australia Bank
Eurodollar Time Deposit
5.320% 07/02/2007 | | | 671,258 | | | | 671,258 | | |
Nationwide Building Society
Commercial Paper
5.301% 07/09/2007 | | | 669,877 | | | | 669,877 | | |
Rabobank Nederland
Eurodollar Time Deposit
5.280% 07/05/2007 | | | 1,006,888 | | | | 1,006,888 | | |
Rabobank Nederland
Eurodollar Time Deposit
5.290% 07/16/2007 | | | 1,342,517 | | | | 1,342,517 | | |
Rabobank Nederland
Eurodollar Time Deposit
5.330% 07/02/2007 | | | 2,013,775 | | | | 2,013,775 | | |
Reserve Primary
Money Market Fund(c) | | | 1,332,768 | | | | 1,332,768 | | |
Royal Bank of Canada
Eurodollar Time Deposit
5.305% 08/30/2007 | | | 1,342,517 | | | | 1,342,517 | | |
Royal Bank of Scotland
Eurodollar Time Deposit
5.270% 07/11/2007 | | | 335,629 | | | | 335,629 | | |
Skandinaviska Enskilda
Banken AB
Eurodollar Time Deposit
5.290% 07/13/2007 | | | 1,342,517 | | | | 1,342,517 | | |
Skandinaviska Enskilda
Banken AB
Eurodollar Time Deposit
5.290% 07/19/2007 | | | 201,378 | | | | 201,378 | | |
Svenska Handlesbanken
Eurodollar Time Deposit
5.300% 07/02/2007 | | | 225,510 | | | | 225,510 | | |
| | | Principal
Amount | | Market
Value | |
UBS AG
Eurodollar Time Deposit
5.277% 07/05/2007 | | $ | 939,762 | | | $ | 939,762 | | |
UBS AG
Eurodollar Time Deposit
5.285% 07/05/2007 | | | 1,342,517 | | | | 1,342,517 | | |
Vanguard Prime
Money Market Fund(c) | | | 671,258 | | | | 671,258 | | |
Wells Fargo
Eurodollar Time Deposit
5.260% 07/02/2007 | | | 362,480 | | | | 362,480 | | |
Wells Fargo
Eurodollar Time Deposit
5.280% 07/11/2007 | | | 1,342,517 | | | | 1,342,517 | | |
Wells Fargo
Eurodollar Time Deposit
5.280% 07/12/2007 | | | 671,258 | | | | 671,258 | | |
| | | | 41,442,836 | | |
| Repurchase Agreements — 0.9% | |
Investors Bank & Trust
Company Repurchase
Agreement, dated
6/29/2007, 3.50%,
due 7/02/2007(e) | | | 6,057,134 | | | | 6,057,134 | | |
TOTAL SHORT-TERM
INVESTMENTS
(Cost $47,499,970) | | | | | | | 47,499,970 | | |
TOTAL INVESTMENTS — 105.8%
(Cost $597,694,247)(f) | | | | | | | 713,731,860 | | |
Other Assets/
(Liabilities) — (5.8%) | | | | | | | (39,050,790 | ) | |
| NET ASSETS — 100.0% | | | | | | $ | 674,681,070 | | |
Notes to Portfolio of Investments
ADR - American Depository Receipt
(a) Non-income producing security.
(b) Denotes all or a portion of security on loan. (Note 2).
(c) Amount represents shares owned of the fund.
(d) Represents investments of security lending collateral. (Note 2).
(e) Maturity value of $6,058,900. Collateralized by a U.S. Government Agency obligation with a rate of 8.625%, maturity date of 11/25/2022, and an aggregate market value, including accrued interest, of $6,359,990.
(f) See Note 6 for aggregate cost for Federal tax purposes.
The accompanying notes are an integral part of the financial statements.
107
MassMutual Select Fundamental Value Fund – Portfolio of Investments
June 30, 2007 (Unaudited)
| | | Number of
Shares | | Market
Value | |
| EQUITIES — 98.5% | |
| COMMON STOCK — 98.5% | |
| Aerospace & Defense — 3.6% | |
| General Dynamics Corp. | | | 319,600 | | | $ | 24,999,112 | | |
| Goodrich Corp. | | | 247,100 | | | | 14,717,276 | | |
Teledyne
Technologies, Inc.(a) | | | 163,600 | | | | 7,517,420 | | |
| | | | 47,233,808 | | |
| Agriculture — 1.2% | |
| Altria Group, Inc. | | | 213,200 | | | | 14,953,848 | | |
| Banks — 10.1% | |
| Bank of America Corp. | | | 982,900 | | | | 48,053,981 | | |
The Bank of New York
Co., Inc. | | | 329,800 | | | | 13,666,912 | | |
PNC Financial Services
Group, Inc. | | | 177,300 | | | | 12,691,134 | | |
| State Street Corp.(b) | | | 273,700 | | | | 18,721,080 | | |
| U.S. Bancorp | | | 365,300 | | | | 12,036,635 | | |
| Wachovia Corp. | | | 260,134 | | | | 13,331,868 | | |
| Wells Fargo & Co. | | | 377,900 | | | | 13,290,743 | | |
| | | | 131,792,353 | | |
| Beverages — 1.4% | |
| PepsiCo, Inc. | | | 283,900 | | | | 18,410,915 | | |
| Building Materials — 1.6% | |
American Standard
Cos., Inc. | | | 362,300 | | | | 21,368,454 | | |
| Chemicals — 3.4% | |
| Agrium, Inc. | | | 374,100 | | | | 16,366,875 | | |
| The Dow Chemical Co. | | | 285,400 | | | | 12,620,388 | | |
Du Pont (E.I.) de
Nemours & Co. | | | 303,100 | | | | 15,409,604 | | |
| | | | 44,396,867 | | |
| Computers — 3.3% | |
| EMC Corp.(a) | | | 869,500 | | | | 15,737,950 | | |
| Hewlett-Packard Co. | | | 355,500 | | | | 15,862,410 | | |
| Sun Microsystems, Inc.(a) | | | 2,188,600 | | | | 11,512,036 | | |
| | | | 43,112,396 | | |
| Cosmetics & Personal Care — 0.9% | |
| Colgate-Palmolive Co. | | | 186,800 | | | | 12,113,980 | | |
| Diversified Financial — 9.5% | |
| Citigroup, Inc. | | | 901,300 | | | | 46,227,677 | | |
The Goldman Sachs
Group, Inc. | | | 94,800 | | | | 20,547,900 | | |
| JP Morgan Chase & Co. | | | 668,236 | | | | 32,376,034 | | |
Nuveen Investments,
Inc. Cl. A | | | 177,000 | | | | 11,000,550 | | |
| | | Number of
Shares | | Market
Value | |
| UBS AG | | | 231,900 | | | $ | 13,916,319 | | |
| | | | 124,068,480 | | |
| Electric — 3.7% | |
| Entergy Corp. | | | 61,000 | | | | 6,548,350 | | |
| Exelon Corp. | | | 324,300 | | | | 23,544,180 | | |
| FPL Group, Inc. | | | 192,500 | | | | 10,922,450 | | |
| SCANA Corp. | | | 185,600 | | | | 7,106,624 | | |
| | | | 48,121,604 | | |
| Foods — 5.9% | |
| Kellogg Co. | | | 221,700 | | | | 11,481,843 | | |
| The Kroger Co. | | | 438,700 | | | | 12,340,631 | | |
| Safeway, Inc. | | | 369,000 | | | | 12,557,070 | | |
| SuperValu, Inc. | | | 371,100 | | | | 17,189,352 | | |
| Tyson Foods, Inc. Cl. A | | | 1,043,400 | | | | 24,039,936 | | |
| | | | 77,608,832 | | |
| Forest Products & Paper — 0.3% | |
Smurfit-Stone
Container Corp.(a) | | | 332,000 | | | | 4,418,920 | | |
| Health Care – Products — 1.6% | |
| Baxter International, Inc. | | | 323,500 | | | | 18,225,990 | | |
| Beckman Coulter, Inc.(b) | | | 46,000 | | | | 2,975,280 | | |
| | | | 21,201,270 | | |
| Health Care – Services — 1.9% | |
| Aetna, Inc. | | | 265,700 | | | | 13,125,580 | | |
| WellPoint, Inc.(a) | | | 138,300 | | | | 11,040,489 | | |
| | | | 24,166,069 | | |
| Household Products — 0.8% | |
| Kimberly-Clark Corp. | | | 154,800 | | | | 10,354,572 | | |
| Insurance — 5.3% | |
| ACE Ltd. | | | 174,500 | | | | 10,909,740 | | |
| Allstate Corp. | | | 249,300 | | | | 15,334,443 | | |
American International
Group, Inc. | | | 364,400 | | | | 25,518,932 | | |
| Chubb Corp. | | | 315,600 | | | | 17,086,584 | | |
| | | | 68,849,699 | | |
| Machinery – Diversified — 1.5% | |
| Deere & Co. | | | 163,400 | | | | 19,728,916 | | |
| Manufacturing — 3.9% | |
| General Electric Co. | | | 1,015,700 | | | | 38,880,996 | | |
| Textron, Inc. | | | 105,700 | | | | 11,638,627 | | |
| | | | 50,519,623 | | |
| Media — 2.3% | |
| Comcast Corp. Cl. A(a) | | | 436,850 | | | | 12,284,222 | | |
| Time Warner, Inc. | | | 806,700 | | | | 16,972,968 | | |
| | | | 29,257,190 | | |
| | | Number of
Shares | | Market
Value | |
| Mining — 1.4% | |
| Alcoa, Inc. | | | 167,400 | | | $ | 6,784,722 | | |
| Cameco Corp.(b) | | | 230,600 | | | | 11,700,644 | | |
| | | | 18,485,366 | | |
| Office Equipment/Supplies — 0.8% | |
| Pitney Bowes, Inc. | | | 223,900 | | | | 10,482,998 | | |
| Oil & Gas — 13.5% | |
| Chevron Corp. | | | 269,000 | | | | 22,660,560 | | |
| ConocoPhillips | | | 240,400 | | | | 18,871,400 | | |
| Exxon Mobil Corp. | | | 748,100 | | | | 62,750,628 | | |
| GlobalSantaFe Corp. | | | 167,600 | | | | 12,109,100 | | |
Newfield
Exploration Co.(a) | | | 487,700 | | | | 22,214,735 | | |
Occidental
Petroleum Corp. | | | 421,500 | | | | 24,396,420 | | |
| XTO Energy, Inc. | | | 231,000 | | | | 13,883,100 | | |
| | | | 176,885,943 | | |
| Pharmaceuticals — 3.3% | |
| Abbott Laboratories | | | 235,800 | | | | 12,627,090 | | |
| Bristol-Myers Squibb Co. | | | 206,500 | | | | 6,517,140 | | |
| Wyeth | | | 426,000 | | | | 24,426,840 | | |
| | | | 43,571,070 | | |
Real Estate Investment Trusts
(REITS) — 1.6% | |
Host Hotels & Resorts,
Inc. REIT(b) | | | 910,643 | | | | 21,054,066 | | |
| Retail — 4.9% | |
| CVS Caremark Corp. | | | 765,200 | | | | 27,891,540 | | |
| The Gap, Inc. | | | 604,600 | | | | 11,547,860 | | |
| Macy's, Inc. | | | 284,300 | | | | 11,309,454 | | |
| McDonald's Corp. | | | 265,400 | | | | 13,471,704 | | |
| | | | 64,220,558 | | |
| Semiconductors — 1.0% | |
| Intel Corp. | | | 542,000 | | | | 12,877,920 | | |
| Telecommunications — 9.8% | |
| AT&T, Inc. | | | 1,120,920 | | | | 46,518,180 | | |
| Cisco Systems, Inc.(a) | | | 653,800 | | | | 18,208,330 | | |
| Corning, Inc.(a) | | | 449,800 | | | | 11,492,390 | | |
Nokia Oyj Sponsored
ADR (Finland) | | | 686,500 | | | | 19,297,515 | | |
Verizon
Communications, Inc. | | | 787,300 | | | | 32,413,141 | | |
| | | | 127,929,556 | | |
TOTAL EQUITIES
(Cost $999,879,182) | | | | | | | 1,287,185,273 | | |
(Continued)
The accompanying notes are an integral part of the financial statements.
108
MassMutual Select Fundamental Value Fund – Portfolio of Investments (Continued)
| | | Principal
Amount | | Market
Value | |
| SHORT-TERM INVESTMENTS — 6.7% | |
| Cash Equivalents — 4.3%(d) | |
Abbey National PLC
Eurodollar Time Deposit
5.280% 07/05/2007 | | $ | 723,014 | | | $ | 723,014 | | |
Abbey National PLC
Eurodollar Time Deposit
5.285% 07/09/2007 | | | 1,807,536 | | | | 1,807,536 | | |
American Beacon
Money Market Fund(c) | | | 2,027,970 | | | | 2,027,970 | | |
Banco Bilbao Vizcaya
Argentaria SA
Eurodollar Time Deposit
5.300% 08/10/2007 | | | 1,355,651 | | | | 1,355,651 | | |
Bank of America
5.270% 07/06/2007 | | | 1,807,534 | | | | 1,807,534 | | |
Bank of America
5.270% 07/16/2007 | | | 361,507 | | | | 361,507 | | |
Bank of America
5.270% 08/17/2007 | | | 451,884 | | | | 451,884 | | |
Bank of America
5.300% 09/17/2007 | | | 903,767 | | | | 903,767 | | |
Bank of Ireland
Eurodollar Time Deposit
5.300% 08/13/2007 | | | 1,807,534 | | | | 1,807,534 | | |
Bank of Montreal
Eurodollar Time Deposit
5.280% 07/03/2007 | | | 451,884 | | | | 451,884 | | |
Bank of Montreal
Eurodollar Time Deposit
5.290% 07/02/2007 | | | 361,507 | | | | 361,507 | | |
Bank of Montreal
Eurodollar Time Deposit
5.310% 08/14/2007 | | | 271,130 | | | | 271,130 | | |
Bank of Nova Scotia
Eurodollar Time Deposit
5.280% 07/09/2007 | | | 1,717,158 | | | | 1,717,158 | | |
Bank Of Nova Scotia
Eurodollar Time Deposit
5.285% 07/11/2007 | | | 994,144 | | | | 994,144 | | |
Barclays
Eurodollar Time Deposit
5.290% 07/06/2007 | | | 1,807,534 | | | | 1,807,534 | | |
Barclays
Eurodollar Time Deposit
5.295% 07/16/2007 | | | 361,507 | | | | 361,507 | | |
Barclays
Eurodollar Time Deposit
5.320% 09/04/2007 | | | 903,767 | | | | 903,767 | | |
Bear Stearns & Co
Commercial Paper
5.435% 07/10/2007 | | | 271,130 | | | | 271,130 | | |
BGI Institutional
Money Market Fund(c) | | | 1,174,897 | | | | 1,174,897 | | |
| | | Principal
Amount | | Market
Value | |
BNP Paribas
Eurodollar Time Deposit
5.350% 07/02/2007 | | $ | 2,711,302 | | | $ | 2,711,302 | | |
Calyon
Eurodollar Time Deposit
5.290% 07/17/2007 | | | 903,767 | | | | 903,767 | | |
Calyon
Eurodollar Time Deposit
5.380% 07/02/2007 | | | 2,711,302 | | | | 2,711,302 | | |
Canadian Imperial
Bank of Commerce
Eurodollar Time Deposit
5.300% 07/30/2007 | | | 1,807,534 | | | | 1,807,534 | | |
Dexia Group
Eurodollar Time Deposit
5.290% 08/08/2007 | | | 1,807,534 | | | | 1,807,534 | | |
Dreyfus Institutional
Cash Advantage
Money Market Fund(c) | | | 542,260 | | | | 542,260 | | |
Federal Home Loan
Bank Discount Note
5.174% 07/20/2007 | | | 134,059 | | | | 134,059 | | |
First Tennessee
National Corp.
Eurodollar Time Deposit
5.300% 07/18/2007 | | | 451,884 | | | | 451,884 | | |
Fortis Bank
Eurodollar Time Deposit
5.290% 07/06/2007 | | | 451,884 | | | | 451,884 | | |
Fortis Bank
Eurodollar Time Deposit
5.290% 07/09/2007 | | | 632,637 | | | | 632,637 | | |
Fortis Bank
Eurodollar Time Deposit
5.300% 07/20/2007 | | | 451,884 | | | | 451,884 | | |
Fortis Bank
Eurodollar Time Deposit
5.300% 07/26/2007 | | | 361,507 | | | | 361,507 | | |
Fortis Bank
Eurodollar Time Deposit
5.350% 07/05/2007 | | | 903,767 | | | | 903,767 | | |
Freddie Mac Discount Note
5.155% 07/16/2007 | | | 170,659 | | | | 170,659 | | |
Freddie Mac Discount Note
5.185% 07/09/2007 | | | 89,094 | | | | 89,094 | | |
Morgan Stanley & Co
Commercial Paper
5.445% 08/01/2007 | | | 813,390 | | | | 813,390 | | |
National Australia Bank
Eurodollar Time Deposit
5.320% 07/02/2007 | | | 903,767 | | | | 903,767 | | |
Nationwide Building
Society Commercial Paper
5.301% 07/09/2007 | | | 901,908 | | | | 901,908 | | |
| | | Principal
Amount | | Market
Value | |
Rabobank Nederland
Eurodollar Time Deposit
5.280% 07/05/2007 | | $ | 1,355,651 | | | $ | 1,355,651 | | |
Rabobank Nederland
Eurodollar Time Deposit
5.290% 07/16/2007 | | | 1,807,534 | | | | 1,807,534 | | |
Rabobank Nederland
Eurodollar Time Deposit
5.330% 07/02/2007 | | | 2,711,302 | | | | 2,711,302 | | |
Reserve Primary
Money Market Fund(c) | | | 1,794,410 | | | | 1,794,410 | | |
Royal Bank of Canada
Eurodollar Time Deposit
5.305% 08/30/2007 | | | 1,807,534 | | | | 1,807,534 | | |
Royal Bank of Scotland
Eurodollar Time Deposit
5.270% 07/11/2007 | | | 451,884 | | | | 451,884 | | |
Skandinaviska Enskilda
Banken AB
Eurodollar Time Deposit
5.290% 07/13/2007 | | | 1,807,534 | | | | 1,807,534 | | |
Skandinaviska Enskilda
Banken AB
Eurodollar Time Deposit
5.290% 07/19/2007 | | | 271,130 | | | | 271,130 | | |
Svenska Handlesbanken
Eurodollar Time Deposit
5.300% 07/02/2007 | | | 303,622 | | | | 303,622 | | |
UBS AG
Eurodollar Time Deposit
5.277% 07/05/2007 | | | 1,265,274 | | | | 1,265,274 | | |
UBS AG
Eurodollar Time Deposit
5.285% 07/05/2007 | | | 1,807,534 | | | | 1,807,534 | | |
Vanguard Prime
Money Market Fund(c) | | | 903,767 | | | | 903,767 | | |
Wells Fargo
Eurodollar Time Deposit
5.260% 07/02/2007 | | | 488,034 | | | | 488,034 | | |
Wells Fargo
Eurodollar Time Deposit
5.280% 07/11/2007 | | | 1,807,534 | | | | 1,807,534 | | |
Wells Fargo
Eurodollar Time Deposit
5.280% 07/12/2007 | | | 903,767 | | | | 903,767 | | |
| | | | 55,797,705 | | |
(Continued)
The accompanying notes are an integral part of the financial statements.
109
MassMutual Select Fundamental Value Fund – Portfolio of Investments (Continued)
| | | Principal
Amount | | Market
Value | |
| Repurchase Agreements — 2.4% | |
Investors Bank & Trust
Company Repurchase
Agreement, dated
6/29/2007, 3.50%,
due 7/02/2007(e) | | $ | 31,699,682 | | | $ | 31,699,682 | | |
TOTAL SHORT-TERM
INVESTMENTS
(Cost $87,497,387) | | | | | 87,497,387 | | |
TOTAL INVESTMENTS — 105.2%
(Cost $1,087,376,569)(f) | | | | | 1,374,682,660 | | |
Other Assets/
(Liabilities) — (5.2%) | | | | | (67,475,958 | ) | |
| NET ASSETS — 100.0% | | | | $ | 1,307,206,702 | | |
Notes to Portfolio of Investments
ADR - American Depository Receipt
(a) Non-income producing security.
(b) Denotes all or a portion of security on loan. (Note 2).
(c) Amount represents shares owned of the fund.
(d) Represents investments of security lending collateral. (Note 2).
(e) Maturity value of $31,708,928. Collateralized by a U.S. Government Agency obligation with a rate of 5.67%, maturity date of 12/15/2034, and an aggregate market value, including accrued interest, of $33,284,666.
(f) See Note 6 for aggregate cost for Federal tax purposes.
The remainder of this page is intentionally left blank.
The accompanying notes are an integral part of the financial statements.
110
MassMutual Select Value Equity Fund – Portfolio of Investments
June 30, 2007 (Unaudited)
| | | Number of
Shares | | Market
Value | |
| EQUITIES — 98.9% | |
| COMMON STOCK — 98.9% | |
| Aerospace & Defense — 1.7% | |
| Raytheon Co. | | | 32,580 | | | $ | 1,755,736 | | |
| Agriculture — 2.5% | |
| Altria Group, Inc. | | | 37,000 | | | | 2,595,180 | | |
| Airlines — 0.8% | |
| AMR Corp.(a) | | | 32,800 | | | | 864,280 | | |
| Automotive & Parts — 0.6% | |
| Autoliv, Inc. | | | 10,600 | | | | 602,822 | | |
| Banks — 5.2% | |
| Bank of America Corp. | | | 85,800 | | | | 4,194,762 | | |
| Peoples United Financial | | | 18,900 | | | | 335,097 | | |
| SunTrust Banks, Inc. | | | 9,300 | | | | 797,382 | | |
| | | | 5,327,241 | | |
| Beverages — 0.5% | |
Molson Coors
Brewing Co. Cl. B | | | 5,900 | | | | 545,514 | | |
| Commercial Services — 0.8% | |
| McKesson Corp. | | | 13,000 | | | | 775,320 | | |
| Computer Related Services — 0.0% | |
| Ingram Micro, Inc. Cl. A(a) | | | 71 | | | | 1,542 | | |
| Computers — 1.6% | |
| Hewlett-Packard Co. | | | 36,700 | | | | 1,637,554 | | |
| Cosmetics & Personal Care — 2.1% | |
| The Procter & Gamble Co. | | | 35,200 | | | | 2,153,888 | | |
| Diversified Financial — 13.4% | |
| AmeriCredit Corp.(a) (b) | | | 22,000 | | | | 584,100 | | |
| Citigroup, Inc. | | | 48,400 | | | | 2,482,436 | | |
Countrywide
Financial Corp.(b) | | | 34,400 | | | | 1,250,440 | | |
| Fannie Mae | | | 40,600 | | | | 2,652,398 | | |
| JP Morgan Chase & Co. | | | 63,800 | | | | 3,091,110 | | |
| Merrill Lynch & Co., Inc. | | | 19,400 | | | | 1,621,452 | | |
| Morgan Stanley | | | 23,900 | | | | 2,004,732 | | |
| | | | 13,686,668 | | |
| Electric — 5.0% | |
| CenterPoint Energy, Inc. | | | 1,000 | | | | 17,400 | | |
Constellation Energy
Group, Inc. | | | 13,880 | | | | 1,209,920 | | |
| Edison International | | | 27,700 | | | | 1,554,524 | | |
| Northeast Utilities | | | 27,600 | | | | 782,736 | | |
| NRG Energy, Inc.(a) | | | 25,600 | | | | 1,064,192 | | |
| Progress Energy, Inc. | | | 10,500 | | | | 478,695 | | |
| | | | 5,107,467 | | |
| | | Number of
Shares | | Market
Value | |
| Electronics — 0.9% | |
| Avnet, Inc.(a) (b) | | | 23,900 | | | $ | 947,396 | | |
| Foods — 1.6% | |
| The Kroger Co. | | | 57,500 | | | | 1,617,475 | | |
| Gas — 0.5% | |
| Energen Corp. | | | 9,400 | | | | 516,436 | | |
| Health Care – Services — 3.0% | |
| Aetna, Inc. | | | 21,200 | | | | 1,047,280 | | |
| WellPoint, Inc.(a) | | | 25,300 | | | | 2,019,699 | | |
| | | | 3,066,979 | | |
| Home Builders — 0.9% | |
| KB Home(b) | | | 22,400 | �� | | | 881,888 | | |
| Insurance — 14.7% | |
| ACE Ltd. | | | 27,100 | | | | 1,694,292 | | |
| Allstate Corp. | | | 19,700 | | | | 1,211,747 | | |
American Financial
Group, Inc. | | | 14,600 | | | | 498,590 | | |
| American International | |
| Group, Inc. | | | 15,600 | | | | 1,092,468 | | |
| Assurant, Inc. | | | 14,700 | | | | 866,124 | | |
| Axis Capital Holdings Ltd. | | | 11,000 | | | | 447,150 | | |
| Chubb Corp. | | | 34,100 | | | | 1,846,174 | | |
Fidelity National
Financial, Inc. | | | 27,126 | | | | 642,886 | | |
Genworth Financial,
Inc. Cl. A | | | 20,500 | | | | 705,200 | | |
The Hartford Financial
Services Group, Inc. | | | 15,700 | | | | 1,546,607 | | |
| Loews Corp. | | | 33,200 | | | | 1,692,536 | | |
| MBIA, Inc.(b) | | | 8,500 | | | | 528,870 | | |
| Metlife, Inc. | | | 28,600 | | | | 1,844,128 | | |
| MGIC Investment Corp.(b) | | | 7,500 | | | | 426,450 | | |
| | | | 15,043,222 | | |
| Iron & Steel — 3.0% | |
| Nucor Corp. | | | 20,100 | | | | 1,178,865 | | |
| United States Steel Corp. | | | 16,900 | | | | 1,837,875 | | |
| | | | 3,016,740 | | |
| Machinery – Construction & Mining — 0.8% | |
| Terex Corp.(a) | | | 10,000 | | | | 813,000 | | |
| Machinery – Diversified — 1.8% | |
| AGCO Corp.(a) | | | 20,100 | | | | 872,541 | | |
| Deere & Co. | | | 8,100 | | | | 977,994 | | |
| | | | 1,850,535 | | |
| Manufacturing — 3.0% | |
| General Electric Co. | | | 81,400 | | | | 3,115,992 | | |
| | | Number of
Shares | | Market
Value | |
| Media — 2.0% | |
| Time Warner, Inc. | | | 95,948 | | | $ | 2,018,746 | | |
| Metal Fabricate & Hardware — 0.8% | |
| Commercial Metals Co. | | | 24,300 | | | | 820,611 | | |
| Oil & Gas — 13.9% | |
| Chevron Corp. | | | 16,900 | | | | 1,423,656 | | |
| ConocoPhillips | | | 15,100 | | | | 1,185,350 | | |
| Exxon Mobil Corp. | | | 51,900 | | | | 4,353,372 | | |
| Marathon Oil Corp. | | | 37,200 | | | | 2,230,512 | | |
| Patterson-UTI Energy, Inc. | | | 24,992 | | | | 655,040 | | |
Pioneer Natural
Resources Co. | | | 21,800 | | | | 1,061,878 | | |
Plains Exploration &
Production Co.(a) | | | 7,900 | | | | 377,699 | | |
| Tesoro Corp. | | | 17,100 | | | | 977,265 | | |
| Valero Energy Corp. | | | 26,200 | | | | 1,935,132 | | |
| | | | 14,199,904 | | |
| Pharmaceuticals — 3.4% | |
| Pfizer, Inc. | | | 135,000 | | | | 3,451,950 | | |
| Retail — 3.8% | |
| Best Buy Co., Inc.(b) | | | 18,000 | | | | 840,060 | | |
| J.C. Penney Co., Inc. | | | 9,900 | | | | 716,562 | | |
| Macy's, Inc. | | | 27,272 | | | | 1,084,880 | | |
| The TJX Cos., Inc. | | | 45,400 | | | | 1,248,500 | | |
| | | | 3,890,002 | | |
| Savings & Loans — 0.6% | |
| Hudson City Bancorp, Inc.(b) | | | 46,900 | | | | 573,118 | | |
| Semiconductors — 0.9% | |
| Applied Materials, Inc. | | | 46,100 | | | | 916,007 | | |
| Telecommunications — 6.5% | |
| AT&T, Inc. | | | 106,300 | | | | 4,411,450 | | |
| CenturyTel, Inc. | | | 28,400 | | | | 1,393,020 | | |
| Embarq Corp. | | | 13,000 | | | | 823,810 | | |
Qwest Communications
International, Inc.(a) | | | 200 | | | | 1,940 | | |
| | | | 6,630,220 | | |
| Transportation — 2.6% | |
Burlington Northern Santa
Fe Corp. | | | 9,600 | | | | 817,344 | | |
| Tidewater, Inc.(b) | | | 15,000 | | | | 1,063,200 | | |
| YRC Worldwide, Inc.(a) (b) | | | 20,578 | | | | 757,270 | | |
| | | | 2,637,814 | | |
TOTAL EQUITIES
(Cost $93,111,917) | | | | | | | 101,061,247 | | |
(Continued)
The accompanying notes are an integral part of the financial statements.
111
MassMutual Select Value Equity Fund – Portfolio of Investments (Continued)
| | | Principal
Amount | | Market
Value | |
| SHORT-TERM INVESTMENTS — 6.2% | |
| Cash Equivalents — 5.4%(d) | |
Abbey National PLC
Eurodollar Time Deposit
5.280% 07/05/2007 | | $ | 71,366 | | | $ | 71,366 | | |
Abbey National PLC
Eurodollar Time Deposit
5.285% 07/09/2007 | | | 178,421 | | | | 178,421 | | |
American Beacon
Money Market Fund(c) | | | 200,175 | | | | 200,175 | | |
Banco Bilbao Vizcaya
Argentaria SA
Eurodollar Time Deposit
5.300% 08/10/2007 | | | 133,812 | | | | 133,812 | | |
Bank of America
5.270% 07/06/2007 | | | 178,416 | | | | 178,416 | | |
Bank of America
5.270% 07/16/2007 | | | 35,683 | | | | 35,683 | | |
Bank of America
5.270% 08/17/2007 | | | 44,604 | | | | 44,604 | | |
Bank of America
5.300% 09/17/2007 | | | 89,208 | | | | 89,208 | | |
Bank of Ireland
Eurodollar Time Deposit
5.300% 08/13/2007 | | | 178,416 | | | | 178,416 | | |
Bank of Montreal
Eurodollar Time Deposit
5.280% 07/03/2007 | | | 44,604 | | | | 44,604 | | |
Bank of Montreal
Eurodollar Time Deposit
5.290% 07/02/2007 | | | 35,683 | | | | 35,683 | | |
Bank of Montreal
Eurodollar Time Deposit
5.310% 08/14/2007 | | | 26,762 | | | | 26,762 | | |
Bank of Nova Scotia
Eurodollar Time Deposit
5.280% 07/09/2007 | | | 169,495 | | | | 169,495 | | |
Bank Of Nova Scotia
Eurodollar Time Deposit
5.285% 07/11/2007 | | | 98,129 | | | | 98,129 | | |
Barclays
Eurodollar Time Deposit
5.290% 07/06/2007 | | | 178,416 | | | | 178,416 | | |
Barclays
Eurodollar Time Deposit
5.295% 07/16/2007 | | | 35,683 | | | | 35,683 | | |
Barclays
Eurodollar Time Deposit
5.320% 09/04/2007 | | | 89,208 | | | | 89,208 | | |
Bear Stearns & Co
Commercial Paper
5.435% 07/10/2007 | | | 26,762 | | | | 26,762 | | |
| | | Principal
Amount | | Market
Value | |
BGI Institutional
Money Market Fund(c) | | $ | 115,970 | | | $ | 115,970 | | |
BNP Paribas
Eurodollar Time Deposit
5.350% 07/02/2007 | | | 267,624 | | | | 267,624 | | |
Calyon
Eurodollar Time Deposit
5.290% 07/17/2007 | | | 89,208 | | | | 89,208 | | |
Calyon
Eurodollar Time Deposit
5.380% 07/02/2007 | | | 267,624 | | | | 267,624 | | |
Canadian Imperial
Bank of Commerce
Eurodollar Time Deposit
5.300% 07/30/2007 | | | 178,416 | | | | 178,416 | | |
Dexia Group
Eurodollar Time Deposit
5.290% 08/08/2007 | | | 178,416 | | | | 178,416 | | |
Dreyfus Institutional
Cash Advantage
Money Market Fund(c) | | | 53,525 | | | | 53,525 | | |
Federal Home Loan Bank
Discount Note
5.174% 07/20/2007 | | | 13,233 | | | | 13,233 | | |
First Tennessee
National Corp.
Eurodollar Time Deposit
5.300% 07/18/2007 | | | 44,604 | | | | 44,604 | | |
Fortis Bank
Eurodollar Time Deposit
5.290% 07/06/2007 | | | 44,604 | | | | 44,604 | | |
Fortis Bank
Eurodollar Time Deposit
5.290% 07/09/2007 | | | 62,446 | | | | 62,446 | | |
Fortis Bank
Eurodollar Time Deposit
5.300% 07/20/2007 | | | 44,604 | | | | 44,604 | | |
Fortis Bank
Eurodollar Time Deposit
5.300% 07/26/2007 | | | 35,683 | | | | 35,683 | | |
Fortis Bank
Eurodollar Time Deposit
5.350% 07/05/2007 | | | 89,208 | | | | 89,208 | | |
Freddie Mac
Discount Note
5.155% 07/16/2007 | | | 16,845 | | | | 16,845 | | |
Freddie Mac
Discount Note
5.185% 07/09/2007 | | | 8,794 | | | | 8,794 | | |
Morgan Stanley & Co
Commercial Paper
5.445% 08/01/2007 | | | 80,287 | | | | 80,287 | | |
| | | Principal
Amount | | Market
Value | |
National Australia Bank
Eurodollar Time Deposit
5.320% 07/02/2007 | | $ | 89,208 | | | $ | 89,208 | | |
Nationwide Building Society
Commercial Paper
5.301% 07/09/2007 | | | 89,025 | | | | 89,025 | | |
Rabobank Nederland
Eurodollar Time Deposit
5.280% 07/05/2007 | | | 133,812 | | | | 133,812 | | |
Rabobank Nederland
Eurodollar Time Deposit
5.290% 07/16/2007 | | | 178,416 | | | | 178,416 | | |
Rabobank Nederland
Eurodollar Time Deposit
5.330% 07/02/2007 | | | 267,624 | | | | 267,624 | | |
Reserve Primary
Money Market Fund(c) | | | 177,121 | | | | 177,121 | | |
Royal Bank of Canada
Eurodollar Time Deposit
5.305% 08/30/2007 | | | 178,416 | | | | 178,416 | | |
Royal Bank of Scotland
Eurodollar Time Deposit
5.270% 07/11/2007 | | | 44,604 | | | | 44,604 | | |
Skandinaviska Enskilda
Banken AB
Eurodollar Time Deposit
5.290% 07/13/2007 | | | 178,416 | | | | 178,416 | | |
Skandinaviska Enskilda
Banken AB
Eurodollar Time Deposit
5.290% 07/19/2007 | | | 26,762 | | | | 26,762 | | |
Svenska Handlesbanken
Eurodollar Time Deposit
5.300% 07/02/2007 | | | 29,970 | | | | 29,970 | | |
UBS AG
Eurodollar Time Deposit
5.277% 07/05/2007 | | | 124,891 | | | | 124,891 | | |
UBS AG
Eurodollar Time Deposit
5.285% 07/05/2007 | | | 178,416 | | | | 178,416 | | |
Vanguard Prime
Money Market Fund(c) | | | 89,208 | | | | 89,208 | | |
Wells Fargo
Eurodollar Time Deposit
5.260% 07/02/2007 | | | 48,172 | | | | 48,172 | | |
Wells Fargo
Eurodollar Time Deposit
5.280% 07/11/2007 | | | 178,416 | | | | 178,416 | | |
Wells Fargo
Eurodollar Time Deposit
5.280% 07/12/2007 | | | 89,208 | | | | 89,208 | | |
| | | | 5,507,619 | | |
(Continued)
The accompanying notes are an integral part of the financial statements.
112
MassMutual Select Value Equity Fund – Portfolio of Investments (Continued)
| | | Principal
Amount | | Market
Value | |
| Repurchase Agreements — 0.8% | |
Investors Bank & Trust
Company Repurchase
Agreement, dated
6/29/2007, 3.50%,
due 7/02/2007(e) | | $ | 809,929 | | | $ | 809,929 | | |
TOTAL SHORT-TERM
INVESTMENTS
(Cost $6,317,548) | | | | | 6,317,548 | | |
TOTAL INVESTMENTS — 105.1%
(Cost $99,429,465)(f) | | | | | 107,378,795 | | |
Other Assets/
(Liabilities) — (5.1%) | | | | | (5,224,352 | ) | |
| NET ASSETS — 100.0% | | | | $ | 102,154,443 | | |
Notes to Portfolio of Investments
(a) Non-income producing security.
(b) Denotes all or a portion of security on loan. (Note 2).
(c) Amount represents shares owned of the fund.
(d) Represents investments of security lending collateral. (Note 2).
(e) Maturity value of $810,165. Collateralized by a U.S. Government Agency obligation with a rate of 7.625%, maturity date of 6/25/2026, and an aggregate market value, including accrued interest, of $850,425.
(f) See Note 6 for aggregate cost for Federal tax purposes.
The remainder of this page is intentionally left blank.
The accompanying notes are an integral part of the financial statements.
113
MassMutual Select Large Cap Value Fund – Portfolio of Investments
June 30, 2007 (Unaudited)
| | | Number of
Shares | | Market
Value | |
| EQUITIES — 98.7% | |
| COMMON STOCK — 98.7% | |
| Advertising — 0.3% | |
WPP Group PLC
Sponsored ADR
(United Kingdom)(a) | | | 52,500 | | | $ | 3,924,375 | | |
| Agriculture — 3.2% | |
| Altria Group, Inc. | | | 701,000 | | | | 49,168,140 | | |
| Banks — 8.8% | |
Commerce
Bancorp, Inc.(a) | | | 226,600 | | | | 8,381,934 | | |
| HSBC Holdings PLC GBP | | | 2,180,087 | | | | 39,861,017 | | |
| Mellon Financial Corp. | | | 410,800 | | | | 18,075,200 | | |
| State Street Corp.(a) | | | 38,900 | | | | 2,660,760 | | |
| Wachovia Corp. | | | 580,714 | | | | 29,761,593 | | |
| Wells Fargo & Co. | | | 960,000 | | | | 33,763,200 | | |
| | | | 132,503,704 | | |
| Beverages — 2.1% | |
Diageo PLC
Sponsored ADR
(United Kingdom) | | | 224,600 | | | | 18,711,426 | | |
Heineken Holding
NV Cl. A EUR | | | 266,050 | | | | 13,720,064 | | |
| | | | 32,431,490 | | |
| Building Materials — 1.2% | |
Martin Marietta
Materials, Inc. | | | 109,600 | | | | 17,757,392 | | |
| Coal — 0.6% | |
Chine Coal
Energy Co. HKD(b) | | | 5,612,200 | | | | 8,417,910 | | |
| Commercial Services — 3.7% | |
Apollo Group,
Inc. Cl. A(b) | | | 47,300 | | | | 2,763,739 | | |
| Block (H&R), Inc.(a) | | | 613,600 | | | | 14,339,832 | | |
| Cosco Pacific Ltd. HKD | | | 1,921,100 | | | | 5,054,968 | | |
Iron Mountain,
Inc.(a) (b) | | | 631,550 | | | | 16,502,401 | | |
| Moody's Corp.(a) | | | 266,500 | | | | 16,576,300 | | |
| | | | 55,237,240 | | |
| Computers — 1.8% | |
| Dell, Inc.(b) | | | 618,200 | | | | 17,649,610 | | |
| Hewlett-Packard Co. | | | 217,300 | | | | 9,695,926 | | |
| | | | 27,345,536 | | |
| | | Number of
Shares | | Market
Value | |
| Cosmetics & Personal Care — 1.3% | |
| Avon Products, Inc. | | | 162,700 | | | $ | 5,979,225 | | |
| The Procter & Gamble Co. | | | 234,000 | | | | 14,318,460 | | |
| | | | 20,297,685 | | |
| Diversified Financial — 12.2% | |
| American Express Co. | | | 1,115,500 | | | | 68,246,290 | | |
| Ameriprise Financial, Inc. | | | 293,660 | | | | 18,667,966 | | |
| Citigroup, Inc. | | | 553,600 | | | | 28,394,144 | | |
E*TRADE
Financial Corp.(b) | | | 84,400 | | | | 1,864,396 | | |
| JP Morgan Chase & Co. | | | 1,174,088 | | | | 56,884,564 | | |
| Morgan Stanley | | | 121,100 | | | | 10,157,868 | | |
| | | | 184,215,228 | | |
| Electronics — 0.5% | |
Agilent
Technologies, Inc.(b) | | | 201,700 | | | | 7,753,348 | | |
| Foods — 0.5% | |
| The Hershey Co. | | | 154,200 | | | | 7,805,604 | | |
| Health Care – Services — 0.9% | |
| UnitedHealth Group, Inc. | | | 281,300 | | | | 14,385,682 | | |
| Holding Company – Diversified — 0.8% | |
China Merchants Holdings
International
Co. Ltd. HKD | | | 2,496,104 | | | | 12,089,257 | | |
| Housewares — 0.3% | |
| Hunter Douglas NV EUR | | | 40,862 | | | | 3,842,285 | | |
| Insurance — 15.4% | |
| Ambac Financial Group, Inc. | | | 63,800 | | | | 5,562,722 | | |
American International
Group, Inc. | | | 882,500 | | | | 61,801,475 | | |
| Aon Corp.(a) | | | 246,700 | | | | 10,511,887 | | |
Berkshire Hathaway,
Inc. Cl. A(b) | | | 439 | | | | 48,059,525 | | |
| Chubb Corp. | | | 67,700 | | | | 3,665,278 | | |
| Loews Corp. | | | 688,900 | | | | 35,120,122 | | |
| Markel Corp.(b) | | | 2,570 | | | | 1,245,319 | | |
| Millea Holdings, Inc. JPY | | | 370,000 | | | | 15,149,914 | | |
Nipponkoa Insurance
Co., Ltd. JPY | | | 214,100 | | | | 1,921,344 | | |
Principal Financial
Group, Inc. | | | 78,000 | | | | 4,546,620 | | |
| Progressive Corp. | | | 1,202,200 | | | | 28,768,646 | | |
| Sun Life Financial, Inc.(a) | | | 49,500 | | | | 2,363,625 | | |
| Transatlantic Holdings, Inc. | | | 201,262 | | | | 14,315,766 | | |
| | | | 233,032,243 | | |
| | | Number of
Shares | | Market
Value | |
| Internet — 1.6% | |
| Amazon.com, Inc.(a) (b) | | | 166,500 | | | $ | 11,390,265 | | |
| Expedia, Inc.(b) | | | 85,748 | | | | 2,511,559 | | |
| Google, Inc. Cl. A(b) | | | 5,850 | | | | 3,061,773 | | |
| IAC/InterActiveCorp(a) (b) | | | 85,248 | | | | 2,950,433 | | |
Liberty Media Holding Corp.
Interactive Cl. A(b) | | | 202,900 | | | | 4,530,757 | | |
| | | | 24,444,787 | | |
| Leisure Time — 1.5% | |
| Harley-Davidson, Inc.(a) | | | 388,100 | | | | 23,134,641 | | |
| Manufacturing — 4.2% | |
| Tyco International Ltd. | | | 1,898,524 | | | | 64,151,126 | | |
| Media — 6.0% | |
Comcast Corp.
Special, Cl. A(a) (b) | | | 1,666,300 | | | | 46,589,748 | | |
| Gannett Co., Inc. | | | 57,000 | | | | 3,132,150 | | |
| Lagardere S.C.A. SA EUR(a) | | | 153,700 | | | | 13,309,661 | | |
Liberty Media Holding Corp.
Capital Cl. A(b) | | | 40,720 | | | | 4,791,930 | | |
| News Corp., Inc. Cl. A | | | 1,103,000 | | | | 23,394,630 | | |
| | | | 91,218,119 | | |
| Mining — 1.4% | |
| BHP Billiton PLC GBP | | | 157,900 | | | | 4,369,759 | | |
| Rio Tinto PLC GBP | | | 56,300 | | | | 4,291,781 | | |
| Vulcan Materials Co.(a) | | | 108,800 | | | | 12,461,952 | | |
| | | | 21,123,492 | | |
| Oil & Gas — 12.3% | |
Canadian Natural
Resources Ltd.(a) | | | 101,700 | | | | 6,747,795 | | |
| ConocoPhillips | | | 865,292 | | | | 67,925,422 | | |
| Devon Energy Corp. | | | 435,700 | | | | 34,110,953 | | |
| EOG Resources, Inc. | | | 374,200 | | | | 27,339,052 | | |
| Occidental Petroleum Corp. | | | 595,700 | | | | 34,479,116 | | |
| Transocean, Inc.(b) | | | 139,500 | | | | 14,784,210 | | |
| | | | 185,386,548 | | |
| Packaging & Containers — 1.9% | |
| Sealed Air Corp. | | | 928,900 | | | | 28,814,478 | | |
| Pharmaceuticals — 1.4% | |
| Cardinal Health, Inc. | | | 192,200 | | | | 13,577,008 | | |
| Express Scripts, Inc.(b) | | | 145,400 | | | | 7,271,454 | | |
| | | | 20,848,462 | | |
| Real Estate — 0.1% | |
Hang Lung
Development Co. HKD | | | 416,000 | | | | 1,876,401 | | |
(Continued)
The accompanying notes are an integral part of the financial statements.
114
MassMutual Select Large Cap Value Fund – Portfolio of Investments (Continued)
| | | Number of
Shares | | Market
Value | |
| Retail — 8.3% | |
Bed Bath &
Beyond, Inc.(a) (b) | | | 237,300 | | | $ | 8,540,427 | | |
| Carmax, Inc.(a) (b) | | | 281,300 | | | | 7,173,150 | | |
| Costco Wholesale Corp. | | | 974,300 | | | | 57,016,036 | | |
| CVS Caremark Corp. | | | 516,261 | | | | 18,817,713 | | |
| Lowe's Companies, Inc. | | | 218,100 | | | | 6,693,489 | | |
| Sears Holdings Corp.(b) | | | 20,140 | | | | 3,413,730 | | |
| Wal-Mart Stores, Inc. | | | 489,900 | | | | 23,569,089 | | |
| | | | 125,223,634 | | |
| Software — 3.0% | |
| Dun & Bradstreet Corp. | | | 141,550 | | | | 14,576,819 | | |
| Microsoft Corp. | | | 1,021,100 | | | | 30,091,817 | | |
| | | | 44,668,636 | | |
| Telecommunications — 2.3% | |
Nokia Oyj Sponsored
ADR (Finland) | | | 155,200 | | | | 4,362,672 | | |
SK Telecom Co. Ltd.
ADR (South Korea)(a) | | | 274,500 | | | | 7,507,575 | | |
| Sprint Nextel Corp. | | | 801,100 | | | | 16,590,781 | | |
| Virgin Media, Inc. | | | 253,738 | | | | 6,183,595 | | |
| | | | 34,644,623 | | |
| Transportation — 1.1% | |
| Asciano Group AUD(b) | | | 155,200 | | | | 1,336,430 | | |
Kuehne & Nagel
International AG SEK | | | 62,450 | | | | 5,718,729 | | |
| Toll Holdings, Ltd. AUD | | | 208,600 | | | | 2,551,796 | | |
United Parcel
Service, Inc. Cl. B | | | 87,100 | | | | 6,358,300 | | |
| | | | 15,965,255 | | |
TOTAL EQUITIES
(Cost $1,021,910,238) | | | | | | | 1,491,707,321 | | |
| | | Principal
Amount | | | |
| SHORT-TERM INVESTMENTS — 6.9% | |
| Cash Equivalents — 5.6%(d) | |
Abbey National PLC
Eurodollar Time Deposit
5.280% 07/05/2007 | | $ | 1,091,190 | | | | 1,091,190 | | |
Abbey National PLC
Eurodollar Time Deposit
5.285% 07/09/2007 | | | 2,727,967 | | | | 2,727,967 | | |
American Beacon
Money Market Fund(c) | | | 3,060,653 | | | | 3,060,653 | | |
Banco Bilbao Vizcaya
Argentaria SA
Eurodollar Time Deposit
5.300% 08/10/2007 | | | 2,045,975 | | | | 2,045,975 | | |
| | | Principal
Amount | | Market
Value | |
Bank of America
5.270% 07/06/2007 | | $ | 2,727,967 | | | $ | 2,727,967 | | |
Bank of America
5.270% 07/16/2007 | | | 545,593 | | | | 545,593 | | |
Bank of America
5.270% 08/17/2007 | | | 681,992 | | | | 681,992 | | |
Bank of America
5.300% 09/17/2007 | | | 1,363,983 | | | | 1,363,983 | | |
Bank of Ireland
Eurodollar Time Deposit
5.300% 08/13/2007 | | | 2,727,967 | | | | 2,727,967 | | |
Bank of Montreal
Eurodollar
Time Deposit
5.280% 07/03/2007 | | | 681,992 | | | | 681,992 | | |
Bank of Montreal
Eurodollar Time Deposit
5.290% 07/02/2007 | | | 545,593 | | | | 545,593 | | |
Bank of Montreal
Eurodollar Time Deposit
5.310% 08/14/2007 | | | 409,195 | | | | 409,195 | | |
Bank of Nova Scotia
Eurodollar Time Deposit
5.280% 07/09/2007 | | | 2,591,569 | | | | 2,591,569 | | |
Bank Of Nova Scotia
Eurodollar Time Deposit
5.285% 07/11/2007 | | | 1,500,382 | | | | 1,500,382 | | |
Barclays
Eurodollar Time Deposit
5.290% 07/06/2007 | | | 2,727,967 | | | | 2,727,967 | | |
Barclays
Eurodollar Time Deposit
5.295% 07/16/2007 | | | 545,593 | | | | 545,593 | | |
Barclays
Eurodollar Time Deposit
5.320% 09/04/2007 | | | 1,363,983 | | | | 1,363,983 | | |
Bear Stearns & Co
Commercial Paper
5.435% 07/10/2007 | | | 409,195 | | | | 409,195 | | |
BGI Institutional
Money Market Fund(c) | | | 1,773,178 | | | | 1,773,178 | | |
BNP Paribas
Eurodollar Time Deposit
5.350% 07/02/2007 | | | 4,091,950 | | | | 4,091,950 | | |
Calyon
Eurodollar Time Deposit
5.290% 07/17/2007 | | | 1,363,983 | | | | 1,363,983 | | |
Calyon
Eurodollar Time Deposit
5.380% 07/02/2007 | | | 4,091,950 | | | | 4,091,950 | | |
Canadian Imperial
Bank of Commerce
Eurodollar Time Deposit
5.300% 07/30/2007 | | | 2,727,967 | | | | 2,727,967 | | |
| | | Principal
Amount | | Market
Value | |
Dexia Group
Eurodollar Time Deposit
5.290% 08/08/2007 | | $ | 2,727,967 | | | $ | 2,727,967 | | |
Dreyfus Institutional
Cash Advantage
Money Market Fund(c) | | | 818,390 | | | | 818,390 | | |
Federal Home Loan Bank
Discount Note
5.174% 07/20/2007 | | | 202,324 | | | | 202,324 | | |
First Tennessee
National Corp.
Eurodollar Time Deposit
5.300% 07/18/2007 | | | 681,992 | | | | 681,992 | | |
Fortis Bank
Eurodollar Time Deposit
5.290% 07/06/2007 | | | 681,992 | | | | 681,992 | | |
Fortis Bank
Eurodollar Time Deposit
5.290% 07/09/2007 | | | 954,788 | | | | 954,788 | | |
Fortis Bank
Eurodollar Time Deposit
5.300% 07/20/2007 | | | 681,992 | | | | 681,992 | | |
Fortis Bank
Eurodollar Time Deposit
5.300% 07/26/2007 | | | 545,593 | | | | 545,593 | | |
Fortis Bank
Eurodollar Time Deposit
5.350% 07/05/2007 | | | 1,363,983 | | | | 1,363,983 | | |
Freddie Mac
Discount Note
5.155% 07/16/2007 | | | 257,562 | | | | 257,562 | | |
Freddie Mac
Discount Note
5.185% 07/09/2007 | | | 134,463 | | | | 134,463 | | |
Morgan Stanley & Co
Commercial Paper
5.445% 08/01/2007 | | | 1,227,585 | | | | 1,227,585 | | |
National Australia Bank
Eurodollar Time Deposit
5.320% 07/02/2007 | | | 1,363,983 | | | | 1,363,983 | | |
Nationwide
Building Society
Commercial Paper
5.301% 07/09/2007 | | | 1,361,177 | | | | 1,361,177 | | |
Rabobank Nederland
Eurodollar Time Deposit
5.280% 07/05/2007 | | | 2,045,975 | | | | 2,045,975 | | |
Rabobank Nederland
Eurodollar Time Deposit
5.290% 07/16/2007 | | | 2,727,967 | | | | 2,727,967 | | |
Rabobank Nederland
Eurodollar Time Deposit
5.330% 07/02/2007 | | | 4,091,950 | | | | 4,091,950 | | |
(Continued)
The accompanying notes are an integral part of the financial statements.
115
MassMutual Select Large Cap Value Fund – Portfolio of Investments (Continued)
| | | Principal
Amount | | Market
Value | |
Reserve Primary
Money Market Fund(c) | | $ | 2,708,159 | | | $ | 2,708,159 | | |
Royal Bank of Canada
Eurodollar Time Deposit
5.305% 08/30/2007 | | | 2,727,967 | | | | 2,727,967 | | |
Royal Bank of Scotland
Eurodollar Time Deposit
5.270% 07/11/2007 | | | 681,992 | | | | 681,992 | | |
Skandinaviska Enskilda
Banken AB
Eurodollar Time Deposit
5.290% 07/13/2007 | | | 2,727,967 | | | | 2,727,967 | | |
Skandinaviska Enskilda
Banken AB
Eurodollar Time Deposit
5.290% 07/19/2007 | | | 409,195 | | | | 409,195 | | |
Svenska Handlesbanken
Eurodollar Time Deposit
5.300% 07/02/2007 | | | 458,232 | | | | 458,232 | | |
UBS AG
Eurodollar Time Deposit
5.277% 07/05/2007 | | | 1,909,577 | | | | 1,909,577 | | |
UBS AG
Eurodollar Time Deposit
5.285% 07/05/2007 | | | 2,727,967 | | | | 2,727,967 | | |
Vanguard Prime
Money Market Fund(c) | | | 1,363,983 | | | | 1,363,983 | | |
Wells Fargo
Eurodollar Time Deposit
5.260% 07/02/2007 | | | 736,551 | | | | 736,551 | | |
Wells Fargo
Eurodollar Time Deposit
5.280% 07/11/2007 | | | 2,727,967 | | | | 2,727,967 | | |
Wells Fargo
Eurodollar Time Deposit
5.280% 07/12/2007 | | | 1,363,983 | | | | 1,363,983 | | |
| | | | 84,211,007 | | |
| Repurchase Agreements — 1.3% | |
Investors Bank & Trust
Company Repurchase
Agreement, dated
6/29/2007, 3.50%,
due 7/02/2007(e) | | | 20,645,909 | | | | 20,645,909 | | |
TOTAL SHORT-TERM
INVESTMENTS
(Cost $104,856,916) | | | 104,856,916 | | |
TOTAL INVESTMENTS — 105.6%
(Cost $1,126,767,154)(f) | | | 1,596,564,237 | | |
Other Assets/
(Liabilities) — (5.6%) | | | (84,396,790 | ) | |
| NET ASSETS — 100.0% | | $ | 1,512,167,447 | | |
Notes to Portfolio of Investments
ADR - American Depository Receipt
AUD - Australian Dollar
EUR - Euro
GBP - British Pound
HKD - Hong Kong Dollar
JPY - Japanese Yen
SEK - Swedish Kronor
(a) Denotes all or a portion of security on loan. (Note 2).
(b) Non-income producing security.
(c) Amount represents shares owned of the fund.
(d) Represents investments of security lending collateral. (Note 2).
(e) Maturity value of $20,651,931. Collateralized by a U.S. Government Agency obligation with a rate of 5.67%, maturity date of 5/15/2036, and an aggregate market value, including accrued interest, of $21,678,205.
(f) See Note 6 for aggregate cost for Federal tax purposes.
The accompanying notes are an integral part of the financial statements.
116
MassMutual Select Indexed Equity Fund – Portfolio of Investments
June 30, 2007 (Unaudited)
| | | Number of
Shares | | Market
Value | |
| EQUITIES — 99.1% | |
| COMMON STOCK — 99.1% | |
| Advertising — 0.2% | |
Interpublic Group of
Companies, Inc.(a) (b) | | | 79,943 | | | $ | 911,349 | | |
| Omnicom Group, Inc. | | | 58,828 | | | | 3,113,178 | | |
| | | | 4,024,527 | | |
| Aerospace & Defense — 2.2% | |
| Boeing Co. | | | 140,940 | | | | 13,552,790 | | |
| General Dynamics Corp. | | | 72,808 | | | | 5,695,042 | | |
| Goodrich Corp. | | | 21,290 | | | | 1,268,032 | | |
L-3 Communications
Holdings, Inc. | | | 21,700 | | | | 2,113,363 | | |
| Lockheed Martin Corp. | | | 64,007 | | | | 6,024,979 | | |
| Northrop Grumman Corp. | | | 61,278 | | | | 4,771,718 | | |
| Raytheon Co. | | | 81,700 | | | | 4,402,813 | | |
| Rockwell Collins, Inc. | | | 30,932 | | | | 2,185,037 | | |
| United Technologies Corp. | | | 180,162 | | | | 12,778,891 | | |
| | | | 52,792,665 | | |
| Agriculture — 1.4% | |
| Altria Group, Inc. | | | 375,939 | | | | 26,368,361 | | |
| Archer-Daniels-Midland Co. | | | 114,879 | | | | 3,801,346 | | |
| Reynolds American, Inc.(b) | | | 31,000 | | | | 2,021,200 | | |
| UST, Inc. | | | 28,987 | | | | 1,556,892 | | |
| | | | 33,747,799 | | |
| Airlines — 0.1% | |
| Southwest Airlines Co. | | | 139,065 | | | | 2,073,459 | | |
| Apparel — 0.4% | |
| Coach, Inc.(a) | | | 65,500 | | | | 3,104,045 | | |
| Jones Apparel Group, Inc. | | | 18,189 | | | | 513,839 | | |
| Liz Claiborne, Inc. | | | 17,292 | | | | 644,992 | | |
| Nike, Inc. Cl. B | | | 66,366 | | | | 3,868,474 | | |
| Polo Ralph Lauren Corp. | | | 10,700 | | | | 1,049,777 | | |
| VF Corp. | | | 16,202 | | | | 1,483,779 | | |
| | | | 10,664,906 | | |
| Auto Manufacturers — 0.4% | |
| Ford Motor Co.(b) | | | 340,214 | | | | 3,204,816 | | |
| General Motors Corp.(b) | | | 100,045 | | | | 3,781,701 | | |
| Paccar, Inc. | | | 45,405 | | | | 3,952,051 | | |
| | | | 10,938,568 | | |
| Automotive & Parts — 0.3% | |
| Genuine Parts Co. | | | 29,312 | | | | 1,453,875 | | |
The Goodyear Tire &
Rubber Co.(a) | | | 35,976 | | | | 1,250,526 | | |
| Johnson Controls, Inc. | | | 34,602 | | | | 4,005,874 | | |
| | | | 6,710,275 | | |
| | | Number of
Shares | | Market
Value | |
| Banks — 6.3% | |
| Bank of America Corp. | | | 795,876 | | | $ | 38,910,378 | | |
The Bank of
New York Co., Inc. | | | 138,303 | | | | 5,731,276 | | |
| BB&T Corp. | | | 96,016 | | | | 3,905,931 | | |
Capital One
Financial Corp. | | | 75,210 | | | | 5,899,472 | | |
| Comerica, Inc. | | | 29,576 | | | | 1,758,885 | | |
Commerce
Bancorp, Inc.(b) | | | 31,000 | | | | 1,146,690 | | |
| Compass Bancshares, Inc. | | | 23,000 | | | | 1,586,540 | | |
| Fifth Third Bancorp(b) | | | 101,088 | | | | 4,020,270 | | |
First Horizon
National Corp.(b) | | | 23,000 | | | | 897,000 | | |
Huntington
Bancshares, Inc.(b) | | | 65,621 | | | | 1,492,222 | | |
| KeyCorp(b) | | | 73,568 | | | | 2,525,589 | | |
| M&T Bank Corp. | | | 14,200 | | | | 1,517,980 | | |
| Marshall and Ilsley Corp. | | | 44,100 | | | | 2,100,483 | | |
| Mellon Financial Corp. | | | 72,068 | | | | 3,170,992 | | |
| National City Corp.(b) | | | 104,571 | | | | 3,484,306 | | |
| Northern Trust Corp. | | | 30,893 | | | | 1,984,566 | | |
PNC Financial Services
Group, Inc. | | | 61,213 | | | | 4,381,627 | | |
| Regions Financial Corp. | | | 128,749 | | | | 4,261,592 | | |
| State Street Corp.(b) | | | 71,268 | | | | 4,874,731 | | |
| SunTrust Banks, Inc. | | | 65,334 | | | | 5,601,737 | | |
| Synovus Financial Corp. | | | 54,899 | | | | 1,685,399 | | |
| U.S. Bancorp(b) | | | 315,534 | | | | 10,396,845 | | |
| Wachovia Corp. | | | 345,617 | | | | 17,712,871 | | |
| Wells Fargo & Co. | | | 597,274 | | | | 21,006,127 | | |
| Zions Bancorp | | | 18,300 | | | | 1,407,453 | | |
| | | | 151,460,962 | | |
| Beverages — 2.0% | |
| Anheuser-Busch Cos., Inc. | | | 136,696 | | | | 7,130,063 | | |
Brown-Forman
Corp. Cl. B(b) | | | 14,542 | | | | 1,062,729 | | |
| The Coca-Cola Co. | | | 358,172 | | | | 18,735,977 | | |
Coca-Cola
Enterprises, Inc. | | | 52,543 | | | | 1,261,032 | | |
Constellation
Brands, Inc. Cl. A(a) (b) | | | 35,100 | | | | 852,228 | | |
Molson Coors
Brewing Co. Cl. B | | | 8,765 | | | | 810,412 | | |
The Pepsi Bottling
Group, Inc. | | | 25,482 | | | | 858,234 | | |
| PepsiCo, Inc. | | | 290,666 | | | | 18,849,690 | | |
| | | | 49,560,365 | | |
| | | Number of
Shares | | Market
Value | |
| Biotechnology — 0.9% | |
| Amgen, Inc.(a) (b) | | | 207,990 | | | $ | 11,499,767 | | |
| Biogen Idec, Inc.(a) | | | 51,291 | | | | 2,744,069 | | |
| Celgene Corp.(a) | | | 69,100 | | | | 3,961,503 | | |
| Genzyme Corp.(a) | | | 48,300 | | | | 3,110,520 | | |
| Millipore Corp.(a) (b) | | | 9,181 | | | | 689,401 | | |
| | | | 22,005,260 | | |
| Building Materials — 0.2% | |
American
Standard Cos., Inc. | | | 32,100 | | | | 1,893,258 | | |
| Masco Corp. | | | 70,492 | | | | 2,006,907 | | |
| | | | 3,900,165 | | |
| Chemicals — 1.6% | |
Air Products &
Chemicals, Inc. | | | 37,505 | | | | 3,014,277 | | |
| Ashland, Inc. | | | 11,825 | | | | 756,209 | | |
| The Dow Chemical Co. | | | 169,320 | | | | 7,487,330 | | |
Du Pont (E.I.) de
Nemours & Co. | | | 166,950 | | | | 8,487,738 | | |
| Eastman Chemical Co. | | | 15,735 | | | | 1,012,233 | | |
| Ecolab, Inc. | | | 32,458 | | | | 1,385,957 | | |
| Hercules, Inc.(a) (b) | | | 22,689 | | | | 445,839 | | |
International Flavors &
Fragrances, Inc. | | | 14,182 | | | | 739,449 | | |
| Monsanto Co. | | | 96,448 | | | | 6,514,098 | | |
| PPG Industries, Inc. | | | 28,108 | | | | 2,139,300 | | |
| Praxair, Inc. | | | 55,756 | | | | 4,013,874 | | |
| Rohm & Haas Co.(b) | | | 24,284 | | | | 1,327,849 | | |
| The Sherwin-Williams Co. | | | 18,989 | | | | 1,262,199 | | |
| Sigma-Aldrich Corp. | | | 24,702 | | | | 1,054,034 | | |
| | | | 39,640,386 | | |
| Coal — 0.2% | |
| CONSOL Energy, Inc. | | | 31,600 | | | | 1,457,076 | | |
| Peabody Energy Corp.(b) | | | 47,000 | | | | 2,273,860 | | |
| | | | 3,730,936 | | |
| Commercial Services — 0.7% | |
Apollo
Group, Inc. Cl. A(a) | | | 25,900 | | | | 1,513,337 | | |
| Block (H&R), Inc.(b) | | | 54,296 | | | | 1,268,898 | | |
| Convergys Corp.(a) | | | 22,171 | | | | 537,425 | | |
Donnelley (R.R.) &
Sons Co.(b) | | | 37,815 | | | | 1,645,331 | | |
| Equifax, Inc. | | | 24,549 | | | | 1,090,467 | | |
| McKesson Corp. | | | 52,898 | | | | 3,154,837 | | |
Monster
Worldwide, Inc.(a) | | | 24,418 | | | | 1,003,580 | | |
| Moody's Corp. | | | 41,672 | | | | 2,591,998 | | |
Robert Half
International, Inc.(b) | | | 30,900 | | | | 1,127,850 | | |
| Western Union | | | 136,151 | | | | 2,836,025 | | |
| | | | 16,769,748 | | |
(Continued)
The accompanying notes are an integral part of the financial statements.
117
MassMutual Select Indexed Equity Fund – Portfolio of Investments (Continued)
| | | Number of
Shares | | Market
Value | |
| Computers — 4.2% | |
Affiliated Computer
Services, Inc. Cl. A(a) | | | 19,100 | | | $ | 1,083,352 | | |
| Apple, Inc.(a) | | | 154,850 | | | | 18,897,894 | | |
Cognizant Technology
Solutions Corp. Cl. A(a) | | | 26,500 | | | | 1,989,885 | | |
Computer
Sciences Corp.(a) | | | 30,296 | | | | 1,792,008 | | |
| Dell, Inc.(a) | | | 410,248 | | | | 11,712,580 | | |
Electronic Data
Systems Corp. | | | 88,623 | | | | 2,457,516 | | |
| EMC Corp.(a) (b) | | | 380,833 | | | | 6,893,077 | | |
| Hewlett-Packard Co. | | | 472,152 | | | | 21,067,422 | | |
International Business
Machines Corp. | | | 244,202 | | | | 25,702,261 | | |
Lexmark
International, Inc. Cl. A(a) | | | 17,928 | | | | 884,030 | | |
| NCR Corp.(a) | | | 31,036 | | | | 1,630,631 | | |
Network
Appliance, Inc.(a) (b) | | | 68,038 | | | | 1,986,710 | | |
| SanDisk Corp.(a) | | | 40,400 | | | | 1,977,176 | | |
| Sun Microsystems, Inc.(a) | | | 648,604 | | | | 3,411,657 | | |
| Unisys Corp.(a) | | | 54,051 | | | | 494,026 | | |
| | | | 101,980,225 | | |
| Cosmetics & Personal Care — 1.8% | |
| Avon Products, Inc. | | | 79,938 | | | | 2,937,722 | | |
| Colgate-Palmolive Co. | | | 93,619 | | | | 6,071,192 | | |
The Estee Lauder
Cos., Inc. Cl. A | | | 21,100 | | | | 960,261 | | |
| The Procter & Gamble Co. | | | 564,323 | | | | 34,530,924 | | |
| | | | 44,500,099 | | |
| Diversified Financial — 8.0% | |
| American Express Co. | | | 214,960 | | | | 13,151,253 | | |
Ameriprise
Financial, Inc. | | | 43,592 | | | | 2,771,143 | | |
The Bear
Stearns Cos., Inc. | | | 21,495 | | | | 3,009,300 | | |
| The Charles Schwab Corp. | | | 184,605 | | | | 3,788,095 | | |
Chicago Mercantile
Exchange
Holdings, Inc.(b) | | | 6,200 | | | | 3,313,032 | | |
| CIT Group, Inc. | | | 33,700 | | | | 1,847,771 | | |
| Citigroup, Inc. | | | 885,741 | | | | 45,429,656 | | |
Countrywide
Financial Corp.(b) | | | 104,998 | | | | 3,816,677 | | |
E*TRADE
Financial Corp.(a) | | | 79,000 | | | | 1,745,110 | | |
| Fannie Mae | | | 175,779 | | | | 11,483,642 | | |
Federated
Investors, Inc. Cl. B | | | 16,600 | | | | 636,278 | | |
| Franklin Resources, Inc. | | | 30,130 | | | | 3,991,321 | | |
| Freddie Mac | | | 120,328 | | | | 7,303,910 | | |
The Goldman
Sachs Group, Inc. | | | 73,000 | | | | 15,822,750 | | |
| | | Number of
Shares | | Market
Value | |
| JP Morgan Chase & Co. | | | 611,048 | | | $ | 29,605,276 | | |
Janus Capital
Group, Inc.(b) | | | 35,594 | | | | 990,937 | | |
| Legg Mason, Inc. | | | 22,900 | | | | 2,252,902 | | |
Lehman Brothers
Holdings, Inc. | | | 96,636 | | | | 7,201,315 | | |
| Merrill Lynch & Co., Inc. | | | 157,370 | | | | 13,152,985 | | |
| Morgan Stanley | | | 190,199 | | | | 15,953,892 | | |
| SLM Corp. | | | 74,931 | | | | 4,314,527 | | |
| T. Rowe Price Group, Inc. | | | 48,026 | | | | 2,492,069 | | |
| | | | 194,073,841 | | |
| Electric — 3.2% | |
| AES Corp.(a) | | | 119,253 | | | | 2,609,256 | | |
| Allegheny Energy, Inc.(a) | | | 30,700 | | | | 1,588,418 | | |
| Ameren Corp. | | | 37,042 | | | | 1,815,428 | | |
American Electric
Power Co., Inc. | | | 72,408 | | | | 3,261,256 | | |
| CenterPoint Energy, Inc. | | | 59,222 | | | | 1,030,463 | | |
| CMS Energy Corp. | | | 35,854 | | | | 616,689 | | |
| Consolidated Edison, Inc. | | | 51,174 | | | | 2,308,971 | | |
Constellation Energy
Group, Inc. | | | 32,564 | | | | 2,838,604 | | |
| Dominion Resources, Inc. | | | 64,320 | | | | 5,551,459 | | |
| DTE Energy Co. | | | 29,052 | | | | 1,400,887 | | |
| Duke Energy Corp. | | | 230,268 | | | | 4,213,904 | | |
| Dynegy, Inc. Cl. A(a) | | | 68,007 | | | | 641,986 | | |
| Edison International | | | 57,087 | | | | 3,203,722 | | |
| Entergy Corp. | | | 36,706 | | | | 3,940,389 | | |
| Exelon Corp. | | | 122,248 | | | | 8,875,205 | | |
| FirstEnergy Corp. | | | 56,987 | | | | 3,688,769 | | |
| FPL Group, Inc. | | | 73,330 | | | | 4,160,744 | | |
Integrys Energy
Group, Inc. | | | 13,300 | | | | 674,709 | | |
| PG&E Corp. | | | 60,481 | | | | 2,739,789 | | |
Pinnacle West
Capital Corp. | | | 15,350 | | | | 611,698 | | |
| PPL Corp. | | | 66,910 | | | | 3,130,719 | | |
| Progress Energy, Inc. | | | 44,121 | | | | 2,011,476 | | |
Public Service
Enterprise Group, Inc. | | | 44,882 | | | | 3,939,742 | | |
| Southern Co. | | | 137,046 | | | | 4,699,307 | | |
| Teco Energy, Inc. | | | 34,600 | | | | 594,428 | | |
| TXU Corp. | | | 82,232 | | | | 5,534,214 | | |
| Xcel Energy, Inc.(b) | | | 75,287 | | | | 1,541,125 | | |
| | | | 77,223,357 | | |
| Electrical Components & Equipment — 0.3% | |
| Emerson Electric Co. | | | 143,508 | | | | 6,716,174 | | |
| Molex, Inc. | | | 26,647 | | | | 799,676 | | |
| | | | 7,515,850 | | |
| Electronics — 0.5% | |
Agilent
Technologies, Inc.(a) | | | 73,405 | | | | 2,821,688 | | |
Applera Corp. – Applied
Biosystems Group | | | 34,068 | | | | 1,040,437 | | |
| | | Number of
Shares | | Market
Value | |
| Jabil Circuit, Inc. | | | 31,600 | | | $ | 697,412 | | |
| PerkinElmer, Inc. | | | 20,474 | | | | 533,552 | | |
| Solectron Corp.(a) | | | 159,353 | | | | 586,419 | | |
| Tektronix, Inc.(b) | | | 16,770 | | | | 565,820 | | |
Thermo Fisher
Scientific, Inc.(a) | | | 74,375 | | | | 3,846,675 | | |
| Waters Corp.(a) | | | 18,900 | | | | 1,121,904 | | |
| | | | 11,213,907 | | |
| Engineering & Construction — 0.1% | |
| Fluor Corp. | | | 15,235 | | | | 1,696,722 | | |
| Entertainment — 0.1% | |
International
Game Technology | | | 58,156 | | | | 2,308,793 | | |
| Environmental Controls — 0.2% | |
Allied Waste
Industries, Inc.(a) | | | 41,634 | | | | 560,394 | | |
| Waste Management, Inc. | | | 93,097 | | | | 3,635,438 | | |
| | | | 4,195,832 | | |
| Foods — 1.8% | |
| Campbell Soup Co. | | | 37,646 | | | | 1,461,041 | | |
| ConAgra Foods, Inc. | | | 91,369 | | | | 2,454,171 | | |
| Dean Foods Co. | | | 23,100 | | | | 736,197 | | |
| General Mills, Inc. | | | 62,851 | | | | 3,671,755 | | |
| Heinz (H. J.) Co. | | | 56,422 | | | | 2,678,352 | | |
| The Hershey Co. | | | 30,384 | | | | 1,538,038 | | |
| Kellogg Co. | | | 43,216 | | | | 2,238,157 | | |
| Kraft Foods, Inc. Cl. A | | | 291,452 | | | | 10,273,683 | | |
| The Kroger Co. | | | 129,475 | | | | 3,642,132 | | |
| McCormick & Co., Inc. | | | 21,000 | | | | 801,780 | | |
| Safeway, Inc. | | | 77,777 | | | | 2,646,751 | | |
| Sara Lee Corp. | | | 129,636 | | | | 2,255,666 | | |
| SuperValu, Inc. | | | 36,041 | | | | 1,669,419 | | |
| Sysco Corp. | | | 111,178 | | | | 3,667,762 | | |
| Tyson Foods, Inc. Cl. A | | | 41,600 | | | | 958,464 | | |
Whole Foods
Market, Inc.(b) | | | 26,600 | | | | 1,018,780 | | |
| Wrigley (Wm.) Jr. Co.(b) | | | 40,355 | | | | 2,232,035 | | |
| | | | 43,944,183 | | |
| Forest Products & Paper — 0.3% | |
| International Paper Co. | | | 77,988 | | | | 3,045,431 | | |
| MeadWestvaco Corp. | | | 30,750 | | | | 1,086,090 | | |
| Temple-Inland, Inc. | | | 18,886 | | | | 1,162,056 | | |
| Weyerhaeuser Co. | | | 37,864 | | | | 2,988,606 | | |
| | | | 8,282,183 | | |
| Gas — 0.2% | |
| KeySpan Corp. | | | 29,400 | | | | 1,234,212 | | |
| Nicor, Inc.(b) | | | 9,482 | | | | 406,967 | | |
| NiSource, Inc. | | | 45,285 | | | | 937,852 | | |
| Sempra Energy | | | 45,761 | | | | 2,710,424 | | |
| | | | 5,289,455 | | |
(Continued)
The accompanying notes are an integral part of the financial statements.
118
MassMutual Select Indexed Equity Fund – Portfolio of Investments (Continued)
| | | Number of
Shares | | Market
Value | |
| Hand & Machine Tools — 0.1% | |
| The Black & Decker Corp. | | | 12,950 | | | $ | 1,143,615 | | |
| Snap-on, Inc. | | | 9,103 | | | | 459,793 | | |
| The Stanley Works | | | 13,555 | | | | 822,789 | | |
| | | | 2,426,197 | | |
| Health Care – Products — 3.0% | |
| Bard (C.R.), Inc. | | | 17,478 | | | | 1,444,207 | | |
| Bausch & Lomb, Inc. | | | 10,494 | | | | 728,703 | | |
| Baxter International, Inc. | | | 117,126 | | | | 6,598,879 | | |
| Becton, Dickinson & Co. | | | 42,746 | | | | 3,184,577 | | |
| Biomet, Inc. | | | 45,994 | | | | 2,102,846 | | |
| Boston Scientific Corp.(a) | | | 211,240 | | | | 3,240,422 | | |
| Johnson & Johnson | | | 518,100 | | | | 31,925,322 | | |
| Medtronic, Inc. | | | 208,414 | | | | 10,808,350 | | |
| Patterson Cos., Inc.(a) | | | 23,900 | | | | 890,753 | | |
St. Jude
Medical, Inc.(a) (b) | | | 62,392 | | | | 2,588,644 | | |
| Stryker Corp. | | | 53,402 | | | | 3,369,132 | | |
Varian Medical
Systems, Inc.(a) | | | 22,700 | | | | 964,977 | | |
| Zimmer Holdings, Inc.(a) | | | 42,878 | | | | 3,639,913 | | |
| | | | 71,486,725 | | |
| Health Care – Services — 1.4% | |
| Aetna, Inc. | | | 92,996 | | | | 4,594,002 | | |
Coventry Health
Care, Inc.(a) | | | 26,990 | | | | 1,555,974 | | |
| Humana, Inc.(a) | | | 29,196 | | | | 1,778,328 | | |
Laboratory Corp. of
America Holdings(a) (b) | | | 21,800 | | | | 1,706,068 | | |
| Manor Care, Inc.(b) | | | 13,881 | | | | 906,291 | | |
| Quest Diagnostics, Inc. | | | 29,370 | | | | 1,516,961 | | |
Tenet
Healthcare Corp.(a) (b) | | | 76,128 | | | | 495,593 | | |
| UnitedHealth Group, Inc. | | | 238,996 | | | | 12,222,255 | | |
| WellPoint, Inc.(a) | | | 111,240 | | | | 8,880,289 | | |
| | | | 33,655,761 | | |
| Home Builders — 0.2% | |
| Centex Corp.(b) | | | 20,810 | | | | 834,481 | | |
| D.R. Horton, Inc.(b) | | | 48,900 | | | | 974,577 | | |
| KB Home(b) | | | 14,470 | | | | 569,684 | | |
| Lennar Corp. Cl. A | | | 23,200 | | | | 848,192 | | |
| Pulte Homes, Inc. | | | 35,792 | | | | 803,530 | | |
| | | | 4,030,464 | | |
| Home Furnishing — 0.1% | |
Harman International
Industries, Inc. | | | 11,100 | | | | 1,296,480 | | |
| Whirlpool Corp. | | | 13,695 | | | | 1,522,884 | | |
| | | | 2,819,364 | | |
| | | Number of
Shares | | Market
Value | |
| Household Products — 0.4% | |
| Avery Dennison Corp. | | | 17,698 | | | $ | 1,176,563 | | |
| The Clorox Co. | | | 25,615 | | | | 1,590,692 | | |
| Fortune Brands, Inc.(b) | | | 26,280 | | | | 2,164,684 | | |
| Kimberly-Clark Corp. | | | 82,281 | | | | 5,503,776 | | |
| | | | 10,435,715 | | |
| Housewares — 0.1% | |
| Newell Rubbermaid, Inc. | | | 47,171 | | | | 1,388,243 | | |
| Industrial – Distribution — 0.0% | |
| W.W. Grainger, Inc. | | | 13,766 | | | | 1,280,926 | | |
| Insurance — 4.9% | |
| ACE Ltd. | | | 56,700 | | | | 3,544,884 | | |
| AFLAC, Inc. | | | 88,838 | | | | 4,566,273 | | |
| Allstate Corp. | | | 111,615 | | | | 6,865,439 | | |
Ambac Financial
Group, Inc. | | | 18,900 | | | | 1,647,891 | | |
American International
Group, Inc. | | | 464,108 | | | | 32,501,483 | | |
| Aon Corp. | | | 55,352 | | | | 2,358,549 | | |
| Assurant, Inc. | | | 17,800 | | | | 1,048,776 | | |
| Chubb Corp. | | | 70,318 | | | | 3,807,017 | | |
| Cigna Corp. | | | 53,364 | | | | 2,786,668 | | |
| Cincinnati Financial Corp. | | | 27,885 | | | | 1,210,209 | | |
Genworth
Financial, Inc. Cl. A | | | 78,800 | | | | 2,710,720 | | |
The Hartford Financial
Services Group, Inc. | | | 57,034 | | | | 5,618,419 | | |
| Lincoln National Corp. | | | 49,103 | | | | 3,483,858 | | |
| Loews Corp. | | | 78,344 | | | | 3,993,977 | | |
Marsh &
McLennan Cos., Inc. | | | 97,052 | | | | 2,996,966 | | |
| MBIA, Inc.(b) | | | 24,611 | | | | 1,531,296 | | |
| Metlife, Inc. | | | 133,100 | | | | 8,582,288 | | |
MGIC
Investment Corp.(b) | | | 15,887 | | | | 903,335 | | |
Principal Financial
Group, Inc. | | | 46,100 | | | | 2,687,169 | | |
| Progressive Corp. | | | 131,148 | | | | 3,138,372 | | |
| Prudential Financial, Inc. | | | 84,300 | | | | 8,196,489 | | |
| Safeco Corp. | | | 21,025 | | | | 1,309,017 | | |
| Torchmark Corp. | | | 18,026 | | | | 1,207,742 | | |
St. Paul
Travelers Companies | | | 121,159 | | | | 6,482,007 | | |
| Unum Group | | | 63,725 | | | | 1,663,860 | | |
| XL Capital Ltd. Cl. A | | | 32,300 | | | | 2,722,567 | | |
| | | | 117,565,271 | | |
| Internet — 1.8% | |
| Amazon.com, Inc.(a) (b) | | | 55,094 | | | | 3,768,981 | | |
| eBay, Inc.(a) | | | 206,000 | | | | 6,629,080 | | |
| Google, Inc. Cl. A(a) | | | 39,064 | | | | 20,445,316 | | |
| IAC/InterActiveCorp(a) | | | 38,600 | | | | 1,335,946 | | |
| | | Number of
Shares | | Market
Value | |
| Symantec Corp.(a) | | | 164,682 | | | $ | 3,326,576 | | |
| VeriSign, Inc.(a) | | | 44,900 | | | | 1,424,677 | | |
| Yahoo!, Inc.(a) | | | 217,320 | | | | 5,895,892 | | |
| | | | 42,826,468 | | |
| Iron & Steel — 0.3% | |
Allegheny
Technologies, Inc. | | | 18,347 | | | | 1,924,233 | | |
| Nucor Corp. | | | 53,300 | | | | 3,126,045 | | |
| United States Steel Corp. | | | 21,556 | | | | 2,344,215 | | |
| | | | 7,394,493 | | |
| Leisure Time — 0.3% | |
| Brunswick Corp. | | | 16,555 | | | | 540,190 | | |
| Carnival Corp. | | | 78,368 | | | | 3,822,007 | | |
| Harley-Davidson, Inc. | | | 45,936 | | | | 2,738,245 | | |
| | | | 7,100,442 | | |
| Lodging — 0.5% | |
Harrah's
Entertainment, Inc. | | | 33,016 | | | | 2,814,944 | | |
| Hilton Hotels Corp. | | | 68,751 | | | | 2,301,096 | | |
Marriott
International, Inc. Cl. A | | | 57,846 | | | | 2,501,261 | | |
Starwood Hotels & Resorts
Worldwide, Inc. | | | 37,627 | | | | 2,523,643 | | |
Wyndham
Worldwide Corp.(a) | | | 33,988 | | | | 1,232,405 | | |
| | | | 11,373,349 | | |
| Machinery – Construction & Mining — 0.4% | |
| Caterpillar, Inc. | | | 116,032 | | | | 9,085,306 | | |
| Terex Corp.(a) | | | 18,600 | | | | 1,512,180 | | |
| | | | 10,597,486 | | |
| Machinery – Diversified — 0.4% | |
| Cummins, Inc.(b) | | | 19,146 | | | | 1,937,767 | | |
| Deere & Co. | | | 41,113 | | | | 4,963,984 | | |
| Rockwell Automation, Inc. | | | 29,732 | | | | 2,064,590 | | |
| | | | 8,966,341 | | |
| Manufacturing — 5.3% | |
| 3M Co. | | | 130,698 | | | | 11,343,279 | | |
Cooper
Industries Ltd. Cl. A | | | 31,230 | | | | 1,782,921 | | |
| Danaher Corp. | | | 43,600 | | | | 3,291,800 | | |
| Dover Corp. | | | 34,859 | | | | 1,783,038 | | |
| Eastman Kodak Co.(b) | | | 52,947 | | | | 1,473,515 | | |
| Eaton Corp. | | | 25,256 | | | | 2,348,808 | | |
| General Electric Co. | | | 1,843,675 | | | | 70,575,879 | | |
Honeywell
International, Inc. | | | 141,710 | | | | 7,975,439 | | |
| Illinois Tool Works, Inc. | | | 72,066 | | | | 3,905,257 | | |
| Ingersoll-Rand Co. Ltd. Cl. A | | | 55,772 | | | | 3,057,421 | | |
| ITT Corp. | | | 30,910 | | | | 2,110,535 | | |
(Continued)
The accompanying notes are an integral part of the financial statements.
119
MassMutual Select Indexed Equity Fund – Portfolio of Investments (Continued)
| | | Number of
Shares | | Market
Value | |
| Leggett & Platt, Inc.(b) | | | 30,747 | | | $ | 677,971 | | |
| Pall Corp. | | | 20,718 | | | | 952,821 | | |
| Parker Hannifin Corp. | | | 21,898 | | | | 2,144,033 | | |
| Textron, Inc. | | | 21,955 | | | | 2,417,465 | | |
| Tyco International Ltd. | | | 358,554 | | | | 12,115,540 | | |
| | | | 127,955,722 | | |
| Media — 3.2% | |
| CBS Corp. Cl. B | | | 136,009 | | | | 4,531,820 | | |
Clear Channel
Communications, Inc. | | | 90,121 | | | | 3,408,376 | | |
| Comcast Corp. Cl. A(a) | | | 561,794 | | | | 15,797,647 | | |
The DIRECTV
Group, Inc.(a) | | | 136,600 | | | | 3,156,826 | | |
| Dow Jones & Co., Inc.(b) | | | 12,557 | | | | 721,400 | | |
| Gannett Co., Inc. | | | 40,471 | | | | 2,223,881 | | |
The McGraw-Hill
Companies, Inc. | | | 62,488 | | | | 4,254,183 | | |
| Meredith Corp. | | | 5,689 | | | | 350,442 | | |
New York
Times Co. Cl. A(b) | | | 23,000 | | | | 584,200 | | |
| News Corp., Inc. Cl. A | | | 417,200 | | | | 8,848,812 | | |
| The Scripps (E.W.) Co. Cl. A | | | 14,400 | | | | 657,936 | | |
| The McClatchy Co. Cl. A | | | 1 | | | | 25 | | |
| Time Warner, Inc. | | | 674,194 | | | | 14,185,042 | | |
| Tribune Co. | | | 14,757 | | | | 433,856 | | |
| Viacom, Inc. Cl. B(a) | | | 123,409 | | | | 5,137,517 | | |
| The Walt Disney Co. | | | 359,784 | | | | 12,283,026 | | |
| | | | 76,574,989 | | |
| Metal Fabricate & Hardware — 0.1% | |
| Precision Castparts Corp. | | | 24,300 | | | | 2,949,048 | | |
| Mining — 0.7% | |
| Alcoa, Inc. | | | 157,666 | | | | 6,390,203 | | |
Freeport-McMoran
Copper & Gold, Inc.(b) | | | 66,820 | | | | 5,534,032 | | |
| Newmont Mining Corp.(b) | | | 79,097 | | | | 3,089,529 | | |
| Vulcan Materials Co.(b) | | | 17,178 | | | | 1,967,568 | | |
| | | | 16,981,332 | | |
| Office Equipment/Supplies — 0.2% | |
| Pitney Bowes, Inc. | | | 41,355 | | | | 1,936,241 | | |
| Xerox Corp.(a) | | | 166,777 | | | | 3,082,039 | | |
| | | | 5,018,280 | | |
| Oil & Gas — 8.6% | |
| Anadarko Petroleum Corp. | | | 84,608 | | | | 4,398,770 | | |
| Apache Corp. | | | 59,456 | | | | 4,851,015 | | |
| Chesapeake Energy Corp. | | | 75,600 | | | | 2,615,760 | | |
| Chevron Corp. | | | 385,016 | | | | 32,433,748 | | |
| ConocoPhillips | | | 292,218 | | | | 22,939,113 | | |
| Devon Energy Corp. | | | 78,400 | | | | 6,137,936 | | |
| ENSCO International, Inc. | | | 26,400 | | | | 1,610,664 | | |
| EOG Resources, Inc. | | | 42,600 | | | | 3,112,356 | | |
| | | Number of
Shares | | Market
Value | |
| Exxon Mobil Corp. | | | 1,009,798 | | | $ | 84,701,856 | | |
| Hess Corp. | | | 47,680 | | | | 2,811,213 | | |
| Marathon Oil Corp. | | | 124,314 | | | | 7,453,867 | | |
| Murphy Oil Corp. | | | 32,400 | | | | 1,925,856 | | |
Nabors
Industries Ltd.(a) (b) | | | 52,738 | | | | 1,760,394 | | |
| Noble Corp. | | | 25,000 | | | | 2,438,000 | | |
| Occidental Petroleum Corp. | | | 151,502 | | | | 8,768,936 | | |
| Rowan Companies, Inc. | | | 21,666 | | | | 887,873 | | |
| Sunoco, Inc. | | | 22,612 | | | | 1,801,724 | | |
| Transocean, Inc.(a) | | | 50,972 | | | | 5,402,013 | | |
| Valero Energy Corp. | | | 97,800 | | | | 7,223,508 | | |
| XTO Energy, Inc. | | | 70,366 | | | | 4,228,997 | | |
| | | | 207,503,599 | | |
| Oil & Gas Services — 1.6% | |
| Baker Hughes, Inc. | | | 58,283 | | | | 4,903,349 | | |
| BJ Services Co.(b) | | | 53,400 | | | | 1,518,696 | | |
| Halliburton Co. | | | 161,868 | | | | 5,584,446 | | |
National Oilwell
Varco, Inc.(a) | | | 32,600 | | | | 3,398,224 | | |
| Schlumberger Ltd. | | | 212,010 | | | | 18,008,129 | | |
| Smith International, Inc. | | | 34,600 | | | | 2,028,944 | | |
Weatherford
International Ltd.(a) | | | 58,800 | | | | 3,248,112 | | |
| | | | 38,689,900 | | |
| Packaging & Containers — 0.1% | |
| Ball Corp. | | | 17,608 | | | | 936,217 | | |
| Bemis Co., Inc. | | | 15,988 | | | | 530,482 | | |
| Pactiv Corp.(a) | | | 23,598 | | | | 752,540 | | |
| Sealed Air Corp. | | | 27,896 | | | | 865,334 | | |
| | | | 3,084,573 | | |
| Pharmaceuticals — 5.7% | |
| Abbott Laboratories | | | 274,937 | | | | 14,722,876 | | |
| Allergan, Inc. | | | 55,258 | | | | 3,185,071 | | |
| AmerisourceBergen Corp. | | | 34,032 | | | | 1,683,563 | | |
Barr
Pharmaceuticals, Inc.(a) | | | 18,200 | | | | 914,186 | | |
| Bristol-Myers Squibb Co. | | | 355,684 | | | | 11,225,387 | | |
| Cardinal Health, Inc. | | | 70,579 | | | | 4,985,701 | | |
| Eli Lilly & Co. | | | 178,695 | | | | 9,985,477 | | |
| Express Scripts, Inc.(a) | | | 50,200 | | | | 2,510,502 | | |
Forest
Laboratories, Inc.(a) | | | 55,900 | | | | 2,551,835 | | |
| Gilead Sciences, Inc.(a) | | | 169,276 | | | | 6,562,831 | | |
| Hospira, Inc.(a) | | | 26,193 | | | | 1,022,575 | | |
King
Pharmaceuticals, Inc.(a) | | | 45,348 | | | | 927,820 | | |
Medco Health
Solutions, Inc.(a) | | | 51,241 | | | | 3,996,286 | | |
| Merck & Co., Inc. | | | 387,662 | | | | 19,305,568 | | |
| | | Number of
Shares | | Market
Value | |
Mylan
Laboratories, Inc.(b) | | | 41,900 | | | $ | 762,161 | | |
| Pfizer, Inc. | | | 1,259,821 | | | | 32,213,623 | | |
| Schering-Plough Corp. | | | 265,586 | | | | 8,084,438 | | |
Watson
Pharmaceutical, Inc.(a) | | | 19,871 | | | | 646,404 | | |
| Wyeth | | | 240,204 | | | | 13,773,297 | | |
| | | | 139,059,601 | | |
| Pipelines — 0.4% | |
| El Paso Corp. | | | 122,335 | | | | 2,107,832 | | |
| Questar Corp. | | | 29,600 | | | | 1,564,360 | | |
| Spectra Energy Corp. | | | 112,734 | | | | 2,926,575 | | |
| The Williams Cos., Inc. | | | 109,591 | | | | 3,465,267 | | |
| | | | 10,064,034 | | |
| Real Estate — 0.0% | |
CB Richard Ellis
Group, Inc. Cl. A(a) | | | 32,600 | | | | 1,189,900 | | |
| Real Estate Investment Trusts (REITS) — 1.2% | |
Apartment Investment &
Management Co. Cl. A(b) | | | 18,000 | | | | 907,560 | | |
Archstone-Smith
Trust REIT(b) | | | 41,400 | | | | 2,447,154 | | |
AvalonBay
Communities, Inc. | | | 15,000 | | | | 1,783,200 | | |
| Boston Properties, Inc. | | | 21,400 | | | | 2,185,582 | | |
Developers Diversified
Realty Corp. REIT | | | 22,500 | | | | 1,185,975 | | |
| Equity Residential REIT | | | 54,000 | | | | 2,464,020 | | |
General Growth
Properties, Inc. REIT | | | 44,000 | | | | 2,329,800 | | |
Host Hotels &
Resorts, Inc. REIT(b) | | | 92,200 | | | | 2,131,664 | | |
| Kimco Realty Corp. | | | 40,700 | | | | 1,549,449 | | |
Plum Creek
Timber Co., Inc. | | | 29,500 | | | | 1,228,970 | | |
| ProLogis | | | 46,700 | | | | 2,657,230 | | |
| Public Storage | | | 22,604 | | | | 1,736,439 | | |
Simon Property
Group, Inc. REIT | | | 41,100 | | | | 3,823,944 | | |
| Vornado Realty Trust | | | 24,400 | | | | 2,680,096 | | |
| | | | 29,111,083 | | |
| Retail — 5.5% | |
Abercrombie &
Fitch Co. Cl. A | | | 15,600 | | | | 1,138,488 | | |
| AutoNation, Inc.(a) | | | 28,468 | | | | 638,822 | | |
| AutoZone, Inc.(a) | | | 9,336 | | | | 1,275,484 | | |
Bed Bath &
Beyond, Inc.(a) | | | 48,196 | | | | 1,734,574 | | |
| Best Buy Co., Inc.(b) | | | 71,411 | | | | 3,332,751 | | |
| Big Lots, Inc.(a) | | | 18,996 | | | | 558,862 | | |
| Circuit City Stores, Inc.(b) | | | 25,659 | | | | 386,938 | | |
(Continued)
The accompanying notes are an integral part of the financial statements.
120
MassMutual Select Indexed Equity Fund – Portfolio of Investments (Continued)
| | | Number of
Shares | | Market
Value | |
| Costco Wholesale Corp. | | | 82,089 | | | $ | 4,803,848 | | |
| CVS Caremark Corp. | | | 275,332 | | | | 10,035,851 | | |
| Darden Restaurants, Inc. | | | 24,128 | | | | 1,061,391 | | |
| Dillards, Inc. Cl. A | | | 11,365 | | | | 408,344 | | |
| Dollar General Corp. | | | 54,331 | | | | 1,190,936 | | |
| Family Dollar Stores, Inc. | | | 25,924 | | | | 889,712 | | |
| The Gap, Inc. | | | 95,203 | | | | 1,818,377 | | |
| The Home Depot, Inc. | | | 357,387 | | | | 14,063,178 | | |
| J.C. Penney Co., Inc.(b) | | | 39,161 | | | | 2,834,473 | | |
| Kohl's Corp.(a) | | | 56,676 | | | | 4,025,696 | | |
| Limited Brands, Inc. | | | 60,459 | | | | 1,659,600 | | |
| Lowe's Companies, Inc. | | | 267,800 | | | | 8,218,782 | | |
| Macy's, Inc. | | | 81,462 | | | | 3,240,558 | | |
| McDonald's Corp. | | | 216,060 | | | | 10,967,206 | | |
| Nordstrom, Inc. | | | 39,376 | | | | 2,012,901 | | |
| Office Depot, Inc.(a) | | | 49,859 | | | | 1,510,728 | | |
| OfficeMax, Inc. | | | 13,101 | | | | 514,869 | | |
| RadioShack Corp.(b) | | | 23,830 | | | | 789,726 | | |
| Sears Holdings Corp.(a) | | | 15,198 | | | | 2,576,061 | | |
| Staples, Inc. | | | 131,384 | | | | 3,117,742 | | |
| Starbucks Corp.(a) | | | 132,496 | | | | 3,476,695 | | |
| Target Corp.(b) | | | 154,210 | | | | 9,807,756 | | |
| Tiffany & Co. | | | 24,156 | | | | 1,281,717 | | |
| The TJX Cos., Inc. | | | 79,060 | | | | 2,174,150 | | |
| Walgreen Co. | | | 177,780 | | | | 7,740,541 | | |
| Wal-Mart Stores, Inc. | | | 436,973 | | | | 21,022,771 | | |
| Wendy's International, Inc. | | | 17,601 | | | | 646,837 | | |
| Yum! Brands, Inc. | | | 96,840 | | | | 3,168,605 | | |
| | | | 134,124,970 | | |
| Savings & Loans — 0.4% | |
| Hudson City Bancorp, Inc. | | | 87,800 | | | | 1,072,916 | | |
| Sovereign Bancorp, Inc.(b) | | | 66,739 | | | | 1,410,862 | | |
| Washington Mutual, Inc. | | | 162,399 | | | | 6,924,693 | | |
| | | | 9,408,471 | | |
| Semiconductors — 2.7% | |
Advanced Micro
Devices, Inc.(a) (b) | | | 97,442 | | | | 1,393,421 | | |
| Altera Corp. | | | 64,804 | | | | 1,434,113 | | |
| Analog Devices, Inc. | | | 61,125 | | | | 2,300,745 | | |
| Applied Materials, Inc.(b) | | | 248,652 | | | | 4,940,715 | | |
| Broadcom Corp. Cl. A(a) | | | 81,300 | | | | 2,378,025 | | |
| Intel Corp. | | | 1,039,032 | | | | 24,687,400 | | |
| KLA-Tencor Corp. | | | 35,628 | | | | 1,957,759 | | |
| Linear Technology Corp.(b) | | | 47,549 | | | | 1,720,323 | | |
| LSI Corp.(a) | | | 136,442 | | | | 1,024,679 | | |
Maxim Integrated
Products, Inc. | | | 60,099 | | | | 2,007,908 | | |
MEMC Electronic
Materials, Inc.(a) | | | 39,800 | | | | 2,432,576 | | |
Micron
Technology, Inc.(a) (b) | | | 132,080 | | | | 1,654,962 | | |
National
Semiconductor Corp.(b) | | | 53,024 | | | | 1,498,988 | | |
| | | Number of
Shares | | Market
Value | |
Novellus
Systems, Inc.(a) (b) | | | 22,931 | | | $ | 650,552 | | |
| Nvidia Corp.(a) | | | 63,900 | | | | 2,639,709 | | |
| QLogic Corp.(a) | | | 29,600 | | | | 492,840 | | |
| Teradyne, Inc.(a) (b) | | | 36,406 | | | | 640,017 | | |
| Texas Instruments, Inc. | | | 259,969 | | | | 9,782,633 | | |
| Xilinx, Inc. | | | 56,368 | | | | 1,508,971 | | |
| | | | 65,146,336 | | |
| Software — 3.8% | |
| Adobe Systems, Inc.(a) | | | 106,944 | | | | 4,293,802 | | |
| Autodesk, Inc.(a) | | | 42,612 | | | | 2,006,173 | | |
Automatic Data
Processing, Inc. | | | 99,208 | | | | 4,808,612 | | |
| BMC Software, Inc.(a) | | | 35,631 | | | | 1,079,619 | | |
| CA, Inc. | | | 77,387 | | | | 1,998,906 | | |
| Citrix Systems, Inc.(a) | | | 32,927 | | | | 1,108,652 | | |
| Compuware Corp.(a) | | | 59,137 | | | | 701,365 | | |
| Electronic Arts, Inc.(a) | | | 56,900 | | | | 2,692,508 | | |
Fidelity National
Information Services, Inc. | | | 28,200 | | | | 1,530,696 | | |
| First Data Corp. | | | 137,351 | | | | 4,487,257 | | |
| Fiserv, Inc.(a) | | | 31,401 | | | | 1,783,577 | | |
| IMS Health, Inc. | | | 36,625 | | | | 1,176,761 | | |
| Intuit, Inc.(a) | | | 59,600 | | | | 1,792,768 | | |
| Microsoft Corp. | | | 1,511,140 | | | | 44,533,296 | | |
| Novell, Inc.(a) | | | 63,682 | | | | 496,083 | | |
| Oracle Corp.(a) | | | 707,028 | | | | 13,935,522 | | |
| Paychex, Inc. | | | 63,106 | | | | 2,468,707 | | |
| | | | 90,894,304 | | |
| Telecommunications — 6.3% | |
| Alltel Corp. | | | 63,957 | | | | 4,320,295 | | |
| AT&T, Inc. | | | 1,104,775 | | | | 45,848,163 | | |
| Avaya, Inc.(a) | | | 82,075 | | | | 1,382,143 | | |
| CenturyTel, Inc. | | | 21,848 | | | | 1,071,644 | | |
| Ciena Corp.(a) | | | 15,128 | | | | 546,575 | | |
| Cisco Systems, Inc.(a) | | | 1,087,087 | | | | 30,275,373 | | |
Citizens
Communications Co.(b) | | | 61,800 | | | | 943,686 | | |
| Corning, Inc.(a) | | | 280,561 | | | | 7,168,334 | | |
| Embarq Corp. | | | 25,605 | | | | 1,622,589 | | |
| JDS Uniphase Corp.(a) (b) | | | 38,147 | | | | 512,314 | | |
Juniper
Networks, Inc.(a) (b) | | | 103,300 | | | | 2,600,061 | | |
| Motorola, Inc. | | | 415,502 | | | | 7,354,385 | | |
| Qualcomm, Inc. | | | 297,518 | | | | 12,909,306 | | |
Qwest Communications
International, Inc.(a) (b) | | | 278,821 | | | | 2,704,564 | | |
| Sprint Nextel Corp. | | | 516,913 | | | | 10,705,268 | | |
| Tellabs, Inc.(a) | | | 80,723 | | | | 868,579 | | |
Verizon
Communications, Inc. | | | 518,663 | | | | 21,353,356 | | |
| Windstream Corp. | | | 88,363 | | | | 1,304,238 | | |
| | | | 153,490,873 | | |
| | | Number of
Shares | | Market
Value | |
| Textiles — 0.0% | |
| Cintas Corp. | | | 23,900 | | | $ | 942,377 | | |
| Toys, Games & Hobbies — 0.1% | |
| Hasbro, Inc. | | | 30,304 | | | | 951,849 | | |
| Mattel, Inc. | | | 67,952 | | | | 1,718,506 | | |
| | | | 2,670,355 | | |
| Transportation — 1.7% | |
Burlington Northern
Santa Fe Corp. | | | 62,856 | | | | 5,351,560 | | |
C.H. Robinson
Worldwide, Inc. | | | 30,800 | | | | 1,617,616 | | |
| CSX Corp. | | | 78,872 | | | | 3,555,550 | | |
| FedEx Corp. | | | 55,112 | | | | 6,115,779 | | |
| Norfolk Southern Corp. | | | 72,377 | | | | 3,804,859 | | |
| Ryder System, Inc.(b) | | | 10,705 | | | | 575,929 | | |
| Union Pacific Corp. | | | 49,238 | | | | 5,669,756 | | |
United Parcel
Service, Inc. Cl. B | | | 191,300 | | | | 13,964,900 | | |
| | | | 40,655,949 | | |
TOTAL EQUITIES
(Cost $1,843,203,982) | | | | | | | 2,399,107,409 | | |
| | | Principal
Amount | | | |
| SHORT-TERM INVESTMENTS — 5.9% | |
| Cash Equivalents — 5.0%(e) | |
Abbey National PLC
Eurodollar Time Deposit
5.280% 07/05/2007 | | $ | 1,559,266 | | | | 1,559,266 | | |
Abbey National PLC
Eurodollar Time Deposit
5.285% 07/09/2007 | | | 3,898,179 | | | | 3,898,179 | | |
American Beacon
Money Market Fund(c) | | | 4,373,576 | | | | 4,373,576 | | |
Banco Bilbao Vizcaya
Argentaria SA
Eurodollar Time Deposit
5.300% 08/10/2007 | | | 2,923,634 | | | | 2,923,634 | | |
Bank of America
5.270% 07/06/2007 | | | 3,898,179 | | | | 3,898,179 | | |
Bank of America
5.270% 07/16/2007 | | | 779,636 | | | | 779,636 | | |
Bank of America
5.270% 08/17/2007 | | | 974,545 | | | | 974,545 | | |
Bank of America
5.300% 09/17/2007 | | | 1,949,089 | | | | 1,949,089 | | |
Bank of Ireland
Eurodollar Time Deposit
5.300% 08/13/2007 | | | 3,898,179 | | | | 3,898,179 | | |
(Continued)
The accompanying notes are an integral part of the financial statements.
121
MassMutual Select Indexed Equity Fund – Portfolio of Investments (Continued)
| | | Principal
Amount | | Market
Value | |
Bank of Montreal
Eurodollar Time Deposit
5.280% 07/03/2007 | | $ | 974,545 | | | $ | 974,545 | | |
Bank of Montreal
Eurodollar Time Deposit
5.290% 07/02/2007 | | | 779,636 | | | | 779,636 | | |
Bank of Montreal
Eurodollar Time Deposit
5.310% 08/14/2007 | | | 584,727 | | | | 584,727 | | |
Bank of Nova Scotia
Eurodollar Time Deposit
5.280% 07/09/2007 | | | 3,703,270 | | | | 3,703,270 | | |
Bank Of Nova Scotia
Eurodollar Time Deposit
5.285% 07/11/2007 | | | 2,143,998 | | | | 2,143,998 | | |
Barclays
Eurodollar Time Deposit
5.290% 07/06/2007 | | | 3,898,179 | | | | 3,898,179 | | |
Barclays
Eurodollar Time Deposit
5.295% 07/16/2007 | | | 779,636 | | | | 779,636 | | |
Barclays
Eurodollar Time Deposit
5.320% 09/04/2007 | | | 1,949,089 | | | | 1,949,089 | | |
Bear Stearns & Co
Commercial Paper
5.435% 07/10/2007 | | | 584,727 | | | | 584,727 | | |
BGI Institutional
Money Market Fund(c) | | | 2,533,816 | | | | 2,533,816 | | |
BNP Paribas
Eurodollar Time Deposit
5.350% 07/02/2007 | | | 5,847,268 | | | | 5,847,268 | | |
Calyon
Eurodollar Time Deposit
5.290% 07/17/2007 | | | 1,949,089 | | | | 1,949,089 | | |
Calyon
Eurodollar Time Deposit
5.380% 07/02/2007 | | | 5,847,268 | | | | 5,847,268 | | |
Canadian Imperial
Bank of Commerce
Eurodollar Time Deposit
5.300% 07/30/2007 | | | 3,898,179 | | | | 3,898,179 | | |
Dexia Group
Eurodollar Time Deposit
5.290% 08/08/2007 | | | 3,898,179 | | | | 3,898,179 | | |
Dreyfus Institutional
Cash Advantage
Money Market Fund(c) | | | 1,169,454 | | | | 1,169,454 | | |
Federal Home Loan Bank
Discount Note
5.174% 07/20/2007 | | | 289,115 | | | | 289,115 | | |
First Tennessee
National Corp.
Eurodollar Time Deposit
5.300% 07/18/2007 | | | 974,545 | | | | 974,545 | | |
| | | Principal
Amount | | Market
Value | |
Fortis Bank
Eurodollar Time Deposit
5.290% 07/06/2007 | | $ | 974,545 | | | $ | 974,545 | | |
Fortis Bank
Eurodollar Time Deposit
5.290% 07/09/2007 | | | 1,364,363 | | | | 1,364,363 | | |
Fortis Bank
Eurodollar Time Deposit
5.300% 07/20/2007 | | | 974,545 | | | | 974,545 | | |
Fortis Bank
Eurodollar Time Deposit
5.300% 07/26/2007 | | | 779,636 | | | | 779,636 | | |
Fortis Bank
Eurodollar Time Deposit
5.350% 07/05/2007 | | | 1,949,089 | | | | 1,949,089 | | |
Freddie Mac Discount Note
5.155% 07/16/2007 | | | 368,048 | | | | 368,048 | | |
Freddie Mac Discount Note
5.185% 07/09/2007 | | | 192,143 | | | | 192,143 | | |
Morgan Stanley & Co
Commercial Paper
5.445% 08/01/2007 | | | 1,754,180 | | | | 1,754,180 | | |
National Australia Bank
Eurodollar Time Deposit
5.320% 07/02/2007 | | | 1,949,089 | | | | 1,949,089 | | |
Nationwide
Building Society
Commercial Paper
5.301% 07/09/2007 | | | 1,945,080 | | | | 1,945,080 | | |
Rabobank Nederland
Eurodollar Time Deposit
5.280% 07/05/2007 | | | 2,923,634 | | | | 2,923,634 | | |
Rabobank Nederland
Eurodollar Time Deposit
5.290% 07/16/2007 | | | 3,898,179 | | | | 3,898,179 | | |
Rabobank Nederland
Eurodollar Time Deposit
5.330% 07/02/2007 | | | 5,847,268 | | | | 5,847,268 | | |
Reserve Primary
Money Market Fund(c) | | | 3,869,873 | | | | 3,869,873 | | |
Royal Bank of Canada
Eurodollar Time Deposit
5.305% 08/30/2007 | | | 3,898,179 | | | | 3,898,179 | | |
Royal Bank of Scotland
Eurodollar Time Deposit
5.270% 07/11/2007 | | | 974,545 | | | | 974,545 | | |
Skandinaviska Enskilda
Banken AB
Eurodollar Time Deposit
5.290% 07/13/2007 | | | 3,898,179 | | | | 3,898,179 | | |
Skandinaviska Enskilda
Banken AB
Eurodollar Time Deposit
5.290% 07/19/2007 | | | 584,727 | | | | 584,727 | | |
Svenska Handlesbanken
Eurodollar Time Deposit
5.300% 07/02/2007 | | | 654,799 | | | | 654,799 | | |
| | | Principal
Amount | | Market
Value | |
UBS AG
Eurodollar Time Deposit
5.277% 07/05/2007 | | $ | 2,728,725 | | | $ | 2,728,725 | | |
UBS AG
Eurodollar Time Deposit
5.285% 07/05/2007 | | | 3,898,179 | | | | 3,898,179 | | |
Vanguard Prime
Money Market Fund(c) | | | 1,949,089 | | | | 1,949,089 | | |
Wells Fargo
Eurodollar Time Deposit
5.260% 07/02/2007 | | | 1,052,508 | | | | 1,052,508 | | |
Wells Fargo
Eurodollar Time Deposit
5.280% 07/11/2007 | | | 3,898,179 | | | | 3,898,179 | | |
Wells Fargo
Eurodollar Time Deposit
5.280% 07/12/2007 | | | 1,949,089 | | | | 1,949,089 | | |
| | | | 120,334,873 | | |
| Repurchase Agreements — 0.8% | |
Investors Bank & Trust
Company Repurchase
Agreement, dated
6/29/2007, 3.50%,
due 7/02/2007(f) | | | 17,868,316 | | | | 17,868,316 | | |
| U.S. Government Agencies — 0.1% | |
U.S. Treasury Bill(d)
4.946% 08/09/2007 | | | 3,185,000 | | | | 3,167,496 | | |
TOTAL SHORT-TERM
INVESTMENTS
(Cost $141,370,685) | | | | | | | 141,370,685 | | |
TOTAL INVESTMENTS — 105.0%
(Cost $1,984,574,667)(g) | | | | | | | 2,540,478,094 | | |
Other Assets/
(Liabilities) — (5.0%) | | | | | | | (120,211,610 | ) | |
| NET ASSETS — 100.0% | | $ | 2,420,266,484 | | |
Notes to Portfolio of Investments
(a) Non-income producing security.
(b) Denotes all or a portion of security on loan. (Note 2).
(c) Amount represents shares owned of the fund.
(d) This security is held as collateral for open futures contracts. (Note 2).
(e) Represents investments of security lending collateral. (Note 2).
(f) Maturity value of $17,873,528. Collateralized by a U.S. Government Agency obligation with a rate of 7.625%, maturity date 11/25/2030, and an aggregate market value, including accrued interest, of $18,761,732.
(g) See Note 6 for aggregate cost for Federal tax purposes.
The accompanying notes are an integral part of the financial statements.
122
MassMutual Select Core Opportunities Fund – Portfolio of Investments
June 30, 2007 (Unaudited)
| | | Number of
Shares | | Market
Value | |
| EQUITIES — 97.7% | |
| COMMON STOCK — 97.7% | |
| Aerospace & Defense — 2.7% | |
| United Technologies Corp. | | | 18,200 | | | $ | 1,290,926 | | |
| Auto Manufacturers — 1.4% | |
| Ford Motor Co.(a) | | | 72,300 | | | | 681,066 | | |
| Banks — 1.5% | |
| Bank of America Corp. | | | 14,100 | | | | 689,349 | | |
| Beverages — 6.8% | |
| The Coca-Cola Co. | | | 26,100 | | | | 1,365,291 | | |
Diageo PLC Sponsored
ADR (United Kingdom) | | | 8,700 | | | | 724,797 | | |
| PepsiCo, Inc. | | | 17,500 | | | | 1,134,875 | | |
| | | | 3,224,963 | | |
| Building Materials — 1.1% | |
| USG Corp.(a) (b) | | | 10,923 | | | | 535,664 | | |
| Chemicals — 2.2% | |
| PPG Industries, Inc. | | | 13,400 | | | | 1,019,874 | | |
| Coal — 1.3% | |
| Peabody Energy Corp. | | | 13,103 | | | | 633,923 | | |
| Commercial Services — 0.3% | |
| Western Union | | | 6,800 | | | | 141,644 | | |
| Computers — 4.0% | |
| Dell, Inc.(b) | | | 23,600 | | | | 673,780 | | |
| Seagate Technology(a) | | | 55,685 | | | | 1,212,262 | | |
| | | | 1,886,042 | | |
| Cosmetics & Personal Care — 2.3% | |
| The Procter & Gamble Co. | | | 18,000 | | | | 1,101,420 | | |
| Diversified Financial — 7.7% | |
| The Charles Schwab Corp. | | | 67,200 | | | | 1,378,944 | | |
| Citigroup, Inc. | | | 11,900 | | | | 610,351 | | |
| Franklin Resources, Inc. | | | 3,600 | | | | 476,892 | | |
| Legg Mason, Inc. | | | 11,864 | | | | 1,167,180 | | |
| | | | 3,633,367 | | |
| Electric — 1.2% | |
| Exelon Corp. | | | 8,100 | | | | 588,060 | | |
| Engineering & Construction — 1.7% | |
ABB Ltd. Sponsored
ADR (Switzerland) | | | 35,400 | | | | 800,040 | | |
| Environmental Controls — 1.6% | |
| Waste Management, Inc. | | | 19,100 | | | | 745,855 | | |
| | | Number of
Shares | | Market
Value | |
| Foods — 0.2% | |
| General Mills, Inc. | | | 1,483 | | | $ | 86,637 | | |
| Health Care – Products — 1.2% | |
| Medtronic, Inc. | | | 10,600 | | | | 549,716 | | |
| Home Builders — 0.7% | |
| Toll Brothers, Inc.(a) (b) | | | 13,700 | | | | 342,226 | | |
| Insurance — 4.2% | |
| Ambac Financial Group, Inc. | | | 8,363 | | | | 729,170 | | |
American
International Group, Inc. | | | 17,900 | | | | 1,253,537 | | |
| | | | 1,982,707 | | |
| Internet — 4.1% | |
| Google, Inc. Cl. A(b) | | | 1,800 | | | | 942,084 | | |
| Yahoo!, Inc.(b) | | | 36,700 | | | | 995,671 | | |
| | | | 1,937,755 | | |
| Machinery – Construction & Mining — 3.4% | |
| Caterpillar, Inc. | | | 20,400 | | | | 1,597,320 | | |
| Machinery – Diversified — 1.4% | |
| Rockwell Automation, Inc. | | | 9,563 | | | | 664,055 | | |
| Manufacturing — 5.8% | |
| General Electric Co. | | | 55,900 | | | | 2,139,852 | | |
| Textron, Inc. | | | 5,559 | | | | 612,102 | | |
| | | | 2,751,954 | | |
| Media — 1.3% | |
| Viacom, Inc. Cl. B(b) | | | 14,600 | | | | 607,798 | | |
| Mining — 1.6% | |
| Newmont Mining Corp.(a) | | | 18,900 | | | | 738,234 | | |
| Oil & Gas — 5.9% | |
| Chesapeake Energy Corp.(a) | | | 24,300 | | | | 840,780 | | |
| Transocean, Inc.(b) | | | 18,300 | | | | 1,939,434 | | |
| | | | 2,780,214 | | |
| Oil & Gas Services — 7.4% | |
| BJ Services Co. | | | 13,600 | | | | 386,784 | | |
| Halliburton Co. | | | 42,400 | | | | 1,462,800 | | |
| Schlumberger Ltd. | | | 19,344 | | | | 1,643,079 | | |
| | | | 3,492,663 | | |
| Pharmaceuticals — 7.2% | |
| Gilead Sciences, Inc.(b) | | | 17,600 | | | | 682,352 | | |
| Merck & Co., Inc. | | | 16,500 | | | | 821,700 | | |
Novartis AG ADR
(Switzerland) | | | 5,800 | | | | 325,206 | | |
| Pfizer, Inc. | | | 33,600 | | | | 859,152 | | |
| Wyeth | | | 12,600 | | | | 722,484 | | |
| | | | 3,410,894 | | |
| | | Number of
Shares | | Market
Value | |
| Retail — 2.4% | |
| Best Buy Co., Inc. | | | 4,800 | | | $ | 224,016 | | |
| The Home Depot, Inc. | | | 16,000 | | | | 629,600 | | |
| Tiffany & Co. | | | 4,968 | | | | 263,602 | | |
| | | | 1,117,218 | | |
| Semiconductors — 10.3% | |
| Intel Corp. | | | 91,200 | | | | 2,166,912 | | |
STMicroelectronics
NV NY Shares(a) | | | 32,400 | | | | 621,756 | | |
Taiwan Semiconductor
Manufacturing Co. Ltd.
Sponsored ADR (Taiwan) | | | 95,801 | | | | 1,066,263 | | |
| Texas Instruments, Inc. | | | 27,400 | | | | 1,031,062 | | |
| | | | 4,885,993 | | |
| Telecommunications — 1.7% | |
| Cisco Systems, Inc.(b) | | | 8,400 | | | | 233,940 | | |
| Juniper Networks, Inc.(b) | | | 21,900 | | | | 551,223 | | |
| | | | 785,163 | | |
| Transportation — 3.1% | |
United Parcel
Service, Inc. Cl. B | | | 20,400 | | | | 1,489,200 | | |
TOTAL EQUITIES
(Cost $42,790,565) | | | | | | | 46,191,940 | | |
| | | Principal
Amount | | | |
| SHORT-TERM INVESTMENTS — 13.1% | |
| Cash Equivalents — 8.4%(d) | |
Abbey National PLC
Eurodollar Time Deposit
5.280% 07/05/2007 | | $ | 51,126 | | | | 51,126 | | |
Abbey National PLC
Eurodollar Time Deposit
5.285% 07/09/2007 | | | 127,810 | | | | 127,810 | | |
American Beacon
Money Market Fund(c) | | | 143,401 | | | | 143,401 | | |
Banco Bilbao
Vizcaya Argentaria SA
Eurodollar Time Deposit
5.300% 08/10/2007 | | | 95,860 | | | | 95,860 | | |
Bank of America
5.270% 07/06/2007 | | | 127,814 | | | | 127,814 | | |
Bank of America
5.270% 07/16/2007 | | | 25,563 | | | | 25,563 | | |
Bank of America
5.270% 08/17/2007 | | | 31,954 | | | | 31,954 | | |
Bank of America
5.300% 09/17/2007 | | | 63,907 | | | | 63,907 | | |
Bank of Ireland
Eurodollar Time Deposit
5.300% 08/13/2007 | | | 127,814 | | | | 127,814 | | |
(Continued)
The accompanying notes are an integral part of the financial statements.
123
MassMutual Select Core Opportunities Fund – Portfolio of Investments (Continued)
| | | Principal
Amount | | Market
Value | |
Bank of Montreal
Eurodollar Time Deposit
5.280% 07/03/2007 | | $ | 31,954 | | | $ | 31,954 | | |
Bank of Montreal
Eurodollar Time Deposit
5.290% 07/02/2007 | | | 25,563 | | | | 25,563 | | |
Bank of Montreal
Eurodollar Time Deposit
5.310% 08/14/2007 | | | 19,172 | | | | 19,172 | | |
Bank of Nova Scotia
Eurodollar Time Deposit
5.280% 07/09/2007 | | | 121,423 | | | | 121,423 | | |
Bank Of Nova Scotia
Eurodollar Time Deposit
5.285% 07/11/2007 | | | 70,298 | | | | 70,298 | | |
Barclays
Eurodollar Time Deposit
5.290% 07/06/2007 | | | 127,814 | | | | 127,814 | | |
Barclays
Eurodollar Time Deposit
5.295% 07/16/2007 | | | 25,563 | | | | 25,563 | | |
Barclays
Eurodollar Time Deposit
5.320% 09/04/2007 | | | 63,907 | | | | 63,907 | | |
Bear Stearns & Co
Commercial Paper
5.435% 07/10/2007 | | | 19,172 | | | | 19,172 | | |
BGI Institutional
Money Market Fund(c) | | | 83,079 | | | | 83,079 | | |
BNP Paribas
Eurodollar Time Deposit
5.350% 07/02/2007 | | | 191,721 | | | | 191,721 | | |
Calyon
Eurodollar Time Deposit
5.290% 07/17/2007 | | | 63,907 | | | | 63,907 | | |
Calyon
Eurodollar Time Deposit
5.380% 07/02/2007 | | | 191,721 | | | | 191,721 | | |
Canadian Imperial
Bank of Commerce
Eurodollar Time Deposit
5.300% 07/30/2007 | | | 127,814 | | | | 127,814 | | |
Dexia Group
Eurodollar Time Deposit
5.290% 08/08/2007 | | | 127,814 | | | | 127,814 | | |
Dreyfus Institutional
Cash Advantage
Money Market Fund(c) | | | 38,344 | | | | 38,344 | | |
Federal Home Loan
Bank Discount Note
5.174% 07/20/2007 | | | 9,480 | | | | 9,480 | | |
First Tennessee National Corp.
Eurodollar Time Deposit
5.300% 07/18/2007 | | | 31,954 | | | | 31,954 | | |
| | | Principal
Amount | | Market
Value | |
Fortis Bank
Eurodollar Time Deposit
5.290% 07/06/2007 | | $ | 31,954 | | | $ | 31,954 | | |
Fortis Bank
Eurodollar Time Deposit
5.290% 07/09/2007 | | | 44,735 | | | | 44,735 | | |
Fortis Bank
Eurodollar Time Deposit
5.300% 07/20/2007 | | | 31,954 | | | | 31,954 | | |
Fortis Bank
Eurodollar Time Deposit
5.300% 07/26/2007 | | | 25,563 | | | | 25,563 | | |
Fortis Bank
Eurodollar Time Deposit
5.350% 07/05/2007 | | | 63,907 | | | | 63,907 | | |
Freddie Mac Discount Note
5.155% 07/16/2007 | | | 12,068 | | | | 12,068 | | |
Freddie Mac Discount Note
5.185% 07/09/2007 | | | 6,300 | | | | 6,300 | | |
Morgan Stanley & Co
Commercial Paper
5.445% 08/01/2007 | | | 57,516 | | | | 57,516 | | |
National Australia Bank
Eurodollar Time Deposit
5.320% 07/02/2007 | | | 63,907 | | | | 63,907 | | |
Nationwide Building Society
Commercial Paper
5.301% 07/09/2007 | | | 63,776 | | | | 63,776 | | |
Rabobank Nederland
Eurodollar Time Deposit
5.280% 07/05/2007 | | | 95,860 | | | | 95,860 | | |
Rabobank Nederland
Eurodollar Time Deposit
5.290% 07/16/2007 | | | 127,814 | | | | 127,814 | | |
Rabobank Nederland
Eurodollar Time Deposit
5.330% 07/02/2007 | | | 191,721 | | | | 191,721 | | |
Reserve Primary
Money Market Fund(c) | | | 126,886 | | | | 126,886 | | |
Royal Bank of Canada
Eurodollar Time Deposit
5.305% 08/30/2007 | | | 127,814 | | | | 127,814 | | |
Royal Bank of Scotland
Eurodollar Time Deposit
5.270% 07/11/2007 | | | 31,954 | | | | 31,954 | | |
Skandinaviska Enskilda
Banken AB
Eurodollar Time Deposit
5.290% 07/13/2007 | | | 127,814 | | | | 127,814 | | |
Skandinaviska Enskilda
Banken AB
Eurodollar Time Deposit
5.290% 07/19/2007 | | | 19,172 | | | | 19,172 | | |
| | | Principal
Amount | | Market
Value | |
Svenska Handlesbanken
Eurodollar Time Deposit
5.300% 07/02/2007 | | $ | 21,470 | | | $ | 21,470 | | |
UBS AG
Eurodollar Time Deposit
5.277% 07/05/2007 | | | 89,470 | | | | 89,470 | | |
UBS AG
Eurodollar Time Deposit
5.285% 07/05/2007 | | | 127,814 | | | | 127,814 | | |
Vanguard Prime
Money Market Fund(c) | | | 63,907 | | | | 63,907 | | |
Wells Fargo
Eurodollar Time Deposit
5.260% 07/02/2007 | | | 34,510 | | | | 34,510 | | |
Wells Fargo
Eurodollar Time Deposit
5.280% 07/11/2007 | | | 127,814 | | | | 127,814 | | |
Wells Fargo
Eurodollar Time Deposit
5.280% 07/12/2007 | | | 63,907 | | | | 63,907 | | |
| | | | 3,945,556 | | |
| Repurchase Agreements — 4.7% | |
Investors Bank & Trust
Company Repurchase
Agreement, dated
6/29/2007, 3.50%,
due 7/02/2007(e) | | | 2,222,036 | | | | 2,222,036 | | |
TOTAL SHORT-TERM
INVESTMENTS
(Cost $6,167,592) | | | | | | | 6,167,592 | | |
TOTAL INVESTMENTS — 110.8%
(Cost $48,958,157)(f) | | | | | | | 52,359,532 | | |
Other Assets/
(Liabilities) — (10.8%) | | | | | | | (5,087,318 | ) | |
| NET ASSETS — 100.0% | | | | | | $ | 47,272,214 | | |
Notes to Portfolio of Investments
ADR - American Depository Receipt
(a) Denotes all or a portion of security on loan. (Note 2).
(b) Non-income producing security.
(c) Amount represents shares owned of the fund.
(d) Represents investments of security lending collateral. (Note 2).
(e) Maturity value of $2,222,685. Collateralized by a U.S. Government Agency Obligation with a rate of 8.125%, maturity date of 11/25/2027, and an aggregate market value, including accrued interest, of $2,333,138.
(f) See Note 6 for aggregate cost for Federal tax purposes.
The accompanying notes are an integral part of the financial statements.
124
MassMutual Select Blue Chip Growth Fund – Portfolio of Investments
June 30, 2007 (Unaudited)
| | | Number of
Shares | | Market
Value | |
| EQUITIES — 99.4% | |
| COMMON STOCK — 99.4% | |
| Advertising — 0.4% | |
| Omnicom Group, Inc. | | | 40,400 | | | $ | 2,137,968 | | |
| Aerospace & Defense — 1.7% | |
| General Dynamics Corp. | | | 71,300 | | | | 5,577,086 | | |
| Rockwell Collins, Inc. | | | 26,100 | | | | 1,843,704 | | |
| United Technologies Corp. | | | 29,800 | | | | 2,113,714 | | |
| | | | 9,534,504 | | |
| Apparel — 0.6% | |
| Coach, Inc.(a) | | | 72,300 | | | | 3,426,297 | | |
| Banks — 3.8% | |
| Mellon Financial Corp. | | | 65,200 | | | | 2,868,800 | | |
| Northern Trust Corp. | | | 72,700 | | | | 4,670,248 | | |
| State Street Corp.(b) | | | 146,300 | | | | 10,006,920 | | |
| Wells Fargo & Co. | | | 99,200 | | | | 3,488,864 | | |
| | | | 21,034,832 | | |
| Beverages — 0.5% | |
| PepsiCo, Inc. | | | 45,200 | | | | 2,931,220 | | |
| Biotechnology — 2.0% | |
| Amgen, Inc.(a) | | | 100 | | | | 5,529 | | |
| Celgene Corp.(a) | | | 74,700 | | | | 4,282,551 | | |
| Genentech, Inc.(a) | | | 95,400 | | | | 7,217,964 | | |
| | | | 11,506,044 | | |
| Chemicals — 0.9% | |
| Monsanto Co. | | | 75,400 | | | | 5,092,516 | | |
| Commercial Services — 0.6% | |
| Accenture Ltd. Cl. A | | | 27,700 | | | | 1,188,053 | | |
| Monster Worldwide, Inc.(a) | | | 55,600 | | | | 2,285,160 | | |
| | | | 3,473,213 | | |
| Computers — 3.0% | |
| Apple, Inc.(a) | | | 69,400 | | | | 8,469,576 | | |
| Dell, Inc.(a) | | | 111,800 | | | | 3,191,890 | | |
| EMC Corp.(a) | | | 191,000 | | | | 3,457,100 | | |
| Hewlett-Packard Co. | | | 32,400 | | | | 1,445,688 | | |
| | | | 16,564,254 | | |
| Cosmetics & Personal Care — 1.2% | |
| The Procter & Gamble Co. | | | 108,000 | | | | 6,608,520 | | |
| Diversified Financial — 12.8% | |
| American Express Co. | | | 132,900 | | | | 8,130,822 | | |
| Ameriprise Financial, Inc. | | | 38,800 | | | | 2,466,516 | | |
| The Charles Schwab Corp. | | | 250,500 | | | | 5,140,260 | | |
| | | Number of
Shares | | Market
Value | |
Chicago Mercantile
Exchange
Holdings, Inc.(b) | | | 3,900 | | | $ | 2,084,004 | | |
| Citigroup, Inc. | | | 125,700 | | | | 6,447,153 | | |
Countrywide Financial
Corp.(b) | | | 83,800 | | | | 3,046,130 | | |
| Deutsche Boerse AG | | | 4,750 | | | | 536,282 | | |
E*TRADE Financial
Corp.(a) | | | 142,000 | | | | 3,136,780 | | |
| Franklin Resources, Inc. | | | 66,200 | | | | 8,769,514 | | |
The Goldman Sachs
Group, Inc. | | | 35,500 | | | | 7,694,625 | | |
Interactive Brokers
Group, Inc.(a) | | | 10,900 | | | | 295,717 | | |
Intercontinental
Exchange, Inc.(a) | | | 10,500 | | | | 1,552,425 | | |
| Legg Mason, Inc. | | | 45,300 | | | | 4,456,614 | | |
| Merrill Lynch & Co., Inc. | | | 40,400 | | | | 3,376,632 | | |
| Morgan Stanley | | | 92,200 | | | | 7,733,736 | | |
| UBS AG Registered | | | 109,900 | | | | 6,531,751 | | |
| | | | 71,398,961 | | |
| Electronics — 0.2% | |
Thermo Fisher
Scientific, Inc.(a) | | | 18,300 | | | | 946,476 | | |
| Engineering & Construction — 0.8% | |
| Foster Wheeler Ltd.(a) | | | 25,100 | | | | 2,685,449 | | |
McDermott
International, Inc.(a) | | | 22,900 | | | | 1,903,448 | | |
| | | | 4,588,897 | | |
| Entertainment — 0.5% | |
International Game
Technology | | | 70,900 | | | | 2,814,730 | | |
| Foods — 0.2% | |
| Sysco Corp. | | | 37,000 | | | | 1,220,630 | | |
| Health Care – Products — 3.2% | |
| Alcon, Inc. | | | 13,700 | | | | 1,848,267 | | |
| Baxter International, Inc. | | | 18,800 | | | | 1,059,192 | | |
| Medtronic, Inc. | | | 127,900 | | | | 6,632,894 | | |
St. Jude Medical,
Inc.(a) (b) | | | 99,700 | | | | 4,136,553 | | |
| Stryker Corp. | | | 64,500 | | | | 4,069,305 | | |
| | | | 17,746,211 | | |
| Health Care – Services — 3.8% | |
| Aetna, Inc. | | | 106,900 | | | | 5,280,860 | | |
| Humana, Inc.(a) | | | 32,400 | | | | 1,973,484 | | |
Laboratory Corp. of
America Holdings(a) (b) | | | 23,900 | | | | 1,870,414 | | |
| | | Number of
Shares | | Market
Value | |
| UnitedHealth Group, Inc. | | | 100,300 | | | $ | 5,129,342 | | |
| WellPoint, Inc.(a) | | | 87,500 | | | | 6,985,125 | | |
| | | | 21,239,225 | | |
| Home Furnishing — 0.8% | |
Harman International
Industries, Inc. | | | 38,300 | | | | 4,473,440 | | |
| Household Products — 0.0% | |
| Fortune Brands, Inc.(b) | | | 1,300 | | | | 107,081 | | |
| Insurance — 3.1% | |
American International
Group, Inc. | | | 123,900 | | | | 8,676,717 | | |
The Hartford Financial
Services Group, Inc. | | | 21,300 | | | | 2,098,263 | | |
| Prudential Financial, Inc. | | | 65,800 | | | | 6,397,734 | | |
| | | | 17,172,714 | | |
| Internet — 5.2% | |
| Amazon.com, Inc.(a) (b) | | | 136,900 | | | | 9,365,329 | | |
| eBay, Inc.(a) | | | 143,000 | | | | 4,601,740 | | |
| Google, Inc. Cl. A(a) | | | 26,200 | | | | 13,712,556 | | |
| Yahoo!, Inc.(a) | | | 53,400 | | | | 1,448,742 | | |
| | | | 29,128,367 | | |
| Lodging — 1.5% | |
Marriott International,
Inc. Cl. A | | | 89,100 | | | | 3,852,684 | | |
| MGM Mirage(a) | | | 19,300 | | | | 1,591,864 | | |
| Wynn Resorts Ltd.(b) | | | 32,300 | | | | 2,896,987 | | |
| | | | 8,341,535 | | |
| Machinery – Construction & Mining — 0.3% | |
| Joy Global, Inc. | | | 26,600 | | | | 1,551,578 | | |
| Manufacturing — 6.3% | |
| Danaher Corp. | | | 168,200 | | | | 12,699,100 | | |
| General Electric Co. | | | 525,500 | | | | 20,116,140 | | |
| Illinois Tool Works, Inc. | | | 41,400 | | | | 2,243,466 | | |
| | | | 35,058,706 | | |
| Media — 1.9% | |
Grupo Televisa SA
Sponsored ADR (Mexico) | | | 61,200 | | | | 1,689,732 | | |
Rogers Communications,
Inc. Cl. B(b) | | | 122,200 | | | | 5,192,278 | | |
| Time Warner, Inc. | | | 58,200 | | | | 1,224,528 | | |
| Viacom, Inc. Cl. B(a) | | | 58,000 | | | | 2,414,540 | | |
| | | | 10,521,078 | | |
| Mining — 0.3% | |
Freeport-McMoran
Copper & Gold, Inc. | | | 19,300 | | | | 1,598,426 | | |
(Continued)
The accompanying notes are an integral part of the financial statements.
125
MassMutual Select Blue Chip Growth Fund – Portfolio of Investments (Continued)
| | | Number of
Shares | | Market
Value | |
| Oil & Gas — 2.9% | |
| EOG Resources, Inc. | | | 26,200 | | | $ | 1,914,172 | | |
| Exxon Mobil Corp. | | | 77,800 | | | | 6,525,864 | | |
| Murphy Oil Corp. | | | 43,200 | | | | 2,567,808 | | |
| Sunoco, Inc. | | | 9,000 | | | | 717,120 | | |
Total SA Sponsored
ADR (France) | | | 58,000 | | | | 4,696,840 | | |
| | | | 16,421,804 | | |
| Oil & Gas Services — 5.3% | |
| Baker Hughes, Inc. | | | 84,200 | | | | 7,083,746 | | |
| Schlumberger Ltd. | | | 156,700 | | | | 13,310,098 | | |
| Smith International, Inc. | | | 156,000 | | | | 9,147,840 | | |
| | | | 29,541,684 | | |
| Pharmaceuticals — 7.7% | |
| Allergan, Inc. | | | 41,000 | | | | 2,363,240 | | |
| Cardinal Health, Inc. | | | 39,700 | | | | 2,804,408 | | |
| Eli Lilly & Co. | | | 40,000 | | | | 2,235,200 | | |
| Express Scripts, Inc.(a) | | | 75,800 | | | | 3,790,758 | | |
| Gilead Sciences, Inc.(a) | | | 214,600 | | | | 8,320,042 | | |
Medco Health
Solutions, Inc.(a) | | | 51,300 | | | | 4,000,887 | | |
| Merck & Co., Inc. | | | 64,100 | | | | 3,192,180 | | |
| Novartis AG | | | 51,800 | | | | 2,898,866 | | |
| Roche Holding AG | | | 25,134 | | | | 4,432,840 | | |
| Schering-Plough Corp. | | | 100,100 | | | | 3,047,044 | | |
| Sepracor, Inc.(a) (b) | | | 26,100 | | | | 1,070,622 | | |
| Wyeth | | | 82,700 | | | | 4,742,018 | | |
| | | | 42,898,105 | | |
| Retail — 6.5% | |
Bed Bath &
Beyond, Inc.(a) | | | 66,900 | | | | 2,407,731 | | |
| CVS Caremark Corp. | | | 270,168 | | | | 9,847,624 | | |
| The Home Depot, Inc. | | | 82,500 | | | | 3,246,375 | | |
| Kohl's Corp.(a) | | | 130,700 | | | | 9,283,621 | | |
| McDonald's Corp. | | | 18,000 | | | | 913,680 | | |
| Target Corp. | | | 108,800 | | | | 6,919,680 | | |
| Wal-Mart Stores, Inc. | | | 74,100 | | | | 3,564,951 | | |
| | | | 36,183,662 | | |
| Semiconductors — 5.4% | |
| Analog Devices, Inc. | | | 105,600 | | | | 3,974,784 | | |
| Applied Materials, Inc. | | | 67,500 | | | | 1,341,225 | | |
| ASML Holding NV(a) (b) | | | 83,500 | | | | 2,292,075 | | |
| Intel Corp. | | | 185,600 | | | | 4,409,856 | | |
Marvell Technology
Group Ltd.(a) (b) | | | 280,700 | | | | 5,111,547 | | |
Maxim Integrated
Products, Inc. | | | 113,300 | | | | 3,785,353 | | |
| Texas Instruments, Inc. | | | 126,000 | | | | 4,741,380 | | |
| Xilinx, Inc. | | | 180,000 | | | | 4,818,600 | | |
| | | | 30,474,820 | | |
| | | Number of
Shares | | Market
Value | |
| Software — 6.8% | |
| Adobe Systems, Inc.(a) | | | 83,300 | | | $ | 3,344,495 | | |
| Autodesk, Inc.(a) | | | 99,800 | | | | 4,698,584 | | |
Automatic Data
Processing, Inc. | | | 148,300 | | | | 7,188,101 | | |
| Electronic Arts, Inc.(a) | | | 66,300 | | | | 3,137,316 | | |
| Intuit, Inc.(a) | | | 44,300 | | | | 1,332,544 | | |
| Microsoft Corp. | | | 468,700 | | | | 13,812,589 | | |
| Oracle Corp.(a) | | | 214,400 | | | | 4,225,824 | | |
| Paychex, Inc. | | | 13,800 | | | | 539,856 | | |
| | | | 38,279,309 | | |
| Telecommunications — 8.8% | |
America Movil SAB de CV
Sponsored ADR (Mexico) | | | 132,400 | | | | 8,199,532 | | |
American Tower Corp.
Cl. A(a) | | | 183,500 | | | | 7,707,000 | | |
| AT&T, Inc. | | | 30,800 | | | | 1,278,200 | | |
| Cisco Systems, Inc.(a) | | | 357,000 | | | | 9,942,450 | | |
| Corning, Inc.(a) | | | 105,600 | | | | 2,698,080 | | |
Juniper Networks,
Inc.(a) (b) | | | 222,900 | | | | 5,610,393 | | |
MetroPCS
Communications, Inc.(a) | | | 38,900 | | | | 1,285,256 | | |
Nokia Oyj Sponsored
ADR (Finland) | | | 181,400 | | | | 5,099,154 | | |
| Qualcomm, Inc. | | | 104,900 | | | | 4,551,611 | | |
Telefonaktiebolaget LM
Ericsson Cl. B Sponsored
ADR (Sweden)(b) | | | 76,100 | | | | 3,035,629 | | |
| | | | 49,407,305 | | |
| Transportation — 0.4% | |
Expeditors International of
Washington, Inc. | | | 51,800 | | | | 2,139,340 | | |
TOTAL EQUITIES
(Cost $478,147,669) | | | | | | | 555,563,452 | | |
| | | Principal
Amount | | | |
| SHORT-TERM INVESTMENTS — 9.5% | |
| Cash Equivalents — 7.0%(d) | |
Abbey National PLC
Eurodollar Time Deposit
5.280% 07/05/2007 | | $ | 502,385 | | | | 502,385 | | |
Abbey National PLC
Eurodollar Time Deposit
5.285% 07/09/2007 | | | 1,255,973 | | | | 1,255,973 | | |
American Beacon
Money Market Fund(c) | | | 1,409,144 | | | | 1,409,144 | | |
| | | Principal
Amount | | Market
Value | |
Banco Bilbao
Vizcaya Argentaria SA
Eurodollar Time Deposit
5.300% 08/10/2007 | | $ | 941,980 | | | $ | 941,980 | | |
Bank of America
5.270% 07/06/2007 | | | 1,255,973 | | | | 1,255,973 | | |
Bank of America
5.270% 07/16/2007 | | | 251,195 | | | | 251,195 | | |
Bank of America
5.270% 08/17/2007 | | | 313,993 | | | | 313,993 | | |
Bank of America
5.300% 09/17/2007 | | | 627,987 | | | | 627,987 | | |
Bank of Ireland
Eurodollar Time Deposit
5.300% 08/13/2007 | | | 1,255,973 | | | | 1,255,973 | | |
Bank of Montreal
Eurodollar Time Deposit
5.280% 07/03/2007 | | | 313,993 | | | | 313,993 | | |
Bank of Montreal
Eurodollar Time Deposit
5.290% 07/02/2007 | | | 251,195 | | | | 251,195 | | |
Bank of Montreal
Eurodollar Time Deposit
5.310% 08/14/2007 | | | 188,396 | | | | 188,396 | | |
Bank of Nova Scotia
Eurodollar Time Deposit
5.280% 07/09/2007 | | | 1,193,174 | | | | 1,193,174 | | |
Bank Of Nova Scotia
Eurodollar Time Deposit
5.285% 07/11/2007 | | | 690,785 | | | | 690,785 | | |
Barclays
Eurodollar Time Deposit
5.290% 07/06/2007 | | | 1,255,973 | | | | 1,255,973 | | |
Barclays
Eurodollar Time Deposit
5.295% 07/16/2007 | | | 251,195 | | | | 251,195 | | |
Barclays
Eurodollar Time Deposit
5.320% 09/04/2007 | | | 627,987 | | | | 627,987 | | |
Bear Stearns & Co
Commercial Paper
5.435% 07/10/2007 | | | 188,396 | | | | 188,396 | | |
BGI Institutional
Money Market Fund(c) | | | 816,382 | | | | 816,382 | | |
BNP Paribas
Eurodollar Time Deposit
5.350% 07/02/2007 | | | 1,883,960 | | | | 1,883,960 | | |
Calyon
Eurodollar Time Deposit
5.290% 07/17/2007 | | | 627,987 | | | | 627,987 | | |
Calyon
Eurodollar Time Deposit
5.380% 07/02/2007 | | | 1,883,960 | | | | 1,883,960 | | |
(Continued)
The accompanying notes are an integral part of the financial statements.
126
MassMutual Select Blue Chip Growth Fund – Portfolio of Investments (Continued)
| | | Principal
Amount | | Market
Value | |
Canadian Imperial
Bank of Commerce
Eurodollar Time Deposit
5.300% 07/30/2007 | | $ | 1,255,973 | | | $ | 1,255,973 | | |
Dexia Group
Eurodollar Time Deposit
5.290% 08/08/2007 | | | 1,255,973 | | | | 1,255,973 | | |
Dreyfus Institutional
Cash Advantage
Money Market Fund(c) | | | 376,792 | | | | 376,792 | | |
Federal Home Loan
Bank Discount Note
5.174% 07/20/2007 | | | 93,151 | | | | 93,151 | | |
First Tennessee
National Corp.
Eurodollar Time Deposit
5.300% 07/18/2007 | | | 313,993 | | | | 313,993 | | |
Fortis Bank
Eurodollar Time Deposit
5.290% 07/06/2007 | | | 313,993 | | | | 313,993 | | |
Fortis Bank
Eurodollar Time Deposit
5.290% 07/09/2007 | | | 439,591 | | | | 439,591 | | |
Fortis Bank
Eurodollar Time Deposit
5.300% 07/20/2007 | | | 313,993 | | | | 313,993 | | |
Fortis Bank
Eurodollar Time Deposit
5.300% 07/26/2007 | | | 251,195 | | | | 251,195 | | |
Fortis Bank
Eurodollar Time Deposit
5.350% 07/05/2007 | | | 627,987 | | | | 627,987 | | |
Freddie Mac
Discount Note
5.155% 07/16/2007 | | | 118,583 | | | | 118,583 | | |
Freddie Mac
Discount Note
5.185% 07/09/2007 | | | 61,908 | | | | 61,908 | | |
Morgan Stanley & Co
Commercial Paper
5.445% 08/01/2007 | | | 565,188 | | | | 565,188 | | |
National Australia Bank
Eurodollar Time Deposit
5.320% 07/02/2007 | | | 627,987 | | | | 627,987 | | |
Nationwide Building
Society
Commercial Paper
5.301% 07/09/2007 | | | 626,695 | | | | 626,695 | | |
Rabobank Nederland
Eurodollar Time Deposit
5.280% 07/05/2007 | | | 941,980 | | | | 941,980 | | |
| | | Principal
Amount | | Market
Value | |
Rabobank Nederland
Eurodollar Time Deposit
5.290% 07/16/2007 | | $ | 1,255,973 | | | $ | 1,255,973 | | |
Rabobank Nederland
Eurodollar Time Deposit
5.330% 07/02/2007 | | | 1,883,960 | | | | 1,883,960 | | |
Reserve Primary
Money Market Fund(c) | | | 1,246,853 | | | | 1,246,853 | | |
Royal Bank of Canada
Eurodollar Time Deposit
5.305% 08/30/2007 | | | 1,255,973 | | | | 1,255,973 | | |
Royal Bank of Scotland
Eurodollar Time Deposit
5.270% 07/11/2007 | | | 313,993 | | | | 313,993 | | |
Skandinaviska Enskilda
Banken AB
Eurodollar Time Deposit
5.290% 07/13/2007 | | | 1,255,973 | | | | 1,255,973 | | |
Skandinaviska Enskilda
Banken AB
Eurodollar Time Deposit
5.290% 07/19/2007 | | | 188,396 | | | | 188,396 | | |
Svenska Handlesbanken
Eurodollar Time Deposit
5.300% 07/02/2007 | | | 210,973 | | | | 210,973 | | |
UBS AG
Eurodollar Time Deposit
5.277% 07/05/2007 | | | 879,181 | | | | 879,181 | | |
UBS AG
Eurodollar Time Deposit
5.285% 07/05/2007 | | | 1,255,973 | | | | 1,255,973 | | |
Vanguard Prime
Money Market Fund(c) | | | 627,987 | | | | 627,987 | | |
Wells Fargo
Eurodollar Time Deposit
5.260% 07/02/2007 | | | 339,113 | | | | 339,113 | | |
Wells Fargo
Eurodollar Time Deposit
5.280% 07/11/2007 | | | 1,255,973 | | | | 1,255,973 | | |
Wells Fargo
Eurodollar Time Deposit
5.280% 07/12/2007 | | | 627,987 | | | | 627,987 | | |
| | | | 38,771,276 | | |
| Repurchase Agreements — 2.5% | |
Investors Bank & Trust
Company Repurchase
Agreement, dated
6/29/2007, 3.50%,
due 7/02/2007(e) | | | 14,112,841 | | | | 14,112,841 | | |
| | | Market
Value | |
TOTAL SHORT-TERM
INVESTMENTS
(Cost $52,884,117) | | $ | 52,884,117 | | |
TOTAL INVESTMENTS — 108.9%
(Cost $531,031,786)(f) | | | 608,447,569 | | |
Other Assets/
(Liabilities) — (8.9%) | | | (49,777,955 | ) | |
| NET ASSETS — 100.0% | | $ | 558,669,614 | | |
Notes to Portfolio of Investments
ADR - American Depository Receipt
(a) Non-income producing security.
(b) Denotes all or a portion of security on loan. (Note 2).
(c) Amount represents shares owned of the fund.
(d) Represents investments of security lending collateral. (Note 2).
(e) Maturity value of $14,116,958. Collaterized by a U.S. Government Agency obligation with a rate of 4.694%, maturity date 8/01/2035, and an aggregate market value, including accrued interest, of $14,818,484.
(f) See Note 6 for aggregate cost for Federal tax purposes.
The accompanying notes are an integral part of the financial statements.
127
MassMutual Select Large Cap Growth Fund – Portfolio of Investments
June 30, 2007 (Unaudited)
| | | Number of
Shares | | Market
Value | |
| EQUITIES — 99.7% | |
| COMMON STOCK — 99.7% | |
| Aerospace & Defense — 4.7% | |
| Boeing Co. | | | 14,990 | | | $ | 1,441,438 | | |
Spirit AeroSystems
Holdings, Inc. Cl. A(a) | | | 18,300 | | | | 659,715 | | |
| | | | 2,101,153 | | |
| Apparel — 1.2% | |
| Nike, Inc. Cl. B | | | 8,800 | | | | 512,952 | | |
| Beverages — 1.1% | |
| PepsiCo, Inc. | | | 7,775 | | | | 504,209 | | |
| Biotechnology — 3.3% | |
| Celgene Corp.(a) | | | 9,300 | | | | 533,169 | | |
| Genentech, Inc.(a) | | | 12,250 | | | | 926,835 | | |
| | | | 1,460,004 | | |
| Chemicals — 2.9% | |
Air Products &
Chemicals, Inc. | | | 4,000 | | | | 321,480 | | |
| Monsanto Co. | | | 14,000 | | | | 945,560 | | |
| | | | 1,267,040 | | |
| Commercial Services — 0.5% | |
| Moody's Corp.(b) | | | 3,300 | | | | 205,260 | | |
| Computers — 10.4% | |
| Apple, Inc.(a) | | | 18,535 | | | | 2,262,011 | | |
| Hewlett-Packard Co. | | | 30,500 | | | | 1,360,910 | | |
| Network Appliance, Inc.(a) | | | 18,550 | | | | 541,660 | | |
| Sun Microsystems, Inc.(a) | | | 81,800 | | | | 430,268 | | |
| | | | 4,594,849 | | |
| Cosmetics & Personal Care — 3.6% | |
| Colgate-Palmolive Co. | | | 6,800 | | | | 440,980 | | |
| The Procter & Gamble Co. | | | 18,900 | | | | 1,156,491 | | |
| | | | 1,597,471 | | |
| Diversified Financial — 17.3% | |
Blackstone Group
(The), LP(a) (b) | | | 13,700 | | | | 400,999 | | |
Chicago Mercantile
Exchange Holdings, Inc.(b) | | | 2,900 | | | | 1,549,644 | | |
Credit Suisse Group,
Sponsored ADR
(Switzerland) | | | 7,900 | | | | 560,584 | | |
| Franklin Resources, Inc. | | | 10,000 | | | | 1,324,700 | | |
The Goldman Sachs
Group, Inc. | | | 2,595 | | | | 562,466 | | |
| JP Morgan Chase & Co. | | | 12,250 | | | | 593,513 | | |
| Janus Capital Group, Inc.(b) | | | 8,700 | | | | 242,208 | | |
| | | Number of
Shares | | Market
Value | |
| Lazard Ltd. Cl. A | | | 4,400 | | | $ | 198,132 | | |
| Legg Mason, Inc. | | | 9,020 | | | | 887,388 | | |
| Merrill Lynch & Co., Inc. | | | 12,000 | | | | 1,002,960 | | |
| NYSE Euronext(b) | | | 4,050 | | | | 298,161 | | |
| | | | 7,620,755 | | |
| Engineering & Construction — 0.7% | |
| Fluor Corp. | | | 2,665 | | | | 296,801 | | |
| Foods — 0.4% | |
| Wrigley (Wm.) Jr. Co.(b) | | | 3,040 | | | | 168,142 | | |
| Health Care – Products — 2.4% | |
| Alcon, Inc. | | | 7,800 | | | | 1,052,298 | | |
| Health Care – Services — 4.3% | |
| WellPoint, Inc.(a) | | | 23,690 | | | | 1,891,173 | | |
| Insurance — 1.1% | |
American International
Group, Inc. | | | 7,280 | | | | 509,819 | | |
| Internet — 7.8% | |
Akamai Technologies,
Inc.(a) (b) | | | 11,975 | | | | 582,464 | | |
| eBay, Inc.(a) | | | 11,900 | | | | 382,942 | | |
| Google, Inc. Cl. A(a) | | | 4,725 | | | | 2,472,971 | | |
| | | | 3,438,377 | | |
| Lodging — 3.6% | |
| Hilton Hotels Corp. | | | 10,400 | | | | 348,088 | | |
Las Vegas Sands
Corp.(a) (b) | | | 5,300 | | | | 404,867 | | |
Starwood Hotels &
Resorts Worldwide, Inc. | | | 12,800 | | | | 858,496 | | |
| | | | 1,611,451 | | |
| Machinery – Diversified — 0.3% | |
| Deere & Co. | | | 1,260 | | | | 152,132 | | |
| Manufacturing — 1.2% | |
| Honeywell International, Inc. | | | 9,130 | | | | 513,836 | | |
| Media — 3.6% | |
Comcast Corp. Special,
Cl. A(a) (b) | | | 52,700 | | | | 1,473,492 | | |
| Time Warner, Inc. | | | 6,200 | | | | 130,448 | | |
| | | | 1,603,940 | | |
| Oil & Gas Services — 3.9% | |
| Baker Hughes, Inc. | | | 3,600 | | | | 302,868 | | |
| Halliburton Co. | | | 18,550 | | | | 639,975 | | |
| Schlumberger Ltd. | | | 9,160 | | | | 778,050 | | |
| | | | 1,720,893 | | |
| | | Number of
Shares | | Market
Value | |
| Pharmaceuticals — 9.4% | |
| Abbott Laboratories | | | 21,200 | | | $ | 1,135,260 | | |
| Gilead Sciences, Inc.(a) | | | 33,260 | | | | 1,289,490 | | |
Medco Health
Solutions, Inc.(a) | | | 5,800 | | | | 452,342 | | |
| Merck & Co., Inc. | | | 11,100 | | | | 552,780 | | |
Teva Pharmaceutical
Sponsored ADR (Israel) | | | 5,800 | | | | 239,250 | | |
| Wyeth | | | 8,200 | | | | 470,188 | | |
| | | | 4,139,310 | | |
| Retail — 4.4% | |
| Kohl's Corp.(a) | | | 10,200 | | | | 724,506 | | |
| McDonald's Corp. | | | 7,775 | | | | 394,659 | | |
| Target Corp. | | | 12,700 | | | | 807,720 | | |
| | | | 1,926,885 | | |
| Semiconductors — 2.2% | |
| Broadcom Corp. Cl. A(a) | | | 33,945 | | | | 992,891 | | |
| Software — 3.4% | |
| Adobe Systems, Inc.(a) | | | 16,200 | | | | 650,430 | | |
| Microsoft Corp. | | | 28,400 | | | | 836,948 | | |
| | | | 1,487,378 | | |
| Telecommunications — 5.5% | |
America Movil SAB de CV,
Series L, Sponsored
ADR (Mexico) | | | 1,600 | | | | 99,088 | | |
| Cisco Systems, Inc.(a) | | | 61,600 | | | | 1,715,560 | | |
| Qualcomm, Inc. | | | 14,550 | | | | 631,325 | | |
| | | | 2,445,973 | | |
| Transportation — 0.5% | |
Hertz Global
Holdings, Inc.(a) | | | 8,000 | | | | 212,560 | | |
TOTAL EQUITIES
(Cost $39,375,820) | | | | | | | 44,027,552 | | |
| | | Principal
Amount | | | |
| SHORT-TERM INVESTMENTS — 10.6% | |
| Cash Equivalents — 10.5%(d) | |
Abbey National PLC
Eurodollar Time Deposit
5.280% 07/05/2007 | | $ | 59,931 | | | | 59,931 | | |
Abbey National PLC
Eurodollar Time Deposit
5.285% 07/09/2007 | | | 149,817 | | | | 149,817 | | |
American Beacon
Money Market Fund(c) | | | 168,088 | | | | 168,088 | | |
(Continued)
The accompanying notes are an integral part of the financial statements.
128
MassMutual Select Large Cap Growth Fund – Portfolio of Investments (Continued)
| | | Principal
Amount | | Market
Value | |
Banco Bilbao Vizcaya
Argentaria SA
Eurodollar Time Deposit
5.300% 08/10/2007 | | $ | 112,363 | | | $ | 112,363 | | |
Bank of America
5.270% 07/06/2007 | | | 149,817 | | | | 149,817 | | |
Bank of America
5.270% 07/16/2007 | | | 29,963 | | | | 29,963 | | |
Bank of America
5.270% 08/17/2007 | | | 37,454 | | | | 37,454 | | |
Bank of America
5.300% 09/17/2007 | | | 74,909 | | | | 74,909 | | |
Bank of Ireland
Eurodollar Time Deposit
5.300% 08/13/2007 | | | 149,817 | | | | 149,817 | | |
Bank of Montreal
Eurodollar Time Deposit
5.280% 07/03/2007 | | | 37,454 | | | | 37,454 | | |
Bank of Montreal
Eurodollar Time Deposit
5.290% 07/02/2007 | | | 29,963 | | | | 29,963 | | |
Bank of Montreal
Eurodollar Time Deposit
5.310% 08/14/2007 | | | 22,473 | | | | 22,473 | | |
Bank of Nova Scotia
Eurodollar Time Deposit
5.280% 07/09/2007 | | | 142,327 | | | | 142,327 | | |
Bank Of Nova Scotia
Eurodollar Time Deposit
5.285% 07/11/2007 | | | 82,400 | | | | 82,400 | | |
Barclays
Eurodollar Time Deposit
5.290% 07/06/2007 | | | 149,817 | | | | 149,817 | | |
Barclays
Eurodollar Time Deposit
5.295% 07/16/2007 | | | 29,963 | | | | 29,963 | | |
Barclays
Eurodollar Time Deposit
5.320% 09/04/2007 | | | 74,909 | | | | 74,909 | | |
Bear Stearns & Co
Commercial Paper
5.435% 07/10/2007 | | | 22,473 | | | | 22,473 | | |
BGI Institutional
Money Market Fund(c) | | | 97,381 | | | | 97,381 | | |
BNP Paribas
Eurodollar Time Deposit
5.350% 07/02/2007 | | | 224,726 | | | | 224,726 | | |
Calyon
Eurodollar Time Deposit
5.290% 07/17/2007 | | | 74,909 | | | | 74,909 | | |
| | | Principal
Amount | | Market
Value | |
Calyon
Eurodollar Time Deposit
5.380% 07/02/2007 | | $ | 224,726 | | | $ | 224,726 | | |
Canadian Imperial
Bank of Commerce
Eurodollar Time Deposit
5.300% 07/30/2007 | | | 149,817 | | | | 149,817 | | |
Dexia Group
Eurodollar Time Deposit
5.290% 08/08/2007 | | | 149,817 | | | | 149,817 | | |
Dreyfus Institutional
Cash Advantage
Money Market Fund(c) | | | 44,945 | | | | 44,945 | | |
Federal Home Loan
Bank Discount Note
5.174% 07/20/2007 | | | 11,111 | | | | 11,111 | | |
First Tennessee
National Corp.
Eurodollar Time Deposit
5.300% 07/18/2007 | | | 37,454 | | | | 37,454 | | |
Fortis Bank
Eurodollar Time Deposit
5.290% 07/06/2007 | | | 37,454 | | | | 37,454 | | |
Fortis Bank
Eurodollar Time Deposit
5.290% 07/09/2007 | | | 52,436 | | | | 52,436 | | |
Fortis Bank
Eurodollar Time Deposit
5.300% 07/20/2007 | | | 37,454 | | | | 37,454 | | |
Fortis Bank
Eurodollar Time Deposit
5.300% 07/26/2007 | | | 29,963 | | | | 29,963 | | |
Fortis Bank
Eurodollar Time Deposit
5.350% 07/05/2007 | | | 74,909 | | | | 74,909 | | |
Freddie Mac
Discount Note
5.155% 07/16/2007 | | | 14,145 | | | | 14,145 | | |
Freddie Mac
Discount Note
5.185% 07/09/2007 | | | 7,385 | | | | 7,385 | | |
Morgan Stanley & Co
Commercial Paper
5.445% 08/01/2007 | | | 67,418 | | | | 67,418 | | |
National Australia Bank
Eurodollar Time Deposit
5.320% 07/02/2007 | | | 74,909 | | | | 74,909 | | |
Nationwide
Building Society
Commercial Paper
5.301% 07/09/2007 | | | 74,755 | | | | 74,755 | | |
| | | Principal
Amount | | Market
Value | |
Rabobank Nederland
Eurodollar Time Deposit
5.280% 07/05/2007 | | $ | 112,363 | | | $ | 112,363 | | |
Rabobank Nederland
Eurodollar Time Deposit
5.290% 07/16/2007 | | | 149,817 | | | | 149,817 | | |
Rabobank Nederland
Eurodollar Time Deposit
5.330% 07/02/2007 | | | 224,726 | | | | 224,726 | | |
Reserve Primary
Money Market Fund(c) | | | 148,730 | | | | 148,730 | | |
Royal Bank of Canada
Eurodollar Time Deposit
5.305% 08/30/2007 | | | 149,817 | | | | 149,817 | | |
Royal Bank of Scotland
Eurodollar Time Deposit
5.270% 07/11/2007 | | | 37,454 | | | | 37,454 | | |
Skandinaviska Enskilda
Banken AB
Eurodollar Time Deposit
5.290% 07/13/2007 | | | 149,817 | | | | 149,817 | | |
Skandinaviska Enskilda
Banken AB
Eurodollar Time Deposit
5.290% 07/19/2007 | | | 22,473 | | | | 22,473 | | |
Svenska Handlesbanken
Eurodollar Time Deposit
5.300% 07/02/2007 | | | 25,166 | | | | 25,166 | | |
UBS AG
Eurodollar Time Deposit
5.277% 07/05/2007 | | | 104,872 | | | | 104,872 | | |
UBS AG
Eurodollar Time Deposit
5.285% 07/05/2007 | | | 149,817 | | | | 149,817 | | |
Vanguard Prime
Money Market Fund(c) | | | 74,909 | | | | 74,909 | | |
Wells Fargo
Eurodollar Time Deposit
5.260% 07/02/2007 | | | 40,451 | | | | 40,451 | | |
Wells Fargo
Eurodollar Time Deposit
5.280% 07/11/2007 | | | 149,817 | | | | 149,817 | | |
Wells Fargo
Eurodollar Time Deposit
5.280% 07/12/2007 | | | 74,909 | | | | 74,909 | | |
| | | | 4,624,790 | | |
| Repurchase Agreements — 0.1% | |
Investors Bank & Trust
Company Repurchase
Agreement, dated
6/29/2007, 3.50%,
due 7/02/2007(e) | | | 44,159 | | | | 44,159 | | |
(Continued)
The accompanying notes are an integral part of the financial statements.
129
MassMutual Select Large Cap Growth Fund – Portfolio of Investments (Continued)
| | | Market
Value | |
TOTAL SHORT-TERM
INVESTMENTS
(Cost $4,668,949) | | $ | 4,668,949 | | |
TOTAL INVESTMENTS — 110.3%
(Cost $44,044,769)(f) | | | 48,696,501 | | |
Other Assets/
(Liabilities) — (10.3%) | | | (4,564,903 | ) | |
| NET ASSETS — 100.0% | | $ | 44,131,598 | | |
Notes to Portfolio of Investments
ADR - American Depository Receipt
(a) Non-income producing security.
(b) Denotes all or a portion of security on loan. (Note 2).
(c) Amount represents shares owned of the fund.
(d) Represents investments of security lending collateral. (Note 2).
(e) Maturity value of $44,172. Collateralized by a U.S. Government Agency obligation with a rate of 4.495%, maturity date of 1/01/2034, and an aggregate market value, including accrued interest, of $46,367.
(f) See Note 6 for aggregate cost for Federal tax purposes.
The remainder of this page is intentionally left blank.
The accompanying notes are an integral part of the financial statements.
130
MassMutual Select Growth Equity Fund – Portfolio of Investments
June 30, 2007 (Unaudited)
| | | Number of
Shares | | Market
Value | |
| EQUITIES — 97.6% | |
| COMMON STOCK — 97.6% | |
| Advertising — 0.2% | |
| Omnicom Group, Inc. | | | 20,000 | | | $ | 1,058,400 | | |
| Aerospace & Defense — 1.6% | |
| General Dynamics Corp. | | | 9,500 | | | | 743,090 | | |
| Lockheed Martin Corp. | | | 43,200 | | | | 4,066,416 | | |
| Northrop Grumman Corp. | | | 7,000 | | | | 545,090 | | |
| Raytheon Co. | | | 12,900 | | | | 695,181 | | |
| United Technologies Corp. | | | 17,500 | | | | 1,241,275 | | |
| | | | 7,291,052 | | |
| Agriculture — 0.9% | |
| Altria Group, Inc. | | | 23,700 | | | | 1,662,318 | | |
| UST, Inc. | | | 41,100 | | | | 2,207,481 | | |
| | | | 3,869,799 | | |
| Apparel — 2.4% | |
| Coach, Inc.(a) | | | 101,900 | | | | 4,829,041 | | |
Columbia
Sportswear Co.(b) | | | 3,700 | | | | 254,116 | | |
| Liz Claiborne, Inc. | | | 10,200 | | | | 380,460 | | |
| Nike, Inc. Cl. B | | | 51,900 | | | | 3,025,251 | | |
| Polo Ralph Lauren Corp. | | | 8,000 | | | | 784,880 | | |
| VF Corp. | | | 17,900 | | | | 1,639,282 | | |
| | | | 10,913,030 | | |
| Auto Manufacturers — 1.1% | |
| Paccar, Inc. | | | 58,950 | | | | 5,131,008 | | |
| Automotive & Parts — 0.3% | |
The Goodyear Tire &
Rubber Co.(a) | | | 38,100 | | | | 1,324,356 | | |
| Banks — 0.2% | |
Investors Financial
Services Corp. | | | 6,400 | | | | 394,688 | | |
Peoples United
Financial(b) | | | 16,740 | | | | 296,800 | | |
| | | | 691,488 | | |
| Beverages — 1.7% | |
| Anheuser-Busch Cos., Inc. | | | 71,000 | | | | 3,703,360 | | |
| The Coca-Cola Co. | | | 77,300 | | | | 4,043,563 | | |
| | | | 7,746,923 | | |
| Biotechnology — 0.1% | |
| Amgen, Inc.(a) | | | 3,900 | | | | 215,631 | | |
| | | Number of
Shares | | Market
Value | |
| Building Materials — 0.6% | |
American Standard
Cos., Inc. | | | 27,300 | | | $ | 1,610,154 | | |
Martin Marietta
Materials, Inc. | | | 2,300 | | | | 372,646 | | |
| Masco Corp.(b) | | | 21,100 | | | | 600,717 | | |
| | | | 2,583,517 | | |
| Chemicals — 1.2% | |
| Albemarle Corp. | | | 19,700 | | | | 759,041 | | |
| Ecolab, Inc. | | | 15,600 | | | | 666,120 | | |
| Hercules, Inc.(a) (b) | | | 24,700 | | | | 485,355 | | |
International Flavors &
Fragrances, Inc. | | | 15,600 | | | | 813,384 | | |
| Lyondell Chemical Co. | | | 7,500 | | | | 278,400 | | |
| PPG Industries, Inc. | | | 9,000 | | | | 684,990 | | |
| The Sherwin-Williams Co. | | | 23,600 | | | | 1,568,692 | | |
| | | | 5,255,982 | | |
| Commercial Services — 1.1% | |
| Apollo Group, Inc. Cl. A(a) | | | 4,100 | | | | 239,563 | | |
| Career Education Corp.(a) | | | 11,400 | | | | 384,978 | | |
Corrections
Corp. of America(a) | | | 3,000 | | | | 189,330 | | |
ITT Educational
Services, Inc.(a) | | | 9,100 | | | | 1,068,158 | | |
| Manpower, Inc. | | | 11,200 | | | | 1,033,088 | | |
| McKesson Corp. | | | 17,200 | | | | 1,025,808 | | |
| Moody's Corp. | | | 12,100 | | | | 752,620 | | |
| Rent-A-Center, Inc.(a) | | | 13,400 | | | | 351,482 | | |
| | | | 5,045,027 | | |
| Computer Related Services — 0.0% | |
| Ingram Micro, Inc. Cl. A(a) | | | 7,300 | | | | 158,483 | | |
| Computers — 8.4% | |
Affiliated Computer Services,
Inc. Cl. A(a) | | | 6,800 | | | | 385,696 | | |
| Apple, Inc.(a) | | | 48,800 | | | | 5,955,552 | | |
Cognizant Technology
Solutions Corp. Cl. A(a) | | | 20,600 | | | | 1,546,854 | | |
| Dell, Inc.(a) | | | 302,800 | | | | 8,644,940 | | |
| EMC Corp.(a) | | | 142,500 | | | | 2,579,250 | | |
FactSet Research
Systems, Inc. | | | 11,000 | | | | 751,850 | | |
| Hewlett-Packard Co. | | | 46,700 | | | | 2,083,754 | | |
International Business
Machines Corp. | | | 132,800 | | | | 13,977,200 | | |
Lexmark International,
Inc. Cl. A(a) | | | 43,600 | | | | 2,149,916 | | |
| | | | 38,075,012 | | |
| | | Number of
Shares | | Market
Value | |
| Computers & Information — 0.4% | |
| CDW Corp.(a) | | | 20,000 | | | $ | 1,699,400 | | |
| Cosmetics & Personal Care — 0.4% | |
| Avon Products, Inc. | | | 26,300 | | | | 966,525 | | |
| Colgate-Palmolive Co. | | | 3,600 | | | | 233,460 | | |
The Estee Lauder
Cos., Inc. Cl. A | | | 11,900 | | | | 541,569 | | |
| | | | 1,741,554 | | |
| Diversified Financial — 2.7% | |
| Citigroup, Inc. | | | 14,700 | | | | 753,963 | | |
Countrywide
Financial Corp.(b) | | | 12,300 | | | | 447,105 | | |
| Eaton Vance Corp. | | | 3,400 | | | | 150,212 | | |
The First
Marblehead Corp.(b) | | | 17,900 | | | | 691,656 | | |
| Franklin Resources, Inc. | | | 9,800 | | | | 1,298,206 | | |
The Goldman Sachs
Group, Inc. | | | 27,300 | | | | 5,917,275 | | |
| Morgan Stanley | | | 37,800 | | | | 3,170,664 | | |
| | | | 12,429,081 | | |
| Electric — 0.9% | |
| AES Corp.(a) | | | 51,600 | | | | 1,129,008 | | |
American Electric
Power Co., Inc. | | | 11,200 | | | | 504,448 | | |
| CenterPoint Energy, Inc. | | | 21,600 | | | | 375,840 | | |
Constellation Energy
Group, Inc. | | | 7,700 | | | | 671,209 | | |
| Entergy Corp. | | | 14,200 | | | | 1,524,370 | | |
| | | | 4,204,875 | | |
| Electrical Components & Equipment — 0.8% | |
| Emerson Electric Co. | | | 17,800 | | | | 833,040 | | |
Energizer
Holdings, Inc.(a) | | | 21,300 | | | | 2,121,480 | | |
| Molex, Inc. | | | 17,600 | | | | 528,176 | | |
| | | | 3,482,696 | | |
| Electronics — 0.8% | |
| Amphenol Corp. Cl. A | | | 18,300 | | | | 652,395 | | |
| Avnet, Inc.(a) | | | 14,900 | | | | 590,636 | | |
| FLIR Systems, Inc.(a) (b) | | | 14,200 | | | | 656,750 | | |
| Trimble Navigation Ltd.(a) | | | 19,200 | | | | 618,240 | | |
| Waters Corp.(a) | | | 21,000 | | | | 1,246,560 | | |
| | | | 3,764,581 | | |
| Environmental Controls — 0.2% | |
| Nalco Holding Co. | | | 5,200 | | | | 142,740 | | |
| Waste Management, Inc. | | | 20,200 | | | | 788,810 | | |
| | | | 931,550 | | |
(Continued)
The accompanying notes are an integral part of the financial statements.
131
MassMutual Select Growth Equity Fund – Portfolio of Investments (Continued)
| | | Number of
Shares | | Market
Value | |
| Foods — 2.0% | |
| Campbell Soup Co. | | | 5,600 | | | $ | 217,336 | | |
Corn Products
International, Inc. | | | 7,900 | | | | 359,055 | | |
| General Mills, Inc. | | | 3,900 | | | | 227,838 | | |
| Heinz (H. J.) Co. | | | 24,700 | | | | 1,172,509 | | |
| Kraft Foods, Inc. Cl. A | | | 24,626 | | | | 868,066 | | |
| The Kroger Co. | | | 59,000 | | | | 1,659,670 | | |
| McCormick & Co., Inc. | | | 15,900 | | | | 607,062 | | |
| Safeway, Inc. | | | 36,000 | | | | 1,225,080 | | |
| Sara Lee Corp. | | | 19,500 | | | | 339,300 | | |
| Sysco Corp. | | | 73,800 | | | | 2,434,662 | | |
| | | | 9,110,578 | | |
| Gas — 0.0% | |
| Sempra Energy | | | 3,400 | | | | 201,382 | | |
| Hand & Machine Tools — 0.1% | |
Lincoln Electric
Holdings, Inc. | | | 4,900 | | | | 363,776 | | |
| Health Care – Products — 6.2% | |
| Bard (C.R.), Inc. | | | 10,100 | | | | 834,563 | | |
| Baxter International, Inc. | | | 40,600 | | | | 2,287,404 | | |
| Becton, Dickinson & Co. | | | 20,500 | | | | 1,527,250 | | |
| Biomet, Inc. | | | 6,000 | | | | 274,320 | | |
| Dentsply International, Inc. | | | 2,900 | | | | 110,954 | | |
| IDEXX Laboratories, Inc.(a) | | | 3,100 | | | | 293,353 | | |
| Immucor, Inc.(a) | | | 14,700 | | | | 411,159 | | |
| Johnson & Johnson | | | 194,100 | | | | 11,960,442 | | |
| Kinetic Concepts, Inc.(a) | | | 2,300 | | | | 119,531 | | |
| Patterson Cos., Inc.(a) | | | 17,600 | | | | 655,952 | | |
| Respironics, Inc.(a) | | | 3,900 | | | | 166,101 | | |
| St. Jude Medical, Inc.(a) | | | 4,900 | | | | 203,301 | | |
| Stryker Corp. | | | 64,600 | | | | 4,075,614 | | |
| Techne Corp.(a) | | | 4,200 | | | | 240,282 | | |
| Zimmer Holdings, Inc.(a) | | | 59,000 | | | | 5,008,510 | | |
| | | | 28,168,736 | | |
| Health Care – Services — 2.4% | |
| Aetna, Inc. | | | 22,400 | | | | 1,106,560 | | |
Laboratory Corp. of
America Holdings(a) (b) | | | 10,900 | | | | 853,034 | | |
| Lincare Holdings, Inc.(a) | | | 12,200 | | | | 486,170 | | |
| Manor Care, Inc.(b) | | | 10,500 | | | | 685,545 | | |
| Quest Diagnostics, Inc. | | | 38,500 | | | | 1,988,525 | | |
| UnitedHealth Group, Inc. | | | 108,552 | | | | 5,551,349 | | |
| WellPoint, Inc.(a) | | | 4,300 | | | | 343,269 | | |
| | | | 11,014,452 | | |
| Home Builders — 0.3% | |
| Centex Corp.(b) | | | 8,100 | | | | 324,810 | | |
| Lennar Corp. Cl. A | | | 7,200 | | | | 263,232 | | |
| Thor Industries, Inc.(b) | | | 19,600 | | | | 884,744 | | |
| | | | 1,472,786 | | |
| | | Number of
Shares | | Market
Value | |
| Home Furnishing — 0.1% | |
Tempur-Pedic
International, Inc.(b) | | | 9,900 | | | $ | 256,410 | | |
| Household Products — 0.8% | |
| Church & Dwight Co., Inc. | | | 4,800 | | | | 232,608 | | |
| Kimberly-Clark Corp. | | | 52,600 | | | | 3,518,414 | | |
| | | | 3,751,022 | | |
| Industrial – Distribution — 0.1% | |
| W.W. Grainger, Inc. | | | 5,300 | | | | 493,165 | | |
| Insurance — 3.3% | |
| AFLAC, Inc.(b) | | | 32,400 | | | | 1,665,360 | | |
| Allstate Corp. | | | 25,100 | | | | 1,543,901 | | |
Ambac Financial
Group, Inc. | | | 10,100 | | | | 880,619 | | |
American International
Group, Inc. | | | 34,500 | | | | 2,416,035 | | |
| W.R. Berkley Corp. | | | 1,400 | | | | 45,556 | | |
| Brown & Brown, Inc. | | | 15,100 | | | | 379,614 | | |
| Cigna Corp. | | | 38,600 | | | | 2,015,692 | | |
| Markel Corp.(a) | | | 500 | | | | 242,280 | | |
| MBIA, Inc.(b) | | | 8,600 | | | | 535,092 | | |
| Odyssey Re Holdings Corp. | | | 1,200 | | | | 51,468 | | |
Philadelphia Consolidated
Holding Corp.(a) | | | 2,700 | | | | 112,860 | | |
| The PMI Group, Inc. | | | 13,800 | | | | 616,446 | | |
| Progressive Corp. | | | 21,800 | | | | 521,674 | | |
| Prudential Financial, Inc. | | | 9,900 | | | | 962,577 | | |
| Radian Group, Inc. | | | 4,200 | | | | 226,800 | | |
Reinsurance Group
of America, Inc. | | | 1,900 | | | | 114,456 | | |
| Torchmark Corp. | | | 10,200 | | | | 683,400 | | |
| St. Paul Travelers Companies | | | 35,000 | | | | 1,872,500 | | |
| | | | 14,886,330 | | |
| Internet — 0.7% | |
| Amazon.com, Inc.(a) | | | 17,200 | | | | 1,176,652 | | |
| eBay, Inc.(a) | | | 19,500 | | | | 627,510 | | |
| Expedia, Inc.(a) | | | 12,400 | | | | 363,196 | | |
| IAC/InterActiveCorp(a) | | | 8,000 | | | | 276,880 | | |
| McAfee, Inc.(a) | | | 25,000 | | | | 880,000 | | |
| | | | 3,324,238 | | |
| Investment Companies — 0.0% | |
American Capital
Strategies Ltd.(b) | | | 4,700 | | | | 199,844 | | |
| Iron & Steel — 0.1% | |
| Cleveland-Cliffs, Inc. | | | 3,200 | | | | 248,544 | | |
| Leisure Time — 1.2% | |
| Harley-Davidson, Inc.(b) | | | 88,600 | | | | 5,281,446 | | |
| | | Number of
Shares | | Market
Value | |
| Lodging — 1.1% | |
Choice Hotels
International, Inc. | | | 6,100 | | | $ | 241,072 | | |
Marriott
International, Inc. Cl. A | | | 61,100 | | | | 2,641,964 | | |
| MGM Mirage(a) | | | 23,700 | | | | 1,954,776 | | |
| | | | 4,837,812 | | |
| Machinery – Diversified — 0.3% | |
| Deere & Co. | | | 8,400 | | | | 1,014,216 | | |
| Graco, Inc. | | | 5,400 | | | | 217,512 | | |
| | | | 1,231,728 | | |
| Manufacturing — 1.7% | |
| Carlisle Cos., Inc. | | | 5,700 | | | | 265,107 | | |
| Crane Co. | | | 4,800 | | | | 218,160 | | |
| Danaher Corp. | | | 36,600 | | | | 2,763,300 | | |
| Honeywell International, Inc. | | | 22,400 | | | | 1,260,672 | | |
| Illinois Tool Works, Inc. | | | 28,300 | | | | 1,533,577 | | |
| Textron, Inc. | | | 2,700 | | | | 297,297 | | |
| Tyco International Ltd. | | | 38,900 | | | | 1,314,431 | | |
| | | | 7,652,544 | | |
| Media — 3.9% | |
| Citadel Broadcasting Corp. | | | 3,279 | | | | 21,150 | | |
| Comcast Corp. Cl. A(a) | | | 241,800 | | | | 6,799,416 | | |
The DIRECTV
Group, Inc.(a) | | | 203,400 | | | | 4,700,574 | | |
EchoStar
Communications Corp.
Cl. A(a) | | | 1,900 | | | | 82,403 | | |
| Gannett Co., Inc. | | | 22,100 | | | | 1,214,395 | | |
Liberty Media
Holding Corp.
Capital Cl. A(a) | | | 8,100 | | | | 953,208 | | |
The McGraw-Hill
Companies, Inc. | | | 9,300 | | | | 633,144 | | |
| News Corp., Inc. Cl. A | | | 32,700 | | | �� | 693,567 | | |
| Time Warner, Inc. | | | 65,700 | | | | 1,382,328 | | |
| The Walt Disney Co. | | | 39,800 | | | | 1,358,772 | | |
| | | | 17,838,957 | | |
| Metal Fabricate & Hardware — 0.3% | |
| Precision Castparts Corp. | | | 12,200 | | | | 1,480,592 | | |
| Mining — 0.1% | |
| Southern Copper Corp.(b) | | | 1,100 | | | | 103,686 | | |
| Vulcan Materials Co.(b) | | | 2,800 | | | | 320,712 | | |
| | | | 424,398 | | |
| Office Equipment/Supplies — 0.1% | |
| Pitney Bowes, Inc. | | | 11,300 | | | | 529,066 | | |
| Oil & Gas — 5.6% | |
| Anadarko Petroleum Corp. | | | 8,300 | | | | 431,517 | | |
| Apache Corp. | | | 4,600 | | | | 375,314 | | |
(Continued)
The accompanying notes are an integral part of the financial statements.
132
MassMutual Select Growth Equity Fund – Portfolio of Investments (Continued)
| | | Number of
Shares | | Market
Value | |
| Chevron Corp. | | | 83,600 | | | $ | 7,042,464 | | |
| ConocoPhillips | | | 18,637 | | | | 1,463,005 | | |
| Devon Energy Corp. | | | 5,800 | | | | 454,082 | | |
| Exxon Mobil Corp. | | | 178,900 | | | | 15,006,132 | | |
| Occidental Petroleum Corp. | | | 6,800 | | | | 393,584 | | |
| | | | 25,166,098 | | |
| Packaging & Containers — 0.3% | |
| Owens-Illinois, Inc.(a) | | | 8,200 | | | | 287,000 | | |
| Pactiv Corp.(a) | | | 33,100 | | | | 1,055,559 | | |
| | | | 1,342,559 | | |
| Pharmaceuticals — 7.9% | |
| Abbott Laboratories | | | 34,800 | | | | 1,863,540 | | |
| Bristol-Myers Squibb Co. | | | 17,000 | | | | 536,520 | | |
| Cardinal Health, Inc. | | | 20,400 | | | | 1,441,056 | | |
| Express Scripts, Inc.(a) | | | 40,600 | | | | 2,030,406 | | |
| Forest Laboratories, Inc.(a) | | | 98,600 | | | | 4,501,090 | | |
| Merck & Co., Inc. | | | 296,100 | | | | 14,745,780 | | |
| NBTY, Inc.(a) | | | 11,200 | | | | 483,840 | | |
| Pfizer, Inc. | | | 132,600 | | | | 3,390,582 | | |
| Schering-Plough Corp. | | | 204,500 | | | | 6,224,980 | | |
| Wyeth | | | 9,400 | | | | 538,996 | | |
| | | | 35,756,790 | | |
| Retail — 18.1% | |
Abercrombie &
Fitch Co. Cl. A | | | 9,400 | | | | 686,012 | | |
American Eagle
Outfitters, Inc. | | | 83,400 | | | | 2,140,044 | | |
| AutoNation, Inc.(a) | | | 33,800 | | | | 758,472 | | |
| AutoZone, Inc.(a) | | | 15,400 | | | | 2,103,948 | | |
Bed Bath &
Beyond, Inc.(a) | | | 53,500 | | | | 1,925,465 | | |
| Best Buy Co., Inc. | | | 11,600 | | | | 541,372 | | |
| Big Lots, Inc.(a) (b) | | | 19,400 | | | | 570,748 | | |
Brinker
International, Inc.(b) | | | 7,050 | | | | 206,354 | | |
| Carmax, Inc.(a) (b) | | | 50,400 | | | | 1,285,200 | | |
| Costco Wholesale Corp. | | | 9,000 | | | | 526,680 | | |
| Dollar General Corp. | | | 28,800 | | | | 631,296 | | |
| Dollar Tree Stores, Inc.(a) | | | 30,400 | | | | 1,323,920 | | |
| Family Dollar Stores, Inc. | | | 40,200 | | | | 1,379,664 | | |
| The Gap, Inc. | | | 25,000 | | | | 477,500 | | |
| The Home Depot, Inc. | | | 301,500 | | | | 11,864,025 | | |
| J.C. Penney Co., Inc. | | | 16,800 | | | | 1,215,984 | | |
| Jack in the Box, Inc.(a) | | | 12,500 | | | | 886,750 | | |
| Kohl's Corp.(a) | | | 103,700 | | | | 7,365,811 | | |
| Limited Brands, Inc.(b) | | | 44,300 | | | | 1,216,035 | | |
| Lowe's Companies, Inc.(b) | | | 209,800 | | | | 6,438,762 | | |
| McDonald's Corp. | | | 121,100 | | | | 6,147,036 | | |
| Nordstrom, Inc. | | | 43,800 | | | | 2,239,056 | | |
| OfficeMax, Inc. | | | 12,700 | | | | 499,110 | | |
| O'Reilly Automotive, Inc.(a) | | | 10,200 | | | | 372,810 | | |
| | | Number of
Shares | | Market
Value | |
| Petsmart, Inc. | | | 11,800 | | | $ | 382,910 | | |
| RadioShack Corp.(b) | | | 26,700 | | | | 884,838 | | |
| Sears Holdings Corp.(a) | | | 6,400 | | | | 1,084,800 | | |
| Staples, Inc. | | | 87,000 | | | | 2,064,510 | | |
| Starbucks Corp.(a) | | | 51,800 | | | | 1,359,232 | | |
| Target Corp. | | | 78,600 | | | | 4,998,960 | | |
| Tiffany & Co. | | | 16,900 | | | | 896,714 | | |
| The TJX Cos., Inc. | | | 42,100 | | | | 1,157,750 | | |
| Walgreen Co. | | | 55,600 | | | | 2,420,824 | | |
| Wal-Mart Stores, Inc. | | | 242,000 | | | | 11,642,620 | | |
| Yum! Brands, Inc. | | | 64,200 | | | | 2,100,624 | | |
| | | | 81,795,836 | | |
| Semiconductors — 1.2% | |
| Intel Corp. | | | 194,800 | | | | 4,628,448 | | |
Novellus
Systems, Inc.(a) (b) | | | 21,000 | | | | 595,770 | | |
| | | | 5,224,218 | | |
| Software — 7.5% | |
| Adobe Systems, Inc.(a) | | | 21,800 | | | | 875,270 | | |
| BEA Systems, Inc.(a) | | | 16,300 | | | | 223,147 | | |
| BMC Software, Inc.(a) | | | 26,800 | | | | 812,040 | | |
| CA, Inc. | | | 9,400 | | | | 242,802 | | |
| Citrix Systems, Inc.(a) | | | 4,700 | | | | 158,249 | | |
| Compuware Corp.(a) | | | 18,300 | | | | 217,038 | | |
| First Data Corp. | | | 28,600 | | | | 934,362 | | |
| Fiserv, Inc.(a) | | | 38,800 | | | | 2,203,840 | | |
| Intuit, Inc.(a) | | | 11,600 | | | | 348,928 | | |
| Microsoft Corp. | | | 566,100 | | | | 16,682,967 | | |
MoneyGram
International, Inc. | | | 18,900 | | | | 528,255 | | |
| Oracle Corp.(a) | | | 465,800 | | | | 9,180,918 | | |
| SEI Investments Co. | | | 32,000 | | | | 929,280 | | |
Total System
Services, Inc.(b) | | | 13,300 | | | | 392,483 | | |
| | | | 33,729,579 | | |
| Telecommunications — 4.6% | |
| AT&T, Inc. | | | 118,260 | | | | 4,907,790 | | |
| Cisco Systems, Inc.(a) | | | 526,600 | | | | 14,665,810 | | |
| Juniper Networks, Inc.(a) | | | 9,500 | | | | 239,115 | | |
| Polycom, Inc.(a) | | | 21,100 | | | | 708,960 | | |
Telephone and Data
Systems, Inc. | | | 6,900 | | | | 431,733 | | |
| | | | 20,953,408 | | |
| Textiles — 0.0% | |
| Cintas Corp.(b) | | | 3,900 | | | | 153,777 | | |
| Toys, Games & Hobbies — 0.6% | |
| Hasbro, Inc. | | | 16,600 | | | | 521,406 | | |
| Mattel, Inc. | | | 88,100 | | | | 2,228,049 | | |
| | | | 2,749,455 | | |
| | | Number of
Shares | | Market
Value | |
| Transportation — 1.0% | |
C.H. Robinson
Worldwide, Inc. | | | 10,800 | | | $ | 567,216 | | |
| CSX Corp. | | | 10,900 | | | | 491,372 | | |
Expeditors International of
Washington, Inc. | | | 4,600 | | | | 189,980 | | |
| FedEx Corp. | | | 29,600 | | | | 3,284,712 | | |
| | | | 4,533,280 | | |
TOTAL EQUITIES
(Cost $416,627,779) | | | | | | | 441,786,251 | | |
| RIGHTS — 0.0% | |
Computers
Seagate Technology(a) (c) | | | 66,000 | | | | 0 | | |
TOTAL RIGHTS
(Cost $0) | | | | | | | 0 | | |
TOTAL LONG TERM
INVESTMENTS
(Cost $416,627,779) | | | | | | | 441,786,251 | | |
| | | Principal
Amount | | | |
| SHORT-TERM INVESTMENTS — 6.0% | |
| Cash Equivalents — 3.6%(e) | |
Abbey National PLC
Eurodollar Time Deposit
5.280% 07/05/2007 | | $ | 213,308 | | | | 213,308 | | |
Abbey National PLC
Eurodollar Time Deposit
5.285% 07/09/2007 | | | 533,270 | | | | 533,270 | | |
American Beacon
Money Market Fund(d) | | | 598,303 | | | | 598,303 | | |
Banco Bilbao Vizcaya
Argentaria SA
Eurodollar Time Deposit
5.300% 08/10/2007 | | | 399,952 | | | | 399,952 | | |
Bank of America
5.270% 07/06/2007 | | | 533,269 | | | | 533,269 | | |
Bank of America
5.270% 07/16/2007 | | | 106,654 | | | | 106,654 | | |
Bank of America
5.270% 08/17/2007 | | | 133,317 | | | | 133,317 | | |
Bank of America
5.300% 09/17/2007 | | | 266,634 | | | | 266,634 | | |
Bank of Ireland
Eurodollar Time Deposit
5.300% 08/13/2007 | | | 533,269 | | | | 533,269 | | |
Bank of Montreal
Eurodollar Time Deposit
5.280% 07/03/2007 | | | 133,317 | | | | 133,317 | | |
(Continued)
The accompanying notes are an integral part of the financial statements.
133
MassMutual Select Growth Equity Fund – Portfolio of Investments (Continued)
| | | Principal
Amount | | Market
Value | |
Bank of Montreal
Eurodollar Time Deposit
5.290% 07/02/2007 | | $ | 106,654 | | | $ | 106,654 | | |
Bank of Montreal
Eurodollar Time Deposit
5.310% 08/14/2007 | | | 79,990 | | | | 79,990 | | |
Bank of Nova Scotia
Eurodollar Time Deposit
5.280% 07/09/2007 | | | 506,605 | | | | 506,605 | | |
Bank Of Nova Scotia
Eurodollar Time Deposit
5.285% 07/11/2007 | | | 293,298 | | | | 293,298 | | |
Barclays
Eurodollar Time Deposit
5.290% 07/06/2007 | | | 533,269 | | | | 533,269 | | |
Barclays
Eurodollar Time Deposit
5.295% 07/16/2007 | | | 106,654 | | | | 106,654 | | |
Barclays
Eurodollar Time Deposit
5.320% 09/04/2007 | | | 266,634 | | | | 266,634 | | |
Bear Stearns & Co
Commercial Paper
5.435% 07/10/2007 | | | 79,990 | | | | 79,990 | | |
BGI Institutional
Money Market Fund(d) | | | 346,625 | | | | 346,625 | | |
BNP Paribas
Eurodollar Time Deposit
5.350% 07/02/2007 | | | 799,903 | | | | 799,903 | | |
Calyon
Eurodollar Time Deposit
5.290% 07/17/2007 | | | 266,634 | | | | 266,634 | | |
Calyon
Eurodollar Time Deposit
5.380% 07/02/2007 | | | 799,903 | | | | 799,903 | | |
Canadian Imperial
Bank of Commerce
Eurodollar Time Deposit
5.300% 07/30/2007 | | | 533,269 | | | | 533,269 | | |
Dexia Group
Eurodollar Time Deposit
5.290% 08/08/2007 | | | 533,269 | | | | 533,269 | | |
Dreyfus Institutional
Cash Advantage
Money Market Fund(d) | | | 159,981 | | | | 159,981 | | |
Federal Home Loan
Bank Discount Note
5.174% 07/20/2007 | | | 39,551 | | | | 39,551 | | |
First Tennessee
National Corp.
Eurodollar Time Deposit
5.300% 07/18/2007 | | | 133,317 | | | | 133,317 | | |
| | | Principal
Amount | | Market
Value | |
Fortis Bank
Eurodollar Time Deposit
5.290% 07/06/2007 | | $ | 133,317 | | | $ | 133,317 | | |
Fortis Bank
Eurodollar Time Deposit
5.290% 07/09/2007 | | | 186,644 | | | | 186,644 | | |
Fortis Bank
Eurodollar Time Deposit
5.300% 07/20/2007 | | | 133,317 | | | | 133,317 | | |
Fortis Bank
Eurodollar Time Deposit
5.300% 07/26/2007 | | | 106,654 | | | | 106,654 | | |
Fortis Bank
Eurodollar Time Deposit
5.350% 07/05/2007 | | | 266,634 | | | | 266,634 | | |
Freddie Mac Discount Note
5.155% 07/16/2007 | | | 50,349 | | | | 50,349 | | |
Freddie Mac Discount Note
5.185% 07/09/2007 | | | 26,285 | | | | 26,285 | | |
Morgan Stanley & Co
Commercial Paper
5.445% 08/01/2007 | | | 239,971 | | | | 239,971 | | |
National Australia Bank
Eurodollar Time Deposit
5.320% 07/02/2007 | | | 266,634 | | | | 266,634 | | |
Nationwide
Building Society
Commercial Paper
5.301% 07/09/2007 | | | 266,086 | | | | 266,086 | | |
Rabobank Nederland
Eurodollar Time Deposit
5.280% 07/05/2007 | | | 399,952 | | | | 399,952 | | |
Rabobank Nederland
Eurodollar Time Deposit
5.290% 07/16/2007 | | | 533,269 | | | | 533,269 | | |
Rabobank Nederland
Eurodollar Time Deposit
5.330% 07/02/2007 | | | 799,903 | | | | 799,903 | | |
Reserve Primary
Money Market Fund(d) | | | 529,397 | | | | 529,397 | | |
Royal Bank of Canada
Eurodollar Time Deposit
5.305% 08/30/2007 | | | 533,269 | | | | 533,269 | | |
Royal Bank of Scotland
Eurodollar Time Deposit
5.270% 07/11/2007 | | | 133,317 | | | | 133,317 | | |
Skandinaviska
Enskilda Banken AB
Eurodollar Time Deposit
5.290% 07/13/2007 | | | 533,269 | | | | 533,269 | | |
Skandinaviska
Enskilda Banken AB
Eurodollar Time Deposit
5.290% 07/19/2007 | | | 79,990 | | | | 79,990 | | |
| | | Principal
Amount | | Market
Value | |
Svenska Handlesbanken
Eurodollar Time Deposit
5.300% 07/02/2007 | | $ | 89,576 | | | $ | 89,576 | | |
UBS AG
Eurodollar Time Deposit
5.277% 07/05/2007 | | | 373,288 | | | | 373,288 | | |
UBS AG
Eurodollar Time Deposit
5.285% 07/05/2007 | | | 533,269 | | | | 533,269 | | |
Vanguard Prime
Money Market Fund(d) | | | 266,634 | | | | 266,634 | | |
Wells Fargo
Eurodollar Time Deposit
5.260% 07/02/2007 | | | 143,983 | | | | 143,983 | | |
Wells Fargo
Eurodollar Time Deposit
5.280% 07/11/2007 | | | 533,269 | | | | 533,269 | | |
Wells Fargo
Eurodollar Time Deposit
5.280% 07/12/2007 | | | 266,634 | | | | 266,634 | | |
| | | | 16,461,749 | | |
| Repurchase Agreements — 2.4% | |
Investors Bank & Trust
Company Repurchase
Agreement, dated
6/29/2007, 3.50%,
due 7/02/2007(f) | | | 10,639,757 | | | | 10,639,757 | | |
TOTAL SHORT-TERM
INVESTMENTS
(Cost $27,101,506) | | | | | | | 27,101,506 | | |
TOTAL INVESTMENTS — 103.6%
(Cost $443,729,285)(g) | | | | | | | 468,887,757 | | |
Other Assets/
(Liabilities) — (3.6%) | | | | | | | (16,293,667 | ) | |
| NET ASSETS — 100.0% | | | | | | $ | 452,594,090 | | |
Notes to Portfolio of Investments
(a) Non-income producing security.
(b) Denotes all or a portion of security on loan. (Note 2).
(c) This security is valued in good faith under procedures established by the Board of Trustees.
(d) Amount represents shares owned of the fund.
(e) Represents investments of security lending collateral. (Note 2).
(f) Maturity value of $10,642,861. Collateralized by a U.S. Government Agency obligation with a rate of 8.20%, maturity date of 2/25/2029, and an aggregate market value, including accrued interest, of $11,171,745.
(g) See Note 6 for aggregate cost for Federal tax purposes.
The accompanying notes are an integral part of the financial statements.
134
MassMutual Select Aggressive Growth Fund – Portfolio of Investments
June 30, 2007 (Unaudited)
| | | Number of
Shares | | Market
Value | |
| EQUITIES — 98.9% | |
| COMMON STOCK — 98.9% | |
| Biotechnology — 8.7% | |
| Genentech, Inc.(a) | | | 363,900 | | | $ | 27,532,674 | | |
| Genzyme Corp.(a) | | | 284,700 | | | | 18,334,680 | | |
| | | | 45,867,354 | | |
| Chemicals — 0.8% | |
| Praxair, Inc. | | | 60,000 | | | | 4,319,400 | | |
| Commercial Services — 4.6% | |
| Iron Mountain, Inc.(a) (b) | | | 176,350 | | | | 4,608,025 | | |
| Moody's Corp.(b) | | | 227,300 | | | | 14,138,060 | | |
Weight Watchers
International, Inc. | | | 60,000 | | | | 3,050,400 | | |
| Western Union | | | 120,000 | | | | 2,499,600 | | |
| | | | 24,296,085 | | |
| Computers — 7.3% | |
| Apple, Inc.(a) | | | 221,700 | | | | 27,056,268 | | |
| Research In Motion Ltd.(a) | | | 22,500 | | | | 4,499,775 | | |
| SanDisk Corp.(a) | | | 65,000 | | | | 3,181,100 | | |
| Seagate Technology(b) | | | 175,000 | | | | 3,809,750 | | |
| | | | 38,546,893 | | |
| Cosmetics & Personal Care — 0.8% | |
| The Procter & Gamble Co. | | | 72,000 | | | | 4,405,680 | | |
| Diversified Financial — 10.0% | |
Chicago
Mercantile Exchange
Holdings, Inc.(b) | | | 47,700 | | | | 25,488,972 | | |
Intercontinental
Exchange, Inc.(a) | | | 186,100 | | | | 27,514,885 | | |
| | | | 53,003,857 | | |
| Entertainment — 0.7% | |
International
Game Technology | | | 100,000 | | | | 3,970,000 | | |
| Health Care – Products — 8.4% | |
Intuitive
Surgical, Inc.(a) (b) | | | 74,400 | | | | 10,324,488 | | |
| Patterson Cos., Inc.(a) | | | 142,000 | | | | 5,292,340 | | |
| Stryker Corp.(b) | | | 151,600 | | | | 9,564,444 | | |
Varian Medical
Systems, Inc.(a) | | | 219,500 | | | | 9,330,945 | | |
| Zimmer Holdings, Inc.(a) | | | 115,800 | | | | 9,830,262 | | |
| | | | 44,342,479 | | |
| | | Number of
Shares | | Market
Value | |
| Health Care – Services — 0.9% | |
| UnitedHealth Group, Inc. | | | 95,000 | | | $ | 4,858,300 | | |
| Internet — 12.2% | |
| eBay, Inc.(a) | | | 155,000 | | | | 4,987,900 | | |
| Google, Inc. Cl. A(a) | | | 91,200 | | | | 47,732,256 | | |
| Yahoo!, Inc.(a) | | | 432,700 | | | | 11,739,151 | | |
| | | | 64,459,307 | | |
| Lodging — 0.7% | |
| MGM Mirage(a) | | | 48,500 | | | | 4,000,280 | | |
| Oil & Gas Services — 6.3% | |
National Oilwell
Varco, Inc.(a) | | | 109,800 | | | | 11,445,552 | | |
| Schlumberger Ltd. | | | 259,500 | | | | 22,041,930 | | |
| | | | 33,487,482 | | |
| Pharmaceuticals — 6.7% | |
| Abraxis BioScience, Inc.(b) | | | 159,300 | | | | 3,541,239 | | |
| Allergan, Inc. | | | 404,600 | | | | 23,321,144 | | |
Teva Pharmaceutical
Sponsored ADR (Israel) | | | 208,200 | | | | 8,588,250 | | |
| | | | 35,450,633 | | |
| Retail — 11.8% | |
| Lowe's Companies, Inc. | | | 496,800 | | | | 15,246,792 | | |
| Staples, Inc. | | | 175,000 | | | | 4,152,750 | | |
| Starbucks Corp.(a) (b) | | | 885,200 | | | | 23,227,648 | | |
| Walgreen Co. | | | 367,300 | | | | 15,992,242 | | |
| Wal-Mart Stores, Inc. | | | 75,000 | | | | 3,608,250 | | |
| | | | 62,227,682 | | |
| Semiconductors — 2.8% | |
| Broadcom Corp. Cl. A(a) | | | 498,600 | | | | 14,584,050 | | |
| Software — 4.1% | |
| Cerner Corp.(a) (b) | | | 111,200 | | | | 6,168,264 | | |
| Intuit, Inc.(a) | | | 140,000 | | | | 4,211,200 | | |
| Paychex, Inc. | | | 100,000 | | | | 3,912,000 | | |
| Salesforce.com, Inc.(a) (b) | | | 171,700 | | | | 7,359,062 | | |
| | | | 21,650,526 | | |
| Telecommunications — 9.0% | |
America Movil SAB de CV
Sponsored ADR (Mexico) | | | 348,800 | | | | 21,601,184 | | |
Crown Castle
International Corp.(a) | | | 53,400 | | | | 1,936,818 | | |
| Qualcomm, Inc. | | | 557,200 | | | | 24,176,908 | | |
| | | | 47,714,910 | | |
| | | Number of
Shares | | Market
Value | |
| Transportation — 3.1% | |
Expeditors International of
Washington, Inc. | | | 281,000 | | | $ | 11,605,300 | | |
United Parcel
Service, Inc. Cl. B | | | 63,000 | | | | 4,599,000 | | |
| | | | 16,204,300 | | |
TOTAL EQUITIES
(Cost $440,692,640) | | | | | | | 523,389,218 | | |
| | | Principal
Amount | | | |
| SHORT-TERM INVESTMENTS — 14.7% | |
| Cash Equivalents — 13.7%(d) | |
Abbey National PLC
Eurodollar Time Deposit
5.280% 07/05/2007 | | $ | 935,962 | | | | 935,962 | | |
Abbey National PLC
Eurodollar Time Deposit
5.285% 07/09/2007 | | | 2,339,903 | | | | 2,339,903 | | |
American Beacon
Money Market Fund(c) | | | 2,625,265 | | | | 2,625,265 | | |
Banco Bilbao Vizcaya
Argentaria SA
Eurodollar Time Deposit
5.300% 08/10/2007 | | | 1,754,928 | | | | 1,754,928 | | |
Bank of America
5.270% 07/06/2007 | | | 2,339,905 | | | | 2,339,905 | | |
Bank of America
5.270% 07/16/2007 | | | 467,981 | | | | 467,981 | | |
Bank of America
5.270% 08/17/2007 | | | 584,976 | | | | 584,976 | | |
Bank of America
5.300% 09/17/2007 | | | 1,169,952 | | | | 1,169,952 | | |
Bank of Ireland
Eurodollar Time Deposit
5.300% 08/13/2007 | | | 2,339,905 | | | | 2,339,905 | | |
Bank of Montreal
Eurodollar Time Deposit
5.280% 07/03/2007 | | | 584,976 | | | | 584,976 | | |
Bank of Montreal
Eurodollar Time Deposit
5.290% 07/02/2007 | | | 467,981 | | | | 467,981 | | |
Bank of Montreal
Eurodollar Time Deposit
5.310% 08/14/2007 | | | 350,985 | | | | 350,985 | | |
Bank of Nova Scotia
Eurodollar Time Deposit
5.280% 07/09/2007 | | | 2,222,909 | | | | 2,222,909 | | |
(Continued)
The accompanying notes are an integral part of the financial statements.
135
MassMutual Select Aggressive Growth Fund – Portfolio of Investments (Continued)
| | | Principal
Amount | | Market
Value | |
Bank Of Nova Scotia
Eurodollar Time Deposit
5.285% 07/11/2007 | | $ | 1,286,947 | | | $ | 1,286,947 | | |
Barclays
Eurodollar Time Deposit
5.290% 07/06/2007 | | | 2,339,905 | | | | 2,339,905 | | |
Barclays
Eurodollar Time Deposit
5.295% 07/16/2007 | | | 467,981 | | | | 467,981 | | |
Barclays
Eurodollar Time Deposit
5.320% 09/04/2007 | | | 1,169,952 | | | | 1,169,952 | | |
Bear Stearns & Co
Commercial Paper
5.435% 07/10/2007 | | | 350,985 | | | | 350,985 | | |
BGI Institutional
Money Market Fund(c) | | | 1,520,937 | | | | 1,520,937 | | |
BNP Paribas
Eurodollar Time Deposit
5.350% 07/02/2007 | | | 3,509,857 | | | | 3,509,857 | | |
Calyon
Eurodollar Time Deposit
5.290% 07/17/2007 | | | 1,169,952 | | | | 1,169,952 | | |
Calyon
Eurodollar Time Deposit
5.380% 07/02/2007 | | | 3,509,857 | | | | 3,509,857 | | |
Canadian Imperial
Bank of Commerce
Eurodollar Time Deposit
5.300% 07/30/2007 | | | 2,339,905 | | | | 2,339,905 | | |
Dexia Group
Eurodollar Time Deposit
5.290% 08/08/2007 | | | 2,339,905 | | | | 2,339,905 | | |
Dreyfus Institutional
Cash Advantage
Money Market Fund(c) | | | 701,971 | | | | 701,971 | | |
Federal Home
Loan Bank
Discount Note
5.174% 07/20/2007 | | | 173,543 | | | | 173,543 | | |
First Tennessee
National Corp.
Eurodollar Time Deposit
5.300% 07/18/2007 | | | 584,976 | | | | 584,976 | | |
Fortis Bank
Eurodollar Time Deposit
5.290% 07/06/2007 | | | 584,976 | | | | 584,976 | | |
Fortis Bank
Eurodollar Time Deposit
5.290% 07/09/2007 | | | 818,966 | | | | 818,966 | | |
Fortis Bank
Eurodollar Time Deposit
5.300% 07/20/2007 | | | 584,976 | | | | 584,976 | | |
| | | Principal
Amount | | Market
Value | |
Fortis Bank
Eurodollar Time Deposit
5.300% 07/26/2007 | | $ | 467,981 | | | $ | 467,981 | | |
Fortis Bank
Eurodollar Time Deposit
5.350% 07/05/2007 | | | 1,169,952 | | | | 1,169,952 | | |
Freddie Mac Discount Note
5.155% 07/16/2007 | | | 220,923 | | | | 220,923 | | |
Freddie Mac Discount Note
5.185% 07/09/2007 | | | 115,335 | | | | 115,335 | | |
Morgan Stanley & Co
Commercial Paper
5.445% 08/01/2007 | | | 1,052,957 | | | | 1,052,957 | | |
National Australia Bank
Eurodollar Time Deposit
5.320% 07/02/2007 | | | 1,169,952 | | | | 1,169,952 | | |
Nationwide Building Society
Commercial Paper
5.301% 07/09/2007 | | | 1,167,546 | | | | 1,167,546 | | |
Rabobank Nederland
Eurodollar Time Deposit
5.280% 07/05/2007 | | | 1,754,928 | | | | 1,754,928 | | |
Rabobank Nederland
Eurodollar Time Deposit
5.290% 07/16/2007 | | | 2,339,905 | | | | 2,339,905 | | |
Rabobank Nederland
Eurodollar Time Deposit
5.330% 07/02/2007 | | | 3,509,857 | | | | 3,509,857 | | |
Reserve Primary
Money Market Fund(c) | | | 2,322,914 | | | | 2,322,914 | | |
Royal Bank of Canada
Eurodollar Time Deposit
5.305% 08/30/2007 | | | 2,339,905 | | | | 2,339,905 | | |
Royal Bank of Scotland
Eurodollar Time Deposit
5.270% 07/11/2007 | | | 584,976 | | | | 584,976 | | |
Skandinaviska Enskilda
Banken AB
Eurodollar Time Deposit
5.290% 07/13/2007 | | | 2,339,905 | | | | 2,339,905 | | |
Skandinaviska Enskilda
Banken AB
Eurodollar Time Deposit
5.290% 07/19/2007 | | | 350,985 | | | | 350,985 | | |
Svenska Handlesbanken
Eurodollar Time Deposit
5.300% 07/02/2007 | | | 393,047 | | | | 393,047 | | |
UBS AG
Eurodollar Time Deposit
5.277% 07/05/2007 | | | 1,637,933 | | | | 1,637,933 | | |
UBS AG
Eurodollar Time Deposit
5.285% 07/05/2007 | | | 2,339,905 | | | | 2,339,905 | | |
| | | Principal
Amount | | Market
Value | |
Vanguard Prime
Money Market Fund(c) | | $ | 1,169,952 | | | $ | 1,169,952 | | |
Wells Fargo
Eurodollar Time Deposit
5.260% 07/02/2007 | | | 631,775 | | | | 631,775 | | |
Wells Fargo
Eurodollar Time Deposit
5.280% 07/11/2007 | | | 2,339,905 | | | | 2,339,905 | | |
Wells Fargo
Eurodollar Time Deposit
5.280% 07/12/2007 | | | 1,169,952 | | | | 1,169,952 | | |
| | | | 72,231,709 | | |
| Repurchase Agreements — 1.0% | |
Investors Bank & Trust
Company Repurchase
Agreement, dated
6/29/2007, 3.50%,
due 7/02/2007(e) | | | 5,508,800 | | | | 5,508,800 | | |
TOTAL SHORT-TERM
INVESTMENTS
(Cost $77,740,509) | | | | | | | 77,740,509 | | |
TOTAL INVESTMENTS — 113.6%
(Cost $518,433,149)(f) | | | | | | | 601,129,727 | | |
Other Assets/
(Liabilities) — (13.6%) | | | | | | | (72,081,635 | ) | |
| NET ASSETS — 100.0% | | | | | | $ | 529,048,092 | | |
Notes to Portfolio of Investments
ADR - American Depository Receipt
(a) Non-income producing security.
(b) Denotes all or a portion of security on loan. (Note 2).
(c) Amount represents shares owned of the fund.
(d) Represents investments of security lending collateral. (Note 2).
(e) Maturity value of $5,510,407. Collaterized by a U.S. Government Agency obligation with a rate of 8.625%, maturity date of 3/25/2016, and an aggregate market value, including accrued interest, of $5,784,240.
(f) See Note 6 for aggregate cost for Federal tax purposes.
The accompanying notes are an integral part of the financial statements.
136
MassMutual Select OTC 100 Fund – Portfolio of Investments
June 30, 2007 (Unaudited)
| | | Number of
Shares | | Market
Value | |
| EQUITIES — 98.5% | |
| COMMON STOCK — 98.5% | |
| Advertising — 0.3% | |
| Lamar Advertising Co. Cl. A | | | 2,148 | | | $ | 134,808 | | |
| Airlines — 0.5% | |
Ryanair Holdings
PLC Sponsored
ADR (Ireland)(a) (b) | | | 3,112 | | | | 117,478 | | |
| UAL Corp.(a) (b) | | | 2,917 | | | | 118,401 | | |
| | | | 235,879 | | |
| Auto Manufacturers — 1.5% | |
| Paccar, Inc. | | | 7,451 | | | | 648,535 | | |
| Biotechnology — 5.8% | |
| Amgen, Inc.(a) | | | 14,464 | | | | 799,715 | | |
| Biogen Idec, Inc.(a) | | | 9,982 | | | | 534,037 | | |
| Celgene Corp.(a) | | | 10,081 | | | | 577,944 | | |
| Genzyme Corp.(a) | | | 8,858 | | | | 570,455 | | |
Vertex
Pharmaceuticals, Inc.(a) | | | 3,630 | | | | 103,673 | | |
| | | | 2,585,824 | | |
| Chemicals — 0.3% | |
| Sigma-Aldrich Corp. | | | 3,414 | | | | 145,675 | | |
| Commercial Services — 1.3% | |
| Apollo Group, Inc. Cl. A(a) | | | 4,687 | | | | 273,861 | | |
| Fastenal Co.(b) | | | 3,865 | | | | 161,789 | | |
| Monster Worldwide, Inc.(a) | | | 3,616 | | | | 148,618 | | |
| | | | 584,268 | | |
| Computers — 15.6% | |
| Apple, Inc.(a) | | | 32,283 | | | | 3,939,817 | | |
Cadence Design
Systems, Inc.(a) | | | 7,804 | | | | 171,376 | | |
Cognizant Technology
Solutions Corp. Cl. A(a) | | | 3,750 | | | | 281,587 | | |
| Dell, Inc.(a) | | | 22,363 | | | | 638,464 | | |
Logitech
International S.A.(a) (b) | | | 4,763 | | | | 125,696 | | |
| Network Appliance, Inc.(a) | | | 10,383 | | | | 303,184 | | |
| Research In Motion Ltd.(a) | | | 4,978 | | | | 995,550 | | |
| SanDisk Corp.(a) | | | 5,603 | | | | 274,211 | | |
| Sun Microsystems, Inc.(a) | | | 41,560 | | | | 218,606 | | |
| | | | 6,948,491 | | |
| Computers & Information — 0.4% | |
| CDW Corp.(a) | | | 2,205 | | | | 187,359 | | |
| | | Number of
Shares | | Market
Value | |
| Electronics — 1.3% | |
Flextronics
International Ltd.(a) | | | 17,671 | | | $ | 190,847 | | |
| Garmin Ltd.(b) | | | 5,368 | | | | 397,071 | | |
| | | | 587,918 | | |
| Foods — 0.3% | |
Whole Foods
Market, Inc.(b) | | | 3,710 | | | | 142,093 | | |
| Health Care – Products — 1.9% | |
| Biomet, Inc. | | | 8,849 | | | | 404,576 | | |
| Dentsply International, Inc. | | | 3,948 | | | | 151,050 | | |
| Intuitive Surgical, Inc.(a) | | | 1,002 | | | | 139,048 | | |
| Patterson Cos., Inc.(a) | | | 3,570 | | | | 133,054 | | |
| | | | 827,728 | | |
| Internet — 13.1% | |
Akamai
Technologies, Inc.(a) (b) | | | 4,251 | | | | 206,769 | | |
| Amazon.com, Inc.(a) (b) | | | 7,280 | | | | 498,025 | | |
Check Point Software
Technologies Ltd.(a) | | | 5,967 | | | | 136,107 | | |
| Checkfree Corp.(a) (b) | | | 2,247 | | | | 90,329 | | |
| eBay, Inc.(a) | | | 27,218 | | | | 875,875 | | |
| Expedia, Inc.(a) (b) | | | 8,019 | | | | 234,877 | | |
| Google, Inc. Cl. A(a) | | | 3,768 | | | | 1,972,096 | | |
| IAC/InterActiveCorp(a) | | | 8,002 | | | | 276,949 | | |
Liberty Media Holding
Corp. Interactive Cl. A(a) | | | 16,040 | | | | 358,173 | | |
| Symantec Corp.(a) | | | 25,211 | | | | 509,262 | | |
| VeriSign, Inc.(a) | | | 6,129 | | | | 194,473 | | |
| Yahoo!, Inc.(a) | | | 17,288 | | | | 469,023 | | |
| | | | 5,821,958 | | |
| Lodging — 0.6% | |
| Wynn Resorts Ltd.(b) | | | 2,975 | | | | 266,828 | | |
| Machinery – Construction & Mining — 0.4% | |
| Joy Global, Inc. | | | 2,855 | | | | 166,532 | | |
| Media — 4.3% | |
| Comcast Corp. Cl. A(a) | | | 38,763 | | | | 1,090,016 | | |
Discovery
Holding Co. Cl. A(a) | | | 6,375 | | | | 146,561 | | |
EchoStar Communications
Corp. Cl. A(a) | | | 5,756 | | | | 249,638 | | |
Liberty
Global, Inc. Cl. A(a) | | | 5,192 | | | | 213,080 | | |
Sirius Satellite
Radio, Inc.(a) (b) | | | 42,369 | | | | 127,954 | | |
XM Satellite Radio
Holdings, Inc. Cl. A(a) | | | 8,593 | | | | 101,140 | | |
| | | | 1,928,389 | | |
| | | Number of
Shares | | Market
Value | |
| Oil & Gas — 0.3% | |
| Patterson-UTI Energy, Inc. | | | 4,285 | | | $ | 112,310 | | |
| Pharmaceuticals — 5.2% | |
Amylin Pharmaceuticals,
Inc.(a) (b) | | | 3,392 | | | | 139,615 | | |
| Cephalon, Inc.(a) (b) | | | 1,700 | | | | 136,663 | | |
| Express Scripts, Inc.(a) | | | 6,506 | | | | 325,365 | | |
| Gilead Sciences, Inc.(a) | | | 24,610 | | | | 954,130 | | |
| Sepracor, Inc.(a) | | | 2,798 | | | | 114,774 | | |
Teva Pharmaceutical
Sponsored ADR (Israel) | | | 16,201 | | | | 668,291 | | |
| | | | 2,338,838 | | |
| Retail — 6.1% | |
Bed Bath &
Beyond, Inc.(a) (b) | | | 9,972 | | | | 358,892 | | |
| Costco Wholesale Corp. | | | 6,296 | | | | 368,442 | | |
| Petsmart, Inc. | | | 3,606 | | | | 117,015 | | |
| Ross Stores, Inc. | | | 3,704 | | | | 114,083 | | |
| Sears Holdings Corp.(a) | | | 4,269 | | | | 723,595 | | |
| Staples, Inc. | | | 12,856 | | | | 305,073 | | |
| Starbucks Corp.(a) | | | 27,562 | | | | 723,227 | | |
| | | | 2,710,327 | | |
| Semiconductors — 10.5% | |
| Altera Corp. | | | 13,364 | | | | 295,745 | | |
| Applied Materials, Inc. | | | 19,125 | | | | 380,014 | | |
| Broadcom Corp. Cl. A(a) | | | 11,431 | | | | 334,357 | | |
| Intel Corp. | | | 54,442 | | | | 1,293,542 | | |
| KLA-Tencor Corp. | | | 6,214 | | | | 341,459 | | |
| Lam Research Corp.(a) (b) | | | 3,733 | | | | 191,876 | | |
| Linear Technology Corp.(b) | | | 9,079 | | | | 328,478 | | |
Marvell Technology
Group Ltd.(a) | | | 14,944 | | | | 272,130 | | |
Maxim Integrated
Products, Inc. | | | 12,025 | | | | 401,755 | | |
| Microchip Technology, Inc. | | | 4,877 | | | | 180,644 | | |
| Nvidia Corp.(a) | | | 9,537 | | | | 393,973 | | |
| Xilinx, Inc. | | | 10,575 | | | | 283,093 | | |
| | | | 4,697,066 | | |
| Software — 15.0% | |
| Activision, Inc.(a) (b) | | | 6,851 | | | | 127,908 | | |
| Adobe Systems, Inc.(a) | | | 15,421 | | | | 619,153 | | |
| Autodesk, Inc.(a) | | | 6,447 | | | | 303,525 | | |
| BEA Systems, Inc.(a) | | | 9,725 | | | | 133,135 | | |
| Citrix Systems, Inc.(a) | | | 5,742 | | | | 193,333 | | |
| Electronic Arts, Inc.(a) | | | 8,403 | | | | 397,630 | | |
| Fiserv, Inc.(a) | | | 5,630 | | | | 319,784 | | |
(Continued)
The accompanying notes are an integral part of the financial statements.
137
MassMutual Select OTC 100 Fund – Portfolio of Investments (Continued)
| | | Number of
Shares | | Market
Value | |
Infosys Technologies Ltd.
Sponsored ADR (India) | | | 3,010 | | | $ | 151,644 | | |
| Intuit, Inc.(a) | | | 11,351 | | | | 341,438 | | |
| Microsoft Corp. | | | 88,106 | | | | 2,596,484 | | |
| Oracle Corp.(a) | | | 57,361 | | | | 1,130,585 | | |
| Paychex, Inc. | | | 9,696 | | | | 379,308 | | |
| | | | 6,693,927 | | |
| Telecommunications — 12.3% | |
| Cisco Systems, Inc.(a) | | | 58,043 | | | | 1,616,498 | | |
| Juniper Networks, Inc.(a) | | | 9,960 | | | | 250,693 | | |
Level 3 Communications,
Inc.(a) (b) | | | 39,908 | | | | 233,462 | | |
Millicom International
Cellular SA(a) (b) | | | 2,620 | | | | 240,097 | | |
| NII Holdings, Inc. Cl. B(a) | | | 4,254 | | | | 343,468 | | |
| Qualcomm, Inc. | | | 53,792 | | | | 2,334,035 | | |
Telefonaktiebolaget LM
Ericsson Cl. B Sponsored
ADR (Sweden)(b) | | | 3,555 | | | | 141,809 | | |
| Tellabs, Inc.(a) | | | 6,765 | | | | 72,791 | | |
| Virgin Media, Inc. | | | 9,590 | | | | 233,708 | | |
| | | | 5,466,561 | | |
| Textiles — 0.5% | |
| Cintas Corp. | | | 5,093 | | | | 200,817 | | |
| Transportation — 1.0% | |
C.H. Robinson
Worldwide, Inc. | | | 4,476 | | | | 235,080 | | |
Expeditors International of
Washington, Inc. | | | 5,600 | | | | 231,280 | | |
| | | | 466,360 | | |
TOTAL EQUITIES
(Cost $34,676,759) | | | | | | | 43,898,491 | | |
| | | Principal
Amount | | | |
| SHORT-TERM INVESTMENTS — 10.4% | |
| Cash Equivalents — 9.0%(d) | |
Abbey National PLC
Eurodollar Time Deposit
5.280% 07/05/2007 | | $ | 52,064 | | | | 52,064 | | |
Abbey National PLC
Eurodollar Time Deposit
5.285% 07/09/2007 | | | 130,155 | | | | 130,155 | | |
American Beacon
Money Market Fund(c) | | | 146,032 | | | | 146,032 | | |
Banco Bilbao Vizcaya
Argentaria SA
Eurodollar Time Deposit
5.300% 08/10/2007 | | | 97,619 | | | | 97,619 | | |
Bank of America
5.270% 07/06/2007 | | | 130,159 | | | | 130,159 | | |
| | | Principal
Amount | | Market
Value | |
Bank of America
5.270% 07/16/2007 | | $ | 26,032 | | | $ | 26,032 | | |
Bank of America
5.270% 08/17/2007 | | | 32,540 | | | | 32,540 | | |
Bank of America
5.300% 09/17/2007 | | | 65,079 | | | | 65,079 | | |
Bank of Ireland
Eurodollar Time Deposit
5.300% 08/13/2007 | | | 130,159 | | | | 130,159 | | |
Bank of Montreal
Eurodollar Time Deposit
5.280% 07/03/2007 | | | 32,540 | | | | 32,540 | | |
Bank of Montreal
Eurodollar Time Deposit
5.290% 07/02/2007 | | | 26,032 | | | | 26,032 | | |
Bank of Montreal
Eurodollar Time Deposit
5.310% 08/14/2007 | | | 19,524 | | | | 19,524 | | |
Bank of Nova Scotia
Eurodollar Time Deposit
5.280% 07/09/2007 | | | 123,651 | | | | 123,651 | | |
Bank Of Nova Scotia
Eurodollar Time Deposit
5.285% 07/11/2007 | | | 71,587 | | | | 71,587 | | |
Barclays
Eurodollar Time Deposit
5.290% 07/06/2007 | | | 130,159 | | | | 130,159 | | |
Barclays
Eurodollar Time Deposit
5.295% 07/16/2007 | | | 26,032 | | | | 26,032 | | |
Barclays
Eurodollar Time Deposit
5.320% 09/04/2007 | | | 65,079 | | | | 65,079 | | |
Bear Stearns & Co
Commercial Paper
5.435% 07/10/2007 | | | 19,524 | | | | 19,524 | | |
BGI Institutional
Money Market Fund(c) | | | 84,603 | | | | 84,603 | | |
BNP Paribas
Eurodollar Time Deposit
5.350% 07/02/2007 | | | 195,238 | | | | 195,238 | | |
Calyon
Eurodollar Time Deposit
5.290% 07/17/2007 | | | 65,079 | | | | 65,079 | | |
Calyon
Eurodollar Time Deposit
5.380% 07/02/2007 | | | 195,238 | | | | 195,238 | | |
Canadian Imperial
Bank of Commerce
Eurodollar Time Deposit
5.300% 07/30/2007 | | | 130,159 | | | | 130,159 | | |
Dexia Group
Eurodollar Time Deposit
5.290% 08/08/2007 | | | 130,159 | | | | 130,159 | | |
| | | Principal
Amount | | Market
Value | |
Dreyfus Institutional
Cash Advantage
Money Market Fund(c) | | $ | 39,048 | | | $ | 39,048 | | |
Federal Home Loan Bank
Discount Note
5.174% 07/20/2007 | | | 9,653 | | | | 9,653 | | |
First Tennessee
National Corp.
Eurodollar Time Deposit
5.300% 07/18/2007 | | | 32,540 | | | | 32,540 | | |
Fortis Bank
Eurodollar Time Deposit
5.290% 07/06/2007 | | | 32,540 | | | | 32,540 | | |
Fortis Bank
Eurodollar Time Deposit
5.290% 07/09/2007 | | | 45,556 | | | | 45,556 | | |
Fortis Bank
Eurodollar Time Deposit
5.300% 07/20/2007 | | | 32,540 | | | | 32,540 | | |
Fortis Bank
Eurodollar Time Deposit
5.300% 07/26/2007 | | | 26,032 | | | | 26,032 | | |
Fortis Bank
Eurodollar Time Deposit
5.350% 07/05/2007 | | | 65,079 | | | | 65,079 | | |
Freddie Mac Discount Note
5.155% 07/16/2007 | | | 12,289 | | | | 12,289 | | |
Freddie Mac Discount Note
5.185% 07/09/2007 | | | 6,416 | | | | 6,416 | | |
Morgan Stanley & Co
Commercial Paper
5.445% 08/01/2007 | | | 58,571 | | | | 58,571 | | |
National Australia Bank
Eurodollar Time Deposit
5.320% 07/02/2007 | | | 65,079 | | | | 65,079 | | |
Nationwide Building Society
Commercial Paper
5.301% 07/09/2007 | | | 64,946 | | | | 64,946 | | |
Rabobank Nederland
Eurodollar Time Deposit
5.280% 07/05/2007 | | | 97,619 | | | | 97,619 | | |
Rabobank Nederland
Eurodollar Time Deposit
5.290% 07/16/2007 | | | 130,159 | | | | 130,159 | | |
Rabobank Nederland
Eurodollar Time Deposit
5.330% 07/02/2007 | | | 195,238 | | | | 195,238 | | |
Reserve Primary
Money Market Fund(c) | | | 129,214 | | | | 129,214 | | |
Royal Bank of Canada
Eurodollar Time Deposit
5.305% 08/30/2007 | | | 130,159 | | | | 130,159 | | |
Royal Bank of Scotland
Eurodollar Time Deposit
5.270% 07/11/2007 | | | 32,540 | | | | 32,540 | | |
(Continued)
The accompanying notes are an integral part of the financial statements.
138
MassMutual Select OTC 100 Fund – Portfolio of Investments (Continued)
| | | Principal
Amount | | Market
Value | |
Skandinaviska Enskilda
Banken AB
Eurodollar Time Deposit
5.290% 07/13/2007 | | $ | 130,159 | | | $ | 130,159 | | |
Skandinaviska Enskilda
Banken AB
Eurodollar Time Deposit
5.290% 07/19/2007 | | | 19,524 | | | | 19,524 | | |
Svenska Handlesbanken
Eurodollar Time Deposit
5.300% 07/02/2007 | | | 21,864 | | | | 21,864 | | |
UBS AG
Eurodollar Time Deposit
5.277% 07/05/2007 | | | 91,111 | | | | 91,111 | | |
UBS AG
Eurodollar Time Deposit
5.285% 07/05/2007 | | | 130,159 | | | | 130,159 | | |
Vanguard Prime Money
Market Fund(c) | | | 65,079 | | | | 65,079 | | |
Wells Fargo
Eurodollar Time Deposit
5.260% 07/02/2007 | | | 35,143 | | | | 35,143 | | |
Wells Fargo
Eurodollar Time Deposit
5.280% 07/11/2007 | | | 130,159 | | | | 130,159 | | |
Wells Fargo
Eurodollar Time Deposit
5.280% 07/12/2007 | | | 65,079 | | | | 65,079 | | |
| | | | 4,017,938 | | |
| Repurchase Agreements — 1.2% | |
Investors Bank & Trust
Company Repurchase
Agreement, dated
6/29/2007, 3.50%,
due 7/02/2007(f) | | | 508,650 | | | | 508,650 | | |
| U.S. Government Agencies — 0.2% | |
U.S. Treasury Bill(e)
4.946% 08/09/2007 | | | 100,000 | | | | 99,465 | | |
TOTAL SHORT-TERM
INVESTMENTS
(Cost $4,626,053) | | | | | | | 4,626,053 | | |
TOTAL INVESTMENTS — 108.9%
(Cost $39,302,812)(g) | | | | | | | 48,524,544 | | |
Other Assets/
(Liabilities) — (8.9%) | | | | | | | (3,953,026 | ) | |
| NET ASSETS — 100.0% | | | | | | $ | 44,571,518 | | |
Notes to Portfolio of Investments
ADR - American Depository Receipt
(a) Non-income producing security.
(b) Denotes all or a portion of security on loan. (Note 2).
(c) Amount represents shares owned of the fund.
(d) Represents investments of security lending collateral. (Note 2).
(e) This security is held as collateral for open future contracts. (Note 2).
(f) Maturity value of $508,799. Collateralized by a U.S. Government Agency obligation with a rate of 8.125%, maturity date of 8/25/2014, and an aggregate market value, including accrued interest, of $534,083.
(g) See Note 6 for aggregate cost for Federal tax purposes.
The accompanying notes are an integral part of the financial statements.
139
MassMutual Select Focused Value Fund – Portfolio of Investments
June 30, 2007 (Unaudited)
| | | Number of
Shares | | Market
Value | |
| EQUITIES — 95.0% | |
| COMMON STOCK — 95.0% | |
| Advertising — 1.0% | |
Catalina
Marketing Corp. | | | 172,697 | | | $ | 5,439,956 | | |
| Harte-Hanks, Inc. | | | 196,765 | | | | 5,052,925 | | |
| | | | 10,492,881 | | |
| Apparel — 0.4% | |
| Jones Apparel Group, Inc. | | | 138,393 | | | | 3,909,602 | | |
| Banks — 4.4% | |
| City National Corp. | | | 51,694 | | | | 3,933,396 | | |
| Mellon Financial Corp.(a) | | | 900,000 | | | | 39,600,000 | | |
The South Financial
Group, Inc. | | | 41,293 | | | | 934,874 | | |
| | | | 44,468,270 | | |
| Beverages — 0.3% | |
| PepsiAmericas, Inc. | | | 123,373 | | | | 3,030,041 | | |
| Chemicals — 4.5% | |
| Huntsman Corp. | | | 1,400,000 | | | | 34,034,000 | | |
International Flavors &
Fragrances, Inc. | | | 130,617 | | | | 6,810,370 | | |
| The Valspar Corp. | | | 164,900 | | | | 4,684,809 | | |
| | | | 45,529,179 | | |
| Commercial Services — 1.0% | |
Corinthian
Colleges, Inc.(b) | | | 623,170 | | | | 10,151,439 | | |
| Computers — 9.4% | |
| Dell, Inc.(b) | | | 1,500,000 | | | | 42,825,000 | | |
| Diebold, Inc.(a) | | | 139,873 | | | | 7,301,371 | | |
| Hewlett-Packard Co. | | | 1,000,000 | | | | 44,620,000 | | |
| | | | 94,746,371 | | |
| Computers & Information — 0.5% | |
| CDW Corp.(b) | | | 64,290 | | | | 5,462,721 | | |
| Diversified Financial — 7.4% | |
| JP Morgan Chase & Co. | | | 800,000 | | | | 38,760,000 | | |
| Morgan Stanley | | | 420,000 | | | | 35,229,600 | | |
| | | | 73,989,600 | | |
| Electrical Components & Equipment — 0.9% | |
| Hubbell, Inc. Cl. B | | | 106,702 | | | | 5,785,382 | | |
| Molex, Inc. | | | 122,250 | | | | 3,668,723 | | |
| | | | 9,454,105 | | |
| Electronics — 1.2% | |
| Cymer, Inc.(b) | | | 139,385 | | | | 5,603,277 | | |
| | | Number of
Shares | | Market
Value | |
Flextronics
International Ltd.(b) | | | 265,555 | | | $ | 2,867,994 | | |
Mettler-Toledo
International, Inc.(b) | | | 41,879 | | | | 3,999,863 | | |
| | | | 12,471,134 | | |
| Entertainment — 0.3% | |
International Speedway
Corp. Cl. A | | | 61,479 | | | | 3,240,558 | | |
| Foods — 1.2% | |
Hain Celestial
Group, Inc.(b) | | | 241,793 | | | | 6,562,262 | | |
| Pilgrim's Pride Corp. | | | 142,576 | | | | 5,442,126 | | |
| | | | 12,004,388 | | |
| Health Care – Services — 0.8% | |
| Quest Diagnostics, Inc. | | | 113,092 | | | | 5,841,202 | | |
Universal Health
Services, Inc. Cl. B | | | 30,626 | | | | 1,883,499 | | |
| | | | 7,724,701 | | |
| Home Builders — 2.3% | |
| Lennar Corp. Cl. A(a) | | | 619,100 | | | | 22,634,296 | | |
| Insurance — 2.6% | |
Ambac Financial
Group, Inc. | | | 23,215 | | | | 2,024,116 | | |
Gallagher
(Arthur J.) & Co.(a) | | | 183,103 | | | | 5,104,912 | | |
| MBIA, Inc.(a) | | | 68,043 | | | | 4,233,635 | | |
RenaissanceRe
Holdings Ltd. | | | 36,000 | | | | 2,231,640 | | |
Stewart
Information Services | | | 109,128 | | | | 4,346,568 | | |
| Unum Group | | | 79,658 | | | | 2,079,870 | | |
White Mountains
Insurance Group Ltd. | | | 8,904 | | | | 5,396,002 | | |
| Willis Group Holdings Ltd. | | | 26,600 | | | | 1,171,996 | | |
| | | | 26,588,739 | | |
| Leisure Time — 3.6% | |
| Carnival Corp.(a) | | | 740,000 | | | | 36,089,800 | | |
| Machinery – Diversified — 1.0% | |
Albany International
Corp. Cl. A(a) | | | 105,533 | | | | 4,267,755 | | |
| Briggs & Stratton Corp.(a) | | | 135,800 | | | | 4,285,848 | | |
| Tennant Co. | | | 35,071 | | | | 1,280,092 | | |
| | | | 9,833,695 | | |
| Manufacturing — 1.6% | |
| Carlisle Cos., Inc. | | | 51,125 | | | | 2,377,824 | | |
| Dover Corp. | | | 120,256 | | | | 6,151,094 | | |
| | | Number of
Shares | | Market
Value | |
| Federal Signal Corp.(a) | | | 216,237 | | | $ | 3,429,519 | | |
| Pall Corp. | | | 95,819 | | | | 4,406,716 | | |
| | | | 16,365,153 | | |
| Media — 10.8% | |
Cablevision Systems
Corp. Cl. A(b) | | | 411,800 | | | | 14,903,042 | | |
Discovery Holding
Co. Cl. A(b) | | | 1,600,000 | | | | 36,784,000 | | |
Liberty Media Holding
Corp. Capital Cl. A(b) | | | 182,500 | | | | 21,476,600 | | |
| Time Warner, Inc. | | | 1,700,000 | | | | 35,768,000 | | |
| | | | 108,931,642 | | |
| Office Furnishings — 0.5% | |
| Steelcase, Inc. Cl. A | | | 249,388 | | | | 4,613,678 | | |
| Oil & Gas — 0.3% | |
| Cimarex Energy Co. | | | 69,935 | | | | 2,756,138 | | |
| Pharmaceuticals — 0.3% | |
Medco Health
Solutions, Inc.(b) | | | 38,064 | | | | 2,968,611 | | |
| Real Estate Investment Trusts (REITS) — 0.6% | |
| CapitalSource, Inc.(a) | | | 224,254 | | | | 5,514,406 | | |
| Retail — 14.3% | |
| CBRL Group, Inc.(a) | | | 59,445 | | | | 2,525,224 | | |
| Guitar Center, Inc.(b) | | | 96,568 | | | | 5,775,732 | | |
| McDonald's Corp. | | | 901,500 | | | | 45,760,140 | | |
| Tiffany & Co.(a) | | | 800,000 | | | | 42,448,000 | | |
| Yum! Brands, Inc. | | | 1,300,000 | | | | 42,536,000 | | |
| Zale Corp.(a) (b) | | | 195,620 | | | | 4,657,712 | | |
| | | | 143,702,808 | | |
| Semiconductors — 11.7% | |
| Entegris, Inc.(a) (b) | | | 662,275 | | | | 7,867,827 | | |
| Intel Corp. | | | 2,000,000 | | | | 47,520,000 | | |
Micron
Technology, Inc.(a) (b) | | | 1,849,000 | | | | 23,167,970 | | |
National
Semiconductor Corp.(a) | | | 1,400,000 | | | | 39,578,000 | | |
| | | | 118,133,797 | | |
| Software — 1.7% | |
| IMS Health, Inc. | | | 177,052 | | | | 5,688,681 | | |
MoneyGram
International, Inc. | | | 236,550 | | | | 6,611,573 | | |
Parametric
Technology Corp.(b) | | | 207,013 | | | | 4,473,551 | | |
| | | | 16,773,805 | | |
(Continued)
The accompanying notes are an integral part of the financial statements.
140
MassMutual Select Focused Value Fund – Portfolio of Investments (Continued)
| | | Number of
Shares | | Market
Value | |
| Telecommunications — 7.6% | |
| Sprint Nextel Corp. | | | 1,900,000 | | | $ | 39,349,000 | | |
| Virgin Media, Inc. | | | 1,540,000 | | | | 37,529,800 | | |
| | | | 76,878,800 | | |
| Textiles — 0.5% | |
| G&K Services, Inc. Cl. A | | | 137,145 | | | | 5,418,598 | | |
| Transportation — 2.3% | |
| Union Pacific Corp. | | | 200,000 | | | | 23,030,000 | | |
TOTAL EQUITIES
(Cost $735,433,732) | | | | | | | 956,908,956 | | |
| | | Principal
Amount | | | |
| SHORT-TERM INVESTMENTS — 21.0% | |
| Cash Equivalents — 15.8%(d) | |
Abbey National PLC
Eurodollar Time Deposit
5.280% 07/05/2007 | | $ | 2,064,733 | | | | 2,064,733 | | |
Abbey National PLC
Eurodollar Time Deposit
5.285% 07/09/2007 | | | 5,161,823 | | | | 5,161,823 | | |
American Beacon
Money Market Fund(c) | | | 5,791,327 | | | | 5,791,327 | | |
Banco Bilbao Vizcaya
Argentaria SA
Eurodollar Time Deposit
5.300% 08/10/2007 | | | 3,871,367 | | | | 3,871,367 | | |
Bank of America
5.270% 07/06/2007 | | | 5,161,823 | | | | 5,161,823 | | |
Bank of America
5.270% 07/16/2007 | | | 1,032,365 | | | | 1,032,365 | | |
Bank of America
5.270% 08/17/2007 | | | 1,290,456 | | | | 1,290,456 | | |
Bank of America
5.300% 09/17/2007 | | | 2,580,911 | | | | 2,580,911 | | |
Bank of Ireland
Eurodollar Time Deposit
5.300% 08/13/2007 | | | 5,161,823 | | | | 5,161,823 | | |
Bank of Montreal
Eurodollar Time Deposit
5.280% 07/03/2007 | | | 1,290,456 | | | | 1,290,456 | | |
Bank of Montreal
Eurodollar Time Deposit
5.290% 07/02/2007 | | | 1,032,365 | | | | 1,032,365 | | |
Bank of Montreal
Eurodollar Time Deposit
5.310% 08/14/2007 | | | 774,274 | | | | 774,274 | | |
Bank of Nova Scotia
Eurodollar Time Deposit
5.280% 07/09/2007 | | | 4,903,735 | | | | 4,903,735 | | |
| | | Principal
Amount | | Market
Value | |
Bank Of Nova Scotia
Eurodollar Time Deposit
5.285% 07/11/2007 | | $ | 2,839,002 | | | $ | 2,839,002 | | |
Barclays
Eurodollar Time Deposit
5.290% 07/06/2007 | | | 5,161,823 | | | | 5,161,823 | | |
Barclays
Eurodollar Time Deposit
5.295% 07/16/2007 | | | 1,032,365 | | | | 1,032,365 | | |
Barclays
Eurodollar Time Deposit
5.320% 09/04/2007 | | | 2,580,911 | | | | 2,580,911 | | |
Bear Stearns & Co
Commercial Paper
5.435% 07/10/2007 | | | 774,274 | | | | 774,274 | | |
BGI Institutional
Money Market Fund(c) | | | 3,355,185 | | | | 3,355,185 | | |
BNP Paribas
Eurodollar Time Deposit
5.350% 07/02/2007 | | | 7,742,735 | | | | 7,742,735 | | |
Calyon
Eurodollar Time Deposit
5.290% 07/17/2007 | | | 2,580,911 | | | | 2,580,911 | | |
Calyon
Eurodollar Time Deposit
5.380% 07/02/2007 | | | 7,742,735 | | | | 7,742,735 | | |
Canadian Imperial
Bank of Commerce
Eurodollar Time Deposit
5.300% 07/30/2007 | | | 5,161,823 | | | | 5,161,823 | | |
Dexia Group
Eurodollar Time Deposit
5.290% 08/08/2007 | | | 5,161,823 | | | | 5,161,823 | | |
Dreyfus Institutional
Cash Advantage
Money Market Fund(c) | | | 1,548,547 | | | | 1,548,547 | | |
Federal Home Loan
Bank Discount Note
5.174% 07/20/2007 | | | 382,835 | | | | 382,835 | | |
First Tennessee
National Corp.
Eurodollar Time Deposit
5.300% 07/18/2007 | | | 1,290,456 | | | | 1,290,456 | | |
Fortis Bank
Eurodollar Time Deposit
5.290% 07/06/2007 | | | 1,290,456 | | | | 1,290,456 | | |
Fortis Bank
Eurodollar Time Deposit
5.290% 07/09/2007 | | | 1,806,642 | | | | 1,806,642 | | |
Fortis Bank
Eurodollar Time Deposit
5.300% 07/20/2007 | | | 1,290,456 | | | | 1,290,456 | | |
| | | Principal
Amount | | Market
Value | |
Fortis Bank
Eurodollar Time Deposit
5.300% 07/26/2007 | | $ | 1,032,365 | | | $ | 1,032,365 | | |
Fortis Bank
Eurodollar Time Deposit
5.350% 07/05/2007 | | | 2,580,911 | | | | 2,580,911 | | |
Freddie Mac Discount Note
5.155% 07/16/2007 | | | 487,355 | | | | 487,355 | | |
Freddie Mac Discount Note
5.185% 07/09/2007 | | | 254,429 | | | | 254,429 | | |
Morgan Stanley & Co
Commercial Paper
5.445% 08/01/2007 | | | 2,322,820 | | | | 2,322,820 | | |
National Australia Bank
Eurodollar Time Deposit
5.320% 07/02/2007 | | | 2,580,911 | | | | 2,580,911 | | |
Nationwide
Building Society
Commercial Paper
5.301% 07/09/2007 | | | 2,575,602 | | | | 2,575,602 | | |
Rabobank Nederland
Eurodollar Time Deposit
5.280% 07/05/2007 | | | 3,871,367 | | | | 3,871,367 | | |
Rabobank Nederland
Eurodollar Time Deposit
5.290% 07/16/2007 | | | 5,161,823 | | | | 5,161,823 | | |
Rabobank Nederland
Eurodollar Time Deposit
5.330% 07/02/2007 | | | 7,742,735 | | | | 7,742,735 | | |
Reserve Primary
Money Market Fund(c) | | | 5,124,342 | | | | 5,124,342 | | |
Royal Bank of Canada
Eurodollar Time Deposit
5.305% 08/30/2007 | | | 5,161,823 | | | | 5,161,823 | | |
Royal Bank of Scotland
Eurodollar Time Deposit
5.270% 07/11/2007 | | | 1,290,456 | | | | 1,290,456 | | |
Skandinaviska Enskilda
Banken AB
Eurodollar Time Deposit
5.290% 07/13/2007 | | | 5,161,823 | | | | 5,161,823 | | |
Skandinaviska Enskilda
Banken AB
Eurodollar Time Deposit
5.290% 07/19/2007 | | | 774,274 | | | | 774,274 | | |
Svenska Handlesbanken
Eurodollar Time Deposit
5.300% 07/02/2007 | | | 867,060 | | | | 867,060 | | |
UBS AG
Eurodollar Time Deposit
5.277% 07/05/2007 | | | 3,613,276 | | | | 3,613,276 | | |
UBS AG
Eurodollar Time Deposit
5.285% 07/05/2007 | | | 5,161,823 | | | | 5,161,823 | | |
(Continued)
The accompanying notes are an integral part of the financial statements.
141
MassMutual Select Focused Value Fund – Portfolio of Investments (Continued)
| | | Principal
Amount | | Market
Value | |
Vanguard Prime
Money Market Fund(c) | | $ | 2,580,911 | | | $ | 2,580,911 | | |
Wells Fargo
Eurodollar Time Deposit
5.260% 07/02/2007 | | | 1,393,692 | | | | 1,393,692 | | |
Wells Fargo
Eurodollar Time Deposit
5.280% 07/11/2007 | | | 5,161,823 | | | | 5,161,823 | | |
Wells Fargo
Eurodollar Time Deposit
5.280% 07/12/2007 | | | 2,580,911 | | | | 2,580,911 | | |
| | | | 159,342,969 | | |
| Repurchase Agreements — 5.2% | |
Investors Bank & Trust
Company Repurchase
Agreement, dated
6/29/2007, 3.50%,
due 7/02/2007(e) | | | 51,760,521 | | | | 51,760,521 | | |
TOTAL SHORT-TERM
INVESTMENTS
(Cost $211,103,490) | | | | | | | 211,103,490 | | |
TOTAL INVESTMENTS — 116.0%
(Cost $946,537,222)(f) | | | | | | | 1,168,012,446 | | |
Other Assets/
(Liabilities) — (16.0%) | | | | | | | (160,800,925 | ) | |
| NET ASSETS — 100.0% | | | | | | $ | 1,007,211,521 | | |
Notes to Portfolio of Investments
(a) Denotes all or a portion of security on loan. (Note 2).
(b) Non-income producing security.
(c) Amount represents shares owned of the fund.
(d) Represents investments of security lending collateral. (Note 2).
(e) Maturity value of $51,775,618. Collateralized by a U.S. Government Agency obligation with a rate of 5.62%, maturity date of 8/15/2036, and an aggregate market value, including accrued interest, of $54,348,547.
(f) See Note 6 for aggregate cost for Federal tax purposes.
The remainder of this page is intentionally left blank.
The accompanying notes are an integral part of the financial statements.
142
MassMutual Select Mid-Cap Value Fund – Portfolio of Investments
June 30, 2007 (Unaudited)
| | | Number of
Shares | | Market
Value | |
| EQUITIES — 97.5% | |
| COMMON STOCK — 97.5% | |
| Advertising — 4.4% | |
| Catalina Marketing Corp. | | | 171,373 | | | $ | 5,398,249 | | |
| Harte-Hanks, Inc. | | | 169,435 | | | | 4,351,091 | | |
| | | | 9,749,340 | | |
| Apparel — 1.8% | |
| Jones Apparel Group, Inc. | | | 138,437 | | | | 3,910,845 | | |
| Banks — 2.1% | |
| City National Corp. | | | 49,806 | | | | 3,789,739 | | |
The South Financial
Group, Inc. | | | 36,716 | | | | 831,250 | | |
| | | | 4,620,989 | | |
| Beverages — 1.3% | |
| PepsiAmericas, Inc. | | | 118,987 | | | | 2,922,321 | | |
| Chemicals — 5.3% | |
International Flavors &
Fragrances, Inc. | | | 133,843 | | | | 6,978,574 | | |
| The Valspar Corp. | | | 163,960 | | | | 4,658,104 | | |
| | | | 11,636,678 | | |
| Commercial Services — 4.7% | |
| Corinthian Colleges, Inc.(a) | | | 632,400 | | | | 10,301,796 | | |
| Computers — 3.3% | |
| Diebold, Inc. | | | 141,427 | | | | 7,382,489 | | |
| Computers & Information — 2.4% | |
| CDW Corp.(a) | | | 63,350 | | | | 5,382,850 | | |
| Electrical Components & Equipment — 4.3% | |
| Hubbell, Inc. Cl. B | | | 110,758 | | | | 6,005,299 | | |
| Molex, Inc. | | | 118,100 | | | | 3,544,181 | | |
| | | | 9,549,480 | | |
| Electronics — 6.0% | |
| Cymer, Inc.(a) | | | 159,450 | | | | 6,409,890 | | |
Flextronics
International Ltd.(a) (b) | | | 271,055 | | | | 2,927,394 | | |
Mettler-Toledo
International, Inc.(a) | | | 41,611 | | | | 3,974,267 | | |
| | | | 13,311,551 | | |
| Entertainment — 1.6% | |
International
Speedway Corp. Cl. A | | | 67,351 | | | | 3,550,071 | | |
| Foods — 5.5% | |
| Hain Celestial Group, Inc.(a) | | | 240,117 | | | | 6,516,775 | | |
| Pilgrim's Pride Corp.(b) | | | 147,514 | | | | 5,630,609 | | |
| | | | 12,147,384 | | |
| | | Number of
Shares | | Market
Value | |
| Health Care – Services — 3.6% | |
| Quest Diagnostics, Inc. | | | 117,978 | | | $ | 6,093,564 | | |
Universal Health
Services, Inc. Cl. B | | | 30,084 | | | | 1,850,166 | | |
| | | | 7,943,730 | | |
| Insurance — 12.0% | |
Ambac Financial
Group, Inc.(b) | | | 23,195 | | | | 2,022,372 | | |
Gallagher
(Arthur J.) & Co.(b) | | | 192,537 | | | | 5,367,932 | | |
| MBIA, Inc.(b) | | | 67,527 | | | | 4,201,530 | | |
| RenaissanceRe Holdings Ltd. | | | 37,700 | | | | 2,337,023 | | |
| Stewart Information Services | | | 101,972 | | | | 4,061,545 | | |
| Unum Group | | | 76,862 | | | | 2,006,867 | | |
White Mountains Insurance
Group Ltd. | | | 9,067 | | | | 5,494,783 | | |
| Willis Group Holdings Ltd. | | | 25,600 | | | | 1,127,936 | | |
| | | | 26,619,988 | | |
| Machinery – Diversified — 4.5% | |
Albany International
Corp. Cl. A(b) | | | 108,367 | | | | 4,382,361 | | |
| Briggs & Stratton Corp.(b) | | | 134,200 | | | | 4,235,352 | | |
| Tennant Co. | | | 35,644 | | | | 1,301,006 | | |
| | | | 9,918,719 | | |
| Manufacturing — 7.4% | |
| Carlisle Cos., Inc.(b) | | | 48,775 | | | | 2,268,525 | | |
| Dover Corp. | | | 118,864 | | | | 6,079,894 | | |
| Federal Signal Corp. | | | 223,473 | | | | 3,544,282 | | |
| Pall Corp. | | | 98,311 | | | | 4,521,323 | | |
| | | | 16,414,024 | | |
| Office Furnishings — 2.2% | |
| Steelcase, Inc. Cl. A(b) | | | 262,402 | | | | 4,854,437 | | |
| Oil & Gas — 1.3% | |
| Cimarex Energy Co. | | | 74,825 | | | | 2,948,853 | | |
| Pharmaceuticals — 1.3% | |
Medco Health
Solutions, Inc.(a) | | | 36,746 | | | | 2,865,821 | | |
| Real Estate Investment Trusts (REITS) — 2.6% | |
| CapitalSource, Inc.(b) | | | 236,272 | | | | 5,809,928 | | |
| Retail — 6.2% | |
| CBRL Group, Inc.(b) | | | 64,344 | | | | 2,733,333 | | |
| Guitar Center, Inc.(a) | | | 105,088 | | | | 6,285,313 | | |
| Zale Corp.(a) (b) | | | 194,960 | | | | 4,641,998 | | |
| | | | 13,660,644 | | |
| | | Number of
Shares | | Market
Value | |
| Semiconductors — 3.6% | |
| Entegris, Inc.(a) (b) | | | 663,105 | | | $ | 7,877,687 | | |
| Software — 7.7% | |
| IMS Health, Inc. | | | 181,328 | | | | 5,826,069 | | |
MoneyGram
International, Inc.(b) | | | 238,130 | | | | 6,655,734 | | |
Parametric
Technology Corp.(a) (b) | | | 206,117 | | | | 4,454,188 | | |
| | | | 16,935,991 | | |
| Textiles — 2.4% | |
| G&K Services, Inc. Cl. A | | | 135,195 | | | | 5,341,554 | | |
TOTAL EQUITIES
(Cost $204,515,658) | | | | | | | 215,657,170 | | |
| | | Principal
Amount | | | |
| SHORT-TERM INVESTMENTS — 26.0% | |
| Cash Equivalents — 21.9%(d) | |
Abbey National PLC
Eurodollar Time Deposit
5.280% 07/05/2007 | | $ | 628,348 | | | | 628,348 | | |
Abbey National PLC
Eurodollar Time Deposit
5.285% 07/09/2007 | | | 1,570,870 | | | | 1,570,870 | | |
American Beacon
Money Market Fund(c) | | | 1,762,444 | | | | 1,762,444 | | |
Banco Bilbao Vizcaya
Argentaria SA
Eurodollar Time Deposit
5.300% 08/10/2007 | | | 1,178,153 | | | | 1,178,153 | | |
Bank of America
5.270% 07/06/2007 | | | 1,570,871 | | | | 1,570,871 | | |
Bank of America
5.270% 07/16/2007 | | | 314,174 | | | | 314,174 | | |
Bank of America
5.270% 08/17/2007 | | | 392,718 | | | | 392,718 | | |
Bank of America
5.300% 09/17/2007 | | | 785,435 | | | | 785,435 | | |
Bank of Ireland
Eurodollar Time Deposit
5.300% 08/13/2007 | | | 1,570,871 | | | | 1,570,871 | | |
Bank of Montreal
Eurodollar Time Deposit
5.280% 07/03/2007 | | | 392,718 | | | | 392,718 | | |
Bank of Montreal
Eurodollar Time Deposit
5.290% 07/02/2007 | | | 314,174 | | | | 314,174 | | |
(Continued)
The accompanying notes are an integral part of the financial statements.
143
MassMutual Select Mid-Cap Value Fund – Portfolio of Investments (Continued)
| | | Principal
Amount | | Market
Value | |
Bank of Montreal
Eurodollar Time Deposit
5.310% 08/14/2007 | | $ | 235,631 | | | $ | 235,631 | | |
Bank of Nova Scotia
Eurodollar Time Deposit
5.280% 07/09/2007 | | | 1,492,327 | | | | 1,492,327 | | |
Bank Of Nova Scotia
Eurodollar Time Deposit
5.285% 07/11/2007 | | | 863,979 | | | | 863,979 | | |
Barclays
Eurodollar Time Deposit
5.290% 07/06/2007 | | | 1,570,871 | | | | 1,570,871 | | |
Barclays
Eurodollar Time Deposit
5.295% 07/16/2007 | | | 314,174 | | | | 314,174 | | |
Barclays
Eurodollar Time Deposit
5.320% 09/04/2007 | | | 785,435 | | | | 785,435 | | |
Bear Stearns & Co
Commercial Paper
5.435% 07/10/2007 | | | 235,631 | | | | 235,631 | | |
BGI Institutional
Money Market Fund(c) | | | 1,021,066 | | | | 1,021,066 | | |
BNP Paribas
Eurodollar Time Deposit
5.350% 07/02/2007 | | | 2,356,306 | | | | 2,356,306 | | |
Calyon
Eurodollar Time Deposit
5.290% 07/17/2007 | | | 785,435 | | | | 785,435 | | |
Calyon
Eurodollar Time Deposit
5.380% 07/02/2007 | | | 2,356,306 | | | | 2,356,306 | | |
Canadian Imperial
Bank of Commerce
Eurodollar Time Deposit
5.300% 07/30/2007 | | | 1,570,871 | | | | 1,570,871 | | |
Dexia Group
Eurodollar Time Deposit
5.290% 08/08/2007 | | | 1,570,871 | | | | 1,570,871 | | |
Dreyfus Institutional
Cash Advantage
Money Market Fund(c) | | | 471,261 | | | | 471,261 | | |
Federal Home Loan Bank
Discount Note
5.174% 07/20/2007 | | | 116,506 | | | | 116,506 | | |
First Tennessee
National Corp.
Eurodollar Time Deposit
5.300% 07/18/2007 | | | 392,718 | | | | 392,718 | | |
Fortis Bank
Eurodollar Time Deposit
5.290% 07/06/2007 | | | 392,718 | | | | 392,718 | | |
| | | Principal
Amount | | Market
Value | |
Fortis Bank
Eurodollar Time Deposit
5.290% 07/09/2007 | | $ | 549,805 | | | $ | 549,805 | | |
Fortis Bank
Eurodollar Time Deposit
5.300% 07/20/2007 | | | 392,718 | | | | 392,718 | | |
Fortis Bank
Eurodollar Time Deposit
5.300% 07/26/2007 | | | 314,174 | | | | 314,174 | | |
Fortis Bank
Eurodollar Time Deposit
5.350% 07/05/2007 | | | 785,435 | | | | 785,435 | | |
Freddie Mac Discount Note
5.155% 07/16/2007 | | | 148,314 | | | | 148,314 | | |
Freddie Mac Discount Note
5.185% 07/09/2007 | | | 77,429 | | | | 77,429 | | |
Morgan Stanley & Co
Commercial Paper
5.445% 08/01/2007 | | | 706,892 | | | | 706,892 | | |
National Australia Bank
Eurodollar Time Deposit
5.320% 07/02/2007 | | | 785,435 | | | | 785,435 | | |
Nationwide Building Society
Commercial Paper
5.301% 07/09/2007 | | | 783,820 | | | | 783,820 | | |
Rabobank Nederland
Eurodollar Time Deposit
5.280% 07/05/2007 | | | 1,178,153 | | | | 1,178,153 | | |
Rabobank Nederland
Eurodollar Time Deposit
5.290% 07/16/2007 | | | 1,570,871 | | | | 1,570,871 | | |
Rabobank Nederland
Eurodollar Time Deposit
5.330% 07/02/2007 | | | 2,356,306 | | | | 2,356,306 | | |
Reserve Primary
Money Market Fund(c) | | | 1,559,464 | | | | 1,559,464 | | |
Royal Bank of Canada
Eurodollar Time Deposit
5.305% 08/30/2007 | | | 1,570,871 | | | | 1,570,871 | | |
Royal Bank of Scotland
Eurodollar Time Deposit
5.270% 07/11/2007 | | | 392,718 | | | | 392,718 | | |
Skandinaviska Enskilda
Banken AB
Eurodollar Time Deposit
5.290% 07/13/2007 | | | 1,570,871 | | | | 1,570,871 | | |
Skandinaviska Enskilda
Banken AB
Eurodollar Time Deposit
5.290% 07/19/2007 | | | 235,631 | | | | 235,631 | | |
Svenska Handlesbanken
Eurodollar Time Deposit
5.300% 07/02/2007 | | | 263,868 | | | | 263,868 | | |
| | | Principal
Amount | | Market
Value | |
UBS AG
Eurodollar Time Deposit
5.277% 07/05/2007 | | $ | 1,099,610 | | | $ | 1,099,610 | | |
UBS AG
Eurodollar Time Deposit
5.285% 07/05/2007 | | | 1,570,871 | | | | 1,570,871 | | |
Vanguard Prime
Money Market Fund(c) | | | 785,435 | | | | 785,435 | | |
Wells Fargo
Eurodollar Time Deposit
5.260% 07/02/2007 | | | 424,135 | | | | 424,135 | | |
Wells Fargo
Eurodollar Time Deposit
5.280% 07/11/2007 | | | 1,570,871 | | | | 1,570,871 | | |
Wells Fargo
Eurodollar Time Deposit
5.280% 07/12/2007 | | | 785,435 | | | | 785,435 | | |
| | | | 48,492,014 | | |
| Repurchase Agreements — 4.1% | |
Investors Bank & Trust
Company Repurchase
Agreement, dated
6/29/2007, 3.50%,
due 7/02/2007(e) | | | 8,916,885 | | | | 8,916,885 | | |
TOTAL SHORT-TERM
INVESTMENTS
(Cost $57,408,899) | | | | | | | 57,408,899 | | |
TOTAL INVESTMENTS — 123.5%
(Cost $261,924,557)(f) | | | | | | | 273,066,069 | | |
Other Assets/
(Liabilities) — (23.5%) | | | | | | | (51,906,292 | ) | |
| NET ASSETS — 100.0% | | | | | | $ | 221,159,777 | | |
Notes to Portfolio of Investments
(a) Non-income producing security.
(b) Denotes all or a portion of security on loan. (Note 2).
(c) Amount represents shares owned of the fund.
(d) Represents investments of security lending collateral. (Note 2).
(e) Maturity value of $8,919,485. Collateralized by a U.S. Government Agency Obligation with a rate of 8.525%, maturity date of 2/25/2028, and an aggregate market value, including accrued interest, of $9,362,729.
(f) See Note 6 for aggregate cost for Federal tax purposes.
The accompanying notes are an integral part of the financial statements.
144
MassMutual Select Small Cap Value Equity Fund – Portfolio of Investments
June 30, 2007 (Unaudited)
| | | Number of
Shares | | Market
Value | |
| EQUITIES — 97.2% | |
| COMMON STOCK — 97.2% | |
| Aerospace & Defense — 0.3% | |
| Curtiss-Wright Corp. | | | 7,300 | | | $ | 340,253 | | |
| Kaman Corp. | | | 2,700 | | | | 84,213 | | |
| Orbital Sciences Corp.(a) | | | 300 | | | | 6,303 | | |
Teledyne
Technologies, Inc.(a) | | | 1,100 | | | | 50,545 | | |
| | | | 481,314 | | |
| Agriculture — 0.4% | |
| Universal Corp. | | | 9,300 | | | | 566,556 | | |
| Airlines — 0.6% | |
| Alaska Air Group, Inc.(a) | | | 6,300 | | | | 175,518 | | |
| ExpressJet Holdings, Inc.(a) | | | 5,900 | | | | 35,282 | | |
Republic Airways
Holdings, Inc.(a) | | | 20,400 | | | | 415,140 | | |
| SkyWest, Inc. | | | 11,700 | | | | 278,811 | | |
| | | | 904,751 | | |
| Apparel — 1.8% | |
| Cherokee, Inc. | | | 2,400 | | | | 87,696 | | |
| Columbia Sportswear Co.(b) | | | 13,300 | | | | 913,444 | | |
| Kellwood Co. | | | 17,500 | | | | 492,100 | | |
| Maidenform Brands, Inc.(a) | | | 5,000 | | | | 99,300 | | |
Perry Ellis
International, Inc.(a) | | | 9,900 | | | | 318,483 | | |
| The Warnaco Group, Inc.(a) | | | 24,000 | | | | 944,160 | | |
| Wolverine World Wide, Inc. | | | 1,700 | | | | 47,107 | | |
| | | | 2,902,290 | | |
| Automotive & Parts — 1.8% | |
Aftermarket
Technology Corp.(a) | | | 27,800 | | | | 825,104 | | |
| ArvinMeritor, Inc.(b) | | | 46,000 | | | | 1,021,200 | | |
| Lear Corp.(a) | | | 12,000 | | | | 427,320 | | |
| Modine Manufacturing Co. | | | 14,400 | | | | 325,440 | | |
Standard Motor
Products, Inc. | | | 11,300 | | | | 169,839 | | |
| | | | 2,768,903 | | |
| Banking, Savings & Loans — 0.1% | |
Berkshire Hills
Bancorp, Inc. | | | 2,700 | | | | 85,077 | | |
| Sterling Financial Corp./PA | | | 3,700 | | | | 38,924 | | |
| | | | 124,001 | | |
| Banks — 10.9% | |
| Amcore Financial, Inc. | | | 12,300 | | | | 356,577 | | |
| Bancfirst Corp. | | | 2,100 | | | | 89,922 | | |
| | | Number of
Shares | | Market
Value | |
| Banner Corp. | | | 4,400 | | | $ | 149,864 | | |
Centennial Bank
Holdings, Inc.(a) | | | 53,000 | | | | 448,910 | | |
Central Pacific
Financial Corp. | | | 16,800 | | | | 554,568 | | |
| Chemical Financial Corp.(b) | | | 18,300 | | | | 473,421 | | |
| Chittenden Corp. | | | 12,700 | | | | 443,865 | | |
Citizens Republic
Bancorp, Inc. | | | 52,294 | | | | 956,980 | | |
| City Bank Lynnwood WA | | | 400 | | | | 12,604 | | |
| City Holding Co. | | | 7,200 | | | | 275,976 | | |
| CVB Financial Corp.(b) | | | 5,170 | | | | 57,490 | | |
| F.N.B. Corp.(b) | | | 34,100 | | | | 570,834 | | |
| First Bancorp(b) | | | 19,200 | | | | 211,008 | | |
First Bancorp,
North Carolina | | | 12,300 | | | | 230,379 | | |
| First Charter Corp. | | | 19,600 | | | | 381,612 | | |
First Commonwealth
Financial Corp.(b) | | | 11,700 | | | | 127,764 | | |
| First Community Bancorp | | | 16,600 | | | | 949,686 | | |
First Community
Bancshares, Inc. | | | 1,100 | | | | 34,309 | | |
| First Financial Bancorp | | | 39,100 | | | | 586,109 | | |
| First Indiana Corp. | | | 100 | | | | 2,212 | | |
| First Merchants Corp. | | | 15,500 | | | | 372,465 | | |
| First Midwest Bancorp, Inc. | | | 800 | | | | 28,408 | | |
First Regional Bancorp/Los
Angeles, CA(a) | | | 1,500 | | | | 38,160 | | |
| FirstMerit Corp. | | | 48,000 | | | | 1,004,640 | | |
| Fremont General Corp.(b) | | | 8,800 | | | | 94,688 | | |
| Frontier Financial Corp.(b) | | | 7,700 | | | | 173,481 | | |
Great Southern
Bancorp, Inc.(b) | | | 6,900 | | | | 186,645 | | |
| Hanmi Financial Corp. | | | 16,500 | | | | 281,490 | | |
| Horizon Financial Corp. | | | 3,875 | | | | 84,436 | | |
| IBERIABANK Corp. | | | 2,800 | | | | 138,460 | | |
| Independent Bank Corp. | | | 27,655 | | | | 475,943 | | |
| Integra Bank Corp. | | | 19,300 | | | | 414,371 | | |
| Irwin Financial Corp. | | | 21,100 | | | | 315,867 | | |
| ITLA Capital Corp. | | | 4,500 | | | | 234,540 | | |
| Lakeland Bancorp, Inc.(b) | | | 6,900 | | | | 91,770 | | |
| Macatawa Bank Corp. | | | 8,200 | | | | 130,462 | | |
MainSource Financial
Group, Inc. | | | 1,230 | | | | 20,652 | | |
National Penn
Bancshares, Inc.(b) | | | 5,600 | | | | 93,408 | | |
| Old National Bancorp(b) | | | 17,600 | | | | 292,336 | | |
| Omega Financial Corp. | | | 7,900 | | | | 212,431 | | |
Oriental Financial
Group, Inc. | | | 67,500 | | | | 736,425 | | |
| Peoples Bancorp, Inc. | | | 600 | | | | 16,242 | | |
| | | Number of
Shares | | Market
Value | |
| Provident Bankshares Corp. | | | 23,300 | | | $ | 763,774 | | |
| Renasant Corp. | | | 1,600 | | | | 36,384 | | |
| S&T Bancorp | | | 11,900 | | | | 391,510 | | |
| Santander BanCorp | | | 2,400 | | | | 35,664 | | |
| SCBT Financial Corp. | | | 1,215 | | | | 44,226 | | |
Simmons First National
Corp. Cl. A | | | 7,000 | | | | 193,130 | | |
| Sun Bancorp, Inc.(a) | | | 5,355 | | | | 90,339 | | |
Susquehanna
Bancshares, Inc.(b) | | | 23,100 | | | | 516,747 | | |
| Taylor Capital Group, Inc. | | | 11,800 | | | | 324,854 | | |
| Trustmark Corp. | | | 3,700 | | | | 95,682 | | |
| UMB Financial Corp. | | | 12,200 | | | | 449,814 | | |
| United Bankshares, Inc.(b) | | | 24,800 | | | | 788,640 | | |
| W Holding Co., Inc.(b) | | | 54,400 | | | | 143,616 | | |
| WesBanco, Inc. | | | 27,000 | | | | 796,500 | | |
| West Coast Bancorp | | | 4,200 | | | | 127,638 | | |
| | | | 17,149,928 | | |
| Biotechnology — 0.2% | |
Bio-Rad Laboratories,
Inc. Cl. A(a) | | | 3,100 | | | | 234,267 | | |
Celera Genomics Group -
Applera Corp.(a) | | | 5,600 | | | | 69,440 | | |
| Incyte Corp.(a) (b) | | | 5,800 | | | | 34,800 | | |
| Maxygen, Inc.(a) | | | 4,500 | | | | 38,565 | | |
| | | | 377,072 | | |
| Building Materials — 0.2% | |
| Goodman Global, Inc.(a) | | | 17,500 | | | | 388,850 | | |
| Chemicals — 3.4% | |
| Arch Chemicals, Inc. | | | 5,500 | | | | 193,270 | | |
| CF Industries Holdings, Inc. | | | 12,800 | | | | 766,592 | | |
| Georgia Gulf Corp.(b) | | | 4,200 | | | | 76,062 | | |
| H.B. Fuller Co. | | | 21,400 | | | | 639,646 | | |
| Hercules, Inc.(a) | | | 13,500 | | | | 265,275 | | |
| Innospec, Inc. | | | 14,300 | | | | 846,703 | | |
| Minerals Technologies, Inc. | | | 3,200 | | | | 214,240 | | |
| NL Industries | | | 7,200 | | | | 72,144 | | |
| OM Group, Inc.(a) | | | 5,400 | | | | 285,768 | | |
| Rockwood Holdings, Inc.(a) | | | 29,200 | | | | 1,067,260 | | |
| Sensient Technologies Corp. | | | 19,400 | | | | 492,566 | | |
| Spartech Corp. | | | 4,400 | | | | 116,820 | | |
| Tronox, Inc. Cl. B | | | 19,800 | | | | 278,190 | | |
| | | | 5,314,536 | | |
| Commercial Services — 5.5% | |
| ABM Industries, Inc.(b) | | | 30,900 | | | | 797,529 | | |
Albany Molecular
Research, Inc.(a) | | | 2,900 | | | | 43,065 | | |
| Bowne & Co., Inc. | | | 4,900 | | | | 95,599 | | |
(Continued)
The accompanying notes are an integral part of the financial statements.
145
MassMutual Select Small Cap Value Equity Fund – Portfolio of Investments (Continued)
| | | Number of
Shares | | Market
Value | |
| CDI Corp. | | | 3,800 | | | $ | 122,360 | | |
| Clayton Holdings, Inc.(a) | | | 11,600 | | | | 132,124 | | |
| Coinstar, Inc.(a) | | | 6,300 | | | | 198,324 | | |
Consolidated
Graphics, Inc.(a) | | | 5,800 | | | | 401,824 | | |
Cross Country
Healthcare, Inc.(a) | | | 12,900 | | | | 215,172 | | |
| Deluxe Corp.(b) | | | 26,600 | | | | 1,080,226 | | |
DynCorp
International, Inc.(a) | | | 34,700 | | | | 763,053 | | |
| Exponent, Inc.(a) | | | 4,900 | | | | 109,613 | | |
Global Cash Access
Holdings, Inc.(a) | | | 4,800 | | | | 76,896 | | |
| Healthspring, Inc.(a) | | | 21,500 | | | | 409,790 | | |
Heidrick & Struggles
International, Inc.(a) | | | 14,500 | | | | 742,980 | | |
| Interactive Data Corp. | | | 28,900 | | | | 773,942 | | |
Jackson Hewitt Tax
Service, Inc. | | | 1,000 | | | | 28,110 | | |
| Korn/Ferry International(a) | | | 4,100 | | | | 107,666 | | |
| MPS Group, Inc.(a) | | | 2,400 | | | | 32,088 | | |
PharmaNet Development
Group, Inc.(a) | | | 2,400 | | | | 76,512 | | |
| QC Holdings, Inc.(b) | | | 2,400 | | | | 36,000 | | |
| Rent-A-Center, Inc.(a) (b) | | | 3,000 | | | | 78,690 | | |
| Spherion Corp.(a) | | | 76,200 | | | | 715,518 | | |
| Standard Parking Corp.(a) | | | 800 | | | | 28,104 | | |
Stewart Enterprises,
Inc. Cl. A(b) | | | 70,100 | | | | 546,079 | | |
Valassis
Communications, Inc.(a) | | | 1,300 | | | | 22,347 | | |
| Viad Corp. | | | 20,200 | | | | 851,834 | | |
Volt Information
Sciences, Inc.(a) (b) | | | 1,050 | | | | 19,362 | | |
Watson Wyatt Worldwide,
Inc. Cl. A | | | 2,700 | | | | 136,296 | | |
| Wright Express Corp.(a) | | | 1,400 | | | | 47,978 | | |
| | | | 8,689,081 | | |
| Computer Integrated Systems Design — 0.0% | |
| 3Com Corp.(a) | | | 15,900 | | | | 65,667 | | |
| Computers — 2.4% | |
| Agilysys, Inc. | | | 35,800 | | | | 805,500 | | |
CACI International,
Inc. Cl. A(a) | | | 1,800 | | | | 87,930 | | |
| Ciber, Inc.(a) | | | 63,400 | | | | 518,612 | | |
Electronics for
Imaging, Inc.(a) | | | 2,200 | | | | 62,084 | | |
Manhattan
Associates, Inc.(a) | | | 9,700 | | | | 270,727 | | |
| Mentor Graphics Corp.(a) | | | 3,900 | | | | 51,363 | | |
| MTS Systems Corp. | | | 6,500 | | | | 290,355 | | |
| Palm, Inc.(a) (b) | | | 52,800 | | | | 845,328 | | |
| | | Number of
Shares | | Market
Value | |
| Perot Systems Corp. Cl. A(a) | | | 36,200 | | | $ | 616,848 | | |
| Quantum Corp.(a) (b) | | | 3,500 | | | | 11,095 | | |
Silicon Storage
Technology, Inc.(a) | | | 71,500 | | | | 266,695 | | |
| | | | 3,826,537 | | |
| Consumer Services — 0.3% | |
Core-Mark Holding
Co., Inc.(a) | | | 12,700 | | | | 456,946 | | |
| Cosmetics & Personal Care — 0.1% | |
| Elizabeth Arden, Inc.(a) | | | 4,800 | | | | 116,448 | | |
| Diversified Financial — 1.6% | |
Asset Acceptance
Capital Corp.(a) | | | 8,900 | | | | 157,530 | | |
| Asta Funding, Inc.(b) | | | 2,300 | | | | 88,389 | | |
| CompuCredit Corp.(a) (b) | | | 18,300 | | | | 640,866 | | |
| Doral Financial Corp.(a) (b) | | | 1,500 | | | | 1,770 | | |
Friedman, Billings, Ramsey
Group, Inc. Cl. A(b) | | | 89,500 | | | | 488,670 | | |
Knight Capital Group,
Inc. Cl. A(a) | | | 800 | | | | 13,280 | | |
| LaBranche & Co., Inc.(a) | | | 17,200 | | | | 126,936 | | |
| Piper Jaffray Cos.(a) | | | 5,600 | | | | 312,088 | | |
| SWS Group, Inc. | | | 500 | | | | 10,810 | | |
Waddell & Reed Financial,
Inc. Cl. A | | | 29,400 | | | | 764,694 | | |
| | | | 2,605,033 | | |
| Electric — 2.6% | |
| Black Hills Corp.(b) | | | 23,100 | | | | 918,225 | | |
| CH Energy Group, Inc.(b) | | | 3,800 | | | | 170,886 | | |
| El Paso Electric Co.(a) | | | 36,900 | | | | 906,264 | | |
Empire District Electric
Co. (The)(b) | | | 6,800 | | | | 152,116 | | |
| Idacorp, Inc. | | | 3,000 | | | | 96,120 | | |
| PNM Resources, Inc.(b) | | | 22,200 | | | | 616,938 | | |
Portland General
Electric Co. | | | 7,300 | | | | 200,312 | | |
| Westar Energy, Inc. | | | 42,100 | | | | 1,022,188 | | |
| | | | 4,083,049 | | |
| Electrical Components & Equipment — 0.5% | |
| EnerSys(a) | | | 4,200 | | | | 76,860 | | |
Graftech
International Ltd.(a) | | | 35,700 | | | | 601,188 | | |
| Greatbatch, Inc.(a) | | | 700 | | | | 22,680 | | |
| Littelfuse, Inc.(a) | | | 900 | | | | 30,393 | | |
| | | | 731,121 | | |
| Electronics — 2.2% | |
| Bel Fuse, Inc. Cl. B | | | 500 | | | | 17,015 | | |
| Checkpoint Systems, Inc.(a) | | | 36,200 | | | | 914,050 | | |
| Coherent, Inc.(a) | | | 10,900 | | | | 332,559 | | |
| Cubic Corp. | | | 2,300 | | | | 69,414 | | |
| | | Number of
Shares | | Market
Value | |
| Kemet Corp.(a) | | | 71,200 | | | $ | 501,960 | | |
| Methode Electronics, Inc. | | | 50,500 | | | | 790,325 | | |
| Park Electrochemical Corp. | | | 15,600 | | | | 439,608 | | |
| Stoneridge, Inc.(a) | | | 800 | | | | 9,872 | | |
| TTM Technologies, Inc.(a) | | | 4,400 | | | | 57,200 | | |
| Varian, Inc.(a) | | | 4,800 | | | | 263,184 | | |
| | | | 3,395,187 | | |
| Energy — 0.2% | |
| Energy Partners Ltd.(a) | | | 18,900 | | | | 315,441 | | |
| Energy – Alternate Sources — 0.5% | |
| Headwaters, Inc.(a) (b) | | | 48,400 | | | | 835,868 | | |
| Engineering & Construction — 1.7% | |
| Dycom Industries, Inc.(a) | | | 28,200 | | | | 845,436 | | |
| Emcor Group, Inc.(a) | | | 16,200 | | | | 1,180,980 | | |
| Perini Corp.(a) | | | 10,200 | | | | 627,606 | | |
| | | | 2,654,022 | | |
| Entertainment — 0.1% | |
Pinnacle
Entertainment, Inc.(a) | | | 100 | | | | 2,815 | | |
Steinway Musical
Instruments, Inc. | | | 4,100 | | | | 141,819 | | |
| | | | 144,634 | | |
| Entertainment & Leisure — 0.0% | |
Lakes
Entertainment, Inc.(a) (b) | | | 2,300 | | | | 27,163 | | |
| Environmental Controls — 0.9% | |
| TETRA Technologies, Inc.(a) | | | 27,200 | | | | 586,160 | | |
| Waste Connections, Inc.(a) | | | 27,450 | | | | 830,088 | | |
| | | | 1,416,248 | | |
| Foods — 1.5% | |
| Flowers Foods, Inc. | | | 2,300 | | | | 76,728 | | |
| Nash Finch Co.(b) | | | 15,800 | | | | 782,100 | | |
| Seaboard Corp.(b) | | | 200 | | | | 469,000 | | |
| Spartan Stores, Inc. | | | 1,700 | | | | 55,947 | | |
| TreeHouse Foods, Inc.(a) | | | 28,100 | | | | 747,741 | | |
Village Super Market,
Inc. Cl. A | | | 6,100 | | | | 291,641 | | |
| | | | 2,423,157 | | |
| Forest Products & Paper — 1.2% | |
| BlueLinx Holdings, Inc. | | | 2,100 | | | | 22,029 | | |
Buckeye
Technologies, Inc.(a) | | | 56,900 | | | | 880,243 | | |
Building Materials
Holding Corp.(b) | | | 1,300 | | | | 18,447 | | |
| Rock-Tenn Co. Cl. A | | | 14,000 | | | | 444,080 | | |
Schweitzer-Mauduit
International, Inc. | | | 13,100 | | | | 406,100 | | |
| Wausau Paper Corp. | | | 12,000 | | | | 160,800 | | |
| | | | 1,931,699 | | |
(Continued)
The accompanying notes are an integral part of the financial statements.
146
MassMutual Select Small Cap Value Equity Fund – Portfolio of Investments (Continued)
| | | Number of
Shares | | Market
Value | |
| Gas — 1.8% | |
| New Jersey Resources Corp. | | | 17,500 | | | $ | 892,850 | | |
| Nicor, Inc.(b) | | | 7,900 | | | | 339,068 | | |
| Northwest Natural Gas Co. | | | 10,200 | | | | 471,138 | | |
Piedmont Natural Gas
Co., Inc.(b) | | | 20,000 | | | | 493,000 | | |
| South Jersey Industries, Inc. | | | 500 | | | | 17,690 | | |
| Southwest Gas Corp. | | | 12,600 | | | | 426,006 | | |
| WGL Holdings, Inc.(b) | | | 4,900 | | | | 159,936 | | |
| | | | 2,799,688 | | |
| Health Care – Products — 1.2% | |
| CONMED Corp.(a) | | | 27,500 | | | | 805,200 | | |
| Invacare Corp. | | | 1,400 | | | | 25,662 | | |
Medical Action
Industries, Inc.(a) | | | 2,300 | | | | 41,538 | | |
| Steris Corp. | | | 30,900 | | | | 945,540 | | |
| Symmetry Medical, Inc.(a) | | | 600 | | | | 9,606 | | |
| | | | 1,827,546 | | |
| Health Care – Services — 1.1% | |
| Alliance Imaging, Inc.(a) | | | 800 | | | | 7,512 | | |
Apria Healthcare
Group, Inc.(a) (b) | | | 4,800 | | | | 138,096 | | |
| Centene Corp.(a) | | | 37,700 | | | | 807,534 | | |
| Medcath Corp.(a) (b) | | | 3,000 | | | | 95,400 | | |
| Odyssey Healthcare, Inc.(a) | | | 900 | | | | 10,674 | | |
| RehabCare Group, Inc.(a) | | | 15,100 | | | | 215,024 | | |
| Res-Care, Inc.(a) | | | 6,000 | | | | 126,840 | | |
Sunrise Senior
Living, Inc.(a) (b) | | | 6,500 | | | | 259,935 | | |
| | | | 1,661,015 | | |
| Home Builders — 0.2% | |
| AMREP Corp.(b) | | | 200 | | | | 9,510 | | |
| Levitt Corp. Cl. A | | | 300 | | | | 2,829 | | |
| M/I Homes, Inc. | | | 700 | | | | 18,620 | | |
Meritage
Homes Corp.(a) (b) | | | 3,600 | | | | 96,300 | | |
| Monaco Coach Corp. | | | 600 | | | | 8,610 | | |
WCI
Communities, Inc.(a) (b) | | | 1,200 | | | | 20,016 | | |
| Winnebago Industries, Inc. | | | 6,300 | | | | 185,976 | | |
| | | | 341,861 | | |
Home Construction, Furnishings &
Appliances — 0.5% | |
| Beazer Homes USA, Inc. | | | 1,200 | | | | 29,604 | | |
| Brookfield Homes Corp.(b) | | | 24,500 | | | | 712,705 | | |
| | | | 742,309 | | |
| Home Furnishing — 0.1% | |
Kimball International,
Inc. Cl. B | | | 4,400 | | | | 61,644 | | |
| Sealy Corp. | | | 5,600 | | | | 92,512 | | |
| | | | 154,156 | | |
| | | Number of
Shares | | Market
Value | |
| Household Products — 2.0% | |
| ACCO Brands Corp.(a) (b) | | | 5,400 | | | $ | 124,470 | | |
American Greetings
Corp. Cl. A | | | 19,100 | | | | 541,103 | | |
| Blyth, Inc. | | | 9,000 | | | | 239,220 | | |
| Playtex Products, Inc.(a) | | | 40,000 | | | | 592,400 | | |
Prestige Brands
Holdings, Inc.(a) | | | 57,200 | | | | 742,456 | | |
Tupperware
Brands Corp.(b) | | | 20,300 | | | | 583,422 | | |
| WD-40 Co. | | | 7,800 | | | | 256,386 | | |
| | | | 3,079,457 | | |
| Insurance — 7.6% | |
| Alfa Corp. | | | 1,000 | | | | 15,570 | | |
American Equity Investment
Life Holding Co.(b) | | | 71,600 | | | | 864,928 | | |
American Physicians
Capital, Inc.(a) | | | 13,800 | | | | 558,900 | | |
Amtrust Financial
Services, Inc.(b) | | | 26,900 | | | | 505,451 | | |
| Argonaut Group, Inc. | | | 9,400 | | | | 293,374 | | |
Aspen Insurance
Holdings Ltd.(b) | | | 45,100 | | | | 1,265,957 | | |
| Bristol West Holdings, Inc. | | | 9,400 | | | | 210,278 | | |
| CNA Surety Corp.(a) | | | 6,500 | | | | 122,915 | | |
| The Commerce Group, Inc. | | | 32,100 | | | | 1,114,512 | | |
Delphi Financial Group,
Inc. Cl. A | | | 5,100 | | | | 213,282 | | |
FBL Financial Group,
Inc. Cl. A | | | 17,300 | | | | 680,236 | | |
First Mercury
Financial Corp.(a) | | | 10,300 | | | | 215,991 | | |
Flagstone Reinsurance
Holdings Ltd(a) | | | 26,700 | | | | 355,644 | | |
FPIC Insurance
Group, Inc.(a) | | | 18,800 | | | | 766,476 | | |
Horace Mann
Educators Corp. | | | 21,500 | | | | 456,660 | | |
| Independence Holding Co. | | | 800 | | | | 16,344 | | |
| IPC Holdings Ltd. | | | 1,800 | | | | 58,122 | | |
| Max Capital Group Ltd. | | | 4,700 | | | | 133,010 | | |
| The Midland Co. | | | 9,000 | | | | 422,460 | | |
| Navigators Group, Inc.(a) | | | 16,600 | | | | 894,740 | | |
| NYMAGIC, Inc. | | | 2,300 | | | | 92,460 | | |
Odyssey Re
Holdings Corp.(b) | | | 10,200 | | | | 437,478 | | |
The Phoenix
Companies, Inc. | | | 13,900 | | | | 208,639 | | |
| PMA Capital Corp. Cl. A(a) | | | 35,900 | | | | 383,771 | | |
SeaBright Insurance
Holdings(a) | | | 13,200 | | | | 230,736 | | |
| State Auto Financial Corp. | | | 11,900 | | | | 364,735 | | |
| Stewart Information Services | | | 1,300 | | | | 51,779 | | |
| | | Number of
Shares | | Market
Value | |
| Triad Guaranty, Inc.(a) (b) | | | 11,200 | | | $ | 447,216 | | |
| United Fire & Casualty Co.(b) | | | 15,100 | | | | 534,238 | | |
Universal American
Financial Corp.(a) | | | 5,000 | | | | 106,400 | | |
| | | | 12,022,302 | | |
| Internet — 2.2% | |
Authorize.Net
Holdings, Inc.(a) | | | 5,200 | | | | 93,028 | | |
| CMGI, Inc.(a) | | | 191,700 | | | | 373,815 | | |
| EarthLink, Inc.(a) | | | 7,000 | | | | 52,290 | | |
| FTD Group, Inc. | | | 4,900 | | | | 90,209 | | |
| Harris Interactive, Inc.(a) | | | 10,800 | | | | 57,780 | | |
| i2 Technologies, Inc.(a) (b) | | | 8,100 | | | | 150,984 | | |
| Interwoven, Inc.(a) | | | 12,000 | | | | 168,480 | | |
| Ipass, Inc.(a) (b) | | | 1,000 | | | | 5,420 | | |
| RealNetworks, Inc.(a) | | | 7,800 | | | | 63,726 | | |
Secure
Computing Corp.(a) (b) | | | 62,500 | | | | 474,375 | | |
| SonicWALL, Inc.(a) | | | 6,000 | | | | 51,540 | | |
| TIBCO Software, Inc.(a) | | | 101,200 | | | | 915,860 | | |
| United Online, Inc. | | | 33,900 | | | | 559,011 | | |
| Vignette Corp.(a) | | | 20,500 | | | | 392,780 | | |
| | | | 3,449,298 | | |
| Investment Companies — 1.4% | |
| Apollo Investment Corp. | | | 23,100 | | | | 497,112 | | |
| Ares Capital Corp.(b) | | | 4,000 | | | | 67,400 | | |
| Capital Southwest Corp.(b) | | | 1,000 | | | | 155,790 | | |
| Compass Diversified Trust | | | 46,200 | | | | 823,746 | | |
| Gladstone Capital Corp.(b) | | | 3,100 | | | | 66,526 | | |
| MCG Capital Corp. | | | 14,500 | | | | 232,290 | | |
NGP Capital
Resources Co.(b) | | | 21,000 | | | | 351,120 | | |
| | | | 2,193,984 | | |
| Iron & Steel — 0.4% | |
Schnitzer Steel Industries,
Inc. Cl. A | | | 13,000 | | | | 623,220 | | |
| Leisure Time — 0.6% | |
| Polaris Industries, Inc.(b) | | | 14,300 | | | | 774,488 | | |
Town Sports International
Holdings, Inc.(a) | | | 10,700 | | | | 206,724 | | |
| | | | 981,212 | | |
| Lodging — 0.2% | |
| Ameristar Casinos, Inc. | | | 8,500 | | | | 295,290 | | |
| Lodgian, Inc.(a) | | | 1,400 | | | | 21,042 | | |
| | | | 316,332 | | |
| Machinery – Diversified — 0.9% | |
| Cascade Corp. | | | 800 | | | | 62,752 | | |
| Chart Industries, Inc.(a) | | | 1,200 | | | | 34,128 | | |
(Continued)
The accompanying notes are an integral part of the financial statements.
147
MassMutual Select Small Cap Value Equity Fund – Portfolio of Investments (Continued)
| | | Number of
Shares | | Market
Value | |
| NACCO Industries, Inc. Cl. A | | | 5,300 | | | $ | 824,097 | | |
| Nordson Corp. | | | 8,900 | | | | 446,424 | | |
| | | | 1,367,401 | | |
| Manufacturing — 2.9% | |
| A.O. Smith Corp. | | | 11,300 | | | | 450,757 | | |
| AptarGroup, Inc.(b) | | | 33,100 | | | | 1,177,036 | | |
| Barnes Group, Inc. | | | 21,700 | | | | 687,456 | | |
| Blount International, Inc.(a) | | | 11,600 | | | | 151,728 | | |
| Clarcor, Inc. | | | 8,500 | | | | 318,155 | | |
| EnPro Industries, Inc.(a) | | | 15,300 | | | | 654,687 | | |
| Koppers Holdings, Inc. | | | 3,200 | | | | 107,776 | | |
| Reddy Ice Holdings, Inc.(b) | | | 11,900 | | | | 339,388 | | |
| Tredegar Corp. | | | 35,800 | | | | 762,540 | | |
| | | | 4,649,523 | | |
| Media — 2.2% | |
| Belo Corp. Cl. A(b) | | | 12,800 | | | | 263,552 | | |
Citadel
Broadcasting Corp.(b) | | | 128,900 | | | | 831,405 | | |
| Cox Radio, Inc. Cl. A(a) | | | 100 | | | | 1,424 | | |
Entravision Communications
Corp. Cl. A(a) | | | 41,000 | | | | 427,630 | | |
| Gray Television, Inc. | | | 67,600 | | | | 626,652 | | |
Journal Communications,
Inc. Cl. A | | | 24,400 | | | | 317,444 | | |
| Lee Enterprises, Inc. | | | 16,300 | | | | 340,018 | | |
| Lin TV Corp. Cl. A(a) | | | 27,800 | | | | 522,918 | | |
| Westwood One, Inc. | | | 22,800 | | | | 163,932 | | |
| | | | 3,494,975 | | |
| Metal Fabricate & Hardware — 0.8% | |
| Ampco-Pittsburgh Corp. | | | 18,700 | | | | 749,683 | | |
| Castle (A.M.) & Co. | | | 3,100 | | | | 111,321 | | |
| Circor International, Inc. | | | 3,600 | | | | 145,548 | | |
| NN, Inc. | | | 200 | | | | 2,360 | | |
| Quanex Corp. | | | 3,800 | | | | 185,060 | | |
| | | | 1,193,972 | | |
| Mining — 0.5% | |
| Usec, Inc.(a) (b) | | | 33,500 | | | | 736,330 | | |
| Office Equipment/Supplies — 0.2% | |
| Ikon Office Solutions, Inc.(b) | | | 16,800 | | | | 262,248 | | |
| Office Furnishings — 0.2% | |
| CompX International, Inc. | | | 17,900 | | | | 331,150 | | |
| Oil & Gas — 1.9% | |
| Berry Petroleum Co. Cl. A | | | 8,000 | | | | 301,440 | | |
| Bill Barrett Corp.(a) (b) | | | 300 | | | | 11,049 | | |
| Bois d'Arc Energy, Inc.(a) | | | 1,400 | | | | 23,842 | | |
Bronco Drilling
Co., Inc.(a) (b) | | | 9,200 | | | | 150,972 | | |
| Callon Petroleum Co.(a) | | | 1,300 | | | | 18,421 | | |
| EXCO Resources, Inc.(a) (b) | | | 25,400 | | | | 442,976 | | |
| | | Number of
Shares | | Market
Value | |
| Forest Oil Corp.(a) | | | 1,507 | | | $ | 63,686 | | |
| Giant Industries, Inc.(a) | | | 1,600 | | | | 123,232 | | |
| Grey Wolf, Inc.(a) (b) | | | 69,500 | | | | 572,680 | | |
Petrohawk
Energy Corp.(a) (b) | | | 18,900 | | | | 299,754 | | |
| Rosetta Resources, Inc.(a) | | | 33,500 | | | | 721,590 | | |
| Stone Energy Corp.(a) | | | 8,300 | | | | 284,358 | | |
| Swift Energy Co.(a) (b) | | | 900 | | | | 38,484 | | |
| | | | 3,052,484 | | |
| Oil & Gas Services — 0.9% | |
| Gulf Island Fabrication, Inc. | | | 5,100 | | | | 176,970 | | |
Hornbeck Offshore
Services, Inc.(a) (b) | | | 15,400 | | | | 596,904 | | |
Oil States
International, Inc.(a) (b) | | | 6,000 | | | | 248,040 | | |
Trico Marine
Services, Inc.(a) (b) | | | 6,000 | | | | 245,280 | | |
| Union Drilling, Inc.(a) | | | 11,200 | | | | 183,904 | | |
| | | | 1,451,098 | | |
| Packaging & Containers — 0.5% | |
| Silgan Holdings, Inc. | | | 13,400 | | | | 740,752 | | |
| Pharmaceuticals — 0.7% | |
Neurocrine
Biosciences, Inc.(a) (b) | | | 5,200 | | | | 58,396 | | |
Par Pharmaceutical
Cos., Inc.(a) | | | 5,500 | | | | 155,265 | | |
| Perrigo Co. | | | 4,400 | | | | 86,152 | | |
| Sciele Pharma, Inc.(a) (b) | | | 18,900 | | | | 445,284 | | |
| ViroPharma, Inc.(a) | | | 25,400 | | | | 350,520 | | |
| | | | 1,095,617 | | |
| Real Estate — 0.5% | |
Affordable Residential
Communities(a) (b) | | | 2,359 | | | | 27,883 | | |
| Avatar Holdings, Inc.(a) (b) | | | 9,900 | | | | 761,706 | | |
| | | | 789,589 | | |
| Real Estate Investment Trusts (REITS) — 8.6% | |
American Financial
Realty Trust | | | 8,500 | | | | 87,720 | | |
American Home Mortgage
Investment Corp. REIT(b) | | | 41,400 | | | | 760,932 | | |
| Anthracite Capital, Inc. | | | 12,500 | | | | 146,250 | | |
Anworth Mortgage
Asset Corp. | | | 300 | | | | 2,715 | | |
| Arbor Realty Trust, Inc. | | | 21,300 | | | | 549,753 | | |
| Ashford Hospitality Trust | | | 43,500 | | | | 511,560 | | |
| Capital Lease Funding, Inc. | | | 33,700 | | | | 362,275 | | |
| Crystal River Capital, Inc. | | | 20,200 | | | | 490,456 | | |
DiamondRock
Hospitality Co. | | | 5,400 | | | | 103,032 | | |
Entertainment
Properties Trust | | | 2,000 | | | | 107,560 | | |
| | | Number of
Shares | | Market
Value | |
| Equity One, Inc.(b) | | | 29,700 | | | $ | 758,835 | | |
| Extra Space Storage, Inc.(b) | | | 13,500 | | | | 222,750 | | |
First Industrial Realty
Trust, Inc.(b) | | | 20,500 | | | | 794,580 | | |
| Gramercy Capital Corp.(b) | | | 24,400 | | | | 671,976 | | |
| Hersha Hospitality Trust | | | 66,400 | | | | 784,848 | | |
IMPAC Mortgage
Holdings, Inc.(b) | | | 73,800 | | | | 340,218 | | |
| Inland Real Estate Corp.(b) | | | 2,800 | | | | 47,544 | | |
Investors Real
Estate Trust(b) | | | 7,200 | | | | 74,376 | | |
| JER Investors Trust, Inc.(b) | | | 19,900 | | | | 298,500 | | |
Luminent Mortgage
Capital, Inc.(b) | | | 10,900 | | | | 109,981 | | |
Medical Properties
Trust, Inc. | | | 6,000 | | | | 79,380 | | |
MFA Mortgage
Investments, Inc. | | | 54,100 | | | | 393,848 | | |
National Retail
Properties, Inc.(b) | | | 39,100 | | | | 854,726 | | |
| Newcastle Investment Corp. | | | 15,400 | | | | 386,078 | | |
| Novastar Financial, Inc.(b) | | | 81,800 | | | | 570,964 | | |
| Pennsylvania REIT | | | 21,800 | | | | 966,394 | | |
Ramco-Gershenson
Properties Trust(b) | | | 4,900 | | | | 176,057 | | |
| Realty Income Corp.(b) | | | 32,700 | | | | 823,713 | | |
Senior Housing
Properties Trust | | | 6,700 | | | | 136,345 | | |
| Spirit Finance Corp. | | | 36,000 | | | | 524,160 | | |
Sunstone Hotel
Investors, Inc.(b) | | | 38,300 | | | | 1,087,337 | | |
| Winston Hotels, Inc. | | | 18,100 | | | | 271,500 | | |
| | | | 13,496,363 | | |
| Retail — 4.5% | |
| 99 Cents Only Stores(a) | | | 5,300 | | | | 69,483 | | |
| AFC Enterprises, Inc.(a) | | | 39,900 | | | | 689,871 | | |
Blockbuster,
Inc. Cl. A(a) (b) | | | 71,800 | | | | 309,458 | | |
| Books-A-Million, Inc. | | | 1,500 | | | | 25,410 | | |
| Brown Shoe Co., Inc. | | | 1,725 | | | | 41,952 | | |
| Casey's General Stores, Inc. | | | 7,300 | | | | 198,998 | | |
| CEC Entertainment, Inc.(a) | | | 3,600 | | | | 126,720 | | |
| Charming Shoppes, Inc.(a) | | | 6,000 | | | | 64,980 | | |
| CSK Auto Corp.(a) | | | 47,000 | | | | 864,800 | | |
| Domino's Pizza, Inc.(b) | | | 15,300 | | | | 279,531 | | |
| Dress Barn, Inc.(a) | | | 33,900 | | | | 695,628 | | |
| Fred's, Inc. | | | 4,400 | | | | 58,872 | | |
| Group 1 Automotive, Inc. | | | 2,300 | | | | 92,782 | | |
| Hot Topic, Inc.(a) | | | 33,100 | | | | 359,797 | | |
| IHOP Corp.(b) | | | 300 | | | | 16,329 | | |
| Insight Enterprises, Inc.(a) | | | 3,900 | | | | 88,023 | | |
| Jack in the Box, Inc.(a) | | | 1,900 | | | | 134,786 | | |
| Jo-Ann Stores, Inc.(a) | | | 17,400 | | | | 494,682 | | |
(Continued)
The accompanying notes are an integral part of the financial statements.
148
MassMutual Select Small Cap Value Equity Fund – Portfolio of Investments (Continued)
| | | Number of
Shares | | Market
Value | |
| Longs Drug Stores Corp. | | | 500 | | | $ | 26,260 | | |
| Movado Group, Inc. | | | 12,900 | | | | 435,246 | | |
| O'Charley's, Inc. | | | 9,700 | | | | 195,552 | | |
Papa John's
International, Inc.(a) | | | 1,900 | | | | 54,644 | | |
| Payless ShoeSource, Inc.(a) | | | 29,100 | | | | 918,105 | | |
The PEP Boys - Manny,
Moe & Jack | | | 5,900 | | | | 118,944 | | |
| School Specialty, Inc.(a) (b) | | | 19,900 | | | | 705,256 | | |
| Shoe Carnival, Inc.(a) | | | 3,000 | | | | 82,470 | | |
| Syms Corp.(a) (b) | | | 100 | | | | 1,973 | | |
| Systemax, Inc.(b) | | | 800 | | | | 16,648 | | |
| | | | 7,167,200 | | |
| Savings & Loans — 2.0% | |
Bankunited Financial
Corp. Cl. A(b) | | | 10,600 | | | | 212,742 | | |
Dime
Community Bancshares | | | 4,400 | | | | 58,036 | | |
| Downey Financial Corp.(b) | | | 9,100 | | | | 600,418 | | |
First Niagara Financial
Group, Inc. | | | 9,000 | | | | 117,900 | | |
FirstFed
Financial Corp.(a) (b) | | | 14,300 | | | | 811,239 | | |
| Franklin Bank Corp.(a) (b) | | | 31,600 | | | | 470,840 | | |
| KNBT Bancorp, Inc. | | | 10,500 | | | | 154,350 | | |
NewAlliance
Bancshares, Inc.(b) | | | 27,600 | | | | 406,272 | | |
| Oceanfirst Financial Corp. | | | 200 | | | | 3,520 | | |
Partners Trust Financial
Group, Inc. | | | 27,100 | | | | 284,550 | | |
Provident Financial
Services, Inc.(b) | | | 3,100 | | | | 48,856 | | |
United Community
Financial Corp. | | | 5,600 | | | | 55,888 | | |
| | | | 3,224,611 | | |
| Semiconductors — 2.9% | |
| Actel Corp.(a) | | | 15,700 | | | | 218,387 | | |
| Asyst Technologies, Inc.(a) | | | 6,400 | | | | 46,272 | | |
| ATMI, Inc.(a) | | | 300 | | | | 9,000 | | |
| Axcelis Technologies, Inc.(a) | | | 2,600 | | | | 16,874 | | |
Brooks
Automation, Inc.(a) (b) | | | 16,600 | | | | 301,290 | | |
| Credence Systems Corp.(a) | | | 135,700 | | | | 488,520 | | |
| Emulex Corp.(a) | | | 30,500 | | | | 666,120 | | |
| Entegris, Inc.(a) (b) | | | 81,700 | | | | 970,596 | | |
| Genesis Microchip, Inc.(a) | | | 1,800 | | | | 16,848 | | |
MKS
Instruments, Inc.(a) (b) | | | 11,200 | | | | 310,240 | | |
Pericom
Semiconductor Corp.(a) | | | 1,900 | | | | 21,204 | | |
| Photronics, Inc.(a) | | | 55,200 | | | | 821,376 | | |
Rudolph
Technologies, Inc.(a) | | | 19,700 | | | | 327,217 | | |
| | | Number of
Shares | | Market
Value | |
| Skyworks Solutions, Inc.(a) | | | 6,700 | | | $ | 49,245 | | |
Triquint
Semiconductor, Inc.(a) | | | 2,700 | | | | 13,662 | | |
| Veeco Instruments, Inc.(a) | | | 100 | | | | 2,074 | | |
| Zoran Corp.(a) | | | 14,400 | | | | 288,576 | | |
| | | | 4,567,501 | | |
| Software — 0.4% | |
| Blackbaud, Inc. | | | 100 | | | | 2,208 | | |
Bottomline
Technologies, Inc.(a) | | | 17,500 | | | | 216,125 | | |
| Digi International, Inc.(a) | | | 1,600 | | | | 23,584 | | |
ManTech International
Corp. Cl. A(a) | | | 500 | | | | 15,415 | | |
| OPNET Technologies, Inc.(a) | | | 200 | | | | 2,302 | | |
| Pegasystems, Inc. | | | 18,500 | | | | 202,205 | | |
| Sybase, Inc.(a) | | | 5,000 | | | | 119,450 | | |
| | | | 581,289 | | |
| Telecommunications — 3.9% | |
| Adaptec, Inc.(a) | | | 2,700 | | | | 10,287 | | |
Alaska Communications
Systems Group, Inc. | | | 22,400 | | | | 354,816 | | |
| Arris Group, Inc.(a) | | | 11,000 | | | | 193,490 | | |
| Atlantic Tele-Network, Inc. | | | 9,700 | | | | 277,808 | | |
| Cincinnati Bell, Inc.(a) | | | 44,300 | | | | 256,054 | | |
Consolidated
Communications
Holdings, Inc. | | | 33,400 | | | | 754,840 | | |
| Ditech Networks, Inc.(a) | | | 15,500 | | | | 126,945 | | |
| EMS Technologies, Inc.(a) | | | 8,800 | | | | 194,128 | | |
| Extreme Networks, Inc.(a) | | | 2,100 | | | | 8,505 | | |
| Foundry Networks, Inc.(a) | | | 27,400 | | | | 456,484 | | |
General Communication,
Inc. Cl. A(a) | | | 20,400 | | | | 261,324 | | |
Premiere Global
Services, Inc.(a) | | | 61,800 | | | | 804,636 | | |
RF Micro
Devices, Inc.(a) (b) | | | 97,300 | | | | 607,152 | | |
| Savvis, Inc.(a) | | | 1,100 | | | | 54,461 | | |
| Surewest Communications | | | 27,900 | | | | 759,996 | | |
| Sycamore Networks, Inc.(a) | | | 3,500 | | | | 14,070 | | |
| Symmetricom, Inc.(a) | | | 44,400 | | | | 372,960 | | |
| Syniverse Holdings, Inc.(a) | | | 34,100 | | | | 438,526 | | |
| USA Mobility, Inc.(a) | | | 1,700 | | | | 45,492 | | |
| UTStarcom, Inc.(a) (b) | | | 29,200 | | | | 163,812 | | |
| | | | 6,155,786 | | |
| Toys, Games & Hobbies — 0.6% | |
| JAKKS Pacific, Inc.(a) (b) | | | 26,400 | | | | 742,896 | | |
Leapfrog
Enterprises, Inc.(a) (b) | | | 12,100 | | | | 124,025 | | |
| RC2 Corp.(a) | | | 2,600 | | | | 104,026 | | |
| | | | 970,947 | | |
| | | Number of
Shares | | Market
Value | |
| Transportation — 1.8% | |
Atlas Air Worldwide
Holdings, Inc.(a) | | | 15,000 | | | $ | 884,100 | | |
| General Maritime Corp.(b) | | | 30,600 | | | | 819,468 | | |
| Gulfmark Offshore, Inc.(a) | | | 17,300 | | | | 886,106 | | |
| Heartland Express, Inc. | | | 15,800 | | | | 257,540 | | |
| Sirva, Inc.(a) | | | 1,400 | | | | 2,772 | | |
| | | | 2,849,986 | | |
TOTAL EQUITIES
(Cost $152,486,290) | | | | | | | 153,066,704 | | |
| | | Principal
Amount | | | |
| SHORT-TERM INVESTMENTS — 26.9% | |
| Cash Equivalents — 24.6%(d) | |
Abbey National PLC
Eurodollar Time Deposit
5.280% 07/05/2007 | | $ | 501,103 | | | | 501,103 | | |
Abbey National PLC
Eurodollar Time Deposit
5.285% 07/09/2007 | | | 1,252,765 | | | | 1,252,765 | | |
American Beacon
Money Market Fund(c) | | | 1,405,535 | | | | 1,405,535 | | |
Banco Bilbao Vizcaya
Argentaria SA
Eurodollar Time Deposit
5.300% 08/10/2007 | | | 939,567 | | | | 939,567 | | |
Bank of America
5.270% 07/06/2007 | | | 1,252,756 | | | | 1,252,756 | | |
Bank of America
5.270% 07/16/2007 | | | 250,551 | | | | 250,551 | | |
Bank of America
5.270% 08/17/2007 | | | 313,189 | | | | 313,189 | | |
Bank of America
5.300% 09/17/2007 | | | 626,378 | | | | 626,378 | | |
Bank of Ireland
Eurodollar Time Deposit
5.300% 08/13/2007 | | | 1,252,756 | | | | 1,252,756 | | |
Bank of Montreal
Eurodollar Time Deposit
5.280% 07/03/2007 | | | 313,189 | | | | 313,189 | | |
Bank of Montreal
Eurodollar Time Deposit
5.290% 07/02/2007 | | | 250,551 | | | | 250,551 | | |
Bank of Montreal
Eurodollar Time Deposit
5.310% 08/14/2007 | | | 187,913 | | | | 187,913 | | |
Bank of Nova Scotia
Eurodollar Time Deposit
5.280% 07/09/2007 | | | 1,190,119 | | | | 1,190,119 | | |
(Continued)
The accompanying notes are an integral part of the financial statements.
149
MassMutual Select Small Cap Value Equity Fund – Portfolio of Investments (Continued)
| | | Principal
Amount | | Market
Value | |
Bank Of Nova Scotia
Eurodollar Time Deposit
5.285% 07/11/2007 | | $ | 689,016 | | | $ | 689,016 | | |
Barclays
Eurodollar Time Deposit
5.290% 07/06/2007 | | | 1,252,756 | | | | 1,252,756 | | |
Barclays
Eurodollar Time Deposit
5.295% 07/16/2007 | | | 250,551 | | | | 250,551 | | |
Barclays
Eurodollar Time Deposit
5.320% 09/04/2007 | | | 626,378 | | | | 626,378 | | |
Bear Stearns & Co
Commercial Paper
5.435% 07/10/2007 | | | 187,913 | | | | 187,913 | | |
BGI Institutional
Money Market Fund(c) | | | 814,292 | | | | 814,292 | | |
BNP Paribas
Eurodollar Time Deposit
5.350% 07/02/2007 | | | 1,879,135 | | | | 1,879,135 | | |
Calyon
Eurodollar Time Deposit
5.290% 07/17/2007 | | | 626,378 | | | | 626,378 | | |
Calyon
Eurodollar Time Deposit
5.380% 07/02/2007 | | | 1,879,135 | | | | 1,879,135 | | |
Canadian Imperial
Bank of Commerce
Eurodollar Time Deposit
5.300% 07/30/2007 | | | 1,252,756 | | | | 1,252,756 | | |
Dexia Group
Eurodollar Time Deposit
5.290% 08/08/2007 | | | 1,252,756 | | | | 1,252,756 | | |
Dreyfus Institutional
Cash Advantage
Money Market Fund(c) | | | 375,827 | | | | 375,827 | | |
Federal Home Loan Bank
Discount Note
5.174% 07/20/2007 | | | 92,913 | | | | 92,913 | | |
First Tennessee
National Corp.
Eurodollar Time Deposit
5.300% 07/18/2007 | | | 313,189 | | | | 313,189 | | |
Fortis Bank
Eurodollar Time Deposit
5.290% 07/06/2007 | | | 313,189 | | | | 313,189 | | |
Fortis Bank
Eurodollar Time Deposit
5.290% 07/09/2007 | | | 438,465 | | | | 438,465 | | |
Fortis Bank
Eurodollar Time Deposit
5.300% 07/20/2007 | | | 313,189 | | | | 313,189 | | |
| | | Principal
Amount | | Market
Value | |
Fortis Bank
Eurodollar Time Deposit
5.300% 07/26/2007 | | $ | 250,551 | | | $ | 250,551 | | |
Fortis Bank
Eurodollar Time Deposit
5.350% 07/05/2007 | | | 626,378 | | | | 626,378 | | |
Freddie Mac Discount Note
5.155% 07/16/2007 | | | 118,279 | | | | 118,279 | | |
Freddie Mac Discount Note
5.185% 07/09/2007 | | | 61,749 | | | | 61,749 | | |
Morgan Stanley & Co
Commercial Paper
5.445% 08/01/2007 | | | 563,740 | | | | 563,740 | | |
National Australia Bank
Eurodollar Time Deposit
5.320% 07/02/2007 | | | 626,378 | | | | 626,378 | | |
Nationwide Building Society
Commercial Paper
5.301% 07/09/2007 | | | 625,090 | | | | 625,090 | | |
Rabobank Nederland
Eurodollar Time Deposit
5.280% 07/05/2007 | | | 939,567 | | | | 939,567 | | |
Rabobank Nederland
Eurodollar Time Deposit
5.290% 07/16/2007 | | | 1,252,756 | | | | 1,252,756 | | |
Rabobank Nederland
Eurodollar Time Deposit
5.330% 07/02/2007 | | | 1,879,135 | | | | 1,879,135 | | |
Reserve Primary
Money Market Fund(c) | | | 1,243,660 | | | | 1,243,660 | | |
Royal Bank of Canada
Eurodollar Time Deposit
5.305% 08/30/2007 | | | 1,252,756 | | | | 1,252,756 | | |
Royal Bank of Scotland
Eurodollar Time Deposit
5.270% 07/11/2007 | | | 313,189 | | | | 313,189 | | |
Skandinaviska Enskilda
Banken AB
Eurodollar Time Deposit
5.290% 07/13/2007 | | | 1,252,756 | | | | 1,252,756 | | |
Skandinaviska Enskilda
Banken AB
Eurodollar Time Deposit
5.290% 07/19/2007 | | | 187,913 | | | | 187,913 | | |
Svenska Handlesbanken
Eurodollar Time Deposit
5.300% 07/02/2007 | | | 210,433 | | | | 210,433 | | |
UBS AG
Eurodollar Time Deposit
5.277% 07/05/2007 | | | 876,930 | | | | 876,930 | | |
UBS AG
Eurodollar Time Deposit
5.285% 07/05/2007 | | | 1,252,756 | | | | 1,252,756 | | |
| | | Principal
Amount | | Market
Value | |
Vanguard Prime
Money Market Fund(c) | | $ | 626,378 | | | $ | 626,378 | | |
Wells Fargo
Eurodollar Time Deposit
5.260% 07/02/2007 | | | 338,244 | | | | 338,244 | | |
Wells Fargo
Eurodollar Time Deposit
5.280% 07/11/2007 | | | 1,252,756 | | | | 1,252,756 | | |
Wells Fargo
Eurodollar Time Deposit
5.280% 07/12/2007 | | | 626,378 | | | | 626,378 | | |
| | | | 38,671,982 | | |
| Repurchase Agreements — 2.3% | |
Investors Bank & Trust
Company Repurchase
Agreement, dated
6/29/2007, 3.50%,
due 7/02/2007(e) | | | 3,678,296 | | | | 3,678,296 | | |
TOTAL SHORT-TERM
INVESTMENTS
(Cost $42,350,278) | | | | | | | 42,350,278 | | |
TOTAL INVESTMENTS — 124.1%
(Cost $194,836,568)(f) | | | | | | | 195,416,982 | | |
Other Assets/
(Liabilities) — (24.1%) | | | | | | | (38,004,823 | ) | |
| NET ASSETS — 100.0% | | | | | | $ | 157,412,159 | | |
Notes to Portfolio of Investments
(a) Non-income producing security.
(b) Denotes all or a portion of security on loan. (Note 2).
(c) Amount represents shares owned of the fund.
(d) Represents investments of security lending collateral. (Note 2).
(e) Maturity value of $3,679,369. Collateralized by a U.S. Government Agency obligation with a rate of 9.125%, maturity date of 01/25/2015, and an aggregate market value, including accrued interest, of $3,862,211.
(f) See Note 6 for aggregate cost for Federal tax purposes.
The accompanying notes are an integral part of the financial statements.
150
MassMutual Select Small Company Value Fund – Portfolio of Investments
June 30, 2007 (Unaudited)
| | | Number of
Shares | | Market
Value | |
| EQUITIES — 96.9% | |
| COMMON STOCK — 96.9% | |
| Aerospace & Defense — 1.2% | |
| AAR Corp.(a) (b) | | | 53,100 | | | $ | 1,752,830 | | |
| EDO Corp.(b) | | | 40,800 | | | | 1,341,096 | | |
| Moog, Inc. Cl. A(a) | | | 57,248 | | | | 2,525,209 | | |
Orbital Sciences
Corp.(a) (b) | | | 93,825 | | | | 1,971,263 | | |
Teledyne
Technologies, Inc.(a) | | | 26,400 | | | | 1,213,080 | | |
| | | | 8,803,478 | | |
| Agriculture — 0.5% | |
Alliance One
International, Inc.(a) | | | 124,500 | | | | 1,251,225 | | |
| Universal Corp. | | | 42,025 | | | | 2,560,163 | | |
| | | | 3,811,388 | | |
| Airlines — 0.7% | |
Airtran Holdings,
Inc.(a) (b) | | | 158,800 | | | | 1,734,096 | | |
Republic Airways
Holdings, Inc.(a) | | | 94,250 | | | | 1,917,987 | | |
| SkyWest, Inc. | | | 61,200 | | | | 1,458,396 | | |
| | | | 5,110,479 | | |
| Apparel — 1.6% | |
| Kellwood Co. | | | 41,550 | | | | 1,168,386 | | |
| K-Swiss, Inc. Cl. A(b) | | | 58,400 | | | | 1,654,472 | | |
| Maidenform Brands, Inc.(a) | | | 76,775 | | | | 1,524,751 | | |
| Phillips-Van Heusen Corp. | | | 99,525 | | | | 6,028,229 | | |
| Wolverine World Wide, Inc. | | | 47,800 | | | | 1,324,538 | | |
| | | | 11,700,376 | | |
| Automotive & Parts — 0.9% | |
| Accuride Corp.(a) | | | 60,900 | | | | 938,469 | | |
| ArvinMeritor, Inc.(b) | | | 77,400 | | | | 1,718,280 | | |
| Tenneco, Inc.(a) | | | 107,950 | | | | 3,782,568 | | |
| | | | 6,439,317 | | |
| Banks — 6.7% | |
Boston Private Financial
Holdings, Inc.(b) | | | 57,000 | | | | 1,531,590 | | |
Central Pacific
Financial Corp. | | | 77,375 | | | | 2,554,149 | | |
| City Holding Co. | | | 60,725 | | | | 2,327,589 | | |
Columbia Banking
Systems, Inc. | | | 108,800 | | | | 3,182,400 | | |
| East West Bancorp, Inc.(b) | | | 115,500 | | | | 4,490,640 | | |
| First Charter Corp. | | | 39,950 | | | | 777,826 | | |
| First Republic Bank | | | 109,100 | | | | 5,854,306 | | |
| | | Number of
Shares | | Market
Value | |
| FirstMerit Corp. | | | 82,500 | | | $ | 1,726,725 | | |
| Glacier Bancorp, Inc.(b) | | | 75,600 | | | | 1,538,460 | | |
| Home Bancshares, Inc.(b) | | | 49,200 | | | | 1,109,460 | | |
| IBERIABANK Corp. | | | 47,600 | | | | 2,353,820 | | |
Independent Bank
Corp./Rockland, MA | | | 59,575 | | | | 1,759,845 | | |
National Penn
Bancshares, Inc.(b) | | | 105,975 | | | | 1,767,663 | | |
Oriental Financial
Group, Inc. | | | 29,348 | | | | 320,187 | | |
| Pacific Capital Bancorp | | | 139,200 | | | | 3,755,616 | | |
Prosperity
Bancshares, Inc.(b) | | | 57,900 | | | | 1,896,804 | | |
| Sterling Bancshares, Inc. | | | 106,812 | | | | 1,208,044 | | |
| Sterling Financial Corp.(b) | | | 62,700 | | | | 1,814,538 | | |
| SVB Financial Group(a) (b) | | | 90,000 | | | | 4,779,900 | | |
| West Coast Bancorp | | | 44,050 | | | | 1,338,679 | | |
| Westamerica Bancorp.(b) | | | 49,825 | | | | 2,204,258 | | |
| Wintrust Financial Corp. | | | 36,400 | | | | 1,596,140 | | |
| | | | 49,888,639 | | |
| Biotechnology — 0.7% | |
| Exelixis, Inc.(a) | | | 116,100 | | | | 1,404,810 | | |
Myriad Genetics,
Inc.(a) (b) | | | 94,800 | | | | 3,525,612 | | |
| | | | 4,930,422 | | |
| Building Materials — 1.7% | |
| Drew Industries, Inc.(a) | | | 28,900 | | | | 957,746 | | |
Florida Rock
Industries, Inc.(b) | | | 55,400 | | | | 3,739,500 | | |
| Genlyte Group, Inc.(a) | | | 41,500 | | | | 3,259,410 | | |
| Gibraltar Industries, Inc. | | | 113,100 | | | | 2,505,165 | | |
Universal Forest
Products, Inc. | | | 48,800 | | | | 2,062,288 | | |
| | | | 12,524,109 | | |
| Building Materials & Construction — 0.2% | |
Beacon Roofing
Supply, Inc.(a) (b) | | | 96,500 | | | | 1,639,535 | | |
| Chemicals — 2.5% | |
| Airgas, Inc. | | | 87,500 | | | | 4,191,250 | | |
| American Vanguard Corp.(b) | | | 100,000 | | | | 1,432,000 | | |
| Arch Chemicals, Inc. | | | 80,000 | | | | 2,811,200 | | |
| Ferro Corp. | | | 65,500 | | | | 1,632,915 | | |
| Innospec, Inc. | | | 89,300 | | | | 5,287,453 | | |
| OM Group, Inc.(a) | | | 21,175 | | | | 1,120,581 | | |
Symyx Technologies,
Inc.(a) (b) | | | 85,400 | | | | 982,954 | | |
| The Valspar Corp. | | | 34,800 | | | | 988,668 | | |
| | | | 18,447,021 | | |
| | | Number of
Shares | | Market
Value | |
| Coal — 0.5% | |
Alpha Natural
Resources, Inc.(a) | | | 60,525 | | | $ | 1,258,315 | | |
Foundation Coal
Holdings, Inc. | | | 56,450 | | | | 2,294,128 | | |
| | | | 3,552,443 | | |
| Commercial Services — 6.2% | |
| Aaron Rents, Inc.(b) | | | 264,300 | | | | 7,717,560 | | |
| Administaff, Inc. | | | 25,498 | | | | 853,928 | | |
Consolidated
Graphics, Inc.(a) | | | 20,075 | | | | 1,390,796 | | |
Dollar Thrifty Automotive
Group, Inc.(a) | | | 80,800 | | | | 3,299,872 | | |
| Electro Rent Corp. | | | 146,900 | | | | 2,135,926 | | |
| FTI Consulting, Inc.(a) | | | 101,400 | | | | 3,856,242 | | |
| Landauer, Inc. | | | 29,800 | | | | 1,467,650 | | |
| Live Nation, Inc.(a) (b) | | | 36,400 | | | | 814,632 | | |
Macquarie Infrastructure
Co. LLC(b) | | | 37,500 | | | | 1,555,500 | | |
| McGrath Rentcorp | | | 120,600 | | | | 4,063,014 | | |
| MPS Group, Inc.(a) | | | 229,900 | | | | 3,073,763 | | |
Pharmaceutical Product
Development, Inc. | | | 106,700 | | | | 4,083,409 | | |
| Quanta Services, Inc.(a) (b) | | | 101,375 | | | | 3,109,171 | | |
| Rent-A-Center, Inc.(a) (b) | | | 66,600 | | | | 1,746,918 | | |
| Service Corp. International | | | 135,175 | | | | 1,727,536 | | |
| Sotheby's | | | 53,800 | | | | 2,475,876 | | |
| Startek, Inc. | | | 83,100 | | | | 896,649 | | |
| Steiner Leisure Ltd.(a) | | | 19,300 | | | | 948,016 | | |
Volt Information
Sciences, Inc.(a) (b) | | | 32,712 | | | | 603,209 | | |
| | | | 45,819,667 | | |
| Computers — 1.1% | |
Brocade Communications
Systems, Inc.(a) | | | 181,750 | | | | 1,421,285 | | |
| Imation Corp. | | | 35,500 | | | | 1,308,530 | | |
| Mentor Graphics Corp.(a) | | | 56,250 | | | | 740,812 | | |
| Perot Systems Corp. Cl. A(a) | | | 81,475 | | | | 1,388,334 | | |
| SYKES Enterprises, Inc.(a) | | | 83,200 | | | | 1,579,968 | | |
| Xyratex Ltd.(a) | | | 61,000 | | | | 1,356,030 | | |
| | | | 7,794,959 | | |
| Consumer Products — 0.5% | |
| Pool Corp.(b) | | | 88,800 | | | | 3,465,864 | | |
| Cosmetics & Personal Care — 0.3% | |
| Elizabeth Arden, Inc.(a) | | | 87,950 | | | | 2,133,667 | | |
| Diversified Financial — 2.9% | |
| Advanta Corp. Cl. B | | | 70,687 | | | | 2,201,193 | | |
(Continued)
The accompanying notes are an integral part of the financial statements.
151
MassMutual Select Small Company Value Fund – Portfolio of Investments (Continued)
| | | Number of
Shares | | Market
Value | |
Affiliated Managers
Group, Inc.(a) (b) | | | 16,350 | | | $ | 2,105,226 | | |
Asset Acceptance
Capital Corp.(a) | | | 49,200 | | | | 870,840 | | |
Calamos Asset
Management, Inc. Cl. A | | | 50,697 | | | | 1,295,308 | | |
| Eaton Vance Corp. | | | 84,127 | | | | 3,716,731 | | |
| Jefferies Group, Inc. | | | 105,700 | | | | 2,851,786 | | |
| JMP Group, Inc.(a) | | | 34,700 | | | | 362,615 | | |
Raymond James
Financial, Inc. | | | 112,003 | | | | 3,460,893 | | |
| Student Loan Corp. | | | 11,400 | | | | 2,324,460 | | |
Waddell & Reed Financial,
Inc. Cl. A | | | 96,075 | | | | 2,498,911 | | |
| | | | 21,687,963 | | |
| Electric — 2.5% | |
| Avista Corp. | | | 99,350 | | | | 2,140,992 | | |
| Black Hills Corp.(b) | | | 117,400 | | | | 4,666,650 | | |
| Cleco Corp. | | | 173,150 | | | | 4,242,175 | | |
| El Paso Electric Co.(a) | | | 95,500 | | | | 2,345,480 | | |
| MGE Energy, Inc.(b) | | | 36,250 | | | | 1,184,287 | | |
| PNM Resources, Inc. | | | 67,100 | | | | 1,864,709 | | |
| Westar Energy, Inc. | | | 71,700 | | | | 1,740,876 | | |
| | | | 18,185,169 | | |
| Electrical Components & Equipment — 1.8% | |
Advanced Energy
Industries, Inc.(a) | | | 94,200 | | | | 2,134,572 | | |
| Belden, Inc. | | | 87,100 | | | | 4,820,985 | | |
C&D Technologies,
Inc.(a) (b) | | | 86,000 | | | | 481,600 | | |
Graftech
International Ltd.(a) | | | 132,025 | | | | 2,223,301 | | |
| Greatbatch, Inc.(a) | | | 58,900 | | | | 1,908,360 | | |
| Littelfuse, Inc.(a) | | | 62,600 | | | | 2,114,002 | | |
| | | | 13,682,820 | | |
| Electronics — 3.3% | |
| Analogic Corp. | | | 19,100 | | | | 1,404,041 | | |
| Avnet, Inc.(a) | | | 48,950 | | | | 1,940,378 | | |
Benchmark
Electronics, Inc.(a) (b) | | | 73,500 | | | | 1,662,570 | | |
| Checkpoint Systems, Inc.(a) | | | 89,398 | | | | 2,257,299 | | |
| CTS Corp. | | | 79,975 | | | | 1,012,483 | | |
| FLIR Systems, Inc.(a) (b) | | | 103,100 | | | | 4,768,375 | | |
| Itron, Inc.(a) (b) | | | 62,850 | | | | 4,898,529 | | |
| Methode Electronics, Inc. | | | 32,600 | | | | 510,190 | | |
| Sanmina-SCI Corp.(a) | | | 387,700 | | | | 1,213,501 | | |
| TTM Technologies, Inc.(a) | | | 90,800 | | | | 1,180,400 | | |
| Woodward Governor Co. | | | 68,900 | | | | 3,697,863 | | |
| | | | 24,545,629 | | |
| | | Number of
Shares | | Market
Value | |
| Energy – Alternate Sources — 0.3% | |
| Headwaters, Inc.(a) (b) | | | 76,635 | | | $ | 1,323,486 | | |
| Verenium Corp.(a) (b) | | | 134,000 | | | | 679,380 | | |
| | | | 2,002,866 | | |
| Engineering & Construction — 1.6% | |
| Emcor Group, Inc.(a) | | | 29,500 | | | | 2,150,550 | | |
| Granite Construction, Inc. | | | 14,525 | | | | 932,214 | | |
Insituform Technologies,
Inc. Cl. A(a) (b) | | | 130,300 | | | | 2,841,843 | | |
| URS Corp.(a) | | | 98,625 | | | | 4,788,244 | | |
Washington Group
International, Inc.(a) | | | 17,300 | | | | 1,384,173 | | |
| | | | 12,097,024 | | |
| Entertainment — 0.3% | |
| Macrovision Corp.(a) (b) | | | 64,525 | | | | 1,939,621 | | |
| Environmental Controls — 1.9% | |
Allied Waste
Industries, Inc.(a) | | | 169,700 | | | | 2,284,162 | | |
| Calgon Carbon Corp.(a) (b) | | | 222,750 | | | | 2,583,900 | | |
Casella Waste Systems,
Inc. Cl. A(a) | | | 127,400 | | | | 1,373,372 | | |
| Metal Management, Inc. | | | 84,000 | | | | 3,701,880 | | |
Mine Safety
Appliances Co.(b) | | | 37,025 | | | | 1,620,214 | | |
| Waste Connections, Inc.(a) | | | 84,050 | | | | 2,541,672 | | |
| | | | 14,105,200 | | |
| Foods — 1.2% | |
| Nash Finch Co.(b) | | | 49,000 | | | | 2,425,500 | | |
| Spartan Stores, Inc. | | | 60,175 | | | | 1,980,359 | | |
| TreeHouse Foods, Inc.(a) | | | 101,075 | | | | 2,689,606 | | |
Wild Oats
Markets, Inc.(a) (b) | | | 47,000 | | | | 787,720 | | |
Winn-Dixie
Stores Inc.-W/I(a) (b) | | | 43,300 | | | | 1,268,690 | | |
| | | | 9,151,875 | | |
| Forest Products & Paper — 1.1% | |
Buckeye
Technologies, Inc.(a) | | | 176,075 | | | | 2,723,880 | | |
Building Materials
Holding Corp.(b) | | | 91,700 | | | | 1,301,223 | | |
| Deltic Timber Corp. | | | 49,900 | | | | 2,735,518 | | |
| Wausau Paper Corp. | | | 122,300 | | | | 1,638,820 | | |
| | | | 8,399,441 | | |
| Gas — 0.9% | |
| AGL Resources, Inc. | | | 44,325 | | | | 1,794,276 | | |
| Nicor, Inc.(b) | | | 33,550 | | | | 1,439,966 | | |
| Southwest Gas Corp. | | | 67,000 | | | | 2,265,270 | | |
| Vectren Corp. | | | 47,900 | | | | 1,289,947 | | |
| | | | 6,789,459 | | |
| | | Number of
Shares | | Market
Value | |
| Hand & Machine Tools — 0.7% | |
Franklin Electric
Co., Inc.(b) | | | 65,900 | | | $ | 3,109,162 | | |
| Snap-on, Inc. | | | 46,100 | | | | 2,328,511 | | |
| | | | 5,437,673 | | |
| Health Care – Products — 1.1% | |
| Arrow International, Inc. | | | 48,500 | | | | 1,856,580 | | |
| CONMED Corp.(a) | | | 46,575 | | | | 1,363,716 | | |
| PSS World Medical, Inc.(a) | | | 90,975 | | | | 1,657,565 | | |
West Pharmaceutical
Services, Inc. | | | 66,500 | | | | 3,135,475 | | |
| | | | 8,013,336 | | |
| Health Care – Services — 2.0% | |
| AMERIGROUP Corp.(a) (b) | | | 73,900 | | | | 1,758,820 | | |
| Centene Corp.(a) (b) | | | 66,100 | | | | 1,415,862 | | |
| Covance, Inc.(a) | | | 59,000 | | | | 4,045,040 | | |
| Healthways, Inc.(a) (b) | | | 56,730 | | | | 2,687,300 | | |
| Medcath Corp.(a) (b) | | | 84,325 | | | | 2,681,535 | | |
Sunrise Senior
Living, Inc.(a) (b) | | | 63,500 | | | | 2,539,365 | | |
| | | | 15,127,922 | | |
| Home Builders — 1.4% | |
Hovnanian K.
Enterprises, Inc.(a) (b) | | | 81,104 | | | | 1,340,649 | | |
| M/I Homes, Inc.(b) | | | 61,600 | | | | 1,638,560 | | |
Meritage Homes
Corp.(a) (b) | | | 45,700 | | | | 1,222,475 | | |
| Skyline Corp. | | | 39,600 | | | | 1,188,396 | | |
| Standard-Pacific Corp.(b) | | | 88,000 | | | | 1,542,640 | | |
Winnebago
Industries, Inc.(b) | | | 109,400 | | | | 3,229,488 | | |
| | | | 10,162,208 | | |
| Home Furnishing — 0.4% | |
| Ethan Allen Interiors, Inc.(b) | | | 41,600 | | | | 1,424,800 | | |
| Stanley Furniture Co., Inc.(b) | | | 80,400 | | | | 1,651,416 | | |
| | | | 3,076,216 | | |
| Household Products — 0.9% | |
| Church & Dwight Co., Inc. | | | 37,900 | | | | 1,836,634 | | |
| CSS Industries, Inc. | | | 57,400 | | | | 2,273,614 | | |
The Scotts
Miracle-Gro Co.(b) | | | 55,300 | | | | 2,374,582 | | |
| | | | 6,484,830 | | |
| Insurance — 5.9% | |
| Argonaut Group, Inc. | | | 48,725 | | | | 1,520,707 | | |
Delphi Financial Group,
Inc. Cl. A | | | 111,752 | | | | 4,673,469 | | |
| Employers Holdings, Inc. | | | 15,000 | | | | 318,600 | | |
The Hanover Insurance
Group, Inc. | | | 49,825 | | | | 2,430,962 | | |
(Continued)
The accompanying notes are an integral part of the financial statements.
152
MassMutual Select Small Company Value Fund – Portfolio of Investments (Continued)
| | | Number of
Shares | | Market
Value | |
HCC Insurance
Holdings, Inc. | | | 44,000 | | | $ | 1,470,040 | | |
Horace Mann
Educators Corp. | | | 100,600 | | | | 2,136,744 | | |
| IPC Holdings Ltd. | | | 57,400 | | | | 1,853,446 | | |
| James River Group, Inc. | | | 3,000 | | | | 99,690 | | |
| Markel Corp.(a) | | | 5,500 | | | | 2,665,080 | | |
| Max Capital Group Ltd. | | | 92,700 | | | | 2,623,410 | | |
| The Midland Co. | | | 59,000 | | | | 2,769,460 | | |
| National Interstate Corp.(b) | | | 6,400 | | | | 166,912 | | |
| Navigators Group, Inc.(a) | | | 38,175 | | | | 2,057,633 | | |
Philadelphia Consolidated
Holding Corp.(a) | | | 87,110 | | | | 3,641,198 | | |
| The Phoenix Companies, Inc. | | | 133,800 | | | | 2,008,338 | | |
| ProAssurance Corp.(a) (b) | | | 99,500 | | | | 5,539,165 | | |
| Protective Life Corp. | | | 44,700 | | | | 2,137,107 | | |
| State Auto Financial Corp. | | | 60,800 | | | | 1,863,520 | | |
United America Indemnity
Ltd. Cl. A(a) | | | 105,568 | | | | 2,625,476 | | |
| United Fire & Casualty Co.(b) | | | 36,000 | | | | 1,273,680 | | |
| | | | 43,874,637 | | |
| Internet — 1.3% | |
| Digital River, Inc.(a) | | | 24,750 | | | | 1,119,938 | | |
| Harris Interactive, Inc.(a) | | | 242,725 | | | | 1,298,579 | | |
j2 Global
Communications, Inc.(a) | | | 44,425 | | | | 1,550,433 | | |
| United Online, Inc. | | | 90,350 | | | | 1,489,872 | | |
| Vignette Corp.(a) | | | 87,625 | | | | 1,678,895 | | |
| Websense, Inc.(a) | | | 107,600 | | | | 2,286,500 | | |
| | | | 9,424,217 | | |
| Investment Companies — 0.9% | |
| Ares Capital Corp.(b) | | | 96,800 | | | | 1,631,080 | | |
| Compass Diversified Trust | | | 77,800 | | | | 1,387,174 | | |
Hercules Technology
Growth Capital, Inc.(b) | | | 116,800 | | | | 1,577,968 | | |
| Kohlberg Capital Corp. | | | 126,100 | | | | 2,339,155 | | |
| | | | 6,935,377 | | |
| Iron & Steel — 1.1% | |
| Carpenter Technology Corp. | | | 34,700 | | | | 4,521,757 | | |
| Chaparral Steel Co. | | | 24,225 | | | | 1,741,051 | | |
| Cleveland-Cliffs, Inc.(b) | | | 23,825 | | | | 1,850,488 | | |
| | | | 8,113,296 | | |
| Leisure Time — 0.1% | |
Multimedia Games,
Inc.(a) (b) | | | 64,175 | | | | 818,873 | | |
| Machinery – Construction & Mining — 1.3% | |
Bucyrus International,
Inc. Cl. A(b) | | | 112,875 | | | | 7,989,293 | | |
| Joy Global, Inc. | | | 23,250 | | | | 1,356,173 | | |
| | | | 9,345,466 | | |
| | | Number of
Shares | | Market
Value | |
| Machinery – Diversified — 1.3% | |
| Flowserve Corp. | | | 21,975 | | | $ | 1,573,410 | | |
| IDEX Corp. | | | 105,425 | | | | 4,063,080 | | |
| Nordson Corp. | | | 75,900 | | | | 3,807,144 | | |
| | | | 9,443,634 | | |
| Machinery & Components — 0.2% | |
| Watsco, Inc.(b) | | | 31,603 | | | | 1,719,203 | | |
| Manufacturing — 3.3% | |
| Ameron International Corp. | | | 36,900 | | | | 3,328,011 | | |
| AptarGroup, Inc.(b) | | | 114,000 | | | | 4,053,840 | | |
| Barnes Group, Inc. | | | 57,575 | | | | 1,823,976 | | |
| Freightcar America, Inc. | | | 40,900 | | | | 1,956,656 | | |
| Harsco Corp. | | | 61,700 | | | | 3,208,400 | | |
| Hexcel Corp.(a) (b) | | | 153,300 | | | | 3,230,031 | | |
Matthews International
Corp. Cl. A | | | 103,300 | | | | 4,504,913 | | |
| Myers Industries, Inc. | | | 103,400 | | | | 2,286,174 | | |
| | | | 24,392,001 | | |
| Media — 0.7% | |
| Journal Register Co. | | | 96,000 | | | | 430,080 | | |
| Lee Enterprises, Inc. | | | 64,700 | | | | 1,349,642 | | |
Saga Communications,
Inc. Cl. A(a) | | | 119,200 | | | | 1,168,160 | | |
| Scholastic Corp.(a) (b) | | | 54,125 | | | | 1,945,253 | | |
| | | | 4,893,135 | | |
| Medical Supplies — 0.6% | |
| Owens & Minor, Inc. | | | 118,700 | | | | 4,147,378 | | |
| Metal Fabricate & Hardware — 0.9% | |
| Ampco-Pittsburgh Corp. | | | 41,025 | | | | 1,644,692 | | |
| Commercial Metals Co. | | | 48,075 | | | | 1,623,493 | | |
| Timken Co. | | | 85,100 | | | | 3,072,961 | | |
| | | | 6,341,146 | | |
| Mining — 0.6% | |
| Meridian Gold, Inc.(a) | | | 66,200 | | | | 1,825,796 | | |
| Royal Gold, Inc.(b) | | | 55,700 | | | | 1,323,989 | | |
| Stillwater Mining Co.(a) | | | 144,050 | | | | 1,585,991 | | |
| | | | 4,735,776 | | |
| Oil & Gas — 5.3% | |
Atwood
Oceanics, Inc.(a) (b) | | | 37,100 | | | | 2,545,802 | | |
| Cabot Oil & Gas Corp. | | | 244,875 | | | | 9,030,990 | | |
| Forest Oil Corp.(a) (b) | | | 155,553 | | | | 6,573,670 | | |
| GeoMet, Inc.(a) (b) | | | 60,100 | | | | 460,366 | | |
| Mariner Energy, Inc.(a) | | | 68,384 | | | | 1,658,312 | | |
| Penn Virginia Corp. | | | 142,200 | | | | 5,716,440 | | |
Petrohawk
Energy Corp.(a) (b) | | | 126,875 | | | | 2,012,238 | | |
| Swift Energy Co.(a) (b) | | | 47,600 | | | | 2,035,376 | | |
| Todco(a) | | | 77,200 | | | | 3,644,612 | | |
| | | Number of
Shares | | Market
Value | |
| W&T Offshore, Inc. | | | 54,400 | | | $ | 1,522,656 | | |
Whiting
Petroleum Corp.(a) | | | 101,875 | | | | 4,127,975 | | |
| | | | 39,328,437 | | |
| Oil & Gas Services — 1.4% | |
| CARBO Ceramics, Inc.(b) | | | 35,000 | | | | 1,533,350 | | |
Oceaneering
International, Inc.(a) | | | 8,459 | | | | 445,282 | | |
TETRA
Technologies, Inc.(a) (b) | | | 184,600 | | | | 5,205,720 | | |
| Union Drilling, Inc.(a) | | | 32,300 | | | | 530,366 | | |
| W-H Energy Services, Inc.(a) | | | 46,500 | | | | 2,878,815 | | |
| | | | 10,593,533 | | |
| Packaging & Containers — 0.2% | |
| Chesapeake Corp. | | | 28,500 | | | | 358,245 | | |
Graphic
Packaging Corp.(a) (b) | | | 292,625 | | | | 1,416,305 | | |
| | | | 1,774,550 | | |
| Pharmaceuticals — 1.0% | |
Barr
Pharmaceuticals, Inc.(a) | | | 28,000 | | | | 1,406,440 | | |
Noven
Pharmaceuticals, Inc.(a) | | | 93,625 | | | | 2,195,506 | | |
| Pharmion Corp.(a) (b) | | | 60,600 | | | | 1,754,370 | | |
| ViroPharma, Inc.(a) | | | 126,625 | | | | 1,747,425 | | |
| | | | 7,103,741 | | |
| Pipelines — 0.5% | |
| Oneok, Inc. | | | 74,400 | | | | 3,750,504 | | |
| Real Estate Investment Trusts (REITS) — 5.7% | |
American Campus
Communities REIT | | | 64,425 | | | | 1,822,583 | | |
Anworth Mortgage
Asset Corp. | | | 145,450 | | | | 1,316,323 | | |
| FelCor Lodging Trust, Inc. | | | 124,500 | | | | 3,240,735 | | |
First Potomac Realty
Trust REIT | | | 90,200 | | | | 2,100,758 | | |
| Highwoods Properties, Inc. | | | 36,575 | | | | 1,371,563 | | |
| Home Properties, Inc.(b) | | | 30,025 | | | | 1,559,198 | | |
| Innkeepers USA Trust | | | 11,000 | | | | 195,030 | | |
| Kilroy Realty Corp. | | | 74,300 | | | | 5,263,412 | | |
| LaSalle Hotel Properties | | | 74,000 | | | | 3,213,080 | | |
Lexington Realty
Trust REIT(b) | | | 107,300 | | | | 2,231,840 | | |
| LTC Properties, Inc. | | | 80,825 | | | | 1,838,769 | | |
MFA Mortgage
Investments, Inc. | | | 194,450 | | | | 1,415,596 | | |
National Retail
Properties, Inc.(b) | | | 72,475 | | | | 1,584,304 | | |
Parkway Properties,
Inc. REIT(b) | | | 31,100 | | | | 1,493,733 | | |
(Continued)
The accompanying notes are an integral part of the financial statements.
153
MassMutual Select Small Company Value Fund – Portfolio of Investments (Continued)
| | | Number of
Shares | | Market
Value | |
| Potlatch Corp. | | | 103,843 | | | $ | 4,470,441 | | |
| SL Green Realty Corp. | | | 22,300 | | | | 2,762,747 | | |
Strategic Hotels & Resorts,
Inc. REIT(b) | | | 119,900 | | | | 2,696,551 | | |
| Sun Communities, Inc.(b) | | | 52,575 | | | | 1,565,158 | | |
| Washington REIT(b) | | | 66,300 | | | | 2,254,200 | | |
| | | | 42,396,021 | | |
| Retail — 4.7% | |
| AFC Enterprises, Inc.(a) | | | 76,900 | | | | 1,329,601 | | |
| Brinker International, Inc.(b) | | | 68,001 | | | | 1,990,389 | | |
| Brown Shoe Co., Inc. | | | 61,175 | | | | 1,487,776 | | |
| Casey's General Stores, Inc. | | | 81,200 | | | | 2,213,512 | | |
Cash America
International, Inc. | | | 44,061 | | | | 1,747,019 | | |
| CEC Entertainment, Inc.(a) | | | 37,375 | | | | 1,315,600 | | |
| Dollar Tree Stores, Inc.(a) | | | 43,100 | | | | 1,877,005 | | |
| Fred's, Inc.(b) | | | 86,100 | | | | 1,152,018 | | |
| Group 1 Automotive, Inc. | | | 24,350 | | | | 982,279 | | |
Haverty Furniture
Companies, Inc.(b) | | | 131,500 | | | | 1,534,605 | | |
| Hot Topic, Inc.(a) (b) | | | 147,000 | | | | 1,597,890 | | |
| OfficeMax, Inc. | | | 28,400 | | | | 1,116,120 | | |
| The Pantry, Inc.(a) | | | 19,275 | | | | 888,578 | | |
RARE Hospitality
International, Inc.(a) | | | 116,200 | | | | 3,110,674 | | |
| Ruby Tuesday, Inc. | | | 56,500 | | | | 1,487,645 | | |
| School Specialty, Inc.(a) (b) | | | 39,600 | | | | 1,403,424 | | |
| Sonic Corp.(a) | | | 86,250 | | | | 1,907,850 | | |
| Stein Mart, Inc. | | | 263,981 | | | | 3,236,407 | | |
| Tractor Supply Co.(a) (b) | | | 35,425 | | | | 1,843,871 | | |
| Wet Seal, Inc. Cl. A(a) (b) | | | 287,300 | | | | 1,726,673 | | |
| Zale Corp.(a) | | | 48,825 | | | | 1,162,523 | | |
| | | | 35,111,459 | | |
| Savings & Loans — 0.8% | |
| Astoria Financial Corp. | | | 95,150 | | | | 2,382,556 | | |
| Flushing Financial Corp. | | | 116,950 | | | | 1,878,217 | | |
| Northwest Bancorp, Inc.(b) | | | 65,500 | | | | 1,712,170 | | |
| | | | 5,972,943 | | |
| Semiconductors — 1.7% | |
| Atmel Corp.(a) | | | 306,675 | | | | 1,705,113 | | |
| ATMI, Inc.(a) (b) | | | 48,100 | | | | 1,443,000 | | |
| Brooks Automation, Inc.(a) | | | 195,900 | | | | 3,555,585 | | |
Fairchild Semiconductor
International, Inc.(a) | | | 100,000 | | | | 1,932,000 | | |
| GSI Group, Inc.(a) | | | 181,400 | | | | 1,775,906 | | |
OmniVision
Technologies, Inc.(a) (b) | | | 33,425 | | | | 605,327 | | |
| Zoran Corp.(a) | | | 93,875 | | | | 1,881,255 | | |
| | | | 12,898,186 | | |
| | | Number of
Shares | | Market
Value | |
| Software — 2.9% | |
CSG Systems
International, Inc.(a) | | | 52,675 | | | $ | 1,396,414 | | |
| Global Payments, Inc. | | | 73,100 | | | | 2,898,415 | | |
MicroStrategy,
Inc. Cl. A(a) (b) | | | 11,775 | | | | 1,112,620 | | |
MoneyGram
International, Inc.(b) | | | 79,100 | | | | 2,210,845 | | |
| Packeteer, Inc.(a) | | | 65,400 | | | | 510,774 | | |
| Progress Software Corp.(a) | | | 108,500 | | | | 3,449,215 | | |
SeaChange
International, Inc.(a) | | | 242,350 | | | | 1,880,636 | | |
| SPSS, Inc.(a) (b) | | | 118,450 | | | | 5,228,383 | | |
| Wind River Systems, Inc.(a) | | | 242,100 | | | | 2,663,100 | | |
| | | | 21,350,402 | | |
| Telecommunications — 1.6% | |
| CommScope, Inc.(a) | | | 47,675 | | | | 2,781,836 | | |
| Ixia(a) | | | 154,800 | | | | 1,433,448 | | |
Nice Systems Ltd.
ADR (Israel) (a) | | | 52,500 | | | | 1,823,850 | | |
Oplink
Communications, Inc.(a) | | | 98,800 | | | | 1,482,000 | | |
Premiere Global
Services, Inc.(a) | | | 192,900 | | | | 2,511,558 | | |
| Symmetricom, Inc.(a) | | | 120,675 | | | | 1,013,670 | | |
| UTStarcom, Inc.(a) (b) | | | 146,300 | | | | 820,743 | | |
Wireless
Facilities, Inc.(a) (b) | | | 200,300 | | | | 336,504 | | |
| | | | 12,203,609 | | |
| Textiles — 0.4% | |
| Culp, Inc.(a) | | | 57,800 | | | | 520,778 | | |
| G&K Services, Inc. Cl. A | | | 67,400 | | | | 2,662,974 | | |
| | | | 3,183,752 | | |
| Transportation — 2.9% | |
Genesee & Wyoming,
Inc. Cl. A(a) | | | 109,700 | | | | 3,273,448 | | |
| Hub Group, Inc. Cl. A(a) | | | 48,300 | | | | 1,698,228 | | |
| Kirby Corp.(a) | | | 121,300 | | | | 4,656,707 | | |
| Landstar System, Inc. | | | 149,700 | | | | 7,223,025 | | |
| Pacer International, Inc. | | | 38,600 | | | | 907,872 | | |
| UTI Worldwide, Inc.(b) | | | 130,700 | | | | 3,501,453 | | |
| | | | 21,260,733 | | |
TOTAL EQUITIES
(Cost $597,982,034) | | | | | | | 718,062,625 | | |
| MUTUAL FUNDS — 0.3% | |
| Financial Services — 0.0% | |
Government Reserve
Investment Fund | | | 6,301 | | | | 6,301 | | |
| | | Number of
Shares | | Market
Value | |
| Investment Companies — 0.3% | |
| First Financial Fund(b) | | | 142,631 | | | $ | 1,962,603 | | |
TOTAL MUTUAL FUNDS
(Cost $2,494,461) | | | | | | | 1,968,904 | | |
TOTAL LONG TERM INVESTMENTS
(Cost $600,476,495) | | | | | | | 720,031,529 | | |
| | | Principal
Amount | | | |
| SHORT-TERM INVESTMENTS — 26.5% | |
| Cash Equivalents — 23.5%(d) | |
Abbey National PLC
Eurodollar Time Deposit
5.280% 07/05/2007 | | $ | 2,249,391 | | | | 2,249,391 | | |
Abbey National PLC
Eurodollar Time Deposit
5.285% 07/09/2007 | | | 5,623,475 | | | | 5,623,475 | | |
American Beacon
Money Market Fund(c) | | | 6,309,279 | | | | 6,309,279 | | |
Banco Bilbao Vizcaya
Argentaria SA
Eurodollar Time Deposit
5.300% 08/10/2007 | | | 4,217,605 | | | | 4,217,605 | | |
Bank of America
5.270% 07/06/2007 | | | 5,623,475 | | | | 5,623,475 | | |
Bank of America
5.270% 07/16/2007 | | | 1,124,695 | | | | 1,124,695 | | |
Bank of America
5.270% 08/17/2007 | | | 1,405,868 | | | | 1,405,868 | | |
Bank of America
5.300% 09/17/2007 | | | 2,811,737 | | | | 2,811,737 | | |
Bank of Ireland
Eurodollar Time Deposit
5.300% 08/13/2007 | | | 5,623,475 | | | | 5,623,475 | | |
Bank of Montreal
Eurodollar Time Deposit
5.280% 07/03/2007 | | | 1,405,868 | | | | 1,405,868 | | |
Bank of Montreal
Eurodollar Time Deposit
5.290% 07/02/2007 | | | 1,124,695 | | | | 1,124,695 | | |
Bank of Montreal
Eurodollar Time Deposit
5.310% 08/14/2007 | | | 843,521 | | | | 843,521 | | |
Bank of Nova Scotia
Eurodollar Time Deposit
5.280% 07/09/2007 | | | 5,342,301 | | | | 5,342,301 | | |
Bank Of Nova Scotia
Eurodollar Time Deposit
5.285% 07/11/2007 | | | 3,092,912 | | | | 3,092,912 | | |
Barclays
Eurodollar Time Deposit
5.290% 07/06/2007 | | | 5,623,475 | | | | 5,623,475 | | |
(Continued)
The accompanying notes are an integral part of the financial statements.
154
MassMutual Select Small Company Value Fund – Portfolio of Investments (Continued)
| | | Principal
Amount | | Market
Value | |
Barclays
Eurodollar Time Deposit
5.295% 07/16/2007 | | $ | 1,124,695 | | | $ | 1,124,695 | | |
Barclays
Eurodollar Time Deposit
5.320% 09/04/2007 | | | 2,811,737 | | | | 2,811,737 | | |
Bear Stearns & Co
Commercial Paper
5.435% 07/10/2007 | | | 843,521 | | | | 843,521 | | |
BGI Institutional
Money Market Fund(c) | | | 3,655,259 | | | | 3,655,259 | | |
BNP Paribas
Eurodollar Time Deposit
5.350% 07/02/2007 | | | 8,435,212 | | | | 8,435,212 | | |
Calyon
Eurodollar Time Deposit
5.290% 07/17/2007 | | | 2,811,737 | | | | 2,811,737 | | |
Calyon
Eurodollar Time Deposit
5.380% 07/02/2007 | | | 8,435,212 | | | | 8,435,212 | | |
Canadian Imperial
Bank of Commerce
Eurodollar Time Deposit
5.300% 07/30/2007 | | | 5,623,475 | | | | 5,623,475 | | |
Dexia Group
Eurodollar Time Deposit
5.290% 08/08/2007 | | | 5,623,475 | | | | 5,623,475 | | |
Dreyfus Institutional
Cash Advantage
Money Market Fund(c) | | | 1,687,042 | | | | 1,687,042 | | |
Federal Home Loan
Bank Discount Note
5.174% 07/20/2007 | | | 417,075 | | | | 417,075 | | |
First Tennessee National Corp.
Eurodollar Time Deposit
5.300% 07/18/2007 | | | 1,405,868 | | | | 1,405,868 | | |
Fortis Bank
Eurodollar Time Deposit
5.290% 07/06/2007 | | | 1,405,868 | | | | 1,405,868 | | |
Fortis Bank
Eurodollar Time Deposit
5.290% 07/09/2007 | | | 1,968,216 | | | | 1,968,216 | | |
Fortis Bank
Eurodollar Time Deposit
5.300% 07/20/2007 | | | 1,405,868 | | | | 1,405,868 | | |
Fortis Bank
Eurodollar Time Deposit
5.300% 07/26/2007 | | | 1,124,695 | | | | 1,124,695 | | |
Fortis Bank
Eurodollar Time Deposit
5.350% 07/05/2007 | | | 2,811,737 | | | | 2,811,737 | | |
Freddie Mac Discount Note
5.155% 07/16/2007 | | | 530,942 | | | | 530,942 | | |
| | | Principal
Amount | | Market
Value | |
Freddie Mac Discount Note
5.185% 07/09/2007 | | $ | 277,184 | | | $ | 277,184 | | |
Morgan Stanley & Co
Commercial Paper
5.445% 08/01/2007 | | | 2,530,563 | | | | 2,530,563 | | |
National Australia Bank
Eurodollar Time Deposit
5.320% 07/02/2007 | | | 2,811,737 | | | | 2,811,737 | | |
Nationwide Building
Society Commercial Paper
5.301% 07/09/2007 | | | 2,805,952 | | | | 2,805,952 | | |
Rabobank Nederland
Eurodollar Time Deposit
5.280% 07/05/2007 | | | 4,217,605 | | | | 4,217,605 | | |
Rabobank Nederland
Eurodollar Time Deposit
5.290% 07/16/2007 | | | 5,623,475 | | | | 5,623,475 | | |
Rabobank Nederland
Eurodollar Time Deposit
5.330% 07/02/2007 | | | 8,435,212 | | | | 8,435,212 | | |
Reserve Primary
Money Market Fund(c) | | | 5,582,642 | | | | 5,582,642 | | |
Royal Bank of Canada
Eurodollar Time Deposit
5.305% 08/30/2007 | | | 5,623,475 | | | | 5,623,475 | | |
Royal Bank of Scotland
Eurodollar Time Deposit
5.270% 07/11/2007 | | | 1,405,868 | | | | 1,405,868 | | |
Skandinaviska
Enskilda Banken AB
Eurodollar Time Deposit
5.290% 07/13/2007 | | | 5,623,475 | | | | 5,623,475 | | |
Skandinaviska
Enskilda Banken AB
Eurodollar Time Deposit
5.290% 07/19/2007 | | | 843,521 | | | | 843,521 | | |
Svenska Handlesbanken
Eurodollar Time Deposit
5.300% 07/02/2007 | | | 944,607 | | | | 944,607 | | |
UBS AG
Eurodollar Time Deposit
5.277% 07/05/2007 | | | 3,936,433 | | | | 3,936,433 | | |
UBS AG
Eurodollar Time Deposit
5.285% 07/05/2007 | | | 5,623,475 | | | | 5,623,475 | | |
Vanguard Prime
Money Market Fund(c) | | | 2,811,737 | | | | 2,811,737 | | |
Wells Fargo
Eurodollar Time Deposit
5.260% 07/02/2007 | | | 1,518,339 | | | | 1,518,339 | | |
Wells Fargo
Eurodollar Time Deposit
5.280% 07/11/2007 | | | 5,623,476 | | | | 5,623,476 | | |
| | | Principal
Amount | | Market
Value | |
Wells Fargo
Eurodollar Time Deposit
5.280% 07/12/2007 | | $ | 2,811,738 | | | $ | 2,811,738 | | |
| | | | 173,593,920 | | |
| Repurchase Agreements — 3.0% | |
Investors Bank & Trust
Company Repurchase
Agreement, dated
6/29/2007, 3.50%,
due 7/02/2007(e) | | | 22,357,497 | | | | 22,357,497 | | |
TOTAL SHORT-TERM
INVESTMENTS
(Cost $195,951,417) | | | | | 195,951,417 | | |
TOTAL INVESTMENTS — 123.7%
(Cost $796,427,912)(f) | | | | | 915,982,946 | | |
Other Assets/
(Liabilities) — (23.7%) | | | | | (175,214,148 | ) | |
| NET ASSETS — 100.0% | | | | $ | 740,768,798 | | |
Notes to Portfolio of Investments
ADR - American Depository Receipt
(a) Non-income producing security.
(b) Denotes all or a portion of security on loan. (Note 2).
(c) Amount represents shares owned of the fund.
(d) Represents investments of security lending collateral. (Note 2).
(e) Maturity value of $22,364,018. Collateralized by a U.S. Government Agency obligation with a rate of 5.82%, maturity date of 11/15/2033, and an aggregate market value, including accrued interest, of $23,475,372.
(f) See Note 6 for aggregate cost for Federal tax purposes.
The accompanying notes are an integral part of the financial statements.
155
MassMutual Select Small Cap Core Equity Fund – Portfolio of Investments
June 30, 2007 (Unaudited)
| | | Number of
Shares | | Market
Value | |
| EQUITIES — 98.5% | |
| COMMON STOCK — 98.5% | |
| Aerospace & Defense — 0.2% | |
| Aerovironment, Inc.(a) | | | 4,900 | | | $ | 100,989 | | |
| Agriculture — 0.9% | |
Alliance One
International, Inc.(a) | | | 19,300 | | | | 193,965 | | |
| Universal Corp. | | | 4,700 | | | | 286,324 | | |
| | | | 480,289 | | |
| Airlines — 0.3% | |
| ExpressJet Holdings, Inc.(a) | | | 22,500 | | | | 134,550 | | |
| Pinnacle Airlines Corp.(a)(b) | | | 2,100 | | | | 39,375 | | |
| | | | 173,925 | | |
| Apparel — 2.3% | |
| Deckers Outdoor Corp.(a) | | | 6,271 | | | | 632,744 | | |
| Jones Apparel Group, Inc. | | | 630 | | | | 17,798 | | |
| Kellwood Co. | | | 3,520 | | | | 98,982 | | |
Perry Ellis
International, Inc.(a) | | | 17,250 | | | | 554,933 | | |
| | | | 1,304,457 | | |
| Auto Manufacturers — 0.2% | |
| Force Protection, Inc.(a) (b) | | | 4,300 | | | | 88,752 | | |
| Automotive & Parts — 2.8% | |
American Axle &
Manufacturing Holdings, Inc. | | | 7,000 | | | | 207,340 | | |
| ArvinMeritor, Inc. | | | 1,400 | | | | 31,080 | | |
| Cooper Tire & Rubber Co. | | | 29,200 | | | | 806,504 | | |
| Lear Corp.(a) | | | 1,900 | | | | 67,659 | | |
| Standard Motor Products, Inc. | | | 11,300 | | | | 169,839 | | |
| Visteon Corp.(a) | | | 35,200 | | | | 285,120 | | |
| | | | 1,567,542 | | |
| Banks — 4.5% | |
| 1st Source Corp. | | | 200 | | | | 4,984 | | |
| Bank Mutual Corp. | | | 10,700 | | | | 123,371 | | |
| Banner Corp. | | | 100 | | | | 3,406 | | |
| Cascade Bancorp(b) | | | 6,522 | | | | 150,919 | | |
| Chemical Financial Corp. | | | 100 | | | | 2,587 | | |
| Chittenden Corp. | | | 684 | | | | 23,906 | | |
| City National Corp. | | | 4,200 | | | | 319,578 | | |
| East West Bancorp, Inc. | | | 1,000 | | | | 38,880 | | |
First Regional Bancorp/
Los Angeles, CA(a) | | | 6,335 | | | | 161,162 | | |
| First South Bancorp, Inc.(b) | | | 3 | | | | 81 | | |
| Greater Bay Bancorp | | | 1,009 | | | | 28,091 | | |
| Hanmi Financial Corp. | | | 15,500 | | | | 264,430 | | |
| Horizon Financial Corp. | | | 221 | | | | 4,816 | | |
| | | Number of
Shares | | Market
Value | |
Preferred Bank/
Los Angeles, CA | | | 4,771 | | | $ | 190,840 | | |
| Signature Bank(a) | | | 700 | | | | 23,870 | | |
| TriCo Bancshares | | | 400 | | | | 8,944 | | |
| Umpqua Holdings Corp. | | | 38,900 | | | | 914,539 | | |
Vineyard National
Bancorp Co.(b) | | | 9,790 | | | | 224,876 | | |
| Wintrust Financial Corp. | | | 200 | | | | 8,770 | | |
| | | | 2,498,050 | | |
| Beverages — 0.0% | |
| National Beverage Corp.(a) | | | 24 | | | | 276 | | |
| Biotechnology — 2.7% | |
| Cambrex Corp. | | | 12,200 | | | | 161,894 | | |
Celera Genomics Group -
Applera Corp.(a) | | | 33,950 | | | | 420,980 | | |
Millennium
Pharmaceuticals, Inc.(a) | | | 44,606 | | | | 471,485 | | |
Omrix
Biopharmaceuticals, Inc.(a) | | | 1,800 | | | | 56,628 | | |
Savient
Pharmaceuticals, Inc.(a) | | | 33,135 | | | | 411,537 | | |
| | | | 1,522,524 | | |
| Chemicals — 3.7% | |
| Albemarle Corp. | | | 100 | | | | 3,853 | | |
CF Industries
Holdings, Inc.(b) | | | 17,940 | | | | 1,074,427 | | |
| Innospec, Inc. | | | 5,010 | | | | 296,642 | | |
| OM Group, Inc.(a) | | | 4,557 | | | | 241,156 | | |
| Stepan Co. | | | 900 | | | | 27,252 | | |
| Terra Industries, Inc.(a) | | | 17,800 | | | | 452,476 | | |
| | | | 2,095,806 | | |
| Commercial Services — 9.6% | |
| ABM Industries, Inc. | | | 21,000 | | | | 542,010 | | |
Albany Molecular
Research, Inc.(a) | | | 9,400 | | | | 139,590 | | |
| Arbitron, Inc. | | | 700 | | | | 36,071 | | |
| Bowne & Co., Inc. | | | 14,900 | | | | 290,699 | | |
| CDI Corp. | | | 100 | | | | 3,220 | | |
| CorVel Corp.(a) | | | 9,658 | | | | 252,460 | | |
| CPI Corp. | | | 6,889 | | | | 478,786 | | |
Diamond Management &
Technology Consultants, Inc. | | | 9,400 | | | | 124,080 | | |
| DynCorp International, Inc.(a) | | | 10,300 | | | | 226,497 | | |
| Gartner Group, Inc.(a) | | | 5,000 | | | | 122,950 | | |
Great Lakes Dredge &
Dock Corp.(a) | | | 7,800 | | | | 74,100 | | |
ITT Educational
Services, Inc.(a) | | | 2,400 | | | | 281,712 | | |
| | | Number of
Shares | | Market
Value | |
| Kelly Services, Inc. Cl. A | | | 100 | | | $ | 2,746 | | |
| MPS Group, Inc.(a) | | | 4,251 | | | | 56,836 | | |
PharmaNet Development
Group, Inc.(a) | | | 12,000 | | | | 382,560 | | |
Pre-Paid Legal
Services, Inc.(a) (b) | | | 10,100 | | | | 649,531 | | |
| Service Corp. International | | | 100 | | | | 1,278 | | |
| Sotheby's | | | 6,100 | | | | 280,722 | | |
| Spherion Corp.(a) | | | 60,683 | | | | 569,813 | | |
| Stanley, Inc.(a) | | | 5,400 | | | | 95,148 | | |
| TeleTech Holdings, Inc.(a) | | | 21,150 | | | | 686,952 | | |
Volt Information
Sciences, Inc.(a) (b) | | | 4,860 | | | | 89,618 | | |
| | | | 5,387,379 | | |
| Communications — 1.3% | |
| Andrew Corp.(a) (b) | | | 51,600 | | | | 745,104 | | |
| Computer Related Services — 0.3% | |
| Ingram Micro, Inc. Cl. A(a) | | | 6,519 | | | | 141,527 | | |
| Computers — 1.8% | |
| Agilysys, Inc. | | | 3,600 | | | | 81,000 | | |
| Ansoft Corp.(a) | | | 11,377 | | | | 335,508 | | |
| Ciber, Inc.(a) | | | 20,200 | | | | 165,236 | | |
| Covansys Corp.(a) | | | 900 | | | | 30,537 | | |
| Manhattan Associates, Inc.(a) | | | 5,300 | | | | 147,923 | | |
| SYKES Enterprises, Inc.(a) | | | 73 | | | | 1,386 | | |
| Synopsys, Inc.(a) | | | 8,555 | | | | 226,109 | | |
| | | | 987,699 | | |
| Computers & Information — 0.4% | |
| Tech Data Corp.(a) | | | 5,405 | | | | 207,876 | | |
| Diversified Financial — 2.0% | |
| AmeriCredit Corp.(a)(b) | | | 22,400 | | | | 594,720 | | |
| Cowen Group, Inc.(a) | | | 2,200 | | | | 39,402 | | |
| GAMCO Investors, Inc. Cl. A | | | 1,300 | | | | 72,865 | | |
| Piper Jaffray Cos.(a) | | | 3,100 | | | | 172,763 | | |
| SWS Group, Inc. | | | 2,350 | | | | 50,807 | | |
| World Acceptance Corp.(a) | | | 4,020 | | | | 171,775 | | |
| | | | 1,102,332 | | |
| Electric — 1.2% | |
| OGE Energy Corp. | | | 45 | | | | 1,649 | | |
| Portland General Electric Co. | | | 300 | | | | 8,232 | | |
| Reliant Energy, Inc.(a) | | | 25,500 | | | | 687,225 | | |
| | | | 697,106 | | |
| Electrical Components & Equipment — 2.4% | |
Advanced Energy
Industries, Inc.(a) | | | 20,300 | | | | 459,998 | | |
| Belden, Inc. | | | 10,855 | | | | 600,824 | | |
| Energizer Holdings, Inc.(a) | | | 300 | | | | 29,880 | | |
(Continued)
The accompanying notes are an integral part of the financial statements.
156
MassMutual Select Small Cap Core Equity Fund – Portfolio of Investments (Continued)
| | | Number of
Shares | | Market
Value | |
| General Cable Corp.(a) | | | 925 | | | $ | 70,069 | | |
| Superior Essex, Inc.(a) | | | 5,743 | | | | 214,501 | | |
| | | | 1,375,272 | | |
| Electronics — 1.7% | |
| Avnet, Inc.(a) | | | 13,100 | | | | 519,284 | | |
| II-VI, Inc.(a) | | | 200 | | | | 5,434 | | |
Mettler-Toledo
International, Inc.(a) | | | 100 | | | | 9,551 | | |
| Varian, Inc.(a) | | | 8,000 | | | | 438,640 | | |
| | | | 972,909 | | |
| Engineering & Construction — 1.2% | |
| Emcor Group, Inc.(a) | | | 3,007 | | | | 219,210 | | |
| Perini Corp.(a) | | | 7,200 | | | | 443,016 | | |
| | | | 662,226 | | |
| Foods — 2.5% | |
| American Dairy, Inc.(a) | | | 1,700 | | | | 31,722 | | |
Chiquita Brands
International, Inc.(a)(b) | | | 14,200 | | | | 269,232 | | |
| Dean Foods Co. | | | 2,500 | | | | 79,675 | | |
| Fresh Del Monte Produce, Inc. | | | 3,300 | | | | 82,665 | | |
| Ingles Markets, Inc. Cl. A | | | 4,249 | | | | 146,378 | | |
| Nash Finch Co.(b) | | | 5,700 | | | | 282,150 | | |
Performance Food
Group Co.(a) | | | 13,772 | | | | 447,452 | | |
| Seaboard Corp.(b) | | | 18 | | | | 42,210 | | |
| Spartan Stores, Inc. | | | 1,223 | | | | 40,249 | | |
Village Super Market,
Inc. Cl. A | | | 200 | | | | 9,562 | | |
| | | | 1,431,295 | | |
| Forest Products & Paper — 1.2% | |
| Buckeye Technologies, Inc.(a) | | | 2,200 | | | | 34,034 | | |
| Domtar Corp.(a) | | | 9,200 | | | | 102,672 | | |
| Rock-Tenn Co. Cl. A | | | 6,714 | | | | 212,968 | | |
| United Stationers, Inc.(a) | | | 5,200 | | | | 346,528 | | |
| | | | 696,202 | | |
| Hand & Machine Tools — 0.5% | |
| Baldor Electric Co. | | | 6,000 | | | | 295,680 | | |
| Health Care – Products — 2.7% | |
| Align Technology, Inc.(a)(b) | | | 8,400 | | | | 202,944 | | |
| CONMED Corp.(a) | | | 12,200 | | | | 357,216 | | |
| Dentsply International, Inc. | | | 2,800 | | | | 107,128 | | |
| Immucor, Inc.(a) | | | 14,600 | | | | 408,362 | | |
West Pharmaceutical
Services, Inc. | | | 3,800 | | | | 179,170 | | |
| Zoll Medical Corp.(a) | | | 11,636 | | | | 259,599 | | |
| | | | 1,514,419 | | |
| Health Care – Services — 2.3% | |
Apria Healthcare
Group, Inc.(a)(b) | | | 17,300 | | | | 497,721 | | |
| | | Number of
Shares | | Market
Value | |
| Kindred Healthcare, Inc.(a) | | | 12,600 | | | $ | 387,072 | | |
| Medcath Corp.(a) | | | 7,100 | | | | 225,780 | | |
| WellCare Health Plans, Inc.(a) | | | 1,700 | | | | 153,867 | | |
| | | | 1,264,440 | | |
| Home Builders — 0.1% | |
| AMREP Corp.(b) | | | 759 | | | | 36,090 | | |
| Coachmen Industries, Inc. | | | 1,600 | | | | 15,456 | | |
| | | | 51,546 | | |
| Home Furnishing — 0.3% | |
Tempur-Pedic
International, Inc.(b) | | | 6,300 | | | | 163,170 | | |
| Household Products — 0.3% | |
American Greetings
Corp. Cl. A | | | 6,300 | | | | 178,479 | | |
| Insurance — 2.6% | |
| Alleghany Corp.(a) | | | 100 | | | | 40,650 | | |
American Physicians
Capital, Inc.(a) | | | 900 | | | | 36,450 | | |
Aspen Insurance
Holdings Ltd.(b) | | | 3,900 | | | | 109,473 | | |
| Assured Guaranty Ltd.(b) | | | 5,300 | | | | 156,668 | | |
Infinity Property &
Casualty Corp. | | | 600 | | | | 30,438 | | |
| IPC Holdings Ltd. | | | 6,300 | | | | 203,427 | | |
| Max Capital Group Ltd. | | | 8,800 | | | | 249,040 | | |
Meadowbrook Insurance
Group, Inc.(a) | | | 7,300 | | | | 80,008 | | |
| NYMAGIC, Inc. | | | 5,000 | | | | 201,000 | | |
| The PMI Group, Inc. | | | 1,900 | | | | 84,873 | | |
Reinsurance Group of
America, Inc. | | | 3,995 | | | | 240,659 | | |
| Wesco Financial Corp. | | | 50 | | | | 19,250 | | |
| | | | 1,451,936 | | |
| Internet — 4.9% | |
Authorize.Net
Holdings, Inc.(a) | | | 16,300 | | | | 291,607 | | |
| Blue Nile, Inc.(a)(b) | | | 4,600 | | | | 277,840 | | |
| Chordiant Software, Inc.(a) | | | 16,100 | | | | 252,126 | | |
| CMGI, Inc.(a) | | | 108,500 | | | | 211,575 | | |
| InfoSpace, Inc. | | | 500 | | | | 11,605 | | |
| Interwoven, Inc.(a) | | | 38,975 | | | | 547,209 | | |
| RealNetworks, Inc.(a) | | | 12,700 | | | | 103,759 | | |
| S1 Corp.(a) | | | 44,026 | | | | 351,768 | | |
| Shutterfly, Inc.(a)(b) | | | 5,300 | | | | 114,215 | | |
| Vignette Corp.(a) | | | 29,600 | | | | 567,136 | | |
| | | | 2,728,840 | | |
| Investment Companies — 0.3% | |
| Capital Southwest Corp.(b) | | | 1,200 | | | | 186,948 | | |
| | | Number of
Shares | | Market
Value | |
| Iron & Steel — 1.7% | |
| Cleveland-Cliffs, Inc. | | | 9,000 | | | $ | 699,030 | | |
| Ryerson, Inc.(b) | | | 6,900 | | | | 259,785 | | |
| | | | 958,815 | | |
| Leisure Time — 0.0% | |
| K2, Inc.(a) | | | 1,300 | | | | 19,747 | | |
| WMS Industries, Inc.(a) | | | 50 | | | | 1,443 | | |
| | | | 21,190 | | |
| Machinery – Diversified — 1.1% | |
| AGCO Corp.(a) | | | 7,804 | | | | 338,772 | | |
| Gerber Scientific, Inc.(a) | | | 392 | | | | 4,555 | | |
| NACCO Industries, Inc. Cl. A | | | 700 | | | | 108,843 | | |
| Robbins & Myers, Inc.(b) | | | 2,600 | | | | 138,138 | | |
| | | | 590,308 | | |
| Manufacturing — 1.6% | |
| AZZ, Inc.(a) | | | 1,700 | | | | 57,205 | | |
| EnPro Industries, Inc.(a) | | | 1,174 | | | | 50,235 | | |
| SPX Corp. | | | 1,964 | | | | 172,459 | | |
| Tredegar Corp. | | | 28,900 | | | | 615,570 | | |
| | | | 895,469 | | |
| Media — 0.6% | |
| Belo Corp. Cl. A(b) | | | 16,300 | | | | 335,617 | | |
| Medical Supplies — 0.2% | |
| Cynosure, Inc. Cl. A(a) | | | 800 | | | | 29,144 | | |
| Sonic Innovations, Inc.(a) | | | 8,500 | | | | 74,375 | | |
| | | | 103,519 | | |
| Mining — 2.1% | |
Brush Engineered
Materials, Inc.(a) | | | 3,500 | | | | 146,965 | | |
| Usec, Inc.(a)(b) | | | 47,455 | | | | 1,043,061 | | |
| | | | 1,190,026 | | |
| Office Equipment/Supplies — 0.3% | |
| Ikon Office Solutions, Inc.(b) | | | 12,199 | | | | 190,426 | | |
| Oil & Gas — 2.3% | |
| Holly Corp. | | | 3,481 | | | | 258,255 | | |
Plains Exploration &
Production Co.(a) | | | 4,200 | | | | 200,802 | | |
| Pogo Producing Co.(b) | | | 1,800 | | | | 91,422 | | |
| Rosetta Resources, Inc.(a) | | | 11,200 | | | | 241,248 | | |
| Swift Energy Co.(a)(b) | | | 3,400 | | | | 145,384 | | |
| Western Refining, Inc. | | | 5,700 | | | | 329,460 | | |
| | | | 1,266,571 | | |
| Oil & Gas Services — 0.8% | |
| Matrix Service Co.(a) | | | 5,000 | | | | 124,250 | | |
| Trico Marine Services, Inc.(a) | | | 7,700 | | | | 314,776 | | |
| | | | 439,026 | | |
(Continued)
The accompanying notes are an integral part of the financial statements.
157
MassMutual Select Small Cap Core Equity Fund – Portfolio of Investments (Continued)
| | | Number of
Shares | | Market
Value | |
| Pharmaceuticals — 3.5% | |
Caraco Pharmaceutical
Laboratories Ltd.(a) | | | 12,220 | | | $ | 185,500 | | |
| NBTY, Inc.(a) | | | 12,900 | | | | 557,280 | | |
| Pharmion Corp.(a) | | | 9,800 | | | | 283,710 | | |
| Pozen, Inc.(a) | | | 21,000 | | | | 379,470 | | |
Watson
Pharmaceutical, Inc.(a) | | | 16,600 | | | | 539,998 | | |
| | | | 1,945,958 | | |
| Pipelines — 0.1% | |
| Oneok, Inc. | | | 1,500 | | | | 75,615 | | |
| Real Estate — 0.5% | |
| Jones Lang Lasalle, Inc. | | | 2,500 | | | | 283,750 | | |
| Real Estate Investment Trusts (REITS) — 6.2% | |
| Agree Realty Corp. REIT | | | 700 | | | | 21,875 | | |
| Anthracite Capital, Inc. | | | 44,101 | | | | 515,982 | | |
| Arbor Realty Trust, Inc. | | | 10,714 | | | | 276,528 | | |
| BRT Realty Trust REIT | | | 4,200 | | | | 109,242 | | |
| Cousins Properties, Inc. | | | 50 | | | | 1,451 | | |
| Crystal River Capital, Inc. | | | 19,000 | | | | 461,320 | | |
Entertainment
Properties Trust | | | 10,100 | | | | 543,178 | | |
| Gramercy Capital Corp.(b) | | | 4,300 | | | | 118,422 | | |
Health Care Property
Investors, Inc. | | | 100 | | | | 2,893 | | |
| HRPT Properties Trust | | | 20,800 | | | | 216,320 | | |
Medical Properties
Trust, Inc.(b) | | | 17,160 | | | | 227,027 | | |
NorthStar Realty Finance
Corp. REIT(b) | | | 5,900 | | | | 73,809 | | |
Omega Healthcare
Investors, Inc. REIT | | | 8,500 | | | | 134,555 | | |
| RAIT Financial Trust(b) | | | 12,200 | | | | 317,444 | | |
| Redwood Trust, Inc.(b) | | | 6,382 | | | | 308,761 | | |
| Resource Capital Corp. | | | 8,300 | | | | 116,034 | | |
Senior Housing
Properties Trust | | | 700 | | | | 14,245 | | |
| Winston Hotels, Inc. | | | 84 | | | | 1,260 | | |
| | | | 3,460,346 | | |
| Retail — 5.3% | |
| Aeropostale, Inc.(a) | | | 400 | | | | 16,672 | | |
Asbury Automotive
Group, Inc. | | | 14,697 | | | | 366,690 | | |
| Bell Microproducts, Inc.(a) | | | 2,600 | | | | 16,952 | | |
| Big Lots, Inc.(a) | | | 1,706 | | | | 50,191 | | |
| Brown Shoe Co., Inc. | | | 1,900 | | | | 46,208 | | |
| CEC Entertainment, Inc.(a) | | | 10,800 | | | | 380,160 | | |
| EZCORP, Inc. Cl. A(a) | | | 17,024 | | | | 225,398 | | |
| Jack in the Box, Inc.(a) | | | 3,100 | | | | 219,914 | | |
| Jo-Ann Stores, Inc.(a) | | | 5,600 | | | | 159,208 | | |
| Landry's Restaurants, Inc. | | | 10,100 | | | | 305,626 | | |
| | | Number of
Shares | | Market
Value | |
| O'Charley's, Inc. | | | 19,600 | | | $ | 395,136 | | |
| Payless ShoeSource, Inc.(a) | | | 900 | | | | 28,395 | | |
| RadioShack Corp.(b) | | | 10,200 | | | | 338,028 | | |
| Sonic Automotive, Inc. | | | 14,100 | | | | 408,477 | | |
| | | | 2,957,055 | | |
| Savings & Loans — 2.5% | |
| Bankfinancial Corp. | | | 1,400 | | | | 21,630 | | |
| Downey Financial Corp.(b) | | | 5,100 | | | | 336,498 | | |
Partners Trust Financial
Group, Inc.(b) | | | 38,200 | | | | 401,100 | | |
Provident Financial
Services, Inc.(b) | | | 42,200 | | | | 665,072 | | |
| | | | 1,424,300 | | |
| Semiconductors — 1.9% | |
| Actel Corp.(a) | | | 2,000 | | | | 27,820 | | |
Applied Micro
Circuits Corp.(a) | | | 1,900 | | | | 4,750 | | |
| Atmel Corp.(a) | | | 21,748 | | | | 120,919 | | |
| Exar Corp.(a) | | | 5,029 | | | | 67,389 | | |
| Novellus Systems, Inc.(a) | | | 9,700 | | | | 275,189 | | |
| Skyworks Solutions, Inc.(a) | | | 78,700 | | | | 578,445 | | |
Triquint
Semiconductor, Inc.(a) | | | 2,185 | | | | 11,056 | | |
| | | | 1,085,568 | | |
| Software — 1.4% | |
| Captaris, Inc.(a) | | | 18,694 | | | | 95,713 | | |
| Compuware Corp.(a) | | | 100 | | | | 1,186 | | |
| Double-Take Software, Inc.(a) | | | 19,000 | | | | 311,790 | | |
| MicroStrategy, Inc. Cl. A(a) | | | 755 | | | | 71,340 | | |
| Pegasystems, Inc. | | | 3,200 | | | | 34,976 | | |
| SYNNEX Corp.(a) | | | 13,081 | | | | 269,599 | | |
| Total System Services, Inc. | | | 800 | | | | 23,608 | | |
| | | | 808,212 | | |
| Telecommunications — 5.5% | |
| Cbeyond, Inc.(a) | | | 5,200 | | | | 200,252 | | |
| C-COR, Inc.(a) | | | 31,700 | | | | 445,702 | | |
| CT Communications, Inc. | | | 2,939 | | | | 89,669 | | |
| Ditech Networks, Inc.(a) | | | 1,400 | | | | 11,466 | | |
| EMS Technologies, Inc.(a) | | | 3,700 | | | | 81,622 | | |
| IDT Corp. Cl. B | | | 7,500 | | | | 77,400 | | |
| Novatel Wireless, Inc.(a) | | | 33,900 | | | | 882,078 | | |
| NTELOS Holdings Corp. | | | 4,800 | | | | 132,672 | | |
| PAETEC Holding Corp.(a)(b) | | | 20,600 | | | | 232,574 | | |
| Polycom, Inc.(a) | | | 5,700 | | | | 191,520 | | |
| Surewest Communications | | | 4,000 | | | | 108,960 | | |
| USA Mobility, Inc.(a) | | | 12,500 | | | | 334,500 | | |
| UTStarcom, Inc.(a)(b) | | | 49,592 | | | | 278,211 | | |
| | | | 3,066,626 | | |
| Transportation — 3.7% | |
| General Maritime Corp.(b) | | | 5,700 | | | | 152,646 | | |
| | | Number of
Shares | | Market
Value | |
| Gulfmark Offshore, Inc.(a) | | | 11,800 | | | $ | 604,396 | | |
| Hub Group, Inc. Cl. A(a) | | | 13,800 | | | | 485,208 | | |
Overseas Shipholding
Group, Inc. | | | 907 | | | | 73,830 | | |
P.A.M. Transportation
Services, Inc.(a) | | | 14,686 | | | | 268,460 | | |
| Saia, Inc.(a) | | | 3,200 | | | | 87,232 | | |
| Ship Finance International Ltd. | | | 13,700 | | | | 406,616 | | |
U.S. Xpress Enterprises,
Inc. Cl. A(a) | | | 127 | | | | 2,360 | | |
| YRC Worldwide, Inc.(a) | | | 600 | | | | 22,080 | | |
| | | | 2,102,828 | | |
TOTAL EQUITIES
(Cost $54,003,982) | | | | | | | 55,276,220 | | |
| MUTUAL FUND — 0.1% | |
| Investment Companies | |
iShares Russell 2000
Index Fund(b) | | | 500 | | | | 41,470 | | |
TOTAL MUTUAL FUND
(Cost $38,870) | | | | | | | 41,470 | | |
TOTAL LONG TERM INVESTMENTS
(Cost $54,042,852) | | | | | | | 55,317,690 | | |
| | | Principal
Amount | | | |
| SHORT-TERM INVESTMENTS — 18.0% | |
| Cash Equivalents — 17.5%(d) | |
Abbey National PLC
Eurodollar Time Deposit
5.280% 07/05/2007 | | $ | 126,912 | | | | 126,912 | | |
Abbey National PLC
Eurodollar Time Deposit
5.285% 07/09/2007 | | | 317,295 | | | | 317,295 | | |
American Beacon
Money Market Fund(c) | | | 355,990 | | | | 355,990 | | |
Banco Bilbao Vizcaya
Argentaria SA
Eurodollar Time Deposit
5.300% 08/10/2007 | | | 237,971 | | | | 237,971 | | |
Bank of America
5.270% 07/06/2007 | | | 317,295 | | | | 317,295 | | |
Bank of America
5.270% 07/16/2007 | | | 63,459 | | | | 63,459 | | |
Bank of America
5.270% 08/17/2007 | | | 79,324 | | | | 79,324 | | |
Bank of America
5.300% 09/17/2007 | | | 158,647 | | | | 158,647 | | |
Bank of Ireland
Eurodollar Time Deposit
5.300% 08/13/2007 | | | 317,295 | | | | 317,295 | | |
(Continued)
The accompanying notes are an integral part of the financial statements.
158
MassMutual Select Small Cap Core Equity Fund – Portfolio of Investments (Continued)
| | | Principal
Amount | | Market
Value | |
Bank of Montreal
Eurodollar Time Deposit
5.280% 07/03/2007 | | $ | 79,324 | | | $ | 79,324 | | |
Bank of Montreal
Eurodollar Time Deposit
5.290% 07/02/2007 | | | 63,459 | | | | 63,459 | | |
Bank of Montreal
Eurodollar Time Deposit
5.310% 08/14/2007 | | | 47,594 | | | | 47,594 | | |
Bank of Nova Scotia
Eurodollar Time Deposit
5.280% 07/09/2007 | | | 301,430 | | | | 301,430 | | |
Bank Of Nova Scotia
Eurodollar Time Deposit
5.285% 07/11/2007 | | | 174,512 | | | | 174,512 | | |
Barclays
Eurodollar Time Deposit
5.290% 07/06/2007 | | | 317,295 | | | | 317,295 | | |
Barclays
Eurodollar Time Deposit
5.295% 07/16/2007 | | | 63,459 | | | | 63,459 | | |
Barclays
Eurodollar Time Deposit
5.320% 09/04/2007 | | | 158,647 | | | | 158,647 | | |
Bear Stearns & Co
Commercial Paper
5.435% 07/10/2007 | | | 47,594 | | | | 47,594 | | |
BGI Institutional
Money Market Fund(c) | | | 206,241 | | | | 206,241 | | |
BNP Paribas
Eurodollar Time Deposit
5.350% 07/02/2007 | | | 475,942 | | | | 475,942 | | |
Calyon
Eurodollar Time Deposit
5.290% 07/17/2007 | | | 158,647 | | | | 158,647 | | |
Calyon
Eurodollar Time Deposit
5.380% 07/02/2007 | | | 475,942 | | | | 475,942 | | |
Canadian Imperial
Bank of Commerce
Eurodollar Time Deposit
5.300% 07/30/2007 | | | 317,295 | | | | 317,295 | | |
Dexia Group
Eurodollar Time Deposit
5.290% 08/08/2007 | | | 317,295 | | | | 317,295 | | |
Dreyfus Institutional
Cash Advantage
Money Market Fund(c) | | | 95,188 | | | | 95,188 | | |
Federal Home Loan
Bank Discount Note
5.174% 07/20/2007 | | | 23,533 | | | | 23,533 | | |
First Tennessee National Corp.
Eurodollar Time Deposit
5.300% 07/18/2007 | | | 79,324 | | | | 79,324 | | |
| | | Principal
Amount | | Market
Value | |
Fortis Bank
Eurodollar Time Deposit
5.290% 07/06/2007 | | $ | 79,324 | | | $ | 79,324 | | |
Fortis Bank
Eurodollar Time Deposit
5.290% 07/09/2007 | | | 111,053 | | | | 111,053 | | |
Fortis Bank
Eurodollar Time Deposit
5.300% 07/20/2007 | | | 79,324 | | | | 79,324 | | |
Fortis Bank
Eurodollar Time Deposit
5.300% 07/26/2007 | | | 63,459 | | | | 63,459 | | |
Fortis Bank
Eurodollar Time Deposit
5.350% 07/05/2007 | | | 158,647 | | | | 158,647 | | |
Freddie Mac Discount Note
5.155% 07/16/2007 | | | 29,957 | | | | 29,957 | | |
Freddie Mac Discount Note
5.185% 07/09/2007 | | | 15,640 | | | | 15,640 | | |
Morgan Stanley & Co
Commercial Paper
5.445% 08/01/2007 | | | 142,783 | | | | 142,783 | | |
National Australia Bank
Eurodollar Time Deposit
5.320% 07/02/2007 | | | 158,647 | | | | 158,647 | | |
Nationwide Building
Society Commercial Paper
5.301% 07/09/2007 | | | 158,321 | | | | 158,321 | | |
Rabobank Nederland
Eurodollar Time Deposit
5.280% 07/05/2007 | | | 237,971 | | | | 237,971 | | |
Rabobank Nederland
Eurodollar Time Deposit
5.290% 07/16/2007 | | | 317,295 | | | | 317,295 | | |
Rabobank Nederland
Eurodollar Time Deposit
5.330% 07/02/2007 | | | 475,942 | | | | 475,942 | | |
Reserve Primary
Money Market Fund(c) | | | 314,991 | | | | 314,991 | | |
Royal Bank of Canada
Eurodollar Time Deposit
5.305% 08/30/2007 | | | 317,295 | | | | 317,295 | | |
Royal Bank of Scotland
Eurodollar Time Deposit
5.270% 07/11/2007 | | | 79,324 | | | | 79,324 | | |
Skandinaviska Enskilda
Banken AB
Eurodollar Time Deposit
5.290% 07/13/2007 | | | 317,295 | | | | 317,295 | | |
Skandinaviska Enskilda
Banken AB
Eurodollar Time Deposit
5.290% 07/19/2007 | | | 47,594 | | | | 47,594 | | |
| | | Principal
Amount | | Market
Value | |
Svenska Handlesbanken
Eurodollar Time Deposit
5.300% 07/02/2007 | | $ | 53,298 | | | $ | 53,298 | | |
UBS AG
Eurodollar Time Deposit
5.277% 07/05/2007 | | | 222,106 | | | | 222,106 | | |
UBS AG
Eurodollar Time Deposit
5.285% 07/05/2007 | | | 317,295 | | | | 317,295 | | |
Vanguard Prime
Money Market Fund(c) | | | 158,647 | | | | 158,647 | | |
Wells Fargo
Eurodollar Time Deposit
5.260% 07/02/2007 | | | 85,670 | | | | 85,670 | | |
Wells Fargo
Eurodollar Time Deposit
5.280% 07/11/2007 | | | 317,295 | | | | 317,295 | | |
Wells Fargo
Eurodollar Time Deposit
5.280% 07/12/2007 | | | 158,647 | | | | 158,647 | | |
| | | | 9,794,729 | | |
| Repurchase Agreements — 0.5% | |
Investors Bank & Trust
Company Repurchase
Agreement, dated
6/29/2007, 3.50%,
due 7/02/2007(e) | | | 286,855 | | | | 286,855 | | |
TOTAL SHORT-TERM
INVESTMENTS
(Cost $10,081,584) | | | | | | | 10,081,584 | | |
TOTAL INVESTMENTS — 116.6%
(Cost $64,124,436)(f) | | | | | | | 65,399,274 | | |
Other Assets/
(Liabilities) — (16.6%) | | | | | | | (9,296,351 | ) | |
| NET ASSETS — 100.0% | | | | | | $ | 56,102,923 | | |
Notes to Portfolio of Investments
(a) Non-income producing security.
(b) Denotes all or a portion of security on loan. (Note 2).
(c) Amount represents shares owned of the fund.
(d) Represents investments of security lending collateral. (Note 2).
(e) Maturity value of $286,939. Collateralized by a U.S. Government Agency obligation with a rate of 8.125%, maturity date of 11/25/2009, and an aggregate market value, including accrued interest, of $301,198.
(f) See Note 6 for aggregate cost for Federal tax purposes.
The accompanying notes are an integral part of the financial statements.
159
MassMutual Select Mid Cap Growth Equity Fund – Portfolio of Investments
June 30, 2007 (Unaudited)
| | | Number of
Shares | | Market
Value | |
| EQUITIES — 99.9% | |
| COMMON STOCK — 99.9% | |
| Aerospace & Defense — 1.0% | |
| Rockwell Collins, Inc. | | | 24,525 | | | $ | 1,732,446 | | |
| Apparel — 3.4% | |
| Coach, Inc.(a) | | | 40,225 | | | | 1,906,263 | | |
| Phillips-Van Heusen Corp. | | | 30,800 | | | | 1,865,556 | | |
| VF Corp. | | | 20,425 | | | | 1,870,521 | | |
| | | | 5,642,340 | | |
| Auto Manufacturers — 1.5% | |
| Paccar, Inc. | | | 28,100 | | | | 2,445,824 | | |
| Automotive & Parts — 1.4% | |
The Goodyear Tire &
Rubber Co.(a) | | | 68,825 | | | | 2,392,357 | | |
| Biotechnology — 1.5% | |
| Celgene Corp.(a) | | | 44,000 | | | | 2,522,520 | | |
| Chemicals — 1.2% | |
| Albemarle Corp. | | | 51,425 | | | | 1,981,405 | | |
| Commercial Services — 8.6% | |
| Convergys Corp.(a) | | | 71,900 | | | | 1,742,856 | | |
Corrections Corp. of
America(a) | | | 54,550 | | | | 3,442,650 | | |
ITT Educational
Services, Inc.(a) | | | 16,275 | | | | 1,910,359 | | |
| Manpower, Inc. | | | 22,800 | | | | 2,103,072 | | |
| Quanta Services, Inc.(a) (b) | | | 109,650 | | | | 3,362,965 | | |
Ritchie Bros.
Auctioneers, Inc. | | | 28,200 | | | | 1,765,884 | | |
| | | | 14,327,786 | | |
| Computers — 6.0% | |
Brocade Communications
Systems, Inc.(a) | | | 191,900 | | | | 1,500,658 | | |
Cognizant Technology
Solutions Corp. Cl. A(a) | | | 37,575 | | | | 2,821,507 | | |
Electronic Data
Systems Corp. | | | 60,000 | | | | 1,663,800 | | |
FactSet Research
Systems, Inc. | | | 39,550 | | | | 2,703,242 | | |
Lexmark International,
Inc. Cl. A(a) | | | 25,000 | | | | 1,232,750 | | |
| | | | 9,921,957 | | |
| Cosmetics & Personal Care — 1.9% | |
| Alberto-Culver Co. | | | 133,125 | | | | 3,157,725 | | |
| | | Number of
Shares | | Market
Value | |
| Diversified Financial — 6.0% | |
| Ameriprise Financial, Inc. | | | 30,175 | | | $ | 1,918,225 | | |
Chicago Mercantile
Exchange Holdings, Inc. | | | 3,325 | | | | 1,776,747 | | |
The First
Marblehead Corp.(b) | | | 33,950 | | | | 1,311,828 | | |
IntercontinentalExchange,
Inc.(a) | | | 19,400 | | | | 2,868,290 | | |
| T. Rowe Price Group, Inc. | | | 40,300 | | | | 2,091,167 | | |
| | | | 9,966,257 | | |
| Electric — 2.8% | |
| Allegheny Energy, Inc.(a) | | | 34,425 | | | | 1,781,149 | | |
Constellation Energy
Group, Inc. | | | 32,125 | | | | 2,800,336 | | |
| | | | 4,581,485 | | |
| Electrical Components & Equipment — 1.7% | |
| General Cable Corp.(a) | | | 37,100 | | | | 2,810,325 | | |
| Electronics — 3.9% | |
| Amphenol Corp. Cl. A | | | 63,000 | | | | 2,245,950 | | |
| Avnet, Inc.(a) | | | 59,500 | | | | 2,358,580 | | |
Thermo Fisher
Scientific, Inc.(a) | | | 35,125 | | | | 1,816,665 | | |
| | | | 6,421,195 | | |
| Environmental Controls — 2.1% | |
| Stericycle, Inc.(a) | | | 79,100 | | | | 3,516,786 | | |
| Foods — 2.2% | |
| The Kroger Co. | | | 131,150 | | | | 3,689,249 | | |
| Health Care – Products — 3.1% | |
| Dentsply International, Inc. | | | 46,500 | | | | 1,779,090 | | |
| Intuitive Surgical, Inc.(a) | | | 13,100 | | | | 1,817,887 | | |
| St. Jude Medical, Inc.(a) (b) | | | 38,600 | | | | 1,601,514 | | |
| | | | 5,198,491 | | |
| Health Care – Services — 6.9% | |
| Health Net, Inc.(a) | | | 29,700 | | | | 1,568,160 | | |
Laboratory Corp. of
America Holdings(a) (b) | | | 27,200 | | | | 2,128,672 | | |
| Manor Care, Inc. | | | 32,200 | | | | 2,102,338 | | |
Universal Health Services,
Inc. Cl. B | | | 34,925 | | | | 2,147,887 | | |
WellCare Health
Plans, Inc.(a) (b) | | | 39,900 | | | | 3,611,349 | | |
| | | | 11,558,406 | | |
| Household Products — 1.3% | |
| Church & Dwight Co., Inc. | | | 46,150 | | | | 2,236,429 | | |
| | | Number of
Shares | | Market
Value | |
| Insurance — 2.6% | |
| CNA Financial Corp.(b) | | | 58,200 | | | $ | 2,775,558 | | |
Philadelphia Consolidated
Holding Corp.(a) | | | 38,075 | | | | 1,591,535 | | |
| | | | 4,367,093 | | |
| Internet — 1.6% | |
| HLTH Corp.(a) (b) | | | 195,300 | | | | 2,736,153 | | |
| Iron & Steel — 3.0% | |
| Allegheny Technologies, Inc. | | | 25,775 | | | | 2,703,282 | | |
| Chaparral Steel Co. | | | 31,800 | | | | 2,285,466 | | |
| | | | 4,988,748 | | |
| Lodging — 2.4% | |
Starwood Hotels & Resorts
Worldwide, Inc. | | | 36,200 | | | | 2,427,934 | | |
| Wynn Resorts Ltd.(b) | | | 17,100 | | | | 1,533,699 | | |
| | | | 3,961,633 | | |
| Machinery – Diversified — 2.9% | |
| The Manitowoc Co., Inc. | | | 40,225 | | | | 3,233,286 | | |
Zebra Technologies
Corp. Cl. A(a) | | | 43,200 | | | | 1,673,568 | | |
| | | | 4,906,854 | | |
| Media — 1.0% | |
EchoStar Communications
Corp. Cl. A(a) | | | 37,500 | | | | 1,626,375 | | |
| Metal Fabricate & Hardware — 1.2% | |
| Precision Castparts Corp. | | | 17,100 | | | | 2,075,256 | | |
| Oil & Gas — 2.2% | |
| Holly Corp. | | | 49,350 | | | | 3,661,277 | | |
| Oil & Gas Services — 2.2% | |
FMC
Technologies, Inc.(a) (b) | | | 22,900 | | | | 1,814,138 | | |
National Oilwell
Varco, Inc.(a) | | | 18,175 | | | | 1,894,562 | | |
| | | | 3,708,700 | | |
| Packaging & Containers — 1.6% | |
| Owens-Illinois, Inc.(a) | | | 76,100 | | | | 2,663,500 | | |
| Pharmaceuticals — 0.9% | |
| ImClone Systems, Inc.(a) | | | 40,300 | | | | 1,425,008 | | |
| Real Estate — 1.4% | |
| Jones Lang Lasalle, Inc. | | | 20,125 | | | | 2,284,188 | | |
| Real Estate Investment Trusts (REITS) — 0.9% | |
| Boston Properties, Inc. | | | 14,500 | | | | 1,480,885 | | |
(Continued)
The accompanying notes are an integral part of the financial statements.
160
MassMutual Select Mid Cap Growth Equity Fund – Portfolio of Investments (Continued)
| | | Number of
Shares | | Market
Value | |
| Retail — 6.2% | |
| AutoZone, Inc.(a) | | | 15,950 | | | $ | 2,179,089 | | |
Dick's Sporting
Goods, Inc.(a) (b) | | | 39,000 | | | | 2,268,630 | | |
| J.C. Penney Co., Inc.(b) | | | 31,225 | | | | 2,260,066 | | |
| RadioShack Corp.(b) | | | 56,500 | | | | 1,872,410 | | |
| Yum! Brands, Inc. | | | 54,800 | | | | 1,793,056 | | |
| | | | 10,373,251 | | |
| Semiconductors — 3.5% | |
MEMC Electronic
Materials, Inc.(a) | | | 43,675 | | | | 2,669,416 | | |
| Nvidia Corp.(a) | | | 74,800 | | | | 3,089,988 | | |
| | | | 5,759,404 | | |
| Software — 1.6% | |
Nuance Communications,
Inc.(a) (b) | | | 162,150 | | | | 2,712,770 | | |
| Telecommunications — 5.8% | |
Juniper
Networks, Inc.(a) (b) | | | 124,900 | | | | 3,143,733 | | |
Qwest Communications
International, Inc.(a) (b) | | | 220,225 | | | | 2,136,183 | | |
SBA Communications
Corp. Cl. A(a) | | | 69,200 | | | | 2,324,428 | | |
| US Cellular Corp.(a) | | | 22,575 | | | | 2,045,295 | | |
| | | | 9,649,639 | | |
| Toys, Games & Hobbies — 2.4% | |
| Hasbro, Inc. | | | 60,475 | | | | 1,899,520 | | |
| Mattel, Inc. | | | 82,875 | | | | 2,095,909 | | |
| | | | 3,995,429 | | |
TOTAL EQUITIES
(Cost $147,540,108) | | | | | | | 166,479,146 | | |
| | | Principal
Amount | | | |
| SHORT-TERM INVESTMENTS — 15.6% | |
| Cash Equivalents — 15.6%(d) | |
Abbey National PLC
Eurodollar Time Deposit
5.280% 07/05/2007 | | $ | 337,833 | | | | 337,833 | | |
Abbey National PLC
Eurodollar Time Deposit
5.285% 07/09/2007 | | | 844,599 | | | | 844,599 | | |
American Beacon
Money Market Fund(c) | | | 947,601 | | | | 947,601 | | |
Banco Bilbao Vizcaya
Argentaria SA
Eurodollar Time Deposit
5.300% 08/10/2007 | | | 633,449 | | | | 633,449 | | |
| | | Principal
Amount | | Market
Value | |
Bank of America
5.270% 07/06/2007 | | $ | 844,599 | | | $ | 844,599 | | |
Bank of America
5.270% 07/16/2007 | | | 168,920 | | | | 168,920 | | |
Bank of America
5.270% 08/17/2007 | | | 211,150 | | | | 211,150 | | |
Bank of America
5.300% 09/17/2007 | | | 422,299 | | | | 422,299 | | |
Bank of Ireland
Eurodollar Time Deposit
5.300% 08/13/2007 | | | 844,599 | | | | 844,599 | | |
Bank of Montreal
Eurodollar Time Deposit
5.280% 07/03/2007 | | | 211,150 | | | | 211,150 | | |
Bank of Montreal
Eurodollar Time Deposit
5.290% 07/02/2007 | | | 168,920 | | | | 168,920 | | |
Bank of Montreal
Eurodollar Time Deposit
5.310% 08/14/2007 | | | 126,690 | | | | 126,690 | | |
Bank of Nova Scotia
Eurodollar Time Deposit
5.280% 07/09/2007 | | | 802,369 | | | | 802,369 | | |
Bank Of Nova Scotia
Eurodollar Time Deposit
5.285% 07/11/2007 | | | 464,529 | | | | 464,529 | | |
Barclays
Eurodollar Time Deposit
5.290% 07/06/2007 | | | 844,599 | | | | 844,599 | | |
Barclays
Eurodollar Time Deposit
5.295% 07/16/2007 | | | 168,920 | | | | 168,920 | | |
Barclays
Eurodollar Time Deposit
5.320% 09/04/2007 | | | 422,299 | | | | 422,299 | | |
Bear Stearns & Co
Commercial Paper
5.435% 07/10/2007 | | | 126,690 | | | | 126,690 | | |
BGI Institutional
Money Market Fund(c) | | | 548,989 | | | | 548,989 | | |
BNP Paribas
Eurodollar Time Deposit
5.350% 07/02/2007 | | | 1,266,898 | | | | 1,266,898 | | |
Calyon
Eurodollar Time Deposit
5.290% 07/17/2007 | | | 422,299 | | | | 422,299 | | |
Calyon
Eurodollar Time Deposit
5.380% 07/02/2007 | | | 1,266,898 | | | | 1,266,898 | | |
Canadian Imperial
Bank of Commerce
Eurodollar Time Deposit
5.300% 07/30/2007 | | | 844,599 | | | | 844,599 | | |
| | | Principal
Amount | | Market
Value | |
Dexia Group
Eurodollar Time Deposit
5.290% 08/08/2007 | | $ | 844,599 | | | $ | 844,599 | | |
Dreyfus Institutional
Cash Advantage
Money Market Fund(c) | | | 253,380 | | | | 253,380 | | |
Federal Home Loan
Bank Discount Note
5.174% 07/20/2007 | | | 62,641 | | | | 62,641 | | |
First Tennessee
National Corp.
Eurodollar Time Deposit
5.300% 07/18/2007 | | | 211,150 | | | | 211,150 | | |
Fortis Bank
Eurodollar Time Deposit
5.290% 07/06/2007 | | | 211,150 | | | | 211,150 | | |
Fortis Bank
Eurodollar Time Deposit
5.290% 07/09/2007 | | | 295,610 | | | | 295,610 | | |
Fortis Bank
Eurodollar Time Deposit
5.300% 07/20/2007 | | | 211,150 | | | | 211,150 | | |
Fortis Bank
Eurodollar Time Deposit
5.300% 07/26/2007 | | | 168,920 | | | | 168,920 | | |
Fortis Bank
Eurodollar Time Deposit
5.350% 07/05/2007 | | | 422,299 | | | | 422,299 | | |
Freddie Mac Discount Note
5.155% 07/16/2007 | | | 79,743 | | | | 79,743 | | |
Freddie Mac Discount Note
5.185% 07/09/2007 | | | 41,631 | | | | 41,631 | | |
Morgan Stanley & Co
Commercial Paper
5.445% 08/01/2007 | | | 380,069 | | | | 380,069 | | |
National Australia Bank
Eurodollar Time Deposit
5.320% 07/02/2007 | | | 422,299 | | | | 422,299 | | |
Nationwide Building
Society Commercial Paper
5.301% 07/09/2007 | | | 421,431 | | | | 421,431 | | |
Rabobank Nederland
Eurodollar Time Deposit
5.280% 07/05/2007 | | | 633,449 | | | | 633,449 | | |
Rabobank Nederland
Eurodollar Time Deposit
5.290% 07/16/2007 | | | 844,599 | | | | 844,599 | | |
Rabobank Nederland
Eurodollar Time Deposit
5.330% 07/02/2007 | | | 1,266,898 | | | | 1,266,898 | | |
Reserve Primary
Money Market Fund(c) | | | 838,466 | | | | 838,466 | | |
(Continued)
The accompanying notes are an integral part of the financial statements.
161
MassMutual Select Mid Cap Growth Equity Fund – Portfolio of Investments (Continued)
| | | Principal
Amount | | Market
Value | |
Royal Bank of Canada
Eurodollar Time Deposit
5.305% 08/30/2007 | | $ | 844,599 | | | $ | 844,599 | | |
Royal Bank of Scotland
Eurodollar Time Deposit
5.270% 07/11/2007 | | | 211,150 | | | | 211,150 | | |
Skandinaviska Enskilda
Banken AB
Eurodollar Time Deposit
5.290% 07/13/2007 | | | 844,599 | | | | 844,599 | | |
Skandinaviska Enskilda
Banken AB
Eurodollar Time Deposit
5.290% 07/19/2007 | | | 126,690 | | | | 126,690 | | |
Svenska Handlesbanken
Eurodollar Time Deposit
5.300% 07/02/2007 | | | 141,872 | | | | 141,872 | | |
UBS AG
Eurodollar Time Deposit
5.277% 07/05/2007 | | | 591,219 | | | | 591,219 | | |
UBS AG
Eurodollar Time Deposit
5.285% 07/05/2007 | | | 844,599 | | | | 844,599 | | |
Vanguard Prime
Money Market Fund(c) | | | 422,299 | | | | 422,299 | | |
Wells Fargo
Eurodollar Time Deposit
5.260% 07/02/2007 | | | 228,042 | | | | 228,042 | | |
Wells Fargo
Eurodollar Time Deposit
5.280% 07/11/2007 | | | 844,599 | | | | 844,599 | | |
Wells Fargo
Eurodollar Time Deposit
5.280% 07/12/2007 | | | 422,299 | | | | 422,299 | | |
| | | | 26,072,349 | | |
TOTAL SHORT-TERM
INVESTMENTS
(Cost $26,072,349) | | | | | | | 26,072,349 | | |
TOTAL INVESTMENTS — 115.5%
(Cost $173,612,457)(e) | | | | | | | 192,551,495 | | |
Other Assets/
(Liabilities) — (15.5%) | | | | | | | (25,883,980 | ) | |
| NET ASSETS — 100.0% | | | | | | $ | 166,667,515 | | |
Notes to Portfolio of Investments
(a) Non-income producing security.
(b) Denotes all or a portion of security on loan. (Note 2).
(c) Amount represents shares owned of the fund.
(d) Represents investments of security lending collateral. (Note 2).
(e) See Note 6 for aggregate cost for Federal tax purposes.
The remainder of this page is intentionally left blank.
The accompanying notes are an integral part of the financial statements.
162
MassMutual Select Mid Cap Growth Equity II Fund – Portfolio of Investments
June 30, 2007 (Unaudited)
| | | Number of
Shares | | Market
Value | |
| EQUITIES — 96.4% | |
| COMMON STOCK — 96.4% | |
| Advertising — 2.6% | |
| Catalina Marketing Corp. | | | 185,000 | | | $ | 5,827,500 | | |
Clear Channel Outdoor
Holdings, Inc. Cl. A(a) | | | 317,300 | | | | 8,992,282 | | |
Focus Media Holding
Ltd. ADR (China)(a) (b) | | | 32,300 | | | | 1,631,150 | | |
| Getty Images, Inc.(a) | | | 10,900 | | | | 521,129 | | |
Lamar Advertising
Co. Cl. A | | | 248,800 | | | | 15,614,688 | | |
| Omnicom Group, Inc. | | | 47,200 | | | | 2,497,824 | | |
WPP Group PLC
Sponsored ADR
(United Kingdom) | | | 28,600 | | | | 2,137,850 | | |
| | | | 37,222,423 | | |
| Aerospace & Defense — 2.2% | |
Alliant
Techsystems, Inc.(a) | | | 114,500 | | | | 11,352,675 | | |
Empresa Brasileira de
Aeronautica SA
ADR (Brazil)(b) | | | 31,400 | | | | 1,513,794 | | |
| Rockwell Collins, Inc. | | | 255,800 | | | | 18,069,712 | | |
| | | | 30,936,181 | | |
| Airlines — 0.8% | |
| SkyWest, Inc. | | | 52,400 | | | | 1,248,692 | | |
| Southwest Airlines Co. | | | 677,200 | | | | 10,097,052 | | |
| | | | 11,345,744 | | |
| Apparel — 0.3% | |
| Coach, Inc.(a) | | | 79,700 | | | | 3,776,983 | | |
| Auto Manufacturers — 0.6% | |
| Oshkosh Truck Corp. | | | 144,000 | | | | 9,060,480 | | |
| Banks — 0.8% | |
| City National Corp. | | | 8,500 | | | | 646,765 | | |
| East West Bancorp, Inc. | | | 16,700 | | | | 649,296 | | |
First Horizon
National Corp.(b) | | | 19,700 | | | | 768,300 | | |
| Northern Trust Corp. | | | 60,600 | | | | 3,892,944 | | |
| State Street Corp. | | | 12,000 | | | | 820,800 | | |
SVB
Financial Group(a) (b) | | | 56,800 | | | | 3,016,648 | | |
| Synovus Financial Corp. | | | 23,700 | | | | 727,590 | | |
| UCBH Holdings, Inc. | | | 29,900 | | | | 546,273 | | |
| | | | 11,068,616 | | |
| | | Number of
Shares | | Market
Value | |
| Beverages — 0.4% | |
Brown-Forman
Corp. Cl. B | | | 32,200 | | | $ | 2,353,176 | | |
| Cott Corp.(a) (b) | | | 223,000 | | | | 3,208,970 | | |
| | | | 5,562,146 | | |
| Biotechnology — 2.0% | |
| Celgene Corp.(a) (b) | | | 57,400 | | | | 3,290,742 | | |
Charles River Laboratories
International, Inc.(a) | | | 21,700 | | | | 1,120,154 | | |
Decode
Genetics, Inc.(a) (b) | | | 86,300 | | | | 322,330 | | |
| Genzyme Corp.(a) | | | 15,600 | | | | 1,004,640 | | |
Human Genome
Sciences, Inc.(a) (b) | | | 196,000 | | | | 1,748,320 | | |
| Illumina, Inc.(a) (b) | | | 104,600 | | | | 4,245,714 | | |
Integra LifeSciences
Holdings Corp.(a) (b) | | | 17,600 | | | | 869,792 | | |
| Invitrogen Corp.(a) | | | 20,700 | | | | 1,526,625 | | |
Martek
Biosciences Corp.(a) (b) | | | 26,500 | | | | 688,205 | | |
| Millipore Corp.(a) (b) | | | 20,200 | | | | 1,516,818 | | |
| PDL BioPharma, Inc.(a) | | | 119,000 | | | | 2,772,700 | | |
| QIAGEN NV(a) (b) | | | 221,500 | | | | 3,940,485 | | |
Vertex
Pharmaceuticals, Inc.(a) | | | 192,200 | | | | 5,489,232 | | |
| | | | 28,535,757 | | |
| Building Materials — 0.6% | |
American Standard
Cos., Inc. | | | 132,000 | | | | 7,785,360 | | |
| Genlyte Group, Inc.(a) | | | 14,000 | | | | 1,099,560 | | |
| | | | 8,884,920 | | |
| Chemicals — 0.2% | |
| Ecolab, Inc. | | | 42,400 | | | | 1,810,480 | | |
| Sigma-Aldrich Corp. | | | 24,100 | | | | 1,028,347 | | |
| The Valspar Corp. | | | 22,900 | | | | 650,589 | | |
| | | | 3,489,416 | | |
| Coal — 1.5% | |
| CONSOL Energy, Inc. | | | 292,500 | | | | 13,487,175 | | |
Foundation Coal
Holdings, Inc. | | | 129,700 | | | | 5,271,008 | | |
| Peabody Energy Corp.(b) | | | 66,000 | | | | 3,193,080 | | |
| | | | 21,951,263 | | |
| Commercial Services — 5.9% | |
Apollo Group,
Inc. Cl. A(a) | | | 31,706 | | | | 1,852,582 | | |
| Block (H&R), Inc.(b) | | | 34,900 | | | | 815,613 | | |
| | | Number of
Shares | | Market
Value | |
| ChoicePoint, Inc.(a) | | | 122,900 | | | $ | 5,217,105 | | |
The Corporate Executive
Board Co. | | | 60,900 | | | | 3,953,019 | | |
| DeVry, Inc.(b) | | | 35,200 | | | | 1,197,504 | | |
| Equifax, Inc. | | | 25,500 | | | | 1,132,710 | | |
| Fastenal Co.(b) | | | 158,100 | | | | 6,618,066 | | |
Iron
Mountain, Inc.(a) (b) | | | 292,975 | | | | 7,655,437 | | |
ITT Educational
Services, Inc.(a) | | | 14,700 | | | | 1,725,486 | | |
Laureate
Education, Inc.(a) | | | 82,000 | | | | 5,056,120 | | |
| LECG Corp.(a) | | | 41,800 | | | | 631,598 | | |
| Manpower, Inc. | | | 132,800 | | | | 12,249,472 | | |
Monster
Worldwide, Inc.(a) | | | 258,900 | | | | 10,640,790 | | |
| Moody's Corp.(b) | | | 10,100 | | | | 628,220 | | |
Quanta
Services, Inc.(a) (b) | | | 214,800 | | | | 6,587,916 | | |
Resources
Connection, Inc.(a) | | | 44,000 | | | | 1,459,920 | | |
Ritchie Bros.
Auctioneers, Inc.(b) | | | 38,900 | | | | 2,435,918 | | |
Robert Half
International, Inc.(b) | | | 178,900 | | | | 6,529,850 | | |
| SAIC, Inc.(a) | | | 95,000 | | | | 1,716,650 | | |
United
Rentals, Inc.(a) (b) | | | 119,000 | | | | 3,872,260 | | |
| VistaPrint Ltd.(a) (b) | | | 23,500 | | | | 898,875 | | |
| Western Union | | | 41,400 | | | | 862,362 | | |
| | | | 83,737,473 | | |
| Computers — 2.9% | |
Cadence Design
Systems, Inc.(a) | | | 34,000 | | | | 746,640 | | |
Cognizant Technology
Solutions Corp. Cl. A(a) | | | 37,200 | | | | 2,793,348 | | |
| DST Systems, Inc.(a) (b) | | | 174,800 | | | | 13,845,908 | | |
FactSet Research
Systems, Inc. | | | 24,000 | | | | 1,640,400 | | |
| IHS, Inc. Cl. A(a) | | | 66,000 | | | | 3,036,000 | | |
Jack Henry &
Associates, Inc. | | | 203,800 | | | | 5,247,850 | | |
Network
Appliance, Inc.(a) | | | 110,300 | | | | 3,220,760 | | |
Perot Systems
Corp. Cl. A(a) | | | 79,000 | | | | 1,346,160 | | |
| Seagate Technology | | | 428,000 | | | | 9,317,560 | | |
| Synopsys, Inc.(a) | | | 24,100 | | | | 636,963 | | |
| | | | 41,831,589 | | |
(Continued)
The accompanying notes are an integral part of the financial statements.
163
MassMutual Select Mid Cap Growth Equity II Fund – Portfolio of Investments (Continued)
| | | Number of
Shares | | Market
Value | |
| Cosmetics & Personal Care — 0.2% | |
| Avon Products, Inc. | | | 82,100 | | | $ | 3,017,175 | | |
| Diversified Financial — 3.7% | |
Affiliated Managers
Group, Inc.(a) (b) | | | 12,900 | | | | 1,661,004 | | |
| BlackRock, Inc.(b) | | | 10,400 | | | | 1,628,536 | | |
CBOT Holdings,
Inc. Cl. A(a) (b) | | | 4,600 | | | | 950,360 | | |
Chicago Mercantile
Exchange
Holdings, Inc.(b) | | | 5,200 | | | | 2,778,672 | | |
E*TRADE
Financial Corp.(a) | | | 315,200 | | | | 6,962,768 | | |
| Eaton Vance Corp. | | | 248,800 | | | | 10,991,984 | | |
Federated
Investors, Inc. Cl. B | | | 31,000 | | | | 1,188,230 | | |
Interactive Brokers
Group, Inc.(a) | | | 125,400 | | | | 3,402,102 | | |
Intercontinental
Exchange, Inc.(a) | | | 18,100 | | | | 2,676,085 | | |
Janus Capital
Group, Inc.(b) | | | 38,600 | | | | 1,074,624 | | |
| Lazard Ltd. Cl. A | | | 78,300 | | | | 3,525,849 | | |
| Legg Mason, Inc. | | | 30,890 | | | | 3,038,958 | | |
Nuveen Investments,
Inc. Cl. A(b) | | | 124,000 | | | | 7,706,600 | | |
| Nymex Holdings, Inc.(b) | | | 23,800 | | | | 2,989,994 | | |
optionsXpress
Holdings, Inc.(b) | | | 24,600 | | | | 631,236 | | |
TD Ameritrade
Holding Corp.(a) | | | 34,300 | | | | 686,000 | | |
| | | | 51,893,002 | | |
| Electric — 0.5% | |
| AES Corp.(a) | | | 138,000 | | | | 3,019,440 | | |
| Reliant Energy, Inc.(a) | | | 130,300 | | | | 3,511,585 | | |
| | | | 6,531,025 | | |
| Electrical Components & Equipment — 1.0% | |
| Ametek, Inc. | | | 351,500 | | | | 13,947,520 | | |
| Electronics — 2.5% | |
| Cogent, Inc.(a) (b) | | | 243,400 | | | | 3,575,546 | | |
| Cymer, Inc.(a) | | | 14,600 | | | | 586,920 | | |
Dolby Laboratories,
Inc. Cl. A(a) | | | 198,800 | | | | 7,039,508 | | |
| FLIR Systems, Inc.(a) | | | 224,500 | | | | 10,383,125 | | |
| Garmin Ltd.(b) | | | 46,400 | | | | 3,432,208 | | |
| Gentex Corp. | | | 43,600 | | | | 858,484 | | |
| II-VI, Inc.(a) | | | 24,100 | | | | 654,797 | | |
| Jabil Circuit, Inc. | | | 279,400 | | | | 6,166,358 | | |
National
Instruments Corp. | | | 21,300 | | | | 693,741 | | |
| | | Number of
Shares | | Market
Value | |
Thermo Fisher
Scientific, Inc.(a) | | | 13,100 | | | $ | 677,532 | | |
| Waters Corp.(a) | | | 31,700 | | | | 1,881,712 | | |
| | | | 35,949,931 | | |
| Energy – Alternate Sources — 0.7% | |
| First Solar, Inc.(a) (b) | | | 67,000 | | | | 5,982,430 | | |
SunPower
Corp. Cl. A(a) (b) | | | 68,000 | | | | 4,287,400 | | |
| | | | 10,269,830 | | |
| Engineering & Construction — 0.7% | |
| Fluor Corp. | | | 29,700 | | | | 3,307,689 | | |
| Foster Wheeler Ltd.(a) | | | 26,600 | | | | 2,845,934 | | |
McDermott
International, Inc.(a) | | | 47,300 | | | | 3,931,576 | | |
| | | | 10,085,199 | | |
| Entertainment — 1.4% | |
DreamWorks Animation
SKG, Inc. Cl. A(a) | | | 137,100 | | | | 3,953,964 | | |
International
Game Technology | | | 304,800 | | | | 12,100,560 | | |
Pinnacle
Entertainment, Inc.(a) | | | 108,000 | | | | 3,040,200 | | |
| Shuffle Master, Inc.(a) (b) | | | 25,450 | | | | 422,470 | | |
| | | | 19,517,194 | | |
| Environmental Controls — 0.3% | |
| Republic Services, Inc. | | | 62,150 | | | | 1,904,276 | | |
| Stericycle, Inc.(a) | | | 45,000 | | | | 2,000,700 | | |
| | | | 3,904,976 | | |
| Foods — 0.7% | |
| The Hershey Co. | | | 33,900 | | | | 1,716,018 | | |
| McCormick & Co., Inc. | | | 44,400 | | | | 1,695,192 | | |
Whole Foods
Market, Inc.(b) | | | 111,000 | | | | 4,251,300 | | |
| Wrigley (Wm.) Jr. Co.(b) | | | 45,275 | | | | 2,504,160 | | |
| | | | 10,166,670 | | |
| Health Care – Products — 3.2% | |
American Medical
Systems
Holdings, Inc.(a) (b) | | | 34,300 | | | | 618,772 | | |
| ArthoCare Corp.(a) | | | 19,900 | | | | 873,809 | | |
| Bard (C.R.), Inc. | | | 76,900 | | | | 6,354,247 | | |
| Becton, Dickinson & Co. | | | 8,100 | | | | 603,450 | | |
Dade Behring
Holdings, Inc. | | | 15,700 | | | | 833,984 | | |
Dentsply
International, Inc. | | | 28,400 | | | | 1,086,584 | | |
Edwards
Lifesciences Corp.(a) (b) | | | 180,900 | | | | 8,925,606 | | |
| | | Number of
Shares | | Market
Value | |
| Gen-Probe, Inc.(a) | | | 114,700 | | | $ | 6,930,174 | | |
| Henry Schein, Inc.(a) | | | 59,700 | | | | 3,189,771 | | |
| Hologic, Inc.(a) (b) | | | 19,100 | | | | 1,056,421 | | |
| Intuitive Surgical, Inc.(a) | | | 10,800 | | | | 1,498,716 | | |
| Kyphon, Inc.(a) | | | 21,200 | | | | 1,020,780 | | |
| Patterson Cos., Inc.(a) | | | 17,100 | | | | 637,317 | | |
| Resmed, Inc.(a) | | | 90,100 | | | | 3,717,526 | | |
| Respironics, Inc.(a) | | | 22,200 | | | | 945,498 | | |
St. Jude
Medical, Inc.(a) (b) | | | 81,100 | | | | 3,364,839 | | |
| Techne Corp.(a) | | | 27,000 | | | | 1,544,670 | | |
Varian Medical
Systems, Inc.(a) | | | 24,900 | | | | 1,058,499 | | |
| Zimmer Holdings, Inc.(a) | | | 9,400 | | | | 797,966 | | |
| | | | 45,058,629 | | |
| Health Care – Services — 3.6% | |
Community Health
Systems, Inc.(a) | | | 155,000 | | | | 6,269,750 | | |
Coventry Health
Care, Inc.(a) | | | 93,200 | | | | 5,372,980 | | |
| DaVita, Inc.(a) | | | 70,850 | | | | 3,817,398 | | |
Health Management
Associates, Inc. Cl. A(b) | | | 257,500 | | | | 2,925,200 | | |
| Health Net, Inc.(a) | | | 148,700 | | | | 7,851,360 | | |
| Healthways, Inc.(a) (b) | | | 21,900 | | | | 1,037,403 | | |
| Humana, Inc.(a) | | | 62,500 | | | | 3,806,875 | | |
Laboratory Corp. of
America
Holdings(a) (b) | | | 24,100 | | | | 1,886,066 | | |
| Lincare Holdings, Inc.(a) | | | 43,600 | | | | 1,737,460 | | |
| Manor Care, Inc. | | | 227,200 | | | | 14,833,888 | | |
| Quest Diagnostics, Inc. | | | 28,500 | | | | 1,472,025 | | |
| | | | 51,010,405 | | |
| Home Builders — 0.4% | |
| Centex Corp.(b) | | | 15,000 | | | | 601,500 | | |
| KB Home(b) | | | 18,400 | | | | 724,408 | | |
| Lennar Corp. Cl. A(b) | | | 27,300 | | | | 998,088 | | |
Meritage
Homes Corp.(a) (b) | | | 24,300 | | | | 650,025 | | |
| Pulte Homes, Inc. | | | 33,800 | | | | 758,810 | | |
| Thor Industries, Inc.(b) | | | 13,600 | | | | 613,904 | | |
| Toll Brothers, Inc.(a) (b) | | | 26,100 | | | | 651,978 | | |
| Winnebago Industries, Inc. | | | 29,800 | | | | 879,696 | | |
| | | | 5,878,409 | | |
| Home Furnishing — 1.1% | |
Harman International
Industries, Inc. | | | 133,000 | | | | 15,534,400 | | |
| Household Products — 0.2% | |
| Avery Dennison Corp. | | | 17,300 | | | | 1,150,104 | | |
| The Clorox Co. | | | 28,200 | | | | 1,751,220 | | |
| | | | 2,901,324 | | |
(Continued)
The accompanying notes are an integral part of the financial statements.
164
MassMutual Select Mid Cap Growth Equity II Fund – Portfolio of Investments (Continued)
| | | Number of
Shares | | Market
Value | |
| Industrial – Distribution — 0.1% | |
| W.W. Grainger, Inc.(b) | | | 21,200 | | | $ | 1,972,660 | | |
| Insurance — 2.1% | |
Ambac Financial
Group, Inc. | | | 18,900 | | | | 1,647,891 | | |
| Aon Corp. | | | 24,000 | | | | 1,022,640 | | |
Arch Capital
Group Ltd.(a) | | | 23,900 | | | | 1,733,706 | | |
| Assurant, Inc. | | | 110,000 | | | | 6,481,200 | | |
| Axis Capital Holdings Ltd. | | | 195,900 | | | | 7,963,335 | | |
| Brown & Brown, Inc. | | | 34,000 | | | | 854,760 | | |
| Cigna Corp. | | | 30,000 | | | | 1,566,600 | | |
| Markel Corp.(a) | | | 1,660 | | | | 804,370 | | |
Marsh & McLennan
Cos., Inc.(b) | | | 27,500 | | | | 849,200 | | |
| MBIA, Inc.(b) | | | 15,600 | | | | 970,632 | | |
OneBeacon Insurance
Group Ltd. | | | 23,900 | | | | 605,387 | | |
Principal Financial
Group, Inc. | | | 65,000 | | | | 3,788,850 | | |
RenaissanceRe
Holdings Ltd. | | | 15,000 | | | | 929,850 | | |
| Willis Group Holdings Ltd. | | | 20,100 | | | | 885,606 | | |
| | | | 30,104,027 | | |
| Internet — 4.4% | |
| Amazon.com, Inc.(a) | | | 292,400 | | | | 20,003,084 | | |
Baidu.com ADR
(China)(a) (b) | | | 8,900 | | | | 1,495,022 | | |
| Checkfree Corp.(a) (b) | | | 188,200 | | | | 7,565,640 | | |
CNET
Networks, Inc.(a) (b) | | | 480,000 | | | | 3,931,200 | | |
| Digital River, Inc.(a) | | | 87,600 | | | | 3,963,900 | | |
| F5 Networks, Inc.(a) | | | 30,000 | | | | 2,418,000 | | |
| McAfee, Inc.(a) | | | 167,200 | | | | 5,885,440 | | |
| Sina Corp.(a) (b) | | | 27,800 | | | | 1,163,708 | | |
| Symantec Corp.(a) | | | 44,600 | | | | 900,920 | | |
| VeriSign, Inc.(a) | | | 466,900 | | | | 14,814,737 | | |
| | | | 62,141,651 | | |
| Iron & Steel — 0.3% | |
Carpenter
Technology Corp. | | | 28,600 | | | | 3,726,866 | | |
| Leisure Time — 0.3% | |
| Harley-Davidson, Inc. | | | 55,500 | | | | 3,308,355 | | |
Royal Caribbean
Cruises Ltd.(b) | | | 14,100 | | | | 606,018 | | |
WMS
Industries, Inc.(a) (b) | | | 27,450 | | | | 792,207 | | |
| | | | 4,706,580 | | |
| Lodging — 1.4% | |
| Boyd Gaming Corp. | | | 13,900 | | | | 683,741 | | |
| | | Number of
Shares | | Market
Value | |
Choice Hotels
International, Inc. | | | 36,900 | | | $ | 1,458,288 | | |
Gaylord
Entertainment Co.(a) | | | 69,000 | | | | 3,701,160 | | |
| Hilton Hotels Corp. | | | 80,500 | | | | 2,694,335 | | |
Marriott
International, Inc. Cl. A | | | 45,400 | | | | 1,963,096 | | |
Melco PBL
Entertainment Ltd. ADR
(Hong Kong)(a) (b) | | | 65,500 | | | | 822,680 | | |
Starwood Hotels &
Resorts Worldwide, Inc. | | | 40,100 | | | | 2,689,507 | | |
| Wynn Resorts Ltd.(b) | | | 64,700 | | | | 5,802,943 | | |
| | | | 19,815,750 | | |
| Machinery – Construction & Mining — 0.2% | |
| Joy Global, Inc. | | | 37,600 | | | | 2,193,208 | | |
| Machinery – Diversified — 0.3% | |
| Graco, Inc. | | | 39,700 | | | | 1,599,116 | | |
| IDEX Corp. | | | 54,525 | | | | 2,101,393 | | |
Zebra Technologies
Corp. Cl. A(a) | | | 14,400 | | | | 557,856 | | |
| | | | 4,258,365 | | |
| Manufacturing — 2.3% | |
| Danaher Corp. | | | 55,000 | | | | 4,152,500 | | |
| Donaldson Co., Inc. | | | 44,000 | | | | 1,564,200 | | |
| ITT Corp. | | | 122,900 | | | | 8,391,612 | | |
| Pall Corp. | | | 18,700 | | | | 860,013 | | |
| Roper Industries, Inc. | | | 314,800 | | | | 17,975,080 | | |
| | | | 32,943,405 | | |
| Media — 2.4% | |
Cablevision Systems
Corp. Cl. A(a) | | | 167,900 | | | | 6,076,301 | | |
Discovery Holding
Co. Cl. A(a) | | | 313,000 | | | | 7,195,870 | | |
The McGraw-Hill
Companies, Inc. | | | 8,600 | | | | 585,488 | | |
| Meredith Corp. | | | 9,800 | | | | 603,680 | | |
Rogers
Communications,
Inc. Cl. B(b) | | | 303,750 | | | | 12,906,337 | | |
Salem Communications
Corp. Cl. A | | | 21,600 | | | | 239,544 | | |
The Scripps (E.W.)
Co. Cl. A | | | 14,600 | | | | 667,074 | | |
XM Satellite Radio
Holdings,
Inc. Cl. A(a) (b) | | | 444,000 | | | | 5,225,880 | | |
| | | | 33,500,174 | | |
| Metal Fabricate & Hardware — 0.3% | |
| Precision Castparts Corp. | | | 33,200 | | | | 4,029,152 | | |
| | | Number of
Shares | | Market
Value | |
| Mining — 0.7% | |
Agnico-Eagle
Mines Ltd.(b) | | | 147,100 | | | $ | 5,369,150 | | |
Teck Cominco
Ltd. Cl. B(b) | | | 108,000 | | | | 4,590,000 | | |
| | | | 9,959,150 | | |
| Office Furnishings — 0.0% | |
| HNI Corp. | | | 13,600 | | | | 557,600 | | |
| Oil & Gas — 3.0% | |
| Bill Barrett Corp.(a) (b) | | | 18,800 | | | | 692,404 | | |
| CNX Gas Corp.(a) (b) | | | 163,000 | | | | 4,987,800 | | |
Compton
Petroleum Corp.(a) | | | 87,800 | | | | 873,610 | | |
Diamond Offshore
Drilling, Inc. | | | 9,400 | | | | 954,664 | | |
| EOG Resources, Inc. | | | 165,000 | | | | 12,054,900 | | |
| Mariner Energy, Inc.(a) | | | 37,800 | | | | 916,650 | | |
| Murphy Oil Corp. | | | 151,000 | | | | 8,975,440 | | |
Nabors
Industries Ltd.(a) (b) | | | 21,800 | | | | 727,684 | | |
| Ultra Petroleum Corp.(a) | | | 23,700 | | | | 1,309,188 | | |
| XTO Energy, Inc. | | | 189,367 | | | | 11,380,957 | | |
| | | | 42,873,297 | | |
| Oil & Gas Services — 4.6% | |
| BJ Services Co. | | | 377,000 | | | | 10,721,880 | | |
Cameron
International Corp.(a) | | | 153,400 | | | | 10,963,498 | | |
| Core Laboratories N.V.(a) | | | 22,700 | | | | 2,308,363 | | |
FMC
Technologies, Inc.(a) (b) | | | 153,800 | | | | 12,184,036 | | |
| Grant Prideco, Inc.(a) | | | 66,000 | | | | 3,552,780 | | |
| Smith International, Inc. | | | 315,100 | | | | 18,477,464 | | |
TETRA
Technologies, Inc.(a) | | | 178,800 | | | | 5,042,160 | | |
Weatherford
International Ltd.(a) | | | 28,500 | | | | 1,574,340 | | |
| | | | 64,824,521 | | |
| Packaging & Containers — 0.1% | |
| Sealed Air Corp. | | | 42,500 | | | | 1,318,350 | | |
| Pharmaceuticals — 5.5% | |
| Alkermes, Inc.(a) | | | 248,200 | | | | 3,623,720 | | |
| Allergan, Inc. | | | 61,310 | | | | 3,533,908 | | |
Amylin
Pharmaceuticals, Inc.(a) (b) | | | 110,900 | | | | 4,564,644 | | |
Barr
Pharmaceuticals, Inc.(a) | | | 195,000 | | | | 9,794,850 | | |
| Cephalon, Inc.(a) (b) | | | 197,900 | | | | 15,909,181 | | |
Elan Corp. PLC Sponsored
ADR (Ireland)(a) (b) | | | 485,500 | | | | 10,647,015 | | |
| Express Scripts, Inc.(a) | | | 63,200 | | | | 3,160,632 | | |
| Gilead Sciences, Inc.(a) | | | 60,000 | | | | 2,326,200 | | |
(Continued)
The accompanying notes are an integral part of the financial statements.
165
MassMutual Select Mid Cap Growth Equity II Fund – Portfolio of Investments (Continued)
| | | Number of
Shares | | Market
Value | |
| Medarex, Inc.(a) (b) | | | 152,600 | | | $ | 2,180,654 | | |
Medco Health
Solutions, Inc.(a) | | | 10,900 | | | | 850,091 | | |
Medicis Pharmaceutical
Corp. Cl. A(b) | | | 83,000 | | | | 2,534,820 | | |
Mylan
Laboratories, Inc.(b) | | | 137,000 | | | | 2,492,030 | | |
| Omnicare, Inc.(b) | | | 68,000 | | | | 2,452,080 | | |
OSI Pharmaceuticals,
Inc.(a) (b) | | | 64,000 | | | | 2,317,440 | | |
| Sepracor, Inc.(a) (b) | | | 109,300 | | | | 4,483,486 | | |
| Theravance, Inc.(a) | | | 110,200 | | | | 3,526,400 | | |
Valeant Pharmaceuticals
International | | | 248,000 | | | | 4,139,120 | | |
| | | | 78,536,271 | | |
| Pipelines — 0.2% | |
| The Williams Cos., Inc. | | | 95,800 | | | | 3,029,196 | | |
| Retail — 6.6% | |
| Advance Auto Parts, Inc. | | | 171,100 | | | | 6,934,683 | | |
| AnnTaylor Stores Corp.(a) | | | 22,900 | | | | 811,118 | | |
Bed Bath &
Beyond, Inc.(a) | | | 240,800 | | | | 8,666,392 | | |
| Best Buy Co., Inc. | | | 110,000 | | | | 5,133,700 | | |
| Carmax, Inc.(a) | | | 218,000 | | | | 5,559,000 | | |
The
Cheesecake Factory(a) (b) | | | 161,900 | | | | 3,969,788 | | |
Chipotle Mexican
Grill, Inc. Cl. B(a) | | | 83,000 | | | | 6,526,290 | | |
Dick's Sporting
Goods, Inc.(a) (b) | | | 10,900 | | | | 634,053 | | |
Family Dollar
Stores, Inc.(b) | | | 37,600 | | | | 1,290,432 | | |
| Men's Wearhouse, Inc. | | | 17,200 | | | | 878,404 | | |
MSC Industrial
Direct Co. Cl. A | | | 26,000 | | | | 1,430,000 | | |
O'Reilly
Automotive, Inc.(a) | | | 215,600 | | | | 7,880,180 | | |
P.F. Chang's China
Bistro, Inc.(a) (b) | | | 67,000 | | | | 2,358,400 | | |
Panera
Bread Co. Cl. A(a) (b) | | | 39,700 | | | | 1,828,582 | | |
| Petsmart, Inc.(b) | | | 324,200 | | | | 10,520,290 | | |
| Ross Stores, Inc. | | | 54,200 | | | | 1,669,360 | | |
Shoppers Drug
Mart Corp. CAD | | | 57,000 | | | | 2,670,446 | | |
Shoppers Drug
Mart Corp. CAD | | | 38,000 | | | | 1,780,297 | | |
| Staples, Inc. | | | 60,650 | | | | 1,439,225 | | |
| Tiffany & Co. | | | 53,000 | | | | 2,812,180 | | |
| Tim Hortons, Inc. | | | 182,800 | | | | 5,621,100 | | |
| The TJX Cos., Inc. | | | 89,600 | | | | 2,464,000 | | |
| Tractor Supply Co.(a) (b) | | | 12,600 | | | | 655,830 | | |
| | | Number of
Shares | | Market
Value | |
Under Armour,
Inc. Cl. A(a) | | | 42,000 | | | $ | 1,917,300 | | |
| Urban Outfitters, Inc.(a) | | | 42,600 | | | | 1,023,678 | | |
| Williams-Sonoma, Inc.(b) | | | 152,000 | | | | 4,800,160 | | |
| Yum! Brands, Inc. | | | 99,600 | | | | 3,258,912 | | |
| | | | 94,533,800 | | |
| Semiconductors — 6.5% | |
| Altera Corp.(b) | | | 445,300 | | | | 9,854,489 | | |
| Analog Devices, Inc. | | | 83,000 | | | | 3,124,120 | | |
| Broadcom Corp. Cl. A(a) | | | 59,100 | | | | 1,728,675 | | |
Fairchild Semiconductor
International, Inc.(a) | | | 202,600 | | | | 3,914,232 | | |
Integrated Device
Technology, Inc.(a) | | | 58,500 | | | | 893,295 | | |
| Intersil Corp. Cl. A | | | 304,800 | | | | 9,589,008 | | |
| KLA-Tencor Corp. | | | 13,700 | | | | 752,815 | | |
| Lam Research Corp.(a) | | | 14,900 | | | | 765,860 | | |
Linear
Technology Corp.(b) | | | 109,600 | | | | 3,965,328 | | |
Marvell Technology
Group Ltd.(a) | | | 524,900 | | | | 9,558,429 | | |
Maxim Integrated
Products, Inc. | | | 88,800 | | | | 2,966,808 | | |
MEMC Electronic
Materials, Inc.(a) | | | 24,900 | | | | 1,521,888 | | |
Microchip
Technology, Inc. | | | 264,400 | | | | 9,793,376 | | |
National
Semiconductor Corp.(b) | | | 80,000 | | | | 2,261,600 | | |
ON Semiconductor
Corp.(a) (b) | | | 425,000 | | | | 4,556,000 | | |
| PMC-Sierra, Inc.(a) (b) | | | 552,000 | | | | 4,266,960 | | |
| QLogic Corp.(a) | | | 77,600 | | | | 1,292,040 | | |
Silicon
Laboratories, Inc.(a) | | | 45,400 | | | | 1,571,294 | | |
| Spansion LLC Cl. A(a) (b) | | | 160,000 | | | | 1,776,000 | | |
| Teradyne, Inc.(a) (b) | | | 405,400 | | | | 7,126,932 | | |
| Xilinx, Inc.(b) | | | 403,100 | | | | 10,790,987 | | |
| | | | 92,070,136 | | |
| Software — 5.5% | |
| Activision, Inc.(a) | | | 95,110 | | | | 1,775,704 | | |
American
Reprographics Co.(a) (b) | | | 58,300 | | | | 1,795,057 | | |
| Autodesk, Inc.(a) | | | 213,800 | | | | 10,065,704 | | |
Avid
Technology, Inc.(a) (b) | | | 131,000 | | | | 4,630,850 | | |
| Cerner Corp.(a) (b) | | | 67,000 | | | | 3,716,490 | | |
| Citrix Systems, Inc.(a) | | | 36,600 | | | | 1,232,322 | | |
| Cognos, Inc.(a) | | | 19,900 | | | | 789,433 | | |
| Dun & Bradstreet Corp. | | | 14,900 | | | | 1,534,402 | | |
| Electronic Arts, Inc.(a) | | | 60,800 | | | | 2,877,056 | | |
| | | Number of
Shares | | Market
Value | |
Fidelity National
Information
Services, Inc. | | | 12,400 | | | $ | 673,072 | | |
| Fiserv, Inc.(a) | | | 23,900 | | | | 1,357,520 | | |
| Global Payments, Inc.(b) | | | 197,300 | | | | 7,822,945 | | |
| Intuit, Inc.(a) | | | 191,500 | | | | 5,760,320 | | |
MoneyGram
International, Inc. | | | 180,900 | | | | 5,056,155 | | |
| NAVTEQ Corp.(a) | | | 214,800 | | | | 9,094,632 | | |
| Paychex, Inc. | | | 93,500 | | | | 3,657,720 | | |
| Red Hat, Inc.(a) (b) | | | 409,000 | | | | 9,112,520 | | |
| Salesforce.com, Inc.(a) (b) | | | 73,000 | | | | 3,128,780 | | |
Satyam Computer
Services Ltd.
ADR (India) | | | 97,800 | | | | 2,421,528 | | |
| SEI Investments Co. | | | 39,600 | | | | 1,149,984 | | |
| THQ, Inc.(a) (b) | | | 34,250 | | | | 1,045,310 | | |
| | | | 78,697,504 | | |
| Telecommunications — 7.5% | |
| ADTRAN, Inc. | | | 79,000 | | | | 2,051,630 | | |
| Amdocs Ltd.(a) | | | 238,000 | | | | 9,477,160 | | |
American
Tower Corp. Cl. A(a) | | | 348,000 | | | | 14,616,000 | | |
| Ciena Corp.(a) (b) | | | 109,000 | | | | 3,938,170 | | |
Comverse
Technology, Inc.(a) | | | 108,000 | | | | 2,251,800 | | |
Crown Castle
International Corp.(a) | | | 434,000 | | | | 15,741,180 | | |
| Foundry Networks, Inc.(a) | | | 54,300 | | | | 904,638 | | |
| Harris Corp. | | | 168,000 | | | | 9,164,400 | | |
| Juniper Networks, Inc.(a) | | | 544,200 | | | | 13,697,514 | | |
Leap Wireless
International, Inc.(a) | | | 168,600 | | | | 14,246,700 | | |
MetroPCS
Communications, Inc.(a) | | | 201,600 | | | | 6,660,864 | | |
| NeuStar, Inc. Cl. A(a) (b) | | | 32,300 | | | | 935,731 | | |
NII Holdings,
Inc. Cl. B(a) | | | 38,500 | | | | 3,108,490 | | |
SBA Communications
Corp. Cl. A(a) (b) | | | 188,800 | | | | 6,341,792 | | |
Time Warner Telecom,
Inc. Cl. A(a) | | | 179,000 | | | | 3,597,900 | | |
| | | | 106,733,969 | | |
| Textiles — 0.1% | |
| Cintas Corp. | | | 31,000 | | | | 1,222,330 | | |
| Transportation — 1.0% | |
C.H. Robinson
Worldwide, Inc. | | | 46,800 | | | | 2,457,936 | | |
Expeditors International
of Washington, Inc. | | | 59,800 | | | | 2,469,740 | | |
(Continued)
The accompanying notes are an integral part of the financial statements.
166
MassMutual Select Mid Cap Growth Equity II Fund – Portfolio of Investments (Continued)
| | | Number of
Shares | | Market
Value | |
| Landstar System, Inc. | | | 48,700 | | | $ | 2,349,775 | | |
| UTI Worldwide, Inc. | | | 264,400 | | | | 7,083,276 | | |
| | | | 14,360,727 | | |
TOTAL EQUITIES
(Cost $1,029,078,200) | | | | | | | 1,371,177,369 | | |
| MUTUAL FUND — 0.0% | |
| Financial Services | |
Government Reserve
Investment Fund | | | 104,623 | | | | 104,623 | | |
TOTAL MUTUAL FUND
(Cost $104,623) | | | | | | | 104,623 | | |
TOTAL LONG TERM INVESTMENTS
(Cost $1,029,182,823) | | | | | | | 1,371,281,992 | | |
| | | Principal
Amount | | | |
| SHORT-TERM INVESTMENTS — 18.1% | |
| Cash Equivalents — 14.2%(d) | |
Abbey National PLC
Eurodollar Time Deposit
5.280% 07/05/2007 | | $ | 2,610,130 | | | | 2,610,130 | | |
Abbey National PLC
Eurodollar Time Deposit
5.285% 07/09/2007 | | | 6,525,341 | | | | 6,525,341 | | |
American Beacon
Money Market Fund(c) | | | 7,321,132 | | | | 7,321,132 | | |
Banco Bilbao Vizcaya
Argentaria SA
Eurodollar Time Deposit
5.300% 08/10/2007 | | | 4,894,006 | | | | 4,894,006 | | |
Bank of America
5.270% 07/06/2007 | | | 6,525,341 | | | | 6,525,341 | | |
Bank of America
5.270% 07/16/2007 | | | 1,305,068 | | | | 1,305,068 | | |
Bank of America
5.270% 08/17/2007 | | | 1,631,335 | | | | 1,631,335 | | |
Bank of America
5.300% 09/17/2007 | | | 3,262,671 | | | | 3,262,671 | | |
Bank of Ireland
Eurodollar Time Deposit
5.300% 08/13/2007 | | | 6,525,341 | | | | 6,525,341 | | |
Bank of Montreal
Eurodollar Time Deposit
5.280% 07/03/2007 | | | 1,631,335 | | | | 1,631,335 | | |
Bank of Montreal
Eurodollar Time Deposit
5.290% 07/02/2007 | | | 1,305,068 | | | | 1,305,068 | | |
| | | Principal
Amount | | Market
Value | |
Bank of Montreal
Eurodollar Time Deposit
5.310% 08/14/2007 | | $ | 978,801 | | | $ | 978,801 | | |
Bank of Nova Scotia
Eurodollar Time Deposit
5.280% 07/09/2007 | | | 6,199,074 | | | | 6,199,074 | | |
Bank Of Nova Scotia
Eurodollar Time Deposit
5.285% 07/11/2007 | | | 3,588,937 | | | | 3,588,937 | | |
Barclays
Eurodollar Time Deposit
5.290% 07/06/2007 | | | 6,525,341 | | | | 6,525,341 | | |
Barclays
Eurodollar Time Deposit
5.295% 07/16/2007 | | | 1,305,068 | | | | 1,305,068 | | |
Barclays
Eurodollar Time Deposit
5.320% 09/04/2007 | | | 3,262,671 | | | | 3,262,671 | | |
Bear Stearns & Co
Commercial Paper
5.435% 07/10/2007 | | | 978,801 | | | | 978,801 | | |
BGI Institutional
Money Market Fund(c) | | | 4,241,471 | | | | 4,241,471 | | |
BNP Paribas
Eurodollar Time Deposit
5.350% 07/02/2007 | | | 9,788,011 | | | | 9,788,011 | | |
Calyon
Eurodollar Time Deposit
5.290% 07/17/2007 | | | 3,262,671 | | | | 3,262,671 | | |
Calyon
Eurodollar Time Deposit
5.380% 07/02/2007 | | | 9,788,011 | | | | 9,788,011 | | |
Canadian Imperial
Bank of Commerce
Eurodollar Time Deposit
5.300% 07/30/2007 | | | 6,525,341 | | | | 6,525,341 | | |
Dexia Group
Eurodollar Time Deposit
5.290% 08/08/2007 | | | 6,525,341 | | | | 6,525,341 | | |
Dreyfus Institutional Cash
Advantage
Money Market Fund(c) | | | 1,957,602 | | | | 1,957,602 | | |
Federal Home Loan
Bank Discount Note
5.174% 07/20/2007 | | | 483,963 | | | | 483,963 | | |
First Tennessee
National Corp.
Eurodollar Time Deposit
5.300% 07/18/2007 | | | 1,631,335 | | | | 1,631,335 | | |
Fortis Bank
Eurodollar Time Deposit
5.290% 07/06/2007 | | | 1,631,335 | | | | 1,631,335 | | |
| | | Principal
Amount | | Market
Value | |
Fortis Bank
Eurodollar Time Deposit
5.290% 07/09/2007 | | $ | 2,283,869 | | | $ | 2,283,869 | | |
Fortis Bank
Eurodollar Time Deposit
5.300% 07/20/2007 | | | 1,631,335 | | | | 1,631,335 | | |
Fortis Bank
Eurodollar Time Deposit
5.300% 07/26/2007 | | | 1,305,068 | | | | 1,305,068 | | |
Fortis Bank
Eurodollar Time Deposit
5.350% 07/05/2007 | | | 3,262,671 | | | | 3,262,671 | | |
Freddie Mac
Discount Note
5.155% 07/16/2007 | | | 616,093 | | | | 616,093 | | |
Freddie Mac
Discount Note
5.185% 07/09/2007 | | | 321,637 | | | | 321,637 | | |
Morgan Stanley & Co
Commercial Paper
5.445% 08/01/2007 | | | 2,936,403 | | | | 2,936,403 | | |
National Australia Bank
Eurodollar Time Deposit
5.320% 07/02/2007 | | | 3,262,671 | | | | 3,262,671 | | |
Nationwide Building
Society
Commercial Paper
5.301% 07/09/2007 | | | 3,255,959 | | | | 3,255,959 | | |
Rabobank Nederland
Eurodollar Time Deposit
5.280% 07/05/2007 | | | 4,894,006 | | | | 4,894,006 | | |
Rabobank Nederland
Eurodollar Time Deposit
5.290% 07/16/2007 | | | 6,525,341 | | | | 6,525,341 | | |
Rabobank Nederland
Eurodollar Time Deposit
5.330% 07/02/2007 | | | 9,788,011 | | | | 9,788,011 | | |
Reserve Primary
Money Market Fund(c) | | | 6,477,960 | | | | 6,477,960 | | |
Royal Bank of Canada
Eurodollar Time Deposit
5.305% 08/30/2007 | | | 6,525,341 | | | | 6,525,341 | | |
Royal Bank of Scotland
Eurodollar Time Deposit
5.270% 07/11/2007 | | | 1,631,335 | | | | 1,631,335 | | |
Skandinaviska Enskilda
Banken AB
Eurodollar Time Deposit
5.290% 07/13/2007 | | | 6,525,341 | | | | 6,525,341 | | |
Skandinaviska Enskilda
Banken AB
Eurodollar Time Deposit
5.290% 07/19/2007 | | | 978,801 | | | | 978,801 | | |
(Continued)
The accompanying notes are an integral part of the financial statements.
167
MassMutual Select Mid Cap Growth Equity II Fund – Portfolio of Investments (Continued)
| | | Principal
Amount | | Market
Value | |
Svenska Handlesbanken
Eurodollar Time Deposit
5.300% 07/02/2007 | | $ | 1,096,099 | | | $ | 1,096,099 | | |
UBS AG
Eurodollar Time Deposit
5.277% 07/05/2007 | | | 4,567,738 | | | | 4,567,738 | | |
UBS AG
Eurodollar Time Deposit
5.285% 07/05/2007 | | | 6,525,341 | | | | 6,525,341 | | |
Vanguard Prime
Money Market Fund(c) | | | 3,262,671 | | | | 3,262,671 | | |
Wells Fargo
Eurodollar Time Deposit
5.260% 07/02/2007 | | | 1,761,842 | | | | 1,761,842 | | |
Wells Fargo
Eurodollar Time Deposit
5.280% 07/11/2007 | | | 6,525,341 | | | | 6,525,341 | | |
Wells Fargo
Eurodollar Time Deposit
5.280% 07/12/2007 | | | 3,262,671 | | | | 3,262,671 | | |
| | | | 201,434,087 | | |
| Repurchase Agreements — 3.9% | |
Investors Bank & Trust
Company Repurchase
Agreement, dated
6/29/2007, 3.50%,
due 7/02/2007(e) | | | 55,622,742 | | | | 55,622,742 | | |
TOTAL SHORT-TERM
INVESTMENTS
(Cost $257,056,829) | | | | | | | 257,056,829 | | |
TOTAL INVESTMENTS — 114.5%
(Cost $1,286,239,652)(f) | | | | | | | 1,628,338,821 | | |
Other Assets/
(Liabilities) — (14.5%) | | | | | | | (206,722,784 | ) | |
| NET ASSETS — 100.0% | | | | | | $ | 1,421,616,037 | | |
Notes to Portfolio of Investments
ADR - American Depository Receipt
CAD - Canadian Dollar
(a) Non-income producing security.
(b) Denotes all or a portion of security on loan. (Note 2).
(c) Amount represents shares owned of the fund.
(d) Represents investments of security lending collateral. (Note 2).
(e) Maturity value of $55,638,965. Collateralized by a U.S. Government Agency obligation with a rate of 5.62%, maturity date of 8/15/2036, and an aggregate market value, including accrued interest, of $58,403,879.
(f) See Note 6 for aggregate cost for Federal tax purposes.
The remainder of this page is intentionally left blank.
The accompanying notes are an integral part of the financial statements.
168
MassMutual Select Small Cap Growth Equity Fund – Portfolio of Investments
June 30, 2007 (Unaudited)
| | | Number of
Shares | | Market
Value | |
| EQUITIES — 92.8% | |
| COMMON STOCK — 92.8% | |
| Advertising — 0.6% | |
| Catalina Marketing Corp. | | | 65,400 | | | $ | 2,060,100 | | |
Focus Media Holding Ltd.
ADR (China)(a) (b) | | | 47,440 | | | | 2,395,720 | | |
| | | | 4,455,820 | | |
| Aerospace & Defense — 1.5% | |
Orbital
Sciences Corp.(a) (b) | | | 72,400 | | | | 1,521,124 | | |
Teledyne
Technologies, Inc.(a) | | | 89,540 | | | | 4,114,363 | | |
| Transdigm Group, Inc.(a) | | | 60,800 | | | | 2,459,968 | | |
| Triumph Group, Inc. | | | 34,730 | | | | 2,273,773 | | |
| | | | 10,369,228 | | |
| Airlines — 0.2% | |
Airtran
Holdings, Inc.(a) (b) | | | 154,000 | | | | 1,681,680 | | |
| Apparel — 1.3% | |
| Crocs, Inc.(a) (b) | | | 18,570 | | | | 799,067 | | |
| Heelys, Inc.(a) (b) | | | 124,100 | | | | 3,209,226 | | |
| Phillips-Van Heusen Corp. | | | 30,800 | | | | 1,865,556 | | |
Skechers
U.S.A., Inc. Cl. A(a) | | | 59,400 | | | | 1,734,480 | | |
| Stride Rite Corp. | | | 83,400 | | | | 1,689,684 | | |
| | | | 9,298,013 | | |
| Apparel, Textiles & Shoes — 0.2% | |
| J. Crew Group, Inc.(a) | | | 20,200 | | | | 1,092,618 | | |
| Automotive & Parts — 2.0% | |
| LKQ Corp.(a) | | | 415,728 | | | | 10,251,852 | | |
| Tenneco, Inc.(a) | | | 54,100 | | | | 1,895,664 | | |
TRW Automotive
Holdings Corp.(a) | | | 44,700 | | | | 1,646,301 | | |
| | | | 13,793,817 | | |
| Banks — 0.6% | |
First
Community Bancorp(b) | | | 53,700 | | | | 3,072,177 | | |
| UCBH Holdings, Inc. | | | 44,300 | | | | 809,361 | | |
| | | | 3,881,538 | | |
| Beverages — 0.1% | |
| Jones Soda Co.(a) (b) | | | 54,800 | | | | 768,296 | | |
| Biotechnology — 0.8% | |
Arena
Pharmaceuticals, Inc.(a) (b) | | | 49,560 | | | | 544,664 | | |
| | | Number of
Shares | | Market
Value | |
Charles River
Laboratories
International, Inc.(a) | | | 47,290 | | | $ | 2,441,110 | | |
Human Genome
Sciences, Inc.(a) (b) | | | 128,700 | | | | 1,148,004 | | |
| Incyte Corp.(a) (b) | | | 158,900 | | | | 953,400 | | |
Vertex
Pharmaceuticals, Inc.(a) | | | 18,190 | | | | 519,506 | | |
| | | | 5,606,684 | | |
| Building Materials — 0.5% | |
| Genlyte Group, Inc.(a) | | | 12,100 | | | | 950,334 | | |
| Goodman Global, Inc.(a) | | | 110,090 | | | | 2,446,200 | | |
| | | | 3,396,534 | | |
| Building Materials & Construction — 0.2% | |
Beacon Roofing
Supply, Inc.(a) (b) | | | 66,233 | | | | 1,125,299 | | |
| Chemicals — 2.2% | |
| Agrium, Inc. | | | 47,440 | | | | 2,075,500 | | |
CF Industries
Holdings, Inc.(b) | | | 39,600 | | | | 2,371,644 | | |
| Cytec Industries, Inc. | | | 34,700 | | | | 2,212,819 | | |
| Ferro Corp.(b) | | | 110,000 | | | | 2,742,300 | | |
| Hercules, Inc.(a) | | | 110,400 | | | | 2,169,360 | | |
| Minerals Technologies, Inc. | | | 25,600 | | | | 1,713,920 | | |
| Terra Industries, Inc.(a) (b) | | | 73,130 | | | | 1,858,965 | | |
| | | | 15,144,508 | | |
| Coal — 0.4% | |
| Arch Coal, Inc. | | | 30,930 | | | | 1,076,364 | | |
Foundation Coal
Holdings, Inc. | | | 39,200 | | | | 1,593,088 | | |
| | | | 2,669,452 | | |
| Commercial Services — 8.6% | |
| AerCap Holdings NV(a) | | | 55,600 | | | | 1,779,200 | | |
| Bankrate, Inc.(a) (b) | | | 117,500 | | | | 5,630,600 | | |
| Bowne & Co., Inc. | | | 102,500 | | | | 1,999,775 | | |
| CoStar Group, Inc.(a) (b) | | | 95,400 | | | | 5,044,752 | | |
| Dollar Financial Corp.(a) | | | 59,090 | | | | 1,684,065 | | |
Emergency Medical
Services Corp. Cl. A(a) | | | 37,150 | | | | 1,453,679 | | |
| Interactive Data Corp. | | | 78,270 | | | | 2,096,071 | | |
ITT Educational
Services, Inc.(a) | | | 129,150 | | | | 15,159,627 | | |
| Kenexa Corp.(a) (b) | | | 88,155 | | | | 3,324,325 | | |
| Lifecell Corp.(a) (b) | | | 114,000 | | | | 3,481,560 | | |
| Live Nation, Inc.(a) (b) | | | 69,550 | | | | 1,556,529 | | |
Resources
Connection, Inc.(a) | | | 57,780 | | | | 1,917,140 | | |
| | | Number of
Shares | | Market
Value | |
| Sotheby's | | | 100,000 | | | $ | 4,602,000 | | |
Stewart Enterprises,
Inc. Cl. A(b) | | | 270,000 | | | | 2,103,300 | | |
TeleTech
Holdings, Inc.(a) (b) | | | 76,670 | | | | 2,490,242 | | |
| VistaPrint Ltd.(a) (b) | | | 144,550 | | | | 5,529,037 | | |
| | | | 59,851,902 | | |
| Computer Related Services — 0.4% | |
| Ingram Micro, Inc. Cl. A(a) | | | 121,000 | | | | 2,626,910 | | |
| Computers — 5.9% | |
| The BISYS Group, Inc.(a) | | | 132,100 | | | | 1,562,743 | | |
| Comtech Group, Inc.(a) (b) | | | 272,500 | | | | 4,498,975 | | |
| Diebold, Inc. | | | 40,884 | | | | 2,134,145 | | |
Electronics for
Imaging, Inc.(a) (b) | | | 97,500 | | | | 2,751,450 | | |
FactSet Research
Systems, Inc. | | | 194,144 | | | | 13,269,742 | | |
| IHS, Inc. Cl. A(a) | | | 35,930 | | | | 1,652,780 | | |
| Mentor Graphics Corp.(a) | | | 55,300 | | | | 728,301 | | |
| MICROS Systems, Inc.(a) | | | 131,100 | | | | 7,131,840 | | |
Riverbed
Technology, Inc.(a) (b) | | | 65,100 | | | | 2,852,682 | | |
Smart
Modular Technologies(a) | | | 267,900 | | | | 3,686,304 | | |
| Syntel, Inc. | | | 23,340 | | | | 709,303 | | |
| | | | 40,978,265 | | |
| Cosmetics & Personal Care — 0.8% | |
Bare
Escentuals, Inc.(a) (b) | | | 153,250 | | | | 5,233,487 | | |
| Diversified Financial — 2.5% | |
Aberdeen Asset
Management PLC GBP | | | 467,780 | | | | 1,824,069 | | |
| Advanta Corp. Cl. B | | | 67,950 | | | | 2,115,963 | | |
| FCStone Group, Inc.(a) (b) | | | 56,650 | | | | 3,246,611 | | |
| Financial Federal Corp.(b) | | | 197,624 | | | | 5,893,148 | | |
| JMP Group, Inc.(a) | | | 43,325 | | | | 452,746 | | |
The Nasdaq Stock
Market, Inc.(a) (b) | | | 46,700 | | | | 1,387,457 | | |
Nuveen Investments,
Inc. Cl. A | | | 20,500 | | | | 1,274,075 | | |
Portfolio Recovery
Associates, Inc.(b) | | | 26,870 | | | | 1,612,737 | | |
| | | | 17,806,806 | | |
| Electric — 0.2% | |
| El Paso Electric Co.(a) | | | 62,900 | | | | 1,544,824 | | |
(Continued)
The accompanying notes are an integral part of the financial statements.
169
MassMutual Select Small Cap Growth Equity Fund – Portfolio of Investments (Continued)
| | | Number of
Shares | | Market
Value | |
| Electronics — 0.2% | |
Benchmark
Electronics, Inc.(a) (b) | | | 57,450 | | | $ | 1,299,519 | | |
| Energy – Alternate Sources — 0.5% | |
| C. Rokas SA Cl. C | | | 29,148 | | | | 776,338 | | |
| Evergreen Solar, Inc.(a) (b) | | | 112,070 | | | | 1,042,251 | | |
Trina Solar Ltd. Sponsored
ADR (China)(a) | | | 25,600 | | | | 1,317,120 | | |
| | | | 3,135,709 | | |
| Engineering & Construction — 1.8% | |
| Chicago Bridge & Iron Co. | | | 229,848 | | | | 8,674,464 | | |
Washington Group
International, Inc.(a) | | | 51,830 | | | | 4,146,918 | | |
| | | | 12,821,382 | | |
| Entertainment — 3.3% | |
| Churchill Downs, Inc. | | | 33,700 | | | | 1,765,206 | | |
DreamWorks Animation
SKG, Inc. Cl. A(a) | | | 80,700 | | | | 2,327,388 | | |
National
CineMedia, Inc.(a) (b) | | | 112,700 | | | | 3,156,727 | | |
Pinnacle
Entertainment, Inc.(a) | | | 46,390 | | | | 1,305,878 | | |
Scientific Games
Corp. Cl. A(a) (b) | | | 250,150 | | | | 8,742,742 | | |
| Vail Resorts, Inc.(a) (b) | | | 90,200 | | | | 5,490,474 | | |
| | | | 22,788,415 | | |
| Environmental Controls — 0.6% | |
| Stericycle, Inc.(a) | | | 33,940 | | | | 1,508,972 | | |
| Waste Connections, Inc.(a) | | | 91,560 | | | | 2,768,774 | | |
| | | | 4,277,746 | | |
| Foods — 0.4% | |
United Natural
Foods, Inc.(a) (b) | | | 117,100 | | | | 3,112,518 | | |
| Gas — 0.2% | |
| UGI Corp. | | | 60,900 | | | | 1,661,352 | | |
| Health Care – Products — 4.4% | |
| AngioDynamics, Inc.(a) | | | 66,230 | | | | 1,192,802 | | |
| Arrow International, Inc. | | | 35,300 | | | | 1,351,284 | | |
| Cytyc Corp.(a) | | | 73,970 | | | | 3,188,847 | | |
Dade Behring
Holdings, Inc. | | | 47,500 | | | | 2,523,200 | | |
| Hologic, Inc.(a) (b) | | | 27,080 | | | | 1,497,795 | | |
| ICU Medical, Inc.(a) | | | 17,260 | | | | 741,144 | | |
| Kensey Nash Corp.(a) (b) | | | 60,800 | | | | 1,630,048 | | |
| Kyphon, Inc.(a) (b) | | | 210,800 | | | | 10,150,020 | | |
Mindray Medical
International, Ltd.,
ADR (China)(b) | | | 22,400 | | | | 683,872 | | |
| Visicu, Inc.(a) (b) | | | 272,400 | | | | 2,492,460 | | |
| | | Number of
Shares | | Market
Value | |
| Vital Images, Inc.(a) | | | 148,300 | | | $ | 4,027,828 | | |
| Volcano Corp.(a) | | | 54,710 | | | | 1,105,689 | | |
| | | | 30,584,989 | | |
| Health Care – Services — 3.0% | |
Community Health
Systems, Inc.(a) | | | 45,200 | | | | 1,828,340 | | |
| Healthways, Inc.(a) (b) | | | 196,250 | | | | 9,296,362 | | |
Icon PLC Sponsored ADR
(United Kingdom)(a) | | | 37,900 | | | | 1,657,746 | | |
| LifePoint Hospitals, Inc.(a) | | | 56,890 | | | | 2,200,505 | | |
Magellan Health
Services, Inc.(a) | | | 30,600 | | | | 1,421,982 | | |
| Manor Care, Inc. | | | 47,180 | | | | 3,080,382 | | |
Matria
Healthcare, Inc.(a) (b) | | | 50,950 | | | | 1,542,766 | | |
| | | | 21,028,083 | | |
| Holding Company – Diversified — 0.1% | |
Freedom Acquisition
Holding, Inc.(a) (b) | | | 90,110 | | | | 992,111 | | |
| Home Furnishing — 0.6% | |
| DTS, Inc.(a) (b) | | | 136,650 | | | | 2,974,871 | | |
| TiVo, Inc.(a) (b) | | | 266,500 | | | | 1,543,035 | | |
| | | | 4,517,906 | | |
| Household Products — 0.7% | |
| Fossil, Inc.(a) | | | 82,070 | | | | 2,420,244 | | |
| Jarden Corp.(a) (b) | | | 64,850 | | | | 2,789,199 | | |
| | | | 5,209,443 | | |
| Insurance — 2.7% | |
Allied World Assurance
Holdings Ltd. | | | 47,530 | | | | 2,435,913 | | |
Aspen Insurance
Holdings Ltd. | | | 66,000 | | | | 1,852,620 | | |
| Assured Guaranty Ltd. | | | 40,600 | | | | 1,200,136 | | |
FPIC Insurance
Group, Inc.(a) | | | 17,800 | | | | 725,706 | | |
Platinum Underwriters
Holdings Ltd. | | | 49,600 | | | | 1,723,600 | | |
| ProAssurance Corp.(a) (b) | | | 82,960 | | | | 4,618,383 | | |
Reinsurance Group of
America, Inc. | | | 29,900 | | | | 1,801,176 | | |
Security Capital
Assurance Ltd. | | | 143,540 | | | | 4,431,080 | | |
| | | | 18,788,614 | | |
| Internet — 6.5% | |
| Checkfree Corp.(a) (b) | | | 94,049 | | | | 3,780,770 | | |
Cogent Communications
Group, Inc.(a) (b) | | | 27,500 | | | | 821,425 | | |
Ctrip.com International
Ltd. ADR (China) | | | 17,800 | | | | 1,399,614 | | |
| | | Number of
Shares | | Market
Value | |
DealerTrack
Holdings, Inc.(a) | | | 80,250 | | | $ | 2,956,410 | | |
| Equinix, Inc.(a) (b) | | | 23,520 | | | | 2,151,374 | | |
| Harris Interactive, Inc.(a) | | | 205,200 | | | | 1,097,820 | | |
| Knot (The), Inc.(a) (b) | | | 189,000 | | | | 3,815,910 | | |
| LoopNet, Inc.(a) (b) | | | 277,000 | | | | 6,462,410 | | |
| Opsware, Inc.(a) (b) | | | 156,800 | | | | 1,491,168 | | |
| Priceline.com, Inc.(a) (b) | | | 26,280 | | | | 1,806,487 | | |
| S1 Corp.(a) | | | 207,300 | | | | 1,656,327 | | |
| Sapient Corp.(a) | | | 257,300 | | | | 1,988,929 | | |
| Sina Corp.(a) (b) | | | 185,500 | | | | 7,765,030 | | |
| Stamps.com, Inc.(a) | | | 237,100 | | | | 3,267,238 | | |
The TriZetto
Group, Inc.(a) (b) | | | 134,420 | | | | 2,602,371 | | |
| Vocus, Inc.(a) | | | 106,800 | | | | 2,681,748 | | |
| | | | 45,745,031 | | |
| Investment Companies — 0.1% | |
Babcock & Brown
Wind Partners | | | 530,640 | | | | 876,256 | | |
| Lodging — 1.9% | |
Gaylord
Entertainment Co.(a) | | | 243,300 | | | | 13,050,612 | | |
| Machinery – Construction & Mining — 1.8% | |
Bucyrus International,
Inc. Cl. A(b) | | | 178,250 | | | | 12,616,535 | | |
| Machinery – Diversified — 0.5% | |
| Flowserve Corp. | | | 30,190 | | | | 2,161,604 | | |
| Lindsay Corp.(b) | | | 31,860 | | | | 1,411,079 | | |
| | | | 3,572,683 | | |
| Manufacturing — 0.3% | |
| Hexcel Corp.(a) (b) | | | 101,100 | | | | 2,130,177 | | |
| Media — 1.1% | |
Central European Media
Enterprises Ltd.(a) (b) | | | 11,410 | | | | 1,113,388 | | |
Charter Communications,
Inc. Cl. A(a) (b) | | | 823,000 | | | | 3,333,150 | | |
LodgeNet
Entertainment Corp.(a) | | | 51,400 | | | | 1,647,884 | | |
NET Servicos de
Comunicacao SA,
ADR (Brazil)(b) | | | 101,640 | | | | 1,680,109 | | |
| | | | 7,774,531 | | |
| Mining — 0.1% | |
| SXR Uranium One, Inc.(a) | | | 68,895 | | | | 887,723 | | |
| Oil & Gas — 3.7% | |
| Bill Barrett Corp.(a) (b) | | | 231,050 | | | | 8,509,572 | | |
| Cabot Oil & Gas Corp. | | | 54,660 | | | | 2,015,861 | | |
Comstock
Resources, Inc.(a) | | | 69,100 | | | | 2,070,927 | | |
(Continued)
The accompanying notes are an integral part of the financial statements.
170
MassMutual Select Small Cap Growth Equity Fund – Portfolio of Investments (Continued)
| | | Number of
Shares | | Market
Value | |
Denbury
Resources, Inc.(a) | | | 58,740 | | | $ | 2,202,750 | | |
| Forest Oil Corp.(a) (b) | | | 29,450 | | | | 1,244,557 | | |
| Grey Wolf, Inc.(a) (b) | | | 152,400 | | | | 1,255,776 | | |
Newfield
Exploration Co.(a) | | | 117,750 | | | | 5,363,513 | | |
| OPTI Canada, Inc. CAD(a) | | | 86,200 | | | | 1,859,625 | | |
Whiting
Petroleum Corp.(a) | | | 40,800 | | | | 1,653,216 | | |
| | | | 26,175,797 | | |
| Oil & Gas Services — 0.9% | |
Complete Production
Services, Inc.(a) | | | 99,370 | | | | 2,568,715 | | |
| Core Laboratories N.V.(a) | | | 18,800 | | | | 1,911,772 | | |
TETRA
Technologies, Inc.(a) | | | 70,600 | | | | 1,990,920 | | |
| | | | 6,471,407 | | |
| Packaging & Containers — 0.5% | |
| Greif, Inc. Cl. A | | | 14,810 | | | | 882,824 | | |
| Owens-Illinois, Inc.(a) | | | 72,870 | | | | 2,550,450 | | |
| | | | 3,433,274 | | |
| Pharmaceuticals — 2.1% | |
Adams Respiratory
Therapeutics, Inc.(a) (b) | | | 131,450 | | | | 5,177,816 | | |
| Alkermes, Inc.(a) | | | 128,460 | | | | 1,875,516 | | |
Amylin
Pharmaceuticals, Inc.(a) (b) | | | 77,160 | | | | 3,175,906 | | |
| The Medicines Co.(a) | | | 82,760 | | | | 1,458,231 | | |
| Perrigo Co. | | | 92,500 | | | | 1,811,150 | | |
Warner
Chilcott, Ltd. Cl. A(a) | | | 49,600 | | | | 897,264 | | |
| | | | 14,395,883 | | |
| Real Estate Investment Trusts (REITS) — 0.6% | |
American Campus
Communities REIT | | | 58,600 | | | | 1,657,794 | | |
| Redwood Trust, Inc.(b) | | | 33,600 | | | | 1,625,568 | | |
| U-Store-It Trust REIT | | | 72,500 | | | | 1,188,275 | | |
| | | | 4,471,637 | | |
| Retail — 5.0% | |
BJ's Wholesale
Club, Inc.(a) | | | 34,230 | | | | 1,233,307 | | |
| Borders Group, Inc.(b) | | | 81,800 | | | | 1,559,108 | | |
California Pizza
Kitchen, Inc.(a) | | | 65,385 | | | | 1,404,470 | | |
| Childrens Place(a) | | | 16,180 | | | | 835,535 | | |
Chipotle Mexican Grill,
Inc. Cl. A(a) (b) | | | 16,000 | | | | 1,364,480 | | |
| Citi Trends, Inc.(a) (b) | | | 32,540 | | | | 1,235,218 | | |
| Denny's Corp.(a) | | | 383,700 | | | | 1,707,465 | | |
Dick's Sporting
Goods, Inc.(a) | | | 27,400 | | | | 1,593,858 | | |
| | | Number of
Shares | | Market
Value | |
| Dollar Tree Stores, Inc.(a) | | | 54,130 | | | $ | 2,357,362 | | |
| Gamestop Corp. Cl. A(a) | | | 25,210 | | | | 985,711 | | |
Nu Skin Enterprises,
Inc. Cl. A | | | 121,000 | | | | 1,996,500 | | |
O'Reilly
Automotive, Inc.(a) | | | 221,070 | | | | 8,080,109 | | |
P.F. Chang's China
Bistro, Inc.(a) (b) | | | 40,100 | | | | 1,411,520 | | |
| Retail Ventures, Inc.(a) | | | 63,340 | | | | 1,021,674 | | |
Stella International
Holdings, Ltd. | | | 56,500 | | | | 112,036 | | |
Under Armour,
Inc. Cl. A(a) (b) | | | 14,180 | | | | 647,317 | | |
| United Auto Group, Inc. | | | 103,400 | | | | 2,201,386 | | |
| Urban Outfitters, Inc.(a) | | | 59,400 | | | | 1,427,382 | | |
| Zumiez, Inc.(a) (b) | | | 96,900 | | | | 3,660,882 | | |
| | | | 34,835,320 | | |
| Semiconductors — 1.7% | |
Cypress
Semiconductor Corp.(a) (b) | | | 84,200 | | | | 1,961,018 | | |
| Emulex Corp.(a) | | | 85,550 | | | | 1,868,412 | | |
ON
Semiconductor Corp.(a) (b) | | | 228,600 | | | | 2,450,592 | | |
| Semtech Corp.(a) (b) | | | 115,500 | | | | 2,001,615 | | |
Spreadtrum
Communications, Inc.,
ADR (China)(a) | | | 20,400 | | | | 296,412 | | |
Varian Semiconductor
Equipment
Associates, Inc.(a) | | | 33,990 | | | | 1,361,639 | | |
| Verigy Ltd.(a) | | | 68,000 | | | | 1,945,480 | | |
| | | | 11,885,168 | | |
| Software — 10.0% | |
| Activision, Inc.(a) (b) | | | 110,170 | | | | 2,056,874 | | |
Allscripts Healthcare
Solutions, Inc.(a) (b) | | | 425,350 | | | | 10,837,918 | | |
American
Reprographics Co.(a) (b) | | | 13,150 | | | | 404,889 | | |
| Ansys, Inc.(a) | | | 74,580 | | | | 1,976,370 | | |
| Blackbaud, Inc. | | | 506,150 | | | | 11,175,792 | | |
| Blackboard, Inc.(a) (b) | | | 265,250 | | | | 11,172,330 | | |
| Cerner Corp.(a) (b) | | | 171,500 | | | | 9,513,105 | | |
Concur
Technologies, Inc.(a) (b) | | | 93,500 | | | | 2,136,475 | | |
| EPIQ Systems, Inc.(a) (b) | | | 211,918 | | | | 3,424,595 | | |
| InPhonic, Inc.(a) (b) | | | 34,400 | | | | 160,304 | | |
MoneyGram
International, Inc. | | | 54,480 | | | | 1,522,716 | | |
| Omnicell, Inc.(a) | | | 147,700 | | | | 3,069,206 | | |
| Red Hat, Inc.(a) (b) | | | 261,390 | | | | 5,823,769 | | |
| THQ, Inc.(a) (b) | | | 41,675 | | | | 1,271,921 | | |
| | | Number of
Shares | | Market
Value | |
Transaction Systems
Architects, Inc. Cl. A(a) | | | 20,890 | | | $ | 703,157 | | |
Trident
Microsystems, Inc.(a) (b) | | | 82,700 | | | | 1,517,545 | | |
VeriFone
Holdings, Inc.(a) (b) | | | 62,284 | | | | 2,195,511 | | |
| Verint Systems, Inc.(a) | | | 34,800 | | | | 1,089,240 | | |
| | | | 70,051,717 | | |
| Storage & Warehousing — 0.8% | |
| Mobile Mini, Inc.(a) | | | 184,600 | | | | 5,390,320 | | |
| Telecommunications — 2.3% | |
ADC
Telecommunications, Inc.(a) | | | 112,800 | | | | 2,067,624 | | |
| CommScope, Inc.(a) | | | 18,400 | | | | 1,073,640 | | |
| Foundry Networks, Inc.(a) | | | 70,400 | | | | 1,172,864 | | |
General Communication,
Inc. Cl. A(a) | | | 158,900 | | | | 2,035,509 | | |
Leap Wireless
International, Inc.(a) | | | 19,030 | | | | 1,608,035 | | |
| NeuStar, Inc. Cl. A(a) (b) | | | 49,700 | | | | 1,439,809 | | |
| Polycom, Inc.(a) | | | 62,500 | | | | 2,100,000 | | |
Powerwave
Technologies, Inc.(a) (b) | | | 241,900 | | | | 1,620,730 | | |
Sonus
Networks, Inc.(a) (b) | | | 308,390 | | | | 2,627,483 | | |
| | | | 15,745,694 | | |
| Toys, Games & Hobbies — 0.2% | |
Marvel
Entertainment, Inc.(a) (b) | | | 42,510 | | | | 1,083,155 | | |
| Transportation — 4.6% | |
American Commercial
Lines, Inc.(a) (b) | | | 26,930 | | | | 701,527 | | |
| Con-way, Inc. | | | 29,800 | | | | 1,497,152 | | |
Florida East
Coast Industries(b) | | | 19,140 | | | | 1,588,237 | | |
J.B. Hunt Transport
Services, Inc.(b) | | | 351,150 | | | | 10,295,718 | | |
| Kansas City Southern(a) (b) | | | 311,000 | | | | 11,674,940 | | |
| Landstar System, Inc. | | | 33,560 | | | | 1,619,270 | | |
Navios Maritime
Holdings, Inc. | | | 168,070 | | | | 2,030,286 | | |
| Werner Enterprises, Inc. | | | 67,500 | | | | 1,360,125 | | |
| YRC Worldwide, Inc.(a) (b) | | | 41,300 | | | | 1,519,840 | | |
| | | | 32,287,095 | | |
| Trucking & Leasing — 0.6% | |
| Aircastle, Ltd. | | | 58,920 | | | | 2,345,605 | | |
| GATX Corp. | | | 33,000 | | | | 1,625,250 | | |
| | | | 3,970,855 | | |
TOTAL EQUITIES
(Cost $495,689,804) | | | | | | | 648,394,338 | | |
(Continued)
The accompanying notes are an integral part of the financial statements.
171
MassMutual Select Small Cap Growth Equity Fund – Portfolio of Investments (Continued)
| | | Number of
Shares | | Market
Value | |
| MUTUAL FUND — 3.3% | |
| Investment Companies | |
iShares Russell
2000 Growth
Index Fund(b) | | | 267,510 | | | $ | 22,947,008 | | |
TOTAL MUTUAL FUND
(Cost $20,657,831) | | | | | | | 22,947,008 | | |
TOTAL LONG TERM INVESTMENTS
(Cost $516,347,635) | | | | | | | 671,341,346 | | |
| | | Principal
Amount | | | |
| SHORT-TERM INVESTMENTS — 43.4% | |
| Cash Equivalents — 39.5%(d) | |
Abbey National PLC
Eurodollar Time Deposit
5.280% 07/05/2007 | | $ | 3,578,694 | | | | 3,578,694 | | |
Abbey National PLC
Eurodollar Time Deposit
5.285% 07/09/2007 | | | 8,946,711 | | | | 8,946,711 | | |
American Beacon
Money Market Fund(c) | | | 10,037,797 | | | | 10,037,797 | | |
Banco Bilbao Vizcaya
Argentaria SA
Eurodollar Time Deposit
5.300% 08/10/2007 | | | 6,710,034 | | | | 6,710,034 | | |
Bank of America
5.270% 07/06/2007 | | | 8,946,711 | | | | 8,946,711 | | |
Bank of America
5.270% 07/16/2007 | | | 1,789,342 | | | | 1,789,342 | | |
Bank of America
5.270% 08/17/2007 | | | 2,236,678 | | | | 2,236,678 | | |
Bank of America
5.300% 09/17/2007 | | | 4,473,356 | | | | 4,473,356 | | |
Bank of Ireland
Eurodollar Time Deposit
5.300% 08/13/2007 | | | 8,946,711 | | | | 8,946,711 | | |
Bank of Montreal
Eurodollar Time Deposit
5.280% 07/03/2007 | | | 2,236,678 | | | | 2,236,678 | | |
Bank of Montreal
Eurodollar Time Deposit
5.290% 07/02/2007 | | | 1,789,342 | | | | 1,789,342 | | |
Bank of Montreal
Eurodollar Time Deposit
5.310% 08/14/2007 | | | 1,342,007 | | | | 1,342,007 | | |
Bank of Nova Scotia
Eurodollar Time Deposit
5.280% 07/09/2007 | | | 8,499,376 | | | | 8,499,376 | | |
| | | Principal
Amount | | Market
Value | |
Bank Of Nova Scotia
Eurodollar Time Deposit
5.285% 07/11/2007 | | $ | 4,920,691 | | | $ | 4,920,691 | | |
Barclays
Eurodollar Time Deposit
5.290% 07/06/2007 | | | 8,946,711 | | | | 8,946,711 | | |
Barclays
Eurodollar Time Deposit
5.295% 07/16/2007 | | | 1,789,342 | | | | 1,789,342 | | |
Barclays
Eurodollar Time Deposit
5.320% 09/04/2007 | | | 4,473,356 | | | | 4,473,356 | | |
Bear Stearns & Co
Commercial Paper
5.435% 07/10/2007 | | | 1,342,007 | | | | 1,342,007 | | |
BGI Institutional
Money Market Fund(c) | | | 5,815,364 | | | | 5,815,364 | | |
BNP Paribas
Eurodollar Time Deposit
5.350% 07/02/2007 | | | 13,420,068 | | | | 13,420,068 | | |
Calyon
Eurodollar Time Deposit
5.290% 07/17/2007 | | | 4,473,356 | | | | 4,473,356 | | |
Calyon
Eurodollar Time Deposit
5.380% 07/02/2007 | | | 13,420,068 | | | | 13,420,068 | | |
Canadian Imperial
Bank of Commerce
Eurodollar Time Deposit
5.300% 07/30/2007 | | | 8,946,711 | | | | 8,946,711 | | |
Dexia Group
Eurodollar Time Deposit
5.290% 08/08/2007 | | | 8,946,711 | | | | 8,946,711 | | |
Dreyfus Institutional
Cash Advantage
Money Market Fund(c) | | | 2,684,014 | | | | 2,684,014 | | |
Federal Home Loan
Bank Discount Note
5.174% 07/20/2007 | | | 663,549 | | | | 663,549 | | |
First Tennessee
National Corp.
Eurodollar Time Deposit
5.300% 07/18/2007 | | | 2,236,678 | | | | 2,236,678 | | |
Fortis Bank
Eurodollar Time Deposit
5.290% 07/06/2007 | | | 2,236,678 | | | | 2,236,678 | | |
Fortis Bank
Eurodollar Time Deposit
5.290% 07/09/2007 | | | 3,131,349 | | | | 3,131,349 | | |
Fortis Bank
Eurodollar Time Deposit
5.300% 07/20/2007 | | | 2,236,678 | | | | 2,236,678 | | |
| | | Principal
Amount | | Market
Value | |
Fortis Bank
Eurodollar Time Deposit
5.300% 07/26/2007 | | $ | 1,789,342 | | | $ | 1,789,342 | | |
Fortis Bank
Eurodollar Time Deposit
5.350% 07/05/2007 | | | 4,473,356 | | | | 4,473,356 | | |
Freddie Mac Discount Note
5.155% 07/16/2007 | | | 844,707 | | | | 844,707 | | |
Freddie Mac Discount Note
5.185% 07/09/2007 | | | 440,987 | | | | 440,987 | | |
Morgan Stanley & Co
Commercial Paper
5.445% 08/01/2007 | | | 4,026,020 | | | | 4,026,020 | | |
National Australia Bank
Eurodollar Time Deposit
5.320% 07/02/2007 | | | 4,473,356 | | | | 4,473,356 | | |
Nationwide Building Society
Commercial Paper
5.301% 07/09/2007 | | | 4,464,153 | | | | 4,464,153 | | |
Rabobank Nederland
Eurodollar Time Deposit
5.280% 07/05/2007 | | | 6,710,034 | | | | 6,710,034 | | |
Rabobank Nederland
Eurodollar Time Deposit
5.290% 07/16/2007 | | | 8,946,711 | | | | 8,946,711 | | |
Rabobank Nederland
Eurodollar Time Deposit
5.330% 07/02/2007 | | | 13,420,068 | | | | 13,420,068 | | |
Reserve Primary
Money Market Fund(c) | | | 8,881,749 | | | | 8,881,749 | | |
Royal Bank of Canada
Eurodollar Time Deposit
5.305% 08/30/2007 | | | 8,946,711 | | | | 8,946,711 | | |
Royal Bank of Scotland
Eurodollar Time Deposit
5.270% 07/11/2007 | | | 2,236,678 | | | | 2,236,678 | | |
Skandinaviska Enskilda
Banken AB
Eurodollar Time Deposit
5.290% 07/13/2007 | | | 8,946,711 | | | | 8,946,711 | | |
Skandinaviska Enskilda
Banken AB
Eurodollar Time Deposit
5.290% 07/19/2007 | | | 1,342,007 | | | | 1,342,007 | | |
Svenska Handlesbanken
Eurodollar Time Deposit
5.300% 07/02/2007 | | | 1,502,830 | | | | 1,502,830 | | |
UBS AG
Eurodollar Time Deposit
5.277% 07/05/2007 | | | 6,262,699 | | | | 6,262,699 | | |
UBS AG
Eurodollar Time Deposit
5.285% 07/05/2007 | | | 8,946,711 | | | | 8,946,711 | | |
(Continued)
The accompanying notes are an integral part of the financial statements.
172
MassMutual Select Small Cap Growth Equity Fund – Portfolio of Investments (Continued)
| | | Principal
Amount | | Market
Value | |
Vanguard Prime
Money Market Fund(c) | | $ | 4,473,356 | | | $ | 4,473,356 | | |
Wells Fargo
Eurodollar Time Deposit
5.260% 07/02/2007 | | | 2,415,612 | | | | 2,415,612 | | |
Wells Fargo
Eurodollar Time Deposit
5.280% 07/11/2007 | | | 8,946,711 | | | | 8,946,711 | | |
Wells Fargo
Eurodollar Time Deposit
5.280% 07/12/2007 | | | 4,473,356 | | | | 4,473,356 | | |
| | | | 276,180,633 | | |
| Repurchase Agreements — 3.9% | |
Investors Bank & Trust
Company Repurchase
Agreement, dated
6/29/2007, 3.50%,
due 7/02/2007(e) | | | 27,495,200 | | | | 27,495,200 | | |
TOTAL SHORT-TERM
INVESTMENTS
(Cost $303,675,833) | | | | | | | 303,675,833 | | |
TOTAL INVESTMENTS — 139.5%
(Cost $820,023,468)(f) | | | | | | | 975,017,179 | | |
Other Assets/
(Liabilities) — (39.5%) | | | | | | | (276,011,168 | ) | |
| NET ASSETS — 100.0% | | | | | | $ | 699,006,011 | | |
Notes to Portfolio of Investments
ADR - American Depository Receipt
CAD - Canadian Dollar
GBP - British Pound
(a) Non-income producing security.
(b) Denotes all or a portion of security on loan. (Note 2).
(c) Amount represents shares owned of the fund.
(d) Represents investments of security lending collateral. (Note 2).
(e) Maturity value of $27,503,219. Collateralized by a U.S. Government Agency obligation with a rate of 5.82%, maturity date of 6/15/2034, and an aggregate market value, including accrued interest, of $28,869,960.
(f) See Note 6 for aggregate cost for Federal tax purposes.
The remainder of this page is intentionally left blank.
The accompanying notes are an integral part of the financial statements.
173
MassMutual Select Small Company Growth Fund – Portfolio of Investments
June 30, 2007 (Unaudited)
| | | Number of
Shares | | Market
Value | |
| EQUITIES — 98.5% | |
| COMMON STOCK — 98.5% | |
| Advertising — 1.6% | |
| Gaiam, Inc. Cl. A(a) (b) | | | 54,900 | | | $ | 1,000,827 | | |
| Marchex, Inc. Cl. B(b) | | | 101,800 | | | | 1,661,376 | | |
| | | | 2,662,203 | | |
| Apparel — 5.9% | |
| Carter's, Inc.(a) | | | 40,720 | | | | 1,056,277 | | |
| Crocs, Inc.(a) (b) | | | 68,800 | | | | 2,960,464 | | |
| Quiksilver, Inc.(a) | | | 223,700 | | | | 3,160,881 | | |
| Volcom, Inc.(a) (b) | | | 54,630 | | | | 2,738,602 | | |
| | | | 9,916,224 | | |
| Automotive & Parts — 1.2% | |
| Titan International, Inc.(b) | | | 65,030 | | | | 2,055,598 | | |
| Banks — 1.7% | |
| Bancorp, Inc.(a) | | | 3,600 | | | | 80,496 | | |
| Bank of the Ozarks, Inc. | | | 2,900 | | | | 80,823 | | |
Boston Private Financial
Holdings, Inc. | | | 13,785 | | | | 370,403 | | |
| Cascade Bancorp(b) | | | 16,168 | | | | 374,128 | | |
| Cobiz Inc. | | | 12,200 | | | | 221,064 | | |
| East West Bancorp, Inc. | | | 16,100 | | | | 625,968 | | |
| Glacier Bancorp, Inc.(b) | | | 13,602 | | | | 276,801 | | |
| SVB Financial Group(a) | | | 3,600 | | | | 191,196 | | |
| UCBH Holdings, Inc. | | | 21,900 | | | | 400,113 | | |
Virginia
Commerce Bancorp(a) (b) | | | 8,269 | | | | 139,829 | | |
| WSB Financial Group, Inc.(a) | | | 10,900 | | | | 172,220 | | |
| | | | 2,933,041 | | |
| Beverages — 0.0% | |
| Peet's Coffee & Tea, Inc.(a) | | | 3,100 | | | | 76,353 | | |
| Biotechnology — 2.4% | |
3SBio, Inc., Sponsored
ADR (China) (a) | | | 56,300 | | | | 542,732 | | |
| Affymetrix, Inc.(a) (b) | | | 63,500 | | | | 1,580,515 | | |
| Cell Genesys, Inc.(a) (b) | | | 233,700 | | | | 782,895 | | |
| Illumina, Inc.(a) | | | 6,300 | | | | 255,717 | | |
Integra LifeSciences
Holdings Corp.(a) (b) | | | 1,700 | | | | 84,014 | | |
| Myriad Genetics, Inc.(a) (b) | | | 14,960 | | | | 556,362 | | |
| Tercica, Inc.(a) (b) | | | 51,600 | | | | 263,160 | | |
| | | | 4,065,395 | | |
| Building Materials — 0.9% | |
| Texas Industries, Inc.(b) | | | 18,530 | | | | 1,452,937 | | |
| | | Number of
Shares | | Market
Value | |
| Chemicals — 2.9% | |
| Hercules, Inc.(a) | | | 4,400 | | | $ | 86,460 | | |
| Metabolix, Inc.(a) (b) | | | 28,900 | | | | 723,367 | | |
| Quaker Chemical Corp. | | | 18,200 | | | | 429,520 | | |
| Terra Industries, Inc.(a) (b) | | | 128,200 | | | | 3,258,844 | | |
| Zoltek Cos., Inc.(a) | | | 10,370 | | | | 430,666 | | |
| | | | 4,928,857 | | |
| Commercial Services — 3.6% | |
Corrections Corp.
of America(a) | | | 30,245 | | | | 1,908,762 | | |
| Gartner Group, Inc.(a) | | | 3,400 | | | | 83,606 | | |
| The Geo Group, Inc.(a) | | | 21,160 | | | | 615,756 | | |
Global Cash Access
Holdings, Inc.(a) | | | 110,455 | | | | 1,769,489 | | |
Heartland Payment
Systems, Inc.(b) | | | 14,700 | | | | 431,151 | | |
| Kenexa Corp.(a) (b) | | | 16,700 | | | | 629,757 | | |
| Strayer Education, Inc.(b) | | | 3,900 | | | | 513,669 | | |
| Wright Express Corp.(a) | | | 2,500 | | | | 85,675 | | |
| | | | 6,037,865 | | |
| Computers — 1.2% | |
| Digimarc Corp.(a) | | | 34,600 | | | | 339,426 | | |
| FactSet Research Systems, Inc. | | | 16,585 | | | | 1,133,585 | | |
| Immersion Corp.(a) | | | 37,300 | | | | 558,754 | | |
| Limelight Networks, Inc.(a) | | | 2,100 | | | | 41,538 | | |
| | | | 2,073,303 | | |
| Consumer Products — 0.4% | |
| Pool Corp.(b) | | | 15,275 | | | | 596,183 | | |
| Cosmetics & Personal Care — 0.8% | |
| Bare Escentuals, Inc.(a) | | | 19,800 | | | | 676,170 | | |
Physicians Formula
Holdings, Inc.(a) | | | 46,750 | | | | 735,144 | | |
| | | | 1,411,314 | | |
| Diversified Financial — 6.3% | |
Affiliated Managers
Group, Inc.(a) (b) | | | 8,600 | | | | 1,107,336 | | |
| Cohen & Steers, Inc.(b) | | | 12,000 | | | | 521,400 | | |
| Cowen Group, Inc.(a) | | | 50,310 | | | | 901,052 | | |
| Evercore Partners, Inc. Cl. A | | | 26,800 | | | | 797,836 | | |
| Federated Investors, Inc. Cl. B | | | 19,800 | | | | 758,934 | | |
| Greenhill & Co., Inc.(b) | | | 29,790 | | | | 2,046,871 | | |
Investment
Technology Group, Inc.(a) | | | 21,870 | | | | 947,627 | | |
The Nasdaq Stock
Market, Inc.(a) (b) | | | 49,500 | | | | 1,470,645 | | |
| optionsXpress Holdings, Inc. | | | 8,600 | | | | 220,676 | | |
| Piper Jaffray Cos.(a) | | | 16,700 | | | | 930,691 | | |
| | | Number of
Shares | | Market
Value | |
Thomas Weisel
Partners Group, Inc.(a) (b) | | | 26,000 | | | $ | 432,900 | | |
| TradeStation Group, Inc.(a) | | | 18,500 | | | | 215,525 | | |
Waddell & Reed
Financial, Inc. Cl. A | | | 9,600 | | | | 249,696 | | |
| | | | 10,601,189 | | |
| Electric — 0.5% | |
| EnerNOC, Inc.(a) | | | 13,310 | | | | 507,510 | | |
| Ormat Technologies, Inc. | | | 7,000 | | | | 263,760 | | |
| | | | 771,270 | | |
| Electrical Components & Equipment — 1.8% | |
| Active Power, Inc.(a) | | | 89,600 | | | | 159,488 | | |
Advanced Energy
Industries, Inc.(a) | | | 21,320 | | | | 483,111 | | |
| General Cable Corp.(a) | | | 21,085 | | | | 1,597,189 | | |
| Superior Essex, Inc.(a) | | | 5,300 | | | | 197,955 | | |
| Universal Display Corp.(a) (b) | | | 37,800 | | | | 593,838 | | |
| | | | 3,031,581 | | |
| Electronics — 4.4% | |
| Cogent, Inc.(a) | | | 9,600 | | | | 141,024 | | |
| Coherent, Inc.(a) | | | 62,695 | | | | 1,912,824 | | |
| Cymer, Inc.(a) | | | 19,800 | | | | 795,960 | | |
| Daktronics, Inc.(b) | | | 15,975 | | | | 343,143 | | |
Dolby
Laboratories, Inc. Cl. A(a) | | | 31,035 | | | | 1,098,949 | | |
| Eagle Test Systems, Inc.(a) | | | 34,530 | | | | 554,552 | | |
| Oyo Geospace Corp.(a) (b) | | | 34,534 | | | | 2,562,077 | | |
| | | | 7,408,529 | | |
| Energy – Alternate Sources — 0.4% | |
| Evergreen Solar, Inc.(a) (b) | | | 49,500 | | | | 460,350 | | |
| US Bioenergy Corp.(a) (b) | | | 24,500 | | | | 278,320 | | |
| | | | 738,670 | | |
| Engineering & Construction — 0.9% | |
| Emcor Group, Inc.(a) | | | 1,300 | | | | 94,770 | | |
| ENGlobal Corp.(a) | | | 8,900 | | | | 108,135 | | |
| Infrasource Services, Inc.(a) | | | 37,240 | | | | 1,381,604 | | |
| | | | 1,584,509 | | |
| Entertainment — 0.8% | |
| Vail Resorts, Inc.(a) (b) | | | 21,745 | | | | 1,323,618 | | |
| Environmental Controls — 1.3% | |
| ADA-ES, Inc.(a) | | | 11,200 | | | | 234,416 | | |
| Waste Connections, Inc.(a) | | | 63,440 | | | | 1,918,426 | | |
| | | | 2,152,842 | | |
| Foods — 0.1% | |
| B&G Foods, Inc. Cl. A | | | 15,900 | | | | 209,880 | | |
(Continued)
The accompanying notes are an integral part of the financial statements.
174
MassMutual Select Small Company Growth Fund – Portfolio of Investments (Continued)
| | | Number of
Shares | | Market
Value | |
| Health Care – Products — 5.4% | |
American Medical Systems
Holdings, Inc.(a) (b) | | | 88,905 | | | $ | 1,603,846 | | |
| Arrow International, Inc. | | | 45,085 | | | | 1,725,854 | | |
| Cutera, Inc.(a) | | | 46,795 | | | | 1,166,131 | | |
| DJO, Inc.(a) | | | 16,950 | | | | 699,527 | | |
Foxhollow
Technologies, Inc.(a) | | | 15,400 | | | | 327,096 | | |
| Home Diagnostics, Inc.(a) | | | 24,500 | | | | 288,365 | | |
| Lemaitre Vascular, Inc.(a) | | | 26,300 | | | | 157,800 | | |
| OraSure Technologies, Inc.(a) | | | 34,600 | | | | 283,028 | | |
| Respironics, Inc.(a) | | | 28,255 | | | | 1,203,380 | | |
| Somanetics Corp.(a) | | | 15,400 | | | | 281,974 | | |
| Thoratec Corp.(a) (b) | | | 45,475 | | | | 836,285 | | |
| Vital Images, Inc.(a) | | | 22,345 | | | | 606,890 | | |
| | | | 9,180,176 | | |
| Health Care – Services — 2.8% | |
| Alliance Imaging, Inc.(a) | | | 84,900 | | | | 797,211 | | |
| Centene Corp.(a) (b) | | | 49,280 | | | | 1,055,578 | | |
Five Star Quality
Care, Inc.(a) (b) | | | 74,200 | | | | 592,116 | | |
Icon PLC Sponsored
ADR (United Kingdom) (a) | | | 17,265 | | | | 755,171 | | |
| Matria Healthcare, Inc.(a) (b) | | | 36,895 | | | | 1,117,181 | | |
| Sun Healthcare Group, Inc.(a) | | | 29,200 | | | | 423,108 | | |
| | | | 4,740,365 | | |
| Home Builders — 0.2% | |
| Meritage Homes Corp.(a) (b) | | | 10,700 | | | | 286,225 | | |
| Home Furnishing — 1.8% | |
| Universal Electronics, Inc.(a) | | | 81,698 | | | | 2,967,271 | | |
| Household Products — 0.1% | |
| Church & Dwight Co., Inc. | | | 1,800 | | | | 87,228 | | |
| Industrial – Distribution — 0.3% | |
| MWI Veterinary Supply, Inc.(a) | | | 10,765 | | | | 429,416 | | |
| Insurance — 1.2% | |
American Safety Insurance
Holdings Ltd.(a) | | | 21,090 | | | | 502,575 | | |
| Castlepoint Holdings Ltd.(b) | | | 23,700 | | | | 348,153 | | |
First Mercury
Financial Corp.(a) | | | 52,440 | | | | 1,099,667 | | |
| | | | 1,950,395 | | |
| Internet — 5.8% | |
| Avocent Corp.(a) | | | 47,700 | | | | 1,383,777 | | |
| CNET Networks, Inc.(a) (b) | | | 270,480 | | | | 2,215,231 | | |
Cogent Communications
Group, Inc.(a) (b) | | | 27,100 | | | | 809,477 | | |
| DealerTrack Holdings, Inc.(a) | | | 10,200 | | | | 375,768 | | |
| i2 Technologies, Inc.(a) (b) | | | 13,500 | | | | 251,640 | | |
| Internet Capital Group, Inc.(a) | | | 50,775 | | | | 629,610 | | |
| | | Number of
Shares | | Market
Value | |
| Knot (The), Inc.(a) (b) | | | 34,600 | | | $ | 698,574 | | |
| Liquidity Services, Inc.(a) | | | 40,100 | | | | 753,078 | | |
| Move, Inc.(a) | | | 151,600 | | | | 679,168 | | |
| Online Resources Corp.(a) | | | 8,900 | | | | 97,722 | | |
| Opsware, Inc.(a) | | | 22,400 | | | | 213,024 | | |
Secure
Computing Corp.(a) (b) | | | 78,100 | | | | 592,779 | | |
| Shutterfly, Inc.(a) (b) | | | 33,600 | | | | 724,080 | | |
| Sourcefire, Inc.(a) | | | 6,000 | | | | 83,940 | | |
| US Auto Parts Network, Inc.(a) | | | 38,805 | | | | 367,095 | | |
| | | | 9,874,963 | | |
| Iron & Steel — 0.4% | |
Claymont Steel
Holdings, Inc.(a) | | | 35,460 | | | | 758,489 | | |
| Machinery – Construction & Mining — 1.5% | |
Bucyrus International,
Inc. Cl. A(b) | | | 35,115 | | | | 2,485,440 | | |
| Machinery – Diversified — 0.4% | |
| Chart Industries, Inc.(a) | | | 22,700 | | | | 645,588 | | |
| Manufacturing — 0.9% | |
| A.O. Smith Corp. | | | 6,300 | | | | 251,307 | | |
| Actuant Corp. Cl. A | | | 20,610 | | | | 1,299,667 | | |
| | | | 1,550,974 | | |
| Media — 1.6% | |
Entravision Communications
Corp. Cl. A(a) | | | 94,775 | | | | 988,503 | | |
Martha Stewart Living
Omnimedia, Inc. Cl. A(b) | | | 61,300 | | | | 1,054,360 | | |
Outdoor Channel
Holdings, Inc.(a) | | | 53,100 | | | | 598,437 | | |
| | | | 2,641,300 | | |
| Metal Fabricate & Hardware — 1.2% | |
| Dynamic Materials Corp. | | | 10,200 | | | | 382,500 | | |
| Kaydon Corp.(b) | | | 24,335 | | | | 1,268,340 | | |
| Northwest Pipe Co.(a) | | | 9,050 | | | | 321,909 | | |
| | | | 1,972,749 | | |
| Office Furnishings — 0.5% | |
| Knoll, Inc. | | | 41,400 | | | | 927,360 | | |
| Oil & Gas — 2.1% | |
| Arena Resources Inc.(a) | | | 4,200 | | | | 244,062 | | |
| Atwood Oceanics, Inc.(a) (b) | | | 9,600 | | | | 658,752 | | |
| Edge Petroleum Corp.(a) (b) | | | 16,315 | | | | 228,573 | | |
Goodrich Petroleum
Corp.(a) (b) | | | 37,200 | | | | 1,288,236 | | |
| Kodiak Oil & Gas Corp.(a) | | | 27,900 | | | | 161,820 | | |
| Unit Corp.(a) | | | 14,990 | | | | 943,021 | | |
| | | | 3,524,464 | | |
| | | Number of
Shares | | Market
Value | |
| Oil & Gas Services — 3.3% | |
Cal Dive
International, Inc.(a) (b) | | | 56,800 | | | $ | 944,584 | | |
Complete Production
Services, Inc.(a) | | | 14,300 | | | | 369,655 | | |
| Core Laboratories N.V.(a) | | | 10,210 | | | | 1,038,255 | | |
| Hercules Offshore, Inc.(a) (b) | | | 6,000 | | | | 194,280 | | |
| Lufkin Industries, Inc. | | | 8,905 | | | | 574,818 | | |
Natural Gas Services
Group, Inc.(a) | | | 22,100 | | | | 395,148 | | |
Superior Offshore
International, Inc.(a) | | | 27,300 | | | | 496,860 | | |
| TETRA Technologies, Inc.(a) | | | 52,189 | | | | 1,471,730 | | |
| Union Drilling, Inc.(a) | | | 7,800 | | | | 128,076 | | |
| | | | 5,613,406 | | |
| Pharmaceuticals — 7.3% | |
| Alkermes, Inc.(a) | | | 89,100 | | | | 1,300,860 | | |
Altus
Pharmaceuticals, Inc.(a) (b) | | | 25,000 | | | | 288,500 | | |
Animal Health
International, Inc.(a) | | | 61,005 | | | | 883,962 | | |
| Cephalon, Inc.(a) (b) | | | 44,800 | | | | 3,601,472 | | |
Cubist
Pharmaceuticals, Inc.(a) (b) | | | 114,710 | | | | 2,260,934 | | |
| CV Therapeutics, Inc.(a) (b) | | | 81,800 | | | | 1,080,578 | | |
Ista
Pharmaceuticals, Inc.(a) (b) | | | 76,300 | | | | 563,094 | | |
| Medarex, Inc.(a) (b) | | | 166,700 | | | | 2,382,143 | | |
| | | | 12,361,543 | | |
| Real Estate — 0.5% | |
| HFF, Inc. Cl. A(a) | | | 20,800 | | | | 322,608 | | |
Meruelo Maddux
Properties, Inc.(a) | | | 74,200 | | | | 605,472 | | |
| | | | 928,080 | | |
| Retail — 5.1% | |
| BJ's Restaurants, Inc.(a) | | | 26,580 | | | | 524,689 | | |
Build-A-Bear
Workshop, Inc.(a) (b) | | | 55,340 | | | | 1,446,588 | | |
Cash America
International, Inc. | | | 41,640 | | | | 1,651,026 | | |
| Genesco, Inc.(a) (b) | | | 44,460 | | | | 2,325,703 | | |
| Hot Topic, Inc.(a) | | | 6,000 | | | | 65,220 | | |
| Jamba, Inc.(a) (b) | | | 7,800 | | | | 71,292 | | |
McCormick & Schmick's
Seafood Restaurants, Inc.(a) | | | 3,400 | | | | 88,196 | | |
Red Robin Gourmet
Burgers, Inc.(a) | | | 27,150 | | | | 1,096,046 | | |
| School Specialty, Inc.(a) (b) | | | 30,255 | | | | 1,072,237 | | |
| Zumiez, Inc.(a) (b) | | | 8,300 | | | | 313,574 | | |
| | | | 8,654,571 | | |
(Continued)
The accompanying notes are an integral part of the financial statements.
175
MassMutual Select Small Company Growth Fund – Portfolio of Investments (Continued)
| | | Number of
Shares | | Market
Value | |
| Semiconductors — 3.3% | |
Brooks
Automation, Inc.(a) (b) | | | 9,900 | | | $ | 179,685 | | |
| IPG Photonics Corp.(a) | | | 11,700 | | | | 233,415 | | |
Lattice
Semiconductor Corp.(a) | | | 315,000 | | | | 1,801,800 | | |
| PLX Technology, Inc.(a) | | | 47,112 | | | | 525,770 | | |
| Rudolph Technologies, Inc.(a) | | | 10,900 | | | | 181,049 | | |
| Skyworks Solutions, Inc.(a) | | | 179,200 | | | | 1,317,120 | | |
Triquint
Semiconductor, Inc.(a) | | | 255,000 | | | | 1,290,300 | | |
| | | | 5,529,139 | | |
| Software — 8.3% | |
| Advent Software, Inc.(a) (b) | | | 17,200 | | | | 559,860 | | |
| Ansys, Inc.(a) | | | 57,150 | | | | 1,514,475 | | |
| Avid Technology, Inc.(a) (b) | | | 28,795 | | | | 1,017,903 | | |
| Commvault Systems, Inc.(a) | | | 19,500 | | | | 336,765 | | |
| Eclipsys Corp.(a) | | | 85,995 | | | | 1,702,701 | | |
| Red Hat, Inc.(a) (b) | | | 164,100 | | | | 3,656,148 | | |
THE9 Ltd. ADR
(Cayman Islands) (a) (b) | | | 25,680 | | | | 1,187,957 | | |
| THQ, Inc.(a) (b) | | | 51,600 | | | | 1,574,832 | | |
Trident
Microsystems, Inc.(a) (b) | | | 37,840 | | | | 694,364 | | |
| Wind River Systems, Inc.(a) | | | 161,200 | | | | 1,773,200 | | |
| | | | 14,018,205 | | |
| Telecommunications — 5.1% | |
| Acme Packet, Inc.(a) | | | 7,300 | | | | 83,876 | | |
| BigBand Networks, Inc.(a) (b) | | | 18,000 | | | | 235,980 | | |
| Clearwire Corp. Cl. A(a) (b) | | | 47,700 | | | | 1,165,311 | | |
| EMS Technologies, Inc.(a) | | | 38,135 | | | | 841,258 | | |
| Ixia(a) | | | 73,135 | | | | 677,230 | | |
| Polycom, Inc.(a) | | | 78,100 | | | | 2,624,160 | | |
| RF Micro Devices, Inc.(a) (b) | | | 297,100 | | | | 1,853,904 | | |
RRSat Global
Communications(a) | | | 19,300 | | | | 385,421 | | |
Sirenza
Microdevices, Inc.(a) (b) | | | 18,180 | | | | 215,797 | | |
Switch & Data
Facilities Co., Inc.(a) (b) | | | 30,315 | | | | 581,745 | | |
| | | | 8,664,682 | | |
| Toys, Games & Hobbies — 0.2% | |
Marvel
Entertainment, Inc.(a) (b) | | | 14,600 | | | | 372,008 | | |
| Transportation — 0.1% | |
| Hub Group, Inc. Cl. A(a) | | | 4,800 | | | | 168,768 | | |
| Knight Transportation, Inc. | | | 4,400 | | | | 85,272 | | |
| | | | 254,040 | | |
TOTAL EQUITIES
(Cost $142,450,182) | | | | | | | 166,449,438 | | |
| | | Principal
Amount | | Market
Value | |
| SHORT-TERM INVESTMENTS — 32.5% | |
| Cash Equivalents — 31.3%(d) | |
Abbey National PLC
Eurodollar Time Deposit
5.280% 07/05/2007 | | $ | 685,505 | | | $ | 685,505 | | |
Abbey National PLC
Eurodollar Time Deposit
5.285% 07/09/2007 | | | 1,713,763 | | | | 1,713,763 | | |
American Beacon Money
Market Fund(c) | | | 1,922,760 | | | | 1,922,760 | | |
Banco Bilbao Vizcaya
Argentaria SA
Eurodollar Time Deposit
5.300% 08/10/2007 | | | 1,285,321 | | | | 1,285,321 | | |
Bank of America
5.270% 07/06/2007 | | | 1,713,761 | | | | 1,713,761 | | |
Bank of America
5.270% 07/16/2007 | | | 342,752 | | | | 342,752 | | |
Bank of America
5.270% 08/17/2007 | | | 428,441 | | | | 428,441 | | |
Bank of America
5.300% 09/17/2007 | | | 856,880 | | | | 856,880 | | |
Bank of Ireland
Eurodollar Time Deposit
5.300% 08/13/2007 | | | 1,713,761 | | | | 1,713,761 | | |
Bank of Montreal
Eurodollar Time Deposit
5.280% 07/03/2007 | | | 428,441 | | | | 428,441 | | |
Bank of Montreal
Eurodollar Time Deposit
5.290% 07/02/2007 | | | 342,752 | | | | 342,752 | | |
Bank of Montreal
Eurodollar Time Deposit
5.310% 08/14/2007 | | | 257,064 | | | | 257,064 | | |
Bank of Nova Scotia
Eurodollar Time Deposit
5.280% 07/09/2007 | | | 1,628,072 | | | | 1,628,072 | | |
Bank Of Nova Scotia
Eurodollar Time Deposit
5.285% 07/11/2007 | | | 942,569 | | | | 942,569 | | |
Barclays
Eurodollar Time Deposit
5.290% 07/06/2007 | | | 1,713,761 | | | | 1,713,761 | | |
Barclays
Eurodollar Time Deposit
5.295% 07/16/2007 | | | 342,752 | | | | 342,752 | | |
Barclays
Eurodollar Time Deposit
5.320% 09/04/2007 | | | 856,880 | | | | 856,880 | | |
Bear Stearns &
Co Commercial Paper
5.435% 07/10/2007 | | | 257,064 | | | | 257,064 | | |
| | | Principal
Amount | | Market
Value | |
BGI Institutional Money
Market Fund(c) | | $ | 1,113,944 | | | $ | 1,113,944 | | |
BNP Paribas
Eurodollar Time Deposit
5.350% 07/02/2007 | | | 2,570,641 | | | | 2,570,641 | | |
Calyon
Eurodollar Time Deposit
5.290% 07/17/2007 | | | 856,880 | | | | 856,880 | | |
Calyon
Eurodollar Time Deposit
5.380% 07/02/2007 | | | 2,570,641 | | | | 2,570,641 | | |
Canadian Imperial Bank of
Commerce
Eurodollar Time Deposit
5.300% 07/30/2007 | | | 1,713,761 | | | | 1,713,761 | | |
Dexia Group
Eurodollar Time Deposit
5.290% 08/08/2007 | | | 1,713,761 | | | | 1,713,761 | | |
Dreyfus Institutional Cash
Advantage Money
Market Fund(c) | | | 514,128 | | | | 514,128 | | |
Federal Home Loan Bank
Discount Note
5.174% 07/20/2007 | | | 127,104 | | | | 127,104 | | |
First Tennessee National Corp.
Eurodollar Time Deposit
5.300% 07/18/2007 | | | 428,441 | | | | 428,441 | | |
Fortis Bank
Eurodollar Time Deposit
5.290% 07/06/2007 | | | 428,441 | | | | 428,441 | | |
Fortis Bank
Eurodollar Time Deposit
5.290% 07/09/2007 | | | 599,816 | | | | 599,816 | | |
Fortis Bank
Eurodollar Time Deposit
5.300% 07/20/2007 | | | 428,441 | | | | 428,441 | | |
Fortis Bank
Eurodollar Time Deposit
5.300% 07/26/2007 | | | 342,752 | | | | 342,752 | | |
Fortis Bank
Eurodollar Time Deposit
5.350% 07/05/2007 | | | 856,880 | | | | 856,880 | | |
Freddie Mac Discount Note
5.155% 07/16/2007 | | | 161,805 | | | | 161,805 | | |
Freddie Mac Discount Note
5.185% 07/09/2007 | | | 84,472 | | | | 84,472 | | |
Morgan Stanley & Co
Commercial Paper
5.445% 08/01/2007 | | | 771,192 | | | | 771,192 | | |
National Australia Bank
Eurodollar Time Deposit
5.320% 07/02/2007 | | | 856,880 | | | | 856,880 | | |
Nationwide Building Society
Commercial Paper
5.301% 07/09/2007 | | | 855,118 | | | | 855,118 | | |
(Continued)
The accompanying notes are an integral part of the financial statements.
176
MassMutual Select Small Company Growth Fund – Portfolio of Investments (Continued)
| | | Principal
Amount | | Market
Value | |
Rabobank Nederland
Eurodollar Time Deposit
5.280% 07/05/2007 | | $ | 1,285,321 | | | $ | 1,285,321 | | |
Rabobank Nederland
Eurodollar Time Deposit
5.290% 07/16/2007 | | | 1,713,761 | | | | 1,713,761 | | |
Rabobank Nederland
Eurodollar Time Deposit
5.330% 07/02/2007 | | | 2,570,641 | | | | 2,570,641 | | |
Reserve Primary Money
Market Fund(c) | | | 1,701,317 | | | | 1,701,317 | | |
Royal Bank of Canada
Eurodollar Time Deposit
5.305% 08/30/2007 | | | 1,713,761 | | | | 1,713,761 | | |
Royal Bank of Scotland
Eurodollar Time Deposit
5.270% 07/11/2007 | | | 428,441 | | | | 428,441 | | |
Skandinaviska Enskilda
Banken AB
Eurodollar Time Deposit
5.290% 07/13/2007 | | | 1,713,761 | | | | 1,713,761 | | |
Skandinaviska Enskilda
Banken AB
Eurodollar Time Deposit
5.290% 07/19/2007 | | | 257,064 | | | | 257,064 | | |
Svenska Handlesbanken
Eurodollar Time Deposit
5.300% 07/02/2007 | | | 287,870 | | | | 287,870 | | |
UBS AG
Eurodollar Time Deposit
5.277% 07/05/2007 | | | 1,199,633 | | | | 1,199,633 | | |
UBS AG
Eurodollar Time Deposit
5.285% 07/05/2007 | | | 1,713,761 | | | | 1,713,761 | | |
Vanguard Prime Money
Market Fund(c) | | | 856,880 | | | | 856,880 | | |
Wells Fargo
Eurodollar Time Deposit
5.260% 07/02/2007 | | | 462,715 | | | | 462,715 | | |
Wells Fargo
Eurodollar Time Deposit
5.280% 07/11/2007 | | | 1,713,761 | | | | 1,713,761 | | |
Wells Fargo
Eurodollar Time Deposit
5.280% 07/12/2007 | | | 856,880 | | | | 856,880 | | |
| | | | 52,902,964 | | |
| Repurchase Agreements — 1.2% | |
Investors Bank & Trust
Company Repurchase
Agreement, dated
6/29/2007, 3.50%,
due 7/2/2007(e) | | | 2,044,320 | | | | 2,044,320 | | |
| | | Market
Value | |
TOTAL SHORT-TERM
INVESTMENTS
(Cost $54,947,284) | | $ | 54,947,284 | | |
TOTAL INVESTMENTS — 131.0%
(Cost $197,397,466) (f) | | | 221,396,722 | | |
Other Assets/
(Liabilities) — (31.0%) | | | (52,371,043 | ) | |
| NET ASSETS — 100.0% | | $ | 169,025,679 | | |
Notes to Portfolio of Investments
ADR - American Depository Receipt
(a) Non-income producing security.
(b) Denotes all or a portion of security on loan. (Note 2).
(c) Amount represents shares owned of the fund.
(d) Represents investments of security lending collateral. (Note 2).
(e) Maturity value of $2,044,916. Collateralized by a U.S. Government Agency Obligation with a rate of 8.875%, maturity date of 9/25/2015, and an aggregate market value, including accrued interest, of $2,146,536.
(f) See Note 6 for aggregate cost for Federal tax purposes.
The accompanying notes are an integral part of the financial statements.
177
MassMutual Select Emerging Growth Fund – Portfolio of Investments
June 30, 2007 (Unaudited)
| | | Number of
Shares | | Market
Value | |
| EQUITIES — 95.8% | |
| COMMON STOCK — 95.8% | |
| Advertising — 0.4% | |
| Marchex, Inc. Cl. B(a) | | | 22,200 | | | $ | 362,304 | | |
| Airlines — 1.5% | |
| Copa Holdings SA Cl. A | | | 22,900 | | | | 1,539,796 | | |
| Apparel — 6.4% | |
| Coach, Inc.(b) | | | 22,900 | | | | 1,085,231 | | |
| Crocs, Inc.(a) (b) | | | 72,000 | | | | 3,098,160 | | |
| Deckers Outdoor Corp.(b) | | | 16,000 | | | | 1,614,400 | | |
| Volcom, Inc.(a) (b) | | | 14,400 | | | | 721,872 | | |
| | | | 6,519,663 | | |
| Automotive & Parts — 1.3% | |
| Cooper Tire & Rubber Co. | | | 46,600 | | | | 1,287,092 | | |
| Banks — 1.0% | |
Midwest Banc
Holdings, Inc.(a) | | | 12,500 | | | | 181,250 | | |
| Signature Bank(b) | | | 14,500 | | | | 494,450 | | |
| Sterling Financial Corp.(a) | | | 13,200 | | | | 382,008 | | |
| | | | 1,057,708 | | |
| Biotechnology — 1.3% | |
| Digene Corp.(a) (b) | | | 2,800 | | | | 168,140 | | |
Martek
Biosciences Corp.(a) (b) | | | 4,900 | | | | 127,253 | | |
Omrix
Biopharmaceuticals, Inc.(b) | | | 19,200 | | | | 604,032 | | |
| PDL BioPharma, Inc.(b) | | | 10,900 | | | | 253,970 | | |
Regeneron
Pharmaceuticals, Inc.(b) | | | 13,000 | | | | 232,960 | | |
| | | | 1,386,355 | | |
| Chemicals — 1.3% | |
| KMG Chemicals, Inc.(a) | | | 18,700 | | | | 494,241 | | |
| Terra Industries, Inc.(b) | | | 31,700 | | | | 805,814 | | |
| | | | 1,300,055 | | |
| Commercial Services — 7.7% | |
| The Advisory Board Co.(b) | | | 10,800 | | | | 600,048 | | |
AMN Healthcare
Services, Inc.(b) | | | 23,500 | | | | 517,000 | | |
| Capella Education Co.(b) | | | 1,400 | | | | 64,442 | | |
DynCorp
International, Inc.(b) | | | 43,100 | | | | 947,769 | | |
| Euronet Worldwide, Inc.(a) (b) | | | 13,800 | | | | 402,408 | | |
| FTI Consulting, Inc.(b) | | | 36,500 | | | | 1,388,095 | | |
Huron Consulting
Group, Inc.(b) | | | 37,300 | | | | 2,723,273 | | |
| TeleTech Holdings, Inc.(a) (b) | | | 39,200 | | | | 1,273,216 | | |
| | | | 7,916,251 | | |
| | | Number of
Shares | | Market
Value | |
| Computer Programming Services — 1.9% | |
Shanda Interactive
Entertainment Limited
ADR (Cayman Islands) (b) | | | 63,500 | | | $ | 1,968,500 | | |
| Computer Related Services — 1.2% | |
| Sierra Wireless(a) (b) | | | 48,800 | | | | 1,214,632 | | |
| Computers — 1.6% | |
Riverbed
Technology, Inc.(a) (b) | | | 37,500 | | | | 1,643,250 | | |
| Cosmetics & Personal Care — 0.4% | |
| Chattem, Inc.(b) | | | 1,700 | | | | 107,746 | | |
Physicians Formula
Holdings, Inc.(b) | | | 22,200 | | | | 349,095 | | |
| | | | 456,841 | | |
| Diversified Financial — 0.8% | |
FBR Capital
Markets Corp.(a) (b) | | | 7,900 | | | | 133,510 | | |
Portfolio Recovery
Associates, Inc.(a) | | | 12,200 | | | | 732,244 | | |
| | | | 865,754 | | |
| Electrical Components & Equipment — 1.2% | |
| Graftech International Ltd.(b) | | | 73,000 | | | | 1,229,320 | | |
| Energy – Alternate Sources — 1.1% | |
Trina Solar Ltd. Sponsored
ADR (China) (a) (b) | | | 22,000 | | | | 1,131,900 | | |
| Engineering & Construction — 2.4% | |
| Aecom Technology Corp.(b) | | | 19,200 | | | | 476,352 | | |
KHD Humboldt Wedag
International Ltd.(b) | | | 5,100 | | | | 313,650 | | |
| Perini Corp.(b) | | | 27,000 | | | | 1,661,310 | | |
| | | | 2,451,312 | | |
| Entertainment — 1.8% | |
| Macrovision Corp.(b) | | | 22,500 | | | | 676,350 | | |
| Vail Resorts, Inc.(a) (b) | | | 19,800 | | | | 1,205,226 | | |
| | | | 1,881,576 | | |
| Environmental Controls — 1.0% | |
| Basin Water, Inc.(a) (b) | | | 32,900 | | | | 286,230 | | |
| Clean Harbors, Inc.(b) | | | 14,500 | | | | 716,590 | | |
| | | | 1,002,820 | | |
| Foods — 2.3% | |
| Sanderson Farms, Inc.(a) | | | 53,200 | | | | 2,395,064 | | |
| Forest Products & Paper — 2.1% | |
| Rock-Tenn Co. Cl. A | | | 67,600 | | | | 2,144,272 | | |
| | | Number of
Shares | | Market
Value | |
| Hand & Machine Tools — 1.0% | |
| Lincoln Electric Holdings, Inc. | | | 13,200 | | | $ | 979,968 | | |
| Health Care – Products — 3.3% | |
| Align Technology, Inc.(a) (b) | | | 106,900 | | | | 2,582,704 | | |
| Conceptus, Inc.(b) | | | 18,700 | | | | 362,219 | | |
| Home Diagnostics, Inc.(b) | | | 21,900 | | | | 257,763 | | |
| Micrus Endovascular Corp.(b) | | | 9,600 | | | | 236,160 | | |
| | | | 3,438,846 | | |
| Health Care – Services — 2.3% | |
Icon PLC Sponsored ADR
(United Kingdom) (b) | | | 19,400 | | | | 848,556 | | |
WellCare Health
Plans, Inc.(a) (b) | | | 16,400 | | | | 1,484,364 | | |
| | | | 2,332,920 | | |
| Home Builders — 0.7% | |
Williams Scotsman
International, Inc.(b) | | | 29,100 | | | | 692,871 | | |
| Insurance — 2.9% | |
| Amerisafe, Inc.(b) | | | 20,982 | | | | 411,877 | | |
| Castlepoint Holdings Ltd.(a) | | | 34,500 | | | | 506,805 | | |
Delphi Financial
Group, Inc. Cl. A | | | 18,400 | | | | 769,488 | | |
| Life Partners Holdings, Inc.(a) | | | 27,000 | | | | 879,660 | | |
| United Fire & Casualty Co.(a) | | | 12,400 | | | | 438,712 | | |
| | | | 3,006,542 | | |
| Internet — 9.3% | |
| Akamai Technologies, Inc.(b) | | | 10,800 | | | | 525,312 | | |
| aQuantive, Inc.(b) | | | 10,300 | | | | 657,140 | | |
| Blue Coat Systems, Inc.(b) | | | 42,200 | | | | 2,089,744 | | |
| Navisite, Inc.(b) | | | 61,400 | | | | 466,640 | | |
| NutriSystem, Inc.(a) (b) | | | 9,900 | | | | 691,416 | | |
| Priceline.com, Inc.(a) (b) | | | 40,900 | | | | 2,811,466 | | |
| Shutterfly, Inc.(a) (b) | | | 35,100 | | | | 756,405 | | |
Vasco Data Security
International, Inc.(b) | | | 67,300 | | | | 1,531,748 | | |
| | | | 9,529,871 | | |
| Leisure Time — 1.2% | |
| Life Time Fitness, Inc.(a) (b) | | | 13,900 | | | | 739,897 | | |
| WMS Industries, Inc.(a) (b) | | | 17,200 | | | | 496,392 | | |
| | | | 1,236,289 | | |
| Machinery – Diversified — 2.2% | |
| Chart Industries, Inc.(b) | | | 22,400 | | | | 637,056 | | |
| Dxp Enterprises, Inc.(a) (b) | | | 33,500 | | | | 1,432,125 | | |
| Flow International Corp.(b) | | | 15,400 | | | | 194,040 | | |
| | | | 2,263,221 | | |
(Continued)
The accompanying notes are an integral part of the financial statements.
178
MassMutual Select Emerging Growth Fund – Portfolio of Investments (Continued)
| | | Number of
Shares | | Market
Value | |
| Manufacturing — 1.7% | |
| Ceradyne, Inc.(a) (b) | | | 12,300 | | | $ | 909,708 | | |
ESCO
Technologies, Inc.(a) (b) | | | 9,100 | | | | 329,966 | | |
| Hexcel Corp.(b) | | | 21,800 | | | | 459,326 | | |
| | | | 1,699,000 | | |
| Media — 0.5% | |
LodgeNet
Entertainment Corp.(b) | | | 15,800 | | | | 506,548 | | |
| Medical Supplies — 0.9% | |
| Cynosure, Inc. Cl. A(b) | | | 20,500 | | | | 746,815 | | |
| Wright Medical Group, Inc.(b) | | | 7,200 | | | | 173,664 | | |
| | | | 920,479 | | |
| Metal Fabricate & Hardware — 2.3% | |
| Dynamic Materials Corp. | | | 25,100 | | | | 941,250 | | |
| Haynes International, Inc.(b) | | | 16,600 | | | | 1,401,538 | | |
| | | | 2,342,788 | | |
| Oil & Gas Services — 3.6% | |
| Bolt Technology Corp.(a) (b) | | | 18,800 | | | | 827,952 | | |
Cal Dive
International, Inc.(a) (b) | | | 39,100 | | | | 650,233 | | |
| CARBO Ceramics, Inc. | | | 10,300 | | | | 451,243 | | |
| Flotek Industries, Inc.(b) | | | 9,500 | | | | 569,525 | | |
| Input/Output, Inc.(a) (b) | | | 36,100 | | | | 563,521 | | |
| W-H Energy Services, Inc.(b) | | | 9,600 | | | | 594,336 | | |
| | | | 3,656,810 | | |
| Pharmaceuticals — 2.2% | |
Acadia
Pharmaceuticals, Inc.(a) (b) | | | 13,300 | | | | 181,811 | | |
Angiotech
Pharmaceuticals, Inc.(b) | | | 24,400 | | | | 173,484 | | |
| Medarex, Inc.(a) (b) | | | 32,200 | | | | 460,138 | | |
Penwest
Pharmaceuticals Co.(a) (b) | | | 47,100 | | | | 587,337 | | |
United
Therapeutics Corp.(a) (b) | | | 13,700 | | | | 873,512 | | |
| | | | 2,276,282 | | |
| Real Estate Investment Trusts (REITS) — 0.4% | |
| RAIT Financial Trust | | | 14,500 | | | | 377,290 | | |
| Retail — 4.7% | |
| BJ's Restaurants, Inc.(a) (b) | | | 22,900 | | | | 452,046 | | |
Chipotle Mexican
Grill, Inc. Cl. A(a) (b) | | | 11,400 | | | | 972,192 | | |
| Citi Trends, Inc.(a) (b) | | | 10,200 | | | | 387,192 | | |
First Cash Financial
Services, Inc.(b) | | | 33,900 | | | | 794,616 | | |
| Hibbett Sports, Inc.(b) | | | 21,200 | | | | 580,456 | | |
McCormick & Schmick's
Seafood Restaurants, Inc.(b) | | | 16,900 | | | | 438,386 | | |
| | | Number of
Shares | | Market
Value | |
| Under Armour, Inc. Cl. A(a) (b) | | | 13,100 | | | $ | 598,015 | | |
| Zumiez, Inc.(a) (b) | | | 16,500 | | | | 623,370 | | |
| | | | 4,846,273 | | |
| Semiconductors — 4.7% | |
| Cavium Networks, Inc.(b) | | | 1,200 | | | | 27,144 | | |
| Microsemi Corp.(a) (b) | | | 30,000 | | | | 718,500 | | |
Silicon Motion Technology
Corp. ADR (Taiwan) (b) | | | 68,000 | | | | 1,688,440 | | |
SiRF Technology
Holdings, Inc.(b) | | | 500 | | | | 10,370 | | |
| Tessera Technologies, Inc.(b) | | | 11,300 | | | | 458,215 | | |
Varian Semiconductor
Equipment
Associates, Inc.(b) | | | 11,650 | | | | 466,699 | | |
| Verigy Ltd.(b) | | | 51,600 | | | | 1,476,276 | | |
| | | | 4,845,644 | | |
| Software — 3.0% | |
| Double-Take Software, Inc.(b) | | | 5,700 | | | | 93,537 | | |
| Emageon, Inc.(a) (b) | | | 11,900 | | | | 107,338 | | |
| Informatica Corp.(b) | | | 38,300 | | | | 565,691 | | |
| Omniture, Inc.(b) | | | 9,600 | | | | 220,032 | | |
Synchronoss
Technologies, Inc.(b) | | | 37,500 | | | | 1,100,250 | | |
Trident
Microsystems, Inc.(a) (b) | | | 23,100 | | | | 423,885 | | |
| VeriFone Holdings, Inc.(b) | | | 16,000 | | | | 564,000 | | |
| | | | 3,074,733 | | |
| Telecommunications — 6.2% | |
Allot
Communications Ltd.(a) (b) | | | 50,891 | | | | 346,059 | | |
| Aruba Networks, Inc.(b) | | | 10,900 | | | | 219,090 | | |
| BigBand Networks, Inc.(a) (b) | | | 16,000 | | | | 209,760 | | |
| Ceragon Networks Ltd.(b) | | | 77,000 | | | | 883,190 | | |
| Golden Telecom, Inc.(a) | | | 21,500 | | | | 1,182,715 | | |
| Novatel Wireless, Inc.(b) | | | 59,700 | | | | 1,553,394 | | |
| Polycom, Inc.(b) | | | 20,800 | | | | 698,880 | | |
Powerwave
Technologies, Inc.(a) (b) | | | 93,500 | | | | 626,450 | | |
Switch & Data
Facilities Co., Inc.(b) | | | 19,500 | | | | 374,205 | | |
| Symmetricom, Inc.(b) | | | 36,300 | | | | 304,920 | | |
| | | | 6,398,663 | | |
| Transportation — 4.0% | |
| Diana Shipping, Inc. | | | 41,000 | | | | 918,400 | | |
| DryShips, Inc.(a) | | | 32,200 | | | | 1,396,836 | | |
| Knight Transportation, Inc. | | | 25,500 | | | | 494,190 | | |
Navios Maritime
Holdings, Inc. | | | 110,500 | | | | 1,334,839 | | |
| | | | 4,144,265 | | |
TOTAL EQUITIES
(Cost $82,670,060) | | | | | | | 98,323,768 | | |
| | | Principal
Amount | | Market
Value | |
| SHORT-TERM INVESTMENTS — 32.2% | |
| Cash Equivalents — 28.9%(d) | |
Abbey National PLC
Eurodollar Time Deposit
5.280% 07/05/2007 | | $ | 384,520 | | | $ | 384,520 | | |
Abbey National PLC
Eurodollar Time Deposit
5.285% 07/09/2007 | | | 961,300 | | | | 961,300 | | |
American Beacon Money
Market Fund(c) | | | 1,078,535 | | | | 1,078,535 | | |
Banco Bilbao
Vizcaya Argentaria SA
Eurodollar Time Deposit
5.300% 08/10/2007 | | | 720,975 | | | | 720,975 | | |
Bank of America
5.270% 07/06/2007 | | | 961,300 | | | | 961,300 | | |
Bank of America
5.270% 07/16/2007 | | | 192,260 | | | | 192,260 | | |
Bank of America
5.270% 08/17/2007 | | | 240,325 | | | | 240,325 | | |
Bank of America
5.300% 09/17/2007 | | | 480,650 | | | | 480,650 | | |
Bank of Ireland
Eurodollar Time Deposit
5.300% 08/13/2007 | | | 961,300 | | | | 961,300 | | |
Bank of Montreal
Eurodollar Time Deposit
5.280% 07/03/2007 | | | 240,325 | | | | 240,325 | | |
Bank of Montreal
Eurodollar Time Deposit
5.290% 07/02/2007 | | | 192,260 | | | | 192,260 | | |
Bank of Montreal
Eurodollar Time Deposit
5.310% 08/14/2007 | | | 144,195 | | | | 144,195 | | |
Bank of Nova Scotia
Eurodollar Time Deposit
5.280% 07/09/2007 | | | 913,235 | | | | 913,235 | | |
Bank Of Nova Scotia
Eurodollar Time Deposit
5.285% 07/11/2007 | | | 528,715 | | | | 528,715 | | |
Barclays
Eurodollar Time Deposit
5.290% 07/06/2007 | | | 961,300 | | | | 961,300 | | |
Barclays
Eurodollar Time Deposit
5.295% 07/16/2007 | | | 192,260 | | | | 192,260 | | |
Barclays
Eurodollar Time Deposit
5.320% 09/04/2007 | | | 480,650 | | | | 480,650 | | |
Bear Stearns & Co
Commercial Paper
5.435% 07/10/2007 | | | 144,195 | | | | 144,195 | | |
(Continued)
The accompanying notes are an integral part of the financial statements.
179
MassMutual Select Emerging Growth Fund – Portfolio of Investments (Continued)
| | | Principal
Amount | | Market
Value | |
BGI Institutional Money
Market Fund(c) | | $ | 624,845 | | | $ | 624,845 | | |
BNP Paribas
Eurodollar Time Deposit
5.350% 07/02/2007 | | | 1,441,950 | | | | 1,441,950 | | |
Calyon
Eurodollar Time Deposit
5.290% 07/17/2007 | | | 480,650 | | | | 480,650 | | |
Calyon
Eurodollar Time Deposit
5.380% 07/02/2007 | | | 1,441,950 | | | | 1,441,950 | | |
Canadian Imperial
Bank of Commerce
Eurodollar Time Deposit
5.300% 07/30/2007 | | | 961,300 | | | | 961,300 | | |
Dexia Group
Eurodollar Time Deposit
5.290% 08/08/2007 | | | 961,300 | | | | 961,300 | | |
Dreyfus Institutional Cash
Advantage Money
Market Fund(c) | | | 288,390 | | | | 288,390 | | |
Federal Home Loan
Bank Discount Note
5.174% 07/20/2007 | | | 71,296 | | | | 71,296 | | |
First Tennessee National Corp.
Eurodollar Time Deposit
5.300% 07/18/2007 | | | 240,325 | | | | 240,325 | | |
Fortis Bank
Eurodollar Time Deposit
5.290% 07/06/2007 | | | 240,325 | | | | 240,325 | | |
Fortis Bank
Eurodollar Time Deposit
5.290% 07/09/2007 | | | 336,455 | | | | 336,455 | | |
Fortis Bank
Eurodollar Time Deposit
5.300% 07/20/2007 | | | 240,325 | | | | 240,325 | | |
Fortis Bank
Eurodollar Time Deposit
5.300% 07/26/2007 | | | 192,260 | | | | 192,260 | | |
Fortis Bank
Eurodollar Time Deposit
5.350% 07/05/2007 | | | 480,650 | | | | 480,650 | | |
Freddie Mac Discount Note
5.155% 07/16/2007 | | | 90,761 | | | | 90,761 | | |
Freddie Mac Discount Note
5.185% 07/09/2007 | | | 47,383 | | | | 47,383 | | |
Morgan Stanley & Co
Commercial Paper
5.445% 08/01/2007 | | | 432,585 | | | | 432,585 | | |
National Australia Bank
Eurodollar Time Deposit
5.320% 07/02/2007 | | | 480,650 | | | | 480,650 | | |
| | | Principal
Amount | | Market
Value | |
Nationwide Building
Society Commercial Paper
5.301% 07/09/2007 | | $ | 479,661 | | | $ | 479,661 | | |
Rabobank Nederland
Eurodollar Time Deposit
5.280% 07/05/2007 | | | 720,975 | | | | 720,975 | | |
Rabobank Nederland
Eurodollar Time Deposit
5.290% 07/16/2007 | | | 961,300 | | | | 961,300 | | |
Rabobank Nederland
Eurodollar Time Deposit
5.330% 07/02/2007 | | | 1,441,950 | | | | 1,441,950 | | |
Reserve Primary
Money Market Fund(c) | | | 954,320 | | | | 954,320 | | |
Royal Bank of Canada
Eurodollar Time Deposit
5.305% 08/30/2007 | | | 961,300 | | | | 961,300 | | |
Royal Bank of Scotland
Eurodollar Time Deposit
5.270% 07/11/2007 | | | 240,325 | | | | 240,325 | | |
Skandinaviska Enskilda
Banken AB
Eurodollar Time Deposit
5.290% 07/13/2007 | | | 961,300 | | | | 961,300 | | |
Skandinaviska Enskilda
Banken AB
Eurodollar Time Deposit
5.290% 07/19/2007 | | | 144,195 | | | | 144,195 | | |
Svenska Handlesbanken
Eurodollar Time Deposit
5.300% 07/02/2007 | | | 161,475 | | | | 161,475 | | |
UBS AG
Eurodollar Time Deposit
5.277% 07/05/2007 | | | 672,910 | | | | 672,910 | | |
UBS AG
Eurodollar Time Deposit
5.285% 07/05/2007 | | | 961,300 | | | | 961,300 | | |
Vanguard Prime
Money Market Fund(c) | | | 480,650 | | | | 480,650 | | |
Wells Fargo
Eurodollar Time Deposit
5.260% 07/02/2007 | | | 259,551 | | | | 259,551 | | |
Wells Fargo Eurodollar
Time Deposit
5.280% 07/11/2007 | | | 961,300 | | | | 961,300 | | |
Wells Fargo
Eurodollar Time Deposit
5.280% 07/12/2007 | | | 480,650 | | | | 480,650 | | |
| | | | 29,674,862 | | |
| | | Principal
Amount | | Market
Value | |
| Repurchase Agreements — 3.3% | |
Investors Bank & Trust
Company Repurchase
Agreement, dated
6/29/2007, 3.50%,
due 7/02/2007(e) | | $ | 3,393,035 | | | $ | 3,393,035 | | |
TOTAL SHORT-TERM
INVESTMENTS
(Cost $33,067,897) | | | | | 33,067,897 | | |
TOTAL INVESTMENTS — 128.0%
(Cost $115,737,957)(f) | | | | $ | 131,391,665 | | |
Other Assets/
(Liabilities) — (28.0%) | | | | | (28,725,644 | ) | |
| NET ASSETS — 100.0% | | | | $ | 102,666,021 | | |
Notes to Portfolio of Investments
ADR - American Depository Receipt
(a) Denotes all or a portion of security on loan. (Note 2).
(b) Non-income producing security.
(c) Amount represents shares owned of the fund.
(d) Represents investments of security lending collateral. (Note 2).
(e) Maturity value of $3,394,026. Collateralized by a U.S. Government Agency Obligation with a rate of 8.375% maturity date of 6/25/2025 and an aggregate market value, including accrued interest, $3,562,688.
(f) See Note 6 for aggregate cost for Federal tax purposes.
The accompanying notes are an integral part of the financial statements.
180
MassMutual Select Diversified International Fund – Portfolio of Investments
June 30, 2007 (Unaudited)
| | | Number of
Shares | | Market
Value | |
| EQUITIES — 95.8% | |
| COMMON STOCK — 95.8% | |
| Aerospace & Defense — 1.4% | |
| BAE Systems PLC | | | 158,700 | | | $ | 1,283,042 | | |
European Aeronautic
Defense and Space Co.(a) | | | 22,460 | | | | 724,955 | | |
| | | | 2,007,997 | | |
| Airlines — 1.0% | |
| Air France | | | 11,900 | | | | 551,796 | | |
| Deutsche Lufthansa | | | 32,700 | | | | 914,178 | | |
| | | | 1,465,974 | | |
| Auto Manufacturers — 5.8% | |
| DaimlerChrysler AG | | | 5,000 | | | | 460,015 | | |
| Honda Motor Co. Ltd. | | | 34,700 | | | | 1,261,613 | | |
| Hyundai Motor Co. | | | 5,000 | | | | 394,291 | | |
| Isuzu Motors Ltd. | | | 148,000 | | | | 798,227 | | |
| Nissan Motor Co. Ltd. | | | 144,400 | | | | 1,543,812 | | |
| Renault SA | | | 17,800 | | | | 2,843,648 | | |
| Toyota Motor Corp. | | | 15,700 | | | | 987,697 | | |
| | | | 8,289,303 | | |
| Automotive & Parts — 2.1% | |
| Aisin Seiki Co., Ltd. | | | 19,400 | | | | 709,851 | | |
Compagnie Generale
des Etablissements
Michelin Cl. B | | | 10,600 | | | | 1,475,931 | | |
| Hyundai Mobis | | | 8,290 | | | | 786,077 | | |
| | | | 2,971,859 | | |
| Banks — 16.6% | |
| Banco Do Brasil SA | | | 61,200 | | | | 882,142 | | |
| Bank Hapoalim, Ltd. | | | 150,000 | | | | 732,470 | | |
| Barclays PLC | | | 127,700 | | | | 1,768,378 | | |
| BNP Paribas SA | | | 17,400 | | | | 2,065,576 | | |
Canadian Imperial
Bank of Commerce | | | 12,000 | | | | 1,093,747 | | |
| Credit Agricole SA | | | 33,360 | | | | 1,348,335 | | |
| Fortis | | | 38,500 | | | | 1,624,575 | | |
| HBOS PLC | | | 116,090 | | | | 2,278,554 | | |
| Kookmin Bank | | | 9,600 | | | | 840,924 | | |
Mitsubishi Tokyo
Financial Group, Inc. | | | 171 | | | | 1,880,286 | | |
| National Australia Bank | | | 7,500 | | | | 260,855 | | |
| Nordea AB | | | 35,700 | | | | 556,119 | | |
| Royal Bank of Canada(a) | | | 19,300 | | | | 1,037,617 | | |
Royal Bank of Scotland
Group PLC | | | 189,796 | | | | 2,395,174 | | |
| Societe Generale Cl. A | | | 9,400 | | | | 1,730,851 | | |
| | | Number of
Shares | | Market
Value | |
| Standard Bank Group Ltd. | | | 23,900 | | | $ | 329,889 | | |
Sumitomo Mitsui
Financial Group, Inc. | | | 195 | | | | 1,813,104 | | |
Unibanco-Uniao de
Banco Brasileiros SA
Sponsored GDR | | | 11,200 | | | | 1,264,144 | | |
| | | | 23,902,740 | | |
| Beverages — 1.0% | |
| Carlsberg AS Cl. B | | | 4,600 | | | | 554,354 | | |
| Greene King PLC | | | 21,500 | | | | 416,607 | | |
| Marstons PLC | | | 54,300 | | | | 429,195 | | |
| | | | 1,400,156 | | |
| Building Materials — 0.5% | |
| Italcementi SpA | | | 24,100 | | | | 740,915 | | |
| Chemicals — 3.3% | |
| BASF AG | | | 18,700 | | | | 2,446,701 | | |
Dainippon Ink &
Chemical, Inc. | | | 113,000 | | | | 435,513 | | |
| Methanex Corp. | | | 23,200 | | | | 582,451 | | |
Mitsubishi Chemical
Holdings Corp. | | | 146,500 | | | | 1,344,975 | | |
| | | | 4,809,640 | | |
| Commercial Services — 0.7% | |
| Mitsui & Co. Ltd. | | | 53,000 | | | | 1,049,218 | | |
| Computers — 0.3% | |
| Fujitsu, Ltd. | | | 63,000 | | | | 462,982 | | |
| Computers & Information — 0.3% | |
| Corporate Express | | | 26,500 | | | | 403,980 | | |
| Diversified Financial — 2.9% | |
| Credit Suisse Group | | | 26,700 | | | | 1,882,733 | | |
| ORIX Corp. | | | 6,390 | | | | 1,674,617 | | |
Shinhan Financial
Group Co. Ltd. | | | 10,180 | | | | 616,937 | | |
| | | | 4,174,287 | | |
| Electric — 4.7% | |
| British Energy Group PLC | | | 71,300 | | | | 770,220 | | |
| E.ON AG | | | 14,400 | | | | 2,411,051 | | |
Kyushu Electric Power
Co., Inc. | | | 27,200 | | | | 709,802 | | |
| Public Power Corp. | | | 16,840 | | | | 472,828 | | |
| RWE AG | | | 13,940 | | | | 1,483,212 | | |
| Tokyo Electric Power Co. | | | 27,900 | | | | 894,698 | | |
| | | | 6,741,811 | | |
| | | Number of
Shares | | Market
Value | |
| Electrical Components & Equipment — 2.3% | |
| LG Electronics, Inc. | | | 6,130 | | | $ | 505,338 | | |
| Sharp Corp. | | | 69,000 | | | | 1,304,447 | | |
| Toshiba Corp.(a) | | | 179,000 | | | | 1,554,296 | | |
| | | | 3,364,081 | | |
| Electronics — 1.6% | |
| Alps Electric Co. Ltd. | | | 21,300 | | | | 212,106 | | |
| Au Optronics Corp. | | | 626,000 | | | | 1,071,268 | | |
Hon Hai Precision Industry
Co. Ltd. | | | 124,000 | | | | 1,070,947 | | |
| | | | 2,354,321 | | |
| Engineering & Construction — 0.6% | |
| Koninklijke BAM Groep NV | | | 11,800 | | | | 331,715 | | |
| Macquarie Airports | | | 157,897 | | | | 540,803 | | |
| | | | 872,518 | | |
| Forest Products & Paper — 0.4% | |
| Rengo Co Ltd. | | | 35,000 | | | | 172,078 | | |
| Stora Enso OYJ Cl. R | | | 20,400 | | | | 381,239 | | |
| | | | 553,317 | | |
| Gas — 0.1% | |
| Centrica PLC | | | 22,100 | | | | 170,969 | | |
| Home Furnishing — 0.5% | |
| Electrolux AB Cl. B | | | 29,800 | | | | 703,794 | | |
| Insurance — 8.4% | |
| Allianz AG | | | 12,234 | | | | 2,856,687 | | |
| Aviva PLC | | | 77,900 | | | | 1,154,378 | | |
| Fondiaria-Sai SpA | | | 21,000 | | | | 1,010,746 | | |
| ING Canada, Inc. | | | 5,100 | | | | 229,685 | | |
| ING Groep NV | | | 60,600 | | | | 2,659,085 | | |
Muenchener
Rueckversicherungs AG | | | 11,800 | | | | 2,157,263 | | |
| QBE Insurance Group Ltd. | | | 16,081 | | | | 424,806 | | |
| Salam Ltd. | | | 323,400 | | | | 1,022,215 | | |
| Sun Life Financial, Inc. | | | 12,300 | | | | 592,839 | | |
| | | | 12,107,704 | | |
| Investment Companies — 0.3% | |
Macquarie
Infrastructure Group | | | 160,110 | | | | 487,843 | | |
| Iron & Steel — 6.1% | |
| Arcelor Mittal | | | 25,200 | | | | 1,569,502 | | |
| China Steel Corp. | | | 678,000 | | | | 824,961 | | |
| Gerdau Ameristeel Corp. | | | 48,300 | | | | 721,874 | | |
| Gerdau SA ADR(a) | | | 44,900 | | | | 1,154,828 | | |
| JFE Holdings, Inc. | | | 36,300 | | | | 2,244,835 | | |
| Nippon Steel Corp. | | | 60,000 | | | | 422,859 | | |
(Continued)
The accompanying notes are an integral part of the financial statements.
181
MassMutual Select Diversified International Fund – Portfolio of Investments (Continued)
| | | Number of
Shares | | Market
Value | |
| POSCO | | | 1,600 | | | $ | 767,684 | | |
| Voestalpine AG | | | 13,400 | | | | 1,119,604 | | |
| | | | 8,826,147 | | |
| Manufacturing — 0.2% | |
| Bombardier, Inc. Cl. B(b) | | | 56,500 | | | | 343,351 | | |
| Media — 1.0% | |
| Trinity Mirror PLC | | | 58,400 | | | | 613,223 | | |
| Wolters Kluwer NV | | | 25,500 | | | | 775,345 | | |
| | | | 1,388,568 | | |
| Mining — 2.9% | |
| Antofagasta PLC | | | 15,100 | | | | 184,832 | | |
| Kazakhmys PLC | | | 15,000 | | | | 377,142 | | |
| Teck Cominco Ltd. Cl. B | | | 28,200 | | | | 1,210,312 | | |
| Xstrata PLC | | | 27,460 | | | | 1,634,652 | | |
| Zinifex Ltd. | | | 52,600 | | | | 834,765 | | |
| | | | 4,241,703 | | |
| Office Equipment/Supplies — 0.3% | |
| Canon, Inc. | | | 7,300 | | | | 427,417 | | |
| Oil & Gas — 12.5% | |
| BP PLC | | | 77,300 | | | | 929,263 | | |
China
Petroleum & Chemical | | | 1,438,000 | | | | 1,609,612 | | |
| Cosmo Oil Company Ltd. | | | 54,000 | | | | 296,841 | | |
| EnCana Corp. | | | 23,800 | | | | 1,480,678 | | |
| ENI SpA(a) | | | 64,500 | | | | 2,329,656 | | |
Mol Hungarian Oil and
Gas Nyrt. | | | 5,000 | | | | 754,774 | | |
Nippon Mining
Holdings, Inc. | | | 101,500 | | | | 968,505 | | |
| Omv AG | | | 6,500 | | | | 432,212 | | |
| Petroleo Brasileiro S.A. | | | 64,800 | | | | 1,733,430 | | |
| PTT Public Co. Ltd. | | | 120,800 | | | | 944,228 | | |
| Repsol YPF SA | | | 39,100 | | | | 1,536,332 | | |
| Royal Dutch Shell PLC | | | 60,600 | | | | 2,467,381 | | |
| Total SA (France) | | | 31,800 | | | | 2,572,267 | | |
| | | | 18,055,179 | | |
| Pharmaceuticals — 3.7% | |
| AstraZeneca PLC | | | 33,800 | | | | 1,807,521 | | |
| GlaxoSmithKline PLC | | | 29,800 | | | | 778,975 | | |
| Novartis AG | | | 12,690 | | | | 710,166 | | |
| Sanofi-Aventis | | | 24,500 | | | | 1,971,333 | | |
| | | | 5,267,995 | | |
| Retail — 2.2% | |
| Coles Myer Ltd. | | | 27,100 | | | | 370,175 | | |
| Home Retail Group | | | 86,500 | | | | 793,088 | | |
| Mitchells & Butlers PLC | | | 31,200 | | | | 545,684 | | |
| Mitsubishi Corp. | | | 43,300 | | | | 1,128,899 | | |
| Punch Taverns PLC | | | 14,200 | | | | 347,017 | | |
| | | | 3,184,863 | | |
| | | Number of
Shares | | Market
Value | |
| Semiconductors — 4.1% | |
Hynix
Semiconductor, Inc.(b) | | | 24,400 | | | $ | 878,108 | | |
| Samsung Electronics Co. Ltd. | | | 2,200 | | | | 1,027,180 | | |
Samsung Electronics
Co., Ltd. | | | 1,330 | | | | 812,488 | | |
Siliconware Precision
Industries Co. | | | 637,000 | | | | 1,352,228 | | |
Taiwan Semiconductor
Manufacturing Co. Ltd. | | | 324,615 | | | | 699,972 | | |
United
Microelectronics Corp. | | | 1,761,000 | | | | 1,063,215 | | |
| | | | 5,833,191 | | |
| Telecommunications — 6.1% | |
China Netcom Group Corp.
Hk Ltd. | | | 383,500 | | | | 1,062,184 | | |
| China Telecom Corp. Ltd. | | | 942,000 | | | | 556,128 | | |
| Deutsche Telekom AG | | | 51,500 | | | | 949,200 | | |
| France Telecom SA | | | 25,700 | | | | 703,263 | | |
Nippon Telegraph &
Telephone Corp. | | | 312 | | | | 1,379,421 | | |
| Nokia Oyj | | | 21,600 | | | | 605,077 | | |
Oki Electric Industry
Co. Ltd.(a)(b) | | | 102,000 | | | | 188,888 | | |
Philippine Long Distance
Telephone Co. | | | 13,500 | | | | 772,207 | | |
| Vodafone Group PLC | | | 760,400 | | | | 2,553,234 | | |
| | | | 8,769,602 | | |
| Transportation — 1.9% | |
| Mitsui OSK Lines Ltd. | | | 109,000 | | | | 1,471,687 | | |
| Neptune Orient Lines Ltd. | | | 142,000 | | | | 490,553 | | |
Nippon Yusen
Kabushiki Kaish | | | 86,000 | | | | 788,698 | | |
| | | | 2,750,938 | | |
TOTAL EQUITIES
(Cost $125,317,284) | | | | | | | 138,124,363 | | |
| | | Principal
Amount | | | |
| SHORT-TERM INVESTMENTS — 6.8% | |
| Cash Equivalents — 3.9%(d) | |
Abbey National PLC
Eurodollar Time Deposit
5.280% 07/05/2007 | | $ | 71,968 | | | | 71,968 | | |
Abbey National PLC
Eurodollar Time Deposit
5.285% 07/09/2007 | | | 179,916 | | | | 179,916 | | |
American Beacon
Money Market Fund(c) | | | 201,861 | | | | 201,861 | | |
| | | Principal
Amount | | Market
Value | |
Banco Bilbao Vizcaya
Argentaria SA
Eurodollar Time Deposit
5.300% 08/10/2007 | | $ | 134,940 | | | $ | 134,940 | | |
Bank of America Bank
5.270% 07/06/2007 | | | 179,919 | | | | 179,919 | | |
Bank of America Bank
5.270% 07/16/2007 | | | 35,984 | | | | 35,984 | | |
Bank of America Bank
5.270% 08/17/2007 | | | 44,980 | | | | 44,980 | | |
Bank of America Bank
5.300% 09/17/2007 | | | 89,960 | | | | 89,960 | | |
Bank of Ireland
Eurodollar Time Deposit
5.300% 08/13/2007 | | | 179,919 | | | | 179,919 | | |
Bank of Montreal
Eurodollar Time Deposit
5.280% 07/03/2007 | | | 44,980 | | | | 44,980 | | |
Bank of Montreal
Eurodollar Time Deposit
5.290% 07/02/2007 | | | 35,984 | | | | 35,984 | | |
Bank of Montreal
Eurodollar Time Deposit
5.310% 08/14/2007 | | | 26,988 | | | | 26,988 | | |
Bank of Nova Scotia
Eurodollar Time Deposit
5.280% 07/09/2007 | | | 170,923 | | | | 170,923 | | |
Bank of Nova Scotia
Eurodollar Time Deposit
5.285% 07/11/2007 | | | 98,956 | | | | 98,956 | | |
Barclays
Eurodollar Time Deposit
5.290% 07/06/2007 | | | 179,919 | | | | 179,919 | | |
Barclays
Eurodollar Time Deposit
5.295% 07/16/2007 | | | 35,984 | | | | 35,984 | | |
Barclays
Eurodollar Time Deposit
5.320% 09/04/2007 | | | 89,960 | | | | 89,960 | | |
Bear Stearns & Co
Commercial Paper
5.435% 07/10/2007 | | | 26,988 | | | | 26,988 | | |
BGI Institutional
Money Market Fund(c) | | | 116,948 | | | | 116,948 | | |
BNP Paribas
Eurodollar Time Deposit
5.350% 07/02/2007 | | | 269,879 | | | | 269,879 | | |
Calyon
Eurodollar Time Deposit
5.290% 07/17/2007 | | | 89,960 | | | | 89,960 | | |
Calyon
Eurodollar Time Deposit
5.380% 07/02/2007 | | | 269,879 | | | | 269,879 | | |
(Continued)
The accompanying notes are an integral part of the financial statements.
182
MassMutual Select Diversified International Fund – Portfolio of Investments (Continued)
| | | Principal
Amount | | Market
Value | |
Canadian Imperial
Bank of Commerce
Eurodollar Time Deposit
5.300% 07/30/2007 | | $ | 179,919 | | | $ | 179,919 | | |
Dexia Group
Eurodollar Time Deposit
5.290% 08/08/2007 | | | 179,919 | | | | 179,919 | | |
Dreyfus Institutional
Cash Advantage
Money Market Fund(c) | | | 53,976 | | | | 53,976 | | |
Federal Home Loan Bank
Discount Note
5.174% 07/20/2007 | | | 13,344 | | | | 13,344 | | |
First Tennessee
National Corp.
Eurodollar Time Deposit
5.300% 07/18/2007 | | | 44,980 | | | | 44,980 | | |
Fortis Bank
Eurodollar Time Deposit
5.290% 07/06/2007 | | | 44,980 | | | | 44,980 | | |
Fortis Bank
Eurodollar Time Deposit
5.290% 07/09/2007 | | | 62,972 | | | | 62,972 | | |
Fortis Bank
Eurodollar Time Deposit
5.300% 07/20/2007 | | | 44,980 | | | | 44,980 | | |
Fortis Bank
Eurodollar Time Deposit
5.300% 07/26/2007 | | | 35,984 | | | | 35,984 | | |
Fortis Bank
Eurodollar Time Deposit
5.350% 07/05/2007 | | | 89,960 | | | | 89,960 | | |
Freddie Mac Discount Note
5.155% 07/16/2007 | | | 16,987 | | | | 16,987 | | |
Freddie Mac Discount Note
5.185% 07/09/2007 | | | 8,868 | | | | 8,868 | | |
Morgan Stanley & Co
Commercial Paper
5.445% 08/01/2007 | | | 80,964 | | | | 80,964 | | |
National Australia Bank
Eurodollar Time Deposit
5.320% 07/02/2007 | | | 89,960 | | | | 89,960 | | |
Nationwide Building Society
Commercial Paper
5.301% 07/09/2007 | | | 89,775 | | | | 89,775 | | |
Rabobank Nederland
Eurodollar Time Deposit
5.280% 07/05/2007 | | | 134,940 | | | | 134,940 | | |
Rabobank Nederland
Eurodollar Time Deposit
5.290% 07/16/2007 | | | 179,919 | | | | 179,919 | | |
Rabobank Nederland
Eurodollar Time Deposit
5.330% 07/02/2007 | | | 269,879 | | | | 269,879 | | |
| | | Principal
Amount | | Market
Value | |
Reserve Primary
Money Market Fund(c) | | $ | 178,613 | | | $ | 178,613 | | |
Royal Bank of Canada
Eurodollar Time Deposit
5.305% 08/30/2007 | | | 179,919 | | | | 179,919 | | |
Royal Bank of Scotland
Eurodollar Time Deposit
5.270% 07/11/2007 | | | 44,980 | | | | 44,980 | | |
Skandinaviska Enskilda
Banken AB
Eurodollar Time Deposit
5.290% 07/13/2007 | | | 179,919 | | | | 179,919 | | |
Skandinaviska Enskilda
Banken AB
Eurodollar Time Deposit
5.290% 07/19/2007 | | | 26,988 | | | | 26,988 | | |
Svenska Handlesbanken
Eurodollar Time Deposit
5.300% 07/02/2007 | | | 30,222 | | | | 30,222 | | |
UBS AG
Eurodollar Time Deposit
5.277% 07/05/2007 | | | 125,944 | | | | 125,944 | | |
UBS AG
Eurodollar Time Deposit
5.285% 07/05/2007 | | | 179,919 | | | | 179,919 | | |
Vanguard Prime
Money Market Fund(c) | | | 89,960 | | | | 89,960 | | |
Wells Fargo
Eurodollar Time Deposit
5.260% 07/02/2007 | | | 48,578 | | | | 48,578 | | |
Wells Fargo
Eurodollar Time Deposit
5.280% 07/11/2007 | | | 179,919 | | | | 179,919 | | |
Wells Fargo
Eurodollar Time Deposit
5.280% 07/12/2007 | | | 89,960 | | | | 89,960 | | |
| | | | 5,554,022 | | |
| Repurchase Agreements — 2.9% | |
Investors Bank & Trust
Company Repurchase
Agreement, dated
6/29/2007, 3.50%,
due 7/2/2007(e) | | | 4,155,620 | | | | 4,155,620 | | |
TOTAL SHORT-TERM
INVESTMENTS
(Cost $9,709,642) | | | | | | | 9,709,642 | | |
TOTAL INVESTMENTS — 102.6%
(Cost $135,026,926)(f) | | | | | | | 147,834,005 | | |
Other Assets/
(Liabilities) — (2.6%) | | | | | | | (3,703,734 | ) | |
| NET ASSETS — 100.0% | | | | | | $ | 144,130,271 | | |
Notes to Portfolio of Investments
ADR - American Depository Receipt
GDR - Global Depository Receipt
(a) Denotes all or a portion of security on loan. (Note 2).
(b) Non-income producing security.
(c) Amount represents shares owned of the fund.
(d) Represents investments of security lending collateral. (Note 2).
(e) Maturity value of $4,156,832. Collateralized by a U.S. Government Obligation with a rate of 8.125%, maturity date of 9/25/2027, and an aggregate market value, including accrued interest, of $4,363,401.
(f) See Note 6 for aggregate cost for Federal tax purposes.
The accompanying notes are an integral part of the financial statements.
183
MassMutual Select Overseas Fund – Portfolio of Investments
June 30, 2007 (Unaudited)
| | | Number of
Shares | | Market
Value | |
| EQUITIES — 97.2% | |
| COMMON STOCK — 97.2% | |
| Advertising — 1.9% | |
| Publicis Groupe(a) | | | 279,500 | | | $ | 12,191,308 | | |
| WPP Group PLC | | | 882,920 | | | | 13,179,717 | | |
| | | | 25,371,025 | | |
| Auto Manufacturers — 5.3% | |
Bayerische
Motoren Werke AG(a) | | | 418,800 | | | | 27,074,692 | | |
| DaimlerChrysler AG | | | 216,100 | | | | 19,881,847 | | |
| Honda Motor Co. Ltd. | | | 269,500 | | | | 9,798,407 | | |
| Toyota Motor Corp. | | | 246,900 | | | | 15,532,638 | | |
| | | | 72,287,584 | | |
| Automotive & Parts — 0.8% | |
| Bridgestone Corp. | | | 248,500 | | | | 5,316,409 | | |
| Continental AG | | | 44,140 | | | | 6,204,326 | | |
| | | | 11,520,735 | | |
| Banks — 10.8% | |
Australia & New Zealand
Banking Group Ltd. | | | 137,800 | | | | 3,387,490 | | |
Banco Bilbao Vizcaya
Argentaria SA | | | 181,790 | | | | 4,427,077 | | |
Banco Bilbao Vizcaya
Argentaria SA (FRA) | | | 89,353 | | | | 2,187,956 | | |
| Bangkok Bank PCL | | | 396,390 | | | | 1,399,350 | | |
| Bank Central Asia Tbk PT | | | 5,132,500 | | | | 3,093,602 | | |
| Bank of Ireland (Ireland) | | | 578,000 | | | | 11,671,028 | | |
| BNP Paribas SA | | | 132,900 | | | | 15,776,726 | | |
| Credit Agricole SA | | | 363,874 | | | | 14,706,951 | | |
Erste Bank
der oesterreichischen
Sparkassen AG | | | 87,873 | | | | 6,835,769 | | |
| HSBC Holdings PLC | | | 1,753,340 | | | | 32,058,315 | | |
| Intesa Sanpaolo | | | 896,504 | | | | 6,643,500 | | |
| Julius Baer Holding AG | | | 123,342 | | | | 8,768,396 | | |
| Komercni Banka AS | | | 24,802 | | | | 4,600,347 | | |
| Kookmin Bank | | | 94,000 | | | | 8,234,048 | | |
| Lloyds TSB Group PLC | | | 1,569,800 | | | | 17,506,458 | | |
| Shinsei Bank Ltd. | | | 37,000 | | | | 148,358 | | |
| Shizuoka Bank Ltd. (The) | | | 378,000 | | | | 3,826,551 | | |
United Overseas
Bank Ltd. | | | 162,200 | | | | 2,326,719 | | |
| | | | 147,598,641 | | |
| Beverages — 4.5% | |
| Diageo PLC | | | 1,684,627 | | | | 34,919,141 | | |
| Heineken NV | | | 98,500 | | | | 5,765,086 | | |
| | | Number of
Shares | | Market
Value | |
Lotte Chilsung Beverage
Co. Ltd. | | | 5,830 | | | $ | 7,500,750 | | |
| Pernod-Ricard SA(a) | | | 63,088 | | | | 13,907,989 | | |
| | | | 62,092,966 | | |
| Building Materials — 0.6% | |
| Asahi Glass Co. Ltd.(a) | | | 587,000 | | | | 7,890,818 | | |
| Building Materials & Construction — 0.9% | |
| Linde AG(a) | | | 106,190 | | | | 12,765,476 | | |
| Chemicals — 3.9% | |
| Air Liquide | | | 88,072 | | | | 11,516,502 | | |
| Akzo Nobel, Inc. | | | 45,500 | | | | 3,911,745 | | |
| Bayer AG | | | 228,680 | | | | 17,262,780 | | |
| Givaudan SA Registered | | | 21,270 | | | | 20,881,270 | | |
| | | | 53,572,297 | | |
| Commercial Services — 1.9% | |
| Adecco SA | | | 261,200 | | | | 20,045,421 | | |
| G4S PLC | | | 278,200 | | | | 1,168,401 | | |
| Meitec Corp.(a) | | | 148,700 | | | | 4,255,724 | | |
| | | | 25,469,546 | | |
| Cosmetics & Personal Care — 2.0% | |
| Kao Corp. | | | 715,000 | | | | 18,474,617 | | |
| L'Oreal SA | | | 42,800 | | | | 5,040,623 | | |
| Uni-Charm Corp. | | | 56,000 | | | | 3,165,517 | | |
| | | | 26,680,757 | | |
| Diversified Financial — 11.6% | |
Aeon Credit Service
Co. Ltd | | | 252,700 | | | | 3,999,566 | | |
Chinatrust Financial
Holding Co. | | | 21,365,366 | | | | 16,641,854 | | |
| Credit Suisse Group | | | 325,200 | | | | 22,931,260 | | |
Daiwa Securities
Group, Inc. | | | 2,024,020 | | | | 21,444,496 | | |
| Nikko Cordial Corp. | | | 1,340,500 | | | | 17,466,323 | | |
| Nomura Holdings, Inc. | | | 560,400 | | | | 10,852,058 | | |
| Schroders PLC | | | 709,700 | | | | 18,022,039 | | |
| UBS AG Registered | | | 794,757 | | | | 47,235,260 | | |
| | | | 158,592,856 | | |
| Electric — 1.3% | |
| E.ON AG | | | 107,210 | | | | 17,950,613 | | |
| Electrical Components & Equipment — 2.0% | |
| Legrand SA(a) | | | 210,660 | | | | 7,554,128 | | |
| Schneider Electric SA | | | 140,804 | | | | 19,647,306 | | |
| | | | 27,201,434 | | |
| Electrical Equipment & Electronics — 0.0% | |
| ASML Holding NV(b) | | | 8,200 | | | | 225,174 | | |
| | | Number of
Shares | | Market
Value | |
| Electronics — 2.7% | |
| Fanuc Ltd. | | | 73,100 | | | $ | 7,513,891 | | |
| Hirose Electric Co. Ltd. | | | 27,800 | | | | 3,643,042 | | |
Koninklijke Philips
Electronics NV | | | 335,000 | | | | 14,151,326 | | |
| Omron Corp. | | | 430,100 | | | | 11,248,264 | | |
| Orbotech Ltd.(b) | | | 39,100 | | | | 872,712 | | |
| | | | 37,429,235 | | |
| Entertainment — 1.4% | |
| Ladbrokes PLC | | | 828,534 | | | | 7,150,555 | | |
| William Hill PLC | | | 1,018,076 | | | | 12,446,844 | | |
| | | | 19,597,399 | | |
| Food Services — 0.7% | |
| Compass Group PLC | | | 1,408,300 | | | | 9,715,036 | | |
| Foods — 4.5% | |
| Cadbury Schweppes PLC | | | 1,037,100 | | | | 14,080,833 | | |
| Nestle SA | | | 107,781 | | | | 40,699,001 | | |
| Tesco PLC | | | 728,877 | | | | 6,088,598 | | |
| | | | 60,868,432 | | |
| Gas — 0.8% | |
| Gaz De France(a) | | | 130,000 | | | | 6,527,411 | | |
| Tokyo Gas Co. Ltd. | | | 858,000 | | | | 4,056,135 | | |
| | | | 10,583,546 | | |
| Health Care – Products — 0.3% | |
| Synthes, Inc. | | | 30,583 | | | | 3,649,323 | | |
| Holding Company – Diversified — 1.8% | |
LVMH Moet Hennessy
Louis Vuitton SA | | | 215,426 | | | | 24,740,615 | | |
| Household Products — 1.5% | |
| Reckitt Benckiser PLC | | | 364,108 | | | | 19,894,358 | | |
| Insurance — 4.2% | |
| Allianz AG | | | 16,200 | | | | 3,782,764 | | |
Assicurazioni
Generali SpA(a) | | | 82,753 | | | | 3,301,538 | | |
| AXA SA(a) | | | 349,047 | | | | 14,924,781 | | |
Hannover
Rueckversicherungs AG(a) | | | 195,300 | | | | 9,430,087 | | |
| QBE Insurance Group Ltd. | | | 208,992 | | | | 5,520,868 | | |
| Swiss Reinsurance(a) | | | 154,889 | | | | 14,035,796 | | |
| Willis Group Holdings Ltd. | | | 158,000 | | | | 6,961,480 | | |
| | | | 57,957,314 | | |
| Manufacturing — 0.7% | |
| Smiths Group PLC(c) | | | 474,590 | | | | 0 | | |
| Smiths Group PLC | | | 426,268 | | | | 10,103,341 | | |
| | | | 10,103,341 | | |
(Continued)
The accompanying notes are an integral part of the financial statements.
184
MassMutual Select Overseas Fund – Portfolio of Investments (Continued)
| | | Number of
Shares | | Market
Value | |
| Media — 7.1% | |
British Sky Broadcasting
Group PLC | | | 1,604,200 | | | $ | 20,515,800 | | |
Gestevision
Telecinco SA(a) | | | 536,000 | | | | 15,153,151 | | |
Grupo Televisa
SA Sponsored
ADR (Mexico)(a) | | | 174,500 | | | | 4,817,945 | | |
| Johnston Press PLC | | | 1,412,000 | | | | 11,551,251 | | |
Societe Television
Francaise 1(a) | | | 479,142 | | | | 16,516,212 | | |
| Trinity Mirror PLC | | | 1,169,000 | | | | 12,274,959 | | |
| Vivendi SA | | | 365,820 | | | | 15,673,947 | | |
| | | | 96,503,265 | | |
| Mining — 0.4% | |
| BHP Billiton PLC | | | 212,310 | | | | 5,875,513 | | |
| Office Equipment/Supplies — 1.9% | |
| Canon, Inc. | | | 256,850 | | | | 15,038,649 | | |
| Ricoh Co. Ltd. | | | 497,000 | | | | 11,444,188 | | |
| | | | 26,482,837 | | |
| Oil & Gas — 2.6% | |
| BG Group PLC | | | 341,418 | | | | 5,593,064 | | |
Royal Dutch Shell Plc
Class A Shs | | | 307,860 | | | | 12,513,493 | | |
| Total SA (France)(a) | | | 215,600 | | | | 17,439,647 | | |
| | | | 35,546,204 | | |
| Pharmaceuticals — 7.8% | |
| Actelion, Ltd.(a)(b) | | | 77,650 | | | | 3,445,666 | | |
| GlaxoSmithKline PLC | | | 1,700,420 | | | | 44,449,127 | | |
| Novartis AG | | | 405,800 | | | | 22,709,653 | | |
| Roche Holding AG | | | 133,602 | | | | 23,563,154 | | |
| Sanofi-Aventis | | | 52,218 | | | | 4,201,595 | | |
Takeda Pharmaceutical
Co. Ltd. | | | 131,300 | | | | 8,454,532 | | |
| | | | 106,823,727 | | |
| Retail — 2.3% | |
Giordano
International Ltd. | | | 8,745,000 | | | | 4,311,730 | | |
| Li & Fung Ltd. | | | 1,798,800 | | | | 6,496,160 | | |
| Next PLC | | | 115,530 | | | | 4,621,574 | | |
| Signet Group PLC | | | 7,499,000 | | | | 15,553,647 | | |
| | | | 30,983,111 | | |
| Semiconductors — 4.4% | |
| Rohm Co. Ltd. | | | 245,798 | | | | 21,762,351 | | |
Samsung Electronics
Co., Ltd. | | | 54,707 | | | | 33,420,147 | | |
Taiwan Semiconductor
Manufacturing Co. Ltd.
Sponsored ADR (Taiwan) | | | 481,700 | | | | 5,361,321 | | |
| | | | 60,543,819 | | |
| | | Number of
Shares | | Market
Value | |
| Telecommunications — 3.0% | |
Singapore
Telecommunications Ltd. | | | 3,240,500 | | | $ | 7,183,788 | | |
| SK Telecom Co. Ltd | | | 98,430 | | | | 22,685,590 | | |
SK Telecom Co. Ltd.
ADR (South Korea)(a) | | | 72,500 | | | | 1,982,875 | | |
Telefonaktiebolaget LM
Ericsson Cl. B | | | 1,185,010 | | | | 4,715,045 | | |
| Vodafone Group PLC | | | 1,106,600 | | | | 3,715,688 | | |
| | | | 40,282,986 | | |
| Toys, Games & Hobbies — 0.4% | |
| Nintendo Co., Ltd. | | | 13,400 | | | | 4,882,860 | | |
| Transportation — 1.2% | |
Canadian National
Railway Co.(a) | | | 120,420 | | | | 6,132,991 | | |
| TPG NV | | | 236,280 | | | | 10,617,777 | | |
| | | | 16,750,768 | | |
TOTAL EQUITIES
(Cost $1,085,281,146) | | | | | | | 1,328,433,611 | | |
| | | Principal
Amount | | | |
| SHORT-TERM INVESTMENTS — 11.9% | |
| Cash Equivalents — 9.3%(e) | |
Abbey National PLC
Eurodollar Time Deposit
5.280% 07/05/2007 | | $ | 1,657,660 | | | | 1,657,660 | | |
Abbey National PLC
Eurodollar Time Deposit
5.285% 07/09/2007 | | | 4,144,155 | | | | 4,144,155 | | |
American Beacon
Money Market Fund(d) | | | 4,649,550 | | | | 4,649,550 | | |
Banco Bilbao
Vizcaya Argentaria SA
Eurodollar Time Deposit
5.300% 08/10/2007 | | | 3,108,116 | | | | 3,108,116 | | |
Bank of America
5.270% 07/06/2007 | | | 4,144,154 | | | | 4,144,154 | | |
Bank of America
5.270% 07/16/2007 | | | 828,831 | | | | 828,831 | | |
Bank of America
5.270% 08/17/2007 | | | 1,036,039 | | | | 1,036,039 | | |
Bank of America
5.300% 09/17/2007 | | | 2,072,078 | | | | 2,072,078 | | |
Bank of Ireland
Eurodollar Time Deposit
5.300% 08/13/2007 | | | 4,144,154 | | | | 4,144,154 | | |
Bank of Montreal
Eurodollar Time Deposit
5.280% 07/03/2007 | | | 1,036,039 | | | | 1,036,039 | | |
| | | Principal
Amount | | Market
Value | |
Bank of Montreal
Eurodollar Time Deposit
5.290% 07/02/2007 | | $ | 828,831 | | | $ | 828,831 | | |
Bank of Montreal
Eurodollar Time Deposit
5.310% 08/14/2007 | | | 621,623 | | | | 621,623 | | |
Bank of Nova Scotia
Eurodollar Time Deposit
5.280% 07/09/2007 | | | 3,936,947 | | | | 3,936,947 | | |
Bank Of Nova Scotia
Eurodollar Time Deposit
5.285% 07/11/2007 | | | 2,279,285 | | | | 2,279,285 | | |
Barclays
Eurodollar Time Deposit
5.290% 07/06/2007 | | | 4,144,154 | | | | 4,144,154 | | |
Barclays
Eurodollar Time Deposit
5.295% 07/16/2007 | | | 828,831 | | | | 828,831 | | |
Barclays
Eurodollar Time Deposit
5.320% 09/04/2007 | | | 2,072,078 | | | | 2,072,078 | | |
Bear Stearns & Co
Commercial Paper
5.435% 07/10/2007 | | | 621,623 | | | | 621,623 | | |
BGI Institutional
Money Market Fund(d) | | | 2,693,701 | | | | 2,693,701 | | |
BNP Paribas
Eurodollar Time Deposit
5.350% 07/02/2007 | | | 6,216,232 | | | | 6,216,232 | | |
Calyon
Eurodollar Time Deposit
5.290% 07/17/2007 | | | 2,072,078 | | | | 2,072,078 | | |
Calyon
Eurodollar Time Deposit
5.380% 07/02/2007 | | | 6,216,232 | | | | 6,216,232 | | |
Canadian Imperial
Bank of Commerce
Eurodollar Time Deposit
5.300% 07/30/2007 | | | 4,144,154 | | | | 4,144,154 | | |
Dexia Group
Eurodollar Time Deposit
5.290% 08/08/2007 | | | 4,144,154 | | | | 4,144,154 | | |
Dreyfus Institutional
Cash Advantage
Money Market Fund(d) | | | 1,243,247 | | | | 1,243,247 | | |
Federal Home Loan Bank
Discount Note
5.174% 07/20/2007 | | | 307,358 | | | | 307,358 | | |
First Tennessee
National Corp.
Eurodollar Time Deposit
5.300% 07/18/2007 | | | 1,036,039 | | | | 1,036,039 | | |
(Continued)
The accompanying notes are an integral part of the financial statements.
185
MassMutual Select Overseas Fund – Portfolio of Investments (Continued)
| | | Principal
Amount | | Market
Value | |
Fortis Bank
Eurodollar Time Deposit
5.290% 07/06/2007 | | $ | 1,036,039 | | | $ | 1,036,039 | | |
Fortis Bank
Eurodollar Time Deposit
5.290% 07/09/2007 | | | 1,450,454 | | | | 1,450,454 | | |
Fortis Bank
Eurodollar Time Deposit
5.300% 07/20/2007 | | | 1,036,039 | | | | 1,036,039 | | |
Fortis Bank
Eurodollar Time Deposit
5.300% 07/26/2007 | | | 828,831 | | | | 828,831 | | |
Fortis Bank
Eurodollar Time Deposit
5.350% 07/05/2007 | | | 2,072,078 | | | | 2,072,078 | | |
Freddie Mac
Discount Note
5.155% 07/16/2007 | | | 391,272 | | | | 391,272 | | |
Freddie Mac
Discount Note
5.185% 07/09/2007 | | | 204,268 | | | | 204,268 | | |
Morgan Stanley & Co
Commercial Paper
5.445% 08/01/2007 | | | 1,864,870 | | | | 1,864,870 | | |
National Australia Bank
Eurodollar Time Deposit
5.320% 07/02/2007 | | | 2,072,078 | | | | 2,072,078 | | |
Nationwide
Building Society
Commercial Paper
5.301% 07/09/2007 | | | 2,067,815 | | | | 2,067,815 | | |
Rabobank Nederland
Eurodollar Time Deposit
5.280% 07/05/2007 | | | 3,108,116 | | | | 3,108,116 | | |
Rabobank Nederland
Eurodollar Time Deposit
5.290% 07/16/2007 | | | 4,144,154 | | | | 4,144,154 | | |
Rabobank Nederland
Eurodollar Time Deposit
5.330% 07/02/2007 | | | 6,216,232 | | | | 6,216,232 | | |
Reserve Primary
Money Market Fund(d) | | | 4,114,063 | | | | 4,114,063 | | |
Royal Bank of Canada
Eurodollar Time Deposit
5.305% 08/30/2007 | | | 4,144,154 | | | | 4,144,154 | | |
Royal Bank of Scotland
Eurodollar Time Deposit
5.270% 07/11/2007 | | | 1,036,039 | | | | 1,036,039 | | |
Skandinaviska Enskilda
Banken AB
Eurodollar Time Deposit
5.290% 07/13/2007 | | | 4,144,154 | | | | 4,144,154 | | |
| | | Principal
Amount | | Market
Value | |
Skandinaviska Enskilda
Banken AB
Eurodollar Time Deposit
5.290% 07/19/2007 | | $ | 621,623 | | | $ | 621,623 | | |
Svenska Handlesbanken
Eurodollar Time Deposit
5.300% 07/02/2007 | | | 696,117 | | | | 696,117 | | |
UBS AG
Eurodollar Time Deposit
5.277% 07/05/2007 | | | 2,900,908 | | | | 2,900,908 | | |
UBS AG
Eurodollar Time Deposit
5.285% 07/05/2007 | | | 4,144,154 | | | | 4,144,154 | | |
Vanguard Prime
Money Market Fund(d) | | | 2,072,078 | | | | 2,072,078 | | |
Wells Fargo
Eurodollar Time Deposit
5.260% 07/02/2007 | | | 1,118,922 | | | | 1,118,922 | | |
Wells Fargo
Eurodollar Time Deposit
5.280% 07/11/2007 | | | 4,144,154 | | | | 4,144,154 | | |
Wells Fargo
Eurodollar Time Deposit
5.280% 07/12/2007 | | | 2,072,078 | | | | 2,072,078 | | |
| | | | 127,928,033 | | |
| Repurchase Agreements — 2.6% | |
Investors Bank & Trust
Company Repurchase
Agreement, dated
6/29/2007, 3.50%,
due 7/02/2007(f) | | | 35,079,587 | | | | 35,079,586 | | |
TOTAL SHORT-TERM
INVESTMENTS
(Cost $163,007,619) | | | | | | | 163,007,619 | | |
TOTAL INVESTMENTS — 109.1%
(Cost $1,248,288,765)(g) | | | | | | | 1,491,441,230 | | |
Other Assets/
(Liabilities) — (9.1%) | | | | | | | (124,196,872 | ) | |
| NET ASSETS — 100.0% | | | | | | $ | 1,367,244,358 | | |
Notes to Portfolio of Investments
ADR - American Depository Receipt
(a) Denotes all or a portion of security on loan. (Note 2).
(b) Non-income producing security.
(c) This security is valued in good faith under procedures established by the Board of Trustees.
(d) Amount represents shares owned of the fund.
(e) Represents investments of security lending collateral. (Note 2).
(f) Maturity value of $35,089,818. Collateralized by a U.S. Government Agency obligation with a rate of 5.67%, maturity date of 12/15/2035, and an aggregate market value, including accrued interest, of $36,833,566.
(g) See Note 6 for aggregate cost for Federal tax purposes.
The accompanying notes are an integral part of the financial statements.
186
MassMutual Select Destination Retirement Income Fund – Portfolio of Investments
June 30, 2007 (Unaudited)
| | | Number of
Shares | | Market
Value | |
| MUTUAL FUNDS — 100.0% | |
| Investment Companies | |
MassMutual Premier
Capital Appreciation
Fund, Class S | | | 140,341 | | | $ | 1,727,601 | | |
MassMutual Premier Core
Bond Fund, Class S | | | 4,045,729 | | | | 43,289,297 | | |
MassMutual Premier
Diversified Bond
Fund, Class S | | | 3,167,258 | | | | 33,541,261 | | |
MassMutual Premier
Enhanced Index Growth
Fund, Class S | | | 735,245 | | | | 7,448,031 | | |
MassMutual Premier
Enhanced Index
Value Fund, Class S | | | 754,471 | | | | 10,690,856 | | |
MassMutual Premier
Inflation Protected
Bond Fund, Class S | | | 4,553,341 | | | | 45,351,275 | | |
MassMutual Premier
International Equity
Fund, Class S | | | 257,310 | | | | 4,580,120 | | |
MassMutual Premier
Main Street Small Cap
Fund, Class S(a) | | | 471,875 | | | | 5,572,847 | | |
MassMutual Premier
Money Market Fund,
Class S(a) | | | 11,181,346 | | | | 11,181,347 | | |
MassMutual Premier
Short-Duration Bond
Fund, Class S | | | 3,573,151 | | | | 36,481,872 | | |
MassMutual Premier
Strategic Income Fund,
Class S | | | 989,698 | | | | 10,441,311 | | |
MassMutual Premier Value
Fund, Class S | | | 24,164 | | | | 501,160 | | |
MassMutual Select
Aggressive Growth Fund,
Class S(a) | | | 579,398 | | | | 3,876,171 | | |
MassMutual Select
Blue Chip Growth Fund,
Class S | | | 272,151 | | | | 2,933,790 | | |
MassMutual Select
Diversified International
Fund, Class S(a) | | | 416,067 | | | | 4,776,451 | | |
MassMutual Select
Diversified Value Fund,
Class S | | | 267,755 | | | | 3,737,862 | | |
MassMutual Select
Emerging Growth Fund,
Class S(a) | | | 130,755 | | | | 961,050 | | |
| | | Number of
Shares | | Market
Value | |
MassMutual Select Focused
Value Fund, Class S | | | 370,334 | | | $ | 7,647,389 | | |
MassMutual Select
Fundamental Value Fund,
Class S | | | 387,563 | | | | 5,204,975 | | |
MassMutual Select Growth
Equity Fund, Class S(a) | | | 671,031 | | | | 5,844,676 | | |
MassMutual Select
Large Cap Value Fund,
Class S | | | 134,984 | | | | 1,869,535 | | |
MassMutual Select
Mid Cap Growth Equity
Fund, Class S(a) | | | 128,361 | | | | 1,474,872 | | |
MassMutual Select Mid Cap
Growth Equity II Fund,
Class S(a) | | | 139,644 | | | | 2,306,916 | | |
MassMutual Select Mid-Cap
Value Fund, Class S(a) | | | 301,096 | | | | 3,781,768 | | |
MassMutual Select Overseas
Fund, Class S(a) | | | 702,729 | | | | 9,859,282 | | |
MassMutual Select
Small Cap Core Equity
Fund, Class S(a) | | | 214,446 | | | | 2,273,131 | | |
MassMutual Select
Small Cap Growth Equity
Fund, Class S(a) | | | 51,793 | | | | 956,102 | | |
MassMutual Select
Small Cap Value Equity
Fund, Class S(a) | | | 150,295 | | | | 1,711,862 | | |
MassMutual Select
Small Company Growth
Fund, Class S(a) | | | 150,798 | | | | 1,812,590 | | |
MassMutual Select
Small Company Value
Fund, Class S | | | 110,869 | | | | 1,837,092 | | |
| | | | 273,672,492 | | |
TOTAL MUTUAL FUNDS
(Cost $271,854,533) | | | | | | | 273,672,492 | | |
TOTAL INVESTMENTS — 100.0%
(Cost $271,854,533)(b) | | | | | | | 273,672,492 | | |
Other Assets/
(Liabilities) — 0.0% | | | | | | | (93,898 | ) | |
| NET ASSETS — 100.0% | | | | | | $ | 273,578,594 | | |
Notes to Portfolio of Investments
(a) Non-income producing security.
(b) See Note 6 for aggregate cost for Federal tax purposes.
The accompanying notes are an integral part of the financial statements.
187
MassMutual Select Destination Retirement 2010 Fund – Portfolio of Investments
June 30, 2007 (Unaudited)
| | | Number of
Shares | | Market
Value | |
| MUTUAL FUNDS — 100.0% | |
| Investment Companies | |
MassMutual Premier
Capital Appreciation
Fund, Class S | | | 133,589 | | | $ | 1,644,482 | | |
MassMutual Premier
Core Bond Fund, Class S | | | 3,217,051 | | | | 34,422,448 | | |
MassMutual Premier
Diversified Bond
Fund, Class S | | | 2,640,810 | | | | 27,966,176 | | |
MassMutual Premier
Enhanced Index Growth
Fund, Class S | | | 1,224,946 | | | | 12,408,706 | | |
MassMutual Premier
Enhanced Index
Value Fund, Class S | | | 1,087,762 | | | | 15,413,590 | | |
MassMutual Premier
Inflation Protected
Bond Fund, Class S | | | 3,255,941 | | | | 32,429,174 | | |
MassMutual Premier
International Equity
Fund, Class S | | | 243,406 | | | | 4,332,626 | | |
MassMutual Premier
Main Street Small Cap
Fund, Class S(a) | | | 341,253 | | | | 4,030,193 | | |
MassMutual Premier
Money Market Fund,
Class S(a) | | | 10,295,756 | | | | 10,295,756 | | |
MassMutual Premier
Short-Duration Bond
Fund, Class S | | | 2,345,113 | | | | 23,943,604 | | |
MassMutual Premier
Strategic Income Fund,
Class S | | | 723,003 | | | | 7,627,682 | | |
MassMutual Premier Value
Fund, Class S | | | 26,202 | | | | 543,421 | | |
MassMutual Select
Aggressive Growth Fund,
Class S(a) | | | 549,823 | | | | 3,678,318 | | |
MassMutual Select
Blue Chip Growth Fund,
Class S | | | 258,515 | | | | 2,786,794 | | |
MassMutual Select
Diversified International
Fund, Class S(a) | | | 434,765 | | | | 4,991,107 | | |
MassMutual Select Diversified
Value Fund, Class S | | | 192,523 | | | | 2,687,618 | | |
MassMutual Select
Emerging Growth Fund,
Class S(a) | | | 95,457 | | | | 701,611 | | |
| | | Number of
Shares | | Market
Value | |
MassMutual Select Focused
Value Fund, Class S | | | 269,419 | | | $ | 5,563,493 | | |
MassMutual Select
Fundamental Value
Fund, Class S | | | 354,814 | | | | 4,765,153 | | |
MassMutual Select Growth
Equity Fund, Class S(a) | | | 626,209 | | | | 5,454,281 | | |
MassMutual Select
Large Cap Value Fund,
Class S | | | 189,703 | | | | 2,627,391 | | |
MassMutual Select
Mid Cap Growth Equity
Fund, Class S(a) | | | 182,217 | | | | 2,093,674 | | |
MassMutual Select
Mid Cap Growth Equity II
Fund, Class S(a) | | | 199,013 | | | | 3,287,689 | | |
MassMutual Select Mid-Cap
Value Fund, Class S(a) | | | 428,437 | | | | 5,381,165 | | |
MassMutual Select
Overseas Fund,
Class S(a) | | | 700,520 | | | | 9,828,292 | | |
MassMutual Select
Small Cap Core Equity
Fund, Class S(a) | | | 154,716 | | | | 1,639,990 | | |
MassMutual Select
Small Cap Growth Equity
Fund, Class S(a) | | | 36,642 | | | | 676,415 | | |
MassMutual Select
Small Cap Value Equity
Fund, Class S(a) | | | 107,683 | | | | 1,226,506 | | |
MassMutual Select
Small Company Growth
Fund, Class S(a) | | | 115,720 | | | | 1,390,953 | | |
MassMutual Select
Small Company Value
Fund, Class S | | | 79,665 | | | | 1,320,052 | | |
| | | | 235,158,360 | | |
TOTAL MUTUAL FUNDS
(Cost $231,112,774) | | | | | | | 235,158,360 | | |
TOTAL INVESTMENTS — 100.0%
(Cost $231,112,774)(b) | | | | | | | 235,158,360 | | |
Other Assets/
(Liabilities) — 0.0% | | | | | | | (98,446 | ) | |
| NET ASSETS — 100.0% | | | | | | $ | 235,059,914 | | |
Notes to Portfolio of Investments
(a) Non-income producing security.
(b) See Note 6 for aggregate cost for Federal tax purposes.
The accompanying notes are an integral part of the financial statements.
188
MassMutual Select Destination Retirement 2020 Fund – Portfolio of Investments
June 30, 2007 (Unaudited)
| | | Number of
Shares | | Market
Value | |
| MUTUAL FUNDS — 100.0% | |
| Investment Companies | |
MassMutual Premier
Capital Appreciation
Fund, Class S | | | 725,730 | | | $ | 8,933,739 | | |
MassMutual Premier Core
Bond Fund, Class S | | | 6,861,975 | | | | 73,423,135 | | |
MassMutual Premier
Diversified Bond Fund,
Class S | | | 5,524,799 | | | | 58,507,625 | | |
MassMutual Premier
Enhanced Index Growth
Fund, Class S | | | 3,957,757 | | | | 40,092,078 | | |
MassMutual Premier
Enhanced Index Value
Fund, Class S | | | 3,167,042 | | | | 44,876,986 | | |
MassMutual Premier
Inflation Protected Bond
Fund, Class S | | | 6,812,583 | | | | 67,853,329 | | |
MassMutual Premier
International Equity Fund,
Class S | | | 1,168,119 | | | | 20,792,512 | | |
MassMutual Premier Main
Street Small Cap Fund,
Class S(a) | | | 1,979,110 | | | | 23,373,286 | | |
MassMutual Premier
Short-Duration Bond
Fund, Class S | | | 3,007,233 | | | | 30,703,854 | | |
MassMutual Premier
Strategic Income Fund,
Class S | | | 1,529,489 | | | | 16,136,107 | | |
MassMutual Premier Value
Fund, Class S | | | 173,006 | | | | 3,588,152 | | |
MassMutual Select
Aggressive Growth Fund,
Class S(a) | | | 3,378,382 | | | | 22,601,379 | | |
MassMutual Select
Blue Chip Growth Fund,
Class S | | | 1,447,417 | | | | 15,603,155 | | |
MassMutual Select
Diversified International
Fund, Class S(a) | | | 1,878,232 | | | | 21,562,104 | | |
MassMutual Select
Diversified Value Fund,
Class S | | | 1,247,527 | | | | 17,415,473 | | |
MassMutual Select
Emerging Growth Fund,
Class S(a) | | | 298,556 | | | | 2,194,383 | | |
MassMutual Select
Focused Value Fund,
Class S | | | 770,916 | | | | 15,919,405 | | |
| | | Number of
Shares | | Market
Value | |
MassMutual Select
Fundamental Value Fund,
Class S | | | 2,312,094 | | | $ | 31,051,427 | | |
MassMutual Select Growth
Equity Fund, Class S(a) | | | 2,279,465 | | | | 19,854,140 | | |
MassMutual Select Large
Cap Value Fund, Class S | | | 1,236,942 | | | | 17,131,642 | | |
MassMutual Select Mid Cap
Growth Equity Fund,
Class S(a) | | | 1,078,546 | | | | 12,392,499 | | |
MassMutual Select Mid Cap
Growth Equity II Fund,
Class S(a) | | | 1,170,818 | | | | 19,341,914 | | |
MassMutual Select Mid-Cap
Value Fund, Class S(a) | | | 2,519,563 | | | | 31,645,710 | | |
MassMutual Select Overseas
Fund, Class S(a) | | | 3,219,067 | | | | 45,163,504 | | |
MassMutual Select Small Cap
Core Equity Fund,
Class S(a) | | | 901,066 | | | | 9,551,303 | | |
MassMutual Select Small Cap
Growth Equity Fund,
Class S(a) | | | 114,606 | | | | 2,115,624 | | |
MassMutual Select Small Cap
Value Equity Fund,
Class S(a) | | | 316,950 | | | | 3,610,059 | | |
MassMutual Select
Small Company Growth
Fund, Class S(a) | | | 361,792 | | | | 4,348,735 | | |
MassMutual Select
Small Company Value
Fund, Class S | | | 249,214 | | | | 4,129,482 | | |
| | | | 683,912,741 | | |
TOTAL MUTUAL FUNDS
(Cost $655,529,212) | | | | | | | 683,912,741 | | |
TOTAL INVESTMENTS — 100.0%
(Cost $655,529,212)(b) | | | | | | | 683,912,741 | | |
Other Assets/
(Liabilities) — 0.0% | | | | | | | (237,158 | ) | |
| NET ASSETS — 100.0% | | | | | | $ | 683,675,583 | | |
Notes to Portfolio of Investments
(a) Non-income producing security.
(b) See Note 6 for aggregate cost for Federal tax purposes.
The accompanying notes are an integral part of the financial statements.
189
MassMutual Select Destination Retirement 2030 Fund – Portfolio of Investments
June 30, 2007 (Unaudited)
| | | Number of
Shares | | Market
Value | |
| MUTUAL FUNDS — 100.0% | |
| Investment Companies | |
MassMutual Premier
Capital Appreciation
Fund, Class S | | | 947,373 | | | $ | 11,662,156 | | |
MassMutual Premier
Core Bond Fund, Class S | | | 1,671,147 | | | | 17,881,274 | | |
MassMutual Premier
Diversified Bond Fund,
Class S | | | 1,702,364 | | | | 18,028,030 | | |
MassMutual Premier
Enhanced Index Growth
Fund, Class S | | | 2,665,400 | | | | 27,000,506 | | |
MassMutual Premier
Enhanced Index Value
Fund, Class S | | | 1,881,686 | | | | 26,663,485 | | |
MassMutual Premier
Inflation Protected Bond
Fund, Class S | | | 2,611,310 | | | | 26,008,646 | | |
MassMutual Premier
International Equity Fund,
Class S | | | 1,251,894 | | | | 22,283,719 | | |
MassMutual Premier
Main Street Small Cap
Fund, Class S(a) | | | 1,701,896 | | | | 20,099,386 | | |
MassMutual Premier
Short-Duration Bond
Fund, Class S | | | 417,515 | | | | 4,262,824 | | |
MassMutual Premier
Strategic Income Fund,
Class S | | | 1,021,607 | | | | 10,777,954 | | |
MassMutual Premier Value
Fund, Class S | | | 225,714 | | | | 4,681,305 | | |
MassMutual Select
Aggressive Growth Fund,
Class S(a) | | | 4,896,258 | | | | 32,755,964 | | |
MassMutual Select
Blue Chip Growth Fund,
Class S | | | 1,952,358 | | | | 21,046,418 | | |
MassMutual Select
Diversified International
Fund, Class S(a) | | | 1,962,557 | | | | 22,530,151 | | |
MassMutual Select
Diversified Value Fund,
Class S | | | 1,651,218 | | | | 23,050,999 | | |
MassMutual Select
Emerging Growth Fund,
Class S(a) | | | 2,415,601 | | | | 17,754,664 | | |
MassMutual Select Focused
Value Fund, Class S | | | 545,963 | | | | 11,274,129 | | |
| | | Number of
Shares | | Market
Value | |
MassMutual Select
Fundamental Value
Fund, Class S | | | 3,106,898 | | | $ | 41,725,637 | | |
MassMutual Select
Growth Equity Fund,
Class S(a) | | | 2,950,378 | | | | 25,697,795 | | |
MassMutual Select
Large Cap Value
Fund, Class S | | | 1,651,232 | | | | 22,869,559 | | |
MassMutual Select
Mid Cap Growth Equity
Fund, Class S(a) | | | 281,863 | | | | 3,238,610 | | |
MassMutual Select
Mid Cap Growth
Equity II Fund,
Class S(a) | | | 980,027 | | | | 16,190,054 | | |
MassMutual Select
Mid-Cap Value Fund,
Class S(a) | | | 1,788,317 | | | | 22,461,261 | | |
MassMutual Select
Overseas Fund,
Class S(a) | | | 3,159,304 | | | | 44,325,034 | | |
MassMutual Select
Small Cap Core Equity
Fund, Class S(a) | | | 349,393 | | | | 3,703,563 | | |
MassMutual Select
Small Cap Growth
Equity Fund, Class S(a) | | | 82,367 | | | | 1,520,494 | | |
MassMutual Select
Small Cap Value Equity
Fund, Class S(a) | | | 465,234 | | | | 5,299,010 | | |
MassMutual Select
Small Company Growth
Fund, Class S(a) | | | 215,369 | | | | 2,588,733 | | |
MassMutual Select
Small Company Value
Fund, Class S | | | 549,376 | | | | 9,103,162 | | |
| | | | 516,484,522 | | |
TOTAL MUTUAL FUNDS
(Cost $478,878,309) | | | | | | | 516,484,522 | | |
TOTAL INVESTMENTS — 100.0%
(Cost $478,878,309)(b) | | | | | | | 516,484,522 | | |
Other Assets/
(Liabilities) — 0.0% | | | | | | | (186,954 | ) | |
| NET ASSETS — 100.0% | | | | | | $ | 516,297,568 | | |
Notes to Portfolio of Investments
(a) Non-income producing security.
(b) See Note 6 for aggregate cost for Federal tax purposes.
The accompanying notes are an integral part of the financial statements.
190
MassMutual Select Destination Retirement 2040 Fund – Portfolio of Investments
June 30, 2007 (Unaudited)
| | | Number of
Shares | | Market
Value | |
| MUTUAL FUNDS — 100.0% | |
| Investment Companies | |
MassMutual Premier
Capital Appreciation
Fund, Class S | | | 697,832 | | | $ | 8,590,315 | | |
MassMutual Premier
Core Bond Fund, Class S | | | 156,094 | | | | 1,670,210 | | |
MassMutual Premier
Diversified Bond Fund,
Class S | | | 157,710 | | | | 1,670,146 | | |
MassMutual Premier
Enhanced Index Growth
Fund, Class S | | | 1,731,049 | | | | 17,535,531 | | |
MassMutual Premier
Enhanced Index Value
Fund, Class S | | | 1,194,714 | | | | 16,929,101 | | |
MassMutual Premier
Inflation Protected Bond
Fund, Class S | | | 258,556 | | | | 2,575,217 | | |
MassMutual Premier
International Equity
Fund, Class S | | | 800,181 | | | | 14,243,224 | | |
MassMutual Premier
Main Street Small Cap
Fund, Class S(a) | | | 900,708 | | | | 10,637,359 | | |
MassMutual Premier
Strategic Income Fund,
Class S | | | 211,298 | | | | 2,229,196 | | |
MassMutual Premier Value
Fund, Class S | | | 159,353 | | | | 3,304,988 | | |
MassMutual Select
Aggressive Growth Fund,
Class S(a) | | | 3,193,803 | | | | 21,366,539 | | |
MassMutual Select
Blue Chip Growth Fund,
Class S | | | 1,213,635 | | | | 13,082,990 | | |
MassMutual Select
Diversified International
Fund, Class S(a) | | | 1,236,621 | | | | 14,196,410 | | |
MassMutual Select
Diversified Value Fund,
Class S | | | 1,136,595 | | | | 15,866,864 | | |
MassMutual Select
Emerging Growth Fund,
Class S(a) | | | 1,461,360 | | | | 10,740,996 | | |
MassMutual Select Focused
Value Fund, Class S | | | 289,244 | | | | 5,972,881 | | |
MassMutual Select
Fundamental Value Fund,
Class S | | | 2,135,060 | | | | 28,673,861 | | |
| | | Number of
Shares | | Market
Value | |
MassMutual Select
Growth Equity Fund,
Class S(a) | | | 1,868,099 | | | $ | 16,271,145 | | |
MassMutual Select
Large Cap Value Fund,
Class S | | | 1,129,952 | | | | 15,649,834 | | |
MassMutual Select
Mid Cap Growth Equity
Fund, Class S(a) | | | 178,925 | | | | 2,055,849 | | |
MassMutual Select Mid Cap
Growth Equity II Fund,
Class S(a) | | | 527,813 | | | | 8,719,474 | | |
MassMutual Select Mid-Cap
Value Fund, Class S(a) | | | 1,190,045 | | | | 14,946,963 | | |
MassMutual Select
Overseas Fund,
Class S(a) | | | 1,987,638 | | | | 27,886,565 | | |
MassMutual Select
Small Cap Core Equity
Fund, Class S(a) | | | 201,315 | | | | 2,133,942 | | |
MassMutual Select
Small Cap Growth Equity
Fund, Class S(a) | | | 56,464 | | | | 1,042,323 | | |
MassMutual Select
Small Cap Value Equity
Fund, Class S(a) | | | 374,428 | | | | 4,264,735 | | |
MassMutual Select
Small Company Growth
Fund, Class S(a) | | | 153,136 | | | | 1,840,695 | | |
MassMutual Select
Small Company Value
Fund, Class S | | | 416,767 | | | | 6,905,830 | | |
| | | | 291,003,183 | | |
TOTAL MUTUAL FUNDS
(Cost $266,833,900) | | | | | | | 291,003,183 | | |
TOTAL INVESTMENTS — 100.0%
(Cost $266,833,900)(b) | | | | | | | 291,003,183 | | |
Other Assets/
(Liabilities) — 0.0% | | | | | | | (102,755 | ) | |
| NET ASSETS — 100.0% | | | | | | $ | 290,900,428 | | |
Notes to Portfolio of Investments
(a) Non-income producing security.
(b) See Note 6 for aggregate cost for Federal tax purposes.
The accompanying notes are an integral part of the financial statements.
191
MassMutual Select Funds – Financial Statements
Statement of Assets and Liabilities
June 30, 2007 (Unaudited)
| | | MassMutual
Select
Strategic Bond
Fund | | MassMutual
Select
Strategic Balanced
Fund | | MassMutual
Select
Diversified Value
Fund | | MassMutual
Select
Fundamental Value
Fund | |
| Assets: | |
| Investments, at value (Note 2)(a) | | $ | 297,424,375 | | | $ | 226,561,513 | | | $ | 666,231,890 | | | $ | 1,287,185,273 | | |
| Short-term investments, at value (Note 2)(b) | | | 39,293,763 | | | | 20,475,054 | | | | 47,499,970 | | | | 87,497,387 | | |
| Total investments(c) | | | 336,718,138 | | | | 247,036,567 | | | | 713,731,860 | | | | 1,374,682,660 | | |
| Cash | | | - | | | | 1,107,959 | | | | - | | | | - | | |
| Foreign currency, at value(d) | | | 20,891 | | | | 135,051 | | | | - | | | | - | | |
| Receivables from: | |
| Investments sold | | | 3,193,279 | | | | 5,725,257 | | | | 5,469,861 | | | | - | | |
| Open forward foreign currency contracts (Note 2) | | | 970,189 | | | | 1,133,506 | | | | - | | | | - | | |
| Investment Adviser (Note 3) | | | 6,129 | | | | - | | | | - | | | | - | | |
| Fund shares sold | | | 109,306 | | | | 193,460 | | | | 554,695 | | | | 1,302,777 | | |
| Interest and dividends | | | 2,494,923 | | | | 1,162,090 | | | | 1,112,826 | | | | 1,955,494 | | |
| Variation margin on open futures contracts (Note 2) | | | 94,506 | | | | 23,468 | | | | - | | | | - | | |
| Foreign taxes withheld | | | - | | | | - | | | | 113 | | | | 54,166 | | |
| Open swap agreements, at value (Note 2) | | | - | | | | 136,121 | | | | - | | | | - | | |
| Prepaid expenses | | | - | | | | - | | | | - | | | | - | | |
| Total assets | | | 343,607,361 | | | | 256,653,479 | | | | 720,869,355 | | | | 1,377,995,097 | | |
| Liabilities: | |
| Payables for: | |
| Investments purchased | | | 11,683,956 | | | | 3,291,107 | | | | 4,175,768 | | | | 13,306,483 | | |
| Written options outstanding, at value (Note 2)(e) | | | 436,612 | | | | 128,794 | | | | - | | | | - | | |
| Open forward foreign currency contracts (Note 2) | | | 965,848 | | | | 1,139,413 | | | | - | | | | - | | |
| Fund shares repurchased | | | 217,480 | | | | 93,262 | | | | 126,566 | | | | 535,401 | | |
| Variation margin on open futures contracts (Note 2) | | | - | | | | - | | | | - | | | | - | | |
| Securities on loan (Note 2) | | | 16,047,957 | | | | 13,326,472 | | | | 41,442,836 | | | | 55,797,705 | | |
| Open swap agreements, at value (Note 2) | | | 238,250 | | | | 155,683 | | | | - | | | | - | | |
| Directors' fees and expenses (Note 3) | | | 6,068 | | | | 10,073 | | | | 15,158 | | | | 50,316 | | |
| Affiliates (Note 3): | |
| Investment management fees | | | 135,743 | | | | 115,282 | | | | 269,496 | | | | 678,498 | | |
| Administration fees | | | 31,265 | | | | 47,516 | | | | 79,142 | | | | 223,781 | | |
| Service fees | | | 36,078 | | | | 19,528 | | | | 61,840 | | | | 187,118 | | |
| Distribution fees | | | 1,547 | | | | 364 | | | | 1,430 | | | | 1,398 | | |
| Accrued expense and other liabilities | | | 40,732 | | | | 15,893 | | | | 16,049 | | | | 7,695 | | |
| Total liabilities | | | 29,841,536 | | | | 18,343,387 | | | | 46,188,285 | | | | 70,788,395 | | |
| Net assets | | $ | 313,765,825 | | | $ | 238,310,092 | | | $ | 674,681,070 | | | $ | 1,307,206,702 | | |
| Net assets consist of: | |
| Paid-in capital | | $ | 315,764,338 | | | $ | 201,425,368 | | | $ | 533,491,226 | | | $ | 938,842,281 | | |
Undistributed net investment income (distributions in excess of
net investment income) | | | 6,712,071 | | | | 3,110,075 | | | | 5,717,454 | | | | 7,422,197 | | |
| Accumulated net realized gain (loss) on investments | | | (2,709,390 | ) | | | 8,901,059 | | | | 19,434,777 | | | | 73,636,133 | | |
| Net unrealized appreciation (depreciation) on investments | | | (6,001,194 | ) | | | 24,873,590 | | | | 116,037,613 | | | | 287,306,091 | | |
| Net Assets | | $ | 313,765,825 | | | $ | 238,310,092 | | | $ | 674,681,070 | | | $ | 1,307,206,702 | | |
| (a) Cost of investments - unaffiliated issuers: | | $ | 302,844,545 | | | $ | 201,626,938 | | | $ | 550,194,277 | | | $ | 999,879,182 | | |
| (b) Cost of short-term investments: | | $ | 39,293,763 | | | $ | 20,475,054 | | | $ | 47,499,970 | | | $ | 87,497,387 | | |
| (c) Securities on loan with market value of: | | $ | 15,703,586 | | | $ | 12,848,395 | | | $ | 40,204,146 | | | $ | 53,867,352 | | |
| (d) Cost of foreign currency: | | $ | 20,479 | | | $ | 120,945 | | | $ | - | | | $ | - | | |
The accompanying notes are an integral part of the financial statements.
192
| | | MassMutual
Select
Value Equity
Fund | | MassMutual
Select
Large Cap Value
Fund | | MassMutual
Select
Indexed Equity
Fund | | MassMutual
Select
Core Opportunities
Fund | |
| Assets: | |
| Investments, at value (Note 2)(a) | | $ | 101,061,247 | | | $ | 1,491,707,321 | | | $ | 2,399,107,409 | | | $ | 46,191,940 | | |
| Short-term investments, at value (Note 2)(b) | | | 6,317,548 | | | | 104,856,916 | | | | 141,370,685 | | | | 6,167,592 | | |
| Total investments(c) | | | 107,378,795 | | | | 1,596,564,237 | | | | 2,540,478,094 | | | | 52,359,532 | | |
| Cash | | | - | | | | - | | | | - | | | | - | | |
| Foreign currency, at value(d) | | | - | | | | 118,663 | | | | - | | | | - | | |
| Receivables from: | |
| Investments sold | | | 211,856 | | | | 2,450,480 | | | | 1,626,167 | | | | 532,030 | | |
| Open forward foreign currency contracts (Note 2) | | | - | | | | - | | | | - | | | | - | | |
| Investment Adviser (Note 3) | | | - | | | | - | | | | - | | | | 591 | | |
| Fund shares sold | | | 79,427 | | | | 1,126,049 | | | | 1,674,783 | | | | 30,463 | | |
| Interest and dividends | | | 126,212 | | | | 1,465,290 | | | | 2,987,671 | | | | 59,431 | | |
| Variation margin on open futures contracts (Note 2) | | | - | | | | - | | | | - | | | | - | | |
| Foreign taxes withheld | | | - | | | | 27,918 | | | | - | | | | 5,025 | | |
| Open swap agreements, at value (Note 2) | | | - | | | | - | | | | - | | | | - | | |
| Prepaid expenses | | | - | | | | - | | | | 14,635 | | | | - | | |
| Total assets | | | 107,796,290 | | | | 1,601,752,637 | | | | 2,546,781,350 | | | | 52,987,072 | | |
| Liabilities: | |
| Payables for: | |
| Investments purchased | | | - | | | | 3,260,624 | | | | 3,623,270 | | | | 1,687,513 | | |
| Written options outstanding, at value (Note 2)(e) | | | - | | | | - | | | | - | | | | - | | |
| Open forward foreign currency contracts (Note 2) | | | - | | | | - | | | | - | | | | - | | |
| Fund shares repurchased | | | 24,611 | | | | 736,592 | | | | 1,485,363 | | | | 12,611 | | |
| Variation margin on open futures contracts (Note 2) | | | - | | | | - | | | | 51,884 | | | | - | | |
| Securities on loan (Note 2) | | | 5,507,619 | | | | 84,211,007 | | | | 120,334,873 | | | | 3,945,556 | | |
| Open swap agreements, at value (Note 2) | | | - | | | | - | | | | - | | | | - | | |
| Directors' fees and expenses (Note 3) | | | 5,850 | | | | 72,623 | | | | 108,014 | | | | 484 | | |
| Affiliates (Note 3): | |
| Investment management fees | | | 57,963 | | | | 788,443 | | | | 193,623 | | | | 26,272 | | |
| Administration fees | | | 13,313 | | | | 245,815 | | | | 613,884 | | | | 8,206 | | |
| Service fees | | | 17,679 | | | | 256,761 | | | | 87,441 | | | | 11,999 | | |
| Distribution fees | | | 95 | | | | 1,153 | | | | 2,879 | | | | 70 | | |
| Accrued expense and other liabilities | | | 14,717 | | | | 12,172 | | | | 13,635 | | | | 22,147 | | |
| Total liabilities | | | 5,641,847 | | | | 89,585,190 | | | | 126,514,866 | | | | 5,714,858 | | |
| Net assets | | $ | 102,154,443 | | | $ | 1,512,167,447 | | | $ | 2,420,266,484 | | | $ | 47,272,214 | | |
| Net assets consist of: | |
| Paid-in capital | | $ | 85,770,669 | | | $ | 981,069,503 | | | $ | 1,890,489,008 | | | $ | 42,026,915 | | |
Undistributed net investment income (distributions in excess of
net investment income) | | | 511,163 | | | | 7,306,137 | | | | 18,063,473 | | | | 151,267 | | |
| Accumulated net realized gain (loss) on investments | | | 7,923,281 | | | | 53,993,973 | | | | (44,059,298 | ) | | | 1,692,657 | | |
| Net unrealized appreciation (depreciation) on investments | | | 7,949,330 | | | | 469,797,834 | | | | 555,773,301 | | | | 3,401,375 | | |
| Net Assets | | $ | 102,154,443 | | | $ | 1,512,167,447 | | | $ | 2,420,266,484 | | | $ | 47,272,214 | | |
| (a) Cost of investments - unaffiliated issuers: | | $ | 93,111,917 | | | $ | 1,021,910,238 | | | $ | 1,843,203,982 | | | $ | 42,790,565 | | |
| (b) Cost of short-term investments: | | $ | 6,317,548 | | | $ | 104,856,916 | | | $ | 141,370,685 | | | $ | 6,167,592 | | |
| (c) Securities on loan with market value of: | | $ | 5,309,886 | | | $ | 81,681,799 | | | $ | 116,531,908 | | | $ | 3,815,714 | | |
| (d) Cost of foreign currency: | | $ | - | | | $ | 118,694 | | | $ | - | | | $ | - | | |
193
MassMutual Select Funds – Financial Statements (Continued)
Statement of Assets and Liabilities
June 30, 2007 (Unaudited)
| | | MassMutual
Select
Strategic Bond
Fund | | MassMutual
Select
Strategic Balanced
Fund | | MassMutual
Select
Diversified Value
Fund | | MassMutual
Select
Fundamental Value
Fund | |
| Class A shares: | |
| Net assets | | $ | 60,812,721 | | | $ | 30,584,318 | | | $ | 100,781,617 | | | $ | 297,796,970 | | |
| Shares outstanding | | | 6,093,198 | | | | 2,583,766 | | | | 7,273,028 | | | | 22,373,645 | | |
| Net asset value and redemption price per share | | $ | 9.98 | | | $ | 11.84 | | | $ | 13.86 | | | $ | 13.31 | | |
Offering price per share
(100/[100-maximum sales charge] of net asset value) | | $ | 10.48 | | | $ | 12.56 | | | $ | 14.71 | | | $ | 14.12 | | |
| Class L shares: | |
| Net assets | | $ | 21,135,226 | | | $ | 90,334,931 | | | $ | 87,359,579 | | | $ | 291,878,365 | | |
| Shares outstanding | | | 2,110,774 | | | | 7,607,780 | | | | 6,274,789 | | | | 21,810,805 | | |
| Net asset value, offering price and redemption price per share | | $ | 10.01 | | | $ | 11.87 | | | $ | 13.92 | | | $ | 13.38 | | |
| Class Y shares: | |
| Net assets | | $ | 146,512,571 | | | $ | 87,350,807 | | | $ | 150,947,393 | | | $ | 149,838,461 | | |
| Shares outstanding | | | 14,621,097 | | | | 7,348,415 | | | | 10,837,320 | | | | 11,172,068 | | |
| Net asset value, offering price and redemption price per share | | $ | 10.02 | | | $ | 11.89 | | | $ | 13.93 | | | $ | 13.41 | | |
| Class S shares: | |
| Net assets | | $ | 82,760,435 | | | $ | 29,456,246 | | | $ | 333,142,591 | | | $ | 564,939,905 | | |
| Shares outstanding | | | 8,253,179 | | | | 2,477,248 | | | | 23,872,158 | | | | 42,063,126 | | |
| Net asset value, offering price and redemption price per share | | $ | 10.03 | | | $ | 11.89 | | | $ | 13.96 | | | $ | 13.43 | | |
| Class Z shares: | |
| Net assets | | $ | - | | | $ | - | | | $ | - | | | $ | - | | |
| Shares outstanding | | | - | | | | - | | | | - | | | | - | | |
| Net asset value, offering price and redemption price per share | | $ | - | | | $ | - | | | $ | - | | | $ | - | | |
| Class N shares: | |
| Net assets | | $ | 2,544,872 | | | $ | 583,790 | | | $ | 2,449,890 | | | $ | 2,753,001 | | |
| Shares outstanding | | | 256,221 | | | | 49,475 | | | | 176,963 | | | | 208,344 | | |
| Net asset value, offering price and redemption price per share | | $ | 9.93 | | | $ | 11.80 | | | $ | 13.84 | | | $ | 13.21 | | |
The accompanying notes are an integral part of the financial statements.
194
| | | MassMutual
Select
Value Equity
Fund | | MassMutual
Select
Large Cap Value
Fund | | MassMutual
Select
Indexed Equity
Fund | | MassMutual
Select
Core Opportunities
Fund | |
| Class A shares: | |
| Net assets | | $ | 28,134,847 | | | $ | 416,313,893 | | | $ | 315,053,412 | | | $ | 19,885,712 | | |
| Shares outstanding | | | 2,597,537 | | | | 30,362,553 | | | | 22,676,502 | | | | 1,716,231 | | |
| Net asset value and redemption price per share | | $ | 10.83 | | | $ | 13.71 | | | $ | 13.89 | | | $ | 11.59 | | |
Offering price per share
(100/[100-maximum sales charge] of net asset value) | | $ | 11.49 | | | $ | 14.55 | | | $ | 14.74 | | | $ | 12.30 | | |
| Class L shares: | |
| Net assets | | $ | 12,242,876 | | | $ | 248,312,699 | | | $ | 357,158,959 | | | $ | 9,294,237 | | |
| Shares outstanding | | | 1,127,447 | | | | 18,024,615 | | | | 25,588,917 | | | | 800,561 | | |
| Net asset value, offering price and redemption price per share | | $ | 10.86 | | | $ | 13.78 | | | $ | 13.96 | | | $ | 11.61 | | |
| Class Y shares: | |
| Net assets | | $ | 5,775,139 | | | $ | 194,905,341 | | | $ | 511,270,199 | | | $ | 6,492,127 | | |
| Shares outstanding | | | 528,462 | | | | 14,100,875 | | | | 36,519,903 | | | | 558,242 | | |
| Net asset value, offering price and redemption price per share | | $ | 10.93 | | | $ | 13.82 | | | $ | 14.00 | | | $ | 11.63 | | |
| Class S shares: | |
| Net assets | | $ | 55,848,269 | | | $ | 651,599,218 | | | $ | 787,049,567 | | | $ | 11,484,455 | | |
| Shares outstanding | | | 5,117,533 | | | | 47,044,776 | | | | 55,661,526 | | | | 986,948 | | |
| Net asset value, offering price and redemption price per share | | $ | 10.91 | | | $ | 13.85 | | | $ | 14.14 | | | $ | 11.64 | | |
| Class Z shares: | |
| Net assets | | $ | - | | | $ | - | | | $ | 445,460,491 | | | $ | - | | |
| Shares outstanding | | | - | | | | - | | | | 31,467,647 | | | | - | | |
| Net asset value, offering price and redemption price per share | | $ | - | | | $ | - | | | $ | 14.16 | | | $ | - | | |
| Class N shares: | |
| Net assets | | $ | 153,312 | | | $ | 1,036,296 | | | $ | 4,273,856 | | | $ | 115,683 | | |
| Shares outstanding | | | 14,153 | | | | 76,415 | | | | 311,155 | | | | 10,010 | | |
| Net asset value, offering price and redemption price per share | | $ | 10.83 | | | $ | 13.56 | | | $ | 13.74 | | | $ | 11.56 | | |
195
MassMutual Select Funds – Financial Statements (Continued)
Statement of Assets and Liabilities
June 30, 2007 (Unaudited)
| | | MassMutual
Select
Blue Chip Growth
Fund | | MassMutual
Select
Large Cap Growth
Fund | | MassMutual
Select
Growth Equity
Fund | | MassMutual
Select
Aggressive Growth
Fund | |
| Assets: | |
| Investments, at value (Note 2)(a) | | $ | 555,563,452 | | | $ | 44,027,552 | | | $ | 441,786,251 | | | $ | 523,389,218 | | |
| Short-term investments, at value (Note 2)(b) | | | 52,884,117 | | | | 4,668,949 | | | | 27,101,506 | | | | 77,740,509 | | |
| Total investments(c) | | | 608,447,569 | | | | 48,696,501 | | | | 468,887,757 | | | | 601,129,727 | | |
| Receivables from: | |
| Investments sold | | | 2,923,705 | | | | 93,491 | | | | - | | | | 281,216 | | |
| Fund shares sold | | | 562,064 | | | | 2,905 | | | | 365,121 | | | | 537,714 | | |
| Interest and dividends | | | 411,391 | | | | 21,513 | | | | 609,767 | | | | 146,522 | | |
| Foreign taxes withheld | | | 20,530 | | | | 80 | | | | - | | | | - | | |
| Total assets | | | 612,365,259 | | | | 48,814,490 | | | | 469,862,645 | | | | 602,095,179 | | |
| Liabilities: | |
| Payables for: | |
| Investments purchased | | | 14,329,688 | | | | - | | | | - | | | | - | | |
| Fund shares repurchased | | | 111,623 | | | | 2,252 | | | | 340,184 | | | | 297,271 | | |
| Variation margin on open futures contracts (Note 2) | | | - | | | | - | | | | 6,750 | | | | - | | |
| Securities on loan (Note 2) | | | 38,771,276 | | | | 4,624,790 | | | | 16,461,749 | | | | 72,231,709 | | |
| Directors' fees and expenses (Note 3) | | | 25,672 | | | | 2,226 | | | | 47,780 | | | | 28,441 | | |
| Affiliates (Note 3): | |
| Investment management fees | | | 258,355 | | | | 23,103 | | | | 270,283 | | | | 309,353 | | |
| Administration fees | | | 150,903 | | | | 7,775 | | | | 84,638 | | | | 93,425 | | |
| Service fees | | | 30,954 | | | | 5,468 | | | | 46,077 | | | | 71,180 | | |
| Distribution fees | | | 1,823 | | | | 1 | | | | 41 | | | | 784 | | |
| Accrued expense and other liabilities | | | 15,351 | | | | 17,277 | | | | 11,053 | | | | 14,924 | | |
| Total liabilities | | | 53,695,645 | | | | 4,682,892 | | | | 17,268,555 | | | | 73,047,087 | | |
| Net assets | | $ | 558,669,614 | | | $ | 44,131,598 | | | $ | 452,594,090 | | | $ | 529,048,092 | | |
| Net assets consist of: | |
| Paid-in capital | | $ | 530,302,045 | | | $ | 37,544,962 | | | $ | 501,291,553 | | | $ | 483,535,564 | | |
Undistributed net investment income (distributions in excess of
net investment income) | | | 644,756 | | | | (26,625 | ) | | | 1,075,112 | | | | (1,785,682 | ) | |
| Accumulated net realized gain (loss) on investments | | | (49,693,438 | ) | | | 1,961,529 | | | | (74,917,862 | ) | | | (35,398,368 | ) | |
| Net unrealized appreciation (depreciation) on investments | | | 77,416,251 | | | | 4,651,732 | | | | 25,145,287 | | | | 82,696,578 | | |
| Net Assets | | $ | 558,669,614 | | | $ | 44,131,598 | | | $ | 452,594,090 | | | $ | 529,048,092 | | |
| (a) Cost of investments - unaffiliated issuers: | | $ | 478,147,669 | | | $ | 39,375,820 | | | $ | 416,627,779 | | | $ | 440,692,640 | | |
| (b) Cost of short-term investments: | | $ | 52,884,117 | | | $ | 4,668,949 | | | $ | 27,101,506 | | | $ | 77,740,509 | | |
| (c) Securities on loan with market value of: | | $ | 37,617,554 | | | $ | 4,495,176 | | | $ | 15,898,486 | | | $ | 70,415,785 | | |
The accompanying notes are an integral part of the financial statements.
196
| | | MassMutual
Select
OTC 100
Fund | | MassMutual
Select
Focused Value
Fund | | MassMutual
Select
Mid-Cap Value
Fund | |
| Assets: | |
| Investments, at value (Note 2)(a) | | $ | 43,898,491 | | | $ | 956,908,956 | | | $ | 215,657,170 | | |
| Short-term investments, at value (Note 2)(b) | | | 4,626,053 | | | | 211,103,490 | | | | 57,408,899 | | |
| Total investments(c) | | | 48,524,544 | | | | 1,168,012,446 | | | | 273,066,069 | | |
| Receivables from: | |
| Investments sold | | | - | | | | 3,552,394 | | | | 1,714,497 | | |
| Fund shares sold | | | 122,118 | | | | 1,412,281 | | | | 207,161 | | |
| Interest and dividends | | | 10,310 | | | | 948,611 | | | | 417,929 | | |
| Foreign taxes withheld | | | - | | | | - | | | | - | | |
| Total assets | | | 48,656,972 | | | | 1,173,925,732 | | | | 275,405,656 | | |
| Liabilities: | |
| Payables for: | |
| Investments purchased | | | - | | | | 5,923,360 | | | | 5,563,146 | | |
| Fund shares repurchased | | | 6,279 | | | | 506,021 | | | | 47,394 | | |
| Variation margin on open futures contracts (Note 2) | | | 49 | | | | - | | | | - | | |
| Securities on loan (Note 2) | | | 4,017,938 | | | | 159,342,969 | | | | 48,492,014 | | |
| Directors' fees and expenses (Note 3) | | | 4,427 | | | | 46,033 | | | | 770 | | |
| Affiliates (Note 3): | |
| Investment management fees | | | 5,321 | | | | 555,568 | | | | 121,761 | | |
| Administration fees | | | 19,000 | | | | 172,306 | | | | 26,020 | | |
| Service fees | | | 12,253 | | | | 162,474 | | | | 4,420 | | |
| Distribution fees | | | 285 | | | | 1,676 | | | | 27 | | |
| Accrued expense and other liabilities | | | 19,902 | | | | 3,804 | | | | (9,673 | ) | |
| Total liabilities | | | 4,085,454 | | | | 166,714,211 | | | | 54,245,879 | | |
| Net assets | | $ | 44,571,518 | | | $ | 1,007,211,521 | | | $ | 221,159,777 | | |
| Net assets consist of: | |
| Paid-in capital | | $ | 56,595,759 | | | $ | 694,592,866 | | | $ | 203,263,224 | | |
Undistributed net investment income (distributions in excess of
net investment income) | | | (56,652 | ) | | | 1,340,594 | | | | 494,205 | | |
| Accumulated net realized gain (loss) on investments | | | (21,188,754 | ) | | | 89,802,837 | | | | 6,260,836 | | |
| Net unrealized appreciation (depreciation) on investments | | | 9,221,165 | | | | 221,475,224 | | | | 11,141,512 | | |
| Net Assets | | $ | 44,571,518 | | | $ | 1,007,211,521 | | | $ | 221,159,777 | | |
| (a) Cost of investments - unaffiliated issuers: | | $ | 34,676,759 | | | $ | 735,433,732 | | | $ | 204,515,658 | | |
| (b) Cost of short-term investments: | | $ | 4,626,053 | | | $ | 211,103,490 | | | $ | 57,408,899 | | |
| (c) Securities on loan with market value of: | | $ | 3,820,795 | | | $ | 154,361,449 | | | $ | 46,642,755 | | |
197
MassMutual Select Funds – Financial Statements (Continued)
Statement of Assets and Liabilities
June 30, 2007 (Unaudited)
| | | MassMutual
Select
Blue Chip Growth
Fund | | MassMutual
Select
Large Cap Growth
Fund | | MassMutual
Select
Growth Equity
Fund | | MassMutual
Select
Aggressive Growth
Fund | |
| Class A shares: | |
| Net assets | | $ | 47,833,388 | | | $ | 9,051,409 | | | $ | 69,092,556 | | | $ | 111,968,708 | | |
| Shares outstanding | | | 4,522,255 | | | | 858,342 | | | | 8,105,604 | | | | 17,342,715 | | |
| Net asset value and redemption price per share | | $ | 10.58 | | | $ | 10.55 | | | $ | 8.52 | | | $ | 6.46 | | |
Offering price per share
(100/[100-maximum sales charge] of net asset value) | | $ | 11.23 | | | $ | 11.19 | | | $ | 9.04 | | | $ | 6.85 | | |
| Class L shares: | |
| Net assets | | $ | 364,559,113 | | | $ | 1,412,026 | | | $ | 171,353,304 | | | $ | 134,531,095 | | |
| Shares outstanding | | | 34,003,735 | | | | 130,344 | | | | 19,879,916 | | | | 20,460,660 | | |
| Net asset value, offering price and redemption price per share | | $ | 10.72 | | | $ | 10.83 | | | $ | 8.62 | | | $ | 6.58 | | |
| Class Y shares: | |
| Net assets | | $ | 31,330,518 | | | $ | 12,556,969 | | | $ | 60,134,209 | | | $ | 41,726,256 | | |
| Shares outstanding | | | 2,920,051 | | | | 1,169,023 | | | | 6,925,925 | | | | 6,284,676 | | |
| Net asset value, offering price and redemption price per share | | $ | 10.73 | | | $ | 10.74 | | | $ | 8.68 | | | $ | 6.64 | | |
| Class S shares: | |
| Net assets | | $ | 112,068,343 | | | $ | 21,109,775 | | | $ | 151,948,139 | | | $ | 239,640,133 | | |
| Shares outstanding | | | 10,399,982 | | | | 1,955,217 | | | | 17,438,513 | | | | 35,841,578 | | |
| Net asset value, offering price and redemption price per share | | $ | 10.78 | | | $ | 10.80 | | | $ | 8.71 | | | $ | 6.69 | | |
| Class N shares: | |
| Net assets | | $ | 2,878,252 | | | $ | 1,419 | | | $ | 65,882 | | | $ | 1,181,900 | | |
| Shares outstanding | | | 275,958 | | | | 135 | | | | 7,864 | | | | 186,598 | | |
| Net asset value, offering price and redemption price per share | | $ | 10.43 | | | $ | 10.51 | | | $ | 8.38 | | | $ | 6.33 | | |
The accompanying notes are an integral part of the financial statements.
198
| | | MassMutual
Select
OTC 100
Fund | | MassMutual
Select
Focused Value
Fund | | MassMutual
Select
Mid-Cap Value
Fund | |
| Class A shares: | |
| Net assets | | $ | 19,052,658 | | | $ | 266,485,875 | | | $ | 8,993,560 | | |
| Shares outstanding | | | 3,967,432 | | | | 13,308,471 | | | | 718,991 | | |
| Net asset value and redemption price per share | | $ | 4.80 | | | $ | 20.02 | | | $ | 12.51 | | |
Offering price per share
(100/[100-maximum sales charge] of net asset value) | | $ | 5.09 | | | $ | 21.24 | | | $ | 13.27 | | |
| Class L shares: | |
| Net assets | | $ | 8,394,975 | | | $ | 185,301,567 | | | $ | 77,481,680 | | |
| Shares outstanding | | | 1,720,525 | | | | 9,112,118 | | | | 6,178,403 | | |
| Net asset value, offering price and redemption price per share | | $ | 4.88 | | | $ | 20.34 | | | $ | 12.54 | | |
| Class Y shares: | |
| Net assets | | $ | 1,474,376 | | | $ | 149,612,475 | | | $ | 897,330 | | |
| Shares outstanding | | | 299,630 | | | | 7,299,853 | | | | 71,450 | | |
| Net asset value, offering price and redemption price per share | | $ | 4.92 | | | $ | 20.50 | | | $ | 12.56 | | |
| Class S shares: | |
| Net assets | | $ | 15,174,722 | | | $ | 402,648,902 | | | $ | 133,741,801 | | |
| Shares outstanding | | | 3,058,613 | | | | 19,504,475 | | | | 10,652,656 | | |
| Net asset value, offering price and redemption price per share | | $ | 4.96 | | | $ | 20.64 | | | $ | 12.55 | | |
| Class N shares: | |
| Net assets | | $ | 474,787 | | | $ | 3,162,702 | | | $ | 45,406 | | |
| Shares outstanding | | | 100,593 | | | | 160,786 | | | | 3,625 | | |
| Net asset value, offering price and redemption price per share | | $ | 4.72 | | | $ | 19.67 | | | $ | 12.52 | | |
199
MassMutual Select Funds – Financial Statements (Continued)
Statement of Assets and Liabilities
June 30, 2007 (Unaudited)
| | | MassMutual
Select
Small Cap Value
Equity Fund | | MassMutual
Select
Small Company Value
Fund | | MassMutual
Select
Small Cap Core
Equity Fund | | MassMutual
Select
Mid Cap Growth
Equity Fund | |
| Assets: | |
| Investments, at value (Note 2)(a) | | $ | 153,066,704 | | | $ | 720,031,529 | | | $ | 55,317,690 | | | $ | 166,479,146 | | |
| Short-term investments, at value (Note 2)(b) | | | 42,350,278 | | | | 195,951,417 | | | | 10,081,584 | | | | 26,072,349 | | |
| Total investments(c) | | | 195,416,982 | | | | 915,982,946 | | | | 65,399,274 | | | | 192,551,495 | | |
| Receivables from: | |
| Investments sold | | | 314,004 | | | | 5,929,460 | | | | 34,200 | | | | 2,568,748 | | |
| Open forward foreign currency contracts (Note 2) | | | - | | | | - | | | | - | | | | - | | |
| Fund shares sold | | | 110,987 | | | | 627,580 | | | | 45,725 | | | | 207,968 | | |
| Interest and dividends | | | 337,547 | | | | 663,360 | | | | 520,460 | | | | 52,920 | | |
| Broker for collateral held for open futures contracts (Note 2) | | | 108,800 | | | | - | | | | - | | | | - | | |
| Variation margin on open futures contracts (Note 2) | | | - | | | | - | | | | 2,030 | | | | - | | |
| Foreign taxes withheld | | | - | | | | - | | | | - | | | | - | | |
| Total assets | | | 196,288,320 | | | | 923,203,346 | | | | 66,001,689 | | | | 195,381,131 | | |
| Liabilities: | |
| Payables for: | |
| Investments purchased | | | - | | | | 7,535,487 | | | | - | | | | 1,970,569 | | |
| Fund shares repurchased | | | 54,554 | | | | 489,264 | | | | 40,536 | | | | 140,118 | | |
| Variation margin on open futures contracts (Note 2) | | | 9,467 | | | | - | | | | - | | | | - | | |
| Securities on loan (Note 2) | | | 38,671,982 | | | | 173,593,920 | | | | 9,794,729 | | | | 26,072,349 | | |
| Directors' fees and expenses (Note 3) | | | 626 | | | | 28,965 | | | | 423 | | | | 11,474 | | |
| Affiliates (Note 3): | |
| Investment management fees | | | 94,121 | | | | 507,048 | | | | 33,262 | | | | 94,915 | | |
| Administration fees | | | 17,535 | | | | 152,279 | | | | 7,139 | | | | 25,782 | | |
| Service fees | | | 6,365 | | | | 108,633 | | | | 1,915 | | | | 18,974 | | |
| Distribution fees | | | 71 | | | | 1,022 | | | | 66 | | | | 188 | | |
| Due to custodian | | | - | | | | - | | | | - | | | | 362,717 | | |
| Accrued expense and other liabilities | | | 21,440 | | | | 17,930 | | | | 20,696 | | | | 16,530 | | |
| Total liabilities | | | 38,876,161 | | | | 182,434,548 | | | | 9,898,766 | | | | 28,713,616 | | |
| Net assets | | $ | 157,412,159 | | | $ | 740,768,798 | | | $ | 56,102,923 | | | $ | 166,667,515 | | |
| Net assets consist of: | |
| Paid-in capital | | $ | 150,650,515 | | | $ | 548,616,430 | | | $ | 54,855,676 | | | $ | 208,090,734 | | |
Undistributed net investment income (distributions in excess of
net investment income) | | | 979,319 | | | | 1,172,076 | | | | 83,834 | | | | (283,513 | ) | |
| Accumulated net realized gain (loss) on investments | | | 5,211,790 | | | | 71,425,258 | | | | (112,511 | ) | | | (60,078,744 | ) | |
| Net unrealized appreciation (depreciation) on investments | | | 570,535 | | | | 119,555,034 | | | | 1,275,924 | | | | 18,939,038 | | |
| Net Assets | | $ | 157,412,159 | | | $ | 740,768,798 | | | $ | 56,102,923 | | | $ | 166,667,515 | | |
| (a) Cost of investments - unaffiliated issuers: | | $ | 152,486,290 | | | $ | 600,476,495 | | | $ | 54,042,852 | | | $ | 147,540,108 | | |
| (b) Cost of short-term investments: | | $ | 42,350,278 | | | $ | 195,951,417 | | | $ | 10,081,584 | | | $ | 26,072,349 | | |
| (c) Securities on loan with market value of: | | $ | 36,934,104 | | | $ | 166,892,948 | | | $ | 9,391,652 | | | $ | 25,271,372 | | |
The accompanying notes are an integral part of the financial statements.
200
| | | MassMutual
Select
Mid Cap Growth
Equity II Fund | | MassMutual
Select
Small Cap Growth
Equity Fund | | MassMutual
Select
Small Company
Growth Fund | | MassMutual
Select
Emerging Growth
Fund | |
| Assets: | |
| Investments, at value (Note 2)(a) | | $ | 1,371,281,992 | | | $ | 671,341,346 | | | $ | 166,449,438 | | | $ | 98,323,768 | | |
| Short-term investments, at value (Note 2)(b) | | | 257,056,829 | | | | 303,675,833 | | | | 54,947,284 | | | | 33,067,897 | | |
| Total investments(c) | | | 1,628,338,821 | | | | 975,017,179 | | | | 221,396,722 | | | | 131,391,665 | | |
| Receivables from: | |
| Investments sold | | | 3,324,384 | | | | 4,682,842 | | | | 1,462,490 | | | | 1,983,577 | | |
| Open forward foreign currency contracts (Note 2) | | | - | | | | - | | | | - | | | | - | | |
| Fund shares sold | | | 1,702,633 | | | | 782,713 | | | | 295,424 | | | | 58,794 | | |
| Interest and dividends | | | 522,557 | | | | 287,008 | | | | 52,760 | | | | 46,616 | | |
| Broker for collateral held for open futures contracts (Note 2) | | | - | | | | - | | | | - | | | | - | | |
| Variation margin on open futures contracts (Note 2) | | | - | | | | - | | | | - | | | | - | | |
| Foreign taxes withheld | | | 1,461 | | | | 709 | | | | - | | | | - | | |
| Total assets | | | 1,633,889,856 | | | | 980,770,451 | | | | 223,207,396 | | | | 133,480,652 | | |
| Liabilities: | |
| Payables for: | |
| Investments purchased | | | 8,690,134 | | | | 4,565,967 | | | | 949,881 | | | | 1,017,785 | | |
| Fund shares repurchased | | | 730,871 | | | | 301,903 | | | | 110,058 | | | | 6,697 | | |
| Variation margin on open futures contracts (Note 2) | | | - | | | | - | | | | - | | | | - | | |
| Securities on loan (Note 2) | | | 201,434,087 | | | | 276,180,633 | | | | 52,902,964 | | | | 29,674,862 | | |
| Directors' fees and expenses (Note 3) | | | 55,863 | | | | 33,268 | | | | 8,048 | | | | 8,282 | | |
| Affiliates (Note 3): | |
| Investment management fees | | | 845,092 | | | | 456,651 | | | | 114,290 | | | | 63,329 | | |
| Administration fees | | | 280,741 | | | | 136,269 | | | | 37,428 | | | | 17,322 | | |
| Service fees | | | 225,749 | | | | 72,310 | | | | 35,287 | | | | 8,122 | | |
| Distribution fees | | | 2,161 | | | | 677 | | | | 452 | | | | 118 | | |
| Due to custodian | | | - | | | | - | | | | - | | | | - | | |
| Accrued expense and other liabilities | | | 9,121 | | | | 16,762 | | | | 23,309 | | | | 18,114 | | |
| Total liabilities | | | 212,273,819 | | | | 281,764,440 | | | | 54,181,717 | | | | 30,814,631 | | |
| Net assets | | $ | 1,421,616,037 | | | $ | 699,006,011 | | | $ | 169,025,679 | | | $ | 102,666,021 | | |
| Net assets consist of: | |
| Paid-in capital | | $ | 986,500,346 | | | $ | 504,717,254 | | | $ | 135,165,064 | | | $ | 115,335,704 | | |
Undistributed net investment income (distributions in excess of
net investment income) | | | (99,316 | ) | | | (1,879,528 | ) | | | (693,093 | ) | | | (151,567 | ) | |
| Accumulated net realized gain (loss) on investments | | | 93,114,948 | | | | 41,173,031 | | | | 10,554,452 | | | | (28,171,824 | ) | |
| Net unrealized appreciation (depreciation) on investments | | | 342,100,059 | | | | 154,995,254 | | | | 23,999,256 | | | | 15,653,708 | | |
| Net Assets | | $ | 1,421,616,037 | | | $ | 699,006,011 | | | $ | 169,025,679 | | | $ | 102,666,021 | | |
| (a) Cost of investments - unaffiliated issuers: | | $ | 1,029,182,823 | | | $ | 516,347,635 | | | $ | 142,450,182 | | | $ | 82,670,060 | | |
| (b) Cost of short-term investments: | | $ | 257,056,829 | | | $ | 303,675,833 | | | $ | 54,947,284 | | | $ | 33,067,897 | | |
| (c) Securities on loan with market value of: | | $ | 194,555,185 | | | $ | 265,621,522 | | | $ | 50,738,387 | | | $ | 28,716,807 | | |
201
MassMutual Select Funds – Financial Statements (Continued)
Statement of Assets and Liabilities
June 30, 2007 (Unaudited)
| | | MassMutual
Select
Small Cap Value
Equity Fund | | MassMutual
Select
Small Company Value
Fund | | MassMutual
Select
Small Cap Core
Equity Fund | | MassMutual
Select
Mid Cap Growth
Equity Fund | |
| Class A shares: | |
| Net assets | | $ | 12,248,820 | | | $ | 170,734,359 | | | $ | 3,365,187 | | | $ | 29,311,049 | | |
| Shares outstanding | | | 1,079,956 | | | | 10,503,309 | | | | 318,888 | | | | 2,632,065 | | |
| Net asset value and redemption price per share | | $ | 11.34 | | | $ | 16.26 | | | $ | 10.55 | | | $ | 11.14 | | |
Offering price per share
(100/[100-maximum sales charge] of net asset value) | | $ | 12.03 | | | $ | 17.25 | | | $ | 10.55 | | | $ | 11.82 | | |
| Class L shares: | |
| Net assets | | $ | 42,708,555 | | | $ | 123,619,735 | | | $ | 20,490,834 | | | $ | 44,932,882 | | |
| Shares outstanding | | | 3,756,272 | | | | 7,540,833 | | | | 1,937,003 | | | | 3,961,364 | | |
| Net asset value, offering price and redemption price per share | | $ | 11.37 | | | $ | 16.39 | | | $ | 10.58 | | | $ | 11.34 | | |
| Class Y shares: | |
| Net assets | | $ | 3,587,713 | | | $ | 156,033,353 | | | $ | 2,124,037 | | | $ | 5,744,118 | | |
| Shares outstanding | | | 315,172 | | | | 9,451,906 | | | | 200,439 | | | | 501,480 | | |
| Net asset value, offering price and redemption price per share | | $ | 11.38 | | | $ | 16.51 | | | $ | 10.60 | | | $ | 11.45 | | |
| Class S shares: | |
| Net assets | | $ | 98,753,475 | | | $ | 288,445,969 | | | $ | 30,017,574 | | | $ | 86,374,230 | | |
| Shares outstanding | | | 8,667,259 | | | | 17,405,388 | | | | 2,832,291 | | | | 7,516,670 | | |
| Net asset value, offering price and redemption price per share | | $ | 11.39 | | | $ | 16.57 | | | $ | 10.60 | | | $ | 11.49 | | |
| Class N shares: | |
| Net assets | | $ | 113,596 | | | $ | 1,935,382 | | | $ | 105,291 | | | $ | 305,236 | | |
| Shares outstanding | | | 10,010 | | | | 121,148 | | | | 10,010 | | | | 27,817 | | |
| Net asset value, offering price and redemption price per share | | $ | 11.35 | | | $ | 15.98 | | | $ | 10.52 | | | $ | 10.97 | | |
The accompanying notes are an integral part of the financial statements.
202
| | | MassMutual
Select
Mid Cap Growth
Equity II Fund | | MassMutual
Select
Small Cap Growth
Equity Fund | | MassMutual
Select
Small Company
Growth Fund | | MassMutual
Select
Emerging Growth
Fund | |
| Class A shares: | |
| Net assets | | $ | 374,798,429 | | | $ | 117,033,095 | | | $ | 58,365,635 | | | $ | 13,585,240 | | |
| Shares outstanding | | | 23,469,767 | | | | 6,620,298 | | | | 4,999,939 | | | | 1,919,539 | | |
| Net asset value and redemption price per share | | $ | 15.97 | | | $ | 17.68 | | | $ | 11.67 | | | $ | 7.08 | | |
Offering price per share
(100/[100-maximum sales charge] of net asset value) | | $ | 16.94 | | | $ | 18.76 | | | $ | 12.38 | | | $ | 7.51 | | |
| Class L shares: | |
| Net assets | | $ | 510,304,597 | | | $ | 117,435,881 | | | $ | 41,855,000 | | | $ | 39,769,697 | | |
| Shares outstanding | | | 31,409,773 | | | | 6,508,740 | | | | 3,523,207 | | | | 5,520,600 | | |
| Net asset value, offering price and redemption price per share | | $ | 16.25 | | | $ | 18.04 | | | $ | 11.88 | | | $ | 7.20 | | |
| Class Y shares: | |
| Net assets | | $ | 210,433,903 | | | $ | 143,503,945 | | | $ | 17,916,882 | | | $ | 783,374 | | |
| Shares outstanding | | | 12,810,327 | | | | 7,857,930 | | | | 1,495,584 | | | | 107,274 | | |
| Net asset value, offering price and redemption price per share | | $ | 16.43 | | | $ | 18.26 | | | $ | 11.98 | | | $ | 7.30 | | |
| Class S shares: | |
| Net assets | | $ | 322,330,291 | | | $ | 319,906,498 | | | $ | 50,421,663 | | | $ | 48,327,002 | | |
| Shares outstanding | | | 19,512,459 | | | | 17,329,332 | | | | 4,193,884 | | | | 6,572,641 | | |
| Net asset value, offering price and redemption price per share | | $ | 16.52 | | | $ | 18.46 | | | $ | 12.02 | | | $ | 7.35 | | |
| Class N shares: | |
| Net assets | | $ | 3,748,817 | | | $ | 1,126,592 | | | $ | 466,499 | | | $ | 200,708 | | |
| Shares outstanding | | | 238,728 | | | | 64,958 | | | | 40,810 | | | | 28,856 | | |
| Net asset value, offering price and redemption price per share | | $ | 15.70 | | | $ | 17.34 | | | $ | 11.43 | | | $ | 6.96 | | |
203
MassMutual Select Funds – Financial Statements (Continued)
Statement of Assets and Liabilities
June 30, 2007 (Unaudited)
| | | MassMutual
Select Diversified
International
Fund | | MassMutual
Select
Overseas
Fund | | MassMutual
Select Destination
Retirement
Income Fund | | MassMutual
Select Destination
Retirement
2010 Fund | |
| Assets: | |
| Investments at value | |
| Unaffiliated issuer(s)(a) | | $ | 138,124,363 | | | $ | 1,328,433,611 | | | $ | - | | | $ | - | | |
| Affiliated issuer(s)(b) | | | - | | | | - | | | | 273,672,492 | | | | 235,158,360 | | |
| Investments, at value (Note 2) | | | - | | | | - | | | | - | | | | - | | |
| Short-term investments, at value (Note 2)(c) | | | 9,709,642 | | | | 163,007,619 | | | | - | | | | - | | |
| Total investments(d) | | | 147,834,005 | | | | 1,491,441,230 | | | | 273,672,492 | | | | 235,158,360 | | |
| Foreign currency, at value(e) | | | 469,604 | | | | 677,301 | | | | - | | | | - | | |
| Receivables from: | |
| Investments sold | | | 149,503 | | | | 4,018,538 | | | | 116,894 | | | | 794 | | |
| Open forward foreign currency contracts (Note 2) | | | 79,915,358 | | | | 115,073,919 | | | | - | | | | - | | |
| Investment Adviser (Note 3) | | | 14,198 | | | | - | | | | - | | | | - | | |
| Fund shares sold | | | 101,386 | | | | 1,208,418 | | | | 381,574 | | | | 164,969 | | |
| Interest and dividends | | | 471,929 | | | | 2,578,844 | | | | - | | | | - | | |
| Variation margin on open futures contracts (Note 2) | | | 56,329 | | | | - | | | | - | | | | - | | |
| Foreign taxes withheld | | | 5,079 | | | | 782,972 | | | | - | | | | - | | |
| Total assets | | | 229,017,391 | | | | 1,615,781,222 | | | | 274,170,960 | | | | 235,324,123 | | |
| Liabilities: | |
| Payables for: | |
| Investments purchased | | | 45,041 | | | | 1,914,596 | | | | 381,574 | | | | 96,120 | | |
| Open forward foreign currency contracts (Note 2) | | | 79,136,707 | | | | 116,469,535 | | | | - | | | | - | | |
| Fund shares repurchased | | | 6,044 | | | | 681,610 | | | | 116,894 | | | | 69,643 | | |
| Securities on loan (Note 2) | | | 5,554,022 | | | | 127,928,033 | | | | - | | | | - | | |
| Directors' fees and expenses (Note 3) | | | 289 | | | | 42,695 | | | | 10,289 | | | | 4,646 | | |
| Affiliates (Note 3): | |
| Investment management fees | | | 99,920 | | | | 1,091,212 | | | | 10,914 | | | | 9,044 | | |
| Administration fees | | | 15,614 | | | | 109,362 | | | | 21,509 | | | | 21,593 | | |
| Service fees | | | 171 | | | | 194,217 | | | | 34,225 | | | | 43,030 | | |
| Distribution fees | | | 68 | | | | 1,961 | | | | 80 | | | | 241 | | |
| Accrued expense and other liabilities | | | 29,244 | | | | 103,643 | | | | 16,881 | | | | 19,892 | | |
| Total liabilities | | | 84,887,120 | | | | 248,536,864 | | | | 592,366 | | | | 264,209 | | |
| Net assets | | $ | 144,130,271 | | | $ | 1,367,244,358 | | | $ | 273,578,594 | | | $ | 235,059,914 | | |
| Net assets consist of: | |
| Paid-in capital | | $ | 127,524,891 | | | $ | 990,626,344 | | | $ | 264,525,901 | | | $ | 225,841,086 | | |
Undistributed net investment income (distributions in excess of
net investment income) | | | 1,443,558 | | | | 17,618,008 | | | | 714 | | | | (66,121 | ) | |
| Accumulated net realized gain (loss) on investments | | | 1,510,323 | | | | 117,766,591 | | | | 7,234,020 | | | | 5,239,363 | | |
| Net unrealized appreciation (depreciation) on investments | | | 13,651,499 | | | | 241,233,415 | | | | 1,817,959 | | | | 4,045,586 | | |
| Net Assets | | $ | 144,130,271 | | | $ | 1,367,244,358 | | | $ | 273,578,594 | | | $ | 235,059,914 | | |
| (a) Cost of investments - unaffiliated issuers: | | $ | 125,317,284 | | | $ | 1,085,281,146 | | | $ | - | | | $ | - | | |
| (b) Cost of investments - affiliated issuers: | | $ | - | | | $ | - | | | $ | 271,854,533 | | | $ | 231,112,774 | | |
| (c) Cost of short-term investments: | | $ | 9,709,642 | | | $ | 163,007,619 | | | $ | - | | | $ | - | | |
| (d) Securities on loan with market value of: | | $ | 5,259,272 | | | $ | 121,699,087 | | | $ | - | | | $ | - | | |
| (e) Cost of foreign currency: | | $ | 462,193 | | | $ | 746,077 | | | $ | - | | | $ | - | | |
The accompanying notes are an integral part of the financial statements.
204
| | | MassMutual
Select Destination
Retirement
2020 Fund | | MassMutual
Select Destination
Retirement
2030 Fund | | MassMutual
Select Destination
Retirement
2040 Fund | |
| Assets: | |
| Investments at value | |
| Unaffiliated issuer(s)(a) | | $ | - | | | $ | - | | | $ | - | | |
| Affiliated issuer(s)(b) | | | 683,912,741 | | | | 516,484,522 | | | | 291,003,183 | | |
| Investments, at value (Note 2) | | | - | | | | - | | | | - | | |
| Short-term investments, at value (Note 2)(c) | | | - | | | | - | | | | - | | |
| Total investments(d) | | | 683,912,741 | | | | 516,484,522 | | | | 291,003,183 | | |
| Foreign currency, at value(e) | | | - | | | | - | | | | - | | |
| Receivables from: | |
| Investments sold | | | 7,347 | | | | 98,234 | | | | 8,201 | | |
| Open forward foreign currency contracts (Note 2) | | | - | | | | - | | | | - | | |
| Investment Adviser (Note 3) | | | - | | | | - | | | | - | | |
| Fund shares sold | | | 885,005 | | | | 643,141 | | | | 416,884 | | |
| Interest and dividends | | | - | | | | - | | | | - | | |
| Variation margin on open futures contracts (Note 2) | | | - | | | | - | | | | - | | |
| Foreign taxes withheld | | | - | | | | - | | | | - | | |
| Total assets | | | 684,805,093 | | | | 517,225,897 | | | | 291,428,268 | | |
| Liabilities: | |
| Payables for: | |
| Investments purchased | | | 571,542 | | | | 521,563 | | | | 325,680 | | |
| Open forward foreign currency contracts (Note 2) | | | - | | | | - | | | | - | | |
| Fund shares repurchased | | | 320,809 | | | | 219,813 | | | | 99,405 | | |
| Securities on loan (Note 2) | | | - | | | | - | | | | - | | |
| Directors' fees and expenses (Note 3) | | | 18,313 | | | | 13,245 | | | | 7,572 | | |
| Affiliates (Note 3): | |
| Investment management fees | | | 26,857 | | | | 20,259 | | | | 11,441 | | |
| Administration fees | | | 73,924 | | | | 56,494 | | | | 29,348 | | |
| Service fees | | | 104,388 | | | | 80,850 | | | | 35,885 | | |
| Distribution fees | | | 230 | | | | 167 | | | | 137 | | |
| Accrued expense and other liabilities | | | 13,447 | | | | 15,938 | | | | 18,372 | | |
| Total liabilities | | | 1,129,510 | | | | 928,329 | | | | 527,840 | | |
| Net assets | | $ | 683,675,583 | | | $ | 516,297,568 | | | $ | 290,900,428 | | |
| Net assets consist of: | |
| Paid-in capital | | $ | 623,003,795 | | | $ | 444,037,048 | | | $ | 245,019,120 | | |
Undistributed net investment income (distributions in excess of
net investment income) | | | (870,891 | ) | | | (671,505 | ) | | | (358,118 | ) | |
| Accumulated net realized gain (loss) on investments | | | 33,159,150 | | | | 35,325,812 | | | | 22,070,143 | | |
| Net unrealized appreciation (depreciation) on investments | | | 28,383,529 | | | | 37,606,213 | | | | 24,169,283 | | |
| Net Assets | | $ | 683,675,583 | | | $ | 516,297,568 | | | $ | 290,900,428 | | |
| (a) Cost of investments - unaffiliated issuers: | | $ | - | | | $ | - | | | $ | - | | |
| (b) Cost of investments - affiliated issuers: | | $ | 655,529,212 | | | $ | 478,878,309 | | | $ | 266,833,900 | | |
| (c) Cost of short-term investments: | | $ | - | | | $ | - | | | $ | - | | |
| (d) Securities on loan with market value of: | | $ | - | | | $ | - | | | $ | - | | |
| (e) Cost of foreign currency: | | $ | - | | | $ | - | | | $ | - | | |
205
MassMutual Select Funds – Financial Statements (Continued)
Statement of Assets and Liabilities
June 30, 2007 (Unaudited)
| | | MassMutual
Select Diversified
International
Fund | | MassMutual
Select
Overseas
Fund | | MassMutual
Select Destination
Retirement
Income Fund | | MassMutual
Select Destination
Retirement
2010 Fund | |
| Class A shares: | |
| Net assets | | $ | 248,677 | | | $ | 305,928,796 | | | $ | 54,855,063 | | | $ | 70,687,830 | | |
| Shares outstanding | | | 21,704 | | | | 22,103,531 | | | | 5,210,449 | | | | 6,326,082 | | |
| Net asset value and redemption price per share | | $ | 11.46 | | | $ | 13.84 | | | $ | 10.53 | | | $ | 11.17 | | |
Offering price per share
(100/[100-maximum sales charge] of net asset value) | | $ | 12.16 | | | $ | 14.68 | | | $ | 11.17 | | | $ | 11.85 | | |
| Class L shares: | |
| Net assets | | $ | 49,863,011 | | | $ | 337,025,275 | | | $ | 92,911,890 | | | $ | 60,967,249 | | |
| Shares outstanding | | | 4,347,740 | | | | 24,166,164 | | | | 8,777,569 | | | | 5,427,540 | | |
| Net asset value, offering price and redemption price per share | | $ | 11.47 | | | $ | 13.95 | | | $ | 10.59 | | | $ | 11.23 | | |
| Class Y shares: | |
| Net assets | | $ | 367,841 | | | $ | 230,590,064 | | | $ | 116,069,908 | | | $ | 72,478,379 | | |
| Shares outstanding | | | 32,057 | | | | 16,481,614 | | | | 10,959,591 | | | | 6,445,505 | | |
| Net asset value, offering price and redemption price per share | | $ | 11.47 | | | $ | 13.99 | | | $ | 10.59 | | | $ | 11.24 | | |
| Class S shares: | |
| Net assets | | $ | 93,536,227 | | | $ | 490,130,589 | | | $ | 9,613,278 | | | $ | 30,529,408 | | |
| Shares outstanding | | | 8,147,074 | | | | 34,945,303 | | | | 907,807 | | | | 2,711,933 | | |
| Net asset value, offering price and redemption price per share | | $ | 11.48 | | | $ | 14.03 | | | $ | 10.59 | | | $ | 11.26 | | |
| Class N shares: | |
| Net assets | | $ | 114,515 | | | $ | 3,569,634 | | | $ | 128,455 | | | $ | 397,048 | | |
| Shares outstanding | | | 10,010 | | | | 260,756 | | | | 12,183 | | | | 35,495 | | |
| Net asset value, offering price and redemption price per share | | $ | 11.44 | | | $ | 13.69 | | | $ | 10.54 | | | $ | 11.19 | | |
The accompanying notes are an integral part of the financial statements.
206
| | | MassMutual
Select Destination
Retirement
2020 Fund | | MassMutual
Select Destination
Retirement
2030 Fund | | MassMutual
Select Destination
Retirement
2040 Fund | |
| Class A shares: | |
| Net assets | | $ | 172,685,438 | | | $ | 135,241,315 | | | $ | 61,255,782 | | |
| Shares outstanding | | | 14,656,112 | | | | 10,476,120 | | | | 4,568,691 | | |
| Net asset value and redemption price per share | | $ | 11.78 | | | $ | 12.91 | | | $ | 13.41 | | |
Offering price per share
(100/[100-maximum sales charge] of net asset value) | | $ | 12.50 | | | $ | 13.70 | | | $ | 14.23 | | |
| Class L shares: | |
| Net assets | | $ | 291,257,889 | | | $ | 235,090,709 | | | $ | 150,953,552 | | |
| Shares outstanding | | | 24,568,081 | | | | 18,094,277 | | | | 11,190,829 | | |
| Net asset value, offering price and redemption price per share | | $ | 11.86 | | | $ | 12.99 | | | $ | 13.49 | | |
| Class Y shares: | |
| Net assets | | $ | 135,980,383 | | | $ | 89,837,604 | | | $ | 40,722,567 | | |
| Shares outstanding | | | 11,471,985 | | | | 6,916,701 | | | | 3,017,940 | | |
| Net asset value, offering price and redemption price per share | | $ | 11.85 | | | $ | 12.99 | | | $ | 13.49 | | |
| Class S shares: | |
| Net assets | | $ | 83,344,514 | | | $ | 55,843,800 | | | $ | 37,733,867 | | |
| Shares outstanding | | | 7,022,146 | | | | 4,293,344 | | | | 2,793,606 | | |
| Net asset value, offering price and redemption price per share | | $ | 11.87 | | | $ | 13.01 | | | $ | 13.51 | | |
| Class N shares: | |
| Net assets | | $ | 407,359 | | | $ | 284,140 | | | $ | 234,660 | | |
| Shares outstanding | | | 34,555 | | | | 21,995 | | | | 17,492 | | |
| Net asset value, offering price and redemption price per share | | $ | 11.79 | | | $ | 12.92 | | | $ | 13.42 | | |
207
MassMutual Select Funds – Financial Statements (Continued)
Statement of Operations
For the Six Months Ended June 30, 2007 (Unaudited)
| | | MassMutual
Select
Strategic Bond
Fund | | MassMutual
Select
Strategic Balanced
Fund | | MassMutual
Select
Diversified Value
Fund | | MassMutual
Select
Fundamental Value
Fund | |
| Investment Income (Note 2): | |
| Dividends(a) | | $ | 8,809 | | | $ | 1,432,966 | | | $ | 7,519,595 | | | $ | 13,135,340 | | |
| Interest | | | 7,712,992 | | | | 2,671,914 | | | | 344,675 | | | | 178,889 | | |
| Securities lending net income | | | 12,406 | | | | 24,313 | | | | 36,253 | | | | 44,876 | | |
| Total investment income | | | 7,734,207 | | | | 4,129,193 | | | | 7,900,523 | | | | 13,359,105 | | |
| Expenses (Note 3): | |
| Investment management fees (Note 3) | | | 778,536 | | | | 716,664 | | | | 1,538,621 | | | | 4,061,259 | | |
| Custody fees | | | 35,768 | | | | 42,119 | | | | 25,167 | | | | 51,866 | | |
| Trustee reporting | | | 1,280 | | | | 1,280 | | | | 1,276 | | | | 1,280 | | |
| Audit and legal fees | | | 19,909 | | | | 20,429 | | | | 16,576 | | | | 18,828 | | |
| Proxy fees | | | 503 | | | | 623 | | | | 540 | | | | 623 | | |
| Shareholder reporting fees | | | 2,679 | | | | 2,607 | | | | 5,934 | | | | 13,676 | | |
| Directors' fees (Note 3) | | | 4,696 | | | | 4,548 | | | | 10,444 | | | | 23,920 | | |
| | | | 843,371 | | | | 788,270 | | | | 1,598,558 | | | | 4,171,452 | | |
| Administration fees (Note 3): | |
| Class A | | | 63,011 | | | | 51,498 | | | | 140,597 | | | | 461,928 | | |
| Class L | | | 24,938 | | | | 149,639 | | | | 110,196 | | | | 451,257 | | |
| Class Y | | | 66,616 | | | | 80,406 | | | | 115,024 | | | | 114,363 | | |
| Class S | | | 19,312 | | | | 15,520 | | | | 85,954 | | | | 321,744 | | |
| Class Z | | | - | | | | - | | | | - | | | | - | | |
| Class N | | | 3,396 | | | | 1,081 | | | | 3,504 | | | | 3,506 | | |
| Distribution fees (Note 3): | |
| Class N | | | 2,830 | | | | 717 | | | | 2,378 | | | | 2,415 | | |
| Service fees (Note 3): | |
| Class A | | | 63,011 | | | | 39,372 | | | | 114,010 | | | | 369,070 | | |
| Class N | | | 2,830 | | | | 717 | | | | 2,378 | | | | 2,415 | | |
| Total expenses | | | 1,089,315 | | | | 1,127,220 | | | | 2,172,599 | | | | 5,898,150 | | |
| Expenses waived (Note 3): | | | (34,999 | ) | | | (10,858 | ) | | | - | | | | - | | |
| Class A Administration fees waived (Note 3) | | | - | | | | - | | | | - | | | | - | | |
| Class L Administration fees waived (Note 3) | | | - | | | | - | | | | - | | | | - | | |
| Class N Administration fees waived (Note 3) | | | - | | | | - | | | | - | | | | - | | |
| Net expenses | | | 1,054,316 | | | | 1,116,362 | | | | 2,172,599 | | | | 5,898,150 | | |
| Net investment income (loss) | | | 6,679,891 | | | | 3,012,831 | | | | 5,727,924 | | | | 7,460,955 | | |
| Realized and unrealized gain (loss): | |
| Net realized gain (loss) on: | |
| Investment transactions | | | (1,008,545 | ) | | | 8,297,911 | | | | 16,833,826 | | | | 45,885,430 | | |
| Closed futures contracts | | | (1,098,903 | ) | | | (249,924 | ) | | | - | | | | - | | |
| Written options | | | 571,432 | | | | 208,195 | | | | - | | | | - | | |
| Closed swap contracts | | | 147,600 | | | | 11,883 | | | | - | | | | - | | |
| Foreign currency transactions | | | (50,343 | ) | | | (25,654 | ) | | | - | | | | - | | |
| Net realized gain (loss) | | | (1,438,759 | ) | | | 8,242,411 | | | | 16,833,826 | | | | 45,885,430 | | |
| Net change in unrealized appreciation (depreciation) on: | |
| Investments | | | (5,547,419 | ) | | | (2,367,600 | ) | | | 15,064,960 | | | | 50,279,444 | | |
| Open futures contracts | | | (47,429 | ) | | | 14,325 | | | | - | | | | - | | |
| Written options | | | (156,532 | ) | | | (63,123 | ) | | | - | | | | - | | |
| Open swap contracts | | | (238,250 | ) | | | 66,450 | | | | - | | | | - | | |
| Translation of assets and liabilities in foreign currencies | | | 40,769 | | | | 10,860 | | | | - | | | | - | | |
| Net unrealized appreciation (depreciation) | | | (5,948,861 | ) | | | (2,339,088 | ) | | | 15,064,960 | | | | 50,279,444 | | |
| Net realized and unrealized gain (loss) | | | (7,387,620 | ) | | | 5,903,323 | | | | 31,898,786 | | | | 96,164,874 | | |
| Net increase (decrease) in net assets resulting from operations | | $ | (707,729 | ) | | $ | 8,916,154 | | | $ | 37,626,710 | | | $ | 103,625,829 | | |
| (a) Net of withholding tax of: | | $ | - | | | $ | 18,457 | | | $ | 48,177 | | | $ | 117,226 | | |
The accompanying notes are an integral part of the financial statements.
208
| | | MassMutual
Select
Value Equity
Fund | | MassMutual
Select
Large Cap Value
Fund | | MassMutual
Select
Indexed Equity
Fund | | MassMutual
Select
Core Opportunities
Fund | |
| Investment Income (Note 2): | |
| Dividends(a) | | $ | 975,919 | | | $ | 14,112,093 | | | $ | 21,830,047 | | | $ | 354,312 | | |
| Interest | | | 20,085 | | | | 375,402 | | | | 765,050 | | | | 31,016 | | |
| Securities lending net income | | | 2,530 | | | | 70,964 | | | | 54,787 | | | | 4,832 | | |
| Total investment income | | | 998,534 | | | | 14,558,459 | | | | 22,649,884 | | | | 390,160 | | |
| Expenses (Note 3): | |
| Investment management fees (Note 3) | | | 350,346 | | | | 4,889,584 | | | | 1,159,483 | | | | 147,713 | | |
| Custody fees | | | 13,405 | | | | 128,516 | | | | 104,880 | | | | 13,582 | | |
| Trustee reporting | | | 1,249 | | | | 1,249 | | | | 1,249 | | | | 888 | | |
| Audit and legal fees | | | 15,160 | | | | 20,087 | | | | 22,934 | | | | 15,412 | | |
| Proxy fees | | | 747 | | | | 623 | | | | 540 | | | | 378 | | |
| Shareholder reporting fees | | | 1,062 | | | | 17,059 | | | | 24,394 | | | | 347 | | |
| Directors' fees (Note 3) | | | 1,855 | | | | 29,754 | | | | 42,598 | | | | 575 | | |
| | | | 383,824 | | | | 5,086,872 | | | | 1,356,078 | | | | 178,895 | | |
| Administration fees (Note 3): | |
| Class A | | | 38,843 | | | | 654,203 | | | | 729,326 | | | | 25,789 | | |
| Class L | | | 17,069 | | | | 513,697 | | | | 832,760 | | | | 12,416 | | |
| Class Y | | | 3,530 | | | | 183,896 | | | | 827,426 | | | | 4,477 | | |
| Class S | | | 21,315 | | | | 241,107 | | | | 1,127,483 | | | | 2,664 | | |
| Class Z | | | - | | | | - | | | | 174,664 | | | | - | | |
| Class N | | | 241 | | | | 4,149 | | | | 12,677 | | | | 191 | | |
| Distribution fees (Note 3): | |
| Class N | | | 184 | | | | 2,770 | | | | 5,983 | | | | 136 | | |
| Service fees (Note 3): | |
| Class A | | | 34,868 | | | | 504,163 | | | | 380,095 | | | | 21,491 | | |
| Class N | | | 184 | | | | 2,770 | | | | 5,983 | | | | 136 | | |
| Total expenses | | | 500,058 | | | | 7,193,627 | | | | 5,452,475 | | | | 246,195 | | |
| Expenses waived (Note 3): | | | - | | | | - | | | | - | | | | (7,534 | ) | |
| Class A Administration fees waived (Note 3) | | | - | | | | - | | | | (304,076 | ) | | | - | | |
| Class L Administration fees waived (Note 3) | | | - | | | | - | | | | (347,200 | ) | | | - | | |
| Class N Administration fees waived (Note 3) | | | - | | | | - | | | | (4,787 | ) | | | - | | |
| Net expenses | | | 500,058 | | | | 7,193,627 | | | | 4,796,412 | | | | 238,661 | | |
| Net investment income (loss) | | | 498,476 | | | | 7,364,832 | | | | 17,853,472 | | | | 151,499 | | |
| Realized and unrealized gain (loss): | |
| Net realized gain (loss) on: | |
| Investment transactions | | | 5,054,012 | | | | 83,418,504 | | | | 3,628,819 | | | | 1,487,581 | | |
| Closed futures contracts | | | - | | | | - | | | | 2,195,822 | | | | - | | |
| Written options | | | - | | | | - | | | | - | | | | - | | |
| Closed swap contracts | | | - | | | | - | | | | - | | | | - | | |
| Foreign currency transactions | | | - | | | | 134,660 | | | | - | | | | - | | |
| Net realized gain (loss) | | | 5,054,012 | | | | 83,553,164 | | | | 5,824,641 | | | | 1,487,581 | | |
| Net change in unrealized appreciation (depreciation) on: | |
| Investments | | | 1,973,437 | | | | 9,433,969 | | | | 129,148,167 | | | | 1,866,167 | | |
| Open futures contracts | | | - | | | | - | | | | (181,858 | ) | | | - | | |
| Written options | | | - | | | | - | | | | - | | | | - | | |
| Open swap contracts | | | - | | | | - | | | | - | | | | - | | |
| Translation of assets and liabilities in foreign currencies | | | - | | | | 1,128 | | | | - | | | | - | | |
| Net unrealized appreciation (depreciation) | | | 1,973,437 | | | | 9,435,097 | | | | 128,966,309 | | | | 1,866,167 | | |
| Net realized and unrealized gain (loss) | | | 7,027,449 | | | | 92,988,261 | | | | 134,790,950 | | | | 3,353,748 | | |
| Net increase (decrease) in net assets resulting from operations | | $ | 7,525,925 | | | $ | 100,353,093 | | | $ | 152,644,422 | | | $ | 3,505,247 | | |
| (a) Net of withholding tax of: | | $ | - | | | $ | 109,634 | | | $ | - | | | $ | 6,264 | | |
209
MassMutual Select Funds – Financial Statements (Continued)
Statement of Operations
For the Six Months Ended June 30, 2007 (Unaudited)
| | | MassMutual
Select
Blue Chip Growth
Fund | | MassMutual
Select
Large Cap Growth
Fund | | MassMutual
Select
Growth Equity
Fund | | MassMutual
Select
Aggressive Growth
Fund | |
| Investment Income (Note 2): | |
| Dividends(a) | | $ | 2,845,737 | | | $ | 172,306 | | | $ | 3,790,720 | | | $ | 971,447 | | |
| Interest | | | 137,865 | | | | 7,346 | | | | 267,056 | | | | 116,651 | | |
| Securities lending net income | | | 32,297 | | | | 12,332 | | | | 10,446 | | | | 19,762 | | |
| Total investment income | | | 3,015,899 | | | | 191,984 | | | | 4,068,222 | | | | 1,107,860 | | |
| Expenses (Note 3): | |
| Investment management fees (Note 3) | | | 1,630,025 | | | | 139,084 | | | | 2,057,539 | | | | 1,996,325 | | |
| Custody fees | | | 28,645 | | | | 2,387 | | | | 95,234 | | | | 105,094 | | |
| Trustee reporting | | | 1,249 | | | | 1,280 | | | | 1,280 | | | | 1,280 | | |
| Audit and legal fees | | | 16,355 | | | | 14,699 | | | | 17,160 | | | | 16,746 | | |
| Proxy fees | | | 623 | | | | 540 | | | | 540 | | | | 623 | | |
| Shareholder reporting fees | | | 4,714 | | | | 445 | | | | 7,770 | | | | 6,300 | | |
| Directors' fees (Note 3) | | | 8,250 | | | | 777 | | | | 13,498 | | | | 10,966 | | |
| | | | 1,689,861 | | | | 159,212 | | | | 2,193,021 | | | | 2,137,334 | | |
| Administration fees (Note 3): | |
| Class A | | | 89,442 | | | | 15,130 | | | | 124,402 | | | | 196,389 | | |
| Class L | | | 602,791 | | | | 2,723 | | | | 400,721 | | | | 273,603 | | |
| Class Y | | | 63,821 | | | | 11,954 | | | | 46,076 | | | | 50,104 | | |
| Class S | | | 62,910 | | | | 17,017 | | | | 82,946 | | | | 104,412 | | |
| Class N | | | 7,296 | | | | 3 | | | | 119 | | | | 2,457 | | |
| Distribution fees (Note 3): | |
| Class N | | | 3,978 | | | | 2 | | | | 86 | | | | 1,558 | | |
| Service fees (Note 3): | |
| Class A | | | 54,738 | | | | 10,718 | | | | 104,540 | | | | 142,558 | | |
| Class N | | | 3,978 | | | | 2 | | | | 86 | | | | 1,558 | | |
| Total expenses | | | 2,578,815 | | | | 216,761 | | | | 2,951,997 | | | | 2,909,973 | | |
| Expenses waived (Note 3): | | | (232,861 | ) | | | - | | | | - | | | | - | | |
| Net expenses | | | 2,345,954 | | | | 216,761 | | | | 2,951,997 | | | | 2,909,973 | | |
| Net investment income (loss) | | | 669,945 | | | | (24,777 | ) | | | 1,116,225 | | | | (1,802,113 | ) | |
| Realized and unrealized gain (loss): | |
| Net realized gain (loss) on: | |
| Investment transactions | | | 9,039,784 | | | | 1,813,860 | | | | 47,482,820 | | | | 33,650,143 | | |
| Realized gain distributions from affiliated issuers (Note 7) | | | - | | | | - | | | | - | | | | - | | |
| Closed futures contracts | | | - | | | | - | | | | 265,614 | | | | - | | |
| Foreign currency transactions | | | (9,697 | ) | | | - | | | | 4 | | | | - | | |
| Net realized gain (loss) | | | 9,030,087 | | | | 1,813,860 | | | | 47,748,438 | | | | 33,650,143 | | |
| Net change in unrealized appreciation (depreciation) on: | |
| Investments | | | 29,829,153 | | | | 1,063,267 | | | | (17,071,634 | ) | | | 4,184,578 | | |
| Open futures contracts | | | - | | | | - | | | | (21,374 | ) | | | - | | |
| Translation of assets and liabilities in foreign currencies | | | (9 | ) | | | - | | | | (7 | ) | | | - | | |
| Net unrealized appreciation (depreciation) | | | 29,829,144 | | | | 1,063,267 | | | | (17,093,015 | ) | | | 4,184,578 | | |
| Net realized and unrealized gain (loss) | | | 38,859,231 | | | | 2,877,127 | | | | 30,655,423 | | | | 37,834,721 | | |
| Net increase (decrease) in net assets resulting from operations | | $ | 39,529,176 | | | $ | 2,852,350 | | | $ | 31,771,648 | | | $ | 36,032,608 | | |
| (a) Net of withholding tax of: | | $ | 87,474 | | | $ | 5,768 | | | $ | - | | | $ | 4,893 | | |
The accompanying notes are an integral part of the financial statements.
210
| | | MassMutual
Select
OTC 100
Fund | | MassMutual
Select
Focused Value
Fund | | MassMutual
Select
Mid-Cap Value
Fund | |
| Investment Income (Note 2): | |
| Dividends(a) | | $ | 106,401 | | | $ | (5,346,617 | ) | | $ | 1,060,333 | | |
| Interest | | | 46,503 | | | | 967,858 | | | | 174,639 | | |
| Securities lending net income | | | 6,033 | | | | 47,690 | | | | 12,878 | | |
| Total investment income | | | 158,937 | | | | (4,331,069 | ) | | | 1,247,850 | | |
| Expenses (Note 3): | |
| Investment management fees (Note 3) | | | 34,479 | | | | 3,347,767 | | | | 581,279 | | |
| Custody fees | | | 17,731 | | | | 46,583 | | | | 15,036 | | |
| Trustee reporting | | | 1,249 | | | | 1,280 | | | | 1,249 | | |
| Audit and legal fees | | | 15,407 | | | | 18,165 | | | | 15,347 | | |
| Proxy fees | | | 540 | | | | 540 | | | | 507 | | |
| Shareholder reporting fees | | | 522 | | | | 10,729 | | | | 994 | | |
| Directors' fees (Note 3) | | | 907 | | | | 18,527 | | | | 1,801 | | |
| | | | 70,835 | | | | 3,443,591 | | | | 616,213 | | |
| Administration fees (Note 3): | |
| Class A | | | 62,157 | | | | 421,380 | | | | 7,710 | | |
| Class L | | | 26,881 | | | | 309,866 | | | | 99,231 | | |
| Class Y | | | 3,383 | | | | 136,639 | | | | 282 | | |
| Class S | | | 29,162 | | | | 161,253 | | | | 23,597 | | |
| Class N | | | 1,510 | | | | 5,198 | | | | 41 | | |
| Distribution fees (Note 3): | |
| Class N | | | 560 | | | | 3,380 | | | | 29 | | |
| Service fees (Note 3): | |
| Class A | | | 24,886 | | | | 315,027 | | | | 6,425 | | |
| Class N | | | 560 | | | | 3,380 | | | | 29 | | |
| Total expenses | | | 219,934 | | | | 4,799,714 | | | | 753,557 | | |
| Expenses waived (Note 3): | | | - | | | | - | | | | - | | |
| Net expenses | | | 219,934 | | | | 4,799,714 | | | | 753,557 | | |
| Net investment income (loss) | | | (60,997 | ) | | | (9,130,783 | ) | | | 494,293 | | |
| Realized and unrealized gain (loss): | |
| Net realized gain (loss) on: | |
| Investment transactions | | | 2,864,591 | | | | 81,643,443 | | | | 6,150,473 | | |
| Realized gain distributions from affiliated issuers (Note 7) | | | - | | | | - | | | | - | | |
| Closed futures contracts | | | 24,487 | | | | - | | | | - | | |
| Foreign currency transactions | | | - | | | | - | | | | - | | |
| Net realized gain (loss) | | | 2,889,078 | | | | 81,643,443 | | | | 6,150,473 | | |
| Net change in unrealized appreciation (depreciation) on: | |
| Investments | | | 1,435,536 | | | | 28,083,854 | | | | 10,675,265 | | |
| Open futures contracts | | | 3,872 | | | | - | | | | - | | |
| Translation of assets and liabilities in foreign currencies | | | - | | | | - | | | | - | | |
| Net unrealized appreciation (depreciation) | | | 1,439,408 | | | | 28,083,854 | | | | 10,675,265 | | |
| Net realized and unrealized gain (loss) | | | 4,328,486 | | | | 109,727,297 | | | | 16,825,738 | | |
| Net increase (decrease) in net assets resulting from operations | | $ | 4,267,489 | | | $ | 100,596,514 | | | $ | 17,320,031 | | |
| (a) Net of withholding tax of: | | $ | 721 | | | $ | - | | | $ | - | | |
211
MassMutual Select Funds – Financial Statements (Continued)
Statement of Operations
For the Six Months Ended June 30, 2007 (Unaudited)
| | | MassMutual
Select Small Cap
Value Equity
Fund | | MassMutual
Select Small
Company Value
Fund | | MassMutual
Select Small Cap
Core Equity
Fund | | MassMutual
Select Mid Cap
Growth Equity
Fund | |
| Investment Income (Note 2): | |
| Dividends(a) | | $ | 1,329,568 | | | $ | 4,460,030 | | | $ | 252,899 | | | $ | 410,483 | | |
| Interest | | | 87,776 | | | | 334,247 | | | | 26,431 | | | | 67,113 | | |
| Securities lending net income | | | 51,136 | | | | 174,168 | | | | 14,845 | | | | 14,325 | | |
| Total investment income | | | 1,468,480 | | | | 4,968,445 | | | | 294,175 | | | | 491,921 | | |
| Expenses (Note 3): | |
| Investment management fees (Note 3) | | | 381,883 | | | | 3,289,511 | | | | 159,307 | | | | 564,889 | | |
| Custody fees | | | 11,857 | | | | 72,426 | | | | 5,544 | | | | 13,840 | | |
| Trustee reporting | | | 888 | | | | 1,280 | | | | 888 | | | | 1,249 | | |
| Audit and legal fees | | | 15,089 | | | | 17,253 | | | | 14,999 | | | | 15,365 | | |
| Proxy fees | | | 378 | | | | 623 | | | | 378 | | | | 540 | | |
| Shareholder reporting fees | | | 555 | | | | 8,585 | | | | 329 | | | | 1,652 | | |
| Directors' fees (Note 3) | | | 979 | | | | 15,028 | | | | 557 | | | | 2,890 | | |
| | | | 411,629 | | | | 3,404,706 | | | | 182,002 | | | | 600,425 | | |
| Administration fees (Note 3): | |
| Class A | | | 11,593 | | | | 310,800 | | | | 3,025 | | | | 46,208 | | |
| Class L | | | 48,603 | | | | 282,581 | | | | 19,745 | | | | 63,063 | | |
| Class Y | | | 2,099 | | | | 177,994 | | | | 1,416 | | | | 13,155 | | |
| Class S | | | 14,699 | | | | 230,349 | | | | 6,328 | | | | 32,088 | | |
| Class N | | | 194 | | | | 3,067 | | | | 182 | | | | 497 | | |
| Distribution fees (Note 3): | |
| Class N | | | 138 | | | | 1,873 | | | | 130 | | | | 348 | | |
| Service fees (Note 3): | |
| Class A | | | 9,661 | | | | 216,254 | | | | 2,520 | | | | 37,567 | | |
| Class N | | | 139 | | | | 1,873 | | | | 130 | | | | 348 | | |
| Total expenses | | | 498,755 | | | | 4,629,497 | | | | 215,478 | | | | 793,699 | | |
| Expenses waived (Note 3): | | | - | | | | - | | | | (591 | ) | | | - | | |
| Net expenses | | | 498,755 | | | | 4,629,497 | | | | 214,887 | | | | 793,699 | | |
| Net investment income (loss) | | | 969,725 | | | | 338,948 | | | | 79,288 | | | | (301,778 | ) | |
| Realized and unrealized gain (loss): | |
| Net realized gain (loss) on: | |
| Investment transactions | | | 4,666,709 | | | | 52,651,062 | | | | 369,397 | | | | 12,344,079 | | |
| Realized gain distributions from affiliated issuers (Note 7) | | | - | | | | - | | | | - | | | | - | | |
| Closed futures contracts | | | 139,842 | | | | - | | | | 37,434 | | | | - | | |
| Foreign currency transactions | | | - | | | | - | | | | - | | | | - | | |
| Net realized gain (loss) | | | 4,806,551 | | | | 52,651,062 | | | | 406,831 | | | | 12,344,079 | | |
| Net change in unrealized appreciation (depreciation) on: | |
| Investments | | | (1,385,863 | ) | | | (4,821,443 | ) | | | 144,787 | | | | (287,076 | ) | |
| Open futures contracts | | | (3,960 | ) | | | - | | | | 10 | | | | - | | |
| Translation of assets and liabilities in foreign currencies | | | - | | | | - | | | | - | | | | - | | |
| Net unrealized appreciation (depreciation) | | | (1,389,823 | ) | | | (4,821,443 | ) | | | 144,797 | | | | (287,076 | ) | |
| Net realized and unrealized gain (loss) | | | 3,416,728 | | | | 47,829,619 | | | | 551,628 | | | | 12,057,003 | | |
| Net increase (decrease) in net assets resulting from operations | | $ | 4,386,453 | | | $ | 48,168,567 | | | $ | 630,916 | | | $ | 11,755,225 | | |
| (a) Net of withholding tax of: | | $ | 1,138 | | | $ | (115 | ) | | $ | - | | | $ | 1,924 | | |
The accompanying notes are an integral part of the financial statements.
212
| | | MassMutual
Select Mid Cap
Growth Equity II
Fund | | MassMutual
Select Small Cap
Growth Equity
Fund | | MassMutual
Select Small
Company Growth
Fund | | MassMutual
Select
Emerging Growth
Fund | |
| Investment Income (Note 2): | |
| Dividends(a) | | $ | 6,131,599 | | | $ | 1,037,760 | | | $ | 154,865 | | | $ | 177,152 | | |
| Interest | | | 677,612 | | | | 564,011 | | | | 54,211 | | | | 72,060 | | |
| Securities lending net income | | | 223,553 | | | | 284,195 | | | | 157,797 | | | | 199,596 | | |
| Total investment income | | | 7,032,764 | | | | 1,885,966 | | | | 366,873 | | | | 448,808 | | |
| Expenses (Note 3): | |
| Investment management fees (Note 3) | | | 4,879,658 | | | | 2,690,181 | | | | 680,537 | | | | 413,402 | | |
| Custody fees | | | 79,696 | | | | 56,098 | | | | 52,790 | | | | 27,177 | | |
| Trustee reporting | | | 1,249 | | | | 1,280 | | | | 1,280 | | | | 1,249 | | |
| Audit and legal fees | | | 19,099 | | | | 16,982 | | | | 15,103 | | | | 15,195 | | |
| Proxy fees | | | 540 | | | | 623 | | | | 540 | | | | 623 | | |
| Shareholder reporting fees | | | 13,588 | | | | 6,778 | | | | 1,730 | | | | 1,183 | | |
| Directors' fees (Note 3) | | | 23,769 | | | | 11,850 | | | | 3,022 | | | | 2,059 | | |
| | | | 5,017,599 | | | | 2,783,792 | | | | 755,002 | | | | 460,888 | | |
| Administration fees (Note 3): | |
| Class A | | | 553,537 | | | | 232,675 | | | | 99,221 | | | | 21,682 | | |
| Class L | | | 840,344 | | | | 222,382 | | | | 72,550 | | | | 72,834 | | |
| Class Y | | | 168,896 | | | | 179,389 | | | | 18,048 | | | | 786 | | |
| Class S | | | 103,422 | | | | 171,801 | | | | 34,074 | | | | 19,873 | | |
| Class N | | | 5,838 | | | | 2,385 | | | | 1,507 | | | | 353 | | |
| Distribution fees (Note 3): | |
| Class N | | | 3,898 | | | | 1,303 | | | | 944 | | | | 230 | | |
| Service fees (Note 3): | |
| Class A | | | 426,585 | | | | 142,746 | | | | 71,055 | | | | 16,210 | | |
| Class N | | | 3,898 | | | | 1,303 | | | | 944 | | | | 230 | | |
| Total expenses | | | 7,124,017 | | | | 3,737,776 | | | | 1,053,345 | | | | 593,086 | | |
| Expenses waived (Note 3): | | | - | | | | - | | | | - | | | | - | | |
| Net expenses | | | 7,124,017 | | | | 3,737,776 | | | | 1,053,345 | | | | 593,086 | | |
| Net investment income (loss) | | | (91,253 | ) | | | (1,851,810 | ) | | | (686,472 | ) | | | (144,278 | ) | |
| Realized and unrealized gain (loss): | |
| Net realized gain (loss) on: | |
| Investment transactions | | | 76,624,456 | | | | 33,109,578 | | | | 9,865,093 | | | | 9,875,040 | | |
| Realized gain distributions from affiliated issuers (Note 7) | | | - | | | | - | | | | - | | | | - | | |
| Closed futures contracts | | | - | | | | - | | | | - | | | | - | | |
| Foreign currency transactions | | | (10,456 | ) | | | (10,365 | ) | | | - | | | | - | | |
| Net realized gain (loss) | | | 76,614,000 | | | | 33,099,213 | | | | 9,865,093 | | | | 9,875,040 | | |
| Net change in unrealized appreciation (depreciation) on: | |
| Investments | | | 93,046,231 | | | | 36,637,747 | | | | 9,720,728 | | | | 3,986,392 | | |
| Open futures contracts | | | - | | | | - | | | | - | | | | - | | |
| Translation of assets and liabilities in foreign currencies | | | 3,472 | | | | 1,641 | | | | - | | | | - | | |
| Net unrealized appreciation (depreciation) | | | 93,049,703 | | | | 36,639,388 | | | | 9,720,728 | | | | 3,986,392 | | |
| Net realized and unrealized gain (loss) | | | 169,663,703 | | | | 69,738,601 | | | | 19,585,821 | | | | 13,861,432 | | |
| Net increase (decrease) in net assets resulting from operations | | $ | 169,572,450 | | | $ | 67,886,791 | | | $ | 18,899,349 | | | $ | 13,717,154 | | |
| (a) Net of withholding tax of: | | $ | 30,465 | | | $ | 7,578 | | | $ | - | | | $ | 748 | | |
213
MassMutual Select Funds – Financial Statements (Continued)
Statement of Operations
For the Six Months Ended June 30, 2007 (Unaudited)
| | | MassMutual
Select Diversified
International
Fund | | MassMutual
Select
Overseas
Fund | | MassMutual
Select Destination
Retirement
Income Fund | | MassMutual
Select Destination
Retirement 2010
Fund | |
| Investment Income (Note 2): | |
| Dividends(a) | | $ | 1,808,903 | | | $ | 25,807,590 | | | $ | - | | | $ | - | | |
| Dividend from affiliated issuers | | | - | | | | - | | | | 281,991 | | | | 193,533 | | |
| Interest | | | 104,695 | | | | 607,528 | | | | - | | | | - | | |
| Securities lending net income | | | 65,104 | | | | 635,406 | | | | - | | | | - | | |
| Total investment income | | | 1,978,702 | | | | 27,050,524 | | | | 281,991 | | | | 193,533 | | |
| Expenses (Note 3): | |
| Investment management fees (Note 3) | | | 465,792 | | | | 6,554,940 | | | | 69,931 | | | | 49,888 | | |
| Custody fees | | | 60,257 | | | | 677,952 | | | | 34,320 | | | | 33,808 | | |
| Trustee reporting | | | 1,249 | | | | 1,280 | | | | 1,249 | | | | 1,249 | | |
| Audit and legal fees | | | 15,128 | | | | 19,405 | | | | 14,548 | | | | 14,224 | | |
| Proxy fees | | | 507 | | | | 540 | | | | 517 | | | | 517 | | |
| Shareholder reporting fees | | | 460 | | | | 13,926 | | | | 2,996 | | | | 1,951 | | |
| Directors' fees (Note 3) | | | 860 | | | | 24,397 | | | | 5,206 | | | | 3,416 | | |
| | | | 544,253 | | | | 7,292,440 | | | | 128,767 | | | | 105,053 | | |
| Administration fees (Note 3): | |
| Class A | | | 206 | | | | 366,523 | | | | 38,770 | | | | 53,977 | | |
| Class L | | | 62,675 | | | | 388,180 | | | | 66,117 | | | | 43,174 | | |
| Class Y | | | 103 | | | | 119,038 | | | | 29,129 | | | | 21,497 | | |
| Class S | | | 15,337 | | | | 96,978 | | | | 890 | | | | 2,241 | | |
| Class N | | | 182 | | | | 4,191 | | | | 122 | | | | 384 | | |
| Distribution fees (Note 3): | |
| Class N | | | 130 | | | | 3,560 | | | | 156 | | | | 437 | | |
| Service fees (Note 3): | |
| Class A | | | 172 | | | | 375,074 | | | | 66,433 | | | | 79,566 | | |
| Class N | | | 130 | | | | 3,560 | | | | 156 | | | | 437 | | |
| Total expenses | | | 623,188 | | | | 8,649,544 | | | | 330,540 | | | | 306,766 | | |
| Expenses waived (Note 3): | | | (72,469 | ) | | | - | | | | - | | | | (14,172 | ) | |
| Class A Administration fees waived (Note 3) | | | - | | | | (150,029 | ) | | | - | | | | - | | |
| Class L Administration fees waived (Note 3) | | | - | | | | (158,895 | ) | | | - | | | | - | | |
| Class N Administration fees waived (Note 3) | | | - | | | | (1,424 | ) | | | - | | | | - | | |
| Net expenses | | | 550,719 | | | | 8,339,196 | | | | 330,540 | | | | 292,594 | | |
| Net investment income (loss) | | | 1,427,983 | | | | 18,711,328 | | | | (48,549 | ) | | | (99,061 | ) | |
| Realized and unrealized gain (loss): | |
| Net realized gain (loss) on: | |
| Investment transactions | | | 444,215 | | | | 94,243,765 | | | | - | | | | - | | |
| Investment transactions with affiliated issuers | | | - | | | | - | | | | 2,966,981 | | | | 1,661,651 | | |
| Realized gain distributions from affiliated issuers (Note 7) | | | - | | | | - | | | | - | | | | - | | |
| Closed futures contracts | | | 230,410 | | | | - | | | | - | | | | - | | |
| Foreign currency transactions | | | 839,431 | | | | (768,157 | ) | | | - | | | | - | | |
| Net realized gain (loss) | | | 1,514,056 | | | | 93,475,608 | | | | 2,966,981 | | | | 1,661,651 | | |
| Net change in unrealized appreciation (depreciation) on: | |
| Investments | | | 12,760,831 | | | | (7,192,870 | ) | | | 5,702,218 | | | | 5,796,342 | | |
| Open futures contracts | | | 52,474 | | | | - | | | | - | | | | - | | |
| Translation of assets and liabilities in foreign currencies | | | 788,335 | | | | (1,925,550 | ) | | | - | | | | - | | |
| Net unrealized appreciation (depreciation) | | | 13,601,640 | | | | (9,118,420 | ) | | | 5,702,218 | | | | 5,796,342 | | |
| Net realized and unrealized gain (loss) | | | 15,115,696 | | | | 84,357,188 | | | | 8,669,199 | | | | 7,457,993 | | |
| Net increase (decrease) in net assets resulting from operations | | $ | 16,543,679 | | | $ | 103,068,516 | | | $ | 8,620,650 | | | $ | 7,358,932 | | |
| (a) Net of withholding tax of: | | $ | 217,551 | | | $ | 2,551,083 | | | $ | - | | | $ | - | | |
The accompanying notes are an integral part of the financial statements.
214
| | | MassMutual
Select Destination
Retirement 2020
Fund | | MassMutual
Select Destination
Retirement 2030
Fund | | MassMutual
Select Destination
Retirement 2040
Fund | |
| Investment Income (Note 2): | |
| Dividends(a) | | $ | - | | | $ | - | | | $ | - | | |
| Dividend from affiliated issuers | | | - | | | | - | | | | - | | |
| Interest | | | - | | | | - | | | | - | | |
| Securities lending net income | | | - | | | | - | | | | - | | |
| Total investment income | | | - | | | | - | | | | - | | |
| Expenses (Note 3): | |
| Investment management fees (Note 3) | | | 156,723 | | | | 117,650 | | | | 65,800 | | |
| Custody fees | | | 32,636 | | | | 32,310 | | | | 31,731 | | |
| Trustee reporting | | | 1,249 | | | | 1,249 | | | | 1,249 | | |
| Audit and legal fees | | | 15,627 | | | | 15,106 | | | | 14,438 | | |
| Proxy fees | | | 517 | | | | 517 | | | | 517 | | |
| Shareholder reporting fees | | | 6,388 | | | | 4,725 | | | | 2,622 | | |
| Directors' fees (Note 3) | | | 11,178 | | | | 8,278 | | | | 4,599 | | |
| | | | 224,318 | | | | 179,835 | | | | 120,956 | | |
| Administration fees (Note 3): | |
| Class A | | | 138,462 | | | | 105,829 | | | | 42,551 | | |
| Class L | | | 243,349 | | | | 191,181 | | | | 114,495 | | |
| Class Y | | | 45,222 | | | | 29,191 | | | | 11,263 | | |
| Class S | | | 9,399 | | | | 5,584 | | | | 1,859 | | |
| Class N | | | 383 | | | | 275 | | | | 219 | | |
| Distribution fees (Note 3): | |
| Class N | | | 424 | | | | 308 | | | | 259 | | |
| Service fees (Note 3): | |
| Class A | | | 196,902 | | | | 152,668 | | | | 65,828 | | |
| Class N | | | 424 | | | | 308 | | | | 259 | | |
| Total expenses | | | 858,883 | | | | 665,179 | | | | 357,689 | | |
| Expenses waived (Note 3): | | | - | | | | (1,975 | ) | | | (4,368 | ) | |
| Class A Administration fees waived (Note 3) | | | - | | | | - | | | | - | | |
| Class L Administration fees waived (Note 3) | | | - | | | | - | | | | - | | |
| Class N Administration fees waived (Note 3) | | | - | | | | - | | | | - | | |
| Net expenses | | | 858,883 | | | | 663,204 | | | | 353,321 | | |
| Net investment income (loss) | | | (858,883 | ) | | | (663,204 | ) | | | (353,321 | ) | |
| Realized and unrealized gain (loss): | |
| Net realized gain (loss) on: | |
| Investment transactions | | | - | | | | - | | | | - | | |
| Investment transactions with affiliated issuers | | | 9,673,700 | | | | 12,892,879 | | | | 7,572,113 | | |
| Realized gain distributions from affiliated issuers (Note 7) | | | - | | | | - | | | | - | | |
| Closed futures contracts | | | - | | | | - | | | | - | | |
| Foreign currency transactions | | | - | | | | - | | | | - | | |
| Net realized gain (loss) | | | 9,673,700 | | | | 12,892,879 | | | | 7,572,113 | | |
| Net change in unrealized appreciation (depreciation) on: | |
| Investments | | | 23,869,175 | | | | 21,162,959 | | | | 14,115,540 | | |
| Open futures contracts | | | - | | | | - | | | | - | | |
| Translation of assets and liabilities in foreign currencies | | | - | | | | - | | | | - | | |
| Net unrealized appreciation (depreciation) | | | 23,869,175 | | | | 21,162,959 | | | | 14,115,540 | | |
| Net realized and unrealized gain (loss) | | | 33,542,875 | | | | 34,055,838 | | | | 21,687,653 | | |
| Net increase (decrease) in net assets resulting from operations | | $ | 32,683,992 | | | $ | 33,392,634 | | | $ | 21,334,332 | | |
| (a) Net of withholding tax of: | | $ | - | | | $ | - | | | $ | - | | |
215
MassMutual Select Funds – Financial Statements
Statement of Changes in Net Assets
| | | MassMutual Select
Strategic Bond Fund | | MassMutual Select
Strategic Balanced Fund | |
| | | Six Months
Ended
June 30, 2007
(Unaudited) | | Year
Ended
December 31, 2006 | | Six Months
Ended
June 30, 2007
(Unaudited) | | Year Ended
December 31, 2006 | |
| Increase (Decrease) in Net Assets: | |
| Operations: | |
| Net investment income (loss) | | $ | 6,679,891 | | | $ | 8,929,292 | | | $ | 3,012,831 | | | $ | 5,590,542 | | |
| Net realized gain (loss) on investment transactions | | | (1,438,759 | ) | | | 67,503 | | | | 8,242,411 | | | | 3,072,054 | | |
| Net change in unrealized appreciation (depreciation) on investments | | | (5,948,861 | ) | | | 56,647 | | | | (2,339,088 | ) | | | 17,109,706 | | |
| Net increase (decrease) in net assets resulting from operations | | | (707,729 | ) | | | 9,053,442 | | | | 8,916,154 | | | | 25,772,302 | | |
| Distributions to shareholders (Note 2): | |
| From net investment income: | |
| Class A | | | - | | | | (1,410,657 | ) | | | - | | | | (654,351 | ) | |
| Class L | | | - | | | | (688,929 | ) | | | - | | | | (2,142,821 | ) | |
| Class Y | | | - | | | | (4,163,489 | ) | | | - | | | | (2,244,347 | ) | |
| Class S | | | - | | | | (2,717,448 | ) | | | - | | | | (514,084 | ) | |
| Class Z | | | - | | | | - | | | | - | | | | - | | |
| Class N | | | - | | | | (73,384 | ) | | | - | | | | (10,465 | ) | |
| Total distributions from net investment income | | | - | | | | (9,053,907 | ) | | | - | | | | (5,566,068 | ) | |
| From net realized gains: | |
| Class A | | | - | | | | - | | | | - | | | | (294,380 | ) | |
| Class L | | | - | | | | - | | | | - | | | | (883,188 | ) | |
| Class Y | | | - | | | | - | | | | - | | | | (864,620 | ) | |
| Class S | | | - | | | | - | | | | - | | | | (192,641 | ) | |
| Class N | | | - | | | | - | | | | - | | | | (5,293 | ) | |
| Total distributions from net realized gains | | | - | | | | - | | | | - | | | | (2,240,122 | ) | |
| Net fund share transactions (Note 5): | |
| Class A | | | 21,605,269 | | | | 18,794,891 | | | | (2,664,296 | ) | | | 3,637,037 | | |
| Class L | | | 3,225,261 | | | | 14,021,659 | | | | (7,943,001 | ) | | | (13,991,003 | ) | |
| Class Y | | | 37,298,784 | | | | 50,252,505 | | | | (11,176,456 | ) | | | 10,128,663 | | |
| Class S | | | 11,448,971 | | | | 8,746,002 | | | | 5,540,575 | | | | 6,783,607 | | |
| Class N | | | 515,980 | | | | 1,806,357 | | | | (8,594 | ) | | | 113,468 | | |
| Increase (decrease) in net assets from fund share transactions | | | 74,094,265 | | | | 93,621,414 | | | | (16,251,772 | ) | | | 6,671,772 | | |
| Total increase (decrease) in net assets | | | 73,386,536 | | | | 93,620,949 | | | | (7,335,618 | ) | | | 24,637,884 | | |
| Net assets: | |
| Beginning of year | | | 240,379,289 | | | | 146,758,340 | | | | 245,645,710 | | | | 221,007,826 | | |
| End of year | | $ | 313,765,825 | | | $ | 240,379,289 | | | $ | 238,310,092 | | | $ | 245,645,710 | | |
Undistributed net investment income (distributions in excess of net investment
income) included in net assets at the end of the year | | $ | 6,712,071 | | | $ | 32,180 | | | $ | 3,110,075 | | | $ | 97,244 | | |
The accompanying notes are an integral part of the financial statements.
216
| | | Select Diversified Value Fund | | MassMutual Select
Fundamental Value Fund | |
| | | Six Months
Ended
June 30, 2007
(Unaudited) | | Year
Ended
December 31, 2006 | | Six Months
Ended
June 30, 2007
(Unaudited) | | Year
Ended
December 31, 2006 | |
| Increase (Decrease) in Net Assets: | |
| Operations: | |
| Net investment income (loss) | | $ | 5,727,924 | | | $ | 7,830,949 | | | $ | 7,460,955 | | | $ | 14,027,101 | | |
| Net realized gain (loss) on investment transactions | | | 16,833,826 | | | | 16,550,397 | | | | 45,885,430 | | | | 121,602,600 | | |
| Net change in unrealized appreciation (depreciation) on investments | | | 15,064,960 | | | | 58,437,836 | | | | 50,279,444 | | | | 88,290,063 | | |
| Net increase (decrease) in net assets resulting from operations | | | 37,626,710 | | | | 82,819,182 | | | | 103,625,829 | | | | 223,919,764 | | |
| Distributions to shareholders (Note 2): | |
| From net investment income: | |
| Class A | | | - | | | | (1,033,357 | ) | | | - | | | | (2,692,300 | ) | |
| Class L | | | - | | | | (813,624 | ) | | | - | | | | (3,246,135 | ) | |
| Class Y | | | - | | | | (2,103,559 | ) | | | - | | | | (1,621,468 | ) | |
| Class S | | | - | | | | (3,754,434 | ) | | | - | | | | (6,575,828 | ) | |
| Class Z | | | - | | | | - | | | | - | | | | - | | |
| Class N | | | - | | | | (17,485 | ) | | | - | | | | (7,783 | ) | |
| Total distributions from net investment income | | | - | | | | (7,722,459 | ) | | | - | | | | (14,143,514 | ) | |
| From net realized gains: | |
| Class A | | | - | | | | (2,376,436 | ) | | | - | | | | (23,956,139 | ) | |
| Class L | | | - | | | | (1,702,691 | ) | | | - | | | | (23,603,240 | ) | |
| Class Y | | | - | | | | (4,216,805 | ) | | | - | | | | (10,181,038 | ) | |
| Class S | | | - | | | | (7,183,386 | ) | | | - | | | | (40,888,297 | ) | |
| Class N | | | - | | | | (46,595 | ) | | | - | | | | (127,470 | ) | |
| Total distributions from net realized gains | | | - | | | | (15,525,913 | ) | | | - | | | | (98,756,184 | ) | |
| Net fund share transactions (Note 5): | |
| Class A | | | 13,067,564 | | | | 45,277,561 | | | | (36,706,814 | ) | | | 33,077,332 | | |
| Class L | | | 24,282,806 | | | | 22,488,886 | | | | (30,512,569 | ) | | | 39,124,863 | | |
| Class Y | | | (656,816 | ) | | | 70,411,890 | | | | 3,573,541 | | | | 39,618,929 | | |
| Class S | | | 68,382,737 | | | | 29,220,209 | | | | (18,751,670 | ) | | | 72,867,232 | | |
| Class N | | | 782,574 | | | | 1,269,832 | | | | 928,025 | | | | (498,239 | ) | |
| Increase (decrease) in net assets from fund share transactions | | | 105,858,865 | | | | 168,668,378 | | | | (81,469,487 | ) | | | 184,190,117 | | |
| Total increase (decrease) in net assets | | | 143,485,575 | | | | 228,239,188 | | | | 22,156,342 | | | | 295,210,183 | | |
| Net assets: | |
| Beginning of year | | | 531,195,495 | | | | 302,956,307 | | | | 1,285,050,360 | | | | 989,840,177 | | |
| End of year | | $ | 674,681,070 | | | $ | 531,195,495 | | | $ | 1,307,206,702 | | | $ | 1,285,050,360 | | |
Undistributed net investment income (distributions in excess of net investment
income) included in net assets at the end of the year | | $ | 5,717,454 | | | $ | (10,470 | ) | | $ | 7,422,197 | | | $ | (38,758 | ) | |
217
MassMutual Select Funds – Financial Statements (Continued)
Statement of Changes in Net Assets
| | | MassMutual Select
Value Equity Fund | | MassMutual Select
Large Cap Value Fund | |
| | | Six Months
Ended
June 30, 2007
(Unaudited) | | Year
Ended
December 31, 2006 | | Six Months
Ended
June 30, 2007
(Unaudited) | | Year
Ended
December 31, 2006 | |
| Increase (Decrease) in Net Assets: | |
| Operations: | |
| Net investment income (loss) | | $ | 498,476 | | | $ | 950,238 | | | $ | 7,364,832 | | | $ | 10,311,506 | | |
| Net realized gain (loss) on investment transactions | | | 5,054,012 | | | | 16,631,806 | | | | 83,553,164 | | | | 52,648,115 | | |
| Net change in unrealized appreciation (depreciation) on investments | | | 1,973,437 | | | | (4,892,525 | ) | | | 9,435,097 | | | | 151,979,004 | | |
| Net increase (decrease) in net assets resulting from operations | | | 7,525,925 | | | | 12,689,519 | | | | 100,353,093 | | | | 214,938,625 | | |
| Distributions to shareholders (Note 2): | |
| From net investment income: | |
| Class A | | | - | | | | (153,963 | ) | | | - | | | | (1,362,073 | ) | |
| Class L | | | - | | | | (106,358 | ) | | | - | | | | (2,220,553 | ) | |
| Class Y | | | - | | | | (49,718 | ) | | | - | | | | (1,520,505 | ) | |
| Class S | | | - | | | | (580,749 | ) | | | - | | | | (4,722,424 | ) | |
| Class Z | | | - | | | | - | | | | - | | | | - | | |
| Class N | | | - | | | | (569 | ) | | | - | | | | (1,869 | ) | |
| Total distributions from net investment income | | | - | | | | (891,357 | ) | | | - | | | | (9,827,424 | ) | |
| From tax return of capital: | |
| Class A | | | - | | | | - | | | | - | | | | - | | |
| Class L | | | - | | | | - | | | | - | | | | - | | |
| Class Y | | | - | | | | - | | | | - | | | | - | | |
| Class S | | | - | | | | - | | | | - | | | | - | | |
| Class Z | | | - | | | | - | | | | - | | | | - | | |
| Class N | | | - | | | | - | | | | - | | | | - | | |
| Total distributions from tax return of capital | | | - | | | | - | | | | - | | | | - | | |
| From net realized gains: | |
| Class A | | | - | | | | (4,080,380 | ) | | | - | | | | - | | |
| Class L | | | - | | | | (1,739,186 | ) | | | - | | | | - | | |
| Class Y | | | - | | | | (734,447 | ) | | | - | | | | - | | |
| Class S | | | - | | | | (8,192,930 | ) | | | - | | | | - | | |
| Class N | | | - | | | | (23,310 | ) | | | - | | | | - | | |
| Total distributions from net realized gains | | | - | | | $ | (14,770,253 | ) | | | - | | | | - | | |
| Net fund share transactions (Note 5): | |
| Class A | | | (2,070,208 | ) | | | (62,467 | ) | | | (12,342,568 | ) | | | (2,420,806 | ) | |
| Class L | | | (755,849 | ) | | | 3,815,547 | | | | (169,886,344 | ) | | | (23,176,223 | ) | |
| Class Y | | | 235,293 | | | | 1,194,325 | | | | (38,325,100 | ) | | | 46,261,428 | | |
| Class S | | | (904,899 | ) | | | (1,588,050 | ) | | | (1,025,916 | ) | | | (10,482,514 | ) | |
| Class Z | | | - | | | | - | | | | - | | | | - | | |
| Class N | | | 709 | | | | 8,612 | | | | (1,719,001 | ) | | | 7,666 | | |
| Increase (decrease) in net assets from fund share transactions | | | (3,494,954 | ) | | | 3,367,967 | | | | (223,298,929 | ) | | | 10,189,551 | | |
| Total increase (decrease) in net assets | | | 4,030,971 | | | | 395,876 | | | | (122,945,836 | ) | | | 215,300,752 | | |
| Net assets: | |
| Beginning of year | | | 98,123,472 | | | | 97,727,596 | | | | 1,635,113,283 | | | | 1,419,812,531 | | |
| End of year | | $ | 102,154,443 | | | $ | 98,123,472 | | | $ | 1,512,167,447 | | | $ | 1,635,113,283 | | |
Undistributed net investment income (distributions in excess of net investment
income) included in net assets at the end of the year | | $ | 511,163 | | | $ | 12,687 | | | $ | 7,306,137 | | | $ | (58,695 | ) | |
* Fund commenced operations on March 31, 2006.
The accompanying notes are an integral part of the financial statements.
218
| | | MassMutual Select
Indexed Equity Fund | | MassMutual Select
Core Opportunities Fund | |
| | | Six Months
Ended
June 30, 2007
(Unaudited) | | Year
Ended
December 31, 2006 | | Six Months
Ended
June 30, 2007
(Unaudited) | | Period
Ended
December 31, 2006* | |
| Increase (Decrease) in Net Assets: | |
| Operations: | |
| Net investment income (loss) | | $ | 17,853,472 | | | $ | 31,682,283 | | | $ | 151,499 | | | $ | 50,687 | | |
| Net realized gain (loss) on investment transactions | | | 5,824,641 | | | | (2,427,519 | ) | | | 1,487,581 | | | | 260,500 | | |
| Net change in unrealized appreciation (depreciation) on investments | | | 128,966,309 | | | | 266,431,803 | | | | 1,866,167 | | | | 1,535,208 | | |
| Net increase (decrease) in net assets resulting from operations | | | 152,644,422 | | | | 295,686,567 | | | | 3,505,247 | | | | 1,846,395 | | |
| Distributions to shareholders (Note 2): | |
| From net investment income: | |
| Class A | | | - | | | | (3,503,000 | ) | | | - | | | | (8,948 | ) | |
| Class L | | | - | | | | (4,715,531 | ) | | | - | | | | (16,426 | ) | |
| Class Y | | | - | | | | (6,712,978 | ) | | | - | | | | (232 | ) | |
| Class S | | | - | | | | (10,405,026 | ) | | | - | | | | (26,002 | ) | |
| Class Z | | | - | | | | (5,924,624 | ) | | | - | | | | - | | |
| Class N | | | - | | | | (44,183 | ) | | | - | | | | - | | |
| Total distributions from net investment income | | | - | | | | (31,305,342 | ) | | | - | | | | (51,608 | ) | |
| From tax return of capital: | |
| Class A | | | - | | | | (19,575 | ) | | | - | | | | - | | |
| Class L | | | - | | | | (26,350 | ) | | | - | | | | - | | |
| Class Y | | | - | | | | (37,511 | ) | | | - | | | | - | | |
| Class S | | | - | | | | (58,143 | ) | | | - | | | | - | | |
| Class Z | | | - | | | | (33,107 | ) | | | - | | | | - | | |
| Class N | | | - | | | | (247 | ) | | | - | | | | - | | |
| Total distributions from tax return of capital | | | - | | | | (174,933 | ) | | | - | | | | - | | |
| From net realized gains: | |
| Class A | | | - | | | | - | | | | - | | | | (17,291 | ) | |
| Class L | | | - | | | | - | | | | - | | | | (15,874 | ) | |
| Class Y | | | - | | | | - | | | | - | | | | (227 | ) | |
| Class S | | | - | | | | - | | | | - | | | | (21,806 | ) | |
| Class N | | | - | | | | - | | | | - | | | | (227 | ) | |
| Total distributions from net realized gains | | | - | | | | - | | | | - | | | | (55,425 | ) | |
| Net fund share transactions (Note 5): | |
| Class A | | | (1,984,002 | ) | | | (10,789,263 | ) | | | 9,227,804 | | | | 8,558,915 | | |
| Class L | | | (3,394,300 | ) | | | 16,443,280 | | | | 631,669 | | | | 7,597,681 | | |
| Class Y | | | (15,468,120 | ) | | | (33,427,438 | ) | | | 1,575,902 | | | | 4,440,570 | | |
| Class S | | | (14,387,359 | ) | | | (12,278,095 | ) | | | 260,762 | | | | 9,634,202 | | |
| Class Z | | | 44,700,492 | | | | 80,860,748 | | | | - | | | | - | | |
| Class N | | | (1,118,689 | ) | | | (307,426 | ) | | | - | | | | 100,100 | | |
| Increase (decrease) in net assets from fund share transactions | | | 8,348,022 | | | | 40,501,806 | | | | 11,696,137 | | | | 30,331,468 | | |
| Total increase (decrease) in net assets | | | 160,992,444 | | | | 304,708,098 | | | | 15,201,384 | | | | 32,070,830 | | |
| Net assets: | |
| Beginning of year | | | 2,259,274,040 | | | | 1,954,565,942 | | | | 32,070,830 | | | | - | | |
| End of year | | $ | 2,420,266,484 | | | $ | 2,259,274,040 | | | $ | 47,272,214 | | | $ | 32,070,830 | | |
Undistributed net investment income (distributions in excess of net investment
income) included in net assets at the end of the year | | $ | 18,063,473 | | | $ | 210,001 | | | $ | 151,267 | | | $ | (232 | ) | |
219
MassMutual Select Funds – Financial Statements (Continued)
Statement of Changes in Net Assets
| | | MassMutual Select
Blue Chip Growth Fund | | MassMutual Select
Large Cap Growth Fund | |
| | | Six Months
Ended
June 30, 2007
(Unaudited) | | Year
Ended
December 31, 2006 | | Six Months
Ended
June 30, 2007
(Unaudited) | | Year
Ended
December 31, 2006 | |
| Increase (Decrease) in Net Assets: | |
| Operations: | |
| Net investment income (loss) | | $ | 669,945 | | | $ | 607,619 | | | $ | (24,777 | ) | | $ | (89,095 | ) | |
| Net realized gain (loss) on investment transactions | | | 9,030,087 | | | | 23,811,187 | | | | 1,813,860 | | | | 3,543,859 | | |
| Net change in unrealized appreciation (depreciation) on investments | | | 29,829,144 | | | | 11,130,027 | | | | 1,063,267 | | | | (3,241,378 | ) | |
| Net increase (decrease) in net assets resulting from operations | | | 39,529,176 | | | | 35,548,833 | | | | 2,852,350 | | | | 213,386 | | |
| Distributions to shareholders (Note 2): | |
| From net investment income: | |
| Class A | | | - | | | | - | | | | - | | | | - | | |
| Class L | | | - | | | | (167,310 | ) | | | - | | | | - | | |
| Class Y | | | - | | | | (121,087 | ) | | | - | | | | - | | |
| Class S | | | - | | | | (185,359 | ) | | | - | | | | - | | |
| Class N | | | - | | | | - | | | | - | | | | - | | |
| Total distributions from net investment income | | | - | | | | (473,756 | ) | | | - | | | | - | | |
| From net realized gains: | |
| Class A | | | - | | | | - | | | | - | | | | (328,937 | ) | |
| Class L | | | - | | | | - | | | | - | | | | (62,649 | ) | |
| Class Y | | | - | | | | - | | | | - | | | | (390,256 | ) | |
| Class S | | | - | | | | - | | | | - | | | | (817,582 | ) | |
| Class N | | | - | | | | - | | | | - | | | | (53 | ) | |
| Total distributions from net realized gains | | | - | | | | - | | | | - | | | | (1,599,477 | ) | |
| Net fund share transactions (Note 5): | |
| Class A | | | 5,187,406 | | | | (885,289 | ) | | | 223,002 | | | | 5,064,052 | | |
| Class L | | | 59,444,833 | | | | (12,322,659 | ) | | | (326,027 | ) | | | 900,400 | | |
| Class Y | | | (17,485,405 | ) | | | 35,988,478 | | | | 1,736,033 | | | | (1,753,415 | ) | |
| Class S | | | 38,687,606 | | | | (10,122,894 | ) | | | (1,215,400 | ) | | | (4,789,114 | ) | |
| Class N | | | (871,323 | ) | | | 1,303,714 | | | | - | | | | 53 | | |
| Increase (decrease) in net assets from fund share transactions | | | 84,963,117 | | | | 13,961,350 | | | | 417,608 | | | | (578,024 | ) | |
| Total increase (decrease) in net assets | | | 124,492,293 | | | | 49,036,427 | | | | 3,269,958 | | | | (1,964,115 | ) | |
| Net assets: | |
| Beginning of year | | | 434,177,321 | | | | 385,140,894 | | | | 40,861,640 | | | | 42,825,755 | | |
| End of year | | $ | 558,669,614 | | | $ | 434,177,321 | | | $ | 44,131,598 | | | $ | 40,861,640 | | |
Undistributed net investment income (distributions in excess of net investment
income) included in net assets at the end of the year | | $ | 644,756 | | | $ | (25,189 | ) | | $ | (26,625 | ) | | $ | (1,848 | ) | |
The accompanying notes are an integral part of the financial statements.
220
| | | MassMutual Select
Growth Equity Fund | | MassMutual Select
Aggressive Growth Fund | |
| | | Six Months
Ended
June 30, 2007
(Unaudited) | | Year
Ended
December 31, 2006 | | Six Months
Ended
June 30, 2007
(Unaudited) | | Year
Ended
December 31, 2006 | |
| Increase (Decrease) in Net Assets: | |
| Operations: | |
| Net investment income (loss) | | $ | 1,116,225 | | | $ | 3,443,436 | | | $ | (1,802,113 | ) | | $ | (4,380,205 | ) | |
| Net realized gain (loss) on investment transactions | | | 47,748,438 | | | | 31,326,940 | | | | 33,650,143 | | | | 7,160,794 | | |
| Net change in unrealized appreciation (depreciation) on investments | | | (17,093,015 | ) | | | (20,557,640 | ) | | | 4,184,578 | | | | (40,891,616 | ) | |
| Net increase (decrease) in net assets resulting from operations | | | 31,771,648 | | | | 14,212,736 | | | | 36,032,608 | | | | (38,111,027 | ) | |
| Distributions to shareholders (Note 2): | |
| From net investment income: | |
| Class A | | | - | | | | (6,261 | ) | | | - | | | | - | | |
| Class L | | | - | | | | (1,413,920 | ) | | | - | | | | - | | |
| Class Y | | | - | | | | (329,284 | ) | | | - | | | | - | | |
| Class S | | | - | | | | (1,659,839 | ) | | | - | | | | - | | |
| Class N | | | - | | | | - | | | | - | | | | - | | |
| Total distributions from net investment income | | | - | | | | (3,409,304 | ) | | | - | | | | - | | |
| From net realized gains: | |
| Class A | | | - | | | | - | | | | - | | | | - | | |
| Class L | | | - | | | | - | | | | - | | | | - | | |
| Class Y | | | - | | | | - | | | | - | | | | - | | |
| Class S | | | - | | | | - | | | | - | | | | - | | |
| Class N | | | - | | | | - | | | | - | | | | - | | |
| Total distributions from net realized gains | | | - | | | | - | | | | - | | | | - | | |
| Net fund share transactions (Note 5): | |
| Class A | | | (55,204,221 | ) | | | (111,135,419 | ) | | | (9,354,875 | ) | | | (14,923,500 | ) | |
| Class L | | | (162,518,449 | ) | | | 22,270,146 | | | | (69,524,048 | ) | | | 10,848,600 | | |
| Class Y | | | (6,456,310 | ) | | | (50,845,101 | ) | | | (15,806,687 | ) | | | 16,306,622 | | |
| Class S | | | (116,633,692 | ) | | | (14,183,831 | ) | | | (13,483,891 | ) | | | 12,849,517 | | |
| Class N | | | (16,895 | ) | | | (1,165,063 | ) | | | (97,849 | ) | | | 210,540 | | |
| Increase (decrease) in net assets from fund share transactions | | | (340,829,567 | ) | | | (155,059,268 | ) | | | (108,267,350 | ) | | | 25,291,779 | | |
| Total increase (decrease) in net assets | | | (309,057,919 | ) | | | (144,255,836 | ) | | | (72,234,742 | ) | | | (12,819,248 | ) | |
| Net assets: | |
| Beginning of year | | | 761,652,009 | | | | 905,907,845 | | | | 601,282,834 | | | | 614,102,082 | | |
| End of year | | $ | 452,594,090 | | | $ | 761,652,009 | | | $ | 529,048,092 | | | $ | 601,282,834 | | |
Undistributed net investment income (distributions in excess of net investment
income) included in net assets at the end of the year | | $ | 1,075,112 | | | $ | (41,113 | ) | | $ | (1,785,682 | ) | | $ | 16,431 | | |
221
MassMutual Select Funds – Financial Statements (Continued)
Statement of Changes in Net Assets
| | | MassMutual Select
OTC 100 Fund | | MassMutual Select
Focused Value Fund | |
| | | Six Months
Ended
June 30, 2007
(Unaudited) | | Year
Ended
December 31, 2006 | | Six Months
Ended
June 30, 2007
(Unaudited) | | Year
Ended
December 31, 2006 | |
| Increase (Decrease) in Net Assets: | |
| Operations: | |
| Net investment income (loss) | | $ | (60,997 | ) | | $ | (151,002 | ) | | $ | (9,130,783 | ) | | $ | 15,718,929 | | |
| Net realized gain (loss) on investment transactions | | | 2,889,078 | | | | 3,433,656 | | | | 81,643,443 | | | | 95,447,118 | | |
| Net change in unrealized appreciation (depreciation) on investments | | | 1,439,408 | | | | (124,005 | ) | | | 28,083,854 | | | | 62,812,113 | | |
| Net increase (decrease) in net assets resulting from operations | | | 4,267,489 | | | | 3,158,649 | | | | 100,596,514 | | | | 173,978,160 | | |
| Distributions to shareholders (Note 2): | |
| From net investment income: | |
| Class A | | | - | | | | - | | | | - | | | | (3,658,397 | ) | |
| Class L | | | - | | | | - | | | | - | | | | (3,143,920 | ) | |
| Class Y | | | - | | | | - | | | | - | | | | (2,373,809 | ) | |
| Class S | | | - | | | | - | | | | - | | | | (6,582,889 | ) | |
| Class N | | | - | | | | - | | | | - | | | | (29,866 | ) | |
| Total distributions from net investment income | | | - | | | | - | | | | - | | | | (15,788,881 | ) | |
| From net realized gains: | |
| Class A | | | - | | | | - | | | | - | | | | (22,576,332 | ) | |
| Class L | | | - | | | | - | | | | - | | | | (16,975,932 | ) | |
| Class Y | | | - | | | | - | | | | - | | | | (11,510,012 | ) | |
| Class S | | | - | | | | - | | | | - | | | | (30,619,407 | ) | |
| Class N | | | - | | | | - | | | | - | | | | (212,331 | ) | |
| Total distributions from net realized gains | | | - | | | | - | | | | - | | | | (81,894,014 | ) | |
| Net fund share transactions (Note 5): | |
| Class A | | | (4,423,900 | ) | | | (5,944,441 | ) | | | (35,589,656 | ) | | | 5,344,278 | | |
| Class L | | | (2,398,756 | ) | | | (3,607,659 | ) | | | (37,801,705 | ) | | | 5,131,188 | | |
| Class Y | | | (144,902 | ) | | | (1,178,623 | ) | | | (10,726,227 | ) | | | 18,416,185 | | |
| Class S | | | (2,422,057 | ) | | | (4,391,517 | ) | | | (21,144,285 | ) | | | (88,762 | ) | |
| Class N | | | (12,024 | ) | | | (30,902 | ) | | | 336,337 | | | | 586,935 | | |
| Increase (decrease) in net assets from fund share transactions | | | (9,401,639 | ) | | | (15,153,142 | ) | | | (104,925,536 | ) | | | 29,389,824 | | |
| Total increase (decrease) in net assets | | | (5,134,150 | ) | | | (11,994,493 | ) | | | (4,329,022 | ) | | | 105,685,089 | | |
| Net assets: | |
| Beginning of year | | | 49,705,668 | | | | 61,700,161 | | | | 1,011,540,543 | | | | 905,855,454 | | |
| End of year | | $ | 44,571,518 | | | $ | 49,705,668 | | | $ | 1,007,211,521 | | | $ | 1,011,540,543 | | |
Undistributed net investment income (distributions in excess of net investment
income) included in net assets at the end of the year | | $ | (56,652 | ) | | $ | 4,345 | | | $ | 1,340,594 | | | $ | 10,471,377 | | |
* Fund commenced operations on August 29, 2006.
The accompanying notes are an integral part of the financial statements.
222
| | | MassMutual Select
Mid-Cap Value Fund | |
| | | Six Months
Ended
June 30, 2007
(Unaudited) | | Period
Ended
December 31, 2006* | |
| Increase (Decrease) in Net Assets: | |
| Operations: | |
| Net investment income (loss) | | $ | 494,293 | | | $ | 68,580 | | |
| Net realized gain (loss) on investment transactions | | | 6,150,473 | | | | 206,403 | | |
| Net change in unrealized appreciation (depreciation) on investments | | | 10,675,265 | | | | 466,247 | | |
| Net increase (decrease) in net assets resulting from operations | | | 17,320,031 | | | | 741,230 | | |
| Distributions to shareholders (Note 2): | |
| From net investment income: | |
| Class A | | | - | | | | (785 | ) | |
| Class L | | | - | | | | (2,035 | ) | |
| Class Y | | | - | | | | - | | |
| Class S | | | - | | | | (95,745 | ) | |
| Class N | | | - | | | | - | | |
| Total distributions from net investment income | | | - | | | | (98,565 | ) | |
| From net realized gains: | |
| Class A | | | - | | | | (626 | ) | |
| Class L | | | - | | | | (1,727 | ) | |
| Class Y | | | - | | | | - | | |
| Class S | | | - | | | | (63,811 | ) | |
| Class N | | | - | | | | - | | |
| Total distributions from net realized gains | | | - | | | | (66,164 | ) | |
| Net fund share transactions (Note 5): | |
| Class A | | | 8,025,814 | | | | 481,541 | | |
| Class L | | | 68,675,530 | | | | 1,592,125 | | |
| Class Y | | | 855,040 | | | | (14,419 | ) | |
| Class S | | | 63,408,359 | | | | 60,211,343 | | |
| Class N | | | 42,096 | | | | (14,184 | ) | |
| Increase (decrease) in net assets from fund share transactions | | | 141,006,839 | | | | 62,256,406 | | |
| Total increase (decrease) in net assets | | | 158,326,870 | | | | 62,832,907 | | |
| Net assets: | |
| Beginning of year | | | 62,832,907 | | | | - | | |
| End of year | | $ | 221,159,777 | | | $ | 62,832,907 | | |
Undistributed net investment income (distributions in excess of net investment
income) included in net assets at the end of the year | | $ | 494,205 | | | $ | (88 | ) | |
223
MassMutual Select Funds – Financial Statements (Continued)
Statement of Changes in Net Assets
| | | MassMutual Select
Small Cap Value Equity Fund | | MassMutual Select
Small Company Value Fund | |
| | | Six Months
Ended
June 30, 2007
(Unaudited) | | Period
Ended
December 31, 2006* | | Six Months
Ended
June 30, 2007
(Unaudited) | | Year
Ended
December 31, 2006 | |
| Increase (Decrease) in Net Assets: | |
| Operations: | |
| Net investment income (loss) | | $ | 969,725 | | | $ | 181,481 | | | $ | 338,948 | | | $ | 898,625 | | |
| Net realized gain (loss) on investment transactions | | | 4,806,551 | | | | 401,406 | | | | 52,651,062 | | | | 63,349,857 | | |
| Net change in unrealized appreciation (depreciation) on investments | | | (1,389,823 | ) | | | 1,960,358 | | | | (4,821,443 | ) | | | 29,735,361 | | |
| Net increase (decrease) in net assets resulting from operations | | | 4,386,453 | | | | 2,543,245 | | | | 48,168,567 | | | | 93,983,843 | | |
| Distributions to shareholders (Note 2): | |
| From net investment income: | |
| Class A | | | - | | | | (13,927 | ) | | | - | | | | - | | |
| Class L | | | - | | | | (4,760 | ) | | | - | | | | - | | |
| Class Y | | | - | | | | (11,044 | ) | | | - | | | | (64,858 | ) | |
| Class S | | | - | | | | (138,323 | ) | | | - | | | | (163,538 | ) | |
| Total distributions from net investment income | | | - | | | | (168,054 | ) | | | - | | | | (228,396 | ) | |
| From net realized gains: | |
| Class A | | | - | | | | - | | | | - | | | | (10,802,878 | ) | |
| Class L | | | - | | | | - | | | | - | | | | (10,055,595 | ) | |
| Class Y | | | - | | | | - | | | | - | | | | (10,656,131 | ) | |
| Class S | | | - | | | | - | | | | - | | | | (17,877,441 | ) | |
| Class N | | | - | | | | - | | | | - | | | | (88,269 | ) | |
| Total distributions from net realized gains | | | - | | | | - | | | | - | | | | (49,480,314 | ) | |
| Net fund share transactions (Note 5): | |
| Class A | | | 8,338,585 | | | | 3,401,430 | | | | (14,187,995 | ) | | | 29,056,512 | | |
| Class L | | | 39,761,603 | | | | 1,003,523 | | | | (51,149,230 | ) | | | 28,318,396 | | |
| Class Y | | | 1,090,753 | | | | 2,172,039 | | | | (29,751,445 | ) | | | 68,192,291 | | |
| Class S | | | 66,690,551 | | | | 28,091,931 | | | | (15,791,567 | ) | | | 50,176,887 | | |
| Class N | | | - | | | | 100,100 | | | | 452,683 | | | | 54,418 | | |
| Increase (decrease) in net assets from fund share transactions | | | 115,881,492 | | | | 34,769,023 | | | | (110,427,554 | ) | | | 175,798,504 | | |
| Total increase (decrease) in net assets | | | 120,267,945 | | | | 37,144,214 | | | | (62,258,987 | ) | | | 220,073,637 | | |
| Net assets: | |
| Beginning of year | | | 37,144,214 | | | | - | | | | 803,027,785 | | | | 582,954,148 | | |
| End of year | | $ | 157,412,159 | | | $ | 37,144,214 | | | $ | 740,768,798 | | | $ | 803,027,785 | | |
Undistributed net investment income (distributions in excess of net investment
income) included in net assets at the end of the year | | $ | 979,319 | | | $ | 9,594 | | | $ | 1,172,076 | | | $ | 833,128 | | |
* Fund commenced operations on March 31, 2006.
The accompanying notes are an integral part of the financial statements.
224
| | | MassMutual Select
Small Cap Core Equity Fund | | MassMutual Select
Mid Cap Growth Equity Fund | |
| | | Six Months
Ended
June 30, 2007
(Unaudited) | | Period
Ended
December 31, 2006* | | Six Months
Ended
June 30, 2007
(Unaudited) | | Year
Ended
December 31, 2006 | |
| Increase (Decrease) in Net Assets: | |
| Operations: | |
| Net investment income (loss) | | $ | 79,288 | | | $ | 57,183 | | | $ | (301,778 | ) | | $ | 841,905 | | |
| Net realized gain (loss) on investment transactions | | | 406,831 | | | | (523,954 | ) | | | 12,344,079 | | | | 19,278,831 | | |
| Net change in unrealized appreciation (depreciation) on investments | | | 144,797 | | | | 1,131,127 | | | | (287,076 | ) | | | (14,650,156 | ) | |
| Net increase (decrease) in net assets resulting from operations | | | 630,916 | | | | 664,356 | | | | 11,755,225 | | | | 5,470,580 | | |
| Distributions to shareholders (Note 2): | |
| From net investment income: | |
| Class A | | | - | | | | (554 | ) | | | - | | | | (50,421 | ) | |
| Class L | | | - | | | | (4,035 | ) | | | - | | | | (139,593 | ) | |
| Class Y | | | - | | | | (2,955 | ) | | | - | | | | (124,608 | ) | |
| Class S | | | - | | | | (41,395 | ) | | | - | | | | (472,320 | ) | |
| Total distributions from net investment income | | | - | | | | (48,939 | ) | | | - | | | | (786,942 | ) | |
| From net realized gains: | |
| Class A | | | - | | | | - | | | | - | | | | - | | |
| Class L | | | - | | | | - | | | | - | | | | - | | |
| Class Y | | | - | | | | - | | | | - | | | | - | | |
| Class S | | | - | | | | - | | | | - | | | | - | | |
| Class N | | | - | | | | - | | | | - | | | | - | | |
| Total distributions from net realized gains | | | - | | | | - | | | | - | | | | - | | |
| Net fund share transactions (Note 5): | |
| Class A | | | 2,543,636 | | | | 753,669 | | | | (3,355,166 | ) | | | (4,709,260 | ) | |
| Class L | | | 17,902,761 | | | | 2,443,541 | | | | 8,445,819 | | | | (9,971,536 | ) | |
| Class Y | | | 391,436 | | | | 1,609,742 | | | | (15,458,376 | ) | | | (2,454,801 | ) | |
| Class S | | | 8,717,858 | | | | 20,393,847 | | | | 13,121,737 | | | | (4,093,209 | ) | |
| Class N | | | - | | | | 100,100 | | | | 39,289 | | | | 70,462 | | |
| Increase (decrease) in net assets from fund share transactions | | | 29,555,691 | | | | 25,300,899 | | | | 2,793,303 | | | | (21,158,344 | ) | |
| Total increase (decrease) in net assets | | | 30,186,607 | | | | 25,916,316 | | | | 14,548,528 | | | | (16,474,706 | ) | |
| Net assets: | |
| Beginning of year | | | 25,916,316 | | | | - | | | | 152,118,987 | | | | 168,593,693 | | |
| End of year | | $ | 56,102,923 | | | $ | 25,916,316 | | | $ | 166,667,515 | | | $ | 152,118,987 | | |
Undistributed net investment income (distributions in excess of net investment
income) included in net assets at the end of the year | | $ | 83,834 | | | $ | 4,546 | | | $ | (283,513 | ) | | $ | 18,265 | | |
225
MassMutual Select Funds – Financial Statements (Continued)
Statement of Changes in Net Assets
| | | MassMutual Select
Mid Cap Growth Equity II Fund | | MassMutual Select
Small Cap Growth Equity Fund | |
| | | Six Months
Ended
June 30, 2007
(Unaudited) | | Year
Ended
December 31, 2006 | | Six Months
Ended
June 30, 2007
(Unaudited) | | Year
Ended
December 31, 2006 | |
| Increase (Decrease) in Net Assets: | |
| Operations: | |
| Net investment income (loss) | | $ | (91,253 | ) | | $ | (453,865 | ) | | $ | (1,851,810 | ) | | $ | (2,754,200 | ) | |
| Net realized gain (loss) on investment transactions | | | 76,614,000 | | | | 101,662,325 | | | | 33,099,213 | | | | 69,524,983 | | |
| Net change in unrealized appreciation (depreciation) on investments | | | 93,049,703 | | | | (13,562,210 | ) | | | 36,639,388 | | | | (15,729,101 | ) | |
| Net increase (decrease) in net assets resulting from operations | | | 169,572,450 | | | | 87,646,250 | | | | 67,886,791 | | | | 51,041,682 | | |
| Distributions to shareholders (Note 2): | |
| From net realized gains: | |
| Class A | | | - | | | | (22,630,116 | ) | | | - | | | | (7,545,360 | ) | |
| Class L | | | - | | | | (38,621,636 | ) | | | - | | | | (6,062,153 | ) | |
| Class Y | | | - | | | | (12,838,903 | ) | | | - | | | | (8,456,512 | ) | |
| Class S | | | - | | | | (16,913,241 | ) | | | - | | | | (18,359,819 | ) | |
| Class N | | | - | | | | (187,256 | ) | | | - | | | | (67,738 | ) | |
| Total distributions from net realized gains | | | - | | | | (91,191,152 | ) | | | - | | | | (40,491,582 | ) | |
| Net fund share transactions (Note 5): | |
| Class A | | | 12,343,749 | | | | 10,412,101 | | | | (8,659,937 | ) | | | 14,377,135 | | |
| Class L | | | (89,738,909 | ) | | | 24,296,375 | | | | 13,190,400 | | | | (18,344,498 | ) | |
| Class Y | | | 6,411,252 | | | | 41,126,530 | | | | (4,793,385 | ) | | | 36,810,331 | | |
| Class S | | | 62,138,354 | | | | (46,496,757 | ) | | | 5,122,017 | | | | (10,701,031 | ) | |
| Class N | | | 671,155 | | | | 931,594 | | | | 30,556 | | | | 45,843 | | |
| Increase (decrease) in net assets from fund share transactions | | | (8,174,399 | ) | | | 30,269,843 | | | | 4,889,651 | | | | 22,187,780 | | |
| Total increase (decrease) in net assets | | | 161,398,051 | | | | 26,724,941 | | | | 72,776,442 | | | | 32,737,880 | | |
| Net assets: | |
| Beginning of year | | | 1,260,217,986 | | | | 1,233,493,045 | | | | 626,229,569 | | | | 593,491,689 | | |
| End of year | | $ | 1,421,616,037 | | | $ | 1,260,217,986 | | | $ | 699,006,011 | | | $ | 626,229,569 | | |
Undistributed net investment income (distributions in excess of net investment
income) included in net assets at the end of the year | | $ | (99,316 | ) | | $ | (8,063 | ) | | $ | (1,879,528 | ) | | $ | (27,718 | ) | |
The accompanying notes are an integral part of the financial statements.
226
| | | MassMutual Select
Small Company Growth Fund | | MassMutual Select
Emerging Growth Fund | |
| | | Six Months
Ended
June 30, 2007
(Unaudited) | | Year
Ended
December 31, 2006 | | Six Months
Ended
June 30, 2007
(Unaudited) | | Year
Ended
December 31, 2006 | |
| Increase (Decrease) in Net Assets: | |
| Operations: | |
| Net investment income (loss) | | $ | (686,472 | ) | | $ | (1,512,557 | ) | | $ | (144,278 | ) | | $ | (802,346 | ) | |
| Net realized gain (loss) on investment transactions | | | 9,865,093 | | | | 12,542,147 | | | | 9,875,040 | | | | 8,102,266 | | |
| Net change in unrealized appreciation (depreciation) on investments | | | 9,720,728 | | | | 8,300,619 | | | | 3,986,392 | | | | (1,022,868 | ) | |
| Net increase (decrease) in net assets resulting from operations | | | 18,899,349 | | | | 19,330,209 | | | | 13,717,154 | | | | 6,277,052 | | |
| Distributions to shareholders (Note 2): | |
| From net realized gains: | |
| Class A | | | - | | | | (4,581,222 | ) | | | - | | | | - | | |
| Class L | | | - | | | | (2,225,883 | ) | | | - | | | | - | | |
| Class Y | | | - | | | | (1,295,426 | ) | | | - | | | | - | | |
| Class S | | | - | | | | (2,438,259 | ) | | | - | | | | - | | |
| Class N | | | - | | | | (52,842 | ) | | | - | | | | - | | |
| Total distributions from net realized gains | | | - | | | | (10,593,632 | ) | | | - | | | | - | | |
| Net fund share transactions (Note 5): | |
| Class A | | | (17,391,483 | ) | | | 3,141,193 | | | | (1,735,938 | ) | | | (1,791,276 | ) | |
| Class L | | | 5,351,947 | | | | 941,751 | | | | (10,882,310 | ) | | | (22,077,858 | ) | |
| Class Y | | | (4,307,279 | ) | | | (9,492,527 | ) | | | (287,058 | ) | | | (3,948,084 | ) | |
| Class S | | | 6,039,780 | | | | 13,364,071 | | | | (8,349,774 | ) | | | 5,492,808 | | |
| Class N | | | (407,813 | ) | | | (195,713 | ) | | | - | | | | - | | |
| Increase (decrease) in net assets from fund share transactions | | | (10,714,848 | ) | | | 7,758,775 | | | | (21,255,080 | ) | | | (22,324,410 | ) | |
| Total increase (decrease) in net assets | | | 8,184,501 | | | | 16,495,352 | | | | (7,537,926 | ) | | | (16,047,358 | ) | |
| Net assets: | |
| Beginning of year | | | 160,841,178 | | | | 144,345,826 | | | | 110,203,947 | | | | 126,251,305 | | |
| End of year | | $ | 169,025,679 | | | $ | 160,841,178 | | | $ | 102,666,021 | | | $ | 110,203,947 | | |
Undistributed net investment income (distributions in excess of net investment
income) included in net assets at the end of the year | | $ | (693,093 | ) | | $ | (6,621 | ) | | $ | (151,567 | ) | | $ | (7,289 | ) | |
227
MassMutual Select Funds – Financial Statements (Continued)
Statement of Changes in Net Assets
| | | MassMutual Select
Diversified International Fund | | MassMutual Select
Overseas Fund | |
| Six Months | | Ended
June 30, 2007
(Unaudited) | | Six Months
Period
Ended
December 31, 2006* | | Ended
June 30, 2007
(Unaudited) | | Six Months
Year
Ended
December 31, 2006 | |
| Increase (Decrease) in Net Assets: | |
| Operations: | |
| Net investment income (loss) | | $ | 1,427,983 | | | $ | 7,040 | | | $ | 18,711,328 | | | $ | 20,635,558 | | |
| Net realized gain (loss) on investment transactions | | | 1,514,056 | | | | 15,335 | | | | 93,475,608 | | | | 109,119,618 | | |
| Net change in unrealized appreciation (depreciation) on investments | | | 13,601,640 | | | | 49,859 | | | | (9,118,420 | ) | | | 134,871,490 | | |
| Net increase (decrease) in net assets resulting from operations | | | 16,543,679 | | | | 72,234 | | | | 103,068,516 | | | | 264,626,666 | | |
| Distributions to shareholders (Note 2): | |
| From net investment income: | |
| Class A | | | - | | | | (82 | ) | | | - | | | | (4,073,572 | ) | |
| Class L | | | - | | | | (95 | ) | | | - | | | | (4,442,693 | ) | |
| Class Y | | | - | | | | (99 | ) | | | - | | | | (3,961,109 | ) | |
| Class S | | | - | | | | (10,190 | ) | | | - | | | | (7,530,640 | ) | |
| Class N | | | - | | | | (67 | ) | | | - | | | | (27,147 | ) | |
| Total distributions from net investment income | | | - | | | | (10,533 | ) | | | - | | | | (20,035,161 | ) | |
| From net realized gains: | |
| Class A | | | - | | | | - | | | | - | | | | (20,650,432 | ) | |
| Class L | | | - | | | | - | | | | - | | | | (19,761,801 | ) | |
| Class Y | | | - | | | | - | | | | - | | | | (16,664,769 | ) | |
| Class S | | | - | | | | - | | | | - | | | | (31,023,295 | ) | |
| Class N | | | - | | | | - | | | | - | | | | (169,262 | ) | |
| Total distributions from net realized gains | | | - | | | | - | | | | - | | | | (88,269,559 | ) | |
| Net fund share transactions (Note 5): | |
| Class A | | | 128,509 | | | | 100,100 | | | | (16,676,299 | ) | | | 65,569,304 | | |
| Class L | | | 43,286,906 | | | | 100,100 | | | | 28,049,318 | | | | 32,431,250 | | |
| Class Y | | | 251,561 | | | | 100,100 | | | | (38,553,167 | ) | | | 91,692,594 | | |
| Class S | | | 72,112,457 | | | | 11,345,058 | | | | (1,051,800 | ) | | | 95,615,530 | | |
| Class N | | | - | | | | 100,100 | | | | 903,536 | | | | 485,262 | | |
| Increase (decrease) in net assets from fund share transactions | | | 115,779,433 | | | | 11,745,458 | | | | (27,328,412 | ) | | | 285,793,940 | | |
| Total increase (decrease) in net assets | | | 132,323,112 | | | | 11,807,159 | | | | 75,740,104 | | | | 442,115,886 | | |
| Net assets: | |
| Beginning of year | | | 11,807,159 | | | | - | | | | 1,291,504,254 | | | | 849,388,368 | | |
| End of year | | $ | 144,130,271 | | | $ | 11,807,159 | | | $ | 1,367,244,358 | | | $ | 1,291,504,254 | | |
Undistributed net investment income (distributions in excess of net investment
income) included in net assets at the end of the year | | $ | 1,443,558 | | | $ | 15,575 | | | $ | 17,618,008 | | | $ | (1,093,320 | ) | |
* Fund commenced operations on December 14, 2006.
The accompanying notes are an integral part of the financial statements.
228
| | | MassMutual Select Destination
Retirement Income Fund | | MassMutual Select Destination
Retirement 2010 Fund | |
| Six Months | | Ended
June 30, 2007
(Unaudited) | | Six Months
Year
Ended
December 31, 2006 | | Ended
June 30, 2007
(Unaudited) | | Year
Ended
December 31, 2006 | |
| Increase (Decrease) in Net Assets: | |
| Operations: | |
| Net investment income (loss) | | $ | (48,549 | ) | | $ | 8,816,993 | | | $ | (99,061 | ) | | $ | 4,818,363 | | |
| Net realized gain (loss) on investment transactions | | | 2,966,981 | | | | 6,454,122 | | | | 1,661,651 | | | | 4,791,203 | | |
| Net change in unrealized appreciation (depreciation) on investments | | | 5,702,218 | | | | (1,451,218 | ) | | | 5,796,342 | | | | (124,788 | ) | |
| Net increase (decrease) in net assets resulting from operations | | | 8,620,650 | | | | 13,819,897 | | | | 7,358,932 | | | | 9,484,778 | | |
| Distributions to shareholders (Note 2): | |
| From net investment income: | |
| Class A | | | - | | | | (1,531,570 | ) | | | - | | | | (1,500,208 | ) | |
| Class L | | | - | | | | (3,081,345 | ) | | | - | | | | (1,393,414 | ) | |
| Class Y | | | - | | | | (4,216,776 | ) | | | - | | | | (1,748,962 | ) | |
| Class S | | | - | | | | (267,270 | ) | | | - | | | | (552,426 | ) | |
| Class N | | | - | | | | (3,466 | ) | | | - | | | | (5,263 | ) | |
| Total distributions from net investment income | | | - | | | | (9,100,427 | ) | | | - | | | | (5,200,273 | ) | |
| From net realized gains: | |
| Class A | | | - | | | | (662,156 | ) | | | - | | | | (766,860 | ) | |
| Class L | | | - | | | | (1,321,548 | ) | | | - | | | | (615,003 | ) | |
| Class Y | | | - | | | | (1,608,621 | ) | | | - | | | | (729,016 | ) | |
| Class S | | | - | | | | (95,327 | ) | | | - | | | | (205,575 | ) | |
| Class N | | | - | | | | (1,712 | ) | | | - | | | | (2,944 | ) | |
| Total distributions from net realized gains | | | - | | | | (3,689,364 | ) | | | - | | | | (2,319,398 | ) | |
| Net fund share transactions (Note 5): | |
| Class A | | | 1,469,786 | | | | 11,244,647 | | | | 14,053,475 | | | | 23,252,365 | | |
| Class L | | | (4,180,913 | ) | | | (8,564,651 | ) | | | 11,673,151 | | | | 11,157,595 | | |
| Class Y | | | (13,827,232 | ) | | | 20,003,796 | | | | 12,266,049 | | | | 27,044,114 | | |
| Class S | | | 576,722 | | | | 4,357,661 | | | | 11,759,196 | | | | 5,719,939 | | |
| Class N | | | 3,913 | | | | 15,800 | | | | 136,131 | | | | 111,604 | | |
| Increase (decrease) in net assets from fund share transactions | | | (15,957,724 | ) | | | 27,057,253 | | | | 49,888,002 | | | | 67,285,617 | | |
| Total increase (decrease) in net assets | | | (7,337,074 | ) | | | 28,087,359 | | | | 57,246,934 | | | | 69,250,724 | | |
| Net assets: | |
| Beginning of year | | | 280,915,668 | | | | 252,828,309 | | | | 177,812,980 | | | | 108,562,256 | | |
| End of year | | $ | 273,578,594 | | | $ | 280,915,668 | | | $ | 235,059,914 | | | $ | 177,812,980 | | |
Undistributed net investment income (distributions in excess of net investment
income) included in net assets at the end of the year | | $ | 714 | | | $ | 49,263 | | | $ | (66,121 | ) | | $ | (2,281 | ) | |
229
MassMutual Select Funds – Financial Statements (Continued)
Statement of Changes in Net Assets
| | | MassMutual Select
Destination Retirement 2020 Fund | | MassMutual Select
Destination Retirement 2030 Fund | |
| | | Six Months
Ended
June 30, 2007
(Unaudited) | | Year
Ended
December 31, 2006 | | Six Months
Ended
June 30, 2007
(Unaudited) | | Year
Ended
December 31, 2006 | |
| Increase (Decrease) in Net Assets: | |
| Operations: | |
| Net investment income (loss) | | $ | (858,883 | ) | | $ | 11,904,727 | | | $ | (663,204 | ) | | $ | 5,057,546 | | |
| Net realized gain (loss) on investment transactions | | | 9,673,700 | | | | 30,507,664 | | | | 12,892,879 | | | | 29,708,788 | | |
| Net change in unrealized appreciation (depreciation) on investments | | | 23,869,175 | | | | (2,497,858 | ) | | | 21,162,959 | | | | 687,987 | | |
| Net increase (decrease) in net assets resulting from operations | | | 32,683,992 | | | | 39,914,533 | | | | 33,392,634 | | | | 35,454,321 | | |
| Distributions to shareholders (Note 2): | |
| From net investment income: | |
| Class A | | | - | | | | (3,136,552 | ) | | | - | | | | (1,639,686 | ) | |
| Class L | | | - | | | | (6,424,077 | ) | | | - | | | | (3,439,766 | ) | |
| Class Y | | | - | | | | (2,578,683 | ) | | | - | | | | (1,184,437 | ) | |
| Class S | | | - | | | | (1,570,368 | ) | | | - | | | | (699,932 | ) | |
| Class N | | | - | | | | (5,880 | ) | | | - | | | | (2,513 | ) | |
| Total distributions from net investment income | | | - | | | | (13,715,560 | ) | | | - | | | | (6,966,334 | ) | |
| From net realized gains: | |
| Class A | | | - | | | | (3,362,064 | ) | | | - | | | | (3,100,821 | ) | |
| Class L | | | - | | | | (6,723,592 | ) | | | - | | | | (6,174,734 | ) | |
| Class Y | | | - | | | | (2,316,380 | ) | | | - | | | | (1,736,195 | ) | |
| Class S | | | - | | | | (1,413,065 | ) | | | - | | | | (1,046,333 | ) | |
| Class N | | | - | | | | (7,343 | ) | | | - | | | | (5,757 | ) | |
| Total distributions from net realized gains | | | - | | | | (13,822,444 | ) | | | - | | | | (12,063,840 | ) | |
| Net fund share transactions (Note 5): | |
| Class A | | | 20,367,697 | | | | 52,046,825 | | | | 14,217,412 | | | | 45,529,843 | | |
| Class L | | | 3,158,655 | | | | 29,632,727 | | | | 8,010,632 | | | | 21,294,973 | | |
| Class Y | | | 24,179,308 | | | | 37,913,330 | | | | 15,687,790 | | | | 32,490,050 | | |
| Class S | | | 12,716,128 | | | | 29,782,159 | | | | 9,617,551 | | | | 23,392,444 | | |
| Class N | | | 81,558 | | | | 64,500 | | | | 58,169 | | | | 39,269 | | |
| Increase (decrease) in net assets from fund share transactions | | | 60,503,346 | | | | 149,439,541 | | | | 47,591,554 | | | | 122,746,579 | | |
| Total increase (decrease) in net assets | | | 93,187,338 | | | | 161,816,070 | | | | 80,984,188 | | | | 139,170,726 | | |
| Net assets: | |
| Beginning of year | | | 590,488,245 | | | | 428,672,175 | | | | 435,313,380 | | | | 296,142,654 | | |
| End of year | | $ | 683,675,583 | | | $ | 590,488,245 | | | $ | 516,297,568 | | | $ | 435,313,380 | | |
Undistributed net investment income (distributions in excess of net investment
income) included in net assets at the end of the year | | $ | (870,891 | ) | | $ | (12,008 | ) | | $ | (671,505 | ) | | $ | (8,301 | ) | |
The accompanying notes are an integral part of the financial statements.
230
| | | MassMutual Select
Destination Retirement 2040 Fund | |
| | | Six Months
Ended
June 30, 2007
(Unaudited) | | Year
Ended
December 31, 2006 | |
| Increase (Decrease) in Net Assets: | |
| Operations: | |
| Net investment income (loss) | | $ | (353,321 | ) | | $ | 1,471,376 | | |
| Net realized gain (loss) on investment transactions | | | 7,572,113 | | | | 21,479,123 | | |
| Net change in unrealized appreciation (depreciation) on investments | | | 14,115,540 | | | | (729,493 | ) | |
| Net increase (decrease) in net assets resulting from operations | | | 21,334,332 | | | | 22,221,006 | | |
| Distributions to shareholders (Note 2): | |
| From net investment income: | |
| Class A | | | - | | | | (461,655 | ) | |
| Class L | | | - | | | | (1,563,379 | ) | |
| Class Y | | | - | | | | (389,713 | ) | |
| Class S | | | - | | | | (338,930 | ) | |
| Class N | | | - | | | | (1,331 | ) | |
| Total distributions from net investment income | | | - | | | | (2,755,008 | ) | |
| From net realized gains: | |
| Class A | | | - | | | | (1,881,363 | ) | |
| Class L | | | - | | | | (5,801,884 | ) | |
| Class Y | | | - | | | | (1,248,775 | ) | |
| Class S | | | - | | | | (1,055,588 | ) | |
| Class N | | | - | | | | (8,120 | ) | |
| Total distributions from net realized gains | | | - | | | | (9,995,730 | ) | |
| Net fund share transactions (Note 5): | |
| Class A | | | 10,097,568 | | | | 18,379,418 | | |
| Class L | | | 4,484,322 | | | | 21,473,945 | | |
| Class Y | | | 6,312,635 | | | | 22,117,975 | | |
| Class S | | | 7,227,866 | | | | (314,756 | ) | |
| Class N | | | 29,757 | | | | 39,160 | | |
| Increase (decrease) in net assets from fund share transactions | | | 28,152,148 | | | | 61,695,742 | | |
| Total increase (decrease) in net assets | | | 49,486,480 | | | | 71,166,010 | | |
| Net assets: | |
| Beginning of year | | | 241,413,948 | | | | 170,247,938 | | |
| End of year | | $ | 290,900,428 | | | $ | 241,413,948 | | |
Undistributed net investment income (distributions in excess of net investment
income) included in net assets at the end of the year | | $ | (358,118 | ) | | $ | (4,797 | ) | |
231
MassMutual Select Strategic Bond Fund – Financial Statements (Continued)
Financial Highlights (For a share outstanding throughout each period)
| | | Class A | |
| | | Six months
ended
6/30/07
(Unaudited) | | Year ended
12/31/06 | | Year ended
12/31/05 | | Period ended
12/31/04+ | |
| Net asset value, beginning of period | | $ | 9.99 | | | $ | 9.97 | | | $ | 10.00 | | | $ | 10.00 | | |
| Income (loss) from investment operations: | |
| Net investment income (loss) | | | 0.22 | *** | | | 0.43 | *** | | | 0.33 | *** | | | - | | |
| Net realized and unrealized gain (loss) on investments | | | (0.23 | ) | | | (0.03 | ) | | | (0.19 | ) | | | - | | |
| Total income (loss) from investment operations | | | (0.01 | ) | | | 0.40 | | | | 0.14 | | | | - | | |
| Less distributions to shareholders: | |
| From net investment income | | | - | | | | (0.38 | ) | | | (0.17 | ) | | | - | | |
| Net asset value, end of period | | $ | 9.98 | | | $ | 9.99 | | | $ | 9.97 | | | $ | 10.00 | | |
| | | | | | | | | | | | | | | | | | |
| Total Return (a) | | | (0.10 | )% (b)** | | | 3.99 | % (b) | | | 1.37 | % (b) | | | 0.00 | %‡ | |
| Ratios / Supplemental Data: | |
| Net assets, end of period (000's) | | $ | 60,813 | | | $ | 39,420 | | | $ | 20,689 | | | $ | 101 | | |
| Ratio of expenses to average daily net assets: | |
| Before expense waiver | | | 1.10 | % * | | | 1.11 | % | | | 1.21 | % | | | - | ‡ | |
| After expense waiver | | | 1.00 | % *# | | | 0.96 | % # | | | 1.00 | % # | | | N/A | | |
| Net investment income (loss) to average daily net assets | | | 4.46 | % * | | | 4.28 | % | | | 3.25 | % | | | 0.00 | %‡ | |
| Portfolio turnover rate | | | 230 | % ** | | | 162 | % | | | 566 | % | | | N/A | | |
| | | Class L | |
| | | Six months
ended
6/30/07
(Unaudited) | | Year ended
12/31/06 | | Year ended
12/31/05 | | Period ended
12/31/04+ | |
| Net asset value, beginning of period | | $ | 10.01 | | | $ | 9.98 | | | $ | 10.00 | | | $ | 10.00 | | |
| Income (loss) from investment operations: | |
| Net investment income (loss) | | | 0.23 | *** | | | 0.46 | *** | | | 0.39 | *** | | | - | | |
| Net realized and unrealized gain (loss) on investments | | | (0.23 | ) | | | (0.03 | ) | | | (0.23 | ) | | | - | | |
| Total income from investment operations | | | 0.00 | | | | 0.43 | | | | 0.16 | | | | - | | |
| Less distributions to shareholders: | |
| From net investment income | | | - | | | | (0.40 | ) | | | (0.18 | ) | | | - | | |
| Net asset value, end of period | | $ | 10.01 | | | $ | 10.01 | | | $ | 9.98 | | | $ | 10.00 | | |
| | | | | | | | | | | | | | | | | | |
| Total Return (a) | | | 0.00 | % ** | | | 4.31 | % | | | 1.57 | % | | | 0.00 | %‡ | |
| Ratios / Supplemental Data: | |
| Net assets, end of period (000's) | | $ | 21,135 | | | $ | 17,942 | | | $ | 3,933 | | | $ | 101 | | |
| Ratio of expenses to average daily net assets: | |
| Before expense waiver | | | 0.85 | % * | | | 0.86 | % | | | 0.96 | % | | | - | ‡ | |
| After expense waiver | | | 0.75 | % *# | | | 0.71 | % # | | | 0.75 | % # | | | N/A | | |
| Net investment income (loss) to average daily net assets | | | 4.67 | % * | | | 4.53 | % | | | 3.82 | % | | | 0.00 | %‡ | |
| Portfolio turnover rate | | | 230 | % ** | | | 162 | % | | | 566 | % | | | N/A | | |
* Annualized.
** Percentage represents results for the period and is not annualized.
*** Per share amount calculated on the average shares method.
+ The Fund commenced operations on December 31, 2004.
‡ Amount is de minimis due to the short period of operations.
# Computed after giving effect to an agreement by MassMutual to waive certain fees and expenses of the Fund.
(a) Employee retirement benefit plans that invest plan assets in the Separate Investment Accounts (SIAs) may be subject to certain charges as set forth in their respective Plan Documents. Total return figures would be lower for the periods presented if they reflected these charges.
(b) Total return excludes sales charges and would be lower for the period presented if it reflected these charges.
The accompanying notes are an integral part of the financial statements.
232
MassMutual Select Strategic Bond Fund – Financial Statements (Continued)
Financial Highlights (For a share outstanding throughout each period)
| | | Class Y | |
| | | Six months
ended
6/30/07
(Unaudited) | | Year ended
12/31/06 | | Year ended
12/31/05 | | Period ended
12/31/04+ | |
| Net asset value, beginning of period | | $ | 10.02 | | | $ | 9.98 | | | $ | 10.00 | | | $ | 10.00 | | |
| Income (loss) from investment operations: | |
| Net investment income (loss) | | | 0.24 | *** | | | 0.46 | *** | | | 0.37 | *** | | | - | | |
| Net realized and unrealized gain (loss) on investments | | | (0.24 | ) | | | (0.03 | ) | | | (0.21 | ) | | | - | | |
| Total income from investment operations | | | 0.00 | | | | 0.43 | | | | 0.16 | | | | - | | |
| Less distributions to shareholders: | |
| From net investment income | | | - | | | | (0.39 | ) | | | (0.18 | ) | | | - | | |
| Net asset value, end of period | | $ | 10.02 | | | $ | 10.02 | | | $ | 9.98 | | | $ | 10.00 | | |
| | | | | | | | | | | | | | | | | | |
| Total Return (a) | | | 0.00 | % ** | | | 4.38 | % | | | 1.57 | % | | | 0.00 | %‡ | |
| Ratios / Supplemental Data: | |
| Net assets, end of period (000's) | | $ | 146,513 | | | $ | 109,603 | | | $ | 59,396 | | | $ | 101 | | |
| Ratio of expenses to average daily net assets: | |
| Before expense waiver | | | 0.70 | % * | | | 0.70 | % | | | 0.81 | % | | | - | ‡ | |
| After expense waiver | | | N/A | | | | N/A | | | | 0.75 | % # | | | N/A | | |
| Net investment income (loss) to average daily net assets | | | 4.74 | % * | | | 4.53 | % | | | 3.64 | % | | | 0.00 | %‡ | |
| Portfolio turnover rate | | | 230 | % ** | | | 162 | % | | | 566 | % | | | N/A | | |
| | | Class S | |
| | | Six months
ended
6/30/07
(Unaudited) | | Year ended
12/31/06 | | Year ended
12/31/05 | | Period ended
12/31/04+ | |
| Net asset value, beginning of period | | $ | 10.02 | | | $ | 9.99 | | | $ | 10.00 | | | $ | 10.00 | | |
| Income (loss) from investment operations: | |
| Net investment income (loss) | | | 0.24 | *** | | | 0.46 | *** | | | 0.33 | *** | | | - | | |
| Net realized and unrealized gain (loss) on investments | | | (0.23 | ) | | | (0.03 | ) | | | (0.16 | ) | | | - | | |
| Total income from investment operations | | | 0.01 | | | | 0.43 | | | | 0.17 | | | | - | | |
| Less distributions to shareholders: | |
| From net investment income | | | - | | | | (0.40 | ) | | | (0.18 | ) | | | - | | |
| Net asset value, end of period | | $ | 10.03 | | | $ | 10.02 | | | $ | 9.99 | | | $ | 10.00 | | |
| | | | | | | | | | | | | | | | | | |
| Total Return (a) | | | 0.10 | % ** | | | 4.31 | % | | | 1.65 | % | | | 0.00 | %‡ | |
| Ratios / Supplemental Data: | |
| Net assets, end of period (000's) | | $ | 82,760 | | | $ | 71,375 | | | $ | 62,533 | | | $ | 49,596 | | |
| Ratio of expenses to average daily net assets: | |
| Before expense waiver | | | 0.65 | % * | | | 0.65 | % | | | 0.76 | % | | | - | ‡ | |
| After expense waiver | | | N/A | | | | N/A | | | | 0.70 | % # | | | N/A | | |
| Net investment income (loss) to average daily net assets | | | 4.78 | % * | | | 4.56 | % | | | 3.23 | % | | | 0.00 | %‡ | |
| Portfolio turnover rate | | | 230 | % ** | | | 162 | % | | | 566 | % | | | N/A | | |
* Annualized.
** Percentage represents results for the period and is not annualized.
*** Per share amount calculated on the average shares method.
+ The Fund commenced operations on December 31, 2004.
‡ Amount is de minimis due to the short period of operations.
# Computed after giving effect to an agreement by MassMutual to waive certain fees and expenses of the Fund.
(a) Employee retirement benefit plans that invest plan assets in the Separate Investment Accounts (SIAs) may be subject to certain charges as set forth in their respective Plan Documents. Total return figures would be lower for the periods presented if they reflected these charges.
The accompanying notes are an integral part of the financial statements.
233
MassMutual Select Strategic Bond Fund – Financial Statements (Continued)
Financial Highlights (For a share outstanding throughout each period)
| | | Class N | |
| | | Six months
ended
6/30/07
(Unaudited) | | Year ended
12/31/06 | | Year ended
12/31/05 | | Period ended
12/31/04+ | |
| Net asset value, beginning of period | | $ | 9.96 | | | $ | 9.96 | | | $ | 10.00 | | | $ | 10.00 | | |
| Income (loss) from investment operations: | |
| Net investment income (loss) | | | 0.21 | *** | | | 0.40 | *** | | | 0.28 | *** | | | - | | |
| Net realized and unrealized gain (loss) on investments | | | (0.24 | ) | | | (0.03 | ) | | | (0.18 | ) | | | - | | |
| Total income from investment operations | | | (0.03 | ) | | | 0.37 | | | | 0.10 | | | | - | | |
| Less distributions to shareholders: | |
| From net investment income | | | - | | | | (0.37 | ) | | | (0.14 | ) | | | - | | |
| Net asset value, end of period | | $ | 9.93 | | | $ | 9.96 | | | $ | 9.96 | | | $ | 10.00 | | |
| Total Return (a) | | | (0.30 | )% (b)** | | | 3.73 | % (b) | | | 0.99 | % (b) | | | 0.00 | %‡ | |
| Ratios / Supplemental Data: | |
| Net assets, end of period (000's) | | $ | 2,545 | | | $ | 2,040 | | | $ | 208 | | | $ | 101 | | |
| Ratio of expenses to average daily net assets: | |
| Before expense waiver | | | 1.40 | % * | | | 1.41 | % | | | 1.51 | % | | | - | ‡ | |
| After expense waiver | | | 1.30 | % *# | | | 1.26 | % # | | | 1.30 | % # | | | N/A | | |
| Net investment income (loss) to average daily net assets | | | 4.14 | % * | | | 3.99 | % | | | 2.78 | % | | | 0.00 | %‡ | |
| Portfolio turnover rate | | | 230 | % ** | | | 162 | % | | | 566 | % | | | N/A | | |
* Annualized.
** Percentage represents results for the period and is not annualized.
*** Per share amount calculated on the average shares method.
+ The Fund commenced operations on December 31, 2004.
‡ Amount is de minimis due to the short period of operations.
# Computed after giving effect to an agreement by MassMutual to waive certain fees and expenses of the Fund.
(a) Employee retirement benefit plans that invest plan assets in the Separate Investment Accounts (SIAs) may be subject to certain charges as set forth in their respective Plan Documents. Total return figures would be lower for the periods presented if they reflected these charges.
(b) Total return excludes sales charges and would be lower for the period presented if it reflected these charges.
The accompanying notes are an integral part of the financial statements.
234
MassMutual Select Strategic Balanced Fund – Financial Statements (Continued)
Financial Highlights (For a share outstanding throughout each period)
| | | Class A | |
| | | Six months
ended
6/30/07
(Unaudited) | | Year ended
12/31/06 | | Year ended
12/31/05† | | Year ended
12/31/04 | | Period ended
12/31/03+ | |
| Net asset value, beginning of period | | $ | 11.42 | | | $ | 10.56 | | | $ | 10.45 | | | $ | 10.00 | | | $ | 10.00 | | |
| Income (loss) from investment operations: | |
| Net investment income (loss) | | | 0.13 | *** | | | 0.24 | *** | | | 0.15 | *** | | | 0.11 | *** | | | - | | |
| Net realized and unrealized gain (loss) on investments | | | 0.29 | | | | 0.97 | | | | 0.20 | | | | 0.42 | | | | - | | |
| Total income from investment operations | | | 0.42 | | | | 1.21 | | | | 0.35 | | | | 0.53 | | | | - | | |
| Less distributions to shareholders: | |
| From net investment income | | | - | | | | (0.24 | ) | | | (0.18 | ) | | | (0.08 | ) | | | - | | |
| From net realized gains | | | - | | | | (0.11 | ) | | | (0.06 | ) | | | - | | | | - | | |
| Total distributions | | | - | | | | (0.35 | ) | | | (0.24 | ) | | | (0.08 | ) | | | - | | |
| Net asset value, end of period | | $ | 11.84 | | | $ | 11.42 | | | $ | 10.56 | | | $ | 10.45 | | | $ | 10.00 | | |
| Total Return (a) | | | 3.59 | %(b)** | | | 11.54 | % (b) | | | 3.33 | % (b) | | | 5.34 | % (b) | | | - | ‡ | |
| Ratios / Supplemental Data: | |
| Net assets, end of period (000's) | | $ | 30,584 | | | $ | 32,130 | | | $ | 26,267 | | | $ | 32,987 | | | $ | 1 | | |
| Ratio of expenses to average daily net assets: | |
| Before expense waiver | | | 1.24 | %* | | | 1.23 | % | | | 1.23 | % | | | 1.24 | % | | | - | ‡ | |
| After expense waiver | | | 1.23 | %*# | | | 1.21 | % # | | | 1.21 | % # | | | 1.21 | % (c)# | | | - | ‡ | |
| Net investment income (loss) to average daily net assets | | | 2.21 | %* | | | 2.16 | % | | | 1.40 | % | | | 1.10 | % | | | - | ‡ | |
| Portfolio turnover rate | | | 79 | %** | | | 85 | % | | | 211 | % | | | 129 | % | | | N/A | | |
| | | Class L | |
| | | Six months
ended
6/30/07
(Unaudited) | | Year ended
12/31/06 | | Year ended
12/31/05† | | Year ended
12/31/04 | | Period ended
12/31/03+ | |
| Net asset value, beginning of period | | $ | 11.45 | | | $ | 10.58 | | | $ | 10.48 | | | $ | 10.00 | | | $ | 10.00 | | |
| Income (loss) from investment operations: | |
| Net investment income (loss) | | | 0.14 | *** | | | 0.26 | *** | | | 0.18 | *** | | | 0.13 | *** | | | - | | |
| Net realized and unrealized gain (loss) on investments | | | 0.28 | | | | 0.98 | | | | 0.20 | | | | 0.43 | | | | - | | |
| Total income from investment operations | | | 0.42 | | | | 1.24 | | | | 0.38 | | | | 0.56 | | | | - | | |
| Less distributions to shareholders: | |
| From net investment income | | | - | | | | (0.26 | ) | | | (0.22 | ) | | | (0.08 | ) | | | - | | |
| From net realized gains | | | - | | | | (0.11 | ) | | | (0.06 | ) | | | - | | | | - | | |
| Total distributions | | | - | | | | (0.37 | ) | | | (0.28 | ) | | | (0.08 | ) | | | - | | |
| Net asset value, end of period | | $ | 11.87 | | | $ | 11.45 | | | $ | 10.58 | | | $ | 10.48 | | | $ | 10.00 | | |
| Total Return (a) | | | 3.67 | %** | | | 11.73 | % | | | 3.63 | % | | | 5.62 | % | | | - | ‡ | |
| Ratios / Supplemental Data: | |
| Net assets, end of period (000's) | | $ | 90,335 | | | $ | 94,872 | | | $ | 101,151 | | | $ | 104,995 | | | $ | 1 | | |
| Ratio of expenses to average daily net assets: | |
| Before expense waiver | | | 0.99 | %* | | | 0.98 | % | | | 0.98 | % | | | 0.98 | % | | | - | ‡ | |
| After expense waiver | | | 0.98 | %*# | | | 0.96 | % # | | | 0.96 | % # | | | 0.96 | % (c)# | | | - | ‡ | |
| Net investment income (loss) to average daily net assets | | | 2.46 | %* | | | 2.39 | % | | | 1.68 | % | | | 1.28 | % | | | - | ‡ | |
| Portfolio turnover rate | | | 79 | %** | | | 85 | % | | | 211 | % | | | 129 | % | | | N/A | | |
* Annualized.
** Percentage represents results for the period and is not annualized.
*** Per share amount calculated on the average shares method.
† Effective January 1, 2005, rebated brokerage commissions are included with realized gain or loss on investment transactions. Prior to January 1, 2005, these amounts were presented as a reduction of expenses. Prior year amounts have not been restated to reflect this change due to immateriality.
+ The Fund commenced operations on December 31, 2003.
‡ Amount is de minimis due to the short period of operations.
# Computed after giving effect to an agreement by MassMutual to waive certain fees and expenses of the Fund.
(a) Employee retirement benefit plans that invest plan assets in the Separate Investment Accounts (SIAs) may be subject to certain charges as set forth in their respective Plan Documents. Total return figures would be lower for the periods presented if they reflected these charges.
(b) Total return excludes sales charges and would be lower for the period presented if it reflected these charges.
(c) The Fund has entered into an agreement with certain brokers to rebate a portion of brokerage commissions. The rebated commissions were used to reduce operating expenses of the Fund.
The accompanying notes are an integral part of the financial statements.
235
MassMutual Select Strategic Balanced Fund – Financial Statements (Continued)
Financial Highlights (For a share outstanding throughout each period)
| | | Class Y | |
| | | Six months
ended
6/30/07
(Unaudited) | | Year ended
12/31/06 | | Year ended
12/31/05† | | Year ended
12/31/04 | | Period ended
12/31/03+ | |
| Net asset value, beginning of period | | $ | 11.45 | | | $ | 10.58 | | | $ | 10.48 | | | $ | 10.00 | | | $ | 10.00 | | |
| Income (loss) from investment operations: | |
| Net investment income (loss) | | | 0.15 | *** | | | 0.28 | *** | | | 0.19 | *** | | | 0.14 | *** | | | - | | |
| Net realized and unrealized gain (loss) on investments | | | 0.29 | | | | 0.98 | | | | 0.20 | | | | 0.43 | | | | - | | |
| Total income from investment operations | | | 0.44 | | | | 1.26 | | | | 0.39 | | | | 0.57 | | | | - | | |
| Less distributions to shareholders: | |
| From net investment income | | | - | | | | (0.28 | ) | | | (0.23 | ) | | | (0.09 | ) | | | - | | |
| From net realized gains | | | - | | | | (0.11 | ) | | | (0.06 | ) | | | - | | | | - | | |
| Total distributions | | | - | | | | (0.39 | ) | | | (0.29 | ) | | | (0.09 | ) | | | - | | |
| Net asset value, end of period | | $ | 11.89 | | | $ | 11.45 | | | $ | 10.58 | | | $ | 10.48 | | | $ | 10.00 | | |
| | | | | | | | | | | | | | | | | | | | | | |
| Total Return (a) | | | 3.84 | %** | | | 11.90 | % | | | 3.76 | % | | | 5.74 | % | | | - | ‡ | |
| Ratios / Supplemental Data: | |
| Net assets, end of period (000's) | | $ | 87,351 | | | $ | 95,028 | | | $ | 78,145 | | | $ | 99,246 | | | $ | 1 | | |
| Ratio of expenses to average daily net assets: | |
| Before expense waiver | | | 0.84 | %* | | | 0.83 | % | | | 0.83 | % | | | 0.83 | % | | | - | ‡ | |
| After expense waiver | | | 0.83 | %*# | | | 0.81 | % # | | | 0.81 | % # | | | 0.81 | % (b)# | | | - | ‡ | |
| Net investment income (loss) to average daily net assets | | | 2.60 | %* | | | 2.54 | % | | | 1.82 | % | | | 1.41 | % | | | - | ‡ | |
| Portfolio turnover rate | | | 79 | %** | | | 85 | % | | | 211 | % | | | 129 | % | | | N/A | | |
| | | Class S | |
| | | Six months
ended
6/30/07
(Unaudited) | | Year ended
12/31/06 | | Year ended
12/31/05† | | Year ended
12/31/04 | | Period ended
12/31/03+ | |
| Net asset value, beginning of period | | $ | 11.45 | | | $ | 10.58 | | | $ | 10.49 | | | $ | 10.00 | | | $ | 10.00 | | |
| Income (loss) from investment operations: | |
| Net investment income (loss) | | | 0.16 | *** | | | 0.29 | *** | | | 0.20 | *** | | | 0.12 | *** | | | - | | |
| Net realized and unrealized gain (loss) on investments | | | 0.28 | | | | 0.98 | | | | 0.19 | | | | 0.47 | | | | - | | |
| Total income from investment operations | | | 0.44 | | | | 1.27 | | | | 0.39 | | | | 0.59 | | | | - | | |
| Less distributions to shareholders: | |
| From net investment income | | | - | | | | (0.29 | ) | | | (0.24 | ) | | | (0.10 | ) | | | - | | |
| From net realized gains | | | - | | | | (0.11 | ) | | | (0.06 | ) | | | - | | | | - | | |
| Total distributions | | | - | | | | (0.40 | ) | | | (0.30 | ) | | | (0.10 | ) | | | - | | |
| Net asset value, end of period | | $ | 11.89 | | | $ | 11.45 | | | $ | 10.58 | | | $ | 10.49 | | | $ | 10.00 | | |
| | | | | | | | | | | | | | | | | | | | | | |
| Total Return (a) | | | 3.84 | %** | | | 11.97 | % | | | 3.85 | % | | | 5.76 | % | | | - | ‡ | |
| Ratios / Supplemental Data: | |
| Net assets, end of period (000's) | | $ | 29,456 | | | $ | 23,044 | | | $ | 15,026 | | | $ | 13,159 | | | $ | 10,001 | | |
| Ratio of expenses to average daily net assets: | |
| Before expense waiver | | | 0.79 | %* | | | 0.78 | % | | | 0.78 | % | | | 0.84 | % | | | - | ‡ | |
| After expense waiver | | | 0.78 | %*# | | | 0.76 | % # | | | 0.76 | % # | | | 0.76 | % (b)# | | | - | ‡ | |
| Net investment income (loss) to average daily net assets | | | 2.73 | %* | | | 2.60 | % | | | 1.90 | % | | | 1.18 | % | | | - | ‡ | |
| Portfolio turnover rate | | | 79 | %** | | | 85 | % | | | 211 | % | | | 129 | % | | | N/A | | |
* Annualized.
** Percentage represents results for the period and is not annualized.
*** Per share amount calculated on the average shares method.
† Effective January 1, 2005, rebated brokerage commissions are included with realized gain or loss on investment transactions. Prior to January 1, 2005, these amounts were presented as a reduction of expenses. Prior year amounts have not been restated to reflect this change due to immateriality.
+ The Fund commenced operations on December 31, 2003.
‡ Amount is de minimis due to the short period of operations.
# Computed after giving effect to an agreement by MassMutual to waive certain fees and expenses of the Fund.
(a) Employee retirement benefit plans that invest plan assets in the Separate Investment Accounts (SIAs) may be subject to certain charges as set forth in their respective Plan Documents. Total return figures would be lower for the periods presented if they reflected these charges.
(b) The Fund has entered into an agreement with certain brokers to rebate a portion of brokerage commissions. The rebated commissions were used to reduce operating expenses of the Fund.
The accompanying notes are an integral part of the financial statements.
236
MassMutual Select Strategic Balanced Fund – Financial Statements (Continued)
Financial Highlights (For a share outstanding throughout each period)
| | | Class N | |
| | | Six months
ended
6/30/07
(Unaudited) | | Year ended
12/31/06 | | Year ended
12/31/05† | | Year ended
12/31/04 | | Period ended
12/31/03+ | |
| Net asset value, beginning of period | | $ | 11.41 | | | $ | 10.56 | | | $ | 10.46 | | | $ | 10.00 | | | $ | 10.00 | | |
| Income (loss) from investment operations: | |
| Net investment income (loss) | | | 0.11 | *** | | | 0.20 | *** | | | 0.12 | *** | | | 0.08 | *** | | | - | | |
| Net realized and unrealized gain (loss) on investments | | | 0.28 | | | | 0.97 | | | | 0.21 | | | | 0.42 | | | | - | | |
| Total income from investment operations | | | 0.39 | | | | 1.17 | | | | 0.33 | | | | 0.50 | | | | - | | |
| Less distributions to shareholders: | |
| From net investment income | | | - | | | | (0.21 | ) | | | (0.17 | ) | | | (0.04 | ) | | | - | | |
| From net realized gains | | | - | | | | (0.11 | ) | | | (0.06 | ) | | | - | | | | - | | |
| Total distributions | | | - | | | | (0.32 | ) | | | (0.23 | ) | | | (0.04 | ) | | | - | | |
| Net asset value, end of period | | $ | 11.80 | | | $ | 11.41 | | | $ | 10.56 | | | $ | 10.46 | | | $ | 10.00 | | |
| | | | | | | | | | | | | | | | | | | | | | |
| Total Return (a) | | | 3.42 | %(b)** | | | 11.21 | % (b) | | | 3.02 | % (b) | | | 5.02 | % (b) | | | - | ‡ | |
| Ratios / Supplemental Data: | |
| Net assets, end of period (000's) | | $ | 584 | | | $ | 572 | | | $ | 419 | | | $ | 422 | | | $ | 1 | | |
| Ratio of expenses to average daily net assets: | |
| Before expense waiver | | | 1.54 | %* | | | 1.53 | % | | | 1.53 | % | | | 1.55 | % | | | - | ‡ | |
| After expense waiver | | | 1.53 | %*# | | | 1.51 | % # | | | 1.51 | % # | | | 1.51 | % (c)# | | | - | ‡ | |
| Net investment income (loss) to average daily net assets | | | 1.92 | %* | | | 1.83 | % | | | 1.13 | % | | | 0.78 | % | | | - | ‡ | |
| Portfolio turnover rate | | | 79 | %** | | | 85 | % | | | 211 | % | | | 129 | % | | | N/A | | |
* Annualized.
** Percentage represents results for the period and is not annualized.
*** Per share amount calculated on the average shares method.
† Effective January 1, 2005, rebated brokerage commissions are included with realized gain or loss on investment transactions. Prior to January 1, 2005, these amounts were presented as a reduction of expenses. Prior year amounts have not been restated to reflect this change due to immateriality.
+ The Fund commenced operations on December 31, 2003.
‡ Amount is de minimis due to the short period of operations.
# Computed after giving effect to an agreement by MassMutual to waive certain fees and expenses of the Fund.
(a) Employee retirement benefit plans that invest plan assets in the Separate Investment Accounts (SIAs) may be subject to certain charges as set forth in their respective Plan Documents. Total return figures would be lower for the periods presented if they reflected these charges.
(b) Total return excludes sales charges and would be lower for the period presented if it reflected these charges.
(c) The Fund has entered into an agreement with certain brokers to rebate a portion of brokerage commissions. The rebated commissions were used to reduce operating expenses of the Fund.
The accompanying notes are an integral part of the financial statements.
237
MassMutual Select Diversified Value Fund – Financial Statements (Continued)
Financial Highlights (For a share outstanding throughout each period)
| | | Class A | |
| | | Six months
ended
6/30/07
(Unaudited) | | Year ended
12/31/06 | | Year ended
12/31/05 | | Period ended
12/31/04† | |
| Net asset value, beginning of period | | $ | 13.08 | | | $ | 11.26 | | | $ | 10.93 | | | $ | 10.00 | | |
| Income (loss) from investment operations: | |
| Net investment income (loss) | | | 0.10 | *** | | | 0.20 | *** | | | 0.14 | *** | | | 0.04 | *** | |
| Net realized and unrealized gain (loss) on investments | | | 0.68 | | | | 2.20 | | | | 0.54 | | | | 0.94 | | |
| Total income from investment operations | | | 0.78 | | | | 2.40 | | | | 0.68 | | | | 0.98 | | |
| Less distributions to shareholders: | |
| From net investment income | | | - | | | | (0.17 | ) | | | (0.12 | ) | | | (0.04 | ) | |
| From net realized gains | | | - | | | | (0.41 | ) | | | (0.23 | ) | | | (0.01 | ) | |
| Total distributions | | | - | | | | (0.58 | ) | | | (0.35 | ) | | | (0.05 | ) | |
| Net asset value, end of period | | $ | 13.86 | | | $ | 13.08 | | | $ | 11.26 | | | $ | 10.93 | | |
| | | | | | | | | | | | | | | | | | |
| Total Return (a) | | | 5.96 | %(b)** | | | 21.41 | % (b) | | | 6.23 | % (b) | | | 9.83 | % (b)** | |
| Ratios / Supplemental Data: | |
| Net assets, end of period (000's) | | $ | 100,782 | | | $ | 82,361 | | | $ | 29,953 | | | $ | 4,998 | | |
| Ratio of expenses to average daily net assets: | |
| Before expense waiver | | | 1.08 | %* | | | 1.08 | % | | | 1.09 | % | | | 1.15 | % * | |
| After expense waiver | | | N/A | | | | N/A | | | | N/A | | | | 1.09 | % *# | |
| Net investment income (loss) to average daily net assets | | | 1.48 | %* | | | 1.58 | % | | | 1.27 | % | | | 1.99 | % * | |
| Portfolio turnover rate | | | 8 | %** | | | 15 | % | | | 16 | % | | | 5 | % ** | |
| | | Class L | |
| | | Six months
ended
6/30/07
(Unaudited) | | Year ended
12/31/06 | | Year ended
12/31/05 | | Period ended
12/31/04† | |
| Net asset value, beginning of period | | $ | 13.13 | | | $ | 11.28 | | | $ | 10.93 | | | $ | 10.00 | | |
| Income (loss) from investment operations: | |
| Net investment income (loss) | | | 0.12 | *** | | | 0.23 | *** | | | 0.17 | *** | | | 0.05 | *** | |
| Net realized and unrealized gain (loss) on investments | | | 0.67 | | | | 2.22 | | | | 0.54 | | | | 0.94 | | |
| Total income from investment operations | | | 0.79 | | | | 2.45 | | | | 0.71 | | | | 0.99 | | |
| Less distributions to shareholders: | |
| From net investment income | | | - | | | | (0.19 | ) | | | (0.13 | ) | | | (0.05 | ) | |
| From net realized gains | | | - | | | | (0.41 | ) | | | (0.23 | ) | | | (0.01 | ) | |
| Total distributions | | | - | | | | (0.60 | ) | | | (0.36 | ) | | | (0.06 | ) | |
| Net asset value, end of period | | $ | 13.92 | | | $ | 13.13 | | | $ | 11.28 | | | $ | 10.93 | | |
| | | | | | | | | | | | | | | | | | |
| Total Return (a) | | | 6.02 | %** | | | 21.82 | % | | | 6.42 | % | | | 9.99 | % ** | |
| Ratios / Supplemental Data: | |
| Net assets, end of period (000's) | | $ | 87,360 | | | $ | 57,853 | | | $ | 29,455 | | | $ | 20,480 | | |
| Ratio of expenses to average daily net assets: | |
| Before expense waiver | | | 0.79 | %* | | | 0.79 | % | | | 0.80 | % | | | 0.86 | % * | |
| After expense waiver | | | N/A | | | | N/A | | | | N/A | | | | 0.80 | % *# | |
| Net investment income (loss) to average daily net assets | | | 1.80 | %* | | | 1.84 | % | | | 1.55 | % | | | 2.28 | % * | |
| Portfolio turnover rate | | | 8 | %** | | | 15 | % | | | 16 | % | | | 5 | % ** | |
* Annualized.
** Percentage represents results for the period and is not annualized.
*** Per share amount calculated on the average shares method.
† For the period from October 15, 2004 (commencement of operations) through December 31, 2004.
# Computed after giving effect to an agreement by MassMutual to waive certain fees and expenses of the Fund.
(a) Employee retirement benefit plans that invest plan assets in the Separate Investment Accounts (SIAs) may be subject to certain charges as set forth in their respective Plan Documents. Total return figures would be lower for the periods presented if they reflected these charges.
(b) Total return excludes sales charges and would be lower for the period presented if it reflected these charges.
The accompanying notes are an integral part of the financial statements.
238
MassMutual Select Diversified Value Fund – Financial Statements (Continued)
Financial Highlights (For a share outstanding throughout each period)
| | | Class Y | |
| | | Six months
ended
6/30/07
(Unaudited) | | Year ended
12/31/06 | | Year ended
12/31/05 | | Period ended
12/31/04† | |
| Net asset value, beginning of period | | $ | 13.12 | | | $ | 11.27 | | | $ | 10.93 | | | $ | 10.00 | | |
| Income (loss) from investment operations: | |
| Net investment income (loss) | | | 0.13 | *** | | | 0.24 | *** | | | 0.19 | *** | | | 0.05 | *** | |
| Net realized and unrealized gain (loss) on investments | | | 0.68 | | | | 2.22 | | | | 0.53 | | | | 0.94 | | |
| Total income from investment operations | | | 0.81 | | | | 2.46 | | | | 0.72 | | | | 0.99 | | |
| Less distributions to shareholders: | |
| From net investment income | | | - | | | | (0.20 | ) | | | (0.15 | ) | | | (0.05 | ) | |
| From net realized gains | | | - | | | | (0.41 | ) | | | (0.23 | ) | | | (0.01 | ) | |
| Total distributions | | | - | | | | (0.61 | ) | | | (0.38 | ) | | | (0.06 | ) | |
| Net asset value, end of period | | $ | 13.93 | | | $ | 13.12 | | | $ | 11.27 | | | $ | 10.93 | | |
| | | | | | | | | | | | | | | | | | |
| Total Return (a) | | | 6.17 | %** | | | 21.92 | % | | | 6.61 | % | | | 9.91 | % ** | |
| Ratios / Supplemental Data: | |
| Net assets, end of period (000's) | | $ | 150,947 | | | $ | 142,836 | | | $ | 56,761 | | | $ | 1,273 | | |
| Ratio of expenses to average daily net assets: | |
| Before expense waiver | | | 0.68 | %* | | | 0.68 | % | | | 0.69 | % | | | 0.75 | % * | |
| After expense waiver | | | N/A | | | | N/A | | | | N/A | | | | 0.69 | % *# | |
| Net investment income (loss) to average daily net assets | | | 1.88 | %* | | | 1.95 | % | | | 1.70 | % | | | 2.39 | % * | |
| Portfolio turnover rate | | | 8 | %** | | | 15 | % | | | 16 | % | | | 5 | % ** | |
| | | Class S | |
| | | Six months
ended
6/30/07
(Unaudited) | | Year ended
12/31/06 | | Year ended
12/31/05 | | Period ended
12/31/04† | |
| Net asset value, beginning of period | | $ | 13.14 | | | $ | 11.28 | | | $ | 10.94 | | | $ | 10.00 | | |
| Income (loss) from investment operations: | |
| Net investment income (loss) | | | 0.13 | *** | | | 0.25 | *** | | | 0.19 | *** | | | 0.06 | *** | |
| Net realized and unrealized gain (loss) on investments | | | 0.69 | | | | 2.23 | | | | 0.53 | | | | 0.94 | | |
| Total income from investment operations | | | 0.82 | | | | 2.48 | | | | 0.72 | | | | 1.00 | | |
| Less distributions to shareholders: | |
| From net investment income | | | - | | | | (0.21 | ) | | | (0.15 | ) | | | (0.05 | ) | |
| From net realized gains | | | - | | | | (0.41 | ) | | | (0.23 | ) | | | (0.01 | ) | |
| Total distributions | | | - | | | | (0.62 | ) | | | (0.38 | ) | | | (0.06 | ) | |
| Net asset value, end of period | | $ | 13.96 | | | $ | 13.14 | | | $ | 11.28 | | | $ | 10.94 | | |
| | | | | | | | | | | | | | | | | | |
| Total Return (a) | | | 6.24 | %** | | | 22.08 | % | | | 6.59 | % | | | 10.03 | % ** | |
| Ratios / Supplemental Data: | |
| Net assets, end of period (000's) | | $ | 333,143 | | | $ | 246,598 | | | $ | 186,641 | | | $ | 173,341 | | |
| Ratio of expenses to average daily net assets: | |
| Before expense waiver | | | 0.58 | %* | | | 0.58 | % | | | 0.59 | % | | | 0.65 | % * | |
| After expense waiver | | | N/A | | | | N/A | | | | N/A | | | | 0.59 | % *# | |
| Net investment income (loss) to average daily net assets | | | 1.97 | %* | | | 2.02 | % | | | 1.75 | % | | | 2.49 | % * | |
| Portfolio turnover rate | | | 8 | %** | | | 15 | % | | | 16 | % | | | 5 | % ** | |
* Annualized.
** Percentage represents results for the period and is not annualized.
*** Per share amount calculated on the average shares method.
† For the period from October 15, 2004 (commencement of operations) through December 31, 2004.
# Computed after giving effect to an agreement by MassMutual to waive certain fees and expenses of the Fund.
(a) Employee retirement benefit plans that invest plan assets in the Separate Investment Accounts (SIAs) may be subject to certain charges as set forth in their respective Plan Documents. Total return figures would be lower for the periods presented if they reflected these charges.
(b) Total return excludes sales charges and would be lower for the period presented if it reflected these charges.
The accompanying notes are an integral part of the financial statements.
239
MassMutual Select Diversified Value Fund – Financial Statements (Continued)
Financial Highlights (For a share outstanding throughout each period)
| | | Class N | |
| | | Six months
ended
6/30/07
(Unaudited) | | Year ended
12/31/06 | | Year ended
12/31/05 | | Period ended
12/31/04† | |
| Net asset value, beginning of period | | $ | 13.09 | | | $ | 11.28 | | | $ | 10.94 | | | $ | 10.00 | | |
| Income (loss) from investment operations: | |
| Net investment income (loss) | | | 0.08 | *** | | | 0.16 | *** | | | 0.11 | *** | | | 0.04 | *** | |
| Net realized and unrealized gain (loss) on investments | | | 0.67 | | | | 2.21 | | | | 0.52 | | | | 0.94 | | |
| Total income from investment operations | | | 0.75 | | | | 2.37 | | | | 0.63 | | | | 0.98 | | |
| Less distributions to shareholders: | |
| From net investment income | | | - | | | | (0.15 | ) | | | (0.06 | ) | | | (0.03 | ) | |
| From net realized gains | | | - | | | | (0.41 | ) | | | (0.23 | ) | | | (0.01 | ) | |
| Total distributions | | | - | | | | (0.56 | ) | | | (0.29 | ) | | | (0.04 | ) | |
| Net asset value, end of period | | $ | 13.84 | | | $ | 13.09 | | | $ | 11.28 | | | $ | 10.94 | | |
| | | | | | | | | | | | | | | | | | |
| Total Return (a) | | | 5.73 | %(b)** | | | 21.11 | % (b) | | | 5.77 | % (b) | | | 9.84 | % (b)** | |
| Ratios / Supplemental Data: | |
| Net assets, end of period (000's) | | $ | 2,450 | | | $ | 1,547 | | | $ | 147 | | | $ | 187 | | |
| Ratio of expenses to average daily net assets: | |
| Before expense waiver | | | 1.39 | %* | | | 1.39 | % | | | 1.40 | % | | | 1.46 | % * | |
| After expense waiver | | | N/A | | | | N/A | | | | N/A | | | | 1.40 | % *# | |
| Net investment income (loss) to average daily net assets | | | 1.16 | %* | | | 1.30 | % | | | 0.95 | % | | | 1.63 | % * | |
| Portfolio turnover rate | | | 8 | %** | | | 15 | % | | | 16 | % | | | 5 | % ** | |
* Annualized.
** Percentage represents results for the period and is not annualized.
*** Per share amount calculated on the average shares method.
† For the period from October 15, 2004 (commencement of operations) through December 31, 2004.
# Computed after giving effect to an agreement by MassMutual to waive certain fees and expenses of the Fund.
(a) Employee retirement benefit plans that invest plan assets in the Separate Investment Accounts (SIAs) may be subject to certain charges as set forth in their respective Plan Documents. Total return figures would be lower for the periods presented if they reflected these charges.
(b) Total return excludes sales charges and would be lower for the period presented if it reflected these charges.
The accompanying notes are an integral part of the financial statements.
240
MassMutual Select Fundamental Value Fund – Financial Statements (Continued)
Financial Highlights (For a share outstanding throughout each period)
| | | Class A | |
| | | Six months
ended
6/30/07
(Unaudited) | | Year ended
12/31/06 | | Year ended
12/31/05† | | Year ended
12/31/04 | | Year ended
12/31/03 | | Year ended
12/31/02 | |
| Net asset value, beginning of period | | $ | 12.28 | | | $ | 11.14 | | | $ | 10.75 | | | $ | 10.01 | | | $ | 7.79 | | | $ | 10.00 | | |
| Income (loss) from investment operations: | |
| Net investment income (loss) | | | 0.06 | *** | | | 0.11 | *** | | | 0.11 | *** | | | 0.10 | *** | | | 0.10 | *** | | | 0.08 | *** | |
Net realized and unrealized gain (loss) on
investments | | | 0.97 | | | | 2.16 | | | | 0.65 | | | | 0.84 | | | | 2.19 | | | | (2.25 | ) | |
Total income (loss) from investment
operations | | | 1.03 | | | | 2.27 | | | | 0.76 | | | | 0.94 | | | | 2.29 | | | | (2.17 | ) | |
| Less distributions to shareholders: | |
| From net investment income | | | - | | | | (0.11 | ) | | | (0.11 | ) | | | (0.09 | ) | | | (0.07 | ) | | | (0.04 | ) | |
| From net realized gains | | | - | | | | (1.02 | ) | | | (0.26 | ) | | | (0.11 | ) | | | - | | | | - | | |
| Total distributions | | | - | | | | (1.13 | ) | | | (0.37 | ) | | | (0.20 | ) | | | (0.07 | ) | | | (0.04 | ) | |
| Net asset value, end of period | | $ | 13.31 | | | $ | 12.28 | | | $ | 11.14 | | | $ | 10.75 | | | $ | 10.01 | | | $ | 7.79 | | |
| Total Return (a) | | | 8.39 | %(c)** | | | 20.54 | % (c) | | | 7.08 | % (c) | | | 9.34 | % (c) | | | 29.43 | % | | | (21.67 | )% | |
| Ratios / Supplemental Data: | |
| Net assets, end of period (000's) | | $ | 297,797 | | | $ | 310,438 | | | $ | 252,362 | | | $ | 214,886 | | | $ | 129,552 | | | $ | 37,973 | | |
| Ratio of expenses to average daily net assets: | |
| Before expense waiver | | | 1.23 | %* | | | 1.23 | % | | | 1.23 | % | | | 1.23 | % | | | 1.24 | % | | | 1.27 | % | |
| After expense waiver | | | N/A | | | | N/A | | | | N/A | | | | 1.22 | % (b)# | | | 1.22 | % (b)# | | | 1.20 | % (b)# | |
Net investment income (loss) to average
daily net assets | | | 0.91 | %* | | | 0.92 | % | | | 0.97 | % | | | 0.96 | % | | | 1.18 | % | | | 1.00 | % | |
| Portfolio turnover rate | | | 16 | %** | | | 43 | % | | | 33 | % | | | 31 | % | | | 28 | % | | | 38 | % | |
| | | Class L | |
| | | Six months
ended
6/30/07
(Unaudited) | | Year ended
12/31/06 | | Year ended
12/31/05† | | Year ended
12/31/04 | | Year ended
12/31/03 | | Year ended
12/31/02 | |
| Net asset value, beginning of period | | $ | 12.33 | | | $ | 11.17 | | | $ | 10.78 | | | $ | 10.03 | | | $ | 7.81 | | | $ | 10.00 | | |
| Income (loss) from investment operations: | |
| Net investment income (loss) | | | 0.07 | *** | | | 0.14 | *** | | | 0.14 | *** | | | 0.12 | *** | | | 0.13 | *** | | | 0.10 | *** | |
Net realized and unrealized gain (loss) on
investments | | | 0.98 | | | | 2.18 | | | | 0.64 | | | | 0.85 | | | | 2.18 | | | | (2.24 | ) | |
Total income (loss) from investment
operations | | | 1.05 | | | | 2.32 | | | | 0.78 | | | | 0.97 | | | | 2.31 | | | | (2.14 | ) | |
| Less distributions to shareholders: | |
| From net investment income | | | - | | | | (0.14 | ) | | | (0.13 | ) | | | (0.11 | ) | | | (0.09 | ) | | | (0.05 | ) | |
| From net realized gains | | | - | | | | (1.02 | ) | | | (0.26 | ) | | | (0.11 | ) | | | - | | | | - | | |
| Total distributions | | | - | | | | (1.16 | ) | | | (0.39 | ) | | | (0.22 | ) | | | (0.09 | ) | | | (0.05 | ) | |
| Net asset value, end of period | | $ | 13.38 | | | $ | 12.33 | | | $ | 11.17 | | | $ | 10.78 | | | $ | 10.03 | | | $ | 7.81 | | |
| Total Return (a) | | | 8.52 | %** | | | 20.90 | % | | | 7.28 | % | | | 9.65 | % | | | 29.56 | % | | | (21.40 | )% | |
| Ratios / Supplemental Data: | |
| Net assets, end of period (000's) | | $ | 291,878 | | | $ | 298,276 | | | $ | 231,639 | | | $ | 236,583 | | | $ | 133,178 | | | $ | 44,235 | | |
| Ratio of expenses to average daily net assets: | |
| Before expense waiver | | | 0.98 | %* | | | 0.98 | % | | | 0.98 | % | | | 0.98 | % | | | 0.99 | % | | | 1.02 | % | |
| After expense waiver | | | N/A | | | | N/A | | | | N/A | | | | 0.97 | % (b)# | | | 0.97 | % (b)# | | | 0.95 | % (b)# | |
Net investment income (loss) to average
daily net assets | | | 1.14 | %* | | | 1.18 | % | | | 1.23 | % | | | 1.21 | % | | | 1.44 | % | | | 1.24 | % | |
| Portfolio turnover rate | | | 16 | %** | | | 43 | % | | | 33 | % | | | 31 | % | | | 28 | % | | | 38 | % | |
* Annualized.
** Percentage represents results for the period and is not annualized.
*** Per share amount calculated on the average shares method.
† Effective January 1, 2005, rebated brokerage commissions are included with realized gain or loss on investment transactions. Prior to January 1, 2005, these amounts were presented as a reduction of expenses. Prior year amounts have not been restated to reflect this change due to immateriality.
# Computed after giving effect to an agreement by MassMutual to waive certain fees and expenses of the Fund.
(a) Employee benefit plans that invest plan assets in the Separate Investment Accounts (SIAs) may be subject to certain charges as set forth in their respective Plan Documents. Total return figures would be lower for the periods presented if they reflected these charges.
(b) The Fund has entered into an agreement with certain brokers to rebate a portion of brokerage commissions. The rebated commissions were used to reduce operating expenses of the Fund.
(c) Total return excludes sales charges and would be lower for the period presented if it reflected these charges.
The accompanying notes are an integral part of the financial statements.
241
MassMutual Select Fundamental Value Fund – Financial Statements (Continued)
Financial Highlights (For a share outstanding throughout each period)
| | | Class Y | |
| | | Six months
ended
6/30/07
(Unaudited) | | Year ended
12/31/06 | | Year ended
12/31/05† | | Year ended
12/31/04 | | Year ended
12/31/03 | | Year ended
12/31/02 | |
| Net asset value, beginning of period | | $ | 12.34 | | | $ | 11.19 | | | $ | 10.78 | | | $ | 10.03 | | | $ | 7.80 | | | $ | 10.00 | | |
| Income (loss) from investment operations: | |
| Net investment income (loss) | | | 0.08 | *** | | | 0.16 | *** | | | 0.15 | *** | | | 0.14 | *** | | | 0.14 | *** | | | 0.12 | *** | |
Net realized and unrealized gain (loss) on
investments | | | 0.99 | | | | 2.17 | | | | 0.66 | | | | 0.84 | | | | 2.19 | | | | (2.26 | ) | |
Total income (loss) from investment
operations | | | 1.07 | | | | 2.33 | | | | 0.81 | | | | 0.98 | | | | 2.33 | | | | (2.14 | ) | |
| Less distributions to shareholders: | |
| From net investment income | | | - | | | | (0.16 | ) | | | (0.14 | ) | | | (0.12 | ) | | | (0.10 | ) | | | (0.06 | ) | |
| From net realized gains | | | - | | | | (1.02 | ) | | | (0.26 | ) | | | (0.11 | ) | | | - | | | | - | | |
| Total distributions | | | - | | | | (1.18 | ) | | | (0.40 | ) | | | (0.23 | ) | | | (0.10 | ) | | | (0.06 | ) | |
| Net asset value, end of period | | $ | 13.41 | | | $ | 12.34 | | | $ | 11.19 | | | $ | 10.78 | | | $ | 10.03 | | | $ | 7.80 | | |
| Total Return (a) | | | 8.58 | %** | | | 21.05 | % | | | 7.55 | % | | | 9.78 | % | | | 29.82 | % | | | (21.41 | )% | |
| Ratios / Supplemental Data: | |
| Net assets, end of period (000's) | | $ | 149,838 | | | $ | 134,485 | | | $ | 85,569 | | | $ | 120,769 | | | $ | 82,989 | | | $ | 40,511 | | |
| Ratio of expenses to average daily net assets: | |
| Before expense waiver | | | 0.83 | %* | | | 0.83 | % | | | 0.83 | % | | | 0.83 | % | | | 0.84 | % | | | 0.87 | % | |
| After expense waiver | | | N/A | | | | N/A | | | | N/A | | | | 0.82 | % (b)# | | | 0.82 | % (b)# | | | 0.81 | % (b)# | |
Net investment income (loss) to average
daily net assets | | | 1.30 | %* | | | 1.32 | % | | | 1.35 | % | | | 1.35 | % | | | 1.60 | % | | | 1.44 | % | |
| Portfolio turnover rate | | | 16 | %** | | | 43 | % | | | 33 | % | | | 31 | % | | | 28 | % | | | 38 | % | |
| | | Class S | |
| | | Six months
ended
6/30/07
(Unaudited) | | Year ended
12/31/06 | | Year ended
12/31/05† | | Year ended
12/31/04 | | Year ended
12/31/03 | | Year ended
12/31/02 | |
| Net asset value, beginning of period | | $ | 12.36 | | | $ | 11.20 | | | $ | 10.80 | | | $ | 10.05 | | | $ | 7.81 | | | $ | 10.00 | | |
| Income (loss) from investment operations: | |
| Net investment income (loss) | | | 0.09 | *** | | | 0.17 | *** | | | 0.16 | *** | | | 0.14 | *** | | | 0.14 | *** | | | 0.12 | *** | |
Net realized and unrealized gain (loss) on
investments | | | 0.98 | | | | 2.17 | | | | 0.66 | | | | 0.85 | | | | 2.20 | | | | (2.25 | ) | |
Total income (loss) from investment
operations | | | 1.07 | | | | 2.34 | | | | 0.82 | | | | 0.99 | | | | 2.34 | | | | (2.13 | ) | |
| Less distributions to shareholders: | |
| From net investment income | | | - | | | | (0.16 | ) | | | (0.16 | ) | | | (0.13 | ) | | | (0.10 | ) | | | (0.06 | ) | |
| From net realized gains | | | - | | | | (1.02 | ) | | | (0.26 | ) | | | (0.11 | ) | | | - | | | | - | | |
| Total distributions | | | - | | | | (1.18 | ) | | | (0.42 | ) | | | (0.24 | ) | | | (0.10 | ) | | | (0.06 | ) | |
| Net asset value, end of period | | $ | 13.43 | | | $ | 12.36 | | | $ | 11.20 | | | $ | 10.80 | | | $ | 10.05 | | | $ | 7.81 | | |
| Total Return (a) | | | 8.66 | %** | | | 21.06 | % | | | 7.57 | % | | | 9.80 | % | | | 29.97 | % | | | (21.35 | )% | |
| Ratios / Supplemental Data: | |
| Net assets, end of period (000's) | | $ | 564,940 | | | $ | 540,185 | | | $ | 418,271 | | | $ | 325,701 | | | $ | 228,535 | | | $ | 101,228 | | |
| Ratio of expenses to average daily net assets: | |
| Before expense waiver | | | 0.79 | %* | | | 0.79 | % | | | 0.79 | % | | | 0.79 | % | | | 0.80 | % | | | 0.83 | % | |
| After expense waiver | | | N/A | | | | N/A | | | | N/A | | | | 0.78 | % (b)# | | | 0.78 | % (b)# | | | 0.77 | % (b)# | |
Net investment income (loss) to average
daily net assets | | | 1.34 | %* | | | 1.37 | % | | | 1.41 | % | | | 1.40 | % | | | 1.63 | % | | | 1.36 | % | |
| Portfolio turnover rate | | | 16 | %** | | | 43 | % | | | 33 | % | | | 31 | % | | | 28 | % | | | 38 | % | |
* Annualized.
** Percentage represents results for the period and is not annualized.
*** Per share amount calculated on the average shares method.
† Effective January 1, 2005, rebated brokerage commissions are included with realized gain or loss on investment transactions. Prior to January 1, 2005, these amounts were presented as a reduction of expenses. Prior year amounts have not been restated to reflect this change due to immateriality.
# Computed after giving effect to an agreement by MassMutual to waive certain fees and expenses of the Fund.
(a) Employee benefit plans that invest plan assets in the Separate Investment Accounts (SIAs) may be subject to certain charges as set forth in their respective Plan Documents. Total return figures would be lower for the periods presented if they reflected these charges.
(b) The Fund has entered into an agreement with certain brokers to rebate a portion of brokerage commissions. The rebated commissions were used to reduce operating expenses of the Fund.
The accompanying notes are an integral part of the financial statements.
242
MassMutual Select Fundamental Value Fund – Financial Statements (Continued)
Financial Highlights (For a share outstanding throughout each period)
| | | Class N | |
| | | Six months
ended
6/30/07
(Unaudited) | | Year ended
12/31/06 | | Year ended
12/31/05† | | Year ended
12/31/04 | | Year ended
12/31/03 | | Year ended
12/31/02++ | |
| Net asset value, beginning of period | | $ | 12.20 | | | $ | 11.07 | | | $ | 10.69 | | | $ | 9.94 | | | $ | 7.76 | | | $ | 7.76 | | |
| Income (loss) from investment operations: | |
| Net investment income (loss) | | | 0.04 | *** | | | 0.07 | *** | | | 0.07 | *** | | | 0.07 | *** | | | 0.08 | *** | | | (0.00 | )***†† | |
Net realized and unrealized gain (loss)
on investments | | | 0.97 | | | | 2.14 | | | | 0.65 | | | | 0.84 | | | | 2.17 | | | | (0.00 | )†† | |
Total income (loss) from investment
operations | | | 1.01 | | | | 2.21 | | | | 0.72 | | | | 0.91 | | | | 2.25 | | | | (0.00 | ) | |
| Less distributions to shareholders: | |
| From net investment income | | | - | | | | (0.06 | ) | | | (0.08 | ) | | | (0.05 | ) | | | (0.07 | ) | | | - | | |
| From net realized gains | | | - | | | | (1.02 | ) | | | (0.26 | ) | | | (0.11 | ) | | | - | | | | - | | |
| Total distributions | | | - | | | | (1.08 | ) | | | (0.34 | ) | | | (0.16 | ) | | | (0.07 | ) | | | - | | |
| Net asset value, end of period | | $ | 13.21 | | | $ | 12.20 | | | $ | 11.07 | | | $ | 10.69 | | | $ | 9.94 | | | $ | 7.76 | | |
| Total Return (a) | | | 8.28 | %(c)** | | | 20.09 | % (c) | | | 6.76 | % (c) | | | 9.10 | % (c) | | | 29.03 | % (c) | | | - | ‡ | |
| Ratios / Supplemental Data: | |
| Net assets, end of period (000's) | | $ | 2,753 | | | $ | 1,667 | | | $ | 1,998 | | | $ | 1,644 | | | $ | 1,968 | | | $ | 101 | | |
| Ratio of expenses to average daily net assets: | |
| Before expense waiver | | | 1.53 | %* | | | 1.53 | % | | | 1.53 | % | | | 1.53 | % | | | 1.54 | % | | | - | ‡ | |
| After expense waiver | | | N/A | | | | N/A | | | | N/A | | | | 1.52 | % (b)# | | | 1.52 | % (b)# | | | - | ‡ | |
Net investment income (loss) to average
daily net assets | | | 0.63 | %* | | | 0.62 | % | | | 0.67 | % | | | 0.65 | % | | | 0.83 | % | | | - | ‡ | |
| Portfolio turnover rate | | | 16 | %** | | | 43 | % | | | 33 | % | | | 31 | % | | | 28 | % | | | 38 | % | |
* Annualized.
** Percentage represents results for the period and is not annualized.
*** Per share amount calculated on the average shares method.
† Effective January 1, 2005, rebated brokerage commissions are included with realized gain or loss on investment transactions. Prior to January 1, 2005, these amounts were presented as a reduction of expenses. Prior year amounts have not been restated to reflect this change due to immateriality.
†† Amount is less than $0.01 per share.
++ Class N commenced operations on December 31, 2002.
‡ Amount is de minimis due to the short period of operations.
# Computed after giving effect to an agreement by MassMutual to waive certain fees and expenses of the Fund.
(a) Employee benefit plans that invest plan assets in the Separate Investment Accounts (SIAs) may be subject to certain charges as set forth in their respective Plan Documents. Total return figures would be lower for the periods presented if they reflected these charges.
(b) The Fund has entered into an agreement with certain brokers to rebate a portion of brokerage commissions. The rebated commissions were used to reduce operating expenses of the Fund.
(c) Total return excludes sales charges and would be lower for the period presented if it reflected these charges.
The accompanying notes are an integral part of the financial statements.
243
MassMutual Select Value Equity Fund – Financial Statements (Continued)
Financial Highlights (For a share outstanding throughout each period)
| | | Class A | |
| | | Six months
ended
6/30/07
(Unaudited) | | Year ended
12/31/06 | | Year ended
12/31/05† | | Year ended
12/31/04 | | Year ended
12/31/03 | | Year ended
12/31/02 | |
| Net asset value, beginning of period | | $ | 10.07 | | | $ | 10.49 | | | $ | 10.48 | | | $ | 9.55 | | | $ | 7.66 | | | $ | 9.34 | | |
| Income (loss) from investment operations: | |
| Net investment income (loss) | | | 0.04 | *** | | | 0.07 | *** | | | 0.04 | *** | | | 0.07 | *** | | | 0.08 | *** | | | 0.07 | *** | |
Net realized and unrealized gain (loss)
on investments | | | 0.72 | | | | 1.25 | | | | 1.02 | | | | 1.16 | | | | 1.91 | | | | (1.68 | ) | |
| Total income (loss) from investment operations | | | 0.76 | | | | 1.32 | | | | 1.06 | | | | 1.23 | | | | 1.99 | | | | (1.61 | ) | |
| Less distributions to shareholders: | |
| From net investment income | | | - | | | | (0.06 | ) | | | (0.04 | ) | | | (0.07 | ) | | | (0.10 | ) | | | (0.07 | ) | |
| From net realized gains | | | - | | | | (1.68 | ) | | | (1.01 | ) | | | (0.23 | ) | | | - | | | | - | | |
| Total distributions | | | - | | | | (1.74 | ) | | | (1.05 | ) | | | (0.30 | ) | | | (0.10 | ) | | | (0.07 | ) | |
| Net asset value, end of period | | $ | 10.83 | | | $ | 10.07 | | | $ | 10.49 | | | $ | 10.48 | | | $ | 9.55 | | | $ | 7.66 | | |
| | | | | | | | | | | | | | | | | | | | | | | | | | |
| Total Return (a) | | | 7.55 | %(c)** | | | 12.83 | % (c) | | | 10.16 | % (c) | | | 12.91 | % (c) | | | 25.96 | % | | | (17.28 | )% | |
| Ratios / Supplemental Data: | |
| Net assets, end of period (000's) | | $ | 28,135 | | | $ | 28,143 | | | $ | 28,829 | | | $ | 25,523 | | | $ | 21,341 | | | $ | 15,852 | | |
| Ratio of expenses to average daily net assets: | |
| Before expense waiver | | | 1.30 | %* | | | 1.31 | % | | | 1.30 | % | | | 1.33 | % | | | 1.29 | % | | | 1.30 | % | |
| After expense waiver | | | N/A | | | | N/A | | | | N/A | | | | 1.29 | % (b)# | | | 1.27 | % (b)# | | | 1.29 | % # | |
Net investment income (loss)
to average daily net assets | | | 0.70 | %* | | | 0.65 | % | | | 0.36 | % | | | 0.69 | % | | | 0.99 | % | | | 0.79 | % | |
| Portfolio turnover rate | | | 62 | %** | | | 177 | % | | | 94 | % | | | 161 | % | | | 66 | % | | | 105 | % | |
| | | Class L | |
| | | Six months
ended
6/30/07
(Unaudited) | | Year ended
12/31/06 | | Year ended
12/31/05† | | Year ended
12/31/04 | | Year ended
12/31/03 | | Year ended
12/31/02 | |
| Net asset value, beginning of period | | $ | 10.08 | | | $ | 10.51 | | | $ | 10.50 | | | $ | 9.57 | | | $ | 7.67 | | | $ | 9.34 | | |
| Income (loss) from investment operations: | |
| Net investment income (loss) | | | 0.05 | *** | | | 0.10 | *** | | | 0.06 | *** | | | 0.09 | *** | | | 0.10 | *** | | | 0.09 | *** | |
Net realized and unrealized gain (loss)
on investments | | | 0.73 | | | | 1.25 | | | | 1.02 | | | | 1.17 | | | | 1.92 | | | | (1.67 | ) | |
| Total income (loss) from investment operations | | | 0.78 | | | | 1.35 | | | | 1.08 | | | | 1.26 | | | | 2.02 | | | | (1.58 | ) | |
| Less distributions to shareholders: | |
| From net investment income | | | - | | | | (0.10 | ) | | | (0.06 | ) | | | (0.10 | ) | | | (0.12 | ) | | | (0.09 | ) | |
| From net realized gains | | | - | | | | (1.68 | ) | | | (1.01 | ) | | | (0.23 | ) | | | - | | | | - | | |
| Total distributions | | | - | | | | (1.78 | ) | | | (1.07 | ) | | | (0.33 | ) | | | (0.12 | ) | | | (0.09 | ) | |
| Net asset value, end of period | | $ | 10.86 | | | $ | 10.08 | | | $ | 10.51 | | | $ | 10.50 | | | $ | 9.57 | | | $ | 7.67 | | |
| | | | | | | | | | | | | | | | | | | | | | | | | | |
| Total Return (a) | | | 7.74 | %** | | | 13.06 | % | | | 10.39 | % | | | 13.16 | % | | | 26.34 | % | | | (16.97 | )% | |
| Ratios / Supplemental Data: | |
| Net assets, end of period (000's) | | $ | 12,243 | | | $ | 12,075 | | | $ | 8,753 | | | $ | 7,461 | | | $ | 6,313 | | | $ | 4,727 | | |
| Ratio of expenses to average daily net assets: | |
| Before expense waiver | | | 1.05 | %* | | | 1.06 | % | | | 1.05 | % | | | 1.08 | % | | | 1.04 | % | | | 1.05 | % | |
| After expense waiver | | | N/A | | | | N/A | | | | N/A | | | | 1.04 | % (b)# | | | 1.02 | % (b)# | | | 1.04 | % # | |
Net investment income (loss)
to average daily net assets | | | 0.94 | %* | | | 0.93 | % | | | 0.60 | % | | | 0.94 | % | | | 1.24 | % | | | 1.07 | % | |
| Portfolio turnover rate | | | 62 | %** | | | 177 | % | | | 94 | % | | | 161 | % | | | 66 | % | | | 105 | % | |
* Annualized.
** Percentage represents results for the period and is not annualized.
*** Per share amount calculated on the average shares method.
† Effective January 1, 2005, rebated brokerage commissions are included with realized gain or loss on investment transactions. Prior to January 1, 2005, these amounts were presented as a reduction of expenses. Prior year amounts have not been restated to reflect this change due to immateriality.
# Computed after giving effect to an agreement by MassMutual to waive certain fees and expenses of the Fund.
(a) Employee retirement benefit plans that invest plan assets in the Separate Investment Accounts (SIAs) may be subject to certain charges as set forth in their respective Plan Documents. Total return figures would be lower for the periods presented if they reflected these charges.
(b) The Fund has entered into an agreement with certain brokers to rebate a portion of brokerage commissions. The rebated commissions were used to reduce operating expenses of the Fund.
(c) Total return excludes sales charges and would be lower for the period presented if it reflected these charges.
The accompanying notes are an integral part of the financial statements.
244
MassMutual Select Value Equity Fund – Financial Statements (Continued)
Financial Highlights (For a share outstanding throughout each period)
| | | Class Y | |
| | | Six months
ended
6/30/07
(Unaudited) | | Year ended
12/31/06 | | Year ended
12/31/05† | | Year ended
12/31/04 | | Year ended
12/31/03 | | Year ended
12/31/02 | |
| Net asset value, beginning of period | | $ | 10.14 | | | $ | 10.55 | | | $ | 10.54 | | | $ | 9.59 | | | $ | 7.68 | | | $ | 9.35 | | |
| Income (loss) from investment operations: | |
| Net investment income (loss) | | | 0.06 | *** | | | 0.12 | *** | | | 0.08 | *** | | | 0.10 | *** | | | 0.12 | *** | | | 0.10 | *** | |
Net realized and unrealized gain (loss)
on investments | | | 0.73 | | | | 1.26 | | | | 1.02 | | | | 1.19 | | | | 1.91 | | | | (1.67 | ) | |
| Total income (loss) from investment operations | | | 0.79 | | | | 1.38 | | | | 1.10 | | | | 1.29 | | | | 2.03 | | | | (1.57 | ) | |
| Less distributions to shareholders: | |
| From net investment income | | | - | | | | (0.11 | ) | | | (0.08 | ) | | | (0.11 | ) | | | (0.12 | ) | | | (0.10 | ) | |
| From net realized gains | | | - | | | | (1.68 | ) | | | (1.01 | ) | | | (0.23 | ) | | | - | | | | - | | |
| Total distributions | | | - | | | | (1.79 | ) | | | (1.09 | ) | | | (0.34 | ) | | | (0.12 | ) | | | (0.10 | ) | |
| Net asset value, end of period | | $ | 10.93 | | | $ | 10.14 | | | $ | 10.55 | | | $ | 10.54 | | | $ | 9.59 | | | $ | 7.68 | | |
| | | | | | | | | | | | | | | | | | | | | | | | | | |
| Total Return (a) | | | 7.79 | %** | | | 13.33 | % | | | 10.49 | % | | | 13.47 | % | | | 26.40 | % | | | (16.87 | )% | |
| Ratios / Supplemental Data: | |
| Net assets, end of period (000's) | | $ | 5,775 | | | $ | 5,136 | | | $ | 4,110 | | | $ | 2,891 | | | $ | 3,378 | | | $ | 7,543 | | |
| Ratio of expenses to average daily net assets: | |
| Before expense waiver | | | 0.90 | %* | | | 0.91 | % | | | 0.90 | % | | | 0.93 | % | | | 0.88 | % | | | 0.90 | % | |
| After expense waiver | | | N/A | | | | N/A | | | | N/A | | | | 0.88 | % (b)# | | | 0.86 | % (b)# | | | 0.89 | % # | |
Net investment income (loss)
to average daily net assets | | | 1.09 | %* | | | 1.06 | % | | | 0.75 | % | | | 1.06 | % | | | 1.42 | % | | | 1.18 | % | |
| Portfolio turnover rate | | | 62 | %** | | | 177 | % | | | 94 | % | | | 161 | % | | | 66 | % | | | 105 | % | |
| | | Class S | |
| | | Six months
ended
6/30/07
(Unaudited) | | Year ended
12/31/06 | | Year ended
12/31/05† | | Year ended
12/31/04 | | Year ended
12/31/03 | | Year ended
12/31/02 | |
| Net asset value, beginning of period | | $ | 10.12 | | | $ | 10.54 | | | $ | 10.52 | | | $ | 9.59 | | | $ | 7.68 | | | $ | 9.35 | | |
| Income (loss) from investment operations: | |
| Net investment income (loss) | | | 0.06 | *** | | | 0.12 | *** | | | 0.09 | *** | | | 0.11 | *** | | | 0.12 | *** | | | 0.10 | *** | |
Net realized and unrealized gain (loss)
on investments | | | 0.73 | | | | 1.26 | | | | 1.02 | | | | 1.17 | | | | 1.92 | | | | (1.68 | ) | |
| Total income (loss) from investment operations | | | 0.79 | | | | 1.38 | | | | 1.11 | | | | 1.28 | | | | 2.04 | | | | (1.58 | ) | |
| Less distributions to shareholders: | |
| From net investment income | | | - | | | | (0.12 | ) | | | (0.08 | ) | | | (0.12 | ) | | | (0.13 | ) | | | (0.09 | ) | |
| From net realized gains | | | - | | | | (1.68 | ) | | | (1.01 | ) | | | (0.23 | ) | | | - | | | | - | | |
| Total distributions | | | - | | | | (1.80 | ) | | | (1.09 | ) | | | (0.35 | ) | | | (0.13 | ) | | | (0.09 | ) | |
| Net asset value, end of period | | $ | 10.91 | | | $ | 10.12 | | | $ | 10.54 | | | $ | 10.52 | | | $ | 9.59 | | | $ | 7.68 | | |
| | | | | | | | | | | | | | | | | | | | | | | | | | |
| Total Return (a) | | | 7.70 | %** | | | 13.40 | % | | | 10.66 | % | | | 13.31 | % | | | 26.63 | % | | | (16.83 | )% | |
| Ratios / Supplemental Data: | |
| Net assets, end of period (000's) | | $ | 55,848 | | | $ | 52,627 | | | $ | 55,895 | | | $ | 51,940 | | | $ | 67,536 | | | $ | 60,499 | | |
| Ratio of expenses to average daily net assets: | |
| Before expense waiver | | | 0.85 | %* | | | 0.86 | % | | | 0.85 | % | | | 0.88 | % | | | 0.84 | % | | | 0.85 | % | |
| After expense waiver | | | N/A | | | | N/A | | | | N/A | | | | 0.84 | % (b)# | | | 0.82 | % (b)# | | | 0.84 | % # | |
Net investment income (loss)
to average daily net assets | | | 1.14 | %* | | | 1.11 | % | | | 0.81 | % | | | 1.12 | % | | | 1.45 | % | | | 1.22 | % | |
| Portfolio turnover rate | | | 62 | %** | | | 177 | % | | | 94 | % | | | 161 | % | | | 66 | % | | | 105 | % | |
* Annualized.
** Percentage represents results for the period and is not annualized.
*** Per share amount calculated on the average shares method.
† Effective January 1, 2005, rebated brokerage commissions are included with realized gain or loss on investment transactions. Prior to January 1, 2005, these amounts were presented as a reduction of expenses. Prior year amounts have not been restated to reflect this change due to immateriality.
# Computed after giving effect to an agreement by MassMutual to waive certain fees and expenses of the Fund.
(a) Employee retirement benefit plans that invest plan assets in the Separate Investment Accounts (SIAs) may be subject to certain charges as set forth in their respective Plan Documents. Total return figures would be lower for the periods presented if they reflected these charges.
(b) The Fund has entered into an agreement with certain brokers to rebate a portion of brokerage commissions. The rebated commissions were used to reduce operating expenses of the Fund.
The accompanying notes are an integral part of the financial statements.
245
MassMutual Select Value Equity Fund – Financial Statements (Continued)
Financial Highlights (For a share outstanding throughout each period)
| | | Class N | |
| | | Six months
ended
6/30/07
(Unaudited) | | Year ended
12/31/06 | | Year ended
12/31/05† | | Year ended
12/31/04 | | Year ended
12/31/03 | | Period ended
12/31/02++ | |
| Net asset value, beginning of period | | $ | 10.09 | | | $ | 10.51 | | | $ | 10.50 | | | $ | 9.56 | | | $ | 7.63 | | | $ | 7.62 | | |
| Income (loss) from investment operations: | |
| Net investment income (loss) | | | 0.02 | *** | | | 0.04 | *** | | | 0.01 | *** | | | 0.04 | *** | | | 0.06 | *** | | | 0.00 | ***†† | |
Net realized and unrealized gain (loss)
on investments | | | 0.72 | | | | 1.26 | | | | 1.01 | | | | 1.15 | | | | 1.90 | | | | 0.01 | | |
| Total income from investment operations | | | 0.74 | | | | 1.30 | | | | 1.02 | | | | 1.19 | | | | 1.96 | | | | 0.01 | | |
| Less distributions to shareholders: | |
| From net investment income | | | - | | | | (0.04 | ) | | | (0.00 | )†† | | | (0.02 | ) | | | (0.03 | ) | | | - | | |
| From net realized gains | | | - | | | | (1.68 | ) | | | (1.01 | ) | | | (0.23 | ) | | | - | | | | - | | |
| Total distributions | | | - | | | | (1.72 | ) | | | (1.01 | ) | | | (0.25 | ) | | | (0.03 | ) | | | - | | |
| Net asset value, end of period | | $ | 10.83 | | | $ | 10.09 | | | $ | 10.51 | | | $ | 10.50 | | | $ | 9.56 | | | $ | 7.63 | | |
| | | | | | | | | | | | | | | | | | | | | | | | | | |
| Total Return (a) | | | 7.33 | %(c)** | | | 12.59 | % (c) | | | 9.83 | % (c) | | | 12.51 | % (c) | | | 25.73 | % (c) | | | - | ‡ | |
| Ratios / Supplemental Data: | |
| Net assets, end of period (000's) | | $ | 153 | | | $ | 142 | | | $ | 140 | | | $ | 282 | | | $ | 315 | | | $ | 101 | | |
| Ratio of expenses to average daily net assets: | |
| Before expense waiver | | | 1.60 | %* | | | 1.61 | % | | | 1.59 | % | | | 1.63 | % | | | 1.58 | % | | | - | ‡ | |
| After expense waiver | | | N/A | | | | N/A | | | | N/A | | | | 1.58 | % (b)# | | | 1.56 | % (b)# | | | - | ‡ | |
Net investment income (loss)
to average daily net assets | | | 0.40 | %* | | | 0.36 | % | | | 0.06 | % | | | 0.39 | % | | | 0.70 | % | | | - | ‡ | |
| Portfolio turnover rate | | | 62 | %** | | | 177 | % | | | 94 | % | | | 161 | % | | | 66 | % | | | 105 | % | |
* Annualized.
** Percentage represents results for the period and is not annualized.
*** Per share amount calculated on the average shares method.
† Effective January 1, 2005, rebated brokerage commissions are included with realized gain or loss on investment transactions. Prior to January 1, 2005, these amounts were presented as a reduction of expenses. Prior year amounts have not been restated to reflect this change due to immateriality.
†† Amount is less than $0.01 per share.
++ Class N commenced operations on December 31, 2002.
‡ Amount is de minimis due to the short period of operations.
# Computed after giving effect to an agreement by MassMutual to waive certain fees and expenses of the Fund.
(a) Employee retirement benefit plans that invest plan assets in the Separate Investment Accounts (SIAs) may be subject to certain charges as set forth in their respective Plan Documents. Total return figures would be lower for the periods presented if they reflected these charges.
(b) The Fund has entered into an agreement with certain brokers to rebate a portion of brokerage commissions. The rebated commissions were used to reduce operating expenses of the Fund.
(c) Total return excludes sales charges and would be lower for the period presented if it reflected these charges.
The accompanying notes are an integral part of the financial statements.
246
MassMutual Select Large Cap Value Fund – Financial Statements (Continued)
Financial Highlights (For a share outstanding throughout each period)
| | | Class A | |
| | | Six months
ended
6/30/07
(Unaudited) | | Year ended
12/31/06 | | Year ended
12/31/05† | | Year ended
12/31/04 | | Year ended
12/31/03 | | Year ended
12/31/02 | |
| Net asset value, beginning of period | | $ | 12.84 | | | $ | 11.28 | | | $ | 10.39 | | | $ | 9.35 | | | $ | 7.24 | | | $ | 8.74 | | |
| Income (loss) from investment operations: | |
| Net investment income (loss) | | | 0.04 | *** | | | 0.04 | *** | | | 0.05 | *** | | | 0.04 | *** | | | 0.04 | *** | | | 0.02 | *** | |
Net realized and unrealized gain (loss)
on investments | | | 0.83 | | | | 1.56 | | | | 0.89 | | | | 1.04 | | | | 2.10 | | | | (1.49 | ) | |
| Total income (loss) from investment operations | | | 0.87 | | | | 1.60 | | | | 0.94 | | | | 1.08 | | | | 2.14 | | | | (1.47 | ) | |
| Less distributions to shareholders: | |
| From net investment income | | | - | | | | (0.04 | ) | | | (0.05 | ) | | | (0.04 | ) | | | (0.03 | ) | | | (0.03 | ) | |
| Net asset value, end of period | | $ | 13.71 | | | $ | 12.84 | | | $ | 11.28 | | | $ | 10.39 | | | $ | 9.35 | | | $ | 7.24 | | |
| Total Return (a) | | | 6.78 | %(c)** | | | 14.21 | % (c) | | | 9.05 | % (c) | | | 11.55 | % (c) | | | 29.61 | % | | | (16.86 | )% | |
| Ratios / Supplemental Data: | |
| Net assets, end of period (000's) | | $ | 416,314 | | | $ | 401,790 | | | $ | 354,647 | | | $ | 266,753 | | | $ | 153,918 | | | $ | 92,001 | | |
| Ratio of expenses to average daily net assets: | |
| Before expense waiver | | | 1.25 | %* | | | 1.25 | % | | | 1.25 | % | | | 1.25 | % | | | 1.25 | % | | | 1.24 | % | |
| After expense waiver | | | N/A | | | | N/A | | | | N/A | | | | 1.25 | % (b)# | | | 1.24 | % (b)# | | | 1.23 | % (b)# | |
Net investment income (loss)
to average daily net assets | | | 0.69 | %* | | | 0.37 | % | | | 0.44 | % | | | 0.41 | % | | | 0.45 | % | | | 0.29 | % | |
| Portfolio turnover rate | | | 4 | %** | | | 18 | % | | | 7 | % | | | 3 | % | | | 7 | % | | | 25 | % | |
| | | Class L | |
| | | Six months
ended
6/30/07
(Unaudited) | | Year ended
12/31/06 | | Year ended
12/31/05† | | Year ended
12/31/04 | | Year ended
12/31/03 | | Year ended
12/31/02 | |
| Net asset value, beginning of period | | $ | 12.88 | | | $ | 11.32 | | | $ | 10.43 | | | $ | 9.37 | | | $ | 7.26 | | | $ | 8.76 | | |
| Income (loss) from investment operations: | |
| Net investment income (loss) | | | 0.06 | *** | | | 0.07 | *** | | | 0.07 | *** | | | 0.06 | *** | | | 0.06 | *** | | | 0.04 | *** | |
Net realized and unrealized gain (loss)
on investments | | | 0.84 | | | | 1.56 | | | | 0.90 | | | | 1.06 | | | | 2.10 | | | | (1.50 | ) | |
| Total income (loss) from investment operations | | | 0.90 | | | | 1.63 | | | | 0.97 | | | | 1.12 | | | | 2.16 | | | | (1.46 | ) | |
| Less distributions to shareholders: | |
| From net investment income | | | - | | | | (0.07 | ) | | | (0.08 | ) | | | (0.06 | ) | | | (0.05 | ) | | | (0.04 | ) | |
| Net asset value, end of period | | $ | 13.78 | | | $ | 12.88 | | | $ | 11.32 | | | $ | 10.43 | | | $ | 9.37 | | | $ | 7.26 | | |
| Total Return (a) | | | 6.99 | %** | | | 14.42 | % | | | 9.25 | % | | | 11.94 | % | | | 29.79 | % | | | (16.64 | )% | |
| Ratios / Supplemental Data: | |
| Net assets, end of period (000's) | | $ | 248,313 | | | $ | 397,105 | | | $ | 369,858 | | | $ | 316,841 | | | $ | 207,025 | | | $ | 114,417 | | |
| Ratio of expenses to average daily net assets: | |
| Before expense waiver | | | 1.00 | %* | | | 1.00 | % | | | 1.00 | % | | | 1.00 | % | | | 1.00 | % | | | 1.00 | % | |
| After expense waiver | | | N/A | | | | N/A | | | | N/A | | | | 1.00 | % (b)# | | | 0.99 | % (b)# | | | 0.98 | % (b)# | |
Net investment income (loss)
to average daily net assets | | | 0.93 | %* | | | 0.63 | % | | | 0.69 | % | | | 0.65 | % | | | 0.70 | % | | | 0.53 | % | |
| Portfolio turnover rate | | | 4 | %** | | | 18 | % | | | 7 | % | | | 3 | % | | | 7 | % | | | 25 | % | |
* Annualized.
** Percentage represents results for the period and is not annualized.
*** Per share amount calculated on the average shares method.
† Effective January 1, 2005, rebated brokerage commissions are included with realized gain or loss on investment transactions. Prior to January 1, 2005, these amounts were presented as a reduction of expenses. Prior year amounts have not been restated to reflect this change.
# Computed after giving effect to an agreement by MassMutual to waive certain fees and expenses of the Fund.
(a) Employee retirement benefit plans that invest plan assets in the Separate Investment Accounts (SIAs) may be subject to certain charges as set forth in their respective Plan Documents. Total return figures would be lower for the periods presented if they reflected these charges.
(b) The Fund has entered into an agreement with certain brokers to rebate a portion of brokerage commissions. The rebated commissions were used to reduce operating expenses of the Fund.
(c) Total return excludes sales charges and would be lower for the period presented if it reflected these charges.
The accompanying notes are an integral part of the financial statements.
247
MassMutual Select Large Cap Value Fund – Financial Statements (Continued)
Financial Highlights (For a share outstanding throughout each period)
| | | Class Y | |
| | | Six months
ended
6/30/07
(Unaudited) | | Year ended
12/31/06 | | Year ended
12/31/05† | | Year ended
12/31/04 | | Year ended
12/31/03 | | Year ended
12/31/02 | |
| Net asset value, beginning of period | | $ | 12.91 | | | $ | 11.34 | | | $ | 10.45 | | | $ | 9.39 | | | $ | 7.27 | | | $ | 8.77 | | |
| Income (loss) from investment operations: | |
| Net investment income (loss) | | | 0.07 | *** | | | 0.09 | *** | | | 0.09 | *** | | | 0.08 | *** | | | 0.07 | *** | | | 0.05 | *** | |
Net realized and unrealized gain (loss)
on investments | | | 0.84 | | | | 1.57 | | | | 0.89 | | | | 1.05 | | | | 2.11 | | | | (1.50 | ) | |
Total income (loss) from investment
operations | | | 0.91 | | | | 1.66 | | | | 0.98 | | | | 1.13 | | | | 2.18 | | | | (1.45 | ) | |
| Less distributions to shareholders: | |
| From net investment income | | | - | | | | (0.09 | ) | | | (0.09 | ) | | | (0.07 | ) | | | (0.06 | ) | | | (0.05 | ) | |
| Net asset value, end of period | | $ | 13.82 | | | $ | 12.91 | | | $ | 11.34 | | | $ | 10.45 | | | $ | 9.39 | | | $ | 7.27 | | |
| Total Return (a) | | | 7.05 | %** | | | 14.65 | % | | | 9.37 | % | | | 12.06 | % | | | 30.04 | % | | | (16.52 | )% | |
| Ratios / Supplemental Data: | |
| Net assets, end of period (000's) | | $ | 194,905 | | | $ | 218,268 | | | $ | 146,699 | | | $ | 127,223 | | | $ | 78,751 | | | $ | 39,762 | | |
| Ratio of expenses to average daily net assets: | |
| Before expense waiver | | | 0.85 | %* | | | 0.85 | % | | | 0.85 | % | | | 0.85 | % | | | 0.85 | % | | | 0.84 | % | |
| After expense waiver | | | N/A | | | | N/A | | | | N/A | | | | 0.85 | % (b)# | | | 0.84 | % (b)# | | | 0.83 | % (b)# | |
Net investment income (loss) to average
daily net assets | | | 1.10 | %* | | | 0.78 | % | | | 0.84 | % | | | 0.81 | % | | | 0.85 | % | | | 0.66 | % | |
| Portfolio turnover rate | | | 4 | %** | | | 18 | % | | | 7 | % | | | 3 | % | | | 7 | % | | | 25 | % | |
| | | Class S | |
| | | Six months
ended
6/30/07
(Unaudited) | | Year ended
12/31/06 | | Year ended
12/31/05† | | Year ended
12/31/04 | | Year ended
12/31/03 | | Year ended
12/31/02 | |
| Net asset value, beginning of period | | $ | 12.93 | | | $ | 11.36 | | | $ | 10.46 | | | $ | 9.40 | | | $ | 7.27 | | | $ | 8.78 | | |
| Income (loss) from investment operations: | |
| Net investment income (loss) | | | 0.08 | *** | | | 0.10 | *** | | | 0.10 | *** | | | 0.09 | *** | | | 0.08 | *** | | | 0.06 | *** | |
Net realized and unrealized gain (loss)
on investments | | | 0.84 | | | | 1.57 | | | | 0.90 | | | | 1.05 | | | | 2.12 | | | | (1.51 | ) | |
Total income (loss) from investment
operations | | | 0.92 | | | | 1.67 | | | | 1.00 | | | | 1.14 | | | | 2.20 | | | | (1.45 | ) | |
| Less distributions to shareholders: | |
| From net investment income | | | - | | | | (0.10 | ) | | | (0.10 | ) | | | (0.08 | ) | | | (0.07 | ) | | | (0.06 | ) | |
| Net asset value, end of period | | $ | 13.85 | | | $ | 12.93 | | | $ | 11.36 | | | $ | 10.46 | | | $ | 9.40 | | | $ | 7.27 | | |
| Total Return (a) | | | 7.12 | %** | | | 14.71 | % | | | 9.57 | % | | | 12.11 | % | | | 30.24 | % | | | (16.53 | )% | |
| Ratios / Supplemental Data: | |
| Net assets, end of period (000's) | | $ | 651,599 | | | $ | 615,354 | | | $ | 546,331 | | | $ | 436,983 | | | $ | 339,287 | | | $ | 233,510 | | |
Ratio of expenses to average daily net assets:
Before expense waiver | | | 0.76 | %* | | | 0.76 | % | | | 0.76 | % | | | 0.76 | % | | | 0.76 | % | | | 0.75 | % | |
| After expense waiver | | | N/A | | | | N/A | | | | N/A | | | | 0.76 | % (b)# | | | 0.75 | % (b)# | | | 0.74 | % (b)# | |
Net investment income (loss) to average
daily net assets | | | 1.15 | %* | | | 0.86 | % | | | 0.93 | % | | | 0.88 | % | | | 0.94 | % | | | 0.76 | % | |
| Portfolio turnover rate | | | 4 | %** | | | 18 | % | | | 7 | % | | | 3 | % | | | 7 | % | | | 25 | % | |
* Annualized.
** Percentage represents results for the period and is not annualized.
*** Per share amount calculated on the average shares method.
† Effective January 1, 2005, rebated brokerage commissions are included with realized gain or loss on investment transactions. Prior to January 1, 2005, these amounts were presented as a reduction of expenses. Prior year amounts have not been restated to reflect this change.
# Computed after giving effect to an agreement by MassMutual to waive certain fees and expenses of the Fund.
(a) Employee retirement benefit plans that invest plan assets in the Separate Investment Accounts (SIAs) may be subject to certain charges as set forth in their respective Plan Documents. Total return figures would be lower for the periods presented if they reflected these charges.
(b) The Fund has entered into an agreement with certain brokers to rebate a portion of brokerage commissions. The rebated commissions were used to reduce operating expenses of the Fund.
The accompanying notes are an integral part of the financial statements.
248
MassMutual Select Large Cap Value Fund – Financial Statements (Continued)
Financial Highlights (For a share outstanding throughout each period)
| | | Class N | |
| | | Six months
ended
6/30/07
(Unaudited) | | Year ended
12/31/06 | | Year ended
12/31/05† | | Year ended
12/31/04 | | Year ended
12/31/03 | | Period ended
12/31/02++ | |
| Net asset value, beginning of period | | $ | 12.71 | | | $ | 11.17 | | | $ | 10.29 | | | $ | 9.25 | | | $ | 7.21 | | | $ | 7.19 | | |
| Income (loss) from investment operations: | |
| Net investment income (loss) | | | 0.03 | *** | | | 0.01 | *** | | | 0.02 | *** | | | 0.01 | *** | | | 0.03 | *** | | | 0.00 | ***†† | |
Net realized and unrealized gain (loss)
on investments | | | 0.82 | | | | 1.54 | | | | 0.87 | | | | 1.03 | | | | 2.07 | | | | 0.02 | | |
| Total income from investment operations | | | 0.85 | | | | 1.55 | | | | 0.89 | | | | 1.04 | | | | 2.10 | | | | 0.02 | | |
| Less distributions to shareholders: | |
| From net investment income | | | - | | | | (0.01 | ) | | | (0.01 | ) | | | - | | | | (0.06 | ) | | | - | | |
| Net asset value, end of period | | $ | 13.56 | | | $ | 12.71 | | | $ | 11.17 | | | $ | 10.29 | | | $ | 9.25 | | | $ | 7.21 | | |
| Total Return (a) | | | 6.69 | %(c)** | | | 13.87 | % (c) | | | 8.65 | % (c) | | | 11.24 | %(c) | | | 29.18 | % (c) | | | - | ‡ | |
| Ratios / Supplemental Data: | |
| Net assets, end of period (000's) | | $ | 1,036 | | | $ | 2,596 | | | $ | 2,279 | | | $ | 2,911 | | | $ | 2,891 | | | $ | 101 | | |
Ratio of expenses to average daily net assets:
Before expense waiver | | | 1.55 | %* | | | 1.55 | % | | | 1.55 | % | | | 1.55 | % | | | 1.57 | % | | | - | ‡ | |
| After expense waiver | | | N/A | | | | N/A | | | | N/A | | | | 1.55 | %# | | | 1.56 | % (b)# | | | N/A | | |
Net investment income (loss) to average
daily net assets | | | 0.52 | %* | | | 0.08 | % | | | 0.15 | % | | | 0.08 | % | | | 0.33 | % | | | 0.00 | %‡ | |
| Portfolio turnover rate | | | 4 | %** | | | 18 | % | | | 7 | % | | | 3 | % | | | 7 | % | | | 25 | % | |
* Annualized.
** Percentage represents results for the period and is not annualized.
*** Per share amount calculated on the average shares method.
† Effective January 1, 2005, rebated brokerage commissions are included with realized gain or loss on investment transactions. Prior to January 1, 2005, these amounts were presented as a reduction of expenses. Prior year amounts have not been restated to reflect this change.
†† Amount is less than $0.01 per share.
++ Class N commenced operations on December 31, 2002.
‡ Amount is de minimis due to the short period of operations.
# Computed after giving effect to an agreement by MassMutual to waive certain fees and expenses of the Fund.
(a) Employee retirement benefit plans that invest plan assets in the Separate Investment Accounts (SIAs) may be subject to certain charges as set forth in their respective Plan Documents. Total return figures would be lower for the periods presented if they reflected these charges.
(b) The Fund has entered into an agreement with certain brokers to rebate a portion of brokerage commissions. The rebated commissions were used to reduce operating expenses of the Fund.
(c) Total return excludes sales charges and would be lower for the period presented if it reflected these charges.
The accompanying notes are an integral part of the financial statements.
249
MassMutual Select Indexed Equity Fund – Financial Statements (Continued)
Financial Highlights (For a share outstanding throughout each period)
| | | Class A | |
| | | Six months
ended
6/30/07
(Unaudited) | | Year ended
12/31/06 | | Year ended
12/31/05 | | Year ended
12/31/04 | | Year ended
12/31/03 | | Year ended
12/31/02 | |
| Net asset value, beginning of period | | $ | 13.03 | | | $ | 11.47 | | | $ | 11.12 | | | $ | 10.23 | | | $ | 8.09 | | | $ | 10.55 | | |
| Income (loss) from investment operations: | |
| Net investment income (loss) | | | 0.09 | *** | | | 0.16 | *** | | | 0.13 | *** | | | 0.13 | *** | | | 0.08 | *** | | | 0.07 | *** | |
Net realized and unrealized gain (loss)
on investments | | | 0.77 | | | | 1.55 | | | | 0.33 | | | | 0.89 | | | | 2.14 | | | | (2.47 | ) | |
Total income (loss) from investment
operations | | | 0.86 | | | | 1.71 | | | | 0.46 | | | | 1.02 | | | | 2.22 | | | | (2.40 | ) | |
| Less distributions to shareholders: | |
| From net investment income | | | - | | | | (0.15 | ) | | | (0.11 | ) | | | (0.13 | ) | | | (0.08 | ) | | | (0.06 | ) | |
| Tax return of capital | | | - | | | | (0.00 | )† | | | - | | | | - | | | | - | | | | - | | |
| Total distributions | | | - | | | | (0.15 | ) | | | (0.11 | ) | | | (0.13 | ) | | | (0.08 | ) | | | (0.06 | ) | |
| Net asset value, end of period | | $ | 13.89 | | | $ | 13.03 | | | $ | 11.47 | | | $ | 11.12 | | | $ | 10.23 | | | $ | 8.09 | | |
| Total Return (a) | | | 6.60 | %(b)** | | | 14.95 | % (b) | | | 4.17 | % (b) | | | 10.01 | % (b) | | | 27.49 | % | | | (22.74 | )% | |
| Ratios / Supplemental Data: | |
| Net assets, end of period (000's) | | $ | 315,053 | | | $ | 297,468 | | | $ | 271,778 | | | $ | 275,920 | | | $ | 160,470 | | | $ | 70,695 | | |
| Ratio of expenses to average daily net assets: | |
| Before expense waiver | | | 0.85 | %* | | | 0.85 | % | | | 0.85 | % | | | 0.85 | % | | | 0.85 | % | | | 0.85 | % | |
| After expense waiver | | | 0.65 | %#* | | | 0.67 | % # | | | 0.75 | % # | | | 0.78 | % # | | | N/A | | | | N/A | | |
Net investment income (loss) to average daily
net assets | | | 1.30 | %* | | | 1.30 | % | | | 1.13 | % | | | 1.32 | % | | | 0.94 | % | | | 0.78 | % | |
| Portfolio turnover rate | | | 2 | %** | | | 4 | % | | | 6 | % | | | 3 | % | | | 2 | % | | | 5 | % | |
| | | Class L | |
| | | Six months
ended
6/30/07
(Unaudited) | | Year ended
12/31/06 | | Year ended
12/31/05 | | Year ended
12/31/04 | | Year ended
12/31/03 | | Year ended
12/31/02 | |
| Net asset value, beginning of period | | $ | 13.07 | | | $ | 11.50 | | | $ | 11.16 | | | $ | 10.26 | | | $ | 8.11 | | | $ | 10.58 | | |
| Income (loss) from investment operations: | |
| Net investment income (loss) | | | 0.10 | *** | | | 0.19 | *** | | | 0.15 | *** | | | 0.16 | *** | | | 0.11 | *** | | | 0.10 | *** | |
Net realized and unrealized gain (loss)
on investments | | | 0.79 | | | | 1.57 | | | | 0.34 | | | | 0.89 | | | | 2.15 | | | | (2.48 | ) | |
Total income (loss) from investment
operations | | | 0.89 | | | | 1.76 | | | | 0.49 | | | | 1.05 | | | | 2.26 | | | | (2.38 | ) | |
| Less distributions to shareholders: | |
| From net investment income | | | - | | | | (0.19 | ) | | | (0.15 | ) | | | (0.15 | ) | | | (0.11 | ) | | | (0.09 | ) | |
| Tax return of capital | | | - | | | | (0.00 | )† | | | - | | | | - | | | | - | | | | - | | |
| Total distributions | | | - | | | | (0.19 | ) | | | (0.15 | ) | | | (0.15 | ) | | | (0.11 | ) | | | (0.09 | ) | |
| Net asset value, end of period | | $ | 13.96 | | | $ | 13.07 | | | $ | 11.50 | | | $ | 11.16 | | | $ | 10.26 | | | $ | 8.11 | | |
| Total Return (a) | | | 6.81 | %** | | | 15.28 | % | | | 4.41 | % | | | 10.25 | % | | | 27.88 | % | | | (22.53 | )% | |
| Ratios / Supplemental Data: | |
| Net assets, end of period (000's) | | $ | 357,159 | | | $ | 337,639 | | | $ | 282,034 | | | $ | 218,755 | | | $ | 176,247 | | | $ | 54,756 | | |
| Ratio of expenses to average daily net assets: | |
| Before expense waiver | | | 0.60 | %* | | | 0.60 | % | | | 0.60 | % | | | 0.60 | % | | | 0.60 | % | | | 0.60 | % | |
| After expense waiver | | | 0.40 | %#* | | | 0.42 | % # | | | 0.50 | % # | | | 0.53 | % # | | | N/A | | | | N/A | | |
Net investment income (loss) to average daily
net assets | | | 1.55 | %* | | | 1.56 | % | | | 1.38 | % | | | 1.52 | % | | | 1.21 | % | | | 1.05 | % | |
| Portfolio turnover rate | | | 2 | %** | | | 4 | % | | | 6 | % | | | 3 | % | | | 2 | % | | | 5 | % | |
* Annualized.
** Percentage represents results for the period and is not annualized.
*** Per share amount calculated on the average shares method.
† Amount is less than $0.01 per share.
# Computed after giving effect to an agreement by MassMutual to waive certain fees and expenses of the Fund.
(a) Employee retirement benefit plans that invest plan assets in the Separate Investment Accounts (SIAs) may be subject to certain charges as set forth in their respective Plan Documents. Total return figures would be lower for the periods presented if they reflected these charges.
(b) Total return excludes sales charges and would be lower for the period presented if it reflected these charges.
The accompanying notes are an integral part of the financial statements.
250
MassMutual Select Indexed Equity Fund – Financial Statements (Continued)
Financial Highlights (For a share outstanding throughout each period)
| | | Class Y | |
| | | Six months
ended
6/30/07
(Unaudited) | | Year ended
12/31/06 | | Year ended
12/31/05 | | Year ended
12/31/04 | | Year ended
12/31/03 | | Year ended
12/31/02 | |
| Net asset value, beginning of period | | $ | 13.12 | | | $ | 11.54 | | | $ | 11.19 | | | $ | 10.29 | | | $ | 8.12 | | | $ | 10.60 | | |
| Income (loss) from investment operations: | |
| Net investment income (loss) | | | 0.10 | *** | | | 0.19 | *** | | | 0.16 | *** | | | 0.17 | *** | | | 0.12 | *** | | | 0.11 | *** | |
Net realized and unrealized gain (loss)
on investments | | | 0.78 | | | | 1.57 | | | | 0.34 | | | | 0.89 | | | | 2.16 | | | | (2.49 | ) | |
Total income (loss) from investment
operations | | | 0.88 | | | | 1.76 | | | | 0.50 | | | | 1.06 | | | | 2.28 | | | | (2.38 | ) | |
| Less distributions to shareholders: | |
| From net investment income | | | - | | | | (0.18 | ) | | | (0.15 | ) | | | (0.16 | ) | | | (0.11 | ) | | | (0.10 | ) | |
| Tax return of capital | | | - | | | | (0.00 | )† | | | - | | | | - | | | | - | | | | - | | |
| Total distributions | | | - | | | | (0.18 | ) | | | (0.15 | ) | | | (0.16 | ) | | | (0.11 | ) | | | (0.10 | ) | |
| Net asset value, end of period | | $ | 14.00 | | | $ | 13.12 | | | $ | 11.54 | | | $ | 11.19 | | | $ | 10.29 | | | $ | 8.12 | | |
| Total Return (a) | | | 6.71 | %** | | | 15.27 | % | | | 4.49 | % | | | 10.31 | % | | | 28.10 | % | | | (22.47 | )% | |
| Ratios / Supplemental Data: | |
| Net assets, end of period (000's) | | $ | 511,270 | | | $ | 494,849 | | | $ | 467,422 | | | $ | 419,366 | | | $ | 299,713 | | | $ | 198,240 | | |
| Net expenses to average daily net assets | | | 0.45 | %* | | | 0.45 | % | | | 0.45 | % | | | 0.45 | % | | | 0.45 | % | | | 0.45 | % | |
Net investment income (loss) to average daily
net assets | | | 1.50 | %* | | | 1.53 | % | | | 1.43 | % | | | 1.63 | % | | | 1.34 | % | | | 1.18 | % | |
| Portfolio turnover rate | | | 2 | %** | | | 4 | % | | | 6 | % | | | 3 | % | | | 2 | % | | | 5 | % | |
| | | Class S | |
| | | Six months
ended
6/30/07
(Unaudited) | | Year ended
12/31/06 | | Year ended
12/31/05 | | Year ended
12/31/04 | | Year ended
12/31/03 | | Year ended
12/31/02 | |
| Net asset value, beginning of period | | $ | 13.25 | | | $ | 11.65 | | | $ | 11.30 | | | $ | 10.38 | | | $ | 8.19 | | | $ | 10.68 | | |
| Income (loss) from investment operations: | |
| Net investment income (loss) | | | 0.10 | *** | | | 0.19 | *** | | | 0.16 | *** | | | 0.17 | *** | | | 0.12 | *** | | | 0.11 | *** | |
Net realized and unrealized gain (loss)
on investments | | | 0.79 | | | | 1.60 | | | | 0.35 | | | | 0.91 | | | | 2.18 | | | | (2.50 | ) | |
Total income (loss) from investment
operations | | | 0.89 | | | | 1.79 | | | | 0.51 | | | | 1.08 | | | | 2.30 | | | | (2.39 | ) | |
| Less distributions to shareholders: | |
| From net investment income | | | - | | | | (0.19 | ) | | | (0.16 | ) | | | (0.16 | ) | | | (0.11 | ) | | | (0.10 | ) | |
| Tax return of capital | | | - | | | | (0.00 | )† | | | - | | | | - | | | | - | | | | - | | |
| Total distributions | | | - | | | | (0.19 | ) | | | (0.16 | ) | | | (0.16 | ) | | | (0.11 | ) | | | (0.10 | ) | |
| Net asset value, end of period | | $ | 14.14 | | | $ | 13.25 | | | $ | 11.65 | | | $ | 11.30 | | | $ | 10.38 | | | $ | 8.19 | | |
| Total Return (a) | | | 6.72 | %** | | | 15.35 | % | | | 4.47 | % | | | 10.39 | % | | | 28.10 | % | | | (22.41 | )% | |
| Ratios / Supplemental Data: | |
| Net assets, end of period (000's) | | $ | 787,050 | | | $ | 751,170 | | | $ | 677,171 | | | $ | 724,614 | | | $ | 710,691 | | | $ | 567,426 | | |
| Net expenses to average daily net assets | | | 0.42 | %* | | | 0.42 | % | | | 0.42 | % | | | 0.42 | % | | | 0.42 | % | | | 0.42 | % | |
Net investment income (loss) to average daily
net assets | | | 1.53 | %* | | | 1.56 | % | | | 1.45 | % | | | 1.62 | % | | | 1.37 | % | | | 1.20 | % | |
| Portfolio turnover rate | | | 2 | %** | | | 4 | % | | | 6 | % | | | 3 | % | | | 2 | % | | | 5 | % | |
* Annualized.
** Percentage represents results for the period and is not annualized.
*** Per share amount calculated on the average shares method.
† Amount is less than $0.01 per share.
(a) Employee retirement benefit plans that invest plan assets in the Separate Investment Accounts (SIAs) may be subject to certain charges as set forth in their respective Plan Documents. Total return figures would be lower for the periods presented if they reflected these charges.
The accompanying notes are an integral part of the financial statements.
251
MassMutual Select Indexed Equity Fund – Financial Statements (Continued)
Financial Highlights (For a share outstanding throughout each period)
| | | Six months
ended
6/30/07
(Unaudited) | | Year ended
12/31/06 | | Year ended
12/31/05 | | Year ended
12/31/04 | | Year ended
12/31/03 | | Year ended
12/31/02 | |
| Net asset value, beginning of period | | $ | 13.25 | | | $ | 11.65 | | | $ | 11.30 | | | $ | 10.38 | | | $ | 8.19 | | | $ | 10.68 | | |
| Income (loss) from investment operations: | |
| Net investment income (loss) | | | 0.12 | *** | | | 0.22 | *** | | | 0.19 | *** | | | 0.21 | *** | | | 0.15 | *** | | | 0.13 | *** | |
Net realized and unrealized gain (loss)
on investments | | | 0.79 | | | | 1.59 | | | | 0.34 | | | | 0.90 | | | | 2.17 | | | | (2.50 | ) | |
Total income (loss) from investment
operations | | | 0.91 | | | | 1.81 | | | | 0.53 | | | | 1.11 | | | | 2.32 | | | | (2.37 | ) | |
| Less distributions to shareholders: | |
| From net investment income | | | - | | | | (0.21 | ) | | | (0.18 | ) | | | (0.19 | ) | | | (0.13 | ) | | | (0.12 | ) | |
| Tax return of capital | | | - | | | | (0.00 | )† | | | - | | | | - | | | | - | | | | - | | |
| Total distributions | | | - | | | | (0.21 | ) | | | (0.18 | ) | | | (0.19 | ) | | | (0.13 | ) | | | (0.12 | ) | |
| Net asset value, end of period | | $ | 14.16 | | | $ | 13.25 | | | $ | 11.65 | | | $ | 11.30 | | | $ | 10.38 | | | $ | 8.19 | | |
| Total Return (a) | | | 6.87 | %** | | | 15.59 | % | | | 4.72 | % | | | 10.68 | % | | | 28.39 | % | | | (22.23 | )% | |
| Ratios / Supplemental Data: | |
| Net assets, end of period (000's) | | $ | 445,460 | | | $ | 373,069 | | | $ | 251,403 | | | $ | 130,164 | | | $ | 42,906 | | | $ | 16,821 | | |
| Net expenses to average daily net assets | | | 0.20 | %* | | | 0.20 | % | | | 0.20 | % | | | 0.20 | % | | | 0.21 | % | | | 0.20 | % | |
Net investment income (loss) to average daily
net assets | | | 1.74 | %* | | | 1.78 | % | | | 1.68 | % | | | 1.93 | % | | | 1.59 | % | | | 1.42 | % | |
| Portfolio turnover rate | | | 2 | %** | | | 4 | % | | | 6 | % | | | 3 | % | | | 2 | % | | | 5 | % | |
| | | Six months
ended
6/30/07
(Unaudited) | | Year ended
12/31/06 | | Year ended
12/31/05 | | Year ended
12/31/04 | | Year ended
12/31/03 | | Period ended
12/31/02++ | |
| Net asset value, beginning of period | | $ | 12.90 | | | $ | 11.35 | | | $ | 11.02 | | | $ | 10.15 | | | $ | 8.05 | | | $ | 8.05 | | |
| Income (loss) from investment operations: | |
| Net investment income (loss) | | | 0.07 | *** | | | 0.12 | *** | | | 0.09 | *** | | | 0.10 | *** | | | 0.06 | *** | | | 0.00 | † | |
Net realized and unrealized gain (loss)
on investments | | | 0.77 | | | | 1.54 | | | | 0.34 | | | | 0.87 | | | | 2.14 | | | | (0.00 | )† | |
Total income (loss) from investment
operations | | | 0.84 | | | | 1.66 | | | | 0.43 | | | | 0.97 | | | | 2.20 | | | | 0.00 | | |
| Less distributions to shareholders: | |
| From net investment income | | | - | | | | (0.11 | ) | | | (0.10 | ) | | | (0.10 | ) | | | (0.10 | ) | | | - | | |
| Tax return of capital | | | - | | | | (0.00 | )† | | | - | | | | - | | | | - | | | | - | | |
| Total distributions | | | - | | | | (0.11 | ) | | | (0.10 | ) | | | (0.10 | ) | | | (0.10 | ) | | | - | | |
| Net asset value, end of period | | $ | 13.74 | | | $ | 12.90 | | | $ | 11.35 | | | $ | 11.02 | | | $ | 10.15 | | | $ | 8.05 | | |
| Total Return (a) | | | 6.51 | %(b)** | | | 14.67 | % (b) | | | 3.86 | % (b) | | | 9.59 | % (b) | | | 27.34 | % (b) | | | 0.00 | % ‡ | |
| Ratios / Supplemental Data: | |
| Net assets, end of period (000's) | | $ | 4,274 | | | $ | 5,079 | | | $ | 4,757 | | | $ | 3,710 | | | $ | 2,487 | | | $ | 101 | | |
| Ratio of expenses to average daily net assets: | | | | | | | | | | | | | | | | | | | | | | | | | |
| Before expense waiver | | | 1.15 | %* | | | 1.15 | % | | | 1.15 | % | | | 1.15 | % | | | 1.15 | % | | | - | ‡ | |
| After expense waiver | | | 0.95 | %#* | | | 0.97 | % # | | | 1.05 | % # | | | 1.07 | % # | | | N/A | | | | N/A | | |
Net investment income (loss) to average daily
net assets | | | 1.00 | %* | | | 1.00 | % | | | 0.84 | % | | | 1.00 | % | | | 0.64 | % | | | 0.00 | % ‡ | |
| Portfolio turnover rate | | | 2 | %** | | | 4 | % | | | 6 | % | | | 3 | % | | | 2 | % | | | 5 | % | |
* Annualized.
** Percentage represents results for the period and is not annualized.
*** Per share amount calculated on the average shares method.
† Amount is less than $0.01 per share.
++ Class N commenced operations on December 31, 2002.
‡ Amount is de minimis due to the short period of operations.
# Computed after giving effect to an agreement by MassMutual to waive certain fees and expenses of the Fund.
(a) Employee retirement benefit plans that invest plan assets in the Separate Investment Accounts (SIAs) may be subject to certain charges as set forth in their respective Plan Documents. Total return figures would be lower for the periods presented if they reflected these charges.
(b) Total return excludes sales charges and would be lower for the period presented if it reflected these charges.
The accompanying notes are an integral part of the financial statements.
252
MassMutual Select Core Opportunities Fund – Financial Statements (Continued)
Financial Highlights (For a share outstanding throughout each period)
| | | Class A | | Class L | | Class Y | |
| | | Six months
ended
6/30/07
(Unaudited) | |
Period ended
12/31/06+ | | Six months
ended
6/30/07
(Unaudited) | | Period ended
12/31/06+ | | Six months
ended
6/30/07
(Unaudited) | | Period ended
12/31/06+ | |
| Net asset value, beginning of period | | $ | 10.72 | | | $ | 10.00 | | | $ | 10.73 | | | $ | 10.00 | | | $ | 10.74 | | | $ | 10.00 | | |
| Income (loss) from investment operations: | |
| Net investment income (loss) | | | 0.03 | *** | | | 0.01 | *** | | | 0.04 | *** | | | 0.03 | *** | | | 0.05 | *** | | | (0.01 | ) *** | |
Net realized and unrealized gain (loss) on
investments | | | 0.84 | | | | 0.74 | | | | 0.84 | | | | 0.74 | | | | 0.84 | | | | 0.79 | | |
Total income from investment
operations | | | 0.87 | | | | 0.75 | | | | 0.88 | | | | 0.77 | | | | 0.89 | | | | 0.78 | | |
| Less distributions to shareholders: | |
| From net investment income | | | - | | | | (0.01 | ) | | | - | | | | (0.02 | ) | | | - | | | | (0.02 | ) | |
| From net realized gains | | | - | | | | (0.02 | ) | | | - | | | | (0.02 | ) | | | - | | | | (0.02 | ) | |
| Total distributions | | | - | | | | (0.03 | ) | | | - | | | | (0.04 | ) | | | - | | | | (0.04 | ) | |
| Net asset value, end of period | | $ | 11.59 | | | $ | 10.72 | | | $ | 11.61 | | | $ | 10.73 | | | $ | 11.63 | | | $ | 10.74 | | |
| Total Return (a) | | | 8.12 | %(b)** | | | 7.55 | % (b)** | | | 8.20 | %** | | | 7.76 | % ** | | | 8.29 | %** | | | 7.86 | % ** | |
| Ratios / Supplemental Data: | |
| Net assets, end of period (000's) | | $ | 19,886 | | | $ | 9,179 | | | $ | 9,294 | | | $ | 8,000 | | | $ | 11,484 | | | $ | 4,436 | | |
| Ratio of expenses to average daily net assets: | |
| Before expense waiver | | | 1.40 | %* | | | 1.67 | % * | | | 1.15 | %* | | | 1.42 | % * | | | 1.00 | %* | | | 1.27 | % * | |
| After expense waiver | | | 1.35 | %*# | | | 1.35 | % *# | | | 1.10 | %*# | | | 1.10 | % *# | | | 0.95 | %*# | | | 0.95 | % *# | |
Net investment income (loss) to average
daily net assets | | | 0.50 | %* | | | 0.13 | % * | | | 0.74 | %* | | | 0.43 | % * | | | 0.90 | %* | | | (0.08 | )% * | |
| Portfolio turnover rate | | | 51 | %** | | | 79 | % ** | | | 51 | %** | | | 79 | % ** | | | 51 | %** | | | 79 | % ** | |
* Annualized.
** Percentage represents results for the period and is not annualized.
*** Per share amount calculated on the average shares method.
+ The Fund commenced operations on March 31, 2006.
# Computed after giving effect to an agreement by MassMutual to waive certain fees and expenses of the Fund.
(a) Employee retirement benefit plans that invest plan assets in the Separate Investment Accounts (SIAs) may be subject to certain charges as set forth in their respective Plan Documents. Total return figures would be lower for the periods presented if they reflected these charges.
(b) Total return excludes sales charges and would be lower for the period if it reflected these charges.
The accompanying notes are an integral part of the financial statements.
253
MassMutual Select Core Opportunities Fund – Financial Statements (Continued)
Financial Highlights (For a share outstanding throughout each period)
| | | Class S | | Class N | |
| | | Six months
ended
6/30/07
(Unaudited) | | Period ended
12/31/06+ | | Six months
ended
6/30/07
(Unaudited) | | Period ended
12/31/06+ | |
| Net asset value, beginning of period | | $ | 10.74 | | | $ | 10.00 | | | $ | 10.71 | | | $ | 10.00 | | |
| Income (loss) from investment operations: | |
| Net investment income (loss) | | | 0.05 | *** | | | (0.04 | )*** | | | 0.01 | *** | | | (0.02 | )*** | |
| Net realized and unrealized gain (loss) on investments | | | 0.85 | | | | 0.75 | | | | 0.84 | | | | 0.75 | | |
| Total income from investment operations | | | 0.90 | | | | 0.79 | | | | 0.85 | | | | 0.73 | | |
| Less distributions to shareholders: | |
| From net investment income | | | - | | | | (0.03 | ) | | | - | | | | - | | |
| From net realized gains | | | - | | | | (0.02 | ) | | | - | | | | (0.02 | ) | |
| Total distributions | | | - | | | | (0.05 | ) | | | - | | | | (0.02 | ) | |
| Net asset value, end of period | | $ | 11.64 | | | $ | 10.74 | | | $ | 11.56 | | | $ | 10.71 | | |
| Total Return (a) | | | 8.38 | %** | | | 7.90 | % ** | | | 7.94 | %(b)** | | | 7.33 | % (b)** | |
| Ratios / Supplemental Data: | |
| Net assets, end of period (000's) | | $ | 6,492 | | | $ | 10,349 | | | $ | 116 | | | $ | 107 | | |
| Ratio of expenses to average daily net assets: | |
| Before expense waiver | | | 0.90 | %* | | | 1.17 | % * | | | 1.70 | %* | | | 1.97 | % * | |
| After expense waiver | | | 0.90 | %*# | | | 0.90 | % *# | | | 1.65 | %*# | | | 1.65 | % *# | |
| Net investment income (loss) to average daily net assets | | | 0.94 | %* | | | (0.53 | )% * | | | 0.19 | %* | | | (0.22 | )% * | |
| Portfolio turnover rate | | | 51 | %** | | | 79 | % ** | | | 51 | %** | | | 79 | % ** | |
* Annualized.
** Percentage represents results for the period and is not annualized.
*** Per share amount calculated on the average shares method.
+ The Fund commenced operations on March 31, 2006.
# Computed after giving effect to an agreement by MassMutual to waive certain fees and expenses of the Fund.
(a) Employee retirement benefit plans that invest plan assets in the Separate Investment Accounts (SIAs) may be subject to certain charges as set forth in their respective Plan Documents. Total return figures would be lower for the periods presented if they reflected these charges.
(b) Total return excludes sales charges and would be lower for the period if it reflected these charges.
The accompanying notes are an integral part of the financial statements.
254
MassMutual Select Blue Chip Growth Fund – Financial Statements (Continued)
Financial Highlights (For a share outstanding throughout each period)
| | | Class A | |
| | | Six months
ended
6/30/07
(Unaudited) | | Year ended
12/31/06 | | Year ended
12/31/05†† | | Year ended
12/31/04 | | Year ended
12/31/03 | | Year ended
12/31/02 | |
| Net asset value, beginning of period | | $ | 9.75 | | | $ | 9.01 | | | $ | 8.74 | | | $ | 8.33 | | | $ | 6.72 | | | $ | 9.07 | | |
| Income (loss) from investment operations: | |
| Net investment income (loss) | | | 0.00 | ***† | | | (0.01 | )*** | | | (0.02 | )*** | | | 0.03 | *** | | | (0.01 | )*** | | | (0.01 | )*** | |
Net realized and unrealized gain (loss)
on investments | | | 0.83 | | | | 0.75 | | | | 0.29 | | | | 0.41 | | | | 1.63 | | | | (2.34 | ) | |
Total income (loss) from investment
operations | | | 0.83 | | | | 0.74 | | | | 0.27 | | | | 0.44 | | | | 1.62 | | | | (2.35 | ) | |
| Less distributions to shareholders: | |
| From net investment income | | | - | | | | - | | | | - | | | | (0.03 | ) | | | (0.01 | ) | | | (0.00 | )† | |
| Net asset value, end of period | | $ | 10.58 | | | $ | 9.75 | | | $ | 9.01 | | | $ | 8.74 | | | $ | 8.33 | | | $ | 6.72 | | |
| Total Return (a) | | | 8.51 | %(c)** | | | 8.21 | % (c) | | | 3.09 | % (c) | | | 5.32 | % (c) | | | 24.09 | % | | | (25.91 | )% | |
| Ratios / Supplemental Data: | |
| Net assets, end of period (000's) | | $ | 47,833 | | | $ | 39,055 | | | $ | 36,742 | | | $ | 37,377 | | | $ | 26,955 | | | $ | 4,914 | | |
| Ratio of expenses to average daily net assets: | |
| Before expense waiver | | | 1.38 | %* | | | 1.39 | % | | | 1.39 | % | | | 1.38 | % | | | 1.39 | % | | | 1.38 | % | |
| After expense waiver | | | 1.28 | %#* | | | 1.31 | % # | | | N/A | | | | 1.38 | % (b)# | | | 1.38 | % (b)# | | | 1.38 | % # | |
Net investment income (loss) to average
daily net assets | | | 0.03 | %* | | | (0.12 | )% | | | (0.20 | )% | | | 0.37 | % | | | (0.13 | )% | | | (0.20 | )% | |
| Portfolio turnover rate | | | 19 | %** | | | 98 | % | | | 28 | % | | | 22 | % | | | 23 | % | | | 30 | % | |
| | | Class L | |
| | | Six months
ended
6/30/07
(Unaudited) | | Year ended
12/31/06 | | Year ended
12/31/05†† | | Year ended
12/31/04 | | Year ended
12/31/03 | | Year ended
12/31/02 | |
| Net asset value, beginning of period | | $ | 9.87 | | | $ | 9.10 | | | $ | 8.81 | | | $ | 8.39 | | | $ | 6.76 | | | $ | 9.09 | | |
| Income (loss) from investment operations: | |
| Net investment income (loss) | | | 0.01 | *** | | | 0.01 | *** | | | 0.00 | ***† | | | 0.05 | *** | | | 0.01 | *** | | | (0.00 | )***† | |
Net realized and unrealized gain (loss)
on investments | | | 0.84 | | | | 0.77 | | | | 0.29 | | | | 0.42 | | | | 1.63 | | | | (2.33 | ) | |
Total income (loss) from investment
operations | | | 0.85 | | | | 0.78 | | | | 0.29 | | | | 0.47 | | | | 1.64 | | | | (2.33 | ) | |
| Less distributions to shareholders: | |
| From net investment income | | | - | | | | (0.01 | ) | | | - | | | | (0.05 | ) | | | (0.01 | ) | | | - | | |
| Net asset value, end of period | | $ | 10.72 | | | $ | 9.87 | | | $ | 9.10 | | | $ | 8.81 | | | $ | 8.39 | | | $ | 6.76 | | |
| Total Return (a) | | | 8.61 | %** | | | 8.52 | % | | | 3.32 | % | | | 5.58 | % | | | 24.25 | % | | | (25.63 | )% | |
| Ratios / Supplemental Data: | |
| Net assets, end of period (000's) | | $ | 364,559 | | | $ | 280,094 | | | $ | 270,082 | | | $ | 301,734 | | | $ | 302,292 | | | $ | 217,427 | | |
| Ratio of expenses to average daily net assets: | |
| Before expense waiver | | | 1.13 | %* | | | 1.14 | % | | | 1.14 | % | | | 1.13 | % | | | 1.13 | % | | | 1.13 | % | |
| After expense waiver | | | 1.03 | %#* | | | 1.06 | % # | | | N/A | | | | 1.13 | % (b)# | | | 1.12 | % (b)# | | | 1.13 | % # | |
Net investment income (loss) to average
daily net assets | | | 0.25 | %* | | | 0.13 | % | | | 0.05 | % | | | 0.54 | % | | | 0.14 | % | | | (0.05 | )% | |
| Portfolio turnover rate | | | 19 | %** | | | 98 | % | | | 28 | % | | | 22 | % | | | 23 | % | | | 30 | % | |
* Annualized.
** Percentage represents results for the period and is not annualized.
*** Per share amount calculated on the average shares method.
† Amount is less than $0.01 per share.
†† Effective January 1, 2005, rebated brokerage commissions are included with realized gain or loss on investment transactions. Prior to January 1, 2005, these amounts were presented as a reduction of expenses. Prior year amounts have not been restated to reflect this change due to immateriality.
# Computed after giving effect to an agreement by MassMutual to waive certain fees and expenses of the Fund.
(a) Employee retirement benefit plans that invest plan assets in the Separate Investment Accounts (SIAs) may be subject to certain charges as set forth in their respective Plan Documents. Total return figures would be lower for the periods presented if they reflected these charges.
(b) The Fund has entered into an agreement with certain brokers to rebate a portion of brokerage commissions. The rebated commissions were used to reduce operating expenses of the Fund.
(c) Total return excludes sales charges and would be lower for the period presented if it reflected these charges.
The accompanying notes are an integral part of the financial statements.
255
MassMutual Select Blue Chip Growth Fund – Financial Statements (Continued)
Financial Highlights (For a share outstanding throughout each period)
| | | Class Y | |
| | | Six months
ended
6/30/07
(Unaudited) | | Year ended
12/31/06 | | Year ended
12/31/05†† | | Year ended
12/31/04 | | Year ended
12/31/03 | | Year ended
12/31/02 | |
| Net asset value, beginning of period | | $ | 9.87 | | | $ | 9.11 | | | $ | 8.82 | | | $ | 8.39 | | | $ | 6.77 | | | $ | 9.10 | | |
| Income (loss) from investment operations: | |
| Net investment income (loss) | | | 0.02 | *** | | | 0.03 | *** | | | 0.01 | *** | | | 0.06 | *** | | | 0.02 | *** | | | 0.01 | *** | |
Net realized and unrealized gain (loss)
on investments | | | 0.84 | | | | 0.76 | | | | 0.30 | | | | 0.43 | | | | 1.62 | | | | (2.34 | ) | |
| Total income (loss) from investment operations | | | 0.86 | | | | 0.79 | | | | 0.31 | | | | 0.49 | | | | 1.64 | | | | (2.33 | ) | |
| Less distributions to shareholders: | |
| From net investment income | | | - | | | | (0.03 | ) | | | (0.02 | ) | | | (0.06 | ) | | | (0.02 | ) | | | (0.00 | )† | |
| Net asset value, end of period | | $ | 10.73 | | | $ | 9.87 | | | $ | 9.11 | | | $ | 8.82 | | | $ | 8.39 | | | $ | 6.77 | | |
| Total Return (a) | | | 8.71 | %** | | | 8.64 | % | | | 3.46 | % | | | 5.83 | % | | | 24.26 | % | | | (25.56 | )% | |
| Ratios / Supplemental Data: | |
| Net assets, end of period (000's) | | $ | 31,331 | | | $ | 44,656 | | | $ | 4,732 | | | $ | 4,331 | | | $ | 3,626 | | | $ | 827 | | |
| Ratio of expenses to average daily net assets: | |
| Before expense waiver | | | 1.01 | %* | | | 1.00 | % | | | 1.02 | % | | | 1.01 | % | | | 1.01 | % | | | 1.01 | % | |
| After expense waiver | | | 0.91 | %#* | | | 0.93 | % # | | | N/A | | | | 1.01 | % (b)# | | | 1.01 | % (b)# | | | 1.01 | % # | |
Net investment income (loss) to average
daily net assets | | | 0.43 | %* | | | 0.29 | % | | | 0.17 | % | | | 0.68 | % | | | 0.26 | % | | | 0.12 | % | |
| Portfolio turnover rate | | | 19 | %** | | | 98 | % | | | 28 | % | | | 22 | % | | | 23 | % | | | 30 | % | |
| | | Class S | |
| | | Six months
ended
6/30/07
(Unaudited) | | Year ended
12/31/06 | | Year ended
12/31/05†† | | Year ended
12/31/04 | | Year ended
12/31/03 | | Year ended
12/31/02 | |
| Net asset value, beginning of period | | $ | 9.91 | | | $ | 9.14 | | | $ | 8.84 | | | $ | 8.42 | | | $ | 6.78 | | | $ | 9.10 | | |
| Income (loss) from investment operations: | |
| Net investment income (loss) | | | 0.03 | *** | | | 0.03 | *** | | | 0.03 | *** | | | 0.07 | *** | | | 0.03 | *** | | | 0.02 | *** | |
Net realized and unrealized gain (loss)
on investments | | | 0.84 | | | | 0.77 | | | | 0.30 | | | | 0.42 | | | | 1.64 | | | | (2.33 | ) | |
| Total income (loss) from investment operations | | | 0.87 | | | | 0.80 | | | | 0.33 | | | | 0.49 | | | | 1.67 | | | | (2.31 | ) | |
| Less distributions to shareholders: | |
| From net investment income | | | - | | | | (0.03 | ) | | | (0.03 | ) | | | (0.07 | ) | | | (0.03 | ) | | | (0.01 | ) | |
| Net asset value, end of period | | $ | 10.78 | | | $ | 9.91 | | | $ | 9.14 | | | $ | 8.84 | | | $ | 8.42 | | | $ | 6.78 | | |
| Total Return (a) | | | 8.78 | %** | | | 8.74 | % | | | 3.68 | % | | | 5.80 | % | | | 24.58 | % | | | (25.43 | )% | |
| Ratios / Supplemental Data: | |
| Net assets, end of period (000's) | | $ | 112,068 | | | $ | 66,864 | | | $ | 71,627 | | | $ | 79,072 | | | $ | 91,674 | | | $ | 72,210 | | |
| Ratio of expenses to average daily net assets: | |
| Before expense waiver | | | 0.88 | %* | | | 0.89 | % | | | 0.88 | % | | | 0.88 | % | | | 0.88 | % | | | 0.88 | % | |
| After expense waiver | | | 0.78 | %#* | | | 0.82 | % # | | | N/A | | | | 0.87 | % (b)# | | | 0.87 | % (b)# | | | 0.88 | % # | |
Net investment income (loss) to average
daily net assets | | | 0.49 | %* | | | 0.37 | % | | | 0.30 | % | | | 0.77 | % | | | 0.39 | % | | | 0.20 | % | |
| Portfolio turnover rate | | | 19 | %** | | | 98 | % | | | 28 | % | | | 22 | % | | | 23 | % | | | 30 | % | |
* Annualized.
** Percentage represents results for the period and is not annualized.
*** Per share amount calculated on the average shares method.
† Amount is less than $0.01 per share.
†† Effective January 1, 2005, rebated brokerage commissions are included with realized gain or loss on investment transactions. Prior to January 1, 2005, these amounts were presented as a reduction of expenses. Prior year amounts have not been restated to reflect this change due to immateriality.
# Computed after giving effect to an agreement by MassMutual to waive certain fees and expenses of the Fund.
(a) Employee retirement benefit plans that invest plan assets in the Separate Investment Accounts (SIAs) may be subject to certain charges as set forth in their respective Plan Documents. Total return figures would be lower for the periods presented if they reflected these charges.
(b) The Fund has entered into an agreement with certain brokers to rebate a portion of brokerage commissions. The rebated commissions were used to reduce operating expenses of the Fund.
The accompanying notes are an integral part of the financial statements.
256
MassMutual Select Blue Chip Growth Fund – Financial Statements (Continued)
Financial Highlights (For a share outstanding throughout each period)
| | | Class N | |
| | | Six months
ended
6/30/07
(Unaudited) | | Year ended
12/31/06 | | Year ended
12/31/05†† | | Year ended
12/31/04 | | Year ended
12/31/03 | | Period ended
12/31/02++ | |
| Net asset value, beginning of period | | $ | 9.63 | | | $ | 8.92 | | | $ | 8.68 | | | $ | 8.27 | | | $ | 6.69 | | | $ | 6.69 | | |
| Income (loss) from investment operations: | |
| Net investment income (loss) | | | (0.01 | )*** | | | (0.04 | )*** | | | (0.04 | )*** | | | 0.01 | *** | | | (0.03 | )*** | | | 0.00 | ***† | |
Net realized and unrealized gain (loss)
on investments | | | 0.81 | | | | 0.75 | | | | 0.28 | | | | 0.41 | | | | 1.61 | | | | (0.00 | )† | |
| Total income (loss) from investment operations | | | 0.80 | | | | 0.71 | | | | 0.24 | | | | 0.42 | | | | 1.58 | | | | 0.00 | | |
| Less distributions to shareholders: | |
| From net investment income | | | - | | | | - | | | | - | | | | (0.01 | ) | | | (0.00 | )† | | | - | | |
| Net asset value, end of period | | $ | 10.43 | | | $ | 9.63 | | | $ | 8.92 | | | $ | 8.68 | | | $ | 8.27 | | | $ | 6.69 | | |
| Total Return (a) | | | 8.31 | % (c)** | | | 7.96 | % (c) | | | 2.77 | % (c) | | | 5.05 | % (c) | | | 23.64 | % (c) | | | 0.00 | % ‡ | |
| Ratios / Supplemental Data: | |
| Net assets, end of period (000's) | | $ | 2,878 | | | $ | 3,509 | | | $ | 1,957 | | | $ | 2,185 | | | $ | 1,493 | | | $ | 101 | | |
| Ratio of expenses to average daily net assets: | |
| Before expense waiver | | | 1.68 | % * | | | 1.69 | % | | | 1.69 | % | | | 1.68 | % | | | 1.69 | % | | | - | ‡ | |
| After expense waiver | | | 1.58 | % #* | | | 1.61 | % # | | | N/A | | | | 1.68 | % (b)# | | | 1.69 | % (b)# | | | N/A | | |
Net investment income (loss) to average
daily net assets | | | (0.28 | )% * | | | (0.41 | )% | | | (0.50 | )% | | | 0.08 | % | | | (0.45 | )% | | | 0.00 | % ‡ | |
| Portfolio turnover rate | | | 19 | % ** | | | 98 | % | | | 28 | % | | | 22 | % | | | 23 | % | | | 30 | % | |
* Annualized.
** Percentage represents results for the period and is not annualized.
*** Per share amount calculated on the average shares method.
† Amount is less than $0.01 per share.
†† Effective January 1, 2005, rebated brokerage commissions are included with realized gain or loss on investment transactions. Prior to January 1, 2005, these amounts were presented as a reduction of expenses. Prior year amounts have not been restated to reflect this change due to immateriality.
++ Class N commenced operations on December 31, 2002.
‡ Amount is de minimis due to the short period of operations.
# Computed after giving effect to an agreement by MassMutual to waive certain fees and expenses of the Fund.
(a) Employee retirement benefit plans that invest plan assets in the Separate Investment Accounts (SIAs) may be subject to certain charges as set forth in their respective Plan Documents. Total return figures would be lower for the periods presented if they reflected these charges.
(b) The Fund has entered into an agreement with certain brokers to rebate a portion of brokerage commissions. The rebated commissions were used to reduce operating expenses of the Fund.
(c) Total return excludes sales charges and would be lower for the period presented if it reflected these charges.
The accompanying notes are an integral part of the financial statements.
257
MassMutual Select Large Cap Growth Fund – Financial Statements (Continued)
Financial Highlights (For a share outstanding throughout each period)
| | | Class A | |
| | | Six months
ended
6/30/07
(Unaudited) | | Year ended
12/31/06 | | Year ended
12/31/05†† | | Year ended
12/31/04 | | Year ended
12/31/03 | | Year ended
12/31/02 | |
| Net asset value, beginning of period | | $ | 9.88 | | | $ | 10.29 | | | $ | 9.03 | | | $ | 8.48 | | | $ | 6.97 | | | $ | 10.00 | | |
| Income (loss) from investment operations: | |
| Net investment income (loss) | | | (0.02 | )*** | | | (0.05 | )*** | | | (0.06 | )*** | | | (0.02 | )*** | | | (0.03 | )*** | | | (0.04 | )*** | |
Net realized and unrealized gain (loss)
on investments | | | 0.69 | | | | 0.05 | | | | 1.32 | | | | 0.57 | | | | 1.54 | | | | (2.99 | ) | |
| Total income (loss) from investment operations | | | 0.67 | | | | 0.00 | | | | 1.26 | | | | 0.55 | | | | 1.51 | | | | (3.03 | ) | |
| Less distributions to shareholders: | |
| From net realized gains | | | - | | | | (0.41 | ) | | | - | | | | - | | | | - | | | | - | | |
| Net asset value, end of period | | $ | 10.55 | | | $ | 9.88 | | | $ | 10.29 | | | $ | 9.03 | | | $ | 8.48 | | | $ | 6.97 | | |
| Total Return (a) | | | 6.78 | % (c)** | | | (0.02 | )% (c) | | | 13.95 | % (c) | | | 6.49 | % (c) | | | 21.66 | % | | | (30.30 | )% | |
| Ratios / Supplemental Data: | |
| Net assets, end of period (000's) | | $ | 9,051 | | | $ | 8,278 | | | $ | 3,452 | | | $ | 1,997 | | | $ | 1,374 | | | $ | 826 | | |
| Ratio of expenses to average daily net assets: | |
| Before expense waiver | | | 1.35 | % * | | | 1.39 | % | | | 1.38 | % | | | 1.37 | % | | | 1.34 | % | | | 1.40 | % | |
| After expense waiver | | | N/A | | | | N/A | | | | 1.35 | % # | | | 1.25 | % (b)# | | | 1.25 | % (b)# | | | 1.22 | % (b)# | |
Net investment income (loss) to average daily
net assets | | | (0.45 | )% * | | | (0.55 | )% | | | (0.65 | )% | | | (0.20 | )% | | | (0.34 | )% | | | (0.48 | )% | |
| Portfolio turnover rate | | | 46 | % ** | | | 98 | % | | | 83 | % | | | 68 | % | | | 47 | % | | | 56 | % | |
| | | Class L | |
| | | Six months
ended
6/30/07
(Unaudited) | | Year ended
12/31/06 | | Year ended
12/31/05†† | | Year ended
12/31/04 | | Year ended
12/31/03 | | Year ended
12/31/02 | |
| Net asset value, beginning of period | | $ | 10.14 | | | $ | 10.53 | | | $ | 9.09 | | | $ | 8.52 | | | $ | 6.99 | | | $ | 10.00 | | |
| Income (loss) from investment operations: | |
| Net investment income (loss) | | | (0.01 | )*** | | | (0.03 | )*** | | | (0.05 | )*** | | | 0.00 | ***† | | | (0.01 | )*** | | | (0.01 | )*** | |
Net realized and unrealized gain (loss)
on investments | | | 0.70 | | | | 0.05 | | | | 1.49 | | | | 0.57 | | | | 1.54 | | | | (3.00 | ) | |
| Total income (loss) from investment operations | | | 0.69 | | | | 0.02 | | | | 1.44 | | | | 0.57 | | | | 1.53 | | | | (3.01 | ) | |
| Less distributions to shareholders: | |
| From net investment income | | | - | | | | - | | | | - | | | | (0.00 | )† | | | - | | | | - | | |
| From net realized gains | | | - | | | | (0.41 | ) | | | - | | | | - | | | | - | | | | - | | |
| Total distributions | | | - | | | | (0.41 | ) | | | - | | | | (0.00 | ) | | | - | | | | - | | |
| Net asset value, end of period | | $ | 10.83 | | | $ | 10.14 | | | $ | 10.53 | | | $ | 9.09 | | | $ | 8.52 | | | $ | 6.99 | | |
| Total Return (a) | | | 6.80 | % ** | | | 0.17 | % | | | 15.84 | % | | | 6.72 | % | | | 21.89 | % | | | (30.10 | )% | |
| Ratios / Supplemental Data: | |
| Net assets, end of period (000's) | | $ | 1,412 | | | $ | 1,630 | | | $ | 1,032 | | | $ | 9,272 | | | $ | 7,628 | | | $ | 3,883 | | |
| Ratio of expenses to average daily net assets: | |
| Before expense waiver | | | 1.10 | % * | | | 1.15 | % | | | 1.09 | % | | | 1.12 | % | | | 1.09 | % | | | 1.15 | % | |
| After expense waiver | | | N/A | | | | N/A | | | | 1.06 | % # | | | 1.00 | % (b)# | | | 1.00 | % (b)# | | | 0.98 | % (b)# | |
Net investment income (loss) to average
daily net assets | | | (0.21 | )% * | | | (0.30 | )% | | | (0.55 | )% | | | 0.04 | % | | | (0.08 | )% | | | (0.20 | )% | |
| Portfolio turnover rate | | | 46 | % ** | | | 98 | % | | | 83 | % | | | 68 | % | | | 47 | % | | | 56 | % | |
* Annualized.
** Percentage represents results for the period and is not annualized.
*** Per share amount calculated on the average shares method.
† Amount is less than $0.01 per share.
†† Effective January 1, 2005, rebated brokerage commissions are included with realized gain or loss on investment transactions. Prior to January 1, 2005, these amounts were presented as a reduction of expenses. Prior year amounts have not been restated to reflect this change due to immateriality.
# Computed after giving effect to an agreement by MassMutual to waive certain fees and expenses of the Fund.
(a) Employee retirement benefit plans that invest plan assets in the Separate Investment Accounts (SIAs) may be subject to certain charges as set forth in their respective Plan Documents. Total return figures would be lower for the periods presented if they reflected these charges.
(b) The Fund has entered into an agreement with certain brokers to rebate a portion of brokerage commissions. The rebated commissions were used to reduce operating expenses of the Fund.
(c) Total return excludes sales charges and would be lower for the period presented if it reflected these charges.
The accompanying notes are an integral part of the financial statements.
258
MassMutual Select Large Cap Growth Fund – Financial Statements (Continued)
Financial Highlights (For a share outstanding throughout each period)
| | | Class Y | |
| | | Six months
ended
6/30/07
(Unaudited) | | Year ended
12/31/06 | | Year ended
12/31/05†† | | Year ended
12/31/04 | | Year ended
12/31/03 | | Year ended
12/31/02 | |
| Net asset value, beginning of period | | $ | 10.05 | | | $ | 10.42 | | | $ | 9.10 | | | $ | 8.53 | | | $ | 7.00 | | | $ | 10.00 | | |
| Income (loss) from investment operations: | |
| Net investment income (loss) | | | (0.00 | )***† | | | (0.02 | )*** | | | (0.02 | )*** | | | 0.02 | *** | | | 0.01 | *** | | | (0.01 | )*** | |
Net realized and unrealized gain (loss)
on investments | | | 0.69 | | | | 0.06 | | | | 1.34 | | | | 0.57 | | | | 1.53 | | | | (2.99 | ) | |
| Total income (loss) from investment operations | | | 0.69 | | | | 0.04 | | | | 1.32 | | | | 0.59 | | | | 1.54 | | | | (3.00 | ) | |
| Less distributions to shareholders: | |
| From net investment income | | | - | | | | - | | | | - | | | | (0.02 | ) | | | (0.01 | ) | | | - | | |
| From net realized gains | | | - | | | | (0.41 | ) | | | - | | | | - | | | | - | | | | - | | |
| | | | | | | | | | | | | | | | | | | | | | | | | | |
| Total distributions | | | - | | | | (0.41 | ) | | | - | | | | (0.02 | ) | | | (0.01 | ) | | | - | | |
| Net asset value, end of period | | $ | 10.74 | | | $ | 10.05 | | | $ | 10.42 | | | $ | 9.10 | | | $ | 8.53 | | | $ | 7.00 | | |
| Total Return (a) | | | 6.87 | % ** | | | 0.37 | % | | | 14.51 | % | | | 6.86 | % | | | 22.04 | % | | | (30.00 | )% | |
| Ratios / Supplemental Data: | |
| Net assets, end of period (000's) | | $ | 12,557 | | | $ | 10,043 | | | $ | 12,099 | | | $ | 9,052 | | | $ | 7,697 | | | $ | 78 | | |
| Ratio of expenses to average daily net assets: | |
| Before expense waiver | | | 0.95 | % * | | | 0.98 | % | | | 0.98 | % | | | 0.97 | % | | | 0.94 | % | | | 1.00 | % | |
| After expense waiver | | | N/A | | | | N/A | | | | 0.95 | % # | | | 0.85 | % (b)# | | | 0.86 | % (b)# | | | 0.82 | % (b)# | |
Net investment income (loss) to average daily
net assets | | | (0.05 | )% * | | | (0.19 | )% | | | (0.26 | )% | | | 0.19 | % | | | 0.08 | % | | | (0.11 | )% | |
| Portfolio turnover rate | | | 46 | % ** | | | 98 | % | | | 83 | % | | | 68 | % | | | 47 | % | | | 56 | % | |
| | | Class S | |
| | | Six months
ended
6/30/07
(Unaudited) | | Year ended
12/31/06 | | Year ended
12/31/05†† | | Year ended
12/31/04 | | Year ended
12/31/03 | | Year ended
12/31/02 | |
| Net asset value, beginning of period | | $ | 10.09 | | | $ | 10.46 | | | $ | 9.14 | | | $ | 8.55 | | | $ | 7.01 | | | $ | 10.00 | | |
| Income (loss) from investment operations: | |
| Net investment income (loss) | | | (0.00 | )***† | | | (0.02 | )*** | | | (0.02 | )*** | | | 0.01 | *** | | | 0.01 | *** | | | (0.00 | )***† | |
Net realized and unrealized gain (loss)
on investments | | | 0.71 | | | | 0.06 | | | | 1.34 | | | | 0.59 | | | | 1.54 | | | | (2.99 | ) | |
| Total income (loss) from investment operations | | | 0.71 | | | | 0.04 | | | | 1.32 | | | | 0.60 | | | | 1.55 | | | | (2.99 | ) | |
| Less distributions to shareholders: | |
| From net investment income | | | - | | | | - | | | | - | | | | (0.01 | ) | | | (0.01 | ) | | | - | | |
| From net realized gains | | | - | | | | (0.41 | ) | | | - | | | | - | | | | - | | | | - | | |
| Total distributions | | | - | | | | (0.41 | ) | | | - | | | | (0.01 | ) | | | (0.01 | ) | | | - | | |
| Net asset value, end of period | | $ | 10.80 | | | $ | 10.09 | | | $ | 10.46 | | | $ | 9.14 | | | $ | 8.55 | | | $ | 7.01 | | |
| Total Return (a) | | | 7.04 | % ** | | | 0.36 | % | | | 14.44 | % | | | 7.08 | % | | | 22.05 | % | | | (29.90 | )% | |
| Ratios / Supplemental Data: | |
| Net assets, end of period (000's) | | $ | 21,110 | | | $ | 20,909 | | | $ | 26,241 | | | $ | 18,791 | | | $ | 33,787 | | | $ | 28,029 | | |
| Ratio of expenses to average daily net assets: | |
| Before expense waiver | | | 0.91 | % * | | | 0.94 | % | | | 0.94 | % | | | 0.93 | % | | | 0.90 | % | | | 0.96 | % | |
| After expense waiver | | | N/A | | | | N/A | | | | 0.91 | % # | | | 0.81 | % (b)# | | | 0.81 | % (b)# | | | 0.77 | % (b)# | |
Net investment income (loss) to average
daily net assets | | | (0.01 | )% * | | | (0.15 | )% | | | (0.21 | )% | | | 0.16 | % | | | 0.11 | % | | | (0.05 | )% | |
| Portfolio turnover rate | | | 46 | % ** | | | 98 | % | | | 83 | % | | | 68 | % | | | 47 | % | | | 56 | % | |
* Annualized.
** Percentage represents results for the period and is not annualized.
*** Per share amount calculated on the average shares method.
† Amount is less than $0.01 per share.
†† Effective January 1, 2005, rebated brokerage commissions are included with realized gain or loss on investment transactions. Prior to January 1, 2005, these amounts were presented as a reduction of expenses. Prior year amounts have not been restated to reflect this change due to immateriality.
# Computed after giving effect to an agreement by MassMutual to waive certain fees and expenses of the Fund.
(a) Employee retirement benefit plans that invest plan assets in the Separate Investment Accounts (SIAs) may be subject to certain charges as set forth in their respective Plan Documents. Total return figures would be lower for the periods presented if they reflected these charges.
(b) The Fund has entered into an agreement with certain brokers to rebate a portion of brokerage commissions. The rebated commissions were used to reduce operating expenses of the Fund.
The accompanying notes are an integral part of the financial statements.
259
MassMutual Select Large Cap Growth Fund – Financial Statements (Continued)
Financial Highlights (For a share outstanding throughout each period)
| | | Class N | |
| | | Six months
ended
6/30/07
(Unaudited) | | Year ended
12/31/06 | | Year ended
12/31/05†† | | Year ended
12/31/04 | | Year ended
12/31/03 | | Period ended
12/31/02++ | |
| Net asset value, beginning of period | | $ | 9.86 | | | $ | 10.31 | | | $ | 9.07 | | | $ | 8.42 | | | $ | 6.94 | | | $ | 6.95 | | |
| Income (loss) from investment operations: | |
| Net investment income (loss) | | | (0.04 | )*** | | | (0.09 | )*** | | | (0.09 | )*** | | | (0.07 | )*** | | | (0.05 | )*** | | | (0.00 | )***† | |
Net realized and unrealized gain (loss)
on investments | | | 0.69 | | | | 0.05 | | | | 1.33 | | | | 0.72 | | | | 1.53 | | | | (0.01 | ) | |
| Total income from investment operations | | | 0.65 | | | | (0.04 | ) | | | 1.24 | | | | 0.65 | | | | 1.48 | | | | (0.01 | ) | |
| Less distributions to shareholders: | |
| From net realized gains | | | - | | | | (0.41 | ) | | | - | | | | - | | | | - | | | | - | | |
| Net asset value, end of period | | $ | 10.51 | | | $ | 9.86 | | | $ | 10.31 | | | $ | 9.07 | | | $ | 8.42 | | | $ | 6.94 | | |
| Total Return (a) | | | 6.59 | % (c)** | | | (0.41 | )% (c) | | | 13.67 | % (c) | | | 7.72 | % (c) | | | 21.33 | % (c) | | | - | ‡ | |
| Ratios / Supplemental Data: | |
| Net assets, end of period (000's) | | $ | 1 | | | $ | 1 | | | $ | 1 | | | $ | 5 | | | $ | 125 | | | $ | 101 | | |
| Ratio of expenses to average daily net assets: | |
| Before expense waiver | | | 1.65 | % * | | | 1.69 | % | | | 1.66 | % | | | 1.67 | % | | | 1.64 | % | | | - | ‡ | |
| After expense waiver | | | N/A | | | | N/A | | | | 1.63 | % # | | | 1.56 | % (b)# | | | 1.55 | % (b)# | | | - | ‡ | |
Net investment income (loss) to average
daily net assets | | | (0.73 | )% * | | | (0.93 | )% | | | (0.94 | )% | | | (0.83 | )% | | | (0.63 | )% | | | - | ‡ | |
| Portfolio turnover rate | | | 46 | % ** | | | 98 | % | | | 83 | % | | | 68 | % | | | 47 | % | | | 56 | % | |
* Annualized.
** Percentage represents results for the period and is not annualized.
*** Per share amount calculated on the average shares method.
† Amount is less than $0.01 per share.
†† Effective January 1, 2005, rebated brokerage commissions are included with realized gain or loss on investment transactions. Prior to January 1, 2005, these amounts were presented as a reduction of expenses. Prior year amounts have not been restated to reflect this change due to immateriality.
++ Class N commenced operations on December 31, 2002.
‡ Amount is de minimis due to the short period of operations.
# Computed after giving effect to an agreement by MassMutual to waive certain fees and expenses of the Fund.
(a) Employee retirement benefit plans that invest plan assets in the Separate Investment Accounts (SIAs) may be subject to certain charges as set forth in their respective Plan Documents. Total return figures would be lower for the periods presented if they reflected these charges.
(b) The Fund has entered into an agreement with certain brokers to rebate a portion of brokerage commissions. The rebated commissions were used to reduce operating expenses of the Fund.
(c) Total return excludes sales charges and would be lower for the period presented if it reflected these charges.
The accompanying notes are an integral part of the financial statements.
260
MassMutual Select Growth Equity Fund – Financial Statements (Continued)
Financial Highlights (For a share outstanding throughout each period)
| | | Class A | |
| | | Six months
ended
6/30/07
(Unaudited) | | Year ended
12/31/06 | | Year ended
12/31/05† | | Year ended
12/31/04 | | Year ended
12/31/03 | | Year ended
12/31/02 | |
| Net asset value, beginning of period | | $ | 8.12 | | | $ | 8.00 | | | $ | 7.74 | | | $ | 7.40 | | | $ | 6.04 | | | $ | 8.39 | | |
| Income (loss) from investment operations: | |
| Net investment income (loss) | | | 0.00 | ***†† | | | 0.01 | *** | | | 0.00 | ***†† | | | 0.00 | ***†† | | | (0.02 | )*** | | | (0.03 | )*** | |
Net realized and unrealized gain (loss)
on investments | | | 0.40 | | | | 0.11 | | | | 0.26 | | | | 0.34 | | | | 1.38 | | | | (2.32 | ) | |
Total income (loss) from investment
operations | | | 0.40 | | | | 0.12 | | | | 0.26 | | | | 0.34 | | | | 1.36 | | | | (2.35 | ) | |
| Less distributions to shareholders: | |
| From net investment income | | | - | | | | (0.00 | )†† | | | (0.00 | )†† | | | (0.00 | )†† | | | - | | | | - | | |
| Net asset value, end of period | | $ | 8.52 | | | $ | 8.12 | | | $ | 8.00 | | | $ | 7.74 | | | $ | 7.40 | | | $ | 6.04 | | |
| Total Return (a) | | | 4.93 | %(c)** | | | 1.51 | % (c) | | | 3.39 | % (c) | | | 4.60 | % (c) | | | 22.52 | % | | | (28.01 | )% | |
| Ratios / Supplemental Data: | |
| Net assets, end of period (000's) | | $ | 69,093 | | | $ | 119,863 | | | $ | 229,120 | | | $ | 224,998 | | | $ | 206,097 | | | $ | 79,267 | | |
| Ratio of expenses to average daily net assets: | |
| Before expense waiver | | | 1.27 | %* | | | 1.25 | % | | | 1.25 | % | | | 1.26 | % | | | 1.26 | % | | | 1.26 | % | |
| After expense waiver | | | N/A | | | | N/A | | | | N/A | | | | 1.24 | % (b)# | | | 1.18 | % (b)# | | | 1.22 | % (b)# | |
Net investment income (loss) to average
daily net assets | | | 0.07 | %* | | | 0.11 | % | | | 0.05 | % | | | 0.01 | % | | | (0.31 | )% | | | (0.41 | )% | |
| Portfolio turnover rate | | | 50 | %** | | | 114 | % | | | 92 | % | | | 181 | % | | | 260 | % | | | 224 | % | |
| | | Class L | |
| | | Six months
ended
6/30/07
(Unaudited) | | Year ended
12/31/06 | | Year ended
12/31/05† | | Year ended
12/31/04 | | Year ended
12/31/03 | | Year ended
12/31/02 | |
| Net asset value, beginning of period | | $ | 8.20 | | | $ | 8.09 | | | $ | 7.83 | | | $ | 7.49 | | | $ | 6.10 | | | $ | 8.45 | | |
| Income (loss) from investment operations: | |
| Net investment income (loss) | | | 0.01 | *** | | | 0.03 | *** | | | 0.02 | *** | | | 0.02 | *** | | | (0.00 | )***†† | | | (0.01 | )*** | |
Net realized and unrealized gain (loss)
on investments | | | 0.41 | | | | 0.12 | | | | 0.26 | | | | 0.34 | | | | 1.39 | | | | (2.34 | ) | |
Total income (loss) from investment
operations | | | 0.42 | | | | 0.15 | | | | 0.28 | | | | 0.36 | | | | 1.39 | | | | (2.35 | ) | |
| Less distributions to shareholders: | |
| From net investment income | | | - | | | | (0.04 | ) | | | (0.02 | ) | | | (0.02 | ) | | | - | | | | - | | |
| Net asset value, end of period | | $ | 8.62 | | | $ | 8.20 | | | $ | 8.09 | | | $ | 7.83 | | | $ | 7.49 | | | $ | 6.10 | | |
| Total Return (a) | | | 5.12 | %** | | | 1.80 | % | | | 3.61 | % | | | 4.82 | % | | | 22.79 | % | | | (27.81 | )% | |
| Ratios / Supplemental Data: | |
| Net assets, end of period (000's) | | $ | 171,353 | | | $ | 319,548 | | | $ | 291,037 | | | $ | 276,387 | | | $ | 201,623 | | | $ | 99,882 | | |
| Ratio of expenses to average daily net assets: | |
| Before expense waiver | | | 1.02 | %* | | | 1.00 | % | | | 1.00 | % | | | 1.01 | % | | | 1.01 | % | | | 1.01 | % | |
| After expense waiver | | | N/A | | | | N/A | | | | N/A | | | | 0.99 | % (b)# | | | 0.92 | % (b)# | | | 0.97 | % (b)# | |
Net investment income (loss) to average
daily net assets | | | 0.32 | %* | | | 0.36 | % | | | 0.30 | % | | | 0.29 | % | | | (0.05 | )% | | | (0.17 | )% | |
| Portfolio turnover rate | | | 50 | %** | | | 114 | % | | | 92 | % | | | 181 | % | | | 260 | % | | | 224 | % | |
* Annualized.
** Percentage represents results for the period and is not annualized.
*** Per share amount calculated on the average shares method.
† Effective January 1, 2005, rebated brokerage commissions are included with realized gain or loss on investment transactions. Prior to January 1, 2005, these amounts were presented as a reduction of expenses. Prior year amounts have not been restated to reflect this change due to immateriality.
†† Amount is less than $0.01 per share.
# Computed after giving effect to an agreement by MassMutual to waive certain fees and expenses of the Fund.
(a) Employee retirement benefit plans that invest plan assets in the Separate Investment Accounts (SIAs) may be subject to certain charges as set forth in their respective Plan Documents. Total return figures would be lower for the periods shown if they reflected these charges.
(b) The Fund has entered into an agreement with certain brokers to rebate a portion of brokerage commissions. The rebated commission were used to reduce operating expenses of the Fund.
(c) Total return excludes sales charges and would be lower for the period presented if it reflected these charges.
The accompanying notes are an integral part of the financial statements.
261
MassMutual Select Growth Equity Fund – Financial Statements (Continued)
Financial Highlights (For a share outstanding throughout each period)
| | | Class Y | |
| | | Six months
ended
6/30/07
(Unaudited) | | Year ended
12/31/06 | | Year ended
12/31/05† | | Year ended
12/31/04 | | Year ended
12/31/03 | | Year ended
12/31/02 | |
| Net asset value, beginning of period | | $ | 8.25 | | | $ | 8.14 | | | $ | 7.88 | | | $ | 7.54 | | | $ | 6.12 | | | $ | 8.47 | | |
| Income (loss) from investment operations: | |
| Net investment income (loss) | | | 0.02 | *** | | | 0.04 | *** | | | 0.04 | *** | | | 0.03 | *** | | | 0.01 | *** | | | (0.00 | )***†† | |
Net realized and unrealized gain (loss)
on investments | | | 0.41 | | | | 0.11 | | | | 0.25 | | | | 0.34 | | | | 1.41 | | | | (2.35 | ) | |
Total income (loss) from investment
operations | | | 0.43 | | | | 0.15 | | | | 0.29 | | | | 0.37 | | | | 1.42 | | | | (2.35 | ) | |
| Less distributions to shareholders: | |
| From net investment income | | | - | | | | (0.04 | ) | | | (0.03 | ) | | | (0.03 | ) | | | - | | | | - | | |
| Net asset value, end of period | | $ | 8.68 | | | $ | 8.25 | | | $ | 8.14 | | | $ | 7.88 | | | $ | 7.54 | | | $ | 6.12 | | |
| Total Return (a) | | | 5.21 | %** | | | 1.88 | % | | | 3.72 | % | | | 4.92 | % | | | 23.20 | % | | | (27.75 | )% | |
| Ratios / Supplemental Data: | |
| Net assets, end of period (000's) | | $ | 60,134 | | | $ | 63,323 | | | $ | 115,290 | | | $ | 112,683 | | | $ | 101,937 | | | $ | 70,469 | | |
| Ratio of expenses to average daily net assets: | |
| Before expense waiver | | | 0.87 | %* | | | 0.85 | % | | | 0.85 | % | | | 0.86 | % | | | 0.86 | % | | | 0.86 | % | |
| After expense waiver | | | N/A | | | | N/A | | | | N/A | | | | 0.84 | % (b)# | | | 0.77 | %(b)# | | | 0.82 | % (b)# | |
Net investment income (loss) to average
daily net assets | | | 0.47 | %* | | | 0.54 | % | | | 0.45 | % | | | 0.42 | % | | | 0.10 | % | | | (0.03 | )% | |
| Portfolio turnover rate | | | 50 | %** | | | 114 | % | | | 92 | % | | | 181 | % | | | 260 | % | | | 224 | % | |
| | | Class S | |
| | | Six months
ended
6/30/07
(Unaudited) | | Year ended
12/31/06 | | Year ended
12/31/05† | | Year ended
12/31/04 | | Year ended
12/31/03 | | Year ended
12/31/02 | |
| Net asset value, beginning of period | | $ | 8.28 | | | $ | 8.17 | | | $ | 7.90 | | | $ | 7.56 | | | $ | 6.14 | | | $ | 8.49 | | |
| Income (loss) from investment operations: | |
| Net investment income (loss) | | | 0.02 | *** | | | 0.05 | *** | | | 0.04 | *** | | | 0.04 | *** | | | 0.01 | *** | | | 0.00 | ***†† | |
Net realized and unrealized gain (loss)
on investments | | | 0.41 | | | | 0.11 | | | | 0.27 | | | | 0.34 | | | | 1.41 | | | | (2.35 | ) | |
Total income (loss) from investment
operations | | | 0.43 | | | | 0.16 | | | | 0.31 | | | | 0.38 | | | | 1.42 | | | | (2.35 | ) | |
| Less distributions to shareholders: | |
| From net investment income | | | - | | | | (0.05 | ) | | | (0.04 | ) | | | (0.04 | ) | | | - | | | | - | | |
| Net asset value, end of period | | $ | 8.71 | | | $ | 8.28 | | | $ | 8.17 | | | $ | 7.90 | | | $ | 7.56 | | | $ | 6.14 | | |
| Total Return (a) | | | 5.19 | %** | | | 2.00 | % | | | 3.91 | % | | | 4.96 | % | | | 23.13 | % | | | (27.68 | )% | |
| Ratios / Supplemental Data: | |
| Net assets, end of period (000's) | | $ | 151,948 | | | $ | 258,838 | | | $ | 269,166 | | | $ | 229,407 | | | $ | 217,508 | | | $ | 130,165 | | |
| Ratio of expenses to average daily net assets: | |
| Before expense waiver | | | 0.81 | %* | | | 0.79 | % | | | 0.79 | % | | | 0.80 | % | | | 0.80 | % | | | 0.80 | % | |
| After expense waiver | | | N/A | | | | N/A | | | | N/A | | | | 0.78 | % (b)# | | | 0.71 | %(b)# | | | 0.76 | % (b)# | |
Net investment income (loss) to average
daily net assets | | | 0.53 | %* | | | 0.58 | % | | | 0.51 | % | | | 0.48 | % | | | 0.16 | % | | | 0.04 | % | |
| Portfolio turnover rate | | | 50 | %** | | | 114 | % | | | 92 | % | | | 181 | % | | | 260 | % | | | 224 | % | |
* Annualized.
** Percentage represents results for the period and is not annualized.
*** Per share amount calculated on the average shares method.
† Effective January 1, 2005, rebated brokerage commissions are included with realized gain or loss on investment transactions. Prior to January 1, 2005, these amounts were presented as a reduction of expenses. Prior year amounts have not been restated to reflect this change due to immateriality.
†† Amount is less than $0.01 per share.
# Computed after giving effect to an agreement by MassMutual to waive certain fees and expenses of the Fund.
(a) Employee retirement benefit plans that invest plan assets in the Separate Investment Accounts (SIAs) may be subject to certain charges as set forth in their respective Plan Documents. Total return figures would be lower for the periods shown if they reflected these charges.
(b) The Fund has entered into an agreement with certain brokers to rebate a portion of brokerage commissions. The rebated commissions were used to reduce operating expenses of the Fund.
The accompanying notes are an integral part of the financial statements.
262
MassMutual Select Growth Equity Fund – Financial Statements (Continued)
Financial Highlights (For a share outstanding throughout each period)
| | | Class N | |
| | Six months
ended
6/30/07
(Unaudited) | | Year ended
12/31/06 | | Year ended
12/31/05† | | Year ended
12/31/04 | | Year ended
12/31/03 | | Period ended
12/31/02++ | |
| Net asset value, beginning of period | | $ | 7.99 | | | $ | 7.89 | | | $ | 7.65 | | | $ | 7.34 | | | $ | 6.01 | | | $ | 6.01 | | |
| Income (loss) from investment operations: | |
| Net investment income (loss) | | | (0.01 | )*** | | | (0.01 | )*** | | | (0.02 | )*** | | | (0.02 | )*** | | | (0.05 | )*** | | | 0.00 | ***†† | |
Net realized and unrealized gain (loss)
on investments | | | 0.40 | | | | 0.11 | | | | 0.26 | | | | 0.33 | | | | 1.38 | | | | (0.00 | )†† | |
Total income from investment
operations | | | 0.39 | | | | 0.10 | | | | 0.24 | | | | 0.31 | | | | 1.33 | | | | 0.00 | | |
| Net asset value, end of period | | $ | 8.38 | | | $ | 7.99 | | | $ | 7.89 | | | $ | 7.65 | | | $ | 7.34 | | | $ | 6.01 | | |
| Total Return (a) | | | 4.88 | % (c)** | | | 1.27 | % (c) | | | 3.14 | % (c) | | | 4.22 | % (c) | | | 22.13 | % (c) | | | - | ‡ | |
| Ratios / Supplemental Data: | |
| Net assets, end of period (000's) | | $ | 66 | | | $ | 79 | | | $ | 1,294 | | | $ | 1,472 | | | $ | 1,661 | | | $ | 101 | | |
| Ratio of expenses to average daily net assets: | |
| Before expense waiver | | | 1.57 | % * | | | 1.55 | % | | | 1.55 | % | | | 1.56 | % | | | 1.57 | % | | | - | ‡ | |
| After expense waiver | | | N/A | | | | N/A | | | | N/A | | | | 1.54 | % (b)# | | | 1.52 | % (b)# | | | - | ‡ | |
Net investment income (loss) to average
daily net assets | | | (0.24 | )% * | | | (0.12 | )% | | | (0.25 | )% | | | (0.31 | )% | | | (0.65 | )% | | | - | ‡ | |
| Portfolio turnover rate | | | 50 | % ** | | | 114 | % | | | 92 | % | | | 181 | % | | | 260 | % | | | 224 | % | |
* Annualized.
** Percentage represents results for the period and is not annualized.
*** Per share amount calculated on the average shares method.
† Effective January 1, 2005, rebated brokerage commissions are included with realized gain or loss on investment transactions. Prior to January 1, 2005, these amounts were presented as a reduction of expenses. Prior year amounts have not been restated to reflect this change due to immateriality.
†† Amount is less than $0.01 per share.
++ Class N commenced operations on December 31, 2002.
‡ Amount is de minimis due to short period of operations.
# Computed after giving effect to an agreement by MassMutual to waive certain fees and expenses of the Fund.
(a) Employee retirement benefit plans that invest plan assets in the Separate Investment Accounts (SIAs) may be subject to certain charges as set forth in their respective Plan Documents. Total return figures would be lower for the periods shown if they reflected these charges.
(b) The Fund has entered into an agreement with certain brokers to rebate a portion of brokerage commissions. The rebated commissions were used to reduce operating expenses of the Fund.
(c) Total return excludes sales charges and would be lower for the period presented if it reflected these charges.
The accompanying notes are an integral part of the financial statements.
263
MassMutual Select Aggressive Growth Fund – Financial Statements (Continued)
Financial Highlights (For a share outstanding throughout each period)
| | | Class A | |
| | | Six months
ended
6/30/07
(Unaudited) | | Year ended
12/31/06 | | Year ended
12/31/05†† | | Year ended
12/31/04 | | Year ended
12/31/03 | | Year ended
12/31/02 | |
| Net asset value, beginning of period | | $ | 6.06 | | | $ | 6.47 | | | $ | 5.89 | | | $ | 4.96 | | | $ | 3.80 | | | $ | 5.28 | | |
| Income (loss) from investment operations: | |
| Net investment income (loss) | | | (0.03 | )*** | | | (0.06 | )*** | | | (0.06 | )*** | | | (0.04 | )*** | | | (0.02 | )*** | | | (0.02 | )*** | |
Net realized and unrealized gain (loss) on
investments | | | 0.43 | | | | (0.35 | ) | | | 0.64 | | | | 0.97 | | | | 1.18 | | | | (1.46 | ) | |
Total income (loss) from investment
operations | | | 0.40 | | | | (0.41 | ) | | | 0.58 | | | | 0.93 | | | | 1.16 | | | | (1.48 | ) | |
| Net asset value, end of period | | $ | 6.46 | | | $ | 6.06 | | | $ | 6.47 | | | $ | 5.89 | | | $ | 4.96 | | | $ | 3.80 | | |
| Total Return (a) | | | 6.60 | % (c)** | | | (6.34 | )% (c) | | | 9.85 | % (c) | | | 18.75 | % (c) | | | 30.53 | % | | | (28.03 | )% | |
| Ratios / Supplemental Data: | |
| Net assets, end of period (000's) | | $ | 111,969 | | | $ | 114,139 | | | $ | 137,756 | | | $ | 117,232 | | | $ | 65,012 | | | $ | 37,203 | | |
| Ratio of expenses to average daily net assets: | |
| Before expense waiver | | | 1.38 | % * | | | 1.35 | % | | | 1.35 | % | | | 1.36 | % | | | 1.37 | % | | | 1.37 | % | |
| After expense waiver | | | N/A | | | | 1.33 | % # | | | 1.27 | % # | | | 1.30 | % (b)# | | | 1.33 | % (b)# | | | 1.34 | % (b)# | |
Net investment income (loss) to average
daily net assets | | | (0.96 | )% * | | | (1.01 | )% | | | (1.02 | )% | | | (0.67 | )% | | | (0.56 | )% | | | (0.56 | )% | |
| Portfolio turnover rate | | | 12 | % ** | | | 49 | % | | | 24 | % | | | 85 | % | | | 93 | % | | | 112 | % | |
| | | Class L | |
| | | Six months
ended
6/30/07
(Unaudited) | | Year ended
12/31/06 | | Year ended
12/31/05†† | | Year ended
12/31/04 | | Year ended
12/31/03 | | Year ended
12/31/02 | |
| Net asset value, beginning of period | | $ | 6.17 | | | $ | 6.56 | | | $ | 5.97 | | | $ | 5.01 | | | $ | 3.82 | | | $ | 5.31 | | |
| Income (loss) from investment operations: | |
| Net investment income (loss) | | | (0.02 | )*** | | | (0.05 | )*** | | | (0.05 | )*** | | | (0.02 | )*** | | | (0.01 | )*** | | | (0.01 | )*** | |
Net realized and unrealized gain (loss) on
investments | | | 0.43 | | | | (0.34 | ) | | | 0.64 | | | | 0.98 | | | | 1.20 | | | | (1.48 | ) | |
Total income (loss) from investment
operations | | | 0.41 | | | | (0.39 | ) | | | 0.59 | | | | 0.96 | | | | 1.19 | | | | (1.49 | ) | |
| Net asset value, end of period | | $ | 6.58 | | | $ | 6.17 | | | $ | 6.56 | | | $ | 5.97 | | | $ | 5.01 | | | $ | 3.82 | | |
| Total Return (a) | | | 6.65 | % ** | | | (5.95 | )% | | | 9.88 | % | | | 19.16 | % | | | 31.15 | % | | | (28.06 | )% | |
| Ratios / Supplemental Data: | |
| Net assets, end of period (000's) | | $ | 134,531 | | | $ | 192,839 | | | $ | 193,605 | | | $ | 152,518 | | | $ | 76,120 | | | $ | 31,012 | | |
| Ratio of expenses to average daily net assets: | |
| Before expense waiver | | | 1.13 | % * | | | 1.10 | % | | | 1.10 | % | | | 1.11 | % | | | 1.12 | % | | | 1.12 | % | |
| After expense waiver | | | N/A | | | | 1.08 | % # | | | 1.02 | % # | | | 1.05 | % (b)# | | | 1.08 | % (b)# | | | 1.09 | % (b)# | |
Net investment income (loss) to average
daily net assets | | | (0.72 | )% * | | | (0.76 | )% | | | (0.77 | )% | | | (0.42 | )% | | | (0.32 | )% | | | (0.31 | )% | |
| Portfolio turnover rate | | | 12 | % ** | | | 49 | % | | | 24 | % | | | 85 | % | | | 93 | % | | | 112 | % | |
* Annualized.
** Percentage represents results for the period and is not annualized.
*** Per share amount calculated on the average shares method.
†† Effective January 1, 2005, rebated brokerage commissions are included with realized gain or loss on investment transactions. Prior to January 1, 2005, these amounts were presented as a reduction of expenses. Prior year amounts have not been restated to reflect this change due to immateriality.
# Computed after giving effect to an agreement by MassMutual to waive certain fees and expenses of the Fund.
(a) Employee retirement benefit plans that invest plan assets in the Separate Investment Accounts (SIAs) may be subject to certain charges as set forth in their respective Plan Documents. Total return figures would be lower for the periods presented if they reflected these charges.
(b) The Fund has entered into an agreement with certain brokers to rebate a portion of brokerage commissions. The rebated commissions were used to reduce operating expenses of the Fund.
(c) Total return excludes sales charges and would be lower for the period presented if it reflected these charges.
The accompanying notes are an integral part of the financial statements.
264
MassMutual Select Aggressive Growth Fund – Financial Statements (Continued)
Financial Highlights (For a share outstanding throughout each period)
| | | Class Y | |
| | | Six months
ended
6/30/07
(Unaudited) | | Year ended
12/31/06 | | Year ended
12/31/05†† | | Year ended
12/31/04 | | Year ended
12/31/03 | | Year ended
12/31/02 | |
| Net asset value, beginning of period | | $ | 6.22 | | | $ | 6.61 | | | $ | 6.00 | | | $ | 5.03 | | | $ | 3.83 | | | $ | 5.31 | | |
| Income (loss) from investment operations: | |
| Net investment income (loss) | | | (0.02 | )*** | | | (0.04 | )*** | | | (0.04 | )*** | | | (0.01 | )*** | | | (0.01 | )*** | | | (0.01 | )*** | |
Net realized and unrealized gain (loss) on
investments | | | 0.44 | | | | (0.35 | ) | | | 0.65 | | | | 0.98 | | | | 1.21 | | | | (1.47 | ) | |
Total income (loss) from investment
operations | | | 0.42 | | | | (0.39 | ) | | | 0.61 | | | | 0.97 | | | | 1.20 | | | | (1.48 | ) | |
| Net asset value, end of period | | $ | 6.64 | | | $ | 6.22 | | | $ | 6.61 | | | $ | 6.00 | | | $ | 5.03 | | | $ | 3.83 | | |
| Total Return (a) | | | 6.75 | % ** | | | (5.90 | )% | | | 10.17 | % | | | 19.28 | % | | | 31.33 | % | | | (27.87 | )% | |
| Ratios / Supplemental Data: | |
| Net assets, end of period (000's) | | $ | 41,726 | | | $ | 53,940 | | | $ | 41,705 | | | $ | 32,242 | | | $ | 17,333 | | | $ | 10,145 | | |
| Ratio of expenses to average daily net assets: | |
| Before expense waiver | | | 0.97 | % * | | | 0.95 | % | | | 0.95 | % | | | 0.96 | % | | | 0.97 | % | | | 0.97 | % | |
| After expense waiver | | | N/A | | | | 0.93 | % # | | | 0.87 | % # | | | 0.90 | % (b)# | | | 0.93 | % (b)# | | | 0.94 | % (b)# | |
Net investment income (loss) to average daily
net assets | | | (0.57 | )% * | | | (0.61 | )% | | | (0.62 | )% | | | (0.27 | )% | | | (0.16 | )% | | | (0.16 | )% | |
| Portfolio turnover rate | | | 12 | % ** | | | 49 | % | | | 24 | % | | | 85 | % | | | 93 | % | | | 112 | % | |
| | | Class S | |
| | | Six months
ended
6/30/07
(Unaudited) | | Year ended
12/31/06 | | Year ended
12/31/05†† | | Year ended
12/31/04 | | Year ended
12/31/03 | | Year ended
12/31/02 | |
| Net asset value, beginning of period | | $ | 6.26 | | | $ | 6.65 | | | $ | 6.03 | | | $ | 5.05 | | | $ | 3.84 | | | $ | 5.32 | | |
| Income (loss) from investment operations: | |
| Net investment income (loss) | | | (0.02 | )*** | | | (0.03 | )*** | | | (0.03 | )*** | | | (0.01 | )*** | | | (0.00 | )***† | | | (0.01 | )*** | |
Net realized and unrealized gain (loss) on
investments | | | 0.45 | | | | (0.36 | ) | | | 0.65 | | | | 0.99 | | | | 1.21 | | | | (1.47 | ) | |
Total income (loss) from investment
operations | | | 0.43 | | | | (0.39 | ) | | | 0.62 | | | | 0.98 | | | | 1.21 | | | | (1.48 | ) | |
| Net asset value, end of period | | $ | 6.69 | | | $ | 6.26 | | | $ | 6.65 | | | $ | 6.03 | | | $ | 5.05 | | | $ | 3.84 | | |
| Total Return (a) | | | 6.87 | % ** | | | (5.86 | )% | | | 10.28 | % | | | 19.41 | % | | | 31.51 | % | | | (27.82 | )% | |
| Ratios / Supplemental Data: | |
| Net assets, end of period (000's) | | $ | 239,640 | | | $ | 239,162 | | | $ | 240,002 | | | $ | 198,154 | | | $ | 108,281 | | | $ | 46,026 | | |
| Ratio of expenses to average daily net assets: | |
| Before expense waiver | | | 0.88 | % * | | | 0.85 | % | | | 0.85 | % | | | 0.86 | % | | | 0.87 | % | | | 0.87 | % | |
| After expense waiver | | | N/A | | | | 0.83 | % # | | | 0.77 | % # | | | 0.80 | % (b)# | | | 0.83 | % (b)# | | | 0.84 | % (b)# | |
Net investment income (loss) to average daily
net assets | | | (0.46 | )% * | | | (0.51 | )% | | | (0.51 | )% | | | (0.17 | )% | | | (0.06 | )% | | | (0.07 | )% | |
| Portfolio turnover rate | | | 12 | % ** | | | 49 | % | | | 24 | % | | | 85 | % | | | 93 | % | | | 112 | % | |
* Annualized.
** Percentage represents results for the period and is not annualized.
*** Per share amount calculated on the average shares method.
† Amount is less than $0.01 per share.
†† Effective January 1, 2005, rebated brokerage commissions are included with realized gain or loss on investment transactions. Prior to January 1, 2005, these amounts were presented as a reduction of expenses. Prior year amounts have not been restated to reflect this change due to immateriality.
# Computed after giving effect to an agreement by MassMutual to waive certain fees and expenses of the Fund.
(a) Employee retirement benefit plans that invest plan assets in the Separate Investment Accounts (SIAs) may be subject to certain charges as set forth in their respective Plan Documents. Total return figures would be lower for the periods presented if they reflected these charges.
(b) The Fund has entered into an agreement with certain brokers to rebate a portion of brokerage commissions. The rebated commissions were used to reduce operating expenses of the Fund.
The accompanying notes are an integral part of the financial statements.
265
MassMutual Select Aggressive Growth Fund – Financial Statements (Continued)
Financial Highlights (For a share outstanding throughout each period)
| | | Class N | |
| | | Six months
ended
6/30/07
(Unaudited) | | Year ended
12/31/06 | | Year ended
12/31/05†† | | Year ended
12/31/04 | | Year ended
12/31/03 | | Period ended
12/31/02++ | |
| Net asset value, beginning of period | | $ | 5.96 | | | $ | 6.37 | | | $ | 5.83 | | | $ | 4.92 | | | $ | 3.77 | | | $ | 3.77 | | |
| Income (loss) from investment operations: | |
| Net investment income (loss) | | | (0.04 | )*** | | | (0.08 | )*** | | | (0.08 | )*** | | | (0.05 | )*** | | | (0.04 | )*** | | | 0.00 | ***† | |
Net realized and unrealized gain (loss) on
investments | | | 0.41 | | | | (0.33 | ) | | | 0.62 | | | | 0.96 | | | | 1.19 | | | | (0.00 | )† | |
| Total income from investment operations | | | 0.37 | | | | (0.41 | ) | | | 0.54 | | | | 0.91 | | | | 1.15 | | | | 0.00 | | |
| Net asset value, end of period | | $ | 6.33 | | | $ | 5.96 | | | $ | 6.37 | | | $ | 5.83 | | | $ | 4.92 | | | $ | 3.77 | | |
| Total Return (a) | | | 6.21 | % (c)** | | | (6.44 | )% (c) | | | 9.26 | % (c) | | | 18.50 | % (c) | | | 30.50 | % (c) | | | - | ‡ | |
| Ratios / Supplemental Data: | |
| Net assets, end of period (000's) | | $ | 1,182 | | | $ | 1,203 | | | $ | 1,034 | | | $ | 1,144 | | | $ | 636 | | | $ | 101 | | |
| Ratio of expenses to average daily net assets: | |
| Before expense waiver | | | 1.68 | % * | | | 1.65 | % | | | 1.65 | % | | | 1.66 | % | | | 1.68 | % | | | - | ‡ | |
| After expense waiver | | | N/A | | | | 1.63 | % # | | | 1.57 | % # | | | 1.59 | % (b)# | | | 1.64 | % (b)# | | | - | ‡ | |
Net investment income (loss) to average daily
net assets | | | (1.26 | )% * | | | (1.31 | )% | | | (1.32 | )% | | | (0.99 | )% | | | (0.91 | )% | | | - | ‡ | |
| Portfolio turnover rate | | | 12 | % ** | | | 49 | % | | | 24 | % | | | 85 | % | | | 93 | % | | | 112 | % | |
* Annualized.
** Percentage represents results for the period and is not annualized.
*** Per share amount calculated on the average shares method.
† Amount is less than $0.01 per share.
†† Effective January 1, 2005, rebated brokerage commissions are included with realized gain or loss on investment transactions. Prior to January 1, 2005, these amounts were presented as a reduction of expenses. Prior year amounts have not been restated to reflect this change due to immateriality.
++ Class N commenced operations on December 31, 2002.
‡ Amount is de minimis due to the short period of operations.
# Computed after giving effect to an agreement by MassMutual to waive certain fees and expenses of the Fund.
(a) Employee retirement benefit plans that invest plan assets in the Separate Investment Accounts (SIAs) may be subject to certain charges as set forth in their respective Plan Documents. Total return figures would be lower for the periods presented if they reflected these charges.
(b) The Fund has entered into an agreement with certain brokers to rebate a portion of brokerage commissions. The rebated commissions are used to reduce operating expenses of the Fund.
(c) Total return excludes sales charges and would be lower for the period presented if it reflected these charges.
The accompanying notes are an integral part of the financial statements.
266
MassMutual Select OTC 100 Fund – Financial Statements (Continued)
Financial Highlights (For a share outstanding throughout each period)
| | | Class A | |
| | | Six months
ended
6/30/07
(Unaudited) | | Year ended
12/31/06 | | Year ended
12/31/05 | | Year ended
12/31/04 | | Year ended
12/31/03 | | Year ended
12/31/02 | |
| Net asset value, beginning of period | | $ | 4.37 | | | $ | 4.12 | | | $ | 4.09 | | | $ | 3.74 | | | $ | 2.53 | | | $ | 4.08 | | |
| Income (loss) from investment operations: | |
| Net investment income (loss) | | | (0.01 | )*** | | | (0.02 | )*** | | | (0.02 | )*** | | | 0.00 | ***† | | | (0.03 | )*** | | | (0.03 | )*** | |
Net realized and unrealized gain (loss) on
investments | | | 0.44 | | | | 0.27 | | | | 0.05 | | | | 0.35 | | | | 1.24 | | | | (1.52 | ) | |
Total income (loss) from investment
operations | | | 0.43 | | | | 0.25 | | | | 0.03 | | | | 0.35 | | | | 1.21 | | | | (1.55 | ) | |
| Less distributions to shareholders: | |
| From net investment income | | | - | | | | - | | | | - | | | | (0.00 | )† | | | - | | | | - | | |
| Net asset value, end of period | | $ | 4.80 | | | $ | 4.37 | | | $ | 4.12 | | | $ | 4.09 | | | $ | 3.74 | | | $ | 2.53 | | |
| Total Return (a) | | | 9.59 | % (b)** | | | 6.31 | % (b) | | | 0.73 | % (b) | | | 9.47 | % (b) | | | 47.83 | % | | | (37.99 | )% | |
| Ratios / Supplemental Data: | |
| Net assets, end of period (000's) | | $ | 19,053 | | | $ | 21,627 | | | $ | 26,216 | | | $ | 32,176 | | | $ | 30,349 | | | $ | 11,644 | | |
| Ratio of expenses to average daily net assets: | |
| Before expense waiver | | | 1.18 | % * | | | 1.15 | % | | | 1.11 | % | | | 1.12 | % | | | 1.17 | % | | | 1.18 | % | |
| After expense waiver | | | N/A | | | | N/A | | | | N/A | | | | N/A | | | | 1.12 | % # | | | 1.04 | % # | |
Net investment income (loss) to average daily
net assets | | | (0.49 | )% * | | | (0.50 | )% | | | (0.50 | )% | | | 0.12 | % | | | (0.86 | )% | | | (0.90 | )% | |
| Portfolio turnover rate | | | 5 | % ** | | | 7 | % | | | 17 | % | | | 30 | % | | | 66 | % | | | 65 | % | |
| | | Class L | |
| | | Six months
ended
6/30/07
(Unaudited) | | Year ended
12/31/06 | | Year ended
12/31/05 | | Year ended
12/31/04 | | Year ended
12/31/03 | | Year ended
12/31/02 | |
| Net asset value, beginning of period | | $ | 4.44 | | | $ | 4.17 | | | $ | 4.13 | | | $ | 3.77 | | | $ | 2.54 | | | $ | 4.10 | | |
| Income (loss) from investment operations: | |
| Net investment income (loss) | | | (0.01 | )*** | | | (0.01 | )*** | | | (0.01 | )*** | | | 0.01 | *** | | | (0.02 | )*** | | | (0.02 | )*** | |
Net realized and unrealized gain (loss) on
investments | | | 0.45 | | | | 0.28 | | | | 0.05 | | | | 0.36 | | | | 1.25 | | | | (1.54 | ) | |
Total income (loss) from investment
operations | | | 0.44 | | | | 0.27 | | | | 0.04 | | | | 0.37 | | | | 1.23 | | | | (1.56 | ) | |
| Less distributions to shareholders: | |
| From net investment income | | | - | | | | - | | | | - | | | | (0.01 | ) | | | - | | | | - | | |
| Net asset value, end of period | | $ | 4.88 | | | $ | 4.44 | | | $ | 4.17 | | | $ | 4.13 | | | $ | 3.77 | | | $ | 2.54 | | |
| Total Return (a) | | | 9.91 | % ** | | | 6.47 | % | | | 0.97 | % | | | 9.82 | % | | | 48.43 | % | | | (38.05 | )% | |
| Ratios / Supplemental Data: | |
| Net assets, end of period (000's) | | $ | 8,395 | | | $ | 9,960 | | | $ | 13,000 | | | $ | 13,101 | | | $ | 15,508 | | | $ | 6,389 | | |
| Ratio of expenses to average daily net assets: | |
| Before expense waiver | | | 0.93 | % * | | | 0.90 | % | | | 0.86 | % | | | 0.87 | % | | | 0.91 | % | | | 0.93 | % | |
| After expense waiver | | | N/A | | | | N/A | | | | N/A | | | | N/A | | | | 0.87 | % # | | | 0.79 | % # | |
Net investment income (loss) to average daily
net assets | | | (0.24 | )% * | | | (0.26 | )% | | | (0.24 | )% | | | 0.26 | % | | | (0.61 | )% | | | (0.65 | )% | |
| Portfolio turnover rate | | | 5 | % ** | | | 7 | % | | | 17 | % | | | 30 | % | | | 66 | % | | | 65 | % | |
* Annualized.
** Percentage represents results for the period and is not annualized.
*** Per share amount calculated on the average shares method.
† Amount is less than $0.01 per share.
# Computed after giving effect to an agreement by MassMutual to waive certain fees and expenses of the Fund.
(a) Employee retirement benefit plans that invest plan assets in the Separate Investment Accounts (SIAs) may be subject to certain charges as set forth in their respective Plan Documents. Total return figures would be lower for the periods presented if they reflected these charges.
(b) Total return excludes sales charges and would be lower for the period presented if it reflected these charges.
The accompanying notes are an integral part of the financial statements.
267
MassMutual Select OTC 100 Fund – Financial Statements (Continued)
Financial Highlights (For a share outstanding throughout each period)
| | | Class Y | |
| | | Six months
ended
6/30/07
(Unaudited) | | Year ended
12/31/06 | | Year ended
12/31/05 | | Year ended
12/31/04 | | Year ended
12/31/03 | | Year ended
12/31/02 | |
| Net asset value, beginning of period | | $ | 4.47 | | | $ | 4.19 | | | $ | 4.15 | | | $ | 3.79 | | | $ | 2.54 | | | $ | 4.11 | | |
| Income (loss) from investment operations: | |
| Net investment income (loss) | | | (0.00 | )***† | | | (0.01 | )*** | | | (0.00 | )***† | | | 0.02 | *** | | | (0.01 | )*** | | | (0.01 | )*** | |
Net realized and unrealized gain (loss) on
investments | | | 0.45 | | | | 0.29 | | | | 0.04 | | | | 0.36 | | | | 1.26 | | | | (1.56 | ) | |
Total income (loss) from investment
operations | | | 0.45 | | | | 0.28 | | | | 0.04 | | | | 0.38 | | | | 1.25 | | | | (1.57 | ) | |
| Less distributions to shareholders: | |
| From net investment income | | | - | | | | - | | | | - | | | | (0.02 | ) | | | - | | | | - | | |
| Net asset value, end of period | | $ | 4.92 | | | $ | 4.47 | | | $ | 4.19 | | | $ | 4.15 | | | $ | 3.79 | | | $ | 2.54 | | |
| Total Return (a) | | | 10.07 | % ** | | | 6.68 | % | | | 0.96 | % | | | 9.98 | % | | | 48.63 | % | | | (37.96 | )% | |
| Ratios / Supplemental Data: | |
| Net assets, end of period (000's) | | $ | 1,474 | | | $ | 1,495 | | | $ | 2,628 | | | $ | 3,777 | | | $ | 3,827 | | | $ | 998 | | |
| Ratio of expenses to average daily net assets: | |
| Before expense waiver | | | 0.78 | % * | | | 0.75 | % | | | 0.71 | % | | | 0.72 | % | | | 0.77 | % | | | 0.78 | % | |
| After expense waiver | | | N/A | | | | N/A | | | | N/A | | | | N/A | | | | 0.73 | % # | | | 0.64 | % # | |
Net investment income (loss) to average daily
net assets | | | (0.10 | )% * | | | (0.12 | )% | | | (0.11 | )% | | | 0.49 | % | | | (0.45 | )% | | | (0.50 | )% | |
| Portfolio turnover rate | | | 5 | % ** | | | 7 | % | | | 17 | % | | | 30 | % | | | 66 | % | | | 65 | % | |
| | | Class S | |
| | | Six months
ended
6/30/07
(Unaudited) | | Year ended
12/31/06 | | Year ended
12/31/05 | | Year ended
12/31/04 | | Year ended
12/31/03 | | Year ended
12/31/02 | |
| Net asset value, beginning of period | | $ | 4.51 | | | $ | 4.22 | | | $ | 4.17 | | | $ | 3.81 | | | $ | 2.56 | | | $ | 4.12 | | |
| Income (loss) from investment operations: | |
| Net investment income (loss) | | | 0.00 | ***† | | | (0.00 | )***† | | | (0.00 | )***† | | | 0.02 | *** | | | (0.01 | )*** | | | (0.01 | )*** | |
Net realized and unrealized gain (loss) on
investments | | | 0.45 | | | | 0.29 | | | | 0.05 | | | | 0.36 | | | | 1.26 | | | | (1.55 | ) | |
Total income (loss) from investment
operations | | | 0.45 | | | | 0.29 | | | | 0.05 | | | | 0.38 | | | | 1.25 | | | | (1.56 | ) | |
| Less distributions to shareholders: | |
| From net investment income | | | - | | | | - | | | | - | | | | (0.02 | ) | | | - | | | | - | | |
| Net asset value, end of period | | $ | 4.96 | | | $ | 4.51 | | | $ | 4.22 | | | $ | 4.17 | | | $ | 3.81 | | | $ | 2.56 | | |
| Total Return (a) | | | 9.98 | % ** | | | 6.87 | % | | | 1.20 | % | | | 10.00 | % | | | 48.83 | % | | | (37.71 | )% | |
| Ratios / Supplemental Data: | |
| Net assets, end of period (000's) | | $ | 15,175 | | | $ | 16,179 | | | $ | 19,404 | | | $ | 25,880 | | | $ | 26,424 | | | $ | 7,211 | | |
| Ratio of expenses to average daily net assets: | |
| Before expense waiver | | | 0.68 | % * | | | 0.65 | % | | | 0.61 | % | | | 0.62 | % | | | 0.67 | % | | | 0.68 | % | |
| After expense waiver | | | N/A | | | | N/A | | | | N/A | | | | N/A | | | | 0.63 | % # | | | 0.54 | % # | |
Net investment income (loss) to average daily
net assets | | | 0.01 | % * | | | (0.00 | )% | | | (0.01 | )% | | | 0.45 | % | | | (0.36 | )% | | | (0.41 | )% | |
| Portfolio turnover rate | | | 5 | % ** | | | 7 | % | | | 17 | % | | | 30 | % | | | 66 | % | | | 65 | % | |
* Annualized.
** Percentage represents results for the period and is not annualized.
*** Per share amount calculated on the average shares method.
† Amount is less than $0.01 per share.
# Computed after giving effect to an agreement by MassMutual to waive certain fees and expenses of the Fund.
(a) Employee retirement benefit plans that invest plan assets in the Separate Investment Accounts (SIAs) may be subject to certain charges as set forth in their respective Plan Documents. Total return figures would be lower for the periods presented if they reflected these charges.
The accompanying notes are an integral part of the financial statements.
268
MassMutual Select OTC 100 Fund – Financial Statements (Continued)
Financial Highlights (For a share outstanding throughout each period)
| | | Class N | |
| | | Six months
ended
6/30/07
(Unaudited) | | Year ended
12/31/06 | | Year ended
12/31/05 | | Year ended
12/31/04 | | Year ended
12/31/03 | | Period ended
12/31/02++ | |
| Net asset value, beginning of period | | $ | 4.31 | | | $ | 4.07 | | | $ | 4.05 | | | $ | 3.71 | | | $ | 2.52 | | | $ | 2.53 | | |
| Income (loss) from investment operations: | |
| Net investment income (loss) | | | (0.02 | )*** | | | (0.03 | )*** | | | (0.03 | )*** | | | 0.00 | ***† | | | (0.04 | )*** | | | (0.00 | )***† | |
Net realized and unrealized gain (loss) on
investments | | | 0.43 | | | | 0.27 | | | | 0.05 | | | | 0.34 | | | | 1.23 | | | | (0.01 | ) | |
Total income (loss) from investment
operations | | | 0.41 | | | | 0.24 | | | | 0.02 | | | | 0.34 | | | | 1.19 | | | | (0.01 | ) | |
| Less distributions to shareholders: | |
| From net investment income | | | - | | | | - | | | | - | | | | (0.00 | )† | | | - | | | | - | | |
| Net asset value, end of period | | $ | 4.72 | | | $ | 4.31 | | | $ | 4.07 | | | $ | 4.05 | | | $ | 3.71 | | | $ | 2.52 | | |
| Total Return (a) | | | 9.51 | % (b)** | | | 5.90 | % (b) | | | 0.49 | % (b) | | | 9.25 | % (b) | | | 47.22 | % (b) | | | - | ‡ | |
| Ratios / Supplemental Data: | |
| Net assets, end of period (000's) | | $ | 475 | | | $ | 445 | | | $ | 451 | | | $ | 432 | | | $ | 150 | | | $ | 100 | | |
| Ratio of expenses to average daily net assets: | |
| Before expense waiver | | | 1.48 | % * | | | 1.45 | % | | | 1.41 | % | | | 1.41 | % | | | 1.46 | % | | | - | ‡ | |
| After expense waiver | | | N/A | | | | N/A | | | | N/A | | | | N/A | | | | 1.42 | % # | | | - | ‡ | |
Net investment income (loss) to average
daily net assets | | | (0.79 | )% * | | | (0.79 | )% | | | (0.79 | )% | | | 0.11 | % | | | (1.15 | )% | | | - | ‡ | |
| Portfolio turnover rate | | | 5 | % ** | | | 7 | % | | | 17 | % | | | 30 | % | | | 66 | % | | | 65 | % | |
* Annualized.
** Percentage represents results for the period and is not annualized.
*** Per share amount calculated on the average shares method.
† Amount is less than $0.01 per share.
++ Class N commenced operations on December 31, 2002.
‡ Amount is de minimis due to the short period of operations.
# Computed after giving effect to an agreement by MassMutual to waive certain fees and expenses of the Fund.
(a) Employee retirement benefit plans that invest plan assets in the Separate Investment Accounts (SIAs) may be subject to certain charges as set forth in their respective Plan Documents. Total return figures would be lower for the periods presented if they reflected these charges.
(b) Total return excludes sales charges and would be lower for the period presented if it reflected these charges.
The accompanying notes are an integral part of the financial statements.
269
MassMutual Select Focused Value Fund – Financial Statements (Continued)
Financial Highlights (For a share outstanding throughout each period)
| | | Class A | |
| | | Six months
ended
6/30/07
(Unaudited) | | Year ended
12/31/06 | | Year ended
12/31/05†† | | Year ended
12/31/04 | | Year ended
12/31/03 | | Year ended
12/31/02 | |
| Net asset value, beginning of period | | $ | 18.08 | | | $ | 16.70 | | | $ | 17.78 | | | $ | 16.92 | | | $ | 11.94 | | | $ | 13.41 | | |
| Income (loss) from investment operations: | |
| Net investment income (loss) | | | (0.20 | )*** | | | 0.25 | *** | | | (0.00 | )***† | | | (0.07 | )*** | | | (0.06 | )*** | | | (0.04 | )*** | |
Net realized and unrealized gain (loss)
on investments | | | 2.14 | | | | 3.02 | | | | 0.53 | | | | 1.96 | | | | 5.45 | | | | (1.33 | ) | |
Total income (loss) from investment
operations | | | 1.94 | | | | 3.27 | | | | 0.53 | | | | 1.89 | | | | 5.39 | | | | (1.37 | ) | |
| Less distributions to shareholders: | |
| From net investment income | | | - | | | | (0.26 | ) | | | (0.01 | ) | | | - | | | | (0.00 | )† | | | - | | |
| From net realized gains | | | - | | | | (1.63 | ) | | | (1.60 | ) | | | (1.03 | ) | | | (0.41 | ) | | | (0.10 | ) | |
| Total distributions | | | - | | | | (1.89 | ) | | | (1.61 | ) | | | (1.03 | ) | | | (0.41 | ) | | | (0.10 | ) | |
| Net asset value, end of period | | $ | 20.02 | | | $ | 18.08 | | | $ | 16.70 | | | $ | 17.78 | | | $ | 16.92 | | | $ | 11.94 | | |
| Total Return (a) | | | 10.79 | % (c)** | | | 19.65 | % (c) | | | 2.98 | % (c) | | | 11.33 | % (c) | | | 45.13 | % | | | (10.18 | )% | |
| Ratios / Supplemental Data: | |
| Net assets, end of period (000's) | | $ | 266,486 | | | $ | 275,925 | | | $ | 252,047 | | | $ | 228,871 | | | $ | 158,981 | | | $ | 54,319 | | |
| Ratio of expenses to average daily net assets: | |
| Before expense waiver | | | 1.29 | % * | | | 1.29 | % | | | 1.30 | % | | | 1.30 | % | | | 1.30 | % | | | 1.30 | % | |
| After expense waiver | | | N/A | | | | N/A | | | | N/A | | | | 1.28 | % (b)# | | | 1.29 | % (b)# | | | 1.30 | % (b)# | |
Net investment income (loss) to average daily
net assets | | | (2.13 | )% * | | | 1.39 | % | | | (0.01 | )% | | | (0.40 | )% | | | (0.40 | )% | | | (0.33 | )% | |
| Portfolio turnover rate | | | 21 | % ** | | | 36 | % | | | 31 | % | | | 32 | % | | | 31 | % | | | 78 | % | |
| | | Class L | |
| | | Six months
ended
6/30/07
(Unaudited) | | Year ended
12/31/06 | | Year ended
12/31/05†† | | Year ended
12/31/04 | | Year ended
12/31/03 | | Year ended
12/31/02 | |
| Net asset value, beginning of period | | $ | 18.34 | | | $ | 16.91 | | | $ | 17.98 | | | $ | 17.05 | | | $ | 12.00 | | | $ | 13.45 | | |
| Income (loss) from investment operations: | |
| Net investment income (loss) | | | (0.18 | )*** | | | 0.30 | *** | | | 0.05 | *** | | | (0.03 | )*** | | | (0.02 | )*** | | | (0.01 | )*** | |
Net realized and unrealized gain (loss)
on investments | | | 2.18 | | | | 3.06 | | | | 0.53 | | | | 1.99 | | | | 5.48 | | | | (1.34 | ) | |
Total income (loss) from investment
operations | | | 2.00 | | | | 3.36 | | | | 0.58 | | | | 1.96 | | | | 5.46 | | | | (1.35 | ) | |
| Less distributions to shareholders: | |
| From net investment income | | | - | | | | (0.30 | ) | | | (0.05 | ) | | | - | | | | (0.00 | )† | | | - | | |
| From net realized gains | | | - | | | | (1.63 | ) | | | (1.60 | ) | | | (1.03 | ) | | | (0.41 | ) | | | (0.10 | ) | |
| Total distributions | | | - | | | | (1.93 | ) | | | (1.65 | ) | | | (1.03 | ) | | | (0.41 | ) | | | (0.10 | ) | |
| Net asset value, end of period | | $ | 20.34 | | | $ | 18.34 | | | $ | 16.91 | | | $ | 17.98 | | | $ | 17.05 | | | $ | 12.00 | | |
| Total Return (a) | | | 10.91 | % ** | | | 19.94 | % | | | 3.26 | % | | | 11.65 | % | | | 45.49 | % | | | (10.00 | )% | |
| Ratios / Supplemental Data: | |
| Net assets, end of period (000's) | | $ | 185,302 | | | $ | 203,635 | | | $ | 180,827 | | | $ | 163,742 | | | $ | 114,730 | | | $ | 39,942 | | |
| Ratio of expenses to average daily net assets: | |
| Before expense waiver | | | 1.04 | % * | | | 1.04 | % | | | 1.05 | % | | | 1.05 | % | | | 1.05 | % | | | 1.05 | % | |
| After expense waiver | | | N/A | | | | N/A | | | | N/A | | | | 1.03 | % (b)# | | | 1.04 | % (b)# | | | 1.05 | % (b)# | |
Net investment income (loss) to average daily
net assets | | | (1.87 | )% * | | | 1.66 | % | | | 0.26 | % | | | (0.16 | )% | | | (0.16 | )% | | | (0.11 | )% | |
| Portfolio turnover rate | | | 21 | % ** | | | 36 | % | | | 31 | % | | | 32 | % | | | 31 | % | | | 78 | % | |
* Annualized.
** Percentage represents results for the period and is not annualized.
*** Per share amount calculated on the average shares method.
† Amount is less than $0.01 per share.
†† Effective January 1, 2005, rebated brokerage commissions are included with realized gain or loss on investment transactions. Prior to January 1, 2005, these amounts were presented as a reduction of expenses. Prior year amounts have not been restated to reflect this change due to immateriality.
# Computed after giving effect to an agreement by MassMutual to waive certain fees and expenses of the Fund.
(a) Employee retirement benefit plans that invest plan assets in the Separate Investment Accounts (SIAs) may be subject to certain charges as set forth in their respective Plan Documents. Total return figures would be lower for the periods presented if they reflected these charges.
(b) The Fund has entered into an agreement with certain brokers to rebate a portion of brokerage commissions. The rebated commissions were used to reduce operating expenses of the Fund.
(c) Total return excludes sales charges and would be lower for the period presented if it reflected these charges.
The accompanying notes are an integral part of the financial statements.
270
MassMutual Select Focused Value Fund – Financial Statements (Continued)
Financial Highlights (For a share outstanding throughout each period)
| | | Class Y | |
| | | Six months
ended
6/30/07
(Unaudited) | | Year ended
12/31/06 | | Year ended
12/31/05†† | | Year ended
12/31/04 | | Year ended
12/31/03 | | Year ended
12/31/02 | |
| Net asset value, beginning of period | | $ | 18.47 | | | $ | 17.02 | | | $ | 18.08 | | | $ | 17.12 | | | $ | 12.03 | | | $ | 13.46 | | |
| Income (loss) from investment operations: | |
| Net investment income (loss) | | | (0.18 | )*** | | | 0.32 | *** | | | 0.07 | *** | | | (0.00 | )***† | | | (0.00 | )***† | | | 0.03 | *** | |
Net realized and unrealized gain (loss)
on investments | | | 2.21 | | | | 3.09 | | | | 0.55 | | | | 1.99 | | | | 5.50 | | | | (1.36 | ) | |
Total income (loss) from investment
operations | | | 2.03 | | | | 3.41 | | | | 0.62 | | | | 1.99 | | | | 5.50 | | | | (1.33 | ) | |
| Less distributions to shareholders: | |
| From net investment income | | | - | | | | (0.33 | ) | | | (0.08 | ) | | | - | | | | (0.00 | )† | | | - | | |
| From net realized gains | | | - | | | | (1.63 | ) | | | (1.60 | ) | | | (1.03 | ) | | | (0.41 | ) | | | (0.10 | ) | |
| Total distributions | | | - | | | | (1.96 | ) | | | (1.68 | ) | | | (1.03 | ) | | | (0.41 | ) | | | (0.10 | ) | |
| Net asset value, end of period | | $ | 20.50 | | | $ | 18.47 | | | $ | 17.02 | | | $ | 18.08 | | | $ | 17.12 | | | $ | 12.03 | | |
| Total Return (a) | | | 10.99 | % ** | | | 20.12 | % | | | 3.44 | % | | | 11.78 | % | | | 45.71 | % | | | (9.85 | )% | |
| Ratios / Supplemental Data: | |
| Net assets, end of period (000's) | | $ | 149,612 | | | $ | 144,555 | | | $ | 116,392 | | | $ | 94,538 | | | $ | 78,549 | | | $ | 45,302 | | |
| Ratio of expenses to average daily net assets: | |
| Before expense waiver | | | 0.89 | % * | | | 0.89 | % | | | 0.90 | % | | | 0.90 | % | | | 0.89 | % | | | 0.90 | % | |
| After expense waiver | | | N/A | | | | N/A | | | | N/A | | | | 0.88 | % (b)# | | | 0.89 | % (b)# | | | 0.90 | % (b)# | |
Net investment income (loss) to average daily
net assets | | | (1.83 | )% * | | | 1.79 | % | | | 0.40 | % | | | (0.01 | )% | | | (0.01 | )% | | | 0.24 | % | |
| Portfolio turnover rate | | | 21 | % ** | | | 36 | % | | | 31 | % | | | 32 | % | | | 31 | % | | | 78 | % | |
| | | Class S | |
| | | Six months
ended
6/30/07
(Unaudited) | | Year ended
12/31/06 | | Year ended
12/31/05†† | | Year ended
12/31/04 | | Year ended
12/31/03 | | Year ended
12/31/02 | |
| Net asset value, beginning of period | | $ | 18.59 | | | $ | 17.11 | | | $ | 18.18 | | | $ | 17.19 | | | $ | 12.06 | | | $ | 13.48 | | |
| Income (loss) from investment operations: | |
| Net investment income (loss) | | | (0.17 | )*** | | | 0.34 | *** | | | 0.09 | *** | | | 0.01 | *** | | | 0.01 | *** | | | 0.02 | *** | |
Net realized and unrealized gain (loss)
on investments | | | 2.22 | | | | 3.12 | | | | 0.54 | | | | 2.01 | | | | 5.53 | | | | (1.34 | ) | |
Total income (loss) from investment
operations | | | 2.05 | | | | 3.46 | | | | 0.63 | | | | 2.02 | | | | 5.54 | | | | (1.32 | ) | |
| Less distributions to shareholders: | |
| From net investment income | | | - | | | | (0.35 | ) | | | (0.10 | ) | | | - | | | | (0.00 | )† | | | - | | |
| From net realized gains | | | - | | | | (1.63 | ) | | | (1.60 | ) | | | (1.03 | ) | | | (0.41 | ) | | | (0.10 | ) | |
| Total distributions | | | - | | | | (1.98 | ) | | | (1.70 | ) | | | (1.03 | ) | | | (0.41 | ) | | | (0.10 | ) | |
| Net asset value, end of period | | $ | 20.64 | | | $ | 18.59 | | | $ | 17.11 | | | $ | 18.18 | | | $ | 17.19 | | | $ | 12.06 | | |
| Total Return (a) | | | 11.08 | % ** | | | 20.28 | % | | | 3.45 | % | | | 11.91 | % | | | 45.94 | % | | | (9.76 | )% | |
| Ratios / Supplemental Data: | |
| Net assets, end of period (000's) | | $ | 402,649 | | | $ | 384,859 | | | $ | 354,769 | | | $ | 326,445 | | | $ | 293,759 | | | $ | 114,178 | | |
| Ratio of expenses to average daily net assets: | |
| Before expense waiver | | | 0.79 | % * | | | 0.79 | % | | | 0.80 | % | | | 0.80 | % | | | 0.80 | % | | | 0.80 | % | |
| After expense waiver | | | N/A | | | | N/A | | | | N/A | | | | 0.78 | % (b)# | | | 0.79 | % (b)# | | | 0.80 | % (b)# | |
Net investment income (loss) to average daily
net assets | | | (1.71 | )% * | | | 1.89 | % | | | 0.50 | % | | | 0.08 | % | | | 0.09 | % | | | 0.13 | % | |
| Portfolio turnover rate | | | 21 | % ** | | | 36 | % | | | 31 | % | | | 32 | % | | | 31 | % | | | 78 | % | |
* Annualized.
** Percentage represents results for the period and is not annualized.
*** Per share amount calculated on the average shares method.
† Amount is less than $0.01 per share.
†† Effective January 1, 2005, rebated brokerage commissions are included with realized gain or loss on investment transactions. Prior to January 1, 2005, these amounts were presented as a reduction of expenses. Prior year amounts have not been restated to reflect this change due to immateriality.
# Computed after giving effect to an agreement by MassMutual to waive certain fees and expenses of the Fund.
(a) Employee retirement benefit plans that invest plan assets in the Separate Investment Accounts (SIAs) may be subject to certain charges as set forth in their respective Plan Documents. Total return figures would be lower for the periods presented if they reflected these charges.
(b) The Fund has entered into an agreement with certain brokers to rebate a portion of brokerage commissions. The rebated commissions were used to reduce operating expenses of the Fund.
The accompanying notes are an integral part of the financial statements.
271
MassMutual Select Focused Value Fund – Financial Statements (Continued)
Financial Highlights (For a share outstanding throughout each period)
| | | Class N | |
| | | Six months
ended
6/30/07
(Unaudited) | | Year ended
12/31/06 | | Year ended
12/31/05†† | | Year ended
12/31/04 | | Year ended
12/31/03 | | Period ended
12/31/02++ | |
| Net asset value, beginning of period | | $ | 17.79 | | | $ | 16.48 | | | $ | 17.60 | | | $ | 16.81 | | | $ | 11.90 | | | $ | 11.77 | | |
| Income (loss) from investment operations: | |
| Net investment income (loss) | | | (0.24 | )*** | | | 0.18 | *** | | | (0.05 | )*** | | | (0.12 | )*** | | | (0.11 | )*** | | | (0.00 | )***† | |
Net realized and unrealized gain (loss)
on investments | | | 2.12 | | | | 2.99 | | | | 0.53 | | | | 1.94 | | | | 5.43 | | | | 0.13 | | |
Total income from investment
operations | | | 1.88 | | | | 3.17 | | | | 0.48 | | | | 1.82 | | | | 5.32 | | | | 0.13 | | |
| Less distributions to shareholders: | |
| From net investment income | | | - | | | | (0.23 | ) | | | - | | | | - | | | | (0.00 | )† | | | - | | |
| Tax return of capital | | | - | | | | - | | | | - | | | | - | | | | (0.41 | ) | | | - | | |
| From net realized gains | | | - | | | | (1.63 | ) | | | (1.60 | ) | | | (1.03 | ) | | | - | | | | - | | |
| Total distributions | | | - | | | | (1.86 | ) | | | (1.60 | ) | | | (1.03 | ) | | | (0.41 | ) | | | - | | |
| Net asset value, end of period | | $ | 19.67 | | | $ | 17.79 | | | $ | 16.48 | | | $ | 17.60 | | | $ | 16.81 | | | $ | 11.90 | | |
| Total Return (a) | | | 10.57 | % (c)** | | | 19.35 | % (c) | | | 2.61 | % (c) | | | 11.05 | % (c) | | | 44.70 | % (c) | | | - | ‡ | |
| Ratios / Supplemental Data: | |
| Net assets, end of period (000's) | | $ | 3,163 | | | $ | 2,567 | | | $ | 1,820 | | | $ | 1,006 | | | $ | 904 | | | $ | 102 | | |
| Ratio of expenses to average daily net assets: | |
| Before expense waiver | | | 1.59 | % * | | | 1.60 | % | | | 1.60 | % | | | 1.60 | % | | | 1.61 | % | | | - | ‡ | |
| After expense waiver | | | N/A | | | | N/A | | | | N/A | | | | 1.58 | % (b)# | | | 1.60 | % (b)# | | | - | ‡ | |
Net investment income (loss) to average daily
net assets | | | (2.62 | )% * | | | 1.03 | % | | | (0.27 | )% | | | (0.72 | )% | | | (0.70 | )% | | | - | ‡ | |
| Portfolio turnover rate | | | 21 | % ** | | | 36 | % | | | 31 | % | | | 32 | % | | | 31 | % | | | 78 | % | |
* Annualized.
** Percentage represents results for the period and is not annualized.
*** Per share amount calculated on the average shares method.
† Amount is less than $0.01 per share.
†† Effective January 1, 2005, rebated brokerage commissions are included with realized gain or loss on investment transactions. Prior to January 1, 2005, these amounts were presented as a reduction of expenses. Prior year amounts have not been restated to reflect this change due to immateriality.
++ Class N commenced operations on December 31, 2002.
‡ Amount is de minimis due to the short period of operations.
# Computed after giving effect to an agreement by MassMutual to waive certain fees and expenses of the Fund.
(a) Employee retirement benefit plans that invest plan assets in the Separate Investment Accounts (SIAs) may be subject to certain charges as set forth in their respective Plan Documents. Total return figures would be lower for the periods presented if they reflected these charges.
(b) The Fund has entered into an agreement with certain brokers to rebate a portion of brokerage commissions. The rebated commissions were used to reduce operating expenses of the Fund.
(c) Total return excludes sales charge and would be lower for the period presented if it reflected these charges.
The accompanying notes are an integral part of the financial statements.
272
MassMutual Select Mid-Cap Value Fund – Financial Statements (Continued)
Financial Highlights (For a share outstanding throughout each period)
| | | Class A | | Class L | | Class Y | |
| | | Six months
ended
6/30/07
(Unaudited) | | Period ended
12/31/06+ | | Six months
ended
6/30/07
(Unaudited) | | Period ended
12/31/06+ | | Six months
ended
6/30/07
(Unaudited) | | Period ended
12/31/06+ | |
| Net asset value, beginning of period | | $ | 11.40 | | | $ | 10.00 | | | $ | 11.42 | | | $ | 10.00 | | | $ | 11.43 | | | $ | 10.00 | | |
| Income (loss) from investment operations: | |
| Net investment income (loss) | | | 0.02 | *** | | | 0.02 | *** | | | 0.03 | *** | | | 0.05 | *** | | | 0.05 | *** | | | 0.03 | *** | |
Net realized and unrealized gain (loss)
on investments | | | 1.09 | | | | 1.41 | | | | 1.09 | | | | 1.39 | | | | 1.08 | | | | 1.40 | | |
| Total income from investment operations | | | 1.11 | | | | 1.43 | | | | 1.12 | | | | 1.44 | | | | 1.13 | | | | 1.43 | | |
| Less distributions to shareholders: | |
| From net investment income | | | - | | | | (0.02 | ) | | | - | | | | (0.01 | ) | | | - | | | | - | | |
| From net realized gains | | | - | | | | (0.01 | ) | | | - | | | | (0.01 | ) | | | - | | | | - | | |
| Total distributions | | | - | | | | (0.03 | ) | | | - | | | | (0.02 | ) | | | - | | | | - | | |
| Net asset value, end of period | | $ | 12.51 | | | $ | 11.40 | | | $ | 12.54 | | | $ | 11.42 | | | $ | 12.56 | | | $ | 11.43 | | |
| Total Return (a) | | | 9.74 | %(b)** | | | 14.27 | % (b)** | | | 9.81 | %** | | | 14.47 | % ** | | | 9.89 | %** | | | 14.42 | %** | |
| Ratios / Supplemental Data: | |
| Net assets, end of period (000's) | | $ | 8,994 | | | $ | 497 | | | $ | 77,482 | | | $ | 1,628 | | | $ | 897 | | | | - | | |
| Ratio of expenses to average daily net assets: | |
| Before expense waiver | | | 1.29 | %* | | | 2.02 | % * | | | 1.04 | %* | | | 1.77 | % * | | | 0.89 | %* | | | 1.62 | %* | |
| After expense waiver | | | N/A | | | | 1.38 | % *# | | | N/A | | | | 1.13 | % *# | | | N/A | | | | 0.98 | %*# | |
Net investment income (loss) to average daily
net assets | | | 0.29 | %* | | | 0.45 | % * | | | 0.49 | %* | | | 1.31 | % * | | | 0.81 | %* | | | 0.68 | %* | |
| Portfolio turnover rate | | | 25 | %** | | | 7 | % ** | | | 25 | %** | | | 7 | % ** | | | 25 | %** | | | 7 | %** | |
| | | Class S | | Class N | |
| | | Six months
ended
6/30/07
(Unaudited) | | Period ended
12/31/06+ | | Six months
ended
6/30/07
(Unaudited) | | Period ended
12/31/06+ | |
| Net asset value, beginning of period | | $ | 11.42 | | | $ | 10.00 | | | $ | 11.41 | | | $ | 10.00 | | |
| Income (loss) from investment operations: | |
| Net investment income (loss) | | | 0.04 | *** | | | 0.06 | *** | | | 0.00 | ***† | | | 0.00 | ****‡ | |
Net realized and unrealized gain (loss) on
investments | | | 1.09 | | | | 1.39 | | | | 1.11 | | | | 1.41 | | |
| Total income from investment operations | | | 1.13 | | | | 1.45 | | | | 1.11 | | | | 1.41 | | |
| Less distributions to shareholders: | |
| From net investment income | | | - | | | | (0.02 | ) | | | - | | | | - | | |
| From net realized gains | | | - | | | | (0.01 | ) | | | - | | | | - | | |
| Total distributions | | | - | | | | (0.03 | ) | | | - | | | | - | | |
| Net asset value, end of period | | $ | 12.55 | | | $ | 11.42 | | | $ | 12.52 | | | $ | 11.41 | | |
| Total Return (a) | | | 9.98 | %** | | | 14.50 | % ** | | | 9.82 | %(b)** | | | 14.22 | % (b)** | |
| Ratios / Supplemental Data: | |
| Net assets, end of period (000's) | | $ | 133,742 | | | $ | 60,708 | | | $ | 45 | | | | - | | |
| Ratio of expenses to average daily net assets: | |
| Before expense waiver | | | 0.79 | %* | | | 1.52 | % * | | | 1.59 | %* | | | 2.32 | % * | |
| After expense waiver | | | N/A | | | | 0.88 | % *# | | | N/A | | | | 1.68 | % *# | |
Net investment income (loss) to average daily
net assets | | | 0.68 | %* | | | 1.51 | % * | | | 0.01 | %* | | | (0.02 | )% * | |
| Portfolio turnover rate | | | 25 | %** | | | 7 | % ** | | | 25 | %** | | | 7 | % ** | |
* Annualized.
** Percentage represents results for the period and is not annualized.
*** Per share amount calculated on the average shares method.
+ The Fund commenced operations on August 29, 2006.
‡ Amount is de minimis due to the short period of operations.
# Computed after giving effect to an agreement by MassMutual to waive certain fees and expenses of the Fund.
(a) Employee retirement benefit plans that invest plan assets in the Separate Investment Accounts (SIAs) may be subject to certain charges as set forth in their respective Plan Documents. Total return figures would be lower for the periods presented if they reflected these charges.
(b) Total return excludes sales charges and would be lower for the period presented if it reflected these charges.
The accompanying notes are an integral part of the financial statements.
273
MassMutual Select Small Cap Value Equity Fund – Financial Statements (Continued)
Financial Highlights (For a share outstanding throughout each period)
| | | Class A | | Class L | | Class Y | |
| | | Six months
ended
6/30/07
(Unaudited) | | Period ended
12/31/06+ | | Six months
ended
6/30/07
(Unaudited) | | Period ended
12/31/06+ | | Six months
ended
6/30/07
(Unaudited) | | Period ended
12/31/06+ | |
| Net asset value, beginning of period | | $ | 10.90 | | | $ | 10.00 | | | $ | 10.91 | | | $ | 10.00 | | | $ | 10.91 | | | $ | 10.00 | | |
| Income (loss) from investment operations: | |
| Net investment income (loss) | | | 0.08 | *** | | | 0.10 | *** | | | 0.10 | *** | | | 0.13 | *** | | | 0.10 | *** | | | 0.10 | *** | |
Net realized and unrealized gain (loss)
on investments | | | 0.36 | | | | 0.84 | | | | 0.36 | | | | 0.83 | | | | 0.37 | | | | 0.86 | | |
Total income from investment
operations | | | 0.44 | | | | 0.94 | | | | 0.46 | | | | 0.96 | | | | 0.47 | | | | 0.96 | | |
| Less distributions to shareholders: | |
| From net investment income | | | - | | | | (0.04 | ) | | | - | | | | (0.05 | ) | | | - | | | | (0.05 | ) | |
| Net asset value, end of period | | $ | 11.34 | | | $ | 10.90 | | | $ | 11.37 | | | $ | 10.91 | | | $ | 11.38 | | | $ | 10.91 | | |
| Total Return (a) | | | 4.13 | %** | | | 9.32 | % (b)** | | | 4.22 | %** | | | 9.61 | % ** | | | 4.31 | %** | | | 9.61 | % ** | |
| Ratios / Supplemental Data: | |
| Net assets, end of period (000's) | | $ | 12,249 | | | $ | 3,653 | | | $ | 42,709 | | | $ | 1,041 | | | $ | 3,588 | | | $ | 2,402 | | |
| Ratio of expenses to average daily net assets: | |
| Before expense waiver | | | 1.36 | %* | | | 1.72 | % * | | | 1.11 | %* | | | 1.47 | % * | | | 0.96 | %* | | | 1.32 | % * | |
| After expense waiver | | | N/A | | | | 1.40 | % *# | | | N/A | | | | 1.15 | % *# | | | N/A | | | | 1.00 | % *# | |
Net investment income (loss) to average daily
net assets | | | 1.46 | %* | | | 1.23 | % * | | | 1.70 | %* | | | 1.69 | % * | | | 1.76 | %* | | | 1.34 | % * | |
| Portfolio turnover rate | | | 49 | %** | | | 63 | % ** | | | 49 | %** | | | 63 | % ** | | | 49 | %** | | | 63 | % ** | |
| | | Class S | | Class N | |
| | | Six months
ended
6/30/07
(Unaudited) | | Period ended
12/31/06+ | | Six months
ended
6/30/07
(Unaudited) | | Period ended
12/31/06+ | |
| Net asset value, beginning of period | | $ | 10.91 | | | $ | 10.00 | | | $ | 10.91 | | | $ | 10.00 | | |
| Income (loss) from investment operations: | |
| Net investment income (loss) | | | 0.12 | *** | | | 0.11 | *** | | | 0.05 | *** | | | 0.04 | *** | |
Net realized and unrealized gain (loss)
on investments | | | 0.36 | | | | 0.85 | | | | 0.39 | | | | 0.87 | | |
Total income from investment
operations | | | 0.48 | | | | 0.96 | | | | 0.44 | | | | 0.91 | | |
| Less distributions to shareholders: | |
| From net investment income | | | - | | | | (0.05 | ) | | | - | | | | - | | |
| Net asset value, end of period | | $ | 11.39 | | | $ | 10.91 | | | $ | 11.35 | | | $ | 10.91 | | |
| Total Return (a) | | | 4.30 | %** | | | 9.74 | % ** | | | 4.03 | %** | | | 9.10 | % (b)** | |
| Ratios / Supplemental Data: | |
| Net assets, end of period (000's) | | $ | 98,753 | | | $ | 29,939 | | | $ | 114 | | | $ | 109 | | |
| Ratio of expenses to average daily net assets: | |
| Before expense waiver | | | 0.86 | %* | | | 1.22 | % * | | | 1.66 | %* | | | 2.02 | % * | |
| After expense waiver | | | N/A | | | | 0.95 | % *# | | | N/A | | | | 1.70 | % *# | |
Net investment income (loss) to average daily
net assets | | | 2.07 | %* | | | 1.40 | % * | | | 0.94 | %* | | | 0.50 | % * | |
| Portfolio turnover rate | | | 49 | %** | | | 63 | % ** | | | 49 | %** | | | 63 | % ** | |
* Annualized.
** Percentage represents results for the period and is not annualized.
*** Per share amount calculated on the average shares method.
+ The Fund commenced operations on March 31, 2006.
# Computed after giving effect to an agreement by MassMutual to waive certain fees and expenses of the Fund.
(a) Employee retirement benefit plans that invest plan assets in the Separate Investment Accounts (SIAs) may be subject to certain charges as set forth in their respective Plan Documents. Total return figures would be lower for the periods presented if they reflected these charges.
(b) Total return excludes sales charges and would be lower for the period presented if it reflected these charges.
The accompanying notes are an integral part of the financial statements.
274
MassMutual Select Small Company Value Fund – Financial Statements (Continued)
Financial Highlights (For a share outstanding throughout each period)
| | | Class A | |
| | | Six months
ended
6/30/07
(Unaudited) | | Year ended
12/31/06 | | Year ended
12/31/05† | | Year ended
12/31/04 | | Year ended
12/31/03 | | Year ended
12/31/02 | |
| Net asset value, beginning of period | | $ | 15.32 | | | $ | 14.28 | | | $ | 14.28 | | | $ | 11.96 | | | $ | 8.66 | | | $ | 10.00 | | |
| Income (loss) from investment operations: | |
| Net investment income (loss) | | | (0.02 | )*** | | | (0.03 | )*** | | | (0.03 | )*** | | | 0.00 | ***†† | | | 0.02 | *** | | | 0.05 | *** | |
Net realized and unrealized gain (loss)
on investments | | | 0.96 | | | | 2.07 | | | | 0.68 | | | | 2.65 | | | | 3.31 | | | | (1.37 | ) | |
Total income (loss) from investment
operations | | | 0.94 | | | | 2.04 | | | | 0.65 | | | | 2.65 | | | | 3.33 | | | | (1.32 | ) | |
| Less distributions to shareholders: | |
| From net investment income | | | - | | | | - | | | | - | | | | - | | | | (0.01 | ) | | | (0.02 | ) | |
| From net realized gains | | | - | | | | (1.00 | ) | | | (0.65 | ) | | | (0.33 | ) | | | (0.02 | ) | | | - | | |
| Total distributions | | | - | | | | (1.00 | ) | | | (0.65 | ) | | | (0.33 | ) | | | (0.03 | ) | | | (0.02 | ) | |
| Net asset value, end of period | | $ | 16.26 | | | $ | 15.32 | | | $ | 14.28 | | | $ | 14.28 | | | $ | 11.96 | | | $ | 8.66 | | |
| Total Return (a) | | | 6.14 | % (c)** | | | 14.46 | % (c) | | | 4.56 | % (c) | | | 22.30 | % (c) | | | 38.66 | % | | | (13.27 | )% | |
| Ratios / Supplemental Data: | |
| Net assets, end of period (000's) | | $ | 170,734 | | | $ | 174,732 | | | $ | 136,675 | | | $ | 115,807 | | | $ | 44,754 | | | $ | 8,602 | | |
| Ratio of expenses to average daily net assets: | |
| Before expense waiver | | | 1.49 | % * | | | 1.49 | % | | | 1.49 | % | | | 1.49 | % | | | 1.51 | % | | | 1.64 | % | |
| After expense waiver | | | N/A | | | | N/A | | | | N/A | | | | 1.44 | % (b)# | | | 1.41 | % (b)# | | | 1.37 | % (b)# | |
Net investment income (loss) to average daily
net assets | | | (0.20 | )% * | | | (0.18 | )% | | | (0.24 | )% | | | (0.02 | )% | | | 0.17 | % | | | 0.52 | % | |
| Portfolio turnover rate | | | 21 | % ** | | | 50 | % | | | 56 | % | | | 36 | % | | | 58 | % | | | 69 | % | |
| | | Class L | |
| | | Six months
ended
6/30/07
(Unaudited) | | Year ended
12/31/06 | | Year ended
12/31/05† | | Year ended
12/31/04 | | Year ended
12/31/03 | | Year ended
12/31/02 | |
| Net asset value, beginning of period | | $ | 15.43 | | | $ | 14.34 | | | $ | 14.31 | | | $ | 11.96 | | | $ | 8.65 | | | $ | 10.00 | | |
| Income (loss) from investment operations: | |
| Net investment income (loss) | | | 0.00 | *** | | | 0.01 | *** | | | 0.00 | ***†† | | | 0.03 | *** | | | 0.05 | *** | | | 0.08 | *** | |
Net realized and unrealized gain (loss)
on investments | | | 0.96 | | | | 2.08 | | | | 0.68 | | | | 2.67 | | | | 3.31 | | | | (1.39 | ) | |
Total income (loss) from investment
operations | | | 0.96 | | | | 2.09 | | | | 0.68 | | | | 2.70 | | | | 3.36 | | | | (1.31 | ) | |
| Less distributions to shareholders: | |
| From net investment income | | | - | | | | - | | | | - | | | | (0.02 | ) | | | (0.03 | ) | | | (0.04 | ) | |
| From net realized gains | | | - | | | | (1.00 | ) | | | (0.65 | ) | | | (0.33 | ) | | | (0.02 | ) | | | - | | |
| Total distributions | | | - | | | | (1.00 | ) | | | (0.65 | ) | | | (0.35 | ) | | | (0.05 | ) | | | (0.04 | ) | |
| Net asset value, end of period | | $ | 16.39 | | | $ | 15.43 | | | $ | 14.34 | | | $ | 14.31 | | | $ | 11.96 | | | $ | 8.65 | | |
| Total Return (a) | | | 6.29 | % ** | | | 14.75 | % | | | 4.76 | % | | | 22.68 | % | | | 38.92 | % | | | (13.10 | )% | |
| Ratios / Supplemental Data: | |
| Net assets, end of period (000's) | | $ | 123,620 | | | $ | 163,441 | | | $ | 125,631 | | | $ | 116,485 | | | $ | 37,776 | | | $ | 3,252 | | |
| Ratio of expenses to average daily net assets: | |
| Before expense waiver | | | 1.24 | %* | | | 1.24 | % | | | 1.24 | % | | | 1.24 | % | | | 1.26 | % | | | 1.39 | % | |
| After expense waiver | | | N/A | | | | N/A | | | | N/A | | | | 1.19 | % (b)# | | | 1.17 | % (b)# | | | 1.11 | % (b)# | |
Net investment income (loss) to average daily
net assets | | | 0.04 | %* | | | 0.07 | % | | | 0.00 | % ††† | | | 0.24 | % | | | 0.45 | % | | | 0.86 | % | |
| Portfolio turnover rate | | | 21 | %** | | | 50 | % | | | 56 | % | | | 36 | % | | | 58 | % | | | 69 | % | |
* Annualized.
** Percentage represents results for the period and is not annualized.
*** Per share amount calculated on the average shares method.
† Effective January 1, 2005, rebated brokerage commissions are included with realized gain or loss on investment transactions. Prior to January 1, 2005, these amounts were presented as a reduction of expenses. Prior year amounts have not been restated to reflect this change due to immateriality.
†† Amount is less than $0.01 per share.
# Computed after giving effect to an agreement by MassMutual to waive certain fees and expenses of the Fund.
(a) Employee retirement benefit plans that invest plan assets in the Separate Investment Accounts (SIAs) may be subject to certain charges as set forth in their respective Plan Documents. Total return figures would be lower for the periods presented if they reflected these charges.
(b) The Fund has entered into an agreement with certain brokers to rebate a portion of brokerage commissions. The rebated commissions were used to reduce operating expenses of the Fund.
(c) Total return excludes sales charges and would be lower for the period presented if it reflected these charges.
The accompanying notes are an integral part of the financial statements.
275
MassMutual Select Small Company Value Fund – Financial Statements (Continued)
Financial Highlights (For a share outstanding throughout each period)
| | | Class Y | |
| | | Six months
ended
6/30/07
(Unaudited) | | Year ended
12/31/06 | | Year ended
12/31/05† | | Year ended
12/31/04 | | Year ended
12/31/03 | | Year ended
12/31/02 | |
| Net asset value, beginning of period | | $ | 15.53 | | | $ | 14.41 | | | $ | 14.35 | | | $ | 11.99 | | | $ | 8.66 | | | $ | 10.00 | | |
| Income (loss) from investment operations: | |
| Net investment income (loss) | | | 0.02 | *** | | | 0.04 | *** | | | 0.02 | *** | | | 0.05 | *** | | | 0.06 | *** | | | 0.11 | *** | |
Net realized and unrealized gain (loss)
on investments | | | 0.96 | | | | 2.09 | | | | 0.69 | | | | 2.67 | | | | 3.33 | | | | (1.40 | ) | |
Total income (loss) from investment
operations | | | 0.98 | | | | 2.13 | | | | 0.71 | | | | 2.72 | | | | 3.39 | | | | (1.29 | ) | |
| Less distributions to shareholders: | |
| From net investment income | | | - | | | | (0.01 | ) | | | - | | | | (0.03 | ) | | | (0.04 | ) | | | (0.05 | ) | |
| From net realized gains | | | - | | | | (1.00 | ) | | | (0.65 | ) | | | (0.33 | ) | | | (0.02 | ) | | | - | | |
| Total distributions | | | - | | | | (1.01 | ) | | | (0.65 | ) | | | (0.36 | ) | | | (0.06 | ) | | | (0.05 | ) | |
| Net asset value, end of period | | $ | 16.51 | | | $ | 15.53 | | | $ | 14.41 | | | $ | 14.35 | | | $ | 11.99 | | | $ | 8.66 | | |
| Total Return (a) | | | 6.31 | %** | | | 14.93 | % | | | 4.96 | % | | | 22.80 | % | | | 39.16 | % | | | (12.92 | )% | |
| Ratios / Supplemental Data: | |
| Net assets, end of period (000's) | | $ | 156,033 | | | $ | 174,630 | | | $ | 98,126 | | | $ | 100,488 | | | $ | 46,409 | | | $ | 19,708 | | |
| Ratio of expenses to average daily net assets: | |
| Before expense waiver | | | 1.09 | %* | | | 1.09 | % | | | 1.09 | % | | | 1.09 | % | | | 1.11 | % | | | 1.24 | % | |
| After expense waiver | | | N/A | | | | N/A | | | | N/A | | | | 1.04 | % (b)# | | | 1.01 | % (b)# | | | 0.92 | % (b)# | |
Net investment income (loss) to average daily
net assets | | | 0.20 | %* | | | 0.22 | % | | | 0.13 | % | | | 0.37 | % | | | 0.58 | % | | | 1.32 | % | |
| Portfolio turnover rate | | | 21 | %** | | | 50 | % | | | 56 | % | | | 36 | % | | | 58 | % | | | 69 | % | |
| | | Class S | |
| | | Six months
ended
6/30/07
(Unaudited) | | Year ended
12/31/06 | | Year ended
12/31/05† | | Year ended
12/31/04 | | Year ended
12/31/03 | | Year ended
12/31/02 | |
| Net asset value, beginning of period | | $ | 15.58 | | | $ | 14.46 | | | $ | 14.39 | | | $ | 12.02 | | | $ | 8.67 | | | $ | 10.00 | | |
| Income (loss) from investment operations: | |
| Net investment income (loss) | | | 0.02 | *** | | | 0.04 | *** | | | 0.03 | *** | | | 0.05 | *** | | | 0.06 | *** | | | 0.07 | *** | |
Net realized and unrealized gain (loss)
on investments | | | 0.97 | | | | 2.09 | | | | 0.69 | | | | 2.68 | | | | 3.35 | | | | (1.36 | ) | |
Total income (loss) from investment
operations | | | 0.99 | | | | 2.13 | | | | 0.72 | | | | 2.73 | | | | 3.41 | | | | (1.29 | ) | |
| Less distributions to shareholders: | |
| From net investment income | | | - | | | | (0.01 | ) | | | - | | | | (0.03 | ) | | | (0.04 | ) | | | (0.04 | ) | |
| From net realized gains | | | - | | | | (1.00 | ) | | | (0.65 | ) | | | (0.33 | ) | | | (0.02 | ) | | | - | | |
| Total distributions | | | - | | | | (1.01 | ) | | | (0.65 | ) | | | (0.36 | ) | | | (0.06 | ) | | | (0.04 | ) | |
| Net asset value, end of period | | $ | 16.57 | �� | | $ | 15.58 | | | $ | 14.46 | | | $ | 14.39 | | | $ | 12.02 | | | $ | 8.67 | | |
| Total Return (a) | | | 6.29 | %** | | | 14.97 | % | | | 5.01 | % | | | 22.86 | % | | | 39.37 | % | | | (12.92 | )% | |
| Ratios / Supplemental Data: | |
| Net assets, end of period (000's) | | $ | 288,446 | | | $ | 288,826 | | | $ | 221,271 | | | $ | 188,743 | | | $ | 80,661 | | | $ | 44,356 | | |
| Ratio of expenses to average daily net assets: | |
| Before expense waiver | | | 1.05 | %* | | | 1.05 | % | | | 1.05 | % | | | 1.05 | % | | | 1.07 | % | | | 1.20 | % | |
| After expense waiver | | | N/A | | | | N/A | | | | N/A | | | | 1.00 | % (b)# | | | 0.97 | % (b)# | | | 0.96 | % (b)# | |
Net investment income (loss) to average daily
net assets | | | 0.23 | %* | | | 0.26 | % | | | 0.20 | % | | | 0.40 | % | | | 0.58 | % | | | 0.76 | % | |
| Portfolio turnover rate | | | 21 | %** | | | 50 | % | | | 56 | % | | | 36 | % | | | 58 | % | | | 69 | % | |
* Annualized.
** Percentage represents results for the period and is not annualized.
*** Per share amount calculated on the average shares method.
† Effective January 1, 2005, rebated brokerage commissions are included with realized gain or loss on investment transactions. Prior to January 1, 2005, these amounts were presented as a reduction of expenses. Prior year amounts have not been restated to reflect this change due to immateriality.
# Computed after giving effect to an agreement by MassMutual to waive certain fees and expenses of the Fund.
(a) Employee retirement benefit plans that invest plan assets in the Separate Investment Accounts (SIAs) may be subject to certain charges as set forth in their respective Plan Documents. Total return figures would be lower for the period presented if they reflected these charges.
(b) The Fund has entered into an agreement with certain brokers to rebate a portion of brokerage commissions. The rebated commissions were used to reduce operating expenses of the Fund.
The accompanying notes are an integral part of the financial statements.
276
MassMutual Select Small Company Value Fund – Financial Statements (Continued)
Financial Highlights (For a share outstanding throughout each period)
| | | Class N | |
| | | Six months
ended
6/30/07
(Unaudited) | | Year ended
12/31/06 | | Year ended
12/31/05† | | Year ended
12/31/04 | | Year ended
12/31/03 | | Period ended
12/31/02+ | |
| Net asset value, beginning of period | | $ | 15.08 | | | $ | 14.11 | | | $ | 14.16 | | | $ | 11.90 | | | $ | 8.63 | | | $ | 8.59 | | |
| Income (loss) from investment operations: | |
| Net investment income (loss) | | | (0.04 | )*** | | | (0.07 | )*** | | | (0.08 | )*** | | | (0.05 | )*** | | | (0.01 | )*** | | | 0.00 | ***†† | |
Net realized and unrealized gain (loss)
on investments | | | 0.94 | | | | 2.04 | | | | 0.68 | | | | 2.64 | | | | 3.30 | | | | 0.04 | | |
Total income from investment
operations | | | 0.90 | | | | 1.97 | | | | 0.60 | | | | 2.59 | | | | 3.29 | | | | 0.04 | | |
| Less distributions to shareholders: | |
| From net investment income | | | - | | | | - | | | | - | | | | - | | | | (0.00 | )†† | | | - | | |
| From net realized gains | | | - | | | | (1.00 | ) | | | (0.65 | ) | | | (0.33 | ) | | | (0.02 | ) | | | - | | |
| Total distributions | | | - | | | | (1.00 | ) | | | (0.65 | ) | | | (0.33 | ) | | | (0.02 | ) | | | - | | |
| Net asset value, end of period | | $ | 15.98 | | | $ | 15.08 | | | $ | 14.11 | | | $ | 14.16 | | | $ | 11.90 | | | $ | 8.63 | | |
| Total Return (a) | | | 5.97 | % (c)** | | | 14.14 | % (c) | | | 4.25 | % (c) | | | 21.91 | % (c) | | | 38.20 | % (c) | | | - | ‡ | |
| Ratios / Supplemental Data: | |
| Net assets, end of period (000's) | | $ | 1,935 | | | $ | 1,398 | | | $ | 1,251 | | | $ | 916 | | | $ | 564 | | | $ | 101 | | |
| Ratio of expenses to average daily net assets: | |
| Before expense waiver | | | 1.79 | % * | | | 1.79 | % | | | 1.79 | % | | | 1.79 | % | | | 1.81 | % | | | - | ‡ | |
| After expense waiver | | | N/A | | | | N/A | | | | N/A | | | | 1.74 | % (b)# | | | 1.72 | % (b)# | | | - | ‡ | |
Net investment income (loss) to average daily
net assets | | | (0.51 | )% * | | | (0.48 | )% | | | (0.54 | )% | | | (0.37 | )% | | | (0.08 | )% | | | - | ‡ | |
| Portfolio turnover rate | | | 21 | % ** | | | 50 | % | | | 56 | % | | | 36 | % | | | 58 | % | | | 69 | % | |
* Annualized.
** Percentage represents results for the period and is not annualized.
*** Per share amount calculated on the average shares method.
† Effective January 1, 2005, rebated brokerage commissions are included with realized gain or loss on investment transactions. Prior to January 1, 2005, these amounts were presented as a reduction of expenses. Prior year amounts have not been restated to reflect this change due to immateriality.
†† Amount is less than $0.01 per share.
+ Class N commenced operations on December 31, 2002.
‡ Amount is de minimis due to the short period of operations.
# Computed after giving effect to an agreement by MassMutual to waive certain fees and expenses of the Fund.
(a) Employee retirement benefit plans that invest plan assets in the Separate Investment Accounts (SIAs) may be subject to certain charges as set forth in their respective Plan Documents. Total return figures would be lower for the periods presented if they reflected these charges.
(b) The Fund has entered into an agreement with certain brokers to rebate a portion of brokerage commissions. The rebated commissions were used to reduce operating expenses of the Fund.
(c) Total return excludes sales charges and would be lower for the period presented if it reflected these charges.
The accompanying notes are an integral part of the financial statements.
277
MassMutual Select Small Cap Core Equity Fund – Financial Statements (Continued)
Financial Highlights (For a share outstanding throughout each period)
| | | Class A | | Class L | |
| | | Six months
ended
6/30/07
(Unaudited) | | Period ended
12/31/06+ | | Six months
ended
6/30/07
(Unaudited) | | Period ended
12/31/06+ | |
| Net asset value, beginning of period | | $ | 10.33 | | | $ | 10.00 | | | $ | 10.34 | | | $ | 10.00 | | |
| Income (loss) from investment operations: | |
| Net investment income (loss) | | | (0.00 | )*** | | | 0.02 | *** | | | 0.01 | *** | | | 0.04 | *** | |
Net realized and unrealized gain (loss)
on investments | | | 0.22 | | | | 0.32 | | | | 0.23 | | | | 0.32 | | |
| Total income from investment operations | | | 0.22 | | | | 0.34 | | | | 0.24 | | | | 0.36 | | |
| Less distributions to shareholders: | |
| From net investment income | | | - | | | | (0.01 | ) | | | - | | | | (0.02 | ) | |
| Net asset value, end of period | | $ | 10.55 | | | $ | 10.33 | | | $ | 10.58 | | | $ | 10.34 | | |
| Total Return (a) | | | 2.13 | % ** | | | 3.37 | % (b)** | | | 2.32 | %** | | | 3.56 | %** | |
| Ratios / Supplemental Data: | |
| Net assets, end of period (000's) | | $ | 3,365 | | | $ | 792 | | | $ | 20,491 | | | $ | 2,559 | | |
| Ratio of expenses to average daily net assets: | |
| Before expense waiver | | | 1.41 | % * | | | 1.99 | % * | | | 1.16 | %* | | | 1.74 | % * | |
| After expense waiver | | | 1.40 | % #* | | | 1.40 | % *# | | | 1.15 | %*# | | | 1.15 | % *# | |
Net investment income (loss) to
average daily net assets | | | (0.08 | )% * | | | 0.23 | % * | | | 0.27 | %* | | | 0.57 | % * | |
| Portfolio turnover rate | | | 73 | % ** | | | 99 | % ** | | | 73 | %** | | | 99 | % ** | |
| | | Class Y | | Class S | | Class N | |
| | | Six months
ended
6/30/07
(Unaudited) | | Period ended
12/31/06+ | | Six months
ended
6/30/07
(Unaudited) | | Period ended
12/31/06+ | | Six months
ended
6/30/07
(Unaudited) | | Period ended
12/31/06+ | |
| Net asset value, beginning of period | | $ | 10.36 | | | $ | 10.00 | | | $ | 10.35 | | | $ | 10.00 | | | $ | 10.32 | | | $ | 10.00 | | |
| Income (loss) from investment operations: | |
| Net investment income (loss) | | | 0.02 | *** | | | 0.05 | *** | | | 0.02 | *** | | | 0.05 | *** | | | (0.02 | )*** | | | (0.02 | )*** | |
Net realized and unrealized gain (loss)
on investments | | | 0.22 | | | | 0.33 | | | | 0.23 | | | | 0.32 | | | | 0.22 | | | | 0.34 | | |
| Total income from investment operations | | | 0.24 | | | | 0.38 | | | | 0.25 | | | | 0.37 | | | | 0.20 | | | | 0.32 | | |
| Less distributions to shareholders: | |
| From net investment income | | | - | | | | (0.02 | ) | | | - | | | | (0.02 | ) | | | - | | | | - | | |
| Net asset value, end of period | | $ | 10.60 | | | $ | 10.36 | | | $ | 10.60 | | | $ | 10.35 | | | $ | 10.52 | | | $ | 10.32 | | |
| Total Return (a) | | | 2.32 | % ** | | | 3.78 | % ** | | | 2.42 | %** | | | 3.71 | % ** | | | 1.94 | % ** | | | 3.20 | % (b)** | |
| Ratios / Supplemental Data: | |
| Net assets, end of period (000's) | | $ | 2,124 | | | $ | 1,707 | | | $ | 30,018 | | | $ | 20,755 | | | $ | 105 | | | $ | 103 | | |
| Ratio of expenses to average daily net assets: | |
| Before expense waiver | | | 1.01 | % * | | | 1.59 | % * | | | 0.91 | %* | | | 1.49 | % * | | | 1.71 | % * | | | 2.29 | % * | |
| After expense waiver | | | 1.00 | % *# | | | 1.00 | % *# | | | 0.91 | %*# | | | 0.95 | % *# | | | 1.70 | % *# | | | 1.70 | % *# | |
Net investment income (loss) to average
daily net assets | | | 0.37 | % * | | | 0.63 | % * | | | 0.46 | %* | | | 0.63 | % * | | | (0.35 | )% * | | | (0.27 | )% * | |
| Portfolio turnover rate | | | 73 | % ** | | | 99 | % ** | | | 73 | %** | | | 99 | % ** | | | 73 | % ** | | | 99 | % ** | |
* Annualized.
** Percentage represents results for the period and is not annualized.
*** Per share amount calculated on the average shares method.
+ The Fund commenced operations on March 31, 2006.
# Computed after giving effect to an agreement by MassMutual to waive certain fees and expenses of the Fund.
(a) Employee retirement benefit plans that invest plan assets in the Separate Investment Accounts (SIAs) may be subject to certain charges as set forth in their respective Plan Documents. Total return figures would be lower for the periods presented if they reflected these charges.
(b) Total return excludes sales charges and would be lower for the period presented if it reflected these charges.
The accompanying notes are an integral part of the financial statements.
278
MassMutual Select Mid Cap Growth Equity Fund – Financial Statements (Continued)
Financial Highlights (For a share outstanding throughout each period)
| | | Class A | |
| | | Six months
ended
6/30/07
(Unaudited) | | Year ended
12/31/06 | | Year ended
12/31/05† | | Year ended
12/31/04 | | Year ended
12/31/03 | | Year ended
12/31/02 | |
| Net asset value, beginning of period | | $ | 10.35 | | | $ | 9.82 | | | $ | 8.74 | | | $ | 7.64 | | | $ | 5.87 | | | $ | 8.18 | | |
| Income (loss) from investment operations: | |
| Net investment income (loss) | | | (0.04 | )*** | | | 0.02 | *** | | | (0.05 | )*** | | | (0.05 | )*** | | | (0.05 | )*** | | | (0.06 | )*** | |
Net realized and unrealized gain (loss)
on investments | | | 0.83 | | | | 0.53 | | | | 1.13 | | | | 1.15 | | | | 1.82 | | | | (2.25 | ) | |
Total income (loss) from investment
operations | | | 0.79 | | | | 0.55 | | | | 1.08 | | | | 1.10 | | | | 1.77 | | | | (2.31 | ) | |
| Less distributions to shareholders: | |
| From net investment income | | | - | | | | (0.02 | ) | | | - | | | | - | | | | - | | | | - | | |
| Net asset value, end of period | | $ | 11.14 | | | $ | 10.35 | | | $ | 9.82 | | | $ | 8.74 | | | $ | 7.64 | | | $ | 5.87 | | |
| Total Return (a) | | | 7.63 | % (c)** | | | 5.47 | % (c) | | | 12.47 | % (c) | | | 14.40 | % (c) | | | 30.15 | % | | | (28.24 | )% | |
| Ratios / Supplemental Data: | |
| Net assets, end of period (000's) | | $ | 29,311 | | | $ | 30,406 | | | $ | 34,053 | | | $ | 29,642 | | | $ | 37,976 | | | $ | 23,351 | | |
| Ratio of expenses to average daily net assets: | |
| Before expense waiver | | | 1.30 | % * | | | 1.31 | % | | | 1.30 | % | | | 1.30 | % | | | 1.30 | % | | | 1.30 | % | |
| After expense waiver | | | N/A | | | | N/A | | | | N/A | | | | 1.27 | % (b)# | | | 1.26 | % (b)# | | | 1.29 | % # | |
Net investment income (loss) to average
daily net assets | | | (0.69 | )% * | | | 0.18 | % | | | (0.59 | )% | | | (0.68 | )% | | | (0.78 | )% | | | (0.90 | )% | |
| Portfolio turnover rate | | | 63 | % ** | | | 130 | % | | | 117 | % | | | 93 | % | | | 128 | % | | | 284 | % | |
| | | Class L | |
| | | Six months
ended
6/30/07
(Unaudited) | | Year ended
12/31/06 | | Year ended
12/31/05† | | Year ended
12/31/04 | | Year ended
12/31/03 | | Year ended
12/31/02 | |
| Net asset value, beginning of period | | $ | 10.53 | | | $ | 10.00 | | | $ | 8.87 | | | $ | 7.73 | | | $ | 5.93 | | | $ | 8.24 | | |
| Income (loss) from investment operations: | |
| Net investment income (loss) | | | (0.02 | )*** | | | 0.05 | *** | | | (0.03 | )*** | | | (0.03 | )*** | | | (0.04 | )*** | | | (0.04 | )*** | |
Net realized and unrealized gain (loss)
on investments | | | 0.83 | | | | 0.52 | | | | 1.16 | | | | 1.17 | | | | 1.84 | | | | (2.27 | ) | |
Total income (loss) from investment
operations | | | 0.81 | | | | 0.57 | | | | 1.13 | | | | 1.14 | | | | 1.80 | | | | (2.31 | ) | |
| Less distributions to shareholders: | |
| From net investment income | | | - | | | | (0.04 | ) | | | - | | | | - | | | | - | | | | - | | |
| Net asset value, end of period | | $ | 11.34 | | | $ | 10.53 | | | $ | 10.00 | | | $ | 8.87 | | | $ | 7.73 | | | $ | 5.93 | | |
| Total Return (a) | | | 7.69 | % ** | | | 5.74 | % | | | 12.74 | % | | | 14.75 | % | | | 30.35 | % | | | (28.03 | )% | |
| Ratios / Supplemental Data: | |
| Net assets, end of period (000's) | | $ | 44,933 | | | $ | 33,742 | | | $ | 42,353 | | | $ | 39,546 | | | $ | 35,668 | | | $ | 24,204 | | |
| Ratio of expenses to average daily net assets: | |
| Before expense waiver | | | 1.05 | % * | | | 1.06 | % | | | 1.05 | % | | | 1.06 | % | | | 1.05 | % | | | 1.05 | % | |
| After expense waiver | | | N/A | | | | N/A | | | | N/A | | | | 1.02 | % (b)# | | | 1.01 | % (b)# | | | 1.04 | % # | |
Net investment income (loss) to average
daily net assets | | | (0.44 | )% * | | | 0.43 | % | | | (0.35 | )% | | | (0.44 | )% | | | (0.54 | )% | | | (0.65 | )% | |
| Portfolio turnover rate | | | 63 | % ** | | | 130 | % | | | 117 | % | | | 93 | % | | | 128 | % | | | 284 | % | |
* Annualized.
** Percentage represents results for the period and is not annualized.
*** Per share amount calculated on the average shares method.
† Effective January 1, 2005, rebated brokerage commissions are included with realized gain or loss on investment transactions. Prior to January 1, 2005, these amounts were presented as a reduction of expenses. Prior year amounts have not been restated to reflect this change due to immateriality.
# Computed after giving effect to an agreement by MassMutual to waive certain fees and expenses of the Fund.
(a) Employee retirement benefit plans that invest plan assets in the Separate Investment Accounts (SIAs) may be subject to certain charges as set forth in their respective Plan Documents. Total return figures would be lower for the periods presented if they reflected these charges.
(b) The Fund has entered into an agreement with certain brokers to rebate a portion of brokerage commissions. The rebated commissions were used to reduce the operating expenses of the Fund.
(c) Total return excludes sales charges and would be lower for the period presented if it reflected these charges.
The accompanying notes are an integral part of the financial statements.
279
MassMutual Select Mid Cap Growth Equity Fund – Financial Statements (Continued)
Financial Highlights (For a share outstanding throughout each period)
| | | Class Y | |
| | | Six months
ended
6/30/07
(Unaudited) | | Year ended
12/31/06 | | Year ended
12/31/05† | | Year ended
12/31/04 | | Year ended
12/31/03 | | Year ended
12/31/02 | |
| Net asset value, beginning of period | | $ | 10.62 | | | $ | 10.08 | | | $ | 8.94 | | | $ | 7.78 | | | $ | 5.95 | | | $ | 8.26 | | |
| Income (loss) from investment operations: | |
| Net investment income (loss) | | | (0.02 | )*** | | | 0.06 | *** | | | (0.02 | )*** | | | (0.02 | )*** | | | (0.03 | )*** | | | (0.03 | )*** | |
Net realized and unrealized gain (loss)
on investments | | | 0.85 | | | | 0.54 | | | | 1.16 | | | | 1.18 | | | | 1.86 | | | | (2.28 | ) | |
Total income (loss) from investment
operations | | | 0.83 | | | | 0.60 | | | | 1.14 | | | | 1.16 | | | | 1.83 | | | | (2.31 | ) | |
| Less distributions to shareholders: | |
| From net investment income | | | - | | | | (0.06 | ) | | | - | | | | - | | | | - | | | | - | | |
| Net asset value, end of period | | $ | 11.45 | | | $ | 10.62 | | | $ | 10.08 | | | $ | 8.94 | | | $ | 7.78 | | | $ | 5.95 | | |
| Total Return (a) | | | 7.82 | % ** | | | 5.90 | % | | | 12.86 | % | | | 14.91 | % | | | 30.76 | % | | | (27.97 | )% | |
| Ratios / Supplemental Data: | |
| Net assets, end of period (000's) | | $ | 5,744 | | | $ | 19,475 | | | $ | 21,345 | | | $ | 15,791 | | | $ | 16,202 | | | $ | 9,379 | | |
| Ratio of expenses to average daily net assets: | |
| Before expense waiver | | | 0.90 | % * | | | 0.91 | % | | | 0.90 | % | | | 0.90 | % | | | 0.90 | % | | | 0.90 | % | |
| After expense waiver | | | N/A | | | | N/A | | | | N/A | | | | 0.87 | % (b)# | | | 0.86 | % (b)# | | | 0.89 | % # | |
Net investment income (loss) to average
daily net assets | | | (0.28 | )% * | | | 0.55 | % | | | (0.19 | )% | | | (0.29 | )% | | | (0.38 | )% | | | (0.50 | )% | |
| Portfolio turnover rate | | | 63 | % ** | | | 130 | % | | | 117 | % | | | 93 | % | | | 128 | % | | | 284 | % | |
| | | Class S | |
| | | Six months
ended
6/30/07
(Unaudited) | | Year ended
12/31/06 | | Year ended
12/31/05† | | Year ended
12/31/04 | | Year ended
12/31/03 | | Year ended
12/31/02 | |
| Net asset value, beginning of period | | $ | 10.65 | | | $ | 10.12 | | | $ | 8.97 | | | $ | 7.79 | | | $ | 5.96 | | | $ | 8.27 | | |
| Income (loss) from investment operations: | |
| Net investment income (loss) | | | (0.01 | )*** | | | 0.06 | *** | | | (0.01 | )*** | | | (0.02 | )*** | | | (0.02 | )*** | | | (0.03 | )*** | |
Net realized and unrealized gain (loss)
on investments | | | 0.85 | | | | 0.54 | | | | 1.16 | | | | 1.20 | | | | 1.85 | | | | (2.28 | ) | |
Total income (loss) from investment
operations | | | 0.84 | | | | 0.60 | | | | 1.15 | | | | 1.18 | | | | 1.83 | | | | (2.31 | ) | |
| Less distributions to shareholders: | |
| From net investment income | | | - | | | | (0.07 | ) | | | - | | | | - | | | | - | | | | - | | |
| Net asset value, end of period | | $ | 11.49 | | | $ | 10.65 | | | $ | 10.12 | | | $ | 8.97 | | | $ | 7.79 | | | $ | 5.96 | | |
| Total Return (a) | | | 7.89 | % ** | | | 5.97 | % | | | 12.82 | % | | | 15.15 | % | | | 30.70 | % | | | (27.93 | )% | |
| Ratios / Supplemental Data: | |
| Net assets, end of period (000's) | | $ | 86,374 | | | $ | 68,251 | | | $ | 70,676 | | | $ | 50,160 | | | $ | 68,504 | | | $ | 47,443 | | |
| Ratio of expenses to average daily net assets: | |
| Before expense waiver | | | 0.83 | % * | | | 0.84 | % | | | 0.83 | % | | | 0.83 | % | | | 0.83 | % | | | 0.83 | % | |
| After expense waiver | | | N/A | | | | N/A | | | | N/A | | | | 0.80 | % (b)# | | | 0.79 | % (b)# | | | 0.82 | % # | |
Net investment income (loss) to average
daily net assets | | | (0.22 | )% * | | | 0.59 | % | | | (0.12 | )% | | | (0.22 | )% | | | (0.32 | )% | | | (0.43 | )% | |
| Portfolio turnover rate | | | 63 | % ** | | | 130 | % | | | 117 | % | | | 93 | % | | | 128 | % | | | 284 | % | |
* Annualized.
** Percentage represents results for the period and is not annualized.
*** Per share amount calculated on the average shares method.
† Effective January 1, 2005, rebated brokerage commissions are included with realized gain or loss on investment transactions. Prior to January 1, 2005, these amounts were presented as a reduction of expenses. Prior year amounts have not been restated to reflect this change due to immateriality.
# Computed after giving effect to an agreement by MassMutual to waive certain fees and expenses of the Fund.
(a) Employee retirement benefit plans that invest plan assets in the Separate Investment Accounts (SIAs) may be subject to certain charges as set forth in their respective Plan Documents. Total return figures would be lower for the periods presented if they reflected these charges.
(b) The Fund has entered into an agreement with certain brokers to rebate a portion of brokerage commissions. The rebated commissions were used to reduce the operating expenses of the Fund.
The accompanying notes are an integral part of the financial statements.
280
MassMutual Select Mid Cap Growth Equity Fund – Financial Statements (Continued)
Financial Highlights (For a share outstanding throughout each period)
| | | Class N | |
| | | Six months
ended
6/30/07
(Unaudited) | | Year ended
12/31/06 | | Year ended
12/31/05† | | Year ended
12/31/04 | | Year ended
12/31/03 | | Period ended
12/31/02++ | |
| Net asset value, beginning of period | | $ | 10.21 | | | $ | 9.71 | | | $ | 8.67 | | | $ | 7.59 | | | $ | 5.85 | | | $ | 5.86 | | |
| Income (loss) from investment operations: | |
| Net investment income (loss) | | | (0.05 | )*** | | | (0.00 | )***†† | | | (0.08 | )*** | | | (0.08 | )*** | | | (0.07 | )*** | | | (0.00 | )***†† | |
Net realized and unrealized gain (loss)
on investments | | | 0.81 | | | | 0.50 | | | | 1.12 | | | | 1.16 | | | | 1.81 | | | | (0.01 | ) | |
Total income from investment
operations | | | 0.76 | | | | 0.50 | | | | 1.04 | | | | 1.08 | | | | 1.74 | | | | (0.01 | ) | |
| Net asset value, end of period | | $ | 10.97 | | | $ | 10.21 | | | $ | 9.71 | | | $ | 8.67 | | | $ | 7.59 | | | $ | 5.85 | | |
| Total Return (a) | | | 7.44 | % (c)** | | | 5.15 | % (c) | | | 12.00 | % (c) | | | 14.23 | % (c) | | | 29.74 | % (c) | | | - | ‡ | |
| Ratios / Supplemental Data: | |
| Net assets, end of period (000's) | | $ | 305 | | | $ | 246 | | | $ | 167 | | | $ | 149 | | | $ | 137 | | | $ | 100 | | |
| Ratio of expenses to average daily net assets: | |
| Before expense waiver | | | 1.60 | % * | | | 1.61 | % | | | 1.60 | % | | | 1.60 | % | | | 1.60 | % | | | - | ‡ | |
| After expense waiver | | | N/A | | | | N/A | | | | N/A | | | | 1.57 | % (b) | | | 1.56 | % (b) | | | - | ‡ | |
Net investment income (loss) to average
daily net assets | | | (0.99 | )% * | | | (0.01 | )% | | | (0.89 | )% | | | (0.99 | )% | | | (1.09 | )% | | | - | ‡ | |
| Portfolio turnover rate | | | 63 | % ** | | | 130 | % | | | 117 | % | | | 93 | % | | | 128 | % | | | 284 | % | |
* Annualized.
** Percentage represents results for the period and is not annualized.
*** Per share amount calculated on the average shares method.
† Effective January 1, 2005, rebated brokerage commissions are included with realized gain or loss on investment transactions. Prior to January 1, 2005, these amounts were presented as a reduction of expenses. Prior year amounts have not been restated to reflect this change due to immateriality.
†† Amount is less than $0.01 per share.
++ Class N commenced operations on December 31, 2002.
‡ Amount is de minimis due to the short period of operations.
(a) Employee retirement benefit plans that invest plan assets in the Separate Investment Accounts (SIAs) may be subject to certain charges as set forth in their respective Plan Documents. Total return figures would be lower for the periods presented if they reflected these charges.
(b) The Fund has entered into an agreement with the certain brokers to rebate a portion of brokerage commissions. The rebated commissions were used to reduce operating expenses of the Fund.
(c) Total return excludes sales charges and would be lower for the period presented if it reflected these charges.
The accompanying notes are an integral part of the financial statements.
281
MassMutual Select Mid Cap Growth Equity II Fund – Financial Statements (Continued)
Financial Highlights (For a share outstanding throughout each period)
| | | Class A | |
| | | Six months
ended
6/30/07
(Unaudited) | | Year ended
12/31/06 | | Year ended
12/31/05† | | Year ended
12/31/04 | | Year ended
12/31/03 | | Year ended
12/31/02 | |
| Net asset value, beginning of period | | $ | 14.05 | | | $ | 14.13 | | | $ | 13.09 | | | $ | 11.17 | | | $ | 8.12 | | | $ | 10.33 | | |
| Income (loss) from investment operations: | |
| Net investment income (loss) | | | (0.02 | )*** | | | (0.04 | )*** | | | (0.09 | )*** | | | (0.10 | )*** | | | (0.09 | )*** | | | (0.08 | )*** | |
Net realized and unrealized gain (loss)
on investments | | | 1.94 | | | | 1.01 | | | | 1.74 | | | | 2.04 | | | | 3.14 | | | | (2.13 | ) | |
Total income (loss) from investment
operations | | | 1.92 | | | | 0.97 | | | | 1.65 | | | | 1.94 | | | | 3.05 | | | | (2.21 | ) | |
| Less distributions to shareholders: | |
| From net realized gains | | | - | | | | (1.05 | ) | | | (0.61 | ) | | | (0.02 | ) | | | - | | | | - | | |
| Net asset value, end of period | | $ | 15.97 | | | $ | 14.05 | | | $ | 14.13 | | | $ | 13.09 | | | $ | 11.17 | | | $ | 8.12 | | |
| Total Return (a) | | | 13.67 | % (c)** | | | 6.97 | % (c) | | | 12.63 | % (c) | | | 17.41 | % (c) | | | 37.56 | % | | | (21.39 | )% | |
| Ratios / Supplemental Data: | |
| Net assets, end of period (000's) | | $ | 374,798 | | | $ | 318,260 | | | $ | 310,072 | | | $ | 208,278 | | | $ | 93,526 | | | $ | 30,968 | | |
| Ratio of expenses to average daily net assets: | |
| Before expense waiver | | | 1.35 | % * | | | 1.35 | % | | | 1.35 | % | | | 1.35 | % | | | 1.35 | % | | | 1.36 | % | |
| After expense waiver | | | N/A | | | | N/A | | | | N/A | | | | 1.34 | % (b)# | | | 1.34 | % (b)# | | | 1.35 | % (b)# | |
Net investment income (loss) to average
daily net assets | | | (0.26 | )% * | | | (0.29 | )% | | | (0.68 | )% | | | (0.89 | )% | | | (0.93 | )% | | | (0.96 | )% | |
| Portfolio turnover rate | | | 20 | % ** | | | 42 | % | | | 28 | % | | | 42 | % | | | 54 | % | | | 61 | % | |
| | | Class L | |
| | | Six months
ended
6/30/07
(Unaudited) | | Year ended
12/31/06 | | Year ended
12/31/05† | | Year ended
12/31/04 | | Year ended
12/31/03 | | Year ended
12/31/02 | |
| Net asset value, beginning of period | | $ | 14.28 | | | $ | 14.34 | | | $ | 13.24 | | | $ | 11.27 | | | $ | 8.17 | | | $ | 10.37 | | |
| Income (loss) from investment operations: | |
| Net investment income (loss) | | | 0.00 | ***†† | | | (0.01 | )*** | | | (0.06 | )*** | | | (0.08 | )*** | | | (0.07 | )*** | | | (0.07 | )*** | |
Net realized and unrealized gain (loss)
on investments | | | 1.97 | | | | 1.04 | | | | 1.77 | | | | 2.07 | | | | 3.17 | | | | (2.13 | ) | |
Total income (loss) from investment
operations | | | 1.97 | | | | 1.03 | | | | 1.71 | | | | 1.99 | | | | 3.10 | | | | (2.20 | ) | |
| Less distributions to shareholders: | |
| From net realized gains | | | - | | | | (1.09 | ) | | | (0.61 | ) | | | (0.02 | ) | | | - | | | | - | | |
| Net asset value, end of period | | $ | 16.25 | | | $ | 14.28 | | | $ | 14.34 | | | $ | 13.24 | | | $ | 11.27 | | | $ | 8.17 | | |
| Total Return (a) | | | 13.80 | %** | | | 7.28 | % | | | 12.94 | % | | | 17.70 | % | | | 37.94 | % | | | (21.22 | )% | |
| Ratios / Supplemental Data: | |
| Net assets, end of period (000's) | | $ | 510,305 | | | $ | 531,194 | | | $ | 508,296 | | | $ | 403,972 | | | $ | 225,279 | | | $ | 116,835 | | |
| Ratio of expenses to average daily net assets: | |
| Before expense waiver | | | 1.09 | %* | | | 1.10 | % | | | 1.10 | % | | | 1.10 | % | | | 1.10 | % | | | 1.11 | % | |
| After expense waiver | | | N/A | | | | N/A | | | | N/A | | | | 1.09 | % (b)# | | | 1.09 | % (b)# | | | 1.09 | % (b)# | |
Net investment income (loss) to average
daily net assets | | | 0.00 | %*††† | | | (0.05 | )% | | | (0.43 | )% | | | (0.65 | )% | | | (0.68 | )% | | | (0.72 | )% | |
| Portfolio turnover rate | | | 20 | %** | | | 42 | % | | | 28 | % | | | 42 | % | | | 54 | % | | | 61 | % | |
* Annualized.
** Percentage represents results for the period and is not annualized.
*** Per share amount calculated on the average shares method.
† Effective January 1, 2005, rebated brokerage commissions are included with realized gain or loss on investment transactions. Prior to January 1, 2005, these amounts were presented as a reduction of expenses. Prior year amounts have not been restated to reflect this change due to immateriality.
†† Amount is less than $0.01 per share.
††† The ratio is less than 0.01%
# Computed after giving effect to an agreement by MassMutual to waive certain fees and expenses of the Fund.
(a) Employee retirement benefit plans that invest plan assets in the Separate Investment Accounts (SIAs) may be subject to certain charges as set forth in their respective Plan Documents. Total return figures would be lower for the periods presented if they reflected these charges.
(b) The Fund has entered into an agreement with the certain brokers to rebate a portion of brokerage commissions. The rebated commissions were used to reduce operating expenses of the Fund.
(c) Total return excludes sales charges and would be lower for the period presented if it reflected these charges.
The accompanying notes are an integral part of the financial statements.
282
MassMutual Select Mid Cap Growth Equity II Fund – Financial Statements (Continued)
Financial Highlights (For a share outstanding throughout each period)
| | | Class Y | |
| | | Six months
ended
6/30/07
(Unaudited) | | Year ended
12/31/06 | | Year ended
12/31/05† | | Year ended
12/31/04 | | Year ended
12/31/03 | | Year ended
12/31/02 | |
| Net asset value, beginning of period | | $ | 14.43 | | | $ | 14.48 | | | $ | 13.35 | | | $ | 11.34 | | | $ | 8.21 | | | $ | 10.40 | | |
| Income (loss) from investment operations: | |
| Net investment income (loss) | | | 0.01 | *** | | | 0.01 | *** | | | (0.04 | )*** | | | (0.06 | )*** | | | (0.05 | )*** | | | (0.04 | )*** | |
Net realized and unrealized gain (loss)
on investments | | | 1.99 | | | | 1.06 | | | | 1.78 | | | | 2.09 | | | | 3.18 | | | | (2.15 | ) | |
Total income (loss) from investment
operations | | | 2.00 | | | | 1.07 | | | | 1.74 | | | | 2.03 | | | | 3.13 | | | | (2.19 | ) | |
| Less distributions to shareholders: | |
| From net realized gains | | | - | | | | (1.12 | ) | | | (0.61 | ) | | | (0.02 | ) | | | - | | | | - | | |
| Net asset value, end of period | | $ | 16.43 | | | $ | 14.43 | | | $ | 14.48 | | | $ | 13.35 | | | $ | 11.34 | | | $ | 8.21 | | |
| Total Return (a) | | | 13.86 | %** | | | 7.45 | % | | | 13.06 | % | | | 17.94 | % | | | 38.12 | % | | | (21.06 | )% | |
| Ratios / Supplemental Data: | |
| Net assets, end of period (000's) | | $ | 210,434 | | | $ | 178,542 | | | $ | 139,779 | | | $ | 99,126 | | | $ | 51,284 | | | $ | 27,835 | | |
| Ratio of expenses to average daily net assets: | |
| Before expense waiver | | | 0.95 | %* | | | 0.95 | % | | | 0.95 | % | | | 0.95 | % | | | 0.95 | % | | | 0.98 | % | |
| After expense waiver | | | N/A | | | | N/A | | | | N/A | | | | 0.94 | % (b)# | | | 0.94 | % (b)# | | | 0.96 | % (b)# | |
Net investment income (loss) to average
daily net assets | | | 0.15 | %* | | | 0.10 | % | | | (0.28 | )% | | | (0.49 | )% | | | (0.53 | )% | | | (0.51 | )% | |
| Portfolio turnover rate | | | 20 | %** | | | 42 | % | | | 28 | % | | | 42 | % | | | 54 | % | | | 61 | % | |
| | | Class S | |
| | | Six months
ended
6/30/07
(Unaudited) | | Year ended
12/31/06 | | Year ended
12/31/05† | | Year ended
12/31/04 | | Year ended
12/31/03 | | Year ended
12/31/02 | |
| Net asset value, beginning of period | | $ | 14.50 | | | $ | 14.54 | | | $ | 13.39 | | | $ | 11.37 | | | $ | 8.22 | | | $ | 10.41 | | |
| Income (loss) from investment operations: | |
| Net investment income (loss) | | | 0.01 | *** | | | 0.03 | *** | | | (0.03 | )*** | | | (0.05 | )*** | | | (0.04 | )*** | | | (0.04 | )*** | |
Net realized and unrealized gain (loss)
on investments | | | 2.01 | | | | 1.05 | | | | 1.79 | | | | 2.09 | | | | 3.19 | | | | (2.15 | ) | |
Total income (loss) from investment
operations | | | 2.02 | | | | 1.08 | | | | 1.76 | | | | 2.04 | | | | 3.15 | | | | (2.19 | ) | |
| Less distributions to shareholders: | |
| From net realized gains | | | - | | | | (1.12 | ) | | | (0.61 | ) | | | (0.02 | ) | | | - | | | | - | | |
| Net asset value, end of period | | $ | 16.52 | | | $ | 14.50 | | | $ | 14.54 | | | $ | 13.39 | | | $ | 11.37 | | | $ | 8.22 | | |
| Total Return (a) | | | 13.93 | %** | | | 7.55 | % | | | 13.17 | % | | | 17.98 | % | | | 38.32 | % | | | (21.04 | )% | |
| Ratios / Supplemental Data: | |
| Net assets, end of period (000's) | | $ | 322,330 | | | $ | 229,547 | | | $ | 273,591 | | | $ | 206,865 | | | $ | 125,907 | | | $ | 72,595 | | |
| Ratio of expenses to average daily net assets: | |
| Before expense waiver | | | 0.86 | %* | | | 0.86 | % | | | 0.86 | % | | | 0.86 | % | | | 0.86 | % | | | 0.87 | % | |
| After expense waiver | | | N/A | | | | N/A | | | | N/A | | | | 0.85 | % (b)# | | | 0.85 | % (b)# | | | 0.85 | % (b)# | |
Net investment income (loss) to average
daily net assets | | | 0.18 | %* | | | 0.21 | % | | | (0.19 | )% | | | (0.41 | )% | | | (0.44 | )% | | | (0.48 | )% | |
| Portfolio turnover rate | | | 20 | %** | | | 42 | % | | | 28 | % | | | 42 | % | | | 54 | % | | | 61 | % | |
* Annualized.
** Percentage represents results for the period and is not annualized.
*** Per share amount calculated on the average shares method.
† Effective January 1, 2005, rebated brokerage commissions are included with realized gain or loss on investment transactions. Prior to January 1, 2005, these amounts were presented as a reduction of expenses. Prior year amounts have not been restated to reflect this change due to immateriality.
# Computed after giving effect to an agreement by MassMutual to waive certain fees and expenses of the Fund.
(a) Employee retirement benefit plans that invest plan assets in the Separate Investment Accounts (SIAs) may be subject to certain charges as set forth in their respective Plan Documents. Total return figures would be lower for the periods presented if they reflected these charges.
(b) The Fund has entered into an agreement with certain brokers to rebate a portion of brokerage commissions. The rebated commissions were used to reduce operating expenses of the Fund.
The accompanying notes are an integral part of the financial statements.
283
MassMutual Select Mid Cap Growth Equity II Fund – Financial Statements (Continued)
Financial Highlights (For a share outstanding throughout each period)
| | | Class N | |
| | | Six months
ended
6/30/07
(Unaudited) | | Year ended
12/31/06 | | Year ended
12/31/05† | | Year ended
12/31/04 | | Year ended
12/31/03 | | Period ended
12/31/02++ | |
| Net asset value, beginning of period | | $ | 13.84 | | | $ | 13.95 | | | $ | 12.97 | | | $ | 11.10 | | | $ | 8.09 | | | $ | 8.05 | | |
| Income (loss) from investment operations: | |
| Net investment income (loss) | | | (0.04 | )*** | | | (0.09 | )*** | | | (0.13 | )*** | | | (0.14 | )*** | | | (0.12 | )*** | | | (0.00 | )***†† | |
Net realized and unrealized gain (loss)
on investments | | | 1.90 | | | | 1.01 | | | | 1.72 | | | | 2.03 | | | | 3.13 | | | | 0.04 | | |
Total income (loss) from investment
operations | | | 1.86 | | | | 0.92 | | | | 1.59 | | | | 1.89 | | | | 3.01 | | | | 0.04 | | |
| Less distributions to shareholders: | |
| From net realized gains | | | - | | | | (1.03 | ) | | | (0.61 | ) | | | (0.02 | ) | | | - | | | | - | | |
| Net asset value, end of period | | $ | 15.70 | | | $ | 13.84 | | | $ | 13.95 | | | $ | 12.97 | | | $ | 11.10 | | | $ | 8.09 | | |
| Total Return (a) | | | 13.44 | % (c)** | | | 6.68 | % (c) | | | 12.28 | % (c) | | | 17.07 | % (c) | | | 37.21 | % (c) | | | - | ‡ | |
| Ratios / Supplemental Data: | |
| Net assets, end of period (000's) | | $ | 3,749 | | | $ | 2,674 | | | $ | 1,755 | | | $ | 1,096 | | | $ | 617 | | | $ | 101 | | |
| Ratio of expenses to average daily net assets: | |
| Before expense waiver | | | 1.65 | % * | | | 1.65 | % | | | 1.65 | % | | | 1.65 | % | | | 1.66 | % | | | - | ‡ | |
| After expense waiver | | | N/A | | | | N/A | | | | N/A | | | | 1.64 | % (b)# | | | 1.65 | % (b)# | | | - | ‡ | |
Net investment income (loss) to average
daily net assets | | | (0.58 | )% * | | | (0.63 | )% | | | (0.97 | )% | | | (1.19 | )% | | | (1.22 | )% | | | - | ‡ | |
| Portfolio turnover rate | | | 20 | % ** | | | 42 | % | | | 28 | % | | | 42 | % | | | 54 | % | | | 61 | % | |
* Annualized.
** Percentage represents results for the period and is not annualized.
*** Per share amount calculated on the average shares method.
† Effective January 1, 2005, rebated brokerage commissions are included with realized gain or loss on investment transactions. Prior to January 1, 2005, these amounts were presented as a reduction of expenses. Prior year amounts have not been restated to reflect this change due to immateriality.
†† Amount is less than $0.01 per share.
++ Class N commenced operations on December 31, 2002.
‡ Amount is de minimis due to the short period of operations.
# Computed after giving effect to an agreement by MassMutual to waive certain fees and expenses of the Fund.
(a) Employee retirement benefit plans that invest plan assets in the Separate Investment Accounts (SIAs) may be subject to certain charges as set forth in their respective Plan Documents. Total return figures would be lower for the periods presented if they reflected these charges.
(b) The Fund has entered into an agreement with certain brokers to rebate a portion of brokerage commissions. The rebated commissions were used to reduce operating expenses of the Fund.
(c) Total return excludes sales charges and would be lower for the period presented if it reflected these charges.
The accompanying notes are an integral part of the financial statements.
284
MassMutual Select Small Cap Growth Equity Fund – Financial Statements (Continued)
Financial Highlights (For a share outstanding throughout each period)
| | | Class A | |
| | | Six months
ended
6/30/07
(Unaudited) | | Year ended
12/31/06 | | Year ended
12/31/05† | | Year ended
12/31/04 | | Year ended
12/31/03 | | Year ended
12/31/02 | |
| Net asset value, beginning of period | | $ | 15.98 | | | $ | 15.72 | | | $ | 14.22 | | | $ | 12.56 | | | $ | 8.76 | | | $ | 11.79 | | |
| Income (loss) from investment operations: | |
| Net investment income (loss) | | | (0.08 | )*** | | | (0.13 | )*** | | | (0.12 | )*** | | | (0.13 | )*** | | | (0.12 | )*** | | | (0.11 | )*** | |
Net realized and unrealized gain (loss)
on investments | | | 1.78 | | | | 1.53 | | | | 1.62 | | | | 1.79 | | | | 3.92 | | | | (2.92 | ) | |
Total income (loss) from investment
operations | | | 1.70 | | | | 1.40 | | | | 1.50 | | | | 1.66 | | | | 3.80 | | | | (3.03 | ) | |
| Less distributions to shareholders: | |
| From net realized gains | | | - | | | | (1.14 | ) | | | - | | | | - | | | | - | | | | - | | |
| Net asset value, end of period | | $ | 17.68 | | | $ | 15.98 | | | $ | 15.72 | | | $ | 14.22 | | | $ | 12.56 | | | $ | 8.76 | | |
| Total Return (a) | | | 10.64 | % (c)** | | | 8.91 | % (c) | | | 10.55 | % (c) | | | 13.22 | % (c) | | | 43.38 | % | | | (25.70 | )% | |
| Ratios / Supplemental Data: | |
| Net assets, end of period (000's) | | $ | 117,033 | | | $ | 114,136 | | | $ | 98,945 | | | $ | 77,739 | | | $ | 67,686 | | | $ | 35,509 | | |
| Ratio of expenses to average daily net assets: | |
| Before expense waiver | | | 1.51 | % * | | | 1.51 | % | | | 1.51 | % | | | 1.52 | % | | | 1.51 | % | | | 1.51 | % | |
| After expense waiver | | | N/A | | | | N/A | | | | N/A | | | | 1.48 | % (b)# | | | 1.49 | % (b)# | | | 1.50 | % (b)# | |
Net investment income (loss) to average
daily net assets | | | (0.93 | )% * | | | (0.80 | )% | | | (0.83 | )% | | | (1.01 | )% | | | (1.11 | )% | | | (1.08 | )% | |
| Portfolio turnover rate | | | 35 | % ** | | | 84 | % | | | 59 | % | | | 64 | % | | | 56 | % | | | 51 | % | |
| | | Class L | |
| | | Six months
ended
6/30/07
(Unaudited) | | Year ended
12/31/06 | | Year ended
12/31/05† | | Year ended
12/31/04 | | Year ended
12/31/03 | | Year ended
12/31/02 | |
| Net asset value, beginning of period | | $ | 16.29 | | | $ | 15.97 | | | $ | 14.41 | | | $ | 12.70 | | | $ | 8.83 | | | $ | 11.85 | | |
| Income (loss) from investment operations: | |
| Net investment income (loss) | | | (0.06 | )*** | | | (0.09 | )*** | | | (0.08 | )*** | | | (0.10 | )*** | | | (0.09 | )*** | | | (0.08 | )*** | |
Net realized and unrealized gain (loss)
on investments | | | 1.81 | | | | 1.55 | | | | 1.64 | | | | 1.81 | | | | 3.96 | | | | (2.94 | ) | |
Total income (loss) from investment
operations | | | 1.75 | | | | 1.46 | | | | 1.56 | | | | 1.71 | | | | 3.87 | | | | (3.02 | ) | |
| Less distributions to shareholders: | |
| From net realized gains | | | - | | | | (1.14 | ) | | | - | | | | - | | | | - | | | | - | | |
| Net asset value, end of period | | $ | 18.04 | | | $ | 16.29 | | | $ | 15.97 | | | $ | 14.41 | | | $ | 12.70 | | | $ | 8.83 | | |
| Total Return (a) | | | 10.80 | % ** | | | 9.15 | % | | | 10.83 | % | | | 13.46 | % | | | 43.83 | % | | | (25.49 | )% | |
| Ratios / Supplemental Data: | |
| Net assets, end of period (000's) | | $ | 117,436 | | | $ | 92,914 | | | $ | 108,840 | | | $ | 90,941 | | | $ | 85,885 | | | $ | 44,419 | | |
| Ratio of expenses to average daily net assets: | |
| Before expense waiver | | | 1.26 | % * | | | 1.26 | % | | | 1.26 | % | | | 1.26 | % | | | 1.26 | % | | | 1.26 | % | |
| After expense waiver | | | N/A | | | | N/A | | | | N/A | | | | 1.23 | % (b)# | | | 1.24 | % (b)# | | | 1.25 | % (b)# | |
Net investment income (loss) to average
daily net assets | | | (0.67 | )% * | | | (0.55 | )% | | | (0.58 | )% | | | (0.76 | )% | | | (0.86 | )% | | | (0.83 | )% | |
| Portfolio turnover rate | | | 35 | % ** | | | 84 | % | | | 59 | % | | | 64 | % | | | 56 | % | | | 51 | % | |
* Annualized.
** Percentage represents results for the period and is not annualized.
*** Per share amount calculated on the average shares method.
† Effective January 1, 2005, rebated brokerage commissions are included with realized gain or loss on investment transactions. Prior to January 1, 2005, these amounts were presented as a reduction of expenses. Prior year amounts have not been restated to reflect this change due to immateriality.
# Computed after giving effect to an agreement by MassMutual to waive certain fees and expenses of the Fund.
(a) Employee retirement benefit plans that invest plan assets in the Separate Investment Accounts (SIAs) may be subject to certain charges as set forth in their respective Plan Documents. Total return figures would be lower for the periods presented if they reflected these charges.
(b) The Fund has entered into an agreement with certain brokers to rebate a portion of brokerage commissions. The rebated commissions were used to reduce operating expenses of the Fund.
(c) Total return excludes sales charges and would be lower for the period presented if it reflected these charges.
The accompanying notes are an integral part of the financial statements.
285
MassMutual Select Small Cap Growth Equity Fund – Financial Statements (Continued)
Financial Highlights (For a share outstanding throughout each period)
| | | Class Y | |
| | | Six months
ended
6/30/07
(Unaudited) | | Year ended
12/31/06 | | Year ended
12/31/05† | | Year ended
12/31/04 | | Year ended
12/31/03 | | Year ended
12/31/02 | |
| Net asset value, beginning of period | | $ | 16.48 | | | $ | 16.11 | | | $ | 14.52 | | | $ | 12.77 | | | $ | 8.87 | | | $ | 11.89 | | |
| Income (loss) from investment operations: | |
| Net investment income (loss) | | | (0.05 | )*** | | | (0.07 | )*** | | | (0.06 | )*** | | | (0.08 | )*** | | | (0.08 | )*** | | | (0.07 | )*** | |
Net realized and unrealized gain (loss)
on investments | | | 1.83 | | | | 1.58 | | | | 1.65 | | | | 1.83 | | | | 3.98 | | | | (2.95 | ) | |
Total income (loss) from investment
operations | | | 1.78 | | | | 1.51 | | | | 1.59 | | | | 1.75 | | | | 3.90 | | | | (3.02 | ) | |
| Less distributions to shareholders: | |
| From net realized gains | | | - | | | | (1.14 | ) | | | - | | | | - | | | | - | | | | - | | |
| Net asset value, end of period | | $ | 18.26 | | | $ | 16.48 | | | $ | 16.11 | | | $ | 14.52 | | | $ | 12.77 | | | $ | 8.87 | | |
| Total Return (a) | | | 10.86 | % ** | | | 9.32 | % | | | 11.02 | % | | | 13.70 | % | | | 43.97 | % | | | (25.40 | )% | |
| Ratios / Supplemental Data: | |
| Net assets, end of period (000's) | | $ | 143,504 | | | $ | 133,777 | | | $ | 95,822 | | | $ | 92,812 | | | $ | 87,801 | | | $ | 43,123 | | |
| Ratio of expenses to average daily net assets: | |
| Before expense waiver | | | 1.11 | % * | | | 1.11 | % | | | 1.11 | % | | | 1.12 | % | | | 1.11 | % | | | 1.11 | % | |
| After expense waiver | | | N/A | | | | N/A | | | | N/A | | | | 1.08 | % (b)# | | | 1.09 | % (b)# | | | 1.10 | % (b)# | |
Net investment income (loss) to average
daily net assets | | | (0.53 | )% * | | | (0.41 | )% | | | (0.44 | )% | | | (0.61 | )% | | | (0.71 | )% | | | (0.68 | )% | |
| Portfolio turnover rate | | | 35 | % ** | | | 84 | % | | | 59 | % | | | 64 | % | | | 56 | % | | | 51 | % | |
| | | Class S | |
| | | Six months
ended
6/30/07
(Unaudited) | | Year ended
12/31/06 | | Year ended
12/31/05† | | Year ended
12/31/04 | | Year ended
12/31/03 | | Year ended
12/31/02 | |
| Net asset value, beginning of period | | $ | 16.64 | | | $ | 16.24 | | | $ | 14.61 | | | $ | 12.84 | | | $ | 8.91 | | | $ | 11.92 | | |
| Income (loss) from investment operations: | |
| Net investment income (loss) | | | (0.03 | )*** | | | (0.04 | )*** | | | (0.04 | )*** | | | (0.06 | )*** | | | (0.06 | )*** | | | (0.06 | )*** | |
Net realized and unrealized gain (loss)
on investments | | | 1.85 | | | | 1.58 | | | | 1.67 | | | | 1.83 | | | | 3.99 | | | | (2.95 | ) | |
Total income (loss) from investment
operations | | | 1.82 | | | | 1.54 | | | | 1.63 | | | | 1.77 | | | | 3.93 | | | | (3.01 | ) | |
| Less distributions to shareholders: | |
| From net realized gains | | | - | | | | (1.14 | ) | | | - | | | | - | | | | - | | | | - | | |
| Net asset value, end of period | | $ | 18.46 | | | $ | 16.64 | | | $ | 16.24 | | | $ | 14.61 | | | $ | 12.84 | | | $ | 8.91 | | |
| Total Return (a) | | | 10.87 | % ** | | | 9.49 | % | | | 11.23 | % | | | 13.79 | % | | | 44.11 | % | | | (25.25 | )% | |
| Ratios / Supplemental Data: | |
| Net assets, end of period (000's) | | $ | 319,906 | | | $ | 284,413 | | | $ | 288,954 | | | $ | 241,673 | | | $ | 243,909 | | | $ | 123,762 | | |
| Ratio of expenses to average daily net assets: | |
| Before expense waiver | | | 0.97 | % * | | | 0.97 | % | | | 0.97 | % | | | 0.97 | % | | | 0.97 | % | | | 0.97 | % | |
| After expense waiver | | | N/A | | | | N/A | | | | N/A | | | | 0.94 | % (b)# | | | 0.95 | % (b)# | | | 0.96 | % (b)# | |
Net investment income (loss) to average
daily net assets | | | (0.39 | )% * | | | (0.26 | )% | | | (0.29 | )% | | | (0.47 | )% | | | (0.57 | )% | | | (0.54 | )% | |
| Portfolio turnover rate | | | 35 | % ** | | | 84 | % | | | 59 | % | | | 64 | % | | | 56 | % | | | 51 | % | |
* Annualized.
** Percentage represents results for the period and is not annualized.
*** Per share amount calculated on the average shares method.
† Effective January 1, 2005, rebated brokerage commissions are included with realized gain or loss on investment transactions. Prior to January 1, 2005, these amounts were presented as a reduction of expenses. Prior year amounts have not been restated to reflect this change due to immateriality.
# Computed after giving effect to an agreement by MassMutual to waive certain fees and expenses of the Fund.
(a) Employee retirement benefit plans that invest plan assets in the Separate Investment Accounts (SIAs) may be subject to certain charges as set forth in their respective Plan Documents. Total return figures would be lower for the periods presented if they reflected these charges.
(b) The Fund has entered into an agreement with certain brokers to rebate a portion of brokerage commissions. The rebated commissions were used to reduce operating expenses of the Fund.
The accompanying notes are an integral part of the financial statements.
286
MassMutual Select Small Cap Growth Equity Fund – Financial Statements (Continued)
Financial Highlights (For a share outstanding throughout each period)
| | | Class N | |
| | | Six months
ended
6/30/07
(Unaudited) | | Year ended
12/31/06 | | Year ended
12/31/05†† | | Year ended
12/31/04 | | Year ended
12/31/03 | | Period ended
12/31/02+ | |
| Net asset value, beginning of period | | $ | 15.70 | | | $ | 15.51 | | | $ | 14.07 | | | $ | 12.47 | | | $ | 8.72 | | | $ | 8.68 | | |
| Income (loss) from investment operations: | |
| Net investment income (loss) | | | (0.10 | )*** | | | (0.18 | )*** | | | (0.16 | ) | | | (0.16 | ) | | | (0.15 | )*** | | | (0.00 | )***† | |
Net realized and unrealized gain (loss)
on investments | | | 1.74 | | | | 1.51 | | | | 1.60 | | | | 1.76 | | | | 3.90 | | | | 0.04 | | |
Total income from investment
operations | | | 1.64 | | | | 1.33 | | | | 1.44 | | | | 1.60 | | | | 3.75 | | | | 0.04 | | |
| Less distributions to shareholders: | |
| From net realized gains | | | - | | | | (1.14 | ) | | | - | | | | - | | | | - | | | | - | | |
| Net asset value, end of period | | $ | 17.34 | | | $ | 15.70 | | | $ | 15.51 | | | $ | 14.07 | | | $ | 12.47 | | | $ | 8.72 | | |
| Total Return (a) | | | 10.51 | % (c)** | | | 8.51 | % (c) | | | 10.31 | % (c) | | | 12.83 | % (c) | | | 43.00 | % (c) | | | - | ‡ | |
| Ratios / Supplemental Data: | |
| Net assets, end of period (000's) | | $ | 1,127 | | | $ | 990 | | | $ | 930 | | | $ | 816 | | | $ | 149 | | | $ | 101 | | |
| Ratio of expenses to average daily net assets: | |
| Before expense waiver | | | 1.81 | % * | | | 1.81 | % | | | 1.81 | % | | | 1.82 | % | | | 1.81 | % | | | - | ‡ | |
| After expense waiver | | | N/A | | | | N/A | | | | N/A | | | | 1.78 | % (b)# | | | 1.79 | % (b)# | | | - | ‡ | |
Net investment income (loss) to average
daily net assets | | | (1.22 | )% * | | | (1.11 | )% | | | (1.13 | )% | | | (1.31 | )% | | | (1.41 | )% | | | - | ‡ | |
| Portfolio turnover rate | | | 35 | % ** | | | 84 | % | | | 59 | % | | | 64 | % | | | 56 | % | | | 51 | % | |
* Annualized.
** Percentage represents results for the period and is not annualized.
*** Per share amount calculated on the average shares method.
† Amount is less than $0.01 per share.
†† Effective January 1, 2005, rebated brokerage commissions are included with realized gain or loss on investment transactions. Prior to January 1, 2005, these amounts were presented as a reduction of expenses. Prior year amounts have not been restated to reflect this change due to immateriality.
+ Class N commenced operations on December 31, 2002.
‡ Amount is de minimis due to the short period of operations.
# Computed after giving effect to an agreement by MassMutual to waive certain fees and expenses of the Fund.
(a) Employee retirement benefit plans that invest plan assets in the Separate Investment Accounts (SIAs) may be subject to certain charges set forth in their respective Plan Documents. Total return figures would be lower for the periods presented if they reflected these charges.
(b) The Fund has entered into an agreement with certain brokers to rebate a portion of brokerage commissions. The rebated commissions were used to reduce operating expenses of the Fund.
(c) Total return excludes sales charges and would be lower for the period presented if it reflected these changes.
The accompanying notes are an integral part of the financial statements.
287
MassMutual Select Small Company Growth Fund – Financial Statements (Continued)
Financial Highlights (For a share outstanding throughout each period)
| | | Class A | |
| | | Six months
ended
6/30/07
(Unaudited) | | Year ended
12/31/06 | | Year ended
12/31/05† | | Year ended
12/31/04 | | Year ended
12/31/03 | | Year ended
12/31/02 | |
| Net asset value, beginning of period | | $ | 10.40 | | | $ | 9.69 | | | $ | 10.05 | | | $ | 10.67 | | | $ | 6.99 | | | $ | 10.00 | | |
| Income (loss) from investment operations: | |
| Net investment income (loss) | | | (0.06 | )*** | | | (0.12 | )*** | | | (0.11 | )*** | | | (0.08 | )*** | | | (0.10 | )*** | | | (0.06 | )*** | |
Net realized and unrealized gain (loss)
on investments | | | 1.33 | | | | 1.54 | | | | (0.02 | ) | | | 0.20 | †† | | | 4.30 | | | | (2.95 | ) | |
Total income (loss) from investment
operations | | | 1.27 | | | | 1.42 | | | | (0.13 | ) | | | 0.12 | | | | 4.20 | | | | (3.01 | ) | |
| Less distributions to shareholders: | |
| From net realized gains | | | - | | | | (0.71 | ) | | | (0.23 | ) | | | (0.74 | ) | | | (0.52 | ) | | | - | | |
| Net asset value, end of period | | $ | 11.67 | | | $ | 10.40 | | | $ | 9.69 | | | $ | 10.05 | | | $ | 10.67 | | | $ | 6.99 | | |
| Total Return (a) | | | 12.21 | % (c) ** | | | 14.95 | % (c) | | | (1.09 | )% (c) | | | 1.70 | % (c) | | | 60.01 | % | | | (30.10 | )% | |
| Ratios / Supplemental Data: | |
| Net assets, end of period (000's) | | $ | 58,366 | | | $ | 69,380 | | | $ | 62,461 | | | $ | 66,985 | | | $ | 54,038 | | | $ | 5,038 | | |
| Ratio of expenses to average daily net assets: | |
| Before expense waiver | | | 1.54 | % * | | | 1.55 | % | | | 1.54 | % | | | 1.52 | % | | | 1.58 | % | | | 1.83 | % | |
| After expense waiver | | | N/A | | | | N/A | | | | 1.52 | % # | | | 1.35 | % (b)# | | | 1.37 | % (b)# | | | 1.16 | % (b)# | |
Net investment income (loss) to average
daily net assets | | | (1.08 | )% * | | | (1.15 | )% | | | (1.18 | )% | | | (0.77 | )% | | | (1.00 | )% | | | (0.80 | )% | |
| Portfolio turnover rate | | | 43 | % ** | | | 102 | % | | | 149 | % | | | 220 | % | | | 141 | % | | | 150 | % | |
| | | Class L | |
| | | Six months
ended
6/30/07
(Unaudited) | | Year ended
12/31/06 | | Year ended
12/31/05† | | Year ended
12/31/04 | | Year ended
12/31/03 | | Year ended
12/31/02 | |
| Net asset value, beginning of period | | $ | 10.57 | | | $ | 9.81 | | | $ | 10.14 | | | $ | 10.74 | | | $ | 7.01 | | | $ | 10.00 | | |
| Income (loss) from investment operations: | |
| Net investment income (loss) | | | (0.05 | )*** | | | (0.09 | )*** | | | (0.09 | )*** | | | (0.05 | )*** | | | (0.07 | )*** | | | (0.04 | )*** | |
Net realized and unrealized gain (loss)
on investments | | | 1.36 | | | | 1.56 | | | | (0.01 | ) | | | 0.19 | †† | | | 4.32 | | | | (2.95 | ) | |
Total income (loss) from investment
operations | | | 1.31 | | | | 1.47 | | | | (0.10 | ) | | | 0.14 | | | | 4.25 | | | | (2.99 | ) | |
| Less distributions to shareholders: | |
| From net realized gains | | | - | | | | (0.71 | ) | | | (0.23 | ) | | | (0.74 | ) | | | (0.52 | ) | | | - | | |
| Net asset value, end of period | | $ | 11.88 | | | $ | 10.57 | | | $ | 9.81 | | | $ | 10.14 | | | $ | 10.74 | | | $ | 7.01 | | |
| Total Return (a) | | | 12.39 | % ** | | | 15.28 | % | | | (0.88 | )% | | | 1.97 | % | | | 60.55 | % | | | (29.90 | )% | |
| Ratios / Supplemental Data: | |
| Net assets, end of period (000's) | | $ | 41,855 | | | $ | 31,256 | | | $ | 28,468 | | | $ | 43,008 | | | $ | 35,948 | | | $ | 10,319 | | |
| Ratio of expenses to average daily net assets: | |
| Before expense waiver | | | 1.29 | % * | | | 1.30 | % | | | 1.29 | % | | | 1.27 | % | | | 1.33 | % | | | 1.58 | % | |
| After expense waiver | | | N/A | | | | N/A | | | | 1.26 | % # | | | 1.10 | % (b)# | | | 1.10 | % (b)# | | | 0.92 | % (b)# | |
Net investment income (loss) to average
daily net assets | | | (0.82 | )% * | | | (0.89 | )% | | | (0.91 | )% | | | (0.54 | )% | | | (0.72 | )% | | | (0.59 | )% | |
| Portfolio turnover rate | | | 43 | % ** | | | 102 | % | | | 149 | % | | | 220 | % | | | 141 | % | | | 150 | % | |
* Annualized.
** Percentage represents results for the period and is not annualized.
*** Per share amount calculated on the average shares method.
† Effective January 1, 2005, rebated brokerage commissions are included with realized gain or loss on investment transactions. Prior to January 1, 2005, these amounts were presented as a reduction of expenses. Prior year amounts have not been restated to reflect this change due to immateriality.
†† The amount shown for a share outstanding does not correspond with the aggregate net realized and unrealized gain (loss) for the period due to the timing of purchases and redemptions of Fund shares in relation to the fluctuating market values of the Fund.
# Computed after giving effect to an agreement by MassMutual to waive certain fees and expenses of the Fund.
(a) Employee retirement benefit plans that invest plan assets in the Separate Investment Accounts (SIAs) may be subject to certain charges as set forth in their respective Plan Documents. Total return figures would be lower for the periods presented if they reflected these charges.
(b) The Fund has entered into an agreement with certain brokers to rebate a portion of brokerage commissions. The rebated commissions were used to reduce operating expenses of the Fund.
(c) Total return excludes sales charges and would be lower for the period presented if it reflected these charges.
The accompanying notes are an integral part of the financial statements.
288
MassMutual Select Small Company Growth Fund – Financial Statements (Continued)
Financial Highlights (For a share outstanding throughout each period)
| | | Class Y | |
| | | Six months
ended
6/30/07
(Unaudited) | | Year ended
12/31/06 | | Year ended
12/31/05† | | Year ended
12/31/04 | | Year ended
12/31/03 | | Year ended
12/31/02 | |
| Net asset value, beginning of period | | $ | 10.65 | | | $ | 9.87 | | | $ | 10.19 | | | $ | 10.77 | | | $ | 7.02 | | | $ | 10.00 | | |
| Income (loss) from investment operations: | |
| Net investment income (loss) | | | (0.04 | )*** | | | (0.08 | )*** | | | (0.07 | )*** | | | (0.04 | )*** | | | (0.05 | )*** | | | (0.04 | )*** | |
Net realized and unrealized gain (loss)
on investments | | | 1.37 | | | | 1.57 | | | | (0.02 | ) | | | 0.20 | †† | | | 4.32 | | | | (2.94 | ) | |
Total income (loss) from investment
operations | | | 1.33 | | | | 1.49 | | | | (0.09 | ) | | | 0.16 | | | | 4.27 | | | | (2.98 | ) | |
| Less distributions to shareholders: | |
| From net realized gains | | | - | | | | (0.71 | ) | | | (0.23 | ) | | | (0.74 | ) | | | (0.52 | ) | | | - | | |
| Net asset value, end of period | | $ | 11.98 | | | $ | 10.65 | | | $ | 9.87 | | | $ | 10.19 | | | $ | 10.77 | | | $ | 7.02 | | |
| Total Return (a) | | | 12.49 | % ** | | | 15.39 | % | | | (0.68 | )% | | | 2.06 | % | | | 60.75 | % | | | (29.80 | )% | |
| Ratios / Supplemental Data: | |
| Net assets, end of period (000's) | | $ | 17,917 | | | $ | 20,226 | | | $ | 27,617 | | | $ | 40,990 | | | $ | 37,730 | | | $ | 10,545 | | |
| Ratio of expenses to average daily net assets: | |
| Before expense waiver | | | 1.14 | % * | | | 1.15 | % | | | 1.14 | % | | | 1.12 | % | | | 1.18 | % | | | 1.43 | % | |
| After expense waiver | | | N/A | | | | N/A | | | | 1.12 | % # | | | 0.95 | % (b)# | | | 0.95 | % (b)# | | | 0.83 | % (b)# | |
Net investment income (loss) to average
daily net assets | | | (0.69 | )% * | | | (0.73 | )% | | | (0.77 | )% | | | (0.40 | )% | | | (0.60 | )% | | | (0.52 | )% | |
| Portfolio turnover rate | | | 43 | % ** | | | 102 | % | | | 149 | % | | | 220 | % | | | 141 | % | | | 150 | % | |
| | | Class S | |
| | | Six months
ended
6/30/07
(Unaudited) | | Year ended
12/31/06 | | Year ended
12/31/05† | | Year ended
12/31/04 | | Year ended
12/31/03 | | Year ended
12/31/02 | |
| Net asset value, beginning of period | | $ | 10.69 | | | $ | 9.90 | | | $ | 10.21 | | | $ | 10.78 | | | $ | 7.02 | | | $ | 10.00 | | |
| Income (loss) from investment operations: | |
| Net investment income (loss) | | | (0.04 | )*** | | | (0.07 | )*** | | | (0.07 | )*** | | | (0.04 | )*** | | | (0.05 | )*** | | | (0.03 | )*** | |
Net realized and unrealized gain (loss)
on investments | | | 1.37 | | | | 1.57 | | | | (0.01 | ) | | | 0.21 | †† | | | 4.33 | | | | (2.95 | ) | |
Total income (loss) from investment
operations | | | 1.33 | | | | 1.50 | | | | (0.08 | ) | | | 0.17 | | | | 4.28 | | | | (2.98 | ) | |
| Less distributions to shareholders: | |
| From net realized gains | | | - | | | | (0.71 | ) | | | (0.23 | ) | | | (0.74 | ) | | | (0.52 | ) | | | - | | |
| Net asset value, end of period | | $ | 12.02 | | | $ | 10.69 | | | $ | 9.90 | | | $ | 10.21 | | | $ | 10.78 | | | $ | 7.02 | | |
| Total Return (a) | | | 12.44 | % ** | | | 15.44 | % | | | (0.67 | )% | | | 2.25 | % | | | 60.66 | % | | | (29.70 | )% | |
| Ratios / Supplemental Data: | |
| Net assets, end of period (000's) | | $ | 50,422 | | | $ | 39,194 | | | $ | 24,869 | | | $ | 28,081 | | | $ | 30,181 | | | $ | 8,763 | | |
| Ratio of expenses to average daily net assets: | |
| Before expense waiver | | | 1.10 | % * | | | 1.11 | % | | | 1.10 | % | | | 1.08 | % | | | 1.14 | % | | | 1.39 | % | |
| After expense waiver | | | N/A | | | | N/A | | | | 1.08 | % # | | | 0.92 | % (b)# | | | 0.92 | % (b)# | | | 0.80 | % (b)# | |
Net investment income (loss) to average daily
net assets | | | (0.64 | )% * | | | (0.70 | )% | | | (0.74 | )% | | | (0.34 | )% | | | (0.55 | )% | | | (0.41 | )% | |
| Portfolio turnover rate | | | 43 | % ** | | | 102 | % | | | 149 | % | | | 220 | % | | | 141 | % | | | 150 | % | |
* Annualized.
** Percentage represents results for the period and is not annualized.
*** Per share amount calculated on the average shares method.
† Effective January 1, 2005, rebated brokerage commissions are included with realized gain or loss on investment transactions. Prior to January 1, 2005, these amounts were presented as a reduction of expenses. Prior year amounts have not been restated to reflect this change due to immateriality.
†† The amount shown for a share outstanding does not correspond with the aggregate net realized and unrealized gain (loss) for the period due to the timing of purchases and redemptions of Fund shares in relation to the fluctuating market values of the Fund.
# Computed after giving effect to an agreement by MassMutual to waive certain fees and expenses of the Fund.
(a) Employee retirement benefit plans that invest plan assets in the Separate Investment Accounts (SIAs) may be subject to certain charges as set forth in their respective Plan Documents. Total return figures would be lower for the periods presented if they reflected these charges.
(b) The Fund has entered into an agreement with certain brokers to rebate a portion of brokerage commissions. The rebated commissions were used to reduce operating expenses of the Fund.
The accompanying notes are an integral part of the financial statements.
289
MassMutual Select Small Company Growth Fund – Financial Statements (Continued)
Financial Highlights (For a share outstanding throughout each period)
| | | Class N | |
| | | Six months
ended
6/30/07
(Unaudited) | | Year ended
12/31/06 | | Year ended
12/31/05†† | | Year ended
12/31/04 | | Year ended
12/31/03 | | Period ended
12/31/02++ | |
| Net asset value, beginning of period | | $ | 10.20 | | | $ | 9.54 | | | $ | 9.93 | | | $ | 10.59 | | | $ | 6.95 | | | $ | 6.90 | | |
| Income (loss) from investment operations: | |
| Net investment income (loss) | | | (0.07 | )*** | | | (0.15 | )*** | | | (0.14 | )*** | | | (0.11 | )*** | | | (0.13 | )*** | | | 0.00 | ***† | |
Net realized and unrealized gain (loss)
on investments | | | 1.30 | | | | 1.52 | | | | (0.02 | ) | | | 0.19 | ††† | | | 4.29 | | | | 0.05 | | |
Total income (loss) from investment
operations | | | 1.23 | | | | 1.37 | | | | (0.16 | ) | | | 0.08 | | | | 4.16 | | | | 0.05 | | |
| Less distributions to shareholders: | |
| From net realized gains | | | - | | | | (0.71 | ) | | | (0.23 | ) | | | (0.74 | ) | | | (0.52 | ) | | | - | | |
| Net asset value, end of period | | $ | 11.43 | | | $ | 10.20 | | | $ | 9.54 | | | $ | 9.93 | | | $ | 10.59 | | | $ | 6.95 | | |
| Total Return (a) | | | 12.06 | % (c)** | | | 14.66 | % (c) | | | (1.41 | )% (c) | | | 1.33 | % (c) | | | 59.78 | % (c) | | | - | ‡ | |
| Ratios / Supplemental Data: | |
| Net assets, end of period (000's) | | $ | 466 | | | $ | 786 | | | $ | 931 | | | $ | 910 | | | $ | 953 | | | $ | 101 | | |
| Ratio of expenses to average daily net assets: | |
| Before expense waiver | | | 1.84 | % * | | | 1.85 | % | | | 1.84 | % | | | 1.82 | % | | | 1.88 | % | | | - | ‡ | |
| After expense waiver | | | N/A | | | | N/A | | | | 1.82 | % # | | | 1.65 | % (b)# | | | 1.68 | % (b)# | | | - | ‡ | |
Net investment income (loss) to average
daily net assets | | | (1.36 | )% * | | | (1.44 | )% | | | (1.49 | )% | | | (1.06 | )% | | | (1.31 | )% | | | - | ‡ | |
| Portfolio turnover rate | | | 43 | % ** | | | 102 | % | | | 149 | % | | | 220 | % | | | 141 | % | | | 150 | % | |
* Annualized.
** Percentage represents results for the period and is not annualized.
*** Per share amount calculated on the average shares method.
† Amount is less than $0.01 per share.
†† Effective January 1, 2005, rebated brokerage commissions are included with realized gain or loss on investment transactions. Prior to January 1, 2005, these amounts were presented as a reduction of expenses. Prior year amounts have not been restated to reflect this change due to immateriality.
††† The amount shown for a share outstanding does not correspond with the aggregate net realized and unrealized gain (loss) for the period due to the timing of purchases and redemptions of Fund shares in relation to the fluctuating market values of the Fund.
++ Class N commenced operations on December 31, 2002.
‡ Amount is de minimis due to the short period of operations.
# Computed after giving effect to an agreement by MassMutual to waive certain fees and expenses of the Fund.
(a) Employee retirement benefit plans that invest plan assets in the Separate Investment Accounts (SIAs) may be subject to certain charges as set forth in their respective Plan Documents. Total return figures would be lower for the periods presented if they reflected these charges.
(b) The Fund has entered into an agreement with certain brokers to rebate a portion of brokerage commissions. The rebated commissions were used to reduce operating expenses of the Fund.
(c) Total return excludes sales charges and would be lower for the period presented if it reflected these charges.
The accompanying notes are an integral part of the financial statements.
290
MassMutual Select Emerging Growth Fund – Financial Statements (Continued)
Financial Highlights (For a share outstanding throughout each period)
| | | Class A | |
| | | Six months
ended
6/30/07
(Unaudited) | | Year ended
12/31/06 | | Year ended
12/31/05 | | Year ended
12/31/04 | | Year ended
12/31/03 | | Year ended
12/31/02 | |
| Net asset value, beginning of period | | $ | 6.22 | | | $ | 5.90 | | | $ | 5.88 | | | $ | 5.13 | | | $ | 3.53 | | | $ | 6.11 | | |
| Income (loss) from investment operations: | |
| Net investment income (loss) | | | (0.02 | )*** | | | (0.06 | )*** | | | (0.06 | )*** | | | (0.07 | )*** | | | (0.06 | )*** | | | (0.05 | )*** | |
Net realized and unrealized gain (loss)
on investments | | | 0.88 | | | | 0.38 | | | | 0.08 | | | | 0.82 | | | | 1.66 | | | | (2.53 | ) | |
Total income (loss) from investment
operations | | | 0.86 | | | | 0.32 | | | | 0.02 | | | | 0.75 | | | | 1.60 | | | | (2.58 | ) | |
| Net asset value, end of period | | $ | 7.08 | | | $ | 6.22 | | | $ | 5.90 | | | $ | 5.88 | | | $ | 5.13 | | | $ | 3.53 | | |
| Total Return (a) | | | 13.83 | % (b)** | | | 5.42 | % (b) | | | 0.34 | % (b) | | | 14.62 | % (b) | | | 45.33 | % | | | (42.23 | )% | |
| Ratios / Supplemental Data: | |
| Net assets, end of period (000's) | | $ | 13,585 | | | $ | 13,650 | | | $ | 14,956 | | | $ | 27,052 | | | $ | 26,130 | | | $ | 10,153 | | |
| Ratio of expenses to average daily net assets: | |
| Before expense waiver | | | 1.47 | % * | | | 1.46 | % | | | 1.45 | % | | | 1.47 | % | | | 1.48 | % | | | 1.46 | % | |
| After expense waiver | | | N/A | | | | N/A | | | | N/A | | | | N/A | | | | 1.45 | % # | | | 1.39 | % # | |
Net investment income (loss) to average
daily net assets | | | (0.61 | )% * | | | (0.97 | )% | | | (1.09 | )% | | | (1.32 | )% | | | (1.32 | )% | | | (1.23 | )% | |
| Portfolio turnover rate | | | 75 | % ** | | | 288 | % | | | 124 | % | | | 176 | % | | | 198 | % | | | 175 | % | |
| | | Class L | |
| | | Six months
ended
6/30/07
(Unaudited) | | Year ended
12/31/06 | | Year ended
12/31/05 | | Year ended
12/31/04 | | Year ended
12/31/03 | | Year ended
12/31/02 | |
| Net asset value, beginning of period | | $ | 6.32 | | | $ | 5.99 | | | $ | 5.94 | | | $ | 5.18 | | | $ | 3.55 | | | $ | 6.13 | | |
| Income (loss) from investment operations: | |
| Net investment income (loss) | | | (0.01 | )*** | | | (0.04 | )*** | | | (0.05 | )*** | | | (0.06 | )*** | | | (0.05 | )*** | | | (0.04 | )*** | |
Net realized and unrealized gain (loss)
on investments | | | 0.89 | | | | 0.37 | | | | 0.10 | | | | 0.82 | | | | 1.68 | | | | (2.54 | ) | |
Total income (loss) from investment
operations | | | 0.88 | | | | 0.33 | | | | 0.05 | | | | 0.76 | | | | 1.63 | | | | (2.58 | ) | |
| Net asset value, end of period | | $ | 7.20 | | | $ | 6.32 | | | $ | 5.99 | | | $ | 5.94 | | | $ | 5.18 | | | $ | 3.55 | | |
| Total Return (a) | | | 13.92 | % ** | | | 5.51 | % | | | 0.84 | % | | | 14.67 | % | | | 45.92 | % | | | (42.09 | )% | |
| Ratios / Supplemental Data: | |
| Net assets, end of period (000's) | | $ | 39,770 | | | $ | 44,933 | | | $ | 63,777 | | | $ | 65,342 | | | $ | 49,424 | | | $ | 20,924 | | |
| Ratio of expenses to average daily net assets: | |
| Before expense waiver | | | 1.21 | % * | | | 1.21 | % | | | 1.21 | % | | | 1.22 | % | | | 1.23 | % | | | 1.21 | % | |
| After expense waiver | | | N/A | | | | N/A | | | | N/A | | | | N/A | | | | 1.20 | % # | | | 1.14 | % # | |
Net investment income (loss) to average
daily net assets | | | (0.35 | )% * | | | (0.73 | )% | | | (0.84 | )% | | | (1.06 | )% | | | (1.07 | )% | | | (0.98 | )% | |
| Portfolio turnover rate | | | 75 | % ** | | | 288 | % | | | 124 | % | | | 176 | % | | | 198 | % | | | 175 | % | |
* Annualized.
** Percentage represents results for the period and is not annualized.
*** Per share amount calculated on the average shares method.
# Computed after giving effect to an agreement by MassMutual to waive certain fees and expenses of the Fund.
(a) Employee retirement benefit plans that invest plan assets in the Separate Investment Accounts (SIAs) may be subject to certain charges as set forth in their respective Plan Documents. Total return figures would be lower for the periods presented if they reflected these charges.
(b) Total return excludes sales charges and would be lower for the period presented if it reflected these charges.
The accompanying notes are an integral part of the financial statements.
291
MassMutual Select Emerging Growth Fund – Financial Statements (Continued)
Financial Highlights (For a share outstanding throughout each period)
| | | Class Y | |
| | | Six months
ended
6/30/07
(Unaudited) | | Year ended
12/31/06 | | Year ended
12/31/05 | | Year ended
12/31/04 | | Year ended
12/31/03 | | Year ended
12/31/02 | |
| Net asset value, beginning of period | | $ | 6.40 | | | $ | 6.05 | | | $ | 5.99 | | | $ | 5.21 | | | $ | 3.57 | | | $ | 6.15 | | |
| Income (loss) from investment operations: | |
| Net investment income (loss) | | | (0.01 | )*** | | | (0.04 | )*** | | | (0.04 | )*** | | | (0.05 | )*** | | | (0.04 | )*** | | | (0.04 | )*** | |
Net realized and unrealized gain (loss)
on investments | | | 0.91 | | | | 0.39 | | | | 0.10 | | | | 0.83 | | | | 1.68 | | | | (2.54 | ) | |
Total income (loss) from investment
operations | | | 0.90 | | | | 0.35 | | | | 0.06 | | | | 0.78 | | | | 1.64 | | | | (2.58 | ) | |
| Net asset value, end of period | | $ | 7.30 | | | $ | 6.40 | | | $ | 6.05 | | | $ | 5.99 | | | $ | 5.21 | | | $ | 3.57 | | |
| Total Return (a) | | | 13.88 | % ** | | | 6.13 | % | | | 0.83 | % | | | 14.97 | % | | | 45.94 | % | | | (41.95 | )% | |
| Ratios / Supplemental Data: | |
| Net assets, end of period (000's) | | $ | 783 | | | $ | 980 | | | $ | 4,760 | | | $ | 4,427 | | | $ | 3,051 | | | $ | 1,664 | | |
| Ratio of expenses to average daily net assets: | |
| Before expense waiver | | | 1.07 | % * | | | 1.06 | % | | | 1.05 | % | | | 1.07 | % | | | 1.08 | % | | | 1.06 | % | |
| After expense waiver | | | N/A | | | | N/A | | | | N/A | | | | N/A | | | | 1.04 | % # | | | 0.99 | % # | |
Net investment income (loss) to average
daily net assets | | | (0.22 | )% * | | | (0.57 | )% | | | (0.68 | )% | | | (0.91 | )% | | | (0.91 | )% | | | (0.83 | )% | |
| Portfolio turnover rate | | | 75 | % ** | | | 288 | % | | | 124 | % | | | 176 | % | | | 198 | % | | | 175 | % | |
| | | Class S | |
| | | Six months
ended
6/30/07
(Unaudited) | | Year ended
12/31/06 | | Year ended
12/31/05 | | Year ended
12/31/04 | | Year ended
12/31/03 | | Year ended
12/31/02 | |
| Net asset value, beginning of period | | $ | 6.45 | | | $ | 6.09 | | | $ | 6.03 | | | $ | 5.24 | | | $ | 3.58 | | | $ | 6.15 | | |
| Income (loss) from investment operations: | |
| Net investment income (loss) | | | (0.00 | )*** | | | (0.03 | )*** | | | (0.03 | )*** | | | (0.04 | )*** | | | (0.04 | )*** | | | (0.03 | )*** | |
Net realized and unrealized gain (loss)
on investments | | | 0.90 | | | | 0.39 | | | | 0.09 | | | | 0.83 | | | | 1.70 | | | | (2.54 | ) | |
Total income (loss) from investment
operations | | | 0.90 | | | | 0.36 | | | | 0.06 | | | | 0.79 | | | | 1.66 | | | | (2.57 | ) | |
| Net asset value, end of period | | $ | 7.35 | | | $ | 6.45 | | | $ | 6.09 | | | $ | 6.03 | | | $ | 5.24 | | | $ | 3.58 | | |
| Total Return (a) | | | 13.95 | % ** | | | 5.91 | % | | | 1.00 | % | | | 15.08 | % | | | 46.37 | % | | | (41.79 | )% | |
| Ratios / Supplemental Data: | |
| Net assets, end of period (000's) | | $ | 48,327 | | | $ | 50,464 | | | $ | 42,591 | | | $ | 39,812 | | | $ | 41,306 | | | $ | 24,658 | | |
| Ratio of expenses to average daily net assets: | |
| Before expense waiver | | | 0.97 | % * | | | 0.96 | % | | | 0.96 | % | | | 0.97 | % | | | 0.98 | % | | | 0.96 | % | |
| After expense waiver | | | N/A | | | | N/A | | | | N/A | | | | N/A | | | | 0.94 | % # | | | 0.89 | % # | |
Net investment income (loss) to average
daily net assets | | | (0.11 | )% * | | | (0.46 | )% | | | (0.59 | )% | | | 0.81 | % | | | (0.81 | )% | | | (0.73 | )% | |
| Portfolio turnover rate | | | 75 | % ** | | | 288 | % | | | 124 | % | | | 176 | % | | | 198 | % | | | 175 | % | |
* Annualized.
** Percentage represents results for the period and is not annualized.
*** Per share amount calculated on the average shares method.
# Computed after giving effect to an agreement by MassMutual to waive certain fees and expenses of the Fund.
(a) Employee retirement benefit plans that invest plan assets in the Separate Investment Accounts (SIAs) may be subject to certain charges as set forth in their respective Plan Documents. Total return figures would be lower for the periods presented if they reflected these charges.
The accompanying notes are an integral part of the financial statements.
292
MassMutual Select Emerging Growth Fund – Financial Statements (Continued)
Financial Highlights (For a share outstanding throughout each period)
| | | Class N | |
| | | Six months
ended
6/30/07
(Unaudited) | | Year ended
12/31/06 | | Year ended
12/31/05 | | Year ended
12/31/04 | | Year ended
12/31/03 | | Period ended
12/31/02++ | |
| Net asset value, beginning of period | | $ | 6.12 | | | $ | 5.83 | | | $ | 5.82 | | | $ | 5.09 | | | $ | 3.51 | | | $ | 3.50 | | |
| Income (loss) from investment operations: | |
| Net investment income (loss) | | | (0.03 | )*** | | | (0.08 | )*** | | | (0.08 | )*** | | | (0.08 | )*** | | | (0.07 | )*** | | | (0.00 | )***† | |
Net realized and unrealized gain (loss)
on investments | | | 0.87 | | | | 0.37 | | | | 0.09 | | | | 0.81 | | | | 1.65 | | | | 0.01 | | |
Total income (loss) from investment
operations | | | 0.84 | | | | 0.29 | | | | 0.01 | | | | 0.73 | | | | 1.58 | | | | 0.01 | | |
| Net asset value, end of period | | $ | 6.96 | | | $ | 6.12 | | | $ | 5.83 | | | $ | 5.82 | | | $ | 5.09 | | | $ | 3.51 | | |
| Total Return (a) | | | 13.73 | % (b)** | | | 4.97 | % (b) | | | 0.17 | % (b) | | | 14.34 | % (b) | | | 45.01 | % (b) | | | - | ‡ | |
| Ratios / Supplemental Data: | |
| Net assets, end of period (000's) | | $ | 201 | | | $ | 177 | | | $ | 168 | | | $ | 168 | | | $ | 147 | | | $ | 101 | | |
| Ratio of expenses to average daily net assets: | |
| Before expense waiver | | | 1.77 | % * | | | 1.76 | % | | | 1.76 | % | | | 1.77 | % | | | 1.78 | % | | | - | ‡ | |
| After expense waiver | | | N/A | | | | N/A | | | | N/A | | | | N/A | | | | 1.74 | % # | | | - | ‡ | |
Net investment income (loss) to average
daily net assets | | | (0.91 | )% * | | | (1.27 | )% | | | (1.39 | )% | | | (1.61 | )% | | | (1.61 | )% | | | - | ‡ | |
| Portfolio turnover rate | | | 75 | % ** | | | 288 | % | | | 124 | % | | | 176 | % | | | 198 | % | | | 175 | % | |
* Annualized.
** Percentage represents results for the period and is not annualized.
*** Per share amount calculated on the average shares method.
† Amount is less than $0.01 per share.
++ Class N commenced operations on December 31, 2002.
‡ Amount is de minimis due to the short period of operations.
# Computed after giving effect to an agreement by MassMutual to waive certain fees and expenses of the Fund.
(a) Employee retirement benefit plans that invest plan assets in the Separate Investment Accounts (SIAs) may be subject to certain charges as set forth in their respective Plan Documents. Total return figures would be lower for the periods presented if they reflected these charges.
(b) Total return excludes sales charges and would be lower for the period presented if it reflected these charges.
The accompanying notes are an integral part of the financial statements.
293
MassMutual Select Diversified International Fund – Financial Statements (Continued)
Financial Highlights (For a share outstanding throughout each period)
| | | Class A | | Class L | |
| | | Six months
ended
6/30/07
(Unaudited) | | Period ended
12/31/06+ | | Six months
ended
6/30/07
(Unaudited) | | Period ended
12/31/06+ | |
| Net asset value, beginning of period | | $ | 10.06 | | | $ | 10.00 | | | $ | 10.06 | | | $ | 10.00 | | |
| Income (loss) from investment operations: | |
| Net investment income (loss) | | | 0.12 | *** | | | 0.00 | † | | | 0.14 | *** | | | 0.01 | *** | |
Net realized and unrealized gain (loss) on
investments | | | 1.28 | | | | 0.07 | | | | 1.27 | | | | 0.06 | | |
Total income from investment
operations | | | 1.40 | | | | 0.07 | | | | 1.41 | | | | 0.07 | | |
| Less distributions to shareholders: | |
| From net investment income | | | - | | | | (0.01 | ) | | | - | | | | (0.01 | ) | |
| Net asset value, end of period | | $ | 11.46 | | | $ | 10.06 | | | $ | 11.47 | | | $ | 10.06 | | |
| | | | | | | | | | | | | | | | | | |
| Total Return (a) | | | 13.92 | %(b)** | | | 0.68 | % (b)** | | | 14.02 | %** | | | 0.70 | % ** | |
| Ratios / Supplemental Data: | |
| Net assets, end of period (000's) | | $ | 249 | | | $ | 101 | | | $ | 49,863 | | | $ | 101 | | |
| Ratio of expenses to average daily net assets: | |
| Before expense waiver | | | 1.60 | %* | | | 8.81 | % * | | | 1.35 | %* | | | 8.56 | % * | |
| After expense waiver | | | 1.42 | %*# | | | 1.42 | % *# | | | 1.17 | %*# | | | 1.17 | % *# | |
Net investment income (loss) to average
daily net assets | | | 2.29 | %* | | | 0.97 | % * | | | 2.61 | %* | | | 1.23 | % * | |
| Portfolio turnover rate | | | 6 | %** | | | 0 | % ** | | | 6 | %** | | | 0 | % ** | |
| | | Class Y | | Class S | | Class N | |
| | | Six months
ended
6/30/07
(Unaudited) | | Period ended
12/31/06+ | | Six months
ended
6/30/07
(Unaudited) | | Period ended
12/31/06+ | | Six months
ended
6/30/07
(Unaudited) | | Period ended
12/31/06+ | |
| Net asset value, beginning of period | | $ | 10.06 | | | $ | 10.00 | | | $ | 10.06 | | | $ | 10.00 | | | $ | 10.06 | | | $ | 10.00 | | |
| Income (loss) from investment operations: | |
| Net investment income (loss) | | | 0.13 | *** | | | 0.01 | *** | | | 0.15 | *** | | | 0.01 | *** | | | 0.10 | *** | | | 0.00 | †† | |
Net realized and unrealized gain (loss) on
investments | | | 1.28 | | | | 0.06 | | | | 1.27 | | | | 0.06 | | | | 1.28 | | | | 0.07 | | |
Total income from investment
operations | | | 1.41 | | | | 0.07 | | | | 1.42 | | | | 0.07 | | | | 1.38 | | | | 0.07 | | |
| Less distributions to shareholders: | |
| From net investment income | | | - | | | | (0.01 | ) | | | - | | | | (0.01 | ) | | | - | | | | (0.01 | ) | |
| Net asset value, end of period | | $ | 11.47 | | | $ | 10.06 | | | $ | 11.48 | | | $ | 10.06 | | | $ | 11.44 | | | $ | 10.06 | | |
| | | | | | | | | | | | | | | | | | | | | | | | | | |
| Total Return (a) | | | 14.02 | %** | | | 0.70 | % ** | | | 14.12 | %** | | | 0.70 | % ** | | | 13.72 | %(b)** | | | 0.67 | % (b)** | |
| Ratios / Supplemental Data: | |
| Net assets, end of period (000's) | | $ | 368 | | | $ | 101 | | | $ | 93,536 | | | $ | 11,404 | | | $ | 115 | | | $ | 101 | | |
| Ratio of expenses to average daily net assets: | |
| Before expense waiver | | | 1.20 | %* | | | 8.41 | % * | | | 1.10 | %* | | | 8.30 | % * | | | 1.90 | %* | | | 9.11 | % * | |
| After expense waiver | | | 1.09 | %*# | | | 1.09 | % *# | | | 0.99 | %*# | | | 0.99 | % *# | | | 1.72 | %*# | | | 1.72 | % *# | |
Net investment income (loss) to average
daily net assets | | | 2.41 | %* | | | 1.32 | % * | | | 2.84 | %* | | | 1.40 | % * | | | 1.88 | %* | | | 0.67 | % * | |
| Portfolio turnover rate | | | 6 | %** | | | 0 | % ** | | | 6 | %** | | | 0 | % ** | | | 6 | % | | | 0 | % | |
* Annualized.
** Percentage represents results for the period and is not annualized.
*** Per share amount calculated on the average shares method.
† Amount is less than $0.01 per share.
†† Net investment income (loss) is less than $0.01 per share.
+ The Fund commenced operations on December 14, 2006.
# Computed after giving effect to an agreement by MassMutual to waive certain fees and expenses of the fund.
(a) Employee retirement benefit plans that invest plan assets in the Separate Investment Accounts (SIAs) may be subject to certain charges as set forth by their respective Plan Documents. Total return figures would be lower for the period presented if they reflected these charges.
(b) Total return excludes sales charges and would be lower for the period presented if it reflected these charges.
The accompanying notes are an integral part of the financial statements.
294
MassMutual Select Overseas Fund – Financial Statements (Continued)
Financial Highlights (For a share outstanding throughout each period)
| | | Class A | |
| | | Six months
ended
6/30/07
(Unaudited) | | Year ended
12/31/06 | | Year ended
12/31/05†† | | Year ended
12/31/04 | | Year ended
12/31/03 | | Year ended
12/31/02 | |
| Net asset value, beginning of period | | $ | 12.80 | | | $ | 10.95 | | | $ | 10.94 | | | $ | 9.55 | | | $ | 7.36 | | | $ | 8.41 | | |
| Income (loss) from investment operations: | |
| Net investment income (loss) | | | 0.17 | *** | | | 0.21 | *** | | | 0.08 | *** | | | 0.05 | *** | | | 0.02 | *** | | | 0.01 | *** | |
Net realized and unrealized gain (loss)
on investments | | | 0.87 | | | | 2.78 | | | | 1.15 | | | | 1.63 | | | | 2.18 | | | | (1.05 | ) | |
Total income (loss) from investment
operations | | | 1.04 | | | | 2.99 | | | | 1.23 | | | | 1.68 | | | | 2.20 | | | | (1.04 | ) | |
| Less distributions to shareholders: | |
| From net investment income | | | - | | | | (0.19 | ) | | | (0.18 | ) | | | (0.06 | ) | | | (0.01 | ) | | | (0.01 | ) | |
| Tax return of capital | | | - | | | | - | | | | - | | | | - | | | | - | | | | (0.00 | )† | |
| From net realized gains | | | - | | | | (0.95 | ) | | | (1.04 | ) | | | (0.23 | ) | | | - | | | | - | | |
| Total distributions | | | - | | | | (1.14 | ) | | | (1.22 | ) | | | (0.29 | ) | | | (0.01 | ) | | | (0.01 | ) | |
| Net asset value, end of period | | $ | 13.84 | | | $ | 12.80 | | | $ | 10.95 | | | $ | 10.94 | | | $ | 9.55 | | | $ | 7.36 | | |
| Total Return (a) | | | 8.13 | %(c)** | | | 27.38 | % (c) | | | 11.17 | % (c) | | | 17.53 | % (c) | | | 30.27 | % | | | (12.66 | )% | |
| Ratios / Supplemental Data: | |
| Net assets, end of period (000's) | | $ | 305,929 | | | $ | 299,546 | | | $ | 198,300 | | | $ | 134,927 | | | $ | 65,012 | | | $ | 18,674 | | |
| Ratio of expenses to average daily net assets: | |
| Before expense waiver | | | 1.61 | %* | | | 1.61 | % | | | 1.62 | % | | | 1.64 | % | | | 1.74 | % | | | 2.13 | % | |
| After expense waiver | | | 1.51 | %#* | | | 1.53 | % # | | | N/A | | | | 1.63 | % (b)# | | | 1.64 | % (b)# | | | 1.63 | % (b)# | |
Net investment income (loss) to average
daily net assets | | | 2.59 | %* | | | 1.66 | % | | | 0.69 | % | | | 0.49 | % | | | 0.22 | % | | | 0.09 | % | |
| Portfolio turnover rate | | | 22 | %** | | | 36 | % | | | 88 | % | | | 66 | % | | | 92 | % | | | 138 | % | |
| | | Class L | |
| | | Six months
ended
6/30/07
(Unaudited) | | Year ended
12/31/06 | | Year ended
12/31/05†† | | Year ended
12/31/04 | | Year ended
12/31/03 | | Year ended
12/31/02 | |
| Net asset value, beginning of period | | $ | 12.88 | | | $ | 11.00 | | | $ | 10.99 | | | $ | 9.59 | | | $ | 7.35 | | | $ | 8.42 | | |
| Income (loss) from investment operations: | |
| Net investment income (loss) | | | 0.19 | *** | | | 0.24 | *** | | | 0.11 | *** | | | 0.08 | *** | | | 0.04 | *** | | | 0.02 | *** | |
Net realized and unrealized gain (loss)
on investments | | | 0.88 | | | | 2.80 | | | | 1.14 | | | | 1.63 | | | | 2.23 | | | | (1.08 | ) | |
Total income (loss) from investment
operations | | | 1.07 | | | | 3.04 | | | | 1.25 | | | | 1.71 | | | | 2.27 | | | | (1.06 | ) | |
| Less distributions to shareholders: | |
| From net investment income | | | - | | | | (0.21 | ) | | | (0.20 | ) | | | (0.08 | ) | | | (0.03 | ) | | | (0.01 | ) | |
| Tax return of capital | | | - | | | | - | | | | - | | | | - | | | | - | | | | (0.00 | )† | |
| From net realized gains | | | - | | | | (0.95 | ) | | | (1.04 | ) | | | (0.23 | ) | | | - | | | | - | | |
| Total distributions | | | - | | | | (1.16 | ) | | | (1.24 | ) | | | (0.31 | ) | | | (0.03 | ) | | | (0.01 | ) | |
| Net asset value, end of period | | $ | 13.95 | | | $ | 12.88 | | | $ | 11.00 | | | $ | 10.99 | | | $ | 9.59 | | | $ | 7.35 | | |
| Total Return (a) | | | 8.31 | %** | | | 27.66 | % | | | 11.44 | % | | | 17.77 | % | | | 30.68 | % | | | (12.44 | )% | |
| Ratios / Supplemental Data: | |
| Net assets, end of period (000's) | | $ | 337,025 | | | $ | 283,387 | | | $ | 210,428 | | | $ | 175,493 | | | $ | 81,542 | | | $ | 19,236 | | |
| Ratio of expenses to average daily net assets: | |
| Before expense waiver | | | 1.36 | %* | | | 1.36 | % | | | 1.37 | % | | | 1.39 | % | | | 1.49 | % | | | 1.88 | % | |
| After expense waiver | | | 1.26 | %#* | | | 1.28 | % # | | | N/A | | | | 1.38 | % (b)# | | | 1.39 | % (b)# | | | 1.37 | % (b)# | |
Net investment income (loss) to average
daily net assets | | | 2.89 | %* | | | 1.90 | % | | | 0.94 | % | | | 0.75 | % | | | 0.44 | % | | | 0.20 | % | |
| Portfolio turnover rate | | | 22 | %** | | | 36 | % | | | 88 | % | | | 66 | % | | | 92 | % | | | 138 | % | |
* Annualized.
** Percentage represents results for the period and is not annualized.
*** Per share amount calculated on the average shares method.
† Amount is less than $0.01 per share.
†† Effective January 1, 2005, rebated brokerage commissions are included with realized gain or loss on investment transactions. Prior to January 1, 2005, these amounts were presented as a reduction of expenses. Prior year amounts have not been restated to reflect this change due to immateriality.
# Computed after giving effect to an agreement by MassMutual to waive certain fees and expenses of the Fund.
(a) Employee retirement benefit plans that invest plan assets in the Separate Investment Accounts (SIAs) may be subject to certain charges as set forth in their respective Plan Documents. Total return figures would be lower for the periods presented if they reflected these charges.
(b) The Fund has entered into an agreement with certain brokers to rebate a portion of brokerage commissions. The rebated commissions were used to reduce operating expenses of the Fund.
(c) Total return excludes sales charges and would be lower for the period presented if it reflected these charges.
The accompanying notes are an integral part of the financial statements.
295
MassMutual Select Overseas Fund – Financial Statements (Continued)
Financial Highlights (For a share outstanding throughout each period)
| | | Class Y | |
| | | Six months
ended
6/30/07
(Unaudited) | | Year ended
12/31/06 | | Year ended
12/31/05†† | | Year ended
12/31/04 | | Year ended
12/31/03 | | Year ended
12/31/02 | |
| Net asset value, beginning of period | | $ | 12.91 | | | $ | 11.03 | | | $ | 11.01 | | | $ | 9.61 | | | $ | 7.36 | | | $ | 8.43 | | |
| Income (loss) from investment operations: | |
| Net investment income (loss) | | | 0.19 | *** | | | 0.24 | *** | | | 0.12 | *** | | | 0.09 | *** | | | 0.04 | *** | | | (0.00 | )***† | |
Net realized and unrealized gain (loss)
on investments | | | 0.89 | | | | 2.81 | | | | 1.16 | | | | 1.63 | | | | 2.25 | | | | (1.05 | ) | |
Total income (loss) from investment
operations | | | 1.08 | | | | 3.05 | | | | 1.28 | | | | 1.72 | | | | 2.29 | | | | (1.05 | ) | |
| Less distributions to shareholders: | |
| From net investment income | | | - | | | | (0.22 | ) | | | (0.22 | ) | | | (0.09 | ) | | | (0.04 | ) | | | (0.02 | ) | |
| Tax return of capital | | | - | | | | - | | | | - | | | | - | | | | - | | | | (0.00 | )† | |
| From net realized gains | | | - | | | | (0.95 | ) | | | (1.04 | ) | | | (0.23 | ) | | | - | | | | - | | |
| Total distributions | | | - | | | | (1.17 | ) | | | (1.26 | ) | | | (0.32 | ) | | | (0.04 | ) | | | (0.02 | ) | |
| Net asset value, end of period | | $ | 13.99 | | | $ | 12.91 | | | $ | 11.03 | | | $ | 11.01 | | | $ | 9.61 | | | $ | 7.36 | | |
| Total Return (a) | | | 8.37 | %** | | | 27.67 | % | | | 11.69 | % | | | 17.84 | % | | | 30.88 | % | | | (12.34 | )% | |
| Ratios / Supplemental Data: | |
| Net assets, end of period (000's) | | $ | 230,590 | | | $ | 248,042 | | | $ | 130,666 | | | $ | 93,675 | | | $ | 72,650 | | | $ | 19,204 | | |
| Ratio of expenses to average daily net assets: | |
| Before expense waiver | | | 1.21 | %* | | | 1.21 | % | | | 1.22 | % | | | 1.24 | % | | | 1.34 | % | | | 1.73 | % | |
| After expense waiver | | | 1.21 | %*# | | | N/A | | | | N/A | | | | 1.23 | % (b)# | | | 1.24 | % (b)# | | | 1.22 | % (b)# | |
Net investment income (loss) to average
daily net assets | | | 2.88 | %* | | | 1.95 | % | | | 1.05 | % | | | 0.91 | % | | | 0.50 | % | | | (0.02 | )% | |
| Portfolio turnover rate | | | 22 | %** | | | 36 | % | | | 88 | % | | | 66 | % | | | 92 | % | | | 138 | % | |
| | | Class S | |
| | | Six months
ended
6/30/07
(Unaudited) | | Year ended
12/31/06 | | Year ended
12/31/05†† | | Year ended
12/31/04 | | Year ended
12/31/03 | | Year ended
12/31/02 | |
| Net asset value, beginning of period | | $ | 12.94 | | | $ | 11.05 | | | $ | 11.03 | | | $ | 9.62 | | | $ | 7.37 | | | $ | 8.43 | | |
| Income (loss) from investment operations: | |
| Net investment income (loss) | | | 0.20 | *** | | | 0.26 | *** | | | 0.13 | *** | | | 0.10 | *** | | | 0.06 | *** | | | 0.05 | *** | |
Net realized and unrealized gain (loss)
on investments | | | 0.89 | | | | 2.81 | | | | 1.16 | | | | 1.63 | | | | 2.23 | | | | (1.09 | ) | |
Total income from investment
operations | | | 1.09 | | | | 3.07 | | | | 1.29 | | | | 1.73 | | | | 2.29 | | | | (1.04 | ) | |
| Less distributions to shareholders: | |
| From net investment income | | | - | | | | (0.23 | ) | | | (0.23 | ) | | | (0.09 | ) | | | (0.04 | ) | | | (0.02 | ) | |
| Tax return of capital | | | - | | | | - | | | | - | | | | - | | | | - | | | | (0.00 | )† | |
| From net realized gains | | | - | | | | (0.95 | ) | | | (1.04 | ) | | | (0.23 | ) | | | - | | | | - | | |
| Total distributions | | | - | | | | (1.18 | ) | | | (1.27 | ) | | | (0.32 | ) | | | (0.04 | ) | | | (0.02 | ) | |
| Net asset value, end of period | | $ | 14.03 | | | $ | 12.94 | | | $ | 11.05 | | | $ | 11.03 | | | $ | 9.62 | | | $ | 7.37 | | |
| Total Return (a) | | | 8.42 | %** | | | 27.77 | % | | | 11.73 | % | | | 17.98 | % | | | 30.87 | % | | | (12.23 | )% | |
| Ratios / Supplemental Data: | |
| Net assets, end of period (000's) | | $ | 490,131 | | | $ | 458,067 | | | $ | 308,301 | | | $ | 211,818 | | | $ | 134,965 | | | $ | 54,437 | | |
| Ratio of expenses to average daily net assets: | |
| Before expense waiver | | | 1.16 | %* | | | 1.16 | % | | | 1.17 | % | | | 1.19 | % | | | 1.29 | % | | | 1.68 | % | |
| After expense waiver | | | 1.16 | %*# | | | N/A | | | | N/A | | | | 1.18 | % (b)# | | | 1.19 | % (b)# | | | 1.18 | % (b)# | |
Net investment income (loss) to average
daily net assets | | | 2.95 | %* | | | 2.05 | % | | | 1.11 | % | | | 0.96 | % | | | 0.69 | % | | | 0.68 | % | |
| Portfolio turnover rate | | | 22 | %** | | | 36 | % | | | 88 | % | | | 66 | % | | | 92 | % | | | 138 | % | |
* Annualized.
** Percentage represents results for the period and is not annualized.
*** Per share amount calculated on the average shares method.
† Amount is less than $0.01 per share.
†† Effective January 1, 2005, rebated brokerage commissions are included with realized gain or loss on investment transactions. Prior to January 1, 2005, these amounts were presented as a reduction of expenses. Prior year amounts have not been restated to reflect this change due to immateriality.
# Computed after giving effect to an agreement by MassMutual to waive certain fees and expenses of the Fund.
(a) Employee retirement benefit plans that invest plan assets in the Separate Investment Accounts (SIAs) may be subject to certain charges as set forth in their respective Plan Documents. Total return figures would be lower for the periods presented if they reflected these charges.
(b) The Fund has entered into an agreement with certain brokers to rebate a portion of brokerage commissions. The rebated commissions were used to reduce operating expenses of the Fund.
The accompanying notes are an integral part of the financial statements.
296
MassMutual Select Overseas Fund – Financial Statements (Continued)
Financial Highlights (For a share outstanding throughout each period)
| | | Class N | |
| | | Six months
ended
6/30/07
(Unaudited) | | Year ended
12/31/06 | | Year ended
12/31/05†† | | Year ended
12/31/04 | | Year ended
12/31/03 | | Period ended
12/31/02++ | |
| Net asset value, beginning of period | | $ | 12.67 | | | $ | 10.86 | | | $ | 10.86 | | | $ | 9.50 | | | $ | 7.31 | | | $ | 7.24 | | |
| Income (loss) from investment operations: | |
| Net investment income (loss) | | | 0.16 | *** | | | 0.17 | *** | | | 0.05 | *** | | | 0.02 | *** | | | (0.02 | )*** | | | (0.00 | )***† | |
Net realized and unrealized gain (loss)
on investments | | | 0.86 | | | | 2.74 | | | | 1.13 | | | | 1.61 | | | | 2.21 | | | | 0.07 | | |
Total income from investment
operations | | | 1.02 | | | | 2.91 | | | | 1.18 | | | | 1.63 | | | | 2.19 | | | | 0.07 | | |
| Less distributions to shareholders: | |
| From net investment income | | | - | | | | (0.15 | ) | | | (0.14 | ) | | | (0.04 | ) | | | - | | | | - | | |
| From net realized gains | | | - | | | | (0.95 | ) | | | (1.04 | ) | | | (0.23 | ) | | | - | | | | - | | |
| Total distributions | | | - | | | | (1.10 | ) | | | (1.18 | ) | | | (0.27 | ) | | | - | | | | - | | |
| Net asset value, end of period | | $ | 13.69 | | | $ | 12.67 | | | $ | 10.86 | | | $ | 10.86 | | | $ | 9.50 | | | $ | 7.31 | | |
| Total Return (a) | | | 8.05 | %(c)** | | | 26.91 | % (c) | | | 10.86 | % (c) | | | 17.12 | % (c) | | | 29.96 | % (c) | | | - | ‡ | |
| Ratios / Supplemental Data: | |
| Net assets, end of period (000's) | | $ | 3,570 | | | $ | 2,462 | | | $ | 1,693 | | | $ | 884 | | | $ | 255 | | | $ | 102 | | |
| Ratio of expenses to average daily net assets: | |
| Before expense waiver | | | 1.91 | %* | | | 1.91 | % | | | 1.92 | % | | | 1.94 | % | | | 2.04 | % | | | - | ‡ | |
| After expense waiver | | | 1.81 | %#* | | | 1.83 | % # | | | N/A | | | | 1.93 | % (b)# | | | 1.94 | % (b)# | | | - | ‡ | |
Net investment income (loss) to average
daily net assets | | | 2.44 | %* | | | 1.40 | % | | | 0.44 | % | | | 0.17 | % | | | (0.22 | )% | | | - | ‡ | |
| Portfolio turnover rate | | | 22 | %** | | | 36 | % | | | 88 | % | | | 66 | % | | | 92 | % | | | 138 | % | |
* Annualized.
** Percentage represents results for the period and is not annualized.
*** Per share amount calculated on the average shares method.
† Amount is less than $0.01 per share.
†† Effective January 1, 2005, rebated brokerage commissions are included with realized gain or loss on investment transactions. Prior to January 1, 2005, these amounts were presented as a reduction of expenses. Prior year amounts have not been restated to reflect this change due to immateriality.
++ Class N commenced operations on December 31, 2002.
‡ Amount is de minimis due to the short period of operations.
# Computed after giving effect to an agreement by MassMutual to waive certain fees and expenses of the Fund.
(a) Employee retirement benefit plans that invest plan assets in the Separate Investment Accounts (SIAs) may be subject to certain charges as set forth in their respective Plan Documents. Total return figures would be lower for the periods presented if they reflected these charges.
(b) The Fund has entered into an agreement with certain brokers to rebate a portions of brokerage commissions. The rebated commissions were used to reduce operating expenses of the Fund.
(c) Total return excludes sales charges and would be lower for the period presented if it reflected these charges.
The accompanying notes are an integral part of the financial statements.
297
MassMutual Select Destination Retirement Income Fund – Financial Statements (Continued)
Financial Highlights (For a share outstanding throughout each period)
| | | Class A | |
| | | Six months
ended
6/30/07
(Unaudited) | | Year ended
12/31/06 | | Year ended
12/31/05 | | Year ended
12/31/04 | | Period ended
12/31/03† | |
| Net asset value, beginning of period | | $ | 10.23 | | | $ | 10.18 | | | $ | 10.32 | | | $ | 10.00 | | | $ | 10.00 | | |
| Income (loss) from investment operations: | |
| Net investment income (loss) | | | (0.01 | )*** | | | 0.33 | *** | | | 0.51 | *** | | | 0.62 | *** | | | - | | |
| Net realized and unrealized gain (loss) on investments | | | 0.31 | | | | 0.20 | | | | (0.22 | ) | | | 0.01 | | | | - | | |
| Total income from investment operations | | | 0.30 | | | | 0.53 | | | | 0.29 | | | | 0.63 | | | | - | | |
| Less distributions to shareholders: | |
| From net investment income | | | - | | | | (0.33 | ) | | | (0.35 | ) | | | (0.27 | ) | | | - | | |
| From net realized gains | | | - | | | | (0.15 | ) | | | (0.08 | ) | | | (0.04 | ) | | | - | | |
| Total distributions | | | - | | | | (0.48 | ) | | | (0.43 | ) | | | (0.31 | ) | | | - | | |
| Net asset value, end of period | | $ | 10.53 | | | $ | 10.23 | | | $ | 10.18 | | | $ | 10.32 | | | $ | 10.00 | | |
| | | | | | | | | | | | | | | | | | | | | | |
| Total Return (a) | | | 2.93 | % (b)** | | | 5.14 | % (b) | | | 2.85 | % (b) | | | 6.35 | % (b) | | | - | ‡ | |
| Ratios / Supplemental Data: | |
| Net assets, end of period (000's) | | $ | 54,855 | | | $ | 51,843 | | | $ | 40,457 | | | $ | 11,819 | | | $ | 101 | | |
| Ratio of expenses to average daily net assets: | |
| Before expense waiver | | | 0.49 | % * | | | 0.47 | % | | | 0.47 | % | | | 0.50 | % | | | - | ‡ | |
| After expense waiver | | | N/A | | | | N/A | | | | N/A | | | | 0.50 | % # | | | - | ‡ | |
| Net investment income (loss) to average daily net assets | | | (0.29 | )% * | | | 3.22 | % | | | 4.92 | % | | | 6.00 | % | | | - | ‡ | |
| Portfolio turnover rate | | | 22 | % ** | | | 27 | % | | | 15 | % | | | 33 | % | | | N/A | | |
| | | Class L | |
| | | Six months
ended
6/30/07
(Unaudited) | | Year ended
12/31/06 | | Year ended
12/31/05 | | Year ended
12/31/04 | | Period ended
12/31/03† | |
| Net asset value, beginning of period | | $ | 10.27 | | | $ | 10.22 | | | $ | 10.34 | | | $ | 10.00 | | | $ | 10.00 | | |
| Income (loss) from investment operations: | |
| Net investment income (loss) | | | (0.00 | )***†† | | | 0.32 | *** | | | 0.33 | *** | | | 0.34 | *** | | | - | | |
| Net realized and unrealized gain (loss) on investments | | | 0.32 | | | | 0.23 | | | | (0.01 | ) | | | 0.32 | | | | - | | |
| Total income from investment operations | | | 0.32 | | | | 0.55 | | | | 0.32 | | | | 0.66 | | | | - | | |
| Less distributions to shareholders: | |
| From net investment income | | | - | | | | (0.35 | ) | | | (0.36 | ) | | | (0.28 | ) | | | - | | |
| From net realized gains | | | - | | | | (0.15 | ) | | | (0.08 | ) | | | (0.04 | ) | | | - | | |
| Total distributions | | | - | | | | (0.50 | ) | | | (0.44 | ) | | | (0.32 | ) | | | - | | |
| Net asset value, end of period | | $ | 10.59 | | | $ | 10.27 | | | $ | 10.22 | | | $ | 10.34 | | | $ | 10.00 | | |
| | | | | | | | | | | | | | | | | | | | | | |
| Total Return (a) | | | 3.12 | % ** | | | 5.34 | % | | | 3.15 | % | | | 6.62 | % | | | - | ‡ | |
| Ratios / Supplemental Data: | |
| Net assets, end of period (000's) | | $ | 92,912 | | | $ | 94,347 | | | $ | 102,343 | | | $ | 97,859 | | | $ | 101 | | |
| Ratio of expenses to average daily net assets: | |
| Before expense waiver | | | 0.24 | % * | | | 0.22 | % | | | 0.22 | % | | | 0.23 | % | | | - | ‡ | |
| After expense waiver | | | N/A | | | | N/A | | | | N/A | | | | 0.23 | % # | | | - | ‡ | |
| Net investment income (loss) to average daily net assets | | | (0.03 | )% * | | | 3.13 | % | | | 3.19 | % | | | 3.36 | % | | | - | ‡ | |
| Portfolio turnover rate | | | 22 | % ** | | | 27 | % | | | 15 | % | | | 33 | % | | | N/A | | |
* Annualized.
** Percentage represents results for the period and is not annualized.
*** Per share amount calculated on the average shares method.
† The Fund commenced operations on December 31, 2003.
†† Amount is less than $0.01 per share.
‡ Amount is de minimis due to the short period of operations.
# Computed after giving effect to an agreement by MassMutual to waive certain fees and expenses of the Fund.
(a) Employee retirement benefit plans that invest plan assets in the Separate Investment Accounts (SIAs) may be subject to certain charges as set forth in their respective Plan Documents. Total return figures would be lower for the periods presented if they reflected these charges.
(b) Total return excludes sales charges and would be lower for the period presented if it reflected these charges.
The accompanying notes are an integral part of the financial statements.
298
MassMutual Select Destination Retirement Income Fund – Financial Statements (Continued)
Financial Highlights (For a share outstanding throughout each period)
| | | Class Y | |
| | | Six months
ended
6/30/07
(Unaudited) | | Year ended
12/31/06 | | Year ended
12/31/05 | | Year ended
12/31/04 | | Period ended
12/31/03† | |
| Net asset value, beginning of period | | $ | 10.27 | | | $ | 10.22 | | | $ | 10.35 | | | $ | 10.00 | | | $ | 10.00 | | |
| Income (loss) from investment operations: | |
| Net investment income (loss) | | | 0.00 | ***†† | | | 0.38 | *** | | | 0.40 | *** | | | 0.45 | *** | | | - | | |
| Net realized and unrealized gain (loss) on investments | | | 0.32 | | | | 0.18 | | | | (0.07 | ) | | | 0.23 | | | | - | | |
| Total income from investment operations | | | 0.32 | | | | 0.56 | | | | 0.33 | | | | 0.68 | | | | - | | |
| Less distributions to shareholders: | |
| From net investment income | | | - | | | | (0.36 | ) | | | (0.38 | ) | | | (0.29 | ) | | | - | | |
| From net realized gains | | | - | | | | (0.15 | ) | | | (0.08 | ) | | | (0.04 | ) | | | - | | |
| Total distributions | | | - | | | | (0.51 | ) | | | (0.46 | ) | | | (0.33 | ) | | | - | | |
| Net asset value, end of period | | $ | 10.59 | | | $ | 10.27 | | | $ | 10.22 | | | $ | 10.35 | | | $ | 10.00 | | |
| | | | | | | | | | | | | | | | | | | | | | |
| Total Return (a) | | | 3.12 | %** | | | 5.45 | % | | | 3.16 | % | | | 6.80 | % | | | - | ‡ | |
| Ratios / Supplemental Data: | |
| Net assets, end of period (000's) | | $ | 116,070 | | | $ | 125,831 | | | $ | 105,478 | | | $ | 80,590 | | | $ | 101 | | |
| Ratio of expenses to average daily net assets: | |
| Before expense waiver | | | 0.14 | %* | | | 0.12 | % | | | 0.12 | % | | | 0.13 | % | | | - | ‡ | |
| After expense waiver | | | N/A | | | | N/A | | | | N/A | | | | 0.13 | % # | | | - | ‡ | |
| Net investment income (loss) to average daily net assets | | | 0.06 | %* | | | 3.62 | % | | | 3.84 | % | | | 4.38 | % | | | - | ‡ | |
| Portfolio turnover rate | | | 22 | %** | | | 27 | % | | | 15 | % | | | 33 | % | | | N/A | | |
| | | Class S | |
| | | Six months
ended
6/30/07
(Unaudited) | | Year ended
12/31/06 | | Year ended
12/31/05 | | Year ended
12/31/04 | | Period ended
12/31/03† | |
| Net asset value, beginning of period | | $ | 10.27 | | | $ | 10.22 | | | $ | 10.34 | | | $ | 10.00 | | | $ | 10.00 | | |
| Income (loss) from investment operations: | |
| Net investment income (loss) | | | 0.00 | ***†† | | | 0.35 | *** | | | 0.61 | *** | | | 0.37 | *** | | | - | | |
| Net realized and unrealized gain (loss) on investments | | | 0.32 | | | | 0.21 | | | | (0.27 | ) | | | 0.30 | | | | - | | |
| Total income from investment operations | | | 0.32 | | | | 0.56 | | | | 0.34 | | | | 0.67 | | | | - | | |
| Less distributions to shareholders: | |
| From net investment income | | | - | | | | (0.36 | ) | | | (0.38 | ) | | | (0.29 | ) | | | - | | |
| From net realized gains | | | - | | | | (0.15 | ) | | | (0.08 | ) | | | (0.04 | ) | | | - | | |
| Total distributions | | | - | | | | (0.51 | ) | | | (0.46 | ) | | | (0.33 | ) | | | - | | |
| Net asset value, end of period | | $ | 10.59 | | | $ | 10.27 | | | $ | 10.22 | | | $ | 10.34 | | | $ | 10.00 | | |
| | | | | | | | | | | | | | | | | | | | | | |
| Total Return (a) | | | 3.12 | %** | | | 5.47 | % | | | 3.29 | % | | | 6.71 | % | | | - | ‡ | |
| Ratios / Supplemental Data: | |
| Net assets, end of period (000's) | | $ | 9,613 | | | $ | 8,773 | | | $ | 4,445 | | | $ | 1,195 | | | $ | 601 | | |
| Ratio of expenses to average daily net assets: | |
| Before expense waiver | | | 0.11 | %* | | | 0.10 | % | | | 0.09 | % | | | 0.71 | % | | | - | ‡ | |
| After expense waiver | | | N/A | | | | N/A | | | | N/A | | | | 0.12 | % # | | | - | ‡ | |
| Net investment income (loss) to average daily net assets | | | 0.09 | %* | | | 3.41 | % | | | 5.82 | % | | | 3.64 | % | | | - | ‡ | |
| Portfolio turnover rate | | | 22 | %** | | | 27 | % | | | 15 | % | | | 33 | % | | | N/A | | |
* Annualized.
** Percentage represents results for the period and is not annualized.
*** Per share amount calculated on the average shares method.
† The Fund commenced operations on December 31, 2003.
‡ Amount is de minimis due to the short period of operations.
# Computed after giving effect to an agreement by MassMutual to waive certain fees and expenses of the Fund.
†† Amount is less than $0.01 per share.
(a) Employee retirement benefit plans that invest plan assets in the Separate Investment Accounts (SIAs) may be subject to certain charges as set forth in their respective Plan Documents. Total return figures would be lower for the periods presented if they reflected these charges.
The accompanying notes are an integral part of the financial statements.
299
MassMutual Select Destination Retirement Income Fund – Financial Statements (Continued)
Financial Highlights (For a share outstanding throughout each period)
| | | Class N | |
| | | Six months
ended
6/30/07
(Unaudited) | | Year ended
12/31/06 | | Year ended
12/31/05 | | Year ended
12/31/04 | | Period ended
12/31/03† | |
| Net asset value, beginning of period | | $ | 10.26 | | | $ | 10.21 | | | $ | 10.34 | | | $ | 10.00 | | | $ | 10.00 | | |
| Income (loss) from investment operations: | |
| Net investment income (loss) | | | (0.03 | )*** | | | 0.30 | *** | | | 0.30 | *** | | | 0.15 | *** | | | - | | |
| Net realized and unrealized gain (loss) on investments | | | 0.31 | | | | 0.20 | | | | (0.04 | ) | | | 0.45 | | | | - | | |
| Total income from investment operations | | | 0.28 | | | | 0.50 | | | | 0.26 | | | | 0.60 | | | | - | | |
| Less distributions to shareholders: | |
| From net investment income | | | - | | | | (0.30 | ) | | | (0.31 | ) | | | (0.22 | ) | | | - | | |
| From net realized gains | | | - | | | | (0.15 | ) | | | (0.08 | ) | | | (0.04 | ) | | | - | | |
| Total distributions | | | - | | | | (0.45 | ) | | | (0.39 | ) | | | (0.26 | ) | | | - | | |
| Net asset value, end of period | | $ | 10.54 | | | $ | 10.26 | | | $ | 10.21 | | | $ | 10.34 | | | $ | 10.00 | | |
| | | | | | | | | | | | | | | | | | | | | | |
| Total Return (a) | | | 2.73 | % (b)** | | | 4.83 | % (b) | | | 2.50 | % (b) | | | 6.02 | % (b) | | | 0.00 | %‡ | |
| Ratios / Supplemental Data: | |
| Net assets, end of period (000's) | | $ | 128 | | | $ | 121 | | | $ | 105 | | | $ | 104 | | | $ | 101 | | |
| Ratio of expenses to average daily net assets: | |
| Before expense waiver | | | 0.79 | % * | | | 0.77 | % | | | 0.77 | % | | | 1.53 | % | | | - | ‡ | |
| After expense waiver | | | N/A | | | | N/A | | | | N/A | | | | 0.80 | % # | | | N/A | | |
| Net investment income (loss) to average daily net assets | | | (0.58 | )% * | | | 2.95 | % | | | 2.85 | % | | | 1.52 | % | | | 0.00 | %‡ | |
| Portfolio turnover rate | | | 22 | % ** | | | 27 | % | | | 15 | % | | | 33 | % | | | N/A | | |
* Annualized.
** Percentage represents results for the period and is not annualized.
*** Per share amount calculated on the average shares method.
† The Fund commenced operations on December 31, 2003.
‡ Amount is de minimis due to the short period of operations.
# Computed after giving effect to an agreement by MassMutual to waive certain fees and expenses of the Fund.
(a) Employee retirement benefit plans that invest plan assets in the Separate Investment Accounts (SIAs) may be subject to certain charges as set forth in their respective Plan Documents. Total return figures would be lower for the periods presented if they reflected these charges.
(b) Total return excludes sales charges and would be lower for the period presented if it reflected these charges.
The accompanying notes are an integral part of the financial statements.
300
MassMutual Select Destination Retirement 2010 Fund – Financial Statements (Continued)
Financial Highlights (For a share outstanding throughout each period)
| | | Class A | |
| | | Six months
ended
6/30/07
(Unaudited) | | Year ended
12/31/06 | | Year ended
12/31/05 | | Year ended
12/31/04 | | Period ended
12/31/03+ | |
| Net asset value, beginning of period | | $ | 10.77 | | | $ | 10.57 | | | $ | 10.54 | | | $ | 10.00 | | | $ | 10.00 | | |
| Income (loss) from investment operations: | |
| Net investment income (loss) | | | (0.02 | )*** | | | 0.33 | *** | | | 0.45 | *** | | | 0.56 | *** | | | - | | |
| Net realized and unrealized gain (loss) on investments | | | 0.42 | | | | 0.34 | | | | (0.05 | ) | | | 0.18 | | | | - | | |
| Total income from investment operations | | | 0.40 | | | | 0.67 | | | | 0.40 | | | | 0.74 | | | | - | | |
| Less distributions to shareholders: | |
| From net investment income | | | - | | | | (0.31 | ) | | | (0.31 | ) | | | (0.18 | ) | | | - | | |
| From net realized gains | | | - | | | | (0.16 | ) | | | (0.06 | ) | | | (0.02 | ) | | | - | | |
| Total distributions | | | - | | | | (0.47 | ) | | | (0.37 | ) | | | (0.20 | ) | | | - | | |
| Net asset value, end of period | | $ | 11.17 | | | $ | 10.77 | | | $ | 10.57 | | | $ | 10.54 | | | $ | 10.00 | | |
| | | | | | | | | | | | | | | | | | | | | | |
| Total Return (a) | | | 3.71 | % (b)** | | | 6.39 | % (b) | | | 3.82 | % (b) | | | 7.36 | % (b) | | | - | ‡ | |
| Ratios / Supplemental Data: | |
| Net assets, end of period (000's) | | $ | 70,688 | | | $ | 54,312 | | | $ | 30,338 | | | $ | 7,272 | | | $ | 101 | | |
| Ratio of expenses to average daily net assets: | |
| Before expense waiver | | | 0.52 | % * | | | 0.52 | % | | | 0.54 | % | | | 1.13 | % | | | - | ‡ | |
| After expense waiver | | | 0.51 | % *# | | | 0.50 | % # | | | 0.50 | % # | | | 0.50 | % # | | | - | ‡ | |
| Net investment income (loss) to average daily net assets | | | (0.31 | )% * | | | 3.10 | % | | | 4.24 | % | | | 5.34 | % | | | - | ‡ | |
| Portfolio turnover rate | | | 17 | % ** | | | 34 | % | | | 17 | % | | | 28 | % | | | N/A | | |
| | | Class L | |
| | | Six months
ended
6/30/07
(Unaudited) | | Year ended
12/31/06 | | Year ended
12/31/05 | | Year ended
12/31/04 | | Period ended
12/31/03+ | |
| Net asset value, beginning of period | | $ | 10.82 | | | $ | 10.60 | | | $ | 10.56 | | | $ | 10.00 | | | $ | 10.00 | | |
| Income (loss) from investment operations: | |
| Net investment income (loss) | | | (0.00 | )***† | | | 0.36 | *** | | | 0.36 | *** | | | 1.25 | *** | | | - | | |
| Net realized and unrealized gain (loss) on investments | | | 0.41 | | | | 0.35 | | | | 0.07 | | | | (0.48 | ) | | | - | | |
| Total income from investment operations | | | 0.41 | | | | 0.71 | | | | 0.43 | | | | 0.77 | | | | - | | |
| Less distributions to shareholders: | |
| From net investment income | | | - | | | | (0.33 | ) | | | (0.33 | ) | | | (0.19 | ) | | | - | | |
| From net realized gains | | | - | | | | (0.16 | ) | | | (0.06 | ) | | | (0.02 | ) | | | - | | |
| Total distributions | | | - | | | | (0.49 | ) | | | (0.39 | ) | | | (0.21 | ) | | | - | | |
| Net asset value, end of period | | $ | 11.23 | | | $ | 10.82 | | | $ | 10.60 | | | $ | 10.56 | | | $ | 10.00 | | |
| | | | | | | | | | | | | | | | | | | | | | |
| Total Return (a) | | | 3.89 | % ** | | | 6.69 | % | | | 4.03 | % | | | 7.68 | % | | | - | ‡ | |
| Ratios / Supplemental Data: | |
| Net assets, end of period (000's) | | $ | 60,967 | | | $ | 47,387 | | | $ | 35,621 | | | $ | 22,880 | | | $ | 101 | | |
| Ratio of expenses to average daily net assets: | |
| Before expense waiver | | | 0.27 | % * | | | 0.27 | % | | | 0.29 | % | | | 0.88 | % | | | - | ‡ | |
| After expense waiver | | | 0.26 | % *# | | | 0.25 | % # | | | 0.25 | % # | | | 0.25 | % # | | | - | ‡ | |
| Net investment income (loss) to average daily net assets | | | (0.07 | )% * | | | 3.35 | % | | | 3.37 | % | | | 12.10 | % | | | - | ‡ | |
| Portfolio turnover rate | | | 17 | % ** | | | 34 | % | | | 17 | % | | | 28 | % | | | N/A | | |
* Annualized.
** Percentage represents results for the period and is not annualized.
*** Per share amount calculated on the average shares method.
+ The Fund commenced operations on December 31, 2003.
† Amount is less than $0.01 per share.
‡ Amount is de minimis due to the short period of operations.
# Computed after giving effect to an agreement by MassMutual to waive certain fees and expenses of the Fund.
(a) Employee retirement benefit plans that invest plan assets in the Separate Investment Accounts (SIAs) may be subject to certain charges as set forth in their respective Plan Documents. Total return figures would be lower for the periods presented if they reflected these charges.
(b) Total return excludes sales charges and would be lower for the period presented if it reflected these charges.
The accompanying notes are an integral part of the financial statements.
301
MassMutual Select Destination Retirement 2010 Fund – Financial Statements (Continued)
Financial Highlights (For a share outstanding throughout each period)
| | | Class Y | |
| | | Six months
ended
6/30/07
(Unaudited) | | Year ended
12/31/06 | | Year ended
12/31/05 | | Year ended
12/31/04 | | Period ended
12/31/03+ | |
| Net asset value, beginning of period | | $ | 10.82 | | | $ | 10.61 | | | $ | 10.56 | | | $ | 10.00 | | | $ | 10.00 | | |
| Income (loss) from investment operations: | |
| Net investment income (loss) | | | 0.00 | ***† | | | 0.39 | *** | | | 0.52 | *** | | | 0.85 | *** | | | - | | |
| Net realized and unrealized gain (loss) on investments | | | 0.42 | | | | 0.32 | | | | (0.07 | ) | | | (0.08 | ) | | | - | | |
| Total income from investment operations | | | 0.42 | | | | 0.71 | | | | 0.45 | | | | 0.77 | | | | - | | |
| Less distributions to shareholders: | |
| From net investment income | | | - | | | | (0.34 | ) | | | (0.34 | ) | | | (0.19 | ) | | | - | | |
| From net realized gains | | | - | | | | (0.16 | ) | | | (0.06 | ) | | | (0.02 | ) | | | - | | |
| Total distributions | | | - | | | | (0.50 | ) | | | (0.40 | ) | | | (0.21 | ) | | | - | | |
| Net asset value, end of period | | $ | 11.24 | | | $ | 10.82 | | | $ | 10.61 | | | $ | 10.56 | | | $ | 10.00 | | |
| | | | | | | | | | | | | | | | | | | | | | |
| Total Return (a) | | | 3.88 | %** | | | 6.77 | % | | | 4.22 | % | | | 7.69 | % | | | - | ‡ | |
| Ratios / Supplemental Data: | |
| Net assets, end of period (000's) | | $ | 72,478 | | | $ | 57,929 | | | $ | 30,365 | | | $ | 5,605 | | | $ | 101 | | |
| Ratio of expenses to average daily net assets: | |
| Before expense waiver | | | 0.17 | %* | | | 0.17 | % | | | 0.19 | % | | | 0.78 | % | | | - | ‡ | |
| After expense waiver | | | 0.16 | %*# | | | 0.15 | % # | | | 0.15 | % # | | | 0.15 | % # | | | - | ‡ | |
| Net investment income (loss) to average daily net assets | | | 0.04 | %* | | | 3.62 | % | | | 4.80 | % | | | 8.17 | % | | | - | ‡ | |
| Portfolio turnover rate | | | 17 | %** | | | 34 | % | | | 17 | % | | | 28 | % | | | N/A | | |
| | | Class S | |
| | | Six months
ended
6/30/07
(Unaudited) | | Year ended
12/31/06 | | Year ended
12/31/05 | | Year ended
12/31/04 | | Period ended
12/31/03+ | |
| Net asset value, beginning of period | | $ | 10.83 | | | $ | 10.61 | | | $ | 10.57 | | | $ | 10.00 | | | $ | 10.00 | | |
| Income (loss) from investment operations: | |
| Net investment income (loss) | | | 0.00 | ***† | | | 0.40 | *** | | | 0.61 | *** | | | 0.36 | *** | | | - | | |
| Net realized and unrealized gain (loss) on investments | | | 0.43 | | | | 0.33 | | | | (0.17 | ) | | | 0.42 | | | | - | | |
| Total income from investment operations | | | 0.43 | | | | 0.73 | | | | 0.44 | | | | 0.78 | | | | - | | |
| Less distributions to shareholders: | |
| From net investment income | | | - | | | | (0.35 | ) | | | (0.34 | ) | | | (0.19 | ) | | | - | | |
| From net realized gains | | | - | | | | (0.16 | ) | | | (0.06 | ) | | | (0.02 | ) | | | - | | |
| Total distributions | | | - | | | | (0.51 | ) | | | (0.40 | ) | | | (0.21 | ) | | | - | | |
| Net asset value, end of period | | $ | 11.26 | | | $ | 10.83 | | | $ | 10.61 | | | $ | 10.57 | | | $ | 10.00 | | |
| | | | | | | | | | | | | | | | | | | | | | |
| Total Return (a) | | | 3.97 | %** | | | 6.90 | % | | | 4.15 | % | | | 7.80 | % | | | - | ‡ | |
| Ratios / Supplemental Data: | |
| Net assets, end of period (000's) | | $ | 30,529 | | | $ | 17,935 | | | $ | 12,104 | | | $ | 2,319 | | | $ | 601 | | |
| Ratio of expenses to average daily net assets: | |
| Before expense waiver | | | 0.13 | %* | | | 0.12 | % | | | 0.14 | % | | | 0.73 | % | | | - | ‡ | |
| After expense waiver | | | 0.11 | %*# | | | 0.10 | % # | | | 0.10 | % # | | | 0.10 | % # | | | - | ‡ | |
| Net investment income (loss) to average daily net assets | | | 0.08 | %* | | | 3.66 | % | | | 5.69 | % | | | 3.49 | % | | | - | ‡ | |
| Portfolio turnover rate | | | 17 | %** | | | 34 | % | | | 17 | % | | | 28 | % | | | N/A | | |
* Annualized.
** Percentage represents results for the period and is not annualized.
*** Per share amount calculated on the average shares method.
† Amount is less than $0.01 per share.
+ The Fund commenced operations on December 31, 2003.
‡ Amount is de minimis due to the short period of operations.
# Computed after giving effect to an agreement by MassMutual to waive certain fees and expenses of the Fund.
(a) Employee retirement benefit plans that invest plan assets in the Separate Investment Accounts (SIAs) may be subject to certain charges as set forth in their respective Plan Documents. Total return figures would be lower for the periods presented if they reflected these charges.
The accompanying notes are an integral part of the financial statements.
302
MassMutual Select Destination Retirement 2010 Fund – Financial Statements (Continued)
Financial Highlights (For a share outstanding throughout each period)
| | | Class N | |
| | | Six months
ended
6/30/07
(Unaudited) | | Year ended
12/31/06 | | Year ended
12/31/05 | | Year ended
12/31/04 | | Year ended
12/31/03+ | |
| Net asset value, beginning of period | | $ | 10.80 | | | $ | 10.60 | | | $ | 10.56 | | | $ | 10.00 | | | $ | 10.00 | | |
| Income (loss) from investment operations: | |
| Net investment income (loss) | | | (0.03 | )*** | | | 0.32 | *** | | | 0.27 | *** | | | (0.00 | )† | | | - | | |
| Net realized and unrealized gain (loss) on investments | | | 0.42 | | | | 0.32 | | | | 0.10 | | | | 0.70 | | | | - | | |
| Total income from investment operations | | | 0.39 | | | | 0.64 | | | | 0.37 | | | | 0.70 | | | | - | | |
| Less distributions to shareholders: | |
| From net investment income | | | - | | | | (0.28 | ) | | | (0.27 | ) | | | (0.12 | ) | | | - | | |
| From net realized gains | | | - | | | | (0.16 | ) | | | (0.06 | ) | | | (0.02 | ) | | | - | | |
| Total distributions | | | - | | | | (0.44 | ) | | | (0.33 | ) | | | (0.14 | ) | | | - | | |
| Net asset value, end of period | | $ | 11.19 | | | $ | 10.80 | | | $ | 10.60 | | | $ | 10.56 | | | $ | 10.00 | | |
| | | | | | | | | | | | | | | | | | | | | | |
| Total Return (a) | | | 3.61 | % (b)** | | | 6.14 | % (b) | | | 3.51 | % (b) | | | 6.98 | % (b) | | | - | ‡ | |
| Ratios / Supplemental Data: | |
| Net assets, end of period (000's) | | $ | 397 | | | $ | 249 | | | $ | 134 | | | $ | 107 | | | $ | 101 | | |
| Ratio of expenses to average daily net assets: | |
| Before expense waiver | | | 0.83 | % * | | | 0.82 | % | | | 0.84 | % | | | 1.43 | % | | | - | ‡ | |
| After expense waiver | | | 0.81 | % *# | | | 0.80 | % # | | | 0.80 | % # | | | 0.80 | % # | | | N/A | | |
| Net investment income (loss) to average daily net assets | | | (0.62 | )% * | | | 3.00 | % | | | 2.50 | % | | | 0.02 | % | | | - | ‡ | |
| Portfolio turnover rate | | | 17 | % ** | | | 34 | % | | | 17 | % | | | 28 | % | | | N/A | | |
* Annualized.
** Percentage represents results for the period and is not annualized.
*** Per share amount calculated on the average shares method.
† Amount is less than $0.01 per share.
+ The Fund commenced operations on December 31, 2003.
‡ Amount is de minimis due to the short period of operations.
# Computed after giving effect to an agreement by MassMutual to waive certain fees and expenses of the Fund.
(a) Employee retirement benefit plans that invest plan assets in the Separate Investment Accounts (SIAs) may be subject to certain charges as set forth in their respective Plan Documents. Total return figures would be lower for the periods presented if they reflected these charges.
(b) Total return excludes sales charges and would be lower for the period presented if it reflected these charges.
The accompanying notes are an integral part of the financial statements.
303
MassMutual Select Destination Retirement 2020 Fund – Financial Statements (Continued)
Financial Highlights (For a share outstanding throughout each period)
| | | Class A | |
| | | Six months
ended
6/30/07
(Unaudited) | | Year ended
12/31/06 | | Year ended
12/31/05 | | Year ended
12/31/04 | | Period ended
12/31/03+ | |
| Net asset value, beginning of period | | $ | 11.20 | | | $ | 10.91 | | | $ | 10.75 | | | $ | 10.00 | | | $ | 10.00 | | |
| Income (loss) from investment operations: | |
| Net investment income (loss) | | | (0.03 | )*** | | | 0.26 | *** | | | 0.37 | *** | | | 0.64 | *** | | | - | | |
| Net realized and unrealized gain (loss) on investments | | | 0.61 | | | | 0.57 | | | | 0.19 | | | | 0.34 | | | | - | | |
| Total income from investment operations | | | 0.58 | | | | 0.83 | | | | 0.56 | | | | 0.98 | | | | - | | |
| Less distributions to shareholders: | |
| From net investment income | | | - | | | | (0.25 | ) | | | (0.27 | ) | | | (0.19 | ) | | | - | | |
| From net realized gains | | | - | | | | (0.29 | ) | | | (0.13 | ) | | | (0.04 | ) | | | - | | |
| Total distributions | | | - | | | | (0.54 | ) | | | (0.40 | ) | | | (0.23 | ) | | | - | | |
| Net asset value, end of period | | $ | 11.78 | | | $ | 11.20 | | | $ | 10.91 | | | $ | 10.75 | | | $ | 10.00 | | |
| | | | | | | | | | | | | | | | | | | | | | |
| Total Return (a) | | | 5.18 | % (b)** | | | 7.72 | % (b) | | | 5.23 | % (b) | | | 9.76 | % (b) | | | - | ‡ | |
| Ratios / Supplemental Data: | |
| Net assets, end of period (000's) | | $ | 172,685 | | | $ | 144,228 | | | $ | 89,351 | | | $ | 21,577 | | | $ | 101 | | |
| Ratio of expenses to average daily net assets: | |
| Before expense waiver | | | 0.50 | % * | | | 0.50 | % | | | 0.50 | % | | | 0.52 | % | | | - | ‡ | |
| After expense waiver | | | N/A | | | | N/A | | | | N/A | | | | 0.50 | % # | | | - | ‡ | |
| Net investment income (loss) to average daily net assets | | | (0.50 | )% * | | | 2.32 | % | | | 3.43 | % | | | 6.11 | % | | | - | ‡ | |
| Portfolio turnover rate | | | 22 | % ** | | | 32 | % | | | 23 | % | | | 19 | % | | | N/A | | |
| | | Class L | |
| | | Six months
ended
6/30/07
(Unaudited) | | Year ended
12/31/06 | | Year ended
12/31/05 | | Year ended
12/31/04 | | Period ended
12/31/03+ | |
| Net asset value, beginning of period | | $ | 11.25 | | | $ | 10.96 | | | $ | 10.77 | | | $ | 10.00 | | | $ | 10.00 | | |
| Income (loss) from investment operations: | |
| Net investment income (loss) | | | (0.01 | )*** | | | 0.25 | *** | | | 0.25 | *** | | | 0.21 | *** | | | - | | |
| Net realized and unrealized gain (loss) on investments | | | 0.62 | | | | 0.60 | | | | 0.35 | | | | 0.79 | | | | - | | |
| Total income from investment operations | | | 0.61 | | | | 0.85 | | | | 0.60 | | | | 1.00 | | | | - | | |
| Less distributions to shareholders: | |
| From net investment income | | | - | | | | (0.27 | ) | | | (0.28 | ) | | | (0.19 | ) | | | - | | |
| From net realized gains | | | - | | | | (0.29 | ) | | | (0.13 | ) | | | (0.04 | ) | | | - | | |
| Total distributions | | | - | | | | (0.56 | ) | | | (0.41 | ) | | | (0.23 | ) | | | - | | |
| Net asset value, end of period | | $ | 11.86 | | | $ | 11.25 | | | $ | 10.96 | | | $ | 10.77 | | | $ | 10.00 | | |
| | | | | | | | | | | | | | | | | | | | | | |
| Total Return (a) | | | 5.42 | % ** | | | 7.87 | % | | | 5.50 | % | | | 10.07 | % | | | - | ‡ | |
| Ratios / Supplemental Data: | |
| Net assets, end of period (000's) | | $ | 291,258 | | | $ | 273,584 | | | $ | 237,433 | | | $ | 212,094 | | | $ | 101 | | |
| Ratio of expenses to average daily net assets: | |
| Before expense waiver | | | 0.25 | % * | | | 0.24 | % | | | 0.25 | % | | | 0.26 | % | | | - | ‡ | |
| After expense waiver | | | N/A | | | | N/A | | | | N/A | | | | 0.25 | % # | | | - | ‡ | |
| Net investment income (loss) to average daily net assets | | | (0.25 | )% * | | | 2.19 | % | | | 2.31 | % | | | 1.99 | % | | | - | ‡ | |
| Portfolio turnover rate | | | 22 | % ** | | | 32 | % | | | 23 | % | | | 19 | % | | | N/A | | |
* Annualized.
** Percentage represents results for the period and is not annualized.
*** Per share amount calculated on the average shares method.
+ The Fund commenced operations on December 31, 2003.
‡ Amount is de minimis due to the short period of operations.
# Computed after giving effect to an agreement by MassMutual to waive certain fees and expenses of the Fund.
(a) Employee retirement benefit plans that invest plan assets in the Separate Investment Accounts (SIAs) may be subject to certain charges as set forth in their respective Plan Documents. Total return figures would be lower for the periods presented if they reflected these charges.
(b) Total return excludes sales charges and would be lower for the period presented if it reflected these charges.
The accompanying notes are an integral part of the financial statements.
304
MassMutual Select Destination Retirement 2020 Fund – Financial Statements (Continued)
Financial Highlights (For a share outstanding throughout each period)
| | | Class Y | |
| | | Six months
ended
6/30/07
(Unaudited) | | Year ended
12/31/06 | | Year ended
12/31/05 | | Year ended
12/31/04 | | Period ended
12/31/03+ | |
| Net asset value, beginning of period | | $ | 11.25 | | | $ | 10.95 | | | $ | 10.77 | | | $ | 10.00 | | | $ | 10.00 | | |
| Income (loss) from investment operations: | |
| Net investment income (loss) | | | (0.01 | )*** | | | 0.30 | *** | | | 0.45 | *** | | | 0.81 | *** | | | - | | |
| Net realized and unrealized gain (loss) on investments | | | 0.61 | | | | 0.58 | | | | 0.16 | | | | 0.20 | | | | - | | |
| Total income from investment operations | | | 0.60 | | | | 0.88 | | | | 0.61 | | | | 1.01 | | | | - | | |
| Less distributions to shareholders: | |
| From net investment income | | | - | | | | (0.29 | ) | | | (0.30 | ) | | | (0.20 | ) | | | - | | |
| From net realized gains | | | - | | | | (0.29 | ) | | | (0.13 | ) | | | (0.04 | ) | | | - | | |
| Total distributions | | | - | | | | (0.58 | ) | | | (0.43 | ) | | | (0.24 | ) | | | - | | |
| Net asset value, end of period | | $ | 11.85 | | | $ | 11.25 | | | $ | 10.95 | | | $ | 10.77 | | | $ | 10.00 | | |
| | | | | | | | | | | | | | | | | | | | | | |
| Total Return (a) | | | 5.33 | % ** | | | 8.08 | % | | | 5.63 | % | | | 10.07 | % | | | - | ‡ | |
| Ratios / Supplemental Data: | |
| Net assets, end of period (000's) | | $ | 135,980 | | | $ | 105,565 | | | $ | 65,716 | | | $ | 10,249 | | | $ | 101 | | |
| Ratio of expenses to average daily net assets: | |
| Before expense waiver | | | 0.15 | % * | | | 0.15 | % | | | 0.14 | % | | | 0.19 | % | | | - | ‡ | |
| After expense waiver | | | N/A | | | | N/A | | | | N/A | | | | 0.15 | % # | | | - | ‡ | |
| Net investment income (loss) to average daily net assets | | | (0.15 | )% * | | | 2.66 | % | | | 4.04 | % | | | 7.69 | % | | | - | ‡ | |
| Portfolio turnover rate | | | 22 | % ** | | | 32 | % | | | 23 | % | | | 19 | % | | | N/A | | |
| | | Class S | |
| | | Six months
ended
6/30/07
(Unaudited) | | Year ended
12/31/06 | | Year ended
12/31/05 | | Year ended
12/31/04 | | Period ended
12/31/03+ | |
| Net asset value, beginning of period | | $ | 11.26 | | | $ | 10.96 | | | $ | 10.78 | | | $ | 10.00 | | | $ | 10.00 | | |
| Income (loss) from investment operations: | |
| Net investment income (loss) | | | (0.01 | )*** | | | 0.30 | *** | | | 0.38 | *** | | | 0.52 | *** | | | - | | |
| Net realized and unrealized gain (loss) on investments | | | 0.62 | | | | 0.58 | | | | 0.23 | | | | 0.50 | | | | - | | |
| Total income from investment operations | | | 0.61 | | | | 0.88 | | | | 0.61 | | | | 1.02 | | | | - | | |
| Less distributions to shareholders: | |
| From net investment income | | | - | | | | (0.29 | ) | | | (0.30 | ) | | | (0.20 | ) | | | - | | |
| From net realized gains | | | - | | | | (0.29 | ) | | | (0.13 | ) | | | (0.04 | ) | | | - | | |
| Total distributions | | | - | | | | (0.58 | ) | | | (0.43 | ) | | | (0.24 | ) | | | - | | |
| Net asset value, end of period | | $ | 11.87 | | | $ | 11.26 | | | $ | 10.96 | | | $ | 10.78 | | | $ | 10.00 | | |
| | | | | | | | | | | | | | | | | | | | | | |
| Total Return (a) | | | 5.42 | % ** | | | 8.12 | % | | | 5.65 | % | | | 10.19 | % | | | - | ‡ | |
| Ratios / Supplemental Data: | |
| Net assets, end of period (000's) | | $ | 83,345 | | | $ | 66,802 | | | $ | 35,933 | | | $ | 12,389 | | | $ | 601 | | |
| Ratio of expenses to average daily net assets: | |
| Before expense waiver | | | 0.10 | % * | | | 0.10 | % | | | 0.10 | % | | | 0.21 | % | | | - | ‡ | |
| After expense waiver | | | N/A | | | | N/A | | | | N/A | | | | 0.10 | % # | | | - | ‡ | |
| Net investment income (loss) to average daily net assets | | | (0.10 | )% * | | | 2.69 | % | | | 3.45 | % | | | 5.00 | % | | | - | ‡ | |
| Portfolio turnover rate | | | 22 | % ** | | | 32 | % | | | 23 | % | | | 19 | % | | | N/A | | |
* Annualized.
** Percentage represents results for the period and is not annualized.
*** Per share amount calculated on the average shares method.
+ The Fund commenced operations on December 31, 2003.
‡ Amount is de minimis due to the short period of operations.
# Computed after giving effect to an agreement by MassMutual to waive certain fees and expenses of the Fund.
(a) Employee retirement benefit plans that invest plan assets in the Separate Investment Accounts (SIAs) may be subject to certain charges as set forth in their respective Plan Documents. Total return figures would be lower for the periods presented if they reflected these charges.
The accompanying notes are an integral part of the financial statements.
305
MassMutual Select Destination Retirement 2020 Fund – Financial Statements (Continued)
Financial Highlights (For a share outstanding throughout each period)
| | | Class N | |
| | | Six months
ended
6/30/07
(Unaudited) | | Year ended
12/31/06 | | Year ended
12/31/05 | | Year ended
12/31/04 | | Period ended
12/31/03+ | |
| Net asset value, beginning of period | | $ | 11.22 | | | $ | 10.94 | | | $ | 10.77 | | | $ | 10.00 | | | $ | 10.00 | | |
| Income (loss) from investment operations: | |
| Net investment income (loss) | | | (0.05 | )*** | | | 0.21 | *** | | | 0.27 | *** | | | 0.06 | *** | | | - | | |
| Net realized and unrealized gain (loss) on investments | | | 0.62 | | | | 0.58 | | | | 0.27 | | | | 0.88 | | | | - | | |
| Total income from investment operations | | | 0.57 | | | | 0.79 | | | | 0.54 | | | | 0.94 | | | | - | | |
| Less distributions to shareholders: | |
| From net investment income | | | - | | | | (0.22 | ) | | | (0.24 | ) | | | (0.13 | ) | | | - | | |
| From net realized gains | | | - | | | | (0.29 | ) | | | (0.13 | ) | | | (0.04 | ) | | | - | | |
| Total distributions | | | - | | | | (0.51 | ) | | | (0.37 | ) | | | (0.17 | ) | | | - | | |
| Net asset value, end of period | | $ | 11.79 | | | $ | 11.22 | | | $ | 10.94 | | | $ | 10.77 | | | $ | 10.00 | | |
| | | | | | | | | | | | | | | | | | | | | | |
| Total Return (a) | | | 5.08 | % (b)** | | | 7.31 | % **(b) | | | 4.99 | % (b) | | | 9.39 | % (b) | | | - | ‡ | |
| Ratios / Supplemental Data: | |
| Net assets, end of period (000's) | | $ | 407 | | | $ | 309 | | | $ | 238 | | | $ | 113 | | | $ | 101 | | |
| Ratio of expenses to average daily net assets: | |
| Before expense waiver | | | 0.80 | % * | | | 0.80 | % | | | 0.80 | % | | | 1.57 | % | | | - | ‡ | |
| After expense waiver | | | N/A | | | | N/A | | | | N/A | | | | 0.80 | % # | | | N/A | | |
| Net investment income (loss) to average daily net assets | | | (0.80 | )% * | | | 1.93 | % | | | 2.46 | % | | | 0.55 | % | | | - | ‡ | |
| Portfolio turnover rate | | | 22 | % ** | | | 32 | % | | | 23 | % | | | 19 | % | | | N/A | | |
* Annualized.
** Percentage represents results for the period and is not annualized.
*** Per share amount calculated on the average shares method.
+ The Fund commenced operations on December 31, 2003.
‡ Amount is de minimis due to the short period of operations.
# Computed after giving effect to an agreement by MassMutual to waive certain fees and expenses of the Fund.
(a) Employee retirement benefit plans that invest plan assets in the Separate Investment Accounts (SIAs) may be subject to certain charges as set forth in their respective Plan Documents. Total return figures would be lower for the periods presented if they reflected these charges.
(b) Total return excludes sales charges and would be lower for the period presented if it reflected these charges.
The accompanying notes are an integral part of the financial statements.
306
MassMutual Select Destination Retirement 2030 Fund – Financial Statements (Continued)
Financial Highlights (For a share outstanding throughout each period)
| | | Class A | |
| | | Six months
ended
6/30/07
(Unaudited) | | Year ended
12/31/06 | | Year ended
12/31/05 | | Year ended
12/31/04 | | Period ended
12/31/03+ | |
| Net asset value, beginning of period | | $ | 12.05 | | | $ | 11.50 | | | $ | 11.11 | | | $ | 10.00 | | | $ | 10.00 | | |
| Income (loss) from investment operations: | |
| Net investment income (loss) | | | (0.00 | )***†† | | | 0.15 | *** | | | 0.21 | *** | | | 0.27 | *** | | | - | | |
| Net realized and unrealized gain (loss) on investments | | | 0.86 | | | | 0.95 | | | | 0.52 | | | | 0.95 | | | | - | | |
| Total income from investment operations | | | 0.86 | | | | 1.10 | | | | 0.73 | | | | 1.22 | | | | - | | |
| Less distributions to shareholders: | |
| From net investment income | | | - | | | | (0.18 | ) | | | (0.18 | ) | | | (0.10 | ) | | | - | | |
| From net realized gains | | | - | | | | (0.37 | ) | | | (0.16 | ) | | | (0.01 | ) | | | - | | |
| Total distributions | | | - | | | | (0.55 | ) | | | (0.34 | ) | | | (0.11 | ) | | | - | | |
| Net asset value, end of period | | $ | 12.91 | | | $ | 12.05 | | | $ | 11.50 | | | $ | 11.11 | | | $ | 10.00 | | |
| | | | | | | | | | | | | | | | | | | | | | |
| Total Return (a) | | | 7.14 | % (b)** | | | 9.70 | % (b) | | | 6.56 | % (b) | | | 12.24 | % (b) | | | - | ‡ | |
| Ratios / Supplemental Data: | |
| Net assets, end of period (000's) | | $ | 135,241 | | | $ | 112,499 | | | $ | 63,024 | | | $ | 21,459 | | | $ | 101 | | |
| Ratio of expenses to average daily net assets: | |
| Before expense waiver | | | 0.50 | % * | | | 0.50 | % | | | 0.50 | % | | | 0.52 | % | | | - | ‡ | |
| After expense waiver | | | N/A | | | | N/A | | | | N/A | | | | 0.50 | % # | | | N/A | | |
| Net investment income (loss) to average daily net assets | | | (0.50 | )% * | | | 1.31 | % | | | 1.89 | % | | | 2.58 | % | | | - | ‡ | |
| Portfolio turnover rate | | | 25 | % ** | | | 34 | % | | | 17 | % | | | 10 | % | | | N/A | | |
| | | Class L | |
| | | Six months
ended
6/30/07
(Unaudited) | | Year ended
12/31/06 | | Year ended
12/31/05 | | Year ended
12/31/04 | | Period ended
12/31/03+ | |
| Net asset value, beginning of period | | $ | 12.11 | | | $ | 11.55 | | | $ | 11.13 | | | $ | 10.00 | | | $ | 10.00 | | |
| Income (loss) from investment operations: | |
| Net investment income (loss) | | | (0.00 | )***†† | | | 0.15 | *** | | | 0.14 | *** | | | 0.10 | *** | | | - | | |
| Net realized and unrealized gain (loss) on investments | | | 0.88 | | | | 0.98 | | | | 0.63 | | | | 1.15 | | | | - | | |
| Total income from investment operations | | | 0.88 | | | | 1.13 | | | | 0.77 | | | | 1.25 | | | | - | | |
| Less distributions to shareholders: | |
| From net investment income | | | - | | | | (0.20 | ) | | | (0.19 | ) | | | (0.11 | ) | | | - | | |
| From net realized gains | | | - | | | | (0.37 | ) | | | (0.16 | ) | | | (0.01 | ) | | | - | | |
| Total distributions | | | - | | | | (0.57 | ) | | | (0.35 | ) | | | (0.12 | ) | | | - | | |
| Net asset value, end of period | | $ | 12.99 | | | $ | 12.11 | | | $ | 11.55 | | | $ | 11.13 | | | $ | 10.00 | | |
| | | | | | | | | | | | | | | | | | | | | | |
| Total Return (a) | | | 7.27 | % ** | | | 9.93 | % | | | 6.92 | % | | | 12.49 | % | | | - | ‡ | |
| Ratios / Supplemental Data: | |
| Net assets, end of period (000's) | | $ | 235,091 | | | $ | 211,382 | | | $ | 180,837 | | | $ | 168,132 | | | $ | 101 | | |
| Ratio of expenses to average daily net assets: | |
| Before expense waiver | | | 0.25 | % * | | | 0.25 | % | | | 0.25 | % | | | 0.26 | % | | | - | ‡ | |
| After expense waiver | | | N/A | | | | N/A | | | | N/A | | | | 0.25 | % # | | | N/A | | |
| Net investment income (loss) to average daily net assets | | | (0.25 | )% * | | | 1.28 | % | | | 1.26 | % | | | 0.93 | % | | | - | ‡ | |
| Portfolio turnover rate | | | 25 | % ** | | | 34 | % | | | 17 | % | | | 10 | % | | | N/A | | |
* Annualized.
** Percentage represents results for the period and is not annualized.
*** Per share amount calculated on the average shares method.
†† Amount is less than $0.01 per share.
+ The Fund commenced operations on December 31, 2003.
‡ Amount is de minimis due to the short period of operations.
# Computed after giving effect to an agreement by MassMutual to waive certain fees and expenses of the Fund.
(a) Employee retirement benefit plans that invest plan assets in the Separate Investment Accounts (SIAs) may be subject to certain charges as set forth in their respective Plan Documents. Total return figures would be lower for the periods presented if they reflected these charges.
(b) Total return excludes sales charges and would be lower for the period presented if it reflected these charges.
The accompanying notes are an integral part of the financial statements.
307
MassMutual Select Destination Retirement 2030 Fund – Financial Statements (Continued)
Financial Highlights (For a share outstanding throughout each period)
| | | Class Y | |
| | | Six months
ended
6/30/07
(Unaudited) | | Year ended
12/31/06 | | Year ended
12/31/05 | | Year ended
12/31/04 | | Period ended
12/31/03+ | |
| Net asset value, beginning of period | | $ | 12.10 | | | $ | 11.54 | | | $ | 11.13 | | | $ | 10.00 | | | $ | 10.00 | | |
| Income (loss) from investment operations: | |
| Net investment income (loss) | | | (0.00 | )***†† | | | 0.22 | *** | | | 0.32 | *** | | | 0.43 | *** | | | - | | |
| Net realized and unrealized gain (loss) on investments | | | 0.89 | | | | 0.93 | | | | 0.46 | | | | 0.83 | | | | - | | |
| Total income from investment operations | | | 0.89 | | | | 1.15 | | | | 0.78 | | | | 1.26 | | | | - | | |
| Less distributions to shareholders: | |
| From net investment income | | | - | | | | (0.22 | ) | | | (0.21 | ) | | | (0.12 | ) | | | - | | |
| From net realized gains | | | - | | | | (0.37 | ) | | | (0.16 | ) | | | (0.01 | ) | | | - | | |
| Total distributions | | | - | | | | (0.59 | ) | | | (0.37 | ) | | | (0.13 | ) | | | - | | |
| Net asset value, end of period | | $ | 12.99 | | | $ | 12.10 | | | $ | 11.54 | | | $ | 11.13 | | | $ | 10.00 | | |
| | | | | | | | | | | | | | | | | | | | | | |
| Total Return (a) | | | 7.36 | % ** | | | 10.05 | % | | | 6.97 | % | | | 12.60 | % | | | - | ‡ | |
| Ratios / Supplemental Data: | |
| Net assets, end of period (000's) | | $ | 89,838 | | | $ | 68,388 | | | $ | 33,819 | | | $ | 3,169 | | | $ | 101 | | |
| Ratio of expenses to average daily net assets: | |
| Before expense waiver | | | 0.15 | % * | | | 0.15 | % | | | 0.15 | % | | | 0.23 | % | | | - | ‡ | |
| After expense waiver | | | N/A | | | | N/A | | | | N/A | | | | 0.15 | % # | | | N/A | | |
| Net investment income (loss) to average daily net assets | | | (0.15 | )% * | | | 1.82 | % | | | 2.77 | % | | | 4.01 | % | | | - | ‡ | |
| Portfolio turnover rate | | | 25 | % ** | | | 34 | % | | | 17 | % | | | 10 | % | | | N/A | | |
| | | Class S | |
| | | Six months
ended
6/30/07
(Unaudited) | | Year ended
12/31/06 | | Year ended
12/31/05 | | Year ended
12/31/04 | | Period ended
12/31/03+ | |
| Net asset value, beginning of period | | $ | 12.11 | | | $ | 11.55 | | | $ | 11.14 | | | $ | 10.00 | | | $ | 10.00 | | |
| Income (loss) from investment operations: | |
| Net investment income (loss) | | | (0.00 | )***†† | | | 0.20 | *** | | | 0.27 | *** | | | 0.33 | *** | | | - | | |
| Net realized and unrealized gain (loss) on investments | | | 0.90 | | | | 0.95 | | | | 0.51 | | | | 0.94 | | | | - | | |
| Total income from investment operations | | | 0.90 | | | | 1.15 | | | | 0.78 | | | | 1.27 | | | | - | | |
| Less distributions to shareholders: | |
| From net investment income | | | - | | | | (0.22 | ) | | | (0.21 | ) | | | (0.12 | ) | | | - | | |
| From net realized gains | | | - | | | | (0.37 | ) | | | (0.16 | ) | | | (0.01 | ) | | | - | | |
| Total distributions | | | - | | | | (0.59 | ) | | | (0.37 | ) | | | (0.13 | ) | | | - | | |
| Net asset value, end of period | | $ | 13.01 | | | $ | 12.11 | | | $ | 11.55 | | | $ | 11.14 | | | $ | 10.00 | | |
| | | | | | | | | | | | | | | | | | | | | | |
| Total Return (a) | | | 7.34 | % ** | | | 10.17 | % | | | 6.98 | % | | | 12.71 | % | | | - | ‡ | |
| Ratios / Supplemental Data: | |
| Net assets, end of period (000's) | | $ | 55,844 | | | $ | 42,835 | | | $ | 18,300 | | | $ | 4,245 | | | $ | 601 | | |
| Ratio of expenses to average daily net assets: | |
| Before expense waiver | | | 0.10 | % * | | | 0.10 | % | | | 0.10 | % | | | 0.45 | % | | | - | ‡ | |
| After expense waiver | | | N/A | | | | N/A | | | | N/A | | | | 0.10 | % # | | | N/A | | |
| Net investment income (loss) to average daily net assets | | | (0.10 | )% * | | | 1.66 | % | | | 2.42 | % | | | 3.16 | % | | | - | ‡ | |
| Portfolio turnover rate | | | 25 | % ** | | | 34 | % | | | 17 | % | | | 10 | % | | | N/A | | |
* Annualized.
** Percentage represents results for the period and is not annualized.
*** Per share amount calculated on the average shares method.
†† Amount is less than $0.01 per share.
+ The Fund commenced operations on December 31, 2003.
‡ Amount is de minimis due to the short period of operations.
# Computed after giving effect to an agreement by MassMutual to waive certain fees and expenses of the Fund.
(a) Employee retirement benefit plans that invest plan assets in the Separate Investment Accounts (SIAs) may be subject to certain charges as set forth in their respective Plan Documents. Total return figures would be lower for the periods presented if they reflected these charges.
The accompanying notes are an integral part of the financial statements.
308
MassMutual Select Destination Retirement 2030 Fund – Financial Statements (Continued)
Financial Highlights (For a share outstanding throughout each period)
| | | Class N | |
| | | Six months
ended
6/30/07
(Unaudited) | | Year ended
12/31/06 | | Year ended
12/31/05 | | Year ended
12/31/04 | | Period ended
12/31/03+ | |
| Net asset value, beginning of period | | $ | 12.07 | | | $ | 11.52 | | | $ | 11.13 | | | $ | 10.00 | | | $ | 10.00 | | |
| Income (loss) from investment operations: | |
| Net investment income (loss) | | | (0.00 | )***†† | | | 0.09 | *** | | | 0.14 | *** | | | (0.02 | )*** | | | - | | |
| Net realized and unrealized gain (loss) on investments | | | 0.85 | | | | 0.98 | | | | 0.55 | | | | 1.21 | | | | - | | |
| Total income from investment operations | | | 0.85 | | | | 1.07 | | | | 0.69 | | | | 1.19 | | | | - | | |
| Less distributions to shareholders: | |
| From net investment income | | | - | | | | (0.15 | ) | | | (0.14 | ) | | | (0.05 | ) | | | - | | |
| From net realized gains | | | - | | | | (0.37 | ) | | | (0.16 | ) | | | (0.01 | ) | | | - | | |
| Total distributions | | | - | | | | (0.52 | ) | | | (0.30 | ) | | | (0.06 | ) | | | - | | |
| Net asset value, end of period | | $ | 12.92 | | | $ | 12.07 | | | $ | 11.52 | | | $ | 11.13 | | | $ | 10.00 | | |
| | | | | | | | | | | | | | | | | | | | | | |
| Total Return (a) | | | 7.04 | % (b)** | | | 9.39 | % (b) | | | 6.20 | % (b) | | | 11.89 | % (b) | | | - | ‡ | |
| Ratios / Supplemental Data: | |
| Net assets, end of period (000's) | | $ | 284 | | | $ | 209 | | | $ | 162 | | | $ | 113 | | | $ | 101 | | |
| Ratio of expenses to average daily net assets: | |
| Before expense waiver | | | 0.80 | % * | | | 0.80 | % | | | 0.80 | % | | | 1.47 | % | | | - | ‡ | |
| After expense waiver | | | N/A | | | | N/A | | | | N/A | | | | 0.80 | % # | | | N/A | | |
| Net investment income (loss) to average daily net assets | | | (0.80 | )% * | | | 0.78 | % | | | 1.26 | % | | | (0.24 | )% | | | - | ‡ | |
| Portfolio turnover rate | | | 25 | % ** | | | 34 | % | | | 17 | % | | | 10 | % | | | N/A | | |
* Annualized.
** Percentage represents results for the period and is not annualized.
*** Per share amount calculated on the average shares method.
†† Amount is less than $0.01 per share.
+ The Fund commenced operations on December 31, 2003.
‡ Amount is de minimis due to the short period of operations.
# Computed after giving effect to an agreement by MassMutual to waive certain fees and expenses of the Fund.
(a) Employee retirement benefit plans that invest plan assets in the Separate Investment Accounts (SIAs) may be subject to certain charges as set forth in their respective Plan Documents. Total return figures would be lower for the periods presented if they reflected these charges.
(b) Total Return excludes sales charges and would be lower for the period presented if it reflected these charges.
The accompanying notes are an integral part of the financial statements.
309
MassMutual Select Destination Retirement 2040 Fund – Financial Statements (Continued)
Financial Highlights (For a share outstanding throughout each period)
| | | Class A | |
| | | Six months
ended
6/30/07
(Unaudited) | | Year ended
12/31/06 | | Year ended
12/31/05 | | Year ended
12/31/04 | | Period ended
12/31/03+ | |
| Net asset value, beginning of period | | $ | 12.39 | | | $ | 11.77 | | | $ | 11.26 | | | $ | 10.00 | | | $ | 10.00 | | |
| Income (loss) from investment operations: | |
| Net investment income (loss) | | | (0.03 | )*** | | | 0.07 | *** | | | 0.10 | *** | | | 0.20 | *** | | | - | | |
| Net realized and unrealized gain (loss) on investments | | | 1.05 | | | | 1.24 | | | | 0.73 | | | | 1.14 | | | | - | | |
| Total income from investment operations | | | 1.02 | | | | 1.31 | | | | 0.83 | | | | 1.34 | | | | - | | |
| Less distributions to shareholders: | |
| From net investment income | | | - | | | | (0.13 | ) | | | (0.11 | ) | | | (0.06 | ) | | | - | | |
| From net realized gains | | | - | | | | (0.56 | ) | | | (0.21 | ) | | | (0.02 | ) | | | - | | |
| Total distributions | | | - | | | | (0.69 | ) | | | (0.32 | ) | | | (0.08 | ) | | | - | | |
| Net asset value, end of period | | $ | 13.41 | | | $ | 12.39 | | | $ | 11.77 | | | $ | 11.26 | | | $ | 10.00 | | |
| Total Return (a) | | | 8.23 | % (b)** | | | 11.26 | % (b) | | | 7.47 | % (b) | | | 13.39 | % (b) | | | - | ‡ | |
| Ratios / Supplemental Data: | |
| Net assets, end of period (000's) | | $ | 61,256 | | | $ | 46,934 | | | $ | 26,913 | | | $ | 6,414 | | | $ | 101 | | |
| Ratio of expenses to average daily net assets: | |
| Before expense waiver | | | 0.50 | % * | | | 0.50 | % | | | 0.50 | % | | | 0.55 | % | | | - | ‡ | |
| After expense waiver | | | N/A | | | | N/A | | | | 0.50 | % # | | | 0.50 | % # | | | - | ‡ | |
| Net investment income (loss) to average daily net assets | | | (0.50 | )% * | | | 0.59 | % | | | 0.85 | % | | | 1.92 | % | | | - | ‡ | |
| Portfolio turnover rate | | | 25 | % ** | | | 42 | % | | | 18 | % | | | 13 | % | | | N/A | | |
| | | Class L | |
| | | Six months
ended
6/30/07
(Unaudited) | | Year ended
12/31/06 | | Year ended
12/31/05 | | Year ended
12/31/04 | | Period ended
12/31/03+ | |
| Net asset value, beginning of period | | $ | 12.45 | | | $ | 11.81 | | | $ | 11.28 | | | $ | 10.00 | | | $ | 10.00 | | |
| Income (loss) from investment operations: | |
| Net investment income (loss) | | | (0.02 | )*** | | | 0.08 | *** | | | 0.07 | *** | | | 0.04 | *** | | | - | | |
| Net realized and unrealized gain (loss) on investments | | | 1.06 | | | | 1.27 | | | | 0.80 | | | | 1.33 | | | | - | | |
| Total income from investment operations | | | 1.04 | | | | 1.35 | | | | 0.87 | | | | 1.37 | | | | - | | |
| Less distributions to shareholders: | |
| From net investment income | | | - | | | | (0.15 | ) | | | (0.13 | ) | | | (0.07 | ) | | | - | | |
| From net realized gains | | | - | | | | (0.56 | ) | | | (0.21 | ) | | | (0.02 | ) | | | - | | |
| Total distributions | | | - | | | | (0.71 | ) | | | (0.34 | ) | | | (0.09 | ) | | | - | | |
| Net asset value, end of period | | $ | 13.49 | | | $ | 12.45 | | | $ | 11.81 | | | $ | 11.28 | | | $ | 10.00 | | |
| | | | | | | | | | | | | | | | | | | | | | |
| Total Return (a) | | | 8.35 | % ** | | | 11.58 | % | | | 7.75 | % | | | 13.63 | % | | | - | ‡ | |
| Ratios / Supplemental Data: | |
| Net assets, end of period (000's) | | $ | 150,954 | | | $ | 134,968 | | | $ | 107,540 | | | $ | 101,487 | | | $ | 101 | | |
| Ratio of expenses to average daily net assets: | |
| Before expense waiver | | | 0.25 | % * | | | 0.25 | % | | | 0.25 | % | | | 0.27 | % | | | - | ‡ | |
| After expense waiver | | | N/A | | | | N/A | | | | 0.25 | % # | | | 0.25 | % # | | | - | ‡ | |
| Net investment income (loss) to average daily net assets | | | (0.25 | )% * | | | 0.68 | % | | | 0.60 | % | | | 0.41 | % | | | - | ‡ | |
| Portfolio turnover rate | | | 25 | % ** | | | 42 | % | | | 18 | % | | | 13 | % | | | N/A | | |
* Annualized.
** Percentage represents results for the period and is not annualized.
*** Per share amount calculated on the average shares method.
+ The Fund commenced operations on December 31, 2003.
‡ Amount is de minimis due to the short period of operations.
# Computed after giving effect to an agreement by MassMutual to waive certain fees and expenses of the Fund.
(a) Employee retirement benefit plans that invest plan assets in the Separate Investment Accounts (SIAs) may be subject to certain charges as set forth in their respective Plan Documents. Total return figures would be lower for the periods presented if they reflected these charges.
(b) Total return excludes sales charges and would be lower for the period presented if it reflected these charges.
The accompanying notes are an integral part of the financial statements.
310
MassMutual Select Destination Retirement 2040 Fund – Financial Statements (Continued)
Financial Highlights (For a share outstanding throughout each period)
| | | Class Y | |
| | | Six months
ended
6/30/07
(Unaudited) | | Year ended
12/31/06 | | Year ended
12/31/05 | | Year ended
12/31/04 | | Period ended
12/31/03+ | |
| Net asset value, beginning of period | | $ | 12.44 | | | $ | 11.81 | | | $ | 11.28 | | | $ | 10.00 | | | $ | 10.00 | | |
| Income (loss) from investment operations: | |
| Net investment income (loss) | | | (0.01 | )*** | | | 0.12 | *** | | | 0.16 | *** | | | 0.27 | *** | | | - | | |
| Net realized and unrealized gain (loss) on investments | | | 1.06 | | | | 1.23 | | | | 0.72 | | | | 1.11 | | | | - | | |
| Total income from investment operations | | | 1.05 | | | | 1.35 | | | | 0.88 | | | | 1.38 | | | | - | | |
| Less distributions to shareholders: | |
| From net investment income | | | - | | | | (0.16 | ) | | | (0.14 | ) | | | (0.08 | ) | | | - | | |
| From net realized gains | | | - | | | | (0.56 | ) | | | (0.21 | ) | | | (0.02 | ) | | | - | | |
| Total distributions | | | - | | | | (0.72 | ) | | | (0.35 | ) | | | (0.10 | ) | | | - | | |
| Net asset value, end of period | | $ | 13.49 | | | $ | 12.44 | | | $ | 11.81 | | | $ | 11.28 | | | $ | 10.00 | | |
| | | | | | | | | | | | | | | | | | | | | | |
| Total Return (a) | | | 8.44 | % ** | | | 11.60 | % | | | 7.88 | % | | | 13.74 | % | | | - | ‡ | |
| Ratios / Supplemental Data: | |
| Net assets, end of period (000's) | | $ | 40,723 | | | $ | 31,379 | | | $ | 8,379 | | | $ | 596 | | | $ | 101 | | |
| Ratio of expenses to average daily net assets: | |
| Before expense waiver | | | 0.15 | % * | | | 0.15 | % | | | 0.15 | % | | | 0.54 | % | | | - | ‡ | |
| After expense waiver | | | N/A | | | | N/A | | | | 0.15 | % # | | | 0.15 | % # | | | - | ‡ | |
| Net investment income (loss) to average daily net assets | | | (0.15 | )% * | | | 0.96 | % | | | 1.41 | % | | | 2.55 | % | | | - | ‡ | |
| Portfolio turnover rate | | | 25 | % ** | | | 42 | % | | | 18 | % | | | 13 | % | | | N/A | | |
| | | Class S | |
| | | Six months
ended
6/30/07
(Unaudited) | | Year ended
12/31/06 | | Year ended
12/31/05 | | Year ended
12/31/04 | | Period ended
12/31/03+ | |
| Net asset value, beginning of period | | $ | 12.45 | | | $ | 11.82 | | | $ | 11.28 | | | $ | 10.00 | | | $ | 10.00 | | |
| Income (loss) from investment operations: | |
| Net investment income (loss) | | | (0.01 | )*** | | | 0.08 | *** | | | 0.27 | *** | | | 0.09 | *** | | | - | | |
| Net realized and unrealized gain (loss) on investments | | | 1.07 | | | | 1.28 | | | | 0.63 | | | | 1.29 | | | | - | | |
| Total income from investment operations | | | 1.06 | | | | 1.36 | | | | 0.90 | | | | 1.38 | | | | - | | |
| Less distributions to shareholders: | |
| From net investment income | | | - | | | | (0.17 | ) | | | (0.15 | ) | | | (0.08 | ) | | | - | | |
| From net realized gains | | | - | | | | (0.56 | ) | | | (0.21 | ) | | | (0.02 | ) | | | - | | |
| Total distributions | | | - | | | | (0.73 | ) | | | (0.36 | ) | | | (0.10 | ) | | | - | | |
| Net asset value, end of period | | $ | 13.51 | | | $ | 12.45 | | | $ | 11.82 | | | $ | 11.28 | | | $ | 10.00 | | |
| | | | | | | | | | | | | | | | | | | | | | |
| Total Return (a) | | | 8.51 | % ** | | | 11.63 | % | | | 8.00 | % | | | 13.75 | % | | | - | ‡ | |
| Ratios / Supplemental Data: | |
| Net assets, end of period (000's) | | $ | 37,734 | | | $ | 27,944 | | | $ | 27,274 | | | $ | 1,741 | | | $ | 601 | | |
| Ratio of expenses to average daily net assets: | |
| Before expense waiver | | | 0.10 | % * | | | 0.10 | % | | | 0.10 | % | | | 0.66 | % | | | - | ‡ | |
| After expense waiver | | | N/A | | | | N/A | | | | 0.10 | % # | | | 0.10 | % # | | | - | ‡ | |
| Net investment income (loss) to average daily net assets | | | (0.10 | )% * | | | 0.67 | % | | | 2.37 | % | | | 0.85 | % | | | - | ‡ | |
| Portfolio turnover rate | | | 25 | % ** | | | 42 | % | | | 18 | % | | | 13 | % | | | N/A | | |
* Annualized.
** Percentage represents results for the period and is not annualized.
*** Per share amount calculated on the average shares method.
+ The Fund commenced operations on December 31, 2003.
‡ Amount is de minimis due to the short period of operations.
# Computed after giving effect to an agreement by MassMutual to waive certain fees and expenses of the Fund.
(a) Employee retirement benefit plans that invest plan assets in the Separate Investment Accounts (SIAs) may be subject to certain charges as set forth in their respective Plan Documents. Total return figures would be lower for the periods presented if they reflected these charges.
The accompanying notes are an integral part of the financial statements.
311
MassMutual Select Destination Retirement 2040 Fund – Financial Statements (Continued)
Financial Highlights (For a share outstanding throughout each period)
| | | Class N | |
| | | Six months
ended
6/30/07
(Unaudited) | | Year ended
12/31/06 | | Year ended
12/31/05 | | Year ended
12/31/04 | | Period ended
12/31/03+ | |
| Net asset value, beginning of period | | $ | 12.41 | | | $ | 11.79 | | | $ | 11.28 | | | $ | 10.00 | | | $ | 10.00 | | |
| Income (loss) from investment operations: | |
| Net investment income (loss) | | | (0.05 | )*** | | | 0.02 | *** | | | 0.07 | *** | | | (0.07 | )*** | | | - | | |
| Net realized and unrealized gain (loss) on investments | | | 1.06 | | | | 1.25 | | | | 0.73 | | | | 1.38 | | | | - | | |
| Total income from investment operations | | | 1.01 | | | | 1.27 | | | | 0.80 | | | | 1.31 | | | | - | | |
| Less distributions to shareholders: | |
| From net investment income | | | - | | | | (0.09 | ) | | | (0.08 | ) | | | (0.01 | ) | | | - | | |
| From net realized gains | | | - | | | | (0.56 | ) | | | (0.21 | ) | | | (0.02 | ) | | | - | | |
| Total distributions | | | - | | | | (0.65 | ) | | | (0.29 | ) | | | (0.03 | ) | | | - | | |
| Net asset value, end of period | | $ | 13.42 | | | $ | 12.41 | | | $ | 11.79 | | | $ | 11.28 | | | $ | 10.00 | | |
| Total Return (a) | | | 8.14 | % (b)** | | | 10.91 | % (b) | | | 7.11 | % (b) | | | 13.03 | % (b) | | | - | ‡ | |
| Ratios / Supplemental Data: | |
| Net assets, end of period (000's) | | $ | 235 | | | $ | 189 | | | $ | 142 | | | $ | 114 | | | $ | 101 | | |
| Ratio of expenses to average daily net assets: | |
| Before expense waiver | | | 0.80 | % * | | | 0.80 | % | | | 0.80 | % | | | 1.54 | % | | | - | ‡ | |
| After expense waiver | | | N/A | | | | N/A | | | | 0.80 | % # | | | 0.80 | % # | | | N/A | | |
| Net investment income (loss) to average daily net assets | | | (0.80 | )% * | | | 0.18 | % | | | 0.59 | % | | | (0.63 | )% | | | - | ‡ | |
| Portfolio turnover rate | | | 25 | % ** | | | 2 | % | | | 18 | % | | | 13 | % | | | N/A | | |
* Annualized.
** Percentage represents results for the period and is not annualized.
*** Per share amount calculated on the average shares method.
+ The Fund commenced operations on December 31, 2003.
‡ Amount is de minimis due to the short period of operations.
# Computed after giving effect to an agreement by MassMutual to waive certain fees and expenses of the Fund.
(a) Employee retirement benefit plans that invest plan assets in the Separate Investment Accounts (SIAs) may be subject to certain charges as set forth in their respective Plan Documents. Total return figures would be lower for the periods presented if they reflected these charges.
(b) Total return excludes sales charges and would be lower for the period presented if it reflected these charges.
The accompanying notes are an integral part of the financial statements.
312
Notes to Financial Statements (Unaudited)
1. The Fund
MassMutual Select Funds (the "Trust") is registered under the Investment Company Act of 1940, as amended (the "1940 Act"), as an open-end, management investment company. The Trust is organized under the laws of the Commonwealth of Massachusetts as a Massachusetts business trust pursuant to an Agreement and Declaration of Trust dated May 28, 1993, as amended. The Trust consists of the following series (each individually referred to as a "Fund" or collectively as the "Funds"): MassMutual Select Strategic Bond Fund ("Strategic Bond Fund"), MassMutual Select Strategic Balanced Fund ("Strategic Balanced Fund"), MassMutual Select Diversified Value Fund ("Diversified Value Fund"), MassMutual Select Fundamental Value Fund ("Fundamental Value Fund"), MassMu tual Select Value Equity Fund ("Value Equity Fund"), MassMutual Select Large Cap Value Fund ("Large Cap Value Fund"), MassMutual Select Indexed Equity Fund ("Indexed Equity Fund"), MassMutual Select Core Opportunities Fund ("Core Opportunities Fund"), MassMutual Select Blue Chip Growth Fund ("Blue Chip Growth Fund"), MassMutual Select Large Cap Growth Fund ("Large Cap Growth Fund"), MassMutual Select Growth Equity Fund ("Growth Equity Fund"), MassMutual Select Aggressive Growth Fund ("Aggressive Growth Fund"), MassMutual Select OTC 100 Fund ("OTC 100 Fund"), MassMutual Select Focused Value Fund ("Focused Value Fund"), MassMutual Select Mid-Cap Value Fund ("Mid-Cap Value Fund"), MassMutual Select Small Cap Value Equity Fund ("Small Cap Value Equity Fund"), MassMutual Select Small Company Value Fund ("Small Company Value Fund"), MassMutual Select Small Cap Core Equity Fund ("Small Cap Core Equity Fund"), MassMutual Select Mid Cap Growth Equity Fund ("Mid Cap Growth Equity Fund"), MassMutual Select Mid Cap Grow th Equity II Fund ("Mid Cap Growth Equity II Fund"), MassMutual Select Small Cap Growth Equity Fund ("Small Cap Growth Equity Fund"), MassMutual Select Small Company Growth Fund ("Small Company Growth Fund"), MassMutual Select Emerging Growth Fund ("Emerging Growth Fund"), MassMutual Select Diversified International Fund ("Diversified International Fund"), MassMutual Select Overseas Fund ("Overseas Fund"), MassMutual Select Destination Retirement Income Fund ("Destination Retirement Income Fund"), MassMutual Select Destination Retirement 2010 Fund ("Destination Retirement 2010 Fund"), MassMutual Select Destination Retirement 2020 Fund ("Destination Retirement 2020 Fund"), MassMutual Select Destination Retirement 2030 Fund ("Destination Retirement 2030 Fund") and MassMutual Select Destination Retirement 2040 Fund ("Destination Retirement 2040 Fund").
Each Fund has five classes of shares: Class A, Class L, Class Y, Class S and Class N. Additionally, the Indexed Equity Fund has a sixth class of shares: Class Z. The principal economic difference among the classes is the level of service and administration fees borne by the classes. The classes of shares are offered to different types of investors, as outlined in the Trust's Prospectus.
The five Destination Retirement Funds invest all of their investable assets in shares of various funds advised by MassMutual as a control affiliate of MassMutual. The financial statements included herein are those of the Destination Retirement Funds and the applicable MassMutual Select Funds. The financial statements of the applicable MassMutual Premier Funds, or Oppenheimer Funds which are advised by Oppenheimer Funds, Inc., a majority owned, indirect subsidiary of MassMutual, are presented separately and can be obtained from the SEC's EDGAR database on its Internet site at www.sec.gov or by calling MassMutual at 1-888-309-3539. The assets of each Destination Retirement Fund are diversified and a shareholder's interest is limited to the Select, Premier or Oppenheimer Funds in which the shares are invested.
2. Significant Accounting Policies
The following is a summary of significant accounting policies followed consistently by each Fund in the preparation of the financial statements in conformity with accounting principles generally accepted in the United States of America ("generally accepted accounting principles"). The preparation of the financial statements in accordance with generally accepted accounting principles requires management to make estimates and assumptions that affect the reported amounts and disclosures in the financial statements. Actual results could differ from those estimates.
313
Notes to Financial Statements (Unaudited) (Continued)
Investment Valuation
Equity securities are valued on the basis of valuations furnished by a pricing service, authorized by the Board of Trustees ("Trustees"), which provides the last reported sale price for securities listed on a national securities exchange or the official closing price on the NASDAQ National Market System, or in the case of over-the-counter securities not so listed, the last reported bid price. Debt securities (other than short-term obligations with a remaining maturity of sixty days or less) are valued on the basis of valuations furnished by a pricing service, authorized by the Trustees, which determines valuations taking into account appropriate factors such as institutional-size trading in similar groups of securities, yield, quality, coupon rate, m aturity, type of issue, trading characteristics and other market data. Short-term securities with a remaining maturity of sixty days or less are valued at either amortized cost or at original cost plus accrued interest, whichever approximates current market value. Shares of other funds of the Trust are valued at their net asset value as reported on each business day. All other securities and other assets, including futures, options, swaps and debt securities for which the prices supplied by a pricing agent are deemed by the Trustees not to be representative of market values, including restricted securities and securities for which no market quotation is available, are valued at fair value in accordance with procedures approved by the Trustees. Securities are typically valued on the basis of valuations furnished by a primary pricing service or, if no such valuation is available, from a secondary pricing service. However, valuation methods approved by the Trustees which are intended to reflect fair value may b e used when pricing service information is not readily available or when a security's value is believed to have been materially affected by a significant event, such as a natural disaster, an economic event like a bankruptcy filing, or a substantial fluctuation in domestic or foreign markets, that has occurred after the close of the exchange or market on which the security is principally traded (for example, a foreign exchange or market). In such a case, a Fund's value for a security is likely to be different from the last quoted market price or pricing service information. In addition, a fair value pricing service is used to assist in the pricing of foreign securities held by the Trust's foreign funds. Due to the subjective and variable nature of fair value pricing, it is possible that the value determined for a particular asset may be materially different from the value realized upon such asset's sale.
Portfolio securities traded on more than one national securities exchange are valued at the last price on the business day as of which such value is being determined at the close of the exchange representing the principal market for such securities. All assets and liabilities expressed in foreign currencies are converted into U.S. dollars at the mean between the buying and selling rates of such currencies against U.S. dollars last quoted by any major bank. If such quotations are not available, the rate of exchange is determined in accordance with policies established by the Trustees.
Securities Lending
Each Fund may lend its securities to qualified brokers; however, securities lending cannot exceed 33% of the total assets of the Funds taken at current value. The loans are collateralized at all times with cash or securities with a market value at least equal to 100% of the market value of the securities on loan. The market value of the loaned securities is determined at the close of business of the Fund and any additional collateral is delivered to the Fund the next business day. As with other extensions of credit, the Funds may bear the risk of delay in recovery or even loss of rights in the collateral should the borrower of the securities fail financially. The Funds receive compensation for lending their securities. At June 30, 2007, the Funds loane d securities having the following market values collateralized by cash, which was invested in short-term instruments in the following amounts:
| | | Securities on Loan | | Collateral | |
| Strategic Bond Fund | | $ | 15,703,586 | | | $ | 16,047,957 | | |
| Strategic Balanced Fund | | | 12,848,395 | | | | 13,326,472 | | |
| Diversified Value Fund | | | 40,204,146 | | | | 41,442,836 | | |
| Fundamental Value Fund | | | 53,867,352 | | | | 55,797,705 | | |
| Value Equity Fund | | | 5,309,886 | | | | 5,507,619 | | |
| Large Cap Value Fund | | | 81,681,799 | | | | 84,211,007 | | |
| Indexed Equity Fund | | | 116,531,908 | | | | 120,334,873 | | |
| Core Opportunities Fund | | | 3,815,714 | | | | 3,945,556 | | |
| Blue Chip Growth Fund | | | 37,617,554 | | | | 38,771,276 | | |
314
Notes to Financial Statements (Unaudited) (Continued)
| | | Securities on Loan | | Collateral | |
| Large Cap Growth Fund | | $ | 4,495,176 | | | $ | 4,624,790 | | |
| Growth Equity Fund | | | 15,898,486 | | | | 16,461,749 | | |
| Aggressive Growth Fund | | | 70,415,785 | | | | 72,231,709 | | |
| OTC 100 Fund | | | 3,820,795 | | | | 4,017,938 | | |
| Focused Value Fund | | | 154,361,449 | | | | 159,342,969 | | |
| Mid-Cap Value Fund | | | 46,642,755 | | | | 48,492,014 | | |
| Small Cap Value Equity Fund | | | 36,934,104 | | | | 38,671,982 | | |
| Small Company Value Fund | | | 166,892,948 | | | | 173,593,920 | | |
| Small Cap Core Equity Fund | | | 9,391,652 | | | | 9,794,729 | | |
| Mid Cap Growth Equity Fund | | | 25,271,372 | | | | 26,072,349 | | |
| Mid Cap Growth Equity II Fund | | | 194,555,185 | | | | 201,434,087 | | |
| Small Cap Growth Equity Fund | | | 265,621,522 | | | | 276,180,633 | | |
| Small Company Growth Fund | | | 50,738,387 | | | | 52,902,964 | | |
| Emerging Growth Fund | | | 28,716,807 | | | | 29,674,862 | | |
| Diversified International Fund | | | 5,259,272 | | | | 5,554,022 | | |
| Overseas Fund | | | 121,699,087 | | | | 127,928,033 | | |
| | | $ | 1,568,295,122 | | | $ | 1,626,364,051 | | |
For each Fund the amount of securities on loan indicated in the table above may not correspond with the securities on loan identified on the Portfolio of Investments because securities with pending sales are in process of recall from the brokers.
The Trust receives, as fees, a share of the income earned on investment of the cash collateral received for the loan of securities. For the the six months ended June 30, 2007, the Trust earned securities lending income as follows:
| | | Securities
Lending
Gross Income | | Securities
Lending
Fees and Expenses | | Securities
Lending
Net Income | |
| Strategic Bond Fund | | $ | 232,455 | | | $ | 220,049 | | | $ | 12,406 | | |
| Strategic Balanced Fund | | | 578,767 | | | | 554,454 | | | | 24,313 | | |
| Diversified Value Fund | | | 942,278 | | | | 906,025 | | | | 36,253 | | |
| Fundamental Value Fund | | | 1,382,462 | | | | 1,337,586 | | | | 44,876 | | |
| Value Equity Fund | | | 173,922 | | | | 171,392 | | | | 2,530 | | |
| Large Cap Value Fund | | | 2,730,075 | | | | 2,659,111 | | | | 70,964 | | |
| Indexed Equity Fund | | | 2,746,802 | | | | 2,692,015 | | | | 54,787 | | |
| Core Opportunities Fund | | | 136,542 | | | | 131,710 | | | | 4,832 | | |
| Blue Chip Growth Fund | | | 986,826 | | | | 954,529 | | | | 32,297 | | |
| Large Cap Growth Fund | | | 95,871 | | | | 83,539 | | | | 12,332 | | |
| Growth Equity Fund | | | 654,412 | | | | 643,966 | | | | 10,446 | | |
| Aggressive Growth Fund | | | 1,296,585 | | | | 1,276,823 | | | | 19,762 | | |
| OTC 100 Fund | | | 159,951 | | | | 153,918 | | | | 6,033 | | |
| Focused Value Fund | | | 1,924,806 | | | | 1,877,116 | | | | 47,690 | | |
| Mid-Cap Value Fund | | | 620,193 | | | | 607,315 | | | | 12,878 | | |
| Small Cap Value Equity Fund | | | 492,108 | | | | 440,972 | | | | 51,136 | | |
| Small Company Value Fund | | | 4,034,048 | | | | 3,859,880 | | | | 174,168 | | |
| Small Cap Core Equity Fund | | | 193,637 | | | | 178,792 | | | | 14,845 | | |
| Mid Cap Growth Equity Fund | | | 733,877 | | | | 719,552 | | | | 14,325 | | |
| Mid Cap Growth Equity II Fund | | | 4,977,547 | | | | 4,753,994 | | | | 223,553 | | |
| Small Cap Growth Equity Fund | | | 5,998,921 | | | | 5,714,726 | | | | 284,195 | | |
| Small Company Growth Fund | | | 1,237,954 | | | | 1,080,157 | | | | 157,797 | | |
| Emerging Growth Fund | | | 834,442 | | | | 634,846 | | | | 199,596 | | |
| Diversified International Fund | | | 188,764 | | | | 123,660 | | | | 65,104 | | |
| Overseas Fund | | | 2,961,352 | | | | 2,325,946 | | | | 635,406 | | |
| | | $ | 36,314,597 | | | $ | 34,102,073 | | | $ | 2,212,524 | | |
315
Notes to Financial Statements (Unaudited) (Continued)
Repurchase Agreements
Each Fund may enter into repurchase agreements with certain banks and broker/dealers whereby a Fund acquires a security for cash and obtains a simultaneous commitment from the seller to repurchase the security at an agreed upon price and date. The Funds, through their custodian, take possession of the securities collateralizing the repurchase agreement. The collateral is marked to market daily to ensure that the market value of the underlying assets remains sufficient to protect the Funds in the event of default by the seller. Collateral for certain tri-party repurchase agreements is held at the counterparty's custodian in a segregated account for the benefit of the Funds and the counterparty. In connection with transactions in repurchase agreements , if the seller defaults and the value of the collateral declines or if the seller enters insolvency proceedings, realization of collateral by the Funds may be delayed or limited.
Accounting for Investments
Investment transactions are accounted for on the trade date. Realized gains and losses on sales of investments and unrealized appreciation and depreciation of investments are computed on the specific identification cost method. Interest income, adjusted for amortization of discounts and premiums on debt securities, is earned from the settlement date and is recorded on the accrual basis. Dividend income is recorded on the ex-dividend date.
Federal Income Tax
It is each Fund's intent to continue to comply with the provisions of subchapter M of the Internal Revenue Code of 1986, as amended (the "Code"), applicable to a regulated investment company. Under such provisions, the Funds will not be subject to federal income taxes on their ordinary income and net realized capital gains to the extent they are distributed or deemed to have been distributed to their shareholders. Therefore, no federal income tax provision is required. Withholding taxes on foreign interest, dividends, and capital gains have been provided for in accordance with the applicable country's tax rules and rates.
Dividends and Distributions to Shareholders
Dividends from net investment income of each Fund are declared and paid annually and at other times as may be required to satisfy tax or regulatory requirements. Distributions of any net realized capital gains of each Fund are declared and paid annually and at other times as may be required to satisfy tax or regulatory requirements. Distributions to shareholders are recorded on the ex-dividend date. Income and capital gain distributions are determined in accordance with income tax regulations, which may differ from generally accepted accounting principles. These differences are primarily due to investments in forward contracts, passive foreign investment companies, the deferral of wash sale losses, and paydowns on certain mortg age-backed securities. As a result, net investment income and net realized gain on investment transactions for a reporting period may differ significantly from distributions during such period.
Accordingly, the Funds may periodically make reclassifications among certain of their capital accounts without affecting the net asset value of the Funds.
Foreign Currency Translation
The books and records of the Funds are maintained in U.S. dollars. The market values of foreign currencies, foreign securities and other assets and liabilities denominated in foreign currencies are translated into U.S. dollars at the mean of the buying and selling rates of such currencies against the U.S. dollar at the end of each business day. Purchases and sales of foreign securities and income and expense items are translated at the rates of exchange prevailing on the respective dates of such transactions. The Funds do not isolate that portion of the results of operations arising from changes in the exchange rates from that portion arising from changes in the market prices of securities. Net realized foreign currency gains and losses resul ting from changes in exchange rates include foreign currency gains and losses between trade date and settlement date on investment securities transactions, foreign currency transactions and the difference between the amounts of dividends recorded on the books of the Funds and the amount actually received.
Forward Foreign Currency
Contracts
Each Fund may enter into forward foreign currency contracts in order to hedge the effect of currency movements of foreign denominated securities or obligations, or for the Diversified International Fund to generate additional returns by buying currencies in excess of underlying equities when opportunities arise. A forward foreign currency contract is an agreement between two parties to buy and sell a currency at a set price on a future date. The market value of a forward foreign currency contract fluctuates with changes in foreign currency exchange and interest rates. Forward foreign currency contracts are marked to market daily and the change in their value is recorded by the Funds as an unrealized gain or loss. When a forward forei gn currency contract is extinguished, through delivery or offset by entering into another forward foreign currency contract, the Funds record a realized gain or
316
Notes to Financial Statements (Unaudited) (Continued)
loss equal to the difference between the value of the contract at the time it was opened and the value of the contract at the time it was extinguished or offset.
Forward foreign currency contracts involve a risk of loss from the potential inability of counterparties to meet the terms of their contracts and from unanticipated movements in foreign currency values and interest rates.
The notional or contractual amounts of these instruments represent the investments the Funds have in particular classes of financial instruments and do not necessarily represent the amounts potentially subject to risk. The measurement of the risk associated with these instruments is meaningful only when all related and offsetting transactions and counterparty risk are considered.
A summary of open forward foreign currency contracts for the Strategic Bond Fund, Strategic Balanced Fund, Diversified International Fund and Overseas Fund at June 30, 2007 is as follows:
Settlement
Date | | Contracts to
Deliver/Receive | | Units of
Currency | | In Exchange
for U.S.
Dollars | | Contracts at
Value | | Unrealized
Appreciation
(Depreciation) | |
| Strategic Bond Fund | |
| SELLS | |
| 08/08/07 | | Euro | | | 712,885 | | | $ | 970,190 | | | $ | 965,849 | | | $ | 4,341 | | |
| | | $ | 4,341 | | |
| Strategic Balanced Fund | |
| BUYS | |
| 08/08/07 | | Canadian Dollar | | | 306,575 | | | | 274,217 | | | | 289,254 | | | $ | 15,037 | | |
| SELLS | |
| 08/08/07 | | Canadian Dollar | | | 453,253 | | | | 405,414 | | | | 427,645 | | | | (22,231 | ) | |
| 08/08/07 | | Euro | | | 322,810 | | | | 438,838 | | | | 437,551 | | | | 1,287 | | |
| | | | | | | | (20,944 | ) | |
| | | $ | (5,907 | ) | |
| Diversified International Fund | |
| BUYS | |
| 09/18/07 | | Australian Dollar | | | 22,290,000 | | | | 18,761,994 | | | | 18,870,883 | | | | 108,889 | | |
| 09/18/07 | | British Pound | | | 7,645,000 | | | | 15,135,648 | | | | 15,321,627 | | | | 185,979 | | |
| 09/18/07 | | New Zealand Dollar | | | 9,411,000 | | | | 7,048,961 | | | | 7,226,289 | | | | 177,328 | | |
| | | $ | 472,196 | | |
| SELLS | |
| 09/18/07 | | Australian Dollar | | | 1,288,000 | | | | 1,073,038 | | | | 1,090,431 | | | | (17,393 | ) | |
| 09/18/07 | | British Pound | | | 435,000 | | | | 855,684 | | | | 871,800 | | | | (16,116 | ) | |
| 09/18/07 | | Euro | | | 10,602,000 | | | | 14,300,641 | | | | 14,354,833 | | | | (54,192 | ) | |
| 09/18/07 | | Japanese Yen | | | 2,411,156,000 | | | | 20,110,708 | | | | 19,717,443 | | | | 393,265 | | |
| 09/18/07 | | Swiss Franc | | | 2,627,000 | | | | 2,156,488 | | | | 2,155,597 | | | | 891 | | |
| | | $ | 306,455 | | |
| | | $ | 778,651 | | |
| Overseas Fund | |
| SELLS | |
| 07/18/07 | | British Pound | | | 10,130,000 | | | | 19,851,761 | | | | 20,309,781 | | | | (458,020 | ) | |
| 07/25/07 | | British Pound | | | 9,850,000 | | | | 19,554,220 | | | | 19,753,494 | | | | (199,274 | ) | |
| 10/05/07 | | British Pound | | | 21,900,000 | | | | 43,190,085 | | | | 43,889,402 | | | | (699,317 | ) | |
| 10/19/07 | | British Pound | | | 16,230,000 | | | | 32,477,853 | | | | 32,516,858 | | | | (39,005 | ) | |
| | | $ | (1,395,616 | ) | |
317
Notes to Financial Statements (Unaudited) (Continued)
Delayed Delivery Transactions, When Issued Securities, and Forward Commitments
Each Fund may purchase or sell securities on a "when issued" or delayed delivery or on a forward commitment basis. The Funds use forward commitments to manage interest rate exposure or as a temporary substitute for purchasing or selling particular debt securities. Payment and delivery may take place after the customary settlement period for that security. The price of the underlying securities and the date when the securities will be delivered and paid for are fixed at the time the transaction is negotiated. These securities are valued on the basis of valuations furnished by a pricing service, authorized by the Trustees, which determines valuations taking into account appropriate factors such as institutional-size trading in similar groups of securities, yield, quality, coupon rate, maturity, type of issue, trading characteristics and other market data. Securities for which no market quotation is available, are valued at fair value in accordance with procedures approved by the Trustees. The Funds record on a daily basis the unrealized appreciation (depreciation) based upon changes in the value of these securities. When a forward commitment contract is closed, the Funds record a realized gain or loss equal to the difference between the value of the contract at the time it was opened and the value of the contract at the time it was closed. Losses may arise due to changes in the value of the underlying securities or if the counterparty does not perform under the contract, or if the issuer does not issue the securities due to political, economic, or other factors. Funds monitor exposure to ensure counterparties are creditworthy and concentration of exposure is minimized.
A summary of open obligations for Strategic Bond Fund under these forward commitments at June 30, 2007 is as follows:
Forward
Commitment
Contracts to Buy | | Expiration
of
Contracts | | Aggregate
Face Value
of Contracts | | Cost | | Market
Value | | Unrealized
Appreciation
(Depreciation) | |
| Strategic Bond Fund | |
| FNMA TBA | |
| 6.0% 7/01/2037 | | Jul-07 | | $ | 10,000,000 | | | $ | 9,846,305 | | | $ | 9,889,844 | | | $ | 43,539 | | |
| | | $ | 43,539 | | |
Financial Futures Contracts
The Funds may purchase and sell financial futures contracts and options on such futures contracts for the purpose of hedging the market risk on existing securities or as a substitute for the purchase of securities. Futures contracts are contracts for delayed delivery of securities at a specific future date and at a specific price or yield. Upon entering into a contract, the Funds deposit and maintain as collateral such initial margin as required by the exchange on which the transaction is effected. Pursuant to the contract, the Fund agrees to receive from or pay to the broker an amount of cash equal to the daily fluctuation in value of the contract. Such receipts or payments are known as variation margin and are recorded by the Funds as unreal ized gains or losses. When the contract is closed, each Fund records a realized gain or loss equal to the difference between the value of the contract at the time it was opened and the value at the time it was closed. Futures contracts are valued at the settlement price established each day by the board of trade or exchange on which they are traded.
A summary of open futures contracts for the Strategic Bond Fund, Strategic Balanced Fund, Indexed Equity Fund, Growth Equity Fund, OTC 100 Fund, Small Cap Value Equity Fund, Small Cap Core Equity Fund, and Diversified International Fund at June 30, 2007, is as follows:
Number of
Contracts | | Type | | Expiration Date | | Notional
Contract
Value | | Net Unrealized
Appreciation
(Depreciation) | |
| Strategic Bond Fund | |
| | BUYS
1 | | | Euro FX Curr | | 9/19/07 | | $ | 169,600 | | | $ | 1,695 | | |
| | 124 | | | 90 Day Euro | | 3/17/08 | | | 29,384,900 | | | | 4,980 | | |
| | 59 | | | 90 Day Euro | | 9/17/07 | | | 13,963,825 | | | | (32,445 | ) | |
| | 126 | | | 90 Day Euro | | 12/7/07 | | | 29,835,225 | | | | (26,430 | ) | |
318
Notes to Financial Statements (Unaudited) (Continued)
Number of
Contracts | | Type | | Expiration Date | | Notional
Contract
Value | | Net Unrealized
Appreciation
(Depreciation) | |
| Strategic Bond Fund (continued) | |
| | 33 | | | Euribor 3M | | 9/17/07 | | $ | 71,209 | | | $ | (67,320 | ) | |
| | 263 | | | U.S. Treasury Note 5 Year | | 10/3/07 | | | 27,372,547 | | | | (78,033 | ) | |
| | 7 | | | 3MO GBP Libor | | 9/19/07 | | | 18 | | | | (147 | ) | |
| | 11 | | | 3MO GBP Libor | | 9/19/07 | | | 28 | | | | (234 | ) | |
| | 11 | | | 90 Day GBP Libor | | 9/19/07 | | | 2,585,512 | | | | (20,385 | ) | |
| | 6 | | | Euro Bond Future | | 10/10/07 | | | 896,181 | | | | (20,787 | ) | |
| | 4 | | | Euro Bond Future | | 8/24/07 | | | 755 | | | | (6,335 | ) | |
| | 234 | | | U.S. Long Bond Future | | 9/28/07 | | | 25,213,500 | | | | (39,575 | ) | |
| | | $ | (285,016 | ) | |
| | SELLS
2 | | | U.S. Treasury Note 2 Year | | 9/28/07 | | $ | 407,563 | | | $ | 490 | | |
| | 70 | | | U.S. Treasury Note 10 Year | | 9/28/07 | | | 7,339,219 | | | | (80,397 | ) | |
| | 5 | | | U.S. Treasury Note 10 Year | | 12/31/07 | | | 527,344 | | | | (6,838 | ) | |
| | | $ | (86,745 | ) | |
| Strategic Balanced Fund | |
| | BUYS
33 | | | 90 Day Euro | | 3/17/08 | | $ | 7,820,175 | | | $ | (3,428 | ) | |
| | 9 | | | 90 Day Euro | | 9/17/07 | | | 2,130,075 | | | | (4,258 | ) | |
| | 35 | | | 90 Day Euro | | 12/17/07 | | | 8,287,563 | | | | (7,300 | ) | |
| | 13 | | | 90 Day Euro | | 9/17/07 | | | 28,052 | | | | (17,422 | ) | |
| | 125 | | | U.S. Treasury Note 5 Year | | 10/3/07 | | | 13,006,241 | | | | 8,364 | | |
| | 2 | | | 3MO GBP Libor | | 9/19/07 | | | 5 | | | | (24 | ) | |
| | 4 | | | 3MO GBP Libor | | 9/19/07 | | | 10 | | | | (49 | ) | |
| | 4 | | | 90 Day GBP Libor | | 9/19/07 | | | 940,186 | | | | (4,196 | ) | |
| | 4 | | | Euro Bond Future | | 10/10/07 | | | 597,454 | | | | (9,067 | ) | |
| | 55 | | | U.S. Long Bond Future | | 9/28/07 | | | 5,926,250 | | | | (3,406 | ) | |
| | | $ | (40,786 | ) | |
| | SELLS
35 | | | U.S. Treasury Note 10 Year | | 9/28/07 | | $ | 3,693,864 | | | $ | (12,788 | ) | |
| | 2 | | | U.S. Treasury Note 10 Year | | 12/31/07 | | | 210,936 | | | | (2,729 | ) | |
| | | $ | (15,517 | ) | |
| Indexed Equity Fund | |
| | BUYS
58 | | | S&P 500 Index | | 9/15/07 | | $ | 21,973,300 | | | $ | (130,126 | ) | |
| Growth Equity Fund | |
| | BUYS
15 | | | S&P 500 Index | | 9/15/07 | | $ | 5,682,750 | | | $ | (13,185 | ) | |
| OTC 100 Fund | |
| | BUYS
16 | | | Nasdaq 100 | | 9/21/07 | | $ | 625,920 | | | $ | (567 | ) | |
| Small Cap Value Equity Fund | |
| | BUYS
46 | | | Russell Mini | | 9/21/07 | | $ | 3,873,660 | | | $ | (9,879 | ) | |
| Small Cap Core Equity Fund | |
| | BUYS
2 | | | Russell Mini | | 9/21/07 | | $ | 168,420 | | | $ | 1,086 | | |
| Diversified International Fund | |
| | BUYS
49 | | | DJ Euro | | 9/20/07 | | $ | 2,983,695 | | | $ | 56,801 | | |
319
Notes to Financial Statements (Unaudited) (Continued)
Options
The Funds may purchase put and call options. By purchasing a put option, a Fund obtains the right (but not the obligation) to sell the instrument underlying the option at a fixed strike price. In return for this right, a Fund pays the current market price for the option (known as the option premium). Options have various types of underlying instruments, including specific securities, indexes of securities, indexes of security prices, indexes of interest rates, futures contracts and swap agreements. A Fund may terminate its position in a put option it has purchased by allowing it to expire or by exercising the option. A Fund may also close out a put option position by entering into an offsetting transaction, if a liquid market exists. If the option is allowed to e xpire, a Fund will lose the entire premium it paid. Premiums paid for purchasing options which expire are treated as realized losses. If a Fund exercises a put option on a security, it will sell the instrument underlying the option at the strike price. If a Fund exercises an option on an index, settlement is in cash and does not involve the actual sale of securities.
The buyer of a typical put option can expect to realize a gain if the price of the underlying instrument falls substantially. However, if the price of the instrument underlying the option does not fall enough to offset the cost of purchasing the option, a put buyer can expect to suffer a loss (limited to the amount of the premium paid, plus related transaction costs).
The features of call options are essentially the same as those of put options, except that the purchaser of a call option obtains the right to purchase, rather than sell, the instrument underlying the option at the option's strike price. A call buyer typically attempts to participate in potential price increases of the instrument underlying the option with risk limited to the cost of the option if security prices fall. At the same time, the buyer can expect to suffer a loss if security prices do not rise sufficiently to offset the cost of the option. See the Portfolio of Investments of the Strategic Bond Fund and Strategic Balanced Fund for open purchased option contracts as of June 30, 2007.
The Funds may also "write" put and call options. When a Fund writes a put option, it takes the opposite side of the transaction from the option's purchaser. In return for receipt of the premium, a Fund assumes the obligation to pay the strike price for the instrument underlying the option if the other party to the option chooses to exercise it. A Fund may seek to terminate its position in a put option it writes before exercise by purchasing an offsetting option in the market at its current price. If the market is not liquid for a put option a Fund has written, however, a Fund must continue to be prepared to pay the strike price while the option is outstanding, regardless of price changes, and must continue to post margin as discussed below.
If the price of the underlying instrument rises, a put writer would generally expect to profit, although its gain would be limited to the amount of the premium it received. If security prices remain the same over time, it is likely that the writer will also profit, because it should be able to close out the option at a lower price. If security prices fall, the put writer would expect to suffer a loss. This loss should be less than the loss from purchasing and holding the underlying instrument directly, however, because the premium received for writing the option should offset a portion of the decline.
Writing a call option obligates a Fund to sell or deliver the option's underlying instrument in return for the strike price upon exercise of the option. The characteristics of writing call options are similar to those of writing put options, except that writing calls generally is a profitable strategy if prices remain the same or fall. Through receipt of the option premium a call writer offsets part of the effect of a price increase. At the same time, because a call writer must be prepared to deliver the underlying instrument in return for the strike price, even if its current value is greater, a call writer gives up some ability to participate in security price increases.
The writer of an exchange traded put or call option on a security, an index of securities or a futures contract is required to deposit cash or securities or a letter of credit as margin and to make mark to market payments of variation margin as the position becomes unprofitable. When a Fund writes a call or put option, an amount equal to the premium received is recorded as a liability. Premiums received from writing options which expire are treated as realized gains. Premiums received from writing options which are exercised or closed are added to the proceeds or offset against the amount paid on the underlying investments to determine the realized gain or loss.
320
Notes to Financial Statements (Unaudited) (Continued)
A summary of open written option contracts for the Strategic Bond Fund and the Strategic Balanced Fund at June 30, 2007, is as follows:
| Strategic Bond Fund | |
Notional
Amount | | Expiration
Date | | Market Description | | Premiums | | Value | |
| $ | 107,500 | | | 3/17/2008 | | Call - IMM Euro Future | | $ | 9,498 | | | $ | 13,438 | | |
| | 60,000 | | | 9/17/2007 | | Call - IMM Euro Future | | | 7,680 | | | | 150 | | |
| | 40,000 | | | 9/17/2007 | | Call - IMM Euro Future | | | 2,933 | | | | 400 | | |
| | 70,000 | | | 12/17/2007 | | Call - IMM Euro Future | | | 4,585 | | | | 700 | | |
| | 132,500 | | | 9/17/2007 | | Put - 90 Day Euro Future | | | 8,685 | | | | 13,581 | | |
| | 10,000 | | | 8/24/2007 | | Call - 5 Year U.S. Treasury Note Future | | | 3,325 | | | | 5,469 | | |
| | 50,000 | | | 7/27/2007 | | Call - 10 Year U.S. Treasury Note Future | | | 13,359 | | | | 19,531 | | |
| | 34,000 | | | 7/27/2007 | | Put - 10 Year U.S. Treasury Note Future | | | 13,189 | | | | 3,188 | | |
| | 63,000 | | | 8/24/2007 | | Call - 10 Year U.S. Treasury Note Future | | | 34,498 | | | | 2,953 | | |
| | 60,000 | | | 8/24/2007 | | Call - 10 Year U.S. Treasury Note Future | | | 20,887 | | | | 1,875 | | |
| | 4,000 | | | 8/24/2007 | | Call - 10 Year U.S. Treasury Note Future | | | 980 | | | | 438 | | |
| | 9,000 | | | 8/24/2007 | | Call - 10 Year U.S. Treasury Note Future | | | 2,189 | | | | 2,391 | | |
| | 133,000 | | | 8/24/2007 | | Call - 10 Year U.S. Treasury Note Future | | | 47,804 | | | | 81,047 | | |
| | 24,000 | | | 8/24/2007 | | Put - 10 Year U.S. Treasury Note Future | | | 16,271 | | | | 2,625 | | |
| | 58,000 | | | 8/24/2007 | | Put - 10 Year U.S. Treasury Note Future | | | 31,101 | | | | 12,688 | | |
| | 13,000 | | | 8/24/2007 | | Put - 10 Year U.S. Treasury Note Future | | | 2,779 | | | | 813 | | |
| | 77,000 | | | 11/20/2007 | | Call - 10 Year U.S. Treasury Note Future | | | 25,724 | | | | 26,469 | | |
| | 102,000 | | | 11/20/2007 | | Call - 10 Year U.S. Treasury Note Future | | | 35,365 | | | | 58,969 | | |
| | 26,000 | | | 11/20/2007 | | Call - 10 Year U.S. Treasury Note Future | | | 15,323 | | | | 24,375 | | |
| | 9,000 | | | 11/20/2007 | | Put - 10 Year U.S. Treasury Note Future | | | 3,611 | | | | 5,766 | | |
| | 21,000 | | | 11/20/2007 | | Put - 10 Year U.S. Treasury Note Future | | | 11,708 | | | | 5,250 | | |
| | 12,000 | | | 11/20/2007 | | Put - 10 Year U.S. Treasury Note Future | | | 5,753 | | | | 4,875 | | |
| | 12,000 | | | 7/27/2007 | | Call - U.S. Treasury Bond Future | | | 4,065 | | | | 8,625 | | |
| | 9,000 | | | 8/24/2007 | | Call - U.S. Treasury Bond Future | | | 3,189 | | | | 140 | | |
| | 4,000 | | | 8/24/2007 | | Call - U.S. Treasury Bond Future | | | 2,105 | | | | 125 | | |
| | 8,000 | | | 8/24/2007 | | Call - U.S. Treasury Bond Future | | | 2,148 | | | | 3,000 | | |
| | 20,000 | | | 8/24/2007 | | Call - U.S. Treasury Bond Future | | | 6,463 | | | | 2,187 | | |
| | 114,000 | | | 8/27/2007 | | Call - U.S. Treasury Bond Future | | | 47,305 | | | | 74,812 | | |
| | 13,000 | | | 8/24/2007 | | Call - U.S. Treasury Bond Future | | | 7,232 | | | | 13,609 | | |
| | 80,000 | | | 8/24/2007 | | Put - U.S. Treasury Bond Future | | | 53,163 | | | | 28,750 | | |
| | 21,000 | | | 8/24/2007 | | Put - U.S. Treasury Bond Future | | | 7,770 | | | | 4,921 | | |
| | 21,000 | | | 11/20/2007 | | Call - U.S. Treasury Bond Future | | | 9,083 | | | | 13,453 | | |
| | | $ | 459,770 | | | $ | 436,613 | | |
| Strategic Balanced Fund | |
Notional
Amount | | Expiration
Date | | Market Description | | Premiums | | Value | |
| $ | 25,000 | | | 3/17/2008 | | Call - IMM Euro Future | | $ | 2,213 | | | $ | 3,125 | | |
| | 17,500 | | | 9/17/2007 | | Call - IMM Euro Future | | | 2,228 | | | | 44 | | |
| | 10,000 | | | 9/17/2007 | | Call - IMM Euro Future | | | 768 | | | | 100 | | |
| | 20,000 | | | 12/17/2007 | | Put - IMM Euro Future | | | 1,310 | | | | 200 | | |
| | 42,500 | | | 9/17/2007 | | Put - 90 Day Euro Future | | | 2,790 | | | | 4,356 | | |
| | 3,000 | | | 8/24/2007 | | Call - 5 Year U.S. Treasury Note Future | | | 1,016 | | | | 1,641 | | |
| | 16,000 | | | 7/27/2007 | | Call - 10 Year U.S. Treasury Note Future | | | 4,279 | | | | 6,250 | | |
| | 10,000 | | | 7/27/2007 | | Put - 10 Year U.S. Treasury Note Future | | | 3,841 | | | | 938 | | |
| | 19,000 | | | 8/24/2007 | | Call - 10 Year U.S. Treasury Note Future | | | 10,389 | | | | 891 | | |
321
Notes to Financial Statements (Unaudited) (Continued)
Notional
Amount | | Expiration
Date | |
Market Description | | Premiums | | Value | |
| $ 18,000 | | 8/24/2007 | | Call - 10 Year U.S. Treasury Note Future | | $ | 6,238 | | | $ | 563 | | |
| 1,000 | | 8/24/2007 | | Call - 10 Year U.S. Treasury Note Future | | | 245 | | | | 109 | | |
| 3,000 | | 8/24/2007 | | Call - 10 Year U.S. Treasury Note Future | | | 735 | | | | 797 | | |
| 39,000 | | 8/24/2007 | | Call - 10 Year U.S. Treasury Note Future | | | 14,008 | | | | 23,766 | | |
| 6,000 | | 8/24/2007 | | Put - 10 Year U.S. Treasury Note Future | | | 4,048 | | | | 656 | | |
| 18,000 | | 8/24/2007 | | Put - 10 Year U.S. Treasury Note Future | | | 9,660 | | | | 3,938 | | |
| 4,000 | | 8/24/2007 | | Put - 10 Year U.S. Treasury Note Future | | | 855 | | | | 250 | | |
| 25,000 | | 11/20/2007 | | Call - 10 Year U.S. Treasury Note Future | | | 8,391 | | | | 8,594 | | |
| 32,000 | | 11/20/2007 | | Call - 10 Year U.S. Treasury Note Future | | | 11,293 | | | | 18,500 | | |
| 8,000 | | 11/20/2007 | | Call - 10 Year U.S. Treasury Note Future | | | 4,726 | | | | 7,500 | | |
| 3,000 | | 11/20/2007 | | Put - 10 Year U.S. Treasury Note Future | | | 1,204 | | | | 1,922 | | |
| 7,000 | | 11/20/2007 | | Put - 10 Year U.S. Treasury Note Future | | | 3,903 | | | | 1,750 | | |
| 4,000 | | 11/20/2007 | | Put - 10 Year U.S. Treasury Note Future | | | 1,918 | | | | 1,625 | | |
| 3,000 | | 7/27/2007 | | Call - U.S. Treasury Bond Future | | | 1,016 | | | | 2,156 | | |
| 3,000 | | 8/24/2007 | | Call - U.S. Treasury Bond Future | | | 1,063 | | | | 47 | | |
| 1,000 | | 8/24/2007 | | Call - U.S. Treasury Bond Future | | | 526 | | | | 31 | | |
| 2,000 | | 8/24/2007 | | Call - U.S. Treasury Bond Future | | | 536 | | | | 750 | | |
| 5,000 | | 8/24/2007 | | Call - U.S. Treasury Bond Future | | | 1,616 | | | | 547 | | |
| 32,000 | | 8/27/2007 | | Call - U.S. Treasury Bond Future | | | 13,324 | | | | 21,000 | | |
| 4,000 | | 8/24/2007 | | Call - U.S. Treasury Bond Future | | | 2,214 | | | | 4,188 | | |
| 21,000 | | 8/24/2007 | | Put - U.S. Treasury Bond Future | | | 14,113 | | | | 7,546 | | |
| 5,000 | | 8/24/2007 | | Put - U.S. Treasury Bond Future | | | 1,850 | | | | 1,171 | | |
| 6,000 | | 11/20/2007 | | Call - U.S. Treasury Bond Future | | | 2,595 | | | | 3,843 | | |
| | | $ | 134,911 | | | $ | 128,794 | | |
Transactions in options written for the Strategic Bond Fund and the Strategic Balanced Fund during the the six months ended June 30, 2007 were as follows:
| | | Number of
Contracts | | Premiums
Received | |
| Strategic Bond Fund | |
| Options outstanding at December 31, 2006 | | | 787 | | | $ | 399,050 | | |
| Options written | | | 2,528 | | | | 1,029,991 | | |
| Options terminated in closing purchase transactions | | | (2,144 | ) | | | (969,271 | ) | |
| Options outstanding at June 30, 2007 | | | 1,171 | | | $ | 459,770 | | |
| Strategic Balanced Fund | |
| Options outstanding at December 31, 2006 | | | 290 | | | $ | 147,863 | | |
| Options written | | | 810 | | | | 332,991 | | |
| Options terminated in closing purchase transactions | | | (756 | ) | | | (345,943 | ) | |
| Options outstanding at June 30, 2007 | | | 344 | | | $ | 134,911 | | |
Exchange traded options are valued at the last sale price, or if no sales are reported, the last bid price for purchased options and the last ask price for written options. Options traded over-the-counter are valued using prices supplied by a primary pricing source chosen by the Trust.
Swaps
The Funds may engage in swap transactions, including, but not limited to, interest rate, currency, credit default, indices, basket, specific security and commodity swaps, interest rate caps, floors and collars and options on swaps (collectively defined as "swap transactions").
322
Notes to Financial Statements (Unaudited) (Continued)
Each Fund may enter into swap transactions for any legal purpose consistent with its investment objective and policies, such as for the purpose of attempting to obtain or preserve a particular return or spread at a lower cost than obtaining that return or spread through purchases and/or sales of instruments in cash markets, to protect against currency fluctuation, as a duration management technique, to protect against any increase in the price of securities a Fund anticipates purchasing at a later date, or to gain exposure to certain markets in the most economical way possible.
Swap agreements are two-party contracts entered into primarily by institutional counterparties for periods ranging from a few weeks to several years. In a standard swap transaction, two parties agree to exchange the returns (or differentials in rates of return) that would be earned or realized on specified notional investments or instruments. The gross returns to be exchanged or "swapped" between the parties are calculated by reference to a "notional amount," i.e., the return on or increase in value of a particular dollar amount invested at a particular interest rate, in a particular foreign currency or commodity, or in a "basket" of securities representing a particular index. The purchaser of an interest rate cap or floor, upon payment of a fee, has the right to receive payments (and the seller of the cap is obligated to make payments) to the extent a specified interest rate exceeds (in the case of a cap) or is less than (in the case of a f loor) a specified level over a specified period of time or at specified dates. The purchaser of an interest rate collar, upon payment of a fee, has the right to receive payments (and the seller of the collar is obligated to make payments) to the extent that a specified interest rate falls outside an agreed upon range over a specified period of time or at specified dates. The purchaser of an option on an interest rate swap, upon payment of a fee (either at the time of purchase or in the form of higher payments or lower receipts within an interest rate swap transaction) has the right, but not the obligation, to initiate a new swap transaction of a pre-specified notional amount with pre-specified terms with the seller of the option as the counterparty.
The amount of a Fund's potential gain or loss on any swap transaction is not subject to any fixed limit. Nor is there any fixed limit on a Fund's potential loss if it sells a cap or collar. If the Fund buys a cap, floor or collar, however, the Fund's potential loss is limited to the amount of the fee that it has paid. When measured against the initial amount of cash required to initiate the transaction, which is typically zero in the case of most conventional swap transactions, swaps, caps, floors and collars tend to be more volatile than many other types of instruments.
The Funds will maintain cash or liquid assets in an amount sufficient at all times to cover its current obligations under its swap transactions, caps, floors and collars. If a Fund enters into a swap agreement on a net basis, it will segregate assets with a daily value at least equal to the excess, if any, of a Fund's accrued obligations under the swap agreement over the accrued amount a Fund is entitled to receive under the agreement. If a Fund enters into a swap agreement on other than a net basis, or sells a cap, floor or collar, it will segregate assets with a daily value at least equal to the full amount of a Fund's accrued obligation under the agreement.
During the term of a swap, cap, floor or collar, changes in the value of the instrument are recognized as unrealized gains or losses by marking to market to reflect the market value of the instrument. When the instrument is terminated, a Fund will record a realized gain or loss equal to the difference, if any, between the proceeds from (or cost of) the closing transaction and a Fund's basis in the contract.
During the term of a swap, cap, floor or collar, the periodic net payments can be made for a set period of time or may be triggered by a predetermined credit event. The net periodic payments may be based on a fixed or variable interest rate; the change in market value of a specific security, basket of securities or index; or the return generated by a security. These periodic payments received or made by the Trust are recorded in the accompanying Statement of Operations as realized gains and losses, respectively.
The Funds may enter into credit default swaps to buy or sell credit protection on an individual issuer or a basket of issuers of bonds. When a Fund is the buyer of a credit default swap contract, the Fund is entitled to receive the par or other agreed-upon value, of a referenced debt obligation from the counterparty to the contract in the event of a default by a third party, such as a U.S. or foreign corporate issuer, on the debt obligation. In return, the Fund would pay the counterparty a periodic stream of
323
Notes to Financial Statements (Unaudited) (Continued)
payments over the term of the contract provided that no event of default has occurred. If no default occurs, the Fund would have spent the stream of payments and received no benefit from the contract. When a Fund is the seller of a credit default swap contract, it receives the stream of payments, but is obligated to pay upon default of the referenced debt obligation. As the seller, the Fund would effectively add leverage to its portfolio because, in addition to its total net assets, the Fund would be subject to investment exposure on the notional amount of the swap. During the period that the credit default swap contract is open, the contract is marked to market in accordance with the terms of the contract based on the current interest rate spreads and credit risk of the referred obligation of the underlying issuer and interest accrual through valuation date. Changes in the value of credit default swap contracts are recorded as unrealized ga ins or losses and periodic cash settlements are recorded as realized gains or losses. The Fund will segregate assets in the form of cash and cash equivalents in an amount equal to the aggregate market value of the credit default swaps of which it is the seller, marked to market on a daily basis. These transactions involve certain risks, including the risk that the seller may be unable to fulfill the transaction.
A summary of open swap agreements for the Strategic Bond Fund and Strategic Balanced Fund at June 30, 2007, is as follows:
| Strategic Bond Fund | |
Notional
Amount | | Expiration
Date | | Description | | Net Unrealized
Appreciation
(Depreciation) | |
| Credit Default Swaps | |
| | 1,000,000 | USD | | 06/20/12 | | Agreement with Barclays Capital Inc dated 4/26/07 | | $ | (33,044 | ) | |
| | | | | | | to receive 1.87% per year times the notional amount. | | |
| | |
| | | | | | | The Fund pays payment only upon a default event of | | |
| | |
| | | | | | | The AES Corporation. | | | | | |
| | 1,000,000 | USD | | 06/20/12 | | Agreement with Barclays Capital Inc dated 4/26/07
to receive 2.62% per year times the notional amount.
The Fund makes payment only upon a default event
of HCA INC. SR Note. | | | (23,258 | ) | |
| | 1,000,000 | USD | | 06/20/12 | | Agreement with Barclays Capital Inc dated 4/26/07
to receive 1.75% per year times the notional amount.
The Fund makes payment only upon a default event
of The Eastman Kodak Company Note. | | | (16,854 | ) | |
| | 1,000,000 | USD | | 06/20/12 | | Agreement with Barclays Capital Inc dated 4/26/07
to receive .95% per year times the notional amount.
The Fund makes payment only upon a default event
of El Paso Corporation. | | | (16,214 | ) | |
| | 2,000,000 | USD | | 06/20/12 | | Agreement with Morgan Stanley & Co Inc dated
4/26/07 to receive 2.92% per year times the notional
amount. The Fund makes payment only upon a
default event of Ford Motor Credit Company Note. | | | (1,737 | ) | |
| | 8,400,000 | USD | | 06/20/12 | | Agreement with Morgan Stanley & Co Inc dated
6/25/07 to receive .75% per year times the notional
amount. The Fund makes payment only upon a
default event of CDX.NA.IG.HVOL.8. | | | (99,264) | | |
| | 2,100,000 | USD | | 06/20/12 | | Agreement with Goldman Sachs Group Inc. dated
6/26/07 to receive 2.75% per year times the notional
amount. The Fund makes payment only upon a
default event of CDX.NA.HY.8. | | | (47,761 | ) | |
| | 100,000 | USD | | 06/20/12 | | Agreement with Goldman Sachs Group Inc. dated
6/29/07 to receive 3.24% per year times the notional
amount. The Fund makes payment only upon a
default event of TXU CORP. | | | (118 | ) | |
| | | $ | (238,250 | ) | |
324
Notes to Financial Statements (Unaudited) (Continued)
| Strategic Balanced Fund | |
Notional
Amount | | Expiration
Date | | Description | | Net Unrealized
Appreciation
(Depreciation) | |
| Credit Default Swaps | |
| | 100,000 | USD | | 03/20/15 | | Agreement with Deutsche Bank AG dated 2/01/05 | | $ | (13,761 | ) | |
| | | | | | | to receive 2.93% per year times the notional amount. | | |
| | |
| | | | | | | The Fund makes payment only upon a default event | | |
| | |
| | | | | | | of Ford Motor Company Note. | | | | | |
| | 100,000 | USD | | 03/20/10 | | Agreement with Deutsche Bank AG dated 2/3/05 to
receive 1.25% per year times the notional amount.
The Fund makes payment only upon a default event
of Eastman Kodak Company Debt Obligation. | | | 33 | | |
| | 45,000 | USD | | 01/25/35 | | Agreement with Deutsche Bank AG dated 2/19/05
to pay 1.30% per year times the notional amount. The
Fund receives payment only upon a default event of
Morgan Stanley Capital I Trust, Series 2005-WMC1,
Class B2. | | | 3,192 | | |
| | 45,000 | USD | | 09/25/35 | | Agreement with Deutsche Bank AG dated 2/19/05
to pay 1.30% per year times the notional amount.
The Fund receives payment only upon a default
event of Merrill Lynch Mortgage Investors, Inc.,
Series 2005-WMC1, Class B2. | | | 3,815 | | |
| | 45,000 | USD | | 02/25/35 | | Agreement with Deutsche Bank AG dated 2/19/05
to pay 1.25% per year times the notional amount.
The Fund receives payment only upon a default
event of Long Beach Mortgage Loan Trust
Series 2005-1, Class M9. | | | 3,161 | | |
| | 45,000 | USD | | 01/25/35 | | Agreement with Deutsche Bank AG dated 2/19/05 to
pay 2.25% per year times the notional amount. The
Fund receives payment only upon a default event of
Morgan Stanley Capital I, Series 2005-WMC1,
Class B3. | | | 6,150 | | |
| | 45,000 | USD | | 03/25/35 | | Agreement with Deutsche Bank AG dated 2/19/05 to
pay 2.25% per year times the notional amount. The
Fund receives payment only upon a default event of
New Century Home Equity Loan Trust,
Series 2005-1, Class M9. | | | 3,834 | | |
| | 45,000 | USD | | 06/25/35 | | Agreement with Deutsche Bank AG dated 2/19/05 to
pay 1.35% per year times the notional amount. The
Fund receives payment only upon a default event of
Novastar Home Equity Loan Trust, Series 2005-1,
Class B2. | | | 3,164 | | |
| | 45,000 | USD | | 06/25/35 | | Agreement with Deutsche Bank AG dated 2/19/05 to
pay 2.25% per year times the notional amount. The
Fund receives payment only upon a default event of
Novastar Home Equity Loan Trust, Series 2005-1,
Class B3. | | | 4,169 | | |
| | 45,000 | USD | | 02/25/35 | | Agreement with Deutsche Bank AG dated 2/19/05 to
pay 1.30% per year times the notional amount. The
Fund receives payment only upon a default event of
ACE Securities Corp., Series 2005-HE1, Class M8. | | | 3,671 | | |
| | 45,000 | USD | | 11/25/34 | | Agreement with Deutsche Bank AG dated 2/19/05 to
pay 1.40% per year times the notional amount. The
Fund receives payment only upon a default event of
Finance America Mortgage Loan, Series 2004-3,
Class M8. | | | 3,494 | | |
325
Notes to Financial Statements (Unaudited) (Continued)
Notional
Amount | | Expiration
Date | | Description | | Net Unrealized
Appreciation
(Depreciation) | |
| Credit Default Swaps (continued) | |
| | 45,000 | USD | | 01/25/36 | | Agreement with Deutsche Bank AG dated 2/19/05 to | | $ | 6,487 | | |
| | | | | | | pay 2.25% per year times the notional amount. The | | |
| | |
| | | | | | | Fund receives payment only upon a default event of | | |
| | |
| | | | | | | Park Place Securities, Inc., Series 2005-WCH1, | | |
| | |
| | | | | | | Class M9. | | | | | |
| | 45,000 | USD | | 02/25/35 | | Agreement with Deutsche Bank AG dated 2/19/05 to
pay 2.20% per year times the notional amount. The
Fund receives payment only upon a default event of
ACE Securities Corp., Series 2005-HE1, Class M9. | | | 4,556 | | |
| | 45,000 | USD | | 11/25/34 | | Agreement with Deutsche Bank AG dated 2/19/05 to
pay 1.40% per year times the notional amount. The
Fund receives payment only upon a default event of
Argent Securities, Inc., Series 2004-W11, Class M9. | | | 1,923 | | |
| | 45,000 | USD | | 11/25/34 | | Agreement with Deutsche Bank AG dated 2/19/05 to
pay 2.25% per year times the notional amount. The
Fund receives payment only upon a default event of
Finance America Mortgage Loan, Series 2004-3,
Class M8. | | | 2,349 | | |
| | 45,000 | USD | | 02/25/35 | | Agreement with Deutsche Bank AG dated 2/19/05 to
pay 2.25% per year times the notional amount. The
Fund receives payment only upon a default event of
Long Beach Mortgage Loan Trust, Series 2005-1,
Class M9. | | | 5,728 | | |
| | 45,000 | USD | | 12/25/34 | | Agreement with Deutsche Bank AG dated 2/19/05 to
pay 1.25% per year times the notional amount. The
Fund receives payment only upon a default event of
MASTR Asset Backed Securities, Series 2005-NC1,
Class M8. | | | 3,582 | | |
| | 45,000 | USD | | 12/25/34 | | Agreement with Deutsche Bank AG dated 2/19/05 to
pay 2.20% per year times the notional amount. The
Fund receives payment only upon a default event of
MASTR Asset Backed Securities, Series 2005-NC1,
Class M9. | | | 4,482 | | |
| | 45,000 | USD | | 11/25/34 | | Agreement with Deutsche Bank AG dated 2/19/05 to
pay 2.25% per year times the notional amount. The
Fund receives payment only upon a default event of
Argent Securities, Inc., Series 2004-W11, Class M10. | | | 4,311 | | |
| | 45,000 | USD | | 03/25/35 | | Agreement with Deutsche Bank AG dated 2/19/05 to
pay 1.45% per year times the notional amount. The
Fund receives payment only upon a default event of
Aegis Asset Backed Securities Trust, Series 2005-1,
Class B2. | | | 4,453 | | |
| | 45,000 | USD | | 03/25/35 | | Agreement with Deutsche Bank AG dated 2/19/05 to
pay 2.25% per year times the notional amount. The
Fund receives payment only upon a default event of
Aegis Asset Backed Securities Trust, Series 2005-1,
Class B3. | | | 7,403 | | |
| | 45,000 | USD | | 02/25/35 | | Agreement with Deutsche Bank AG dated 2/19/05 to
pay 1.25% per year times the notional amount. The
Fund receives payment only upon a default event of
Fremont Home Loan Trust, Series 2005-A, Class M9. | | | 4,439 | | |
326
Notes to Financial Statements (Unaudited) (Continued)
Notional
Amount | | Expiration
Date | | Description | | Net Unrealized
Appreciation
(Depreciation) | |
| Credit Default Swaps (continued) | |
| | 45,000 | USD | | 04/25/35 | | Agreement with Deutsche Bank AG dated 2/19/05 to | | $ | 2,586 | | |
| | | | | | | pay 1.45% per year times the notional amount. The | | |
| | |
| | | | | | | Fund receives payment only upon a default event of | | |
| | |
| | | | | | | Aames Mortgage Investment Trust, Series 2005-1, | | |
| | |
| | | | | | | Class M8. | | | | | |
| | 45,000 | USD | | 02/25/35 | | Agreement with Deutsche Bank AG dated 2/19/05 to
pay 2.20% per year times the notional amount. The
Fund receives payment only upon a default event of
Fremont Home Loan Trust, Series 2005-A, Class M9. | | | 5,310 | | |
| | 45,000 | USD | | 01/25/35 | | Agreement with Deutsche Bank AG dated 2/19/05 to
pay 2.25% per year times the notional amount. The
Fund receives payment only upon a default event of
People's Choice Home Loan Securities Trust,
Series 2005-1, Class B3. | | | 3,877 | | |
| | 45,000 | USD | | 04/25/35 | | Agreement with Deutsche Bank AG dated 2/19/05 to
pay 2.25% per year times the notional amount. The
Fund receives payment only upon a default event of
Aames Mortgage Investment Trust, Series 2005-1,
Class M9. | | | 3,359 | | |
| | 45,000 | USD | | 10/25/35 | | Agreement with Deutsche Bank AG dated 2/19/05 to
pay 2.25% per year times the notional amount. The
Fund receives payment only upon a default event of
Merrill Lynch Mortgage Investors, Series 2005-NC1,
Class B3. | | | 5,043 | | |
| | 45,000 | USD | | 10/25/35 | | Agreement with Deutsche Bank AG dated 2/19/05 to
pay 1.30% per year times the notional amount. The
Fund receives payment only upon a default event of
Merrill Lynch Mortgage Investors, Series 2005-NC1,
Class B2. | | | 2,553 | | |
| | 45,000 | USD | | 09/25/35 | | Agreement with Deutsche Bank AG dated 2/19/05
to pay 2.25% per year times the notional amount.
The Fund receives payment only upon a default
event of Merrill Lynch Mortgage Investors,
Series 2005-WMC1, Class B3. | | | 1,229 | | |
| | 45,000 | USD | | 01/25/35 | | Agreement with Deutsche Bank AG dated 2/19/05 to
pay 1.40% per year times the notional amount. The
Fund receives payment only upon a default event of
People's Choice Home Loan Securities Trust,
Series 2005-1, Class B2. | | | 4,967 | | |
| | 45,000 | USD | | 03/25/35 | | Agreement with Deutsche Bank AG dated 2/19/05 to
pay 1.30% per year times the notional amount. The
Fund receives payment only upon a default event of
New Century Home Equity Loan Trust, Series 2005-1,
Class M8. | | | 2,324 | | |
| | 45,000 | USD | | 01/25/36 | | Agreement with Deutsche Bank AG dated 2/19/05 to
pay 1.35% per year times the notional amount. The
Fund receives payment only upon a default event of
Park Place Securities, Inc., Series 2005-WCH1,
Class M8. | | | 4,302 | | |
| | 114,545 | USD | | 12/20/09 | | Agreement with Goldman Sachs dated 7/09/04 to
receive 4.00% per year times the notional amount.
The Fund makes payment only upon a default event of
an entity within the CDX.NA.HY.3 B IBOXX Index. | | | 6,957 | | |
327
Notes to Financial Statements (Unaudited) (Continued)
Notional
Amount | | Expiration
Date | | Description | | Net Unrealized
Appreciation
(Depreciation) | |
| Credit Default Swaps (continued) | |
| | 100,000 | USD | | 06/20/10 | | Agreement with Goldman Sachs dated 5/04/05 to | | $ | 5,967 | | |
| | | | | | | receive 4.75% per year times the notional amount. | | |
| | |
| | | | | | | The Fund makes payment only upon a default event | | |
| | |
| | | | | | | of Ford Motor Credit Company Note. | | | | | |
| | 400,000 | USD | | 12/20/09 | | Agreement with Deutsche Bank AG dated 11/02/04
to receive 0.215% per year times the notional
amount. The Fund makes payment only upon a
default event of FNMA Senior Debt.. | | | 1,516 | | |
| | 60,000 | USD | | 09/20/10 | | Agreement with Deutsche Bank AG dated 7/28/05 to
receive 2.30% per year times the notional amount.
The Fund makes payment only upon a default event
of Eastman Kodak Company. | | | 1,646 | | |
| | 2,600,000 | USD | | 06/20/12 | | Agreement with Morgan Stanley & Co Inc dated
6/25/07 to receives .75% per year times the notional
amount. The Fund makes payment only upon a
default event of CDX.NA.IG.HVOL.8. | | | (30,725 | ) | |
| Interest Rate Swaps | |
| | 4,170,000 | USD | | 01/10/08 | | Agreement with Deutsche Bank AG dated 1/10/05 to
receive the notional amount multiplied by 3.754%
and to pay the notional amount multiplied by the
3 month Floating Rate LIBOR. | | | (37,398 | ) | |
| | 2,510,000 | USD | | 06/17/10 | | Agreement with Deutsche Bank AG dated 6/17/05 to
receive the notional amount multiplied by 4.313%
and to pay the notional amount multiplied by the
3 month Floating Rate LIBOR. | | | (73,800 | ) | |
| | | $ | (19,652 | ) | |
Allocation of Operating Activity
In maintaining the records for the Funds, the income and expense accounts are allocated to each class of shares. Investment income, unrealized and realized gains or losses are prorated among the classes of shares based on the relative net assets of each. Expenses are allocated to each class of shares depending on the nature of the expenditures. Administration and service fees, which are directly attributable to a class of shares, are charged to that class' operations. Expenses of the Fund not directly attributable to the operations of any class of shares or Fund are prorated among the Funds and classes to which the expense relates based on the relative net assets of each.
In addition, the Destination Retirement Income Fund, Destination Retirement 2010 Fund, Destination Retirement 2020 Fund, Destination Retirement 2030 Fund and Destination Retirement 2040 Fund will also incur certain fees and expenses indirectly as a shareholder in the underlying funds. Because the underlying funds have varied expense and fee levels and each Fund may own different proportions of underlying funds at different times, the amount of fees and expenses indirectly incurred by each Fund will vary.
Foreign Securities
The Diversified International Fund and Overseas Fund invest substantially all of their assets in foreign securities. The other Funds may also invest in foreign securities, subject to certain percentage restrictions. Investing in securities of foreign companies and foreign governments involves special risks and considerations not typically associated with investing in securities of U.S. companies and the U.S. Government. These risks include revaluation of currencies and future adverse political and economic developments. Moreover, securities of many foreign companies and foreign governments and their markets may be less liquid and their prices more volatile than those of securities of comparable U.S. companies and the U.S. Government.
328
Notes to Financial Statements (Unaudited) (Continued)
3. Management
Fees and Other
Transactions
Investment Management Fees
Under agreements between the Trust and Massachusetts Mutual Life Insurance Company ("MassMutual") on behalf of each Fund, MassMutual is responsible for providing investment management services for each Fund. In return for this service, MassMutual receives advisory fees monthly based upon each Fund's average daily net assets at the following annual rates:
| Strategic Bond Fund | | | 0.55 | % | |
| Strategic Balanced Fund | | | 0.60 | % | |
| Diversified Value Fund | | | 0.50 | % | |
| Fundamental Value Fund | | | 0.65 | % | |
| Value Equity Fund | | | 0.70 | % | |
| Large Cap Value Fund | | | 0.65 | % | |
| Indexed Equity Fund | | | 0.10 | % | |
| Core Opportunities Fund | | | 0.70 | % | |
| Blue Chip Growth Fund | | | 0.70 | % | |
| Large Cap Growth Fund | | | 0.65 | % | |
| Growth Equity Fund | | | 0.68 | % | |
| Aggressive Growth Fund | | | 0.73 | % | |
| OTC 100 Fund | | | 0.15 | % | |
| Focused Value Fund | | | 0.69 | % | |
| Mid-Cap Value Fund | | | 0.70 | % | |
| Small Cap Value Equity | | | 0.75 | % | |
| Small Company Value Fund | | | 0.85 | % | |
| Small Cap Core Equity Fund | | | 0.75 | % | |
| Mid Cap Growth Equity Fund | | | 0.70 | % | |
| Mid Cap Growth Equity II Fund | | | 0.75 | % | |
| Small Cap Growth Equity Fund | | | 0.82 | % | |
| Small Company Growth Fund | | | 0.85 | % | |
| Emerging Growth Fund | | | 0.79 | % | |
| Diversified International Fund | | | 0.90 | % | |
| Overseas Fund | | | 1.00 | % | |
| Destination Retirement Income Fund | | | 0.05 | % | |
| Destination Retirement 2010 Fund | | | 0.05 | % | |
| Destination Retirement 2020 Fund | | | 0.05 | % | |
| Destination Retirement 2030 Fund | | | 0.05 | % | |
| Destination Retirement 2040 Fund | | | 0.05 | % | |
MassMutual has also entered into investment sub-advisory agreements with the following unaffiliated investment sub-advisers: AllianceBernstein L.P. for the Diversified Value Fund, the Large Cap Growth Fund and the Diversified International Fund; Wellington Management Company, LLP for the Fundamental Value Fund and a portion of the Small Cap Growth Equity Fund; Fidelity Management & Research Company for the Value Equity Fund; Davis Selected Advisers, L.P. for the Large Cap Value Fund; Northern Trust Investments, N.A. for the Indexed Equity Fund and the OTC 100 Fund; Grantham, Mayo, Van Otterloo & Co. LLC for the Growth Equity Fund; Sands Capital Management, LLC for a portion of the Aggressive Growth Fund; Cooke & Bieler, L.P. for the Mid-Cap Value Fund and a portion of the Focused Value Fund; Harris Associates, L.P. for a portion of the Focused Value Fund and a portion of the Overseas Fund; Clover Capital Management, Inc. for a po rtion of the Small Company Value Fund; EARNEST Partners, LLC for a portion of the Small Company Value Fund; Navellier & Associates, Inc. for the Mid Cap Growth Equity Fund; T. Rowe Price Associates, Inc. for the Blue Chip Growth Fund, the Mid Cap Growth Equity II Fund and a portion of the Small Company Value Fund; Waddell & Reed Investment Management Company for a portion of the Small Cap Growth Equity Fund; Mazama Capital Management, Inc. for a portion of the Small Company Growth Fund; Eagle Asset Management, Inc. for a portion of the Small Company Growth Fund; Delaware Management Company for a portion of the Emerging Growth Fund and a portion of the Aggressive Growth Fund; Insight Capital Research & Management, Inc. for a portion of the Emerging Growth Fund; Massachusetts Financial Services Company for a portion of the Overseas Fund; Western Asset Management Company for a portion of the Strategic Bond Fund and a portion of the Strategic Balanced Fund; Western Asset Management Company Limited fo r a portion of the Strategic Bond Fund and a portion of the Strategic Balanced Fund; Clear Bridge Advisors, LLC for a portion of the Strategic Balanced Fund; Victory Capital Management, Inc. for the Core Opportunities Fund; SSgA Funds Management, Inc. for the Small Cap Value Equity Fund; and Goldman Sachs Asset Management, L.P. for the Small Cap Core Equity Fund. MassMutual pays a sub-advisory fee to each of these sub-advisers based upon the aggregate net assets under management which include (1) the average daily net assets of the specified Fund which it manages, and (2) the average daily net assets of all other funds or
329
Notes to Financial Statements (Unaudited) (Continued)
accounts of MassMutual or its affiliates for which the sub-adviser provides sub-advisory services and which have substantially the same investment objective, policies and investment strategies.
The Fund sub-adviser fees are paid out of the management fees previously disclosed above.
Administration Fees
Under separate administrative and shareholder services agreements between each Fund and MassMutual, MassMutual provides certain administrative and shareholder services and bears some class specific administrative expenses. In return for these services, MassMutual receives an administrative services fee monthly based upon the average daily net assets of the applicable class of shares of the Funds at the following annual rates:
| | | Class A | | Class L | | Class Y | | Class S | | Class Z | | Class N | |
| Strategic Bond Fund | | | 0.2500 | % | | | 0.2500 | % | | | 0.1000 | % | | | 0.0500 | % | | N/A | | | 0.3000 | % | |
| Strategic Balanced Fund | | | 0.3270 | % | | | 0.3270 | % | | | 0.1770 | % | | | 0.1270 | % | | N/A | | | 0.3770 | % | |
| Diversified Value Fund | | | 0.3083 | % | | | 0.2683 | % | | | 0.1583 | % | | | 0.0583 | % | | N/A | | | 0.3683 | % | |
| Fundamental Value Fund | | | 0.3129 | % | | | 0.3129 | % | | | 0.1629 | % | | | 0.1229 | % | | N/A | | | 0.3629 | % | |
| Value Equity Fund | | | 0.2785 | % | | | 0.2785 | % | | | 0.1285 | % | | | 0.0785 | % | | N/A | | | 0.3285 | % | |
| Large Cap Value Fund | | | 0.3244 | % | | | 0.3244 | % | | | 0.1744 | % | | | 0.0844 | % | | N/A | | | 0.3744 | % | |
| Indexed Equity Fund | | | 0.4797 | % | | | 0.4797 | % | | | 0.3297 | % | | | 0.2997 | % | | | 0.0855 | % | | | 0.5297 | % | |
| Core Opportunities Fund | | | 0.3000 | % | | | 0.3000 | % | | | 0.1500 | % | | | 0.0500 | % | | N/A | | | 0.3500 | % | |
| Blue Chip Growth Fund | | | 0.4085 | % | | | 0.4085 | % | | | 0.2885 | % | | | 0.1585 | % | | N/A | | | 0.4585 | % | |
| Large Cap Growth Fund | | | 0.3529 | % | | | 0.3529 | % | | | 0.2029 | % | | | 0.1629 | % | | N/A | | | 0.4029 | % | |
| Growth Equity Fund | | | 0.2975 | % | | | 0.2975 | % | | | 0.1475 | % | | | 0.0875 | % | | N/A | | | 0.3475 | % | |
| Aggressive Growth Fund | | | 0.3444 | % | | | 0.3444 | % | | | 0.1944 | % | | | 0.0944 | % | | N/A | | | 0.3944 | % | |
| OTC 100 Fund | | | 0.6244 | % | | | 0.6244 | % | | | 0.4744 | % | | | 0.3744 | % | | N/A | | | 0.6744 | % | |
| Focused Value Fund | | | 0.3344 | % | | | 0.3344 | % | | | 0.1844 | % | | | 0.0844 | % | | N/A | | | 0.3844 | % | |
| Mid-Cap Value Fund | | | 0.3000 | % | | | 0.3000 | % | | | 0.1500 | % | | | 0.0500 | % | | N/A | | | 0.3500 | % | |
| Small Cap Value Equity Fund | | | 0.3000 | % | | | 0.3000 | % | | | 0.1500 | % | | | 0.0500 | % | | N/A | | | 0.3500 | % | |
| Small Company Value Fund | | | 0.3593 | % | | | 0.3593 | % | | | 0.2093 | % | | | 0.1693 | % | | N/A | | | 0.4093 | % | |
| Small Cap Core Equity | | | 0.3000 | % | | | 0.3000 | % | | | 0.1500 | % | | | 0.0500 | % | | N/A | | | 0.3500 | % | |
| Mid Cap Growth Equity Fund | | | 0.3075 | % | | | 0.3075 | % | | | 0.1575 | % | | | 0.0875 | % | | N/A | | | 0.3575 | % | |
| Mid Cap Growth Equity II Fund | | | 0.3244 | % | | | 0.3244 | % | | | 0.1744 | % | | | 0.0844 | % | | N/A | | | 0.3744 | % | |
| Small Cap Growth Equity Fund | | | 0.4075 | % | | | 0.4075 | % | | | 0.2575 | % | | | 0.1175 | % | | N/A | | | 0.4575 | % | |
| Small Company Growth Fund | | | 0.3491 | % | | | 0.3491 | % | | | 0.1991 | % | | | 0.1591 | % | | N/A | | | 0.3991 | % | |
| Emerging Growth Fund | | | 0.3344 | % | | | 0.3344 | % | | | 0.1844 | % | | | 0.0844 | % | | N/A | | | 0.3844 | % | |
| Diversified International Fund | | | 0.3000 | % | | | 0.3000 | % | | | 0.1500 | % | | | 0.0500 | % | | N/A | | | 0.3500 | % | |
| Overseas Fund | | | 0.2443 | % | | | 0.2443 | % | | | 0.0943 | % | | | 0.0443 | % | | N/A | | | 0.2943 | % | |
| Destination Retirement Income Fund | | | 0.1459 | % | | | 0.1459 | % | | | 0.0459 | % | | | 0.0200 | % | | N/A | | | 0.1959 | % | |
| Destination Retirement 2010 Fund | | | 0.1696 | % | | | 0.1696 | % | | | 0.0696 | % | | | 0.0196 | % | | N/A | | | 0.2196 | % | |
| Destination Retirement 2020 Fund | | | 0.1758 | % | | | 0.1758 | % | | | 0.0758 | % | | | 0.0258 | % | | N/A | | | 0.2258 | % | |
| Destination Retirement 2030 Fund | | | 0.1733 | % | | | 0.1733 | % | | | 0.0733 | % | | | 0.0233 | % | | N/A | | | 0.2233 | % | |
| Destination Retirement 2040 Fund | | | 0.1616 | % | | | 0.1616 | % | | | 0.0616 | % | | | 0.0116 | % | | N/A | | | 0.2116 | % | |
Distribution and Service Fees
MML Distributors, LLC (the "Distributor") acts as distributor to each Fund. Pursuant to separate 12b-1 Plans adopted by the Funds, Class A shares of each Fund pay an annual fee of 0.25% of the average daily net asset value of the Class A shares to: (i) the Distributor for services provided and expenses incurred by its connection with the distribution of Class A shares of the Fund; and (ii) MassMutual for services provided and expenses incurred by it for purposes of maintaining or providing personal services to Class A shareholders. Pursuant to separate 12b-1 Plans adopted by the Funds, Class N shares of each Fund pay an annual fee of 0.50% of the average daily net asset value of the Class N shares as follows: 0.25% of the average daily net a sset value of the Class N shares to the Distributor for services provided and expenses incurred by its connection with the distribution of Class N shares of the Fund;
330
Notes to Financial Statements (Unaudited) (Continued)
and 0.25% of the average daily net asset value of the Class N shares to MassMutual for services provided and expenses incurred by it for purposes of maintaining or providing personal services to Class N shareholders. The Distribution fee may be spent by the Distributor on any activities or expenses primarily intended to result in the sale of Class A or Class N shares of the Fund. The Servicing Fee may be spent by MassMutual on personal services rendered to Class A or Class N shareholders of a Fund and/or maintenance of Class A or Class N shareholder accounts. The Distributor is a majority owned subsidiary of MassMutual. In addition, OppenheimerFunds Distributor, Inc. (the "Sub-Distributor") acts as a sub-distributor to each Fund. The Sub-Distributor is an affiliate of the Distributor and an indirect majority owned subsidiary of MassMutual.
Indirect Expenses
The Destination Retirement Income Fund, Destination Retirement 2010 Fund, Destination Retirement 2020 Fund, Destination Retirement 2030 Fund and Destination Retirement 2040 Fund incur fees and expenses indirectly as shareholders in the underlying funds. For the the six months ended June 30, 2007, these expenses were as follows:
| | | Indirect
Operating
Expenses | |
| Destination Retirement Income Fund | | | 0.65 | % | |
| Destination Retirement 2010 Fund | | | 0.67 | % | |
| Destination Retirement 2020 Fund | | | 0.73 | % | |
| Destination Retirement 2030 Fund | | | 0.80 | % | |
| Destination Retirement 2040 Fund | | | 0.83 | % | |
Expense Caps and Waivers
MassMutual agreed to cap the fees and expenses of the following Funds through March 31, 2008, unless otherwise noted, as follows:
| | | Class A | | Class L | | Class Y | | Class S | | Class N | |
| Strategic Bond Fund | | | 1.00 | % | | | 0.75 | % | | | 0.75 | % | | | 0.70 | % | | | 1.30 | % | |
| Strategic Balanced Fund* | | | 1.21 | % | | | 0.96 | % | | | 0.81 | % | | | 0.76 | % | | | 1.51 | % | |
| Core Opportunities Fund | | | 1.35 | % | | | 1.10 | % | | | 0.95 | % | | | 0.90 | % | | | 1.65 | % | |
| Mid-Cap Value Fund | | | 1.38 | % | | | 1.13 | % | | | 0.98 | % | | | 0.88 | % | | | 1.68 | % | |
| Small Cap Value Equity Fund | | | 1.40 | % | | | 1.15 | % | | | 1.00 | % | | | 0.95 | % | | | 1.70 | % | |
| Small Cap Core Equity Fund | | | 1.40 | % | | | 1.15 | % | | | 1.00 | % | | | 0.95 | % | | | 1.70 | % | |
| Diversified International Fund | | | 1.42 | % | | | 1.17 | % | | | 1.09 | % | | | 0.99 | % | | | 1.72 | % | |
| Destination Retirement Income Fund* | | | 0.50 | % | | | 0.25 | % | | | 0.15 | % | | | 0.12 | % | | | 0.80 | % | |
| Destination Retirement 2010 Fund* | | | 0.50 | % | | | 0.25 | % | | | 0.15 | % | | | 0.10 | % | | | 0.80 | % | |
| Destination Retirement 2020 Fund* | | | 0.50 | % | | | 0.25 | % | | | 0.15 | % | | | 0.10 | % | | | 0.80 | % | |
| Destination Retirement 2030 Fund* | | | 0.50 | % | | | 0.25 | % | | | 0.15 | % | | | 0.10 | % | | | 0.80 | % | |
| Destination Retirement 2040 Fund* | | | 0.50 | % | | | 0.25 | % | | | 0.15 | % | | | 0.10 | % | | | 0.80 | % | |
* Expense Caps in effect through March 31, 2007
MassMutual has agreed to voluntarily waive, through March 31, 2008, 0.20% of certain expenses for Classes A, L and N of the Indexed Equity Fund and 0.10% of certain expenses for Classes A, L and N of the Overseas Fund. MassMutual has also agreed to voluntarily waive, through March 31, 2008, 0.10% of the management fees for each class of the Blue Chip Growth Fund.
Rebated Brokerage Commissions
The Strategic Balanced Fund, Fundamental Value Fund, Large Cap Value Fund, Core Opportunities Fund, Blue Chip Growth Fund, Large Cap Growth Fund, Aggressive Growth Fund, Focused Value Fund, Mid-Cap Value Fund, Small Company Value Fund, Mid Cap Growth Equity Fund, Mid Cap Growth Equity II Fund, Small Cap Growth Equity Fund, and Small Company Growth Fund, have entered into agreements with certain brokers whereby the brokers will rebate, in cash, a portion of brokerage
331
Notes to Financial Statements (Unaudited) (Continued)
commissions. For the the six months ended June 30, 2007, brokerage commissions rebated under these agreements are as follows:
| | | Commissions | |
| Strategic Balanced Fund | | $ | 3,163 | | |
| Fundamental Value Fund | | | 28,491 | | |
| Large Cap Value Fund | | | 54,857 | | |
| Core Opportunities Fund | | | 10,310 | | |
| Blue Chip Growth Fund | | | 9,023 | | |
| Large Cap Growth Fund | | | 4,038 | | |
| Aggressive Growth Fund | | | 11,488 | | |
| Focused Value Fund | | | 90,966 | | |
| Mid-Cap Value Fund | | | 96,979 | | |
| Small Company Value Fund | | | 135,989 | | |
| Mid Cap Growth Equity Fund | | | 17,102 | | |
| Mid Cap Growth Equity II Fund | | | 15,348 | | |
| Small Cap Growth Equity Fund | | | 89,113 | | |
| Small Company Growth Fund | | | 39,983 | | |
Other
Certain officers and trustees of the Funds are also officers of MassMutual. The compensation of each trustee who is not an officer of MassMutual is borne by the Funds.
The following table shows certain concentrations of principal shareholders of each Fund with record or Beneficial ownership as of June 30, 2007. Investment activities of these shareholders could have a material effect on the respective Funds.
| | | Shareholders
Holding in Excess of
10% of Fund's
Outstanding Shares
("Principal Shareholders") | | Total % owned
by Principal
Shareholders | | Total %
Ownership by
Related Party | |
| Strategic Bond Fund | | | 3 | | | | 94.9 | % | | | 88.1 | % | |
| Strategic Balanced Fund | | | 3 | | | | 92.4 | % | | | 81.7 | % | |
| Diversified Value Fund | | | 4 | | | | 85.2 | % | | | 51.0 | % | |
| Fundamental Value Fund | | | 1 | | | | 56.8 | % | | | 56.8 | % | |
| Value Equity Fund | | | 2 | | | | 95.4 | % | | | 95.4 | % | |
| Large Cap Value Fund | | | 2 | | | | 80.0 | % | | | 78.7 | % | |
| Indexed Equity Fund | | | 2 | | | | 80.5 | % | | | 72.8 | % | |
| Core Opportunities Fund | | | 3 | | | | 95.8 | % | | | 83.7 | % | |
| Blue Chip Growth Fund | | | 4 | | | | 79.9 | % | | | 79.9 | % | |
| Large Cap Growth Fund | | | 2 | | | | 91.7 | % | | | 91.7 | % | |
| Growth Equity Fund | | | 6 | | | | 83.0 | % | | | 66.0 | % | |
| Aggressive Growth Fund | | | 4 | | | | 80.5 | % | | | 77.8 | % | |
| OTC 100 Fund | | | 2 | | | | 92.9 | % | | | 92.9 | % | |
| Focused Value Fund | | | 2 | | | | 85.8 | % | | | 80.6 | % | |
| Mid-Cap Value Fund | | | 6 | | | | 87.0 | % | | | 85.3 | % | |
| Small Cap Value Equity Fund | | | 3 | | | | 76.9 | % | | | 76.9 | % | |
| Small Company Value Fund | | | 2 | | | | 88.4 | % | | | 79.3 | % | |
| Small Cap Core Equity Fund | | | 6 | | | | 80.0 | % | | | 78.6 | % | |
| Mid Cap Growth Equity Fund | | | 4 | | | | 98.2 | % | | | 98.2 | % | |
| Mid Cap Growth Equity II Fund | | | 2 | | | | 64.9 | % | | | 54.1 | % | |
| Small Cap Growth Equity Fund | | | 3 | | | | 90.8 | % | | | 88.6 | % | |
| Small Company Growth Fund | | | 2 | | | | 83.6 | % | | | 83.6 | % | |
| Emerging Growth Fund | | | 5 | | | | 84.2 | % | | | 84.2 | % | |
332
Notes to Financial Statements (Unaudited) (Continued)
| | | Shareholders
Holding in Excess of
10% of Fund's
Outstanding Shares
("Principal Shareholders") | | Total % owned
by Principal
Shareholders | | Total %
Ownership by
Related Party | |
| Diversified International Fund | | | 6 | | | | 83.7 | % | | | 83.7 | % | |
| Overseas Fund | | | 2 | | | | 76.4 | % | | | 76.4 | % | |
| Destination Retirement Income Fund | | | 3 | | | | 89.3 | % | | | 52.7 | % | |
| Destination Retirement 2010 Fund | | | 3 | | | | 81.5 | % | | | 66.7 | % | |
| Destination Retirement 2020 Fund | | | 3 | | | | 84.3 | % | | | 77.1 | % | |
| Destination Retirement 2030 Fund | | | 3 | | | | 88.4 | % | | | 77.8 | % | |
| Destination Retirement 2040 Fund | | | 3 | | | | 96.0 | % | | | 78.6 | % | |
Principal shareholders hold 10% or more of shares outstanding.
Deferred Compensation
Trustees of the Funds who are not employees of MassMutual or its subsidiaries may elect to defer receipt of their annual fees in accordance with terms of the Non-Qualified Deferred Compensation Plan. Any amounts deferred shall accrue interest at a rate equal to eight percent (8%) per annum
For the the six months ended June 30, 2007, no significant amounts have been deferred.
4. Purchases and Sales of Investments
Cost of purchases and proceeds from sales of investment securities (excluding short-term investments) for the the six months ended June 30, 2007, were as follows:
| | | | | Long -Term U.S.
Government Securities | | Other Long -Term
Securities | |
| Purchases | | Strategic Bond Fund | | $ | 587,593,149 | | | $ | 85,931,452 | | |
| | | Strategic Balanced Fund | | | 149,608,475 | | | | 33,848,332 | | |
| | | Diversified Value Fund | | | | | 161,311,617 | | |
| | | Fundamental Value Fund | | | | | 201,796,724 | | |
| | | Value Equity Fund | | | | | 62,424,599 | | |
| | | Large Cap Value Fund | | | | | 60,421,130 | | |
| | | Indexed Equity Fund | | | | | 90,851,427 | | |
| | | Core Opportunities Fund | | | | | 37,618,722 | | |
| | | Blue Chip Growth Fund | | | | | 175,947,233 | | |
| | | Large Cap Growth Fund | | | | | 20,148,942 | | |
| | | Growth Equity Fund | | | | | 295,555,896 | | |
| | | Aggressive Growth Fund | | | | | 63,475,569 | | |
| | | OTC 100 Fund | | | | | 2,373,910 | | |
| | | Focused Value Fund | | | | | 191,979,545 | | |
| | | Mid Cap Value Fund | | | | | 178,180,750 | | |
| | | Small Cap Value Equity Fund | | | | | 162,419,051 | | |
| | | Small Company Value Fund | | | | | 157,889,099 | | |
| | | Small Cap Core Equity Fund | | | | | 59,840,611 | | |
| | | Mid Cap Growth Equity Fund | | | | | 107,965,346 | | |
| | | Mid Cap Growth Equity II Fund | | | | | 254,628,149 | | |
| | | Small Cap Growth Equity Fund | | | | | 230,163,155 | | |
| | | Small Company Growth Fund | | | | | 68,528,566 | | |
| | | Emerging Growth Fund | | | | | 78,203,597 | | |
| | | Diversified International Fund | | | | | 121,857,194 | | |
| | | Overseas Fund | | | | | 284,754,109 | | |
| | | Destination Retirement Income Fund | | | | | 62,561,797 | | |
| | | Destination Retirement 2010 Fund | | | | | 83,647,932 | | |
| | | Destination Retirement 2020 Fund | | | | | 197,244,872 | | |
| | | Destination Retirement 2030 Fund | | | | | 167,111,767 | | |
| | | Destination Retirement 2040 Fund | | | | | 93,145,928 | | |
333
Notes to Financial Statements (Unaudited) (Continued)
| | | | | Long -Term U.S.
Government Securities | | Other Long -Term
Securities | |
| Sales | | Strategic Bond Fund | | $ | 507,496,099 | | | $ | 63,191,818 | | |
| | | Strategic Balanced Fund | | | 147,465,049 | | | | 45,884,057 | | |
| | | Diversified Value Fund | | | - | | | | 47,374,176 | | |
| | | Fundamental Value Fund | | | - | | | | 269,095,803 | | |
| | | Value Equity Fund | | | - | | | | 65,379,484 | | |
| | | Large Cap Value Fund | | | - | | | | 272,016,103 | | |
| | | Indexed Equity Fund | | | - | | | | 35,229,304 | | |
| | | Core Opportunities Fund | | | - | | | | 20,333,343 | | |
| | | Blue Chip Growth Fund | | | - | | | | 91,388,540 | | |
| | | Large Cap Growth Fund | | | - | | | | 19,816,438 | | |
| | | Growth Equity Fund | | | - | | | | 635,821,862 | | |
| | | Aggressive Growth Fund | | | - | | | | 174,011,503 | | |
| | | OTC 100 Fund | | | - | | | | 12,265,798 | | |
| | | Focused Value Fund | | | - | | | | 282,357,319 | | |
| | | Mid Cap Value Fund | | | - | | | | 39,503,231 | | |
| | | Small Cap Value Equity Fund | | | - | | | | 47,076,624 | | |
| | | Small Company Value Fund | | | - | | | | 272,894,865 | | |
| | | Small Cap Core Equity Fund | | | - | | | | 30,566,208 | | |
| | | Mid Cap Growth Equity Fund | | | - | | | | 101,083,625 | | |
| | | Mid Cap Growth Equity II Fund | | | - | | | | 288,205,216 | | |
| | | Small Cap Growth Equity Fund | | | - | | | | 224,525,832 | | |
| | | Small Company Growth Fund | | | - | | | | 84,280,591 | | |
| | | Emerging Growth Fund | | | - | | | | 105,189,774 | | |
| | | Diversified International Fund | | | - | | | | 6,237,134 | | |
| | | Overseas Fund | | | - | | | | 324,257,544 | | |
| | | Destination Retirement Income Fund | | | - | | | | 78,583,207 | | |
| | | Destination Retirement 2010 Fund | | | - | | | | 33,851,943 | | |
| | | Destination Retirement 2020 Fund | | | - | | | | 137,598,336 | | |
| | | Destination Retirement 2030 Fund | | | - | | | | 120,182,080 | | |
| | | Destination Retirement 2040 Fund | | | - | | | | 65,349,854 | | |
5. Capital Share Transactions
The Funds are authorized to issue an unlimited number of shares, with no par value in each class of shares. Changes in shares outstanding for each Fund were as follows:
| | | Class A | |
| | | Six months ended June 30, 2007 | | Year ended December 31, 2006 | |
| | | Shares | | Amount | | Shares | | Amount | |
| Strategic Bond Fund | |
| Sold | | | 2,697,325 | | | $ | 27,124,832 | | | | 2,776,260 | | | $ | 27,948,119 | | |
| Issued as reinvestment of dividends | | | - | | | | - | | | | 140,762 | | | | 1,410,514 | | |
| Redeemed | | | (549,038 | ) | | | (5,519,563 | ) | | | (1,048,130 | ) | | | (10,563,742 | ) | |
| Net increase (decrease) | | | 2,148,287 | | | $ | 21,605,269 | | | | 1,868,892 | | | $ | 18,794,891 | | |
| Strategic Balanced Fund | |
| Sold | | | 469,115 | | | $ | 5,425,686 | | | | 825,933 | | | $ | 9,080,612 | | |
| Issued as reinvestment of dividends | | | - | | | | - | | | | 83,294 | | | | 948,726 | | |
| Redeemed | | | (697,724 | ) | | | (8,089,982 | ) | | | (583,195 | ) | | | (6,392,301 | ) | |
| Net increase (decrease) | | | (228,609 | ) | | $ | (2,664,296 | ) | | | 326,032 | | | $ | 3,637,037 | | |
| Diversified Value Fund | |
| Sold | | | 1,942,729 | | | $ | 26,046,037 | | | | 4,408,393 | | | $ | 54,575,392 | | |
| Issued as reinvestment of dividends | | | - | | | | - | | | | 263,206 | | | | 3,409,637 | | |
| Redeemed | | | (965,805 | ) | | | (12,978,473 | ) | | | (1,036,368 | ) | | | (12,707,468 | ) | |
| Net increase (decrease) | | | 976,924 | | | $ | 13,067,564 | | | | 3,635,231 | | | $ | 45,277,561 | | |
334
Notes to Financial Statements (Unaudited) (Continued)
| | | Class A | |
| | | Six months ended June 30, 2007 | | Year ended December 31, 2006 | |
| | | Shares | | Amount | | Shares | | Amount | |
| Fundamental Value Fund | |
| Sold | | | 4,191,109 | | | $ | 53,345,663 | | | | 9,204,707 | | | $ | 112,589,433 | | |
| Issued as reinvestment of dividends | | | - | | | | - | | | | 2,179,576 | | | | 26,646,405 | | |
| Redeemed | | | (7,106,610 | ) | | | (90,052,477 | ) | | | (8,753,987 | ) | | | (106,158,506 | ) | |
| Net increase (decrease) | | | (2,915,501 | ) | | $ | (36,706,814 | ) | | | 2,630,296 | | | $ | 33,077,332 | | |
| Value Equity Fund | |
| Sold | | | 245,713 | | | $ | 2,568,732 | | | | 816,647 | | | $ | 8,925,476 | | |
| Issued as reinvestment of dividends | | | - | | | | - | | | | 419,428 | | | | 4,227,812 | | |
| Redeemed | | | (442,645 | ) | | | (4,638,940 | ) | | | (1,190,353 | ) | | | (13,215,755 | ) | |
| Net increase (decrease) | | | (196,932 | ) | | $ | (2,070,208 | ) | | | 45,722 | | | $ | (62,467 | ) | |
| Large Cap Value Fund | |
| Sold | | | 5,079,710 | | | $ | 66,742,007 | | | | 12,150,939 | | | $ | 142,902,434 | | |
| Issued as reinvestment of dividends | | | - | | | | - | | | | 106,412 | | | | 1,362,070 | | |
| Redeemed | | | (6,020,497 | ) | | | (79,084,575 | ) | | | (12,400,519 | ) | | | (146,685,310 | ) | |
| Net increase (decrease) | | | (940,787 | ) | | $ | (12,342,568 | ) | | | (143,168 | ) | | $ | (2,420,806 | ) | |
| Indexed Equity Fund | |
| Sold | | | 4,252,593 | | | $ | 56,706,585 | | | | 7,845,772 | | | $ | 95,167,656 | | |
| Issued as reinvestment of dividends | | | - | | | | - | | | | 271,793 | | | | 3,522,431 | | |
| Redeemed | | | (4,404,626 | ) | | | (58,690,587 | ) | | | (8,993,650 | ) | | | (109,479,350 | ) | |
| Net increase (decrease) | | | (152,033 | ) | | $ | (1,984,002 | ) | | | (876,085 | ) | | $ | (10,789,263 | ) | |
| Core Opportunities Fund* | |
| Sold | | | 1,277,664 | | | $ | 13,867,073 | | | | 898,589 | | | $ | 8,988,287 | | |
| Issued as reinvestment of dividends | | | - | | | | - | | | | 2,429 | | | | 25,896 | | |
| Redeemed | | | (417,858 | ) | | | (4,639,269 | ) | | | (44,593 | ) | | | (455,268 | ) | |
| Net increase (decrease) | | | 859,806 | | | $ | 9,227,804 | | | | 856,425 | | | $ | 8,558,915 | | |
| Blue Chip Growth Fund | |
| Sold | | | 1,337,699 | | | $ | 13,503,826 | | | | 1,835,056 | | | $ | 16,656,533 | | |
| Issued as reinvestment of dividends | | | - | | | | - | | | | - | | | | - | | |
| Redeemed | | | (819,705 | ) | | | (8,316,420 | ) | | | (1,909,956 | ) | | | (17,541,822 | ) | |
| Net increase (decrease) | | | 517,994 | | | $ | 5,187,406 | | | | (74,900 | ) | | $ | (885,289 | ) | |
| Large Cap Growth Fund | |
| Sold | | | 129,715 | | | $ | 1,333,955 | | | | 705,288 | | | $ | 7,119,608 | | |
| Issued as reinvestment of dividends | | | - | | | | - | | | | 33,429 | | | | 328,937 | | |
| Redeemed | | | (109,183 | ) | | | (1,110,953 | ) | | | (236,258 | ) | | | (2,384,493 | ) | |
| Net increase (decrease) | | | 20,532 | | | $ | 223,002 | | | | 502,459 | | | $ | 5,064,052 | | |
| Growth Equity Fund | |
| Sold | | | 884,115 | | | $ | 7,389,904 | | | | 3,943,759 | | | $ | 31,251,222 | | |
| Issued as reinvestment of dividends | | | - | | | | - | | | | 776 | | | | 6,260 | | |
| Redeemed | | | (7,544,600 | ) | | | (62,594,125 | ) | | | (17,827,647 | ) | | | (142,392,901 | ) | |
| Net increase (decrease) | | | (6,660,485 | ) | | $ | (55,204,221 | ) | | | (13,883,112 | ) | | $ | (111,135,419 | ) | |
| Aggressive Growth Fund | |
| Sold | | | 2,969,813 | | | $ | 18,816,556 | | | | 7,782,836 | | | $ | 47,480,416 | | |
| Issued as reinvestment of dividends | | | - | | | | - | | | | - | | | | - | | |
| Redeemed | | | (4,455,777 | ) | | | (28,171,431 | ) | | | (10,258,886 | ) | | | (62,403,916 | ) | |
| Net increase (decrease) | | | (1,485,964 | ) | | $ | (9,354,875 | ) | | | (2,476,050 | ) | | $ | (14,923,500 | ) | |
| OTC 100 Fund | |
| Sold | | | 535,041 | | | $ | 2,431,742 | | | | 1,339,825 | | | $ | 5,494,961 | | |
| Issued as reinvestment of dividends | | | - | | | | - | | | | - | | | | - | | |
| Redeemed | | | (1,511,102 | ) | | | (6,855,642 | ) | | | (2,760,942 | ) | | | (11,439,402 | ) | |
| Net increase (decrease) | | | (976,061 | ) | | $ | (4,423,900 | ) | | | (1,421,117 | ) | | $ | (5,944,441 | ) | |
| Focused Value Fund | |
| Sold | | | 2,837,030 | | | $ | 53,387,535 | | | | 6,004,128 | | | $ | 107,872,935 | | |
| Issued as reinvestment of dividends | | | - | | | | - | | | | 1,460,006 | | | | 26,234,307 | | |
| Redeemed | | | (4,791,635 | ) | | | (88,977,191 | ) | | | (7,295,756 | ) | | | (128,762,964 | ) | |
| Net increase (decrease) | | | (1,954,605 | ) | | $ | (35,589,656 | ) | | | 168,378 | | | $ | 5,344,278 | | |
335
Notes to Financial Statements (Unaudited) (Continued)
| | | Class A | |
| | | Six months ended June 30, 2007 | | Year ended December 31, 2006 | |
| | | Shares | | Amount | | Shares | | Amount | |
| Mid-Cap Value Fund** | |
| Sold | | | 735,792 | | | $ | 8,754,445 | | | | 61,616 | | | $ | 688,940 | | |
| Issued as reinvestment of dividends | | | - | | | | - | | | | 124 | | | | 1,411 | | |
| Redeemed | | | (60,339 | ) | | | (728,631 | ) | | | (18,202 | ) | | | (208,810 | ) | |
| Net increase (decrease) | | | 675,453 | | | $ | 8,025,814 | | | | 43,538 | | | $ | 481,541 | | |
| Small Cap Value Equity Fund* | |
| Sold | | | 873,087 | | | $ | 9,787,352 | | | | 344,341 | | | $ | 3,495,332 | | |
| Issued as reinvestment of dividends | | | - | | | | - | | | | 1,251 | | | | 13,502 | | |
| Redeemed | | | (128,391 | ) | | | (1,448,767 | ) | | | (10,332 | ) | | | (107,404 | ) | |
| Net increase (decrease) | | | 744,696 | | | $ | 8,338,585 | | | | 335,260 | | | $ | 3,401,430 | | |
| Small Company Value Fund | |
| Sold | | | 3,216,382 | | | $ | 50,652,387 | | | | 6,424,793 | | | $ | 99,568,954 | | |
| Issued as reinvestment of dividends | | | - | | | | - | | | | 713,445 | | | | 10,802,432 | | |
| Redeemed | | | (4,120,230 | ) | | | (64,840,382 | ) | | | (5,301,475 | ) | | | (81,314,874 | ) | |
| Net increase (decrease) | | | (903,848 | ) | | $ | (14,187,995 | ) | | | 1,836,763 | | | $ | 29,056,512 | | |
| Small Cap Core Equity Fund* | |
| Sold | | | 440,989 | | | $ | 4,661,582 | | | | 79,503 | | | $ | 782,482 | | |
| Issued as reinvestment of dividends | | | - | | | | - | | | | 47 | | | | 482 | | |
| Redeemed | | | (198,734 | ) | | | (2,117,946 | ) | | | (2,917 | ) | | | (29,295 | ) | |
| Net increase (decrease) | | | 242,255 | | | $ | 2,543,636 | | | | 76,633 | | | $ | 753,669 | | |
| Mid Cap Growth Equity Fund | |
| Sold | | | 443,719 | | | $ | 4,846,530 | | | | 1,629,814 | | | $ | 17,188,740 | | |
| Issued as reinvestment of dividends | | | - | | | | - | | | | 4,895 | | | | 50,416 | | |
| Redeemed | | | (750,037 | ) | | | (8,201,696 | ) | | | (2,162,386 | ) | | | (21,948,416 | ) | |
| Net increase (decrease) | | | (306,318 | ) | | $ | (3,355,166 | ) | | | (527,677 | ) | | $ | (4,709,260 | ) | |
| Mid Cap Growth Equity II Fund | |
| Sold | | | 5,305,817 | | | $ | 79,485,084 | | | | 9,861,471 | | | $ | 143,065,514 | | |
| Issued as reinvestment of dividends | | | - | | | | - | | | | 1,616,135 | | | | 22,627,219 | | |
| Redeemed | | | (4,484,759 | ) | | | (67,141,335 | ) | | | (10,778,817 | ) | | | (155,280,632 | ) | |
| Net increase (decrease) | | | 821,058 | | | $ | 12,343,749 | | | | 698,789 | | | $ | 10,412,101 | | |
| Small Cap Growth Equity Fund | |
| Sold | | | 1,403,990 | | | $ | 23,641,133 | | | | 3,296,723 | | | $ | 54,467,470 | | |
| Issued as reinvestment of dividends | | | - | | | | - | | | | 473,560 | | | | 7,543,806 | | |
| Redeemed | | | (1,926,168 | ) | | | (32,301,070 | ) | | | (2,921,175 | ) | | | (47,634,141 | ) | |
| Net increase (decrease) | | | (522,178 | ) | | $ | (8,659,937 | ) | | | 849,108 | | | $ | 14,377,135 | | |
| Small Company Growth Fund | |
| Sold | | | 863,513 | | | $ | 9,431,875 | | | | 3,341,080 | | | $ | 35,384,659 | | |
| Issued as reinvestment of dividends | | | - | | | | - | | | | 450,503 | | | | 4,581,035 | | |
| Redeemed | | | (2,535,032 | ) | | | (26,823,358 | ) | | | (3,564,793 | ) | | | (36,824,501 | ) | |
| Net increase (decrease) | | | (1,671,519 | ) | | $ | (17,391,483 | ) | | | 226,790 | | | $ | 3,141,193 | | |
| Emerging Growth Fund | |
| Sold | | | 382,324 | | | $ | 2,519,094 | | | | 1,087,125 | | | $ | 6,707,674 | | |
| Issued as reinvestment of dividends | | | - | | | | - | | | | - | | | | - | | |
| Redeemed | | | (657,724 | ) | | | (4,255,032 | ) | | | (1,426,372 | ) | | | (8,498,950 | ) | |
| Net increase (decrease) | | | (275,400 | ) | | $ | (1,735,938 | ) | | | (339,247 | ) | | $ | (1,791,276 | ) | |
| Diversified International Fund*** | |
| Sold | | | 12,079 | | | $ | 132,714 | | | | 10,010 | | | $ | 100,100 | | |
| Issued as reinvestment of dividends | | | - | | | | - | | | | - | | | | - | | |
| Redeemed | | | (385 | ) | | | (4,205 | ) | | | - | | | | - | | |
| Net increase (decrease) | | | 11,694 | | | $ | 128,509 | | | | 10,010 | | | $ | 100,100 | | |
| Overseas Fund | |
| Sold | | | 5,462,194 | | | $ | 73,169,653 | | | | 11,803,013 | | | $ | 146,273,893 | | |
| Issued as reinvestment of dividends | | | - | | | | - | | | | 1,943,931 | | | | 24,721,000 | | |
| Redeemed | | | (6,768,051 | ) | | | (89,845,952 | ) | | | (8,453,687 | ) | | | (105,425,589 | ) | |
| Net increase (decrease) | | | (1,305,857 | ) | | $ | (16,676,299 | ) | | | 5,293,257 | | | $ | 65,569,304 | | |
336
Notes to Financial Statements (Unaudited) (Continued)
| | | Class A | |
| | | Six months ended June 30, 2007 | | Year ended December 31, 2006 | |
| | | Shares | | Amount | | Shares | | Amount | |
| Destination Retirement Income Fund | |
| Sold | | | 1,108,795 | | | $ | 11,533,590 | | | | 2,487,800 | | | $ | 25,601,104 | | |
| Issued as reinvestment of dividends | | | - | | | | - | | | | 213,906 | | | | 2,193,703 | | |
| Redeemed | | | (966,329 | ) | | | (10,063,804 | ) | | | (1,607,348 | ) | | | (16,550,160 | ) | |
| Net increase (decrease) | | | 142,466 | | | $ | 1,469,786 | | | | 1,094,358 | | | $ | 11,244,647 | | |
| Destination Retirement 2010 Fund | |
| Sold | | | 2,403,328 | | | $ | 26,364,747 | | | | 3,343,813 | | | $ | 35,854,891 | | |
| Issued as reinvestment of dividends | | | - | | | | - | | | | 210,404 | | | | 2,266,373 | | |
| Redeemed | | | (1,119,429 | ) | | | (12,311,272 | ) | | | (1,383,257 | ) | | | (14,868,899 | ) | |
| Net increase (decrease) | | | 1,283,899 | | | $ | 14,053,475 | | | | 2,170,960 | | | $ | 23,252,365 | | |
| Destination Retirement 2020 Fund | |
| Sold | | | 4,433,421 | | | $ | 50,948,854 | | | | 7,509,092 | | | $ | 83,298,361 | | |
| Issued as reinvestment of dividends | | | - | | | | - | | | | 583,471 | | | | 6,498,616 | | |
| Redeemed | | | (2,657,381 | ) | | | (30,581,157 | ) | | | (3,399,372 | ) | | | (37,750,152 | ) | |
| Net increase (decrease) | | | 1,776,040 | | | $ | 20,367,697 | | | | 4,693,191 | | | $ | 52,046,825 | | |
| Destination Retirement 2030 Fund | |
| Sold | | | 3,238,285 | | | $ | 40,321,894 | | | | 5,699,913 | | | $ | 67,240,317 | | |
| Issued as reinvestment of dividends | | | - | | | | - | | | | 398,633 | | | | 4,739,725 | | |
| Redeemed | | | (2,099,604 | ) | | | (26,104,482 | ) | | | (2,242,622 | ) | | | (26,450,199 | ) | |
| Net increase (decrease) | | | 1,138,681 | | | $ | 14,217,412 | | | | 3,855,924 | | | $ | 45,529,843 | | |
| Destination Retirement 2040 Fund | |
| Sold | | | 1,789,123 | | | $ | 23,016,194 | | | | 2,660,814 | | | $ | 32,348,078 | | |
| Issued as reinvestment of dividends | | | - | | | | - | | | | 191,643 | | | | 2,342,162 | | |
| Redeemed | | | (1,009,253 | ) | | | (12,918,626 | ) | | | (1,350,830 | ) | | | (16,310,822 | ) | |
| Net increase (decrease) | | | 779,870 | | | $ | 10,097,568 | | | | 1,501,627 | | | $ | 18,379,418 | | |
| | | Class L | |
| | | Six months ended June 30, 2007 | | Year ended December, 31 2006 | |
| | | Shares | | Amount | | Shares | | Amount | |
| Strategic Bond Fund | |
| Sold | | | 432,301 | | | $ | 4,366,626 | | | | 1,427,387 | | | $ | 14,320,171 | | |
| Issued as reinvestment of dividends | | | - | | | | - | | | | 68,614 | | | | 688,929 | | |
| Redeemed | | | (113,263 | ) | | | (1,141,365 | ) | | | (98,272 | ) | | | (987,441 | ) | |
| Net increase (decrease) | | | 319,038 | | | $ | 3,225,261 | | | | 1,397,729 | | | $ | 14,021,659 | | |
| Strategic Balanced Fund | |
| Sold | | | 742,204 | | | $ | 8,652,402 | | | | 1,881,633 | | | $ | 20,810,824 | | |
| Issued as reinvestment of dividends | | | - | | | | - | | | | 265,207 | | | | 3,026,009 | | |
| Redeemed | | | (1,422,186 | ) | | | (16,595,403 | ) | | | (3,421,961 | ) | | | (37,827,836 | ) | |
| Net increase (decrease) | | | (679,982 | ) | | $ | (7,943,001 | ) | | | (1,275,121 | ) | | $ | (13,991,003 | ) | |
| Diversified Value Fund | |
| Sold | | | 3,064,478 | | | $ | 40,676,226 | | | | 2,725,099 | | | $ | 33,476,404 | | |
| Issued as reinvestment of dividends | | | - | | | | - | | | | 193,585 | | | | 2,516,315 | | |
| Redeemed | | | (1,197,157 | ) | | | (16,393,420 | ) | | | (1,122,998 | ) | | | (13,503,833 | ) | |
| Net increase (decrease) | | | 1,867,321 | | | $ | 24,282,806 | | | | 1,795,686 | | | $ | 22,488,886 | | |
| Fundamental Value Fund | |
| Sold | | | 6,298,205 | | | $ | 79,948,781 | | | | 12,300,387 | | | $ | 148,470,874 | | |
| Issued as reinvestment of dividends | | | - | | | | - | | | | 2,187,060 | | | | 26,849,375 | | |
| Redeemed | | | (8,680,318 | ) | | | (110,461,350 | ) | | | (11,025,060 | ) | | | (136,195,386 | ) | |
| Net increase (decrease) | | | (2,382,113 | ) | | $ | (30,512,569 | ) | | | 3,462,387 | | | $ | 39,124,863 | | |
| Value Equity Fund | |
| Sold | | | 130,769 | | | $ | 1,376,407 | | | | 403,675 | | | $ | 4,444,324 | | |
| Issued as reinvestment of dividends | | | - | | | | - | | | | 182,898 | | | | 1,845,544 | | |
| Redeemed | | | (200,759 | ) | | | (2,132,256 | ) | | | (222,218 | ) | | | (2,474,321 | ) | |
| Net increase (decrease) | | | (69,990 | ) | | $ | (755,849 | ) | | | 364,355 | | | $ | 3,815,547 | | |
337
Notes to Financial Statements (Unaudited) (Continued)
| | | Class L | |
| | | Six months ended June 30, 2007 | | Year ended December, 31 2006 | |
| | | Shares | | Amount | | Shares | | Amount | |
| Large Cap Value Fund | |
| Sold | | | 3,650,035 | | | $ | 47,964,276 | | | | 11,470,621 | | | $ | 135,569,050 | | |
| Issued as reinvestment of dividends | | | - | | | | - | | | | 172,806 | | | | 2,220,553 | | |
| Redeemed | | | (16,454,995 | ) | | | (217,850,620 | ) | | | (13,500,137 | ) | | | (160,965,826 | ) | |
| Net increase (decrease) | | | (12,804,960 | ) | | $ | (169,886,344 | ) | | | (1,856,710 | ) | | $ | (23,176,223 | ) | |
| Indexed Equity Fund | |
| Sold | | | 2,926,856 | | | $ | 39,270,496 | | | | 7,923,035 | | | $ | 96,785,715 | | |
| Issued as reinvestment of dividends | | | - | | | | - | | | | 364,847 | | | | 4,741,880 | | |
| Redeemed | | | (3,163,478 | ) | | | (42,664,796 | ) | | | (6,981,915 | ) | | | (85,084,315 | ) | |
| Net increase (decrease) | | | (236,622 | ) | | $ | (3,394,300 | ) | | | 1,305,967 | | | $ | 16,443,280 | | |
| Core Opportunities Fund* | |
| Sold | | | 84,298 | | | $ | 953,290 | | | | 774,820 | | | $ | 7,888,460 | | |
| Issued as reinvestment of dividends | | | - | | | | - | | | | 2,984 | | | | 31,841 | | |
| Redeemed | | | (29,436 | ) | | | (321,621 | ) | | | (32,105 | ) | | | (322,620 | ) | |
| Net increase (decrease) | | | 54,862 | | | $ | 631,669 | | | | 745,699 | | | $ | 7,597,681 | | |
| Blue Chip Growth Fund | |
| Sold | | | 11,830,553 | | | $ | 122,909,863 | | | | 11,648,346 | | | $ | 107,753,876 | | |
| Issued as reinvestment of dividends | | | - | | | | - | | | | 17,020 | | | | 167,310 | | |
| Redeemed | | | (6,200,091 | ) | | | (63,465,030 | ) | | | (12,968,851 | ) | | | (120,243,845 | ) | |
| Net increase (decrease) | | | 5,630,462 | | | $ | 59,444,833 | | | | (1,303,485 | ) | | $ | (12,322,659 | ) | |
| Large Cap Growth Fund | |
| Sold | | | 15,759 | | | $ | 167,216 | | | | 343,758 | | | $ | 3,627,493 | | |
| Issued as reinvestment of dividends | | | - | | | | - | | | | 6,203 | | | | 62,649 | | |
| Redeemed | | | (46,148 | ) | | | (493,243 | ) | | | (287,296 | ) | | | (2,789,742 | ) | |
| Net increase (decrease) | | | (30,389 | ) | | $ | (326,027 | ) | | | 62,665 | | | $ | 900,400 | | |
| Growth Equity Fund | |
| Sold | | | 5,483,000 | | | $ | 45,586,497 | | | | 20,226,554 | | | $ | 160,352,050 | | |
| Issued as reinvestment of dividends | | | - | | | | - | | | | 173,655 | | | | 1,413,920 | | |
| Redeemed | | | (24,567,451 | ) | | | (208,104,946 | ) | | | (17,397,236 | ) | | | (139,495,824 | ) | |
| Net increase (decrease) | | | (19,084,451 | ) | | $ | (162,518,449 | ) | | | 3,002,973 | | | $ | 22,270,146 | | |
| Aggressive Growth Fund | |
| Sold | | | 4,387,493 | | | $ | 28,161,406 | | | | 17,113,585 | | | $ | 105,466,073 | | |
| Issued as reinvestment of dividends | | | - | | | | - | | | | - | | | | - | | |
| Redeemed | | | (15,200,209 | ) | | | (97,685,454 | ) | | | (15,346,599 | ) | | | (94,617,473 | ) | |
| Net increase (decrease) | | | (10,812,716 | ) | | $ | (69,524,048 | ) | | | 1,766,986 | | | $ | 10,848,600 | | |
| OTC 100 Fund | |
| Sold | | | 216,160 | | | $ | 996,192 | | | | 565,891 | | | $ | 2,380,620 | | |
| Issued as reinvestment of dividends | | | - | | | | - | | | | - | | | | - | | |
| Redeemed | | | (738,952 | ) | | | (3,394,948 | ) | | | (1,440,277 | ) | | | (5,988,279 | ) | |
| Net increase (decrease) | | | (522,792 | ) | | $ | (2,398,756 | ) | | | (874,386 | ) | | $ | (3,607,659 | ) | |
| Focused Value Fund | |
| Sold | | | 2,556,627 | | | $ | 48,414,160 | | | | 5,943,460 | | | $ | 105,502,724 | | |
| Issued as reinvestment of dividends | | | - | | | | - | | | | 1,104,159 | | | | 20,119,852 | | |
| Redeemed | | | (4,549,227 | ) | | | (86,215,865 | ) | | | (6,639,203 | ) | | | (120,491,388 | ) | |
| Net increase (decrease) | | | (1,992,600 | ) | | $ | (37,801,705 | ) | | | 408,416 | | | $ | 5,131,188 | | |
| Mid-Cap Value Fund** | |
| Sold | | | 7,003,841 | | | $ | 80,416,042 | | | | 153,230 | | | $ | 1,713,496 | | |
| Issued as reinvestment of dividends | | | - | | | | - | | | | 331 | | | | 3,762 | | |
| Redeemed | | | (968,065 | ) | | | (11,740,512 | ) | | | (10,934 | ) | | | (125,133 | ) | |
| Net increase (decrease) | | | 6,035,776 | | | $ | 68,675,530 | | | | 142,627 | | | $ | 1,592,125 | | |
| Small Cap Value Equity Fund* | |
| Sold | | | 3,983,475 | | | $ | 43,407,456 | | | | 95,295 | | | $ | 1,002,037 | | |
| Issued as reinvestment of dividends | | | - | | | | - | | | | 394 | | | | 4,252 | | |
| Redeemed | | | (322,626 | ) | | | (3,645,853 | ) | | | (266 | ) | | | (2,766 | ) | |
| Net increase (decrease) | | | 3,660,849 | | | $ | 39,761,603 | | | | 95,423 | | | $ | 1,003,523 | | |
338
Notes to Financial Statements (Unaudited) (Continued)
| | | Class L | |
| | | Six months ended June 30, 2007 | | Year ended December, 31 2006 | |
| | | Shares | | Amount | | Shares | | Amount | |
| Small Company Value Fund | |
| Sold | | | 2,484,578 | | | $ | 38,955,698 | | | | 5,253,600 | | | $ | 81,130,876 | | |
| Issued as reinvestment of dividends | | | - | | | | - | | | | 659,456 | | | | 10,055,595 | | |
| Redeemed | | | (5,536,201 | ) | | | (90,104,928 | ) | | | (4,080,260 | ) | | | (62,868,075 | ) | |
| Net increase (decrease) | | | (3,051,623 | ) | | $ | (51,149,230 | ) | | | 1,832,796 | | | $ | 28,318,396 | | |
| Small Cap Core Equity Fund* | |
| Sold | | | 1,795,536 | | | $ | 19,031,904 | | | | 256,062 | | | $ | 2,526,095 | | |
| Issued as reinvestment of dividends | | | - | | | | - | | | | 377 | | | | 3,871 | | |
| Redeemed | | | (105,942 | ) | | | (1,129,143 | ) | | | (9,030 | ) | | | (86,425 | ) | |
| Net increase (decrease) | | | 1,689,594 | | | $ | 17,902,761 | | | | 247,409 | | | $ | 2,443,541 | | |
| Mid Cap Growth Equity Fund | |
| Sold | | | 1,816,575 | | | $ | 20,237,418 | | | | 1,303,412 | | | $ | 14,057,986 | | |
| Issued as reinvestment of dividends | | | - | | | | - | | | | 13,320 | | | | 139,593 | | |
| Redeemed | | | (1,060,059 | ) | | | (11,791,599 | ) | | | (2,348,248 | ) | | | (24,169,115 | ) | |
| Net increase (decrease) | | | 756,516 | | | $ | 8,445,819 | | | | (1,031,516 | ) | | $ | (9,971,536 | ) | |
| Mid Cap Growth Equity II Fund | |
| Sold | | | 6,912,247 | | | $ | 105,579,480 | | | | 15,278,507 | | | $ | 224,690,143 | | |
| Issued as reinvestment of dividends | | | - | | | | - | | | | 2,715,551 | | | | 38,621,636 | | |
| Redeemed | | | (12,704,511 | ) | | | (195,318,389 | ) | | | (16,244,135 | ) | | | (239,015,404 | ) | |
| Net increase (decrease) | | | (5,792,264 | ) | | $ | (89,738,909 | ) | | | 1,749,923 | | | $ | 24,296,375 | | |
| Small Cap Growth Equity Fund | |
| Sold | | | 2,138,805 | | | $ | 36,254,615 | | | | 2,191,537 | | | $ | 36,890,961 | | |
| Issued as reinvestment of dividends | | | - | | | | - | | | | 373,515 | | | | 6,062,153 | | |
| Redeemed | | | (1,333,765 | ) | | | (23,064,215 | ) | | | (3,677,407 | ) | | | (61,297,612 | ) | |
| Net increase (decrease) | | | 805,040 | | | $ | 13,190,400 | | | | (1,112,355 | ) | | $ | (18,344,498 | ) | |
| Small Company Growth Fund | |
| Sold | | | 1,534,481 | | | $ | 16,295,552 | | | | 2,360,646 | | | $ | 25,157,433 | | |
| Issued as reinvestment of dividends | | | - | | | | - | | | | 215,767 | | | | 2,225,883 | | |
| Redeemed | | | (967,664 | ) | | | (10,943,605 | ) | | | (2,520,749 | ) | | | (26,441,565 | ) | |
| Net increase (decrease) | | | 566,817 | | | $ | 5,351,947 | | | | 55,664 | | | $ | 941,751 | | |
| Emerging Growth Fund | |
| Sold | | | 2,027,567 | | | $ | 13,090,754 | | | | 2,965,454 | | | $ | 18,379,237 | | |
| Issued as reinvestment of dividends | | | - | | | | - | | | | - | | | | - | | |
| Redeemed | | | (3,612,972 | ) | | | (23,973,064 | ) | | | (6,512,774 | ) | | | (40,457,095 | ) | |
| Net increase (decrease) | | | (1,585,405 | ) | | $ | (10,882,310 | ) | | | (3,547,320 | ) | | $ | (22,077,858 | ) | |
| Diversified International Fund*** | |
| Sold | | | 5,010,995 | | | $ | 50,493,523 | | | | 10,010 | | | $ | 100,100 | | |
| Issued as reinvestment of dividends | | | - | | | | - | | | | - | | | | - | | |
| Redeemed | | | (673,265 | ) | | | (7,206,617 | ) | | | - | | | | - | | |
| Net increase (decrease) | | | 4,337,730 | | | $ | 43,286,906 | | | | 10,010 | | | $ | 100,100 | | |
| Overseas Fund | |
| Sold | | | 6,323,107 | | | $ | 83,929,365 | | | | 12,336,284 | | | $ | 151,856,410 | | |
| Issued as reinvestment of dividends | | | - | | | | - | | | | 1,891,415 | | | | 24,204,494 | | |
| Redeemed | | | (4,163,095 | ) | | | (55,880,047 | ) | | | (11,344,115 | ) | | | (143,629,654 | ) | |
| Net increase (decrease) | | | 2,160,012 | | | $ | 28,049,318 | | | | 2,883,584 | | | $ | 32,431,250 | | |
| Destination Retirement Income Fund | |
| Sold | | | 1,859,142 | | | $ | 19,479,402 | | | | 2,778,537 | | | $ | 28,845,873 | | |
| Issued as reinvestment of dividends | | | - | | | | - | | | | 427,570 | | | | 4,402,893 | | |
| Redeemed | | | (2,265,403 | ) | | | (23,660,315 | ) | | | (4,037,309 | ) | | | (41,813,417 | ) | |
| Net increase (decrease) | | | (406,261 | ) | | $ | (4,180,913 | ) | | | (831,202 | ) | | $ | (8,564,651 | ) | |
| Destination Retirement 2010 Fund | |
| Sold | | | 1,751,446 | | | $ | 19,445,501 | | | | 2,092,093 | | | $ | 22,660,053 | | |
| Issued as reinvestment of dividends | | | - | | | | - | | | | 185,633 | | | | 2,008,417 | | |
| Redeemed | | | (705,395 | ) | | | (7,772,350 | ) | | | (1,256,101 | ) | | | (13,510,875 | ) | |
| Net increase (decrease) | | | 1,046,051 | | | $ | 11,673,151 | | | | 1,021,625 | | | $ | 11,157,595 | | |
339
Notes to Financial Statements (Unaudited) (Continued)
| | | Class L | |
| | | Six months ended June 30, 2007 | | Year ended December, 31 2006 | |
| | | Shares | | Amount | | Shares | | Amount | |
| Destination Retirement 2020 Fund | |
| Sold | | | 4,332,053 | | | $ | 50,311,437 | | | | 7,852,565 | | | $ | 87,765,918 | | |
| Issued as reinvestment of dividends | | | - | | | | - | | | | 1,174,305 | | | | 13,147,669 | | |
| Redeemed | | | (4,076,195 | ) | | | (47,152,782 | ) | | | (6,384,716 | ) | | | (71,280,860 | ) | |
| Net increase (decrease) | | | 255,858 | | | $ | 3,158,655 | | | | 2,642,154 | | | $ | 29,632,727 | | |
| Destination Retirement 2030 Fund | |
| Sold | | | 3,275,102 | | | $ | 41,122,963 | | | | 5,950,843 | | | $ | 70,652,278 | | |
| Issued as reinvestment of dividends | | | - | | | | - | | | | 804,908 | | | | 9,614,500 | | |
| Redeemed | | | (2,634,598 | ) | | | (33,112,331 | ) | | | (4,965,560 | ) | | | (58,971,805 | ) | |
| Net increase (decrease) | | | 640,504 | | | $ | 8,010,632 | | | | 1,790,191 | | | $ | 21,294,973 | | |
| Destination Retirement 2040 Fund | |
| Sold | | | 2,197,016 | | | $ | 28,493,122 | | | | 4,639,907 | | | $ | 56,854,306 | | |
| Issued as reinvestment of dividends | | | - | | | | - | | | | 600,257 | | | | 7,365,263 | | |
| Redeemed | | | (1,849,164 | ) | | | (24,008,800 | ) | | | (3,502,908 | ) | | | (42,745,624 | ) | |
| Net increase (decrease) | | | 347,852 | | | $ | 4,484,322 | | | | 1,737,256 | | | $ | 21,473,945 | | |
| | | Class Y | |
| | | Six months ended June 30, 2007 | | Year ended December, 31 2006 | |
| | | Shares | | Amount | | Shares | | Amount | |
| Strategic Bond Fund | |
| Sold | | | 4,279,278 | | | $ | 43,341,398 | | | | 6,214,089 | | | $ | 62,493,589 | | |
| Issued as reinvestment of dividends | | | - | | | | - | | | | 414,247 | | | | 4,163,489 | | |
| Redeemed | | | (598,633 | ) | | | (6,042,614 | ) | | | (1,637,456 | ) | | | (16,404,573 | ) | |
| Net increase (decrease) | | | 3,680,645 | | | $ | 37,298,784 | | | | 4,990,880 | | | $ | 50,252,505 | | |
| Strategic Balanced Fund | |
| Sold | | | 515,645 | | | $ | 6,029,260 | | | | 3,382,597 | | | $ | 37,132,285 | | |
| Issued as reinvestment of dividends | | | - | | | | - | | | | 272,239 | | | | 3,108,967 | | |
| Redeemed | | | (1,466,267 | ) | | | (17,205,716 | ) | | | (2,740,980 | ) | | | (30,112,589 | ) | |
| Net increase (decrease) | | | (950,622 | ) | | $ | (11,176,456 | ) | | | 913,856 | | | $ | 10,128,663 | | |
| Diversified Value Fund | |
| Sold | | | 1,334,781 | | | $ | 17,841,676 | | | | 8,325,737 | | | $ | 99,628,898 | | |
| Issued as reinvestment of dividends | | | - | | | | - | | | | 486,656 | | | | 6,320,364 | | |
| Redeemed | | | (1,381,675 | ) | | | (18,498,492 | ) | | | (2,964,988 | ) | | | (35,537,372 | ) | |
| Net increase (decrease) | | | (46,894 | ) | | $ | (656,816 | ) | | | 5,847,405 | | | $ | 70,411,890 | | |
| Fundamental Value Fund | |
| Sold | | | 1,783,897 | | | $ | 23,103,940 | | | | 3,853,902 | | | $ | 46,981,680 | | |
| Issued as reinvestment of dividends | | | - | | | | - | | | | 959,842 | | | | 11,802,506 | | |
| Redeemed | | | (1,506,290 | ) | | | (19,530,399 | ) | | | (1,566,182 | ) | | | (19,165,257 | ) | |
| Net increase (decrease) | | | 277,607 | | | $ | 3,573,541 | | | | 3,247,562 | | | $ | 39,618,929 | | |
| Value Equity Fund | |
| Sold | | | 83,294 | | | $ | 886,515 | | | | 230,879 | | | $ | 2,522,788 | | |
| Issued as reinvestment of dividends | | | - | | | | - | | | | 77,280 | | | | 784,165 | | |
| Redeemed | | | (61,273 | ) | | | (651,222 | ) | | | (191,189 | ) | | | (2,112,628 | ) | |
| Net increase (decrease) | | | 22,021 | | | $ | 235,293 | | | | 116,970 | | | $ | 1,194,325 | | |
| Large Cap Value Fund | |
| Sold | | | 1,490,474 | | | $ | 19,617,560 | | | | 7,344,424 | | | $ | 86,210,374 | | |
| Issued as reinvestment of dividends | | | - | | | | - | | | | 118,052 | | | | 1,520,505 | | |
| Redeemed | | | (4,293,011 | ) | | | (57,942,660 | ) | | | (3,492,196 | ) | | | (41,469,451 | ) | |
| Net increase (decrease) | | | (2,802,537 | ) | | $ | (38,325,100 | ) | | | 3,970,280 | | | $ | 46,261,428 | | |
| Indexed Equity Fund | |
| Sold | | | 9,002,877 | | | $ | 122,207,832 | | | | 11,684,942 | | | $ | 143,859,082 | | |
| Issued as reinvestment of dividends | | | - | | | | - | | | | 517,825 | | | | 6,750,490 | | |
| Redeemed | | | (10,208,885 | ) | | | (137,675,952 | ) | | | (14,990,637 | ) | | | (184,037,010 | ) | |
| Net increase (decrease) | | | (1,206,008 | ) | | $ | (15,468,120 | ) | | | (2,787,870 | ) | | $ | (33,427,438 | ) | |
340
Notes to Financial Statements (Unaudited) (Continued)
| | | Class Y | |
| | | Six months ended June 30, 2007 | | Year ended December, 31 2006 | |
| | | Shares | | Amount | | Shares | | Amount | |
| Core Opportunities Fund* | |
| Sold | | | 176,531 | | | $ | 1,915,023 | | | | 413,025 | | | $ | 4,440,570 | | |
| Issued as reinvestment of dividends | | | - | | | | - | | | | - | | | | - | | |
| Redeemed | | | (31,314 | ) | | | (339,121 | ) | | | - | | | | - | | |
| Net increase (decrease) | | | 145,217 | | | $ | 1,575,902 | | | | 413,025 | | | $ | 4,440,570 | | |
| Blue Chip Growth Fund | |
| Sold | | | 658,441 | | | $ | 6,702,583 | | | | 4,639,666 | | | $ | 41,857,465 | | |
| Issued as reinvestment of dividends | | | - | | | | - | | | | 12,318 | | | | 121,087 | | |
| Redeemed | | | (2,261,789 | ) | | | (24,187,988 | ) | | | (648,180 | ) | | | (5,990,074 | ) | |
| Net increase (decrease) | | | (1,603,348 | ) | | $ | (17,485,405 | ) | | | 4,003,804 | | | $ | 35,988,478 | | |
| Large Cap Growth Fund | |
| Sold | | | 171,475 | | | $ | 1,760,567 | | | | 2,927 | | | $ | 30,308 | | |
| Issued as reinvestment of dividends | | | - | | | | - | | | | 39,026 | | | | 390,256 | | |
| Redeemed | | | (2,250 | ) | | | (24,534 | ) | | | (203,677 | ) | | | (2,173,979 | ) | |
| Net increase (decrease) | | | 169,225 | | | $ | 1,736,033 | | | | (161,724 | ) | | $ | (1,753,415 | ) | |
| Growth Equity Fund | |
| Sold | | | 759,550 | | | $ | 6,415,417 | | | | 1,634,079 | | | $ | 13,147,479 | | |
| Issued as reinvestment of dividends | | | - | | | | - | | | | 40,190 | | | | 329,284 | | |
| Redeemed | | | (1,505,491 | ) | | | (12,871,727 | ) | | | (8,162,175 | ) | | | (64,321,864 | ) | |
| Net increase (decrease) | | | (745,941 | ) | | $ | (6,456,310 | ) | | | (6,487,906 | ) | | $ | (50,845,101 | ) | |
| Aggressive Growth Fund | |
| Sold | | | 1,216,472 | | | $ | 7,926,583 | | | | 6,298,891 | | | $ | 41,074,534 | | |
| Issued as reinvestment of dividends | | | - | | | | - | | | | - | | | | - | | |
| Redeemed | | | (3,602,195 | ) | | | (23,733,270 | ) | | | (3,938,751 | ) | | | (24,767,912 | ) | |
| Net increase (decrease) | | | (2,385,723 | ) | | $ | (15,806,687 | ) | | | 2,360,140 | | | $ | 16,306,622 | | |
| OTC 100 Fund | |
| Sold | | | 50,313 | | | $ | 236,638 | | | | 988,269 | | | $ | 4,226,663 | | |
| Issued as reinvestment of dividends | | | - | | | | - | | | | - | | | | - | | |
| Redeemed | | | (84,846 | ) | | | (381,540 | ) | | | (1,280,823 | ) | | | (5,405,286 | ) | |
| Net increase (decrease) | | | (34,533 | ) | | $ | (144,902 | ) | | | (292,554 | ) | | $ | (1,178,623 | ) | |
| Focused Value Fund | |
| Sold | | | 1,110,317 | | | $ | 21,407,034 | | | | 1,970,847 | | | $ | 36,176,870 | | |
| Issued as reinvestment of dividends | | | - | | | | - | | | | 756,235 | | | | 13,883,821 | | |
| Redeemed | | | (1,638,466 | ) | | | (32,133,261 | ) | | | (1,739,593 | ) | | | (31,644,506 | ) | |
| Net increase (decrease) | | | (528,149 | ) | | $ | (10,726,227 | ) | | | 987,489 | | | $ | 18,416,185 | | |
| Mid-Cap Value Fund** | |
| Sold | | | 87,238 | | | $ | 1,046,016 | | | | 10,010 | | | $ | 100,081 | | |
| Issued as reinvestment of dividends | | | - | | | | - | | | | - | | | | - | | |
| Redeemed | | | (15,798 | ) | | | (190,976 | ) | | | (10,000 | ) | | | (114,500 | ) | |
| Net increase (decrease) | | | 71,440 | | | $ | 855,040 | | | | 10 | | | $ | (14,419 | ) | |
| Small Cap Value Equity Fund* | |
| Sold | | | 131,160 | | | $ | 1,496,713 | | | | 233,052 | | | $ | 2,304,332 | | |
| Issued as reinvestment of dividends | | | - | | | | - | | | | 976 | | | | 10,536 | | |
| Redeemed | | | (36,091 | ) | | | (405,960 | ) | | | (13,925 | ) | | | (142,829 | ) | |
| Net increase (decrease) | | | 95,069 | | | $ | 1,090,753 | | | | 220,103 | | | $ | 2,172,039 | | |
| Small Company Value Fund | |
| Sold | | | 1,038,208 | | | $ | 16,794,195 | | | | 6,021,113 | | | $ | 92,746,485 | | |
| Issued as reinvestment of dividends | | | - | | | | - | | | | 698,933 | | | | 10,720,989 | | |
| Redeemed | | | (2,834,375 | ) | | | (46,545,640 | ) | | | (2,281,469 | ) | | | (35,275,183 | ) | |
| Net increase (decrease) | | | (1,796,167 | ) | | $ | (29,751,445 | ) | | | 4,438,577 | | | $ | 68,192,291 | | |
| Small Cap Core Equity Fund* | |
| Sold | | | 71,592 | | | $ | 770,464 | | | | 181,129 | | | $ | 1,769,707 | | |
| Issued as reinvestment of dividends | | | - | | | | - | | | | 269 | | | | 2,774 | | |
| Redeemed | | | (35,987 | ) | | | (379,028 | ) | | | (16,564 | ) | | | (162,739 | ) | |
| Net increase (decrease) | | | 35,605 | | | $ | 391,436 | | | | 164,834 | | | $ | 1,609,742 | | |
341
Notes to Financial Statements (Unaudited) (Continued)
| | | Class Y | |
| | | Six months ended June 30, 2007 | | Year ended December, 31 2006 | |
| | | Shares | | Amount | | Shares | | Amount | |
| Mid Cap Growth Equity Fund | |
| Sold | | | 221,211 | | | $ | 2,469,158 | | | | 1,007,178 | | | $ | 11,037,552 | | |
| Issued as reinvestment of dividends | | | - | | | | - | | | | 11,789 | | | | 124,608 | | |
| Redeemed | | | (1,553,595 | ) | | | (17,927,534 | ) | | | (1,301,607 | ) | | | (13,616,961 | ) | |
| Net increase (decrease) | | | (1,332,384 | ) | | $ | (15,458,376 | ) | | | (282,640 | ) | | $ | (2,454,801 | ) | |
| Mid Cap Growth Equity II Fund | |
| Sold | | | 2,126,385 | | | $ | 32,518,300 | | | | 5,653,209 | | | $ | 85,210,078 | | |
| Issued as reinvestment of dividends | | | - | | | | - | | | | 893,128 | | | | 12,838,903 | | |
| Redeemed | | | (1,692,786 | ) | | | (26,107,048 | ) | | | (3,825,150 | ) | | | (56,922,451 | ) | |
| Net increase (decrease) | | | 433,599 | | | $ | 6,411,252 | | | | 2,721,187 | | | $ | 41,126,530 | | |
| Small Cap Growth Equity Fund | |
| Sold | | | 1,387,358 | | | $ | 23,950,565 | | | | 4,376,755 | | | $ | 73,740,430 | | |
| Issued as reinvestment of dividends | | | - | | | | - | | | | 515,013 | | | | 8,456,512 | | |
| Redeemed | | | (1,648,516 | ) | | | (28,743,950 | ) | | | (2,719,595 | ) | | | (45,386,611 | ) | |
| Net increase (decrease) | | | (261,158 | ) | | $ | (4,793,385 | ) | | | 2,172,173 | | | $ | 36,810,331 | | |
| Small Company Growth Fund | |
| Sold | | | 265,908 | | | $ | 2,952,677 | | | | 845,836 | | | $ | 9,212,161 | | |
| Issued as reinvestment of dividends | | | - | | | | - | | | | 124,520 | | | | 1,295,426 | | |
| Redeemed | | | (669,492 | ) | | | (7,259,956 | ) | | | (1,868,569 | ) | | | (20,000,114 | ) | |
| Net increase (decrease) | | | (403,584 | ) | | $ | (4,307,279 | ) | | | (898,213 | ) | | $ | (9,492,527 | ) | |
| Emerging Growth Fund | |
| Sold | | | 23,824 | | | $ | 161,284 | | | | 336,613 | | | $ | 2,099,219 | | |
| Issued as reinvestment of dividends | | | - | | | | - | | | | - | | | | - | | |
| Redeemed | | | (69,514 | ) | | | (448,342 | ) | | | (970,552 | ) | | | (6,047,303 | ) | |
| Net increase (decrease) | | | (45,690 | ) | | $ | (287,058 | ) | | | (633,939 | ) | | $ | (3,948,084 | ) | |
| Diversified International Fund*** | |
| Sold | | | 22,047 | | | $ | 251,561 | | | | 10,010 | | | $ | 100,100 | | |
| Issued as reinvestment of dividends | | | - | | | | - | | | | - | | | | - | | |
| Redeemed | | | - | | | | - | | | | - | | | | - | | |
| Net increase (decrease) | | | 22,047 | | | $ | 251,561 | | | | 10,010 | | | $ | 100,100 | | |
| Overseas Fund | |
| Sold | | | 2,585,315 | | | $ | 34,797,265 | | | | 8,426,065 | | | $ | 104,619,647 | | |
| Issued as reinvestment of dividends | | | - | | | | - | | | | 1,606,680 | | | | 20,625,878 | | |
| Redeemed | | | (5,309,456 | ) | | | (73,350,432 | ) | | | (2,669,500 | ) | | | (33,552,931 | ) | |
| Net increase (decrease) | | | (2,724,141 | ) | | $ | (38,553,167 | ) | | | 7,363,245 | | | $ | 91,692,594 | | |
| Destination Retirement Income Fund | |
| Sold | | | 1,529,369 | | | $ | 15,964,553 | | | | 2,662,426 | | | $ | 27,651,785 | | |
| Issued as reinvestment of dividends | | | - | | | | - | | | | 565,676 | | | | 5,825,397 | | |
| Redeemed | | | (2,818,527 | ) | | | (29,791,785 | ) | | | (1,300,672 | ) | | | (13,473,386 | ) | |
| Net increase (decrease) | | | (1,289,158 | ) | | $ | (13,827,232 | ) | | | 1,927,430 | | | $ | 20,003,796 | | |
| Destination Retirement 2010 Fund | |
| Sold | | | 1,936,000 | | | $ | 21,628,464 | | | | 3,822,651 | | | $ | 41,542,722 | | |
| Issued as reinvestment of dividends | | | - | | | | - | | | | 228,799 | | | | 2,477,978 | | |
| Redeemed | | | (843,615 | ) | | | (9,362,415 | ) | | | (1,561,398 | ) | | | (16,976,586 | ) | |
| Net increase (decrease) | | | 1,092,385 | | | $ | 12,266,049 | | | | 2,490,052 | | | $ | 27,044,114 | | |
| Destination Retirement 2020 Fund | |
| Sold | | | 3,102,085 | | | $ | 36,032,913 | | | | 4,999,467 | | | $ | 56,022,275 | | |
| Issued as reinvestment of dividends | | | - | | | | - | | | | 436,963 | | | | 4,895,063 | | |
| Redeemed | | | (1,017,399 | ) | | | (11,853,605 | ) | | | (2,050,403 | ) | | | (23,004,008 | ) | |
| Net increase (decrease) | | | 2,084,686 | | | $ | 24,179,308 | | | | 3,386,027 | | | $ | 37,913,330 | | |
| Destination Retirement 2030 Fund | |
| Sold | | | 1,943,264 | | | $ | 24,266,265 | | | | 3,704,763 | | | $ | 44,330,836 | | |
| Issued as reinvestment of dividends | | | - | | | | - | | | | 243,872 | | | | 2,920,632 | | |
| Redeemed | | | (677,916 | ) | | | (8,578,475 | ) | | | (1,228,582 | ) | | | (14,761,418 | ) | |
| Net increase (decrease) | | | 1,265,348 | | | $ | 15,687,790 | | | | 2,720,053 | | | $ | 32,490,050 | | |
342
Notes to Financial Statements (Unaudited) (Continued)
| | | Class Y | |
| | | Six months ended June 30, 2007 | | Year ended December, 31 2006 | |
| | | Shares | | Amount | | Shares | | Amount | |
| Destination Retirement 2040 Fund | |
| Sold | | | 931,780 | | | $ | 12,003,617 | | | | 2,464,622 | | | $ | 30,092,449 | | |
| Issued as reinvestment of dividends | | | - | | | | - | | | | 133,247 | | | | 1,638,488 | | |
| Redeemed | | | (435,296 | ) | | | (5,690,982 | ) | | | (786,012 | ) | | | (9,612,962 | ) | |
| Net increase (decrease) | | | 496,484 | | | $ | 6,312,635 | | | | 1,811,857 | | | $ | 22,117,975 | | |
| | | Class S | |
| | | Six months ended June 30, 2007 | | Year ended December, 31 2006 | |
| | | Shares | | Amount | | Shares | | Amount | |
| Strategic Bond Fund | |
| Sold | | | 1,475,696 | | | $ | 14,907,909 | | | | 926,637 | | | $ | 9,437,814 | | |
| Issued as reinvestment of dividends | | | - | | | | - | | | | 71,977 | | | | 723,420 | | |
| Redeemed | | | (343,541 | ) | | | (3,458,938 | ) | | | (138,065 | ) | | | (1,415,232 | ) | |
| Net increase (decrease) | | | 1,132,155 | | | $ | 11,448,971 | | | | 860,549 | | | $ | 8,746,002 | | |
| Strategic Balanced Fund | |
| Sold | | | 706,744 | | | $ | 8,347,689 | | | | 688,363 | | | $ | 7,817,361 | | |
| Issued as reinvestment of dividends | | | - | | | | - | | | | 28,596 | | | | 326,570 | | |
| Redeemed | | | (242,325 | ) | | | (2,807,114 | ) | | | (123,732 | ) | | | (1,360,324 | ) | |
| Net increase (decrease) | | | 464,419 | | | $ | 5,540,575 | | | | 593,227 | | | $ | 6,783,607 | | |
| Diversified Value Fund | |
| Sold | | | 7,340,101 | | | $ | 98,165,372 | | | | 5,414,038 | | | $ | 67,989,364 | | |
| Issued as reinvestment of dividends | | | - | | | | - | | | | 840,910 | | | | 10,937,820 | | |
| Redeemed | | | (2,232,378 | ) | | | (29,782,635 | ) | | | (4,031,118 | ) | | | (49,706,975 | ) | |
| Net increase (decrease) | | | 5,107,723 | | | $ | 68,382,737 | | | | 2,223,830 | | | $ | 29,220,209 | | |
| Fundamental Value Fund | |
| Sold | | | 6,584,482 | | | $ | 85,216,855 | | | | 17,120,035 | | | $ | 210,273,954 | | |
| Issued as reinvestment of dividends | | | - | | | | - | | | | 3,856,744 | | | | 47,464,125 | | |
| Redeemed | | | (8,229,943 | ) | | | (103,968,525 | ) | | | (14,620,318 | ) | | | (184,870,847 | ) | |
| Net increase (decrease) | | | (1,645,461 | ) | | $ | (18,751,670 | ) | | | 6,356,461 | | | $ | 72,867,232 | | |
| Value Equity Fund | |
| Sold | | | 703,149 | | | $ | 7,340,674 | | | | 1,432,698 | | | $ | 15,857,135 | | |
| Issued as reinvestment of dividends | | | - | | | | - | | | | 865,480 | | | | 8,773,679 | | |
| Redeemed | | | (783,710 | ) | | | (8,245,573 | ) | | | (2,404,390 | ) | | | (26,218,864 | ) | |
| Net increase (decrease) | | | (80,561 | ) | | $ | (904,899 | ) | | | (106,212 | ) | | $ | (1,588,050 | ) | |
| Large Cap Value Fund | |
| Sold | | | 11,130,081 | | | $ | 150,729,969 | | | | 15,777,721 | | | $ | 187,985,838 | | |
| Issued as reinvestment of dividends | | | - | | | | - | | | | 366,079 | | | | 4,722,424 | | |
| Redeemed | | | (11,667,775 | ) | | | (151,755,885 | ) | | | (16,657,176 | ) | | | (203,190,776 | ) | |
| Net increase (decrease) | | | (537,694 | ) | | $ | (1,025,916 | ) | | | (513,376 | ) | | $ | (10,482,514 | ) | |
| Indexed Equity Fund | |
| Sold | | | 8,527,450 | | | $ | 115,790,081 | | | | 17,579,217 | | | $ | 221,061,294 | | |
| Issued as reinvestment of dividends | | | - | | | | - | | | | 794,698 | | | | 10,463,169 | | |
| Redeemed | | | (9,575,899 | ) | | | (130,177,440 | ) | | | (19,785,035 | ) | | | (243,802,558 | ) | |
| Net increase (decrease) | | | (1,048,449 | ) | | $ | (14,387,359 | ) | | | (1,411,120 | ) | | $ | (12,278,095 | ) | |
| Core Opportunities Fund* | |
| Sold | | | 23,846 | | | $ | 263,692 | | | | 964,444 | | | $ | 9,645,714 | | |
| Issued as reinvestment of dividends | | | - | | | | - | | | | 16 | | | | 167 | | |
| Redeemed | | | (263 | ) | | | (2,930 | ) | | | (1,095 | ) | | | (11,679 | ) | |
| Net increase (decrease) | | | 23,583 | | | $ | 260,762 | | | | 963,365 | | | $ | 9,634,202 | | |
| Blue Chip Growth Fund | |
| Sold | | | 7,324,104 | | | $ | 75,163,404 | | | | 1,607,129 | | | $ | 15,148,154 | | |
| Issued as reinvestment of dividends | | | - | | | | - | | | | 18,799 | | | | 185,359 | | |
| Redeemed | | | (3,672,024 | ) | | | (36,475,798 | ) | | | (2,718,941 | ) | | | (25,456,407 | ) | |
| Net increase (decrease) | | | 3,652,080 | | | $ | 38,687,606 | | | | (1,093,013 | ) | | $ | (10,122,894 | ) | |
343
Notes to Financial Statements (Unaudited) (Continued)
| | | Class S | |
| | | Six months ended June 30, 2007 | | Year ended December, 31 2006 | |
| | | Shares | | Amount | | Shares | | Amount | |
| Large Cap Growth Fund | |
| Sold | | | 282,193 | | | $ | 2,940,784 | | | | 726,229 | | | $ | 7,395,947 | | |
| Issued as reinvestment of dividends | | | - | | | | - | | | | 60,311 | | | | 606,127 | | |
| Redeemed | | | (398,350 | ) | | | (4,156,184 | ) | | | (1,223,490 | ) | | | (12,791,188 | ) | |
| Net increase (decrease) | | | (116,157 | ) | | $ | (1,215,400 | ) | | | (436,950 | ) | | $ | (4,789,114 | ) | |
| Growth Equity Fund | |
| Sold | | | 975,140 | | | $ | 8,300,282 | | | | 9,493,736 | | | $ | 76,500,571 | | |
| Issued as reinvestment of dividends | | | - | | | | - | | | | 201,987 | | | | 1,659,839 | | |
| Redeemed | | | (14,795,093 | ) | | | (124,933,974 | ) | | | (11,378,556 | ) | | | (92,344,241 | ) | |
| Net increase (decrease) | | | (13,819,953 | ) | | $ | (116,633,692 | ) | | | (1,682,833 | ) | | $ | (14,183,831 | ) | |
| Aggressive Growth Fund | |
| Sold | | | 9,365,366 | | | $ | 62,106,521 | | | | 17,868,705 | | | $ | 112,241,738 | | |
| Issued as reinvestment of dividends | | | - | | | | - | | | | - | | | | - | | |
| Redeemed | | | (11,714,120 | ) | | | (75,590,412 | ) | | | (15,788,301 | ) | | | (99,392,221 | ) | |
| Net increase (decrease) | | | (2,348,754 | ) | | $ | (13,483,891 | ) | | | 2,080,404 | | | $ | 12,849,517 | | |
| OTC 100 Fund | |
| Sold | | | 955,953 | | | $ | 4,509,021 | | | | 1,933,498 | | | $ | 8,155,143 | | |
| Issued as reinvestment of dividends | | | - | | | | - | | | | - | | | | - | | |
| Redeemed | | | (1,485,614 | ) | | | (6,931,078 | ) | | | (2,938,737 | ) | | | (12,546,660 | ) | |
| Net increase (decrease) | | | (529,661 | ) | | $ | (2,422,057 | ) | | | (1,005,239 | ) | | $ | (4,391,517 | ) | |
| Focused Value Fund | |
| Sold | | | 4,579,498 | | | $ | 89,616,601 | | | | 6,263,898 | | | $ | 115,697,724 | | |
| Issued as reinvestment of dividends | | | - | | | | - | | | | 2,013,610 | | | | 37,202,296 | | |
| Redeemed | | | (5,776,281 | ) | | | (110,760,886 | ) | | | (8,306,787 | ) | | | (152,988,782 | ) | |
| Net increase (decrease) | | | (1,196,783 | ) | | $ | (21,144,285 | ) | | | (29,279 | ) | | $ | (88,762 | ) | |
| Mid-Cap Value Fund** | |
| Sold | | | 5,735,330 | | | $ | 68,214,024 | | | | 5,766,999 | | | $ | 65,388,624 | | |
| Issued as reinvestment of dividends | | | - | | | | - | | | | 14,021 | | | | 159,556 | | |
| Redeemed | | | (397,978 | ) | | | (4,805,665 | ) | | | (465,716 | ) | | | (5,336,837 | ) | |
| Net increase (decrease) | | | 5,337,352 | | | $ | 63,408,359 | | | | 5,315,304 | | | $ | 60,211,343 | | |
| Small Cap Value Equity Fund* | |
| Sold | | | 6,488,917 | | | $ | 73,058,785 | | | | 2,797,853 | | | $ | 28,652,496 | | |
| Issued as reinvestment of dividends | | | - | | | | - | | | | 8,051 | | | | 87,031 | | |
| Redeemed | | | (564,916 | ) | | | (6,368,234 | ) | | | (62,646 | ) | | | (647,596 | ) | |
| Net increase (decrease) | | | 5,924,001 | | | $ | 66,690,551 | | | | 2,743,258 | | | $ | 28,091,931 | | |
| Small Company Value Fund | |
| Sold | | | 5,926,984 | | | $ | 98,130,342 | | | | 11,024,989 | | | $ | 173,853,170 | | |
| Issued as reinvestment of dividends | | | - | | | | - | | | | 1,171,855 | | | | 18,040,979 | | |
| Redeemed | | | (7,055,173 | ) | | | (113,921,909 | ) | | | (8,970,153 | ) | | | (141,717,262 | ) | |
| Net increase (decrease) | | | (1,128,189 | ) | | $ | (15,791,567 | ) | | | 3,226,691 | | | $ | 50,176,887 | | |
| Small Cap Core Equity Fund* | |
| Sold | | | 843,463 | | | $ | 8,887,242 | | | | 2,009,309 | | | $ | 20,440,025 | | |
| Issued as reinvestment of dividends | | | - | | | | - | | | | 2,073 | | | | 21,326 | | |
| Redeemed | | | (16,025 | ) | | | (169,384 | ) | | | (6,529 | ) | | | (67,504 | ) | |
| Net increase (decrease) | | | 827,438 | | | $ | 8,717,858 | | | | 2,004,853 | | | $ | 20,393,847 | | |
| Mid Cap Growth Equity Fund | |
| Sold | | | 3,030,038 | | | $ | 34,532,632 | | | | 5,560,405 | | | $ | 60,768,613 | | |
| Issued as reinvestment of dividends | | | - | | | | - | | | | 44,558 | | | | 472,320 | | |
| Redeemed | | | (1,920,442 | ) | | | (21,410,895 | ) | | | (6,180,566 | ) | | | (65,334,142 | ) | |
| Net increase (decrease) | | | 1,109,596 | | | $ | 13,121,737 | | | | (575,603 | ) | | $ | (4,093,209 | ) | |
| Mid Cap Growth Equity II Fund | |
| Sold | | | 7,327,976 | | | $ | 117,768,001 | | | | 5,973,730 | | | $ | 89,431,385 | | |
| Issued as reinvestment of dividends | | | - | | | | - | | | | 1,171,211 | | | | 16,913,240 | | |
| Redeemed | | | (3,647,196 | ) | | | (55,629,647 | ) | | | (10,131,246 | ) | | | (152,841,382 | ) | |
| Net increase (decrease) | | | 3,680,780 | | | $ | 62,138,354 | | | | (2,986,305 | ) | | $ | (46,496,757 | ) | |
344
Notes to Financial Statements (Unaudited) (Continued)
| | | Class S | |
| | | Six months ended June 30, 2007 | | Year ended December, 31 2006 | |
| | | Shares | | Amount | | Shares | | Amount | |
| Small Cap Growth Equity Fund | |
| Sold | | | 2,939,393 | | | $ | 52,146,469 | | | | 6,369,754 | | | $ | 109,248,302 | | |
| Issued as reinvestment of dividends | | | - | | | | - | | | | 1,107,347 | | | | 18,359,819 | | |
| Redeemed | | | (2,698,810 | ) | | | (47,024,452 | ) | | | (8,177,262 | ) | | | (138,309,152 | ) | |
| Net increase (decrease) | | | 240,583 | | | $ | 5,122,017 | | | | (700,161 | ) | | $ | (10,701,031 | ) | |
| Small Company Growth Fund | |
| Sold | | | 1,455,508 | | | $ | 16,440,441 | | | | 2,692,915 | | | $ | 29,484,859 | | |
| Issued as reinvestment of dividends | | | - | | | | - | | | | 163,666 | | | | 1,713,217 | | |
| Redeemed | | | (929,410 | ) | | | (10,400,661 | ) | | | (1,701,568 | ) | | | (17,834,005 | ) | |
| Net increase (decrease) | | | 526,098 | | | $ | 6,039,780 | | | | 1,155,013 | | | $ | 13,364,071 | | |
| Emerging Growth Fund | |
| Sold | | | 399,411 | | | $ | 2,726,625 | | | | 3,987,640 | | | $ | 24,991,893 | | |
| Issued as reinvestment of dividends | | | - | | | | - | | | | - | | | | - | | |
| Redeemed | | | (1,656,417 | ) | | | (11,076,399 | ) | | | (3,156,178 | ) | | | (19,499,085 | ) | |
| Net increase (decrease) | | | (1,257,006 | ) | | $ | (8,349,774 | ) | | | 831,462 | | | $ | 5,492,808 | | |
| Diversified International Fund*** | |
| Sold | | | 7,046,271 | | | $ | 72,472,044 | | | | 1,133,644 | | | $ | 11,344,510 | | |
| Issued as reinvestment of dividends | | | - | | | | - | | | | 30 | | | | 548 | | |
| Redeemed | | | (32,871 | ) | | | (359,587 | ) | | | - | | | | - | | |
| Net increase (decrease) | | | 7,013,400 | | | $ | 72,112,457 | | | | 1,133,674 | | | $ | 11,345,058 | | |
| Overseas Fund | |
| Sold | | | 8,288,226 | | | $ | 114,311,353 | | | | 13,897,955 | | | $ | 174,043,851 | | |
| Issued as reinvestment of dividends | | | - | | | | - | | | | 2,998,481 | | | | 38,553,935 | | |
| Redeemed | | | (8,730,285 | ) | | | (115,363,153 | ) | | | (9,401,443 | ) | | | (116,982,256 | ) | |
| Net increase (decrease) | | | (442,059 | ) | | $ | (1,051,800 | ) | | | 7,494,993 | | | $ | 95,615,530 | | |
| Destination Retirement Income Fund | |
| Sold | | | 285,377 | | | $ | 2,998,013 | | | | 893,169 | | | $ | 9,240,597 | | |
| Issued as reinvestment of dividends | | | - | | | | - | | | | 35,213 | | | | 362,597 | | |
| Redeemed | | | (231,850 | ) | | | (2,421,291 | ) | | | (509,134 | ) | | | (5,245,533 | ) | |
| Net increase (decrease) | | | 53,527 | | | $ | 576,722 | | | | 419,248 | | | $ | 4,357,661 | | |
| Destination Retirement 2010 Fund | |
| Sold | | | 1,593,316 | | | $ | 17,723,941 | | | | 1,436,820 | | | $ | 15,600,760 | | |
| Issued as reinvestment of dividends | | | - | | | | - | | | | 69,908 | | | | 758,001 | | |
| Redeemed | | | (537,302 | ) | | | (5,964,745 | ) | | | (991,171 | ) | | | (10,638,822 | ) | |
| Net increase (decrease) | | | 1,056,014 | | | $ | 11,759,196 | | | | 515,557 | | | $ | 5,719,939 | | |
| Destination Retirement 2020 Fund | |
| Sold | | | 2,173,660 | | | $ | 25,333,968 | | | | 3,698,072 | | | $ | 41,392,192 | | |
| Issued as reinvestment of dividends | | | - | | | | - | | | | 266,032 | | | | 2,983,433 | | |
| Redeemed | | | (1,086,315 | ) | | | (12,617,840 | ) | | | (1,307,917 | ) | | | (14,593,466 | ) | |
| Net increase (decrease) | | | 1,087,345 | | | $ | 12,716,128 | | | | 2,656,187 | | | $ | 29,782,159 | | |
| Destination Retirement 2030 Fund | |
| Sold | | | 1,389,886 | | | $ | 17,559,521 | | | | 2,757,710 | | | $ | 32,874,418 | | |
| Issued as reinvestment of dividends | | | - | | | | - | | | | 145,742 | | | | 1,746,264 | | |
| Redeemed | | | (632,809 | ) | | | (7,941,970 | ) | | | (951,913 | ) | | | (11,228,238 | ) | |
| Net increase (decrease) | | | 757,077 | | | $ | 9,617,551 | | | | 1,951,539 | | | $ | 23,392,444 | | |
| Destination Retirement 2040 Fund | |
| Sold | | | 1,056,838 | | | $ | 13,810,963 | | | | 1,588,091 | | | $ | 19,470,179 | | |
| Issued as reinvestment of dividends | | | - | | | | - | | | | 113,295 | | | | 1,394,518 | | |
| Redeemed | | | (507,321 | ) | | | (6,583,097 | ) | | | (1,765,304 | ) | | | (21,179,453 | ) | |
| Net increase (decrease) | | | 549,517 | | | $ | 7,227,866 | | | | (63,918 | ) | | $ | (314,756 | ) | |
345
Notes to Financial Statements (Unaudited) (Continued)
| | | Class Z | |
| | | Six months ended June 30, 2007 | | Year ended December, 31 2006 | |
| | | Shares | | Amount | | Shares | | Amount | |
| Indexed Equity Fund | |
| Sold | | | 5,993,237 | | | $ | 81,702,293 | | | | 12,739,176 | | | $ | 156,939,556 | | |
| Issued as reinvestment of dividends | | | - | | | | - | | | | 452,676 | | | | 5,957,731 | | |
| Redeemed | | | (2,688,196 | ) | | | (37,001,801 | ) | | | (6,606,015 | ) | | | (82,036,539 | ) | |
| Net increase (decrease) | | | 3,305,041 | | | $ | 44,700,492 | | | | 6,585,837 | | | $ | 80,860,748 | | |
| | | Class N | |
| | | Six months ended June 30, 2007 | | Year ended December, 31 2006 | |
| | | Shares | | Amount | | Shares | | Amount | |
| Strategic Bond Fund | |
| Sold | | | 60,197 | | | $ | 603,355 | | | | 182,606 | | | $ | 1,793,930 | | |
| Issued as reinvestment of dividends | | | - | | | | - | | | | 6,969 | | | | 69,625 | | |
| Redeemed | | | (8,795 | ) | | | (87,375 | ) | | | (5,597 | ) | | | (57,198 | ) | |
| Net increase (decrease) | | | 51,402 | | | $ | 515,980 | | | | 183,978 | | | $ | 1,806,357 | | |
| Strategic Balanced Fund | |
| Sold | | | 1,656 | | | $ | 19,242 | | | | 18,231 | | | $ | 198,159 | | |
| Issued as reinvestment of dividends | | | - | | | | - | | | | 1,106 | | | | 12,572 | | |
| Redeemed | | | (2,355 | ) | | | (27,836 | ) | | | (8,833 | ) | | | (97,263 | ) | |
| Net increase (decrease) | | | (699 | ) | | $ | (8,594 | ) | | | 10,504 | | | $ | 113,468 | | |
| Diversified Value Fund | |
| Sold | | | 67,657 | | | $ | 901,415 | | | | 123,669 | | | $ | 1,483,862 | | |
| Issued as reinvestment of dividends | | | - | | | | - | | | | 4,384 | | | | 56,776 | | |
| Redeemed | | | (8,846 | ) | | | (118,841 | ) | | | (22,923 | ) | | | (270,806 | ) | |
| Net increase (decrease) | | | 58,811 | | | $ | 782,574 | | | | 105,130 | | | $ | 1,269,832 | | |
| Fundamental Value Fund | |
| Sold | | | 275,126 | | | $ | 3,602,683 | | | | 72,782 | | | $ | 874,051 | | |
| Issued as reinvestment of dividends | | | - | | | | - | | | | 11,129 | | | | 135,253 | | |
| Redeemed | | | (203,401 | ) | | | (2,674,658 | ) | | | (127,865 | ) | | | (1,507,543 | ) | |
| Net increase (decrease) | | | 71,725 | | | $ | 928,025 | | | | (43,954 | ) | | $ | (498,239 | ) | |
| Value Equity Fund | |
| Sold | | | 87 | | | $ | 900 | | | | 644 | | | $ | 7,366 | | |
| Issued as reinvestment of dividends | | | - | | | | - | | | | 124 | | | | 1,250 | | |
| Redeemed | | | (19 | ) | | | (191 | ) | | | - | | | | (4 | ) | |
| Net increase (decrease) | | | 68 | | | $ | 709 | | | | 768 | | | $ | 8,612 | | |
| Large Cap Value Fund | |
| Sold | | | 12,500 | | | $ | 164,313 | | | | 28,719 | | | $ | 332,052 | | |
| Issued as reinvestment of dividends | | | - | | | | - | | | | 147 | | | | 1,869 | | |
| Redeemed | | | (140,316 | ) | | | (1,883,314 | ) | | | (28,587 | ) | | | (326,255 | ) | |
| Net increase (decrease) | | | (127,816 | ) | | $ | (1,719,001 | ) | | | 279 | | | $ | 7,666 | | |
| Indexed Equity Fund | |
| Sold | | | 21,224 | | | $ | 282,830 | | | | 52,530 | | | $ | 629,495 | | |
| Issued as reinvestment of dividends | | | - | | | | - | | | | 3,463 | | | | 44,430 | | |
| Redeemed | | | (103,788 | ) | | | (1,401,519 | ) | | | (81,353 | ) | | | (981,351 | ) | |
| Net increase (decrease) | | | (82,564 | ) | | $ | (1,118,689 | ) | | | (25,360 | ) | | $ | (307,426 | ) | |
| Core Opportunities Fund* | |
| Sold | | | - | | | $ | - | | | | 10,010 | | | $ | 100,100 | | |
| Issued as reinvestment of dividends | | | - | | | | - | | | | - | | | | - | | |
| Redeemed | | | - | | | | - | | | | - | | | | - | | |
| Net increase (decrease) | | | - | | | $ | - | | | | 10,010 | | | $ | 100,100 | | |
| Blue Chip Growth Fund | |
| Sold | | | 9,846 | | | $ | 97,807 | | | | 178,502 | | | $ | 1,603,841 | | |
| Issued as reinvestment of dividends | | | - | | | | - | | | | - | | | | - | | |
| Redeemed | | | (98,258 | ) | | | (969,130 | ) | | | (33,522 | ) | | | (300,127 | ) | |
| Net increase (decrease) | | | (88,412 | ) | | $ | (871,323 | ) | | | 144,980 | | | $ | 1,303,714 | | |
346
Notes to Financial Statements (Unaudited) (Continued)
| | | Class N | |
| | | Six months ended June 30, 2007 | | Year ended December, 31 2006 | |
| | | Shares | | Amount | | Shares | | Amount | |
| Large Cap Growth Fund | |
| Sold | | | - | | | $ | - | | | | - | | | $ | - | | |
| Issued as reinvestment of dividends | | | - | | | | - | | | | 5 | | | | 53 | | |
| Redeemed | | | - | | | | - | | | | - | | | | - | | |
| Net increase (decrease) | | | - | | | $ | - | | | | 5 | | | $ | 53 | | |
| Growth Equity Fund | |
| Sold | | | 89 | | | $ | 720 | | | | 3,398 | | | $ | 26,728 | | |
| Issued as reinvestment of dividends | | | - | | | | - | | | | - | | | | - | | |
| Redeemed | | | (2,147 | ) | | | (17,615 | ) | | | (157,603 | ) | | | (1,191,791 | ) | |
| Net increase (decrease) | | | (2,058 | ) | | $ | (16,895 | ) | | | (154,205 | ) | | $ | (1,165,063 | ) | |
| Aggressive Growth Fund | |
| Sold | | | 13,337 | | | $ | 82,827 | | | | 98,751 | | | $ | 566,431 | | |
| Issued as reinvestment of dividends | | | - | | | | - | | | | - | | | | - | | |
| Redeemed | | | (28,761 | ) | | | (180,676 | ) | | | (58,959 | ) | | | (355,891 | ) | |
| Net increase (decrease) | | | (15,424 | ) | | $ | (97,849 | ) | | | 39,792 | | | $ | 210,540 | | |
| OTC 100 Fund | |
| Sold | | | 55 | | | $ | 251 | | | | 3,774 | | | $ | 15,462 | | |
| Issued as reinvestment of dividends | | | - | | | | - | | | | - | | | | - | | |
| Redeemed | | | (2,745 | ) | | | (12,275 | ) | | | (11,413 | ) | | | (46,364 | ) | |
| Net increase (decrease) | | | (2,690 | ) | | $ | (12,024 | ) | | | (7,639 | ) | | $ | (30,902 | ) | |
| Focused Value Fund | |
| Sold | | | 83,096 | | | $ | 1,578,453 | | | | 76,648 | | | $ | 1,305,149 | | |
| Issued as reinvestment of dividends | | | - | | | | - | | | | 13,700 | | | | 242,197 | | |
| Redeemed | | | (66,625 | ) | | | (1,242,116 | ) | | | (56,493 | ) | | | (960,411 | ) | |
| Net increase (decrease) | | | 16,471 | | | $ | 336,337 | | | | 33,855 | | | $ | 586,935 | | |
| Mid-Cap Value Fund** | |
| Sold | | | 3,657 | | | $ | 42,618 | | | | 10,010 | | | $ | 100,116 | | |
| Issued as reinvestment of dividends | | | - | | | | - | | | | - | | | | - | | |
| Redeemed | | | (42 | ) | | | (522 | ) | | | (10,000 | ) | | | (114,300 | ) | |
| Net increase (decrease) | | | 3,615 | | | $ | 42,096 | | | | 10 | | | $ | (14,184 | ) | |
| Small Cap Value Equity Fund* | |
| Sold | | | - | | | $ | - | | | | 10,010 | | | $ | 100,100 | | |
| Issued as reinvestment of dividends | | | - | | | | - | | | | - | | | | - | | |
| Redeemed | | | - | | | | - | | | | - | | | | - | | |
| Net increase (decrease) | | | - | | | $ | - | | | | 10,010 | | | $ | 100,100 | | |
| Small Company Value Fund | |
| Sold | | | 69,554 | | | $ | 1,104,757 | | | | 62,296 | | | $ | 945,284 | | |
| Issued as reinvestment of dividends | | | - | | | | - | | | | 5,135 | | | | 76,530 | | |
| Redeemed | | | (41,130 | ) | | | (652,074 | ) | | | (63,388 | ) | | | (967,396 | ) | |
| Net increase (decrease) | | | 28,424 | | | $ | 452,683 | | | | 4,043 | | | $ | 54,418 | | |
| Small Cap Core Equity Fund* | |
| Sold | | | - | | | $ | - | | | | 10,010 | | | $ | 100,100 | | |
| Issued as reinvestment of dividends | | | - | | | | - | | | | - | | | | - | | |
| Redeemed | | | - | | | | - | | | | - | | | | - | | |
| Net increase (decrease) | | | - | | | $ | - | | | | 10,010 | | | $ | 100,100 | | |
| Mid Cap Growth Equity Fund | |
| Sold | | | 3,853 | | | $ | 40,494 | | | | 8,489 | | | $ | 86,835 | | |
| Issued as reinvestment of dividends | | | - | | | | - | | | | - | | | | - | | |
| Redeemed | | | (113 | ) | | | (1,205 | ) | | | (1,585 | ) | | | (16,373 | ) | |
| Net increase (decrease) | | | 3,740 | | | $ | 39,289 | | | | 6,904 | | | $ | 70,462 | | |
| Mid Cap Growth Equity II Fund | |
| Sold | | | 57,808 | | | $ | 853,011 | | | | 131,233 | | | $ | 1,848,485 | | |
| Issued as reinvestment of dividends | | | - | | | | - | | | | 13,578 | | | | 187,256 | | |
| Redeemed | | | (12,347 | ) | | | (181,856 | ) | | | (77,409 | ) | | | (1,104,147 | ) | |
| Net increase (decrease) | | | 45,461 | | | $ | 671,155 | | | | 67,402 | | | $ | 931,594 | | |
347
Notes to Financial Statements (Unaudited) (Continued)
| | | Class N | |
| | | Six months ended June 30, 2007 | | Year ended December, 31 2006 | |
| | | Shares | | Amount | | Shares | | Amount | |
| Small Cap Growth Equity Fund | |
| Sold | | | 6,397 | | | $ | 105,781 | | | | 12,585 | | | $ | 202,939 | | |
| Issued as reinvestment of dividends | | | - | | | | - | | | | 3,491 | | | | 54,629 | | |
| Redeemed | | | (4,505 | ) | | | (75,225 | ) | | | (12,951 | ) | | | (211,725 | ) | |
| Net increase (decrease) | | | 1,892 | | | $ | 30,556 | | | | 3,125 | | | $ | 45,843 | | |
| Small Company Growth Fund | |
| Sold | | | 2,566 | | | $ | 27,454 | | | | 26,190 | | | $ | 281,109 | | |
| Issued as reinvestment of dividends | | | - | | | | - | | | | 4,211 | | | | 42,005 | | |
| Redeemed | | | (38,862 | ) | | | (435,267 | ) | | | (50,842 | ) | | | (518,827 | ) | |
| Net increase (decrease) | | | (36,296 | ) | | $ | (407,813 | ) | | | (20,441 | ) | | $ | (195,713 | ) | |
| Emerging Growth Fund | |
| Sold | | | - | | | $ | - | | | | - | | | $ | - | | |
| Issued as reinvestment of dividends | | | - | | | | - | | | | - | | | | - | | |
| Redeemed | | | - | | | | - | | | | - | | | | - | | |
| Net increase (decrease) | | | - | | | $ | - | | | | - | | | $ | - | | |
| Diversified International Fund*** | |
| Sold | | | - | | | $ | - | | | | 10,010 | | | $ | 100,100 | | |
| Issued as reinvestment of dividends | | | - | | | | - | | | | - | | | | - | | |
| Redeemed | | | - | | | | - | | | | - | | | | - | | |
| Net increase (decrease) | | | - | | | $ | - | | | | 10,010 | | | $ | 100,100 | | |
| Overseas Fund | |
| Sold | | | 111,535 | | | $ | 1,516,246 | | | | 69,051 | | | $ | 841,131 | | |
| Issued as reinvestment of dividends | | | - | | | | - | | | | 15,592 | | | | 196,409 | | |
| Redeemed | | | (45,058 | ) | | | (612,710 | ) | | | (46,340 | ) | | | (552,278 | ) | |
| Net increase (decrease) | | | 66,477 | | | $ | 903,536 | | | | 38,303 | | | $ | 485,262 | | |
| Destination Retirement Income Fund | |
| Sold | | | 1,246 | | | $ | 13,064 | | | | 1,943 | | | $ | 19,800 | | |
| Issued as reinvestment of dividends | | | - | | | | - | | | | 75 | | | | 772 | | |
| Redeemed | | | (871 | ) | | | (9,151 | ) | | | (455 | ) | | | (4,772 | ) | |
| Net increase (decrease) | | | 375 | | | $ | 3,913 | | | | 1,563 | | | $ | 15,800 | | |
| Destination Retirement 2010 Fund | |
| Sold | | | 15,036 | | | $ | 165,002 | | | | 10,791 | | | $ | 115,432 | | |
| Issued as reinvestment of dividends | | | - | | | | - | | | | 346 | | | | 3,740 | | |
| Redeemed | | | (2,612 | ) | | | (28,871 | ) | | | (705 | ) | | | (7,568 | ) | |
| Net increase (decrease) | | | 12,424 | | | $ | 136,131 | | | | 10,432 | | | $ | 111,604 | | |
| Destination Retirement 2020 Fund | |
| Sold | | | 9,068 | | | $ | 105,641 | | | | 7,139 | | | $ | 79,344 | | |
| Issued as reinvestment of dividends | | | - | | | | - | | | | 729 | | | | 8,122 | | |
| Redeemed | | | (2,094 | ) | | | (24,083 | ) | | | (2,090 | ) | | | (22,966 | ) | |
| Net increase (decrease) | | | 6,974 | | | $ | 81,558 | | | | 5,778 | | | $ | 64,500 | | |
| Destination Retirement 2030 Fund | |
| Sold | | | 5,448 | | | $ | 68,270 | | | | 4,954 | | | $ | 58,912 | | |
| Issued as reinvestment of dividends | | | - | | | | - | | | | 260 | | | | 3,100 | | |
| Redeemed | | | (782 | ) | | | (10,101 | ) | | | (1,930 | ) | | | (22,743 | ) | |
| Net increase (decrease) | | | 4,666 | | | $ | 58,169 | | | | 3,284 | | | $ | 39,269 | | |
| Destination Retirement 2040 Fund | |
| Sold | | | 2,483 | | | $ | 32,441 | | | | 4,425 | | | $ | 54,437 | | |
| Issued as reinvestment of dividends | | | - | | | | - | | | | 244 | | | | 2,982 | | |
| Redeemed | | | (203 | ) | | | (2,684 | ) | | | (1,520 | ) | | | (18,259 | ) | |
| Net increase (decrease) | | | 2,280 | | | $ | 29,757 | | | | 3,149 | | | $ | 39,160 | | |
* Fund commenced operations on March 31, 2006.
** Fund commenced operations on August 29, 2006.
*** Fund commenced operations on December 14, 2006.
348
Notes to Financial Statements (Unaudited) (Continued)
Redemptions or exchanges of Class A shares made within eighteen months of purchase from initial investments of $1 million or more are subject to a contingent deferred sales charge of 1% of the amount redeemed. Redemptions or exchanges of Class N shares made within eighteen months of purchase are subject to a contingent deferred sales charge of 1% of the amount redeemed. The distributor receives all contingent deferred sales charges. Any contingent deferred sales charges during the six months ended June 30, 2007 were waived for any redemptions or exchanges subject to such a charge.
6. Federal Income Tax Information
At June 30, 2007, the cost of securities and the unrealized appreciation (depreciation) in the value of investments owned by the Funds, as computed on a Federal income tax basis, were as follows:
| | | Federal
Income Tax
Cost | | Tax Basis
Unrealized
Appreciation | | Tax Basis
Unrealized
Depreciation | | Net Unrealized
Appreciation
(Depreciation) | |
| Strategic Bond Fund | | $ | 342,138,308 | | | $ | 437,350 | | | $ | (5,857,520 | ) | | $ | (5,420,170 | ) | |
| Strategic Balanced Fund | | | 222,101,992 | | | | 28,010,286 | | | | (3,075,711 | ) | | | 24,934,575 | | |
| Diversified Value Fund | | | 597,694,247 | | | | 123,085,944 | | | | (7,048,331 | ) | | | 116,037,613 | | |
| Fundamental Value Fund | | | 1,087,376,569 | | | | 289,809,945 | | | | (2,503,854 | ) | | | 287,306,091 | | |
| Value Equity Fund | | | 99,429,465 | | | | 9,390,819 | | | | (1,441,489 | ) | | | 7,949,330 | | |
| Large Cap Value Fund | | | 1,126,767,154 | | | | 473,362,910 | | | | (3,565,827 | ) | | | 469,797,083 | | |
| Indexed Equity Fund | | | 1,984,574,667 | | | | 668,120,445 | | | | (112,218,018 | ) | | | 555,902,427 | | |
| Core Opportunities Fund | | | 48,958,157 | | | | 3,862,905 | | | | (461,530 | ) | | | 3,401,375 | | |
| Blue Chip Growth Fund | | | 531,031,786 | | | | 81,747,200 | | | | (4,331,417 | ) | | | 77,415,783 | | |
| Large Cap Growth Fund | | | 44,044,769 | | | | 5,403,367 | | | | (751,635 | ) | | | 4,651,732 | | |
| Growth Equity Fund | | | 443,729,285 | | | | 32,288,757 | | | | (7,130,285 | ) | | | 25,158,472 | | |
| Aggressive Growth Fund | | | 518,433,149 | | | | 98,713,941 | | | | (16,017,363 | ) | | | 82,696,578 | | |
| OTC 100 Fund | | | 39,302,812 | | | | 11,094,520 | | | | (1,872,788 | ) | | | 9,221,732 | | |
| Focused Value Fund | | | 946,537,222 | | | | 231,608,193 | | | | (10,132,969 | ) | | | 221,475,224 | | |
| Mid-Cap Value Fund | | | 261,924,557 | | | | 15,485,927 | | | | (4,344,415 | ) | | | 11,141,512 | | |
| Small Cap Value Equity Fund | | | 194,836,568 | | | | 8,045,630 | | | | (7,465,216 | ) | | | 580,414 | | |
| Small Company Value Fund | | | 796,427,912 | | | | 151,062,821 | | | | (31,507,787 | ) | | | 119,555,034 | | |
| Small Cap Core Equity Fund | | | 64,124,436 | | | | 3,586,512 | | | | (2,311,674 | ) | | | 1,274,838 | | |
| Mid Cap Growth Equity Fund | | | 173,612,457 | | | | 22,039,884 | | | | (3,100,846 | ) | | | 18,939,038 | | |
| Mid Cap Growth Equity II Fund | | | 1,286,239,652 | | | | 369,471,553 | | | | (27,372,384 | ) | | | 342,099,169 | | |
| Small Cap Growth Equity Fund | | | 820,023,468 | | | | 168,972,424 | | | | (13,978,713 | ) | | | 154,993,711 | | |
| Small Company Growth Fund | | | 197,397,466 | | | | 30,030,944 | | | | (6,031,688 | ) | | | 23,999,256 | | |
| Emerging Growth Fund | | | 115,737,957 | | | | 17,038,674 | | | | (1,384,966 | ) | | | 15,653,708 | | |
| Diversified International Fund | | | 135,026,926 | | | | 15,264,180 | | | | (2,457,101 | ) | | | 12,807,079 | | |
| Overseas Fund | | | 1,248,288,765 | | | | 253,235,317 | | | | (10,082,852 | ) | | | 243,152,465 | | |
| Destination Retirement Income Fund | | | 271,854,533 | | | | 5,688,476 | | | | (3,870,517 | ) | | | 1,817,959 | | |
| Destination Retirement 2010 Fund | | | 231,112,774 | | | | 5,914,187 | | | | (1,868,601 | ) | | | 4,045,586 | | |
| Destination Retirement 2020 Fund | | | 655,529,212 | | | | 33,564,230 | | | | (5,180,701 | ) | | | 28,383,529 | | |
| Destination Retirement 2030 Fund | | | 478,878,309 | | | | 39,042,998 | | | | (1,436,785 | ) | | | 37,606,213 | | |
| Destination Retirement 2040 Fund | | | 266,833,900 | | | | 24,364,657 | | | | (195,374 | ) | | | 24,169,283 | | |
At December 31, 2006, the following Funds had available, for Federal income tax purposes, unused capital losses:
| | | Expiring
2009 | | Expiring
2010 | | Expiring
2011 | | Expiring
2012 | | Expiring
2013 | | Expiring
2014 | |
| Strategic Bond Fund | | $ | - | | | $ | - | | | $ | - | | | $ | - | | | $ | 630,808 | | | $ | - | | |
| Large Cap Value Fund | | | - | | | | 8,806,465 | | | | 10,621,856 | | | | 9,443,094 | | | | - | | | | - | | |
| Indexed Equity Fund | | | - | | | | 21,973,224 | | | | - | | | | - | | | | - | | | | - | | |
| Blue Chip Growth Fund | | | - | | | | 34,126,514 | | | | 16,672,836 | | | | 4,273,407 | | | | - | | | | - | | |
349
Notes to Financial Statements (Unaudited) (Continued)
| | | Expiring
2009 | | Expiring
2010 | | Expiring
2011 | | Expiring
2012 | | Expiring
2013 | | Expiring
2014 | |
| Growth Equity Fund | | $ | 19,055,196 | | | $ | 98,921,181 | | | $ | - | | | $ | - | | | $ | - | | | $ | - | | |
| Aggressive Growth Fund | | | 27,527,320 | | | | 39,256,002 | | | | - | | | | - | | | | - | | | | - | | |
| OTC 100 Fund | | | - | | | | 2,180,264 | | | | 13,741,961 | | | | 7,702,832 | | | | - | | | | - | | |
| Small Cap Core Equity Fund | | | - | | | | - | | | | - | | | | - | | | | - | | | | 494,912 | | |
| Mid Cap Growth Equity Fund | | | 35,293,704 | | | | 35,977,324 | | | | 976,172 | | | | - | | | | - | | | | - | | |
| Emerging Growth Fund | | | 9,235,482 | | | | 28,322,542 | | | | - | | | | - | | | | - | | | | - | | |
Net capital loss carryforwards may be applied against any net realized taxable gains in each succeeding year, or until their respective expiration dates, whichever occurs first.
Certain differences exist from the amounts reflected in the Statement of Changes in Net Assets primarily due to the character of short-term capital gains treated as ordinary income for tax purposes.
The Funds distinguish between distributions on a tax basis and financial reporting basis. Accounting principles generally accepted in the United States of America require that only distributions in excess of tax basis earnings and profits be reported in the financial statements as a return of capital.
The tax character of distributions paid during the year ended December 31, 2006 was as follows:
| | | Ordinary
Income | | Long Term
Capital Gain | | Short Term
Capital Gain | | Return of
Capital | |
| Strategic Bond Fund | | $ | 9,053,907 | | | $ | - | | | $ | - | | | $ | - | | |
| Strategic Balanced Fund | | | 5,566,068 | | | | 2,240,122 | | | | - | | | | - | | |
| Diversified Value Fund | | | 7,691,998 | | | | 15,556,374 | | | | - | | | | - | | |
| Fundamental Value Fund | | | 25,168,210 | | | | 87,731,488 | | | | - | | | | - | | |
| Value Equity Fund | | | 5,190,133 | | | | 10,471,477 | | | | - | | | | - | | |
| Large Cap Value Fund | | | 9,827,424 | | | | - | | | | - | | | | - | | |
| Indexed Equity Fund | | | 31,305,342 | | | | - | | | | - | | | | 174,933 | | |
| Core Opportunities Fund | | | 106,850 | | | | 183 | | | | - | | | | - | | |
| Blue Chip Growth Fund | | | 473,756 | | | | - | | | | - | | | | - | | |
| Large Cap Growth Fund | | | - | | | | 1,599,477 | | | | - | | | | - | | |
| Growth Equity Fund | | | 3,409,304 | | | | - | | | | - | | | | - | | |
| Focused Value Fund | | | 19,675,951 | | | | 78,006,944 | | | | - | | | | - | | |
| Mid-Cap Value Fund | | | 164,729 | | | | - | | | | - | | | | - | | |
| Small Cap Value Equity Fund | | | 168,054 | | | | - | | | | - | | | | - | | |
| Small Company Value Fund | | | 6,748,468 | | | | 42,960,242 | | | | - | | | | - | | |
| Small Cap Core Equity Fund | | | 48,939 | | | | - | | | | - | | | | - | | |
| Mid Cap Growth Equity Fund | | | 786,942 | | | | - | | | | - | | | | - | | |
| Mid Cap Growth Equity II Fund | | | 8,549,416 | | | | 82,641,736 | | | | - | | | | - | | |
| Small Cap Growth Equity Fund | | | - | | | | 40,491,582 | | | | - | | | | - | | |
| Small Company Growth Fund | | | - | | | | 10,593,632 | | | | - | | | | - | | |
| Diversified International Fund | | | 10,533 | | | | - | | | | - | | | | - | | |
| Overseas Fund | | | 39,509,993 | | | | 68,794,727 | | | | - | | | | - | | |
| Destination Retirement Income Fund | | | 9,100,427 | | | | 3,689,364 | | | | - | | | | - | | |
| Destination Retirement 2010 Fund | | | 5,304,504 | | | | 2,215,167 | | | | - | | | | - | | |
| Destination Retirement 2020 Fund | | | 13,715,560 | | | | 13,822,444 | | | | - | | | | - | | |
| Destination Retirement 2030 Fund | | | 6,966,352 | | | | 12,063,822 | | | | - | | | | - | | |
| Destination Retirement 2040 Fund | | | 2,755,008 | | | | 9,995,730 | | | | - | | | | - | | |
350
Notes to Financial Statements (Unaudited) (Continued)
At December 31, 2006, the components of distributable earnings on a tax basis were as follows:
| | | Undistributed
Ordinary
Income | | Undistributed
Long Term
Capital Gain
(Capital Loss
Carryover) | | Other
Temporary
Differences | | Unrealized
Appreciation
(Depreciation) | |
| Strategic Bond Fund | | $ | - | | | $ | (630,808 | ) | | $ | (744,742 | ) | | $ | 84,766 | | |
| Strategic Balanced Fund | | | 398,351 | | | | 495,393 | | | | (7,897 | ) | | | 27,082,723 | | |
| Diversified Value Fund | | | 768,501 | | | | 1,832,450 | | | | (10,470 | ) | | | 100,972,653 | | |
| Fundamental Value Fund | | | 3,510,216 | | | | 24,879,638 | | | | (38,758 | ) | | | 236,387,496 | | |
| Value Equity Fund | | | 1,804,438 | | | | 1,293,949 | | | | (4,959 | ) | | | 5,764,421 | | |
| Large Cap Value Fund | | | - | | | | (28,871,415 | ) | | | (58,695 | ) | | | 459,674,961 | | |
| Indexed Equity Fund | | | - | | | | (21,973,224 | ) | | | (5,678,051 | ) | | | 404,784,329 | | |
| Core Opportunities Fund | | | 4 06,519 | | | | (59 | ) | | | (232 | ) | | | 1,333,824 | | |
| Blue Chip Growth Fund | | | - | | | | (55,072,757 | ) | | | (25,189 | ) | | | 43,936,339 | | |
| Large Cap Growth Fund | | | - | | | | 362,321 | | | | (1,848 | ) | | | 3,373,813 | | |
| Growth Equity Fund | | | - | | | | (117,976,377 | ) | | | (41,113 | ) | | | 37,548,379 | | |
| Aggressive Growth Fund | | | - | | | | (66,783,322 | ) | | | (23,194 | ) | | | 76,286,436 | | |
| OTC 100 Fund | | | - | | | | (23,625,057 | ) | | | 455 | | | | 7,332,872 | | |
| Focused Value Fund | | | - | | | | 8,439,337 | | | | (37,161 | ) | | | 203,619,965 | | |
| Mid-Cap Value Fund | | | 110,363 | | | | - | | | | (88 | ) | | | 466,247 | | |
| Small Cap Value Equity Fund | | | 389,810 | | | | 16,432 | | | | 7,296 | | | | 1,961,653 | | |
| Small Company Value Fund | | | 3,037,932 | | | | 16,801,502 | | | | 23,627 | | | | 124,120,740 | | |
| Small Cap Core Equity Fund | | | - | | | | (4 94,912 | ) | | | (1,255 | ) | | | 1,112,498 | | |
| Mid Cap Growth Equity Fund | | | - | | | | (72,247,200 | ) | | | 18,265 | | | | 19,050,491 | | |
| Mid Cap Growth Equity II Fund | | | - | | | | 20,705,690 | | | | (53,823 | ) | | | 244,891,374 | | |
| Small Cap Growth Equity Fund | | | - | | | | 10,275,242 | | | | (27,718 | ) | | | 116,154,442 | | |
| Small Company Growth Fund | | | 2,286,935 | | | | 1,028,568 | | | | (6,621 | ) | | | 11,652,384 | | |
| Emerging Growth Fund | | | - | | | | (37,558,024 | ) | | | (7,289 | ) | | | 11,178,476 | | |
| Diversified International Fund | | | 25,374 | | | | 389 | | | | (3,438 | ) | | | 39,376 | | |
| Overseas Fund | | | 2,894,634 | | | | 22,688,344 | | | | (372,960 | ) | | | 248,339,480 | | |
| Destination Retirement Income Fund | | | 440,251 | | | | 5,069,567 | | | | (7,726 | ) | | | (5,070,049 | ) | |
| Destination Retirement 2010 Fund | | | 405,538 | | | | 3,739,153 | | | | (2,281 | ) | | | (2,282,514 | ) | |
| Destination Retirement 2020 Fund | | | 761,438 | | | | 23,752,874 | | | | (13,093 | ) | | | 3,486,577 | | |
| Destination Retirement 2030 Fund | | | 20,543 | | | | 22,791,631 | | | | (9,411 | ) | | | 16,065,123 | | |
| Destination Retirement 2040 Fund | | | 171,438 | | | | 14,463,924 | | | | (5,464 | ) | | | 9,917,078 | | |
Pursuant to Section 852 of the Internal Revenue Code, the following Funds have designated capital gains dividend for the year ended December 31, 2006:
| | | Long Term
Capital Dividend | |
| Strategic Balanced Fund | | $ | 2,240,122 | | |
| Diversified Value Fund | | | 15,556,374 | | |
| Fundamental Value Fund | | | 87,731,488 | | |
| Value Equity Fund | | | 10,471,477 | | |
| Core Opportunities Fund | | | 183 | | |
| Large Cap Growth Fund | | | 1,599,477 | | |
| Focused Value Fund | | | 78,006,944 | | |
| Small Company Value Fund | | | 42,960,242 | | |
| Mid Cap Growth Equity II Fund | | | 82,641,736 | | |
| Small Cap Growth Equity Fund | | | 40,491,582 | | |
| Small Company Growth Fund | | | 10,593,632 | | |
| Overseas Fund | | | 68,794,727 | | |
| Destination Retirement Income Fund | | | 3,689,364 | | |
| Destination Retirement 2010 Fund | | | 2,215,167 | | |
| Destination Retirement 2020 Fund | | | 13,822,444 | | |
| Destination Retirement 2030 Fund | | | 12,063,822 | | |
| Destination Retirement 2040 Fund | | | 9,995,730 | | |
351
Notes to Financial Statements (Unaudited) (Continued)
The following Funds have elected to defer to January 1, 2007 post-October losses:
| | | Amount | |
| Strategic Bond Fund | | $ | 740,701 | | |
| Indexed Equity Fund | | | 5,626,954 | | |
The following Funds have elected to defer to January 1, 2007 post-October currency losses:
| | | Amount | |
| Strategic Bond Fund | | $ | 120 | | |
| Mid Cap Growth Equity II Fund | | | 9,020 | | |
| Overseas Fund | | | 200,491 | | |
The Funds adopted Financial Accounting Standards Board Interpretation No. 48 "Accounting for Uncertainty in Income Taxes" (FIN 48) on June 29, 2007. The adoption of FIN 48 did not have a material effect on the net asset value, financial condition or results of operations of the Funds as there was no liability for unrecognized tax benefits and no change to the beginning net asset value of the Funds. As of and during the period ended June 30, 2007, the Funds did not have a liability for any unrecognized tax benefits.
The Funds recognize interest and penalties, if any, related to unrecognized tax benefits as income tax expense in the Statements of Operations. During the period ended June 30, 2007, the Funds did not incur any interest or penalties. The Funds are subject to examination by U.S. federal, state and foreign tax authorities for returns filed after 2004, 2005 and 2006 respectively.
7. Investment in Affiliated Issuers
A summary of the Fund's transactions in the securities of these issuers during the six months ended June 30, 2007, is as follows:
| | | Value,
beginning
of period | | Purchases | | Sales
Proceeds | | Value,
end of
period | | Dividend
Income | | Realized
Gains
Distributions | |
Destination Retirement
Income Fund | | | |
Aggressive Growth Fund,
Class S | | $ | 41,937 | | | $ | 3,851,747 | | | $ | 159,530 | | | $ | 3,876,171 | | | $ | - | | | $ | - | | |
Blue Chip Growth Fund,
Class S | | | 54,370 | | | | 2,689,487 | | | | 33,706 | | | | 2,933,790 | | | | - | | | | - | | |
Capital Appreciation
Fund, Class S* | | | 34,102 | | | | 1,610,313 | | | | 31,554 | | | | 1,727,601 | | | | - | | | | - | | |
| Core Bond Fund, Class S* | | | 50,557,393 | | | | 2,840,826 | | | | 10,501,337 | | | | 43,289,297 | | | | - | | | | - | | |
Diversified Bond Fund,
Class S* | | | 42,736,493 | | | | 2,315,081 | | | | 11,960,802 | | | | 33,541,261 | | | | - | | | | - | | |
Diversified International
Fund, Class S | | | 124,016 | | | | 4,238,324 | | | | 133,539 | | | | 4,776,451 | | | | - | | | | - | | |
Diversified Value Fund,
Class S | | | 186,943 | | | | 3,391,507 | | | | 69,086 | | | | 3,737,862 | | | | - | | | | - | | |
Emerging Growth Fund,
Class S | | | 713,449 | | | | 202,432 | | | | 60,975 | | | | 961,050 | | | | - | | | | - | | |
Enhanced Index Growth
Fund, Class S* | | | 938,886 | | | | 6,383,211 | | | | 34,811 | | | | 7,448,031 | | | | - | | | | - | | |
Enhanced Index Value
Fund, Class S* | | | 444,405 | | | | 10,025,703 | | | | 281,619 | | | | 10,690,856 | | | | - | | | | - | | |
Focused Value Fund,
Class S | | | 5,679,171 | | | | 1,618,993 | | | | 309,046 | | | | 7,647,389 | | | | - | | | | - | | |
Fundamental Value Fund,
Class S | | | 3,964,061 | | | | 1,220,377 | | | | 326,995 | | | | 5,204,975 | | | | - | | | | - | | |
Growth Equity Fund,
Class S | | | 15,770,224 | | | | - | | | | 10,375,237 | | | | 5,844,676 | | | | - | | | | - | | |
Inflation-Protected Bond
Fund, Class S* | | | 52,781,308 | | | | 3,526,276 | | | | 11,594,482 | | | | 45,351,275 | | | | - | | | | - | | |
International Equity Fund,
Class S* | | | 124,150 | | | | 4,182,482 | | | | 110,778 | | | | 4,580,120 | | | | - | | | | - | | |
Large Cap Value Fund,
Class S | | | 12,270,259 | | | | 484,117 | | | | 10,855,959 | | | | 1,869,535 | | | | - | | | | - | | |
Main Street Small Cap
Fund, Class S* | | | 3,927,961 | | | | 1,473,637 | | | | 224,613 | | | | 5,572,847 | | | | - | | | | - | | |
352
Notes to Financial Statements (Unaudited) (Continued)
| | | Value,
beginning
of period | | Purchases | | Sales
Proceeds | | Value,
end of
period | | Dividend
Income | | Realized
Gains
Distributions | |
Mid Cap Growth Equity
Fund, Class S | | $ | 1,119,717 | | | $ | 337,629 | | | $ | 71,071 | | | $ | 1,474,872 | | | $ | - | | | $ | - | | |
Mid Cap Growth Equity II
Fund, Class S | | | 1,682,384 | | | | 487,142 | | | | 106,756 | | | | 2,306,916 | | | | - | | | | - | | |
Mid-Cap Value Fund,
Class S | | | 2,826,702 | | | | 809,135 | | | | 151,188 | | | | 3,781,768 | | | | - | | | | - | | |
Money Market Fund,
Class S* | | | 14,136,687 | | | | 1,037,485 | | | | 3,992,825 | | | | 11,181,347 | | | | 281,991 | | | | - | | |
| Overseas Fund, Class S | | | 14,188,387 | | | | 2,288,573 | | | | 7,196,810 | | | | 9,859,282 | | | | - | | | | - | | |
Short-Duration Bond
Fund, Class S* | | | 42,306,043 | | | | 2,332,833 | | | | 9,026,025 | | | | 36,481,872 | | | | - | | | | - | | |
Small Cap Core Equity
Fund, Class S | | | 1,698,923 | | | | 627,165 | | | | 90,049 | | | | 2,273,131 | | | | - | | | | - | | |
Small Cap Growth Equity
Fund, Class S | | | 704,408 | | | | 211,436 | | | | 38,664 | | | | 956,102 | | | | - | | | | - | | |
Small Cap Value Equity
Fund, Class S | | | 1,416,279 | | | | 307,617 | | | | 73,351 | | | | 1,711,862 | | | | - | | | | - | | |
Small Company Growth
Fund, Class S | | | 1,304,137 | | | | 412,127 | | | | 78,459 | | | | 1,812,590 | | | | - | | | | - | | |
Small Company Value
Fund, Class S | | | 1,404,486 | | | | 418,039 | | | | 73,351 | | | | 1,837,092 | | | | - | | | | - | | |
Strategic Income Fund,
Class S* | | | 7,868,327 | | | | 2,790,166 | | | | 605,144 | | | | 10,441,311 | | | | - | | | | - | | |
| Value Fund, Class S* | | | 19,096 | | | | 447,939 | | | | 15,446 | | | | 501,160 | | | | - | | | | - | | |
| Totals | | $ | 281,024,704 | | | $ | 62,561,799 | | | $ | 78,583,208 | | | $ | 273,672,492 | | | $ | 281,991 | | | $ | - | | |
| | | Value,
beginning
of period | | Purchases | | Sales
Proceeds | | Value,
end of
period | | Dividend
Income | | Realized
Gains
Distributions | |
Destination
Retirement
2010 Fund | |
Aggressive Growth Fund,
Class S | | $ | 42,409 | | | $ | 3,594,503 | | | $ | 89,234 | | | $ | 3,678,318 | | | $ | - | | | $ | - | | |
Blue Chip Growth Fund,
Class S | | | 58,425 | | | | 2,556,067 | | | | 34,165 | | | | 2,786,794 | | | | - | | | | - | | |
Capital Appreciation
Fund, Class S* | | | 43,593 | | | | 1,515,307 | | | | 20,499 | | | | 1,644,482 | | | | - | | | | - | | |
| Core Bond Fund, Class S* | | | 28,725,271 | | | | 7,615,618 | | | | 2,137,440 | | | | 34,422,448 | | | | - | | | | - | | |
Diversified Bond Fund,
Class S* | | | 23,589,673 | | | | 6,670,074 | | | | 2,542,685 | | | | 27,966,176 | | | | - | | | | - | | |
Diversified International
Fund, Class S | | | 88,508 | | | | 4,437,835 | | | | 103,293 | | | | 4,991,107 | | | | - | | | | - | | |
Diversified Value Fund,
Class S | | | 72,690 | | | | 2,506,823 | | | | 46,873 | | | | 2,687,618 | | | | - | | | | - | | |
Emerging Growth Fund,
Class S | | | 451,744 | | | | 198,959 | | | | 23,838 | | | | 701,611 | | | | - | | | | - | | |
Enhanced Index Growth
Fund, Class S* | | | 2,173,381 | | | | 9,865,550 | | | | 81,213 | | | | 12,408,706 | | | | - | | | | - | | |
Enhanced Index Value
Fund, Class S* | | | 5,802,078 | | | | 9,383,326 | | | | 402,675 | | | | 15,413,590 | | | | - | | | | - | | |
Focused Value Fund,
Class S | | | 3,595,807 | | | | 1,633,883 | | | | 127,476 | | | | 5,563,493 | | | | - | | | | - | | |
Fundamental Value Fund,
Class S | | | 5,007,772 | | | | 1,405,313 | | | | 1,942,700 | | | | 4,765,153 | | | | - | | | | - | | |
Growth Equity Fund,
Class S | | | 15,448,604 | | | | - | | | | 10,424,277 | | | | 5,454,281 | | | | - | | | | - | | |
Inflation-Protected Bond
Fund, Class S* | | | 26,351,680 | | | | 7,742,613 | | | | 2,010,841 | | | | 32,429,174 | | | | - | | | | - | | |
International Equity Fund,
Class S* | | | 88,646 | | | | 3,960,938 | | | | 58,951 | | | | 4,332,626 | | | | - | | | | - | | |
353
Notes to Financial Statements (Unaudited) (Continued)
| | | Value,
beginning
of period | | Purchases | | Sales
Proceeds | | Value,
end of
period | | Dividend
Income | | Realized
Gains
Distributions | |
Large Cap Value Fund,
Class S | | $ | 7,017,866 | | | $ | 597,179 | | | $ | 5,068,538 | | | $ | 2,627,391 | | | $ | - | | | $ | - | | |
Main Street Small Cap
Fund, Class S* | | | 2,479,432 | | | | 1,388,847 | | | | 104,596 | | | | 4,030,193 | | | | - | | | | - | | |
Mid Cap Growth Equity
Fund, Class S | | | 1,420,526 | | | | 604,455 | | | | 48,065 | | | | 2,093,674 | | | | - | | | | - | | |
Mid Cap Growth
Equity II Fund, Class S | | | 2,104,421 | | | | 917,501 | | | | 72,095 | | | | 3,287,689 | | | | - | | | | - | | |
Mid-Cap Value Fund,
Class S | | | 3,584,424 | | | | 1,504,688 | | | | 120,161 | | | | 5,381,165 | | | | - | | | | - | | |
Money Market Fund,
Class S* | | | 8,940,430 | | | | 2,041,299 | | | | 685,972 | | | | 10,295,756 | | | | 196,533 | | | | - | | |
| Overseas Fund, Class S | | | 12,580,028 | | | | 2,444,702 | | | | 5,753,824 | | | | 9,828,292 | | | | - | | | | - | | |
Short-Duration Bond
Fund, Class S* | | | 19,620,867 | | | | 5,346,190 | | | | 1,466,562 | | | | 23,943,604 | | | | - | | | | - | | |
Small Cap Core Equity
Fund, Class S | | | 1,072,333 | | | | 591,426 | | | | 44,826 | | | | 1,639,990 | | | | - | | | | - | | |
Small Cap Growth Equity
Fund, Class S | | | 445,992 | | | | 194,891 | | | | 19,096 | | | | 676,415 | | | | - | | | | - | | |
Small Cap Value Equity
Fund, Class S | | | 898,542 | | | | 310,600 | | | | 24,555 | | | | 1,226,506 | | | | - | | | | - | | |
Small Company Growth
Fund, Class S | | | 737,090 | | | | 552,597 | | | | 31,870 | | | | 1,390,953 | | | | - | | | | - | | |
Small Company Value
Fund, Class S | | | 891,037 | | | | 402,966 | | | | 33,566 | | | | 1,320,052 | | | | - | | | | - | | |
Strategic Income Fund,
Class S* | | | 4,566,363 | | | | 3,158,985 | | | | 311,883 | | | | 7,627,682 | | | | - | | | | - | | |
| Value Fund, Class S* | | | 4,745 | | | | 504,796 | | | | 20,172 | | | | 543,421 | | | | - | | | | - | | |
| Totals | | $ | 177,904,377 | | | $ | 83,647,931 | | | $ | 33,851,941 | | | $ | 235,158,360 | | | $ | 196,533 | | | $ | - | | |
| | | Value,
beginning
of period | | Purchases | | Sales
Proceeds | | Value,
end of
period | | Dividend
Income | | Realized
Gains
Distributions | |
Destination
Retirement
2020 Fund | |
Aggressive Growth
Fund, Class S | | $ | 36,546,634 | | | $ | 3,399,587 | | | $ | 19,020,428 | | | $ | 22,601,379 | | | $ | - | | | $ | - | | |
Blue Chip Growth
Fund, Class S | | | 558,357 | | | | 13,853,040 | | | | 38,591 | | | | 15,603,155 | | | | - | | | | - | | |
Capital Appreciation
Fund, Class S* | | | 356,555 | | | | 8,001,892 | | | | 314 | | | | 8,933,739 | | | | - | | | | - | | |
| Core Bond Fund, Class S* | | | 73,785,571 | | | | 6,109,305 | | | | 7,078,465 | | | | 73,423,135 | | | | - | | | | - | | |
Diversified Bond Fund,
Class S* | | | 60,151,563 | | | | 4,890,059 | | | | 7,207,910 | | | | 58,507,625 | | | | - | | | | - | | |
Diversified International
Fund, Class S | | | 524,732 | | | | 18,635,772 | | | | 157,818 | | | | 21,562,104 | | | | - | | | | - | | |
Diversified Value Fund,
Class S | | | 423,111 | | | | 16,028,203 | | | | 105,541 | | | | 17,415,473 | | | | - | | | | - | | |
Emerging Growth Fund,
Class S | | | 1,500,859 | | | | 509,256 | | | | 48,698 | | | | 2,194,383 | | | | - | | | | - | | |
Enhanced Index Growth
Fund, Class S* | | | 2,268,543 | | | | 36,295,211 | | | | 376,856 | | | | 40,092,078 | | | | - | | | | - | | |
Enhanced Index Value
Fund, Class S* | | | 18,927,990 | | | | 24,800,937 | | | | 818,369 | | | | 44,876,986 | | | | - | | | | - | | |
Focused Value Fund,
Class S | | | 11,836,478 | | | | 2,868,947 | | | | 197,068 | | | | 15,919,405 | | | | - | | | | - | | |
Fundamental Value Fund,
Class S | | | 33,186,946 | | | | 5,623,108 | | | | 9,857,083 | | | | 31,051,427 | | | | - | | | | - | | |
354
Notes to Financial Statements (Unaudited) (Continued)
| | | Value,
beginning
of period | | Purchases | | Sales
Proceeds | | Value,
end of
period | | Dividend
Income | | Realized
Gains
Distributions | |
Growth Equity Fund,
Class S | | $ | 43,145,158 | | | $ | - | | | $ | 24,749,810 | | | $ | 19,854,140 | | | $ | - | | | $ | - | | |
Inflation-Protected Bond
Fund, Class S* | | | 75,871,733 | | | | 7,526,550 | | | | 16,633,661 | | | | 67,853,329 | | | | - | | | | - | | |
International Equity Fund,
Class S* | | | 12,000,876 | | | | 7,218,888 | | | | 145,865 | | | | 20,792,512 | | | | - | | | | - | | |
Large Cap Value Fund,
Class S | | | 36,596,326 | | | | 2,482,805 | | | | 22,756,066 | | | | 17,131,642 | | | | - | | | | - | | |
Main Street Small Cap
Fund, Class S* | | | 16,551,884 | | | | 5,390,663 | | | | 275,879 | | | | 23,373,286 | | | | - | | | | - | | |
Mid Cap Growth Equity
Fund, Class S | | | 8,734,543 | | | | 3,064,711 | | | | 157,649 | | | | 12,392,499 | | | | - | | | | - | | |
Mid Cap Growth
Equity II Fund, Class S | | | 14,022,341 | | | | 3,464,098 | | | | 236,461 | | | | 19,341,914 | | | | - | | | | - | | |
Mid-Cap Value Fund,
Class S | | | 23,755,783 | | | | 5,729,007 | | | | 394,109 | | | | 31,645,710 | | | | - | | | | - | | |
| Overseas Fund, Class S | | | 52,936,022 | | | | 7,508,744 | | | | 18,402,347 | | | | 45,163,504 | | | | - | | | | - | | |
Short-Duration Bond
Fund, Class S* | | | 35,554,538 | | | | 3,038,461 | | | | 8,652,396 | | | | 30,703,854 | | | | - | | | | - | | |
Small Cap Core Equity
Fund, Class S | | | 7,137,626 | | | | 2,375,161 | | | | 118,230 | | | | 9,551,303 | | | | - | | | | - | | |
Small Cap Growth Equity
Fund, Class S | | | 1,481,756 | | | | 493,790 | | | | 29,595 | | | | 2,115,624 | | | | - | | | | - | | |
Small Cap Value Equity
Fund, Class S | | | 2,979,312 | | | | 546,306 | | | | 49,260 | | | | 3,610,059 | | | | - | | | | - | | |
Small Company Growth
Fund, Class S | | | 2,977,782 | | | | 1,010,587 | | | | 49,260 | | | | 4,348,735 | | | | - | | | | - | | |
Small Company Value
Fund, Class S | | | 2,954,424 | | | | 1,038,458 | | | | 50,048 | | | | 4,129,482 | | | | - | | | | - | | |
Strategic Income Fund,
Class S* | | | 13,776,905 | | | | 2,220,192 | | | | 451,779 | | | | 16,136,107 | | | | - | | | | - | | |
| Value Fund, Class S* | | | 178,981 | | | | 3,121,136 | | | | 67,084 | | | | 3,588,152 | | | | - | | | | - | | |
| Totals | | $ | 590,723,329 | | | $ | 197,244,874 | | | $ | 138,126,640 | | | $ | 683,912,741 | | | $ | - | | | $ | - | | |
| | | Value,
beginning
of period | | Purchases | | Sales
Proceeds | | Value,
end of
period | | Dividend
Income | | Realized
Gains
Distributions | |
Destination
Retirement
2030 Fund | |
Aggressive Growth Fund,
Class S | | $ | 42,234,220 | | | $ | 3,655,605 | | | $ | 15,354,230 | | | $ | 32,755,964 | | | $ | - | | | $ | - | | |
Blue Chip Growth Fund,
Class S | | | 1,158,853 | | | | 18,680,101 | | | | 135,770 | | | | 21,046,418 | | | | - | | | | - | | |
Capital Appreciation
Fund, Class S* | | | 729,889 | | | | 10,295,008 | | | | 37,404 | | | | 11,662,156 | | | | - | | | | - | | |
| Core Bond Fund, Class S* | | | 19,236,064 | | | | 1,726,954 | | | | 3,244,608 | | | | 17,881,274 | | | | - | | | | - | | |
Diversified Bond Fund,
Class S* | | | 21,578,742 | | | | 1,729,100 | | | | 5,512,507 | | | | 18,028,030 | | | | - | | | | - | | |
Diversified International
Fund, Class S | | | 562,401 | | | | 19,339,610 | | | | 153,245 | | | | 22,530,151 | | | | - | | | | - | | |
Diversified Value Fund,
Class S | | | 851,600 | | | | 20,935,319 | | | | 183,245 | | | | 23,050,999 | | | | - | | | | - | | |
Emerging Growth Fund,
Class S | | | 19,828,545 | | | | - | | | | 4,379,462 | | | | 17,754,664 | | | | - | | | | - | | |
Enhanced Index Growth
Fund, Class S* | | | 2,987,535 | | | | 22,389,671 | | | | 101,587 | | | | 27,000,506 | | | | - | | | | - | | |
Enhanced Index Value
Fund, Class S* | | | 17,155,715 | | | | 8,795,653 | | | | 485,655 | | | | 26,663,485 | | | | - | | | | - | | |
355
Notes to Financial Statements (Unaudited) (Continued)
| | | Value,
beginning
of period | | Purchases | | Sales
Proceeds | | Value,
end of
period | | Dividend
Income | | Realized
Gains
Distributions | |
Focused Value Fund,
Class S | | $ | 8,697,065 | | | $ | 1,676,202 | | | $ | 135,128 | | | $ | 11,274,129 | | | $ | - | | | $ | - | | |
Fundamental Value Fund,
Class S | | | 40,490,196 | | | | 6,253,169 | | | | 8,033,289 | | | | 41,725,637 | | | | - | | | | - | | |
Growth Equity Fund,
Class S | | | 46,570,456 | | | | - | | | | 22,448,978 | | | | 25,697,795 | | | | - | | | | - | | |
Inflation-Protected Bond
Fund, Class S* | | | 34,369,827 | | | | 3,735,296 | | | | 12,639,427 | | | | 26,008,646 | | | | - | | | | - | | |
International Equity Fund,
Class S* | | | 13,784,435 | | | | 7,148,477 | | | | 608,590 | | | | 22,283,719 | | | | - | | | | - | | |
Large Cap Value Fund,
Class S | | | 37,782,629 | | | | 2,452,052 | | | | 18,601,482 | | | | 22,869,559 | | | | - | | | | - | | |
Main Street Small Cap
Fund, Class S* | | | 15,253,602 | | | | 3,475,324 | | | | 234,658 | | | | 20,099,386 | | | | - | | | | - | | |
Mid Cap Growth Equity
Fund, Class S | | | 456,028 | | | | 2,910,900 | | | | 235,049 | | | | 3,238,610 | | | | - | | | | - | | |
Mid Cap Growth
Equity II Fund, Class S | | | 12,911,970 | | | | 2,455,181 | | | | 996,189 | | | | 16,190,054 | | | | - | | | | - | | |
Mid-Cap Value Fund,
Class S | | | 17,536,356 | | | | 3,302,508 | | | | 262,088 | | | | 22,461,261 | | | | - | | | | - | | |
| Overseas Fund, Class S | | | 55,759,632 | | | | 4,799,213 | | | | 19,404,467 | | | | 44,325,034 | | | | - | | | | - | | |
Short Duration Bond
Fund, Class S* | | | 4,374,550 | | | | 510,379 | | | | 716,105 | | | | 4,262,824 | | | | - | | | | - | | |
Small Cap Core Equity
Fund, Class S | | | 203,330 | | | | 3,470,707 | | | | 26,403 | | | | 3,703,563 | | | | - | | | | - | | |
Small Cap Growth Equity
Fund, Class S | | | 57,034 | | | | 1,447,172 | | | | 74,441 | | | | 1,520,494 | | | | - | | | | - | | |
Small Cap Value Equity
Fund, Class S | | | 171,870 | | | | 4,935,675 | | | | 52,687 | | | | 5,299,010 | | | | - | | | | - | | |
Small Company Growth
Fund, Class S | | | 157,667 | | | | 2,379,288 | | | | 128,870 | | | | 2,588,733 | | | | - | | | | - | | |
Small Company Value
Fund, Class S | | | 13,353,769 | | | | 831,776 | | | | 5,517,712 | | | | 9,103,162 | | | | - | | | | - | | |
Strategic Income Fund,
Class S* | | | 7,152,360 | | | | 3,576,330 | | | | 335,584 | | | | 10,777,954 | | | | - | | | | - | | |
| Value Fund, Class S* | | | 92,656 | | | | 4,205,099 | | | | 143,217 | | | | 4,681,305 | | | | - | | | | - | | |
| Totals | | $ | 435,498,996 | | | $ | 167,111,769 | | | $ | 120,182,077 | | | $ | 516,484,522 | | | $ | - | | | $ | - | | |
| | | Value,
beginning
of period | | Purchases | | Sales
Proceeds | | Value,
end of
period | | Dividend
Income | | Realized
Gains
Distributions | |
Destination
Retirement
2040 Fund | |
Aggressive Growth Fund,
Class S | | $ | 27,178,392 | | | $ | 1,695,516 | | | $ | 8,977,500 | | | $ | 21,366,539 | | | $ | - | | | $ | - | | |
Blue Chip Growth Fund,
Class S | | | 893,742 | | | | 11,514,098 | | | | 177,414 | | | | 13,082,990 | | | | - | | | | - | | |
Capital Appreciation
Fund, Class S* | | | 497,611 | | | | 7,632,932 | | | | 76,130 | | | | 8,590,315 | | | | - | | | | - | | |
| Core Bond Fund, Class S* | | | 1,474,911 | | | | 281,777 | | | | 97,936 | | | | 1,670,210 | | | | - | | | | - | | |
Diversified Bond Fund,
Class S* | | | 1,475,419 | | | | 282,368 | | | | 103,419 | | | | 1,670,146 | | | | - | | | | - | | |
Diversified International
Fund, Class S | | | 447,400 | | | | 12,160,397 | | | | 209,154 | | | | 14,196,410 | | | | - | | | | - | | |
Diversified Value Fund,
Class S | | | 771,377 | | | | 14,322,964 | | | | 247,397 | | | | 15,866,864 | | | | - | | | | - | | |
Emerging Growth Fund,
Class S | | | 13,012,975 | | | | - | | | | 3,710,318 | | | | 10,740,996 | | | | - | | | | - | | |
356
Notes to Financial Statements (Unaudited) (Continued)
| | | Value,
beginning
of period | | Purchases | | Sales
Proceeds | | Value,
end of
period | | Dividend
Income | | Realized
Gains
Distributions | |
Enhanced Index Growth
Fund, Class S* | | $ | 5,390,003 | | | $ | 11,355,739 | | | $ | 415,438 | | | $ | 17,535,531 | | | $ | - | | | $ | - | | |
Enhanced Index Value
Fund, Class S* | | | 13,684,190 | | | | 2,980,203 | | | | 506,954 | | | | 16,929,101 | | | | - | | | | - | | |
Focused Value Fund,
Class S | | | 4,794,073 | | | | 746,777 | | | | 135,086 | | | | 5,972,881 | | | | - | | | | - | | |
Fundamental Value Fund,
Class S | | | 27,430,569 | | | | 3,464,771 | | | | 4,387,111 | | | | 28,673,861 | | | | - | | | | - | | |
Growth Equity Fund,
Class S | | | 29,542,422 | | | | - | | | | 14,283,739 | | | | 16,271,145 | | | | - | | | | - | | |
Inflation-Protected Bond
Fund, Class S* | | | 2,379,022 | | | | 346,801 | | | | 181,425 | | | | 2,575,217 | | | | - | | | | - | | |
International Equity Fund,
Class S* | | | 10,029,918 | | | | 4,604,055 | | | | 1,691,890 | | | | 14,243,224 | | | | - | | | | - | | |
Large Cap Value Fund,
Class S | | | 25,951,783 | | | | 5,198,079 | | | | 12,300,023 | | | | 15,649,834 | | | | - | | | | - | | |
Main Street Small Cap
Fund, Class S* | | | 8,438,484 | | | | 1,650,606 | | | | 323,197 | | | | 10,637,359 | | | | - | | | | - | | |
Mid Cap Growth Equity
Fund, Class S | | | 346,311 | | | | 1,746,913 | | | | 111,660 | | | | 2,055,849 | | | | - | | | | - | | |
Mid Cap Growth
Equity II Fund, Class S | | | 7,118,806 | | | | 1,089,030 | | | | 500,953 | | | | 8,719,474 | | | | - | | | | - | | |
Mid-Cap Value Fund,
Class S | | | 12,158,315 | | | | 1,823,656 | | | | 326,286 | | | | 14,946,963 | | | | - | | | | - | | |
| Overseas Fund, Class S | | | 35,624,109 | | | | 2,156,648 | | | | 11,981,699 | | | | 27,886,565 | | | | - | | | | - | | |
Small Cap Core Equity
Fund, Class S | | | 147,712 | | | | 2,000,256 | | | | 45,694 | | | | 2,133,942 | | | | - | | | | - | | |
Small Cap Growth Equity
Fund, Class S | | | 87,753 | | | | 914,095 | | | | 27,474 | | | | 1,042,323 | | | | - | | | | - | | |
Small Cap Value Equity
Fund, Class S | | | 166,726 | | | | 3,960,834 | | | | 67,028 | | | | 4,264,735 | | | | - | | | | - | | |
Small Company Growth
Fund, Class S | | | 147,972 | | | | 1,627,790 | | | | 76,595 | | | | 1,840,695 | | | | - | | | | - | | |
Small Company Value
Fund, Class S | | | 10,289,593 | | | | 448,220 | | | | 4,175,753 | | | | 6,905,830 | | | | - | | | | - | | |
Strategic Income Fund,
Class S* | | | 1,961,334 | | | | 281,494 | | | | 92,075 | | | | 2,229,196 | | | | - | | | | - | | |
| Value Fund, Class S* | | | 78,534 | | | | 2,960,749 | | | | 120,506 | | | | 3,304,988 | | | | - | | | | - | | |
| Totals | | $ | 241,519,456 | | | $ | 97,246,768 | | | $ | 65,349,854 | | | $ | 291,003,183 | | | $ | - | | | $ | - | | |
* MassMutual Premier Funds
8. New Accounting Pronouncements
In September 2006, Statement of Financial Accounting Standards No. 157, Fair Value Measurements (SFAS 157), was issued and is effective for fiscal years beginning after November 15, 2007. SFAS 157 determines fair value, establishes a framework for measuring fair value and expands disclosures about fair value measurements. Management is currently evaluating the impact the adoption of SFAS 157 will have on the Funds' financial statement disclosures.
9. Proxy Voting (Unaudited)
A description of the policies and procedures that each Fund's investment adviser and sub-advisers use to vote proxies relating to the Fund's portfolio securities is available, without charge, upon request, by calling 1-888-309-3539, and on the Securities and Exchange Commission's website at http://www.sec.gov.
Information regarding how the Funds voted proxies relating to portfolio securities during the most recent 12-month period ended June 30 is available, without charge, upon request, on the MassMutual website at http://www.massmutual.com/retire and on the Securities and Exchange Commission's website at http://www.sec.gov.
357
Notes to Financial Statements (Unaudited) (Continued)
10. Quarterly Reporting (Unaudited)
The Funds file their complete schedule of portfolio holdings with the SEC for the first and third quarters of each fiscal year on Form N-Q. The Funds' Forms N-Q are available on the SEC website at http://www.sec.gov. The Funds' Forms N-Q may be reviewed and copied at the SEC's Public Reference Room in Washington D.C. Information on the operation of the SEC's Public Reference Room may be obtained by calling 1-800-SEC-0330.
11. Trustees' Approval of Investment Advisory Contracts (Unaudited)
At Contract Committee meetings held on January 30, 2007 and February 27, 2007 and a Board meeting held on February 27, 2007, the Board of Trustees of the Trust (the "Board"), including the Trustees who are not "interested persons" (as such term is defined in the 1940 Act) of the Trust, the Adviser or Sub-Advisers (the "Independent Trustees"), approved the existing Advisory Agreement for the Emerging Growth Fund and the existing Advisory Agreements and Sub-Advisory Agreements (collectively, the "Contracts") for each of the Strategic Bond Fund, Strategic Balanced Fund, Diversified Value Fund, Fundamental Value Fund, Value Equity Fund, Large Cap Value Fund, Indexed Equity Fund, Blue Chip Growth F und, Large Cap Growth Fund, Growth Equity Fund, Aggressive Growth Fund, OTC 100 Fund, Focused Value Fund, Small Company Value Fund, Mid Cap Growth Equity Fund, Mid Cap Growth Equity II Fund, Small Cap Growth Equity Fund, Small Company Growth Fund, Overseas Fund, Destination Retirement Income Fund, Destination Retirement 2010 Fund, Destination Retirement 2020 Fund, Destination Retirement 2030 Fund and Destination Retirement 2040 Fund (each a "Fund" and collectively, the "Funds"). Approval was not needed for the Sub-Advisory Agreements with Delaware Management Company ("DMC") for the Aggressive Growth Fund and with ClearBridge Advisors, LLC ("Clearbridge") for the Strategic Balanced Fund because these agreements were approved in August 2006 and November 2006, respectively, for an initial two-year period. In preparation for the meetings, the Trustees requested, and the Adviser and Sub-Advisers provided in advance of the meetings, certain materials relevant to the consideration of the Contracts.
At the meeting held on January 30, 2007, the Trustees' independent counsel reviewed with all of the Independent Trustees (who comprise the Contract Committee (the "Committee")) the requirement under the 1940 Act that the Trustees, including a majority of the Independent Trustees, consider annually the continuation of the Funds' Contracts. In advance of the meeting, the Committee received a memorandum, prepared by independent counsel, addressing the Committee's duties and responsibilities in approving the Contracts, including identification of types of information relevant to such consideration. The Trustees' independent counsel reviewed the memorandum and the role of the Independent Trustees in renewing the Contracts, including, among other things, (i) the nature of the Trustees' responsibilities and factors the Trustees are entitled or required to consider in this regard, (ii) the enhanced disclosure requirements relating to the Board's app roval of the Contracts, and (iii) recent mutual fund fee litigation.
In addition, the Committee received in advance of the meeting (i) a memorandum from the Adviser discussing the nature and quality of the services it provides as investment manager to the Funds, (ii) a profitability analysis prepared by the Adviser, and (iii) a fee study report (the "Third-Party Report") with respect to each Fund prepared by an independent third-party vendor (the "Third-Party"). The Third-Party Report provided detailed comparative fee, expense and performance information for each Fund to assist the Committee in its evaluation of the Contracts.
Representatives of the Adviser ("Management") gave a presentation which provided an overview of the nature and quality of services provided by the Adviser to the Funds. This presentation included a discussion of the Adviser's operations and capabilities. A representative of the Third-Party was present for a portion of the meeting and made a presentation to the Committee with respect to the Third-Party Report.
The Committee then reviewed, and considered separately for each Fund, the detailed information presented in the Third-Party Report regarding (i) Fund expenses including, among other things, both the Fund's advisory fee and total net expense ratios versus its expense group and expense universe; and
358
Notes to Financial Statements (Unaudited) (Continued)
(ii) the Fund's relative performance (over various time periods versus its performance group, performance universe and benchmark index, taking into account the Fund's strategy).
For Funds whose total net expenses ranked in the fourth or fifth quintile of their respective expense group, Management noted a number of factors for the Committee to consider in addition, such as (i) the rankings of a number of the Funds improved when compared against the larger expense universe; (ii) the investment advisory fees of a couple of the Funds ranked in one of the top three quintiles; (iii) a number of Funds experienced above average performance; and (iv) for one Fund, the absolute difference between the Fund's total expenses and the median of those in its expense group was small. Management also noted those Funds for which a fee waiver had previously been implemented.
When considering the performance of those Funds whose three-year total return placed in the fourth or fifth quintile of their respective performance universes, the Committee reviewed each Fund's absolute performance and relative performance over various periods of time versus its performance group, performance universe and the Third-Party benchmark index. Management described (i) actions that had been taken or were proposed to be taken to improve performance; or (ii) why it considered the performance to be acceptable based on the Fund's investment strategy or risk profile. For example, Management reviewed the sub-adviser and/or portfolio changes that had been made or were being considered with respect to certain of the Funds in order to improve performance. Management noted, among other things, that over the past year it had replaced Fidelity Management & Research Company ("Fidelity") with T. Rowe Price Associates, Inc. ("T. Rowe Price") as the sub-adviser to the Blue Chip Growth Fund and RS Investment Management, L.P. ("RS") with DMC and Insight Capital Research & Management, Inc. ("Insight Capital") as co-sub-advisers to the Emerging Growth Fund. Management also noted that it was considering various courses of action to address the continued underperformance by Grantham, Mayo, Van Otterloo & Co. LLC ("GMO"), the sub-adviser to the Growth Equity Fund, and that it had begun rebalancing the underlying funds in the Destination Retirement Funds, which would be further discussed at the February meeting of the Board. In a number of cases, Management pointed out differences between a Fund's strategy and risk profile versus those in the Third-Party peer group to which the Fund is compared and explained why it believed the Fund's absolute and/or relative performance was acceptable, taking into account the Fund's risk profile, investment strategy and/or prevailing market conditions. In addition, Management noted, with respect to certain of t he Funds, recent improvement in performance in the one-year performance time period.
In conjunction with its review of the Third-Party Report, the Committee also reviewed and considered information included in the materials concerning economies of scale and profitability of the Adviser's relationship with the various Funds, including: (i) a description of the revenue (including management fees and administrative service fees, as applicable) and expense allocation methodology employed by the Adviser; and (ii) profitability information for the Funds, and each Fund individually, which included a sensitivity analysis for those Funds without breakpoints of the expected level of profitability assuming increased Fund assets of $100 million and $250 million. The discussions and consideration included the intangible benefits derived by the Adviser and its affiliates resulting from their relationships with the Funds and the so-called "fallout benefits" to the Adviser, such as any reputational value derived from serving as investment a dviser to the Funds. It was noted that the Select Funds do not have breakpoints as the advisory fee is established at the time of a Fund's introduction based upon a mature fund projection.
The Committee next considered the materials provided by the Adviser in advance of the Meeting and information discussed with Management at the Meeting relating to the Adviser and the nature, scope and quality of services the Adviser provides to the Funds. The Committee noted the fact that the Adviser delegates substantially all responsibility for furnishing a continuous investment program for the Funds, and making investment decisions with respect to a Fund's assets, to the relevant Sub-Advisers. The Committee reviewed the Adviser's ability to provide investment oversight, administrative and shareholder services to the Funds. The Committee also considered the experience and qualifications of
359
Notes to Financial Statements (Unaudited) (Continued)
the personnel of the Adviser that perform, or oversee the performance of, the services provided to the Funds and the needs of the Funds for administrative and shareholder services.
The Committee also considered, and discussed with Management, among other things: (i) the ability of the Adviser to monitor the operations and performance of each Fund's Sub-Adviser; (ii) the financial condition, stability and business strategy of the Adviser; (iii) the ability of the Adviser with respect to regulatory compliance and the ability to monitor compliance with the investment policies of the Funds; (iv) the profitability of the Adviser; (v) possible economies of scale; and (vi) any conditions affecting the Adviser's future provision of high quality services to the Funds.
The Committee discussed with Management and considered a wide range of information about, among other things: (i) each Sub-Adviser and its personnel with responsibilities for providing services to the respective Fund; (ii) the terms of the Sub-Advisory Agreements; (iii) the scope and quality of services provided to each Fund under the Sub-Advisory Agreements; and (iv) the fees payable to each Sub-Adviser by the Adviser. The Committee also noted that each Sub-Adviser may receive research services from brokers in connection with portfolio securities transactions for the Funds and that research services furnished by brokers through which the Funds effect securities transactions may be used by the Sub-Adviser in advising other accounts that it advises; and that, conversely, research services furnished to a Sub-Adviser in connection with other accounts each Sub-Adviser advises may be used by the Sub-Adviser in advising the Funds.
Prior to the votes being taken to approve the Contracts, the Committee met separately in executive session to discuss the appropriateness of such contracts. In its deliberation with respect to these matters, the Committee was advised by its independent legal counsel. The Committee weighed the foregoing matters in light of the advice given to it by its independent legal counsel as to the law applicable to the review of investment advisory contracts. In arriving at a decision, the Committee did not identify any single matter as all-important or controlling. The foregoing summary does not detail all of the matters considered.
After its deliberation, the Committee indicated that it was prepared to recommend approval of the Contracts for each of the Funds, with the exception of the Indexed Equity Fund, OTC 100 Fund, Blue Chip Growth Fund and Growth Equity Fund, for which it requested additional information. The Committee requested that this information be provided at the February 27, 2007 meeting.
As to the Strategic Bond Fund, Strategic Balanced Fund, Diversified Value Fund, Fundamental Value Fund, Value Equity Fund, Large Cap Value Fund, Large Cap Growth Fund, Aggressive Growth Fund, Focused Value Fund, Small Company Value Fund, Mid Cap Growth Equity Fund, Mid Cap Growth Equity II Fund, Small Cap Growth Equity Fund, Small Company Growth Fund, Emerging Growth Fund, Overseas Fund, Destination Retirement Income Fund, Destination Retirement 2010 Fund, Destination Retirement 2020 Fund, Destination Retirement 2030 Fund and Destination Retirement 2040 Fund the Committee concluded that: (i) overall, it was satisfied with the nature, extent and quality of services provided, and expected to be provided in the future, under the Contracts, including the level of the Adviser's oversight of the Funds and the sub-advisory process; (ii) the Adviser's level of profitability from its relationship to the various Funds was not excessive and that the ad visory fees payable under the Contracts, and the Funds' total expenses, were fair and reasonable; (iii) the investment processes, research capabilities and philosophies of each Sub-Adviser are well suited to each Fund, given their investment objective and policies; (iv) either the relative or absolute performance of a Fund (in each case, taking into account the applicable investment strategy and risk profile of the Fund), or the steps the Adviser has proposed to be taken to remedy any underperformance of the Fund, are sufficient to warrant continuation of the Contract for each of the Funds; and (v) the terms of the Contracts are fair and reasonable with respect to each Fund and are in the best interests of each Fund's shareholders. In arriving at a decision to recommend approval of these Contracts to the Board, the Committee did not identify any single matter as all-important or controlling. The foregoing summary does not detail all of the matters considered.
360
Notes to Financial Statements (Unaudited) (Continued)
At its meeting on February 27, 2007, the Committee discussed the Indexed Equity Fund, OTC 100 Fund, Blue Chip Growth Fund and Growth Equity Fund in more detail. Management first reviewed with the Committee a memorandum prepared and provided to the Committee in advance of the meeting, which responded to the Committee's request for more information regarding these Funds. Management then discussed the Blue Chip Growth Fund and reminded the Committee that the Fund has (i) a contractual advisory fee and total expenses that are competitive in both the Third-Party Report's defined peer expense group and expense universe and (ii) strong one-year performance that resulted from the sub-adviser change that was made last year from Fidelity to T. Rowe Price. Management noted that the Fund's administrative fee reflects a complicated history relating to the Fund's pricing structure at its inception, which Management explained to the Committee, and the Advi ser's more recent decision to waive a portion of the management fee rather than a portion of the administrative fee. Management referred the Committee to the memorandum for additional detail.
Next, Management discussed the Indexed Equity Fund. Management noted that the Committee had questioned the Fund's performance given that the Fund's total expenses were only two basis points above the peer group median. Management stated that it had analyzed the Fund's performance and concluded that the Fund's performance on a gross basis was in-line with the index, which meant that Northern Trust Investments, N.A. ("Northern Trust") had been managing the portfolio to expectations. Management explained that the reason for the discrepancy between the Fund's one-year expense ranking and the Fund's one-year performance ranking appeared to be due to the following factors: (i) NAV rounding; (ii) timing of expense reimbursement; (iii) tracking error; and (iv) cash flows. Management stated that it would not expect the same discrepancy next year given the Fund's current pricing.
Next, Management discussed the OTC 100 Fund, and noted that the Committee had questioned the Fund's relative performance as compared against the Third-Party Report's defined peer group and peer universe. Management reminded the Committee that the OTC 100 Fund is an index fund that is intended to match the NASDAQ 100 Index gross of fees and that the Fund's Sub-Adviser, Northern Trust, has managed the Fund's portfolio consistent with this mandate. Management also emphasized that, as the Third-Party originally noted at the January 30, 2007 meeting, the construction of the peer group and peer universe for this Fund was challenging because there were so few funds with this particular mandate. As a result, the Third-Party compared this Fund with funds with dissimilar investment mandates, creating a non-meaningful performance comparison. Management indicated that it is the opinion of the Adviser that the more appropriate comparison would be to meas ure the Fund's performance versus that of the Index. The performance of the OTC 100 Fund was in line with the Index gross of fees, and the Sub-Adviser's tracking error actually helped the Funds' performance.
Lastly, Management discussed the Growth Equity Fund. Management stated that at the January 30, 2007 meeting, the Committee expressed a concern regarding the performance of this Fund, which ranked in the fifth quintile for the one-, three-, and five-year periods. Management explained that although the Fund had outperformed the Russell 1000 Growth Index since inception in 1999, the one, three-, and five-year performance is uncompetitive, mostly due to GMO's challenging performance since it was hired in May 2004. Management stated that as a result of GMO's continued underperformance, the Adviser (i) has expanded its large cap growth search to include other managers that focus on high quality growth stocks; (ii) was evaluating all options, including replacing GMO, in whole or in part; and (iii) anticipated completing its due diligence and making a recommendation for the Board at a meeting in the near future. It was noted that GMO is one of the p remier asset managers in the country and generally in very high demand by investors. It was also noted that GMO had experienced a period of relative underperformance in recent years, not due to a lack of investment expertise or diligence, but apparently due to its generally bearish view of equity markets, in particular, the U.S. equity markets.
361
Notes to Financial Statements (Unaudited) (Continued)
Prior to the votes being taken to approve the Contracts for these four Funds, the Committee met separately in executive session to discuss the appropriateness of such Contracts. In its deliberation with respect to these matters, the Committee was advised by its independent legal counsel. The Committee weighed the foregoing matters in light of the advice given to it by its independent legal counsel as to the review of investment advisory contracts. The Committee considered the additional information that had been presented and determined, on the basis of that information, to recommend for approval to the Board the Contracts for the Indexed Equity Fund, OTC 100 Fund, Blue Chip Growth Fund and Growth Equity Fund. In arriving at a decision, the Committee did not identify any single matter as all-important or controlling. The foregoing summary does not detail all of the matters considered.
At the Board meeting on February 27, 2007, the Board, including the Independent Trustees, also approved the Contracts for each of the Strategic Bond Fund, Strategic Balanced Fund, Diversified Value Fund, Fundamental Value Fund, Value Equity Fund, Large Cap Value Fund, Indexed Equity Fund, Blue Chip Growth Fund, Large Cap Growth Fund, Growth Equity Fund, Aggressive Growth Fund, OTC 100 Fund, Focused Value Fund, Small Company Value Fund, Mid Cap Growth Equity Fund, Mid Cap Growth Equity II Fund, Small Cap Growth Equity Fund, Small Company Growth Fund, Emerging Growth Fund, Overseas Fund, Destination Retirement Income Fund, Destination Retirement 2010 Fund, Destination Retirement 2020 Fund, Destination Retirement 2030 Fund and Destination Retirement 2040 Fund.
At a special meeting held on June 28, 2006, the Trustees, including the Independent Trustees, approved the termination of the existing Sub-Advisory Agreement with RS for the Emerging Growth Fund and approved the Adviser's entering into interim sub-advisory agreements (the "Interim Sub-Advisory Agreements") with DMC and Insight Capital. At a meeting held on August 7, 2006, the Trustees, including the Independent Trustees, approved new sub-advisory agreements (the "New Sub-Advisory Agreements") with DMC and Insight Capital for the Emerging Growth Fund.
The Trustees considered, among others, the following factors in reaching this decision: (i) the RS emerging growth strategy had transitioned to become more conservative than when the firm was first hired in 2000; (ii) performance of the strategy under RS' management was no longer consistent with an emerging growth mandate; and (iii) RS announced in May that it intended to sell a 65% ownership position in the firm to Guardian Life Insurance Company of America in a deal expected to close during the second half of 2006, bringing into question the future alignment of interests of investors and management.
After arriving at the decision to replace RS as sub-adviser of the Fund, the Trustees determined that it would be appropriate to find another sub-adviser that invested in a small capitalization emerging growth style. After careful consideration, the Trustees determined that it would be appropriate to hire two sub-advisers, and that DMC and Insight Capital would provide an improvement over the incumbent RS.
In coming to this recommendation, the Trustees considered a wide range of information of the type they regularly consider when determining whether to continue a Fund's Sub-Advisory Agreement as in effect from year to year. The Trustees considered information about, among other things: DMC and Insight Capital and their personnel (including particularly those personnel with responsibilities for providing services to the Fund), resources and investment process; the terms of the relevant advisory agreements (in this case, the Interim Sub-Advisory Agreements); the scope and quality of the services that DMC and Insight Capital would provide to the Fund; the investment performance of DMC and Insight Capital and of similar funds sub-advised by other sub-advisers; the advisory fee rates payable to DMC and Insight Capital by the Adviser and by other funds and client accounts managed or sub-advised by DMC and Insight Capital, and payable by similar fun ds managed by other advisers; and DMC's and Insight Capital's practices regarding the selection and compensation of brokers and dealers that execute portfolio transactions for the Fund, and the brokers' and dealers' provision of brokerage and research services to DMC and Insight Capital. The Trustees did not generally review the
362
Notes to Financial Statements (Unaudited) (Continued)
profitability of the Sub-Advisers based on the fact that the sub-advisory fees were paid by the Adviser and on the conclusion that, accordingly, the sub-advisory fees were being negotiated at arm's length.
Based on the foregoing, the Trustees concluded that the investment processes, research capabilities and philosophies of DMC and Insight Capital would be well suited to the Fund, given its investment objectives and policies.
Following their review, the Trustees determined that the terms of the Interim Sub-Advisory Agreements were fair and reasonable and were in the best interest of the Fund's shareholders. The Trustees, including the Independent Trustees, voted to approve, on June 28, 2006, the Interim Sub-Advisory Agreements for the Fund. On August 7, 2006, the Trustees, including the Independent Trustees, unanimously voted to approve the New Sub-Advisory Agreements for the Fund.
Prior to the votes being taken to approve both the Interim Sub-Advisory Agreements and New Sub-Advisory Agreements, the Independent Trustees were advised by their independent legal counsel. Prior to the votes being taken to approve the New Sub-Advisory Agreements, the Independent Trustees met separately in executive session to discuss the appropriateness of such contracts. The Independent Trustees weighed the foregoing matters in light of the advice given to them by their independent legal counsel as to the law applicable to the review of investment advisory contracts. In arriving at a decision, the Trustees, including the Independent Trustees, did not identify any single matter as all-important or controlling. The foregoing summary does not detail all of the matters considered.
The New Sub-Advisory Agreements with DMC and Insight Capital for the Emerging Growth Fund became effective on August 7, 2006.
At a meeting held on November 6, 2006, the Trustees, including the Independent Trustees, approved a new Investment Sub-Advisory Agreement (the "New Sub-Advisory Agreement") with ClearBridge for the Strategic Balanced Fund.
The Trustees considered, among others, the following factors in reaching this decision: (i) Legg Mason, Inc. ("Legg Mason") had purchased substantially all of Citigroup Inc.'s worldwide asset management business on December 1, 2005, including Salomon Brothers Asset Management Inc. ("SaBAM"), the Fund's current sub-adviser; (ii) as part of an internal reorganization following the acquisition, Legg Mason intended to combine the equity investment operations of certain of its subsidiaries, including SaBAM and, in conjunction with this reorganization, SaBAM changed its name to ClearBridge Asset Management Inc. on October 1, 2006; (iii) the portfolio managers of ClearBridge Asset Management Inc. were dual officers of both ClearBridge Asset Management Inc. and ClearBridge and the compliance policies and procedures were the same for both entities; (iv) the portfolio managers performing the Fund's day-to-day management would not be changing; and (v) other than the "name change," the New Sub-Advisory Agreement would be virtually identical to the existing agreement in place with ClearBridge Asset Management Inc.
The Trustees, including the Independent Trustees, unanimously voted to approve, on November 6, 2006, the New Sub-Advisory Agreement for the Fund. Prior to a vote being taken to approve the New Sub-Advisory Agreement, the Independent Trustees met separately in executive session to discuss the appropriateness of the agreement. In their deliberations with respect to these matters, the Independent Trustees were advised by their independent legal counsel. The Independent Trustees weighed the foregoing matters in light of the advice given to them by their independent legal counsel as to the law applicable to the review of investment advisory contracts. In arriving at a decision, the Trustees, including the Independent Trustees, did not identify any single matter as all-important or controlling. The foregoing summary does not detail all of the matters considered.
The New Sub-Advisory Agreement with Clearbridge for the Strategic Balanced Fund took effect on November 15, 2006.
363
Notes to Financial Statements (Unaudited) (Continued)
At their meetings on August 7, 2006 and May 9, 2007, respectively, the Board, including the Independent Trustees, approved amended Sub-Advisory Agreements ("Amended Sub-Advisory Agreements") with AllianceBernstein, L.P. ("AllianceBernstein") and Fidelity for the Large Cap Growth Fund and the Value Equity Fund, respectively. Under the Amended Sub-Advisory Agreements, a modification would be made to each investment sub-advisory fee, whereby the sub-advisory fees paid to AllianceBernstein and Fidelity, respectively, would decrease.
In approving the Amended Sub-Advisory Agreements, the Trustees discussed with Management and considered a wide range of information about, among other things: (i) each Sub-Adviser and its personnel with responsibilities for providing services to the respective Fund; (ii) the terms of the Amended Sub-Advisory Agreements; (iii) the scope and quality of the services provided to each Fund under the Amended Sub-Advisory Agreements; and (iv) the fees payable to the Sub-Advisers by the Adviser. The Trustees were informed that the sub-advisory fees were negotiated at arm's length. The Trustees were also informed that the Sub-Advisers might receive research services from brokers in connection with portfolio securities transactions for the Funds and that research services furnished by brokers through whom the Funds effect securities transactions may be used by the sub-advisers in advising other accounts that they advise. Conversely, research services furnished to the Sub-Advisers in connection with other accounts the Sub-Advisers advise may be used by the Sub-Advisers in advising the Funds.
Based on the foregoing, the Trustees concluded that (i) the Adviser's level of profitability from its relationship to the Funds was not excessive and that the sub-advisory fee amounts under the Amended Sub-Advisory Agreements were fair and reasonable; (ii) overall, the Trustees were satisfied with the nature, extent and quality of services provided, and expected to be provided in the future, under the Amended Sub-Advisory Agreements; (iii) the investment processes, research capabilities and philosophies of the Sub-Advisers would be well suited to the Funds, given each Fund's investment objective and policies; and (iv) the terms of the Amended Sub-Advisory Agreements are fair and reasonable with respect to the Funds and are in the best interest of each Fund's shareholders. After carefully considering the information summarized above, the Trustees, including the Independent Trustees voting separately, unanimously voted to approve the Amended S ub-Advisory Agreements.
Prior to the votes being taken to approve the Amended Sub-Advisory Agreements, the Independent Trustees met separately in executive session to discuss the appropriateness of such contracts. In their deliberation with respect to these matters, the Independent Trustees were advised by their independent legal counsel. The Independent Trustees weighed the foregoing matters in light of the advice given to them by their independent legal counsel as to the law applicable to the review of investment advisory contracts. In arriving at a decision, the Independent Trustees did not identify any single matter as all-important or controlling. The foregoing summary does not detail all of the matters considered.
The Amended Sub-Advisory Agreement with AllianceBernstein for the Large Cap Growth Fund took effect on August 7, 2006. The Amended Sub-Advisory Agreement with Fidelity for the Value Equity Fund took effect retroactively to March 1, 2007.
364
Other Information (Unaudited)
Fund Expenses June 30, 2007
| Expense Examples: | | The following information is in regards to expenses for the six months ended June 30, 2007:
As a shareholder of the Funds, you may incur two types of costs: (1) transaction costs, including sales charges (loads) on purchase payments or redemptions; and (2) ongoing costs, including management fees, distribution and/or service (12b-1) fees; and other Fund expenses. These examples are intended to help you understand your ongoing costs (in dollars) of investing in the Funds and to compare these costs with the ongoing costs of investing in other mutual funds.
These examples are based on an investment of $1,000 invested for the six months ended June 30, 2007. | |
|
| Actual Expenses: | | The first line of each table on the following pages provides information about actual account values and actual expenses. You may use the information in this line, together with the amount you invested, to estimate the expenses that you paid over the period. Simply divide your account value by $1,000 (for example, an $8,600 account value divided by $1,000 = 8.6), then multiply the result by the number in the first line under the heading entitled "Operating Expenses Incurred" to estimate the expenses you paid on your account during this period. | |
|
| Hypothetical Example for Comparison Purposes: | | The second line of each table on the following pages provides information about hypothetical account values and hypothetical expenses based on the Fund's actual expense ratio and an assumed rate of return of 5% per year before expenses, which is not the Fund's actual return. The hypothetical account values and expenses may not be used to estimate the actual ending account balance or expenses you paid for the period. You may use this information to compare the ongoing costs of investing in the Fund and other funds. To do so, compare this 5% hypothetical example with the 5% hypothetical examples that appear in the shareholder reports of the other funds.
Please note that the expenses shown in the tables are meant to highlight your ongoing costs only and do not reflect any transactional costs, such as sales charges (loads). Therefore, the second line of the table is useful i n comparing ongoing costs only, and will not help you determine the relative total costs of owning different funds. In addition, if these transactional costs were included, your costs would have been higher. | |
|
365
Other Information (Unaudited) (Continued)
The Funds incur ongoing operating expenses during the normal course of business, such as management fees, shareholder service fees and other expenses. The following tables, assuming a $1,000 investment in a class of shares, disclose the ending account value and operating expenses incurred for the six months ended June 30, 2007, based on, (1) the classes' actual return and actual expenses, and (2) a hypothetical annualized 5% return and the classes' actual expenses:
Strategic Bond Fund
Class A
| | | Beginning
Value | | Ending
Value | | Operating
Expense
Incurred* | |
| 1) Actual | | $ | 1,000.00 | | | $ | 999.00 | | | $ | 4.93 | | |
| 2) Hypothetical | | | 1,000.00 | | | | 1,019.73 | | | | 4.98 | | |
* Expenses are calculated using the annualized expense ratio for the six months ended June 30, 2007 of 1.00%, multiplied by the average account value over the period, multiplied by the number of days in the period, divided by the number of days in the year.
Class L
| | | Beginning
Value | | Ending
Value | | Operating
Expense
Incurred* | |
| 1) Actual | | $ | 1,000.00 | | | $ | 1,000.00 | | | $ | 3.70 | | |
| 2) Hypothetical | | | 1,000.00 | | | | 1,020.96 | | | | 3.74 | | |
* Expenses are calculated using the annualized expense ratio for the six months ended June 30, 2007 of 0.75%, multiplied by the average account value over the period, multiplied by the number of days in the period, divided by the number of days in the year.
Class Y
| | | Beginning
Value | | Ending
Value | | Operating
Expense
Incurred* | |
| 1) Actual | | $ | 1,000.00 | | | $ | 1,000.00 | | | $ | 3.45 | | |
| 2) Hypothetical | | | 1,000.00 | | | | 1,021.21 | | | | 3.49 | | |
* Expenses are calculated using the annualized expense ratio for the six months ended June 30, 2007 of 0.70%, multiplied by the average account value over the period, multiplied by the number of days in the period, divided by the number of days in the year.
Class S
| | | Beginning
Value | | Ending
Value | | Operating
Expense
Incurred* | |
| 1) Actual | | $ | 1,000.00 | | | $ | 1,001.00 | | | $ | 3.21 | | |
| 2) Hypothetical | | | 1,000.00 | | | | 1,021.45 | | | | 3.24 | | |
* Expenses are calculated using the annualized expense ratio for the six months ended June 30, 2007 of 0.65%, multiplied by the average account value over the period, multiplied by the number of days in the period, divided by the number of days in the year.
366
Other Information (Unaudited) (Continued)
Class N
| | | Beginning
Value | | Ending
Value | | Operating
Expense
Incurred* | |
| 1) Actual | | $ | 1,000.00 | | | $ | 997.00 | | | $ | 6.40 | | |
| 2) Hypothetical | | | 1,000.00 | | | | 1,018.25 | | | | 6.47 | | |
* Expenses are calculated using the annualized expense ratio for the six months ended June 30, 2007 of 1.30%, multiplied by the average account value over the period, multiplied by the number of days in the period, divided by the number of days in the year.
Strategic Balanced Fund
Class A
| | | Beginning
Value | | Ending
Value | | Operating
Expense
Incurred* | |
| 1) Actual | | $ | 1,000.00 | | | $ | 1,035.90 | | | $ | 6.17 | | |
| 2) Hypothetical | | | 1,000.00 | | | | 1,018.59 | | | | 6.12 | | |
* Expenses are calculated using the annualized expense ratio for the six months ended June 30, 2007 of 1.23%, multiplied by the average account value over the period, multiplied by the number of days in the period, divided by the number of days in the year.
Class L
| | | Beginning
Value | | Ending
Value | | Operating
Expense
Incurred* | |
| 1) Actual | | $ | 1,000.00 | | | $ | 1,036.70 | | | $ | 4.92 | | |
| 2) Hypothetical | | | 1,000.00 | | | | 1,019.82 | | | | 4.88 | | |
* Expenses are calculated using the annualized expense ratio for the six months ended June 30, 2007 of 0.98%, multiplied by the average account value over the period, multiplied by the number of days in the period, divided by the number of days in the year.
Class Y
| | | Beginning
Value | | Ending
Value | | Operating
Expense
Incurred* | |
| 1) Actual | | $ | 1,000.00 | | | $ | 1,038.40 | | | $ | 4.17 | | |
| 2) Hypothetical | | | 1,000.00 | | | | 1,020.56 | | | | 4.14 | | |
* Expenses are calculated using the annualized expense ratio for the six months ended June 30, 2007 of 0.83%, multiplied by the average account value over the period, multiplied by the number of days in the period, divided by the number of days in the year.
Class S
| | | Beginning
Value | | Ending
Value | | Operating
Expense
Incurred* | |
| 1) Actual | | $ | 1,000.00 | | | $ | 1,038.40 | | | $ | 3.92 | | |
| 2) Hypothetical | | | 1,000.00 | | | | 1,020.81 | | | | 3.89 | | |
* Expenses are calculated using the annualized expense ratio for the six months ended June 30, 2007 of 0.78%, multiplied by the average account value over the period, multiplied by the number of days in the period, divided by the number of days in the year.
367
Other Information (Unaudited) (Continued)
Class N
| | | Beginning
Value | | Ending
Value | | Operating
Expense
Incurred* | |
| 1) Actual | | $ | 1,000.00 | | | $ | 1,034.20 | | | $ | 7.67 | | |
| 2) Hypothetical | | | 1,000.00 | | | | 1,017.11 | | | | 7.61 | | |
* Expenses are calculated using the annualized expense ratio for the six months ended June 30, 2007 of 1.53%, multiplied by the average account value over the period, multiplied by the number of days in the period, divided by the number of days in the year.
Diversified Value Fund
Class A
| | | Beginning
Value | | Ending
Value | | Operating
Expense
Incurred* | |
| 1) Actual | | $ | 1,000.00 | | | $ | 1,059.60 | | | $ | 5.48 | | |
| 2) Hypothetical | | | 1,000.00 | | | | 1,019.33 | | | | 5.38 | | |
* Expenses are calculated using the annualized expense ratio for the six months ended June 30, 2007 of 1.08%, multiplied by the average account value over the period, multiplied by the number of days in the period, divided by the number of days in the year.
Class L
| | | Beginning
Value | | Ending
Value | | Operating
Expense
Incurred* | |
| 1) Actual | | $ | 1,000.00 | | | $ | 1,060.20 | | | $ | 4.01 | | |
| 2) Hypothetical | | | 1,000.00 | | | | 1,020.76 | | | | 3.94 | | |
* Expenses are calculated using the annualized expense ratio for the six months ended June 30, 2007 of 0.79%, multiplied by the average account value over the period, multiplied by the number of days in the period, divided by the number of days in the year.
Class Y
| | | Beginning
Value | | Ending
Value | | Operating
Expense
Incurred* | |
| 1) Actual | | $ | 1,000.00 | | | $ | 1,061.70 | | | $ | 3.46 | | |
| 2) Hypothetical | | | 1,000.00 | | | | 1,021.30 | | | | 3.39 | | |
* Expenses are calculated using the annualized expense ratio for the six months ended June 30, 2007 of 0.68%, multiplied by the average account value over the period, multiplied by the number of days in the period, divided by the number of days in the year.
Class S
| | | Beginning
Value | | Ending
Value | | Operating
Expense
Incurred* | |
| 1) Actual | | $ | 1,000.00 | | | $ | 1,062.40 | | | $ | 2.95 | | |
| 2) Hypothetical | | | 1,000.00 | | | | 1,021.80 | | | | 2.89 | | |
* Expenses are calculated using the annualized expense ratio for the six months ended June 30, 2007 of 0.58%, multiplied by the average account value over the period, multiplied by the number of days in the period, divided by the number of days in the year.
368
Other Information (Unaudited) (Continued)
Class N
| | | Beginning
Value | | Ending
Value | | Operating
Expense
Incurred* | |
| 1) Actual | | $ | 1,000.00 | | | $ | 1,057.30 | | | $ | 7.05 | | |
| 2) Hypothetical | | | 1,000.00 | | | | 1,017.80 | | | | 6.92 | | |
* Expenses are calculated using the annualized expense ratio for the six months ended June 30, 2007 of 1.39%, multiplied by the average account value over the period, multiplied by the number of days in the period, divided by the number of days in the year.
Fundamental Value Fund
Class A
| | | Beginning
Value | | Ending
Value | | Operating
Expense
Incurred* | |
| 1) Actual | | $ | 1,000.00 | | | $ | 1,083.90 | | | $ | 6.32 | | |
| 2) Hypothetical | | | 1,000.00 | | | | 1,018.59 | | | | 6.12 | | |
* Expenses are calculated using the annualized expense ratio for the six months ended June 30, 2007 of 1.23%, multiplied by the average account value over the period, multiplied by the number of days in the period, divided by the number of days in the year.
Class L
| | | Beginning
Value | | Ending
Value | | Operating
Expense
Incurred* | |
| 1) Actual | | $ | 1,000.00 | | | $ | 1,085.20 | | | $ | 5.04 | | |
| 2) Hypothetical | | | 1,000.00 | | | | 1,019.82 | | | | 4.88 | | |
* Expenses are calculated using the annualized expense ratio for the six months ended June 30, 2007 of 0.98%, multiplied by the average account value over the period, multiplied by the number of days in the period, divided by the number of days in the year.
Class Y
| | | Beginning
Value | | Ending
Value | | Operating
Expense
Incurred* | |
| 1) Actual | | $ | 1,000.00 | | | $ | 1,085.80 | | | $ | 4.27 | | |
| 2) Hypothetical | | | 1,000.00 | | | | 1,020.56 | | | | 4.14 | | |
* Expenses are calculated using the annualized expense ratio for the six months ended June 30, 2007 of 0.83%, multiplied by the average account value over the period, multiplied by the number of days in the period, divided by the number of days in the year.
Class S
| | | Beginning
Value | | Ending
Value | | Operating
Expense
Incurred* | |
| 1) Actual | | $ | 1,000.00 | | | $ | 1,086.60 | | | $ | 4.06 | | |
| 2) Hypothetical | | | 1,000.00 | | | | 1,020.76 | | | | 3.94 | | |
* Expenses are calculated using the annualized expense ratio for the six months ended June 30, 2007 of 0.79%, multiplied by the average account value over the period, multiplied by the number of days in the period, divided by the number of days in the year.
369
Other Information (Unaudited) (Continued)
Class N
| | | Beginning
Value | | Ending
Value | | Operating
Expense
Incurred* | |
| 1) Actual | | $ | 1,000.00 | | | $ | 1,082.80 | | | $ | 7.86 | | |
| 2) Hypothetical | | | 1,000.00 | | | | 1,017.11 | | | | 7.61 | | |
* Expenses are calculated using the annualized expense ratio for the six months ended June 30, 2007 of 1.53%, multiplied by the average account value over the period, multiplied by the number of days in the period, divided by the number of days in the year.
Value Equity Fund
Class A
| | | Beginning
Value | | Ending
Value | | Operating
Expense
Incurred* | |
| 1) Actual | | $ | 1,000.00 | | | $ | 1,075.50 | | | $ | 6.65 | | |
| 2) Hypothetical | | | 1,000.00 | | | | 1,018.25 | | | | 6.47 | | |
* Expenses are calculated using the annualized expense ratio for the six months ended June 30, 2007 of 1.30%, multiplied by the average account value over the period, multiplied by the number of days in the period, divided by the number of days in the year.
Class L
| | | Beginning
Value | | Ending
Value | | Operating
Expense
Incurred* | |
| 1) Actual | | $ | 1,000.00 | | | $ | 1,077.40 | | | $ | 5.38 | | |
| 2) Hypothetical | | | 1,000.00 | | | | 1,019.48 | | | | 5.23 | | |
* Expenses are calculated using the annualized expense ratio for the six months ended June 30, 2007 of 1.05%, multiplied by the average account value over the period, multiplied by the number of days in the period, divided by the number of days in the year.
Class Y
| | | Beginning
Value | | Ending
Value | | Operating
Expense
Incurred* | |
| 1) Actual | | $ | 1,000.00 | | | $ | 1,077.90 | | | $ | 4.61 | | |
| 2) Hypothetical | | | 1,000.00 | | | | 1,020.22 | | | | 4.48 | | |
* Expenses are calculated using the annualized expense ratio for the six months ended June 30, 2007 of 0.90%, multiplied by the average account value over the period, multiplied by the number of days in the period, divided by the number of days in the year.
Class S
| | | Beginning
Value | | Ending
Value | | Operating
Expense
Incurred* | |
| 1) Actual | | $ | 1,000.00 | | | $ | 1,077.00 | | | $ | 4.35 | | |
| 2) Hypothetical | | | 1,000.00 | | | | 1,020.47 | | | | 4.23 | | |
* Expenses are calculated using the annualized expense ratio for the six months ended June 30, 2007 of 0.85%, multiplied by the average account value over the period, multiplied by the number of days in the period, divided by the number of days in the year.
370
Other Information (Unaudited) (Continued)
Class N
| | | Beginning
Value | | Ending
Value | | Operating
Expense
Incurred* | |
| 1) Actual | | $ | 1,000.00 | | | $ | 1,073.30 | | | $ | 8.18 | | |
| 2) Hypothetical | | | 1,000.00 | | | | 1,016.77 | | | | 7.96 | | |
* Expenses are calculated using the annualized expense ratio for the six months ended June 30, 2007 of 1.60%, multiplied by the average account value over the period, multiplied by the number of days in the period, divided by the number of days in the year.
Large Cap Value Fund
Class A
| | | Beginning
Value | | Ending
Value | | Operating
Expense
Incurred* | |
| 1) Actual | | $ | 1,000.00 | | | $ | 1,067.80 | | | $ | 6.37 | | |
| 2) Hypothetical | | | 1,000.00 | | | | 1,018.49 | | | | 6.22 | | |
* Expenses are calculated using the annualized expense ratio for the six months ended June 30, 2007 of 1.25%, multiplied by the average account value over the period, multiplied by the number of days in the period, divided by the number of days in the year.
Class L
| | | Beginning
Value | | Ending
Value | | Operating
Expense
Incurred* | |
| 1) Actual | | $ | 1,000.00 | | | $ | 1,069.90 | | | $ | 5.10 | | |
| 2) Hypothetical | | | 1,000.00 | | | | 1,019.73 | | | | 4.98 | | |
* Expenses are calculated using the annualized expense ratio for the six months ended June 30, 2007 of 1.00%, multiplied by the average account value over the period, multiplied by the number of days in the period, divided by the number of days in the year.
Class Y
| | | Beginning
Value | | Ending
Value | | Operating
Expense
Incurred* | |
| 1) Actual | | $ | 1,000.00 | | | $ | 1,070.50 | | | $ | 4.34 | | |
| 2) Hypothetical | | | 1,000.00 | | | | 1,020.47 | | | | 4.23 | | |
* Expenses are calculated using the annualized expense ratio for the six months ended June 30, 2007 of 0.85%, multiplied by the average account value over the period, multiplied by the number of days in the period, divided by the number of days in the year.
Class S
| | | Beginning
Value | | Ending
Value | | Operating
Expense
Incurred* | |
| 1) Actual | | $ | 1,000.00 | | | $ | 1,071.20 | | | $ | 3.88 | | |
| 2) Hypothetical | | | 1,000.00 | | | | 1,020.91 | | | | 3.79 | | |
* Expenses are calculated using the annualized expense ratio for the six months ended June 30, 2007 of 0.76%, multiplied by the average account value over the period, multiplied by the number of days in the period, divided by the number of days in the year.
371
Other Information (Unaudited) (Continued)
Class N
| | | Beginning
Value | | Ending
Value | | Operating
Expense
Incurred* | |
| 1) Actual | | $ | 1,000.00 | | | $ | 1,066.90 | | | $ | 7.90 | | |
| 2) Hypothetical | | | 1,000.00 | | | | 1,017.01 | | | | 7.71 | | |
* Expenses are calculated using the annualized expense ratio for the six months ended June 30, 2007 of 1.55%, multiplied by the average account value over the period, multiplied by the number of days in the period, divided by the number of days in the year.
Indexed Equity Fund
Class A
| | | Beginning
Value | | Ending
Value | | Operating
Expense
Incurred* | |
| 1) Actual | | $ | 1,000.00 | | | $ | 1,066.00 | | | $ | 3.31 | | |
| 2) Hypothetical | | | 1,000.00 | | | | 1,021.45 | | | | 3.24 | | |
* Expenses are calculated using the annualized expense ratio for the six months ended June 30, 2007 of 0.65%, multiplied by the average account value over the period, multiplied by the number of days in the period, divided by the number of days in the year.
Class L
| | | Beginning
Value | | Ending
Value | | Operating
Expense
Incurred* | |
| 1) Actual | | $ | 1,000.00 | | | $ | 1,068.10 | | | $ | 2.04 | | |
| 2) Hypothetical | | | 1,000.00 | | | | 1,022.68 | | | | 1.99 | | |
* Expenses are calculated using the annualized expense ratio for the six months ended June 30, 2007 of 0.40%, multiplied by the average account value over the period, multiplied by the number of days in the period, divided by the number of days in the year.
Class Y
| | | Beginning
Value | | Ending
Value | | Operating
Expense
Incurred* | |
| 1) Actual | | $ | 1,000.00 | | | $ | 1,067.10 | | | $ | 2.29 | | |
| 2) Hypothetical | | | 1,000.00 | | | | 1,022.44 | | | | 2.24 | | |
* Expenses are calculated using the annualized expense ratio for the six months ended June 30, 2007 of 0.45%, multiplied by the average account value over the period, multiplied by the number of days in the period, divided by the number of days in the year.
Class S
| | | Beginning
Value | | Ending
Value | | Operating
Expense
Incurred* | |
| 1) Actual | | $ | 1,000.00 | | | $ | 1,067.20 | | | $ | 2.14 | | |
| 2) Hypothetical | | | 1,000.00 | | | | 1,022.59 | | | | 2.09 | | |
* Expenses are calculated using the annualized expense ratio for the six months ended June 30, 2007 of 0.42%, multiplied by the average account value over the period, multiplied by the number of days in the period, divided by the number of days in the year.
372
Other Information (Unaudited) (Continued)
Class Z
| | | Beginning
Value | | Ending
Value | | Operating
Expense
Incurred* | |
| 1) Actual | | $ | 1,000.00 | | | $ | 1,068.70 | | | $ | 1.02 | | |
| 2) Hypothetical | | | 1,000.00 | | | | 1,023.67 | | | | 1.00 | | |
* Expenses are calculated using the annualized expense ratio for the six months ended June 30, 2007 of 0.20%, multiplied by the average account value over the period, multiplied by the number of days in the period, divided by the number of days in the year.
Class N
| | | Beginning
Value | | Ending
Value | | Operating
Expense
Incurred* | |
| 1) Actual | | $ | 1,000.00 | | | $ | 1,065.10 | | | $ | 4.84 | | |
| 2) Hypothetical | | | 1,000.00 | | | | 1,019.97 | | | | 4.73 | | |
* Expenses are calculated using the annualized expense ratio for the six months ended June 30, 2007 of 0.95%, multiplied by the average account value over the period, multiplied by the number of days in the period, divided by the number of days in the year.
Core Opportunities Fund
Class A
| | | Beginning
Value | | Ending
Value | | Operating
Expense
Incurred* | |
| 1) Actual | | $ | 1,000.00 | | | $ | 1,081.20 | | | $ | 6.93 | | |
| 2) Hypothetical | | | 1,000.00 | | | | 1,018.00 | | | | 6.72 | | |
* Expenses are calculated using the annualized expense ratio for the six months ended June 30, 2007 of 1.35%, multiplied by the average account value over the period, multiplied by the number of days in the period, divided by the number of days in the year.
Class L
| | | Beginning
Value | | Ending
Value | | Operating
Expense
Incurred* | |
| 1) Actual | | $ | 1,000.00 | | | $ | 1,082.00 | | | $ | 5.65 | | |
| 2) Hypothetical | | | 1,000.00 | | | | 1,019.23 | | | | 5.48 | | |
* Expenses are calculated using the annualized expense ratio for the six months ended June 30, 2007 of 1.10%, multiplied by the average account value over the period, multiplied by the number of days in the period, divided by the number of days in the year.
Class Y
| | | Beginning
Value | | Ending
Value | | Operating
Expense
Incurred* | |
| 1) Actual | | $ | 1,000.00 | | | $ | 1,082.90 | | | $ | 4.88 | | |
| 2) Hypothetical | | | 1,000.00 | | | | 1,019.97 | | | | 4.73 | | |
* Expenses are calculated using the annualized expense ratio for the six months ended June 30, 2007 of 0.95%, multiplied by the average account value over the period, multiplied by the number of days in the period, divided by the number of days in the year.
373
Other Information (Unaudited) (Continued)
Class S
| | | Beginning
Value | | Ending
Value | | Operating
Expense
Incurred* | |
| 1) Actual | | $ | 1,000.00 | | | $ | 1083.80 | | | $ | 4.62 | | |
| 2) Hypothetical | | | 1,000.00 | | | | 1,020.22 | | | | 4.48 | | |
* Expenses are calculated using the annualized expense ratio for the six months ended June 30, 2007 of 0.90%, multiplied by the average account value over the period, multiplied by the number of days in the period, divided by the number of days in the year.
Class N
| | | Beginning
Value | | Ending
Value | | Operating
Expense
Incurred* | |
| 1) Actual | | $ | 1,000.00 | | | $ | 1,079.40 | | | $ | 8.46 | | |
| 2) Hypothetical | | | 1,000.00 | | | | 1,016.52 | | | | 8.20 | | |
* Expenses are calculated using the annualized expense ratio for the six months ended June 30, 2007 of 1.65%, multiplied by the average account value over the period, multiplied by the number of days in the period, divided by the number of days in the year.
Blue Chip Growth Fund
Class A
| | | Beginning
Value | | Ending
Value | | Operating
Expense
Incurred* | |
| 1) Actual | | $ | 1,000.00 | | | $ | 1,085.10 | | | $ | 6.58 | | |
| 2) Hypothetical | | | 1,000.00 | | | | 1,018.35 | | | | 6.37 | | |
* Expenses are calculated using the annualized expense ratio for the six months ended June 30, 2007 of 1.28%, multiplied by the average account value over the period, multiplied by the number of days in the period, divided by the number of days in the year.
Class L
| | | Beginning
Value | | Ending
Value | | Operating
Expense
Incurred* | |
| 1) Actual | | $ | 1,000.00 | | | $ | 1,086.10 | | | $ | 5.30 | | |
| 2) Hypothetical | | | 1,000.00 | | | | 1,019.58 | | | | 5.13 | | |
* Expenses are calculated using the annualized expense ratio for the six months ended June 30, 2007 of 1.03%, multiplied by the average account value over the period, multiplied by the number of days in the period, divided by the number of days in the year.
Class Y
| | | Beginning
Value | | Ending
Value | | Operating
Expense
Incurred* | |
| 1) Actual | | $ | 1,000.00 | | | $ | 1,087.10 | | | $ | 4.68 | | |
| 2) Hypothetical | | | 1,000.00 | | | | 1,020.17 | | | | 4.53 | | |
* Expenses are calculated using the annualized expense ratio for the six months ended June 30, 2007 of 0.91%, multiplied by the average account value over the period, multiplied by the number of days in the period, divided by the number of days in the year.
374
Other Information (Unaudited) (Continued)
Class S
| | | Beginning
Value | | Ending
Value | | Operating
Expense
Incurred* | |
| 1) Actual | | $ | 1,000.00 | | | $ | 1,087.80 | | | $ | 4.02 | | |
| 2) Hypothetical | | | 1,000.00 | | | | 1,020.81 | | | | 3.89 | | |
* Expenses are calculated using the annualized expense ratio for the six months ended June 30, 2007 of 0.78%, multiplied by the average account value over the period, multiplied by the number of days in the period, divided by the number of days in the year.
Class N
| | | Beginning
Value | | Ending
Value | | Operating
Expense
Incurred* | |
| 1) Actual | | $ | 1,000.00 | | | $ | 1,083.10 | | | $ | 8.12 | | |
| 2) Hypothetical | | | 1,000.00 | | | | 1,016.87 | | | | 7.86 | | |
* Expenses are calculated using the annualized expense ratio for the six months ended June 30, 2007 of 1.58%, multiplied by the average account value over the period, multiplied by the number of days in the period, divided by the number of days in the year.
Large Cap Growth Fund
Class A
| | | Beginning
Value | | Ending
Value | | Operating
Expense
Incurred* | |
| 1) Actual | | $ | 1,000.00 | | | $ | 1,067.80 | | | $ | 6.88 | | |
| 2) Hypothetical | | | 1,000.00 | | | | 1,018.00 | | | | 6.72 | | |
* Expenses are calculated using the annualized expense ratio for the six months ended June 30, 2007 of 1.35%, multiplied by the average account value over the period, multiplied by the number of days in the period, divided by the number of days in the year.
Class L
| | | Beginning
Value | | Ending
Value | | Operating
Expense
Incurred* | |
| 1) Actual | | $ | 1,000.00 | | | $ | 1,068.00 | | | $ | 5.61 | | |
| 2) Hypothetical | | | 1,000.00 | | | | 1,019.23 | | | | 5.48 | | |
* Expenses are calculated using the annualized expense ratio for the six months ended June 30, 2007 of 1.10%, multiplied by the average account value over the period, multiplied by the number of days in the period, divided by the number of days in the year.
Class Y
| | | Beginning
Value | | Ending
Value | | Operating
Expense
Incurred* | |
| 1) Actual | | $ | 1,000.00 | | | $ | 1,068.70 | | | $ | 4.85 | | |
| 2) Hypothetical | | | 1,000.00 | | | | 1,019.97 | | | | 4.73 | | |
* Expenses are calculated using the annualized expense ratio for the six months ended June 30, 2007 of 0.95%, multiplied by the average account value over the period, multiplied by the number of days in the period, divided by the number of days in the year.
375
Other Information (Unaudited) (Continued)
Class S
| | | Beginning
Value | | Ending
Value | | Operating
Expense
Incurred* | |
| 1) Actual | | $ | 1,000.00 | | | $ | 1,070.40 | | | $ | 4.65 | | |
| 2) Hypothetical | | | 1,000.00 | | | | 1,020.17 | | | | 4.53 | | |
* Expenses are calculated using the annualized expense ratio for the six months ended June 30, 2007 of 0.91%, multiplied by the average account value over the period, multiplied by the number of days in the period, divided by the number of days in the year.
Class N
| | | Beginning
Value | | Ending
Value | | Operating
Expense
Incurred* | |
| 1) Actual | | $ | 1,000.00 | | | $ | 1,065.90 | | | $ | 8.20 | | |
| 2) Hypothetical | | | 1,000.00 | | | | 1,016.72 | | | | 8.01 | | |
* Expenses are calculated using the annualized expense ratio for the six months ended June 30, 2007 of 1.61%, multiplied by the average account value over the period, multiplied by the number of days in the period, divided by the number of days in the year.
Growth Equity Fund
Class A
| | | Beginning
Value | | Ending
Value | | Operating
Expense
Incurred* | |
| 1) Actual | | $ | 1,000.00 | | | $ | 1,049.30 | | | $ | 6.42 | | |
| 2) Hypothetical | | | 1,000.00 | | | | 1,018.39 | | | | 6.32 | | |
* Expenses are calculated using the annualized expense ratio for the six months ended June 30, 2007 of 1.27%, multiplied by the average account value over the period, multiplied by the number of days in the period, divided by the number of days in the year.
Class L
| | | Beginning
Value | | Ending
Value | | Operating
Expense
Incurred* | |
| 1) Actual | | $ | 1,000.00 | | | $ | 1,051.20 | | | $ | 5.16 | | |
| 2) Hypothetical | | | 1,000.00 | | | | 1,019.63 | | | | 5.08 | | |
* Expenses are calculated using the annualized expense ratio for the six months ended June 30, 2007 of 1.02%, multiplied by the average account value over the period, multiplied by the number of days in the period, divided by the number of days in the year.
Class Y
| | | Beginning
Value | | Ending
Value | | Operating
Expense
Incurred* | |
| 1) Actual | | $ | 1,000.00 | | | $ | 1,052.10 | | | $ | 4.40 | | |
| 2) Hypothetical | | | 1,000.00 | | | | 1,020.37 | | | | 4.33 | | |
* Expenses are calculated using the annualized expense ratio for the six months ended June 30, 2007 of 0.87%, multiplied by the average account value over the period, multiplied by the number of days in the period, divided by the number of days in the year.
376
Other Information (Unaudited) (Continued)
Class S
| | | Beginning
Value | | Ending
Value | | Operating
Expense
Incurred* | |
| 1) Actual | | $ | 1,000.00 | | | $ | 1,051.90 | | | $ | 4.10 | | |
| 2) Hypothetical | | | 1,000.00 | | | | 1,020.66 | | | | 4.04 | | |
* Expenses are calculated using the annualized expense ratio for the six months ended June 30, 2007 of 0.81%, multiplied by the average account value over the period, multiplied by the number of days in the period, divided by the number of days in the year.
Class N
| | | Beginning
Value | | Ending
Value | | Operating
Expense
Incurred* | |
| 1) Actual | | $ | 1,000.00 | | | $ | 1,048.80 | | | $ | 7.93 | | |
| 2) Hypothetical | | | 1,000.00 | | | | 1,016.92 | | | | 7.81 | | |
* Expenses are calculated using the annualized expense ratio for the six months ended June 30, 2007 of 1.57%, multiplied by the average account value over the period, multiplied by the number of days in the period, divided by the number of days in the year.
Aggressive Growth Fund
Class A
| | | Beginning
Value | | Ending
Value | | Operating
Expense
Incurred* | |
| 1) Actual | | $ | 1,000.00 | | | $ | 1,066.00 | | | $ | 7.03 | | |
| 2) Hypothetical | | | 1,000.00 | | | | 1,017.85 | | | | 6.87 | | |
* Expenses are calculated using the annualized expense ratio for the six months ended June 30, 2007 of 1.38%, multiplied by the average account value over the period, multiplied by the number of days in the period, divided by the number of days in the year.
Class L
| | | Beginning
Value | | Ending
Value | | Operating
Expense
Incurred* | |
| 1) Actual | | $ | 1,000.00 | | | $ | 1,066.50 | | | $ | 5.76 | | |
| 2) Hypothetical | | | 1,000.00 | | | | 1,019.08 | | | | 5.63 | | |
* Expenses are calculated using the annualized expense ratio for the six months ended June 30, 2007 of 1.13%, multiplied by the average account value over the period, multiplied by the number of days in the period, divided by the number of days in the year.
Class Y
| | | Beginning
Value | | Ending
Value | | Operating
Expense
Incurred* | |
| 1) Actual | | $ | 1,000.00 | | | $ | 1,067.50 | | | $ | 4.95 | | |
| 2) Hypothetical | | | 1,000.00 | | | | 1,019.87 | | | | 4.83 | | |
* Expenses are calculated using the annualized expense ratio for the six months ended June 30, 2007 of 0.97%, multiplied by the average account value over the period, multiplied by the number of days in the period, divided by the number of days in the year.
377
Other Information (Unaudited) (Continued)
Class S
| | | Beginning
Value | | Ending
Value | | Operating
Expense
Incurred* | |
| 1) Actual | | $ | 1,000.00 | | | $ | 1,068.70 | | | $ | 4.49 | | |
| 2) Hypothetical | | | 1,000.00 | | | | 1,020.32 | | | | 4.38 | | |
* Expenses are calculated using the annualized expense ratio for the six months ended June 30, 2007 of 0.88%, multiplied by the average account value over the period, multiplied by the number of days in the period, divided by the number of days in the year.
Class N
| | | Beginning
Value | | Ending
Value | | Operating
Expense
Incurred* | |
| 1) Actual | | $ | 1,000.00 | | | $ | 1,062.10 | | | $ | 8.54 | | |
| 2) Hypothetical | | | 1,000.00 | | | | 1,016.37 | | | | 8.35 | | |
* Expenses are calculated using the annualized expense ratio for the six months ended June 30, 2007 of 1.68%, multiplied by the average account value over the period, multiplied by the number of days in the period, divided by the number of days in the year.
OTC 100 Fund
Class A
| | | Beginning
Value | | Ending
Value | | Operating
Expense
Incurred* | |
| 1) Actual | | $ | 1,000.00 | | | $ | 1,095.90 | | | $ | 6.10 | | |
| 2) Hypothetical | | | 1,000.00 | | | | 1,018.84 | | | | 5.87 | | |
* Expenses are calculated using the annualized expense ratio for the six months ended June 30, 2007 of 1.18%, multiplied by the average account value over the period, multiplied by the number of days in the period, divided by the number of days in the year.
Class L
| | | Beginning
Value | | Ending
Value | | Operating
Expense
Incurred* | |
| 1) Actual | | $ | 1,000.00 | | | $ | 1,099.10 | | | $ | 4.81 | | |
| 2) Hypothetical | | | 1,000.00 | | | | 1,020.07 | | | | 4.63 | | |
* Expenses are calculated using the annualized expense ratio for the six months ended June 30, 2007 of 0.93%, multiplied by the average account value over the period, multiplied by the number of days in the period, divided by the number of days in the year.
Class Y
| | | Beginning
Value | | Ending
Value | | Operating
Expense
Incurred* | |
| 1) Actual | | $ | 1,000.00 | | | $ | 1,100.70 | | | $ | 4.04 | | |
| 2) Hypothetical | | | 1,000.00 | | | | 1,020.81 | | | | 3.89 | | |
* Expenses are calculated using the annualized expense ratio for the six months ended June 30, 2007 of 0.78%, multiplied by the average account value over the period, multiplied by the number of days in the period, divided by the number of days in the year.
378
Other Information (Unaudited) (Continued)
Class S
| | | Beginning
Value | | Ending
Value | | Operating
Expense
Incurred* | |
| 1) Actual | | $ | 1,000.00 | | | $ | 1,099.80 | | | $ | 3.52 | | |
| 2) Hypothetical | | | 1,000.00 | | | | 1,021.30 | | | | 3.39 | | |
* Expenses are calculated using the annualized expense ratio for the six months ended June 30, 2007 of 0.68%, multiplied by the average account value over the period, multiplied by the number of days in the period, divided by the number of days in the year.
Class N
| | | Beginning
Value | | Ending
Value | | Operating
Expense
Incurred* | |
| 1) Actual | | $ | 1,000.00 | | | $ | 1,095.10 | | | $ | 7.65 | | |
| 2) Hypothetical | | | 1,000.00 | | | | 1,017.36 | | | | 7.36 | | |
* Expenses are calculated using the annualized expense ratio for the six months ended June 30, 2007 of 1.48%, multiplied by the average account value over the period, multiplied by the number of days in the period, divided by the number of days in the year.
Focused Value Fund
Class A
| | | Beginning
Value | | Ending
Value | | Operating
Expense
Incurred* | |
| 1) Actual | | $ | 1,000.00 | | | $ | 1,107.90 | | | $ | 6.70 | | |
| 2) Hypothetical | | | 1,000.00 | | | | 1,018.30 | | | | 6.42 | | |
* Expenses are calculated using the annualized expense ratio for the six months ended June 30, 2007 of 1.29%, multiplied by the average account value over the period, multiplied by the number of days in the period, divided by the number of days in the year.
Class L
| | | Beginning
Value | | Ending
Value | | Operating
Expense
Incurred* | |
| 1) Actual | | $ | 1,000.00 | | | $ | 1,109.10 | | | $ | 5.41 | | |
| 2) Hypothetical | | | 1,000.00 | | | | 1,019.53 | | | | 5.18 | | |
* Expenses are calculated using the annualized expense ratio for the six months ended June 30, 2007 of 1.04.%, multiplied by the average account value over the period, multiplied by the number of days in the period, divided by the number of days in the year.
Class Y
| | | Beginning
Value | | Ending
Value | | Operating
Expense
Incurred* | |
| 1) Actual | | $ | 1,000.00 | | | $ | 1,109.90 | | | $ | 4.63 | | |
| 2) Hypothetical | | | 1,000.00 | | | | 1,020.27 | | | | 4.43 | | |
* Expenses are calculated using the annualized expense ratio for the six months ended June 30, 2007 of 0.89%, multiplied by the average account value over the period, multiplied by the number of days in the period, divided by the number of days in the year.
379
Other Information (Unaudited) (Continued)
Class S
| | | Beginning
Value | | Ending
Value | | Operating
Expense
Incurred* | |
| 1) Actual | | $ | 1,000.00 | | | $ | 1,110.80 | | | $ | 4.11 | | |
| 2) Hypothetical | | | 1,000.00 | | | | 1,020.76 | | | | 3.94 | | |
* Expenses are calculated using the annualized expense ratio for the six months ended June 30, 2007 of 0.79%, multiplied by the average account value over the period, multiplied by the number of days in the period, divided by the number of days in the year.
Class N
| | | Beginning
Value | | Ending
Value | | Operating
Expense
Incurred* | |
| 1) Actual | | $ | 1,000.00 | | | $ | 1,105.70 | | | $ | 8.26 | | |
| 2) Hypothetical | | | 1,000.00 | | | | 1,016.82 | | | | 7.91 | | |
* Expenses are calculated using the annualized expense ratio for the six months ended June 30, 2007 of 1.59%, multiplied by the average account value over the period, multiplied by the number of days in the period, divided by the number of days in the year.
Mid Cap Value Fund
Class A
| | | Beginning
Value | | Ending
Value | | Operating
Expense
Incurred* | |
| 1) Actual | | $ | 1,000.00 | | | $ | 1,097.40 | | | $ | 6.67 | | |
| 2) Hypothetical | | | 1,000.00 | | | | 1,018.30 | | | | 6.42 | | |
* Expenses are calculated using the annualized expense ratio for the six months ended June 30, 2007 of 1.29%, multiplied by the average account value over the period, multiplied by the number of days in the period, divided by the number of days in the year.
Class L
| | | Beginning
Value | | Ending
Value | | Operating
Expense
Incurred* | |
| 1) Actual | | $ | 1,000.00 | | | $ | 1,098.10 | | | $ | 5.38 | | |
| 2) Hypothetical | | | 1,000.00 | | | | 1,019.53 | | | | 5.18 | | |
* Expenses are calculated using the annualized expense ratio for the six months ended June 30, 2007 of 1.04%, multiplied by the average account value over the period, multiplied by the number of days in the period, divided by the number of days in the year.
Class Y
| | | Beginning
Value | | Ending
Value | | Operating
Expense
Incurred* | |
| 1) Actual | | $ | 1,000.00 | | | $ | 1,098.90 | | | $ | 4.61 | | |
| 2) Hypothetical | | | 1,000.00 | | | | 1,020.27 | | | | 4.43 | | |
* Expenses are calculated using the annualized expense ratio for the six months ended June 30, 2007 of 0.89%, multiplied by the average account value over the period, multiplied by the number of days in the period, divided by the number of days in the year.
380
Other Information (Unaudited) (Continued)
Class S
| | | Beginning
Value | | Ending
Value | | Operating
Expense
Incurred* | |
| 1) Actual | | $ | 1,000.00 | | | $ | 1,099.80 | | | $ | 4.09 | | |
| 2) Hypothetical | | | 1,000.00 | | | | 1,020.76 | | | | 3.94 | | |
* Expenses are calculated using the annualized expense ratio for the six months ended June 30, 2007 of 0.79%, multiplied by the average account value over the period, multiplied by the number of days in the period, divided by the number of days in the year.
Class N
| | | Beginning
Value | | Ending
Value | | Operating
Expense
Incurred* | |
| 1) Actual | | $ | 1,000.00 | | | $ | 1,098.20 | | | $ | 8.23 | | |
| 2) Hypothetical | | | 1,000.00 | | | | 1,016.82 | | | | 7.91 | | |
* Expenses are calculated using the annualized expense ratio for the six months ended June 30, 2007 of 1.59%, multiplied by the average account value over the period, multiplied by the number of days in the period, divided by the number of days in the year.
Small Cap Value Equity Fund
Class A
| | | Beginning
Value | | Ending
Value | | Operating
Expense
Incurred* | |
| 1) Actual | | $ | 1,000.00 | | | $ | 1,041.30 | | | $ | 6.85 | | |
| 2) Hypothetical | | | 1,000.00 | | | | 1,017.95 | | | | 6.77 | | |
* Expenses are calculated using the annualized expense ratio for the six months ended June 30, 2007 of 1.36%, multiplied by the average account value over the period, multiplied by the number of days in the period, divided by the number of days in the year.
Class L
| | | Beginning
Value | | Ending
Value | | Operating
Expense
Incurred* | |
| 1) Actual | | $ | 1,000.00 | | | $ | 1,042.20 | | | $ | 5.59 | | |
| 2) Hypothetical | | | 1,000.00 | | | | 1,019.18 | | | | 5.53 | | |
* Expenses are calculated using the annualized expense ratio for the six months ended June 30, 2007 of 1.11%, multiplied by the average account value over the period, multiplied by the number of days in the period, divided by the number of days in the year.
Class Y
| | | Beginning
Value | | Ending
Value | | Operating
Expense
Incurred* | |
| 1) Actual | | $ | 1,000.00 | | | $ | 1,043.10 | | | $ | 4.84 | | |
| 2) Hypothetical | | | 1,000.00 | | | | 1,019.92 | | | | 4.78 | | |
* Expenses are calculated using the annualized expense ratio for the six months ended June 30, 2007 of 0.96%, multiplied by the average account value over the period, multiplied by the number of days in the period, divided by the number of days in the year.
381
Other Information (Unaudited) (Continued)
Class S
| | | Beginning
Value | | Ending
Value | | Operating
Expense
Incurred* | |
| 1) Actual | | $ | 1,000.00 | | | $ | 1,043.00 | | | $ | 4.33 | | |
| 2) Hypothetical | | | 1,000.00 | | | | 1,020.42 | | | | 4.28 | | |
* Expenses are calculated using the annualized expense ratio for the six months ended June 30, 2007 of 0.86%, multiplied by the average account value over the period, multiplied by the number of days in the period, divided by the number of days in the year.
Class N
| | | Beginning
Value | | Ending
Value | | Operating
Expense
Incurred* | |
| 1) Actual | | $ | 1,000.00 | | | $ | 1,040.30 | | | $ | 8.35 | | |
| 2) Hypothetical | | | 1,000.00 | | | | 1,016.47 | | | | 8.25 | | |
* Expenses are calculated using the annualized expense ratio for the six months ended June 30, 2007 of 1.66%, multiplied by the average account value over the period, multiplied by the number of days in the period, divided by the number of days in the year.
Small Company Value Fund
Class A
| | | Beginning
Value | | Ending
Value | | Operating
Expense
Incurred* | |
| 1) Actual | | $ | 1,000.00 | | | $ | 1,061.40 | | | $ | 7.57 | | |
| 2) Hypothetical | | | 1,000.00 | | | | 1,017.31 | | | | 7.41 | | |
* Expenses are calculated using the annualized expense ratio for the six months ended June 30, 2007 of 1.49%, multiplied by the average account value over the period, multiplied by the number of days in the period, divided by the number of days in the year.
Class L
| | | Beginning
Value | | Ending
Value | | Operating
Expense
Incurred* | |
| 1) Actual | | $ | 1,000.00 | | | $ | 1,062.90 | | | $ | 6.31 | | |
| 2) Hypothetical | | | 1,000.00 | | | | 1,018.54 | | | | 6.17 | | |
* Expenses are calculated using the annualized expense ratio for the six months ended June 30, 2007 of 1.24%, multiplied by the average account value over the period, multiplied by the number of days in the period, divided by the number of days in the year.
Class Y
| | | Beginning
Value | | Ending
Value | | Operating
Expense
Incurred* | |
| 1) Actual | | $ | 1,000.00 | | | $ | 1,063.10 | | | $ | 5.54 | | |
| 2) Hypothetical | | | 1,000.00 | | | | 1,019.28 | | | | 5.43 | | |
* Expenses are calculated using the annualized expense ratio for the six months ended June 30, 2007 of 1.09%, multiplied by the average account value over the period, multiplied by the number of days in the period, divided by the number of days in the year.
382
Other Information (Unaudited) (Continued)
Class S
| | | Beginning
Value | | Ending
Value | | Operating
Expense
Incurred* | |
| 1) Actual | | $ | 1,000.00 | | | $ | 1,062.90 | | | $ | 5.34 | | |
| 2) Hypothetical | | | 1,000.00 | | | | 1,019.48 | | | | 5.23 | | |
* Expenses are calculated using the annualized expense ratio for the six months ended June 30, 2007 of 1.05%, multiplied by the average account value over the period, multiplied by the number of days in the period, divided by the number of days in the year.
Class N
| | | Beginning
Value | | Ending
Value | | Operating
Expense
Incurred* | |
| 1) Actual | | $ | 1,000.00 | | | $ | 1,059.70 | | | $ | 9.09 | | |
| 2) Hypothetical | | | 1,000.00 | | | | 1,015.83 | | | | 8.90 | | |
* Expenses are calculated using the annualized expense ratio for the six months ended June 30, 2007 of 1.79%, multiplied by the average account value over the period, multiplied by the number of days in the period, divided by the number of days in the year.
Small Cap Core Equity Fund
Class A
| | | Beginning
Value | | Ending
Value | | Operating
Expense
Incurred* | |
| 1) Actual | | $ | 1,000.00 | | | $ | 1,021.30 | | | $ | 6.98 | | |
| 2) Hypothetical | | | 1,000.00 | | | | 1,017.75 | | | | 6.97 | | |
* Expenses are calculated using the annualized expense ratio for the six months ended June 30, 2007 of 1.40%, multiplied by the average account value over the period, multiplied by the number of days in the period, divided by the number of days in the year.
Class L
| | | Beginning
Value | | Ending
Value | | Operating
Expense
Incurred* | |
| 1) Actual | | $ | 1,000.00 | | | $ | 1,023.20 | | | $ | 5.74 | | |
| 2) Hypothetical | | | 1,000.00 | | | | 1,018.99 | | | | 5.73 | | |
* Expenses are calculated using the annualized expense ratio for the six months ended June 30, 2007 of 1.15%, multiplied by the average account value over the period, multiplied by the number of days in the period, divided by the number of days in the year.
Class Y
| | | Beginning
Value | | Ending
Value | | Operating
Expense
Incurred* | |
| 1) Actual | | $ | 1,000.00 | | | $ | 1,023.20 | | | $ | 4.99 | | |
| 2) Hypothetical | | | 1,000.00 | | | | 1,019.73 | | | | 4.98 | | |
* Expenses are calculated using the annualized expense ratio for the six months ended June 30, 2007 of 1.00%, multiplied by the average account value over the period, multiplied by the number of days in the period, divided by the number of days in the year.
383
Other Information (Unaudited) (Continued)
Class S
| | | Beginning
Value | | Ending
Value | | Operating
Expense
Incurred* | |
| 1) Actual | | $ | 1,000.00 | | | $ | 1,024.20 | | | $ | 4.54 | | |
| 2) Hypothetical | | | 1,000.00 | | | | 1,020.17 | | | | 4.53 | | |
* Expenses are calculated using the annualized expense ratio for the six months ended June 30, 2007 of 0.91%, multiplied by the average account value over the period, multiplied by the number of days in the period, divided by the number of days in the year.
Class N
| | | Beginning
Value | | Ending
Value | | Operating
Expense
Incurred* | |
| 1) Actual | | $ | 1,000.00 | | | $ | 1,019.40 | | | $ | 8.46 | | |
| 2) Hypothetical | | | 1,000.00 | | | | 1,016.27 | | | | 8.45 | | |
* Expenses are calculated using the annualized expense ratio for the six months ended June 30, 2007 of 1.70 %, multiplied by the average account value over the period, multiplied by the number of days in the period, divided by the number of days in the year.
Mid Cap Growth Equity Fund
Class A
| | | Beginning
Value | | Ending
Value | | Operating
Expense
Incurred* | |
| 1) Actual | | $ | 1,000.00 | | | $ | 1,076.30 | | | $ | 6.66 | | |
| 2) Hypothetical | | | 1,000.00 | | | | 1,018.25 | | | | 6.47 | | |
* Expenses are calculated using the annualized expense ratio for the six months ended June 30, 2007 of 1.30%, multiplied by the average account value over the period, multiplied by the number of days in the period, divided by the number of days in the year.
Class L
| | | Beginning
Value | | Ending
Value | | Operating
Expense
Incurred* | |
| 1) Actual | | $ | 1,000.00 | | | $ | 1,076.90 | | | $ | 5.38 | | |
| 2) Hypothetical | | | 1,000.00 | | | | 1,019.48 | | | | 5.23 | | |
* Expenses are calculated using the annualized expense ratio for the six months ended June 30, 2007 of 1.05%, multiplied by the average account value over the period, multiplied by the number of days in the period, divided by the number of days in the year.
Class Y
| | | Beginning
Value | | Ending
Value | | Operating
Expense
Incurred* | |
| 1) Actual | | $ | 1,000.00 | | | $ | 1,078.20 | | | $ | 4.61 | | |
| 2) Hypothetical | | | 1,000.00 | | | | 1,020.22 | | | | 4.48 | | |
* Expenses are calculated using the annualized expense ratio for the six months ended June 30, 2007 of 0.90%, multiplied by the average account value over the period, multiplied by the number of days in the period, divided by the number of days in the year.
384
Other Information (Unaudited) (Continued)
Class S
| | | Beginning
Value | | Ending
Value | | Operating
Expense
Incurred* | |
| 1) Actual | | $ | 1,000.00 | | | $ | 1,078.90 | | | $ | 4.25 | | |
| 2) Hypothetical | | | 1,000.00 | | | | 1,020.56 | | | | 4.14 | | |
* Expenses are calculated using the annualized expense ratio for the six months ended June 30, 2007 of 0.83%, multiplied by the average account value over the period, multiplied by the number of days in the period, divided by the number of days in the year.
Class N
| | | Beginning
Value | | Ending
Value | | Operating
Expense
Incurred* | |
| 1) Actual | | $ | 1,000.00 | | | $ | 1,074.40 | | | $ | 8.18 | | |
| 2) Hypothetical | | | 1,000.00 | | | | 1,016.77 | | | | 7.96 | | |
* Expenses are calculated using the annualized expense ratio the six months ended June 30, 2007 of 1.60%, multiplied by the average account value over the period, multiplied by the number of days in the period, divided by the number of days in the year.
Mid Cap Growth Equity II Fund
Class A
| | | Beginning
Value | | Ending
Value | | Operating
Expense
Incurred* | |
| 1) Actual | | $ | 1,000.00 | | | $ | 1,136.70 | | | $ | 7.11 | | |
| 2) Hypothetical | | | 1,000.00 | | | | 1,018.00 | | | | 6.72 | | |
* Expenses are calculated using the annualized expense ratio for the six months ended June 30, 2007 of 1.35%, multiplied by the average account value over the period, multiplied by the number of days in the period, divided by the number of days in the year.
Class L
| | | Beginning
Value | | Ending
Value | | Operating
Expense
Incurred* | |
| 1) Actual | | $ | 1,000.00 | | | $ | 1,138.00 | | | $ | 5.75 | | |
| 2) Hypothetical | | | 1,000.00 | | | | 1,019.28 | | | | 5.43 | | |
* Expenses are calculated using the annualized expense ratio for the six months ended June 30, 2007 of 1.09%, multiplied by the average account value over the period, multiplied by the number of days in the period, divided by the number of days in the year.
Class Y
| | | Beginning
Value | | Ending
Value | | Operating
Expense
Incurred* | |
| 1) Actual | | $ | 1,000.00 | | | $ | 1,138.60 | | | $ | 5.01 | | |
| 2) Hypothetical | | | 1,000.00 | | | | 1,019.97 | | | | 4.43 | | |
* Expenses are calculated using the annualized expense ratio for the six months ended June 30, 2007 of 0.95%, multiplied by the average account value over the period, multiplied by the number of days in the period, divided by the number of days in the year.
385
Other Information (Unaudited) (Continued)
Class S
| | | Beginning
Value | | Ending
Value | | Operating
Expense
Incurred* | |
| 1) Actual | | $ | 1,000.00 | | | $ | 1,139.30 | | | $ | 4.54 | | |
| 2) Hypothetical | | | 1,000.00 | | | | 1,020.42 | | | | 4.28 | | |
* Expenses are calculated using the annualized expense ratio for the six months ended June 30, 2007 of 0.86%, multiplied by the average account value over the period, multiplied by the number of days in the period, divided by the number of days in the year.
Class N
| | | Beginning
Value | | Ending
Value | | Operating
Expense
Incurred* | |
| 1) Actual | | $ | 1,000.00 | | | $ | 1,134.40 | | | $ | 8.68 | | |
| 2) Hypothetical | | | 1,000.00 | | | | 1,016.52 | | | | 8.20 | | |
* Expenses are calculated using the annualized expense ratio for the six months ended June 30, 2007 of 1.65%, multiplied by the average account value over the period, multiplied by the number of days in the period, divided by the number of days in the year.
Small Cap Growth Equity Fund
Class A
| | | Beginning
Value | | Ending
Value | | Operating
Expense
Incurred* | |
| 1) Actual | | $ | 1,000.00 | | | $ | 1,106.40 | | | $ | 7.84 | | |
| 2) Hypothetical | | | 1,000.00 | | | | 1,017.21 | | | | 7.51 | | |
* Expenses are calculated using the annualized expense ratio for the six months ended June 30, 2007 of 1.51%, multiplied by the average account value over the period, multiplied by the number of days in the period, divided by the number of days in the year.
Class L
| | | Beginning
Value | | Ending
Value | | Operating
Expense
Incurred* | |
| 1) Actual | | $ | 1,000.00 | | | $ | 1,108.00 | | | $ | 6.55 | | |
| 2) Hypothetical | | | 1,000.00 | | | | 1,018.44 | | | | 6.27 | | |
* Expenses are calculated using the annualized expense ratio for the six months ended June 30, 2007 of 1.26%, multiplied by the average account value over the period, multiplied by the number of days in the period, divided by the number of days in the year.
Class Y
| | | Beginning
Value | | Ending
Value | | Operating
Expense
Incurred* | |
| 1) Actual | | $ | 1,000.00 | | | $ | 1,108.60 | | | $ | 5.77 | | |
| 2) Hypothetical | | | 1,000.00 | | | | 1,019.18 | | | | 5.53 | | |
* Expenses are calculated using the annualized expense ratio for the six months ended June 30, 2007 of 1.11%, multiplied by the average account value over the period, multiplied by the number of days in the period, divided by the number of days in the year.
386
Other Information (Unaudited) (Continued)
Class S
| | | Beginning
Value | | Ending
Value | | Operating
Expense
Incurred* | |
| 1) Actual | | $ | 1,000.00 | | | $ | 1,108.70 | | | $ | 5.04 | | |
| 2) Hypothetical | | | 1,000.00 | | | | 1,019.87 | | | | 4.83 | | |
* Expenses are calculated using the annualized expense ratio for the six months ended June 30, 2007 of 0.97%, multiplied by the average account value over the period, multiplied by the number of days in the period, divided by the number of days in the year.
Class N
| | | Beginning
Value | | Ending
Value | | Operating
Expense
Incurred* | |
| 1) Actual | | $ | 1,000.00 | | | $ | 1,105.10 | | | $ | 9.40 | | |
| 2) Hypothetical | | | 1,000.00 | | | | 1,015.73 | | | | 9.00 | | |
* Expenses are calculated using the annualized expense ratio for the six months ended June 30, 2007 of 1.81%, multiplied by the average account value over the period, multiplied by the number of days in the period, divided by the number of days in the year.
Small Company Growth Fund
Class A
| | | Beginning
Value | | Ending
Value | | Operating
Expense
Incurred* | |
| 1) Actual | | $ | 1,000.00 | | | $ | 1,122.10 | | | $ | 8.06 | | |
| 2) Hypothetical | | | 1,000.00 | | | | 1,017.06 | | | | 7.66 | | |
* Expenses are calculated using the annualized expense ratio for the six months ended June 30, 2007 of 1.54%, multiplied by the average account value over the period, multiplied by the number of days in the period, divided by the number of days in the year.
Class L
| | | Beginning
Value | | Ending
Value | | Operating
Expense
Incurred* | |
| 1) Actual | | $ | 1,000.00 | | | $ | 1,123.90 | | | $ | 6.76 | | |
| 2) Hypothetical | | | 1,000.00 | | | | 1,018.30 | | | | 6.42 | | |
* Expenses are calculated using the annualized expense ratio for the six months ended June 30, 2007 of 1.29%, multiplied by the average account value over the period, multiplied by the number of days in the period, divided by the number of days in the year.
Class Y
| | | Beginning
Value | | Ending
Value | | Operating
Expense
Incurred* | |
| 1) Actual | | $ | 1,000.00 | | | $ | 1,124.90 | | | $ | 5.97 | | |
| 2) Hypothetical | | | 1,000.00 | | | | 1,019.04 | | | | 5.68 | | |
* Expenses are calculated using the annualized expense ratio for the six months ended June 30, 2007 of 1.14%, multiplied by the average account value over the period, multiplied by the number of days in the period, divided by the number of days in the year.
387
Other Information (Unaudited) (Continued)
Class S
| | | Beginning
Value | | Ending
Value | | Operating
Expense
Incurred* | |
| 1) Actual | | $ | 1,000.00 | | | $ | 1,124.40 | | | $ | 5.76 | | |
| 2) Hypothetical | | | 1,000.00 | | | | 1,019.23 | | | | 5.48 | | |
* Expenses are calculated using the annualized expense ratio for the six months ended June 30, 2007 of 1.10%, multiplied by the average account value over the period, multiplied by the number of days in the period, divided by the number of days in the year.
Class N
| | | Beginning
Value | | Ending
Value | | Operating
Expense
Incurred* | |
| 1) Actual | | $ | 1,000.00 | | | $ | 1,120.60 | | | $ | 9.62 | | |
| 2) Hypothetical | | | 1,000.00 | | | | 1,015.58 | | | | 9.14 | | |
* Expenses are calculated using the annualized expense ratio for the six months ended June 30, 2007 of 1.84%, multiplied by the average account value over the period, multiplied by the number of days in the period, divided by the number of days in the year.
Emerging Growth Fund
Class A
| | | Beginning
Value | | Ending
Value | | Operating
Expense
Incurred* | |
| 1) Actual | | $ | 1,000.00 | | | $ | 1,138.30 | | | $ | 7.75 | | |
| 2) Hypothetical | | | 1,000.00 | | | | 1,017.41 | | | | 7.31 | | |
* Expenses are calculated using the annualized expense ratio for the six months ended June 30, 2007 of 1.47%, multiplied by the average account value over the period, multiplied by the number of days in the period, divided by the number of days in the year.
Class L
| | | Beginning
Value | | Ending
Value | | Operating
Expense
Incurred* | |
| 1) Actual | | $ | 1,000.00 | | | $ | 1,139.20 | | | $ | 6.38 | | |
| 2) Hypothetical | | | 1,000.00 | | | | 1,018.69 | | | | 6.02 | | |
* Expenses are calculated using the annualized expense ratio for the six months ended June 30, 2007 of 1.21%, multiplied by the average account value over the period, multiplied by the number of days in the period, divided by the number of days in the year.
Class Y
| | | Beginning
Value | | Ending
Value | | Operating
Expense
Incurred* | |
| 1) Actual | | $ | 1,000.00 | | | $ | 1,138.80 | | | $ | 5.64 | | |
| 2) Hypothetical | | | 1,000.00 | | | | 1,019.38 | | | | 5.33 | | |
* Expenses are calculated using the annualized expense ratio for the six months ended June 30, 2007 of 1.07%, multiplied by the average account value over the period, multiplied by the number of days in the period, divided by the number of days in the year.
388
Other Information (Unaudited) (Continued)
Class S
| | | Beginning
Value | | Ending
Value | | Operating
Expense
Incurred* | |
| 1) Actual | | $ | 1,000.00 | | | $ | 1,139.50 | | | $ | 5.12 | | |
| 2) Hypothetical | | | 1,000.00 | | | | 1,019.87 | | | | 4.83 | | |
* Expenses are calculated using the annualized expense ratio for the six months ended June 30, 2007 of 0.97%, multiplied by the average account value over the period, multiplied by the number of days in the period, divided by the number of days in the year.
Class N
| | | Beginning
Value | | Ending
Value | | Operating
Expense
Incurred* | |
| 1) Actual | | $ | 1,000.00 | | | $ | 1,137.30 | | | $ | 9.33 | | |
| 2) Hypothetical | | | 1,000.00 | | | | 1,015.93 | | | | 8.80 | | |
* Expenses are calculated using the annualized expense ratio for the six months ended June 30, 2007 of 1.77%, multiplied by the average account value over the period, multiplied by the number of days in the period, divided by the number of days in the year.
Diversified International Fund
Class A
| | | Beginning
Value | | Ending
Value | | Operating
Expense
Incurred* | |
| 1) Actual | | $ | 1,000.00 | | | $ | 1,139.20 | | | $ | 7.49 | | |
| 2) Hypothetical | | | 1,000.00 | | | | 1,017.65 | | | | 7.06 | | |
* Expenses are calculated using the annualized expense ratio for the six months ended June 30, 2007 of 1.42%, multiplied by the average account value over the period, multiplied by the number of days in the period, divided by the number of days in the year.
Class L
| | | Beginning
Value | | Ending
Value | | Operating
Expense
Incurred* | |
| 1) Actual | | $ | 1,000.00 | | | $ | 1,140.20 | | | $ | 6.17 | | |
| 2) Hypothetical | | | 1,000.00 | | | | 1,018.89 | | | | 5.82 | | |
* Expenses are calculated using the annualized expense ratio for the six months ended June 30, 2007 of 1.17%, multiplied by the average account value over the period, multiplied by the number of days in the period, divided by the number of days in the year.
Class Y
| | | Beginning
Value | | Ending
Value | | Operating
Expense
Incurred* | |
| 1) Actual | | $ | 1,000.00 | | | $ | 1,140.20 | | | $ | 5.75 | | |
| 2) Hypothetical | | | 1,000.00 | | | | 1,019.28 | | | | 5.43 | | |
* Expenses are calculated using the annualized expense ratio for the six months ended June 30, 2007 of 1.09%, multiplied by the average account value over the period, multiplied by the number of days in the period, divided by the number of days in the year.
389
Other Information (Unaudited) (Continued)
Class S
| | | Beginning
Value | | Ending
Value | | Operating
Expense
Incurred* | |
| 1) Actual | | $ | 1,000.00 | | | $ | 1,141.20 | | | $ | 5.23 | | |
| 2) Hypothetical | | | 1,000.00 | | | | 1,019.78 | | | | 4.93 | | |
* Expenses are calculated using the annualized expense ratio for the six months ended June 30, 2007 of 0.99%, multiplied by the average account value over the period, multiplied by the number of days in the period, divided by the number of days in the year.
Class N
| | | Beginning
Value | | Ending
Value | | Operating
Expense
Incurred* | |
| 1) Actual | | $ | 1,000.00 | | | $ | 1,137.20 | | | $ | 9.06 | | |
| 2) Hypothetical | | | 1,000.00 | | | | 1,016.18 | | | | 8.55 | | |
* Expenses are calculated using the annualized expense ratio for the six months ended June 30, 2007 of 1.72%, multiplied by the average account value over the period, multiplied by the number of days in the period, divided by the number of days in the year
Overseas Fund
Class A
| | | Beginning
Value | | Ending
Value | | Operating
Expense
Incurred* | |
| 1) Actual | | $ | 1,000.00 | | | $ | 1,081.30 | | | $ | 7.75 | | |
| 2) Hypothetical | | | 1,000.00 | | | | 1,017.21 | | | | 7.51 | | |
* Expenses are calculated using the annualized expense ratio for the six months ended June 30, 2007 of 1.51%, multiplied by the average account value over the period, multiplied by the number of days in the period, divided by the number of days in the year.
Class L
| | | Beginning
Value | | Ending
Value | | Operating
Expense
Incurred* | |
| 1) Actual | | $ | 1,000.00 | | | $ | 1,083.10 | | | $ | 6.47 | | |
| 2) Hypothetical | | | 1,000.00 | | | | 1,018.44 | | | | 6.27 | | |
* Expenses are calculated using the annualized expense ratio for the six months ended June 30, 2007 of 1.26%, multiplied by the average account value over the period, multiplied by the number of days in the period, divided by the number of days in the year.
Class Y
| | | Beginning
Value | | Ending
Value | | Operating
Expense
Incurred* | |
| 1) Actual | | $ | 1,000.00 | | | $ | 1,083.70 | | | $ | 6.22 | | |
| 2) Hypothetical | | | 1,000.00 | | | | 1,018.69 | | | | 6.02 | | |
* Expenses are calculated using the annualized expense ratio for the six months ended June 30, 2007 of 1.21%, multiplied by the average account value over the period, multiplied by the number of days in the period, divided by the number of days in the year.
390
Other Information (Unaudited) (Continued)
Class S
| | | Beginning
Value | | Ending
Value | | Operating
Expense
Incurred* | |
| 1) Actual | | $ | 1,000.00 | | | $ | 1,084.20 | | | $ | 5.96 | | |
| 2) Hypothetical | | | 1,000.00 | | | | 1,018.94 | | | | 5.77 | | |
* Expenses are calculated using the annualized expense ratio for the six months ended June 30, 2007 of 1.16%, multiplied by the average account value over the period, multiplied by the number of days in the period, divided by the number of days in the year.
Class N
| | | Beginning
Value | | Ending
Value | | Operating
Expense
Incurred* | |
| 1) Actual | | $ | 1,000.00 | | | $ | 1,080.50 | | | $ | 9.29 | | |
| 2) Hypothetical | | | 1,000.00 | | | | 1,015.73 | | | | 9.00 | | |
* Expenses are calculated using the annualized expense ratio for the six months ended June 30, 2007 of 1.81%, multiplied by the average account value over the period, multiplied by the number of days in the period, divided by the number of days in the year.
Destination Retirement Income Fund
Class A
| | | Beginning
Value | | Ending
Value | | Operating
Expense
Incurred* | |
| 1) Actual | | $ | 1,000.00 | | | $ | 1,029.30 | | | $ | 2.45 | | |
| 2) Hypothetical | | | 1,000.00 | | | | 1,022.24 | | | | 2.44 | | |
* Expenses are calculated using the annualized expense ratio for the six months ended June 30, 2007 of 0.49%, multiplied by the average account value over the period, multiplied by the number of days in the period, divided by the number of days in the year.
Class L
| | | Beginning
Value | | Ending
Value | | Operating
Expense
Incurred* | |
| 1) Actual | | $ | 1,000.00 | | | $ | 1,031.20 | | | $ | 1.20 | | |
| 2) Hypothetical | | | 1,000.00 | | | | 1,023.47 | | | | 1.20 | | |
* Expenses are calculated using the annualized expense ratio for the six months ended June 30, 2007 of 0.24%, multiplied by the average account value over the period, multiplied by the number of days in the period, divided by the number of days in the year.
Class Y
| | | Beginning
Value | | Ending
Value | | Operating
Expense
Incurred* | |
| 1) Actual | | $ | 1,000.00 | | | $ | 1,031.20 | | | $ | 0.70 | | |
| 2) Hypothetical | | | 1,000.00 | | | | 1,023.97 | | | | 0.70 | | |
* Expenses are calculated using the annualized expense ratio for the six months ended June 30, 2007 of 0.14%, multiplied by the average account value over the period, multiplied by the number of days in the period, divided by the number of days in the year.
391
Other Information (Unaudited) (Continued)
Class S
| | | Beginning
Value | | Ending
Value | | Operating
Expense
Incurred* | |
| 1) Actual | | $ | 1,000.00 | | | $ | 1,031.20 | | | $ | 0.55 | | |
| 2) Hypothetical | | | 1,000.00 | | | | 1,024.12 | | | | 0.55 | | |
* Expenses are calculated using the annualized expense ratio for the six months ended June 30, 2007 of 0.11%, multiplied by the average account value over the period, multiplied by the number of days in the period, divided by the number of days in the year.
Class N
| | | Beginning
Value | | Ending
Value | | Operating
Expense
Incurred* | |
| 1) Actual | | $ | 1,000.00 | | | $ | 1,027.30 | | | $ | 3.95 | | |
| 2) Hypothetical | | | 1,000.00 | | | | 1,020.76 | | | | 3.94 | | |
* Expenses are calculated using the annualized expense ratio for the six months ended June 30, 2007 of 0.79%, multiplied by the average account value over the period, multiplied by the number of days in the period, divided by the number of days in the year.
Destination Retirement 2010 Fund
Class A
| | | Beginning
Value | | Ending
Value | | Operating
Expense
Incurred* | |
| 1) Actual | | $ | 1,000.00 | | | $ | 1,037.10 | | | $ | 2.56 | | |
| 2) Hypothetical | | | 1,000.00 | | | | 1,022.14 | | | | 2.54 | | |
* Expenses are calculated using the annualized expense ratio for the six months ended June 30, 2007 of 0.51%, multiplied by the average account value over the period, multiplied by the number of days in the period, divided by the number of days in the year.
Class L
| | | Beginning
Value | | Ending
Value | | Operating
Expense
Incurred* | |
| 1) Actual | | $ | 1,000.00 | | | $ | 1,038.90 | | | $ | 1.31 | | |
| 2) Hypothetical | | | 1,000.00 | | | | 1,023.38 | | | | 1.30 | | |
* Expenses are calculated using the annualized expense ratio for the six months ended June 30, 2007 of 0.26%, multiplied by the average account value over the period, multiplied by the number of days in the period, divided by the number of days in the year.
Class Y
| | | Beginning
Value | | Ending
Value | | Operating
Expense
Incurred* | |
| 1) Actual | | $ | 1,000.00 | | | $ | 1,038.80 | | | $ | 0.80 | | |
| 2) Hypothetical | | | 1,000.00 | | | | 1,023.87 | | | | 0.80 | | |
* Expenses are calculated using the annualized expense ratio for the six months ended June 30, 2007 of 0.16%, multiplied by the average account value over the period, multiplied by the number of days in the period, divided by the number of days in the year.
392
Other Information (Unaudited) (Continued)
Class S
| | | Beginning
Value | | Ending
Value | | Operating
Expense
Incurred* | |
| 1) Actual | | $ | 1,000.00 | | | $ | 1,039.70 | | | $ | 0.55 | | |
| 2) Hypothetical | | | 1,000.00 | | | | 1,024.12 | | | | 0.55 | | |
* Expenses are calculated using the annualized expense ratio for the six months ended June 30, 2007 of 0.11%, multiplied by the average account value over the period, multiplied by the number of days in the period, divided by the number of days in the year.
Class N
| | | Beginning
Value | | Ending
Value | | Operating
Expense
Incurred* | |
| 1) Actual | | $ | 1,000.00 | | | $ | 1,036.10 | | | $ | 4.07 | | |
| 2) Hypothetical | | | 1,000.00 | | | | 1,020.66 | | | | 4.04 | | |
* Expenses are calculated using the annualized expense ratio for the six months ended June 30, 2007 of 0.81%, multiplied by the average account value over the period, multiplied by the number of days in the period, divided by the number of days in the year.
Destination Retirement 2020 Fund
Class A
| | | Beginning
Value | | Ending
Value | | Operating
Expense
Incurred* | |
| 1) Actual | | $ | 1,000.00 | | | $ | 1,051.80 | | | $ | 2.53 | | |
| 2) Hypothetical | | | 1,000.00 | | | | 1,022.19 | | | | 2.49 | | |
* Expenses are calculated using the annualized expense ratio for the six months ended June 30, 2007 of 0.50%, multiplied by the average account value over the period, multiplied by the number of days in the period, divided by the number of days in the year.
Class L
| | | Beginning
Value | | Ending
Value | | Operating
Expense
Incurred* | |
| 1) Actual | | $ | 1,000.00 | | | $ | 1,054.20 | | | $ | 1.27 | | |
| 2) Hypothetical | | | 1,000.00 | | | | 1,023.42 | | | | 1.25 | | |
* Expenses are calculated using the annualized expense ratio for the six months ended June 30, 2007 of 0.25%, multiplied by the average account value over the period, multiplied by the number of days in the period, divided by the number of days in the year.
Class Y
| | | Beginning
Value | | Ending
Value | | Operating
Expense
Incurred* | |
| 1) Actual | | $ | 1,000.00 | | | $ | 1,053.30 | | | $ | 0.76 | | |
| 2) Hypothetical | | | 1,000.00 | | | | 1,023.92 | | | | 0.75 | | |
* Expenses are calculated using the annualized expense ratio for the six months ended June 30, 2007 of 0.15%, multiplied by the average account value over the period, multiplied by the number of days in the period, divided by the number of days in the year.
393
Other Information (Unaudited) (Continued)
Class S
| | | Beginning
Value | | Ending
Value | | Operating
Expense
Incurred* | |
| 1) Actual | | $ | 1,000.00 | | | $ | 1,054.20 | | | $ | 0.51 | | |
| 2) Hypothetical | | | 1,000.00 | | | | 1,024.16 | | | | 0.50 | | |
* Expenses are calculated using the annualized expense ratio for the six months ended June 30, 2007 of 0.10%, multiplied by the average account value over the period, multiplied by the number of days in the period, divided by the number of days in the year.
Class N
| | | Beginning
Value | | Ending
Value | | Operating
Expense
Incurred* | |
| 1) Actual | | $ | 1,000.00 | | | $ | 1,050.80 | | | $ | 4.05 | | |
| 2) Hypothetical | | | 1,000.00 | | | | 1,020.71 | | | | 3.99 | | |
* Expenses are calculated using the annualized expense ratio for the six months ended June 30, 2007 of 0.80%, multiplied by the average account value over the period, multiplied by the number of days in the period, divided by the number of days in the year.
Destination Retirement 2030 Fund
Class A
| | | Beginning
Value | | Ending
Value | | Operating
Expense
Incurred* | |
| 1) Actual | | $ | 1,000.00 | | | $ | 1,071.40 | | | $ | 2.55 | | |
| 2) Hypothetical | | | 1,000.00 | | | | 1,022.19 | | | | 2.49 | | |
* Expenses are calculated using the annualized expense ratio for the six months ended June 30, 2007 of 0.50%, multiplied by the average account value over the period, multiplied by the number of days in the period, divided by the number of days in the year.
Class L
| | | Beginning
Value | | Ending
Value | | Operating
Expense
Incurred* | |
| 1) Actual | | $ | 1,000.00 | | | $ | 1,072.70 | | | $ | 1.28 | | |
| 2) Hypothetical | | | 1,000.00 | | | | 1,023.42 | | | | 1.25 | | |
* Expenses are calculated using the annualized expense ratio for the six months ended June 30, 2007 of 0.25%, multiplied by the average account value over the period, multiplied by the number of days in the period, divided by the number of days in the year.
Class Y
| | | Beginning
Value | | Ending
Value | | Operating
Expense
Incurred* | |
| 1) Actual | | $ | 1,000.00 | | | $ | 1,073.60 | | | $ | 0.77 | | |
| 2) Hypothetical | | | 1,000.00 | | | | 1,023.92 | | | | 0.75 | | |
* Expenses are calculated using the annualized expense ratio for the six months ended June 30, 2007 of 0.15%, multiplied by the average account value over the period, multiplied by the number of days in the period, divided by the number of days in the year.
394
Other Information (Unaudited) (Continued)
Class S
| | | Beginning
Value | | Ending
Value | | Operating
Expense
Incurred* | |
| 1) Actual | | $ | 1,000.00 | | | $ | 1,073.40 | | | $ | 0.51 | | |
| 2) Hypothetical | | | 1,000.00 | | | | 1,024.16 | | | | 0.50 | | |
* Expenses are calculated using the annualized expense ratio for the six months ended June 30, 2007 of 0.10%, multiplied by the average account value over the period, multiplied by the number of days in the period, divided by the number of days in the year.
Class N
| | | Beginning
Value | | Ending
Value | | Operating
Expense
Incurred* | |
| 1) Actual | | $ | 1,000.00 | | | $ | 1,070.40 | | | $ | 4.08 | | |
| 2) Hypothetical | | | 1,000.00 | | | | 1,020.71 | | | | 3.99 | | |
* Expenses are calculated using the annualized expense ratio for the six months ended June 30, 2007 of 0.80%, multiplied by the average account value over the period, multiplied by the number of days in the period, divided by the number of days in the year.
Destination Retirement 2040 Fund
Class A
| | | Beginning
Value | | Ending
Value | | Operating
Expense
Incurred* | |
| 1) Actual | | $ | 1,000.00 | | | $ | 1,082.30 | | | $ | 2.57 | | |
| 2) Hypothetical | | | 1,000.00 | | | | 1,022.19 | | | | 2.49 | | |
* Expenses are calculated using the annualized expense ratio for the six months ended June 30, 2007 of 0.50%, multiplied by the average account value over the period, multiplied by the number of days in the period, divided by the number of days in the year.
Class L
| | | Beginning
Value | | Ending
Value | | Operating
Expense
Incurred* | |
| 1) Actual | | $ | 1,000.00 | | | $ | 1,083.50 | | | $ | 1.28 | | |
| 2) Hypothetical | | | 1,000.00 | | | | 1,023.42 | | | | 1.25 | | |
* Expenses are calculated using the annualized expense ratio for the six months ended June 30, 2007 of 0.25%, multiplied by the average account value over the period, multiplied by the number of days in the period, divided by the number of days in the year.
Class Y
| | | Beginning
Value | | Ending
Value | | Operating
Expense
Incurred* | |
| 1) Actual | | $ | 1,000.00 | | | $ | 1,084.40 | | | $ | 0.77 | | |
| 2) Hypothetical | | | 1,000.00 | | | | 1,023.92 | | | | 0.75 | | |
* Expenses are calculated using the annualized expense ratio for the six months ended June 30, 2007 of 0.15%, multiplied by the average account value over the period, multiplied by the number of days in the period, divided by the number of days in the year.
395
Other Information (Unaudited) (Continued)
Class S
| | | Beginning
Value | | Ending
Value | | Operating
Expense
Incurred* | |
| 1) Actual | | $ | 1,000.00 | | | $ | 1,085.10 | | | $ | 0.51 | | |
| 2) Hypothetical | | | 1,000.00 | | | | 1,024.16 | | | | 0.50 | | |
* Expenses are calculated using the annualized expense ratio for the six months ended June 30, 2007 of 0.10%, multiplied by the average account value over the period, multiplied by the number of days in the period, divided by the number of days in the year.
Class N
| | | Beginning
Value | | Ending
Value | | Operating
Expense
Incurred* | |
| 1) Actual | | $ | 1,000.00 | | | $ | 1,081.40 | | | $ | 4.11 | | |
| 2) Hypothetical | | | 1,000.00 | | | | 1,020.71 | | | | 3.99 | | |
* Expenses are calculated using the annualized expense ratio for the six months ended June 30, 2007 of 0.80%, multiplied by the average account value over the period, multiplied by the number of days in the period, divided by the number of days in the year.
396
[This page is intentionally left blank.]
Distributor:
MML Distributors, LLC
1295 State Street
Springfield, MA 01111-0001
August 29, 2007

© 2007 Massachusetts Mutual Life Insurance Company. All rights reserved.
MassMutual Financial Group is a marketing designation (or fleet name) for
Massachusetts Mutual Life Insurance Company (MassMutual) and its affiliates.
L4543 807
Item 2. Code of Ethics.
Not applicable to this filing.
Item 3. Audit Committee Financial Expert.
Not applicable to this filing.
Item 4. Principal Accountant Fees and Services.
Not applicable to this filing.
Items 5. Audit Committee of Listed Registrants
Not applicable to this filing.
Item 6. Schedule of Investments.
Not applicable to this filing.
Item 7. Disclosure of Proxy Voting Policies and Procedures for Closed-End Management Investment Companies.
Not applicable to this filing.
Item 8. Portfolio Managers of Closed-End Management Investment Companies.
Not applicable to this filing.
Item 9. Purchases of Equity Securities by Closed-End Management Investment Company and Affiliated Purchasers.
Not applicable to this filing.
Item 10. Submission of Matters to a Vote of Security Holders.
Not applicable to this filing.
Item 11. Controls and Procedures.
(a) The Registrant’s Principal Executive Officer and Principal Financial Officer concluded that the Registrant’s disclosure controls and procedures (as defined in Rule 30a-3(c) under the Investment Company Act of 1940) were effective as of a date within 90 days prior to the filing date of this report (the “Evaluation Date”), based on their evaluation of the effectiveness of the Registrant’s disclosure controls and procedures as of the Evaluation Date.
(b) There were no changes in the Registrant’s internal control over financial reporting (as defined in Rule 30a-3(d) under the 1940 Act (17 CFR 270.30a-3(d))) that occurred during the Registrant’s most recent fiscal quarter that has materially affected, or is reasonably likely to materially affect, the Registrant’s internal control over financial reporting.
Item 12. Exhibits.
(a)(1) Code of Ethics (Item 2) is not applicable to this filing.
(a)(2) Certification of Principal Executive Officer and Principal Financial Officer of the Registrant as required by Rule 30a-2(a) under the Investment Company Act of 1940 (17 CFR 270.30a-2(a)) is attached hereto as Exhibit 99CERT.
(a)(3) Not applicable to this filing.
(b) Certification pursuant to Section 906 of the Sarbanes-Oxley Act of 2002 as required by Rule 30a-2(b), under the Investment Company Act of 1940 (17 CFR 270.30a-2(b)), Rule 15d-14(b) under the Securities Exchange Act of 1934 (17 CFR 240.15d-14(b)) and Section 1350 of Chapter 63 of Title 18 of the United States Code (18 U.S.C. 1350) is attached hereto as Exhibit 99.906CERT.
SIGNATURES
Pursuant to the requirements of the Securities Exchange Act of 1934 and the Investment Company Act of 1940, the registrant has duly caused this report to be signed on its behalf by the undersigned, thereunto duly authorized.
(Registrant) | | MassMutual Select Funds |
| |
By (Signature and Title) | /s/ Frederick C. Castellani |
| Frederick C. Castellani, President and Principal Executive Officer |
| |
Date | 8/22/07 | |
|
|
Pursuant to the requirements of the Securities Exchange Act of 1934 and the Investment Company Act of 1940, this report has been signed below by the following persons on behalf of the registrant and in the capacities and on the dates indicated. |
|
|
By (Signature and Title) | /s/ Frederick C. Castellani |
| Frederick C. Castellani, President and Principal Executive Officer |
|
|
Date | 8/22/07 | |
|
By (Signature and Title) | /s/ Nicholas H. Palmerino |
| Nicholas H. Palmerino, Treasurer and Principal Financial Officer |
| | |
| | |
Date | 8/22/07 | |
| | | | | |