UNITED STATES
SECURITIES AND EXCHANGE COMMISSION
Washington, D.C. 20549
FORM N-CSR
CERTIFIED SHAREHOLDER REPORT OF REGISTERED
MANAGEMENT INVESTMENT COMPANIES
Investment Company Act file number | 811-08274 |
|
MassMutual Select Funds |
(Exact name of registrant as specified in charter) |
|
1295 State Street, Springfield, MA | | 01111 |
(Address of principal executive offices) | | (Zip code) |
|
Frederick C. Castellani
1295 State Street, Springfield, MA 01111 |
(Name and address of agent for service) |
|
Registrant’s telephone number, including area code: | 413-788-8411 | |
|
Date of fiscal year end: | 12/31/2006 | |
|
Date of reporting period: | 06/30/2006 | |
| | | | | | | | |
Item 1. Reports to Stockholders.
RETIREMENT SERVICES
MassMutual
Select Funds
Semi-Annual Report, June 30, 2006
| I N V E S T |

| |
I N S U R E |
|
R E T I R E |
You can’t predict. You can prepare.®
Table of Contents
| Letter to Shareholders | | | 1 | | |
|
| Portfolio Manager Reports | | | 3 | | |
|
| Portfolio of Investments | |
|
| MassMutual Select Strategic Bond Fund | | | 81 | | |
|
| MassMutual Select Strategic Balanced Fund | | | 88 | | |
|
| MassMutual Select Diversified Value Fund | | | 95 | | |
|
| MassMutual Select Fundamental Value Fund | | | 98 | | |
|
| MassMutual Select Value Equity Fund | | | 100 | | |
|
| MassMutual Select Large Cap Value Fund | | | 104 | | |
|
| MassMutual Select Indexed Equity Fund | | | 106 | | |
|
| MassMutual Select Core Opportunities Fund | | | 112 | | |
|
| MassMutual Select Blue Chip Growth Fund | | | 113 | | |
|
| MassMutual Select Large Cap Growth Fund | | | 116 | | |
|
| MassMutual Select Growth Equity Fund | | | 118 | | |
|
| MassMutual Select Aggressive Growth Fund | | | 122 | | |
|
| MassMutual Select OTC 100 Fund | | | 123 | | |
|
| MassMutual Select Focused Value Fund | | | 126 | | |
|
| MassMutual Select Small Cap Value Equity Fund | | | 128 | | |
|
| MassMutual Select Small Company Value Fund | | | 133 | | |
|
| MassMutual Select Small Cap Core Equity Fund | | | 138 | | |
|
| MassMutual Select Mid Cap Growth Equity Fund | | | 142 | | |
|
| MassMutual Select Mid Cap Growth Equity II Fund | | | 144 | | |
|
| MassMutual Select Small Cap Growth Equity Fund | | | 149 | | |
|
| MassMutual Select Small Company Growth Fund | | | 153 | | |
|
| MassMutual Select Emerging Growth Fund | | | 156 | | |
|
| MassMutual Select Overseas Fund | | | 159 | | |
|
| MassMutual Select Destination Retirement Income Fund | | | 162 | | |
|
| MassMutual Select Destination Retirement 2010 Fund | | | 163 | | |
|
| MassMutual Select Destination Retirement 2020 Fund | | | 164 | | |
|
| MassMutual Select Destination Retirement 2030 Fund | | | 165 | | |
|
| MassMutual Select Destination Retirement 2040 Fund | | | 166 | | |
|
| Statement of Assets and Liabilities | | | 168 | | |
|
| Statement of Operations | | | 184 | | |
|
| Statement of Changes in Net Assets | | | 192 | | |
|
| Financial Highlights | | | 206 | | |
|
| Notes to Financial Statements | | | 284 | | |
|
| Other Information (Unaudited) | | | 327 | | |
|
This material must be preceded or accompanied by a current prospectus for the MassMutual Select Funds. Investors should consider a Fund's investment objective, risks and charges and expenses carefully before investing. This and other information about the investment company is available in the prospectus. Read it carefully before investing.
MassMutual Select Funds – President's Letter to Shareholders
June 30, 2006

Frederick C. Castellani
"Although we expect occasional weakness in the financial markets, MassMutual believes that individuals who diversify their investments can help to reduce their investment losses and increase their total returns – potentially increasing the likelihood of reaching their financial goals."
Stocks outpace bonds for the year-to-date period
In an environment of rising inflation, a slowing economy and indications of a slowdown in the real estate market, equities outperformed bonds for the six months ended June 30, 2006. The Dow Jones Industrial AverageSM (The Dow), which measures blue-chip activity, returned 4.04% for the period. The technology-laden Nasdaq Composite® Index (Nasdaq) lost 1.51%, and the S&P 500® Index, a broad measure of U.S. large-cap stock performance, gained 2.70%. The clear outperformer, however, was the MSCI® EAFE® Index, a benchmark for foreign stocks that advanced 10.16% during this challenging period*.
In the bond market, the Lehman Brothers® Aggregate Bond Index, which measures the U.S. investment-grade fixed-income markets, returned –0.72% for the six-month period ended June 30, 2006*. Investors in this market segment continued to face the challenges posed by a Federal Reserve (Fed) that remained in a tightening mode – raising the federal funds target rate in 0.25% increments four times – from 4.25% at the start of the first quarter to 5.25% at the end of June.
Turning to the first quarter of 2006, most U.S. stock indexes posted strong gains, as solid growth in corporate profits and signs of an uptick in overall economic activity helped to boost share prices. Against this backdrop, foreign stocks continued to outperform their U.S.-based counterparts.
As early estimates placed first quarter economic growth around the robust level of 5.0%, bond yields rose and prices fell. (The official Gross Domestic Product (GDP) for the first quarter came in at 4.8%.) Additionally, inflationary pressures at the wholesale level were somewhat stronger than expected, as the core Producer Price Index – excluding food and energy – ticked up by 0.4% in January and 0.3% in February. (Rising inflation tends to drive bond prices lower.) The period featured two hikes in short-term interest rates by the Fed, and longer-term rates also rose during the quarter. Consequently, the Lehman Brothers Aggregate Bond Index fell slightly.
The second quarter saw a turnaround in the fortunes of the equity markets, as investor uncertainty (caused in part by global unrest and rising oil prices) led many of the markets lower. In fact, The Dow was the only domestic equity benchmark to post a return in positive territory, advancing 0.37%. Even the first quarter's clear winner, foreign stocks, only produced a 0.70% gain, as measured by the MSCI EAFE Index – aided in part by a weaker U.S. dollar.
Meanwhile, with rising inflation and interest rates making headlines, bond prices remained on the defensive during the second quarter. Treasuries and higher-quality corporate bonds struggled against rising yields across all maturities. Bond prices in the longer maturities were particularly weak. As a result, the Lehman Brothers Aggregate Bond Index ended the quarter just below the break-even mark, returning –0.08%*.
A look at the recent market volatility
The stock market recovery of the past few years can be divided into two phases. First, there was a period of strongly advancing share prices for roughly a year following the March 2003 lows, as investors were cheered by early military success in Iraq and signs that the U.S. economy was finally on the mend after a prolonged three-year bear market in stocks. A key player in this recovery was former Fed chairman Alan Greenspan, who from early 2001 through November 2002, advocated the
* Indexes are unmanaged, do not incur fees or expenses and cannot be purchased directly for investment.
(Continued)
1
MassMutual Select Funds – President's Letter to Shareholders (Continued)
Fed's strategy to progressively lower the target federal funds rate from 6.50% to 1.25% – a level unseen for decades. One final 0.25% cut would follow near the end of June 2003, while the economic rally was still in motion.
Naturally, short-term interest rates could not remain at 1.00% forever. In June 2004, Mr. Greenspan began raising rates again, employing a methodical, gradual approach to "removing policy accommodation," which appeared to calm investors' nerves. As a result, stock prices trended irregularly higher for almost the next two years. With the economy growing at a healthy, sustainable pace and short-term interest rates on track to return to merely a neutral level, there was a lot for investors to like about the financial environment. The stock market, of course, generally likes predictability and dislikes uncertainty.
Nevertheless, a few storm clouds dotted the horizon. Most notably, these included the rapid escalation of crude oil prices, which exceeded $70 at the end of June 2006 – and significant rallies in commodity prices, such as copper and gold, suggesting the possibility of worsening inflation on the horizon. For quite a while, though, it seemed as though the economy and the stock market were holding together nicely in the face of the twin threats of advancing commodity prices and rising interest rates.
So what happened to change things in the more recent environment? For one thing, inflation crept up to levels the Fed considers unacceptable. At the same time, near the end of May, there were signs that the Fed's credit-tightening moves were beginning to slow the economy. Central bank officials have stated numerous times that interest rate policy in the immediate future will be determined by economic data, rather than by the previous agenda of removing the stimulative monetary conditions that brought the economy out of recession. However, the conundrum facing the Fed under Ben Bernanke, Mr. Greenspan's successor, was – and is – what to do when the data give conflicting signals. All of this could add up to uncertainty – and, in all likelihood, increased volatility in the financial markets – at least, until additional information clarifies the si tuation.
Outlook
While the second quarter was disappointing, occasional weakness in the stock and bond markets is a normal occurrence. MassMutual believes investors would be wise to adhere to established investing principles, including taking a long-term perspective and employing a strategy of diversification among investment types. Although diversification cannot prevent losses, the long-term effect of proper diversification has tended to be a reduction in losses and an increase in total returns. By helping smooth out the peaks and valleys of investing, diversification can help investors to stay the course and may increase the likelihood of reaching their financial goals.

Frederick C. Castellani
President
The information provided is the opinion of MassMutual Retirement Services Investments Marketing as of 7/1/06 and is subject to change without notice. It is not to be construed as tax, legal or investment advice. Of course, past performance does not guarantee future results.
2
MassMutual Select Strategic Bond Fund – Portfolio Manager Report
What is the investment objective of the MassMutual Select Strategic Bond Fund? This Fund seeks a superior total rate of return by investing in fixed-income instruments. The Fund normally invests at least 80% of its net assets in U.S. dollar-denominated, fixed-income securities and other debt instruments of domestic and foreign entities, including corporate bonds, securities issued or guaranteed by the U.S. government, its agencies or instrumentalities, mortgage-backed securities and money market instruments.
How did the Fund perform during the six months ended June 30, 2006? The Fund's Class S shares returned –1.40%, trailing the –0.72% return of the Lehman Brothers® Aggregate Bond Index, an unmanaged index of fixed-rate investment-grade securities with at least one year to maturity, combining the Lehman Brothers® Government/Credit Index and the Lehman Brothers® Mortgage-Backed Securities Index.
What was the investment background during the period? Interest rates rose across the yield curve in the first quarter. The yield curve is a graphical representation of bond yields with very short maturities to the longest available, with the curve indicating whether short-term rates are higher or lower than long-term rates. Driven by the Federal Reserve's (Fed's) decision to raise its target funds rate from 4.25% to 4.75% and by news that suggested the economy was stronger than expected, short-term interest rates rose more than had been expected, and somewhat more than long-term rates, resulting in a flatter yield curve. The curve briefly inverted in February (i.e., short-term interest rates were higher than long-term rates), only to revert to a slight upward slope in March. Investment-grade credit spreads – or the differences in yields betw een comparable bonds – declined modestly, as the outlook for the economy improved. Tightening spreads often indicate decreasing yields and increasing prices for a specific group of bonds. Bond prices move in the opposite direction to interest rates (or yields); when yields rise, the prices of existing bonds fall – and vice versa. Mortgage-backed spreads were mixed. High-yield spreads tightened significantly, led by positive restructuring announcements that sparked strong gains in General Motors (GM) and Ford bonds. Emerging market spreads extended their long tightening process, leaving yields at record-low levels.
During the second quarter, interest rates moved broadly higher across the yield curve, driven by a more-active-than-expected Fed, a stronger-than-expected economy, and a mild rise in inflation concerns. Short-term rates rose more than long-term rates, leaving the yield curve substantially flat. The Fed raised its target federal funds rate by 0.25% at each of its two meetings, exceeding the market's expectation that only one more tightening was likely to occur. The economy proved resilient, despite rising energy prices and a softer housing market, while headline inflation registered 3%-4% and core inflation drifted slightly higher. Corporate profits exceeded expectations. The housing market exhibited signs of a spreading slowdown, which in turn gave rise to a widely held perception that the economy was likely to slow enough to reduce inflation pressures and allow the Fed to soon end its tightening cycle.
What factors contributed to the Fund's performance? During the first quarter, our decision to extend duration moderately as rates rose suffered, since rates continued to drift higher. A modest exposure to the short end of the yield curve also hampered the Fund's performance, since short-term rates rose more than had been expected. A moderately overweight exposure to BBB-rated corporate bonds contributed to returns as spreads narrowed, and an emphasis on BB-rated bonds, particularly those of GM and Ford, benefited as spreads narrowed and their prices rose. An overweight exposure to the mortgage-backed sector added somewhat to performance. A modest exposure to emerging market debt had a positive impact on performance, as spreads were generally tighter. Moderate non-dollar bond exposure hampered the Fund's progress, as our choice of bonds underperfo rmed their U.S. counterparts.
The Fund's strategies produced mixed results in the second quarter. Overweight duration detracted somewhat from performance, as interest rates rose, and modest yield curve exposure suffered as the
3
MassMutual Select Strategic Bond Fund – Portfolio Manager Report (Continued)
curve flattened. Underweight exposure to the corporate bond sector benefited from wider spreads, but an emphasis on lower-quality issues was penalized as those sectors underperformed. The Fund's overweight exposure to the mortgage-backed sector was a modest negative for performance, as spreads widened marginally and prices fell. Treasury Inflation-Protected Securities (TIPS) exposure contributed to the Fund's progress, thanks mainly to an outsized inflation adjustment for the period and a rise in breakeven spreads (the difference between TIPS' return and the rate of inflation that is needed for TIPS to break even to nominal Treasuries). Non-dollar bond exposure detracted modestly from returns, as foreign yields rose more than their U.S. counterparts, but our decision to leave some currency exposure unhedged benefited the Fund due to the weaker dollar. Emerging market and high-yield debt exposure detracted somewhat from returns, as spreads wi dened and prices fell, but our emphasis on the auto sector benefited from a significant tightening in GM spreads, thanks to positive restructuring news.
What is your outlook? With economic growth moderating and monetary policy having achieved a degree of neutrality, we think that inflation pressures are likely to moderate and interest rates are likely to be relatively stable over the next several years. Thus, we will continue to follow a tactical duration strategy that calls for duration to rise as rates rise, and to fall as rates fall.
MassMutual Select Strategic Bond Fund
Quality Structure
(% of Net Assets) on 6/30/06
| U.S. Governments, Aaa/AAA | | | 72.7 | % | |
| Aa/AA | | | 2.5 | % | |
| A/A | | | 3.7 | % | |
| Baa/BBB | | | 7.5 | % | |
| Ba/BB | | | 5.2 | % | |
| B/B | | | 1.5 | % | |
| Forward Currency Contracts | | | 0.0 | % | |
| Purchased Options | | | 0.1 | % | |
| Futures | | | (0.2 | %) | |
| Written Options | | | 0.1 | % | |
Short-Term Investments and
Other Assets and Liabilities | | | 6.9 | % | |
| Total | | | 100.0 | % | |
4
MassMutual Select Strategic Bond Fund – Portfolio Manager Report (Continued)
Growth of a $10,000 Investment
Hypothetical Investments in MassMutual Select Strategic Bond Fund Class S, Class A, Class A (sales load deducted), Class Y, Class L, Class N, Class N (CDSC fees deducted) and the Lehman Brothers Aggregate Bond Index.
MassMutual Select Strategic Bond Fund
Total Return
| | | Year to Date
1/1/06 - 6/30/06 | | One Year
7/1/05 - 6/30/06 | | Since Inception
12/31/04 - 6/30/06 | |
| Class S | | | –1.40 | % | | | –1.93 | % | | | 0.15 | % | |
| Class A | | | –1.50 | % | | | –2.11 | % | | | –0.10 | % | |
Class A (sales
load deducted)* | | | –6.18 | % | | | –6.76 | % | | | –3.30 | % | |
| Class Y | | | –1.30 | % | | | –1.91 | % | | | 0.16 | % | |
| Class L | | | –1.30 | % | | | –1.91 | % | | | 0.17 | % | |
| Class N | | | –1.71 | % | | | –2.58 | % | | | –0.49 | % | |
Class N (CDSC
fees deducted)* | | | –2.69 | % | | | –3.54 | % | | | –0.49 | % | |
Lehman Brothers
Aggregate
Bond Index | | | –0.72 | % | | | –0.81 | % | | | 1.26 | % | |
GROWTH OF A $10,000 INVESTMENT SINCE INCEPTION
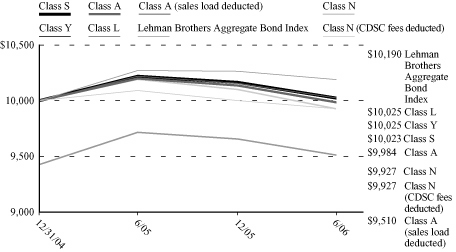
* Class A (sales load deducted) returns include the 4.75% maximum sales charge and Class N (CDSC fees deducted) returns include the 1.00% maximum contingent deferred sales charge for the first 18 months shown.
Performance data quoted represents past performance; past performance is not predictive of future results. The investment return and principal value of shares of the Fund will fluctuate with market conditions so that shares of the Fund, when redeemed, may be worth more or less than their original cost. Current performance of the Fund may be lower or higher than the performance quoted. Performance data current to the most recent month end may be obtained by calling 1-888-309-3539.
Investors should note that the Fund is a professionally managed mutual fund, while the Lehman Brothers Aggregate Bond Index is unmanaged and does not incur expenses, and cannot be purchased directly by investors. Investors should read the Fund's prospectus with regard to the Fund's investment objective, risks and charges and expenses in conjunction with these financial statements. Employee retirement benefit plans that invest plan assets in the Separate Investment Accounts (SIAs) may be subject to certain charges as set forth in their respective Plan Documents. Total return figures would be lower for the periods presented if they reflected these charges. The performance tables and charts do not reflect the deduction of taxes that a shareholder would pay on the fund distributions or the redemption of the fund shares.
5
MassMutual Select Strategic Balanced Fund – Portfolio Manager Report
What is the investment objective of the MassMutual Select Strategic Balanced Fund? This Fund seeks long-term capital growth, consistent with preservation of capital and balanced by current income.
How did the Fund perform during the six months ended June 30, 2006? The Fund's Class S shares returned 1.98%, trailing the 2.25% return of the Lipper Balanced Fund Index, an unmanaged, equally weighted index of the 30 largest mutual funds within the Lipper Balanced Category. Conversely, the Fund's 1.98% advance outperformed the –0.72% return of the Lehman Brothers® Aggregate Bond Index, an unmanaged index of fixed-rate investment-grade securities with at least one year to maturity, combining the Lehman Brothers® Government/Credit Index and the Lehman Brothers® Mortgage-Backed Securities Index, but underperformed the 3.23% of the Russell 3000® Index, which measures the performa nce of the 3,000 largest U.S. companies based on total market capitalization.
What was the investment background during the period? During the first quarter, the overall market was buoyed by optimism regarding corporate profits and the possibility that the Federal Reserve (Fed) would stop raising interest rates sooner rather than later. Interest rates rose across the yield curve. The yield curve is a graphical representation of bond yields with very short maturities to the longest available, with the curve indicating whether short-term rates are higher or lower than long-term rates. Driven by the Fed's decision to raise its target funds rate from 4.25% to 4.75% during the period and by news that suggested the economy was stronger than expected, short-term interest rates rose more than had been expected, and somewhat more than long-term rates, resulting in a flatter yield curve. The yield curve briefly inverted in February (i.e., short-term interest rates exceeded long-term rates), only to revert to a slight upward slope in March when long-term rates increased.
During the second quarter, stocks advanced through the first week of May and then corrected over much of the remainder of the period. Interest rates moved broadly higher across the yield curve, driven by a more-active-than-expected Fed, a stronger-than-expected economy, and a mild rise in inflation concerns. Short-term interest rates rose more than their long-term counterparts, leaving the yield curve substantially flat. The Fed raised its target funds rate by 0.25% at each of its two meetings, exceeding the market's expectation that only one more tightening was likely to occur during the period. The economy proved resilient, despite rising energy prices, a softer housing market and corporate profits that exceeded expectations.
What factors contributed to the Fund's performance with respect to its stock portfolio? During the first quarter, the largest contributors to the Fund's performance came from its holdings in the industrials, information technology and financials sectors. Conversely, the Fund's investments in the telecommunications services sector were the only detractors from performance. During the second quarter, the largest contributors to the Fund's results were in the energy and consumer staples sectors. Our holdings in the information technology and financials sectors were the largest detractors from performance, however.
What factors contributed to the Fund's performance with respect to its bond portfolio? During the first quarter, the Fund's modest exposure to the short end of the yield curve hampered results, since short-term rates rose more than had been expected. A moderately overweight exposure to BBB-rated corporate bonds contributed to returns, as spreads – or the differences in yields between comparable bonds – narrowed. Tightening spreads often indicate decreasing yields and increasing prices for a specific group of bonds. Bond prices move in the opposite direction to interest rates (or yields); when yields rise, the prices of existing bonds fall – and vice versa. An emphasis on BB-rated bonds, particularly those of General Motors (GM) and Ford, benefited the Fund as spreads narrowed and their prices rose. Also having a positive impact on performance was our modest exposure to emerging market debt, as spreads were generally tighter in the first quarter. Turning to the second quarter, the Fund's underweight exposure to the corporate bond sector benefited from wider spreads, but our emphasis on lower-quality issues was penalized, as those sectors underperformed. Our
6
MassMutual Select Strategic Balanced Fund – Portfolio Manager Report (Continued)
overweight exposure to the mortgage-backed sector was a modest negative for performance, as spreads widened marginally. Emerging market and high-yield debt exposure also detracted somewhat from second quarter returns, as spreads widened and prices fell. Conversely, our emphasis on the auto sector benefited from a significant tightening in GM spreads, thanks to positive restructuring news.
What is your outlook? From the perspective of the Fund's equity portfolio, we believe that 2006 may witness a change in market leadership in the direction of larger companies. There have been only four six-year periods since 1925 during which the S&P 500® Index has shown a decline (including 2000-2005). Larger companies were significantly overpriced relative to smaller- and mid-cap stocks as the decade began, but now arguably are as cheap, in a relative sense, as they were 25 years ago. Historically speaking, leadership changes have usually occurred in correcting stock markets – and we suspect the transition to larger company leadership may become apparent within the next few months.
With respect to the fixed-income segment of the portfolio, we believe that with economic growth moderating and monetary policy having achieved a degree of neutrality, inflation pressures may moderate and interest rates may remain relatively stable over the next several years.
MassMutual Select Strategic
Balanced Fund
Asset Allocation
(% of Net Assets) on 06/30/06
| Equities | | | 58.8 | % | |
| Bonds & Notes | | | 35.3 | % | |
| Purchased Options | | | 0.0 | % | |
| Forward Currency Contracts | | | (0.0 | %) | |
| Futures | | | (0.1 | %) | |
| Swaps | | | (0.1 | %) | |
| Written Options | | | (0.0 | %) | |
Short-Term Investments and
Other Assets and Liabilities | | | 6.1 | % | |
| | | | 100.0 | % | |
MassMutual Select Strategic
Balanced Fund
Largest Stock Holdings (6/30/06)
News Corp., Inc., Cl. B
JP Morgan Chase & Co.
The PMI Group, Inc.
Bank of America Corp.
Cisco Systems, Inc.
Honeywell International, Inc.
The Walt Disney Co.
Abbott Laboratories
Merrill Lynch & Co., Inc.
Pearson PLC
7
MassMutual Select Strategic Balanced Fund – Portfolio Manager Report (Continued)
Growth of a $10,000 Investment
Hypothetical Investments in MassMutual Select Strategic Balanced Fund Class S, Class A, Class A (sales load deducted), Class Y, the Lipper Balanced Fund Index, the Lehman Brothers Aggregate Bond Index and the Russell 3000 Index.
MassMutual Select Strategic Balanced Fund
Total Return
| | | Year to Date
1/1/06 - 6/30/06 | | One Year
7/1/05 - 6/30/06 | | Since Inception
12/31/03 - 6/30/06 | |
| Class S | | | 1.98 | % | | | 6.11 | % | | | 4.64 | % | |
| Class A | | | 1.80 | % | | | 5.69 | % | | | 4.19 | % | |
Class A (sales
load deducted)* | | | –4.05 | % | | | –0.38 | % | | | 1.75 | % | |
| Class Y | | | 1.89 | % | | | 6.03 | % | | | 4.56 | % | |
| Lipper Balanced | | | 2.25 | % | | | 7.03 | % | | | 6.57 | % | |
| Lehman Aggregate | | | –0.72 | % | | | –0.81 | % | | | 2.43 | % | |
| Russell 3000 | | | 3.23 | % | | | 9.56 | % | | | 8.52 | % | |
Hypothetical Investments in MassMutual Select Strategic Balanced Fund Class L, Class N, Class N (CDSC fees deducted), the Lipper Balanced Fund Index, the Lehman Brothers Aggregate Bond Index and the Russell 3000 Index.
MassMutual Select Strategic Balanced Fund
Total Return
| | | Year to Date
1/1/06 - 6/30/06 | | One Year
7/1/05 - 6/30/06 | | Since Inception
12/31/03 - 6/30/06 | |
| Class L | | | 1.80 | % | | | 5.89 | % | | | 4.42 | % | |
| Class N | | | 1.61 | % | | | 5.28 | % | | | 3.86 | % | |
Class N (CDSC
fees deducted)* | | | 0.61 | % | | | 4.28 | % | | | 3.86 | % | |
| Lipper Balanced | | | 2.25 | % | | | 7.03 | % | | | 6.57 | % | |
| Lehman Aggregate | | | –0.72 | % | | | –0.81 | % | | | 2.43 | % | |
| Russell 3000 | | | 3.23 | % | | | 9.56 | % | | | 8.52 | % | |
GROWTH OF A $10,000 INVESTMENT SINCE INCEPTION
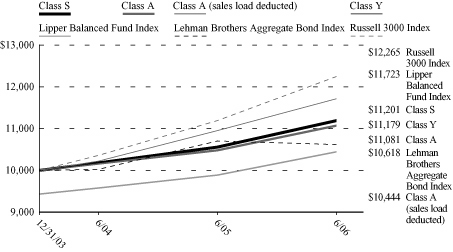
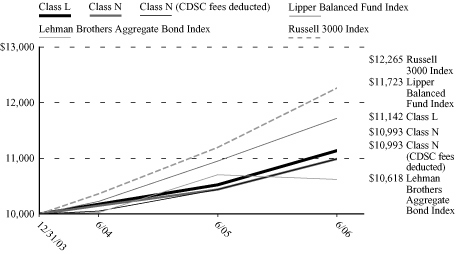
* Class A (sales load deducted) returns include the 5.75% maximum sales charge and Class N (CDSC fees deducted) returns include the 1.00% maximum contingent deferred sales charge for the first 18 months shown.
Performance data quoted represents past performance; past performance is not predictive of future results. The investment return and principal value of shares of the Fund will fluctuate with market conditions so that shares of the Fund, when redeemed, may be worth more or less than their original cost. Current performance of the Fund may be lower or higher than the performance quoted. Performance data current to the most recent month end may be obtained by calling 1-888-309-3539.
Investors should note that the Fund is a professionally managed mutual fund, while the Lipper Balanced Fund Index, the Lehman Brothers Aggregate Bond Index and the Russell 3000 Index are unmanaged and do not incur expenses, and cannot be purchased directly by investors. Investors should read the Fund's prospectus with regard to the Fund's investment objective, risks and charges and expenses in conjunction with these financial statements. Employee retirement benefit plans that invest plan assets in the Separate Investment Accounts (SIAs) may be subject to certain charges as set forth in their respective Plan Documents. Total return figures would be lower for the periods presented if they reflected these charges. The performance tables and charts do not reflect the deduction of taxes that a shareholder would pay on the fund distributions or the redemption of the fund shares.
8
MassMutual Select Diversified Value Fund – Portfolio Manager Report
What is the investment objective of the MassMutual Select Diversified Value Fund? This Fund seeks to achieve long-term growth of capital and income by investing primarily in a diversified portfolio of equity securities of larger, well-established companies.
How did the Fund perform during the six months ended June 30, 2006? The Fund's Class S shares returned 5.94%, underperforming the 6.56% return of the Russell 1000® Value Index, an unmanaged index representative of stocks with a greater-than-average value orientation among the stocks of the largest 1000 U.S. companies based on capitalization.
What was the investment background during the period? During the first quarter, domestic equity markets rose, as the S&P 500® Index increased by 4.2% on investor confidence that U.S. companies could continue to provide earnings gains in 2006. Investor optimism prevailed despite high oil prices, the prospects for further interest rate increases and a slowdown in the housing market. In this environment, value stocks outperformed growth stocks. All sectors were in the positive column, although dispersion of returns was quite narrow. Even the energy sector, which outperformed all other sectors in 2005, was in line with other industries during the first quarter, albeit toward the high end of the range. Telecommunications stocks gained, as the proposed AT&T/BellSouth merger fueled speculation of further industry consolidation. Ho wever, consumer cyclicals lagged, as troubles in the U.S. auto industry grew.
After much turbulence, the S&P 500 Index ended the second quarter down 1.4%, reducing its gain for the first six months to 2.7%. While this was not a significant quarterly drop by historical standards, the mid-quarter rout came as a shock to investors after an extended period of strong markets and low volatility. In the decline, value stocks once again outperformed their growth counterparts. Sector performance was mixed, however, with no clear theme. Housing-related, technology and capital equipment stocks fell the most in the quarter. Conversely, energy and industrial resource stocks finished the quarter in positive territory, rebounding from their steep declines during the worst of the market downdraft in May and early June. Utilities and consumer staples issues also posted gains.
What factors contributed to the Fund's performance? During the first quarter, the Fund's returns, relative to the Russell 1000 Value Index, were helped by our positioning within the energy and technology sectors. In energy, offshore drillers Diamond Offshore Drilling, GlobalSantaFe and Rowan gained, as major oil producers continued to spend heavily on exploration. In technology, Corning was a key contributor, as the company continued to benefit from robust demand for high-end LCD televisions. Telecommunications equipment manufacturers Tellabs and ADC Telecommunications rose on continued strong broadband infrastructure. Conversely, relative returns were hurt by our stock selection within the financials sector, as several of our insurance holdings declined on disappointing pricing. Another chief detractor was Intel, as shares of the company fell on investor concerns regarding a slowdown in PC sales. Stock selection in industrial resources and consumer staples also detracted from performance. Finally, many of our auto parts holdings hampered performance, as pressure in that industry continues.
Turning to the second quarter, the Fund's relative returns were hurt by our stock selection within the energy sector, especially first quarter winners Diamond Offshore Drilling, GlobalSantaFe and Rowan. These offshore drillers suffered as natural gas prices fell, reflecting above-normal natural gas inventories due to an unseasonably warm winter. Contributing to returns, on the other hand, was stock selection within the consumer growth sector, particularly our positions in Comcast and CBS. Comcast benefited from strength in its Internet-based phone service rollout and subscription growth for high-speed Internet. Meanwhile, shares of CBS rose after the company reported solid television viewership ratings. Additionally, CBS sold Paramount Parks for a higher-than-expected price and planned to devote the proceeds to share buybacks.
9
MassMutual Select Diversified Value Fund – Portfolio Manager Report (Continued)
What is your outlook? It is impossible to predict with any certainty whether or not the volatility that the equity markets have experienced in the first six months of 2006 is nearing an end. Numerous forces will continue to influence the direction that the market takes moving forward – such as oil prices, inflation, geopolitical unrest and Federal Reserve policy. We believe, however, that we have positioned the Fund to be ready to handle the wide array of market conditions that investors may face throughout the remainder of the year.
MassMutual Select Diversified Value Fund
Industry Table
(% of Net Assets) on 6/30/06
| Banking, Savings & Loans | | | 15.7 | % | |
| Energy | | | 12.1 | % | |
| Insurance | | | 9.3 | % | |
| Financial Services | | | 8.7 | % | |
| Telephone Utilities | | | 6.0 | % | |
| Pharmaceuticals | | | 5.3 | % | |
Broadcasting, Publishing &
Printing | | | 4.1 | % | |
| Foods | | | 3.7 | % | |
Electrical Equipment &
Electronics | | | 3.5 | % | |
| Electric Utilities | | | 3.1 | % | |
| Automotive & Parts | | | 2.5 | % | |
| Cosmetics & Personal Care | | | 2.5 | % | |
| Tobacco | | | 2.2 | % | |
Computers & Office
Equipment | | | 1.9 | % | |
| Industrial – Diversified | | | 1.9 | % | |
| Communications | | | 1.8 | % | |
| Aerospace & Defense | | | 1.7 | % | |
| Chemicals | | | 1.4 | % | |
| Beverages | | | 1.3 | % | |
| Transportation | | | 1.2 | % | |
| Restaurants | | | 1.1 | % | |
| Computers & Information | | | 1.1 | % | |
| Metals & Mining | | | 0.9 | % | |
| Household Products | | | 0.9 | % | |
| Retail | | | 0.8 | % | |
| Containers | | | 0.7 | % | |
| Apparel, Textiles & Shoes | | | 0.6 | % | |
| Entertainment & Leisure | | | 0.5 | % | |
| Prepackaged Software | | | 0.4 | % | |
| Healthcare | | | 0.4 | % | |
| Advertising | | | 0.3 | % | |
Computer Programming
Services | | | 0.3 | % | |
| Forest Products & Paper | | | 0.2 | % | |
| Toys, Games | | | 0.2 | % | |
Building Materials &
Construction | | | 0.2 | % | |
Home Construction,
Furnishings & Appliances | | | 0.1 | % | |
Short-Term Investments and
Other Assets and Liabilities | | | 1.4 | % | |
| | | | 100.0 | % | |
MassMutual Select Diversified Value Fund
Largest Holdings
Largest Stock Holdings (6/30/06)
Exxon Mobil Corp.
Citigroup, Inc.
Bank of America Corp.
Pfizer, Inc.
JP Morgan Chase & Co.
AT&T, Inc.
American International Group, Inc.
General Electric Co.
Verizon Communications, Inc.
Altria Group, Inc.
10
MassMutual Select Diversified Value Fund – Portfolio Manager Report (Continued)
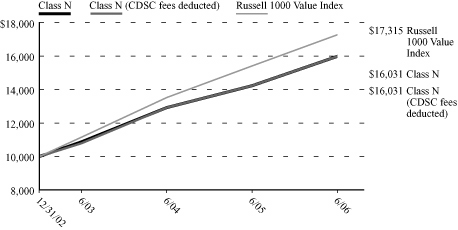
Growth of a $10,000 Investment
Hypothetical Investments in MassMutual Select Diversified Value Fund Class S, Class A, Class A (sales load deducted), Class Y, Class L, Class N, Class N (CDSC fees deducted) and the Russell 1000 Value Index.
MassMutual Select Diversified Value Fund
Total Return
| | | Year to Date
1/1/06 - 6/30/06 | | One Year
7/1/05 - 6/30/06 | | Since Inception
10/15/04 - 6/30/06 | |
| Class S | | | 5.94 | % | | | 11.79 | % | | | 13.54 | % | |
| Class A | | | 5.60 | % | | | 11.16 | % | | | 12.98 | % | |
Class A (sales
load deducted)* | | | –0.48 | % | | | 4.77 | % | | | 9.13 | % | |
| Class Y | | | 5.86 | % | | | 11.63 | % | | | 13.43 | % | |
| Class L | | | 5.76 | % | | | 11.53 | % | | | 13.30 | % | |
| Class N | | | 5.50 | % | | | 10.87 | % | | | 12.64 | % | |
Class N (CDSC
fees deducted)* | | | 4.50 | % | | | 9.87 | % | | | 12.64 | % | |
Russell 1000
Value Index | | | 6.56 | % | | | 12.10 | % | | | 14.74 | % | |
GROWTH OF A $10,000 INVESTMENT SINCE INCEPTION
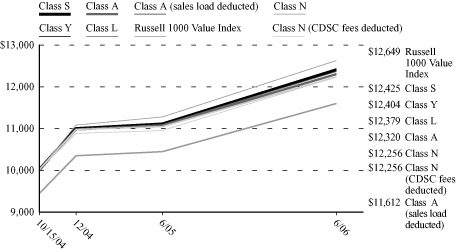
* Class A (sales load deducted) returns include the 5.75% maximum sales charge and Class N (CDSC fees deducted) returns include the 1.00% maximum contingent deferred sales charge for the first 18 months shown.
Performance data quoted represents past performance; past performance is not predictive of future results. The investment return and principal value of shares of the Fund will fluctuate with market conditions so that shares of the Fund, when redeemed, may be worth more or less than their original cost. Current performance of the Fund may be lower or higher than the performance quoted. Performance data current to the most recent month end may be obtained by calling 1-888-309-3539.
Investors should note that the Fund is a professionally managed mutual fund, while the Russell 1000 Value Index is unmanaged and does not incur expenses, and cannot be purchased directly by investors. Investors should read the Fund's prospectus with regard to the Fund's investment objective, risks and charges and expenses in conjunction with these financial statements. Employee retirement benefit plans that invest plan assets in the Separate Investment Accounts (SIAs) may be subject to certain charges as set forth in their respective Plan Documents. Total return figures would be lower for the periods presented if they reflected these charges. The performance tables and charts do not reflect the deduction of taxes that a shareholder would pay on the fund distributions or the redemption of the fund shares.
11
MassMutual Select Fundamental Value Fund – Portfolio Manager Report
What is the investment objective of the MassMutual Select Fundamental Value Fund? The Fund seeks long-term total return by investing at least 80% of its net assets in equity securities, with a focus on companies with large capitalizations (generally having market capitalizations above $2 billion).
How did the Fund perform during the six months ended June 30, 2006? The Fund's Class S shares returned 7.14%, outpacing the 2.70% return of the S&P 500® Index, a widely recognized, unmanaged index representative of common stocks of larger capitalized U.S. companies.
What was the investment backdrop during the period? During the first quarter, U.S. equity markets posted one of their strongest quarters in recent years in the face of rising long-term interest rates and noticeable cooling in the housing market. Value stocks outperformed the broader market, as the Russell 1000® Value Index return of 5.9% bested the S&P 500 Index return of 4.2%.
Turning to the second quarter, domestic stock markets were weak, as investors became increasingly nervous about inflation and continued Federal Reserve tightening. Evidence suggesting some cooling in the U.S. housing market became more apparent during this period. In this environment, value stocks outpaced the broader market, as the Russell 1000 Value Index return of 0.6% outperformed the S&P 500 Index return of –1.4%.
What factors contributed to the Fund's performance? During the first quarter, stock selection in three of ten broad industry sectors added to the Fund's performance relative to its benchmark, the S&P 500 Index. Our holdings in the energy, industrials, and consumer staples sectors were the largest contributors. Conversely, the Fund's investments in the health care, utilities, and materials sectors detracted from relative results. From an industry weightings standpoint, the Fund's allocations to capital goods, transportation, and food/staples retailing contributed to the Fund's relative results. Our purchases during the first quarter reflected stock-specific fundamentals. For example, we purchased shares of aerospace and defense companies Lockheed Martin and Goodrich on the belief that aircraft orders should remain strong for the foreseeable fu ture – and defense spending likely will remain robust as international tensions remain elevated. We purchased shares of Abbott Laboratories, which we expected would benefit from its strong pharmaceutical product pipeline, and Sun Microsystems, where we expected revenues and cost performance to positively surprise investors. Our purchases were funded by sales of stocks that had achieved our price objectives, including CSX, GlobalSantaFe, and Rockwell Automation. Our reduced earnings outlook for Dollar General caused us to eliminate the position.
Turning to the second quarter, stock selection in six of ten broad industry sectors fueled the portfolio's benchmark-relative performance. Investments in the financials, consumer staples, and utilities sectors were the largest contributors to the Fund's progress. Conversely, holdings in the information technology, energy, and health care sectors detracted the most from relative results. With respect to industry weightings, the portfolio's allocations to health care equipment/services, food/staples retailing, and capital goods hampered the Fund relative to its benchmark. During this period, we trimmed or eliminated some big winners in the capital goods area, including Caterpillar and Rockwell Automation. We also trimmed shares of companies whose earnings had not lived up to our expectations, such as AIG and Citigroup. We reduced energy holdings – specifically, ExxonMobil and Cameco – and eliminated electric utilities PPL and Consoli dated Edison. Proceeds were used to build positions in several technology-related companies, including EMC, Hewlett Packard and Cisco. We also built a position in UPS, which had languished following its IPO at the beginning of the decade, despite very robust earnings growth, and we added to the Fund's AT&T position, as we continued to gain confidence in the earnings outlook for the company. Finally, we added Aetna on market confusion following their most recent earnings report, since we believe that Aetna's valuation does not reflect its strong fundamentals.
12
MassMutual Select Fundamental Value Fund – Portfolio Manager Report (Continued)
What is your outlook? Little has changed in the economic trend or in the strong corporate profit growth over the past few years, despite greater capital market volatility during the second quarter. Despite the ongoing trend in vigorous global growth, the economic and investment market cycles are quite advanced, and we believe there may be storm clouds on the horizon for the U.S. consumer. We think higher energy costs, increased real estate taxes, and lower mortgage equity withdrawals eventually could contribute to a consumer slowdown, while uncertainty remains with respect to the extent of that slowdown and its impact overseas.
MassMutual Select Fundamental Value Fund
Industry Table
(% of Net Assets) on 6/30/06
| Banking, Savings & Loans | | | 13.4 | % | |
| Energy | | | 11.0 | % | |
| Insurance | | | 8.4 | % | |
| Financial Services | | | 8.0 | % | |
| Electric Utilities | | | 5.4 | % | |
| Telephone Utilities | | | 5.2 | % | |
| Retail | | | 4.5 | % | |
| Aerospace & Defense | | | 4.5 | % | |
| Pharmaceuticals | | | 3.9 | % | |
| Metals & Mining | | | 3.4 | % | |
Broadcasting, Publishing &
Printing | | | 3.3 | % | |
| Foods | | | 3.2 | % | |
| Medical Supplies | | | 2.9 | % | |
| Chemicals | | | 2.3 | % | |
| Air Transportation | | | 2.3 | % | |
| Machinery & Components | | | 1.9 | % | |
| Computers & Information | | | 1.9 | % | |
| Lodging | | | 1.8 | % | |
| Manufacturing | | | 1.8 | % | |
| Beverages | | | 1.5 | % | |
Computers & Office
Equipment | | | 1.5 | % | |
Electrical Equipment &
Electronics | | | 1.5 | % | |
| Communications Equipment | | | 1.0 | % | |
| Transportation | | | 1.0 | % | |
| Cosmetics & Personal Care | | | 0.9 | % | |
| Apparel, Textiles & Shoes | | | 0.9 | % | |
Computer Integrated
Systems Design | | | 0.9 | % | |
| Restaurants | | | 0.9 | % | |
Short-Term Investments and
Other Assets and Liabilities | | | 0.8 | % | |
| | | | 100.0 | % | |
MassMutual Select Fundamental
Value Fund
Largest Stock Holdings (6/30/06)
Exxon Mobil Corp.
Citigroup, Inc.
CVS Corp.
Bank of America Corp.
Golden West Financial Corp.
Occidental Petroleum Corp.
AT&T, Inc.
JP Morgan Chase & Co.
WellPoint, Inc.
The Goldman Sachs Group, Inc.
13
MassMutual Select Fundamental Value Fund – Portfolio Manager Report (Continued)
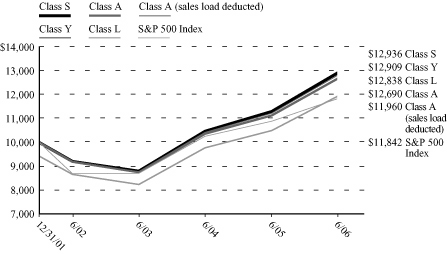
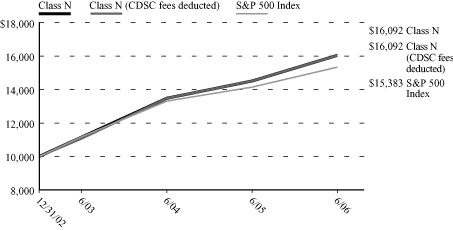
Growth of a $10,000 Investment
Hypothetical Investments in MassMutual Select Fundamental Value Fund Class S, Class A, Class A (sales load deducted), Class Y, Class L and the S&P 500 Index.
MassMutual Select Fundamental Value Fund
Total Return
| | | Year to Date
1/1/06 -
6/30/06 | | One Year
7/1/05 -
6/30/06 | | Five Year
Average
Annual
7/1/01 -
6/30/06 | | Since
Inception
Average
Annual
12/31/01 -
6/30/06 | |
| Class S | | | 7.14 | % | | | 14.41 | % | | N/A | | | 5.89 | % | |
| Class A | | | 6.91 | % | | | 13.95 | % | | N/A | | | 5.44 | % | |
Class A (sales
load deducted)* | | | 0.76 | % | | | 7.40 | % | | N/A | | | 4.06 | % | |
| Class Y | | | 7.15 | % | | | 14.39 | % | | N/A | | | 5.84 | % | |
| Class L | | | 7.16 | % | | | 14.33 | % | | N/A | | | 5.71 | % | |
| S&P 500 Index | | | 2.70 | % | | | 8.62 | % | | | 2.49 | % | | | 3.83 | % | |
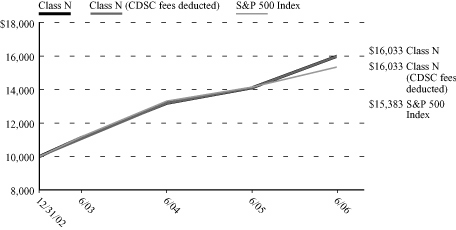
Hypothetical Investments in MassMutual Select Fundamental Value Fund Class N, Class N (CDSC fees deducted) and the S&P 500 Index.
MassMutual Select Fundamental Value Fund
Total Return
| | | Year to Date
1/1/06 - 6/30/06 | | One Year
7/1/05 - 6/30/06 | | Since Inception
Average Annual
12/31/02 - 6/30/06 | |
| Class N | | | 6.68 | % | | | 13.58 | % | | | 14.45 | % | |
Class N (CDSC
fees deducted)* | | | 5.68 | % | | | 12.58 | % | | | 14.45 | % | |
| S&P 500 Index | | | 2.70 | % | | | 8.62 | % | | | 13.10 | % | |
GROWTH OF A $10,000 INVESTMENT SINCE INCEPTION
* Class A (sales load deducted) returns include the 5.75% maximum sales charge and Class N (CDSC fees deducted) returns include the 1.00% maximum contingent deferred sales charge for the first 18 months shown.
Performance data quoted represents past performance; past performance is not predictive of future results. The investment return and principal value of shares of the Fund will fluctuate with market conditions so that shares of the Fund, when redeemed, may be worth more or less than their original cost. Current performance of the Fund may be lower or higher than the performance quoted. Performance data current to the most recent month end may be obtained by calling 1-888-309-3539.
Investors should note that the Fund is a professionally managed mutual fund, while the S&P 500 Index is unmanaged and does not incur expenses, and cannot be purchased directly by investors. Investors should read the Fund's prospectus with regard to the Fund's investment objective, risks and charges and expenses in conjunction with these financial statements. Employee retirement benefit plans that invest plan assets in the Separate Investment Accounts (SIAs) may be subject to certain charges as set forth in their respective Plan Documents. Total return figures would be lower for the periods presented if they reflected these charges. The performance tables and charts do not reflect the deduction of taxes that a shareholder would pay on the fund distributions or the redemption of the fund shares.
14
MassMutual Select Value Equity Fund – Portfolio Manager Report
What is the investment objective of the MassMutual Select Value Equity Fund? The Fund seeks long-term growth of capital by investing in securities of companies that Fund management believes are undervalued in the marketplace relative to factors such as the company's assets, sales, earnings, growth potential, or cash flow – or relative to securities of other companies in the same industry.
How did the Fund perform during the six months ended June 30, 2006? The Fund's Class S shares returned 3.32%, trailing the 6.56% return of the Russell 1000® Value Index, an unmanaged index representative of stocks with a greater-than-average value orientation among the stocks of the largest 1000 U.S. companies based on capitalization.
What was the investment background during the period? The domestic equity market posted positive returns during the first quarter of 2006. Despite concerns about inflation, a slowdown in the housing market and higher short-term interest rates, strong corporate earnings and healthy economic growth fueled U.S. stocks. The impact from energy prices was mixed. The price for natural gas declined during the period, due to higher-than-normal temperatures and lower demand for home heating fuel in the U.S. Yet oil prices increased slightly and pushed gasoline prices higher. The Federal Reserve (Fed) raised its target short-term interest rate from 4.25% to 4.75% during the quarter. Long-term interest rates also increased, but the spread between long rates and short rates remained close to zero. With respect to market performance by capitalization, 2006 sta rted off just like six of the previous seven years had finished, with small-cap stocks outperforming large caps (as measured by the Russell 2000® and Russell 1000® Indexes, respectively). In terms of style, the Russell 3000® Value Index topped the Russell 3000® Growth Index during the first three months of the year, just as it had in the previous six calendar years.
During the second quarter, U.S. equities pulled back amid investor concerns about monetary tightening and potential inflationary pressures. More-volatile information technology stocks fared the worst, while defensive market sectors, including utilities, held up relatively well. Less-liquid small- and mid-cap stocks – which had done well in 2006 through early May – underperformed large-cap stocks, while value stocks once again bested their growth counterparts. Investment-grade bond yields rose amid continued Fed interest rate hikes and an uptick in the core inflation rate. High-yield bond yield spreads – or the difference in yields relative to comparable bonds – remained narrow, but widened modestly versus comparable-duration Treasuries.
What factors contributed to the Fund's performance? Hurting the Fund's performance during the first quarter was negative security selection within the materials and health care sectors. Within materials, the Fund held an overweight position in chemical stocks, which were hampered by concerns about the supply and demand fundamentals for ethylene. Within health care, the Fund's pharmaceutical holdings lagged, due in part to lower-than-expected earnings for the fourth quarter. Also hurting performance was an underweight position in the strong-performing telecommunications services stocks, which benefited from robust earnings and industry consolidation. Contributing to the Fund's performance, relative to the benchmark (the Russell 1000 Value Index) was strong security selection within the media industry, where the Fund held underweight positions in s tocks with exposure to traditional media, such as radio and television, and was overweight in stocks with exposure to emerging markets and outdoor advertising. Also helping performance was an underweight position in the poor-performing commercial banks.
During the second quarter, from a sector perspective, financials held back the Fund's relative return the most. Specifically, the Fund's positions narrowly trailed their segment of the benchmark, as certain insurance and bank stocks were negatively impacted by downward earnings estimate revisions. Amid heightened economic concerns, an above-average weighting and lagging returns in industrials and an overweight position in weak-performing information technology stocks also worked against the Fund's relative return. Conversely, the Fund's overexposure to and good stock choices in telecommunication services stocks were a plus, as their underlying business fundamentals showed signs of stability and negative investor sentiment toward the sector continued to abate.
15
MassMutual Select Value Equity Fund – Portfolio Manager Report (Continued)
What is your outlook? It is impossible to predict with any certainty whether or not the volatility that the equity markets have experienced in the first six months of 2006 is nearing an end. Numerous forces will continue to influence the direction that the market takes moving forward – such as oil prices, inflation, geopolitical unrest and Fed policy. We believe, however, that we have positioned the Fund to be ready to handle the wide array of market conditions that investors may face throughout the remainder of the year.
MassMutual Select Value Equity Fund
Industry Table
(% of Net Assets) on 6/30/06
| Energy | | | 11.2 | % | |
| Banking, Savings & Loans | | | 9.7 | % | |
| Insurance | | | 8.2 | % | |
| Pharmaceuticals | | | 7.0 | % | |
Electrical Equipment &
Electronics | | | 6.5 | % | |
| Aerospace & Defense | | | 5.2 | % | |
| Telephone Utilities | | | 4.4 | % | |
| Retail | | | 4.0 | % | |
| Financial Services | | | 3.9 | % | |
| Commercial Services | | | 3.9 | % | |
| Medical Supplies | | | 3.9 | % | |
| Metals & Mining | | | 2.4 | % | |
| Cosmetics & Personal Care | | | 2.3 | % | |
| Chemicals | | | 2.0 | % | |
| Foods | | | 1.6 | % | |
Broadcasting, Publishing &
Printing | | | 1.6 | % | |
| Entertainment & Leisure | | | 1.6 | % | |
| Electric Utilities | | | 1.6 | % | |
| Machinery & Components | | | 1.5 | % | |
Computers & Office
Equipment | | | 1.5 | % | |
| Communications | | | 1.4 | % | |
| Industrial – Diversified | | | 1.1 | % | |
| Tobacco | | | 1.0 | % | |
Photography Equipment/
Supplies | | | 1.0 | % | |
| Real Estate | | | 0.9 | % | |
| Computers & Information | | | 0.9 | % | |
| Prepackaged Software | | | 0.8 | % | |
Building Materials &
Construction | | | 0.8 | % | |
| Air Transportation | | | 0.8 | % | |
Information Retrieval
Services | | | 0.7 | % | |
| Apparel, Textiles & Shoes | | | 0.6 | % | |
| Automotive & Parts | | | 0.5 | % | |
| Beverages | | | 0.5 | % | |
| Restaurants | | | 0.5 | % | |
| Oil & Gas | | | 0.5 | % | |
| Containers | | | 0.5 | % | |
Data Processing &
Preparation | | | 0.4 | % | |
| Transportation | | | 0.3 | % | |
| Diversified Financial | | | 0.3 | % | |
| Advertising | | | 0.2 | % | |
| Forest Products & Paper | | | 0.2 | % | |
| Internet Content | | | 0.2 | % | |
Home Construction,
Furnishings & Appliances | | | 0.2 | % | |
| Electronics | | | 0.1 | % | |
Computer Integrated
Systems Design | | | 0.1 | % | |
Computer Programming
Services | | | 0.1 | % | |
| Healthcare | | | 0.1 | % | |
| Manufacturing | | | 0.1 | % | |
| Communications Equipment | | | 0.1 | % | |
| Internet Software | | | 0.1 | % | |
| Heavy Machinery | | | 0.1 | % | |
| Travel | | | 0.0 | % | |
Short-Term Investments and
Other Assets and Liabilities | | | 0.9 | % | |
| | | | 100.0 | % | |
MassMutual Select Value Equity Fund
Largest Stock Holdings (6/30/06)
Honeywell International, Inc.
General Electric Co.
American International Group, Inc.
AT&T, Inc.
Exxon Mobil Corp.
JP Morgan Chase & Co.
Bank of America Corp.
Citigroup, Inc.
Halliburton Co.
Pfizer, Inc.
16
MassMutual Select Value Equity Fund – Portfolio Manager Report (Continued)
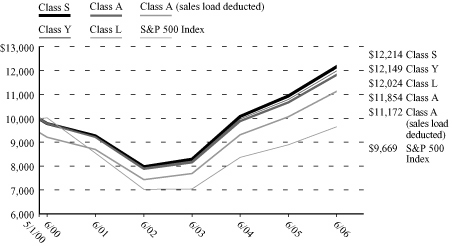
Growth of a $10,000 Investment
Hypothetical Investments in MassMutual Select Value Equity Fund Class S, Class A, Class A (sales load deducted), Class Y, Class L and the Russell 1000 Value Index.
MassMutual Select Value Equity Fund
Total Return
| | | Year to Date
1/1/06 -
6/30/06 | | One Year
7/1/05 -
6/30/06 | | Five Year
Average
Annual
7/1/01 -
6/30/06 | | Since
Inception
Average
Annual
5/1/01 -
6/30/06 | |
| Class S | | | 3.32 | % | | | 13.26 | % | | | 5.34 | % | | | 4.91 | % | |
| Class A | | | 3.15 | % | | | 12.77 | % | | | 4.86 | % | | | 4.46 | % | |
Class A (sales
load deducted)* | | | –2.79 | % | | | 6.28 | % | | | 3.63 | % | | | 3.27 | % | |
| Class Y | | | 3.41 | % | | | 13.30 | % | | | 5.30 | % | | | 4.88 | % | |
| Class L | | | 3.24 | % | | | 12.99 | % | | | 5.13 | % | | | 4.71 | % | |
Russell 1000
Value Index | | | 6.56 | % | | | 12.10 | % | | | 6.90 | % | | | 6.66 | % | |
Hypothetical Investments in MassMutual Select Value Equity Fund, Class N, Class N (CDSC fees deducted) and the Russell 1000 Value Index.
MassMutual Select Value Equity Fund
Total Return
| | | Year to Date
1/1/06 - 6/30/06 | | One Year
7/1/05 - 6/30/06 | | Since Inception
Average Annual
12/31/02 - 6/30/06 | |
| Class N | | | 3.04 | % | | | 12.54 | % | | | 14.44 | % | |
Class N (CDSC
fees deducted)* | | | 2.04 | % | | | 11.54 | % | | | 14.44 | % | |
Russell 1000
Value Index | | | 6.56 | % | | | 12.10 | % | | | 16.99 | % | |
GROWTH OF A $10,000 INVESTMENT SINCE INCEPTION

* Class A (sales load deducted) returns include the 5.75% maximum sales charge and Class N (CDSC fees deducted) returns include the 1.00% maximum contingent deferred sales charge for the first 18 months shown.
Performance data quoted represents past performance; past performance is not predictive of future results. The investment return and principal value of shares of the Fund will fluctuate with market conditions so that shares of the Fund, when redeemed, may be worth more or less than their original cost. Current performance of the Fund may be lower or higher than the performance quoted. Performance data current to the most recent month end may be obtained by calling 1-888-309-3539.
Investors should note that the Fund is a professionally managed mutual fund, while the Russell 1000 Value Index is unmanaged and does not incur expenses, and cannot be purchased directly by investors. Investors should read the Fund's prospectus with regard to the Fund's investment objective, risks and charges and expenses in conjunction with these financial statements. Employee retirement benefit plans that invest plan assets in the Separate Investment Accounts (SIAs) may be subject to certain charges as set forth in their respective Plan Documents. Total return figures would be lower for the periods presented if they reflected these charges. The performance tables and charts do not reflect the deduction of taxes that a shareholder would pay on the fund distributions or the redemption of the fund shares.
17
MassMutual Select Large Cap Value Fund – Portfolio Manager Report
What is the investment objective of the Select Large Cap Value Fund? This Fund seeks both capital growth and income by investing in large-capitalization companies that the Fund's sub-adviser believes foster the creation of long-term value – such as proven management, a durable franchise and business model, and sustainable competitive advantages.
How did the Fund perform during the six months ended June 30, 2006? The Fund's Class S shares returned 3.08%, outpacing the 2.70% return of the S&P 500® Index, a widely recognized, unmanaged index representative of common stocks of larger capitalized U.S. companies.
What was the investment backdrop during the period?
For the six months ended June 30, 2006, equities outperformed bonds against a backdrop of rising inflation, a slowing economy and indications of a slowdown in the real estate market. In the first quarter, most U.S. stock indexes posted strong gains, as solid growth in corporate profits and signs of an uptick in overall economic activity helped to boost share prices.
The second quarter saw a turnaround in the fortunes of the equity markets, as investor uncertainty (caused in part by global unrest and rising oil prices) led many of the markets lower. In fact, The Dow Jones Industrial AverageSM was the only domestic equity benchmark to post a return in positive territory, advancing 0.37%.
What factors contributed to the Fund's performance? During the first quarter, the Fund's holdings in financials, energy and materials were notable contributors to absolute performance. Top individual contributors included Costco Wholesale, Occidental Petroleum, Martin Marietta, ConocoPhillips and JPMorgan Chase. Detractors during the period were largely stock specific, and included Transatlantic Holdings, HCA Inc., Altria Group, Tyco International and Progressive Corp. Among the few changes we made in the first quarter, we added Sprint Nextel to the portfolio. Sprint Nextel offers consumers and businesses a wide range of telephone and data services delivered over wireless and wireline networks. While competition remains fierce in the telecommunications industry, we believe Sprint Nextel represents an attractive risk/reward trade-off, given its ca sh-generating assets, attractive competitive position and valuation.
During the second quarter, the Fund's investments in consumer staples, consumer discretionary and energy were notable contributors to performance. Top-performing positions included Comcast, Golden West Financial, Occidental Petroleum, Costco and News Corp. Detracting from performance, on the other hand, were individual issues within the information technology, materials, telecommunications and health care sectors. Less-than-favorable returns came from American International Group, Moody's, Microsoft, Sealed Air and Sprint Nextel.
What is your outlook? Our belief is that the major averages are likely to advance in a range-bound fashion for the foreseeable future. Our view is that in such an environment, prudent stock selection may offer the potential to generate attractive returns.
18
MassMutual Select Large Cap Value Fund – Portfolio Manager Report (Continued)
MassMutual Select Large Cap Value Fund
Industry Table
(% of Net Assets) on 6/30/06
| Banking, Savings & Loans | | | 14.6 | % | |
| Energy | | | 12.1 | % | |
| Financial Services | | | 12.0 | % | |
| Insurance | | | 10.9 | % | |
| Retail | | | 6.7 | % | |
| Commercial Services | | | 5.0 | % | |
Broadcasting, Publishing &
Printing | | | 4.6 | % | |
| Tobacco | | | 4.4 | % | |
| Industrial – Diversified | | | 4.1 | % | |
| Healthcare | | | 2.8 | % | |
| Beverages | | | 2.0 | % | |
| Containers | | | 2.0 | % | |
| Prepackaged Software | | | 2.0 | % | |
| Automotive & Parts | | | 1.8 | % | |
| Entertainment & Leisure | | | 1.6 | % | |
Building Materials &
Construction | | | 1.5 | % | |
| Cosmetics & Personal Care | | | 1.5 | % | |
| Transportation | | | 1.4 | % | |
| Telephone Utilities | | | 1.3 | % | |
| Communications | | | 1.3 | % | |
| Pharmaceuticals | | | 0.9 | % | |
| Foods | | | 0.7 | % | |
| Computers & Information | | | 0.7 | % | |
Computers & Office
Equipment | | | 0.6 | % | |
| Advertising | | | 0.3 | % | |
| Metals & Mining | | | 0.3 | % | |
| Household Products | | | 0.2 | % | |
| Computer Related Services | | | 0.2 | % | |
| Travel | | | 0.1 | % | |
Short-Term Investments and
Other Assets and Liabilities | | | 2.4 | % | |
| | | | 100.0 | % | |
MassMutual Select Large Cap
Value Fund
Largest Stock Holdings (6/30/06)
American Express Co.
Altria Group, Inc.
Costco Wholesale Corp.
ConocoPhillips
Tyco International Ltd.
JP Morgan Chase & Co.
American International Group, Inc.
Berkshire Hathaway, Inc. Cl. A
Golden West Financial Corp.
HSBC Holdings PLC
19
MassMutual Select Large Cap Value Fund – Portfolio Manager Report (Continued)
Growth of a $10,000 Investment
Hypothetical Investments in MassMutual Select Large Cap Value Fund Class S, Class A, Class A (sales load deducted), Class Y, Class L and the S&P 500 Index.
MassMutual Select Large Cap Value Fund
Total Return
| | | Year to Date
1/1/06 -
6/30/06 | | One Year
7/1/05 -
6/30/06 | | Five Year
Average
Annual
7/1/01 -
6/30/06 | | Since
Inception
Average
Annual
5/1/00 -
6/30/06 | |
| Class S | | | 3.08 | % | | | 11.45 | % | | | 5.65 | % | | | 3.30 | % | |
| Class A | | | 2.84 | % | | | 10.97 | % | | | 5.13 | % | | | 2.80 | % | |
Class A (sales
load deducted)* | | | –3.08 | % | | | 4.59 | % | | | 3.89 | % | | | 1.81 | % | |
| Class Y | | | 3.09 | % | | | 11.46 | % | | | 5.56 | % | | | 3.21 | % | |
| Class L | | | 2.92 | % | | | 11.27 | % | | | 5.41 | % | | | 3.03 | % | |
| S&P 500 Index | | | 2.70 | % | | | 8.62 | % | | | 2.49 | % | | | –0.54 | % | |
Hypothetical Investments in MassMutual Select Large Cap Value Fund Class N, Class N (CDSC fees deducted) and the S&P 500 Index.
MassMutual Select Large Cap Value Fund
Total Return
| | | Year to Date
1/1/06 - 6/30/06 | | One Year
7/1/05 - 6/30/06 | | Since Inception
Average Annual
12/31/02 - 6/30/06 | |
| Class N | | | 2.78 | % | | | 10.70 | % | | | 14.57 | % | |
Class N (CDSC
fees deducted)* | | | 1.78 | % | | | 9.70 | % | | | 14.57 | % | |
| S&P 500 Index | | | 2.70 | % | | | 8.62 | % | | | 13.10 | % | |
GROWTH OF A $10,000 INVESTMENT SINCE INCEPTION
* Class A (sales load deducted) returns include the 5.75% maximum sales charge and Class N (CDSC fees deducted) returns include the 1.00% maximum contingent deferred sales charge for the first 18 months shown.
Performance data quoted represents past performance; past performance is not predictive of future results. The investment return and principal value of shares of the Fund will fluctuate with market conditions so that shares of the Fund, when redeemed, may be worth more or less than their original cost. Current performance of the Fund may be lower or higher than the performance quoted. Performance data current to the most recent month end may be obtained by calling 1-888-309-3539.
Investors should note that the Fund is a professionally managed mutual fund, while the S&P 500 Index is unmanaged and does not incur expenses, and cannot be purchased directly by investors. Investors should read the Fund's prospectus with regard to the Fund's investment objective, risks and charges and expenses in conjunction with these financial statements. Employee retirement benefit plans that invest plan assets in the Separate Investment Accounts (SIAs) may be subject to certain charges as set forth in their respective Plan Documents. Total return figures would be lower for the periods presented if they reflected these charges. The performance tables and charts do not reflect the deduction of taxes that a shareholder would pay on the fund distributions or the redemption of the fund shares.
20
MassMutual Select Indexed Equity Fund – Portfolio Manager Report
What is the investment objective of the Select Indexed Equity Fund? The Fund seeks to approximate as closely as practicable (before fees and expenses) the capitalization-weighted total rate of return of that portion of the U.S. market for publicly traded common stocks composed of larger-capitalized companies. The Fund pursues this objective by investing at least 80% of its net assets in the equity securities of companies that make up the S&P 500 Index.
How did the Fund perform during the six months ended June 30, 2006? The Fund's Class S shares returned 2.49%, moderately trailing the 2.70% return of the S&P 500 Index, a widely recognized, unmanaged index representative of common stocks of larger capitalized U.S. companies.
What was the investment backdrop during the period? The Federal Reserve (Fed) raised interest rates twice during the first quarter of 2006, bringing the federal funds rate to 4.75% as of March 31. The new chairman of the Fed, Ben Bernanke, announced that additional hikes might be necessary due to "elevated prices of energy and other commodities." Oil prices remained a concern for investors and cast a shadow over future growth in both the U.S. and abroad. During the first quarter of 2006, crude oil prices ranged between $60 and $70 per barrel, within striking distance of the 2005 high of $71. On the positive side however, the U.S. Commerce Department announced that businesses saw their after-tax profits rise 13.8% during the fourth quarter of 2005, a dramatic improvement from the third quarter, when profits were down 4.3%.
The Fed maintained its tightening policy and increased interest rates by 0.25% at each Federal Open Market Committee (FOMC) meeting in May and June. This last increase was the 17th consecutive one since June 2004, and brought the federal funds rate to 5.25% as of June 29. Ahead of the June meeting, there had been some market speculation that the Fed might raise their key interest rate by 0.50%. The continued rise in energy and commodity prices had fueled concerns about inflationary pressure on the U.S. economy. The lack of substantial progress in talks with Iran regarding their nuclear program contributed substantially to rising oil prices. Crude prices finished the quarter just above $70 per barrel, after reaching a new high of $75 in late April. In addition, the escalation of the conflict with North Korea that culminated with the actual testing of long-range missiles, added to the nervousness that pervaded financial markets.
What factors contributed to the Fund's performance? During the quarter ended March 31, 2006, large-capitalization stocks underperformed both mid- and small-cap stocks. Value stocks outpaced growth issues during the period. Telecommunication services was the best-performing sector in the Index, returning 14.45%; utilities was the worst-performing sector, with its return of –1.16%.
Turning to the second quarter, large-cap stocks outperformed both mid- and small-cap issues. Value stocks once again outpaced their growth counterparts. During the quarter, utilities was the best-performing sector in the Index, while information technology was the worst-performing.
What is your outlook? It is impossible to predict with any certainty whether or not the volatility that the equity markets have experienced in the first six months of 2006 is nearing an end. Numerous forces will continue to influence the direction that the market takes moving forward – such as oil prices, inflation, geopolitical unrest and Fed policy. We expect these factors to have the greatest impact on market conditions as the remainder of 2006 unfolds.
21
MassMutual Select Indexed Equity Fund – Portfolio Manager Report (Continued)
MassMutual Select Indexed Equity Fund
Industry Table
(% of Net Assets) on 6/30/06
| Energy | | | 9.9 | % | |
| Banking, Savings & Loans | | | 9.4 | % | |
| Pharmaceuticals | | | 8.1 | % | |
| Financial Services | | | 6.0 | % | |
Electrical Equipment &
Electronics | | | 6.0 | % | |
| Insurance | | | 5.3 | % | |
| Retail | | | 4.8 | % | |
| Computers & Information | | | 3.5 | % | |
| Telephone Utilities | | | 3.2 | % | |
| Electric Utilities | | | 3.0 | % | |
| Prepackaged Software | | | 2.9 | % | |
| Aerospace & Defense | | | 2.3 | % | |
Broadcasting, Publishing &
Printing | | | 2.3 | % | |
| Cosmetics & Personal Care | | | 2.3 | % | |
| Beverages | | | 2.1 | % | |
| Transportation | | | 2.0 | % | |
| Medical Supplies | | | 2.0 | % | |
| Industrial – Diversified | | | 1.6 | % | |
| Foods | | | 1.6 | % | |
| Commercial Services | | | 1.5 | % | |
| Tobacco | | | 1.5 | % | |
| Chemicals | | | 1.3 | % | |
| Healthcare | | | 1.3 | % | |
| Machinery & Components | | | 1.2 | % | |
Information Retrieval
Services | | | 1.2 | % | |
| Entertainment & Leisure | | | 1.1 | % | |
Computers & Office
Equipment | | | 1.0 | % | |
| Communications | | | 1.0 | % | |
| Metals & Mining | | | 1.0 | % | |
Data Processing &
Preparation | | | 0.7 | % | |
| Real Estate | | | 0.7 | % | |
| Household Products | | | 0.7 | % | |
| Automotive & Parts | | | 0.6 | % | |
| Restaurants | | | 0.6 | % | |
| Apparel, Textiles & Shoes | | | 0.6 | % | |
| Communications Equipment | | | 0.4 | % | |
Home Construction,
Furnishings & Appliances | | | 0.4 | % | |
| Manufacturing | | | 0.4 | % | |
| Forest Products & Paper | | | 0.4 | % | |
Computer Integrated
Systems Design | | | 0.3 | % | |
| Lodging | | | 0.3 | % | |
| Food Retailers | | | 0.3 | % | |
| Advertising | | | 0.2 | % | |
Building Materials &
Construction | | | 0.2 | % | |
| Containers | | | 0.2 | % | |
| Air Transportation | | | 0.1 | % | |
| Toys, Games | | | 0.1 | % | |
| Retail – Grocery | | | 0.1 | % | |
Photography Equipment/
Supplies | | | 0.1 | % | |
| Industrial – Distribution | | | 0.1 | % | |
Computer Programming
Services | | | 0.0 | % | |
| Travel | | | 0.0 | % | |
Short-Term Investments and
Other Assets and Liabilities | | | 2.1 | % | |
| | | | 100.0 | % | |
MassMutual Select Indexed
Equity Fund
Largest Stock Holdings (6/30/06)
Exxon Mobil Corp.
General Electric Co.
Citigroup, Inc.
Bank of America Corp.
Microsoft Corp.
The Procter & Gamble Co.
Johnson & Johnson
Pfizer, Inc.
American International Group, Inc.
Altria Group, Inc.
22
MassMutual Select Indexed Equity Fund – Portfolio Manager Report (Continued)
Growth of a $10,000 Investment
Hypothetical Investments in MassMutual Select Indexed Equity Fund Class S, Class A, Class A (sales load deducted), Class Y and the S&P 500 Index.
MassMutual Select Indexed Equity Fund
Total Return
| | | Year to Date
1/1/06 -
6/30/06 | | One Year
7/1/05 -
6/30/06 | | Five Year
Average
Annual
7/1/01 -
6/30/06 | | Since
Inception
Average
Annual
3/1/98 -
6/30/06 | |
| Class S | | | 2.49 | % | | | 8.12 | % | | | 2.05 | % | | | 3.47 | % | |
| Class A | | | 2.35 | % | | | 7.88 | % | | | 1.67 | % | | | 3.03 | % | |
Class A (sales
load deducted)* | | | –3.53 | % | | | 1.68 | % | | | 0.48 | % | | | 2.30 | % | |
| Class Y | | | 2.43 | % | | | 8.09 | % | | | 2.01 | % | | | 3.41 | % | |
| S&P 500 Index | | | 2.70 | % | | | 8.62 | % | | | 2.49 | % | | | 3.92 | % | |
Hypothetical Investments in MassMutual Select Indexed Equity Fund Class L and the S&P 500 Index.
MassMutual Select Indexed Equity Fund
Total Return
| | | Year to Date
1/1/06 -
6/30/06 | | One Year
7/1/05 -
6/30/06 | | Five Year
Average
Annual
7/1/01 -
6/30/06 | | Since
Inception
Average
Annual
7/1/99 -
6/30/06 | |
| Class L | | | 2.52 | % | | | 8.11 | % | | | 1.93 | % | | | –0.10 | % | |
| S&P 500 Index | | | 2.70 | % | | | 8.62 | % | | | 2.49 | % | | | 0.47 | % | |
GROWTH OF A $10,000 INVESTMENT SINCE INCEPTION
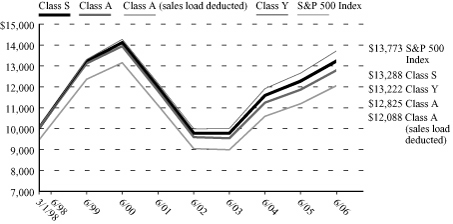

* Class A (sales load deducted) returns include the 5.75% maximum sales charge.
Performance data quoted represents past performance; past performance is not predictive of future results. The investment return and principal value of shares of the Fund will fluctuate with market conditions so that shares of the Fund, when redeemed, may be worth more or less than their original cost. Current performance of the Fund may be lower or higher than the performance quoted. Performance data current to the most recent month end may be obtained by calling 1-888-309-3539.
Investors should note that the Fund is a professionally managed mutual fund, while the S&P 500 Index is unmanaged and does not incur expenses, and cannot be purchased directly by investors. Investors should read the Fund's prospectus with regard to the Fund's investment objective, risks and charges and expenses in conjunction with these financial statements. Employee retirement benefit plans that invest plan assets in the Separate Investment Accounts (SIAs) may be subject to certain charges as set forth in their respective Plan Documents. Total return figures would be lower for the periods presented if they reflected these charges. The performance tables and charts do not reflect the deduction of taxes that a shareholder would pay on the fund distributions or the redemption of the fund shares.
23
MassMutual Select Indexed Equity Fund – Portfolio Manager Report (Continued)
Growth of a $10,000 Investment
Hypothetical Investments in MassMutual Select Indexed Equity Fund Class Z and the S&P 500 Index.
MassMutual Select Indexed Equity Fund
Total Return
| | | Year to Date
1/1/06 -
6/30/06 | | One Year
7/1/05 -
6/30/06 | | Five Year
Average
Annual
5/1/01 -
6/30/06 | | Since Inception
Average
Annual
5/1/01 -
6/30/06 | |
| Class Z | | | 2.66 | % | | | 8.46 | % | | | 2.31 | % | | | 1.88 | % | |
| S&P 500 Index | | | 2.70 | % | | | 8.62 | % | | | 2.49 | % | | | 2.06 | % | |
Hypothetical Investments in MassMutual Select Indexed Equity Fund Class N, Class N (CDSC fees deducted) and the S&P 500 Index.
MassMutual Select Indexed Equity Fund
Total Return
| | | Year to Date
1/1/06 - 6/30/06 | | One Year
7/1/05 - 6/30/06 | | Since Inception
Average Annual
12/31/02 - 6/30/06 | |
| Class N | | | 2.20 | % | | | 7.51 | % | | | 11.88 | % | |
Class N (CDSC
fees deducted)* | | | 1.20 | % | | | 6.51 | % | | | 11.88 | % | |
| S&P 500 Index | | | 2.70 | % | | | 8.62 | % | | | 13.10 | % | |
GROWTH OF A $10,000 INVESTMENT SINCE INCEPTION


* Class N (CDSC fees deducted) returns include the 1.00% maximum contingent deferred sales charge for the first 18 months shown.
Performance data quoted represents past performance; past performance is not predictive of future results. The investment return and principal value of shares of the Fund will fluctuate with market conditions so that shares of the Fund, when redeemed, may be worth more or less than their original cost. Current performance of the Fund may be lower or higher than the performance quoted. Performance data current to the most recent month end may be obtained by calling 1-888-309-3539.
Investors should note that the Fund is a professionally managed mutual fund, while the S&P 500 Index is unmanaged and does not incur expenses, and cannot be purchased directly by investors. Investors should read the Fund's prospectus with regard to the Fund's investment objective, risks and charges and expenses in conjunction with these financial statements. Employee retirement benefit plans that invest plan assets in the Separate Investment Accounts (SIAs) may be subject to certain charges as set forth in their respective Plan Documents. Total return figures would be lower for the periods presented if they reflected these charges. The performance tables and charts do not reflect the deduction of taxes that a shareholder would pay on the fund distributions or the redemption of the fund shares.
24
MassMutual Select Core Opportunities Fund – Portfolio Manager Report
What is the investment objective of the MassMutual Select Core Opportunities Fund? This Fund seeks long-term growth of capital by normally investing at least 80% of its net assets in equity securities and securities convertible into common stocks traded on U.S. exchanges and issued by large, established companies. The Fund's sub-adviser seeks to invest in both growth and value securities.
How did the Fund perform during the three months ended June 30, 2006? Since the Fund's inception on March 31, 2006, its Class S shares returned –3.70%, trailing the –1.85% return of the S&P 500® Index, a widely recognized, unmanaged index representative of common stocks of larger capitalized U.S. companies.
What was the investment background during the period? Equities declined swiftly after the May 10 Federal Reserve (Fed) meeting, but a late June rally helped to mitigate some of the quarter's earlier losses. The Fed's seventeen interest rate increases appeared to be slowing economic growth, but higher inflation reports raised concerns that the Fed will need to continue its campaign of increases. Risk reduction was the overriding theme of the quarter, as higher-beta stocks lagged more defensive securities, value outperformed growth, and large capitalization stocks performed better than their small- and mid-cap counterparts.
What factors contributed to the Fund's performance during the period? Energy/utilities was the best-performing sector during the second quarter, as oil prices climbed from the high $60's per barrel to the mid $70's, and the utility industry showed its defensiveness during a difficult equity market. Weatherford performed very well for the portfolio on the heels of a very good first quarter earnings report, with significant top-line growth and margin expansion. Pricing trends continued to favor the oil service companies, and Weatherford took advantage of that with recent contract signings. Hess Corporation also appreciated nicely, as the company reported a 14% increase in production and better cost controls. Hess also announced positive news associated with major exploration projects in the Gulf of Mexico.
Consumer staples was the worst-performing sector within the portfolio, relative to the benchmark, the S&P 500 Index, for the second quarter. Health care stocks fell on pricing concerns, options backdating in some securities, and further compression due to lowered growth expectations. Amgen declined as sales trends in key products were weaker than expected and a potential competitive threat to its important Epogen franchise progressed. After strong appreciation throughout the past 18 months, CIGNA's stock declined over higher medical loss trends in the industry and concerns regarding a more competitive, lower pricing environment.
Technology was the worst-performing sector on an absolute basis during the second quarter, primarily in the electronics and hardware/software industries. Inventory buildup has gone from being an Intel-specific issue to a problem throughout technology end markets. Within the hardware/software industry, Microsoft announced the delay of its new operating system and an additional $2.5 billion in capital spending plans – with little detail for the rationale. The portfolio's technology holdings declined less than the benchmark, primarily due to better stock selection in the electronics industry. Nokia performed better, as the handset industry has outpaced the PC market, and a new position in Intel worked well, as the Company appears to be at the threshold of a meaningful restructuring plan and a new product cycle. Lastly, Oracle posted a very good fiscal fourth quarter, with better-than-expected growth in both its database and applications bu sinesses.
What is your outlook? As of June 30, 2006, the S&P 500 Index was trading at 14 to 15 times 2006 estimates after five years of multiple contractions. At this level, we are not overly concerned with expectations of slowing earnings growth, which is still solid. We also expect higher-quality, large-cap stocks to assume leadership as the domestic economic and profit cycles reach maturity. Risks to this optimistic outlook have shifted to some degree, from an overheated economy creating inflationary pressures to one where economic growth is decelerating as oil approaches $80 per barrel and housing fundamentals deteriorate. Ironically, any hint of weakness could provide a better environment for equities, if it results in the end of the Fed's tightening stance.
25
MassMutual Select Core Opportunities Fund – Portfolio Manager Report (Continued)
MassMutual Select Core Opportunities Fund
Industry Table
(% of Net Assets) on 6/30/06
| Energy | | | 10.2 | % | |
| Pharmaceuticals | | | 8.7 | % | |
| Computers & Information | | | 7.3 | % | |
Electrical Equipment &
Electronics | | | 7.3 | % | |
| Prepackaged Software | | | 7.0 | % | |
| Insurance | | | 6.0 | % | |
| Banking, Savings & Loans | | | 4.4 | % | |
| Commercial Services | | | 4.2 | % | |
| Financial Services | | | 4.0 | % | |
| Machinery & Components | | | 3.1 | % | |
| Medical Supplies | | | 2.8 | % | |
| Cosmetics & Personal Care | | | 2.7 | % | |
| Metals & Mining | | | 2.7 | % | |
Data Processing &
Preparation | | | 2.5 | % | |
| Communications | | | 2.3 | % | |
| Retail | | | 2.3 | % | |
Information Retrieval
Services | | | 2.3 | % | |
Broadcasting, Publishing &
Printing | | | 2.2 | % | |
| Transportation | | | 2.2 | % | |
| Chemicals | | | 1.9 | % | |
| Foods | | | 1.8 | % | |
| Aerospace & Defense | | | 1.6 | % | |
| Tobacco | | | 1.6 | % | |
| Forest Products & Paper | | | 1.4 | % | |
| Telephone Utilities | | | 1.3 | % | |
| Real Estate | | | 0.6 | % | |
Short-Term Investments and
Other Assets and Liabilities | | | 5.6 | % | |
| | | | 100.0 | % | |
MassMutual Select Core
Opportunities Fund
Largest Stock Holdings (6/30/06)
General Electric Co.
Amgen, Inc.
Halliburton Co.
International Business Machines Corp.
Oracle Corp.
Intel Corp.
Bank of America Corp.
Medtronic, Inc.
The Procter & Gamble Co.
Pfizer, Inc.
26
MassMutual Select Core Opportunities Fund – Portfolio Manager Report (Continued)
Growth of a $10,000 Investment
Hypothetical Investments in MassMutual Select Core Opportunities Fund Class S, Class A, Class A (sales load deducted), Class Y, Class L, Class N, Class N (CDSC fees deducted) and the S&P 500 Index.
MassMutual Select Core Opportunities Fund
Total Return
| | | Since Inception
3/31/06 - 6/30/06 | |
| Class S | | | –3.70 | % | |
| Class A | | | –3.80 | % | |
| Class A (sales load deducted)* | | | –9.33 | % | |
| Class Y | | | –3.70 | % | |
| Class L | | | –3.70 | % | |
| Class N | | | –3.80 | % | |
| Class N (CDSC fees deducted)* | | | –4.76 | % | |
| S&P 500 Index | | | –1.85 | % | |
GROWTH OF A $10,000 INVESTMENT SINCE INCEPTION

* Class A (sales load deducted) returns include the 5.75% maximum sales charge and Class N (CDSC fees deducted) returns include the 1.00% maximum contingent deferred sales charge.
Performance data quoted represents past performance; past performance is not predictive of future results. The investment return and principal value of shares of the Fund will fluctuate with market conditions so that shares of the Fund, when redeemed, may be worth more or less than their original cost. Current performance of the Fund may be lower or higher than the performance quoted. Performance data current to the most recent month end may be obtained by calling 1-888-309-3539.
Investors should note that the Fund is a professionally managed mutual fund, while the S&P 500 Index is unmanaged and does not incur expenses, and cannot be purchased directly by investors. Investors should read the Fund's prospectus with regard to the Fund's investment objective, risks and charges and expenses in conjunction with these financial statements. Employee retirement benefit plans that invest plan assets in the Separate Investment Accounts (SIAs) may be subject to certain charges as set forth in their respective Plan Documents. Total return figures would be lower for the periods presented if they reflected these charges. The performance tables and charts do not reflect the deduction of taxes that a shareholder would pay on the fund distributions or the redemption of the fund shares.
27
MassMutual Select Blue Chip Growth Fund – Portfolio Manager Report
What is the investment objective of the Select Blue Chip Growth Fund? The Fund seeks growth of capital over the long term by normally investing at least 80% of its net assets in the common stocks of large and medium-sized blue chip growth companies.
How did the Fund perform during the six months ended June 30, 2006? The Fund's Class S shares returned –1.86%, trailing the 2.70% return of the S&P 500® Index, a widely recognized, unmanaged index representative of common stocks of larger capitalized U.S. companies.
What was the investment backdrop during the period? For the six months ended June 30, 2006, equities outperformed bonds against a backdrop of rising inflation, a slowing economy and indications of a slowdown in the real estate market. In the first quarter, most U.S. stock indexes posted strong gains, as solid growth in corporate profits and signs of an uptick in overall economic activity helped to boost share prices.
The second quarter saw a turnaround in the fortunes of the equity markets, as investor uncertainty, caused in part by global unrest and rising oil prices, led many of the markets lower. In fact, the Dow Jones Industrial AverageSM was the only domestic equity benchmark to post a return in positive territory, advancing 0.37%.
What factors contributed to the Fund's performance? Energy stocks produced the best returns in the market during the year-to-date period, and the portfolio's overweight in the energy sector enhanced performance relative to the S&P 500 Index. Our emphasis on energy equipment and services stocks also proved favorable, as these companies continued to benefit from increased spending by energy producers on infrastructure, equipment and specialized services.
Stock selection was most successful in the consumer discretionary sector. Portfolio holdings in the gaming industry also performed well during the period. Another sector that contributed positively to relative results was the materials sector, as a healthy economy and soaring commodity prices boosted returns within the sector. Metals and mining companies were the best performers.
On the downside, disappointing stock selection in the health care sector, which posted poor returns during the period, detracted from the Fund's relative performance. The weakest performers were health care providers and services companies, which declined on concerns about slowing enrollment growth and cost pressures related to Medicare. The portfolio's industrial and business services holdings also hindered relative performance during the period. The key issue in this sector was what the portfolio did not own – the Fund held underweight positions in several areas that performed well, including aerospace and defense and air freight and logistics. The consumer staples sector was another area of relative weakness. We have remained underweight in this sector because of its below-average growth, but we have found selected opportunities with promising growth prospects. Examples include consumer products maker Procter & Gamble and beverage and snack company PepsiCo.
What is your outlook? Despite the recent increases in inflation and interest rates, we continue to expect solid economic growth in 2006, with stable unemployment and consumer confidence. In addition, we anticipate continued growth in corporate earnings, leading to increased business spending. However, as profit growth moderates, diligent stock selection should become increasingly important. Valuations are reasonable, particularly for large-cap growth companies generating consistent earnings and cash flow growth. We remain vigilant in seeking companies with durable, long-term growth characteristics.
28
MassMutual Select Blue Chip Growth Fund – Portfolio Manager Report (Continued)
MassMutual Select Blue Chip Growth Fund
Industry Table
(% of Net Assets) on 6/30/06
| Financial Services | | | 12.6 | % | |
Electrical Equipment &
Electronics | | | 10.0 | % | |
| Pharmaceuticals | | | 8.6 | % | |
| Retail | | | 6.9 | % | |
| Banking, Savings & Loans | | | 5.1 | % | |
| Insurance | | | 5.0 | % | |
| Energy | | | 4.6 | % | |
| Healthcare | | | 4.4 | % | |
| Prepackaged Software | | | 4.4 | % | |
| Computers & Information | | | 3.8 | % | |
Information Retrieval
Services | | | 3.5 | % | |
| Machinery & Components | | | 3.3 | % | |
| Industrial – Diversified | | | 3.3 | % | |
| Communications | | | 3.1 | % | |
| Medical Supplies | | | 2.7 | % | |
Data Processing &
Preparation | | | 2.0 | % | |
| Aerospace & Defense | | | 2.0 | % | |
Broadcasting, Publishing &
Printing | | | 1.7 | % | |
| Lodging | | | 1.5 | % | |
| Cosmetics & Personal Care | | | 1.4 | % | |
| Commercial Services | | | 1.4 | % | |
| Beverages | | | 1.2 | % | |
| Household Products | | | 0.9 | % | |
| Chemicals | | | 0.9 | % | |
| Entertainment & Leisure | | | 0.8 | % | |
| Metals & Mining | | | 0.8 | % | |
| Transportation | | | 0.7 | % | |
Home Construction,
Furnishings & Appliances | | | 0.6 | % | |
| Telephone Utilities | | | 0.6 | % | |
| Manufacturing | | | 0.5 | % | |
| Foods | | | 0.4 | % | |
Communications
Equipment | | | 0.3 | % | |
| Advertising | | | 0.3 | % | |
Short-Term Investments and
Other Assets and Liabilities | | | 0.7 | % | |
| | | | 100.0 | % | |
MassMutual Select Blue Chip Growth Fund
Largest Stock Holdings (6/30/06)
General Electric Co.
Danaher Corp.
Microsoft Corp.
UnitedHealth Group, Inc.
Schlumberger Ltd.
Citigroup, Inc.
State Street Corp.
Google, Inc. Cl. A
Wal-Mart Stores, Inc.
Kohl's Corp.
29
MassMutual Select Blue Chip Growth Fund – Portfolio Manager Report (Continued)
Growth of a $10,000 Investment
Hypothetical Investments in MassMutual Select Blue Chip Growth Fund Class S, Class A, Class A (sales load deducted), Class Y, Class L and the S&P 500 Index.
MassMutual Select Blue Chip Growth Fund
Total Return
| | | Year to Date
1/1/06 -
6/30/06 | | One Year
7/1/05 -
6/30/06 | | Five Year
Average
Annual
7/1/01 -
6/30/06 | | Since
Inception
Average
Annual
6/1/01 -
6/30/06 | |
| Class S | | | –1.86 | % | | | 3.99 | % | | | –1.55 | % | | | –1.84 | % | |
| Class A | | | –2.11 | % | | | 3.52 | % | | | –2.05 | % | | | –2.35 | % | |
Class A (sales
load deducted)* | | | –7.74 | % | | | –2.43 | % | | | –3.20 | % | | | –3.48 | % | |
| Class Y | | | –1.87 | % | | | 3.88 | % | | | –1.67 | % | | | –1.96 | % | |
| Class L | | | –1.98 | % | | | 3.75 | % | | | –1.81 | % | | | –2.09 | % | |
| S&P 500 Index | | | 2.70 | % | | | 8.62 | % | | | 2.49 | % | | | 1.96 | % | |
Hypothetical Investments in MassMutual Select Blue Chip Growth Fund Class N, Class N (CDSC fees deducted) and the S&P 500 Index.
MassMutual Select Blue Chip Growth Fund
Total Return
| | | Year to Date
1/1/06 - 6/30/06 | | One Year
7/1/05 - 6/30/06 | | Since Inception
Average Annual
12/31/02 - 6/30/06 | |
| Class N | | | –2.24 | % | | | 3.20 | % | | | 7.90 | % | |
Class N (CDSC
fees deducted)* | | | –3.22 | % | | | 2.20 | % | | | 7.90 | % | |
| S&P 500 Index | | | 2.70 | % | | | 8.62 | % | | | 13.10 | % | |
GROWTH OF A $10,000 INVESTMENT SINCE INCEPTION
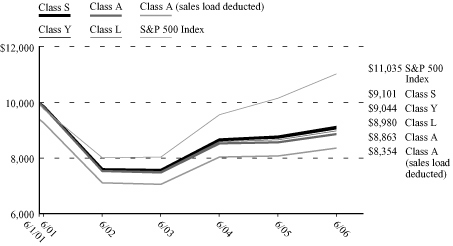
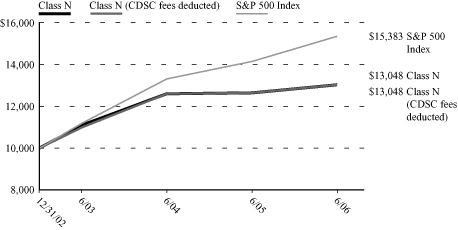
* Class A (sales load deducted) returns include the 5.75% maximum sales charge and Class N (CDSC fees deducted) returns include the 1.00% maximum contingent deferred sales charge for the first 18 months shown.
Performance data quoted represents past performance; past performance is not predictive of future results. The investment return and principal value of shares of the Fund will fluctuate with market conditions so that shares of the Fund, when redeemed, may be worth more or less than their original cost. Current performance of the Fund may be lower or higher than the performance quoted. Performance data current to the most recent month end may be obtained by calling 1-888-309-3539.
Investors should note that the Fund is a professionally managed mutual fund, while the S&P 500 Index is unmanaged and does not incur expenses, and cannot be purchased directly by investors. Investors should read the Fund's prospectus with regard to the Fund's investment objective, risks and charges and expenses in conjunction with these financial statements. Employee retirement benefit plans that invest plan assets in the Separate Investment Accounts (SIAs) may be subject to certain charges as set forth in their respective Plan Documents. Total return figures would be lower for the periods presented if they reflected these charges. The performance tables and charts do not reflect the deduction of taxes that a shareholder would pay on the fund distributions or the redemption of the fund shares.
30
MassMutual Select Large Cap Growth Fund – Portfolio Manager Report
What is the investment objective of the Select Large Cap Growth Fund? The Fund seeks long-term growth of capital and future income by normally investing at least 80% of its net assets in the common stocks and securities convertible into common stocks of companies which the Fund's sub-adviser believes offer prospects for long-term growth and which, at the time of purchase, have market capitalizations of at least approximately $10 billion.
How did the Fund perform during the six months ended June 30, 2006? The Fund's Class S shares returned –7.17%, underperforming the 2.70% return of the S&P 500® Index, a widely recognized, unmanaged index representative of common stocks of larger capitalized U.S. companies.
What was the investment backdrop during the period? The U.S. stock market's first quarter returns varied greatly by month. January's performance was robust, with the S&P 500 Index making a 2.7% single-month gain. February marked a significant pullback, while in March, the market regained steam, albeit below January's pace to end 4.2% ahead for the quarter. During this period, investors began incorporating increased inflation into their analyses. Such a perception bodes poorly for longer-term assets, such as growth stocks. In this environment, the growth style lagged value, preventing three quarters of growth outperformance from gaining further traction.
For the second quarter of 2006, U.S. equity markets were down nearly across the board, as fears of the Federal Reserve increasing interest rates to combat inflation drove the yield on the 10-year Treasury up 0.30% to 5.14%. The market uncertainty that emerged in the first quarter accelerated in the second, and investors who had gotten out of touch with volatility in recent years saw renewed gyrations in day-to-day returns. Growth stocks in particular suffered more than their share of this volatility.
What factors contributed to the Fund's performance? In the first quarter, the Fund's underperformance was driven primarily by stock-specific issues related to several of our information technology and health care holdings. Ironically, the information technology sector was an overall contributor to relative performance. Although Yahoo! and Juniper were detractors, Broadcom, Corning and Qualcomm were the top three performing stocks for the first quarter.
The health care sector was the largest detractor from performance in the first quarter. Our underperformance was due primarily to holding overweight positions in Alcon, Genentech and St. Jude. Sector allocation also detracted from our first quarter results. Another drag on the Fund's performance came from our underweight position in the top-performing industrials sector. A more positive result came from our overweight position in key performer Broadcom. In that same vein, the most significant contributions to the Fund's first quarter progress came from an underweight position in the consumer staples sector and our overweight position in the financial services sector.
Turning to the second quarter, the Fund's underperformance was driven by stock-specific issues related to several of our information technology and health care holdings, compounded by overall market problems, including inflation worries. The information technology sector was the largest detractor from relative performance. However, our overweight position in Google and underweight position in Microsoft were primary contributors to the Fund's second quarter performance. Their contributions, however, could not offset the weaknesses of Broadcom, Advanced Micro Devices, eBay and Qualcomm.
The health care sector was the second-largest detractor from performance in the second quarter. Our underperformance was due primarily to holding overweight positions in Teva Pharma, UnitedHealth Group and St. Jude. Sector allocation also detracted from returns. The most significant detractors included underweight positions in the industrials and consumer staples sectors. The largest contribution came from our overweight position in the energy sector, which was one of the top performers for the quarter.
31
MassMutual Select Large Cap Growth Fund – Portfolio Manager Report (Continued)
What is your outlook? We believe that the renewed outperformance of value stocks is only a temporary phenomenon. Economic indicators in the first quarter started showing surprising strength, and first quarter U.S. Gross Domestic Product (GDP) did come in far ahead of what was anticipated. But we see this surge as an offset to the fourth quarter of 2005, during which GDP was considerably lower than many recent quarters. When you average these two quarters together, you see the economic slowdown that we have been anticipating. Historically, growth stocks have generally outperformed value stocks during periods of decelerating economic growth.
MassMutual Select Large Cap Growth Fund
Industry Table
(% of Net Assets) on 6/30/06
| Pharmaceuticals | | | 13.2 | % | |
| Financial Services | | | 10.1 | % | |
Information Retrieval
Services | | | 9.2 | % | |
| Energy | | | 7.7 | % | |
| Insurance | | | 7.0 | % | |
Electrical Equipment &
Electronics | | | 6.0 | % | |
| Communications | | | 5.9 | % | |
| Banking, Savings & Loans | | | 5.1 | % | |
| Healthcare | | | 4.9 | % | |
| Retail | | | 4.3 | % | |
| Computers & Information | | | 4.2 | % | |
| Aerospace & Defense | | | 4.2 | % | |
| Cosmetics & Personal Care | | | 4.0 | % | |
| Lodging | | | 3.0 | % | |
| Household Products | | | 2.7 | % | |
| Commercial Services | | | 1.8 | % | |
| Chemicals | | | 1.6 | % | |
| Restaurants | | | 1.6 | % | |
| Machinery & Components | | | 0.6 | % | |
| Prepackaged Software | | | 0.6 | % | |
| Industrial – Diversified | | | 0.5 | % | |
| Foods | | | 0.5 | % | |
Short-Term Investments and
Other Assets and Liabilities | | | 1.3 | % | |
| | | | 100.0 | % | |
MassMutual Select Large Cap
Growth Fund
Largest Stock Holdings (6/30/06)
WellPoint, Inc.
Google, Inc. Cl. A
Apple Computer, Inc.
The Procter & Gamble Co.
Halliburton Co.
Genentech, Inc.
Boeing Co.
Yahoo!, Inc.
Legg Mason, Inc.
Qualcomm, Inc.
32
MassMutual Select Large Cap Growth Fund – Portfolio Manager Report (Continued)
Growth of a $10,000 Investment
Hypothetical Investments in MassMutual Select Large Cap Growth Fund Class S, Class A, Class A (sales load deducted), Class Y, Class L and the S&P 500 Index.
MassMutual Select Large Cap Growth Fund
Total Return
| | | Year to Date
1/1/06 - 6/30/06 | | One Year
7/1/05 - 6/30/06 | | Since Inception
Average Annual
12/31/01 - 6/30/06 | |
| Class S | | | –7.17 | % | | | 7.17 | % | | | –0.60 | % | |
| Class A | | | –7.39 | % | | | 6.72 | % | | | –1.06 | % | |
Class A (sales
load deducted)* | | | –12.71 | % | | | 0.58 | % | | | –2.36 | % | |
| Class Y | | | –7.29 | % | | | 7.10 | % | | | –0.69 | % | |
| Class L | | | –7.31 | % | | | 6.90 | % | | | –0.53 | % | |
| S&P 500 Index | | | 2.70 | % | | | 8.62 | % | | | 3.83 | % | |
Hypothetical Investments in MassMutual Select Large Cap Growth Fund Class N, Class N (CDSC fees deducted) and the S&P 500 Index.
MassMutual Select Large Cap Growth Fund
Total Return
| | | Year to Date
1/1/06 - 6/30/06 | | One Year
7/1/05 - 6/30/06 | | Since Inception
Average Annual
12/31/02 - 6/30/06 | |
| Class N | | | –7.57 | % | | | 6.36 | % | | | 9.44 | % | |
Class N (CDSC
fees deducted)* | | | –8.49 | % | | | 5.36 | % | | | 9.44 | % | |
| S&P 500 Index | | | 2.70 | % | | | 8.62 | % | | | 13.10 | % | |
GROWTH OF A $10,000 INVESTMENT SINCE INCEPTION
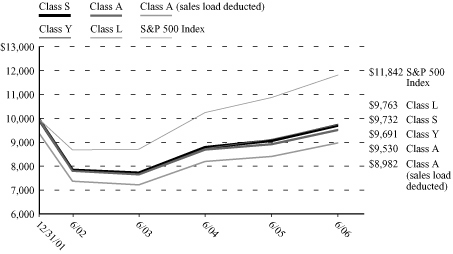
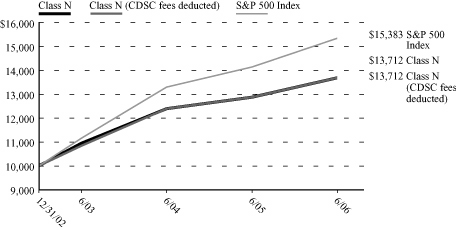
* Class A (sales load deducted) returns include the 5.75% maximum sales charge and Class N (CDSC fees deducted) returns include the 1.00% maximum contingent deferred sales charge for the first 18 months shown.
Performance data quoted represents past performance; past performance is not predictive of future results. The investment return and principal value of shares of the Fund will fluctuate with market conditions so that shares of the Fund, when redeemed, may be worth more or less than their original cost. Current performance of the Fund may be lower or higher than the performance quoted. Performance data current to the most recent month end may be obtained by calling 1-888-309-3539.
Investors should note that the Fund is a professionally managed mutual fund, while the S&P 500 Index is unmanaged and does not incur expenses, and cannot be purchased directly by investors. Investors should read the Fund's prospectus with regard to the Fund's investment objective, risks and charges and expenses in conjunction with these financial statements. Employee retirement benefit plans that invest plan assets in the Separate Investment Accounts (SIAs) may be subject to certain charges as set forth in their respective Plan Documents. Total return figures would be lower for the periods presented if they reflected these charges. The performance tables and charts do not reflect the deduction of taxes that a shareholder would pay on the fund distributions or the redemption of the fund shares.
33
MassMutual Select Growth Equity Fund – Portfolio Manager Report
What is the investment objective of the Select Growth Equity Fund? This Fund seeks long-term growth of capital and future income by normally investing at least 80% of its net assets in the common stocks and securities convertible into common stocks of companies that the Fund's sub-adviser believes offer prospects for long-term growth.
How did the Fund perform during the six months ended June 30, 2006? The Fund's Class S shares returned –5.14%, lagging the 2.70% return of the S&P 500® Index, a widely recognized, unmanaged index representative of common stocks of larger capitalized U.S. companies.
What was the investment background during the period? Stocks picked up in the first quarter of 2006, exactly where they left off in late 2005, posting solid gains in the face of economic uncertainty and potentially setting the stage for a fourth consecutive year of equity gains since 2002. Solid growth in corporate profits and signs of an uptick in overall economic activity helped to boost share prices during the first three months of the year. High-quality U.S. stocks again underperformed their low-quality counterparts, although the spread appeared to taper during the period.
In a dramatic turnaround, the majority of the U.S. equity market indexes posted negative returns in the second quarter, with the exception of the Dow Jones Industrial AverageSM, which advanced 0.37%. Leading the markets lower was investor uncertainty, caused in part by global unrest and rising oil prices. The spread between high- and low-quality stocks was considerable during the timeframe, although both ended the quarter in negative territory.
What factors contributed to the Fund's performance? Portfolio performance in the first quarter was hindered by the Fund's overweight position (relative to its benchmark, the S&P 500 Index) in health care and its underweight position in the services sector. Lower-than-benchmark positions in the food & beverage, machinery and manufacturing sectors contributed to relative returns, but not enough to offset overall negative sector performance. Stock selection was negative for the quarter, due in large part to picks among technology issues. Specific contributors included the portfolio's overweight positions in Merck & Co., Caterpillar Inc., Nvidia Corp., Fannie Mae, and Schwab Corp., as well as underweight positions in Medtronic Inc., Johnson & Johnson and General Electric. Detractors included overweight positions in Intel Corp., United Health Group, Altria Group, Lowe's Companies and Dell Inc., as well as the portfolio's underweight position in Cisco Systems and QUALCOMM.
Turning to the second quarter, the Fund's progress was hampered by underweight positions in manufacturing and consumer goods, and an overweight position in health care. The Fund's underweight position in technology and construction, and greater-than-benchmark allocations to the financial and oil & gas sectors contributed to relative returns. Stock selection was negative for the quarter, due in large part to picks among health care, financial, retail stores and technology issues. Specific stock contributors included the portfolio's overweight positions in Merck & Co., Caterpillar Inc., and Altria Group, as well as underweight positions in Microsoft, eBay, Cisco Systems, and Boston Scientific. Detractors included overweight positions in UnitedHealth Group, Home Depot, QUALCOMM, Dell Inc., Express Scripts, Broadcom Corp., Motorola and Aetna Inc., as well as the portfolio's underweight position in Comcast Corp.
What is your outlook? Our market outlook for the remainder of 2006 is for a moderate, yet sustained bear market. Numerous forces will likely continue to influence the direction that the market takes moving forward – such as oil prices, inflation, geopolitical unrest and Fed policy. We believe, however, that we have positioned the Fund to be ready to handle the wide array of market conditions that investors may face throughout the remainder of the year.
34
MassMutual Select Growth Equity Fund – Portfolio Manager Report (Continued)
MassMutual Select Growth Equity Fund
Industry Table
(% of Net Assets) on 6/30/06
| Pharmaceuticals | | | 14.4 | % | |
| Retail | | | 13.6 | % | |
| Insurance | | | 6.6 | % | |
Electrical Equipment &
Electronics | | | 5.6 | % | |
| Healthcare | | | 5.1 | % | |
| Financial Services | | | 5.1 | % | |
| Transportation | | | 4.4 | % | |
| Energy | | | 4.1 | % | |
| Medical Supplies | | | 3.3 | % | |
| Commercial Services | | | 3.2 | % | |
| Machinery & Components | | | 2.8 | % | |
| Communications | | | 2.5 | % | |
| Computers & Information | | | 2.0 | % | |
Computers & Office
Equipment | | | 1.9 | % | |
| Banking, Savings & Loans | | | 1.8 | % | |
| Foods | | | 1.7 | % | |
| Food Retailers | | | 1.6 | % | |
| Beverages | | | 1.5 | % | |
| Communications Equipment | | | 1.4 | % | |
| Household Products | | | 1.4 | % | |
| Aerospace & Defense | | | 1.3 | % | |
Information Retrieval
Services | | | 1.1 | % | |
| Prepackaged Software | | | 1.1 | % | |
| Tobacco | | | 1.0 | % | |
| Industrial – Diversified | | | 1.0 | % | |
| Metals & Mining | | | 1.0 | % | |
| Apparel, Textiles & Shoes | | | 1.0 | % | |
Home Construction,
Furnishings & Appliances | | | 0.9 | % | |
| Manufacturing | | | 0.8 | % | |
Data Processing &
Preparation | | | 0.8 | % | |
| Telephone Utilities | | | 0.7 | % | |
| Automotive & Parts | | | 0.7 | % | |
| Restaurants | | | 0.6 | % | |
Building Materials &
Construction | | | 0.4 | % | |
| Internet Content | | | 0.3 | % | |
| Cosmetics & Personal Care | | | 0.2 | % | |
| Advertising | | | 0.2 | % | |
| Heavy Machinery | | | 0.1 | % | |
Computer Programming
Services | | | 0.1 | % | |
Broadcasting, Publishing &
Printing | | | 0.1 | % | |
Computer Integrated
Systems Design | | | 0.0 | % | |
Short-Term Investments and
Other Assets and Liabilities | | | 2.6 | % | |
| | | | 100.0 | % | |
MassMutual Select Growth Equity Fund
Largest Stock Holdings (6/30/06)
The Home Depot, Inc.
Merck & Co., Inc.
Pfizer, Inc.
Lowe's Companies, Inc.
Qualcomm, Inc.
American International Group, Inc.
UnitedHealth Group, Inc.
Genentech, Inc.
Wal-Mart Stores, Inc.
Hewlett-Packard Co.
35
MassMutual Select Growth Equity Fund – Portfolio Manager Report (Continued)
Growth of a $10,000 Investment
Hypothetical Investments in MassMutual Select Growth Equity Fund Class S, Class A, Class A (sales load deducted), Class Y, Class L and the S&P 500 Index.
MassMutual Select Growth Equity Fund
Total Return
| | | Year to Date
1/1/06 -
6/30/06 | | One Year
7/1/05 -
6/30/06 | | Five Year
Average
Annual
7/1/01 -
6/30/06 | | Since
Inception
Average
Annual
5/3/99 -
6/30/06 | |
| Class S | | | –5.14 | % | | | –1.44 | % | | | –3.63 | % | | | –2.33 | % | |
| Class A | | | –5.38 | % | | | –1.79 | % | | | –4.07 | % | | | –2.76 | % | |
Class A (sales
load deducted)* | | | –10.82 | % | | | –7.44 | % | | | –5.20 | % | | | –3.56 | % | |
| Class Y | | | –5.16 | % | | | –1.51 | % | | | –3.69 | % | | | –2.39 | % | |
| Class L | | | –5.19 | % | | | –1.65 | % | | | –3.82 | % | | | –2.51 | % | |
| S&P 500 Index | | | 2.70 | % | | | 8.62 | % | | | 2.49 | % | | | 0.88 | % | |
��
Hypothetical Investments in MassMutual Select Growth Equity Fund Class N, Class N (CDSC fees deducted) and the S&P 500 Index.
MassMutual Select Growth Equity Fund
Total Return
| | | Year to Date
1/1/06 - 6/30/06 | | One Year
7/1/05 - 6/30/06 | | Since Inception
Average Annual
12/31/02 - 6/30/06 | |
| Class N | | | –5.45 | % | | | –2.10 | % | | | 6.37 | % | |
Class N (CDSC
fees deducted)* | | | –6.40 | % | | | –3.08 | % | | | 6.37 | % | |
| S&P 500 Index | | | 2.70 | % | | | 8.62 | % | | | 13.10 | % | |
GROWTH OF A $10,000 INVESTMENT SINCE INCEPTION
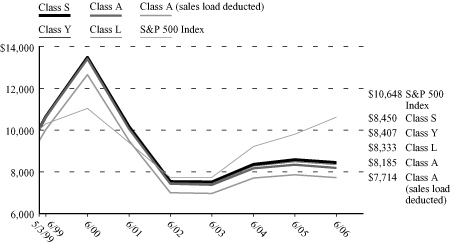
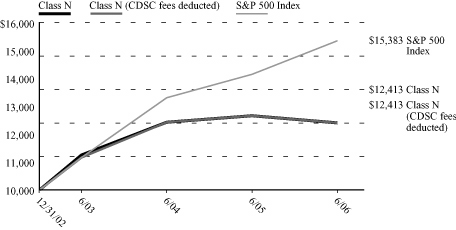
* Class A (sales load deducted) returns include the 5.75% maximum sales charge and Class N (CDSC fees deducted) returns include the 1.00% maximum contingent deferred sales charge for the first 18 months shown.
Performance data quoted represents past performance; past performance is not predictive of future results. The investment return and principal value of shares of the Fund will fluctuate with market conditions so that shares of the Fund, when redeemed, may be worth more or less than their original cost. Current performance of the Fund may be lower or higher than the performance quoted. Performance data current to the most recent month end may be obtained by calling 1-888-309-3539.
Investors should note that the Fund is a professionally managed mutual fund, while the S&P 500 Index is unmanaged and does not incur expenses, and cannot be purchased directly by investors. Investors should read the Fund's prospectus with regard to the Fund's investment objective, risks and charges and expenses in conjunction with these financial statements. Employee retirement benefit plans that invest plan assets in the Separate Investment Accounts (SIAs) may be subject to certain charges as set forth in their respective Plan Documents. Total return figures would be lower for the periods presented if they reflected these charges. The performance tables and charts do not reflect the deduction of taxes that a shareholder would pay on the fund distributions or the redemption of the fund shares.
36
MassMutual Select Aggressive Growth Fund – Portfolio Manager Report
What is the investment objective of the MassMutual Select Aggressive Growth Fund? This Fund seeks long-term capital appreciation by investing primarily in U.S. common stocks and other equity securities.
How did the Fund perform during the six months ended June 30, 2006? The Fund's Class S shares returned –9.32%, underperforming the 2.70% return of the S&P 500® Index, a widely recognized, unmanaged index representative of common stocks of larger capitalized U.S. companies.
What was the investment background during the period? For the six months ended June 30, 2006, equities outperformed bonds, against a backdrop of rising inflation, a slowing economy and indications of a slowdown in the real estate market. In the first quarter of 2006, most U.S. stock indexes posted strong gains, as solid growth in corporate profits and signs of an uptick in overall economic activity helped to boost share prices.
The second quarter saw a turnaround in the fortunes of the equity markets, as investor uncertainty – caused in part by global unrest and rising oil prices – led many of the markets lower. In fact, the Dow Jones Industrial AverageSM was the only broad domestic equity benchmark to post a return in positive territory, advancing 0.37%.
What factors contributed to the Fund's performance during the period? In the first quarter of 2006, from a sector perspective, several overweight positions in the consumer discretionary sector were the greatest detractors from the Fund's performance relative to its benchmark, the S&P 500 Index. True to our long-term fundamental approach to investing, however, we maintained our commitment to the sector, as we are optimistic about its prospects for the future.
Turning to the second quarter of 2006, the Fund's overweight position in the health care and consumer discretionary sectors relative to its benchmark detracted from performance. Also hampering the Fund's progress were underweight positions in the transportation and energy sectors. Conversely, underweight stakes in the technology and basic industry sectors, and an overweight position in telecommunications contributed to the Fund's relative performance in the second quarter.
What is your outlook? It is impossible to predict with any certainty whether or not the volatility that the equity markets have experienced in the first six months of 2006 is nearing an end. Numerous forces will continue to influence the direction that the market takes moving forward – such as oil prices, inflation, geopolitical unrest and Federal Reserve policy. We believe, however, that we have positioned the Fund to be ready to handle the wide array of market conditions that investors may face throughout the remainder of the year.
37
MassMutual Select Aggressive Growth Fund – Portfolio Manager Report (Continued)
MassMutual Select Aggressive Growth Fund
Industry Table
(% of Net Assets) on 6/30/06
| Pharmaceuticals | | | 15.1 | % | |
| Commercial Services | | | 14.7 | % | |
| Medical Supplies | | | 14.0 | % | |
Information Retrieval
Services | | | 12.2 | % | |
| Retail | | | 9.9 | % | |
| Food Retailers | | | 7.9 | % | |
| Communications | | | 6.4 | % | |
| Financial Services | | | 6.3 | % | |
| Computers & Information | | | 3.4 | % | |
| Prepackaged Software | | | 2.9 | % | |
| Energy | | | 2.5 | % | |
| Transportation | | | 1.0 | % | |
Data Processing &
Preparation | | | 0.5 | % | |
| Chemicals | | | 0.5 | % | |
| Healthcare | | | 0.5 | % | |
| Cosmetics & Personal Care | | | 0.4 | % | |
| Lodging | | | 0.4 | % | |
| Telephone Utilities | | | 0.4 | % | |
Short-Term Investments and
Other Assets and Liabilities | | | 1.0 | % | |
| | | | 100.0 | % | |
MassMutual Select Aggressive
Growth Fund
Largest Stock Holdings (6/30/06)
Google, Inc. Cl. A
Starbucks Corp.
Genentech, Inc.
eBay, Inc.
Chicago Mercantile Exchange Holdings, Inc.
Allergan, Inc.
Apollo Group, Inc. Cl. A
Qualcomm, Inc.
Genzyme Corp.
Lowe's Companies, Inc.
38
MassMutual Select Aggressive Growth Fund – Portfolio Manager Report (Continued)
Growth of a $10,000 Investment
Hypothetical Investments in MassMutual Select Aggressive Growth Fund Class S, Class A, Class A (sales load deducted), Class Y, Class L and the S&P 500 Index.
MassMutual Select Aggressive Growth Fund
Total Return
| | | Year to Date
1/1/06 -
6/30/06 | | One Year
7/1/05 -
6/30/06 | | Five Year
Average
Annual
7/1/01 -
6/30/06 | | Since
Inception
Average
Annual
5/1/00 -
6/30/06 | |
| Class S | | | –9.32 | % | | | 2.03 | % | | | 0.27 | % | | | –7.83 | % | |
| Class A | | | –9.58 | % | | | 1.56 | % | | | –0.24 | % | | | –8.29 | % | |
Class A (sales
load deducted)* | | | –14.78 | % | | | –4.28 | % | | | –1.41 | % | | | –9.17 | % | |
| Class Y | | | –9.38 | % | | | 1.87 | % | | | 0.13 | % | | | –7.93 | % | |
| Class L | | | –9.45 | % | | | 1.71 | % | | | 0.00 | % | | | –8.06 | % | |
| S&P 500 Index | | | 2.70 | % | | | 8.62 | % | | | 2.49 | % | | | –0.54 | % | |
Hypothetical Investments in MassMutual Select Aggressive Growth Fund Class N, Class N (CDSC fees deducted) and the S&P 500 Index.
MassMutual Select Aggressive Growth Fund
Total Return
| | | Year to Date
1/1/06 - 6/30/06 | | One Year
7/1/05 - 6/30/06 | | Since Inception
Average Annual
12/31/02 - 6/30/06 | |
| Class N | | | –9.58 | % | | | 1.23 | % | | | 12.88 | % | |
Class N (CDSC
fees deducted)* | | | –10.48 | % | | | 0.23 | % | | | 12.88 | % | |
| S&P 500 Index | | | 2.70 | % | | | 8.62 | % | | | 13.10 | % | |
GROWTH OF A $10,000 INVESTMENT SINCE INCEPTION

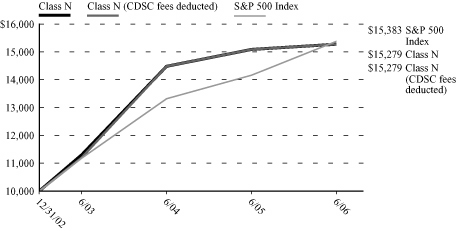
* Class A (sales load deducted) returns include the 5.75% maximum sales charge and Class N (CDSC fees deducted) returns include the 1.00% maximum contingent deferred sales charge for the first 18 months shown.
Performance data quoted represents past performance; past performance is not predictive of future results. The investment return and principal value of shares of the Fund will fluctuate with market conditions so that shares of the Fund, when redeemed, may be worth more or less than their original cost. Current performance of the Fund may be lower or higher than the performance quoted. Performance data current to the most recent month end may be obtained by calling 1-888-309-3539.
Investors should note that the Fund is a professionally managed mutual fund, while the S&P 500 Index is unmanaged and does not incur expenses, and cannot be purchased directly by investors. Investors should read the Fund's prospectus with regard to the Fund's investment objective, risks and charges and expenses in conjunction with these financial statements. Employee retirement benefit plans that invest plan assets in the Separate Investment Accounts (SIAs) may be subject to certain charges as set forth in their respective Plan Documents. Total return figures would be lower for the periods presented if they reflected these charges. The performance tables and charts do not reflect the deduction of taxes that a shareholder would pay on the fund distributions or the redemption of the fund shares.
39
MassMutual Select OTC 100 Fund – Portfolio Manager Report
What is the investment objective of the Select OTC 100 Fund? This Fund seeks to approximate, as closely as practicable (before fees and expenses), the total return of the 100 largest publicly traded over-the-counter common stocks. The Fund pursues this objective by investing at least 80% of its net assets in the equity securities of companies included in the NASDAQ 100 Index®, which is generally recognized as representative of the over-the-counter market.
How did the Fund perform during the six months ended June 30, 2006? The Fund's Class S shares returned –4.27%, nearly in line with the –4.25% return of the NASDAQ 100 Index.
The NASDAQ 100 Index is a modified capitalization-weighted index composed of the 100 largest non-financial companies listed on the National Association of Securities Dealers Automated Quotations System ("NASDAQ").
What was the investment backdrop during the period? The Federal Reserve (Fed) raised interest rates twice during the first quarter of 2006, bringing the federal funds rate to 4.75% as of March 31. The new chairman of the Fed, Ben Bernanke, announced that additional hikes might be necessary due to "elevated prices of energy and other commodities." Oil prices remained a concern for investors and cast a shadow over future growth in both the U.S. and abroad. During the first quarter of 2006, crude oil prices ranged between $60 and $70 per barrel, within striking distance of the 2005 high of $71. On the positive side, however, the U.S. Commerce Department announced that businesses saw their after-tax profits rise 13.8% during the fourth quarter of 2005, a dramatic improvement from the third quarter, when profits were down 4.3%.
The Fed maintained its tightening policy and increased interest rates by 0.25% at each Federal Open Market Committee (FOMC) meeting in May and June. This last increase was the 17th consecutive one since June 2004, and brought the federal funds rate to 5.25% as of June 29. Ahead of the June meeting, there had been some market speculation that the Fed might raise their key interest rate by 0.50%. The continued rise in energy and commodity prices had fueled concerns about inflationary pressure on the U.S. economy. The lack of substantial progress in talks with Iran regarding their nuclear program contributed substantially to rising oil prices. Crude prices finished the quarter just above $70 per barrel, after reaching a new high of $75 in late April. In addition, the escalation of the conflict with North Korea that culminated with the actual testing of long-range missiles, added to the nervousness that pervaded financial markets.
What factors contributed to the Fund's performance? The NASDAQ 100 Index finished the first quarter of 2006 up 3.69%. The industrial sector advanced 16.84% for the quarter. The information technology sector returned 2.67%. Consumer discretionary also advanced for the quarter, with a return of 5.35%.
The second quarter produced very different results for the NASDAQ 100 Index. It finished the period with a loss of 7.47%, following poor performance from the information technology sector, which finished down 10.44%. The energy and health care sectors also contributed to the negative return of the index, with returns of –11.14% and –7.97%, respectively. On the upside, the materials sector showed strong returns, advancing 10.75% for the second quarter.
What is your outlook? It is impossible to predict with any certainty whether or not the volatility that the equity markets have experienced in the first six months of 2006 is nearing an end. Numerous forces will continue to influence the direction that the market takes moving forward – such as oil prices, inflation, geopolitical unrest and Fed policy. We expect these factors to have the greatest impact on market conditions as the remainder of 2006 unfolds.
40
MassMutual Select OTC 100 Fund – Portfolio Manager Report (Continued)
MassMutual Select OTC 100 Fund
Industry Table
(% of Net Assets) on 6/30/06
| Prepackaged Software | | | 14.8 | % | |
Electrical Equipment &
Electronics | | | 12.4 | % | |
| Pharmaceuticals | | | 12.1 | % | |
| Computers & Information | | | 11.2 | % | |
| Communications | | | 10.7 | % | |
Information Retrieval
Services | | | 6.3 | % | |
| Retail | | | 5.9 | % | |
| Commercial Services | | | 5.5 | % | |
| Food Retailers | | | 3.0 | % | |
Broadcasting, Publishing &
Printing | | | 2.7 | % | |
| Transportation | | | 1.8 | % | |
| Medical Supplies | | | 1.8 | % | |
| Manufacturing | | | 1.5 | % | |
Computer Integrated
Systems Design | | | 1.5 | % | |
| Automotive & Parts | | | 1.1 | % | |
Computer Programming
Services | | | 1.1 | % | |
| Computer Related Services | | | 1.0 | % | |
| Healthcare | | | 1.0 | % | |
| Advertising | | | 0.8 | % | |
Data Processing &
Preparation | | | 0.7 | % | |
| Retail – Grocery | | | 0.7 | % | |
| Telephone Utilities | | | 0.6 | % | |
| Lodging | | | 0.6 | % | |
| Apparel, Textiles & Shoes | | | 0.5 | % | |
| Machinery & Components | | | 0.5 | % | |
| Travel | | | 0.4 | % | |
| Energy | | | 0.4 | % | |
| Internet Content | | | 0.4 | % | |
| Communications Equipment | | | 0.3 | % | |
Short-Term Investments and
Other Assets and Liabilities | | | (1.3 | )% | |
| | | | 100.0 | % | |
MassMutual Select OTC 100 Fund
Largest Stock Holdings (6/30/06)
Microsoft Corp.
Qualcomm, Inc.
Apple Computer, Inc.
Google, Inc. Cl. A
Cisco Systems, Inc.
Starbucks Corp.
Intel Corp.
Amgen, Inc.
Oracle Corp.
Comcast Corp. Cl. A
41
MassMutual Select OTC 100 Fund – Portfolio Manager Report (Continued)
Growth of a $10,000 Investment
Hypothetical Investments in MassMutual Select OTC 100 Fund Class S, Class A, Class A (sales load deducted), Class Y, Class L and the NASDAQ 100 Index.
MassMutual Select OTC 100 Fund
Total Return
| | | Year to Date
1/1/06 -
6/30/06 | | One Year
7/1/05 -
6/30/06 | | Five Year
Average
Annual
7/1/01 -
6/30/06 | | Since
Inception
Average
Annual
5/1/00 -
6/30/06 | |
| Class S | | | –4.27 | % | | | 5.21 | % | | | –3.25 | % | | | –13.60 | % | |
| Class A | | | –4.61 | % | | | 4.80 | % | | | –3.74 | % | | | –14.04 | % | |
Class A (sales
load deducted)* | | | –10.10 | % | | | –1.23 | % | | | –4.87 | % | | | –14.86 | % | |
| Class Y | | | –4.30 | % | | | 5.25 | % | | | –3.37 | % | | | –13.71 | % | |
| Class L | | | –4.56 | % | | | 5.01 | % | | | –3.51 | % | | | –13.84 | % | |
| NASDAQ 100 Index | | | –4.25 | % | | | 5.47 | % | | | –2.98 | % | | | –13.21 | % | |
Hypothetical Investments in MassMutual Select OTC 100 Fund Class N, Class N (CDSC fees deducted) and the NASDAQ 100 Index.
MassMutual Select OTC 100 Fund
Total Return
| | | Year to Date
1/1/06 - 6/30/06 | | One Year
7/1/05 - 6/30/06 | | Since Inception
Average Annual
12/31/02 - 6/30/06 | |
| Class N | | | –4.67 | % | | | 4.58 | % | | | 13.03 | % | |
Class N (CDSC
fees deducted)* | | | –5.62 | % | | | 3.58 | % | | | 13.03 | % | |
| NASDAQ 100 Index | | | –4.25 | % | | | 5.47 | % | | | 14.20 | % | |
GROWTH OF A $10,000 INVESTMENT SINCE INCEPTION


* Class A (sales load deducted) returns include the 5.75% maximum sales charge and Class N (CDSC fees deducted) returns include the 1.00% maximum contingent deferred sales charge for the first 18 months shown.
Performance data quoted represents past performance; past performance is not predictive of future results. The investment return and principal value of shares of the Fund will fluctuate with market conditions so that shares of the Fund, when redeemed, may be worth more or less than their original cost. Current performance of the Fund may be lower or higher than the performance quoted. Performance data current to the most recent month end may be obtained by calling 1-888-309-3539.
Investors note that the Fund is a professionally managed mutual fund, while the NASDAQ 100 Index is unmanaged and does not incur expenses, and cannot be purchased directly by investors. Investors should read the Fund's prospectus with regard to the Fund's investment objective, risks and charges and expenses in conjunction with these financial statements. Employee retirement benefit plans that invest plan assets in the Separate Investment Accounts (SIAs) may be subject to certain charges as set forth in their respective Plan Documents. Total return figures would be lower for the periods presented if they reflected these charges. The performance tables and charts do not reflect the deduction of taxes that a shareholder would pay on the fund distributions or the redemption of the fund shares.
42
MassMutual Select Focused Value Fund – Portfolio Manager Report
What is the investment objective of the MassMutual Select Focused Value Fund? This Fund seeks growth of capital over the long term by investing primarily in a non-diversified portfolio of U.S. equity securities. As a non-diversified fund, the Fund is not limited in the percentage of its assets that it may invest in any one company. (This means that the Fund may hold larger positions in a smaller number of stocks than a diversified fund. As a result, an increase or decrease in value of a single stock could have a greater impact on the Fund's net asset value and its total return.)
How did the Fund perform during the six months ended June 30, 2006? The Fund's Class S shares returned 2.39%, trailing the 6.32% return of the Russell 2500TM Index, a widely recognized, unmanaged index representative of common stocks of mid-capitalized U.S. companies.
What was the investment background during the period? For the six months ended June 30, 2006, equities outperformed bonds, against a backdrop of rising inflation, a slowing economy and indications of a slowdown in the real estate market. In the first quarter of 2006, most U.S. stock indexes posted strong gains, as solid growth in corporate profits and signs of an uptick in overall economic activity helped to boost share prices.
The second quarter saw a turnaround in the fortunes of the equity markets, as investor uncertainty (caused in part by global unrest and rising oil prices) led many of the markets lower. In fact, the Dow Jones Industrial AverageSM was the only broad domestic equity benchmark to post a return in positive territory, advancing 0.37%.
What factors contributed to the Fund's performance? During the first quarter of 2006, the portfolio benefited most by lack of exposure to both energy and utility stocks, which both experienced weaker performance during the period. Conversely, the Fund's performance was dampened by consumer discretionary and industrials holdings.
Hewlett-Packard, Cablevision Systems and Morgan Stanley had the most significant positive impact on first quarter performance. Additionally, Pepsi Bottling Group and JPMorgan Chase were solid contributors – as were CBRL group (a restaurant company), Seagate Technology and Itron Corporation (a manufacturer of automatic meter reading equipment). Interestingly, stock selection strength did not come from the winners we chose, but the losers we avoided. Only six portfolio holdings posted negative results in the first quarter.
Turning to the second quarter, overall, the portfolio benefited most by its financials, consumer discretionary, and health care stocks. Conversely, performance was diminished by lack of exposure to both utility and energy stocks, along with an overweight position in the technology sector. On a stock-specific basis, Cablevision Systems, Washington Mutual, and Pepsi Bottling Group made the greatest contributions to performance during the period. JPMorgan Chase and Yum! Brands also fueled the Fund's returns.
What is your outlook? A lackluster equity market has generally been the friend of investors like us, as it has provided the Fund with a wonderful opportunity to own some very strong businesses – with below-average risk profiles – trading at large discounts to intrinsic values. Our level of conviction remains quite high, and we are confident in the portfolio's strong position.
43
MassMutual Select Focused Value Fund – Portfolio Manager Report (Continued)
MassMutual Select Focused Value Fund
Industry Table
(% of Net Assets) on 6/30/06
Electrical Equipment &
Electronics | | | 10.4 | % | |
| Restaurants | | | 9.0 | % | |
| Banking, Savings & Loans | | | 8.7 | % | |
Broadcasting, Publishing &
Printing | | | 8.3 | % | |
| Retail | | | 6.2 | % | |
| Transportation | | | 5.4 | % | |
| Medical Supplies | | | 5.3 | % | |
| Industrial – Diversified | | | 4.5 | % | |
| Financial Services | | | 4.4 | % | |
Computers & Office
Equipment | | | 4.3 | % | |
| Computers & Information | | | 3.8 | % | |
| Commercial Services | | | 3.4 | % | |
| Beverages | | | 3.2 | % | |
| Insurance | | | 2.9 | % | |
Home Construction,
Furnishings & Appliances | | | 2.7 | % | |
| Machinery & Components | | | 2.3 | % | |
| Chemicals | | | 2.1 | % | |
| Advertising | | | 1.9 | % | |
| Foods | | | 1.8 | % | |
| Automotive & Parts | | | 1.0 | % | |
| Apparel, Textiles & Shoes | | | 0.8 | % | |
Computer Integrated
Systems Design | | | 0.8 | % | |
Data Processing &
Preparation | | | 0.7 | % | |
| Healthcare | | | 0.7 | % | |
| Pharmaceuticals | | | 0.4 | % | |
| Toys, Games | | | 0.4 | % | |
| Entertainment & Leisure | | | 0.3 | % | |
Short-Term Investments and
Other Assets and Liabilities | | | 4.3 | % | |
| | | | 100.0 | % | |
MassMutual Select Focused Value Fund
Largest Stock Holdings (6/30/06)
JP Morgan Chase & Co.
McDonald's Corp.
Hewlett-Packard Co.
Yum! Brands, Inc.
Baxter International, Inc.
Tyco International Ltd.
Washington Mutual, Inc.
Morgan Stanley
Tiffany & Co.
Intel Corp.
44
MassMutual Select Focused Value Fund – Portfolio Manager Report (Continued)
Growth of a $10,000 Investment
Hypothetical Investments in MassMutual Select Focused Value Fund Class S, Class A, Class A (sales load deducted), Class Y, Class L and the Russell 2500 Index.
MassMutual Select Focused Value Fund
Total Return
| | | Year to Date
1/1/06 -
6/30/06 | | One Year
7/1/05 -
6/30/06 | | Five Year
Average
Annual
7/1/01 -
6/30/06 | | Since
Inception
Average
Annual
5/1/00 -
6/30/06 | |
| Class S | | | 2.39 | % | | | 4.43 | % | | | 10.98 | % | | | 13.43 | % | |
| Class A | | | 2.09 | % | | | 3.86 | % | | | 10.43 | % | | | 12.85 | % | |
Class A (sales
load deducted)* | | | –3.78 | % | | | –2.12 | % | | | 9.13 | % | | | 11.78 | % | |
| Class Y | | | 2.29 | % | | | 4.30 | % | | | 10.87 | % | | | 13.30 | % | |
| Class L | | | 2.25 | % | | | 4.19 | % | | | 10.72 | % | | | 13.14 | % | |
| Russell 2500 Index | | | 6.32 | % | | | 13.53 | % | | | 9.65 | % | | | 8.43 | % | |
Hypothetical Investments in MassMutual Select Focused Value Fund Class N, Class N (CDSC fees deducted) and the Russell 2500 Index.
MassMutual Select Focused Value Fund
Total Return
| | | Year to Date
1/1/06 - 6/30/06 | | One Year
7/1/05 - 6/30/06 | | Since Inception
Average Annual
12/31/02 - 6/30/06 | |
| Class N | | | 2.00 | % | | | 3.61 | % | | | 16.39 | % | |
Class N (CDSC
fees deducted)* | | | 1.00 | % | | | 2.66 | % | | | 16.39 | % | |
| Russell 2500 Index | | | 6.32 | % | | | 13.53 | % | | | 21.70 | % | |
GROWTH OF A $10,000 INVESTMENT SINCE INCEPTION
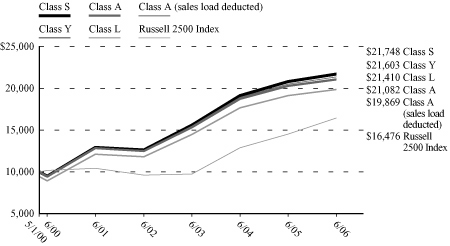
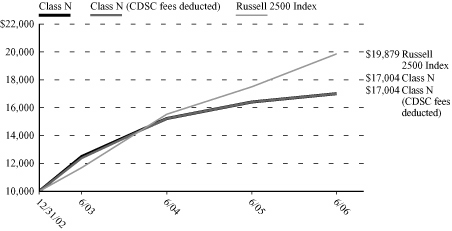
* Class A (sales load deducted) returns include the 5.75% maximum sales charge and Class N (CDSC fees deducted) returns include the 1.00% maximum contingent deferred sales charge for the first 18 months shown.
Performance data quoted represents past performance; past performance is not predictive of future results. The investment return and principal value of shares of the Fund will fluctuate with market conditions so that shares of the Fund, when redeemed, may be worth more or less than their original cost. Current performance of the Fund may be lower or higher than the performance quoted. Performance data current to the most recent month end may be obtained by calling 1-888-309-3539.
Investors should note that the Fund is a professionally managed mutual fund, while the Russell 2500 Index is unmanaged and does not incur expenses, and cannot be purchased directly by investors. Investors should read the Fund's prospectus with regard to the Fund's investment objective, risks and charges and expenses in conjunction with these financial statements. Employee retirement benefit plans that invest plan assets in the Separate Investment Accounts (SIAs) may be subject to certain charges as set forth in their respective Plan Documents. Total return figures would be lower for the periods presented if they reflected these charges. The performance tables and charts do not reflect the deduction of taxes that a shareholder would pay on the fund distributions or the redemption of the fund shares.
45
MassMutual Select Small Cap Value Equity Fund – Portfolio Manager Report
What is the investment objective of the MassMutual Select Small Cap Value Equity Fund? This Fund seeks to maximize total return through investment primarily in small capitalization equity securities.
How did the Fund perform during the three months ended June 30, 2006? Since the Fund's inception on March 31, 2006, its Class S shares returned –2.10%, outpacing the –2.40% return of the Russell 2000® Value Index, a widely recognized, unmanaged index that measures the performance of those Russell 2000® Index Companies with lower price-to-book ratios and lower forecasted growth rates.
What was the investment backdrop during the period? The second quarter proved to be a challenging environment for investors. Increased volatility amid drastic return swings and concerns over the May meeting of the Federal Open Market Committee (FOMC) influenced the market, which seemed to lack any clear direction. Stocks continued trending upward in April before reversing sharply in May. June finished up the quarter slightly positive.
After touching its lowest level since November 2005 on June 14, 2006, the S&P 500® Index bounced sharply to finish the month of June with a 0.1% return. Still, its May sell-off left the S&P 500 Index with a 1.4% loss for the second quarter and 2.7% gain since the start of the year. Smaller stocks were particularly punished when monetary policy uncertainty drove volatility higher in May and June. The Russell 2000 Index lost 5.0% for the three months ended June 30, 2006 though it retained an 8.2% gain year-to-date due to its strong run-up in the first quarter of the year.
Growth stocks did not fare as well as value stocks during the second quarter. The Russell 1000® Growth Index slipped 3.9% for the quarter, and was down 0.9% for the year as of June 30, 2006. The Russell 1000® Value Index gained 0.6% for the quarter, and was ahead 6.6% year-to-date as of the end of the second quarter. Style sentiment was similar among small caps, as the Russell 2000® Growth Index dropped 7.3% for the quarter, while the Russell 2000® Value Index only declined 2.7% over the same period. As of June 30, 2006 for the year, the Russell 2000 Growth Index had gained 6.1%, while the Russell 2000 Value Index had advanced 10.4%.
What factors contributed to the Fund's performance? Stock selection was positive in the second quarter and the main contributor to relative returns. The Fund's stock selection was most favorable in the electronic equipment and specialty retail industries. Conversely, our stock picks in the biotechnology and food & beverage industries hampered the Fund's progress in the second quarter.
What is your outlook? While data dependency and policy uncertainty suggest little clarity regarding the evolution of short-term interest rates in the second half of 2006, the volatile equity markets in May and June may have already factored in the possibility of additional monetary tightening in the near term. Investors may therefore grow comfortable with a modest rebuilding of equity positions, especially if second quarter earnings reports can create fresh enthusiasm for newly lower share prices. The risks include higher inflation, which might exacerbate concerns that corporate profits growth will eventually fall victim to rising interest rates. In the meantime, reasonable valuations and resilient profits may help equities to repair much of their second-quarter damage.
46
MassMutual Select Small Cap Value Equity Fund – Portfolio Manager Report (Continued)
MassMutual Select Small Cap Value Equity Fund
Industry Table
(% of Net Assets) on 6/30/06
| Banking, Savings & Loans | | | 15.6 | % | |
| Financial Services | | | 12.1 | % | |
Electrical Equipment &
Electronics | | | 6.4 | % | |
| Commercial Services | | | 5.8 | % | |
| Insurance | | | 5.7 | % | |
| Energy | | | 4.0 | % | |
| Chemicals | | | 3.3 | % | |
| Apparel, Textiles & Shoes | | | 2.7 | % | |
| Automotive & Parts | | | 2.6 | % | |
Broadcasting, Publishing &
Printing | | | 2.6 | % | |
| Electric Utilities | | | 2.5 | % | |
| Prepackaged Software | | | 2.5 | % | |
| Pharmaceuticals | | | 2.0 | % | |
Building Materials &
Construction | | | 1.8 | % | |
| Retail | | | 1.7 | % | |
| Communications | | | 1.7 | % | |
| Metals & Mining | | | 1.6 | % | |
| Forest Products & Paper | | | 1.6 | % | |
| Foods | | | 1.6 | % | |
| Computers & Information | | | 1.5 | % | |
| Medical Supplies | | | 1.4 | % | |
| Telephone Utilities | | | 1.3 | % | |
| Transportation | | | 1.3 | % | |
| Entertainment & Leisure | | | 1.3 | % | |
| Machinery & Components | | | 1.2 | % | |
| Restaurants | | | 1.1 | % | |
Computer Integrated
Systems Design | | | 1.1 | % | |
| Lodging | | | 0.8 | % | |
| Aerospace & Defense | | | 0.7 | % | |
Home Construction,
Furnishings & Appliances | | | 0.7 | % | |
| Water Companies | | | 0.7 | % | |
Data Processing &
Preparation | | | 0.6 | % | |
Information Retrieval
Services | | | 0.6 | % | |
| Healthcare | | | 0.5 | % | |
| Real Estate | | | 0.5 | % | |
| Beverages | | | 0.4 | % | |
| Containers | | | 0.4 | % | |
| Heavy Machinery | | | 0.4 | % | |
| Industrial – Diversified | | | 0.4 | % | |
| Oil & Gas | | | 0.3 | % | |
Computer Programming
Services | | | 0.2 | % | |
Computer Maintenance &
Repair | | | 0.2 | % | |
| Computer Related Services | | | 0.2 | % | |
| Air Transportation | | | 0.2 | % | |
| Household Products | | | 0.1 | % | |
| Tobacco | | | 0.1 | % | |
| Advertising | | | 0.1 | % | |
| Electronics | | | 0.0 | % | |
| Environmental Controls | | | 0.0 | % | |
Short-Term Investments and
Other Assets and Liabilities | | | 3.9 | % | |
| | | | 100.0 | % | |
MassMutual Select
Small Cap Value Equity Fund
Largest Stock Holdings (6/30/06)
Universal Compression Holdings, Inc.
Westar Energy, Inc.
Group 1 Automotive, Inc.
Emcor Group, Inc.
Old National Bancorp
ArvinMeritor, Inc.
Big Lots, Inc.
FelCor Lodging Trust, Inc.
Texas Industries, Inc.
Senior Housing Properties Trust
47
MassMutual Select Small Cap Value Equity Fund – Portfolio Manager Report (Continued)
Growth of a $10,000 Investment
Hypothetical Investments in MassMutual Select Small Cap Value Equity Fund Class S, Class A, Class A (sales load deducted), Class Y, Class L, Class N, Class N (CDSC fees deducted) and the Russell 2000 Value Index.
MassMutual Select Small Cap Value Equity Fund
Total Return
| | | Since Inception
3/31/06 - 6/30/06 | |
| Class S | | | –2.10 | % | |
| Class A | | | –2.20 | % | |
| Class A (sales load deducted)* | | | –7.82 | % | |
| Class Y | | | –2.10 | % | |
| Class L | | | –2.20 | % | |
| Class N | | | –2.30 | % | |
| Class N (CDSC fees deducted)* | | | –3.28 | % | |
| Russell 2000 Value Index | | | –2.40 | % | |
GROWTH OF A $10,000 INVESTMENT SINCE INCEPTION

* Class A (sales load deducted) returns include the 5.75% maximum sales charge and Class N (CDSC fees deducted) returns include the 1.00% maximum contingent deferred sales charge.
Performance data quoted represents past performance; past performance is not predictive of future results. The investment return and principal value of shares of the Fund will fluctuate with market conditions so that shares of the Fund, when redeemed, may be worth more or less than their original cost. Current performance of the Fund may be lower or higher than the performance quoted. Performance data current to the most recent month end may be obtained by calling 1-888-309-3539.
Investors should note that the Fund is a professionally managed mutual fund, while the Russell 2000 Value Index is unmanaged and does not incur expenses, and cannot be purchased directly by investors. Investors should read the Fund's prospectus with regard to the Fund's investment objective, risks and charges and expenses in conjunction with these financial statements. Employee retirement benefit plans that invest plan assets in the Separate Investment Accounts (SIAs) may be subject to certain charges as set forth in their respective Plan Documents. Total return figures would be lower for the periods presented if they reflected these charges. The performance tables and charts do not reflect the deduction of taxes that a shareholder would pay on the fund distributions or the redemption of the fund shares.
48
MassMutual Select Small Company Value Fund – Portfolio Manager Report
What is the investment objective of the MassMutual Select Small Company Value Fund? The Fund seeks to achieve long-term growth of capital by investing primarily in a diversified portfolio of equity securities of smaller companies.
How did the Fund perform during the six months ended June 30, 2006? The Fund's Class S shares returned 9.13%, outpacing the 8.21% return of the Russell 2000® Index, a widely recognized, unmanaged index representative of common stocks of smaller capitalized U.S. companies.
What was the investment background during the period? The U.S. stock market produced solid gains in the first three months of 2006. Despite the specter of rising short-term interest rates, stocks drew support from healthy corporate profit growth (represented by the S&P 500® Index's 15th consecutive quarter of double-digit earnings growth), better-than-expected economic data, and lively merger activity. Small-cap stocks led the market's advance, with the small-cap Russell 2000 Index enjoying its best quarter in 15 years while mid-cap stocks outpaced large-cap names. Value and growth stocks were mixed during the quarter, but value shares outperformed in most segments of the market.
In an about-face, U.S. stocks fell in the second quarter, erasing much of the market's gains from the first three months of the year. Inflation concerns surfaced as record-high commodity prices filtered through to the retail level, producing surprisingly strong increases in the Consumer Price Index. Consequently, the Federal Reserve indicated that further interest rate increases were likely. The combination of higher inflation and rising interest rates put downward pressure on stocks. Small-cap stocks suffered the largest declines, while larger-company stocks held up the best. Value shares comfortably outpaced growth issues across all market capitalizations.
What factors contributed to the Fund's performance? During the first quarter, sector weightings drove much of the portfolio's outperformance, but stock selection – especially in the energy and health care sectors – also contributed to the Fund's bottom line. Performance was also fueled by stock selection in the financials and consumer discretionary sectors. In both of these sectors, we sold some of our more extended positions, and re-deployed the proceeds into inexpensive stocks with improving fundamentals. Conversely, the portfolio was beset by weakness from certain holdings in its health care and utilities sectors, where some of its investments were impacted by company-specific events.
Turning to the second quarter, stock selection in the consumer staples and utilities sectors boosted performance. In addition, merger and acquisition activity helped to drive the Fund's results. Three companies, Alderwoods Group, Aviall Inc., and NRG Energy, were all bid for at significant premiums to their prior prices. Favorable stock selection in the information technology sector and an overweight in energy stocks also contributed positively to performance relative to the Russell 2000 Index, while poor stock picks among industrial and business services stocks detracted from relative results. Also hampering the Fund's progress were weaker stock picks in the materials and financials sectors. Within materials, speculative activity in the metals and mining industries made for a particularly challenging environment. Consequently, we made adjustments to both of these sectors during the final weeks of the quarter in an effort to addr ess these issues. Finally, hampering the Fund's performance in the second quarter was the portfolio's relative overweight position in homebuilders, where our holdings have been negatively impacted by investor concerns over continued interest rate increases and real estate slowdowns in several geographic markets.
What is your outlook? Despite a recent uptick in the inflation rate, the economy appears to remain on solid footing as we enter the second half of the year. Evidence suggests that the six-year market leadership of small-cap stocks may be coming to an end, and the economic recovery has reached a mature stage where growth-oriented stocks have historically outperformed. As a result, we are cautious about the small-cap value segment of the market going forward. To face these expected challenges, we have positioned the portfolio in a variety of attractively valued stocks with improving fundamentals.
49
MassMutual Select Small Company Value Fund – Portfolio Manager Report (Continued)
MassMutual Select Small Company Value Fund
Industry Table
(% of Net Assets) on 6/30/06
| Financial Services | | | 10.3 | % | |
| Commercial Services | | | 10.0 | % | |
| Energy | | | 9.8 | % | |
| Banking, Savings & Loans | | | 8.9 | % | |
Electrical Equipment &
Electronics | | | 6.6 | % | |
| Insurance | | | 5.0 | % | |
| Transportation | | | 4.4 | % | |
| Chemicals | | | 3.3 | % | |
| Machinery & Components | | | 3.3 | % | |
| Metals & Mining | | | 2.9 | % | |
| Retail | | | 2.7 | % | |
| Electric Utilities | | | 2.4 | % | |
| Apparel, Textiles & Shoes | | | 2.4 | % | |
| Healthcare | | | 2.2 | % | |
| Prepackaged Software | | | 1.6 | % | |
| Restaurants | | | 1.5 | % | |
| Computer Related Services | | | 1.4 | % | |
| Pharmaceuticals | | | 1.4 | % | |
Home Construction,
Furnishings & Appliances | | | 1.4 | % | |
| Forest Products & Paper | | | 1.4 | % | |
Building Materials &
Construction | | | 1.3 | % | |
| Heavy Machinery | | | 1.2 | % | |
| Industrial – Diversified | | | 1.2 | % | |
| Medical Supplies | | | 1.1 | % | |
| Automotive & Parts | | | 1.1 | % | |
| Communications | | | 0.8 | % | |
| Lodging | | | 0.6 | % | |
| Consumer Products | | | 0.6 | % | |
| Manufacturing | | | 0.6 | % | |
| Foods | | | 0.6 | % | |
| Entertainment & Leisure | | | 0.5 | % | |
Broadcasting, Publishing &
Printing | | | 0.5 | % | |
| Household Products | | | 0.5 | % | |
| Aerospace & Defense | | | 0.4 | % | |
| Tobacco | | | 0.4 | % | |
| Air Transportation | | | 0.4 | % | |
Computer Integrated
Systems Design | | | 0.3 | % | |
| Heavy Construction | | | 0.3 | % | |
| Food Retailers | | | 0.3 | % | |
Data Processing &
Preparation | | | 0.2 | % | |
| Cosmetics & Personal Care | | | 0.2 | % | |
| Telephone Utilities | | | 0.1 | % | |
| Containers | | | 0.1 | % | |
Short-Term Investments and
Other Assets and Liabilities | | | 3.8 | % | |
| | | | 100.0 | % | |
MassMutual Select
Small Company Value Fund
Largest Stock Holdings (6/30/06)
Landstar System, Inc.
Cabot Oil & Gas Corp. Cl. A
Oceaneering International, Inc.
Phillips-Van Heusen Corp.
Dollar Thrifty Automotive Group, Inc.
East West Bancorp, Inc.
Texas Regional Bancshares, Inc.
TETRA Technologies, Inc.
FelCor Lodging Trust, Inc.
First Republic Bank
50
MassMutual Select Small Company Value Fund – Portfolio Manager Report (Continued)
Growth of a $10,000 Investment
Hypothetical Investments in MassMutual Select Small Company Value Fund Class S, Class A, Class A (sales load deducted), Class Y, Class L and the Russell 2000 Index.
MassMutual Select Small Company Value Fund
Total Return
| | | Year to Date
1/1/06 - 6/30/06 | | One Year
7/1/05 - 6/30/06 | | Since Inception
Average Annual
12/31/01 - 6/30/06 | |
| Class S | | | 9.13 | % | | | 15.81 | % | | | 12.65 | % | |
| Class A | | | 8.96 | % | | | 15.31 | % | | | 12.16 | % | |
Class A (sales
load deducted)* | | | 2.70 | % | | | 8.68 | % | | | 10.69 | % | |
| Class Y | | | 9.16 | % | | | 15.78 | % | | | 12.59 | % | |
| Class L | | | 9.14 | % | | | 15.62 | % | | | 12.42 | % | |
| Russell 2000 Index | | | 8.21 | % | | | 14.57 | % | | | 10.25 | % | |
Hypothetical Investments in MassMutual Select Small Company Value Fund Class N, Class N (CDSC fees deducted) and the Russell 2000 Index.
MassMutual Select Small Company Value Fund
Total Return
| | | Year to Date
1/1/06 - 6/30/06 | | One Year
7/1/05 - 6/30/06 | | Since Inception
Average Annual
12/31/02 - 6/30/06 | |
| Class N | | | 8.79 | % | | | 14.95 | % | | | 20.49 | % | |
Class N (CDSC
fees deducted)* | | | 7.79 | % | | | 13.95 | % | | | 20.49 | % | |
| Russell 2000 Index | | | 8.21 | % | | | 14.57 | % | | | 21.49 | % | |
GROWTH OF A $10,000 INVESTMENT SINCE INCEPTION
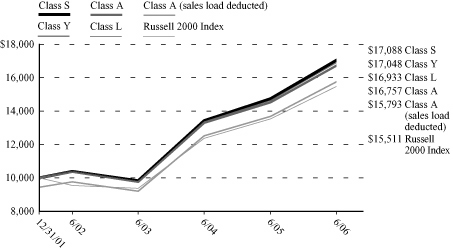

* Class A (sales load deducted) returns include the 5.75% maximum sales charge and Class N (CDSC fees deducted) returns include the 1.00% maximum contingent deferred sales charge for the first 18 months shown.
Performance data quoted represents past performance; past performance is not predictive of future results. The investment return and principal value of shares of the Fund will fluctuate with market conditions so that shares of the Fund, when redeemed, may be worth more or less than their original cost. Current performance of the Fund may be lower or higher than the performance quoted. Performance data current to the most recent month end may be obtained by calling 1-888-309-3539.
Investors should note that the Fund is a professionally managed mutual fund, while the Russell 2000 Index is unmanaged and does not incur expenses, and cannot be purchased directly by investors. Investors should read the Fund's prospectus with regard to the Fund's investment objective, risks and charges and expenses in conjunction with these financial statements. Employee retirement benefit plans that invest plan assets in the Separate Investment Accounts (SIAs) may be subject to certain charges as set forth in their respective Plan Documents. Total return figures would be lower for the periods presented if they reflected these charges. The performance tables and charts do not reflect the deduction of taxes that a shareholder would pay on the fund distributions or the redemption of the fund shares.
51
MassMutual Select Small Cap Core Equity Fund – Portfolio Manager Report
What is the investment objective of the MassMutual Select Small Cap Core Equity Fund? The Fund seeks long-term growth of capital by investing primarily in small capitalization equity securities.
How did the Fund perform during the three months ended June 30, 2006? Since the Fund's inception on March 31, 2006, its Class S shares returned –4.90%, trailing the –4.71% return of the Russell 2000® Index, a widely recognized, unmanaged index representative of common stocks of smaller capitalized U.S. companies.
What was the investment background during the period? The second quarter saw a turnaround in the fortunes of the equity markets (on the heels of a strong first quarter), as investor uncertainty, caused in part by global unrest and rising oil prices, led many of the markets lower. In fact, the Dow Jones Industrial AverageSM was the only broad domestic equity benchmark to post a return in positive territory, with its 0.37% advance.
What factors contributed to the Fund's performance? Returns to our investment themes were positive overall. Valuation was the best-performing theme, as inexpensive companies outperformed their more richly valued industry counterparts. Other investment themes, including profitability, management impact, analyst sentiment and momentum also added value, albeit less significantly. Meanwhile, earnings quality was relatively flat for the quarter.
Among sectors, stock selection was positive overall for the period. The Fund's holdings in the consumer discretionary and information technology sectors helped performance. Conversely, holdings in the energy and materials sectors detracted the most from excess returns.
In individual stocks, overweights in Group 1 Automotive, Inc.; Swift Transportation; Applera Corp-Applied Biosystems Group; American Home Mortgage Investment Corp. and Volt Information Sciences, Inc. were among the biggest positive contributors to relative performance. On the downside, overweights in United Industrial; Sunrise Assisted Living, Inc.; Neurocrine Biosciences; Six Flags, Inc. and Bon-Ton Stores, Inc. were among the least successful selections for the period.
What is your outlook? Looking ahead, we believe that less-expensive stocks could outpace more-expensive ones and good momentum could do better than poor momentum stocks. We also prefer companies about which fundamental research analysts are becoming more positive. In addition, we are optimistic about firms that are profitable, have sustainable earnings, and use their capital to enhance shareholder value. As such, we anticipate remaining fully invested and expect that the value we add over time will be due primarily to stock selection as opposed to sector or size allocations.
52
MassMutual Select Small Cap Core Equity Fund – Portfolio Manager Report (Continued)
MassMutual Select Small Cap Core Equity Fund
Industry Table
(% of Net Assets) on 6/30/06
| Financial Services | | | 9.5 | % | |
| Commercial Services | | | 8.6 | % | |
| Banking, Savings & Loans | | | 7.9 | % | |
| Pharmaceuticals | | | 6.0 | % | |
Electrical Equipment &
Electronics | | | 5.8 | % | |
| Medical Supplies | | | 4.1 | % | |
| Insurance | | | 3.7 | % | |
| Prepackaged Software | | | 3.4 | % | |
Computer Integrated
Systems Design | | | 3.1 | % | |
| Apparel, Textiles & Shoes | | | 3.0 | % | |
| Chemicals | | | 2.8 | % | |
| Foods | | | 2.7 | % | |
| Energy | | | 2.6 | % | |
| Transportation | | | 2.6 | % | |
| Automotive & Parts | | | 2.6 | % | |
| Retail | | | 2.3 | % | |
| Restaurants | | | 2.2 | % | |
| Electric Utilities | | | 2.0 | % | |
| Communications | | | 1.9 | % | |
| Entertainment & Leisure | | | 1.8 | % | |
Building Materials &
Construction | | | 1.8 | % | |
| Real Estate | | | 1.7 | % | |
Broadcasting, Publishing &
Printing | | | 1.7 | % | |
| Metals & Mining | | | 1.6 | % | |
| Healthcare | | | 1.6 | % | |
| Forest Products & Paper | | | 1.5 | % | |
| Telephone Utilities | | | 1.2 | % | |
Data Processing &
Preparation | | | 1.2 | % | |
Home Construction,
Furnishings & Appliances | | | 1.1 | % | |
| Computers & Information | | | 1.1 | % | |
| Heavy Machinery | | | 1.0 | % | |
| Aerospace & Defense | | | 0.9 | % | |
| Lodging | | | 0.7 | % | |
| Machinery & Components | | | 0.7 | % | |
| Beverages | | | 0.6 | % | |
| Computer Related Services | | | 0.6 | % | |
Information Retrieval
Services | | | 0.5 | % | |
Computer Programming
Services | | | 0.5 | % | |
| Internet Software | | | 0.4 | % | |
| Manufacturing | | | 0.2 | % | |
| Advertising | | | 0.1 | % | |
| Industrial – Diversified | | | 0.1 | % | |
Short-Term Investments and
Other Assets and Liabilities | | | 0.6 | % | |
| | | | 100.0 | % | |
MassMutual Select Small Cap Core
Equity Fund
Largest Stock Holdings (6/30/06)
American Home Mortgage Investment
Corp. REIT
Ikon Office Solutions, Inc.
NACCO Industries, Inc. Cl. A
Fremont General Corp.
Group 1 Automotive, Inc.
Applera Corp. – Applied Biosystems Group
Swift Energy Co.
Alkermes, Inc.
Senior Housing Properties Trust
Scholastic Corp.
53
MassMutual Select Small Cap Core Equity Fund – Portfolio Manager Report (Continued)
Growth of a $10,000 Investment
Hypothetical Investments in MassMutual Select Small Cap Core Equity Fund Class S, Class A, Class A (sales load deducted), Class Y, Class L, Class N, Class N (CDSC fees deducted) and the Russell 2000 Index.
MassMutual Select Small Cap Core Equity Fund
Total Return
| | | Since Inception
3/31/06 - 6/30/06 | |
| Class S | | | –4.90 | % | |
| Class A | | | –5.00 | % | |
| Class A (sales load deducted)* | | | –10.46 | % | |
| Class Y | | | –4.80 | % | |
| Class L | | | –4.90 | % | |
| Class N | | | –5.10 | % | |
| Class N (CDSC fees deducted)* | | | –6.05 | % | |
| Russell 2000 Index | | | –4.71 | % | |
GROWTH OF A $10,000 INVESTMENT SINCE INCEPTION
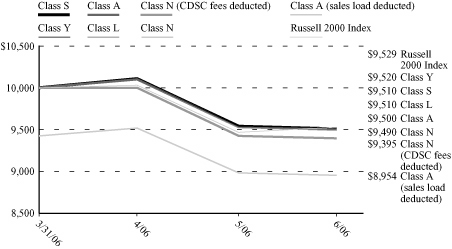
* Class A (sales load deducted) returns include the 5.75% maximum sales charge and Class N (CDSC fees deducted) returns include the 1.00% maximum contingent deferred sales charge.
Performance data quoted represents past performance; past performance is not predictive of future results. The investment return and principal value of shares of the Fund will fluctuate with market conditions so that shares of the Fund, when redeemed, may be worth more or less than their original cost. Current performance of the Fund may be lower or higher than the performance quoted. Performance data current to the most recent month end may be obtained by calling 1-888-309-3539.
Investors should note that the Fund is a professionally managed mutual fund, while the Russell 2000 Index is unmanaged and does not incur expenses, and cannot be purchased directly by investors. Investors should read the Fund's prospectus with regard to the Fund's investment objective, risks and charges and expenses in conjunction with these financial statements. Employee retirement benefit plans that invest plan assets in the Separate Investment Accounts (SIAs) may be subject to certain charges as set forth in their respective Plan Documents. Total return figures would be lower for the periods presented if they reflected these charges. The performance tables and charts do not reflect the deduction of taxes that a shareholder would pay on the fund distributions or the redemption of the fund shares.
54
MassMutual Select Mid Cap Growth Equity Fund – Portfolio Manager Report
What is the investment objective of the MassMutual Select Mid Cap Growth Equity Fund? This Fund seeks long-term capital growth by investing, under normal conditions, at least 80% of its net assets in stocks of companies with market capitalizations, at the time of purchase, that fall within the range of companies in either the S&P MidCap 400® Index or the Russell MidCap® Growth Index (as of January 31, 2006, between $468 million and $23.8 billion).
How did the Fund perform during the six months ended June 30, 2006? The Fund's Class S shares returned 6.42%, moderately outperforming the 6.32% return of the
Russell 2500TM Index, a widely recognized, unmanaged index representative of common stocks of mid-capitalized U.S. companies.
What was the investment background during the period? For the six months ended June 30, 2006, equities outperformed bonds, against a backdrop of rising inflation, a slowing economy and indications of a slowdown in the real estate market. In the first quarter of 2006, most U.S. stock indexes posted strong gains, as solid growth in corporate profits and signs of an uptick in overall economic activity helped to boost share prices.
The second quarter saw a turnaround in the fortunes of the equity markets, as investor uncertainty (caused in part by global unrest and rising oil prices) led many of the markets lower. In fact, the Dow Jones Industrial AverageSM was the only broad domestic equity benchmark to post a return in positive territory, advancing 0.37%.
What factors contributed to the Fund's performance? During the first quarter, the three sectors that contributed the most to portfolio performance were materials, energy and technology. Only two sectors detracted from the Fund's performance relative to the Fund's benchmark, the Russell 2500 Index – consumer discretionary and health care. In terms of how the portfolio was structured at the end of the first quarter, the three sectors where the portfolio held the greatest overweight positions relative to the benchmark were technology, health care, and materials. Conversely, the three sectors where the portfolio was most underweight relative to the benchmark included consumer discretionary, finance, and consumer durables.
During the second quarter, the three sectors that aided the Fund's overall performance the most were the materials, consumer discretionary and durables sectors. Conversely, the transportation, health care and finance sectors hampered relative portfolio performance. Stock selection accounted for nearly 93% of the Fund's relative performance experienced during the quarter. Some of the best-performing stocks included Choice Hotels International and Tenaris S.A. – while stocks such as Broadcom Corp. and Oshkosh Truck Corp. did not perform as expected. As of June 30, 2006, the portfolio was composed, once again, to have the greatest overweight positions in the materials, technology, and health care sectors. Conversely, the Fund's three largest underweight positions were in the consumer discretionary, transportation, and consumer staples sectors.
What is your outlook? In the third quarter, we expect investors to increasingly return to the market as earnings pre-announcement season approaches. While it is widely anticipated that U.S. economic growth peaked in the first quarter, we expect the average stock in the S&P 500® Index has potential to advance substantially. In addition, forward earnings estimates are still climbing, presenting some exciting opportunities for the portfolio.
55
MassMutual Select Mid Cap Growth Equity Fund – Portfolio Manager Report (Continued)
MassMutual Select Mid Cap Growth Equity Fund
Industry Table
(% of Net Assets) on 6/30/06
| Metals & Mining | | | 13.5 | % | |
Electrical Equipment &
Electronics | | | 9.1 | % | |
| Commercial Services | | | 7.9 | % | |
| Healthcare | | | 7.3 | % | |
| Energy | | | 6.3 | % | |
| Computers & Information | | | 5.3 | % | |
| Financial Services | | | 4.5 | % | |
| Medical Supplies | | | 4.2 | % | |
| Telephone Utilities | | | 3.8 | % | |
| Prepackaged Software | | | 3.5 | % | |
Computer Programming
Services | | | 2.5 | % | |
| Machinery & Components | | | 2.3 | % | |
| Lodging | | | 2.3 | % | |
| Banking, Savings & Loans | | | 2.3 | % | |
| Heavy Machinery | | | 2.2 | % | |
| Foods | | | 2.2 | % | |
| Pharmaceuticals | | | 2.2 | % | |
| Restaurants | | | 2.1 | % | |
| Aerospace & Defense | | | 1.8 | % | |
| Communications | | | 1.7 | % | |
| Automotive & Parts | | | 1.7 | % | |
| Real Estate | | | 1.5 | % | |
Building Materials &
Construction | | | 1.3 | % | |
| Industrial – Diversified | | | 1.3 | % | |
| Beverages | | | 1.3 | % | |
| Manufacturing | | | 1.2 | % | |
| Containers | | | 1.1 | % | |
| Retail | | | 1.1 | % | |
| Insurance | | | 1.0 | % | |
| Advertising | | | 0.9 | % | |
Short-Term Investments and
Other Assets and Liabilities | | | 0.6 | % | |
| | | | 100.0 | % | |
MassMutual Select Mid Cap
Growth Equity Fund
Largest Stock Holdings (6/30/06)
Tenaris SA ADR (Argentina)
Intuitive Surgical, Inc.
Allegheny Technologies, Inc.
Chicago Mercantile Exchange Holdings, Inc.
NII Holdings, Inc. Cl. B
MEMC Electronic Materials, Inc.
Joy Global, Inc.
Choice Hotels International, Inc.
Celgene Corp.
Darden Restaurants, Inc.
56
MassMutual Select Mid Cap Growth Equity Fund – Portfolio Manager Report (Continued)
Growth of a $10,000 Investment
Hypothetical Investments in MassMutual Select Mid Cap Growth Equity Fund Class S, Class A, Class A (sales load deducted), Class Y, Class L and the Russell 2500 Index.
MassMutual Select Mid Cap Growth Equity Fund
Total Return
| | | Year to Date
1/1/06 -
6/30/06 | | One Year
7/1/05 -
6/30/06 | | Five Year
Average
Annual
7/1/00 -
6/30/06 | | Since
Inception
Average
Annual
5/3/99 -
6/30/06 | |
| Class S | | | 6.42 | % | | | 16.81 | % | | | 2.19 | % | | | 2.44 | % | |
| Class A | | | 6.10 | % | | | 16.28 | % | | | 1.69 | % | | | 1.97 | % | |
Class A (sales
load deducted)* | | | 0.00 | % | | | 9.59 | % | | | 0.50 | % | | | 1.13 | % | |
| Class Y | | | 6.34 | % | | | 16.76 | % | | | 2.11 | % | | | 2.38 | % | |
| Class L | | | 6.20 | % | | | 16.45 | % | | | 1.96 | % | | | 2.23 | % | |
| Russell 2500 Index | | | 6.32 | % | | | 13.53 | % | | | 9.65 | % | | | 10.56 | % | |
Hypothetical Investments in MassMutual Select Mid Cap Growth Equity Fund Class N, Class N (CDSC fees deducted) and the Russell 2500 Index.
MassMutual Select Mid Cap Growth Equity Fund
Total Return
| | | Year to Date
1/1/06 - 6/30/06 | | One Year
7/1/05 - 6/30/06 | | Since Inception
Average Annual
12/31/02 - 6/30/06 | |
| Class N | | | 5.97 | % | | | 15.88 | % | | | 17.46 | % | |
Class N (CDSC
fees deducted)* | | | 4.97 | % | | | 14.88 | % | | | 17.46 | % | |
| Russell 2500 Index | | | 6.32 | % | | | 13.53 | % | | | 21.70 | % | |
GROWTH OF A $10,000 INVESTMENT SINCE INCEPTION
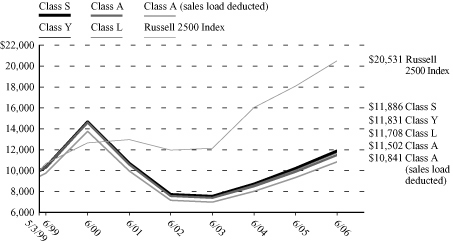
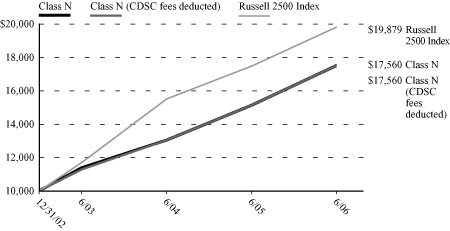
* Class A (sales load deducted) returns include the 5.75% maximum sales charge and Class N (CDSC fees deducted) returns include the 1.00% maximum contingent deferred sales charge for the first 18 months shown.
Performance data quoted represents past performance; past performance is not predictive of future results. The investment return and principal value of shares of the Fund will fluctuate with market conditions so that shares of the Fund, when redeemed, may be worth more or less than their original cost. Current performance of the Fund may be lower or higher than the performance quoted. Performance data current to the most recent month end may be obtained by calling 1-888-309-3539.
Investors should note that the Fund is a professionally managed mutual fund, while the Russell 2500 Index is unmanaged and does not incur expenses, and cannot be purchased directly by investors. Investors should read the Fund's prospectus with regard to the Fund's investment objective, risks and charges and expenses in conjunction with these financial statements. Employee retirement benefit plans that invest plan assets in the Separate Investment Accounts (SIAs) may be subject to certain charges as set forth in their respective Plan Documents. Total return figures would be lower for the periods presented if they reflected these charges. The performance tables and charts do not reflect the deduction of taxes that a shareholder would pay on the fund distributions or the redemption of the fund shares.
57
MassMutual Select Mid Cap Growth Equity II Fund – Portfolio Manager Report
What is the investment objective of the MassMutual Select Mid Cap Growth Equity II Fund? This Fund seeks growth of capital over the long term by investing, under normal conditions, at least 80% of its net assets in a broadly diversified portfolio of common stocks of mid-cap companies whose earnings the Fund's sub-adviser expects to grow at a faster rate than the average company. Mid-cap companies are defined as those whose market capitalizations, at the time of purchase, fall within the range of companies in either the S&P MidCap 400® Index or the Russell MidCap® Growth Index (as of January 31, 2006, between $468 million and $23.8 billion).
How did the Fund perform during the six months ended June 30, 2006? The Fund's Class S shares returned 1.38%, lagging the 4.24% return of the S&P MidCap 400 Index, a widely recognized, unmanaged index representative of common stocks of mid-capitalized U.S. companies.
What was the investment background during the period? During the first six months of 2006, investors seemed to be taking notice of the risks to the market – moderation in economic growth, continued high commodity prices and global interest rate increases – all with a dramatic decline in risk premiums in recent years. As a result, the second quarter witnessed a change in investor psychology from risk-seeking to risk-averse. Traditional growth sectors like consumer discretionary, health care and information technology fared poorly in the second quarter and in the first half of the year.
Cyclical and commodity-oriented stocks led the market in the first quarter and the early part of the second quarter. The continuation of Federal Reserve (Fed) rate increases and the kindling of inflation fears then sent the U.S. equity market tumbling following the Federal Open Market Committee's May 10 meeting. However, the Fed's language from its June 29 meeting – suggesting a near end to its recent tightening campaign – led to a rally at the end of the quarter, with growth stocks participating.
What factors contributed to the Fund's performance? Stock selection in the information technology (IT) sector and in industrials and business services companies detracted the most from the Fund's performance relative to the S&P MidCap 400 Index for the six months ended June 30, 2006. Conversely, our stock choices in the consumer discretionary and energy sectors contributed positively to relative returns during the same period.
In the IT sector, weak stock selection in the electronic equipment and instruments industry, among computers and peripherals companies and in the Internet software and services industry, all weighed on relative performance. Further dampening the sector were investigations by the Securities and Exchange Commission (SEC) and the Department of Justice into the practices of technology companies in granting stock options to executives. The portfolio maintains an overweight position in the sector, driven by a heavier emphasis on IT services, as they have steadier business models than other industries in the sector.
Within the industrials and business services sectors, weak stock selection in the air freight industry and among machinery companies detracted from relative performance. The portfolio maintains a larger exposure to defense stocks, expecting a long-term upward trend in defense spending and a cyclical tilt toward companies with business models leveraged to an improving economy.
The consumer discretionary sector produced the largest boost to relative performance in the period on the strength of stock selection in household durables and media. We are maintaining an underweight position in the consumer discretionary sector, as the portfolio is tilted away from the consumer and toward business. Capital spending has been suppressed since the technology bubble burst, and companies have healthy balance sheets with the need to replace aging technology. Finally, the energy sector added to the Fund's relative performance and was home to one of the portfolio's largest first-half contributors, FMC Technologies, which provides mission-critical technology solutions for the energy, food processing and airline industries. We remain positive on energy, believing long-term demand far outweighs supply. Our sector weighting in the sector is similar to that of the benchmark.
What is your outlook? While the economy may moderate from its rapid pace in recent years, we expect growth to remain solid. Valuations are reasonable and the market's recent weakness provided us with opportunities to upgrade the portfolio. We will continue to make adjustments to the Fund to position the portfolio appropriately for opportunities that arise.
58
MassMutual Select Mid Cap Growth Equity II Fund – Portfolio Manager Report (Continued)
MassMutual Select Mid Cap Growth Equity II Fund
Industry Table
(% of Net Assets) on 6/30/06
Electrical Equipment &
Electronics | | | 10.4 | % | |
| Commercial Services | | | 7.3 | % | |
| Pharmaceuticals | | | 6.5 | % | |
| Energy | | | 5.6 | % | |
| Financial Services | | | 5.2 | % | |
| Retail | | | 5.1 | % | |
| Healthcare | | | 4.9 | % | |
| Prepackaged Software | | | 4.5 | % | |
| Medical Supplies | | | 4.3 | % | |
| Advertising | | | 3.8 | % | |
| Communications | | | 3.8 | % | |
| Machinery & Components | | | 3.6 | % | |
| Computers & Information | | | 2.5 | % | |
| Metals & Mining | | | 2.2 | % | |
| Aerospace & Defense | | | 2.2 | % | |
Computer Integrated
Systems Design | | | 1.9 | % | |
| Lodging | | | 1.9 | % | |
| Insurance | | | 1.7 | % | |
| Transportation | | | 1.7 | % | |
| Banking, Savings & Loans | | | 1.7 | % | |
| Telephone Utilities | | | 1.5 | % | |
| Computer Related Services | | | 1.3 | % | |
Home Construction,
Furnishings & Appliances | | | 1.2 | % | |
| Air Transportation | | | 1.2 | % | |
Information Retrieval
Services | | | 1.2 | % | |
Computer Programming
Services | | | 1.1 | % | |
Broadcasting, Publishing &
Printing | | | 1.0 | % | |
| Industrial – Diversified | | | 0.9 | % | |
| Entertainment & Leisure | | | 0.9 | % | |
| Restaurants | | | 0.9 | % | |
| Manufacturing | | | 0.9 | % | |
| Chemicals | | | 0.8 | % | |
| Automotive & Parts | | | 0.8 | % | |
| Heavy Machinery | | | 0.7 | % | |
| Apparel, Textiles & Shoes | | | 0.7 | % | |
| Foods | | | 0.4 | % | |
| Electric Utilities | | | 0.3 | % | |
Data Processing &
Preparation | | | 0.3 | % | |
| Industrial – Distribution | | | 0.2 | % | |
| Beverages | | | 0.2 | % | |
| Retail – Grocery | | | 0.2 | % | |
Building Materials &
Construction | | | 0.2 | % | |
| Cosmetics & Personal Care | | | 0.1 | % | |
| Agribusiness | | | 0.1 | % | |
| Containers | | | 0.1 | % | |
| Education | | | 0.0 | % | |
Short-Term Investments and
Other Assets and Liabilities | | | 2.0 | % | |
| | | | 100.0 | % | |
MassMutual Select Mid Cap
Growth Equity II Fund
Largest Stock Holdings (6/30/06)
BJ Services Co.
Crown Castle International Corp.
Smith International, Inc.
Rockwell Collins, Inc.
Roper Industries, Inc.
XTO Energy, Inc.
Lamar Advertising Co.
Murphy Oil Corp.
American Tower Corp. Cl. A
Ametek, Inc.
59
MassMutual Select Mid Cap Growth Equity II Fund – Portfolio Manager Report (Continued)
Growth of a $10,000 Investment
Hypothetical Investments in MassMutual Select Mid Cap Growth Equity II Fund Class S, Class A, Class A (sales load deducted), Class Y, Class L and the S&P MidCap 400 Index.
MassMutual Select Mid Cap Growth Equity II Fund
Total Return
| | | Year to Date
1/1/06 -
6/30/06 | | One Year
7/1/05 -
6/30/06 | | Five Year
Average
Annual
7/1/01 -
6/30/06 | | Since
Inception
Average
Annual
6/1/00 -
6/30/06 | |
| Class S | | | 1.38 | % | | | 13.62 | % | | | 8.01 | % | | | 7.35 | % | |
| Class A | | | 1.13 | % | | | 13.13 | % | | | 7.49 | % | | | 6.82 | % | |
Class A (sales
load deducted)* | | | –4.68 | % | | | 6.62 | % | | | 6.22 | % | | | 5.79 | % | |
| Class Y | | | 1.31 | % | | | 13.52 | % | | | 7.93 | % | | | 7.26 | % | |
| Class L | | | 1.26 | % | | | 13.41 | % | | | 7.76 | % | | | 7.09 | % | |
S&P MidCap
400 Index | | | 4.24 | % | | | 12.97 | % | | | 9.29 | % | | | 9.35 | % | |
Hypothetical Investments in MassMutual Select Mid Cap Growth Equity II Fund Class N, Class N (CDSC fees deducted) and the S&P MidCap 400 Index.
MassMutual Select Mid Cap Growth Equity II Fund
Total Return
| | | Year to Date
1/1/06 - 6/30/06 | | One Year
7/1/05 - 6/30/06 | | Since Inception
Average Annual
12/31/02 - 6/30/06 | |
| Class N | | | 1.00 | % | | | 12.80 | % | | | 18.87 | % | |
Class N (CDSC
fees deducted)* | | | 0.00 | % | | | 11.80 | % | | | 18.87 | % | |
| S&P MidCap 400 Index | | | 4.24 | % | | | 12.97 | % | | | 19.45 | % | |
GROWTH OF A $10,000 INVESTMENT SINCE INCEPTION
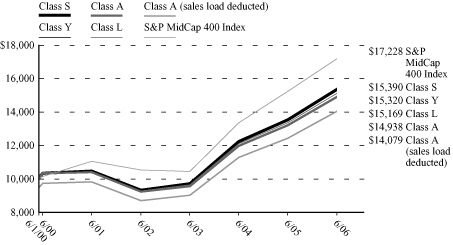
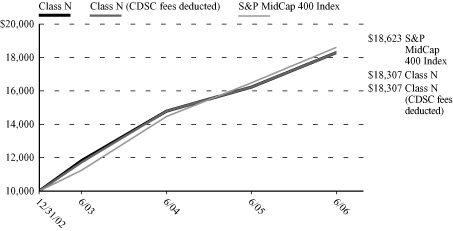
* Class A (sales load deducted) returns include the 5.75% maximum sales charge and Class N (CDSC fees deducted) returns include the 1.00% maximum contingent deferred sales charge for the first 18 months shown.
Performance data quoted represents past performance; past performance is not predictive of future results. The investment return and principal value of shares of the Fund will fluctuate with market conditions so that shares of the Fund, when redeemed, may be worth more or less than their original cost. Current performance of the Fund may be lower or higher than the performance quoted. Performance data current to the most recent month end may be obtained by calling 1-888-309-3539.
Investors should note that the Fund is a professionally managed mutual fund, while the S&P MidCap 400 Index is unmanaged and does not incur expenses, and cannot be purchased directly by investors. Investors should read the Fund's prospectus with regard to the Fund's investment objective, risks and charges and expenses in conjunction with these financial statements. Employee retirement benefit plans that invest plan assets in the Separate Investment Accounts (SIAs) may be subject to certain charges as set forth in their respective Plan Documents. Total return figures would be lower for the periods presented if they reflected these charges. The performance tables and charts do not reflect the deduction of taxes that a shareholder would pay on the fund distributions or the redemption of the fund shares.
60
MassMutual Select Small Cap Growth Equity Fund – Portfolio Manager Report
What is the investment objective of the Select Small Cap Growth Equity Fund? This Fund seeks long-term capital appreciation by investing primarily in common stocks and equity securities of smaller companies that the Fund's managers believe offer potential for long-term growth.
How did the Fund perform during the six months ended June 30, 2006? The Fund's Class S shares returned 4.31%, trailing the 8.21% return of the Russell 2000® Index, a widely recognized, unmanaged index representative of common stocks of smaller capitalized U.S. companies.
What was the investment background during the period? U.S. equity markets generally moved higher in the first quarter, supported by strength in corporate earnings, a solidifying global economy, and benign inflation. Small-caps outperformed their larger-cap peers for the quarter – and all sectors within the Russell 2000 Index had positive returns. Materials and telecommunication services were the largest gaining sectors, while utilities, consumer discretionary, and financials stocks trailed the index return.
Turning to the second quarter, domestic equity markets moved lower, driven by inflationary fears, higher interest rates, and concerns about a slowing economy. Small-cap stocks underperformed both mid- and large-caps. From a sector perspective, performance within the Russell 2000 Index was tilted in favor of defensively oriented sectors. The energy, utilities, and consumer staples sectors performed best, whereas the information technology, health care, and consumer discretionary sectors lagged the index.
What factors contributed to the Fund's performance? The vast majority of the Fund's underperformance in the first quarter was driven by poor stock selection in the industrials sector. While heavy machinery and general industrial stocks in the index were reaching new highs, our portfolio suffered from across-the-board underperformance in transportation-related stocks. The portfolio's progress was also hampered by unfavorable stock selection in the information technology, telecommunication services, and utilities sectors.
On the upside, although it is normally a minor contributor to our performance, the financials sector excelled in the first quarter, due to our underexposure (relative to the benchmark Russell 2000 Index) to banks and thrifts and our overexposure to investment managers and stock exchanges. Additionally, the portfolio was helped by strong stock selection in the health care and consumer discretionary sectors.
Turning to the second quarter, stock selection in the information technology sector hurt relative performance during the period. On a stock-specific basis, Foundry Networks, Goodman Global, and Cognos all detracted from relative returns.
Conversely, strong stock selection in the consumer discretionary sector contributed to the Fund's second quarter performance, led by specialty retailers DSW, Citi Trends, and Too, fashion brand management company Iconix, and gaming company Pinnacle Entertainment. Favorable stock selection in both industrials and health care also contributed to performance for the period. Additionally, our investment picks in the health care sector fueled the Fund's progress, as health care service providers Genesis Healthcare, Manor Care, and Magellan Health all performed well. Within the energy sector, service provider Tetra Technologies and exploration and production stock OPTI Canada outperformed.
61
MassMutual Select Small Cap Growth Equity Fund – Portfolio Manager Report (Continued)
What is your outlook? The annual rebalance of the Russell 2000 Index resulted in a 50% contraction in the market capitalization range. While focused first and foremost on investment merit and philosophy, we are working to adjust the portfolio's market capitalization to within historical ranges relative to the index. It is impossible to predict with any certainty whether or not the volatility that the equity markets have experienced in the first six months of 2006 is nearing an end. Numerous forces will continue to influence the direction that the market takes moving forward – such as oil prices, inflation, geopolitical unrest and Federal Reserve policy. We believe, however, that we have positioned the Fund to be ready to handle the wide array of market conditions that investors may face throughout the remainder of the year.
MassMutual Select Small Cap Growth Equity Fund
Industry Table
(% of Net Assets) on 6/30/06
| Commercial Services | | | 10.1 | % | |
| Prepackaged Software | | | 8.8 | % | |
| Healthcare | | | 6.3 | % | |
| Energy | | | 6.0 | % | |
Electrical Equipment &
Electronics | | | 5.1 | % | |
| Financial Services | | | 4.2 | % | |
| Transportation | | | 3.8 | % | |
| Medical Supplies | | | 3.7 | % | |
| Automotive & Parts | | | 3.1 | % | |
| Pharmaceuticals | | | 2.9 | % | |
| Computer Related Services | | | 2.8 | % | |
| Entertainment & Leisure | | | 2.7 | % | |
| Retail | | | 2.4 | % | |
| Computers & Information | | | 2.3 | % | |
| Banking, Savings & Loans | | | 2.2 | % | |
Data Processing &
Preparation | | | 2.0 | % | |
| Insurance | | | 2.0 | % | |
| Foods | | | 1.8 | % | |
| Advertising | | | 1.7 | % | |
| Chemicals | | | 1.3 | % | |
| Apparel, Textiles & Shoes | | | 1.2 | % | |
| Communications | | | 1.2 | % | |
| Telephone Utilities | | | 1.2 | % | |
Information Retrieval
Services | | | 1.1 | % | |
| Machinery & Components | | | 1.1 | % | |
| Lodging | | | 1.0 | % | |
Computer Integrated Systems
Design | | | 1.0 | % | |
| Air Transportation | | | 0.9 | % | |
Broadcasting, Publishing &
Printing | | | 0.9 | % | |
| Heavy Machinery | | | 0.9 | % | |
Building Materials &
Construction | | | 0.6 | % | |
| Industrial – Diversified | | | 0.5 | % | |
| Metals & Mining | | | 0.5 | % | |
| Internet Software | | | 0.5 | % | |
| Restaurants | | | 0.5 | % | |
| Electric Utilities | | | 0.5 | % | |
Computer & Other Data
Processing Service | | | 0.4 | % | |
| Aerospace & Defense | | | 0.4 | % | |
Home Construction,
Furnishings & Appliances | | | 0.3 | % | |
Computer Maintenance &
Repair | | | 0.3 | % | |
| Cosmetics & Personal Care | | | 0.3 | % | |
| Oil & Gas | | | 0.3 | % | |
| Household Products | | | 0.2 | % | |
Short-Term Investments and
Other Assets and Liabilities | | | 9.0 | % | |
| | | | 100.0 | % | |
MassMutual Select Small Cap Growth
Equity Fund
Largest Stock Holdings (6/30/06)
ITT Educational Services, Inc.
Checkfree Corp.
iShares Russell 2000 Growth Index Fund
FactSet Research Systems, Inc.
Blackbaud, Inc.
Kansas City Southern
Healthways, Inc.
The Corporate Executive Board Co.
Scientific Games Corp. Cl. A
J.B. Hunt Transport Services, Inc.
62
MassMutual Select Small Cap Growth Equity Fund – Portfolio Manager Report (Continued)
Growth of a $10,000 Investment
Hypothetical Investments in MassMutual Select Small Cap Growth Equity Fund Class S, Class A, Class A (sales load deducted), Class Y, Class L and the Russell 2000 Index.
MassMutual Select Small Cap Growth Equity Fund
Total Return
| | | Year to Date
1/1/06 -
6/30/06 | | One Year
7/1/05 -
6/30/06 | | Five Year
Average
Annual
7/1/01 -
6/30/06 | | Since
Inception
Average
Annual
5/3/99 -
6/30/06 | |
| Class S | | | 4.31 | % | | | 15.07 | % | | | 5.61 | % | | | 8.19 | % | |
| Class A | | | 4.13 | % | | | 14.48 | % | | | 5.04 | % | | | 7.63 | % | |
Class A (sales
load deducted)* | | | –1.85 | % | | | 7.89 | % | | | 3.81 | % | | | 6.74 | % | |
| Class Y | | | 4.28 | % | | | 14.98 | % | | | 5.47 | % | | | 8.05 | % | |
| Class L | | | 4.20 | % | | | 14.76 | % | | | 5.31 | % | | | 7.89 | % | |
| Russell 2000 Index | | | 8.21 | % | | | 14.57 | % | | | 8.50 | % | | | 8.83 | % | |
Hypothetical Investments in MassMutual Select Small Cap Growth Equity Fund Class N, Class N (CDSC fees deducted) and the Russell 2000 Index.
MassMutual Select Small Cap Growth Equity Fund
Total Return
| | | Year to Date
1/1/06 - 6/30/06 | | One Year
7/1/05 - 6/30/06 | | Since Inception
Average Annual
12/31/02 - 6/30/06 | |
| Class N | | | 3.87 | % | | | 14.08 | % | | | 19.36 | % | |
Class N (CDSC
fees deducted)* | | | 2.87 | % | | | 13.08 | % | | | 19.36 | % | |
| Russell 2000 Index | | | 8.21 | % | | | 14.57 | % | | | 21.49 | % | |
GROWTH OF A $10,000 INVESTMENT SINCE INCEPTION
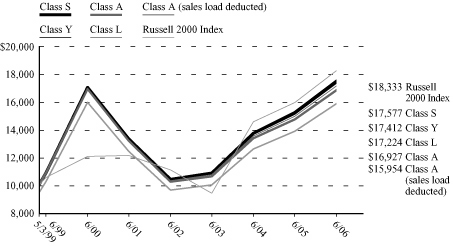
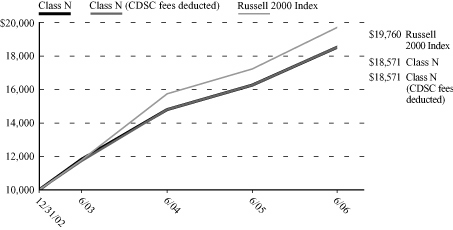
* Class A (sales load deducted) returns include the 5.75% maximum sales charge and Class N (CDSC fees deducted) returns include the 1.00% maximum contingent deferred sales charge for the first 18 months shown.
Performance data quoted represents past performance; past performance is not predictive of future results. The investment return and principal value of shares of the Fund will fluctuate with market conditions so that shares of the Fund, when redeemed, may be worth more or less than their original cost. Current performance of the Fund may be lower or higher than the performance quoted. Performance data current to the most recent month end may be obtained by calling 1-888-309-3539.
Investors should note that the Fund is a professionally managed mutual fund, while the Russell 2000 Index is unmanaged and does not incur expenses, and cannot be purchased directly by investors. Investors should read the Fund's prospectus with regard to the Fund's investment objective, risks and charges and expenses in conjunction with these financial statements. Employee retirement benefit plans that invest plan assets in the Separate Investment Accounts (SIAs) may be subject to certain charges as set forth in their respective Plan Documents. Total return figures would be lower for the periods presented if they reflected these charges. The performance tables and charts do not reflect the deduction of taxes that a shareholder would pay on the fund distributions or the redemption of the fund shares.
63
MassMutual Select Small Company Growth Fund – Portfolio Manager Report
What is the investment objective of the MassMutual Select Small Company Growth Fund? The Fund seeks long-term capital appreciation by investing primarily in common stocks and equity securities of smaller companies the Fund's sub-advisers believe offer potential for long-term growth.
How did the Fund perform during the six months ended June 30, 2006? The Fund's Class S shares returned 4.14%, trailing the 8.21% return of the Russell 2000® Index, a widely recognized, unmanaged index representative of common stocks of smaller capitalized U.S. companies.
What was the investment background during the period? In the first quarter and for the fourth quarter in a row, the U.S. stock market posted positive investment results across all major market capitalization and style segments. Large-cap stocks lagged as they have since 2001, but finally managed to recover to the levels last seen over five years ago. While mid-cap growth and value stocks performed in line with each other, small-cap growth stocks outperformed their value counterparts during the quarter. Meanwhile, the U.S. economy began its fifth year of expansion, as corporate profits proved more than adequate to shoulder the burden of higher oil prices following last year's devastating hurricane season. The Federal Reserve continued its fight against the threat of inflation by twice raising the federal funds target rate by 0.25%, bringing the to tal to 15 increases since June 2004 at the end of the first quarter.
Following four straight quarters of positive returns, domestic equities corrected in the second quarter, with small-cap and growth stocks declining most. Concerns about energy and commodity prices, questions about the widespread practice of options backdating, and the 16th and 17th consecutive increases in the federal funds rate won out over strong fundamental performance and a strong economy. The persistent value bias in the stock market re-emerged in the second quarter after three quarters of outperformance by growth stocks, which remained at historically attractive valuations relative to their value counterparts. Value stocks outperformed their growth counterparts across all market capitalization segments in the second quarter, as commodity prices reached new highs and triggered a growth stock sell-off. The U.S. economy, meanwhile, continued to show strength after posting stronger-than-expected Gross Domestic Product (GDP) growth of 5.6% for the first quarter and low unemployment, which was at a level of 4.6% at quarter-end.
What factors contributed to the Fund's performance? During the first quarter, every major sector finished with positive returns in both the portfolio and the Russell 2000 Index (the Fund's benchmark). Our top-performing sectors were producer durables and materials/processing. Our best picks in producer durables were OYO Geospace, a seismic acquisition company, and wire and cable provider, General Cable. The Fund's strength in the materials/processing sector was driven by aluminum recycler Aleris International and cotton-seed producer Delta & Pine Land. The portfolio also benefited from takeovers of Datastream and Duratek. Conversely, our worst-performing sectors relative to the benchmark were technology and energy, though we had solid absolute returns in both. In technology, we held an underweight position in semiconductors, and our holdings there didn't keep pace with the performance of the sector. We decreased our exposure to the health care sector during the quarter, and held a slightly overweight position in producer durables and technology. We ended the quarter with a slight underweight position in the autos/transportation and financial services sectors.
During the second quarter, our top-performing sectors were industrials and energy. We also had strong relative returns in information technology. The Fund benefited from strong stock selection in the industrials sector, including electrical equipment manufacturer stock General Cable and commercial services stock Corrections Corp. of America. The Fund found strength in the energy sector, driven by energy equipment/services stocks Tetra Technologies and Core Laboratories. In the technology sector, our software and Internet services picks were flat for the period. Our worst-performing sector in the second quarter was health care, where we trailed in health care equipment and biotechnology. We decreased our exposure to the health care sector slightly and held a nearly below-market weight in the
64
MassMutual Select Small Company Growth Fund – Portfolio Manager Report (Continued)
sector relative to the benchmark. We ended the quarter with slightly overweight stakes in energy and technology – and moderately underweight positions in the industrials and financials sectors.
What is your outlook? Moderate economic growth is expected for the remainder of the year and throughout 2007, and we believe growth in business spending will continue to drive U.S. GDP growth over the next six to eight quarters.
MassMutual Select Small Company Growth Fund
Industry Table
(% of Net Assets) on 6/30/06
Electrical Equipment &
Electronics | | | 16.1 | % | |
| Pharmaceuticals | | | 8.8 | % | |
| Medical Supplies | | | 6.8 | % | |
| Commercial Services | | | 6.8 | % | |
| Retail | | | 5.9 | % | |
| Energy | | | 5.5 | % | |
| Communications | | | 4.4 | % | |
Computer Integrated Systems
Design | | | 4.3 | % | |
| Metals & Mining | | | 3.6 | % | |
| Prepackaged Software | | | 3.3 | % | |
| Apparel, Textiles & Shoes | | | 3.0 | % | |
| Insurance | | | 2.7 | % | |
| Financial Services | | | 2.6 | % | |
| Healthcare | | | 2.6 | % | |
| Banking, Savings & Loans | | | 2.2 | % | |
| Advertising | | | 2.0 | % | |
| Computers & Information | | | 2.0 | % | |
| Heavy Machinery | | | 1.8 | % | |
| Restaurants | | | 1.6 | % | |
| Machinery & Components | | | 1.6 | % | |
| Data Processing & Preparation | | | 1.5 | % | |
| Agribusiness | | | 1.2 | % | |
| Entertainment & Leisure | | | 1.1 | % | |
| Computer Related Services | | | 1.1 | % | |
Home Construction,
Furnishings & Appliances | | | 0.9 | % | |
Information Retrieval
Services | | | 0.8 | % | |
Broadcasting, Publishing &
Printing | | | 0.8 | % | |
| Consumer Products | | | 0.7 | % | |
| Lodging | | | 0.6 | % | |
| Chemicals | | | 0.6 | % | |
| Computer & Data Processing Services | | | 0.5 | % | |
| Telephone Utilities | | | 0.4 | % | |
| Internet Software | | | 0.2 | % | |
Building Materials &
Construction | | | 0.1 | % | |
Computer Programming
Services | | | 0.0 | % | |
Short-Term Investments and
Other Assets and Liabilities | | | 1.9 | % | |
| | | | 100.0 | % | |
MassMutual Select Small Company
Growth Fund
Largest Stock Holdings (6/30/06)
Polycom, Inc.
Aleris International, Inc.
Altera Corp.
Cephalon, Inc.
Centene Corp.
Unit Corp.
Lattice Semiconductor Corp.
Cash America International, Inc.
Ansys, Inc.
Delta & Pine Land Co.
65
MassMutual Select Small Company Growth Fund – Portfolio Manager Report (Continued)
Growth of a $10,000 Investment
Hypothetical Investments in MassMutual Select Small Company Growth Fund Class S, Class A, Class A (sales load deducted), Class Y, Class L and the Russell 2000 Index.
MassMutual Select Small Company Growth Fund
Total Return
| | | Year to Date
1/1/06 - 6/30/06 | | One Year
7/1/05 - 6/30/06 | | Since Inception
Average Annual
12/31/01 - 6/30/06 | |
| Class S | | | 4.14 | % | | | 11.41 | % | | | 4.03 | % | |
| Class A | | | 3.92 | % | | | 10.85 | % | | | 3.54 | % | |
Class A (sales
load deducted)* | | | –2.05 | % | | | 4.48 | % | | | 2.18 | % | |
| Class Y | | | 4.15 | % | | | 11.32 | % | | | 3.97 | % | |
| Class L | | | 4.08 | % | | | 11.17 | % | | | 3.83 | % | |
| Russell 2000 Index | | | 8.21 | % | | | 14.57 | % | | | 10.25 | % | |
Hypothetical Investments in MassMutual Select Small Company Growth Fund Class N, Class N (CDSC fees deducted) and the Russell 2000 Index.
MassMutual Select Small Company Growth Fund
Total Return
| | | Year to Date
1/1/06 - 6/30/06 | | One Year
7/1/05 - 6/30/06 | | Since Inception
Average Annual
12/31/02 - 6/30/06 | |
| Class N | | | 3.77 | % | | | 10.44 | % | | | 15.76 | % | |
Class N (CDSC
fees deducted)* | | | 2.77 | % | | | 9.44 | % | | | 15.76 | % | |
| Russell 2000 Index | | | 8.21 | % | | | 14.57 | % | | | 21.49 | % | |
GROWTH OF A $10,000 INVESTMENT SINCE INCEPTION
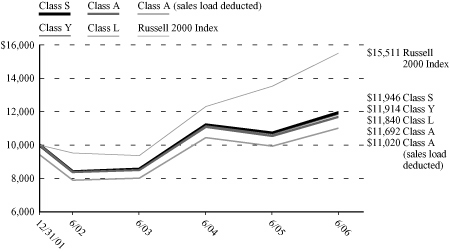
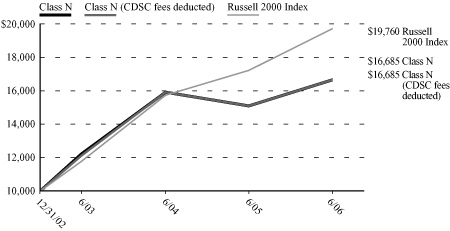
* Class A (sales load deducted) returns include the 5.75% maximum sales charge and Class N (CDSC fees deducted) returns include the 1.00% maximum contingent deferred sales charge for the first 18 months shown.
Performance data quoted represents past performance; past performance is not predictive of future results. The investment return and principal value of shares of the Fund will fluctuate with market conditions so that shares of the Fund, when redeemed, may be worth more or less than their original cost. Current performance of the Fund may be lower or higher than the performance quoted. Performance data current to the most recent month end may be obtained by calling 1-888-309-3539.
Investors should note that the Fund is a professionally managed mutual fund, while the Russell 2000 Index is unmanaged and does not incur expenses, and cannot be purchased directly by investors. Investors should read the Fund's prospectus with regard to the Fund's investment objective, risks and charges and expenses in conjunction with these financial statements. Employee retirement benefit plans that invest plan assets in the Separate Investment Accounts (SIAs) may be subject to certain charges as set forth in their respective Plan Documents. Total return figures would be lower for the periods presented if they reflected these charges. The performance tables and charts do not reflect the deduction of taxes that a shareholder would pay on the fund distributions or the redemption of the fund shares.
66
MassMutual Select Emerging Growth Fund – Portfolio Manager Report
What is the investment objective of the Select Emerging Growth Fund? This Fund seeks capital appreciation by investing primarily in smaller, rapidly growing emerging companies – generally in industry segments experiencing rapid growth, and often including technology and technology-related stocks. The Fund will normally invest at least 80% of its net assets in equity securities (primarily common stocks) of these emerging growth companies in both the U.S. and abroad.
How did the Fund perform during the six months ended June 30, 2006? The Fund's Class S shares returned 3.45%, trailing the 8.21% return of the Russell 2000® Index, a widely recognized, unmanaged index representative of common stocks of smaller capitalized U.S. companies.
What was the investment backdrop during the period? For the six months ended June 30, 2006, equities outperformed bonds, against a backdrop of rising inflation, a slowing economy and indications of a slowdown in the real estate market. In the first quarter of 2006, most U.S. stock indexes posted strong gains, as solid growth in corporate profits and signs of an uptick in overall economic activity helped to boost share prices.
The second quarter saw a turnaround in the fortunes of the equity markets, as investor uncertainty (caused in part by global unrest and rising oil prices) led many of the markets lower. In fact, The Dow Jones Industrial AverageSM was the only domestic equity benchmark to post a return in positive territory, advancing 0.37%.
What factors contributed to the Fund's performance? During the first quarter, the Fund benefited from favorable stock selection in the energy sector, with Dril-Quip (which provides offshore drilling and production equipment to the oil and gas industry) bringing in strong returns. Hydril and TETRA Technologies, two other energy companies, also provided solid results. We remained nearly market weighted in energy on our belief that elevated commodity prices would continue. Our focus has been on the drilling equipment and services industries.
Our underweight position in metals and mining firms hampered the Fund in the first quarter. These cyclical businesses, which enjoyed superior performance throughout 2005, were selling at very high valuation levels relative to long-term averages. Despite their recent strong performance, we remained underweighted in these cyclical stocks, many of which reside in the materials and processing and producer durables sectors, due to our view that construction slowdowns would ultimately result in declining sales. We have avoided cyclical groups related to real estate for similar reasons.
The portfolio held an overweight position in the technology sector during the first quarter. One of our largest technology contributors during this period was NetLogic Microsystems, which makes processors to control networking speeds.
Turning to the second quarter, our best-performing stocks included Lifecell, which manufactures artificial skin for complex hernia repair and breast reconstruction, and J2 Global, which provides Internet fax services to individuals and small offices. In financial services, one of our better performers was optionsXpress, which provides a discount brokerage business for the market niche of options trading.
Conversely, a number of our worst performers in the second quarter were in the technology sector. For example, Atheros, which makes the semiconductors that enable "wi-fi" networks, performed poorly, though it has a technology lead over its two competitors, Marvel and Broadcom, in what we believe will be a huge market.
As of June 30, we remained significantly underweight in transportation, materials, and producer durables, believing that these areas of the market are vulnerable to increasingly difficult growth
67
MassMutual Select Emerging Growth Fund – Portfolio Manager Report (Continued)
hurdles. We held overweight positions in technology and health care, due to our belief that these sectors offer more long-term emerging growth opportunities.
What is your outlook? We believe that as the world economy cools due to high energy prices, foreign low-cost competition and higher interest rates, our holdings – which are skewed toward traditional growth industries such as networking, semiconductors, Internet services, low-cost health care services, and medical devices – may provide solid earnings growth.
MassMutual Select Emerging Growth Fund
Industry Table
(% of Net Assets) on 6/30/06
| Commercial Services | | | 15.5 | % | |
Electrical Equipment &
Electronics | | | 10.6 | % | |
| Medical Supplies | | | 10.2 | % | |
| Financial Services | | | 6.3 | % | |
| Healthcare | | | 4.4 | % | |
| Prepackaged Software | | | 4.3 | % | |
| Apparel, Textiles & Shoes | | | 3.6 | % | |
| Computers & Information | | | 3.6 | % | |
| Energy | | | 3.5 | % | |
| Telephone Utilities | | | 3.1 | % | |
| Retail | | | 2.8 | % | |
| Heavy Machinery | | | 2.8 | % | |
| Transportation | | | 2.3 | % | |
| Advertising | | | 2.1 | % | |
Data Processing &
Preparation | | | 1.5 | % | |
| Pharmaceuticals | | | 1.5 | % | |
| Insurance | | | 1.5 | % | |
Home Construction,
Furnishings & Appliances | | | 1.4 | % | |
| Banking, Savings & Loans | | | 1.3 | % | |
| Communications | | | 1.2 | % | |
Information Retrieval
Services | | | 1.2 | % | |
| Restaurants | | | 1.0 | % | |
| Internet Software | | | 0.9 | % | |
| Machinery & Components | | | 0.8 | % | |
| Computer Related Services | | | 0.8 | % | |
Computer Integrated Systems
Design | | | 0.7 | % | |
| Metals & Mining | | | 0.7 | % | |
| Foods | | | 0.7 | % | |
| Entertainment & Leisure | | | 0.6 | % | |
| Telecommunications | | | 0.6 | % | |
| Aerospace & Defense | | | 0.6 | % | |
| Lodging | | | 0.5 | % | |
| Beverages | | | 0.5 | % | |
| Consumer Services | | | 0.4 | % | |
| Industrial – Distribution | | | 0.3 | % | |
Computer & Other Data
Processing Service | | | 0.2 | % | |
| Chemicals | | | 0.0 | % | |
Short-Term Investments and
Other Assets and Liabilities | | | 6.0 | % | |
| | | | 100.0 | % | |
MassMutual Select Emerging Growth Fund
Largest Stock Holdings (6/30/06)
Lifecell Corp.
j2 Global Communications, Inc.
Portfolio Recovery Associates, Inc.
Dril-Quip, Inc.
Hornbeck Offshore Services, Inc.
M-Systems Flash Disk Pioneers Ltd.
Huron Consulting Group, Inc.
Kyphon, Inc.
FTI Consulting, Inc.
Atheros Communications, Inc.
68
MassMutual Select Emerging Growth Fund – Portfolio Manager Report (Continued)
Growth of a $10,000 Investment
Hypothetical Investments in MassMutual Select Emerging Growth Fund Class S, Class A, Class A (sales load deducted), Class Y, Class L and the Russell 2000 Index.
MassMutual Select Emerging Growth Fund
Total Return
| | | Year to Date
1/1/06 -
6/30/06 | | One Year
7/1/05 -
6/30/06 | | Five Year
Average
Annual
7/1/01 -
6/30/06 | | Since
Inception
Average
Annual
5/1/00 -
6/30/06 | |
| Class S | | | 3.45 | % | | | 10.14 | % | | | –1.49 | % | | | –7.22 | % | |
| Class A | | | 3.22 | % | | | 9.53 | % | | | –2.07 | % | | | –7.73 | % | |
Class A (sales
load deducted)* | | | –2.71 | % | | | 3.23 | % | | | –3.22 | % | | | –8.61 | % | |
| Class Y | | | 3.48 | % | | | 10.04 | % | | | –1.64 | % | | | –7.34 | % | |
| Class L | | | 3.34 | % | | | 9.95 | % | | | –1.78 | % | | | –7.48 | % | |
| Russell 2000 Index | | | 8.21 | % | | | 14.57 | % | | | 8.50 | % | | | 7.34 | % | |
Hypothetical Investments in MassMutual Select Emerging Growth Fund Class N, Class N (CDSC fees deducted) and the Russell 2000 Index.
MassMutual Select Emerging Growth Fund
Total Return
| | | Year to Date
1/1/06 - 6/30/06 | | One Year
7/1/05 - 6/30/06 | | Since Inception
Average Annual
12/31/02 - 6/30/06 | |
| Class N | | | 2.92 | % | | | 9.29 | % | | | 16.66 | % | |
Class N (CDSC
fees deducted)* | | | 1.92 | % | | | 8.29 | % | | | 16.66 | % | |
| Russell 2000 Index | | | 8.21 | % | | | 14.57 | % | | | 21.49 | % | |
GROWTH OF A $10,000 INVESTMENT SINCE INCEPTION
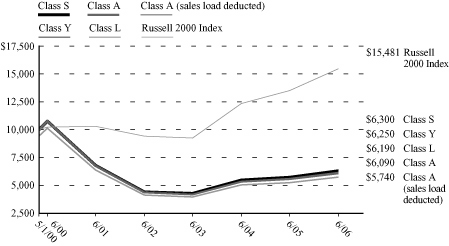

* Class A (sales load deducted) returns include the 5.75% maximum sales charge and Class N (CDSC fees deducted) returns include the 1.00% maximum contingent deferred sales charge for the first 18 months shown.
Performance data quoted represents past performance; past performance is not predictive of future results. The investment return and principal value of shares of the Fund will fluctuate with market conditions so that shares of the Fund, when redeemed, may be worth more or less than their original cost. Current performance of the Fund may be lower or higher than the performance quoted. Performance data current to the most recent month end may be obtained by calling 1-888-309-3539.
Investors should note that the Fund is a professionally managed mutual fund, while the Russell 2000 Index is unmanaged and does not incur expenses, and cannot be purchased directly by investors. Investors should read the Fund's prospectus with regard to the Fund's investment objective, risks and charges and expenses in conjunction with these financial statements. Employee retirement benefit plans that invest plan assets in the Separate Investment Accounts (SIAs) may be subject to certain charges as set forth in their respective Plan Documents. Total return figures would be lower for the periods presented if they reflected these charges. The performance tables and charts do not reflect the deduction of taxes that a shareholder would pay on the fund distributions or the redemption of the fund shares.
69
MassMutual Select Overseas Fund – Portfolio Manager Report
What is the investment objective of the MassMutual Select Overseas Fund? The Fund seeks growth of capital over the long term by investing in both foreign and domestic equity securities. The Fund invests at least 80% of its net assets in stocks of foreign companies – including those in Europe, Latin America and Asia.
How did the Fund perform during the six months ended June 30, 2006? The Fund's Class S shares returned 11.03%, ahead of the 10.16% return of the Morgan Stanley Capital International Europe, Australasia, Far East (MSCI® EAFE®) Index, a widely recognized, unmanaged index representative of foreign securities in the major non-U.S. markets of Europe, Australia and the Far East.
What was the investment background during the period? For the six months ended June 30, 2006, equities outperformed bonds, against a backdrop of rising inflation, a slowing economy and indications of a slowdown in the real estate market. In the first quarter of 2006, most U.S. stock indexes posted strong gains, as solid growth in corporate profits and signs of an uptick in overall economic activity helped to boost share prices. Against this backdrop, foreign stocks continued to outperform their U.S.-based counterparts.
The second quarter saw a turnaround in the fortunes of the equity markets, as investor uncertainty (caused in part by global unrest and rising oil prices) led many of the markets lower. In fact, the Dow Jones Industrial AverageSM was the only broad domestic equity benchmark to post a return in positive territory, advancing 0.37%. Even the first quarter's clear winner, foreign stocks, only managed to eke out a 0.70% gain, as measured by the MSCI EAFE Index – aided in part by a weaker U.S. dollar.
What factors contributed to the Fund's performance? The Fund's stock selection was once again strong in the first quarter of 2006. From a regional perspective, the greatest contributors to relative performance were the Fund's positions in Germany and the Netherlands, coupled with an overweight allocation in South Korea. The greatest detractor from performance was the Fund's overweight allocation in Taiwan, relative to the Fund's benchmark, the MSCI EAFE Index. From a sector standpoint, stock selection in the utilities, communications, industrial goods and services, energy, and transportation sectors all fueled the Fund's first quarter progress. Conversely, hampering the Fund's performance were stock choices in the autos, housing, technology, and consumer staples sectors. The Fund's modest cash position also detracted, due to the strong appreciati on of the MSCI EAFE Index during the period.
Turning to the second quarter, regionally speaking, the portfolio's underweight position in Japan was the largest contributor to performance. Other contributions came from positions in the UK and the relative overweight allocations in Taiwan and South Korea. The greatest detractors from relative performance were the portfolio's positions in Germany. On a sector basis, stock selection in the health care, technology, consumer staples, and leisure sectors all fueled the Fund's returns – as did overweight positions in the health care and consumer staples sectors. Conversely, stock selection in the basic materials, utilities and communications sectors hampered the Fund during the second quarter. Underweight positions in the utilities and communications sectors also dragged down the Fund somewhat, as did its modest cash position.
What is your outlook? We remain stock pickers, despite the focus of many investors and commentators on short-term moves in currencies, commodity prices and economic data. We seek to add value through long-term, fundamental research into individual companies, rather than attempting to make broad sector or regional calls. We continue to see a pick-up in corporate activity, including mergers and acquisitions, higher capital spending and share buybacks, which should offer compelling opportunities for investors focused on cash flows. Overall, despite weakened share prices, foreign companies continue to generate profit and cash flow growth, and we believe investment opportunities for long-term value investors have improved. We welcome market instability and weakness because those factors make quality companies selling at low prices more identifiable.
70
MassMutual Select Overseas Fund – Portfolio Manager Report (Continued)
MassMutual Select Overseas Fund
Country Weightings
(% of Net Assets) on 6/30/06
| Banking, Savings & Loans | | | 13.0 | % | |
| Pharmaceuticals | | | 9.0 | % | |
| Automotive & Parts | | | 6.6 | % | |
| Foods | | | 6.5 | % | |
Broadcasting, Publishing &
Printing | | | 6.3 | % | |
Electrical Equipment &
Electronics | | | 5.6 | % | |
| Chemicals | | | 5.2 | % | |
| Beverages | | | 4.5 | % | |
| Insurance | | | 4.4 | % | |
| Communications | | | 3.9 | % | |
| Retail | | | 3.7 | % | |
| Cosmetics & Personal Care | | | 2.8 | % | |
| Financial Services | | | 2.8 | % | |
| Energy | | | 2.7 | % | |
| Commercial Services | | | 1.9 | % | |
| Telecommunications | | | 1.8 | % | |
| Advertising | | | 1.6 | % | |
| Entertainment & Leisure | | | 1.6 | % | |
| Electric Utilities | | | 1.4 | % | |
| Household Products | | | 1.4 | % | |
| Telephone Utilities | | | 1.1 | % | |
| Miscellaneous | | | 1.0 | % | |
| Industrial Services | | | 0.9 | % | |
| Computers & Information | | | 0.9 | % | |
| Electronics | | | 0.8 | % | |
| Apparel, Textiles & Shoes | | | 0.8 | % | |
| Medical Supplies | | | 0.7 | % | |
| Toys, Games | | | 0.7 | % | |
| Tobacco | | | 0.5 | % | |
| Computer Related Services | | | 0.5 | % | |
| Transportation | | | 0.4 | % | |
Building Materials &
Construction | | | 0.4 | % | |
| Oil & Gas | | | 0.3 | % | |
| Industrial – Diversified | | | 0.3 | % | |
| Metals & Mining | | | 0.2 | % | |
| Real Estate | | | 0.0 | % | |
Short-Term Investments and
Other Assets and Liabilities | | | 3.8 | % | |
| | | | 100.0 | % | |
MassMutual Select Overseas Fund
Largest Stock Holdings (6/30/06)
Nestle SA
GlaxoSmithKline PLC
Diageo PLC
British Sky Broadcasting Group PLC
NTT DoCoMo, Inc.
DaimlerChrysler AG Registered
Reckitt Benckiser PLC
Bayerische Motoren Werke AG
Schneider Electric SA
Vodafone Group PLC
71
MassMutual Select Overseas Fund – Portfolio Manager Report (Continued)
Growth of a $10,000 Investment
Hypothetical Investments in MassMutual Select Overseas Fund Class S, Class A, Class A (sales load deducted), Class Y, Class L and the MSCI EAFE Index.
MassMutual Select Overseas Fund
Total Return
| | | Year to Date
1/1/06 -
6/30/06 | | One Year
7/1/05 -
6/30/06 | | Five Year
Average
Annual
7/1/01 -
6/30/06 | | Since
Inception
Average
Annual
5/1/01 -
6/30/06 | |
| Class S | | | 11.03 | % | | | 24.51 | % | | | 8.63 | % | | | 6.98 | % | |
| Class A | | | 10.78 | % | | | 23.94 | % | | | 8.15 | % | | | 6.51 | % | |
Class A (sales
load deducted)* | | | 4.41 | % | | | 16.81 | % | | | 6.88 | % | | | 5.29 | % | |
| Class Y | | | 10.96 | % | | | 24.39 | % | | | 8.56 | % | | | 6.91 | % | |
| Class L | | | 10.90 | % | | | 24.16 | % | | | 8.40 | % | | | 6.76 | % | |
| MSCI EAFE Index | | | 10.16 | % | | | 26.55 | % | | | 10.02 | % | | | 8.04 | % | |
Hypothetical Investments in MassMutual Select Overseas Fund Class N, Class N (CDSC fees deducted) and the MSCI EAFE Index.
MassMutual Select Overseas Fund
Total Return
| | | Year to Date
1/1/06 - 6/30/06 | | One Year
7/1/05 - 6/30/06 | | Since Inception
Average Annual
12/31/02 - 6/30/06 | |
| Class N | | | 10.59 | % | | | 23.51 | % | | | 19.85 | % | |
Class N (CDSC
fees deducted)* | | | 9.59 | % | | | 22.51 | % | | | 19.85 | % | |
| MSCI EAFE Index | | | 10.16 | % | | | 26.55 | % | | | 23.62 | % | |
GROWTH OF A $10,000 INVESTMENT SINCE INCEPTION
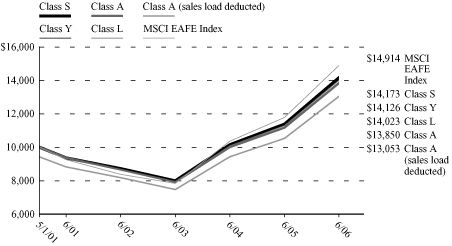

* Class A (sales load deducted) returns include the 5.75% maximum sales charge and Class N (CDSC fees deducted) returns include the 1.00% maximum contingent deferred sales charge for the first 18 months shown.
Performance data quoted represents past performance; past performance is not predictive of future results. The investment return and principal value of shares of the Fund will fluctuate with market conditions so that shares of the Fund, when redeemed, may be worth more or less than their original cost. Current performance of the Fund may be lower or higher than the performance quoted. Performance data current to the most recent month end may be obtained by calling 1-888-309-3539.
Investors should note that the Fund is a professionally managed mutual fund, while the MSCI EAFE Index is unmanaged and does not incur expenses, and cannot be purchased directly by investors. Investors should read the Fund's prospectus with regard to the Fund's investment objective, risks and charges and expenses in conjunction with these financial statements. Employee retirement benefit plans that invest plan assets in the Separate Investment Accounts (SIAs) may be subject to certain charges as set forth in their respective Plan Documents. Total return figures would be lower for the periods presented if they reflected these charges. The performance tables and charts do not reflect the deduction of taxes that a shareholder would pay on the fund distributions or the redemption of the fund shares.
72
MassMutual Select Destination Retirement Series – Portfolio Manager Report
What are the investment objectives of the Funds that comprise the MassMutual Select Destination Retirement Series? • Destination Retirement Income Fund: This Fund seeks to achieve high current income and, as a secondary objective, capital appreciation, by investing in a combination of MassMutual equity, fixed-income and money market funds using an asset allocation strategy designed for investors already in retirement.
• Destination Retirement 2010 / 2020 / 2030 / 2040 Funds: Each of these Funds seeks to achieve as high a total rate of return on an annual basis as is considered consistent with prudent investment risk and the preservation of capital by investing in a combination of MassMutual equity, fixed-income and money market funds. Each Fund uses an asset allocation strategy designed for investors expecting to retire around the year 2010, 2020, 2030, or 2040, respectively.
How did the Fund perform during the six months ended June 30, 2006? For the six months ended June 30, 2006, each Fund's return is shown below. Also shown are the returns of each Fund's custom benchmark; the Lipper Balanced Fund Index, an unmanaged equally weighted index of the 30 largest mutual funds within the Lipper Balanced Category; the Lehman Brothers® Aggregate Bond Index, an unmanaged index of fixed-rate investment-grade securities with at least one year to maturity combining the Lehman Brothers Government/Credit Index and the Lehman Brothers Mortgage-Backed Securities Index; and the S&P 500® Index, a widely recognized, unmanaged index representative of common stocks of larger capitalized U.S. companies.
Destination Retirement
Income Fund | | Custom
Benchmark | | Lipper Balanced
Fund Index | | Lehman Brothers
Aggregate Bond Index | | S&P 500
Index | |
| | 0.20 | % | | | 1.03 | % | | | 2.25 | % | | | –0.72 | % | | | 2.70 | % | |
Destination Retirement
2010 Fund | | | | | | | | | |
| | 0.75 | % | | | 1.37 | % | | | 2.25 | % | | | –0.72 | % | | | 2.70 | % | |
Destination Retirement
2020 Fund | | | | | | | | | |
| | 0.64 | % | | | 0.91 | % | | | 2.25 | % | | | –0.72 | % | | | 2.70 | % | |
Destination Retirement
2030 Fund | | | | | | | | | |
| | 1.39 | % | | | 0.24 | % | | | 2.25 | % | | | –0.72 | % | | | 2.70 | % | |
Destination Retirement
2040 Fund | | | | | | | | | |
| | 1.95 | % | | | –0.16 | % | | | 2.25 | % | | | –0.72 | % | | | 2.70 | % | |
The Destination Retirement Income, 2010 and 2020 Funds underperformed their respective custom benchmarks, the Lipper Balanced Fund Index and the S&P 500 Index for the six-month period. The Destination Retirement 2030 and 2040 Funds both outperformed their respective custom benchmarks for the six months ended June 30, 2006 – though they trailed the Lipper Balanced Fund Index and the S&P 500 Index for the period. All of the Destination Retirement Funds outperformed the Lehman Brothers Aggregate Bond Index for the year-to-date timeframe.
Destination Retirement Custom Benchmarks
• The Custom Destination Income Index comprises the MSCI® EAFE®, Dow Jones Wilshire 5000 (full cap), Lehman Brothers Aggregate Bond and T-Bill Indexes. The weightings of each Index can vary, depending on the weightings of the underlying mutual funds that comprise the Destination Retirement Income Fund.
• The Custom Destination 2010 Index comprises the MSCI EAFE, Dow Jones Wilshire 5000 (full cap), Lehman Brothers Aggregate Bond and T-Bill Indexes. The weightings of each Index can vary, depending on the weightings of the underlying mutual funds that comprise the Destination Retirement 2010 Fund.
73
MassMutual Select Destination Retirement Series – Portfolio Manager Report (Continued)
• The Custom Destination 2020 Index comprises the MSCI EAFE, Dow Jones Wilshire 5000 (full cap) and Lehman Brothers Aggregate Bond Indexes. The weightings of each Index can vary, depending on the weightings of the underlying mutual funds that comprise the Destination Retirement 2020 Fund.
• The Custom Destination 2030 Index comprises the MSCI EAFE, Dow Jones Wilshire 5000 (full cap) and Lehman Brothers Aggregate Bond Indexes. The weightings of each Index can vary, depending on the weightings of the underlying mutual funds that comprise the Destination Retirement 2030 Fund.
• The Custom Destination 2040 Index comprises the MSCI EAFE and Dow Jones Wilshire 5000 (full cap) Indexes. The weightings of each Index can vary, depending on the weightings of the underlying mutual funds that comprise the Destination Retirement 2040 Fund.
What was the investment backdrop during the period? The first quarter saw strong market gains. Smaller-capitalization stocks jumped sharply and beat their large-cap competitors once again, real estate investment trusts (REITs) posted more strong gains, and the telecommunications sector surged on the AT&T/BellSouth merger news. During the period, the Lehman Brothers Aggregate Bond Index lost 0.64%, while the Lehman Brothers High Yield Index gained 2.89% and the Lehman Brothers U.S. Treasury Inflation Notes Index returned –2.24%. On the equity side, the S&P 500 Index gained 4.20% and the MSCI EAFE Index, a proxy for foreign stocks, advanced 9.40%. The Russell 2000® Index, a proxy for small-cap stocks, returned 13.94%, and the Wilshire REIT Index gained 15.79%.
The second quarter saw a reversal of much of the strong market gains of the first quarter, due in large part to investor concerns over rising short-term interest rates and economic growth. Smaller-capitalization stocks fell sharply, while large-cap stocks generally had more muted losses. The Russell 2000 Index had a –5.03% return, while the S&P 500 Index, which is more heavily weighted towards large-cap stocks, posted a –1.44% return. Following over five years of strong returns, REITs posted only modest losses, as the Wilshire REIT Index returned –1.20%. The Lehman Brothers Aggregate Bond Index was slightly negative, with its –0.08% return, while the Lehman Brothers High Yield Index held up well, with a gain of 0.26%. The Lehman Brothers U.S. Treasury Inflation Notes Index returned 0.50%. The MSCI EAFE Index gained 0.70%, due to foreign currency strength.
What factors contributed to the Funds' performance? The performance of each Select Destination Retirement Fund is affected by the results of its underlying funds. In the first quarter, although Premier Inflation-Protected Bond Fund posted returns ahead of its benchmark, our allocation to this area was a drag on performance. Select Aggressive Growth Fund gave back some of last year's gains, posting a –1.65% return. On the plus side, Select Small Company Value and Select Overseas Funds posted gains of 13.00% and 9.58%, respectively.
Turning to the second quarter, key contributors to performance included Select Overseas Fund, which advanced 1.32%, and Premier Inflation-Protected Bond Fund, which gained 0.40%. Select Fundamental Value Fund also added strength, with its 1.10% advance. Hampering Select Destination Retirement Funds' performance in the second quarter were its small-cap and more aggressive options, such as Select Aggressive Growth and Premier Small Company Opportunities Funds, with their respective returns of –7.80% and –6.55%.
What is your outlook? We will continue to manage the Destination Retirement Fund Series with the goal of providing a vehicle for investors to confidently navigate the markets through any weather.
74
MassMutual Select Destination Retirement Series – Portfolio Manager Report (Continued)
MassMutual Select Destination
Retirement Income Fund
Asset Allocation
(% of Net Assets) on 6/30/06
| Mutual Fund | | | 100.0 | % | |
Short-Term Investments and
Other Assets and Liabilities | | | (0.0 | )% | |
| | | | 100.0 | % | |
MassMutual Select Destination
Retirement 2010 Fund
Asset Allocation
(% of Net Assets) on 6/30/06
| Mutual Fund | | | 100.0 | % | |
Short-Term Investments and
Other Assets and Liabilities | | | (0.0 | )% | |
| | | | 100.0 | % | |
MassMutual Select Destination
Retirement 2020 Fund
Asset Allocation
(% of Net Assets) on 6/30/06
| Mutual Fund | | | 100.0 | % | |
Short-Term Investments and
Other Assets and Liabilities | | | (0.0 | )% | |
| | | | 100.0 | % | |
MassMutual Select Destination
Retirement 2030 Fund
Asset Allocation
(% of Net Assets) on 6/30/06
| Mutual Fund | | | 100.0 | % | |
Short-Term Investments and
Other Assets and Liabilities | | | (0.0 | )% | |
| | | | 100.0 | % | |
MassMutual Select Destination
Retirement 2040 Fund
Asset Allocation
(% of Net Assets) on 6/30/06
| Mutual Fund | | | 100.0 | % | |
Short-Term Investments and
Other Assets and Liabilities | | | (0.0 | )% | |
| | | | 100.0 | % | |
75
MassMutual Select Destination Retirement Series – Portfolio Manager Report (Continued)
Growth of a $10,000 Investment
Hypothetical Investments in MassMutual Select Destination Retirement Income Fund Class S, Class A, Class A (sales load deducted), Class Y, the Custom Destination Income Index, the Lipper Balanced Fund Index, the Lehman Brothers Aggregate Bond Index and the S&P 500 Index.
MassMutual Select Destination Retirement Income Fund
Total Return
| | | Year to Date
1/1/06 - 6/30/06 | | One Year
7/1/05 - 6/30/06 | | Since Inception
12/31/03 - 6/30/06 | |
| Class S | | | 0.20 | % | | | 2.01 | % | | | 4.05 | % | |
| Class A | | | 0.10 | % | | | 1.67 | % | | | 3.69 | % | |
Class A (sales
load deducted)** | | | –5.66 | % | | | –4.17 | % | | | 1.27 | % | |
| Class Y | | | 0.29 | % | | | 2.08 | % | | | 4.07 | % | |
| S&P 500 Index | | | 2.70 | % | | | 8.62 | % | | | 7.46 | % | |
Lipper Balanced
Fund Index | | | 2.25 | % | | | 7.03 | % | | | 6.57 | % | |
Lehman Brothers
Aggregate Bond Index | | | –0.72 | % | | | –0.81 | % | | | 2.43 | % | |
Custom Destination
Income Index | | | 1.03 | % | | | 3.51 | % | | | 4.91 | % | |
Hypothetical Investments in MassMutual Select Destination Retirement Income Fund Class L, Class N, Class N (CDSC fees deducted), the Custom Destination Income Index, the Lipper Balanced Fund Index, the Lehman Brothers Aggregate Bond Index and the S&P 500 Index.
MassMutual Select Destination Retirement Income Fund
Total Return
| | | Year to Date
1/1/06 - 6/30/06 | | One Year
7/1/05 - 6/30/06 | | Since Inception
12/31/03 - 6/30/06 | |
| Class L | | | 0.20 | % | | | 1.97 | % | | | 3.96 | % | |
| Class N | | | 0.00 | % | | | 1.42 | % | | | 3.38 | % | |
Class N (CDSC
fees deducted)** | | | –1.00 | % | | | 0.44 | % | | | 3.38 | % | |
| S&P 500 Index | | | 2.70 | % | | | 8.62 | % | | | 7.46 | % | |
Lipper Balanced
Fund Index | | | 2.25 | % | | | 7.03 | % | | | 6.57 | % | |
Lehman Brothers
Aggregate Bond Index | | | –0.72 | % | | | –0.81 | % | | | 2.43 | % | |
Custom Destination
Income Index | | | 1.03 | % | | | 3.51 | % | | | 4.91 | % | |
GROWTH OF A $10,000 INVESTMENT SINCE INCEPTION*
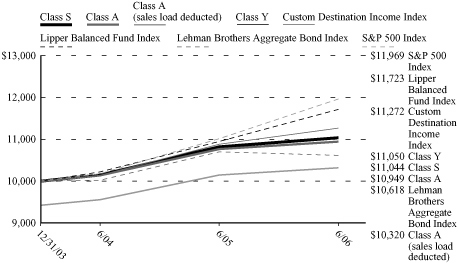
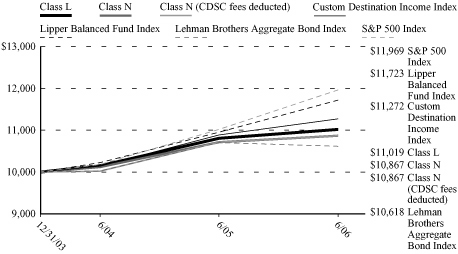
* The custom benchmark $10,000 growth chart values commence on 1/1/04.
** Class A (sales load deducted) returns include the 5.75% maximum sales charge and Class N (CDSC fees deducted) returns include the 1.00% maximum contingent deferred sales charge for the first 18 months shown.
Performance data quoted represents past performance; past performance is not predictive of future results. The investment return and principal value of shares of the Fund will fluctuate with market conditions so that shares of the Fund, when redeemed, may be worth more or less than their original cost. Current performance of the Fund may be lower or higher than the performance quoted. Performance data current to the most recent month end may be obtained by calling 1-888-309-3539.
Investors should note that the Fund is a professionally managed mutual fund, while the Custom Destination Income Index, the Lipper Balanced Fund Index, the Lehman Brothers Aggregate Bond Index and the S&P 500 Index are unmanaged and do not incur expenses, and cannot be purchased directly by investors. Investors should read the Fund's prospectus with regard to the Fund's investment objective, risks and charges and expenses in conjunction with these financial statements. Employee retirement benefit plans that invest plan assets in the Separate Investment Accounts (SIAs) may be subject to certain charges as set forth in their respective Plan Documents. Total return figures would be lower for the periods presented if they reflected these charges. The performance tables and charts do not reflect the deduction of taxes that a shareholder would pay on the fund distributions or the redemption of the fund shares.
76
MassMutual Select Destination Retirement Series – Portfolio Manager Report (Continued)
Growth of a $10,000 Investment
Hypothetical Investments in MassMutual Select Destination Retirement 2010 Fund Class S, Class A, Class A (sales load deducted), Class Y, the Custom Destination 2010 Index, the Lipper Balanced Fund Index, the Lehman Brothers Aggregate Bond Index and the S&P 500 Index.
MassMutual Select Destination Retirement 2010 Fund
Total Return
| | | Year to Date
1/1/06 - 6/30/06 | | One Year
7/1/05 - 6/30/06 | | Since Inception
12/31/03 - 6/30/06 | |
| Class S | | | 0.75 | % | | | 3.76 | % | | | 5.05 | % | |
| Class A | | | 0.47 | % | | | 3.33 | % | | | 4.63 | % | |
Class A (sales
load deducted)** | | | –5.30 | % | | | –2.61 | % | | | 2.18 | % | |
| Class Y | | | 0.66 | % | | | 3.73 | % | | | 5.00 | % | |
| S&P 500 Index | | | 2.70 | % | | | 8.62 | % | | | 7.46 | % | |
Lipper Balanced
Fund Index | | | 2.25 | % | | | 7.03 | % | | | 6.57 | % | |
Lehman Brothers
Aggregate Bond Index | | | –0.72 | % | | | –0.81 | % | | | 2.43 | % | |
Custom Destination
2010 Index | | | 1.37 | % | | | 7.94 | % | | | 5.73 | % | |
Hypothetical Investments in MassMutual Select Destination Retirement 2010 Fund Class L, Class N, Class N (CDSC fees deducted), the Custom Destination 2010 Index, the Lipper Balanced Fund Index, the Lehman Brothers Aggregate Bond Index and the S&P 500 Index.
MassMutual Select Destination Retirement 2010 Fund
Total Return
| | | Year to Date
1/1/06 - 6/30/06 | | One Year
7/1/05 - 6/30/06 | | Since Inception
12/31/03 - 6/30/06 | |
| Class L | | | 0.66 | % | | | 3.63 | % | | | 4.92 | % | |
| Class N | | | 0.38 | % | | | 3.03 | % | | | 4.32 | % | |
Class N (CDSC
fees deducted)** | | | –0.62 | % | | | 2.03 | % | | | 4.32 | % | |
| S&P 500 Index | | | 2.70 | % | | | 8.62 | % | | | 7.46 | % | |
Lipper Balanced
Fund Index | | | 2.25 | % | | | 7.03 | % | | | 6.57 | % | |
Lehman Brothers
Aggregate Bond Index | | | –0.72 | % | | | –0.81 | % | | | 2.43 | % | |
Custom Destination
2010 Index | | | 1.37 | % | | | 7.94 | % | | | 5.73 | % | |
GROWTH OF A $10,000 INVESTMENT SINCE INCEPTION*
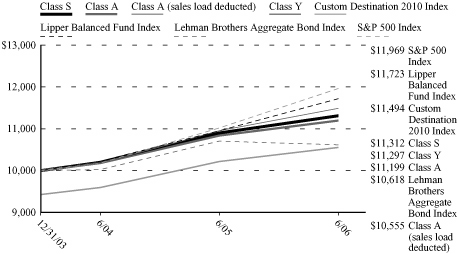
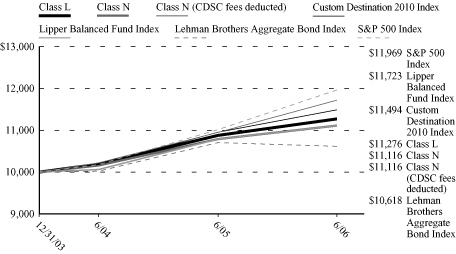
* The custom benchmark $10,000 growth chart values commence on 1/1/04.
** Class A (sales load deducted) returns include the 5.75% maximum sales charge and Class N (CDSC fees deducted) returns include the 1.00% maximum contingent deferred sales charge for the first 18 months shown.
Performance data quoted represents past performance; past performance is not predictive of future results. The investment return and principal value of shares of the Fund will fluctuate with market conditions so that shares of the Fund, when redeemed, may be worth more or less than their original cost. Current performance of the Fund may be lower or higher than the performance quoted. Performance data current to the most recent month end may be obtained by calling 1-888-309-3539.
Investors should note that the Fund is a professionally managed mutual fund, while the Custom Destination 2010 Index, the Lipper Balanced Fund Index, the Lehman Brothers Aggregate Bond Index and the S&P 500 Index are unmanaged and do not incur expenses, and cannot be purchased directly by investors. Investors should read the Fund's prospectus with regard to the Fund's investment objective, risks and charges and expenses in conjunction with these financial statements. Employee retirement benefit plans that invest plan assets in the Separate Investment Accounts (SIAs) may be subject to certain charges as set forth in their respective Plan Documents. Total return figures would be lower for the periods presented if they reflected these charges. The performance tables and charts do not reflect the deduction of taxes that a shareholder would pay on the fund distributions or the redemption of the fund shares.
77
MassMutual Select Destination Retirement Series – Portfolio Manager Report (Continued)
Growth of a $10,000 Investment
Hypothetical Investments in MassMutual Select Destination Retirement 2020 Fund Class S, Class A, Class A (sales load deducted), Class Y, the Custom Destination 2020 Index, the Lipper Balanced Fund Index, the Lehman Brothers Aggregate Bond Index and the S&P 500 Index.
MassMutual Select Destination Retirement 2020 Fund
Total Return
| | | Year to Date
1/1/06 - 6/30/06 | | One Year
7/1/05 - 6/30/06 | | Since Inception
12/31/03 - 6/30/06 | |
| Class S | | | 0.64 | % | | | 5.54 | % | | | 6.54 | % | |
| Class A | | | 0.46 | % | | | 5.12 | % | | | 6.12 | % | |
Class A (sales
load deducted)** | | | –5.32 | % | | | –0.92 | % | | | 3.64 | % | |
| Class Y | | | 0.64 | % | | | 5.52 | % | | | 6.48 | % | |
| S&P 500 Index | | | 2.70 | % | | | 8.62 | % | | | 7.46 | % | |
Lipper Balanced
Fund Index | | | 2.25 | % | | | 7.03 | % | | | 6.57 | % | |
Lehman Brothers
Aggregate Bond Index | | | –0.72 | % | | | –0.81 | % | | | 2.43 | % | |
Custom Destination
2020 Index | | | 0.91 | % | | | 8.80 | % | | | 7.20 | % | |
Hypothetical Investments in MassMutual Select Destination Retirement 2020 Fund Class L, Class N, Class N (CDSC fees deducted), the Custom Destination 2020 Index, the Lipper Balanced Fund Index, the Lehman Brothers Aggregate Bond Index and the S&P 500 Index.
MassMutual Select Destination Retirement 2020 Fund
Total Return
| | | Year to Date
1/1/06 - 6/30/06 | | One Year
7/1/05 - 6/30/06 | | Since Inception
12/31/03 - 6/30/06 | |
| Class L | | | 0.55 | % | | | 5.39 | % | | | 6.39 | % | |
| Class N | | | 0.27 | % | | | 4.79 | % | | | 5.81 | % | |
Class N (CDSC
fees deducted)** | | | –0.73 | % | | | 3.79 | % | | | 5.81 | % | |
| S&P 500 Index | | | 2.70 | % | | | 8.62 | % | | | 7.46 | % | |
Lipper Balanced
Fund Index | | | 2.25 | % | | | 7.03 | % | | | 6.57 | % | |
Lehman Brothers
Aggregate Bond Index | | | –0.72 | % | | | –0.81 | % | | | 2.43 | % | |
Custom Destination
2020 Index | | | 0.91 | % | | | 8.80 | % | | | 7.20 | % | |
GROWTH OF A $10,000 INVESTMENT SINCE INCEPTION*


* The custom benchmark $10,000 growth chart values commence on 1/1/04.
** Class A (sales load deducted) returns include the 5.75% maximum sales charge and Class N (CDSC fees deducted) returns include the 1.00% maximum contingent deferred sales charge for the first 18 months shown.
Performance data quoted represents past performance; past performance is not predictive of future results. The investment return and principal value of shares of the Fund will fluctuate with market conditions so that shares of the Fund, when redeemed, may be worth more or less than their original cost. Current performance of the Fund may be lower or higher than the performance quoted. Performance data current to the most recent month end may be obtained by calling 1-888-309-3539.
Investors should note that the Fund is a professionally managed mutual fund, while the Custom Destination 2020 Index, the Lipper Balanced Fund Index, the Lehman Brothers Aggregate Bond Index and the S&P 500 Index are unmanaged and do not incur expenses, and cannot be purchased directly by investors. Investors should read the Fund's prospectus with regard to the Fund's investment objective, risks and charges and expenses in conjunction with these financial statements. Employee retirement benefit plans that invest plan assets in the Separate Investment Accounts (SIAs) may be subject to certain charges as set forth in their respective Plan Documents. Total return figures would be lower for the periods presented if they reflected these charges. The performance tables and charts do not reflect the deduction of taxes that a shareholder would pay on the fund distributions or the redemption of the fund shares.
78
MassMutual Select Destination Retirement Series – Portfolio Manager Report (Continued)
Growth of a $10,000 Investment
Hypothetical Investments in MassMutual Select Destination Retirement 2030 Fund Class S, Class A, Class A (sales load deducted), Class Y, the Custom Destination 2030 Index, the Lipper Balanced Fund Index, the Lehman Brothers Aggregate Bond Index and the S&P 500 Index.
MassMutual Select Destination Retirement 2030 Fund
Total Return
| | | Year to Date
1/1/06 - 6/30/06 | | One Year
7/1/05 - 6/30/06 | | Since Inception
12/31/03 - 6/30/06 | |
| Class S | | | 1.39 | % | | | 8.37 | % | | | 8.36 | % | |
| Class A | | | 1.22 | % | | | 7.96 | % | | | 7.94 | % | |
Class A (sales
load deducted)** | | | –4.60 | % | | | 1.75 | % | | | 5.42 | % | |
| Class Y | | | 1.39 | % | | | 8.35 | % | | | 8.31 | % | |
| S&P 500 Index | | | 2.70 | % | | | 8.62 | % | | | 7.46 | % | |
Lipper Balanced
Fund Index | | | 2.25 | % | | | 7.03 | % | | | 6.57 | % | |
Lehman Brothers
Aggregate Bond Index | | | –0.72 | % | | | –0.81 | % | | | 2.43 | % | |
Custom Destination
2030 Index | | | 0.24 | % | | | 9.64 | % | | | 9.17 | % | |
Hypothetical Investments in MassMutual Select Destination Retirement 2030 Fund Class L, Class N, Class N (CDSC fees deducted), the Custom Destination 2030 Index, the Lipper Balanced Fund Index, the Lehman Brothers Aggregate Bond Index and the S&P 500 Index.
MassMutual Select Destination Retirement 2030 Fund
Total Return
| | | Year to Date
1/1/06 - 6/30/06 | | One Year
7/1/05 - 6/30/06 | | Since Inception
12/31/03 - 6/30/06 | |
| Class L | | | 1.30 | % | | | 8.21 | % | | | 8.22 | % | |
| Class N | | | 1.13 | % | | | 7.68 | % | | | 7.62 | % | |
Class N (CDSC
fees deducted)** | | | 0.13 | % | | | 6.68 | % | | | 7.62 | % | |
| S&P 500 Index | | | 2.70 | % | | | 8.62 | % | | | 7.46 | % | |
Lipper Balanced
Fund Index | | | 2.25 | % | | | 7.03 | % | | | 6.57 | % | |
Lehman Brothers
Aggregate Bond Index | | | –0.72 | % | | | –0.81 | % | | | 2.43 | % | |
Custom Destination
2030 Index | | | 0.24 | % | | | 9.64 | % | | | 9.17 | % | |
GROWTH OF A $10,000 INVESTMENT SINCE INCEPTION*
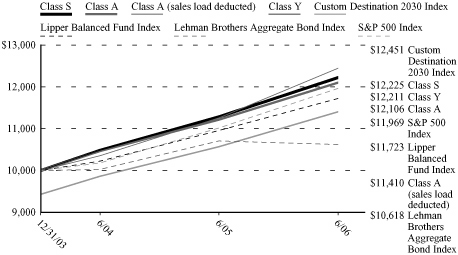
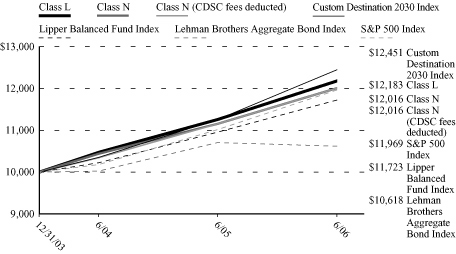
* The custom benchmark $10,000 growth chart values commence on 1/1/04.
** Class A (sales load deducted) returns include the 5.75% maximum sales charge and Class N (CDSC fees deducted) returns include the 1.00% maximum contingent deferred sales charge for the first 18 months shown.
Performance data quoted represents past performance; past performance is not predictive of future results. The investment return and principal value of shares of the Fund will fluctuate with market conditions so that shares of the Fund, when redeemed, may be worth more or less than their original cost. Current performance of the Fund may be lower or higher than the performance quoted. Performance data current to the most recent month end may be obtained by calling 1-888-309-3539.
Investors should note that the Fund is a professionally managed mutual fund, while the Custom Destination 2030 Index, the Lipper Balanced Fund Index, the Lehman Brothers Aggregate Bond Index and the S&P 500 Index are unmanaged and do not incur expenses, and cannot be purchased directly by investors. Investors should read the Fund's prospectus with regard to the Fund's investment objective, risks and charges and expenses in conjunction with these financial statements. Employee retirement benefit plans that invest plan assets in the Separate Investment Accounts (SIAs) may be subject to certain charges as set forth in their respective Plan Documents. Total return figures would be lower for the periods presented if they reflected these charges. The performance tables and charts do not reflect the deduction of taxes that a shareholder would pay on the fund distributions or the redemption of the fund shares.
79
MassMutual Select Destination Retirement Series – Portfolio Manager Report (Continued)
Growth of a $10,000 Investment
Hypothetical Investments in MassMutual Select Destination Retirement 2040 Fund Class S, Class A, Class A (sales load deducted), Class Y, the Custom Destination 2040 Index, the Lipper Balanced Fund Index, the Lehman Brothers Aggregate Bond Index and the S&P 500 Index.
MassMutual Select Destination Retirement 2040 Fund
Total Return
| | | Year to Date
1/1/06 - 6/30/06 | | One Year
7/1/05 - 6/30/06 | | Since Inception
12/31/03 - 6/30/06 | |
| Class S | | | 1.95 | % | | | 10.39 | % | | | 9.41 | % | |
| Class A | | | 1.78 | % | | | 9.97 | % | | | 8.99 | % | |
Class A (sales
load deducted)** | | | –4.07 | % | | | 3.65 | % | | | 6.44 | % | |
| Class Y | | | 1.95 | % | | | 10.28 | % | | | 9.36 | % | |
| S&P 500 Index | | | 2.70 | % | | | 8.62 | % | | | 7.46 | % | |
Lipper Balanced
Fund Index | | | 2.25 | % | | | 7.03 | % | | | 6.57 | % | |
Lehman Brothers
Aggregate Bond Index | | | –0.72 | % | | | –0.81 | % | | | 2.43 | % | |
Custom Destination
2040 Index | | | –0.16 | % | | | 10.13 | % | | | 10.30 | % | |
Hypothetical Investments in MassMutual Select Destination Retirement 2040 Fund Class L, Class N, Class N (CDSC fees deducted), the Custom Destination 2040 Index, the Lipper Balanced Fund Index, the Lehman Brothers Aggregate Bond Index and the S&P 500 Index.
MassMutual Select Destination Retirement 2040 Fund
Total Return
| | | Year to Date
1/1/06 - 6/30/06 | | One Year
7/1/05 - 6/30/06 | | Since Inception
12/31/03 - 6/30/06 | |
| Class L | | | 1.95 | % | | | 10.24 | % | | | 9.27 | % | |
| Class N | | | 1.61 | % | | | 9.52 | % | | | 8.64 | % | |
Class N (CDSC
fees deducted)** | | | 0.61 | % | | | 8.52 | % | | | 8.64 | % | |
| S&P 500 Index | | | 2.70 | % | | | 8.62 | % | | | 7.46 | % | |
Lipper Balanced
Fund Index | | | 2.25 | % | | | 7.03 | % | | | 6.57 | % | |
Lehman Brothers
Aggregate Bond Index | | | –0.72 | % | | | –0.81 | % | | | 2.43 | % | |
Custom Destination
2040 Index | | | –0.16 | % | | | 10.13 | % | | | 10.30 | % | |
GROWTH OF A $10,000 INVESTMENT SINCE INCEPTION*

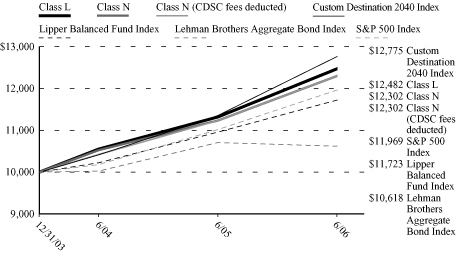
* The custom benchmark $10,000 growth chart values commence on 1/1/04.
** Class A (sales load deducted) returns include the 5.75% maximum sales charge and Class N (CDSC fees deducted) returns include the 1.00% maximum contingent deferred sales charge for the first 18 months shown.
Performance data quoted represents past performance; past performance is not predictive of future results. The investment return and principal value of shares of the Fund will fluctuate with market conditions so that shares of the Fund, when redeemed, may be worth more or less than their original cost. Current performance of the Fund may be lower or higher than the performance quoted. Performance data current to the most recent month end may be obtained by calling 1-888-309-3539.
Investors should note that the Fund is a professionally managed mutual fund, while the Custom Destination 2040 Index, the Lipper Balanced Fund Index, the Lehman Brothers Aggregate Bond Index and the S&P 500 Index are unmanaged and do not incur expenses, and cannot be purchased directly by investors. Investors should read the Fund's prospectus with regard to the Fund's investment objective, risks and charges and expenses in conjunction with these financial statements. Employee retirement benefit plans that invest plan assets in the Separate Investment Accounts (SIAs) may be subject to certain charges as set forth in their respective Plan Documents. Total return figures would be lower for the periods presented if they reflected these charges. The performance tables and charts do not reflect the deduction of taxes that a shareholder would pay on the fund distributions or the redemption of the fund shares.
80
MassMutual Select Strategic Bond Fund – Portfolio of Investments
June 30, 2006 (Unaudited)
| | | Number of
Shares | | Market
Value | |
| EQUITIES — 0.1% | |
| PREFERRED STOCK — 0.1% | |
| Automotive & Parts | |
| General Motors Corp. | | | 5,000 | | | $ | 87,150 | | |
General Motors Corp.,
Series B | | | 6,100 | | | | 112,850 | | |
TOTAL PREFERRED STOCK
(Cost $179,580) | | | | | | | 200,000 | | |
TOTAL EQUITIES
(Cost $179,580) | | | | | | | 200,000 | | |
| | | Principal
Amount | | | |
| BONDS & NOTES — 93.1% | |
| CORPORATE DEBT — 19.7% | |
| Aerospace & Defense — 0.0% | |
DRS Technologies, Inc.
6.625% 02/01/2016 | | $ | 55,000 | | | | 53,212 | | |
| Apparel, Textiles & Shoes — 0.0% | |
Oxford Industries, Inc.
8.875% 06/01/2011 | | | 25,000 | | | | 25,000 | | |
| Automotive & Parts — 0.6% | |
DaimlerChrysler
NA Holding
5.875% 03/15/2011 | | | 290,000 | | | | 285,259 | | |
DaimlerChrysler
NA Holding
7.200% 09/01/2009 | | | 65,000 | | | | 67,046 | | |
DaimlerChrysler
NA Holding MTN
5.750% 05/18/2009 | | | 250,000 | | | | 247,602 | | |
Ford Motor Co.
6.625% 10/01/2028 | | | 40,000 | | | | 27,600 | | |
Ford Motor Co.(a)
7.450% 07/16/2031 | | | 190,000 | | | | 137,275 | | |
General Motors Corp.(a)
8.250% 07/15/2023 | | | 80,000 | | | | 63,000 | | |
General Motors Corp.(a)
8.375% 07/15/2033 | | | 280,000 | | | | 225,400 | | |
General Motors
Corp. EUR(b)
8.375% 07/05/2033 | | | 40,000 | | | | 39,539 | | |
Visteon Corp.
8.250% 08/01/2010 | | | 90,000 | | | | 84,150 | | |
| | | | | | | | 1,176,871 | | |
| | | Principal
Amount | | Market
Value | |
| Banking, Savings & Loans — 3.7% | |
Bank of America Corp.
3.875% 01/15/2008 | | $ | 645,000 | | | $ | 628,970 | | |
Bank of America Corp.
4.500% 08/01/2010 | | | 130,000 | | | | 124,660 | | |
Bank One Corp.
2.625% 06/30/2008 | | | 205,000 | | | | 193,517 | | |
Credit Suisse First Boston
USA, Inc.
4.875% 08/15/2010 | | | 50,000 | | | | 48,462 | | |
Glitnir Banki HF(c)
6.693% 06/15/2016 | | | 420,000 | | | | 417,596 | | |
International Finance Corp.
5.125% 05/02/2011 | | | 2,000,000 | | | | 1,976,066 | | |
JP Morgan Chase & Co.
5.125% 09/15/2014 | | | 1,070,000 | | | | 1,010,668 | | |
KeyBank NA
4.950% 09/15/2015 | | | 180,000 | | | | 166,035 | | |
Rabobank Capital
Fund II(c)
5.260% 12/31/2049 | | | 10,000 | | | | 9,383 | | |
Rabobank Capital
Funding Trust(c)
5.254% 12/31/2049 | | | 95,000 | | | | 87,028 | | |
Resona Preferred
Global Securities(c)
7.191% 12/31/2049 | | | 230,000 | | | | 230,711 | | |
Shinsei Finance
Cayman Ltd.(c)
6.418% 07/20/2049 | | | 300,000 | | | | 281,755 | | |
Wachovia Capital Trust III
5.800% 03/15/2042 | | | 230,000 | | | | 223,192 | | |
Wachovia Corp.
5.250% 08/01/2014 | | | 990,000 | | | | 944,221 | | |
Wells Fargo & Co.
4.200% 01/15/2010 | | | 765,000 | | | | 731,049 | | |
| | | | | | | | 7,073,313 | | |
| Broadcasting, Publishing & Printing — 1.0% | |
Clear Channel
Communications, Inc.
4.250% 05/15/2009 | | | 50,000 | | | | 47,414 | | |
Clear Channel
Communications, Inc.
4.625% 01/15/2008 | | | 10,000 | | | | 9,793 | | |
Clear Channel
Communications, Inc.
5.500% 09/15/2014 | | | 345,000 | | | | 312,330 | | |
Comcast Corp.
6.500% 01/15/2015 | | | 835,000 | | | | 841,545 | | |
| | | Principal
Amount | | Market
Value | |
Cox Communications, Inc.
3.875% 10/01/2008 | | $ | 75,000 | | | $ | 71,744 | | |
CSC Holdings, Inc.
7.625% 07/15/2018 | | | 55,000 | | | | 54,450 | | |
Kabel Deutschland
GMBH(c)
10.625% 07/01/2014 | | | 50,000 | | | | 52,750 | | |
News America, Inc.
6.200% 12/15/2034 | | | 170,000 | | | | 154,273 | | |
Rogers Cable, Inc.
6.750% 03/15/2015 | | | 40,000 | | | | 38,100 | | |
Shaw Communications, Inc.
7.250% 04/06/2011 | | | 20,000 | | | | 19,950 | | |
Time Warner
Entertainment Co., LP
8.375% 07/15/2033 | | | 210,000 | | | | 237,578 | | |
| | | | | | | | 1,839,927 | | |
| Chemicals — 0.0% | |
Graham Packaging Co.(a)
9.875% 10/15/2014 | | | 40,000 | | | | 39,600 | | |
Westlake Chemicals
6.625% 01/15/2016 | | | 20,000 | | | | 18,475 | | |
| | | | | | | | 58,075 | | |
| Commercial Services — 0.2% | |
Service Corp.
International(c)
8.000% 06/15/2017 | | | 30,000 | | | | 28,050 | | |
Waste Management, Inc.
6.375% 11/15/2012 | | | 200,000 | | | | 204,029 | | |
Waste Management, Inc.
6.500% 11/15/2008 | | | 90,000 | | | | 91,407 | | |
| | | | | | | | 323,486 | | |
| Communications — 0.2% | |
Intelsat Bermuda Ltd.(c)
9.250% 06/15/2016 | | | 40,000 | | | | 41,300 | | |
Intelsat Ltd.
7.625% 04/15/2012 | | | 45,000 | | | | 37,125 | | |
SBC Communications, Inc.
5.100% 09/15/2014 | | | 230,000 | | | | 213,374 | | |
| | | | | | | | 291,799 | | |
| Computer Software/Services — 0.0% | |
UGS Corp.
10.000% 06/01/2012 | | | 35,000 | | | | 37,625 | | |
| Computers & Office Equipment — 0.2% | |
Electronic Data
Systems Corp.
7.125% 10/15/2009 | | | 380,000 | | | | 392,445 | | |
(Continued)
The accompanying notes are an integral part of the financial statements.
81
MassMutual Select Strategic Bond Fund – Portfolio of Investments (Continued)
| | | Principal
Amount | | Market
Value | |
| Electric Utilities — 1.6% | |
AES Corp.
7.750% 03/01/2014 | | $ | 340,000 | | | $ | 341,700 | | |
AES Corp.
8.875% 02/15/2011 | | | 10,000 | | | | 10,499 | | |
Dominion Resources, Inc.
4.750% 12/15/2010 | | | 30,000 | | | | 28,634 | | |
Dominion Resources, Inc.
5.700% 09/17/2012 | | | 370,000 | | | | 362,065 | | |
Duke Energy Corp.
5.625% 11/30/2012 | | | 425,000 | | | | 419,951 | | |
Duke Energy Corp.
6.250% 01/15/2012 | | | 50,000 | | | | 50,861 | | |
Exelon Corp.
5.625% 06/15/2035 | | | 430,000 | | | | 377,204 | | |
FirstEnergy Corp., Series B
6.450% 11/15/2011 | | | 230,000 | | | | 234,030 | | |
FirstEnergy Corp., Series C
7.375% 11/15/2031 | | | 735,000 | | | | 788,545 | | |
Oncor Electric Delivery Co.
6.375% 01/15/2015 | �� | | 25,000 | | | | 25,058 | | |
Pacific Gas & Electric Co.
6.050% 03/01/2034 | | | 260,000 | | | | 245,392 | | |
TXU Corp., Series P
5.550% 11/15/2014 | | | 20,000 | | | | 18,140 | | |
TXU Corp., Series R
6.550% 11/15/2034 | | | 215,000 | | | | 188,874 | | |
| | | | | | | | 3,090,953 | | |
| Energy — 2.3% | |
Amerada Hess Corp.
7.300% 08/15/2031 | | | 745,000 | | | | 789,481 | | |
Chesapeake Energy Corp.
6.500% 08/15/2017 | | | 40,000 | | | | 36,500 | | |
Chesapeake Energy Corp.
7.625% 07/15/2013 | | | 20,000 | | | | 20,125 | | |
Conoco, Inc.
6.950% 04/15/2029 | | | 560,000 | | | | 609,362 | | |
Devon Energy Corp.
7.950% 04/15/2032 | | | 435,000 | | | | 501,240 | | |
Dynegy Holdings, Inc.
8.750% 02/15/2012 | | | 5,000 | | | | 5,075 | | |
El Paso Corp. MTN(a)
7.750% 01/15/2032 | | | 380,000 | | | | 370,025 | | |
El Paso Corp. MTN
7.800% 08/01/2031 | | | 52,000 | | | | 50,505 | | |
Kerr - McGee Corp.
7.875% 09/15/2031 | | | 680,000 | | | | 767,539 | | |
Kinder Morgan Energy
Partners LP
5.000% 12/15/2013 | | | 40,000 | | | | 36,659 | | |
Kinder Morgan Energy
Partners LP
6.300% 02/01/2009 | | | 60,000 | | | | 60,268 | | |
| | | Principal
Amount | | Market
Value | |
Kinder Morgan Energy
Partners LP
6.750% 03/15/2011 | | $ | 60,000 | | | $ | 61,294 | | |
Pemex Project Funding
Master Trust(c)
6.625% 06/15/2035 | | | 190,000 | | | | 171,950 | | |
Suburban Propane
Partners
6.875% 12/15/2013 | | | 80,000 | | | | 74,800 | | |
Williams Cos., Inc.
7.750% 06/15/2031 | | | 210,000 | | | | 206,850 | | |
Williams Cos., Inc.
Series A
7.500% 01/15/2031 | | | 315,000 | | | | 303,975 | | |
XTO Energy, Inc.
6.250% 04/15/2013 | | | 245,000 | | | | 245,160 | | |
XTO Energy, Inc.
7.500% 04/15/2012 | | | 40,000 | | | | 42,522 | | |
| | | | | | | | 4,353,330 | | |
| Entertainment & Leisure — 0.4% | |
AMC Entertainment, Inc.
11.000% 02/01/2016 | | | 30,000 | | | | 32,100 | | |
Liberty Media Corp.
7.875% 07/15/2009 | | | 750,000 | | | | 776,458 | | |
| | | | | | | | 808,558 | | |
| Financial Services — 6.3% | |
Anadarko Finance Co.
6.750% 05/01/2011 | | | 165,000 | | | | 169,540 | | |
Anadarko Finance Co.,
Series B
7.500% 05/01/2031 | | | 180,000 | | | | 193,393 | | |
Apache Finance
Canada Corp.
4.375% 05/15/2015 | | | 385,000 | | | | 345,163 | | |
Banque Paribas - New York
6.875% 03/01/2009 | | | 110,000 | | | | 113,102 | | |
ChevronTexaco Capital Co.
3.500% 09/17/2007 | | | 150,000 | | | | 146,336 | | |
Citigroup, Inc.
4.125% 02/22/2010 | | | 5,000 | | | | 4,754 | | |
Citigroup, Inc.
5.125% 02/14/2011 | | | 860,000 | | | | 839,808 | | |
Deutsche Telekom
International Finance BV
5.750% 03/23/2016 | | | 200,000 | | | | 188,762 | | |
Ford Motor Credit Co.
4.950% 01/15/2008 | | | 110,000 | | | | 103,549 | | |
Ford Motor Credit Co.
7.250% 10/25/2011 | | | 80,000 | | | | 70,966 | | |
Ford Motor Credit Co.
7.375% 10/28/2009 | | | 1,705,000 | | | | 1,576,337 | | |
| | | Principal
Amount | | Market
Value | |
Ford Motor Credit Co.
7.375% 02/01/2011 | | $ | 130,000 | | | $ | 116,404 | | |
Ford Motor Credit Co.(c)
10.486% 06/15/2011 | | | 298,000 | | | | 299,022 | | |
General Electric
Capital Corp.
4.125% 09/01/2009 | | | 340,000 | | | | 325,668 | | |
General Electric
Capital Corp.
4.250% 01/15/2008 | | | 230,000 | | | | 225,578 | | |
General Motors
Acceptance Corp.
5.125% 05/09/2008 | | | 90,000 | | | | 86,220 | | |
General Motors
Acceptance Corp.(a)
5.625% 05/15/2009 | | | 780,000 | | | | 741,905 | | |
General Motors
Acceptance Corp.
5.850% 01/14/2009 | | | 240,000 | | | | 230,065 | | |
General Motors
Acceptance Corp.
6.125% 08/28/2007 | | | 1,320,000 | | | | 1,306,195 | | |
General Motors
Acceptance Corp.
7.750% 01/19/2010 | | | 110,000 | | | | 109,433 | | |
General Motors
Acceptance Corp. MTN
4.375% 12/10/2007 | | | 140,000 | | | | 134,289 | | |
General Motors
Acceptance Corp. MTN
6.311% 11/30/2007 | | | 50,000 | | | | 48,176 | | |
Goldman Sachs
Group, Inc.
4.500% 06/15/2010 | | | 150,000 | | | | 143,410 | | |
Goldman Sachs
Group, Inc.
5.000% 01/15/2011 | | | 100,000 | | | | 96,707 | | |
Household Finance Corp.
4.625% 01/15/2008 | | | 560,000 | | | | 552,000 | | |
Household Finance Corp.
Series MTN
4.125% 11/16/2009 | | | 300,000 | | | | 285,530 | | |
ILFC E-Capital Trust I(c)
5.900% 12/21/2065 | | | 100,000 | | | | 97,480 | | |
Kaupthing Bank(c)
0.000% 04/11/2011 | | | 690,000 | | | | 690,240 | | |
Kaupthing Bank
(Iceland)(c)
7.125% 05/19/2016 | | | 150,000 | | | | 150,045 | | |
Lehman Brothers
Holdings, Inc.
4.000% 01/22/2008 | | | 415,000 | | | | 404,159 | | |
Morgan Stanley
3.625% 04/01/2008 | | | 690,000 | | | | 667,765 | | |
(Continued)
The accompanying notes are an integral part of the financial statements.
82
MassMutual Select Strategic Bond Fund – Portfolio of Investments (Continued)
| | | Principal
Amount | | Market
Value | |
MUFG Capital
Finance 1 Ltd.
6.346% 07/29/2049 | | $ | 180,000 | | | $ | 173,626 | | |
Pacific Energy Partners,
LP/Pacific Energy
Finance Corp.
7.125% 06/15/2014 | | | 20,000 | | | | 20,200 | | |
Sprint Capital Corp.
6.000% 01/15/2007 | | | 755,000 | | | | 756,012 | | |
Sprint Capital Corp.
8.375% 03/15/2012 | | | 30,000 | | | | 33,147 | | |
Telecom Italia Capital SA
4.950% 09/30/2014 | | | 100,000 | | | | 89,526 | | |
Telecom Italia Capital SA
5.250% 10/01/2015 | | | 150,000 | | | | 135,769 | | |
Ventas Realty Corp. REIT
6.500% 06/01/2016 | | | 35,000 | | | | 33,556 | | |
Ventas Realty Corp. REIT
7.125% 06/01/2015 | | | 20,000 | | | | 20,000 | | |
Verizon Global
Funding Corp.
7.375% 09/01/2012 | | | 220,000 | | | | 233,850 | | |
| | | | | | | | 11,957,687 | | |
| Forest Products & Paper — 0.4% | |
Weyerhaeuser Co.
6.750% 03/15/2012 | | | 670,000 | | | | 684,513 | | |
| Healthcare — 0.5% | |
DaVita, Inc.
7.250% 03/15/2015 | | | 110,000 | | | | 105,600 | | |
HCA, Inc.
5.750% 03/15/2014 | | | 140,000 | | | | 125,187 | | |
HCA, Inc.
6.250% 02/15/2013 | | | 155,000 | | | | 144,734 | | |
HCA, Inc.
6.375% 01/15/2015 | | | 170,000 | | | | 157,513 | | |
Tenet Healthcare Corp.(c)
9.500% 02/01/2015 | | | 274,000 | | | | 269,205 | | |
Tenet Healthcare Corp.
9.875% 07/01/2014 | | | 30,000 | | | | 30,000 | | |
| | | | | | | | 832,239 | | |
| Industrial – Diversified — 0.4% | |
Jacuzzi Brands, Inc.
9.625% 07/01/2010 | | | 35,000 | | | | 36,969 | | |
Tyco International
Group SA
6.000% 11/15/2013 | | | 310,000 | | | | 307,116 | | |
Tyco International
Group SA
6.375% 10/15/2011 | | | 115,000 | | | | 117,343 | | |
Tyco International
Group SA
6.875% 01/15/2029 | | | 330,000 | | | | 340,163 | | |
| | | Principal
Amount | | Market
Value | |
Tyco International
Group SA
7.000% 06/15/2028 | | $ | 10,000 | | | $ | 10,436 | | |
| | | | | | | | 812,027 | | |
| Insurance — 0.0% | |
ASIF Global Financing(c)
4.900% 01/17/2013 | | | 30,000 | | | | 28,430 | | |
| Lodging — 0.1% | |
Boyd Gaming Corp.
7.125% 02/01/2016 | | | 30,000 | | | | 28,987 | | |
Inn of the Mountain Gods
Resort & Casino
12.000% 11/15/2010 | | | 50,000 | | | | 53,125 | | |
Station Casinos, Inc.
6.625% 03/15/2018 | | | 10,000 | | | | 9,050 | | |
| | | | | | | | 91,162 | | |
| Media – Broadcasting & Publishing — 0.5% | |
AOL Time Warner, Inc.
6.875% 05/01/2012 | | | 375,000 | | | | 387,552 | | |
AOL Time Warner, Inc.
7.700% 05/01/2032 | | | 400,000 | | | | 434,741 | | |
| | | | | | | | 822,293 | | |
| Oil & Gas — 0.2% | |
El Paso Natural Gas Co.
8.375% 06/15/2032 | | | 349,000 | | | | 371,205 | | |
Pride International, Inc.
7.375% 07/15/2014 | | | 20,000 | | | | 20,100 | | |
Western Oil Sands, Inc.
8.375% 05/01/2012 | | | 30,000 | | | | 31,875 | | |
| | | | | | | | 423,180 | | |
| Photography Equipment/Supplies — 0.2% | |
Eastman Kodak Co.
7.250% 11/15/2013 | | | 290,000 | | | | 279,294 | | |
Eastman Kodak Co. MTN
3.625% 05/15/2008 | | | 120,000 | | | | 113,483 | | |
| | | | | | | | 392,777 | | |
| Prepackaged Software — 0.0% | |
Sungard Data
Systems, Inc.(c)
10.250% 08/15/2015 | | | 35,000 | | | | 36,181 | | |
| Real Estate — 0.0% | |
Forest City Enterprises, Inc.
7.625% 06/01/2015 | | | 35,000 | | | | 35,263 | | |
| Retail — 0.1% | |
Wal-Mart Stores, Inc.
3.375% 10/01/2008 | | | 255,000 | | | | 243,395 | | |
| | | Principal
Amount | | Market
Value | |
| Telephone Utilities — 0.4% | |
BellSouth Corp.
4.750% 11/15/2012 | | $ | 10,000 | | | $ | 9,272 | | |
British Telecom PLC
8.375% 12/15/2010 | | | 130,000 | | | | 142,723 | | |
Cincinnati Bell, Inc.
7.000% 02/15/2015 | | | 60,000 | | | | 56,550 | | |
Koninklijke KPN NV
8.000% 10/01/2010 | | | 270,000 | | | | 286,383 | | |
Koninklijke KPN NV
8.375% 10/01/2030 | | | 200,000 | | | | 214,707 | | |
Qwest Communications
International, Inc.
8.670% 02/15/2009 | | | 15,000 | | | | 15,281 | | |
Windstream Corp.(c)
8.625% 08/01/2016 | | | 20,000 | | | | 20,450 | | |
| | | | | | | | 745,366 | | |
| Tobacco — 0.3% | |
Altria Group, Inc.
7.000% 11/04/2013 | | | 580,000 | | | | 611,900 | | |
| Transportation — 0.1% | |
OMI Corp.
7.625% 12/01/2013 | | | 105,000 | | | | 104,738 | | |
TOTAL CORPORATE DEBT
(Cost $38,693,175) | | | | | | | 37,345,745 | | |
NON-U.S. GOVERNMENT AGENCY
OBLIGATIONS — 21.2% | |
| Collateralized Mortgage Obligations | |
| Financial Services — 21.2% | |
AAA Trust, Series 2005-2,
Class A1(c)
5.423% 11/26/2035 | | | 32,976 | | | | 32,976 | | |
American Home Mortgage
Investment Trust,
Series 2005-4,
Class 1A1
5.613% 11/25/2045 | | | 723,917 | | | | 725,298 | | |
Banc of America
Commercial Mortgage,
Inc., Series 2005-5,
Class A4
5.115% 09/10/2015 | | | 280,000 | | | | 264,142 | | |
Banc of America
Commercial Mortgage,
Inc., Series 2005-6,
Class A4
5.182% 09/10/2047 | | | 840,000 | | | | 799,327 | | |
(Continued)
The accompanying notes are an integral part of the financial statements.
83
MassMutual Select Strategic Bond Fund – Portfolio of Investments (Continued)
| | | Principal
Amount | | Market
Value | |
Bear Stearns Asset Backed
Securities, Inc.,
Series 2005-AQ2,
Class A1
5.483% 09/25/2035 | | $ | 615,659 | | | $ | 616,140 | | |
Bear Stearns Asset Backed
Securities, Inc.,
Series 2005-AQ2,
Class A2
4.470% 09/25/2035 | | | 900,000 | | | | 902,672 | | |
Bear Stearns Asset Backed
Securities, Inc.,
Series 2005-AQ2,
Class A3
4.560% 09/25/2035 | | | 900,000 | | | | 904,219 | | |
Bear Stearns Asset Backed
Securities, Inc.,
Series 2005-SD4,
Class 2A1
5.723% 12/25/2042 | | | 701,932 | | | | 705,881 | | |
Countrywide Alternative
Loan Trust,
Series 2005-24,
Class 4A1
5.497% 07/20/2035 | | | 372,740 | | | | 373,187 | | |
Countrywide Alternative
Loan Trust,
Series 2005-38,
Class A3
5.309% 09/25/2035 | | | 241,209 | | | | 242,006 | | |
Countrywide Alternative
Loan Trust,
Series 2005-44,
Class 1A1
5.653% 10/25/2035 | | | 686,491 | | | | 688,088 | | |
Countrywide Alternative
Loan Trust,
Series 2005-59,
Class 1A1
5.597% 11/20/2035 | | | 867,626 | | | | 868,061 | | |
Countrywide Alternative
Loan Trust,
Series 2005-J12,
Class 2A1
5.593% 08/25/2035 | | | 739,527 | | | | 740,585 | | |
Countrywide Asset-Backed
Certificates, Series 2005-17,
Class 1AF1
4.580% 12/27/2035 | | | 1,070,224 | | | | 1,070,951 | | |
Countrywide Home Equity
Loan Trust, Series 2005-G,
Class 2A
5.429% 12/15/2035 | | | 546,772 | | | | 547,883 | | |
| | | Principal
Amount | | Market
Value | |
Countrywide Home Loan
Mortgage Pass Through
Trust, Series 2005-R3,
Class AF(c)
5.723% 09/25/2035 | | $ | 1,007,348 | | | $ | 1,011,236 | | |
Credit-Based Asset
Servicing and Securitization,
Series 2004-CB8,
Class AV1
3.901% 12/25/2035 | | | 520,280 | | | | 521,580 | | |
Delta Funding Home Equity
Loan Trust, Series 1999-1,
Class A6F
6.340% 12/15/2028 | | | 90,890 | | | | 90,763 | | |
Equifirst Mortgage
Loan Trust, Series 2005-1,
Class A1
3.150% 04/25/2035 | | | 45,903 | | | | 45,903 | | |
First Franklin Mortgage
Loan Asset Backed
Certificates,
Series 2004-FF10,
Class A2
5.723% 12/25/2032 | | | 530,703 | | | | 533,025 | | |
First Franklin Mortgage
Loan Asset Backed
Certificates,
Series 2005-FF1,
Class A2B
4.411% 12/25/2034 | | | 1,200,000 | | | | 1,201,126 | | |
GE Capital Commercial
Mortgage Corp.,
Series 2005-C4, Class A4
5.330% 11/10/2045 | | | 350,000 | | | | 337,352 | | |
GS Mortgage
Securities Corp. II,
Series 2005-GG4,
Class AABA
4.680% 07/10/2039 | | | 200,000 | | | | 188,072 | | |
GSAA Trust, Series 2005-7,
Class AV1
3.436% 07/25/2035 | | | 250,042 | | | | 250,120 | | |
GSMPS Mortgage Loan
Trust, Series 2005-RP3,
Class 1AF
5.673% 09/25/2035 | | | 678,319 | | | | 680,189 | | |
GSR Mortgage Loan Trust,
Series 2005-AR5,
Class 2A3
5.195% 10/25/2035 | | | 798,849 | | | | 783,630 | | |
Harborview Mortgage
Loan Trust,
Series 2006-2, Class 1A
5.450% 04/25/2036 | | | 566,369 | | | | 562,540 | | |
| | | Principal
Amount | | Market
Value | |
HSI Asset Securitization
Corp. Trust,
Series 2005-I1,
Class 2A4
5.713% 11/25/2035 | | $ | 1,400,000 | | | $ | 1,402,740 | | |
Impac Secured Assets
Corp., Series 2005-2,
Class A1
5.643% 03/25/2036 | | | 1,288,964 | | | | 1,291,707 | | |
Indymac Index Mortgage
Loan Trust,
Series 2004-AR12, Cl. A1
5.713% 12/25/2034 | | | 224,309 | | | | 224,309 | | |
Irwin Home Equity,
Series 2006-1,
Class 2A1(c)
5.473% 09/25/2035 | | | 1,275,321 | | | | 1,279,491 | | |
IXIS Real Estate Capital
Trust, Series 2006-HE1,
Class A1
5.413% 03/25/2036 | | | 1,391,742 | | | | 1,391,959 | | |
JP Morgan Chase
Commercial Mortgage
Securities Corp.,
Series 2005-CB12,
Class A4
4.895% 09/12/2037 | | | 500,000 | | | | 464,496 | | |
JP Morgan Chase
Commercial Mortgage
Securities Corp.,
Series 2005-CB13,
Class A4
5.290% 01/12/2043 | | | 100,000 | | | | 95,840 | | |
Keycorp Student Loan
Trust, Series 2005-A,
Class 1A1
5.490% 12/27/2019 | | | 91,489 | | | | 91,418 | | |
LB-UBS Commercial
Mortgage Trust,
Series 2005-C3, Class A5
4.739% 07/15/2030 | | | 140,000 | | | | 128,877 | | |
LB-UBS Commercial
Mortgage Trust,
Series 2005-C3,
Class AAB
4.664% 07/15/2030 | | | 100,000 | | | | 93,890 | | |
LB-UBS Commercial
Mortgage Trust,
Series 2005-C5, Class A4
4.954% 09/15/2040 | | | 100,000 | | | | 93,460 | | |
Lehman XS Trust,
Series 2005-5N,
Class 1A1
5.623% 11/25/2035 | | | 641,611 | | | | 643,569 | | |
(Continued)
The accompanying notes are an integral part of the financial statements.
84
MassMutual Select Strategic Bond Fund – Portfolio of Investments (Continued)
| | | Principal
Amount | | Market
Value | |
Lehman XS Trust,
Series 2006-2N,
Class 1A1
5.583% 02/25/2046 | | $ | 1,505,759 | | | $ | 1,508,603 | | |
MASTR Adjustable Rate
Mortgages Trust,
Series 2006-2,
Class 3A1
4.852% 01/25/2036 | | | 887,581 | | | | 865,974 | | |
MASTR Reperforming
Loan Trust,
Series 2005-2,
Class 1A1F(c)
5.673% 05/25/2035 | | | 663,160 | | | | 664,956 | | |
Merrill Lynch Mortgage
Trust, Series 2006-C1,
Class A4
5.660% 05/12/2039 | | | 610,000 | | | | 601,075 | | |
Morgan Stanley Capital I,
Series 2005-HQ6,
Class A4A
4.989% 08/13/2042 | | | 240,000 | | | | 224,673 | | |
Morgan Stanley Mortgage
Loan Trust,
Series 2006-3AR,
Class 2A3
5.910% 03/25/2036 | | | 571,175 | | | | 569,394 | | |
MSDWCC Heloc Trust,
Series 2005-1, Class A
5.513% 07/25/2017 | | | 39,752 | | | | 39,814 | | |
Origen Manufactured
Housing, Series 2005-B,
Class A3
5.605% 05/15/2022 | | | 3,000,000 | | | | 2,909,481 | | |
Residential Asset Securities
Corp., Series 2004-KS5,
Class A2B3
4.829% 06/25/2034 | | | 1,600,000 | | | | 1,602,501 | | |
Residential Funding
Mortgage Securities II,
Inc., Series 2005-HSA1,
Class AI1
4.499% 12/25/2035 | | | 1,094,336 | | | | 1,094,507 | | |
Structured Asset Securities
Corp., Series 2002-AL1,
Class A3
3.450% 02/25/2032 | | | 239,138 | | | | 218,058 | | |
Wachovia Mortgage Loan
Trust LLC,
Series 2005-WMC1,
Class A1
5.433% 10/25/2035 | | | 326,934 | | | | 326,977 | | |
| | | Principal
Amount | | Market
Value | |
Washington Mutual, Inc.,
Series 2005-AR11,
Class A1A
5.643% 08/25/2045 | | $ | 1,201,075 | | | $ | 1,201,360 | | |
Washington Mutual, Inc.,
Series 2005-AR13,
Class A1A1
5.613% 10/25/2045 | | | 678,556 | | | | 678,901 | | |
Washington Mutual, Inc.,
Series 2005-AR15,
Class A1A1
5.341% 11/25/2045 | | | 845,005 | | | | 844,903 | | |
Washington Mutual, Inc.,
Series 2005-AR15,
Class A1A2
5.603% 11/25/2045 | | | 845,005 | | | | 843,688 | | |
Washington Mutual, Inc.,
Series 2005-AR19,
Class A1A1
4.640% 12/25/2045 | | | 1,086,733 | | | | 1,089,448 | | |
Washington Mutual, Inc.,
Series 2005-AR19,
Class A1A2
5.613% 12/25/2045 | | | 1,358,416 | | | | 1,359,353 | | |
Washington Mutual, Inc.,
Series 2005-AR8,
Class 1A1A
5.593% 07/25/2045 | | | 240,932 | | | | 241,320 | | |
Washington Mutual, Inc.,
Series 2005-AR9,
Class A1A
5.643% 07/25/2045 | | | 420,427 | | | | 421,037 | | |
TOTAL NON-U.S. GOVERNMENT
AGENCY OBLIGATIONS
(Cost $40,435,024) | | | | | | | 40,194,731 | | |
| SOVEREIGN DEBT OBLIGATIONS — 3.5% | |
Canada
Government CAD(b)
4.000% 12/01/2031 | | | 274,905 | | | | 352,912 | | |
Queensland Treasury
Corp. AUD(b)
6.000% 06/14/2011 | | | 750,000 | | | | 559,720 | | |
Republic of Brazil
8.000% 01/15/2018 | | | 700,000 | | | | 739,900 | | |
Republic of Brazil
8.875% 04/15/2024 | | | 53,000 | | | | 58,811 | | |
Republic of Brazil
10.125% 05/15/2027 | | | 95,000 | | | | 118,038 | | |
Republic of Brazil
11.000% 08/17/2040 | | | 452,000 | | | | 560,480 | | |
Republic of Brazil
12.250% 03/06/2030 | | | 36,000 | | | | 52,830 | | |
| | | Principal
Amount | | Market
Value | |
Republic of Colombia
8.125% 05/21/2024 | | $ | 13,000 | | | $ | 13,163 | | |
Republic of Colombia
11.750% 02/25/2020 | | | 176,000 | | | | 231,440 | | |
Republic of Panama
7.125% 01/29/2026 | | | 223,000 | | | | 215,195 | | |
Republic of Panama
8.875% 09/30/2027 | | | 30,000 | | | | 33,975 | | |
Russian Federation
5.000% 03/31/2030 | | | 1,645,000 | | | | 1,750,774 | | |
United Mexican States
5.625% 01/15/2017 | | | 28,000 | | | | 26,040 | | |
United Mexican States
7.500% 04/08/2033 | | | 1,692,000 | | | | 1,797,750 | | |
United Mexican States
8.300% 08/15/2031 | | | 100,000 | | | | 115,500 | | |
TOTAL SOVEREIGN DEBT
OBLIGATIONS
(Cost $6,801,312) | | | | | | | 6,626,528 | | |
U.S. GOVERNMENT AGENCY
OBLIGATIONS — 42.9% | |
| Federal Home Loan Bank — 0.1% | |
Federal Home Loan Bank
4.625% 02/18/2011 | | | 60,000 | | | | 58,128 | | |
Federal Home Loan Bank
5.125% 06/18/2008 | | | 50,000 | | | | 49,617 | | |
| | | | | | | | 107,745 | | |
Federal Home Loan Mortgage Corporation
(FHLMC) — 2.7% | |
| Pass-Through Securities | |
FHLMC
4.125% 10/18/2010 | | | 50,000 | | | | 47,441 | | |
FHLMC
4.375% 11/16/2007 | | | 220,000 | | | | 216,803 | | |
FHLMC
4.650% 10/10/2013 | | | 700,000 | | | | 656,595 | | |
FHLMC
4.750% 01/18/2011 | | | 230,000 | | | | 223,323 | | |
FHLMC
5.000% 01/01/2021-
01/01/2036 | | | 2,064,422 | | | | 1,938,936 | | |
FHLMC
5.250% 02/24/2011 | | | 1,060,000 | | | | 1,043,938 | | |
FHLMC
5.300% 05/12/2020 | | | 570,000 | | | | 529,801 | | |
FHLMC
5.625% 11/23/2035 | | | 170,000 | | | | 156,924 | | |
FHLMC
6.750% 09/15/2029 | | | 50,000 | | | | 57,173 | | |
FHLMC MTN
5.125% 04/18/2011 | | | 340,000 | | | | 334,813 | | |
| Total Pass-Through Securities | | | | | | | 5,205,747 | | |
(Continued)
The accompanying notes are an integral part of the financial statements.
85
MassMutual Select Strategic Bond Fund – Portfolio of Investments (Continued)
| | | Principal
Amount | | Market
Value | |
Federal National Mortgage Association
(FNMA) — 34.7% | |
| Pass-Through Securities | |
FNMA
3.310% 01/26/2007 | | $ | 110,000 | | | $ | 108,597 | | |
FNMA
4.492% 03/01/2036 | | | 1,553,289 | | | | 1,576,820 | | |
FNMA
4.500% 10/15/2008 | | | 120,000 | | | | 117,663 | | |
FNMA
4.610% 10/10/2013 | | | 510,000 | | | | 477,391 | | |
FNMA
5.000% 11/01/2020-
03/01/2036 | | | 47,811,212 | | | | 44,736,082 | | |
FNMA
5.200% 11/08/2010 | | | 440,000 | | | | 432,320 | | |
FNMA
5.500% 06/01/2020-
06/01/2036 | | | 11,431,792 | | | | 11,033,772 | | |
FNMA
5.625% 05/19/2011 | | | 770,000 | | | | 766,620 | | |
FNMA
6.000% 10/01/2035-
03/01/2036 | | | 6,081,859 | | | | 5,985,879 | | |
FNMA
6.500% 12/01/2034 | | | 123,338 | | | | 124,398 | | |
FNMA
6.625% 09/15/2009 | | | 410,000 | | | | 423,863 | | |
| Total Pass-Through Securities | | | | | | | 65,783,405 | | |
Government National Mortgage Association
(GNMA) — 5.4% | |
| Pass-Through Securities | |
GNMA
4.500% 09/15/2035 | | | 185,421 | | | | 170,167 | | |
GNMA
5.000% 08/15/2033-
05/15/2035 | | | 5,139,094 | | | | 4,873,709 | | |
GNMA
5.500% 02/15/2035-
02/15/2036 | | | 3,012,723 | | | | 2,920,554 | | |
GNMA
6.000% 04/15/2029-
02/15/2036 | | | 2,266,346 | | | | 2,249,320 | | |
| Total Pass-Through Securities | | | | | | | 10,213,750 | | |
TOTAL U.S. GOVERNMENT
AGENCY OBLIGATIONS
(Cost $83,925,844) | | | | | | | 81,310,647 | | |
| U.S. TREASURY OBLIGATIONS — 5.8% | |
| U.S. Treasury Bonds — 3.9% | |
U.S. Treasury Bond(a)
6.250% 08/15/2023 | | | 460,000 | | | | 507,438 | | |
| | | Principal
Amount | | Market
Value | |
U.S. Treasury
Inflation Index
2.000% 01/15/2026 | | $ | 1,400,617 | | | $ | 1,281,565 | | |
U.S. Treasury
Inflation Index
2.375% 01/15/2025 | | | 3,515,957 | | | | 3,421,466 | | |
U.S. Treasury
Inflation Index
3.875% 04/15/2029 | | | 1,838,055 | | | | 2,274,593 | | |
| | | | | | | | 7,485,062 | | |
| U.S. Treasury Notes — 1.8% | |
U.S. Treasury
Inflation Index
2.000% 01/15/2014 | | | 1,090,210 | | | | 1,052,223 | | |
U.S. Treasury
Inflation Index
2.000% 01/15/2016 | | | 1,593,456 | | | | 1,522,248 | | |
U.S. Treasury Note(a)
3.000% 02/15/2008 | | | 10,000 | | | | 9,662 | | |
U.S. Treasury Note
3.625% 04/30/2007 | | | 110,000 | | | | 108,505 | | |
U.S. Treasury Note
3.750% 05/15/2008 | | | 70,000 | | | | 68,228 | | |
U.S. Treasury Note
4.250% 01/15/2011 | | | 40,000 | | | | 38,625 | | |
U.S. Treasury Note
4.500% 02/15/2009 | | | 140,000 | | | | 137,791 | | |
U.S. Treasury Note(a)
4.500% 02/15/2016 | | | 430,000 | | | | 409,172 | | |
| | | | | | | | 3,346,454 | | |
| U.S. Treasury Strips — 0.1% | |
U.S. Treasury Strips
0.000% 11/15/2021 | | | 560,000 | | | | 247,683 | | |
TOTAL U.S. TREASURY
OBLIGATIONS
(Cost $11,590,410) | | | | | | | 11,079,199 | | |
TOTAL BONDS & NOTES
(Cost $181,445,765) | | | | | | | 176,556,850 | | |
| OPTIONS — 0.1% | |
90 Day
Eurodollar Futures,
December 2006
Call, Expires 12/18/2006,
Strike 94.5 | | | 65,000 | | | | 6,987 | | |
90 Day
Eurodollar Futures,
September 2006 Call,
Expires 9/18/2006,
Strike 94.5 | | | 122,500 | | | | 7,350 | | |
| | | Principal
Amount | | Market
Value | |
Eurodollar Future Options,
September 2006 Call,
Expires 9/18/2006,
Strike 96 | | $ | 297,500 | | | $ | 124,950 | | |
U.S. Bond Future Options,
September 2006 Call,
Expires 8/25/2006,
Strike 108 | | | 5,000 | | | | 2,969 | | |
TOTAL OPTIONS
(Cost $345,045) | | | | | | | 142,256 | | |
TOTAL LONG TERM INVESTMENTS
(Cost $181,970,390) | | | | | | | 176,899,106 | | |
| SHORT-TERM INVESTMENTS — 7.3% | |
| Cash Equivalents — 1.3%(e) | |
Abbey National PLC
Eurodollar Time Deposit
5.100% 07/10/2006 | | | 27,299 | | | | 27,299 | | |
ABN Amro Bank NV
Certificate of Deposit
5.305% 11/21/2006 | | | 27,296 | | | | 27,296 | | |
American Beacon Money
Market Fund(d) | | | 27,843 | | | | 27,843 | | |
Bank of America
5.270% 07/14/2006 | | | 54,598 | | | | 54,598 | | |
Bank of America
5.310% 03/08/2007 | | | 54,598 | | | | 54,598 | | |
Bank of Montreal
Eurodollar Time Deposit
5.290% 08/03/2006 | | | 54,598 | | | | 54,598 | | |
Bank of Nova Scotia
Eurodollar Time Deposit
5.290% 08/08/2006 | | | 54,598 | | | | 54,598 | | |
Barclays
Eurodollar Time Deposit
5.150% 08/01/2006 | | | 81,897 | | | | 81,897 | | |
Branch Banker & Trust
Eurodollar Time Deposit
5.250% 07/26/2006 | | | 98,276 | | | | 98,276 | | |
Calyon
Eurodollar Time Deposit
5.300% 08/08/2006 | | | 54,598 | | | | 54,598 | | |
Canadian Imperial
Bank of Commerce
Eurodollar Time Deposit
5.310% 07/31/2006 | | | 54,598 | | | | 54,598 | | |
Deutsche Bank
Eurodollar Time Deposit
5.250% 07/05/2006 | | | 136,495 | | | | 136,495 | | |
Dexia Group
Eurodollar Time Deposit
5.300% 08/09/2006 | | | 70,977 | | | | 70,977 | | |
(Continued)
The accompanying notes are an integral part of the financial statements.
86
MassMutual Select Strategic Bond Fund – Portfolio of Investments (Continued)
| | | Principal
Amount | | Market
Value | |
Federal Home Loan Bank
Discount Note
5.181% 07/19/2006 | | $ | 43,459 | | | $ | 43,459 | | |
First Tennessee
National Corporation
Eurodollar Time Deposit
5.270% 07/24/2006 | | | 65,517 | | | | 65,517 | | |
Fortis Bank
Eurodollar Time Deposit
5.090% 07/05/2006 | | | 54,598 | | | | 54,598 | | |
Fortis Bank
Eurodollar Time Deposit
5.250% 07/03/2006 | | | 54,598 | | | | 54,598 | | |
Fortis Bank
Eurodollar Time Deposit
5.250% 07/06/2006 | | | 54,598 | | | | 54,598 | | |
Freddie Mac
Discount Note
5.191% 07/25/2006 | | | 32,583 | | | | 32,583 | | |
Harris NA
Eurodollar Time Deposit
5.080% 07/05/2006 | | | 38,218 | | | | 38,218 | | |
HBOS Halifax
Bank of Scotland
Certificate of Deposit
5.110% 07/10/2006 | | | 54,598 | | | | 54,598 | | |
National Australia Bank
Eurodollar Time Deposit
5.290% 07/03/2006 | | | 191,092 | | | | 191,092 | | |
National City Corporation
Eurodollar Time Deposit
5.220% 07/03/2006 | | | 64,819 | | | | 64,819 | | |
Skandinaviska Enskilda
Banken AB
Eurodollar Time Deposit
5.130% 07/12/2006 | | | 54,598 | | | | 54,598 | | |
Societe Generale
Eurodollar Time Deposit
5.200% 08/08/2006 | | | 54,598 | | | | 54,598 | | |
Societe Generale
Eurodollar Time Deposit
5.270% 07/17/2006 | | | 70,977 | | | | 70,977 | | |
Standard Chartered Bank
Eurodollar Time Deposit
5.260% 07/07/2006 | | | 81,897 | | | | 81,897 | | |
Svenska Handlesbanken
Eurodollar Time Deposit
5.290% 07/03/2006 | | | 183,040 | | | | 183,040 | | |
The Bank of the West
Eurodollar Time Deposit
5.250% 08/07/2006 | | | 92,816 | | | | 92,816 | | |
Toronto Dominion Bank
Eurodollar Time Deposit
5.300% 07/31/2006 | | | 152,874 | | | | 152,874 | | |
| | | Principal
Amount | | Market
Value | |
UBS AG
Eurodollar Time Deposit
5.250% 07/21/2006 | | $ | 81,897 | | | $ | 81,897 | | |
UBS AG
Eurodollar Time Deposit
5.250% 08/04/2006 | | | 81,897 | | | | 81,897 | | |
Wells Fargo
Eurodollar Time Deposit
5.160% 07/13/2006 | | | 54,598 | | | | 54,598 | | |
Wells Fargo
Eurodollar Time Deposit
5.170% 07/03/2006 | | | 54,598 | | | | 54,598 | | |
Wells Fargo
Eurodollar Time Deposit
5.210% 07/06/2006 | | | 27,299 | | | | 27,299 | | |
Wells Fargo
Eurodollar Time Deposit
5.250% 07/03/2006 | | | 54,598 | | | | 54,598 | | |
| | | | | | | | 2,497,438 | | |
| Discount Notes — 0.4% | |
FNMA
4.960% 09/25/2006 | | | 185,000 | | | | 182,783 | | |
FNMA
4.960% 09/25/2006 | | | 535,000 | | | | 528,587 | | |
| | | | | | | | 711,370 | | |
| Repurchase Agreement — 5.5% | |
Investors Bank & Trust
Company Repurchase
Agreement, dated
06/30/2006, 3.75%,
due 07/03/2006(f) | | | 10,497,362 | | | | 10,497,362 | | |
| Sovereign Debt Obligations — 0.1% | |
Canada T-Bill
4.860% 09/20/2006 | | | 230,000 | | | | 227,454 | | |
TOTAL SHORT-TERM
INVESTMENTS
(Cost $13,933,624) | | | | | | | 13,933,624 | | |
TOTAL INVESTMENTS — 100.6%
(Cost $195,904,014)(g) | | | | | | | 190,832,730 | | |
Other Assets/
(Liabilities) — (0.6%) | | | | | | | (1,163,174 | ) | |
| NET ASSETS — 100.0% | | | | | | $ | 189,669,556 | | |
Notes to Portfolio of Investments
AUD - Australian Dollar
CAD - Canadian Dollar
EUR - Euro
MTN - Medium Term Note
REIT - Real Estate Investment Trust
(a) Denotes all or a portion of security on loan. (Note 2).
(b) The principal amount of the security is in foreign currency. The market value is in U.S. dollars.
(c) Securities exempt from registration under rule 144A of the Securities Act of 1933. These securities may be resold in transactions exempt from registration, normally to qualified institutional buyers. At June 30, 2006, these securities amounted to a value of $5,900,235 or 3.1% of net assets.
(d) Amount represents shares owned of the fund.
(e) Represents investments of security lending collateral. (Note 2).
(f) Maturity value $10,500,643. Collateralized by a U.S. Government Agency obligation with a rate of 4.281%, maturity date of 03/01/2034, and an aggregate market value, including accrued interest, of $11,022,230.
(g) See Note 6 for aggregate cost for Federal tax purposes.
The accompanying notes are an integral part of the financial statements.
87
MassMutual Select Strategic Balanced Fund – Portfolio of Investments
June 30, 2006 (Unaudited)
| | | Number of
Shares | | Market
Value | |
| EQUITIES — 58.8% | |
| COMMON STOCK — 58.7% | |
| Advertising — 0.8% | |
Interpublic Group of
Companies, Inc.(a) (b) | | | 200,900 | | | $ | 1,677,515 | | |
| Aerospace & Defense — 3.5% | |
| Boeing Co. | | | 23,800 | | | | 1,949,458 | | |
Honeywell
International, Inc. | | | 73,300 | | | | 2,953,990 | | |
| Raytheon Co. | | | 62,700 | | | | 2,794,539 | | |
| | | | | | | | 7,697,987 | | |
| Air Transportation — 1.0% | |
| Southwest Airlines Co. | | | 133,100 | | | | 2,178,847 | | |
US Airways Group, Inc.
Aircraft Statutory Trust
Certificates of Beneficial
Interest 1989 | | | 30,000 | | | | 342 | | |
US Airways Group, Inc.
Aircraft Statutory Trust
Certificates of Beneficial
Interest 1993 | | | 100,000 | | | | 43,000 | | |
| | | | | | | | 2,222,189 | | |
| Automotive & Parts — 0.4% | |
| Lear Corp.(b) | | | 44,600 | | | | 990,566 | | |
| Banking, Savings & Loans — 5.2% | |
| Bank of America Corp. | | | 63,520 | | | | 3,055,312 | | |
| JP Morgan Chase & Co. | | | 83,240 | | | | 3,496,080 | | |
Mitsubishi Tokyo Financial
Group, Inc. JPY | | | 194 | | | | 2,703,908 | | |
| State Street Corp. | | | 22,400 | | | | 1,301,216 | | |
| Unilever PLC | | | 44,055 | | | | 981,034 | | |
| | | | | | | | 11,537,550 | | |
| Beverages — 0.4% | |
Molson Coors
Brewing Co. Cl. B | | | 12,300 | | | | 834,924 | | |
| Broadcasting, Publishing & Printing — 2.4% | |
| Pearson PLC | | | 213,600 | | | | 2,879,889 | | |
| Time Warner, Inc. | | | 141,000 | | | | 2,439,300 | | |
| | | | | | | | 5,319,189 | | |
| Chemicals — 1.5% | |
| Dow Chemical Co. | | | 36,000 | | | | 1,405,080 | | |
Du Pont (E.I.) de
Nemours & Co. | | | 47,700 | | | | 1,984,320 | | |
WGI Heavy
Minerals, Inc.(a) | | | 41,300 | | | | 33,453 | | |
| | | | | | | | 3,422,853 | | |
| | | Number of
Shares | | Market
Value | |
| Commercial Services — 0.4% | |
| eBay, Inc.(a) | | | 30,600 | | | $ | 896,274 | | |
| Communications — 0.6% | |
Nokia Oyj Sponsored ADR
(Finland) | | | 71,100 | | | | 1,440,486 | | |
| Communications Equipment — 0.7% | |
| Motorola, Inc. | | | 76,400 | | | | 1,539,460 | | |
| Computer Programming Services — 0.2% | |
| VeriSign, Inc.(a) | | | 15,600 | | | | 361,452 | | |
| Computers & Information — 2.1% | |
| Cisco Systems, Inc.(a) | | | 153,600 | | | | 2,999,808 | | |
International Business
Machines Corp. | | | 22,100 | | | | 1,697,722 | | |
| Wave Systems Corp. Cl. A(a) | | | 28,100 | | | | 18,827 | | |
| | | | | | | | 4,716,357 | | |
| Cosmetics & Personal Care — 0.2% | |
| Kimberly-Clark Corp. | | | 9,000 | | | | 555,300 | | |
| Electrical Equipment & Electronics — 2.8% | |
| Intel Corp. | | | 19,000 | | | | 360,050 | | |
International
DisplayWorks, Inc.(a) (b) | | | 9,200 | | | | 47,840 | | |
| Novellus Systems, Inc.(a) | | | 42,500 | | | | 1,049,750 | | |
Samsung Electronics Co.
Ltd. GDR (Korea)(c) | | | 5,000 | | | | 1,589,017 | | |
Taiwan Semiconductor
Manufacturing Co. Ltd.
Sponsored ADR (Taiwan) | | | 196,471 | | | | 1,803,601 | | |
| Texas Instruments, Inc. | | | 43,300 | | | | 1,311,557 | | |
| | | | | | | | 6,161,815 | | |
| Energy — 5.2% | |
| Anadarko Petroleum Corp. | | | 26,000 | | | | 1,239,940 | | |
BP PLC, Sponsored ADR
(United Kingdom) | | | 3,700 | | | | 257,557 | | |
| Chevron Corp. | | | 22,400 | | | | 1,390,144 | | |
| ConocoPhillips | | | 10,900 | | | | 714,277 | | |
| Exxon Mobil Corp. | | | 17,700 | | | | 1,085,895 | | |
| GlobalSantaFe Corp. | | | 31,100 | | | | 1,796,025 | | |
| Halliburton Co. | | | 22,000 | | | | 1,632,620 | | |
| Murphy Oil Corp.(b) | | | 37,400 | | | | 2,089,164 | | |
| The Williams Cos., Inc. | | | 53,000 | | | | 1,238,080 | | |
| | | | | | | | 11,443,702 | | |
| Entertainment & Leisure — 3.0% | |
| News Corp., Inc., Cl. B(b) | | | 186,800 | | | | 3,769,624 | | |
| The Walt Disney Co. | | | 98,000 | | | | 2,940,000 | | |
| | | | | | | | 6,709,624 | | |
| | | Number of
Shares | | Market
Value | |
| Financial Services — 2.7% | |
| American Express Co. | | | 43,100 | | | $ | 2,293,782 | | |
| Franklin Resources, Inc. | | | 4,700 | | | | 408,007 | | |
The Goldman Sachs
Group, Inc. | | | 2,900 | | | | 436,247 | | |
| Merrill Lynch & Co., Inc. | | | 41,900 | | | | 2,914,564 | | |
| | | | | | | | 6,052,600 | | |
| Foods — 2.2% | |
| Kraft Foods, Inc. Cl. A(b) | | | 45,500 | | | | 1,405,950 | | |
| Safeway, Inc. | | | 80,000 | | | | 2,080,000 | | |
Unilever PLC,
Sponsored ADR
(United Kingdom)(b) | | | 66,780 | | | | 1,505,221 | | |
| | | | | | | | 4,991,171 | | |
| Forest Products & Paper — 0.7% | |
| Weyerhaeuser Co. | | | 23,400 | | | | 1,456,650 | | |
| Healthcare — 1.4% | |
| Enzo Biochem, Inc.(a) (b) | | | 55,980 | | | | 844,178 | | |
GlaxoSmithKline PLC ADR
(United Kingdom) | | | 39,500 | | | | 2,204,100 | | |
| | | | | | | | 3,048,278 | | |
| Information Retrieval Services — 0.1% | |
| Yahoo!, Inc.(a) | | | 4,300 | | | | 141,900 | | |
| Insurance — 5.0% | |
American International
Group, Inc. | | | 26,600 | | | | 1,570,730 | | |
| Chubb Corp. | | | 56,400 | | | | 2,814,360 | | |
The Hartford Financial
Services Group, Inc. | | | 24,300 | | | | 2,055,780 | | |
| MGIC Investment Corp. | | | 25,300 | | | | 1,644,500 | | |
| The PMI Group, Inc. | | | 69,100 | | | | 3,080,478 | | |
| | | | | | | | 11,165,848 | | |
| Machinery & Components — 1.8% | |
| Baker Hughes, Inc. | | | 15,700 | | | | 1,285,045 | | |
| Caterpillar, Inc. | | | 35,300 | | | | 2,629,144 | | |
| | | | | | | | 3,914,189 | | |
| Manufacturing — 0.7% | |
| Applied Materials, Inc. | | | 89,700 | | | | 1,460,316 | | |
| Medical Supplies — 0.8% | |
Agilent
Technologies, Inc.(a) | | | 52,600 | | | | 1,660,056 | | |
| Medtronic, Inc. | | | 1,400 | | | | 65,688 | | |
| | | | | | | | 1,725,744 | | |
(Continued)
The accompanying notes are an integral part of the financial statements.
88
MassMutual Select Strategic Balanced Fund – Portfolio of Investments (Continued)
| | | Number of
Shares | | Market
Value | |
| Metals & Mining — 1.5% | |
| Alcoa, Inc. | | | 67,100 | | | $ | 2,171,356 | | |
RTI International
Metals, Inc.(a) (b) | | | 19,310 | | | | 1,078,270 | | |
| | | | | | | | 3,249,626 | | |
| Pharmaceuticals — 6.6% | |
| Abbott Laboratories | | | 67,400 | | | | 2,939,314 | | |
| Amgen, Inc.(a) | | | 11,600 | | | | 756,668 | | |
Bentley
Pharmaceuticals, Inc.(a) (b) | | | 23,800 | | | | 260,848 | | |
| Eli Lilly & Co. | | | 25,700 | | | | 1,420,439 | | |
| Johnson & Johnson | | | 40,400 | | | | 2,420,768 | | |
Novartis AG ADR
(Switzerland) | | | 27,800 | | | | 1,498,976 | | |
| Pfizer, Inc. | | | 112,900 | | | | 2,649,763 | | |
| Wyeth | | | 63,200 | | | | 2,806,712 | | |
| | | | | | | | 14,753,488 | | |
| Prepackaged Software — 1.1% | |
| Microsoft Corp. | | | 103,500 | | | | 2,411,550 | | |
| Retail — 2.2% | |
| The Home Depot, Inc. | | | 73,100 | | | | 2,616,249 | | |
| Wal-Mart Stores, Inc. | | | 47,300 | | | | 2,278,441 | | |
| | | | | | | | 4,894,690 | | |
| Telephone Utilities — 1.2% | |
| Sprint Nextel Corp. | | | 6,400 | | | | 127,936 | | |
Vodafone Group PLC,
Sponsored ADR
(United Kingdom) | | | 120,700 | | | | 2,570,910 | | |
| | | | | | | | 2,698,846 | | |
| Toys, Games — 0.3% | |
| Hasbro, Inc. | | | 43,400 | | | | 785,974 | | |
TOTAL COMMON STOCK
(Cost $116,154,296) | | | | | | | 130,278,113 | | |
| PREFERRED STOCK — 0.1% | |
| Automotive & Parts | |
General Motors Corp.,
Series B | | | 5,200 | | | | 96,200 | | |
TOTAL PREFERRED STOCK
(Cost $94,676) | | | | | | | 96,200 | | |
TOTAL EQUITIES
(Cost $116,248,972) | | | | | | | 130,374,313 | | |
| | | Principal
Amount | | Market
Value | |
| BONDS & NOTES — 35.3% | |
| ASSET BACKED SECURITIES — 0.1% | |
| Financial Services | |
Wachovia Asset
Securitization, Inc.,
Series 2002-HE1, Class A
5.693% 09/27/2032 | | $ | 265,744 | | | $ | 266,325 | | |
TOTAL ASSET BACKED
SECURITIES
(Cost $267,239) | | | | | | | 266,325 | | |
| CORPORATE DEBT — 8.8% | |
| Aerospace & Defense — 0.0% | |
DRS Technologies, Inc.
6.625% 02/01/2016 | | | 20,000 | | | | 19,350 | | |
| Automotive & Parts — 0.4% | |
DaimlerChrysler
NA Holding
4.050% 06/04/2008 | | | 55,000 | | | | 53,177 | | |
DaimlerChrysler
NA Holding
5.875% 03/15/2011 | | | 100,000 | | | | 98,365 | | |
DaimlerChrysler
NA Holding
7.200% 09/01/2009 | | | 80,000 | | | | 82,518 | | |
DaimlerChrysler
NA Holding MTN
5.750% 05/18/2009 | | | 110,000 | | | | 108,945 | | |
Ford Motor Co.
6.625% 10/01/2028 | | | 50,000 | | | | 34,500 | | |
Ford Motor Co.(b)
7.450% 07/16/2031 | | | 150,000 | | | | 108,375 | | |
General Motors Corp.(b)
8.375% 07/15/2033 | | | 470,000 | | | | 378,350 | | |
General Motors
Corp. EUR(d)
8.375% 07/05/2033 | | | 90,000 | | | | 88,962 | | |
Visteon Corp.
8.250% 08/01/2010 | | | 40,000 | | | | 37,400 | | |
| | | | | | | | 990,592 | | |
| Banking, Savings & Loans — 1.3% | |
Aiful Corp.(c)
5.000% 08/10/2010 | | | 100,000 | | | | 95,089 | | |
Bank of America Corp.
3.875% 01/15/2008 | | | 145,000 | | | | 141,396 | | |
Bank of America Corp.
4.500% 08/01/2010 | | | 210,000 | | | | 201,374 | | |
Bank One Corp.
2.625% 06/30/2008 | | | 545,000 | | | | 514,472 | | |
CIT Group, Inc.
5.400% 03/07/2013 | | | 110,000 | | | | 106,411 | | |
| | | Principal
Amount | | Market
Value | |
Export-Import
Bank of Korea(c)
5.250% 02/10/2014 | | $ | 5,000 | | | $ | 4,756 | | |
Glitnir Banki HF(c)
6.693% 06/15/2016 | | | 140,000 | | | | 139,199 | | |
International Finance Corp.
5.125% 05/02/2011 | | | 1,000,000 | | | | 988,033 | | |
KeyBank NA
4.950% 09/15/2015 | | | 90,000 | | | | 83,018 | | |
KeyBank NA
5.450% 03/03/2016 | | | 40,000 | | | | 38,241 | | |
Rabobank Capital
Fund II(c)
5.260% 12/31/2049 | | | 10,000 | | | | 9,383 | | |
Rabobank Capital
Funding Trust(c)
5.254% 12/31/2049 | | | 120,000 | | | | 109,931 | | |
Resona Preferred Global
Securities(c)
7.191% 12/31/2049 | | | 155,000 | | | | 155,479 | | |
Shinsei Finance
Cayman Ltd.(c)
6.418% 07/20/2049 | | | 100,000 | | | | 93,918 | | |
SLM Corp.
4.490% 04/01/2009 | | | 20,000 | | | | 19,208 | | |
Wachovia Capital Trust III
5.800% 03/15/2042 | | | 120,000 | | | | 116,448 | | |
Wells Fargo & Co.
4.200% 01/15/2010 | | | 180,000 | | | | 172,012 | | |
| | | | | | | | 2,988,368 | | |
| Beverages — 0.1% | |
Anheuser-Busch Cos., Inc.
4.950% 01/15/2014 | | | 195,000 | | | | 184,994 | | |
| Broadcasting, Publishing & Printing — 0.4% | |
Clear Channel
Communications, Inc.
4.250% 05/15/2009 | | | 50,000 | | | | 47,414 | | |
Clear Channel
Communications, Inc.
4.625% 01/15/2008 | | | 10,000 | | | | 9,793 | | |
Clear Channel
Communications, Inc.
5.500% 09/15/2014 | | | 150,000 | | | | 135,796 | | |
Comcast Corp.
6.500% 01/15/2015 | | | 395,000 | | | | 398,096 | | |
Cox Communications, Inc.
3.875% 10/01/2008 | | | 120,000 | | | | 114,790 | | |
CSC Holdings, Inc.
7.625% 07/15/2018 | | | 25,000 | | | | 24,750 | | |
Kabel Deutschland
GMBH(c)
10.625% 07/01/2014 | | | 25,000 | | | | 26,375 | | |
(Continued)
The accompanying notes are an integral part of the financial statements.
89
MassMutual Select Strategic Balanced Fund – Portfolio of Investments (Continued)
| | | Principal
Amount | | Market
Value | |
Rogers Cable, Inc.
6.750% 03/15/2015 | | $ | 20,000 | | | $ | 19,050 | | |
| | | | | | | | 776,064 | | |
| Chemicals — 0.0% | |
Graham Packaging Co.(b)
9.875% 10/15/2014 | | | 15,000 | | | | 14,850 | | |
Westlake Chemicals
6.625% 01/15/2016 | | | 10,000 | | | | 9,237 | | |
| | | | | | | | 24,087 | | |
| Commercial Services — 0.1% | |
Service Corp.
International(c)
8.000% 06/15/2017 | | | 15,000 | | | | 14,025 | | |
Waste Management, Inc.
6.375% 11/15/2012 | | | 175,000 | | | | 178,525 | | |
Waste Management, Inc.
6.500% 11/15/2008 | | | 110,000 | | | | 111,719 | | |
| | | | | | | | 304,269 | | |
| Communications — 0.1% | |
Intelsat Bermuda Ltd.(c)
9.250% 06/15/2016 | | | 15,000 | | | | 15,487 | | |
Intelsat Ltd.
6.500% 11/01/2013 | | | 30,000 | | | | 22,800 | | |
SBC
Communications, Inc.(b)
5.100% 09/15/2014 | | | 120,000 | | | | 111,326 | | |
| | | | | | | | 149,613 | | |
| Computer Software/Services — 0.0% | |
UGS Corp.
10.000% 06/01/2012 | | | 15,000 | | | | 16,125 | | |
| Computers & Office Equipment — 0.0% | |
Electronic Data
Systems Corp.
7.125% 10/15/2009 | | | 10,000 | | | | 10,327 | | |
| Electric Utilities — 0.9% | |
AES Corp.
7.750% 03/01/2014 | | | 560,000 | | | | 562,800 | | |
AES Corp.
8.875% 02/15/2011 | | | 10,000 | | | | 10,500 | | |
The Cleveland Electric
Illuminating Co.
5.650% 12/15/2013 | | | 40,000 | | | | 38,774 | | |
Dominion Resources, Inc.
4.750% 12/15/2010 | | | 40,000 | | | | 38,179 | | |
Dominion Resources, Inc.
5.700% 09/17/2012 | | | 165,000 | | | | 161,461 | | |
Duke Energy Corp.
5.625% 11/30/2012 | | | 145,000 | | | | 143,277 | | |
Duke Energy Corp.
6.250% 01/15/2012 | | | 80,000 | | | | 81,378 | | |
| | | Principal
Amount | | Market
Value | |
Exelon Corp.
5.625% 06/15/2035 | | $ | 30,000 | | | $ | 26,317 | | |
FirstEnergy Corp., Series B
6.450% 11/15/2011 | | | 60,000 | | | | 61,051 | | |
FirstEnergy Corp., Series C
7.375% 11/15/2031 | | | 315,000 | | | | 337,948 | | |
Oncor Electric Delivery Co.
6.375% 01/15/2015 | | | 30,000 | | | | 30,070 | | |
Pacific Gas & Electric Co.
6.050% 03/01/2034 | | | 210,000 | | | | 198,201 | | |
TXU Corp., Series P(b)
5.550% 11/15/2014 | | | 40,000 | | | | 36,281 | | |
TXU Corp., Series R
6.550% 11/15/2034 | | | 270,000 | | | | 237,191 | | |
| | | | | | | | 1,963,428 | | |
| Energy — 0.9% | |
Amerada Hess Corp.
7.300% 08/15/2031 | | | 330,000 | | | | 349,703 | | |
Chesapeake Energy Corp.
6.500% 08/15/2017 | | | 20,000 | | | | 18,250 | | |
Chesapeake Energy Corp.
7.625% 07/15/2013 | | | 5,000 | | | | 5,031 | | |
Conoco Funding Co.
6.350% 10/15/2011 | | | 40,000 | | | | 41,153 | | |
Conoco, Inc.(b)
6.950% 04/15/2029 | | | 185,000 | | | | 201,307 | | |
ConocoPhillips Co.
4.750% 10/15/2012 | | | 150,000 | | | | 142,665 | | |
Devon Energy Corp.
7.950% 04/15/2032 | | | 190,000 | | | | 218,932 | | |
Dynegy Holdings, Inc.
8.750% 02/15/2012 | | | 20,000 | | | | 20,300 | | |
El Paso Corp. MTN(b)
7.750% 01/15/2032 | | | 60,000 | | | | 58,425 | | |
El Paso Corp. MTN
7.800% 08/01/2031 | | | 136,000 | | | | 132,090 | | |
Kerr - McGee Corp.
7.875% 09/15/2031 | | | 280,000 | | | | 316,046 | | |
Kinder Morgan Energy
Partners LP
5.000% 12/15/2013 | | | 20,000 | | | | 18,329 | | |
Kinder Morgan Energy
Partners LP
6.300% 02/01/2009 | | | 30,000 | | | | 30,134 | | |
Kinder Morgan Energy
Partners LP
6.750% 03/15/2011 | | | 40,000 | | | | 40,863 | | |
Pemex Project Funding
Master Trust(c)
6.625% 06/15/2035 | | | 70,000 | | | | 63,350 | | |
Suburban Propane
Partners
6.875% 12/15/2013 | | | 35,000 | | | | 32,725 | | |
| | | Principal
Amount | | Market
Value | |
Williams Cos., Inc.
Series A
7.500% 01/15/2031 | | $ | 290,000 | | | $ | 279,850 | | |
XTO Energy, Inc.
6.250% 04/15/2013 | | | 30,000 | | | | 30,020 | | |
XTO Energy, Inc.
7.500% 04/15/2012 | | | 50,000 | | | | 53,153 | | |
| | | | | | | | 2,052,326 | | |
| Entertainment & Leisure — 0.0% | |
AMC Entertainment, Inc.
11.000% 02/01/2016 | | | 15,000 | | | | 16,050 | | |
| Financial Services — 2.4% | |
Anadarko Finance Co.
6.750% 05/01/2011 | | | 205,000 | | | | 210,640 | | |
Banque Paribas - New York
6.875% 03/01/2009 | | | 170,000 | | | | 174,795 | | |
Citigroup, Inc.
5.125% 02/14/2011 | | | 370,000 | | | | 361,313 | | |
Deutsche Telekom
International Finance BV
5.750% 03/23/2016 | | | 75,000 | | | | 70,786 | | |
Devon Financing Corp. ULC
6.875% 09/30/2011 | | | 70,000 | | | | 72,779 | | |
E*TRADE Financial Corp.
7.375% 09/15/2013 | | | 20,000 | | | | 20,000 | | |
Ford Motor Credit Co.
7.375% 10/28/2009 | | | 610,000 | | | | 563,968 | | |
Ford Motor Credit Co.
7.375% 02/01/2011 | | | 120,000 | | | | 107,450 | | |
Ford Motor Credit Co.(c)
10.486% 06/15/2011 | | | 551,000 | | | | 552,890 | | |
General Electric
Capital Corp.
4.125% 09/01/2009 | | | 150,000 | | | | 143,677 | | |
General Electric
Capital Corp.
4.250% 01/15/2008 | | | 110,000 | | | | 107,885 | | |
General Electric
Capital Corp., Series A
5.589% 09/15/2014 | | | 380,000 | | | | 381,785 | | |
General Motors
Acceptance Corp.
5.125% 05/09/2008 | | | 40,000 | | | | 38,320 | | |
General Motors
Acceptance Corp.(b)
5.625% 05/15/2009 | | | 120,000 | | | | 114,139 | | |
General Motors
Acceptance Corp.
5.850% 01/14/2009 | | | 130,000 | | | | 124,619 | | |
General Motors
Acceptance Corp.
6.125% 08/28/2007 | | | 240,000 | | | | 237,490 | | |
(Continued)
The accompanying notes are an integral part of the financial statements.
90
MassMutual Select Strategic Balanced Fund – Portfolio of Investments (Continued)
| | | Principal
Amount | | Market
Value | |
General Motors
Acceptance Corp.
7.750% 01/19/2010 | | $ | 140,000 | | | $ | 139,278 | | |
General Motors
Acceptance Corp. MTN
4.375% 12/10/2007 | | | 90,000 | | | | 86,329 | | |
General Motors
Acceptance Corp. MTN
6.311% 11/30/2007 | | | 80,000 | | | | 77,082 | | |
Goldman Sachs
Group, Inc.
4.500% 06/15/2010 | | | 110,000 | | | | 105,168 | | |
Goldman Sachs
Group, Inc.
5.000% 01/15/2011 | | | 80,000 | | | | 77,366 | | |
Household Finance Corp.
Series MTN
4.125% 11/16/2009 | | | 375,000 | | | | 356,912 | | |
Kaupthing Bank
0.000% 04/11/2011 | | | 320,000 | | | | 320,111 | | |
Kaupthing Bank
(Iceland)(c)
7.125% 05/19/2016 | | | 100,000 | | | | 100,030 | | |
Lehman Brothers
Holdings, Inc.
4.000% 01/22/2008 | | | 190,000 | | | | 185,036 | | |
Morgan Stanley
3.625% 04/01/2008 | | | 310,000 | | | | 300,011 | | |
MUFG Capital
Finance 1 Ltd.
6.346% 07/29/2049 | | | 100,000 | | | | 96,459 | | |
Sprint Capital Corp.
8.375% 03/15/2012 | | | 50,000 | | | | 55,245 | | |
Telecom Italia Capital SA
4.950% 09/30/2014 | | | 120,000 | | | | 107,431 | | |
Ventas Realty Corp. REIT
6.500% 06/01/2016 | | | 15,000 | | | | 14,381 | | |
Ventas Realty Corp. REIT
7.125% 06/01/2015 | | | 10,000 | | | | 10,000 | | |
Verizon Global
Funding Corp.
7.375% 09/01/2012 | | | 60,000 | | | | 63,777 | | |
| | | | | | | | 5,377,152 | | |
| Forest Products & Paper — 0.2% | |
Weyerhaeuser Co.
6.750% 03/15/2012 | | | 385,000 | | | | 393,339 | | |
| Healthcare — 0.5% | |
DaVita, Inc.
7.250% 03/15/2015 | | | 50,000 | | | | 48,000 | | |
HCA, Inc.
6.250% 02/15/2013 | | | 190,000 | | | | 177,416 | | |
| | | Principal
Amount | | Market
Value | |
HCA, Inc.
6.375% 01/15/2015 | | $ | 320,000 | | | $ | 296,496 | | |
HCA, Inc.
7.500% 11/06/2033 | | | 20,000 | | | | 18,280 | | |
HCA, Inc.
7.690% 06/15/2025 | | | 10,000 | | | | 9,450 | | |
Tenet Healthcare Corp.(c)
9.500% 02/01/2015 | | | 526,000 | | | | 516,795 | | |
Tenet Healthcare Corp.
9.875% 07/01/2014 | | | 30,000 | | | | 30,000 | | |
| | | | | | | | 1,096,437 | | |
| Industrial – Diversified — 0.4% | |
Jacuzzi Brands, Inc.
9.625% 07/01/2010 | | | 15,000 | | | | 15,844 | | |
Tyco International
Group SA
6.375% 10/15/2011 | | | 180,000 | | | | 183,668 | | |
Tyco International
Group SA
6.875% 01/15/2029 | | | 550,000 | | | | 566,939 | | |
Tyco International
Group SA
7.000% 06/15/2028 | | | 10,000 | | | | 10,436 | | |
| | | | | | | | 776,887 | | |
| Insurance — 0.0% | |
ASIF Global Financing(c)
4.900% 01/17/2013 | | | 50,000 | | | | 47,383 | | |
| Lodging — 0.0% | |
Boyd Gaming Corp.
7.125% 02/01/2016 | | | 15,000 | | | | 14,494 | | |
Inn of the Mountain Gods
Resort & Casino
12.000% 11/15/2010 | | | 20,000 | | | | 21,250 | | |
Station Casinos, Inc.
6.625% 03/15/2018 | | | 10,000 | | | | 9,050 | | |
| | | | | | | | 44,794 | | |
| Media – Broadcasting & Publishing — 0.3% | |
AOL Time Warner, Inc.
6.875% 05/01/2012 | | | 355,000 | | | | 366,882 | | |
AOL Time Warner, Inc.
7.700% 05/01/2032 | | | 235,000 | | | | 255,410 | | |
| | | | | | | | 622,292 | | |
| Metals & Mining — 0.0% | |
Corporacion Nacional del
Cobre(c)
4.750% 10/15/2014 | | | 100,000 | | | | 91,387 | | |
| Oil & Gas — 0.1% | |
El Paso Natural Gas Co.
8.375% 06/15/2032 | | | 168,000 | | | | 178,689 | | |
| | | Principal
Amount | | Market
Value | |
Pride International, Inc.
7.375% 07/15/2014 | | $ | 10,000 | | | $ | 10,050 | | |
Western Oil Sands, Inc.
8.375% 05/01/2012 | | | 15,000 | | | | 15,937 | | |
| | | | | | | | 204,676 | | |
| Photography Equipment/Supplies — 0.2% | |
Eastman Kodak Co.
7.250% 11/15/2013 | | | 240,000 | | | | 231,140 | | |
Eastman Kodak Co. MTN
3.625% 05/15/2008 | | | 140,000 | | | | 132,397 | | |
| | | | | | | | 363,537 | | |
| Prepackaged Software — 0.0% | |
Sungard Data
Systems, Inc.(c)
10.250% 08/15/2015 | | | 15,000 | | | | 15,506 | | |
| Real Estate — 0.0% | |
Forest City Enterprises, Inc.
7.625% 06/01/2015 | | | 15,000 | | | | 15,112 | | |
| Telephone Utilities — 0.3% | |
BellSouth Corp.
4.750% 11/15/2012 | | | 10,000 | | | | 9,272 | | |
British Telecom PLC
8.375% 12/15/2010 | | | 160,000 | | | | 175,659 | | |
Cincinnati Bell, Inc.
7.000% 02/15/2015 | | | 25,000 | | | | 23,562 | | |
Koninklijke KPN NV
8.000% 10/01/2010 | | | 180,000 | | | | 190,922 | | |
Koninklijke KPN NV
8.375% 10/01/2030 | | | 125,000 | | | | 134,192 | | |
Qwest Communications
International, Inc.
7.500% 02/15/2014 | | | 20,000 | | | | 19,500 | | |
U.S. West
Communications, Inc.
5.625% 11/15/2008 | | | 30,000 | | | | 29,250 | | |
Windstream Corp.(c)
8.625% 08/01/2016 | | | 10,000 | | | | 10,225 | | |
| | | | | | | | 592,582 | | |
| Tobacco — 0.2% | |
Altria Group, Inc.
7.000% 11/04/2013 | | | 325,000 | | | | 342,875 | | |
Philip Morris Cos., Inc.
7.750% 01/15/2027 | | | 10,000 | | | | 11,221 | | |
| | | | | | | | 354,096 | | |
| Transportation — 0.0% | |
OMI Corp.
7.625% 12/01/2013 | | | 50,000 | | | | 49,875 | | |
TOTAL CORPORATE DEBT
(Cost $20,002,651) | | | | | | | 19,540,648 | | |
(Continued)
The accompanying notes are an integral part of the financial statements.
91
MassMutual Select Strategic Balanced Fund – Portfolio of Investments (Continued)
| | | Principal
Amount | | Market
Value | |
NON-U.S. GOVERNMENT
AGENCY OBLIGATIONS — 4.0% | |
| Collateralized Mortgage Obligations | |
| Financial Services — 4.0% | |
Amresco Residential
Securities Mortgage Loan
Trust, Series 1997-3,
Class M1A
5.878% 09/25/2027 | | $ | 64,181 | | | $ | 64,187 | | |
Bear Stearns Adjustable
Rate Mortgage Trust,
Series 2004-4, Class A6
3.513% 06/25/2034 | | | 400,000 | | | | 379,007 | | |
Countrywide Home Equity
Loan Trust,
Series 2005-G, Class 2A
5.429% 12/15/2035 | | | 615,119 | | | | 616,368 | | |
Countrywide Home Loan
Mortgage Pass Through
Trust, Series 2005-R3,
Class AF(c)
5.723% 09/25/2035 | | | 755,511 | | | | 758,427 | | |
CRIIMI MAE Commercial
Mortgage Trust,
Series 1998-C1,
Class A2(c)
7.000% 06/02/2033 | | | 127,400 | | | | 128,023 | | |
First Franklin Mortgage
Loan Asset Backed
Certificates,
Series 2004-FF10,
Class A2
5.723% 12/25/2032 | | | 597,041 | | | | 599,653 | | |
Greenpoint Mortgage
Funding Trust,
Series 2005-HE4,
Class 2A1A
5.543% 07/25/2030 | | | 340,045 | | | | 340,735 | | |
GS Mortgage Securities
Corp. II,
Series 2005-GG4,
Class AABA
4.680% 07/10/2039 | | | 300,000 | | | | 282,108 | | |
Harborview Mortgage
Loan Trust,
Series 2006-2, Class 1A
5.450% 04/25/2036 | | | 188,790 | | | | 187,513 | | |
Impac Secured
Assets Corp.,
Series 2005-2, Class A1
5.643% 03/25/2036 | | | 736,551 | | | | 738,118 | | |
| | | Principal
Amount | | Market
Value | |
Indymac Index Mortgage
Loan Trust,
Series 2005-AR15,
Class A2
5.099% 09/25/2035 | | $ | 166,251 | | | $ | 154,850 | | |
JP Morgan Chase
Commercial Mortgage
Securities Corp.,
Series 2005-CB12,
Class A4
4.895% 09/12/2037 | | | 600,000 | | | | 557,396 | | |
Keycorp Student Loan
Trust, Series 2005-A,
Class 1A1
5.490% 12/27/2019 | | | 605,236 | | | | 604,764 | | |
LB-UBS Commercial
Mortgage Trust,
Series 2005-C3, Class A5
4.739% 07/15/2030 | | | 210,000 | | | | 193,316 | | |
LB-UBS Commercial
Mortgage Trust,
Series 2005-C3,
Class AAB
4.664% 07/15/2030 | | | 200,000 | | | | 187,779 | | |
LB-UBS Commercial
Mortgage Trust,
Series 2005-C5, Class A4
4.954% 09/15/2040 | | | 200,000 | | | | 186,921 | | |
Mach One Trust
Commercial
Mortgage-Backed,
Series 2004-1A,
Class X, IO(c)
1.637% 05/28/2040 | | | 2,574,927 | | | | 113,400 | | |
MASTR Adjustable Rate
Mortgages Trust,
Series 2005-1,
Class 1A3(c)
7.000% 08/25/2034 | | | 348,149 | | | | 352,935 | | |
MLCC Mortgage Investors,
Inc., Series 2004-B,
Class A3
6.475% 05/25/2029 | | | 292,992 | | | | 296,407 | | |
MSDWCC Heloc Trust,
Series 2005-1, Class A
5.513% 07/25/2017 | | | 658,744 | | | | 659,773 | | |
Mutual Fund Fee Trust,
Series 2000-3
9.070% 07/01/2008 | | | 663,388 | | | | 93,597 | | |
Option One Mortgage
Loan Trust,
Series 2003-3, Class A1
5.613% 06/25/2033 | | | 377,989 | | | | 380,115 | | |
| | | Principal
Amount | | Market
Value | |
Residential Asset
Mortgage Products, Inc.,
Series 2002-RS4, Cl. A11
5.642% 08/25/2032 | | $ | 23,908 | | | $ | 23,919 | | |
Residential Asset Mortgage
Products, Inc.,
Series 2004-RP1,
Cl. A2A(c)
5.623% 11/25/2042 | | | 143,639 | | | | 143,664 | | |
UCFC Home Equity Loan,
Series 1998-D, Cl. MF1
6.905% 04/15/2030 | | | 118,943 | | | | 118,600 | | |
Wachovia Mortgage Loan
Trust LLC,
Series 2005-WMC1,
Class A1
5.433% 10/25/2035 | | | 367,801 | | | | 367,849 | | |
Washington Mutual MSC
Mortgage Pass-Through
Certificates,
Series 2004-RA1,
Class 2A
7.000% 03/25/2034 | | | 236,349 | | | | 237,438 | | |
TOTAL NON-U.S. GOVERNMENT
AGENCY OBLIGATIONS
(Cost $9,118,219) | | | | | | | 8,766,862 | | |
| SOVEREIGN DEBT OBLIGATIONS — 1.7% | |
Canada Government CAD(d)
4.000% 12/01/2031 | | | 239,006 | | | | 306,826 | | |
Queensland Treasury
Corp. AUD(d)
6.000% 06/14/2011 | | | 620,000 | | | | 462,702 | | |
Republic of Brazil
8.000% 01/15/2018 | | | 310,000 | | | | 327,670 | | |
Republic of Brazil
8.875% 04/15/2024 | | | 14,000 | | | | 15,519 | | |
Republic of Brazil
10.125% 05/15/2027 | | | 75,000 | | | | 93,187 | | |
Republic of Brazil
11.000% 08/17/2040 | | | 217,000 | | | | 269,080 | | |
Republic of Brazil
12.250% 03/06/2030 | | | 29,000 | | | | 42,557 | | |
Republic of Colombia
8.125% 05/21/2024 | | | 32,000 | | | | 32,400 | | |
Republic of Colombia
11.750% 02/25/2020 | | | 64,000 | | | | 84,160 | | |
Republic of Panama
7.125% 01/29/2026 | | | 105,000 | | | | 101,325 | | |
Russian Federation
5.000% 03/31/2030 | | | 905,000 | | | | 963,192 | | |
United Mexican States
7.500% 04/08/2033 | | | 337,000 | | | | 358,063 | | |
(Continued)
The accompanying notes are an integral part of the financial statements.
92
MassMutual Select Strategic Balanced Fund – Portfolio of Investments (Continued)
| | | Principal
Amount | | Market
Value | |
United Mexican States
8.300% 08/15/2031 | | $ | 120,000 | | | $ | 138,600 | | |
United Mexican States
11.500% 05/15/2026 | | | 340,000 | | | | 501,500 | | |
TOTAL SOVEREIGN DEBT
OBLIGATIONS
(Cost $3,524,844) | | | | | | | 3,696,781 | | |
U.S. GOVERNMENT AGENCY
OBLIGATIONS — 17.9% | |
| Federal Home Loan Bank — 0.1% | |
Federal Home Loan Bank
4.625% 02/18/2011 | | | 120,000 | | | | 116,256 | | |
Federal Home Loan Bank
5.125% 06/18/2008 | | | 110,000 | | | | 109,158 | | |
| | | | | | | | 225,414 | | |
Federal Home Loan Mortgage Corporation
(FHLMC) — 1.5% | |
| Pass-Through Securities | |
FHLMC
4.125% 10/18/2010 | | | 50,000 | | | | 47,441 | | |
FHLMC
4.650% 10/10/2013 | | | 760,000 | | | | 712,874 | | |
FHLMC
4.750% 01/18/2011 | | | 130,000 | | | | 126,226 | | |
FHLMC
5.000% 08/01/2020-
10/01/2035 | | | 1,953,702 | | | | 1,865,821 | | |
FHLMC
5.250% 02/24/2011 | | | 500,000 | | | | 492,423 | | |
FHLMC
5.625% 11/23/2035 | | | 140,000 | | | | 129,232 | | |
FHLMC
6.750% 09/15/2029 | | | 100,000 | | | | 114,346 | | |
| Total Pass-Through Securities | | | | | | | 3,488,363 | | |
Federal National Mortgage Association
(FNMA) — 13.4% | |
| Pass-Through Securities | |
FNMA
4.500% 09/01/2035 | | | 294,748 | | | | 267,024 | | |
FNMA
4.610% 10/10/2013 | | | 760,000 | | | | 711,407 | | |
FNMA
5.000% 11/01/2020-
02/01/2036 | | | 21,148,650 | | | | 19,824,837 | | |
FNMA
5.200% 11/08/2010 | | | 210,000 | | | | 206,334 | | |
FNMA
5.500% 02/01/2021-
09/01/2035 | | | 3,587,763 | | | | 3,507,447 | | |
FNMA
5.625% 05/19/2011 | | | 340,000 | | | | 338,507 | | |
| | | Principal
Amount | | Market
Value | |
FNMA
6.000% 08/01/2031-
01/01/2036 | | $ | 3,542,319 | | | $ | 3,489,997 | | |
FNMA
6.162% 11/01/2035 | | | 287,772 | | | | 294,951 | | |
FNMA
6.166% 11/01/2035 | | | 388,345 | | | | 398,039 | | |
FNMA
6.167% 11/01/2035 | | | 192,480 | | | | 197,289 | | |
FNMA
6.500% 12/01/2034 | | | 246,676 | | | | 248,796 | | |
FNMA
6.625% 09/15/2009 | | | 190,000 | | | | 196,424 | | |
| Total Pass-Through Securities | | | | | | | 29,681,052 | | |
Government National Mortgage Association
(GNMA) — 2.9% | |
| Pass-Through Securities | |
GNMA
5.000% 05/15/2034-
09/15/2035 | | | 4,358,348 | | | | 4,132,196 | | |
GNMA
6.000% 01/15/2032-
01/15/2036 | | | 2,181,535 | | | | 2,166,765 | | |
GNMA
6.500% 10/15/2032 | | | 84,727 | | | | 86,024 | | |
| Total Pass-Through Securities | | | | | | | 6,384,985 | | |
TOTAL U.S. GOVERNMENT
AGENCY OBLIGATIONS
(Cost $41,133,912) | | | | | | | 39,779,814 | | |
| U.S. TREASURY OBLIGATIONS — 2.8% | |
| U.S. Treasury Bonds — 2.0% | |
U.S. Treasury Bond(b)
6.250% 08/15/2023 | | | 190,000 | | | | 209,594 | | |
U.S. Treasury Inflation Index
2.000% 01/15/2026 | | | 690,159 | | | | 631,496 | | |
U.S. Treasury Inflation Index
2.375% 01/15/2025 | | | 1,581,646 | | | | 1,539,140 | | |
U.S. Treasury Inflation Index
3.875% 04/15/2029 | | | 1,691,011 | | | | 2,092,626 | | |
| | | | | | | | 4,472,856 | | |
| U.S. Treasury Notes — 0.8% | |
U.S. Treasury
Inflation Index
2.000% 01/15/2014 | | | 719,539 | | | | 694,467 | | |
U.S. Treasury
Inflation Index
2.000% 01/15/2016 | | | 60,896 | | | | 58,175 | | |
U.S. Treasury Note
3.125% 05/15/2007 | | | 10,000 | | | | 9,816 | | |
U.S. Treasury Note(b)
4.375% 11/15/2008 | | | 60,000 | | | | 58,973 | | |
| | | Principal
Amount | | Market
Value | |
U.S. Treasury Note
4.500% 02/15/2009 | | $ | 70,000 | | | $ | 68,895 | | |
U.S. Treasury Note(b)
4.500% 02/15/2016 | | | 180,000 | | | | 171,281 | | |
U.S. Treasury Note(b)
5.125% 05/15/2016 | | | 720,000 | | | | 719,212 | | |
| | | | | | | | 1,780,819 | | |
TOTAL U.S. TREASURY
OBLIGATIONS
(Cost $6,481,983) | | | | | | | 6,253,675 | | |
TOTAL BONDS & NOTES
(Cost $80,528,848) | | | | | | | 78,304,105 | | |
| OPTIONS — 0.0% | |
90 Day
Eurodollar Futures,
December 2006 Call,
Expires 12/18/2006,
Strike 94.5 | | | 70,000 | | | | 7,525 | | |
90 Day
Eurodollar Futures,
September 2006 Call,
Expires 9/18/2006,
Strike 94.5 | | | 57,500 | | | | 3,450 | | |
Eurodollar Future Options,
September 2006 Call,
Expires 9/18/2006,
Strike 96 | | | 130,000 | | | | 54,600 | | |
U.S. Bond Future Options,
September 2006 Call,
Expires 8/25/2006,
Strike 108 | | | 2,000 | | | | 1,188 | | |
TOTAL OPTIONS
(Cost $187,650) | | | | | | | 66,763 | | |
TOTAL LONG TERM
INVESTMENTS
(Cost $196,965,470) | | | | | | | 208,745,181 | | |
| SHORT-TERM INVESTMENTS — 12.2% | |
| Cash Equivalents — 6.4%(f) | |
Abbey National PLC
Eurodollar Time Deposit
5.100% 07/10/2006 | | | 155,295 | | | | 155,295 | | |
ABN Amro Bank NV
Certificate of Deposit
5.305% 11/21/2006 | | | 155,295 | | | | 155,295 | | |
American Beacon Money
Market Fund(e) | | | 158,388 | | | | 158,388 | | |
Bank of America
5.270% 07/14/2006 | | | 310,593 | | | | 310,593 | | |
Bank of America
5.310% 03/08/2007 | | | 310,593 | | | | 310,593 | | |
(Continued)
The accompanying notes are an integral part of the financial statements.
93
MassMutual Select Strategic Balanced Fund – Portfolio of Investments (Continued)
| | | Principal
Amount | | Market
Value | |
Bank of Montreal
Eurodollar Time Deposit
5.290% 08/03/2006 | | $ | 310,593 | | | $ | 310,593 | | |
Bank of Nova Scotia
Eurodollar Time Deposit
5.290% 08/08/2006 | | | 310,593 | | | | 310,593 | | |
Barclays
Eurodollar Time Deposit
5.150% 08/01/2006 | | | 465,889 | | | | 465,889 | | |
Branch Banker & Trust
Eurodollar Time Deposit
5.250% 07/26/2006 | | | 559,067 | | | | 559,067 | | |
Calyon
Eurodollar Time Deposit
5.300% 08/08/2006 | | | 310,593 | | | | 310,593 | | |
Canadian Imperial
Bank of Commerce
Eurodollar Time Deposit
5.310% 07/31/2006 | | | 310,593 | | | | 310,593 | | |
Deutsche Bank
Eurodollar Time Deposit
5.250% 07/05/2006 | | | 776,482 | | | | 776,482 | | |
Dexia Group
Eurodollar Time Deposit
5.300% 08/09/2006 | | | 403,771 | | | | 403,771 | | |
Federal Home Loan Bank
Discount Note
5.181% 07/19/2006 | | | 247,228 | | | | 247,228 | | |
First Tennessee
National Corporation
Eurodollar Time Deposit
5.270% 07/24/2006 | | | 372,711 | | | | 372,711 | | |
Fortis Bank
Eurodollar Time Deposit
5.090% 07/05/2006 | | | 310,593 | | | | 310,593 | | |
Fortis Bank
Eurodollar Time Deposit
5.250% 07/03/2006 | | | 310,593 | | | | 310,593 | | |
Fortis Bank
Eurodollar Time Deposit
5.250% 07/06/2006 | | | 310,593 | | | | 310,593 | | |
Freddie Mac
Discount Note
5.191% 07/25/2006 | | | 185,357 | | | | 185,357 | | |
Harris NA
Eurodollar Time Deposit
5.080% 07/05/2006 | | | 217,415 | | | | 217,415 | | |
HBOS Halifax
Bank of Scotland
Certificate of Deposit
5.110% 07/10/2006 | | | 310,593 | | | | 310,593 | | |
National Australia Bank
Eurodollar Time Deposit
5.290% 07/03/2006 | | | 1,087,075 | | | | 1,087,075 | | |
| | | Principal
Amount | | Market
Value | |
National City Corporation
Eurodollar Time Deposit
5.220% 07/03/2006 | | $ | 368,739 | | | $ | 368,739 | | |
Skandinaviska Enskilda
Banken AB
Eurodollar Time Deposit
5.130% 07/12/2006 | | | 310,593 | | | | 310,593 | | |
Societe Generale
Eurodollar Time Deposit
5.200% 08/08/2006 | | | 310,593 | | | | 310,593 | | |
Societe Generale
Eurodollar Time Deposit
5.270% 07/17/2006 | | | 403,771 | | | | 403,771 | | |
Standard Chartered Bank
Eurodollar Time Deposit
5.260% 07/07/2006 | | | 465,889 | | | | 465,889 | | |
Svenska Handlesbanken
Eurodollar Time Deposit
5.290% 07/03/2006 | | | 1,041,264 | | | | 1,041,264 | | |
The Bank of the West
Eurodollar Time Deposit
5.250% 08/07/2006 | | | 528,008 | | | | 528,008 | | |
Toronto Dominion Bank
Eurodollar Time Deposit
5.300% 07/31/2006 | | | 869,660 | | | | 869,660 | | |
UBS AG
Eurodollar Time Deposit
5.250% 07/21/2006 | | | 465,889 | | | | 465,889 | | |
UBS AG
Eurodollar Time Deposit
5.250% 08/04/2006 | | | 465,889 | | | | 465,889 | | |
Wells Fargo
Eurodollar Time Deposit
5.160% 07/13/2006 | | | 310,593 | | | | 310,593 | | |
Wells Fargo
Eurodollar Time Deposit
5.170% 07/03/2006 | | | 310,593 | | | | 310,593 | | |
Wells Fargo
Eurodollar Time Deposit
5.210% 07/06/2006 | | | 155,296 | | | | 155,296 | | |
Wells Fargo
Eurodollar Time Deposit
5.250% 07/03/2006 | | | 310,593 | | | | 310,593 | | |
| | | | | | | | 14,207,273 | | |
| Commercial Paper — 0.4% | |
Toyota Motor Credit Co
5.020% 07/06/2006 | | | 900,000 | | | | 899,246 | | |
| Discount Notes — 0.1% | |
FNMA
4.960% 09/25/2006 | | | 190,000 | | | | 187,723 | | |
| | | Principal
Amount | | Market
Value | |
| Repurchase Agreement — 5.1% | |
Investors Bank & Trust
Company Repurchase
Agreement, dated
06/30/2006, 3.75%,
due 07/03/2006(g) | | $ | 11,400,997 | | | $ | 11,400,996 | | |
| Time Deposit — 0.1% | |
Deutshe Bank AG CD
5.37% 07/03/2006 | | | 300,000 | | | | 300,000 | | |
| Sovereign Debt Obligations — 0.0% | |
Canada T-Bill
4.860% 09/20/2006 | | | 100,000 | | | | 98,893 | | |
TOTAL SHORT-TERM
INVESTMENTS
(Cost $27,094,131) | | | | | | | 27,094,131 | | |
TOTAL INVESTMENTS — 106.3%
(Cost $224,059,601)(h) | | | | | | | 235,839,312 | | |
Other Assets/
(Liabilities) — (6.3%) | | | | | | | (14,048,177 | ) | |
| NET ASSETS — 100.0% | | | | | | $ | 221,791,135 | | |
Notes to Portfolio of Investments
ADR - American Depository Receipt
AUD - Australian Dollar
CAD - Canadian Dollar
EUR - Euro
GDR - Global Depository Receipt
JPY - Japanese Yen
MTN - Medium Term Note
REIT - Real Estate Investment Trust
(a) Non-income producing security.
(b) Denotes all or a portion of security on loan. (Note 2).
(c) Securities exempt from registration under rule 144A of the Securities Act of 1933. These securities may be resold in transactions exempt from registration, normally to qualified institutional buyers. At June 30, 2006, these securities amounted to a value of $5,146,674 or 2.3% of net assets.
(d) The principal amount of the security is in foreign currency. The market value is in U.S. dollars.
(e) Amount represents shares owned of the fund.
(f) Represents investments of security lending collateral. (Note 2).
(g) Maturity value of $11,404,559. Collaterized by a U.S. Government Agency obligation with a rate of 4.289%, maturity date of 07/01/2018, and an aggregate market value, including accrued interest, of $11,971,046.
(h) See Note 6 for aggregrate cost for Federal tax purposes.
The accompanying notes are an integral part of the financial statements.
94
MassMutual Select Diversified Value Fund – Portfolio of Investments
June 30, 2006 (Unaudited)
| | | Number of
Shares | | Market
Value | |
| EQUITIES — 98.6% | |
| COMMON STOCK | |
| Advertising — 0.3% | |
Interpublic Group of
Companies, Inc.(a) (b) | | | 117,700 | | | $ | 982,795 | | |
| Aerospace & Defense — 1.7% | |
| Boeing Co. | | | 25,000 | | | | 2,047,750 | | |
| Goodrich Corp. | | | 33,900 | | | | 1,365,831 | | |
| Northrop Grumman Corp. | | | 50,200 | | | | 3,215,812 | | |
| | | | | | | | 6,629,393 | | |
| Apparel, Textiles & Shoes — 0.6% | |
| Jones Apparel Group, Inc. | | | 21,300 | | | | 677,127 | | |
| Limited Brands | | | 61,800 | | | | 1,581,462 | | |
| | | | | | | | 2,258,589 | | |
| Automotive & Parts — 2.5% | |
American Axle &
Manufacturing
Holdings, Inc.(b) | | | 14,591 | | | | 249,652 | | |
| Autoliv, Inc. | | | 39,400 | | | | 2,228,858 | | |
| BorgWarner, Inc. | | | 27,100 | | | | 1,764,210 | | |
| DaimlerChrysler AG(b) | | | 37,600 | | | | 1,855,936 | | |
| Lear Corp.(b) | | | 10,650 | | | | 236,536 | | |
Magna International,
Inc. Cl. A(b) | | | 25,000 | | | | 1,799,250 | | |
Toyota Motor Corp.,
Sponsored ADR (Japan) | | | 16,500 | | | | 1,725,735 | | |
| | | | | | | | 9,860,177 | | |
| Banking, Savings & Loans — 15.7% | |
| Bank of America Corp. | | | 288,000 | | | | 13,852,800 | | |
Bank of New York Co.,
Inc. (The) | | | 107,100 | | | | 3,448,620 | | |
| Comerica, Inc. | | | 45,000 | | | | 2,339,550 | | |
| Fannie Mae | | | 97,000 | | | | 4,665,700 | | |
| Freddie Mac | | | 71,100 | | | | 4,053,411 | | |
| JP Morgan Chase & Co. | | | 263,488 | | | | 11,066,496 | | |
| KeyCorp(b) | | | 43,000 | | | | 1,534,240 | | |
| Mellon Financial Corp. | | | 24,500 | | | | 843,535 | | |
| National City Corp. | | | 88,800 | | | | 3,213,672 | | |
| Regions Financial Corp. | | | 74,100 | | | | 2,454,192 | | |
| SunTrust Banks, Inc. | | | 24,500 | | | | 1,868,370 | | |
| U.S. Bancorp | | | 74,300 | | | | 2,294,384 | | |
| Wachovia Corp. | | | 71,900 | | | | 3,888,352 | | |
| Washington Mutual, Inc. | | | 54,500 | | | | 2,484,110 | | |
| Wells Fargo & Co. | | | 44,600 | | | | 2,991,768 | | |
| | | | | | | | 60,999,200 | | |
| | | Number of
Shares | | Market
Value | |
| Beverages — 1.3% | |
| The Coca-Cola Co. | | | 80,600 | | | $ | 3,467,412 | | |
| PepsiCo, Inc. | | | 27,200 | | | | 1,633,088 | | |
| | | | | | | | 5,100,500 | | |
| Broadcasting, Publishing & Printing — 4.1% | |
| CBS Corp. Cl. B | | | 100,850 | | | | 2,727,992 | | |
| Comcast Corp. Cl. A(a) (b) | | | 125,500 | | | | 4,108,870 | | |
| Gannett Co., Inc. | | | 9,800 | | | | 548,114 | | |
Liberty Media Holding
Corp. Capital Cl. A(a) | | | 2,400 | | | | 201,048 | | |
Liberty Media Holding
Corp. Interactive Cl. A(a) | | | 12,000 | | | | 207,120 | | |
| Time Warner, Inc. | | | 307,125 | | | | 5,313,263 | | |
| Viacom, Inc. Cl. B(a) | | | 81,850 | | | | 2,933,504 | | |
| | | | | | | | 16,039,911 | | |
| Building Materials & Construction — 0.2% | |
| Masco Corp.(b) | | | 23,100 | | | | 684,684 | | |
| Chemicals — 1.4% | |
Arkema, Sponsored ADR
(France)(a) | | | 445 | | | | 17,360 | | |
Du Pont (E.I.)
de Nemours & Co. | | | 29,900 | | | | 1,243,840 | | |
| Hercules, Inc.(a) | | | 32,500 | | | | 495,950 | | |
| The Lubrizol Corp. | | | 33,400 | | | | 1,330,990 | | |
| PPG Industries, Inc. | | | 35,000 | | | | 2,310,000 | | |
| | | | | | | | 5,398,140 | | |
| Communications — 1.8% | |
ADC
Telecommunications, Inc.(a) | | | 35,200 | | | | 593,472 | | |
American Tower
Corp. Cl. A(a) | | | 31,000 | | | | 964,720 | | |
Crown Castle
International Corp.(a) | | | 67,000 | | | | 2,314,180 | | |
Nokia Oyj Sponsored ADR
(Finland) | | | 72,600 | | | | 1,470,876 | | |
| Tellabs, Inc.(a) | | | 111,800 | | | | 1,488,058 | | |
| | | | | | | | 6,831,306 | | |
| Computer Programming Services — 0.3% | |
| Ceridian Corp.(a) | | | 39,500 | | | | 965,380 | | |
| Computers & Information — 1.1% | |
| Cisco Systems, Inc.(a) | | | 41,400 | | | | 808,542 | | |
International Business
Machines Corp. | | | 22,400 | | | | 1,720,768 | | |
| Solectron Corp.(a) | | | 287,375 | | | | 982,823 | | |
| Tech Data Corp.(a) | | | 17,200 | | | | 658,932 | | |
| | | | | | | | 4,171,065 | | |
| | | Number of
Shares | | Market
Value | |
| Computers & Office Equipment — 1.9% | |
Electronic Data
Systems Corp. | | | 90,300 | | | $ | 2,172,618 | | |
| Hewlett-Packard Co. | | | 167,152 | | | | 5,295,375 | | |
| | | | | | | | 7,467,993 | | |
| Containers — 0.7% | |
| Crown Holdings, Inc.(a) | | | 50,400 | | | | 784,728 | | |
| Owens-Illinois, Inc.(a) | | | 64,000 | | | | 1,072,640 | | |
Smurfit-Stone
Container Corp.(a) | | | 90,800 | | | | 993,352 | | |
| | | | | | | | 2,850,720 | | |
| Cosmetics & Personal Care — 2.5% | |
| Colgate-Palmolive Co. | | | 37,600 | | | | 2,252,240 | | |
| Kimberly-Clark Corp. | | | 37,300 | | | | 2,301,410 | | |
| The Procter & Gamble Co. | | | 94,900 | | | | 5,276,440 | | |
| | | | | | | | 9,830,090 | | |
| Electric Utilities — 3.1% | |
| Alliant Energy Corp. | | | 9,700 | | | | 332,710 | | |
American Electric
Power Co., Inc. | | | 81,000 | | | | 2,774,250 | | |
Constellation Energy
Group, Inc. | | | 32,300 | | | | 1,760,996 | | |
| Dominion Resources, Inc. | | | 42,600 | | | | 3,186,054 | | |
| Entergy Corp. | | | 30,700 | | | | 2,172,025 | | |
| Northeast Utilities(b) | | | 40,600 | | | | 839,202 | | |
Pinnacle West
Capital Corp. | | | 20,700 | | | | 826,137 | | |
| | | | | | | | 11,891,374 | | |
| Electrical Equipment & Electronics — 3.5% | |
| Agere Systems, Inc.(a) | | | 71,100 | | | | 1,045,170 | | |
| Arrow Electronics, Inc.(a) | | | 34,100 | | | | 1,098,020 | | |
| Celestica, Inc.(a) | | | 72,500 | | | | 691,650 | | |
| Celestica, Inc.(a) | | | 13,200 | | | | 125,928 | | |
Flextronics
International Ltd.(a) | | | 92,200 | | | | 979,164 | | |
| General Electric Co. | | | 248,300 | | | | 8,183,968 | | |
| Hubbell, Inc. Cl. B | | | 16,300 | | | | 776,695 | | |
| Sanmina-SCI Corp.(a) | | | 154,500 | | | | 710,700 | | |
| | | | | | | | 13,611,295 | | |
| Energy — 12.1% | |
BP PLC, Sponsored ADR
(United Kingdom) | | | 21,100 | | | | 1,468,771 | | |
| Chevron Corp. | | | 86,200 | | | | 5,349,572 | | |
| ConocoPhillips | | | 75,300 | | | | 4,934,409 | | |
Diamond Offshore
Drilling, Inc.(b) | | | 18,000 | | | | 1,510,740 | | |
| ENSCO International, Inc. | | | 26,800 | | | | 1,233,336 | | |
(Continued)
The accompanying notes are an integral part of the financial statements.
95
MassMutual Select Diversified Value Fund – Portfolio of Investments (Continued)
| | | Number of
Shares | | Market
Value | |
| Exxon Mobil Corp. | | | 352,100 | | | $ | 21,601,335 | | |
| GlobalSantaFe Corp. | | | 28,400 | | | | 1,640,100 | | |
| Marathon Oil Corp. | | | 42,700 | | | | 3,556,910 | | |
| Noble Corp. | | | 19,600 | | | | 1,458,632 | | |
| Occidental Petroleum Corp. | | | 7,200 | | | | 738,360 | | |
| Rowan Companies, Inc. | | | 33,500 | | | | 1,192,265 | | |
Total SA Sponsored ADR
(France) | | | 31,400 | | | | 2,057,328 | | |
| Xcel Energy, Inc. | | | 19,900 | | | | 381,682 | | |
| | | | | | | | 47,123,440 | | |
| Entertainment & Leisure — 0.5% | |
| The Walt Disney Co. | | | 63,700 | | | | 1,911,000 | | |
| Financial Services — 8.7% | |
| Ameriprise Financial, Inc. | | | 25,900 | | | | 1,156,953 | | |
| Citigroup, Inc.(b) | | | 353,100 | | | | 17,033,544 | | |
| Countrywide Financial Corp. | | | 47,600 | | | | 1,812,608 | | |
The Goldman Sachs
Group, Inc. | | | 9,100 | | | | 1,368,913 | | |
Huntington
Bancshares, Inc.(b) | | | 89,100 | | | | 2,100,978 | | |
Lehman Brothers
Holdings, Inc. | | | 24,000 | | | | 1,563,600 | | |
| Merrill Lynch & Co., Inc. | | | 83,800 | | | | 5,829,128 | | |
| Morgan Stanley | | | 23,900 | | | | 1,510,719 | | |
PNC Financial Services
Group, Inc. | | | 10,000 | | | | 701,700 | | |
Waddell & Reed Financial,
Inc. Cl. A | | | 40,600 | | | | 834,736 | | |
| | | | | | | | 33,912,879 | | |
| Foods — 3.7% | |
| Archer-Daniels-Midland Co. | | | 72,700 | | | | 3,001,056 | | |
| Bunge Ltd.(b) | | | 10,500 | | | | 527,625 | | |
| ConAgra Foods, Inc. | | | 78,000 | | | | 1,724,580 | | |
| Del Monte Foods Co. | | | 47,600 | | | | 534,548 | | |
| General Mills, Inc. | | | 47,700 | | | | 2,464,182 | | |
| Kellogg Co. | | | 45,500 | | | | 2,203,565 | | |
| The Kroger Co. | | | 101,200 | | | | 2,212,232 | | |
| Safeway, Inc.(b) | | | 64,800 | | | | 1,684,800 | | |
| | | | | | | | 14,352,588 | | |
| Forest Products & Paper — 0.2% | |
| Sonoco Products Co. | | | 27,400 | | | | 867,210 | | |
| Healthcare — 0.4% | |
GlaxoSmithKline PLC ADR
(United Kingdom) | | | 18,700 | | | | 1,043,460 | | |
| Tenet Healthcare Corp.(a) (b) | | | 76,700 | | | | 535,366 | | |
| | | | | | | | 1,578,826 | | |
Home Construction, Furnishings &
Appliances — 0.1% | |
| Leggett & Platt, Inc. | | | 17,600 | | | | 439,648 | | |
| | | Number of
Shares | | Market
Value | |
| Household Products — 0.9% | |
| The Clorox Co. | | | 31,400 | | | $ | 1,914,458 | | |
| Newell Rubbermaid, Inc. | | | 56,700 | | | | 1,464,561 | | |
| | | | | | | | 3,379,019 | | |
| Industrial – Diversified — 1.9% | |
| Cooper Industries Ltd. Cl. A | | | 17,200 | | | | 1,598,224 | | |
| Eaton Corp. | | | 23,600 | | | | 1,779,440 | | |
| SPX Corp. | | | 29,400 | | | | 1,644,930 | | |
| Textron, Inc. | | | 21,000 | | | | 1,935,780 | | |
| Tyco International Ltd. | | | 17,200 | | | | 473,000 | | |
| | | | | | | | 7,431,374 | | |
| Insurance — 9.3% | |
| ACE Ltd. | | | 18,000 | | | | 910,620 | | |
| Allstate Corp. | | | 29,400 | | | | 1,609,062 | | |
American International
Group, Inc. | | | 144,100 | | | | 8,509,105 | | |
| Chubb Corp. | | | 32,400 | | | | 1,616,760 | | |
Genworth
Financial, Inc. Cl. A | | | 72,400 | | | | 2,522,416 | | |
The Hartford Financial
Services Group, Inc. | | | 36,600 | | | | 3,096,360 | | |
| MBIA, Inc.(b) | | | 20,000 | | | | 1,171,000 | | |
| Metlife, Inc.(b) | | | 62,975 | | | | 3,224,950 | | |
| MGIC Investment Corp. | | | 13,700 | | | | 890,500 | | |
Old Republic
International Corp. | | | 53,400 | | | | 1,141,158 | | |
| PartnerRe Ltd.(b) | | | 18,100 | | | | 1,159,305 | | |
| Prudential Financial, Inc. | | | 18,100 | | | | 1,406,370 | | |
| RenaissanceRe Holdings Ltd. | | | 21,000 | | | | 1,017,660 | | |
| St. Paul Travelers Cos. | | | 79,424 | | | | 3,540,722 | | |
| Torchmark Corp. | | | 17,500 | | | | 1,062,600 | | |
| UnumProvident Corp. | | | 78,600 | | | | 1,425,018 | | |
| XL Capital Ltd. Cl. A | | | 29,700 | | | | 1,820,610 | | |
| | | | | | | | 36,124,216 | | |
| Metals & Mining — 0.9% | |
| Alcoa, Inc. | | | 10,300 | | | | 333,308 | | |
| Crane Co. | | | 16,500 | | | | 686,400 | | |
| United States Steel Corp. | | | 33,900 | | | | 2,377,068 | | |
| | | | | | | | 3,396,776 | | |
| Pharmaceuticals — 5.3% | |
| Abbott Laboratories | | | 4,800 | | | | 209,328 | | |
| AmerisourceBergen Corp. | | | 34,700 | | | | 1,454,624 | | |
| Eli Lilly & Co. | | | 35,200 | | | | 1,945,504 | | |
| Merck & Co., Inc. | | | 139,100 | | | | 5,067,413 | | |
| Pfizer, Inc. | | | 472,200 | | | | 11,082,534 | | |
| Wyeth | | | 19,300 | | | | 857,113 | | |
| | | | | | | | 20,616,516 | | |
| Prepackaged Software — 0.4% | |
| Microsoft Corp. | | | 70,100 | | | | 1,633,330 | | |
| | | Number of
Shares | | Market
Value | |
| Restaurants — 1.1% | |
| McDonald's Corp. | | | 128,200 | | | $ | 4,307,520 | | |
| Retail — 0.8% | |
| Office Depot, Inc.(a) | | | 60,700 | | | | 2,306,600 | | |
| Target Corp. | | | 19,700 | | | | 962,739 | | |
| | | | | | | | 3,269,339 | | |
| Telephone Utilities — 6.0% | |
| AT&T, Inc. | | | 313,000 | | | | 8,729,570 | | |
| BellSouth Corp. | | | 100,310 | | | | 3,631,222 | | |
| Embarq Corp.(a) | | | 7,012 | | | | 287,422 | | |
| Sprint Nextel Corp. | | | 140,250 | | | | 2,803,598 | | |
Verizon
Communications, Inc. | | | 238,900 | | | | 8,000,761 | | |
| | | | | | | | 23,452,573 | | |
| Tobacco — 2.2% | |
| Altria Group, Inc. | | | 98,200 | | | | 7,210,826 | | |
| UST, Inc.(b) | | | 27,900 | | | | 1,260,801 | | |
| | | | | | | | 8,471,627 | | |
| Toys, Games — 0.2% | |
| Mattel, Inc. | | | 47,100 | | | | 777,621 | | |
| Transportation — 1.2% | |
| CSX Corp. | | | 30,400 | | | | 2,141,376 | | |
| Norfolk Southern Corp. | | | 45,500 | | | | 2,421,510 | | |
| | | | | | | | 4,562,886 | | |
TOTAL EQUITIES
(Cost $336,804,117) | | | | | | | 383,181,000 | | |
| | | Principal
Amount | | | |
| SHORT-TERM INVESTMENTS — 5.7% | |
| Cash Equivalents — 4.4%(d) | |
Abbey National PLC
Eurodollar Time Deposit
5.100% 07/10/2006 | | $ | 189,359 | | | | 189,358 | | |
ABN Amro Bank NV
Certificate of Deposit
5.305% 11/21/2006 | | | 189,359 | | | | 189,359 | | |
American Beacon Money
Market Fund(c) | | | 193,130 | | | | 193,130 | | |
Bank of America
5.270% 07/14/2006 | | | 378,718 | | | | 378,718 | | |
Bank of America
5.310% 03/08/2007 | | | 378,718 | | | | 378,718 | | |
Bank of Montreal
Eurodollar Time Deposit
5.290% 08/03/2006 | | | 378,718 | | | | 378,718 | | |
Bank of Nova Scotia
Eurodollar Time Deposit
5.290% 08/08/2006 | | | 378,718 | | | | 378,718 | | |
(Continued)
The accompanying notes are an integral part of the financial statements.
96
MassMutual Select Diversified Value Fund – Portfolio of Investments (Continued)
| | | Principal
Amount | | Market
Value | |
Barclays
Eurodollar Time Deposit
5.150% 08/01/2006 | | $ | 568,077 | | | $ | 568,077 | | |
Branch Banker & Trust
Eurodollar Time Deposit
5.250% 07/26/2006 | | | 681,692 | | | | 681,692 | | |
Calyon
Eurodollar Time Deposit
5.300% 08/08/2006 | | | 378,718 | | | | 378,718 | | |
Canadian Imperial
Bank of Commerce
Eurodollar Time Deposit
5.310% 07/31/2006 | | | 378,718 | | | | 378,718 | | |
Deutsche Bank
Eurodollar Time Deposit
5.250% 07/05/2006 | | | 946,795 | | | | 946,795 | | |
Dexia Group
Eurodollar Time Deposit
5.300% 08/09/2006 | | | 492,333 | | | | 492,333 | | |
Federal Home Loan Bank
Discount Note
5.181% 07/19/2006 | | | 301,454 | | | | 301,454 | | |
First Tennessee
National Corporation
Eurodollar Time Deposit
5.270% 07/24/2006 | | | 454,461 | | | | 454,461 | | |
Fortis Bank
Eurodollar Time Deposit
5.090% 07/05/2006 | | | 378,718 | | | | 378,718 | | |
Fortis Bank
Eurodollar Time Deposit
5.250% 07/03/2006 | | | 378,718 | | | | 378,718 | | |
Fortis Bank
Eurodollar Time Deposit
5.250% 07/06/2006 | | | 378,718 | | | | 378,718 | | |
Freddie Mac
Discount Note
5.191% 07/25/2006 | | | 226,012 | | | | 226,012 | | |
Harris NA
Eurodollar Time Deposit
5.080% 07/05/2006 | | | 265,102 | | | | 265,102 | | |
HBOS Halifax
Bank of Scotland
Certificate of Deposit
5.110% 07/10/2006 | | | 378,718 | | | | 378,718 | | |
National Australia Bank
Eurodollar Time Deposit
5.290% 07/03/2006 | | | 1,325,513 | | | | 1,325,513 | | |
National City Corporation
Eurodollar Time Deposit
5.220% 07/03/2006 | | | 449,618 | | | | 449,618 | | |
Skandinaviska Enskilda
Banken AB
Eurodollar Time Deposit
5.130% 07/12/2006 | | | 378,718 | | | | 378,718 | | |
| | | Principal
Amount | | Market
Value | |
Societe Generale
Eurodollar Time Deposit
5.200% 08/08/2006 | | $ | 378,718 | | | $ | 378,718 | | |
Societe Generale
Eurodollar Time Deposit
5.270% 07/17/2006 | | | 492,333 | | | | 492,333 | | |
Standard Chartered Bank
Eurodollar Time Deposit
5.260% 07/07/2006 | | | 568,077 | | | | 568,077 | | |
Svenska Handlesbanken
Eurodollar Time Deposit
5.290% 07/03/2006 | | | 1,269,654 | | | | 1,269,654 | | |
The Bank of the West
Eurodollar Time Deposit
5.250% 08/07/2006 | | | 643,820 | | | | 643,820 | | |
Toronto Dominion Bank
Eurodollar Time Deposit
5.300% 07/31/2006 | | | 1,060,410 | | | | 1,060,410 | | |
UBS AG
Eurodollar Time Deposit
5.250% 07/21/2006 | | | 568,077 | | | | 568,077 | | |
UBS AG
Eurodollar Time Deposit
5.250% 08/04/2006 | | | 568,077 | | | | 568,077 | | |
Wells Fargo
Eurodollar Time Deposit
5.160% 07/13/2006 | | | 378,718 | | | | 378,718 | | |
Wells Fargo
Eurodollar Time Deposit
5.170% 07/03/2006 | | | 378,718 | | | | 378,718 | | |
Wells Fargo
Eurodollar Time Deposit
5.210% 07/06/2006 | | | 189,359 | | | | 189,359 | | |
Wells Fargo
Eurodollar Time Deposit
5.250% 07/03/2006 | | | 378,718 | | | | 378,718 | | |
| | | | | | | | 17,323,481 | | |
| Repurchase Agreement — 1.3% | |
Investors Bank & Trust
Company Repurchase
Agreement, dated
06/30/2006, 3.75%,
due 07/03/2006(e) | | | 4,933,773 | | | | 4,933,773 | | |
TOTAL SHORT-TERM
INVESTMENTS
(Cost $22,257,254) | | | | | | | 22,257,254 | | |
TOTAL INVESTMENTS — 104.3%
(Cost $359,061,371)(f) | | | | | | | 405,438,254 | | |
Other Assets/
(Liabilities) — (4.3%) | | | | | | | (16,623,545 | ) | |
| NET ASSETS — 100.0% | | | | | | $ | 388,814,709 | | |
Notes to Portfolio of Investments
ADR - American Depository Receipt
(a) Non-income producing security.
(b) Denotes all or a portion of security on loan. (Note 2).
(c) Amount represents shares owned of the fund.
(d) Represents investments of security lending collateral. (Note 2).
(e) Maturity value of $4,935,315. Collateralized by a U.S. Government Agency obligation with a rate of 4.318%, maturity date of 07/01/2033, and aggregate market value, including accrued interest, of $5,180,461.
(f) See Note 6 for aggregate cost for Federal tax purposes.
The accompanying notes are an integral part of the financial statements.
97
MassMutual Select Fundamental Value Fund – Portfolio of Investments
June 30, 2006 (Unaudited)
| | | Number of
Shares | | Market
Value | |
| EQUITIES — 99.2% | |
| COMMON STOCK | |
| Aerospace & Defense — 4.5% | |
| General Dynamics Corp. | | | 400,800 | | | $ | 26,236,368 | | |
| Goodrich Corp. | | | 261,100 | | | | 10,519,719 | | |
| Lockheed Martin Corp. | | | 186,700 | | | | 13,393,858 | | |
| | | | | | | | 50,149,945 | | |
| Air Transportation — 2.3% | |
| AMR Corp.(a) | | | 221,900 | | | | 5,640,698 | | |
| Southwest Airlines Co. | | | 1,198,900 | | | | 19,625,993 | | |
| | | | | | | | 25,266,691 | | |
| Apparel, Textiles & Shoes — 0.9% | |
| Nike, Inc. Cl. B | | | 129,800 | | | | 10,513,800 | | |
| Banking, Savings & Loans — 13.4% | |
| Bank of America Corp. | | | 773,100 | | | | 37,186,110 | | |
Golden West
Financial Corp. | | | 440,200 | | | | 32,662,840 | | |
| JP Morgan Chase & Co. | | | 713,236 | | | | 29,955,912 | | |
| National City Corp. | | | 296,300 | | | | 10,723,097 | | |
| SunTrust Banks, Inc. | | | 131,300 | | | | 10,012,938 | | |
| U.S. Bancorp | | | 323,400 | | | | 9,986,592 | | |
Washington
Mutual, Inc.(b) | | | 110,400 | | | | 5,032,032 | | |
| Wells Fargo & Co. | | | 228,900 | | | | 15,354,612 | | |
| | | | | | | | 150,914,133 | | |
| Beverages — 1.5% | |
| PepsiCo, Inc. | | | 281,500 | | | | 16,901,260 | | |
| Broadcasting, Publishing & Printing — 3.3% | |
| Comcast Corp. Cl. A(a) (b) | | | 466,200 | | | | 15,263,388 | | |
| Gannett Co., Inc. | | | 103,400 | | | | 5,783,162 | | |
| Time Warner, Inc. | | | 893,800 | | | | 15,462,740 | | |
| | | | | | | | 36,509,290 | | |
| Chemicals — 2.3% | |
| Dow Chemical Co. | | | 316,300 | | | | 12,345,189 | | |
Du Pont (E.I.) de
Nemours & Co. | | | 324,100 | | | | 13,482,560 | | |
| | | | | | | | 25,827,749 | | |
| Communications Equipment — 1.0% | |
| Motorola, Inc. | | | 583,200 | | | | 11,751,480 | | |
| Computer Integrated Systems Design — 0.9% | |
Sun
Microsystems, Inc.(a) | | | 2,433,700 | | | | 10,099,855 | | |
| | | Number of
Shares | | Market
Value | |
| Computers & Information — 1.9% | |
| Cisco Systems, Inc.(a) | | | 544,700 | | | $ | 10,637,991 | | |
| EMC Corp.(a) | | | 921,500 | | | | 10,108,855 | | |
| | | | | | | | 20,746,846 | | |
| Computers & Office Equipment — 1.5% | |
| Hewlett-Packard Co. | | | 211,900 | | | | 6,712,992 | | |
| Pitney Bowes, Inc. | | | 245,500 | | | | 10,139,150 | | |
| | | | | | | | 16,852,142 | | |
| Cosmetics & Personal Care — 0.9% | |
| Kimberly-Clark Corp. | | | 171,400 | | | | 10,575,380 | | |
| Electric Utilities — 5.4% | |
| Dominion Resources, Inc. | | | 167,850 | | | | 12,553,502 | | |
| Entergy Corp. | | | 64,600 | | | | 4,570,450 | | |
| Exelon Corp.(b) | | | 270,900 | | | | 15,395,247 | | |
| FPL Group, Inc.(b) | | | 210,800 | | | | 8,722,904 | | |
| SCANA Corp. | | | 235,900 | | | | 9,101,022 | | |
| TXU Corp. | | | 171,300 | | | | 10,242,027 | | |
| | | | | | | | 60,585,152 | | |
| Electrical Equipment & Electronics — 1.5% | |
| General Electric Co.(b) | | | 506,100 | | | | 16,681,056 | | |
| Energy — 11.0% | |
| ConocoPhillips | | | 378,400 | | | | 24,796,552 | | |
| Exxon Mobil Corp. | | | 794,500 | | | | 48,742,575 | | |
| GlobalSantaFe Corp. | | | 262,500 | | | | 15,159,375 | | |
Occidental
Petroleum Corp. | | | 308,900 | | | | 31,677,695 | | |
| XTO Energy, Inc. | | | 67,500 | | | | 2,988,225 | | |
| | | | | | | | 123,364,422 | | |
| Financial Services — 8.0% | |
| Citigroup, Inc. | | | 849,400 | | | | 40,975,056 | | |
The Goldman Sachs
Group, Inc. | | | 183,700 | | | | 27,633,991 | | |
| Merrill Lynch & Co., Inc. | | | 141,400 | | | | 9,835,784 | | |
PNC Financial Services
Group, Inc. | | | 162,900 | | | | 11,430,693 | | |
| | | | | | | | 89,875,524 | | |
| Foods — 3.2% | |
| Campbell Soup Co. | | | 271,400 | | | | 10,071,654 | | |
| Kellogg Co. | | | 245,600 | | | | 11,894,408 | | |
| Safeway, Inc.(b) | | | 517,900 | | | | 13,465,400 | | |
| | | | | | | | 35,431,462 | | |
| Insurance — 8.4% | |
| ACE Ltd. | | | 179,800 | | | | 9,096,082 | | |
| Aetna, Inc. | | | 294,600 | | | | 11,763,378 | | |
| Allstate Corp. | | | 201,300 | | | | 11,017,149 | | |
| | | Number of
Shares | | Market
Value | |
American International
Group, Inc. | | | 280,800 | | | $ | 16,581,240 | | |
| Chubb Corp. | | | 349,700 | | | | 17,450,030 | | |
| WellPoint, Inc.(a) | | | 396,900 | | | | 28,882,413 | | |
| | | | | | | | 94,790,292 | | |
| Lodging — 1.8% | |
Host Hotels &
Resorts, Inc.(b) | | | 948,443 | | | | 20,742,448 | | |
| Machinery & Components — 1.9% | |
| Caterpillar, Inc. | | | 293,500 | | | | 21,859,880 | | |
| Manufacturing — 1.8% | |
American Standard
Cos., Inc. | | | 254,000 | | | | 10,990,580 | | |
| Applied Materials, Inc. | | | 575,100 | | | | 9,362,628 | | |
| | | | | | | | 20,353,208 | | |
| Medical Supplies — 2.9% | |
| Baxter International, Inc. | | | 358,500 | | | | 13,178,460 | | |
| Beckman Coulter, Inc. | | | 144,900 | | | | 8,049,195 | | |
| Boston Scientific Corp.(a) | | | 653,000 | | | | 10,996,520 | | |
| | | | | | | | 32,224,175 | | |
| Metals & Mining — 3.4% | |
| Alcoa, Inc. | | | 616,800 | | | | 19,959,648 | | |
| Cameco Corp.(b) | | | 276,400 | | | | 11,047,708 | | |
| Precision Castparts Corp. | | | 129,100 | | | | 7,715,016 | | |
| | | | | | | | 38,722,372 | | |
| Pharmaceuticals — 3.9% | |
| Abbott Laboratories(a) | | | 252,100 | | | | 10,994,081 | | |
| Pfizer, Inc. | | | 513,620 | | | | 12,054,661 | | |
| Wyeth | | | 472,000 | | | | 20,961,520 | | |
| | | | | | | | 44,010,262 | | |
| Restaurants — 0.9% | |
| McDonald's Corp. | | | 294,000 | | | | 9,878,400 | | |
| Retail — 4.5% | |
| CVS Corp. | | | 1,259,300 | | | | 38,660,510 | | |
Federated Department
Stores, Inc. | | | 315,000 | | | | 11,529,000 | | |
| | | | | | | | 50,189,510 | | |
| Telephone Utilities — 5.2% | |
| AT&T, Inc. | | | 1,094,128 | | | | 30,515,230 | | |
| BellSouth Corp. | | | 377,900 | | | | 13,679,980 | | |
| Embarq Corp.(a) | | | 31,500 | | | | 1,291,185 | | |
| Sprint Nextel Corp. | | | 647,100 | | | | 12,935,529 | | |
| | | | | | | | 58,421,924 | | |
(Continued)
The accompanying notes are an integral part of the financial statements.
98
MassMutual Select Fundamental Value Fund – Portfolio of Investments (Continued)
| | | Number of
Shares | | Market
Value | |
| Transportation — 1.0% | |
United Parcel
Service, Inc. Cl. B | | | 138,400 | | | $ | 11,394,472 | | |
TOTAL EQUITIES
(Cost $954,205,225) | | | | | | | 1,114,633,130 | | |
| | | Principal
Amount | | | |
| SHORT-TERM INVESTMENTS — 5.4% | |
| Cash Equivalents — 4.1%(d) | |
Abbey National PLC
Eurodollar Time Deposit
5.100% 07/10/2006 | | $ | 508,037 | | | | 508,037 | | |
ABN Amro Bank NV
Certificate of Deposit
5.305% 11/21/2006 | | | 508,038 | | | | 508,038 | | |
American Beacon Money
Market Fund(c) | | | 518,156 | | | | 518,156 | | |
Bank of America
5.270% 07/14/2006 | | | 1,016,077 | | | | 1,016,077 | | |
Bank of America
5.310% 03/08/2007 | | | 1,016,077 | | | | 1,016,077 | | |
Bank of Montreal
Eurodollar Time Deposit
5.290% 08/03/2006 | | | 1,016,077 | | | | 1,016,077 | | |
Bank of Nova Scotia
Eurodollar Time Deposit
5.290% 08/08/2006 | | | 1,016,077 | | | | 1,016,077 | | |
Barclays
Eurodollar Time Deposit
5.150% 08/01/2006 | | | 1,524,115 | | | | 1,524,115 | | |
Branch Banker & Trust
Eurodollar Time Deposit
5.250% 07/26/2006 | | | 1,828,938 | | | | 1,828,938 | | |
Calyon
Eurodollar Time Deposit
5.300% 08/08/2006 | | | 1,016,077 | | | | 1,016,077 | | |
Canadian Imperial
Bank of Commerce
Eurodollar Time Deposit
5.310% 07/31/2006 | | | 1,016,077 | | | | 1,016,077 | | |
Deutsche Bank
Eurodollar Time Deposit
5.250% 07/05/2006 | | | 2,540,192 | | | | 2,540,192 | | |
Dexia Group
Eurodollar Time Deposit
5.300% 08/09/2006 | | | 1,320,900 | | | | 1,320,900 | | |
Federal Home Loan Bank
Discount Note
5.181% 07/19/2006 | | | 808,784 | | | | 808,784 | | |
| | | Principal
Amount | | Market
Value | |
First Tennessee
National Corporation
Eurodollar Time Deposit
5.270% 07/24/2006 | | $ | 1,219,292 | | | $ | 1,219,292 | | |
Fortis Bank
Eurodollar Time Deposit
5.090% 07/05/2006 | | | 1,016,077 | | | | 1,016,077 | | |
Fortis Bank
Eurodollar Time Deposit
5.250% 07/03/2006 | | | 1,016,077 | | | | 1,016,077 | | |
Fortis Bank
Eurodollar Time Deposit
5.250% 07/06/2006 | | | 1,016,077 | | | | 1,016,077 | | |
Freddie Mac
Discount Note
5.191% 07/25/2006 | | | 606,378 | | | | 606,378 | | |
Harris NA
Eurodollar Time Deposit
5.080% 07/05/2006 | | | 711,254 | | | | 711,254 | | |
HBOS Halifax
Bank of Scotland
Certificate of Deposit
5.110% 07/10/2006 | | | 1,016,077 | | | | 1,016,077 | | |
National Australia Bank
Eurodollar Time Deposit
5.290% 07/03/2006 | | | 3,556,269 | | | | 3,556,269 | | |
National City Corporation
Eurodollar Time Deposit
5.220% 07/03/2006 | | | 1,206,298 | | | | 1,206,298 | | |
Skandinaviska Enskilda
Banken AB
Eurodollar Time Deposit
5.130% 07/12/2006 | | | 1,016,077 | | | | 1,016,077 | | |
Societe Generale
Eurodollar Time Deposit
5.200% 08/08/2006 | | | 1,016,077 | | | | 1,016,077 | | |
Societe Generale
Eurodollar Time Deposit
5.270% 07/17/2006 | | | 1,320,900 | | | | 1,320,900 | | |
Standard Chartered Bank
Eurodollar Time Deposit
5.260% 07/07/2006 | | | 1,524,115 | | | | 1,524,115 | | |
Svenska Handlesbanken
Eurodollar Time Deposit
5.290% 07/03/2006 | | | 3,406,404 | | | | 3,406,404 | | |
The Bank of the West
Eurodollar Time Deposit
5.250% 08/07/2006 | | | 1,727,331 | | | | 1,727,331 | | |
Toronto Dominion Bank
Eurodollar Time Deposit
5.300% 07/31/2006 | | | 2,845,015 | | | | 2,845,015 | | |
UBS AG
Eurodollar Time Deposit
5.250% 07/21/2006 | | | 1,524,115 | | | | 1,524,115 | | |
| | | Principal
Amount | | Market
Value | |
UBS AG
Eurodollar Time Deposit
5.250% 08/04/2006 | | $ | 1,524,115 | | | $ | 1,524,115 | | |
Wells Fargo
Eurodollar Time Deposit
5.160% 07/13/2006 | | | 1,016,077 | | | | 1,016,077 | | |
Wells Fargo
Eurodollar Time Deposit
5.170% 07/03/2006 | | | 1,016,077 | | | | 1,016,077 | | |
Wells Fargo
Eurodollar Time Deposit
5.210% 07/06/2006 | | | 508,038 | | | | 508,038 | | |
Wells Fargo
Eurodollar Time Deposit
5.250% 07/03/2006 | | | 1,016,077 | | | | 1,016,077 | | |
| | | | | | | | 46,477,839 | | |
| Repurchase Agreement — 1.3% | |
Investors Bank & Trust
Company Repurchase
Agreement, dated
06/30/2006, 3.75%,
due 07/03/2006(e) | | | 14,022,791 | | | | 14,022,791 | | |
TOTAL SHORT-TERM
INVESTMENTS
(Cost $60,500,630) | | | | | | | 60,500,630 | | |
TOTAL INVESTMENTS — 104.6%
(Cost $1,014,705,855)(f) | | | | | | | 1,175,133,760 | | |
Other Assets/
(Liabilities) — (4.6%) | | | | | | | (51,326,324 | ) | |
| NET ASSETS — 100.0% | | | | | | $ | 1,123,807,436 | | |
Notes to Portfolio of Investments
(a) Non-income producing security.
(b) Denotes all or a portion of security on loan. (Note 2).
(c) Amount represents shares owned of the fund.
(d) Represents investments of security lending collateral. (Note 2).
(e) Maturity value of $14,027,173. Collateralized by U.S. Government Agency obligations with a rate of 4.42%, and aggregate market value, including accrued interest, of $14,723,930.
(f) See Note 6 for aggregate cost for Federal tax purposes.
The accompanying notes are an integral part of the financial statements.
99
MassMutual Select Value Equity Fund – Portfolio of Investments
June 30, 2006 (Unaudited)
| | | Number of
Shares | | Market
Value | |
| EQUITIES — 99.1% | |
| COMMON STOCK | |
| Advertising — 0.2% | |
Clear Channel Outdoor
Holdings, Inc. Cl. A(a) | | | 5,000 | | | $ | 104,800 | | |
| Lamar Advertising Co.(a) | | | 2,450 | | | | 131,957 | | |
| | | | | | | | 236,757 | | |
| Aerospace & Defense — 5.2% | |
European Aeronautic
Defense and Space Co.(b) | | | 4,100 | | | | 116,739 | | |
| General Dynamics Corp. | | | 4,800 | | | | 314,208 | | |
| Goodrich Corp. | | | 5,600 | | | | 225,624 | | |
| Honeywell International, Inc. | | | 97,100 | | | | 3,913,130 | | |
| Raytheon Co. | | | 5,100 | | | | 227,307 | | |
| Rockwell Collins, Inc. | | | 3,000 | | | | 167,610 | | |
| United Technologies Corp. | | | 3,150 | | | | 199,773 | | |
| | | | | | | | 5,164,391 | | |
| Air Transportation — 0.8% | |
ACE Aviation
Holdings, Inc. Cl. A(a) | | | 3,200 | | | | 89,737 | | |
| Airtran Holdings, Inc.(a) (b) | | | 11,800 | | | | 175,348 | | |
Grupo Aeroportuario del
Pacifico SA de CV ADR
(Mexico) | | | 2,600 | | | | 82,810 | | |
| JetBlue Airways Corp.(a) (b) | | | 9,050 | | | | 109,867 | | |
| Southwest Airlines Co. | | | 11,700 | | | | 191,529 | | |
| UAL Corp.(a) (b) | | | 3,700 | | | | 114,774 | | |
| | | | | | | | 764,065 | | |
| Apparel, Textiles & Shoes — 0.6% | |
Casual Male Retail
Group, Inc.(a) | | | 5,400 | | | | 54,270 | | |
| Deckers Outdoor Corp.(a) (b) | | | 5,150 | | | | 198,584 | | |
| Eddie Bauer Holdings, Inc.(a) | | | 3,300 | | | | 37,950 | | |
| The Gymboree Corp.(a) | | | 4,200 | | | | 145,992 | | |
| Too, Inc. | | | 2,700 | | | | 103,653 | | |
| VF Corp. | | | 800 | | | | 54,336 | | |
| | | | | | | | 594,785 | | |
| Automotive & Parts — 0.5% | |
| General Motors Corp.(b) | | | 10,800 | | | | 321,732 | | |
| Hyundai Motor Co. | | | 1,150 | | | | 98,084 | | |
| Renault SA | | | 300 | | | | 31,941 | | |
| Tenneco, Inc.(a) | | | 3,000 | | | | 78,000 | | |
| | | | | | | | 529,757 | | |
| Banking, Savings & Loans — 9.7% | |
| Bank of America Corp. | | | 42,458 | | | | 2,042,230 | | |
| Bank of China Ltd.-H(a) | | | 76,000 | | | | 34,491 | | |
| | | Number of
Shares | | Market
Value | |
| Capital One Financial Corp. | | | 4,500 | | | $ | 384,525 | | |
| Fannie Mae | | | 19,850 | | | | 954,785 | | |
| Freddie Mac | | | 5,500 | | | | 313,555 | | |
| Golden West Financial Corp. | | | 2,000 | | | | 148,400 | | |
| Hudson City Bancorp, Inc. | | | 17,500 | | | | 233,275 | | |
Investors Financial
Services Corp. | | | 4,200 | | | | 188,580 | | |
| JP Morgan Chase & Co. | | | 56,656 | | | | 2,379,552 | | |
Kookmin Bank
Sponsored ADR (Korea) | | | 3,000 | | | | 249,180 | | |
| Mizuho Financial Group, Inc. | | | 23 | | | | 195,379 | | |
| Standard Chartered PLC | | | 4,100 | | | | 99,082 | | |
| State Street Corp. | | | 8,050 | | | | 467,624 | | |
| UBS AG | | | 2,600 | | | | 285,220 | | |
| UCBH Holdings, Inc. | | | 12,948 | | | | 214,160 | | |
| W Holding Co., Inc.(b) | | | 2,385 | | | | 15,860 | | |
| Wachovia Corp. | | | 16,357 | | | | 884,587 | | |
| Wells Fargo & Co. | | | 6,600 | | | | 442,728 | | |
| | | | | | | | 9,533,213 | | |
| Beverages — 0.5% | |
| The Coca-Cola Co. | | | 8,500 | | | | 365,670 | | |
Diageo PLC Sponsored ADR
(United Kingdom) | | | 1,650 | | | | 111,457 | | |
| | | | | | | | 477,127 | | |
| Broadcasting, Publishing & Printing — 1.6% | |
| CBS Corp. Cl. B | | | 4,239 | | | | 114,665 | | |
Clear Channel
Communications, Inc. | | | 7,850 | | | | 242,957 | | |
| Comcast Corp. Cl. A(a) | | | 15,200 | | | | 497,648 | | |
| Time Warner, Inc. | | | 17,650 | | | | 305,345 | | |
Univision Communications,
Inc. Cl. A(a) | | | 9,800 | | | | 328,300 | | |
| Viacom, Inc. Cl. B(a) | | | 3,339 | | | | 119,670 | | |
| | | | | | | | 1,608,585 | | |
| Building Materials & Construction — 0.8% | |
| Chemed Corp. | | | 2,300 | | | | 125,419 | | |
| Interline Brands, Inc.(a) | | | 6,000 | | | | 140,280 | | |
| Masco Corp. | | | 18,400 | | | | 545,376 | | |
| | | | | | | | 811,075 | | |
| Chemicals — 2.0% | |
| Chemtura Corp. | | | 15,200 | | | | 141,968 | | |
| Cytec Industries, Inc.(b) | | | 4,100 | | | | 220,006 | | |
Du Pont (E.I.) de
Nemours & Co. | | | 19,000 | | | | 790,400 | | |
| Georgia Gulf Corp. | | | 3,750 | | | | 93,825 | | |
| Lyondell Chemical Co. | | | 7,805 | | | | 176,861 | | |
| Nova Chemicals Corp. | | | 1,700 | | | | 48,943 | | |
| | | Number of
Shares | | Market
Value | |
Nova Chemicals
Corp. (CAD)(c) | | | 4,050 | | | $ | 116,891 | | |
| Praxair, Inc. | | | 7,800 | | | | 421,200 | | |
| | | | | | | | 2,010,094 | | |
| Commercial Services — 3.9% | |
ABB Ltd. Sponsored ADR
(Switzerland) | | | 13,800 | | | | 178,848 | | |
Allied Waste
Industries, Inc.(a) (b) | | | 9,400 | | | | 106,784 | | |
Apollo Group,
Inc. Cl. A(a) (b) | | | 4,400 | | | | 227,348 | | |
| The Brink's Co. | | | 5,750 | | | | 324,357 | | |
| Cendant Corp. | | | 17,700 | | | | 288,333 | | |
| Cintas Corp. | | | 3,600 | | | | 143,136 | | |
| Dycom Industries, Inc.(a) | | | 9,900 | | | | 210,771 | | |
| eBay, Inc.(a) | | | 3,800 | | | | 111,302 | | |
| Ecolab, Inc.(b) | | | 9,100 | | | | 369,278 | | |
| Fluor Corp. | | | 5,900 | | | | 548,287 | | |
Jacobs Engineering
Group, Inc.(a) | | | 3,050 | | | | 242,902 | | |
| MasterCard, Inc. Cl. A(a) | | | 2,100 | | | | 100,800 | | |
| Paychex, Inc. | | | 3,200 | | | | 124,736 | | |
| PerkinElmer, Inc. | | | 5,400 | | | | 112,860 | | |
Robert Half
International, Inc.(b) | | | 9,470 | | | | 397,740 | | |
| Service Corp. International | | | 19,900 | | | | 161,986 | | |
| Smiths Group PLC | | | 11,600 | | | | 189,304 | | |
| | | | | | | | 3,838,772 | | |
| Communications — 1.4% | |
Alcatel SA Sponsored ADR
(France)(a) | | | 14,300 | | | | 180,323 | | |
American Tower
Corp. Cl. A(a) (b) | | | 12,750 | | | | 396,780 | | |
L-3 Communications
Holdings, Inc. | | | 1,400 | | | | 105,588 | | |
| Lucent Technologies, Inc.(a) | | | 51,100 | | | | 123,662 | | |
Nokia Oyj Sponsored ADR
(Finland) | | | 17,600 | | | | 356,576 | | |
| Nortel Networks Corp.(a) | | | 60,200 | | | | 134,848 | | |
Nortel Networks
Corp. CAD(a) (c) | | | 18,200 | | | | 40,634 | | |
| | | | | | | | 1,338,411 | | |
| Communications Equipment — 0.1% | |
| Motorola, Inc. | | | 4,200 | | | | 84,630 | | |
| Computer Integrated Systems Design — 0.1% | |
| Teradyne, Inc.(a) (b) | | | 8,800 | | | | 122,584 | | |
(Continued)
The accompanying notes are an integral part of the financial statements.
100
MassMutual Select Value Equity Fund – Portfolio of Investments (Continued)
| | | Number of
Shares | | Market
Value | |
| Computer Programming Services — 0.1% | |
Infosys Technologies Ltd.
Sponsored ADR (India)(b) | | | 1,400 | | | $ | 106,974 | | |
| Computers & Information — 0.9% | |
Comverse
Technology, Inc.(a) (b) | | | 2,950 | | | | 58,321 | | |
| Jabil Circuit, Inc. | | | 2,700 | | | | 69,120 | | |
Satyam Computer
Services Ltd. ADR | | | 1,100 | | | | 36,454 | | |
| Seagate Technology(a) | | | 11,650 | | | | 263,756 | | |
| Symbol Technologies, Inc. | | | 29,300 | | | | 316,147 | | |
Zebra Technologies
Corp. Cl. A(a) | | | 4,050 | | | | 138,348 | | |
| | | | | | | | 882,146 | | |
| Computers & Office Equipment — 1.5% | |
| Hewlett-Packard Co. | | | 43,900 | | | | 1,390,752 | | |
| Xerox Corp.(a) (b) | | | 7,300 | | | | 101,543 | | |
| | | | | | | | 1,492,295 | | |
| Containers — 0.5% | |
| Ball Corp. | | | 2,150 | | | | 79,636 | | |
| Owens-Illinois, Inc.(a) | | | 7,400 | | | | 124,024 | | |
Smurfit-Stone
Container Corp.(a) | | | 22,725 | | | | 248,611 | | |
| | | | | | | | 452,271 | | |
| Cosmetics & Personal Care — 2.3% | |
| Alberto-Culver Co. | | | 2,100 | | | | 102,312 | | |
| Avon Products, Inc. | | | 27,750 | | | | 860,250 | | |
| Colgate-Palmolive Co. | | | 21,400 | | | | 1,281,860 | | |
| | | | | | | | 2,244,422 | | |
| Data Processing & Preparation — 0.4% | |
| First Data Corp. | | | 6,450 | | | | 290,508 | | |
| IMS Health, Inc. | | | 3,000 | | | | 80,550 | | |
| | | | | | | | 371,058 | | |
| Diversified Financial — 0.3% | |
| Nomura Holdings, Inc. | | | 15,800 | | | | 296,864 | | |
| Electric Utilities — 1.6% | |
| AES Corp.(a) | | | 6,250 | | | | 115,312 | | |
| CMS Energy Corp.(a) | | | 22,800 | | | | 295,032 | | |
| Exelon Corp. | | | 8,500 | | | | 483,055 | | |
| Mirant Corp.(a) (b) | | | 11,500 | | | | 308,200 | | |
| PPL Corp. | | | 10,800 | | | | 348,840 | | |
| | | | | | | | 1,550,439 | | |
| Electrical Equipment & Electronics — 6.5% | |
Freescale Semiconductor,
Inc. Cl. A(a) | | | 7,700 | | | | 223,300 | | |
| General Electric Co.(b) | | | 112,600 | | | | 3,711,296 | | |
| Hexcel Corp.(a) | | | 23,450 | | | | 368,399 | | |
| Intel Corp. | | | 8,300 | | | | 157,285 | | |
| | | Number of
Shares | | Market
Value | |
Marvell Technology
Group Ltd.(a) | | | 3,447 | | | $ | 152,806 | | |
| Micron Technology, Inc.(a) | | | 30,200 | | | | 454,812 | | |
| Molex, Inc. | | | 5,400 | | | | 181,278 | | |
| Rockwell Automation, Inc. | | | 3,200 | | | | 230,432 | | |
| Samsung Electronics Co. Ltd. | | | 185 | | | | 118,069 | | |
Sony Corp. Sponsored
ADR (Japan) | | | 12,250 | | | | 539,490 | | |
| Spansion LLC Cl. A(a) (b) | | | 1,900 | | | | 30,286 | | |
Vishay
Intertechnology, Inc.(a) (b) | | | 12,150 | | | | 191,119 | | |
| Xilinx, Inc. | | | 3,000 | | | | 67,950 | | |
| | | | | | | | 6,426,522 | | |
| Electronics — 0.1% | |
| Imation Corp. | | | 3,500 | | | | 143,675 | | |
| Energy — 11.2% | |
| Anadarko Petroleum Corp. | | | 7,600 | | | | 362,444 | | |
| Ashland, Inc. | | | 1,800 | | | | 120,060 | | |
| BJ Services Co. | | | 4,228 | | | | 157,535 | | |
| Chevron Corp.(b) | | | 14,116 | | | | 876,039 | | |
| ConocoPhillips | | | 3,840 | | | | 251,635 | | |
| El Paso Corp.(b) | | | 22,650 | | | | 339,750 | | |
| EOG Resources, Inc.(b) | | | 3,500 | | | | 242,690 | | |
| Exxon Mobil Corp. | | | 40,200 | | | | 2,466,270 | | |
| GlobalSantaFe Corp. | | | 7,250 | | | | 418,687 | | |
| Halliburton Co. | | | 22,250 | | | | 1,651,173 | | |
| Hess Corp. | | | 6,200 | | | | 327,670 | | |
| Hugoton Royalty Trust(b) | | | 381 | | | | 11,316 | | |
National Oilwell
Varco, Inc.(a) | | | 18,102 | | | | 1,146,219 | | |
| Noble Corp. | | | 2,800 | | | | 208,376 | | |
| Occidental Petroleum Corp. | | | 3,450 | | | | 353,798 | | |
Quicksilver
Resources, Inc.(a) (b) | | | 14,850 | | | | 546,629 | | |
| Schlumberger Ltd.(b) | | | 9,900 | | | | 644,589 | | |
| Ultra Petroleum Corp.(a) | | | 2,400 | | | | 142,248 | | |
| Valero Energy Corp. | | | 8,200 | | | | 545,464 | | |
| XTO Energy, Inc. | | | 4,900 | | | | 216,923 | | |
| | | | | | | | 11,029,515 | | |
| Entertainment & Leisure — 1.6% | |
| Gaylord Entertainment(a) (b) | | | 4,100 | | | | 178,924 | | |
Leapfrog
Enterprises, Inc.(a) (b) | | | 2,400 | | | | 24,240 | | |
| Live Nation, Inc.(a) | | | 2,300 | | | | 46,828 | | |
| Macrovision Corp.(a) | | | 5,100 | | | | 109,752 | | |
| News Corp., Inc. Cl. A | | | 17,982 | | | | 344,895 | | |
| The Walt Disney Co. | | | 28,500 | | | | 855,000 | | |
| | | | | | | | 1,559,639 | | |
| Financial Services — 3.9% | |
Annaly Mortgage
Management, Inc. REIT(b) | | | 6,200 | | | | 79,422 | | |
| | | Number of
Shares | | Market
Value | |
| The Bear Stearns Cos., Inc. | | | 800 | | | $ | 112,064 | | |
| Citigroup, Inc. | | | 35,700 | | | | 1,722,168 | | |
| Doral Financial Corp.(b) | | | 17,800 | | | | 114,098 | | |
Equity Lifestyle Properties,
Inc. REIT | | | 2,300 | | | | 100,809 | | |
| IntercontinentalExchange, Inc.(a) | | | 100 | | | | 5,794 | | |
Lehman Brothers
Holdings, Inc. | | | 5,500 | | | | 358,325 | | |
| Merrill Lynch & Co., Inc. | | | 2,500 | | | | 173,900 | | |
| Morgan Stanley | | | 16,300 | | | | 1,030,323 | | |
| The Charles Schwab Corp. | | | 11,900 | | | | 190,162 | | |
| | | | | | | | 3,887,065 | | |
| Foods — 1.6% | |
| Carrefour SA | | | 1,400 | | | | 81,476 | | |
| The Kroger Co. | | | 36,750 | | | | 803,355 | | |
| McCormick & Co., Inc. | | | 6,700 | | | | 224,785 | | |
| Nestle SA | | | 529 | | | | 164,578 | | |
| Safeway, Inc. | | | 9,200 | | | | 239,200 | | |
| Tyson Foods, Inc. Cl. A | | | 6,500 | | | | 96,590 | | |
| | | | | | | | 1,609,984 | | |
| Forest Products & Paper — 0.2% | |
| Packaging Corp. of America | | | 9,300 | | | | 204,786 | | |
| Healthcare — 0.1% | |
| HCA, Inc. | | | 800 | | | | 34,520 | | |
| UnitedHealth Group, Inc. | | | 1,550 | | | | 69,409 | | |
| | | | | | | | 103,929 | | |
| Heavy Machinery — 0.1% | |
| Atlas Copco AB Cl. A | | | 1,800 | | | | 49,541 | | |
Home Construction, Furnishings &
Appliances — 0.2% | |
| Whirlpool Corp. | | | 2,100 | | | | 173,565 | | |
| Industrial – Diversified — 1.1% | |
| Cooper Industries Ltd. Cl. A | | | 1,700 | | | | 157,964 | | |
| Textron, Inc. | | | 2,700 | | | | 248,886 | | |
| Tyco International Ltd. | | | 26,150 | | | | 719,125 | | |
| | | | | | | | 1,125,975 | | |
| Information Retrieval Services — 0.7% | |
| Google, Inc. Cl. A(a) | | | 1,375 | | | | 576,579 | | |
WebMD Health
Corp. Cl. A(a) (b) | | | 2,200 | | | | 104,060 | | |
| | | | | | | | 680,639 | | |
| Insurance — 8.2% | |
| ACE Ltd. | | | 20,800 | | | | 1,052,272 | | |
American International
Group, Inc. | | | 58,000 | | | | 3,424,900 | | |
Aspen Insurance
Holdings Ltd. | | | 7,700 | | | | 179,333 | | |
| W.R. Berkley Corp. | | | 17,425 | | | | 594,715 | | |
(Continued)
The accompanying notes are an integral part of the financial statements.
101
MassMutual Select Value Equity Fund – Portfolio of Investments (Continued)
| | | Number of
Shares | | Market
Value | |
Endurance Specialty
Holdings Ltd. | | | 2,900 | | | $ | 92,800 | | |
The Hartford Financial
Services Group, Inc. | | | 12,950 | | | | 1,095,570 | | |
| Hilb, Rogal & Hobbs Co. | | | 4,200 | | | | 156,534 | | |
Muenchener
Rueckversicherungs AG | | | 1,000 | | | | 135,556 | | |
| Navigators Group, Inc.(a) | | | 1,200 | | | | 52,584 | | |
| PartnerRe Ltd.(b) | | | 10,000 | | | | 640,500 | | |
Platinum Underwriters
Holdings Ltd. | | | 7,500 | | | | 209,850 | | |
| Scottish Re Group Ltd. | | | 5,500 | | | | 91,740 | | |
| Swiss Reinsurance | | | 1,593 | | | | 110,245 | | |
| XL Capital Ltd. Cl. A(b) | | | 4,500 | | | | 275,850 | | |
| | | | | | | | 8,112,449 | | |
| Internet Content — 0.2% | |
| BEA Systems, Inc.(a) | | | 14,100 | | | | 184,569 | | |
| Internet Software — 0.1% | |
Covad Communications
Group, Inc.(a) | | | 40,000 | | | | 80,400 | | |
| Machinery & Components — 1.5% | |
Chicago Bridge &
Iron Co. NV(b) | | | 3,000 | | | | 72,450 | | |
| Deere & Co. | | | 4,850 | | | | 404,927 | | |
| Flowserve Corp.(a) | | | 2,500 | | | | 142,250 | | |
| FMC Technologies, Inc.(a) | | | 4,500 | | | | 303,570 | | |
| Smith International, Inc.(b) | | | 10,900 | | | | 484,723 | | |
| Watsco, Inc. | | | 1,500 | | | | 89,730 | | |
| | | | | | | | 1,497,650 | | |
| Manufacturing — 0.1% | |
| Applied Materials, Inc. | | | 6,200 | | | | 100,936 | | |
| Medical Supplies — 3.9% | |
| Agilent Technologies, Inc.(a) | | | 9,250 | | | | 291,930 | | |
| Allergan, Inc. | | | 1,050 | | | | 112,623 | | |
| Bard (C.R.), Inc. | | | 2,753 | | | | 201,685 | | |
| Baxter International, Inc. | | | 33,400 | | | | 1,227,784 | | |
| Cooper Cos., Inc. | | | 1,500 | | | | 66,435 | | |
| Dionex Corp.(a) | | | 2,450 | | | | 133,917 | | |
| Hologic, Inc.(a) | | | 1,100 | | | | 54,296 | | |
| Illumina, Inc.(a) | | | 2,600 | | | | 77,116 | | |
| Medtronic, Inc. | | | 2,050 | | | | 96,186 | | |
| Thermo Electron Corp.(a) (b) | | | 16,650 | | | | 603,396 | | |
Varian Medical
Systems, Inc.(a) | | | 2,100 | | | | 99,435 | | |
| Varian, Inc.(a) | | | 5,000 | | | | 207,550 | | |
| Waters Corp.(a) | | | 15,000 | | | | 666,000 | | |
| | | | | | | | 3,838,353 | | |
| Metals & Mining — 2.4% | |
| Alcoa, Inc. | | | 15,600 | | | | 504,816 | | |
| Allegheny Technologies, Inc. | | | 700 | | | | 48,468 | | |
| | | Number of
Shares | | Market
Value | |
| CONSOL Energy, Inc. | | | 5,300 | | | $ | 247,616 | | |
Freeport-McMoRan
Copper & Gold, Inc. Cl. B | | | 2,200 | | | | 121,902 | | |
| Massey Energy Co.(b) | | | 5,500 | | | | 198,000 | | |
Mittal Steel Co. NV Cl. A ADR
(Netherlands)(b) | | | 8,700 | | | | 265,437 | | |
| Newmont Mining Corp. | | | 13,350 | | | | 706,616 | | |
| Oregon Steel Mills, Inc.(a) | | | 5,800 | | | | 293,828 | | |
| | | | | | | | 2,386,683 | | |
| Oil & Gas — 0.5% | |
| Pride International, Inc.(a) | | | 14,900 | | | | 465,327 | | |
| Pharmaceuticals — 7.0% | |
| Alkermes, Inc.(a) | | | 1,700 | | | | 32,164 | | |
Alnylam
Pharmaceuticals, Inc.(a) (b) | | | 16,000 | | | | 241,280 | | |
| Amgen, Inc.(a) | | | 700 | | | | 45,661 | | |
| Biogen Idec, Inc.(a) | | | 5,550 | | | | 257,132 | | |
| Bristol-Myers Squibb Co. | | | 23,600 | | | | 610,296 | | |
| Cephalon, Inc.(a) (b) | | | 14,900 | | | | 895,490 | | |
Inverness Medical
Innovations, Inc.(a) | | | 5,300 | | | | 149,619 | | |
| Johnson & Johnson | | | 6,650 | | | | 398,468 | | |
| Merck & Co., Inc. | | | 41,450 | | | | 1,510,024 | | |
Neurocrine
Biosciences, Inc.(a) (b) | | | 4,400 | | | | 46,640 | | |
| Pfizer, Inc. | | | 67,400 | | | | 1,581,878 | | |
| Schering-Plough Corp. | | | 30,500 | | | | 580,415 | | |
Teva Pharmaceutical
Sponsored ADR (Israel) | | | 1,800 | | | | 56,862 | | |
| Wyeth | | | 11,000 | | | | 488,510 | | |
| | | | | | | | 6,894,439 | | |
| Photography Equipment/Supplies — 1.0% | |
| Eastman Kodak Co.(b) | | | 39,300 | | | | 934,554 | | |
| Prepackaged Software — 0.8% | |
| Electronic Arts, Inc.(a) | | | 1,950 | | | | 83,928 | | |
| Emdeon Corp.(a) | | | 8,400 | | | | 104,244 | | |
| NAVTEQ Corp.(a) | | | 2,450 | | | | 109,466 | | |
| Symantec Corp.(a) | | | 26,900 | | | | 418,026 | | |
TradeStation
Group, Inc.(a) (b) | | | 7,700 | | | | 97,559 | | |
| | | | | | | | 813,223 | | |
| Real Estate — 0.9% | |
Equity Office
Properties Trust | | | 5,600 | | | | 204,456 | | |
| Equity Residential REIT | | | 9,950 | | | | 445,064 | | |
General Growth Properties,
Inc. REIT | | | 5,330 | | | | 240,170 | | |
| | | | | | | | 889,690 | | |
| | | Number of
Shares | | Market
Value | |
| Restaurants — 0.5% | |
| McDonald's Corp. | | | 14,200 | | | $ | 477,120 | | |
| Retail — 4.0% | |
| 99 Cents Only Stores(a) | | | 9,300 | | | | 97,278 | | |
| Best Buy Co., Inc. | | | 10,700 | | | | 586,788 | | |
| Circuit City Stores, Inc. | | | 5,000 | | | | 136,100 | | |
| Coldwater Creek, Inc.(a) | | | 7,800 | | | | 208,728 | | |
| CVS Corp. | | | 8,600 | | | | 264,020 | | |
| Family Dollar Stores, Inc. | | | 8,100 | | | | 197,883 | | |
Federated Department
Stores, Inc. | | | 16,100 | | | | 589,260 | | |
| The Home Depot, Inc. | | | 15,550 | | | | 556,535 | | |
| Kohl's Corp.(a) | | | 6,600 | | | | 390,192 | | |
Lotte Shopping Co. Ltd. GDR
(Korea)(a) (b) (d) | | | 6,800 | | | | 132,244 | | |
| OfficeMax, Inc. | | | 1,300 | | | | 52,975 | | |
| Saks, Inc. | | | 7,500 | | | | 121,275 | | |
| Staples, Inc. | | | 8,500 | | | | 206,720 | | |
| The TJX Cos., Inc. | | | 3,800 | | | | 86,868 | | |
| Wal-Mart Stores, Inc. | | | 7,700 | | | | 370,909 | | |
| | | | | | | | 3,997,775 | | |
| Telephone Utilities — 4.4% | |
| AT&T, Inc. | | | 88,550 | | | | 2,469,660 | | |
| Mastec, Inc.(a) | | | 8,500 | | | | 112,285 | | |
| Sprint Nextel Corp. | | | 29,566 | | | | 591,024 | | |
| TELUS Corp. CAD(c) | | | 4,300 | | | | 178,186 | | |
Verizon
Communications, Inc. | | | 30,400 | | | | 1,018,096 | | |
| | | | | | | | 4,369,251 | | |
| Tobacco — 1.0% | |
| Altria Group, Inc. | | | 13,500 | | | | 991,305 | | |
| Transportation — 0.3% | |
| EGL, Inc.(a) | | | 2,200 | | | | 110,440 | | |
| OMI Corp.(b) | | | 8,900 | | | | 192,685 | | |
| | | | | | | | 303,125 | | |
| Travel — 0.0% | |
| Expedia, Inc.(a) | | | 2,550 | | | | 38,174 | | |
TOTAL EQUITIES
(Cost $90,747,216) | | | | | | | 97,880,573 | | |
| | | Principal
Amount | | | |
| SHORT-TERM INVESTMENTS — 15.5% | |
| Cash Equivalents — 13.4%(f) | |
Abbey National PLC
Eurodollar Time Deposit
5.100% 07/10/2006 | | $ | 144,895 | | | | 144,895 | | |
(Continued)
The accompanying notes are an integral part of the financial statements.
102
MassMutual Select Value Equity Fund – Portfolio of Investments (Continued)
| | | Principal
Amount | | Market
Value | |
ABN Amro Bank NV
Certificate of Deposit
5.305% 11/21/2006 | | $ | 144,902 | | | $ | 144,902 | | |
American Beacon Money
Market Fund(e) | | | 147,788 | | | | 147,788 | | |
Bank of America
5.270% 07/14/2006 | | | 289,805 | | | | 289,805 | | |
Bank of America
5.310% 03/08/2007 | | | 289,805 | | | | 289,805 | | |
Bank of Montreal
Eurodollar Time Deposit
5.290% 08/03/2006 | | | 289,805 | | | | 289,805 | | |
Bank of Nova Scotia
Eurodollar Time Deposit
5.290% 08/08/2006 | | | 289,805 | | | | 289,805 | | |
Barclays
Eurodollar Time Deposit
5.150% 08/01/2006 | | | 434,707 | | | | 434,707 | | |
Branch Banker & Trust
Eurodollar Time Deposit
5.250% 07/26/2006 | | | 521,648 | | | | 521,648 | | |
Calyon
Eurodollar Time Deposit
5.300% 08/08/2006 | | | 289,805 | | | | 289,805 | | |
Canadian Imperial
Bank of Commerce
Eurodollar Time Deposit
5.310% 07/31/2006 | | | 289,805 | | | | 289,805 | | |
Deutsche Bank
Eurodollar Time Deposit
5.250% 07/05/2006 | | | 724,511 | | | | 724,511 | | |
Dexia Group
Eurodollar Time Deposit
5.300% 08/09/2006 | | | 376,746 | | | | 376,746 | | |
Federal Home Loan Bank
Discount Note
5.181% 07/19/2006 | | | 230,681 | | | | 230,681 | | |
First Tennessee
National Corporation
Eurodollar Time Deposit
5.270% 07/24/2006 | | | 347,765 | | | | 347,765 | | |
Fortis Bank
Eurodollar Time Deposit
5.090% 07/05/2006 | | | 289,805 | | | | 289,805 | | |
Fortis Bank
Eurodollar Time Deposit
5.250% 07/03/2006 | | | 289,805 | | | | 289,805 | | |
Fortis Bank
Eurodollar Time Deposit
5.250% 07/06/2006 | | | 289,805 | | | | 289,805 | | |
Freddie Mac
Discount Note
5.191% 07/25/2006 | | | 172,950 | | | | 172,950 | | |
| | | Principal
Amount | | Market
Value | |
Harris NA
Eurodollar Time Deposit
5.080% 07/05/2006 | | $ | 202,863 | | | $ | 202,863 | | |
HBOS Halifax
Bank of Scotland
Certificate of Deposit
5.110% 07/10/2006 | | | 289,805 | | | | 289,805 | | |
National Australia Bank
Eurodollar Time Deposit
5.290% 07/03/2006 | | | 1,014,316 | | | | 1,014,316 | | |
National City Corporation
Eurodollar Time Deposit
5.220% 07/03/2006 | | | 344,059 | | | | 344,059 | | |
Skandinaviska Enskilda
Banken AB
Eurodollar Time Deposit
5.130% 07/12/2006 | | | 289,805 | | | | 289,805 | | |
Societe Generale
Eurodollar Time Deposit
5.200% 08/08/2006 | | | 289,805 | | | | 289,805 | | |
Societe Generale
Eurodollar Time Deposit
5.270% 07/17/2006 | | | 376,746 | | | | 376,746 | | |
Standard Chartered Bank
Eurodollar Time Deposit
5.260% 07/07/2006 | | | 434,707 | | | | 434,707 | | |
Svenska Handlesbanken
Eurodollar Time Deposit
5.290% 07/03/2006 | | | 971,571 | | | | 971,571 | | |
The Bank of the West
Eurodollar Time Deposit
5.250% 08/07/2006 | | | 492,668 | | | | 492,668 | | |
Toronto Dominion Bank
Eurodollar Time Deposit
5.300% 07/31/2006 | | | 811,453 | | | | 811,453 | | |
UBS AG
Eurodollar Time Deposit
5.250% 07/21/2006 | | | 434,707 | | | | 434,707 | | |
UBS AG
Eurodollar Time Deposit
5.250% 08/04/2006 | | | 434,707 | | | | 434,707 | | |
Wells Fargo
Eurodollar Time Deposit
5.160% 07/13/2006 | | | 289,805 | | | | 289,805 | | |
Wells Fargo
Eurodollar Time Deposit
5.170% 07/03/2006 | | | 289,805 | | | | 289,805 | | |
Wells Fargo
Eurodollar Time Deposit
5.210% 07/06/2006 | | | 144,902 | | | | 144,902 | | |
Wells Fargo
Eurodollar Time Deposit
5.250% 07/03/2006 | | | 289,805 | | | | 289,805 | | |
| | | | | | | | 13,256,367 | | |
| | | Principal
Amount | | Market
Value | |
| Repurchase Agreement — 2.1% | |
Investors Bank & Trust
Company Repurchase
Agreement, dated
06/30/2006, 3.75%,
due 07/03/2006(g) | | $ | 2,098,948 | | | $ | 2,098,948 | | |
TOTAL SHORT-TERM
INVESTMENTS
(Cost $15,355,315) | | | | | 15,355,315 | | |
TOTAL INVESTMENTS — 114.6%
(Cost $106,102,531)(h) | | | | | 113,235,888 | | |
Other Assets/
(Liabilities) — (14.6%) | | | | | (14,414,080 | ) | |
| NET ASSETS — 100.0% | | | | $ | 98,821,808 | | |
Notes to Portfolio of Investments
ADR - American Depository Receipt
CAD - Canadian Dollar
GDR - Global Depository Receipt
REIT - Real Estate Investment Trust
(a) Non-income producing security.
(b) Denotes all or a portion of security on loan. (Note 2).
(c) The principal amount of the security is in foreign currency. The market value is in U.S. dollars.
(d) Securities exempt from registration under rule 144A of the Securities Act of 1933. These securities may be resold in transactions exempt from registration, normally to qualified institutional buyers. At June 30, 2006, these securities amounted to a value of $132,244 or 0.1% of net assets.
(e) Amount represents shares owned of the fund.
(f) Represents investments of security lending collateral. (Note 2).
(g) Maturity value of $2,099,604. Collateralized by U.S. Government Agency obligation with a rate of 8.125%, maturity date of 08/25/2026, and an aggregate market value, including accrued interest, of $2,203,896.
(h) See Note 6 for aggregate cost for Federal tax purposes.
The accompanying notes are an integral part of the financial statements.
103
MassMutual Select Large Cap Value Fund – Portfolio of Investments
June 30, 2006 (Unaudited)
| | | Number of
Shares | | Market
Value | |
| EQUITIES — 97.6% | |
| COMMON STOCK | |
| Advertising — 0.3% | |
WPP Group PLC
Sponsored ADR
(United Kingdom) | | | 64,900 | | | $ | 3,912,821 | | |
| Automotive & Parts — 1.8% | |
| Harley-Davidson, Inc. | | | 474,800 | | | | 26,061,772 | | |
| Banking, Savings & Loans — 14.6% | |
Commerce
Bancorp, Inc.(a) | | | 234,100 | | | | 8,350,347 | | |
Golden West
Financial Corp. | | | 692,900 | | | | 51,413,180 | | |
| HSBC Holdings PLC | | | 2,596,283 | | | | 45,448,796 | | |
| JP Morgan Chase & Co. | | | 1,428,988 | | | | 60,017,496 | | |
Lloyds TSB Group PLC
Sponsored ADR
(United Kingdom)(a) | | | 260,800 | | | | 10,293,776 | | |
| State Street Corp. | | | 47,500 | | | | 2,759,275 | | |
| Wells Fargo & Co. | | | 587,700 | | | | 39,422,916 | | |
| | | | 217,705,786 | | |
| Beverages — 2.0% | |
Diageo PLC Sponsored
ADR (United Kingdom) | | | 269,200 | | | | 18,184,460 | | |
Heineken Holding
NV Cl. A(a) | | | 327,550 | | | | 12,000,177 | | |
| | | | 30,184,637 | | |
| Broadcasting, Publishing & Printing — 4.6% | |
Comcast Corp.
Special, Cl. A(b) | | | 1,348,500 | | | | 44,203,830 | | |
| Gannett Co., Inc. | | | 71,600 | | | | 4,004,588 | | |
| Lagardere S.C.A. SA(a) | | | 170,000 | | | | 12,453,777 | | |
Liberty Media Holding
Corp. Capital Cl. A(b) | | | 50,320 | | | | 4,215,306 | | |
Liberty Media
Holding Corp.
Interactive Cl. A(b) | | | 251,600 | | | | 4,342,616 | | |
| | | | 69,220,117 | | |
| Building Materials & Construction — 1.5% | |
Martin Marietta
Materials, Inc. | | | 134,300 | | | | 12,241,445 | | |
| Vulcan Materials Co. | | | 133,800 | | | | 10,436,400 | | |
| | | | 22,677,845 | | |
| Commercial Services — 5.0% | |
Apollo Group,
Inc. Cl. A(b) | | | 111,000 | | | | 5,735,370 | | |
| | | Number of
Shares | | Market
Value | |
| Block (H&R), Inc.(a) | | | 750,000 | | | $ | 17,895,000 | | |
| Cosco Pacific Ltd. | | | 2,169,300 | | | | 4,811,980 | | |
Dun &
Bradstreet Corp.(b) | | | 143,050 | | | | 9,967,724 | | |
| Iron Mountain, Inc.(b) | | | 514,500 | | | | 19,232,010 | | |
| Moody's Corp. | | | 323,900 | | | | 17,639,594 | | |
| | | | 75,281,678 | | |
| Communications — 1.3% | |
Nokia Oyj Sponsored
ADR (Finland) | | | 198,000 | | | | 4,011,480 | | |
| NTL, Inc.(a) | | | 302,138 | | | | 7,523,236 | | |
SK Telecom Co. Ltd.
ADR (South Korea)(a) | | | 350,300 | | | | 8,204,026 | | |
| | | | 19,738,742 | | |
| Computer Related Services — 0.2% | |
| IAC/InterActiveCorp(a) (b) | | | 104,948 | | | | 2,780,073 | | |
| Computers & Information — 0.7% | |
| Dell, Inc.(b) | | | 424,400 | | | | 10,359,604 | | |
| Computers & Office Equipment — 0.6% | |
| Hewlett-Packard Co. | | | 267,800 | | | | 8,483,904 | | |
| Containers — 2.0% | |
| Sealed Air Corp.(a) | | | 570,000 | | | | 29,685,600 | | |
| Cosmetics & Personal Care — 1.5% | |
| Avon Products, Inc. | | | 200,300 | | | | 6,209,300 | | |
The Procter &
Gamble Co. | | | 285,200 | | | | 15,857,120 | | |
| | | | 22,066,420 | | |
| Energy — 12.1% | |
| BHP Billiton PLC | | | 199,200 | | | | 3,865,995 | | |
| ConocoPhillips | | | 944,092 | | | | 61,866,349 | | |
| Devon Energy Corp. | | | 535,600 | | | | 32,355,596 | | |
| EOG Resources, Inc. | | | 457,100 | | | | 31,695,314 | | |
Occidental
Petroleum Corp. | | | 363,200 | | | | 37,246,160 | | |
| Transocean, Inc.(b) | | | 169,500 | | | | 13,614,240 | | |
| | | | 180,643,654 | | |
| Entertainment & Leisure — 1.6% | |
| News Corp., Inc. Cl. A | | | 1,263,000 | | | | 24,224,340 | | |
| Financial Services — 12.0% | |
| American Express Co. | | | 1,257,500 | | | | 66,924,150 | | |
Ameriprise
Financial, Inc. | | | 344,360 | | | | 15,382,561 | | |
Berkshire
Hathaway, Inc. Cl. A(b) | | | 594 | | | | 54,445,446 | | |
| | | Number of
Shares | | Market
Value | |
| Citigroup, Inc.(a) | | | 671,400 | | | $ | 32,388,336 | | |
| Morgan Stanley | | | 150,900 | | | | 9,538,389 | | |
| | | | 178,678,882 | | |
| Foods — 0.7% | |
| The Hershey Co.(a) | | | 190,000 | | | | 10,463,300 | | |
| Healthcare — 2.8% | |
| Caremark Rx, Inc. | | | 375,700 | | | | 18,736,159 | | |
| HCA, Inc. | | | 538,600 | | | | 23,240,590 | | |
| | | | 41,976,749 | | |
| Household Products — 0.2% | |
| Hunter Douglas NV | | | 45,362 | | | | 3,036,800 | | |
| Industrial – Diversified — 4.1% | |
| Tyco International Ltd. | | | 2,229,024 | | | | 61,298,160 | | |
| Insurance — 10.9% | |
American International
Group, Inc. | | | 989,300 | | | | 58,418,165 | | |
| Aon Corp. | | | 301,500 | | | | 10,498,230 | | |
| Chubb Corp. | | | 83,400 | | | | 4,161,660 | | |
| Loews Corp. | | | 839,700 | | | | 29,767,365 | | |
| Markel Corp.(a) (b) | | | 3,000 | | | | 1,041,000 | | |
Principal Financial
Group, Inc. | | | 94,100 | | | | 5,236,665 | | |
| Progressive Corp. | | | 1,458,800 | | | | 37,505,748 | | |
| Sun Life Financial, Inc. | | | 59,800 | | | | 2,387,814 | | |
Transatlantic
Holdings, Inc. | | | 255,462 | | | | 14,280,326 | | |
| | | | 163,296,973 | | |
| Metals & Mining — 0.3% | |
| Rio Tinto PLC | | | 70,700 | | | | 3,677,300 | | |
| Pharmaceuticals — 0.9% | |
| Cardinal Health, Inc. | | | 218,000 | | | | 14,023,940 | | |
| Prepackaged Software — 2.0% | |
| Microsoft Corp. | | | 1,271,400 | | | | 29,623,620 | | |
| Retail — 6.7% | |
Bed Bath &
Beyond, Inc.(b) | | | 118,400 | | | | 3,927,328 | | |
| Costco Wholesale Corp. | | | 1,157,200 | | | | 66,110,836 | | |
| Wal-Mart Stores, Inc. | | | 626,600 | | | | 30,183,322 | | |
| | | | 100,221,486 | | |
| Telephone Utilities — 1.3% | |
| Sprint Nextel Corp. | | | 992,800 | | | | 19,846,072 | | |
| Tobacco — 4.4% | |
| Altria Group, Inc. | | | 901,600 | | | | 66,204,488 | | |
(Continued)
The accompanying notes are an integral part of the financial statements.
104
MassMutual Select Large Cap Value Fund – Portfolio of Investments (Continued)
| | | Number of
Shares | | Market
Value | |
| Transportation — 1.4% | |
China Merchants
Holdings
International Co. Ltd. | | | 2,466,000 | | | $ | 7,515,619 | | |
Kuehne & Nagel
International AG | | | 70,750 | | | | 5,106,943 | | |
United Parcel
Service, Inc. Cl. B | | | 106,800 | | | | 8,792,844 | | |
| | | | 21,415,406 | | |
| Travel — 0.1% | |
| Expedia, Inc.(b) | | | 108,948 | | | | 1,630,952 | | |
TOTAL EQUITIES
(Cost $1,121,817,379) | | | | | | | 1,458,421,121 | | |
| | | Principal
Amount | | | |
| SHORT-TERM INVESTMENTS — 5.5% | |
| Cash Equivalents — 4.1%(d) | |
Abbey National PLC
Eurodollar Time Deposit
5.100% 07/10/2006 | | $ | 670,514 | | | | 670,514 | | |
ABN Amro Bank NV
Certificate of Deposit
5.305% 11/21/2006 | | | 670,514 | | | | 670,514 | | |
American Beacon Money
Market Fund(c) | | | 683,868 | | | | 683,868 | | |
Bank of America
5.270% 07/14/2006 | | | 1,341,029 | | | | 1,341,029 | | |
Bank of America
5.310% 03/08/2007 | | | 1,341,029 | | | | 1,341,029 | | |
Bank of Montreal
Eurodollar Time Deposit
5.290% 08/03/2006 | | | 1,341,029 | | | | 1,341,029 | | |
Bank of Nova Scotia
Eurodollar Time Deposit
5.290% 08/08/2006 | | | 1,341,029 | | | | 1,341,029 | | |
Barclays
Eurodollar Time Deposit
5.150% 08/01/2006 | | | 2,011,543 | | | | 2,011,543 | | |
Branch Banker & Trust
Eurodollar Time Deposit
5.250% 07/26/2006 | | | 2,413,851 | | | | 2,413,851 | | |
Calyon
Eurodollar Time Deposit
5.300% 08/08/2006 | | | 1,341,029 | | | | 1,341,029 | | |
Canadian Imperial
Bank of Commerce
Eurodollar Time Deposit
5.310% 07/31/2006 | | | 1,341,029 | | | | 1,341,029 | | |
Deutsche Bank
Eurodollar Time Deposit
5.250% 07/05/2006 | | | 3,352,571 | | | | 3,352,571 | | |
| | | Principal
Amount | | Market
Value | |
Dexia Group
Eurodollar Time Deposit
5.300% 08/09/2006 | | $ | 1,743,337 | | | $ | 1,743,337 | | |
Federal Home Loan
Bank Discount Note
5.181% 07/19/2006 | | | 1,067,441 | | | | 1,067,441 | | |
First Tennessee
National Corporation
Eurodollar Time Deposit
5.270% 07/24/2006 | | | 1,609,234 | | | | 1,609,234 | | |
Fortis Bank
Eurodollar Time Deposit
5.090% 07/05/2006 | | | 1,341,029 | | | | 1,341,029 | | |
Fortis Bank
Eurodollar Time Deposit
5.250% 07/03/2006 | | | 1,341,029 | | | | 1,341,029 | | |
Fortis Bank
Eurodollar Time Deposit
5.250% 07/06/2006 | | | 1,341,029 | | | | 1,341,029 | | |
Freddie Mac
Discount Note
5.191% 07/25/2006 | | | 800,303 | | | | 800,303 | | |
Harris NA
Eurodollar Time Deposit
5.080% 07/05/2006 | | | 938,720 | | | | 938,720 | | |
HBOS Halifax
Bank of Scotland
Certificate of Deposit
5.110% 07/10/2006 | | | 1,341,029 | | | | 1,341,029 | | |
National Australia Bank
Eurodollar Time Deposit
5.290% 07/03/2006 | | | 4,693,600 | | | | 4,693,600 | | |
National City Corporation
Eurodollar Time Deposit
5.220% 07/03/2006 | | | 1,592,085 | | | | 1,592,085 | | |
Skandinaviska Enskilda
Banken AB
Eurodollar Time Deposit
5.130% 07/12/2006 | | | 1,341,029 | | | | 1,341,029 | | |
Societe Generale
Eurodollar Time Deposit
5.200% 08/08/2006 | | | 1,341,029 | | | | 1,341,029 | | |
Societe Generale
Eurodollar Time Deposit
5.270% 07/17/2006 | | | 1,743,337 | | | | 1,743,337 | | |
Standard Chartered Bank
Eurodollar Time Deposit
5.260% 07/07/2006 | | | 2,011,543 | | | | 2,011,543 | | |
Svenska Handlesbanken
Eurodollar Time Deposit
5.290% 07/03/2006 | | | 4,495,807 | | | | 4,495,807 | | |
The Bank of the West
Eurodollar Time Deposit
5.250% 08/07/2006 | | | 2,279,748 | | | | 2,279,748 | | |
| | | Principal
Amount | | Market
Value | |
Toronto Dominion Bank
Eurodollar Time Deposit
5.300% 07/31/2006 | | $ | 3,754,880 | | | $ | 3,754,880 | | |
UBS AG
Eurodollar Time Deposit
5.250% 07/21/2006 | | | 2,011,543 | | | | 2,011,543 | | |
UBS AG
Eurodollar Time Deposit
5.250% 08/04/2006 | | | 2,011,543 | | | | 2,011,543 | | |
Wells Fargo
Eurodollar Time Deposit
5.160% 07/13/2006 | | | 1,341,022 | | | | 1,341,022 | | |
Wells Fargo
Eurodollar Time Deposit
5.170% 07/03/2006 | | | 1,341,029 | | | | 1,341,029 | | |
Wells Fargo
Eurodollar Time Deposit
5.210% 07/06/2006 | | | 670,514 | | | | 670,514 | | |
Wells Fargo
Eurodollar Time Deposit
5.250% 07/03/2006 | | | 1,341,029 | | | | 1,341,029 | | |
| | | | 61,341,924 | | |
| Repurchase Agreement — 1.4% | |
Investors Bank & Trust
Company Repurchase
Agreement, dated
06/30/2006, 3.75%,
due 07/03/2006(e) | | | 20,455,756 | | | | 20,455,756 | | |
TOTAL SHORT-TERM
INVESTMENTS
(Cost $81,797,680) | | | | | | | 81,797,680 | | |
TOTAL INVESTMENTS — 103.1%
(Cost $1,203,615,059)(f) | | | | | | | 1,540,218,801 | | |
Other Assets/
(Liabilities) — (3.1%) | | | | | | | (46,519,890 | ) | |
| NET ASSETS — 100.0% | | | | | | $ | 1,493,698,911 | | |
Notes to Portfolio of Investments
ADR - American Depository Receipt
(a) Denotes all or a portion of security on loan. (Note 2).
(b) Non-income producing security.
(c) Amount represents shares owned of the fund.
(d) Represents investments of security lending collateral. (Note 2).
(e) Maturity value of $20,462,149. Collateralized by a U.S. Government Agency obligation with a rate of 5.599%, maturity date of 06/15/2034, and an aggregate market value, including accrued interest, of $21,478,544.
(f) See Note 6 for aggregate cost for Federal tax purposes.
The accompanying notes are an integral part of the financial statements.
105
MassMutual Select Indexed Equity Fund – Portfolio of Investments
June 30, 2006 (Unaudited)
| | | Number of
Shares | | Market
Value | |
| EQUITIES — 97.9% | |
| COMMON STOCK | |
| Advertising — 0.2% | |
Interpublic Group of
Companies, Inc.(a) (b) | | | 69,243 | | | $ | 578,179 | | |
Monster
Worldwide, Inc.(a) | | | 21,818 | | | | 930,756 | | |
| Omnicom Group, Inc. | | | 30,014 | | | | 2,673,947 | | |
| | | | 4,182,882 | | |
| Aerospace & Defense — 2.3% | |
| Boeing Co. | | | 134,840 | | | | 11,044,744 | | |
| General Dynamics Corp. | | | 67,708 | | | | 4,432,166 | | |
| Goodrich Corp. | | | 21,290 | | | | 857,774 | | |
Honeywell
International, Inc.(b) | | | 140,010 | | | | 5,642,403 | | |
| Lockheed Martin Corp. | | | 60,407 | | | | 4,333,598 | | |
Northrop
Grumman Corp. | | | 59,078 | | | | 3,784,537 | | |
| Raytheon Co. | | | 74,600 | | | | 3,324,922 | | |
| Rockwell Collins, Inc. | | | 28,832 | | | | 1,610,844 | | |
United
Technologies Corp. | | | 171,162 | | | | 10,855,094 | | |
| | | | 45,886,082 | | |
| Air Transportation — 0.1% | |
| Southwest Airlines Co. | | | 122,465 | | | | 2,004,752 | | |
| Apparel, Textiles & Shoes — 0.6% | |
| Coach, Inc.(a) | | | 63,800 | | | | 1,907,620 | | |
| The Gap, Inc. | | | 96,703 | | | | 1,682,632 | | |
| Jones Apparel Group, Inc. | | | 18,189 | | | | 578,228 | | |
| Limited Brands | | | 58,259 | | | | 1,490,848 | | |
| Liz Claiborne, Inc. | | | 17,292 | | | | 640,842 | | |
| Nike, Inc. Cl. B | | | 31,883 | | | | 2,582,523 | | |
| Nordstrom, Inc. | | | 37,376 | | | | 1,364,224 | | |
| VF Corp. | | | 16,202 | | | | 1,100,440 | | |
| | | | 11,347,357 | | |
| Automotive & Parts — 0.6% | |
| AutoNation, Inc.(a) | | | 28,468 | | | | 610,354 | | |
Cooper Tire &
Rubber Co.(b) | | | 12,730 | | | | 141,812 | | |
| Ford Motor Co.(b) | | | 314,114 | | | | 2,176,810 | | |
| General Motors Corp.(b) | | | 95,245 | | | | 2,837,349 | | |
| Genuine Parts Co. | | | 28,112 | | | | 1,171,146 | | |
The Goodyear Tire &
Rubber Co.(a) (b) | | | 28,776 | | | | 319,414 | | |
| Harley-Davidson, Inc. | | | 45,936 | | | | 2,521,427 | | |
Navistar
International Corp.(a) | | | 10,309 | | | | 253,704 | | |
| | | Number of
Shares | | Market
Value | |
| Paccar, Inc.(b) | | | 28,804 | | | $ | 2,372,874 | | |
| | | | 12,404,890 | | |
| Banking, Savings & Loans — 9.4% | |
| AmSouth Bancorporation | | | 56,694 | | | | 1,499,556 | | |
| Bank of America Corp. | | | 769,376 | | | | 37,006,986 | | |
Bank of New York Co.,
Inc. (The) | | | 130,003 | | | | 4,186,097 | | |
| BB&T Corp.(b) | | | 93,216 | | | | 3,876,853 | | |
Capital One
Financial Corp. | | | 50,446 | | | | 4,310,611 | | |
| Comerica, Inc. | | | 29,576 | | | | 1,537,656 | | |
Commerce
Bancorp, Inc.(b) | | | 31,000 | | | | 1,105,770 | | |
Compass
Bancshares, Inc. | | | 23,000 | | | | 1,278,800 | | |
| Fannie Mae | | | 163,079 | | | | 7,844,100 | | |
| Fifth Third Bancorp(b) | | | 97,188 | | | | 3,591,097 | | |
First Horizon
National Corp.(b) | | | 23,000 | | | | 924,600 | | |
| Freddie Mac | | | 116,428 | | | | 6,637,560 | | |
Golden West
Financial Corp. | | | 43,358 | | | | 3,217,164 | | |
| JP Morgan Chase & Co. | | | 587,448 | | | | 24,672,816 | | |
| KeyCorp(b) | | | 67,168 | | | | 2,396,554 | | |
| M&T Bank Corp. | | | 14,400 | | | | 1,698,048 | | |
| Marshall and Ilsley Corp. | | | 33,500 | | | | 1,532,290 | | |
| Mellon Financial Corp. | | | 68,468 | | | | 2,357,353 | | |
| National City Corp. | | | 95,871 | | | | 3,469,571 | | |
North Fork
Bancorporation, Inc. | | | 80,200 | | | | 2,419,634 | | |
| Northern Trust Corp. | | | 30,893 | | | | 1,708,383 | | |
| Regions Financial Corp. | | | 75,642 | | | | 2,505,263 | | |
| SLM Corp. | | | 70,331 | | | | 3,721,917 | | |
| Sovereign Bancorp, Inc. | | | 61,940 | | | | 1,257,991 | | |
| State Street Corp. | | | 55,068 | | | | 3,198,900 | | |
| SunTrust Banks, Inc. | | | 61,634 | | | | 4,700,209 | | |
| Synovus Financial Corp. | | | 50,199 | | | | 1,344,329 | | |
| U.S. Bancorp(b) | | | 303,534 | | | | 9,373,130 | | |
| Wachovia Corp. | | | 273,415 | | | | 14,786,283 | | |
| Washington Mutual, Inc. | | | 161,999 | | | | 7,383,914 | | |
| Wells Fargo & Co. | | | 282,437 | | | | 18,945,874 | | |
| Zions Bancorp | | | 16,500 | | | | 1,286,010 | | |
| | | | 185,775,319 | | |
| Beverages — 2.1% | |
Anheuser-Busch
Cos., Inc. | | | 129,696 | | | | 5,912,841 | | |
Brown-Forman
Corp. Cl. B | | | 14,942 | | | | 1,071,192 | | |
| The Coca-Cola Co. | | | 347,172 | | | | 14,935,339 | | |
| | | Number of
Shares | | Market
Value | |
Coca-Cola
Enterprises, Inc.(b) | | | 50,343 | | | $ | 1,025,487 | | |
Constellation Brands,
Inc. Cl. A(a) (b) | | | 32,500 | | | | 812,500 | | |
Molson Coors
Brewing Co. Cl. B | | | 10,265 | | | | 696,788 | | |
The Pepsi Bottling
Group, Inc. | | | 25,482 | | | | 819,246 | | |
| PepsiCo, Inc. | | | 279,166 | | | | 16,761,127 | | |
| | | | 42,034,520 | | |
| Broadcasting, Publishing & Printing — 2.3% | |
| CBS Corp. Cl. B | | | 130,209 | | | | 3,522,153 | | |
Clear Channel
Communications, Inc. | | | 87,721 | | | | 2,714,965 | | |
Comcast
Corp. Cl. A(a) (b) | | | 360,396 | | | | 11,799,365 | | |
| Dow Jones & Co., Inc.(b) | | | 9,857 | | | | 345,094 | | |
| Gannett Co., Inc. | | | 40,471 | | | | 2,263,543 | | |
The McGraw-Hill
Companies, Inc. | | | 62,388 | | | | 3,133,749 | | |
| Meredith Corp. | | | 5,689 | | | | 281,833 | | |
New York
Times Co. Cl. A(b) | | | 23,000 | | | | 564,420 | | |
The Scripps
(E.W.) Co. Cl. A | | | 14,400 | | | | 621,216 | | |
| Time Warner, Inc. | | | 721,894 | | | | 12,488,766 | | |
| Tribune Co. | | | 44,295 | | | | 1,436,487 | | |
Univision
Communications,
Inc. Cl. A(a) | | | 37,700 | | | | 1,262,950 | | |
| Viacom, Inc. Cl. B(a) | | | 130,209 | | | | 4,666,691 | | |
| | | | 45,101,232 | | |
| Building Materials & Construction — 0.2% | |
| Louisiana-Pacific Corp.(b) | | | 18,184 | | | | 398,230 | | |
| Masco Corp.(b) | | | 72,992 | | | | 2,163,483 | | |
| Vulcan Materials Co. | | | 16,678 | | | | 1,300,884 | | |
| | | | 3,862,597 | | |
| Chemicals — 1.3% | |
Air Products &
Chemicals, Inc. | | | 37,005 | | | | 2,365,360 | | |
| Dow Chemical Co. | | | 163,020 | | | | 6,362,671 | | |
Du Pont (E.I.) de
Nemours & Co. | | | 155,150 | | | | 6,454,240 | | |
| Eastman Chemical Co. | | | 14,135 | | | | 763,290 | | |
| Hercules, Inc.(a) | | | 16,489 | | | | 251,622 | | |
International Flavors &
Fragrances, Inc. | | | 14,182 | | | | 499,774 | | |
| Monsanto Co. | | | 45,424 | | | | 3,824,246 | | |
| PPG Industries, Inc. | | | 27,708 | | | | 1,828,728 | | |
(Continued)
The accompanying notes are an integral part of the financial statements.
106
MassMutual Select Indexed Equity Fund – Portfolio of Investments (Continued)
| | | Number of
Shares | | Market
Value | |
| Praxair, Inc. | | | 53,456 | | | $ | 2,886,624 | | |
| Rohm & Haas Co. | | | 24,284 | | | | 1,217,114 | | |
| | | | 26,453,669 | | |
| Commercial Services — 1.5% | |
Allied Waste
Industries, Inc.(a) (b) | | | 36,834 | | | | 418,434 | | |
Apollo Group,
Inc. Cl. A(a) (b) | | | 23,900 | | | | 1,234,913 | | |
| Block (H&R), Inc.(b) | | | 53,296 | | | | 1,271,643 | | |
| Cendant Corp. | | | 169,944 | | | | 2,768,388 | | |
| Cintas Corp.(b) | | | 23,900 | | | | 950,264 | | |
| Convergys Corp.(a) | | | 20,871 | | | | 406,984 | | |
Donnelley (R.R.) &
Sons Co. | | | 34,815 | | | | 1,112,339 | | |
| eBay, Inc.(a) | | | 194,400 | | | | 5,693,976 | | |
| Ecolab, Inc. | | | 33,258 | | | | 1,349,610 | | |
| Equifax, Inc. | | | 23,249 | | | | 798,371 | | |
| Fluor Corp. | | | 14,135 | | | | 1,313,566 | | |
| Moody's Corp. | | | 42,072 | | | | 2,291,241 | | |
| Paychex, Inc. | | | 56,306 | | | | 2,194,808 | | |
| PerkinElmer, Inc. | | | 20,474 | | | | 427,907 | | |
| Public Storage, Inc.(b) | | | 15,200 | | | | 1,153,680 | | |
| Quest Diagnostics, Inc. | | | 27,770 | | | | 1,663,978 | | |
Robert Half
International, Inc.(b) | | | 27,900 | | | | 1,171,800 | | |
| Ryder System, Inc.(b) | | | 10,705 | | | | 625,493 | | |
| Waste Management, Inc. | | | 93,097 | | | | 3,340,320 | | |
| | | | 30,187,715 | | |
| Communications — 1.0% | |
ADC
Telecommunications, Inc.(a) | | | 21,270 | | | | 358,612 | | |
| Andrew Corp.(a) (b) | | | 30,142 | | | | 267,058 | | |
| Avaya, Inc.(a) | | | 70,875 | | | | 809,392 | | |
| Ciena Corp.(a) (b) | | | 98,100 | | | | 471,861 | | |
Citizens
Communications Co. | | | 54,100 | | | | 706,005 | | |
L-3 Communications
Holdings, Inc. | | | 19,800 | | | | 1,493,316 | | |
Lucent
Technologies, Inc.(a) | | | 743,752 | | | | 1,799,880 | | |
Network
Appliance, Inc.(a) (b) | | | 63,038 | | | | 2,225,241 | | |
| Qualcomm, Inc. | | | 279,118 | | | | 11,184,258 | | |
| Tellabs, Inc.(a) | | | 75,923 | | | | 1,010,535 | | |
| | | | 20,326,158 | | |
| Communications Equipment — 0.4% | |
| Motorola, Inc. | | | 421,302 | | | | 8,489,235 | | |
| Computer Integrated Systems Design — 0.3% | |
| Autodesk, Inc.(a) | | | 38,912 | | | | 1,340,908 | | |
Computer
Sciences Corp.(a) | | | 32,296 | | | | 1,564,418 | | |
| | | Number of
Shares | | Market
Value | |
Parametric
Technology Corp.(a) | | | 17,475 | | | $ | 222,107 | | |
Sun
Microsystems, Inc.(a) | | | 583,304 | | | | 2,420,712 | | |
| Teradyne, Inc.(a) (b) | | | 36,406 | | | | 507,136 | | |
| Unisys Corp.(a) | | | 54,051 | | | | 339,440 | | |
| | | | 6,394,721 | | |
| Computer Programming Services — 0.0% | |
| VeriSign, Inc.(a) | | | 41,500 | | | | 961,555 | | |
| Computers & Information — 3.5% | |
| Apple Computer, Inc.(a) | | | 143,550 | | | | 8,199,576 | | |
| Cisco Systems, Inc.(a) | | | 1,036,587 | | | | 20,244,544 | | |
Comverse
Technology, Inc.(a) (b) | | | 33,129 | | | | 654,960 | | |
| Dell, Inc.(a) | | | 382,948 | | | | 9,347,761 | | |
| EMC Corp.(a) | | | 400,533 | | | | 4,393,847 | | |
| Gateway, Inc.(a) | | | 48,768 | | | | 92,659 | | |
International Business
Machines Corp. | | | 264,102 | | | | 20,288,316 | | |
International
Game Technology | | | 58,156 | | | | 2,206,439 | | |
| Jabil Circuit, Inc. | | | 29,600 | | | | 757,760 | | |
Lexmark
International, Inc.(a) | | | 19,428 | | | | 1,084,665 | | |
| SanDisk Corp.(a) | | | 31,100 | | | | 1,585,478 | | |
| Solectron Corp.(a) | | | 159,353 | | | | 544,987 | | |
| Symbol Technologies, Inc. | | | 41,722 | | | | 450,180 | | |
| | | | 69,851,172 | | |
| Computers & Office Equipment — 1.0% | |
Electronic Data
Systems Corp. | | | 87,423 | | | | 2,103,397 | | |
| Hewlett-Packard Co. | | | 470,252 | | | | 14,897,583 | | |
| Pitney Bowes, Inc. | | | 37,255 | | | | 1,538,631 | | |
| Xerox Corp.(a) (b) | | | 159,977 | | | | 2,225,280 | | |
| | | | 20,764,891 | | |
| Containers — 0.2% | |
| Ball Corp. | | | 17,608 | | | | 652,200 | | |
| Bemis Co., Inc. | | | 15,988 | | | | 489,553 | | |
| Pactiv Corp.(a) (b) | | | 23,598 | | | | 584,050 | | |
| Sealed Air Corp.(b) | | | 13,948 | | | | 726,412 | | |
| Temple-Inland, Inc. | | | 18,886 | | | | 809,643 | | |
| | | | 3,261,858 | | |
| Cosmetics & Personal Care — 2.3% | |
| Alberto-Culver Co. | | | 12,847 | | | | 625,906 | | |
| Avon Products, Inc. | | | 78,538 | | | | 2,434,678 | | |
| Colgate-Palmolive Co. | | | 86,819 | | | | 5,200,458 | | |
The Estee Lauder
Cos., Inc. Cl. A | | | 20,400 | | | | 788,868 | | |
| Kimberly-Clark Corp. | | | 77,681 | | | | 4,792,918 | | |
| The Procter & Gamble Co. | | | 554,323 | | | | 30,820,359 | | |
| | | | 44,663,187 | | |
| | | Number of
Shares | | Market
Value | |
| Data Processing & Preparation — 0.7% | |
Affiliated Computer
Services, Inc. Cl. A(a) | | | 20,100 | | | $ | 1,037,361 | | |
Automatic Data
Processing, Inc. | | | 96,708 | | | | 4,385,708 | | |
| First Data Corp. | | | 129,251 | | | | 5,821,465 | | |
| Fiserv, Inc.(a) | | | 33,001 | | | | 1,496,925 | | |
| IMS Health, Inc. | | | 36,625 | | | | 983,381 | | |
| NCR Corp.(a) | | | 30,436 | | | | 1,115,175 | | |
| | | | 14,840,015 | | |
| Electric Utilities — 3.0% | |
| AES Corp.(a) | | | 108,153 | | | | 1,995,423 | | |
| Allegheny Energy, Inc.(a) | | | 26,600 | | | | 986,062 | | |
| Ameren Corp. | | | 33,242 | | | | 1,678,721 | | |
American Electric
Power Co., Inc. | | | 65,708 | | | | 2,250,499 | | |
| CenterPoint Energy, Inc. | | | 51,722 | | | | 646,525 | | |
| CMS Energy Corp.(a) | | | 35,854 | | | | 463,951 | | |
| Consolidated Edison, Inc. | | | 42,274 | | | | 1,878,657 | | |
Constellation Energy
Group, Inc. | | | 29,264 | | | | 1,595,473 | | |
| Dominion Resources, Inc. | | | 58,520 | | | | 4,376,711 | | |
| DTE Energy Co. | | | 29,052 | | | | 1,183,578 | | |
| Duke Energy Corp. | | | 211,668 | | | | 6,216,689 | | |
| Edison International | | | 57,087 | | | | 2,226,393 | | |
| Entergy Corp. | | | 34,706 | | | | 2,455,449 | | |
| Exelon Corp.(b) | | | 112,448 | | | | 6,390,420 | | |
| FirstEnergy Corp. | | | 57,987 | | | | 3,143,475 | | |
| FPL Group, Inc.(b) | | | 66,230 | | | | 2,740,597 | | |
| NiSource, Inc. | | | 43,285 | | | | 945,344 | | |
| PG&E Corp.(b) | | | 60,481 | | | | 2,375,694 | | |
Pinnacle West
Capital Corp. | | | 15,350 | | | | 612,618 | | |
| PPL Corp. | | | 62,410 | | | | 2,015,843 | | |
| Progress Energy, Inc.(b) | | | 44,121 | | | | 1,891,467 | | |
Public Service
Enterprise Group, Inc. | | | 42,482 | | | | 2,808,910 | | |
| Southern Co.(b) | | | 129,046 | | | | 4,135,924 | | |
| Teco Energy, Inc. | | | 32,900 | | | | 491,526 | | |
| TXU Corp. | | | 77,932 | | | | 4,659,554 | | |
| | | | 60,165,503 | | |
| Electrical Equipment & Electronics — 6.0% | |
Advanced Micro
Devices, Inc.(a) | | | 80,742 | | | | 1,971,720 | | |
| Altera Corp.(a) | | | 61,004 | | | | 1,070,620 | | |
American Power
Conversion Corp.(b) | | | 28,942 | | | | 564,080 | | |
| Analog Devices, Inc. | | | 61,825 | | | | 1,987,055 | | |
| Broadcom Corp. Cl. A(a) | | | 74,000 | | | | 2,223,700 | | |
| Emerson Electric Co. | | | 69,354 | | | | 5,812,559 | | |
Freescale Semiconductor,
Inc. Cl. B(a) | | | 67,309 | | | | 1,978,885 | | |
(Continued)
The accompanying notes are an integral part of the financial statements.
107
MassMutual Select Indexed Equity Fund – Portfolio of Investments (Continued)
| | | Number of
Shares | | Market
Value | |
| General Electric Co.(b) | | | 1,756,675 | | | $ | 57,900,008 | | |
| Intel Corp. | | | 991,432 | | | | 18,787,636 | | |
| JDS Uniphase Corp.(a) | | | 283,576 | | | | 717,447 | | |
| Johnson Controls, Inc. | | | 31,902 | | | | 2,622,982 | | |
| Kla-Tencor Corp. | | | 33,328 | | | | 1,385,445 | | |
| Linear Technology Corp. | | | 51,949 | | | | 1,739,772 | | |
| LSI Logic Corp.(a) (b) | | | 63,842 | | | | 571,386 | | |
Maxim Integrated
Products, Inc. | | | 53,999 | | | | 1,733,908 | | |
Micron
Technology, Inc.(a) | | | 103,380 | | | | 1,556,903 | | |
| Molex, Inc. | | | 24,847 | | | | 834,114 | | |
National
Semiconductor Corp. | | | 57,324 | | | | 1,367,177 | | |
| Novellus Systems, Inc.(a) | | | 25,031 | | | | 618,266 | | |
| Nvidia Corp.(a) | | | 58,400 | | | | 1,243,336 | | |
| PMC-Sierra, Inc.(a) (b) | | | 33,079 | | | | 310,943 | | |
| QLogic Corp.(a) | | | 29,600 | | | | 510,304 | | |
Rockwell
Automation, Inc. | | | 30,132 | | | | 2,169,805 | | |
| Sanmina-SCI Corp.(a) | | | 97,624 | | | | 449,070 | | |
| Texas Instruments, Inc. | | | 269,669 | | | | 8,168,274 | | |
| Xilinx, Inc. | | | 58,568 | | | | 1,326,565 | | |
| | | | 119,621,960 | | |
| Energy — 9.9% | |
Anadarko
Petroleum Corp. | | | 77,708 | | | | 3,705,895 | | |
| Apache Corp. | | | 55,156 | | | | 3,764,397 | | |
| Ashland, Inc. | | | 11,825 | | | | 788,727 | | |
| BJ Services Co.(b) | | | 54,600 | | | | 2,034,396 | | |
Chesapeake
Energy Corp.(b) | | | 63,000 | | | | 1,905,750 | | |
| Chevron Corp.(b) | | | 375,216 | | | | 23,285,905 | | |
| ConocoPhillips | | | 278,018 | | | | 18,218,520 | | |
| Devon Energy Corp. | | | 74,500 | | | | 4,500,545 | | |
| Dynegy, Inc. Cl. A(a) | | | 48,037 | | | | 262,762 | | |
| El Paso Corp.(b) | | | 108,935 | | | | 1,634,025 | | |
| EOG Resources, Inc. | | | 40,500 | | | | 2,808,270 | | |
| Exxon Mobil Corp. | | | 1,019,998 | | | | 62,576,877 | | |
| Halliburton Co. | | | 86,984 | | | | 6,455,083 | | |
| Hess Corp.(b) | | | 40,080 | | | | 2,118,228 | | |
| Kerr-McGee Corp. | | | 37,986 | | | | 2,634,329 | | |
| KeySpan Corp. | | | 29,400 | | | | 1,187,760 | | |
| Kinder Morgan, Inc. | | | 17,900 | | | | 1,788,031 | | |
| Marathon Oil Corp. | | | 61,757 | | | | 5,144,358 | | |
| Murphy Oil Corp.(b) | | | 27,300 | | | | 1,524,978 | | |
| Nabors Industries Ltd.(a) | | | 51,738 | | | | 1,748,227 | | |
National Oilwell
Varco, Inc.(a) | | | 29,500 | | | | 1,867,940 | | |
| Nicor, Inc.(b) | | | 5,882 | | | | 244,103 | | |
| Noble Corp. | | | 22,800 | | | | 1,696,776 | | |
Occidental
Petroleum Corp. | | | 72,551 | | | | 7,440,105 | | |
| Peoples Energy Corp. | | | 3,826 | | | | 137,392 | | |
| | | Number of
Shares | | Market
Value | |
| Rowan Companies, Inc. | | | 18,366 | | | $ | 653,646 | | |
| Schlumberger Ltd. | | | 199,210 | | | | 12,970,563 | | |
| Sempra Energy | | | 45,761 | | | | 2,081,210 | | |
| Sunoco, Inc. | | | 22,612 | | | | 1,566,785 | | |
| Transocean, Inc.(a) | | | 54,772 | | | | 4,399,287 | | |
| Valero Energy Corp. | | | 105,000 | | | | 6,984,600 | | |
Weatherford
International Ltd.(a) | | | 58,800 | | | | 2,917,656 | | |
| The Williams Cos., Inc. | | | 98,991 | | | | 2,312,430 | | |
| Xcel Energy, Inc. | | | 65,387 | | | | 1,254,123 | | |
| XTO Energy, Inc. | | | 61,166 | | | | 2,707,819 | | |
| | | | 197,321,498 | | |
| Entertainment & Leisure — 1.1% | |
| Brunswick Corp. | | | 16,555 | | | | 550,454 | | |
Harrah's
Entertainment, Inc. | | | 30,416 | | | | 2,165,011 | | |
| News Corp., Inc. Cl. A | | | 404,500 | | | | 7,758,310 | | |
| The Walt Disney Co. | | | 371,384 | | | | 11,141,520 | | |
| | | | 21,615,295 | | |
| Financial Services — 6.0% | |
| American Express Co. | | | 208,560 | | | | 11,099,563 | | |
| Ameriprise Financial, Inc. | | | 41,692 | | | | 1,862,382 | | |
Apartment Investment &
Management
Co. Cl. A(b) | | | 18,000 | | | | 782,100 | | |
Archstone-Smith
Trust REIT | | | 34,300 | | | | 1,744,841 | | |
The Bear Stearns
Cos., Inc. | | | 19,695 | | | | 2,758,876 | | |
| CIT Group, Inc. | | | 33,700 | | | | 1,762,173 | | |
| Citigroup, Inc. | | | 841,141 | | | | 40,576,642 | | |
Countrywide
Financial Corp. | | | 101,598 | | | | 3,868,852 | | |
E*TRADE
Financial Corp.(a) | | | 70,400 | | | | 1,606,528 | | |
Federated Investors,
Inc. Cl. B | | | 13,400 | | | | 422,100 | | |
| Franklin Resources, Inc. | | | 24,830 | | | | 2,155,492 | | |
The Goldman Sachs
Group, Inc. | | | 73,500 | | | | 11,056,605 | | |
Huntington
Bancshares, Inc. | | | 46,621 | | | | 1,099,323 | | |
| Janus Capital Group, Inc. | | | 37,194 | | | | 665,773 | | |
| Legg Mason, Inc. | | | 22,300 | | | | 2,219,296 | | |
Lehman Brothers
Holdings, Inc. | | | 91,036 | | | | 5,930,995 | | |
| Merrill Lynch & Co., Inc. | | | 154,770 | | | | 10,765,801 | | |
| Morgan Stanley | | | 180,999 | | | | 11,440,947 | | |
PNC Financial Services
Group, Inc. | | | 48,513 | | | | 3,404,157 | | |
| The Charles Schwab Corp. | | | 173,905 | | | | 2,779,002 | | |
| T. Rowe Price Group, Inc. | | | 44,026 | | | | 1,664,623 | | |
| | | | 119,666,071 | | |
| | | Number of
Shares | | Market
Value | |
| Food Retailers — 0.3% | |
| Starbucks Corp.(a) | | | 128,596 | | | $ | 4,855,785 | | |
| SuperValu, Inc. | | | 34,841 | | | | 1,069,619 | | |
| | | | 5,925,404 | | |
| Foods — 1.6% | |
| Archer-Daniels-Midland Co. | | | 109,679 | | | | 4,527,549 | | |
| Campbell Soup Co. | | | 30,846 | | | | 1,144,695 | | |
| ConAgra Foods, Inc. | | | 85,169 | | | | 1,883,087 | | |
| Dean Foods Co.(a) | | | 23,100 | | | | 859,089 | | |
| General Mills, Inc. | | | 61,751 | | | | 3,190,057 | | |
| Heinz (H. J.) Co. | | | 56,422 | | | | 2,325,715 | | |
| The Hershey Co.(b) | | | 30,384 | | | | 1,673,247 | | |
| Kellogg Co. | | | 43,216 | | | | 2,092,951 | | |
| The Kroger Co. | | | 120,475 | | | | 2,633,584 | | |
| McCormick & Co., Inc. | | | 21,000 | | | | 704,550 | | |
| Safeway, Inc. | | | 78,777 | | | | 2,048,202 | | |
| Sara Lee Corp. | | | 129,636 | | | | 2,076,769 | | |
| Sysco Corp. | | | 104,378 | | | | 3,189,792 | | |
| Tyson Foods, Inc. Cl. A(b) | | | 41,600 | | | | 618,176 | | |
| Wrigley (Wm.) Jr. Co. | | | 39,255 | | | | 1,780,607 | | |
| | | | 30,748,070 | | |
| Forest Products & Paper — 0.4% | |
| International Paper Co. | | | 81,251 | | | | 2,624,407 | | |
| MeadWestvaco Corp. | | | 30,750 | | | | 858,848 | | |
Plum Creek Timber
Co., Inc. | | | 29,500 | | | | 1,047,250 | | |
| Weyerhaeuser Co. | | | 41,011 | | | | 2,552,935 | | |
| | | | 7,083,440 | | |
| Healthcare — 1.3% | |
| Caremark Rx, Inc. | | | 75,600 | | | | 3,770,172 | | |
Coventry Health
Care, Inc.(a) | | | 26,490 | | | | 1,455,361 | | |
| Express Scripts, Inc.(a) | | | 24,700 | | | | 1,771,978 | | |
| HCA, Inc. | | | 67,688 | | | | 2,920,737 | | |
Health Management
Associates, Inc. Cl. A | | | 40,700 | | | | 802,197 | | |
| Humana, Inc.(a) | | | 27,796 | | | | 1,492,645 | | |
Laboratory Corp. of
America Holdings(a) | | | 21,800 | | | | 1,356,614 | | |
| Manor Care, Inc.(b) | | | 14,481 | | | | 679,449 | | |
Tenet
Healthcare Corp.(a) (b) | | | 76,128 | | | | 531,373 | | |
| UnitedHealth Group, Inc. | | | 228,596 | | | | 10,236,529 | | |
| | | | 25,017,055 | | |
Home Construction, Furnishings &
Appliances — 0.4% | |
| Centex Corp.(b) | | | 20,810 | | | | 1,046,743 | | |
| D.R. Horton, Inc.(b) | | | 45,100 | | | | 1,074,282 | | |
Harman
International Industries | | | 11,100 | | | | 947,607 | | |
| KB Home | | | 13,070 | | | | 599,260 | | |
(Continued)
The accompanying notes are an integral part of the financial statements.
108
MassMutual Select Indexed Equity Fund – Portfolio of Investments (Continued)
| | | Number of
Shares | | Market
Value | |
| Leggett & Platt, Inc. | | | 30,747 | | | $ | 768,060 | | |
| Lennar Corp. Cl. A(b) | | | 22,600 | | | | 1,002,762 | | |
| Pulte Homes, Inc. | | | 35,792 | | | | 1,030,452 | | |
| Whirlpool Corp. | | | 12,695 | | | | 1,049,242 | | |
| | | | 7,518,408 | | |
| Household Products — 0.7% | |
The Black &
Decker Corp. | | | 12,950 | | | | 1,093,757 | | |
| The Clorox Co. | | | 24,515 | | | | 1,494,680 | | |
| Corning, Inc.(a) | | | 261,261 | | | | 6,319,904 | | |
| Fortune Brands, Inc. | | | 24,080 | | | | 1,709,921 | | |
| Newell Rubbermaid, Inc. | | | 45,971 | | | | 1,187,431 | | |
| The Sherwin-Williams Co. | | | 18,989 | | | | 901,598 | | |
| Snap-on, Inc. | | | 8,403 | | | | 339,649 | | |
| The Stanley Works | | | 13,555 | | | | 640,067 | | |
| | | | 13,687,007 | | |
| Industrial – Distribution — 0.1% | |
| Grainger (W.W.), Inc. | | | 13,766 | | | | 1,035,616 | | |
| Industrial – Diversified — 1.6% | |
| 3M Co. | | | 127,198 | | | | 10,273,781 | | |
Cooper Industries
Ltd. Cl. A | | | 14,965 | | | | 1,390,548 | | |
| Danaher Corp. | | | 39,700 | | | | 2,553,504 | | |
| Eaton Corp. | | | 25,256 | | | | 1,904,302 | | |
Illinois Tool
Works, Inc.(b) | | | 69,066 | | | | 3,280,635 | | |
| ITT Industries, Inc. | | | 30,910 | | | | 1,530,045 | | |
| Textron, Inc. | | | 21,955 | | | | 2,023,812 | | |
| Tyco International Ltd. | | | 339,654 | | | | 9,340,485 | | |
| | | | 32,297,112 | | |
| Information Retrieval Services — 1.2% | |
| Google, Inc. Cl. A(a) | | | 34,746 | | | | 14,570,040 | | |
Juniper
Networks, Inc.(a) (b) | | | 95,400 | | | | 1,525,446 | | |
| Yahoo!, Inc.(a) | | | 213,220 | | | | 7,036,260 | | |
| | | | 23,131,746 | | |
| Insurance — 5.3% | |
| ACE Ltd. | | | 53,500 | | | | 2,706,565 | | |
| Aetna, Inc. | | | 95,596 | | | | 3,817,148 | | |
| AFLAC, Inc. | | | 84,638 | | | | 3,922,971 | | |
| Allstate Corp. | | | 108,715 | | | | 5,949,972 | | |
Ambac Financial
Group, Inc. | | | 18,900 | | | | 1,532,790 | | |
American International
Group, Inc. | | | 437,508 | | | | 25,834,847 | | |
| Aon Corp. | | | 55,352 | | | | 1,927,357 | | |
| Chubb Corp. | | | 65,418 | | | | 3,264,358 | | |
| Cigna Corp. | | | 20,388 | | | | 2,008,422 | | |
| Cincinnati Financial Corp. | | | 27,885 | | | | 1,310,874 | | |
| | | Number of
Shares | | Market
Value | |
Genworth Financial,
Inc. Cl. A | | | 62,900 | | | $ | 2,191,436 | | |
The Hartford Financial
Services Group, Inc. | | | 50,834 | | | | 4,300,556 | | |
| Lincoln National Corp. | | | 48,603 | | | | 2,743,153 | | |
| Loews Corp. | | | 70,944 | | | | 2,514,965 | | |
Marsh & McLennan
Cos., Inc. | | | 90,952 | | | | 2,445,699 | | |
| MBIA, Inc.(b) | | | 23,611 | | | | 1,382,424 | | |
| Metlife, Inc.(b) | | | 127,700 | | | | 6,539,517 | | |
| MGIC Investment Corp. | | | 15,087 | | | | 980,655 | | |
Principal Financial
Group, Inc. | | | 46,100 | | | | 2,565,465 | | |
| Progressive Corp. | | | 131,148 | | | | 3,371,815 | | |
| Prudential Financial, Inc. | | | 83,400 | | | | 6,480,180 | | |
| Safeco Corp. | | | 22,325 | | | | 1,258,014 | | |
| St. Paul Travelers Cos. | | | 117,259 | | | | 5,227,406 | | |
| Torchmark Corp. | | | 18,026 | | | | 1,094,539 | | |
| UnumProvident Corp.(b) | | | 53,425 | | | | 968,595 | | |
| WellPoint, Inc.(a) | | | 107,440 | | | | 7,818,409 | | |
| XL Capital Ltd. Cl. A | | | 29,400 | | | | 1,802,220 | | |
| | | | 105,960,352 | | |
| Lodging — 0.3% | |
| Hilton Hotels Corp. | | | 57,751 | | | | 1,633,198 | | |
Marriott International,
Inc. Cl. A | | | 57,846 | | | | 2,205,090 | | |
Starwood Hotels &
Resorts Worldwide, Inc. | | | 36,627 | | | | 2,210,073 | | |
| | | | 6,048,361 | | |
| Machinery & Components — 1.2% | |
| Baker Hughes, Inc. | | | 57,683 | | | | 4,721,354 | | |
| Caterpillar, Inc. | | | 113,032 | | | | 8,418,623 | | |
| Cummins, Inc.(b) | | | 7,473 | | | | 913,574 | | |
| Deere & Co. | | | 39,913 | | | | 3,332,336 | | |
| Dover Corp. | | | 32,859 | | | | 1,624,220 | | |
| Ingersoll-Rand Co. Cl. A | | | 56,372 | | | | 2,411,594 | | |
| Pall Corp. | | | 19,618 | | | | 549,304 | | |
| Parker Hannifin Corp. | | | 19,998 | | | | 1,551,845 | | |
| | | | 23,522,850 | | |
| Manufacturing — 0.4% | |
American Standard
Cos., Inc. | | | 31,900 | | | | 1,380,313 | | |
| Applied Materials, Inc. | | | 267,452 | | | | 4,354,119 | | |
| Avery Dennison Corp. | | | 17,698 | | | | 1,027,546 | | |
| Millipore Corp.(a) (b) | | | 8,181 | | | | 515,321 | | |
| | | | 7,277,299 | | |
| Medical Supplies — 2.0% | |
Agilent
Technologies, Inc.(a) | | | 72,205 | | | | 2,278,790 | | |
| Allergan, Inc. | | | 25,329 | | | | 2,716,789 | | |
Applera Corp. - Applied
Biosystems Group | | | 32,168 | | | | 1,040,635 | | |
| | | Number of
Shares | | Market
Value | |
| Bard (C.R.), Inc.(b) | | | 17,178 | | | $ | 1,258,460 | | |
| Bausch & Lomb, Inc.(b) | | | 8,994 | | | | 441,066 | | |
| Baxter International, Inc. | | | 108,426 | | | | 3,985,740 | | |
| Becton, Dickinson & Co. | | | 41,946 | | | | 2,564,159 | | |
| Biomet, Inc. | | | 42,094 | | | | 1,317,121 | | |
| Boston Scientific Corp.(a) | | | 204,840 | | | | 3,449,506 | | |
Fisher Scientific
International, Inc.(a) | | | 20,200 | | | | 1,475,610 | | |
| Medtronic, Inc.(b) | | | 203,414 | | | | 9,544,185 | | |
Patterson
Cos., Inc.(a) (b) | | | 23,300 | | | | 813,869 | | |
| St. Jude Medical, Inc.(a) | | | 60,792 | | | | 1,970,877 | | |
| Stryker Corp. | | | 49,602 | | | | 2,088,740 | | |
| Tektronix, Inc. | | | 14,070 | | | | 413,939 | | |
Thermo
Electron Corp.(a) (b) | | | 26,175 | | | | 948,582 | | |
| Waters Corp.(a) | | | 17,700 | | | | 785,880 | | |
| Zimmer Holdings, Inc.(a) | | | 41,178 | | | | 2,335,616 | | |
| | | | 39,429,564 | | |
| Metals & Mining — 1.0% | |
| Alcoa, Inc. | | | 146,966 | | | | 4,755,820 | | |
Allegheny
Technologies, Inc.(b) | | | 14,547 | | | | 1,007,234 | | |
| CONSOL Energy, Inc. | | | 16,449 | | | | 768,497 | | |
Freeport-McMoRan
Copper & Gold,
Inc. Cl. B | | | 30,783 | | | | 1,705,686 | | |
| Newmont Mining Corp. | | | 74,897 | | | | 3,964,298 | | |
| Nucor Corp. | | | 52,400 | | | | 2,842,700 | | |
| Phelps Dodge Corp. | | | 34,078 | | | | 2,799,848 | | |
| United States Steel Corp. | | | 18,356 | | | | 1,287,123 | | |
| | | | 19,131,206 | | |
| Pharmaceuticals — 8.1% | |
| Abbott Laboratories | | | 259,337 | | | | 11,309,687 | | |
| AmerisourceBergen Corp. | | | 34,032 | | | | 1,426,621 | | |
| Amgen, Inc.(a) | | | 198,790 | | | | 12,967,072 | | |
| Barr Pharmaceuticals(a) | | | 18,200 | | | | 867,958 | | |
| Biogen Idec, Inc.(a) (b) | | | 57,591 | | | | 2,668,191 | | |
| Bristol-Myers Squibb Co. | | | 330,184 | | | | 8,538,558 | | |
| Cardinal Health, Inc. | | | 71,279 | | | | 4,585,378 | | |
| Eli Lilly & Co. | | | 190,395 | | | | 10,523,132 | | |
Forest
Laboratories, Inc.(a) | | | 55,300 | | | | 2,139,557 | | |
| Genzyme Corp.(a) | | | 43,800 | | | | 2,673,990 | | |
| Gilead Sciences, Inc.(a) | | | 77,738 | | | | 4,598,980 | | |
| Hospira, Inc.(a) | | | 26,193 | | | | 1,124,727 | | |
| Johnson & Johnson | | | 501,600 | | | | 30,055,872 | | |
King
Pharmaceuticals, Inc.(a) | | | 42,648 | | | | 725,016 | | |
| McKesson Corp. | | | 51,398 | | | | 2,430,097 | | |
Medco Health
Solutions, Inc.(a) | | | 51,241 | | | | 2,935,084 | | |
(Continued)
The accompanying notes are an integral part of the financial statements.
109
MassMutual Select Indexed Equity Fund – Portfolio of Investments (Continued)
| | | Number of
Shares | | Market
Value | |
| MedImmune, Inc.(a) | | | 42,169 | | | $ | 1,142,780 | | |
| Merck & Co., Inc. | | | 368,562 | | | | 13,426,714 | | |
| Mylan Laboratories, Inc. | | | 36,500 | | | | 730,000 | | |
| Pfizer, Inc. | | | 1,240,021 | | | | 29,103,293 | | |
| Schering-Plough Corp.(b) | | | 249,286 | | | | 4,743,913 | | |
| Sigma-Aldrich Corp. | | | 12,351 | | | | 897,177 | | |
Watson
Pharmaceutical, Inc.(a) | | | 18,371 | | | | 427,677 | | |
| Wyeth | | | 226,504 | | | | 10,059,043 | | |
| | | | 160,100,517 | | |
| Photography Equipment/Supplies — 0.1% | |
| Eastman Kodak Co.(b) | | | 48,647 | | | | 1,156,826 | | |
| Prepackaged Software — 2.9% | |
| Adobe Systems, Inc.(a) | | | 101,044 | | | | 3,067,696 | | |
| BMC Software, Inc.(a) | | | 35,631 | | | | 851,581 | | |
| CA, Inc.(b) | | | 77,387 | | | | 1,590,303 | | |
| Citrix Systems, Inc.(a) | | | 29,127 | | | | 1,169,158 | | |
| Compuware Corp.(a) | | | 69,337 | | | | 464,558 | | |
| Electronic Arts, Inc.(a) | | | 50,900 | | | | 2,190,736 | | |
| Intuit, Inc.(a) | | | 29,800 | | | | 1,799,622 | | |
| Microsoft Corp. | | | 1,479,090 | | | | 34,462,797 | | |
| Novell, Inc.(a) (b) | | | 71,082 | | | | 471,274 | | |
| Oracle Corp.(a) (b) | | | 656,528 | | | | 9,513,091 | | |
| Symantec Corp.(a) | | | 175,782 | | | | 2,731,652 | | |
| | | | 58,312,468 | | |
| Real Estate — 0.7% | |
| Boston Properties, Inc.(b) | | | 15,200 | | | | 1,374,080 | | |
Equity Office
Properties Trust(b) | | | 68,600 | | | | 2,504,586 | | |
| Equity Residential REIT | | | 47,900 | | | | 2,142,567 | | |
| Kimco Realty Corp.(b) | | | 34,100 | | | | 1,244,309 | | |
| ProLogis | | | 40,900 | | | | 2,131,708 | | |
Simon Property Group,
Inc. REIT | | | 30,800 | | | | 2,554,552 | | |
| Vornado Realty Trust(b) | | | 19,800 | | | | 1,931,490 | | |
| | | | 13,883,292 | | |
| Restaurants — 0.6% | |
| Darden Restaurants, Inc. | | | 22,428 | | | | 883,663 | | |
| McDonald's Corp. | | | 211,160 | | | | 7,094,976 | | |
| Wendy's International, Inc. | | | 19,301 | | | | 1,125,055 | | |
| Yum! Brands, Inc. | | | 47,420 | | | | 2,383,803 | | |
| | | | 11,487,497 | | |
| Retail — 4.8% | |
| Amazon.com, Inc.(a) (b) | | | 51,994 | | | | 2,011,128 | | |
| AutoZone, Inc.(a) | | | 9,336 | | | | 823,435 | | |
Bed Bath &
Beyond, Inc.(a) | | | 47,296 | | | | 1,568,808 | | |
| Best Buy Co., Inc. | | | 68,311 | | | | 3,746,175 | | |
| Big Lots, Inc.(a) | | | 18,996 | | | | 324,452 | | |
| Circuit City Stores, Inc. | | | 27,459 | | | | 747,434 | | |
| | | Number of
Shares | | Market
Value | |
Costco
Wholesale Corp.(b) | | | 79,689 | | | $ | 4,552,633 | | |
| CVS Corp. | | | 136,878 | | | | 4,202,155 | | |
| Dillards, Inc. Cl. A | | | 11,365 | | | | 361,975 | | |
| Dollar General Corp. | | | 52,431 | | | | 732,985 | | |
| Family Dollar Stores, Inc. | | | 25,924 | | | | 633,323 | | |
Federated Department
Stores, Inc. | | | 90,962 | | | | 3,329,209 | | |
| The Home Depot, Inc. | | | 348,487 | | | | 12,472,350 | | |
| J.C. Penney Co., Inc. | | | 39,161 | | | | 2,643,759 | | |
| Kohl's Corp.(a) | | | 57,576 | | | | 3,403,893 | | |
Lowe's
Companies, Inc.(b) | | | 131,750 | | | | 7,993,273 | | |
| Office Depot, Inc.(a) | | | 49,859 | | | | 1,894,642 | | |
| OfficeMax, Inc. | | | 13,101 | | | | 533,866 | | |
| RadioShack Corp.(b) | | | 23,830 | | | | 333,620 | | |
Sears
Holdings Corp.(a) (b) | | | 16,898 | | | | 2,616,486 | | |
| Staples, Inc. | | | 122,784 | | | | 2,986,107 | | |
| Target Corp. | | | 148,110 | | | | 7,238,136 | | |
| Tiffany & Co. | | | 24,156 | | | | 797,631 | | |
| The TJX Cos., Inc. | | | 77,860 | | | | 1,779,880 | | |
| Walgreen Co. | | | 170,780 | | | | 7,657,775 | | |
| Wal-Mart Stores, Inc. | | | 420,973 | | | | 20,278,269 | | |
| | | | 95,663,399 | | |
| Retail – Grocery — 0.1% | |
| Whole Foods Market, Inc. | | | 23,400 | | | | 1,512,576 | | |
| Telephone Utilities — 3.2% | |
| Alltel Corp. | | | 64,557 | | | | 4,120,673 | | |
| AT&T, Inc. | | | 653,875 | | | | 18,236,574 | | |
| BellSouth Corp. | | | 303,023 | | | | 10,969,433 | | |
| CenturyTel, Inc. | | | 21,848 | | | | 811,653 | | |
| Embarq Corp.(a) | | | 25,005 | | | | 1,024,955 | | |
Qwest Communications
International, Inc.(a) | | | 259,121 | | | | 2,096,289 | | |
| Sprint Nextel Corp. | | | 500,113 | | | | 9,997,259 | | |
Verizon
Communications, Inc. | | | 493,263 | | | | 16,519,378 | | |
| | | | 63,776,214 | | |
| Tobacco — 1.5% | |
| Altria Group, Inc. | | | 351,739 | | | | 25,828,195 | | |
Reynolds
American, Inc.(b) | | | 15,100 | | | | 1,741,030 | | |
| UST, Inc.(b) | | | 29,387 | | | | 1,327,999 | | |
| | | | 28,897,224 | | |
| Toys, Games — 0.1% | |
| Hasbro, Inc. | | | 28,504 | | | | 516,207 | | |
| Mattel, Inc. | | | 65,752 | | | | 1,085,566 | | |
| | | | 1,601,773 | | |
| | | Number of
Shares | | Market
Value | |
| Transportation — 2.0% | |
Burlington Northern
Santa Fe Corp. | | | 62,856 | | | $ | 4,981,338 | | |
| Carnival Corp. | | | 72,968 | | | | 3,045,684 | | |
| CSX Corp. | | | 35,586 | | | | 2,506,678 | | |
| FedEx Corp. | | | 51,212 | | | | 5,984,634 | | |
| Norfolk Southern Corp. | | | 69,477 | | | | 3,697,566 | | |
| Union Pacific Corp. | | | 44,438 | | | | 4,130,956 | | |
United Parcel
Service, Inc. Cl. B | | | 184,000 | | | | 15,148,720 | | |
| | | | 39,495,576 | | |
| Travel — 0.0% | |
Sabre Holdings
Corp. Cl. A(b) | | | 23,928 | | | | 526,416 | | |
TOTAL EQUITIES
(Cost $1,749,114,839) | | | | | | | 1,941,411,402 | | |
| | | Principal
Amount | | | |
| SHORT-TERM INVESTMENTS — 8.8% | |
| Cash Equivalents — 6.7%(d) | |
Abbey National PLC
Eurodollar Time Deposit
5.100% 07/10/2006 | | $ | 1,450,149 | | | | 1,450,149 | | |
ABN Amro Bank NV
Certificate of Deposit
5.305% 11/21/2006 | | | 1,450,152 | | | | 1,450,152 | | |
American Beacon Money
Market Fund(c) | | | 1,479,032 | | | | 1,479,032 | | |
Bank of America
5.270% 07/14/2006 | | | 2,900,304 | | | | 2,900,304 | | |
Bank of America
5.310% 03/08/2007 | | | 2,900,304 | | | | 2,900,304 | | |
Bank of Montreal
Eurodollar Time Deposit
5.290% 08/03/2006 | | | 2,900,304 | | | | 2,900,304 | | |
Bank of Nova Scotia
Eurodollar Time Deposit
5.290% 08/08/2006 | | | 2,900,304 | | | | 2,900,304 | | |
Barclays
Eurodollar Time Deposit
5.150% 08/01/2006 | | | 4,350,456 | | | | 4,350,456 | | |
Branch Banker & Trust
Eurodollar Time Deposit
5.250% 07/26/2006 | | | 5,220,547 | | | | 5,220,547 | | |
Calyon
Eurodollar Time Deposit
5.300% 08/08/2006 | | | 2,900,304 | | | | 2,900,304 | | |
Canadian Imperial
Bank of Commerce
Eurodollar Time Deposit
5.310% 07/31/2006 | | | 2,900,304 | | | | 2,900,304 | | |
(Continued)
The accompanying notes are an integral part of the financial statements.
110
MassMutual Select Indexed Equity Fund – Portfolio of Investments (Continued)
| | | Principal
Amount | | Market
Value | |
Deutsche Bank
Eurodollar Time Deposit
5.250% 07/05/2006 | | $ | 7,250,760 | | | $ | 7,250,760 | | |
Dexia Group
Eurodollar Time Deposit
5.300% 08/09/2006 | | | 3,770,395 | | | | 3,770,395 | | |
Federal Home Loan
Bank Discount Note
5.181% 07/19/2006 | | | 2,308,603 | | | | 2,308,603 | | |
First Tennessee
National Corporation
Eurodollar Time Deposit
5.270% 07/24/2006 | | | 3,480,365 | | | | 3,480,365 | | |
Fortis Bank
Eurodollar Time Deposit
5.090% 07/05/2006 | | | 2,900,304 | | | | 2,900,304 | | |
Fortis Bank
Eurodollar Time Deposit
5.250% 07/03/2006 | | | 2,900,304 | | | | 2,900,304 | | |
Fortis Bank
Eurodollar Time Deposit
5.250% 07/06/2006 | | | 2,900,304 | | | | 2,900,304 | | |
Freddie Mac
Discount Note
5.191% 07/25/2006 | | | 1,730,852 | | | | 1,730,852 | | |
Harris NA
Eurodollar Time Deposit
5.080% 07/05/2006 | | | 2,030,213 | | | | 2,030,213 | | |
HBOS Halifax
Bank of Scotland
Certificate of Deposit
5.110% 07/10/2006 | | | 2,900,304 | | | | 2,900,304 | | |
National Australia Bank
Eurodollar Time Deposit
5.290% 07/03/2006 | | | 10,151,064 | | | | 10,151,064 | | |
National City Corporation
Eurodollar Time Deposit
5.220% 07/03/2006 | | | 3,443,274 | | | | 3,443,274 | | |
Skandinaviska Enskilda
Banken AB
Eurodollar Time Deposit
5.130% 07/12/2006 | | | 2,900,304 | | | | 2,900,304 | | |
Societe Generale
Eurodollar Time Deposit
5.200% 08/08/2006 | | | 2,900,304 | | | | 2,900,304 | | |
Societe Generale
Eurodollar Time Deposit
5.270% 07/17/2006 | | | 3,770,395 | | | | 3,770,395 | | |
Standard Chartered Bank
Eurodollar Time Deposit
5.260% 07/07/2006 | | | 4,350,456 | | | | 4,350,456 | | |
Svenska Handlesbanken
Eurodollar Time Deposit
5.290% 07/03/2006 | | | 9,723,287 | | | | 9,723,287 | | |
| | | Principal
Amount | | Market
Value | |
The Bank of the West
Eurodollar Time Deposit
5.250% 08/07/2006 | | $ | 4,930,517 | | | $ | 4,930,517 | | |
Toronto Dominion Bank
Eurodollar Time Deposit
5.300% 07/31/2006 | | | 8,120,851 | | | | 8,120,851 | | |
UBS AG
Eurodollar Time Deposit
5.250% 07/21/2006 | | | 4,350,456 | | | | 4,350,456 | | |
UBS AG
Eurodollar Time Deposit
5.250% 08/04/2006 | | | 4,350,456 | | | | 4,350,456 | | |
Wells Fargo
Eurodollar Time Deposit
5.160% 07/13/2006 | | | 2,900,304 | | | | 2,900,304 | | |
Wells Fargo
Eurodollar Time Deposit
5.170% 07/03/2006 | | | 2,900,304 | | | | 2,900,304 | | |
Wells Fargo
Eurodollar Time Deposit
5.210% 07/06/2006 | | | 1,450,152 | | | | 1,450,152 | | |
Wells Fargo
Eurodollar Time Deposit
5.250% 07/03/2006 | | | 2,900,304 | | | | 2,900,304 | | |
| | | | 132,666,992 | | |
| Repurchase Agreement — 2.0% | |
Investors Bank & Trust
Company Repurchase
Agreement, dated
06/30/2006, 3.75%,
due 07/03/2006(e) | | | 39,274,221 | | | | 39,274,221 | | |
| U.S. Treasury Bills — 0.1% | |
U.S. Treasury Bill
4.658% 09/21/2006 | | | 3,185,000 | | | | 3,151,208 | | |
TOTAL SHORT-TERM
INVESTMENTS
(Cost $175,092,421) | | | | | | | 175,092,421 | | |
TOTAL INVESTMENTS — 106.7%
(Cost $1,924,207,260)(f) | | | | | | | 2,116,503,823 | | |
Other Assets/
(Liabilities) — (6.7%) | | | | | | | (132,208,852 | ) | |
| NET ASSETS — 100.0% | | | | | | $ | 1,984,294,971 | | |
Notes to Portfolio of Investments
REIT - Real Estate Investment Trust
(a) Non-income producing security.
(b) Denotes all or a portion of security on loan. (Note 2).
(c) Amount represents shares owned of the fund.
(d) Represents investments of security lending collateral. (Note 2).
(e) Maturity value of $39,286,495. Collateralized by a U.S. Government Agency obligation with a rate of 5.55%, maturity date 12/15/2035, and an aggregate market value, including accrued interest, of $41,237,932.
(f) See Note 6 for aggregate cost for Federal tax purposes.
The accompanying notes are an integral part of the financial statements.
111
MassMutual Select Core Opportunities Fund – Portfolio of Investments
June 30, 2006 (Unaudited)
| | | Number of
Shares | | Market
Value | |
| EQUITIES — 94.4% | |
| COMMON STOCK | |
| Aerospace & Defense — 1.6% | |
| Honeywell International, Inc. | | | 4,700 | | | $ | 189,410 | | |
| Banking, Savings & Loans — 4.4% | |
| Bank of America Corp. | | | 6,800 | | | | 327,080 | | |
| Capital One Financial Corp. | | | 1,200 | | | | 102,540 | | |
North Fork
Bancorporation, Inc. | | | 2,400 | | | | 72,408 | | |
| | | | 502,028 | | |
| Broadcasting, Publishing & Printing — 2.2% | |
| Time Warner, Inc. | | | 14,900 | | | | 257,770 | | |
| Chemicals — 1.9% | |
| Celanese Corp. Cl. A | | | 4,073 | | | | 83,170 | | |
| PPG Industries, Inc. | | | 2,000 | | | | 132,000 | | |
| | | | 215,170 | | |
| Commercial Services — 4.2% | |
ABB Ltd. Sponsored
ADR (Switzerland) | | | 18,800 | | | | 243,648 | | |
Siemens AG Sponsored
ADR (Germany) | | | 2,800 | | | | 243,096 | | |
| | | | 486,744 | | |
| Communications — 2.3% | |
Nokia Oyj Sponsored
ADR (Finland) | | | 5,000 | | | | 101,300 | | |
| Research In Motion Ltd.(a) | | | 2,400 | | | | 167,448 | | |
| | | | 268,748 | | |
| Computers & Information — 7.3% | |
| Cisco Systems, Inc.(a) | | | 14,700 | | | | 287,091 | | |
| Dell, Inc.(a) | | | 6,900 | | | | 168,429 | | |
International Business
Machines Corp. | | | 5,000 | | | | 384,100 | | |
| | | | 839,620 | | |
| Cosmetics & Personal Care — 2.7% | |
| The Procter & Gamble Co. | | | 5,600 | | | | 311,360 | | |
| Data Processing & Preparation — 2.5% | |
| First Data Corp. | | | 6,300 | | | | 283,752 | | |
| Electrical Equipment & Electronics — 7.3% | |
| General Electric Co. | | | 15,200 | | | | 500,992 | | |
| Intel Corp. | | | 17,500 | | | | 331,625 | | |
| | | | 832,617 | | |
| Energy — 10.2% | |
| Canadian Natural Resources Ltd. | | | 300 | | | | 16,614 | | |
| Halliburton Co. | | | 6,400 | | | | 474,944 | | |
| | | Number of
Shares | | Market
Value | |
| Hess Corp. | | | 3,900 | | | $ | 206,115 | | |
| Transocean, Inc.(a) | | | 3,200 | | | | 257,024 | | |
Weatherford
International Ltd.(a) | | | 4,353 | | | | 215,996 | | |
| | | | 1,170,693 | | |
| Financial Services — 4.0% | |
| American Express Co. | | | 3,200 | | | | 170,304 | | |
| Merrill Lynch & Co., Inc. | | | 1,500 | | | | 104,340 | | |
| Morgan Stanley | | | 2,900 | | | | 183,309 | | |
| | | | 457,953 | | |
| Foods — 1.8% | |
| General Mills, Inc. | | | 4,083 | | | | 210,928 | | |
| Forest Products & Paper — 1.4% | |
| Weyerhaeuser Co. | | | 2,500 | | | | 155,625 | | |
| Information Retrieval Services — 2.3% | |
| Yahoo!, Inc.(a) | | | 7,900 | | | | 260,700 | | |
| Insurance — 6.0% | |
| Ambac Financial Group, Inc. | | | 1,363 | | | | 110,539 | | |
American International
Group, Inc. | | | 4,900 | | | | 289,345 | | |
| Cigna Corp. | | | 800 | | | | 78,808 | | |
| Genworth Financial, Inc. Cl. A | | | 1,400 | | | | 48,776 | | |
| Marsh & McLennan Cos., Inc. | | | 5,800 | | | | 155,962 | | |
| | | | 683,430 | | |
| Machinery & Components — 3.1% | |
| Caterpillar, Inc. | | | 2,700 | | | | 201,096 | | |
| Deere & Co. | | | 1,861 | | | | 155,375 | | |
| | | | 356,471 | | |
| Medical Supplies — 2.8% | |
| Medtronic, Inc. | | | 6,800 | | | | 319,056 | | |
| Metals & Mining — 2.7% | |
| Alcoa, Inc. | | | 6,100 | | | | 197,396 | | |
| Newmont Mining Corp. | | | 2,100 | | | | 111,153 | | |
| | | | 308,549 | | |
| Pharmaceuticals — 8.7% | |
| Amgen, Inc.(a) | | | 7,500 | | | | 489,225 | | |
| McKesson Corp. | | | 1,300 | | | | 61,464 | | |
| Novartis AG ADR (Switzerland) | | | 3,000 | | | | 161,760 | | |
| Pfizer, Inc. | | | 12,400 | | | | 291,028 | | |
| | | | 1,003,477 | | |
| Prepackaged Software — 7.0% | |
| Microsoft Corp. | | | 11,300 | | | | 263,290 | | |
| Oracle Corp.(a) | | | 26,200 | | | | 379,638 | | |
| Symantec Corp.(a) | | | 10,200 | | | | 158,508 | | |
| | | | 801,436 | | |
| | | Number of
Shares | | Market
Value | |
| Real Estate — 0.6% | |
| Equity Office Properties Trust | | | 1,800 | | | $ | 65,718 | | |
| Retail — 2.3% | |
| Tiffany & Co. | | | 5,100 | | | | 168,402 | | |
| The TJX Cos., Inc. | | | 4,300 | | | | 98,298 | | |
| | | | 266,700 | | |
| Telephone Utilities — 1.3% | |
| Sprint Nextel Corp. | | | 7,600 | | | | 151,924 | | |
| Tobacco — 1.6% | |
| UST, Inc. | | | 4,000 | | | | 180,760 | | |
| Transportation — 2.2% | |
United Parcel Service,
Inc. Cl. B | | | 3,000 | | | | 246,990 | | |
TOTAL EQUITIES
(Cost $11,187,364) | | | | | | | 10,827,629 | | |
| | | Principal
Amount | | | |
| SHORT-TERM INVESTMENTS — 7.1% | |
| Repurchase Agreement | |
Investors Bank & Trust
Company Repurchase
Agreement, dated
06/30/2006, 3.75%,
due 07/03/2006(b) | | $ | 817,245 | | | | 817,245 | | |
TOTAL SHORT-TERM
INVESTMENTS
(Cost $817,245) | | | | | | | 817,245 | | |
TOTAL INVESTMENTS — 101.5%
(Cost $12,004,609)(c) | | | | | | | 11,644,874 | | |
Other Assets/
(Liabilities) — (1.5%) | | | | | | | (171,053 | ) | |
| NET ASSETS — 100.0% | | | | | | $ | 11,473,821 | | |
Notes to Portfolio of Investments
ADR - American Depository Receipt
(a) Non-income producing security.
(b) Maturity value of $817,500. Collateralized by a U.S. Government Agency obligation with a rate of 7.875%, maturity date of 02/25/2014, and an aggregate market value, including accrued interest, of $858,107.
(c) See Note 6 for aggregate cost for Federal tax purposes.
The accompanying notes are an integral part of the financial statements.
112
MassMutual Select Blue Chip Growth Fund – Portfolio of Investments
June 30, 2006 (Unaudited)
| | | Number of
Shares | | Market
Value | |
| EQUITIES — 99.3% | |
| COMMON STOCK | |
| Advertising — 0.3% | |
| Monster Worldwide, Inc.(a) | | | 12,900 | | | $ | 550,314 | | |
| Omnicom Group, Inc. | | | 6,600 | | | | 587,994 | | |
| | | | 1,138,308 | | |
| Aerospace & Defense — 2.0% | |
| General Dynamics Corp. | | | 49,000 | | | | 3,207,540 | | |
| Honeywell International, Inc. | | | 55,600 | | | | 2,240,680 | | |
| Rockwell Collins, Inc. | | | 25,400 | | | | 1,419,098 | | |
| United Technologies Corp. | | | 19,800 | | | | 1,255,716 | | |
| | | | 8,123,034 | | |
| Banking, Savings & Loans — 5.1% | |
| Mellon Financial Corp. | | | 32,600 | | | | 1,122,418 | | |
| Northern Trust Corp. | | | 58,200 | | | | 3,218,460 | | |
| SLM Corp. | | | 98,500 | | | | 5,212,620 | | |
| State Street Corp. | | | 128,200 | | | | 7,447,138 | | |
| Wells Fargo & Co. | | | 53,500 | | | | 3,588,780 | | |
| | | | 20,589,416 | | |
| Beverages — 1.2% | |
| PepsiCo, Inc. | | | 78,200 | | | | 4,695,128 | | |
| Broadcasting, Publishing & Printing — 1.7% | |
Grupo Televisa SA
Sponsored ADR (Mexico) | | | 53,400 | | | | 1,031,154 | | |
The McGraw-Hill
Companies, Inc. | | | 10,700 | | | | 537,461 | | |
| The Scripps (E.W.) Co. Cl. A | | | 13,900 | | | | 599,646 | | |
| Time Warner, Inc. | | | 115,300 | | | | 1,994,690 | | |
| Viacom, Inc. Cl. B(a) | | | 71,200 | | | | 2,551,808 | | |
| | | | 6,714,759 | | |
| Chemicals — 0.9% | |
| Monsanto Co. | | | 42,800 | | | | 3,603,332 | | |
| Commercial Services — 1.4% | |
| Cintas Corp.(b) | | | 9,700 | | | | 385,672 | | |
| eBay, Inc.(a) | | | 60,100 | | | | 1,760,329 | | |
| Paychex, Inc. | | | 13,500 | | | | 526,230 | | |
| Quest Diagnostics, Inc. | | | 48,400 | | | | 2,900,128 | | |
| | | | 5,572,359 | | |
| Communications — 3.1% | |
America Movil SA de CV
Sponsored ADR
Series L (Mexico) | | | 84,600 | | | | 2,813,796 | | |
American Tower
Corp. Cl. A(a) (b) | | | 114,600 | | | | 3,566,352 | | |
| | | Number of
Shares | | Market
Value | |
Nokia Oyj Sponsored
ADR (Finland) | | | 211,700 | | | $ | 4,289,042 | | |
| Qualcomm, Inc. | | | 23,200 | | | | 929,624 | | |
Rogers Communications,
Inc. Cl. B(b) | | | 28,400 | | | | 1,147,360 | | |
| | | | 12,746,174 | | |
| Communications Equipment — 0.3% | |
Telefonaktiebolaget LM
Ericsson Cl. B Sponsored
ADR (Sweden)(b) | | | 42,400 | | | | 1,400,896 | | |
| Computers & Information — 3.8% | |
| Apple Computer, Inc.(a) | | | 38,200 | | | | 2,181,984 | | |
| Cisco Systems, Inc.(a) | | | 285,300 | | | | 5,571,909 | | |
| Dell, Inc.(a) | | | 78,500 | | | | 1,916,185 | | |
| EMC Corp.(a) | | | 183,700 | | | | 2,015,189 | | |
International
Game Technology | | | 96,400 | | | | 3,657,416 | | |
| | | | 15,342,683 | | |
| Cosmetics & Personal Care — 1.4% | |
| The Procter & Gamble Co. | | | 104,300 | | | | 5,799,080 | | |
| Data Processing & Preparation — 2.0% | |
Automatic Data
Processing, Inc. | | | 105,900 | | | | 4,802,565 | | |
| First Data Corp. | | | 76,800 | | | | 3,459,072 | | |
| | | | 8,261,637 | | |
| Electrical Equipment & Electronics — 10.0% | |
| Analog Devices, Inc. | | | 82,900 | | | | 2,664,406 | | |
| Garmin Ltd.(b) | | | 30,100 | | | | 3,173,744 | | |
| General Electric Co.(b) | | | 463,100 | | | | 15,263,776 | | |
| Intel Corp. | | | 64,600 | | | | 1,224,170 | | |
| Linear Technology Corp.(b) | | | 85,200 | | | | 2,853,348 | | |
Marvell Technology
Group Ltd.(a) (b) | | | 82,100 | | | | 3,639,493 | | |
Maxim Integrated
Products, Inc. | | | 157,600 | | | | 5,060,536 | | |
| Texas Instruments, Inc. | | | 103,100 | | | | 3,122,899 | | |
| Xilinx, Inc.(b) | | | 152,700 | | | | 3,458,655 | | |
| | | | 40,461,027 | | |
| Energy — 4.6% | |
| EOG Resources, Inc. | | | 6,100 | | | | 422,974 | | |
| Exxon Mobil Corp. | | | 78,700 | | | | 4,828,245 | | |
| Murphy Oil Corp.(b) | | | 37,100 | | | | 2,072,406 | | |
| Schlumberger Ltd. | | | 137,000 | | | | 8,920,070 | | |
Total SA Sponsored
ADR (France) | | | 34,300 | | | | 2,247,336 | | |
| | | | 18,491,031 | | |
| | | Number of
Shares | | Market
Value | |
| Entertainment & Leisure — 0.8% | |
| Harrah's Entertainment, Inc. | | | 45,900 | | | $ | 3,267,162 | | |
| Financial Services — 12.6% | |
| American Express Co. | | | 111,300 | | | | 5,923,386 | | |
| Ameriprise Financial, Inc. | | | 15,200 | | | | 678,984 | | |
Chicago Mercantile
Exchange Holdings, Inc. | | | 2,400 | | | | 1,178,760 | | |
| Citigroup, Inc. | | | 175,300 | | | | 8,456,472 | | |
| Countrywide Financial Corp. | | | 31,400 | | | | 1,195,712 | | |
| E*TRADE Financial Corp.(a) | | | 131,200 | | | | 2,993,984 | | |
| Franklin Resources, Inc. | | | 55,000 | | | | 4,774,550 | | |
The Goldman Sachs
Group, Inc. | | | 33,200 | | | | 4,994,276 | | |
| Legg Mason, Inc. | | | 44,600 | | | | 4,438,592 | | |
| Merrill Lynch & Co., Inc. | | | 67,300 | | | | 4,681,388 | | |
| Morgan Stanley | | | 27,800 | | | | 1,757,238 | | |
| The Charles Schwab Corp. | | | 207,800 | | | | 3,320,644 | | |
| TD Ameritrade Holding Corp. | | | 120,000 | | | | 1,777,200 | | |
| UBS AG Registered(a) | | | 44,400 | | | | 4,815,086 | | |
| | | | 50,986,272 | | |
| Foods — 0.4% | |
| Sysco Corp. | | | 55,000 | | | | 1,680,800 | | |
| Healthcare — 4.4% | |
| Caremark Rx, Inc. | | | 115,300 | | | | 5,750,011 | | |
GlaxoSmithKline PLC ADR
(United Kingdom) | | | 9,600 | | | | 535,680 | | |
| Humana, Inc.(a) | | | 50,600 | | | | 2,717,220 | | |
| UnitedHealth Group, Inc. | | | 200,900 | | | | 8,996,302 | | |
| | | | 17,999,213 | | |
Home Construction, Furnishings &
Appliances — 0.6% | |
Harman
International Industries | | | 27,300 | | | | 2,330,601 | | |
| Household Products — 0.9% | |
| Corning, Inc.(a) | | | 110,400 | | | | 2,670,576 | | |
| Fortune Brands, Inc. | | | 14,700 | | | | 1,043,847 | | |
| | | | 3,714,423 | | |
| Industrial – Diversified — 3.3% | |
| Danaher Corp. | | | 155,000 | | | | 9,969,600 | | |
| Illinois Tool Works, Inc. | | | 68,600 | | | | 3,258,500 | | |
| | | | 13,228,100 | | |
| Information Retrieval Services — 3.5% | |
| Google, Inc. Cl. A(a) | | | 17,600 | | | | 7,380,208 | | |
Juniper
Networks, Inc.(a) (b) | | | 100,900 | | | | 1,613,391 | | |
| Yahoo!, Inc.(a) | | | 161,200 | | | | 5,319,600 | | |
| | | | 14,313,199 | | |
(Continued)
The accompanying notes are an integral part of the financial statements.
113
MassMutual Select Blue Chip Growth Fund – Portfolio of Investments (Continued)
| | | Number of
Shares | | Market
Value | |
| Insurance — 5.0% | |
| Aetna, Inc. | | | 33,600 | | | $ | 1,341,648 | | |
| AFLAC, Inc. | | | 12,900 | | | | 597,915 | | |
American International
Group, Inc. | | | 107,800 | | | | 6,365,590 | | |
The Hartford Financial
Services Group, Inc. | | | 37,000 | | | | 3,130,200 | | |
| Marsh & McLennan Cos., Inc. | | | 52,400 | | | | 1,409,036 | | |
| Prudential Financial, Inc. | | | 34,400 | | | | 2,672,880 | | |
| WellPoint, Inc.(a) | | | 65,000 | | | | 4,730,050 | | |
| | | | 20,247,319 | | |
| Lodging — 1.5% | |
| Las Vegas Sands Corp.(a) | | | 46,000 | | | | 3,581,560 | | |
Marriott International,
Inc. Cl. A | | | 68,200 | | | | 2,599,784 | | |
| | | | 6,181,344 | | |
| Machinery & Components — 3.3% | |
| Baker Hughes, Inc. | | | 66,100 | | | | 5,410,285 | | |
| Deere & Co. | | | 19,800 | | | | 1,653,102 | | |
| Smith International, Inc.(b) | | | 141,300 | | | | 6,283,611 | | |
| | | | 13,346,998 | | |
| Manufacturing — 0.5% | |
| Applied Materials, Inc. | | | 120,800 | | | | 1,966,624 | | |
| Medical Supplies — 2.7% | |
| Allergan, Inc.(b) | | | 14,100 | | | | 1,512,366 | | |
| Medtronic, Inc.(b) | | | 103,100 | | | | 4,837,452 | | |
| St. Jude Medical, Inc.(a) | | | 61,200 | | | | 1,984,104 | | |
| Stryker Corp. | | | 64,200 | | | | 2,703,462 | | |
| | | | 11,037,384 | | |
| Metals & Mining — 0.8% | |
| BHP Billiton Ltd. | | | 68,000 | | | | 1,465,007 | | |
| CONSOL Energy, Inc. | | | 37,800 | | | | 1,766,016 | | |
| | | | 3,231,023 | | |
| Pharmaceuticals — 8.6% | |
| Alcon, Inc.(b) | | | 4,500 | | | | 443,475 | | |
| Amgen, Inc.(a) | | | 88,700 | | | | 5,785,901 | | |
| Cardinal Health, Inc. | | | 23,100 | | | | 1,486,023 | | |
| Genentech, Inc.(a) | | | 61,100 | | | | 4,997,980 | | |
| Gilead Sciences, Inc.(a) | | | 79,600 | | | | 4,709,136 | | |
| Johnson & Johnson | | | 55,300 | | | | 3,313,576 | | |
Medco Health
Solutions, Inc.(a) | | | 18,000 | | | | 1,031,040 | | |
| Novartis AG | | | 51,800 | | | | 2,778,108 | | |
| Pfizer, Inc. | | | 114,300 | | | | 2,682,621 | | |
| Roche Holding AG | | | 12,200 | | | | 1,997,857 | | |
| Sepracor, Inc.(a) (b) | | | 56,600 | | | | 3,234,124 | | |
| Wyeth | | | 56,700 | | | | 2,518,047 | | |
| | | | 34,977,888 | | |
| | | Number of
Shares | | Market
Value | |
| Prepackaged Software — 4.4% | |
| Adobe Systems, Inc.(a) | | | 62,200 | | | $ | 1,888,392 | | |
| Intuit, Inc.(a) | | | 45,300 | | | | 2,735,667 | | |
| Microsoft Corp. | | | 397,600 | | | | 9,264,080 | | |
| Oracle Corp.(a) (b) | | | 263,100 | | | | 3,812,319 | | |
| | | | 17,700,458 | | |
| Retail — 6.9% | |
| Amazon.com, Inc.(a) (b) | | | 54,400 | | | | 2,104,192 | | |
| Best Buy Co., Inc. | | | 25,200 | | | | 1,381,968 | | |
| CVS Corp. | | | 70,800 | | | | 2,173,560 | | |
| The Home Depot, Inc. | | | 134,400 | | | | 4,810,176 | | |
| Kohl's Corp.(a) (b) | | | 108,900 | | | | 6,438,168 | | |
| Target Corp. | | | 88,200 | | | | 4,310,334 | | |
| Wal-Mart Stores, Inc. | | | 144,100 | | | | 6,941,297 | | |
| | | | 28,159,695 | | |
| Telephone Utilities — 0.6% | |
| TELUS Corp. | | | 55,000 | | | | 2,220,900 | | |
| Transportation — 0.7% | |
| Union Pacific Corp. | | | 14,000 | | | | 1,301,440 | | |
United Parcel Service,
Inc. Cl. B | | | 19,700 | | | | 1,621,901 | | |
| | | | 2,923,341 | | |
TOTAL EQUITIES
(Cost $394,405,315) | | | | | | | 402,451,608 | | |
| | | Principal
Amount | | | |
| SHORT-TERM INVESTMENTS — 9.7% | |
| Cash Equivalents — 9.1%(d) | |
Abbey National PLC
Eurodollar Time Deposit
5.100% 07/10/2006 | | $ | 404,158 | | | | 404,158 | | |
ABN Amro Bank NV
Certificate of Deposit
5.305% 11/21/2006 | | | 404,158 | | | | 404,158 | | |
American Beacon Money
Market Fund(c) | | | 412,207 | | | | 412,207 | | |
Bank of America
5.270% 07/14/2006 | | | 808,316 | | | | 808,316 | | |
Bank of America
5.310% 03/08/2007 | | | 808,316 | | | | 808,316 | | |
Bank of Montreal
Eurodollar Time Deposit
5.290% 08/03/2006 | | | 808,316 | | | | 808,316 | | |
Bank of Nova Scotia
Eurodollar Time Deposit
5.290% 08/08/2006 | | | 808,316 | | | | 808,316 | | |
Barclays
Eurodollar Time Deposit
5.150% 08/01/2006 | | | 1,212,475 | | | | 1,212,475 | | |
| | | Principal
Amount | | Market
Value | |
Branch Banker & Trust
Eurodollar Time Deposit
5.250% 07/26/2006 | | $ | 1,454,969 | | | $ | 1,454,969 | | |
Calyon
Eurodollar Time Deposit
5.300% 08/08/2006 | | | 808,316 | | | | 808,316 | | |
Canadian Imperial
Bank of Commerce
Eurodollar Time Deposit
5.310% 07/31/2006 | | | 808,316 | | | | 808,316 | | |
Deutsche Bank
Eurodollar Time Deposit
5.250% 07/05/2006 | | | 2,020,791 | | | | 2,020,791 | | |
Dexia Group
Eurodollar Time Deposit
5.300% 08/09/2006 | | | 1,050,811 | | | | 1,050,811 | | |
Federal Home Loan
Bank Discount Note
5.181% 07/19/2006 | | | 643,409 | | | | 643,409 | | |
First Tennessee
National Corporation
Eurodollar Time Deposit
5.270% 07/24/2006 | | | 969,980 | | | | 969,980 | | |
Fortis Bank
Eurodollar Time Deposit
5.090% 07/05/2006 | | | 808,316 | | | | 808,316 | | |
Fortis Bank
Eurodollar Time Deposit
5.250% 07/03/2006 | | | 808,316 | | | | 808,316 | | |
Fortis Bank
Eurodollar Time Deposit
5.250% 07/06/2006 | | | 808,316 | | | | 808,316 | | |
Freddie Mac
Discount Note
5.191% 07/25/2006 | | | 482,390 | | | | 482,390 | | |
Harris NA
Eurodollar Time Deposit
5.080% 07/05/2006 | | | 565,822 | | | | 565,822 | | |
HBOS Halifax
Bank of Scotland
Certificate of Deposit
5.110% 07/10/2006 | | | 808,316 | | | | 808,316 | | |
National Australia Bank
Eurodollar Time Deposit
5.290% 07/03/2006 | | | 2,829,107 | | | | 2,829,107 | | |
National City Corporation
Eurodollar Time Deposit
5.220% 07/03/2006 | | | 959,643 | | | | 959,643 | | |
Skandinaviska Enskilda
Banken AB
Eurodollar Time Deposit
5.130% 07/12/2006 | | | 808,316 | | | | 808,316 | | |
Societe Generale
Eurodollar Time Deposit
5.200% 08/08/2006 | | | 808,316 | | | | 808,316 | | |
(Continued)
The accompanying notes are an integral part of the financial statements.
114
MassMutual Select Blue Chip Growth Fund – Portfolio of Investments (Continued)
| | | Principal
Amount | | Market
Value | |
Societe Generale
Eurodollar Time Deposit
5.270% 07/17/2006 | | $ | 1,050,811 | | | $ | 1,050,811 | | |
Standard Chartered Bank
Eurodollar Time Deposit
5.260% 07/07/2006 | | | 1,212,475 | | | | 1,212,475 | | |
Svenska Handlesbanken
Eurodollar Time Deposit
5.290% 07/03/2006 | | | 2,709,886 | | | | 2,709,886 | | |
The Bank of the West
Eurodollar Time Deposit
5.250% 08/07/2006 | | | 1,374,138 | | | | 1,374,138 | | |
Toronto Dominion Bank
Eurodollar Time Deposit
5.300% 07/31/2006 | | | 2,263,286 | | | | 2,263,286 | | |
UBS AG
Eurodollar Time Deposit
5.250% 07/21/2006 | | | 1,212,475 | | | | 1,212,475 | | |
UBS AG
Eurodollar Time Deposit
5.250% 08/04/2006 | | | 1,212,475 | | | | 1,212,475 | | |
Wells Fargo
Eurodollar Time Deposit
5.160% 07/13/2006 | | | 808,316 | | | | 808,316 | | |
Wells Fargo
Eurodollar Time Deposit
5.170% 07/03/2006 | | | 808,316 | | | | 808,316 | | |
Wells Fargo
Eurodollar Time Deposit
5.210% 07/06/2006 | | | 404,158 | | | | 404,158 | | |
Wells Fargo
Eurodollar Time Deposit
5.250% 07/03/2006 | | | 808,316 | | | | 808,316 | | |
| | | | 36,974,364 | | |
| Repurchase Agreement — 0.6% | |
Investors Bank & Trust
Company Repurchase
Agreement, dated
06/30/2006, 3.75%,
due 07/03/2006(e) | | | 2,314,640 | | | | 2,314,640 | | |
TOTAL SHORT-TERM
INVESTMENTS
(Cost $39,289,004) | | | | | | | 39,289,004 | | |
TOTAL INVESTMENTS — 109.0%
(Cost $433,694,319)(f) | | | | | | | 441,740,612 | | |
Other Assets/
(Liabilities) — (9.0%) | | | | | | | (36,322,552 | ) | |
| NET ASSETS — 100.0% | | | | | | $ | 405,418,060 | | |
Notes to Portfolio of Investments
ADR - American Depository Receipt
(a) Non-income producing security.
(b) Denotes all or a portion of security on loan. (Note 2).
(c) Amount represents shares owned of the fund.
(d) Represents investments of security lending collateral. (Note 2).
(e) Maturity value of $2,315,363. Collaterized by a U.S. Government Agency obligation with a rate of 5.749%, maturity date 03/15/2032, and an aggregate market value, including accrued interest, of $2,430,372.
(f) See Note 6 for aggregate cost for Federal tax purposes.
The accompanying notes are an integral part of the financial statements.
115
MassMutual Select Large Cap Growth Fund – Portfolio of Investments
June 30, 2006 (Unaudited)
| | | Number of
Shares | | Market
Value | |
| EQUITIES — 98.7% | |
| COMMON STOCK | |
| Aerospace & Defense — 4.2% | |
| Boeing Co. | | | 15,490 | | | $ | 1,268,786 | | |
| Rockwell Collins, Inc. | | | 3,600 | | | | 201,132 | | |
| | | | 1,469,918 | | |
| Banking, Savings & Loans — 5.1% | |
| JP Morgan Chase & Co. | | | 19,450 | | | | 816,900 | | |
| Northern Trust Corp. | | | 9,490 | | | | 524,797 | | |
| UBS AG | | | 4,200 | | | | 460,740 | | |
| | | | 1,802,437 | | |
| Chemicals — 1.6% | |
| Monsanto Co. | | | 6,800 | | | | 572,492 | | |
| Commercial Services — 1.8% | |
| eBay, Inc.(a) | | | 22,180 | | | | 649,652 | | |
| Communications — 5.9% | |
America Movil SA de CV
Sponsored ADR
Series L (Mexico) | | | 9,200 | | | | 305,992 | | |
| Network Appliance, Inc.(a) | | | 18,050 | | | | 637,165 | | |
| Qualcomm, Inc. | | | 28,150 | | | | 1,127,970 | | |
| | | | 2,071,127 | | |
| Computers & Information — 4.2% | |
| Apple Computer, Inc.(a) | | | 25,750 | | | | 1,470,840 | | |
| Cosmetics & Personal Care — 4.0% | |
| The Procter & Gamble Co. | | | 25,600 | | | | 1,423,360 | | |
| Electrical Equipment & Electronics — 6.0% | |
Advanced Micro
Devices, Inc.(a) | | | 27,550 | | | | 672,771 | | |
| Broadcom Corp. Cl. A(a) | | | 32,445 | | | | 974,972 | | |
| Emerson Electric Co. | | | 4,400 | | | | 368,764 | | |
| Nvidia Corp.(a) | | | 5,300 | | | | 112,837 | | |
| | | | 2,129,344 | | |
| Energy — 7.7% | |
| GlobalSantaFe Corp. | | | 8,150 | | | | 470,662 | | |
| Halliburton Co. | | | 18,850 | | | | 1,398,858 | | |
| Nabors Industries Ltd.(a) | | | 17,200 | | | | 581,188 | | |
| Schlumberger Ltd. | | | 4,260 | | | | 277,369 | | |
| | | | 2,728,077 | | |
| Financial Services — 10.1% | |
| Franklin Resources, Inc. | | | 7,350 | | | | 638,054 | | |
The Goldman Sachs
Group, Inc. | | | 5,160 | | | | 776,219 | | |
| Legg Mason, Inc. | | | 11,570 | | | | 1,151,446 | | |
| | | Number of
Shares | | Market
Value | |
| Merrill Lynch & Co., Inc. | | | 9,450 | | | $ | 657,342 | | |
The Nasdaq Stock
Market, Inc.(a) | | | 11,100 | | | | 331,890 | | |
| | | | 3,554,951 | | |
| Foods — 0.5% | |
| Wrigley (Wm.) Jr. Co. | | | 3,875 | | | | 175,770 | | |
| Healthcare — 4.9% | |
| Caremark Rx, Inc. | | | 20,400 | | | | 1,017,348 | | |
| UnitedHealth Group, Inc. | | | 16,350 | | | | 732,153 | | |
| | | | 1,749,501 | | |
| Household Products — 2.7% | |
| Corning, Inc.(a) | | | 39,550 | | | | 956,715 | | |
| Industrial – Diversified — 0.5% | |
| Textron, Inc. | | | 2,100 | | | | 193,578 | | |
| Information Retrieval Services — 9.2% | |
| Google, Inc. Cl. A(a) | | | 3,805 | | | | 1,595,551 | | |
| Juniper Networks, Inc.(a) (b) | | | 29,830 | | | | 476,982 | | |
| Yahoo!, Inc.(a) (b) | | | 36,250 | | | | 1,196,250 | | |
| | | | 3,268,783 | | |
| Insurance — 7.0% | |
American International
Group, Inc. | | | 12,600 | | | | 744,030 | | |
| WellPoint, Inc.(a) | | | 23,790 | | | | 1,731,198 | | |
| | | | 2,475,228 | | |
| Lodging — 3.0% | |
| Hilton Hotels Corp. | | | 17,400 | | | | 492,072 | | |
| Las Vegas Sands Corp.(a) | | | 2,300 | | | | 179,078 | | |
Marriott International,
Inc. Cl. A | | | 5,600 | | | | 213,472 | | |
Starwood Hotels & Resorts
Worldwide, Inc. | | | 3,200 | | | | 193,088 | | |
| | | | 1,077,710 | | |
| Machinery & Components — 0.6% | |
| Baker Hughes, Inc. | | | 2,800 | | | | 229,180 | | |
| Pharmaceuticals — 13.2% | |
| Alcon, Inc.(b) | | | 10,500 | | | | 1,034,775 | | |
| Amgen, Inc.(a) | | | 2,670 | | | | 174,164 | | |
| Genentech, Inc.(a) (b) | | | 16,400 | | | | 1,341,520 | | |
| Gilead Sciences, Inc.(a) | | | 12,680 | | | | 750,149 | | |
Medco Health
Solutions, Inc.(a) | | | 7,950 | | | | 455,376 | | |
Teva Pharmaceutical
Sponsored ADR (Israel) | | | 28,500 | | | | 900,315 | | |
| | | | 4,656,299 | | |
| | | Number of
Shares | | Market
Value | |
| Prepackaged Software — 0.6% | |
| Microsoft Corp. | | | 8,400 | | | $ | 195,720 | | |
| Restaurants — 1.6% | |
| McDonald's Corp. | | | 16,600 | | | | 557,760 | | |
| Retail — 4.3% | |
| Lowe's Companies, Inc. | | | 11,970 | | | | 726,220 | | |
| Target Corp. | | | 12,300 | | | | 601,101 | | |
| Walgreen Co. | | | 4,500 | | | | 201,780 | | |
| | | | 1,529,101 | | |
TOTAL EQUITIES
(Cost $34,274,739) | | | | | | | 34,937,543 | | |
| | | Principal
Amount | |
| SHORT-TERM INVESTMENTS — 8.2% | |
| Cash Equivalents — 7.7%(d) | |
Abbey National PLC
Eurodollar Time Deposit
5.100% 07/10/2006 | | $ | 29,594 | | | | 29,594 | | |
ABN Amro Bank NV
Certificate of Deposit
5.305% 11/21/2006 | | | 29,594 | | | | 29,594 | | |
American Beacon Money
Market Fund(c) | | | 30,182 | | | | 30,182 | | |
Bank of America
5.270% 07/14/2006 | | | 59,186 | | | | 59,186 | | |
Bank of America
5.310% 03/08/2007 | | | 59,186 | | | | 59,186 | | |
Bank of Montreal
Eurodollar Time Deposit
5.290% 08/03/2006 | | | 59,185 | | | | 59,185 | | |
Bank of Nova Scotia
Eurodollar Time Deposit
5.290% 08/08/2006 | | | 59,185 | | | | 59,185 | | |
Barclays
Eurodollar Time Deposit
5.150% 08/01/2006 | | | 88,778 | | | | 88,778 | | |
Branch Banker & Trust
Eurodollar Time Deposit
5.250% 07/26/2006 | | | 106,534 | | | | 106,534 | | |
Calyon
Eurodollar Time Deposit
5.300% 08/08/2006 | | | 59,185 | | | | 59,185 | | |
Canadian Imperial
Bank of Commerce
Eurodollar Time Deposit
5.310% 07/31/2006 | | | 59,185 | | | | 59,185 | | |
(Continued)
The accompanying notes are an integral part of the financial statements.
116
MassMutual Select Large Cap Growth Fund – Portfolio of Investments (Continued)
| | | Principal
Amount | | Market
Value | |
Deutsche Bank
Eurodollar Time Deposit
5.250% 07/05/2006 | | $ | 147,964 | | | $ | 147,964 | | |
Dexia Group
Eurodollar Time Deposit
5.300% 08/09/2006 | | | 76,941 | | | | 76,941 | | |
Federal Home Loan
Bank Discount Note
5.181% 07/19/2006 | | | 47,111 | | | | 47,111 | | |
First Tennessee National
Corporation
Eurodollar Time Deposit
5.270% 07/24/2006 | | | 71,023 | | | | 71,023 | | |
Fortis Bank
Eurodollar Time Deposit
5.090% 07/05/2006 | | | 59,185 | | | | 59,185 | | |
Fortis Bank
Eurodollar Time Deposit
5.250% 07/03/2006 | | | 59,185 | | | | 59,185 | | |
Fortis Bank
Eurodollar Time Deposit
5.250% 07/06/2006 | | | 59,185 | | | | 59,185 | | |
Freddie Mac
Discount Note
5.191% 07/25/2006 | | | 35,321 | | | | 35,321 | | |
Harris NA
Eurodollar Time Deposit
5.080% 07/05/2006 | | | 41,430 | | | | 41,430 | | |
HBOS Halifax
Bank of Scotland
Certificate of Deposit
5.110% 07/10/2006 | | | 59,185 | | | | 59,185 | | |
National Australia Bank
Eurodollar Time Deposit
5.290% 07/03/2006 | | | 207,149 | | | | 207,149 | | |
National City Corporation
Eurodollar Time Deposit
5.220% 07/03/2006 | | | 70,266 | | | | 70,266 | | |
Skandinaviska Enskilda
Banken AB
Eurodollar Time Deposit
5.130% 07/12/2006 | | | 59,185 | | | | 59,185 | | |
Societe Generale
Eurodollar Time Deposit
5.200% 08/08/2006 | | | 59,185 | | | | 59,185 | | |
Societe Generale
Eurodollar Time Deposit
5.270% 07/17/2006 | | | 76,941 | | | | 76,941 | | |
Standard Chartered Bank
Eurodollar Time Deposit
5.260% 07/07/2006 | | | 88,778 | | | | 88,778 | | |
Svenska Handlesbanken
Eurodollar Time Deposit
5.290% 07/03/2006 | | | 198,420 | | | | 198,420 | | |
| | | Principal
Amount | | Market
Value | |
The Bank of the West
Eurodollar Time Deposit
5.250% 08/07/2006 | | $ | 100,615 | | | $ | 100,615 | | |
Toronto Dominion Bank
Eurodollar Time Deposit
5.300% 07/31/2006 | | | 165,719 | | | | 165,719 | | |
UBS AG
Eurodollar Time Deposit
5.250% 07/21/2006 | | | 88,778 | | | | 88,778 | | |
UBS AG
Eurodollar Time Deposit
5.250% 08/04/2006 | | | 88,778 | | | | 88,778 | | |
Wells Fargo
Eurodollar Time Deposit
5.160% 07/13/2006 | | | 59,185 | | | | 59,185 | | |
Wells Fargo
Eurodollar Time Deposit
5.170% 07/03/2006 | | | 59,185 | | | | 59,185 | | |
Wells Fargo
Eurodollar Time Deposit
5.210% 07/06/2006 | | | 29,593 | | | | 29,593 | | |
Wells Fargo
Eurodollar Time Deposit
5.250% 07/03/2006 | | | 59,185 | | | | 59,185 | | |
| | | | 2,707,286 | | |
| Repurchase Agreement — 0.5% | |
Investors Bank & Trust
Company Repurchase
Agreement, dated
06/30/2006, 3.75%,
due 07/03/2006(e) | | | 191,168 | | | | 191,168 | | |
TOTAL SHORT-TERM
INVESTMENTS
(Cost $2,898,454) | | | | | | | 2,898,454 | | |
TOTAL INVESTMENTS — 106.9%
(Cost $37,173,193)(f) | | | | | | | 37,835,997 | | |
Other Assets/
(Liabilities) — (6.9%) | | | | | | | (2,457,531 | ) | |
| NET ASSETS — 100.0% | | | | | | $ | 35,378,466 | | |
Notes to Portfolio of Investments
ADR - American Depository Receipt
(a) Non-income producing security.
(b) Denotes all or a portion of security on loan. (Note 2).
(c) Amount represents shares owned of the fund.
(d) Represents investments of security lending collateral. (Note 2).
(e) Maturity value of $191,228. Collateralized by U.S. Government Agency obligations with a rate of 7.125%, maturity date of 06/25/2030, and an aggregate market value, including accrued interest, of $200,726.
(f) See Note 6 for aggregate cost for Federal tax purposes.
The accompanying notes are an integral part of the financial statements.
117
MassMutual Select Growth Equity Fund – Portfolio of Investments
June 30, 2006 (Unaudited)
| | | Number of
Shares | | Market
Value | |
| EQUITIES — 97.4% | |
| COMMON STOCK | |
| Advertising — 0.2% | |
Monster
Worldwide, Inc.(a) | | | 29,700 | | | $ | 1,267,002 | | |
| Aerospace & Defense — 1.3% | |
| Boeing Co. | | | 48,000 | | | | 3,931,680 | | |
| General Dynamics Corp. | | | 25,200 | | | | 1,649,592 | | |
| Goodrich Corp. | | | 52,900 | | | | 2,131,341 | | |
| Northrop Grumman Corp. | | | 30,000 | | | | 1,921,800 | | |
| United Technologies Corp. | | | 18,200 | | | | 1,154,244 | | |
| | | | 10,788,657 | | |
| Apparel, Textiles & Shoes — 1.0% | |
Abercrombie &
Fitch Co. Cl. A | | | 6,800 | | | | 376,924 | | |
| AnnTaylor Stores Corp.(a) | | | 21,500 | | | | 932,670 | | |
| bebe stores, Inc.(b) | | | 13,800 | | | | 212,796 | | |
| Chico's FAS, Inc.(a) | | | 82,700 | | | | 2,231,246 | | |
| Claire's Stores, Inc. | | | 63,400 | | | | 1,617,334 | | |
| Liz Claiborne, Inc. | | | 8,400 | | | | 311,304 | | |
| Nordstrom, Inc. | | | 65,900 | | | | 2,405,350 | | |
| Timberland Co. Cl. A(a) | | | 7,200 | | | | 187,920 | | |
| | | | 8,275,544 | | |
| Automotive & Parts — 0.7% | |
| AutoNation, Inc.(a) | | | 102,000 | | | | 2,186,880 | | |
| Harley-Davidson, Inc. | | | 36,000 | | | | 1,976,040 | | |
| Paccar, Inc.(b) | | | 17,700 | | | | 1,458,126 | | |
| | | | 5,621,046 | | |
| Banking, Savings & Loans — 1.8% | |
| Fannie Mae | | | 53,000 | | | | 2,549,300 | | |
| Golden West Financial Corp. | | | 5,600 | | | | 415,520 | | |
| JP Morgan Chase & Co. | | | 157,200 | | | | 6,602,400 | | |
| Mellon Financial Corp. | | | 73,000 | | | | 2,513,390 | | |
| State Street Corp. | | | 56,300 | | | | 3,270,467 | | |
| | | | 15,351,077 | | |
| Beverages — 1.5% | |
| Anheuser-Busch Cos., Inc. | | | 26,400 | | | | 1,203,576 | | |
| Brown-Forman Corp. Cl. B | | | 3,800 | | | | 272,422 | | |
| The Coca-Cola Co. | | | 242,000 | | | | 10,410,840 | | |
The Pepsi Bottling
Group, Inc. | | | 6,600 | | | | 212,190 | | |
| | | | 12,099,028 | | |
| Broadcasting, Publishing & Printing — 0.1% | |
Univision Communications,
Inc. Cl. A(a) | | | 16,400 | | | | 549,400 | | |
| | | Number of
Shares | | Market
Value | |
| Building Materials & Construction — 0.4% | |
Martin Marietta
Materials, Inc. | | | 29,500 | | | $ | 2,688,925 | | |
| Masco Corp.(b) | | | 29,100 | | | | 862,524 | | |
| | | | 3,551,449 | | |
| Commercial Services — 3.2% | |
Allied Waste
Industries, Inc.(a) | | | 19,400 | | | | 220,384 | | |
| Equifax, Inc. | | | 23,900 | | | | 820,726 | | |
| Fastenal Co. | | | 53,900 | | | | 2,171,631 | | |
| Fluor Corp. | | | 13,900 | | | | 1,291,727 | | |
| Global Payments, Inc. | | | 26,300 | | | | 1,276,865 | | |
| Iron Mountain, Inc.(a) | | | 7,600 | | | | 284,088 | | |
ITT Educational
Services, Inc.(a) | | | 17,000 | | | | 1,118,770 | | |
Jacobs Engineering
Group, Inc.(a) | | | 800 | | | | 63,712 | | |
| Manpower, Inc. | | | 13,300 | | | | 859,180 | | |
MoneyGram
International, Inc. | | | 24,200 | | | | 821,590 | | |
| Moody's Corp. | | | 124,400 | | | | 6,774,824 | | |
| Paychex, Inc. | | | 71,200 | | | | 2,775,376 | | |
Pharmaceutical Product
Development, Inc. | | | 35,200 | | | | 1,236,224 | | |
| Quest Diagnostics, Inc. | | | 32,400 | | | | 1,941,408 | | |
| Rent-A-Center, Inc.(a) | | | 32,900 | | | | 817,894 | | |
Robert Half
International, Inc.(b) | | | 49,300 | | | | 2,070,600 | | |
| Ryder System, Inc. | | | 9,800 | | | | 572,614 | | |
| Waste Management, Inc. | | | 30,700 | | | | 1,101,516 | | |
Weight Watchers
International, Inc. | | | 14,800 | | | | 605,172 | | |
| | | | 26,824,301 | | |
| Communications — 2.5% | |
| Harris Corp. | | | 28,900 | | | | 1,199,639 | | |
| Network Appliance, Inc.(a) | | | 9,000 | | | | 317,700 | | |
| Qualcomm, Inc. | | | 474,300 | | | | 19,005,201 | | |
| Tellabs, Inc.(a) | | | 46,900 | | | | 624,239 | | |
| | | | 21,146,779 | | |
| Communications Equipment — 1.4% | |
| Motorola, Inc. | | | 590,900 | | | | 11,906,635 | | |
| Computer Integrated Systems Design — 0.0% | |
| Computer Sciences Corp.(a) | | | 4,800 | | | | 232,512 | | |
| Computer Programming Services — 0.1% | |
| Ceridian Corp.(a) | | | 42,700 | | | | 1,043,588 | | |
| Computers & Information — 2.0% | |
| CDW Corp. | | | 15,400 | | | | 841,610 | | |
| | | Number of
Shares | | Market
Value | |
| Dell, Inc.(a) (b) | | | 298,500 | | | $ | 7,286,385 | | |
International Business
Machines Corp. | | | 47,500 | | | | 3,648,950 | | |
International
Game Technology | | | 78,300 | | | | 2,970,702 | | |
Lexmark
International, Inc.(a) | | | 27,800 | | | | 1,552,074 | | |
| | | | 16,299,721 | | |
| Computers & Office Equipment — 1.9% | |
| Hewlett-Packard Co. | | | 471,100 | | | | 14,924,448 | | |
| Pitney Bowes, Inc. | | | 20,600 | | | | 850,780 | | |
| | | | 15,775,228 | | |
| Cosmetics & Personal Care — 0.2% | |
| Colgate-Palmolive Co. | | | 32,100 | | | | 1,922,790 | | |
| Data Processing & Preparation — 0.8% | |
Affiliated Computer
Services, Inc. Cl. A(a) | | | 26,700 | | | | 1,377,987 | | |
| First Data Corp. | | | 81,200 | | | | 3,657,248 | | |
| Fiserv, Inc.(a) | | | 19,000 | | | | 861,840 | | |
Total System
Services, Inc.(b) | | | 28,600 | | | | 550,550 | | |
| | | | 6,447,625 | | |
| Electrical Equipment & Electronics — 5.6% | |
American Power
Conversion Corp.(b) | | | 11,200 | | | | 218,288 | | |
| Avnet, Inc.(a) | | | 11,800 | | | | 236,236 | | |
| AVX Corp.(b) | | | 18,000 | | | | 284,220 | | |
| Broadcom Corp. Cl. A(a) | | | 166,600 | | | | 5,006,330 | | |
| Emerson Electric Co. | | | 93,300 | | | | 7,819,473 | | |
| Energizer Holdings, Inc.(a) | | | 5,600 | | | | 327,992 | | |
| General Electric Co. | | | 98,900 | | | | 3,259,744 | | |
| Intel Corp. | | | 273,800 | | | | 5,188,510 | | |
| Intersil Corp. Cl. A | | | 35,400 | | | | 823,050 | | |
| Johnson Controls, Inc. | | | 29,800 | | | | 2,450,156 | | |
Lincoln Electric
Holdings, Inc. | | | 9,500 | | | | 595,175 | | |
| Microchip Technology, Inc. | | | 52,800 | | | | 1,771,440 | | |
| Micron Technology, Inc.(a) | | | 56,800 | | | | 855,408 | | |
National
Semiconductor Corp. | | | 117,200 | | | | 2,795,220 | | |
| Nvidia Corp.(a) | | | 116,400 | | | | 2,478,156 | | |
| Rockwell Automation, Inc. | | | 42,100 | | | | 3,031,621 | | |
| Texas Instruments, Inc. | | | 289,800 | | | | 8,778,042 | | |
| Wesco International, Inc.(a) | | | 13,300 | | | | 887,908 | | |
| | | | 46,806,969 | | |
(Continued)
The accompanying notes are an integral part of the financial statements.
118
MassMutual Select Growth Equity Fund – Portfolio of Investments (Continued)
| | | Number of
Shares | | Market
Value | |
| Energy — 4.1% | |
Anadarko
Petroleum Corp. | | | 56,500 | | | $ | 2,694,485 | | |
| BJ Services Co.(b) | | | 100,300 | | | | 3,737,178 | | |
| ConocoPhillips | | | 54,137 | | | | 3,547,598 | | |
| Exxon Mobil Corp. | | | 211,500 | | | | 12,975,525 | | |
| Helmerich & Payne, Inc. | | | 700 | | | | 42,182 | | |
| Hess Corp.(b) | | | 35,500 | | | | 1,876,175 | | |
| Marathon Oil Corp. | | | 43,600 | | | | 3,631,880 | | |
| Occidental Petroleum Corp. | | | 22,500 | | | | 2,307,375 | | |
| Questar Corp. | | | 3,100 | | | | 249,519 | | |
| Sunoco, Inc. | | | 44,000 | | | | 3,048,760 | | |
| | | | 34,110,677 | | |
| Financial Services — 5.1% | |
| The Bear Stearns Cos., Inc. | | | 14,200 | | | | 1,989,136 | | |
Chicago Mercantile
Exchange Holdings, Inc. | | | 3,900 | | | | 1,915,485 | | |
| E*TRADE Financial Corp.(a) | | | 174,500 | | | | 3,982,090 | | |
Federated Investors,
Inc. Cl. B | | | 46,200 | | | | 1,455,300 | | |
| Franklin Resources, Inc. | | | 11,200 | | | | 972,272 | | |
The Goldman Sachs
Group, Inc. | | | 72,800 | | | | 10,951,304 | | |
Investment Technology
Group, Inc.(a) | | | 16,800 | | | | 854,448 | | |
Lehman Brothers
Holdings, Inc. | | | 68,000 | | | | 4,430,200 | | |
| Merrill Lynch & Co., Inc. | | | 93,200 | | | | 6,482,992 | | |
Raymond James
Financial, Inc. | | | 7,200 | | | | 217,944 | | |
| The Charles Schwab Corp. | | | 433,300 | | | | 6,924,134 | | |
TD Ameritrade
Holding Corp. | | | 149,300 | | | | 2,211,133 | | |
| | | | 42,386,438 | | |
| Food Retailers — 1.6% | |
| Starbucks Corp.(a) | | | 322,000 | | | | 12,158,720 | | |
| SuperValu, Inc. | | | 48,100 | | | | 1,476,670 | | |
| | | | 13,635,390 | | |
| Foods — 1.7% | |
| Archer-Daniels-Midland Co. | | | 105,400 | | | | 4,350,912 | | |
| Dean Foods Co.(a) | | | 32,300 | | | | 1,201,237 | | |
| Heinz (H. J.) Co. | | | 5,700 | | | | 234,954 | | |
| The Kroger Co. | | | 267,300 | | | | 5,843,178 | | |
| Sara Lee Corp. | | | 53,700 | | | | 860,274 | | |
| Sysco Corp. | | | 45,700 | | | | 1,396,592 | | |
| | | | 13,887,147 | | |
| Healthcare — 5.1% | |
| Caremark Rx, Inc. | | | 65,500 | | | | 3,266,485 | | |
Coventry Health
Care, Inc.(a) | | | 13,800 | | | | 758,172 | | |
| Express Scripts, Inc.(a) | | | 154,700 | | | | 11,098,178 | | |
| | | Number of
Shares | | Market
Value | |
| HCA, Inc. | | | 5,100 | | | $ | 220,065 | | |
Health Management
Associates, Inc. Cl. A | | | 27,300 | | | | 538,083 | | |
| Health Net, Inc.(a) | | | 85,000 | | | | 3,839,450 | | |
| Humana, Inc.(a) | | | 31,500 | | | | 1,691,550 | | |
| IDEXX Laboratories, Inc.(a) | | | 5,700 | | | | 428,241 | | |
| Lincare Holdings, Inc.(a) | | | 72,100 | | | | 2,728,264 | | |
| UnitedHealth Group, Inc. | | | 398,252 | | | | 17,833,725 | | |
Universal Health
Services, Inc. Cl. B | | | 5,200 | | | | 261,352 | | |
| | | | 42,663,565 | | |
| Heavy Machinery — 0.1% | |
Cameron
International Corp.(a) | | | 22,300 | | | | 1,065,271 | | |
Home Construction, Furnishings &
Appliances — 0.9% | |
| Centex Corp. | | | 14,800 | | | | 744,440 | | |
Harman International
Industries, Inc. | | | 10,800 | | | | 921,996 | | |
| HNI Corp.(b) | | | 9,600 | | | | 435,360 | | |
| Lennar Corp. Cl. A | | | 18,700 | | | | 829,719 | | |
Mohawk
Industries, Inc.(a) (b) | | | 16,400 | | | | 1,153,740 | | |
| NVR, Inc.(a) | | | 1,500 | | | | 736,875 | | |
| The Ryland Group, Inc. | | | 13,200 | | | | 575,124 | | |
| Whirlpool Corp. | | | 25,745 | | | | 2,127,824 | | |
| | | | 7,525,078 | | |
| Household Products — 1.4% | |
| Corning, Inc.(a) | | | 405,600 | | | | 9,811,464 | | |
| Newell Rubbermaid, Inc.(b) | | | 59,200 | | | | 1,529,136 | | |
| | | | 11,340,600 | | |
| Industrial – Diversified — 1.0% | |
| Danaher Corp. | | | 45,900 | | | | 2,952,288 | | |
| Illinois Tool Works, Inc. | | | 71,800 | | | | 3,410,500 | | |
| ITT Industries, Inc. | | | 39,300 | | | | 1,945,350 | | |
| | | | 8,308,138 | | |
| Information Retrieval Services — 1.1% | |
| Google, Inc. Cl. A(a) | | | 22,100 | | | | 9,267,193 | | |
| Insurance — 6.6% | |
| Aetna, Inc. | | | 6,400 | | | | 255,552 | | |
| AFLAC, Inc. | | | 173,300 | | | | 8,032,455 | | |
Ambac Financial
Group, Inc. | | | 14,000 | | | | 1,135,400 | | |
American International
Group, Inc. | | | 317,600 | | | | 18,754,280 | | |
| Aon Corp. | | | 87,000 | | | | 3,029,340 | | |
| W.R. Berkley Corp. | | | 57,400 | | | | 1,959,062 | | |
| Brown & Brown, Inc. | | | 30,800 | | | | 899,976 | | |
| Chubb Corp. | | | 35,400 | | | | 1,766,460 | | |
| | | Number of
Shares | | Market
Value | |
The Hanover Insurance
Group, Inc. | | | 4,900 | | | $ | 232,554 | | |
| Lincoln National Corp. | | | 19,700 | | | | 1,111,868 | | |
| Loews Corp. | | | 82,200 | | | | 2,913,990 | | |
| MBIA, Inc.(b) | | | 12,600 | | | | 737,730 | | |
Old Republic
International Corp. | | | 12,200 | | | | 260,714 | | |
| The PMI Group, Inc. | | | 26,400 | | | | 1,176,912 | | |
| Progressive Corp. | | | 269,100 | | | | 6,918,561 | | |
| Prudential Financial, Inc. | | | 5,300 | | | | 411,810 | | |
| Radian Group, Inc. | | | 9,500 | | | | 586,910 | | |
| St. Paul Travelers Cos. | | | 107,100 | | | | 4,774,518 | | |
| | | | 54,958,092 | | |
| Internet Content — 0.3% | |
| BEA Systems, Inc.(a) | | | 177,300 | | | | 2,320,857 | | |
| Machinery & Components — 2.8% | |
| Baker Hughes, Inc. | | | 95,600 | | | | 7,824,860 | | |
| Caterpillar, Inc. | | | 141,300 | | | | 10,524,024 | | |
| Cummins, Inc.(b) | | | 16,900 | | | | 2,066,025 | | |
| Flowserve Corp.(a) | | | 20,300 | | | | 1,155,070 | | |
| FMC Technologies, Inc.(a) | | | 12,800 | | | | 863,488 | | |
| Parker Hannifin Corp. | | | 11,000 | | | | 853,600 | | |
| | | | 23,287,067 | | |
| Manufacturing — 0.8% | |
| American Standard Cos., Inc. | | | 27,800 | | | | 1,202,906 | | |
| Applied Materials, Inc. | | | 115,100 | | | | 1,873,828 | | |
| Lam Research Corp.(a) | | | 6,000 | | | | 279,720 | | |
| Millipore Corp.(a) (b) | | | 15,300 | | | | 963,747 | | |
| Terex Corp.(a) | | | 23,600 | | | | 2,329,320 | | |
| | | | 6,649,521 | | |
| Medical Supplies — 3.3% | |
| Agilent Technologies, Inc.(a) | | | 212,400 | | | | 6,703,344 | | |
| Allergan, Inc. | | | 65,700 | | | | 7,046,982 | | |
Applera Corp. - Applied
Biosystems Group | | | 78,900 | | | | 2,552,415 | | |
| Baxter International, Inc. | | | 27,300 | | | | 1,003,548 | | |
| Henry Schein, Inc.(a) | | | 20,300 | | | | 948,619 | | |
| Medtronic, Inc. | | | 39,300 | | | | 1,843,956 | | |
| Mentor Corp. | | | 20,300 | | | | 883,050 | | |
| Respironics, Inc.(a) | | | 39,200 | | | | 1,341,424 | | |
| Stryker Corp. | | | 21,100 | | | | 888,521 | | |
| Techne Corp.(a) | | | 17,800 | | | | 906,376 | | |
Varian Medical
Systems, Inc.(a) | | | 63,500 | | | | 3,006,725 | | |
| | | | 27,124,960 | | |
| Metals & Mining — 1.0% | |
| Crane Co. | | | 7,300 | | | | 303,680 | | |
| Nucor Corp. | | | 109,600 | | | | 5,945,800 | | |
Reliance Steel &
Aluminum Co. | | | 24,700 | | | | 2,048,865 | | |
| | | | 8,298,345 | | |
(Continued)
The accompanying notes are an integral part of the financial statements.
119
MassMutual Select Growth Equity Fund – Portfolio of Investments (Continued)
| | | Number of
Shares | | Market
Value | |
| Pharmaceuticals — 14.4% | |
| Abbott Laboratories | | | 59,900 | | | $ | 2,612,239 | | |
| AmerisourceBergen Corp. | | | 60,400 | | | | 2,531,968 | | |
| Amgen, Inc.(a) | | | 68,100 | | | | 4,442,163 | | |
Barr
Pharmaceuticals, Inc.(a) | | | 44,400 | | | | 2,117,436 | | |
| Biogen Idec, Inc.(a) | | | 19,700 | | | | 912,701 | | |
| Bristol-Myers Squibb Co. | | | 130,300 | | | | 3,369,558 | | |
| Cardinal Health, Inc. | | | 73,200 | | | | 4,708,956 | | |
| Celgene Corp.(a) | | | 42,400 | | | | 2,011,032 | | |
Endo Pharmaceuticals
Holdings, Inc.(a) | | | 35,300 | | | | 1,164,194 | | |
| Forest Laboratories, Inc.(a) | | | 223,700 | | | | 8,654,953 | | |
| Genentech, Inc.(a) | | | 217,900 | | | | 17,824,220 | | |
| Gilead Sciences, Inc.(a) | | | 33,300 | | | | 1,970,028 | | |
| Johnson & Johnson | | | 130,400 | | | | 7,813,568 | | |
King
Pharmaceuticals, Inc.(a) | | | 52,900 | | | | 899,300 | | |
| McKesson Corp. | | | 115,700 | | | | 5,470,296 | | |
| Merck & Co., Inc. | | | 749,000 | | | | 27,286,070 | | |
| Omnicare, Inc.(b) | | | 34,500 | | | | 1,635,990 | | |
| Pfizer, Inc. | | | 906,500 | | | | 21,275,555 | | |
| Wyeth | | | 74,400 | | | | 3,304,104 | | |
| | | | 120,004,331 | | |
| Prepackaged Software — 1.1% | |
| BMC Software, Inc.(a) | | | 84,300 | | | | 2,014,770 | | |
| Cerner Corp.(a) (b) | | | 30,200 | | | | 1,120,722 | | |
| Citrix Systems, Inc.(a) | | | 65,200 | | | | 2,617,128 | | |
| DST Systems, Inc.(a) (b) | | | 24,100 | | | | 1,433,950 | | |
| Fair Isaac Corp.(b) | | | 30,800 | | | | 1,118,348 | | |
| Microsoft Corp. | | | 29,500 | | | | 687,350 | | |
| | | | 8,992,268 | | |
| Restaurants — 0.6% | |
| Applebee's International, Inc. | | | 47,800 | | | | 918,716 | | |
| Brinker International, Inc.(b) | | | 29,400 | | | | 1,067,220 | | |
| Darden Restaurants, Inc. | | | 37,400 | | | | 1,473,560 | | |
| Sonic Corp.(a) | | | 27,450 | | | | 570,685 | | |
| Wendy's International, Inc. | | | 23,900 | | | | 1,393,131 | | |
| | | | 5,423,312 | | |
| Retail — 13.6% | |
| Advance Auto Parts, Inc. | | | 72,300 | | | | 2,089,470 | | |
| AutoZone, Inc.(a) | | | 23,900 | | | | 2,107,980 | | |
| Bed Bath & Beyond, Inc.(a) | | | 103,000 | | | | 3,416,510 | | |
| Best Buy Co., Inc. | | | 67,100 | | | | 3,679,764 | | |
| BJ's Wholesale Club, Inc.(a) | | | 17,500 | | | | 496,125 | | |
| Circuit City Stores, Inc. | | | 57,900 | | | | 1,576,038 | | |
| Costco Wholesale Corp.(b) | | | 64,000 | | | | 3,656,320 | | |
| Dollar General Corp.(b) | | | 96,100 | | | | 1,343,478 | | |
Dollar Tree
Stores, Inc.(a) (b) | | | 42,100 | | | | 1,115,650 | | |
| Family Dollar Stores, Inc. | | | 8,200 | | | | 200,326 | | |
| The Home Depot, Inc. | | | 850,100 | | | | 30,425,079 | | |
| | | Number of
Shares | | Market
Value | |
| Lowe's Companies, Inc. | | | 338,400 | | | $ | 20,530,728 | | |
| Men's Wearhouse, Inc. | | | 27,600 | | | | 836,280 | | |
| Office Depot, Inc.(a) | | | 173,900 | | | | 6,608,200 | | |
| O'Reilly Automotive, Inc.(a) | | | 59,600 | | | | 1,858,924 | | |
| Staples, Inc. | | | 133,400 | | | | 3,244,288 | | |
| Tiffany & Co. | | | 60,400 | | | | 1,994,408 | | |
| The TJX Cos., Inc. | | | 66,900 | | | | 1,529,334 | | |
| Walgreen Co. | | | 220,700 | | | | 9,896,188 | | |
| Wal-Mart Stores, Inc.(b) | | | 343,000 | | | | 16,522,310 | | |
| | | | 113,127,400 | | |
| Telephone Utilities — 0.7% | |
| ADTRAN, Inc. | | | 42,000 | | | | 942,060 | | |
| BellSouth Corp. | | | 103,400 | | | | 3,743,080 | | |
| CenturyTel, Inc. | | | 8,500 | | | | 315,775 | | |
Qwest Communications
International, Inc.(a) (b) | | | 120,700 | | | | 976,463 | | |
| | | | 5,977,378 | | |
| Tobacco — 1.0% | |
| Altria Group, Inc. | | | 108,900 | | | | 7,996,527 | | |
| UST, Inc. | | | 9,400 | | | | 424,786 | | |
| | | | 8,421,313 | | |
| Transportation — 4.4% | |
Burlington Northern Santa
Fe Corp. | | | 82,200 | | | | 6,514,350 | | |
Expeditors International of
Washington, Inc. | | | 119,800 | | | | 6,709,998 | | |
| FedEx Corp. | | | 97,500 | | | | 11,393,850 | | |
| Landstar System, Inc. | | | 8,700 | | | | 410,901 | | |
| Norfolk Southern Corp. | | | 47,500 | | | | 2,527,950 | | |
| Polaris Industries, Inc. | | | 300 | | | | 12,990 | | |
Robinson (C.H.)
Worldwide, Inc. | | | 105,500 | | | | 5,623,150 | | |
| Thor Industries, Inc.(b) | | | 25,000 | | | | 1,211,250 | | |
| Union Pacific Corp. | | | 19,900 | | | | 1,849,904 | | |
| | | | 36,254,343 | | |
TOTAL EQUITIES
(Cost $823,582,801) | | | | | | | 810,938,035 | | |
| RIGHTS — 0.0% | |
| Computers & Information | |
| Seagate Technology(c) | | | 66,000 | | | | 0 | | |
TOTAL RIGHTS
(Cost $0) | | | | | | | 0 | | |
TOTAL LONG TERM INVESTMENTS
(Cost $823,582,801) | | | | | | | 810,938,035 | | |
| | | Principal
Amount | | Market
Value | |
| SHORT-TERM INVESTMENTS — 5.9% | |
| Cash Equivalents — 3.0%(f) | |
Abbey National PLC
Eurodollar Time Deposit
5.100% 07/10/2006 | | $ | 266,085 | | | $ | 266,085 | | |
ABN Amro Bank NV
Certificate of Deposit
5.305% 11/21/2006 | | | 266,085 | | | | 266,085 | | |
American Beacon Money
Market Fund(d) | | | 271,384 | | | | 271,384 | | |
Bank of America
5.270% 07/14/2006 | | | 532,169 | | | | 532,169 | | |
Bank of America
5.310% 03/08/2007 | | | 532,169 | | | | 532,169 | | |
Bank of Montreal
Eurodollar Time Deposit
5.290% 08/03/2006 | | | 532,169 | | | | 532,169 | | |
Bank of Nova Scotia
Eurodollar Time Deposit
5.290% 08/08/2006 | | | 532,169 | | | | 532,169 | | |
Barclays
Eurodollar Time Deposit
5.150% 08/01/2006 | | | 798,255 | | | | 798,255 | | |
Branch Banker & Trust
Eurodollar Time Deposit
5.250% 07/26/2006 | | | 957,906 | | | | 957,906 | | |
Calyon
Eurodollar Time Deposit
5.300% 08/08/2006 | | | 532,169 | | | | 532,169 | | |
Canadian Imperial
Bank of Commerce
Eurodollar Time Deposit
5.310% 07/31/2006 | | | 532,169 | | | | 532,169 | | |
Deutsche Bank
Eurodollar Time Deposit
5.250% 07/05/2006 | | | 1,330,424 | | | | 1,330,424 | | |
Dexia Group
Eurodollar Time Deposit
5.300% 08/09/2006 | | | 691,821 | | | | 691,821 | | |
Federal Home Loan
Bank Discount Note
5.181% 07/19/2006 | | | 423,600 | | | | 423,600 | | |
First Tennessee
National Corporation
Eurodollar Time Deposit
5.270% 07/24/2006 | | | 638,604 | | | | 638,604 | | |
Fortis Bank
Eurodollar Time Deposit
5.090% 07/05/2006 | | | 532,170 | | | | 532,170 | | |
Fortis Bank
Eurodollar Time Deposit
5.250% 07/03/2006 | | | 532,170 | | | | 532,170 | | |
(Continued)
The accompanying notes are an integral part of the financial statements.
120
MassMutual Select Growth Equity Fund – Portfolio of Investments (Continued)
| | | Principal
Amount | | Market
Value | |
Fortis Bank
Eurodollar Time Deposit
5.250% 07/06/2006 | | $ | 532,170 | | | $ | 532,170 | | |
Freddie Mac
Discount Note
5.191% 07/25/2006 | | | 317,590 | | | | 317,590 | | |
Harris NA
Eurodollar Time Deposit
5.080% 07/05/2006 | | | 372,519 | | | | 372,519 | | |
HBOS Halifax
Bank of Scotland
Certificate of Deposit
5.110% 07/10/2006 | | | 532,170 | | | | 532,170 | | |
National Australia Bank
Eurodollar Time Deposit
5.290% 07/03/2006 | | | 1,862,594 | | | | 1,862,594 | | |
National City Corporation
Eurodollar Time Deposit
5.220% 07/03/2006 | | | 631,798 | | | | 631,798 | | |
Skandinaviska Enskilda
Banken AB
Eurodollar Time Deposit
5.130% 07/12/2006 | | | 532,170 | | | | 532,170 | | |
Societe Generale
Eurodollar Time Deposit
5.200% 08/08/2006 | | | 532,169 | | | | 532,169 | | |
Societe Generale
Eurodollar Time Deposit
5.270% 07/17/2006 | | | 691,821 | | | | 691,821 | | |
Standard Chartered Bank
Eurodollar Time Deposit
5.260% 07/07/2006 | | | 798,255 | | | | 798,255 | | |
Svenska Handlesbanken
Eurodollar Time Deposit
5.290% 07/03/2006 | | | 1,784,102 | | | | 1,784,102 | | |
The Bank of the West
Eurodollar Time Deposit
5.250% 08/07/2006 | | | 904,689 | | | | 904,689 | | |
Toronto Dominion Bank
Eurodollar Time Deposit
5.300% 07/31/2006 | | | 1,490,075 | | | | 1,490,075 | | |
UBS AG
Eurodollar Time Deposit
5.250% 07/21/2006 | | | 798,255 | | | | 798,255 | | |
UBS AG
Eurodollar Time Deposit
5.250% 08/04/2006 | | | 798,255 | | | | 798,255 | | |
Wells Fargo
Eurodollar Time Deposit
5.160% 07/13/2006 | | | 532,170 | | | | 532,170 | | |
Wells Fargo
Eurodollar Time Deposit
5.170% 07/03/2006 | | | 532,170 | | | | 532,170 | | |
| | | Principal
Amount | | Market
Value | |
Wells Fargo
Eurodollar Time Deposit
5.210% 07/06/2006 | | $ | 266,085 | | | $ | 266,085 | | |
Wells Fargo
Eurodollar Time Deposit
5.250% 07/03/2006 | | | 532,170 | | | | 532,170 | | |
| | | | 24,342,745 | | |
| Repurchase Agreement — 2.8% | |
Investors Bank & Trust
Company Repurchase
Agreement, dated
6/30/2006, 3.75%,
due 7/03/2006, 3.75%,
due 07/03/2006(g) | | | 23,315,589 | | | | 23,315,589 | | |
| U.S. Treasury Bills — 0.1% | |
U.S. Treasury Bill(e)
4.520% 08/24/2006 | | | 1,000,000 | | | | 993,221 | | |
TOTAL SHORT-TERM
INVESTMENTS
(Cost $48,651,555) | | | | | | | 48,651,555 | | |
TOTAL INVESTMENTS — 103.3%
(Cost $872,234,356)(h) | | | | | | | 859,589,590 | | |
Other Assets/
(Liabilities) — (3.3%) | | | | | | | (27,264,886 | ) | |
| NET ASSETS — 100.0% | | | | | | $ | 832,324,704 | | |
Notes to Portfolio of Investments
(a) Non-income producing security.
(b) Denotes all or a portion of security on loan. (Note 2).
(c) This security is valued in good faith under procedures established by the board of trustees.
(d) Amount represents shares owned of the fund.
(e) This security is held as collateral for open futures contracts. (Note 2).
(f) Represents investments of security lending collateral. (Note 2).
(g) Maturity value of $23,322,875. Collateralized by a U.S. Government Agency obligation with a rate of 5.549%, maturity date of 05/15/2036, and an aggregate market value, including accrued interest, of $24,481,368.
(h) See Note 6 for aggregate cost for Federal tax purposes.
The accompanying notes are an integral part of the financial statements.
121
MassMutual Select Aggressive Growth Fund – Portfolio of Investments
June 30, 2006 (Unaudited)
| | | Number of
Shares | | Market
Value | |
| EQUITIES — 99.0% | |
| COMMON STOCK | |
| Chemicals — 0.5% | |
| Praxair, Inc. | | | 55,000 | | | $ | 2,970,000 | | |
| Commercial Services — 14.7% | |
| Apollo Group, Inc. Cl. A(a) | | | 504,500 | | | | 26,067,515 | | |
| eBay, Inc.(a) | | | 1,198,500 | | | | 35,104,065 | | |
| Iron Mountain, Inc.(a) | | | 175,000 | | | | 6,541,500 | | |
| Moody's Corp. | | | 383,500 | | | | 20,885,410 | | |
| Paychex, Inc. | | | 70,000 | | | | 2,728,600 | | |
Weight Watchers
International, Inc. | | | 40,000 | | | | 1,635,600 | | |
| | | | 92,962,690 | | |
| Communications — 6.4% | |
America Movil SA de CV
Sponsored ADR
Series L (Mexico) | | | 369,100 | | | | 12,276,266 | | |
| Qualcomm, Inc. | | | 650,200 | | | | 26,053,514 | | |
XM Satellite Radio Holdings,
Inc. Cl. A(a) | | | 130,000 | | | | 1,904,500 | | |
| | | | 40,234,280 | | |
| Computers & Information — 3.4% | |
| Apple Computer, Inc.(a) | | | 226,700 | | | | 12,949,104 | | |
International Game
Technology | | | 77,000 | | | | 2,921,380 | | |
| SanDisk Corp.(a) | | | 55,000 | | | | 2,803,900 | | |
| Seagate Technology(a) | | | 125,000 | | | | 2,830,000 | | |
| | | | 21,504,384 | | |
| Cosmetics & Personal Care — 0.4% | |
| The Procter & Gamble Co. | | | 50,000 | | | | 2,780,000 | | |
| Data Processing & Preparation — 0.5% | |
| First Data Corp. | | | 70,000 | | | | 3,152,800 | | |
| Energy — 2.5% | |
| Schlumberger Ltd. | | | 243,600 | | | | 15,860,796 | | |
| Financial Services — 6.3% | |
Chicago Mercantile
Exchange Holdings, Inc. | | | 65,200 | | | | 32,022,980 | | |
IntercontinentalExchange,
Inc.(a) | | | 130,800 | | | | 7,578,552 | | |
| | | | 39,601,532 | | |
| Food Retailers — 7.9% | |
| Starbucks Corp.(a) | | | 1,318,100 | | | | 49,771,456 | | |
| Healthcare — 0.5% | |
| UnitedHealth Group, Inc. | | | 65,000 | | | | 2,910,700 | | |
| | | Number of
Shares | | Market
Value | |
| Information Retrieval Services — 12.2% | |
| Google, Inc. Cl. A(a) | | | 132,500 | | | $ | 55,561,225 | | |
| Yahoo!, Inc.(a) | | | 644,300 | | | | 21,261,900 | | |
| | | | 76,823,125 | | |
| Lodging — 0.4% | |
| MGM Mirage(a) | | | 65,000 | | | | 2,652,000 | | |
| Medical Supplies — 14.0% | |
| Allergan, Inc. | | | 244,100 | | | | 26,182,166 | | |
Intuitive Surgical,
Inc.(a) | | | 76,400 | | | | 9,012,908 | | |
| Medtronic, Inc. | | | 235,100 | | | | 11,030,892 | | |
| Patterson Cos., Inc.(a) | | | 211,400 | | | | 7,384,202 | | |
| Stryker Corp. | | | 304,700 | | | | 12,830,917 | | |
Varian Medical
Systems, Inc.(a) | | | 226,700 | | | | 10,734,245 | | |
| Zimmer Holdings, Inc.(a) | | | 191,700 | | | | 10,873,224 | | |
| | | | 88,048,554 | | |
| Pharmaceuticals — 15.1% | |
| Abraxis BioScience, Inc.(a) | | | 237,300 | | | | 5,657,232 | | |
| Genentech, Inc.(a) | | | 502,600 | | | | 41,112,680 | | |
| Genzyme Corp.(a) | | | 423,900 | | | | 25,879,095 | | |
Teva Pharmaceutical
Sponsored ADR
(Israel) | | | 720,700 | | | | 22,766,913 | | |
| | | | 95,415,920 | | |
| Prepackaged Software — 2.9% | |
| Intuit, Inc.(a) | | | 50,000 | | | | 3,019,500 | | |
| NAVTEQ Corp.(a) | | | 45,000 | | | | 2,010,600 | | |
| Red Hat, Inc.(a) | | | 566,200 | | | | 13,249,080 | | |
| | | | 18,279,180 | | |
| Retail — 9.9% | |
| Bed Bath & Beyond, Inc.(a) | | | 327,400 | | | | 10,859,858 | | |
| Lowe's Companies, Inc. | | | 379,100 | | | | 22,999,997 | | |
| Staples, Inc. | | | 130,000 | | | | 3,161,600 | | |
| Walgreen Co. | | | 499,400 | | | | 22,393,096 | | |
| Wal-Mart Stores, Inc. | | | 60,000 | | | | 2,890,200 | | |
| | | | 62,304,751 | | |
| Telephone Utilities — 0.4% | |
| Sprint Nextel Corp. | | | 120,000 | | | | 2,398,800 | | |
| Transportation — 1.0% | |
Expeditors International of
Washington, Inc. | | | 56,000 | | | | 3,136,560 | | |
United Parcel
Service, Inc. Cl. B | | | 40,000 | | | | 3,293,200 | | |
| | | | 6,429,760 | | |
TOTAL EQUITIES
(Cost $578,046,398) | | | | | | | 624,100,728 | | |
| | | Principal
Amount | | Market
Value | |
| SHORT-TERM INVESTMENTS — 1.2% | |
| Repurchase Agreement | |
Investors Bank & Trust
Company Repurchase
Agreement, dated
06/30/2006, 3.75%, 3.75%,
due 07/03/2006(b) | | $ | 7,483,680 | | | $ | 7,483,680 | | |
TOTAL SHORT-TERM
INVESTMENTS
(Cost $7,483,680) | | | | | 7,483,680 | | |
TOTAL INVESTMENTS — 100.2%
(Cost $585,530,078)(c) | | | | | 631,584,408 | | |
Other Assets/
(Liabilities) — (0.2%) | | | | | (1,524,795 | ) | |
| NET ASSETS — 100.0% | | | | $ | 630,059,613 | | |
Notes to Portfolio of Investments
ADR - American Depository Receipt
(a) Non-income producing security.
(b) Maturity value of $7,486,018. Collaterized by a U.S. Government Agency obligation with a rate of 3.75%, maturity date of 06/01/2033, and an aggregate market value, including accrued interest, of $7,857,864.
(c) See Note 6 for aggregate cost for Federal tax purposes.
The accompanying notes are an integral part of the financial statements.
122
MassMutual Select OTC 100 Fund – Portfolio of Investments
June 30, 2006 (Unaudited)
| | | Number of
Shares | | Market
Value | |
| EQUITIES — 101.3% | |
| COMMON STOCK | |
| Advertising — 0.8% | |
| Lamar Advertising Co.(a) | | | 3,245 | | | $ | 174,830 | | |
| Monster Worldwide, Inc.(a) | | | 4,988 | | | | 212,788 | | |
| | | | 387,618 | | |
| Apparel, Textiles & Shoes — 0.5% | |
| Ross Stores, Inc. | | | 5,403 | | | | 151,554 | | |
| Urban Outfitters, Inc.(a) (b) | | | 6,758 | | | | 118,197 | | |
| | | | 269,751 | | |
| Automotive & Parts — 1.1% | |
| Paccar, Inc.(b) | | | 7,116 | | | | 586,216 | | |
| Broadcasting, Publishing & Printing — 2.7% | |
| Comcast Corp. Cl. A(a) (b) | | | 36,502 | | | | 1,195,075 | | |
| Liberty Global, Inc. Cl. A(a) | | | 9,037 | | | | 194,296 | | |
| | | | 1,389,371 | | |
| Commercial Services — 5.5% | |
Akamai
Technologies, Inc.(a) | | | 5,611 | | | | 203,062 | | |
| Apollo Group, Inc. Cl. A(a) | | | 6,685 | | | | 345,414 | | |
| Cintas Corp. | | | 7,691 | | | | 305,794 | | |
| eBay, Inc.(a) | | | 40,153 | | | | 1,176,081 | | |
| Fastenal Co. | | | 5,483 | | | | 220,910 | | |
| Paychex, Inc. | | | 13,819 | | | | 538,665 | | |
| | | | 2,789,926 | | |
| Communications — 10.7% | |
EchoStar Communications
Corp. Cl. A(a) | | | 8,141 | | | | 250,824 | | |
Millicom International
Cellular SA(a) (b) | | | 3,800 | | | | 172,634 | | |
Network
Appliance, Inc.(a) (b) | | | 14,923 | | | | 526,782 | | |
| NTL, Inc.(b) | | | 11,993 | | | | 298,626 | | |
| Qualcomm, Inc. | | | 77,214 | | | | 3,093,965 | | |
| Research In Motion Ltd.(a) | | | 7,064 | | | | 492,855 | | |
Sirius Satellite
Radio, Inc.(a) (b) | | | 58,075 | | | | 275,856 | | |
| Tellabs, Inc.(a) | | | 9,900 | | | | 131,769 | | |
XM Satellite
Radio Holdings,
Inc. Cl. A(a) (b) | | | 10,281 | | | | 150,617 | | |
| | | | 5,393,928 | | |
| Communications Equipment — 0.3% | |
Telefonaktiebolaget LM
Ericsson Cl. B Sponsored
ADR (Sweden) | | | 4,210 | | | | 139,098 | | |
| | | Number of
Shares | | Market
Value | |
| Computer Integrated Systems Design — 1.5% | |
| Autodesk, Inc.(a) | | | 9,195 | | | $ | 316,860 | | |
Cadence Design
Systems, Inc.(a) | | | 11,291 | | | | 193,641 | | |
| Sun Microsystems, Inc.(a) | | | 58,194 | | | | 241,505 | | |
| | | | 752,006 | | |
| Computer Programming Services — 1.1% | |
Cognizant Technology
Solutions Corp. Cl. A(a) | | | 5,207 | | | | 350,796 | | |
| VeriSign, Inc.(a) (b) | | | 8,781 | | | | 203,456 | | |
| | | | 554,252 | | |
| Computer Related Services — 1.0% | |
| Checkfree Corp.(a) (b) | | | 3,365 | | | | 166,769 | | |
| IAC/InterActiveCorp(a) (b) | | | 12,605 | | | | 333,906 | | |
| | | | 500,675 | | |
| Computers & Information — 11.2% | |
| Apple Computer, Inc.(a) | | | 45,351 | | | | 2,590,449 | | |
| CDW Corp. | | | 3,129 | | | | 171,000 | | |
| Cisco Systems, Inc.(a) | | | 83,336 | | | | 1,627,552 | | |
Comverse
Technology, Inc.(a) (b) | | | 8,106 | | | | 160,256 | | |
| Dell, Inc.(a) | | | 32,168 | | | | 785,221 | | |
| SanDisk Corp.(a) (b) | | | 6,880 | | | | 350,742 | | |
| | | | 5,685,220 | | |
| Data Processing & Preparation — 0.7% | |
| Fiserv, Inc.(a) | | | 8,421 | | | | 381,977 | | |
| Electrical Equipment & Electronics — 12.4% | |
| Altera Corp.(a) | | | 19,306 | | | | 338,820 | | |
American Power
Conversion Corp. | | | 7,389 | | | | 144,012 | | |
| ATI Technologies, Inc.(a) (b) | | | 9,567 | | | | 139,678 | | |
| Broadcom Corp. Cl. A(a) | | | 16,278 | | | | 489,154 | | |
Flextronics
International Ltd.(a) | | | 23,918 | | | | 254,009 | | |
| Garmin Ltd. | | | 3,879 | | | | 409,002 | | |
| Intel Corp. | | | 77,827 | | | | 1,474,822 | | |
| JDS Uniphase Corp.(a) (b) | | | 74,240 | | | | 187,827 | | |
| KLA-Tencor Corp. | | | 9,247 | | | | 384,398 | | |
| Linear Technology Corp. | | | 15,494 | | | | 518,894 | | |
Marvell Technology
Group Ltd.(a) | | | 10,681 | | | | 473,489 | | |
Maxim Integrated
Products, Inc. | | | 17,166 | | | | 551,200 | | |
| Microchip Technology, Inc. | | | 6,847 | | | | 229,717 | | |
| Nvidia Corp.(a) | | | 13,193 | | | | 280,879 | | |
| Xilinx, Inc. | | | 17,379 | | | | 393,634 | | |
| | | | 6,269,535 | | |
| | | Number of
Shares | | Market
Value | |
| Energy — 0.4% | |
Patterson-UTI
Energy, Inc.(b) | | | 6,646 | | | $ | 188,148 | | |
| Food Retailers — 3.0% | |
| Starbucks Corp.(a) | | | 40,826 | | | | 1,541,590 | | |
| Healthcare — 1.0% | |
| Express Scripts, Inc.(a) | | | 4,948 | | | | 354,970 | | |
| Lincare Holdings, Inc.(a) | | | 3,576 | | | | 135,316 | | |
| | | | 490,286 | | |
| Information Retrieval Services — 6.3% | |
| Google, Inc. Cl. A(a) | | | 4,971 | | | | 2,084,489 | | |
Juniper
Networks, Inc.(a) (b) | | | 14,298 | | | | 228,625 | | |
| Yahoo!, Inc.(a) | | | 25,846 | | | | 852,918 | | |
| | | | 3,166,032 | | |
| Internet Content — 0.4% | |
| BEA Systems, Inc.(a) | | | 13,960 | | | | 182,736 | | |
| Lodging — 0.6% | |
| Wynn Resorts Ltd.(a) (b) | | | 4,194 | | | | 307,420 | | |
| Machinery & Components — 0.5% | |
| Joy Global, Inc. | | | 4,672 | | | | 243,364 | | |
| Manufacturing — 1.5% | |
| Applied Materials, Inc. | | | 30,915 | | | | 503,296 | | |
| Lam Research Corp.(a) | | | 5,583 | | | | 260,279 | | |
| | | | 763,575 | | |
| Medical Supplies — 1.8% | |
| Biomet, Inc. | | | 12,684 | | | | 396,882 | | |
| Dentsply International, Inc. | | | 2,918 | | | | 176,831 | | |
| Intuitive Surgical, Inc.(a) (b) | | | 1,371 | | | | 161,737 | | |
| Patterson Cos., Inc.(a) (b) | | | 5,126 | | | | 179,051 | | |
| | | | 914,501 | | |
| Pharmaceuticals — 12.1% | |
| Amgen, Inc.(a) | | | 20,951 | | | | 1,366,634 | | |
Amylin
Pharmaceuticals, Inc.(a) (b) | | | 4,538 | | | | 224,041 | | |
| Biogen Idec, Inc.(a) | | | 14,258 | | | | 660,573 | | |
| Celgene Corp.(a) | | | 13,165 | | | | 624,416 | | |
| Genzyme Corp.(a) | | | 12,514 | | | | 763,980 | | |
| Gilead Sciences, Inc.(a) | | | 17,098 | | | | 1,011,518 | | |
| MedImmune, Inc.(a) | | | 10,178 | | | | 275,824 | | |
| Sepracor, Inc.(a) (b) | | | 4,082 | | | | 233,245 | | |
| Sigma-Aldrich Corp. | | | 2,499 | | | | 181,527 | | |
Teva Pharmaceutical
Sponsored ADR (Israel) | | | 24,009 | | | | 758,444 | | |
| | | | 6,100,202 | | |
(Continued)
The accompanying notes are an integral part of the financial statements.
123
MassMutual Select OTC 100 Fund – Portfolio of Investments (Continued)
| | | Number of
Shares | | Market
Value | |
| Prepackaged Software — 14.8% | |
| Activision, Inc.(a) | | | 9,480 | | | $ | 107,882 | | |
| Adobe Systems, Inc.(a) (b) | | | 22,480 | | | | 682,493 | | |
Check Point Software
Technologies Ltd.(a) | | | 9,318 | | | | 163,810 | | |
| Citrix Systems, Inc.(a) | | | 8,300 | | | | 333,162 | | |
| Electronic Arts, Inc.(a) | | | 11,739 | | | | 505,247 | | |
| Intuit, Inc.(a) | | | 8,416 | | | | 508,242 | | |
| Microsoft Corp. | | | 134,165 | | | | 3,126,045 | | |
| Oracle Corp.(a) | | | 84,995 | | | | 1,231,578 | | |
| Red Hat, Inc.(a) (b) | | | 6,893 | | | | 161,296 | | |
| Symantec Corp.(a) | | | 41,668 | | | | 647,521 | | |
| | | | 7,467,276 | | |
| Retail — 5.9% | |
| Amazon.com, Inc.(a) (b) | | | 10,601 | | | | 410,047 | | |
| Bed Bath & Beyond, Inc.(a) | | | 14,522 | | | | 481,695 | | |
| Costco Wholesale Corp. | | | 9,533 | | | | 544,620 | | |
| Petsmart, Inc. | | | 5,252 | | | | 134,451 | | |
| Sears Holdings Corp.(a) (b) | | | 6,207 | | | | 961,092 | | |
| Staples, Inc. | | | 18,719 | | | | 455,246 | | |
| | | | 2,987,151 | | |
| Retail – Grocery — 0.7% | |
| Whole Foods Market, Inc. | | | 5,266 | | | | 340,394 | | |
| Telephone Utilities — 0.6% | |
| NII Holdings, Inc. Cl. B(a) | | | 5,715 | | | | 322,212 | | |
| Transportation — 1.8% | |
Discovery Holding
Co. Cl. A(a) | | | 9,131 | | | | 133,587 | | |
Expeditors International
of Washington, Inc. | | | 7,992 | | | | 447,632 | | |
Robinson (C.H.)
Worldwide, Inc. | | | 6,372 | | | | 339,628 | | |
| | | | 920,847 | | |
| Travel — 0.4% | |
| Expedia, Inc.(a) | | | 13,448 | | | | 201,317 | | |
TOTAL EQUITIES
(Cost $47,340,370) | | | | | | | 51,236,624 | | |
| | | Principal
Amount | | | |
| SHORT-TERM INVESTMENTS — 15.0% | |
| Cash Equivalents — 14.6%(e) | |
Abbey National PLC
Eurodollar Time Deposit
5.100% 07/10/2006 | | $ | 80,567 | | | | 80,567 | | |
ABN Amro Bank NV
Certificate of Deposit
5.305% 11/21/2006 | | | 80,560 | | | | 80,560 | | |
| | | Principal
Amount | | Market
Value | |
American Beacon Money
Market Fund(c) | | $ | 82,164 | | | $ | 82,164 | | |
Bank of America
5.270% 07/14/2006 | | | 161,119 | | | | 161,119 | | |
Bank of America
5.310% 03/08/2007 | | | 161,119 | | | | 161,119 | | |
Bank of Montreal
Eurodollar Time Deposit
5.290% 08/03/2006 | | | 161,119 | | | | 161,119 | | |
Bank of Nova Scotia
Eurodollar Time Deposit
5.290% 08/08/2006 | | | 161,119 | | | | 161,119 | | |
Barclays
Eurodollar Time Deposit
5.150% 08/01/2006 | | | 241,679 | | | | 241,679 | | |
Branch Banker & Trust
Eurodollar Time Deposit
5.250% 07/26/2006 | | | 290,015 | | | | 290,015 | | |
Calyon
Eurodollar Time Deposit
5.300% 08/08/2006 | | | 161,119 | | | | 161,119 | | |
Canadian Imperial
Bank of Commerce
Eurodollar Time Deposit
5.310% 07/31/2006 | | | 161,119 | | | | 161,119 | | |
Deutsche Bank
Eurodollar Time Deposit
5.250% 07/05/2006 | | | 402,799 | | | | 402,799 | | |
Dexia Group
Eurodollar Time Deposit
5.300% 08/09/2006 | | | 209,455 | | | | 209,455 | | |
Federal Home Loan
Bank Discount Note
5.181% 07/19/2006 | | | 128,249 | | | | 128,249 | | |
First Tennessee
National Corporation
Eurodollar Time Deposit
5.270% 07/24/2006 | | | 193,343 | | | | 193,343 | | |
Fortis Bank
Eurodollar Time Deposit
5.090% 07/05/2006 | | | 161,119 | | | | 161,119 | | |
Fortis Bank
Eurodollar Time Deposit
5.250% 07/03/2006 | | | 161,119 | | | | 161,119 | | |
Fortis Bank
Eurodollar Time Deposit
5.250% 07/06/2006 | | | 161,119 | | | | 161,119 | | |
Freddie Mac
Discount Note
5.191% 07/25/2006 | | | 96,153 | | | | 96,153 | | |
Harris NA
Eurodollar Time Deposit
5.080% 07/05/2006 | | | 112,784 | | | | 112,784 | | |
| | | Principal
Amount | | Market
Value | |
HBOS Halifax
Bank of Scotland
Certificate of Deposit
5.110% 07/10/2006 | | $ | 161,119 | | | $ | 161,119 | | |
National Australia Bank
Eurodollar Time Deposit
5.290% 07/03/2006 | | | 563,918 | | | | 563,918 | | |
National City Corporation
Eurodollar Time Deposit
5.220% 07/03/2006 | | | 191,283 | | | | 191,283 | | |
Skandinaviska Enskilda
Banken AB
Eurodollar Time Deposit
5.130% 07/12/2006 | | | 161,119 | | | | 161,119 | | |
Societe Generale
Eurodollar Time Deposit
5.200% 08/08/2006 | | | 161,119 | | | | 161,119 | | |
Societe Generale
Eurodollar Time Deposit
5.270% 07/17/2006 | | | 209,455 | | | | 209,455 | | |
Standard Chartered Bank
Eurodollar Time Deposit
5.260% 07/07/2006 | | | 241,679 | | | | 241,679 | | |
Svenska Handlesbanken
Eurodollar Time Deposit
5.290% 07/03/2006 | | | 540,154 | | | | 540,154 | | |
The Bank of the West
Eurodollar Time Deposit
5.250% 08/07/2006 | | | 273,903 | | | | 273,903 | | |
Toronto Dominion Bank
Eurodollar Time Deposit
5.300% 07/31/2006 | | | 451,134 | | | | 451,134 | | |
UBS AG
Eurodollar Time Deposit
5.250% 07/21/2006 | | | 241,679 | | | | 241,679 | | |
UBS AG
Eurodollar Time Deposit
5.250% 08/04/2006 | | | 241,679 | | | | 241,679 | | |
Wells Fargo
Eurodollar Time Deposit
5.160% 07/13/2006 | | | 161,119 | | | | 161,119 | | |
Wells Fargo
Eurodollar Time Deposit
5.170% 07/03/2006 | | | 161,119 | | | | 161,119 | | |
Wells Fargo
Eurodollar Time Deposit
5.210% 07/06/2006 | | | 80,560 | | | | 80,560 | | |
Wells Fargo
Eurodollar Time Deposit
5.250% 07/03/2006 | | | 161,119 | | | | 161,119 | | |
| | | | 7,369,997 | | |
(Continued)
The accompanying notes are an integral part of the financial statements.
124
MassMutual Select OTC 100 Fund – Portfolio of Investments (Continued)
| | | Principal
Amount | | Market
Value | |
| U.S. Treasury Bills — 0.4% | |
U.S. Treasury Bill(d)
4.658% 09/21/2006 | | $ | 120,000 | | | $ | 118,695 | | |
U.S. Treasury Bill(d)
4.747% 09/21/2006 | | | 80,000 | | | | 79,135 | | |
| | | | 197,830 | | |
TOTAL SHORT-TERM
INVESTMENTS
(Cost $7,567,827) | | | | | 7,567,827 | | |
TOTAL INVESTMENTS — 116.3%
(Cost $54,908,197)(f) | | | | | 58,804,451 | | |
Other Assets/
(Liabilities) — (16.3%) | | | | | (8,223,390 | ) | |
| NET ASSETS — 100.0% | | | | $ | 50,581,061 | | |
Notes to Portfolio of Investments
ADR - American Depository Receipt
(a) Non-income producing security.
(b) Denotes all or a portion of security on loan. (Note 2).
(c) Amount represents shares owned of the fund.
(d) This security is held as collateral for open futures contracts. (Note 2).
(e) Represents investments of security lending collateral. (Note 2).
(f) See Note 6 for aggregate cost for Federal tax purposes.
The remainder of this page is intentionally left blank.
The accompanying notes are an integral part of the financial statements.
125
MassMutual Select Focused Value Fund – Portfolio of Investments
June 30, 2006 (Unaudited)
| | | Number of
Shares | | Market
Value | |
| EQUITIES — 95.7% | |
| COMMON STOCK | |
| Advertising — 1.9% | |
| Catalina Marketing Corp. | | | 413,330 | | | $ | 11,763,372 | | |
| Harte-Hanks, Inc. | | | 203,900 | | | | 5,227,996 | | |
| | | | 16,991,368 | | |
| Apparel, Textiles & Shoes — 0.8% | |
| Jones Apparel Group, Inc. | | | 232,850 | | | | 7,402,301 | | |
| Automotive & Parts — 1.0% | |
| Federal Signal Corp. | | | 366,700 | | | | 5,551,838 | | |
Superior Industries
International, Inc.(a) | | | 164,600 | | | | 3,010,534 | | |
| | | | 8,562,372 | | |
| Banking, Savings & Loans — 8.7% | |
| JP Morgan Chase & Co. | | | 975,000 | | | | 40,950,000 | | |
The South Financial
Group, Inc.(a) | | | 171,976 | | | | 4,541,886 | | |
| Washington Mutual, Inc. | | | 700,000 | | | | 31,906,000 | | |
| | | | 77,397,886 | | |
| Beverages — 3.2% | |
The Pepsi Bottling
Group, Inc. | | | 800,000 | | | | 25,720,000 | | |
| PepsiAmericas, Inc. | | | 109,800 | | | | 2,427,678 | | |
| | | | 28,147,678 | | |
| Broadcasting, Publishing & Printing — 8.3% | |
Cablevision Systems
Corp. Cl. A | | | 1,086,500 | | | | 23,305,425 | | |
Liberty Global,
Inc. Cl. A(b) | | | 174,366 | | | | 3,748,869 | | |
Liberty Global,
Inc. Cl. C(b) | | | 176,832 | | | | 3,637,434 | | |
Liberty Media Holding
Corp. Capital Cl. A(b) | | | 160,000 | | | | 13,403,200 | | |
Liberty Media Holding
Corp. Interactive Cl. A(b) | | | 7,625 | | | | 131,608 | | |
| Time Warner, Inc. | | | 1,700,000 | | | | 29,410,000 | | |
| | | | 73,636,536 | | |
| Chemicals — 2.1% | |
| Albemarle Corp.(a) | | | 114,200 | | | | 5,467,896 | | |
International Flavors &
Fragrances, Inc. | | | 170,900 | | | | 6,022,516 | | |
| The Valspar Corp. | | | 279,700 | | | | 7,386,877 | | |
| | | | 18,877,289 | | |
| Commercial Services — 3.4% | |
| ARAMARK Corp. Cl. B | | | 150,200 | | | | 4,973,122 | | |
| | | Number of
Shares | | Market
Value | |
| G&K Services, Inc. Cl. A | | | 194,150 | | | $ | 6,659,345 | | |
MoneyGram
International, Inc. | | | 336,200 | | | | 11,413,990 | | |
| Quest Diagnostics, Inc. | | | 75,900 | | | | 4,547,928 | | |
| Viad Corp. | | | 78,500 | | | | 2,457,050 | | |
| | | | 30,051,435 | | |
| Computer Integrated Systems Design — 0.8% | |
Parametric
Technology Corp.(b) | | | 559,340 | | | | 7,109,211 | | |
| Computers & Information — 3.8% | |
| CDW Corp. | | | 75,900 | | | | 4,147,935 | | |
| Dell, Inc.(b) | | | 1,200,000 | | | | 29,292,000 | | |
| | | | 33,439,935 | | |
| Computers & Office Equipment — 4.3% | |
| Hewlett-Packard Co. | | | 1,200,000 | | | | 38,016,000 | | |
| Data Processing & Preparation — 0.7% | |
| IMS Health, Inc. | | | 246,500 | | | | 6,618,525 | | |
| Electrical Equipment & Electronics — 10.4% | |
American Power
Conversion Corp.(a) | | | 682,600 | | | | 13,303,874 | | |
| Entegris, Inc.(b) | | | 1,139,900 | | | | 10,863,247 | | |
Flextronics
International Ltd.(b) | | | 450,300 | | | | 4,782,186 | | |
| Hubbell, Inc. Cl. B | | | 191,300 | | | | 9,115,445 | | |
| Intel Corp. | | | 1,600,000 | | | | 30,320,000 | | |
National
Semiconductor Corp. | | | 1,000,000 | | | | 23,850,000 | | |
| | | | 92,234,752 | | |
| Entertainment & Leisure — 0.3% | |
International
Speedway Corp. Cl. A | | | 64,500 | | | | 2,990,865 | | |
| Financial Services — 4.4% | |
| CapitalSource, Inc.(a) | | | 302,346 | | | | 7,093,037 | | |
| Morgan Stanley | | | 500,000 | | | | 31,605,000 | | |
| | | | 38,698,037 | | |
| Foods — 1.8% | |
Hain Celestial
Group, Inc.(b) | | | 410,000 | | | | 10,561,600 | | |
| Pilgrim's Pride Corp.(a) | | | 206,200 | | | | 5,319,960 | | |
| | | | 15,881,560 | | |
| Healthcare — 0.7% | |
Universal Health
Services, Inc. Cl. B | | | 130,400 | | | | 6,553,904 | | |
| | | Number of
Shares | | Market
Value | |
Home Construction, Furnishings &
Appliances — 2.7% | |
| Lennar Corp. Cl. A(a) | | | 400,000 | | | $ | 17,748,000 | | |
| Steelcase, Inc.(a) | | | 379,200 | | | | 6,237,840 | | |
| | | | 23,985,840 | | |
| Industrial – Diversified — 4.5% | |
| Carlisle Cos., Inc.(a) | | | 85,700 | | | | 6,796,010 | | |
| Tyco International Ltd. | | | 1,200,000 | | | | 33,000,000 | | |
| | | | 39,796,010 | | |
| Insurance — 2.9% | |
Ambac Financial
Group, Inc. | | | 40,950 | | | | 3,321,045 | | |
Gallagher
(Arthur J.) & Co.(a) | | | 223,700 | | | | 5,668,558 | | |
| MBIA, Inc.(a) | | | 115,350 | | | | 6,753,743 | | |
| UnumProvident Corp.(a) | | | 322,300 | | | | 5,843,299 | | |
White Mountains
Insurance Group Ltd.(a) | | | 8,480 | | | | 4,129,760 | | |
| | | | 25,716,405 | | |
| Machinery & Components — 2.3% | |
| Dover Corp. | | | 203,900 | | | | 10,078,777 | | |
| Pall Corp.(a) | | | 301,100 | | | | 8,430,800 | | |
| Tennant Co. | | | 44,100 | | | | 2,217,348 | | |
| | | | 20,726,925 | | |
| Medical Supplies — 5.3% | |
| Baxter International, Inc. | | | 900,000 | | | | 33,084,000 | | |
Mettler-Toledo
International, Inc.(b) | | | 235,200 | | | | 14,246,064 | | |
| | | | 47,330,064 | | |
| Pharmaceuticals — 0.4% | |
Medco Health
Solutions, Inc.(b) | | | 61,700 | | | | 3,534,176 | | |
| Restaurants — 9.0% | |
| CBRL Group, Inc. | | | 98,369 | | | | 3,336,676 | | |
| McDonald's Corp. | | | 1,150,000 | | | | 38,640,000 | | |
| Yum! Brands, Inc. | | | 750,000 | | | | 37,702,500 | | |
| | | | 79,679,176 | | |
| Retail — 6.2% | |
| Big Lots, Inc.(a) (b) | | | 876,700 | | | | 14,974,036 | | |
| Dollar General Corp. | | | 116,200 | | | | 1,624,476 | | |
| Tiffany & Co. | | | 934,730 | | | | 30,864,785 | | |
| Zale Corp.(a) (b) | | | 293,900 | | | | 7,080,051 | | |
| | | | 54,543,348 | | |
| Toys, Games — 0.4% | |
| Hasbro, Inc. | | | 184,900 | | | | 3,348,539 | | |
(Continued)
The accompanying notes are an integral part of the financial statements.
126
MassMutual Select Focused Value Fund – Portfolio of Investments (Continued)
| | | Number of
Shares | | Market
Value | |
| Transportation — 5.4% | |
| Carnival Corp.(a) | | | 625,000 | | | $ | 26,087,500 | | |
Discovery Holding Co.
Cl. A(a) (b) | | | 1,500,000 | | | | 21,945,000 | | |
| | | | 48,032,500 | | |
TOTAL EQUITIES
(Cost $753,526,023) | | | | | | | 849,302,637 | | |
| | | Principal
Amount | | | |
| SHORT-TERM INVESTMENTS — 18.3% | |
| Cash Equivalents — 14.0%(d) | |
Abbey National PLC
Eurodollar Time Deposit
5.100% 07/10/2006 | | $ | 1,355,638 | | | | 1,355,638 | | |
ABN Amro Bank NV
Certificate of Deposit
5.305% 11/21/2006 | | | 1,355,638 | | | | 1,355,638 | | |
American Beacon Money
Market Fund(c) | | | 1,382,635 | | | | 1,382,635 | | |
Bank of America
5.270% 07/14/2006 | | | 2,711,275 | | | | 2,711,275 | | |
Bank of America
5.310% 03/08/2007 | | | 2,711,275 | | | | 2,711,275 | | |
Bank of Montreal
Eurodollar Time Deposit
5.290% 08/03/2006 | | | 2,711,275 | | | | 2,711,275 | | |
Bank of Nova Scotia
Eurodollar Time Deposit
5.290% 08/08/2006 | | | 2,711,275 | | | | 2,711,275 | | |
Barclays
Eurodollar Time Deposit
5.150% 08/01/2006 | | | 4,066,913 | | | | 4,066,913 | | |
Branch Banker & Trust
Eurodollar Time Deposit
5.250% 07/26/2006 | | | 4,880,295 | | | | 4,880,295 | | |
Calyon
Eurodollar Time Deposit
5.300% 08/08/2006 | | | 2,711,275 | | | | 2,711,275 | | |
Canadian Imperial
Bank of Commerce
Eurodollar Time Deposit
5.310% 07/31/2006 | | | 2,711,275 | | | | 2,711,275 | | |
Deutsche Bank
Eurodollar Time Deposit
5.250% 07/05/2006 | | | 6,778,188 | | | | 6,778,188 | | |
Dexia Group
Eurodollar Time Deposit
5.300% 08/09/2006 | | | 3,524,658 | | | | 3,524,658 | | |
Federal Home Loan
Bank Discount Note
5.181% 07/19/2006 | | | 2,158,139 | | | | 2,158,139 | | |
| | | Principal
Amount | | Market
Value | |
First Tennessee
National Corporation
Eurodollar Time Deposit
5.270% 07/24/2006 | | $ | 3,253,530 | | | $ | 3,253,530 | | |
Fortis Bank
Eurodollar Time Deposit
5.090% 07/05/2006 | | | 2,711,275 | | | | 2,711,275 | | |
Fortis Bank
Eurodollar Time Deposit
5.250% 07/03/2006 | | | 2,711,275 | | | | 2,711,275 | | |
Fortis Bank
Eurodollar Time Deposit
5.250% 07/06/2006 | | | 2,711,275 | | | | 2,711,275 | | |
Freddie Mac
Discount Note
5.191% 07/25/2006 | | | 1,618,044 | | | | 1,618,044 | | |
Harris NA
Eurodollar Time Deposit
5.080% 07/05/2006 | | | 1,897,893 | | | | 1,897,893 | | |
HBOS Halifax
Bank of Scotland
Certificate of Deposit
5.110% 07/10/2006 | | | 2,711,275 | | | | 2,711,275 | | |
National Australia Bank
Eurodollar Time Deposit
5.290% 07/03/2006 | | | 9,489,463 | | | | 9,489,463 | | |
National City Corporation
Eurodollar Time Deposit
5.220% 07/03/2006 | | | 3,218,858 | | | | 3,218,858 | | |
Skandinaviska Enskilda
Banken AB
Eurodollar Time Deposit
5.130% 07/12/2006 | | | 2,711,275 | | | | 2,711,275 | | |
Societe Generale
Eurodollar Time Deposit
5.200% 08/08/2006 | | | 2,711,275 | | | | 2,711,275 | | |
Societe Generale
Eurodollar Time Deposit
5.270% 07/17/2006 | | | 3,524,658 | | | | 3,524,658 | | |
Standard Chartered Bank
Eurodollar Time Deposit
5.260% 07/07/2006 | | | 4,066,913 | | | | 4,066,913 | | |
Svenska Handlesbanken
Eurodollar Time Deposit
5.290% 07/03/2006 | | | 9,089,568 | | | | 9,089,568 | | |
The Bank of the West
Eurodollar Time Deposit
5.250% 08/07/2006 | | | 4,609,168 | | | | 4,609,168 | | |
Toronto Dominion Bank
Eurodollar Time Deposit
5.300% 07/31/2006 | | | 7,591,571 | | | | 7,591,571 | | |
UBS AG
Eurodollar Time Deposit
5.250% 07/21/2006 | | | 4,066,913 | | | | 4,066,913 | | |
| | | Principal
Amount | | Market
Value | |
UBS AG
Eurodollar Time Deposit
5.250% 08/04/2006 | | $ | 4,066,913 | | | $ | 4,066,913 | | |
Wells Fargo
Eurodollar Time Deposit
5.160% 07/13/2006 | | | 2,711,275 | | | | 2,711,275 | | |
Wells Fargo
Eurodollar Time Deposit
5.170% 07/03/2006 | | | 2,711,275 | | | | 2,711,275 | | |
Wells Fargo
Eurodollar Time Deposit
5.210% 07/06/2006 | | | 1,355,637 | | | | 1,355,637 | | |
Wells Fargo
Eurodollar Time Deposit
5.250% 07/03/2006 | | | 2,711,275 | | | | 2,711,275 | | |
| | | | 124,020,358 | | |
| Repurchase Agreement — 4.3% | |
Investors Bank & Trust
Company Repurchase
Agreement, dated
06/30/2006, 3.75%,
due 07/03/2006(e) | | | 38,731,587 | | | | 38,731,587 | | |
TOTAL SHORT-TERM
INVESTMENTS
(Cost $162,751,945) | | | | | | | 162,751,945 | | |
TOTAL INVESTMENTS — 114.0%
(Cost $916,277,968)(f) | | | | | | | 1,012,054,582 | | |
Other Assets/
(Liabilities) — (14.0%) | | | | | | | (124,573,881 | ) | |
| NET ASSETS — 100.0% | | | | | | $ | 887,480,701 | | |
Notes to Portfolio of Investments
(a) Denotes all or a portion of security on loan. (Note 2).
(b) Non-income producing security.
(c) Amount represents shares owned of the fund.
(d) Represents investments of security lending collateral. (Note 2).
(e) Maturity value of $38,743,691. Collateralized by a U.S. Government Agency obligation with a rate of 5.749%, maturity date of 04/15/2023, and an aggregate market value, including accrued interest, of $40,668,167.
(f) See Note 6 for aggregate cost for Federal tax purposes.
The accompanying notes are an integral part of the financial statements.
127
MassMutual Select Small Cap Value Equity Fund – Portfolio of Investments
June 30, 2006 (Unaudited)
| | | Number of
Shares | | Market
Value | |
| EQUITIES — 96.1% | |
| COMMON STOCK | |
| Advertising — 0.1% | |
| Catalina Marketing Corp. | | | 300 | | | $ | 8,538 | | |
| Aerospace & Defense — 0.7% | |
| AAR Corp.(a) | | | 500 | | | | 11,115 | | |
| Kaman Corp. | | | 600 | | | | 10,920 | | |
| Orbital Sciences Corp.(a) | | | 3,300 | | | | 53,262 | | |
| Triumph Group, Inc.(a) | | | 200 | | | | 9,600 | | |
| | | | 84,897 | | |
| Air Transportation — 0.2% | |
| ExpressJet Holdings, Inc.(a) | | | 1,000 | | | | 6,910 | | |
| Forward Air Corp. | | | 200 | | | | 8,146 | | |
Republic Airways
Holdings, Inc.(a) | | | 100 | | | | 1,702 | | |
| SkyWest, Inc. | | | 200 | | | | 4,960 | | |
| | | | 21,718 | | |
| Apparel, Textiles & Shoes — 2.7% | |
Albany International
Corp. Cl. A | | | 900 | | | | 38,151 | | |
| Brown Shoe Co., Inc. | | | 1,250 | | | | 42,600 | | |
| The Buckle, Inc. | | | 300 | | | | 12,561 | | |
| Charming Shoppes, Inc.(a) | | | 2,600 | | | | 29,224 | | |
| Payless ShoeSource, Inc.(a) | | | 2,400 | | | | 65,208 | | |
| Phillips-Van Heusen Corp. | | | 1,700 | | | | 64,872 | | |
| Skechers U.S.A., Inc. Cl. A(a) | | | 600 | | | | 14,466 | | |
| Wolverine World Wide, Inc. | | | 1,600 | | | | 37,328 | | |
| | | | 304,410 | | |
| Automotive & Parts — 2.6% | |
| A.O. Smith Corp. | | | 200 | | | | 9,272 | | |
Aftermarket
Technology Corp.(a) | | | 2,100 | | | | 52,185 | | |
| ArvinMeritor, Inc. | | | 4,100 | | | | 70,479 | | |
Commercial Vehicle
Group, Inc.(a) | | | 100 | | | | 2,068 | | |
| Federal Signal Corp. | | | 1,600 | | | | 24,224 | | |
| Group 1 Automotive, Inc. | | | 1,300 | | | | 73,242 | | |
| Modine Manufacturing Co. | | | 900 | | | | 21,024 | | |
| Visteon Corp.(a) | | | 5,200 | | | | 37,492 | | |
| | | | 289,986 | | |
| Banking, Savings & Loans — 15.6% | |
| 1st Source Corp. | | | 1,400 | | | | 47,362 | | |
| Amcore Financial, Inc. | | | 100 | | | | 2,931 | | |
| Bancfirst Corp. | | | 700 | | | | 31,325 | | |
| Bank of Granite Corp. | | | 2,400 | | | | 49,992 | | |
| Banner Corp. | | | 1,500 | | | | 57,810 | | |
| Camden National Corp. | | | 100 | | | | 3,990 | | |
| | | Number of
Shares | | Market
Value | |
| Capitol Bancorp Ltd. | | | 1,100 | | | $ | 42,845 | | |
| Chemical Financial Corp. | | | 100 | | | | 3,060 | | |
| Citizens Banking Corp. | | | 2,700 | | | | 65,907 | | |
| Clifton Savings Bancorp, Inc. | | | 1,000 | | | | 10,830 | | |
Columbia Banking
Systems, Inc. | | | 400 | | | | 14,952 | | |
| Community Banks, Inc. | | | 420 | | | | 10,920 | | |
Community Trust
Bancorp, Inc. | | | 100 | | | | 3,493 | | |
| CompuCredit Corp.(a) | | | 1,100 | | | | 42,284 | | |
| Corus Bankshares, Inc. | | | 200 | | | | 5,236 | | |
| CVB Financial Corp. | | | 200 | | | | 3,132 | | |
Dime
Community Bancshares | | | 700 | | | | 9,499 | | |
| F.N.B. Corp. | | | 3,100 | | | | 48,887 | | |
Federal Agricultural
Mortgage Corp. Cl. C | | | 400 | | | | 11,080 | | |
| First Bancorp | | | 6,500 | | | | 60,450 | | |
| First Charter Corp. | | | 2,300 | | | | 56,419 | | |
First Commonwealth
Financial Corp. | | | 100 | | | | 1,270 | | |
| First Indiana Corp. | | | 800 | | | | 20,824 | | |
| First Merchants Corp. | | | 700 | | | | 17,017 | | |
| First Midwest Bancorp, Inc. | | | 800 | | | | 29,664 | | |
First Niagara Financial
Group, Inc. | | | 2,100 | | | | 29,442 | | |
| First Place Financial Corp. | | | 1,900 | | | | 43,719 | | |
| FirstFed Financial Corp.(a) | | | 100 | | | | 5,767 | | |
| FNB Corp., VA | | | 500 | | | | 18,500 | | |
| Franklin Bank Corp.(a) | | | 2,500 | | | | 50,475 | | |
| Great Southern Bancorp, Inc. | | | 800 | | | | 24,424 | | |
| Heartland Financial USA, Inc. | | | 100 | | | | 2,665 | | |
| Horizon Financial Corp. | | | 1,200 | | | | 32,916 | | |
| Independent Bank Corp. | | | 1,100 | | | | 28,930 | | |
| Integra Bank Corp. | | | 2,000 | | | | 43,500 | | |
| ITLA Capital Corp. | | | 400 | | | | 21,032 | | |
| MAF Bancorp, Inc. | | | 1,400 | | | | 59,976 | | |
MainSource Financial
Group, Inc. | | | 600 | | | | 10,458 | | |
| MCG Capital Corp. | | | 2,900 | | | | 46,110 | | |
| NASB Financial, Inc. | | | 100 | | | | 3,377 | | |
| NetBank, Inc. | | | 1,300 | | | | 8,619 | | |
| Oceanfirst Financial Corp. | | | 200 | | | | 4,444 | | |
| Old National Bancorp | | | 3,600 | | | | 71,892 | | |
| Omega Financial Corp. | | | 1,400 | | | | 43,834 | | |
| Pacific Capital Bancorp | | | 300 | | | | 9,336 | | |
Partners Trust Financial
Group, Inc. | | | 2,200 | | | | 25,102 | | |
Pennfed Financial
Services, Inc. | | | 800 | | | | 14,920 | | |
| Peoples Bancorp, Inc. | | | 600 | | | | 17,904 | | |
| | | Number of
Shares | | Market
Value | |
| PFF Bancorp, Inc. | | | 200 | | | $ | 6,632 | | |
| Provident Bankshares Corp. | | | 700 | | | | 25,473 | | |
Provident Financial
Services, Inc. | | | 3,100 | | | | 55,645 | | |
| R&G Financial Corp. Cl. B | | | 2,700 | | | | 23,193 | | |
| Renasant Corp. | | | 1,100 | | | | 44,385 | | |
| Republic Bancorp, Inc. | | | 1,400 | | | | 17,346 | | |
| Sandy Spring Bancorp, Inc. | | | 800 | | | | 28,848 | | |
| Santander BanCorp | | | 1,000 | | | | 24,620 | | |
| SCBT Financial Corp. | | | 300 | | | | 10,695 | | |
Simmons First National
Corp. Cl. A | | | 900 | | | | 26,109 | | |
| Sterling Bancshares, Inc. | | | 800 | | | | 15,000 | | |
| Susquehanna Bancshares, Inc. | | | 1,700 | | | | 40,630 | | |
| TierOne Corp. | | | 100 | | | | 3,377 | | |
| Trustmark Corp. | | | 1,100 | | | | 34,067 | | |
| Union Bankshares Corp. | | | 400 | | | | 17,256 | | |
| United Bankshares, Inc. | | | 1,000 | | | | 36,630 | | |
United Community
Financial Corp. | | | 4,700 | | | | 56,400 | | |
| WesBanco, Inc. | | | 300 | | | | 9,297 | | |
| West Coast Bancorp | | | 500 | | | | 14,735 | | |
| WSFS Financial Corp. | | | 100 | | | | 6,145 | | |
| | | | 1,765,004 | | |
| Beverages — 0.4% | |
Boston Beer Co.,
Inc. Cl. A(a) | | | 1,300 | | | | 38,077 | | |
| M&F Worldwide Corp.(a) | | | 600 | | | | 9,660 | | |
| | | | 47,737 | | |
| Broadcasting, Publishing & Printing — 2.6% | |
American Greetings
Corp. Cl. A | | | 2,800 | | | | 58,828 | | |
| Citadel Broadcasting Corp. | | | 3,200 | | | | 28,480 | | |
| Cox Radio, Inc. Cl. A(a) | | | 4,100 | | | | 59,122 | | |
Cumulus Media,
Inc. Cl. A(a) | | | 300 | | | | 3,201 | | |
Emmis Communications
Corp. Cl. A(a) | | | 100 | | | | 1,564 | | |
Entercom
Communications Corp. | | | 1,100 | | | | 28,776 | | |
Entravision Communications
Corp. Cl. A(a) | | | 2,200 | | | | 18,854 | | |
| Gray Television, Inc. | | | 2,100 | | | | 12,159 | | |
| Journal Register Co. | | | 1,100 | | | | 9,856 | | |
| Lin TV Corp. Cl. A(a) | | | 1,400 | | | | 10,570 | | |
| Reader's Digest Association | | | 1,100 | | | | 15,356 | | |
Salem Communications
Corp. Cl. A | | | 100 | | | | 1,301 | | |
| Scholastic Corp.(a) | | | 1,600 | | | | 41,552 | | |
| | | | 289,619 | | |
(Continued)
The accompanying notes are an integral part of the financial statements.
128
MassMutual Select Small Cap Value Equity Fund – Portfolio of Investments (Continued)
| | | Number of
Shares | | Market
Value | |
| Building Materials & Construction — 1.8% | |
| Comfort Systems USA, Inc. | | | 1,600 | | | $ | 22,864 | | |
| Emcor Group, Inc.(a) | | | 1,500 | | | | 73,005 | | |
| Granite Construction, Inc. | | | 800 | | | | 36,216 | | |
| Texas Industries, Inc. | | | 1,300 | | | | 69,030 | | |
| | | | 201,115 | | |
| Chemicals — 3.3% | |
| Georgia Gulf Corp. | | | 100 | | | | 2,502 | | |
| H.B. Fuller Co. | | | 1,200 | | | | 52,284 | | |
| Hercules, Inc.(a) | | | 4,100 | | | | 62,566 | | |
| Innospec, Inc. | | | 2,300 | | | | 58,466 | | |
| Olin Corp. | | | 200 | | | | 3,586 | | |
| OM Group, Inc.(a) | | | 1,800 | | | | 55,530 | | |
| Schulman (A.), Inc. | | | 200 | | | | 4,578 | | |
| TETRA Technologies, Inc.(a) | | | 3,100 | | | | 54,994 | | |
| UAP Holding Corp. | | | 1,800 | | | | 39,258 | | |
| Usec, Inc. | | | 3,000 | | | | 35,550 | | |
| | | | 369,314 | | |
| Commercial Services — 5.8% | |
Celera Genomics
Group - Applera Corp.(a) | | | 200 | | | | 2,590 | | |
| Consolidated Graphics, Inc.(a) | | | 400 | | | | 20,824 | | |
Dollar Thrifty Automotive
Group, Inc.(a) | | | 100 | | | | 4,507 | | |
| Dycom Industries, Inc.(a) | | | 100 | | | | 2,129 | | |
| Forrester Research, Inc.(a) | | | 1,600 | | | | 44,768 | | |
| FTD Group, Inc.(a) | | | 3,800 | | | | 51,300 | | |
| Harris Interactive, Inc.(a) | | | 4,800 | | | | 27,360 | | |
| Ipass, Inc.(a) | | | 1,000 | | | | 5,600 | | |
| John H. Harland Co. | | | 1,400 | | | | 60,900 | | |
Magellan Health
Services, Inc.(a) | | | 900 | | | | 40,779 | | |
Marlin Business
Services Corp.(a) | | | 1,000 | | | | 22,560 | | |
| Maximus, Inc. | | | 100 | | | | 2,315 | | |
| MPS Group, Inc.(a) | | | 2,400 | | | | 36,144 | | |
| NCO Group, Inc.(a) | | | 500 | | | | 13,220 | | |
| Pegasystems, Inc. | | | 1,500 | | | | 9,630 | | |
| PRA International(a) | | | 100 | | | | 2,227 | | |
| Regis Corp. | | | 200 | | | | 7,122 | | |
| Rent-A-Center, Inc.(a) | | | 200 | | | | 4,972 | | |
| SOURCECORP, Inc.(a) | | | 700 | | | | 17,353 | | |
| Spherion Corp.(a) | | | 4,400 | | | | 40,128 | | |
| Standard Parking Corp.(a) | | | 400 | | | | 10,832 | | |
Stewart Enterprises,
Inc. Cl. A | | | 5,100 | | | | 29,325 | | |
| The Standard Register Co. | | | 1,600 | | | | 18,960 | | |
| Unifirst Corp. | | | 200 | | | | 6,900 | | |
Universal Compression
Holdings, Inc.(a) | | | 1,300 | | | | 81,861 | | |
| Vertrue, Inc.(a) | | | 300 | | | | 12,909 | | |
Volt Information
Sciences, Inc.(a) | | | 1,000 | | | | 46,600 | | |
| | | Number of
Shares | | Market
Value | |
| Wright Express Corp.(a) | | | 1,000 | | | $ | 28,740 | | |
| | | | 652,555 | | |
| Communications — 1.7% | |
| CT Communications, Inc. | | | 2,500 | | | | 57,175 | | |
| Cubic Corp. | | | 800 | | | | 15,688 | | |
| Ditech Networks, Inc.(a) | | | 2,700 | | | | 23,544 | | |
| McData Corp. Cl. A(a) | | | 1,400 | | | | 5,712 | | |
| Polycom, Inc.(a) | | | 1,200 | | | | 26,304 | | |
Standard
Microsystems Corp.(a) | | | 100 | | | | 2,183 | | |
| Sycamore Networks, Inc.(a) | | | 3,500 | | | | 14,210 | | |
| Syniverse Holdings, Inc.(a) | | | 100 | | | | 1,470 | | |
| Ulticom, Inc.(a) | | | 3,900 | | | | 40,833 | | |
| UTStarcom, Inc.(a) | | | 300 | | | | 2,337 | | |
| | | | 189,456 | | |
| Computer Integrated Systems Design — 1.1% | |
| Adaptec, Inc.(a) | | | 2,700 | | | | 11,718 | | |
| Brady Corp. Cl. A | | | 1,400 | | | | 51,576 | | |
| Netscout Systems, Inc.(a) | | | 3,600 | | | | 32,112 | | |
| Perot Systems Corp. Cl. A(a) | | | 1,400 | | | | 20,272 | | |
| RadiSys Corp.(a) | | | 400 | | | | 8,784 | | |
| | | | 124,462 | | |
| Computer Maintenance & Repair — 0.2% | |
Electronics for
Imaging, Inc.(a) | | | 1,200 | | | | 25,056 | | |
| Computer Programming Services — 0.2% | |
| Ciber, Inc.(a) | | | 1,200 | | | | 7,908 | | |
| Covansys Corp.(a) | | | 500 | | | | 6,285 | | |
| RealNetworks, Inc.(a) | | | 1,200 | | | | 12,840 | | |
| | | | 27,033 | | |
| Computer Related Services — 0.2% | |
| Checkpoint Systems, Inc.(a) | | | 500 | | | | 11,105 | | |
| RSA Security, Inc.(a) | | | 500 | | | | 13,595 | | |
| | | | 24,700 | | |
| Computers & Information — 1.5% | |
| Black Box Corp. | | | 400 | | | | 15,332 | | |
| Cirrus Logic, Inc.(a) | | | 1,200 | | | | 9,768 | | |
| Emulex Corp.(a) | | | 1,500 | | | | 24,405 | | |
| Extreme Networks, Inc.(a) | | | 2,100 | | | | 8,736 | | |
| Foundry Networks, Inc.(a) | | | 1,400 | | | | 14,924 | | |
Global Imaging
Systems, Inc.(a) | | | 300 | | | | 12,384 | | |
| Palm Inc.(a) | | | 4,000 | | | | 64,400 | | |
| ProQuest Co.(a) | | | 1,100 | | | | 13,519 | | |
| Quantum Corp.(a) | | | 3,500 | | | | 9,170 | | |
| | | | 172,638 | | |
| Containers — 0.4% | |
| Silgan Holdings, Inc. | | | 1,200 | | | | 44,412 | | |
| | | Number of
Shares | | Market
Value | |
| Data Processing & Preparation — 0.6% | |
CSG Systems
International, Inc.(a) | | | 2,400 | | | $ | 59,376 | | |
| eFunds Corp.(a) | | | 600 | | | | 13,230 | | |
| | | | 72,606 | | |
| Electric Utilities — 2.5% | |
| Avista Corp. | | | 1,200 | | | | 27,396 | | |
| Black Hills Corp. | | | 400 | | | | 13,732 | | |
| CH Energy Group, Inc. | | | 200 | | | | 9,600 | | |
| Cleco Corp. | | | 1,500 | | | | 34,875 | | |
| Duquesne Light Holdings, Inc. | | | 3,400 | | | | 55,896 | | |
| El Paso Electric Co.(a) | | | 500 | | | | 10,080 | | |
| Idacorp, Inc. | | | 700 | | | | 24,003 | | |
| NorthWestern Corp. | | | 800 | | | | 27,480 | | |
| Portland General Electric Co. | | | 200 | | | | 4,994 | | |
| Westar Energy, Inc. | | | 3,600 | | | | 79,200 | | |
| | | | 287,256 | | |
| Electrical Equipment & Electronics — 6.4% | |
| Agilysys, Inc. | | | 2,600 | | | | 46,800 | | |
| AMIS Holdings, Inc.(a) | | | 400 | | | | 4,000 | | |
| Anaren, Inc.(a) | | | 1,300 | | | | 26,637 | | |
| Barnes Group, Inc. | | | 2,200 | | | | 43,890 | | |
| Belden CDT, Inc. | | | 1,500 | | | | 49,575 | | |
| CTS Corp. | | | 3,700 | | | | 55,093 | | |
| Cymer, Inc.(a) | | | 900 | | | | 41,814 | | |
Electro Scientific
Industries, Inc.(a) | | | 500 | | | | 8,995 | | |
| Exar Corp.(a) | | | 500 | | | | 6,635 | | |
| Genesis Microchip, Inc.(a) | | | 700 | | | | 8,092 | | |
| Graftech International Ltd.(a) | | | 300 | | | | 1,740 | | |
| Kopin Corp.(a) | | | 3,500 | | | | 12,635 | | |
Lattice
Semiconductor Corp.(a) | | | 300 | | | | 1,854 | | |
| Littelfuse, Inc.(a) | | | 1,700 | | | | 58,446 | | |
| Methode Electronics, Inc. | | | 700 | | | | 7,357 | | |
| MKS Instruments, Inc.(a) | | | 3,000 | | | | 60,360 | | |
| Moog, Inc. Cl. A(a) | | | 1,200 | | | | 41,064 | | |
| Newport Corp.(a) | | | 800 | | | | 12,896 | | |
Oplink
Communications, Inc.(a) | | | 1,100 | | | | 20,141 | | |
Pericom
Semiconductor Corp.(a) | | | 1,200 | | | | 9,960 | | |
| Portalplayer, Inc.(a) | | | 900 | | | | 8,829 | | |
| RF Micro Devices, Inc.(a) | | | 2,500 | | | | 14,925 | | |
| Skyworks Solutions, Inc.(a) | | | 6,700 | | | | 36,917 | | |
| Spectrum Brands, Inc.(a) | | | 4,300 | | | | 55,556 | | |
| Technitrol, Inc. | | | 900 | | | | 20,835 | | |
Triquint
Semiconductor, Inc.(a) | | | 2,700 | | | | 12,042 | | |
| TTM Technologies, Inc.(a) | | | 1,400 | | | | 20,258 | | |
| Zoran Corp.(a) | | | 1,400 | | | | 34,076 | | |
| | | | 721,422 | | |
(Continued)
The accompanying notes are an integral part of the financial statements.
129
MassMutual Select Small Cap Value Equity Fund – Portfolio of Investments (Continued)
| | | Number of
Shares | | Market
Value | |
| Electronics — 0.0% | |
| Imation Corp. | | | 100 | | | $ | 4,105 | | |
| Energy — 4.0% | |
| Alon USA Energy, Inc. | | | 700 | | | | 22,029 | | |
| Bill Barrett Corp.(a) | | | 1,100 | | | | 32,571 | | |
| Callon Petroleum Co.(a) | | | 600 | | | | 11,604 | | |
| Giant Industries, Inc.(a) | | | 400 | | | | 26,620 | | |
Harvest Natural
Resources, Inc.(a) | | | 3,000 | | | | 40,620 | | |
| Houston Exploration Co.(a) | | | 200 | | | | 12,238 | | |
| The Laclede Group, Inc. | | | 900 | | | | 30,924 | | |
| Newpark Resources, Inc.(a) | | | 1,600 | | | | 9,840 | | |
| Nicor, Inc. | | | 300 | | | | 12,450 | | |
| Northwest Natural Gas Co. | | | 700 | | | | 25,921 | | |
| Penn Virginia Corp. | | | 700 | | | | 48,916 | | |
| Peoples Energy Corp. | | | 1,000 | | | | 35,910 | | |
| Petrohawk Energy Corp.(a) | | | 100 | | | | 1,260 | | |
Remington Oil &
Gas Corp.(a) | | | 100 | | | | 4,397 | | |
| South Jersey Industries, Inc. | | | 500 | | | | 13,695 | | |
| Southwest Gas Corp. | | | 700 | | | | 21,938 | | |
| Stone Energy Corp.(a) | | | 400 | | | | 18,620 | | |
| Swift Energy Co.(a) | | | 700 | | | | 30,051 | | |
| Transmontaigne, Inc.(a) | | | 600 | | | | 6,726 | | |
| Veritas DGC, Inc.(a) | | | 1,000 | | | | 51,580 | | |
| | | | 457,910 | | |
| Entertainment & Leisure — 1.3% | |
| Blockbuster, Inc. Cl. A(a) | | | 900 | | | | 4,482 | | |
| JAKKS Pacific, Inc.(a) | | | 600 | | | | 12,054 | | |
| Lakes Entertainment, Inc.(a) | | | 1,000 | | | | 12,090 | | |
| Leapfrog Enterprises, Inc.(a) | | | 1,500 | | | | 15,150 | | |
| Live Nation, Inc.(a) | | | 3,000 | | | | 61,080 | | |
| Macrovision Corp.(a) | | | 500 | | | | 10,760 | | |
| Multimedia Games, Inc.(a) | | | 900 | | | | 9,117 | | |
Steinway Musical
Instruments, Inc.(a) | | | 1,000 | | | | 24,520 | | |
| | | | 149,253 | | |
| Environmental Controls — 0.0% | |
| Input/Output, Inc.(a) | | | 200 | | | | 1,890 | | |
| Financial Services — 12.1% | |
Accredited Home Lenders
Holding Co.(a) | | | 500 | | | | 23,905 | | |
American Financial
Realty Trust | | | 4,600 | | | | 44,528 | | |
American Home Mortgage
Investment Corp. REIT | | | 1,500 | | | | 55,290 | | |
| Anthracite Capital, Inc. REIT | | | 4,300 | | | | 52,288 | | |
| Anworth Mortgage Asset Corp. | | | 300 | | | | 2,490 | | |
| Arbor Realty Trust, Inc. REIT | | | 500 | | | | 12,525 | | |
Capital Lease Funding,
Inc. REIT | | | 700 | | | | 7,987 | | |
| Capital Trust Cl. A REIT | | | 1,200 | | | | 42,744 | | |
| | | Number of
Shares | | Market
Value | |
| Chittenden Corp. | | | 800 | | | $ | 20,680 | | |
DiamondRock
Hospitality Co. REIT | | | 4,300 | | | | 63,683 | | |
| Doral Financial Corp. | | | 1,500 | | | | 9,615 | | |
Education Realty Trust,
Inc. REIT | | | 900 | | | | 14,985 | | |
| The Enstar Group, Inc.(a) | | | 200 | | | | 18,438 | | |
| Equity Inns, Inc. REIT | | | 1,300 | | | | 21,528 | | |
| FelCor Lodging Trust, Inc. | | | 3,200 | | | | 69,568 | | |
Fieldstone Investment
Corp. REIT | | | 4,500 | | | | 41,220 | | |
First Industrial Realty
Trust, Inc. | | | 700 | | | | 26,558 | | |
Friedman Billings Ramsey
Group, Inc. Cl. A | | | 4,500 | | | | 49,365 | | |
Glenborough Realty
Trust, Inc. | | | 2,800 | | | | 60,312 | | |
| Gramercy Capital Corp. REIT | | | 1,700 | | | | 44,030 | | |
Heritage Property Investment
Trust REIT | | | 400 | | | | 13,968 | | |
Highland Hospitality
Corp. REIT | | | 3,400 | | | | 47,872 | | |
| Highwoods Properties, Inc. | | | 1,000 | | | | 36,180 | | |
IMPAC Mortgage Holdings,
Inc. REIT | | | 1,500 | | | | 16,770 | | |
| Innkeepers USA Trust | | | 1,200 | | | | 20,736 | | |
| Kite Realty Group Trust REIT | | | 800 | | | | 12,472 | | |
Knight Capital Group,
Inc. Cl. A(a) | | | 1,000 | | | | 15,230 | | |
| LaBranche & Co., Inc.(a) | | | 2,700 | | | | 32,697 | | |
| LTC Properties, Inc. | | | 500 | | | | 11,175 | | |
Medical Properties Trust,
Inc. REIT | | | 5,000 | | | | 55,200 | | |
National Health Investors,
Inc. REIT | | | 500 | | | | 13,445 | | |
Nationwide Health Properties,
Inc. REIT | | | 500 | | | | 11,255 | | |
| Novastar Financial, Inc. | | | 500 | | | | 15,805 | | |
Omega Healthcare
Investors, Inc. REIT | | | 100 | | | | 1,322 | | |
| Pennsylvania REIT | | | 1,400 | | | | 56,518 | | |
| Piper Jaffray Cos.(a) | | | 900 | | | | 55,089 | | |
| PS Business Parks, Inc. REIT | | | 900 | | | | 53,100 | | |
Senior Housing
Properties Trust | | | 3,800 | | | | 68,058 | | |
| Stifel Financial Corp.(a) | | | 100 | | | | 3,531 | | |
| Strategic Hotels & Resorts, Inc. | | | 1,600 | | | | 33,184 | | |
| SWS Group, Inc. | | | 500 | | | | 12,060 | | |
| Trustreet Properties, Inc. REIT | | | 4,100 | | | | 54,079 | | |
Waddell & Reed Financial,
Inc. Cl. A | | | 700 | | | | 14,392 | | |
| Winston Hotels, Inc. REIT | | | 3,400 | | | | 41,650 | | |
| | | | 1,377,527 | | |
| | | Number of
Shares | | Market
Value | |
| Foods — 1.6% | |
Chiquita Brands
International, Inc. | | | 2,000 | | | $ | 27,560 | | |
| Flowers Foods, Inc. | | | 100 | | | | 2,864 | | |
| Hain Celestial Group, Inc.(a) | | | 500 | | | | 12,880 | | |
| J&J Snack Foods Corp. | | | 100 | | | | 3,307 | | |
| Pathmark Stores, Inc.(a) | | | 1,000 | | | | 9,410 | | |
Performance Food
Group Co.(a) | | | 1,500 | | | | 45,570 | | |
| Sensient Technologies Corp. | | | 3,200 | | | | 66,912 | | |
| TreeHouse Foods, Inc.(a) | | | 500 | | | | 11,945 | | |
| | | | 180,448 | | |
| Forest Products & Paper — 1.6% | |
| BlueLinx Holdings, Inc. | | | 2,500 | | | | 32,575 | | |
Building Materials
Holding Corp. | | | 100 | | | | 2,787 | | |
| Greif, Inc. Cl. A | | | 500 | | | | 37,480 | | |
| Rock-Tenn Co. Cl. A | | | 3,200 | | | | 51,040 | | |
| United Stationers, Inc.(a) | | | 1,200 | | | | 59,184 | | |
| | | | 183,066 | | |
| Healthcare — 0.5% | |
| Alliance Imaging, Inc.(a) | | | 800 | | | | 5,120 | | |
Cross Country
Healthcare, Inc.(a) | | | 1,800 | | | | 32,742 | | |
| Kindred Healthcare, Inc.(a) | | | 200 | | | | 5,200 | | |
| Odyssey Healthcare, Inc.(a) | | | 900 | | | | 15,813 | | |
| | | | 58,875 | | |
| Heavy Machinery — 0.4% | |
| Cascade Corp. | | | 400 | | | | 15,820 | | |
| Lawson Products | | | 100 | | | | 3,942 | | |
| Lindsay Manufacturing Co. | | | 200 | | | | 5,424 | | |
| NACCO Industries, Inc. Cl. A | | | 100 | | | | 13,741 | | |
| NN, Inc. | | | 200 | | | | 2,470 | | |
| | | | 41,397 | | |
Home Construction, Furnishings &
Appliances — 0.7% | |
Furniture Brands
International, Inc. | | | 900 | | | | 18,756 | | |
Kimball International,
Inc. Cl. B | | | 2,900 | | | | 57,159 | | |
| Palm Harbor Homes, Inc.(a) | | | 100 | | | | 1,759 | | |
| | | | 77,674 | | |
| Household Products — 0.1% | |
| Ferro Corp. | | | 800 | | | | 12,768 | | |
| Industrial – Diversified — 0.4% | |
| Blyth, Inc. | | | 100 | | | | 1,846 | | |
| Nordson Corp. | | | 800 | | | | 39,344 | | |
| | | | 41,190 | | |
(Continued)
The accompanying notes are an integral part of the financial statements.
130
MassMutual Select Small Cap Value Equity Fund – Portfolio of Investments (Continued)
| | | Number of
Shares | | Market
Value | |
| Information Retrieval Services — 0.6% | |
| Avocent Corp.(a) | | | 1,500 | | | $ | 39,375 | | |
| InfoSpace, Inc.(a) | | | 1,300 | | | | 29,471 | | |
| | | | 68,846 | | |
| Insurance — 5.7% | |
21st Century
Insurance Group | | | 400 | | | | 5,760 | | |
Affirmative Insurance
Holdings, Inc. | | | 2,900 | | | | 45,385 | | |
| Alfa Corp. | | | 1,000 | | | | 16,560 | | |
American Equity
Investment Life
Holding Co. | | | 600 | | | | 6,396 | | |
| AMERIGROUP Corp.(a) | | | 2,100 | | | | 65,184 | | |
| Argonaut Group, Inc.(a) | | | 800 | | | | 24,032 | | |
| Clark, Inc. | | | 200 | | | | 2,640 | | |
Delphi Financial Group,
Inc. Cl. A | | | 600 | | | | 21,816 | | |
| Direct General Corp. | | | 1,600 | | | | 27,072 | | |
FBL Financial Group,
Inc. Cl. A | | | 1,700 | | | | 55,080 | | |
Great American Financial
Resources, Inc. | | | 100 | | | | 2,093 | | |
| Harleysville Group, Inc. | | | 800 | | | | 25,376 | | |
Horace Mann
Educators Corp. | | | 800 | | | | 13,560 | | |
| NYMAGIC, Inc. | | | 500 | | | | 14,525 | | |
| Odyssey Re Holdings Corp. | | | 2,100 | | | | 55,335 | | |
| Ohio Casualty Corp. | | | 2,100 | | | | 62,433 | | |
The Phoenix
Companies, Inc. | | | 4,300 | | | | 60,544 | | |
Safety Insurance
Group, Inc. | | | 1,000 | | | | 47,550 | | |
SeaBright Insurance
Holdings(a) | | | 1,600 | | | | 25,776 | | |
| State Auto Financial Corp. | | | 500 | | | | 16,270 | | |
| Triad Guaranty, Inc.(a) | | | 1,200 | | | | 58,656 | | |
| | | | 652,043 | | |
| Lodging — 0.8% | |
| Ameristar Casinos, Inc. | | | 200 | | | | 3,890 | | |
| Great Wolf Resorts Inc.(a) | | | 700 | | | | 8,407 | | |
| LaSalle Hotel Properties | | | 400 | | | | 18,520 | | |
| Lodgian, Inc.(a) | | | 600 | | | | 8,550 | | |
| Vail Resorts, Inc.(a) | | | 1,300 | | | | 48,230 | | |
| | | | 87,597 | | |
| Machinery & Components — 1.2% | |
| Asyst Technologies, Inc.(a) | | | 3,000 | | | | 22,590 | | |
| Axcelis Technologies, Inc.(a) | | | 3,300 | | | | 19,470 | | |
| Kadant, Inc.(a) | | | 1,300 | | | | 29,900 | | |
| Regal-Beloit Corp. | | | 500 | | | | 22,075 | | |
| Valmont Industries, Inc. | | | 400 | | | | 18,596 | | |
| Woodward Governor Co. | | | 900 | | | | 27,459 | | |
| | | | 140,090 | | |
| | | Number of
Shares | | Market
Value | |
| Medical Supplies — 1.4% | |
Bio-Rad Laboratories,
Inc. Cl. A(a) | | | 500 | | | $ | 32,470 | | |
| Coherent, Inc.(a) | | | 700 | | | | 23,611 | | |
| Excel Technology, Inc.(a) | | | 100 | | | | 2,992 | | |
| MTS Systems Corp. | | | 300 | | | | 11,853 | | |
Rofin-Sinar
Technologies, Inc.(a) | | | 400 | | | | 22,988 | | |
| Varian, Inc.(a) | | | 500 | | | | 20,755 | | |
| Vital Signs, Inc. | | | 800 | | | | 39,624 | | |
| | | | 154,293 | | |
| Metals & Mining — 1.6% | |
| Castle (A.M.) & Co. | | | 1,200 | | | | 38,700 | | |
| Circor International, Inc. | | | 400 | | | | 12,196 | | |
| General Cable Corp.(a) | | | 100 | | | | 3,500 | | |
| Gibraltar Industries, Inc. | | | 2,100 | | | | 60,900 | | |
| Quanex Corp. | | | 150 | | | | 6,461 | | |
| Stillwater Mining Co.(a) | | | 1,400 | | | | 17,752 | | |
| Superior Essex, Inc.(a) | | | 1,500 | | | | 44,895 | | |
| | | | 184,404 | | |
| Oil & Gas — 0.3% | |
| WGL Holdings, Inc. | | | 1,100 | | | | 31,845 | | |
| Pharmaceuticals — 2.0% | |
Albany Molecular
Research, Inc.(a) | | | 2,900 | | | | 30,972 | | |
| Alpharma, Inc. Cl. A | | | 1,700 | | | | 40,868 | | |
Martek
Biosciences Corp.(a) | | | 200 | | | | 5,790 | | |
| Maxygen, Inc.(a) | | | 200 | | | | 1,496 | | |
| Molecular Devices Corp.(a) | | | 1,100 | | | | 33,616 | | |
| NBTY, Inc.(a) | | | 1,100 | | | | 26,301 | | |
| Perrigo Co. | | | 3,500 | | | | 56,350 | | |
Prestige Brands
Holdings, Inc.(a) | | | 2,700 | | | | 26,919 | | |
Savient
Pharmaceuticals, Inc.(a) | | | 800 | | | | 4,200 | | |
| | | | 226,512 | | |
| Prepackaged Software — 2.5% | |
| Altiris, Inc.(a) | | | 1,000 | | | | 18,040 | | |
| Aspen Technology, Inc.(a) | | | 4,800 | | | | 62,976 | | |
| Borland Software Corp.(a) | | | 1,500 | | | | 7,920 | | |
Brocade Communications
Systems, Inc.(a) | | | 4,300 | | | | 26,402 | | |
Dendrite
International, Inc.(a) | | | 1,600 | | | | 14,784 | | |
| EPIQ Systems, Inc.(a) | | | 600 | | | | 9,984 | | |
Internet Security
Systems, Inc.(a) | | | 100 | | | | 1,885 | | |
| Keane, Inc.(a) | | | 1,500 | | | | 18,750 | | |
Magma Design
Automation, Inc.(a) | | | 2,900 | | | | 21,315 | | |
| Opnet Technologies, Inc.(a) | | | 3,000 | | | | 38,880 | | |
| | | Number of
Shares | | Market
Value | |
| SonicWALL, Inc.(a) | | | 6,000 | | | $ | 53,940 | | |
| Sybase, Inc.(a) | | | 300 | | | | 5,820 | | |
| | | | 280,696 | | |
| Real Estate — 0.5% | |
| Alderwoods Group, Inc.(a) | | | 2,800 | | | | 54,488 | | |
| Restaurants — 1.1% | |
| CEC Entertainment, Inc.(a) | | | 500 | | | | 16,060 | | |
| Domino's Pizza, Inc. | | | 700 | | | | 17,318 | | |
| Jack in the Box, Inc.(a) | | | 500 | | | | 19,600 | | |
Krispy Kreme
Doughnuts, Inc.(a) | | | 1,100 | | | | 8,954 | | |
| Landry's Restaurants, Inc. | | | 500 | | | | 16,225 | | |
Papa John's
International, Inc.(a) | | | 1,400 | | | | 46,480 | | |
| | | | 124,637 | | |
| Retail — 1.7% | |
| 99 Cents Only Stores(a) | | | 2,000 | | | | 20,920 | | |
| Big Lots, Inc.(a) | | | 4,100 | | | | 70,028 | | |
| Casey's General Stores, Inc. | | | 400 | | | | 10,004 | | |
Cash America
International, Inc. | | | 100 | | | | 3,200 | | |
| Central Garden & Pet Co.(a) | | | 200 | | | | 8,610 | | |
| CSK Auto Corp.(a) | | | 700 | | | | 8,379 | | |
| Genesco, Inc.(a) | | | 100 | | | | 3,387 | | |
| Longs Drug Stores Corp. | | | 800 | | | | 36,496 | | |
| Stride Rite Corp. | | | 300 | | | | 3,957 | | |
| Systemax, Inc.(a) | | | 1,600 | | | | 12,480 | | |
| Zale Corp.(a) | | | 600 | | | | 14,454 | | |
| | | | 191,915 | | |
| Telephone Utilities — 1.3% | |
| Cincinnati Bell, Inc.(a) | | | 15,900 | | | | 65,190 | | |
Fairpoint
Communications, Inc. | | | 200 | | | | 2,880 | | |
General Communication,
Inc. Cl. A(a) | | | 3,800 | | | | 46,816 | | |
| Golden Telecom, Inc. | | | 500 | | | | 12,675 | | |
Iowa Telecommunications
Services, Inc. | | | 200 | | | | 3,784 | | |
| Mastec, Inc.(a) | | | 400 | | | | 5,284 | | |
TALK America
Holdings, Inc.(a) | | | 2,700 | | | | 16,713 | | |
| | | | 153,342 | | |
| Tobacco — 0.1% | |
| Vector Group Ltd. | | | 700 | | | | 11,375 | | |
| Transportation — 1.3% | |
| Arkansas Best Corp. | | | 500 | | | | 25,105 | | |
| Heartland Express, Inc. | | | 1,900 | | | | 33,991 | | |
| Horizon Lines, Inc. Cl. A | | | 3,200 | | | | 51,264 | | |
| SCS Transportation, Inc.(a) | | | 300 | | | | 8,259 | | |
| Sirva, Inc.(a) | | | 1,400 | | | | 9,058 | | |
(Continued)
The accompanying notes are an integral part of the financial statements.
131
MassMutual Select Small Cap Value Equity Fund – Portfolio of Investments (Continued)
| | | Number of
Shares | | Market
Value | |
Trico Marine
Services, Inc.(a) | | | 300 | | | $ | 10,200 | | |
| Werner Enterprises, Inc. | | | 700 | | | | 14,189 | | |
| | | | 152,066 | | |
| Water Companies — 0.7% | |
| Pico Holdings, Inc.(a) | | | 1,300 | | | | 41,925 | | |
| SJW Corp. | | | 1,400 | | | | 35,630 | | |
| | | | 77,555 | | |
TOTAL EQUITIES
(Cost $11,079,790) | | | | | | | 10,901,741 | | |
| | | Principal
Amount | | | |
| SHORT-TERM INVESTMENTS — 7.0% | |
| Repurchase Agreement | |
Investors Bank & Trust
Company Repurchase
Agreement, dated
06/30/2006, 3.75%,
due 07/03/2006(b) | | $ | 789,765 | | | | 789,765 | | |
TOTAL SHORT-TERM
INVESTMENTS
(Cost $789,765) | | | | | | | 789,765 | | |
TOTAL INVESTMENTS — 103.1%
(Cost $11,869,555)(c) | | | | | | | 11,691,506 | | |
Other Assets/
(Liabilities) — (3.1%) | | | | | | | (347,096 | ) | |
| NET ASSETS — 100.0% | | | | | | $ | 11,344,410 | | |
Notes to Portfolio of Investments
REIT - Real Estate Investment Trust
(a) Non-income producing security.
(b) Maturity value of 1,931,469. Collateralized by a U.S. Government Agency obligation with a rate of 7.625%, maturity date of 07/25/2025, and an aggregate market value, including accrued interest, of 2,027,409.
(c) See Note 6 for aggregate cost for Federal tax purposes.
The remainder of this page is intentionally left blank.
The accompanying notes are an integral part of the financial statements.
132
MassMutual Select Small Company Value Fund – Portfolio of Investments
June 30, 2006 (Unaudited)
| | | Number of
Shares | | Market
Value | |
| EQUITIES — 95.6% | |
| COMMON STOCK | |
| Aerospace & Defense — 0.4% | |
| Armor Holdings, Inc.(a) | | | 27,525 | | | $ | 1,509,196 | | |
Orbital Sciences
Corp.(a) (b) | | | 113,950 | | | | 1,839,153 | | |
| | | | 3,348,349 | | |
| Air Transportation — 0.4% | |
| Air Methods Corp.(a) | | | 52,350 | | | | 1,370,523 | | |
Continental Airlines,
Inc. Cl. B(a) (b) | | | 53,125 | | | | 1,583,125 | | |
| | | | 2,953,648 | | |
| Apparel, Textiles & Shoes — 2.4% | |
| AnnTaylor Stores Corp.(a) | | | 55,575 | | | | 2,410,843 | | |
| Brown Shoe Co., Inc. | | | 57,250 | | | | 1,951,080 | | |
| Childrens Place(a) (b) | | | 15,425 | | | | 926,271 | | |
| Culp, Inc.(a) | | | 52,000 | | | | 254,280 | | |
| Guess ?, Inc.(a) | | | 25,625 | | | | 1,069,844 | | |
| Hot Topic, Inc.(a) (b) | | | 55,700 | | | | 641,107 | | |
| Phillips-Van Heusen Corp. | | | 178,575 | | | | 6,814,422 | | |
| Too, Inc.(a) | | | 48,525 | | | | 1,862,875 | | |
Wolverine
World Wide, Inc. | | | 93,750 | | | | 2,187,187 | | |
| | | | 18,117,909 | | |
| Automotive & Parts — 1.1% | |
| Accuride Corp.(a) | | | 66,500 | | | | 829,255 | | |
Aftermarket
Technology Corp.(a) | | | 56,075 | | | | 1,393,464 | | |
| Group 1 Automotive, Inc. | | | 14,000 | | | | 788,760 | | |
| Myers Industries, Inc. | | | 106,000 | | | | 1,822,140 | | |
Winnebago
Industries, Inc.(b) | | | 112,700 | | | | 3,498,208 | | |
| | | | 8,331,827 | | |
| Banking, Savings & Loans — 8.9% | |
| Advanta Corp. Cl. B | | | 75,025 | | | | 2,697,149 | | |
| Astoria Financial Corp. | | | 121,250 | | | | 3,692,062 | | |
Bankunited Financial
Corp. Cl. A | | | 85,475 | | | | 2,608,697 | | |
Central Pacific
Financial Corp. | | | 44,300 | | | | 1,714,410 | | |
The Colonial
BancGroup, Inc. | | | 142,750 | | | | 3,665,820 | | |
| Financial Federal Corp.(b) | | | 61,125 | | | | 1,699,886 | | |
| First Charter Corp. | | | 51,200 | | | | 1,255,936 | | |
| First Midwest Bancorp, Inc. | | | 52,875 | | | | 1,960,605 | | |
| First Republic Bank | | | 131,400 | | | | 6,018,120 | | |
| Greater Bay Bancorp | | | 72,400 | | | | 2,081,500 | | |
Home
Bancshares, Inc.(a) (b) | | | 3,900 | | | | 88,530 | | |
| | | Number of
Shares | | Market
Value | |
| Nelnet, Inc. Cl. A(a) | | | 21,050 | | | $ | 853,577 | | |
| NetBank, Inc. | | | 113,500 | | | | 752,505 | | |
| Northwest Bancorp, Inc. | | | 60,300 | | | | 1,597,950 | | |
Oriental Financial
Group, Inc. | | | 37,348 | | | | 476,560 | | |
| Pacific Capital Bancorp | | | 38,300 | | | | 1,191,896 | | |
| PFF Bancorp, Inc. | | | 78,300 | | | | 2,596,428 | | |
| Prosperity Bancshares, Inc. | | | 66,050 | | | | 2,172,384 | | |
| Provident Bankshares Corp. | | | 46,250 | | | | 1,683,037 | | |
Provident Financial
Services, Inc. | | | 116,800 | | | | 2,096,560 | | |
| Sterling Bancshares, Inc. | | | 187,875 | | | | 3,522,656 | | |
| Sterling Financial Corp. | | | 112,185 | | | | 3,422,764 | | |
| Student Loan Corp. | | | 12,600 | | | | 2,545,200 | | |
| SVB Financial Group(a) (b) | | | 101,400 | | | | 4,609,644 | | |
Texas Regional
Bancshares, Inc. | | | 166,770 | | | | 6,323,918 | | |
| TierOne Corp. | | | 62,950 | | | | 2,125,821 | | |
| United Bankshares, Inc. | | | 43,000 | | | | 1,575,090 | | |
United Community
Banks, Inc.(b) | | | 49,100 | | | | 1,494,604 | | |
| West Coast Bancorp | | | 61,225 | | | | 1,804,301 | | |
| | | | 68,327,610 | | |
| Broadcasting, Publishing & Printing — 0.5% | |
| CSS Industries, Inc. | | | 62,400 | | | | 1,794,000 | | |
| Journal Register Co. | | | 99,600 | | | | 892,416 | | |
Saga Communications,
Inc. Cl. A(a) | | | 113,200 | | | | 1,025,592 | | |
| | | | 3,712,008 | | |
| Building Materials & Construction — 1.3% | |
| Andersons Inc. (The)(b) | | | 18,550 | | | | 771,865 | | |
| Eagle Materials, Inc. | | | 32,450 | | | | 1,541,375 | | |
| ElkCorp | | | 44,300 | | | | 1,230,211 | | |
| Emcor Group, Inc.(a) | | | 57,025 | | | | 2,775,407 | | |
Florida Rock
Industries, Inc.(b) | | | 77,000 | | | | 3,824,590 | | |
| | | | 10,143,448 | | |
| Chemicals — 3.3% | |
| Airgas, Inc. | | | 97,800 | | | | 3,643,050 | | |
| Arch Chemicals, Inc. | | | 83,900 | | | | 3,024,595 | | |
| Church & Dwight, Inc. | | | 43,475 | | | | 1,583,359 | | |
| H.B. Fuller Co. | | | 46,425 | | | | 2,022,737 | | |
| Innospec, Inc. | | | 75,200 | | | | 1,911,584 | | |
| MacDermid, Inc. | | | 93,500 | | | | 2,692,800 | | |
| OM Group, Inc.(a) | | | 62,325 | | | | 1,922,726 | | |
| Pioneer Cos., Inc.(a) | | | 40,325 | | | | 1,100,066 | | |
| The Scotts Miracle-Gro Co. | | | 47,500 | | | | 2,010,200 | | |
| Symyx Technologies, Inc.(a) | | | 63,500 | | | | 1,533,525 | | |
| The Valspar Corp. | | | 44,300 | | | | 1,169,963 | | |
| | | Number of
Shares | | Market
Value | |
West Pharmaceutical
Services, Inc.(b) | | | 76,700 | | | $ | 2,782,676 | | |
| | | | 25,397,281 | | |
| Commercial Services — 10.0% | |
| Aaron Rents, Inc.(b) | | | 218,200 | | | | 5,865,216 | | |
| Aaron Rents, Inc. Cl. A | | | 4,825 | | | | 116,813 | | |
| Administaff, Inc. | | | 31,798 | | | | 1,138,686 | | |
Allied Waste
Industries, Inc.(a) | | | 224,900 | | | | 2,554,864 | | |
Asset Acceptance
Capital Corp.(a) | | | 52,756 | | | | 1,044,569 | | |
Casella Waste Systems,
Inc. Cl. A(a) | | | 145,900 | | | | 1,909,831 | | |
| Diversa Corp.(a) | | | 155,300 | | | | 1,500,198 | | |
Dollar Thrifty Automotive
Group, Inc.(a) | | | 149,275 | | | | 6,727,824 | | |
| Exelixis, Inc.(a) | | | 124,500 | | | | 1,251,225 | | |
| FTI Consulting, Inc.(a) | | | 106,500 | | | | 2,851,005 | | |
| G&K Services, Inc. Cl. A | | | 74,800 | | | | 2,565,640 | | |
| Global Payments, Inc. | | | 81,300 | | | | 3,947,115 | | |
| Ipass, Inc.(a) | | | 196,650 | | | | 1,101,240 | | |
Jackson Hewitt Tax
Service, Inc. | | | 89,250 | | | | 2,797,987 | | |
| Landauer, Inc. | | | 32,900 | | | | 1,575,910 | | |
Macquarie
Infrastructure Co. Trust | | | 80,500 | | | | 2,220,995 | | |
| McGrath Rentcorp(b) | | | 131,000 | | | | 3,643,110 | | |
| Metal Management Inc. | | | 87,200 | | | | 2,670,064 | | |
MoneyGram
International, Inc. | | | 84,500 | | | | 2,868,775 | | |
| MPS Group, Inc.(a) | | | 258,800 | | | | 3,897,528 | | |
| Per-Se Technologies, Inc.(a) | | | 50,025 | | | | 1,259,629 | | |
Pharmaceutical Product
Development, Inc. | | | 161,200 | | | | 5,661,344 | | |
Portfolio Recovery
Associates, Inc.(a) (b) | | | 24,575 | | | | 1,123,077 | | |
| Quanta Services, Inc.(a) (b) | | | 115,925 | | | | 2,008,980 | | |
| Rent-A-Center, Inc.(a) | | | 75,975 | | | | 1,888,738 | | |
| Startek, Inc. | | | 89,900 | | | | 1,344,005 | | |
| Steiner Leisure Ltd.(a) | | | 21,900 | | | | 865,707 | | |
| Synagro Technologies, Inc. | | | 92,000 | | | | 361,560 | | |
| United Rentals, Inc.(a) (b) | | | 62,050 | | | | 1,984,359 | | |
| URS Corp.(a) | | | 97,825 | | | | 4,108,650 | | |
Washington Group
International, Inc. | | | 19,625 | | | | 1,046,797 | | |
Waste
Connections, Inc.(a) | | | 63,100 | | | | 2,296,840 | | |
Wireless
Facilities, Inc.(a) (b) | | | 230,300 | | | | 633,325 | | |
| | | | 76,831,606 | | |
(Continued)
The accompanying notes are an integral part of the financial statements.
133
MassMutual Select Small Company Value Fund – Portfolio of Investments (Continued)
| | | Number of
Shares | | Market
Value | |
| Communications — 0.8% | |
American Tower
Corp. Cl. A(a) (b) | | | 17,800 | | | $ | 553,936 | | |
Nice Systems Ltd. ADR
(Israel)(a) | | | 76,200 | | | | 2,144,268 | | |
| Polycom, Inc.(a) | | | 59,075 | | | | 1,294,924 | | |
Premiere Global
Services, Inc.(a) | | | 195,800 | | | | 1,478,290 | | |
SeaChange
International, Inc.(a) (b) | | | 144,225 | | | | 1,003,806 | | |
| | | | 6,475,224 | | |
| Computer Integrated Systems Design — 0.3% | |
| Websense, Inc.(a) | | | 120,900 | | | | 2,483,286 | | |
| Computer Related Services — 1.4% | |
| Carreker Corp.(a) | | | 124,975 | | | | 893,571 | | |
| Checkpoint Systems, Inc.(a) | | | 151,948 | | | | 3,374,765 | | |
| Electro Rent Corp.(a) | | | 142,100 | | | | 2,276,442 | | |
Neoware
Systems, Inc.(a) (b) | | | 78,575 | | | | 965,687 | | |
| RSA Security, Inc.(a) | | | 129,900 | | | | 3,531,981 | | |
| | | | 11,042,446 | | |
| Consumer Products — 0.6% | |
| Pool Corp.(b) | | | 100,000 | | | | 4,363,000 | | |
| Containers — 0.1% | |
| Chesapeake Corp. | | | 30,100 | | | | 493,941 | | |
| Cosmetics & Personal Care — 0.2% | |
| Elizabeth Arden, Inc.(a) | | | 74,490 | | | | 1,331,881 | | |
| Data Processing & Preparation — 0.2% | |
CSG Systems
International, Inc.(a) | | | 45,550 | | | | 1,126,907 | | |
| eFunds Corp.(a) | | | 13,500 | | | | 297,675 | | |
| | | | 1,424,582 | | |
| Electric Utilities — 2.4% | |
| Allegheny Energy, Inc.(a) | | | 39,650 | | | | 1,469,825 | | |
| Avista Corp. | | | 131,675 | | | | 3,006,140 | | |
| Black Hills Corp. | | | 79,900 | | | | 2,742,967 | | |
| Cleco Corp. | | | 101,650 | | | | 2,363,362 | | |
| El Paso Electric Co.(a) | | | 106,600 | | | | 2,149,056 | | |
| NRG Energy, Inc.(a) | | | 41,650 | | | | 2,006,697 | | |
| Otter Tail Corp. | | | 11,600 | | | | 317,028 | | |
| PNM Resources, Inc. | | | 70,900 | | | | 1,769,664 | | |
| Reliant Energy, Inc.(a) (b) | | | 102,475 | | | | 1,227,650 | | |
| Sierra Pacific Resources(a) | | | 77,175 | | | | 1,080,450 | | |
| | | | 18,132,839 | | |
| Electrical Equipment & Electronics — 6.6% | |
| Acuity Brands, Inc. | | | 37,300 | | | | 1,451,343 | | |
| Aeroflex, Inc.(a) | | | 142,275 | | | | 1,660,349 | | |
| Analogic Corp. | | | 19,900 | | | | 927,539 | | |
| | | Number of
Shares | | Market
Value | |
| ATMI, Inc.(a) (b) | | | 60,800 | | | $ | 1,496,896 | | |
| Belden CDT, Inc. | | | 104,650 | | | | 3,458,682 | | |
| C&D Technologies, Inc. | | | 97,000 | | | | 729,440 | | |
| Cymer, Inc.(a) (b) | | | 41,550 | | | | 1,930,413 | | |
| EDO Corp. | | | 51,000 | | | | 1,241,340 | | |
| Entegris, Inc.(a) | | | 206,032 | | | | 1,963,485 | | |
Fairchild Semiconductor
International, Inc.(a) (b) | | | 205,525 | | | | 3,734,389 | | |
| FLIR Systems, Inc.(a) | | | 144,800 | | | | 3,194,288 | | |
| Franklin Electric Co., Inc. | | | 95,400 | | | | 4,926,456 | | |
| Genlyte Group, Inc.(a) | | | 45,600 | | | | 3,302,808 | | |
| Hexcel Corp.(a) | | | 119,400 | | | | 1,875,774 | | |
| Littelfuse, Inc.(a) | | | 92,500 | | | | 3,180,150 | | |
| LSI Logic Corp.(a) (b) | | | 242,550 | | | | 2,170,823 | | |
| Methode Electronics, Inc. | | | 56,600 | | | | 594,866 | | |
| Moog, Inc. Cl. A(a) | | | 96,123 | | | | 3,289,329 | | |
OmniVision
Technologies, Inc.(a) (b) | | | 38,125 | | | | 805,200 | | |
ON
Semiconductor Corp.(a) (b) | | | 194,250 | | | | 1,142,190 | | |
Rudolph
Technologies, Inc.(a) | | | 58,200 | | | | 843,900 | | |
| Sanmina-SCI Corp.(a) | | | 513,600 | | | | 2,362,560 | | |
| Semtech Corp.(a) | | | 57,275 | | | | 827,624 | | |
| TTM Technologies, Inc.(a) | | | 103,675 | | | | 1,500,177 | | |
| Zoran Corp.(a) | | | 88,475 | | | | 2,153,482 | | |
| | | | 50,763,503 | | |
| Energy — 9.8% | |
| Atwood Oceanics, Inc.(a) | | | 49,300 | | | | 2,445,280 | | |
| Cabot Oil & Gas Corp. Cl. A | | | 157,375 | | | | 7,711,375 | | |
| CARBO Ceramics, Inc.(b) | | | 38,400 | | | | 1,886,592 | | |
| Denbury Resources, Inc.(a) | | | 48,500 | | | | 1,535,995 | | |
| Encore Acquisition Co.(a) | | | 39,037 | | | | 1,047,363 | | |
| Forest Oil Corp.(a) (b) | | | 90,500 | | | | 3,000,980 | | |
| Giant Industries, Inc.(a) | | | 20,925 | | | | 1,392,559 | | |
| Headwaters, Inc.(a) | | | 85,835 | | | | 2,193,943 | | |
| Helmerich & Payne, Inc. | | | 37,425 | | | | 2,255,231 | | |
| Houston Exploration Co.(a) | | | 49,300 | | | | 3,016,667 | | |
| Mariner Energy, Inc.(a) (b) | | | 72,384 | | | | 1,329,694 | | |
| Nicor, Inc.(b) | | | 38,425 | | | | 1,594,638 | | |
Oceaneering
International, Inc.(a) | | | 160,000 | | | | 7,336,000 | | |
| Oneok, Inc. | | | 114,800 | | | | 3,907,792 | | |
| Penn Virginia Corp. | | | 76,500 | | | | 5,345,820 | | |
| SEACOR Holdings, Inc.(a) | | | 23,550 | | | | 1,933,455 | | |
| Southern Union Co.(b) | | | 82,250 | | | | 2,225,685 | | |
| Southwest Gas Corp. | | | 74,300 | | | | 2,328,562 | | |
| Swift Energy Co.(a) | | | 60,700 | | | | 2,605,851 | | |
| Tesoro Corp. | | | 18,000 | | | | 1,338,480 | | |
| TETRA Technologies, Inc.(a) | | | 202,800 | | | | 6,142,812 | | |
| Todco Cl. A | | | 89,000 | | | | 3,635,650 | | |
| Union Drilling, Inc.(a) | | | 23,900 | | | | 355,154 | | |
| Vectren Corp. | | | 52,400 | | | | 1,427,900 | | |
| W-H Energy Services, Inc.(a) | | | 53,600 | | | | 2,724,488 | | |
| | | Number of
Shares | | Market
Value | |
Whiting
Petroleum Corp.(a) (b) | | | 108,025 | | | $ | 4,523,007 | | |
| | | | 75,240,973 | | |
| Entertainment & Leisure — 0.5% | |
| Callaway Golf Co.(b) | | | 122,600 | | | | 1,592,574 | | |
| Live Nation, Inc.(a) | | | 42,200 | | | | 859,192 | | |
| Macrovision Corp.(a) | | | 29,000 | | | | 624,080 | | |
Multimedia
Games, Inc.(a) (b) | | | 73,225 | | | | 741,769 | | |
| | | | 3,817,615 | | |
| Financial Services — 9.7% | |
Accredited Home Lenders
Holding Co.(a) | | | 40,200 | | | | 1,921,962 | | |
Affiliated Managers
Group, Inc.(a) (b) | | | 16,150 | | | | 1,403,274 | | |
| AG Edwards, Inc. | | | 19,425 | | | | 1,074,591 | | |
| Allied Capital Corp.(b) | | | 84,000 | | | | 2,416,680 | | |
American Capital
Strategies Ltd.(b) | | | 35,300 | | | | 1,181,844 | | |
| AmeriCredit Corp.(a) | | | 29,100 | | | | 812,472 | | |
Annaly Mortgage
Management, Inc. REIT | | | 141,800 | | | | 1,816,458 | | |
Boston Private Financial
Holdings, Inc. | | | 42,200 | | | | 1,177,380 | | |
| Capital Trust Cl. A REIT | | | 22,050 | | | | 785,421 | | |
CBL & Associates
Properties, Inc. REIT(b) | | | 33,350 | | | | 1,298,316 | | |
Columbia Equity Trust,
Inc. REIT | | | 53,500 | | | | 821,760 | | |
| East West Bancorp, Inc. | | | 171,150 | | | | 6,488,297 | | |
| Eaton Vance Corp. | | | 111,527 | | | | 2,783,714 | | |
FelCor Lodging
Trust, Inc.(b) | | | 281,975 | | | | 6,130,137 | | |
First Potomac Realty
Trust REIT | | | 86,200 | | | | 2,567,898 | | |
Glenborough Realty
Trust, Inc.(b) | | | 51,100 | | | | 1,100,694 | | |
| Home Properties, Inc.(b) | | | 34,250 | | | | 1,901,218 | | |
| Innkeepers USA Trust | | | 74,100 | | | | 1,280,448 | | |
Investment Technology
Group, Inc.(a) | | | 26,350 | | | | 1,340,161 | | |
| Jefferies Group, Inc. | | | 200,525 | | | | 5,941,556 | | |
| Kilroy Realty Corp.(b) | | | 82,700 | | | | 5,975,075 | | |
| LTC Properties, Inc. | | | 58,225 | | | | 1,301,329 | | |
Mid-America Apartment
Communities, Inc. REIT | | | 50,575 | | | | 2,819,556 | | |
NorthStar Realty Finance
Corp. REIT | | | 93,475 | | | | 1,122,635 | | |
Ocwen
Financial Corp.(a) (b) | | | 110,950 | | | | 1,410,175 | | |
Raymond James
Financial, Inc. | | | 127,103 | | | | 3,847,408 | | |
(Continued)
The accompanying notes are an integral part of the financial statements.
134
MassMutual Select Small Company Value Fund – Portfolio of Investments (Continued)
| | | Number of
Shares | | Market
Value | |
Reckson Associates
Realty Corp. | | | 27,825 | | | $ | 1,151,399 | | |
| Redwood Trust, Inc.(b) | | | 19,225 | | | | 938,757 | | |
| SL Green Realty Corp. | | | 31,500 | | | | 3,448,305 | | |
Strategic Hotels &
Resorts, Inc. | | | 177,625 | | | | 3,683,943 | | |
Tanger Factory Outlet
Centers, Inc. REIT | | | 53,150 | | | | 1,720,466 | | |
| Washington REIT | | | 75,500 | | | | 2,770,850 | | |
| | | | 74,434,179 | | |
| Food Retailers — 0.3% | |
| The Pantry, Inc.(a) | | | 39,050 | | | | 2,246,937 | | |
| Foods — 0.6% | |
| Nash Finch Co.(b) | | | 36,000 | | | | 766,440 | | |
Performance Food
Group Co.(a) (b) | | | 41,650 | | | | 1,265,327 | | |
| Spartan Stores, Inc. | | | 68,600 | | | | 1,003,618 | | |
Wild Oats
Markets, Inc.(a) (b) | | | 63,700 | | | | 1,248,520 | | |
| | | | 4,283,905 | | |
| Forest Products & Paper — 1.4% | |
Building Materials
Holding Corp.(b) | | | 53,500 | | | | 1,491,045 | | |
| Deltic Timber Corp. | | | 55,500 | | | | 3,128,535 | | |
| Potlatch Corp. | | | 64,568 | | | | 2,437,442 | | |
| School Specialty, Inc.(a) | | | 50,400 | | | | 1,605,240 | | |
| Wausau Paper Corp. | | | 137,000 | | | | 1,705,650 | | |
| | | | 10,367,912 | | |
| Healthcare — 2.2% | |
Community Health
Systems, Inc.(a) | | | 34,600 | | | | 1,271,550 | | |
| Covance Inc.(a) | | | 75,200 | | | | 4,603,744 | | |
| Healthways, Inc.(a) | | | 72,230 | | | | 3,802,187 | | |
| LCA-Vision, Inc.(b) | | | 37,375 | | | | 1,977,511 | | |
Odyssey
Healthcare, Inc.(a) (b) | | | 80,900 | | | | 1,421,413 | | |
Sunrise Senior
Living, Inc.(a) | | | 80,900 | | | | 2,236,885 | | |
| VCA Antech, Inc.(a) | | | 53,500 | | | | 1,708,255 | | |
| | | | 17,021,545 | | |
| Heavy Construction — 0.3% | |
Hovnanian K.
Enterprises, Inc.(a) | | | 81,804 | | | | 2,460,664 | | |
| Heavy Machinery — 1.2% | |
Bucyrus International,
Inc. Cl. A | | | 70,050 | | | | 3,537,525 | | |
| JLG Industries, Inc. | | | 266,200 | | | | 5,989,500 | | |
| | | | 9,527,025 | | |
| | | Number of
Shares | | Market
Value | |
Home Construction, Furnishings &
Appliances — 1.4% | |
Harman International
Industries | | | 41,600 | | | $ | 3,551,392 | | |
| Meritage Homes Corp.(a) | | | 50,600 | | | | 2,390,850 | | |
| Standard-Pacific Corp. | | | 93,900 | | | | 2,413,230 | | |
| Stanley Furniture Co., Inc. | | | 88,700 | | | | 2,126,139 | | |
| | | | 10,481,611 | | |
| Household Products — 0.5% | |
| Lifetime Brands, Inc.(b) | | | 56,900 | | | | 1,233,023 | | |
| Snap-on, Inc. | | | 58,700 | | | | 2,372,654 | | |
| | | | 3,605,677 | | |
| Industrial – Diversified — 1.2% | |
| Ameron International Corp. | | | 37,500 | | | | 2,513,250 | | |
| Harsco Corp. | | | 40,800 | | | | 3,180,768 | | |
| Nordson Corp. | | | 75,000 | | | | 3,688,500 | | |
| | | | 9,382,518 | | |
| Insurance — 5.0% | |
| AMERIGROUP Corp.(a) | | | 94,100 | | | | 2,920,864 | | |
| The Commerce Group, Inc. | | | 80,694 | | | | 2,383,701 | | |
Delphi Financial
Group, Inc. Cl. A | | | 108,077 | | | | 3,929,680 | | |
FPIC Insurance
Group, Inc.(a) | | | 40,000 | | | | 1,550,000 | | |
HCC Insurance
Holdings, Inc. | | | 42,450 | | | | 1,249,728 | | |
| Markel Corp.(a) (b) | | | 8,900 | | | | 3,088,300 | | |
| Max Re Capital Ltd. | | | 99,000 | | | | 2,162,160 | | |
| The Midland Co. | | | 63,300 | | | | 2,404,134 | | |
| Navigators Group, Inc.(a) | | | 30,350 | | | | 1,329,937 | | |
| Ohio Casualty Corp. | | | 44,050 | | | | 1,309,607 | | |
Philadelphia Consolidated
Holding Corp.(a) | | | 67,882 | | | | 2,060,898 | | |
| ProAssurance Corp.(a) | | | 109,400 | | | | 5,270,892 | | |
| Protective Life Corp. | | | 27,600 | | | | 1,286,712 | | |
| Scottish Re Group Ltd. | | | 42,100 | | | | 702,228 | | |
SeaBright Insurance
Holdings(a) | | | 60,900 | | | | 981,099 | | |
| Selective Insurance Group | | | 14,975 | | | | 836,653 | | |
| State Auto Financial Corp. | | | 39,000 | | | | 1,269,060 | | |
United America
Indemnity Ltd. Cl. A(a) | | | 74,443 | | | | 1,551,392 | | |
| United Fire & Casualty Co. | | | 56,500 | | | | 1,702,345 | | |
| | | | 37,989,390 | | |
| Lodging — 0.6% | |
| LaSalle Hotel Properties(b) | | | 82,700 | | | | 3,829,010 | | |
Monarch Casino &
Resort, Inc.(a) | | | 38,200 | | | | 1,074,184 | | |
| | | | 4,903,194 | | |
| | | Number of
Shares | | Market
Value | |
| Machinery & Components — 3.3% | |
Brooks
Automation, Inc.(a) (b) | | | 262,002 | | | $ | 3,091,624 | | |
| Flowserve Corp.(a) | | | 46,125 | | | | 2,624,513 | | |
| Gardner Denver, Inc.(a) | | | 38,000 | | | | 1,463,000 | | |
| IDEX Corp. | | | 78,450 | | | | 3,702,840 | | |
Insituform Technologies,
Inc. Cl. A(a) (b) | | | 140,300 | | | | 3,211,467 | | |
| Joy Global, Inc. | | | 23,250 | | | | 1,211,093 | | |
Lone Star
Technologies, Inc.(a) | | | 37,500 | | | | 2,025,750 | | |
| Timken Co. | | | 93,400 | | | | 3,129,834 | | |
| Watsco, Inc. | | | 40,203 | | | | 2,404,943 | | |
| Woodward Governor Co. | | | 74,900 | | | | 2,285,199 | | |
| | | | 25,150,263 | | |
| Manufacturing — 0.6% | |
| AptarGroup, Inc. | | | 63,500 | | | | 3,150,235 | | |
| Terex Corp.(a) | | | 11,850 | | | | 1,169,595 | | |
| | | | 4,319,830 | | |
| Medical Supplies — 1.1% | |
| Arrow International, Inc. | | | 55,900 | | | | 1,837,433 | | |
| Cooper Cos., Inc. | | | 61,500 | | | | 2,723,835 | | |
| Owens & Minor, Inc. | | | 132,100 | | | | 3,778,060 | | |
| | | | 8,339,328 | | |
| Metals & Mining — 2.9% | |
| Carpenter Technology | | | 38,800 | | | | 4,481,400 | | |
| Commercial Metals Co. | | | 70,800 | | | | 1,819,560 | | |
| Gibraltar Industries, Inc. | | | 118,200 | | | | 3,427,800 | | |
Matthews International
Corp. Cl. A | | | 114,600 | | | | 3,950,262 | | |
| Meridian Gold, Inc.(a) | | | 74,400 | | | | 2,356,992 | | |
| NCI Building Systems, Inc.(a) | | | 19,150 | | | | 1,018,206 | | |
| NS Group, Inc.(a) | | | 20,900 | | | | 1,151,172 | | |
| Quanex Corp. | | | 21,212 | | | | 913,601 | | |
Reliance Steel &
Aluminum Co. | | | 25,250 | | | | 2,094,488 | | |
| The Shaw Group, Inc.(a) (b) | | | 33,225 | | | | 923,655 | | |
| | | | 22,137,136 | | |
| Pharmaceuticals — 1.4% | |
| Alkermes, Inc.(a) (b) | | | 66,450 | | | | 1,257,234 | | |
| Barr Pharmaceuticals(a) | | | 37,100 | | | | 1,769,299 | | |
| Molecular Devices Corp.(a) | | | 22,750 | | | | 695,240 | | |
| Myriad Genetics, Inc.(a) (b) | | | 121,700 | | | | 3,072,925 | | |
| PetMed Express, Inc.(a) | | | 78,200 | | | | 857,854 | | |
| Pharmion Corp.(a) (b) | | | 55,400 | | | | 943,462 | | |
| Serologicals Corp.(a) | | | 61,900 | | | | 1,946,136 | | |
| | | | 10,542,150 | | |
| Prepackaged Software — 1.6% | |
Aspen
Technology, Inc.(a) (b) | | | 120,625 | | | | 1,582,600 | | |
(Continued)
The accompanying notes are an integral part of the financial statements.
135
MassMutual Select Small Company Value Fund – Portfolio of Investments (Continued)
| | | Number of
Shares | | Market
Value | |
| MicroStrategy, Inc. Cl. A(a) | | | 13,300 | | | $ | 1,297,016 | | |
| Packeteer, Inc.(a) | | | 121,900 | | | | 1,382,346 | | |
| Progress Software Corp.(a) | | | 107,600 | | | | 2,518,916 | | |
| SonicWALL, Inc.(a) | | | 142,200 | | | | 1,278,378 | | |
| SPSS, Inc.(a) (b) | | | 131,875 | | | | 4,238,463 | | |
| | | | 12,297,719 | | |
| Restaurants — 1.5% | |
| Brinker International, Inc. | | | 57,801 | | | | 2,098,176 | | |
| CEC Entertainment, Inc.(a) | | | 4,634 | | | | 148,844 | | |
| Centerplate, Inc. | | | 23,700 | | | | 317,580 | | |
| Domino's Pizza, Inc. | | | 89,500 | | | | 2,214,230 | | |
RARE Hospitality
International, Inc.(a) | | | 121,800 | | | | 3,502,968 | | |
| Ruby Tuesday, Inc.(b) | | | 57,500 | | | | 1,403,575 | | |
| Sonic Corp.(a) | | | 84,950 | | | | 1,766,111 | | |
| | | | 11,451,484 | | |
| Retail — 2.7% | |
| Casey's General Stores, Inc. | | | 113,200 | | | | 2,831,132 | | |
Cash America
International, Inc. | | | 42,825 | | | | 1,370,400 | | |
| Dollar Tree Stores, Inc.(a) | | | 49,425 | | | | 1,309,763 | | |
| Fred's, Inc.(b) | | | 97,500 | | | | 1,301,625 | | |
| Gamestop Corp., Cl. A(a) (b) | | | 50,850 | | | | 2,135,700 | | |
| Genesco, Inc.(a) | | | 43,375 | | | | 1,469,111 | | |
| Hancock Fabrics, Inc. | | | 80,000 | | | | 267,200 | | |
Haverty Furniture
Companies, Inc. | | | 150,000 | | | | 2,353,500 | | |
| OfficeMax, Inc. | | | 32,300 | | | | 1,316,225 | | |
| Stein Mart, Inc. | | | 321,281 | | | | 4,754,959 | | |
ValueVision Media,
Inc. Cl. A(a) | | | 128,975 | | | | 1,422,594 | | |
| | | | 20,532,209 | | |
| Telephone Utilities — 0.1% | |
| Brightpoint, Inc.(a) | | | 64,989 | | | | 879,301 | | |
| Tobacco — 0.4% | |
Alliance One
International, Inc. | | | 143,300 | | | | 636,252 | | |
Loews Corp. -
Carolina Group | | | 48,575 | | | | 2,495,298 | | |
| | | | 3,131,550 | | |
| Transportation — 4.4% | |
| EGL, Inc.(a) (b) | | | 26,650 | | | | 1,337,830 | | |
| Freightcar America, Inc. | | | 20,475 | | | | 1,136,567 | | |
Genesee & Wyoming,
Inc. Cl. A(a) | | | 121,200 | | | | 4,298,964 | | |
Greenbrier Cos., Inc.
(The)(b) | | | 30,500 | | | | 998,570 | | |
| Hub Group, Inc. Cl. A(a) | | | 55,100 | | | | 1,351,603 | | |
| Kirby Corp.(a) | | | 134,800 | | | | 5,324,600 | | |
| Laidlaw International, Inc. | | | 59,575 | | | | 1,501,290 | | |
| | | Number of
Shares | | Market
Value | |
| Landstar System, Inc.(b) | | | 169,500 | | | $ | 8,005,485 | | |
| Pacer International, Inc. | | | 65,350 | | | | 2,129,103 | | |
| SCS Transportation, Inc.(a) | | | 64,225 | | | | 1,768,114 | | |
| Skyline Corp. | | | 43,200 | | | | 1,848,096 | | |
| UTI Worldwide, Inc. | | | 146,000 | | | | 3,683,580 | | |
| | | | 33,383,802 | | |
TOTAL EQUITIES
(Cost $614,459,644) | | | | | | | 731,602,305 | | |
| MUTUAL FUNDS — 0.6% | |
| Financial Services — 0.6% | |
| First Financial Fund(b) | | | 153,531 | | | | 2,421,184 | | |
Government Reserve
Investment Fund(a) | | | 500 | | | | 500 | | |
iShares Russell 2000 Index
Fund(b) | | | 3,400 | | | | 243,780 | | |
iShares Russell 2000 Value
Index Fund(b) | | | 30,400 | | | | 2,192,752 | | |
| | | | 4,858,216 | | |
TOTAL MUTUAL FUNDS
(Cost $4,946,404) | | | | | | | 4,858,216 | | |
TOTAL LONG TERM INVESTMENTS
(Cost $619,406,048) | | | | | | | 736,460,521 | | |
| | | Principal
Amount | | | |
| SHORT-TERM INVESTMENTS — 16.8% | |
| Cash Equivalents — 13.4%(d) | |
Abbey National PLC
Eurodollar Time Deposit
5.100% 07/10/2006 | | $ | 1,116,858 | | | $ | 1,116,858 | | |
ABN Amro Bank NV
Certificate of Deposit
5.305% 11/21/2006 | | | 1,116,858 | | | | 1,116,858 | | |
American Beacon Money
Market Fund(c) | | | 1,139,101 | | | | 1,139,100 | | |
Bank of America
5.270% 07/14/2006 | | | 2,233,717 | | | | 2,233,717 | | |
Bank of America
5.310% 03/08/2007 | | | 2,233,717 | | | | 2,233,717 | | |
Bank of Montreal
Eurodollar Time Deposit
5.290% 08/03/2006 | | | 2,233,717 | | | | 2,233,717 | | |
Bank of Nova Scotia
Eurodollar Time Deposit
5.290% 08/08/2006 | | | 2,233,717 | | | | 2,233,717 | | |
Barclays
Eurodollar Time Deposit
5.150% 08/01/2006 | | | 3,350,575 | | | | 3,350,575 | | |
| | | Principal
Amount | | Market
Value | |
Branch Banker & Trust
Eurodollar Time Deposit
5.250% 07/26/2006 | | $ | 4,020,690 | | | $ | 4,020,690 | | |
Calyon
Eurodollar Time Deposit
5.300% 08/08/2006 | | | 2,233,717 | | | | 2,233,717 | | |
Canadian Imperial
Bank of Commerce
Eurodollar Time Deposit
5.310% 07/31/2006 | | | 2,233,717 | | | | 2,233,717 | | |
Deutsche Bank
Eurodollar Time Deposit
5.250% 07/05/2006 | | | 5,584,292 | | | | 5,584,292 | | |
Dexia Group
Eurodollar Time Deposit
5.300% 08/09/2006 | | | 2,903,832 | | | | 2,903,832 | | |
Federal Home Loan
Bank Discount Note
5.181% 07/19/2006 | | | 1,778,009 | | | | 1,778,009 | | |
First Tennessee
National Corporation
Eurodollar Time Deposit
5.270% 07/24/2006 | | | 2,680,460 | | | | 2,680,460 | | |
Fortis Bank
Eurodollar Time Deposit
5.090% 07/05/2006 | | | 2,233,717 | | | | 2,233,717 | | |
Fortis Bank
Eurodollar Time Deposit
5.250% 07/03/2006 | | | 2,233,717 | | | | 2,233,717 | | |
Fortis Bank
Eurodollar Time Deposit
5.250% 07/06/2006 | | | 2,233,717 | | | | 2,233,717 | | |
Freddie Mac
Discount Note
5.191% 07/25/2006 | | | 1,333,044 | | | | 1,333,044 | | |
Harris NA
Eurodollar Time Deposit
5.080% 07/05/2006 | | | 1,563,602 | | | | 1,563,602 | | |
HBOS Halifax
Bank of Scotland
Certificate of Deposit
5.110% 07/10/2006 | | | 2,233,717 | | | | 2,233,717 | | |
National Australia Bank
Eurodollar Time Deposit
5.290% 07/03/2006 | | | 7,818,009 | | | | 7,818,008 | | |
National City Corporation
Eurodollar Time Deposit
5.220% 07/03/2006 | | | 2,651,894 | | | | 2,651,894 | | |
Skandinaviska Enskilda
Banken AB
Eurodollar Time Deposit
5.130% 07/12/2006 | | | 2,233,717 | | | | 2,233,717 | | |
Societe Generale
Eurodollar Time Deposit
5.200% 08/08/2006 | | | 2,508,816 | | | | 2,508,815 | | |
(Continued)
The accompanying notes are an integral part of the financial statements.
136
MassMutual Select Small Company Value Fund – Portfolio of Investments (Continued)
| | | Principal
Amount | | Market
Value | |
Societe Generale
Eurodollar Time Deposit
5.270% 07/17/2006 | | $ | 2,628,733 | | | $ | 2,628,733 | | |
Standard Chartered Bank
Eurodollar Time Deposit
5.260% 07/07/2006 | | | 3,350,575 | | | | 3,350,575 | | |
Svenska Handlesbanken
Eurodollar Time Deposit
5.290% 07/03/2006 | | | 7,488,550 | | | | 7,488,549 | | |
The Bank of the West
Eurodollar Time Deposit
5.250% 08/07/2006 | | | 3,797,318 | | | | 3,797,318 | | |
Toronto Dominion Bank
Eurodollar Time Deposit
5.300% 07/31/2006 | | | 6,254,407 | | | | 6,254,407 | | |
UBS AG
Eurodollar Time Deposit
5.250% 07/21/2006 | | | 3,350,575 | | | | 3,350,575 | | |
UBS AG
Eurodollar Time Deposit
5.250% 08/04/2006 | | | 3,350,575 | | | | 3,350,575 | | |
Wells Fargo
Eurodollar Time Deposit
5.160% 07/13/2006 | | | 2,233,717 | | | | 2,233,717 | | |
Wells Fargo
Eurodollar Time Deposit
5.170% 07/03/2006 | | | 1,116,858 | | | | 1,116,858 | | |
Wells Fargo
Eurodollar Time Deposit
5.210% 07/06/2006 | | | 2,233,717 | | | | 2,233,717 | | |
Wells Fargo
Eurodollar Time Deposit
5.250% 07/03/2006 | | | 2,233,717 | | | | 2,233,717 | | |
| | | | 102,175,665 | | |
| Repurchase Agreement — 3.4% | |
Investors Bank & Trust
Company Repurchase
Agreement, dated
06/30/2006, 3.75%,
due 07/03/2006(e) | | | 26,145,558 | | | | 26,145,558 | | |
TOTAL SHORT-TERM
INVESTMENTS
(Cost $128,321,223) | | | | | | | 128,321,223 | | |
TOTAL INVESTMENTS — 113.0%
(Cost $747,727,271)(f) | | | | | | | 864,781,744 | | |
Other Assets/
(Liabilities) — (13.0%) | | | | | | | (99,725,675 | ) | |
| NET ASSETS — 100.0% | | | | | | $ | 765,056,069 | | |
Notes to Portfolio of Investments
ADR - American Depository Receipt
REIT - Real Estate Investment Trust
(a) Non-income producing security.
(b) Denotes all or a portion of security on loan. (Note 2).
(c) Amount represents shares owned of the fund.
(d) Represents investments of security lending collateral. (Note 2).
(e) Maturity value of $26,153,729. Collateralized by a U.S. Government Agency obligation with a rate of 5.823%, maturity date of 12/25/2033, and an aggregate market value, including accrued interest, of $27,452,836.
(f) See Note 6 for aggregate cost for Federal tax purposes.
The accompanying notes are an integral part of the financial statements.
137
MassMutual Select Small Cap Core Equity Fund – Portfolio of Investments
June 30, 2006 (Unaudited)
| | | Number of
Shares | | Market
Value | |
| EQUITIES — 99.4% | |
| COMMON STOCK | |
| Advertising — 0.1% | |
| Catalina Marketing Corp. | | | 400 | | | $ | 11,384 | | |
| Aerospace & Defense — 0.9% | |
| HEICO Corp. | | | 1,400 | | | | 39,690 | | |
| Kaman Corp. | | | 1,400 | | | | 25,480 | | |
| Sequa Corp. Cl. A(a) | | | 400 | | | | 32,600 | | |
| | | | 97,770 | | |
| Apparel, Textiles & Shoes — 3.0% | |
| Brown Shoe Co., Inc. | | | 2,100 | | | | 71,568 | | |
| Christopher & Banks Corp. | | | 980 | | | | 28,420 | | |
| Dress Barn, Inc.(a) | | | 2,100 | | | | 53,235 | | |
| Guess ?, Inc.(a) | | | 605 | | | | 25,259 | | |
| Hartmarx Corp.(a) | | | 3,800 | | | | 22,800 | | |
| Kellwood Co. | | | 2,920 | | | | 85,468 | | |
| Skechers U.S.A., Inc. Cl. A(a) | | | 1,200 | | | | 28,932 | | |
| | | | 315,682 | | |
| Automotive & Parts — 2.6% | |
| A.O. Smith Corp. | | | 300 | | | | 13,908 | | |
| ArvinMeritor, Inc. | | | 2,400 | | | | 41,256 | | |
| Group 1 Automotive, Inc. | | | 1,900 | | | | 107,046 | | |
| Myers Industries, Inc. | | | 600 | | | | 10,314 | | |
Rush Enterprises,
Inc. Cl. A(a) | | | 600 | | | | 10,902 | | |
| Sonic Automotive, Inc. | | | 1,600 | | | | 35,488 | | |
TRW Automotive
Holdings Corp.(a) | | | 400 | | | | 10,912 | | |
| United Auto Group, Inc. | | | 1,984 | | | | 42,358 | | |
| | | | 272,184 | | |
| Banking, Savings & Loans — 7.9% | |
| Cascade Bancorp | | | 1,000 | | | | 28,510 | | |
| Cathay General Bancorp | | | 2,500 | | | | 90,950 | | |
Central Pacific
Financial Corp. | | | 1,100 | | | | 42,570 | | |
| City National Corp. | | | 1,300 | | | | 84,617 | | |
Columbia Banking
Systems, Inc. | | | 700 | | | | 26,166 | | |
| CompuCredit Corp.(a) | | | 1,400 | | | | 53,816 | | |
| First Community Bancorp | | | 400 | | | | 23,632 | | |
| First Indiana Corp. | | | 500 | | | | 13,015 | | |
First Regional Bancorp/
Los Angeles, CA(a) | | | 82 | | | | 7,216 | | |
| Greater Bay Bancorp | | | 2,100 | | | | 60,375 | | |
| Hanmi Financial Corp. | | | 3,700 | | | | 71,928 | | |
| Nara Bancorp, Inc. | | | 2,187 | | | | 41,006 | | |
Partners Trust Financial
Group, Inc. | | | 5,900 | | | | 67,319 | | |
| | | Number of
Shares | | Market
Value | |
Preferred Bank/
Los Angeles, CA | | | 712 | | | $ | 38,170 | | |
| Signature Bank(a) | | | 700 | | | | 22,666 | | |
| Southwest Bancorp Inc. | | | 200 | | | | 5,100 | | |
| TierOne Corp. | | | 1,500 | | | | 50,655 | | |
| TriCo Bancshares | | | 400 | | | | 10,952 | | |
Virginia Commerce
Bancorp(a) | | | 900 | | | | 21,510 | | |
| Wilshire Bancorp, Inc. | | | 2,436 | | | | 43,897 | | |
| World Acceptance Corp.(a) | | | 800 | | | | 28,416 | | |
| | | | 832,486 | | |
| Beverages — 0.6% | |
| Boston Beer Co., Inc. Cl. A(a) | | | 400 | | | | 11,716 | | |
| Hansen Natural Corp.(a) | | | 100 | | | | 19,037 | | |
| M&F Worldwide Corp.(a) | | | 1,100 | | | | 17,710 | | |
| National Beverage Corp. | | | 1,000 | | | | 14,350 | | |
| | | | 62,813 | | |
| Broadcasting, Publishing & Printing — 1.7% | |
| Belo Corp. Cl. A | | | 500 | | | | 7,800 | | |
| Cox Radio, Inc. Cl. A(a) | | | 5,100 | | | | 73,542 | | |
| Scholastic Corp.(a) | | | 3,700 | | | | 96,089 | | |
| | | | 177,431 | | |
| Building Materials & Construction — 1.8% | |
| Andersons Inc. (The) | | | 502 | | | | 20,888 | | |
| Comfort Systems USA, Inc. | | | 3,500 | | | | 50,015 | | |
| Emcor Group, Inc.(a) | | | 1,600 | | | | 77,872 | | |
| Louisiana-Pacific Corp. | | | 700 | | | | 15,330 | | |
| US Concrete, Inc.(a) | | | 1,900 | | | | 20,995 | | |
| | | | 185,100 | | |
| Chemicals — 2.8% | |
| CF Industries Holdings, Inc. | | | 2,240 | | | | 31,942 | | |
| Innospec, Inc. | | | 800 | | | | 20,336 | | |
| NewMarket Corp. | | | 1,500 | | | | 73,590 | | |
| OM Group, Inc.(a) | | | 1,300 | | | | 40,105 | | |
| Schulman (A.), Inc. | | | 1,400 | | | | 32,046 | | |
| SurModics, Inc.(a) | | | 500 | | | | 18,055 | | |
| Terra Industries, Inc.(a) | | | 1,400 | | | | 8,918 | | |
| Tronox, Inc. Cl. B | | | 1,800 | | | | 23,706 | | |
| Usec, Inc. | | | 4,300 | | | | 50,955 | | |
| | | | 299,653 | | |
| Commercial Services — 8.6% | |
| Ambassadors Group, Inc. | | | 800 | | | | 23,104 | | |
| Amerco(a) | | | 200 | | | | 20,132 | | |
| American Ecology Corp. | | | 1,000 | | | | 26,500 | | |
American
Reprographics Co.(a) | | | 600 | | | | 21,750 | | |
| Arbitron, Inc. | | | 1,000 | | | | 38,330 | | |
| | | Number of
Shares | | Market
Value | |
| BearingPoint, Inc.(a) | | | 1,100 | | | $ | 9,207 | | |
| CBIZ, Inc.(a) | | | 5,000 | | | | 37,050 | | |
Dollar Thrifty Automotive
Group, Inc.(a) | | | 800 | | | | 36,056 | | |
| Exelixis, Inc.(a) | | | 3,683 | | | | 37,014 | | |
| Global Payments, Inc. | | | 900 | | | | 43,695 | | |
| Ikon Office Solutions, Inc. | | | 8,900 | | | | 112,140 | | |
| Kforce, Inc.(a) | | | 2,600 | | | | 40,274 | | |
| Luminex Corp.(a) | | | 1,700 | | | | 29,563 | | |
| MPS Group, Inc.(a) | | | 4,000 | | | | 60,240 | | |
| On Assignment, Inc.(a) | | | 1,700 | | | | 15,623 | | |
| PHH Corp.(a) | | | 700 | | | | 19,278 | | |
Portfolio Recovery
Associates, Inc.(a) | | | 200 | | | | 9,140 | | |
| Service Corp. International | | | 1,500 | | | | 12,210 | | |
| Sotheby's(a) | | | 1,200 | | | | 31,500 | | |
| SOURCECORP, Inc.(a) | | | 1,679 | | | | 41,623 | | |
| Spherion Corp.(a) | | | 6,700 | | | | 61,104 | | |
| Startek, Inc. | | | 800 | | | | 11,960 | | |
| TeleTech Holdings, Inc.(a) | | | 3,000 | | | | 37,980 | | |
| United Rentals, Inc.(a) | | | 1,200 | | | | 38,376 | | |
Universal Compression
Holdings, Inc.(a) | | | 1,100 | | | | 69,267 | | |
Volt Information
Sciences, Inc.(a) | | | 200 | | | | 9,320 | | |
| World Fuel Services Corp. | | | 400 | | | | 18,276 | | |
| | | | 910,712 | | |
| Communications — 1.9% | |
| Broadwing Corp.(a) | | | 1,000 | | | | 10,350 | | |
| CT Communications, Inc. | | | 920 | | | | 21,040 | | |
| Ditech Networks, Inc.(a) | | | 4,000 | | | | 34,880 | | |
| Polycom, Inc.(a) | | | 4,100 | | | | 89,872 | | |
| Sycamore Networks, Inc.(a) | | | 5,700 | | | | 23,142 | | |
| Syniverse Holdings, Inc.(a) | | | 1,583 | | | | 23,270 | | |
| | | | 202,554 | | |
| Computer Integrated Systems Design — 3.1% | |
| Adaptec, Inc.(a) | | | 2,500 | | | | 10,850 | | |
| Ansoft Corp.(a) | | | 3,700 | | | | 75,776 | | |
| Digital Insight Corp.(a) | | | 1,200 | | | | 41,148 | | |
| Hypercom Corp.(a) | | | 4,100 | | | | 38,335 | | |
| JDA Software Group, Inc.(a) | | | 1,600 | | | | 22,448 | | |
| Mentor Graphics Corp.(a) | | | 1,600 | | | | 20,768 | | |
| SYKES Enterprises, Inc.(a) | | | 2,700 | | | | 43,632 | | |
| Synopsys, Inc.(a) | | | 3,000 | | | | 56,310 | | |
| Websense, Inc.(a) | | | 1,100 | | | | 22,594 | | |
| | | | 331,861 | | |
| Computer Programming Services — 0.5% | |
| RealNetworks, Inc.(a) | | | 3,500 | | | | 37,450 | | |
| Stellent, Inc. | | | 1,200 | | | | 11,460 | | |
| | | | 48,910 | | |
(Continued)
The accompanying notes are an integral part of the financial statements.
138
MassMutual Select Small Cap Core Equity Fund – Portfolio of Investments (Continued)
| | | Number of
Shares | | Market
Value | |
| Computer Related Services — 0.6% | |
| EarthLink, Inc.(a) | | | 1,100 | | | $ | 9,526 | | |
| eCollege.com, Inc.(a) | | | 1,600 | | | | 33,824 | | |
| NetFlix, Inc.(a) | | | 600 | | | | 16,326 | | |
| | | | 59,676 | | |
| Computers & Information — 1.1% | |
| Cirrus Logic, Inc.(a) | | | 9,231 | | | | 75,140 | | |
| Redback Networks, Inc.(a) | | | 600 | | | | 11,004 | | |
| VeriFone Holdings, Inc.(a) | | | 556 | | | | 16,947 | | |
| Western Digital Corp.(a) | | | 600 | | | | 11,886 | | |
| | | | 114,977 | | |
| Data Processing & Preparation — 1.2% | |
CSG Systems
International, Inc.(a) | | | 2,000 | | | | 49,480 | | |
| S1 Corp.(a) | | | 3,626 | | | | 17,405 | | |
| The TriZetto Group, Inc.(a) | | | 3,800 | | | | 56,202 | | |
| | | | 123,087 | | |
| Electric Utilities — 2.0% | |
| Avista Corp. | | | 2,200 | | | | 50,226 | | |
| NorthWestern Corp. | | | 2,000 | | | | 68,700 | | |
| Ormat Technologies, Inc. | | | 500 | | | | 19,075 | | |
| Pepco Holdings, Inc. | | | 1,100 | | | | 25,938 | | |
| Reliant Energy, Inc.(a) | | | 1,200 | | | | 14,376 | | |
| UIL Holdings Corp. | | | 400 | | | | 22,516 | | |
| WPS Resources Corp. | | | 300 | | | | 14,880 | | |
| | | | 215,711 | | |
| Electrical Equipment & Electronics — 5.8% | |
| Acuity Brands, Inc. | | | 1,281 | | | | 49,844 | | |
| Analogic Corp. | | | 600 | | | | 27,966 | | |
| Anaren, Inc.(a) | | | 2,500 | | | | 51,225 | | |
Atheros
Communications, Inc.(a) | | | 500 | | | | 9,480 | | |
| Atmel Corp.(a) | | | 9,900 | | | | 54,945 | | |
| Cymer, Inc.(a) | | | 600 | | | | 27,876 | | |
| DSP Group, Inc.(a) | | | 500 | | | | 12,425 | | |
Electro Scientific
Industries, Inc.(a) | | | 1,700 | | | | 30,583 | | |
| Intersil Corp. Cl. A | | | 758 | | | | 17,624 | | |
| Kemet Corp.(a) | | | 5,000 | | | | 46,100 | | |
| LSI Logic Corp.(a) | | | 1,200 | | | | 10,740 | | |
Oplink
Communications, Inc.(a) | | | 600 | | | | 10,986 | | |
| OSI Systems, Inc.(a) | | | 700 | | | | 12,439 | | |
| Plexus Corp.(a) | | | 1,200 | | | | 41,052 | | |
| RF Micro Devices, Inc.(a) | | | 3,300 | | | | 19,701 | | |
| Spansion LLC Cl. A(a) | | | 1,800 | | | | 28,692 | | |
| Synaptics, Inc.(a) | | | 700 | | | | 14,980 | | |
| Sypris Solutions, Inc. | | | 1,700 | | | | 16,065 | | |
Triquint
Semiconductor, Inc.(a) | | | 12,485 | | | | 55,683 | | |
| TTM Technologies, Inc.(a) | | | 700 | | | | 10,129 | | |
| | | Number of
Shares | | Market
Value | |
| United Industrial Corp. | | | 1,000 | | | $ | 45,250 | | |
| Vicor Corp. | | | 700 | | | | 11,599 | | |
| Zoran Corp.(a) | | | 400 | | | | 9,736 | | |
| | | | 615,120 | | |
| Energy — 2.6% | |
| Berry Petroleum Co. Cl. A | | | 400 | | | | 13,260 | | |
Harvest Natural
Resources, Inc.(a) | | | 2,536 | | | | 34,338 | | |
| KCS Energy, Inc.(a) | | | 600 | | | | 17,820 | | |
Petroleum
Development Corp.(a) | | | 600 | | | | 22,620 | | |
| Swift Energy Co.(a) | | | 2,400 | | | | 103,032 | | |
| TETRA Technologies, Inc.(a) | | | 1 | | | | 30 | | |
| Tidewater, Inc. | | | 600 | | | | 29,520 | | |
| Todco Cl. A | | | 100 | | | | 4,085 | | |
| Unit Corp.(a) | | | 200 | | | | 11,378 | | |
| W&T Offshore, Inc. | | | 1,100 | | | | 42,779 | | |
| | | | 278,862 | | |
| Entertainment & Leisure — 1.8% | |
Bally Total Fitness
Holding Corp.(a) | | | 1,400 | | | | 9,492 | | |
| Churchill Downs, Inc. | | | 1,000 | | | | 37,450 | | |
DreamWorks Animation
SKG, Inc. Cl. A(a) | | | 1,100 | | | | 25,190 | | |
| JAKKS Pacific, Inc.(a) | | | 791 | | | | 15,891 | | |
| Live Nation, Inc.(a) | | | 1,980 | | | | 40,313 | | |
| Six Flags, Inc.(a) | | | 2,914 | | | | 16,377 | | |
| Sunterra Corp.(a) | | | 3,900 | | | | 39,936 | | |
World Wrestling
Entertainment, Inc. | | | 600 | | | | 10,134 | | |
| | | | 194,783 | | |
| Financial Services — 9.5% | |
Accredited Home Lenders
Holding Co.(a) | | | 900 | | | | 43,029 | | |
| Agree Realty Corp. REIT | | | 700 | | | | 23,779 | | |
American Home Mortgage
Investment Corp. REIT | | | 3,279 | | | | 120,864 | | |
| Anthracite Capital, Inc. REIT | | | 5,000 | | | | 60,800 | | |
| Apollo Investment Corp. | | | 1,600 | | | | 29,568 | | |
| Arbor Realty Trust, Inc. REIT | | | 3,300 | | | | 82,665 | | |
CentraCore Properties
Trust REIT | | | 1,600 | | | | 39,600 | | |
| Chittenden Corp. | | | 1,384 | | | | 35,776 | | |
| FelCor Lodging Trust, Inc. | | | 2,400 | | | | 52,176 | | |
First Cash Financial
Services, Inc.(a) | | | 2,100 | | | | 41,475 | | |
| Gramercy Capital Corp. REIT | | | 1,500 | | | | 38,850 | | |
| HRPT Properties Trust | | | 900 | | | | 10,404 | | |
| iStar Financial, Inc. | | | 400 | | | | 15,100 | | |
| JER Investors Trust, Inc. REIT | | | 900 | | | | 13,995 | | |
| Morningstar Inc.(a) | | | 400 | | | | 16,592 | | |
| | | Number of
Shares | | Market
Value | |
National Health Realty,
Inc. REIT | | | 800 | | | $ | 15,160 | | |
New Century Financial
Corp. REIT | | | 800 | | | | 36,600 | | |
| Newkirk Realty Trust, Inc. | | | 3,423 | | | | 59,423 | | |
| optionsXpress Holdings, Inc. | | | 62 | | | | 1,445 | | |
| Piper Jaffray Cos.(a) | | | 600 | | | | 36,726 | | |
Senior Housing
Properties Trust | | | 5,700 | | | | 102,087 | | |
| SWS Group, Inc. | | | 600 | | | | 14,472 | | |
Thomas Weisel Partners
Group, Inc.(a) | | | 2,906 | | | | 55,243 | | |
| Winston Hotels, Inc. REIT | | | 4,500 | | | | 55,125 | | |
| | | | 1,000,954 | | |
| Foods — 2.7% | |
| Great Atlantic & Pacific Tea Co. | | | 1,548 | | | | 35,171 | | |
| Imperial Sugar Co. | | | 600 | | | | 14,232 | | |
| Lance, Inc. | | | 1,100 | | | | 25,322 | | |
Performance Food
Group Co.(a) | | | 1,600 | | | | 48,608 | | |
| Pilgrim's Pride Corp. | | | 1,100 | | | | 28,380 | | |
| Premium Standard Farms, Inc. | | | 1,999 | | | | 32,444 | | |
| Seaboard Corp. | | | 28 | | | | 35,840 | | |
| Smart & Final, Inc.(a) | | | 2,300 | | | | 38,732 | | |
| Spartan Stores, Inc. | | | 2,200 | | | | 32,186 | | |
| | | | 290,915 | | |
| Forest Products & Paper — 1.5% | |
| BlueLinx Holdings, Inc. | | | 2,200 | | | | 28,666 | | |
| Buckeye Technologies, Inc.(a) | | | 2,200 | | | | 16,808 | | |
| Rock-Tenn Co. Cl. A | | | 700 | | | | 11,165 | | |
| United Stationers, Inc.(a) | | | 1,300 | | | | 64,116 | | |
| Universal Forest Products, Inc. | | | 600 | | | | 37,638 | | |
| | | | 158,393 | | |
| Healthcare — 1.6% | |
| National Healthcare Corp. | | | 200 | | | | 8,910 | | |
| Res-Care, Inc.(a) | | | 1,200 | | | | 24,000 | | |
| Sierra Health Services, Inc.(a) | | | 1,300 | | | | 58,539 | | |
| Sunrise Senior Living, Inc.(a) | | | 2,800 | | | | 77,420 | | |
| | | | 168,869 | | |
| Heavy Machinery — 1.0% | |
| NACCO Industries, Inc. Cl. A | | | 800 | | | | 109,928 | | |
Home Construction, Furnishings &
Appliances — 1.1% | |
| Cavco Industries, Inc.(a) | | | 200 | | | | 8,888 | | |
Furniture Brands
International, Inc. | | | 4,400 | | | | 91,696 | | |
Kimball International,
Inc. Cl. B | | | 800 | | | | 15,768 | | |
| | | | 116,352 | | |
(Continued)
The accompanying notes are an integral part of the financial statements.
139
MassMutual Select Small Cap Core Equity Fund – Portfolio of Investments (Continued)
| | | Number of
Shares | | Market
Value | |
| Industrial – Diversified — 0.1% | |
| SPX Corp. | | | 200 | | | $ | 11,190 | | |
| Information Retrieval Services — 0.5% | |
| InfoSpace, Inc.(a) | | | 2,300 | | | | 52,141 | | |
| Insurance — 3.7% | |
American Physicians
Capital, Inc.(a) | | | 700 | | | | 36,813 | | |
| Argonaut Group, Inc.(a) | | | 1,900 | | | | 57,076 | | |
| W.R. Berkley Corp. | | | 1,350 | | | | 46,076 | | |
| Fremont General Corp. | | | 5,800 | | | | 107,648 | | |
| Molina Healthcare, Inc.(a) | | | 300 | | | | 11,415 | | |
Reinsurance Group of
America, Inc. | | | 1,000 | | | | 49,150 | | |
| Safety Insurance Group, Inc. | | | 200 | | | | 9,510 | | |
SeaBright
Insurance Holdings(a) | | | 1,400 | | | | 22,554 | | |
| Selective Insurance Group | | | 700 | | | | 39,109 | | |
| Tower Group, Inc. | | | 400 | | | | 12,100 | | |
| | | | 391,451 | | |
| Internet Software — 0.4% | |
| webMethods, Inc.(a) | | | 3,900 | | | | 38,493 | | |
| Lodging — 0.7% | |
| Marcus Corp. | | | 2,700 | | | | 56,376 | | |
Monarch Casino &
Resort, Inc.(a) | | | 400 | | | | 11,248 | | |
| Vail Resorts, Inc.(a) | | | 300 | | | | 11,130 | | |
| | | | 78,754 | | |
| Machinery & Components — 0.7% | |
| AGCO Corp.(a) | | | 300 | | | | 7,897 | | |
| Axcelis Technologies, Inc.(a) | | | 2,800 | | | | 16,520 | | |
| Valmont Industries, Inc. | | | 800 | | | | 37,192 | | |
| Woodward Governor Co. | | | 500 | | | | 15,255 | | |
| | | | 76,864 | | |
| Manufacturing — 0.2% | |
| EnPro Industries, Inc.(a) | | | 700 | | | | 23,520 | | |
| Medical Supplies — 4.1% | |
Applera Corp. - Applied
Biosystems Group | | | 3,200 | | | | 103,520 | | |
| Bruker BioSciences Corp.(a) | | | 517 | | | | 2,771 | | |
| Candela Corp.(a) | | | 540 | | | | 8,564 | | |
| Coherent, Inc.(a) | | | 500 | | | | 16,865 | | |
| Dade Behring Holdings, Inc. | | | 1,000 | | | | 41,640 | | |
| Haemonetics Corp.(a) | | | 300 | | | | 13,953 | | |
| Illumina, Inc.(a) | | | 1,000 | | | | 29,660 | | |
| Immucor, Inc.(a) | | | 900 | | | | 17,307 | | |
| Intuitive Surgical, Inc.(a) | | | 200 | | | | 23,594 | | |
| MTS Systems Corp. | | | 600 | | | | 23,706 | | |
| PSS World Medical, Inc.(a) | | | 2,400 | | | | 42,360 | | |
| Tektronix, Inc. | | | 1,000 | | | | 29,420 | | |
| | | Number of
Shares | | Market
Value | |
| Thoratec Corp.(a) | | | 1,500 | | | $ | 20,805 | | |
| Varian, Inc.(a) | | | 500 | | | | 20,755 | | |
| Viasys Healthcare, Inc.(a) | | | 700 | | | | 17,920 | | |
| Zoll Medical Corp.(a) | | | 700 | | | | 22,932 | | |
| | | | 435,772 | | |
| Metals & Mining — 1.6% | |
| Castle (A.M.) & Co. | | | 400 | | | | 12,900 | | |
| Encore Wire Corp.(a) | | | 1,000 | | | | 35,940 | | |
| General Cable Corp.(a) | | | 1,900 | | | | 66,500 | | |
| Steel Dynamics, Inc. | | | 200 | | | | 13,148 | | |
| Steel Technologies, Inc. | | | 1,010 | | | | 19,634 | | |
| Superior Essex, Inc.(a) | | | 493 | | | | 14,756 | | |
| Wheeling-Pittsburgh Corp.(a) | | | 400 | | | | 7,956 | | |
| | | | 170,834 | | |
| Pharmaceuticals — 6.0% | |
Albany Molecular
Research, Inc.(a) | | | 1,000 | | | | 10,680 | | |
| Alkermes, Inc.(a) | | | 5,400 | | | | 102,168 | | |
| Alpharma, Inc. Cl. A | | | 2,500 | | | | 60,100 | | |
| Arqule, Inc.(a) | | | 6,813 | | | | 38,425 | | |
Caraco Pharmaceutical
Laboratories Ltd.(a) | | | 2,000 | | | | 18,300 | | |
| Cephalon, Inc.(a) | | | 600 | | | | 36,060 | | |
| Diagnostic Products Corp. | | | 200 | | | | 11,634 | | |
Endo Pharmaceuticals
Holdings, Inc.(a) | | | 1,200 | | | | 39,576 | | |
| Immunogen, Inc.(a) | | | 7,189 | | | | 22,502 | | |
| Invitrogen Corp.(a) | | | 300 | | | | 19,821 | | |
| Molecular Devices Corp.(a) | | | 600 | | | | 18,336 | | |
| Myriad Genetics, Inc.(a) | | | 1,300 | | | | 32,825 | | |
| NBTY, Inc.(a) | | | 700 | | | | 16,737 | | |
| Neurocrine Biosciences, Inc.(a) | | | 900 | | | | 9,540 | | |
New River
Pharmaceuticals, Inc.(a) | | | 2,320 | | | | 66,120 | | |
| Pain Therapeutics, Inc.(a) | | | 3,700 | | | | 30,895 | | |
| PDL BioPharma, Inc.(a) | | | 400 | | | | 7,364 | | |
| Savient Pharmaceuticals, Inc.(a) | | | 5,500 | | | | 28,875 | | |
| USANA Health Sciences, Inc.(a) | | | 700 | | | | 26,530 | | |
| Watson Pharmaceutical, Inc.(a) | | | 1,700 | | | | 39,576 | | |
| | | | 636,064 | | |
| Prepackaged Software — 3.4% | |
| Advent Software, Inc.(a) | | | 500 | | | | 18,035 | | |
| Ansys, Inc.(a) | | | 300 | | | | 14,346 | | |
| Blackbaud, Inc. | | | 700 | | | | 15,890 | | |
Brocade Communications
Systems, Inc.(a) | | | 3,600 | | | | 22,104 | | |
Internet Security
Systems, Inc.(a) | | | 1,900 | | | | 35,815 | | |
| Interwoven, Inc.(a) | | | 3,100 | | | | 26,598 | | |
| MicroStrategy, Inc. Cl. A(a) | | | 600 | | | | 58,512 | | |
| Novell, Inc.(a) | | | 1,500 | | | | 9,945 | | |
| | | Number of
Shares | | Market
Value | |
| Red Hat, Inc.(a) | | | 2,000 | | | $ | 46,800 | | |
| SonicWALL, Inc.(a) | | | 4,400 | | | | 39,556 | | |
| SPSS, Inc.(a) | | | 829 | | | | 26,644 | | |
| TradeStation Group, Inc.(a) | | | 1,060 | | | | 13,430 | | |
| Vignette Corp.(a) | | | 1,900 | | | | 27,702 | | |
| | | | 355,377 | | |
| Real Estate — 1.7% | |
| Alderwoods Group, Inc.(a) | | | 1,500 | | | | 29,190 | | |
California Coastal
Communities, Inc.(a) | | | 1,100 | | | | 35,200 | | |
Consolidated-Tomoka
Land Co. | | | 300 | | | | 16,542 | | |
| Housevalues, Inc.(a) | | | 1,300 | | | | 9,009 | | |
| Jones Lang Lasalle, Inc. | | | 1,000 | | | | 87,550 | | |
| | | | 177,491 | | |
| Restaurants — 2.2% | |
| Bob Evans Farms, Inc. | | | 600 | | | | 18,006 | | |
Lone Star Steakhouse &
Saloon, Inc. | | | 1,300 | | | | 34,099 | | |
| Luby's, Inc.(a) | | | 2,100 | | | | 21,903 | | |
| O'Charley's, Inc.(a) | | | 3,500 | | | | 59,500 | | |
Papa John's
International, Inc.(a) | | | 1,107 | | | | 36,752 | | |
Ryan's Restaurant
Group, Inc.(a) | | | 5,500 | | | | 65,505 | | |
| | | | 235,765 | | |
| Retail — 2.3% | |
| Big Lots, Inc.(a) | | | 1,700 | | | | 29,036 | | |
| Bon-Ton Stores (The), Inc. | | | 700 | | | | 15,316 | | |
| Borders Group, Inc. | | | 2,000 | | | | 36,920 | | |
Cash America
International, Inc. | | | 2,200 | | | | 70,400 | | |
| Marvel Entertainment, Inc.(a) | | | 1,556 | | | | 31,120 | | |
| Perry Ellis International, Inc.(a) | | | 900 | | | | 22,779 | | |
| Stage Stores, Inc. | | | 600 | | | | 19,800 | | |
Trans World
Entertainment Corp.(a) | | | 2,100 | | | | 15,162 | | |
| | | | 240,533 | | |
| Telephone Utilities — 1.2% | |
| Brightpoint, Inc.(a) | | | 1,320 | | | | 17,860 | | |
| Golden Telecom, Inc. | | | 3,100 | | | | 78,585 | | |
| Lightbridge, Inc.(a) | | | 2,400 | | | | 31,080 | | |
| | | | 127,525 | | |
| Transportation — 2.6% | |
| Arctic Cat, Inc. | | | 600 | | | | 11,706 | | |
Covenant Transport,
Inc. Cl. A(a) | | | 700 | | | | 10,654 | | |
| EGL, Inc.(a) | | | 400 | | | | 20,080 | | |
Frozen Food
Express Industries(a) | | | 3,400 | | | | 37,468 | | |
(Continued)
The accompanying notes are an integral part of the financial statements.
140
MassMutual Select Small Cap Core Equity Fund – Portfolio of Investments (Continued)
| | | Number of
Shares | | Market
Value | |
Hornbeck Offshore
Services, Inc.(a) | | | 1,500 | | | $ | 53,280 | | |
| Marten Transport Ltd.(a) | | | 1,400 | | | | 30,436 | | |
Overseas Shipholding
Group, Inc. | | | 500 | | | | 29,575 | | |
| SCS Transportation, Inc.(a) | | | 1,800 | | | | 49,554 | | |
| Trico Marine Services, Inc.(a) | | | 300 | | | | 10,200 | | |
US Xpress Enterprises,
Inc. Cl. A(a) | | | 900 | | | | 24,318 | | |
| | | | 277,271 | | |
TOTAL EQUITIES
(Cost $10,713,242) | | | | | | | 10,525,212 | | |
| | | Principal
Amount | | | |
| SHORT-TERM INVESTMENTS — 0.6% | |
| Repurchase Agreement | |
Investors Bank & Trust
Company Repurchase
Agreement, dated
06/30/2006, 3.75%,
due 07/03/2006(b) | | $ | 69,556 | | | | 69,556 | | |
TOTAL SHORT-TERM
INVESTMENTS
(Cost $69,556) | | | | | | | 69,556 | | |
TOTAL INVESTMENTS — 100.0%
(Cost $10,782,798)(c) | | | | | | | 10,594,768 | | |
Other Assets/
(Liabilities) — 0.0% | | | | | | | (3,119 | ) | |
| NET ASSETS — 100.0% | | | | | | $ | 10,591,649 | | |
Notes to Portfolio of Investments
REIT - Real Estate Investment Trust
(a) Non-income producing security.
(b) Maturity value of $69,578. Collateralized by a U.S. Government Agency obligation with a rate of 4.616%, maturity date of 08/01/2034, and an aggregate marke value, including accrued interest, of 73,034.
(c) See Note 6 for aggregate cost for Federal tax purposes.
The remainder of this page is intentionally left blank.
The accompanying notes are an integral part of the financial statements.
141
MassMutual Select Mid Cap Growth Equity Fund – Portfolio of Investments
June 30, 2006 (Unaudited)
| | | Number of
Shares | | Market
Value | |
| EQUITIES — 99.4% | |
| COMMON STOCK | |
| Advertising — 0.9% | |
Monster
Worldwide, Inc.(a) | | | 39,000 | | | $ | 1,663,740 | | |
| Aerospace & Defense — 1.8% | |
| Rockwell Collins, Inc. | | | 63,075 | | | | 3,524,000 | | |
| Automotive & Parts — 1.7% | |
| Oshkosh Truck Corp. | | | 68,100 | | | | 3,236,112 | | |
| Banking, Savings & Loans — 2.3% | |
| Cullen/Frost Bankers, Inc. | | | 36,600 | | | | 2,097,180 | | |
| Hudson City Bancorp, Inc. | | | 168,300 | | | | 2,243,439 | | |
| | | | 4,340,619 | | |
| Beverages — 1.3% | |
| Brown-Forman Corp. Cl. B | | | 34,475 | | | | 2,471,513 | | |
| Building Materials & Construction — 1.3% | |
Martin Marietta
Materials, Inc. | | | 28,125 | | | | 2,563,594 | | |
| Commercial Services — 7.9% | |
Akamai
Technologies, Inc.(a) (b) | | | 87,125 | | | | 3,153,054 | | |
The Corporate Executive
Board Co. | | | 25,225 | | | | 2,527,545 | | |
| Global Payments, Inc. | | | 60,550 | | | | 2,939,702 | | |
Pharmaceutical Product
Development, Inc. | | | 90,900 | | | | 3,192,408 | | |
| Stericycle, Inc.(a) | | | 53,000 | | | | 3,450,300 | | |
| | | | 15,263,009 | | |
| Communications — 1.7% | |
American Tower
Corp. Cl. A(a) (b) | | | 104,162 | | | | 3,241,521 | | |
| Computer Programming Services — 2.5% | |
| Ceridian Corp.(a) | | | 98,925 | | | | 2,417,727 | | |
Cognizant Technology
Solutions Corp. Cl. A(a) | | | 36,000 | | | | 2,425,320 | | |
| | | | 4,843,047 | | |
| Computers & Information — 5.3% | |
Nuance
Communications, Inc.(a) | | | 349,125 | | | | 3,512,197 | | |
| SanDisk Corp.(a) (b) | | | 60,550 | | | | 3,086,839 | | |
| Western Digital Corp.(a) | | | 185,050 | | | | 3,665,840 | | |
| | | | 10,264,876 | | |
| | | Number of
Shares | | Market
Value | |
| Containers — 1.1% | |
| Pactiv Corp.(a) | | | 83,000 | | | $ | 2,054,250 | | |
| Electrical Equipment & Electronics — 9.1% | |
| Ametek, Inc. | | | 53,875 | | | | 2,552,597 | | |
| Broadcom Corp. Cl. A(a) | | | 89,550 | | | | 2,690,977 | | |
| LSI Logic Corp.(a) (b) | | | 274,250 | | | | 2,454,537 | | |
MEMC Electronic
Materials, Inc.(a) (b) | | | 127,025 | | | | 4,763,437 | | |
National
Semiconductor Corp. | | | 101,000 | | | | 2,408,850 | | |
| Nvidia Corp.(a) | | | 122,800 | | | | 2,614,412 | | |
| | | | 17,484,810 | | |
| Energy — 6.3% | |
| Berry Petroleum Co. Cl. A | | | 61,700 | | | | 2,045,355 | | |
| Denbury Resources, Inc.(a) | | | 70,100 | | | | 2,220,067 | | |
| Helmerich & Payne, Inc. | | | 36,300 | | | | 2,187,438 | | |
| Peabody Energy Corp. | | | 50,450 | | | | 2,812,587 | | |
| Sunoco, Inc. | | | 42,075 | | | | 2,915,377 | | |
| | | | 12,180,824 | | |
| Financial Services — 4.5% | |
Chicago Mercantile
Exchange
Holdings, Inc.(b) | | | 10,100 | | | | 4,960,615 | | |
The Nasdaq Stock
Market, Inc.(a) | | | 57,175 | | | | 1,709,533 | | |
| T. Rowe Price Group, Inc. | | | 54,200 | | | | 2,049,302 | | |
| | | | 8,719,450 | | |
| Foods — 2.2% | |
| Hormel Foods Corp. | | | 55,500 | | | | 2,061,270 | | |
Panera Bread
Co. Cl. A(a) (b) | | | 32,675 | | | | 2,197,067 | | |
| | | | 4,258,337 | | |
| Healthcare — 7.3% | |
| Covance Inc.(a) (b) | | | 39,925 | | | | 2,444,209 | | |
| DaVita, Inc.(a) | | | 36,300 | | | | 1,804,110 | | |
| Express Scripts, Inc.(a) | | | 35,400 | | | | 2,539,596 | | |
| Health Net, Inc.(a) | | | 51,725 | | | | 2,336,418 | | |
| IDEXX Laboratories, Inc.(a) | | | 29,950 | | | | 2,250,144 | | |
Sierra Health
Services, Inc.(a) | | | 58,925 | | | | 2,653,393 | | |
| | | | 14,027,870 | | |
| Heavy Machinery — 2.2% | |
Cameron
International Corp.(a) (b) | | | 48,700 | | | | 2,326,399 | | |
| The Toro Co. | | | 42,025 | | | | 1,962,568 | | |
| | | | 4,288,967 | | |
| | | Number of
Shares | | Market
Value | |
| Industrial – Diversified — 1.3% | |
| ITT Industries, Inc. | | | 50,450 | | | $ | 2,497,275 | | |
| Insurance — 1.0% | |
| Brown & Brown, Inc. | | | 67,150 | | | | 1,962,123 | | |
| Lodging — 2.3% | |
Choice Hotels
International, Inc.(b) | | | 74,050 | | | | 4,487,430 | | |
| Machinery & Components — 2.3% | |
| Joy Global, Inc. | | | 86,625 | | | | 4,512,296 | | |
| Manufacturing — 1.2% | |
| Lam Research Corp.(a) (b) | | | 47,200 | | | | 2,200,464 | | |
| Medical Supplies — 4.2% | |
| Intuitive Surgical, Inc.(a) (b) | | | 48,825 | | | | 5,759,885 | | |
| Techne Corp.(a) | | | 47,125 | | | | 2,399,605 | | |
| | | | 8,159,490 | | |
| Metals & Mining — 13.5% | |
Allegheny
Technologies, Inc.(b) | | | 78,425 | | | | 5,430,147 | | |
| Cameco Corp.(b) | | | 75,675 | | | | 3,024,730 | | |
| Glamis Gold Ltd.(a) | | | 89,975 | | | | 3,406,454 | | |
| Goldcorp, Inc. | | | 79,850 | | | | 2,413,067 | | |
| Precision Castparts Corp. | | | 60,550 | | | | 3,618,468 | | |
Tenaris SA ADR
(Argentina) | | | 147,275 | | | | 5,963,165 | | |
Titanium
Metals Corp.(a) (b) | | | 63,600 | | | | 2,186,568 | | |
| | | | 26,042,599 | | |
| Pharmaceuticals — 2.2% | |
| Celgene Corp.(a) (b) | | | 87,475 | | | | 4,148,939 | | |
| Prepackaged Software — 3.5% | |
| Intuit, Inc.(a) | | | 42,875 | | | | 2,589,221 | | |
| Red Hat, Inc.(a) (b) | | | 108,575 | | | | 2,540,655 | | |
| Salesforce.com, Inc.(a) (b) | | | 63,525 | | | | 1,693,577 | | |
| | | | 6,823,453 | | |
| Real Estate — 1.5% | |
CB Richard Ellis Group,
Inc. Cl. A(a) | | | 116,150 | | | | 2,892,135 | | |
| Restaurants — 2.1% | |
| Darden Restaurants, Inc. | | | 102,625 | | | | 4,043,425 | | |
| Retail — 1.1% | |
MSC Industrial Direct
Co. Cl. A | | | 42,650 | | | | 2,028,861 | | |
(Continued)
The accompanying notes are an integral part of the financial statements.
142
MassMutual Select Mid Cap Growth Equity Fund – Portfolio of Investments (Continued)
| | | Number of
Shares | | Market
Value | |
| Telephone Utilities — 3.8% | |
| NII Holdings, Inc. Cl. B(a) | | | 85,775 | | | $ | 4,835,995 | | |
| US Cellular Corp.(a) | | | 42,075 | | | | 2,549,745 | | |
| | | | 7,385,740 | | |
TOTAL EQUITIES
(Cost $160,775,626) | | | | | | | 191,610,769 | | |
| | | Principal
Amount | | | |
| SHORT-TERM INVESTMENTS — 21.7% | |
| Cash Equivalents — 20.6%(d) | |
Abbey National PLC
Eurodollar Time Deposit
5.100% 07/10/2006 | | $ | 434,592 | | | | 434,592 | | |
ABN Amro Bank NV
Certificate of Deposit
5.305% 11/21/2006 | | | 434,594 | | | | 434,594 | | |
American Beacon Money
Market Fund(c) | | | 443,249 | | | | 443,249 | | |
Bank of America
5.270% 07/14/2006 | | | 869,188 | | | | 869,188 | | |
Bank of America
5.310% 03/08/2007 | | | 869,188 | | | | 869,188 | | |
Bank of Montreal
Eurodollar Time Deposit
5.290% 08/03/2006 | | | 869,188 | | | | 869,188 | | |
Bank of Nova Scotia
Eurodollar Time Deposit
5.290% 08/08/2006 | | | 869,188 | | | | 869,188 | | |
Barclays
Eurodollar Time Deposit
5.150% 08/01/2006 | | | 1,303,782 | | | | 1,303,782 | | |
Branch Banker & Trust
Eurodollar Time Deposit
5.250% 07/26/2006 | | | 1,564,538 | | | | 1,564,538 | | |
Calyon
Eurodollar Time Deposit
5.300% 08/08/2006 | | | 869,188 | | | | 869,188 | | |
Canadian Imperial
Bank of Commerce
Eurodollar Time Deposit
5.310% 07/31/2006 | | | 869,188 | | | | 869,188 | | |
Deutsche Bank
Eurodollar Time Deposit
5.250% 07/05/2006 | | | 2,172,970 | | | | 2,172,970 | | |
Dexia Group
Eurodollar Time Deposit
5.300% 08/09/2006 | | | 1,129,944 | | | | 1,129,944 | | |
Federal Home Loan
Bank Discount Note
5.181% 07/19/2006 | | | 691,862 | | | | 691,862 | | |
| | | Principal
Amount | | Market
Value | |
First Tennessee
National Corporation
Eurodollar Time Deposit
5.270% 07/24/2006 | | $ | 1,043,025 | | | $ | 1,043,025 | | |
Fortis Bank
Eurodollar Time Deposit
5.090% 07/05/2006 | | | 869,188 | | | | 869,188 | | |
Fortis Bank
Eurodollar Time Deposit
5.250% 07/03/2006 | | | 869,188 | | | | 869,188 | | |
Fortis Bank
Eurodollar Time Deposit
5.250% 07/06/2006 | | | 869,188 | | | | 869,188 | | |
Freddie Mac
Discount Note
5.191% 07/25/2006 | | | 518,717 | | | | 518,717 | | |
Harris NA
Eurodollar Time Deposit
5.080% 07/05/2006 | | | 608,432 | | | | 608,432 | | |
HBOS Halifax
Bank of Scotland
Certificate of Deposit
5.110% 07/10/2006 | | | 869,188 | | | | 869,188 | | |
National Australia Bank
Eurodollar Time Deposit
5.290% 07/03/2006 | | | 3,042,158 | | | | 3,042,158 | | |
National City Corporation
Eurodollar Time Deposit
5.220% 07/03/2006 | | | 1,031,910 | | | | 1,031,910 | | |
Skandinaviska Enskilda
Banken AB
Eurodollar Time Deposit
5.130% 07/12/2006 | | | 869,188 | | | | 869,188 | | |
Societe Generale
Eurodollar Time Deposit
5.200% 08/08/2006 | | | 869,188 | | | | 869,188 | | |
Societe Generale
Eurodollar Time Deposit
5.270% 07/17/2006 | | | 1,129,944 | | | | 1,129,944 | | |
Standard Chartered Bank
Eurodollar Time Deposit
5.260% 07/07/2006 | | | 1,303,782 | | | | 1,303,782 | | |
Svenska Handlesbanken
Eurodollar Time Deposit
5.290% 07/03/2006 | | | 2,913,958 | | | | 2,913,958 | | |
The Bank of the West
Eurodollar Time Deposit
5.250% 08/07/2006 | | | 1,477,619 | | | | 1,477,619 | | |
Toronto Dominion Bank
Eurodollar Time Deposit
5.300% 07/31/2006 | | | 2,433,726 | | | | 2,433,726 | | |
UBS AG
Eurodollar Time Deposit
5.250% 07/21/2006 | | | 1,303,782 | | | | 1,303,782 | | |
| | | Principal
Amount | | Market
Value | |
UBS AG
Eurodollar Time Deposit
5.250% 08/04/2006 | | $ | 1,303,782 | | | $ | 1,303,782 | | |
Wells Fargo
Eurodollar Time Deposit
5.160% 07/13/2006 | | | 869,188 | | | | 869,188 | | |
Wells Fargo
Eurodollar Time Deposit
5.170% 07/03/2006 | | | 869,188 | | | | 869,188 | | |
Wells Fargo
Eurodollar Time Deposit
5.210% 07/06/2006 | | | 434,594 | | | | 434,594 | | |
Wells Fargo
Eurodollar Time Deposit
5.250% 07/03/2006 | | | 869,188 | | | | 869,188 | | |
| | | | 39,758,780 | | |
| Repurchase Agreement — 1.1% | |
Investors Bank & Trust
Company Repurchase
Agreement, dated
06/30/2006, 3.75%,
due 07/03/2006(e) | | | 2,130,563 | | | | 2,130,563 | | |
TOTAL SHORT-TERM
INVESTMENTS
(Cost $41,889,343) | | | | | | | 41,889,343 | | |
TOTAL INVESTMENTS — 121.1%
(Cost $202,664,969)(f) | | | | | | | 233,500,112 | | |
Other Assets/
(Liabilities) — (21.1%) | | | | | | | (40,675,861 | ) | |
| NET ASSETS — 100.0% | | | | | | $ | 192,824,251 | | |
Notes to Portfolio of Investments
ADR - American Depository Receipt
(a) Non-income producing security.
(b) Denotes all or a portion of security on loan. (Note 2).
(c) Amount represents shares owned of the fund.
(d) Represents investments of security lending collateral. (Note 2).
(e) Maturity value of $2,131,229. Collateralized by a U.S. Government Agency obligation with a rate of 4.375%, maturity date of 06/20/2023, and an aggregate market value, including accrued interest, of $2,237,091.
(f) See Note 6 for aggregate cost for Federal tax purposes.
The accompanying notes are an integral part of the financial statements.
143
MassMutual Select Mid Cap Growth Equity II Fund – Portfolio of Investments
June 30, 2006 (Unaudited)
| | | Number of
Shares | | Market
Value | |
| EQUITIES — 97.2% | |
| COMMON STOCK | |
| Advertising — 3.8% | |
| aQuantive, Inc.(a) (b) | | | 159,000 | | | $ | 4,027,470 | | |
| Catalina Marketing Corp. | | | 173,000 | | | | 4,923,580 | | |
Clear Channel Outdoor
Holdings, Inc. Cl. A(a) | | | 167,700 | | | | 3,514,992 | | |
| Getty Images, Inc.(a) (b) | | | 152,300 | | | | 9,672,573 | | |
| Harte-Hanks, Inc. | | | 28,400 | | | | 728,176 | | |
| Lamar Advertising Co.(a) | | | 234,800 | | | | 12,646,328 | | |
Monster
Worldwide, Inc.(a) | | | 223,500 | | | | 9,534,510 | | |
| Omnicom Group, Inc. | | | 31,900 | | | | 2,841,971 | | |
WPP Group PLC
Sponsored ADR
(United Kingdom) | | | 50,600 | | | | 3,050,674 | | |
| | | | 50,940,274 | | |
| Aerospace & Defense — 2.2% | |
Alliant
Techsystems, Inc.(a) (b) | | | 72,000 | | | | 5,497,200 | | |
Empresa Brasileira de
Aeronautica SA
ADR (Brazil)(b) | | | 63,700 | | | | 2,323,139 | | |
| Goodrich Corp. | | | 159,000 | | | | 6,406,110 | | |
| Rockwell Collins, Inc. | | | 264,000 | | | | 14,749,680 | | |
| | | | 28,976,129 | | |
| Agribusiness — 0.1% | |
| Delta & Pine Land Co.(b) | | | 35,000 | | | | 1,029,000 | | |
| Air Transportation — 1.2% | |
| SkyWest, Inc. | | | 167,500 | | | | 4,154,000 | | |
| Southwest Airlines Co. | | | 716,200 | | | | 11,724,194 | | |
| | | | 15,878,194 | | |
| Apparel, Textiles & Shoes — 0.7% | |
| Coach, Inc.(a) | | | 86,600 | | | | 2,589,340 | | |
| Ross Stores, Inc. | | | 220,100 | | | | 6,173,805 | | |
| | | | 8,763,145 | | |
| Automotive & Parts — 0.8% | |
| Harley-Davidson, Inc.(b) | | | 55,800 | | | | 3,062,862 | | |
| Oshkosh Truck Corp. | | | 149,000 | | | | 7,080,480 | | |
Winnebago
Industries, Inc.(b) | | | 22,900 | | | | 710,816 | | |
| | | | 10,854,158 | | |
| Banking, Savings & Loans — 1.7% | |
| City National Corp. | | | 12,100 | | | | 787,589 | | |
First Horizon
National Corp. | | | 18,400 | | | | 739,680 | | |
| | | Number of
Shares | | Market
Value | |
Investors Financial
Services Corp. | | | 175,600 | | | $ | 7,884,440 | | |
| Mellon Financial Corp. | | | 51,100 | | | | 1,759,373 | | |
| Northern Trust Corp. | | | 46,400 | | | | 2,565,920 | | |
| State Street Corp. | | | 38,900 | | | | 2,259,701 | | |
| SVB Financial Group(a) | | | 55,700 | | | | 2,532,122 | | |
| Synovus Financial Corp. | | | 106,300 | | | | 2,846,714 | | |
| UCBH Holdings, Inc. | | | 42,400 | | | | 701,296 | | |
| | | | 22,076,835 | | |
| Beverages — 0.2% | |
| Cott Corp.(a) | | | 195,000 | | | | 2,546,700 | | |
| Broadcasting, Publishing & Printing — 1.0% | |
Citadel
Broadcasting Corp.(b) | | | 304,700 | | | | 2,711,830 | | |
The McGraw-Hill
Companies, Inc.(b) | | | 21,800 | | | | 1,095,014 | | |
| Meredith Corp. | | | 16,900 | | | | 837,226 | | |
| Radio One, Inc. Cl. D(a) | | | 115,400 | | | | 853,960 | | |
Salem Communications
Corp. Cl. A | | | 54,300 | | | | 706,443 | | |
The Scripps (E.W.)
Co. Cl. A | | | 14,600 | | | | 629,844 | | |
Univision
Communications,
Inc. Cl. A(a) | | | 173,700 | | | | 5,818,950 | | |
| | | | 12,653,267 | | |
| Building Materials & Construction — 0.2% | |
| Kinetic Concepts, Inc.(a) | | | 51,000 | | | | 2,251,650 | | |
| Chemicals — 0.8% | |
Aventine
Renewable Energy
Holdings, Inc.(a) | | | 21,800 | | | | 848,020 | | |
| Monsanto Co. | | | 9,500 | | | | 799,805 | | |
| Nalco Holding Co.(a) | | | 229,000 | | | | 4,037,270 | | |
| Praxair, Inc.(b) | | | 20,600 | | | | 1,112,400 | | |
Symyx
Technologies, Inc.(a) | | | 26,600 | | | | 642,390 | | |
| The Valspar Corp. | | | 62,100 | | | | 1,640,061 | | |
| VeraSun Energy(a) (b) | | | 69,100 | | | | 1,813,184 | | |
| | | | 10,893,130 | | |
| Commercial Services — 7.3% | |
Apollo Group,
Inc. Cl. A(a) | | | 22,006 | | | | 1,137,050 | | |
| Block (H&R), Inc. | | | 45,700 | | | | 1,090,402 | | |
| Cintas Corp. | | | 47,500 | | | | 1,888,600 | | |
The Corporate Executive
Board Co. | | | 29,600 | | | | 2,965,920 | | |
| | | Number of
Shares | | Market
Value | |
Decode
Genetics, Inc.(a) (b) | | | 136,700 | | | $ | 846,173 | | |
| DeVry, Inc.(a) (b) | | | 37,500 | | | | 823,875 | | |
Dun &
Bradstreet Corp.(a) | | | 23,600 | | | | 1,644,448 | | |
| Ecolab, Inc.(b) | | | 76,400 | | | | 3,100,312 | | |
| Equifax, Inc. | | | 32,500 | | | | 1,116,050 | | |
| Fastenal Co. | | | 26,900 | | | | 1,083,801 | | |
| Fluor Corp. | | | 45,000 | | | | 4,181,850 | | |
| Gen-Probe, Inc.(a) | | | 76,000 | | | | 4,102,480 | | |
| Global Payments, Inc. | | | 106,500 | | | | 5,170,575 | | |
Iron
Mountain, Inc.(a) (b) | | | 282,950 | | | | 10,576,671 | | |
ITT Educational
Services, Inc.(a) | | | 20,000 | | | | 1,316,200 | | |
Laureate
Education, Inc.(a) | | | 73,000 | | | | 3,111,990 | | |
| LECG Corp.(a) | | | 41,800 | | | | 772,046 | | |
| Manpower, Inc. | | | 164,700 | | | | 10,639,620 | | |
MoneyGram
International, Inc. | | | 344,700 | | | | 11,702,565 | | |
| Moody's Corp. | | | 83,000 | | | | 4,520,180 | | |
| Paychex, Inc. | | | 97,000 | | | | 3,781,060 | | |
| QIAGEN NV(a) (b) | | | 59,100 | | | | 810,852 | | |
Quest
Diagnostics, Inc.(b) | | | 44,600 | | | | 2,672,432 | | |
Resources
Connection, Inc.(a) | | | 44,000 | | | | 1,100,880 | | |
Ritchie Bros.
Auctioneers, Inc. | | | 38,500 | | | | 2,047,430 | | |
Robert Half
International, Inc. | | | 163,100 | | | | 6,850,200 | | |
| Stericycle, Inc.(a) | | | 21,000 | | | | 1,367,100 | | |
United
Rentals, Inc.(a) (b) | | | 123,000 | | | | 3,933,540 | | |
Universal Technical
Institute, Inc.(a) (b) | | | 22,100 | | | | 486,642 | | |
| Viad Corp. | | | 65,000 | | | | 2,034,500 | | |
| | | | 96,875,444 | | |
| Communications — 3.8% | |
American Tower
Corp. Cl. A(a) (b) | | | 383,000 | | | | 11,918,960 | | |
Crown Castle
International Corp.(a) (b) | | | 456,000 | | | | 15,750,240 | | |
EchoStar
Communications
Corp. Cl. A(a) | | | 75,000 | | | | 2,310,750 | | |
| Harris Corp. | | | 176,000 | | | | 7,305,760 | | |
Rogers Communications,
Inc. Cl. B(b) | | | 217,675 | | | | 8,794,070 | | |
(Continued)
The accompanying notes are an integral part of the financial statements.
144
MassMutual Select Mid Cap Growth Equity II Fund – Portfolio of Investments (Continued)
| | | Number of
Shares | | Market
Value | |
SBA Communications
Corp. Cl. A(a) | | | 122,100 | | | $ | 3,191,694 | | |
XM Satellite Radio
Holdings, Inc. Cl. A(a) | | | 54,700 | | | | 801,355 | | |
| | | | 50,072,829 | | |
| Computer Integrated Systems Design — 1.9% | |
Avid
Technology, Inc.(a) (b) | | | 134,400 | | | | 4,479,552 | | |
Cadence Design
Systems, Inc.(a) | | | 44,000 | | | | 754,600 | | |
| Cogent, Inc.(a) (b) | | | 273,400 | | | | 4,120,138 | | |
| F5 Networks, Inc.(a) (b) | | | 15,300 | | | | 818,244 | | |
| FileNET Corp.(a) | | | 39,400 | | | | 1,061,042 | | |
Jack Henry &
Associates, Inc. | | | 226,500 | | | | 4,452,990 | | |
National
Instruments Corp. | | | 42,600 | | | | 1,167,240 | | |
| Synopsys, Inc.(a) | | | 33,100 | | | | 621,287 | | |
| Teradyne, Inc.(a) (b) | | | 474,200 | | | | 6,605,606 | | |
| Websense, Inc.(a) | | | 49,300 | | | | 1,012,622 | | |
| | | | 25,093,321 | | |
| Computer Programming Services — 1.1% | |
Cognizant Technology
Solutions Corp. Cl. A(a) | | | 56,800 | | | | 3,826,616 | | |
Mercury
Interactive Corp.(a) | | | 31,700 | | | | 1,108,549 | | |
| VeriSign, Inc.(a) (b) | | | 431,900 | | | | 10,007,123 | | |
| | | | 14,942,288 | | |
| Computer Related Services — 1.3% | |
CACI International,
Inc. Cl. A(a) | | | 89,000 | | | | 5,191,370 | | |
| Checkfree Corp.(a) (b) | | | 184,600 | | | | 9,148,776 | | |
| CNET Networks, Inc.(a) | | | 384,000 | | | | 3,064,320 | | |
| | | | 17,404,466 | | |
| Computers & Information — 2.5% | |
| CDW Corp. | | | 21,200 | | | | 1,158,580 | | |
| Cognos, Inc.(a) | | | 48,600 | | | | 1,382,670 | | |
Comverse
Technology, Inc.(a) (b) | | | 101,000 | | | | 1,996,770 | | |
International
Game Technology | | | 301,700 | | | | 11,446,498 | | |
| Jabil Circuit, Inc. | | | 267,400 | | | | 6,845,440 | | |
Satyam Computer
Services Ltd. ADR | | | 54,500 | | | | 1,806,130 | | |
| Symbol Technologies, Inc. | | | 657,998 | | | | 7,099,799 | | |
Zebra Technologies
Corp. Cl. A(a) (b) | | | 22,000 | | | | 751,520 | | |
| | | | 32,487,407 | | |
| | | Number of
Shares | | Market
Value | |
| Containers — 0.1% | |
| Sealed Air Corp.(b) | | | 13,300 | | | $ | 692,664 | | |
| Cosmetics & Personal Care — 0.1% | |
| Avon Products, Inc. | | | 52,100 | | | | 1,615,100 | | |
| Data Processing & Preparation — 0.3% | |
FactSet Research
Systems, Inc. | | | 28,400 | | | | 1,343,320 | | |
| Fiserv, Inc.(a) | | | 25,100 | | | | 1,138,536 | | |
| SEI Investments Co. | | | 19,300 | | | | 943,384 | | |
| | | | 3,425,240 | | |
| Education — 0.0% | |
Career
Education Corp.(a) (b) | | | 20,100 | | | | 600,789 | | |
| Electric Utilities — 0.3% | |
| AES Corp.(a) | | | 191,100 | | | | 3,525,795 | | |
| Electrical Equipment & Electronics — 10.4% | |
Advanced Micro
Devices, Inc.(a) | | | 42,600 | | | | 1,040,292 | | |
| Altera Corp.(a) | | | 561,000 | | | | 9,845,550 | | |
American Power
Conversion Corp.(b) | | | 55,100 | | | | 1,073,899 | | |
| Ametek, Inc. | | | 248,300 | | | | 11,764,454 | | |
| Analog Devices, Inc. | | | 134,600 | | | | 4,326,044 | | |
| Broadcom Corp. Cl. A(a) | | | 128,400 | | | | 3,858,420 | | |
| Cymer, Inc.(a) (b) | | | 20,400 | | | | 947,784 | | |
Dolby Laboratories,
Inc. Cl. A(a) | | | 166,400 | | | | 3,877,120 | | |
Flextronics
International Ltd.(a) | | | 434,000 | | | | 4,609,080 | | |
| FLIR Systems, Inc.(a) (b) | | | 197,800 | | | | 4,363,468 | | |
| Garmin Ltd.(b) | | | 67,000 | | | | 7,064,480 | | |
| Gentex Corp.(b) | | | 377,600 | | | | 5,286,400 | | |
Integrated Device
Technology, Inc.(a) | | | 88,000 | | | | 1,247,840 | | |
| Intersil Corp. Cl. A | | | 311,200 | | | | 7,235,400 | | |
| KLA-Tencor Corp. | | | 25,000 | | | | 1,039,250 | | |
Linear
Technology Corp.(b) | | | 245,400 | | | | 8,218,446 | | |
Marvell Technology
Group Ltd.(a) | | | 185,900 | | | | 8,240,947 | | |
Maxim Integrated
Products, Inc. | | | 124,100 | | | | 3,984,851 | | |
Microchip
Technology, Inc. | | | 300,500 | | | | 10,081,775 | | |
National
Semiconductor Corp.(b) | | | 356,400 | | | | 8,500,140 | | |
| Novellus Systems, Inc.(a) | | | 178,000 | | | | 4,396,600 | | |
| PMC-Sierra, Inc.(a) (b) | | | 272,000 | | | | 2,556,800 | | |
| QLogic Corp.(a) | | | 48,000 | | | | 827,520 | | |
| Semtech Corp.(a) | | | 145,300 | | | | 2,099,585 | | |
| | | Number of
Shares | | Market
Value | |
Silicon
Laboratories, Inc.(a) (b) | | | 96,100 | | | $ | 3,377,915 | | |
Spansion
LLC Cl. A(a) (b) | | | 193,000 | | | | 3,076,420 | | |
SunPower
Corp. Cl. A(a) (b) | | | 62,000 | | | | 1,737,240 | | |
| Teleflex, Inc. | | | 48,000 | | | | 2,592,960 | | |
| Xilinx, Inc.(b) | | | 470,800 | | | | 10,663,620 | | |
| | | | 137,934,300 | | |
| Energy — 5.6% | |
| Bill Barrett Corp.(a) (b) | | | 139,000 | | | | 4,115,790 | | |
| BJ Services Co. | | | 438,000 | | | | 16,319,880 | | |
Compton
Petroleum Corp.(a) | | | 183,800 | | | | 2,121,052 | | |
Diamond Offshore
Drilling, Inc.(b) | | | 28,000 | | | | 2,350,040 | | |
| EOG Resources, Inc.(b) | | | 153,000 | | | | 10,609,020 | | |
| Murphy Oil Corp.(b) | | | 220,600 | | | | 12,322,716 | | |
Nabors
Industries Ltd.(a) (b) | | | 60,000 | | | | 2,027,400 | | |
| Ultra Petroleum Corp.(a) | | | 65,500 | | | | 3,882,185 | | |
Weatherford
International Ltd.(a) | | | 83,500 | | | | 4,143,270 | | |
| The Williams Cos., Inc. | | | 141,600 | | | | 3,307,776 | | |
| XTO Energy, Inc. | | | 307,367 | | | | 13,607,137 | | |
| | | | 74,806,266 | | |
| Entertainment & Leisure — 0.9% | |
| Brunswick Corp. | | | 116,300 | | | | 3,866,975 | | |
DreamWorks Animation
SKG, Inc. Cl. A(a) (b) | | | 99,700 | | | | 2,283,130 | | |
Harrah's
Entertainment, Inc. | | | 42,800 | | | | 3,046,504 | | |
Shuffle
Master, Inc.(a) (b) | | | 58,950 | | | | 1,932,381 | | |
WMS
Industries, Inc.(a) (b) | | | 32,300 | | | | 884,697 | | |
| | | | 12,013,687 | | |
| Financial Services — 4.4% | |
Affiliated Managers
Group, Inc.(a) (b) | | | 8,800 | | | | 764,632 | | |
| BlackRock, Inc. Cl. A(b) | | | 11,400 | | | | 1,586,538 | | |
| CapitalSource, Inc.(b) | | | 51,400 | | | | 1,205,844 | | |
CBOT Holdings
Inc. Cl. A(a) | | | 40,800 | | | | 4,879,272 | | |
Chicago Mercantile
Exchange
Holdings, Inc. | | | 11,000 | | | | 5,402,650 | | |
E*TRADE
Financial Corp.(a) | | | 327,300 | | | | 7,468,986 | | |
| East West Bancorp, Inc. | | | 21,000 | | | | 796,110 | | |
| Eaton Vance Corp. | | | 260,000 | | | | 6,489,600 | | |
(Continued)
The accompanying notes are an integral part of the financial statements.
145
MassMutual Select Mid Cap Growth Equity II Fund – Portfolio of Investments (Continued)
| | | Number of
Shares | | Market
Value | |
Federated Investors,
Inc. Cl. B | | | 18,000 | | | $ | 567,000 | | |
Fidelity National
Information
Services, Inc.(b) | | | 187,100 | | | | 6,623,340 | | |
| Janus Capital Group, Inc. | | | 72,500 | | | | 1,297,750 | | |
| Lazard Ltd. Cl. A(b) | | | 18,700 | | | | 755,480 | | |
| Legg Mason, Inc. | | | 73,490 | | | | 7,313,725 | | |
Nuveen Investments,
Inc. Cl. A(b) | | | 111,900 | | | | 4,817,295 | | |
optionsXpress
Holdings, Inc. | | | 34,700 | | | | 808,857 | | |
The Charles
Schwab Corp.(b) | | | 60,200 | | | | 961,996 | | |
TD Ameritrade
Holding Corp. | | | 455,700 | | | | 6,748,917 | | |
| | | | 58,487,992 | | |
| Foods — 0.4% | |
| The Hershey Co.(b) | | | 31,000 | | | | 1,707,170 | | |
| McCormick & Co., Inc. | | | 47,500 | | | | 1,593,625 | | |
| Panera Bread Co. Cl. A(a) | | | 11,700 | | | | 786,708 | | |
| Wrigley (Wm.) Jr. Co. | | | 25,875 | | | | 1,173,690 | | |
| | | | 5,261,193 | | |
| Healthcare — 4.9% | |
Community Health
Systems, Inc.(a) | | | 120,000 | | | | 4,410,000 | | |
Coventry Health
Care, Inc.(a) | | | 122,400 | | | | 6,724,656 | | |
| DaVita, Inc.(a) | | | 92,350 | | | | 4,589,795 | | |
Elan Corp. PLC
Sponsored
ADR (Ireland)(a) (b) | | | 380,000 | | | | 6,346,000 | | |
| Express Scripts, Inc.(a) | | | 30,500 | | | | 2,188,070 | | |
Health Management
Associates, Inc. Cl. A | | | 279,500 | | | | 5,508,945 | | |
| Healthways, Inc.(a) (b) | | | 24,700 | | | | 1,300,208 | | |
Human Genome
Sciences, Inc.(a) (b) | | | 77,000 | | | | 823,900 | | |
| Humana, Inc.(a) | | | 159,100 | | | | 8,543,670 | | |
Laboratory Corp. of
America Holdings(a) | | | 133,400 | | | | 8,301,482 | | |
LifePoint
Hospitals, Inc.(a) | | | 23,000 | | | | 738,990 | | |
| Lincare Holdings, Inc.(a) | | | 54,900 | | | | 2,077,416 | | |
| Manor Care, Inc. | | | 235,000 | | | | 11,026,200 | | |
| Triad Hospitals, Inc.(a) | | | 66,000 | | | | 2,612,280 | | |
| | | | 65,191,612 | | |
| Heavy Machinery — 0.7% | |
Cameron
International Corp.(a) | | | 195,400 | | | | 9,334,258 | | |
| | | Number of
Shares | | Market
Value | |
Home Construction, Furnishings &
Appliances — 1.2% | |
| Centex Corp. | | | 21,500 | | | $ | 1,081,450 | | |
Harman International
Industries, Inc. | | | 105,500 | | | | 9,006,535 | | |
| HNI Corp.(b) | | | 21,400 | | | | 970,490 | | |
| KB Home | | | 17,800 | | | | 816,130 | | |
| Lennar Corp. Cl. A(b) | | | 43,100 | | | | 1,912,347 | | |
| Meritage Homes Corp.(a) | | | 15,200 | | | | 718,200 | | |
| Pulte Homes, Inc. | | | 27,800 | | | | 800,362 | | |
| Toll Brothers, Inc.(a) (b) | | | 34,500 | | | | 882,165 | | |
| | | | 16,187,679 | | |
| Industrial – Distribution — 0.2% | |
| Grainger (W.W.), Inc. | | | 36,000 | | | | 2,708,280 | | |
| Industrial – Diversified — 0.9% | |
| Danaher Corp. | | | 103,100 | | | | 6,631,392 | | |
| ITT Industries, Inc. | | | 116,800 | | | | 5,781,600 | | |
| | | | 12,412,992 | | |
| Information Retrieval Services — 1.2% | |
| ChoicePoint, Inc.(a) (b) | | | 187,800 | | | | 7,844,406 | | |
| Digital River, Inc.(a) (b) | | | 31,500 | | | | 1,272,285 | | |
Juniper
Networks, Inc.(a) (b) | | | 374,400 | | | | 5,986,656 | | |
| Sina Corp.(a) (b) | | | 27,900 | | | | 696,942 | | |
| | | | 15,800,289 | | |
| Insurance — 1.7% | |
Ambac Financial
Group, Inc. | | | 11,300 | | | | 916,430 | | |
Arch Capital
Group Ltd.(a) | | | 27,600 | | | | 1,641,096 | | |
| Assurant, Inc. | | | 148,000 | | | | 7,163,200 | | |
| Axis Capital Holdings Ltd. | | | 195,700 | | | | 5,598,977 | | |
| Brown & Brown, Inc. | | | 31,500 | | | | 920,430 | | |
| Markel Corp.(a) (b) | | | 2,560 | | | | 888,320 | | |
Marsh & McLennan
Cos., Inc. | | | 33,000 | | | | 887,370 | | |
| MBIA, Inc.(b) | | | 11,500 | | | | 673,325 | | |
Principal Financial
Group, Inc. | | | 63,000 | | | | 3,505,950 | | |
Willis Group
Holdings Ltd. | | | 20,100 | | | | 645,210 | | |
| | | | 22,840,308 | | |
| Lodging — 1.9% | |
| Boyd Gaming Corp. | | | 42,100 | | | | 1,699,156 | | |
Choice Hotels
International, Inc. | | | 42,500 | | | | 2,575,500 | | |
| Hilton Hotels Corp. | | | 121,000 | | | | 3,421,880 | | |
Las Vegas
Sands Corp.(a) (b) | | | 15,800 | | | | 1,230,188 | | |
| | | Number of
Shares | | Market
Value | |
Marriott International,
Inc. Cl. A | | | 90,000 | | | $ | 3,430,800 | | |
Starwood Hotels &
Resorts Worldwide, Inc. | | | 52,600 | | | | 3,173,884 | | |
| Station Casinos, Inc.(b) | | | 28,200 | | | | 1,919,856 | | |
| Wynn Resorts Ltd.(a) (b) | | | 102,900 | | | | 7,542,570 | | |
| | | | 24,993,834 | | |
| Machinery & Components — 3.6% | |
FMC
Technologies, Inc.(a) | | | 142,000 | | | | 9,579,320 | | |
| Graco, Inc. | | | 46,200 | | | | 2,124,276 | | |
| Grant Prideco, Inc.(a) | | | 99,400 | | | | 4,448,150 | | |
| IDEX Corp. | | | 18,550 | | | | 875,560 | | |
| Pall Corp. | | | 26,300 | | | | 736,400 | | |
| Roper Industries, Inc. | | | 308,000 | | | | 14,399,000 | | |
Smith
International, Inc.(b) | | | 346,300 | | | | 15,399,961 | | |
| | | | 47,562,667 | | |
| Manufacturing — 0.9% | |
American Standard
Cos., Inc.(b) | | | 124,000 | | | | 5,365,480 | | |
| Avery Dennison Corp. | | | 13,300 | | | | 772,198 | | |
| Lam Research Corp.(a) | | | 19,900 | | | | 927,738 | | |
| Millipore Corp.(a) (b) | | | 17,200 | | | | 1,083,428 | | |
| Pentair, Inc. | | | 107,000 | | | | 3,658,330 | | |
| | | | 11,807,174 | | |
| Medical Supplies — 4.3% | |
| Allergan, Inc.(b) | | | 39,255 | | | | 4,210,491 | | |
American Medical
Systems
Holdings, Inc.(a) (b) | | | 45,300 | | | | 754,245 | | |
| ArthoCare Corp.(a) (b) | | | 19,900 | | | | 835,999 | | |
| Bard (C.R.), Inc. | | | 66,700 | | | | 4,886,442 | | |
| Becton, Dickinson & Co. | | | 25,400 | | | | 1,552,702 | | |
| Biomet, Inc. | | | 51,400 | | | | 1,608,306 | | |
Dade Behring
Holdings, Inc. | | | 26,000 | | | | 1,082,640 | | |
Dentsply
International, Inc. | | | 23,100 | | | | 1,399,860 | | |
Edwards
Lifesciences Corp.(a) | | | 181,800 | | | | 8,259,174 | | |
| Henry Schein, Inc.(a) (b) | | | 28,900 | | | | 1,350,497 | | |
| Hologic, Inc.(a) | | | 17,100 | | | | 844,056 | | |
| II-VI, Inc.(a) | | | 41,300 | | | | 755,790 | | |
Integra LifeSciences
Holdings Corp.(a) (b) | | | 23,600 | | | | 915,916 | | |
| Kyphon, Inc.(a) (b) | | | 28,400 | | | | 1,089,424 | | |
Patterson
Cos., Inc.(a) (b) | | | 234,000 | | | | 8,173,620 | | |
| Resmed, Inc.(a) | | | 40,200 | | | | 1,887,390 | | |
| Respironics, Inc.(a) | | | 40,300 | | | | 1,379,066 | | |
(Continued)
The accompanying notes are an integral part of the financial statements.
146
MassMutual Select Mid Cap Growth Equity II Fund – Portfolio of Investments (Continued)
| | | Number of
Shares | | Market
Value | |
St. Jude
Medical, Inc.(a) | | | 74,100 | | | $ | 2,402,322 | | |
| Techne Corp.(a) | | | 40,700 | | | | 2,072,444 | | |
Thermo
Electron Corp.(a) (b) | | | 145,000 | | | | 5,254,800 | | |
Varian Medical
Systems, Inc.(a) | | | 42,000 | | | | 1,988,700 | | |
Ventana Medical
Systems, Inc.(a) | | | 27,200 | | | | 1,283,296 | | |
| Waters Corp.(a) | | | 35,300 | | | | 1,567,320 | | |
| Zimmer Holdings, Inc.(a) | | | 13,600 | | | | 771,392 | | |
| | | | 56,325,892 | | |
| Metals & Mining — 2.2% | |
| CONSOL Energy, Inc. | | | 234,000 | | | | 10,932,480 | | |
Foundation Coal
Holdings, Inc. | | | 166,300 | | | | 7,804,459 | | |
| Newmont Mining Corp. | | | 85,000 | | | | 4,499,050 | | |
| Precision Castparts Corp. | | | 55,800 | | | | 3,334,608 | | |
Teck Cominco
Ltd. Cl. B(b) | | | 50,000 | | | | 2,988,000 | | |
| | | | 29,558,597 | | |
| Pharmaceuticals — 6.5% | |
| Alkermes, Inc.(a) | | | 207,200 | | | | 3,920,224 | | |
Amylin
Pharmaceuticals, Inc.(a) (b) | | | 119,900 | | | | 5,919,463 | | |
| Atherogenics, Inc.(a) (b) | | | 45,800 | | | | 597,690 | | |
Barr
Pharmaceuticals, Inc.(a) | | | 128,000 | | | | 6,104,320 | | |
| Celgene Corp.(a) (b) | | | 74,200 | | | | 3,519,306 | | |
| Cephalon, Inc.(a) (b) | | | 191,900 | | | | 11,533,190 | | |
Charles River
Laboratories
International, Inc.(a) | | | 28,600 | | | | 1,052,480 | | |
| Genzyme Corp.(a) (b) | | | 16,200 | | | | 989,010 | | |
| Gilead Sciences, Inc.(a) | | | 58,000 | | | | 3,431,280 | | |
| Invitrogen Corp.(a) | | | 18,300 | | | | 1,209,081 | | |
Martek
Biosciences Corp.(a) (b) | | | 26,500 | | | | 767,175 | | |
Medco Health
Solutions, Inc.(a) (b) | | | 45,200 | | | | 2,589,056 | | |
| MedImmune, Inc.(a) | | | 361,500 | | | | 9,796,650 | | |
Millennium
Pharmaceuticals, Inc.(a) (b) | | | 74,500 | | | | 742,765 | | |
| Myogen, Inc.(a) (b) | | | 102,000 | | | | 2,958,000 | | |
| Nektar Therapeutics(a) (b) | | | 41,500 | | | | 761,110 | | |
Neurocrine
Biosciences, Inc.(a) (b) | | | 106,200 | | | | 1,125,720 | | |
| Omnicare, Inc. | | | 87,400 | | | | 4,144,508 | | |
OSI
Pharmaceuticals, Inc.(a) (b) | | | 100,500 | | | | 3,312,480 | | |
| PDL BioPharma, Inc.(a) (b) | | | 145,100 | | | | 2,671,291 | | |
| Sepracor, Inc.(a) (b) | | | 117,500 | | | | 6,713,950 | | |
| | | Number of
Shares | | Market
Value | |
| Sigma-Aldrich Corp. | | | 11,600 | | | $ | 842,624 | | |
| Theravance, Inc.(a) | | | 95,100 | | | | 2,175,888 | | |
Valeant Pharmaceuticals
International | | | 215,000 | | | | 3,637,800 | | |
Vertex
Pharmaceuticals, Inc.(a) (b) | | | 168,200 | | | | 6,174,622 | | |
| | | | 86,689,683 | | |
| Prepackaged Software — 4.5% | |
| Activision, Inc.(a) | | | 84,810 | | | | 965,138 | | |
| Adobe Systems, Inc.(a) | | | 218,900 | | | | 6,645,804 | | |
Check Point Software
Technologies Ltd.(a) | | | 64,300 | | | | 1,130,394 | | |
| Citrix Systems, Inc.(a) | | | 49,300 | | | | 1,978,902 | | |
| DST Systems, Inc.(a) (b) | | | 162,600 | | | | 9,674,700 | | |
Electronic
Arts, Inc.(a) (b) | | | 14,700 | | | | 632,688 | | |
| Fair Isaac Corp.(b) | | | 25,500 | | | | 925,905 | | |
Hyperion
Solutions Corp.(a) | | | 20,700 | | | | 571,320 | | |
Internet Security
Systems, Inc.(a) | | | 33,400 | | | | 629,590 | | |
| Intuit, Inc.(a) | | | 144,400 | | | | 8,720,316 | | |
| McAfee, Inc.(a) | | | 250,100 | | | | 6,069,927 | | |
| NAVTEQ Corp.(a) | | | 239,400 | | | | 10,696,392 | | |
| Red Hat, Inc.(a) (b) | | | 278,400 | | | | 6,514,560 | | |
| Salesforce.com, Inc.(a) (b) | | | 121,600 | | | | 3,241,856 | | |
| THQ, Inc.(a) (b) | | | 54,250 | | | | 1,171,800 | | |
| | | | 59,569,292 | | |
| Restaurants — 0.9% | |
The Cheesecake
Factory(a) (b) | | | 166,200 | | | | 4,479,090 | | |
OSI Restaurant
Partners, Inc. | | | 29,900 | | | | 1,034,540 | | |
P.F. Chang's China
Bistro, Inc.(a) | | | 62,000 | | | | 2,357,240 | | |
| Tim Hortons, Inc.(a) (b) | | | 152,900 | | | | 3,937,175 | | |
| | | | 11,808,045 | | |
| Retail — 5.1% | |
| Advance Auto Parts, Inc. | | | 35,300 | | | | 1,020,170 | | |
| Amazon.com, Inc.(a) | | | 253,900 | | | | 9,820,852 | | |
Bed Bath &
Beyond, Inc.(a) | | | 234,500 | | | | 7,778,365 | | |
| Best Buy Co., Inc. | | | 98,000 | | | | 5,374,320 | | |
| Carmax, Inc.(a) (b) | | | 106,000 | | | | 3,758,760 | | |
Dick's Sporting
Goods, Inc.(a) | | | 51,600 | | | | 2,043,360 | | |
| Dollar General Corp.(b) | | | 97,600 | | | | 1,364,448 | | |
| Family Dollar Stores, Inc. | | | 50,700 | | | | 1,238,601 | | |
| Fred's, Inc.(b) | | | 48,500 | | | | 647,475 | | |
| Men's Wearhouse, Inc. | | | 26,900 | | | | 815,070 | | |
| Michaels Stores, Inc. | | | 23,400 | | | | 965,016 | | |
| | | Number of
Shares | | Market
Value | |
MSC Industrial Direct
Co. Cl. A | | | 26,000 | | | $ | 1,236,820 | | |
O'Reilly
Automotive, Inc.(a) | | | 227,000 | | | | 7,080,130 | | |
| Petsmart, Inc. | | | 340,700 | | | | 8,721,920 | | |
| Shoppers Drug Mart Corp. | | | 23,000 | | | | 838,585 | | |
Shoppers Drug Mart
Corp. CAD | | | 25,000 | | | | 911,505 | | |
Shoppers Drug Mart
Corp. CAD(c) | | | 38,000 | | | | 1,385,488 | | |
| Staples, Inc. | | | 70,150 | | | | 1,706,048 | | |
| Tiffany & Co. | | | 80,500 | | | | 2,658,110 | | |
| The TJX Cos., Inc. | | | 137,700 | | | | 3,147,822 | | |
| Williams-Sonoma, Inc.(b) | | | 148,900 | | | | 5,070,045 | | |
| | | | 67,582,910 | | |
| Retail – Grocery — 0.2% | |
| Whole Foods Market, Inc. | | | 38,000 | | | | 2,456,320 | | |
| Telephone Utilities — 1.5% | |
| ADTRAN, Inc. | | | 105,000 | | | | 2,355,150 | | |
| Amdocs Ltd.(a) | | | 198,000 | | | | 7,246,800 | | |
Level 3
Communications, Inc.(a) (b) | | | 198,000 | | | | 879,120 | | |
| NeuStar, Inc. Cl. A(a) (b) | | | 52,300 | | | | 1,765,125 | | |
| NII Holdings, Inc. Cl. B(a) | | | 51,000 | | | | 2,875,380 | | |
| TELUS Corp. | | | 122,400 | | | | 5,072,085 | | |
| TELUS Corp. CAD | | | 7,600 | | | | 314,933 | | |
| | | | 20,508,593 | | |
| Transportation — 1.7% | |
Discovery Holding
Co. Cl. A(a) | | | 271,000 | | | | 3,964,730 | | |
Expeditors International
of Washington, Inc. | | | 51,000 | | | | 2,856,510 | | |
| Landstar System, Inc.(b) | | | 55,600 | | | | 2,625,988 | | |
Robinson (C.H.)
Worldwide, Inc. | | | 50,800 | | | | 2,707,640 | | |
Royal Caribbean
Cruises Ltd. | | | 47,400 | | | | 1,813,050 | | |
| Thor Industries, Inc.(b) | | | 30,700 | | | | 1,487,415 | | |
| UTI Worldwide, Inc. | | | 275,700 | | | | 6,955,911 | | |
| | | | 22,411,244 | | |
TOTAL EQUITIES
(Cost $1,070,874,784) | | | | | | | 1,287,850,932 | | |
| MUTUAL FUND — 0.8% | |
| Financial Services | |
Government Reserve
Investment Fund | | | 11,284,995 | | | | 11,284,995 | | |
TOTAL MUTUAL FUND
(Cost $11,284,995) | | | | | | | 11,284,995 | | |
TOTAL LONG TERM INVESTMENTS
(Cost $1,082,159,779) | | | | | | | 1,299,135,927 | | |
(Continued)
The accompanying notes are an integral part of the financial statements.
147
MassMutual Select Mid Cap Growth Equity II Fund – Portfolio of Investments (Continued)
| | | Principal
Amount | | Market
Value | |
| SHORT-TERM INVESTMENTS — 16.4% | |
| Cash Equivalents — 14.0%(e) | |
Abbey National PLC
Eurodollar Time Deposit
5.100% 07/10/2006 | | $ | 2,024,353 | | | $ | 2,024,353 | | |
ABN Amro Bank NV
Certificate of Deposit
5.305% 11/21/2006 | | | 2,024,348 | | | | 2,024,348 | | |
American Beacon Money
Market Fund(d) | | | 2,064,663 | | | | 2,064,663 | | |
Bank of America
5.270% 07/14/2006 | | | 4,048,697 | | | | 4,048,697 | | |
Bank of America
5.310% 03/08/2007 | | | 4,048,697 | | | | 4,048,697 | | |
Bank of Montreal
Eurodollar Time Deposit
5.290% 08/03/2006 | | | 4,048,697 | | | | 4,048,697 | | |
Bank of Nova Scotia
Eurodollar Time Deposit
5.290% 08/08/2006 | | | 4,048,697 | | | | 4,048,697 | | |
Barclays
Eurodollar Time Deposit
5.150% 08/01/2006 | | | 6,073,045 | | | | 6,073,045 | | |
Branch Banker & Trust
Eurodollar Time Deposit
5.250% 07/26/2006 | | | 7,287,654 | | | | 7,287,654 | | |
Calyon
Eurodollar Time Deposit
5.300% 08/08/2006 | | | 4,048,697 | | | | 4,048,697 | | |
Canadian Imperial
Bank of Commerce
Eurodollar Time Deposit
5.310% 07/31/2006 | | | 4,048,697 | | | | 4,048,697 | | |
Deutsche Bank
Eurodollar Time Deposit
5.250% 07/05/2006 | | | 10,121,742 | | | | 10,121,742 | | |
Dexia Group
Eurodollar Time Deposit
5.300% 08/09/2006 | | | 5,263,306 | | | | 5,263,306 | | |
Federal Home Loan
Bank Discount Note
5.181% 07/19/2006 | | | 3,222,709 | | | | 3,222,709 | | |
First Tennessee
National Corporation
Eurodollar Time Deposit
5.270% 07/24/2006 | | | 4,858,437 | | | | 4,858,437 | | |
Fortis Bank
Eurodollar Time Deposit
5.090% 07/05/2006 | | | 4,048,697 | | | | 4,048,697 | | |
Fortis Bank
Eurodollar Time Deposit
5.250% 07/03/2006 | | | 4,048,697 | | | | 4,048,697 | | |
| | | Principal
Amount | | Market
Value | |
Fortis Bank
Eurodollar Time Deposit
5.250% 07/06/2006 | | $ | 4,048,697 | | | $ | 4,048,697 | | |
Freddie Mac
Discount Note
5.191% 07/25/2006 | | | 2,416,194 | | | | 2,416,194 | | |
Harris NA
Eurodollar Time Deposit
5.080% 07/05/2006 | | | 2,834,088 | | | | 2,834,088 | | |
HBOS Halifax
Bank of Scotland
Certificate of Deposit
5.110% 07/10/2006 | | | 4,048,697 | | | | 4,048,697 | | |
National Australia Bank
Eurodollar Time Deposit
5.290% 07/03/2006 | | | 14,170,439 | | | | 14,170,439 | | |
National City Corporation
Eurodollar Time Deposit
5.220% 07/03/2006 | | | 4,806,660 | | | | 4,806,660 | | |
Skandinaviska Enskilda
Banken AB
Eurodollar Time Deposit
5.130% 07/12/2006 | | | 4,048,697 | | | | 4,048,697 | | |
Societe Generale
Eurodollar Time Deposit
5.200% 08/08/2006 | | | 4,048,697 | | | | 4,048,697 | | |
Societe Generale
Eurodollar Time Deposit
5.270% 07/17/2006 | | | 5,263,306 | | | | 5,263,306 | | |
Standard Chartered Bank
Eurodollar Time Deposit
5.260% 07/07/2006 | | | 6,073,045 | | | | 6,073,045 | | |
Svenska Handlesbanken
Eurodollar Time Deposit
5.290% 07/03/2006 | | | 13,573,283 | | | | 13,573,283 | | |
The Bank of the West
Eurodollar Time Deposit
5.250% 08/07/2006 | | | 6,882,785 | | | | 6,882,785 | | |
Toronto Dominion Bank
Eurodollar Time Deposit
5.300% 07/31/2006 | | | 11,336,352 | | | | 11,336,352 | | |
UBS AG
Eurodollar Time Deposit
5.250% 07/21/2006 | | | 6,073,045 | | | | 6,073,045 | | |
UBS AG
Eurodollar Time Deposit
5.250% 08/04/2006 | | | 6,073,045 | | | | 6,073,045 | | |
Wells Fargo
Eurodollar Time Deposit
5.160% 07/13/2006 | | | 4,048,697 | | | | 4,048,697 | | |
Wells Fargo
Eurodollar Time Deposit
5.170% 07/03/2006 | | | 4,048,697 | | | | 4,048,697 | | |
| | | Principal
Amount | | Market
Value | |
Wells Fargo
Eurodollar Time Deposit
5.210% 07/06/2006 | | $ | 2,024,348 | | | $ | 2,024,348 | | |
Wells Fargo
Eurodollar Time Deposit
5.250% 07/03/2006 | | | 4,048,697 | | | | 4,048,697 | | |
| | | | 185,197,302 | | |
| Repurchase Agreement — 2.4% | |
Investors Bank & Trust
Company Repurchase
Agreement, dated
06/30/2006, 3.75%,
due 07/03/2006(f) | | | 31,906,085 | | | | 31,906,085 | | |
TOTAL SHORT-TERM
INVESTMENTS
(Cost $217,103,387) | | | | | | | 217,103,387 | | |
TOTAL INVESTMENTS — 114.4%
(Cost $1,299,263,166)(g) | | | | | | | 1,516,239,314 | | |
Other Assets/
(Liabilities) — (14.4%) | | | | | | | (190,761,307 | ) | |
| NET ASSETS — 100.0% | | | | | | $ | 1,325,478,007 | | |
Notes to Portfolio of Investments
ADR - American Depository Receipt
(a) Non-income producing security.
(b) Denotes all or a portion of security on loan. (Note 2).
(c) Securities exempt from registration under rule 144A of the Securities Act of 1933. These securities may be resold in transactions exempt from registration, normally to qualified institutional buyers. At June 30, 2006, these securities amounted to a value of $1,385,488 or 0.1% of net assets.
(d) Amount represents shares owned of the fund.
(e) Represents investments of security lending collateral. (Note 2).
(f) Maturity value of $31,916,056. Collateralized by a U.S. Government Agency obligation with a rate of 5.699%, maturity date of 06/15/2034, and an aggregate market value, including accrued interest, of $33,501,389.
(g) See Note 6 for aggregate cost for Federal tax purposes.
The accompanying notes are an integral part of the financial statements.
148
MassMutual Select Small Cap Growth Equity Fund – Portfolio of Investments
June 30, 2006 (Unaudited)
| | | Number of
Shares | | Market
Value | |
| EQUITIES — 89.2% | |
| COMMON STOCK | |
| Advertising — 1.7% | |
| Catalina Marketing Corp. | | | 92,500 | | | $ | 2,632,550 | | |
Focus Media Holding
Limited ADR (China)(a) | | | 22,380 | | | | 1,458,281 | | |
| Getty Images, Inc.(a) (b) | | | 110,150 | | | | 6,995,626 | | |
| | | | 11,086,457 | | |
| Aerospace & Defense — 0.4% | |
Alliant
Techsystems, Inc.(a) (b) | | | 26,300 | | | | 2,008,005 | | |
| Transdigm Group, Inc.(a) | | | 23,900 | | | | 572,405 | | |
| | | | 2,580,410 | | |
| Air Transportation — 0.9% | |
Airtran
Holdings, Inc.(a) (b) | | | 157,700 | | | | 2,343,422 | | |
| Copa Holdings SA Cl. A | | | 42,650 | | | | 966,022 | | |
Gol Linhas Aereas
Inteligentes
SA ADR (Brazil)(b) | | | 32,580 | | | | 1,156,590 | | |
JetBlue
Airways Corp.(a) (b) | | | 147,700 | | | | 1,793,078 | | |
| | | | 6,259,112 | | |
| Apparel, Textiles & Shoes — 1.2% | |
| Citi Trends, Inc.(a) (b) | | | 25,300 | | | | 1,080,057 | | |
| DSW, Inc. Cl. A(a) (b) | | | 31,630 | | | | 1,151,965 | | |
Iconix Brand
Group, Inc.(a) | | | 67,130 | | | | 1,096,904 | | |
Skechers U.S.A.,
Inc. Cl. A(a) | | | 127,600 | | | | 3,076,436 | | |
| Too, Inc.(a) | | | 43,930 | | | | 1,686,473 | | |
| | | | 8,091,835 | | |
| Automotive & Parts — 3.1% | |
| A.S.V., Inc.(a) (b) | | | 214,900 | | | | 4,951,296 | | |
Aftermarket
Technology Corp.(a) | | | 43,140 | | | | 1,072,029 | | |
American Axle &
Manufacturing
Holdings, Inc.(b) | | | 113,400 | | | | 1,940,274 | | |
| LKQ Corp.(a) | | | 419,248 | | | | 7,965,712 | | |
| Tenneco, Inc.(a) | | | 108,100 | | | | 2,810,600 | | |
| United Auto Group, Inc. | | | 91,400 | | | | 1,951,390 | | |
| | | | 20,691,301 | | |
| Banking, Savings & Loans — 2.2% | |
| Advanta Corp. Cl. B | | | 80,800 | | | | 2,904,760 | | |
| | | Number of
Shares | | Market
Value | |
Euronet
Worldwide, Inc.(a) (b) | | | 67,800 | | | $ | 2,601,486 | | |
| Financial Federal Corp.(b) | | | 203,024 | | | | 5,646,097 | | |
| First Community Bancorp | | | 49,180 | | | | 2,905,554 | | |
| Signature Bank(a) | | | 22,270 | | | | 721,103 | | |
| | | | 14,779,000 | | |
| Broadcasting, Publishing & Printing — 0.9% | |
Central European Media
Enterprises Ltd.(a) (b) | | | 15,490 | | | | 978,813 | | |
Charter Communications,
Inc. Cl. A(a) (b) | | | 891,500 | | | | 1,007,395 | | |
LodgeNet
Entertainment Corp.(a) | | | 82,400 | | | | 1,536,760 | | |
| TiVo, Inc.(a) (b) | | | 356,900 | | | | 2,551,835 | | |
| | | | 6,074,803 | | |
| Building Materials & Construction — 0.6% | |
Beacon Roofing
Supply, Inc.(a) | | | 110,819 | | | | 2,439,126 | | |
Martin Marietta
Materials, Inc. | | | 15,560 | | | | 1,418,294 | | |
| | | | 3,857,420 | | |
| Chemicals — 1.3% | |
| Cytec Industries, Inc. | | | 46,900 | | | | 2,516,654 | | |
| Hercules, Inc.(a) | | | 170,600 | | | | 2,603,356 | | |
| Minerals Technologies, Inc. | | | 43,700 | | | | 2,272,400 | | |
| VeraSun Energy(a) (b) | | | 48,100 | | | | 1,262,144 | | |
| | | | 8,654,554 | | |
| Commercial Services — 10.1% | |
| ADVO, Inc. | | | 81,650 | | | | 2,009,406 | | |
American
Reprographics Co.(a) | | | 47,500 | | | | 1,721,875 | | |
| Bowne & Co., Inc. | | | 137,100 | | | | 1,960,530 | | |
The Corporate
Executive Board Co. | | | 97,990 | | | | 9,818,598 | | |
Corrections
Corp. of America(a) | | | 45,970 | | | | 2,433,652 | | |
Ctrip.com International
Ltd. ADR (China)(b) | | | 20,250 | | | | 1,033,763 | | |
| Exelixis, Inc.(a) | | | 129,300 | | | | 1,299,465 | | |
| Harris Interactive, Inc.(a) | | | 258,200 | | | | 1,471,740 | | |
| Ikon Office Solutions, Inc. | | | 82,700 | | | | 1,042,020 | | |
| Incyte Corp.(a) | | | 212,600 | | | | 977,960 | | |
ITT Educational
Services, Inc.(a) | | | 187,000 | | | | 12,306,470 | | |
Lincoln Educational
Services Corp.(a) (b) | | | 149,000 | | | | 2,546,410 | | |
Magellan Health
Services, Inc.(a) | | | 87,220 | | | | 3,951,938 | | |
| | | Number of
Shares | | Market
Value | |
| Mobile Mini, Inc.(a) | | | 122,700 | | | $ | 3,590,202 | | |
MoneyGram
International, Inc. | | | 57,260 | | | | 1,943,977 | | |
| Move, Inc.(a) | | | 220,110 | | | | 1,206,203 | | |
Pharmaceutical Product
Development, Inc. | | | 60,110 | | | | 2,111,063 | | |
Resources
Connection, Inc.(a) | | | 49,810 | | | | 1,246,246 | | |
| Sotheby's(a) | | | 142,800 | | | | 3,748,500 | | |
| Stericycle, Inc.(a) | | | 28,130 | | | | 1,831,263 | | |
| URS Corp.(a) | | | 22,730 | | | | 954,660 | | |
Valassis
Communications, Inc.(a) | | | 83,600 | | | | 1,972,124 | | |
| Vertrue, Inc.(a) (b) | | | 66,100 | | | | 2,844,283 | | |
| VistaPrint Ltd.(a) | | | 66,180 | | | | 1,769,653 | | |
Washington Group
International, Inc. | | | 35,800 | | | | 1,909,572 | | |
| | | | 67,701,573 | | |
| Communications — 1.2% | |
Crown Castle
International Corp.(a) | | | 51,960 | | | | 1,794,698 | | |
| Polycom, Inc.(a) | | | 102,900 | | | | 2,255,568 | | |
Powerwave
Technologies, Inc.(a) (b) | | | 196,800 | | | | 1,794,816 | | |
SBA Communications
Corp. Cl. A(a) | | | 53,620 | | | | 1,401,627 | | |
| Syniverse Holdings, Inc.(a) | | | 50,240 | | | | 738,528 | | |
| | | | 7,985,237 | | |
Computer & Other Data Processing
Service — 0.4% | |
| IHS, Inc. Cl. A(a) | | | 55,090 | | | | 1,632,317 | | |
| LoopNet, Inc.(a) (b) | | | 72,110 | | | | 1,341,967 | | |
| | | | 2,974,284 | | |
| Computer Integrated Systems Design — 1.0% | |
| Avid Technology, Inc.(a) (b) | | | 90,350 | | | | 3,011,366 | | |
| Hypercom Corp.(a) | | | 168,580 | | | | 1,576,223 | | |
| Sapient Corp.(a) | | | 344,300 | | | | 1,824,790 | | |
| | | | 6,412,379 | | |
| Computer Maintenance & Repair — 0.3% | |
Electronics for
Imaging, Inc.(a) | | | 88,700 | | | | 1,852,056 | | |
| Computer Related Services — 2.8% | |
| Checkfree Corp.(a) | | | 245,649 | | | | 12,174,364 | | |
| Ingram Micro, Inc. Cl. A(a) | | | 162,000 | | | | 2,937,060 | | |
| NetFlix, Inc.(a) (b) | | | 129,330 | | | | 3,519,069 | | |
| | | | 18,630,493 | | |
(Continued)
The accompanying notes are an integral part of the financial statements.
149
MassMutual Select Small Cap Growth Equity Fund – Portfolio of Investments (Continued)
| | | Number of
Shares | | Market
Value | |
| Computers & Information — 2.3% | |
| Cognos, Inc.(a) | | | 38,300 | | | $ | 1,089,635 | | |
| Foundry Networks, Inc.(a) | | | 91,000 | | | | 970,060 | | |
Redback
Networks, Inc.(a) (b) | | | 56,360 | | | | 1,033,642 | | |
Scientific Games
Corp. Cl. A(a) | | | 257,100 | | | | 9,157,902 | | |
VeriFone
Holdings, Inc.(a) (b) | | | 99,664 | | | | 3,037,759 | | |
| | | | 15,288,998 | | |
| Cosmetics & Personal Care — 0.3% | |
Nu Skin Enterprises,
Inc. Cl. A | | | 118,200 | | | | 1,755,270 | | |
| Data Processing & Preparation — 2.0% | |
FactSet Research
Systems, Inc. | | | 250,724 | | | | 11,859,245 | | |
| The BISYS Group, Inc.(a) | | | 131,400 | | | | 1,800,180 | | |
| | | | 13,659,425 | | |
| Electric Utilities — 0.5% | |
| El Paso Electric Co.(a) | | | 111,600 | | | | 2,249,856 | | |
Suntech Power Holdings Co.
Ltd. ADR (China)(a) (b) | | | 28,200 | | | | 796,650 | | |
| | | | 3,046,506 | | |
| Electrical Equipment & Electronics — 5.1% | |
Benchmark
Electronics, Inc.(a) (b) | | | 82,950 | | | | 2,000,754 | | |
| Cree, Inc.(a) (b) | | | 156,590 | | | | 3,720,578 | | |
| CSR PLC(a) | | | 29,573 | | | | 681,929 | | |
Cypress
Semiconductor Corp.(a) (b) | | | 134,400 | | | | 1,954,176 | | |
| Daktronics, Inc. | | | 62,690 | | | | 1,809,860 | | |
Energy Conversion
Devices, Inc.(a) | | | 41,400 | | | | 1,508,202 | | |
Evergreen
Solar, Inc.(a) (b) | | | 58,390 | | | | 757,902 | | |
FuelCell
Energy, Inc.(a) (b) | | | 138,800 | | | | 1,329,704 | | |
| Gentex Corp.(b) | | | 236,580 | | | | 3,312,120 | | |
Integrated Device
Technology, Inc.(a) | | | 131,760 | | | | 1,868,357 | | |
International
Rectifier Corp.(a) | | | 67,450 | | | | 2,635,946 | | |
| Newport Corp.(a) | | | 81,500 | | | | 1,313,780 | | |
ON
Semiconductor Corp.(a) (b) | | | 216,300 | | | | 1,271,844 | | |
| Photon Dynamics, Inc.(a) | | | 98,600 | | | | 1,234,472 | | |
| Semtech Corp.(a) | | | 132,700 | | | | 1,917,515 | | |
Silicon-On-Insulator
Technologies(a) | | | 36,460 | | | | 1,044,579 | | |
Teledyne
Technologies, Inc.(a) | | | 98,230 | | | | 3,218,015 | | |
| | | Number of
Shares | | Market
Value | |
| TomTom NV(a) (b) | | | 25,040 | | | $ | 966,105 | | |
Trident
Microsystems, Inc.(a) | | | 83,200 | | | | 1,579,136 | | |
| | | | 34,124,974 | | |
| Energy — 6.0% | |
Acergy SA,
Sponsored ADR(a) | | | 68,120 | | | | 1,042,236 | | |
| Alon USA Energy, Inc.(b) | | | 111,210 | | | | 3,499,779 | | |
| Arch Coal, Inc.(b) | | | 33,680 | | | | 1,427,022 | | |
| Bill Barrett Corp.(a) (b) | | | 148,200 | | | | 4,388,202 | | |
Cabot Oil & Gas
Corp. Cl. A(b) | | | 26,920 | | | | 1,319,080 | | |
Comstock
Resources, Inc.(a) | | | 100,800 | | | | 3,009,888 | | |
Denbury
Resources, Inc.(a) | | | 33,100 | | | | 1,048,277 | | |
| EXCO Resources, Inc.(a) | | | 198,900 | | | | 2,267,460 | | |
| Frontier Oil Corp. | | | 37,330 | | | | 1,209,492 | | |
| Grey Wolf, Inc.(a) (b) | | | 203,900 | | | | 1,570,030 | | |
| Newfield Exploration Co.(a) | | | 166,100 | | | | 8,128,934 | | |
OPTI Canada,
Inc. CAD(a) (c) | | | 118,600 | | | | 2,439,692 | | |
| Range Resources Corp. | | | 49,525 | | | | 1,346,585 | | |
TETRA
Technologies, Inc.(a) | | | 93,600 | | | | 2,835,144 | | |
| UGI Corp. | | | 92,500 | | | | 2,277,350 | | |
Whiting
Petroleum Corp.(a) (b) | | | 55,500 | | | | 2,323,785 | | |
| | | | 40,132,956 | | |
| Entertainment & Leisure — 2.7% | |
| Churchill Downs, Inc. | | | 41,400 | | | | 1,550,430 | | |
DreamWorks Animation
SKG, Inc. Cl. A(a) (b) | | | 97,100 | | | | 2,223,590 | | |
Gaylord
Entertainment(a) (b) | | | 161,100 | | | | 7,030,404 | | |
| Live Nation, Inc.(a) | | | 36,660 | | | | 746,398 | | |
Pinnacle
Entertainment, Inc.(a) | | | 63,810 | | | | 1,955,777 | | |
| Shuffle Master, Inc.(a) (b) | | | 146,900 | | | | 4,815,382 | | |
| | | | 18,321,981 | | |
| Financial Services — 2.4% | |
Affiliated Managers
Group, Inc.(a) (b) | | | 32,689 | | | | 2,840,347 | | |
| Apollo Investment Corp. | | | 113,600 | | | | 2,099,328 | | |
Investment Technology
Group, Inc.(a) | | | 39,100 | | | | 1,988,626 | | |
| Jones Soda Co.(a) | | | 54,800 | | | | 443,880 | | |
The Nasdaq Stock
Market, Inc.(a) | | | 60,400 | | | | 1,805,960 | | |
National Financial
Partners Corp. | | | 19,710 | | | | 873,350 | | |
| | | Number of
Shares | | Market
Value | |
Nuveen Investments,
Inc. Cl. A(b) | | | 49,890 | | | $ | 2,147,765 | | |
| Redwood Trust, Inc.(b) | | | 49,300 | | | | 2,407,319 | | |
Strategic Hotels &
Resorts, Inc. | | | 72,000 | | | | 1,493,280 | | |
| | | | 16,099,855 | | |
| Foods — 1.8% | |
Panera
Bread Co. Cl. A(a) (b) | | | 123,300 | | | | 8,290,692 | | |
United Natural
Foods, Inc.(a) (b) | | | 120,500 | | | | 3,978,910 | | |
| | | | 12,269,602 | | |
| Healthcare — 6.3% | |
Allscripts Healthcare
Solutions, Inc.(a) (b) | | | 360,800 | | | | 6,332,040 | | |
| AmSurg Corp.(a) (b) | | | 342,900 | | | | 7,800,975 | | |
| Covance Inc.(a) | | | 16,070 | | | | 983,805 | | |
Genesis
HealthCare Corp.(a) (b) | | | 73,300 | | | | 3,472,221 | | |
| Healthways, Inc.(a) (b) | | | 201,650 | | | | 10,614,856 | | |
Human Genome
Sciences, Inc.(a) (b) | | | 241,000 | | | | 2,578,700 | | |
| LifePoint Hospitals, Inc.(a) | | | 118,760 | | | | 3,815,759 | | |
| Manor Care, Inc.(b) | | | 77,000 | | | | 3,612,840 | | |
Matria
Healthcare, Inc.(a) (b) | | | 68,250 | | | | 1,461,915 | | |
| Symbion, Inc.(a) (b) | | | 65,060 | | | | 1,350,646 | | |
| | | | 42,023,757 | | |
| Heavy Machinery — 0.9% | |
Bucyrus International,
Inc. Cl. A(b) | | | 74,595 | | | | 3,767,048 | | |
| Goodman Global, Inc.(a) | | | 76,200 | | | | 1,156,716 | | |
| Verigy Ltd.(a) | | | 51,100 | | | | 805,847 | | |
| | | | 5,729,611 | | |
Home Construction, Furnishings &
Appliances — 0.3% | |
| Ethan Allen Interiors, Inc. | | | 51,400 | | | | 1,878,670 | | |
| Household Products — 0.2% | |
| Ferro Corp. | | | 103,600 | | | | 1,653,456 | | |
| Industrial – Diversified — 0.5% | |
| Nordson Corp. | | | 73,800 | | | | 3,629,484 | | |
| Information Retrieval Services — 1.1% | |
| Bankrate, Inc.(a) (b) | | | 26,990 | | | | 1,019,142 | | |
| CoStar Group, Inc.(a) (b) | | | 109,000 | | | | 6,521,470 | | |
| | | | 7,540,612 | | |
| Insurance — 2.0% | |
| Arch Capital Group Ltd.(a) | | | 37,420 | | | | 2,224,993 | | |
Aspen Insurance
Holdings Ltd. | | | 88,300 | | | | 2,056,507 | | |
(Continued)
The accompanying notes are an integral part of the financial statements.
150
MassMutual Select Small Cap Growth Equity Fund – Portfolio of Investments (Continued)
| | | Number of
Shares | | Market
Value | |
Platinum Underwriters
Holdings Ltd. | | | 66,200 | | | $ | 1,852,276 | | |
| ProAssurance Corp.(a) | | | 74,750 | | | | 3,601,455 | | |
Reinsurance Group of
America, Inc. | | | 40,100 | | | | 1,970,915 | | |
United America
Indemnity Ltd. Cl. A(a) | | | 92,600 | | | | 1,929,784 | | |
| | | | 13,635,930 | | |
| Internet Software — 0.5% | |
| Opsware, Inc.(a) | | | 420,400 | | | | 3,464,096 | | |
| Lodging — 1.0% | |
| Vail Resorts, Inc.(a) (b) | | | 186,200 | | | | 6,908,020 | | |
| Machinery & Components — 1.1% | |
Axcelis
Technologies, Inc.(a) | | | 280,700 | | | | 1,656,130 | | |
Chicago Bridge &
Iron Co. NV | | | 236,198 | | | | 5,704,182 | | |
| | | | 7,360,312 | | |
| Medical Supplies — 3.7% | |
| Arrow International, Inc. | | | 68,100 | | | | 2,238,447 | | |
| Hologic, Inc.(a) | | | 6,540 | | | | 322,814 | | |
| Intralase Corp.(a) (b) | | | 312,700 | | | | 5,234,598 | | |
| Intuitive Surgical, Inc.(a) | | | 3,710 | | | | 437,669 | | |
| Kensey Nash Corp.(a) (b) | | | 81,300 | | | | 2,398,350 | | |
| Kyphon, Inc.(a) (b) | | | 222,220 | | | | 8,524,359 | | |
PSS World
Medical, Inc.(a) (b) | | | 303,000 | | | | 5,347,950 | | |
| | | | 24,504,187 | | |
| Metals & Mining — 0.5% | |
| Carpenter Technology | | | 10,400 | | | | 1,201,200 | | |
| CommScope, Inc.(a) | | | 44,600 | | | | 1,401,332 | | |
The Shaw
Group, Inc.(a) (b) | | | 34,590 | | | | 961,602 | | |
| | | | 3,564,134 | | |
| Oil & Gas — 0.3% | |
| Pride International, Inc.(a) | | | 53,100 | | | | 1,658,313 | | |
| Pharmaceuticals — 2.9% | |
| Alkermes, Inc.(a) (b) | | | 141,310 | | | | 2,673,585 | | |
Amylin
Pharmaceuticals, Inc.(a) (b) | | | 72,730 | | | | 3,590,680 | | |
Arena
Pharmaceuticals, Inc.(a) (b) | | | 33,630 | | | | 389,435 | | |
| Atherogenics, Inc.(a) (b) | | | 44,600 | | | | 582,030 | | |
| Digene Corp.(a) (b) | | | 66,970 | | | | 2,594,418 | | |
Encysive
Pharmaceuticals, Inc.(a) | | | 45,020 | | | | 311,989 | | |
| The Medicines Co.(a) | | | 94,720 | | | | 1,851,776 | | |
| Mylan Laboratories, Inc. | | | 88,100 | | | | 1,762,000 | | |
| | | Number of
Shares | | Market
Value | |
Vertex
Pharmaceuticals, Inc.(a) (b) | | | 28,670 | | | $ | 1,052,476 | | |
| Visicu Inc.(a) (b) | | | 216,820 | | | | 3,826,873 | | |
| Zymogenetics, Inc.(a) | | | 50,100 | | | | 950,397 | | |
| | | | 19,585,659 | | |
| Prepackaged Software — 8.8% | |
| Activision, Inc.(a) | | | 105,750 | | | | 1,203,435 | | |
| Ansys, Inc.(a) | | | 38,310 | | | | 1,831,984 | | |
| Blackbaud, Inc. | | | 520,100 | | | | 11,806,270 | | |
| Blackboard, Inc.(a) | | | 272,600 | | | | 7,894,496 | | |
| Cerner Corp.(a) (b) | | | 176,200 | | | | 6,538,782 | | |
Dendrite
International, Inc.(a) | | | 311,900 | | | | 2,881,956 | | |
| Epicor Software Corp.(a) | | | 165,800 | | | | 1,745,874 | | |
| EPIQ Systems, Inc.(a) (b) | | | 145,129 | | | | 2,414,947 | | |
| Kenexa Corp.(a) | | | 95,575 | | | | 3,044,064 | | |
| MicroStrategy, Inc. Cl. A(a) | | | 51,236 | | | | 4,996,535 | | |
| Red Hat, Inc.(a) (b) | | | 184,540 | | | | 4,318,236 | | |
Take-Two Interactive
Software, Inc.(a) (b) | | | 439,214 | | | | 4,682,021 | | |
| THQ, Inc.(a) (b) | | | 34,735 | | | | 750,276 | | |
Transaction Systems
Architects, Inc. Cl. A(a) | | | 46,500 | | | | 1,938,585 | | |
| Verint Systems, Inc.(a) | | | 27,770 | | | | 810,606 | | |
| Vignette Corp.(a) | | | 143,300 | | | | 2,089,314 | | |
| | | | 58,947,381 | | |
| Restaurants — 0.5% | |
California Pizza
Kitchen, Inc.(a) | | | 58,490 | | | | 1,607,305 | | |
RARE Hospitality
International, Inc.(a) | | | 63,200 | | | | 1,817,632 | | |
| | | | 3,424,937 | | |
| Retail — 2.4% | |
| Borders Group, Inc. | | | 89,000 | | | | 1,642,940 | | |
| GameStop Corp. Cl. B(a) | | | 25,650 | | | | 878,513 | | |
| O'Reilly Automotive, Inc.(a) | | | 227,220 | | | | 7,086,992 | | |
| Stamps.com, Inc.(a) (b) | | | 90,300 | | | | 2,512,146 | | |
| Zumiez, Inc.(a) | | | 102,000 | | | | 3,832,140 | | |
| | | | 15,952,731 | | |
| Telephone Utilities — 1.2% | |
| Equinix, Inc.(a) (b) | | | 22,070 | | | | 1,210,760 | | |
General Communication,
Inc. Cl. A(a) | | | 221,700 | | | | 2,731,344 | | |
| NeuStar, Inc. Cl. A(a) (b) | | | 117,310 | | | | 3,959,213 | | |
| | | | 7,901,317 | | |
| Transportation — 3.8% | |
American Commercial
Lines, Inc.(a) | | | 27,960 | | | | 1,684,590 | | |
| Con-way, Inc. | | | 31,900 | | | | 1,847,967 | | |
| GATX Corp. | | | 45,600 | | | | 1,938,000 | | |
| | | Number of
Shares | | Market
Value | |
J.B. Hunt Transport
Services, Inc. | | | 361,000 | | | $ | 8,992,510 | | |
| Kansas City Southern(a) (b) | | | 405,250 | | | | 11,225,425 | | |
| | | | 25,688,492 | | |
TOTAL EQUITIES
(Cost $484,002,713) | | | | | | | 597,381,580 | | |
| MUTUAL FUND — 1.8% | |
| Financial Services | |
iShares Russell 2000
Growth Index Fund(b) | | | 161,640 | | | | 11,882,156 | | |
TOTAL MUTUAL FUND
(Cost $11,467,894) | | | | | | | 11,882,156 | | |
TOTAL LONG TERM INVESTMENTS
(Cost $495,470,607) | | | | | | | 609,263,736 | | |
| | | Principal
Amount | | | |
| SHORT-TERM INVESTMENTS — 35.8% | |
| Cash Equivalents — 26.6%(e) | |
Abbey National PLC
Eurodollar Time Deposit
5.100% 07/10/2006 | | $ | 1,947,701 | | | | 1,947,701 | | |
ABN Amro Bank NV
Certificate of Deposit
5.305% 11/21/2006 | | | 1,947,701 | | | | 1,947,701 | | |
American Beacon Money
Market Fund(d) | | | 1,986,489 | | | | 1,986,489 | | |
Bank of America
5.270% 07/14/2006 | | | 3,895,401 | | | | 3,895,401 | | |
Bank of America
5.310% 03/08/2007 | | | 3,895,401 | | | | 3,895,401 | | |
Bank of Montreal
Eurodollar Time Deposit
5.290% 08/03/2006 | | | 3,895,401 | | | | 3,895,401 | | |
Bank of Nova Scotia
Eurodollar Time Deposit
5.290% 08/08/2006 | | | 3,895,401 | | | | 3,895,401 | | |
Barclays
Eurodollar Time Deposit
5.150% 08/01/2006 | | | 5,843,102 | | | | 5,843,102 | | |
Branch Banker & Trust
Eurodollar Time Deposit
5.250% 07/26/2006 | | | 7,011,721 | | | | 7,011,721 | | |
Calyon
Eurodollar Time Deposit
5.300% 08/08/2006 | | | 3,895,401 | | | | 3,895,401 | | |
(Continued)
The accompanying notes are an integral part of the financial statements.
151
MassMutual Select Small Cap Growth Equity Fund – Portfolio of Investments (Continued)
| | | Principal
Amount | | Market
Value | |
Canadian Imperial
Bank of Commerce
Eurodollar Time Deposit
5.310% 07/31/2006 | | $ | 3,895,401 | | | $ | 3,895,401 | | |
Deutsche Bank
Eurodollar Time Deposit
5.250% 07/05/2006 | | | 9,738,500 | | | | 9,738,500 | | |
Dexia Group
Eurodollar Time Deposit
5.300% 08/09/2006 | | | 5,064,020 | | | | 5,064,020 | | |
Federal Home Loan
Bank Discount Note
5.181% 07/19/2006 | | | 3,100,686 | | | | 3,100,686 | | |
First Tennessee
National Corporation
Eurodollar Time Deposit
5.270% 07/24/2006 | | | 4,674,480 | | | | 4,674,480 | | |
Fortis Bank
Eurodollar Time Deposit
5.090% 07/05/2006 | | | 3,895,400 | | | | 3,895,400 | | |
Fortis Bank
Eurodollar Time Deposit
5.250% 07/03/2006 | | | 3,895,400 | | | | 3,895,400 | | |
Fortis Bank
Eurodollar Time Deposit
5.250% 07/06/2006 | | | 3,895,400 | | | | 3,895,400 | | |
Freddie Mac
Discount Note
5.191% 07/25/2006 | | | 2,324,709 | | | | 2,324,709 | | |
Harris NA
Eurodollar Time Deposit
5.080% 07/05/2006 | | | 2,726,780 | | | | 2,726,780 | | |
HBOS Halifax
Bank of Scotland
Certificate of Deposit
5.110% 07/10/2006 | | | 3,895,400 | | | | 3,895,400 | | |
National Australia Bank
Eurodollar Time Deposit
5.290% 07/03/2006 | | | 13,633,902 | | | | 13,633,902 | | |
National City Corporation
Eurodollar Time Deposit
5.220% 07/03/2006 | | | 4,624,664 | | | | 4,624,664 | | |
Skandinaviska Enskilda
Banken AB
Eurodollar Time Deposit
5.130% 07/12/2006 | | | 3,895,400 | | | | 3,895,400 | | |
Societe Generale
Eurodollar Time Deposit
5.200% 08/08/2006 | | | 3,895,400 | | | | 3,895,400 | | |
Societe Generale
Eurodollar Time Deposit
5.270% 07/17/2006 | | | 5,064,020 | | | | 5,064,020 | | |
Standard Chartered Bank
Eurodollar Time Deposit
5.260% 07/07/2006 | | | 5,843,101 | | | | 5,843,101 | | |
| | | Principal
Amount | | Market
Value | |
Svenska Handlesbanken
Eurodollar Time Deposit
5.290% 07/03/2006 | | $ | 13,059,355 | | | $ | 13,059,355 | | |
The Bank of the West
Eurodollar Time Deposit
5.250% 08/07/2006 | | | 6,622,182 | | | | 6,622,182 | | |
Toronto Dominion Bank
Eurodollar Time Deposit
5.300% 07/31/2006 | | | 10,907,121 | | | | 10,907,121 | | |
UBS AG
Eurodollar Time Deposit
5.250% 07/21/2006 | | | 5,843,101 | | | | 5,843,101 | | |
UBS AG
Eurodollar Time Deposit
5.250% 08/04/2006 | | | 5,843,101 | | | | 5,843,101 | | |
Wells Fargo
Eurodollar Time Deposit
5.160% 07/13/2006 | | | 3,895,400 | | | | 3,895,400 | | |
Wells Fargo
Eurodollar Time Deposit
5.170% 07/03/2006 | | | 3,895,400 | | | | 3,895,400 | | |
Wells Fargo
Eurodollar Time Deposit
5.210% 07/06/2006 | | | 1,947,700 | | | | 1,947,700 | | |
Wells Fargo
Eurodollar Time Deposit
5.250% 07/03/2006 | | | 3,895,400 | | | | 3,895,400 | | |
| | | | 178,185,142 | | |
| Repurchase Agreement — 9.2% | |
Investors Bank & Trust
Company Repurchase
Agreement, dated
06/30/2006, 3.75%,
due 07/03/2006(f) | | | 61,939,292 | | | | 61,939,292 | | |
TOTAL SHORT-TERM
INVESTMENTS
(Cost $240,124,434) | | | | | | | 240,124,434 | | |
TOTAL INVESTMENTS — 126.8%
(Cost $735,595,041)(g) | | | | | | | 849,388,170 | | |
Other Assets/
(Liabilities) — (26.8%) | | | | | | | (179,549,502 | ) | |
| NET ASSETS — 100.0% | | | | | | $ | 669,838,668 | | |
Notes to Portfolio of Investments
ADR - American Depository Receipt
CAD - Canadian Dollar
(a) Non-income producing security.
(b) Denotes all or a portion of security on loan. (Note 2).
(c) The principal amount of the security is in foreign currency. The market value is in U.S. dollars.
(d) Amount represents shares owned of the fund.
(e) Represents investments of security lending collateral. (Note 2).
(f) Maturity value of $61,958,648. Collateralized by a U.S. Government Agency obligation with a rate of 5.673%, maturity date of 05/25/2034, and an aggregate market value, including accrued interest, of $65,036,257.
(g) See Note 6 for aggregate cost for Federal tax purposes.
The accompanying notes are an integral part of the financial statements.
152
MassMutual Select Small Company Growth Fund – Portfolio of Investments
June 30, 2006 (Unaudited)
| | | Number of
Shares | | Market
Value | |
| EQUITIES — 98.1% | |
| COMMON STOCK | |
| Advertising — 2.0% | |
| AQuantive, Inc.(a) (b) | | | 63,700 | | | $ | 1,613,521 | | |
| Jupitermedia Corp.(a) (b) | | | 41,900 | | | | 544,700 | | |
| Marchex, Inc. Cl. B(a) (b) | | | 64,000 | | | | 1,051,520 | | |
| | | | 3,209,741 | | |
| Agribusiness — 1.2% | |
| Delta & Pine Land Co.(b) | | | 67,670 | | | | 1,989,498 | | |
| Apparel, Textiles & Shoes — 3.0% | |
| Crocs, Inc.(a) (b) | | | 35,700 | | | | 897,855 | | |
| Hot Topic, Inc.(a) (b) | | | 78,400 | | | | 902,384 | | |
| Quiksilver, Inc.(a) (b) | | | 148,900 | | | | 1,813,602 | | |
| Too, Inc.(a) | | | 25,900 | | | | 994,301 | | |
| Volcom, Inc.(a) | | | 5,900 | | | | 188,741 | | |
| | | | 4,796,883 | | |
| Banking, Savings & Loans — 2.2% | |
| Bank of the Ozarks, Inc. | | | 4,400 | | | | 146,520 | | |
| Cascade Bancorp | | | 3,575 | | | | 101,923 | | |
Euronet
Worldwide, Inc.(a) (b) | | | 9,600 | | | | 368,352 | | |
| Glacier Bancorp, Inc. | | | 9,535 | | | | 279,090 | | |
| Placer Sierra Bancshares | | | 9,700 | | | | 224,943 | | |
| SVB Financial Group(a) (b) | | | 35,100 | | | | 1,595,646 | | |
| UCBH Holdings, Inc. | | | 12,100 | | | | 200,134 | | |
United PanAm
Financial Corp.(a) | | | 13,900 | | | | 422,560 | | |
Vineyard National
Bancorp Co. | | | 8,800 | | | | 236,720 | | |
| | | | 3,575,888 | | |
| Broadcasting, Publishing & Printing — 0.8% | |
Entravision Communications
Corp. Cl. A(a) | | | 94,775 | | | | 812,222 | | |
Outdoor Channel
Holdings, Inc.(a) (b) | | | 43,300 | | | | 446,856 | | |
| | | | 1,259,078 | | |
| Building Materials & Construction — 0.1% | |
| Comfort Systems USA, Inc. | | | 9,700 | | | | 138,613 | | |
| Chemicals — 0.6% | |
| ADA-ES, Inc.(a) | | | 7,700 | | | | 132,055 | | |
| Symyx Technologies, Inc.(a) | | | 32,700 | | | | 789,705 | | |
| | | | 921,760 | | |
| | | Number of
Shares | | Market
Value | |
| Commercial Services — 6.8% | |
| Affymetrix, Inc.(a) | | | 26,800 | | | $ | 686,080 | | |
Corrections Corp.
of America(a) | | | 31,140 | | | | 1,648,552 | | |
| Decode Genetics, Inc.(a) (b) | | | 120,020 | | | | 742,924 | | |
| Global Payments, Inc. | | | 15,920 | | | | 772,916 | | |
Heartland Payment
Systems, Inc.(a) (b) | | | 7,100 | | | | 197,948 | | |
Internet Capital
Group, Inc.(a) | | | 50,775 | | | | 456,975 | | |
Lionbridge
Technologies, Inc.(a) | | | 88,400 | | | | 488,852 | | |
| Move, Inc.(a) | | | 140,300 | | | | 768,844 | | |
| Navigant Consulting, Inc.(a) | | | 22,700 | | | | 514,155 | | |
| Per-Se Technologies, Inc.(a) | | | 31,015 | | | | 780,958 | | |
| Strayer Education, Inc. | | | 3,200 | | | | 310,784 | | |
| Waste Connections, Inc.(a) | | | 52,290 | | | | 1,903,356 | | |
| Wind River Systems, Inc.(a) | | | 148,900 | | | | 1,325,210 | | |
| World Fuel Services Corp. | | | 4,100 | | | | 187,329 | | |
| | | | 10,784,883 | | |
| Communications — 4.4% | |
| Harmonic, Inc.(a) | | | 30,100 | | | | 134,848 | | |
InterDigital
Communications Corp.(a) | | | 22,500 | | | | 785,475 | | |
| McData Corp. Cl. A(a) | | | 392,450 | | | | 1,601,196 | | |
| Polycom, Inc.(a) | | | 177,200 | | | | 3,884,224 | | |
SBA Communications
Corp. Cl. A(a) | | | 25,600 | | | | 669,184 | | |
| | | | 7,074,927 | | |
| Computer & Data Processing Services — 0.5% | |
| Digimarc Corp.(a) | | | 117,900 | | | | 727,443 | | |
| Computer Integrated Systems Design — 4.3% | |
| Avid Technology, Inc.(a) (b) | | | 33,835 | | | | 1,127,721 | | |
| Cogent, Inc.(a) (b) | | | 85,460 | | | | 1,287,882 | | |
| Digital Insight Corp.(a) | | | 11,200 | | | | 384,048 | | |
| Mentor Graphics Corp.(a) | | | 37,100 | | | | 481,558 | | |
| Quality Systems, Inc. | | | 49,825 | | | | 1,834,557 | | |
| RadiSys Corp.(a) | | | 80,700 | | | | 1,772,172 | | |
| | | | 6,887,938 | | |
| Computer Programming Services — 0.0% | |
| PDF Solutions, Inc.(a) | | | 5,600 | | | | 69,496 | | |
| Computer Related Services — 1.1% | |
| CNET Networks, Inc.(a) | | | 133,000 | | | | 1,061,340 | | |
| eCollege.com, Inc.(a) | | | 23,255 | | | | 491,611 | | |
| NetFlix, Inc.(a) (b) | | | 7,800 | | | | 212,238 | | |
| | | | 1,765,189 | | |
| | | Number of
Shares | | Market
Value | |
| Computers & Information — 2.0% | |
| Immersion Corp.(a) | | | 188,400 | | | $ | 1,104,024 | | |
M-Systems Flash Disk
Pioneers Ltd.(a) (b) | | | 37,415 | | | | 1,108,606 | | |
| Solectron Corp.(a) | | | 289,200 | | | | 989,064 | | |
| | | | 3,201,694 | | |
| Consumer Products — 0.7% | |
| Pool Corp.(b) | | | 26,505 | | | | 1,156,413 | | |
| Data Processing & Preparation — 1.5% | |
FactSet Research
Systems, Inc. | | | 36,455 | | | | 1,724,322 | | |
Netsmart
Technologies, Inc.(a) | | | 49,070 | | | | 635,947 | | |
| | | | 2,360,269 | | |
| Electrical Equipment & Electronics — 16.1% | |
| Active Power, Inc.(a) | | | 26,800 | | | | 90,852 | | |
Advanced Energy
Industries, Inc.(a) | | | 85,005 | | | | 1,125,466 | | |
| Altera Corp.(a) | | | 181,600 | | | | 3,187,080 | | |
| ATMI, Inc.(a) (b) | | | 29,405 | | | | 723,951 | | |
| Cree, Inc.(a) (b) | | | 37,100 | | | | 881,496 | | |
| Cymer, Inc.(a) | | | 11,500 | | | | 534,290 | | |
Dolby Laboratories,
Inc. Cl. A(a) | | | 72,785 | | | | 1,695,891 | | |
| EMS Technologies, Inc.(a) | | | 35,885 | | | | 644,853 | | |
Integrated Device
Technology, Inc.(a) | | | 122,590 | | | | 1,738,326 | | |
International
DisplayWorks, Inc.(a) (b) | | | 46,300 | | | | 240,760 | | |
| Ixia(a) | | | 79,340 | | | | 714,060 | | |
Lamson & Sessions
Co. (The)(a) (b) | | | 5,300 | | | | 150,308 | | |
Lattice
Semiconductor Corp.(a) | | | 360,000 | | | | 2,224,800 | | |
Oplink
Communications, Inc.(a) | | | 20,085 | | | | 367,756 | | |
| Photon Dynamics, Inc.(a) | | | 33,985 | | | | 425,492 | | |
| Pixelworks, Inc.(a) | | | 171,500 | | | | 468,195 | | |
| PLX Technology, Inc.(a) | | | 86,612 | | | | 1,058,399 | | |
| RF Micro Devices, Inc.(a) | | | 274,300 | | | | 1,637,571 | | |
Rudolph
Technologies, Inc.(a) | | | 36,000 | | | | 522,000 | | |
| Skyworks Solutions, Inc.(a) | | | 180,700 | | | | 995,657 | | |
STATS ChipPAC Ltd.
ADR (Singapore)(a) (b) | | | 54,526 | | | | 341,333 | | |
| Supertex, Inc.(a) | | | 23,430 | | | | 935,794 | | |
Trident
Microsystems, Inc.(a) (b) | | | 61,790 | | | | 1,172,774 | | |
(Continued)
The accompanying notes are an integral part of the financial statements.
153
MassMutual Select Small Company Growth Fund – Portfolio of Investments (Continued)
| | | Number of
Shares | | Market
Value | |
Triquint
Semiconductor, Inc.(a) | | | 306,600 | | | $ | 1,367,436 | | |
| Ultra Clean Holdings(a) | | | 58,400 | | | | 511,000 | | |
| Universal Electronics, Inc.(a) | | | 106,593 | | | | 1,887,762 | | |
| | | | 25,643,302 | | |
| Energy — 5.5% | |
| Atwood Oceanics, Inc.(a) | | | 5,300 | | | | 262,880 | | |
Complete Production
Services, Inc.(a) | | | 15,300 | | | | 361,692 | | |
| Core Laboratories NV(a) | | | 21,075 | | | | 1,286,418 | | |
| Hercules Offshore, Inc.(a) | | | 8,000 | | | | 280,000 | | |
Horizon
Offshore, Inc.(a) (b) | | | 36,835 | | | | 772,062 | | |
Patterson-UTI
Energy, Inc.(b) | | | 45,800 | | | | 1,296,598 | | |
| TETRA Technologies, Inc.(a) | | | 60,494 | | | | 1,832,363 | | |
| Union Drilling, Inc.(a) | | | 33,100 | | | | 491,866 | | |
| Unit Corp.(a) | | | 39,360 | | | | 2,239,190 | | |
| | | | 8,823,069 | | |
| Entertainment & Leisure — 1.1% | |
| Shuffle Master, Inc.(a) (b) | | | 54,555 | | | | 1,788,313 | | |
| Financial Services — 2.6% | |
Accredited Home Lenders
Holding Co.(a) (b) | | | 17,100 | | | | 817,551 | | |
Federated
Investors, Inc. Cl. B | | | 17,700 | | | | 557,550 | | |
| Greenhill & Co., Inc.(b) | | | 15,700 | | | | 953,932 | | |
NorthStar Realty Finance
Corp. REIT | | | 25,100 | | | | 301,451 | | |
| Saxon Capital, Inc. REIT | | | 54,800 | | | | 626,912 | | |
Thomas Weisel Partners
Group, Inc.(a) | | | 48,100 | | | | 914,381 | | |
| | | | 4,171,777 | | |
| Healthcare — 2.6% | |
| Alliance Imaging, Inc.(a) | | | 121,800 | | | | 779,520 | | |
| Five Star Quality Care, Inc.(a) | | | 45,100 | | | | 499,257 | | |
| Healthways, Inc.(a) (b) | | | 22,630 | | | | 1,191,243 | | |
| Horizon Health Corp.(a) | | | 61,220 | | | | 1,278,274 | | |
| Matria Healthcare, Inc.(a) | | | 17,215 | | | | 368,745 | | |
| | | | 4,117,039 | | |
| Heavy Machinery — 1.8% | |
Bucyrus International,
Inc. Cl. A | | | 33,865 | | | | 1,710,183 | | |
| Hydril(a) | | | 3,200 | | | | 251,264 | | |
Natural Gas Services
Group, Inc.(a) (b) | | | 19,800 | | | | 296,406 | | |
| Verigy Ltd.(a) | | | 43,900 | | | | 692,303 | | |
| | | | 2,950,156 | | |
| | | Number of
Shares | | Market
Value | |
Home Construction, Furnishings &
Appliances — 0.9% | |
| Meritage Homes Corp.(a) | | | 13,600 | | | $ | 642,600 | | |
| Miller (Herman), Inc. | | | 32,700 | | | | 842,679 | | |
| | | | 1,485,279 | | |
| Information Retrieval Services — 0.8% | |
DealerTrack
Holdings, Inc.(a) | | | 4,100 | | | | 90,651 | | |
| InfoSpace, Inc.(a) | | | 42,500 | | | | 963,475 | | |
| Knot (The), Inc.(a) | | | 11,500 | | | | 240,695 | | |
| | | | 1,294,821 | | |
| Insurance — 2.7% | |
American Safety Insurance
Holdings, Ltd.(a) | | | 23,530 | | | | 388,245 | | |
| Centene Corp.(a) (b) | | | 97,685 | | | | 2,298,528 | | |
Darwin Professional
Underwriters, Inc.(a) | | | 3,200 | | | | 56,512 | | |
Philadelphia Consolidated
Holding Corp.(a) | | | 49,555 | | | | 1,504,490 | | |
| | | | 4,247,775 | | |
| Internet Software — 0.2% | |
| Opsware, Inc.(a) | | | 28,900 | | | | 238,136 | | |
| Lodging — 0.6% | |
| Vail Resorts, Inc.(a) (b) | | | 26,240 | | | | 973,504 | | |
| Machinery & Components — 1.6% | |
| Actuant Corp. Cl. A(b) | | | 23,020 | | | | 1,149,849 | | |
Brooks
Automation, Inc.(a) (b) | | | 115,900 | | | | 1,367,620 | | |
| | | | 2,517,469 | | |
| Medical Supplies — 6.8% | |
American Medical Systems
Holdings, Inc.(a) (b) | | | 100,045 | | | | 1,665,749 | | |
| Arrow International, Inc. | | | 28,945 | | | | 951,422 | | |
| Coherent, Inc.(a) (b) | | | 53,910 | | | | 1,818,384 | | |
| Cyberonics, Inc.(a) (b) | | | 53,700 | | | | 1,144,884 | | |
| Cynosure, Inc. Cl. A(a) | | | 9,700 | | | | 138,710 | | |
| DJ Orthopedics, Inc.(a) | | | 18,275 | | | | 673,068 | | |
Ista
Pharmaceuticals, Inc.(a) (b) | | | 66,400 | | | | 479,408 | | |
| Oyo Geospace Corp.(a) | | | 27,300 | | | | 1,559,103 | | |
PSS World
Medical, Inc.(a) (b) | | | 15,300 | | | | 270,045 | | |
| Respironics, Inc.(a) | | | 47,370 | | | | 1,621,001 | | |
| Thoratec Corp.(a) | | | 33,570 | | | | 465,616 | | |
| | | | 10,787,390 | | |
| Metals & Mining — 3.6% | |
| Aleris International, Inc.(a) | | | 75,005 | | | | 3,438,979 | | |
| Cleveland-Cliffs, Inc. | | | 5,485 | | | | 434,906 | | |
| General Cable Corp.(a) | | | 53,990 | | | | 1,889,650 | | |
| | | | 5,763,535 | | |
| | | Number of
Shares | | Market
Value | |
| Pharmaceuticals — 8.8% | |
| Alkermes, Inc.(a) (b) | | | 41,900 | | | $ | 792,748 | | |
Arena
Pharmaceuticals, Inc.(a) (b) | | | 42,200 | | | | 488,676 | | |
Ariad
Pharmaceuticals, Inc.(a) | | | 125,185 | | | | 564,584 | | |
| BioScrip, Inc.(a) | | | 51,600 | | | | 277,092 | | |
| Cell Genesys, Inc.(a) (b) | | | 112,400 | | | | 564,248 | | |
| Cephalon, Inc.(a) (b) | | | 51,900 | | | | 3,119,190 | | |
Cubist
Pharmaceuticals, Inc.(a) (b) | | | 57,500 | | | | 1,447,850 | | |
| CV Therapeutics, Inc.(a) (b) | | | 51,900 | | | | 725,043 | | |
| Dendreon Corp.(a) (b) | | | 54,480 | | | | 263,683 | | |
Endo Pharmaceuticals
Holdings, Inc.(a) | | | 29,100 | | | | 959,718 | | |
| Medarex, Inc.(a) | | | 190,700 | | | | 1,832,627 | | |
OraSure
Technologies, Inc.(a) | | | 81,400 | | | | 774,928 | | |
Par Pharmaceutical
Cos., Inc.(a) | | | 24,200 | | | | 446,732 | | |
Taro Pharmaceutical
Industries Ltd.(a) (b) | | | 56,000 | | | | 594,160 | | |
| Telik, Inc.(a) (b) | | | 56,900 | | | | 938,850 | | |
| Tercica, Inc.(a) (b) | | | 46,300 | | | | 244,927 | | |
| | | | 14,035,056 | | |
| Prepackaged Software — 3.3% | |
| Advent Software, Inc.(a) | | | 31,800 | | | | 1,147,026 | | |
| Ansys, Inc.(a) | | | 42,815 | | | | 2,047,413 | | |
| i2 Technologies, Inc.(a) (b) | | | 11,800 | | | | 149,506 | | |
| Kenexa Corp.(a) | | | 13,700 | | | | 436,345 | | |
| THQ, Inc.(a) (b) | | | 56,900 | | | | 1,229,040 | | |
TradeStation
Group, Inc.(a) (b) | | | 20,900 | | | | 264,803 | | |
| | | | 5,274,133 | | |
| Restaurants — 1.6% | |
McCormick & Schmick's
Seafood
Restaurants, Inc.(a) | | | 32,100 | | | | 763,980 | | |
Red Robin Gourmet
Burgers, Inc.(a) (b) | | | 43,270 | | | | 1,841,571 | | |
| | | | 2,605,551 | | |
| Retail — 5.9% | |
| Allion Healthcare, Inc.(a) | | | 82,880 | | | | 720,227 | | |
| Blue Nile, Inc.(a) (b) | | | 13,000 | | | | 418,080 | | |
Build-A-Bear
Workshop, Inc.(a) (b) | | | 39,215 | | | | 843,515 | | |
Cash America
International, Inc. | | | 64,775 | | | | 2,072,800 | | |
| Gaiam, Inc. Cl. A(a) | | | 29,800 | | | | 417,796 | | |
| Genesco, Inc.(a) | | | 53,830 | | | | 1,823,222 | | |
| Golf Galaxy, Inc.(a) | | | 21,800 | | | | 293,210 | | |
| GSI Commerce, Inc.(a) | | | 23,300 | | | | 315,249 | | |
(Continued)
The accompanying notes are an integral part of the financial statements.
154
MassMutual Select Small Company Growth Fund – Portfolio of Investments (Continued)
| | | Number of
Shares | | Market
Value | |
| Guitar Center, Inc.(a) (b) | | | 16,240 | | | $ | 722,193 | | |
| Knoll, Inc. | | | 40,400 | | | | 741,744 | | |
Marvel
Entertainment, Inc.(a) (b) | | | 49,250 | | | | 985,000 | | |
| | | | 9,353,036 | | |
| Telephone Utilities — 0.4% | |
| Mastec, Inc.(a) | | | 42,500 | | | | 561,425 | | |
TOTAL EQUITIES
(Cost $153,838,663) | | | | | | | 156,550,479 | | |
| | | Principal
Amount | |
| SHORT-TERM INVESTMENTS — 28.4% | |
| Cash Equivalents — 26.3%(d) | |
Abbey National PLC
Eurodollar Time Deposit
5.100% 07/10/2006 | | $ | 459,121 | | | | 459,121 | | |
ABN Amro Bank NV
Certificate of Deposit
5.305% 11/21/2006 | | | 459,120 | | | | 459,120 | | |
American Beacon Money
Market Fund(c) | | | 468,265 | | | | 468,265 | | |
Bank of America
5.270% 07/14/2006 | | | 918,240 | | | | 918,240 | | |
Bank of America
5.310% 03/08/2007 | | | 918,240 | | | | 918,240 | | |
Bank of Montreal
Eurodollar Time Deposit
5.290% 08/03/2006 | | | 918,240 | | | | 918,240 | | |
Bank of Nova Scotia
Eurodollar Time Deposit
5.290% 08/08/2006 | | | 918,240 | | | | 918,240 | | |
Barclays
Eurodollar Time Deposit
5.150% 08/01/2006 | | | 1,377,361 | | | | 1,377,361 | | |
Branch Banker & Trust
Eurodollar Time Deposit
5.250% 07/26/2006 | | | 1,652,832 | | | | 1,652,832 | | |
Calyon
Eurodollar Time Deposit
5.300% 08/08/2006 | | | 918,240 | | | | 918,240 | | |
Canadian Imperial
Bank of Commerce
Eurodollar Time Deposit
5.310% 07/31/2006 | | | 918,240 | | | | 918,240 | | |
Deutsche Bank
Eurodollar Time Deposit
5.250% 07/05/2006 | | | 2,295,600 | | | | 2,295,600 | | |
Dexia Group
Eurodollar Time Deposit
5.300% 08/09/2006 | | | 1,193,711 | | | | 1,193,711 | | |
| | | Principal
Amount | | Market
Value | |
Federal Home Loan
Bank Discount Note
5.181% 07/19/2006 | | $ | 730,907 | | | $ | 730,907 | | |
First Tennessee
National Corporation
Eurodollar Time Deposit
5.270% 07/24/2006 | | | 1,101,889 | | | | 1,101,889 | | |
Fortis Bank
Eurodollar Time Deposit
5.090% 07/05/2006 | | | 918,240 | | | | 918,240 | | |
Fortis Bank
Eurodollar Time Deposit
5.250% 07/03/2006 | | | 918,239 | | | | 918,239 | | |
Fortis Bank
Eurodollar Time Deposit
5.250% 07/06/2006 | | | 918,239 | | | | 918,239 | | |
Freddie Mac
Discount Note
5.191% 07/25/2006 | | | 547,990 | | | | 547,990 | | |
Harris NA
Eurodollar Time Deposit
5.080% 07/05/2006 | | | 642,767 | | | | 642,767 | | |
HBOS Halifax
Bank of Scotland
Certificate of Deposit
5.110% 07/10/2006 | | | 918,239 | | | | 918,239 | | |
National Australia Bank
Eurodollar Time Deposit
5.290% 07/03/2006 | | | 3,213,839 | | | | 3,213,839 | | |
National City Corporation
Eurodollar Time Deposit
5.220% 07/03/2006 | | | 1,090,144 | | | | 1,090,144 | | |
Skandinaviska Enskilda
Banken AB
Eurodollar Time Deposit
5.130% 07/12/2006 | | | 918,239 | | | | 918,239 | | |
Societe Generale
Eurodollar Time Deposit
5.200% 08/08/2006 | | | 918,239 | | | | 918,239 | | |
Societe Generale
Eurodollar Time Deposit
5.270% 07/17/2006 | | | 1,193,711 | | | | 1,193,711 | | |
Standard Chartered Bank
Eurodollar Time Deposit
5.260% 07/07/2006 | | | 1,377,360 | | | | 1,377,360 | | |
Svenska Handlesbanken
Eurodollar Time Deposit
5.290% 07/03/2006 | | | 3,078,404 | | | | 3,078,404 | | |
The Bank of the West
Eurodollar Time Deposit
5.250% 08/07/2006 | | | 1,561,008 | | | | 1,561,008 | | |
Toronto Dominion Bank
Eurodollar Time Deposit
5.300% 07/31/2006 | | | 2,571,071 | | | | 2,571,071 | | |
| | | Principal
Amount | | Market
Value | |
UBS AG
Eurodollar Time Deposit
5.250% 07/21/2006 | | $ | 1,377,360 | | | $ | 1,377,360 | | |
UBS AG
Eurodollar Time Deposit
5.250% 08/04/2006 | | | 1,377,360 | | | | 1,377,360 | | |
Wells Fargo
Eurodollar Time Deposit
5.160% 07/13/2006 | | | 918,239 | | | | 918,239 | | |
Wells Fargo
Eurodollar Time Deposit
5.170% 07/03/2006 | | | 918,239 | | | | 918,239 | | |
Wells Fargo
Eurodollar Time Deposit
5.210% 07/06/2006 | | | 459,120 | | | | 459,120 | | |
Wells Fargo
Eurodollar Time Deposit
5.250% 07/03/2006 | | | 918,239 | | | | 918,239 | | |
| | | | 42,002,532 | | |
| Repurchase Agreement — 2.1% | |
Investors Bank & Trust
Company Repurchase
Agreement, dated
06/30/2006, 3.75%,
due 07/03/2006(e) | | | 3,391,935 | | | | 3,391,935 | | |
TOTAL SHORT-TERM
INVESTMENTS
(Cost $45,394,467) | | | | | | | 45,394,467 | | |
TOTAL INVESTMENTS — 126.5%
(Cost $199,233,130)(f) | | | | | | | 201,944,946 | | |
Other Assets/
(Liabilities) — (26.5%) | | | | | | | (42,265,231 | ) | |
| NET ASSETS — 100.0% | | | | | | $ | 159,679,715 | | |
Notes to Portfolio of Investments
ADR - American Depository Receipt
REIT - Real Estate Investment Trust
(a) Non-income producing security.
(b) Denotes all or a portion of security on loan. (Note 2).
(c) Amount represents shares owned of the fund.
(d) Represents investments of security lending collateral. (Note 2).
(e) Maturity value of $3,392,995. Collateralized by a U.S. Government Agency Obligation with a rate of 8.875%, maturity date of 01/25/2016, and an aggregate market value, including accrued interest, of $3,561,531.
(f) See Note 6 for aggregate cost for Federal tax purposes.
The accompanying notes are an integral part of the financial statements.
155
MassMutual Select Emerging Growth Fund – Portfolio of Investments
June 30, 2006 (Unaudited)
| | | Number of
Shares | | Market
Value | |
| EQUITIES — 94.0% | |
| COMMON STOCK | |
| Advertising — 2.1% | |
| aQuantive, Inc.(a) | | | 67,220 | | | $ | 1,702,683 | | |
| Marchex, Inc. Cl. B(a) | | | 23,810 | | | | 391,198 | | |
| Valueclick, Inc.(a) | | | 29,128 | | | | 447,115 | | |
| | | | 2,540,996 | | |
| Aerospace & Defense — 0.6% | |
| Armor Holdings, Inc.(a) | | | 13,550 | | | | 742,946 | | |
| Apparel, Textiles & Shoes — 3.6% | |
| Christopher & Banks Corp. | | | 52,560 | | | | 1,524,240 | | |
| Iconix Brand Group, Inc.(a) | | | 57,770 | | | | 943,962 | | |
| J Crew Group, Inc.(a) | | | 730 | | | | 20,038 | | |
| Steven Madden Ltd. | | | 41,640 | | | | 1,233,377 | | |
| Volcom, Inc.(a) | | | 21,800 | | | | 697,382 | | |
| | | | 4,418,999 | | |
| Banking, Savings & Loans — 1.3% | |
| PrivateBancorp, Inc. | | | 30,441 | | | | 1,260,562 | | |
| SVB Financial Group(a) | | | 6,700 | | | | 304,582 | | |
| | | | 1,565,144 | | |
| Beverages — 0.5% | |
| Peet's Coffee & Tea, Inc.(a) | | | 21,940 | | | | 662,369 | | |
| Chemicals — 0.0% | |
Aventine Renewable Energy
Holdings, Inc.(a) | | | 1,110 | | | | 43,179 | | |
| Commercial Services — 15.5% | |
| Akamai Technologies, Inc.(a) | | | 34,310 | | | | 1,241,679 | | |
AMN Healthcare
Services, Inc.(a) | | | 67,560 | | | | 1,371,468 | | |
Ctrip.com International Ltd.
ADR (China) | | | 26,010 | | | | 1,327,810 | | |
| FTI Consulting, Inc.(a) | | | 64,120 | | | | 1,716,492 | | |
Heartland Payment
Systems, Inc.(a) (b) | | | 49,000 | | | | 1,366,120 | | |
Huron Consulting
Group, Inc.(a) | | | 52,942 | | | | 1,857,735 | | |
Keryx
Biopharmaceuticals(a) | | | 69,820 | | | | 991,444 | | |
| Lifecell Corp.(a) (b) | | | 84,230 | | | | 2,604,392 | | |
| Liquidity Services, Inc.(a) | | | 26,910 | | | | 418,989 | | |
Portfolio Recovery
Associates, Inc.(a) | | | 48,190 | | | | 2,202,283 | | |
| Sotheby's(a) | | | 38,720 | | | | 1,016,400 | | |
| Team, Inc.(a) | | | 42,600 | | | | 1,067,130 | | |
THE9 Ltd. ADR
(Cayman Islands)(a) | | | 44,100 | | | | 1,022,679 | | |
| | | Number of
Shares | | Market
Value | |
| VistaPrint Ltd.(a) | | | 34,850 | | | $ | 931,889 | | |
| | | | 19,136,510 | | |
| Communications — 1.2% | |
| AudioCodes Ltd.(a) | | | 119,890 | | | | 1,306,801 | | |
| Openwave Systems, Inc.(a) | | | 19,520 | | | | 225,261 | | |
| | | | 1,532,062 | | |
Computer & Other Data Processing
Service — 0.2% | |
| Omniture, Inc.(a) | | | 36,690 | | | | 267,470 | | |
| Computer Integrated Systems Design — 0.7% | |
| Eclipsys Corp.(a) | | | 48,900 | | | | 888,024 | | |
| Computer Related Services — 0.8% | |
| Neoware Systems, Inc.(a) | | | 18,710 | | | | 229,946 | | |
| NetFlix, Inc.(a) | | | 26,630 | | | | 724,602 | | |
| | | | 954,548 | | |
| Computers & Information — 3.6% | |
M-Systems Flash Disk
Pioneers Ltd.(a) (b) | | | 63,310 | | | | 1,875,875 | | |
| Netgear, Inc.(a) | | | 16,470 | | | | 356,575 | | |
| Rackable Systems, Inc.(a) | | | 22,600 | | | | 892,474 | | |
| Redback Networks, Inc.(a) | | | 38,790 | | | | 711,409 | | |
| Xyratex Ltd.(a) | | | 21,620 | | | | 571,849 | | |
| | | | 4,408,182 | | |
| Consumer Services — 0.4% | |
Icon PLC Sponsored ADR
(United Kingdom)(a) | | | 7,930 | | | | 438,529 | | |
| Data Processing & Preparation — 1.5% | |
FactSet Research
Systems, Inc. | | | 21,070 | | | | 996,611 | | |
| The TriZetto Group, Inc.(a) | | | 61,010 | | | | 902,338 | | |
| | | | 1,898,949 | | |
| Electrical Equipment & Electronics — 10.6% | |
American Science &
Engineering, Inc.(a) | | | 17,200 | | | | 996,224 | | |
Atheros
Communications, Inc.(a) | | | 90,300 | | | | 1,712,088 | | |
| FormFactor, Inc.(a) | | | 32,810 | | | | 1,464,310 | | |
| Hittite Microwave Corp.(a) | | | 43,500 | | | | 1,572,960 | | |
| Itron, Inc.(a) | | | 7,680 | | | | 455,117 | | |
| Ixia(a) | | | 27,380 | | | | 246,420 | | |
Netlogic
Microsystems, Inc.(a) (b) | | | 40,810 | | | | 1,316,122 | | |
O2Micro International Ltd.
ADR (Cayman Islands)(a) | | | 48,570 | | | | 373,503 | | |
OmniVision
Technologies, Inc.(a) | | | 21,040 | | | | 444,365 | | |
| | | Number of
Shares | | Market
Value | |
| Silicon Image, Inc.(a) | | | 91,780 | | | $ | 989,388 | | |
Silicon Motion Technology
Corp. ADR (Taiwan)(a) | | | 66,850 | | | | 958,629 | | |
SiRF Technology
Holdings, Inc.(a) | | | 19,780 | | | | 637,312 | | |
| Tessera Technologies, Inc.(a) | | | 29,150 | | | | 801,625 | | |
| Trident Microsystems, Inc.(a) | | | 21,510 | | | | 408,260 | | |
Vimicro International Corp.
ADR (Cayman Islands)(a) | | | 40,300 | | | | 508,183 | | |
Volterra
Semiconductor Corp.(a) | | | 17,300 | | | | 263,998 | | |
| | | | 13,148,504 | | |
| Energy — 3.5% | |
Oceaneering
International, Inc.(a) | | | 19,020 | | | | 872,067 | | |
| Parallel Petroleum Corp.(a) | | | 57,560 | | | | 1,422,308 | | |
| TETRA Technologies, Inc.(a) | | | 37,020 | | | | 1,121,336 | | |
| W-H Energy Services, Inc.(a) | | | 18,930 | | | | 962,212 | | |
| | | | 4,377,923 | | |
| Entertainment & Leisure — 0.6% | |
Pinnacle
Entertainment, Inc.(a) | | | 26,120 | | | | 800,578 | | |
| Financial Services — 6.3% | |
Affiliated Managers
Group, Inc.(a) | | | 14,370 | | | | 1,248,609 | | |
Boston Private Financial
Holdings, Inc. | | | 33,610 | | | | 937,719 | | |
| GFI Group, Inc.(a) | | | 19,500 | | | | 1,052,025 | | |
| Gmarket, Inc. ADR(a) | | | 2,940 | | | | 45,188 | | |
| Greenhill & Co., Inc. | | | 10,400 | | | | 631,904 | | |
| IntercontinentalExchange, Inc.(a) | | | 6,070 | | | | 351,696 | | |
International Securities
Exchange, Inc. | | | 23,960 | | | | 912,157 | | |
Investment Technology
Group, Inc.(a) | | | 28,490 | | | | 1,449,001 | | |
| optionsXpress Holdings, Inc. | | | 48,350 | | | | 1,127,039 | | |
| | | | 7,755,338 | | |
| Foods — 0.7% | |
United Natural
Foods, Inc.(a) | | | 25,480 | | | | 841,350 | | |
| Healthcare — 4.4% | |
Allscripts Healthcare
Solutions, Inc.(a) | | | 32,390 | | | | 568,445 | | |
| Healthways, Inc.(a) | | | 16,670 | | | | 877,509 | | |
| LCA-Vision, Inc. | | | 20,650 | | | | 1,092,592 | | |
| Matria Healthcare, Inc.(a) | | | 19,635 | | | | 420,582 | | |
Nighthawk Radiology
Holdings, Inc.(a) | | | 25,730 | | | | 461,596 | | |
(Continued)
The accompanying notes are an integral part of the financial statements.
156
MassMutual Select Emerging Growth Fund – Portfolio of Investments (Continued)
| | | Number of
Shares | | Market
Value | |
Radiation Therapy
Services, Inc.(a) | | | 34,380 | | | $ | 925,166 | | |
United Surgical Partners
International, Inc.(a) | | | 37,005 | | | | 1,112,740 | | |
| | | | 5,458,630 | | |
| Heavy Machinery — 2.8% | |
| Dril-Quip, Inc.(a) | | | 26,260 | | | | 2,164,874 | | |
| Lufkin Industries, Inc. | | | 20,990 | | | | 1,247,436 | | |
| | | | 3,412,310 | | |
Home Construction, Furnishings &
Appliances — 1.4% | |
| Select Comfort Corp.(a) (b) | | | 72,849 | | | | 1,673,342 | | |
| Industrial – Distribution — 0.3% | |
MWI Veterinary
Supply, Inc.(a) | | | 11,640 | | | | 424,045 | | |
| Information Retrieval Services — 1.2% | |
| Digital River, Inc.(a) | | | 36,470 | | | | 1,473,023 | | |
| Insurance — 1.5% | |
| Centene Corp.(a) | | | 26,780 | | | | 630,133 | | |
| Navigators Group, Inc.(a) | | | 27,320 | | | | 1,197,162 | | |
| | | | 1,827,295 | | |
| Internet Software — 0.9% | |
WebEx
Communications, Inc.(a) | | | 32,606 | | | | 1,158,817 | | |
| Lodging — 0.5% | |
| Four Seasons Hotels, Inc. | | | 10,980 | | | | 674,611 | | |
| Machinery & Components — 0.8% | |
| Gardner Denver, Inc.(a) | | | 25,270 | | | | 972,895 | | |
| Medical Supplies — 10.2% | |
| Altus Pharmaceuticals, Inc.(a) | | | 31,520 | | | | 581,544 | | |
| AngioDynamics, Inc.(a) | | | 24,780 | | | | 670,299 | | |
| Eagle Test Systems, Inc.(a) | | | 45,750 | | | | 641,415 | | |
| I-Flow Corp.(a) (b) | | | 47,010 | | | | 508,648 | | |
| Illumina, Inc.(a) | | | 45,560 | | | | 1,351,310 | | |
| Intralase Corp.(a) | | | 31,470 | | | | 526,808 | | |
| Intuitive Surgical, Inc.(a) | | | 9,210 | | | | 1,086,504 | | |
| IRIS International, Inc.(a) | | | 31,940 | | | | 420,330 | | |
| Kyphon, Inc.(a) | | | 46,140 | | | | 1,769,930 | | |
| NuVasive, Inc.(a) | | | 43,680 | | | | 796,286 | | |
| PolyMedica Corp. | | | 32,310 | | | | 1,161,868 | | |
| Resmed, Inc.(a) | | | 18,070 | | | | 848,387 | | |
| SonoSite, Inc.(a) | | | 26,570 | | | | 1,037,293 | | |
| Vital Images, Inc.(a) | | | 48,280 | | | | 1,192,516 | | |
| | | | 12,593,138 | | |
| Metals & Mining — 0.7% | |
| Dynamic Materials Corp. | | | 25,920 | | | | 874,282 | | |
| | | Number of
Shares | | Market
Value | |
| Pharmaceuticals — 1.5% | |
| Adolor Corp.(a) | | | 42,430 | | | $ | 1,061,174 | | |
| Array Biopharma, Inc.(a) | | | 17,850 | | | | 153,510 | | |
| Solexa, Inc.(a) (b) | | | 72,600 | | | | 617,100 | | |
| | | | 1,831,784 | | |
| Prepackaged Software — 4.3% | |
| Altiris, Inc.(a) | | | 37,210 | | | | 671,268 | | |
| Informatica Corp.(a) | | | 78,270 | | | | 1,030,033 | | |
| Kenexa Corp.(a) | | | 43,050 | | | | 1,371,143 | | |
| MicroStrategy, Inc. Cl. A(a) | | | 10,190 | | | | 993,729 | | |
| Quest Software, Inc.(a) | | | 28,930 | | | | 406,177 | | |
| SPSS, Inc.(a) | | | 10,080 | | | | 323,971 | | |
| THQ, Inc.(a) | | | 16,770 | | | | 362,232 | | |
Ultimate Software
Group, Inc.(a) | | | 8,330 | | | | 159,603 | | |
| | | | 5,318,156 | | |
| Restaurants — 1.0% | |
California Pizza
Kitchen, Inc.(a) | | | 38,328 | | | | 1,053,253 | | |
Chipotle Mexican
Grill, Inc. Cl. A(a) | | | 2,610 | | | | 159,080 | | |
| | | | 1,212,333 | | |
| Retail — 2.8% | |
| Coldwater Creek, Inc.(a) | | | 49,850 | | | | 1,333,986 | | |
| GSI Commerce, Inc.(a) | | | 51,413 | | | | 695,618 | | |
| Stamps.com, Inc.(a) | | | 20,270 | | | | 563,911 | | |
| Zumiez, Inc.(a) | | | 24,730 | | | | 929,106 | | |
| | | | 3,522,621 | | |
| Telecommunications — 0.6% | |
Time Warner Telecom,
Inc. Cl. A(a) (b) | | | 52,940 | | | | 786,159 | | |
| Telephone Utilities — 3.1% | |
| Equinix, Inc.(a) | | | 23,850 | | | | 1,308,411 | | |
j2 Global
Communications, Inc.(a) | | | 82,502 | | | | 2,575,712 | | |
| | | | 3,884,123 | | |
| Transportation — 2.3% | |
American Commercial
Lines, Inc.(a) | | | 12,400 | | | | 747,100 | | |
Hornbeck Offshore
Services, Inc.(a) | | | 59,410 | | | | 2,110,243 | | |
| | | | 2,857,343 | | |
TOTAL EQUITIES
(Cost $109,729,727) | | | | | | | 116,376,507 | | |
| | | Principal
Amount | | Market
Value | |
| SHORT-TERM INVESTMENTS — 7.6% | |
| Cash Equivalents — 3.6%(d) | |
Abbey National PLC
Eurodollar Time Deposit
5.100% 07/10/2006 | | $ | 48,586 | | | $ | 48,586 | | |
ABN Amro Bank NV
Certificate of Deposit
5.305% 11/21/2006 | | | 48,582 | | | | 48,582 | | |
American Beacon Money
Market Fund(c) | | | 49,550 | | | | 49,550 | | |
Bank of America
5.270% 07/14/2006 | | | 97,164 | | | | 97,164 | | |
Bank of America
5.310% 03/08/2007 | | | 97,164 | | | | 97,164 | | |
Bank of Montreal
Eurodollar Time Deposit
5.290% 08/03/2006 | | | 97,164 | | | | 97,164 | | |
Bank of Nova Scotia
Eurodollar Time Deposit
5.290% 08/08/2006 | | | 97,164 | | | | 97,164 | | |
Barclays
Eurodollar Time Deposit
5.150% 08/01/2006 | | | 145,746 | | | | 145,746 | | |
Branch Banker & Trust
Eurodollar Time Deposit
5.250% 07/26/2006 | | | 174,895 | | | | 174,895 | | |
Calyon
Eurodollar Time Deposit
5.300% 08/08/2006 | | | 97,164 | | | | 97,164 | | |
Canadian Imperial
Bank of Commerce
Eurodollar Time Deposit
5.310% 07/31/2006 | | | 97,164 | | | | 97,164 | | |
Deutsche Bank
Eurodollar Time Deposit
5.250% 07/05/2006 | | | 242,910 | | | | 242,910 | | |
Dexia Group
Eurodollar Time Deposit
5.300% 08/09/2006 | | | 126,313 | | | | 126,313 | | |
Federal Home Loan
Bank Discount Note
5.181% 07/19/2006 | | | 77,341 | | | | 77,341 | | |
First Tennessee
National Corporation
Eurodollar Time Deposit
5.270% 07/24/2006 | | | 116,597 | | | | 116,597 | | |
Fortis Bank
Eurodollar Time Deposit
5.090% 07/05/2006 | | | 97,164 | | | | 97,164 | | |
Fortis Bank
Eurodollar Time Deposit
5.250% 07/03/2006 | | | 97,164 | | | | 97,164 | | |
(Continued)
The accompanying notes are an integral part of the financial statements.
157
MassMutual Select Emerging Growth Fund – Portfolio of Investments (Continued)
| | | Principal
Amount | | Market
Value | |
Fortis Bank
Eurodollar Time Deposit
5.250% 07/06/2006 | | $ | 97,164 | | | $ | 97,164 | | |
Freddie Mac
Discount Note
5.191% 07/25/2006 | | | 57,986 | | | | 57,986 | | |
Harris NA
Eurodollar Time Deposit
5.080% 07/05/2006 | | | 68,015 | | | | 68,015 | | |
HBOS Halifax
Bank of Scotland
Certificate of Deposit
5.110% 07/10/2006 | | | 97,164 | | | | 97,164 | | |
National Australia Bank
Eurodollar Time Deposit
5.290% 07/03/2006 | | | 340,074 | | | | 340,074 | | |
National City Corporation
Eurodollar Time Deposit
5.220% 07/03/2006 | | | 115,354 | | | | 115,354 | | |
Skandinaviska Enskilda
Banken AB
Eurodollar Time Deposit
5.130% 07/12/2006 | | | 97,164 | | | | 97,164 | | |
Societe Generale
Eurodollar Time Deposit
5.200% 08/08/2006 | | | 97,164 | | | | 97,164 | | |
Societe Generale
Eurodollar Time Deposit
5.270% 07/17/2006 | | | 126,313 | | | | 126,313 | | |
Standard Chartered Bank
Eurodollar Time Deposit
5.260% 07/07/2006 | | | 145,746 | | | | 145,746 | | |
Svenska Handlesbanken
Eurodollar Time Deposit
5.290% 07/03/2006 | | | 325,743 | | | | 325,743 | | |
The Bank of the West
Eurodollar Time Deposit
5.250% 08/07/2006 | | | 165,179 | | | | 165,179 | | |
Toronto Dominion Bank
Eurodollar Time Deposit
5.300% 07/31/2006 | | | 272,059 | | | | 272,059 | | |
UBS AG
Eurodollar Time Deposit
5.250% 07/21/2006 | | | 145,746 | | | | 145,746 | | |
UBS AG
Eurodollar Time Deposit
5.250% 08/04/2006 | | | 145,746 | | | | 145,746 | | |
Wells Fargo
Eurodollar Time Deposit
5.160% 07/13/2006 | | | 97,164 | | | | 97,164 | | |
Wells Fargo
Eurodollar Time Deposit
5.170% 07/03/2006 | | | 97,164 | | | | 97,164 | | |
| | | Principal
Amount | | Market
Value | |
Wells Fargo
Eurodollar Time Deposit
5.210% 07/06/2006 | | $ | 48,582 | | | $ | 48,582 | | |
Wells Fargo
Eurodollar Time Deposit
5.250% 07/03/2006 | | | 97,164 | | | | 97,164 | | |
| | | | 4,444,523 | | |
| Repurchase Agreement — 4.0% | |
Investors Bank & Trust
Company Repurchase
Agreement, dated
06/30/2006, 3.75%,
due 07/03/2006(e) | | | 5,005,079 | | | | 5,005,079 | | |
TOTAL SHORT-TERM
INVESTMENTS
(Cost $9,449,602) | | | | | | | 9,449,602 | | |
TOTAL INVESTMENTS — 101.6%
(Cost $119,179,329)(f) | | | | | | | 125,826,109 | | |
Other Assets/
(Liabilities) — (1.6%) | | | | | | | (1,992,500 | ) | |
| NET ASSETS — 100.0% | | | | | | $ | 123,833,609 | | |
Notes to Portfolio of Investments
ADR - American Depository Receipt
(a) Non-income producing security.
(b) Denotes all or a portion of security on loan. (Note 2).
(c) Amount represents shares owned of the fund.
(d) Represents investments of security lending collateral. (Note 2).
(e) Maturity value of $5,006,643. Collateralized by a U.S. Government Agency obligation with a rate of 8.375%, maturity date of 10/25/2017, and an aggregate market value, including accrued interest, of $5,255,333.
(f) See Note 6 for aggregate cost for Federal tax purposes.
The accompanying notes are an integral part of the financial statements.
158
MassMutual Select Overseas Fund – Portfolio of Investments
June 30, 2006 (Unaudited)
| | | Number of
Shares | | Market
Value | |
| EQUITIES — 96.2% | |
| COMMON STOCK | |
| Advertising — 1.6% | |
| Publicis Groupe(a) | | | 266,000 | | | $ | 10,200,980 | | |
| WPP Group PLC | | | 621,390 | | | | 7,447,240 | | |
| | | | 17,648,220 | | |
| Apparel, Textiles & Shoes — 0.8% | |
Giordano
International Ltd. | | | 8,813,000 | | | | 4,160,802 | | |
| Next PLC | | | 148,720 | | | | 4,444,195 | | |
| | | | 8,604,997 | | |
| Automotive & Parts — 6.6% | |
Bayerische Motoren
Werke AG | | | 354,000 | | | | 17,551,561 | | |
| Bridgestone Corp. | | | 325,000 | | | | 6,285,056 | | |
Compagnie Generale
des Etablissements
Michelin Cl. B | | | 129,000 | | | | 7,692,865 | | |
DaimlerChrysler
AG Registered | | | 391,000 | | | | 19,169,040 | | |
| Honda Motor Co. Ltd. | | | 293,000 | | | | 9,251,023 | | |
| Toyota Motor Corp. | | | 215,200 | | | | 11,247,203 | | |
| | | | 71,196,748 | | |
| Banking, Savings & Loans — 13.0% | |
Australia &
New Zealand
Banking Group Ltd. | | | 409,300 | | | | 8,109,920 | | |
Banco Bilbao
Vizcaya Argentaria SA | | | 129,120 | | | | 2,643,959 | | |
Banco Bilbao Vizcaya
Argentaria SA (FRA) | | | 392,993 | | | | 7,957,834 | | |
| Bangkok Bank PCL | | | 967,190 | | | | 2,684,237 | | |
Bank Central
Asia Tbk PT | | | 5,966,000 | | | | 2,636,396 | | |
| Bank of Ireland (Ireland) | | | 801,500 | | | | 14,260,985 | | |
| BNP Paribas SA | | | 67,800 | | | | 6,440,796 | | |
Chinatrust Financial
Holding Co. | | | 19,890,506 | | | | 16,474,625 | | |
| Credit Agricole SA | | | 292,744 | | | | 11,051,843 | | |
| Credit Suisse Group | | | 258,200 | | | | 14,301,223 | | |
Erste Bank
der oesterreichischen
Sparkassen AG | | | 77,553 | | | | 4,332,309 | | |
| Julius Baer Holding AG | | | 80,638 | | | | 6,929,901 | | |
| Kookmin Bank | | | 94,000 | | | | 7,780,769 | | |
| Lloyds TSB Group PLC | | | 962,000 | | | | 9,390,437 | | |
| Shinsei Bank Ltd. | | | 1,029,000 | | | | 6,531,548 | | |
| | | Number of
Shares | | Market
Value | |
Svenska Handelsbanken
AB Cl. A | | | 121,100 | | | $ | 3,086,645 | | |
UniCredito
Italiano SpA(a) | | | 1,081,869 | | | | 8,401,766 | | |
United Overseas
Bank Ltd. | | | 685,000 | | | | 6,731,227 | | |
| | | | 139,746,420 | | |
| Beverages — 4.5% | |
| Diageo PLC | | | 1,501,647 | | | | 25,014,057 | | |
Heineken Holding
NV Cl. A | | | 196,250 | | | | 7,189,848 | | |
Lotte Chilsung
Beverage Co. Ltd. | | | 5,830 | | | | 7,079,908 | | |
| Pernod-Ricard SA(a) | | | 44,590 | | | | 8,779,634 | | |
| | | | 48,063,447 | | |
| Broadcasting, Publishing & Printing — 6.3% | |
British Sky Broadcasting
Group PLC | | | 1,942,000 | | | | 20,399,509 | | |
Gestevision
Telecinco SA(a) | | | 288,000 | | | | 6,855,921 | | |
Grupo Televisa
SA Sponsored
ADR (Mexico) | | | 379,990 | | | | 7,337,607 | | |
| Johnston Press PLC | | | 1,412,000 | | | | 10,710,874 | | |
Societe
Television Francaise 1 | | | 117,000 | | | | 3,786,974 | | |
| Trinity Mirror PLC | | | 1,103,000 | | | | 9,848,638 | | |
| Vivendi SA | | | 247,400 | | | | 8,605,053 | | |
| | | | 67,544,576 | | |
| Building Materials & Construction — 0.4% | |
| Legrand SA(a) | | | 148,150 | | | | 4,142,278 | | |
| Chemicals — 5.2% | |
| Air Liquide SA | | | 74,206 | | | | 14,346,003 | | |
| Akzo Nobel, Inc. | | | 174,000 | | | | 9,334,909 | | |
| Bayer AG | | | 177,250 | | | | 8,087,902 | | |
| Givaudan SA Registered | | | 10,100 | | | | 7,875,612 | | |
Lonza Group
AG Registered(a) | | | 98,000 | | | | 6,656,829 | | |
| Nitto Denko Corp. | | | 55,600 | | | | 3,960,675 | | |
| Syngenta AG(b) | | | 45,000 | | | | 5,935,945 | | |
| | | | 56,197,875 | | |
| Commercial Services — 1.9% | |
| Adecco SA(a) | | | 239,000 | | | | 14,001,778 | | |
Michael Page
International PLC | | | 271,800 | | | | 1,746,507 | | |
| Smiths Group PLC | | | 257,130 | | | | 4,196,184 | | |
| | | | 19,944,469 | | |
| | | Number of
Shares | | Market
Value | |
| Communications — 3.9% | |
| SK Telecom Co. Ltd. | | | 75,830 | | | $ | 16,355,019 | | |
SK Telecom Co. Ltd.
ADR (South Korea)(a) | | | 72,500 | | | | 1,697,950 | | |
Telefonaktiebolaget LM
Ericsson Cl. B | | | 2,179,530 | | | | 7,133,781 | | |
| Vodafone Group PLC | | | 7,990,000 | | | | 16,851,129 | | |
| | | | 42,037,879 | | |
| Computer Related Services — 0.5% | |
| Meitec Corp.(a) | | | 148,700 | | | | 4,853,230 | | |
| Computers & Information — 0.9% | |
| Canon, Inc. | | | 190,650 | | | | 9,314,932 | | |
| Cosmetics & Personal Care — 2.8% | |
| L'Oreal SA | | | 28,440 | | | | 2,664,981 | | |
| Reckitt Benckiser PLC | | | 504,708 | | | | 18,659,812 | | |
| Uni-Charm Corp. | | | 155,000 | | | | 8,576,793 | | |
| | | | 29,901,586 | | |
| Electric Utilities — 1.4% | |
| E.ON AG | | | 86,570 | | | | 9,891,850 | | |
| Iberdrola SA | | | 162,633 | | | | 5,561,649 | | |
| | | | 15,453,499 | | |
| Electrical Equipment & Electronics — 5.6% | |
| Fanuc Ltd. | | | 30,800 | | | | 2,776,734 | | |
Koninklijke Philips
Electronics NV | | | 373,000 | | | | 11,591,377 | | |
| Omron Corp. | | | 153,000 | | | | 3,895,865 | | |
| Ricoh Co. Ltd. | | | 400,000 | | | | 7,875,357 | | |
Samsung Electronics
Co. Ltd. | | | 25,408 | | | | 16,215,690 | | |
| Schneider Electric SA | | | 168,604 | | | | 17,469,335 | | |
| | | | 59,824,358 | | |
| Electronics — 0.8% | |
| Rohm Co. Ltd. | | | 97,500 | | | | 8,745,491 | | |
| Energy — 2.7% | |
| BG Group PLC | | | 276,428 | | | | 3,665,845 | | |
| CNOOC Ltd. | | | 4,641,000 | | | | 3,725,157 | | |
Royal Dutch Shell Plc
Class A Shs | | | 231,850 | | | | 7,736,126 | | |
| Total SA | | | 205,240 | | | | 13,380,243 | | |
| | | | 28,507,371 | | |
| Entertainment & Leisure — 1.6% | |
| Ladbrokes PLC | | | 779,324 | | | | 5,814,499 | | |
| William Hill PLC | | | 948,656 | | | | 10,877,737 | | |
| | | | 16,692,236 | | |
(Continued)
The accompanying notes are an integral part of the financial statements.
159
MassMutual Select Overseas Fund – Portfolio of Investments (Continued)
| | | Number of
Shares | | Market
Value | |
| Financial Services — 2.8% | |
Daiwa Securities
Group, Inc. | | | 974,000 | | | $ | 11,673,942 | | |
| ORIX Corp. | | | 12,710 | | | | 3,097,918 | | |
| UBS AG Registered | | | 138,033 | | | | 14,969,388 | | |
| | | | 29,741,248 | | |
| Foods — 6.5% | |
| Cadbury Schweppes PLC | | | 1,427,000 | | | | 13,621,075 | | |
| Compass Group PLC | | | 2,420,000 | | | | 11,634,988 | | |
| Nestle SA | | | 107,133 | | | | 33,330,306 | | |
| Tesco PLC | | | 1,800,907 | | | | 11,016,817 | | |
| | | | 69,603,186 | | |
| Household Products — 1.4% | |
| Henkel KGaA | | | 98,100 | | | | 10,132,463 | | |
| Kao Corp. | | | 200,000 | | | | 5,241,642 | | |
| | | | 15,374,105 | | |
| Industrial – Diversified — 0.3% | |
| Enodis PLC | | | 724,400 | | | | 2,868,596 | | |
| Industrial Services — 0.9% | |
| Asahi Glass Co. Ltd.(a) | | | 751,000 | | | | 9,531,440 | | |
| Insurance — 4.4% | |
Assicurazioni
Generali SpA | | | 206,800 | | | | 7,475,089 | | |
| AXA SA | | | 469,347 | | | | 15,276,894 | | |
Hannover
Rueckversicherungs AG(a) (b) | | | 217,000 | | | | 7,535,727 | | |
QBE Insurance
Group Ltd. | | | 415,702 | | | | 6,324,213 | | |
| Swiss Reinsurance(a) | | | 124,819 | | | | 8,638,242 | | |
Willis Group
Holdings Ltd. | | | 80,000 | | | | 2,568,000 | | |
| | | | 47,818,165 | | |
| Medical Supplies — 0.7% | |
| Orbotech Ltd.(b) | | | 39,100 | | | | 896,563 | | |
| Smith & Nephew PLC | | | 603,068 | | | | 4,598,712 | | |
| Synthes, Inc.(a) | | | 19,103 | | | | 2,282,170 | | |
| | | | 7,777,445 | | |
| Metals & Mining — 0.2% | |
Cia Vale do Rio Doce
ADR (Brazil) | | | 110,380 | | | | 2,653,535 | | |
| Miscellaneous — 1.0% | |
LVMH Moet Hennessy
Louis Vuitton SA | | | 111,246 | | | | 10,974,755 | | |
| Oil & Gas — 0.3% | |
| Tokyo Gas Co. Ltd.(a) | | | 711,000 | | | | 3,357,994 | | |
| | | Number of
Shares | | Market
Value | |
| Pharmaceuticals — 9.0% | |
| Actelion Ltd.(b) | | | 16,700 | | | $ | 1,668,675 | | |
| AstraZeneca PLC | | | 125,495 | | | | 7,461,599 | | |
| GlaxoSmithKline PLC | | | 1,176,200 | | | | 32,558,567 | | |
| Novartis AG | | | 273,000 | | | | 14,641,379 | | |
| Roche Holding AG | | | 101,702 | | | | 16,654,595 | | |
| Sanofi-Aventis(a) | | | 169,573 | | | | 16,448,754 | | |
Takeda Pharmaceutical
Co. Ltd. | | | 126,000 | | | | 7,847,975 | | |
| | | | 97,281,544 | | |
| Real Estate — 0.0% | |
| United Overseas Land Ltd. | | | 56,100 | | | | 101,018 | | |
| Retail — 3.7% | |
| Esprit Holdings Ltd. | | | 662,000 | | | | 5,421,091 | | |
| Li & Fung Ltd. | | | 1,786,800 | | | | 3,625,824 | | |
| Metro AG | | | 123,000 | | | | 6,920,719 | | |
| Signet Group PLC | | | 7,383,000 | | | | 13,044,983 | | |
The Swatch Group
AG Cl. B | | | 64,300 | | | | 10,754,714 | | |
| | | | 39,767,331 | | |
| Telecommunications — 1.8% | |
| NTT DoCoMo, Inc. | | | 13,170 | | | | 19,296,764 | | |
| Telephone Utilities — 1.1% | |
| Fastweb(a) (b) | | | 30,641 | | | | 1,322,320 | | |
Hutchison
Telecommunications
International Ltd.(b) | | | 3,049,000 | | | | 4,923,069 | | |
Singapore
Telecommunications Ltd. | | | 3,748,000 | | | | 5,994,876 | | |
| | | | 12,240,265 | | |
| Tobacco — 0.5% | |
| KT&G Corp. | | | 100,800 | | | | 5,878,523 | | |
| Toys, Games — 0.7% | |
| Nintendo Co. Ltd. | | | 42,700 | | | | 7,181,121 | | |
| Transportation — 0.4% | |
Canadian National
Railway Co. | | | 99,980 | | | | 4,374,125 | | |
TOTAL EQUITIES
(Cost $897,875,403) | | | | | | | 1,034,240,772 | | |
| | | Principal
Amount | | Market
Value | |
| SHORT-TERM INVESTMENTS — 10.8% | |
| Cash Equivalents — 7.4%(d) | |
Abbey National PLC
Eurodollar Time Deposit
5.100% 07/10/2006 | | $ | 868,805 | | | $ | 868,805 | | |
ABN Amro Bank NV
Certificate of Deposit
5.305% 11/21/2006 | | | 868,803 | | | | 868,803 | | |
American Beacon Money
Market Fund(c) | | | 886,105 | | | | 886,105 | | |
Bank of America
5.270% 07/14/2006 | | | 1,737,605 | | | | 1,737,605 | | |
Bank of America
5.310% 03/08/2007 | | | 1,737,605 | | | | 1,737,605 | | |
Bank of Montreal
Eurodollar Time Deposit
5.290% 08/03/2006 | | | 1,737,605 | | | | 1,737,605 | | |
Bank of Nova Scotia
Eurodollar Time Deposit
5.290% 08/08/2006 | | | 1,737,605 | | | | 1,737,605 | | |
Barclays
Eurodollar Time Deposit
5.150% 08/01/2006 | | | 2,606,408 | | | | 2,606,408 | | |
Branch Banker & Trust
Eurodollar Time Deposit
5.250% 07/26/2006 | | | 3,127,690 | | | | 3,127,690 | | |
Calyon
Eurodollar Time Deposit
5.300% 08/08/2006 | | | 1,737,605 | | | | 1,737,605 | | |
Canadian Imperial
Bank of Commerce
Eurodollar Time Deposit
5.310% 07/31/2006 | | | 1,737,605 | | | | 1,737,605 | | |
Deutsche Bank
Eurodollar Time Deposit
5.250% 07/05/2006 | | | 4,344,013 | | | | 4,344,013 | | |
Dexia Group
Eurodollar Time Deposit
5.300% 08/09/2006 | | | 2,258,887 | | | | 2,258,887 | | |
Federal Home Loan
Bank Discount Note
5.181% 07/19/2006 | | | 1,383,111 | | | | 1,383,111 | | |
First Tennessee
National Corporation
Eurodollar Time Deposit
5.270% 07/24/2006 | | | 2,085,126 | | | | 2,085,126 | | |
Fortis Bank
Eurodollar Time Deposit
5.090% 07/05/2006 | | | 1,737,605 | | | | 1,737,605 | | |
(Continued)
The accompanying notes are an integral part of the financial statements.
160
MassMutual Select Overseas Fund – Portfolio of Investments (Continued)
| | | Principal
Amount | | Market
Value | |
Fortis Bank
Eurodollar Time Deposit
5.250% 07/03/2006 | | $ | 1,737,605 | | | $ | 1,737,605 | | |
Fortis Bank
Eurodollar Time Deposit
5.250% 07/06/2006 | | | 1,737,605 | | | | 1,737,605 | | |
Freddie Mac
Discount Note
5.191% 07/25/2006 | | | 1,036,973 | | | | 1,036,973 | | |
Harris NA
Eurodollar Time Deposit
5.080% 07/05/2006 | | | 1,216,324 | | | | 1,216,324 | | |
HBOS Halifax
Bank of Scotland
Certificate of Deposit
5.110% 07/10/2006 | | | 1,737,605 | | | | 1,737,605 | | |
National Australia Bank
Eurodollar Time Deposit
5.290% 07/03/2006 | | | 6,081,618 | | | | 6,081,618 | | |
National City Corporation
Eurodollar Time Deposit
5.220% 07/03/2006 | | | 2,062,905 | | | | 2,062,905 | | |
Skandinaviska
Enskilda Banken AB
Eurodollar Time Deposit
5.130% 07/12/2006 | | | 1,737,605 | | | | 1,737,605 | | |
Societe Generale
Eurodollar Time Deposit
5.200% 08/08/2006 | | | 1,737,605 | | | | 1,737,605 | | |
Societe Generale
Eurodollar Time Deposit
5.270% 07/17/2006 | | | 2,258,887 | | | | 2,258,887 | | |
Standard
Chartered Bank
Eurodollar Time Deposit
5.260% 07/07/2006 | | | 2,606,408 | | | | 2,606,408 | | |
Svenska Handlesbanken
Eurodollar Time Deposit
5.290% 07/03/2006 | | | 5,825,333 | | | | 5,825,333 | | |
The Bank of the West
Eurodollar Time Deposit
5.250% 08/07/2006 | | | 2,953,929 | | | | 2,953,929 | | |
Toronto Dominion Bank
Eurodollar Time Deposit
5.300% 07/31/2006 | | | 4,865,294 | | | | 4,865,294 | | |
UBS AG
Eurodollar Time Deposit
5.250% 07/21/2006 | | | 2,606,408 | | | | 2,606,408 | | |
UBS AG
Eurodollar Time Deposit
5.250% 08/04/2006 | | | 2,606,408 | | | | 2,606,408 | | |
| | | Principal
Amount | | Market
Value | |
Wells Fargo
Eurodollar Time Deposit
5.160% 07/13/2006 | | $ | 1,737,605 | | | $ | 1,737,605 | | |
Wells Fargo
Eurodollar Time Deposit
5.170% 07/03/2006 | | | 1,737,605 | | | | 1,737,605 | | |
Wells Fargo
Eurodollar Time Deposit
5.210% 07/06/2006 | | | 868,803 | | | | 868,803 | | |
Wells Fargo
Eurodollar Time Deposit
5.250% 07/03/2006 | | | 1,737,605 | | | | 1,737,605 | | |
| | | | 79,482,313 | | |
| Repurchase Agreement — 3.4% | |
Investors Bank & Trust
Company Repurchase
Agreement, dated
06/30/2006, 3.75%,
due 07/03/2006(e) | | | 36,952,158 | | | | 36,952,158 | | |
TOTAL SHORT-TERM
INVESTMENTS
(Cost $116,434,471) | | | | | | | 116,434,471 | | |
TOTAL INVESTMENTS — 107.0%
(Cost $1,014,309,874)(f) | | | | | | | 1,150,675,243 | | |
Other Assets/
(Liabilities) — (7.0%) | | | | | | | (75,421,806 | ) | |
| NET ASSETS — 100.0% | | | | | | $ | 1,075,253,437 | | |
Notes to Portfolio of Investments
ADR - American Depository Receipt
(a) Denotes all or a portion of security on loan. (Note 2).
(b) Non-income producing security.
(c) Amount represents shares owned of the fund.
(d) Represents investments of security lending collateral. (Note 2).
(e) Maturity value of $36,963,706. Collateralized by a U.S. Government Agency obligation with a rate of 5.549%, maturity date of 12/15/2034, and an aggregate market value, including accrued interest, of $38,799,766.
(f) See Note 6 for aggregate cost for Federal tax purposes.
The accompanying notes are an integral part of the financial statements.
161
MassMutual Select Destination Retirement Income Fund – Portfolio of Investments
June 30, 2006 (Unaudited)
| | | Number of
Shares | | Market
Value | |
| MUTUAL FUNDS — 100.0% | |
| Financial Services | |
MassMutual Premier
Core Bond Fund,
Class S | | | 4,390,641 | | | $ | 46,540,795 | | |
MassMutual Premier
Diversified Bond Fund,
Class S | | | 4,458,125 | | | | 46,542,821 | | |
MassMutual Premier
Inflation Protected
Bond Fund,
Class S | | | 4,918,413 | | | | 49,282,499 | | |
MassMutual Premier
Money Market Fund,
Class S(a) | | | 12,891,401 | | | | 12,891,402 | | |
MassMutual Premier
Short-Duration
Bond Fund,
Class S | | | 3,821,563 | | | | 38,712,429 | | |
MassMutual Premier
Small Company
Opportunities Fund,
Class S(a) | | | 940,980 | | | | 15,582,626 | | |
MassMutual Select
Growth Equity Fund,
Class S | | | 2,325,768 | | | | 18,024,700 | | |
MassMutual Select
Large Cap Value Fund,
Class S | | | 1,541,244 | | | | 18,047,962 | | |
MassMutual Select
Overseas Fund,
Class S | | | 1,068,943 | | | | 13,126,623 | | |
TOTAL MUTUAL FUNDS
(Cost $261,081,683) | | | | | | | 258,751,857 | | |
| TOTAL INVESTMENTS — 100.0%(b) | | | | | | | 258,751,857 | | |
Other Assets/
(Liabilities) — 0.0% | | | | | | | (83,422 | ) | |
| NET ASSETS — 100.0% | | | | | | $ | 258,668,435 | | |
Notes to Portfolio of Investments
(a) Non-income producing security.
(b) See Note 6 for aggregate cost for Federal tax purposes.
The remainder of this page is intentionally left blank.
The accompanying notes are an integral part of the financial statements.
162
MassMutual Select Destination Retirement 2010 Fund – Portfolio of Investments
June 30, 2006 (Unaudited)
| | | Number of
Shares | | Market
Value | |
| MUTUAL FUNDS — 100.0% | |
| Financial Services | |
MassMutual Premier
Core Bond Fund,
Class S | | | 2,006,824 | | | $ | 21,272,339 | | |
MassMutual Premier
Diversified Bond Fund,
Class S | | | 2,037,669 | | | | 21,273,265 | | |
MassMutual Premier
Inflation Protected
Bond Fund,
Class S | | | 2,129,739 | | | | 21,339,981 | | |
MassMutual Premier
Money Market Fund,
Class S(a) | | | 7,070,693 | | | | 7,070,693 | | |
MassMutual Premier
Short-Duration
Bond Fund,
Class S | | | 1,537,109 | | | | 15,570,909 | | |
MassMutual Premier
Small Company
Opportunities Fund,
Class S(a) | | | 516,112 | | | | 8,546,822 | | |
MassMutual Select
Fundamental
Value Fund, Class S | | | 589,224 | | | | 7,070,693 | | |
MassMutual Select
Growth Equity Fund,
Class S | | | 2,004,575 | | | | 15,535,460 | | |
MassMutual Select
Large Cap Value Fund,
Class S | | | 724,580 | | | | 8,484,831 | | |
MassMutual Select Mid
Cap Growth
Equity II Fund,
Class S(a) | | | 385,588 | | | | 5,683,570 | | |
MassMutual Select
Overseas Fund, Class S | | | 820,824 | | | | 10,079,717 | | |
TOTAL MUTUAL FUNDS
(Cost $143,223,840) | | | | | | | 141,928,280 | | |
| TOTAL INVESTMENTS — 100.0%(b) | | | | | | | 141,928,280 | | |
Other Assets/
(Liabilities) — 0.0% | | | | | | | (62,949 | ) | |
| NET ASSETS — 100.0% | | | | | | $ | 141,865,331 | | |
Notes to Portfolio of Investments
(a) Non-income producing security.
(b) See Note 6 for aggregate cost for Federal tax purposes.
The remainder of this page is intentionally left blank.
The accompanying notes are an integral part of the financial statements.
163
MassMutual Select Destination Retirement 2020 Fund – Portfolio of Investments
June 30, 2006 (Unaudited)
| | | Number of
Shares | | Market
Value | |
| MUTUAL FUNDS — 100.0% | |
| Financial Services | |
MassMutual Premier
Core Bond Fund,
Class S | | | 5,646,991 | | | $ | 59,858,108 | | |
MassMutual Premier
Diversified Bond Fund,
Class S | | | 5,255,969 | | | | 54,872,316 | | |
MassMutual
Premier Inflation
Protected Bond Fund,
Class S | | | 6,492,221 | | | | 65,052,057 | | |
MassMutual Premier
Short-Duration
Bond Fund, Class S | | | 2,949,053 | | | | 29,873,902 | | |
MassMutual Premier
Small Company
Opportunities Fund,
Class S | | | 1,512,784 | | | | 25,051,700 | | |
MassMutual Select
Aggressive
Growth Fund, Class S(a) | | | 6,599,103 | | | | 39,792,594 | | |
MassMutual Select
Focused Value Fund,
Class S | | | 1,133,049 | | | | 19,862,344 | | |
MassMutual Select
Fundamental
Value Fund, Class S | | | 3,730,556 | | | | 44,766,668 | | |
MassMutual Select
Growth Equity Fund,
Class S | | | 5,768,909 | | | | 44,709,045 | | |
MassMutual Select
Large Cap Value Fund,
Class S | | | 3,822,943 | | | | 44,766,668 | | |
MassMutual Select Mid
Cap Growth
Equity II Fund,
Class S | | | 1,695,313 | | | | 24,988,909 | | |
MassMutual Select
Overseas Fund, Class S | | | 3,711,920 | | | | 45,582,377 | | |
| | | | 499,176,688 | | |
TOTAL MUTUAL FUNDS
(Cost $492,047,199) | | | | | | | 499,176,688 | | |
| TOTAL INVESTMENTS — 100.0%(b) | | | | | | | 499,176,688 | | |
Other Assets/
(Liabilities) — 0.0% | | | | | | | (174,043 | ) | |
| NET ASSETS — 100.0% | | | | | | $ | 499,002,645 | | |
Notes to Portfolio of Investments
(a) Non-income producing security.
(b) See Note 6 for aggregate cost for Federal tax purposes.
The remainder of this page is intentionally left blank.
The accompanying notes are an integral part of the financial statements.
164
MassMutual Select Destination Retirement 2030 Fund – Portfolio of Investments
June 30, 2006 (Unaudited)
| | | Number of
Shares | | Market
Value | |
| MUTUAL FUNDS — 100.0% | |
| Financial Services | |
MassMutual Premier
Core Bond Fund,
Class S | | | 673,381 | | | $ | 7,137,834 | | |
MassMutual Premier
Diversified Bond Fund,
Class S | | | 2,393,056 | | | | 24,983,503 | | |
MassMutual Premier
Inflation Protected
Bond Fund, Class S | | | 2,858,482 | | | | 28,641,988 | | |
MassMutual Select
Aggressive Growth Fund,
Class S(a) | | | 7,082,232 | | | | 42,705,858 | | |
MassMutual Select
Emerging Growth Fund,
Class S(a) | | | 2,856,180 | | | | 17,993,932 | | |
MassMutual Select
Focused Value Fund,
Class S | | | 1,013,333 | | | | 17,763,724 | | |
MassMutual Select
Fundamental
Value Fund, Class S | | | 3,855,390 | | | | 46,264,680 | | |
MassMutual Select
Growth Equity Fund,
Class S | | | 5,961,947 | | | | 46,205,093 | | |
MassMutual Select
Large Cap Value Fund,
Class S | | | 3,646,956 | | | | 42,705,858 | | |
MassMutual Select
Mid Cap Growth
Equity II Fund,
Class S(a) | | | 1,212,956 | | | | 17,878,969 | | |
MassMutual Select
Overseas Fund,
Class S | | | 3,836,171 | | | | 47,108,185 | | |
MassMutual
Select Small Company
Value Fund, Class S(a) | | | 1,139,181 | | | | 17,976,278 | | |
| | | | 357,365,902 | | |
TOTAL MUTUAL FUNDS
(Cost $340,655,196) | | | | | | | 357,365,902 | | |
| TOTAL INVESTMENTS — 100.0%(b) | | | | | | | 357,365,902 | | |
Other Assets/
(Liabilities) — 0.0% | | | | | | | (132,075 | ) | |
| NET ASSETS — 100.0% | | | | | | $ | 357,233,827 | | |
Notes to Portfolio of Investments
(a) Non-income producing security.
(b) See Note 6 for aggregate cost for Federal tax purposes.
The remainder of this page is intentionally left blank.
The accompanying notes are an integral part of the financial statements.
165
MassMutual Select Destination Retirement 2040 Fund – Portfolio of Investments
June 30, 2006 (Unaudited)
| | | Number of
Shares | | Market
Value | |
| MUTUAL FUNDS — 100.0% | |
| Financial Services | |
MassMutual Premier
Inflation Protected
Bond Fund, Class S | | | 216,049 | | | $ | 2,164,812 | | |
MassMutual Select
Aggressive Growth Fund,
Class S(a) | | | 4,996,004 | | | | 30,125,902 | | |
MassMutual Select
Emerging Growth Fund,
Class S(a) | | | 2,072,407 | | | | 13,056,162 | | |
MassMutual Select
Focused Value Fund,
Class S | | | 735,256 | | | | 12,889,044 | | |
MassMutual Select
Fundamental
Value Fund, Class S | | | 2,689,813 | | | | 32,277,753 | | |
MassMutual Select
Growth Equity Fund,
Class S | | | 4,159,504 | | | | 32,236,160 | | |
MassMutual Select
Large Cap Value Fund,
Class S | | | 2,756,426 | | | | 32,277,753 | | |
MassMutual Select
Mid Cap Growth
Equity II Fund,
Class S(a) | | | 880,102 | | | | 12,972,705 | | |
MassMutual Select
Overseas Fund, Class S | | | 2,676,428 | | | | 32,866,539 | | |
MassMutual Select
Small Company
Value Fund, Class S(a) | | | 964,337 | | | | 15,217,238 | | |
| | | | 216,084,068 | | |
TOTAL MUTUAL FUNDS
(Cost $204,878,809) | | | | | | | 216,084,068 | | |
| TOTAL INVESTMENTS — 100.0%(b) | | | | | | | 216,084,068 | | |
Other Assets/
(Liabilities) — 0.0% | | | | | | | (73,045 | ) | |
| NET ASSETS — 100.0% | | | | | | $ | 216,011,023 | | |
Notes to Portfolio of Investments
(a) Non-income producing security.
(b) See Note 6 for aggregate cost for Federal tax purposes.
The remainder of this page is intentionally left blank.
The accompanying notes are an integral part of the financial statements.
166
[This page is intentionally left blank.]
MassMutual Select Funds – Financial Statements
Statement of Assets and Liabilities
June 30, 2006 (Unaudited)
| | | MassMutual
Select
Strategic Bond
Fund | | MassMutual
Select
Strategic Balanced
Fund | | MassMutual
Select
Diversified Value
Fund | | MassMutual
Select
Fundamental Value
Fund | | MassMutual
Select
Value Equity
Fund | | MassMutual
Select
Large Cap Value
Fund | | MassMutual
Select
Indexed Equity
Fund | |
| Assets: | |
| Investments, at value (Note 2)(a) | | $ | 176,899,106 | | | $ | 208,745,181 | | | $ | 383,181,000 | | | $ | 1,114,633,130 | | | $ | 97,880,573 | | | $ | 1,458,421,121 | | | $ | 1,941,411,402 | | |
| Short-term investments, at value (Note 2)(b) | | | 13,933,624 | | | | 27,094,131 | | | | 22,257,254 | | | | 60,500,630 | | | | 15,355,315 | | | | 81,797,680 | | | | 175,092,421 | | |
| Total investments(c) | | | 190,832,730 | | | | 235,839,312 | | | | 405,438,254 | | | | 1,175,133,760 | | | | 113,235,888 | | | | 1,540,218,801 | | | | 2,116,503,823 | | |
| Cash | | | - | | | | - | | | | - | | | | - | | | | 80,685 | | | | 100 | | | | - | | |
| Foreign currency, at value(d) | | | - | | | | 123,334 | | | | - | | | | - | | | | - | | | | - | | | | - | | |
| Receivables from: | |
| Investments sold | | | 478,227 | | | | 219,187 | | | | 978,068 | | | | 4,735,676 | | | | 375,167 | | | | 783,335 | | | | 989,937 | | |
| Investment Adviser (Note 3) | | | - | | | | 4,511 | | | | - | | | | - | | | | - | | | | - | | | | - | | |
| Fund shares sold | | | 544,211 | | | | 1,042,953 | | | | 284,247 | | | | 2,029,474 | | | | 309,312 | | | | 17,539,167 | | | | 3,381,272 | | |
| Interest and dividends | | | 1,385,344 | | | | 990,157 | | | | 576,141 | | | | 1,528,378 | | | | 132,452 | | | | 2,150,013 | | | | 2,612,209 | | |
| Variation margin on open futures contracts (Note 2) | | | 159,859 | | | | 44,495 | | | | - | | | | - | | | | - | | | | - | | | | - | | |
| Foreign taxes withheld | | | - | | | | 4,893 | | | | 640 | | | | - | | | | - | | | | 13,476 | | | | - | | |
| Total assets | | | 193,400,371 | | | | 238,268,842 | | | | 407,277,350 | | | | 1,183,427,288 | | | | 114,133,504 | | | | 1,560,704,892 | | | | 2,123,487,241 | | |
| Liabilities: | |
| Payables for: | |
| Investments purchased | | | 836,046 | | | | 425,762 | | | | - | | | | 11,111,513 | | | | 1,394,465 | | | | 890,039 | | | | 73,556 | | |
| Written options outstanding, at value (Note 2)(e) | | | 102,766 | | | | 50,572 | | | | - | | | | - | | | | - | | | | - | | | | - | | |
| Open forward foreign currency contracts (Note 2) | | | 5,918 | | | | 5,973 | | | | - | | | | - | | | | - | | | | - | | | | - | | |
| Fund shares repurchased | | | 127,256 | | | | 1,321,835 | | | | 875,917 | | | | 1,027,948 | | | | 550,548 | | | | 3,415,616 | | | | 5,440,923 | | |
| Variation margin on open futures contracts (Note 2) | | | - | | | | - | | | | - | | | | - | | | | - | | | | - | | | | 113,610 | | |
| Securities on loan (Note 2) | | | 2,497,438 | | | | 14,207,273 | | | | 17,323,481 | | | | 46,477,839 | | | | 13,256,367 | | | | 61,341,924 | | | | 132,666,992 | | |
| Open swap agreements, at value | | | - | | | | 260,979 | | | | - | | | | - | | | | - | | | | - | | | | - | | |
| Directors' fees and expenses (Note 3) | | | 2,818 | | | | 7,184 | | | | 8,399 | | | | 33,918 | | | | 4,638 | | | | 52,798 | | | | 81,359 | | |
| Affiliates (Note 3): | |
| Investment management fees | | | 84,239 | | | | 108,375 | | | | 157,358 | | | | 577,170 | | | | 55,961 | | | | 777,696 | | | | 161,205 | | |
| Administration fees | | | 12,761 | | | | 45,862 | | | | 43,492 | | | | 194,096 | | | | 12,648 | | | | 254,799 | | | | 433,270 | | |
| Service fees | | | 16,517 | | | | 17,281 | | | | 25,877 | | | | 160,250 | | | | 18,922 | | | | 227,626 | | | | 172,288 | | |
| Distribution fees | | | 132 | | | | 270 | | | | 283 | | | | 1,134 | | | | 91 | | | | 1,472 | | | | 3,026 | | |
| Accrued expense and other liabilities | | | 44,924 | | | | 26,341 | | | | 27,834 | | | | 35,984 | | | | 18,056 | | | | 44,011 | | | | 46,041 | | |
| Total liabilities | | | 3,730,815 | | | | 16,477,707 | | | | 18,462,641 | | | | 59,619,852 | | | | 15,311,696 | | | | 67,005,981 | | | | 139,192,270 | | |
| Net assets | | $ | 189,669,556 | | | $ | 221,791,135 | | | $ | 388,814,709 | | | $ | 1,123,807,436 | | | $ | 98,821,808 | | | $ | 1,493,698,911 | | | $ | 1,984,294,971 | | |
| Net assets consist of: | |
| Paid-in capital | | $ | 193,629,759 | | | $ | 207,453,675 | | | $ | 326,004,686 | | | $ | 898,897,554 | | | $ | 83,608,979 | | | $ | 1,220,436,401 | | | $ | 1,822,668,226 | | |
| Undistributed net investment income (distributions in excess of net investment income) | | | 4,007,822 | | | | 2,586,408 | | | | 3,040,058 | | | | 6,097,415 | | | | 373,510 | | | | 5,703,405 | | | | 15,068,410 | | |
| Accumulated net realized gain (loss) on investments | | | (2,645,289 | ) | | | 264,708 | | | | 13,393,082 | | | | 58,384,562 | | | | 7,706,763 | | | | (69,045,631 | ) | | | (46,374,321 | ) | |
| Net unrealized appreciation (depreciation) on investments | | | (5,322,736 | ) | | | 11,486,344 | | | | 46,376,883 | | | | 160,427,905 | | | | 7,132,556 | | | | 336,604,736 | | | | 192,932,656 | | |
| Net Assets | | $ | 189,669,556 | | | $ | 221,791,135 | | | $ | 388,814,709 | | | $ | 1,123,807,436 | | | $ | 98,821,808 | | | $ | 1,493,698,911 | | | $ | 1,984,294,971 | | |
| (a) Cost of investments - unaffiliated issuers: | | $ | 181,970,390 | | | $ | 196,965,470 | | | $ | 336,804,117 | | | $ | 954,205,225 | | | $ | 90,747,216 | | | $ | 1,121,817,379 | | | $ | 1,749,114,839 | | |
| (b) Cost of short-term investments: | | $ | 13,933,624 | | | $ | 27,094,131 | | | $ | 22,257,254 | | | $ | 60,500,630 | | | $ | 15,355,315 | | | $ | 81,797,680 | | | $ | 175,092,421 | | |
| (c) Securities on loan with market value of: | | $ | 2,428,470 | | | $ | 13,608,019 | | | $ | 16,672,372 | | | $ | 45,105,476 | | | $ | 12,833,835 | | | $ | 59,181,583 | | | $ | 127,742,209 | | |
| (d) Cost of foreign currency: | | $ | - | | | $ | 120,123 | | | $ | - | | | $ | - | | | $ | - | | | $ | - | | | $ | - | | |
| (e) Premiums on written options | | $ | 279,313 | | | $ | 135,747 | | | $ | - | | | $ | - | | | $ | - | | | $ | - | | | $ | - | | |
The accompanying notes are an integral part of the financial statements.
168
169
MassMutual Select Funds – Financial Statements (Continued)
Statement of Assets and Liabilities
June 30, 2006 (Unaudited)
| | | MassMutual
Select
Strategic Bond
Fund | | MassMutual
Select
Strategic Balanced
Fund | | MassMutual
Select
Diversified Value
Fund | | MassMutual
Select
Fundamental Value
Fund | | MassMutual
Select
Value Equity
Fund | | MassMutual
Select
Large Cap Value
Fund | | MassMutual
Select
Indexed Equity
Fund | |
| Class A shares: | |
| Net assets | | $ | 29,491,895 | | | $ | 28,383,949 | | | $ | 44,086,834 | | | $ | 261,594,011 | | | $ | 29,689,697 | | | $ | 371,383,457 | | | $ | 270,173,587 | | |
| Shares outstanding | | | 3,004,024 | | | | 2,641,384 | | | | 3,706,586 | | | | 21,961,476 | | | | 2,744,378 | | | | 32,013,960 | | | | 23,021,395 | | |
| Net asset value and redemption price per share | | $ | 9.82 | | | $ | 10.75 | | | $ | 11.89 | | | $ | 11.91 | | | $ | 10.82 | | | $ | 11.60 | | | $ | 11.74 | | |
| Offering price per share (100/[100-maximum sales charge] of net asset value) | | $ | 10.31 | | | $ | 11.41 | | | $ | 12.62 | | | $ | 12.64 | | | $ | 11.48 | | | $ | 12.31 | | | $ | 12.46 | | |
| Class L shares: | |
| Net assets | | $ | 5,326,414 | | | $ | 91,418,305 | | | $ | 41,212,642 | | | $ | 291,823,269 | | | $ | 8,905,378 | | | $ | 344,025,653 | | | $ | 302,370,776 | | |
| Shares outstanding | | | 540,929 | | | | 8,486,131 | | | | 3,453,538 | | | | 24,389,809 | | | | 820,693 | | | | 29,520,490 | | | | 25,650,159 | | |
| Net asset value, offering price and redemption price per share | | $ | 9.85 | | | $ | 10.77 | | | $ | 11.93 | | | $ | 11.96 | | | $ | 10.85 | | | $ | 11.65 | | | $ | 11.79 | | |
| Class Y shares: | |
| Net assets | | $ | 90,588,779 | | | $ | 85,809,220 | | | $ | 107,680,181 | | | $ | 96,048,150 | | | $ | 4,602,614 | | | $ | 192,872,457 | | | $ | 458,276,885 | | |
| Shares outstanding | | | 9,199,865 | | | | 7,957,141 | | | | 9,023,479 | | | | 8,009,556 | | | | 422,012 | | | | 16,498,178 | | | | 38,757,235 | | |
| Net asset value, offering price and redemption price per share | | $ | 9.85 | | | $ | 10.78 | | | $ | 11.93 | | | $ | 11.99 | | | $ | 10.91 | | | $ | 11.69 | | | $ | 11.82 | | |
| Class S shares: | |
| Net assets | | $ | 62,578,650 | | | $ | 15,748,827 | | | $ | 194,790,827 | | | $ | 473,106,732 | | | $ | 55,479,929 | | | $ | 582,991,658 | | | $ | 639,555,569 | | |
| Shares outstanding | | | 6,350,807 | | | | 1,459,508 | | | | 16,296,208 | | | | 39,417,184 | | | | 5,093,049 | | | | 49,773,758 | | | | 53,552,153 | | |
| Net asset value, offering price and redemption price per share | | $ | 9.85 | | | $ | 10.79 | | | $ | 11.95 | | | $ | 12.00 | | | $ | 10.89 | | | $ | 11.71 | | | $ | 11.94 | | |
| Class Z shares: | |
| Net assets | | $ | - | | | $ | - | | | $ | - | | | $ | - | | | $ | - | | | $ | - | | | $ | 309,070,396 | | |
| Shares outstanding | | | - | | | | - | | | | - | | | | - | | | | - | | | | - | | | | 25,850,294 | | |
| Net asset value, offering price and redemption price per share | | $ | - | | | $ | - | | | $ | - | | | $ | - | | | $ | - | | | $ | - | | | $ | 11.96 | | |
| Class N shares: | |
| Net assets | | $ | 1,683,818 | | | $ | 430,834 | | | $ | 1,044,225 | | | $ | 1,235,274 | | | $ | 144,190 | | | $ | 2,425,686 | | | $ | 4,847,758 | | |
| Shares outstanding | | | 171,905 | | | | 40,184 | | | | 87,740 | | | | 104,561 | | | | 13,317 | | | | 211,379 | | | | 417,829 | | |
| Net asset value, offering price and redemption price per share | | $ | 9.80 | | | $ | 10.72 | | | $ | 11.90 | | | $ | 11.81 | | | $ | 10.83 | | | $ | 11.48 | | | $ | 11.60 | | |
The accompanying notes are an integral part of the financial statements.
170
171
MassMutual Select Funds – Financial Statements (Continued)
Statement of Assets and Liabilities
June 30, 2006 (Unaudited)
| | | MassMutual
Select Core
Opportunities
Fund | | MassMutual
Select Blue
Chip Growth
Fund | | MassMutual
Select Large
Cap Growth
Fund | | MassMutual
Select
Growth Equity
Fund | | MassMutual
Select
Aggressive Growth
Fund | | MassMutual
Select
OTC 100
Fund | | MassMutual
Select
Focused Value
Fund | |
| Assets: | |
| Investments, at value (Note 2)(a) | | $ | 10,827,629 | | | $ | 402,451,608 | | | $ | 34,937,543 | | | $ | 810,938,035 | | | $ | 624,100,728 | | | $ | 51,236,624 | | | $ | 849,302,637 | | |
| Short-term investments, at value (Note 2)(b) | | | 817,245 | | | | 39,289,004 | | | | 2,898,454 | | | | 48,651,555 | | | | 7,483,680 | | | | 7,567,827 | | | | 162,751,945 | | |
| Total investments(c) | | | 11,644,874 | | | | 441,740,612 | | | | 37,835,997 | | | | 859,589,590 | | | | 631,584,408 | | | | 58,804,451 | | | | 1,012,054,582 | | |
| Receivables from: | |
| Investments sold | | | 18,081 | | | | 699,866 | | | | 237,704 | | | | 37,560,918 | | | | 785,438 | | | | 694,342 | | | | 1,247,300 | | |
| Investment Adviser (Note 3) | | | 4,086 | | | | - | | | | - | | | | - | | | | - | | | | - | | | | - | | |
| Fund shares sold | | | 10,061 | | | | 511,446 | | | | 108,353 | | | | - | | | | 685,991 | | | | 112,852 | | | | 1,271,727 | | |
| Interest and dividends | | | 9,233 | | | | 343,203 | | | | 11,315 | | | | 841,002 | | | | 55,201 | | | | 6,402 | | | | 1,007,285 | | |
| Foreign taxes withheld | | | 381 | | | | 10,286 | | | | - | | | | 102 | | | | - | | | | - | | | | - | | |
| Total assets | | | 11,686,716 | | | | 443,305,413 | | | | 38,193,369 | | | | 897,991,612 | | | | 633,111,038 | | | | 59,618,047 | | | | 1,015,580,894 | | |
| Liabilities: | |
| Payables for: | |
| Investments purchased | | | 193,661 | | | | - | | | | 46,247 | | | | 37,968,224 | | | | 324,816 | | | | - | | | | 979,591 | | |
| Fund shares repurchased | | | - | | | | 532,998 | | | | 7,670 | | | | - | | | | 2,087,506 | | | | 1,403,082 | | | | 2,216,916 | | |
| Variation margin on open futures contracts (Note 2) | | | - | | | | - | | | | - | | | | 30,400 | | | | - | | | | 7,471 | | | | - | | |
| Securities on loan (Note 2) | | | - | | | | 36,974,364 | | | | 2,707,286 | | | | 24,342,745 | | | | - | | | | 7,369,997 | | | | 124,020,358 | | |
| Directors' fees and expenses (Note 3) | | | 97 | | | | 20,375 | | | | 1,752 | | | | 38,869 | | | | 21,314 | | | | 3,860 | | | | 34,333 | | |
| Affiliates (Note 3): | |
| Investment management fees | | | 6,109 | | | | 194,406 | | | | 19,307 | | | | 453,391 | | | | 368,934 | | | | 6,433 | | | | 500,707 | | |
| Administration fees | | | 737 | | | | 117,024 | | | | 6,628 | | | | 140,775 | | | | 119,540 | | | | 23,179 | | | | 158,320 | | |
| Service fees | | | 125 | | | | 23,451 | | | | 3,270 | | | | 98,967 | | | | 77,701 | | | | 14,984 | | | | 153,688 | | |
| Distribution fees | | | 61 | | | | 1,620 | | | | 1 | | | | 431 | | | | 547 | | | | 276 | | | | 1,056 | | |
| Due to custodian | | | - | | | | - | | | | - | | | | 2,555,548 | | | | - | | | | 189,893 | | | | - | | |
| Accrued expense and other liabilities | | | 12,105 | | | | 23,115 | | | | 22,742 | | | | 37,558 | | | | 51,067 | | | | 17,811 | | | | 35,224 | | |
| Total liabilities | | | 212,895 | | | | 37,887,353 | | | | 2,814,903 | | | | 65,666,908 | | | | 3,051,425 | | | | 9,036,986 | | | | 128,100,193 | | |
| Net assets | | $ | 11,473,821 | | | $ | 405,418,060 | | | $ | 35,378,466 | | | $ | 832,324,704 | | | $ | 630,059,613 | | | $ | 50,581,061 | | | $ | 887,480,701 | | |
| Net assets consist of: | |
| Paid-in capital | | $ | 11,886,180 | | | $ | 459,153,696 | | | $ | 33,180,514 | | | $ | 969,621,885 | | | $ | 649,597,990 | | | $ | 72,497,969 | | | $ | 730,303,879 | | |
| Undistributed net investment income (distributions in excess of net investment income) | | | 11,817 | | | | 227,426 | | | | (63,878 | ) | | | 2,059,599 | | | | (2,281,155 | ) | | | (101,838 | ) | | | 12,341,992 | | |
| Accumulated net realized gain (loss) on investments | | | (64,441 | ) | | | (62,009,870 | ) | | | 1,599,026 | | | | (126,909,543 | ) | | | (63,311,552 | ) | | | (25,720,928 | ) | | | 49,058,216 | | |
| Net unrealized appreciation (depreciation) on investments | | | (359,735 | ) | | | 8,046,808 | | | | 662,804 | | | | (12,447,237 | ) | | | 46,054,330 | | | | 3,905,858 | | | | 95,776,614 | | |
| Net Assets | | $ | 11,473,821 | | | $ | 405,418,060 | | | $ | 35,378,466 | | | $ | 832,324,704 | | | $ | 630,059,613 | | | $ | 50,581,061 | | | $ | 887,480,701 | | |
| (a) Cost of investments - unaffiliated issuers: | | $ | 11,187,364 | | | $ | 394,405,315 | | | $ | 34,274,739 | | | $ | 823,582,801 | | | $ | 578,046,398 | | | $ | 47,340,370 | | | $ | 753,526,023 | | |
| (b) Cost of short-term investments: | | $ | 817,245 | | | $ | 39,289,004 | | | $ | 2,898,454 | | | $ | 48,651,555 | | | $ | 7,483,680 | | | $ | 7,567,827 | | | $ | 162,751,945 | | |
| (c) Securities on loan with market value of: | | $ | - | | | $ | 35,895,394 | | | $ | 2,652,015 | | | $ | 23,520,633 | | | $ | - | | | $ | 7,096,102 | | | $ | 119,670,872 | | |
The accompanying notes are an integral part of the financial statements.
172
173
MassMutual Select Funds – Financial Statements (Continued)
Statement of Assets and Liabilities
June 30, 2006 (Unaudited)
| | | MassMutual
Select Core
Opportunities
Fund | | MassMutual
Select Blue
Chip Growth
Fund | | MassMutual
Select Large
Cap Growth
Fund | | MassMutual
Select
Growth Equity
Fund | | MassMutual
Select
Aggressive Growth
Fund | | MassMutual
Select
OTC 100
Fund | | MassMutual
Select
Focused Value
Fund | |
| Class A shares: | |
| Net assets | | $ | 834,601 | | | $ | 34,582,124 | | | $ | 6,281,389 | | | $ | 146,096,749 | | | $ | 119,341,595 | | | $ | 22,040,203 | | | $ | 240,187,317 | | |
| Shares outstanding | | | 86,753 | | | | 3,920,483 | | | | 659,149 | | | | 19,299,060 | | | | 20,406,589 | | | | 5,605,644 | | | | 14,076,490 | | |
| Net asset value and redemption price per share | | $ | 9.62 | | | $ | 8.82 | | | $ | 9.53 | | | $ | 7.57 | | | $ | 5.85 | | | $ | 3.93 | | | $ | 17.06 | | |
| Offering price per share (100/[100-maximum sales charge] of net asset value) | | $ | 9.62 | | | $ | 8.97 | | | $ | 10.11 | | | $ | 8.03 | | | $ | 6.21 | | | $ | 4.17 | | | $ | 18.10 | | |
| Class L shares: | |
| Net assets | | $ | 1,198,389 | | | $ | 267,513,632 | | | $ | 2,131,656 | | | $ | 337,185,101 | | | $ | 223,978,450 | | | $ | 10,013,842 | | | $ | 185,284,529 | | |
| Shares outstanding | | | 124,474 | | | | 29,978,553 | | | | 218,498 | | | | 43,958,057 | | | | 37,698,634 | | | | 2,510,710 | | | | 10,712,396 | | |
| Net asset value, offering price and redemption price per share | | $ | 9.63 | | | $ | 8.92 | | | $ | 9.76 | | | $ | 7.67 | | | $ | 5.94 | | | $ | 3.99 | | | $ | 17.30 | | |
| Class Y shares: | |
| Net assets | | $ | 96,419 | | | $ | 40,710,245 | | | $ | 9,283,596 | | | $ | 68,627,480 | | | $ | 50,439,153 | | | $ | 1,733,651 | | | $ | 117,081,081 | | |
| Shares outstanding | | | 10,010 | | | | 4,554,501 | | | | 960,819 | | | | 8,886,901 | | | | 8,421,230 | | | | 432,138 | | | | 6,720,479 | | |
| Net asset value, offering price and redemption price per share | | $ | 9.63 | | | $ | 8.94 | | | $ | 9.66 | | | $ | 7.72 | | | $ | 5.99 | | | $ | 4.01 | | | $ | 17.42 | | |
| Class S shares: | |
| Net assets | | $ | 9,248,164 | | | $ | 59,488,233 | | | $ | 17,680,590 | | | $ | 280,338,250 | | | $ | 235,431,577 | | | $ | 16,369,650 | | | $ | 342,837,942 | | |
| Shares outstanding | | | 960,010 | | | | 6,633,082 | | | | 1,821,733 | | | | 36,159,393 | | | | 39,066,888 | | | | 4,049,987 | | | | 19,556,037 | | |
| Net asset value, offering price and redemption price per share | | $ | 9.63 | | | $ | 8.97 | | | $ | 9.71 | | | $ | 7.75 | | | $ | 6.03 | | | $ | 4.04 | | | $ | 17.53 | | |
| Class N shares: | |
| Net assets | | $ | 96,248 | | | $ | 3,123,826 | | | $ | 1,235 | | | $ | 77,124 | | | $ | 868,838 | | | $ | 423,715 | | | $ | 2,089,832 | | |
| Shares outstanding | | | 10,010 | | | | 358,082 | | | | 130 | | | | 10,333 | | | | 150,971 | | | | 109,313 | | | | 124,326 | | |
| Net asset value, offering price and redemption price per share | | $ | 9.62 | | | $ | 8.72 | | | $ | 9.52 | | | $ | 7.46 | | | $ | 5.75 | | | $ | 3.88 | | | $ | 16.81 | | |
The accompanying notes are an integral part of the financial statements.
174
175
MassMutual Select Funds – Financial Statements (Continued)
Statement of Assets and Liabilities
June 30, 2006 (Unaudited)
| | | MassMutual
Select Small
Cap Value
Equity Fund | | MassMutual
Select Small
Company Value
Fund | | MassMutual
Select Small
Cap Core
Equity Fund | | MassMutual
Select Mid
Cap Growth
Equity Fund | | MassMutual
Select Mid
Cap Growth
Equity II Fund | | MassMutual
Select Small
Cap Growth
Equity Fund | | MassMutual
Select
Small Company
Growth Fund | |
| Assets: | |
| Investments, at value (Note 2)(a) | | $ | 10,901,741 | | | $ | 736,460,521 | | | $ | 10,525,212 | | | $ | 191,610,769 | | | $ | 1,299,135,927 | | | $ | 609,263,736 | | | $ | 156,550,479 | | |
| Short-term investments, at value (Note 2)(b) | | | 789,765 | | | | 128,321,223 | | | | 69,556 | | | | 41,889,343 | | | | 217,103,387 | | | | 240,124,434 | | | | 45,394,467 | | |
| Total investments(c) | | | 11,691,506 | | | | 864,781,744 | | | | 10,594,768 | | | | 233,500,112 | | | | 1,516,239,314 | | | | 849,388,170 | | | | 201,944,946 | | |
| Cash | | | 931,099 | | | | - | | | | - | | | | - | | | | - | | | | - | | | | - | | |
| Foreign currency, at value(d) | | | - | | | | - | | | | - | | | | - | | | | - | | | | 35,722 | | | | - | | |
| Receivables from: | |
| Investments sold | | | 2,023,304 | | | | 8,458,606 | | | | - | | | | - | | | | 4,397,722 | | | | 6,536,802 | | | | 2,140,630 | | |
| Investment Adviser (Note 3) | | | 6,292 | | | | - | | | | 2,983 | | | | - | | | | - | | | | - | | | | - | | |
| Fund shares sold | | | 1,809 | | | | 1,555,743 | | | | 95 | | | | 417,321 | | | | 2,317,837 | | | | 1,315,972 | | | | 538,567 | | |
| Interest and dividends | | | 31,639 | | | | 697,921 | | | | 13,674 | | | | 61,912 | | | | 805,030 | | | | 248,394 | | | | 69,983 | | |
| Variation margin on open futures contracts (Note 2) | | | 4,698 | | | | - | | | | - | | | | - | | | | - | | | | - | | | | - | | |
| Total assets | | | 14,690,347 | | | | 875,494,014 | | | | 10,611,520 | | | | 233,979,345 | | | | 1,523,759,903 | | | | 857,525,060 | | | | 204,694,126 | | |
| Liabilities: | |
| Payables for: | |
| Investments purchased | | | 3,313,387 | | | | 5,949,202 | | | | - | | | | - | | | | 9,328,748 | | | | 5,879,897 | | | | 2,686,632 | | |
| Fund shares repurchased | | | 7,575 | | | | 1,494,118 | | | | - | | | | 1,202,446 | | | | 2,342,991 | | | | 2,910,640 | | | | 93,306 | | |
| Securities on loan (Note 2) | | | - | | | | 102,175,665 | | | | - | | | | 39,758,780 | | | | 185,197,302 | | | | 178,185,142 | | | | 42,002,532 | | |
| Directors' fees and expenses (Note 3) | | | 97 | | | | 18,366 | | | | 97 | | | | 9,319 | | | | 40,220 | | | | 25,189 | | | | 5,964 | | |
| Affiliates (Note 3): | |
| Investment management fees | | | 5,921 | | | | 514,197 | | | | 6,270 | | | | 110,933 | | | | 799,787 | | | | 444,445 | | | | 110,654 | | |
| Administration fees | | | 465 | | | | 153,683 | | | | 565 | | | | 30,578 | | | | 270,673 | | | | 129,182 | | | | 37,482 | | |
| Service fees | | | 122 | | | | 94,347 | | | | 125 | | | | 25,071 | | | | 208,614 | | | | 73,824 | | | | 44,528 | | |
| Distribution fees | | | 61 | | | | 877 | | | | 61 | | | | 159 | | | | 1,201 | | | | 630 | | | | 636 | | |
| Due to custodian | | | - | | | | - | | | | - | | | | - | | | | 55,784 | | | | - | | | | - | | |
| Accrued expense and other liabilities | | | 18,309 | | | | 37,490 | | | | 12,753 | | | | 17,808 | | | | 36,576 | | | | 37,443 | | | | 32,677 | | |
| Total liabilities | | | 3,345,937 | | | | 110,437,945 | | | | 19,871 | | | | 41,155,094 | | | | 198,281,896 | | | | 187,686,392 | | | | 45,014,411 | | |
| Net assets | | $ | 11,344,410 | | | $ | 765,056,069 | | | $ | 10,591,649 | | | $ | 192,824,251 | | | $ | 1,325,478,007 | | | $ | 669,838,668 | | | $ | 159,679,715 | | |
| Net assets consist of: | |
| Paid-in capital | | $ | 11,545,795 | | | $ | 612,973,193 | | | $ | 11,098,572 | | | $ | 242,193,436 | | | $ | 1,042,615,612 | | | $ | 533,097,012 | | | $ | 149,587,774 | | |
| Undistributed net investment income (distributions in excess of net investment income) | | | 24,828 | | | | 1,001,341 | | | | 5,735 | | | | 274,444 | | | | 1,709,074 | | | | (1,303,352 | ) | | | (759,138 | ) | |
| Accumulated net realized gain (loss) on investments | | | (67,993 | ) | | | 34,027,062 | | | | (324,628 | ) | | | (80,478,772 | ) | | | 64,177,033 | | | | 24,251,175 | | | | 8,139,263 | | |
| Net unrealized appreciation (depreciation) on investments | | | (158,220 | ) | | | 117,054,473 | | | | (188,030 | ) | | | 30,835,143 | | | | 216,976,288 | | | | 113,793,833 | | | | 2,711,816 | | |
| Net Assets | | $ | 11,344,410 | | | $ | 765,056,069 | | | $ | 10,591,649 | | | $ | 192,824,251 | | | $ | 1,325,478,007 | | | $ | 669,838,668 | | | $ | 159,679,715 | | |
| (a) Cost of investments - unaffiliated issuers: | | $ | 11,079,790 | | | $ | 619,406,048 | | | $ | 10,713,242 | | | $ | 160,775,626 | | | $ | 1,082,159,779 | | | $ | 495,470,607 | | | $ | 153,838,663 | | |
| (b) Cost of short-term investments: | | $ | 789,765 | | | $ | 128,321,223 | | | $ | 69,556 | | | $ | 41,889,343 | | | $ | 217,103,387 | | | $ | 240,124,434 | | | $ | 45,394,467 | | |
| (c) Securities on loan with market value of: | | $ | - | | | $ | 97,971,431 | | | $ | - | | | $ | 38,515,165 | | | $ | 178,464,593 | | | $ | 170,123,963 | | | $ | 40,100,312 | | |
| (d) Cost of foreign currency: | | $ | - | | | $ | - | | | $ | - | | | $ | - | | | $ | - | | | $ | 35,331 | | | $ | - | | |
The accompanying notes are an integral part of the financial statements.
176
177
MassMutual Select Funds – Financial Statements (Continued)
Statement of Assets and Liabilities
June 30, 2006 (Unaudited)
| | | MassMutual
Select Small
Cap Value
Equity Fund | | MassMutual
Select Small
Company Value
Fund | | MassMutual
Select Small
Cap Core
Equity Fund | | MassMutual
Select Mid
Cap Growth
Equity Fund | | MassMutual
Select Mid
Cap Growth
Equity II Fund | | MassMutual
Select Small
Cap Growth
Equity Fund | | MassMutual
Select
Small Company
Growth Fund | |
| Class A shares: | |
| Net assets | | $ | 97,894 | | | $ | 153,471,305 | | | $ | 119,340 | | | $ | 38,804,814 | | | $ | 325,005,690 | | | $ | 115,923,542 | | | $ | 68,306,769 | | |
| Shares outstanding | | | 10,010 | | | | 9,863,204 | | | | 12,559 | | | | 3,720,496 | | | | 22,745,044 | | | | 7,083,477 | | | | 6,784,224 | | |
| Net asset value and redemption price per share | | $ | 9.78 | | | $ | 15.56 | | | $ | 9.50 | | | $ | 10.43 | | | $ | 14.29 | | | $ | 16.37 | | | $ | 10.07 | | |
| Offering price per share (100/[100-maximum sales charge] of net asset value) | | $ | 9.78 | | | $ | 16.51 | | | $ | 9.50 | | | $ | 11.01 | | | $ | 15.16 | | | $ | 16.95 | | | $ | 10.68 | | |
| Class L shares: | |
| Net assets | | $ | 97,954 | | | $ | 151,351,777 | | | $ | 133,724 | | | $ | 43,536,791 | | | $ | 549,527,673 | | | $ | 96,664,326 | | | $ | 35,247,463 | | |
| Shares outstanding | | | 10,010 | | | | 9,673,405 | | | | 14,062 | | | | 4,097,642 | | | | 37,845,933 | | | | 5,809,812 | | | | 3,452,803 | | |
| Net asset value, offering price and redemption price per share | | $ | 9.79 | | | $ | 15.65 | | | $ | 9.51 | | | $ | 10.62 | | | $ | 14.52 | | | $ | 16.64 | | | $ | 10.21 | | |
| Class Y shares: | |
| Net assets | | $ | 97,992 | | | $ | 164,345,400 | | | $ | 1,111,185 | | | $ | 26,268,960 | | | $ | 163,620,011 | | | $ | 133,362,982 | | | $ | 20,497,347 | | |
| Shares outstanding | | | 10,010 | | | | 10,446,940 | | | | 116,778 | | | | 2,448,771 | | | | 11,151,656 | | | | 7,935,618 | | | | 1,994,900 | | |
| Net asset value, offering price and redemption price per share | | $ | 9.79 | | | $ | 15.73 | | | $ | 9.52 | | | $ | 10.73 | | | $ | 14.67 | | | $ | 16.81 | | | $ | 10.27 | | |
| Class S shares: | |
| Net assets | | $ | 10,952,752 | | | $ | 294,597,195 | | | $ | 9,132,358 | | | $ | 83,964,994 | | | $ | 284,873,707 | | | $ | 322,890,548 | | | $ | 34,861,658 | | |
| Shares outstanding | | | 1,118,703 | | | | 18,663,594 | | | | 960,010 | | | | 7,797,030 | | | | 19,323,826 | | | | 19,045,830 | | | | 3,383,019 | | |
| Net asset value, offering price and redemption price per share | | $ | 9.79 | | | $ | 15.78 | | | $ | 9.51 | | | $ | 10.77 | | | $ | 14.74 | | | $ | 16.95 | | | $ | 10.30 | | |
| Class N shares: | |
| Net assets | | $ | 97,818 | | | $ | 1,290,392 | | | $ | 95,042 | | | $ | 248,692 | | | $ | 2,450,926 | | | $ | 997,270 | | | $ | 766,478 | | |
| Shares outstanding | | | 10,010 | | | | 84,052 | | | | 10,010 | | | | 24,165 | | | | 174,006 | | | | 61,854 | | | | 77,420 | | |
| Net asset value, offering price and redemption price per share | | $ | 9.77 | | | $ | 15.35 | | | $ | 9.49 | | | $ | 10.29 | | | $ | 14.09 | | | $ | 16.12 | | | $ | 9.90 | | |
The accompanying notes are an integral part of the financial statements.
178
179
MassMutual Select Funds – Financial Statements (Continued)
Statement of Assets and Liabilities
June 30, 2006 (Unaudited)
| | | MassMutual
Select
Emerging Growth
Fund | | MassMutual
Select
Overseas
Fund | | MassMutual
Select Destination
Retirement
Income Fund | | MassMutual
Select Destination
Retirement
2010 Fund | | MassMutual
Select Destination
Retirement
2020 Fund | | MassMutual
Select Destination
Retirement
2030 Fund | | MassMutual
Select Destination
Retirement
2040 Fund | |
| Assets: | |
| Investments at value | |
| Unaffiliated issuer(s)(a) | | $ | 116,376,507 | | | $ | 1,034,240,772 | | | $ | - | | | $ | - | | | $ | - | | | $ | - | | | $ | - | | |
| Affiliated issuer(s)(b) | | | - | | | | - | | | | 258,751,857 | | | | 141,928,280 | | | | 499,176,688 | | | | 357,365,902 | | | | 216,084,068 | | |
| Short-term investments, at value (Note 2)(c) | | | 9,449,602 | | | | 116,434,471 | | | | - | | | | - | | | | - | | | | - | | | | - | | |
| Total investments(d) | | | 125,826,109 | | | | 1,150,675,243 | | | | 258,751,857 | | | | 141,928,280 | | | | 499,176,688 | | | | 357,365,902 | | | | 216,084,068 | | |
| Cash | | | - | | | | 2 | | | | - | | | | - | | | | - | | | | - | | | | - | | |
| Foreign currency, at value(e) | | | - | | | | 731,322 | | | | - | | | | - | | | | - | | | | - | | | | - | | |
| Receivables from: | |
| Investments sold | | | 3,217,847 | | | | 2,088,390 | | | | - | | | | - | | | | - | | | | - | | | | - | | |
| Investment Adviser (Note 3) | | | - | | | | - | | | | - | | | | 1,575 | | | | - | | | | - | | | | - | | |
| Fund shares sold | | | 100,519 | | | | 1,703,409 | | | | - | | | | - | | | | - | | | | - | | | | - | | |
| Interest and dividends | | | 22,071 | | | | 2,836,701 | | | | - | | | | - | | | | - | | | | - | | | | - | | |
| Foreign taxes withheld | | | - | | | | 275,544 | | | | - | | | | - | | | | - | | | | - | | | | - | | |
| Total assets | | | 129,166,546 | | | | 1,158,310,611 | | | | 258,751,857 | | | | 141,929,855 | | | | 499,176,688 | | | | 357,365,902 | | | | 216,084,068 | | |
| Liabilities: | |
| Payables for: | |
| Investments purchased | | | 660,550 | | | | 322,134 | | | | - | | | | - | | | | - | | | | - | | | | - | | |
| Open forward foreign currency contracts (Note 2) | | | - | | | | 21,989 | | | | - | | | | - | | | | - | | | | - | | | | - | | |
| Fund shares repurchased | | | 85,154 | | | | 2,013,622 | | | | - | | | | - | | | | - | | | | - | | | | - | | |
| Securities on loan (Note 2) | | | 4,444,523 | | | | 79,482,313 | | | | - | | | | - | | | | - | | | | - | | | | - | | |
| Directors' fees and expenses (Note 3) | | | 6,909 | | | | 25,811 | | | | 6,752 | | | | 2,350 | | | | 10,941 | | | | 7,817 | | | | 4,540 | | |
| Affiliates (Note 3): | |
| Investment management fees | | | 79,946 | | | | 836,079 | | | | 10,574 | | | | 5,783 | | | | 20,107 | | | | 14,361 | | | | 8,722 | | |
| Administration fees | | | 23,071 | | | | 83,972 | | | | 21,244 | | | | 14,209 | | | | 58,169 | | | | 42,245 | | | | 22,224 | | |
| Service fees | | | 10,698 | | | | 152,111 | | | | 28,001 | | | | 26,361 | | | | 66,651 | | | | 50,141 | | | | 21,147 | | |
| Distribution fees | | | 111 | | | | 1,249 | | | | 68 | | | | 86 | | | | 159 | | | | 107 | | | | 105 | | |
| Accrued expense and other liabilities | | | 21,975 | | | | 117,894 | | | | 16,783 | | | | 15,735 | | | | 18,016 | | | | 17,404 | | | | 16,307 | | |
| Total liabilities | | | 5,332,937 | | | | 83,057,174 | | | | 83,422 | | | | 64,524 | | | | 174,043 | | | | 132,075 | | | | 73,045 | | |
| Net assets | | $ | 123,833,609 | | | $ | 1,075,253,437 | | | $ | 258,668,435 | | | $ | 141,865,331 | | | $ | 499,002,645 | | | $ | 357,233,827 | | | $ | 216,011,023 | | |
| Net assets consist of: | |
| Paid-in capital | | $ | 153,173,068 | | | $ | 861,947,519 | | | $ | 258,771,231 | | | $ | 141,593,770 | | | $ | 481,758,621 | | | $ | 331,599,940 | | | $ | 198,464,745 | | |
| Undistributed net investment income (distributions in excess of net investment income) | | | (514,862 | ) | | | 18,108,932 | | | | (19,746 | ) | | | (51,014 | ) | | | (633,025 | ) | | | (467,004 | ) | | | (253,755 | ) | |
| Accumulated net realized gain (loss) on investments | | | (35,471,377 | ) | | | 58,845,260 | | | | 2,246,776 | | | | 1,618,135 | | | | 10,747,560 | | | | 9,390,185 | | | | 6,594,774 | | |
| Net unrealized appreciation (depreciation) on investments | | | 6,646,780 | | | | 136,351,726 | | | | (2,329,826 | ) | | | (1,295,560 | ) | | | 7,129,489 | | | | 16,710,706 | | | | 11,205,259 | | |
| Net Assets | | $ | 123,833,609 | | | $ | 1,075,253,437 | | | $ | 258,668,435 | | | $ | 141,865,331 | | | $ | 499,002,645 | | | $ | 357,233,827 | | | $ | 216,011,023 | | |
| (a) Cost of investments - unaffiliated issuers: | | $ | 109,729,727 | | | $ | 897,875,403 | | | $ | - | | | $ | - | | | $ | - | | | $ | - | | | $ | - | | |
| (b) Cost of investments - affiliated issuers: | | $ | - | | | $ | - | | | $ | 261,081,683 | | | $ | 143,223,840 | | | $ | 492,047,199 | | | $ | 340,655,196 | | | $ | 204,878,809 | | |
| (c) Cost of short-term investments: | | $ | 9,449,602 | | | $ | 116,434,471 | | | $ | - | | | $ | - | | | $ | - | | | $ | - | | | $ | - | | |
| (d) Securities on loan with market value of: | | $ | 4,306,711 | | | $ | 75,090,970 | | | $ | - | | | $ | - | | | $ | - | | | $ | - | | | $ | - | | |
| (e) Cost of foreign currency: | | $ | - | | | $ | 728,259 | | | $ | - | | | $ | - | | | $ | - | | | $ | - | | | $ | - | | |
The accompanying notes are an integral part of the financial statements.
180
181
MassMutual Select Funds – Financial Statements (Continued)
Statement of Assets and Liabilities
June 30, 2006 (Unaudited)
| | | MassMutual
Select
Emerging Growth
Fund | | MassMutual
Select
Overseas
Fund | | MassMutual
Select Destination
Retirement
Income Fund | | MassMutual
Select Destination
Retirement
2010 Fund | | MassMutual
Select Destination
Retirement
2020 Fund | | MassMutual
Select Destination
Retirement
2030 Fund | | MassMutual
Select Destination
Retirement
2040 Fund | |
| Class A shares: | |
| Net assets | | $ | 16,270,684 | | | $ | 247,735,362 | | | $ | 46,441,009 | | | $ | 45,897,262 | | | $ | 114,064,936 | | | $ | 85,294,999 | | | $ | 34,806,660 | | |
| Shares outstanding | | | 2,671,316 | | | | 20,419,427 | | | | 4,557,428 | | | | 4,321,911 | | | | 10,407,543 | | | | 7,328,534 | | | | 2,906,037 | | |
| Net asset value and redemption price per share | | $ | 6.09 | | | $ | 12.13 | | | $ | 10.19 | | | $ | 10.62 | | | $ | 10.96 | | | $ | 11.64 | | | $ | 11.98 | | |
| Offering price per share (100/[100-maximum sales charge] of net asset value) | | $ | 6.46 | | | $ | 12.87 | | | $ | 10.81 | | | $ | 11.27 | | | $ | 11.63 | | | $ | 12.35 | | | $ | 12.71 | | |
| Class L shares: | |
| Net assets | | $ | 51,350,455 | | | $ | 265,036,367 | | | $ | 96,322,039 | | | $ | 37,686,741 | | | $ | 253,414,750 | | | $ | 193,762,029 | | | $ | 123,960,820 | | |
| Shares outstanding | | | 8,302,380 | | | | 21,703,570 | | | | 9,406,184 | | | | 3,532,374 | | | | 23,003,310 | | | | 16,559,149 | | | | 10,298,654 | | |
| Net asset value, offering price and redemption price per share | | $ | 6.19 | | | $ | 12.21 | | | $ | 10.24 | | | $ | 10.67 | | | $ | 11.02 | | | $ | 11.70 | | | $ | 12.04 | | |
| Class Y shares: | |
| Net assets | | $ | 5,057,605 | | | $ | 186,576,951 | | | $ | 108,526,717 | | | $ | 44,811,959 | | | $ | 81,417,882 | | | $ | 46,265,674 | | | $ | 23,688,828 | | |
| Shares outstanding | | | 809,578 | | | | 15,230,613 | | | | 10,592,633 | | | | 4,196,433 | | | | 7,391,523 | | | | 3,954,529 | | | | 1,967,418 | | |
| Net asset value, offering price and redemption price per share | | $ | 6.25 | | | $ | 12.25 | | | $ | 10.25 | | | $ | 10.68 | | | $ | 11.02 | | | $ | 11.70 | | | $ | 12.04 | | |
| Class S shares: | |
| Net assets | | $ | 50,981,619 | | | $ | 373,996,346 | | | $ | 7,258,053 | | | $ | 13,328,515 | | | $ | 49,848,574 | | | $ | 31,738,297 | | | $ | 33,382,272 | | |
| Shares outstanding | | | 8,096,825 | | | | 30,468,010 | | | | 708,488 | | | | 1,246,989 | | | | 4,520,267 | | | | 2,709,658 | | | | 2,769,758 | | |
| Net asset value, offering price and redemption price per share | | $ | 6.30 | | | $ | 12.28 | | | $ | 10.24 | | | $ | 10.69 | | | $ | 11.03 | | | $ | 11.71 | | | $ | 12.05 | | |
| Class N shares: | |
| Net assets | | $ | 173,246 | | | $ | 1,908,411 | | | $ | 120,617 | | | $ | 140,854 | | | $ | 256,503 | | | $ | 172,828 | | | $ | 172,443 | | |
| Shares outstanding | | | 28,856 | | | | 158,839 | | | | 11,818 | | | | 13,239 | | | | 23,389 | | | | 14,836 | | | | 14,390 | | |
| Net asset value, offering price and redemption price per share | | $ | 6.00 | | | $ | 12.01 | | | $ | 10.21 | | | $ | 10.64 | | | $ | 10.97 | | | $ | 11.65 | | | $ | 11.98 | | |
The accompanying notes are an integral part of the financial statements.
182
183
MassMutual Select Funds – Financial Statements (Continued)
Statement of Operations
For the Six Months Ended June 30, 2006 (Unaudited)
| | | MassMutual
Select
Strategic Bond
Fund | | MassMutual
Select
Strategic Balanced
Fund | | MassMutual
Select
Diversified Value
Fund | | MassMutual
Select
Fundamental Value
Fund | | MassMutual
Select
Value Equity
Fund | | MassMutual
Select
Large Cap Value
Fund | | MassMutual
Select
Indexed Equity
Fund | |
| Investment income (Note 2): | |
| Dividends(a) | | $ | 8,613 | | | $ | 1,230,206 | | | $ | 4,125,829 | | | $ | 10,826,155 | | | $ | 823,324 | | | $ | 11,804,974 | | | $ | 18,527,015 | | |
| Interest | | | 4,648,010 | | | | 2,414,629 | | | | 132,292 | | | | 255,839 | | | | 35,596 | | | | 550,812 | | | | 607,726 | | |
| Securities lending income | | | 13,889 | | | | 25,088 | | | | 15,744 | | | | 24,920 | | | | 19,238 | | | | 81,570 | | | | 62,489 | | |
| Total investment income | | | 4,670,512 | | | | 3,669,923 | | | | 4,273,865 | | | | 11,106,914 | | | | 878,158 | | | | 12,437,356 | | | | 19,197,230 | | |
| Expenses (Note 3): | |
| Investment management fees (Note 3) | | | 493,035 | | | | 680,431 | | | | 896,667 | | | | 3,430,990 | | | | 345,388 | | | | 4,726,551 | | | | 992,495 | | |
| Custody fees | | | 27,134 | | | | 25,601 | | | | 16,607 | | | | 44,467 | | | | 21,548 | | | | 110,033 | | | | 90,220 | | |
| Trustee reporting | | | 2,457 | | | | 2,458 | | | | 2,458 | | | | 2,458 | | | | 1,346 | | | | 1,349 | | | | 1,335 | | |
| Audit and legal fees | | | 13,600 | | | | 15,092 | | | | 14,774 | | | | 17,914 | | | | 14,035 | | | | 19,933 | | | | 22,733 | | |
| Proxy fees | | | 453 | | | | 736 | | | | 540 | | | | 673 | | | | 696 | | | | 694 | | | | 536 | | |
| Shareholder reporting fees | | | 1,953 | | | | 3,069 | | | | 4,028 | | | | 12,704 | | | | 1,236 | | | | 17,941 | | | | 24,704 | | |
| Directors' fees (Note 3) | | | 3,542 | | | | 5,202 | | | | 7,351 | | | | 23,331 | | | | 2,262 | | | | 32,891 | | | | 45,325 | | |
| | | | 542,174 | | | | 732,589 | | | | 942,425 | | | | 3,532,537 | | | | 386,511 | | | | 4,909,392 | | | | 1,177,348 | | |
| Administration fees (Note 3): | |
| Class A | | | 31,083 | | | | 43,552 | | | | 59,588 | | | | 394,002 | | | | 41,816 | | | | 580,885 | | | | 652,076 | | |
| Class L | | | 6,147 | | | | 156,906 | | | | 47,384 | | | | 407,882 | | | | 12,784 | | | | 573,374 | | | | 700,980 | | |
| Class Y | | | 43,655 | | | | 78,100 | | | | 75,013 | | | | 73,989 | | | | 3,192 | | | | 165,497 | | | | 786,074 | | |
| Class S | | | 15,496 | | | | 9,861 | | | | 55,238 | | | | 276,696 | | | | 21,336 | | | | 232,347 | | | | 999,743 | | |
| Class Z | | | - | | | | - | | | | - | | | | - | | | | - | | | | - | | | | 116,283 | | |
| Class N | | | 314 | | | | 810 | | | | 776 | | | | 3,666 | | | | 238 | | | | 4,345 | | | | 12,851 | | |
| Distribution fees (Note 3): | |
| Class N | | | 261 | | | | 537 | | | | 527 | | | | 2,526 | | | | 181 | | | | 2,901 | | | | 6,066 | | |
| Service fees (Note 3): | |
| Class A | | | 31,083 | | | | 33,297 | | | | 48,319 | | | | 314,799 | | | | 37,537 | | | | 447,661 | | | | 339,835 | | |
| Class N | | | 261 | | | | 537 | | | | 527 | | | | 2,526 | | | | 181 | | | | 2,901 | | | | 6,066 | | |
| Total expenses | | | 670,474 | | | | 1,056,189 | | | | 1,229,797 | | | | 5,008,623 | | | | 503,776 | | | | 6,919,303 | | | | 4,797,322 | | |
| Expenses waived (Note 3) | | | - | | | | (14,735 | ) | | | - | | | | - | | | | - | | | | - | | | | - | | |
| Class A Administration fees waived (Note 3) | | | (18,650 | ) | | | - | | | | - | | | | - | | | | - | | | | - | | | | (204,397 | ) | |
| Class L Administration fees waived (Note 3) | | | (3,688 | ) | | | - | | | | - | | | | - | | | | - | | | | - | | | | (221,597 | ) | |
| Class N Administration fees waived (Note 3) | | | (157 | ) | | | - | | | | - | | | | - | | | | - | | | | - | | | | (3,650 | ) | |
| Net expenses | | | 647,979 | | | | 1,041,454 | | | | 1,229,797 | | | | 5,008,623 | | | | 503,776 | | | | 6,919,303 | | | | 4,367,678 | | |
| Net investment income | | | 4,022,533 | | | | 2,628,469 | | | | 3,044,068 | | | | 6,098,291 | | | | 374,382 | | | | 5,518,053 | | | | 14,829,552 | | |
| Realized and unrealized gain (loss): | |
| Net realized gain (loss) on: | |
| Investment transactions | | | (1,340,618 | ) | | | 549,173 | | | | 11,931,565 | | | | 53,401,744 | | | | 6,741,940 | | | | 8,953,178 | | | | 2,174,731 | | |
| Closed futures contracts | | | (427,485 | ) | | | (388,057 | ) | | | - | | | | - | | | | - | | | | - | | | | (686,895 | ) | |
| Written options | | | 283,949 | | | | 214,759 | | | | - | | | | - | | | | - | | | | - | | | | - | | |
| Closed swap contracts | | | - | | | | (50,616 | ) | | | - | | | | - | | | | - | | | | - | | | | - | | |
| Foreign currency transactions | | | 41,385 | | | | 25,689 | | | | - | | | | - | | | | 2,429 | | | | 17,652 | | | | - | | |
| Net realized gain (loss) | | | (1,442,769 | ) | | | 350,948 | | | | 11,931,565 | | | | 53,401,744 | | | | 6,744,369 | | | | 8,970,830 | | | | 1,487,836 | | |
| Net change in unrealized appreciation (depreciation) on: | |
| Investments | | | (4,907,337 | ) | | | 1,410,279 | | | | 3,842,066 | | | | 11,691,321 | | | | (3,735,061 | ) | | | 28,220,009 | | | | 31,921,374 | | |
| Open futures contracts | | | (381,169 | ) | | | (10,071 | ) | | | - | | | | - | | | | - | | | | - | | | | 636,093 | | |
| Written options | | | 136,144 | | | | 55,311 | | | | - | | | | - | | | | - | | | | - | | | | - | | |
| Open swap contracts | | | - | | | | (31,536 | ) | | | - | | | | - | | | | - | | | | - | | | | - | | |
| Translation of assets and liabilities in foreign currencies | | | (61,394 | ) | | | (40,611 | ) | | | - | | | | - | | | | (801 | ) | | | 994 | | | | - | | |
| Net unrealized gain (loss) | | | (5,213,756 | ) | | | 1,383,372 | | | | 3,842,066 | | | | 11,691,321 | | | | (3,735,862 | ) | | | 28,221,003 | | | | 32,557,467 | | |
| Net realized and unrealized gain (loss) | | | (6,656,525 | ) | | | 1,734,320 | | | | 15,773,631 | | | | 65,093,065 | | | | 3,008,507 | | | | 37,191,833 | | | | 34,045,303 | | |
| Net increase (decrease) in net assets resulting from operations | | $ | (2,633,992 | ) | | $ | 4,362,789 | | | $ | 18,817,699 | | | $ | 71,191,356 | | | $ | 3,382,889 | | | $ | 42,709,886 | | | $ | 48,874,855 | | |
| (a) Net of withholding tax of: | | $ | - | | | $ | 21,235 | | | $ | 6,050 | | | $ | 3,786 | | | $ | 5,751 | | | $ | 68,063 | | | $ | - | | |
The accompanying notes are an integral part of the financial statements.
184
185
MassMutual Select Funds – Financial Statements (Continued)
Statement of Operations
For the Six Months Ended June 30, 2006 (Unaudited)
| | | MassMutual
Select Core
Opportunities
Fund* | | MassMutual
Select
Blue Chip Growth
Fund | | MassMutual
Select
Large Cap Growth
Fund | | MassMutual
Select
Growth Equity
Fund | | MassMutual
Select
Aggressive Growth
Fund | | MassMutual
Select
OTC 100
Fund | | MassMutual
Select
Focused Value
Fund | |
| Investment income (Note 2): | |
| Dividends(a) | | $ | 34,046 | | | $ | 2,008,054 | | | $ | 131,160 | | | $ | 5,843,401 | | | $ | 643,027 | | | $ | 129,625 | | | $ | 16,151,799 | | |
| Interest | | | 2,438 | | | | 194,315 | | | | 7,290 | | | | 424,574 | | | | 168,561 | | | | 15,248 | | | | 658,498 | | |
| Securities lending income | | | - | | | | 46,845 | | | | 1,776 | | | | 16,297 | | | | - | | | | 10,615 | | | | 76,238 | | |
| Total investment income | | | 36,484 | | | | 2,249,214 | | | | 140,226 | | | | 6,284,272 | | | | 811,588 | | | | 155,488 | | | | 16,886,535 | | |
| Expenses (Note 3): | |
| Investment management fees (Note 3) | | | 18,613 | | | | 1,320,411 | | | | 128,988 | | | | 2,993,594 | | | | 2,286,458 | | | | 43,524 | | | | 3,124,895 | | |
| Custody fees | | | 3,349 | | | | 30,120 | | | | 9,815 | | | | 51,074 | | | | 40,309 | | | | 16,430 | | | | 44,457 | | |
| Trustee reporting | | | 800 | | | | 1,343 | | | | 2,458 | | | | 2,458 | | | | 2,458 | | | | 1,346 | | | | 2,458 | | |
| Audit and legal fees | | | 8,883 | | | | 15,286 | | | | 13,604 | | | | 17,599 | | | | 16,347 | | | | 14,304 | | | | 17,664 | | |
| Proxy fees | | | 375 | | | | 695 | | | | 540 | | | | 547 | | | | 757 | | | | 536 | | | | 593 | | |
| Shareholder reporting fees | | | 81 | | | | 4,765 | | | | 537 | | | | 11,347 | | | | 7,870 | | | | 780 | | | | 11,449 | | |
| Directors' fees (Note 3) | | | 135 | | | | 8,749 | | | | 976 | | | | 20,886 | | | | 14,399 | | | | 1,428 | | | | 20,911 | | |
| | | | 32,236 | | | | 1,381,369 | | | | 156,918 | | | | 3,097,505 | | | | 2,368,598 | | | | 78,348 | | | | 3,222,427 | | |
| Administration fees (Note 3): | |
| Class A | | | 78 | | | | 72,503 | | | | 7,828 | | | | 271,646 | | | | 221,547 | | | | 76,825 | | | | 412,319 | | |
| Class L | | | 633 | | | | 540,556 | | | | 4,577 | | | | 461,404 | | | | 341,537 | | | | 38,742 | | | | 314,502 | | |
| Class Y | | | 37 | | | | 14,334 | | | | 10,336 | | | | 79,544 | | | | 53,899 | | | | 5,552 | | | | 109,347 | | |
| Class S | | | 1,186 | | | | 51,200 | | | | 18,301 | | | | 121,981 | | | | 114,725 | | | | 34,119 | | | | 147,991 | | |
| Class N | | | 86 | | | | 5,882 | | | | 2 | | | | 1,724 | | | | 1,815 | | | | 1,513 | | | | 3,418 | | |
| Distribution fees (Note 3): | |
| Class N | | | 62 | | | | 3,207 | | | | 2 | | | | 1,240 | | | | 1,150 | | | | 561 | | | | 2,223 | | |
| Service fees (Note 3): | |
| Class A | | | 65 | | | | 44,371 | | | | 5,546 | | | | 228,274 | | | | 160,821 | | | | 30,760 | | | | 308,252 | | |
| Class N | | | 62 | | | | 3,207 | | | | 2 | | | | 1,240 | | | | 1,150 | | | | 561 | | | | 2,223 | | |
| Total expenses | | | 34,445 | | | | 2,116,629 | | | | 203,512 | | | | 4,264,558 | | | | 3,265,242 | | | | 266,981 | | | | 4,522,702 | | |
| Expenses waived (Note 3) | | | (9,778 | ) | | | (96,722 | ) | | | - | | | | - | | | | (125,570 | ) | | | - | | | | - | | |
| Net expenses | | | 24,667 | | | | 2,019,907 | | | | 203,512 | | | | 4,264,558 | | | | 3,139,672 | | | | 266,981 | | | | 4,522,702 | | |
| Net investment income (loss) | | | 11,817 | | | | 229,307 | | | | (63,286 | ) | | | 2,019,714 | | | | (2,328,084 | ) | | | (111,493 | ) | | | 12,363,833 | | |
| Realized and unrealized gain (loss): | |
| Net realized gain (loss) on: | |
| Investment transactions | | | (64,441 | ) | | | 20,734,142 | | | | 3,396,331 | | | | 27,758,590 | | | | 12,931,439 | | | | 1,944,810 | | | | 43,888,756 | | |
| Closed futures contracts | | | - | | | | - | | | | - | | | | (367,183 | ) | | | - | | | | (113,654 | ) | | | - | | |
| Foreign currency transactions | | | - | | | | (33,579 | ) | | | - | | | | - | | | | - | | | | - | | | | - | | |
| Net realized gain (loss) | | | (64,441 | ) | | | 20,700,563 | | | | 3,396,331 | | | | 27,391,407 | | | | 12,931,439 | | | | 1,831,156 | | | | 43,888,756 | | |
| Net change in unrealized appreciation (depreciation) on: | |
| Investments | | | (359,735 | ) | | | (28,411,570 | ) | | | (6,167,039 | ) | | | (75,747,996 | ) | | | (73,349,286 | ) | | | (4,009,508 | ) | | | (34,802,643 | ) | |
| Open futures contracts | | | - | | | | - | | | | - | | | | 504,811 | | | | - | | | | 9,604 | | | | - | | |
| Translation of assets and liabilities in foreign currencies | | | - | | | | 1,298 | | | | - | | | | 6 | | | | - | | | | - | | | | - | | |
| Net unrealized gain (loss) | | | (359,735 | ) | | | (28,410,272 | ) | | | (6,167,039 | ) | | | (75,243,179 | ) | | | (73,349,286 | ) | | | (3,999,904 | ) | | | (34,802,643 | ) | |
| Net realized and unrealized gain (loss) | | | (424,176 | ) | | | (7,709,709 | ) | | | (2,770,708 | ) | | | (47,851,772 | ) | | | (60,417,847 | ) | | | (2,168,748 | ) | | | 9,086,113 | | |
| Net increase (decrease) in net assets resulting from operations | | $ | (412,359 | ) | | $ | (7,480,402 | ) | | $ | (2,833,994 | ) | | $ | (45,832,058 | ) | | $ | (62,745,931 | ) | | $ | (2,280,241 | ) | | $ | 21,449,946 | | |
| (a) Net of withholding tax of: | | $ | (34 | ) | | $ | 46,326 | | | $ | 1,591 | | | $ | - | | | $ | 18,309 | | | $ | 1,040 | | | $ | - | | |
* Fund commenced operations on March 31, 2006.
The accompanying notes are an integral part of the financial statements.
186
187
MassMutual Select Funds – Financial Statements (Continued)
Statement of Operations
For the Six Months Ended June 30, 2006 (Unaudited)
| | | MassMutual
Select Small
Cap Value Equity
Fund* | | MassMutual
Select Small
Company Value
Fund | | MassMutual
Select Small
Cap Core Equity
Fund* | | MassMutual
Select Mid Cap
Growth Equity
Fund | | MassMutual
Select Mid Cap
Growth Equity II
Fund | | MassMutual
Select Small Cap
Growth Equity
Fund | | MassMutual
Select Small
Company Growth
Fund | |
| Investment income (Note 2): | |
| Dividends(a) | | $ | 40,056 | | | $ | 3,848,236 | | | $ | 29,151 | | | $ | 1,143,684 | | | $ | 7,838,772 | | | $ | 1,251,176 | | | $ | 160,987 | | |
| Interest | | | 8,766 | | | | 508,915 | | | | 995 | | | | 105,853 | | | | 728,242 | | | | 949,993 | | | | 68,933 | | |
| Securities lending income | | | - | | | | 133,427 | | | | - | | | | 11,902 | | | | 376,951 | | | | 240,048 | | | | 131,810 | | |
| Total investment income | | | 48,822 | | | | 4,490,578 | | | | 30,146 | | | | 1,261,439 | | | | 8,943,965 | | | | 2,441,217 | | | | 361,730 | | |
| Expenses (Note 3): | |
| Investment management fees (Note 3) | | | 18,661 | | | | 2,940,469 | | | | 18,956 | | | | 702,025 | | | | 4,958,003 | | | | 2,687,757 | | | | 707,921 | | |
| Custody fees | | | 12,669 | | | | 65,628 | | | | 3,660 | | | | 14,519 | | | | 98,763 | | | | 74,199 | | | | 62,268 | | |
| Trustee reporting | | | 800 | | | | 2,458 | | | | 800 | | | | 1,346 | | | | 1,342 | | | | 2,458 | | | | 2,486 | | |
| Audit and legal fees | | | 8,883 | | | | 16,126 | | | | 8,883 | | | | 14,400 | | | | 19,009 | | | | 16,227 | | | | 14,043 | | |
| Proxy fees | | | 375 | | | | 778 | | | | 375 | | | | 567 | | | | 547 | | | | 694 | | | | 591 | | |
| Shareholder reporting fees | | | 81 | | | | 7,783 | | | | 81 | | | | 2,283 | | | | 15,933 | | | | 7,683 | | | | 1,898 | | |
| Directors' fees (Note 3) | | | 135 | | | | 14,324 | | | | 135 | | | | 4,215 | | | | 29,197 | | | | 14,131 | | | | 3,503 | | |
| | | | 41,604 | | | | 3,047,566 | | | | 32,890 | | | | 739,355 | | | | 5,122,794 | | | | 2,803,149 | | | | 792,710 | | |
| Administration fees (Note 3): | |
| Class A | | | 74 | | | | 256,810 | | | | 78 | | | | 58,581 | | | | 530,123 | | | | 228,564 | | | | 117,032 | | |
| Class L | | | 74 | | | | 258,529 | | | | 74 | | | | 74,819 | | | | 877,417 | | | | 206,730 | | | | 63,520 | | |
| Class Y | | | 37 | | | | 145,639 | | | | 149 | | | | 20,404 | | | | 142,806 | | | | 157,415 | | | | 29,545 | | |
| Class S | | | 1,193 | | | | 223,852 | | | | 1,177 | | | | 38,352 | | | | 121,793 | | | | 187,210 | | | | 25,802 | | |
| Class N | | | 86 | | | | 2,877 | | | | 86 | | | | 436 | | | | 3,701 | | | | 2,265 | | | | 2,031 | | |
| Distribution fees (Note 3): | |
| Class N | | | 62 | | | | 1,757 | | | | 61 | | | | 305 | | | | 2,471 | | | | 1,238 | | | | 1,272 | | |
| Service fees (Note 3): | |
| Class A | | | 62 | | | | 178,687 | | | | 65 | | | | 47,627 | | | | 408,541 | | | | 140,224 | | | | 83,810 | | |
| Class N | | | 62 | | | | 1,757 | | | | 61 | | | | 305 | | | | 2,471 | | | | 1,238 | | | | 1,272 | | |
| Total expenses | | | 43,254 | | | | 4,117,474 | | | | 34,641 | | | | 980,184 | | | | 7,212,117 | | | | 3,728,033 | | | | 1,116,994 | | |
| Expenses waived (Note 3) | | | (19,260 | ) | | | - | | | | (10,230 | ) | | | - | | | | - | | | | - | | | | - | | |
| Net expenses | | | 23,994 | | | | 4,117,474 | | | | 24,411 | | | | 980,184 | | | | 7,212,117 | | | | 3,728,033 | | | | 1,116,994 | | |
| Net investment income (loss) | | | 24,828 | | | | 373,104 | | | | 5,735 | | | | 281,255 | | | | 1,731,848 | | | | (1,286,816 | ) | | | (755,264 | ) | |
| Realized and unrealized gain (loss): | |
| Net realized gain (loss) on: | |
| Investment transactions | | | (23,475 | ) | | | 29,587,442 | | | | (324,628 | ) | | | 11,332,661 | | | | 57,676,368 | | | | 45,320,062 | | | | 7,888,608 | | |
| Closed futures contracts | | | (44,518 | ) | | | - | | | | - | | | | - | | | | - | | | | - | | | | - | | |
| Foreign currency transactions | | | - | | | | - | | | | - | | | | - | | | | 2,313 | | | | (11,269 | ) | | | - | | |
| Net realized gain (loss) | | | (67,993 | ) | | | 29,587,442 | | | | (324,628 | ) | | | 11,332,661 | | | | 57,678,681 | | | | 45,308,793 | | | | 7,888,608 | | |
| Net change in unrealized appreciation (depreciation) on: | |
| Investments | | | (178,049 | ) | | | 22,413,357 | | | | (188,030 | ) | | | (3,041,127 | ) | | | (45,636,347 | ) | | | (20,291,838 | ) | | | (3,266,093 | ) | |
| Open futures contracts | | | 19,829 | | | | - | | | | - | | | | - | | | | - | | | | - | | | | - | | |
| Translation of assets and liabilities in foreign currencies | | | - | | | | - | | | | - | | | | - | | | | 69 | | | | 704 | | | | - | | |
| Net unrealized gain (loss) | | | (158,220 | ) | | | 22,413,357 | | | | (188,030 | ) | | | (3,041,127 | ) | | | (45,636,278 | ) | | | (20,291,134 | ) | | | (3,266,093 | ) | |
| Net realized and unrealized gain (loss) | | | (226,213 | ) | | | 52,000,799 | | | | (512,658 | ) | | | 8,291,534 | | | | 12,042,403 | | | | 25,017,659 | | | | 4,622,515 | | |
| Net increase (decrease) in net assets resulting from operations | | $ | (201,385 | ) | | $ | 52,373,903 | | | $ | (506,923 | ) | | $ | 8,572,789 | | | $ | 13,774,251 | | | $ | 23,730,843 | | | $ | 3,867,251 | | |
| (a) Net of withholding tax of: | | $ | 36 | | | $ | 417 | | | $ | - | | | $ | 1,928 | | | $ | 24,928 | | | $ | 6,000 | | | $ | - | | |
* Fund commenced operations on March 31, 2006.
The accompanying notes are an integral part of the financial statements.
188
189
MassMutual Select Funds – Financial Statements (Continued)
Statement of Operations
For the Six Months Ended June 30, 2006 (Unaudited)
| | | MassMutual
Select
Emerging Growth
Fund | | MassMutual
Select
Overseas
Fund | | MassMutual
Select Destination
Retirement Income
Fund | | MassMutual
Select Destination
Retirement 2010
Fund | | MassMutual
Select Destination
Retirement 2020
Fund | | MassMutual
SelectDestination
Retirement 2030
Fund | | MassMutual
Select Destination
Retirement 2040
Fund | |
| Investment income (Note 2): | |
| Dividends(a) | | $ | 49,780 | | | $ | 23,530,715 | | | $ | - | | | $ | - | | | $ | - | | | $ | - | | | $ | - | | |
| Dividend from affiliated issuers | | | - | | | | - | | | | 262,907 | | | | 125,889 | | | | - | | | | - | | | | - | | |
| Interest | | | 139,625 | | | | 531,857 | | | | - | | | | - | | | | - | | | | - | | | | - | | |
| Securities lending income | | | 65,311 | | | | 440,411 | | | | - | | | | - | | | | - | | | | - | | | | - | | |
| Total investment income | | | 254,716 | | | | 24,502,983 | | | | 262,907 | | | | 125,889 | | | | - | | | | - | | | | - | | |
| Expenses (Note 3): | |
| Investment management fees (Note 3) | | | 528,220 | | | | 4,861,150 | | | | 63,936 | | | | 31,710 | | | | 117,453 | | | | 83,589 | | | | 50,705 | | |
| Custody fees | | | 36,308 | | | | 558,912 | | | | 9,314 | | | | 11,421 | | | | 12,455 | | | | 12,513 | | | | 10,485 | | |
| Trustee reporting | | | 1,346 | | | | 2,458 | | | | 1,347 | | | | 1,347 | | | | 1,345 | | | | 1,347 | | | | 1,345 | | |
| Audit and legal fees | | | 14,210 | | | | 17,514 | | | | 13,647 | | | | 12,975 | | | | 14,375 | | | | 13,837 | | | | 13,302 | | |
| Proxy fees | | | 693 | | | | 591 | | | | 526 | | | | 526 | | | | 526 | | | | 526 | | | | 526 | | |
| Shareholder reporting fees | | | 1,669 | | | | 12,554 | | | | 3,167 | | | | 1,417 | | | | 5,553 | | | | 3,886 | | | | 2,292 | | |
| Directors' fees (Note 3) | | | 3,075 | | | | 20,334 | | | | 5,803 | | | | 2,605 | | | | 10,172 | | | | 7,134 | | | | 4,202 | | |
| | | | 585,521 | | | | 5,473,513 | | | | 97,740 | | | | 62,001 | | | | 161,879 | | | | 122,832 | | | | 82,857 | | |
| Administration fees (Note 3): | |
| Class A | | | 27,523 | | | | 276,676 | | | | 31,337 | | | | 32,136 | | | | 88,499 | | | | 64,664 | | | | 25,495 | | |
| Class L | | | 104,430 | | | | 279,131 | | | | 70,572 | | | | 29,921 | | | | 215,976 | | | | 163,517 | | | | 95,235 | | |
| Class Y | | | 4,828 | | | | 79,059 | | | | 24,718 | | | | 13,873 | | | | 29,046 | | | | 15,106 | | | | 6,256 | | |
| Class S | | | 20,844 | | | | 77,000 | | | | 824 | | | | 1,338 | | | | 6,003 | | | | 3,453 | | | | 1,910 | | |
| Class N | | | 341 | | | | 2,794 | | | | 105 | | | | 148 | | | | 282 | | | | 188 | | | | 167 | | |
| Distribution fees (Note 3): | |
| Class N | | | 223 | | | | 2,373 | | | | 133 | | | | 169 | | | | 313 | | | | 211 | | | | 197 | | |
| Service fees (Note 3): | |
| Class A | | | 20,576 | | | | 283,131 | | | | 53,696 | | | | 47,371 | | | | 125,852 | | | | 93,284 | | | | 39,441 | | |
| Class N | | | 222 | | | | 2,373 | | | | 133 | | | | 169 | | | | 313 | | | | 211 | | | | 197 | | |
| Total expenses | | | 764,508 | | | | 6,476,050 | | | | 279,258 | | | | 187,126 | | | | 628,163 | | | | 463,466 | | | | 251,755 | | |
| Expenses waived (Note 3) | | | - | | | | - | | | | - | | | | (11,011 | ) | | | - | | | | - | | | | - | | |
| Class A Administration fees waived (Note 3) | | | - | | | | (60,966 | ) | | | - | | | | - | | | | - | | | | - | | | | - | | |
| Class L Administration fees waived (Note 3) | | | - | | | | (61,274 | ) | | | - | | | | - | | | | - | | | | - | | | | - | | |
| Class N Administration fees waived (Note 3) | | | - | | | | (505 | ) | | | - | | | | - | | | | - | | | | - | | | | - | | |
| Net expenses | | | 764,508 | | | | 6,353,305 | | | | 279,258 | | | | 176,115 | | | | 628,163 | | | | 463,466 | | | | 251,755 | | |
| Net investment income (loss) | | | (509,792 | ) | | | 18,149,678 | | | | (16,351 | ) | | | (50,226 | ) | | | (628,163 | ) | | | (463,466 | ) | | | (251,755 | ) | |
| Realized and unrealized gain (loss): | |
| Net realized gain (loss) on: | |
| Investment transactions | | | 10,711,845 | | | | 58,526,825 | | | | - | | | | - | | | | - | | | | - | | | | - | | |
| Investment transactions with affiliated issuers | | | - | | | | - | | | | 408,403 | | | | 97,378 | | | | 2,143,643 | | | | 2,698,173 | | | | 2,299,303 | | |
| Foreign currency transactions | | | - | | | | (1,475,634 | ) | | | - | | | | - | | | | - | | | | - | | | | - | | |
| Net realized gain (loss) | | | 10,711,845 | | | | 57,051,191 | | | | 408,403 | | | | 97,378 | | | | 2,143,643 | | | | 2,698,173 | | | | 2,299,303 | | |
| Net change in unrealized appreciation (depreciation) on: | |
| Investments | | | (6,043,404 | ) | | | 20,885,024 | | | | 103,215 | | | | 330,408 | | | | 117,277 | | | | 955,439 | | | | 422,023 | | |
| Translation of assets and liabilities in foreign currencies | | | - | | | | (13,643 | ) | | | - | | | | - | | | | - | | | | - | | | | - | | |
| Net unrealized gain (loss) | | | (6,043,404 | ) | | | 20,871,381 | | | | 103,215 | | | | 330,408 | | | | 117,277 | | | | 955,439 | | | | 422,023 | | |
| Net realized and unrealized gain (loss) | | | 4,668,441 | | | | 77,922,572 | | | | 511,618 | | | | 427,786 | | | | 2,260,920 | | | | 3,653,612 | | | | 2,721,326 | | |
| Net increase (decrease) in net assets resulting from operations | | $ | 4,158,649 | | | $ | 96,072,250 | | | $ | 495,267 | | | $ | 377,560 | | | $ | 1,632,757 | | | $ | 3,190,146 | | | $ | 2,469,571 | | |
| (a) Net of withholding tax of: | | $ | 23 | | | $ | 1,622,863 | | | $ | - | | | $ | - | | | $ | - | | | $ | - | | | $ | - | | |
The accompanying notes are an integral part of the financial statements.
190
191
MassMutual Select Funds – Financial Statements (Continued)
Statement of Changes in Net Assets
| | | MassMutual
Select Strategic Bond Fund | | MassMutual
Select Strategic Balanced Fund | | MassMutual
Select Diversified Value Fund | | MassMutual
Select Fundamental Value Fund | |
| | | Six Months
Ended
June 30, 2006
(Unaudited) | | Year
Ended
December 31, 2005 | | Six Months
Ended
June 30, 2006
(Unaudited) | | Year
Ended
December 31, 2005 | | Six Months
Ended
June 30, 2006
(Unaudited) | | Year
Ended
December 31, 2005 | | Six Months
Ended
June 30, 2006
(Unaudited) | | Year
Ended
December 31, 2005 | |
| Increase (Decrease) in Net Assets: | |
| Operations: | |
| Net investment income (loss) | | $ | 4,022,533 | | | $ | 2,380,986 | | | $ | 2,628,469 | | | $ | 4,039,563 | | | $ | 3,044,068 | | | $ | 3,771,569 | | | $ | 6,098,291 | | | $ | 11,680,878 | | |
| Net realized gain (loss) on investment transactions | | | (1,442,769 | ) | | | (1,065,142 | ) | | | 350,948 | | | | 2,823,256 | | | | 11,931,565 | | | | 6,585,611 | | | | 53,401,744 | | | | 29,708,134 | | |
| Net change in unrealized appreciation (depreciation) on investments | | | (5,213,756 | ) | | | (108,980 | ) | | | 1,383,372 | | | | 1,319,775 | | | | 3,842,066 | | | | 4,579,594 | | | | 11,691,321 | | | | 25,619,113 | | |
| Net increase (decrease) in net assets resulting from operations | | | (2,633,992 | ) | | | 1,206,864 | | | | 4,362,789 | | | | 8,182,594 | | | | 18,817,699 | | | | 14,936,774 | | | | 71,191,356 | | | | 67,008,125 | | |
| Distributions to shareholders (Note 2): | |
| From net investment income: | |
| Class A | | | - | | | | (342,236 | ) | | | - | | | | (430,553 | ) | | | - | | | | (311,691 | ) | | | - | | | | (2,372,146 | ) | |
| Class L | | | - | | | | (68,904 | ) | | | - | | | | (2,053,931 | ) | | | - | | | | (336,293 | ) | | | - | | | | (2,662,089 | ) | |
| Class Y | | | - | | | | (1,037,693 | ) | | | - | | | | (1,683,636 | ) | | | - | | | | (733,054 | ) | | | - | | | | (1,043,210 | ) | |
| Class S | | | - | | | | (1,081,367 | ) | | | - | | | | (342,793 | ) | | | - | | | | (2,403,726 | ) | | | - | | | | (5,579,634 | ) | |
| Class Z | | | - | | | | - | | | | - | | | | - | | | | - | | | | - | | | | - | | | | - | | |
| Class N | | | - | | | | (2,877 | ) | | | - | | | | (6,465 | ) | | | - | | | | (1,053 | ) | | | - | | | | (14,742 | ) | |
| Total distributions from net investment income | | | - | | | | (2,533,077 | ) | | | - | | | | (4,517,378 | ) | | | - | | | | 3,785,817 | | | | - | | | | (11,671,821 | ) | |
| From net realized gains: | |
| Class A | | | - | | | | - | | | | - | | | | (147,178 | ) | | | - | | | | (570,517 | ) | | | - | | | | (5,791,123 | ) | |
| Class L | | | - | | | | - | | | | - | | | | (567,589 | ) | | | - | | | | (573,938 | ) | | | - | | | | (5,289,113 | ) | |
| Class Y | | | - | | | | - | | | | - | | | | (437,120 | ) | | | - | | | | (972,003 | ) | | | - | | | | (1,939,795 | ) | |
| Class S | | | - | | | | - | | | | - | | | | (85,609 | ) | | | - | | | | (3,628,119 | ) | | | - | | | | (9,498,076 | ) | |
| Class N | | | - | | | | - | | | | - | | | | (2,378 | ) | | | - | | | | (3,947 | ) | | | - | | | | (48,776 | ) | |
| Total distributions from net realized gains | | | - | | | | - | | | | - | | | | (1,239,874 | ) | | | - | | | | (5,748,524 | ) | | | - | | | | (22,566,883 | ) | |
| Net fund share transactions (Note 5): | |
| Class A | | | 9,182,956 | | | | 20,867,007 | | | | 1,670,815 | | | | (7,192,905 | ) | | | 12,211,312 | | | | 24,553,255 | | | | (7,804,639 | ) | | | 29,648,337 | | |
| Class L | | | 1,470,613 | | | | 3,855,702 | | | | (11,789,301 | ) | | | (4,795,954 | ) | | | 10,096,386 | | | | 8,319,449 | | | | 42,794,841 | | | | (13,052,664 | ) | |
| Class Y | | | 32,519,735 | | | | 60,098,842 | | | | 6,101,618 | | | | (21,959,573 | ) | | | 46,743,403 | | | | 55,782,020 | | | | 4,324,974 | | | | (39,395,750 | ) | |
| Class S | | | 898,774 | | | | 13,154,159 | | | | 431,789 | | | | 1,728,230 | | | | (2,896,504 | ) | | | 8,666,050 | | | | 24,359,917 | | | | 79,996,127 | | |
| Class Z | | | - | | | | - | | | | - | | | | - | | | | - | | | | - | | | | - | | | | - | | |
| Class N | | | 1,473,130 | | | | 108,343 | | | | 5,599 | | | | (6,706 | ) | | | 886,106 | | | | (46,321 | ) | | | (899,190 | ) | | | 291,208 | | |
| Increase (decrease) in net assets from fund share transactions | | | 45,545,208 | | | | 98,084,053 | | | | (3,579,480 | ) | | | (32,226,908 | ) | | | 67,040,703 | | | | 97,274,453 | | | | 62,775,903 | | | | 57,487,258 | | |
| Total increase (decrease) in net assets | | | 42,911,216 | | | | 96,757,840 | | | | 783,309 | | | | (29,801,566 | ) | | | 85,858,402 | | | | 102,676,886 | | | | 133,967,259 | | | | 90,256,679 | | |
| Net assets: | |
| Beginning of period | | | 146,758,340 | | | | 50,000,500 | | | | 221,007,826 | | | | 250,809,392 | | | | 302,956,307 | | | | 200,279,421 | | | | 989,840,177 | | | | 899,583,498 | | |
| End of period | | $ | 189,669,556 | | | $ | 146,758,340 | | | $ | 221,791,135 | | | $ | 221,007,826 | | | $ | 388,814,709 | | | $ | 302,956,307 | | | $ | 1,123,807,436 | | | $ | 989,840,177 | | |
Undistributed net investment income (distributions in excess of net investment
income) included in net assets at the end of the year | | $ | 4,007,822 | | | $ | (14,711 | ) | | $ | 2,586,408 | | | $ | (42,061 | ) | | $ | 3,040,058 | | | $ | (4,010 | ) | | $ | 6,097,415 | | | $ | (876 | ) | |
The accompanying notes are an integral part of the financial statements.
192
193
MassMutual Select Funds – Financial Statements (Continued)
Statement of Changes in Net Assets
| | | MassMutual
Select Value Equity Fund | | MassMutual
Select Large Cap Value Fund | | MassMutual
Select Indexed Equity Fund | | MassMutual
Select Core
Opportunities Fund | |
| | | Six Months
Ended
June 30, 2006
(Unaudited) | | Year
Ended
December 31, 2005 | | Six Months
Ended
June 30, 2006
(Unaudited) | | Year
Ended
December 31, 2005 | | Six Months
Ended
June 30, 2006
(Unaudited) | | Year
Ended
December 31, 2005 | | Period
Ended
June 30, 2006*
(Unaudited) | |
| Increase (Decrease) in Net Assets: | |
| Operations: | |
| Net investment income (loss) | | $ | 374,382 | | | $ | 591,566 | | | $ | 5,518,053 | | | $ | 9,506,053 | | | $ | 14,829,552 | | | $ | 25,899,195 | | | $ | 11,817 | | |
| Net realized gain (loss) on investment transactions | | | 6,744,369 | | | | 8,977,601 | | | | 8,970,830 | | | | 8,151,161 | | | | 1,487,836 | | | | 295,182 | | | | (64,441 | ) | |
| Net change in unrealized appreciation (depreciation) on investments | | | (3,735,862 | ) | | | (584,616 | ) | | | 28,221,003 | | | | 102,411,217 | | | | 32,557,467 | | | | 56,230,335 | | | | (359,735 | ) | |
| Net increase (decrease) in net assets resulting from operations | | | 3,382,889 | | | | 8,984,551 | | | | 42,709,886 | | | | 120,068,431 | | | | 48,874,855 | | | | 82,424,712 | | | | (412,359 | ) | |
| Distributions to shareholders (Note 2): | |
| From net investment income: | |
| Class A | | | - | | | | (93,905 | ) | | | - | | | | (1,568,896 | ) | | | - | | | | (2,686,882 | ) | | | - | | |
| Class L | | | - | | | | (49,122 | ) | | | - | | | | (2,452,234 | ) | | | - | | | | (3,734,937 | ) | | | - | | |
| Class Y | | | - | | | | (28,354 | ) | | | - | | | | (1,149,099 | ) | | | - | | | | (6,163,443 | ) | | | - | | |
| Class S | | | - | | | | (409,121 | ) | | | - | | | | (4,828,320 | ) | | | - | | | | (8,944,597 | ) | | | - | | |
| Class Z | | | - | | | | - | | | | - | | | | - | | | | - | | | | (3,917,901 | ) | | | - | | |
| Class N | | | - | | | | (134 | ) | | | - | | | | (2,537 | ) | | | - | | | | (39,746 | ) | | | - | | |
| Total distributions from net investment income | | | - | | | | (580,636 | ) | | | - | | | | (10,001,086 | ) | | | - | | | | (25,487,506 | ) | | | - | | |
| From net realized gains: | |
| Class A | | | - | | | | (2,544,412 | ) | | | - | | | | - | | | | - | | | | - | | | | - | | |
| Class L | | | - | | | | (780,846 | ) | | | - | | | | - | | | | - | | | | - | | | | - | | |
| Class Y | | | - | | | | (364,717 | ) | | | - | | | | - | | | | - | | | | - | | | | - | | |
| Class S | | | - | | | | (4,883,438 | ) | | | - | | | | - | | | | - | | | | - | | | | - | | |
| Class N | | | - | | | | (27,613 | ) | | | - | | | | - | | | | - | | | | - | | | | - | | |
| Total distributions from net realized gains | | | - | | | | (8,601,026 | ) | | | - | | | | - | | | | - | | | | - | | | | - | | |
| Net fund share transactions (Note 5): | |
| Class A | | | (152,711 | ) | | | 3,339,603 | | | | 6,680,889 | | | | 60,927,871 | | | | (8,131,001 | ) | | | (12,985,153 | ) | | | 831,556 | | |
| Class L | | | (187,493 | ) | | | 1,310,289 | | | | (36,518,578 | ) | | | 24,532,700 | | | | 13,538,628 | | | | 55,546,512 | | | | 1,254,324 | | |
| Class Y | | | 333,820 | | | | 1,260,705 | | | | 41,129,126 | | | | 6,624,216 | | | | (20,680,227 | ) | | | 33,790,225 | | | | 100,100 | | |
| Class S | | | (2,282,293 | ) | | | 4,059,226 | | | | 19,802,631 | | | | 67,795,890 | | | | (54,607,389 | ) | | | (67,371,379 | ) | | | 9,600,100 | | |
| Class Z | | | - | | | | - | | | | - | | | | - | | | | 50,750,554 | | | | 115,208,351 | | | | - | | |
| Class N | | | - | | | | (142,815 | ) | | | 82,426 | | | | (846,677 | ) | | | (16,391 | ) | | | 911,459 | | | | 100,100 | | |
| Increase (decrease) in net assets from fund share transactions | | | (2,288,677 | ) | | | 9,827,008 | | | | 31,176,494 | | | | 159,034,000 | | | | (19,145,826 | ) | | | 125,100,015 | | | | 11,886,180 | | |
| Total increase (decrease) in net assets | | | 1,094,212 | | | | 9,629,897 | | | | 73,886,380 | | | | 269,101,345 | | | | 29,729,029 | | | | 182,037,221 | | | | 11,473,821 | | |
| Net assets: | |
| Beginning of period | | | 97,727,596 | | | | 88,097,699 | | | | 1,419,812,531 | | | | 1,150,711,186 | | | | 1,954,565,942 | | | | 1,772,528,721 | | | | - | | |
| End of period | | $ | 98,821,808 | | | $ | 97,727,596 | | | $ | 1,493,698,911 | | | $ | 1,419,812,531 | | | $ | 1,984,294,971 | | | $ | 1,954,565,942 | | | $ | 11,473,821 | | |
Undistributed net investment income (distributions in excess of net investment
income) included in net assets at the end of the year | | $ | 373,510 | | | $ | (872 | ) | | $ | 5,703,405 | | | $ | 185,352 | | | $ | 15,068,410 | | | $ | 238,858 | | | $ | 11,817 | | |
* Fund commenced operations on March 31, 2006.
The accompanying notes are an integral part of the financial statements.
194
195
MassMutual Select Funds – Financial Statements (Continued)
Statement of Changes in Net Assets
| | | MassMutual
Select Blue Chip Growth Fund | | MassMutual
Select Large Cap Growth Fund | | MassMutual
Select Growth Equity Fund | | MassMutual
Select Aggressive Growth Fund | |
| | | Six Months
Ended
June 30, 2006
(Unaudited) | | Year
Ended
December 31, 2005 | | Six Months
Ended
June 30, 2006
(Unaudited) | | Year
Ended
December 31, 2005 | | Six Months
Ended
June 30, 2006
(Unaudited) | | Year
Ended
December 31, 2005 | | Six Months
Ended
June 30, 2006
(Unaudited) | | Year
Ended
December 31, 2005 | |
| Increase (Decrease) in Net Assets: | |
| Operations: | |
| Net investment income (loss) | | $ | 229,307 | | | $ | 267,521 | | | $ | (63,286 | ) | | $ | (89,608 | ) | | $ | 2,019,714 | | | $ | 2,685,574 | | | $ | (2,328,084 | ) | | $ | (3,673,799 | ) | |
| Net realized gain (loss) on investment transactions | | | 20,700,563 | | | | 3,326,881 | | | | 3,396,331 | | | | 2,493,286 | | | | 27,391,407 | | | | 28,964,576 | | | | 12,931,439 | | | | 5,764,566 | | |
| Net change in unrealized appreciation (depreciation) on investments | | | (28,410,272 | ) | | | 8,576,144 | | | | (6,167,039 | ) | | | 1,848,966 | | | | (75,243,179 | ) | | | 1,460,964 | | | | (73,349,286 | ) | | | 47,189,568 | | |
| Net increase (decrease) in net assets resulting from operations | | | (7,480,402 | ) | | | 12,170,546 | | | | (2,833,994 | ) | | | 4,252,644 | | | | (45,832,058 | ) | | | 33,111,114 | | | | (62,745,931 | ) | | | 49,280,335 | | |
| Distributions to shareholders (Note 2): | |
| From net investment income: | |
| Class A | | | - | | | | - | | | | - | | | | - | | | | - | | | | (60,482 | ) | | | - | | | | - | | |
| Class L | | | - | | | | (64,479 | ) | | | - | | | | - | | | | - | | | | (813,516 | ) | | | - | | | | - | | |
| Class Y | | | - | | | | (7,874 | ) | | | - | | | | - | | | | - | | | | (469,363 | ) | | | - | | | | - | | |
| Class S | | | - | | | | (199,883 | ) | | | - | | | | - | | | | - | | | | (1,267,551 | ) | | | - | | | | - | | |
| Total distributions from net investment income | | | - | | | | (272,236 | ) | | | - | | | | - | | | | - | | | | (2,610,912 | ) | | | - | | | | - | | |
| From net realized gains: | |
| Class A | | | - | | | | - | | | | - | | | | - | | | | - | | | | - | | | | - | | | | - | | |
| Class L | | | - | | | | - | | | | - | | | | - | | | | - | | | | - | | | | - | | | | - | | |
| Class Y | | | - | | | | - | | | | - | | | | - | | | | - | | | | - | | | | - | | | | - | | |
| Class S | | | - | | | | - | | | | - | | | | - | | | | - | | | | - | | | | - | | | | - | | |
| Class N | | | - | | | | - | | | | - | | | | - | | | | - | | | | - | | | | - | | | | - | | |
| Total distributions from net realized gains | | | - | | | | - | | | | - | | | | - | | | | - | | | | - | | | | - | | | | - | | |
| Net fund share transactions (Note 5): | |
| Class A | | | (1,468,563 | ) | | | (1,854,478 | ) | | | 3,325,148 | | | | 1,118,727 | | | | (75,503,420 | ) | | | (3,388,645 | ) | | | (5,578,650 | ) | | | 9,254,957 | | |
| Class L | | | 3,068,159 | | | | (39,940,194 | ) | | | 1,454,913 | | | | (7,945,778 | ) | | | 63,469,610 | | | | 4,982,540 | | | | 50,158,050 | | | | 25,043,026 | | |
| Class Y | | | 36,234,911 | | | | 266,870 | | | | (2,143,166 | ) | | | 1,532,071 | | | | (40,839,453 | ) | | | (1,196,928 | ) | | | 14,605,578 | | | | 6,932,778 | | |
| Class S | | | (11,320,854 | ) | | | (9,637,642 | ) | | | (7,250,190 | ) | | | 4,755,246 | | | | 26,284,134 | | | | 30,287,831 | | | | 19,591,016 | | | | 22,455,628 | | |
| Class N | | | 1,243,915 | | | | (290,832 | ) | | | - | | | | (4,003 | ) | | | (1,161,954 | ) | | | (224,315 | ) | | | (72,532 | ) | | | (154,129 | ) | |
| Increase (decrease) in net assets from fund share transactions | | | 27,757,568 | | | | (51,456,276 | ) | | | (4,613,295 | ) | | | (543,737 | ) | | | (27,751,083 | ) | | | 30,460,483 | | | | 78,703,462 | | | | 63,532,260 | | |
| Total increase (decrease) in net assets | | | 20,277,166 | | | | (39,557,966 | ) | | | (7,447,289 | ) | | | 3,708,907 | | | | (73,583,141 | ) | | | 60,960,685 | | | | 15,957,531 | | | | 112,812,595 | | |
| Net assets: | |
| Beginning of period | | | 385,140,894 | | | | 424,698,860 | | | | 42,825,755 | | | | 39,116,848 | | | | 905,907,845 | | | | 844,947,160 | | | | 614,102,082 | | | | 501,289,487 | | |
| End of period | | $ | 405,418,060 | | | $ | 385,140,894 | | | $ | 35,378,466 | | | $ | 42,825,755 | | | $ | 832,324,704 | | | $ | 905,907,845 | | | $ | 630,059,613 | | | $ | 614,102,082 | | |
Undistributed net investment income (distributions in excess of net investment
income) included in net assets at the end of the year | | $ | 227,426 | | | $ | (1,881 | ) | | $ | (63,878 | ) | | $ | (592 | ) | | $ | 2,059,599 | | | $ | 39,885 | | | $ | (2,281,155 | ) | | $ | 46,929 | | |
The accompanying notes are an integral part of the financial statements.
196
197
MassMutual Select Funds – Financial Statements (Continued)
Statement of Changes in Net Assets
| | | MassMutual
Select OTC 100 Fund | | MassMutual
Select Focused Value Fund | | MassMutual
Select Mid Cap Growth Equity II Fund | | MassMutual
Select Small Cap Growth Equity Fund | |
| | | Six Months
Ended
June 30, 2006
(Unaudited) | | Year
Ended
December 31, 2005 | | Six Months
Ended
June 30, 2006
(Unaudited) | | Year
Ended
December 31, 2005 | | Six Months
Ended
June 30, 2006
(Unaudited) | | Year
Ended
December 31, 2005 | | Six Months
Ended
June 30, 2006
(Unaudited) | | Year
Ended
December 31, 2005 | |
| Increase (Decrease) in Net Assets: | |
| Operations: | |
| Net investment income (loss) | | $ | (111,493 | ) | | $ | (172,088 | ) | | $ | 12,363,833 | | | $ | 2,536,210 | | | $ | 1,731,848 | | | $ | (4,259,388 | ) | | $ | (1,286,816 | ) | | $ | (2,378,090 | ) | |
| Net realized gain (loss) on investment transactions | | | 1,831,156 | | | | 3,922,576 | | | | 43,888,756 | | | | 71,577,426 | | | | 57,678,681 | | | | 60,099,532 | | | | 45,308,793 | | | | 40,597,886 | | |
| Net change in unrealized appreciation (depreciation) on investments | | | (3,999,904 | ) | | | (3,763,145 | ) | | | (34,802,643 | ) | | | (46,054,030 | ) | | | (45,636,278 | ) | | | 74,121,137 | | | | (20,291,134 | ) | | | 18,136,683 | | |
| Net increase (decrease) in net assets resulting from operations | | | (2,280,241 | ) | | | (12,657 | ) | | | 21,449,946 | | | | 28,059,606 | | | | 13,774,251 | | | | 129,961,281 | | | | 23,730,843 | | | | 56,356,479 | | |
| Distributions to shareholders (Note 2): | |
| From net investment income: | |
| Class A | | | - | | | | - | | | | - | | | | (129,217 | ) | | | - | | | | (12,815,709 | ) | | | - | | | | - | | |
| Class L | | | - | | | | - | | | | - | | | | (546,015 | ) | | | - | | | | (20,803,086 | ) | | | - | | | | - | | |
| Class Y | | | - | | | | - | | | | - | | | | (501,460 | ) | | | - | | | | (5,656,274 | ) | | | - | | | | - | | |
| Class S | | | - | | | | - | | | | - | | | | (1,847,519 | ) | | | - | | | | (10,961,612 | ) | | | - | | | | - | | |
| Class N | | | - | | | | - | | | | - | | | | - | | | | - | | | | (73,587 | ) | | | - | | | | - | | |
| Total distributions from net investment income | | | - | | | | - | | | | - | | | | (3,024,211 | ) | | | - | | | | (50,310,268 | ) | | | - | | | | - | | |
| From net realized gains: | |
| Class A | | | - | | | | - | | | | - | | | | (22,263,955 | ) | | | - | | | | - | | | | - | | | | - | | |
| Class L | | | - | | | | - | | | | - | | | | (15,772,380 | ) | | | - | | | | - | | | | - | | | | - | | |
| Class Y | | | - | | | | - | | | | - | | | | (9,888,129 | ) | | | - | | | | - | | | | - | | | | - | | |
| Class S | | | - | | | | - | | | | - | | | | (30,462,036 | ) | | | - | | | | - | | | | - | | | | - | | |
| Class N | | | - | | | | - | | | | - | | | | (180,428 | ) | | | - | | | | - | | | | - | | | | - | | |
| Total distributions from net realized gains | | | - | | | | - | | | | - | | | | (78,566,928 | ) | | | - | | | | - | | | | - | | | | - | | |
| Net fund share transactions (Note 5): | |
| Class A | | | (3,165,145 | ) | | | (5,873,246 | ) | | | (17,580,590 | ) | | | 38,167,464 | | | | 11,992,115 | | | | 81,679,580 | | | | 13,213,603 | | | | 12,673,439 | | |
| Class L | | | (2,485,411 | ) | | | (311,897 | ) | | | 309,971 | | | | 28,119,866 | | | | 35,156,773 | | | | 71,154,725 | | | | (16,482,152 | ) | | | 7,539,532 | | |
| Class Y | | | (836,950 | ) | | | (1,111,054 | ) | | | (2,121,706 | ) | | | 28,472,905 | | | | 22,547,561 | | | | 30,727,568 | | | | 33,630,671 | | | | (7,593,827 | ) | |
| Class S | | | (2,344,889 | ) | | | (6,374,810 | ) | | | (20,666,630 | ) | | | 49,092,551 | | | | 7,844,645 | | | | 50,385,601 | | | | 22,223,222 | | | | 20,504,783 | | |
| Class N | | | (6,464 | ) | | | 17,729 | | | | 234,256 | | | | 932,351 | | | | 669,617 | | | | 556,973 | | | | 30,792 | | | | 29,440 | | |
| Increase (decrease) in net assets from fund share transactions | | | (8,838,859 | ) | | | (13,653,278 | ) | | | (39,824,699 | ) | | | 144,785,137 | | | | 78,210,711 | | | | 234,504,447 | | | | 52,616,136 | | | | 33,153,367 | | |
| Total increase (decrease) in net assets | | | (11,119,100 | ) | | | (13,665,935 | ) | | | (18,374,753 | ) | | | 91,253,604 | | | | 91,984,962 | | | | 314,155,460 | | | | 76,346,979 | | | | 89,509,846 | | |
| Net assets: | |
| Beginning of period | | | 61,700,161 | | | | 75,366,096 | | | | 905,855,454 | | | | 814,601,850 | | | | 1,233,493,045 | | | | 919,337,585 | | | | 593,491,689 | | | | 503,981,843 | | |
| End of period | | $ | 50,581,061 | | | $ | 61,700,161 | | | $ | 887,480,701 | | | $ | 905,855,454 | | | $ | 1,325,478,007 | | | $ | 1,233,493,045 | | | $ | 669,838,668 | | | $ | 593,491,689 | | |
Undistributed net investment income (distributions in excess of net investment
income) included in net assets at the end of the year | | $ | (101,838 | ) | | $ | 9,655 | | | $ | 12,341,992 | | | $ | (21,841 | ) | | $ | 1,709,074 | | | $ | (22,774 | ) | | $ | (1,303,352 | ) | | $ | (16,536 | ) | |
The accompanying notes are an integral part of the financial statements.
198
199
MassMutual Select Funds – Financial Statements (Continued)
Statement of Changes in Net Assets
| | | MassMutual
Select Small Company Growth Fund | | MassMutual
Select Small Cap
Value Equity Fund | | MassMutual
Select Small Company Value Fund | | MassMutual
Select Small Cap
Core Equity Fund | | MassMutual
Select Mid Cap Growth Equity Fund | |
| | | Six Months
Ended
June 30, 2006
(Unaudited) | | Year
Ended
December 31, 2005 | | Period
Ended
June 30, 2006*
(Unaudited) | | Six Months
Ended
June 30, 2006
(Unaudited) | | Year
Ended
December 31, 2005 | | Period
Ended
June 30, 2006*
(Unaudited) | | Six Months
Ended
June 30, 2006
(Unaudited) | | Year
Ended
December 31, 2005 | |
| Increase (Decrease) in Net Assets: | |
| Operations: | |
| Net investment income (loss) | | $ | (755,264 | ) | | $ | (1,435,439 | ) | | $ | 24,828 | | | $ | 373,104 | | | $ | 217,669 | | | $ | 5,735 | | | $ | 281,255 | | | $ | (422,710 | ) | |
| Net realized gain (loss) on investment transactions | | | 7,888,608 | | | | 2,810,089 | | | | (67,993 | ) | | | 29,587,442 | | | | 25,737,990 | | | | (324,628 | ) | | | 11,332,661 | | | | 16,225,009 | | |
| Net change in unrealized appreciation (depreciation) on investments | | | (3,266,093 | ) | | | 5,454,661 | | | | (158,220 | ) | | | 22,413,357 | | | | 282,773 | | | | (188,030 | ) | | | (3,041,127 | ) | | | 2,068,720 | | |
| Net increase (decrease) in net assets resulting from operations | | | 3,867,251 | | | | (4,080,011 | ) | | | (201,385 | ) | | | 52,373,903 | | | | 26,238,432 | | | | (506,923 | ) | | | 8,572,789 | | | | 17,871,019 | | |
| Distributions to shareholders (Note 2): | |
| From net realized gains: | |
| Class A | | | - | | | | (1,516,455 | ) | | | - | | | | - | | | | (5,943,592 | ) | | | - | | | | - | | | | - | | |
| Class L | | | - | | | | (664,297 | ) | | | - | | | | - | | | | (5,478,825 | ) | | | - | | | | - | | | | - | | |
| Class Y | | | - | | | | (657,684 | ) | | | - | | | | - | | | | (4,303,502 | ) | | | - | | | | - | | | | - | | |
| Class S | | | - | | | | (559,268 | ) | | | - | | | | - | | | | (9,472,764 | ) | | | - | | | | - | | | | - | | |
| Class N | | | - | | | | (25,785 | ) | | | - | | | | - | | | | (55,816 | ) | | | - | | | | - | | | | - | | |
| Total distributions from net realized gains | | | - | | | | (3,423,489 | ) | | | - | | | | - | | | | (25,254,499 | ) | | | - | | | | - | | | | - | | |
| Net fund share transactions (Note 5): | |
| Class A | | | 4,160,696 | | | | (2,135,735 | ) | | | 100,100 | | | | 5,653,334 | | | | 21,041,121 | | | | 123,752 | | | | 2,997,010 | | | | 855,153 | | |
| Class L | | | 6,150,148 | | | | (12,283,454 | ) | | | 100,100 | | | | 14,460,328 | | | | 8,906,998 | | | | 136,912 | | | | (861,167 | ) | | | (1,873,476 | ) | |
| Class Y | | | (8,482,360 | ) | | | (11,533,610 | ) | | | 100,100 | | | | 55,796,777 | | | | (2,843,056 | ) | | | 1,137,708 | | | | 3,872,719 | | | | 3,344,355 | | |
| Class S | | | 9,832,489 | | | | (2,224,039 | ) | | | 11,145,395 | | | | 53,895,878 | | | | 32,086,401 | | | | 9,600,100 | | | | 9,577,667 | | | | 13,108,475 | | |
| Class N | | | (194,335 | ) | | | 51,508 | | | | 100,100 | | | | (78,299 | ) | | | 339,616 | | | | 100,100 | | | | 71,540 | | | | 217 | | |
| Increase (decrease) in net assets from fund share transactions | | | 11,466,638 | | | | (28,125,330 | ) | | | 11,545,795 | | | | 129,728,018 | | | | 59,531,080 | | | | 11,098,572 | | | | 15,657,769 | | | | 15,434,724 | | |
| Total increase (decrease) in net assets | | | 15,333,889 | | | | (35,628,830 | ) | | | 11,344,410 | | | | 182,101,921 | | | | 60,515,013 | | | | 10,591,649 | | | | 24,230,558 | | | | 33,305,743 | | |
| Net assets: | |
| Beginning of period | | | 144,345,826 | | | | 179,974,656 | | | | - | | | | 582,954,148 | | | | 522,439,135 | | | | - | | | | 168,593,693 | | | | 135,287,950 | | |
| End of period | | $ | 159,679,715 | | | $ | 144,345,826 | | | $ | 11,344,410 | | | $ | 765,056,069 | | | $ | 582,954,148 | | | $ | 10,591,649 | | | $ | 192,824,251 | | | $ | 168,593,693 | | |
Undistributed net investment income (distributions in excess of net investment
income) included in net assets at the end of the year | | $ | (759,138 | ) | | $ | (3,874 | ) | | $ | 24,828 | | | $ | 1,001,341 | | | $ | 628,237 | | | $ | 5,735 | | | $ | 274,444 | | | $ | (6,811 | ) | |
* Fund commenced operations on March 31, 2006.
The accompanying notes are an integral part of the financial statements.
200
201
MassMutual Select Funds – Financial Statements (Continued)
Statement of Changes in Net Assets
| | | MassMutual
Select Emerging Growth Fund | | MassMutual
Select Overseas Fund | | MassMutual Select Destination
Retirement Income Fund | | MassMutual Select Destination
Retirement 2010 Fund | |
| | | Six Months
Ended
June 30, 2006
(Unaudited) | | Year
Ended
December 31, 2005 | | Six Months
Ended
June 30, 2006
(Unaudited) | | Year
Ended
December 31, 2005 | | Six Months
Ended
June 30, 2006
(Unaudited) | | Year
Ended
December 31, 2005 | | Six Months
Ended
June 30, 2006
(Unaudited) | | Year
Ended
December 31, 2005 | |
| Increase (Decrease) in Net Assets: | |
| Operations: | |
| Net investment income (loss) | | $ | (509,792 | ) | | $ | (1,024,800 | ) | | $ | 18,149,678 | | | $ | 6,769,490 | | | $ | (16,351 | ) | | $ | 8,159,890 | | | $ | (50,226 | ) | | $ | 2,929,119 | | |
| Net realized gain (loss) on investment transactions | | | 10,711,845 | | | | 10,110,141 | | | | 57,051,191 | | | | 80,201,610 | | | | 408,403 | | | | 3,464,486 | | | | 97,378 | | | | 2,331,996 | | |
| Net change in unrealized appreciation (depreciation) on investments | | | (6,043,404 | ) | | | (8,040,745 | ) | | | 20,871,381 | | | | (5,807,089 | ) | | | 103,215 | | | | (4,647,067 | ) | | | 330,408 | | | | (1,832,592 | ) | |
| Net increase (decrease) in net assets resulting from operations | | | 4,158,649 | | | | 1,044,596 | | | | 96,072,250 | | | | 81,164,011 | | | | 495,267 | | | | 6,977,309 | | | | 377,560 | | | | 3,428,523 | | |
| Distributions to shareholders (Note 2): | |
| From net investment income: | |
| Class A | | | - | | | | - | | | | - | | | | (2,854,223 | ) | | | - | | | | (1,323,726 | ) | | | - | | | | (869,889 | ) | |
| Class L | | | - | | | | - | | | | - | | | | (3,470,917 | ) | | | - | | | | (3,501,979 | ) | | | - | | | | (1,056,482 | ) | |
| Class Y | | | - | | | | - | | | | - | | | | (2,316,757 | ) | | | - | | | | (3,717,136 | ) | | | - | | | | (934,223 | ) | |
| Class S | | | - | | | | - | | | | - | | | | (5,707,125 | ) | | | - | | | | (158,967 | ) | | | - | | | | (376,371 | ) | |
| Class N | | | - | | | | - | | | | - | | | | (20,367 | ) | | | - | | | | (3,141 | ) | | | - | | | | (3,424 | ) | |
| Total distributions from net investment income | | | - | | | | - | | | | - | | | | (14,369,389 | ) | | | - | | | | (8,704,949 | ) | | | - | | | | (3,240,389 | ) | |
| From net realized gains: | |
| Class A | | | - | | | | - | | | | - | | | | (16,904,250 | ) | | | - | | | | (256,810 | ) | | | - | | | | (155,411 | ) | |
| Class L | | | - | | | | - | | | | - | | | | (17,918,062 | ) | | | - | | | | (801,214 | ) | | | - | | | | (184,574 | ) | |
| Class Y | | | - | | | | - | | | | - | | | | (10,900,232 | ) | | | - | | | | (769,250 | ) | | | - | | | | (159,464 | ) | |
| Class S | | | - | | | | - | | | | - | | | | (26,144,087 | ) | | | - | | | | (26,946 | ) | | | - | | | | (60,535 | ) | |
| Class N | | | - | | | | - | | | | - | | | | (147,404 | ) | | | - | | | | (842 | ) | | | - | | | | (723 | ) | |
| Total distributions from net realized gains | | | - | | | | - | | | | - | | | | (72,014,035 | ) | | | - | | | | (1,855,062 | ) | | | - | | | | (560,707 | ) | |
| Net fund share transactions (Note 5): | |
| Class A | | | 941,972 | | | | (11,815,637 | ) | | | 27,893,129 | | | | 64,637,331 | | | | 5,985,681 | | | | 29,313,445 | | | | 15,495,999 | | | | 23,208,765 | | |
| Class L | | | (14,912,127 | ) | | | (2,069,057 | ) | | | 30,737,190 | | | | 35,307,207 | | | | (6,264,199 | ) | | | 5,692,816 | | | | 1,872,873 | | | | 12,708,691 | | |
| Class Y | | | 165,053 | | | | 175,729 | | | | 39,810,833 | | | | 37,955,448 | | | | 2,784,282 | | | | 26,488,324 | | | | 14,361,195 | | | | 24,880,272 | | |
| Class S | | | 7,228,757 | | | | 2,115,434 | | | | 31,306,497 | | | | 99,096,780 | | | | 2,823,131 | | | | 3,347,968 | | | | 1,189,062 | | | | 9,928,092 | | |
| Class N | | | - | | | | (1 | ) | | | 45,170 | | | | 813,739 | | | | 15,964 | | | | 1,945 | | | | 6,386 | | | | 26,543 | | |
| Increase (decrease) in net assets from fund share transactions | | | (6,576,345 | ) | | | (11,593,532 | ) | | | 129,792,819 | | | | 237,810,505 | | | | 5,344,859 | | | | 64,844,498 | | | | 32,925,515 | | | | 70,752,363 | | |
| Total increase (decrease) in net assets | | | (2,417,696 | ) | | | (10,548,936 | ) | | | 225,865,069 | | | | 232,591,092 | | | | 5,840,126 | | | | 61,261,796 | | | | 33,303,075 | | | | 70,379,790 | | |
| Net assets: | |
| Beginning of period | | | 126,251,305 | | | | 136,800,241 | | | | 849,388,368 | | | | 616,797,276 | | | | 252,828,309 | | | | 191,566,513 | | | | 108,562,256 | | | | 38,182,466 | | |
| End of period | | $ | 123,833,609 | | | $ | 126,251,305 | | | $ | 1,075,253,437 | | | $ | 849,388,368 | | | $ | 258,668,435 | | | $ | 252,828,309 | | | $ | 141,865,331 | | | $ | 108,562,256 | | |
Undistributed net investment income (distributions in excess of net investment
income) included in net assets at the end of the year | | $ | (514,862 | ) | | $ | (5,070 | ) | | $ | 18,108,932 | | | $ | (40,746 | ) | | $ | (19,746 | ) | | $ | (3,395 | ) | | $ | (51,014 | ) | | $ | (788 | ) | |
The accompanying notes are an integral part of the financial statements.
202
203
MassMutual Select Funds – Financial Statements (Continued)
Statement of Changes in Net Assets
| | | MassMutual Select
Destination Retirement 2020 Fund | | MassMutual
Select Destination Retirement 2030 Fund | | MassMutual
Select Destination Retirement 2040 Fund | |
| | | Six Months
Ended
June 30, 2006
(Unaudited) | | Year
Ended
December 31, 2005 | | Six Months
Ended
June 30, 2006
(Unaudited) | | Year
Ended
December 31, 2005 | | Six Months
Ended
June 30, 2006
(Unaudited) | | Year
Ended
December 31, 2005 | |
| Increase (Decrease) in Net Assets: | |
| Operations: | |
| Net investment income (loss) | | $ | (628,163 | ) | | $ | 9,110,238 | | | $ | (463,466 | ) | | $ | 3,489,479 | | | $ | (251,755 | ) | | $ | 953,136 | | |
| Net realized gain (loss) on investment transactions | | | 2,143,643 | | | | 14,151,788 | | | | 2,698,173 | | | | 10,559,898 | | | | 2,299,303 | | | | 7,059,596 | | |
| Net change in unrealized appreciation (depreciation) on investments | | | 117,277 | | | | (3,036,359 | ) | | | 955,439 | | | | 2,961,392 | | | | 422,023 | | | | 2,085,182 | | |
| Net increase (decrease) in net assets resulting from operations | | | 1,632,757 | | | | 20,225,667 | | | | 3,190,146 | | | | 17,010,769 | | | | 2,469,571 | | | | 10,097,914 | | |
| Distributions to shareholders (Note 2): | |
| From net investment income: | |
| Class A | | | - | | | | (2,127,995 | ) | | | - | | | | (956,366 | ) | | | - | | | | (253,728 | ) | |
| Class L | | | - | | | | (5,891,386 | ) | | | - | | | | (2,919,055 | ) | | | - | | | | (1,131,929 | ) | |
| Class Y | | | - | | | | (1,706,889 | ) | | | - | | | | (585,844 | ) | | | - | | | | (98,447 | ) | |
| Class S | | | - | | | | (931,744 | ) | | | - | | | | (322,484 | ) | | | - | | | | (329,216 | ) | |
| Class N | | | - | | | | (5,049 | ) | | | - | | | | (1,962 | ) | | | - | | | | (911 | ) | |
| Total distributions from net investment income | | | - | | | | (10,663,063 | ) | | | - | | | | (4,785,711 | ) | | | - | | | | (1,814,231 | ) | |
| From net realized gains: | |
| Class A | | | - | | | | (953,611 | ) | | | - | | | | (736,225 | ) | | | - | | | | (418,704 | ) | |
| Class L | | | - | | | | (2,714,789 | ) | | | - | | | | (2,391,371 | ) | | | - | | | | (1,885,024 | ) | |
| Class Y | | | - | | | | (721,793 | ) | | | - | | | | (371,980 | ) | | | - | | | | (115,830 | ) | |
| Class S | | | - | | | | (385,665 | ) | | | - | | | | (196,980 | ) | | | - | | | | (328,170 | ) | |
| Class N | | | - | | | | (2,734 | ) | | | - | | | | (2,093 | ) | | | - | | | | (2,407 | ) | |
| Total distributions from net realized gains | | | - | | | | (4,778,592 | ) | | | - | | | | (3,698,649 | ) | | | - | | | | (2,750,135 | ) | |
| Net fund share transactions (Note 5): | |
| Class A | | | 24,500,600 | | | | 67,225,245 | | | | 21,773,842 | | | | 40,172,488 | | | | 7,559,061 | | | | 19,572,005 | | |
| Class L | | | 14,870,953 | | | | 21,613,892 | | | | 10,669,478 | | | | 6,510,573 | | | | 14,726,388 | | | | 1,440,119 | | |
| Class Y | | | 15,507,076 | | | | 55,083,473 | | | | 12,150,914 | | | | 29,947,392 | | | | 15,310,564 | | | | 7,539,775 | | |
| Class S | | | 13,801,409 | | | | 23,420,403 | | | | 13,297,641 | | | | 13,825,455 | | | | 5,668,782 | | | | 25,786,914 | | |
| Class N | | | 17,675 | | | | 121,627 | | | | 9,152 | | | | 43,095 | | | | 28,719 | | | | 23,549 | | |
| Increase (decrease) in net assets from fund share transactions | | | 68,697,713 | | | | 167,464,640 | | | | 57,901,027 | | | | 90,499,003 | | | | 43,293,514 | | | | 54,362,362 | | |
| Total increase (decrease) in net assets | | | 70,330,470 | | | | 172,248,652 | | | | 61,091,173 | | | | 99,025,412 | | | | 45,763,085 | | | | 59,895,910 | | |
| Net assets: | |
| Beginning of period | | | 428,672,175 | | | | 256,423,523 | | | | 296,142,654 | | | | 197,117,242 | | | | 170,247,938 | | | | 110,352,028 | | |
| End of period | | $ | 499,002,645 | | | $ | 428,672,175 | | | $ | 357,233,827 | | | $ | 296,142,654 | | | $ | 216,011,023 | | | $ | 170,247,938 | | |
Undistributed net investment income (distributions in excess of net investment
income) included in net assets at the end of the year | | $ | (633,025 | ) | | $ | (4,862 | ) | | $ | (467,004 | ) | | $ | (3,538 | ) | | $ | (253,755 | ) | | $ | (2,000 | ) | |
The accompanying notes are an integral part of the financial statements.
204
205
MassMutual Select Strategic Bond Fund – Financial Statements (Continued)
Financial Highlights (For a share outstanding throughout each period)
| | | Class A | |
| | | Six months
ended
6/30/06
(Unaudited) | | Year ended
12/31/05 | | Period ended
12/31/04+ | |
| Net asset value, beginning of period | | $ | 9.97 | | | $ | 10.00 | | | $ | 10.00 | | |
| Income (loss) from investment operations: | |
| Net investment income | | | 0.21 | *** | | | 0.33 | *** | | | 0.00 | | |
| Net realized and unrealized loss on investments | | | (0.36 | ) | | | (0.19 | ) | | | 0.00 | | |
| Total income (loss) from investment operations | | | (0.15 | ) | | | 0.14 | | | | 0.00 | | |
| Less distributions to shareholders: | |
| From net investment income | | | - | | | | (0.17 | ) | | | - | | |
| Net asset value, end of period | | $ | 9.82 | | | $ | 9.97 | | | $ | 10.00 | | |
| Total Return(a) | | | (1.50 | )% (b)** | | | 1.37 | % (b) | | | 0.00 | %‡ | |
| Ratios / Supplemental Data: | |
| Net assets, end of period (000's) | | $ | 29,492 | | | $ | 20,689 | | | $ | 101 | | |
| Ratio of expenses to average daily net assets: | |
| Before expense waiver | | | 1.11 | % * | | | 1.21 | % | | | - | ‡ | |
| After expense waiver | | | 0.96 | % *# | | | 1.00 | % # | | | N/A‡ | | |
| Net investment income to average daily net assets | | | 4.25 | % * | | | 3.25 | % | | | 0.00 | %‡ | |
| Portfolio turnover rate | | | 137 | % ** | | | 566 | % | | | N/A | | |
| | | Class L | |
| | | Six months
ended
6/30/06
(Unaudited) | | Year ended
12/31/05 | | Period ended
12/31/04+ | |
| Net asset value, beginning of period | | $ | 9.98 | | | $ | 10.00 | | | $ | 10.00 | | |
| Income (loss) from investment operations: | |
| Net investment income | | | 0.22 | *** | | | 0.39 | *** | | | 0.00 | | |
| Net realized and unrealized loss on investments | | | (0.35 | ) | | | (0.23 | ) | | | 0.00 | | |
| Total income (loss) from investment operations | | | (0.13 | ) | | | 0.16 | | | | 0.00 | | |
| Less distributions to shareholders: | |
| From net investment income | | | - | | | | (0.18 | ) | | | - | | |
| Net asset value, end of period | | $ | 9.85 | | | $ | 9.98 | | | $ | 10.00 | | |
| Total Return(a) | | | (1.30 | )% ** | | | 1.57 | % | | | 0.00 | %‡ | |
| Ratios / Supplemental Data: | |
| Net assets, end of period (000's) | | $ | 5,326 | | | $ | 3,933 | | | $ | 101 | | |
| Ratio of expenses to average daily net assets: | |
| Before expense waiver | | | 0.85 | % * | | | 0.96 | % | | | - | ‡ | |
| After expense waiver | | | 0.70 | % *# | | | 0.75 | % # | | | N/A‡ | | |
| Net investment income to average daily net assets | | | 4.53 | % * | | | 3.82 | % | | | 0.00 | %‡ | |
| Portfolio turnover rate | | | 137 | % ** | | | 566 | % | | | N/A | | |
* Annualized.
** Percentage represents results for the period and are not annualized.
*** Per share amount calculated on the average shares method.
# Computed after giving effect to an agreement by MassMutual to waive certain fees and expenses of the Fund.
(a) Employee retirement benefit plans that invest plan assets in the Separate Investment Accounts (SIAs) may be subject to certain charges as set forth in their respective Plan Documents. Total return figures would be lower for the period presented if they reflected these charges.
(b) Total Return excludes a front-end sales charge and would be lower for the period presented if it reflected these charges.
+ The Fund commenced operations on December 31, 2004.
‡ Amounts are de minimus due to the short period of operations.
The accompanying notes are an integral part of the financial statements.
206
MassMutual Select Strategic Bond Fund – Financial Statements (Continued)
Financial Highlights (For a share outstanding throughout each period)
| | | Class Y | |
| | | Six months
ended
6/30/06
(Unaudited) | | Year ended
12/31/05 | | Period ended
12/31/04+ | |
| Net asset value, beginning of period | | $ | 9.98 | | | $ | 10.00 | | | $ | 10.00 | | |
| Income (loss) from investment operations: | |
| Net investment income | | | 0.22 | *** | | | 0.37 | *** | | | 0.00 | | |
| Net realized and unrealized loss on investments | | | (0.35 | ) | | | (0.21 | ) | | | 0.00 | | |
| Total income (loss) from investment operations | | | (0.13 | ) | | | 0.16 | | | | 0.00 | | |
| Less distributions to shareholders: | |
| From net investment income | | | - | | | | (0.18 | ) | | | - | | |
| Net asset value, end of period | | $ | 9.85 | | | $ | 9.98 | | | $ | 10.00 | | |
| | | | | | | | | | | | | | |
| Total Return(a) | | | (1.30 | )% ** | | | 1.57 | % | | | 0.00 | %‡ | |
| Ratios / Supplemental Data: | |
| Net assets, end of period (000's) | | $ | 90,589 | | | $ | 59,396 | | | $ | 101 | | |
| Ratio of expenses to average daily net assets: | |
| Before expense waiver | | | 0.71 | % * | | | 0.81 | % | | | - | ‡ | |
| After expense waiver | | | N/A | | | | 0.75 | % # | | | N/A ‡ | | |
| Net investment income to average daily net assets | | | 4.50 | % * | | | 3.64 | % | | | 0.00 | %‡ | |
| Portfolio turnover rate | | | 137 | % ** | | | 566 | % | | | N/A | | |
| | | Class S | |
| | | Six months
ended
6/30/06
(Unaudited) | | Year ended
12/31/05 | | Period ended
12/31/04+ | |
| Net asset value, beginning of period | | $ | 9.99 | | | $ | 10.00 | | | $ | 10.00 | | |
| Income (loss) from investment operations: | |
| Net investment income | | | 0.22 | *** | | | 0.33 | *** | | | 0.00 | | |
| Net realized and unrealized loss on investments | | | (0.36 | ) | | | (0.16 | ) | | | 0.00 | | |
| Total income (loss) from investment operations | | | (0.14 | ) | | | 0.17 | | | | 0.00 | | |
| Less distributions to shareholders: | |
| From net investment income | | | - | | | | (0.18 | ) | | | - | | |
| Net asset value, end of period | | $ | 9.85 | | | $ | 9.99 | | | $ | 10.00 | | |
| | | | | | | | | | | | | | |
| Total Return(a) | | | (1.40 | )% ** | | | 1.65 | % | | | 0.00 | %‡ | |
| Ratios / Supplemental Data: | |
| Net assets, end of period (000's) | | $ | 62,579 | | | $ | 62,533 | | | $ | 49,596 | | |
| Ratio of expenses to average daily net assets: | |
| Before expense waiver | | | 0.65 | % * | | | 0.76 | % | | | - | ‡ | |
| After expense waiver | | | N/A | | | | 0.70 | % # | | | N/A‡ | | |
| Net investment income to average daily net assets | | | 4.50 | % * | | | 3.23 | % | | | 0.00 | %‡ | |
| Portfolio turnover rate | | | 137 | % ** | | | 566 | % | | | N/A | | |
* Annualized.
** Percentage represents results for the period and are not annualized.
*** Per share amount calculated on the average shares method.
# Computed after giving effect to an agreement by MassMutual to waive certain fees and expenses of the Fund.
(a) Employee retirement benefit plans that invest plan assets in the Separate Investment Accounts (SIAs) may be subject to certain charges as set forth in their respective Plan Documents. Total return figures would be lower for the period presented if they reflected these charges.
+ The Fund commenced operations on December 31, 2004.
‡ Amounts are de minimus due to the short period of operations.
The accompanying notes are an integral part of the financial statements.
207
MassMutual Select Strategic Bond Fund – Financial Statements (Continued)
Financial Highlights (For a share outstanding throughout each period)
| | | Class N | |
| | | Six months
ended
6/30/06
(Unaudited) | | Year ended
12/31/05 | | Period ended
12/31/04+ | |
| Net asset value, beginning of period | | $ | 9.96 | | | $ | 10.00 | | | $ | 10.00 | | |
| Income (loss) from investment operations: | |
| Net investment income | | | 0.20 | *** | | | 0.28 | *** | | | 0.00 | | |
| Net realized and unrealized gain on investments | | | (0.36 | ) | | | (0.18 | ) | | | 0.00 | | |
| Total income from investment operations | | | (0.16 | ) | | | 0.10 | | | | 0.00 | | |
| Less distributions to shareholders: | |
| From net investment income | | | - | | | | (0.14 | ) | | | - | | |
| Net asset value, end of period | | $ | 9.80 | | | $ | 9.96 | | | $ | 10.00 | | |
| | | | | | | | | | | | | | |
| Total Return(a) | | | (1.71 | )% (b)** | | | 0.99 | % (b) | | | 0.00 | %‡ | |
| Ratios / Supplemental Data: | |
| Net assets, end of period (000's) | | $ | 1,684 | | | $ | 208 | | | $ | 101 | | |
| Ratio of expenses to average daily net assets: | |
| Before expense waiver | | | 1.43 | % * | | | 1.51 | % | | | - | ‡ | |
| After expense waiver | | | 1.28 | % *# | | | 1.30 | % # | | | N/A‡ | | |
| Net investment income to average daily net assets | | | 4.10 | % * | | | 2.78 | % | | | 0.00 | %‡ | |
| Portfolio turnover rate | | | 137 | % ** | | | 566 | % | | | N/A | | |
* Annualized.
** Percentage represents results for the period and are not annualized.
*** Per share amount calculated on the average shares method.
# Computed after giving effect to an agreement by MassMutual to waive certain fees and expenses of the Fund.
(a) Employee retirement benefit plans that invest plan assets in the Separate Investment Accounts (SIAs) may be subject to certain charges as set forth in their respective Plan Documents. Total return figures would be lower for the period presented if they reflected these charges.
(b) Total Return excludes a contingent deferred sales charge and would be lower for the period presented if it reflected these charges.
+ The Fund commenced operations on December 31, 2004.
‡ Amounts are de minimus due to the short period of operations.
The accompanying notes are an integral part of the financial statements.
208
MassMutual Select Strategic Balanced Fund – Financial Statements (Continued)
Financial Highlights (For a share outstanding throughout each period)
| | | Class A | |
| | | Six months
ended
6/30/06
(Unaudited) | | Year ended
12/31/05† | | Year ended
12/31/04 | | Period ended
12/31/03+ | |
| Net asset value, beginning of period | | $ | 10.56 | | | $ | 10.45 | | | $ | 10.00 | | | $ | 10.00 | | |
| Income (loss) from investment operations: | |
| Net investment income | | | 0.11 | *** | | | 0.15 | *** | | | 0.11 | *** | | | - | | |
| Net realized and unrealized gain on investments | | | 0.08 | | | | 0.20 | | | | 0.42 | | | | - | | |
| Total income from investment operations | | | 0.19 | | | | 0.35 | | | | 0.53 | | | | 0.00 | | |
| Less distributions to shareholders: | |
| From net investment income | | | - | | | | (0.18 | ) | | | (0.08 | ) | | | - | | |
| From net realized gains | | | - | | | | (0.06 | ) | | | - | | | | - | | |
| Total distributions | | | - | | | | (0.24 | ) | | | (0.08 | ) | | | - | | |
| Net asset value, end of period | | $ | 10.75 | | | $ | 10.56 | | | $ | 10.45 | | | $ | 10.00 | | |
| | | | | | | | | | | | | | | | | | |
| Total Return(a) | | | 1.80 | %(b)** | | | 3.33 | % (b) | | | 5.34 | % (b) | | | - | ‡ | |
| Ratios / Supplemental Data: | |
| Net assets, end of period (000's) | | $ | 28,384 | | | $ | 26,267 | | | $ | 32,987 | | | $ | 1 | | |
| Ratio of expenses to average daily net assets: | |
| Before expense waiver | | | 1.22 | %* | | | 1.23 | % | | | 1.24 | % | | | - | ‡ | |
| After expense waiver | | | 1.21 | %#* | | | 1.21 | % # | | | 1.21 | % (c)# | | | - | ‡ | |
| Net investment income to average daily net assets | | | 2.04 | %* | | | 1.40 | % | | | 1.10 | % | | | - | ‡ | |
| Portfolio turnover rate | | | 60 | %** | | | 211 | % | | | 129 | % | | | N/A | | |
| | | Class L | |
| | | Six months
ended
6/30/06
(Unaudited) | | Year ended
12/31/05† | | Year ended
12/31/04 | | Period ended
12/31/03+ | |
| Net asset value, beginning of period | | $ | 10.58 | | | $ | 10.48 | | | $ | 10.00 | | | $ | 10.00 | | |
| Income (loss) from investment operations: | |
| Net investment income | | | 0.12 | *** | | | 0.18 | *** | | | 0.13 | *** | | | - | | |
| Net realized and unrealized gain on investments | | | 0.07 | | | | 0.20 | | | | 0.43 | | | | - | | |
| Total income from investment operations | | | 0.19 | | | | 0.38 | | | | 0.56 | | | | 0.00 | | |
| Less distributions to shareholders: | |
| From net investment income | | | - | | | | (0.22 | ) | | | (0.08 | ) | | | - | | |
| From net realized gains | | | - | | | | (0.06 | ) | | | - | | | | - | | |
| Total distributions | | | - | | | | (0.28 | ) | | | (0.08 | ) | | | - | | |
| Net asset value, end of period | | $ | 10.77 | | | $ | 10.58 | | | $ | 10.48 | | | $ | 10.00 | | |
| | | | | | | | | | | | | | | | | | |
| Total Return(a) | | | 1.80 | %** | | | 3.63 | % | | | 5.62 | % | | | - | ‡ | |
| Ratios / Supplemental Data: | |
| Net assets, end of period (000's) | | $ | 91,418 | | | $ | 101,151 | | | $ | 104,995 | | | $ | 1 | | |
| Ratio of expenses to average daily net assets: | |
| Before expense waiver | | | 0.97 | %* | | | 0.98 | % | | | 0.98 | % | | | - | ‡ | |
| After expense waiver | | | 0.96 | %#* | | | 0.96 | % # | | | 0.96 | % (c)# | | | - | ‡ | |
| Net investment income to average daily net assets | | | 2.26 | %* | | | 1.68 | % | | | 1.28 | % | | | - | ‡ | |
| Portfolio turnover rate | | | 60 | %** | | | 211 | % | | | 129 | % | | | N/A | | |
* Annualized.
** Percentage represents results for the period and are not annualized.
*** Per share amount calculated on the average share method.
† Effective January 1, 2005, brokerage commissions are included with realized gain or loss on investment transactions. Prior to January 1, 2005, these amounts were presented as a reduction of expenses. Prior year amounts have not been restated to reflect this change due to immateriality. (See Note 3).
+ The Fund commenced operations on December 31, 2003.
‡ Amounts are de minimis due to the short period of operations.
# Computed after giving effect to an agreement by MassMutual to waive certain fees and expenses of the Fund.
(a) Employee retirement benefit plans that invest plan assets in the Separate Investment Accounts (SIAs) may be subject to certain charges as set forth in their respective Plan Documents. Total return figures would be lower for the periods presented if they reflected these charges.
(b) Total Return excludes a front-end sales charge and would be lower for the years presented if it reflected these charges.
(c) The Fund has entered into an agreement with certain brokers to rebate a portion of brokerage commissions. The rebated commissions are used to reduce operating expenses of the Fund.
The accompanying notes are an integral part of the financial statements.
209
MassMutual Select Strategic Balanced Fund – Financial Statements (Continued)
Financial Highlights (For a share outstanding throughout each period)
| | | Class Y | |
| | | Six months
ended
6/30/06
(Unaudited) | | Year ended
12/31/05† | | Year ended
12/31/04 | | Period ended
12/31/03+ | |
| Net asset value, beginning of period | | $ | 10.58 | | | $ | 10.48 | | | $ | 10.00 | | | $ | 10.00 | | |
| Income (loss) from investment operations: | |
| Net investment income | | | 0.13 | *** | | | 0.19 | *** | | | 0.14 | *** | | | - | | |
| Net realized and unrealized gain on investments | | | 0.07 | | | | 0.20 | | | | 0.43 | | | | - | | |
| Total income from investment operations | | | 0.20 | | | | 0.39 | | | | 0.57 | | | | 0.00 | | |
| Less distributions to shareholders: | |
| From net investment income | | | - | | | | (0.23 | ) | | | (0.09 | ) | | | - | | |
| From net realized gains | | | - | | | | (0.06 | ) | | | - | | | | - | | |
| Total distributions | | | - | | | | (0.29 | ) | | | (0.09 | ) | | | - | | |
| Net asset value, end of period | | $ | 10.78 | | | $ | 10.58 | | | $ | 10.48 | | | $ | 10.00 | | |
| | | | | | | | | | | | | | | | | | |
| Total Return(a) | | | 1.89 | %** | | | 3.76 | % | | | 5.74 | % | | | - | ‡ | |
| Ratios / Supplemental Data: | |
| Net assets, end of period (000's) | | $ | 85,809 | | | $ | 78,145 | | | $ | 99,246 | | | $ | 1 | | |
| Ratio of expenses to average daily net assets: | |
| Before expense waiver | | | 0.82 | %* | | | 0.83 | % | | | 0.83 | % | | | - | ‡ | |
| After expense waiver | | | 0.81 | %#* | | | 0.81 | % # | | | 0.81 | % (c)# | | | - | ‡ | |
| Net investment income to average daily net assets | | | 2.43 | %* | | | 1.82 | % | | | 1.41 | % | | | - | ‡ | |
| Portfolio turnover rate | | | 60 | %** | | | 211 | % | | | 129 | % | | | N/A | | |
| | | Class S | |
| | | Six months
ended
6/30/06
(Unaudited) | | Year ended
12/31/05† | | Year ended
12/31/04 | | Period ended
12/31/03+ | |
| Net asset value, beginning of period | | $ | 10.58 | | | $ | 10.49 | | | $ | 10.00 | | | $ | 10.00 | | |
| Income (loss) from investment operations: | |
| Net investment income | | | 0.13 | *** | | | 0.20 | *** | | | 0.12 | *** | | | - | | |
| Net realized and unrealized gain on investments | | | 0.08 | | | | 0.19 | | | | 0.47 | | | | - | | |
| Total income from investment operations | | | 0.21 | | | | 0.39 | | | | 0.59 | | | | 0.00 | | |
| Less distributions to shareholders: | |
| From net investment income | | | - | | | | (0.24 | ) | | | (0.10 | ) | | | - | | |
| From net realized gains | | | - | | | | (0.06 | ) | | | - | | | | - | | |
| Total distributions | | | - | | | | (0.30 | ) | | | (0.10 | ) | | | - | | |
| Net asset value, end of period | | $ | 10.79 | | | $ | 10.58 | | | $ | 10.49 | | | $ | 10.00 | | |
| | | | | | | | | | | | | | | | | | |
| Total Return(a) | | | 1.98 | %** | | | 3.85 | % | | | 5.76 | % | | | - | ‡ | |
| Ratios / Supplemental Data: | |
| Net assets, end of period (000's) | | $ | 15,749 | | | $ | 15,026 | | | $ | 13,159 | | | $ | 10,001 | | |
| Ratio of expenses to average daily net assets: | |
| Before expense waiver | | | 0.77 | %* | | | 0.78 | % | | | 0.84 | % | | | - | ‡ | |
| After expense waiver | | | 0.76 | %#* | | | 0.76 | % # | | | 0.76 | % (c)# | | | - | ‡ | |
| Net investment income to average daily net assets | | | 2.49 | %* | | | 1.90 | % | | | 1.18 | % | | | - | ‡ | |
| Portfolio turnover rate | | | 60 | %** | | | 211 | % | | | 129 | % | | | N/A | | |
* Annualized.
** Percentage represents results for the period and are not annualized.
*** Per share amount calculated on the average share method.
† Effective January 1, 2005, brokerage commissions are included with realized gain or loss on investment transactions. Prior to January 1, 2005, these amounts were presented as a reduction of expenses. Prior year amounts have not been restated to reflect this change due to immateriality. (See Note 3).
+ The Fund commenced operations on December 31, 2003.
‡ Amounts are de minimis due to the short period of operations.
# Computed after giving effect to an agreement by MassMutual to waive certain fees and expenses of the Fund.
(a) Employee retirement benefit plans that invest plan assets in the Separate Investment Accounts (SIAs) may be subject to certain charges as set forth in their respective Plan Documents. Total return figures would be lower for the periods presented if they reflected these charges.
(c) The Fund has entered into an agreement with certain brokers to rebate a portion of brokerage commissions. The rebated commissions are used to reduce operating expenses of the Fund.
The accompanying notes are an integral part of the financial statements.
210
MassMutual Select Strategic Balanced Fund – Financial Statements (Continued)
Financial Highlights (For a share outstanding throughout each period)
| | | Class N | |
| | | Six months
ended
6/30/06
(Unaudited) | | Year ended
12/31/05† | | Year ended
12/31/04 | | Period ended
12/31/03+ | |
| Net asset value, beginning of period | | $ | 10.56 | | | $ | 10.46 | | | $ | 10.00 | | | $ | 10.00 | | |
| Income (loss) from investment operations: | |
| Net investment income | | | 0.09 | *** | | | 0.12 | *** | | | 0.08 | *** | | | - | | |
| Net realized and unrealized gain on investments | | | 0.07 | | | | 0.21 | | | | 0.42 | | | | - | | |
| Total income from investment operations | | | 0.16 | | | | 0.33 | | | | 0.50 | | | | 0.00 | | |
| Less distributions to shareholders: | |
| From net investment income | | | - | | | | (0.17 | ) | | | (0.04 | ) | | | - | | |
| From net realized gains | | | - | | | | (0.06 | ) | | | - | | | | - | | |
| Total distributions | | | - | | | | (0.23 | ) | | | (0.04 | ) | | | - | | |
| Net asset value, end of period | | $ | 10.72 | | | $ | 10.56 | | | $ | 10.46 | | | $ | 10.00 | | |
| | | | | | | | | | | | | | | | | | |
| Total Return(a) | | | 1.61 | %(b)** | | | 3.02 | % (b) | | | 5.02 | % (b) | | | - | ‡ | |
| Ratios / Supplemental Data: | |
| Net assets, end of period (000's) | | $ | 431 | | | $ | 419 | | | $ | 422 | | | $ | 1 | | |
| Ratio of expenses to average daily net assets: | |
| Before expense waiver | | | 1.52 | %* | | | 1.53 | % | | | 1.55 | % | | | - | ‡ | |
| After expense waiver | | | 1.51 | %#* | | | 1.51 | % # | | | 1.51 | % (c)# | | | - | ‡ | |
| Net investment income to average daily net assets | | | 1.74 | %* | | | 1.13 | % | | | 0.78 | % | | | - | ‡ | |
| Portfolio turnover rate | | | 60 | %** | | | 211 | % | | | 129 | % | | | N/A | | |
* Annualized.
** Percentage represents results for the period and are not annualized.
*** Per share amount calculated on the average share method.
† Effective January 1, 2005, brokerage commissions are included with realized gain or loss on investment transactions. Prior to January 1, 2005, these amounts were presented as a reduction of expenses. Prior year amounts have not been restated to reflect this change due to immateriality. (See Note 3).
+ The Fund commenced operations on December 31, 2003.
‡ Amounts are de minimis due to the short period of operations.
# Computed after giving effect to an agreement by MassMutual to waive certain fees and expenses of the Fund.
(a) Employee retirement benefit plans that invest plan assets in the Separate Investment Accounts (SIAs) may be subject to certain charges as set forth in their respective Plan Documents. Total return figures would be lower for the periods presented if they reflected these charges.
(b) Total Return excludes a contingent deferred sales charge and would be lower for the period presented if it reflected these charges.
(c) The Fund has entered into an agreement with certain brokers to rebate a portion of brokerage commissions. The rebated commissions are used to reduce operating expenses of the Fund.
The accompanying notes are an integral part of the financial statements.
211
MassMutual Select Diversified Value Fund – Financial Statements (Continued)
Financial Highlights (For a share outstanding throughout each period)
| | | Class A | |
| | | Six months
ended
6/30/06
(Unaudited) | | Year ended
12/31/05 | | Period ended
12/31/04† | |
| Net asset value, beginning of period | | $ | 11.26 | | | $ | 10.93 | | | $ | 10.00 | | |
| Income (loss) from investment operations: | |
| Net investment income | | | 0.08 | *** | | | 0.14 | *** | | | 0.04 | *** | |
| Net realized and unrealized gain on investments | | | 0.55 | | | | 0.54 | | | | 0.94 | | |
| Total income from investment operations | | | 0.63 | | | | 0.68 | | | | 0.98 | | |
| Less distributions to shareholders: | |
| From net investment income | | | - | | | | (0.12 | ) | | | (0.04 | ) | |
| From net realized gains | | | - | | | | (0.23 | ) | | | (0.01 | ) | |
| Total distributions | | | - | | | | (0.35 | ) | | | (0.05 | ) | |
| Net asset value, end of period | | $ | 11.89 | | | $ | 11.26 | | | $ | 10.93 | | |
| | | | | | | | | | | | | | |
| Total Return(a) | | | 5.60 | %(b)** | | | 6.23 | % (b) | | | 9.83 | % **(b) | |
| Ratios / Supplemental Data: | |
| Net assets, end of period (000's) | | $ | 44,087 | | | $ | 29,953 | | | $ | 4,998 | | |
| Ratio of expenses to average daily net assets: | |
| Before expense waiver | | | 1.08 | %* | | | 1.09 | % | | | 1.15 | % * | |
| After expense waiver | | | N/A | | | | N/A | | | | 1.09 | % *# | |
| Net investment income to average daily net assets | | | 1.30 | %* | | | 1.27 | % | | | 1.99 | % * | |
| Portfolio turnover rate | | | 9 | %** | | | 16 | % | | | 5 | % ** | |
| | | Class L | |
| | | Six months
ended
6/30/06
(Unaudited) | | Year ended
12/31/05 | | Period ended
12/31/04† | |
| Net asset value, beginning of period | | $ | 11.28 | | | $ | 10.93 | | | $ | 10.00 | | |
| Income (loss) from investment operations: | |
| Net investment income | | | 0.09 | *** | | | 0.17 | *** | | | 0.05 | *** | |
| Net realized and unrealized gain on investments | | | 0.56 | | | | 0.54 | | | | 0.94 | | |
| Total income from investment operations | | | 0.65 | | | | 0.71 | | | | 0.99 | | |
| Less distributions to shareholders: | |
| From net investment income | | | - | | | | (0.13 | ) | | | (0.05 | ) | |
| From net realized gains | | | - | | | | (0.23 | ) | | | (0.01 | ) | |
| Total distributions | | | - | | | | (0.36 | ) | | | (0.06 | ) | |
| Net asset value, end of period | | $ | 11.93 | | | $ | 11.28 | | | $ | 10.93 | | |
| | | | | | | | | | | | | | |
| Total Return(a) | | | 5.76 | %** | | | 6.42 | % | | | 9.99 | % ** | |
| Ratios / Supplemental Data: | |
| Net assets, end of period (000's) | | $ | 41,213 | | | $ | 29,455 | | | $ | 20,480 | | |
| Ratio of expenses to average daily net assets: | |
| Before expense waiver | | | 0.79 | %* | | | 0.80 | % | | | 0.86 | % * | |
| After expense waiver | | | N/A | | | | N/A | | | | 0.80 | % *# | |
| Net investment income to average daily net assets | | | 1.59 | %* | | | 1.55 | % | | | 2.28 | % * | |
| Portfolio turnover rate | | | 9 | %** | | | 16 | % | | | 5 | % ** | |
* Annualized.
** Percentages represent results for the period and are not annualized.
*** Per share amount calculated on the average share method.
† For the period from October 15, 2004 (commencement of operations) through December 31, 2004.
# Computed after giving effect to an agreement by MassMutual to waive certain fees and expense of the Fund.
(a) Employee retirement benefit plans that invest plan assets in the Separate Investment Accounts (SIAs) may be subject to certain charges as set forth in their respective Plan Documents. Total return figures would be lower for the period presented if they reflected these charges.
(b) Total return excludes a front end sales charge for Class A and would be lower for the period presented if they reflected these charges.
The accompanying notes are an integral part of the financial statements.
212
MassMutual Select Diversified Value Fund – Financial Statements (Continued)
Financial Highlights (For a share outstanding throughout each period)
| | | Class Y | |
| | | Six months
ended
6/30/06
(Unaudited) | | Year ended
12/31/05 | | Period ended
12/31/04† | |
| Net asset value, beginning of period | | $ | 11.27 | | | $ | 10.93 | | | $ | 10.00 | | |
| Income (loss) from investment operations: | |
| Net investment income | | | 0.10 | *** | | | 0.19 | *** | | | 0.05 | *** | |
| Net realized and unrealized gain on investments | | | 0.56 | | | | 0.53 | | | | 0.94 | | |
| Total income from investment operations | | | 0.66 | | | | 0.72 | | | | 0.99 | | |
| Less distributions to shareholders: | |
| From net investment income | | | - | | | | (0.15 | ) | | | (0.05 | ) | |
| From net realized gains | | | - | | | | (0.23 | ) | | | (0.01 | ) | |
| Total distributions | | | - | | | | (0.38 | ) | | | (0.06 | ) | |
| Net asset value, end of period | | $ | 11.93 | | | $ | 11.27 | | | $ | 10.93 | | |
| | | | | | | | | | | | | | |
| Total Return(a) | | | 5.86 | %** | | | 6.61 | % | | | 9.91 | % ** | |
| Ratios / Supplemental Data: | |
| Net assets, end of period (000's) | | $ | 107,680 | | | $ | 56,761 | | | $ | 1,273 | | |
| Ratio of expenses to average daily net assets: | |
| Before expense waiver | | | 0.68 | %* | | | 0.69 | % | | | 0.75 | % * | |
| After expense waiver | | | N/A | | | | N/A | | | | 0.69 | % *# | |
| Net investment income to average daily net assets | | | 1.72 | %* | | | 1.70 | % | | | 2.39 | % * | |
| Portfolio turnover rate | | | 9 | %** | | | 16 | % | | | 5 | % ** | |
| | | Class S | |
| | | Six months
ended
6/30/06
(Unaudited) | | Year ended
12/31/05 | | Period ended
12/31/04† | |
| Net asset value, beginning of period | | $ | 11.28 | | | $ | 10.94 | | | $ | 10.00 | | |
| Income (loss) from investment operations: | |
| Net investment income | | | 0.11 | *** | | | 0.19 | *** | | | 0.06 | *** | |
| Net realized and unrealized gain on investments | | | 0.56 | | | | 0.53 | | | | 0.94 | | |
| Total income from investment operations | | | 0.67 | | | | 0.72 | | | | 1.00 | | |
| Less distributions to shareholders: | |
| From net investment income | | | - | | | | (0.15 | ) | | | (0.05 | ) | |
| From net realized gains | | | - | | | | (0.23 | ) | | | (0.01 | ) | |
| Total distributions | | | - | | | | (0.38 | ) | | | (0.06 | ) | |
| Net asset value, end of period | | $ | 11.95 | | | $ | 11.28 | | | $ | 10.94 | | |
| | | | | | | | | | | | | | |
| Total Return(a) | | | 5.94 | %** | | | 6.59 | % | | | 10.03 | % ** | |
| Ratios / Supplemental Data: | |
| Net assets, end of period (000's) | | $ | 194,791 | | | $ | 186,641 | | | $ | 173,341 | | |
| Ratio of expenses to average daily net assets: | |
| Before expense waiver | | | 0.58 | %* | | | 0.59 | % | | | 0.65 | % * | |
| After expense waiver | | | N/A | | | | N/A | | | | 0.59 | % *# | |
| Net investment income to average daily net assets | | | 1.79 | %* | | | 1.75 | % | | | 2.49 | % * | |
| Portfolio turnover rate | | | 9 | %** | | | 16 | % | | | 5 | % ** | |
* Annualized.
** Percentages represent results for the period and are not annualized.
*** Per share amount calculated on the average share method.
† For the period from October 15, 2004 (commencement of operations) through December 31, 2004.
# Computed after giving effect to an agreement by MassMutual to waive certain fees and expense of the Fund.
(a) Employee retirement benefit plans that invest plan assets in the Separate Investment Accounts (SIAs) may be subject to certain charges as set forth in their respective Plan Documents. Total return figures would be lower for the period presented if they reflected these charges.
The accompanying notes are an integral part of the financial statements.
213
MassMutual Select Diversified Value Fund – Financial Statements (Continued)
Financial Highlights (For a share outstanding throughout each period)
| | | Class N | |
| | | Six months
ended
6/30/06
(Unaudited) | | Year ended
12/31/05 | | Period ended
12/31/04† | |
| Net asset value, beginning of period | | $ | 11.28 | | | $ | 10.94 | | | $ | 10.00 | | |
| Income (loss) from investment operations: | |
| Net investment income | | | 0.05 | *** | | | 0.11 | *** | | | 0.04 | *** | |
| Net realized and unrealized gain on investments | | | 0.57 | | | | 0.52 | | | | 0.94 | | |
| Total income from investment operations | | | 0.62 | | | | 0.63 | | | | 0.98 | | |
| Less distributions to shareholders: | |
| From net investment income | | | - | | | | (0.06 | ) | | | (0.03 | ) | |
| From net realized gains | | | - | | | | (0.23 | ) | | | (0.01 | ) | |
| Total distributions | | | - | | | | (0.29 | ) | | | (0.04 | ) | |
| Net asset value, end of period | | $ | 11.90 | | | $ | 11.28 | | | $ | 10.94 | | |
| | | | | | | | | | | | | | |
| Total Return(a) | | | 5.50 | %(b)** | | | 5.77 | % (b) | | | 9.84 | % **(b) | |
| Ratios / Supplemental Data: | |
| Net assets, end of period (000's) | | $ | 1,044 | | | $ | 147 | | | $ | 187 | | |
| Ratio of expenses to average daily net assets: | |
| Before expense waiver | | | 1.40 | %* | | | 1.40 | % | | | 1.46 | % * | |
| After expense waiver | | | N/A | | | | N/A | | | | 1.40 | % *# | |
| Net investment income to average daily net assets | | | 0.93 | %* | | | 0.95 | % | | | 1.63 | % * | |
| Portfolio turnover rate | | | 9 | %** | | | 16 | % | | | 5 | % ** | |
* Annualized.
** Percentages represent results for the period and are not annualized.
*** Per share amount calculated on the average share method.
† For the period from October 15, 2004 (commencement of operations) through December 31, 2004.
# Computed after giving effect to an agreement by MassMutual to waive certain fees and expenses of the Fund.
(a) Employee retirement benefit plans that invest plan assets in the Separate Investment Accounts (SIAs) may be subject to certain charges as set forth in their respective Plan Documents. Total return figures would be lower for the period presented if they reflected these charges.
(b) Total return excludes a front end sales charge for Class A and a contingent deferred sales charge for Class N and would be lower for the period presented if they reflected these charges.
The accompanying notes are an integral part of the financial statements.
214
MassMutual Select Fundamental Value Fund – Financial Statements (Continued)
Financial Highlights (For a share outstanding throughout each period)
| | | Class A | |
| | | Six months
ended
6/30/06
(Unaudited) | | Year ended
12/31/05† | | Year ended
12/31/04 | | Year ended
12/31/03 | | Year ended
12/31/02 | | Period ended
12/31/01+ | |
| Net asset value, beginning of period | | $ | 11.14 | | | $ | 10.75 | | | $ | 10.01 | | | $ | 7.79 | | | $ | 10.00 | | | $ | 10.00 | | |
| Income (loss) from investment operations: | |
| Net investment income | | | 0.05 | *** | | | 0.11 | *** | | | 0.10 | *** | | | 0.10 | *** | | | 0.08 | *** | | | - | | |
Net realized and unrealized gain (loss) on
investments | | | 0.72 | | | | 0.65 | | | | 0.84 | | | | 2.19 | | | | (2.25 | ) | | | - | | |
Total income (loss) from investment
operations | | | 0.77 | | | | 0.76 | | | | 0.94 | | | | 2.29 | | | | (2.17 | ) | | | 0.00 | | |
| Less distributions to shareholders: | |
| From net investment income | | | - | | | | (0.11 | ) | | | (0.09 | ) | | | (0.07 | ) | | | (0.04 | ) | | | - | | |
| From net realized gains | | | - | | | | (0.26 | ) | | | (0.11 | ) | | | - | | | | - | | | | - | | |
| Total distributions | | | - | | | | (0.37 | ) | | | (0.20 | ) | | | (0.07 | ) | | | (0.04 | ) | | | - | | |
| Net asset value, end of period | | $ | 11.91 | | | $ | 11.14 | | | $ | 10.75 | | | $ | 10.01 | | | $ | 7.79 | | | $ | 10.00 | | |
| Total Return(a) | | | 6.91 | %**(c) | | | 7.08 | % (c) | | | 9.34 | % (c) | | | 29.43 | % | | | (21.67 | )% | | | - | | |
| Ratios / Supplemental Data: | |
| Net assets, end of period (000's) | | $ | 261,594 | | | $ | 252,362 | | | $ | 214,886 | | | $ | 129,552 | | | $ | 37,973 | | | $ | 1 | | |
| Ratio of expenses to average daily net assets: | |
| Before expense waiver | | | 1.23 | %* | | | 1.23 | % | | | 1.23 | % | | | 1.24 | % | | | 1.27 | % | | | - | | |
| After expense waiver | | | N/A | | | | N/A | | | | 1.22 | % (b)# | | | 1.22 | % (b)# | | | 1.20 | % (b)# | | | - | | |
| Net investment income to average daily net assets | | | 0.88 | %* | | | 0.97 | % | | | 0.96 | % | | | 1.18 | % | | | 1.00 | % | | | - | | |
| Portfolio turnover rate | | | 14 | %** | | | 33 | % | | | 31 | % | | | 28 | % | | | 38 | % | | | N/A | | |
| | | Class L | |
| | | Six months
ended
6/30/06
(Unaudited) | | Year ended
12/31/05† | | Year ended
12/31/04 | | Year ended
12/31/03 | | Year ended
12/31/02 | | Period ended
12/31/01+ | |
| Net asset value, beginning of period | | $ | 11.17 | | | $ | 10.78 | | | $ | 10.03 | | | $ | 7.81 | | | $ | 10.00 | | | $ | 10.00 | | |
| Income (loss) from investment operations: | |
| Net investment income | | | 0.07 | *** | | | 0.14 | *** | | | 0.12 | *** | | | 0.13 | *** | | | 0.10 | *** | | | - | | |
Net realized and unrealized gain (loss) on
investments | | | 0.72 | | | | 0.64 | | | | 0.85 | | | | 2.18 | | | | (2.24 | ) | | | - | | |
Total income (loss) from investment
operations | | | 0.79 | | | | 0.78 | | | | 0.97 | | | | 2.31 | | | | (2.14 | ) | | | 0.00 | | |
| Less distributions to shareholders: | |
| From net investment income | | | - | | | | (0.13 | ) | | | (0.11 | ) | | | (0.09 | ) | | | (0.05 | ) | | | - | | |
| From net realized gains | | | - | | | | (0.26 | ) | | | (0.11 | ) | | | - | | | | - | | | | - | | |
| Total distributions | | | - | | | | (0.39 | ) | | | (0.22 | ) | | | (0.09 | ) | | | (0.05 | ) | | | - | | |
| Net asset value, end of period | | $ | 11.96 | | | $ | 11.17 | | | $ | 10.78 | | | $ | 10.03 | | | $ | 7.81 | | | $ | 10.00 | | |
| Total Return(a) | | | 7.16 | %** | | | 7.28 | % | | | 9.65 | % | | | 29.56 | % | | | (21.40 | )% | | | - | | |
| Ratios / Supplemental Data: | |
| Net assets, end of period (000's) | | $ | 291,823 | | | $ | 231,639 | | | $ | 236,583 | | | $ | 133,178 | | | $ | 44,235 | | | $ | 1 | | |
| Ratio of expenses to average daily net assets: | |
| Before expense waiver | | | 0.98 | %* | | | 0.98 | % | | | 0.98 | % | | | 0.99 | % | | | 1.02 | % | | | - | | |
| After expense waiver | | | N/A | | | | N/A | | | | 0.97 | % (b)# | | | 0.97 | % (b)# | | | 0.95 | % (b)# | | | - | | |
| Net investment income to average daily net assets | | | 1.12 | %* | | | 1.23 | % | | | 1.21 | % | | | 1.44 | % | | | 1.24 | % | | | - | | |
| Portfolio turnover rate | | | 14 | %** | | | 33 | % | | | 31 | % | | | 28 | % | | | 38 | % | | | N/A | | |
* Annualized.
** Percentages represent results for the period and are not annualized.
*** Per share amount calculated on the average shares method.
† Effective January 1, 2005, rebated brokerage commissions are included with realized gain or loss on investment transactions. Prior to January 1, 2005, these amounts were presented as a reduction of expenses. Prior year amounts have not been restated to reflect this change due to immateriality. (see Note 3)
+ The Fund commenced operations on December 31, 2001.
# Computed after giving effect to an agreement by MassMutual to waive certain fees and expenses of the Fund.
(a) Employee benefit plans that invest plan assets in the Separate Investment Accounts (SIAs) may be subject to certain charges as set forth in their respective Plan Documents. Total return figures would be lower for the periods presented if they reflected these charges.
(b) The Fund has entered into an agreement with certain brokers to rebate a portion of brokerage commissions. The rebated commissions are used to reduce operating expenses of the Fund.
(c) Total Return excludes a front-end sales charge and would be lower for the periods presented if it reflected these charges.
The accompanying notes are an integral part of the financial statements.
215
MassMutual Select Fundamental Value Fund – Financial Statements (Continued)
Financial Highlights (For a share outstanding throughout each period)
| | | Class Y | |
| | | Six months
ended
6/30/06
(Unaudited) | | Year ended
12/31/05† | | Year ended
12/31/04 | | Year ended
12/31/03 | | Year ended
12/31/02 | | Period ended
12/31/01+ | |
| Net asset value, beginning of period | | $ | 11.19 | | | $ | 10.78 | | | $ | 10.03 | | | $ | 7.80 | | | $ | 10.00 | | | $ | 10.00 | | |
| Income (loss) from investment operations: | |
| Net investment income | | | 0.07 | *** | | | 0.15 | *** | | | 0.14 | *** | | | 0.14 | *** | | | 0.12 | *** | | | - | | |
Net realized and unrealized gain (loss) on
investments | | | 0.73 | | | | 0.66 | | | | 0.84 | | | | 2.19 | | | | (2.26 | ) | | | - | | |
Total income (loss) from investment
operations | | | 0.80 | | | | 0.81 | | | | 0.98 | | | | 2.33 | | | | (2.14 | ) | | | 0.00 | | |
| Less distributions to shareholders: | |
| From net investment income | | | - | | | | (0.14 | ) | | | (0.12 | ) | | | (0.10 | ) | �� | | (0.06 | ) | | | - | | |
| From net realized gains | | | - | | | | (0.26 | ) | | | (0.11 | ) | | | - | | | | - | | | | - | | |
| Total distributions | | | - | | | | (0.40 | ) | | | (0.23 | ) | | | (0.10 | ) | | | (0.06 | ) | | | - | | |
| Net asset value, end of period | | $ | 11.99 | | | $ | 11.19 | | | $ | 10.78 | | | $ | 10.03 | | | $ | 7.80 | | | $ | 10.00 | | |
| Total Return(a) | | | 7.15 | %** | | | 7.55 | % | | | 9.78 | % | | | 29.82 | % | | | (21.41 | )% | | | - | | |
| Ratios / Supplemental Data: | |
| Net assets, end of period (000's) | | $ | 96,048 | | | $ | 85,569 | | | $ | 120,769 | | | $ | 82,989 | | | $ | 40,511 | | | $ | 1 | | |
| Ratio of expenses to average daily net assets: | |
| Before expense waiver | | | 0.83 | %* | | | 0.83 | % | | | 0.83 | % | | | 0.84 | % | | | 0.87 | % | | | - | | |
| After expense waiver | | | N/A | | | | N/A | | | | 0.82 | % (b)# | | | 0.82 | % (b)# | | | 0.81 | % (b)# | | | - | | |
| Net investment income to average daily net assets | | | 1.27 | %* | | | 1.35 | % | | | 1.35 | % | | | 1.60 | % | | | 1.44 | % | | | - | | |
| Portfolio turnover rate | | | 14 | %** | | | 33 | % | | | 31 | % | | | 28 | % | | | 38 | % | | | N/A | | |
| | | Class S | |
| | | Six months
ended
6/30/06
(Unaudited) | | Year ended
12/31/05† | | Year ended
12/31/04 | | Year ended
12/31/03 | | Year ended
12/31/02 | | Period ended
12/31/01+ | |
| Net asset value, beginning of period | | $ | 11.20 | | | $ | 10.80 | | | $ | 10.05 | | | $ | 7.81 | | | $ | 10.00 | | | $ | 10.00 | | |
| Income (loss) from investment operations: | |
| Net investment income | | | 0.08 | *** | | | 0.16 | *** | | | 0.14 | *** | | | 0.14 | *** | | | 0.12 | *** | | | - | | |
Net realized and unrealized gain (loss) on
investments | | | 0.72 | | | | 0.66 | | | | 0.85 | | | | 2.20 | | | | (2.25 | ) | | | - | | |
Total income (loss) from investment
operations | | | 0.80 | | | | 0.82 | | | | 0.99 | | | | 2.34 | | | | (2.13 | ) | | | 0.00 | | |
| Less distributions to shareholders: | |
| From net investment income | | | - | | | | (0.16 | ) | | | (0.13 | ) | | | (0.10 | ) | | | (0.06 | ) | | | - | | |
| From net realized gains | | | - | | | | (0.26 | ) | | | (0.11 | ) | | | - | | | | - | | | | - | | |
| Total distributions | | | - | | | | (0.42 | ) | | | (0.24 | ) | | | (0.10 | ) | | | (0.06 | ) | | | - | | |
| Net asset value, end of period | | $ | 12.00 | | | $ | 11.20 | | | $ | 10.80 | | | $ | 10.05 | | | $ | 7.81 | | | $ | 10.00 | | |
| Total Return(a) | | | 7.14 | %** | | | 7.57 | % | | | 9.80 | % | | | 29.97 | % | | | (21.35 | )% | | | - | | |
| Ratios / Supplemental Data: | |
| Net assets, end of period (000's) | | $ | 473,107 | | | $ | 418,271 | | | $ | 325,701 | | | $ | 228,535 | | | $ | 101,228 | | | $ | 10,001 | | |
| Ratio of expenses to average daily net assets: | |
| Before expense waiver | | | 0.79 | %* | | | 0.79 | % | | | 0.79 | % | | | 0.80 | % | | | 0.83 | % | | | - | | |
| After expense waiver | | | N/A | | | | N/A | | | | 0.78 | % (b)# | | | 0.78 | % (b)# | | | 0.77 | % (b)# | | | - | | |
| Net investment income to average daily net assets | | | 1.31 | %* | | | 1.41 | % | | | 1.40 | % | | | 1.63 | % | | | 1.36 | % | | | - | | |
| Portfolio turnover rate | | | 14 | %** | | | 33 | % | | | 31 | % | | | 28 | % | | | 38 | % | | | N/A | | |
* Annualized.
** Percentages represent results for the period and are not annualized.
*** Per share amount calculated on the average shares method.
† Effective January 1, 2005, rebated brokerage commissions are included with realized gain or loss on investment transactions. Prior to January 1, 2005, these amounts were presented as a reduction of expenses. Prior year amounts have not been restated to reflect this change due to immateriality. (see Note 3)
+ The Fund commenced operations on December 31, 2001.
# Computed after giving effect to an agreement by MassMutual to waive certain fees and expenses of the Fund.
(a) Employee benefit plans that invest plan assets in the Separate Investment Accounts (SIAs) may be subject to certain charges as set forth in their respective Plan Documents. Total return figures would be lower for the periods presented if they reflected these charges.
(b) The Fund has entered into an agreement with certain brokers to rebate a portion of brokerage commissions. The rebated commissions are used to reduce operating expenses of the Fund.
The accompanying notes are an integral part of the financial statements.
216
MassMutual Select Fundamental Value Fund – Financial Statements (Continued)
Financial Highlights (For a share outstanding throughout each period)
| | | Class N | |
| | | Six months
ended
6/30/06
(Unaudited) | | Year ended
12/31/05† | | Year ended
12/31/04 | | Year ended
12/31/03 | | Year ended
12/31/02++ | |
| Net asset value, beginning of period | | $ | 11.07 | | | $ | 10.69 | | | $ | 9.94 | | | $ | 7.76 | | | $ | 7.76 | | |
| Income (loss) from investment operations: | |
| Net investment income (loss) | | | 0.03 | *** | | | 0.07 | *** | | | 0.07 | *** | | | 0.08 | *** | | | (0.00 | )***†† | |
Net realized and unrealized gain (loss) on
investments | | | 0.71 | | | | 0.65 | | | | 0.84 | | | | 2.17 | | | | (0.00 | )†† | |
Total income (loss) from investment
operations | | | 0.74 | | | | 0.72 | | | | 0.91 | | | | 2.25 | | | | (0.00 | ) | |
| Less distributions to shareholders: | |
| From net investment income | | | - | | | | (0.08 | ) | | | (0.05 | ) | | | (0.07 | ) | | | - | | |
| From net realized gains | | | - | | | | (0.26 | ) | | | (0.11 | ) | | | - | | | | - | | |
| Total distributions | | | - | | | | (0.34 | ) | | | (0.16 | ) | | | (0.07 | ) | | | - | | |
| Net asset value, end of period | | $ | 11.81 | | | $ | 11.07 | | | $ | 10.69 | | | $ | 9.94 | | | $ | 7.76 | | |
| | | | | | | | | | | | | | | | | | | | | | |
| Total Return(a) | | | 6.68 | %**(c) | | | 6.76 | % (c) | | | 9.10 | % (c) | | | 29.03 | % (c) | | | - | ‡ | |
| Ratios / Supplemental Data: | |
| Net assets, end of period (000's) | | $ | 1,235 | | | $ | 1,998 | | | $ | 1,644 | | | $ | 1,968 | | | $ | 101 | | |
| Ratio of expenses to average daily net assets: | |
| Before expense waiver | | | 1.53 | %* | | | 1.53 | % | | | 1.53 | % | | | 1.54 | % | | | - | ‡ | |
| After expense waiver | | | N/A | | | | N/A | | | | 1.52 | % (b) | | | 1.52 | % (b) | | | - | ‡ | |
| Net investment income to average daily net assets | | | 0.59 | %* | | | 0.67 | % | | | 0.65 | % | | | 0.83 | % | | | - | ‡ | |
| Portfolio turnover rate | | | 14 | %** | | | 33 | % | | | 31 | % | | | 28 | % | | | 38 | % | |
* Annualized.
** Percentages represent results for the period and are not annualized.
*** Per share amount calculated on the average shares method.
† Effective January 1, 2005, rebated brokerage commissions are included with realized gain or loss on investment transactions. Prior to January 1, 2005, these amounts were presented as a reduction of expenses. Prior year amounts have not been restated to reflect this change due to immateriality. (see Note 3)
†† Net investment loss and net realized and unrealized gain(loss) on investments are less than $0.01 per share.
++ Class N commenced operations on December 31, 2002.
‡ Amounts are de minimis due to the short period of operations.
(a) Employee benefit plans that invest plan assets in the Separate Investment Accounts (SIAs) may be subject to certain charges as set forth in their respective Plan Documents. Total return figures would be lower for the periods presented if they reflected these charges.
(b) The Fund has entered into an agreement with certain brokers to rebate a portion of brokerage commissions. The rebated commissions are used to reduce operating expenses of the Fund.
(c) Total Return excludes contingent deferred sales charge and would be lower for the periods presented if they reflected these charges.
The accompanying notes are an integral part of the financial statements.
217
MassMutual Select Value Equity Fund – Financial Statements (Continued)
Financial Highlights (For a share outstanding throughout each period)
| | | Class A | |
| | | Six months
ended
6/30/06
(Unaudited) | | Year ended
12/31/05† | | Year ended
12/31/04 | | Year ended
12/31/03 | | Year ended
12/31/02 | | Period ended
12/31/01+ | |
| Net asset value, beginning of period | | $ | 10.49 | | | $ | 10.48 | | | $ | 9.55 | | | $ | 7.66 | | | $ | 9.34 | | | $ | 10.00 | | |
| Income (loss) from investment operations: | |
| Net investment income | | | 0.03 | *** | | | 0.04 | *** | | | 0.07 | *** | | | 0.08 | *** | | | 0.07 | *** | | | 0.04 | *** | |
Net realized and unrealized gain (loss) on
investments | | | 0.30 | | | | 1.02 | | | | 1.16 | | | | 1.91 | | | | (1.68 | ) | | | (0.67 | ) | |
Total income (loss) from investment
operations | | | 0.33 | | | | 1.06 | | | | 1.23 | | | | 1.99 | | | | (1.61 | ) | | | (0.63 | ) | |
| Less distributions to shareholders: | |
| From net investment income | | | - | | | | (0.04 | ) | | | (0.07 | ) | | | (0.10 | ) | | | (0.07 | ) | | | (0.03 | ) | |
| From net realized gains | | | - | | | | (1.01 | ) | | | (0.23 | ) | | | - | | | | - | | | | - | | |
| Total distributions | | | - | | | | (1.05 | ) | | | (0.30 | ) | | | (0.10 | ) | | | (0.07 | ) | | | (0.03 | ) | |
| Net asset value, end of period | | $ | 10.82 | | | $ | 10.49 | | | $ | 10.48 | | | $ | 9.55 | | | $ | 7.66 | | | $ | 9.34 | | |
| Total Return(a) | | | 3.15 | %(c)** | | | 10.16 | % (c) | | | 12.91 | % (c) | | | 25.96 | % | | | (17.28 | )% | | | (6.29 | )% ** | |
| Ratios / Supplemental Data: | |
| Net assets, end of period (000's) | | $ | 29,690 | | | $ | 28,829 | | | $ | 25,523 | | | $ | 21,341 | | | $ | 15,852 | | | $ | 8,881 | | |
| Ratio of expenses to average daily net assets: | |
| Before expense waiver | | | 1.31 | %* | | | 1.30 | % | | | 1.33 | % | | | 1.29 | % | | | 1.30 | % | | | 1.29 | % * | |
| After expense waiver | | | N/A | | | | N/A | | | | 1.29 | % (b)# | | | 1.27 | % (b)# | | | 1.29 | % # | | | 1.29 | % *# | |
Net investment income to average
daily net assets | | | 0.47 | %* | | | 0.36 | % | | | 0.69 | % | | | 0.99 | % | | | 0.79 | % | | | 0.65 | % * | |
| Portfolio turnover rate | | | 52 | %** | | | 94 | % | | | 161 | % | | | 66 | % | | | 105 | % | | | 62 | % ** | |
| | | Class L | |
| | | Six months
ended
6/30/06
(Unaudited) | | Year ended
12/31/05† | | Year ended
12/31/04 | | Year ended
12/31/03 | | Year ended
12/31/02 | | Period ended
12/31/01+ | |
| Net asset value, beginning of period | | $ | 10.51 | | | $ | 10.50 | | | $ | 9.57 | | | $ | 7.67 | | | $ | 9.34 | | | $ | 10.00 | | |
| Income (loss) from investment operations: | |
| Net investment income | | | 0.04 | *** | | | 0.06 | *** | | | 0.09 | *** | | | 0.10 | *** | | | 0.09 | *** | | | 0.05 | *** | |
Net realized and unrealized gain (loss) on
investments | | | 0.30 | | | | 1.02 | | | | 1.17 | | | | 1.92 | | | | (1.67 | ) | | | (0.67 | ) | |
Total income (loss) from investment
operations | | | 0.34 | | | | 1.08 | | | | 1.26 | | | | 2.02 | | | | (1.58 | ) | | | (0.62 | ) | |
| Less distributions to shareholders: | |
| From net investment income | | | - | | | | (0.06 | ) | | | (0.10 | ) | | | (0.12 | ) | | | (0.09 | ) | | | (0.04 | ) | |
| From net realized gains | | | - | | | | (1.01 | ) | | | (0.23 | ) | | | - | | | | - | | | | - | | |
| Total distributions | | | - | | | | (1.07 | ) | | | (0.33 | ) | | | (0.12 | ) | | | (0.09 | ) | | | (0.04 | ) | |
| Net asset value, end of period | | $ | 10.85 | | | $ | 10.51 | | | $ | 10.50 | | | $ | 9.57 | | | $ | 7.67 | | | $ | 9.34 | | |
| Total Return(a) | | | 3.24 | %** | | | 10.39 | % | | | 13.16 | % | | | 26.34 | % | | | (16.97 | )% | | | (6.21 | )% ** | |
| Ratios / Supplemental Data: | |
| Net assets, end of period (000's) | | $ | 8,905 | | | $ | 8,753 | | | $ | 7,461 | | | $ | 6,313 | | | $ | 4,727 | | | $ | 2,658 | | |
| Ratio of expenses to average daily net assets: | |
| Before expense waiver | | | 1.06 | %* | | | 1.05 | % | | | 1.08 | % | | | 1.04 | % | | | 1.05 | % | | | 1.05 | % * | |
| After expense waiver | | | N/A | | | | N/A | | | | 1.04 | % (b)# | | | 1.02 | % (b)# | | | 1.04 | % # | | | 1.04 | % *# | |
Net investment income to average
daily net assets | | | 0.72 | %* | | | 0.60 | % | | | 0.94 | % | | | 1.24 | % | | | 1.07 | % | | | 0.87 | % * | |
| Portfolio turnover rate | | | 52 | %** | | | 94 | % | | | 161 | % | | | 66 | % | | | 105 | % | | | 62 | % ** | |
* Annualized.
** Percentages represent results for the period and are not annualized.
*** Per share amount calculated on the average shares method.
† Effective January 1, 2005, brokerage commissions are included with realized gain or loss on investment transactions. Prior to January 1, 2005, these amounts were presented as a reduction of expenses. Prior year amounts have not been restated to reflect this change due to immateriality. (See Note 3)
+ For the period from May 1, 2001 (commencement of operations) through December 31, 2001.
# Computed after giving effect to an agreement by MassMutual to waive certain fees and expenses of the Fund.
(a) Employee retirement benefit plans that invest plan assets in the Separate Investment Accounts (SIAs) may be subject to certain charges as set forth in their Plan Documents. Total return figures would be lower for the periods presented if they reflected these charges.
(b) The Fund has entered into an agreement with certain brokers to rebate a portion of brokerage commissions. The rebated commissions are used to reduce operating expenses of the Fund.
(c) Total Return excludes a front-end sales charge and would be lower for the periods presented if it reflected these charges.
The accompanying notes are an integral part of the financial statements.
218
MassMutual Select Value Equity Fund – Financial Statements (Continued)
Financial Highlights (For a share outstanding throughout each period)
| | | Class Y | |
| | | Six months
ended
6/30/06
(Unaudited) | | Year ended
12/31/05† | | Year ended
12/31/04 | | Year ended
12/31/03 | | Year ended
12/31/02 | | Period ended
12/31/01+ | |
| Net asset value, beginning of period | | $ | 10.55 | | | $ | 10.54 | | | $ | 9.59 | | | $ | 7.68 | | | $ | 9.35 | | | $ | 10.00 | | |
| Income (loss) from investment operations: | |
| Net investment income | | | 0.05 | *** | | | 0.08 | *** | | | 0.10 | *** | | | 0.12 | *** | | | 0.10 | *** | | | 0.06 | *** | |
Net realized and unrealized gain (loss) on
investments | | | 0.31 | | | | 1.02 | | | | 1.19 | | | | 1.91 | | | | (1.67 | ) | | | (0.67 | ) | |
Total income (loss) from investment
operations | | | 0.36 | | | | 1.10 | | | | 1.29 | | | | 2.03 | | | | (1.57 | ) | | | (0.61 | ) | |
| Less distributions to shareholders: | |
| From net investment income | | | - | | | | (0.08 | ) | | | (0.11 | ) | | | (0.12 | ) | | | (0.10 | ) | | | (0.04 | ) | |
| From net realized gains | | | - | | | | (1.01 | ) | | | (0.23 | ) | | | - | | | | - | | | | - | | |
| Total distributions | | | - | | | | (1.09 | ) | | | (0.34 | ) | | | (0.12 | ) | | | (0.10 | ) | | | (0.04 | ) | |
| Net asset value, end of period | | $ | 10.91 | | | $ | 10.55 | | | $ | 10.54 | | | $ | 9.59 | | | $ | 7.68 | | | $ | 9.35 | | |
| Total Return(a) | | | 3.41 | %** | | | 10.49 | % | | | 13.47 | % | | | 26.40 | % | | | (16.87 | )% | | | (6.12 | )% ** | |
| Ratios / Supplemental Data: | |
| Net assets, end of period (000's) | | $ | 4,603 | | | $ | 4,110 | | | $ | 2,891 | | | $ | 3,378 | | | $ | 7,543 | | | $ | 5,977 | | |
| Ratio of expenses to average daily net assets: | |
| Before expense waiver | | | 0.91 | %* | | | 0.90 | % | | | 0.93 | % | | | 0.88 | % | | | 0.90 | % | | | 0.90 | % * | |
| After expense waiver | | | N/A | | | | N/A | | | | 0.88 | % (b)# | | | 0.86 | % (b)# | | | 0.89 | % # | | | 0.90 | % *# | |
| Net investment income to average daily net assets | | | 0.87 | %* | | | 0.75 | % | | | 1.06 | % | | | 1.42 | % | | | 1.18 | % | | | 0.93 | % * | |
| Portfolio turnover rate | | | 52 | %** | | | 94 | % | | | 161 | % | | | 66 | % | | | 105 | % | | | 62 | % ** | |
| | | Class S | |
| | | Six months
ended
6/30/06
(Unaudited) | | Year ended
12/31/05† | | Year ended
12/31/04 | | Year ended
12/31/03 | | Year ended
12/31/02 | | Period ended
12/31/01+ | |
| Net asset value, beginning of period | | $ | 10.54 | | | $ | 10.52 | | | $ | 9.59 | | | $ | 7.68 | | | $ | 9.35 | | | $ | 10.00 | | |
| Income (loss) from investment operations: | |
| Net investment income | | | 0.05 | *** | | | 0.09 | *** | | | 0.11 | *** | | | 0.12 | *** | | | 0.10 | *** | | | 0.07 | *** | |
Net realized and unrealized gain
(loss) on investments | | | 0.30 | | | | 1.02 | | | | 1.17 | | | | 1.92 | | | | (1.68 | ) | | | (0.68 | ) | |
Total income (loss) from investment
operations | | | 0.35 | | | | 1.11 | | | | 1.28 | | | | 2.04 | | | | (1.58 | ) | | | (0.61 | ) | |
| Less distributions to shareholders: | |
| From net investment income | | | - | | | | (0.08 | ) | | | (0.12 | ) | | | (0.13 | ) | | | (0.09 | ) | | | (0.04 | ) | |
| From net realized gains | | | - | | | | (1.01 | ) | | | (0.23 | ) | | | - | | | | - | | | | - | | |
| Total distributions | | | - | | | | (1.09 | ) | | | (0.35 | ) | | | (0.13 | ) | | | (0.09 | ) | | | (0.04 | ) | |
| Net asset value, end of period | | $ | 10.89 | | | $ | 10.54 | | | $ | 10.52 | | | $ | 9.59 | | | $ | 7.68 | | | $ | 9.35 | | |
| Total Return(a) | | | 3.32 | %** | | | 10.66 | % | | | 13.31 | % | | | 26.63 | % | | | (16.83 | )% | | | (6.09 | )% ** | |
| Ratios / Supplemental Data: | |
| Net assets, end of period (000's) | | $ | 55,480 | | | $ | 55,895 | | | $ | 51,940 | | | $ | 67,536 | | | $ | 60,499 | | | $ | 51,604 | | |
| Ratio of expenses to average daily net assets: | |
| Before expense waiver | | | 0.86 | %* | | | 0.85 | % | | | 0.88 | % | | | 0.84 | % | | | 0.85 | % | | | 0.87 | % * | |
| After expense waiver | | | N/A | | | | N/A | | | | 0.84 | % (b)# | | | 0.82 | % (b)# | | | 0.84 | % # | | | 0.86 | % *# | |
| Net investment income to average daily net assets | | | 0.91 | %* | | | 0.81 | % | | | 1.12 | % | | | 1.45 | % | | | 1.22 | % | | | 1.05 | % * | |
| Portfolio turnover rate | | | 52 | %** | | | 94 | % | | | 161 | % | | | 66 | % | | | 105 | % | | | 62 | % ** | |
* Annualized.
** Percentages represent results for the period and are not annualized.
*** Per share amount calculated on the average shares method.
† Effective January 1, 2005, brokerage commissions are included with realized gain or loss on investment transactions. Prior to January 1, 2005, these amounts were presented as a reduction of expenses. Prior year amounts have not been restated to reflect this change due to immateriality. (See Note 3)
+ For the period from May 1, 2001 (commencement of operations) through December 31, 2001.
# Computed after giving effect to an agreement by MassMutual to waive certain fees and expenses of the Fund.
(a) Employee retirement benefit plans that invest plan assets in the Separate Investment Accounts (SIAs) may be subject to certain charges as set forth in their Plan Documents. Total return figures would be lower for the periods presented if they reflected these charges.
(b) The Fund has entered into an agreement with certain brokers to rebate a portion of brokerage commissions. The rebated commissions are used to reduce operating expenses of the Fund.
The accompanying notes are an integral part of the financial statements.
219
MassMutual Select Value Equity Fund – Financial Statements (Continued)
| | | Class N | |
| | | Six months
ended
6/30/06
(Unaudited) | | Year ended
12/31/05† | | Year ended
12/31/04 | | Year ended
12/31/03 | | Year ended
12/31/02++ | |
| Net asset value, beginning of period | | $ | 10.51 | | | $ | 10.50 | | | $ | 9.56 | | | $ | 7.63 | | | $ | 7.62 | | |
| Income (loss) from investment operations: | |
| Net investment income | | | 0.01 | *** | | | 0.01 | *** | | | 0.04 | *** | | | 0.06 | *** | | | 0.00 | ***†† | |
| Net realized and unrealized gain on investments | | | 0.31 | | | | 1.01 | | | | 1.15 | | | | 1.90 | | | | 0.01 | | |
| Total income from investment operations | | | 0.32 | | | | 1.02 | | | | 1.19 | | | | 1.96 | | | | 0.01 | | |
| Less distributions to shareholders: | |
| From net investment income | | | - | | | | (0.00 | )††† | | | (0.02 | ) | | | (0.03 | ) | | | - | | |
| From net realized gains | | | - | | | | (1.01 | ) | | | (0.23 | ) | | | - | | | | - | | |
| Total distributions | | | - | | | | (1.01 | ) | | | (0.25 | ) | | | (0.03 | ) | | | - | | |
| Net asset value, end of period | | $ | 10.83 | | | $ | 10.51 | | | $ | 10.50 | | | $ | 9.56 | | | $ | 7.63 | | |
| | | | | | | | | | | | | | | | | | | | | | |
| Total Return(a) | | | 3.04 | %(c)** | | | 9.83 | % (c) | | | 12.51 | % (c) | | | 25.73 | % (c) | | | - | ‡ | |
| Ratios / Supplemental Data: | |
| Net assets, end of period (000's) | | $ | 144 | | | $ | 140 | | | $ | 282 | | | $ | 315 | | | $ | 101 | | |
| Ratio of expenses to average daily net assets: | |
| Before expense waiver | | | 1.61 | %* | | | 1.59 | % | | | 1.63 | % | | | 1.58 | % | | | - | ‡ | |
| After expense waiver | | | N/A | | | | N/A | | | | 1.58 | % (b) | | | 1.56 | % (b) | | | - | ‡ | |
| Net investment income to average daily net assets | | | 0.18 | %* | | | 0.06 | % | | | 0.39 | % | | | 0.70 | % | | | - | ‡ | |
| Portfolio turnover rate | | | 52 | %** | | | 94 | % | | | 161 | % | | | 66 | % | | | 105 | % | |
*** Per share amount calculated on the average shares method.
† Effective January 1, 2005, brokerage commissions are included with realized gain or loss on investment transactions. Prior to January 1, 2005, these amounts were presented as a reduction of expenses. Prior year amounts have not been restated to reflect this change due to immateriality. (See Note 3)
†† Net investment income is less than $0.01 per share.
††† Distribution from net investment income is less than $0.01 per share.
* Annualized.
** Percentages represent results for the period and are not annualized.
++ Class N commenced operations on December 31, 2002.
‡ Amounts are de minimis due to the short period of operations.
(a) Employee retirement benefit plans that invest plan assets in the Separate Investment Accounts (SIAs) may be subject to certain charges as set forth in their Plan Documents. Total return figures would be lower for the periods presented if they reflected these charges.
(b) The Fund has entered into an agreement with certain brokers to rebate a portion of brokerage commissions. The rebated commissions are used to reduce operating expenses of the Fund.
(c) Total Return excludes contingent deferred sales charge and would be lower for the periods presented if it reflected these charges.
The accompanying notes are an integral part of the financial statements.
220
MassMutual Select Large Cap Value Fund – Financial Statements (Continued)
Financial Highlights (For a share outstanding throughout each period)
| | | Class A | |
| | | Six months
ended
6/30/06
(Unaudited) | | Year ended
12/31/05† | | Year ended
12/31/04 | | Year ended
12/31/03 | | Year ended
12/31/02 | | Year ended
12/31/01 | |
| Net asset value, beginning of period | | $ | 11.28 | | | $ | 10.39 | | | $ | 9.35 | | | $ | 7.24 | | | $ | 8.74 | | | $ | 9.92 | | |
| Income (loss) from investment operations: | |
| Net investment income | | | 0.03 | *** | | | 0.05 | *** | | | 0.04 | *** | | | 0.04 | *** | | | 0.02 | *** | | | 0.01 | *** | |
Net realized and unrealized gain (loss)
on investments | | | 0.29 | | | | 0.89 | | | | 1.04 | | | | 2.10 | | | | (1.49 | ) | | | (1.18 | ) | |
Total income (loss) from investment
operations | | | 0.32 | | | | 0.94 | | | | 1.08 | | | | 2.14 | | | | (1.47 | ) | | | (1.17 | ) | |
| Less distributions to shareholders: | |
| From net investment income | | | - | | | | (0.05 | ) | | | (0.04 | ) | | | (0.03 | ) | | | (0.03 | ) | | | (0.01 | ) | |
| Net asset value, end of period | | $ | 11.60 | | | $ | 11.28 | | | $ | 10.39 | | | $ | 9.35 | | | $ | 7.24 | | | $ | 8.74 | | |
| Total Return(a) | | | 2.84 | %**(c) | | | 9.05 | % (c) | | | 11.55 | % (c) | | | 29.61 | % | | | (16.86 | )% | | | (11.75 | )% | |
| Ratios / Supplemental Data: | |
| Net assets, end of period (000's) | | $ | 371,383 | | | $ | 354,647 | | | $ | 266,753 | | | $ | 153,918 | | | $ | 92,001 | | | $ | 73,431 | | |
| Ratio of expenses to average daily net assets: | |
| Before expense waiver | | | 1.25 | %* | | | 1.25 | % | | | 1.25 | % | | | 1.25 | % | | | 1.24 | % | | | 1.25 | % | |
| After expense waiver | | | N/A | | | | N/A | | | | 1.25 | % (b)# | | | 1.24 | % (b)# | | | 1.23 | % (b)# | | | 1.24 | % # | |
| Net investment income to average daily net assets | | | 0.46 | %* | | | 0.44 | % | | | 0.41 | % | | | 0.45 | % | | | 0.29 | % | | | 0.12 | % | |
| Portfolio turnover rate | | | 8 | %** | | | 7 | % | | | 3 | % | | | 7 | % | | | 25 | % | | | 20 | % | |
| | | Class L | |
| | | Six months
ended
6/30/06
(Unaudited) | | Year ended
12/31/05† | | Year ended
12/31/04 | | Year ended
12/31/03 | | Year ended
12/31/02 | | Year ended
12/31/01 | |
| Net asset value, beginning of period | | $ | 11.32 | | | $ | 10.43 | | | $ | 9.37 | | | $ | 7.26 | | | $ | 8.76 | | | $ | 9.93 | | |
| Income (loss) from investment operations: | |
| Net investment income | | | 0.04 | *** | | | 0.07 | *** | | | 0.06 | *** | | | 0.06 | *** | | | 0.04 | *** | | | 0.03 | *** | |
Net realized and unrealized gain (loss)
on investments | | | 0.29 | | | | 0.90 | | | | 1.06 | | | | 2.10 | | | | (1.50 | ) | | | (1.17 | ) | |
Total income (loss) from investment
operations | | | 0.33 | | | | 0.97 | | | | 1.12 | | | | 2.16 | | | | (1.46 | ) | | | (1.14 | ) | |
| Less distributions to shareholders: | |
| From net investment income | | | - | | | | (0.08 | ) | | | (0.06 | ) | | | (0.05 | ) | | | (0.04 | ) | | | (0.03 | ) | |
| Net asset value, end of period | | $ | 11.65 | | | $ | 11.32 | | | $ | 10.43 | | | $ | 9.37 | | | $ | 7.26 | | | $ | 8.76 | | |
| Total Return(a) | | | 2.92 | %** | | | 9.25 | % | | | 11.94 | % | | | 29.79 | % | | | (16.64 | )% | | | (11.47 | )% | |
| Ratios / Supplemental Data: | |
| Net assets, end of period (000's) | | $ | 344,026 | | | $ | 369,858 | | | $ | 316,841 | | | $ | 207,025 | | | $ | 114,417 | | | $ | 105,322 | | |
| Ratio of expenses to average daily net assets: | |
| Before expense waiver | | | 1.00 | %* | | | 1.00 | % | | | 1.00 | % | | | 1.00 | % | | | 1.00 | % | | | 1.00 | % | |
| After expense waiver | | | N/A | | | | N/A | | | | 1.00 | % (b)# | | | 0.99 | % (b)# | | | 0.98 | % (b)# | | | 0.99 | % # | |
| Net investment income to average daily net assets | | | 0.71 | %* | | | 0.69 | % | | | 0.65 | % | | | 0.70 | % | | | 0.53 | % | | | 0.37 | % | |
| Portfolio turnover rate | | | 8 | %** | | | 7 | % | | | 3 | % | | | 7 | % | | | 25 | % | | | 20 | % | |
* Annualized.
** Percentage represents results for the period and are not annualized.
*** Per share amount calculated on the average shares method.
† Effective January 1, 2005, rebated brokerage commissions are included with realized gain or loss on investment transactions. Prior to January 1, 2005, these amounts were presented as a reduction of expenses. Prior year amounts have not been restated to reflect this change. (see note 3)
# Computed after giving effect to an agreement by MassMutual to waive certain fees and expenses of the Fund.
(a) Employee retirement benefit plans that invest plan assets in the Separate Investment Accounts (SIAs) may be subject to certain charges as set forth by their respective Plan Documents. Total return figures would be lower for the periods presented if they reflected these charges.
(b) The Fund has entered into agreements with certain brokers to rebate a portion of brokerage commissions. The rebated commissions are used to reduce operating expenses of the Fund.
(c) Total Return excludes a front-end sales charge and would be lower for the period presented if it reflected these charges.
The accompanying notes are an integral part of the financial statements.
221
MassMutual Select Large Cap Value Fund – Financial Statements (Continued)
Financial Highlights (For a share outstanding throughout each period)
| | | Class Y | |
| | | Six months
ended
6/30/06
(Unaudited) | | Year ended
12/31/05† | | Year ended
12/31/04 | | Year ended
12/31/03 | | Year ended
12/31/02 | | Year ended
12/31/01 | |
| Net asset value, beginning of period | | $ | 11.34 | | | $ | 10.45 | | | $ | 9.39 | | | $ | 7.27 | | | $ | 8.77 | | | $ | 9.94 | | |
| Income (loss) from investment operations: | |
| Net investment income | | | 0.05 | *** | | | 0.09 | *** | | | 0.08 | *** | | | 0.07 | *** | | | 0.05 | *** | | | 0.05 | *** | |
Net realized and unrealized gain (loss)
on investments | | | 0.30 | | | | 0.89 | | | | 1.05 | | | | 2.11 | | | | (1.50 | ) | | | (1.18 | ) | |
Total income (loss) from investment
operations | | | 0.35 | | | | 0.98 | | | | 1.13 | | | | 2.18 | | | | (1.45 | ) | | | (1.13 | ) | |
| Less distributions to shareholders: | |
| From net investment income | | | - | | | | (0.09 | ) | | | (0.07 | ) | | | (0.06 | ) | | | (0.05 | ) | | | (0.04 | ) | |
| Net asset value, end of period | | $ | 11.69 | | | $ | 11.34 | | | $ | 10.45 | | | $ | 9.39 | | | $ | 7.27 | | | $ | 8.77 | | |
| | | | | | | | | | | | | | | | | | | | | | | | | | |
| Total Return(a) | | | 3.09 | %** | | | 9.37 | % | | | 12.06 | % | | | 30.04 | % | | | (16.52 | )% | | | (11.34 | )% | |
| Ratios / Supplemental Data: | |
| Net assets, end of period (000's) | | $ | 192,872 | | | $ | 146,699 | | | $ | 127,223 | | | $ | 78,751 | | | $ | 39,762 | | | $ | 52,286 | | |
| Ratio of expenses to average daily net assets: | |
| Before expense waiver | | | 0.85 | %* | | | 0.85 | % | | | 0.85 | % | | | 0.85 | % | | | 0.84 | % | | | 0.85 | % | |
| After expense waiver | | | N/A | | | | N/A | | | | 0.85 | % (b)# | | | 0.84 | % (b)# | | | 0.83 | % (b)# | | | 0.84 | % # | |
| Net investment income to average daily net assets | | | 0.86 | %* | | | 0.84 | % | | | 0.81 | % | | | 0.85 | % | | | 0.66 | % | | | 0.52 | % | |
| Portfolio turnover rate | | | 8 | %** | | | 7 | % | | | 3 | % | | | 7 | % | | | 25 | % | | | 20 | % | |
| | | Class S | |
| | | Six months
ended
6/30/06
(Unaudited) | | Year ended
12/31/05† | | Year ended
12/31/04 | | Year ended
12/31/03 | | Year ended
12/31/02 | | Year ended
12/31/01 | |
| Net asset value, beginning of period | | $ | 11.36 | | | $ | 10.46 | | | $ | 9.40 | | | $ | 7.27 | | | $ | 8.78 | | | $ | 9.94 | | |
| Income (loss) from investment operations: | |
| Net investment income | | | 0.05 | *** | | | 0.10 | *** | | | 0.09 | *** | | | 0.08 | *** | | | 0.06 | *** | | | 0.06 | *** | |
Net realized and unrealized gain (loss)
on investments | | | 0.30 | | | | 0.90 | | | | 1.05 | | | | 2.12 | | | | (1.51 | ) | | | (1.17 | ) | |
Total income (loss) from investment
operations | | | 0.35 | | | | 1.00 | | | | 1.14 | | | | 2.20 | | | | (1.45 | ) | | | (1.11 | ) | |
| Less distributions to shareholders: | |
| From net investment income | | | - | | | | (0.10 | ) | | | (0.08 | ) | | | (0.07 | ) | | | (0.06 | ) | | | (0.05 | ) | |
| Net asset value, end of period | | $ | 11.71 | | | $ | 11.36 | | | $ | 10.46 | | | $ | 9.40 | | | $ | 7.27 | | | $ | 8.78 | | |
| | | | | | | | | | | | | | | | | | | | | | | | | | |
| Total Return(a) | | | 3.08 | %** | | | 9.57 | % | | | 12.11 | % | | | 30.24 | % | | | (16.53 | )% | | | (11.20 | )% | |
| Ratios / Supplemental Data: | |
| Net assets, end of period (000's) | | $ | 582,992 | | | $ | 546,331 | | | $ | 436,983 | | | $ | 339,287 | | | $ | 233,510 | | | $ | 277,873 | | |
| Ratio of expenses to average daily net assets: | |
| Before expense waiver | | | 0.76 | %* | | | 0.76 | % | | | 0.76 | % | | | 0.76 | % | | | 0.75 | % | | | 0.76 | % | |
| After expense waiver | | | N/A | | | | N/A | | | | 0.76 | % (b)# | | | 0.75 | % (b)# | | | 0.74 | % (b)# | | | 0.75 | % # | |
| Net investment income to average daily net assets | | | 0.95 | %* | | | 0.93 | % | | | 0.88 | % | | | 0.94 | % | | | 0.76 | % | | | 0.62 | % | |
| Portfolio turnover rate | | | 8 | %** | | | 7 | % | | | 3 | % | | | 7 | % | | | 25 | % | | | 20 | % | |
* Annualized.
** Percentage represents results for the period and are not annualized.
*** Per share amount calculated on the average shares method.
† Effective January 1, 2005, rebated brokerage commissions are included with realized gain or loss on investment transactions. Prior to January 1, 2005, these amounts were presented as a reduction of expenses. Prior year amounts have not been restated to reflect this change. (see note 3)
# Computed after giving effect to an agreement by MassMutual to waive certain fees and expenses of the Fund.
(a) Employee retirement benefit plans that invest plan assets in the Separate Investment Accounts (SIAs) may be subject to certain charges as set forth by their respective Plan Documents. Total return figures would be lower for the periods presented if they reflected these charges.
(b) The Fund has entered into agreements with certain brokers to rebate a portion of brokerage commissions. The rebated commissions are used to reduce operating expenses of the Fund.
The accompanying notes are an integral part of the financial statements.
222
MassMutual Select Large Cap Value Fund – Financial Statements (Continued)
Financial Highlights (For a share outstanding throughout each period)
| | | Class N | |
| | | Six months
ended
6/30/06
(Unaudited) | | Year ended
12/31/05† | | Year ended
12/31/04 | | Year ended
12/31/03 | | Period ended
12/31/02++ | |
| Net asset value, beginning of period | | $ | 11.17 | | | $ | 10.29 | | | $ | 9.25 | | | $ | 7.21 | | | $ | 7.19 | | |
| Income (loss) from investment operations: | |
| Net investment income | | | 0.01 | *** | | | 0.02 | *** | | | 0.01 | *** | | | 0.03 | *** | | | 0.00 | ***†† | |
Net realized and unrealized gain on
investments | | | 0.30 | | | | 0.87 | | | | 1.03 | | | | 2.07 | | | | 0.02 | | |
Total income from investment
operations | | | 0.31 | | | | 0.89 | | | | 1.04 | | | | 2.10 | | | | 0.02 | | |
| Less distributions to shareholders: | |
| From net investment income | | | - | | | | (0.01 | ) | | | - | | | | (0.06 | ) | | | - | | |
| Net asset value, end of period | | $ | 11.48 | | | $ | 11.17 | | | $ | 10.29 | | | $ | 9.25 | | | $ | 7.21 | | |
| | | | | | | | | | | | | | | | | | | | | | |
| Total Return(a) | | | 2.78 | %**(c) | | | 8.65 | % (c) | | | 11.24 | %(c) | | | 29.18 | % (c) | | | - | ‡ | |
| Ratios / Supplemental Data: | |
| Net assets, end of period (000's) | | $ | 2,426 | | | $ | 2,279 | | | $ | 2,911 | | | $ | 2,891 | | | $ | 101 | | |
| Ratio of expenses to average daily net assets: | |
| Before expense waiver | | | 1.55 | %* | | | 1.55 | % | | | 1.55 | % | | | 1.57 | % | | | - | ‡ | |
| After expense waiver | | | N/A | | | | N/A | | | | 1.55 | %# | | | 1.56 | % (b)# | | | - | ‡ | |
| Net investment income to average daily net assets | | | 0.16 | %* | | | 0.15 | % | | | 0.08 | % | | | 0.33 | % | | | - | ‡ | |
| Portfolio turnover rate | | | 8 | %** | | | 7 | % | | | 3 | % | | | 7 | % | | | 25 | % | |
* Annualized.
** Percentage represents results for the period and are not annualized.
*** Per share amount calculated on the average shares method.
† Effective January 1, 2005, rebated brokerage commissions are included with realized gain or loss on investment transactions. Prior to January 1, 2005, these amounts were presented as a reduction of expenses. Prior year amounts have not been restated to reflect this change. (see note 3)
†† Net investment income is less than $0.01 per share.
++ Class N commenced operations on December 31, 2002.
‡ Amounts are de minimis due to the short period of operations.
# Computed after giving effect to an agreement by MassMutual to waive certain fees and expenses of the Fund.
(a) Employee retirement benefit plans that invest plan assets in the Separate Investment Accounts (SIAs) may be subject to certain charges as set forth by their respective Plan Documents. Total return figures would be lower for the periods presented if they reflected these charges.
(b) The Fund has entered into agreements with certain brokers to rebate a portion of brokerage commissions. The rebated commissions are used to reduce operating expenses of the Fund.
(c) Total Return excludes contingent deferred sales charge and would be lower for the periods presented if they reflected these charges.
The accompanying notes are an integral part of the financial statements.
223
MassMutual Select Indexed Equity Fund – Financial Statements (Continued)
Financial Highlights (For a share outstanding throughout each period)
| | | Class A | |
| | | Six months
ended
6/30/06
(Unaudited) | | Year ended
12/31/05 | | Year ended
12/31/04 | | Year ended
12/31/03 | | Year ended
12/31/02 | | Year ended
12/31/01 | |
| Net asset value, beginning of period | | $ | 11.47 | | | $ | 11.12 | | | $ | 10.23 | | | $ | 8.09 | | | $ | 10.55 | | | $ | 12.17 | | |
| Income (loss) from investment operations: | |
| Net investment income | | | 0.07 | *** | | | 0.13 | *** | | | 0.13 | *** | | | 0.08 | *** | | | 0.07 | *** | | | 0.06 | *** | |
Net realized and unrealized gain (loss)
on investments | | | 0.20 | | | | 0.33 | | | | 0.89 | | | | 2.14 | | | | (2.47 | ) | | | (1.60 | ) | |
Total income (loss) from investment
operations | | | 0.27 | | | | 0.46 | | | | 1.02 | | | | 2.22 | | | | (2.40 | ) | | | (1.54 | ) | |
| Less distributions to shareholders: | |
| From net investment income | | | - | | | | (0.11 | ) | | | (0.13 | ) | | | (0.08 | ) | | | (0.06 | ) | | | (0.08 | ) | |
| Net asset value, end of period | | $ | 11.74 | | | $ | 11.47 | | | $ | 11.12 | | | $ | 10.23 | | | $ | 8.09 | | | $ | 10.55 | | |
| | | | | | | | | | | | | | | | | | | | | | | | | | |
| Total Return(a) | | | 2.35 | %**(b) | | | 4.17 | % (b) | | | 10.01 | % (b) | | | 27.49 | % | | | (22.74 | )% | | | (12.69 | )% | |
| Ratios / Supplemental Data: | |
| Net assets, end of period (000's) | | $ | 270,174 | | | $ | 271,778 | | | $ | 275,920 | | | $ | 160,470 | | | $ | 70,695 | | | $ | 81,682 | | |
| Ratio of expenses to average daily net assets: | |
| Before expense waiver | | | 0.85 | %* | | | 0.85 | % | | | 0.85 | % | | | 0.85 | % | | | 0.85 | % | | | 0.86 | % | |
| After expense waiver | | | 0.70 | %*# | | | 0.75 | % # | | | 0.78 | % # | | | N/A | | | | N/A | | | | N/A | | |
Net investment income to average daily
net assets | | | 1.24 | %* | | | 1.13 | % | | | 1.32 | % | | | 0.94 | % | | | 0.78 | % | | | 0.52 | % | |
| Portfolio turnover rate | | | 3 | %** | | | 6 | % | | | 3 | % | | | 2 | % | | | 5 | % | | | 4 | % | |
| | | Class L | |
| | | Six months
ended
6/30/06
(Unaudited) | | Year ended
12/31/05 | | Year ended
12/31/04 | | Year ended
12/31/03 | | Year ended
12/31/02 | | Year ended
12/31/01 | |
| Net asset value, beginning of period | | $ | 11.50 | | | $ | 11.16 | | | $ | 10.26 | | | $ | 8.11 | | | $ | 10.58 | | | $ | 12.18 | | |
| Income (loss) from investment operations: | |
| Net investment income | | | 0.09 | *** | | | 0.15 | *** | | | 0.16 | *** | | | 0.11 | *** | | | 0.10 | *** | | | 0.08 | *** | |
Net realized and unrealized gain (loss)
on investments | | | 0.20 | | | | 0.34 | | | | 0.89 | | | | 2.15 | | | | (2.48 | ) | | | (1.60 | ) | |
Total income (loss) from investment
operations | | | 0.29 | | | | 0.49 | | | | 1.05 | | | | 2.26 | | | | (2.38 | ) | | | (1.52 | ) | |
| Less distributions to shareholders: | |
| From net investment income | | | - | | | | (0.15 | ) | | | (0.15 | ) | | | (0.11 | ) | | | (0.09 | ) | | | (0.08 | ) | |
| Net asset value, end of period | | $ | 11.79 | | | $ | 11.50 | | | $ | 11.16 | | | $ | 10.26 | | | $ | 8.11 | | | $ | 10.58 | | |
| | | | | | | | | | | | | | | | | | | | | | | | | | |
| Total Return(a) | | | 2.52 | %** | | | 4.41 | % | | | 10.25 | % | | | 27.88 | % | | | (22.53 | )% | | | (12.46 | )% | |
| Ratios / Supplemental Data: | |
| Net assets, end of period (000's) | | $ | 302,371 | | | $ | 282,034 | | | $ | 218,755 | | | $ | 176,247 | | | $ | 54,756 | | | $ | 40,420 | | |
| Ratio of expenses to average daily net assets: | |
| Before expense waiver | | | 0.60 | %* | | | 0.60 | % | | | 0.60 | % | | | 0.60 | % | | | 0.60 | % | | | 0.60 | % | |
| After expense waiver | | | 0.45 | %*# | | | 0.50 | % # | | | 0.53 | % # | | | N/A | | | | N/A | | | | N/A | | |
Net investment income to average daily
net assets | | | 1.49 | %* | | | 1.38 | % | | | 1.52 | % | | | 1.21 | % | | | 1.05 | % | | | 0.75 | % | |
| Portfolio turnover rate | | | 3 | %** | | | 6 | % | | | 3 | % | | | 2 | % | | | 5 | % | | | 4 | % | |
* Annualized.
** Percentages represent results for the period and are not annualized.
*** Per share amount calculated on the average shares method.
# Computed after giving effect to an agreement by MassMutual to waive certain fees and expenses of the Fund for the years ended December 31, 2005 and June 30, 2006.
(a) Employee retirement benefit plans that invest plan assets in the Separate Investment Accounts (SIAs) may be subject to certain charges as set forth in their respective Plan Documents. Total return figures would be lower for the periods presented if they reflected these charges.
(b) Total Return excludes a front-end sales charge and would be lower for the periods presented if it reflected these charges.
The accompanying notes are an integral part of the financial statements.
224
MassMutual Select Indexed Equity Fund – Financial Statements (Continued)
Financial Highlights (For a share outstanding throughout each period)
| | | Class Y | |
| | | Six months
ended
6/30/06
(Unaudited) | | Year ended
12/31/05 | | Year ended
12/31/04 | | Year ended
12/31/03 | | Year ended
12/31/02 | | Year ended
12/31/01 | |
| Net asset value, beginning of period | | $ | 11.54 | | | $ | 11.19 | | | $ | 10.29 | | | $ | 8.12 | | | $ | 10.60 | | | $ | 12.21 | | |
| Income (loss) from investment operations: | |
| Net investment income | | | 0.09 | *** | | | 0.16 | *** | | | 0.17 | *** | | | 0.12 | *** | | | 0.11 | *** | | | 0.10 | *** | |
Net realized and unrealized gain (loss)
on investments | | | 0.19 | | | | 0.34 | | | | 0.89 | | | | 2.16 | | | | (2.49 | ) | | | (1.61 | ) | |
Total income (loss) from investment
operations | | | 0.28 | | | | 0.50 | | | | 1.06 | | | | 2.28 | | | | (2.38 | ) | | | (1.51 | ) | |
| Less distributions to shareholders: | |
| From net investment income | | | - | | | | (0.15 | ) | | | (0.16 | ) | | | (0.11 | ) | | | (0.10 | ) | | | (0.10 | ) | |
| Net asset value, end of period | | $ | 11.82 | | | $ | 11.54 | | | $ | 11.19 | | | $ | 10.29 | | | $ | 8.12 | | | $ | 10.60 | | |
| | | | | | | | | | | | | | | | | | | | | | | | | | |
| Total Return(a) | | | 2.43 | %** | | | 4.49 | % | | | 10.31 | % | | | 28.10 | % | | | (22.47 | )% | | | (12.37 | )% | |
| Ratios / Supplemental Data: | |
| Net assets, end of period (000's) | | $ | 458,277 | | | $ | 467,422 | | | $ | 419,366 | | | $ | 299,713 | | | $ | 198,240 | | | $ | 172,244 | | |
| Net expenses to average daily net assets | | | 0.45 | %* | | | 0.45 | % | | | 0.45 | % | | | 0.45 | % | | | 0.45 | % | | | 0.45 | % | |
Net investment income to average daily
net assets | | | 1.49 | %* | | | 1.43 | % | | | 1.63 | % | | | 1.34 | % | | | 1.18 | % | | | 0.90 | % | |
| Portfolio turnover rate | | | 3 | %** | | | 6 | % | | | 3 | % | | | 2 | % | | | 5 | % | | | 4 | % | |
| | | Class S | |
| | | Six months
ended
6/30/06
(Unaudited) | | Year ended
12/31/05 | | Year ended
12/31/04 | | Year ended
12/31/03 | | Year ended
12/31/02 | | Year ended
12/31/01 | |
| Net asset value, beginning of period | | $ | 11.65 | | | $ | 11.30 | | | $ | 10.38 | | | $ | 8.19 | | | $ | 10.68 | | | $ | 12.29 | | |
| Income (loss) from investment operations: | |
| Net investment income | | | 0.09 | *** | | | 0.16 | *** | | | 0.17 | *** | | | 0.12 | *** | | | 0.11 | *** | | | 0.11 | *** | |
Net realized and unrealized gain (loss)
on investments | | | 0.20 | | | | 0.35 | | | | 0.91 | | | | 2.18 | | | | (2.50 | ) | | | (1.62 | ) | |
Total income (loss) from investment
operations | | | 0.29 | | | | 0.51 | | | | 1.08 | | | | 2.30 | | | | (2.39 | ) | | | (1.51 | ) | |
| Less distributions to shareholders: | |
| From net investment income | | | - | | | | (0.16 | ) | | | (0.16 | ) | | | (0.11 | ) | | | (0.10 | ) | | | (0.10 | ) | |
| Net asset value, end of period | | $ | 11.94 | | | $ | 11.65 | | | $ | 11.30 | | | $ | 10.38 | | | $ | 8.19 | | | $ | 10.68 | | |
| | | | | | | | | | | | | | | | | | | | | | | | | | |
| Total Return(a) | | | 2.49 | %** | | | 4.47 | % | | | 10.39 | % | | | 28.10 | % | | | (22.41 | )% | | | (12.33 | )% | |
| Ratios / Supplemental Data: | |
| Net assets, end of period (000's) | | $ | 639,556 | | | $ | 677,171 | | | $ | 724,614 | | | $ | 710,691 | | | $ | 567,426 | | | $ | 642,799 | | |
| Net expenses to average daily net assets | | | 0.42 | %* | | | 0.42 | % | | | 0.42 | % | | | 0.42 | % | | | 0.42 | % | | | 0.42 | % | |
Net investment income to average daily
net assets | | | 1.51 | %* | | | 1.45 | % | | | 1.62 | % | | | 1.37 | % | | | 1.20 | % | | | 0.92 | % | |
| Portfolio turnover rate | �� | | 3 | %** | | | 6 | % | | | 3 | % | | | 2 | % | | | 5 | % | | | 4 | % | |
* Annualized.
** Percentages represent results for the period and are not annualized.
*** Per share amount calculated on the average shares method.
(a) Employee retirement benefit plans that invest plan assets in the Separate Investment Accounts (SIAs) may be subject to certain charges as set forth in their respective Plan Documents. Total return figures would be lower for the periods presented if they reflected these charges.
The accompanying notes are an integral part of the financial statements.
225
MassMutual Select Indexed Equity Fund – Financial Statements (Continued)
Financial Highlights (For a share outstanding throughout each period)
| | | Class Z | |
| | | Six months
ended
6/30/06
(Unaudited) | | Year ended
12/31/05 | | Year ended
12/31/04 | | Year ended
12/31/03 | | Year ended
12/31/02 | | Period ended
12/31/01+ | |
| Net asset value, beginning of period | | $ | 11.65 | | | $ | 11.30 | | | $ | 10.38 | | | $ | 8.19 | | | $ | 10.68 | | | $ | 11.66 | | |
| Income (loss) from investment operations: | |
| Net investment income | | | 0.10 | *** | | | 0.19 | *** | | | 0.21 | *** | | | 0.15 | *** | | | 0.13 | *** | | | 0.09 | *** | |
Net realized and unrealized gain (loss)
on investments | | | 0.21 | | | | 0.34 | | | | 0.90 | | | | 2.17 | | | | (2.50 | ) | | | (0.95 | ) | |
Total income (loss) from investment
operations | | | 0.31 | | | | 0.53 | | | | 1.11 | | | | 2.32 | | | | (2.37 | ) | | | (0.86 | ) | |
| Less distributions to shareholders: | |
| From net investment income | | | - | | | | (0.18 | ) | | | (0.19 | ) | | | (0.13 | ) | | | (0.12 | ) | | | (0.12 | ) | |
| Net asset value, end of period | | $ | 11.96 | | | $ | 11.65 | | | $ | 11.30 | | | $ | 10.38 | | | $ | 8.19 | | | $ | 10.68 | | |
| | | | | | | | | | | | | | | | | | | | | | | | | | |
| Total Return(a) | | | 2.66 | %** | | | 4.72 | % | | | 10.68 | % | | | 28.39 | % | | | (22.23 | )% | | | (7.33 | )% ** | |
| Ratios / Supplemental Data: | |
| Net assets, end of period (000's) | | $ | 309,070 | | | $ | 251,403 | | | $ | 130,164 | | | $ | 42,906 | | | $ | 16,821 | | | $ | 95 | | |
| Net expenses to average daily net assets | | | 0.20 | %* | | | 0.20 | % | | | 0.20 | % | | | 0.21 | % | | | 0.20 | % | | | 0.21 | % * | |
| Net investment income to average daily net assets | | | 1.73 | %* | | | 1.68 | % | | | 1.93 | % | | | 1.59 | % | | | 1.42 | % | | | 1.20 | % * | |
| Portfolio turnover rate | | | 3 | %** | | | 6 | % | | | 3 | % | | | 2 | % | | | 5 | % | | | 4 | % ** | |
| | | Class N | |
| | | Six months
ended
6/30/06
(Unaudited) | |
Year ended
12/31/05 | |
Year ended
12/31/04 | |
Year ended
12/31/03 | | Year ended
12/31/02++ | |
| Net asset value, beginning of period | | $ | 11.35 | | | $ | 11.02 | | | $ | 10.15 | | | $ | 8.05 | | | $ | 8.05 | | |
| Income (loss) from investment operations: | |
| Net investment income | | | 0.05 | *** | | | 0.09 | *** | | | 0.10 | *** | | | 0.06 | *** | | | 0.00 | † | |
Net realized and unrealized gain (loss)
on investments | | | 0.20 | | | | 0.34 | | | | 0.87 | | | | 2.14 | | | | (0.00 | )† | |
Total income (loss) from investment
operations | | | 0.25 | | | | 0.43 | | | | 0.97 | | | | 2.20 | | | | 0.00 | | |
| Less distributions to shareholders: | |
| From net investment income | | | - | | | | (0.10 | ) | | | (0.10 | ) | | | (0.10 | ) | | | - | | |
| Net asset value, end of period | | $ | 11.60 | | | $ | 11.35 | | | $ | 11.02 | | | $ | 10.15 | | | $ | 8.05 | | |
| | | | | | | | | | | | | | | | | | | | | | |
| Total Return(a) | | | 2.20 | %**(b) | | | 3.86 | % (b) | | | 9.59 | % (b) | | | 27.34 | % (b) | | | 0.00 | % ‡ | |
| Ratios / Supplemental Data: | |
| Net assets, end of period (000's) | | $ | 4,848 | | | $ | 4,757 | | | $ | 3,710 | | | $ | 2,487 | | | $ | 101 | | |
| Ratio of expenses to average daily net assets: | |
| Before expense waiver | | | 1.15 | %* | | | 1.15 | % | | | 1.15 | % | | | 1.15 | % | | | - | ‡ | |
| After expense waiver | | | 1.00 | %*# | | | 1.05 | % # | | | 1.07 | % # | | | N/A | | | | N/A | | |
| Net investment income to average daily net assets | | | 0.94 | %* | | | 0.84 | % | | | 1.00 | % | | | 0.64 | % | | | 0.00 | % ‡ | |
| Portfolio turnover rate | | | 3 | %** | | | 6 | % | | | 3 | % | | | 2 | % | | | 5 | % | |
* Annualized.
** Percentages represent results for the period and are not annualized.
*** Per share amount calculated on the average shares method.
† Net investment income and net realized and unrealized loss on investments are less than $0.01 per share.
+ For the period from May 1, 2001 (commencement of operations) through December 31, 2001.
++ Class N commenced operations on December 31, 2002.
‡ Amounts are de minimis due to the short period of operations.
# Computed after giving effect to an agreement by MassMutual to waive certain fees and expenses of the Fund.
(a) Employee retirement benefit plans that invest plan assets in the Separate Investment Accounts (SIAs) may be subject to certain charges as set forth in their respective Plan Documents. Total return figures would be lower for the periods presented if they reflected these charges.
(b) Total Return excludes contingent deferred sales charge and would be lower for the periods presented if they reflected these charges.
The accompanying notes are an integral part of the financial statements.
226
MassMutual Select Core Opportunities Fund – Financial Statements (Continued)
Financial Highlights (For a share outstanding throughout each period)
| | | Class A | | Class L | | Class Y | | Class S | | Class N | |
| | | Period ended
6/30/06
(Unaudited)+ | | Period ended
6/30/06
(Unaudited)+ | | Period ended
6/30/06
(Unaudited)+ | | Period ended
6/30/06
(Unaudited)+ | | Period ended
6/30/06
(Unaudited)+ | |
| Net asset value, beginning of period | | $ | 10.00 | | | $ | 10.00 | | | $ | 10.00 | | | $ | 10.00 | | | $ | 10.00 | | |
| Income (loss) from investment operations: | |
| Net investment income | | | 0.00 | ***† | | | 0.01 | *** | | | 0.01 | *** | | | 0.01 | *** | | | (0.01 | ) *** | |
| Net realized and unrealized loss on investments | | | (0.38 | ) | | | (0.38 | ) | | | (0.38 | ) | | | (0.38 | ) | | | (0.37 | ) | |
| Total loss from investment operations | | | (0.38 | ) | | | (0.37 | ) | | | (0.37 | ) | | | (0.37 | ) | | | (0.38 | ) | |
| Net asset value, end of period | | $ | 9.62 | | | $ | 9.63 | | | $ | 9.63 | | | $ | 9.63 | | | $ | 9.62 | | |
| | | | | | | | | | | | | | | | | | | | | | |
| Total Return | | | (3.80 | )% ** | | | (3.70 | )% ** | | | (3.70 | )% ** | | | (3.70 | )% ** | | | (3.80 | )% ** | |
| Ratios / Supplemental Data: | |
| Net assets, end of period (000's) | | $ | 835 | | | $ | 1,198 | | | $ | 96 | | | $ | 9,248 | | | $ | 96 | | |
| Ratio of expenses to average daily net assets: | |
| Before expense waiver | | | 1.88 | % * | | | 1.52 | % * | | | 1.36 | % * | | | 1.26 | % * | | | 2.06 | % * | |
| After expense waiver | | | 1.35 | % *# | | | 1.10 | % *# | | | 0.95 | % *# | | | 0.90 | % *# | | | 1.65 | % *# | |
| Net investment income to average daily net assets | | | 0.02 | % * | | | 0.55 | % * | | | 0.40 | % * | | | 0.45 | % * | | | (0.30 | )% * | |
| Portfolio turnover rate | | | 33 | % ** | | | 33 | % ** | | | 33 | % ** | | | 33 | % ** | | | 33 | % ** | |
* Annualized.
** Percentage represents results for the period and are not annualized.
*** Per share amount calculated on the average shares method.
† Net investment income is less than $0.01 per share.
# Computed after giving effect to an agreement by MassMutual to waive certain fees and expenses of the Fund.
+ The Fund commenced operations on March 31, 2006.
The accompanying notes are an integral part of the financial statements.
227
MassMutual Select Focused Value Fund – Financial Statements (Continued)
Financial Highlights (For a share outstanding throughout each period)
| | | Class A | |
| | | Six months
ended
6/30/06
(Unaudited) | | Year ended
12/31/05††† | | Year ended
12/31/04 | | Year ended
12/31/03 | | Year ended
12/31/02 | | Year ended
12/31/01 | |
| Net asset value, beginning of period | | $ | 16.70 | | | $ | 17.78 | | | $ | 16.92 | | | $ | 11.94 | | | $ | 13.41 | | | $ | 10.51 | | |
| Income (loss) from investment operations: | |
| Net investment income (loss) | | | 0.21 | *** | | | (0.00 | )***† | | | (0.07 | )*** | | | (0.06 | )*** | | | (0.04 | )*** | | | (0.04 | )*** | |
Net realized and unrealized gain (loss) on
investments | | | 0.15 | | | | 0.53 | | | | 1.96 | | | | 5.45 | | | | (1.33 | ) | | | 3.30 | | |
Total income (loss) from investment
operations | | | 0.36 | | | | 0.53 | | | | 1.89 | | | | 5.39 | | | | (1.37 | ) | | | 3.26 | | |
| Less distributions to shareholders: | |
| From net investment income | | | - | | | | (0.01 | ) | | | - | | | | (0.00 | )† | | | - | | | | (0.00 | )† | |
| From net realized gains | | | - | | | | (1.60 | ) | | | (1.03 | ) | | | (0.41 | ) | | | (0.10 | ) | | | (0.36 | ) | |
| Total distributions | | | - | | | | (1.61 | ) | | | (1.03 | ) | | | (0.41 | ) | | | (0.10 | ) | | | (0.36 | ) | |
| Net asset value, end of period | | $ | 17.06 | | | $ | 16.70 | | | $ | 17.78 | | | $ | 16.92 | | | $ | 11.94 | | | $ | 13.41 | | |
| Total Return(a) | | | 2.09 | %(c)** | | | 2.98 | % (c) | | | 11.33 | % (c) | | | 45.13 | % | | | (10.18 | )% | | | 31.08 | % | |
| Ratios / Supplemental Data: | |
| Net assets, end of period (000's) | | $ | 240,187 | | | $ | 252,047 | | | $ | 228,871 | | | $ | 158,981 | | | $ | 54,319 | | | $ | 24,562 | | |
| Ratio of expenses to average daily net assets: | |
| Before expense waiver | | | 1.30 | %* | | | 1.30 | % | | | 1.30 | % | | | 1.30 | % | | | 1.30 | % | | | 1.29 | % | |
| After expense waiver | | | N/A | | | | N/A | | | | 1.28 | % (b)# | | | 1.29 | % (b)# | | | 1.30 | % (b)# | | | 1.29 | % # | |
Net investment income (loss) to average
daily net assets | | | 2.40 | %* | | | (0.01 | )% | | | (0.40 | )% | | | (0.40 | )% | | | (0.33 | )% | | | (0.30 | )% | |
| Portfolio turnover rate | | | 20 | %** | | | 31 | % | | | 32 | % | | | 31 | % | | | 78 | % | | | 53 | % | |
| | | Class L | |
| | | Six months
ended
6/30/06
(Unaudited) | | Year ended
12/31/05††† | | Year ended
12/31/04 | | Year ended
12/31/03 | | Year ended
12/31/02 | | Year ended
12/31/01 | |
| Net asset value, beginning of period | | $ | 16.91 | | | $ | 17.98 | | | $ | 17.05 | | | $ | 12.00 | | | $ | 13.45 | | | $ | 10.51 | | |
| Income (loss) from investment operations: | |
| Net investment income (loss) | | | 0.24 | *** | | | 0.05 | *** | | | (0.03 | )*** | | | (0.02 | )*** | | | (0.01 | )*** | | | 0.00 | ***† | |
Net realized and unrealized gain (loss) on
investments | | | 0.15 | | | | 0.53 | | | | 1.99 | | | | 5.48 | | | | (1.34 | ) | | | 3.31 | | |
Total income (loss) from investment
operations | | | 0.39 | | | | 0.58 | | | | 1.96 | | | | 5.46 | | | | (1.35 | ) | | | 3.31 | | |
| Less distributions to shareholders: | |
| From net investment income | | | - | | | | (0.05 | ) | | | - | | | | (0.00 | )† | | | - | | | | (0.01 | ) | |
| From net realized gains | | | - | | | | (1.60 | ) | | | (1.03 | ) | | | (0.41 | ) | | | (0.10 | ) | | | (0.36 | ) | |
| Total distributions | | | - | | | | (1.65 | ) | | | (1.03 | ) | | | (0.41 | ) | | | (0.10 | ) | | | (0.37 | ) | |
| Net asset value, end of period | | $ | 17.30 | | | $ | 16.91 | | | $ | 17.98 | | | $ | 17.05 | | | $ | 12.00 | | | $ | 13.45 | | |
| Total Return(a) | | | 2.25 | %** | | | 3.26 | % | | | 11.65 | % | | | 45.49 | % | | | (10.00 | )% | | | 31.50 | % | |
| Ratios / Supplemental Data: | |
| Net assets, end of period (000's) | | $ | 185,285 | | | $ | 180,827 | | | $ | 163,742 | | | $ | 114,730 | | | $ | 39,942 | | | $ | 25,594 | | |
| Ratio of expenses to average daily net assets: | |
| Before expense waiver | | | 1.05 | %* | | | 1.05 | % | | | 1.05 | % | | | 1.05 | % | | | 1.05 | % | | | 1.04 | % | |
| After expense waiver | | | N/A | | | | N/A | | | | 1.03 | % (b)# | | | 1.04 | % (b)# | | | 1.05 | % (b)# | | | 1.04 | % # | |
Net investment income (loss) to average
daily net assets | | | 2.75 | %* | | | 0.26 | % | | | (0.16 | )% | | | (0.16 | )% | | | (0.11 | )% | | | 0.00 | % †† | |
| Portfolio turnover rate | | | 20 | %** | | | 31 | % | | | 32 | % | | | 31 | % | | | 78 | % | | | 53 | % | |
* Annualized.
** Percentages represent results for the period and are not annualized.
*** Per share amount calculated on the average shares method.
† Net investment income (loss) and distributions from net investment income are less than $0.01 per share.
†† The ratio of net investment income to average daily net assets is less than 0.01%.
††† Effective January 1, 2005, rebated brokerage commissions are included with realized gain or loss on investment transactions. Prior to January 1, 2005, these amounts were presented as a reduction of expenses. Prior year amounts have not been restated to reflect this change due to immateriality. (See Note 3).
# Computed after giving effect to an agreement by MassMutual to waive certain fees and expenses of the Fund.
(a) Employee retirement benefit plans that invest plan assets in the Separate Investment Accounts (SIAs) may be subject to certain charges as set forth in their respective Plan Documents. Total return figures would be lower for the periods presented if they reflected these charges.
(b) The Fund has entered into agreements with certain brokers to rebate a portion of brokerage commissions. The rebated commissions are used to reduce operating expense of the Fund.
(c) Total Return excludes a front-end sales charge and would be lower for the period presented if it reflected these charges.
The accompanying notes are an integral part of the financial statements.
228
MassMutual Select Focused Value Fund – Financial Statements (Continued)
Financial Highlights (For a share outstanding throughout each period)
| | | Class Y | |
| | | Six months
ended
6/30/06
(Unaudited) | | Year ended
12/31/05†† | | Year ended
12/31/04 | | Year ended
12/31/03 | | Year ended
12/31/02 | | Year ended
12/31/01 | |
| Net asset value, beginning of period | | $ | 17.02 | | | $ | 18.08 | | | $ | 17.12 | | | $ | 12.03 | | | $ | 13.46 | | | $ | 10.52 | | |
| Income (loss) from investment operations: | |
| Net investment income (loss) | | | 0.25 | *** | | | 0.07 | *** | | | (0.00 | )***† | | | (0.00 | )***† | | | 0.03 | *** | | | 0.02 | *** | |
Net realized and unrealized gain (loss) on
investments | | | 0.15 | | | | 0.55 | | | | 1.99 | | | | 5.50 | | | | (1.36 | ) | | | 3.30 | | |
Total income (loss) from investment
operations | | | 0.40 | | | | 0.62 | | | | 1.99 | | | | 5.50 | | | | (1.33 | ) | | | 3.32 | | |
| Less distributions to shareholders: | |
| From net investment income | | | - | | | | (0.08 | ) | | | - | | | | (0.00 | )† | | | - | | | | (0.02 | ) | |
| From net realized gains | | | - | | | | (1.60 | ) | | | (1.03 | ) | | | (0.41 | ) | | | (0.10 | ) | | | (0.36 | ) | |
| Total distributions | | | - | | | | (1.68 | ) | | | (1.03 | ) | | | (0.41 | ) | | | (0.10 | ) | | | (0.38 | ) | |
| Net asset value, end of period | | $ | 17.42 | | | $ | 17.02 | | | $ | 18.08 | | | $ | 17.12 | | | $ | 12.03 | | | $ | 13.46 | | |
| Total Return(a) | | | 2.29 | %** | | | 3.44 | % | | | 11.78 | % | | | 45.71 | % | | | (9.85 | )% | | | 31.60 | % | |
| Ratios / Supplemental Data: | |
| Net assets, end of period (000's) | | $ | 117,081 | | | $ | 116,392 | | | $ | 94,538 | | | $ | 78,549 | | | $ | 45,302 | | | $ | 10,137 | | |
| Ratio of expenses to average daily net assets: | |
| Before expense waiver | | | 0.90 | %* | | | 0.90 | % | | | 0.90 | % | | | 0.89 | % | | | 0.90 | % | | | 0.89 | % | |
| After expense waiver | | | N/A | | | | N/A | | | | 0.88 | % (b)# | | | 0.89 | % (b)# | | | 0.90 | % (b)# | | | 0.89 | % # | |
Net investment income (loss) to average
daily net assets | | | 2.86 | %* | | | 0.40 | % | | | (0.01 | )% | | | (0.01 | )% | | | 0.24 | % | | | 0.14 | % | |
| Portfolio turnover rate | | | 20 | %** | | | 31 | % | | | 32 | % | | | 31 | % | | | 78 | % | | | 53 | % | |
| | | Class S | |
| | | Six months
ended
6/30/06
(Unaudited) | | Year ended
12/31/05†† | | Year ended
12/31/04 | | Year ended
12/31/03 | | Year ended
12/31/02 | | Year ended
12/31/01 | |
| Net asset value, beginning of period | | $ | 17.11 | | | $ | 18.18 | | | $ | 17.19 | | | $ | 12.06 | | | $ | 13.48 | | | $ | 10.53 | | |
| Income (loss) from investment operations: | |
| Net investment income | | | 0.26 | *** | | | 0.09 | *** | | | 0.01 | *** | | | 0.01 | *** | | | 0.02 | *** | | | 0.03 | *** | |
Net realized and unrealized gain (loss) on
investments | | | 0.16 | | | | 0.54 | | | | 2.01 | | | | 5.53 | | | | (1.34 | ) | | | 3.31 | | |
Total income (loss) from investment
operations | | | 0.42 | | | | 0.63 | | | | 2.02 | | | | 5.54 | | | | (1.32 | ) | | | 3.34 | | |
| Less distributions to shareholders: | |
| From net investment income | | | - | | | | (0.10 | ) | | | - | | | | (0.00 | )† | | | - | | | | (0.03 | ) | |
| From net realized gains | | | - | | | | (1.60 | ) | | | (1.03 | ) | | | (0.41 | ) | | | (0.10 | ) | | | (0.36 | ) | |
| Total distributions | | | - | | | | (1.70 | ) | | | (1.03 | ) | | | (0.41 | ) | | | (0.10 | ) | | | (0.39 | ) | |
| Net asset value, end of period | | $ | 17.53 | | | $ | 17.11 | | | $ | 18.18 | | | $ | 17.19 | | | $ | 12.06 | | | $ | 13.48 | | |
| Total Return(a) | | | 2.39 | %** | | | 3.45 | % | | | 11.91 | % | | | 45.94 | % | | | (9.76 | )% | | | 31.70 | % | |
| Ratios / Supplemental Data: | |
| Net assets, end of period (000's) | | $ | 342,838 | | | $ | 354,769 | | | $ | 326,445 | | | $ | 293,759 | | | $ | 114,178 | | | $ | 110,092 | | |
| Ratio of expenses to average daily net assets: | |
| Before expense waiver | | | 0.80 | %* | | | 0.80 | % | | | 0.80 | % | | | 0.80 | % | | | 0.80 | % | | | 0.79 | % | |
| After expense waiver | | | N/A | | | | N/A | | | | 0.78 | % (b)# | | | 0.79 | % (b)# | | | 0.80 | % (b)# | | | 0.79 | % # | |
| Net investment income to average daily net assets | | | 2.91 | %* | | | 0.50 | % | | | 0.08 | % | | | 0.09 | % | | | 0.13 | % | | | 0.28 | % | |
| Portfolio turnover rate | | | 20 | %** | | | 31 | % | | | 32 | % | | | 31 | % | | | 78 | % | | | 53 | % | |
* Annualized.
** Percentages represent results for the period and are not annualized.
*** Per share amount calculated on the average shares method.
† Net investment loss and distributions from net investment income are less than $0.01 per share.
†† Effective January 1, 2005, rebated brokerage commissions are included with realized gain or loss on investment transactions. Prior to January 1, 2005, these amounts were presented as a reduction of expenses. Prior year amounts have not been restated to reflect this change due to immateriality. (See Note 3).
# Computed after giving effect to an agreement by MassMutual to waive certain fees and expenses of the Fund.
(a) Employee retirement benefit plans that invest plan assets in the Separate Investment Accounts (SIAs) may be subject to certain charges as set forth in their respective Plan Documents. Total return figures would be lower for the periods presented if they reflected these charges.
(b) The Fund has entered into agreements with certain brokers to rebate a portion of brokerage commissions. The rebated commissions are used to reduce operating expense of the Fund.
The accompanying notes are an integral part of the financial statements.
229
MassMutual Select Focused Value Fund – Financial Statements (Continued)
Financial Highlights (For a share outstanding throughout each period)
| | | Class N | |
| | | Six months
ended
6/30/06
(Unaudited) | | Year ended
12/31/05†† | | Year ended
12/31/04 | | Year ended
12/31/03 | | Period ended
12/31/02++ | |
| Net asset value, beginning of period | | $ | 16.48 | | | $ | 17.60 | | | $ | 16.81 | | | $ | 11.90 | | | $ | 11.77 | | |
| Income (loss) from investment operations: | |
| Net investment loss | | | 0.17 | *** | | | (0.05 | )*** | | | (0.12 | )*** | | | (0.11 | )*** | | | (0.00 | )***† | |
| Net realized and unrealized gain on investments | | | 0.16 | | | | 0.53 | | | | 1.94 | | | | 5.43 | | | | 0.13 | | |
| Total income from investment operations | | | 0.33 | | | | 0.48 | | | | 1.82 | | | | 5.32 | | | | 0.13 | | |
| Less distributions to shareholders: | |
| From net investment income | | | - | | | | - | | | | - | | | | (0.00 | )† | | | - | | |
| Tax return of capital | | | - | | | | - | | | | - | | | | (0.41 | ) | | | - | | |
| From net realized gains | | | - | | | | (1.60 | ) | | | (1.03 | ) | | | - | | | | - | | |
| Total distributions | | | - | | | | (1.60 | ) | | | (1.03 | ) | | | (0.41 | ) | | | - | | |
| Net asset value, end of period | | $ | 16.81 | | | $ | 16.48 | | | $ | 17.60 | | | $ | 16.81 | | | $ | 11.90 | | |
| | | | | | | | | | | | | | | | | | | | | | |
| Total Return(a) | | | 2.00 | %(c)** | | | 2.61 | % (c) | | | 11.05 | % (c) | | | 44.70 | % (c) | | | - | ‡ | |
| Ratios / Supplemental Data: | |
| Net assets, end of period (000's) | | $ | 2,090 | | | $ | 1,820 | | | $ | 1,006 | | | $ | 904 | | | $ | 102 | | |
| Ratio of expenses to average daily net assets: | |
| Before expense waiver | | | 1.60 | %* | | | 1.60 | % | | | 1.60 | % | | | 1.61 | % | | | - | ‡ | |
| After expense waiver | | | N/A | | | | N/A | | | | 1.58 | % (b)# | | | 1.60 | % (b)# | | | - | ‡ | |
| Net investment loss to average daily net assets | | | 2.23 | %* | | | (0.27 | )% | | | (0.72 | )% | | | (0.70 | )% | | | - | ‡ | |
| Portfolio turnover rate | | | 20 | %** | | | 31 | % | | | 32 | % | | | 31 | % | | | 78 | % | |
* Annualized.
** Percentages represent results for the period and are not annualized.
*** Per share amount calculated on the average shares method.
† Net investment loss and distributions from net investment income are less than $0.01 per share.
†† Effective January 1, 2005, rebated brokerage commissions are included with realized gain or loss on investment transactions. Prior to January 1, 2005, these amounts were presented as a reduction of expenses. Prior year amounts have not been restated to reflect this change due to immateriality. (See Note 3).
++ Class N commenced operations on December 31, 2002.
‡ Amounts are de minimis due to the short period of operations.
# Computed after giving effect to an agreement by MassMutual to waive certain fees and expenses of the Fund.
(a) Employee retirement benefit plans that invest plan assets in the Separate Investment Accounts (SIAs) may be subject to certain charges as set forth in their respective Plan Documents. Total return figures would be lower for the periods presented if they reflected these charges.
(b) The Fund has entered into agreements with certain brokers to rebate a portion of brokerage commissions. The rebated commissions are used to reduce operating expense of the Fund.
(c) Total Return excludes contingent deferred sales charge and would be lower for the periods presented if it reflected these charges.
The accompanying notes are an integral part of the financial statements.
230
MassMutual Select OTC 100 Fund – Financial Statements (Continued)
Financial Highlights (For a share outstanding throughout each period)
| | | Class A | |
| | | Six months
ended
6/30/06
(Unaudited) | | Year ended
12/31/05 | | Year ended
12/31/04 | | Year ended
12/31/03 | | Year ended
12/31/02 | | Year ended
12/31/01 | |
| Net asset value, beginning of period | | $ | 4.12 | | | $ | 4.09 | | | $ | 3.74 | | | $ | 2.53 | | | $ | 4.08 | | | $ | 6.08 | | |
| Income (loss) from investment operations: | |
| Net investment income (loss) | | | (0.01 | )*** | | | (0.02 | )*** | | | 0.00 | ***† | | | (0.03 | )*** | | | (0.03 | )*** | | | (0.04 | )*** | |
Net realized and unrealized gain (loss) on
investments | | | (0.18 | ) | | | 0.05 | | | | 0.35 | | | | 1.24 | | | | (1.52 | ) | | | (1.96 | ) | |
Total income (loss) from investment
operations | | | (0.19 | ) | | | 0.03 | | | | 0.35 | | | | 1.21 | | | | (1.55 | ) | | | (2.00 | ) | |
| Less distributions to shareholders: | |
| From net investment income | | | - | | | | - | | | | (0.00 | )† | | | - | | | | - | | | | - | | |
| Net asset value, end of period | | $ | 3.93 | | | $ | 4.12 | | | $ | 4.09 | | | $ | 3.74 | | | $ | 2.53 | | | $ | 4.08 | | |
| Total Return(a) | | | (4.61 | )% (b)** | | | 0.73 | % (b) | | | 9.47 | % (b) | | | 47.83 | % | | | (37.99 | )% | | | (33.00 | )% | |
| Ratios / Supplemental Data: | |
| Net assets, end of period (000's) | | $ | 22,040 | | | $ | 26,216 | | | $ | 32,176 | | | $ | 30,349 | | | $ | 11,644 | | | $ | 12,472 | | |
| Ratio of expenses to average daily net assets: | |
| Before expense waiver | | | 1.14 | % * | | | 1.11 | % | | | 1.12 | % | | | 1.17 | % | | | 1.18 | % | | | 1.11 | % | |
| After expense waiver | | | N/A | | | | N/A | | | | N/A | | | | 1.12 | % # | | | 1.04 | % # | | | 1.07 | % # | |
Net investment income (loss) to average
daily net assets | | | (0.61 | )% * | | | (0.50 | )% | | | 0.12 | % | | | (0.86 | )% | | | (0.90 | )% | | | (0.90 | )% | |
| Portfolio turnover rate | | | 3 | % ** | | | 17 | % | | | 30 | % | | | 66 | % | | | 65 | % | | | 45 | % | |
| | | Class L | |
| | | Six months
ended
6/30/06
(Unaudited) | | Year ended
12/31/05 | | Year ended
12/31/04 | | Year ended
12/31/03 | | Year ended
12/31/02 | | Year ended
12/31/01 | |
| Net asset value, beginning of period | | $ | 4.17 | | | $ | 4.13 | | | $ | 3.77 | | | $ | 2.54 | | | $ | 4.10 | | | $ | 6.09 | | |
| Income (loss) from investment operations: | |
| Net investment income (loss) | | | (0.01 | )*** | | | (0.01 | )*** | | | 0.01 | *** | | | (0.02 | )*** | | | (0.02 | )*** | | | (0.03 | )*** | |
Net realized and unrealized gain (loss) on
investments | | | (0.17 | ) | | | 0.05 | | | | 0.36 | | | | 1.25 | | | | (1.54 | ) | | | (1.96 | ) | |
Total income (loss) from investment
operations | | | (0.18 | ) | | | 0.04 | | | | 0.37 | | | | 1.23 | | | | (1.56 | ) | | | (1.99 | ) | |
| Less distributions to shareholders: | |
| From net investment income | | | - | | | | - | | | | (0.01 | ) | | | - | | | | - | | | | - | | |
| Net asset value, end of period | | $ | 3.99 | | | $ | 4.17 | | | $ | 4.13 | | | $ | 3.77 | | | $ | 2.54 | | | $ | 4.10 | | |
| Total Return(a) | | | (4.56 | )% ** | | | 0.97 | % | | | 9.82 | % | | | 48.43 | % | | | (38.05 | )% | | | (32.68 | )% | |
| Ratios / Supplemental Data: | |
| Net assets, end of period (000's) | | $ | 10,014 | | | $ | 13,000 | | | $ | 13,101 | | | $ | 15,508 | | | $ | 6,389 | | | $ | 8,225 | | |
| Ratio of expenses to average daily net assets: | |
| Before expense waiver | | | 0.89 | % * | | | 0.86 | % | | | 0.87 | % | | | 0.91 | % | | | 0.93 | % | | | 0.86 | % | |
| After expense waiver | | | N/A | | | | N/A | | | | N/A | | | | 0.87 | % # | | | 0.79 | % # | | | 0.82 | % # | |
Net investment income (loss) to average
daily net assets | | | (0.36 | )% * | | | (0.24 | )% | | | 0.26 | % | | | (0.61 | )% | | | (0.65 | )% | | | (0.65 | )% | |
| Portfolio turnover rate | | | 3 | % ** | | | 17 | % | | | 30 | % | | | 66 | % | | | 65 | % | | | 45 | % | |
* Annualized.
** Percentages represent results for the period and are not annualized.
*** Per share amount calculated on the average shares method.
† Net investment income and distributions from net investment income are less than $0.01 per share.
# Computed after giving effect to an agreement by MassMutual to waive certain fees and expenses of the Fund.
(a) Employee retirement benefit plans that invest plan assets in the Separate Investment Accounts (SIAs) may be subject to certain charges as set forth in their respective Plan Documents. Total return figures would be lower for the periods presented if they reflected these charges.
(b) Total Return excludes a front-end sales charge and would be lower for the periods presented if it reflected these charges.
The accompanying notes are an integral part of the financial statements.
231
MassMutual Select OTC 100 Fund – Financial Statements (Continued)
Financial Highlights (For a share outstanding throughout each period)
| | | Class Y | |
| | | Six months
ended
6/30/06
(Unaudited) | | Year ended
12/31/05 | | Year ended
12/31/04 | | Year ended
12/31/03 | | Year ended
12/31/02 | | Year ended
12/31/01 | |
| Net asset value, beginning of period | | $ | 4.19 | | | $ | 4.15 | | | $ | 3.79 | | | $ | 2.54 | | | $ | 4.11 | | | $ | 6.10 | | |
| Income (loss) from investment operations: | |
| Net investment income (loss) | | | 0.00 | ***† | | | (0.00 | )***† | | | 0.02 | *** | | | (0.01 | )*** | | | (0.01 | )*** | | | (0.02 | )*** | |
Net realized and unrealized gain (loss) on
investments | | | (0.18 | ) | | | 0.04 | | | | 0.36 | | | | 1.26 | | | | (1.56 | ) | | | (1.97 | ) | |
Total income (loss) from
investment operations | | | (0.18 | ) | | | 0.04 | | | | 0.38 | | | | 1.25 | | | | (1.57 | ) | | | (1.99 | ) | |
| Less distributions to shareholders: | |
| From net investment income | | | - | | | | - | | | | (0.02 | ) | | | - | | | | - | | | | - | | |
| Net asset value, end of period | | $ | 4.01 | | | $ | 4.19 | | | $ | 4.15 | | | $ | 3.79 | | | $ | 2.54 | | | $ | 4.11 | | |
| Total Return(a) | | | (4.30 | )% ** | | | 0.96 | % | | | 9.98 | % | | | 48.63 | % | | | (37.96 | )% | | | (32.62 | )% | |
| Ratios / Supplemental Data: | |
| Net assets, end of period (000's) | | $ | 1,734 | | | $ | 2,628 | | | $ | 3,777 | | | $ | 3,827 | | | $ | 998 | | | $ | 350 | | |
Ratio of expenses to average
daily net assets: | |
| Before expense waiver | | | 0.75 | % * | | | 0.71 | % | | | 0.72 | % | | | 0.77 | % | | | 0.78 | % | | | 0.71 | % | |
| After expense waiver | | | N/A | | | | N/A | | | | N/A | | | | 0.73 | % # | | | 0.64 | % # | | | 0.67 | % # | |
Net investment income (loss) to average
daily net assets | | | (0.20 | )% * | | | (0.11 | )% | | | 0.49 | % | | | (0.45 | )% | | | (0.50 | )% | | | (0.50 | )% | |
| Portfolio turnover rate | | | 3 | % ** | | | 17 | % | | | 30 | % | | | 66 | % | | | 65 | % | | | 45 | % | |
| | | Class S | |
| | | Six months
ended
6/30/06
(Unaudited) | | Year ended
12/31/05 | | Year ended
12/31/04 | | Year ended
12/31/03 | | Year ended
12/31/02 | | Year ended
12/31/01 | |
| Net asset value, beginning of period | | $ | 4.22 | | | $ | 4.17 | | | $ | 3.81 | | | $ | 2.56 | | | $ | 4.12 | | | $ | 6.10 | | |
| Income (loss) from investment operations: | |
| Net investment income (loss) | | | 0.00 | ***† | | | (0.00 | )***† | | | 0.02 | *** | | | (0.01 | )*** | | | (0.01 | )*** | | | (0.02 | )*** | |
Net realized and unrealized gain (loss) on
investments | | | (0.18 | ) | | | 0.05 | | | | 0.36 | | | | 1.26 | | | | (1.55 | ) | | | (1.96 | ) | |
Total income (loss) from
investment operations | | | (0.18 | ) | | | 0.05 | | | | 0.38 | | | | 1.25 | | | | (1.56 | ) | | | (1.98 | ) | |
| Less distributions to shareholders: | |
| From net investment income | | | - | | | | - | | | | (0.02 | ) | | | - | | | | - | | | | - | | |
| Net asset value, end of period | | $ | 4.04 | | | $ | 4.22 | | | $ | 4.17 | | | $ | 3.81 | | | $ | 2.56 | | | $ | 4.12 | | |
| Total Return(a) | | | (4.27 | )% ** | | | 1.20 | % | | | 10.00 | % | | | 48.83 | % | | | (37.71 | )% | | | (32.62 | )% | |
| Ratios / Supplemental Data: | |
| Net assets, end of period (000's) | | $ | 16,370 | | | $ | 19,404 | | | $ | 25,880 | | | $ | 26,424 | | | $ | 7,211 | | | $ | 19,602 | | |
Ratio of expenses to average
daily net assets: | |
| Before expense waiver | | | 0.64 | % * | | | 0.61 | % | | | 0.62 | % | | | 0.67 | % | | | 0.68 | % | | | 0.62 | % | |
| After expense waiver | | | N/A | | | | N/A | | | | N/A | | | | 0.63 | % # | | | 0.54 | % # | | | 0.58 | % # | |
Net investment income (loss) to average
daily net assets | | | (0.11 | )% * | | | (0.01 | )% | | | 0.45 | % | | | (0.36 | )% | | | (0.41 | )% | | | (0.39 | )% | |
| Portfolio turnover rate | | | 3 | % ** | | | 17 | % | | | 30 | % | | | 66 | % | | | 65 | % | | | 45 | % | |
* Annualized.
** Percentages represent results for the period and are not annualized.
*** Per share amount calculated on the average shares method.
† Net investment income (loss) is less than $0.01 per share.
# Computed after giving effect to an agreement by MassMutual to waive certain fees and expenses of the Fund.
(a) Employee retirement benefit plans that invest plan assets in the Separate Investment Accounts (SIAs) may be subject to certain charges as set forth in their respective Plan Documents. Total return figures would be lower for the periods presented if they reflected these charges.
The accompanying notes are an integral part of the financial statements.
232
MassMutual Select OTC 100 Fund – Financial Statements (Continued)
Financial Highlights (For a share outstanding throughout each period)
| | | Class N | |
| | | Six months
ended
6/30/06
(Unaudited) | | Year ended
12/31/05 | | Year ended
12/31/04 | | Year ended
12/31/03 | | Period ended
12/31/02++ | |
| Net asset value, beginning of period | | $ | 4.07 | | | $ | 4.05 | | | $ | 3.71 | | | $ | 2.52 | | | $ | 2.53 | | |
| Income (loss) from investment operations: | |
| Net investment loss | | | (0.02 | )*** | | | (0.03 | )*** | | | 0.00 | ***† | | | (0.04 | )*** | | | (0.00 | )***† | |
Net realized and unrealized gain
on investments | | | (0.17 | ) | | | 0.05 | | | | 0.34 | | | | 1.23 | | | | (0.01 | ) | |
Total income from investment
operations | | | (0.19 | ) | | | 0.02 | | | | 0.34 | | | | 1.19 | | | | (0.01 | ) | |
| Less distributions to shareholders: | |
| From net investment income | | | - | | | | - | | | | (0.00 | )†† | | | - | | | | - | | |
| Net asset value, end of period | | $ | 3.88 | | | $ | 4.07 | | | $ | 4.05 | | | $ | 3.71 | | | $ | 2.52 | | |
| Total Return(a) | | | (4.67 | )% (b)** | | | 0.49 | % (b) | | | 9.25 | % (b) | | | 47.22 | % (b) | | | - | ‡ | |
| Ratios / Supplemental Data: | |
| Net assets, end of period (000's) | | $ | 424 | | | $ | 451 | | | $ | 432 | | | $ | 150 | | | $ | 100 | | |
Ratio of expenses to average
daily net assets: | |
| Before expense waiver | | | 1.44 | % * | | | 1.41 | % | | | 1.41 | % | | | 1.46 | % | | | - | ‡ | |
| After expense waiver | | | N/A | | | | N/A | | | | N/A | | | | 1.42 | % # | | | - | ‡ | |
Net investment loss to average
daily net assets | | | (0.91 | )% * | | | (0.79 | )% | | | 0.11 | % | | | (1.15 | )% | | | - | ‡ | |
| Portfolio turnover rate | | | 3 | % ** | | | 17 | % | | | 30 | % | | | 66 | % | | | 65 | % | |
* Annualized.
** Percentages represent results for the period and are not annualized.
*** Per share amount calculated on the average shares method.
† Net investment income (loss) is less than $0.01 per share.
†† Distributions from net investment income are less than $0.01 per share.
++ Class N commenced operations on December 31, 2002.
‡ Amounts are de minimis due to the short period of operations.
# Computed after giving effect to an agreement by MassMutual to waive certain fees and expenses of the Fund.
(a) Employee retirement benefit plans that invest plan assets in the Separate Investment Accounts (SIAs) may be subject to certain charges as set forth in their respective Plan Documents. Total return figures would be lower for the periods presented if they reflected these charges.
(b) Total Return excludes contingent deferred sales charge and would be lower for the periods presented if they reflected these charges.
The accompanying notes are an integral part of the financial statements.
233
MassMutual Select Aggressive Growth Fund – Financial Statements (Continued)
Financial Highlights (For a share outstanding throughout each period)
| | | Class A | |
| | | Six months
ended
6/30/06
(Unaudited) | | Year ended
12/31/05†† | | Year ended
12/31/04 | | Year ended
12/31/03 | | Year ended
12/31/02 | | Year ended
12/31/01(d) | |
| Net asset value, beginning of period | | $ | 6.47 | | | $ | 5.89 | | | $ | 4.96 | | | $ | 3.80 | | | $ | 5.28 | | | $ | 7.75 | | |
| Income (loss) from investment operations: | |
| Net investment loss | | | (0.03 | )*** | | | (0.06 | )*** | | | (0.04 | )*** | | | (0.02 | )*** | | | (0.02 | )*** | | | (0.02 | )*** | |
Net realized and unrealized gain (loss) on
investments | | | (0.59 | ) | | | 0.64 | | | | 0.97 | | | | 1.18 | | | | (1.46 | ) | | | (2.45 | ) | |
Total income (loss) from investment
operations | | | (0.62 | ) | | | 0.58 | | | | 0.93 | | | | 1.16 | | | | (1.48 | ) | | | (2.47 | ) | |
| Net asset value, end of period | | $ | 5.85 | | | $ | 6.47 | | | $ | 5.89 | | | $ | 4.96 | | | $ | 3.80 | | | $ | 5.28 | | |
| Total Return(a) | | | (9.58 | )% **(c) | | | 9.85 | % (c) | | | 18.75 | % (c) | | | 30.53 | % | | | (28.03 | )% | | | (31.87 | )% | |
| Ratios / Supplemental Data: | |
| Net assets, end of period (000's) | | $ | 119,342 | | | $ | 137,756 | | | $ | 117,232 | | | $ | 65,012 | | | $ | 37,203 | | | $ | 34,747 | | |
| Ratio of expenses to average daily net assets: | |
| Before expense waiver | | | 1.35 | % * | | | 1.35 | % | | | 1.36 | % | | | 1.37 | % | | | 1.37 | % | | | 1.36 | % | |
| After expense waiver | | | 1.31 | % *# | | | 1.27 | % # | | | 1.30 | % (b)# | | | 1.33 | % (b)# | | | 1.34 | % (b)# | | | 1.35 | % # | |
Net investment income (loss) to average
daily net assets | | | (1.05 | )% * | | | (1.02 | )% | | | (0.67 | )% | | | (0.56 | )% | | | (0.56 | )% | | | (0.33 | )% | |
| Portfolio turnover rate | | | 23 | % ** | | | 24 | % | | | 85 | % | | | 93 | % | | | 112 | % | | | 112 | % | |
| | | Class L | |
| | | Six months
ended
6/30/06
(Unaudited) | | Year ended
12/31/05†† | | Year ended
12/31/04 | | Year ended
12/31/03 | | Year ended
12/31/02 | | Year ended
12/31/01(d) | |
| Net asset value, beginning of period | | $ | 6.56 | | | $ | 5.97 | | | $ | 5.01 | | | $ | 3.82 | | | $ | 5.31 | | | $ | 7.77 | | |
| Income (loss) from investment operations: | |
| Net investment loss | | | (0.03 | )*** | | | (0.05 | )*** | | | (0.02 | )*** | | | (0.01 | )*** | | | (0.01 | )*** | | | (0.00 | )***† | |
Net realized and unrealized gain (loss) on
investments | | | (0.59 | ) | | | 0.64 | | | | 0.98 | | | | 1.20 | | | | (1.48 | ) | | | (2.46 | ) | |
Total income (loss) from investment
operations | | | (0.62 | ) | | | 0.59 | | | | 0.96 | | | | 1.19 | | | | (1.49 | ) | | | (2.46 | ) | |
| Net asset value, end of period | | $ | 5.94 | | | $ | 6.56 | | | $ | 5.97 | | | $ | 5.01 | | | $ | 3.82 | | | $ | 5.31 | | |
| Total Return(a) | | | (9.45 | )% ** | | | 9.88 | % | | | 19.16 | % | | | 31.15 | % | | | (28.06 | )% | | | (31.66 | )% | |
| Ratios / Supplemental Data: | |
| Net assets, end of period (000's) | | $ | 223,978 | | | $ | 193,605 | | | $ | 152,518 | | | $ | 76,120 | | | $ | 31,012 | | | $ | 27,980 | | |
| Ratio of expenses to average daily net assets: | |
| Before expense waiver | | | 1.10 | % * | | | 1.10 | % | | | 1.11 | % | | | 1.12 | % | | | 1.12 | % | | | 1.11 | % | |
| After expense waiver | | | 1.06 | % *# | | | 1.02 | % # | | | 1.05 | % (b)# | | | 1.08 | % (b)# | | | 1.09 | % (b)# | | | 1.10 | % # | |
Net investment income (loss) to average
daily net assets | | | (0.81 | )% * | | | (0.77 | )% | | | (0.42 | )% | | | (0.32 | )% | | | (0.31 | )% | | | (0.08 | )% | |
| Portfolio turnover rate | | | 23 | % ** | | | 24 | % | | | 85 | % | | | 93 | % | | | 112 | % | | | 112 | % | |
* Annualized.
** Percentage represents results for the period and are not annualized.
*** Per share amount calculated on the average shares method.
† Net investment loss is less than $0.01 per share.
†† Effective January 1, 2005, rebated brokerage commissions are included with realized gain or loss on investment transactions. Prior to January 1, 2005, these amounts were presented as a reduction of expenses. Prior year amounts have not been restated to reflect this change due to immateriality. (See Note 3)
# Computed after giving effect to an agreement by MassMutual to waive certain fees and expenses of the Fund.
(a) Employee retirement benefit plans that invest plan assets in the Separate Investment Accounts (SIAs) may be subject to certain charges as set forth by their respective Plan Documents. Total return figures would be lower for the periods presented if they reflected these charges.
(b) The Fund has entered into agreements with certain brokers to rebate a portion of brokerage commissions. The rebated commissions are used to reduce operating expenses of the Fund.
(c) Total Return excludes a front-end sales charge and would be lower for the periods presented if it reflected these charges.
(d) The Fund has adopted the provisions of the AICPA Audit and Accounting Guide for Investment Companies and began amortizing premiums and discounts on debt securities. The effect of this change for the year ended December 31, 2001 was an increase to net investment loss per share of less than $0.01, a decrease to net realized and unrealized gains and losses per share of less than $0.01 and an increase in the ratio of net investment loss to average net assets of 0.02%. Per share data and ratios/supplemental data for periods prior to January 1, 2001 have not been restated to reflect this change in presentation.
The accompanying notes are an integral part of the financial statements.
234
MassMutual Select Aggressive Growth Fund – Financial Statements (Continued)
Financial Highlights (For a share outstanding throughout each period)
| | | Class Y | |
| | | Six months
ended
6/30/06
(Unaudited) | | Year ended
12/31/05†† | | Year ended
12/31/04 | | Year ended
12/31/03 | | Year ended
12/31/02 | | Year ended
12/31/01(c) | |
| Net asset value, beginning of period | | $ | 6.61 | | | $ | 6.00 | | | $ | 5.03 | | | $ | 3.83 | | | $ | 5.31 | | | $ | 7.77 | | |
Income (loss) from investment
operations: | |
| Net investment loss | | | (0.02 | )*** | | | (0.04 | )*** | | | (0.01 | )*** | | | (0.01 | )*** | | | (0.01 | )*** | | | (0.00 | )***† | |
Net realized and unrealized gain (loss) on
investments | | | (0.60 | ) | | | 0.65 | | | | 0.98 | | | | 1.21 | | | | (1.47 | ) | | | (2.46 | ) | |
Total income (loss) from
investment operations | | | (0.62 | ) | | | 0.61 | | | | 0.97 | | | | 1.20 | | | | (1.48 | ) | | | (2.46 | ) | |
| Net asset value, end of period | | $ | 5.99 | | | $ | 6.61 | | | $ | 6.00 | | | $ | 5.03 | | | $ | 3.83 | | | $ | 5.31 | | |
| Total Return(a) | | | (9.38 | )% ** | | | 10.17 | % | | | 19.28 | % | | | 31.33 | % | | | (27.87 | )% | | | (31.66 | )% | |
| Ratios / Supplemental Data: | |
| Net assets, end of period (000's) | | $ | 50,439 | | | $ | 41,705 | | | $ | 32,242 | | | $ | 17,333 | | | $ | 10,145 | | | $ | 12,095 | | |
Ratio of expenses to average daily
net assets: | |
| Before expense waiver | | | 0.95 | % * | | | 0.95 | % | | | 0.96 | % | | | 0.97 | % | | | 0.97 | % | | | 0.96 | % | |
| After expense waiver | | | 0.91 | % *# | | | 0.87 | % # | | | 0.90 | % (b)# | | | 0.93 | % (b)# | | | 0.94 | % (b)# | | | 0.94 | % # | |
Net investment income (loss) to
average daily net assets | | | (0.65 | )% * | | | (0.62 | )% | | | (0.27 | )% | | | (0.16 | )% | | | (0.16 | )% | | | (0.02 | )% | |
| Portfolio turnover rate | | | 23 | % ** | | | 24 | % | | | 85 | % | | | 93 | % | | | 112 | % | | | 112 | % | |
| | | Class S | |
| | | Six months
ended
6/30/06
(Unaudited) | | Year ended
12/31/05†† | | Year ended
12/31/04 | | Year ended
12/31/03 | | Year ended
12/31/02 | | Year ended
12/31/01(c) | |
| Net asset value, beginning of period | | $ | 6.65 | | | $ | 6.03 | | | $ | 5.05 | | | $ | 3.84 | | | $ | 5.32 | | | $ | 7.77 | | |
Income (loss) from investment
operations: | |
| Net investment income (loss) | | | (0.02 | )*** | | | (0.03 | )*** | | | (0.01 | )*** | | | (0.00 | )***† | | | (0.01 | )*** | | | 0.01 | *** | |
Net realized and unrealized gain (loss) on
investments | | | (0.60 | ) | | | 0.65 | | | | 0.99 | | | | 1.21 | | | | (1.47 | ) | | | (2.46 | ) | |
Total income (loss) from
investment operations | | | (0.62 | ) | | | 0.62 | | | | 0.98 | | | | 1.21 | | | | (1.48 | ) | | | (2.45 | ) | |
| Net asset value, end of period | | $ | 6.03 | | | $ | 6.65 | | | $ | 6.03 | | | $ | 5.05 | | | $ | 3.84 | | | $ | 5.32 | | |
| Total Return(a) | | | (9.32 | )% ** | | | 10.28 | % | | | 19.41 | % | | | 31.51 | % | | | (27.82 | )% | | | (31.53 | )% | |
| Ratios / Supplemental Data: | |
| Net assets, end of period (000's) | | $ | 235,432 | | | $ | 240,002 | | | $ | 198,154 | | | $ | 108,281 | | | $ | 46,026 | | | $ | 76,724 | | |
Ratio of expenses to average daily
net assets: | |
| Before expense waiver | | | 0.85 | % * | | | 0.85 | % | | | 0.86 | % | | | 0.87 | % | | | 0.87 | % | | | 0.86 | % | |
| After expense waiver | | | 0.81 | % *# | | | 0.77 | % # | | | 0.80 | % (b)# | | | 0.83 | % (b)# | | | 0.84 | % (b)# | | | 0.85 | % # | |
Net investment income (loss) to
average daily net assets | | | (0.55 | )% * | | | (0.51 | )% | | | (0.17 | )% | | | (0.06 | )% | | | (0.07 | )% | | | 0.17 | % | |
| Portfolio turnover rate | | | 23 | % ** | | | 24 | % | | | 85 | % | | | 93 | % | | | 112 | % | | | 112 | % | |
* Annualized.
** Percentage represents results for the period and are not annualized.
*** Per share amount calculated on the average shares method.
† Net investment loss is less than $0.01 per share.
†† Effective January 1, 2005, rebated brokerage commissions are included with realized gain or loss on investment transactions. Prior to January 1, 2005, these amounts were presented as a reduction of expenses. Prior year amounts have not been restated to reflect this change due to immateriality. (See Note 3)
# Computed after giving effect to an agreement by MassMutual to waive certain fees and expenses of the Fund.
(a) Employee retirement benefit plans that invest plan assets in the Separate Investment Accounts (SIAs) may be subject to certain charges as set forth by their respective Plan Documents. Total return figures would be lower for the periods presented if they reflected these charges.
(b) The Fund has entered into agreements with certain brokers to rebate a portion of brokerage commissions. The rebated commissions are used to reduce operating expenses of the Fund.
(c) The Fund has adopted the provisions of the AICPA Audit and Accounting Guide for Investment Companies and began amortizing premiums and discounts on debt securities. The effect of this change for the year ended December 31, 2001 was an increase to net investment loss per share of less than $0.01, a decrease to net realized and unrealized gains and losses per share of less than $0.01 and an increase in the ratio of net investment loss to average net assets of 0.02%. Per share data and ratios/supplemental data for periods prior to January 1, 2001 have not been restated to reflect this change in presentation.
The accompanying notes are an integral part of the financial statements.
235
MassMutual Select Aggressive Growth Fund – Financial Statements (Continued)
Financial Highlights (For a share outstanding throughout each period)
| | | Class N | |
| | | Six months
ended
6/30/06
(Unaudited) | | Year ended
12/31/05†† | | Year ended
12/31/04 | | Year ended
12/31/03 | | Period ended
12/31/02++ | |
| Net asset value, beginning of period | | $ | 6.37 | | | $ | 5.83 | | | $ | 4.92 | | | $ | 3.77 | | | $ | 3.77 | | |
| Income (loss) from investment operations: | |
| Net investment income (loss) | | | (0.04 | )*** | | | (0.08 | )*** | | | (0.05 | )*** | | | (0.04 | )*** | | | 0.00 | ***† | |
Net realized and unrealized gain on
investments | | | (0.58 | ) | | | 0.62 | | | | 0.96 | | | | 1.19 | | | | (0.00 | )† | |
Total income from investment
operations | | | (0.62 | ) | | | 0.54 | | | | 0.91 | | | | 1.15 | | | | 0.00 | | |
| Net asset value, end of period | | $ | 5.75 | | | $ | 6.37 | | | $ | 5.83 | | | $ | 4.92 | | | $ | 3.77 | | |
| Total Return(a) | | | (9.58 | )% **(c) | | | 9.26 | % (c) | | | 18.50 | % (c) | | | 30.50 | % (c) | | | - | ‡ | |
| Ratios / Supplemental Data: | |
| Net assets, end of period (000's) | | $ | 869 | | | $ | 1,034 | | | $ | 1,144 | | | $ | 636 | | | $ | 101 | | |
| Ratio of expenses to average daily net assets: | |
| Before expense waiver | | | 1.65 | % * | | | 1.65 | % | | | 1.66 | % | | | 1.68 | % | | | - | ‡ | |
| After expense waiver | | | 1.61 | % *# | | | 1.57 | % # | | | 1.59 | % (b)# | | | 1.64 | % (b)# | | | - | ‡ | |
| Net investment loss to average daily net assets | | | (1.35 | )% * | | | (1.32 | )% | | | (0.99 | )% | | | (0.91 | )% | | | - | ‡ | |
| Portfolio turnover rate | | | 23 | % ** | | | 24 | % | | | 85 | % | | | 93 | % | | | 112 | % | |
* Annualized.
** Percentage represents results for the period and are not annualized.
*** Per share amount calculated on the average shares method.
† Net investment income and net realized and unrealized losses on investments are less than $0.01 per share.
†† Effective January 1, 2005, rebated brokerage commissions are included with realized gain or loss on investment transactions. Prior to January 1, 2005, these amounts were presented as a reduction of expenses. Prior year amounts have not been restated to reflect this change due to immateriality. (See Note 3)
++ Class N commenced operations on December 31, 2002.
‡ Amounts are de minimis due to the short period of operations.
# Computed after giving effect to an agreement by MassMutual to waive certain fees and expenses of the Fund.
(a) Employee retirement benefit plans that invest plan assets in the Separate Investment Accounts (SIAs) may be subject to certain charges as set forth by their respective Plan Documents. Total return figures would be lower for the periods presented if they reflected these charges.
(b) The Fund has entered into agreements with certain brokers to rebate a portion of brokerage commissions. The rebated commissions are used to reduce operating expenses of the Fund.
(c) Total Return excludes contingent deferred sales charge and would be lower for the periods presented if they reflected these charges.
The accompanying notes are an integral part of the financial statements.
236
MassMutual Select Growth Equity Fund – Financial Statements (Continued)
Financial Highlights (For a share outstanding throughout each period)
| | | Class A | |
| | | Six months
ended
6/30/06
(Unaudited) | | Year ended
12/31/05† | | Year ended
12/31/04 | | Year ended
12/31/03 | | Year ended
12/31/02 | | Year ended
12/31/01 | |
| Net asset value, beginning of period | | $ | 8.00 | | | $ | 7.74 | | | $ | 7.40 | | | $ | 6.04 | | | $ | 8.39 | | | $ | 11.24 | | |
| Income (loss) from investment operations: | |
| Net investment income (loss) | | | 0.01 | *** | | | 0.00 | ***†† | | | 0.00 | ***†† | | | (0.02 | )*** | | | (0.03 | )*** | | | (0.03 | )*** | |
Net realized and unrealized gain (loss) on
investments | | | (0.44 | ) | | | 0.26 | | | | 0.34 | | | | 1.38 | | | | (2.32 | ) | | | (2.82 | ) | |
Total income (loss) from
investment operations | | | (0.43 | ) | | | 0.26 | | | | 0.34 | | | | 1.36 | | | | (2.35 | ) | | | (2.85 | ) | |
| Less distributions to shareholders: | |
| From net investment income | | | - | | | | (0.00 | )††† | | | (0.00 | )††† | | | - | | | | - | | | | - | | |
| Net asset value, end of period | | $ | 7.57 | | | $ | 8.00 | | | $ | 7.74 | | | $ | 7.40 | | | $ | 6.04 | | | $ | 8.39 | | |
| Total Return(a) | | | (5.38 | )% (c)** | | | 3.39 | % (c) | | | 4.60 | % (c) | | | 22.52 | % | | | (28.01 | )% | | | (25.36 | )% | |
| Ratios / Supplemental Data: | |
| Net assets, end of period (000's) | | $ | 146,097 | | | $ | 229,120 | | | $ | 224,998 | | | $ | 206,097 | | | $ | 79,267 | | | $ | 75,186 | | |
Ratio of expenses to average
daily net assets: | |
| Before expense waiver | | | 1.25 | % * | | | 1.25 | % | | | 1.26 | % | | | 1.26 | % | | | 1.26 | % | | | 1.27 | % | |
| After expense waiver | | | N/A | | | | N/A | | | | 1.24 | % (b)# | | | 1.18 | % (b)# | | | 1.22 | % (b)# | | | 1.24 | % # | |
Net investment income (loss) to
average daily net assets | | | 0.16 | % * | | | 0.05 | % | | | 0.01 | % | | | (0.31 | )% | | | (0.41 | )% | | | (0.36 | )% | |
| Portfolio turnover rate | | | 69 | % ** | | | 92 | % | | | 181 | % | | | 260 | % | | | 224 | % | | | 279 | % | |
| | | Class L | |
| | | Six months
ended
6/30/06
(Unaudited) | | Year ended
12/31/05† | | Year ended
12/31/04 | | Year ended
12/31/03 | | Year ended
12/31/02 | | Year ended
12/31/01 | |
| Net asset value, beginning of period | | $ | 8.09 | | | $ | 7.83 | | | $ | 7.49 | | | $ | 6.10 | | | $ | 8.45 | | | $ | 11.29 | | |
| Income (loss) from investment operations: | |
| Net investment income (loss) | | | 0.02 | *** | | | 0.02 | *** | | | 0.02 | *** | | | (0.00 | )***†† | | | (0.01 | )*** | | | (0.01 | )*** | |
Net realized and unrealized gain (loss) on
investments | | | (0.44 | ) | | | 0.26 | | | | 0.34 | | | | 1.39 | | | | (2.34 | ) | | | (2.83 | ) | |
Total income (loss) from
investment operations | | | (0.42 | ) | | | 0.28 | | | | 0.36 | | | | 1.39 | | | | (2.35 | ) | | | (2.84 | ) | |
| Less distributions to shareholders: | |
| From net investment income | | | - | | | | (0.02 | ) | | | (0.02 | ) | | | - | | | | - | | | | - | | |
| Net asset value, end of period | | $ | 7.67 | | | $ | 8.09 | | | $ | 7.83 | | | $ | 7.49 | | | $ | 6.10 | | | $ | 8.45 | | |
| Total Return(a) | | | (5.19 | )% ** | | | 3.61 | % | | | 4.82 | % | | | 22.79 | % | | | (27.81 | )% | | | (25.15 | )% | |
| Ratios / Supplemental Data: | |
| Net assets, end of period (000's) | | $ | 337,185 | | | $ | 291,037 | | | $ | 276,387 | | | $ | 201,623 | | | $ | 99,882 | | | $ | 112,901 | | |
Ratio of expenses to average
daily net assets: | |
| Before expense waiver | | | 1.00 | % * | | | 1.00 | % | | | 1.01 | % | | | 1.01 | % | | | 1.01 | % | | | 1.02 | % | |
| After expense waiver | | | N/A | | | | N/A | | | | 0.99 | % (b)# | | | 0.92 | % (b)# | | | 0.97 | % (b)# | | | 0.99 | % # | |
Net investment income (loss) to
average daily net assets | | | 0.42 | % * | | | 0.30 | % | | | 0.29 | % | | | (0.05 | )% | | | (0.17 | )% | | | (0.11 | )% | |
| Portfolio turnover rate | | | 69 | % ** | | | 92 | % | | | 181 | % | | | 260 | % | | | 224 | % | | | 279 | % | |
* Annualized.
** Percentages represent results for the period and are not annualized.
*** Per share amount calculated on the average shares method.
† Effective January 1, 2005, rebated brokerage commissions are included with realized gain or loss on investment transactions. Prior to January 1, 2005, these amounts were presented as a reduction of expenses. Prior year amounts have not been restated to reflect this change due to immateriality. (See Note 3)
†† Net investment income (loss) is less than $0.01 per share.
††† Distribution from net investment income is less than $0.01 per share.
# Computed after giving effect to an agreement by MassMutual to waive certain fees and expenses of the Fund.
(a) Employee retirement benefit plans that invest plan assets in the Separate Investment Accounts (SIAs) may be subject to certain charges as set forth in their respective Plan Documents. Total return figures would be lower for all periods shown if they reflected these charges.
(b) The Fund has entered into agreements with certain brokers to rebate a portion of brokerage commissions. The rebated commissions are used to reduce operating expenses of the Fund.
(c) Total Return excludes a front-end sales charge and would be lower for the periods presented if they reflected these charges.
The accompanying notes are an integral part of the financial statements.
237
MassMutual Select Growth Equity Fund – Financial Statements (Continued)
Financial Highlights (For a share outstanding throughout each period)
| | | Class Y | |
| | | Six months
ended
6/30/06
(Unaudited) | | Year ended
12/31/05† | | Year ended
12/31/04 | | Year ended
12/31/03 | | Year ended
12/31/02 | | Year ended
12/31/01 | |
| Net asset value, beginning of period | | $ | 8.14 | | | $ | 7.88 | | | $ | 7.54 | | | $ | 6.12 | | | $ | 8.47 | | | $ | 11.31 | | |
| Income (loss) from investment operations: | |
| Net investment income (loss) | | | 0.02 | *** | | | 0.04 | *** | | | 0.03 | *** | | | 0.01 | *** | | | (0.00 | )***†† | | | 0.00 | ***†† | |
Net realized and unrealized gain (loss) on
investments | | | (0.44 | ) | | | 0.25 | | | | 0.34 | | | | 1.41 | | | | (2.35 | ) | | | (2.84 | ) | |
Total income (loss) from
investment operations | | | (0.42 | ) | | | 0.29 | | | | 0.37 | | | | 1.42 | | | | (2.35 | ) | | | (2.84 | ) | |
| Less distributions to shareholders: | |
| From net investment income | | | - | | | | (0.03 | ) | | | (0.03 | ) | | | - | | | | - | | | | - | | |
| Net asset value, end of period | | $ | 7.72 | | | $ | 8.14 | | | $ | 7.88 | | | $ | 7.54 | | | $ | 6.12 | | | $ | 8.47 | | |
| Total Return(a) | | | (5.16 | )% ** | | | 3.72 | % | | | 4.92 | % | | | 23.20 | % | | | (27.75 | )% | | | (25.11 | )% | |
| Ratios / Supplemental Data: | |
| Net assets, end of period (000's) | | $ | 68,627 | | | $ | 115,290 | | | $ | 112,683 | | | $ | 101,937 | | | $ | 70,469 | | | $ | 81,552 | | |
Ratio of expenses to average
daily net assets: | |
| Before expense waiver | | | 0.85 | % * | | | 0.85 | % | | | 0.86 | % | | | 0.86 | % | | | 0.86 | % | | | 0.87 | % | |
| After expense waiver | | | N/A | | | | N/A | | | | 0.84 | % (b)# | | | 0.77 | %(b)# | | | 0.82 | % (b)# | | | 0.84 | % # | |
Net investment income (loss) to
average daily net assets | | | 0.60 | % * | | | 0.45 | % | | | 0.42 | % | | | 0.10 | % | | | (0.03 | )% | | | 0.04 | % | |
| Portfolio turnover rate | | | 69 | % ** | | | 92 | % | | | 181 | % | | | 260 | % | | | 224 | % | | | 279 | % | |
| | | Class S | |
| | | Six months
ended
6/30/06
(Unaudited) | | Year ended
12/31/05† | | Year ended
12/31/04 | | Year ended
12/31/03 | | Year ended
12/31/02 | | Year ended
12/31/01 | |
| Net asset value, beginning of period | | $ | 8.17 | | | $ | 7.90 | | | $ | 7.56 | | | $ | 6.14 | | | $ | 8.49 | | | $ | 11.32 | | |
| Income (loss) from investment operations: | |
| Net investment income | | | 0.03 | *** | | | 0.04 | *** | | | 0.04 | *** | | | 0.01 | *** | | | 0.00 | ***†† | | | 0.01 | *** | |
Net realized and unrealized gain (loss) on
investments | | | (0.45 | ) | | | 0.27 | | | | 0.34 | | | | 1.41 | | | | (2.35 | ) | | | (2.84 | ) | |
Total income (loss) from
investment operations | | | (0.42 | ) | | | 0.31 | | | | 0.38 | | | | 1.42 | | | | (2.35 | ) | | | (2.83 | ) | |
| Less distributions to shareholders: | |
| From net investment income | | | - | | | | (0.04 | ) | | | (0.04 | ) | | | - | | | | - | | | | - | | |
| Net asset value, end of period | | $ | 7.75 | | | $ | 8.17 | | | $ | 7.90 | | | $ | 7.56 | | | $ | 6.14 | | | $ | 8.49 | | |
| Total Return(a) | | | (5.14 | )% ** | | | 3.91 | % | | | 4.96 | % | | | 23.13 | % | | | (27.68 | )% | | | (25.00 | )% | |
| Ratios / Supplemental Data: | |
| Net assets, end of period (000's) | | $ | 280,338 | | | $ | 269,166 | | | $ | 229,407 | | | $ | 217,508 | | | $ | 130,165 | | | $ | 174,610 | | |
Ratio of expenses to average
daily net assets: | |
| Before expense waiver | | | 0.79 | % * | | | 0.79 | % | | | 0.80 | % | | | 0.80 | % | | | 0.80 | % | | | 0.81 | % | |
| After expense waiver | | | N/A | | | | N/A | | | | 0.78 | % (b)# | | | 0.71 | %(b)# | | | 0.76 | % (b)# | | | 0.78 | % # | |
Net investment income (loss) to
average daily net assets | | | 0.64 | % * | | | 0.51 | % | | | 0.48 | % | | | 0.16 | % | | | 0.04 | % | | | 0.10 | % | |
| Portfolio turnover rate | | | 69 | % ** | | | 92 | % | | | 181 | % | | | 260 | % | | | 224 | % | | | 279 | % | |
* Annualized
** Percentages represent results for the period and are not annualized.
*** Per share amount calculated on the average shares method.
† Effective January 1, 2005, rebated brokerage commissions are included with realized gain or loss on investment transactions. Prior to January 1, 2005, these amounts were presented as a reduction of expenses. Prior year amounts have not been restated to reflect this change due to immateriality. (See Note 3)
†† Net investment income (loss) is less than $0.01 per share.
# Computed after giving effect to an agreement by MassMutual to waive certain fees and expenses of the Fund.
(a) Employee retirement benefit plans that invest plan assets in the Separate Investment Accounts (SIAs) may be subject to certain charges as set forth in their respective Plan Documents. Total return figures would be lower for all periods shown if they reflected these charges.
(b) The Fund has entered into agreements with certain brokers to rebate a portion of brokerage commissions. The rebated commissions are used to reduce operating expenses of the Fund.
The accompanying notes are an integral part of the financial statements.
238
MassMutual Select Growth Equity Fund – Financial Statements (Continued)
Financial Highlights (For a share outstanding throughout each period)
| | | Class N | |
| | | Six months
ended
6/30/06
(Unaudited) | | Year ended
12/31/05† | | Year ended
12/31/04 | | Year ended
12/31/03 | | Period ended
12/31/02++ | |
| Net asset value, beginning of period | | $ | 7.89 | | | $ | 7.65 | | | $ | 7.34 | | | $ | 6.01 | | | $ | 6.01 | | |
| Income (loss) from investment operations: | |
| Net investment income | | | (0.00 | )***†† | | | (0.02 | )*** | | | (0.02 | )*** | | | (0.05 | )*** | | | 0.00 | ***†† | |
Net realized and unrealized gain
on investments | | | (0.43 | ) | | | 0.26 | | | | 0.33 | | | | 1.38 | | | | (0.00 | )†† | |
Total income from investment
operations | | | (0.43 | ) | | | 0.24 | | | | 0.31 | | | | 1.33 | | | | 0.00 | | |
| Net asset value, end of period | | $ | 7.46 | | | $ | 7.89 | | | $ | 7.65 | | | $ | 7.34 | | | $ | 6.01 | | |
| Total Return(a) | | | (5.45 | )% (c)** | | | 3.14 | % (c) | | | 4.22 | % (c) | | | 22.13 | % (c) | | | - | ‡ | |
| Ratios / Supplemental Data: | |
| Net assets, end of period (000's) | | $ | 77 | | | $ | 1,294 | | | $ | 1,472 | | | $ | 1,661 | | | $ | 101 | | |
| Ratio of expenses to average daily net assets: | |
| Before expense waiver | | | 1.55 | % * | | | 1.55 | % | | | 1.56 | % | | | 1.57 | % | | | - | ‡ | |
| After expense waiver | | | N/A | | | | N/A | | | | 1.54 | % (b)# | | | 1.52 | % (b)# | | | - | ‡ | |
Net investment income to average
daily net assets | | | (0.11 | )% * | | | (0.25 | )% | | | (0.31 | )% | | | (0.65 | )% | | | - | ‡ | |
| Portfolio turnover rate | | | 69 | % ** | | | 92 | % | | | 181 | % | | | 260 | % | | | 224 | % | |
* Annualized.
** Percentages represent results for the period and are not annualized.
*** Per share amount calculated on the average shares method.
† Effective January 1, 2005, rebated brokerage commissions are included with realized gain or loss on investment transactions. Prior to January 1, 2005, these amounts were presented as a reduction of expenses. Prior year amounts have not been restated to reflect this change due to immateriality. (See Note 3)
†† Net investment income (loss) and net realized and unrealized loss on investments are less then $.01 per share.
‡ Amounts are de minimis due to short period of operations.
(a) Employee retirement benefit plans that invest plan assets in the Separate Investment Accounts (SIAs) may be subject to certain charges as set forth in their respective Plan Documents. Total return figures would be lower for all periods shown if they reflected these charges.
(b) The Fund has entered into agreements with certain brokers to rebate a portion of brokerage commissions. The rebated commissions are used to reduce operating expenses of the Fund.
# Computed after giving effect to an agreement by MassMutual to waive certain fees and expenses of the Fund.
(c) Total Return excludes a contingent deferred sales charge and would be lower for the periods presented if they reflected these charges.
++ Class N commenced operations on December 31,2002.
The accompanying notes are an integral part of the financial statements.
239
MassMutual Select Large Cap Growth Fund – Financial Statements (Continued)
Financial Highlights (For a share outstanding throughout each period)
| | | Class A | |
| | | Six months
ended
6/30/06
(Unaudited) | | Year ended
12/31/05†† | | Year ended
12/31/04 | | Year ended
12/31/03 | | Year ended
12/31/02 | | Period ended
12/31/01+ | |
| Net asset value, beginning of period | | $ | 10.29 | | | $ | 9.03 | | | $ | 8.48 | | | $ | 6.97 | | | $ | 10.00 | | | $ | 10.00 | | |
| Income (loss) from investment operations: | |
| Net investment loss | | | (0.04 | )*** | | | (0.06 | )*** | | | (0.02 | )*** | | | (0.03 | )*** | | | (0.04 | )*** | | | - | | |
Net realized and unrealized gain (loss) on
investments | | | (0.72 | ) | | | 1.32 | | | | 0.57 | | | | 1.54 | | | | (2.99 | ) | | | - | | |
Total income (loss) from
investment operations | | | (0.76 | ) | | | 1.26 | | | | 0.55 | | | | 1.51 | | | | (3.03 | ) | | | 0.00 | | |
| Net asset value, end of period | | $ | 9.53 | | | $ | 10.29 | | | $ | 9.03 | | | $ | 8.48 | | | $ | 6.97 | | | $ | 10.00 | | |
| Total Return(a) | | | (7.39 | )% (c)** | | | 13.95 | % (c) | | | 6.49 | % (c) | | | 21.66 | % | | | (30.30 | )% | | | - | | |
| Ratios / Supplemental Data: | |
| Net assets, end of period (000's) | | $ | 6,281 | | | $ | 3,452 | | | $ | 1,997 | | | $ | 1,374 | | | $ | 826 | | | $ | 1 | | |
Ratio of expenses to average
daily net assets: | |
| Before expense waiver | | | 1.41 | % * | | | 1.38 | % | | | 1.37 | % | | | 1.34 | % | | | 1.40 | % | | | - | | |
| After expense waiver | | | N/A | | | | 1.35 | % # | | | 1.25 | % (b)# | | | 1.25 | % (b)# | | | 1.22 | % (b)# | | | - | | |
Net investment loss to average
daily net assets | | | (0.70 | )% * | | | (0.65 | )% | | | (0.20 | )% | | | (0.34 | )% | | | (0.48 | )% | | | - | | |
| Portfolio turnover rate | | | 46 | % ** | | | 83 | % | | | 68 | % | | | 47 | % | | | 56 | % | | | - | | |
| | | Class L | |
| | | Six months
ended
6/30/06
(Unaudited) | | Year ended
12/31/05†† | | Year ended
12/31/04 | | Year ended
12/31/03 | | Year ended
12/31/02 | | Period ended
12/31/01+ | |
| Net asset value, beginning of period | | $ | 10.53 | | | $ | 9.09 | | | $ | 8.52 | | | $ | 6.99 | | | $ | 10.00 | | | $ | 10.00 | | |
| Income (loss) from investment operations: | |
| Net investment income (loss) | | | (0.02 | )*** | | | (0.05 | )*** | | | 0.00 | ***††† | | | (0.01 | )*** | | | (0.01 | )*** | | | - | | |
Net realized and unrealized gain (loss) on
investments | | | (0.75 | ) | | | 1.49 | | | | 0.57 | | | | 1.54 | | | | (3.00 | ) | | | - | | |
Total income (loss) from
investment operations | | | (0.77 | ) | | | 1.44 | | | | 0.57 | | | | 1.53 | | | | (3.01 | ) | | | 0.00 | | |
| Less distributions to shareholders: | |
| From net investment income | | | - | | | | - | | | | (0.00 | )† | | | - | | | | - | | | | - | | |
| Net asset value, end of period | | $ | 9.76 | | | $ | 10.53 | | | $ | 9.09 | | | $ | 8.52 | | | $ | 6.99 | | | $ | 10.00 | | |
| Total Return(a) | | | (7.31 | )% ** | | | 15.84 | % | | | 6.72 | % | | | 21.89 | % | | | (30.10 | )% | | | - | | |
| Ratios / Supplemental Data: | |
| Net assets, end of period (000's) | | $ | 2,132 | | | $ | 1,032 | | | $ | 9,272 | | | $ | 7,628 | | | $ | 3,883 | | | $ | 1 | | |
Ratio of expenses to average
daily net assets: | |
| Before expense waiver | | | 1.17 | % * | | | 1.09 | % | | | 1.12 | % | | | 1.09 | % | | | 1.15 | % | | | - | | |
| After expense waiver | | | N/A | | | | 1.06 | % # | | | 1.00 | % (b)# | | | 1.00 | % (b)# | | | 0.98 | % (b)# | | | - | | |
Net investment income (loss) to
average daily net assets | | | (0.35 | )% * | | | (0.55 | )% | | | 0.04 | % | | | (0.08 | )% | | | (0.20 | )% | | | - | | |
| Portfolio turnover rate | | | 46 | % ** | | | 83 | % | | | 68 | % | | | 47 | % | | | 56 | % | | | - | | |
* Annualized.
** Percentages represent results for the period and are not annualized.
*** Per share amount calculated on the average shares method.
† Distributions from net investment income was less than $0.01 per share.
†† Effective January 1, 2005, rebated brokerage commissions are included with realized gain or loss on investment transactions. Prior to January 1, 2005, these amounts were presented as a reduction of expenses. Prior year amounts have not been restated to reflect this change due to immateriality. (See Note 3).
††† Net investment income was less than $0.01 per share.
+ The Fund commenced operations on December 31, 2001.
# Computed after giving effect to an agreement by MassMutual to waive certain fees and expenses of the Fund.
(a) Employee retirement benefit plans that invest plan assets in the Separate Investment Accounts (SIAs) may be subject to certain charges as set forth by their respective Plan Documents. Total return figures would be lower for the periods presented if they reflected these charges.
(b) The Fund has entered into agreements with certain brokers to rebate a portion of brokerage commissions. The rebated commissions are used to reduce operating expenses of the Fund.
(c) Total Return excludes a front-end sales charge and would be lower for the period presented if it reflected these charges.
The accompanying notes are an integral part of the financial statements.
240
MassMutual Select Large Cap Growth Fund – Financial Statements (Continued)
Financial Highlights (For a share outstanding throughout each period)
| | | Class Y | |
| | | Six months
ended
6/30/06
(Unaudited) | | Year ended
12/31/05†† | | Year ended
12/31/04 | | Year ended
12/31/03 | | Year ended
12/31/02 | | Period ended
12/31/01+ | |
| Net asset value, beginning of period | | $ | 10.42 | | | $ | 9.10 | | | $ | 8.53 | | | $ | 7.00 | | | $ | 10.00 | | | $ | 10.00 | | |
| Income (loss) from investment operations: | |
| Net investment income (loss) | | | (0.01 | )*** | | | (0.02 | )*** | | | 0.02 | *** | | | 0.01 | *** | | | (0.01 | )*** | | | - | | |
Net realized and unrealized gain (loss) on
investments | | | (0.75 | ) | | | 1.34 | | | | 0.57 | | | | 1.53 | | | | (2.99 | ) | | | - | | |
Total income (loss) from
investment operations | | | (0.76 | ) | | | 1.32 | | | | 0.59 | | | | 1.54 | | | | (3.00 | ) | | | 0.00 | | |
| Less distributions to shareholders: | |
| From net investment income | | | - | | | | - | | | | (0.02 | ) | | | (0.01 | ) | | | - | | | | - | | |
| Net asset value, end of period | | $ | 9.66 | | | $ | 10.42 | | | $ | 9.10 | | | $ | 8.53 | | | $ | 7.00 | | | $ | 10.00 | | |
| Total Return(a) | | | (7.29 | )% ** | | | 14.51 | % | | | 6.86 | % | | | 22.04 | % | | | (30.00 | )% | | | - | | |
| Ratios / Supplemental Data: | |
| Net assets, end of period (000's) | | $ | 9,284 | | | $ | 12,099 | | | $ | 9,052 | | | $ | 7,697 | | | $ | 78 | | | $ | 1 | | |
Ratio of expenses to average
daily net assets: | |
| Before expense waiver | | | 0.99 | % * | | | 0.98 | % | | | 0.97 | % | | | 0.94 | % | | | 1.00 | % | | | - | | |
| After expense waiver | | | N/A | | | | 0.95 | % # | | | 0.85 | % (b)# | | | 0.86 | % (b)# | | | 0.82 | % (b)# | | | - | | |
Net investment income (loss) to
average daily net assets | | | (0.29 | )% * | | | (0.26 | )% | | | 0.19 | % | | | 0.08 | % | | | (0.11 | )% | | | - | | |
| Portfolio turnover rate | | | 46 | % ** | | | 83 | % | | | 68 | % | | | 47 | % | | | 56 | % | | | - | | |
| | | Class S | |
| | | Six months
ended
6/30/06
(Unaudited) | | Year ended
12/31/05†† | | Year ended
12/31/04 | | Year ended
12/31/03 | | Year ended
12/31/02 | | Period ended
12/31/01+ | |
| Net asset value, beginning of period | | $ | 10.46 | | | $ | 9.14 | | | $ | 8.55 | | | $ | 7.01 | | | $ | 10.00 | | | $ | 10.00 | | |
| Income (loss) from investment operations: | |
| Net investment income (loss) | | | (0.01 | )*** | | | (0.02 | )*** | | | 0.01 | *** | | | 0.01 | *** | | | (0.00 | )***† | | | - | | |
Net realized and unrealized gain (loss) on
investments | | | (0.74 | ) | | | 1.34 | | | | 0.59 | | | | 1.54 | | | | (2.99 | ) | | | - | | |
Total income (loss) from
investment operations | | | (0.75 | ) | | | 1.32 | | | | 0.60 | | | | 1.55 | | | | (2.99 | ) | | | 0.00 | | |
| Less distributions to shareholders: | |
| From net investment income | | | - | | | | - | | | | (0.01 | ) | | | (0.01 | ) | | | - | | | | - | | |
| Net asset value, end of period | | $ | 9.71 | | | $ | 10.46 | | | $ | 9.14 | | | $ | 8.55 | | | $ | 7.01 | | | $ | 10.00 | | |
| Total Return(a) | | | (7.17 | )% ** | | | 14.44 | % | | | 7.08 | % | | | 22.05 | % | | | (29.90 | )% | | | - | | |
| Ratios / Supplemental Data: | |
| Net assets, end of period (000's) | | $ | 17,681 | | | $ | 26,241 | | | $ | 18,791 | | | $ | 33,787 | | | $ | 28,029 | | | $ | 10,001 | | |
Ratio of expenses to average
daily net assets: | |
| Before expense waiver | | | 0.95 | % * | | | 0.94 | % | | | 0.93 | % | | | 0.90 | % | | | 0.96 | % | | | - | | |
| After expense waiver | | | N/A | | | | 0.91 | % # | | | 0.81 | % (b)# | | | 0.81 | % (b)# | | | 0.77 | % (b)# | | | - | | |
Net investment income (loss) to
average daily net assets | | | (0.25 | )% * | | | (0.21 | )% | | | 0.16 | % | | | 0.11 | % | | | (0.05 | )% | | | - | | |
| Portfolio turnover rate | | | 46 | % ** | | | 83 | % | | | 68 | % | | | 47 | % | | | 56 | % | | | - | | |
* Annualized.
** Percentages represent results for the period and are not annualized.
*** Per share amount calculated on the average shares method.
† Net investment loss is less than $0.01 per share.
†† Effective January 1, 2005, rebated brokerage commissions are included with realized gain or loss on investment transactions. Prior to January 1, 2005, these amounts were presented as a reduction of expenses. Prior year amounts have not been restated to reflect this change due to immateriality. (See Note 3).
+ The Fund commenced operations on December 31, 2001.
# Computed after giving effect to an agreement by MassMutual to waive certain fees and expenses of the Fund.
(a) Employee retirement benefit plans that invest plan assets in the Separate Investment Accounts (SIAs) may be subject to certain charges as set forth by their respective Plan Documents. Total return figures would be lower for the periods presented if they reflected these charges.
(b) The Fund has entered into agreements with certain brokers to rebate a portion of brokerage commissions. The rebated commissions are used to reduce operating expenses of the Fund.
The accompanying notes are an integral part of the financial statements.
241
MassMutual Select Large Cap Growth Fund – Financial Statements (Continued)
Financial Highlights (For a share outstanding throughout each period)
| | | Class N | |
| | | Six months ended
6/30/06
(Unaudited) | | Year ended
12/31/05†† | | Year ended
12/31/04 | | Year ended
12/31/03 | | Period ended
12/31/02++ | |
| Net asset value, beginning of period | | $ | 10.31 | | | $ | 9.07 | | | $ | 8.42 | | | $ | 6.94 | | | $ | 6.95 | | |
| Income (loss) from investment operations: | |
| Net investment income | | | (0.05 | )*** | | | (0.09 | )*** | | | (0.07 | )*** | | | (0.05 | )*** | | | (0.00 | )***† | |
Net realized and unrealized
gain on investments | | | (0.74 | ) | | | 1.33 | | | | 0.72 | | | | 1.53 | | | | (0.01 | ) | |
Total income from investment
operations | | | (0.79 | ) | | | 1.24 | | | | 0.65 | | | | 1.48 | | | | (0.01 | ) | |
| Net asset value, end of period | | $ | 9.52 | | | $ | 10.31 | | | $ | 9.07 | | | $ | 8.42 | | | $ | 6.94 | | |
| Total Return(a) | | | (7.57 | )% (c)** | | | 13.67 | % (c) | | | 7.72 | % (c) | | | 21.33 | % (c) | | | - | ‡ | |
| Ratios / Supplemental Data: | |
| Net assets, end of period (000's) | | $ | 1 | | | $ | 1 | | | $ | 5 | | | $ | 125 | | | $ | 101 | | |
| Ratio of expenses to average daily net assets: | |
| Before expense waiver | | | 1.70 | % * | | | 1.66 | % | | | 1.67 | % | | | 1.64 | % | | | - | ‡ | |
| After expense waiver | | | N/A | | | | 1.63 | % # | | | 1.56 | % (b)# | | | 1.55 | % (b)# | | | - | ‡ | |
Net investment income to average
daily net assets | | | (0.91 | )% * | | | (0.94 | )% | | | (0.83 | )% | | | (0.63 | )% | | | - | ‡ | |
| Portfolio turnover rate | | | 46 | % ** | | | 83 | % | | | 68 | % | | | 47 | % | | | 56 | % | |
* Annualized.
** Percentages represent results for the period and are not annualized.
*** Per share amount calculated on the average shares method.
† Net investment loss is less than $0.01 per share.
†† Effective January 1, 2005, rebated brokerage commissions are included with realized gain or loss on investment transactions. Prior to January 1, 2005, these amounts were presented as a reduction of expenses. Prior year amounts have not been restated to reflect this change due to immateriality. (See Note 3).
++ Class N commenced operations on December 31, 2002.
‡ Amounts are de minimis due to the short period of operations.
# Computed after giving effect to an agreement by MassMutual to waive certain fees and expenses of the Fund.
(a) Employee retirement benefit plans that invest plan assets in the Separate Investment Accounts (SIAs) may be subject to certain charges as set forth by their respective Plan Documents. Total return figures would be lower for the periods presented if they reflected these charges.
(b) The Fund has entered into agreements with certain brokers to rebate a portion of brokerage commissions. The rebated commissions are used to reduce operating expenses of the Fund.
(c) Total Return excludes contingent deferred sales charge and would be lower for the periods presented if they reflected these charges.
The accompanying notes are an integral part of the financial statements.
242
MassMutual Select Blue Chip Growth Fund – Financial Statements (Continued)
Financial Highlights (For a share outstanding throughout each period)
| | | Class A | |
| | | Six months
ended
6/30/06
(Unaudited) | | Year ended
12/31/05††† | | Year ended
12/31/04 | | Year ended
12/31/03 | | Year ended
12/31/02 | | Period ended
12/31/01+ | |
| Net asset value, beginning of period | | $ | 9.01 | | | $ | 8.74 | | | $ | 8.33 | | | $ | 6.72 | | | $ | 9.07 | | | $ | 10.00 | | |
| Income (loss) from investment operations: | |
| Net investment income (loss) | | | (0.01 | )*** | | | (0.02 | )*** | | | 0.03 | *** | | | (0.01 | )*** | | | (0.01 | )*** | | | (0.02 | )*** | |
Net realized and unrealized gain (loss) on
investments | | | (0.18 | ) | | | 0.29 | | | | 0.41 | | | | 1.63 | | | | (2.34 | ) | | | (0.91 | ) | |
Total income (loss) from
investment operations | | | (0.19 | ) | | | 0.27 | | | | 0.44 | | | | 1.62 | | | | (2.35 | ) | | | (0.93 | ) | |
| Less distributions to shareholders: | |
| From net investment income | | | - | | | | - | | | | (0.03 | ) | | | (0.01 | ) | | | (0.00 | )†† | | | - | | |
| Net asset value, end of period | | $ | 8.82 | | | $ | 9.01 | | | $ | 8.74 | | | $ | 8.33 | | | $ | 6.72 | | | $ | 9.07 | | |
| Total Return(a) | | | (2.11 | )% (c)** | | | 3.09 | % (c) | | | 5.32 | % (c) | | | 24.09 | % | | | (25.91 | )% | | | (9.30 | )% ** | |
| Ratios / Supplemental Data: | |
| Net assets, end of period (000's) | | $ | 34,582 | | | $ | 36,742 | | | $ | 37,377 | | | $ | 26,955 | | | $ | 4,914 | | | $ | 1,006 | | |
Ratio of expenses to average daily
net assets: | |
| Before expense waiver | | | 1.39 | % * | | | 1.39 | % | | | 1.38 | % | | | 1.39 | % | | | 1.38 | % | | | 1.39 | % * | |
| After expense waiver | | | 1.34 | % *# | | | N/A | | | | 1.38 | % (b)# | | | 1.38 | % (b)# | | | 1.38 | % # | | | 1.39 | % *# | |
Net investment income (loss) to
average daily net assets | | | (0.16 | )% * | | | (0.20 | )% | | | 0.37 | % | | | (0.13 | )% | | | (0.20 | )% | | | (0.39 | )% * | |
| Portfolio turnover rate | | | 77 | % ** | | | 28 | % | | | 22 | % | | | 23 | % | | | 30 | % | | | 27 | % ** | |
| | | Class L | |
| | | Six months
ended
6/30/06
(Unaudited) | | Year ended
12/31/05††† | | Year ended
12/31/04 | | Year ended
12/31/03 | | Year ended
12/31/02 | | Period ended
12/31/01+ | |
| Net asset value, beginning of period | | $ | 9.10 | | | $ | 8.81 | | | $ | 8.39 | | | $ | 6.76 | | | $ | 9.09 | | | $ | 10.00 | | |
| Income (loss) from investment operations: | |
| Net investment income (loss) | | | 0.00 | ***† | | | 0.00 | ***† | | | 0.05 | *** | | | 0.01 | *** | | | (0.00 | )***† | | | (0.01 | )*** | |
Net realized and unrealized gain (loss) on
investments | | | (0.18 | ) | | | 0.29 | | | | 0.42 | | | | 1.63 | | | | (2.33 | ) | | | (0.90 | ) | |
Total income (loss) from
investment operations | | | (0.18 | ) | | | 0.29 | | | | 0.47 | | | | 1.64 | | | | (2.33 | ) | | | (0.91 | ) | |
| Less distributions to shareholders: | |
| From net investment income | | | - | | | | - | | | | (0.05 | ) | | | (0.01 | ) | | | - | | | | - | | |
| Net asset value, end of period | | $ | 8.92 | | | $ | 9.10 | | | $ | 8.81 | | | $ | 8.39 | | | $ | 6.76 | | | $ | 9.09 | | |
| Total Return(a) | | | (1.98 | )% ** | | | 3.32 | % | | | 5.58 | % | | | 24.25 | % | | | (25.63 | )% | | | (9.10 | )% ** | |
| Ratios / Supplemental Data: | |
| Net assets, end of period (000's) | | $ | 267,514 | | | $ | 270,082 | | | $ | 301,734 | | | $ | 302,292 | | | $ | 217,427 | | | $ | 314,290 | | |
Ratio of expenses to average daily
net assets: | |
| Before expense waiver | | | 1.14 | % * | | | 1.14 | % | | | 1.13 | % | | | 1.13 | % | | | 1.13 | % | | | 1.14 | % * | |
| After expense waiver | | | 1.09 | % *# | | | N/A | | | | 1.13 | % (b)# | | | 1.12 | % (b)# | | | 1.13 | % # | | | 1.14 | % *# | |
Net investment income (loss) to
average daily net assets | | | 0.10 | % * | | | 0.05 | % | | | 0.54 | % | | | 0.14 | % | | | (0.05 | )% | | | (0.18 | )% * | |
| Portfolio turnover rate | | | 77 | % ** | | | 28 | % | | | 22 | % | | | 23 | % | | | 30 | % | | | 27 | % ** | |
* Annualized.
** Percentages represent results for the period and are not annualized.
*** Per share amount calculated on the average shares method.
† Net investment income (loss) is less than $0.01 per share.
†† Distributions from net investment income is less than $0.01 per share.
††† Effective January 1, 2005, brokerage commissions are included with realized gain or loss on investment transactions. Prior to January 1, 2005, these amounts were presented as a reduction of expenses. Prior year amounts have not been restated to reflect this change due to immateriality. (See Note 3).
+ For the period from June 1, 2001 (commencement of operations) through December 31, 2001.
# Computed after giving effect to an agreement by MassMutual to waive certain fees and expenses of the Fund.
(a) Employee retirement benefit plans that invest plan assets in the Separate Investment Accounts (SIAs) may be subject to certain charges as set forth in their respective Plan Documents. Total return figures would be lower for the periods presented if they reflected these charges.
(b) The Fund has entered into agreements with certain brokers to rebate a portion of brokerage commissions. The rebated commissions are used to reduce operating expenses of the Fund.
(c) Total Return excludes a front-end sales charge and would be lower for the periods presented if it reflected these charges.
The accompanying notes are an integral part of the financial statements.
243
MassMutual Select Blue Chip Growth Fund – Financial Statements (Continued)
Financial Highlights (For a share outstanding throughout each period)
| | | Class Y | |
| | | Six months
ended
6/30/06
(Unaudited) | | Year ended
12/31/05††† | | Year ended
12/31/04 | | Year ended
12/31/03 | | Year ended
12/31/02 | | Period ended
12/31/01+ | |
| Net asset value, beginning of period | | $ | 9.11 | | | $ | 8.82 | | | $ | 8.39 | | | $ | 6.77 | | | $ | 9.10 | | | $ | 10.00 | | |
| Income (loss) from investment operations: | |
| Net investment income (loss) | | | 0.02 | *** | | | 0.01 | *** | | | 0.06 | *** | | | 0.02 | *** | | | 0.01 | *** | | | (0.00 | )**† | |
Net realized and unrealized gain (loss)
on investments | | | (0.19 | ) | | | 0.30 | | | | 0.43 | | | | 1.62 | | | | (2.34 | ) | | | (0.90 | ) | |
Total income (loss) from investment
operations | | | (0.17 | ) | | | 0.31 | | | | 0.49 | | | | 1.64 | | | | (2.33 | ) | | | (0.90 | ) | |
| Less distributions to shareholders: | |
| From net investment income | | | - | | | | (0.02 | ) | | | (0.06 | ) | | | (0.02 | ) | | | (0.00 | )†† | | | - | | |
| Net asset value, end of period | | $ | 8.94 | | | $ | 9.11 | | | $ | 8.82 | | | $ | 8.39 | | | $ | 6.77 | | | $ | 9.10 | | |
| Total Return(a) | | | (1.87 | )% ** | | | 3.46 | % | | | 5.83 | % | | | 24.26 | % | | | (25.56 | )% | | | (9.00 | )% ** | |
| Ratios / Supplemental Data: | |
| Net assets, end of period (000's) | | $ | 40,710 | | | $ | 4,732 | | | $ | 4,331 | | | $ | 3,626 | | | $ | 827 | | | $ | 617 | | |
Ratio of expenses to average daily
net assets: | |
| Before expense waiver | | | 1.00 | % * | | | 1.02 | % | | | 1.01 | % | | | 1.01 | % | | | 1.01 | % | | | 1.02 | % * | |
| After expense waiver | | | 0.95 | % *# | | | N/A | | | | 1.01 | % (b)# | | | 1.01 | % (b)# | | | 1.01 | % # | | | 1.01 | % *# | |
Net investment income (loss) to average
daily net assets | | | 0.37 | % * | | | 0.17 | % | | | 0.68 | % | | | 0.26 | % | | | 0.12 | % | | | (0.02 | )% * | |
| Portfolio turnover rate | | | 77 | % ** | | | 28 | % | | | 22 | % | | | 23 | % | | | 30 | % | | | 27 | % ** | |
| | | Class S | |
| | | Six months
ended
6/30/06
(Unaudited) | | Year ended
12/31/05††† | | Year ended
12/31/04 | | Year ended
12/31/03 | | Year ended
12/31/02 | | Period ended
12/31/01+ | |
| Net asset value, beginning of period | | $ | 9.14 | | | $ | 8.84 | | | $ | 8.42 | | | $ | 6.78 | | | $ | 9.10 | | | $ | 10.00 | | |
| Income (loss) from investment operations: | |
| Net investment income | | | 0.02 | *** | | | 0.03 | *** | | | 0.07 | *** | | | 0.03 | *** | | | 0.02 | *** | | | 0.00 | ***† | |
Net realized and unrealized gain (loss)
on investments | | | (0.19 | ) | | | 0.30 | | | | 0.42 | | | | 1.64 | | | | (2.33 | ) | | | (0.90 | ) | |
Total income (loss) from investment
operations | | | (0.17 | ) | | | 0.33 | | | | 0.49 | | | | 1.67 | | | | (2.31 | ) | | | (0.90 | ) | |
| Less distributions to shareholders: | |
| From net investment income | | | - | | | | (0.03 | ) | | | (0.07 | ) | | | (0.03 | ) | | | (0.01 | ) | | | - | | |
| Net asset value, end of period | | $ | 8.97 | | | $ | 9.14 | | | $ | 8.84 | | | $ | 8.42 | | | $ | 6.78 | | | $ | 9.10 | | |
| Total Return(a) | | | (1.86 | )% ** | | | 3.68 | % | | | 5.80 | % | | | 24.58 | % | | | (25.43 | )% | | | (9.00 | )% ** | |
| Ratios / Supplemental Data: | |
| Net assets, end of period (000's) | | $ | 59,488 | | | $ | 71,627 | | | $ | 79,072 | | | $ | 91,674 | | | $ | 72,210 | | | $ | 113,011 | | |
Ratio of expenses to average daily
net assets: | |
| Before expense waiver | | | 0.89 | % * | | | 0.88 | % | | | 0.88 | % | | | 0.88 | % | | | 0.88 | % | | | 0.89 | % * | |
| After expense waiver | | | 0.84 | % *# | | | N/A | | | | 0.87 | % (b)# | | | 0.87 | % (b)# | | | 0.88 | % # | | | 0.89 | % *# | |
Net investment income to average
daily net assets | | | 0.33 | % * | | | 0.30 | % | | | 0.77 | % | | | 0.39 | % | | | 0.20 | % | | | 0.07 | % * | |
| Portfolio turnover rate | | | 77 | % ** | | | 28 | % | | | 22 | % | | | 23 | % | | | 30 | % | | | 27 | % ** | |
* Annualized.
** Percentages represent results for the period and are not annualized.
*** Per share amount calculated on the average shares method.
† Net investment income (loss) is less than $0.01 per share.
†† Distributions from net investment income is less than $0.01 per share.
††† Effective January 1, 2005, brokerage commissions are included with realized gain or loss on investment transactions. Prior to January 1, 2005, these amounts were presented as a reduction of expenses. Prior year amounts have not been restated to reflect this change due to immateriality. (See Note 3).
+ For the period from June 1, 2001 (commencement of operations) through December 31, 2001.
# Computed after giving effect to an agreement by MassMutual to waive certain fees and expenses of the Fund.
(a) Employee retirement benefit plans that invest plan assets in the Separate Investment Accounts (SIAs) may be subject to certain charges as set forth in their respective Plan Documents. Total return figures would be lower for the periods presented if they reflected these charges.
(b) The Fund has entered into agreements with certain brokers to rebate a portion of brokerage commissions. The rebated commissions are used to reduce operating expenses of the Fund.
The accompanying notes are an integral part of the financial statements.
244
MassMutual Select Blue Chip Growth Fund – Financial Statements (Continued)
Financial Highlights (For a share outstanding throughout each period)
| | | Class N | |
| | | Six months
ended
6/30/06
(Unaudited) | | Year ended
12/31/05††† | | Year ended
12/31/04 | | Year ended
12/31/03 | | Year ended
12/31/02++ | |
| Net asset value, beginning of period | | $ | 8.92 | | | $ | 8.68 | | | $ | 8.27 | | | $ | 6.69 | | | $ | 6.69 | | |
| Income (loss) from investment operations: | |
| Net investment income (loss) | | | (0.02 | )*** | | | (0.04 | )*** | | | 0.01 | *** | | | (0.03 | )*** | | | 0.00 | ***† | |
Net realized and unrealized gain on
investments | | | (0.18 | ) | | | 0.28 | | | | 0.41 | | | | 1.61 | | | | (0.00 | )† | |
Total income from investment
operations | | | (0.20 | ) | | | 0.24 | | | | 0.42 | | | | 1.58 | | | | 0.00 | | |
| Less distributions to shareholders: | |
| From net investment income | | | - | | | | - | | | | (0.01 | ) | | | (0.00 | )†† | | | - | | |
| Net asset value, end of period | | $ | 8.72 | | | $ | 8.92 | | | $ | 8.68 | | | $ | 8.27 | | | $ | 6.69 | | |
| Total Return(a) | | | (2.24 | )% (c)** | | | 2.77 | % (c) | | | 5.05 | % (c) | | | 23.64 | % (c) | | | 0.00 | % ‡ | |
| Ratios / Supplemental Data: | |
| Net assets, end of period (000's) | | $ | 3,124 | | | $ | 1,957 | | | $ | 2,185 | | | $ | 1,493 | | | $ | 101 | | |
| Ratio of expenses to average daily net assets: | |
| Before expense waiver | | | 1.69 | % * | | | 1.69 | % | | | 1.68 | % | | | 1.69 | % | | | - | ‡ | |
| After expense waiver | | | 1.64 | % *# | | | N/A | | | | 1.68 | % (b)# | | | 1.69 | % (b)# | | | N/A ‡ | | |
Net investment income (loss) to average
daily net assets | | | (0.44 | )% * | | | (0.50 | )% | | | 0.08 | % | | | (0.45 | )% | | | 0.00 | % ‡ | |
| Portfolio turnover rate | | | 77 | % ** | | | 28 | % | | | 22 | % | | | 23 | % | | | 30 | % | |
* Annualized.
** Percentages represent results for the period and are not annualized.
*** Per share amount calculated on the average shares method.
† Net investment income and net realized and unrealized loss on investments are less than $0.01 per share.
†† Distributions from net investment income is less than $0.01 per share.
††† Effective January 1, 2005, brokerage commissions are included with realized gain or loss on investment transactions. Prior to January 1, 2005, these amounts were presented as a reduction of expenses. Prior year amounts have not been restated to reflect this change due to immateriality. (See Note 3).
++ Class N commenced operations on December 31, 2002.
‡ Amounts are de minimis due to the short period of operations.
# Computed after giving effect to an agreement by MassMutual to waive certain fees and expenses of the Fund.
(a) Employee retirement benefit plans that invest plan assets in the Separate Investment Accounts (SIAs) may be subject to certain charges as set forth in their respective Plan Documents. Total return figures would be lower for the periods presented if they reflected these charges.
(b) The Fund has entered into agreements with certain brokers to rebate a portion of brokerage commissions. The rebated commissions are used to reduce operating expenses of the Fund.
(c) Total Return excludes contingent deferred sales charge and would be lower for the periods presented if it reflected these charges.
The accompanying notes are an integral part of the financial statements.
245
MassMutual Select Small Cap Value Equity – Financial Statements (Continued)
Financial Highlights (For a share outstanding throughout each period)
| | | Class A | | Class L | | Class Y | | Class S | | Class N | |
| | | Period ended
06/30/06+ | | Period ended
06/30/06+ | | Period ended
06/30/06+ | | Period ended
06/30/06+ | | Period ended
06/30/06+ | |
| Net asset value, beginning of year | | $ | 10.00 | | | $ | 10.00 | | | $ | 10.00 | | | $ | 10.00 | | | $ | 10.00 | | |
| Income (loss) from investment operations: | |
| Net investment income | | | 0.01 | *** | | | 0.02 | *** | | | 0.02 | *** | | | 0.02 | *** | | | 0.01 | *** | |
| Net realized and unrealized loss on investments | | | (0.23 | ) | | | (0.23 | ) | | | (0.23 | ) | | | (0.23 | ) | | | (0.24 | ) | |
| Total loss from investment operations | | | (0.22 | ) | | | (0.21 | ) | | | (0.21 | ) | | | (0.21 | ) | | | (0.23 | ) | |
| Net asset value, end of year | | $ | 9.78 | | | $ | 9.79 | | | $ | 9.79 | | | $ | 9.79 | | | $ | 9.77 | | |
| | | | | | | | | | | | | | | | | | | | | | |
| Total Return | | | (2.20 | )% ** | | | (2.20 | )% ** | | | (2.10 | )% ** | | | (2.10 | )% ** | | | (2.30 | )% ** | |
| Ratios / Supplemental Data: | |
| Net assets, end of year (000's) | | $ | 98 | | | $ | 98 | | | $ | 98 | | | $ | 10,953 | | | $ | 98 | | |
| Ratio of expenses to average daily net assets: | |
| Before expense waiver | | | 2.22 | % * | | | 1.97 | % * | | | 1.82 | % * | | | 1.72 | % * | | | 2.52 | % * | |
| After expense waiver | | | 1.40 | % *# | | | 1.15 | % *# | | | 1.00 | % *# | | | 0.95 | % *# | | | 1.70 | % *# | |
| Net investment income to average daily net assets | | | 0.56 | % * | | | 0.81 | % * | | | 0.96 | % * | | | 1.01 | % * | | | 0.26 | % * | |
| Portfolio turnover rate | | | 29 | % ** | | | 29 | % ** | | | 29 | % ** | | | 29 | % ** | | | 29 | % ** | |
* Annualized.
** Percentage represents results for the period and are not annualized.
*** Per share amount calculated on the average shares method.
# Computed after giving effect to an agreement by MassMutual to waive certain fees and expenses of the Fund.
+ The Fund commenced operations on March 31, 2006.
The accompanying notes are an integral part of the financial statements.
246
MassMutual Select Small Company Value Fund – Financial Statements (Continued)
Financial Highlights (For a share outstanding throughout each period)
| | | Class A | |
| | | Six months
ended
6/30/06
(Unaudited) | | Year ended
12/31/05† | | Year ended
12/31/04 | | Year ended
12/31/03 | | Year ended
12/31/02 | | Period ended
12/31/01+ | |
| Net asset value, beginning of period | | $ | 14.28 | | | $ | 14.28 | | | $ | 11.96 | | | $ | 8.66 | | | $ | 10.00 | | | $ | 10.00 | | |
| Income (loss) from investment operations: | |
| Net investment income (loss) | | | (0.02 | )*** | | | (0.03 | )*** | | | 0.00 | ***†† | | | 0.02 | *** | | | 0.05 | *** | | | - | | |
Net realized and unrealized gain (loss) on
investments | | | 1.30 | | | | 0.68 | | | | 2.65 | | | | 3.31 | | | | (1.37 | ) | | | - | | |
Total income (loss) from investment
operations | | | 1.28 | | | | 0.65 | | | | 2.65 | | | | 3.33 | | | | (1.32 | ) | | | 0.00 | | |
| Less distributions to shareholders: | |
| From net investment income | | | - | | | | - | | | | - | | | | (0.01 | ) | | | (0.02 | ) | | | - | | |
| From net realized gains | | | - | | | | (0.65 | ) | | | (0.33 | ) | | | (0.02 | ) | | | - | | | | - | | |
| Total distributions | | | - | | | | (0.65 | ) | | | (0.33 | ) | | | (0.03 | ) | | | (0.02 | ) | | | - | | |
| Net asset value, end of period | | $ | 15.56 | | | $ | 14.28 | | | $ | 14.28 | | | $ | 11.96 | | | $ | 8.66 | | | $ | 10.00 | | |
| Total Return(a) | | | 8.96 | % **(c) | | | 4.56 | % (c) | | | 22.30 | % (c) | | | 38.66 | % | | | (13.27 | )% | | | - | | |
| Ratios / Supplemental Data: | |
| Net assets, end of period (000's) | | $ | 153,471 | * | | $ | 136,675 | | | $ | 115,807 | | | $ | 44,754 | | | $ | 8,602 | | | $ | 1 | | |
| Ratio of expenses to average daily net assets: | |
| Before expense waiver | | | 1.49 | % * | | | 1.49 | % | | | 1.49 | % | | | 1.51 | % | | | 1.64 | % | | | - | | |
| After expense waiver | | | N/A | | | | N/A | | | | 1.44 | % (b)# | | | 1.41 | % (b)# | | | 1.37 | % (b)# | | | - | | |
Net investment income (loss) to average
daily net assets | | | (0.20 | )% * | | | (0.24 | )% | | | (0.02 | )% | | | 0.17 | % | | | 0.52 | % | | | - | | |
| Portfolio turnover rate | | | 24 | % ** | | | 56 | % | | | 36 | % | | | 58 | % | | | 69 | % | | | N/A | | |
| | | Class L | |
| | | Six months
ended
6/30/06
(Unaudited) | | Year ended
12/31/05† | | Year ended
12/31/04 | | Year ended
12/31/03 | | Year ended
12/31/02 | | Period ended
12/31/01+ | |
| Net asset value, beginning of period | | $ | 14.34 | | | $ | 14.31 | | | $ | 11.96 | | | $ | 8.65 | | | $ | 10.00 | | | $ | 10.00 | | |
| Income (loss) from investment operations: | |
| Net investment income | | | 0.00 | ***†† | | | 0.00 | ***†† | | | 0.03 | *** | | | 0.05 | *** | | | 0.08 | *** | | | - | | |
Net realized and unrealized gain (loss)
on investments | | | 1.31 | | | | 0.68 | | | | 2.67 | | | | 3.31 | | | | (1.39 | ) | | | - | | |
Total income (loss) from investment
operations | | | 1.31 | | | | 0.68 | | | | 2.70 | | | | 3.36 | | | | (1.31 | ) | | | 0.00 | | |
| Less distributions to shareholders: | |
| From net investment income | | | - | | | | - | | | | (0.02 | ) | | | (0.03 | ) | | | (0.04 | ) | | | - | | |
| From net realized gains | | | - | | | | (0.65 | ) | | | (0.33 | ) | | | (0.02 | ) | | | - | | | | - | | |
| Total distributions | | | - | | | | (0.65 | ) | | | (0.35 | ) | | | (0.05 | ) | | | (0.04 | ) | | | - | | |
| Net asset value, end of period | | $ | 15.65 | | | $ | 14.34 | | | $ | 14.31 | | | $ | 11.96 | | | $ | 8.65 | | | $ | 10.00 | | |
| Total Return(a) | | | 9.14 | % ** | | | 4.76 | % | | | 22.68 | % | | | 38.92 | % | | | (13.10 | )% | | | - | ‡ | |
| Ratios / Supplemental Data: | |
| Net assets, end of period (000's) | | $ | 151,352 | * | | $ | 125,631 | | | $ | 116,485 | | | $ | 37,776 | | | $ | 3,252 | | | $ | 1 | | |
| Ratio of expenses to average daily net assets: | |
| Before expense waiver | | | 1.24 | % * | | | 1.24 | % | | | 1.24 | % | | | 1.26 | % | | | 1.39 | % | | | - | ‡ | |
| After expense waiver | | | N/A | | | | N/A | | | | 1.19 | % (b)# | | | 1.17 | % (b)# | | | 1.11 | % (b)# | | | - | ‡ | |
| Net investment income to average daily net assets | | | 0.05 | % * | | | 0.00 | % | | | 0.24 | % | | | 0.45 | % | | | 0.86 | % | | | - | ‡ | |
| Portfolio turnover rate | | | 24 | % ** | | | 56 | % | | | 36 | % | | | 58 | % | | | 69 | % | | | N/A | | |
* Annualized.
** Percentages represent results for the period and are not annualized.
*** Per share amount calculated on the average shares method.
† Effective January 1, 2005, rebated brokerage commissions are included with realized gain or loss on investment transactions. Prior to January 1, 2005, these amounts were presented as a reduction of expenses. Prior year amounts have not been restated to reflect this change due to immateriality. (See Note 3).
†† Net investment income is less than $0.01 per share.
+ The Fund commenced operations on December 31, 2001.
‡ Amounts are de minimis due to the short period of operations.
# Computed after giving effect to an agreement by MassMutual to waive certain fees and expenses of the Fund.
(a) Employee retirement benefit plans that invest plan assets in the Separate Investment Accounts (SIAs) may be subject to certain charges as set forth in their respective Plan Documents. Total return figures would be lower for the period presented if they reflected these charges.
(b) The Fund has entered into an agreement with certain brokers to rebate a portion of brokerage commissions. The rebated commissions are used to reduce operating expenses of the Fund.
(c) Total Return excludes a front-end sales charge and would be lower for the periods presented if it reflected these charges.
The accompanying notes are an integral part of the financial statements.
247
MassMutual Select Small Company Value Fund – Financial Statements (Continued)
Financial Highlights (For a share outstanding throughout each period)
| | | Class Y | |
| | | Six months
ended
6/30/06
(Unaudited) | | Year ended
12/31/05† | | Year ended
12/31/04 | | Year ended
12/31/03 | | Year ended
12/31/02 | | Period ended
12/31/01+ | |
| Net asset value, beginning of period | | $ | 14.41 | | | $ | 14.35 | | | $ | 11.99 | | | $ | 8.66 | | | $ | 10.00 | | | $ | 10.00 | | |
| Income (loss) from investment operations: | |
| Net investment income | | | 0.02 | *** | | | 0.02 | *** | | | 0.05 | *** | | | 0.06 | *** | | | 0.11 | *** | | | - | | |
Net realized and unrealized gain (loss) on
investments | | | 1.30 | | | | 0.69 | | | | 2.67 | | | | 3.33 | | | | (1.40 | ) | | | - | | |
Total income (loss) from investment
operations | | | 1.32 | | | | 0.71 | | | | 2.72 | | | | 3.39 | | | | (1.29 | ) | | | 0.00 | | |
| Less distributions to shareholders: | |
| From net investment income | | | - | | | | - | | | | (0.03 | ) | | | (0.04 | ) | | | (0.05 | ) | | | - | | |
| From net realized gains | | | - | | | | (0.65 | ) | | | (0.33 | ) | | | (0.02 | ) | | | - | | | | - | | |
| Total distributions | | | - | | | | (0.65 | ) | | | (0.36 | ) | | | (0.06 | ) | | | (0.05 | ) | | | - | | |
| Net asset value, end of period | | $ | 15.73 | | | $ | 14.41 | | | $ | 14.35 | | | $ | 11.99 | | | $ | 8.66 | | | $ | 10.00 | | |
| Total Return(a) | | | 9.16 | %** | | | 4.96 | % | | | 22.80 | % | | | 39.16 | % | | | (12.92 | )% | | | - | ‡ | |
| Ratios / Supplemental Data: | |
| Net assets, end of period (000's) | | $ | 164,345 | * | | $ | 98,126 | | | $ | 100,488 | | | $ | 46,409 | | | $ | 19,708 | | | $ | 1 | | |
| Ratio of expenses to average daily net assets: | |
| Before expense waiver | | | 1.09 | %* | | | 1.09 | % | | | 1.09 | % | | | 1.11 | % | | | 1.24 | % | | | - | ‡ | |
| After expense waiver | | | N/A | | | | N/A | | | | 1.04 | % (b)# | | | 1.01 | % (b)# | | | 0.92 | % (b)# | | | - | ‡ | |
| Net investment income to average daily net assets | | | 0.22 | %* | | | 0.13 | % | | | 0.37 | % | | | 0.58 | % | | | 1.32 | % | | | - | ‡ | |
| Portfolio turnover rate | | | 24 | %** | | | 56 | % | | | 36 | % | | | 58 | % | | | 69 | % | | | N/A | | |
| | | Class S | |
| | | Six months
ended
6/30/06
(Unaudited) | | Year ended
12/31/05† | | Year ended
12/31/04 | | Year ended
12/31/03 | | Year ended
12/31/02 | | Period ended
12/31/01+ | |
| Net asset value, beginning of period | | $ | 14.46 | | | $ | 14.39 | | | $ | 12.02 | | | $ | 8.67 | | | $ | 10.00 | | | $ | 10.00 | | |
| Income (loss) from investment operations: | |
| Net investment income | | | 0.02 | *** | | | 0.03 | *** | | | 0.05 | *** | | | 0.06 | *** | | | 0.07 | *** | | | - | | |
Net realized and unrealized gain (loss) on
investments | | | 1.30 | | | | 0.69 | | | | 2.68 | | | | 3.35 | | | | (1.36 | ) | | | - | | |
Total income (loss) from investment
operations | | | 1.32 | | | | 0.72 | | | | 2.73 | | | | 3.41 | | | | (1.29 | ) | | | 0.00 | | |
| Less distributions to shareholders: | |
| From net investment income | | | - | | | | - | | | | (0.03 | ) | | | (0.04 | ) | | | (0.04 | ) | | | - | | |
| From net realized gains | | | - | | | | (0.65 | ) | | | (0.33 | ) | | | (0.02 | ) | | | - | | | | - | | |
| Total distributions | | | - | | | | (0.65 | ) | | | (0.36 | ) | | | (0.06 | ) | | | (0.04 | ) | | | - | | |
| Net asset value, end of period | | $ | 15.78 | | | $ | 14.46 | | | $ | 14.39 | | | $ | 12.02 | | | $ | 8.67 | | | $ | 10.00 | | |
| Total Return(a) | | | 9.13 | %** | | | 5.01 | % | | | 22.86 | % | | | 39.37 | % | | | (12.92 | )% | | | - | ‡ | |
| Ratios / Supplemental Data: | |
| Net assets, end of period (000's) | | $ | 294,597 | * | | $ | 221,271 | | | $ | 188,743 | | | $ | 80,661 | | | $ | 44,356 | | | $ | 10,001 | | |
| Ratio of expenses to average daily net assets: | |
| Before expense waiver | | | 1.05 | %* | | | 1.05 | % | | | 1.05 | % | | | 1.07 | % | | | 1.20 | % | | | - | ‡ | |
| After expense waiver | | | N/A | | | | N/A | | | | 1.00 | % (b)# | | | 0.97 | % (b)# | | | 0.96 | % (b)# | | | - | ‡ | |
| Net investment income to average daily net assets | | | 0.25 | %* | | | 0.20 | % | | | 0.40 | % | | | 0.58 | % | | | 0.76 | % | | | - | ‡ | |
| Portfolio turnover rate | | | 24 | %** | | | 56 | % | | | 36 | % | | | 58 | % | | | 69 | % | | | N/A | | |
* Annualized.
** Percentages represent results for the period and are not annualized.
*** Per share amount calculated on the average shares method.
† Effective January 1, 2005, rebated brokerage commissions are included with realized gain or loss on investment transactions. Prior to January 1, 2005, these amounts were presented as a reduction of expenses. Prior year amounts have not been restated to reflect this change due to immateriality. (See Note 3).
+ The Fund commenced operations on December 31, 2001.
‡ Amounts are de minimis due to the short period of operations.
# Computed after giving effect to an agreement by MassMutual to waive certain fees and expenses of the Fund.
(a) Employee retirement benefit plans that invest plan assets in the Separate Investment Accounts (SIAs) may be subject to certain charges as set forth in their respective Plan Documents. Total return figures would be lower for the period presented if they reflected these charges.
(b) The Fund has entered into an agreement with certain brokers to rebate a portion of brokerage commissions. The rebated commissions are used to reduce operating expenses of the Fund.
The accompanying notes are an integral part of the financial statements.
248
MassMutual Select Small Company Value Fund – Financial Statements (Continued)
Financial Highlights (For a share outstanding throughout each period)
| | | Class N | |
| | | Six months
ended
6/30/06
(Unaudited) | | Year ended
12/31/05† | | Year ended
12/31/04 | | Year ended
12/31/03 | | Year ended
12/31/02+ | |
| Net asset value, beginning of period | | $ | 14.11 | | | $ | 14.16 | | | $ | 11.90 | | | $ | 8.63 | | | $ | 8.59 | | |
| Income (loss) from investment operations: | |
| Net investment income (loss) | | | (0.04 | )*** | | | (0.08 | )*** | | | (0.05 | )*** | | | (0.01 | )*** | | | 0.00 | ***†† | |
| Net realized and unrealized gain on investments | | | 1.28 | | | | 0.68 | | | | 2.64 | | | | 3.30 | | | | 0.04 | | |
| Total income from investment operations | | | 1.24 | | | | 0.60 | | | | 2.59 | | | | 3.29 | | | | 0.04 | | |
| Less distributions to shareholders: | |
| From net investment income | | | - | | | | - | | | | - | | | | (0.00 | )††† | | | - | | |
| From net realized gains | | | - | | | | (0.65 | ) | | | (0.33 | ) | | | (0.02 | ) | | | - | | |
| Total distributions | | | - | | | | (0.65 | ) | | | (0.33 | ) | | | (0.02 | ) | | | - | | |
| Net asset value, end of period | | $ | 15.35 | | | $ | 14.11 | | | $ | 14.16 | | | $ | 11.90 | | | $ | 8.63 | | |
| | | | | | | | | | | | | | | | | | | | | | |
| Total Return(a) | | | 8.79 | % **(c) | | | 4.25 | % (c) | | | 21.91 | % (c) | | | 38.20 | % (c) | | | - | ‡ | |
| Ratios / Supplemental Data: | |
| Net assets, end of period (000's) | | $ | 1,290 | * | | $ | 1,251 | | | $ | 916 | | | $ | 564 | | | $ | 101 | | |
| Ratio of expenses to average daily net assets: | |
| Before expense waiver | | | 1.79 | % * | | | 1.79 | % | | | 1.79 | % | | | 1.81 | % | | | - | ‡ | |
| After expense waiver | | | N/A | | | | N/A | | | | 1.74 | % (b)# | | | 1.72 | % (b)# | | | - | ‡ | |
| Net investment loss to average daily net assets | | | (0.49 | )% * | | | (0.54 | )% | | | (0.37 | )% | | | (0.08 | )% | | | - | ‡ | |
| Portfolio turnover rate | | | 24 | % ** | | | 56 | % | | | 36 | % | | | 58 | % | | | 69 | % | |
* Annualized.
** Percentages represent results for the period and are not annualized.
*** Per share amount calculated on the average shares method.
† Effective January 1, 2005, rebated brokerage commissions are included with realized gain or loss on investment transactions. Prior to January 1, 2005, these amounts were presented as a reduction of expenses. Prior year amounts have not been restated to reflect this change due to immateriality. (See Note 3).
†† Net investment income is less than $0.01 per share.
††† Distributions from net investment income are less than $0.01 per share.
+ Class N commenced operations on December 31, 2002.
‡ Amounts are de minimis due to the short period of operations.
# Computed after giving effect to an agreement by MassMutual to waive certain fees and expenses of the Fund.
(a) Employee retirement benefit plans that invest plan assets in the Separate Investment Accounts (SIAs) may be subject to certain charges as set forth in their respective Plan Documents. Total return figures would be lower for the period presented if they reflected these charges.
(b) The Fund has entered into an agreement with certain brokers to rebate a portion of brokerage commissions. The rebated commissions are used to reduce operating expenses of the Fund.
(c) Total Return excludes contingent deferred sales charge and would be lower for the periods presented if it reflected these charges.
The accompanying notes are an integral part of the financial statements.
249
MassMutual Select Small Cap Core Equity Fund – Financial Statements (Continued)
Financial Highlights (For a share outstanding throughout each period)
| | | Class A | | Class L | | Class Y | | Class S | | Class N | |
| | | Period ended
6/30/06
(Unaudited)+ | | Period ended
6/30/06
(Unaudited)+ | | Period ended
6/30/06
(Unaudited)+ | | Period ended
6/30/06
(Unaudited)+ | | Period ended
6/30/06
(Unaudited)+ | |
| Net asset value, beginning of period | | $ | 10.00 | | | $ | 10.00 | | | $ | 10.00 | | | $ | 10.00 | | | $ | 10.00 | | |
| Income (loss) from investment operations: | |
| Net investment loss | | | (0.00 | )***† | | | 0.00 | ***† | | | 0.02 | *** | | | 0.01 | *** | | | (0.01 | )*** | |
| Net realized and unrealized loss on investments | | | (0.50 | ) | | | (0.49 | ) | | | (0.50 | ) | | | (0.50 | ) | | | (0.50 | ) | |
| Total loss from investment operations | | | (0.50 | ) | | | (0.49 | ) | | | (0.48 | ) | | | (0.49 | ) | | | (0.51 | ) | |
| Net asset value, end of period | | $ | 9.50 | | | $ | 9.51 | | | $ | 9.52 | | | $ | 9.51 | | | $ | 9.49 | | |
| | | | | | | | | | | | | | | | | | | | | | |
| Total Return | | | (5.00 | )% ** | | | (4.90 | )% ** | | | (4.80 | )% ** | | | (4.90 | )% ** | | | (5.10 | )% ** | |
| Ratios / Supplemental Data: | |
| Net assets, end of period (000's) | | $ | 119 | | | $ | 134 | | | $ | 1,111 | | | $ | 9,132 | | | $ | 95 | | |
| Ratio of expenses to average daily net assets: | |
| Before expense waiver | | | 1.85 | % * | | | 1.60 | % * | | | 1.44 | % * | | | 1.35 | % * | | | 2.15 | % * | |
| After expense waiver | | | 1.40 | % *# | | | 1.15 | % *# | | | 1.00 | % *# | | | 0.95 | % *# | | | 1.70 | % *# | |
| Net investment loss to average daily net assets | | | (0.17 | )% * | | | 0.11 | % * | | | 0.76 | % * | | | 0.22 | % * | | | (0.53 | )% * | |
| Portfolio turnover rate | | | 41 | % ** | | | 41 | % ** | | | 41 | % ** | | | 41 | % ** | | | 41 | % ** | |
* Annualized.
** Percentage represents the results for the period and are not annualized.
*** Per share amount calculated on the average shares method.
† Net investment income (loss) is less than $0.01.
# Computed after giving effect to an agreement by MassMutual to waive certain fees and expenses of the Fund.
+ The Fund commenced operations on March 31, 2006.
The accompanying notes are an integral part of the financial statements.
250
MassMutual Select Mid Cap Growth Equity Fund – Financial Statements (Continued)
Financial Highlights (For a share outstanding throughout each period)
| | | Class A | |
| | | Six months
ended
6/30/06
(Unaudited) | | Year ended
12/31/05† | | Year ended
12/31/04 | | Year ended
12/31/03 | | Year ended
12/31/02 | | Year ended
12/31/01 | |
| Net asset value, beginning of period | | $ | 9.82 | | | $ | 8.74 | | | $ | 7.64 | | | $ | 5.87 | | | $ | 8.18 | | | $ | 11.66 | | |
| Income (loss) from investment operations: | |
| Net investment loss | | | (0.00 | )††*** | | | (0.05 | )*** | | | (0.05 | )*** | | | (0.05 | )*** | | | (0.06 | )*** | | | (0.08 | )*** | |
Net realized and unrealized gain (loss) on
investments | | | 0.61 | | | | 1.13 | | | | 1.15 | | | | 1.82 | | | | (2.25 | ) | | | (3.40 | ) | |
Total income (loss) from investment
operations | | | 0.61 | | | | 1.08 | | | | 1.10 | | | | 1.77 | | | | (2.31 | ) | | | (3.48 | ) | |
| Net asset value, end of period | | $ | 10.43 | | | $ | 9.82 | | | $ | 8.74 | | | $ | 7.64 | | | $ | 5.87 | | | $ | 8.18 | | |
| | | | | | | | | | | | | | | | | | | | | | | | | | |
| Total Return(a) | | | 6.10 | % **(c) | | | 12.47 | % (c) | | | 14.40 | % (c) | | | 30.15 | % | | | (28.24 | )% | | | (29.85 | )% | |
| Ratios / Supplemental Data: | |
| Net assets, end of period (000's) | | $ | 38,805 | | | $ | 34,053 | | | $ | 29,642 | | | $ | 37,976 | | | $ | 23,351 | | | $ | 27,226 | | |
| Ratio of expenses to average daily net assets: | |
| Before expense waiver | | | 1.30 | % * | | | 1.30 | % | | | 1.30 | % | | | 1.30 | % | | | 1.30 | % | | | 1.30 | % | |
| After expense waiver | | | N/A | | | | N/A | | | | 1.27 | % (b)# | | | 1.26 | % (b)# | | | 1.29 | % # | | | 1.27 | % # | |
| Net investment loss to average daily net assets | | | (0.01 | )% * | | | (0.59 | )% | | | (0.68 | )% | | | (0.78 | )% | | | (0.90 | )% | | | (0.86 | )% | |
| Portfolio turnover rate | | | 48 | % ** | | | 117 | % | | | 93 | % | | | 128 | % | | | 284 | % | | | 160 | % | |
| | | Class L | |
| | | Six months
ended
6/30/06
(Unaudited) | | Year ended
12/31/05† | | Year ended
12/31/04 | | Year ended
12/31/03 | | Year ended
12/31/02 | | Year ended
12/31/01 | |
| Net asset value, beginning of period | | $ | 10.00 | | | $ | 8.87 | | | $ | 7.73 | | | $ | 5.93 | | | $ | 8.24 | | | $ | 11.72 | | |
| Income (loss) from investment operations: | |
| Net investment income (loss) | | | 0.01 | *** | | | (0.03 | )*** | | | (0.03 | )*** | | | (0.04 | )*** | | | (0.04 | )*** | | | (0.05 | )*** | |
Net realized and unrealized gain (loss) on
investments | | | 0.61 | | | | 1.16 | | | | 1.17 | | | | 1.84 | | | | (2.27 | ) | | | (3.43 | ) | |
Total income (loss) from investment
operations | | | 0.62 | | | | 1.13 | | | | 1.14 | | | | 1.80 | | | | (2.31 | ) | | | (3.48 | ) | |
| Less distributions to shareholders: | |
| From net investment income | | | - | | | | - | | | | - | | | | - | | | | - | | | | (0.00 | )†† | |
| Net asset value, end of period | | $ | 10.62 | | | $ | 10.00 | | | $ | 8.87 | | | $ | 7.73 | | | $ | 5.93 | | | $ | 8.24 | | |
| | | | | | | | | | | | | | | | | | | | | | | | | | |
| Total Return(a) | | | 6.20 | % ** | | | 12.74 | % | | | 14.75 | % | | | 30.35 | % | | | (28.03 | )% | | | (29.68 | )% | |
| Ratios / Supplemental Data: | |
| Net assets, end of period (000's) | | $ | 43,537 | | | $ | 42,353 | | | $ | 39,546 | | | $ | 35,668 | | | $ | 24,204 | | | $ | 28,351 | | |
| Ratio of expenses to average daily net assets: | |
| Before expense waiver | | | 1.04 | % * | | | 1.05 | % | | | 1.06 | % | | | 1.05 | % | | | 1.05 | % | | | 1.05 | % | |
| After expense waiver | | | N/A | | | | N/A | | | | 1.02 | % (b)# | | | 1.01 | % (b)# | | | 1.04 | % # | | | 1.02 | % # | |
Net investment income (loss) to average
daily net assets | | | 0.24 | % * | | | (0.35 | )% | | | (0.44 | )% | | | (0.54 | )% | | | (0.65 | )% | | | (0.61 | )% | |
| Portfolio turnover rate | | | 48 | % * | | | 117 | % | | | 93 | % | | | 128 | % | | | 284 | % | | | 160 | % | |
* Annualized.
** Percentages represent results for the period and are not annualized.
*** Per share amount calculated on the average shares method.
† Effective January 1, 2005, rebated brokerage commissions are included with realized gain or loss on investment transactions. Prior to January 1, 2005, these amounts were presented as a reduction of expenses. Prior year amounts have not been restated to reflect this change due to immateriality. (See Note 3).
†† Net investment loss and distributions from net investment income are less than $0.01 per share.
# Computed after giving effect to an agreement by MassMutual to waive certain fees and expenses of the Fund.
(a) Employee retirement benefit plans that invest plan assets in the Separate Investment Accounts (SIAs) may be subject to certain charges as set forth in their respective Plan Documents. Total return figures would be lower for the periods presented if they reflected these charges.
(b) The Fund has entered into an agreement with certain brokers to rebate a portion of brokerage commissions. The rebated commissions are used to reduce the operating expenses of the Fund.
(c) Total Return excludes a front-end sales charge and would be lower for the period presented if it reflected these charges.
The accompanying notes are an integral part of the financial statements.
251
MassMutual Select Mid Cap Growth Equity Fund – Financial Statements (Continued)
Financial Highlights (For a share outstanding throughout each period)
| | | Class Y | |
| | | Six months
ended
6/30/06
(Unaudited) | | Year ended
12/31/05† | | Year ended
12/31/04 | | Year ended
12/31/03 | | Year ended
12/31/02 | | Year ended
12/31/01 | |
| Net asset value, beginning of period | | $ | 10.08 | | | $ | 8.94 | | | $ | 7.78 | | | $ | 5.95 | | | $ | 8.26 | | | $ | 11.75 | | |
| Income (loss) from investment operations: | |
| Net investment income (loss) | | | 0.02 | *** | | | (0.02 | )*** | | | (0.02 | )*** | | | (0.03 | )*** | | | (0.03 | )*** | | | (0.05 | )*** | |
Net realized and unrealized gain (loss) on
investments | | | 0.63 | | | | 1.16 | | | | 1.18 | | | | 1.86 | | | | (2.28 | ) | | | (3.44 | ) | |
Total income (loss) from investment
operations | | | 0.65 | | | | 1.14 | | | | 1.16 | | | | 1.83 | | | | (2.31 | ) | | | (3.49 | ) | |
| Less distributions to shareholders: | |
| From net investment income | | | - | | | | - | | | | - | | | | - | | | | - | | | | (0.00 | )†† | |
| Net asset value, end of period | | $ | 10.73 | | | $ | 10.08 | | | $ | 8.94 | | | $ | 7.78 | | | $ | 5.95 | | | $ | 8.26 | | |
| Total Return(a) | | | 6.34 | %** | | | 12.86 | % | | | 14.91 | % | | | 30.76 | % | | | (27.97 | )% | | | (29.67 | )% | |
| Ratios / Supplemental Data: | |
| Net assets, end of period (000's) | | $ | 26,269 | | | $ | 21,345 | | | $ | 15,791 | | | $ | 16,202 | | | $ | 9,379 | | | $ | 12,490 | | |
| Ratio of expenses to average daily net assets: | |
| Before expense waiver | | | 0.90 | %* | | | 0.90 | % | | | 0.90 | % | | | 0.90 | % | | | 0.90 | % | | | 0.90 | % | |
| After expense waiver | | | N/A | | | | N/A | | | | 0.87 | % (b)# | | | 0.86 | % (b)# | | | 0.89 | % # | | | 0.87 | % # | |
Net investment income (loss) to average
daily net assets | | | 0.32 | %* | | | (0.19 | )% | | | (0.29 | )% | | | (0.38 | )% | | | (0.50 | )% | | | (0.49 | )% | |
| Portfolio turnover rate | | | 48 | %** | | | 117 | % | | | 93 | % | | | 128 | % | | | 284 | % | | | 160 | % | |
| | | Class S | |
| | | Six months
ended
6/30/06
(Unaudited) | | Year ended
12/31/05† | | Year ended
12/31/04 | | Year ended
12/31/03 | | Year ended
12/31/02 | | Year ended
12/31/01 | |
| Net asset value, beginning of period | | $ | 10.12 | | | $ | 8.97 | | | $ | 7.79 | | | $ | 5.96 | | | $ | 8.27 | | | $ | 11.75 | | |
| Income (loss) from investment operations: | |
| Net investment income (loss) | | | 0.02 | *** | | | (0.01 | )*** | | | (0.02 | )*** | | | (0.02 | )*** | | | (0.03 | )*** | | | (0.04 | )*** | |
Net realized and unrealized gain (loss) on
investments | | | 0.63 | | | | 1.16 | | | | 1.20 | | | | 1.85 | | | | (2.28 | ) | | | (3.43 | ) | |
Total income (loss) from investment
operations | | | 0.65 | | | | 1.15 | | | | 1.18 | | | | 1.83 | | | | (2.31 | ) | | | (3.47 | ) | |
| Less distributions to shareholders: | |
| From net investment income | | | - | | | | - | | | | - | | | | - | | | | - | | | | (0.01 | ) | |
| Net asset value, end of period | | $ | 10.77 | | | $ | 10.12 | | | $ | 8.97 | | | $ | 7.79 | | | $ | 5.96 | | | $ | 8.27 | | |
| Total Return(a) | | | 6.42 | %** | | | 12.82 | % | | | 15.15 | % | | | 30.70 | % | | | (27.93 | )% | | | (29.52 | )% | |
| Ratios / Supplemental Data: | |
| Net assets, end of period (000's) | | $ | 83,965 | | | $ | 70,676 | | | $ | 50,160 | | | $ | 68,504 | | | $ | 47,443 | | | $ | 81,248 | | |
| Ratio of expenses to average daily net assets: | |
| Before expense waiver | | | 0.83 | %* | | | 0.83 | % | | | 0.83 | % | | | 0.83 | % | | | 0.83 | % | | | 0.83 | % | |
| After expense waiver | | | N/A | | | | N/A | | | | 0.80 | % (b)# | | | 0.79 | % (b)# | | | 0.82 | % # | | | 0.80 | % # | |
Net investment income (loss) to average
daily net assets | | | 0.42 | %* | | | (0.12 | )% | | | (0.22 | )% | | | (0.32 | )% | | | (0.43 | )% | | | (0.40 | )% | |
| Portfolio turnover rate | | | 48 | %** | | | 117 | % | | | 93 | % | | | 128 | % | | | 284 | % | | | 160 | % | |
* Annualized.
** Percentages represent results for the period and are not annualized.
*** Per share amount calculated on the average shares method.
† Effective January 1, 2005, rebated brokerage commissions are included with realized gain or loss on investment transactions. Prior to January 1, 2005, these amounts were presented as a reduction of expenses. Prior year amounts have not been restated to reflect this change due to immateriality. (See Note 3).
†† Distributions from net investment income is less than $0.01 per share.
# Computed after giving effect to an agreement by MassMutual to waive certain fees and expenses of the Fund.
(a) Employee retirement benefit plans that invest plan assets in the Separate Investment Accounts (SIAs) may be subject to certain charges as set forth in their respective Plan Documents. Total return figures would be lower for the periods presented if they reflected these charges.
(b) The Fund has entered into an agreement with certain brokers to rebate a portion of brokerage commissions. The rebated commissions are used to reduce the operating expenses of the Fund.
The accompanying notes are an integral part of the financial statements.
252
MassMutual Select Mid Cap Growth Equity Fund – Financial Statements (Continued)
Financial Highlights (For a share outstanding throughout each period)
| | | Class N | |
| | | Six months
ended
6/30/06
(Unaudited) | | Year ended
12/31/05† | | Year ended
12/31/04 | | Year ended
12/31/03 | | Year ended
12/31/02++ | |
| Net asset value, beginning of period | | $ | 9.71 | | | $ | 8.67 | | | $ | 7.59 | | | $ | 5.85 | | | $ | 5.86 | | |
| Income (loss) from investment operations: | |
| Net investment loss | | | (0.01 | )*** | | | (0.08 | )*** | | | (0.08 | )*** | | | (0.07 | )*** | | | (0.00 | )***†† | |
| Net realized and unrealized gain (loss) on investments | | | 0.59 | | | | 1.12 | | | | 1.16 | | | | 1.81 | | | | (0.01 | ) | |
| Total income from investment operations | | | 0.58 | | | | 1.04 | | | | 1.08 | | | | 1.74 | | | | (0.01 | ) | |
| Net asset value, end of period | | $ | 10.29 | | | $ | 9.71 | | | $ | 8.67 | | | $ | 7.59 | | | $ | 5.85 | | |
| | | | | | | | | | | | | | | | | | | | | | |
| Total Return(a) | | | 5.97 | % **(c) | | | 12.00 | % (c) | | | 14.23 | % (c) | | | 29.74 | % (c) | | | - | ‡ | |
| Ratios / Supplemental Data: | |
| Net assets, end of period (000's) | | $ | 249 | | | $ | 167 | | | $ | 149 | | | $ | 137 | | | $ | 100 | | |
| Ratio of expenses to average daily net assets: | |
| Before expense waiver | | | 1.60 | % * | | | 1.60 | % | | | 1.60 | % | | | 1.60 | % | | | - | ‡ | |
| After expense waiver | | | N/A | | | | N/A | | | | 1.57 | % (b) | | | 1.56 | % (b) | | | - | ‡ | |
| Net investment loss to average daily net assets | | | (0.24 | )% * | | | (0.89 | )% | | | (0.99 | )% | | | (1.09 | )% | | | - | ‡ | |
| Portfolio turnover rate | | | 48 | % * | | | 117 | % | | | 93 | % | | | 128 | % | | | 284 | % | |
* Annualized.
** Percentages represent results for the period and are not annualized.
*** Per share amount calculated on the average shares method.
† Effective January 1, 2005, rebated brokerage commissions are included with realized gain or loss on investment transactions. Prior to January 1, 2005, these amounts were presented as a reduction of expenses. Prior year amounts have not been restated to reflect this change due to immateriality. (See Note 3).
†† Net investment loss is less than $0.01 per share.
++ Class N commenced operations on December 31, 2002.
‡ Amounts are de minimis due to the short period of operations.
(a) Employee retirement benefit plans that invest plan assets in the Separate Investment Accounts (SIAs) may be subject to certain charges as set forth in their respective Plan Documents. Total return figures would be lower for the periods presented if they reflected these charges.
(b) The Fund has entered into an agreement with certain brokers to rebate a portion of brokerage commissions. The rebated commissions are used to reduce the operating expenses of the Fund.
(c) Total Return excludes contingent deferred sales charge and would be lower for the periods presented if they reflected these charges.
The accompanying notes are an integral part of the financial statements.
253
MassMutual Select Mid Cap Growth Equity II Fund – Financial Statements (Continued)
Financial Highlights (For a share outstanding throughout each period)
| | | Class A | |
| | | Six months
ended
6/30/06
(Unaudited) | | Year ended
12/31/05† | | Year ended
12/31/04 | | Year ended
12/31/03 | | Year ended
12/31/02 | | Year ended
12/31/01 | |
| Net asset value, beginning of period | | $ | 14.13 | | | $ | 13.09 | | | $ | 11.17 | | | $ | 8.12 | | | $ | 10.33 | | | $ | 10.48 | | |
| Income (loss) from investment operations: | |
| Net investment loss | | | 0.00 | ***†† | | | (0.09 | )*** | | | (0.10 | )*** | | | (0.09 | )*** | | | (0.08 | )*** | | | (0.09 | )*** | |
Net realized and unrealized gain (loss) on
investments | | | 0.16 | | | | 1.74 | | | | 2.04 | | | | 3.14 | | | | (2.13 | ) | | | (0.06 | ) | |
Total income (loss) from investment
operations | | | 0.16 | | | | 1.65 | | | | 1.94 | | | | 3.05 | | | | (2.21 | ) | | | (0.15 | ) | |
| Less distributions to shareholders: | |
| From net realized gains | | | - | | | | (0.61 | ) | | | (0.02 | ) | | | - | | | | - | | | | - | | |
| Net asset value, end of period | | $ | 14.29 | | | $ | 14.13 | | | $ | 13.09 | | | $ | 11.17 | | | $ | 8.12 | | | $ | 10.33 | | |
| Total Return(a) | | | 1.13 | %(c)** | | | 12.63 | % (c) | | | 17.41 | % (c) | | | 37.56 | % | | | (21.39 | )% | | | (1.43 | )% | |
| Ratios / Supplemental Data: | |
| Net assets, end of period (000's) | | $ | 325,006 | | | $ | 310,072 | | | $ | 208,278 | | | $ | 93,526 | | | $ | 30,968 | | | $ | 14,113 | | |
| Ratio of expenses to average daily net assets: | |
| Before expense waiver | | | 1.35 | %* | | | 1.35 | % | | | 1.35 | % | | | 1.35 | % | | | 1.36 | % | | | 1.35 | % | |
| After expense waiver | | | N/A | | | | N/A | | | | 1.34 | % (b)# | | | 1.34 | % (b)# | | | 1.35 | % (b)# | | | 1.35 | % | |
Net investment income (loss) to average
daily net assets | | | 0.01 | %* | | | (0.68 | )% | | | (0.89 | )% | | | (0.93 | )% | | | (0.96 | )% | | | (0.89 | )% | |
| Portfolio turnover rate | | | 19 | %** | | | 28 | % | | | 42 | % | | | 54 | % | | | 61 | % | | | 49 | % | |
| | | Class L | |
| | | Six months
ended
6/30/06
(Unaudited) | | Year ended
12/31/05† | | Year ended
12/31/04 | | Year ended
12/31/03 | | Year ended
12/31/02 | | Year ended
12/31/01 | |
| Net asset value, beginning of period | | $ | 14.34 | | | $ | 13.24 | | | $ | 11.27 | | | $ | 8.17 | | | $ | 10.37 | | | $ | 10.50 | | |
| Income (loss) from investment operations: | |
| Net investment income (loss) | | | 0.02 | *** | | | (0.06 | )*** | | | (0.08 | )*** | | | (0.07 | )*** | | | (0.07 | )*** | | | (0.06 | )*** | |
Net realized and unrealized gain (loss) on
investments | | | 0.16 | | | | 1.77 | | | | 2.07 | | | | 3.17 | | | | (2.13 | ) | | | (0.07 | ) | |
Total income (loss) from investment
operations | | | 0.18 | | | | 1.71 | | | | 1.99 | | | | 3.10 | | | | (2.20 | ) | | | (0.13 | ) | |
| Less distributions to shareholders: | |
| From net realized gains | | | - | | | | (0.61 | ) | | | (0.02 | ) | | | - | | | | - | | | | - | | |
| Net asset value, end of period | | $ | 14.52 | | | $ | 14.34 | | | $ | 13.24 | | | $ | 11.27 | | | $ | 8.17 | | | $ | 10.37 | | |
| Total Return(a) | | | 1.26 | %** | | | 12.94 | % | | | 17.70 | % | | | 37.94 | % | | | (21.22 | )% | | | (1.24 | )% | |
| Ratios / Supplemental Data: | |
| Net assets, end of period (000's) | | $ | 549,528 | | | $ | 508,296 | | | $ | 403,972 | | | $ | 225,279 | | | $ | 116,835 | | | $ | 136,206 | | |
| Ratio of expenses to average daily net assets: | |
| Before expense waiver | | | 1.10 | %* | | | 1.10 | % | | | 1.10 | % | | | 1.10 | % | | | 1.11 | % | | | 1.10 | % | |
| After expense waiver | | | N/A | | | | N/A | | | | 1.09 | % (b)# | | | 1.09 | % (b)# | | | 1.09 | % (b)# | | | 1.10 | % | |
Net investment income (loss) to average
daily net assets | | | 0.25 | %* | | | (0.43 | )% | | | (0.65 | )% | | | (0.68 | )% | | | (0.72 | )% | | | (0.59 | )% | |
| Portfolio turnover rate | | | 19 | %** | | | 28 | % | | | 42 | % | | | 54 | % | | | 61 | % | | | 49 | % | |
* Annualized.
** Percentages represent results for the period and are not annualized.
*** Per share amount calculated on the average shares method.
† Effective January 1, 2005, rebated brokerage commissions are included with realized gain or loss on investment transactions. Prior to January 1, 2005, these amounts were presented as a reduction of expenses. Prior year amounts have not been restated to reflect this change due to immateriality. (See Note 3).
†† Net investment income (loss) is less than $0.01 per share.
# Computed after giving effect to an agreement by MassMutual to waive certain fees and expenses of the Fund.
(a) Employee retirement benefit plans that invest plan assets in the Separate Investment Accounts (SIAs) may be subject to certain charges as set forth in their respective Plan Documents. Total return figures would be lower for the periods presented if they reflected these charges.
(b) The Fund has entered into an agreement with the certain brokers to rebate a portion of brokerage commissions. The rebated commissions are used to reduce operating expenses of the Fund.
(c) Total Return excludes a front-end sales charge and would be lower for the periods presented if it reflected these charges.
The accompanying notes are an integral part of the financial statements.
254
MassMutual Select Mid Cap Growth Equity II Fund – Financial Statements (Continued)
Financial Highlights (For a share outstanding throughout each period)
| | | Class Y | |
| | | Six months
ended
6/30/06
(Unaudited) | | Year ended
12/31/05† | | Year ended
12/31/04 | | Year ended
12/31/03 | | Year ended
12/31/02 | | Year ended
12/31/01 | |
| Net asset value, beginning of period | | $ | 14.48 | | | $ | 13.35 | | | $ | 11.34 | | | $ | 8.21 | | | $ | 10.40 | | | $ | 10.51 | | |
| Income (loss) from investment operations: | |
| Net investment income (loss) | | | 0.03 | *** | | | (0.04 | )*** | | | (0.06 | )*** | | | (0.05 | )*** | | | (0.04 | )*** | | | (0.05 | )*** | |
Net realized and unrealized gain (loss) on
investments | | | 0.16 | | | | 1.78 | | | | 2.09 | | | | 3.18 | | | | (2.15 | ) | | | (0.06 | ) | |
Total income (loss) from investment
operations | | | 0.19 | | | | 1.74 | | | | 2.03 | | | | 3.13 | | | | (2.19 | ) | | | (0.11 | ) | |
| Less distributions to shareholders: | |
| From net realized gains | | | - | | | | (0.61 | ) | | | (0.02 | ) | | | - | | | | - | | | | - | | |
| Net asset value, end of period | | $ | 14.67 | | | $ | 14.48 | | | $ | 13.35 | | | $ | 11.34 | | | $ | 8.21 | | | $ | 10.40 | | |
| Total Return(a) | | | 1.31 | %** | | | 13.06 | % | | | 17.94 | % | | | 38.12 | % | | | (21.06 | )% | | | (1.05 | )% | |
| Ratios / Supplemental Data: | |
| Net assets, end of period (000's) | | $ | 163,620 | | | $ | 139,779 | | | $ | 99,126 | | | $ | 51,284 | | | $ | 27,835 | | | $ | 622 | | |
| Ratio of expenses to average daily net assets: | |
| Before expense waiver | | | 0.95 | %* | | | 0.95 | % | | | 0.95 | % | | | 0.95 | % | | | 0.98 | % | | | 0.95 | % | |
| After expense waiver | | | N/A | | | | N/A | | | | 0.94 | % (b)# | | | 0.94 | % (b)# | | | 0.96 | % (b)# | | | 0.95 | % | |
Net investment income (loss) to average
daily net assets | | | 0.40 | %* | | | (0.28 | )% | | | (0.49 | )% | | | (0.53 | )% | | | (0.51 | )% | | | (0.48 | )% | |
| Portfolio turnover rate | | | 19 | %** | | | 28 | % | | | 42 | % | | | 54 | % | | | 61 | % | | | 49 | % | |
| | | Class S | |
| | | Six months
ended
6/30/06
(Unaudited) | | Year ended
12/31/05† | | Year ended
12/31/04 | | Year ended
12/31/03 | | Year ended
12/31/02 | | Year ended
12/31/01 | |
| Net asset value, beginning of period | | $ | 14.54 | | | $ | 13.39 | | | $ | 11.37 | | | $ | 8.22 | | | $ | 10.41 | | | $ | 10.51 | | |
| Income (loss) from investment operations: | |
| Net investment income (loss) | | | 0.04 | *** | | | (0.03 | )*** | | | (0.05 | )*** | | | (0.04 | )*** | | | (0.04 | )*** | | | (0.03 | )*** | |
Net realized and unrealized gain (loss) on
investments | | | 0.16 | | | | 1.79 | | | | 2.09 | | | | 3.19 | | | | (2.15 | ) | | | (0.07 | ) | |
Total income (loss) from investment
operations | | | 0.20 | | | | 1.76 | | | | 2.04 | | | | 3.15 | | | | (2.19 | ) | | | (0.10 | ) | |
| Less distributions to shareholders: | |
| From net realized gains | | | - | | | | (0.61 | ) | | | (0.02 | ) | | | - | | | | - | | | | - | | |
| Net asset value, end of period | | $ | 14.74 | | | $ | 14.54 | | | $ | 13.39 | | | $ | 11.37 | | | $ | 8.22 | | | $ | 10.41 | | |
| Total Return(a) | | | 1.38 | %** | | | 13.17 | % | | | 17.98 | % | | | 38.32 | % | | | (21.04 | )% | | | (0.95 | )% | |
| Ratios / Supplemental Data: | |
| Net assets, end of period (000's) | | $ | 284,874 | | | $ | 273,591 | | | $ | 206,865 | | | $ | 125,907 | | | $ | 72,595 | | | $ | 88,921 | | |
| Ratio of expenses to average daily net assets: | |
| Before expense waiver | | | 0.86 | %* | | | 0.86 | % | | | 0.86 | % | | | 0.86 | % | | | 0.87 | % | | | 0.86 | % | |
| After expense waiver | | | N/A | | | | N/A | | | | 0.85 | % (b)# | | | 0.85 | % (b)# | | | 0.85 | % (b)# | | | 0.86 | % | |
Net investment income (loss) to average
daily net assets | | | 0.50 | %* | | | (0.19 | )% | | | (0.41 | )% | | | (0.44 | )% | | | (0.48 | )% | | | (0.34 | )% | |
| Portfolio turnover rate | | | 19 | %** | | | 28 | % | | | 42 | % | | | 54 | % | | | 61 | % | | | 49 | % | |
* Annualized.
** Percentages represent results for the period and are not annualized.
*** Per share amount calculated on the average shares method.
† Effective January 1, 2005, rebated brokerage commissions are included with realized gain or loss on investment transactions. Prior to January 1, 2005, these amounts were presented as a reduction of expenses. Prior year amounts have not been restated to reflect this change due to immateriality. (See Note 3).
# Computed after giving effect to an agreement by MassMutual to waive certain fees and expenses of the Fund.
(a) Employee retirement benefit plans that invest plan assets in the Separate Investment Accounts (SIAs) may be subject to certain charges as set forth in their respective Plan Documents. Total return figures would be lower for the periods presented if they reflected these charges.
(b) The Fund has entered into an agreement with the certain brokers to rebate a portion of brokerage commissions. The rebated commissions are used to reduce operating expenses of the Fund.
The accompanying notes are an integral part of the financial statements.
255
MassMutual Select Mid Cap Growth Equity II Fund – Financial Statements (Continued)
Financial Highlights (For a share outstanding throughout each period)
| | | Class N | |
| | | Six months
ended
6/30/06
(Unaudited) | | Year ended
12/31/05† | | Year ended
12/31/04 | | Year ended
12/31/03 | | Year ended
12/31/02++ | |
| Net asset value, beginning of period | | $ | 13.95 | | | $ | 12.97 | | | $ | 11.10 | | | $ | 8.09 | | | $ | 8.05 | | |
| Income (loss) from investment operations: | |
| Net investment loss | | | (0.02 | )*** | | | (0.13 | )*** | | | (0.14 | )*** | | | (0.12 | )*** | | | (0.00 | )***†† | |
| Net realized and unrealized gain on investments | | | 0.16 | | | | 1.72 | | | | 2.03 | | | | 3.13 | | | | 0.04 | | |
| Total income (loss) from investment operations | | | 0.14 | | | | 1.59 | | | | 1.89 | | | | 3.01 | | | | 0.04 | | |
| Less distributions to shareholders: | |
| From net realized gains | | | - | | | | (0.61 | ) | | | (0.02 | ) | | | - | | | | - | | |
| Net asset value, end of period | | $ | 14.09 | | | $ | 13.95 | | | $ | 12.97 | | | $ | 11.10 | | | $ | 8.09 | | |
| | | | | | | | | | | | | | | | | | | | | | |
| Total Return(a) | | | 1.00 | % (c)** | | | 12.28 | % (c) | | | 17.07 | % (c) | | | 37.21 | % (c) | | | - | ‡ | |
| Ratios / Supplemental Data: | |
| Net assets, end of period (000's) | | $ | 2,451 | | | $ | 1,755 | | | $ | 1,096 | | | $ | 617 | | | $ | 101 | | |
| Ratio of expenses to average daily net assets: | |
| Before expense waiver | | | 1.65 | % * | | | 1.65 | % | | | 1.65 | % | | | 1.66 | % | | | - | ‡ | |
| After expense waiver | | | N/A | | | | N/A | | | | 1.64 | % (b)# | | | 1.65 | % (b)# | | | - | ‡ | |
| Net investment loss to average daily net assets | | | (0.28 | )% * | | | (0.97 | )% | | | (1.19 | )% | | | (1.22 | )% | | | - | ‡ | |
| Portfolio turnover rate | | | 19 | % * | | | 28 | % | | | 42 | % | | | 54 | % | | | 61 | % | |
* Annualized.
** Percentages represent results for the period and are not annualized.
*** Per share amount calculated on the average shares mehod.
† Effective January 1, 2005, rebated brokerage commissions are included with realized gain or loss on investment transactions. Prior to January 1, 2005, these amounts were presented as a reduction of expenses. Prior year amounts have not been restated to reflect this change due to immateriality. (See Note 3).
†† Net investment income (loss) is less than $0.01 per share.
‡ Amounts are de minimis due to the short period of operations.
++ Class N commenced operations on December 31, 2002.
# Computed after giving effect to an agreement by MassMutual to waive certain fees and expenses of the Fund.
(a) Employee retirement benefit plans that invest plan assets in the Separate Investment Accounts (SIAs) may be subject to certain charges as set forth in their respective Plan Documents. Total return figures would be lower for the periods presented if they reflected these charges.
(b) The Fund has entered into an agreement with certain brokers to rebate a portion of brokerage commissions. The rebated commissions are used to reduce operating expenses of the Fund.
(c) Total Return excludes contingent deferred sales charge and would be lower for the peiods presented if they reflected these charges.
The accompanying notes are an integral part of the financial statements.
256
MassMutual Select Small Cap Growth Equity Fund – Financial Statements (Continued)
Financial Highlights (For a share outstanding throughout each period)
| | | Class A | |
| | | Six months
ended
6/30/06
(Unaudited) | | Year ended
12/31/05† | | Year ended
12/31/04 | | Year ended
12/31/03 | | Year ended
12/31/02 | | Year ended
12/31/01 | |
| Net asset value, beginning of period | | $ | 15.72 | | | $ | 14.22 | | | $ | 12.56 | | | $ | 8.76 | | | $ | 11.79 | | | $ | 13.37 | | |
| Income (loss) from investment operations: | |
| Net investment loss | | | (0.06 | )*** | | | (0.12 | )*** | | | (0.13 | )*** | | | (0.12 | )*** | | | (0.11 | )*** | | | (0.08 | )*** | |
Net realized and unrealized gain (loss) on
investments | | | 0.71 | | | | 1.62 | | | | 1.79 | | | | 3.92 | | | | (2.92 | ) | | | (1.50 | ) | |
Total income (loss) from investment
operations | | | 0.65 | | | | 1.50 | | | | 1.66 | | | | 3.80 | | | | (3.03 | ) | | | (1.58 | ) | |
| Net asset value, end of period | | $ | 16.37 | | | $ | 15.72 | | | $ | 14.22 | | | $ | 12.56 | | | $ | 8.76 | | | $ | 11.79 | | |
| | | | | | | | | | | | | | | | | | | | | | | | | | |
| Total Return(a) | | | 4.13 | % (c)** | | | 10.55 | % (c) | | | 13.22 | % (c) | | | 43.38 | % | | | (25.70 | )% | | | (11.82 | )% | |
| Ratios / Supplemental Data: | |
| Net assets, end of period (000's) | | $ | 115,924 | | | $ | 98,945 | | | $ | 77,739 | | | $ | 67,686 | | | $ | 35,509 | | | $ | 32,095 | | |
| Ratio of expenses to average daily net assets: | |
| Before expense waiver | | | 1.51 | % * | | | 1.51 | % | | | 1.52 | % | | | 1.51 | % | | | 1.51 | % | | | 1.51 | % | |
| After expense waiver | | | N/A | | | | N/A | | | | 1.48 | % (b)# | | | 1.49 | % (b)# | | | 1.50 | % (b)# | | | 1.49 | % # | |
| Net investment loss to average daily net assets | | | (0.77 | )% * | | | (0.83 | )% | | | (1.01 | )% | | | (1.11 | )% | | | (1.08 | )% | | | (0.67 | )% | |
| Portfolio turnover rate | | | 41 | % ** | | | 59 | % | | | 64 | % | | | 56 | % | | | 51 | % | | | 114 | % | |
| | | Class L | |
| | | Six months
ended
6/30/06
(Unaudited) | | Year ended
12/31/05† | | Year ended
12/31/04 | | Year ended
12/31/03 | | Year ended
12/31/02 | | Year ended
12/31/01 | |
| Net asset value, beginning of period | | $ | 15.97 | | | $ | 14.41 | | | $ | 12.70 | | | $ | 8.83 | | | $ | 11.85 | | | $ | 13.41 | | |
| Income (loss) from investment operations: | |
| Net investment loss | | | (0.04 | )*** | | | (0.08 | )*** | | | (0.10 | )*** | | | (0.09 | )*** | | | (0.08 | )*** | | | (0.05 | )*** | |
Net realized and unrealized gain (loss) on
investments | | | 0.71 | | | | 1.64 | | | | 1.81 | | | | 3.96 | | | | (2.94 | ) | | | (1.51 | ) | |
Total income (loss) from investment
operations | | | 0.67 | | | | 1.56 | | | | 1.71 | | | | 3.87 | | | | (3.02 | ) | | | (1.56 | ) | |
| Net asset value, end of period | | $ | 16.64 | | | $ | 15.97 | | | $ | 14.41 | | | $ | 12.70 | | | $ | 8.83 | | | $ | 11.85 | | |
| | | | | | | | | | | | | | | | | | | | | | | | | | |
| Total Return(a) | | | 4.20 | % (c)** | | | 10.83 | % | | | 13.46 | % | | | 43.83 | % | | | (25.49 | )% | | | (11.63 | )% | |
| Ratios / Supplemental Data: | |
| Net assets, end of period (000's) | | $ | 96,664 | | | $ | 108,840 | | | $ | 90,941 | | | $ | 85,885 | | | $ | 44,419 | | | $ | 43,839 | | |
| Ratio of expenses to average daily net assets: | |
| Before expense waiver | | | 1.26 | % * | | | 1.26 | % | | | 1.26 | % | | | 1.26 | % | | | 1.26 | % | | | 1.26 | % | |
| After expense waiver | | | N/A | | | | N/A | | | | 1.23 | % (b)# | | | 1.24 | % (b)# | | | 1.25 | % (b)# | | | 1.24 | % # | |
| Net investment loss to average daily net assets | | | (0.52 | )% * | | | (0.58 | )% | | | (0.76 | )% | | | (0.86 | )% | | | (0.83 | )% | | | (0.40 | )% | |
| Portfolio turnover rate | | | 41 | % ** | | | 59 | % | | | 64 | % | | | 56 | % | | | 51 | % | | | 114 | % | |
* Annualized.
** Percentages represent results from the period and are not annualized.
*** Per share amount calculated on the average shares method.
† Effective January 1, 2005, rebated brokerage commissions are included with realized gain or loss on investment transactions. Prior to January 1, 2005, these amounts were presented as a reduction of expenses. Prior year amounts have not been restated to reflect this change due to immateriality. (See Note 3).
# Computed after giving effect to an agreement by MassMutual to waive certain fees and expenses of the Fund.
(a) Employee retirement benefit plans that invest plan assets in the Separate Investment Accounts (SIAs) may be subject to certain charges as set forth in their respective Plan Documents. Total return figures would be lower for the period presented if they reflected these charges.
(b) The Fund has entered into an agreement with certain brokers to rebate a portion of brokerage commissions. The rebated commissions are used to reduce operating expenses of the Fund.
(c) Total Return excludes a front-end sales charge and would be lower for the period presented if it reflected these charges.
The accompanying notes are an integral part of the financial statements.
257
MassMutual Select Small Cap Growth Equity Fund – Financial Statements (Continued)
Financial Highlights (For a share outstanding throughout each period)
| | | Class Y | |
| | | Six months
ended
6/30/06
(Unaudited) | | Year ended
12/31/05† | | Year ended
12/31/04 | | Year ended
12/31/03 | | Year ended
12/31/02 | | Year ended
12/31/01 | |
| Net asset value, beginning of period | | $ | 16.11 | | | $ | 14.52 | | | $ | 12.77 | | | $ | 8.87 | | | $ | 11.89 | | | $ | 13.43 | | |
| Income (loss) from investment operations: | |
| Net investment loss | | | (0.03 | )*** | | | (0.06 | )*** | | | (0.08 | )*** | | | (0.08 | )*** | | | (0.07 | )*** | | | (0.03 | )*** | |
Net realized and unrealized gain (loss) on
investments | | | 0.73 | | | | 1.65 | | | | 1.83 | | | | 3.98 | | | | (2.95 | ) | | | (1.51 | ) | |
Total income (loss) from investment
operations | | | 0.70 | | | | 1.59 | | | | 1.75 | | | | 3.90 | | | | (3.02 | ) | | | (1.54 | ) | |
| Net asset value, end of period | | $ | 16.81 | | | $ | 16.11 | | | $ | 14.52 | | | $ | 12.77 | | | $ | 8.87 | | | $ | 11.89 | | |
| Total Return(a) | | | 4.28 | % (c)** | | | 11.02 | % | | | 13.70 | % | | | 43.97 | % | | | (25.40 | )% | | | (11.47 | )% | |
| Ratios / Supplemental Data: | |
| Net assets, end of period (000's) | | $ | 133,363 | | | $ | 95,822 | | | $ | 92,812 | | | $ | 87,801 | | | $ | 43,123 | | | $ | 44,759 | | |
| Ratio of expenses to average daily net assets: | |
| Before expense waiver | | | 1.11 | % * | | | 1.11 | % | | | 1.12 | % | | | 1.11 | % | | | 1.11 | % | | | 1.11 | % | |
| After expense waiver | | | N/A | | | | N/A | | | | 1.08 | % (b)# | | | 1.09 | % (b)# | | | 1.10 | % (b)# | | | 1.09 | % # | |
Net investment income (loss) to average
daily net assets | | | (0.37 | )% * | | | (0.44 | )% | | | (0.61 | )% | | | (0.71 | )% | | | (0.68 | )% | | | (0.25 | )% | |
| Portfolio turnover rate | | | 41 | % ** | | | 59 | % | | | 64 | % | | | 56 | % | | | 51 | % | | | 114 | % | |
| | | Class S | |
| | | Six months
ended
6/30/06
(Unaudited) | | Year ended
12/31/05† | | Year ended
12/31/04 | | Year ended
12/31/03 | | Year ended
12/31/02 | | Year ended
12/31/01 | |
| Net asset value, beginning of period | | $ | 16.24 | | | $ | 14.61 | | | $ | 12.84 | | | $ | 8.91 | | | $ | 11.92 | | | $ | 13.45 | | |
| Income (loss) from investment operations: | |
| Net investment loss | | | (0.02 | )*** | | | (0.04 | )*** | | | (0.06 | )*** | | | (0.06 | )*** | | | (0.06 | )*** | | | (0.01 | )*** | |
Net realized and unrealized gain (loss) on
investments | | | 0.73 | | | | 1.67 | | | | 1.83 | | | | 3.99 | | | | (2.95 | ) | | | (1.52 | ) | |
Total income (loss) from investment
operations | | | 0.71 | | | | 1.63 | | | | 1.77 | | | | 3.93 | | | | (3.01 | ) | | | (1.53 | ) | |
| Net asset value, end of period | | $ | 16.95 | | | $ | 16.24 | | | $ | 14.61 | | | $ | 12.84 | | | $ | 8.91 | | | $ | 11.92 | | |
| Total Return(a) | | | 4.31 | % (c)** | | | 11.23 | % | | | 13.79 | % | | | 44.11 | % | | | (25.25 | )% | | | (11.38 | )% | |
| Ratios / Supplemental Data: | |
| Net assets, end of period (000's) | | $ | 322,891 | | | $ | 288,954 | | | $ | 241,673 | | | $ | 243,909 | | | $ | 123,762 | | | $ | 156,565 | | |
| Ratio of expenses to average daily net assets: | |
| Before expense waiver | | | 0.97 | % * | | | 0.97 | % | | | 0.97 | % | | | 0.97 | % | | | 0.97 | % | | | 0.97 | % | |
| After expense waiver | | | N/A | | | | N/A | | | | 0.94 | % (b)# | | | 0.95 | % (b)# | | | 0.96 | % (b)# | | | 0.95 | % # | |
Net investment income (loss) to average
daily net assets | | | (0.23 | )% * | | | (0.29 | )% | | | (0.47 | )% | | | (0.57 | )% | | | (0.54 | )% | | | (0.09 | )% | |
| Portfolio turnover rate | | | 41 | % ** | | | 59 | % | | | 64 | % | | | 56 | % | | | 51 | % | | | 114 | % | |
* Annualized.
** Percentages represent results from the period and are not annualized.
*** Per share amount calculated on the average shares method.
† Effective January 1, 2005, rebated brokerage commissions are included with realized gain or loss on investment transactions. Prior to January 1, 2005, these amounts were presented as a reduction of expenses. Prior year amounts have not been restated to reflect this change due to immateriality. (See Note 3).
# Computed after giving effect to an agreement by MassMutual to waive certain fees and expenses of the Fund.
(a) Employee retirement benefit plans that invest plan assets in the Separate Investment Accounts (SIAs) may be subject to certain charges as set forth in their respective Plan Documents. Total return figures would be lower for the period presented if they reflected these charges.
(b) The Fund enetered into an agreement with certain brokers to rebate a portion of brokerage commissions. The rebated commissions are used to reduce operating expenses of the Fund.
The accompanying notes are an integral part of the financial statements.
258
MassMutual Select Small Cap Growth Equity Fund – Financial Statements (Continued)
Financial Highlights (For a share outstanding throughout each period)
| | | Class N | |
| | | Six months
ended
6/30/06
(Unaudited) | | Year ended
12/31/05†† | | Year ended
12/31/04 | | Year ended
12/31/03 | | Period ended
12/31/02+ | |
| Net asset value, beginning of period | | $ | 15.51 | | | $ | 14.07 | | | $ | 12.47 | | | $ | 8.72 | | | $ | 8.68 | | |
| Income (loss) from investment operations: | |
| Net investment loss | | | (0.09 | ) | | | (0.16 | ) | | | (0.16 | ) | | | (0.15 | )*** | | | (0.00 | )***† | |
| Net realized and unrealized gain on investments | | | 0.70 | | | | 1.60 | | | | 1.76 | | | | 3.90 | | | | 0.04 | | |
| Total income from investment operations | | | 0.61 | | | | 1.44 | | | | 1.60 | | | | 3.75 | | | | 0.04 | | |
| Net asset value, end of period | | $ | 16.12 | | | $ | 15.51 | | | $ | 14.07 | | | $ | 12.47 | | | $ | 8.72 | | |
| | | | | | | | | | | | | | | | | | | | | | |
| Total Return(a) | | | 3.87 | % (c)** | | | 10.31 | % (c) | | | 12.83 | % (c) | | | 43.00 | % (c) | | | - | ‡ | |
| Ratios / Supplemental Data: | |
| Net assets, end of period (000's) | | $ | 997 | | | $ | 930 | | | $ | 816 | | | $ | 149 | | | $ | 101 | | |
| Ratio of expenses to average daily net assets: | |
| Before expense waiver | | | 1.81 | % * | | | 1.81 | % | | | 1.82 | % | | | 1.81 | % | | | - | ‡ | |
| After expense waiver | | | N/A | | | | N/A | | | | 1.78 | % (b)# | | | 1.79 | % (b)# | | | - | ‡ | |
| Net investment loss to average daily net assets | | | (1.07 | )% * | | | (1.13 | )% | | | (1.31 | )% | | | (1.41 | )% | | | - | ‡ | |
| Portfolio turnover rate | | | 41 | % ** | | | 59 | % | | | 64 | % | | | 56 | % | | | 51 | % | |
* Annualized.
** Percentage represents results from the period and are not annualized.
*** Per share amount calculated on the average shares method.
† Net investment loss is less than $0.01 per share.
†† Effective January 1, 2005, rebated brokerage commissions are included with realized gain or loss on investment transactions. Prior to January 1, 2005, these amounts were presented as a reduction of expenses. Prior year amounts have not been restated to reflect this change due to immateriality. (See Note 3).
+ Class N commenced operations on December 31, 2002.
‡ Amounts are de minimis due to the short period of operations.
# Computed after giving effect to an agreement by MassMutual to waive certain fees and expenses of the Fund.
(a) Employee retirement benefit plans that invest plan assets in the Separate Investment Accounts (SIAs) may be subject to certain charges set forth in their respective Plan Documents. Total return figures would be lower for the period presented if they reflected these charges.
(b) The Fund has entered into an agreement with certain brokers to rebate a portion of brokerage commissions. The rebated commissions are used to reduce operating expenses of the Fund.
(c) Total Return excludes contingent deferred sales charge and would be lower for the periods presented if they reflected these changes.
The accompanying notes are an integral part of the financial statements.
259
MassMutual Select Small Company Growth Fund – Financial Statements (Continued)
Financial Highlights (For a share outstanding throughout each period)
| | | Class A | |
| | | Six months
ended
6/30/06
(Unaudited) | | Year ended
12/31/05†† | | Year ended
12/31/04 | | Year ended
12/31/03 | | Year ended
12/31/02 | | Period ended
12/31/01+ | |
| Net asset value, beginning of period | | $ | 9.69 | | | $ | 10.05 | | | $ | 10.67 | | | $ | 6.99 | | | $ | 10.00 | | | $ | 10.00 | | |
| Income (loss) from investment operations: | |
| Net investment loss | | | (0.06 | )*** | | | (0.11 | )*** | | | (0.08 | )*** | | | (0.10 | )*** | | | (0.06 | )*** | | | - | | |
Net realized and unrealized gain (loss) on
investments | | | 0.44 | | | | (0.02 | ) | | | 0.20 | † | | | 4.30 | | | | (2.95 | ) | | | - | | |
Total income (loss) from investment
operations | | | 0.38 | | | | (0.13 | ) | | | 0.12 | | | | 4.20 | | | | (3.01 | ) | | | 0.00 | | |
| Less distributions to shareholders: | |
| From net realized gains | | | - | | | | (0.23 | ) | | | (0.74 | ) | | | (0.52 | ) | | | - | | | | - | | |
| Net asset value, end of period | | $ | 10.07 | | | $ | 9.69 | | | $ | 10.05 | | | $ | 10.67 | | | $ | 6.99 | | | $ | 10.00 | | |
| Total Return(a) | | | 3.92 | % **(c) | | | (1.09 | )% (c) | | | 1.70 | % (c) | | | 60.01 | % | | | (30.10 | )% | | | - | | |
| Ratios / Supplemental Data: | |
| Net assets, end of period (000's) | | $ | 68,307 | | | $ | 62,461 | | | $ | 66,985 | | | $ | 54,038 | | | $ | 5,038 | | | $ | 1 | | |
| Ratio of expenses to average daily net assets: | |
| Before expense waiver | | | 1.55 | % * | | | 1.54 | % | | | 1.52 | % | | | 1.58 | % | | | 1.83 | % | | | - | | |
| After expense waiver | | | N/A | | | | 1.52 | % # | | | 1.35 | % (b)# | | | 1.37 | % (b)# | | | 1.16 | % (b)# | | | - | | |
| Net investment loss to average daily net assets | | | (1.12 | )% * | | | (1.18 | )% | | | (0.77 | )% | | | (1.00 | )% | | | (0.80 | )% | | | - | | |
| Portfolio turnover rate | | | 53 | % ** | | | 149 | % | | | 220 | % | | | 141 | % | | | 150 | % | | | - | | |
| | | Class L | |
| | | Six months
ended
6/30/06
(Unaudited)†† | | Year ended
12/31/05†† | | Year ended
12/31/04 | | Year ended
12/31/03 | | Year ended
12/31/02 | | Period ended
12/31/01+ | |
| Net asset value, beginning of period | | $ | 9.81 | | | $ | 10.14 | | | $ | 10.74 | | | $ | 7.01 | | | $ | 10.00 | | | $ | 10.00 | | |
| Income (loss) from investment operations: | |
| Net investment loss | | | (0.05 | )*** | | | (0.09 | )*** | | | (0.05 | )*** | | | (0.07 | )*** | | | (0.04 | )*** | | | - | | |
Net realized and unrealized gain (loss) on
investments | | | 0.45 | | | | (0.01 | ) | | | 0.19 | † | | | 4.32 | | | | (2.95 | ) | | | - | | |
Total income (loss) from investment
operations | | | 0.40 | | | | (0.10 | ) | | | 0.14 | | | | 4.25 | | | | (2.99 | ) | | | 0.00 | | |
| Less distributions to shareholders: | |
| From net realized gains | | | - | | | | (0.23 | ) | | | (0.74 | ) | | | (0.52 | ) | | | - | | | | - | | |
| Net asset value, end of period | | $ | 10.21 | | | $ | 9.81 | | | $ | 10.14 | | | $ | 10.74 | | | $ | 7.01 | | | $ | 10.00 | | |
| Total Return(a) | | | 4.08 | % ** | | | (0.88 | )% | | | 1.97 | % | | | 60.55 | % | | | (29.90 | )% | | | - | | |
| Ratios / Supplemental Data: | |
| Net assets, end of period (000's) | | $ | 35,247 | | | $ | 28,468 | | | $ | 43,008 | | | $ | 35,948 | | | $ | 10,319 | | | $ | 1 | | |
| Ratio of expenses to average daily net assets: | |
| Before expense waiver | | | 1.30 | % * | | | 1.29 | % | | | 1.27 | % | | | 1.33 | % | | | 1.58 | % | | | - | | |
| After expense waiver | | | N/A | | | | 1.26 | % # | | | 1.10 | % (b)# | | | 1.10 | % (b)# | | | 0.92 | % (b)# | | | - | | |
| Net investment loss to average daily net assets | | | (0.87 | )% * | | | (0.91 | )% | | | (0.54 | )% | | | (0.72 | )% | | | (0.59 | )% | | | - | | |
| Portfolio turnover rate | | | 53 | % ** | | | 149 | % | | | 220 | % | | | 141 | % | | | 150 | % | | | - | | |
* Annualized.
** Percentages represent results for the period and are not annualized.
*** Per share amount calculated on the average shares method.
† The amount shown for a share outstanding does not correspond with the aggregate net realized and unrealized gain (loss) for the period due to the timing of purchases and redemptions of Fund shares in relation to the fluctuating market values of the Fund.
†† Effective January 1, 2005, rebated brokerage commissions are included with realized gain or loss on investment transactions. Prior to January 1, 2005, these amounts were presented as a reduction of expenses. Prior year amounts have not been restated to reflect this change due to immateriality. (See Note 3).
+ The Fund commenced operations on December 31, 2001.
# Computed after giving effect to an agreement by MassMutual to waive certain fees and expenses of the Fund.
(a) Employee retirement benefit plans that invest plan assets in the Separate Investment Accounts (SIAs) may be subject to certain charges as set forth in their respective Plan Documents. Total return figures would be lower for the periods presented if they reflected these charges.
(b) The Fund has entered into an agreement with certain brokers to rebate a portion of brokerage commissions. The rebated commissions are used to reduce operating expenses of the Fund.
(c) Total Return excludes a front-end sales charge and would be lower for the periods presented if it reflected these charges.
The accompanying notes are an integral part of the financial statements.
260
MassMutual Select Small Company Growth Fund – Financial Statements (Continued)
Financial Highlights (For a share outstanding throughout each period)
| | | Class Y | |
| | | Six months
ended
6/30/06
(Unaudited)†† | | Year ended
12/31/05†† | | Year ended
12/31/04 | | Year ended
12/31/03 | | Year ended
12/31/02 | | Period ended
12/31/01+ | |
| Net asset value, beginning of period | | $ | 9.87 | | | $ | 10.19 | | | $ | 10.77 | | | $ | 7.02 | | | $ | 10.00 | | | $ | 10.00 | | |
| Income (loss) from investment operations: | |
| Net investment loss | | | (0.04 | )*** | | | (0.07 | )*** | | | (0.04 | )*** | | | (0.05 | )*** | | | (0.04 | )*** | | | - | | |
Net realized and unrealized gain (loss) on
investments | | | 0.44 | | | | (0.02 | ) | | | 0.20 | † | | | 4.32 | | | | (2.94 | ) | | | - | | |
Total income (loss) from investment
operations | | | 0.40 | | | | (0.09 | ) | | | 0.16 | | | | 4.27 | | | | (2.98 | ) | | | 0.00 | | |
| Less distributions to shareholders: | |
| From net realized gains | | | - | | | | (0.23 | ) | | | (0.74 | ) | | | (0.52 | ) | | | - | | | | - | | |
| Net asset value, end of period | | $ | 10.27 | | | $ | 9.87 | | | $ | 10.19 | | | $ | 10.77 | | | $ | 7.02 | | | $ | 10.00 | | |
| Total Return(a) | | | 4.15 | % ** | | | (0.68 | )% | | | 2.06 | % | | | 60.75 | % | | | (29.80 | )% | | | - | | |
| Ratios / Supplemental Data: | |
| Net assets, end of period (000's) | | $ | 20,497 | | | $ | 27,617 | | | $ | 40,990 | | | $ | 37,730 | | | $ | 10,545 | | | $ | 1 | | |
| Ratio of expenses to average daily net assets: | |
| Before expense waiver | | | 1.15 | % * | | | 1.14 | % | | | 1.12 | % | | | 1.18 | % | | | 1.43 | % | | | - | | |
| After expense waiver | | | N/A | | | | 1.12 | % # | | | 0.95 | % (b)# | | | 0.95 | % (b)# | | | 0.83 | % (b)# | | | - | | |
| Net investment loss to average daily net assets | | | (0.70 | )% * | | | (0.77 | )% | | | (0.40 | )% | | | (0.60 | )% | | | (0.52 | )% | | | - | | |
| Portfolio turnover rate | | | 53 | % ** | | | 149 | % | | | 220 | % | | | 141 | % | | | 150 | % | | | - | | |
| | | Class S | |
| | | Six months
ended
6/30/06
(Unaudited) | | Year ended
12/31/05†† | | Year ended
12/31/04 | | Year ended
12/31/03 | | Year ended
12/31/02 | | Period ended
12/31/01+ | |
| Net asset value, beginning of period | | $ | 9.90 | | | $ | 10.21 | | | $ | 10.78 | | | $ | 7.02 | | | $ | 10.00 | | | $ | 10.00 | | |
| Income (loss) from investment operations: | |
| Net investment loss | | | (0.04 | )*** | | | (0.07 | )*** | | | (0.04 | )*** | | | (0.05 | )*** | | | (0.03 | )*** | | | - | | |
Net realized and unrealized gain (loss) on
investments | | | 0.44 | | | | (0.01 | ) | | | 0.21 | † | | | 4.33 | | | | (2.95 | ) | | | - | | |
Total income (loss) from investment
operations | | | 0.40 | | | | (0.08 | ) | | | 0.17 | | | | 4.28 | | | | (2.98 | ) | | | 0.00 | | |
| Less distributions to shareholders: | |
| From net realized gains | | | - | | | | (0.23 | ) | | | (0.74 | ) | | | (0.52 | ) | | | - | | | | - | | |
| Net asset value, end of period | | $ | 10.30 | | | $ | 9.90 | | | $ | 10.21 | | | $ | 10.78 | | | $ | 7.02 | | | $ | 10.00 | | |
| Total Return(a) | | | 4.14 | % ** | | | (0.67 | )% | | | 2.25 | % | | | 60.66 | % | | | (29.70 | )% | | | - | | |
| Ratios / Supplemental Data: | |
| Net assets, end of period (000's) | | $ | 34,862 | | | $ | 24,869 | | | $ | 28,081 | | | $ | 30,181 | | | $ | 8,763 | | | $ | 10,001 | | |
| Ratio of expenses to average daily net assets: | |
| Before expense waiver | | | 1.11 | % * | | | 1.10 | % | | | 1.08 | % | | | 1.14 | % | | | 1.39 | % | | | - | | |
| After expense waiver | | | N/A | | | | 1.08 | % # | | | 0.92 | % (b)# | | | 0.92 | % (b)# | | | 0.80 | % (b)# | | | - | | |
| Net investment loss to average daily net assets | | | (0.68 | )% * | | | (0.74 | )% | | | (0.34 | )% | | | (0.55 | )% | | | (0.41 | )% | | | - | | |
| Portfolio turnover rate | | | 53 | % ** | | | 149 | % | | | 220 | % | | | 141 | % | | | 150 | % | | | - | | |
* Annualized.
** Percentages represent results for the period and are not annualized.
*** Per share amount calculated on the average shares method.
† The amount shown for a share outstanding does not correspond with the aggregate net realized and unrealized gain (loss) for the period due to the timing of purchases and redemptions of Fund shares in relation to the fluctuating market values of the Fund.
†† Effective January 1, 2005, rebated brokerage commissions are included with realized gain or loss on investment transactions. Prior to January 1, 2005, these amounts were presented as a reduction of expenses. Prior year amounts have not been restated to reflect this change due to immateriality. (See Note 3).
+ The Fund commenced operations on December 31, 2001.
# Computed after giving effect to an agreement by MassMutual to waive certain fees and expenses of the Fund.
(a) Employee retirement benefit plans that invest plan assets in the Separate Investment Accounts (SIAs) may be subject to certain charges as set forth in their respective Plan Documents. Total return figures would be lower for the periods presented if they reflected these charges.
(b) The Fund has entered into an agreement with certain brokers to rebate a portion of brokerage commissions. The rebated commissions are used to reduce operating expenses of the Fund.
The accompanying notes are an integral part of the financial statements.
261
MassMutual Select Small Company Growth Fund – Financial Statements (Continued)
Financial Highlights (For a share outstanding throughout each period)
| | | Class N | |
| | | Six months
ended
6/30/06
(Unaudited) | | Year ended
12/31/05††† | | Year ended
12/31/04 | | Year ended
12/31/03 | | Period ended
12/31/02++ | |
| Net asset value, beginning of period | | $ | 9.54 | | | $ | 9.93 | | | $ | 10.59 | | | $ | 6.95 | | | $ | 6.90 | | |
| Income (loss) from investment operations: | |
| Net investment income | | | (0.07 | )*** | | | (0.14 | )*** | | | (0.11 | )*** | | | (0.13 | )*** | | | 0.00 | ***†† | |
| Net realized and unrealized gain on investments | | | 0.43 | | | | (0.02 | ) | | | 0.19 | † | | | 4.29 | | | | 0.05 | | |
| Total income from investment operations | | | 0.36 | | | | (0.16 | ) | | | 0.08 | | | | 4.16 | | | | 0.05 | | |
| Less distributions to shareholders: | |
| From net realized gains | | | - | | | | (0.23 | ) | | | (0.74 | ) | | | (0.52 | ) | | | - | | |
| Net asset value, end of period | | $ | 9.90 | | | $ | 9.54 | | | $ | 9.93 | | | $ | 10.59 | | | $ | 6.95 | | |
| | | | | | | | | | | | | | | | | | | | | | |
| Total Return(a) | | | 3.77 | % **(c) | | | (1.41 | )% (c) | | | 1.33 | % (c) | | | 59.78 | % (c) | | | - | ‡ | |
| Ratios / Supplemental Data: | |
| Net assets, end of period (000's) | | $ | 766 | | | $ | 931 | | | $ | 910 | | | $ | 953 | | | $ | 101 | | |
| Ratio of expenses to average daily net assets: | |
| Before expense waiver | | | 1.85 | % * | | | 1.84 | % | | | 1.82 | % | | | 1.88 | % | | | - | ‡ | |
| After expense waiver | | | N/A | | | | 1.82 | % # | | | 1.65 | % (b)# | | | 1.68 | % (b)# | | | - | ‡ | |
| Net investment income to average daily net assets | | | (1.42 | )% * | | | (1.49 | )% | | | (1.06 | )% | | | (1.31 | )% | | | - | ‡ | |
| Portfolio turnover rate | | | 53 | % ** | | | 149 | % | | | 220 | % | | | 141 | % | | | 150 | % | |
* Annualized.
** Percentages represent results for the period and are not annualized.
*** Per share amount calculated on the average shares method.
† The amount shown for a share outstanding does not correspond with the aggregate net realized and unrealized gain (loss) for the period due to the timing of purchases and redemptions of Fund shares in relation to the fluctuating market values of the Fund.
†† Net investment income is less than $ 0.01 per share.
††† Effective January 1, 2005, rebated brokerage commissions are included with realized gain or loss on investment transactions. Prior to January 1, 2005, these amounts were presented as a reduction of expenses. Prior year amounts have not been restated to reflect this change due to immateriality. (See Note 3).
++ Class N commenced operations on December 31, 2002.
‡ Amounts are de minimis due to the short period of operations.
# Computed after giving effect to an agreement by MassMutual to waive certain fees and expenses of the Fund.
(a) Employee retirement benefit plans that invest plan assets in the Separate Investment Accounts (SIAs) may be subject to certain charges as set forth in their respective Plan Documents. Total return figures would be lower for the periods presented if they reflected these charges.
(b) The Fund has entered into an agreement with certain brokers to rebate a portion of brokerage commissions. The rebated commissions are used to reduce operating expenses of the Fund.
(c) Total Return excludes contingent deferred sales charge and would be lower for the periods presented if they reflected these charges.
The accompanying notes are an integral part of the financial statements.
262
MassMutual Select Emerging Growth Fund – Financial Statements (Continued)
Financial Highlights (For a share outstanding throughout each period)
| | | Class A | |
| | | Six months
ended
6/30/06
(Unaudited) | | Year ended
12/31/05 | | Year ended
12/31/04 | | Year ended
12/31/03 | | Year ended
12/31/02 | | Year ended
12/31/01 | |
| Net asset value, beginning of period | | $ | 5.90 | | | $ | 5.88 | | | $ | 5.13 | | | $ | 3.53 | | | $ | 6.11 | | | $ | 7.31 | | |
| Income (loss) from investment operations: | |
| Net investment loss | | | (0.03 | )*** | | | (0.06 | )*** | | | (0.07 | )*** | | | (0.06 | )*** | | | (0.05 | )*** | | | (0.06 | )*** | |
Net realized and unrealized gain (loss) on
investments | | | 0.22 | | | | 0.08 | | | | 0.82 | | | | 1.66 | | | | (2.53 | ) | | | (1.14 | ) | |
Total income (loss) from investment
operations | | | 0.19 | | | | 0.02 | | | | 0.75 | | | | 1.60 | | | | (2.58 | ) | | | (1.20 | ) | |
| Net asset value, end of period | | $ | 6.09 | | | $ | 5.90 | | | $ | 5.88 | | | $ | 5.13 | | | $ | 3.53 | | | $ | 6.11 | | |
| | | | | | | | | | | | | | | | | | | | | | | | | | |
| Total Return(a) | | | 3.22 | % (b)** | | | 0.34 | % (b) | | | 14.62 | % (b) | | | 45.33 | % | | | (42.23 | )% | | | (16.53 | )% | |
| Ratios / Supplemental Data: | |
| Net assets, end of period (000's) | | $ | 16,271 | | | $ | 14,956 | | | $ | 27,052 | | | $ | 26,130 | | | $ | 10,153 | | | $ | 12,760 | | |
| Ratio of expenses to average daily net assets: | |
| Before expense waiver | | | 1.46 | % * | | | 1.45 | % | | | 1.47 | % | | | 1.48 | % | | | 1.46 | % | | | 1.44 | % | |
| After expense waiver | | | N/A | | | | N/A | | | | N/A | | | | 1.45 | % # | | | 1.39 | % # | | | 1.41 | % # | |
| Net investment loss to average daily net assets | | | (1.08 | )% * | | | (1.09 | )% | | | (1.32 | )% | | | (1.32 | )% | | | (1.23 | )% | | | (0.96 | )% | |
| Portfolio turnover rate | | | 90 | % ** | | | 124 | % | | | 176 | % | | | 198 | % | | | 175 | % | | | 139 | % | |
| | | Class L | |
| | | Six months
ended
6/30/06
(Unaudited) | | Year ended
12/31/05 | | Year ended
12/31/04 | | Year ended
12/31/03 | | Year ended
12/31/02 | | Year ended
12/31/01 | |
| Net asset value, beginning of period | | $ | 5.99 | | | $ | 5.94 | | | $ | 5.18 | | | $ | 3.55 | | | $ | 6.13 | | | $ | 7.31 | | |
| Income (loss) from investment operations: | |
| Net investment loss | | | (0.03 | )*** | | | (0.05 | )*** | | | (0.06 | )*** | | | (0.05 | )*** | | | (0.04 | )*** | | | (0.04 | )*** | |
Net realized and unrealized gain (loss) on
investments | | | 0.23 | | | | 0.10 | | | | 0.82 | | | | 1.68 | | | | (2.54 | ) | | | (1.14 | ) | |
Total income (loss) from investment
operations | | | 0.20 | | | | 0.05 | | | | 0.76 | | | | 1.63 | | | | (2.58 | ) | | | (1.18 | ) | |
| Net asset value, end of period | | $ | 6.19 | | | $ | 5.99 | | | $ | 5.94 | | | $ | 5.18 | | | $ | 3.55 | | | $ | 6.13 | | |
| | | | | | | | | | | | | | | | | | | | | | | | | | |
| Total Return(a) | | | 3.34 | % ** | | | 0.84 | % | | | 14.67 | % | | | 45.92 | % | | | (42.09 | )% | | | (16.37 | )% | |
| Ratios / Supplemental Data: | |
| Net assets, end of period (000's) | | $ | 51,350 | | | $ | 63,777 | | | $ | 65,342 | | | $ | 49,424 | | | $ | 20,924 | | | $ | 26,106 | | |
| Ratio of expenses to average daily net assets: | |
| Before expense waiver | | | 1.21 | % * | | | 1.21 | % | | | 1.22 | % | | | 1.23 | % | | | 1.21 | % | | | 1.18 | % | |
| After expense waiver | | | N/A | | | | N/A | | | | N/A | | | | 1.20 | % # | | | 1.14 | % # | | | 1.16 | % # | |
| Net investment loss to average daily net assets | | | (0.83 | )% * | | | (0.84 | )% | | | (1.06 | )% | | | (1.07 | )% | | | (0.98 | )% | | | (0.71 | )% | |
| Portfolio turnover rate | | | 90 | % ** | | | 124 | % | | | 176 | % | | | 198 | % | | | 175 | % | | | 139 | % | |
* Annualized.
** Percentages represent results for the period and are not annualized.
*** Per share amount calculated on the average shares method.
# Computed after giving effect to an agreement by MassMutual to waive certain fees and expenses of the Fund.
(a) Employee retirement benefit plans that invest assets in the Separate Investment Accounts (SIAs) may be subject to certain charges as set forth by their respective Plan Documents. Total return figures would be lower for the periods presented if they reflected these charges.
(b) Total Return excludes a front-end sales charge and would be lower for the periods presented if it reflected these charges.
The accompanying notes are an integral part of the financial statements.
263
MassMutual Select Emerging Growth Fund – Financial Statements (Continued)
Financial Highlights (For a share outstanding throughout each period)
| | | Class Y | |
| | | Six months
ended
6/30/06
(Unaudited) | | Year ended
12/31/05 | | Year ended
12/31/04 | | Year ended
12/31/03 | | Year ended
12/31/02 | | Year ended
12/31/01 | |
| Net asset value, beginning of period | | $ | 6.05 | | | $ | 5.99 | | | $ | 5.21 | | | $ | 3.57 | | | $ | 6.15 | | | $ | 7.32 | | |
| Income (loss) from investment operations: | |
| Net investment loss | | | (0.02 | )*** | | | (0.04 | )*** | | | (0.05 | )*** | | | (0.04 | )*** | | | (0.04 | )*** | | | (0.03 | )*** | |
Net realized and unrealized gain (loss) on
investments | | | 0.22 | | | | 0.10 | | | | 0.83 | | | | 1.68 | | | | (2.54 | ) | | | (1.14 | ) | |
Total income (loss) from investment
operations | | | 0.20 | | | | 0.06 | | | | 0.78 | | | | 1.64 | | | | (2.58 | ) | | | (1.17 | ) | |
| Net asset value, end of period | | $ | 6.25 | | | $ | 6.05 | | | $ | 5.99 | | | $ | 5.21 | | | $ | 3.57 | | | $ | 6.15 | | |
| Total Return(a) | | | 3.48 | % ** | | | 0.83 | % | | | 14.97 | % | | | 45.94 | % | | | (41.95 | )% | | | (16.10 | )% | |
| Ratios / Supplemental Data: | |
| Net assets, end of period (000's) | | $ | 5,058 | | | $ | 4,760 | | | $ | 4,427 | | | $ | 3,051 | | | $ | 1,664 | | | $ | 3,309 | | |
| Ratio of expenses to average daily net assets: | |
| Before expense waiver | | | 1.06 | % * | | | 1.05 | % | | | 1.07 | % | | | 1.08 | % | | | 1.06 | % | | | 1.04 | % | |
| After expense waiver | | | N/A | | | | N/A | | | | N/A | | | | 1.04 | % # | | | 0.99 | % # | | | 1.01 | % # | |
| Net investment loss to average daily net assets | | | (0.68 | )% * | | | (0.68 | )% | | | (0.91 | )% | | | (0.91 | )% | | | (0.83 | )% | | | (0.55 | )% | |
| Portfolio turnover rate | | | 90 | % ** | | | 124 | % | | | 176 | % | | | 198 | % | | | 175 | % | | | 139 | % | |
| | | Class S | |
| | | Six months
ended
6/30/06
(Unaudited) | | Year ended
12/31/05 | | Year ended
12/31/04 | | Year ended
12/31/03 | | Year ended
12/31/02 | | Year ended
12/31/01 | |
| Net asset value, beginning of period | | $ | 6.09 | | | $ | 6.03 | | | $ | 5.24 | | | $ | 3.58 | | | $ | 6.15 | | | $ | 7.32 | | |
| Income (loss) from investment operations: | |
| Net investment loss | | | (0.02 | )*** | | | (0.03 | )*** | | | (0.04 | )*** | | | (0.04 | )*** | | | (0.03 | )*** | | | (0.03 | )*** | |
Net realized and unrealized gain (loss) on
investments | | | 0.23 | | | | 0.09 | | | | 0.83 | | | | 1.70 | | | | (2.54 | ) | | | (1.14 | ) | |
Total income (loss) from investment
operations | | | 0.21 | | | | 0.06 | | | | 0.79 | | | | 1.66 | | | | (2.57 | ) | | | (1.17 | ) | |
| Net asset value, end of period | | $ | 6.30 | | | $ | 6.09 | | | $ | 6.03 | | | $ | 5.24 | | | $ | 3.58 | | | $ | 6.15 | | |
| | | | | | | | | | | | | | | | | | | | | | | | | | |
| Total Return(a) | | | 3.45 | % ** | | | 1.00 | % | | | 15.08 | % | | | 46.37 | % | | | (41.79 | )% | | | (16.10 | )% | |
| Ratios / Supplemental Data: | |
| Net assets, end of period (000's) | | $ | 50,982 | | | $ | 42,591 | | | $ | 39,812 | | | $ | 41,306 | | | $ | 24,658 | | | $ | 56,195 | | |
| Ratio of expenses to average daily net assets: | |
| Before expense waiver | | | 0.96 | % * | | | 0.96 | % | | | 0.97 | % | | | 0.98 | % | | | 0.96 | % | | | 0.94 | % | |
| After expense waiver | | | N/A | | | | N/A | | | | N/A | | | | 0.94 | % # | | | 0.89 | % # | | | 0.91 | % # | |
Net investment income (loss) to average
daily net assets | | | (0.58 | )% * | | | (0.59 | )% | | | 0.81 | % | | | (0.81 | )% | | | (0.73 | )% | | | (0.45 | )% | |
| Portfolio turnover rate | | | 90 | % ** | | | 124 | % | | | 176 | % | | | 198 | % | | | 175 | % | | | 139 | % | |
* Annualized.
** Percentages represent results for the period and are not annualized.
*** Per share amount calculated on the average shares method.
# Computed after giving effect to an agreement by MassMutual to waive certain fees and expenses of the Fund.
(a) Employee retirement benefit plans that invest assets in the Separate Investment Accounts (SIAs) may be subject to certain charges as set forth by their respective Plan Documents. Total return figures would be lower for the periods presented if they reflected these charges.
The accompanying notes are an integral part of the financial statements.
264
MassMutual Select Emerging Growth Fund – Financial Statements (Continued)
Financial Highlights (For a share outstanding throughout each period)
| | | Class N | |
| | | Six months
ended
6/30/06
(Unaudited) | | Year ended
12/31/05 | | Year ended
12/31/04 | | Year ended
12/31/03 | | Year ended
12/31/02++ | |
| Net asset value, beginning of period | | $ | 5.83 | | | $ | 5.82 | | | $ | 5.09 | | | $ | 3.51 | | | $ | 3.50 | | |
| Income (loss) from investment operations: | |
| Net investment loss | | | (0.04 | )*** | | | (0.08 | )*** | | | (0.08 | )*** | | | (0.07 | )*** | | | (0.00 | )***† | |
| Net realized and unrealized gain on investments | | | 0.21 | | | | 0.09 | | | | 0.81 | | | | 1.65 | | | | 0.01 | | |
| Total income from investment operations | | | 0.17 | | | | 0.01 | | | | 0.73 | | | | 1.58 | | | | 0.01 | | |
| Net asset value, end of period | | $ | 6.00 | | | $ | 5.83 | | | $ | 5.82 | | | $ | 5.09 | | | $ | 3.51 | | |
| | | | | | | | | | | | | | | | | | | | | | |
| Total Return(a) | | | 2.92 | % (b)** | | | 0.17 | % (b) | | | 14.34 | % (b) | | | 45.01 | % (b) | | | - | ‡ | |
| Ratios / Supplemental Data: | |
| Net assets, end of period (000's) | | $ | 173 | | | $ | 168 | | | $ | 168 | | | $ | 147 | | | $ | 101 | | |
| Ratio of expenses to average daily net assets: | |
| Before expense waiver | | | 1.76 | % * | | | 1.76 | % | | | 1.77 | % | | | 1.78 | % | | | - | ‡ | |
| After expense waiver | | | N/A | | | | N/A | | | | N/A | | | | 1.74 | % # | | | - | ‡ | |
| Net investment loss to average daily net assets | | | (1.38 | )% * | | | (1.39 | )% | | | (1.61 | )% | | | (1.61 | )% | | | - | ‡ | |
| Portfolio turnover rate | | | 90 | % ** | | | 124 | % | | | 176 | % | | | 198 | % | | | 175 | % | |
* Annualized.
** Percentages represent results for the period and are not annualized.
*** Per share amount calculated on the average shares method.
† Net investment loss is less than $0.01 per share.
++ Class N commenced operations on December 31, 2002.
‡ Amounts are de minimis due to the short period of operations.
# Computed after giving effect to an agreement by MassMutual to waive certain fees and expenses of the Fund.
(a) Employee retirement benefit plans that invest assets in the Separate Investment Accounts (SIAs) may be subject to certain charges as set forth by their respective Plan Documents. Total return figures would be lower for the periods presented if they reflected these charges.
(b) Total Return excludes contingent deferred sales charge and would be lower for the periods presented if they reflected these charges.
The accompanying notes are an integral part of the financial statements.
265
MassMutual Select Overseas Fund – Financial Statements (Continued)
Financial Highlights (For a share outstanding throughout each period)
| | | Class A | |
| | | Six months
ended
6/30/06
(Unaudited) | | Year ended
12/31/05†† | | Year ended
12/31/04 | | Year ended
12/31/03 | | Year ended
12/31/02 | | Period ended
12/31/01+ | |
| Net asset value, beginning of period | | $ | 10.95 | | | $ | 10.94 | | | $ | 9.55 | | | $ | 7.36 | | | $ | 8.41 | | | $ | 10.00 | | |
| Income (loss) from investment operations: | |
| Net investment income (loss) | | | 0.20 | *** | | | 0.08 | *** | | | 0.05 | *** | | | 0.02 | *** | | | 0.01 | *** | | | (0.05 | )*** | |
Net realized and unrealized gain (loss) on
investments | | | 0.98 | | | | 1.15 | | | | 1.63 | | | | 2.18 | | | | (1.05 | ) | | | (1.54 | ) | |
Total income (loss) from investment
operations | | | 1.18 | | | | 1.23 | | | | 1.68 | | | | 2.20 | | | | (1.04 | ) | | | (1.59 | ) | |
| Less distributions to shareholders: | |
| From net investment income | | | - | | | | (0.18 | ) | | | (0.06 | ) | | | (0.01 | ) | | | (0.01 | ) | | | - | | |
| In excess of net investment income | | | - | | | | (1.04 | ) | | | (0.23 | ) | | | - | | | | - | | | | - | | |
| Tax return of capital | | | - | | | | - | | | | - | | | | - | | | | (0.00 | )† | | | - | | |
| Total distributions | | | - | | | | (1.22 | ) | | | (0.29 | ) | | | (0.01 | ) | | | (0.01 | ) | | | - | | |
| Net asset value, end of period | | $ | 12.13 | | | $ | 10.95 | | | $ | 10.94 | | | $ | 9.55 | | | $ | 7.36 | | | $ | 8.41 | | |
| Total Return(a) | | | 10.78 | %(c)** | | | 11.17 | % (c) | | | 17.53 | % (c) | | | 30.27 | % | | | (12.66 | )% | | | (15.90 | )% ** | |
| Ratios / Supplemental Data: | |
| Net assets, end of period (000's) | | $ | 247,735 | | | $ | 198,300 | | | $ | 134,927 | | | $ | 65,012 | | | $ | 18,674 | | | $ | 1,159 | | |
| Ratio of expenses to average daily net assets: | |
| Before expense waiver | | | 1.62 | %* | | | 1.62 | % | | | 1.64 | % | | | 1.74 | % | | | 2.13 | % | | | 1.95 | % * | |
| After expense waiver | | | 1.57 | %# | | | N/A | | | | 1.63 | % (b)# | | | 1.64 | % (b)# | | | 1.63 | % (b)# | | | 1.73 | % *# | |
Net investment income (loss) to average daily
net assets | | | 3.46 | %* | | | 0.69 | % | | | 0.49 | % | | | 0.22 | % | | | 0.09 | % | | | (0.91 | )% * | |
| Portfolio turnover rate | | | 19 | %** | | | 88 | % | | | 66 | % | | | 92 | % | | | 138 | % | | | 111 | % ** | |
| | | Class L | |
| | | Six months
ended
6/30/06
(Unaudited) | | Year ended
12/31/05†† | | Year ended
12/31/04 | | Year ended
12/31/03 | | Year ended
12/31/02 | | Period ended
12/31/01+ | |
| Net asset value, beginning of period | | $ | 11.00 | | | $ | 10.99 | | | $ | 9.59 | | | $ | 7.35 | | | $ | 8.42 | | | $ | 10.00 | | |
| Income (loss) from investment operations: | |
| Net investment income (loss) | | | 0.22 | *** | | | 0.11 | *** | | | 0.08 | *** | | | 0.04 | *** | | | 0.02 | *** | | | (0.03 | )*** | |
Net realized and unrealized gain (loss) on
investments | | | 0.99 | | | | 1.14 | | | | 1.63 | | | | 2.23 | | | | (1.08 | ) | | | (1.55 | ) | |
Total income (loss) from investment
operations | | | 1.21 | | | | 1.25 | | | | 1.71 | | | | 2.27 | | | | (1.06 | ) | | | (1.58 | ) | |
| Less distributions to shareholders: | |
| From net investment income | | | - | | | | (0.20 | ) | | | (0.08 | ) | | | (0.03 | ) | | | (0.01 | ) | | | - | | |
| In excess of net investment income | | | - | | | | (1.04 | ) | | | (0.23 | ) | | | - | | | | - | | | | - | | |
| Tax return of capital | | | - | | | | - | | | | - | | | | - | | | | (0.00 | )† | | | - | | |
| Total distributions | | | - | | | | (1.24 | ) | | | (0.31 | ) | | | (0.03 | ) | | | (0.01 | ) | | | - | | |
| Net asset value, end of period | | $ | 12.21 | | | $ | 11.00 | | | $ | 10.99 | | | $ | 9.59 | | | $ | 7.35 | | | $ | 8.42 | | |
| Total Return(a) | | | 10.90 | %** | | | 11.44 | % | | | 17.77 | % | | | 30.68 | % | | | (12.44 | )% | | | (15.80 | )% ** | |
| Ratios / Supplemental Data: | |
| Net assets, end of period (000's) | | $ | 265,036 | | | $ | 210,428 | | | $ | 175,493 | | | $ | 81,542 | | | $ | 19,236 | | | $ | 899 | | |
| Ratio of expenses to average daily net assets: | |
| Before expense waiver | | | 1.37 | %* | | | 1.37 | % | | | 1.39 | % | | | 1.49 | % | | | 1.88 | % | | | 1.78 | % * | |
| After expense waiver | | | 1.32 | %# | | | N/A | | | | 1.38 | % (b)# | | | 1.39 | % (b)# | | | 1.37 | % (b)# | | | 1.56 | % *# | |
Net investment income (loss) to average daily
net assets | | | 3.74 | %* | | | 0.94 | % | | | 0.75 | % | | | 0.44 | % | | | 0.20 | % | | | (0.59 | )% * | |
| Portfolio turnover rate | | | 19 | %** | | | 88 | % | | | 66 | % | | | 92 | % | | | 138 | % | | | 111 | % ** | |
* Annualized.
** Percentages represent the results for the period and are not annualized.
*** Per share amount calculated on the average shares method.
† Tax return of capital is less than $0.01 per share.
†† Effective January 1, 2005, brokerage commissions are included with realized gain or loss on investment transactions. Prior to January 1, 2005, these amounts were presented as a reduction of expenses. Prior year amounts have not been restated to reflect this change due to immateriality. (See Note 3).
+ For the period May 1, 2001 (commencement of operations) through December 31, 2001.
# Computed after giving effect to an agreement by MassMutual to waive certain fees and expenses of the Fund.
(a) Employee retirement benefit plans that invest plan assets in the Separate Investment Accounts (SIAs) may be subject to certain charges as set forth in their respective Plan Documents. Total return figures would be lower for the periods presented if they reflected these charges.
(b) The Fund has entered into agreement with certain brokers to rebate a portion of brokerage commissions. The rebated commissions are used to reduce operating expenses of the Fund.
(c) Total Return excludes a front-end sales charge and would be lower for the periods presented if it reflected these charges.
The accompanying notes are an integral part of the financial statements.
266
MassMutual Select Overseas Fund – Financial Statements (Continued)
Financial Highlights (For a share outstanding throughout each period)
| | | Class Y | |
| | | Six months
ended
6/30/06
(Unaudited) | | Year ended
12/31/05†† | | Year ended
12/31/04 | | Year ended
12/31/03 | | Year ended
12/31/02 | | Period ended
12/31/01+ | |
| Net asset value, beginning of period | | $ | 11.03 | | | $ | 11.01 | | | $ | 9.61 | | | $ | 7.36 | | | $ | 8.43 | | | $ | 10.00 | | |
| Income (loss) from investment operations: | |
| Net investment income (loss) | | | 0.23 | *** | | | 0.12 | *** | | | 0.09 | *** | | | 0.04 | *** | | | (0.00 | )***† | | | 0.00 | ***† | |
Net realized and unrealized gain (loss) on
investments | | | 0.99 | | | | 1.16 | | | | 1.63 | | | | 2.25 | | | | (1.05 | ) | | | (1.57 | ) | |
Total income (loss) from investment
operations | | | 1.22 | | | | 1.28 | | | | 1.72 | | | | 2.29 | | | | (1.05 | ) | | | (1.57 | ) | |
| Less distributions to shareholders: | |
| From net investment income | | | - | | | | (0.22 | ) | | | (0.09 | ) | | | (0.04 | ) | | | (0.02 | ) | | | - | | |
| In excess of net investment income | | | - | | | | (1.04 | ) | | | (0.23 | ) | | | - | | | | - | | | | - | | |
| Tax return of capital | | | - | | | | - | | | | - | | | | - | | | | (0.00 | )† | | | - | | |
| Total distributions | | | - | | | | (1.26 | ) | | | (0.32 | ) | | | (0.04 | ) | | | (0.02 | ) | | | - | | |
| Net asset value, end of period | | $ | 12.25 | | | $ | 11.03 | | | $ | 11.01 | | | $ | 9.61 | | | $ | 7.36 | | | $ | 8.43 | | |
| Total Return(a) | | | 10.96 | %** | | | 11.69 | % | | | 17.84 | % | | | 30.88 | % | | | (12.34 | )% | | | (15.70 | )% ** | |
| Ratios / Supplemental Data: | |
| Net assets, end of period (000's) | | $ | 186,577 | | | $ | 130,666 | | | $ | 93,675 | | | $ | 72,650 | | | $ | 19,204 | | | $ | 88 | | |
| Ratio of expenses to average daily net assets: | |
| Before expense waiver | | | 1.22 | %* | | | 1.22 | % | | | 1.24 | % | | | 1.34 | % | | | 1.73 | % | | | 1.90 | % * | |
| After expense waiver | | | N/A | | | | N/A | | | | 1.23 | % (b)# | | | 1.24 | % (b)# | | | 1.22 | % (b)# | | | 1.69 | % *# | |
Net investment income (loss) to average daily
net assets | | | 3.84 | %* | | | 1.05 | % | | | 0.91 | % | | | 0.50 | % | | | (0.02 | )% | | | 0.08 | % * | |
| Portfolio turnover rate | | | 19 | %** | | | 88 | % | | | 66 | % | | | 92 | % | | | 138 | % | | | 111 | % ** | |
| | | Class S | |
| | | Six months
ended
6/30/06
(Unaudited) | | Year ended
12/31/05†† | | Year ended
12/31/04 | | Year ended
12/31/03 | | Year ended
12/31/02 | | Period ended
12/31/01+ | |
| Net asset value, beginning of period | | $ | 11.05 | | | $ | 11.03 | | | $ | 9.62 | | | $ | 7.37 | | | $ | 8.43 | | | $ | 10.00 | | |
| Income (loss) from investment operations: | |
| Net investment income | | | 0.23 | *** | | | 0.13 | *** | | | 0.10 | *** | | | 0.06 | *** | | | 0.05 | *** | | | 0.01 | *** | |
Net realized and unrealized gain (loss) on
investments | | | 1.00 | | | | 1.16 | | | | 1.63 | | | | 2.23 | | | | (1.09 | ) | | | (1.58 | ) | |
Total income (loss) from investment
operations | | | 1.23 | | | | 1.29 | | | | 1.73 | | | | 2.29 | | | | (1.04 | ) | | | (1.57 | ) | |
| Less distributions to shareholders: | |
| From net investment income | | | - | | | | (0.23 | ) | | | (0.09 | ) | | | (0.04 | ) | | | (0.02 | ) | | | - | | |
| In excess of net investment income | | | - | | | | (1.04 | ) | | | (0.23 | ) | | | - | | | | - | | | | - | | |
| Tax return of capital | | | - | | | | - | | | | - | | | | - | | | | (0.00 | )† | | | - | | |
| Total distributions | | | - | | | | (1.27 | ) | | | (0.32 | ) | | | (0.04 | ) | | | (0.02 | ) | | | - | | |
| Net asset value, end of period | | $ | 12.28 | | | $ | 11.05 | | | $ | 11.03 | | | $ | 9.62 | | | $ | 7.37 | | | $ | 8.43 | | |
| Total Return(a) | | | 11.03 | %** | | | 11.73 | % | | | 17.98 | % | | | 30.87 | % | | | (12.23 | )% | | | (15.70 | )% ** | |
| Ratios / Supplemental Data: | |
| Net assets, end of period (000's) | | $ | 373,996 | | | $ | 308,301 | | | $ | 211,818 | | | $ | 134,965 | | | $ | 54,437 | | | $ | 20,893 | | |
| Ratio of expenses to average daily net assets: | |
| Before expense waiver | | | 1.17 | %* | | | 1.17 | % | | | 1.19 | % | | | 1.29 | % | | | 1.68 | % | | | 1.85 | % * | |
| After expense waiver | | | N/A | | | | N/A | | | | 1.18 | % (b)# | | | 1.19 | % (b)# | | | 1.18 | % (b)# | | | 1.63 | % *# | |
Net investment income to average daily
net assets | | | 3.86 | %* | | | 1.11 | % | | | 0.96 | % | | | 0.69 | % | | | 0.68 | % | | | 0.14 | % * | |
| Portfolio turnover rate | | | 19 | %** | | | 88 | % | | | 66 | % | | | 92 | % | | | 138 | % | | | 111 | % ** | |
* Annualized.
** Percentages represent the results for the period and are not annualized.
*** Per share amount calculated on the average shares method.
† Net investment income (loss) and tax return of capital are less than $0.01 per share.
†† Effective January 1, 2005, brokerage commissions are included with realized gain or loss on investment transactions. Prior to January 1, 2005, these amounts were presented as a reduction of expenses. Prior year amounts have not been restated to reflect this change due to immateriality. (See Note 3).
+ For the period May 1, 2001 (commencement of operations) through December 31, 2001.
# Computed after giving effect to an agreement by MassMutual to waive certain fees and expenses of the Fund.
(a) Employee retirement benefit plans that invest plan assets in the Separate Investment Accounts (SIAs) may be subject to certain charges as set forth in their respective Plan Documents. Total return figures would be lower for the periods presented if they reflected these charges.
(b) The Fund has entered into agreement with certain brokers to rebate a portion of brokerage commissions. The rebated commissions are used to reduce operating expenses of the Fund.
The accompanying notes are an integral part of the financial statements.
267
MassMutual Select Overseas Fund – Financial Statements (Continued)
Financial Highlights (For a share outstanding throughout each period)
| | | Class N | |
| | | Six months
ended
6/30/06
(Unaudited) | | Year ended
12/31/05†† | | Year ended
12/31/04 | | Year ended
12/31/03 | | Year ended
12/31/02++ | |
| Net asset value, beginning of period | | $ | 10.86 | | | $ | 10.86 | | | $ | 9.50 | | | $ | 7.31 | | | $ | 7.24 | | |
| Income (loss) from investment operations: | |
| Net investment loss | | | 0.19 | *** | | | 0.05 | *** | | | 0.02 | *** | | | (0.02 | )*** | | | (0.00 | )***† | |
| Net realized and unrealized gain on investments | | | 0.96 | | | | 1.13 | | | | 1.61 | | | | 2.21 | | | | 0.07 | | |
| Total income from investment operations | | | 1.15 | | | | 1.18 | | | | 1.63 | | | | 2.19 | | | | 0.07 | | |
| Less distributions to shareholders: | |
| From net investment income | | | - | | | | (0.14 | ) | | | (0.04 | ) | | | - | | | | - | | |
| From net realized gains | | | - | | | | (1.04 | ) | | | (0.23 | ) | | | - | | | | - | | |
| Total distributions | | | - | | | | (1.18 | ) | | | (0.27 | ) | | | - | | | | - | | |
| Net asset value, end of period | | $ | 12.01 | | | $ | 10.86 | | | $ | 10.86 | | | $ | 9.50 | | | $ | 7.31 | | |
| | | | | | | | | | | | | | | | | | | | | | |
| Total Return(a) | | | 10.59 | %(c)** | | | 10.86 | % (c) | | | 17.12 | % (c) | | | 29.96 | % (c) | | | - | ‡ | |
| Ratios / Supplemental Data: | |
| Net assets, end of period (000's) | | $ | 1,908 | | | $ | 1,693 | | | $ | 884 | | | $ | 255 | | | $ | 102 | | |
| Ratio of expenses to average daily net assets: | |
| Before expense waiver | | | 1.92 | %* | | | 1.92 | % | | | 1.94 | % | | | 2.04 | % | | | - | ‡ | |
| After expense waiver | | | 1.87 | %# | | | N/A | | | | 1.93 | % (b)# | | | 1.94 | % (b)# | | | - | ‡ | |
| Net investment loss to average daily net assets | | | 3.20 | %* | | | 0.44 | % | | | 0.17 | % | | | (0.22 | )% | | | - | ‡ | |
| Portfolio turnover rate | | | 19 | %** | | | 88 | % | | | 66 | % | | | 92 | % | | | 138 | % | |
* Annualized.
** Percentages represent the results for the period and are not annualized.
*** Per share amount calculated on the average shares method.
† Net investment loss is less than $0.01 per share.
†† Effective January 1, 2005, brokerage commissions are included with realized gain or loss on investment transactions. Prior to January 1, 2005, these amounts were presented as a reduction of expenses. Prior year amounts have not been restated to reflect this change due to immateriality. (See Note 3).
++ Class N commenced operations on December 31, 2002.
‡ Amounts are de minimis due to the short period of operations.
# Computed after giving effect to an agreement by MassMutual to waive certain fees and expenses of the Fund.
(a) Employee retirement benefit plans that invest plan assets in the Separate Investment Accounts (SIAs) may be subject to certain charges as set forth in their respective Plan Documents. Total return figures would be lower for the periods presented if they reflected these charges.
(b) The Fund has entered into agreement with certain brokers to rebate a portions of brokerage commissions. The rebated commissions are used to reduce operating expenses of the Fund.
(c) Total Return excludes contingent deferred sales charge and would be lower for the periods presented if they reflected these charges.
The accompanying notes are an integral part of the financial statements.
268
MassMutual Select Destination Retirement Income Fund – Financial Statements (Continued)
Financial Highlights (For a share outstanding throughout each period)
| | | Class A | |
| | | Six months
ended
6/30/06
(Unaudited) | | Year ended
12/31/05 | | Year ended
12/31/04 | | Period ended
12/31/03† | |
| Net asset value, beginning of period | | $ | 10.18 | | | $ | 10.32 | | | $ | 10.00 | | | $ | 10.00 | | |
| Income (loss) from investment operations: | |
| Net investment income (loss) | | | (0.01 | )*** | | | 0.51 | *** | | | 0.62 | *** | | | 0.00 | | |
| Net realized and unrealized gain (loss) on investments | | | 0.02 | | | | (0.22 | ) | | | 0.01 | | | | 0.00 | | |
| Total income from investment operations | | | 0.01 | | | | 0.29 | | | | 0.63 | | | | 0.00 | | |
| Less distributions to shareholders: | |
| From net investment income | | | - | | | | (0.35 | ) | | | (0.27 | ) | | | - | | |
| From net realized gains | | | - | | | | (0.08 | ) | | | (0.04 | ) | | | - | | |
| Total distributions | | | - | | | | (0.43 | ) | | | (0.31 | ) | | | - | | |
| Net asset value, end of period | | $ | 10.19 | | | $ | 10.18 | | | $ | 10.32 | | | $ | 10.00 | | |
| Total Return(a) | | | 0.10 | % (b)** | | | 2.85 | % (b) | | | 6.35 | % (b) | | | - | ‡ | |
| Ratios / Supplemental Data: | |
| Net assets, end of period (000's) | | $ | 46,441 | | | $ | 40,457 | | | $ | 11,819 | | | $ | 101 | | |
| Ratio of expenses to average daily net assets: | |
| Before expense waiver | | | 0.47 | % * | | | 0.47 | % | | | 0.50 | % | | | - | ‡ | |
| After expense waiver | | | N/A | | | | N/A | | | | 0.50 | % # | | | - | ‡ | |
| Net investment income (loss) to average daily net assets | | | (0.26 | )% * | | | 4.92 | % | | | 6.00 | % | | | - | ‡ | |
| Portfolio turnover rate | | | 8 | % ** | | | 15 | % | | | 33 | % | | | N/A | | |
| | | Class L | |
| | | Six months
ended
6/30/06
(Unaudited) | | Year ended
12/31/05 | | Year ended
12/31/04 | | Period ended
12/31/03† | |
| Net asset value, beginning of period | | $ | 10.22 | | | $ | 10.34 | | | $ | 10.00 | | | $ | 10.00 | | |
| Income (loss) from investment operations: | |
| Net investment income (loss) | | | (0.00 | )***+ | | | 0.33 | *** | | | 0.34 | *** | | | 0.00 | | |
| Net realized and unrealized gain (loss) on investments | | | 0.02 | | | | (0.01 | ) | | | 0.32 | | | | 0.00 | | |
| Total income from investment operations | | | 0.02 | | | | 0.32 | | | | 0.66 | | | | 0.00 | | |
| Less distributions to shareholders: | |
| From net investment income | | | - | | | | (0.36 | ) | | | (0.28 | ) | | | - | | |
| From net realized gains | | | - | | | | (0.08 | ) | | | (0.04 | ) | | | - | | |
| Total distributions | | | - | | | | (0.44 | ) | | | (0.32 | ) | | | - | | |
| Net asset value, end of period | | $ | 10.24 | | | $ | 10.22 | | | $ | 10.34 | | | $ | 10.00 | | |
| Total Return(a) | | | 0.20 | % ** | | | 3.15 | % | | | 6.62 | % | | | - | ‡ | |
| Ratios / Supplemental Data: | |
| Net assets, end of period (000's) | | $ | 96,322 | | | $ | 102,343 | | | $ | 97,859 | | | $ | 101 | | |
| Ratio of expenses to average daily net assets: | |
| Before expense waiver | | | 0.22 | % * | | | 0.22 | % | | | 0.23 | % | | | - | ‡ | |
| After expense waiver | | | N/A | | | | N/A | | | | 0.23 | % # | | | - | ‡ | |
| Net investment income (loss) to average daily net assets | | | (0.02 | )% * | | | 3.19 | % | | | 3.36 | % | | | - | ‡ | |
| Portfolio turnover rate | | | 8 | % ** | | | 15 | % | | | 33 | % | | | N/A | | |
* Annualized.
** Percentages represent the results for the period and are not annualized.
*** Per share amount calculated on the average shares method.
† The Fund commenced operations on December 31, 2003.
‡ Amounts are de minimus due to the short period of operations.
# Computed after giving effect to an agreement by MassMutual to waive certain fees and expenses of the Fund.
+ Net investment income (loss) is less than $0.01 per share.
(a) Employee retirement benefit plans that invest plan assets in the Separate Investment Accounts (SIAs) may be subject to certain charges as set forth in their respective Plan Documents. Total return figures would be lower for the periods presented if they reflected these charges.
(b) Total Return excludes a front-end sales charge for Class A and a contingent deferred sales charge for Class N and would be lower for the periods presented if they reflected these charges.
The accompanying notes are an integral part of the financial statements.
269
MassMutual Select Destination Retirement Income Fund – Financial Statements (Continued)
Financial Highlights (For a share outstanding throughout each period)
| | | Class Y | |
| | | Six months
ended
6/30/06
(Unaudited) | | Year ended
12/31/05 | | Year ended
12/31/04 | | Period ended
12/31/03† | |
| Net asset value, beginning of period | | $ | 10.22 | | | $ | 10.35 | | | $ | 10.00 | | | $ | 10.00 | | |
| Income (loss) from investment operations: | |
| Net investment income | | | 0.00 | ***+ | | | 0.40 | *** | | | 0.45 | *** | | | 0.00 | | |
| Net realized and unrealized gain (loss) on investments | | | 0.03 | | | | (0.07 | ) | | | 0.23 | | | | 0.00 | | |
| Total income from investment operations | | | 0.03 | | | | 0.33 | | | | 0.68 | | | | 0.00 | | |
| Less distributions to shareholders: | |
| From net investment income | | | - | | | | (0.38 | ) | | | (0.29 | ) | | | - | | |
| From net realized gains | | | - | | | | (0.08 | ) | | | (0.04 | ) | | | - | | |
| Total distributions | | | - | | | | (0.46 | ) | | | (0.33 | ) | | | - | | |
| Net asset value, end of period | | $ | 10.25 | | | $ | 10.22 | | | $ | 10.35 | | | $ | 10.00 | | |
| Total Return(a) | | | 0.29 | %** | | | 3.16 | % | | | 6.80 | % | | | - | ‡ | |
| Ratios / Supplemental Data: | |
| Net assets, end of period (000's) | | $ | 108,527 | | | $ | 105,478 | | | $ | 80,590 | | | $ | 101 | | |
| Ratio of expenses to average daily net assets: | |
| Before expense waiver | | | 0.12 | %* | | | 0.12 | % | | | 0.13 | % | | | - | ‡ | |
| After expense waiver | | | N/A | | | | N/A | | | | 0.13 | % # | | | - | ‡ | |
| Net investment income to average daily net assets | | | 0.08 | %* | | | 3.84 | % | | | 4.38 | % | | | - | ‡ | |
| Portfolio turnover rate | | | 8 | %** | | | 15 | % | | | 33 | % | | | N/A | | |
| | | Class S | |
| | | Six months
ended
6/30/06
(Unaudited) | | Year ended
12/31/05 | | Year ended
12/31/04 | | Period ended
12/31/03† | |
| Net asset value, beginning of period | | $ | 10.22 | | | $ | 10.34 | | | $ | 10.00 | | | $ | 10.00 | | |
| Income (loss) from investment operations: | |
| Net investment income | | | 0.01 | *** | | | 0.61 | *** | | | 0.37 | *** | | | 0.00 | | |
| Net realized and unrealized gain (loss) on investments | | | 0.01 | | | | (0.27 | ) | | | 0.30 | | | | 0.00 | | |
| Total income from investment operations | | | 0.02 | | | | 0.34 | | | | 0.67 | | | | 0.00 | | |
| Less distributions to shareholders: | |
| From net investment income | | | - | | | | (0.38 | ) | | | (0.29 | ) | | | - | | |
| From net realized gains | | | - | | | | (0.08 | ) | | | (0.04 | ) | | | - | | |
| Total distributions | | | - | | | | (0.46 | ) | | | (0.33 | ) | | | - | | |
| Net asset value, end of period | | $ | 10.24 | | | $ | 10.22 | | | $ | 10.34 | | | $ | 10.00 | | |
| Total Return(a) | | | 0.20 | %** | | | 3.29 | % | | | 6.71 | % | | | - | ‡ | |
| Ratios / Supplemental Data: | |
| Net assets, end of period (000's) | | $ | 7,258 | | | $ | 4,445 | | | $ | 1,195 | | | $ | 601 | | |
| Ratio of expenses to average daily net assets: | |
| Before expense waiver | | | 0.10 | %* | | | 0.09 | % | | | 0.71 | % | | | - | ‡ | |
| After expense waiver | | | N/A | | | | N/A | | | | 0.12 | % # | | | - | ‡ | |
| Net investment income to average daily net assets | | | 0.11 | %* | | | 5.82 | % | | | 3.64 | % | | | - | ‡ | |
| Portfolio turnover rate | | | 8 | %** | | | 15 | % | | | 33 | % | | | N/A | | |
* Annualized.
** Percentages represent the results for the period and are not annualized.
*** Per share amount calculated on the average shares method.
† The Fund commenced operations on December 31, 2003.
‡ Amounts are de minimus due to the short period of operations.
# Computed after giving effect to an agreement by MassMutual to waive certain fees and expenses of the Fund.
+ Net investment income (loss) is less than $0.01 per share.
(a) Employee retirement benefit plans that invest plan assets in the Separate Investment Accounts (SIAs) may be subject to certain charges as set forth in their respective Plan Documents. Total return figures would be lower for the periods presented if they reflected these charges.
The accompanying notes are an integral part of the financial statements.
270
MassMutual Select Destination Retirement Income Fund – Financial Statements (Continued)
Financial Highlights (For a share outstanding throughout each period)
| | | Class N | |
| | | Six months
ended
6/30/06
(Unaudited) | | Year ended
12/31/05 | | Year ended
12/31/04 | | Period ended
12/31/03† | |
| Net asset value, beginning of period | | $ | 10.21 | | | $ | 10.34 | | | $ | 10.00 | | | $ | 10.00 | | |
| Income (loss) from investment operations: | |
| Net investment income | | | (0.03 | )*** | | | 0.30 | *** | | | 0.15 | *** | | | 0.00 | | |
| Net realized and unrealized gain on investments | | | 0.03 | | | | (0.04 | ) | | | 0.45 | | | | 0.00 | | |
| Total income from investment operations | | | 0.00 | | | | 0.26 | | | | 0.60 | | | | 0.00 | | |
| Less distributions to shareholders: | |
| From net investment income | | | - | | | | (0.31 | ) | | | (0.22 | ) | | | - | | |
| From net realized gains | | | - | | | | (0.08 | ) | | | (0.04 | ) | | | - | | |
| Total distributions | | | - | | | | (0.39 | ) | | | (0.26 | ) | | | - | | |
| Net asset value, end of period | | $ | 10.21 | | | $ | 10.21 | | | $ | 10.34 | | | $ | 10.00 | | |
| Total Return(a) | | | (0.00 | )% (b)** | | | 2.50 | % (b) | | | 6.02 | % (b) | | | 0.00 | %‡ | |
| Ratios / Supplemental Data: | |
| Net assets, end of period (000's) | | $ | 121 | | | $ | 105 | | | $ | 104 | | | $ | 101 | | |
| Ratio of expenses to average daily net assets: | |
| Before expense waiver | | | 0.77 | % * | | | 0.77 | % | | | 1.53 | % | | | - | ‡ | |
| After expense waiver | | | N/A | | | | N/A | | | | 0.80 | % # | | | N/A‡ | | |
| Net investment income to average daily net assets | | | (0.57 | )% * | | | 2.85 | % | | | 1.52 | % | | | 0.00 | %‡ | |
| Portfolio turnover rate | | | 8 | % ** | | | 15 | % | | | 33 | % | | | N/A | | |
* Annualized.
** Percentage represents results for the period and are not annualized.
*** Per share amount calculated on the average shares method.
† The Fund commenced operations on December 31, 2003.
‡ Amounts are de minimus due to the short period of operations.
# Computed after giving effect to an agreement by MassMutual to waive certain fees and expenses of the Fund.
(a) Employee retirement benefit plans that invest plan assets in the Separate Investment Accounts (SIAs) may be subject to certain charges as set forth in their respective Plan Documents. Total return figures would be lower for the periods presented if they reflected these charges.
(b) Total Return excludes a front-end sales charge for Class A and a contingent deferred sales charge for Class N and would be lower for the periods presented if they reflected these charges.
The accompanying notes are an integral part of the financial statements.
271
MassMutual Select Destination Retirement 2010 Fund – Financial Statements (Continued)
Financial Highlights (For a share outstanding throughout each period)
| | | Class A | |
| | | Six months
ended
6/30/06
(Unaudited) | | Year ended
12/31/05 | | Year ended
12/31/04 | | Period ended
12/31/03+ | |
| Net asset value, beginning of period | | $ | 10.57 | | | $ | 10.54 | | | $ | 10.00 | | | $ | 10.00 | | |
| Income (loss) from investment operations: | |
| Net investment income (loss) | | | (0.02 | )*** | | | 0.45 | *** | | | 0.56 | *** | | | 0.00 | | |
| Net realized and unrealized gain (loss) on investments | | | 0.07 | | | | (0.05 | ) | | | 0.18 | | | | 0.00 | | |
| Total income from investment operations | | | 0.05 | | | | 0.40 | | | | 0.74 | | | | 0.00 | | |
| Less distributions to shareholders: | |
| From net investment income | | | - | | | | (0.31 | ) | | | (0.18 | ) | | | - | | |
| From net realized gains | | | - | | | | (0.06 | ) | | | (0.02 | ) | | | - | | |
| Total distributions | | | - | | | | (0.37 | ) | | | (0.20 | ) | | | - | | |
| Net asset value, end of period | | $ | 10.62 | | | $ | 10.57 | | | $ | 10.54 | | | $ | 10.00 | | |
| | | | | | | | | | | | | | | | | | |
| Total Return(a) | | | 0.47 | % (b)** | | | 3.82 | % (b) | | | 7.36 | % (b) | | | - | ‡ | |
| Ratios / Supplemental Data: | |
| Net assets, end of period (000's) | | $ | 45,897 | | | $ | 30,338 | | | $ | 7,272 | | | $ | 101 | | |
| Ratio of expenses to average daily net assets: | |
| Before expense waiver | | | 0.52 | % * | | | 0.54 | % | | | 1.13 | % | | | - | ‡ | |
| After expense waiver | | | 0.50 | % *# | | | 0.50 | % # | | | 0.50 | % # | | | - | ‡ | |
| Net investment income (loss) to average daily net assets | | | (0.30 | )% * | | | 4.24 | % | | | 5.34 | % | | | - | ‡ | |
| Portfolio turnover rate | | | 8 | % ** | | | 17 | % | | | 28 | % | | | N/A | | |
| | | Class L | |
| | | Six months
ended
6/30/06
(Unaudited) | | Year ended
12/31/05 | | Year ended
12/31/04 | | Period ended
12/31/03+ | |
| Net asset value, beginning of period | | $ | 10.60 | | | $ | 10.56 | | | $ | 10.00 | | | $ | 10.00 | | |
| Income (loss) from investment operations: | |
| Net investment income | | | 0.00 | *** | | | 0.36 | *** | | | 1.25 | *** | | | 0.00 | | |
| Net realized and unrealized gain (loss) on investments | | | 0.07 | | | | 0.07 | | | | (0.48 | ) | | | 0.00 | | |
| Total income from investment operations | | | 0.07 | | | | 0.43 | | | | 0.77 | | | | 0.00 | | |
| Less distributions to shareholders: | |
| From net investment income | | | - | | | | (0.33 | ) | | | (0.19 | ) | | | - | | |
| From net realized gains | | | - | | | | (0.06 | ) | | | (0.02 | ) | | | - | | |
| Total distributions | | | - | | | | (0.39 | ) | | | (0.21 | ) | | | - | | |
| Net asset value, end of period | | $ | 10.67 | | | $ | 10.60 | | | $ | 10.56 | | | $ | 10.00 | | |
| | | | | | | | | | | | | | | | | | |
| Total Return(a) | | | 0.66 | % ** | | | 4.03 | % | | | 7.68 | % | | | 0.00 | %‡ | |
| Ratios / Supplemental Data: | |
| Net assets, end of period (000's) | | $ | 37,687 | | | $ | 35,621 | | | $ | 22,880 | | | $ | 101 | | |
| Ratio of expenses to average daily net assets: | |
| Before expense waiver | | | 0.27 | % * | | | 0.29 | % | | | 0.88 | % | | | - | ‡ | |
| After expense waiver | | | 0.25 | % *# | | | 0.25 | % # | | | 0.25 | % # | | | - | ‡ | |
| Net investment income (loss) to average daily net assets | | | (0.05 | )% * | | | 3.37 | % | | | 12.10 | % | | | - | ‡ | |
| Portfolio turnover rate | | | 8 | % ** | | | 17 | % | | | 28 | % | | | N/A | | |
* Annualized.
** Percentages represent results for the period and are not annualized.
*** Per share amount calculated on the average shares method.
+ The Fund commenced operations on December 31, 2003.
‡ Amounts are de minimis due to the short period of operations.
# Computed after giving effect to an agreement by MassMutual to waive certain fees and expenses of the Fund.
(a) Employee retirement benefit plans that invest plan assets in the Separate Investment Accounts (SIAs) may be subject to certain charges as set forth in their respective Plan Documents. Total return figures would be lower for the period presented if they reflected these charges.
(b) Total Return excludes a front-end sales charge and would be lower for the periods presented if they reflected these charges.
The accompanying notes are an integral part of the financial statements.
272
MassMutual Select Destination Retirement 2010 Fund – Financial Statements (Continued)
Financial Highlights (For a share outstanding throughout each period)
| | | Class Y | |
| | | Six months
ended
6/30/06
(Unaudited) | | Year ended
12/31/05 | | Year ended
12/31/04 | | Period ended
12/31/03+ | |
| Net asset value, beginning of period | | $ | 10.61 | | | $ | 10.56 | | | $ | 10.00 | | | $ | 10.00 | | |
| Income (loss) from investment operations: | |
| Net investment income | | | 0.00 | ***† | | | 0.52 | *** | | | 0.85 | *** | | | 0.00 | | |
| Net realized and unrealized gain (loss) on investments | | | 0.07 | | | | (0.07 | ) | | | (0.08 | ) | | | 0.00 | | |
| Total income from investment operations | | | 0.07 | | | | 0.45 | | | | 0.77 | | | | 0.00 | | |
| Less distributions to shareholders: | |
| From net investment income | | | - | | | | (0.34 | ) | | | (0.19 | ) | | | - | | |
| From net realized gains | | | - | | | | (0.06 | ) | | | (0.02 | ) | | | - | | |
| Total distributions | | | - | | | | (0.40 | ) | | | (0.21 | ) | | | - | | |
| Net asset value, end of period | | $ | 10.68 | | | $ | 10.61 | | | $ | 10.56 | | | $ | 10.00 | | |
| | | | | | | | | | | | | | | | | | |
| Total Return(a) | | | 0.66 | %** | | | 4.22 | % | | | 7.69 | % | | | - | ‡ | |
| Ratios / Supplemental Data: | |
| Net assets, end of period (000's) | | $ | 44,812 | | | $ | 30,365 | | | $ | 5,605 | | | $ | 101 | | |
| Ratio of expenses to average daily net assets: | |
| Before expense waiver | | | 0.17 | %* | | | 0.19 | % | | | 0.78 | % | | | - | ‡ | |
| After expense waiver | | | 0.15 | %*# | | | 0.15 | % # | | | 0.15 | % # | | | - | ‡ | |
| Net investment income to average daily net assets | | | 0.05 | %* | | | 4.80 | % | | | 8.17 | % | | | - | ‡ | |
| Portfolio turnover rate | | | 8 | %** | | | 17 | % | | | 28 | % | | | N/A | | |
| | | Class S | |
| | | Six months
ended
6/30/06
(Unaudited) | | Year ended
12/31/05 | | Year ended
12/31/04 | | Period ended
12/31/03+ | |
| Net asset value, beginning of period | | $ | 10.61 | | | $ | 10.57 | | | $ | 10.00 | | | $ | 10.00 | | |
| Income (loss) from investment operations: | |
| Net investment income | | | 0.01 | *** | | | 0.61 | *** | | | 0.36 | *** | | | 0.00 | | |
| Net realized and unrealized gain (loss) on investments | | | 0.07 | | | | (0.17 | ) | | | 0.42 | | | | 0.00 | | |
| Total income from investment operations | | | 0.08 | | | | 0.44 | | | | 0.78 | | | | 0.00 | | |
| Less distributions to shareholders: | |
| From net investment income | | | - | | | | (0.34 | ) | | | (0.19 | ) | | | - | | |
| From net realized gains | | | - | | | | (0.06 | ) | | | (0.02 | ) | | | - | | |
| Total distributions | | | - | | | | (0.40 | ) | | | (0.21 | ) | | | - | | |
| Net asset value, end of period | | $ | 10.69 | | | $ | 10.61 | | | $ | 10.57 | | | $ | 10.00 | | |
| | | | | | | | | | | | | | | | | | |
| Total Return(a) | | | 0.75 | %** | | | 4.15 | % | | | 7.80 | % | | | - | ‡ | |
| Ratios / Supplemental Data: | |
| Net assets, end of period (000's) | | $ | 13,329 | | | $ | 12,104 | | | $ | 2,319 | | | $ | 601 | | |
| Ratio of expenses to average daily net assets: | |
| Before expense waiver | | | 0.12 | %* | | | 0.14 | % | | | 0.73 | % | | | - | ‡ | |
| After expense waiver | | | 0.10 | %*# | | | 0.10 | % # | | | 0.10 | % # | | | - | ‡ | |
| Net investment income to average daily net assets | | | 0.10 | %* | | | 5.69 | % | | | 3.49 | % | | | - | ‡ | |
| Portfolio turnover rate | | | 8 | %** | | | 17 | % | | | 28 | % | | | N/A | | |
* Annualized.
** Percentages represent results for the period and are not annualized.
*** Per share amount calculated on the average shares method.
† Net investment loss is less than $0.01 per share.
+ The Fund commenced operations on December 31, 2003.
‡ Amounts are de minimis due to the short period of operations.
# Computed after giving effect to an agreement by MassMutual to waive certain fees and expenses of the Fund.
(a) Employee retirement benefit plans that invest plan assets in the Separate Investment Accounts (SIAs) may be subject to certain charges as set forth in their respective Plan Documents. Total return figures would be lower for the period presented if they reflected these charges.
The accompanying notes are an integral part of the financial statements.
273
MassMutual Select Destination Retirement 2010 Fund – Financial Statements (Continued)
Financial Highlights (For a share outstanding throughout each period)
| | | Class N | |
| | | Six months
ended
6/30/06
(Unaudited) | | Year ended
12/31/05 | | Year ended
12/31/04 | | Year ended
12/31/03+ | |
| Net asset value, beginning of period | | $ | 10.60 | | | $ | 10.56 | | | $ | 10.00 | | | $ | 10.00 | | |
| Income (loss) from investment operations: | |
| Net investment income | | | (0.03 | )*** | | | 0.27 | *** | | | (0.00 | )† | | | 0.00 | | |
| Net realized and unrealized gain on investments | | | 0.07 | | | | 0.10 | | | | 0.70 | | | | 0.00 | | |
| Total income from investment operations | | | 0.04 | | | | 0.37 | | | | 0.70 | | | | 0.00 | | |
| Less distributions to shareholders: | |
| From net investment income | | | - | | | | (0.27 | ) | | | (0.12 | ) | | | - | | |
| From net realized gains | | | - | | | | (0.06 | ) | | | (0.02 | ) | | | - | | |
| Total distributions | | | - | | | | (0.33 | ) | | | (0.14 | ) | | | - | | |
| Net asset value, end of period | | $ | 10.64 | | | $ | 10.60 | | | $ | 10.56 | | | $ | 10.00 | | |
| | | | | | | | | | | | | | | | | | |
| Total Return(a) | | | 0.38 | % (b)** | | | 3.51 | % (b) | | | 6.98 | % (b) | | | 0.00 | %‡ | |
| Ratios / Supplemental Data: | |
| Net assets, end of period (000's) | | $ | 141 | | | $ | 134 | | | $ | 107 | | | | - | | |
| Ratio of expenses to average daily net assets: | |
| Before expense waiver | | | 0.82 | % * | | | 0.84 | % | | | 1.43 | % | | | - | ‡ | |
| After expense waiver | | | 0.80 | % *# | | | 0.80 | % # | | | 0.80 | % # | | | N/A‡ | | |
| Net investment income to average daily net assets | | | (0.60 | )% * | | | 2.50 | % | | | 0.02 | % | | | 0.00 | %‡ | |
| Portfolio turnover rate | | | 8 | % ** | | | 17 | % | | | 28 | % | | | N/A | | |
* Annualized.
** Percentages represent results for the period and are not annualized.
*** Per share amount calculated on the average shares method.
† Net investment loss is less than $0.01 per share.
+ The Fund commenced operations on December 31, 2003.
‡ Amounts are de minimis due to the short period of operations.
# Computed after giving effect to an agreement by MassMutual to waive certain fees and expenses of the Fund.
(a) Employee retirement benefit plans that invest plan assets in the Separate Investment Accounts (SIAs) may be subject to certain charges as set forth in their respective Plan Documents. Total return figures would be lower for the period presented if they reflected these charges.
(b) Total Return excludes a contingent deferred sales charge and would be lower for the periods presented if they reflected these charges.
The accompanying notes are an integral part of the financial statements.
274
MassMutual Select Destination Retirement 2020 Fund – Financial Statements (Continued)
Financial Highlights (For a share outstanding throughout each period)
| | | Class A | |
| | | Six months
ended
6/30/06
(Unaudited) | | Year ended
12/31/05 | | Year ended
12/31/04 | | Period ended
12/31/03+ | |
| Net asset value, beginning of period | | $ | 10.91 | | | $ | 10.75 | | | $ | 10.00 | | | $ | 10.00 | | |
| Income (loss) from investment operations: | |
| Net investment income (loss) | | | (0.03 | )*** | | | 0.37 | *** | | | 0.64 | *** | | | 0.00 | | |
| Net realized and unrealized gain on investments | | | 0.08 | | | | 0.19 | | | | 0.34 | | | | 0.00 | | |
| Total income from investment operations | | | 0.05 | | | | 0.56 | | | | 0.98 | | | | 0.00 | | |
| Less distributions to shareholders: | |
| From net investment income | | | - | | | | (0.27 | ) | | | (0.19 | ) | | | - | | |
| From net realized gains | | | - | | | | (0.13 | ) | | | (0.04 | ) | | | - | | |
| Total distributions | | | - | | | | (0.40 | ) | | | (0.23 | ) | | | - | | |
| Net asset value, end of period | | $ | 10.96 | | | $ | 10.91 | | | $ | 10.75 | | | $ | 10.00 | | |
| | | | | | | | | | | | | | | | | | |
| Total Return(a) | | | 0.46 | % **(b) | | | 5.23 | % (b) | | | 9.76 | % (b) | | | - | ‡ | |
| Ratios / Supplemental Data: | |
| Net assets, end of period (000's) | | $ | 114,065 | | | $ | 89,351 | | | $ | 21,577 | | | $ | 101 | | |
| Ratio of expenses to average daily net assets: | |
| Before expense waiver | | | 0.49 | % * | | | 0.50 | % | | | 0.52 | % | | | - | ‡ | |
| After expense waiver | | | N/A | | | | N/A | | | | 0.50 | % # | | | - | ‡ | |
| Net investment income (loss) to average daily net assets | | | (0.49 | )% * | | | 3.43 | % | | | 6.11 | % | | | - | ‡ | |
| Portfolio turnover rate | | | 5 | % ** | | | 23 | % | | | 19 | % | | | N/A | | |
| | | Class L | |
| | | Six months
ended
6/30/06
(Unaudited) | | Year ended
12/31/05 | | Year ended
12/31/04 | | Period ended
12/31/03+ | |
| Net asset value, beginning of period | | $ | 10.96 | | | $ | 10.77 | | | $ | 10.00 | | | $ | 10.00 | | |
| Income (loss) from investment operations: | |
| Net investment income (loss) | | | (0.01 | )*** | | | 0.25 | *** | | | 0.21 | *** | | | 0.00 | | |
| Net realized and unrealized gain on investments | | | 0.07 | | | | 0.35 | | | | 0.79 | | | | 0.00 | | |
| Total income from investment operations | | | 0.06 | | | | 0.60 | | | | 1.00 | | | | 0.00 | | |
| Less distributions to shareholders: | |
| From net investment income | | | - | | | | (0.28 | ) | | | (0.19 | ) | | | - | | |
| From net realized gains | | | - | | | | (0.13 | ) | | | (0.04 | ) | | | - | | |
| Total distributions | | | - | | | | (0.41 | ) | | | (0.23 | ) | | | - | | |
| Net asset value, end of period | | $ | 11.02 | | | $ | 10.96 | | | $ | 10.77 | | | $ | 10.00 | | |
| | | | | | | | | | | | | | | | | | |
| Total Return(a) | | | 0.55 | % ** | | | 5.50 | % | | | 10.07 | % | | | - | ‡ | |
| Ratios / Supplemental Data: | |
| Net assets, end of period (000's) | | $ | 253,415 | | | $ | 237,433 | | | $ | 212,094 | | | $ | 101 | | |
| Ratio of expenses to average daily net assets: | |
| Before expense waiver | | | 0.24 | % * | | | 0.25 | % | | | 0.26 | % | | | - | ‡ | |
| After expense waiver | | | N/A | | | | N/A | | | | 0.25 | % # | | | - | ‡ | |
| Net investment income (loss) to average daily net assets | | | (0.24 | )% * | | | 2.31 | % | | | 1.99 | % | | | - | ‡ | |
| Portfolio turnover rate | | | 5 | % ** | | | 23 | % | | | 19 | % | | | N/A | | |
* Annualized.
** Percentage represents results for the period and are not annualized.
*** Per share amount calculated on the average shares method.
+ The Fund commenced operations on December 31, 2003.
‡ Amounts are de minimis due to the short period of operations.
# Computed after giving effect to an agreement by MassMutual to waive certain fees and expenses of the Fund.
(a) Employee retirement benefit plans that invest assets in the Separate Investment Accounts (SIAs) may be subject to certain charges as set forth in their respective Plan Documents. Total return would be lower for the periods presented if they reflected these charges.
(b) Total return excludes a front-end sales charge and would be lower for the periods presented if it reflected these charges.
The accompanying notes are an integral part of the financial statements.
275
MassMutual Select Destination Retirement 2020 Fund – Financial Statements (Continued)
Financial Highlights (For a share outstanding throughout each period)
| | | Class Y | |
| | | Six months
ended
6/30/06
(Unaudited) | | Year ended
12/31/05 | | Year ended
12/31/04 | | Period ended
12/31/03+ | |
| Net asset value, beginning of period | | $ | 10.95 | | | $ | 10.77 | | | $ | 10.00 | | | $ | 10.00 | | |
| Income (loss) from investment operations: | |
| Net investment income (loss) | | | (0.01 | )*** | | | 0.45 | *** | | | 0.81 | *** | | | 0.00 | | |
| Net realized and unrealized gain on investments | | | 0.08 | | | | 0.16 | | | | 0.20 | | | | 0.00 | | |
| Total income from investment operations | | | 0.07 | | | | 0.61 | | | | 1.01 | | | | 0.00 | | |
| Less distributions to shareholders: | |
| From net investment income | | | - | | | | (0.30 | ) | | | (0.20 | ) | | | - | | |
| From net realized gains | | | - | | | | (0.13 | ) | | | (0.04 | ) | | | - | | |
| Total distributions | | | - | | | | (0.43 | ) | | | (0.24 | ) | | | - | | |
| Net asset value, end of period | | $ | 11.02 | | | $ | 10.95 | | | $ | 10.77 | | | $ | 10.00 | | |
| | | | | | | | | | | | | | | | | | |
| Total Return(a) | | | 0.64 | % ** | | | 5.63 | % | | | 10.07 | % | | | - | ‡ | |
| Ratios / Supplemental Data: | |
| Net assets, end of period (000's) | | $ | 81,418 | | | $ | 65,716 | | | $ | 10,249 | | | $ | 101 | | |
| Ratio of expenses to average daily net assets: | |
| Before expense waiver | | | 0.14 | % * | | | 0.14 | % | | | 0.19 | % | | | - | ‡ | |
| After expense waiver | | | N/A | | | | N/A | | | | 0.15 | % # | | | - | ‡ | |
| Net investment income (loss) to average daily net assets | | | (0.14 | )% * | | | 4.04 | % | | | 7.69 | % | | | - | ‡ | |
| Portfolio turnover rate | | | 5 | % ** | | | 23 | % | | | 19 | % | | | N/A | | |
| | | Class S | |
| | | Six months
ended
6/30/06
(Unaudited) | | Year ended
12/31/05 | | Year ended
12/31/04 | | Period ended
12/31/03+ | |
| Net asset value, beginning of period | | $ | 10.96 | | | $ | 10.78 | | | $ | 10.00 | | | $ | 10.00 | | |
| Income (loss) from investment operations: | |
| Net investment income (loss) | | | (0.01 | )*** | | | 0.38 | *** | | | 0.52 | *** | | | 0.00 | | |
| Net realized and unrealized gain on investments | | | 0.08 | | | | 0.23 | | | | 0.50 | | | | 0.00 | | |
| Total income from investment operations | | | 0.07 | | | | 0.61 | | | | 1.02 | | | | 0.00 | | |
| Less distributions to shareholders: | |
| From net investment income | | | - | | | | (0.30 | ) | | | (0.20 | ) | | | - | | |
| From net realized gains | | | - | | | | (0.13 | ) | | | (0.04 | ) | | | - | | |
| Total distributions | | | - | | | | (0.43 | ) | | | (0.24 | ) | | | - | | |
| Net asset value, end of period | | $ | 11.03 | | | $ | 10.96 | | | $ | 10.78 | | | $ | 10.00 | | |
| | | | | | | | | | | | | | | | | | |
| Total Return(a) | | | 0.64 | % ** | | | 5.65 | % | | | 10.19 | % | | | - | ‡ | |
| Ratios / Supplemental Data: | |
| Net assets, end of period (000's) | | $ | 49,849 | | | $ | 35,933 | | | $ | 12,389 | | | $ | 601 | | |
| Ratio of expenses to average daily net assets: | |
| Before expense waiver | | | 0.09 | % * | | | 0.10 | % | | | 0.21 | % | | | - | ‡ | |
| After expense waiver | | | N/A | | | | N/A | | | | 0.10 | % # | | | - | ‡ | |
| Net investment income (loss) to average daily net assets | | | (0.09 | )% * | | | 3.45 | % | | | 5.00 | % | | | - | ‡ | |
| Portfolio turnover rate | | | 5 | % ** | | | 23 | % | | | 19 | % | | | N/A | | |
* Annualized.
** Percentage represents results for the period and are not annualized.
*** Per share amount calculated on the average shares method.
+ The Fund commenced operations on December 31, 2003.
‡ Amounts are de minimis due to the short period of operations.
# Computed after giving effect to an agreement by MassMutual to waive certain fees and expenses of the Fund.
(a) Employee retirement benefit plans that invest assets in the Separate Investment Accounts (SIAs) may be subject to certain charges as set forth in their respective Plan Documents. Total return would be lower for the periods presented if they reflected these charges.
The accompanying notes are an integral part of the financial statements.
276
MassMutual Select Destination Retirement 2020 Fund – Financial Statements (Continued)
Financial Highlights (For a share outstanding throughout each period)
| | | Class N | |
| | | Six months
ended
6/30/06
(Unaudited) | | Year ended
12/31/05 | | Year ended
12/31/04 | | Period ended
12/31/03+ | |
| Net asset value, beginning of period | | $ | 10.94 | | | $ | 10.77 | | | $ | 10.00 | | | $ | 10.00 | | |
| Income (loss) from investment operations: | |
| Net investment income | | | (0.04 | )*** | | | 0.27 | *** | | | 0.06 | *** | | | 0.00 | | |
| Net realized and unrealized gain on investments | | | 0.07 | | | | 0.27 | | | | 0.88 | | | | 0.00 | | |
| Total income from investment operations | | | 0.03 | | | | 0.54 | | | | 0.94 | | | | 0.00 | | |
| Less distributions to shareholders: | |
| From net investment income | | | - | | | | (0.24 | ) | | | (0.13 | ) | | | - | | |
| From net realized gains | | | - | | | | (0.13 | ) | | | (0.04 | ) | | | - | | |
| Total distributions | | | - | | | | (0.37 | ) | | | (0.17 | ) | | | - | | |
| Net asset value, end of period | | $ | 10.97 | | | $ | 10.94 | | | $ | 10.77 | | | $ | 10.00 | | |
| | | | | | | | | | | | | | | | | | |
| Total Return(a) | | | 0.27 | % **(b) | | | 4.99 | % (b) | | | 9.39 | % (b) | | | 0.00 | %‡ | |
| Ratios / Supplemental Data: | |
| Net assets, end of period (000's) | | $ | 257 | | | $ | 238 | | | $ | 113 | | | $ | 101 | | |
| Ratio of expenses to average daily net assets: | |
| Before expense waiver | | | 0.79 | % * | | | 0.80 | % | | | 1.57 | % | | | - | ‡ | |
| After expense waiver | | | N/A | | | | N/A | | | | 0.80 | % # | | | N/A‡ | | |
| Net investment income to average daily net assets | | | (0.79 | )% * | | | 2.46 | % | | | 0.55 | % | | | 0.00 | %‡ | |
| Portfolio turnover rate | | | 5 | % ** | | | 23 | % | | | 19 | % | | | N/A | | |
* Annualized.
** Percentage represents results for the period and are not annualized.
*** Per share amount calculated on the average shares method.
+ The Fund commenced operations on December 31, 2003.
‡ Amounts are de minimis due to the short period of operations.
# Computed after giving effect to an agreement by MassMutual to waive certain fees and expenses of the Fund.
(a) Employee retirement benefit plans that invest assets in the Separate Investment Accounts (SIAs) may be subject to certain charges as set forth in their respective Plan Documents. Total return would be lower for the periods presented if they reflected these charges.
(b) Total return excludes a contingent deferred sales and would be lower for the periods presented if it reflected these charges.
The accompanying notes are an integral part of the financial statements.
277
MassMutual Select Destination Retirement 2030 Fund – Financial Statements (Continued)
Financial Highlights (For a share outstanding throughout each period)
| | | Class A | |
| | | Six months
ended
6/30/06
(Unaudited) | | Year ended
12/31/05 | | Year ended
12/31/04 | | Period ended
12/31/03+ | |
| Net asset value, beginning of period | | $ | 11.50 | | | $ | 11.11 | | | $ | 10.00 | | | $ | 10.00 | | |
| Income (loss) from investment operations: | |
| Net investment income (loss) | | | (0.03 | )*** | | | 0.21 | *** | | | 0.27 | *** | | | - | | |
| Net realized and unrealized gain on investments | | | 0.17 | | | | 0.52 | | | | 0.95 | | | | - | | |
| Total income from investment operations | | | 0.14 | | | | 0.73 | | | | 1.22 | | | | 0.00 | | |
| Less distributions to shareholders: | |
| From net investment income | | | - | | | | (0.18 | ) | | | (0.10 | ) | | | - | | |
| From net realized gains | | | - | | | | (0.16 | ) | | | (0.01 | ) | | | - | | |
| Total distributions | | | - | | | | (0.34 | ) | | | (0.11 | ) | | | - | | |
| Net asset value, end of period | | $ | 11.64 | | | $ | 11.50 | | | $ | 11.11 | | | $ | 10.00 | | |
| | | | | | | | | | | | | | | | | | |
| Total Return(a) | | | 1.22 | % (b)** | | | 6.56 | % (b) | | | 12.24 | % (b) | | | - | ‡ | |
| Ratios / Supplemental Data: | |
| Net assets, end of period (000's) | | $ | 85,295 | | | $ | 63,024 | | | $ | 21,459 | | | $ | 101 | | |
| Ratio of expenses to average daily net assets: | |
| Before expense waiver | | | 0.50 | % * | | | 0.50 | % | | | 0.52 | % | | | - | ‡ | |
| After expense waiver | | | N/A * | | | | N/A | | | | 0.50 | % # | | | N/A‡ | | |
| Net investment income (loss) to average daily net assets | | | (0.50 | )% * | | | 1.89 | % | | | 2.58 | % | | | 0.00 | %‡ | |
| Portfolio turnover rate | | | 6 | % ** | | | 17 | % | | | 10 | % | | | N/A | | |
| | | Class L | |
| | | Six months
ended
6/30/06
(Unaudited) | | Year ended
12/31/05 | | Year ended
12/31/04 | | Period ended
12/31/03+ | |
| Net asset value, beginning of period | | $ | 11.55 | | | $ | 11.13 | | | $ | 10.00 | | | $ | 10.00 | | |
| Income (loss) from investment operations: | |
| Net investment income (loss) | | | (0.01 | )*** | | | 0.14 | *** | | | 0.10 | *** | | | - | | |
| Net realized and unrealized gain on investments | | | 0.16 | | | | 0.63 | | | | 1.15 | | | | - | | |
| Total income from investment operations | | | 0.15 | | | | 0.77 | | | | 1.25 | | | | 0.00 | | |
| Less distributions to shareholders: | |
| From net investment income | | | - | | | | (0.19 | ) | | | (0.11 | ) | | | - | | |
| From net realized gains | | | - | | | | (0.16 | ) | | | (0.01 | ) | | | - | | |
| Total distributions | | | - | | | | (0.35 | ) | | | (0.12 | ) | | | - | | |
| Net asset value, end of period | | $ | 11.70 | | | $ | 11.55 | | | $ | 11.13 | | | $ | 10.00 | | |
| | | | | | | | | | | | | | | | | | |
| Total Return(a) | | | 1.30 | % ** | | | 6.92 | % | | | 12.49 | % | | | - | ‡ | |
| Ratios / Supplemental Data: | |
| Net assets, end of period (000's) | | $ | 193,762 | | | $ | 180,837 | | | $ | 168,132 | | | $ | 101 | | |
| Ratio of expenses to average daily net assets: | |
| Before expense waiver | | | 0.25 | % * | | | 0.25 | % | | | 0.26 | % | | | - | ‡ | |
| After expense waiver | | | N/A * | | | | N/A | | | | 0.25 | % # | | | N/A‡ | | |
| Net investment income (loss) to average daily net assets | | | (0.25 | )% * | | | 1.26 | % | | | 0.93 | % | | | 0.00 | %‡ | |
| Portfolio turnover rate | | | 6 | % ** | | | 17 | % | | | 10 | % | | | N/A | | |
* Annualized.
** Percentage represents results for the period and are not annualized.
*** Per share amount calculated on the average share method.
+ The Fund commenced operations on December 31, 2003.
‡ Amounts are de minimis due to the short period of operations.
# Computed after giving effect to an agreement by MassMutual to waive certain fees and expenses of the Fund.
(a) Employee retirement benefit plans that invest plan assets in the Separate Investment Accounts (SIAs) may be subject to certain charges as set forth in their respective Plan Documents. Total return figures would be lower for the period presented if they reflected these charges.
(b) Total return excludes a front-end sales charge for Class A and a contingent deferred sales charge for Class N and would be lower for the periods presented if they reflected these charges.
The accompanying notes are an integral part of the financial statements.
278
MassMutual Select Destination Retirement 2030 Fund – Financial Statements (Continued)
Financial Highlights (For a share outstanding throughout each period)
| | | Class Y | |
| | | Six months
ended
6/30/06
(Unaudited) | | Year ended
12/31/05 | | Year ended
12/31/04 | | Period ended
12/31/03+ | |
| Net asset value, beginning of period | | $ | 11.54 | | | $ | 11.13 | | | $ | 10.00 | | | $ | 10.00 | | |
| Income (loss) from investment operations: | |
| Net investment income (loss) | | | (0.01 | )*** | | | 0.32 | *** | | | 0.43 | *** | | | - | | |
| Net realized and unrealized gain on investments | | | 0.17 | | | | 0.46 | | | | 0.83 | | | | - | | |
| Total income from investment operations | | | 0.16 | | | | 0.78 | | | | 1.26 | | | | 0.00 | | |
| Less distributions to shareholders: | |
| From net investment income | | | - | | | | (0.21 | ) | | | (0.12 | ) | | | - | | |
| From net realized gains | | | - | | | | (0.16 | ) | | | (0.01 | ) | | | - | | |
| Total distributions | | | - | | | | (0.37 | ) | | | (0.13 | ) | | | - | | |
| Net asset value, end of period | | $ | 11.70 | | | $ | 11.54 | | | $ | 11.13 | | | $ | 10.00 | | |
| | | | | | | | | | | | | | | | | | |
| Total Return(a) | | | 1.39 | % ** | | | 6.97 | % | | | 12.60 | % | | | - | ‡ | |
| Ratios / Supplemental Data: | |
| Net assets, end of period (000's) | | $ | 46,266 | | | $ | 33,819 | | | $ | 3,169 | | | $ | 101 | | |
| Ratio of expenses to average daily net assets: | |
| Before expense waiver | | | 0.15 | % * | | | 0.15 | % | | | 0.23 | % | | | - | ‡ | |
| After expense waiver | | | N/A * | | | | N/A | | | | 0.15 | % # | | | N/A‡ | | |
| Net investment income (loss) to average daily net assets | | | (0.15 | )% * | | | 2.77 | % | | | 4.01 | % | | | 0.00 | %‡ | |
| Portfolio turnover rate | | | 6 | % | | | 17 | % | | | 10 | % | | | N/A | | |
| | | Class S | |
| | | Six months
ended
6/30/06
(Unaudited) | | Year ended
12/31/05 | | Year ended
12/31/04 | | Period ended
12/31/03+ | |
| Net asset value, beginning of period | | $ | 11.55 | | | $ | 11.14 | | | $ | 10.00 | | | $ | 10.00 | | |
| Income (loss) from investment operations: | |
| Net investment income (loss) | | | (0.01 | )*** | | | 0.27 | *** | | | 0.33 | *** | | | - | | |
| Net realized and unrealized gain on investments | | | 0.17 | | | | 0.51 | | | | 0.94 | | | | - | | |
| Total income from investment operations | | | 0.16 | | | | 0.78 | | | | 1.27 | | | | 0.00 | | |
| Less distributions to shareholders: | |
| From net investment income | | | - | | | | (0.21 | ) | | | (0.12 | ) | | | - | | |
| From net realized gains | | | - | | | | (0.16 | ) | | | (0.01 | ) | | | - | | |
| Total distributions | | | - | | | | (0.37 | ) | | | (0.13 | ) | | | - | | |
| Net asset value, end of period | | $ | 11.71 | | | $ | 11.55 | | | $ | 11.14 | | | $ | 10.00 | | |
| | | | | | | | | | | | | | | | | | |
| Total Return(a) | | | 1.39 | % ** | | | 6.98 | % | | | 12.71 | % | | | - | ‡ | |
| Ratios / Supplemental Data: | |
| Net assets, end of period (000's) | | $ | 31,738 | | | $ | 18,300 | | | $ | 4,245 | | | $ | 601 | | |
| Ratio of expenses to average daily net assets: | |
| Before expense waiver | | | 0.10 | % * | | | 0.10 | % | | | 0.45 | % | | | - | ‡ | |
| After expense waiver | | | N/A * | | | | N/A | | | | 0.10 | % # | | | N/A‡ | | |
| Net investment income (loss) to average daily net assets | | | (0.10 | )% * | | | 2.42 | % | | | 3.16 | % | | | 0.00 | %‡ | |
| Portfolio turnover rate | | | 6 | % ** | | | 17 | % | | | 10 | % | | | N/A | | |
* Annualized.
** Percentage represents results for the period and are not annualized.
*** Per share amount calculated on the average share method.
+ The Fund commenced operations on December 31, 2003.
‡ Amounts are de minimis due to the short period of operations.
# Computed after giving effect to an agreement by MassMutual to waive certain fees and expenses of the Fund.
(a) Employee retirement benefit plans that invest plan assets in the Separate Investment Accounts (SIAs) may be subject to certain charges as set forth in their respective Plan Documents. Total return figures would be lower for the period presented if they reflected these charges.
The accompanying notes are an integral part of the financial statements.
279
MassMutual Select Destination Retirement 2030 Fund – Financial Statements (Continued)
Financial Highlights (For a share outstanding throughout each period)
| | | Class N | |
| | | Six months
ended
6/30/06
(Unaudited) | | Year ended
12/31/05 | | Year ended
12/31/04 | | Period ended
12/31/03+ | |
| Net asset value, beginning of period | | $ | 11.52 | | | $ | 11.13 | | | $ | 10.00 | | | $ | 10.00 | | |
| Income (loss) from investment operations: | |
| Net investment income | | | (0.05 | )*** | | | 0.14 | *** | | | (0.02 | )*** | | | 0.00 | | |
| Net realized and unrealized gain on investments | | | 0.18 | | | | 0.55 | | | | 1.21 | | | | 0.00 | | |
| Total income from investment operations | | | 0.13 | | | | 0.69 | | | | 1.19 | | | | 0.00 | | |
| Less distributions to shareholders: | |
| From net investment income | | | - | | | | (0.14 | ) | | | (0.05 | ) | | | - | | |
| From net realized gains | | | - | | | | (0.16 | ) | | | (0.01 | ) | | | - | | |
| Total distributions | | | - | | | | (0.30 | ) | | | (0.06 | ) | | | - | | |
| Net asset value, end of period | | $ | 11.65 | | | $ | 11.52 | | | $ | 11.13 | | | $ | 10.00 | | |
| | | | | | | | | | | | | | | | | | |
| Total Return(a) | | | 1.13 | % (b)** | | | 6.20 | % (b) | | | 11.89 | % (b) | | | 0.00 | %‡ | |
| Ratios / Supplemental Data: | |
| Net assets, end of period (000's) | | $ | 173 | | | $ | 162 | | | $ | 113 | | | $ | 101 | | |
| Ratio of expenses to average daily net assets: | |
| Before expense waiver | | | 0.80 | % * | | | 0.80 | % | | | 1.47 | % | | | - | ‡ | |
| After expense waiver | | | N/A * | | | | N/A | | | | 0.80 | % # | | | N/A‡ | | |
| Net investment income to average daily net assets | | | (0.80 | )% * | | | 1.26 | % | | | (0.24 | )% | | | 0.00 | %‡ | |
| Portfolio turnover rate | | | 6 | % ** | | | 17 | % | | | 10 | % | | | N/A | | |
* Annualized.
** Percentage represents results for the period and are not annualized.
*** Per share amount calculated on the average share method.
+ The Fund commenced operations on December 31, 2003.
‡ Amounts are de minimis due to the short period of operations.
# Computed after giving effect to an agreement by MassMutual to waive certain fees and expenses of the Fund.
(a) Employee retirement benefit plans that invest plan assets in the Separate Investment Accounts (SIAs) may be subject to certain charges as set forth in their respective Plan Documents. Total return figures would be lower for the period presented if they reflected these charges.
(b) Total return excludes contingent deferred sales charge and would be lowered for the periods presented if they reflected these charges.
The accompanying notes are an integral part of the financial statements.
280
MassMutual Select Destination Retirement 2040 Fund – Financial Statements (Continued)
Financial Highlights (For a share outstanding throughout each period)
| | | Class A | |
| | | Six months
ended
6/30/06
(Unaudited) | | Year ended
12/31/05 | | Year ended
12/31/04 | | Period ended
12/31/03+ | |
| Net asset value, beginning of period | | $ | 11.77 | | | $ | 11.26 | | | $ | 10.00 | | | $ | 10.00 | | |
| Income (loss) from investment operations: | |
| Net investment income (loss) | | | (0.03 | )*** | | | 0.10 | *** | | | 0.20 | *** | | | 0.00 | | |
| Net realized and unrealized gain on investments | | | 0.24 | | | | 0.73 | | | | 1.14 | | | | 0.00 | | |
| Total income from investment operations | | | 0.21 | | | | 0.83 | | | | 1.34 | | | | 0.00 | | |
| Less distributions to shareholders: | |
| From net investment income | | | - | | | | (0.11 | ) | | | (0.06 | ) | | | - | | |
| From net realized gains | | | - | | | | (0.21 | ) | | | (0.02 | ) | | | - | | |
| Total distributions | | | - | | | | (0.32 | ) | | | (0.08 | ) | | | - | | |
| Net asset value, end of period | | $ | 11.98 | | | $ | 11.77 | | | $ | 11.26 | | | $ | 10.00 | | |
| Total Return(a) | | | 1.78 | % **(b) | | | 7.47 | % (b) | | | 13.39 | % (b) | | | - | ‡ | |
| Ratios / Supplemental Data: | |
| Net assets, end of period (000's) | | $ | 34,807 | | | $ | 26,913 | | | $ | 6,414 | | | $ | 101 | | |
| Ratio of expenses to average daily net assets: | |
| Before expense waiver | | | 0.49 | % * | | | 0.50 | % | | | 0.55 | % | | | - | ‡ | |
| After expense waiver | | | N/A | | | | 0.50 | % # | | | 0.50 | % # | | | - | ‡ | |
| Net investment income (loss) to average daily net assets | | | (0.49 | )% * | | | 0.85 | % | | | 1.92 | % | | | - | ‡ | |
| Portfolio turnover rate | | | 7 | % ** | | | 18 | % | | | 13 | % | | | N/A | | |
| | | Class L | |
| | | Six months
ended
6/30/06
(Unaudited) | | Year ended
12/31/05 | | Year ended
12/31/04 | | Period ended
12/31/03+ | |
| Net asset value, beginning of period | | $ | 11.81 | | | $ | 11.28 | | | $ | 10.00 | | | $ | 10.00 | | |
| Income (loss) from investment operations: | |
| Net investment income (loss) | | | (0.01 | )*** | | | 0.07 | *** | | | 0.04 | *** | | | 0.00 | | |
| Net realized and unrealized gain on investments | | | 0.24 | | | | 0.80 | | | | 1.33 | | | | 0.00 | | |
| Total income from investment operations | | | 0.23 | | | | 0.87 | | | | 1.37 | | | | 0.00 | | |
| Less distributions to shareholders: | |
| From net investment income | | | - | | | | (0.13 | ) | | | (0.07 | ) | | | - | | |
| From net realized gains | | | - | | | | (0.21 | ) | | | (0.02 | ) | | | - | | |
| Total distributions | | | - | | | | (0.34 | ) | | | (0.09 | ) | | | - | | |
| Net asset value, end of period | | $ | 12.04 | | | $ | 11.81 | | | $ | 11.28 | | | $ | 10.00 | | |
| | | | | | | | | | | | | | | | | | |
| Total Return(a) | | | 1.95 | % ** | | | 7.75 | % | | | 13.63 | % | | | - | ‡ | |
| Ratios / Supplemental Data: | |
| Net assets, end of period (000's) | | $ | 123,961 | | | $ | 107,540 | | | $ | 101,487 | | | $ | 101 | | |
| Ratio of expenses to average daily net assets: | |
| Before expense waiver | | | 0.24 | % * | | | 0.25 | % | | | 0.27 | % | | | - | ‡ | |
| After expense waiver | | | N/A | | | | 0.25 | % # | | | 0.25 | % # | | | - | ‡ | |
| Net investment income (loss) to average daily net assets | | | (0.24 | )% * | | | 0.60 | % | | | 0.41 | % | | | - | ‡ | |
| Portfolio turnover rate | | | 7 | % ** | | | 18 | % | | | 13 | % | | | N/A | | |
* Annualized.
** Percentage represents results for the period and are not annualized.
*** Per share amount calculated on the average shares method.
+ The Fund commenced operations on December 31, 2003.
‡ Amounts are de minimis due to the short period of operations.
# Computed after giving effect to an agreement by MassMutual to waive certain fees and expenses of the Fund.
(a) Employee retirement benefit plans that invest plan assets in the Separate Investment Accounts (SIAs) may be subject to certain charges as set forth in their respective Plan Documents. Total return figures would be lower for the period presented if they reflected these charges.
(b) Total Return excludes a front-end sales charge for Class A and a contingent deferred sales charge for Class N and would be lower for the periods presented if they reflected these charges.
The accompanying notes are an integral part of the financial statements.
281
MassMutual Select Destination Retirement 2040 Fund – Financial Statements (Continued)
Financial Highlights (For a share outstanding throughout each period)
| | | Class Y | |
| | | Six months
ended
6/30/06
(Unaudited) | | Year ended
12/31/05 | | Year ended
12/31/04 | | Period ended
12/31/03+ | |
| Net asset value, beginning of period | | $ | 11.81 | | | $ | 11.28 | | | $ | 10.00 | | | $ | 10.00 | | |
| Income (loss) from investment operations: | |
| Net investment income (loss) | | | (0.01 | ) *** | | | 0.16 | *** | | | 0.27 | *** | | | 0.00 | | |
| Net realized and unrealized gain on investments | | | 0.24 | | | | 0.72 | | | | 1.11 | | | | 0.00 | | |
| Total income from investment operations | | | 0.23 | | | | 0.88 | | | | 1.38 | | | | 0.00 | | |
| Less distributions to shareholders: | |
| From net investment income | | | - | | | | (0.14 | ) | | | (0.08 | ) | | | - | | |
| From net realized gains | | | - | | | | (0.21 | ) | | | (0.02 | ) | | | - | | |
| Total distributions | | | - | | | | (0.35 | ) | | | (0.10 | ) | | | - | | |
| Net asset value, end of period | | $ | 12.04 | | | $ | 11.81 | | | $ | 11.28 | | | $ | 10.00 | | |
| Total Return(a) | | | 1.95 | % ** | | | 7.88 | % | | | 13.74 | % | | | - | ‡ | |
| Ratios / Supplemental Data: | |
| Net assets, end of period (000's) | | $ | 23,689 | | | $ | 8,379 | | | $ | 596 | | | $ | 101 | | |
| Ratio of expenses to average daily net assets: | |
| Before expense waiver | | | 0.14 | % * | | | 0.15 | % | | | 0.54 | % | | | - | ‡ | |
| After expense waiver | | | N/A | | | | 0.15 | % # | | | 0.15 | % # | | | - | ‡ | |
| Net investment income (loss) to average daily net assets | | | (0.14 | )% * | | | 1.41 | % | | | 2.55 | % | | | - | ‡ | |
| Portfolio turnover rate | | | 7 | % ** | | | 18 | % | | | 13 | % | | | N/A | | |
| | | Class S | |
| | | Six months
ended
6/30/06
(Unaudited) | | Year ended
12/31/05 | | Year ended
12/31/04 | | Period ended
12/31/03+ | |
| Net asset value, beginning of period | | $ | 11.82 | | | $ | 11.28 | | | $ | 10.00 | | | $ | 10.00 | | |
| Income (loss) from investment operations: | |
| Net investment income (loss) | | | (0.01 | )*** | | | 0.27 | *** | | | 0.09 | *** | | | 0.00 | | |
| Net realized and unrealized gain on investments | | | 0.24 | | | | 0.63 | | | | 1.29 | | | | 0.00 | | |
| Total income from investment operations | | | 0.23 | | | | 0.90 | | | | 1.38 | | | | 0.00 | | |
| Less distributions to shareholders: | |
| From net investment income | | | - | | | | (0.15 | ) | | | (0.08 | ) | | | - | | |
| From net realized gains | | | - | | | | (0.21 | ) | | | (0.02 | ) | | | - | | |
| Total distributions | | | - | | | | (0.36 | ) | | | (0.10 | ) | | | - | | |
| Net asset value, end of period | | $ | 12.05 | | | $ | 11.82 | | | $ | 11.28 | | | $ | 10.00 | | |
| | | | | | | | | | | | | | | | | | |
| Total Return(a) | | | 1.95 | % ** | | | 8.00 | % | | | 13.75 | % | | | - | ‡ | |
| Ratios / Supplemental Data: | |
| Net assets, end of period (000's) | | $ | 33,382 | | | $ | 27,274 | | | $ | 1,741 | | | $ | 601 | | |
| Ratio of expenses to average daily net assets: | |
| Before expense waiver | | | 0.09 | % * | | | 0.10 | % | | | 0.66 | % | | | - | ‡ | |
| After expense waiver | | | N/A | | | | 0.10 | % # | | | 0.10 | % # | | | - | ‡ | |
| Net investment income (loss) to average daily net assets | | | (0.09 | )% * | | | 2.37 | % | | | 0.85 | % | | | - | ‡ | |
| Portfolio turnover rate | | | 7 | % ** | | | 18 | % | | | 13 | % | | | N/A | | |
* Annualized.
** Percentage represents results for the period and are not annualized.
*** Per share amount calculated on the average shares method.
+ The Fund commenced operations on December 31, 2003.
‡ Amounts are de minimis due to the short period of operations.
# Computed after giving effect to an agreement by MassMutual to waive certain fees and expenses of the Fund.
(a) Employee retirement benefit plans that invest plan assets in the Separate Investment Accounts (SIAs) may be subject to certain charges as set forth in their respective Plan Documents. Total return figures would be lower for the period presented if they reflected these charges.
The accompanying notes are an integral part of the financial statements.
282
MassMutual Select Destination Retirement 2040 Fund – Financial Statements (Continued)
Financial Highlights (For a share outstanding throughout each period)
| | | Class N | |
| | | Six months
ended
6/30/06
(Unaudited) | | Year ended
12/31/05 | | Year ended
12/31/04 | | Period ended
12/31/03+ | |
| Net asset value, beginning of period | | $ | 11.79 | | | $ | 11.28 | | | $ | 10.00 | | | $ | 10.00 | | |
| Income (loss) from investment operations: | |
| Net investment income | | | (0.05 | )*** | | | 0.07 | *** | | | (0.07 | )*** | | | 0.00 | | |
| Net realized and unrealized gain on investments | | | 0.24 | | | | 0.73 | | | | 1.38 | | | | 0.00 | | |
| Total income from investment operations | | | 0.19 | | | | 0.80 | | | | 1.31 | | | | 0.00 | | |
| Less distributions to shareholders: | |
| From net investment income | | | - | | | | (0.08 | ) | | | (0.01 | ) | | | - | | |
| From net realized gains | | | - | | | | (0.21 | ) | | | (0.02 | ) | | | - | | |
| Total distributions | | | - | | | | (0.29 | ) | | | (0.03 | ) | | | - | | |
| Net asset value, end of period | | $ | 11.98 | | | $ | 11.79 | | | $ | 11.28 | | | $ | 10.00 | | |
| Total Return(a) | | | 1.61 | % **(b) | | | 7.11 | % (b) | | | 13.03 | % (b) | | | 0.00 | % | |
| Ratios / Supplemental Data: | |
| Net assets, end of period (000's) | | $ | 172 | | | $ | 142 | | | $ | 114 | | | $ | 101 | | |
| Ratio of expenses to average daily net assets: | |
| Before expense waiver | | | 0.79 | % * | | | 0.80 | % | | | 1.54 | % | | | - | ‡ | |
| After expense waiver | | | N/A | | | | 0.80 | % # | | | 0.80 | % # | | | N/A‡ | | |
| Net investment income to average daily net assets | | | (0.79 | )% * | | | 0.59 | % | | | (0.63 | )% | | | 0.00 | %‡ | |
| Portfolio turnover rate | | | 7 | % ** | | | 18 | % | | | 13 | % | | | N/A | | |
* Annualized.
** Percentage represents results for the period and are not annualized.
*** Per share amount calculated on the average shares method.
+ The Fund commenced operations on December 31, 2003.
‡ Amounts are de minimis due to the short period of operations.
# Computed after giving effect to an agreement by MassMutual to waive certain fees and expenses of the Fund.
(a) Employee retirement benefit plans that invest plan assets in the Separate Investment Accounts (SIAs) may be subject to certain charges as set forth in their respective Plan Documents. Total return figures would be lower for the period presented if they reflected these charges.
(b) Total Return excludes a front-end sales charge for Class A and a contingent deferred sales charge for Class N and would be lower for the periods presented if they reflected these charges.
The accompanying notes are an integral part of the financial statements.
283
Notes to Financial Statements
1. The Fund MassMutual Select Funds (the "Trust") is registered under the Investment Company Act of 1940, as amended (the "1940 Act"), as an open-end, management investment company. The Trust is organized under the laws of the Commonwealth of Massachusetts as a Massachusetts business trust pursuant to an Agreement and Declaration of Trust dated May 28, 1993, as amended. The Trust consists of the following series (each individually referred to as a "Fund" or collectively as the "Funds"): MassMutual Select Strategic Bond Fund ("Strategic Bond Fund"), MassMutual Select Strategic Balanced Fund ("Strategic Balanced Fund"), MassMutual Select Diversified Value Fund ("Diversified Value Fund"), MassMutual Select Fundamental Value Fund ("Fundamental Value Fund"), MassMutual Select Value Equity Fund ("Value Equity Fund"), MassMutual Select Large Cap Val ue Fund ("Large Cap Value Fund"), MassMutual Select Indexed Equity Fund ("Indexed Equity Fund"), MassMutual Select Core Opportunities Fund ("Core Opportunities Fund"), MassMutual Select Blue Chip Growth Fund ("Blue Chip Growth Fund"), MassMutual Select Large Cap Growth Fund ("Large Cap Growth Fund"), MassMutual Select Growth Equity Fund ("Growth Equity Fund"), MassMutual Select Aggressive Growth Fund ("Aggressive Growth Fund"), MassMutual Select OTC 100 Fund ("OTC 100 Fund"), MassMutual Select Focused Value Fund ("Focused Value Fund"), MassMutual Select Small Cap Value Equity Fund ("Small Cap Value Equity Fund"), MassMutual Select Small Company Value Fund ("Small Company Value Fund"), MassMutual Select Small Cap Core Equity Fund ("Small Cap Core Equity Fund"), MassMutual Select Mid Cap Growth Equity Fund ("Mid Cap Growth Equity Fund"), MassMutual Select Mid Cap Growth Equity II Fund ("Mid Cap Growth Equity II Fund"), MassMutual Select Small Cap Growth Equity Fund ("Small Cap Growth Equity Fund"), MassMutual Select Small Company Growth Fund ("Small Company Growth Fund"), MassMutual Select Emerging Growth Fund ("Emerging Growth Fund"), MassMutual Select Overseas Fund ("Overseas Fund"), MassMutual Select Destination Retirement Income Fund ("Destination Retirement Income Fund"), MassMutual Select Destination Retirement 2010 Fund ("Destination Retirement 2010 Fund"), MassMutual Select Destination Retirement 2020 Fund ("Destination Retirement 2020 Fund"), MassMutual Select Destination Retirement 2030 Fund ("Destination Retirement 2030 Fund") and MassMutual Select Destination Retirement 2040 Fund ("Destination Retirement 2040 Fund").
During the reporting period, each Fund had five classes of shares: Class A, Class L, Class Y, Class S and Class N. Additionally, the Indexed Equity Fund had a sixth class of shares: Class Z. The principal economic difference among the classes is the level of service and administration fees borne by the classes. The classes of shares are offered to different types of investors, as outlined in the Trust's Prospectus.
The five Destination Retirement Funds invest all of their investable assets in shares of various MassMutual Select Funds and MassMutual Premier Funds. The financial statements included herein are those of the Destination Retirement Funds and the applicable MassMutual Select Funds. The financial statements of the applicable MassMutual Premier Funds are presented separately and can be obtained from the SEC's EDGAR database on its Internet site at www.sec.gov or by calling MassMutual at 1-888-309-3539. The assets of each Destination Retirement Fund are diversified and a shareholder's interest is limited to the Premier or Select Funds in which the shares are invested.
2. Significant
Accounting
Policies The following is a summary of significant accounting policies followed consistently by each Fund in the preparation of the financial statements in conformity with accounting principles generally accepted in the United States of America ("generally accepted accounting principles"). The preparation of the financial statements in accordance with generally accepted accounting principles requires management to make estimates and assumptions that affect the reported amounts and disclosures in the financial statements. Actual results could differ from those estimates.
Investment
Valuation Equity securities are valued on the basis of valuations furnished by a pricing service, authorized by the Board of Trustees ("Trustees"), which provides the last reported sale price for securities listed on a national securities exchange or the official closing price on the NASDAQ National Market System, or in the case of over-the-counter securities not so listed, the last reported bid price. Debt securities (other than short-term obligations with a remaining maturity of sixty days or less) are valued on the basis of
284
Notes to Financial Statements (Continued)
valuations furnished by a pricing service, authorized by the Trustees, which determines valuations taking into account appropriate factors such as institutional-size trading in similar groups of securities, yield, quality, coupon rate, maturity, type of issue, trading characteristics and other market data. Short-term securities with a remaining maturity of sixty days or less are valued at either amortized cost or at original cost plus accrued interest, whichever approximates current market value. Shares of other funds of the Trust are valued at their net asset value as reported on each business day. All other securities and other assets, including futures, options, swaps and debt securities for which the prices supplied by a pricing agent are deemed by the Trustees not to be representative of market values, including restricted securities and securities for which no market quotation is available, are valued at fair value in accordance with p rocedures approved by and determined in good faith by the Trustees, although the actual calculation may be done by others. Securities are typically valued on the basis of valuations furnished by a primary pricing service or, if no such valuation is available, from a secondary pricing service. However, valuation methods approved by the Trustees which are intended to reflect fair value may be used when pricing service information is not readily available or when a security's value is believed to have been materially affected by a significant event, such as a natural disaster, an economic event like a bankruptcy filing, or a substantial fluctuation in domestic or foreign markets, that has occurred after the close of the exchange or market on which the security is principally traded (for example, a foreign exchange or market). In such a case, a Fund's value for a security is likely to be different from the last quoted market price or pricing service information. In addition, for each of the Trust's foreign funds , a fair value pricing service is used to assist in the pricing of foreign securities. Due to the subjective and variable nature of fair value pricing, it is possible that the value determined for a particular asset may be materially different from the value realized upon such asset's sale.
Portfolio securities traded on more than one national securities exchange are valued at the last price on the business day as of which such value is being determined at the close of the exchange representing the principal market for such securities. All assets and liabilities expressed in foreign currencies are converted into U.S. dollars at the mean between the buying and selling rates of such currencies against U.S. dollars last quoted by any major bank. If such quotations are not available, the rate of exchange is determined in accordance with policies established by the Trustees.
Securities Lending Each Fund may lend its securities to qualified brokers; however, securities lending cannot exceed 33% of the total assets of the Funds taken at current value. The loans are collateralized at all times with cash or securities with a market value at least equal to 100% of the market value of the securities on loan. The market value of the loaned securities is determined at the close of business of the Fund and any additional collateral is delivered to the Fund the next business day. As with other extensions of credit, the Funds may bear the risk of delay in recovery or even loss of rights in the collateral should the borrower of the securities fail financially. The Funds receive compensation for lending their securities. At June 30, 2006, the Funds loaned securities having the following market values, collateralized by cash, which was i nvested in short-term instruments in the following amounts:
| | | Securities on Loan | | Collateral | |
| Strategic Bond Fund | | $ | 2,428,470 | | | $ | 2,497,438 | | |
| Strategic Balanced Fund | | | 13,608,019 | | | | 14,207,273 | | |
| Diversified Value Fund | | | 16,672,372 | | | | 17,323,481 | | |
| Fundamental Value Fund | | | 45,105,476 | | | | 46,477,839 | | |
| Value Equity Fund | | | 12,833,835 | | | | 13,256,367 | | |
| Large Cap Value Fund | | | 59,181,583 | | | | 61,341,924 | | |
| Indexed Equity Fund | | | 127,742,209 | | | | 132,666,992 | | |
| Blue Chip Growth Fund | | | 35,895,394 | | | | 36,974,364 | | |
| Large Cap Growth Fund | | | 2,652,015 | | | | 2,707,286 | | |
| Growth Equity Fund | | | 23,520,633 | | | | 24,342,745 | | |
| OTC 100 Fund | | | 7,096,102 | | | | 7,369,997 | | |
| Focused Value Fund | | | 119,670,872 | | | | 124,020,358 | | |
285
Notes to Financial Statements (Continued)
| | | Securities on Loan | | Collateral | |
| Small Company Value Fund | | $ | 97,971,431 | | | $ | 102,175,665 | | |
| Mid Cap Growth Equity Fund | | | 38,515,165 | | | | 39,758,780 | | |
| Mid Cap Growth Equity II Fund | | | 178,464,593 | | | | 185,197,302 | | |
| Small Cap Growth Equity Fund | | | 170,123,963 | | | | 178,185,142 | | |
| Small Company Growth Fund | | | 40,100,312 | | | | 42,002,532 | | |
| Emerging Growth Fund | | | 4,306,711 | | | | 4,444,523 | | |
| Overseas Fund | | | 75,090,970 | | | | 79,482,313 | | |
For each Fund the amount of securities on loan indicated in the table above may not correspond with the securities on loan identified on the Portfolio of Investments because securities with pending sales are in process of recall from the brokers. At June 30, 2006, the Strategic Balanced Fund, Small Cap Growth Equity Fund, Small Company Growth Fund and Overseas Fund had securities on loan with pending sales with a value of $549, $107,800, $21,353 and $3,579,903, respectively.
The Trust receives, as fees, a share of the income earned on investment of the cash collateral received for the loan of securities. For the the six months ended June 30, 2006, the Trust earned securities lending income as follows:
| | | Securities
Lending
Gross Income | | Securities
Lending
Fees and
Expenses | | Securities
Lending
Net Income | |
| Strategic Bond Fund | | $ | 205,573 | | | $ | 191,684 | | | $ | 13,889 | | |
| Strategic Balanced Fund | | | 422,630 | | | | 397,542 | | | | 25,088 | | |
| Diversified Value Fund | | | 558,378 | | | | 542,634 | | | | 15,744 | | |
| Fundamental Value Fund | | | 1,761,091 | | | | 1,736,171 | | | | 24,920 | | |
| Value Equity Fund | | | 299,794 | | | | 280,556 | | | | 19,238 | | |
| Large Cap Value Fund | | | 3,490,893 | | | | 3,409,323 | | | | 81,570 | | |
| Indexed Equity Fund | | | 2,921,273 | | | | 2,858,784 | | | | 62,489 | | |
| Blue Chip Growth Fund | | | 603,289 | | | | 556,444 | | | | 46,845 | | |
| Large Cap Growth Fund | | | 93,097 | | | | 91,321 | | | | 1,776 | | |
| Growth Equity Fund | | | 969,268 | | | | 952,971 | | | | 16,297 | | |
| OTC 100 Fund | | | 201,039 | | | | 190,424 | | | | 10,615 | | |
| Focused Value Fund | | | 2,024,834 | | | | 1,948,596 | | | | 76,238 | | |
| Small Company Value Fund | | | 2,461,715 | | | | 2,328,288 | | | | 133,427 | | |
| Mid Cap Growth Equity Fund | | | 778,107 | | | | 766,205 | | | | 11,902 | | |
| Mid Cap Growth Equity II Fund | | | 4,496,614 | | | | 4,119,663 | | | | 376,951 | | |
| Small Cap Growth Equity Fund | | | 4,171,305 | | | | 3,931,257 | | | | 240,048 | | |
| Small Company Growth Fund | | | 1,051,902 | | | | 920,092 | | | | 131,810 | | |
| Emerging Growth Fund | | | 876,187 | | | | 810,876 | | | | 65,311 | | |
| Overseas Fund | | | 2,857,410 | | | | 2,416,999 | | | | 440,411 | | |
Repurchase Agreements Each Fund may enter into repurchase agreements with certain banks and broker/dealers whereby a Fund acquires a security for cash and obtains a simultaneous commitment from the seller to repurchase the security at an agreed upon price and date. The Funds, through their custodian, take possession of the securities collateralizing the repurchase agreement. The collateral is marked to market daily to ensure that the market value of the underlying assets remains sufficient to protect the Funds in the event of default by the seller. Collateral for certain tri-party repurchase agreements is held at the counterparty's custodian in a segregated account for the benefit of the Funds and the counterparty. In connection with transactions in repurchase agreements, if the seller defaults and the value of the collateral declines or if the seller e nters insolvency proceedings, realization of collateral by the Funds may be delayed or limited.
286
Notes to Financial Statements (Continued)
Accounting for Investments Investment transactions are accounted for on the trade date. Realized gains and losses on sales of investments and unrealized appreciation and depreciation of investments are computed on the specific identification cost method. Interest income, adjusted for amortization of discounts and premiums on debt securities, is earned from the settlement date and is recorded on the accrual basis. Dividend income is recorded on the ex-dividend date.
Federal Income Tax It is each Fund's intent to continue to comply with the provisions of subchapter M of the Internal Revenue Code of 1986, as amended (the "Code"), applicable to a regulated investment company. Under such provisions, the Funds will not be subject to federal income taxes on their ordinary income and net realized capital gains to the extent they are distributed or deemed to have been distributed to their shareholders. Therefore, no Federal income tax provision is required. Withholding taxes on foreign interest, dividends, and capital gains have been provided for in accordance with the applicable country's tax rules and rates.
Dividends and Distributions to Shareholders Dividends from net investment income of each Fund are declared and paid annually and at other times as may be required to satisfy tax or regulatory requirements. Distributions of any net realized capital gains of each Fund are declared and paid annually and at other times as may be required to satisfy tax or regulatory requirements. Distributions to shareholders are recorded on the ex-dividend date. Income and capital gain distributions are determined in accordance with income tax regulations, which may differ from generally accepted accounting principles. These differences are primarily due to investments in forward contracts, passive foreign investment companies, the deferral of wash sale losses, and paydowns on certain mortgage-backed securities. As a result, net investment income and net realized gain on i nvestment transactions for a reporting period may differ significantly from distributions during such period.
Accordingly, the Funds may periodically make reclassifications among certain of their capital accounts without impacting the net asset value of the Funds.
Foreign Currency Translation The books and records of the Funds are maintained in U.S. dollars. The market values of foreign currencies, foreign securities and other assets and liabilities denominated in foreign currencies are translated into U.S. dollars at the mean of the buying and selling rates of such currencies against the U.S. dollar at the end of each business day. Purchases and sales of foreign securities and income and expense items are translated at the rates of exchange prevailing on the respective dates of such transactions. The Funds do not isolate that portion of the results of operations arising from changes in the exchange rates from that portion arising from changes in the market prices of securities. Net realized foreign currency gains and losses resulting from changes in exchange rates include foreign currency gains and losses betwee n trade date and settlement date on investment securities transactions, foreign currency transactions and the difference between the amounts of dividends recorded on the books of the Funds and the amount actually received.
Forward Foreign Currency
Contracts Each Fund may enter into forward foreign currency contracts in order to hedge the effect of currency movements of foreign denominated securities or obligations. A forward foreign currency contract is an agreement between two parties to buy and sell a currency at a set price on a future date. The market value of a forward foreign currency contract fluctuates with changes in foreign currency exchange and interest rates. Forward foreign currency contracts are marked to market daily and the change in their value is recorded by the Funds as an unrealized gain or loss. When a forward foreign currency contract is extinguished, through delivery or offset by entering into another forward foreign currency contract, the Funds record a realized gain or loss equal to the difference between the value of the contract at the time it was opened and the value of the contract at the time it was extinguished or offset.
Forward foreign currency contracts involve a risk of loss from the potential inability of counterparties to meet the terms of their contracts and from unanticipated movements in foreign currency values and interest rates.
287
Notes to Financial Statements (Continued)
The notional or contractual amounts of these instruments represent the investments the Funds have in particular classes of financial instruments and do not necessarily represent the amounts potentially subject to risk. The measurement of the risk associated with these instruments is meaningful only when all related and offsetting transactions are considered.
A summary of the obligations for the Strategic Bond Fund and Strategic Balanced Fund under these forward foreign currency contracts at June 30, 2006 is as follows:
Settlement
Date | | Contracts to
Deliver/Receive | | Units of
Currency | | In Exchange
for U.S.
Dollars | | Contracts at
Value | | Unrealized
Appreciation
(Depreciation) | |
| Strategic Bond Fund | |
| SELLS | |
| 08/08/06 | | Australian Dollar | | | 734,839 | | | $ | 545,985 | | | $ | 545,957 | | | $ | 28 | | |
| 08/08/06 | | Canadian Dollar | | | 307,386 | | | | 270,825 | | | | 276,771 | | | | (5,946 | ) | |
| | | $ | (5,918 | ) | |
| Strategic Balanced Fund | |
| BUYS | |
| 08/08/06 | | Canadian Dollar | | | 306,575 | | | | 270,110 | | | | 276,041 | | | | 5,931 | | |
| SELLS | |
| 08/08/06 | | Australian Dollar | | | 623,795 | | | | 463,479 | | | | 463,455 | | | | 24 | | |
| 08/08/06 | | Canadian Dollar | | | 614,773 | | | | 541,650 | | | | 553,543 | | | | (11,893 | ) | |
| | | $ | (11,869 | ) | |
Delayed Delivery Transactions,
When Issued Securities, and Forward Commitments Each Fund may purchase or sell securities on a "when issued" or delayed delivery or on a forward commitment basis. The Funds use forward commitments to manage interest rate exposure or as a temporary substitute for purchasing or selling particular debt securities. Payment and delivery may take place after the customary settlement period for that security. The price of the underlying securities and the date when the securities will be delivered and paid for are fixed at the time the transaction is negotiated. These securities are valued on the basis of valuations furnished by a pricing service, authorized by the Trustees, which determines valuations taking into account appropriate factors such as institutional-size trading in similar groups of securities, yield, quality, c oupon rate, maturity, type of issue, trading characteristics and other market data. Securities for which no market quotation is available, are valued at fair value in accordance with procedures approved by and determined in good faith by the Trustees, although the actual calculation may be done by others. The Funds record on a daily basis the unrealized appreciation (depreciation) based upon changes in the value of these securities. When a forward commitment contract is closed, the Funds record a realized gain or loss equal to the difference between the value of the contract at the time it was opened and the value of the contract at the time it was closed. Losses may arise due to changes in the value of the underlying securities or if the counterparty does not perform under the contract, or if the issuer does not issue the securities due to political, economic, or other factors. Funds monitor exposure to ensure counterparties are creditworthy and concentration of exposure is minimized
At June 30, 2006 the Funds had no open delayed delivery transactions, when issued securities or forward commitments.
Financial Futures Contracts The Funds may purchase and sell financial futures contracts and options on such futures contracts for the purpose of hedging the market risk on existing securities or as a substitute for the purchase of securities. Futures contracts are contracts for delayed delivery of securities at a specific future date and at a specific price or yield. Upon entering into a contract, the Funds deposit and maintain as collateral such initial margin as required by the exchange on which the transaction is effected. Pursuant to the contract, the Fund agrees to receive from or pay to the broker an amount of cash equal to the daily
288
Notes to Financial Statements (Continued)
fluctuation in value of the contract. Such receipts or payments are known as variation margin and are recorded by the Funds as unrealized gains or losses. When the contract is closed, each Fund records a realized gain or loss equal to the difference between the value of the contract at the time it was opened and the value at the time it was closed. Futures contracts are valued at the settlement price established each day by the board of trade or exchange on which they are traded.
A summary of open futures contracts for the Strategic Bond Fund, Strategic Balanced Fund, Indexed Equity Fund, Growth Equity Fund, OTC 100 Fund and the Small Cap Value Equity Fund at June 30, 2006, is as follows:
Number of
Contracts | | Type | | Expiration Date | | Notional
Contract
Value | | Net Unrealized
Appreciation
(Depreciation) | |
| Strategic Bond Fund | |
| | BUYS
12 | | | 90 Day Euro | | 03/17/08 | | $ | 2,847,135 | | | $ | (10,635 | ) | |
| | 145 | | | 90 Day Euro | | 09/18/06 | | | 34,341,875 | | | | (114,625 | ) | |
| | 12 | | | Fed Fund 30 Day | | 07/31/06 | | | 4,740,439 | | | | (3,060 | ) | |
| | 547 | | | U.S. Treasury Note 5 Year | | 10/04/06 | | | 56,869,514 | | | | (306,296 | ) | |
| | 90 | | | U.S. Long Bond | | 09/29/06 | | | 9,637,598 | | | | (38,536 | ) | |
| | | $ | (473,152 | ) | |
| | | SELLS | |
| | 109 | | | U.S. Treasury Note 10 Year | | 09/29/06 | | | 11,480,917 | | | | 51,245 | | |
| | | $ | (421,907 | ) | |
| Strategic Balanced Fund | |
| | BUYS
8 | | | 90 Day Euro | | 03/17/08 | | | 1,898,090 | | | | (7,090 | ) | |
| | 44 | | | 90 Day Euro | | 09/18/06 | | | 10,409,745 | | | | (23,545 | ) | |
| | 5 | | | Fed Fund 30 Day | | 07/31/06 | | | 1,975,183 | | | | (1,275 | ) | |
| | 129 | | | U.S. Treasury Note 5 Year | | 10/04/06 | | | 13,414,606 | | | | (75,200 | ) | |
| | 37 | | | U.S. Long Bond | | 09/29/06 | | | 3,972,982 | | | | (26,700 | ) | |
| | | $ | (133,810 | ) | |
| | | SELLS | |
| | 46 | | | U.S. Treasury Note 10 Year | | 09/29/06 | | | 4,843,114 | | | | 19,582 | | |
| | | $ | (114,228 | ) | |
| Indexed Equity Fund | |
| | BUYS
141 | | | S&P 500 Index | | 09/14/06 | | | 44,462,757 | | | | 636,093 | | |
| Growth Equity Fund | |
| | BUYS
38 | | | S&P 500 Index | | 09/14/06 | | | 11,956,778 | | | | 197,522 | | |
| OTC 100 Fund | |
| | BUYS
23 | | | NASDAQ 100 Index | | 09/15/06 | | | 722,463 | | | | 9,627 | | |
| Small Cap Value Equity Fund | |
| | BUYS
Russell Mini | | | | | 09/15/06 | | | 345,922 | | | | 19,829 | | |
Options The Funds may purchase put and call options. By purchasing a put option, a Fund obtains the right (but not the obligation) to sell the instrument underlying the option at a fixed strike price. In return for this right, a Fund pays the current market price for the option (known as the option premium). Options have various types of underlying instruments, including specific securities, indexes of securities, indexes of security prices, indexes of interest rates and futures contracts. A Fund may terminate its position in a put option it has purchased by allowing it to expire or by exercising the option. A Fund may also close out a put option position by entering into an offsetting transaction, if a liquid market exists. If the option
289
Notes to Financial Statements (Continued)
is allowed to expire, a Fund will lose the entire premium it paid. Premiums paid for purchasing options which expire are treated as realized losses. If a Fund exercises a put option on a security, it will sell the instrument underlying the option at the strike price. If a Fund exercises an option on an index, settlement is in cash and does not involve the actual sale of securities.
The buyer of a typical put option can expect to realize a gain if the price of the underlying instrument falls substantially. However, if the price of the instrument underlying the option does not fall enough to offset the cost of purchasing the option, a put buyer can expect to suffer a loss (limited to the amount of the premium paid, plus related transaction costs).
The features of call options are essentially the same as those of put options, except that the purchaser of a call option obtains the right to purchase, rather than sell, the instrument underlying the option at the option's strike price. A call buyer typically attempts to participate in potential price increases of the instrument underlying the option with risk limited to the cost of the option if security prices fall. At the same time, the buyer can expect to suffer a loss if security prices do not rise sufficiently to offset the cost of the option. See the Portfolio of Investments of the Strategic Balanced Fund for open purchased option contracts as of June 30, 2006.
The Funds may also "write" put and call options. When a Fund writes a put option, it takes the opposite side of the transaction from the option's purchaser. In return for receipt of the premium, a Fund assumes the obligation to pay the strike price for the instrument underlying the option if the other party to the option chooses to exercise it. A Fund may seek to terminate its position in a put option it writes before exercise by purchasing an offsetting option in the market at its current price. If the market is not liquid for a put option a Fund has written, however, a Fund must continue to be prepared to pay the strike price while the option is outstanding, regardless of price changes, and must continue to post margin as discussed below.
If the price of the underlying instrument rises, a put writer would generally expect to profit, although its gain would be limited to the amount of the premium it received. If security prices remain the same over time, it is likely that the writer will also profit, because it should be able to close out the option at a lower price. If security prices fall, the put writer would expect to suffer a loss. This loss should be less than the loss from purchasing and holding the underlying instrument directly, however, because the premium received for writing the option should offset a portion of the decline.
Writing a call option obligates a Fund to sell or deliver the option's underlying instrument in return for the strike price upon exercise of the option. The characteristics of writing call options are similar to those of writing put options, except that writing calls generally is a profitable strategy if prices remain the same or fall. Through receipt of the option premium a call writer offsets part of the effect of a price increase. At the same time, because a call writer must be prepared to deliver the underlying instrument in return for the strike price, even if its current value is greater, a call writer gives up some ability to participate in security price increases.
The writer of an exchange traded put or call option on a security, an index of securities or a futures contract is required to deposit cash or securities or a letter of credit as margin and to make mark to market payments of variation margin as the position becomes unprofitable. When a Fund writes a call or put option, an amount equal to the premium received is recorded as a liability. Premiums received from writing options which expire are treated as realized gains. Premiums received from writing options which are exercised or closed are added to the proceeds or offset against the amount paid on the underlying investments to determine the realized gain or loss.
290
Notes to Financial Statements (Continued)
A summary of open written option contracts for the Strategic Bond Fund and the Strategic Balanced Fund at June 30, 2006, is as follows:
Strategic Bond Fund
| Notional Amount | | Expiration
Date | | Description | | Premiums | | Market
Value | |
| $ | 27,500 | | | 09/18/06 | | Call - 90 Day Euro Future | | $ | 3,845 | | | $ | 69 | | |
| | 17,500 | | | 09/18/06 | | Call - 90 Day Euro Future | | | 4,433 | | | | 325 | | |
| | 262,500 | | | 09/18/06 | | Call - IMM Euro Future | | | 22,800 | | | | 656 | | |
| | 52,500 | | | 09/18/06 | | Call - IMM Euro Future | | | 3,458 | | | | 131 | | |
| | 60,000 | | | 09/18/06 | | Put - IMM Euro Future | | | 5,580 | | | | 13,350 | | |
| | 22,500 | | | 09/18/06 | | Put - IMM Euro Future | | | 1,080 | | | | 3,150 | | |
| | 3,000 | | | 08/26/06 | | Call - 5 Year U.S. Treasury Note Future | | | 594 | | | | 94 | | |
| | 23,000 | | | 08/25/06 | | Call - 5 Year U.S. Treasury Note Future | | | 5,354 | | | | 1,078 | | |
| | 44,000 | | | 08/25/06 | | Call - 5 Year U.S. Treasury Note Future | | | 15,607 | | | | 4,812 | | |
| | 7,000 | | | 08/25/06 | | Call - 5 Year U.S. Treasury Note Future | | | 2,543 | | | | 3,500 | | |
| | 7,000 | | | 07/21/06 | | Call - 10 Year U.S. Treasury Note Future | | | 2,262 | | | | 547 | | |
| | 15,000 | | | 08/25/06 | | Call - 10 Year U.S. Treasury Note Future | | | 8,550 | | | | 234 | | |
| | 15,000 | | | 08/25/06 | | Call - 10 Year U.S. Treasury Note Future | | | 6,050 | | | | 234 | | |
| | 47,000 | | | 08/25/06 | | Call - 10 Year U.S. Treasury Note Future | | | 22,078 | | | | 1,469 | | |
| | 87,000 | | | 08/25/06 | | Call - 10 Year U.S. Treasury Note Future | | | 40,581 | | | | 8,156 | | |
| | 9,000 | | | 08/25/06 | | Call - 10 Year U.S. Treasury Note Future | | | 5,439 | | | | 2,391 | | |
| | 10,000 | | | 11/21/06 | | Call - 10 Year U.S. Treasury Note Future | | | 3,231 | | | | 938 | | |
| | 11,000 | | | 11/21/06 | | Call - 10 Year U.S. Treasury Note Future | | | 3,617 | | | | 3,953 | | |
| | 10,000 | | | 11/21/06 | | Call - 10 Year U.S. Treasury Note Future | | | 7,763 | | | | 10,155 | | |
| | 297,500 | | | 09/18/06 | | Call - U.S. Treasury Bond Future | | | 25,443 | | | | 2,975 | | |
| | 29,000 | | | 08/25/06 | | Call - U.S. Treasury Bond Future | | | 21,573 | | | | 2,719 | | |
| | 12,000 | | | 08/25/06 | | Call - U.S. Treasury Bond Future | | | 12,784 | | | | 188 | | |
| | 7,000 | | | 08/25/06 | | Call - U.S. Treasury Bond Future | | | 4,793 | | | | 2,297 | | |
| | 14,000 | | | 08/25/06 | | Call - U.S. Treasury Bond Future | | | 9,602 | | | | 4,375 | | |
| | 9,000 | | | 08/25/06 | | Put - U.S. Treasury Bond Future | | | 13,174 | | | | 17,438 | | |
| | 19,000 | | | 08/25/06 | | Put - U.S. Treasury Bond Future | | | 12,530 | | | | 10,094 | | |
| | 34,000 | | | 11/21/06 | | Put - U.S. Treasury Bond Future | | | 14,549 | | | | 7,438 | | |
| | | $ | 279,313 | | | $ | 102,766 | | |
Transactions in options written during the the six months ended June 30, 2006 were as follows:
| | | Number of
Contracts | | Premiums
Received | |
| Options outstanding at December 31, 2005 | | | 257 | | | $ | 153,125 | | |
| Options written | | | 1,247 | | | | 570,352 | | |
| Options terminated in closing purchase transactions | | | (777 | ) | | | (444,164 | ) | |
| Options outstanding at June 30, 2006 | | | 727 | | | $ | 279,313 | | |
291
Notes to Financial Statements (Continued)
Strategic Balanced Fund
| Notional Amount | | Expiration
Date | | Description | | Premiums | | Market
Value | |
| $ | 27,500 | | | 09/18/06 | | Put - IMM Euro Future | | $ | 2,558 | | | $ | 6,119 | | |
| | 15,000 | | | 09/18/06 | | Put - IMM Euro Future | | | 720 | | | | 2,100 | | |
| | 27,500 | | | 09/18/06 | | Call - 90 Day Euro Future | | | 3,845 | | | | 69 | | |
| | 127,500 | | | 09/18/06 | | Call - IMM Euro Future | | | 11,156 | | | | 319 | | |
| | 17,500 | | | 09/18/06 | | Call - IMM Euro Future | | | 1,040 | | | | 44 | | |
| | 22,500 | | | 09/18/06 | | Call - 90 Day Euro Future | | | 1,580 | | | | 113 | | |
| | 2,000 | | | 08/26/06 | | Call - 5 Year U.S. Treasury Note Future | | | 396 | | | | 63 | | |
| | 11,000 | | | 08/25/06 | | Call - 5 Year U.S. Treasury Note Future | | | 2,711 | | | | 516 | | |
| | 19,000 | | | 08/25/06 | | Call - 5 Year U.S. Treasury Note Future | | | 6,827 | | | | 2,077 | | |
| | 3,000 | | | 08/25/06 | | Put - 5 Year U.S. Treasury Note Future | | | 1,094 | | | | 1,500 | | |
| | 3,000 | | | 07/21/06 | | Call - 10 Year U.S. Treasury Note Future | | | 969 | | | | 234 | | |
| | 10,000 | | | 08/25/06 | | Call - 10 Year U.S. Treasury Note Future | | | 5,700 | | | | 156 | | |
| | 7,000 | | | 08/25/06 | | Call - 10 Year U.S. Treasury Note Future | | | 2,903 | | | | 109 | | |
| | 27,000 | | | 08/25/06 | | Call - 10 Year U.S. Treasury Note Future | | | 12,240 | | | | 844 | | |
| | 40,000 | | | 08/25/06 | | Call - 10 Year U.S. Treasury Note Future | | | 19,440 | | | | 3,750 | | |
| | 5,000 | | | 08/25/06 | | Call - 10 Year U.S. Treasury Note Future | | | 2,975 | | | | 1,328 | | |
| | 4,000 | | | 11/21/06 | | Call - 10 Year U.S. Treasury Note Future | | | 1,293 | | | | 375 | | |
| | 4,000 | | | 11/21/06 | | Call - 10 Year U.S. Treasury Note Future | | | 1,324 | | | | 1,437 | | |
| | 5,000 | | | 11/21/06 | | Call - 10 Year U.S. Treasury Note Future | | | 3,881 | | | | 5,078 | | |
| | 12,000 | | | 08/25/06 | | Call - U.S. Treasury Bond Future | | | 8,971 | | | | 1,125 | | |
| | 107,500 | | | 09/18/06 | | Call - U.S. Treasury Bond Future | | | 9,348 | | | | 1,075 | | |
| | 8,000 | | | 08/25/06 | | Call - U.S. Treasury Bond Future | | | 8,523 | | | | 125 | | |
| | 3,000 | | | 08/25/06 | | Call - U.S. Treasury Bond Future | | | 2,063 | | | | 984 | | |
| | 6,000 | | | 08/25/06 | | Put - U.S. Treasury Bond Future | | | 8,783 | | | | 11,625 | | |
| | 9,000 | | | 08/25/06 | | Put - U.S. Treasury Bond Future | | | 5,955 | | | | 4,781 | | |
| | 5,000 | | | 08/25/06 | | Call - U.S. Treasury Bond Future | | | 3,428 | | | | 1,563 | | |
| | 14,000 | | | 08/25/06 | | Put - U.S. Treasury Bond Future | | | 6,024 | | | | 3,063 | | |
| | | $ | 135,747 | | | $ | 50,572 | | |
Transactions in options written during the the six months ended June 30, 2006 were as follows:
| | | Number of
Contracts | | Premiums
Received | |
| Options outstanding at December 31, 2005 | | | 233 | | | $ | 138,098 | | |
| Options written | | | 610 | | | | 292,510 | | |
| Options terminated in closing purchase transactions | | | (508 | ) | | | (294,861 | ) | |
| Options outstanding at June 30, 2006 | | | 335 | | | $ | 135,747 | | |
Exchange traded options are valued at the last sale price, or if no sales are reported, the last bid price for purchased options and the last ask price for written options. Options traded over-the-counter are valued using prices supplied by a primary pricing source chosen by the Trust.
Swaps The Funds may engage in swap transactions, including, but not limited to, interest rate, currency, credit default, indices, basket, specific security and commodity swaps, interest rate caps, floors and collars and options on swaps (collectively defined as "swap transactions").
Each Fund may enter into swap transactions for any legal purpose consistent with its investment objective and policies, such as for the purpose of attempting to obtain or preserve a particular return or spread at a lower cost than obtaining that return or spread through purchases and/or sales of instruments
292
Notes to Financial Statements (Continued)
in cash markets, to protect against currency fluctuation, as a duration management technique, to protect against any increase in the price of securities a Fund anticipates purchasing at a later date, or to gain exposure to certain markets in the most economical way possible. A Fund will not sell interest rate caps, floors or collars if it does not own securities with coupons which provide the interest that a Fund may be required to pay.
Swap agreements are two-party contracts entered into primarily by institutional counterparties for periods ranging from a few weeks to several years. In a standard swap transaction, two parties agree to exchange the returns (or differentials in rates of return) that would be earned or realized on specified notional investments or instruments. The gross returns to be exchanged or "swapped" between the parties are calculated by reference to a "notional amount," i.e., the return on or increase in value of a particular dollar amount invested at a particular interest rate, in a particular foreign currency or commodity, or in a "basket" of securities representing a particular index. The purchaser of an interest rate cap or floor, upon payment of a fee, has the right to receive payments (and the seller of the cap is obligated to make payments) to the extent a specified interest rate exceeds (in the case of a cap) or is less than (in the case of a f loor) a specified level over a specified period of time or at specified dates. The purchaser of an interest rate collar, upon payment of a fee, has the right to receive payments (and the seller of the collar is obligated to make payments) to the extent that a specified interest rate falls outside an agreed upon range over a specified period of time or at specified dates. The purchaser of an option on an interest rate swap, upon payment of a fee (either at the time of purchase or in the form of higher payments or lower receipts within an interest rate swap transaction) has the right, but not the obligation, to initiate a new swap transaction of a pre-specified notional amount with pre-specified terms with the seller of the option as the counterparty.
The amount of a Fund's potential gain or loss on any swap transaction is not subject to any fixed limit. Nor is there any fixed limit on a Fund's potential loss if it sells a cap or collar. If the Fund buys a cap, floor or collar, however, the Fund's potential loss is limited to the amount of the fee that it has paid. When measured against the initial amount of cash required to initiate the transaction, which is typically zero in the case of most conventional swap transactions, swaps, caps, floors and collars tend to be more volatile than many other types of instruments.
The Funds will maintain cash or liquid assets in an amount sufficient at all times to cover its current obligations under its swap transactions, caps, floors and collars. If a Fund enters into a swap agreement on a net basis, it will segregate assets with a daily value at least equal to the excess, if any, of a Fund's accrued obligations under the swap agreement over the accrued amount a Fund is entitled to receive under the agreement. If a Fund enters into a swap agreement on other than a net basis, or sells a cap, floor or collar, it will segregate assets with a daily value at least equal to the full amount of a Fund's accrued obligation under the agreement.
During the term of a swap, cap, floor or collar, changes in the value of the instrument are recognized as unrealized gains or losses by marking to market to reflect the market value of the instrument. When the instrument is terminated, a Fund will record a realized gain or loss equal to the difference, if any, between the proceeds from (or cost of) the closing transaction and a Fund's basis in the contract.
293
Notes to Financial Statements (Continued)
A summary of open swap agreements for the Strategic Balanced Fund at June 30, 2006, is as follows:
Notional
Amount | |
Expiration
Date | |
Description | | Net Unrealized
Appreciation
(Depreciation) | |
Credit Default
Swaps | | | | | | | | | |
| $ | 200,000 | | | 3/20/10 | | Agreement with Goldman Sachs dated 10/18/04 | | $ | 1,548.00 | | |
| | | | | | | to receive 0.45% per year times the notional amount. | | |
| | |
| | | | | | | The Fund makes payment only upon a default event | | |
| | |
| | | | | | | of an entity within the CDX.NA.IG FIN.3 IBOXX Index. | | | | | |
| | 200,000 | | | 3/20/15 | | Agreement with Goldman Sachs dated 10/18/04
to receive 0.70% per year times the notional amount.
The Fund makes payment only upon a default event
of an entity within the CDX.NA.IG FIN.3 IBOXX Index. | | | 4,337.00
| | |
| | 400,000 | | | 12/20/09 | | Agreement with Deutsche Bank AG dated 11/01/04
to receive 0.215% per year times the notional amount.
The Fund makes payment only upon a default event
of FNMA Senior Debt, 6.00%, due 5/15/2011. | | | 2,171.00
| | |
| | 180,000 | | | 3/20/15 | | Agreement with Deutsche Bank AG dated 1/12/05
to receive 0.36% per year times the notional amount.
The Fund makes payment only upon a default event
of Apache Corp., 6.25%, due 4/15/12. | | | (1,586.00)
| | |
| | 100,000 | | | 3/20/15 | | Agreement with Deutsche Bank AG dated 1/31/05
to receive 3.51% per year times the notional amount.
The Fund makes payment only upon a default event
of General Motors, 8.375%, due 7/15/33. | | | (18,630.00)
| | |
| | 100,000 | | | 3/20/15 | | Agreement with Deutsche Bank AG dated 1/31/05
to receive 2.93% per year times the notional amount.
The Fund makes payment only upon a default event
of Ford Motor Company Debt Obligation,
7.45%, due 7/16/31. | | | (23,067.00)
| | |
| | 100,000 | | | 3/20/10 | | Agreement with Deutsche Bank AG dated 2/2/05
to receive 1.25% per year times the notional amount.
The Fund makes payment only upon a default event
of Eastman Kodak Co. Debt Obligation,
7.25%, due 11/15/13. | | | (3,464.00)
| | |
| | 45,000 | | | 1/25/35 | | Agreement with Deutsche Bank AG dated 2/18/05
to pay 1.30% per year times the notional amount.
The Fund receives payment only upon a default event
of Morgan Stanley Capital I Trust,
Series 2005-WMC1, Class B2. | | | (169.00)
| | |
| | 45,000 | | | 2/25/35 | | Agreement with Deutsche Bank AG dated 2/18/05
to pay 1.25% per year times the notional amount.
The Fund receives payment only upon a default event
of Fremont Home Loan Trust,
Series 2005-A, Class M8. | | | (53.00)
| | |
| | 45,000 | | | 4/25/35 | | Agreement with Deutsche Bank AG dated 2/18/05
to pay 1.45% per year times the notional amount.
The Fund receives payment only upon a default event
of Aames Mortgage Investment Trust,
Series 2005-1, Class M8. | | | (101.00)
| | |
| | 45,000 | | | 2/25/35 | | Agreement with Deutsche Bank AG dated 2/18/05
to pay 2.20% per year times the notional amount.
The Fund receives payment only upon a default event
of Fremont Home Loan Trust,
Series 2005-A, Class M9. | | | 157.00
| | |
294
Notes to Financial Statements (Continued)
Notional
Amount | | Expiration
Date | | Description | | Net Unrealized
Appreciation
(Depreciation) | |
| $ | 45,000 | | | 1/25/35 | | Agreement with Deutsche Bank AG dated 2/18/05 | | $ | (43.00 | ) | |
| | | | | | | to pay 2.25% per year times the notional amount. | | |
| | |
| | | | | | | The Fund receives payment only upon a default event | | |
| | |
| | | | | | | of Morgan Stanley Capital I, | | |
| | |
| | | | | | | Series 2005-WMC1, Class B3. | | | | | |
| | 45,000 | | | 4/25/35 | | Agreement with Deutsche Bank AG dated 2/18/05
to pay 2.25% per year times the notional amount.
The Fund receives payment only upon a default event
of Aames Mortgage Investment Trust,
Series 2005-1, Class M9. | | | 114.00
| | |
| | 45,000 | | | 10/25/35 | | Agreement with Deutsche Bank AG dated 2/18/05
to pay 2.25% per year times the notional amount.
The Fund receives payment only upon a default event
of Merrill Lynch Mortgage Investors,
Series 2005-NC1, Class B3. | | | 178.00
| | |
| | 45,000 | | | 10/25/35 | | Agreement with Deutsche Bank AG dated 2/18/05
to pay 1.30% per year times the notional amount.
The Fund receives payment only upon a default event
of Merrill Lynch Mortgage Investors,
Series 2005-NC1, Class B2. | | | (184.00)
| | |
| | 45,000 | | | 9/25/35 | | Agreement with Deutsche Bank AG dated 2/18/05
to pay 2.25% per year times the notional amount.
The Fund receives payment only upon a default event
of Merrill Lynch Mortgage Investors,
Series 2005-WMC1, Class B3. | | | (50.00)
| | |
| | 45,000 | | | 1/25/35 | | Agreement with Deutsche Bank AG dated 2/18/05
to pay 1.40% per year times the notional amount.
The Fund receives payment only upon a default event
of People's Choice Home Loan Securities Trust,
Series 2005-1, Class B2. | | | (101.00)
| | |
| | 45,000 | | | 2/25/35 | | Agreement with Deutsche Bank AG dated 2/18/05
to pay 1.25% per year times the notional amount.
The Fund receives payment only upon a default event
of Long Beach Mortgage Loan Trust,
Series 2005-1, Class M8. | | | 506.00
| | |
| | 45,000 | | | 3/25/35 | | Agreement with Deutsche Bank AG dated 2/18/05
to pay 2.25% per year times the notional amount.
The Fund receives payment only upon a default event
of New Century Home Equity Loan Trust,
Series 2005-1, Class M9. | | | 209.00
| | |
| | 45,000 | | | 1/25/36 | | Agreement with Deutsche Bank AG dated 2/18/05
to pay 2.25% per year times the notional amount.
The Fund receives payment only upon a default event
of Park Place Securities, Inc.,
Series 2005-WCH1, Class M9. | | | 503.00
| | |
| | 45,000 | | | 11/25/34 | | Agreement with Deutsche Bank AG dated 2/18/05
to pay 1.40% per year times the notional amount.
The Fund receives payment only upon a default event
of Argent Securities, Inc.,
Series 2004-W11, Class M9. | | | (41.00)
| | |
| | 45,000 | | | 2/25/35 | | Agreement with Deutsche Bank AG dated 2/18/05
to pay 2.25% per year times the notional amount.
The Fund receives payment only upon a default event
of Long Beach Mortgage Loan Trust,
Series 2005-1, Class M9. | | | 545.00
| | |
295
Notes to Financial Statements (Continued)
Notional
Amount | | Expiration
Date | | Description | | Net Unrealized
Appreciation
(Depreciation) | |
| $ | 45,000 | | | 1/25/34 | | Agreement with Deutsche Bank AG dated | | $ | 259.00 | | |
| | | | | | | 2/18/05 to pay 1.35% per year times the notional | | |
| | |
| | | | | | | amount. The Fund receives payment only upon a | | |
| | |
| | | | | | | default event of Park Place Securities, Inc., | | |
| | |
| | | | | | | Series 2005-WCH1, Class M8. | | | | | |
| | 45,000 | | | 11/25/34 | | Agreement with Deutsche Bank AG dated 2/18/05
to pay 2.25% per year times the notional amount.
The Fund receives payment only upon a default
event of Argent Securities, Inc.,
Series 2004-W11, Class M10. | | | 174.00
| | |
| | 45,000 | | | 3/25/35 | | Agreement with Deutsche Bank AG dated 2/18/05
to pay 1.30% per year times the notional amount.
The Fund receives payment only upon a default
event of New Century Home Equity Loan Trust,
Series 2005-1, Class M8. | | | (107.00)
| | |
| | 45,000 | | | 3/25/35 | | Agreement with Deutsche Bank AG dated 2/18/05
to pay 1.45% per year times the notional amount.
The Fund receives payment only upon a default
event of Aegis Asset Backed Securities Trust,
Series 2005-1, Class B2. | | | 2.00
| | |
| | 45,000 | | | 3/25/35 | | Agreement with Deutsche Bank AG dated 2/18/05
to pay 2.25% per year times the notional amount.
The Fund receives payment only upon a default
event of Aegis Asset Backed Securities Trust,
Series 2005-1, Class B3. | | | 317.00
| | |
| | 45,000 | | | 9/25/35 | | Agreement with Deutsche Bank AG dated 2/18/05
to pay 1.30% per year times the notional amount.
The Fund receives payment only upon a default
event of Merrill Lynch Mortgage Investors, Inc.,
Series 2005-WMC1, Class B2. | | | (185.00)
| | |
| | 45,000 | | | 1/25/35 | | Agreement with Deutsche Bank AG dated 2/18/05
to pay 2.25% per year times the notional amount.
The Fund receives payment only upon a default
event of People's Choice Home Loan Securities
Trust, Series 2005-1, Class B3. | | | 157.00
| | |
| | 45,000 | | | 6/25/35 | | Agreement with Deutsche Bank AG dated 2/18/05
to pay 1.35% per year times the notional amount.
The Fund receives payment only upon a default
event of Novastar Home Equity Loan Trust,
Series 2005-1, Class B2. | | | (51.00)
| | |
| | 45,000 | | | 6/25/35 | | Agreement with Deutsche Bank AG dated 2/18/05
to pay 2.25% per year times the notional amount.
The Fund receives payment only upon a default
event of Novastar Home Equity Loan Trust,
Series 2005-1, Class B3. | | | 5.00
| | |
| | 45,000 | | | 2/25/35 | | Agreement with Deutsche Bank AG dated 2/18/05
to pay 1.30% per year times the notional amount.
The Fund receives payment only upon a default
event of ACE Securities Corp.,
Series 2005-HE1, Class M8. | | | (206.00)
| | |
| | 45,000 | | | 11/25/34 | | Agreement with Deutsche Bank AG dated 2/18/05
to pay 1.40% per year times the notional amount.
The Fund receives payment only upon a default
event of Finance America Mortgage Loan,
Series 2004-3, Class M8. | | | (176.00)
| | |
296
Notes to Financial Statements (Continued)
Notional
Amount | | Expiration
Date | | Description | | Net Unrealized
Appreciation
(Depreciation) | |
| $ | 45,000 | | | 2/25/35 | | Agreement with Deutsche Bank AG dated 2/18/05 | | $ | 5.00 | | |
| | | | | | | to pay 2.20% per year times the notional amount. | | |
| | |
| | | | | | | The Fund receives payment only upon a default event | | |
| | |
| | | | | | | of ACE Securities Corp., | | |
| | |
| | | | | | | Series 2005-HE1, Class M9. | | | | | |
| | 45,000 | | | 11/25/34 | | Agreement with Deutsche Bank AG dated 2/18/05
to pay 2.25% per year times the notional amount.
The Fund receives payment only upon a default event
of Finance America Mortgage Loan,
Series 2004-3, Class M9. | | | 50.00
| | |
| | 45,000 | | | 12/25/34 | | Agreement with Deutsche Bank AG dated 2/18/05
to pay 1.25% per year times the notional amount.
The Fund receives payment only upon a default event
of MASTR Asset Backed Securities,
Series 2005-NC1, Class M8. | | | 93.00
| | |
| | 45,000 | | | 12/25/34 | | Agreement with Deutsche Bank AG dated 2/18/05
to pay 2.20% per year times the notional amount.
The Fund receives payment only upon a default event
of MASTR Asset Backed Securities,
Series 2005-NC1, Class M9. | | | 44.00
| | |
| | 120,000 | | | 12/20/09 | | Agreement with Goldman Sachs dated 4/06/05
to receive 4.00% per year times the notional amount.
The Fund makes payment only upon a default event
of an entity within the CDX.NA.HY.3 B IBOXX Index. | | | 6,037.00
| | |
| | 100,000 | | | 6/20/10 | | Agreement with Goldman Sachs dated 5/03/05
to receive 4.75% per year times the notional amount.
The Fund makes payment only upon a default event
of Ford Motor Credit Company, 7.00%, due 10/01/13. | | | (17.00)
| | |
| | 500,000 | | | 6/20/10 | | Agreement with Goldman Sachs dated 5/11/05
to receive 0.40% per year times the notional amount.
The Fund makes payment only upon a default event
of an entity within the CDX.NA.IG.4 IBOXX Index. | | | 5.00
| | |
| | 1,200,000 | | | 6/20/10 | | Agreement with Goldman Sachs dated 5/13/05
to receive 0.40% per year times the notional amount.
The Fund makes payment only upon a default event
of an entity within the CDX.NA.IG.4 IBOXX Index. | | | 12.00
| | |
| | 60,000 | | | 9/20/10 | | Agreement with Deutsche Bank AG dated 7/27/05
to receive 2.30% per year times the notional amount.
The Fund makes payment only upon a default event
of Eastman Kodak Company, 7.25%, due 11/15/13 | | | (425.00)
| | |
Interest Rate
Swaps | | | | | | | | | |
| | 4,170,000 USD
| | | 1/10/08
| | Agreement with Deutsche Bank AG dated 1/06/05
to receive the notional amount multiplied by 3.754%
and to pay the notional amount multiplied by the
3 month Floating Rate LIBOR. | | | (114,007.00)
| | |
| | 2,510,000 USD
| | | 6/17/10
| | Agreement with Deutsche Bank AG dated 6/15/05
to receive the notional amount multiplied by 4.313%
and to pay the notional amount multiplied by the
3 month Floating Rate LIBOR. | | | (115,744.00)
| | |
| | | $ | (260,979.00 | ) | |
297
Notes to Financial Statements (Continued)
Allocation of Operating Activity In maintaining the records for the Funds, the income and expense accounts are allocated to each class of shares. Investment income, unrealized and realized gains or losses are prorated among the classes of shares based on the relative net assets of each. Expenses are allocated to each class of shares depending on the nature of the expenditures. Administration and service fees, which are directly attributable to a class of shares, are charged to that class' operations. Expenses of the Fund not directly attributable to the operations of any class of shares or Fund are prorated among the Funds and classes to which the expense relates based on the relative net assets of each.
In addition, the Destination Retirement Income Fund, Destination Retirement 2010 Fund, Destination Retirement 2020 Fund, Destination Retirement 2030 Fund and Destination Retirement 2040 Fund will also incur certain fees and expenses indirectly as a shareholder in the underlying funds. Because the underlying funds have varied expense and fee levels and each Fund may own different proportions of underlying funds at different times, the amount of fees and expenses indirectly incurred by each Fund will vary.
Foreign Securities The Overseas Fund invests substantially all of its assets in foreign securities. The other Funds may also invest in foreign securities, subject to certain percentage restrictions. Investing in securities of foreign companies and foreign governments involves special risks and considerations not typically associated with investing in securities of U.S. companies and the U.S. Government. These risks include revaluation of currencies and future adverse political and economic developments. Moreover, securities of many foreign companies and foreign governments and their markets may be less liquid and their prices more volatile than those of securities of comparable U.S. companies and the U.S. Government.
3. Management
Fees and Other
Transactions
Investment Management Fees Under agreements between the Trust and Massachusetts Mutual Life Insurance Company ("MassMutual") on behalf of each Fund, MassMutual is responsible for providing investment management services for each Fund. In return for this service, MassMutual receives advisory fees monthly based upon each Fund's average daily net assets at the following annual rates:
| Strategic Bond Fund | | | 0.55 | % | | Small Cap Value Equity | | | 0.75 | % | |
| Strategic Balanced Fund | | | 0.60 | % | | Small Company Value Fund | | | 0.85 | % | |
| Diversified Value Fund | | | 0.50 | % | | Small Cap Core Equity Fund | | | 0.75 | % | |
| Fundamental Value Fund | | | 0.65 | % | | Mid Cap Growth Equity Fund | | | 0.70 | % | |
| Value Equity Fund | | | 0.70 | % | | Mid Cap Growth Equity II Fund | | | 0.75 | % | |
| Large Cap Value Fund | | | 0.65 | % | | Small Cap Growth Equity Fund | | | 0.82 | % | |
| Indexed Equity Fund | | | 0.10 | % | | Small Company Growth Fund | | | 0.85 | % | |
| Core Opportunities Fund | | | 0.70 | % | | Emerging Growth Fund | | | 0.79 | % | |
| Blue Chip Growth Fund | | | 0.70 | % | | Overseas Fund | | | 1.00 | % | |
| Large Cap Growth Fund | | | 0.65 | % | | Destination Retirement Income Fund | | | 0.05 | % | |
| Growth Equity Fund | | | 0.68 | % | | Destination Retirement 2010 Fund | | | 0.05 | % | |
| Aggressive Growth Fund | | | 0.73 | % | | Destination Retirement 2020 Fund | | | 0.05 | % | |
| OTC 100 Fund | | | 0.15 | % | | Destination Retirement 2030 Fund | | | 0.05 | % | |
| Focused Value Fund | | | 0.69 | % | | Destination Retirement 2040 Fund | | | 0.05 | % | |
MassMutual has also entered into investment sub-advisory agreements with the following unaffiliated investment sub-advisers: AllianceBernstein L.P. for the Diversified Value Fund and the Large Cap Growth Fund; Wellington Management Company, LLP for the Fundamental Value Fund and a portion of the Small Cap Growth Equity Fund; Fidelity Management & Research Company for the Value Equity Fund; Davis Selected Advisers, L.P. for the Large Cap Value Fund; Northern Trust Investments, N.A. for the Indexed Equity Fund and the OTC 100 Fund; Grantham, Mayo, Van Otterloo & Co. LLC
298
Notes to Financial Statements (Continued)
for the Growth Equity Fund; Sands Capital Management, LLC for a portion of the Aggressive Growth Fund; Cooke & Bieler, L.P. for a portion of the Focused Value Fund; Harris Associates, L.P. for a portion of the Focused Value Fund and a portion of the Overseas Fund; Clover Capital Management, Inc. for a portion of the Small Company Value Fund; EARNEST Partners, LLC for a portion of the Small Company Value Fund; Navellier & Associates, Inc. for the Mid Cap Growth Equity Fund; T. Rowe Price Associates, Inc. for the Blue Chip Growth Fund, the Mid Cap Growth Equity II Fund and a portion of the Small Company Value Fund; Waddell & Reed Investment Management Company for a portion of the Small Cap Growth Equity Fund; Mazama Capital Management, Inc. for a portion of the Small Company Growth Fund; Eagle Asset Management, Inc. for a portion of the Small Company Growth Fund; RS Investment Management, L.P. for the Emerging Growth Fund; Massachu setts Financial Services Company for a portion of the Overseas Fund; Western Asset Management Company for a portion of the Strategic Bond Fund and a portion of the Strategic Balanced Fund; Western Asset Management Company Limited for a portion of the Strategic Bond Fund and a portion of the Strategic Balanced Fund; Salomon Brothers Asset Management Inc for a portion of the Strategic Balanced Fund; Victory Capital Management, Inc. for the Core Opportunities Fund; SSgA Funds Management, Inc. for the Small Cap Value Equity Fund; and Goldman Sachs Asset Management, L.P. for the Small Cap Core Equity Fund. Effective June 5, 2006, Delaware Management Company manages the investment and reinvestment for a portion of the Aggressive Growth Fund. Prior to February 16, 2006, Fidelity Management & Research Company managed the investment and reinvestment of the Blue Chip Growth Fund. MassMutual pays a sub-advisory fee to each of these sub-advisers based upon the aggregate net assets under management which include (1) the average daily net assets of the specified Fund which it manages, and (2) the average daily net assets of all other funds or accounts of MassMutual or its affiliates for which the sub-adviser provides sub-advisory services and which have substantially the same investment objective, policies and investment strategies.
Administration Fees Under separate administrative and shareholder services agreements between each Fund and MassMutual, MassMutual provides certain administrative and shareholder services and bears some class specific administrative expenses. In return for these services, MassMutual receives an administrative services fee monthly based upon the average daily net assets of the applicable class of shares of the Fund at the following annual rates:
| | | Class A | | Class L | | Class Y | | Class S | | Class Z | | Class N | |
| Strategic Bond Fund | | | 0.2500 | % | | | 0.2500 | % | | | 0.1000 | % | | | 0.0500 | % | | N/A | | | 0.3000 | % | |
| Strategic Balanced Fund | | | 0.3270 | % | | | 0.3270 | % | | | 0.1770 | % | | | 0.1270 | % | | N/A | | | 0.3770 | % | |
| Diversified Value Fund | | | 0.3083 | % | | | 0.2683 | % | | | 0.1583 | % | | | 0.0583 | % | | N/A | | | 0.3683 | % | |
| Fundamental Value Fund | | | 0.3129 | % | | | 0.3129 | % | | | 0.1629 | % | | | 0.1229 | % | | N/A | | | 0.3629 | % | |
| Value Equity Fund | | | 0.2785 | % | | | 0.2785 | % | | | 0.1285 | % | | | 0.0785 | % | | N/A | | | 0.3285 | % | |
| Large Cap Value Fund | | | 0.3244 | % | | | 0.3244 | % | | | 0.1744 | % | | | 0.0844 | % | | N/A | | | 0.3744 | % | |
| Indexed Equity Fund | | | 0.4797 | % | | | 0.4797 | % | | | 0.3297 | % | | | 0.2997 | % | | | 0.0855 | % | | | 0.5297 | % | |
| Core Opportunities Fund | | | 0.3000 | % | | | 0.3000 | % | | | 0.1500 | % | | | 0.0500 | % | | N/A | | | 0.3500 | % | |
| Blue Chip Growth Fund | | | 0.4085 | % | | | 0.4085 | % | | | 0.2885 | % | | | 0.1585 | % | | N/A | | | 0.4585 | % | |
| Large Cap Growth Fund | | | 0.3529 | % | | | 0.3529 | % | | | 0.2029 | % | | | 0.1629 | % | | N/A | | | 0.4029 | % | |
| Growth Equity Fund | | | 0.2975 | % | | | 0.2975 | % | | | 0.1475 | % | | | 0.0875 | % | | N/A | | | 0.3475 | % | |
| Aggressive Growth Fund | | | 0.3444 | % | | | 0.3444 | % | | | 0.1944 | % | | | 0.0944 | % | | N/A | | | 0.3944 | % | |
| OTC 100 Fund | | | 0.6244 | % | | | 0.6244 | % | | | 0.4744 | % | | | 0.3744 | % | | N/A | | | 0.6744 | % | |
| Focused Value Fund | | | 0.3344 | % | | | 0.3344 | % | | | 0.1844 | % | | | 0.0844 | % | | N/A | | | 0.3844 | % | |
| Small Cap Value Equity Fund | | | 0.3000 | % | | | 0.3000 | % | | | 0.1500 | % | | | 0.0500 | % | | N/A | | | 0.3500 | % | |
| Small Company Value Fund | | | 0.3593 | % | | | 0.3593 | % | | | 0.2093 | % | | | 0.1693 | % | | N/A | | | 0.4093 | % | |
| Small Cap Core Equity | | | 0.3000 | % | | | 0.3000 | % | | | 0.1500 | % | | | 0.0500 | % | | N/A | | | 0.3500 | % | |
| Mid Cap Growth Equity Fund | | | 0.3075 | % | | | 0.3075 | % | | | 0.1575 | % | | | 0.0875 | % | | N/A | | | 0.3575 | % | |
| Mid Cap Growth Equity II Fund | | | 0.3244 | % | | | 0.3244 | % | | | 0.1744 | % | | | 0.0844 | % | | N/A | | | 0.3744 | % | |
| Small Cap Growth Equity Fund | | | 0.4075 | % | | | 0.4075 | % | | | 0.2575 | % | | | 0.1175 | % | | N/A | | | 0.4575 | % | |
| Small Company Growth Fund | | | 0.3491 | % | | | 0.3491 | % | | | 0.1991 | % | | | 0.1591 | % | | N/A | | | 0.3991 | % | |
299
Notes to Financial Statements (Continued)
| | | Class A | | Class L | | Class Y | | Class S | | Class Z | | Class N | |
| Emerging Growth Fund | | | 0.3344 | % | | | 0.3344 | % | | | 0.1844 | % | | | 0.0844 | % | | N/A | | | 0.3844 | % | |
| Overseas Fund | | | 0.2443 | % | | | 0.2443 | % | | | 0.0943 | % | | | 0.0443 | % | | N/A | | | 0.2943 | % | |
Destination Retirement
Income Fund | | | 0.1459 | % | | | 0.1459 | % | | | 0.0459 | % | | | 0.0020 | % | | N/A | | | 0.1959 | % | |
Destination Retirement
2010 Fund | | | 0.1696 | % | | | 0.1696 | % | | | 0.0696 | % | | | 0.0196 | % | | N/A | | | 0.2196 | % | |
Destination Retirement
2020 Fund | | | 0.1758 | % | | | 0.1758 | % | | | 0.0758 | % | | | 0.0258 | % | | N/A | | | 0.2258 | % | |
Destination Retirement
2030 Fund | | | 0.1733 | % | | | 0.1733 | % | | | 0.0733 | % | | | 0.0233 | % | | N/A | | | 0.2233 | % | |
Destination Retirement
2040 Fund | | | 0.1616 | % | | | 0.1616 | % | | | 0.0616 | % | | | 0.0116 | % | | N/A | | | 0.2116 | % | |
Distribution and Service Fees MML Distributors, LLC (the "Distributor") acts as distributor to each Fund. Pursuant to separate 12b-1 Plans adopted by the Funds, Class A shares of each fund pay a fee of 0.25% of the average daily net asset value of the Fund to: (i) the Distributor for services provided and expenses incurred by its connection with the distribution of Class A shares of the Fund; and (ii) MassMutual for services provided and expenses incurred by it for purposes of maintaining or providing personal services to Class A shareholders. Pursuant to separate 12b-1 Plans adopted by the Funds, Class N shares of each fund pay a fee of 0.50% of the average daily net asset value of the Fund as follows: 0.25% of the average daily net asset value of the Fund to the Distributor for services provided and expenses incurred by its connection with the distrib ution of Class N shares of the Fund; and 0.25% of the average daily net asset value of the Fund to MassMutual for services provided and expenses incurred by it for purposes of maintaining or providing personal services to Class N shareholders. The Distribution fee may be spent by the Distributor on any activities or expenses primarily intended to result in the sale of Class A or Class N shares of the Fund. The Servicing Fee may be spent by MassMutual on personal services rendered to Class A or Class N shareholders of a Fund and/or maintenance of Class A or Class N shareholder accounts. The Distributor is a majority owned subsidiary of MassMutual. In addition, OppenheimerFunds Distributor, Inc. (the "Sub-Distributor") acts as a sub-distributor to each Fund. The Sub-Distributor is an affiliate of the Distributor and an indirect majority owned subsidiary of MassMutual.
Indirect Expenses The Destination Retirement Income Fund, Destination Retirement 2010 Fund, Destination Retirement 2020 Fund, Destination Retirement 2030 Fund and Destination Retirement 2040 Fund incur fees and expenses indirectly as shareholders in the underlying funds. For the the six months ended June 30, 2006, these expenses were as follows:
| | | Indirect
Operating
Expenses | |
| Destination Retirement Income Fund | | | 0.64 | % | |
| Destination Retirement 2010 Fund | | | 0.69 | % | |
| Destination Retirement 2020 Fund | | | 0.74 | % | |
| Destination Retirement 2030 Fund | | | 0.84 | % | |
| Destination Retirement 2040 Fund | | | 0.87 | % | |
300
Notes to Financial Statements (Continued)
Expense Caps and Waivers MassMutual agreed to cap the fees and expenses of the following Funds through March 31, 2007, unless otherwise noted, as follows:
| | | Class A | | Class L | | Class Y | | Class S | | Class N | |
| Strategic Bond Fund | | | 1.00 | % | | | 0.75 | % | | | 0.75 | % | | | 0.70 | % | | | 1.30 | % | |
| Strategic Balanced Fund | | | 1.21 | % | | | 0.96 | % | | | 0.81 | % | | | 0.76 | % | | | 1.51 | % | |
| Diversified Value Fund* | | | 1.09 | % | | | 0.80 | % | | | 0.69 | % | | | 0.59 | % | | | 1.40 | % | |
| Core Opportunities Fund | | | 1.35 | % | | | 1.10 | % | | | 0.95 | % | | | 0.90 | % | | | 1.65 | % | |
| Small Cap Value Equity Fund | | | 1.40 | % | | | 1.15 | % | | | 1.00 | % | | | 0.95 | % | | | 1.70 | % | |
| Small Cap Core Equity Fund | | | 1.40 | % | | | 1.15 | % | | | 1.00 | % | | | 0.95 | % | | | 1.70 | % | |
| Destination Retirement Income Fund | | | 0.50 | % | | | 0.25 | % | | | 0.15 | % | | | 0.12 | % | | | 0.80 | % | |
| Destination Retirement 2010 Fund | | | 0.50 | % | | | 0.25 | % | | | 0.15 | % | | | 0.10 | % | | | 0.80 | % | |
| Destination Retirement 2020 Fund | | | 0.50 | % | | | 0.25 | % | | | 0.15 | % | | | 0.10 | % | | | 0.80 | % | |
| Destination Retirement 2030 Fund | | | 0.50 | % | | | 0.25 | % | | | 0.15 | % | | | 0.10 | % | | | 0.80 | % | |
| Destination Retirement 2040 Fund | | | 0.50 | % | | | 0.25 | % | | | 0.15 | % | | | 0.10 | % | | | 0.80 | % | |
* Expense caps in effect through April 30, 2006.
Effective March 31, 2006, MassMutual has agreed to voluntarily waive, through March 31, 2007, 0.20% of the administration fees for Classes A, L and N of the Indexed Equity Fund and 0.10% of the administration fees for Classes A, L and N of the Overseas Fund. MassMutual has also agreed to voluntarily waive, through March 31, 2007, 0.10% of the management fees for each class of the Blue Chip Growth Fund. Effective May 1, 2005, MassMutual has agreed to voluntarily waive, through March 31, 2006, 0.08% of the management fee of all classes of the Aggressive Growth Fund.
Brokerage Commissions The Strategic Balanced Fund, Fundamental Value Fund, Value Equity Fund, Large Cap Value Fund, Blue Chip Growth Fund, Large Cap Growth Fund, Aggressive Growth Fund, Focused Value Fund, Small Company Value Fund, Mid Cap Growth Equity Fund, Mid Cap Growth Equity II Fund, Small Cap Growth Equity Fund, Small Company Growth Fund, Emerging Growth Fund and Overseas Fund have entered into agreements with certain brokers whereby the brokers will rebate, in cash, a portion of brokerage commissions. For the the six months ended June 30, 2006, brokerage commissions under these agreements are as follows:
| | | Commissions | |
| Strategic Balanced Fund | | $ | 7,879 | | |
| Fundamental Value Fund | | | 50,673 | | |
| Value Equity Fund | | | 12,180 | | |
| Blue Chip Growth Fund | | | 29,451 | | |
| Large Cap Growth Fund | | | 8,564 | | |
| Aggressive Growth Fund | | | 17,267 | | |
| Focused Value Fund | | | 91,632 | | |
| Small Company Value Fund | | | 114,062 | | |
| Mid Cap Growth Equity Fund | | | 26,319 | | |
| Mid Cap Growth Equity II Fund | | | 55,617 | | |
| Small Cap Growth Equity Fund | | | 122,376 | | |
| Small Company Growth Fund | | | 51,769 | | |
| Overseas Fund | | | 34,713 | | |
Other Certain officers and trustees of the Funds are also officers of MassMutual. The compensation of each trustee who is not an officer of MassMutual is borne by the Funds.
301
Notes to Financial Statements (Continued)
The following table shows certain concentrations of principal shareholders of each Fund with record or Beneficial ownership as of June 30, 2006. Investment activities of these shareholders could have a material effect on the respective Fund.
| | | Shareholders
Holding in Excess of
10% of Fund's
Outstanding Shares
("Principal Shareholders") | | Total % owned
by Principal
Shareholders | | Total %
Ownership by
Related Party | |
| Strategic Bond Fund | | | 3 | | | | 80.1 | % | | | 90.4 | % | |
| Strategic Balanced Fund | | | 2 | | | | 69.4 | % | | | 87.6 | % | |
| Diversified Value Fund | | | 2 | | | | 66.6 | % | | | 90.9 | % | |
| Fundamental Value Fund | | | 3 | | | | 63.9 | % | | | 94.6 | % | |
| Value Equity Fund | | | 2 | | | | 83.2 | % | | | 96.6 | % | |
| Large Cap Value Fund | | | 3 | | | | 92.5 | % | | | 59.7 | % | |
| Indexed Equity Fund | | | 5 | | | | 87.7 | % | | | 88.6 | % | |
| Core Opportunities Fund | | | 1 | | | | 80.6 | % | | | 90.4 | % | |
| Blue Chip Growth Fund | | | 2 | | | | 81.7 | % | | | 99.7 | % | |
| Large Cap Growth Fund | | | 3 | | | | 59.7 | % | | | 92.5 | % | |
| Growth Equity Fund | | | 3 | | | | 48.8 | % | | | 97.8 | % | |
| Aggressive Growth Fund | | | 3 | | | | 50.4 | % | | | 95.5 | % | |
| OTC 100 Fund | | | 3 | | | | 91.4 | % | | | 95.6 | % | |
| Focused Value Fund | | | 4 | | | | 79.2 | % | | | 94.6 | % | |
| Small Cap Value Equity Fund | | | 2 | | | | 96.5 | % | | | 100.0 | % | |
| Small Company Value Fund | | | 3 | | | | 68.8 | % | | | 88.4 | % | |
| Small Cap Core Equity Fund | | | 1 | | | | 91.4 | % | | | 100.0 | % | |
| Mid Cap Growth Equity Fund | | | 4 | | | | 94.4 | % | | | 99.2 | % | |
| Mid Cap Growth Equity II Fund | | | 4 | | | | 76.5 | % | | | 86.2 | % | |
| Small Cap Growth Equity Fund | | | 4 | | | | 94.0 | % | | | 95.5 | % | |
| Small Company Growth Fund | | | 4 | | | | 86.3 | % | | | 93.3 | % | |
| Emerging Growth Fund | | | 6 | | | | 82.3 | % | | | 100.0 | % | |
| Overseas Fund | | | 4 | | | | 69.7 | % | | | 96.1 | % | |
| Destination Retirement Income Fund | | | 2 | | | | 77.5 | % | | | 54.3 | % | |
| Destination Retirement 2010 Fund | | | 3 | | | | 69.1 | % | | | 78.2 | % | |
| Destination Retirement 2020 Fund | | | 3 | | | | 78.4 | % | | | 86.2 | % | |
| Destination Retirement 2030 Fund | | | 3 | | | | 78.6 | % | | | 85.8 | % | |
| Destination Retirement 2040 Fund | | | 2 | | | | 66.2 | % | | | 79.0 | % | |
Principal shareholders hold 10% or more of shares outstanding.
Deferred Compensation Trustees of the Funds that are not employees of MassMutual or its subsidiaries may elect to defer receipt of their annual fees in accordance with terms of the Non-Qualified Deferred Compensation Plan. Any amounts deferred shall accrue interest at a rate equal to eight percent (8%) per annum
For the the six months ended June 30, 2006, no significant amounts have been deferred.
302
Notes to Financial Statements (Continued)
4. Purchases and Sales of Investments Cost of purchases and proceeds from sales of investment securities (excluding short-term investments) for the the six months ended June 30, 2006, were as follows:
| | | | | Long-Term U.S.
Government Securities | | Other Long-Term
Securities | |
| Purchases | | Strategic Bond Fund | | $ | 221,181,631 | | | $ | 36,102,637 | | |
| | | Strategic Balanced Fund | | | 96,688,387 | | | | 33,831,580 | | |
| | | Diversified Value Fund | | | - | | | | 110,835,261 | | |
| | | Fundamental Value Fund | | | - | | | | 226,711,382 | | |
| | | Value Equity Fund | | | - | | | | 51,193,712 | | |
| | | Large Cap Value Fund | | | - | | | | 146,725,768 | | |
| | | Indexed Equity Fund | | | - | | | | 52,012,443 | | |
| | | Core Opportunities Fund | | | - | | | | 14,617,634 | | |
| | | Blue Chip Growth Fund | | | - | | | | 334,190,918 | | |
| | | Large Cap Growth Fund | | | - | | | | 18,090,120 | | |
| | | Growth Equity Fund | | | - | | | | 597,564,132 | | |
| | | Aggressive Growth Fund | | | - | | | | 218,238,417 | | |
| | | OTC 100 Fund | | | - | | | | 1,953,842 | | |
| | | Focused Value Fund | | | - | | | | 171,742,699 | | |
| | | Small Cap Value Equity Fund | | | - | | | | 14,005,170 | | |
| | | Small Company Value Fund | | | - | | | | 280,419,315 | | |
| | | Small Cap Core Equity Fund | | | - | | | | 15,133,503 | | |
| | | Mid Cap Growth Equity Fund | | | - | | | | 114,591,228 | | |
| | | Mid Cap Growth Equity II Fund | | | - | | | | 317,668,278 | | |
| | | Small Cap Growth Equity Fund | | | - | | | | 282,392,162 | | |
| | | Small Company Growth Fund | | | - | | | | 94,946,114 | | |
| | | Emerging Growth Fund | | | - | | | | 111,950,310 | | |
| | | Overseas Fund | | | - | | | | 318,230,826 | | |
| | | Destination Retirement Income Fund | | | - | | | | 26,410,423 | | |
| | | Destination Retirement 2010 Fund | | | - | | | | 43,412,888 | | |
| | | Destination Retirement 2020 Fund | | | - | | | | 93,968,985 | | |
| | | Destination Retirement 2030 Fund | | | - | | | | 78,074,067 | | |
| | | Destination Retirement 2040 Fund | | | - | | | | 58,021,908 | | |
| Sales | | Strategic Bond Fund | | $ | 233,853,350 | | | $ | 15,762,981 | | |
| | | Strategic Balanced Fund | | | 106,441,654 | | | | 47,548,460 | | |
| | | Diversified Value Fund | | | - | | | | 30,374,250 | | |
| | | Fundamental Value Fund | | | - | | | | 149,894,417 | | |
| | | Value Equity Fund | | | - | | | | 52,862,538 | | |
| | | Large Cap Value Fund | | | - | | | | 116,948,489 | | |
| | | Indexed Equity Fund | | | - | | | | 55,493,866 | | |
| | | Core Opportunities Fund | | | - | | | | 3,365,056 | | |
| | | Blue Chip Growth Fund | | | - | | | | 289,946,678 | | |
| | | Large Cap Growth Fund | | | - | | | | 22,262,015 | | |
| | | Growth Equity Fund | | | - | | | | 619,647,918 | | |
| | | Aggressive Growth Fund | | | - | | | | 142,469,838 | | |
| | | OTC 100 Fund | | | - | | | | 10,878,739 | | |
| | | Focused Value Fund | | | - | | | | 187,729,990 | | |
| | | Small Cap Value Equity Fund | | | - | | | | 2,901,974 | | |
| | | Small Company Value Fund | | | - | | | | 163,147,144 | | |
| | | Small Cap Core Equity Fund | | | - | | | | 4,095,633 | | |
| | | Mid Cap Growth Equity Fund | | | - | | | | 95,535,451 | | |
| | | Mid Cap Growth Equity II Fund | | | - | | | | 252,094,910 | | |
| | | Small Cap Growth Equity Fund | | | - | | | | 248,949,945 | | |
| | | Small Company Growth Fund | | | - | | | | 86,014,046 | | |
| | | Emerging Growth Fund | | | - | | | | 123,137,007 | | |
| | | Overseas Fund | | | - | | | | 182,867,141 | | |
| | | Destination Retirement Income Fund | | | - | | | | 21,123,773 | | |
| | | Destination Retirement 2010 Fund | | | - | | | | 10,551,538 | | |
| | | Destination Retirement 2020 Fund | | | - | | | | 25,877,092 | | |
| | | Destination Retirement 2030 Fund | | | - | | | | 20,619,634 | | |
| | | Destination Retirement 2040 Fund | | | - | | | | 14,978,668 | | |
303
Notes to Financial Statements (Continued)
5. Capital Share Transactions The Funds are authorized to issue an unlimited number of shares, with no par value in each class of shares. Changes in shares outstanding for each Fund are as follows:
| | | Class A | |
| | | Six months ended June 30, 2006 | | Year ended December 31, 2005 | |
| | | Shares | | Amount | | Shares | | Amount | |
| Strategic Bond Fund | |
| Sold | | | 1,283,681 | | | $ | 12,709,147 | | | | 2,348,884 | | | $ | 23,729,809 | | |
| Issued as reinvestment of dividends | | | - | | | | - | | | | 34,157 | | | | 340,548 | | |
| Redeemed | | | (355,677 | ) | | | (3,526,191 | ) | | | (317,132 | ) | | | (3,203,350 | ) | |
| Net increase (decrease) | | | 928,004 | | | $ | 9,182,956 | | | | 2,065,909 | | | $ | 20,867,007 | | |
| Strategic Balanced Fund | |
| Sold | | | 448,199 | | | $ | 4,838,199 | | | | 1,708,793 | | | $ | 17,969,339 | | |
| Issued as reinvestment of dividends | | | - | | | | - | | | | 54,452 | | | | 577,731 | | |
| Redeemed | | | (293,158 | ) | | | (3,167,384 | ) | | | (2,432,523 | ) | | | (25,739,975 | ) | |
| Net increase (decrease) | | | 155,041 | | | $ | 1,670,815 | | | | (669,278 | ) | | $ | (7,192,905 | ) | |
| Diversified Value Fund | |
| Sold | | | 1,542,590 | | | $ | 18,072,510 | | | | 2,536,289 | | | $ | 28,285,481 | | |
| Issued as reinvestment of dividends | | | - | | | | - | | | | 78,067 | | | | 882,209 | | |
| Redeemed | | | (496,877 | ) | | | (5,861,198 | ) | | | (410,569 | ) | | | (4,614,435 | ) | |
| Net increase (decrease) | | | 1,045,713 | | | $ | 12,211,312 | | | | 2,203,787 | | | $ | 24,553,255 | | |
| Fundamental Value Fund | |
| Sold | | | 3,516,000 | | | $ | 41,346,880 | | | | 6,995,767 | | | $ | 77,210,290 | | |
| Issued as reinvestment of dividends | | | - | | | | - | | | | 728,863 | | | | 8,163,269 | | |
| Redeemed | | | (4,213,374 | ) | | | (49,151,519 | ) | | | (5,061,414 | ) | | | (55,725,222 | ) | |
| Net increase (decrease) | | | (697,374 | ) | | $ | (7,804,639 | ) | | | 2,663,216 | | | $ | 29,648,337 | | |
| Value Equity Fund | |
| Sold | | | 438,199 | | | $ | 4,760,289 | | | | 532,262 | | | $ | 5,699,921 | | |
| Issued as reinvestment of dividends | | | - | | | | - | | | �� | 249,642 | | | | 2,638,317 | | |
| Redeemed | | | (442,568 | ) | | | (4,913,000 | ) | | | (467,799 | ) | | | (4,998,635 | ) | |
| Net increase (decrease) | | | (4,369 | ) | | $ | (152,711 | ) | | | 314,105 | | | $ | 3,339,603 | | |
| Large Cap Value Fund | |
| Sold | | | 6,529,957 | | | $ | 75,228,578 | | | | 12,908,778 | | | $ | 136,784,623 | | |
| Issued as reinvestment of dividends | | | - | | | | - | | | | 138,374 | | | | 1,568,893 | | |
| Redeemed | | | (5,962,505 | ) | | | (68,547,689 | ) | | | (7,265,756 | ) | | | (77,425,645 | ) | |
| Net increase (decrease) | | | 567,452 | | | $ | 6,680,889 | | | | 5,781,396 | | | | 60,927,871 | | |
| Indexed Equity Fund | |
| Sold | | | 3,558,628 | | | $ | 41,960,828 | | | | 10,726,779 | | | $ | 119,454,364 | | |
| Issued as reinvestment of dividends | | | - | | | | - | | | | 232,429 | | | | 2,686,879 | | |
| Redeemed | | | (4,241,853 | ) | | | (50,091,829 | ) | | | (12,073,641 | ) | | | (135,126,396 | ) | |
| Net increase (decrease) | | | (683,225 | ) | | $ | (8,131,001 | ) | | | (1,114,433 | ) | | $ | (12,985,153 | ) | |
| Core Opportunities Fund* | |
| Sold | | | 86,753 | | | $ | 831,556 | | | | - | | | $ | - | | |
| Issued as reinvestment of dividends | | | - | | | | - | | | | - | | | | - | | |
| Redeemed | | | - | | | | - | | | | - | | | | - | | |
| Net increase (decrease) | | | 86,753 | | | $ | 831,556 | | | | - | | | $ | - | | |
| Blue Chip Growth Fund | |
| Sold | | | 790,568 | | | $ | 7,159,631 | | | | 1,455,755 | | | $ | 12,556,957 | | |
| Issued as reinvestment of dividends | | | - | | | | - | | | | - | | | | - | | |
| Redeemed | | | (949,246 | ) | | | (8,628,194 | ) | | | (1,652,833 | ) | | | (14,411,435 | ) | |
| Net increase (decrease) | | | (158,678 | ) | | $ | (1,468,563 | ) | | | (197,078 | ) | | $ | (1,854,478 | ) | |
| Large Cap Growth Fund | |
| Sold | | | 412,350 | | | $ | 4,238,350 | | | | 208,869 | | | $ | 2,008,589 | | |
| Issued as reinvestment of dividends | | | - | | | | - | | | | - | | | | - | | |
| Redeemed | | | (88,552 | ) | | | (913,202 | ) | | | (94,707 | ) | | | (889,862 | ) | |
| Net increase (decrease) | | | 323,798 | | | $ | 3,325,148 | | | | 114,162 | | | $ | 1,118,727 | | |
| Growth Equity Fund | |
| Sold | | | 2,700,428 | | | $ | 21,566,399 | | | | 8,481,315 | | | $ | 65,709,786 | | |
| Issued as reinvestment of dividends | | | - | | | | - | | | | 7,476 | | | | 60,480 | | |
| Redeemed | | | (12,050,569 | ) | | | (97,069,819 | ) | | | (8,918,946 | ) | | | (69,158,911 | ) | |
| Net increase (decrease) | | | (9,350,141 | ) | | $ | (75,503,420 | ) | | | (430,155 | ) | | $ | (3,388,645 | ) | |
304
Notes to Financial Statements (Continued)
| | | Class A | |
| | | Six months ended June 30, 2006 | | Year ended December 31, 2005 | |
| | | Shares | | Amount | | Shares | | Amount | |
| Aggressive Growth Fund | |
| Sold | | | 4,357,880 | | | $ | 27,268,897 | | | | 10,875,467 | | | $ | 64,044,062 | | |
| Issued as reinvestment of dividends | | | - | | | | - | | | | - | | | | - | | |
| Redeemed | | | (5,256,020 | ) | | | (32,847,547 | ) | | | (9,458,104 | ) | | | (54,789,105 | ) | |
| Net increase (decrease) | | | (898,140 | ) | | $ | (5,578,650 | ) | | | 1,417,363 | | | $ | 9,254,957 | | |
| OTC 100 Fund | |
| Sold | | | 655,770 | | | $ | 2,730,612 | | | | 1,767,636 | | | $ | 6,868,361 | | |
| Issued as reinvestment of dividends | | | - | | | | - | | | | - | | | | - | | |
| Redeemed | | | (1,414,736 | ) | | | (5,895,757 | ) | | | (3,272,640 | ) | | | (12,741,607 | ) | |
| Net increase (decrease) | | | (758,966 | ) | | $ | (3,165,145 | ) | | | (1,505,004 | ) | | $ | (5,873,246 | ) | |
| Focused Value Fund | |
| Sold | | | 2,581,452 | | | $ | 44,396,137 | | | | 5,964,966 | | | $ | 106,165,181 | | |
| Issued as reinvestment of dividends | | | - | | | | - | | | | 1,318,850 | | | | 22,393,140 | | |
| Redeemed | | | (3,599,660 | ) | | | (61,976,727 | ) | | | (5,062,999 | ) | | | (90,390,857 | ) | |
| Net increase (decrease) | | | (1,018,208 | ) | | $ | (17,580,590 | ) | | | 2,220,817 | | | $ | 38,167,464 | | |
| Small Cap Value Equity Fund* | |
| Sold | | | 10,010 | | | $ | 100,100 | | | | - | | | $ | - | | |
| Issued as reinvestment of dividends | | | - | | | | - | | | | - | | | | - | | |
| Redeemed | | | - | | | | - | | | | - | | | | - | | |
| Net increase (decrease) | | | 10,010 | | | $ | 100,100 | | | | - | | | $ | - | | |
| Small Company Value Fund | |
| Sold | | | 3,467,811 | | | $ | 54,253,296 | | | | 4,037,413 | | | $ | 57,388,767 | | |
| Issued as reinvestment of dividends | | | - | | | | - | | | | 413,561 | | | | 5,943,541 | | |
| Redeemed | | | (3,175,001 | ) | | | (48,599,962 | ) | | | (2,988,005 | ) | | | (42,291,187 | ) | |
| Net increase (decrease) | | | 292,810 | | | $ | 5,653,334 | | | | 1,462,969 | | | $ | 21,041,121 | | |
| Small Cap Core Equity Fund* | |
| Sold | | | 12,559 | | | $ | 123,752 | | | | - | | | $ | - | | |
| Issued as reinvestment of dividends | | | - | | | | - | | | | - | | | | - | | |
| Redeemed | | | - | | | | - | | | | - | | | | - | | |
| Net increase (decrease) | | | 12,559 | | | $ | 123,752 | | | | - | | | $ | - | | |
| Mid Cap Growth Equity Fund | |
| Sold | | | 1,171,958 | | | $ | 12,628,555 | | | | 1,790,605 | | | $ | 16,189,654 | | |
| Issued as reinvestment of dividends | | | - | | | | - | | | | - | | | | - | | |
| Redeemed | | | (917,522 | ) | | | (9,631,545 | ) | | | (1,714,635 | ) | | | (15,334,501 | ) | |
| Net increase (decrease) | | | 254,436 | | | $ | 2,997,010 | | | | 75,970 | | | $ | 855,153 | | |
| Mid Cap Growth Equity II Fund | |
| Sold | | | 5,836,211 | | | $ | 85,662,812 | | | | 11,001,863 | | | $ | 148,072,331 | | |
| Issued as reinvestment of dividends | | | - | | | | - | | | | 903,025 | | | | 12,815,323 | | |
| Redeemed | | | (5,041,087 | ) | | | (73,670,697 | ) | | | (5,868,872 | ) | | | (79,208,074 | ) | |
| Net increase (decrease) | | | 795,124 | | | $ | 11,992,115 | | | | 6,036,016 | | | $ | 81,679,580 | | |
| Small Cap Growth Equity Fund | |
| Sold | | | 2,041,638 | | | $ | 34,019,742 | | | | 3,171,862 | | | $ | 46,429,099 | | |
| Issued as reinvestment of dividends | | | - | | | | - | | | | - | | | | - | | |
| Redeemed | | | (1,251,529 | ) | | | (20,806,139 | ) | | | (2,345,197 | ) | | | (33,755,660 | ) | |
| Net increase (decrease) | | | 790,109 | | | $ | 13,213,603 | | | | 826,665 | | | $ | 12,673,439 | | |
| Small Company Growth Fund | |
| Sold | | | 2,357,556 | | | $ | 25,221,617 | | | | 2,412,491 | | | $ | 22,469,859 | | |
| Issued as reinvestment of dividends | | | - | | | | - | | | | 164,119 | | | | 1,516,456 | | |
| Redeemed | | | (2,018,000 | ) | | | (21,060,921 | ) | | | (2,800,416 | ) | | | (26,122,050 | ) | |
| Net increase (decrease) | | | 339,556 | | | $ | 4,160,696 | | | | (223,806 | ) | | $ | (2,135,735 | ) | |
| Emerging Growth Fund | |
| Sold | | | 791,091 | | | $ | 5,007,613 | | | | 1,437,251 | | | $ | 7,963,663 | | |
| Issued as reinvestment of dividends | | | - | | | | - | | | | - | | | | - | | |
| Redeemed | | | (653,961 | ) | | | (4,065,641 | ) | | | (3,505,464 | ) | | | (19,779,300 | ) | |
| Net increase (decrease) | | | 137,130 | | | $ | 941,972 | | | | (2,068,213 | ) | | $ | (11,815,637 | ) | |
305
Notes to Financial Statements (Continued)
| | | Class A | |
| | | Six months ended June 30, 2006 | | Year ended December 31, 2005 | |
| | | Shares | | Amount | | Shares | | Amount | |
| Overseas Fund | |
| Sold | | | 5,702,207 | | | $ | 68,066,185 | | | | 7,997,440 | | | $ | 89,794,360 | | |
| Issued as reinvestment of dividends | | | - | | | | - | | | | 1,788,506 | | | | 19,755,261 | | |
| Redeemed | | | (3,398,911 | ) | | | (40,173,056 | ) | | | (4,005,459 | ) | | | (44,912,290 | ) | |
| Net increase (decrease) | | | 2,303,296 | | | $ | 27,893,129 | | | | 5,780,487 | | | $ | 64,637,331 | | |
| Destination Retirement Income Fund | |
| Sold | | | 1,465,254 | | | $ | 15,003,876 | | | | 3,846,111 | | | $ | 39,845,126 | | |
| Issued as reinvestment of dividends | | | - | | | | - | | | | 154,128 | | | | 1,574,725 | | |
| Redeemed | | | (881,451 | ) | | | (9,018,195 | ) | | | (1,171,542 | ) | | | (12,106,406 | ) | |
| Net increase (decrease) | | | 583,803 | | | $ | 5,985,681 | | | | 2,828,697 | | | $ | 29,313,445 | | |
| Destination Retirement 2010 Fund | |
| Sold | | | 2,119,744 | | | $ | 22,636,971 | | | | 2,693,595 | | | $ | 28,652,005 | | |
| Issued as reinvestment of dividends | | | - | | | | - | | | | 96,655 | | | | 1,023,789 | | |
| Redeemed | | | (669,056 | ) | | | (7,140,972 | ) | | | (609,125 | ) | | | (6,467,029 | ) | |
| Net increase (decrease) | | | 1,450,688 | | | $ | 15,495,999 | | | | 2,181,125 | | | $ | 23,208,765 | | |
| Destination Retirement 2020 Fund | |
| Sold | | | 4,372,683 | | | $ | 48,315,814 | | | | 7,634,103 | | | $ | 82,762,667 | | |
| Issued as reinvestment of dividends | | | - | | | | - | | | | 281,451 | | | | 3,081,606 | | |
| Redeemed | | | (2,152,021 | ) | | | (23,815,214 | ) | | | (1,735,682 | ) | | | (18,619,028 | ) | |
| Net increase (decrease) | | | 2,220,662 | | | $ | 24,500,600 | | | | 6,179,872 | | | $ | 67,225,245 | | |
| Destination Retirement 2030 Fund | |
| Sold | | | 3,065,687 | | | $ | 36,119,648 | | | | 4,185,575 | | | $ | 47,223,105 | | |
| Issued as reinvestment of dividends | | | - | | | | - | | | | 147,156 | | | | 1,692,407 | | |
| Redeemed | | | (1,218,668 | ) | | | (14,345,806 | ) | | | (783,178 | ) | | | (8,743,024 | ) | |
| Net increase (decrease) | | | 1,847,019 | | | $ | 21,773,842 | | | | 3,549,553 | | | $ | 40,172,488 | | |
| Destination Retirement 2040 Fund | |
| Sold | | | 1,442,918 | | | $ | 17,513,062 | | | | 2,276,690 | | | $ | 25,804,156 | | |
| Issued as reinvestment of dividends | | | - | | | | - | | | | 57,348 | | | | 672,297 | | |
| Redeemed | | | (824,075 | ) | | | (9,954,001 | ) | | | (616,717 | ) | | | (6,904,448 | ) | |
| Net increase (decrease) | | | 618,843 | | | $ | 7,559,061 | | | | 1,717,321 | | | $ | 19,572,005 | | |
| | | Class L | |
| | | Six months ended June 30, 2006 | | Year ended December 31, 2005 | |
| | | Shares | | Amount | | Shares | | Amount | |
| Strategic Bond Fund | |
| Sold | | | 192,253 | | | $ | 1,919,565 | | | | 381,777 | | | $ | 3,834,876 | | |
| Issued as reinvestment of dividends | | | - | | | | - | | | | 6,718 | | | | 67,113 | | |
| Redeemed | | | (45,331 | ) | | | (448,952 | ) | | | (4,598 | ) | | | (46,287 | ) | |
| Net increase (decrease) | | | 146,922 | | | $ | 1,470,613 | | | | 383,897 | | | $ | 3,855,702 | | |
| Strategic Balanced Fund | |
| Sold | | | 927,622 | | | $ | 10,046,841 | | | | 2,279,647 | | | $ | 23,912,167 | | |
| Issued as reinvestment of dividends | | | - | | | | - | | | | 246,847 | | | | 2,621,520 | | |
| Redeemed | | | (2,004,372 | ) | | | (21,836,142 | ) | | | (2,982,704 | ) | | | (31,329,641 | ) | |
| Net increase (decrease) | | | (1,076,750 | ) | | $ | (11,789,301 | ) | | | (456,210 | ) | | $ | (4,795,954 | ) | |
| Diversified Value Fund | |
| Sold | | | 1,626,866 | | | $ | 19,303,763 | | | | 730,346 | | | $ | 8,208,910 | | |
| Issued as reinvestment of dividends | | | - | | | | - | | | | 80,411 | | | | 910,231 | | |
| Redeemed | | | (785,110 | ) | | | (9,207,377 | ) | | | (71,879 | ) | | | (799,692 | ) | |
| Net increase (decrease) | | | 841,756 | | | $ | 10,096,386 | | | | 738,878 | | | $ | 8,319,449 | | |
| Fundamental Value Fund | |
| Sold | | | 7,472,050 | | | $ | 87,754,010 | | | | 5,473,405 | | | $ | 60,338,413 | | |
| Issued as reinvestment of dividends | | | - | | | | - | | | | 707,403 | | | | 7,951,202 | | |
| Redeemed | | | (3,812,772 | ) | | | (44,959,169 | ) | | | (7,403,220 | ) | | | (81,342,279 | ) | |
| Net increase (decrease) | | | 3,659,278 | | | $ | 42,794,841 | | | | (1,222,412 | ) | | $ | (13,052,664 | ) | |
| Value Equity Fund | |
| Sold | | | 113,650 | | | $ | 1,243,545 | | | | 165,026 | | | $ | 1,775,094 | | |
| Issued as reinvestment of dividends | | | - | | | | - | | | | 78,361 | | | | 829,967 | | |
| Redeemed | | | (126,039 | ) | | | (1,431,038 | ) | | | (121,055 | ) | | | (1,294,772 | ) | |
| Net increase (decrease) | | | (12,389 | ) | | $ | (187,493 | ) | | | 122,332 | | | $ | 1,310,289 | | |
306
Notes to Financial Statements (Continued)
| | | Class L | |
| | | Six months ended June 30, 2006 | | Year ended December 31, 2005 | |
| | | Shares | | Amount | | Shares | | Amount | |
| Large Cap Value Fund | |
| Sold | | | 4,699,702 | | | $ | 54,138,036 | | | | 9,502,507 | | | $ | 101,174,284 | | |
| Issued as reinvestment of dividends | | | - | | | | - | | | | 215,532 | | | | 2,452,234 | | |
| Redeemed | | | (7,865,497 | ) | | | (90,656,614 | ) | | | (7,423,968 | ) | | | (79,093,818 | ) | |
| Net increase (decrease) | | | (3,165,795 | ) | | $ | (36,518,578 | ) | | | 2,294,071 | | | $ | 24,532,700 | | |
| Indexed Equity Fund | |
| Sold | | | 4,211,846 | | | $ | 50,087,765 | | | | 9,443,482 | | | $ | 106,083,646 | | |
| Issued as reinvestment of dividends | | | - | | | | - | | | | 322,255 | | | | 3,734,937 | | |
| Redeemed | | | (3,081,259 | ) | | | (36,549,137 | ) | | | (4,845,121 | ) | | | (54,272,071 | ) | |
| Net increase (decrease) | | | 1,130,587 | | | $ | 13,538,628 | | | | 4,920,616 | | | $ | 55,546,512 | | |
| Core Opportunites Fund* | |
| Sold | | | 135,698 | | | $ | 1,362,712 | | | | - | | | $ | - | | |
| Issued as reinvestment of dividends | | | - | | | | - | | | | - | | | | - | | |
| Redeemed | | | (11,224 | ) | | | (108,388 | ) | | | - | | | | - | | |
| Net increase (decrease) | | | 124,474 | | | $ | 1,254,324 | | | | - | | | $ | - | | |
| Blue Chip Growth Fund | |
| Sold | | | 7,030,822 | | | $ | 64,909,562 | | | | 7,456,352 | | | $ | 64,885,981 | | |
| Issued as reinvestment of dividends | | | - | | | | - | | | | 7,024 | | | | 64,479 | | |
| Redeemed | | | (6,729,027 | ) | | | (61,841,403 | ) | | | (12,031,297 | ) | | | (104,890,654 | ) | |
| Net increase (decrease) | | | 301,795 | | | $ | 3,068,159 | | | | (4,567,921 | ) | | $ | (39,940,194 | ) | |
| Large Cap Growth Fund | |
| Sold | | | 340,152 | | | $ | 3,591,722 | | | | 89,542 | | | $ | 872,243 | | |
| Issued as reinvestment of dividends | | | - | | | | - | | | | - | | | | - | | |
| Redeemed | | | (219,722 | ) | | | (2,136,809 | ) | | | (1,011,711 | ) | | | (8,818,021 | ) | |
| Net increase (decrease) | | | 120,430 | | | $ | 1,454,913 | | | | (922,169 | ) | | $ | (7,945,778 | ) | |
| Growth Equity Fund | |
| Sold | | | 15,475,984 | | | $ | 122,943,231 | | | | 8,023,892 | | | $ | 62,496,167 | | |
| Issued as reinvestment of dividends | | | - | | | | - | | | | 99,452 | | | | 813,516 | | |
| Redeemed | | | (7,479,321 | ) | | | (59,473,621 | ) | | | (7,460,743 | ) | | | (58,327,143 | ) | |
| Net increase (decrease) | | | 7,996,663 | | | $ | 63,469,610 | | | | 662,601 | | | $ | 4,982,540 | | |
| Aggressive Growth Fund | |
| Sold | | | 12,881,696 | | | $ | 79,839,991 | | | | 10,230,142 | | | $ | 62,500,195 | | |
| Issued as reinvestment of dividends | | | - | | | | - | | | | - | | | | - | | |
| Redeemed | | | (4,689,452 | ) | | | (29,681,941 | ) | | | (6,283,999 | ) | | | (37,457,169 | ) | |
| Net increase (decrease) | | | 8,192,244 | | | $ | 50,158,050 | | | | 3,946,143 | | | $ | 25,043,026 | | |
| OTC 100 Fund | |
| Sold | | | 380,895 | | | $ | 1,602,904 | | | | 1,281,497 | | | $ | 5,034,418 | | |
| Issued as reinvestment of dividends | | | - | | | | - | | | | - | | | | - | | |
| Redeemed | | | (987,890 | ) | | | (4,088,315 | ) | | | (1,338,273 | ) | | | (5,346,315 | ) | |
| Net increase (decrease) | | | (606,995 | ) | | $ | (2,485,411 | ) | | | (56,776 | ) | | $ | (311,897 | ) | |
| Focused Value Fund | |
| Sold | | | 3,583,465 | | | $ | 62,435,557 | | | | 3,427,366 | | | $ | 61,803,068 | | |
| Issued as reinvestment of dividends | | | - | | | | - | | | | 949,736 | | | | 16,318,395 | | |
| Redeemed | | | (3,567,371 | ) | | | (62,125,586 | ) | | | (2,788,404 | ) | | | (50,001,597 | ) | |
| Net increase (decrease) | | | 16,094 | | | $ | 309,971 | | | | 1,588,698 | | | $ | 28,119,866 | | |
| Small Cap Value Equity Fund* | |
| Sold | | | 10,010 | | | $ | 100,100 | | | | - | | | $ | - | | |
| Issued as reinvestment of dividends | | | - | | | | - | | | | - | | | | - | | |
| Redeemed | | | - | | | | - | | | | - | | | | - | | |
| Net increase (decrease) | | | 10,010 | | | $ | 100,100 | | | | - | | | $ | - | | |
| Small Company Value Fund | |
| Sold | | | 3,653,491 | | | $ | 56,403,624 | | | | 2,646,588 | | | $ | 37,515,010 | | |
| Issued as reinvestment of dividends | | | - | | | | - | | | | 379,682 | | | | 5,478,826 | | |
| Redeemed | | | (2,739,746 | ) | | | (41,943,296 | ) | | | (2,408,512 | ) | | | (34,086,838 | ) | |
| Net increase (decrease) | | | 913,745 | | | $ | 14,460,328 | | | | 617,758 | | | $ | 8,906,998 | | |
307
Notes to Financial Statements (Continued)
| | | Class L | |
| | | Six months ended June 30, 2006 | | Year ended December 31, 2005 | |
| | | Shares | | Amount | | Shares | | Amount | |
| Small Cap Core Equity Fund* | |
| Sold | | | 14,073 | | | $ | 137,010 | | | | - | | | $ | - | | |
| Issued as reinvestment of dividends | | | - | | | | - | | | | - | | | | - | | |
| Redeemed | | | (11 | ) | | | (98 | ) | | | - | | | | - | | |
| Net increase (decrease) | | | 14,062 | | | $ | 136,912 | | | | - | | | $ | - | | |
| Mid Cap Growth Equity Fund | |
| Sold | | | 1,020,851 | | | $ | 11,179,754 | | | | 1,441,597 | | | $ | 13,246,369 | | |
| Issued as reinvestment of dividends | | | - | | | | - | | | | - | | | | - | | |
| Redeemed | | | (1,159,573 | ) | | | (12,040,921 | ) | | | (1,661,780 | ) | | | (15,119,845 | ) | |
| Net increase (decrease) | | | (138,722 | ) | | $ | (861,167 | ) | | | (220,183 | ) | | $ | (1,873,476 | ) | |
| Mid Cap Growth Equity II Fund | |
| Sold | | | 10,028,469 | | | $ | 148,664,659 | | | | 12,719,545 | | | $ | 173,939,040 | | |
| Issued as reinvestment of dividends | | | - | | | | - | | | | 1,444,600 | | | | 20,803,086 | | |
| Redeemed | | | (7,634,650 | ) | | | (113,507,886 | ) | | | (9,217,491 | ) | | | (123,587,401 | ) | |
| Net increase (decrease) | | | 2,393,819 | | | $ | 35,156,773 | | | | 4,946,654 | | | $ | 71,154,725 | | |
| Small Cap Growth Equity Fund | |
| Sold | | | 1,380,099 | | | $ | 23,488,890 | | | | 2,517,452 | | | $ | 36,839,555 | | |
| Issued as reinvestment of dividends | | | - | | | | - | | | | - | | | | - | | |
| Redeemed | | | (2,386,342 | ) | | | (39,971,042 | ) | | | (2,013,948 | ) | | | (29,300,023 | ) | |
| Net increase (decrease) | | | (1,006,243 | ) | | $ | (16,482,152 | ) | | | 503,504 | | | $ | 7,539,532 | | |
| Small Company Growth Fund | |
| Sold | | | 1,697,998 | | | $ | 18,285,501 | | | | 875,692 | | | $ | 8,202,561 | | |
| Issued as reinvestment of dividends | | | - | | | | - | | | | 71,048 | | | | 664,296 | | |
| Redeemed | | | (1,145,921 | ) | | | (12,135,353 | ) | | | (2,286,567 | ) | | | (21,150,311 | ) | |
| Net increase (decrease) | | | 552,077 | | | $ | 6,150,148 | | | | (1,339,827 | ) | | $ | (12,283,454 | ) | |
| Emerging Growth Fund | |
| Sold | | | 2,177,647 | | | $ | 13,676,482 | | | | 1,681,359 | | | $ | 9,497,770 | | |
| Issued as reinvestment of dividends | | | - | | | | - | | | | - | | | | - | | |
| Redeemed | | | (4,528,592 | ) | | | (28,588,609 | ) | | | (2,021,099 | ) | | | (11,566,827 | ) | |
| Net increase (decrease) | | | (2,350,945 | ) | | $ | (14,912,127 | ) | | | (339,740 | ) | | $ | (2,069,057 | ) | |
| Overseas Fund | |
| Sold | | | 7,544,927 | | | $ | 89,781,456 | | | | 6,935,040 | | | $ | 78,117,254 | | |
| Issued as reinvestment of dividends | | | - | | | | - | | | | 1,925,810 | | | | 21,388,979 | | |
| Redeemed | | | (4,963,925 | ) | | | (59,044,266 | ) | | | (5,712,303 | ) | | | (64,199,026 | ) | |
| Net increase (decrease) | | | 2,581,002 | | | $ | 30,737,190 | | | | 3,148,547 | | | $ | 35,307,207 | | |
| Destination Retirement Income Fund | |
| Sold | | | 1,499,690 | | | $ | 15,434,763 | | | | 3,678,923 | | | $ | 38,205,352 | | |
| Issued as reinvestment of dividends | | | - | | | | - | | | | 419,616 | | | | 4,303,193 | | |
| Redeemed | | | (2,108,538 | ) | | | (21,698,962 | ) | | | (3,543,188 | ) | | | (36,815,729 | ) | |
| Net increase (decrease) | | | (608,848 | ) | | $ | (6,264,199 | ) | | | 555,351 | | | $ | 5,692,816 | | |
| Destination Retirement 2010 Fund | |
| Sold | | | 1,053,299 | | | $ | 11,304,803 | | | | 1,524,326 | | | $ | 16,246,283 | | |
| Issued as reinvestment of dividends | | | - | | | | - | | | | 116,833 | | | | 1,241,056 | | |
| Redeemed | | | (880,789 | ) | | | (9,431,930 | ) | | | (448,488 | ) | | | (4,778,648 | ) | |
| Net increase (decrease) | | | 172,510 | | | $ | 1,872,873 | | | | 1,192,671 | | | $ | 12,708,691 | | |
| Destination Retirement 2020 Fund | |
| Sold | | | 4,980,916 | | | $ | 55,503,603 | | | | 8,730,396 | | | $ | 94,622,716 | | |
| Issued as reinvestment of dividends | | | - | | | | - | | | | 783,140 | | | | 8,606,175 | | |
| Redeemed | | | (3,647,675 | ) | | | (40,632,650 | ) | | | (7,527,433 | ) | | | (81,614,999 | ) | |
| Net increase (decrease) | | | 1,333,241 | | | $ | 14,870,953 | | | | 1,986,103 | | | $ | 21,613,892 | | |
| Destination Retirement 2030 Fund | |
| Sold | | | 3,777,146 | | | $ | 44,820,697 | | | | 4,990,776 | | | $ | 55,669,218 | | |
| Issued as reinvestment of dividends | | | - | | | | - | | | | 460,311 | | | | 5,310,425 | | |
| Redeemed | | | (2,881,579 | ) | | | (34,151,219 | ) | | | (4,887,006 | ) | | | (54,469,070 | ) | |
| Net increase (decrease) | | | 895,567 | | | $ | 10,669,478 | | | | 564,081 | | | $ | 6,510,573 | | |
308
Notes to Financial Statements (Continued)
| | | Class L | |
| | | Six months ended June 30, 2006 | | Year ended December 31, 2005 | |
| | | Shares | | Amount | | Shares | | Amount | |
| Destination Retirement 2040 Fund | |
| Sold | | | 3,136,630 | | | $ | 38,442,993 | | | | 3,592,445 | | | $ | 40,604,042 | | |
| Issued as reinvestment of dividends | | | - | | | | - | | | | 256,796 | | | | 3,016,953 | | |
| Redeemed | | | (1,943,697 | ) | | | (23,716,605 | ) | | | (3,740,092 | ) | | | (42,180,876 | ) | |
| Net increase (decrease) | | | 1,192,933 | | | $ | 14,726,388 | | | | 109,149 | | | $ | 1,440,119 | | |
| | | Class Y | |
| | | Six months ended June 30, 2006 | | Year ended December 31, 2005 | |
| | | Shares | | Amount | | Shares | | Amount | |
| Strategic Bond Fund | |
| Sold | | | 4,444,903 | | | $ | 44,414,409 | | | | 5,978,142 | | | $ | 60,501,460 | | |
| Issued as reinvestment of dividends | | | - | | | | - | | | | 103,694 | | | | 1,035,904 | | |
| Redeemed | | | (1,194,610 | ) | | | (11,894,674 | ) | | | (142,374 | ) | | | (1,438,522 | ) | |
| Net increase (decrease) | | | 3,250,293 | | | $ | 32,519,735 | | | | 5,939,462 | | | $ | 60,098,842 | | |
| Strategic Balanced Fund | |
| Sold | | | 2,112,378 | | | $ | 22,785,121 | | | | 1,795,987 | | | $ | 18,744,733 | | |
| Issued as reinvestment of dividends | | | - | | | | - | | | | 199,694 | | | | 2,120,756 | | |
| Redeemed | | | (1,540,418 | ) | | | (16,683,503 | ) | | | (4,079,675 | ) | | | (42,825,062 | ) | |
| Net increase (decrease) | | | 571,960 | | | $ | 6,101,618 | | | | (2,083,994 | ) | | $ | (21,959,573 | ) | |
| Diversified Value Fund | |
| Sold | | | 6,229,056 | | | $ | 73,160,568 | | | | 5,143,235 | | | $ | 58,293,210 | | |
| Issued as reinvestment of dividends | | | - | | | | - | | | | 150,645 | | | | 1,705,057 | | |
| Redeemed | | | (2,242,386 | ) | | | (26,417,165 | ) | | | (373,490 | ) | | | (4,216,247 | ) | |
| Net increase (decrease) | | | 3,986,670 | | | $ | 46,743,403 | | | | 4,920,390 | | | $ | 55,782,020 | | |
| Fundamental Value Fund | |
| Sold | | | 1,111,982 | | | $ | 13,106,839 | | | | 3,439,957 | | | $ | 37,507,575 | | |
| Issued as reinvestment of dividends | | | - | | | | - | | | | 265,156 | | | | 2,983,005 | | |
| Redeemed | | | (749,325 | ) | | | (8,781,865 | ) | | | (7,256,837 | ) | | | (79,886,330 | ) | |
| Net increase (decrease) | | | 362,657 | | | $ | 4,324,974 | | | | (3,551,724 | ) | | $ | (39,395,750 | ) | |
| Value Equity Fund | |
| Sold | | | 149,016 | | | $ | 1,614,795 | | | | 240,576 | | | $ | 2,607,371 | | |
| Issued as reinvestment of dividends | | | - | | | | - | | | | 36,935 | | | | 393,071 | | |
| Redeemed | | | (116,475 | ) | | | (1,280,975 | ) | | | (162,398 | ) | | | (1,739,737 | ) | |
| Net increase (decrease) | | | 32,541 | | | $ | 333,820 | | | | 115,113 | | | $ | 1,260,705 | | |
| Large Cap Value Fund | |
| Sold | | | 5,330,383 | | | $ | 61,555,385 | | | | 4,566,851 | | | $ | 48,011,207 | | |
| Issued as reinvestment of dividends | | | - | | | | - | | | | 100,761 | | | | 1,149,099 | | |
| Redeemed | | | (1,765,337 | ) | | | (20,426,259 | ) | | | (3,911,677 | ) | | | (42,536,090 | ) | |
| Net increase (decrease) | | | 3,565,046 | | | $ | 41,129,126 | | | | 755,935 | | | $ | 6,624,216 | | |
| Indexed Equity Fund | |
| Sold | | | 5,442,947 | | | $ | 64,619,734 | | | | 15,916,082 | | | $ | 177,923,354 | | |
| Issued as reinvestment of dividends | | | - | | | | - | | | | 529,961 | | | | 6,163,443 | | |
| Redeemed | | | (7,199,493 | ) | | | (85,299,961 | ) | | | (13,406,008 | ) | | | (150,296,572 | ) | |
| Net increase (decrease) | | | (1,756,546 | ) | | $ | (20,680,227 | ) | | | 3,040,035 | | | $ | 33,790,225 | | |
| Core Opportunities Fund* | |
| Sold | | | 10,010 | | | $ | 100,100 | | | | - | | | $ | - | | |
| Issued as reinvestment of dividends | | | - | | | | - | | | | - | | | | - | | |
| Redeemed | | | - | | | | - | | | | - | | | | - | | |
| Net increase (decrease) | | | 10,010 | | | $ | 100,100 | | | | - | | | $ | - | | |
| Blue Chip Growth Fund | |
| Sold | | | 4,157,861 | | | $ | 37,347,471 | | | | 192,906 | | | $ | 1,691,220 | | |
| Issued as reinvestment of dividends | | | - | | | | - | | | | 857 | | | | 7,874 | | |
| Redeemed | | | (122,955 | ) | | | (1,112,560 | ) | | | (165,202 | ) | | | (1,432,224 | ) | |
| Net increase (decrease) | | | 4,034,906 | | | $ | 36,234,911 | | | | 28,561 | | | $ | 266,870 | | |
| Large Cap Growth Fund | |
| Sold | | | 2,076 | | | $ | 21,827 | | | | 171,715 | | | $ | 1,578,705 | | |
| Issued as reinvestment of dividends | | | - | | | | - | | | | - | | | | - | | |
| Redeemed | | | (202,779 | ) | | | (2,164,993 | ) | | | (4,960 | ) | | | (46,634 | ) | |
| Net increase (decrease) | | | (200,703 | ) | | $ | (2,143,166 | ) | | | 166,755 | | | $ | 1,532,071 | | |
309
Notes to Financial Statements (Continued)
| | | Class Y | |
| | | Six months ended June 30, 2006 | | Year ended December 31, 2005 | |
| | | Shares | | Amount | | Shares | | Amount | |
| Growth Equity Fund | |
| Sold | | | 1,069,285 | | | $ | 8,610,990 | | | | 2,683,684 | | | $ | 20,986,568 | | |
| Issued as reinvestment of dividends | | | - | | | | - | | | | 57,031 | | | | 469,363 | | |
| Redeemed | | | (6,342,156 | ) | | | (49,450,443 | ) | | | (2,887,391 | ) | | | (22,652,859 | ) | |
| Net increase (decrease) | | | (5,272,871 | ) | | $ | (40,839,453 | ) | | | (146,676 | ) | | $ | (1,196,928 | ) | |
| Aggressive Growth Fund | |
| Sold | | | 4,634,665 | | | $ | 30,854,933 | | | | 3,286,075 | | | $ | 20,754,624 | | |
| Issued as reinvestment of dividends | | | - | | | | - | | | | - | | | | - | | |
| Redeemed | | | (2,523,694 | ) | | | (16,249,355 | ) | | | (2,348,537 | ) | | | (13,821,846 | ) | |
| Net increase (decrease) | | | 2,110,971 | | | $ | 14,605,578 | | | | 937,538 | | | $ | 6,932,778 | | |
| OTC 100 Fund | |
| Sold | | | 854,489 | | | $ | 3,633,810 | | | | 439,185 | | | $ | 1,662,390 | | |
| Issued as reinvestment of dividends | | | - | | | | - | | | | - | | | | - | | |
| Redeemed | | | (1,049,068 | ) | | | (4,470,760 | ) | | | (723,067 | ) | | | (2,773,444 | ) | |
| Net increase (decrease) | | | (194,579 | ) | | $ | (836,950 | ) | | | (283,882 | ) | | $ | (1,111,054 | ) | |
| Focused Value Fund | |
| Sold | | | 785,495 | | | $ | 13,761,094 | | | | 3,603,527 | | | $ | 64,989,052 | | |
| Issued as reinvestment of dividends | | | - | | | | - | | | | 600,954 | | | | 10,389,589 | | |
| Redeemed | | | (905,529 | ) | | | (15,882,800 | ) | | | (2,592,246 | ) | | | (46,905,736 | ) | |
| Net increase (decrease) | | | (120,034 | ) | | $ | (2,121,706 | ) | | | 1,612,235 | | | $ | 28,472,905 | | |
| Small Cap Value Equity Fund* | |
| Sold | | | 10,010 | | | $ | 100,100 | | | | - | | | $ | - | | |
| Issued as reinvestment of dividends | | | - | | | | - | | | | - | | | | - | | |
| Redeemed | | | - | | | | - | | | | - | | | | - | | |
| Net increase (decrease) | | | 10,010 | | | $ | 100,100 | | | | - | | | $ | - | | |
| Small Company Value Fund | |
| Sold | | | 4,772,321 | | | $ | 73,317,716 | | | | 3,083,533 | | | $ | 44,137,520 | | |
| Issued as reinvestment of dividends | | | - | | | | - | | | | 296,884 | | | | 4,303,502 | | |
| Redeemed | | | (1,134,877 | ) | | | (17,520,939 | ) | | | (3,573,580 | ) | | | (51,284,078 | ) | |
| Net increase (decrease) | | | 3,637,444 | | | $ | 55,796,777 | | | | (193,163 | ) | | $ | (2,843,056 | ) | |
| Small Cap Core Equity Fund* | |
| Sold | | | 117,016 | | | $ | 1,139,915 | | | | - | | | $ | - | | |
| Issued as reinvestment of dividends | | | - | | | | - | | | | - | | | | - | | |
| Redeemed | | | (238 | ) | | | (2,207 | ) | | | - | | | | - | | |
| Net increase (decrease) | | | 116,778 | | | $ | 1,137,708 | | | | - | | | $ | - | | |
| Mid Cap Growth Equity Fund | |
| Sold | | | 840,905 | | | $ | 9,327,975 | | | | 1,301,786 | | | $ | 12,085,324 | | |
| Issued as reinvestment of dividends | | | - | | | | - | | | | - | | | | - | | |
| Redeemed | | | (508,638 | ) | | | (5,455,256 | ) | | | (951,754 | ) | | | (8,740,969 | ) | |
| Net increase (decrease) | | | 332,267 | | | $ | 3,872,719 | | | | 350,032 | | | $ | 3,344,355 | | |
| Mid Cap Growth Equity II Fund | |
| Sold | | | 3,044,134 | | | $ | 45,755,169 | | | | 4,999,687 | | | $ | 69,260,078 | | |
| Issued as reinvestment of dividends | | | - | | | | - | | | | 389,082 | | | | 5,656,274 | | |
| Redeemed | | | (1,548,019 | ) | | | (23,207,608 | ) | | | (3,160,909 | ) | | | (44,188,784 | ) | |
| Net increase (decrease) | | | 1,496,115 | | | $ | 22,547,561 | | | | 2,227,860 | | | $ | 30,727,568 | | |
| Small Cap Growth Equity Fund | |
| Sold | | | 3,330,757 | | | $ | 56,372,412 | | | | 3,774,225 | | | $ | 55,429,232 | | |
| Issued as reinvestment of dividends | | | - | | | | - | | | | - | | | | - | | |
| Redeemed | | | (1,342,054 | ) | | | (22,741,741 | ) | | | (4,220,758 | ) | | | (63,023,059 | ) | |
| Net increase (decrease) | | | 1,988,703 | | | $ | 33,630,671 | | | | (446,533 | ) | | $ | (7,593,827 | ) | |
| Small Company Growth Fund | |
| Sold | | | 543,730 | | | $ | 5,964,389 | | | | 535,919 | | | $ | 5,033,150 | | |
| Issued as reinvestment of dividends | | | - | | | | - | | | | 69,966 | | | | 657,684 | | |
| Redeemed | | | (1,346,211 | ) | | | (14,446,749 | ) | | | (1,832,485 | ) | | | (17,224,444 | ) | |
| Net increase (decrease) | | | (802,481 | ) | | $ | (8,482,360 | ) | | | (1,226,600 | ) | | $ | (11,533,610 | ) | |
310
Notes to Financial Statements (Continued)
| | | Class Y | |
| | | Six months ended June 30, 2006 | | Year ended December 31, 2005 | |
| | | Shares | | Amount | | Shares | | Amount | |
| Emerging Growth Fund | |
| Sold | | | 267,681 | | | $ | 1,707,058 | | | | 648,255 | | | $ | 3,597,983 | | |
| Issued as reinvestment of dividends | | | - | | | | - | | | | - | | | | - | | |
| Redeemed | | | (245,006 | ) | | | (1,542,005 | ) | | | (600,424 | ) | | | (3,422,254 | ) | |
| Net increase (decrease) | | | 22,675 | | | $ | 165,053 | | | | 47,831 | | | $ | 175,729 | | |
| Overseas Fund | |
| Sold | | | 4,592,967 | | | $ | 54,270,928 | | | | 4,519,188 | | | $ | 51,959,054 | | |
| Issued as reinvestment of dividends | | | - | | | | - | | | | 1,186,865 | | | | 13,216,989 | | |
| Redeemed | | | (1,204,864 | ) | | | (14,460,095 | ) | | | (2,369,253 | ) | | | (27,220,595 | ) | |
| Net increase (decrease) | | | 3,388,103 | | | $ | 39,810,833 | | | | 3,336,800 | | | $ | 37,955,448 | | |
| Destination Retirement Income Fund | |
| Sold | | | 983,200 | | | $ | 10,111,193 | | | | 3,266,870 | | | $ | 34,248,955 | | |
| Issued as reinvestment of dividends | | | - | | | | - | | | | 437,594 | | | | 4,486,385 | | |
| Redeemed | | | (711,886 | ) | | | (7,326,911 | ) | | | (1,172,083 | ) | | | (12,247,016 | ) | |
| Net increase (decrease) | | | 271,314 | | | $ | 2,784,282 | | | | 2,532,381 | | | $ | 26,488,324 | | |
| Destination Retirement 2010 Fund | |
| Sold | | | 2,046,988 | | | $ | 22,005,159 | | | | 2,549,194 | | | $ | 27,217,392 | | |
| Issued as reinvestment of dividends | | | - | | | | - | | | | 102,863 | | | | 1,093,687 | | |
| Redeemed | | | (713,623 | ) | | | (7,643,964 | ) | | | (319,836 | ) | | | (3,430,807 | ) | |
| Net increase (decrease) | | | 1,333,365 | | | $ | 14,361,195 | | | | 2,332,221 | | | $ | 24,880,272 | | |
| Destination Retirement 2020 Fund | |
| Sold | | | 2,363,038 | | | $ | 26,317,028 | | | | 5,433,548 | | | $ | 59,324,920 | | |
| Issued as reinvestment of dividends | | | - | | | | - | | | | 221,191 | | | | 2,428,681 | | |
| Redeemed | | | (972,787 | ) | | | (10,809,952 | ) | | | (604,787 | ) | | | (6,670,128 | ) | |
| Net increase (decrease) | | | 1,390,251 | | | $ | 15,507,076 | | | | 5,049,952 | | | $ | 55,083,473 | | |
| Destination Retirement 2030 Fund | |
| Sold | | | 1,469,175 | | | $ | 17,435,230 | | | | 2,845,719 | | | $ | 32,221,850 | | |
| Issued as reinvestment of dividends | | | - | | | | - | | | | 82,922 | | | | 957,824 | | |
| Redeemed | | | (445,947 | ) | | | (5,284,316 | ) | | | (282,004 | ) | | | (3,232,282 | ) | |
| Net increase (decrease) | | | 1,023,228 | | | $ | 12,150,914 | | | | 2,646,637 | | | $ | 29,947,392 | | |
| Destination Retirement 2040 Fund | |
| Sold | | | 1,749,244 | | | $ | 21,298,085 | | | | 715,701 | | | $ | 8,216,224 | | |
| Issued as reinvestment of dividends | | | - | | | | - | | | | 17,859 | | | | 210,723 | | |
| Redeemed | | | (491,425 | ) | | | (5,987,521 | ) | | | (76,829 | ) | | | (887,172 | ) | |
| Net increase (decrease) | | | 1,257,819 | | | $ | 15,310,564 | | | | 656,731 | | | $ | 7,539,775 | | |
| | | Class S | |
| | | Six months ended June 30, 2006 | | Year ended December 31, 2005 | |
| | | Shares | | Amount | | Shares | | Amount | |
| Strategic Bond Fund | |
| Sold | | | 124,470 | | | $ | 1,236,801 | | | | 1,281,291 | | | $ | 12,958,670 | | |
| Issued as reinvestment of dividends | | | - | | | | - | | | | 21,187 | | | | 211,873 | | |
| Redeemed | | | (34,139 | ) | | | (338,027 | ) | | | (1,613 | ) | | | (16,384 | ) | |
| Net increase (decrease) | | | 90,331 | | | $ | 898,774 | | | | 1,300,865 | | | $ | 13,154,159 | | |
| Strategic Balanced Fund | |
| Sold | | | 107,761 | | | $ | 1,164,973 | | | | 209,342 | | | $ | 2,193,990 | | |
| Issued as reinvestment of dividends | | | - | | | | - | | | | 12,773 | | | | 135,771 | | |
| Redeemed | | | (67,855 | ) | | | (733,184 | ) | | | (57,201 | ) | | | (601,531 | ) | |
| Net increase (decrease) | | | 39,906 | | | $ | 431,789 | | | | 164,914 | | | $ | 1,728,230 | | |
| Diversified Value Fund | |
| Sold | | | 1,944,609 | | | $ | 23,140,085 | | | | 2,904,595 | | | $ | 33,170,577 | | |
| Issued as reinvestment of dividends | | | - | | | | - | | | | 532,829 | | | | 6,031,845 | | |
| Redeemed | | | (2,189,006 | ) | | | (26,036,589 | ) | | | (2,748,609 | ) | | | (30,536,372 | ) | |
| Net increase (decrease) | | | (244,397 | ) | | $ | (2,896,504 | ) | | | 688,815 | | | $ | 8,666,050 | | |
311
Notes to Financial Statements (Continued)
| | | Class S | |
| | | Six months ended June 30, 2006 | | Year ended December 31, 2005 | |
| | | Shares | | Amount | | Shares | | Amount | |
| Fundamental Value Fund | |
| Sold | | | 6,470,102 | | | $ | 76,379,554 | | | | 11,460,111 | | | $ | 127,098,971 | | |
| Issued as reinvestment of dividends | | | - | | | | - | | | | 1,339,051 | | | | 15,077,709 | | |
| Redeemed | | | (4,405,044 | ) | | | (52,019,637 | ) | | | (5,605,792 | ) | | | (62,180,553 | ) | |
| Net increase (decrease) | | | 2,065,058 | | | $ | 24,359,917 | | | | 7,193,370 | | | $ | 79,996,127 | | |
| Value Equity Fund | |
| Sold | | | 969,539 | | | $ | 10,740,416 | | | | 964,243 | | | $ | 10,375,534 | | |
| Issued as reinvestment of dividends | | | - | | | | - | | | | 498,240 | | | | 5,292,559 | | |
| Redeemed | | | (1,180,796 | ) | | | (13,022,709 | ) | | | (1,093,690 | ) | | | (11,608,867 | ) | |
| Net increase (decrease) | | | (211,257 | ) | | $ | (2,282,293 | ) | | | 368,793 | | | $ | 4,059,226 | | |
| Large Cap Value Fund | |
| Sold | | | 8,400,211 | | | $ | 97,780,272 | | | | 17,519,048 | | | $ | 188,073,876 | | |
| Issued as reinvestment of dividends | | | - | | | | - | | | | 422,916 | | | | 4,828,320 | | |
| Redeemed | | | (6,722,299 | ) | | | (77,977,641 | ) | | | (11,609,856 | ) | | | (125,106,306 | ) | |
| Net increase (decrease) | | | 1,677,912 | | | $ | 19,802,631 | | | | 6,332,108 | | | $ | 67,795,890 | | |
| Indexed Equity Fund | |
| Sold | | | 5,768,386 | | | $ | 69,287,060 | | | | 15,781,993 | | | $ | 178,956,716 | | |
| Issued as reinvestment of dividends | | | - | | | | - | | | | 761,891 | | | | 8,944,597 | | |
| Redeemed | | | (10,337,328 | ) | | | (123,894,449 | ) | | | (22,559,101 | ) | | | (255,272,692 | ) | |
| Net increase (decrease) | | | (4,568,942 | ) | | $ | (54,607,389 | ) | | | (6,015,217 | ) | | $ | (67,371,379 | ) | |
| Core Opportunities Fund* | |
| Sold | | | 960,010 | | | $ | 9,600,100 | | | | - | | | $ | - | | |
| Issued as reinvestment of dividends | | | - | | | | - | | | | - | | | | - | | |
| Redeemed | | | - | | | | - | | | | - | | | | - | | |
| Net increase (decrease) | | | 960,010 | | | $ | 9,600,100 | | | | - | | | $ | - | | |
| Blue Chip Growth Fund | |
| Sold | | | 557,352 | | | $ | 5,145,409 | | | | 1,314,812 | | | $ | 11,440,931 | | |
| Issued as reinvestment of dividends | | | - | | | | - | | | | 21,679 | | | | 199,883 | | |
| Redeemed | | | (1,765,185 | ) | | | (16,466,263 | ) | | | (2,435,482 | ) | | | (21,278,456 | ) | |
| Net increase (decrease) | | | (1,207,833 | ) | | $ | (11,320,854 | ) | | | (1,098,991 | ) | | $ | (9,637,642 | ) | |
| Large Cap Growth Fund | |
| Sold | | | 313,561 | | | $ | 3,293,184 | | | | 732,876 | | | $ | 7,304,053 | | |
| Issued as reinvestment of dividends | | | - | | | | - | | | | - | | | | - | | |
| Redeemed | | | (1,000,152 | ) | | | (10,543,374 | ) | | | (281,398 | ) | | | (2,548,807 | ) | |
| Net increase (decrease) | | | (686,591 | ) | | $ | (7,250,190 | ) | | | 451,478 | | | $ | 4,755,246 | | |
| Growth Equity Fund | |
| Sold | | | 5,824,847 | | | $ | 47,334,416 | | | | 11,533,207 | | | $ | 91,074,627 | | |
| Issued as reinvestment of dividends | | | - | | | | - | | | | 153,457 | | | | 1,267,551 | | |
| Redeemed | | | (2,606,753 | ) | | | (21,050,282 | ) | | | (7,769,008 | ) | | | (62,054,347 | ) | |
| Net increase (decrease) | | | 3,218,094 | | | $ | 26,284,134 | | | | 3,917,656 | | | $ | 30,287,831 | | |
| Aggressive Growth Fund | |
| Sold | | | 10,060,804 | | | $ | 65,127,415 | | | | 17,648,436 | | | $ | 108,842,632 | | |
| Issued as reinvestment of dividends | | | - | | | | - | | | | - | | | | - | | |
| Redeemed | | | (7,103,844 | ) | | | (45,536,399 | ) | | | (14,402,248 | ) | | | (86,387,004 | ) | |
| Net increase (decrease) | | | 2,956,960 | | | $ | 19,591,016 | | | | 3,246,188 | | | $ | 22,455,628 | | |
| OTC 100 Fund | |
| Sold | | | 1,002,694 | | | $ | 4,254,770 | | | | 2,478,859 | | | $ | 9,869,095 | | |
| Issued as reinvestment of dividends | | | - | | | | - | | | | - | | | | - | | |
| Redeemed | | | (1,546,220 | ) | | | (6,599,659 | ) | | | (4,088,677 | ) | | | (16,243,905 | ) | |
| Net increase (decrease) | | | (543,526 | ) | | $ | (2,344,889 | ) | | | (1,609,818 | ) | | $ | (6,374,810 | ) | |
| Focused Value Fund | |
| Sold | | | 2,476,519 | | | $ | 43,754,203 | | | | 6,937,072 | | | $ | 126,762,953 | | |
| Issued as reinvestment of dividends | | | - | | | | - | | | | 1,857,459 | | | | 32,309,556 | | |
| Redeemed | | | (3,651,019 | ) | | | (64,420,833 | ) | | | (6,024,681 | ) | | | (109,979,958 | ) | |
| Net increase (decrease) | | | (1,174,500 | ) | | $ | (20,666,630 | ) | | | 2,769,850 | | | $ | 49,092,551 | | |
312
Notes to Financial Statements (Continued)
| | | Class S | |
| | | Six months ended June 30, 2006 | | Year ended December 31, 2005 | |
| | | Shares | | Amount | | Shares | | Amount | |
| Small Cap Value Equity Fund* | |
| Sold | | | 1,119,815 | | | $ | 11,156,058 | | | | - | | | $ | - | | |
| Issued as reinvestment of dividends | | | - | | | | - | | | | - | | | | - | | |
| Redeemed | | | (1,112 | ) | | | (10,663 | ) | | | - | | | | - | | |
| Net increase (decrease) | | | 1,118,703 | | | $ | 11,145,395 | | | | - | | | $ | - | | |
| Small Company Value Fund | |
| Sold | | | 6,599,841 | | | $ | 104,185,575 | | | | 6,621,529 | | | $ | 95,317,203 | | |
| Issued as reinvestment of dividends | | | - | | | | - | | | | 651,117 | | | | 9,472,764 | | |
| Redeemed | | | (3,243,133 | ) | | | (50,289,697 | ) | | | (5,084,370 | ) | | | (72,703,566 | ) | |
| Net increase (decrease) | | | 3,356,708 | | | $ | 53,895,878 | | | | 2,188,276 | | | $ | 32,086,401 | | |
| Small Cap Core Equity Fund* | |
| Sold | | | 960,010 | | | $ | 9,600,100 | | | | - | | | $ | - | | |
| Issued as reinvestment of dividends | | | - | | | | - | | | | - | | | | - | | |
| Redeemed | | | - | | | | - | | | | - | | | | - | | |
| Net increase (decrease) | | | 960,010 | | | $ | 9,600,100 | | | | - | | | $ | - | | |
| Mid Cap Growth Equity Fund | |
| Sold | | | 3,566,125 | | | $ | 39,658,433 | | | | 4,726,467 | | | $ | 44,091,434 | | |
| Issued as reinvestment of dividends | | | - | | | | - | | | | - | | | | - | | |
| Redeemed | | | (2,751,772 | ) | | | (30,080,766 | ) | | | (3,338,523 | ) | | | (30,982,959 | ) | |
| Net increase (decrease) | | | 814,353 | | | $ | 9,577,667 | | | | 1,387,944 | | | $ | 13,108,475 | | |
| Mid Cap Growth Equity II Fund | |
| Sold | | | 3,450,807 | | | $ | 52,187,347 | | | | 8,806,491 | | | $ | 124,285,928 | | |
| Issued as reinvestment of dividends | | | - | | | | - | | | | 750,159 | | | | 10,961,612 | | |
| Redeemed | | | (2,944,965 | ) | | | (44,342,702 | ) | | | (6,190,085 | ) | | | (84,861,939 | ) | |
| Net increase (decrease) | | | 505,842 | | | $ | 7,844,645 | | | | 3,366,565 | | | $ | 50,385,601 | | |
| Small Cap Growth Equity Fund | |
| Sold | | | 4,307,522 | | | $ | 74,463,170 | | | | 6,248,229 | | | $ | 94,325,620 | | |
| Issued as reinvestment of dividends | | | - | | | | - | | | | - | | | | - | | |
| Redeemed | | | (3,050,602 | ) | | | (52,239,948 | ) | | | (4,996,857 | ) | | | (73,820,837 | ) | |
| Net increase (decrease) | | | 1,256,920 | | | $ | 22,223,222 | | | | 1,251,372 | | | $ | 20,504,783 | | |
| Small Company Growth Fund | |
| Sold | | | 1,708,738 | | | $ | 18,771,467 | | | | 515,623 | | | $ | 4,911,562 | | |
| Issued as reinvestment of dividends | | | - | | | | - | | | | 34,574 | | | | 325,688 | | |
| Redeemed | | | (838,492 | ) | | | (8,938,978 | ) | | | (788,394 | ) | | | (7,461,289 | ) | |
| Net increase (decrease) | | | 870,246 | | | $ | 9,832,489 | | | | (238,197 | ) | | $ | (2,224,039 | ) | |
| Emerging Growth Fund | |
| Sold | | | 2,277,661 | | | $ | 14,827,662 | | | | 2,719,709 | | | $ | 15,672,930 | | |
| Issued as reinvestment of dividends | | | - | | | | - | | | | - | | | | - | | |
| Redeemed | | | (1,179,021 | ) | | | (7,598,905 | ) | | | (2,325,603 | ) | | | (13,557,496 | ) | |
| Net increase (decrease) | | | 1,098,640 | | | $ | 7,228,757 | | | | 394,106 | | | $ | 2,115,434 | | |
| Overseas Fund | |
| Sold | | | 7,103,664 | | | $ | 85,615,646 | | | | 12,014,548 | | | $ | 137,028,288 | | |
| Issued as reinvestment of dividends | | | - | | | | - | | | | 2,855,049 | | | | 31,851,212 | | |
| Redeemed | | | (4,528,023 | ) | | | (54,309,149 | ) | | | (6,179,756 | ) | | | (69,782,720 | ) | |
| Net increase (decrease) | | | 2,575,641 | | | $ | 31,306,497 | | | | 8,689,841 | | | $ | 99,096,780 | | |
| Destination Retirement Income Fund | |
| Sold | | | 579,499 | | | $ | 5,961,236 | | | | 337,256 | | | $ | 3,536,203 | | |
| Issued as reinvestment of dividends | | | - | | | | - | | | | 15,455 | | | | 158,328 | | |
| Redeemed | | | (306,043 | ) | | | (3,138,105 | ) | | | (33,177 | ) | | | (346,563 | ) | |
| Net increase (decrease) | | | 273,456 | | | $ | 2,823,131 | | | | 319,534 | | | $ | 3,347,968 | | |
| Destination Retirement 2010 Fund | |
| Sold | | | 619,606 | | | $ | 6,658,767 | | | | 1,115,029 | | | $ | 12,019,820 | | |
| Issued as reinvestment of dividends | | | - | | | | - | | | | 38,803 | | | | 412,926 | | |
| Redeemed | | | (512,979 | ) | | | (5,469,705 | ) | | | (232,906 | ) | | | (2,504,654 | ) | |
| Net increase (decrease) | | | 106,627 | | | $ | 1,189,062 | | | | 920,926 | | | $ | 9,928,092 | | |
313
Notes to Financial Statements (Continued)
| | | Class S | |
| | | Six months ended June 30, 2006 | | Year ended December 31, 2005 | |
| | | Shares | | Amount | | Shares | | Amount | |
| Destination Retirement 2020 Fund | |
| Sold | | | 1,874,327 | | | $ | 20,823,575 | | | | 2,455,370 | | | $ | 27,010,206 | | |
| Issued as reinvestment of dividends | | | - | | | | - | | | | 119,873 | | | | 1,317,408 | | |
| Redeemed | | | (632,674 | ) | | | (7,022,166 | ) | | | (446,178 | ) | | | (4,907,211 | ) | |
| Net increase (decrease) | | | 1,241,653 | | | $ | 13,801,409 | | | | 2,129,065 | | | $ | 23,420,403 | | |
| Destination Retirement 2030 Fund | |
| Sold | | | 1,577,670 | | | $ | 18,631,919 | | | | 1,294,694 | | | $ | 14,864,505 | | |
| Issued as reinvestment of dividends | | | - | | | | - | | | | 43,018 | | | | 497,492 | | |
| Redeemed | | | (452,740 | ) | | | (5,334,278 | ) | | | (134,152 | ) | | | (1,536,542 | ) | |
| Net increase (decrease) | | | 1,124,930 | | | $ | 13,297,641 | | | | 1,203,560 | | | $ | 13,825,455 | | |
| Destination Retirement 2040 Fund | |
| Sold | | | 922,381 | | | $ | 11,248,507 | | | | 2,281,935 | | | $ | 27,324,165 | | |
| Issued as reinvestment of dividends | | | - | | | | - | | | | 53,693 | | | | 635,905 | | |
| Redeemed | | | (460,630 | ) | | | (5,579,725 | ) | | | (181,951 | ) | | | (2,173,156 | ) | |
| Net increase (decrease) | | | 461,751 | | | $ | 5,668,782 | | | | 2,153,677 | | | $ | 25,786,914 | | |
| | | Class Z | |
| | | Six months ended June 30, 2006 | | Year ended December 31, 2005 | |
| | | Shares | | Amount | | Shares | | Amount | |
| Indexed Equity Fund | |
| Sold | | | 6,419,365 | | | $ | 76,614,152 | | | | 14,223,155 | | | $ | 162,052,893 | | |
| Issued as reinvestment of dividends | | | - | | | | - | | | | 333,722 | | | | 3,917,901 | | |
| Redeemed | | | (2,145,840 | ) | | | (25,863,598 | ) | | | (4,500,068 | ) | | | (50,762,443 | ) | |
| Net increase (decrease) | | | 4,273,525 | | | $ | 50,750,554 | | | | 10,056,809 | | | $ | 115,208,351 | | |
| | | Class N | |
| | | Six months ended June 30, 2006 | | Year ended December 31, 2005 | |
| | | Shares | | Amount | | Shares | | Amount | |
| Strategic Bond Fund | |
| Sold | | | 151,064 | | | $ | 1,473,130 | | | | 10,583 | | | $ | 106,872 | | |
| Issued as reinvestment of dividends | | | - | | | | - | | | | 148 | | | | 1,471 | | |
| Redeemed | | | - | | | | - | | | | - | | | | - | | |
| Net increase (decrease) | | | 151,064 | | | $ | 1,473,130 | | | | 10,731 | | | $ | 108,343 | | |
| Strategic Balanced Fund | |
| Sold | | | 4,963 | | | $ | 53,784 | | | | 3,463 | | | $ | 36,287 | | |
| Issued as reinvestment of dividends | | | - | | | | - | | | | 622 | | | | 6,596 | | |
| Redeemed | | | (4,449 | ) | | | (48,185 | ) | | | (4,792 | ) | | | (49,589 | ) | |
| Net increase (decrease) | | | 514 | | | $ | 5,599 | | | | (707 | ) | | $ | (6,706 | ) | |
| Diversified Value Fund | |
| Sold | | | 92,204 | | | $ | 1,087,596 | | | | 66 | | | $ | 725 | | |
| Issued as reinvestment of dividends | | | - | | | | - | | | | 108 | | | | 1,222 | | |
| Redeemed | | | (17,486 | ) | | | (201,490 | ) | | | (4,264 | ) | | | (48,268 | ) | |
| Net increase (decrease) | | | 74,718 | | | $ | 886,106 | | | | (4,090 | ) | | $ | (46,321 | ) | |
| Fundamental Value Fund | |
| Sold | | | 45,348 | | | $ | 526,199 | | | | 45,051 | | | $ | 491,498 | | |
| Issued as reinvestment of dividends | | | - | | | | - | | | | 5,707 | | | | 63,518 | | |
| Redeemed | | | (121,360 | ) | | | (1,425,389 | ) | | | (24,018 | ) | | | (263,808 | ) | |
| Net increase (decrease) | | | (76,012 | ) | | $ | (899,190 | ) | | | 26,740 | | | $ | 291,208 | | |
| Value Equity Fund | |
| Sold | | | - | | | $ | - | | | | 462 | | | $ | 4,913 | | |
| Issued as reinvestment of dividends | | | - | | | | - | | | | 1,359 | | | | 14,382 | | |
| Redeemed | | | - | | | | - | | | | (15,368 | ) | | | (162,110 | ) | |
| Net increase (decrease) | | | - | | | $ | - | | | | (13,547 | ) | | $ | (142,815 | ) | |
| Large Cap Value Fund | |
| Sold | | | 17,055 | | | $ | 191,549 | | | | 58,225 | | | $ | 603,023 | | |
| Issued as reinvestment of dividends | | | - | | | | - | | | | 226 | | | | 2,537 | | |
| Redeemed | | | (9,628 | ) | | | (109,123 | ) | | | (137,308 | ) | | | (1,452,237 | ) | |
| Net increase (decrease) | | | 7,427 | | | $ | 82,426 | | | | (78,857 | ) | | $ | (846,677 | ) | |
314
Notes to Financial Statements (Continued)
| | | Class N | |
| | | Six months ended June 30, 2006 | | Year ended December 31, 2005 | |
| | | Shares | | Amount | | Shares | | Amount | |
| Indexed Equity Fund | |
| Sold | | | 29,984 | | | $ | 350,477 | | | | 118,895 | | | $ | 1,307,569 | | |
| Issued as reinvestment of dividends | | | - | | | | - | | | | 3,474 | | | | 39,746 | | |
| Redeemed | | | (31,234 | ) | | | (366,869 | ) | | | (39,879 | ) | | | (435,856 | ) | |
| Net increase (decrease) | | | (1,250 | ) | | $ | (16,391 | ) | | | 82,490 | | | $ | 911,459 | | |
| Core Opportunities Fund* | |
| Sold | | | 10,010 | | | $ | 100,100 | | | | - | | | $ | - | | |
| Issued as reinvestment of dividends | | | - | | | | - | | | | - | | | | - | | |
| Redeemed | | | - | | | | - | | | | - | | | | - | | |
| Net increase (decrease) | | | 10,010 | | | $ | 100,100 | | | | - | | | $ | - | | |
| Blue Chip Growth Fund | |
| Sold | | | 160,221 | | | $ | 1,438,135 | | | | 35,051 | | | $ | 300,558 | | |
| Issued as reinvestment of dividends | | | - | | | | - | | | | - | | | | - | | |
| Redeemed | | | (21,529 | ) | | | (194,220 | ) | | | (67,323 | ) | | | (591,390 | ) | |
| Net increase (decrease) | | | 138,692 | | | $ | 1,243,915 | | | | (32,272 | ) | | $ | (290,832 | ) | |
| Large Cap Growth Fund | |
| Sold | | | - | | | $ | - | | | | 83 | | | $ | 747 | | |
| Issued as reinvestment of dividends | | | - | | | | - | | | | - | | | | - | | |
| Redeemed | | | - | | | | - | | | | (485 | ) | | | (4,750 | ) | |
| Net increase (decrease) | | | - | | | $ | - | | | | (402 | ) | | $ | (4,003 | ) | |
| Growth Equity Fund | |
| Sold | | | 3,295 | | | $ | 25,920 | | | | 15,394 | | | $ | 119,758 | | |
| Issued as reinvestment of dividends | | | - | | | | - | | | | - | | | | - | | |
| Redeemed | | | (157,089 | ) | | | (1,187,874 | ) | | | (43,685 | ) | | | (344,073 | ) | |
| Net increase (decrease) | | | (153,794 | ) | | $ | (1,161,954 | ) | | | (28,291 | ) | | $ | (224,315 | ) | |
| Aggressive Growth Fund | |
| Sold | | | 21,642 | | | $ | 130,273 | | | | 51,917 | | | $ | 307,996 | | |
| Issued as reinvestment of dividends | | | - | | | | - | | | | - | | | | - | | |
| Redeemed | | | (32,901 | ) | | | (202,805 | ) | | | (86,082 | ) | | | (462,125 | ) | |
| Net increase (decrease) | | | (11,259 | ) | | $ | (72,532 | ) | | | (34,165 | ) | | $ | (154,129 | ) | |
| OTC 100 Fund | |
| Sold | | | 3,688 | | | $ | 15,091 | | | | 11,598 | | | $ | 45,212 | | |
| Issued as reinvestment of dividends | | | - | | | | - | | | | - | | | | - | | |
| Redeemed | | | (5,297 | ) | | | (21,555 | ) | | | (7,275 | ) | | | (27,483 | ) | |
| Net increase (decrease) | | | (1,609 | ) | | $ | (6,464 | ) | | | 4,323 | | | $ | 17,729 | | |
| Focused Value Fund | |
| Sold | | | 56,811 | | | $ | 957,584 | | | | 79,975 | | | $ | 1,397,017 | | |
| Issued as reinvestment of dividends | | | - | | | | - | | | | 9,941 | | | | 166,530 | | |
| Redeemed | | | (42,945 | ) | | | (723,328 | ) | | | (36,588 | ) | | | (631,196 | ) | |
| Net increase (decrease) | | | 13,866 | | | $ | 234,256 | | | | 53,328 | | | $ | 932,351 | | |
| Small Cap Value Equity Fund* | |
| Sold | | | 10,010 | | | $ | 100,100 | | | | - | | | $ | - | | |
| Issued as reinvestment of dividends | | | - | | | | - | | | | - | | | | - | | |
| Redeemed | | | - | | | | - | | | | - | | | | - | | |
| Net increase (decrease) | | | 10,010 | | | $ | 100,100 | | | | - | | | $ | - | | |
| Small Company Value Fund | |
| Sold | | | 39,053 | | | $ | 596,281 | | | | 47,984 | | | $ | 674,113 | | |
| Issued as reinvestment of dividends | | | - | | | | - | | | | 3,394 | | | | 48,212 | | |
| Redeemed | | | (43,682 | ) | | | (674,580 | ) | | | (27,390 | ) | | | (382,709 | ) | |
| Net increase (decrease) | | | (4,629 | ) | | $ | (78,299 | ) | | | 23,988 | | | $ | 339,616 | | |
| Small Cap Core Equity Fund* | |
| Sold | | | 10,010 | | | $ | 100,100 | | | | - | | | $ | - | | |
| Issued as reinvestment of dividends | | | - | | | | - | | | | - | | | | - | | |
| Redeemed | | | - | | | | - | | | | - | | | | - | | |
| Net increase (decrease) | | | 10,010 | | | $ | 100,100 | | | | - | | | $ | - | | |
315
Notes to Financial Statements (Continued)
| | | Class N | |
| | | Six months ended June 30, 2006 | | Year ended December 31, 2005 | |
| | | Shares | | Amount | | Shares | | Amount | |
| Mid Cap Growth Equity Fund | |
| Sold | | | 7,846 | | | $ | 80,519 | | | | 24 | | | $ | 225 | | |
| Issued as reinvestment of dividends | | | - | | | | - | | | | - | | | | - | | |
| Redeemed | | | (854 | ) | | | (8,979 | ) | | | (1 | ) | | | (8 | ) | |
| Net increase (decrease) | | | 6,992 | | | $ | 71,540 | | | | 23 | | | $ | 217 | | |
| Mid Cap Growth Equity II Fund | |
| Sold | | | 98,410 | | | $ | 1,393,674 | | | | 57,100 | | | $ | 766,803 | | |
| Issued as reinvestment of dividends | | | - | | | | - | | | | 5,251 | | | | 73,587 | | |
| Redeemed | | | (50,269 | ) | | | (724,057 | ) | | | (21,047 | ) | | | (283,417 | ) | |
| Net increase (decrease) | | | 48,141 | | �� | $ | 669,617 | | | | 41,304 | | | $ | 556,973 | | |
| Small Cap Growth Equity Fund | |
| Sold | | | 6,558 | | | $ | 107,172 | | | | 11,550 | | | $ | 163,858 | | |
| Issued as reinvestment of dividends | | | - | | | | - | | | | - | | | | - | | |
| Redeemed | | | (4,645 | ) | | | (76,380 | ) | | | (9,575 | ) | | | (134,418 | ) | |
| Net increase (decrease) | | | 1,913 | | | $ | 30,792 | | | | 1,975 | | | $ | 29,440 | | |
| Small Company Growth Fund | |
| Sold | | | 24,350 | | | $ | 262,608 | | | | 43,041 | | | $ | 396,592 | | |
| Issued as reinvestment of dividends | | | - | | | | - | | | | 2,447 | | | | 22,294 | | |
| Redeemed | | | (44,477 | ) | | | (456,943 | ) | | | (39,663 | ) | | | (367,378 | ) | |
| Net increase (decrease) | | | (20,127 | ) | | $ | (194,335 | ) | | | 5,825 | | | $ | 51,508 | | |
| Emerging Growth Fund | |
| Sold | | | - | | | $ | - | | | | 1 | | | $ | 7 | | |
| Issued as reinvestment of dividends | | | - | | | | - | | | | - | | | | - | | |
| Redeemed | | | - | | | | - | | | | (1 | ) | | | (8 | ) | |
| Net increase (decrease) | | | - | | | $ | - | | | | - | | | $ | (1 | ) | |
| Overseas Fund | |
| Sold | | | 36,725 | | | $ | 438,729 | | | | 91,268 | | | $ | 1,002,678 | | |
| Issued as reinvestment of dividends | | | - | | | | - | | | | 13,822 | | | | 151,417 | | |
| Redeemed | | | (33,862 | ) | | | (393,559 | ) | | | (30,507 | ) | | | (340,356 | ) | |
| Net increase (decrease) | | | 2,863 | | | $ | 45,170 | | | | 74,583 | | | $ | 813,739 | | |
| Destination Retirement Income Fund | |
| Sold | | | 1,573 | | | $ | 15,964 | | | | 607 | | | $ | 6,332 | | |
| Issued as reinvestment of dividends | | | - | | | | - | | | | 10 | | | | 98 | | |
| Redeemed | | | (0 | ) | | | (0 | ) | | | (428 | ) | | | (4,485 | ) | |
| Net increase (decrease) | | | 1,573 | | | $ | 15,964 | | | | 189 | | | $ | 1,945 | | |
| Destination Retirement 2010 Fund | |
| Sold | | | 1,228 | | | $ | 13,129 | | | | 2,447 | | | $ | 26,059 | | |
| Issued as reinvestment of dividends | | | - | | | | - | | | | 78 | | | | 832 | | |
| Redeemed | | | (628 | ) | | | (6,743 | ) | | | (33 | ) | | | (348 | ) | |
| Net increase (decrease) | | | 600 | | | $ | 6,386 | | | | 2,492 | | | $ | 26,543 | | |
| Destination Retirement 2020 Fund | |
| Sold | | | 3,017 | | | $ | 33,366 | | | | 11,563 | | | $ | 124,669 | | |
| Issued as reinvestment of dividends | | | - | | | | - | | | | 375 | | | | 4,108 | | |
| Redeemed | | | (1,431 | ) | | | (15,691 | ) | | | (659 | ) | | | (7,150 | ) | |
| Net increase (decrease) | | | 1,586 | | | $ | 17,675 | | | | 11,279 | | | $ | 121,627 | | |
| Destination Retirement 2030 Fund | |
| Sold | | | 1,457 | | | $ | 17,156 | | | | 3,838 | | | $ | 42,896 | | |
| Issued as reinvestment of dividends | | | - | | | | - | | | | 94 | | | | 1,076 | | |
| Redeemed | | | (666 | ) | | | (8,004 | ) | | | (79 | ) | | | (877 | ) | |
| Net increase (decrease) | | | 791 | | | $ | 9,152 | | | | 3,853 | | | $ | 43,095 | | |
| Destination Retirement 2040 Fund | |
| Sold | | | 3,163 | | | $ | 39,066 | | | | 2,038 | | | $ | 23,973 | | |
| Issued as reinvestment of dividends | | | - | | | | - | | | | 37 | | | | 434 | | |
| Redeemed | | | (836 | ) | | | (10,347 | ) | | | (80 | ) | | | (858 | ) | |
| Net increase (decrease) | | | 2,327 | | | $ | 28,719 | | | | 1,995 | | | $ | 23,549 | | |
* Fund commenced operations on March 31, 2006.
316
Notes to Financial Statements (Continued)
Redemptions or exchanges of Class N made within eighteen months of purchase are subject to a contingent deferred sales charge of 1% of the amount redeemed. The distributor receives all contingent deferred sales charges. Contingent deferred sales charges imposed during the six months ended June 30, 2006 were all waived.
6. Federal Income Tax Information At June 30, 2006, the cost of securities and the unrealized appreciation (depreciation) in the value of investments owned by the Funds, as computed on a Federal income tax basis, were as follows:
| | | Federal
Income Tax
Cost | | Tax Basis
Unrealized
Appreciation | | Tax Basis
Unrealized
Depreciation | | Net Unrealized
Appreciation/
(Depreciation) | |
| Strategic Bond Fund | | $ | 195,904,014 | | | $ | 113,304 | | | $ | (5,184,588 | ) | | $ | (5,071,284 | ) | |
| Strategic Balanced Fund | | | 224,059,601 | | | | 18,648,207 | | | | (6,862,496 | ) | | | 11,785,711 | | |
| Diversified Value Fund | | | 359,061,371 | | | | 56,866,923 | | | | (10,490,040 | ) | | | 46,376,883 | | |
| Fundamental Value Fund | | | 1,014,705,855 | | | | 180,651,095 | | | | (20,223,190 | ) | | | 160,427,905 | | |
| Value Equity Fund | | | 106,102,531 | | | | 9,453,536 | | | | (2,320,179 | ) | | | 7,133,357 | | |
| Large Cap Value Fund | | | 1,203,615,059 | | | | 357,606,382 | | | | (21,002,640 | ) | | | 336,603,742 | | |
| Indexed Equity Fund | | | 1,924,207,260 | | | | 413,321,820 | | | | (221,025,257 | ) | | | 192,296,563 | | |
| Core Opportunities Fund | | | 12,004,609 | | | | 130,375 | | | | (490,110 | ) | | | (359,735 | ) | |
| Blue Chip Growth Fund | | | 433,694,319 | | | | 26,946,080 | | | | (18,899,787 | ) | | | 8,046,293 | | |
| Large Cap Growth Fund | | | 37,173,193 | | | | 2,073,598 | | | | (1,410,794 | ) | | | 662,804 | | |
| Growth Equity Fund | | | 872,234,356 | | | | 26,691,997 | | | | (39,336,763 | ) | | | (12,644,766 | ) | |
| Aggressive Growth Fund | | | 585,530,078 | | | | 91,452,406 | | | | (45,398,076 | ) | | | 46,054,330 | | |
| OTC 100 Fund | | | 54,908,197 | | | | 8,759,017 | | | | (4,862,763 | ) | | | 3,896,254 | | |
| Focused Value Fund | | | 916,277,968 | | | | 122,673,632 | | | | (26,897,018 | ) | | | 95,776,614 | | |
| Small Cap Value Equity Fund | | | 11,869,555 | | | | 329,585 | | | | (507,634 | ) | | | (178,049 | ) | |
| Small Company Value Fund | | | 747,727,271 | | | | 141,113,073 | | | | (24,058,600 | ) | | | 117,054,473 | | |
| Small Cap Core Equity Fund | | | 10,782,798 | | | | 350,456 | | | | (538,486 | ) | | | (188,030 | ) | |
| Mid Cap Growth Equity Fund | | | 202,664,969 | | | | 36,118,212 | | | | (5,283,069 | ) | | | 30,835,143 | | |
| Mid Cap Growth Equity II Fund | | | 1,299,263,166 | | | | 263,972,746 | | | | (46,996,598 | ) | | | 216,976,148 | | |
| Small Cap Growth Equity Fund | | | 735,595,041 | | | | 137,986,037 | | | | (24,192,908 | ) | | | 113,793,129 | | |
| Small Company Growth Fund | | | 199,233,130 | | | | 17,277,031 | | | | (14,565,215 | ) | | | 2,711,816 | | |
| Emerging Growth Fund | | | 119,179,329 | | | | 11,795,056 | | | | (5,148,276 | ) | | | 6,646,780 | | |
| Overseas Fund | | | 1,014,309,874 | | | | 156,212,845 | | | | (19,847,476 | ) | | | 136,365,369 | | |
| Destination Retirement Income Fund | | | 261,081,683 | | | | 3,837,003 | | | | (6,166,829 | ) | | | (2,329,826 | ) | |
| Destination Retirement 2010 Fund | | | 143,223,840 | | | | 1,793,266 | | | | (3,088,826 | ) | | | (1,295,560 | ) | |
| Destination Retirement 2020 Fund | | | 492,047,199 | | | | 15,810,393 | | | | (8,680,904 | ) | | | 7,129,489 | | |
| Destination Retirement 2030 Fund | | | 340,655,196 | | | | 19,791,646 | | | | (3,080,940 | ) | | | 16,710,706 | | |
| Destination Retirement 2040 Fund | | | 204,878,809 | | | | 12,415,881 | | | | (1,210,622 | ) | | | 11,205,259 | | |
At December 31, 2005, the following Funds had available, for Federal income tax purposes, unused capital losses:
| | | Expiring
2009 | | Expiring
2010 | | Expiring
2011 | | Expiring
2012 | | Expiring
2013 | |
| Strategic Bond Fund | | $ | - | | | $ | - | | | $ | - | | | $ | - | | | $ | 809,602 | | |
| Large Cap Value Fund | | | 18,107,685 | | | | 38,862,582 | | | | 10,621,856 | | | | 9,443,094 | | | | - | | |
| Indexed Equity Fund | | | - | | | | 26,502,337 | | | | - | | | | - | | | | - | | |
| Blue Chip Growth Fund | | | 17,542,638 | | | | 42,088,672 | | | | 16,672,836 | | | | 4,273,407 | | | | - | | |
| Large Cap Growth Fund | | | - | | | | - | | | | 1,757,033 | | | | - | | | | - | | |
| Growth Equity Fund | | | 49,735,738 | | | | 98,921,181 | | | | - | | | | - | | | | - | | |
| Aggressive Growth Fund | | | 36,382,312 | | | | 39,256,002 | | | | - | | | | - | | | | - | | |
| OTC 100 Fund | | | - | | | | 4,907,442 | | | | 13,741,961 | | | | 7,702,832 | | | | - | | |
317
Notes to Financial Statements (Continued)
| | | Expiring
2009 | | Expiring
2010 | | Expiring
2011 | | Expiring
2012 | | Expiring
2013 | |
| Mid Cap Growth Equity Fund | | $ | 53,557,180 | | | $ | 35,977,324 | | | $ | 976,172 | | | $ | - | | | $ | - | | |
| Small Cap Growth Equity Fund | | | - | | | | 15,687,379 | | | | 4,198,095 | | | | - | | | | - | | |
| Emerging Growth Fund | | | 17,178,284 | | | | 28,322,542 | | | | - | | | | - | | | | - | | |
Net Capital loss carryforwards may be applied against any net realized taxable gains in each succeeding year, or until their respective expiration dates, whichever occurs first.
Certain differences exist from the amounts reflected in the Statement of Changes in Net Assets primarily due to the character of short-term capital gains treated as ordinary income for tax purposes. The tax character of distributions paid during the year ended December 31, 2005 was as follows:
| | | Ordinary
Income | | Long Term
Capital Gain | | Short Term
Capital Gain | | Return of
Capital | |
| Strategic Bond Fund | | $ | 2,533,077 | | | $ | - | | | $ | - | | | $ | - | | |
| Strategic Balanced Fund | | | 4,517,378 | | | | 1,239,874 | | | | - | | | | - | | |
| Diversified Value Fund | | | 3,774,234 | | | | 4,743,589 | | | | 1,016,518 | | | | - | | |
| Fundamental Value Fund | | | 11,671,821 | | | | 19,530,720 | | | | 3,036,163 | | | | - | | |
| Value Equity Fund | | | 570,825 | | | | 5,879,719 | | | | 2,731,118 | | | | - | | |
| Large Cap Value Fund | | | 10,001,086 | | | | - | | | | - | | | | - | | |
| Indexed Equity Fund | | | 25,487,506 | | | | - | | | | - | | | | - | | |
| Blue Chip Growth Fund | | | 272,236 | | | | - | | | | - | | | | - | | |
| Growth Equity Fund | | | 2,610,912 | | | | - | | | | - | | | | - | | |
| Focused Value Fund | | | 2,545,454 | | | | 74,522,080 | | | | 4,523,605 | | | | - | | |
| Small Company Value Fund | | | - | | | | 24,697,559 | | | | 556,940 | | | | - | | |
| Mid Cap Growth Equity II Fund | | | - | | | | 50,310,268 | | | | - | | | | - | | |
| Small Company Growth Fund | | | - | | | | 315,488 | | | | 3,108,001 | | | | - | | |
| Overseas Fund | | | 14,040,495 | | | | 48,413,806 | | | | 23,929,123 | | | | - | | |
| Destination Retirement Income Fund | | | 8,704,749 | | | | 833,577 | | | | 1,021,685 | | | | - | | |
| Destination Retirement 2010 Fund | | | 3,240,209 | | | | 328,764 | | | | 232,123 | | | | - | | |
| Destination Retirement 2020 Fund | | | 10,662,583 | | | | 3,980,285 | | | | 798,787 | | | | - | | |
| Destination Retirement 2030 Fund | | | 4,785,448 | | | | 2,994,526 | | | | 704,386 | | | | - | | |
| Destination Retirement 2040 Fund | | | 1,812,792 | | | | 2,062,031 | | | | 689,543 | | | | - | | |
At December 31, 2005, the components of distributable earnings on a tax basis were as follows:
| | |
Undistributed
Ordinary
Income | | Undistributed
Long Term
Capital Gain/
(Capital Loss
Carryover) | | Other
Temporary
Differences | | Unrealized
Appreciation
(Depreciation) | |
| Strategic Bond Fund | | $ | 64,668 | | | $ | (809,602 | ) | | $ | (336,577 | ) | | $ | (244,700 | ) | |
| Strategic Balanced Fund | | | - | | | | - | | | | (85,849 | ) | | | 10,060,520 | | |
| Diversified Value Fund | | | - | | | | 1,461,517 | | | | (4,010 | ) | | | 42,534,817 | | |
| Fundamental Value Fund | | | 623,293 | | | | 5,267,184 | | | | (19,917 | ) | | | 147,847,966 | | |
| Value Equity Fund | | | 566,210 | | | | 1,026,647 | | | | (3,300 | ) | | | 10,240,383 | | |
| Large Cap Value Fund | | | - | | | | (77,035,217 | ) | | | (320,568 | ) | | | 307,908,409 | | |
| Indexed Equity Fund | | | 137,921 | | | | (26,502,337 | ) | | | (62,585 | ) | | | 139,178,891 | | |
| Blue Chip Growth Fund | | | - | | | | (80,577,553 | ) | | | (15,157 | ) | | | 34,350,675 | | |
| Large Cap Growth Fund | | | - | | | | (1,757,033 | ) | | | (1,183 | ) | | | 6,790,162 | | |
| Growth Equity Fund | | | 66,282 | | | | (148,656,919 | ) | | | (26,397 | ) | | | 57,151,911 | | |
| Aggressive Growth Fund | | | - | | | | (75,638,314 | ) | | | (12,707 | ) | | | (118,858,575 | ) | |
318
Notes to Financial Statements (Continued)
| | |
Undistributed
Ordinary
Income | | Undistributed
Long Term
Capital Gain/
(Capital Loss
Carryover) | | Other
Temporary
Differences | | Unrealized
Appreciation
(Depreciation) | |
| OTC 100 Fund | | $ | - | | | $ | (26,352,235 | ) | | $ | (3,011 | ) | | $ | 6,718,579 | | |
| Focused Value Fund | | | 1,576,686 | | | | 3,676,884 | | | | (21,841 | ) | | | 130,495,147 | | |
| Small Company Value Fund | | | 5,103,690 | | | | - | | | | (9,822 | ) | | | 94,615,105 | | |
| Mid Cap Growth Equity Fund | | | - | | | | (90,510,676 | ) | | | (1,307,568 | ) | | | 33,876,270 | | |
| Mid Cap Growth Equity II Fund | | | - | | | | 9,004,454 | | | | (22,774 | ) | | | 260,106,464 | | |
| Small Cap Growth Equity Fund | | | - | | | | (19,885,474 | ) | | | (16,782 | ) | | | 132,913,069 | | |
| Small Company Growth Fund | | | - | | | | 2,520,213 | | | | (3,874 | ) | | | 3,708,351 | | |
| Emerging Growth Fund | | | - | | | | (45,500,826 | ) | | | (5,070 | ) | | | 12,007,788 | | |
| Overseas Fund | | | - | | | | 3,527,780 | | | | (7,553 | ) | | | 113,713,441 | | |
| Destination Retirement Income Fund | | | - | | | | 2,226,055 | | | | (3,395 | ) | | | (2,820,723 | ) | |
| Destination Retirement 2010 Fund | | | 104,231 | | | | 1,455,231 | | | | (788 | ) | | | (1,664,673 | ) | |
| Destination Retirement 2020 Fund | | | - | | | | 8,995,621 | | | | (4,862 | ) | | | 6,620,508 | | |
| Destination Retirement 2030 Fund | | | - | | | | 6,849,171 | | | | (3,539 | ) | | | 15,598,109 | | |
| Destination Retirement 2040 Fund | | | - | | | | 4,418,060 | | | | (2,000 | ) | | | 10,660,647 | | |
Pursuant to Section 852 of the Internal Revenue Code, the following Funds have designated capital gains dividend for the year ended December 31, 2005:
| | | Long Term
Capital Dividend | |
| Strategic Balanced Fund | | $ | 1,239,874 | | |
| Diversified Value Fund | | | 4,743,589 | | |
| Fundamental Value Fund | | | 19,530,720 | | |
| Value Equity Fund | | | 5,879,719 | | |
| Focused Value Fund | | | 74,522,080 | | |
| Small Company Value Fund | | | 24,697,559 | | |
| Mid Cap Growth Equity II Fund | | | 50,310,268 | | |
| Small Company Growth Fund | | | 315,488 | | |
| Overseas Fund | | | 48,413,806 | | |
| Destination Retirement Income Fund | | | 833,577 | | |
| Destination Retirement 2010 Fund | | | 328,764 | | |
| Destination Retirement 2020 Fund | | | 3,980,285 | | |
| Destination Retirement 2030 Fund | | | 2,994,526 | | |
| Destination Retirement 2040 Fund | | | 2,062,031 | | |
The following Funds have elected to defer to January 1, 2006 post-October losses:
| | | Amount | |
| Strategic Bond Fund | | $ | 312,753 | | |
| Strategic Balanced Fund | | | 81,743 | | |
| Fundamental Value Fund | | | 739,131 | | |
| Indexed Equity Fund | | | 8,287 | | |
| Mid Cap Growth Equity Fund | | | 1,300,757 | | |
The following Funds have elected to defer to January 1, 2006 post-October currency losses:
| | | Amount | |
| Strategic Bond Fund | | $ | 23,103 | | |
| Large Cap Value Fund | | | 286,915 | | |
319
Notes to Financial Statements (Continued)
7. Investment in Affiliated Issuers A summary of the Fund's transactions in the securities of these issuers during the the six months ended June 30, 2006, is as follows:
| | | Value,
beginning
of period | | Purchases | | Sales
Proceeds | | Value,
end of
period | | Dividend
Income | | Realized
Gains
Distributions | |
Destination
Retirement
Income Fund | | | | | | | | | | | | | | | | | | | | | | | | | |
Core Bond Fund,
Class S* | | $ | 45,547,414 | | | $ | 4,331,247 | | | $ | 2,987,191 | | | $ | 46,540,795 | | | $ | - | | | $ | - | | |
Diversified Bond Fund,
Class S* | | | 45,546,685 | | | | 4,296,550 | | | | 3,032,649 | | | | 46,542,821 | | | | - | | | | - | | |
Growth Equity Fund,
Class S | | | 17,621,789 | | | | 2,642,839 | | | | 1,303,840 | | | | 18,024,700 | | | | - | | | | - | | |
Inflation-Protected Bond
Fund, Class S* | | | 48,169,902 | | | | 5,476,156 | | | | 3,504,055 | | | | 49,282,499 | | | | - | | | | - | | |
Large Cap Value Fund,
Class S | | | 17,667,341 | | | | 1,682,838 | | | | 1,851,634 | | | | 18,047,962 | | | | - | | | | - | | |
Money Market Fund,
Class S* | | | 12,663,884 | | | | 1,253,513 | | | | 1,065,936 | | | | 12,891,402 | | | | 262,907 | | | | - | | |
| Overseas Fund, Class S | | | 12,629,689 | | | | 1,463,626 | | | | 2,349,178 | | | | 13,126,623 | | | | - | | | | - | | |
Short-Duration Bond
Fund, Class S* | | | 37,991,653 | | | | 3,096,845 | | | | 2,914,351 | | | | 38,712,429 | | | | - | | | | - | | |
Small Company
Opportunities Fund,
Class S* | | | 15,075,307 | | | | 2,166,809 | | | | 2,114,939 | | | | 15,582,626 | | | | - | | | | - | | |
| Totals | | $ | 252,913,664 | | | $ | 26,410,423 | | | $ | 21,123,773 | | | $ | 258,751,857 | | | $ | 262,907 | | | $ | - | | |
| | | Value,
beginning
of period | | Purchases | | Sales
Proceeds | | Value,
end of
period | | Dividend
Income | | Realized
Gains
Distributions | |
Destination
Retirement
2010 Fund | | | | | | | | | | | | | | | | | | | | | | | | | |
Core Bond Fund,
Class S* | | $ | 16,312,284 | | | $ | 6,355,016 | | | $ | 1,253,615 | | | $ | 21,272,339 | | | $ | - | | | $ | - | | |
Diversified Bond
Fund, Class S* | | | 16,312,023 | | | | 6,342,253 | | | | 1,272,816 | | | | 21,273,265 | | | | - | | | | - | | |
Fundamental Value
Fund, Class S | | | 5,418,368 | | | | 2,035,567 | | | | 783,786 | | | | 7,070,693 | | | | - | | | | - | | |
Growth Equity Fund,
Class S | | | 11,900,833 | | | | 5,287,202 | | | | 830,235 | | | | 15,535,460 | | | | - | | | | - | | |
Inflation-Protected Bond
Fund, Class S* | | | 16,343,519 | | | | 6,704,713 | | | | 1,399,582 | | | | 21,339,981 | | | | - | | | | - | | |
Large Cap Value
Fund, Class S | | | 6,508,140 | | | | 2,445,026 | | | | 676,508 | | | | 8,484,831 | | | | - | | | | - | | |
Mid Cap Growth
Equity II Fund,
Class S | | | 4,333,188 | | | | 1,792,162 | | | | 465,859 | | | | 5,683,570 | | | | - | | | | - | | |
Money Market Fund,
Class S* | | | 5,442,509 | | | | 2,112,258 | | | | 501,026 | | | | 7,070,693 | | | | 125,889 | | | | - | | |
Overseas Fund,
Class S | | | 7,598,942 | | | | 3,062,431 | | | | 1,439,953 | | | | 10,079,717 | | | | - | | | | - | | |
Short-Duration Bond
Fund, Class S* | | | 11,973,520 | | | | 4,422,825 | | | | 1,021,147 | | | | 15,570,909 | | | | - | | | | - | | |
Small Company
Opportunities Fund,
Class S* | | | 6,478,866 | | | | 2,853,435 | | | | 907,011 | | | | 8,546,822 | | | | - | | | | - | | |
| Totals | | $ | 108,622,192 | | | $ | 43,412,888 | | | $ | 10,551,538 | | | $ | 141,928,280 | | | $ | 125,889 | | | $ | - | | |
320
Notes to Financial Statements (Continued)
| | | Value,
beginning
of period | | Purchases | | Sales
Proceeds | | Value,
end of
period | | Dividend
Income | | Realized
Gains
Distributions | |
Destination
Retirement
2020 Fund | | | | | | | | | | | | | | | | | | | | | | | | | |
Aggressive Growth
Fund, Class S | | $ | 34,201,822 | | | $ | 10,289,604 | | | $ | 979,730 | | | $ | 39,792,594 | | | $ | - | | | $ | - | | |
Core Bond Fund,
Class S* | | | 51,562,379 | | | | 11,002,029 | | | | 2,276,764 | | | | 59,858,108 | | | | - | | | | - | | |
Diversified Bond
Fund, Class S* | | | 47,264,758 | | | | 10,047,970 | | | | 2,138,800 | | | | 54,872,316 | | | | - | | | | - | | |
Focused Value
Fund, Class S | | | 17,103,860 | | | | 3,325,499 | | | | 974,486 | | | | 19,862,344 | | | | - | | | | - | | |
Fundamental Value
Fund, Class S | | | 38,536,302 | | | | 6,953,115 | | | | 3,565,577 | | | | 44,766,668 | | | | - | | | | - | | |
Growth Equity Fund,
Class S | | | 38,473,048 | | | | 9,584,826 | | | | 1,007,251 | | | | 44,709,045 | | | | - | | | | - | | |
Inflation-Protected
Bond Fund, Class S* | | | 55,966,144 | | | | 13,052,154 | | | | 2,920,560 | | | | 65,052,057 | | | | - | | | | - | | |
Large Cap Value
Fund, Class S | | | 38,572,429 | | | | 7,035,433 | | | | 2,080,882 | | | | 44,766,668 | | | | - | | | | - | | |
Mid Cap Growth
Equity II Fund, Class S | | | 21,401,618 | | | | 4,623,459 | | | | 1,293,463 | | | | 24,988,909 | | | | - | | | | - | | |
| Overseas Fund, Class S | | | 38,603,457 | | | | 7,969,818 | | | | 5,381,559 | | | | 45,582,377 | | | | - | | | | - | | |
Short-Duration
Bond Fund, Class S* | | | 25,805,268 | | | | 4,923,177 | | | | 1,249,978 | | | | 29,873,902 | | | | - | | | | - | | |
Small Company
Opportunities
Fund, Class S* | | | 21,332,790 | | | | 5,161,901 | | | | 2,008,042 | | | | 25,051,700 | | | | - | | | | - | | |
| Totals | | $ | 428,823,875 | | | $ | 93,968,985 | | | $ | 25,877,092 | | | $ | 499,176,688 | | | $ | - | | | $ | - | | |
| | | Value,
beginning
of period | | Purchases | | Sales
Proceeds | | Value,
end of
period | | Dividend
Income | | Realized
Gains
Distributions | |
Destination
Retirement
2030 Fund | | | | | | | | | | | | | | | | | | | | | | | | | |
Aggressive Growth
Fund, Class S | | $ | 35,480,786 | | | $ | 12,223,264 | | | $ | 970,496 | | | $ | 42,705,858 | | | $ | - | | | $ | - | | |
Core Bond Fund,
Class S* | | | 5,943,403 | | | | 1,609,746 | | | | 363,945 | | | | 7,137,834 | | | | - | | | | - | | |
Diversified Bond
Fund, Class S* | | | 20,801,577 | | | | 5,617,996 | | | | 1,297,862 | | | | 24,983,503 | | | | - | | | | - | | |
Emerging Growth
Fund, Class S | | | 14,751,544 | | | | 4,241,994 | | | | 1,485,025 | | | | 17,993,932 | | | | - | | | | - | | |
Focused Value
Fund, Class S | | | 14,786,212 | | | | 3,288,219 | | | | 652,830 | | | | 17,763,724 | | | | - | | | | - | | |
Fundamental Value
Fund, Class S | | | 38,496,730 | | | | 8,223,329 | | | | 3,316,308 | | | | 46,264,680 | | | | - | | | | - | | |
Growth Equity Fund,
Class S | | | 38,433,519 | | | | 11,213,476 | | | | 951,400 | | | | 46,205,093 | | | | - | | | | - | | |
Inflation-Protected
Bond Fund, Class S* | | | 23,819,124 | | | | 6,935,668 | | | | 1,658,757 | | | | 28,641,988 | | | | - | | | | - | | |
Large Cap Value
Fund, Class S | | | 35,568,767 | | | | 8,085,835 | | | | 2,095,916 | | | | 42,705,858 | | | | - | | | | - | | |
Mid Cap Growth
Equity II Fund, Class S | | | 14,801,288 | | | | 3,584,855 | | | | 651,925 | | | | 17,878,969 | | | | - | | | | - | | |
| Overseas Fund, Class S | | | 38,563,839 | | | | 9,499,727 | | | | 5,407,712 | | | | 47,108,185 | | | | - | | | | - | | |
Small Company
Value Fund, Class S | | | 14,811,068 | | | | 3,549,958 | | | | 1,767,458 | | | | 17,976,278 | | | | - | | | | - | | |
| Totals | | $ | 296,257,857 | | | $ | 78,074,067 | | | $ | 20,619,634 | | | $ | 357,365,902 | | | $ | - | | | $ | - | | |
321
Notes to Financial Statements (Continued)
| | | Value,
beginning
of period | | Purchases | | Sales
Proceeds | | Value,
end of
period | | Dividend
Income | | Realized
Gains
Distributions | |
Destination
Retirement
2040 Fund | | | | | | | | | | | | | | | | | | | | | | | | | |
Aggressive Growth
Fund, Class S | | $ | 23,815,361 | | | $ | 10,280,377 | | | $ | 1,043,364 | | | $ | 30,125,902 | | | $ | - | | | $ | - | | |
Emerging Growth
Fund, Class S | | | 10,184,380 | | | | 3,708,584 | | | | 1,135,486 | | | | 13,056,162 | | | | - | | | | - | | |
Focused Value Fund,
Class S | | | 10,208,346 | | | | 3,074,626 | | | | 620,243 | | | | 12,889,044 | | | | - | | | | - | | |
Fundamental Value
Fund, Class S | | | 25,555,818 | | | | 7,510,559 | | | | 2,725,975 | | | | 32,277,753 | | | | - | | | | - | | |
Growth Equity Fund,
Class S | | | 25,513,800 | | | | 9,598,397 | | | | 1,043,013 | | | | 32,236,160 | | | | - | | | | - | | |
Inflation-Protected
Bond Fund, Class S* | | | 1,712,999 | | | | 658,025 | | | | 172,198 | | | | 2,164,812 | | | | - | | | | - | | |
Large Cap Value
Fund, Class S | | | 25,579,816 | | | | 7,954,823 | | | | 2,078,168 | | | | 32,277,753 | | | | - | | | | - | | |
Mid Cap Growth
Equity II Fund, Class S | | | 10,218,769 | | | | 3,213,472 | | | | 527,079 | | | | 12,972,705 | | | | - | | | | - | | |
| Overseas Fund, Class S | | | 25,600,427 | | | | 8,349,678 | | | | 4,130,730 | | | | 32,866,539 | | | | - | | | | - | | |
Small Company
Value Fund, Class S | | | 11,929,785 | | | | 3,673,367 | | | | 1,502,412 | | | | 15,217,238 | | | | - | | | | - | | |
| Totals | | $ | 170,319,501 | | | $ | 58,021,908 | | | $ | 14,978,668 | | | $ | 216,084,068 | | | $ | - | | | $ | - | | |
* MassMutual Premier Funds
8. Proxy Voting (Unaudited) A description of the policies and procedures that each Fund's investment adviser and sub-advisers use to vote proxies relating to the Fund's portfolio securities is available, without charge, upon request, by calling 1-888-309-3539, and on the Securities and Exchange Commission's website at http://www.sec.gov.
Information regarding how the Funds voted proxies relating to portfolio securities during the most recent 12-month period ended June 30 is available, without charge, upon request, on the MassMutual website at http://www.massmutual.com/retire and on the Securities and Exchange Commission's website at http://www.sec.gov.
9. Quarterly Reporting (Unaudited) The Funds file their complete schedule of portfolio holdings with the SEC for the first and third quarters of each fiscal year on Form N-Q. The Funds' Forms N-Q are available on the SEC website at http://www.sec.gov. The Funds' Forms N-Q may be reviewed and copied at the SEC's Public Reference Room in Washington D.C. Information on the operation of the SEC's Public Reference Room may be obtained by calling 1-800-SEC-0330.
10. Trustees' Approval
of Investment
Advisory Contracts
(Unaudited) At Contract Committee meetings held on January 26, 2006 and February 6, 2006 and a Board meeting held on February 6, 2006, respectively, the Board of Trustees of the Trust, including the Trustees who are not "interested persons" (as such term is defined in the 1940 Act) of the Trust, the Adviser or Sub-Advisers (the "Independent Trustees"), approved the existing Advisory Agreement for the Blue Chip Growth Fund and the existing Advisory Agreements and Sub-Advisory Agreements for each of the Strategic Bond Fund, Strategic Balanced Fund, Diversified Value Fund, Fundamental Value Fund, Value Equity Fund, Large Cap Value Fund, Indexed Equity Fund, Large Cap Growth Fund, Growth Equity Fund, Aggressive Growth Fund, OTC 100 Fund, Focused Value Fund, Small Company Value Fund, Mid Cap Growth Equity Fund, Mid Cap Growth Equity II Fund, Small Cap Growth Equity Fund, Small Company Growth Fund, Emerging Growth Fund, Overseas Fund, Destination Retirement Income Fund, Destination Retirement 2010 Fund, Destination Retirement 2020 Fund, Destination Retirement 2030 Fund and Destination Retirement 2040 Fund (each a "Fund" and collectively, the "Funds"). In preparation for the meetings, the Trustees requested, and the Adviser and Sub-Advisers provided in
322
Notes to Financial Statements (Continued)
advance of the meetings, certain materials relevant to the consideration of the Advisory Agreements and Sub-Advisory Agreements. The Trustees also requested, and received in advance of the meetings, a fee study report with respect to each Fund prepared by an independent third-party vendor (the "Third-Party Report"). The Third-Party Report presented information concerning advisory fees, total expense ratios and investment performance that compared the Funds to a peer group identified by the third-party vendor. The Trustees also received in board materials in advance of the meetings, memoranda prepared by counsel to the Independent Trustees addressing their duties and responsibilities in approving the Advisory Agreements and Sub-Advisory Agreements, including identification of types of information relevant to such consideration.
Representatives of the third-party vendor preparing the Third-Party Report requested by the Trustees were present for a portion of the January 26, 2006 meeting and made a presentation to the Trustees with respect to this Report. Such representatives also addressed questions posed by the Trustees concerning the Report. At the meeting, representatives of the Adviser made an extensive presentation concerning the Adviser's operations and capabilities as well as the investment strategy to be pursued by each Fund and each Sub-Adviser's capabilities in managing such a strategy.
In approving the Advisory Agreements, the Trustees took note of the fact that the Adviser would delegate substantially all responsibility for furnishing a continuous investment program for the Funds, and making investment decisions with respect to a Fund's assets, to the relevant Sub-Advisers. The Trustees examined the Adviser's ability to provide investment oversight, administrative and shareholder services to the Funds. The Trustees also considered the experience and qualifications of the personnel of the Adviser that would be performing, or overseeing the performance of, the services to be provided to the Funds and the needs of the Funds for administrative and shareholder services. Based on the above, the Trustees concluded that the resources to be devoted by the Adviser were appropriate to fulfill effectively its duties under the Advisory Agreements.
The Trustees considered a number of factors they believed to be relevant to the interests of shareholders of the Funds. Such factors included (i) the ability of the Adviser to monitor the operations and performance of each Fund's Sub-Adviser, (ii) the financial condition, stability and business strategy of the Adviser, (iii) the ability of the Adviser with respect to regulatory compliance and the ability to monitor compliance with the investment policies of the Funds, (iv) possible economies of scale, and (v) any conditions affecting the Adviser's future provision of high quality services to the Funds. The Trustees concluded that the anticipated scope and quality of the services to be provided by the Adviser were satisfactory, in light of market conditions, the resources to be dedicated by the Adviser and its integrity, personnel, and financial resources, to merit approval of the Advisory Agreements.
The Trustees took into account not only the actual dollar amount of fees to be paid by the Funds to the Adviser, but also took into account the estimated profitability of the Funds to the Adviser and the so-called "fallout benefits" to the Adviser, such as any reputational value derived from serving as investment adviser to the Funds. The Trustees considered the fact that the advisory fees did not contain breakpoints due to the Adviser choosing to price for the long-term. The Trustees also reviewed the performance of each Fund for the past one, three and five-year periods, as applicable.
Based on the foregoing, the Trustees concluded that the fees to be paid to the Adviser under the Advisory Agreements and the Funds' total expenses were fair and reasonable, given the anticipated scope and quality of the services to be rendered by the Adviser.
In approving the Sub-Advisory Agreements with respect to the Funds, the Trustees considered a wide range of information about, among other things: each Sub-Adviser and its personnel with responsibilities for providing services to the respective Fund; the terms of the Sub-Advisory Agreements; the scope and quality of services to be provided to each Fund under the Sub-Advisory Agreements; and the fees payable to each Sub-Adviser by the Adviser. The Trustees did not generally review the profitability of the Sub-Advisers based on the fact that the sub-advisory fees were paid by the Adviser and on the conclusion that, accordingly, the sub-advisory fees were being negotiated at
323
Notes to Financial Statements (Continued)
arm's length. The Trustees were also informed that each Sub-Adviser may receive research services from brokers in connection with portfolio securities transactions for the Funds and that research services furnished by brokers through which the Funds effect securities transactions may be used by each Sub-Adviser in advising other accounts that it advises. Conversely, research services furnished to each Sub-Adviser in connection with other accounts each Sub-Adviser advises may be used by a Sub-Adviser in advising the Funds.
Based on the foregoing, the Trustees concluded that the investment processes, research capabilities and philosophies of each Sub-Adviser would be well suited to each Fund, given their investment objectives and policies.
Following their review, the Trustees determined that the terms of the Advisory Agreements and Sub-Advisory Agreements were fair and reasonable with respect to each Fund and were in the best interests of each Fund's shareholders. After carefully considering the information summarized above, the Trustees, including the Independent Trustees voting separately, unanimously voted to approve the Advisory Agreements and the Sub-Advisory Agreements.
Prior to the votes being taken to approve the Advisory Agreements and Sub-Advisory Agreements, the Independent Trustees met separately in executive session to discuss the appropriateness of such contracts. In their deliberations with respect to these matters, the Independent Trustees were advised by their independent legal counsel. The Independent Trustees weighed the foregoing matters in light of the advice given to them by their independent legal counsel as to the law applicable to the review of investment advisory contracts. In arriving at a decision, the Trustees, including the Independent Trustees, did not identify any single matter as all-important or controlling. The foregoing summary does not detail all of the matters considered.
At the Board meeting held on February 6, 2006, the Board of Trustees of the Trust, including the Independent Trustees, also approved the Advisory Agreements and Sub-Advisory Agreements for each of the Core Opportunities Fund, Small Cap Value Equity Fund and Small Cap Core Equity Fund, subject to approval by the shareholders of each of the Funds of the Advisory Agreements and Sub-Advisory Agreements. In preparation for the meeting, the Trustees requested, and the Adviser and Sub-Advisers provided in advance of the meeting, certain materials relevant to the consideration of the Advisory Agreements and Sub-Advisory Agreements. The Trustees also requested, and received in advance of the meeting, a fee study report with respect to each Fund prepared by the Adviser using information provided by an independent third-party vendor. This fee study identified relevant peer group funds and presented comparative information concerning advisory fees and t otal expense ratios. The Trustees also received in board materials in advance of the meeting memoranda prepared by counsel to the Independent Trustees addressing their duties and responsibilities in approving the Advisory Agreements and Sub-Advisory Agreements, including identification of types of information relevant to such consideration.
At the meeting, representatives of the Adviser made an extensive presentation concerning the Adviser's operations and capabilities as well as the investment strategy to be pursued by each Fund and each Sub-Adviser's capabilities in managing such a strategy.
In approving the Advisory Agreements, the Trustees took note of the fact that the Adviser would delegate substantially all responsibility for furnishing a continuous investment program for the Funds, and making investment decisions with respect to a Fund's assets, to the relevant Sub-Adviser. The Trustees examined the Adviser's ability to provide investment oversight, administrative and shareholder services to the Funds. The Trustees also considered the experience and qualifications of the personnel of the Adviser that would be performing, or overseeing the performance of, the services to be provided to the Funds and the needs of the Funds for administrative and shareholder services. Based on the above, the Trustees concluded that the resources to be devoted by the Adviser were appropriate to fulfill effectively its duties under the Advisory Agreements.
324
Notes to Financial Statements (Continued)
The Trustees considered a number of factors they believed to be relevant to the interests of shareholders of the Funds. Such factors included (i) the ability of the Adviser to monitor the operations and performance of each Fund's Sub-Adviser, (ii) the financial condition, stability and business strategy of the Adviser, (iii) the ability of the Adviser with respect to regulatory compliance and the ability to monitor compliance with the investment policies of the Funds, (iv) possible economies of scale, and (v) any conditions affecting the Adviser's future provision of high quality services to the Funds. The Trustees concluded that the anticipated scope and quality of the services to be provided by the Adviser were satisfactory, in light of market conditions, the resources to be dedicated by the Adviser and its integrity, personnel, and financial resources, to merit approval of the Advisory Agreements.
The Trustees took into account not only the actual dollar amount of fees to be paid by the Funds to the Adviser, but also took into account the estimated profitability of the Funds to the Adviser and the so-called "fallout benefits" to the Adviser, such as any reputational value derived from serving as investment adviser to the Funds. The Trustees considered the fact that the advisory fees did not contain breakpoints due to the Adviser choosing to price for the long-term.
Based on the foregoing, the Trustees concluded that the fees to be paid to the Adviser under the Advisory Agreements and the Funds' total expenses were fair and reasonable, given the anticipated scope and quality of the services to be rendered by the Adviser.
In approving the Sub-Advisory Agreements with respect to the Funds, the Trustees considered a wide range of information about, among other things: each Sub-Adviser and its personnel with responsibilities for providing services to the respective Fund; the terms of the Sub-Advisory Agreements; the scope and quality of services to be provided to each Fund under the Sub-Advisory Agreements; and the fees payable to each Sub-Adviser by the Adviser. The Trustees were informed that the sub-advisory fees were negotiated at arm's length. The Trustees were also informed that each Sub-Adviser may receive research services from brokers in connection with portfolio securities transactions for the Funds and that research services furnished by brokers through which the Funds effect securities transactions may be used by each Sub-Adviser in advising other accounts that it advises. Conversely, research services furnished to each Sub-Adviser in connection with other accounts each Sub-Adviser advises may be used by a Sub-Adviser in advising the Funds.
Based on the foregoing, the Trustees concluded that the investment processes, research capabilities and philosophies of each Sub-Adviser would be well suited to each Fund, given their investment objectives and policies.
Following their review, the Trustees determined that the terms of the Advisory Agreements and Sub-Advisory Agreements were fair and reasonable with respect to each Fund and were in the best interests of each Fund's shareholders. After carefully considering the information summarized above, the Trustees, including the Independent Trustees voting separately, unanimously voted to approve the Advisory Agreements and the Sub-Advisory Agreements.
Prior to the votes being taken to approve the Advisory Agreements and Sub-Advisory Agreements, the Independent Trustees met separately in executive session to discuss the appropriateness of such contracts. In their deliberations with respect to these matters, the Independent Trustees were advised by their independent legal counsel. The Independent Trustees weighed the foregoing matters in light of the advice given to them by their independent legal counsel as to the law applicable to the review of investment advisory contracts. In arriving at a decision, the Trustees, including the Independent Trustees, did not identify any single matter as all-important or controlling. The foregoing summary does not detail all of the matters considered.
In addition, at the Board meeting held on February 6, 2006, the Trustees were approved the termination of the Sub-Advisory Agreement with Fidelity Management & Research Company ("FMR") and the approval of a new Sub-Advisory Agreement with T. Rowe Price Associates, Inc. ("T. Rowe Price") for the Blue Chip Growth Fund. At a Board meeting held on May 1, 2006, the Trustees approved a new
325
Notes to Financial Statements (Continued)
Sub-Advisory Agreement with Delaware Management Company ("DMC") to add DMC as an additional Sub-Adviser to the Aggressive Growth Fund.
After arriving at the decision to replace FMR as a Sub-Adviser of the Blue Chip Growth Fund, the Trustees determined that it would be appropriate to find another sub-adviser that invested in blue chip stocks of large-capitalization companies who was from a stable firm and who had a strong track record that represented a successful and consistent approach. After careful consideration, the Trustees determined that T. Rowe Price provided the best opportunity for the Fund.
After arriving at the decision to add a co-sub-adviser, in addition to Sands Capital Management, LLC ("Sands Capital"), to the Aggressive Growth Fund, the Trustees determined that it would be appropriate to find another sub-adviser that invested in large-capitalization companies in an aggressive style similar to that of Sands Capital. The sub-adviser should be a stable firm with a strong track record that represented a successful and consistent approach. After careful consideration, the Trustees determined that DMC provided the best opportunity for the Aggressive Growth Fund.
In coming to each of these recommendations, the Trustees considered a wide range of information of the type they regularly consider when determining whether to continue a Fund's Sub-Advisory Agreement as in effect from year to year. The Trustees considered information about, among other things: each Sub-Adviser and its personnel (including particularly those personnel with responsibilities for providing services to each Fund), resources and investment process; the terms of the Sub-Advisory Agreements; the scope and quality of services to be provided to each Fund under the Sub-Advisory Agreements; the investment performance of the Sub-Advisers in managing similar strategies; the fees payable to each Sub-Adviser by the Adviser and by other funds and client accounts managed or sub-advised by the Sub-Adviser, and payable by similar funds managed by other Advisers; and each Sub-Adviser's practices regarding the selection and compensation of broke rs and dealers that execute portfolio transactions for the Funds, and the brokers' and dealers' provision of brokerage and research services to the Sub-Adviser. The Trustees did not generally review the profitability of the Sub-Advisers based on the fact that the sub-advisory fees were paid by the Adviser and on the conclusion that, accordingly, the sub-advisory fees were being negotiated at arm's length.
Based on the foregoing, the Trustees concluded that the investment processes, research capabilities and philosophies of T. Rowe Price and DMC would be well suited to the Blue Chip Growth Fund and Aggressive Growth Fund, respectively, given their investment objectives and policies.
Following their review, the Trustees determined that the terms of the Sub-Advisory Agreements were fair and reasonable with respect to the Funds and were in the best interests of each Fund's shareholders. After carefully considering the information summarized above, the Trustees, including the Independent Trustees voting separately, unanimously voted to approve these Sub-Advisory Agreements.
Prior to the votes being taken to approve these Sub-Advisory Agreements, the Independent Trustees met separately in executive session to discuss the appropriateness of such contracts. In their deliberations with respect to these matters, the Independent Trustees were advised by their independent legal counsel. The Independent Trustees weighed the foregoing matters in light of the advice given to them by their independent legal counsel as to the law applicable to the review of investment advisory contracts. In arriving at a decision, the Trustees, including the Independent Trustees, did not identify any single matter as all-important or controlling. The foregoing summary does not detail all of the matters considered.
11. Subsequent Event (Unaudited) Effective July 11, 2006, Delaware Management Company and Insight Capital Research & Management, Inc. replaced RS Investment Management, L.P. as co-sub-advisers for the Emerging Growth Fund.
326
Other Information (Unaudited)
Fund Expenses June 30, 2006
| Expense Examples | | The following information is in regards to expenses for the six months ended June 30, 2006:
As a shareholder of the Funds, you may incur two types of costs: (1) transaction costs, including sales charges (loads) on purchase payments or redemptions; and (2) ongoing costs, including management fees, distribution and/or service (12b-1) fees; and other Fund expenses. These examples are intended to help you understand your ongoing costs (in dollars) of investing in the Funds and to compare these costs with the ongoing costs of investing in other mutual funds.
These examples are based on an investment of $1,000 invested for the six months ended June 30, 2006. | |
|
| Actual Expenses | | The first line of each table on the following pages provides information about actual account values and actual expenses. You may use the information in this line, together with the amount you invested, to estimate the expenses that you paid over the period. Simply divide your account value by $1,000 (for example, an $8,600 account value divided by $1,000 = 8.6), then multiply the result by the number in the first line under the heading entitled "Operating Expenses Incurred" to estimate the expenses you paid on your account during this period. | |
|
Hypothetical Example for Comparison
Purposes | | The second line of each table on the following pages provides information about hypothetical account values and hypothetical expenses based on the Fund's actual expense ratio and an assumed rate of return of 5% per year before expenses, which is not the Fund's actual return. The hypothetical account values and expenses may not be used to estimate the actual ending account balance or expenses you paid for the period. You may use this information to compare the ongoing costs of investing in the Fund and other funds. To do so, compare this 5% hypothetical example with the 5% hypothetical examples that appear in the shareholder reports of the other funds.
Please note that the expenses shown in the tables are meant to highlight your ongoing costs only and do not reflect any transactional costs, such as sales charges (loads). Therefore, the second line of the table is useful i n comparing ongoing costs only, and will not help you determine the relative total costs of owning different funds. In addition, if these transactional costs were included, your costs would have been higher. | |
|
327
Other Information (Continued)
The Funds incur ongoing operating expenses during the normal course of business, such as management fees, shareholder service fees and other expenses. The following tables, assuming a $1,000 investment in a class of shares, disclose the ending account value and operating expenses incurred for the six months ended June 30, 2006, based on, (1) the classes' actual return and actual expenses, and (2) a hypothetical annualized 5% return and the classes' actual expenses:
Strategic Bond Fund
Class A
| | | Beginning
Value | | Ending
Value | | Operating
Expense
Incurred* | |
| | 1 | ) Actual | | $ | 1,000.00 | | | $ | 985.00 | | | $ | 4.72 | | |
| | 2 | ) Hypothetical | | | 1,000.00 | | | | 1,020.03 | | | | 4.81 | | |
* Expenses are calculated using the annualized expense ratio for the six months ended June 30, 2006 of 0.96%, multiplied by the average account value over the period, multiplied by the number of days in the period, divided by the number of days in the year.
Class L
| | | Beginning
Value | | Ending
Value | | Operating
Expense
Incurred* | |
| | 1 | ) Actual | | $ | 1,000.00 | | | $ | 987.00 | | | $ | 3.45 | | |
| | 2 | ) Hypothetical | | | 1,000.00 | | | | 1,021.32 | | | | 3.51 | | |
* Expenses are calculated using the annualized expense ratio for the six months ended June 30, 2006 of 0.70%, multiplied by the average account value over the period, multiplied by the number of days in the period, divided by the number of days in the year.
Class Y
| | | Beginning
Value | | Ending
Value | | Operating
Expense
Incurred* | |
| | 1 | ) Actual | | $ | 1,000.00 | | | $ | 987.00 | | | $ | 3.50 | | |
| | 2 | ) Hypothetical | | | 1,000.00 | | | | 1,021.27 | | | | 3.56 | | |
* Expenses are calculated using the annualized expense ratio for the six months ended June 30, 2006 of 0.71%, multiplied by the average account value over the period, multiplied by the number of days in the period, divided by the number of days in the year.
Class S
| | | Beginning
Value | | Ending
Value | | Operating
Expense
Incurred* | |
| | 1 | ) Actual | | $ | 1,000.00 | | | $ | 986.00 | | | $ | 3.20 | | |
| | 2 | ) Hypothetical | | | 1,000.00 | | | | 1,021.57 | | | | 3.26 | | |
* Expenses are calculated using the annualized expense ratio for the six months ended June 30, 2006 of 0.65%, multiplied by the average account value over the period, multiplied by the number of days in the period, divided by the number of days in the year.
328
Other Information (Continued)
Class N
| | | Beginning
Value | | Ending
Value | | Operating
Expense
Incurred* | |
| | 1 | ) Actual | | $ | 1,000.00 | | | $ | 982.90 | | | $ | 6.29 | | |
| | 2 | ) Hypothetical | | | 1,000.00 | | | | 1,018.45 | | | | 6.41 | | |
* Expenses are calculated using the annualized expense ratio for the six months ended June 30, 2006 of 1.28%, multiplied by the average account value over the period, multiplied by the number of days in the period, divided by the number of days in the year.
Strategic Balanced Fund
Class A
| | | Beginning
Value | | Ending
Value | | Operating
Expense
Incurred* | |
| | 1 | ) Actual | | $ | 1,000.00 | | | $ | 1,018.00 | | | $ | 6.05 | | |
| | 2 | ) Hypothetical | | | 1,000.00 | | | | 1,018.79 | | | | 6.06 | | |
* Expenses are calculated using the annualized expense ratio for the six months ended June 30, 2006 of 1.21%, multiplied by the average account value over the period, multiplied by the number of days in the period, divided by the number of days in the year.
Class L
| | | Beginning
Value | | Ending
Value | | Operating
Expense
Incurred* | |
| | 1 | ) Actual | | $ | 1,000.00 | | | $ | 1,018.00 | | | $ | 4.80 | | |
| | 2 | ) Hypothetical | | | 1,000.00 | | | | 1,020.03 | | | | 4.81 | | |
* Expenses are calculated using the annualized expense ratio for the six months ended June 30, 2006 of 0.96%, multiplied by the average account value over the period, multiplied by the number of days in the period, divided by the number of days in the year.
Class Y
| | | Beginning
Value | | Ending
Value | | Operating
Expense
Incurred* | |
| | 1 | ) Actual | | $ | 1,000.00 | | | $ | 1,018.90 | | | $ | 4.05 | | |
| | 2 | ) Hypothetical | | | 1,000.00 | | | | 1,020.78 | | | | 4.06 | | |
* Expenses are calculated using the annualized expense ratio for the six months ended June 30, 2006 of 0.81%, multiplied by the average account value over the period, multiplied by the number of days in the period, divided by the number of days in the year.
Class S
| | | Beginning
Value | | Ending
Value | | Operating
Expense
Incurred* | |
| | 1 | ) Actual | | $ | 1,000.00 | | | $ | 1,019.80 | | | $ | 3.81 | | |
| | 2 | ) Hypothetical | | | 1,000.00 | | | | 1,021.03 | | | | 3.81 | | |
* Expenses are calculated using the annualized expense ratio for the six months ended June 30, 2006 of 0.76%, multiplied by the average account value over the period, multiplied by the number of days in the period, divided by the number of days in the year.
329
Other Information (Continued)
Class N
| | | Beginning
Value | | Ending
Value | | Operating
Expense
Incurred* | |
| | 1 | ) Actual | | $ | 1,000.00 | | | $ | 1,016.10 | | | $ | 7.55 | | |
| | 2 | ) Hypothetical | | | 1,000.00 | | | | 1,017.31 | | | | 7.55 | | |
* Expenses are calculated using the annualized expense ratio for the six months ended June 30, 2006 of 1.51%, multiplied by the average account value over the period, multiplied by the number of days in the period, divided by the number of days in the year.
Diversified Value Fund
Class A
| | | Beginning
Value | | Ending
Value | | Operating
Expense
Incurred* | |
| | 1 | ) Actual | | $ | 1,000.00 | | | $ | 1,056.00 | | | $ | 5.51 | | |
| | 2 | ) Hypothetical | | | 1,000.00 | | | | 1,019.44 | | | | 5.41 | | |
* Expenses are calculated using the annualized expense ratio for the six months ended June 30, 2006 of 1.08%, multiplied by the average account value over the period, multiplied by the number of days in the period, divided by the number of days in the year.
Class L
| | | Beginning
Value | | Ending
Value | | Operating
Expense
Incurred* | |
| | 1 | ) Actual | | $ | 1,000.00 | | | $ | 1,057.60 | | | $ | 4.03 | | |
| | 2 | ) Hypothetical | | | 1,000.00 | | | | 1,020.88 | | | | 3.96 | | |
* Expenses are calculated using the annualized expense ratio for the six months ended June 30, 2006 of 0.79%, multiplied by the average account value over the period, multiplied by the number of days in the period, divided by the number of days in the year.
Class Y
| | | Beginning
Value | | Ending
Value | | Operating
Expense
Incurred* | |
| | 1 | ) Actual | | $ | 1,000.00 | | | $ | 1,058.60 | | | $ | 3.47 | | |
| | 2 | ) Hypothetical | | | 1,000.00 | | | | 1,021.42 | | | | 3.41 | | |
* Expenses are calculated using the annualized expense ratio for the six months ended June 30, 2006 of 0.68%, multiplied by the average account value over the period, multiplied by the number of days in the period, divided by the number of days in the year.
Class S
| | | Beginning
Value | | Ending
Value | | Operating
Expense
Incurred* | |
| | 1 | ) Actual | | $ | 1,000.00 | | | $ | 1,059.40 | | | $ | 2.96 | | |
| | 2 | ) Hypothetical | | | 1,000.00 | | | | 1,021.92 | | | | 2.91 | | |
* Expenses are calculated using the annualized expense ratio for the six months ended June 30, 2006 of 0.58%, multiplied by the average account value over the period, multiplied by the number of days in the period, divided by the number of days in the year.
330
Other Information (Continued)
Class N
| | | Beginning
Value | | Ending
Value | | Operating
Expense
Incurred* | |
| | 1 | ) Actual | | $ | 1,000.00 | | | $ | 1,055.00 | | | $ | 7.13 | | |
| | 2 | ) Hypothetical | | | 1,000.00 | | | | 1,017.85 | | | | 7.00 | | |
* Expenses are calculated using the annualized expense ratio for the six months ended June 30, 2006 of 1.40%, multiplied by the average account value over the period, multiplied by the number of days in the period, divided by the number of days in the year.
Fundamental Value Fund
Class A
| | | Beginning
Value | | Ending
Value | | Operating
Expense
Incurred* | |
| | 1 | ) Actual | | $ | 1,000.00 | | | $ | 1,069.10 | | | $ | 6.31 | | |
| | 2 | ) Hypothetical | | | 1,000.00 | | | | 1,018.70 | | | | 6.16 | | |
* Expenses are calculated using the annualized expense ratio for the six months ended June 30, 2006 of 1.23%, multiplied by the average account value over the period, multiplied by the number of days in the period, divided by the number of days in the year.
Class L
| | | Beginning
Value | | Ending
Value | | Operating
Expense
Incurred* | |
| | 1 | ) Actual | | $ | 1,000.00 | | | $ | 1,071.60 | | | $ | 5.03 | | |
| | 2 | ) Hypothetical | | | 1,000.00 | | | | 1,019.13 | | | | 4.91 | | |
* Expenses are calculated using the annualized expense ratio for the six months ended June 30, 2006 of 0.98%, multiplied by the average account value over the period, multiplied by the number of days in the period, divided by the number of days in the year.
Class Y
| | | Beginning
Value | | Ending
Value | | Operating
Expense
Incurred* | |
| | 1 | ) Actual | | $ | 1,000.00 | | | $ | 1,071.50 | | | $ | 4.26 | | |
| | 2 | ) Hypothetical | | | 1,000.00 | | | | 1,020.68 | | | | 4.16 | | |
* Expenses are calculated using the annualized expense ratio for the six months ended June 30, 2006 of 0.83%, multiplied by the average account value over the period, multiplied by the number of days in the period, divided by the number of days in the year.
Class S
| | | Beginning
Value | | Ending
Value | | Operating
Expense
Incurred* | |
| | 1 | ) Actual | | $ | 1,000.00 | | | $ | 1,071.40 | | | $ | 4.06 | | |
| | 2 | ) Hypothetical | | | 1,000.00 | | | | 1,020.88 | | | | 3.96 | | |
* Expenses are calculated using the annualized expense ratio for the six months ended June 30, 2006 of 0.79%, multiplied by the average account value over the period, multiplied by the number of days in the period, divided by the number of days in the year.
331
Other Information (Continued)
Class N
| | | Beginning
Value | | Ending
Value | | Operating
Expense
Incurred* | |
| | 1 | ) Actual | | $ | 1,000.00 | | | $ | 1,066.80 | | | $ | 7.84 | | |
| | 2 | ) Hypothetical | | | 1,000.00 | | | | 1,017.21 | | | | 7.65 | | |
* Expenses are calculated using the annualized expense ratio for the six months ended June 30, 2006 of 1.53%, multiplied by the average account value over the period, multiplied by the number of days in the period, divided by the number of days in the year.
Value Equity Fund
Class A
| | | Beginning
Value | | Ending
Value | | Operating
Expense
Incurred* | |
| | 1 | ) Actual | | $ | 1,000.00 | | | $ | 1,031.50 | | | $ | 6.60 | | |
| | 2 | ) Hypothetical | | | 1,000.00 | | | | 1,018.30 | | | | 6.56 | | |
* Expenses are calculated using the annualized expense ratio for June 30, 2006 of 1.31%, multiplied by the average account value over the period, multiplied by the number of days in the period, divided by the number of days in the year.
Class L
| | | Beginning
Value | | Ending
Value | | Operating
Expense
Incurred* | |
| | 1 | ) Actual | | $ | 1,000.00 | | | $ | 1,032.40 | | | $ | 5.34 | | |
| | 2 | ) Hypothetical | | | 1,000.00 | | | | 1,019.54 | | | | 5.31 | | |
* Expenses are calculated using the annualized expense ratio for June 30, 2006 of 1.06%, multiplied by the average account value over the period, multiplied by the number of days in the period, divided by the number of days in the year.
Class Y
| | | Beginning
Value | | Ending
Value | | Operating
Expense
Incurred* | |
| | 1 | ) Actual | | $ | 1,000.00 | | | $ | 1,034.10 | | | $ | 4.59 | | |
| | 2 | ) Hypothetical | | | 1,000.00 | | | | 1,020.28 | | | | 4.56 | | |
* Expenses are calculated using the annualized expense ratio for June 30, 2006 of 0.91%, multiplied by the average account value over the period, multiplied by the number of days in the period, divided by the number of days in the year.
Class S
| | | Beginning
Value | | Ending
Value | | Operating
Expense
Incurred* | |
| | 1 | ) Actual | | $ | 1,000.00 | | | $ | 1,033.20 | | | $ | 4.34 | | |
| | 2 | ) Hypothetical | | | 1,000.00 | | | | 1,020.53 | | | | 4.31 | | |
* Expenses are calculated using the annualized expense ratio for June 30, 2006 of 0.86%,, multiplied by the average account value over the period, multiplied by the number of days in the period, divided by the number of days in the year.
332
Other Information (Continued)
Class N
| | | Beginning
Value | | Ending
Value | | Operating
Expense
Incurred* | |
| | 1 | ) Actual | | $ | 1,000.00 | | | $ | 1,030.40 | | | $ | 8.11 | | |
| | 2 | ) Hypothetical | | | 1,000.00 | | | | 1,016.81 | | | | 8.05 | | |
* Expenses are calculated using the annualized expense ratio for June 30, 2006 of 1.61%, multiplied by the average account value over the period, multiplied by the number of days in the period, divided by the number of days in the year.
Large Cap Value Fund
Class A
| | | Beginning
Value | | Ending
Value | | Operating
Expense
Incurred* | |
| | 1 | ) Actual | | $ | 1,000.00 | | | $ | 1,028.40 | | | $ | 6.29 | | |
| | 2 | ) Hypothetical | | | 1,000.00 | | | | 1,018.60 | | | | 6.26 | | |
* Expenses are calculated using the annualized expense ratio for the six months ended June 30, 2006 of 1.25%, multiplied by the average account value over the period, multiplied by the number of days in the period, divided by the number of days in the year.
Class L
| | | Beginning
Value | | Ending
Value | | Operating
Expense
Incurred* | |
| | 1 | ) Actual | | $ | 1,000.00 | | | $ | 1,029.20 | | | $ | 5.03 | | |
| | 2 | ) Hypothetical | | | 1,000.00 | | | | 1,019.84 | | | | 5.01 | | |
* Expenses are calculated using the annualized expense ratio for the six months ended June 30, 2006 of 1.00%, multiplied by the average account value over the period, multiplied by the number of days in the period, divided by the number of days in the year.
Class Y
| | | Beginning
Value | | Ending
Value | | Operating
Expense
Incurred* | |
| | 1 | ) Actual | | $ | 1,000.00 | | | $ | 1,030.90 | | | $ | 4.28 | | |
| | 2 | ) Hypothetical | | | 1,000.00 | | | | 1,020.58 | | | | 4.26 | | |
* Expenses are calculated using the annualized expense ratio for the six months ended June 30, 2006 of 0.85%, multiplied by the average account value over the period, multiplied by the number of days in the period, divided by the number of days in the year.
Class S
| | | Beginning
Value | | Ending
Value | | Operating
Expense
Incurred* | |
| | 1 | ) Actual | | $ | 1,000.00 | | | $ | 1,030.80 | | | $ | 3.83 | | |
| | 2 | ) Hypothetical | | | 1,000.00 | | | | 1,021.03 | | | | 3.81 | | |
* Expenses are calculated using the annualized expense ratio for the six months ended June 30, 2006 of 0.76%, multiplied by the average account value over the period, multiplied by the number of days in the period, divided by the number of days in the year.
333
Other Information (Continued)
Class N
| | | Beginning
Value | | Ending
Value | | Operating
Expense
Incurred* | |
| | 1 | ) Actual | | $ | 1,000.00 | | | $ | 1,027.80 | | | $ | 7.79 | | |
| | 2 | ) Hypothetical | | | 1,000.00 | | | | 1,017.11 | | | | 7.75 | | |
* Expenses are calculated using the annualized expense ratio for the six months ended June 30, 2006 of 1.55%, multiplied by the average account value over the period, multiplied by the number of days in the period, divided by the number of days in the year.
Indexed Equity Fund
Class A
| | | Beginning
Value | | Ending
Value | | Operating
Expense
Incurred* | |
| | 1 | ) Actual | | $ | 1,000.00 | | | $ | 1,023.50 | | | $ | 3.51 | | |
| | 2 | ) Hypothetical | | | 1,000.00 | | | | 1,021.32 | | | | 3.51 | | |
* Expenses are calculated using the annualized expense ratio for the six months ended June 30, 2006 of 0.70%, multiplied by the average account value over the period, multiplied by the number of days in the period, divided by the number of days in the year.
Class L
| | | Beginning
Value | | Ending
Value | | Operating
Expense
Incurred* | |
| | 1 | ) Actual | | $ | 1,000.00 | | | $ | 1,025.20 | | | $ | 2.26 | | |
| | 2 | ) Hypothetical | | | 1,000.00 | | | | 1,022.56 | | | | 2.26 | | |
* Expenses are calculated using the annualized expense ratio for the six months ended June 30, 2006 of 0.45%, multiplied by the average account value over the period, multiplied by the number of days in the period, divided by the number of days in the year.
Class Y
| | | Beginning
Value | | Ending
Value | | Operating
Expense
Incurred* | |
| | 1 | ) Actual | | $ | 1,000.00 | | | $ | 1,024.30 | | | $ | 2.26 | | |
| | 2 | ) Hypothetical | | | 1,000.00 | | | | 1,022.56 | | | | 2.26 | | |
* Expenses are calculated using the annualized expense ratio for the six months ended June 30, 2006 of 0.45%, multiplied by the average account value over the period, multiplied by the number of days in the period, divided by the number of days in the year.
Class S
| | | Beginning
Value | | Ending
Value | | Operating
Expense
Incurred* | |
| | 1 | ) Actual | | $ | 1,000.00 | | | $ | 1,024.90 | | | $ | 2.11 | | |
| | 2 | ) Hypothetical | | | 1,000.00 | | | | 1,022.71 | | | | 2.11 | | |
* Expenses are calculated using the annualized expense ratio for the six months ended June 30, 2006 of 0.42%, multiplied by the average account value over the period, multiplied by the number of days in the period, divided by the number of days in the year.
334
Other Information (Continued)
Class Z
| | | Beginning
Value | | Ending
Value | | Operating
Expense
Incurred* | |
| | 1 | ) Actual | | $ | 1,000.00 | | | $ | 1,026.60 | | | $ | 1.00 | | |
| | 2 | ) Hypothetical | | | 1,000.00 | | | | 1,023.80 | | | | 1.00 | | |
* Expenses are calculated using the annualized expense ratio for the six months ended June 30, 2006 of 0.20%, multiplied by the average account value over the period, multiplied by the number of days in the period, divided by the number of days in the year.
Class N
| | | Beginning
Value | | Ending
Value | | Operating
Expense
Incurred* | |
| | 1 | ) Actual | | $ | 1,000.00 | | | $ | 1,051.90 | | | $ | 5.09 | | |
| | 2 | ) Hypothetical | | | 1,000.00 | | | | 1,019.91 | | | | 5.01 | | |
* Expenses are calculated using the annualized expense ratio for the six months ended June 30, 2006 of 1.00%, multiplied by the average account value over the period, multiplied by the number of days in the period, divided by the number of days in the year.
Core Opportunities Fund
Class A
| | | Beginning
Value | | Ending
Value | | Operating
Expense
Incurred | |
| | 1 | ) Actual | | $ | 1,000.00 | | | $ | 962.00 | | | $ | 3.34 | * | |
| | 2 | ) Hypothetical | | | 1,000.00 | | | | 1,018.10 | | | | 6.76 | ** | |
* Expenses are calculated using the annualized expense ratio for the period March 31, 2006 (commencement of operations) through June 30, 2006 of 1.35%, multiplied by the average account value over the period, multiplied by the number of days in the period, divided by the number of days in the year.
** Expenses are calculated using the annualized expense ratio for the six months ended June 30, 2006 of 1.35%, multiplied by the average account value over the period, multiplied by the number of days in the period, divided by the number of days in the year.
Class L
| | | Beginning
Value | | Ending
Value | | Operating
Expense
Incurred | |
| | 1 | ) Actual | | $ | 1,000.00 | | | $ | 963.00 | | | $ | 2.72 | * | |
| | 2 | ) Hypothetical | | | 1,000.00 | | | | 1,019.34 | | | | 5.51 | ** | |
* Expenses are calculated using the annualized expense ratio for the period March 31, 2006 (commencement of operations) through June 30, 2006 of 1.10%, multiplied by the average account value over the period, multiplied by the number of days in the period, divided by the number of days in the year.
** Expenses are calculated using the annualized expense ratio for the six months ended June 30, 2006 of 1.10%, multiplied by the average account value over the period, multiplied by the number of days in the period, divided by the number of days in the year.
335
Other Information (Continued)
Class Y
| | | Beginning
Value | | Ending
Value | | Operating
Expense
Incurred | |
| | 1 | ) Actual | | $ | 1,000.00 | | | $ | 963.00 | | | $ | 2.35 | * | |
| | 2 | ) Hypothetical | | | 1,000.00 | | | | 1,020.08 | | | | 4.76 | ** | |
* Expenses are calculated using the annualized expense ratio for the period March 31, 2006 (commencement of operations) through June 30, 2006 of 0.95%, multiplied by the average account value over the period, multiplied by the number of days in the period, divided by the number of days in the year.
** Expenses are calculated using the annualized expense ratio for the six months ended June 30, 2006 of 0.95%, multiplied by the average account value over the period, multiplied by the number of days in the period, divided by the number of days in the year.
Class S
| | | Beginning
Value | | Ending
Value | | Operating
Expense
Incurred | |
| | 1 | ) Actual | | $ | 1,000.00 | | | $ | 963.00 | | | $ | 2.23 | * | |
| | 2 | ) Hypothetical | | | 1,000.00 | | | | 1,020.33 | | | | 4.51 | ** | |
* Expenses are calculated using the annualized expense ratio for the period March 31, 2006 (commencement of operations) through June 30, 2006 of 0.90%, multiplied by the average account value over the period, multiplied by the number of days in the period, divided by the number of days in the year.
** Expenses are calculated using the annualized expense ratio for the six months ended of 0.90%, multiplied by the average account value over the period, multiplied by the number of days in the period, divided by the number of days in the year.
Class N
| | | Beginning
Value | | Ending
Value | | Operating
Expense
Incurred | |
| | 1 | ) Actual | | $ | 1,000.00 | | | $ | 962.00 | | | $ | 4.08 | * | |
| | 2 | ) Hypothetical | | | 1,000.00 | | | | 1,016.61 | | | | 8.25 | ** | |
* Expenses are calculated using the annualized expense ratio for the period March 31, 2006 (commencement of operations) through June 30, 2006 of 1.65%, multiplied by the average account value over the period, multiplied by the number of days in the period, divided by the number of days in the year.
** Expenses are calculated using the annualized expense ratio for the six months ended June 30, 2006 of 1.65%, multiplied by the average account value over the period, multiplied by the number of days in the period, divided by the number of days in the year.
336
Other Information (Continued)
Blue Chip Growth Fund
Class A
| | | Beginning
Value | | Ending
Value | | Operating
Expense
Incurred* | |
| | 1 | ) Actual | | $ | 1,000.00 | | | $ | 978.90 | | | $ | 6.57 | | |
| | 2 | ) Hypothetical | | | 1,000.00 | | | | 1,018.15 | | | | 6.71 | | |
* Expenses are calculated using the annualized expense ratio for the six months ended June 30, 2006 of 1.34%, multiplied by the average account value over the period, multiplied by the number of days in the period, divided by the number of days in the year.
Class L
| | | Beginning
Value | | Ending
Value | | Operating
Expense
Incurred* | |
| | 1 | ) Actual | | $ | 1,000.00 | | | $ | 980.20 | | | $ | 5.35 | | |
| | 2 | ) Hypothetical | | | 1,000.00 | | | | 1,019.39 | | | | 5.46 | | |
* Expenses are calculated using the annualized expense ratio for the six months ended June 30, 2006 of 1.09%, multiplied by the average account value over the period, multiplied by the number of days in the period, divided by the number of days in the year.
Class Y
| | | Beginning
Value | | Ending
Value | | Operating
Expense
Incurred* | |
| | 1 | ) Actual | | $ | 1,000.00 | | | $ | 981.30 | | | $ | 4.67 | | |
| | 2 | ) Hypothetical | | | 1,000.00 | | | | 1,020.08 | | | | 4.76 | | |
* Expenses are calculated using the annualized expense ratio for the six months ended June 30, 2006 of 0.95%, multiplied by the average account value over the period, multiplied by the number of days in the period, divided by the number of days in the year.
Class S
| | | Beginning
Value | | Ending
Value | | Operating
Expense
Incurred* | |
| | 1 | ) Actual | | $ | 1,000.00 | | | $ | 981.40 | | | $ | 4.13 | | |
| | 2 | ) Hypothetical | | | 1,000.00 | | | | 1,020.63 | | | | 4.21 | | |
* Expenses are calculated using the annualized expense ratio for the six months ended June 30, 2006 of 0.84%, multiplied by the average account value over the period, multiplied by the number of days in the period, divided by the number of days in the year.
Class N
| | | Beginning
Value | | Ending
Value | | Operating
Expense
Incurred* | |
| | 1 | ) Actual | | $ | 1,000.00 | | | $ | 977.60 | | | $ | 8.04 | | |
| | 2 | ) Hypothetical | | | 1,000.00 | | | | 1,016.66 | | | | 8.20 | | |
* Expenses are calculated using the annualized expense ratio for the six months ended June 30, 2006 of 1.64%, multiplied by the average account value over the period, multiplied by the number of days in the period, divided by the number of days in the year.
337
Other Information (Continued)
Large Cap Growth Fund
Class A
| | | Beginning
Value | | Ending
Value | | Operating
Expense
Incurred* | |
| | 1 | ) Actual | | $ | 1,000.00 | | | $ | 926.10 | | | $ | 6.73 | | |
| | 2 | ) Hypothetical | | | 1,000.00 | | | | 1,017.80 | | | | 7.05 | | |
* Expenses are calculated using the annualized expense ratio for the six months ended June 30, 2006 of 1.41%, multiplied by the average account value over the period, multiplied by the number of days in the period, divided by the number of days in the year.
Class L
| | | Beginning
Value | | Ending
Value | | Operating
Expense
Incurred* | |
| | 1 | ) Actual | | $ | 1,000.00 | | | $ | 926.90 | | | $ | 5.59 | | |
| | 2 | ) Hypothetical | | | 1,000.00 | | | | 1,018.99 | | | | 5.86 | | |
* Expenses are calculated using the annualized expense ratio for the six months ended June 30, 2006 of 1.17%, multiplied by the average account value over the period, multiplied by the number of days in the period, divided by the number of days in the year.
Class Y
| | | Beginning
Value | | Ending
Value | | Operating
Expense
Incurred* | |
| | 1 | ) Actual | | $ | 1,000.00 | | | $ | 927.10 | | | $ | 4.73 | | |
| | 2 | ) Hypothetical | | | 1,000.00 | | | | 1,019.89 | | | | 4.96 | | |
* Expenses are calculated using the annualized expense ratio for the six months ended June 30, 2006 of 0.99%, multiplied by the average account value over the period, multiplied by the number of days in the period, divided by the number of days in the year.
Class S
| | | Beginning
Value | | Ending
Value | | Operating
Expense
Incurred* | |
| | 1 | ) Actual | | $ | 1,000.00 | | | $ | 928.30 | | | $ | 4.54 | | |
| | 2 | ) Hypothetical | | | 1,000.00 | | | | 1,020.08 | | | | 4.76 | | |
* Expenses are calculated using the annualized expense ratio for the six months ended June 30, 2006 of 0.95%, multiplied by the average account value over the period, multiplied by the number of days in the period, divided by the number of days in the year.
Class N
| | | Beginning
Value | | Ending
Value | | Operating
Expense
Incurred* | |
| | 1 | ) Actual | | $ | 1,000.00 | | | $ | 924.30 | | | $ | 8.11 | | |
| | 2 | ) Hypothetical | | | 1,000.00 | | | | 1,016.36 | | | | 8.50 | | |
* Expenses are calculated using the annualized expense ratio for the six months ended June 30, 2006 of 1.70%, multiplied by the average account value over the period, multiplied by the number of days in the period, divided by the number of days in the year.
338
Other Information (Continued)
Growth Equity Fund
Class A
| | | Beginning
Value | | Ending
Value | | Operating
Expense
Incurred* | |
| | 1 | ) Actual | | $ | 1,000.00 | | | $ | 1,053.80 | | | $ | 6.37 | | |
| | 2 | ) Hypothetical | | | 1,000.00 | | | | 1,018.60 | | | | 6.26 | | |
* Expenses are calculated using the annualized expense ratio for the six months ended June 30, 2006 of 1.25%, multiplied by the average account value over the period, multiplied by the number of days in the period, divided by the number of days in the year.
Class L
| | | Beginning
Value | | Ending
Value | | Operating
Expense
Incurred* | |
| | 1 | ) Actual | | $ | 1,000.00 | | | $ | 1,051.90 | | | $ | 5.09 | | |
| | 2 | ) Hypothetical | | | 1,000.00 | | | | 1,019.84 | | | | 5.01 | | |
* Expenses are calculated using the annualized expense ratio for the six months ended June 30, 2006 of 1.00%, multiplied by the average account value over the period, multiplied by the number of days in the period, divided by the number of days in the year.
Class Y
| | | Beginning
Value | | Ending
Value | | Operating
Expense
Incurred* | |
| | 1 | ) Actual | | $ | 1,000.00 | | | $ | 1,051.60 | | | $ | 4.32 | | |
| | 2 | ) Hypothetical | | | 1,000.00 | | | | 1,020.58 | | | | 4.26 | | |
* Expenses are calculated using the annualized expense ratio for the six months ended June 30, 2006 of 0.85%, multiplied by the average account value over the period, multiplied by the number of days in the period, divided by the number of days in the year.
Class S
| | | Beginning
Value | | Ending
Value | | Operating
Expense
Incurred* | |
| | 1 | ) Actual | | $ | 1,000.00 | | | $ | 1,051.40 | | | $ | 4.02 | | |
| | 2 | ) Hypothetical | | | 1,000.00 | | | | 1,020.88 | | | | 3.96 | | |
* Expenses are calculated using the annualized expense ratio for the six months ended June 30, 2006 of 0.79%, multiplied by the average account value over the period, multiplied by the number of days in the period, divided by the number of days in the year.
Class N
| | | Beginning
Value | | Ending
Value | | Operating
Expense
Incurred* | |
| | 1 | ) Actual | | $ | 1,000.00 | | | $ | 1,054.50 | | | $ | 7.90 | | |
| | 2 | ) Hypothetical | | | 1,000.00 | | | | 1,017.11 | | | | 7.75 | | |
* Expenses are calculated using the annualized expense ratio for the six months ended June 30, 2006 of 1.55%, multiplied by the average account value over the period, multiplied by the number of days in the period, divided by the number of days in the year.
339
Other Information (Continued)
Aggressive Growth Fund
Class A
| | | Beginning
Value | | Ending
Value | | Operating
Expense
Incurred* | |
| | 1 | ) Actual | | $ | 1,000.00 | | | $ | 904.20 | | | $ | 6.18 | | |
| | 2 | ) Hypothetical | | | 1,000.00 | | | | 1,019.39 | | | | 6.56 | | |
* Expenses are calculated using the annualized expense ratio for the six months ended June 30, 2006 of 1.31%, multiplied by the average account value over the period, multiplied by the number of days in the period, divided by the number of days in the year.
Class L
| | | Beginning
Value | | Ending
Value | | Operating
Expense
Incurred* | |
| | 1 | ) Actual | | $ | 1,000.00 | | | $ | 905.50 | | | $ | 5.01 | | |
| | 2 | ) Hypothetical | | | 1,000.00 | | | | 1,020.63 | | | | 5.31 | | |
* Expenses are calculated using the annualized expense ratio for the six months ended June 30, 2006 of 1.06%, multiplied by the average account value over the period, multiplied by the number of days in the period, divided by the number of days in the year.
Class Y
| | | Beginning
Value | | Ending
Value | | Operating
Expense
Incurred* | |
| | 1 | ) Actual | | $ | 1,000.00 | | | $ | 906.20 | | | $ | 4.30 | | |
| | 2 | ) Hypothetical | | | 1,000.00 | | | | 1,021.37 | | | | 4.56 | | |
* Expenses are calculated using the annualized expense ratio for the six months ended June 30, 2006 of 0.91%, multiplied by the average account value over the period, multiplied by the number of days in the period, divided by the number of days in the year.
Class S
| | | Beginning
Value | | Ending
Value | | Operating
Expense
Incurred* | |
| | 1 | ) Actual | | $ | 1,000.00 | | | $ | 906.80 | | | $ | 3.83 | | |
| | 2 | ) Hypothetical | | | 1,000.00 | | | | 1,021.87 | | | | 4.06 | | |
* Expenses are calculated using the annualized expense ratio for the six months ended June 30, 2006 of 0.81%, multiplied by the average account value over the period, multiplied by the number of days in the period, divided by the number of days in the year.
Class N
| | | Beginning
Value | | Ending
Value | | Operating
Expense
Incurred* | |
| | 1 | ) Actual | | $ | 1,000.00 | | | $ | 904.20 | | | $ | 7.60 | | |
| | 2 | ) Hypothetical | | | 1,000.00 | | | | 1,016.81 | | | | 8.05 | | |
* Expenses are calculated using the annualized expense ratio for the six months ended June 30, 2006 of 1.61%, multiplied by the average account value over the period, multiplied by the number of days in the period, divided by the number of days in the year.
340
Other Information (Continued)
OTC 100 Fund
Class A
| | | Beginning
Value | | Ending
Value | | Operating
Expense
Incurred* | |
| | 1 | ) Actual | | $ | 1,000.00 | | | $ | 953.90 | | | $ | 5.52 | | |
| | 2 | ) Hypothetical | | | 1,000.00 | | | | 1,019.14 | | | | 5.71 | | |
* Expenses are calculated using the annualized expense ratio for June 30, 2006 of 1.14%, multiplied by the average account value over the period, multiplied by the number of days in the period, divided by the number of days in the year.
Class L
| | | Beginning
Value | | Ending
Value | | Operating
Expense
Incurred* | |
| | 1 | ) Actual | | $ | 1,000.00 | | | $ | 954.40 | | | $ | 4.31 | | |
| | 2 | ) Hypothetical | | | 1,000.00 | | | | 1,020.38 | | | | 4.46 | | |
* Expenses are calculated using the annualized expense ratio for June 30, 2006 of 0.89%, multiplied by the average account value over the period, multiplied by the number of days in the period, divided by the number of days in the year.
Class Y
| | | Beginning
Value | | Ending
Value | | Operating
Expense
Incurred* | |
| | 1 | ) Actual | | $ | 1,000.00 | | | $ | 957.00 | | | $ | 3.64 | | |
| | 2 | ) Hypothetical | | | 1,000.00 | | | | 1,021.08 | | | | 3.76 | | |
* Expenses are calculated using the annualized expense ratio for June 30, 2006 of 0.75%, multiplied by the average account value over the period, multiplied by the number of days in the period, divided by the number of days in the year.
Class S
| | | Beginning
Value | | Ending
Value | | Operating
Expense
Incurred* | |
| | 1 | ) Actual | | $ | 1,000.00 | | | $ | 957.30 | | | $ | 3.11 | | |
| | 2 | ) Hypothetical | | | 1,000.00 | | | | 1,021.62 | | | | 3.21 | | |
* Expenses are calculated using the annualized expense ratio for June 30, 2006 of 0.64%, multiplied by the average account value over the period, multiplied by the number of days in the period, divided by the number of days in the year.
Class N
| | | Beginning
Value | | Ending
Value | | Operating
Expense
Incurred* | |
| | 1 | ) Actual | | $ | 1,000.00 | | | $ | 953.30 | | | $ | 6.97 | | |
| | 2 | ) Hypothetical | | | 1,000.00 | | | | 1,017.65 | | | | 7.20 | | |
* Expenses are calculated using the annualized expense ratio for June 30, 2006 of 1.44%, multiplied by the average account value over the period, multiplied by the number of days in the period, divided by the number of days in the year.
341
Other Information (Continued)
Focused Value Fund
Class A
| | | Beginning
Value | | Ending
Value | | Operating
Expense
Incurred* | |
| | 1 | ) Actual | | $ | 1,000.00 | | | $ | 1,020.90 | | | $ | 6.51 | | |
| | 2 | ) Hypothetical | | | 1,000.00 | | | | 1,020.83 | | | | 6.51 | | |
* Expenses are calculated using the annualized expense ratio for the six months ended June 30, 2006 of 1.30%, multiplied by the average account value over the period, multiplied by the number of days in the period, divided by the number of days in the year.
Class L
| | | Beginning
Value | | Ending
Value | | Operating
Expense
Incurred* | |
| | 1 | ) Actual | | $ | 1,000.00 | | | $ | 1,022.50 | | | $ | 5.27 | | |
| | 2 | ) Hypothetical | | | 1,000.00 | | | | 1,019.59 | | | | 5.26 | | |
* Expenses are calculated using the annualized expense ratio for the six months ended June 30, 2006 of 1.05.%, multiplied by the average account value over the period, multiplied by the number of days in the period, divided by the number of days in the year.
Class Y
| | | Beginning
Value | | Ending
Value | | Operating
Expense
Incurred* | |
| | 1 | ) Actual | | $ | 1,000.00 | | | $ | 1,022.90 | | | $ | 4.51 | | |
| | 2 | ) Hypothetical | | | 1,000.00 | | | | 1,020.33 | | | | 4.51 | | |
* Expenses are calculated using the annualized expense ratio for the six months ended June 30, 2006 of 0.90%, multiplied by the average account value over the period, multiplied by the number of days in the period, divided by the number of days in the year.
Class S
| | | Beginning
Value | | Ending
Value | | Operating
Expense
Incurred* | |
| | 1 | ) Actual | | $ | 1,000.00 | | | $ | 1,023.90 | | | $ | 4.01 | | |
| | 2 | ) Hypothetical | | | 1,000.00 | | | | 1,020.83 | | | | 4.01 | | |
* Expenses are calculated using the annualized expense ratio for the six months ended June 30, 2006 of 0.80%, multiplied by the average account value over the period, multiplied by the number of days in the period, divided by the number of days in the year.
Class N
| | | Beginning
Value | | Ending
Value | | Operating
Expense
Incurred* | |
| | 1 | ) Actual | | $ | 1,000.00 | | | $ | 1,020.00 | | | $ | 8.01 | | |
| | 2 | ) Hypothetical | | | 1,000.00 | | | | 1,016.86 | | | | 8.00 | | |
* Expenses are calculated using the annualized expense ratio for the six months ended June 30, 2006 of 1.60%, multiplied by the average account value over the period, multiplied by the number of days in the period, divided by the number of days in the year.
342
Other Information (Continued)
Small Cap Value Equity Fund
Class A
| | | Beginning
Value | | Ending
Value | | Operating
Expense
Incurred | |
| | 1 | ) Actual | | $ | 1,000.00 | | | $ | 978.00 | | | $ | 3.49 | * | |
| | 2 | ) Hypothetical | | | 1,000.00 | | | | 1,017.85 | | | | 7.00 | ** | |
* Expenses are calculated using the annualized expense ratio for the period March 31, 2006 (commencement of operations) through June 30, 2006 of 1.40%, multiplied by the average account value over the period, multiplied by the number of days in the period, divided by the number of days in the year.
** Expenses are calculated using the annualized expense ratio for the six months ended June 30, 2006 of 1.40%, multiplied by the average account value over the period, multiplied by the number of days in the period, divided by the number of days in the year.
Class L
| | | Beginning
Value | | Ending
Value | | Operating
Expense
Incurred | |
| | 1 | ) Actual | | $ | 1,000.00 | | | $ | 978.00 | | | $ | 2.87 | * | |
| | 2 | ) Hypothetical | | | 1,000.00 | | | | 1,019.09 | | | | 5.76 | ** | |
* Expenses are calculated using the annualized expense ratio for the period March 31, 2006 (commencement of operations) through June 30, 2006 of 1.15%, multiplied by the average account value over the period, multiplied by the number of days in the period, divided by the number of days in the year.
** Expenses are calculated using the annualized expense ratio for the six months ended June 30, 2006 of 1.15%, multiplied by the average account value over the period, multiplied by the number of days in the period, divided by the number of days in the year.
Class Y
| | | Beginning
Value | | Ending
Value | | Operating
Expense
Incurred | |
| | 1 | ) Actual | | $ | 1,000.00 | | | $ | 979.00 | | | $ | 2.49 | * | |
| | 2 | ) Hypothetical | | | 1,000.00 | | | | 1,019.84 | | | | 5.01 | ** | |
* Expenses are calculated using the annualized expense ratio for the period March 31, 2006 (commencement of operations) through June 30, 2006 of 1.00%, multiplied by the average account value over the period, multiplied by the number of days in the period, divided by the number of days in the year.
** Expenses are calculated using the annualized expense ratio for the six months ended June 30, 2006 of 1.00%, multiplied by the average account value over the period, multiplied by the number of days in the period, divided by the number of days in the year.
343
Other Information (Continued)
Class S
| | | Beginning
Value | | Ending
Value | | Operating
Expense
Incurred | |
| | 1 | ) Actual | | $ | 1,000.00 | | | $ | 979.00 | | | $ | 2.37 | * | |
| | 2 | ) Hypothetical | | | 1,000.00 | | | | 1,020.08 | | | | 4.76 | ** | |
* Expenses are calculated using the annualized expense ratio for the period March 31, 2006 (commencement of operations) through June 30, 2006 of 0.95%, multiplied by the average account value over the period, multiplied by the number of days in the period, divided by the number of days in the year.
** Expenses are calculated using the annualized expense ratio for the six months ended June 30, 2006 of 0.95%, multiplied by the average account value over the period, multiplied by the number of days in the period, divided by the number of days in the year.
Class N
| | | Beginning
Value | | Ending
Value | | Operating
Expense
Incurred | |
| | 1 | ) Actual | | $ | 1,000.00 | | | $ | 977.00 | | | $ | 4.24 | * | |
| | 2 | ) Hypothetical | | | 1,000.00 | | | | 1,016.36 | | | | 8.50 | ** | |
* Expenses are calculated using the annualized expense ratio for the period March 31, 2006 (commencement of operations) through June 30, 2006 of 1.70%, multiplied by the average account value over the period, multiplied by the number of days in the period, divided by the number of days in the year.
** Expenses are calculated using the annualized expense ratio for the six months ended June 30, 2006 of 1.70%, multiplied by the average account value over the period, multiplied by the number of days in the period, divided by the number of days in the year.
Small Company Value Fund
Class A
| | | Beginning
Value | | Ending
Value | | Operating
Expense
Incurred* | |
| | 1 | ) Actual | | $ | 1,000.00 | | | $ | 1,089.60 | | | $ | 7.72 | | |
| | 2 | ) Hypothetical | | | 1,000.00 | | | | 1,017.41 | | | | 7.45 | | |
* Expenses are calculated using the annualized expense ratio for the six months ended June 30, 2006 of 1.49%, multiplied by the average account value over the period, multiplied by the number of days in the period, divided by the number of days in the year.
Class L
| | | Beginning
Value | | Ending
Value | | Operating
Expense
Incurred* | |
| | 1 | ) Actual | | $ | 1,000.00 | | | $ | 1,091.40 | | | $ | 6.43 | | |
| | 2 | ) Hypothetical | | | 1,000.00 | | | | 1,018.65 | | | | 6.21 | | |
* Expenses are calculated using the annualized expense ratio for the six months ended June 30, 2006 of 1.24%, multiplied by the average account value over the period, multiplied by the number of days in the period, divided by the number of days in the year.
344
Other Information (Continued)
Class Y
| | | Beginning
Value | | Ending
Value | | Operating
Expense
Incurred* | |
| | 1 | ) Actual | | $ | 1,000.00 | | | $ | 1,091.60 | | | $ | 5.65 | | |
| | 2 | ) Hypothetical | | | 1,000.00 | | | | 1,019.39 | | | | 5.46 | | |
* Expenses are calculated using the annualized expense ratio for the six months ended June 30, 2006 of 1.09%, multiplied by the average account value over the period, multiplied by the number of days in the period, divided by the number of days in the year.
Class S
| | | Beginning
Value | | Ending
Value | | Operating
Expense
Incurred* | |
| | 1 | ) Actual | | $ | 1,000.00 | | | $ | 1,091.30 | | | $ | 5.44 | | |
| | 2 | ) Hypothetical | | | 1,000.00 | | | | 1,019.59 | | | | 5.26 | | |
* Expenses are calculated using the annualized expense ratio for the six months ended June 30, 2006 of 1.05%, multiplied by the average account value over the period, multiplied by the number of days in the period, divided by the number of days in the year.
Class N
| | | Beginning
Value | | Ending
Value | | Operating
Expense
Incurred* | |
| | 1 | ) Actual | | $ | 1,000.00 | | | $ | 1,087.90 | | | $ | 9.27 | | |
| | 2 | ) Hypothetical | | | 1,000.00 | | | | 1,015.92 | | | | 8.95 | | |
* Expenses are calculated using the annualized expense ratio for the six months ended June 30, 2006 of 1.79%, multiplied by the average account value over the period, multiplied by the number of days in the period, divided by the number of days in the year.
Small Cap Core Equity Fund
Class A
| | | Beginning
Value | | Ending
Value | | Operating
Expense
Incurred | |
| | 1 | ) Actual | | $ | 1,000.00 | | | $ | 950.00 | | | $ | 3.44 | * | |
| | 2 | ) Hypothetical | | | 1,000.00 | | | | 1,017.85 | | | | 7.00 | ** | |
* Expenses are calculated using the annualized expense ratio for the period March 31, 2006 (commencement of operations) through June 30, 2006 of 1.40%, multiplied by the average account value over the period, multiplied by the number of days in the period, divided by the number of days in the year.
** Expenses are calculated using the annualized expense ratio for the six months ended June 30, 2006 of 1.40%, multiplied by the average account value over the period, multiplied by the number of days in the period, divided by the number of days in the year.
345
Other Information (Continued)
Class L
| | | Beginning
Value | | Ending
Value | | Operating
Expense
Incurred | |
| | 1 | ) Actual | | $ | 1,000.00 | | | $ | 951.00 | | | $ | 2.83 | * | |
| | 2 | ) Hypothetical | | | 1,000.00 | | | | 1,019.09 | | | | 5.76 | ** | |
* Expenses are calculated using the annualized expense ratio for the period March 31, 2006 (commencement of operations) through June 30, 2006 of 1.15%, multiplied by the average account value over the period, multiplied by the number of days in the period, divided by the number of days in the year.
** Expenses are calculated using the annualized expense ratio for the six months ended June 30, 2006 of 1.15%, multiplied by the average account value over the period, multiplied by the number of days in the period, divided by the number of days in the year.
Class Y
| | | Beginning
Value | | Ending
Value | | Operating
Expense
Incurred | |
| | 1 | ) Actual | | $ | 1,000.00 | | | $ | 952.00 | | | $ | 2.46 | * | |
| | 2 | ) Hypothetical | | | 1,000.00 | | | | 1,019.84 | | | | 5.01 | ** | |
* Expenses are calculated using the annualized expense ratio for the period March 31, 2006 (commencement of operations) through June 30, 2006 of 1.00%, multiplied by the average account value over the period, multiplied by the number of days in the period, divided by the number of days in the year.
** Expenses are calculated using the annualized expense ratio for the six months ended June 30, 2006 of 1.00%, multiplied by the average account value over the period, multiplied by the number of days in the period, divided by the number of days in the year.
Class S
| | | Beginning
Value | | Ending
Value | | Operating
Expense
Incurred | |
| | 1 | ) Actual | | $ | 1,000.00 | | | $ | 951.00 | | | $ | 2.34 | * | |
| | 2 | ) Hypothetical | | | 1,000.00 | | | | 1,020.08 | | | | 4.76 | ** | |
* Expenses are calculated using the annualized expense ratio for the period March 31, 2006 (commencement of operations) through June 30, 2006 of 0.95%, multiplied by the average account value over the period, multiplied by the number of days in the period, divided by the number of days in the year.
** Expenses are calculated using the annualized expense ratio for the six months ended June 30, 2006 of 0.95%, multiplied by the average account value over the period, multiplied by the number of days in the period, divided by the number of days in the year.
346
Other Information (Continued)
Class N
| | | Beginning
Value | | Ending
Value | | Operating
Expense
Incurred | |
| | 1 | ) Actual | | $ | 1,000.00 | | | $ | 949.00 | | | $ | 4.18 | * | |
| | 2 | ) Hypothetical | | | 1,000.00 | | | | 1,016.36 | | | | 8.50 | ** | |
* Expenses are calculated using the annualized expense ratio for the period March 31, 2006 (commencement of operations) through June 30, 2006 of 1.70%, multiplied by the average account value over the period, multiplied by the number of days in the period, divided by the number of days in the year.
** Expenses are calculated using the annualized expense ratio for the six months ended June 30, 2006 of 1.70%, multiplied by the average account value over the period, multiplied by the number of days in the period, divided by the number of days in the year.
Mid Cap Growth Equity Fund
Class A
| | | Beginning
Value | | Ending
Value | | Operating
Expense
Incurred* | |
| | 1 | ) Actual | | $ | 1,000.00 | | | $ | 1,061.00 | | | $ | 6.64 | | |
| | 2 | ) Hypothetical | | | 1,000.00 | | | | 1,018.35 | | | | 6.51 | | |
* Expenses are calculated using the annualized expense ratio for the six months ended June 30, 2006 of 1.30%, multiplied by the average account value over the period, multiplied by the number of days in the period, divided by the number of days in the year.
Class L
| | | Beginning
Value | | Ending
Value | | Operating
Expense
Incurred* | |
| | 1 | ) Actual | | $ | 1,000.00 | | | $ | 1,062.00 | | | $ | 5.32 | | |
| | 2 | ) Hypothetical | | | 1,000.00 | | | | 1,019.64 | | | | 5.21 | | |
* Expenses are calculated using the annualized expense ratio for the six months ended June 30, 2006 of 1.04%, multiplied by the average account value over the period, multiplied by the number of days in the period, divided by the number of days in the year.
Class Y
| | | Beginning
Value | | Ending
Value | | Operating
Expense
Incurred* | |
| | 1 | ) Actual | | $ | 1,000.00 | | | $ | 1,063.40 | | | $ | 4.60 | | |
| | 2 | ) Hypothetical | | | 1,000.00 | | | | 1,020.33 | | | | 4.51 | | |
* Expenses are calculated using the annualized expense ratio for the six months ended June 30, 2006 of 0.90%, multiplied by the average account value over the period, multiplied by the number of days in the period, divided by the number of days in the year.
347
Other Information (Continued)
Class S
| | | Beginning
Value | | Ending
Value | | Operating
Expense
Incurred* | |
| | 1 | ) Actual | | $ | 1,000.00 | | | $ | 1,064.20 | | | $ | 4.25 | | |
| | 2 | ) Hypothetical | | | 1,000.00 | | | | 1,020.68 | | | | 4.16 | | |
* Expenses are calculated using the annualized expense ratio for the six months ended June 30, 2006 of 0.83%, multiplied by the average account value over the period, multiplied by the number of days in the period, divided by the number of days in the year.
Class N
| | | Beginning
Value | | Ending
Value | | Operating
Expense
Incurred* | |
| | 1 | ) Actual | | $ | 1,000.00 | | | $ | 1,059.70 | | | $ | 8.17 | | |
| | 2 | ) Hypothetical | | | 1,000.00 | | | | 1,016.86 | | | | 8.00 | | |
* Expenses are calculated using the annualized expense ratio for the six months ended June 30, 2006 of 1.60%, multiplied by the average account value over the period, multiplied by the number of days in the period, divided by the number of days in the year.
Mid Cap Growth Equity II Fund
Class A
| | | Beginning
Value | | Ending
Value | | Operating
Expense
Incurred* | |
| | 1 | ) Actual | | $ | 1,000.00 | | | $ | 1,011.30 | | | $ | 6.73 | | |
| | 2 | ) Hypothetical | | | 1,000.00 | | | | 1,018.10 | | | | 6.76 | | |
* Expenses are calculated using the annualized expense ratio for the six months ended June 30, 2006 of 1.35%, multiplied by the average account value over the period, multiplied by the number of days in the period, divided by the number of days in the year.
Class L
| | | Beginning
Value | | Ending
Value | | Operating
Expense
Incurred* | |
| | 1 | ) Actual | | $ | 1,000.00 | | | $ | 1,020.60 | | | $ | 5.51 | | |
| | 2 | ) Hypothetical | | | 1,000.00 | | | | 1,019.34 | | | | 5.51 | | |
* Expenses are calculated using the annualized expense ratio for the six months ended June 30, 2006 of 1.10%, multiplied by the average account value over the period, multiplied by the number of days in the period, divided by the number of days in the year.
Class Y
| | | Beginning
Value | | Ending
Value | | Operating
Expense
Incurred* | |
| | 1 | ) Actual | | $ | 1,000.00 | | | $ | 1,013.10 | | | $ | 4.74 | | |
| | 2 | ) Hypothetical | | | 1,000.00 | | | | 1,020.08 | | | | 4.76 | | |
* Expenses are calculated using the annualized expense ratio for the six months ended June 30, 2006 of 0.95%, multiplied by the average account value over the period, multiplied by the number of days in the period, divided by the number of days in the year.
348
Other Information (Continued)
Class S
| | | Beginning
Value | | Ending
Value | | Operating
Expense
Incurred* | |
| | 1 | ) Actual | | $ | 1,000.00 | | | $ | 1,013.80 | | | $ | 4.29 | | |
| | 2 | ) Hypothetical | | | 1,000.00 | | | | 1,020.53 | | | | 4.31 | | |
* Expenses are calculated using the annualized expense ratio for the six months ended June 30, 2006 of 0.86%, multiplied by the average account value over the period, multiplied by the number of days in the period, divided by the number of days in the year.
Class N
| | | Beginning
Value | | Ending
Value | | Operating
Expense
Incurred* | |
| | 1 | ) Actual | | $ | 1,000.00 | | | $ | 1,010.00 | | | $ | 8.22 | | |
| | 2 | ) Hypothetical | | | 1,000.00 | | | | 1,016.61 | | | | 8.25 | | |
* Expenses are calculated using the annualized expense ratio for the six months ended June 30, 2006 of 1.65%, multiplied by the average account value over the period, multiplied by the number of days in the period, divided by the number of days in the year.
Small Cap Growth Equity Fund
Class A
| | | Beginning
Value | | Ending
Value | | Operating
Expense
Incurred* | |
| | 1 | ) Actual | | $ | 1,000.00 | | | $ | 1,041.30 | | | $ | 7.64 | | |
| | 2 | ) Hypothetical | | | 1,000.00 | | | | 1,019.59 | | | | 7.56 | | |
* Expenses are calculated using the annualized expense ratio for the six months ended June 30, 2006 of 1.51%, multiplied by the average account value over the period, multiplied by the number of days in the period, divided by the number of days in the year.
Class L
| | | Beginning
Value | | Ending
Value | | Operating
Expense
Incurred* | |
| | 1 | ) Actual | | $ | 1,000.00 | | | $ | 1,042.00 | | | $ | 6.38 | | |
| | 2 | ) Hypothetical | | | 1,000.00 | | | | 1,020.68 | | | | 6.31 | | |
* Expenses are calculated using the annualized expense ratio for the six months ended June 30, 2006 of 1.26%, multiplied by the average account value over the period, multiplied by the number of days in the period, divided by the number of days in the year.
Class Y
| | | Beginning
Value | | Ending
Value | | Operating
Expense
Incurred* | |
| | 1 | ) Actual | | $ | 1,000.00 | | | $ | 1,042.80 | | | $ | 5.62 | | |
| | 2 | ) Hypothetical | | | 1,000.00 | | | | 1,019.29 | | | | 5.56 | | |
* Expenses are calculated using the annualized expense ratio for the six months ended June 30, 2006 of 1.11%, multiplied by the average account value over the period, multiplied by the number of days in the period, divided by the number of days in the year.
349
Other Information (Continued)
Class S
| | | Beginning
Value | | Ending
Value | | Operating
Expense
Incurred* | |
| | 1 | ) Actual | | $ | 1,000.00 | | | $ | 1,043.10 | | | $ | 4.91 | | |
| | 2 | ) Hypothetical | | | 1,000.00 | | | | 1,019.98 | | | | 4.86 | | |
* Expenses are calculated using the annualized expense ratio for the six months ended June 30, 2006 of 0.97%, multiplied by the average account value over the period, multiplied by the number of days in the period, divided by the number of days in the year.
Class N
| | | Beginning
Value | | Ending
Value | | Operating
Expense
Incurred* | |
| | 1 | ) Actual | | $ | 1,000.00 | | | $ | 1,038.70 | | | $ | 9.15 | | |
| | 2 | ) Hypothetical | | | 1,000.00 | | | | 1,015.82 | | | | 9.05 | | |
* Expenses are calculated using the annualized expense ratio for the six months ended June 30, 2006 of 1.81%, multiplied by the average account value over the period, multiplied by the number of days in the period, divided by the number of days in the year.
Small Company Growth Fund
Class A
| | | Beginning
Value | | Ending
Value | | Operating
Expense
Incurred* | |
| | 1 | ) Actual | | $ | 1,000.00 | | | $ | 1,039.20 | | | $ | 7.84 | | |
| | 2 | ) Hypothetical | | | 1,000.00 | | | | 1,017.11 | | | | 7.75 | | |
* Expenses are calculated using the annualized expense ratio for the six months ended June 30, 2006 of 1.55%, multiplied by the average account value over the period, multiplied by the number of days in the period, divided by the number of days in the year.
Class L
| | | Beginning
Value | | Ending
Value | | Operating
Expense
Incurred* | |
| | 1 | ) Actual | | $ | 1,000.00 | | | $ | 1,040.80 | | | $ | 6.58 | | |
| | 2 | ) Hypothetical | | | 1,000.00 | | | | 1,018.35 | | | | 6.51 | | |
* Expenses are calculated using the annualized expense ratio for the six months ended June 30, 2006 of 1.30%, multiplied by the average account value over the period, multiplied by the number of days in the period, divided by the number of days in the year.
Class Y
| | | Beginning
Value | | Ending
Value | | Operating
Expense
Incurred* | |
| | 1 | ) Actual | | $ | 1,000.00 | | | $ | 1,041.50 | | | $ | 5.82 | | |
| | 2 | ) Hypothetical | | | 1,000.00 | | | | 1,019.09 | | | | 5.76 | | |
* Expenses are calculated using the annualized expense ratio for the six months ended June 30, 2006 of 1.15%, multiplied by the average account value over the period, multiplied by the number of days in the period, divided by the number of days in the year.
350
Other Information (Continued)
Class S
| | | Beginning
Value | | Ending
Value | | Operating
Expense
Incurred* | |
| | 1 | ) Actual | | $ | 1,000.00 | | | $ | 1,041.40 | | | $ | 5.62 | | |
| | 2 | ) Hypothetical | | | 1,000.00 | | | | 1,019.29 | | | | 5.56 | | |
* Expenses are calculated using the annualized expense ratio for the six months ended June 30, 2006 of 1.11%, multiplied by the average account value over the period, multiplied by the number of days in the period, divided by the number of days in the year.
Class N
| | | Beginning
Value | | Ending
Value | | Operating
Expense
Incurred* | |
| | 1 | ) Actual | | $ | 1,000.00 | | | $ | 1,037.70 | | | $ | 9.35 | | |
| | 2 | ) Hypothetical | | | 1,000.00 | | | | 1,015.62 | | | | 9.25 | | |
* Expenses are calculated using the annualized expense ratio for the six months ended June 30, 2006 of 1.85%, multiplied by the average account value over the period, multiplied by the number of days in the period, divided by the number of days in the year.
Emerging Growth Fund
Class A
| | | Beginning
Value | | Ending
Value | | Operating
Expense
Incurred* | |
| | 1 | ) Actual | | $ | 1,000.00 | | | $ | 1,032.20 | | | $ | 7.36 | | |
| | 2 | ) Hypothetical | | | 1,000.00 | | | | 1,017.55 | | | | 7.30 | | |
* Expenses are calculated using the annualized expense ratio for the six months ended June 30, 2006 of 1.46%, multiplied by the average account value over the period, multiplied by the number of days in the period, divided by the number of days in the year.
Class L
| | | Beginning
Value | | Ending
Value | | Operating
Expense
Incurred* | |
| | 1 | ) Actual | | $ | 1,000.00 | | | $ | 1,033.40 | | | $ | 6.10 | | |
| | 2 | ) Hypothetical | | | 1,000.00 | | | | 1,018.79 | | | | 6.06 | | |
* Expenses are calculated using the annualized expense ratio for the six months ended June 30, 2006 of 1.21%, multiplied by the average account value over the period, multiplied by the number of days in the period, divided by the number of days in the year.
Class Y
| | | Beginning
Value | | Ending
Value | | Operating
Expense
Incurred* | |
| | 1 | ) Actual | | $ | 1,000.00 | | | $ | 1,034.80 | | | $ | 5.35 | | |
| | 2 | ) Hypothetical | | | 1,000.00 | | | | 1,019.54 | | | | 5.31 | | |
* Expenses are calculated using the annualized expense ratio for the six months ended June 30, 2006 of 1.06%, multiplied by the average account value over the period, multiplied by the number of days in the period, divided by the number of days in the year.
351
Other Information (Continued)
Class S
| | | Beginning
Value | | Ending
Value | | Operating
Expense
Incurred* | |
| | 1 | ) Actual | | $ | 1,000.00 | | | $ | 1,034.50 | | | $ | 4.84 | | |
| | 2 | ) Hypothetical | | | 1,000.00 | | | | 1,020.03 | | | | 4.81 | | |
* Expenses are calculated using the annualized expense ratio for the six months ended June 30, 2006 of 0.96%, multiplied by the average account value over the period, multiplied by the number of days in the period, divided by the number of days in the year.
Class N
| | | Beginning
Value | | Ending
Value | | Operating
Expense
Incurred* | |
| | 1 | ) Actual | | $ | 1,000.00 | | | $ | 1,029.20 | | | $ | 8.86 | | |
| | 2 | ) Hypothetical | | | 1,000.00 | | | | 1,016.07 | | | | 8.80 | | |
* Expenses are calculated using the annualized expense ratio for the six months ended June 30, 2006 of 1.76%, multiplied by the average account value over the period, multiplied by the number of days in the period, divided by the number of days in the year.
Overseas Fund
Class A
| | | Beginning
Value | | Ending
Value | | Operating
Expense
Incurred* | |
| | 1 | ) Actual | | $ | 1,000.00 | | | $ | 1,107.80 | | | $ | 8.21 | | |
| | 2 | ) Hypothetical | | | 1,000.00 | | | | 1,017.01 | | | | 7.85 | | |
* Expenses are calculated using the annualized expense ratio for the six months ended June 30, 2006 of 1.57%, multiplied by the average account value over the period, multiplied by the number of days in the period, divided by the number of days in the year.
Class L
| | | Beginning
Value | | Ending
Value | | Operating
Expense
Incurred* | |
| | 1 | ) Actual | | $ | 1,000.00 | | | $ | 1,109.00 | | | $ | 6.90 | | |
| | 2 | ) Hypothetical | | | 1,000.00 | | | | 1,018.25 | | | | 6.61 | | |
* Expenses are calculated using the annualized expense ratio for the six months ended June 30, 2006 of 1.32%, multiplied by the average account value over the period, multiplied by the number of days in the period, divided by the number of days in the year.
Class Y
| | | Beginning
Value | | Ending
Value | | Operating
Expense
Incurred* | |
| | 1 | ) Actual | | $ | 1,000.00 | | | $ | 1,109.60 | | | $ | 6.38 | | |
| | 2 | ) Hypothetical | | | 1,000.00 | | | | 1,018.74 | | | | 6.11 | | |
* Expenses are calculated using the annualized expense ratio for the six months ended June 30, 2006 of 1.22%, multiplied by the average account value over the period, multiplied by the number of days in the period, divided by the number of days in the year.
352
Other Information (Continued)
Class S
| | | Beginning
Value | | Ending
Value | | Operating
Expense
Incurred* | |
| | 1 | ) Actual | | $ | 1,000.00 | | | $ | 1,110.30 | | | $ | 6.12 | | |
| | 2 | ) Hypothetical | | | 1,000.00 | | | | 1,018.99 | | | | 5.86 | | |
* Expenses are calculated using the annualized expense ratio for the six months ended June 30, 2006 of 1.17%, multiplied by the average account value over the period, multiplied by the number of days in the period, divided by the number of days in the year.
Class N
| | | Beginning
Value | | Ending
Value | | Operating
Expense
Incurred* | |
| | 1 | ) Actual | | $ | 1,000.00 | | | $ | 1,105.90 | | | $ | 9.76 | | |
| | 2 | ) Hypothetical | | | 1,000.00 | | | | 1,015.52 | | | | 9.35 | | |
* Expenses are calculated using the annualized expense ratio for the six months ended June 30, 2006 of 1.87%, multiplied by the average account value over the period, multiplied by the number of days in the period, divided by the number of days in the year.
Destination Retirement Income Fund
Class A
| | | Beginning
Value | | Ending
Value | | Operating
Expense
Incurred* | |
| | 1 | ) Actual | | $ | 1,000.00 | | | $ | 1,001.00 | | | $ | 2.33 | | |
| | 2 | ) Hypothetical | | | 1,000.00 | | | | 1,022.46 | | | | 2.36 | | |
* Expenses are calculated using the annualized expense ratio for the six months ended June 30, 2006 of 0.47%, multiplied by the average account value over the period, multiplied by the number of days in the period, divided by the number of days in the year.
Class L
| | | Beginning
Value | | Ending
Value | | Operating
Expense
Incurred* | |
| | 1 | ) Actual | | $ | 1,000.00 | | | $ | 1,002.00 | | | $ | 1.09 | | |
| | 2 | ) Hypothetical | | | 1,000.00 | | | | 1,023.70 | | | | 1.10 | | |
* Expenses are calculated using the annualized expense ratio for the six months ended June 30, 2006 of 0.22%, multiplied by the average account value over the period, multiplied by the number of days in the period, divided by the number of days in the year.
Class Y
| | | Beginning
Value | | Ending
Value | | Operating
Expense
Incurred* | |
| | 1 | ) Actual | | $ | 1,000.00 | | | $ | 1,002.90 | | | $ | 0.60 | | |
| | 2 | ) Hypothetical | | | 1,000.00 | | | | 1,024.20 | | | | 0.60 | | |
* Expenses are calculated using the annualized expense ratio for the six months ended June30, 2006 of 0.12%, multiplied by the average account value over the period, multiplied by the number of days in the period, divided by the number of days in the year.
353
Other Information (Continued)
Class S
| | | Beginning
Value | | Ending
Value | | Operating
Expense
Incurred* | |
| | 1 | ) Actual | | $ | 1,000.00 | | | $ | 1,002.00 | | | $ | 0.50 | | |
| | 2 | ) Hypothetical | | | 1,000.00 | | | | 1,024.30 | | | | 0.50 | | |
* Expenses are calculated using the annualized expense ratio for the six months ended June 30, 2006 of 0.10%, multiplied by the average account value over the period, multiplied by the number of days in the period, divided by the number of days in the year.
Class N
| | | Beginning
Value | | Ending
Value | | Operating
Expense
Incurred* | |
| | 1 | ) Actual | | $ | 1,000.00 | | | $ | 1,000.00 | | | $ | 3.82 | | |
| | 2 | ) Hypothetical | | | 1,000.00 | | | | 1,020.98 | | | | 3.86 | | |
* Expenses are calculated using the annualized expense ratio for the six months ended June 30, 2006 of 0.77%, multiplied by the average account value over the period, multiplied by the number of days in the period, divided by the number of days in the year.
Destination Retirement 2010 Fund
Class A
| | | Beginning
Value | | Ending
Value | | Operating
Expense
Incurred* | |
| | 1 | ) Actual | | $ | 1,000.00 | | | $ | 1,004.70 | | | $ | 2.49 | | |
| | 2 | ) Hypothetical | | | 1,000.00 | | | | 1,022.32 | | | | 2.51 | | |
* Expenses are calculated using the annualized expense ratio for the six months ended June 30, 2006 of 0.50%, multiplied by the average account value over the period, multiplied by the number of days in the period, divided by the number of days in the year.
Class L
| | | Beginning
Value | | Ending
Value | | Operating
Expense
Incurred* | |
| | 1 | ) Actual | | $ | 1,000.00 | | | $ | 1,006.60 | | | $ | 1.24 | | |
| | 2 | ) Hypothetical | | | 1,000.00 | | | | 1,023.55 | | | | 1.25 | | |
* Expenses are calculated using the annualized expense ratio for the six months ended June 30, 2006 of 0.25%, multiplied by the average account value over the period, multiplied by the number of days in the period, divided by the number of days in the year.
Class Y
| | | Beginning
Value | | Ending
Value | | Operating
Expense
Incurred* | |
| | 1 | ) Actual | | $ | 1,000.00 | | | $ | 1,006.60 | | | $ | 0.75 | | |
| | 2 | ) Hypothetical | | | 1,000.00 | | | | 1,024.05 | | | | 0.75 | | |
* Expenses are calculated using the annualized expense ratio for the six months ended June 30, 2006 of 0.15%, multiplied by the average account value over the period, multiplied by the number of days in the period, divided by the number of days in the year.
354
Other Information (Continued)
Class S
| | | Beginning
Value | | Ending
Value | | Operating
Expense
Incurred* | |
| | 1 | ) Actual | | $ | 1,000.00 | | | $ | 1,007.50 | | | $ | 0.50 | | |
| | 2 | ) Hypothetical | | | 1,000.00 | | | | 1,024.30 | | | | 0.50 | | |
* Expenses are calculated using the annualized expense ratio for the six months ended June 30, 2006 of 0.10%, multiplied by the average account value over the period, multiplied by the number of days in the period, divided by the number of days in the year.
Class N
| | | Beginning
Value | | Ending
Value | | Operating
Expense
Incurred* | |
| | 1 | ) Actual | | $ | 1,000.00 | | | $ | 1,003.80 | | | $ | 3.97 | | |
| | 2 | ) Hypothetical | | | 1,000.00 | | | | 1,020.83 | | | | 4.01 | | |
* Expenses are calculated using the annualized expense ratio for the six months ended June 30, 2006 of 0.80%, multiplied by the average account value over the period, multiplied by the number of days in the period, divided by the number of days in the year.
Destination Retirement 2020 Fund
Class A
| | | Beginning
Value | | Ending
Value | | Operating
Expense
Incurred* | |
| | 1 | ) Actual | | $ | 1,000.00 | | | $ | 1,004.60 | | | $ | 2.44 | | |
| | 2 | ) Hypothetical | | | 1,000.00 | | | | 1,022.36 | | | | 2.46 | | |
* Expenses are calculated using the annualized expense ratio for the six months ended June 30, 2006 of 0.49%, multiplied by the average account value over the period, multiplied by the number of days in the period, divided by the number of days in the year.
Class L
| | | Beginning
Value | | Ending
Value | | Operating
Expense
Incurred* | |
| | 1 | ) Actual | | $ | 1,000.00 | | | $ | 1,005.50 | | | $ | 1.19 | | |
| | 2 | ) Hypothetical | | | 1,000.00 | | | | 1,023.60 | | | | 1.20 | | |
* Expenses are calculated using the annualized expense ratio for the six months ended June 30, 2006 of 0.24%, multiplied by the average account value over the period, multiplied by the number of days in the period, divided by the number of days in the year.
Class Y
| | | Beginning
Value | | Ending
Value | | Operating
Expense
Incurred* | |
| | 1 | ) Actual | | $ | 1,000.00 | | | $ | 1,006.40 | | | $ | 0.70 | | |
| | 2 | ) Hypothetical | | | 1,000.00 | | | | 1,024.10 | | | | 0.70 | | |
* Expenses are calculated using the annualized expense ratio for the six months ended June 30, 2006 of 0.14%, multiplied by the average account value over the period, multiplied by the number of days in the period, divided by the number of days in the year.
355
Other Information (Continued)
Class S
| | | Beginning
Value | | Ending
Value | | Operating
Expense
Incurred* | |
| | 1 | ) Actual | | $ | 1,000.00 | | | $ | 1,006.40 | | | $ | 0.45 | | |
| | 2 | ) Hypothetical | | | 1,000.00 | | | | 1,024.35 | | | | 0.45 | | |
* Expenses are calculated using the annualized expense ratio for the six months ended June 30, 2006 of 0.09%, multiplied by the average account value over the period, multiplied by the number of days in the period, divided by the number of days in the year.
Class N
| | | Beginning
Value | | Ending
Value | | Operating
Expense
Incurred* | |
| | 1 | ) Actual | | $ | 1,000.00 | | | $ | 1,002.70 | | | $ | 3.92 | | |
| | 2 | ) Hypothetical | | | 1,000.00 | | | | 1,020.88 | | | | 3.96 | | |
* Expenses are calculated using the annualized expense ratio for the six months ended June 30, 2006 of 0.79%, multiplied by the average account value over the period, multiplied by the number of days in the period, divided by the number of days in the year.
Destination Retirement 2030 Fund
Class A
| | | Beginning
Value | | Ending
Value | | Operating
Expense
Incurred* | |
| | 1 | ) Actual | | $ | 1,000.00 | | | $ | 1,012.20 | | | $ | 2.49 | | |
| | 2 | ) Hypothetical | | | 1,000.00 | | | | 1,022.32 | | | | 2.51 | | |
* Expenses are calculated using the annualized expense ratio for the six months ended June 30, 2006 of 0.50%, multiplied by the average account value over the period, multiplied by the number of days in the period, divided by the number of days in the year.
Class L
| | | Beginning
Value | | Ending
Value | | Operating
Expense
Incurred* | |
| | 1 | ) Actual | | $ | 1,000.00 | | | $ | 1,013.00 | | | $ | 1.25 | | |
| | 2 | ) Hypothetical | | | 1,000.00 | | | | 1,023.55 | | | | 1.25 | | |
* Expenses are calculated using the annualized expense ratio for the six months ended June 30, 2006 of 0.25%, multiplied by the average account value over the period, multiplied by the number of days in the period, divided by the number of days in the year.
Class Y
| | | Beginning
Value | | Ending
Value | | Operating
Expense
Incurred* | |
| | 1 | ) Actual | | $ | 1,000.00 | | | $ | 1,013.90 | | | $ | 0.75 | | |
| | 2 | ) Hypothetical | | | 1,000.00 | | | | 1,024.05 | | | | 0.75 | | |
* Expenses are calculated using the annualized expense ratio for the six months ended June 30, 2006 of 0.15%, multiplied by the average account value over the period, multiplied by the number of days in the period, divided by the number of days in the year.
356
Other Information (Continued)
Class S
| | | Beginning
Value | | Ending
Value | | Operating
Expense
Incurred* | |
| | 1 | ) Actual | | $ | 1,000.00 | | | $ | 1,013.90 | | | $ | 0.50 | | |
| | 2 | ) Hypothetical | | | 1,000.00 | | | | 1,024.30 | | | | 0.50 | | |
* Expenses are calculated using the annualized expense ratio for the six months ended June 30, 2006 of 0.10%, multiplied by the average account value over the period, multiplied by the number of days in the period, divided by the number of days in the year.
Class N
| | | Beginning
Value | | Ending
Value | | Operating
Expense
Incurred* | |
| | 1 | ) Actual | | $ | 1,000.00 | | | $ | 1,011.30 | | | $ | 3.99 | | |
| | 2 | ) Hypothetical | | | 1,000.00 | | | | 1,020.83 | | | | 4.01 | | |
* Expenses are calculated using the annualized expense ratio for the six months ended June 30, 2006 of 0.80%, multiplied by the average account value over the period, multiplied by the number of days in the period, divided by the number of days in the year.
Destination Retirement 2040 Fund
Class A
| | | Beginning
Value | | Ending
Value | | Operating
Expense
Incurred* | |
| | 1 | ) Actual | | $ | 1,000.00 | | | $ | 1,017.80 | | | $ | 2.45 | | |
| | 2 | ) Hypothetical | | | 1,000.00 | | | | 1,022.36 | | | | 2.46 | | |
* Expenses are calculated using the annualized expense ratio for the six months ended June 30, 2006 of 0.49%, multiplied by the average account value over the period, multiplied by the number of days in the period, divided by the number of days in the year.
Class L
| | | Beginning
Value | | Ending
Value | | Operating
Expense
Incurred* | |
| | 1 | ) Actual | | $ | 1,000.00 | | | $ | 1,019.50 | | | $ | 1.20 | | |
| | 2 | ) Hypothetical | | | 1,000.00 | | | | 1,023.60 | | | | 1.20 | | |
* Expenses are calculated using the annualized expense ratio for the six months ended June 30, 2006 of 0.24%, multiplied by the average account value over the period, multiplied by the number of days in the period, divided by the number of days in the year.
Class Y
| | | Beginning
Value | | Ending
Value | | Operating
Expense
Incurred* | |
| | 1 | ) Actual | | $ | 1,000.00 | | | $ | 1,019.50 | | | $ | 0.70 | | |
| | 2 | ) Hypothetical | | | 1,000.00 | | | | 1,024.10 | | | | 0.70 | | |
* Expenses are calculated using the annualized expense ratio for the six months ended June 30, 2006 of 0.14%, multiplied by the average account value over the period, multiplied by the number of days in the period, divided by the number of days in the year.
357
Other Information (Continued)
Class S
| | | Beginning
Value | | Ending
Value | | Operating
Expense
Incurred* | |
| | 1 | ) Actual | | $ | 1,000.00 | | | $ | 1,019.50 | | | $ | 0.45 | | |
| | 2 | ) Hypothetical | | | 1,000.00 | | | | 1,024.35 | | | | 0.45 | | |
* Expenses are calculated using the annualized expense ratio for the six months ended June 30, 2006 of 0.09%, multiplied by the average account value over the period, multiplied by the number of days in the period, divided by the number of days in the year.
Class N
| | | Beginning
Value | | Ending
Value | | Operating
Expense
Incurred* | |
| | 1 | ) Actual | | $ | 1,000.00 | | | $ | 1,016.10 | | | $ | 3.95 | | |
| | 2 | ) Hypothetical | | | 1,000.00 | | | | 1,020.88 | | | | 3.96 | | |
* Expenses are calculated using the annualized expense ratio for the six months ended June 30, 2006 of 0.79%, multiplied by the average account value over the period, multiplied by the number of days in the period, divided by the number of days in the year.
358

Massachusetts Mutual Life Insurance Company
and affiliated companies
Springfield MA 01111-0001
www.massmutual.com
Distributor
MML Distributors, LLC
1295 State Street
Springfield, MA 01111-0001
August 29, 2006
©2006 Massachusetts Mutual Life Insurance Company. All rights reserved.
MassMutual Financial Group is a marketing designation (or fleet name) for | |
Massachusetts Mutual Life Insurance Company (MassMutual) and its subsidiaries. | L4543 0806 |
Item 2. Code of Ethics.
Not applicable to this filing.
Item 3. Audit Committee Financial Expert.
Not applicable to this filing.
Item 4. Principal Accountant Fees and Services.
Not applicable to this filing.
Item 5. Audit Committee of Listed Registrants.
Not applicable to this filing.
Item 6. Schedule of Investments.
Not applicable to this filing.
Item 7. Disclosure of Proxy Voting Policies and Procedures for Closed-End Management Investment Companies.
Not applicable to this filing.
Item 8. Portfolio Managers of Closed-End Management Investment Companies.
Not applicable to this filing.
Item 9. Purchases of Equity Securities by Closed-End Management Investment Company and Affiliated Purchasers.
Not applicable to this filing.
Item 10. Submission of Matters to a Vote of Security Holders.
The following procedures for shareholders to submit nominee candidates were adopted by the Registrant’s Nominating Committee and the Board of Trustees on August 7, 2006:
A Trust shareholder must follow the following procedures in order to properly submit a nominee recommendation for the Committee’s consideration.
1. The shareholder must submit any such recommendation (a “Shareholder Recommendation”) in writing to the Trust’s Nominating Committee, to the attention of the Secretary, at the address of the principal executive offices of the Trust.
2. The Shareholder Recommendation must be delivered to or mailed and received at the principal executive offices of the Trust at least 60 calendar days before the date of the meeting at which the Committee is to select a nominee for independent Trustee.
3. The Shareholder Recommendation must include:
(i) a statement in writing setting forth:
(A) the name, age, date of birth, phone number, business address, residence address and nationality of the person recommended by the shareholder (the “Candidate”);
(B) the class or series and number of all shares of the Trust owned of record or beneficially by the Candidate, as reported to such shareholder by the Candidate;
(C) any other information regarding the Candidate called for with respect to director nominees by paragraphs (a), (d), (e) and (f) of Item 401 of Regulation S-K or paragraph (b) of Item 22 of Rule 14a-101 (Schedule 14A) under the Securities Exchange Act of 1934, as amended (the “Exchange Act”), adopted by the Securities and Exchange Commission (or the corresponding provisions of any regulation or rule subsequently adopted by the Securities and Exchange Commission or any successor agency applicable to the Trust);
(D) any other information regarding the Candidate that would be required to be disclosed if the Candidate were a nominee in a proxy statement or other filing required to be made in connection with solicitation of proxies for election of Trustees or directors pursuant to Section 14 of the Exchange Act and the rules and regulations promulgated thereunder; and
(E) whether the recommending shareholder believes that the Candidate is or will be an “interested person” of the Trust (as defined in the Investment Company Act of 1940, as amended) and, if not an “interested person,” information regarding the Candidate that will be sufficient for the Trust to make such determination;
(ii) the written and signed consent of the Candidate to be named as a nominee, for such Candidate’s information submitted in accordance with (i) above, to be disclosed as may be necessary or appropriate and to serve as a Trustee if elected;
(iii) the recommending shareholder’s name as it appears on the Trust’s books, the number of all shares of each series and class of the Trust owned beneficially and of record by the recommending shareholder;
(iv) a description of all arrangements or understandings between the recommending shareholder and the Candidate and any other person or persons (including their names) pursuant to which the recommendation is being made by the recommending shareholder; and
(v) such other information as the Committee may require the Candidate to furnish as it may reasonably require or deem necessary to determine the eligibility of such Candidate to serve as a Trustee or to satisfy applicable law.
Item 11. Controls and Procedures.
(a) The Registrant’s Principal Executive Officer and Principal Financial Officer concluded that the Registrant’s disclosure controls and procedures (as defined in Rule 30a-3(c) under the Investment Company Act of 1940) were effective as of a date within 90 days prior to the filing date of this report (the “Evaluation Date”), based on their evaluation of the effectiveness of the Registrant’s disclosure controls and procedures as of the Evaluation Date.
(b) There were no changes in the Registrant’s internal control over financial reporting (as defined in Rule 30a-3(d) under the 1940 Act (17 CFR 270.30a-3(d)) that occurred during the Registrant’s most recent fiscal quarter that has materially affected, or is reasonably likely to materially affect, the Registrant’s internal control over financial reporting.
Item 12. Exhibits.
(a)(1) Code of Ethics (Item 2) is not applicable to this filing.
(a)(2) Certifications of the Principal Executive Officer and Principal Financial Officer of the Registrant as required by Rule 30a-2(a) under the Investment Company Act of 1940 (17 CFR 270.30a-2(a)) are attached hereto as Exhibit 99CERT.
(a)(3) Not applicable to this filing.
(b) Certifications pursuant to Section 906 of the Sarbanes-Oxley Act of 2002 as required by Rule 30a-2(b), under the Investment Company Act of 1940 (17 CFR 270.30a-2(b)), Rule 15d-14(b) under the Securities
Exchange Act of 1934 (17 CFR 240.15d-14(b)) and Section 1350 of Chapter 63 of Title 18 of the United States Code (18 U.S.C. 1350) are attached hereto as Exhibit 99.906CERT.
SIGNATURES
Pursuant to the requirements of the Securities Exchange Act of 1934 and the Investment Company Act of 1940, the registrant has duly caused this report to be signed on its behalf by the undersigned, thereunto duly authorized.
(Registrant) | | MassMutual Select Funds |
| |
By (Signature and Title) | /s/ Frederick C. Castellani |
| Frederick C. Castellani, President and Principal Executive Officer |
| |
Date | 8/25/06 | | |
| | | | |
Pursuant to the requirements of the Securities Exchange Act of 1934 and the Investment Company Act of 1940, this report has been signed below by the following persons on behalf of the registrant and in the capacities and on the dates indicated.
By (Signature and Title) | /s/ Frederick C. Castellani |
| Frederick C. Castellani, President and Principal Executive Officer |
| |
| |
Date | 8/25/06 | | |
| | | |
By (Signature and Title) | /s/ Nicholas H. Palmerino |
| Nicholas H. Palmerino, Treasurer and Principal Financial Officer |
| |
| |
Date | 8/25/06 | | |
| | | |