Annual Report
Templeton Global Balanced Fund
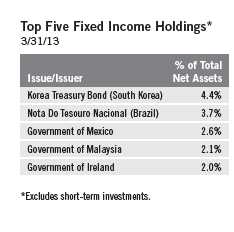
Your Fund’s Goal and Main Investments: Templeton Global Balanced Fund seeks both
income and capital appreciation. Under normal market conditions, the Fund will invest in a diversified
portfolio of debt and equity securities worldwide. The Fund normally invests at least 25% of its assets in
fixed income senior securities and at least 25% of its assets in equity securities. The Fund’s equity
component will generally consist of stocks of companies from a variety of industries located anywhere in
the world, including developing markets, that offer or could offer the opportunity to realize capital
appreciation and/or attractive dividend yields. The Fund’s fixed income component will primarily consist
of developed and developing country government and agency bonds and investment grade and below
investment grade corporate debt securities that offer the opportunity to realize income.
We are pleased to bring you Templeton Global Balanced Fund’s annual report
for the fiscal year ended March 31, 2013.
Performance Overview
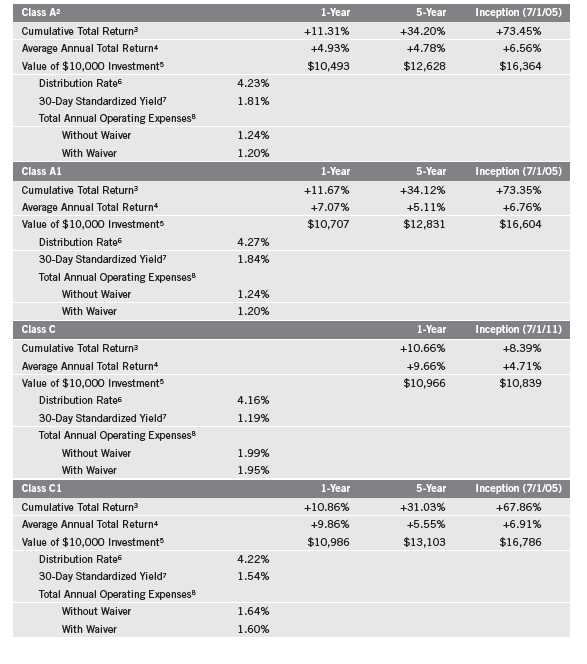
Templeton Global Balanced Fund – Class A delivered a cumulative total return
of +11.31% for the 12 months under review. In comparison, global equity and
fixed income markets, as measured by the Fund’s benchmark, an equally
weighted combination of the MSCI All Country World Index (ACWI) and the
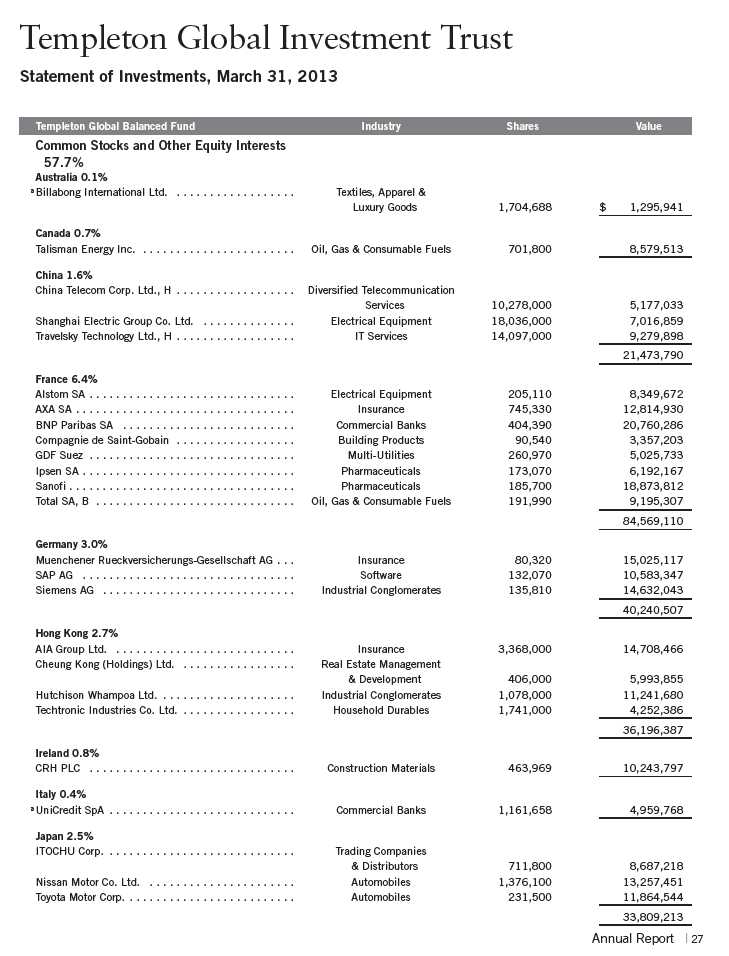
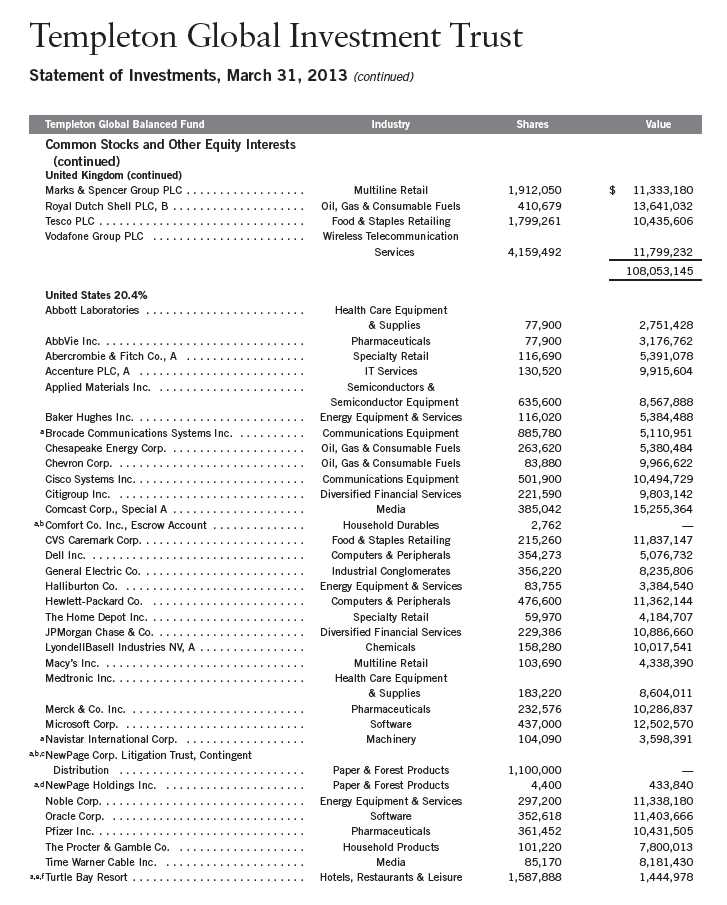
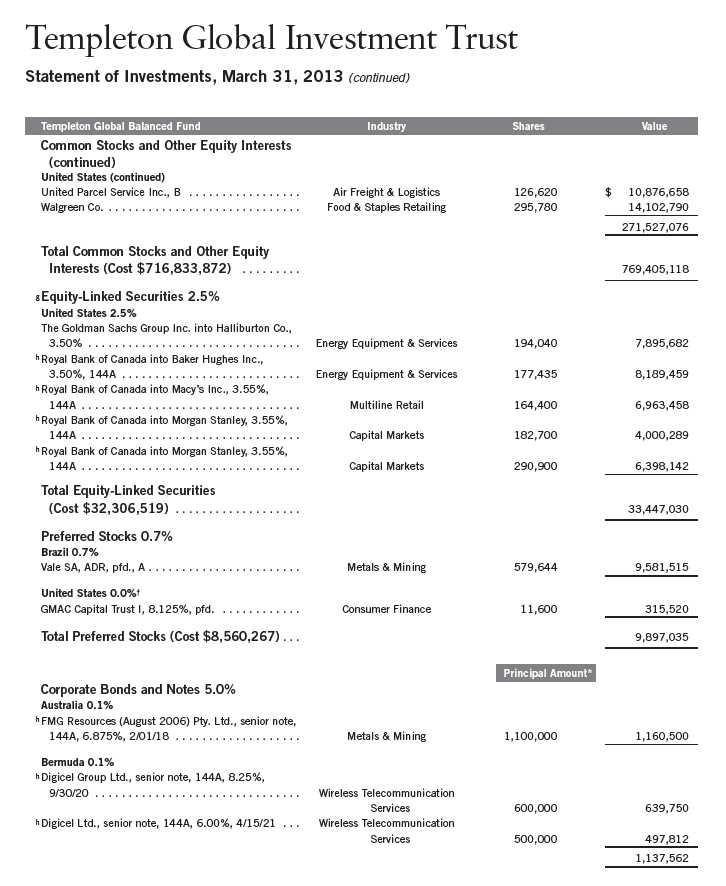
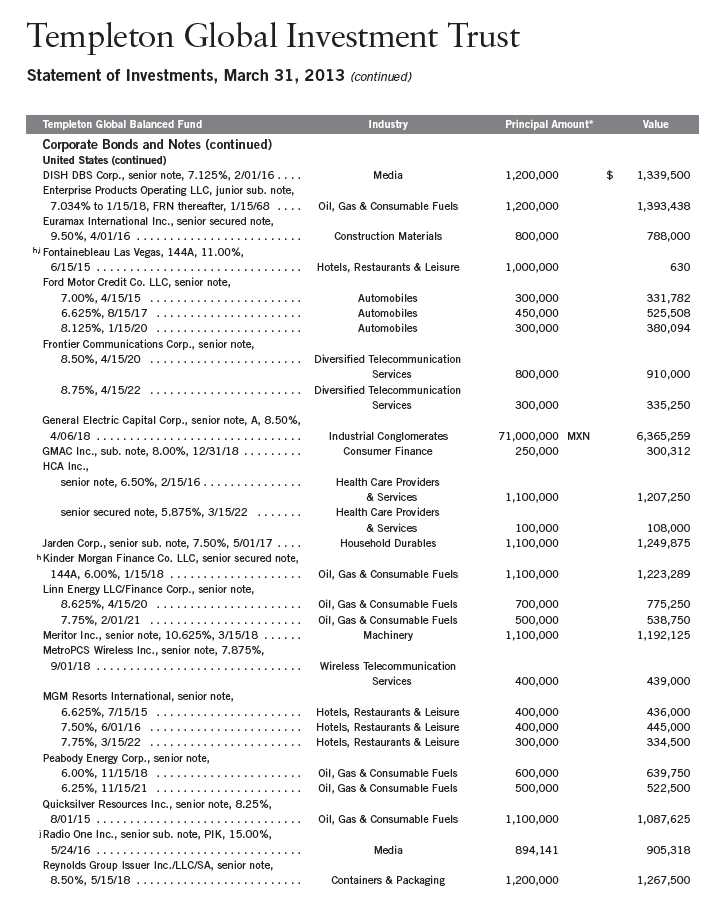
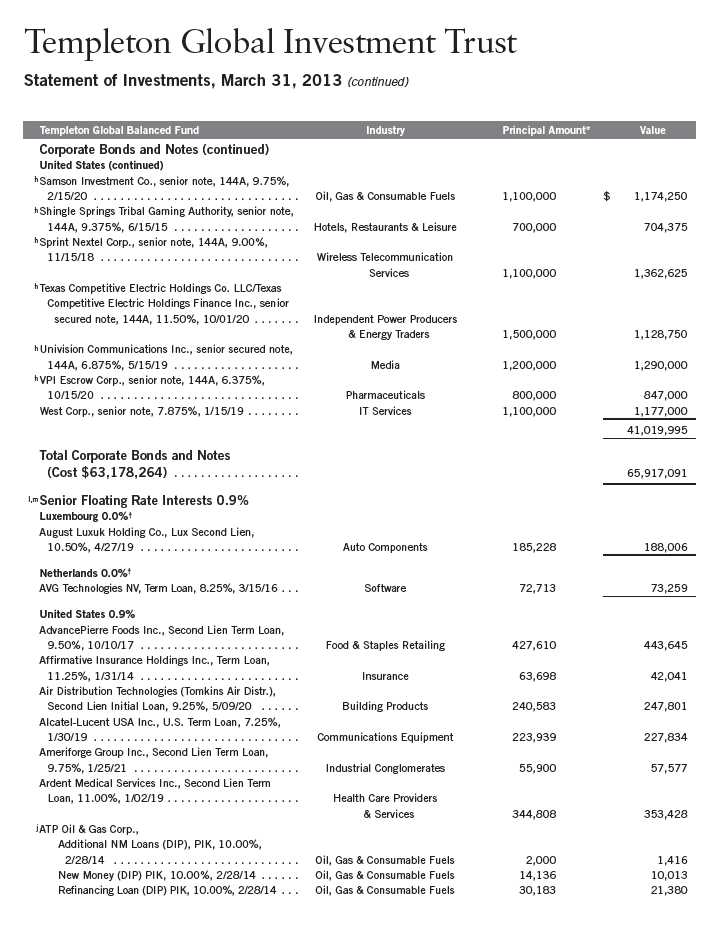
The dollar value, number of shares or principal amount, and names of all portfolio holdings are listed in the
Fund’s Statement of Investments (SOI). The SOI begins on page 27.
Annual Report | 3
Barclays Multiverse Index, posted a +6.51% cumulative total return for the same period.1 You can find more of the Fund’s performance data in the Performance Summary beginning on page 12.
Economic and Market Overview
Global developed and emerging market stocks, as measured by the MSCI ACWI, delivered solid gains during the 12 months under review as redoubled policy support and continued corporate earnings strength helped markets recover from a shaky start. Stocks experienced significant pressure in the spring of 2012 as growing disillusionment with Europe’s austerity and reform manifested itself in electoral results. A Greek coalition effort failed, the Dutch cabinet resigned and the French socialist party candidate won a presidential victory. Eurozone leaders eventually restored some confidence as they permitted the region’s bailout fund to directly recapitalize banks. An interest rate cut, proposed regional banking union and a declaration by European Central Bank President Mario Draghi that his organization would do “whatever it takes” to preserve the euro further supported market stabilization at the beginning of the period.
Policymakers elsewhere followed suit. The U.S. Federal Reserve Board extended its program designed to lower systemically important interest rates and announced a third round of quantitative easing. The Bank of Japan enhanced its intervention with measures that culminated in the appointment of a new policy chief who vowed to defeat deflation at all costs. And in the fall of 2012, the People’s Bank of China slashed interest rates for the first time since the global financial crisis began (before later withdrawing liquidity to discourage asset bubbles). Yet despite generally dovish monetary policies, fiscal tightening occurred in most developed regions as governments attempted to rein in historical levels of indebtedness.
Episodes of political turmoil surfaced throughout the period, but the inconclusive Italian elections and the banking crisis in Cyprus created significant volatility toward the end of the period. While the U.S. had its own tribulations with Congress’s struggle to compromise on a pair of high-profile budget
1. Source: © 2013 Morningstar. All Rights Reserved. The information contained herein: (1) is proprietary to Morningstar
and/or its content providers; (2) may not be copied or distributed; and (3) is not warranted to be accurate, complete or
timely. Neither Morningstar nor its content providers are responsible for any damages or losses arising from any use of
this information. The Fund’s benchmark is currently weighted 50% for the MSCI ACWI and 50% for the Barclays
Multiverse Index and is rebalanced monthly. For the 12 months ended 3/31/13, the MSCI ACWI posted a total return of
+11.19% and the Barclays Multiverse Index posted a +1.68% total return. The indexes are unmanaged and include rein-
vestment of any income or distributions. One cannot invest directly in an index, and an index is not representative of the
Fund’s portfolio.
4 | Annual Report
deadlines, the continuity of the presidential election seemed to assuage the potential chaos. Likewise, China and Japan contributed to the uncertainty and volatility with their respective transitions in power.
Economic indicators remained mixed, with Europe mired in recession, the U.S. showing pockets of strength and China decelerating to more sustainable growth levels. Global corporations proactively sought to cut costs and take advantage of low interest rates in the face of inconsistent and uncertain demand. Consequently, corporate profitability remained surprisingly robust in the face of investor skepticism. In contrast, inconsistent and uncertain growth pressured commodity prices throughout the period.
Investment Strategy
We search for undervalued or out-of-favor debt and equity securities and for equity securities offering current income. When searching for equity securities, we use a bottom-up, value-oriented, long-term approach, focusing on the market price of a security relative to our evaluation of the company’s long-term earnings, asset value and cash flow potential, as reflected by various metrics, including the company’s price/earnings ratio, price/cash flow ratio, price/book value and discounted cash flow. Because this is a global fund, we analyze global economic trends to identify global macro trends (for example, regions with strong economic growth), and evaluate market inefficiencies to identify investment opportunities stemming from market mispricings.
When searching for debt securities, we perform an independent analysis of the securities being considered for the Fund’s portfolio, rather than relying principally on their ratings assigned by rating agencies. Among factors we consider are a company’s experience and managerial strength; responsiveness to changes in interest rates and business conditions; debt maturity schedules and borrowing requirements; a company’s changing financial condition and market recognition of the change; and a security’s relative value based on such factors as anticipated cash flow, interest or dividend coverage, asset coverage and earnings prospects. With respect to sovereign debt securities, we consider market, political and economic conditions, and evaluate interest and currency exchange rate changes and credit risks. We may regularly enter into currency-related transactions involving certain derivative instruments, including currency and cross currency forwards, and currency and currency index futures contracts, to provide a hedge against risks associated with other securities held in the Fund or to implement a currency investment strategy.

Annual Report | 5
Manager’s Discussion
During the fiscal year under review, the Fund’s combined equity and fixed income portfolio outperformed the blended benchmark, which is an equally weighted combination of the MSCI ACWI and the Barclays Multiverse Index. The Fund’s equity and fixed income components outperformed their respective benchmarks, in our view affirming the benefit of a dynamic portfolio in times of market turmoil.
The period was notable for heightened levels of political intervention in markets, a result of the globally coordinated central bank interventions conducted since the global financial crisis began in 2008. Despite bouts of volatility, poli-cymakers largely succeeded in maintaining systemic confidence and stability, and stocks generally gained during the period, underpinned by selective improvements in global economic data and historically strong corporate profit margins.
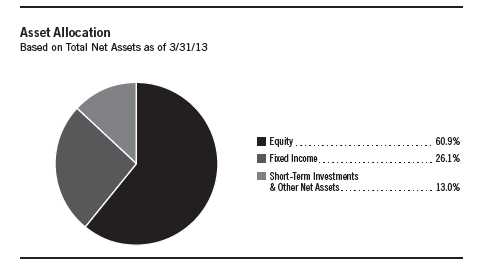
One consequence of political intervention in the markets was significant downward pressure on bond yields. As central banks slashed benchmark borrowing costs and bought debt securities with the aim of facilitating access to credit for businesses and consumers, yield opportunities in fixed income markets became less abundant. As intended, corporations benefited from these policies by taking advantage of historically low borrowing costs to refinance debt and fund acquisitions, share buybacks and dividend payouts. The global financial crisis forced companies to repair their balance sheets and improve profitability to remain competitive in a less forgiving business environment. At a time when most fixed income securities were paying meager coupons, in our assessment, equity securities of many highly profitable, cash-rich companies offered attractive yield prospects at reasonable valuations. In light of these and other considerations, we maintained the Fund’s asset allocation target at approximately 65% equities and 35% fixed income with a bias for additional equity exposure should compelling opportunities arise.
Equity
We were encouraged by the outperformance of some of our highest-conviction holdings during the 12 months under review. The outperformance was particularly notable as it appeared to coincide with renewed investor focus on stock-specific fundamentals after a sustained period of preoccupation with economic headlines. This shift was discernible in the outperformance of value-oriented stocks as the period progressed, particularly those with strong cash
6 | Annual Report
generating capabilities, and several of the Fund’s holdings benefited, led by our investments in the information technology sector.2 We acquired U.S. computer maker Hewlett-Packard (HP) at historically low valuations amid extreme investor skepticism surrounding corporate governance and strategy. HP made its biggest 12-month gain in more than four years after profits exceeded analysts’ estimates, helped by cost-cutting measures and a smaller-than-expected drop in service sales. Even after doubling in less than five months, HP shares remain considerably undervalued, according to our analysis, and strong cash flow generation could create significant scope for debt reduction, share buy-backs and dividend increases.
Our overweighted allocation to health care stocks also aided performance.3 French drugmaker Sanofi was a top contributor and performed well as its longer term assets helped offset patent expirations. The revenue threat posed by patent expirations has deterred many prospective health care investors. We sought to take advantage of the valuation opportunities created by skepticism surrounding the issue to buy shares of companies that are actively addressing patent impacts through investments in product pipelines, new business segments and emerging market operations. We have been stoic in our expectations of an eventual earnings re-acceleration, which would restore earnings growth. Sanofi, which has diversified into biopharmaceuticals, vaccines and medical devices and boasts the highest emerging markets exposure of any major pharmaceuticals manufacturer, is an excellent example of this type of company.
We found far fewer opportunities among materials stocks, as evidenced by our longstanding underweighting in the sector.4 In particular, metals and mining stocks have offered limited opportunities, given our assessment of the industry’s poor capital discipline and overreliance on China — a country that has what we believe to be unsustainably high levels of investment and infrastructure spending — as the primary source of marginal commodity demand. Our underweighted exposure to the materials sector during a period of commodity weakness and relative U.S. dollar strength contributed notably to performance.
2. The information technology sector comprises communications equipment, computers and peripherals, IT services,
semiconductors and semiconductor equipment, and software in the equity section of the SOI.
3. The health care sector comprises health care equipment and supplies, health care providers and services, and
pharmaceuticals in the equity section of the SOI.
4. The materials sector comprises chemicals, construction materials, containers and packaging, metals and mining,
and paper and forest products in the equity section of the SOI.
Annual Report | 7

Within the consumer discretionary sector, we remained positive toward the media industry’s cable stocks, which having made significant infrastructure investment some time ago, recently were characterized by their strong cash profiles.5 We purchased these stocks when investors were skeptical of, and we were optimistic about, the returns cable companies could realize from massive capital spending on fiber. Our perspective represents our time-differentiated view. U.S. cable operator Comcast’s shares surged to a record high during the period as the company benefited from strong broadband subscriber growth and an ongoing turnaround at its recently acquired NBC Universal operations. Although shares were no longer cheap in our view at period-end, we remained holders as the company adds market share in the hugely valuable Internet portal known as broadband.
Elsewhere in the sector, however, select retail holdings struggled. Shares of Kingfisher, a U.K. home improvement retailer, slumped during the period. Like the cable story, we viewed the company’s ongoing strategic restructuring of its operations as potentially able to further boost sales and improve profitability in the face of a sustained anemic economic environment. Hence, we are undeterred by the stock’s near-term softness caused by cold weather and lingering economic malaise.
During the year, we continued to struggle to find value in consumer staples, where, in our assessment, food wholesalers and personal care companies appeared dearly valued and superficially cheap food retail stocks have not yet delivered a convincing business model for ongoing structural changes in the marketplace.6 U.S. drug retailers CVS Caremark and Walgreens are two examples of opportunities we identified through our in-depth analysis. Despite general investor reticence, we assessed the longer term potential of a changing business model. Nonetheless, what we viewed as limited consumer staples bargains left us underweighted in the sector, a position that detracted from relative returns during the review period as renewed volatility rewarded higher exposure to the traditionally defensive sector.
Renewed volatility also punished our overweighted exposure to European banks, and financials holdings were responsible for the bulk of relative losses during the period.7 Swiss diversified financial services firm Credit Suisse Group declined sharply at the beginning of the period after the Swiss National Bank
5. The consumer discretionary sector comprises auto components; automobiles; distributors; hotels, restaurants and
leisure; household durables; media; multiline retail; specialty retail; and textiles, apparel and luxury goods in the
equity section of the SOI.
6. The consumer staples sector comprises food and staples retailing and household products in the equity section of
the SOI.
7. The financials sector comprises capital markets, commercial banks, consumer finance, diversified financial
services, insurance, and real estate management and development in the equity section of the SOI.
8 | Annual Report
urged the company to increase its capital reserves. However, shares later rebounded as the company took aggressive cost-saving measures aimed at nearly doubling its capital ratio. French lender BNP Paribas also detracted during the year as earnings declined. Nonetheless, we remain encouraged by the ongoing restructuring at BNP, where, as at Credit Suisse, management has shrunk the balance sheet and boosted reserves to meet regulatory demands, allowing the firm to raise its dividend during the review period. In contrast, U.K. insurer Aviva was forced to cut its dividend in the first quarter of 2013 to help finance its turnaround strategy. The stock was summarily punished, but we believe the rebased dividend may buy the company time to pay down debt and bring cash conversion levels in line with industry standards. Although the financials sector’s risk profile remains elevated, we continue to find opportunities we consider attractive in European banks and insurers that have restructured and recapitalized, as well as in financial concerns in higher growth markets that stand to benefit from consumer and corporate credit demand growth.
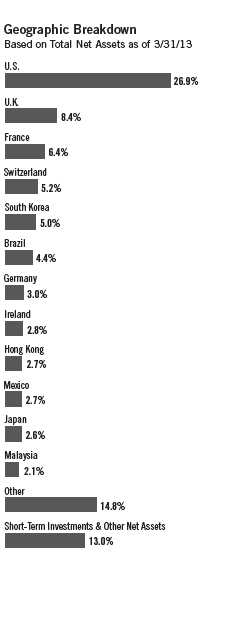
Geographically, stock selection helped offset a detractive lower weighting in the U.S. Overweighting and stock-specific weakness in Europe hurt returns. Stock selection in Australia also detracted from performance.
At Templeton, we continue to find what we consider to be attractive income-oriented equity opportunities across most global regions and sectors. At period-end, global equities still traded at significant discounts to average long-term earnings multiples and offered higher dividend yields than yields on 10-year U.S. Treasuries and higher earnings yields than yields on investment-grade corporate bonds. Although near-term risks remain given the fragility of the global economic recovery and the politicization of financial markets, we believe equity markets continue to offer compelling fundamental value propositions for long-term, income-oriented investors.
Fixed Income
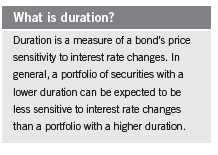
During the period under review, we maintained the Fund’s defensive duration posture as policymakers in the G-3 (U.S., eurozone and Japan), the U.K. and Switzerland continued to pursue historically accommodative monetary policies. With interest rates in the U.S. and Japan at historically low levels, central banks supplying significant liquidity to the financial sector and fiscal deficits that drove record funding needs, we saw what we viewed as limited value in those government bond markets. Our underweighted duration exposures in the U.S. and lack of duration exposure in Japan, however, were largely neutral with respect to performance relative to the fixed income benchmark as yields did not increase significantly during the review period. Select duration exposures in Europe contributed to absolute performance during the period. The Fund maintained little duration exposure in emerging markets, except in
Annual Report | 9
a few countries where rates were already quite high. Nonetheless, select duration exposures in Latin America contributed to performance.
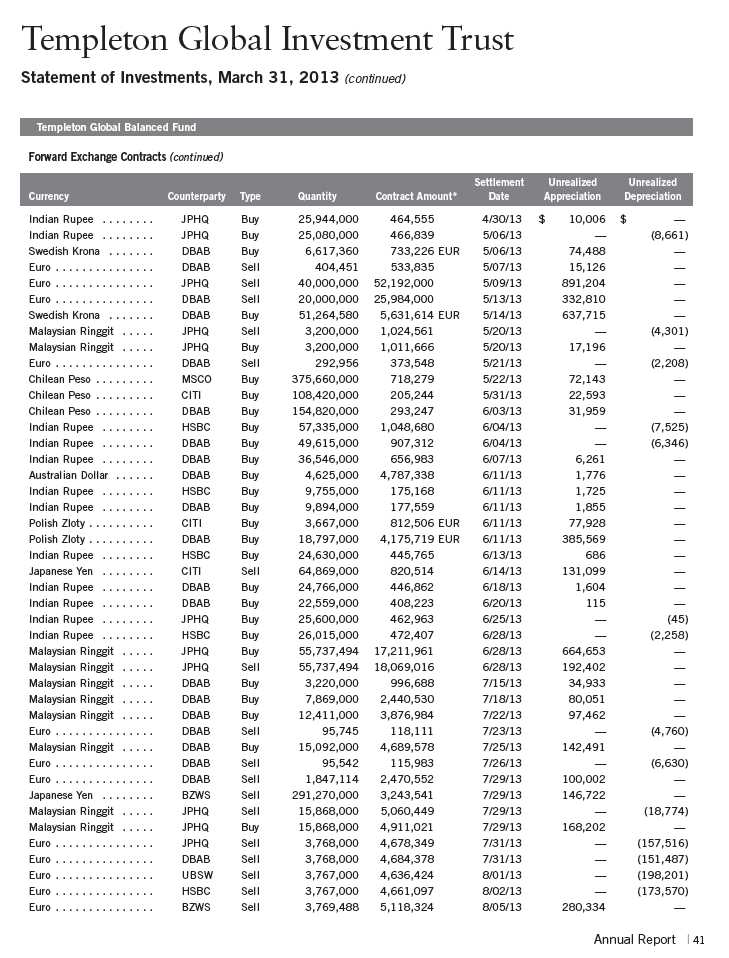
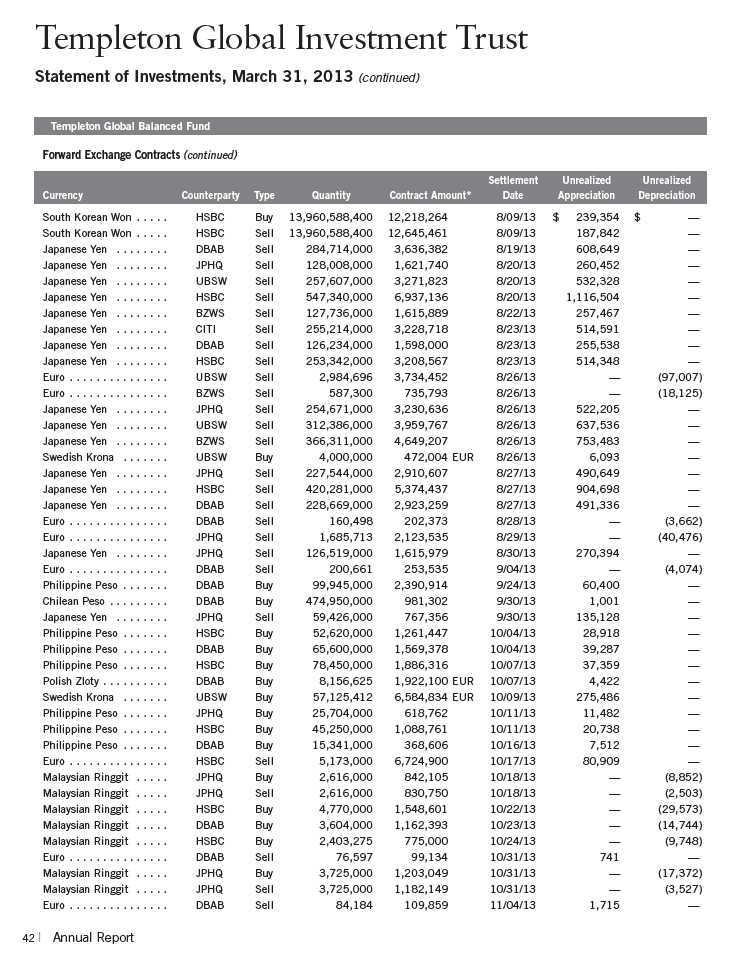
The Fund’s diversified currency exposure contributed to absolute results and performance relative to the Barclays Multiverse Index during the period. As part of the Fund’s investment strategy, we used currency forward contracts to limit or add exposure to various currencies. The U.S. dollar was broadly stronger and gained 4.89% against the currencies of major U.S. trading partners during the period.8 Dollar strength was particularly pronounced against the Japanese yen, which depreciated 12.47% against the U.S. dollar during the year under review.9
Overall, the Fund’s exposure to Asian currencies contributed to performance. The Fund’s large net-negative exposure to the Japanese yen, achieved through the use of currency forward contracts, benefited performance. Currency positions elsewhere in Asia also added to performance as several Asian currencies appreciated against the U.S. dollar. Malaysia’s central bank kept its policy rate constant while Australia, the Philippines and South Korea cut rates during the period. The currencies of these countries posted mixed performance against the U.S. dollar. During the year under review, the Malaysian ringgit declined 1.07%, while the Australian dollar gained 0.64%, the Philippine peso appreciated 5.21% and the South Korean won strengthened 1.84% against the U.S. dollar.9
The euro depreciated 3.57% against the U.S. dollar during the period, and the Fund’s large underweighted position in the monetary union’s currency contributed to relative performance.9 However, this effect was partially offset by the Fund’s exposure to some other European currencies that depreciated against the U.S. dollar. For example, the Norwegian krone depreciated 2.20%, the Hungarian forint fell 6.58%, and the Polish zloty lost 4.11% against the U.S. dollar.9
Exposure to Latin American currencies contributed to absolute performance but detracted from performance relative to the fixed income benchmark. Economic growth in much of the region continued to be supported by domestic and external demand. The Brazilian and Mexican central banks cut their policy rates, while Chile held rates constant. The Brazilian real depreciated 9.52% against the U.S. dollar, while the Chilean peso appreciated 3.48%, and the Mexican peso gained 3.82%.9
8. Source: Federal Reserve H.10 Report.
9. Source: IDC/Exshare.
10 | Annual Report
In addition to purchasing global government bonds, the Fund also invested in the credit sector. As an asset class, such investments may compensate for greater credit risk by offering higher yields relative to U.S. Treasury and European benchmark bonds. Relative to the Barclays Multiverse Index, the Fund’s overall credit positioning during the period contributed to performance. Specifically, the Fund’s overweighted allocation to high yield corporate bonds was a major contributor to relative performance.
Thank you for your continued participation in Templeton Global Balanced Fund. We look forward to serving your future investment needs.

The foregoing information reflects our analysis, opinions and portfolio holdings as of March 31, 2013, the end of
the reporting period. The way we implement our main investment strategies and the resulting portfolio holdings
may change depending on factors such as market and economic conditions. These opinions may not be relied
upon as investment advice or an offer for a particular security. The information is not a complete analysis of
every aspect of any market, country, industry, security or the Fund. Statements of fact are from sources consid-
ered reliable, but the investment manager makes no representation or warranty as to their completeness or
accuracy. Although historical performance is no guarantee of future results, these insights may help you under-
stand our investment management philosophy.
Annual Report | 11
Performance Summary as of 3/31/13
Your dividend income will vary depending on dividends or interest paid by securities in the Fund’s
portfolio, adjusted for operating expenses of each class. Capital gain distributions are net profits
realized from the sale of portfolio securities. The performance table and graphs do not reflect any
taxes that a shareholder would pay on Fund dividends, capital gain distributions, if any, or any
realized gains on the sale of Fund shares. Total return reflects reinvestment of the Fund’s dividends
and capital gain distributions, if any, and any unrealized gains or losses.

12 | Annual Report
Performance Summary (continued)
Performance1
Cumulative total return excludes sales charges. Average annual total returns and value of $10,000 investment include
current maximum sales charges. Class A: 5.75% maximum initial sales charge; Class A1: 4.25% maximum initial sales
charge; Class C/C1: 1% contingent deferred sales charge in first year only; Class R/Advisor Class: no sales charges.
Annual Report | 13

Performance data represent past performance, which does not guarantee future results. Investment return and principal
value will fluctuate, and you may have a gain or loss when you sell your shares. Current performance may differ from
figures shown. For most recent month-end performance, go to franklintempleton.com or call (800) 342-5236.
The investment manager and administrator have contractually agreed to waive or assume certain expenses so that
common expenses (excluding Rule 12b-1 fees and acquired fund fees and expenses) for each class of the Fund do not
exceed 0.95% (other than certain nonroutine expenses) until 7/31/13.
14 | Annual Report
Performance Summary (continued)
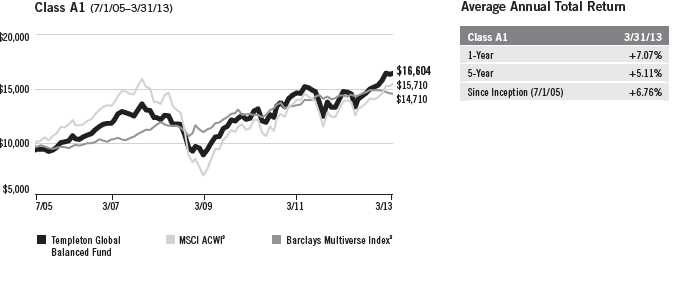
Total Return Index Comparison for a Hypothetical $10,000 Investment1
Total return represents the change in value of an investment over the periods shown. It includes
any current, applicable maximum sales charge, Fund expenses, account fees and reinvested distri-
butions. The unmanaged indexes include reinvestment of any income or distributions. They differ
from the Fund in composition and do not pay management fees or expenses. One cannot invest
directly in an index.

Annual Report | 15
Performance Summary (continued)

16 | Annual Report


Annual Report | 17
Performance Summary (continued)
Endnotes
All investments involve risks, including possible loss of principal. Special risks are associated with foreign investing including currency fluctuations, economic instability and political developments; investments in emerging markets involve heightened risks related to the same factors. To the extent the Fund focuses on particular countries, regions, industries, sectors or types of investment from time to time, it may be subject to greater risks of adverse developments in such areas of focus than a fund that invests in a wider variety of countries, regions, industries, sectors or investments. Current political uncertainty surrounding the European Union (EU) and its membership may increase market volatility. The financial instability of some countries in the EU, including Greece, Italy and Spain, together with the risk of that impacting other more stable countries may increase the economic risk of investing in companies in Europe. Stock prices fluctuate, sometimes rapidly and dramatically, due to factors affecting individual companies, particular industries or sectors, or general market conditions. Bond prices generally move in the opposite direction of interest rates. Thus, as prices of bonds in the Fund adjust to a rise in interest rates, the Fund’s share price may decline. The risks associated with higher yielding, lower rated debt securities include higher risk of default and loss of principal. The Fund’s investment in derivative securities, such as swaps, financial futures and option contracts, and use of foreign currency techniques involve special risks as such may not achieve the anticipated benefits and/or may result in losses to the fund. The Fund is actively managed but there is no guarantee that the manager’s investment decisions will produce the desired results. The Fund’s prospectus also includes a description of the main investment risks.
| |
Class A: | The Fund began offering a new Class A share on 9/27/11. Beginning 7/1/11, the Fund’s existing Class A shares (renamed Class A1 on 9/27/11) were available to new investors with a maximum initial sales charge of 5.75%. Prior to 7/1/11, the Fund offered Class A shares with a lower maximum initial sales charge. |
| |
Class A1 (formerly Class A): | Effective 9/27/11, Class A shares were renamed Class A1. This share class is only available for shareholders who purchased prior to 7/1/11. A new Class A share is available for investors with an initial purchase date on or after 7/1/11. |
| |
Class C: | The Fund began offering a new Class C share on 7/1/11. Prior to that date, the Fund offered a Class C share (renamed Class C1) with lower Rule 12b-1 expenses. These shares have higher annual fees and expenses than Class A shares. |
| |
Class C1 (formerly Class C): | Effective 7/1/11, Class C closed to new investors and was renamed Class C1. These shares have higher annual fees and expenses than Class A shares. A new Class C share is now available. |
| |
Class R: | Shares are available to certain eligible investors as described in the prospectus. These shares have higher annual fees and expenses than Class A shares. |
| |
Advisor Class: | Shares are available to certain eligible investors as described in the prospectus. |
1. Fund investment results reflect the expense reduction, without which the results would have been lower, and yields for the period would have been
1.81%, 1.84%, 1.19%, 1.54%, 1.68% and 2.18% for Classes A, A1, C, C1, R and Advisor, respectively.
2. Total returns have been calculated based upon the returns for Class A1 shares prior to 7/1/11 and are restated to reflect the current, maximum
5.75% initial sales charge.
3. Cumulative total return represents the change in value of an investment over the periods indicated.
4. Average annual total return represents the average annual change in value of an investment over the periods indicated.
5. These figures represent the value of a hypothetical $10,000 investment in the Fund over the periods indicated.
6. Distribution rate is based on an annualization of the respective class’s most recent quarterly dividend and the maximum offering price (NAV for
Classes C, C1, R and Advisor) per share on 3/31/13.
7. The 30-day standardized yield for the 30 days ended 3/31/13 reflects an estimated yield to maturity (assuming all portfolio securities are held to
maturity). It should be regarded as an estimate of the Fund’s rate of investment income, and it may not equal the Fund’s actual income distribution
rate (which reflects the Fund’s past dividends paid to shareholders) or the income reported in the Fund’s financial statements.
8. Figures are as stated in the Fund’s prospectus current as of the date of this report. In periods of market volatility, assets may decline significantly,
causing total annual Fund operating expenses to become higher than the figures shown.
9. Source: © 2013 Morningstar. The MSCI ACWI is a free float-adjusted, market capitalization-weighted index designed to measure equity market
performance in global developed and emerging markets. The Barclays Multiverse Index provides a broad-based measure of the global fixed income
bond market. The index represents the union of the Global Aggregate Index and the Global High Yield Index and captures investment-grade and high
yield securities in all eligible currencies.
18 | Annual Report
Your Fund’s Expenses
As a Fund shareholder, you can incur two types of costs:
- Transaction costs, including sales charges (loads) on Fund purchases; and
- Ongoing Fund costs, including management fees, distribution and service (12b-1) fees, and other Fund expenses. All mutual funds have ongoing costs, sometimes referred to as operating expenses.
The following table shows ongoing costs of investing in the Fund and can help you understand these costs and compare them with those of other mutual funds. The table assumes a $1,000 investment held for the six months indicated.
Actual Fund Expenses
The first line (Actual) for each share class listed in the table provides actual account values and expenses. The “Ending Account Value” is derived from the Fund’s actual return, which includes the effect of Fund expenses.
You can estimate the expenses you paid during the period by following these steps. Of course, your account value and expenses will differ from those in this illustration:
| 1. | Divide your account value by $1,000. |
| | If an account had an $8,600 value, then $8,600 ÷ $1,000 = 8.6. |
| 2. | Multiply the result by the number under the heading “Expenses Paid During Period.” |
| | If Expenses Paid During Period were $7.50, then 8.6 x $7.50 = $64.50. |
In this illustration, the estimated expenses paid this period are $64.50.
Hypothetical Example for Comparison with Other Funds
Information in the second line (Hypothetical) for each class in the table can help you compare ongoing costs of investing in the Fund with those of other mutual funds. This information may not be used to estimate the actual ending account balance or expenses you paid during the period. The hypothetical “Ending Account Value” is based on the actual expense ratio for each class and an assumed 5% annual rate of return before expenses, which does not represent the Fund’s actual return. The figure under the heading “Expenses Paid During Period” shows the hypothetical expenses your account would have incurred under this scenario. You can compare this figure with the 5% hypothetical examples that appear in shareholder reports of other funds.
Annual Report | 19
Your Fund’s Expenses (continued)
Please note that expenses shown in the table are meant to highlight ongoing costs and do not reflect any transaction costs, such as sales charges. Therefore, the second line for each class is useful in comparing ongoing costs only, and will not help you compare total costs of owning different funds. In addition, if transaction costs were included, your total costs would have been higher. Please refer to the Fund prospectus for additional information on operating expenses.

*Expenses are calculated using the most recent six-month expense ratio, net of expense waivers, annualized for each class (A: 1.20%; A1: 1.20%;
C: 1.95%; C1: 1.60%; R: 1.45%; and Advisor: 0.95%), multiplied by the average account value over the period, multiplied by 182/365 to reflect the
one-half year period.
20 | Annual Report

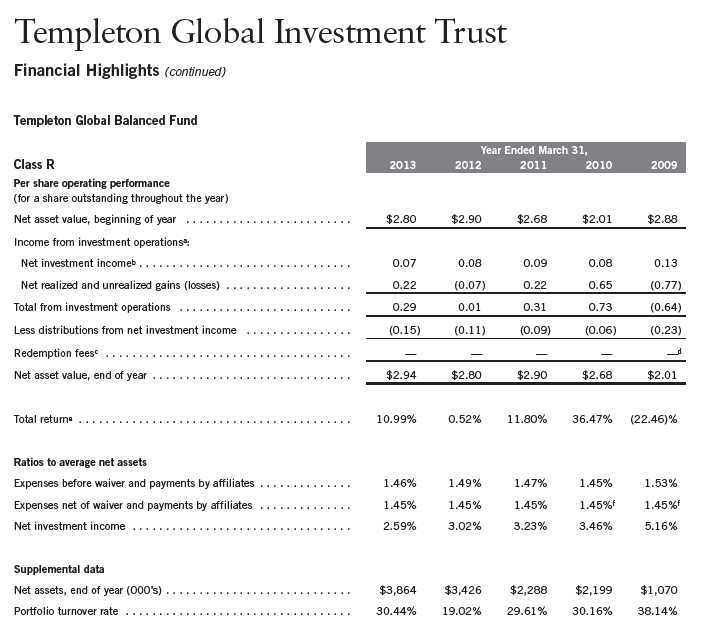
aFor the period September 27, 2011 (effective date) to March 31, 2012.
bThe amount shown for a share outstanding throughout the period may not correlate with the Statement of Operations for the period due to the timing of sales and repurchases of
the Fund shares in relation to income earned and/or fluctuating market value of the investments of the Fund.
cBased on average daily shares outstanding.
dTotal return does not reflect sales commissions or contingent deferred sales charges, if applicable, and is not annualized for periods less than one year.
eRatios are annualized for periods less than one year.
Annual Report | The accompanying notes are an integral part of these financial statements. | 21

aThe amount shown for a share outstanding throughout the period may not correlate with the Statement of Operations for the period due to the timing of sales and repurchases of
the Fund shares in relation to income earned and/or fluctuating market value of the investments of the Fund.
bBased on average daily shares outstanding.
cEffective September 1, 2008, the redemption fee was eliminated.
dAmount rounds to less than $0.01 per share.
eTotal return does not reflect sales commissions or contingent deferred sales charges, if applicable.
fBenefit of expense reduction rounds to less than 0.01%.
22 | The accompanying notes are an integral part of these financial statements. | Annual Report

aFor the period July 1, 2011 (effective date) to March 31, 2012.
bThe amount shown for a share outstanding throughout the period may not correlate with the Statement of Operations for the period due to the timing of sales and repurchases of
the Fund shares in relation to income earned and/or fluctuating market value of the investments of the Fund.
cBased on average daily shares outstanding.
dTotal return does not reflect sales commissions or contingent deferred sales charges, if applicable, and is not annualized for periods less than one year.
eRatios are annualized for periods less than one year.
Annual Report | The accompanying notes are an integral part of these financial statements. | 23

aThe amount shown for a share outstanding throughout the period may not correlate with the Statement of Operations for the period due to the timing of sales and repurchases of
the Fund shares in relation to income earned and/or fluctuating market value of the investments of the Fund.
bBased on average daily shares outstanding.
cEffective September 1, 2008, the redemption fee was eliminated.
dAmount rounds to less than $0.01 per share.
eTotal return does not reflect sales commissions or contingent deferred sales charges, if applicable.
fBenefit of expense reduction rounds to less than 0.01%.
24 | The accompanying notes are an integral part of these financial statements. | Annual Report
aThe amount shown for a share outstanding throughout the period may not correlate with the Statement of Operations for the period due to the timing of sales and repurchases of
the Fund shares in relation to income earned and/or fluctuating market value of the investments of the Fund.
bBased on average daily shares outstanding.
cEffective September 1, 2008, the redemption fee was eliminated.
dAmount rounds to less than $0.01 per share.
eTotal return does not reflect sales commissions or contingent deferred sales charges, if applicable.
fBenefit of expense reduction rounds to less than 0.01%.
Annual Report | The accompanying notes are an integral part of these financial statements. | 25

aThe amount shown for a share outstanding throughout the period may not correlate with the Statement of Operations for the period due to the timing of sales and repurchases of
the Fund shares in relation to income earned and/or fluctuating market value of the investments of the Fund.
bBased on average daily shares outstanding.
cEffective September 1, 2008, the redemption fee was eliminated.
dAmount rounds to less than $0.01 per share.
eBenefit of expense reduction rounds to less than 0.01%.
26 | The accompanying notes are an integral part of these financial statements. | Annual Report

28 | Annual Report
Annual Report | 29
30 | Annual Report

Annual Report | 31

32 | Annual Report
Annual Report | 33
34 | Annual Report
Annual Report | 35
36 | Annual Report

Annual Report | 37
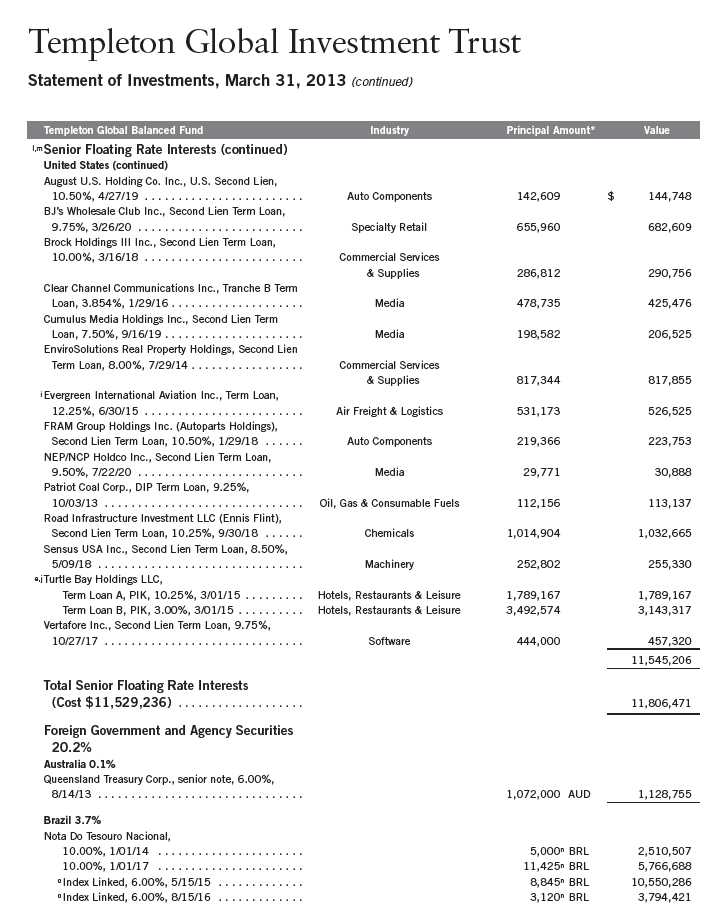
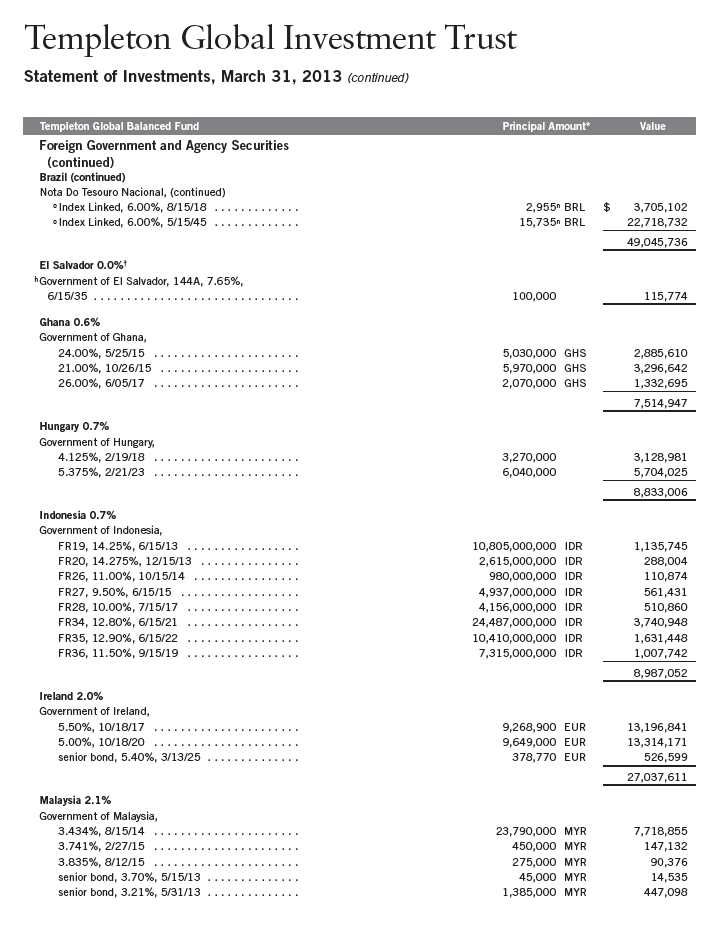
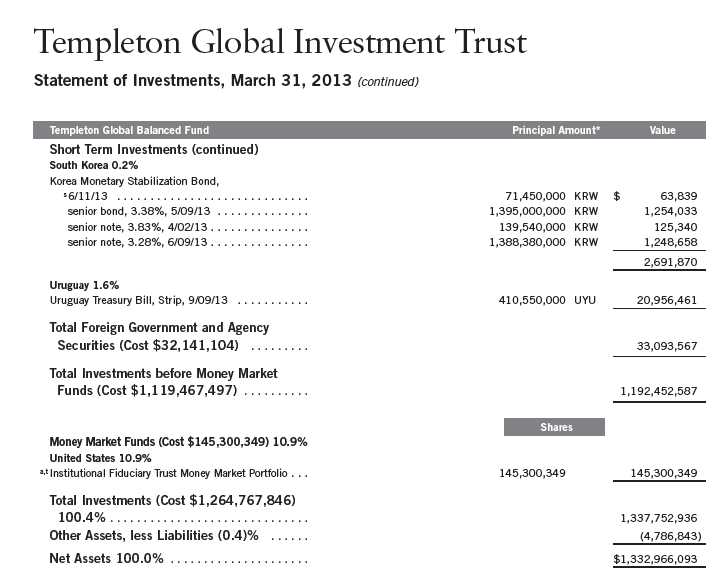
Templeton Global Investment Trust
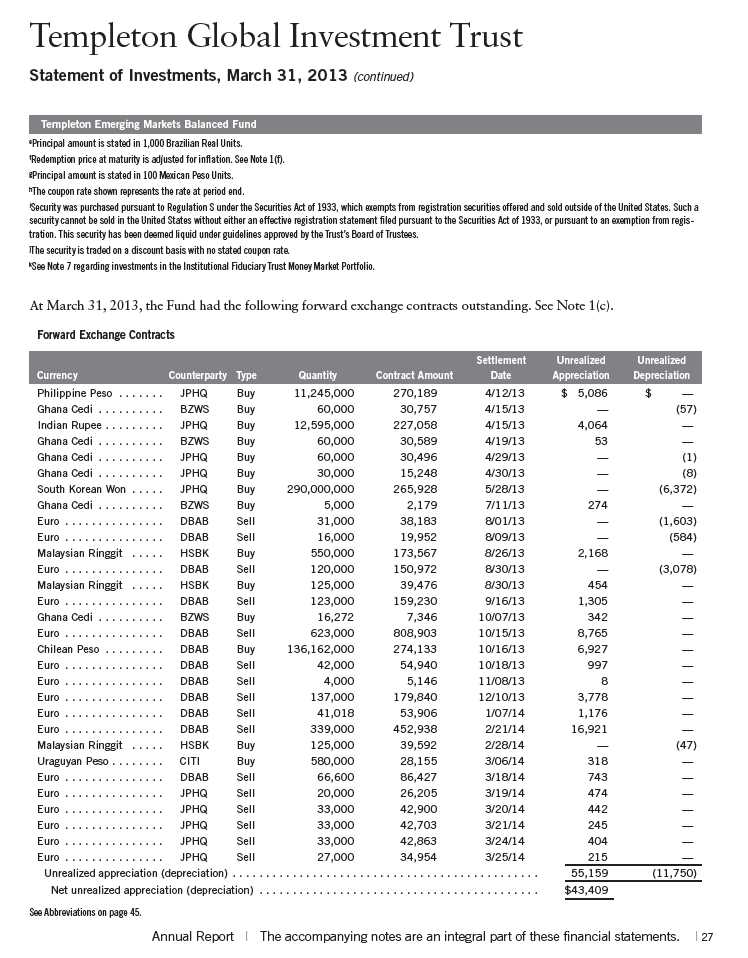
Statement of Investments, March 31, 2013 (continued)

38 | Annual Report
†Rounds to less than 0.1% of net assets.
*The principal amount is stated in U.S. dollars unless otherwise indicated.
aNon-income producing.
bSecurity has been deemed illiquid because it may not be able to be sold within seven days.
cContingent distributions represent the right to receive additional distributions, if any, during the reorganization of the underlying company. Shares represent total underlying
principal of debt securities.
dSee Note 10 regarding restricted securities.
eAt March 31, 2013, pursuant to the Fund’s policies and the requirements of applicable securities law, the Fund may be restricted from trading these securities for a limited or
extended period of time due to ownership limits and/or potential possession of material non-public information.
fSee Note 1(g) regarding investment in FT Holdings Corporation IV.
gSee Note 1(f) regarding equity-linked securities.
hSecurity was purchased pursuant to Rule 144A under the Securities Act of 1933 and may be sold in transactions exempt from registration only to qualified institutional buyers or in
a public offering registered under the Securities Act of 1933. These securities have been deemed liquid under guidelines approved by the Trust’s Board of Trustees. At March 31,
2013, the aggregate value of these securities was $60,614,473, representing 4.55% of net assets.
iSee Note 8 regarding defaulted securities.
jIncome may be received in additional securities and/or cash.
kSecurity was purchased pursuant to Regulation S under the Securities Act of 1933, which exempts from registration securities offered and sold outside of the United States. Such
a security cannot be sold in the United States without either an effective registration statement filed pursuant to the Securities Act of 1933, or pursuant to an exemption from
registration. These securities have been deemed liquid under guidelines approved by the Trust’s Board of Trustees. At March 31, 2013, the aggregate value of these securities was
$7,734,333, representing 0.58% of net assets.
lThe coupon rate shown represents the rate at period end.
Annual Report | 39
Templeton Global Investment Trust
Statement of Investments, March 31, 2013 (continued)
40 | Annual Report

44 | The accompanying notes are an integral part of these financial statements. | Annual Report

Annual Report | The accompanying notes are an integral part of these financial statements. | 45

46 | The accompanying notes are an integral part of these financial statements. | Annual Report

Annual Report | The accompanying notes are an integral part of these financial statements. | 47
Templeton Global Investment Trust
Financial Statements (continued)

48 | The accompanying notes are an integral part of these financial statements. | Annual Report
Templeton Global Investment Trust
Notes to Financial Statements
Templeton Global Balanced Fund
1. ORGANIZATION AND SIGNIFICANT ACCOUNTING POLICIES
Templeton Global Investment Trust (Trust) is registered under the Investment Company Act of 1940, as amended, (1940 Act) as an open-end investment company, consisting of six separate funds. The Templeton Global Balanced Fund (Fund) is included in this report. The financial statements of the remaining funds in the Trust are presented separately. The Fund offers six classes of shares: Class A, Class A1, Class C, Class C1, Class R, and Advisor Class. Effective May 1, 2013, the Fund began offering a new class of shares, Class R6. Each class of shares differs by its initial sales load, contingent deferred sales charges, voting rights on matters affecting a single class, its exchange privilege and fees primarily due to differing arrangements for distribution and transfer agent fees.
The following summarizes the Fund’s significant accounting policies.
a. Financial Instrument Valuation
The Fund’s investments in financial instruments are carried at fair value daily. Fair value is the price that would be received to sell an asset or paid to transfer a liability in an orderly transaction between market participants on the measurement date. Under procedures approved by the Trust’s Board of Trustees (the Board), the Fund’s administrator, investment manager and other affiliates have formed the Valuation and Liquidity Oversight Committee (VLOC). The VLOC provides administration and oversight of the Fund’s valuation policies and procedures, which are approved annually by the Board. Among other things, these procedures allow the Fund to utilize independent pricing services, quotations from securities and financial instrument dealers, and other market sources to determine fair value.
Equity securities and derivative financial instruments (derivatives) listed on an exchange or on the NASDAQ National Market System are valued at the last quoted sale price or the official closing price of the day, respectively. Foreign equity securities are valued as of the close of trading on the foreign stock exchange on which the security is primarily traded, or the NYSE, whichever is earlier. The value is then converted into its U.S. dollar equivalent at the foreign exchange rate in effect at the close of the NYSE on the day that the value of the security is determined. Over-the-counter (OTC) securities are valued within the range of the most recent quoted bid and ask prices. Securities that trade in multiple markets or on multiple exchanges are valued according to the broadest and most representative market. Certain equity securities are valued based upon fundamental characteristics or relationships to similar securities. Investments in open-end mutual funds are valued at the closing net asset value.
Debt securities generally trade in the OTC market rather than on a securities exchange. The Fund’s pricing services use multiple valuation techniques to determine fair value. In instances where sufficient market activity exists, the pricing services may utilize a market-based approach
Annual Report | 49
Templeton Global Investment Trust
Notes to Financial Statements (continued)
Templeton Global Balanced Fund
| 1. | ORGANIZATION AND SIGNIFICANT ACCOUNTING POLICIES (continued) |
| a. | Financial Instrument Valuation (continued) |
through which quotes from market makers are used to determine fair value. In instances where sufficient market activity may not exist or is limited, the pricing services also utilize proprietary valuation models which may consider market characteristics such as benchmark yield curves, credit spreads, estimated default rates, anticipated market interest rate volatility, coupon rates, anticipated timing of principal repayments, underlying collateral, and other unique security features in order to estimate the relevant cash flows, which are then discounted to calculate the fair value. Securities denominated in a foreign currency are converted into their U.S. dollar equivalent at the foreign exchange rate in effect at the close of the NYSE on the date that the values of the foreign debt securities are determined.
Certain derivatives trade in the OTC market. The Fund’s pricing services use various techniques including industry standard option pricing models and proprietary discounted cash flow models to determine the fair value of those instruments. The Fund’s net benefit or obligation under the derivative contract, as measured by the fair market value of the contract, is included in net assets.
The Fund has procedures to determine the fair value of financial instruments for which market prices are not reliable or readily available. Under these procedures, the VLOC convenes on a regular basis to review such financial instruments and considers a number of factors, including significant unobservable valuation inputs, when arriving at fair value. The VLOC primarily employs a market-based approach which may use related or comparable assets or liabilities, recent transactions, market multiples, book values, and other relevant information for the investment to determine the fair value of the investment. An income-based valuation approach may also be used in which the anticipated future cash flows of the investment are discounted to calculate fair value. Discounts may also be applied due to the nature or duration of any restrictions on the disposition of the investments. Due to the inherent uncertainty of valuations of such investments, the fair values may differ significantly from the values that would have been used had an active market existed. The VLOC employs various methods for calibrating these valuation approaches including a regular review of key inputs and assumptions, transactional back-testing or disposition analysis, and reviews of any related market activity.
Trading in securities on foreign securities stock exchanges and OTC markets may be completed before the daily close of business on the NYSE. Occasionally, events occur between the time at which trading in a foreign security is completed and the close of the NYSE that might call into question the reliability of the value of a portfolio security held by the Fund. As a result, differences may arise between the value of the Fund’s portfolio securities as determined at the foreign
50 | Annual Report
Templeton Global Investment Trust
Notes to Financial Statements (continued)
Templeton Global Balanced Fund
| 1. | ORGANIZATION AND SIGNIFICANT ACCOUNTING POLICIES (continued) |
| a. | Financial Instrument Valuation (continued) |
market close and the latest indications of value at the close of the NYSE. In order to minimize the potential for these differences, the VLOC monitors price movements following the close of trading in foreign stock markets through a series of country specific market proxies (such as baskets of American Depositary Receipts, futures contracts and exchange traded funds). These price movements are measured against established trigger thresholds for each specific market proxy to assist in determining if an event has occurred that may call into question the reliability of the values of the foreign securities held by the Fund. If such an event occurs, the securities may be valued using fair value procedures, which may include the use of independent pricing services.
In addition, certain foreign markets may be open on days that the NYSE is closed, which could result in differences between the value of the Fund’s portfolio securities on the last business day and the last calendar day of the reporting period. Any significant security valuation changes due to an open foreign market are adjusted and reflected by the Fund for financial reporting purposes.
b. Foreign Currency Translation
Portfolio securities and other assets and liabilities denominated in foreign currencies are translated into U.S. dollars based on the exchange rate of such currencies against U.S. dollars on the date of valuation. The Fund may enter into foreign currency exchange contracts to facilitate transactions denominated in a foreign currency. Purchases and sales of securities, income and expense items denominated in foreign currencies are translated into U.S. dollars at the exchange rate in effect on the transaction date. Portfolio securities and assets and liabilities denominated in foreign currencies contain risks that those currencies will decline in value relative to the U.S. dollar. Occasionally, events may impact the availability or reliability of foreign exchange rates used to convert the U.S. dollar equivalent value. If such an event occurs, the foreign exchange rate will be valued at fair value using procedures established and approved by the Board.
The Fund does not separately report the effect of changes in foreign exchange rates from changes in market prices on securities held. Such changes are included in net realized and unrealized gain or loss from investments on the Statement of Operations.
Realized foreign exchange gains or losses arise from sales of foreign currencies, currency gains or losses realized between the trade and settlement dates on securities transactions and the difference between the recorded amounts of dividends, interest, and foreign withholding taxes and the U.S. dollar equivalent of the amounts actually received or paid. Net unrealized foreign exchange gains and losses arise from changes in foreign exchange rates on foreign denominated assets and liabilities other than investments in securities held at the end of the reporting period.
Annual Report | 51
Templeton Global Investment Trust
Notes to Financial Statements (continued)
Templeton Global Balanced Fund
| 1. | ORGANIZATION AND SIGNIFICANT ACCOUNTING POLICIES (continued) |
| c. | Securities Purchased on a Delayed Delivery Basis |
The Fund purchases securities on a delayed delivery basis, with payment and delivery scheduled for a future date. These transactions are subject to market fluctuations and are subject to the risk that the value at delivery may be more or less than the trade date purchase price. Although the Fund will generally purchase these securities with the intention of holding the securities, it may sell the securities before the settlement date. Sufficient assets have been segregated for these securities.
d. Derivative Financial Instruments
The Fund invested in derivatives in order to manage risk or gain exposure to various other investments or markets. Derivatives are financial contracts based on an underlying or notional amount, require no initial investment or an initial net investment that is smaller than would normally be required to have a similar response to changes in market factors, and require or permit net settlement. Derivatives contain various risks including the potential inability of the counterparty to fulfill their obligations under the terms of the contract, the potential for an illiquid secondary market, and/or the potential for market movements which expose the Fund to gains or losses in excess of the amounts shown on the Statement of Assets and Liabilities. Realized gain and loss and unrealized appreciation and depreciation on these contracts for the period are included in the Statement of Operations.
The Fund investments in OTC derivatives are subject to the terms of International Swaps and Derivatives Association Master Agreements and other related agreements between the Fund and certain derivative counterparties. These agreements contain various provisions, including but not limited to collateral requirements, events of default, requirements for the Fund to maintain certain net asset levels and/or limit the decline in net assets over various periods of time. Should the Fund fail to meet any of these provisions, the derivative counterparty has the right to terminate the derivative contract and require immediate payment by the Fund for those OTC derivatives with that particular counterparty that are in a net liability position. At March 31, 2013, the Fund had no OTC derivatives in a net liability position for such contracts.
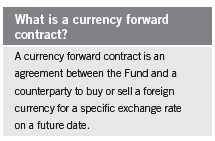
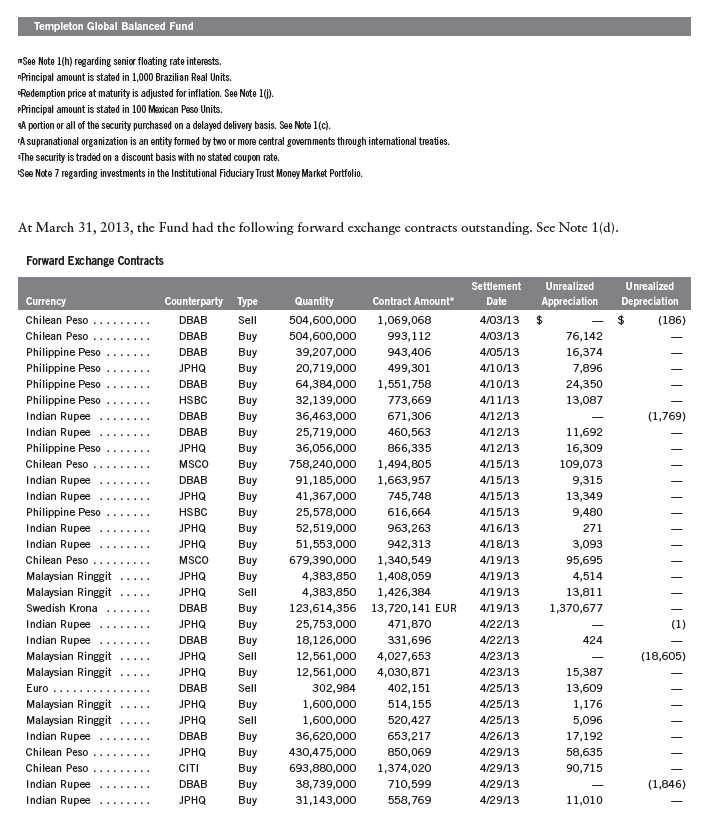
The Fund entered into OTC forward exchange contracts primarily to manage and/or gain exposure to certain foreign currencies. A forward exchange contract is an agreement between the Fund and a counterparty to buy or sell a foreign currency for a specific exchange rate on a future date. Pursuant to the terms of the forward exchange contracts, cash or securities may be required to be deposited as collateral. Unrestricted cash may be invested according to the Fund’s investment objectives.
At March 31, 2013, the Fund held $10,700,936 in United Kingdom Treasury Bonds and Notes and United States Treasury Bonds and Notes as collateral for derivatives.
See Note 11 regarding other derivative information.
52 | Annual Report
Templeton Global Investment Trust
Notes to Financial Statements (continued)
Templeton Global Balanced Fund
| 1. | ORGANIZATION AND SIGNIFICANT ACCOUNTING POLICIES (continued) |
| e. | Restricted Cash |
At March 31, 2013, the Fund held restricted cash in connection with investments in certain derivative securities. Restricted cash is held in a segregated account with the counterparty broker and is reflected in the Statement of Assets and Liabilities.
f. Equity-Linked Securities
The Fund invests in equity-linked securities. Equity-linked securities are hybrid financial instruments that generally combine both debt and equity characteristics into a single note form. Income received from equity linked securities is recorded as realized gains in the Statement of Operations and may be based on the performance of an underlying equity security, an equity index, or an option position. The risks of investing in equity-linked securities include unfavorable price movements in the underlying security and the credit risk of the issuing financial institution. There may be no guarantee of a return of principal with equity linked securities and the appreciation potential may be limited. Equity-linked securities may be more volatile and less liquid than other investments held by the Fund.
g. FT Holdings Corporation IV
The Fund invests in certain securities through its investment in FT Holdings Corporation IV, a Delaware Corporation and a wholly-owned subsidiary (Subsidiary) of the Fund. The Subsidiary has the ability to invest in securities consistent with the investment objective of the Fund. At March 31, 2013, the Subsidiary’s investment, Turtle Bay Resort, as well as any other assets and liabilities of the Subsidiary are reflected in the Fund’s Statement of Investments and Statement of Assets and Liabilities. All income and expenses of the Subsidiary during the period ended March 31, 2013, have been included in the Fund’s Statement of Operations.
h. Senior Floating Rate Interests
The Fund invests in senior secured corporate loans that pay interest at rates which are periodically reset by reference to a base lending rate plus a spread. These base lending rates are generally the prime rate offered by a designated U.S. bank or the London InterBank Offered Rate (LIBOR). Senior secured corporate loans often require prepayment of principal from excess cash flows or at the discretion of the borrower. As a result, actual maturity may be substantially less than the stated maturity.
Senior secured corporate loans in which the Fund invests are generally readily marketable, but may be subject to some restrictions on resale.
Annual Report | 53
Templeton Global Investment Trust
Notes to Financial Statements (continued)
Templeton Global Balanced Fund
| 1. | ORGANIZATION AND SIGNIFICANT ACCOUNTING POLICIES (continued) |
| i. | Income and Deferred Taxes |
It is the Fund’s policy to qualify as a regulated investment company under the Internal Revenue Code. The Fund intends to distribute to shareholders substantially all of its taxable income and net realized gains to relieve it from federal income and excise taxes. As a result, no provision for U.S. federal income taxes is required.
The Fund may be subject to foreign taxation related to income received, capital gains on the sale of securities and certain foreign currency transactions in the foreign jurisdictions in which it invests. Foreign taxes, if any, are recorded based on the tax regulations and rates that exist in the foreign markets in which the Fund invests. When a capital gain tax is determined to apply the Fund records an estimated deferred tax liability in an amount that would be payable if the securities were disposed of on the valuation date.
The Fund recognizes the tax benefits of uncertain tax positions only when the position is “more likely than not” to be sustained upon examination by the tax authorities based on the technical merits of the tax position. As of March 31, 2013, and for all open tax years, the Fund has determined that no liability for unrecognized tax benefits is required in the Fund’s financial statements related to uncertain tax positions taken on a tax return (or expected to be taken on future tax returns). Open tax years are those that remain subject to examination and are based on each tax jurisdiction statute of limitation.
j. Security Transactions, Investment Income, Expenses and Distributions
Security transactions are accounted for on trade date. Realized gains and losses on security transactions are determined on a specific identification basis. Interest income and estimated expenses are accrued daily. Amortization of premium and accretion of discount on debt securities are included in interest income. Facility fees are recognized as income over the expected term of the loan. Dividend income is recorded on the ex-dividend date except that certain dividends from foreign securities are recognized as soon as the Fund is notified of the ex-dividend date. Distributions to shareholders are recorded on the ex-dividend date and are determined according to income tax regulations (tax basis). Distributable earnings determined on a tax basis may differ from earnings recorded in accordance with accounting principles generally accepted in the United States of America. These differences may be permanent or temporary. Permanent differences are reclassified among capital accounts to reflect their tax character. These reclassifications have no impact on net assets or the results of operations. Temporary differences are not reclassified, as they may reverse in subsequent periods.
Common expenses incurred by the Trust are allocated among the funds based on the ratio of net assets of each fund to the combined net assets of the Trust. Fund specific expenses are charged directly to the fund that incurred the expense.
54 | Annual Report
Templeton Global Investment Trust
Notes to Financial Statements (continued)
Templeton Global Balanced Fund
| 1. | ORGANIZATION AND SIGNIFICANT ACCOUNTING POLICIES (continued) |
| j. | Security Transactions, Investment Income, Expenses and Distributions (continued) |
Realized and unrealized gains and losses and net investment income, not including class specific expenses, are allocated daily to each class of shares based upon the relative proportion of net assets of each class. Differences in per share distributions, by class, are generally due to differences in class specific expenses.
Inflation-indexed bonds are adjusted for inflation through periodic increases or decreases in the security’s interest accruals, face amount, or principal redemption value, by amounts corresponding to the rate of inflation as measured by an index. Any increase or decrease in the face amount or principal redemption value will be included as interest income on the Statement of Operations.
k. Accounting Estimates
The preparation of financial statements in accordance with accounting principles generally accepted in the United States of America requires management to make estimates and assumptions that affect the reported amounts of assets and liabilities at the date of the financial statements and the amounts of income and expenses during the reporting period. Actual results could differ from those estimates.
l. Guarantees and Indemnifications
Under the Trust’s organizational documents, its officers and trustees are indemnified by the Trust against certain liabilities arising out of the performance of their duties to the Trust. Additionally, in the normal course of business, the Trust, on behalf of the Fund, enters into contracts with service providers that contain general indemnification clauses. The Trust’s maximum exposure under these arrangements is unknown as this would involve future claims that may be made against the Trust that have not yet occurred. Currently, the Trust expects the risk of loss to be remote.
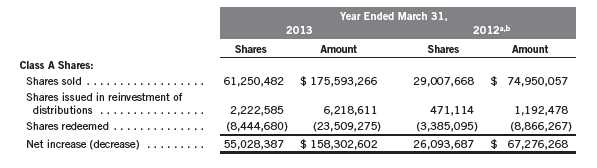
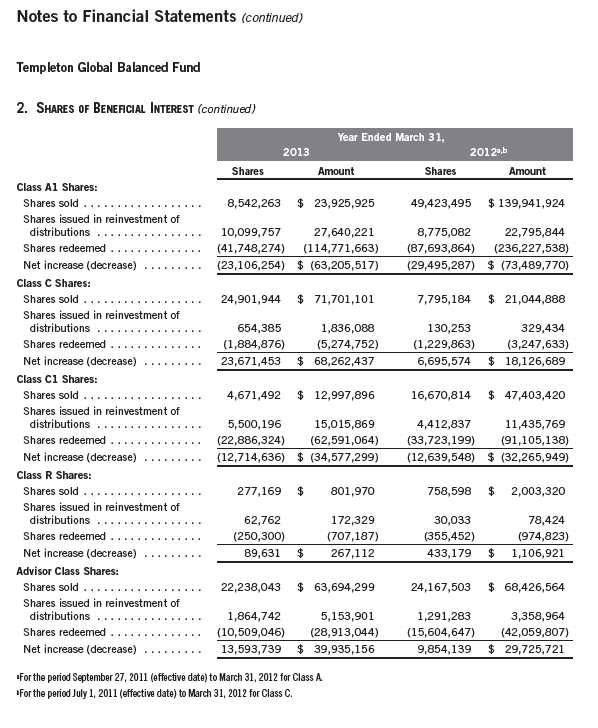
2. SHARES OF BENEFICIAL INTEREST
At March 31, 2013, there were an unlimited number of shares authorized ($0.01 par value).
Transactions in the Fund’s shares were as follows:
Annual Report | 55
Templeton Global Investment Trust
56 | Annual Report
Templeton Global Investment Trust
Notes to Financial Statements (continued)
Templeton Global Balanced Fund
3. TRANSACTIONS WITH AFFILIATES
Franklin Resources, Inc. is the holding company for various subsidiaries that together are
referred to as Franklin Templeton Investments. Certain officers and trustees of the Trust are
also officers and/or directors of the following subsidiaries:

Under a subadvisory agreement, Advisers, an affiliate of TGAL, provides subadvisory services to
the Fund. The subadvisory fee is paid by TGAL based on the average daily net assets, and is not
an additional expense of the Fund.
b. Administrative Fees
The Fund pays an administrative fee to FT Services of 0.20% per year of the average daily net
assets of the Fund.
On February 26, 2013, the Board approved the proposal to combine the Fund’s investment
management and administration agreements. The fees to be paid under the new combined
agreement will not exceed the aggregate fees that would have been paid under the separate
agreements. The new agreement went into effect on May 1, 2013.
Annual Report | 57
Templeton Global Investment Trust
Notes to Financial Statements (continued)
Templeton Global Balanced Fund
| 3. | TRANSACTIONS WITH AFFILIATES (continued) |
| c. | Distribution Fees |
The Board has adopted distribution plans for each share class, with the exception of Advisor Class shares, pursuant to Rule 12b-1 under the 1940 Act. Distribution fees are not charged on shares held by affiliates. Under the Fund’s Class A reimbursement distribution plan, the Fund reimburses Distributors for costs incurred in connection with the servicing, sale and distribution of the Fund’s shares up to the maximum annual plan rate. Under the Class A and A1 reimbursement distribution plans, costs exceeding the maximum for the current plan year cannot be reimbursed in subsequent periods. In addition, under the Fund’s Class C, C1 and R compensation distribution plans, the Fund pays Distributors for costs incurred in connection with the servicing, sale and distribution of the Fund’s shares up to the maximum annual plan rate for each class.
The maximum annual plan rates, based on the average daily net assets, for each class, are as follows:

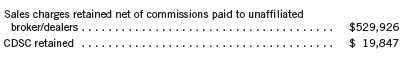
d. Sales Charges/Underwriting Agreements
Front-end sales charges and contingent deferred sales charges (CDSC) do not represent expenses of the Fund. These charges are deducted from the proceeds of sales of Fund shares prior to investment or from redemption proceeds prior to remittance, as applicable. Distributors has advised the Fund of the following commission transactions related to the sales and redemptions of the Fund’s shares for the year:
e. Transfer Agent Fees
Each class of shares, except for the R6 share class, pays transfer agent fees to Investor Services for its performance of shareholder servicing obligations and reimburses Investor Services for out of pocket expenses incurred, including shareholding servicing fees paid to third parties. These fees are allocated daily to such classes based upon the relative proportion of net assets. The R6 share class pays Investor Services transfer agent fees specific to that class.
For the year ended March 31, 2013, the Fund paid transfer agent fees of $1,349,838, of which $595,222 was retained by Investor Services.
58 | Annual Report
Templeton Global Investment Trust
Notes to Financial Statements (continued)
Templeton Global Balanced Fund
| 3. | TRANSACTIONS WITH AFFILIATES (continued) |
| f. | Waiver and Expense Reimbursements |
TGAL and FT Services have contractually agreed in advance to waive or limit their respective fees and to assume as their own expense certain expenses otherwise payable by the Fund so that the expenses (excluding distribution fees, and acquired fund fees and expenses) for Class A, Class A1, Class C, Class C1, Class R and Advisor Class of the Fund do not exceed 0.95%, and Class R6 does not exceed 0.84% (other than certain non-routine expenses or costs, including those relating to litigation, indemnification, reorganizations, and liquidations) until July 31, 2013.
4. EXPENSE OFFSET ARRANGEMENT
The Fund has entered into an arrangement with its custodian whereby credits realized as a result of uninvested cash balances are used to reduce a portion of the Fund’s custodian expenses. During the year ended March 31, 2013, there were no credits earned.
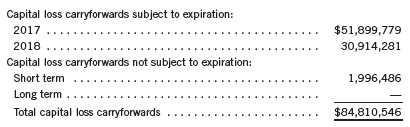
5. INCOME TAXES
For tax purposes, capital losses may be carried over to offset future capital gains, if any. Capital loss carryforwards with no expiration, if any, must be fully utilized before those losses with expiration dates.
At March 31, 2013, capital loss carryforwards were as follows:
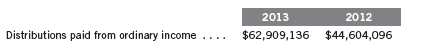
The tax character of distributions paid during the years ended March 31, 2013 and 2012, was as follows:
Annual Report | 59
Templeton Global Investment Trust
Notes to Financial Statements (continued)
Templeton Global Balanced Fund
5. INCOME TAXES (continued)
At March 31, 2013, the cost of investments, net unrealized appreciation (depreciation) and undistributed ordinary income for income tax purposes were as follows:
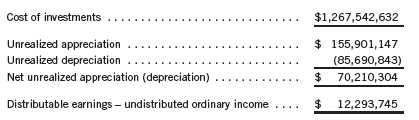
Differences between income and/or capital gains as determined on a book basis and a tax basis are primarily due to differing treatments of foreign currency transactions and tax straddles.
6. INVESTMENT TRANSACTIONS
Purchases and sales of investments (excluding short term securities) for the year ended March 31, 2013, aggregated $386,203,733 and $309,181,637, respectively.
7. INVESTMENTS IN INSTITUTIONAL FIDUCIARY TRUST MONEY MARKET PORTFOLIO
The Fund invests in the Institutional Fiduciary Trust Money Market Portfolio (Sweep Money Fund), an open-end investment company managed by Advisers. Management fees paid by the Fund are reduced on assets invested in the Sweep Money Fund, in an amount not to exceed the management and administrative fees paid by the Sweep Money Fund.
8. CREDIT RISK AND DEFAULTED SECURITIES
At March 31, 2013, the Fund had 7.36% of its portfolio invested in high yield, senior secured floating rate notes, or other securities rated below investment grade. These securities may be more sensitive to economic conditions causing greater price volatility and are potentially subject to a greater risk of loss due to default than higher rated securities.
The Fund held defaulted securities and/or other securities for which the income has been deemed uncollectible. At March 31, 2013, the aggregate value of theses securities was $610,808, representing 0.05% of the Fund’s net assets. The Fund discontinues accruing income on securities for which income has been deemed uncollectible and provides an estimate for losses on interest receivable. The securities have been identified on the accompanying Statement of Investments.
60 | Annual Report
Templeton Global Investment Trust
Notes to Financial Statements (continued)
Templeton Global Balanced Fund
9. CONCENTRATION OF RISK
Investing in foreign securities may include certain risks and considerations not typically associated with investing in U.S. securities, such as fluctuating currency values and changing local and regional economic, political and social conditions, which may result in greater market volatility. In addition, certain foreign securities may not be as liquid as U.S. securities.
10. RESTRICTED SECURITIES
The Fund invests in securities that are restricted under the Securities Act of 1933 (1933 Act) or which are subject to legal, contractual, or other agreed upon restrictions on resale. Restricted securities are often purchased in private placement transactions, and cannot be sold without prior registration unless the sale is pursuant to an exemption under the 1933 Act. Disposal of these securities may require greater effort and expense, and prompt sale at an acceptable price may be difficult. The Fund may have registration rights for restricted securities. The issuer generally incurs all registration costs.
At March 31, 2013, the Fund held investments in restricted securities, excluding certain securities exempt from registration under the 1933 Act deemed to be liquid, as follows:

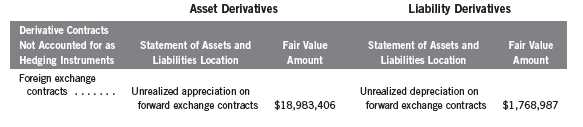
11. OTHER DERIVATIVE INFORMATION
At March 31, 2013, the Fund’s investments in derivative contracts are reflected on the Statement of Assets and Liabilities as follows:
Annual Report | 61
Templeton Global Investment Trust
Notes to Financial Statements (continued)
Templeton Global Balanced Fund
11. OTHER DERIVATIVE INFORMATION (continued)
For the period ended March 31, 2013, the effect of derivative contracts on the Fund’s Statement of Operations was as follows:
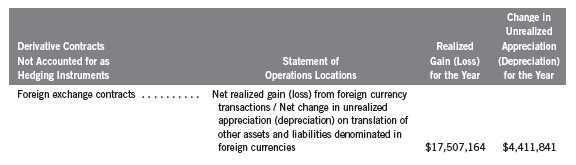
For the year ended March 31, 2013, the average month end market value of derivatives represented 1.42% of average month end net assets. The average month end number of open derivative contracts for the year was 176.
See Note 1(d) regarding derivative financial instruments.
12. CREDIT FACILITY
The Fund, together with other U.S. registered and foreign investment funds (collectively, Borrowers), managed by Franklin Templeton Investments, are borrowers in a joint syndicated senior unsecured credit facility totaling $1.5 billion (Global Credit Facility) which matures on January 17, 2014. This Global Credit Facility provides a source of funds to the Borrowers for temporary and emergency purposes, including the ability to meet future unanticipated or unusually large redemption requests.
Under the terms of the Global Credit Facility, the Fund shall, in addition to interest charged on any borrowings made by the Fund and other costs incurred by the Fund, pay its share of fees and expenses incurred in connection with the implementation and maintenance of the Global Credit Facility, based upon its relative share of the aggregate net assets of all of the Borrowers, including an annual commitment fee of 0.07% based upon the unused portion of the Global Credit Facility. These fees are reflected in other expenses on the Statement of Operations. During the year ended March 31, 2013, the Fund did not use the Global Credit Facility.
62 | Annual Report
Templeton Global Investment Trust
Notes to Financial Statements (continued)
Templeton Global Balanced Fund
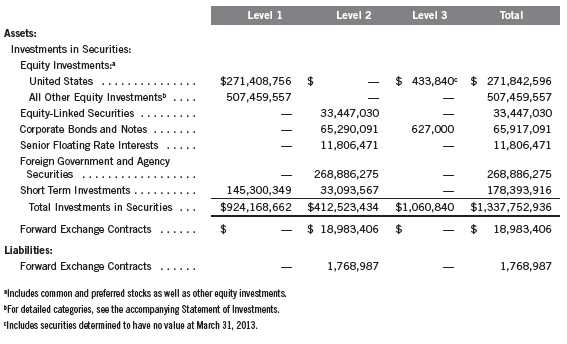
13. FAIR VALUE MEASUREMENTS
The Fund follows a fair value hierarchy that distinguishes between market data obtained from independent sources (observable inputs) and the Fund’s own market assumptions (unobservable inputs). These inputs are used in determining the value of the Fund’s financial instruments and are summarized in the following fair value hierarchy:
- Level 1 – quoted prices in active markets for identical financial instruments
- Level 2 – other significant observable inputs (including quoted prices for similar financial instruments, interest rates, prepayment speed, credit risk, etc.)
- Level 3 – significant unobservable inputs (including the Fund’s own assumptions in determining the fair value of financial instruments)
The inputs or methodology used for valuing financial instruments are not an indication of the risk associated with investing in those financial instruments.
For movements between the levels within the fair value hierarchy, the Fund has adopted a policy of recognizing the transfers as of the date of the underlying event which caused the movement.
A summary of inputs used as of March 31, 2013, in valuing the Fund’s assets and liabilities carried at fair value, is as follows:
A reconciliation of assets in which Level 3 inputs are used in determining fair value is presented when there are significant Level 3 investments at the end of the period.
Annual Report | 63
Templeton Global Investment Trust
Notes to Financial Statements (continued)
Templeton Global Balanced Fund
14. NEW ACCOUNTING PRONOUNCEMENTS
In December 2011, the Financial Accounting Standards Board (FASB) issued Accounting Standards Update (ASU) No. 2011-11, Balance Sheet (Topic 210): Disclosures about Offsetting Assets and Liabilities. The amendments in the ASU enhance disclosures about offsetting of financial assets and liabilities to enable investors to understand the effect of these arrangements on a fund’s financial position. In January 2013, FASB issued ASU No. 2013-01, Balance Sheet (Topic 210): Clarifying the Scope of Disclosures about Offsetting Assets and Liabilities. The amendments in ASU No. 2013-01 clarify the intended scope of disclosures required by ASU No. 2011-11. These ASUs are effective for interim and annual reporting periods beginning on or after January 1, 2013. The Fund believes the adoption of these ASUs will not have a material impact on its financial statements.
15. SUBSEQUENT EVENTS
The Fund has evaluated subsequent events through the issuance of the financial statements and determined that no events have occurred that require disclosure other than those already disclosed in the financial statements.

64 | Annual Report
Templeton Global Investment Trust
Report of Independent Registered Public Accounting Firm
To the Board of Trustees and Shareholders of Templeton Global Balanced Fund
In our opinion, the accompanying statement of assets and liabilities, including the statement of investments, and the related statements of operations and of changes in net assets and the financial highlights present fairly, in all material respects, the financial position of Templeton Global Balanced Fund (the “Fund”), at March 31, 2013, the results of its operations for the year then ended, the changes in its net assets for each of the two years in the period then ended and the financial highlights for the periods presented, in conformity with accounting principles generally accepted in the United States of America. These financial statements and financial highlights (hereafter referred to as “financial statements”) are the responsibility of the Fund’s management. Our responsibility is to express an opinion on these financial statements based on our audits. We conducted our audits of these financial statements in accordance with the standards of the Public Company Accounting Oversight Board (United States). Those standards require that we plan and perform the audit to obtain reasonable assurance about whether the financial statements are free of material misstatement. An audit includes examining, on a test basis, evidence supporting the amounts and disclosures in the financial statements, assessing the accounting principles used and significant estimates made by management, and evaluating the overall financial statement presentation. We believe that our audits, which included confirmation of securities at March 31, 2013 by correspondence with the custodian, transfer agent and brokers, provide a reasonable basis for our opinion.
PricewaterhouseCoopers LLP
San Francisco, California
May 22, 2013
Annual Report | 65
Templeton Global Investment Trust
Tax Information (unaudited)
Templeton Global Balanced Fund
Under Section 854(b)(1)(A) of the Internal Revenue Code (Code), the Fund hereby reports 7.49% of the ordinary income dividends as income qualifying for the dividends received deduction for the fiscal year ended March 31, 2013.
Under Section 854(b)(1)(B) of the Code, the Fund hereby reports the maximum amount allowable but no less than $19,423,934 as qualified dividends for purposes of the maximum rate under Section 1(h)(11) of the Code for the fiscal year ended March 31, 2013. Distributions, including qualified dividend income, paid during calendar year 2013 will be reported to shareholders on Form 1099-DIV by mid-February 2014. Shareholders are advised to check with their tax advisors for information on the treatment of these amounts on their individual income tax returns.
At March 31, 2013, more than 50% of the Fund’s total assets were invested in securities of foreign issuers. In most instances, foreign taxes were withheld from income paid to the Fund on these investments. As shown in the table below, the Fund hereby reports to shareholders the foreign source income and foreign taxes paid, pursuant to Section 853 of the Code. This written statement will allow shareholders of record on March 14, 2013, to treat their proportionate share of foreign taxes paid by the Fund as having been paid directly by them. The shareholder shall consider these amounts as foreign taxes paid in the tax year in which they receive the Fund distribution.
The following table provides a detailed analysis of foreign tax paid, foreign source income, and foreign qualified dividends as reported by the Fund, to Class A, Class A1, Class C, Class C1, Class R and Advisor Class shareholders of record.
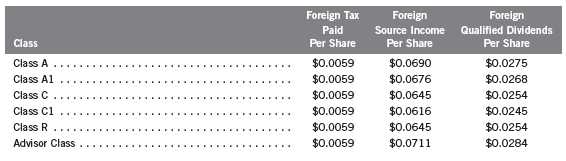
Foreign Tax Paid Per Share (Column 1) is the amount per share available to you, as a tax credit (assuming you held your shares in the Fund for a minimum of 16 days during the 31-day period beginning 15 days before the ex-dividend date of the Fund’s distribution to which the foreign taxes relate), or, as a tax deduction.
Foreign Source Income Per Share (Column 2) is the amount per share of income dividends attributable to foreign securities held by the Fund, plus any foreign taxes withheld on these dividends. The amounts reported include foreign source qualified dividends that have not been adjusted for the rate differential applicable to such dividend income.1
66 | Annual Report
Templeton Global Investment Trust
Tax Information (unaudited) (continued)
Templeton Global Balanced Fund
Foreign Qualified Dividends Per Share (Column 3) is the amount per share of foreign source qualified dividends, plus any foreign taxes withheld on these dividends. These amounts represent the portion of the Foreign Source Income reported to you in column 2 that were derived from qualified foreign securities held by the Fund.1
By mid-February 2014, shareholders will receive Form 1099-DIV which will include their share of taxes paid and foreign source income distributed during the calendar year 2013. The Foreign Source Income reported on Form 1099-DIV has not been adjusted for the rate differential on foreign source qualified dividend income. Shareholders are advised to check with their tax advisors for information on the treatment of these amounts on their 2013 individual income tax returns.
1Qualified dividends are taxed at reduced long term capital gains tax rates. In determining the amount of foreign tax credit that may be applied
against the U.S. tax liability of individuals receiving foreign source qualified dividends, adjustments may be required to the foreign tax credit limita-
tion calculation to reflect the rate differential applicable to such dividend income. The rules however permit certain individuals to elect not to apply
the rate differential adjustments for capital gains and/or dividends for any taxable year. Please consult your tax advisor and the instructions to
Form 1116 for more information.
Annual Report | 67
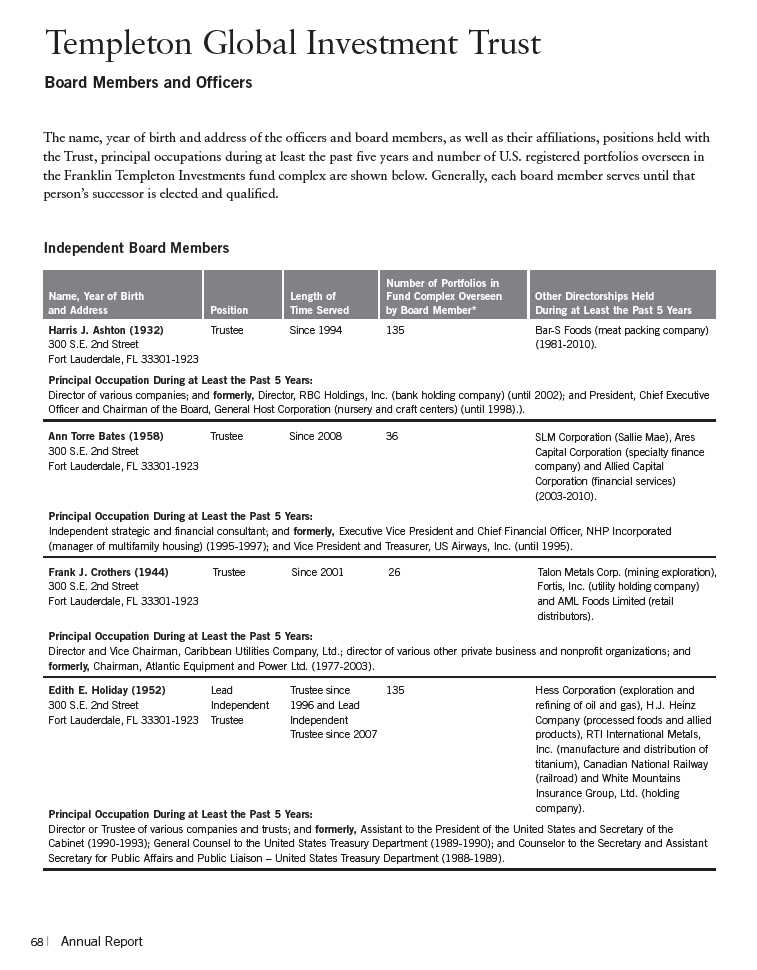
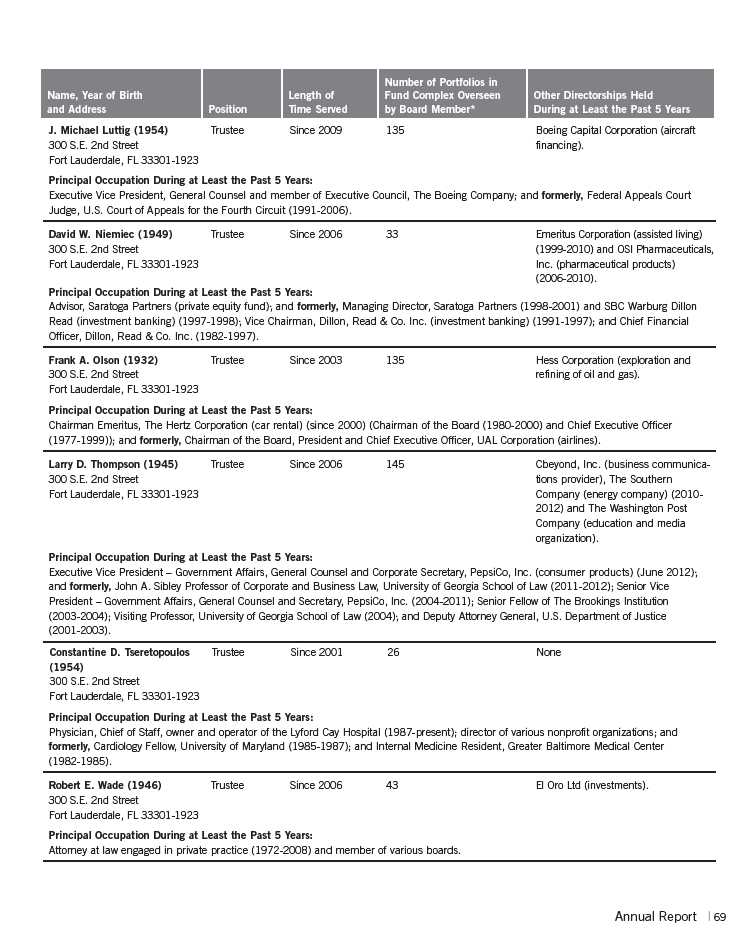

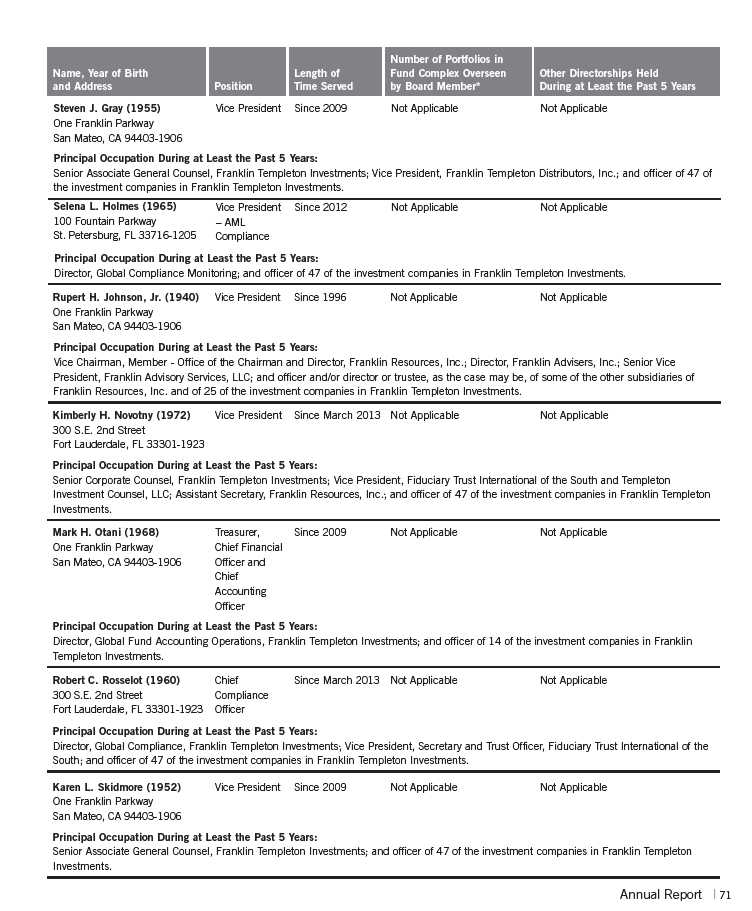

*We base the number of portfolios on each separate series of the U.S. registered investment companies within the Franklin Templeton Investments fund complex. These portfolios
have a common investment manager or affiliated investment managers.
**Charles B. Johnson is considered to be an interested person of the Trust under the federal securities laws due to his position as officer and director and major shareholder of
Franklin Resources, Inc. (Resources), which is the parent company of the Trust’s investment manager and distributor. Gregory E. Johnson is considered to be an interested person of
the Fund under the federal securities laws due to his position as officer and director of Resources.
Note 1: Charles B. Johnson and Rupert H. Johnson, Jr. are brothers and the father and uncle, respectively, of Gregory E. Johnson.
Note 2: Officer information is current as of the date of this report. It is possible that after this date, information about officers may change.
The Sarbanes-Oxley Act of 2002 and Rules adopted by the U.S. Securities and Exchange Commission require the Fund to disclose whether the Fund’s Audit Committee includes at
least one member who is an audit committee financial expert within the meaning of such Act and Rules. The Fund’s Board has determined that there is at least one such financial
expert on the Audit Committee and has designated each of Ann Torre Bates and David W. Niemiec as an audit committee financial expert. The Board believes that Ms. Bates and
Mr. Niemiec qualify as such an expert in view of their extensive business background and experience. Ms. Bates has served as a member of the Fund Audit Committee since
2008. She currently serves as a director of SLM Corporation and Ares Capital Corporation and was formerly a director of Allied Capital Corporation from 2003 to 2010, Executive
Vice President and Chief Financial Officer of NHP Incorporated and Vice President and Treasurer of US Airways, Inc. Mr. Niemiec has served as a member of the Fund Audit
Committee since 2006, currently serves as an Advisor to Saratoga Partners and was formerly its Managing Director from 1998 to 2001. Mr. Niemiec was formerly a director of
Emeritus Corporation from 1999 to 2010 and OSI Pharmaceuticals, Inc. from 2006 to 2010, Managing Director of SBC Warburg Dillon Read from 1997 to 1998, and was Vice
Chairman from 1991 to 1997 and Chief Financial Officer from 1982 to 1997 of Dillon, Read & Co. Inc. As a result of such background and experience, the Board believes that
Ms. Bates and Mr. Niemiec have each acquired an understanding of generally accepted accounting principles and financial statements, the general application of such principles
in connection with the accounting estimates, accruals and reserves, and analyzing and evaluating financial statements that present a breadth and level of complexity of
accounting issues generally comparable to those of the Fund, as well as an understanding of internal controls and procedures for financial reporting and an understanding of
audit committee functions. Ms. Bates and Mr. Niemiec are independent Board members as that term is defined under the applicable U.S. Securities and Exchange Commission
Rules and Releases.
The Statement of Additional Information (SAI) includes additional information about the board members and is available, without charge, upon request. Shareholders may call
(800) DIAL BEN/342-5236 to request the SAI.
72 | Annual Report
Templeton Global Investment Trust
Shareholder Information
Templeton Global Balanced Fund
Board Review of Investment Management Agreement
At a meeting held February 26, 2013, the Board of Trustees (Board), including a majority of non-interested or independent Trustees, approved renewal of the investment management agreements for each of the separate funds within Templeton Global Investment Trust, including Templeton Global Balanced Fund (Fund(s)). In reaching this decision, the Board took into account information furnished throughout the year at regular Board meetings, as well as information prepared specifically in connection with the annual renewal review process. Information furnished and discussed throughout the year included investment performance reports and related financial information for each Fund, along with periodic reports on expenses, shareholder services, legal and compliance matters, pricing, brokerage commissions and execution and other services provided by the Investment Manager (Manager) and its affiliates, as well as a third-party survey of transfer agent fees charged funds within the Franklin Templeton Investments complex in comparison with those charged other fund complexes deemed comparable. Information furnished specifically in connection with the renewal process included a report for each Fund prepared by Lipper, Inc. (Lipper), an independent organization, as well as additional material, including a Fund profitability analysis prepared by management. The Lipper reports compared each Fund’s investment performance and expenses with those of other mutual funds deemed comparable to the Fund as selected by Lipper. The Fund profitability analysis discussed the profitability to Franklin Templeton Investments from its overall U.S. fund operations, as well as on an individual fund-by-fund basis. Additional material accompanying such profitability analysis included information on a fund-by-fund basis listing portfolio managers and other accounts they manage, as well as information on management fees charged by the Manager and its affiliates to U.S. mutual funds and other accounts, including management’s explanation of differences where relevant. Such material also included a memorandum prepared by management describing project initiatives and capital investments relating to the services provided to the Funds by the Franklin Templeton Investments organization, as well as a memorandum relating to economies of scale and an analysis concerning transfer agent fees charged by an affiliate of the Manager.
In considering such materials, the independent Trustees received assistance and advice from and met separately with independent counsel. While the investment management agreements for all Funds were considered at the same Board meeting, the Board dealt with each Fund separately. In approving continuance of the investment management agreement for each Fund, the Board, including a majority of independent Trustees, determined that the management fee structure was fair and reasonable and that continuance of the investment management agreement was in the best interests of each Fund and its shareholders. While attention was given to all information furnished, the following discusses some primary factors relevant to the Board’s decision.
NATURE, EXTENT AND QUALITY OF SERVICES. The Board was satisfied with the nature and quality of the overall services provided by the Manager and its affiliates to the Fund and its shareholders. In addition to investment performance and expenses discussed later, the Board’s opinion was based, in part, upon periodic reports furnished it showing that the investment policies and
Annual Report | 73
Templeton Global Investment Trust
Shareholder Information (continued)
Templeton Global Balanced Fund
Board Review of Investment Management Agreement (continued)
restrictions for the Fund were consistently complied with as well as other reports periodically furnished the Board covering matters such as the compliance of portfolio managers and other management personnel with the code of ethics adopted throughout the Franklin Templeton fund complex, the adherence to fair value pricing procedures established by the Board, and the accuracy of net asset value calculations. The Board also noted the extent of benefits provided Fund shareholders from being part of the Franklin Templeton family of funds, including the right to exchange investments between the same class of funds without a sales charge, the ability to reinvest Fund dividends into other funds and the right to combine holdings in other funds to obtain a reduced sales charge. Favorable consideration was given to management’s continuous efforts and expenditures in establishing back-up systems and recovery procedures to function in the event of a natural disaster, it being noted that such systems and procedures had functioned well during the Florida hurricanes and blackouts experienced in previous years, and that those operations in the New York/New Jersey area ran smoothly during the more recent Hurricane Sandy. Among other factors taken into account by the Board were the Manager’s best execution trading policies, including a favorable report by an independent portfolio trading analytical firm, which also covered FOREX transactions. Consideration was also given to the experience of the Fund’s portfolio management team, the number of accounts managed and general method of compensation. In this latter respect, the Board noted that a primary factor in management’s determination of a portfolio manager’s bonus compensation was the relative investment performance of the funds he or she managed and that a portion of such bonus was required to be invested in a predesignated list of funds within such person’s fund management area so as to be aligned with the interests of shareholders. The Board also took into account the quality of transfer agent and shareholder services provided Fund shareholders by an affiliate of the Manager and the continuous enhancements to the Franklin Templeton website. Particular attention was given to management’s conservative approach and diligent risk management procedures, including continuous monitoring of counterparty credit risk and attention given to derivatives and other complex instruments including expanded collateralization requirements. The Board also took into account, among other things, management’s efforts in establishing a global credit facility for the benefit of the Fund and other accounts managed by Franklin Templeton Investments to provide a source of cash for temporary and emergency purposes or to meet unusual redemption requests as well as the strong financial position of the Manager’s parent company and its commitment to the mutual fund business as evidenced by its subsidization of money market funds.
INVESTMENT PERFORMANCE. While consideration was given to performance reports and discussions with portfolio managers at Board meetings during the year, particular attention in assessing performance was given to the Lipper reports furnished for the agreement renewal. The Lipper report for the Fund showed the investment performance of its Class A1 shares, which have the same expense structure as the Fund’s Class A shares. The Lipper performance universe for the Fund consisted of all retail and institutional mixed-asset target allocation moderate funds as designated by
74 | Annual Report
Templeton Global Investment Trust
Shareholder Information (continued)
Templeton Global Balanced Fund
Board Review of Investment Management Agreement (continued)
Lipper. The Fund’s objective is to generate current income while maintaining capital appreciation. The Lipper report showed the Fund’s income return during 2012 and each of the annualized previous three- and five-year periods to be in the highest or best performing quintiles of such universe. The Lipper report showed the Fund’s 2012 total return to also be in the highest performing quintile of its performance universe and on an annualized basis to be in the second-highest and highest performing quintiles of such universe for the previous three- and five-year periods, respectively. The Board was satisfied with the Fund’s comparative performance as shown in the Lipper report.
COMPARATIVE EXPENSES. Consideration was given to a comparative analysis of the management fees and total expense ratio of the Fund compared with those of a group of other funds selected by Lipper as its appropriate Lipper expense group. Lipper expense data is based upon historical information taken from each fund’s most recent annual report, which reflects historical asset levels that may be quite different from those currently existing, particularly in a period of market volatility. While recognizing such inherent limitation and the fact that expense ratios generally increase as assets decline and decrease as assets grow, the Board believed the independent analysis conducted by Lipper to be an appropriate measure of comparative expenses. In reviewing comparative costs, Lipper provides information on the Fund’s contractual investment management fee in comparison with the effective management fee that would have been charged by other funds within its Lipper expense group assuming they were similar in size to the Fund, as well as the actual total expense ratio of the Fund in comparison with those of its Lipper expense group. The Lipper contractual investment management fee analysis includes administrative charges as being part of a management fee, and actual total expenses, for comparative consistency, are shown by Lipper for Fund Class A shares. The Lipper report for the Fund showed its contractual investment management fee rate was within 14 basis points of its Lipper expense group median, while its actual total expense ratio was within two basis points of such group’s median. The Board found such comparative expenses as shown in the Lipper report to be acceptable and noted that this Fund’s expenses had been subsidized by management fee waivers.
MANAGEMENT PROFITABILITY. The Board also considered the level of profits realized by the Manager and its affiliates in connection with the operation of the Fund. In this respect, the Board reviewed the Fund profitability analysis that addresses the overall profitability of Franklin Templeton’s U.S. fund business, as well as its profits in providing management and other services to each of the individual funds during the 12-month period ended September 30, 2012, being the most recent fiscal year-end for Franklin Resources, Inc., the Manager’s parent. In reviewing the analysis, attention was given to the methodology followed in allocating costs to the Fund, it being recognized that allocation methodologies are inherently subjective and various allocation methodologies may each be reasonable while producing different results. In this respect, the Board noted that, while being continuously refined and reflecting changes in the Manager’s own cost accounting, the cost allocation methodology was consistent with that followed in profitability report presentations for
Annual Report | 75
Templeton Global Investment Trust
Shareholder Information (continued)
Templeton Global Balanced Fund
Board Review of Investment Management Agreement (continued)
the Fund made in prior years and that the Fund’s independent registered public accounting firm had been engaged by the Manager to periodically review the reasonableness of the allocation methodologies solely for use by the Fund’s Board in reference to the profitability analysis. In reviewing and discussing such analysis, management discussed with the Board its belief that costs incurred in establishing the infrastructure necessary for the type of mutual fund operations conducted by the Manager and its affiliates may not be fully reflected in the expenses allocated to the Fund in determining its profitability, as well as the fact that the level of profits, to a certain extent, reflected operational cost savings and efficiencies initiated by management. The Board also took into account management’s expenditures in improving shareholder services provided the Fund, as well as the need to implement systems to meet additional regulatory and compliance requirements resulting from statutes such as the Sarbanes-Oxley and Dodd Frank Acts and recent SEC and other regulatory requirements. In addition, the Board considered a third-party study comparing the profitability of the Manager’s parent on an overall basis to other publicly held managers broken down to show profitability from management operations exclusive of distribution expenses, as well as profitability including distribution expenses. The Board also considered the extent to which the Manager and its affiliates might derive ancillary benefits from fund operations, including revenues generated from transfer agent services and potential benefits resulting from allocation of fund brokerage and the use of commission dollars to pay for research. Based upon its consideration of all these factors, the Board determined that the level of profits realized by the Manager and its affiliates from providing services to the Fund was not excessive in view of the nature, quality and extent of services provided.
ECONOMIES OF SCALE. The Board also considered whether economies of scale are realized by the Manager as the Fund grows larger and the extent to which this is reflected in the level of management fees charged. While recognizing that any precise determination is inherently subjective, the Board noted that based upon the Fund profitability analysis, it appears that as some funds get larger, at some point economies of scale do result in the Manager realizing a larger profit margin on management services provided such a fund. The Board also noted that economies of scale are shared with the Fund and its shareholders through management fee breakpoints so that as a Fund grows in size, its effective management fee rate declines. The investment management advisory agreement for the Fund provides for breakpoints that are above the Fund’s existing asset size, and to the extent economies of scale may be realized by the Manager and its affiliates, the Board believes the schedule of fees for the Fund provides a sharing of benefits with the Fund and its shareholders.
In addition to the investment advisory services provided the Fund under its investment management agreement, administrative services are provided the Fund under a separate agreement at a fixed charge of 20 basis points. At the February 26, 2013, Board meeting, the Board eliminated the separate agreements and approved a new form of investment management agreement for the Fund combining such services. In approving the new form of investment management agreement, the
76 | Annual Report
Templeton Global Investment Trust
Shareholder Information (continued)
Templeton Global Balanced Fund
Board Review of Investment Management Agreement (continued)
Board took into account the fact that the types of services and aggregate fee, including breakpoints, would be the same as provided under the previous separate agreements and that combining such services was consistent with Lipper’s methodology of considering contractual investment management fees to include any separately charged administrative fee. The Board also noted that combining the services under the new form of investment management agreement would have no impact on management’s existing subsidization of expenses of the Fund.
Proxy Voting Policies and Procedures
The Fund’s investment manager has established Proxy Voting Policies and Procedures (Policies) that the Fund uses to determine how to vote proxies relating to portfolio securities. Shareholders may view the Fund’s complete Policies online at franklintempleton.com. Alternatively, shareholders may request copies of the Policies free of charge by calling the Proxy Group collect at (954) 527-7678 or by sending a written request to: Franklin Templeton Companies, LLC, 300 S.E. 2nd Street, Fort Lauderdale, FL 33301, Attention: Proxy Group. Copies of the Fund’s proxy voting records are also made available online at franklintempleton.com and posted on the U.S. Securities and Exchange Commission’s website at sec.gov and reflect the most recent 12-month period ended June 30.
Quarterly Statement of Investments
The Fund files a complete statement of investments with the U.S. Securities and Exchange Commission for the first and third quarters for each fiscal year on Form N-Q. Shareholders may view the filed Form N-Q by visiting the Commission’s website at sec.gov. The filed form may also be viewed and copied at the Commission’s Public Reference Room in Washington, DC. Information regarding the operations of the Public Reference Room may be obtained by calling (800) SEC-0330.
Householding of Reports and Prospectuses
You will receive the Fund’s financial reports every six months as well as an annual updated summary prospectus (prospectus available upon request). To reduce Fund expenses, we try to identify related shareholders in a household and send only one copy of the financial reports and summary prospectus. This process, called “householding,” will continue indefinitely unless you instruct us otherwise. If you prefer not to have these documents householded, please call us at (800) 632-2301. At any time you may view current prospectuses/summary prospectuses and financial reports on our website. If you choose, you may receive these documents through electronic delivery.
Annual Report | 77
This page intentionally left blank.
This page intentionally left blank.
This page intentionally left blank.
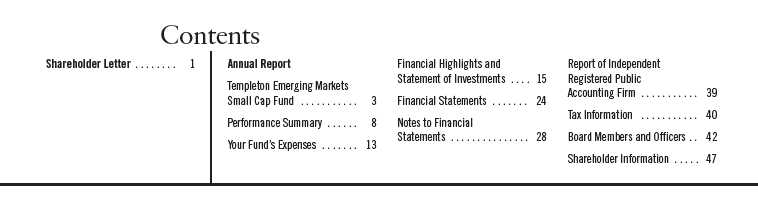
Annual Report
Templeton Emerging Markets
Small Cap Fund
Your Fund’s Goal and Main Investments: Templeton Emerging Markets Small Cap
Fund seeks long-term capital appreciation. Under normal market conditions, the Fund invests at least
80% of its net assets in securities of small-cap companies located in emerging market countries, as
defined in the Fund’s prospectus.
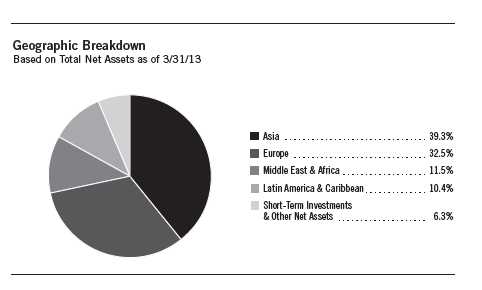
We are pleased to bring you Templeton Emerging Markets Small Cap Fund’s
annual report for the fiscal year ended March 31, 2013.
Economic and Market Overview
The global economy grew at a moderate but uneven pace during the 12 months
under review as monetary easing and fiscal stimulus measures undertaken by
many central banks and governments gained traction. Solid growth in many
emerging market economies, particularly China and Indonesia, offset weakness
in several developed market economies, especially the eurozone. In addition to
measures by major developed market countries, emerging market countries,
including China, South Korea, Brazil and India, implemented fiscal and mone-
tary easing measures. China announced a fiscal stimulus package to fund
The dollar value, number of shares or principal amount, and names of all portfolio holdings are listed in the
Fund’s Statement of Investments (SOI). The SOI begins on page 19.
Annual Report | 3
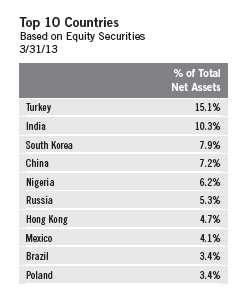
infrastructure projects, South Korea followed its June stimulus package with another package in September, Brazil unveiled an economic stimulus plan to encourage investment in the country’s infrastructure, and India introduced a series of reforms to boost investor confidence. Some emerging market countries such as India, South Korea, China, Mexico, Brazil and Poland also cut interest rates during the 12-month period.
The effects of monetary easing and fiscal stimulus measures implemented by central banks and governments globally were evident during the 12-month period as financial markets remained awash with liquidity. Net inflows to emerging market stock funds for the 12 months ended March 31, 2013, significantly exceeded the net inflows for the prior 12-month period. Investor anxiety about Europe’s recurring financial crisis and slower global economic growth led stock markets worldwide to sell off sharply in May. After reaching a period low in early June, emerging market small cap stocks embarked on an upward trend, more than offsetting earlier losses and ending the period with solid gains. For the 12 months ended March 31, 2013, the MSCI Emerging Markets (EM) Small Cap Index generated a +9.54% total return, with nearly all regions delivering positive returns.1 Asian markets were among the top performers as strong economic growth, robust consumption and substantial investment inflows supported equity prices in the region.
In our view, emerging market countries have generally remained economically healthier than many developed countries, and emerging market small cap stocks could continue to outperform developed market small cap stocks for the longer term. In nine of the past 12 calendar years, emerging market small cap stocks, as measured by the MSCI EM Small Cap Index, outperformed developed market small cap stocks, as measured by the MSCI World Small Cap Index, but past performance does not guarantee future results.
Investment Strategy
Our investment strategy employs a fundamental research, value-oriented, long-term approach. We focus on the market price of a company’s securities relative to our evaluation of the company’s long-term (typically five years) earnings, asset value and cash flow potential. We also consider a company’s profit and loss outlook, balance sheet strength, cash flow trends and asset
1. Source: © 2013 Morningstar. All Rights Reserved. The information contained herein: (1) is proprietary to Morningstar
and/or its content providers; (2) may not be copied or distributed; and (3) is not warranted to be accurate, complete or
timely. Neither Morningstar nor its content providers are responsible for any damages or losses arising from any use of
this information. The index is unmanaged and includes reinvested dividends. One cannot invest directly in an index, and
an index is not representative of the Fund’s portfolio.
4 | Annual Report
value in relation to the current price. The analysis considers the company’s corporate governance behavior as well as its position in its sector, the economic framework and political environment.
Performance Overview
For the 12 months under review, Templeton Emerging Markets Small Cap Fund – Class A delivered a +13.37% cumulative total return. For comparison, the MSCI EM Small Cap Index posted a +9.54% total return.1 Please note index performance information is provided for reference and we do not attempt to track any index but rather undertake investments on the basis of fundamental research. In addition, the Fund’s return reflects the effect of fees and expenses for professional management, while an index does not have such costs. You can find more of the Fund’s performance data in the Performance Summary beginning on page 8.
Manager’s Discussion
During the 12 months under review, key contributors to the Fund’s absolute performance included Amorepacific Group, the holding company for Amorepacific Corp., a prominent South Korean cosmetics and personal care products manufacturer; Grupo Herdez, one of Mexico’s leading processed food companies; and Youngone, a South Korea-based exporter of OEM (original equipment manufacturing) sportswear products. Amorepacific benefited from solid sales of low-end cosmetic brands and new product launches that helped strengthen its market position. The company remained an attractive investment, in our view, because of its strong growth potential resulting from expansion into regional markets such as China and Singapore, as well as in developed markets such the U.S. and Japan. Grupo Herdez’s stock delivered high double-digit gains as many investors favored the company for its track record of solid growth and its leading market share. The company’s diversified portfolio of popular brands, combined with Mexico’s healthy consumption growth, led us to maintain our positive view of the company. Youngone’s stock generated triple-digit gains resulting from the company’s strong earnings growth outlook, improving order flows from big customers, expansion of manufacturing capacity in Bangladesh and higher productivity. In our assessment, Youngone’s continued diversification of its product portfolio, vertically integrated production and low labor cost business model could support the company’s growth in the years ahead.
Annual Report | 5
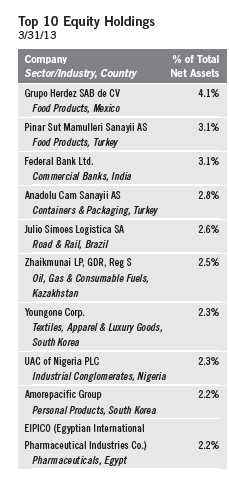
In contrast, key detractors from the Fund’s absolute performance included I.T, a leading fashion apparel retailer in Hong Kong; Lion Industries, a major steel producer in Malaysia; and Reysas (Reysas Gayrimenkul Yatirim Ortakligi), the first and only real estate investment company focused on the warehousing market in Turkey. I.T’s business operations and profit margins were pressured by a challenging retail environment in Hong Kong and China. We maintained our longer term favorable view of the company because of its continued sales growth and a wide range of strong brands that appeal to many consumers in Hong Kong and China. Lion Industries’ share price declined because of general weakness in the global steel industry and disappointing earnings results caused by higher losses in its steel manufacturing and property development divisions. We reduced the Fund’s holdings in the company to raise funds to invest in opportunities we considered to be more attractive. Reysas’ share price was negatively affected by the company’s increased financial leverage resulting from its heavy expansion. The Turkish warehousing market is still in its early stages and, therefore, has significant growth potential. As more companies operating in Turkey begin to outsource their logistics requirements, the country’s logistics warehouse market could grow and mature. In our long-term view, Reysas is well positioned to capitalize on Turkey’s increasing need for high-quality warehouses.
Our continued search for what we considered to be underappreciated companies with attractive valuations led us to increase the Fund’s holdings in India, Poland, Hong Kong, Singapore and Brazil. We also increased the Fund’s exposure to frontier markets as we identified companies with fundamentals we considered to be strong. We added to the Fund’s investments in Nigeria and Ukraine and initiated new positions in Saudi Arabia, Botswana and Turkmenistan. As a result, we increased the Fund’s holdings in apparel retail, department store, diversified banking and health care equipment companies. Key purchases included new positions in Osim International, a Singapore-based specialty retailer of healthy lifestyle products; Hering (Cia Hering), one Brazil’s largest apparel manufacturers and retailers; and Fortuna Entertainment Group, a leading sports betting company in the Czech Republic and other Central and Eastern European countries.
Conversely, we undertook some sales as certain stocks reached their price targets and as we identified companies we considered to be more attractively valued within the Fund’s investment universe. As a result, we reduced the Fund’s holdings in South Korea and Mexico and eliminated the Fund’s position in Thailand. We also reduced holdings in biopharmaceutical and packaged foods and meats companies and eliminated the Fund’s position in health care facilities. Key sales included the Fund’s holdings in Medy-tox, a South Korean biopharmaceutical company; Ulker Biskuvi Sanayi, a Turkish biscuits and chocolates producer; and Bangkok Chain Hospital, a hospital operator in Thailand.
6 | Annual Report
Thank you for your continued participation in Templeton Emerging Markets Small Cap Fund. We look forward to serving your future investment needs.

The foregoing information reflects our analysis, opinions and portfolio holdings as of March 31, 2013, the end of
the reporting period. The way we implement our main investment strategies and the resulting portfolio holdings
may change depending on factors such as market and economic conditions. These opinions may not be relied upon
as investment advice or an offer for a particular security. The information is not a complete analysis of every
aspect of any market, country, industry, security or the Fund. Statements of fact are from sources considered reli-
able, but the investment manager makes no representation or warranty as to their completeness or accuracy.
Although historical performance is no guarantee of future results, these insights may help you understand our
investment management philosophy.
Annual Report | 7
Performance Summary as of 3/31/13
Your dividend income will vary depending on dividends or interest paid by securities in the Fund’s
portfolio, adjusted for operating expenses of each class. Capital gain distributions are net profits
realized from the sale of portfolio securities. The performance table and graphs do not reflect any
taxes that a shareholder would pay on Fund dividends, capital gain distributions, if any, or any
realized gains on the sale of Fund shares. Total return reflects reinvestment of the Fund’s dividends
and capital gain distributions, if any, and any unrealized gains or losses.
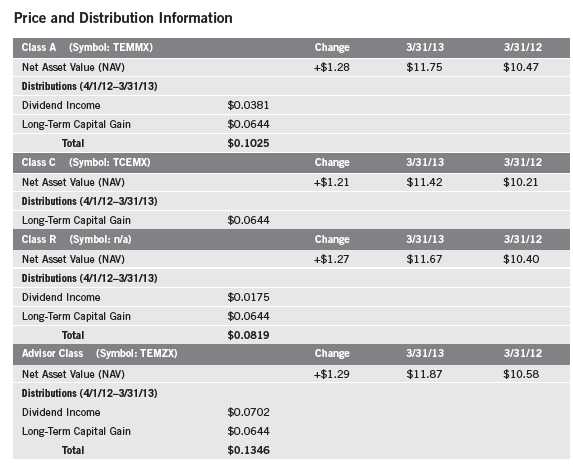
8 | Annual Report
Performance Summary (continued)
Performance1
Cumulative total return excludes sales charges. Average annual total return and value of $10,000 investment include
maximum sales charges. Class A: 5.75% maximum initial sales charge; Class C: 1% contingent deferred sales charge in
first year only; Class R/Advisor Class: no sales charges.

Performance data represent past performance, which does not guarantee future results. Investment return and principal
value will fluctuate, and you may have a gain or loss when you sell your shares. Current performance may differ from
figures shown. For most recent month-end performance, go to franklintempleton.com or call (800) 342-5236.
The investment manager and administrator have contractually agreed to waive or assume certain expenses so that common
expenses (excluding Rule 12b-1 fees and acquired fund fees and expenses) for each class of the Fund do not exceed
1.80% (other than certain nonroutine expenses) until 7/31/13.
Annual Report | 9
Performance Summary (continued)
Total Return Index Comparison for a Hypothetical $10,000 Investment1
Total return represents the change in value of an investment over the periods shown. It includes
any applicable maximum sales charge, Fund expenses, account fees and reinvested distributions.
The unmanaged index includes reinvestment of any income or distributions. It differs from the
Fund in composition and does not pay management fees or expenses. One cannot invest directly
in an index.
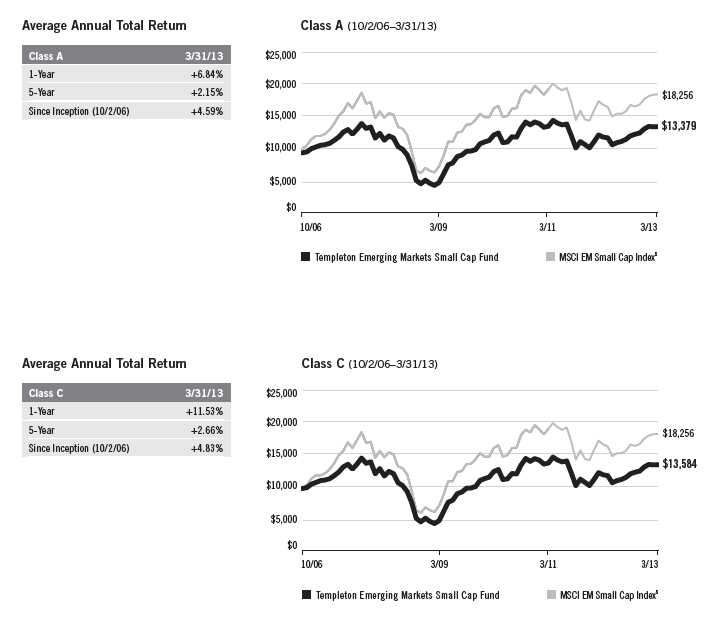
10 | Annual Report


Annual Report | 11
Performance Summary (continued)
Endnotes
All investments involve risks, including possible loss of principal. Special risks are associated with foreign investing, including currency fluctuations, economic instability and political developments. Investments in emerging market countries involve heightened risks related to the same factors, in addition to those associated with these markets’ smaller size, lesser liquidity and lack of established legal, political, business and social frameworks to support securities markets. Smaller company stocks have historically had more price volatility than large-company stocks, particularly over the short term. Because the Fund is nondiversified and may invest a greater portion of its assets in the securities of one issuer than a diversified fund, it may be more sensitive to economic, business, political or other changes affecting similar issuers or securities. All investments in the Fund should be thought of as long-term investments that could experience significant price volatility in any given year. The Fund is designed for the aggressive portion of a well-diversified portfolio. The Fund is actively managed but there is no guarantee that the manager’s investment decisions will produce the desired results. The Fund’s prospectus also includes a description of the main investment risks.
| |
Class C: Class R: | These shares have higher annual fees and expenses than Class A shares. Shares are available to certain eligible investors as described in the prospectus. These shares have higher annual fees and expenses than Class A shares. |
Advisor Class: | Shares are available to certain eligible investors as described in the prospectus. |
1. Fund investment results reflect the expense reduction, without which the results would have been lower.
2. Cumulative total return represents the change in value of an investment over the periods indicated.
3. Average annual total return represents the average annual change in value of an investment over the periods indicated.
4. These figures represent the value of a hypothetical $10,000 investment in the Fund over the periods indicated.
5. Figures are as stated in the Fund’s prospectus current as of the date of this report. In periods of market volatility, assets may decline significantly,
causing total annual Fund operating expenses to become higher than the figures shown.
6. Source: © 2013 Morningstar. The MSCI EM Small Cap Index is a free float-adjusted, market capitalization-weighted index designed to measure
performance of small-cap equities in emerging markets.
12 | Annual Report
Your Fund’s Expenses
As a Fund shareholder, you can incur two types of costs:
- Transaction costs, including sales charges (loads) on Fund purchases; and
- Ongoing Fund costs, including management fees, distribution and service (12b-1) fees, and other Fund expenses. All mutual funds have ongoing costs, sometimes referred to as operating expenses.
The following table shows ongoing costs of investing in the Fund and can help you understand these costs and compare them with those of other mutual funds. The table assumes a $1,000 investment held for the six months indicated.
Actual Fund Expenses
The first line (Actual) for each share class listed in the table provides actual account values and expenses. The “Ending Account Value” is derived from the Fund’s actual return, which includes the effect of Fund expenses.
You can estimate the expenses you paid during the period by following these steps. Of course, your account value and expenses will differ from those in this illustration:
| 1. | Divide your account value by $1,000. |
| | If an account had an $8,600 value, then $8,600 ÷ $1,000 = 8.6. |
| 2. | Multiply the result by the number under the heading “Expenses Paid During Period.” |
| | If Expenses Paid During Period were $7.50, then 8.6 x $7.50 = $64.50. |
In this illustration, the estimated expenses paid this period are $64.50.
Hypothetical Example for Comparison with Other Funds
Information in the second line (Hypothetical) for each class in the table can help you compare ongoing costs of investing in the Fund with those of other mutual funds. This information may not be used to estimate the actual ending account balance or expenses you paid during the period. The hypothetical “Ending Account Value” is based on the actual expense ratio for each class and an assumed 5% annual rate of return before expenses, which does not represent the Fund’s actual return. The figure under the heading “Expenses Paid During Period” shows the hypothetical expenses your account would have incurred under this scenario. You can compare this figure with the 5% hypothetical examples that appear in shareholder reports of other funds.
Annual Report | 13
Your Fund’s Expenses (continued)
Please note that expenses shown in the table are meant to highlight ongoing costs and do not reflect any transaction costs, such as sales charges. Therefore, the second line for each class is useful in comparing ongoing costs only, and will not help you compare total costs of owning different funds. In addition, if transaction costs were included, your total costs would have been higher. Please refer to the Fund prospectus for additional information on operating expenses.

*Expenses are calculated using the most recent six-month expense ratio, net of expense waivers, annualized for each class (A: 2.10%; C: 2.80%;
R: 2.30%; and Advisor: 1.80%), multiplied by the average account value over the period, multiplied by 182/365 to reflect the one-half year period.
14 | Annual Report

aThe amount shown for a share outstanding throughout the period may not correlate with the Statement of Operations for the period due to the timing of sales and repurchases of
the Fund shares in relation to income earned and/or fluctuating market value of the investments of the Fund.
bBased on average daily shares outstanding.
cAmount rounds to less than $0.01 per share.
dEffective September 1, 2008, the redemption fee was eliminated.
eTotal return does not reflect sales commissions or contingent deferred sales charges, if applicable.
Annual Report | The accompanying notes are an integral part of these financial statements. | 15
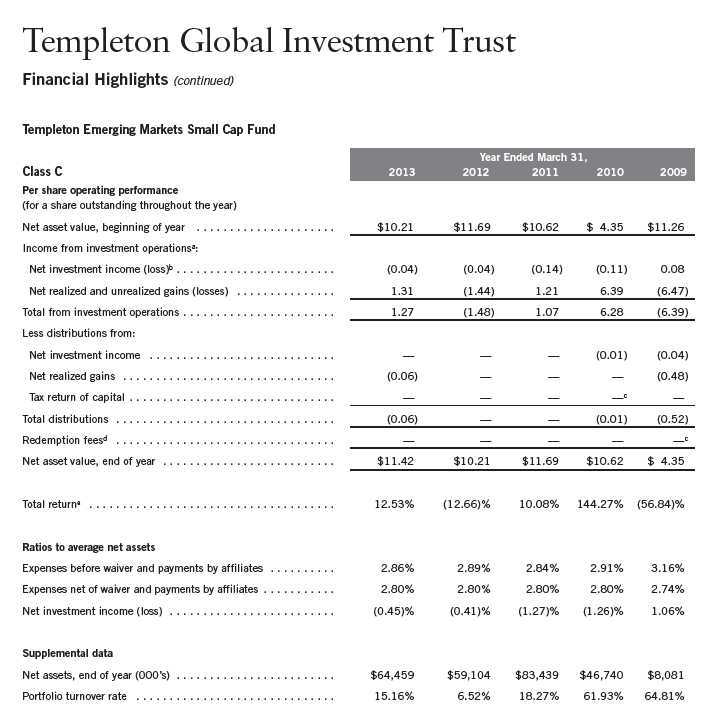
aThe amount shown for a share outstanding throughout the period may not correlate with the Statement of Operations for the period due to the timing of sales and repurchases of
the Fund shares in relation to income earned and/or fluctuating market value of the investments of the Fund.
bBased on average daily shares outstanding.
cAmount rounds to less than $0.01 per share.
dEffective September 1, 2008, the redemption fee was eliminated.
eTotal return does not reflect sales commissions or contingent deferred sales charges, if applicable.
16 | The accompanying notes are an integral part of these financial statements. | Annual Report

aThe amount shown for a share outstanding throughout the period may not correlate with the Statement of Operations for the period due to the timing of sales and repurchases of
the Fund shares in relation to income earned and/or fluctuating market value of the investments of the Fund.
bBased on average daily shares outstanding.
cAmount rounds to less than $0.01 per share.
dEffective September 1, 2008, the redemption fee was eliminated.
eTotal return does not reflect sales commissions or contingent deferred sales charges, if applicable.
Annual Report | The accompanying notes are an integral part of these financial statements. | 17

aThe amount shown for a share outstanding throughout the period may not correlate with the Statement of Operations for the period due to the timing of sales and repurchases of
the Fund shares in relation to income earned and/or fluctuating market value of the investments of the Fund.
bBased on average daily shares outstanding.
cAmount rounds to less than $0.01 per share.
dEffective September 1, 2008, the redemption fee was eliminated.
18 | The accompanying notes are an integral part of these financial statements. | Annual Report
Templeton Global Investment Trust
Statement of Investments, March 31, 2013
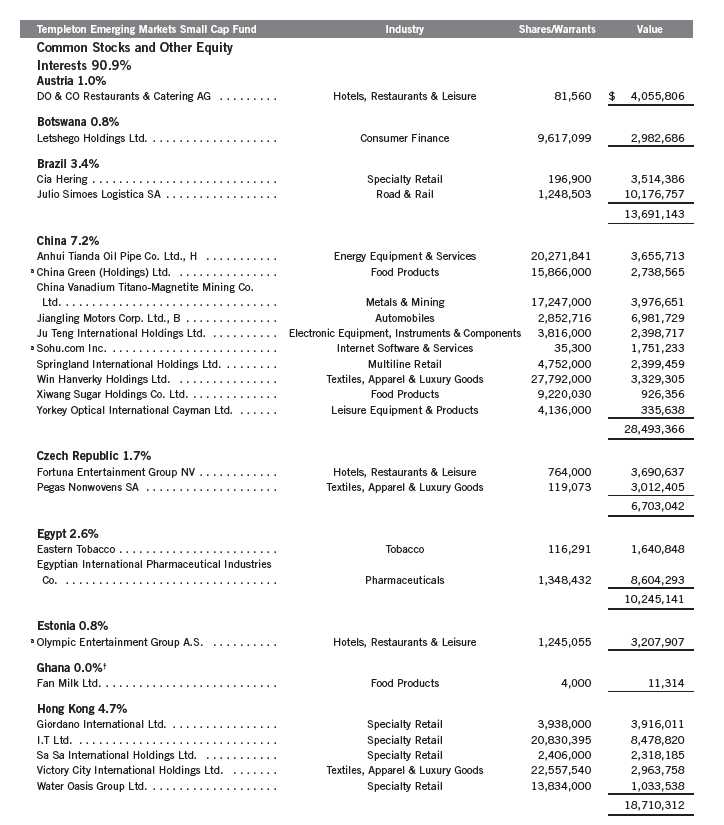
Annual Report | 19
Templeton Global Investment Trust
Statement of Investments, March 31, 2013 (continued)
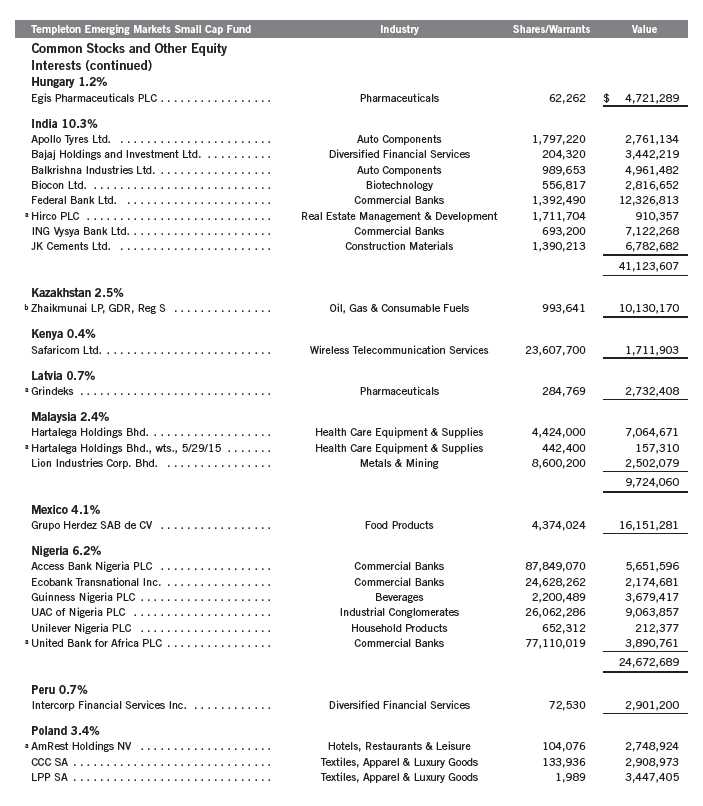
20 | Annual Report
Templeton Global Investment Trust
Statement of Investments, March 31, 2013 (continued)

Templeton Global Investment Trust
Statement of Investments, March 31, 2013 (continued)
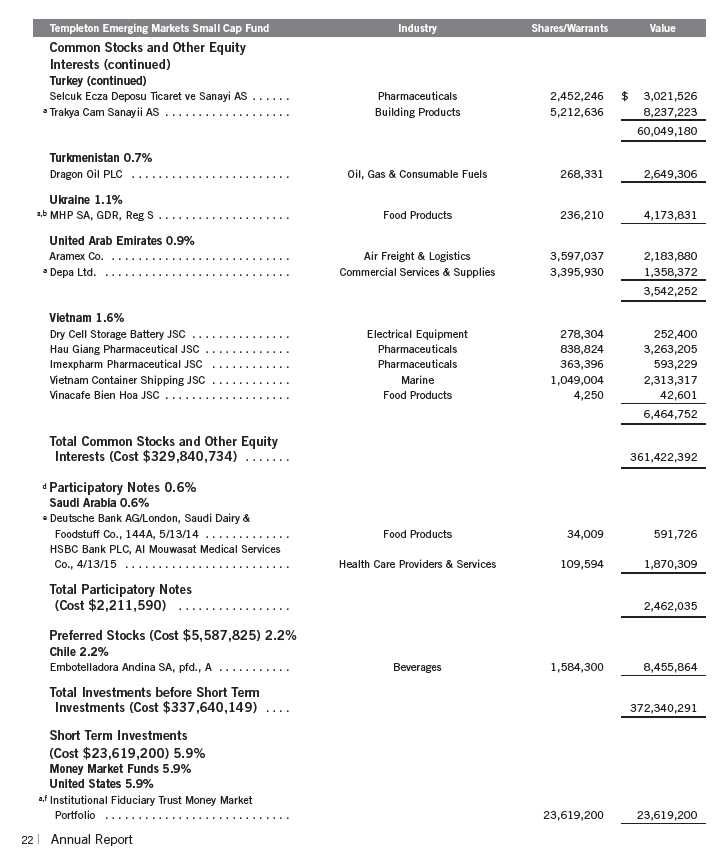
Templeton Global Investment Trust
Statement of Investments, March 31, 2013 (continued)
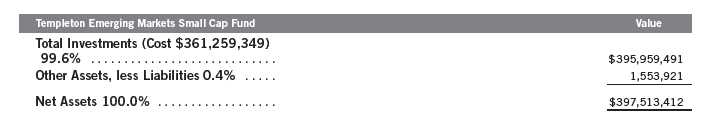
See Abbreviations on page 38.
†Rounds to less than 0.1% of net assets.
aNon-income producing.
bSecurity was purchased pursuant to Regulation S under the Securities Act of 1933, which exempts from registration securities offered and sold outside of the United States. Such a
security cannot be sold in the United States without either an effective registration statement filed pursuant to the Securities Act of 1933, or pursuant to an exemption from regis-
tration. These securities have been deemed liquid under guidelines approved by the Trust’s Board of Trustees. At March 31, 2013, the aggregate value of these securities was
$17,820,991, representing 4.48% of net assets.
cSee Note 9 regarding holdings of 5% voting securities.
dSee Note 1(c) regarding Participatory Notes.
eSecurity was purchased pursuant to Rule 144A under the Securities Act of 1933 and may be sold in transactions exempt from registration only to qualified institutional buyers or in
a public offering registered under the Securities Act of 1933. This security has been deemed liquid under guidelines approved by the Trust’s Board of Trustees. At March 31, 2013,
the value of this security was $591,726, representing 0.15% of net assets.
fSee Note 7 regarding investments in the Institutional Fiduciary Trust Money Market Portfolio.
Annual Report | The accompanying notes are an integral part of these financial statements. | 23

24 | The accompanying notes are an integral part of these financial statements. | Annual Report
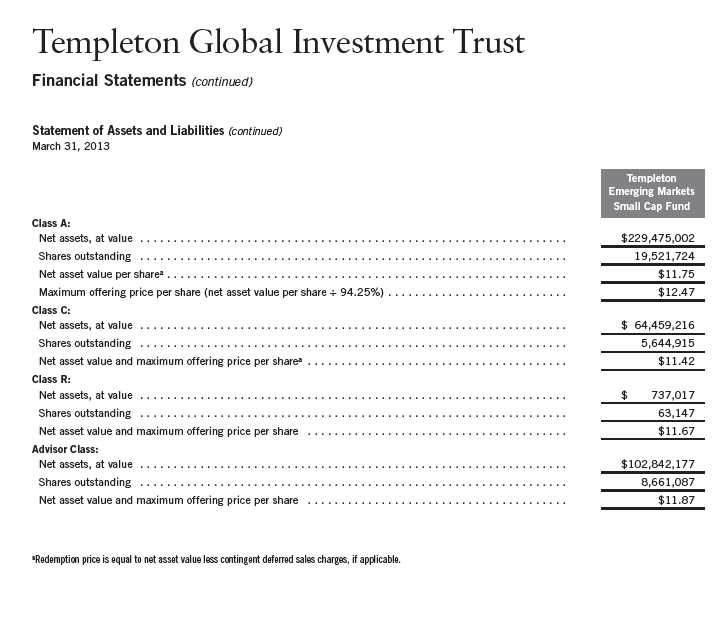
Annual Report | The accompanying notes are an integral part of these financial statements. | 25

26 | The accompanying notes are an integral part of these financial statements. | Annual Report
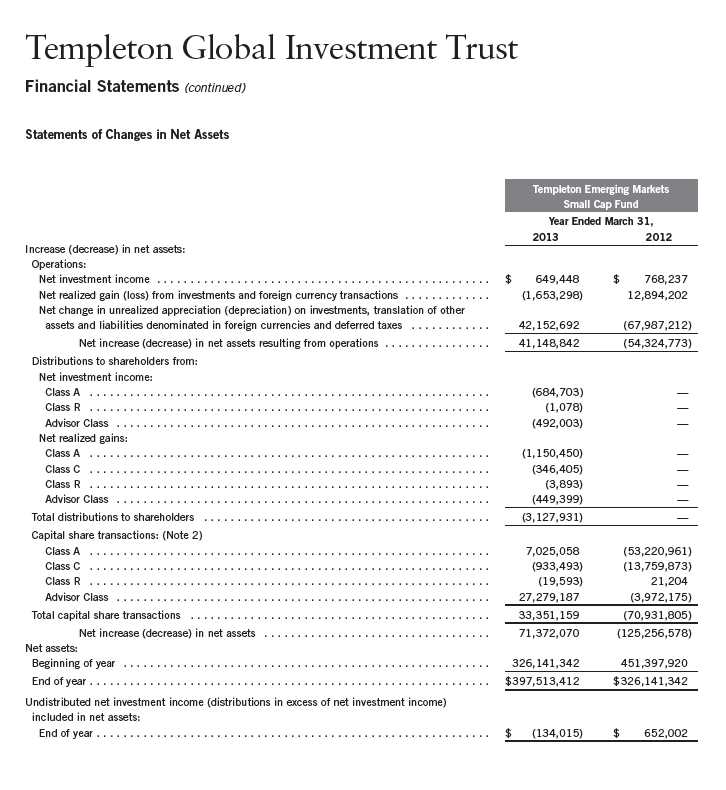
Annual Report | The accompanying notes are an integral part of these financial statements. | 27
Templeton Global Investment Trust
Notes to Financial Statements
Templeton Emerging Markets Small Cap Fund
1. ORGANIZATION AND SIGNIFICANT ACCOUNTING POLICIES
Templeton Global Investment Trust (Trust) is registered under the Investment Company Act of 1940, as amended, (1940 Act) as an open-end investment company, consisting of six separate funds. The Templeton Emerging Markets Small Cap Fund (Fund) is included in this report. The financial statements of the remaining funds in the Trust are presented separately. The Fund offers four classes of shares: Class A, Class C, Class R, and Advisor Class. Each class of shares differs by its initial sales load, contingent deferred sales charges, voting rights on matters affecting a single class, its exchange privilege and fees primarily due to differing arrangements for distribution and transfer agent fees.
The following summarizes the Fund’s significant accounting policies.
a. Financial Instrument Valuation
The Fund’s investments in financial instruments are carried at fair value daily. Fair value is the price that would be received to sell an asset or paid to transfer a liability in an orderly transaction between market participants on the measurement date. Under procedures approved by the Trust’s Board of Trustees (the Board), the Fund’s administrator, investment manager and other affiliates have formed the Valuation and Liquidity Oversight Committee (VLOC). The VLOC provides administration and oversight of the Fund’s valuation policies and procedures, which are approved annually by the Board. Among other things, these procedures allow the Fund to utilize independent pricing services, quotations from securities and financial instrument dealers, and other market sources to determine fair value.
Equity securities listed on an exchange or on the NASDAQ National Market System are valued at the last quoted sale price or the official closing price of the day, respectively. Foreign equity securities are valued as of the close of trading on the foreign stock exchange on which the security is primarily traded, or the NYSE, whichever is earlier. The value is then converted into its U.S. dollar equivalent at the foreign exchange rate in effect at the close of the NYSE on the day that the value of the security is determined. Over-the-counter (OTC) securities are valued within the range of the most recent quoted bid and ask prices. Securities that trade in multiple markets or on multiple exchanges are valued according to the broadest and most representative market. Certain equity securities are valued based upon fundamental characteristics or relationships to similar securities. Investments in open-end mutual funds are valued at the closing net asset value.
The Fund has procedures to determine the fair value of financial instruments for which market prices are not reliable or readily available. Under these procedures, the VLOC convenes on a regular basis to review such financial instruments and considers a number of factors, including significant unobservable valuation inputs, when arriving at fair value. The VLOC primarily employs a market-based approach which may use related or comparable assets or liabilities, recent transactions, market multiples, book values, and other relevant information for the
28 | Annual Report
Templeton Global Investment Trust
Notes to Financial Statements (continued)
Templeton Emerging Markets Small Cap Fund
| 1. | ORGANIZATION AND SIGNIFICANT ACCOUNTING POLICIES (continued) |
| a. | Financial Instrument Valuation (continued) |
investment to determine the fair value of the investment. An income-based valuation approach may also be used in which the anticipated future cash flows of the investment are discounted to calculate fair value. Discounts may also be applied due to the nature or duration of any restrictions on the disposition of the investments. Due to the inherent uncertainty of valuations of such investments, the fair values may differ significantly from the values that would have been used had an active market existed. The VLOC employs various methods for calibrating these valuation approaches including a regular review of key inputs and assumptions, transactional back-testing or disposition analysis, and reviews of any related market activity.
Trading in securities on foreign securities stock exchanges and OTC markets may be completed before the daily close of business on the NYSE. Occasionally, events occur between the time at which trading in a foreign security is completed and the close of the NYSE that might call into question the reliability of the value of a portfolio security held by the Fund. As a result, differences may arise between the value of the Fund’s portfolio securities as determined at the foreign market close and the latest indications of value at the close of the NYSE. In order to minimize the potential for these differences, the VLOC monitors price movements following the close of trading in foreign stock markets through a series of country specific market proxies (such as baskets of American Depositary Receipts, futures contracts and exchange traded funds). These price movements are measured against established trigger thresholds for each specific market proxy to assist in determining if an event has occurred that may call into question the reliability of the values of the foreign securities held by the Fund. If such an event occurs, the securities may be valued using fair value procedures, which may include the use of independent pricing services.
In addition, certain foreign markets may be open on days that the NYSE is closed, which could result in differences between the value of the Fund’s portfolio securities on the last business day and the last calendar day of the reporting period. Any significant security valuation changes due to an open foreign market are adjusted and reflected by the Fund for financial reporting purposes. The Fund’s financial statements have been adjusted to reflect investment values as of March 31, 2013.
b. Foreign Currency Translation
Portfolio securities and other assets and liabilities denominated in foreign currencies are translated into U.S. dollars based on the exchange rate of such currencies against U.S. dollars on the date of valuation. The Fund may enter into foreign currency exchange contracts to facilitate transactions denominated in a foreign currency. Purchases and sales of securities, income and expense items denominated in foreign currencies are translated into U.S. dollars at the exchange rate in effect on the transaction date. Portfolio securities and assets and liabilities denominated in foreign currencies contain risks that those currencies will decline in value relative to the U.S. dollar. Occasionally,
Annual Report | 29
Templeton Global Investment Trust
Notes to Financial Statements (continued)
Templeton Emerging Markets Small Cap Fund
| 1. | ORGANIZATION AND SIGNIFICANT ACCOUNTING POLICIES (continued) |
| b. | Foreign Currency Translation (continued) |
events may impact the availability or reliability of foreign exchange rates used to convert the U.S. dollar equivalent value. If such an event occurs, the foreign exchange rate will be valued at fair value using procedures established and approved by the Board.
The Fund does not separately report the effect of changes in foreign exchange rates from changes in market prices on securities held. Such changes are included in net realized and unrealized gain or loss from investments on the Statement of Operations.
Realized foreign exchange gains or losses arise from sales of foreign currencies, currency gains or losses realized between the trade and settlement dates on securities transactions and the difference between the recorded amounts of dividends, interest, and foreign withholding taxes and the U.S. dollar equivalent of the amounts actually received or paid. Net unrealized foreign exchange gains and losses arise from changes in foreign exchange rates on foreign denominated assets and liabilities other than investments in securities held at the end of the reporting period.
c. Participatory Notes
The Fund invests in Participatory Notes (P-Notes). P-notes are promissory notes that are designed to offer a return linked to the performance of a particular underlying equity security or market. P-Notes are issued by banks or broker-dealers and allow the fund to gain exposure to common stocks in markets where direct investment is not allowed. Income received from P-Notes is recorded as dividend income in the Statement of Operations. P-Notes may contain various risks including the potential inability of the counterparty to fulfill their obligations under the terms of the contract. These securities may be more volatile and less liquid than other investments held by the Fund.
d. Income and Deferred Taxes
It is the Fund’s policy to qualify as a regulated investment company under the Internal Revenue Code. The Fund intends to distribute to shareholders substantially all of its taxable income and net realized gains to relieve it from federal income and excise taxes. As a result, no provision for U.S. federal income taxes is required.
The Fund may be subject to foreign taxation related to income received, capital gains on the sale of securities and certain foreign currency transactions in the foreign jurisdictions in which it invests. Foreign taxes, if any, are recorded based on the tax regulations and rates that exist in the foreign markets in which the Fund invests. When a capital gain tax is determined to apply the Fund records an estimated deferred tax liability in an amount that would be payable if the securities were disposed of on the valuation date.
30 | Annual Report
Templeton Global Investment Trust
Notes to Financial Statements (continued)
Templeton Emerging Markets Small Cap Fund
| 1. | ORGANIZATION AND SIGNIFICANT ACCOUNTING POLICIES (continued) |
| d. | Income and Deferred Taxes (continued) |
The Fund recognizes the tax benefits of uncertain tax positions only when the position is “more likely than not” to be sustained upon examination by the tax authorities based on the technical merits of the tax position. As of March 31, 2013, and for all open tax years, the Fund has determined that no liability for unrecognized tax benefits is required in the Fund’s financial statements related to uncertain tax positions taken on a tax return (or expected to be taken on future tax returns). Open tax years are those that remain subject to examination and are based on each tax jurisdiction statute of limitation.
e. Security Transactions, Investment Income, Expenses and Distributions
Security transactions are accounted for on trade date. Realized gains and losses on security transactions are determined on a specific identification basis. Estimated expenses are accrued daily. Dividend income is recorded on the ex-dividend date except that certain dividends from foreign securities are recognized as soon as the Fund is notified of the ex-dividend date. Distributions to shareholders are recorded on the ex-dividend date and are determined according to income tax regulations (tax basis). Distributable earnings determined on a tax basis may differ from earnings recorded in accordance with accounting principles generally accepted in the United States of America. These differences may be permanent or temporary. Permanent differences are reclassified among capital accounts to reflect their tax character. These reclassifications have no impact on net assets or the results of operations. Temporary differences are not reclassified, as they may reverse in subsequent periods.
Common expenses incurred by the Trust are allocated among the funds based on the ratio of net assets of each fund to the combined net assets of the Trust. Fund specific expenses are charged directly to the fund that incurred the expense.
Realized and unrealized gains and losses and net investment income, not including class specific expenses, are allocated daily to each class of shares based upon the relative proportion of net assets of each class. Differences in per share distributions, by class, are generally due to differences in class specific expenses.
f. Accounting Estimates
The preparation of financial statements in accordance with accounting principles generally accepted in the United States of America requires management to make estimates and assumptions that affect the reported amounts of assets and liabilities at the date of the financial statements and the amounts of income and expenses during the reporting period. Actual results could differ from those estimates.
Annual Report | 31
Templeton Global Investment Trust
Notes to Financial Statements (continued)
Templeton Emerging Markets Small Cap Fund
1. ORGANIZATION AND SIGNIFICANT ACCOUNTING POLICIES (continued)
g. Guarantees and Indemnifications
Under the Trust’s organizational documents, its officers and trustees are indemnified by the Trust
against certain liabilities arising out of the performance of their duties to the Trust. Additionally,
in the normal course of business, the Trust, on behalf of the Fund, enters into contracts with serv-
ice providers that contain general indemnification clauses. The Trust’s maximum exposure under
these arrangements is unknown as this would involve future claims that may be made against the
Trust that have not yet occurred. Currently, the Trust expects the risk of loss to be remote.
2. SHARES OF BENEFICIAL INTEREST
At March 31, 2013, there were an unlimited number of shares authorized ($0.01 par value).
Transactions in the Fund’s shares were as follows:

32 | Annual Report
Templeton Global Investment Trust
Notes to Financial Statements (continued)
Templeton Emerging Markets Small Cap Fund
3. TRANSACTIONS WITH AFFILIATES
Franklin Resources, Inc. is the holding company for various subsidiaries that together are
referred to as Franklin Templeton Investments. Certain officers and trustees of the Trust are also
officers and/or directors of the following subsidiaries:
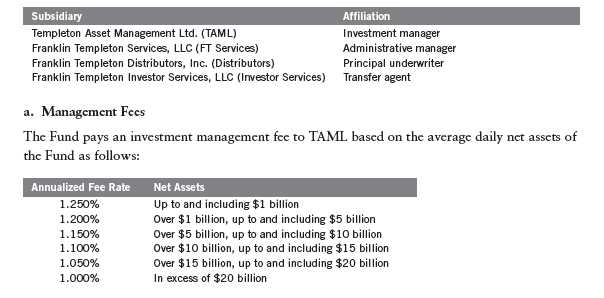
b. Administrative Fees
The Fund pays an administrative fee to FT Services of 0.20% per year of the average daily net
assets of the Fund.
On February 26, 2013, the Board approved the proposal to combine the Fund’s investment
management and administration agreements. The fees to be paid under the new combined
agreement will not exceed the aggregate fees that would have been paid under the separate
agreements. The new agreement went into effect on May 1, 2013.
c. Distribution Fees
The Board has adopted distribution plans for each share class, with the exception of Advisor
Class shares, pursuant to Rule 12b-1 under the 1940 Act. Distribution fees are not charged on
shares held by affiliates. Under the Fund’s Class A reimbursement distribution plan, the Fund
reimburses Distributors for costs incurred in connection with the servicing, sale and distribution
of the Fund’s shares up to the maximum annual plan rate. Under the Class A reimbursement dis-
tribution plan, costs exceeding the maximum for the current plan year cannot be reimbursed in
subsequent periods. In addition, under the Fund’s Class C and R compensation distribution plans,
the Fund pays Distributors for costs incurred in connection with the servicing, sale and distribu-
tion of the Fund’s shares up to the maximum annual plan rate for each class.
Annual Report | 33
Templeton Global Investment Trust
Notes to Financial Statements (continued)
Templeton Emerging Markets Small Cap Fund
3. TRANSACTIONS WITH AFFILIATES (continued)
c. Distribution Fees (continued)
The maximum annual plan rates, based on the average daily net assets, for each class, are as
follows:
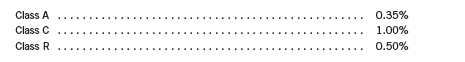
The Board has set the current rate at 0.30% per year for Class A shares until further notice and
approval by the Board.
d. Sales Charges/Underwriting Agreements
Front-end sales charges and contingent deferred sales charges (CDSC) do not represent expenses
of the Fund. These charges are deducted from the proceeds of sales of Fund shares prior to
investment or from redemption proceeds prior to remittance, as applicable. Distributors has
advised the Fund of the following commission transactions related to the sales and redemptions
of the Fund’s shares for the year:
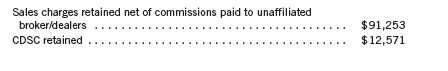
e. Transfer Agent Fees
Each class of shares pays transfer agent fees to Investor Services for its performance of share-
holder servicing obligations and reimburses Investor Services for out of pocket expenses incurred,
including shareholding servicing fees paid to third parties. These fees are allocated daily to such
classes based upon the relative proportion of net assets.
For the year ended March 31, 2013, the Fund paid transfer agent fees of $814,638, of which
$360,283 was retained by Investor Services.
f. Waiver and Expense Reimbursements
TAML and FT Services have contractually agreed in advance to waive or limit their respective fees
and to assume as their own expense certain expenses otherwise payable by the Fund so that the
expenses (excluding distribution fees, and acquired fund fees and expenses) for Class A, Class C,
Class R and Advisor Class of the Fund do not exceed 1.80%, (other than certain non-routine
expenses or costs, including those relating to litigation, indemnification, reorganizations, and
liquidations) until July 31, 2013.
34 | Annual Report
Templeton Global Investment Trust
Notes to Financial Statements (continued)
Templeton Emerging Markets Small Cap Fund
4. EXPENSE OFFSET ARRANGEMENT
The Fund has entered into an arrangement with its custodian whereby credits realized as a result of uninvested cash balances are used to reduce a portion of the Fund’s custodian expenses. During the year ended March 31, 2013, there were no credits earned.
5. INCOME TAXES
For tax purposes, capital losses may be carried over to offset future capital gains, if any. Capital loss carryforwards with no expiration, if any, must be fully utilized before those losses with expiration dates. During the year ended March 31, 2013, the Fund utilized $2,418,287 of capital loss carryforwards.
For tax purposes, the Fund may elect to defer any portion of a post-October capital loss to the first day of the following fiscal year. At March 31, 2013, the Fund deferred post-October capital losses of $5,797,548.
The tax character of distributions paid during the years ended March 31, 2013 and 2012, was as follows:

At March 31, 2013, the cost of investments, net unrealized appreciation (depreciation) and undistributed ordinary income for income tax purposes were as follows:

Differences between income and/or capital gains as determined on a book basis and a tax basis are primarily due to differing treatments of passive foreign investment company shares and corporate actions.
6. INVESTMENT TRANSACTIONS
Purchases and sales of investments (excluding short term securities) for the year ended March 31, 2013, aggregated $79,809,554 and $46,964,193, respectively.
Annual Report | 35
Templeton Global Investment Trust
Notes to Financial Statements (continued)
Templeton Emerging Markets Small Cap Fund
7. INVESTMENTS IN INSTITUTIONAL FIDUCIARY TRUST MONEY MARKET PORTFOLIO
The Fund invests in the Institutional Fiduciary Trust Money Market Portfolio (Sweep Money Fund), an open-end investment company managed by Franklin Advisers, Inc. (an affiliate of the investment manager). Management fees paid by the Fund are reduced on assets invested in the Sweep Money Fund, in an amount not to exceed the management and administrative fees paid by the Sweep Money Fund.
8. CONCENTRATION OF RISK
Investing in foreign securities may include certain risks and considerations not typically associated with investing in U.S. securities, such as fluctuating currency values and changing local and regional economic, political and social conditions, which may result in greater market volatility. In addition, certain foreign securities may not be as liquid as U.S. securities.
9. HOLDINGS OF 5% VOTING SECURITIES OF PORTFOLIO COMPANIES
The 1940 Act defines “affiliated companies” to include investments in portfolio companies in which a fund owns 5% or more of the outstanding voting securities. Investments in “affiliated companies” for the Fund for the year ended March 31, 2013, were as shown below.
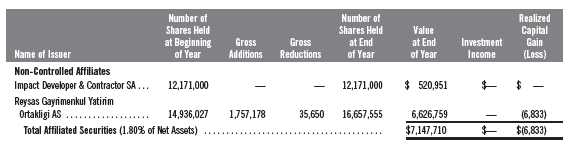
10. CREDIT FACILITY
The Fund, together with other U.S. registered and foreign investment funds (collectively, Borrowers), managed by Franklin Templeton Investments, are borrowers in a joint syndicated senior unsecured credit facility totaling $1.5 billion (Global Credit Facility) which matures on January 17, 2014. This Global Credit Facility provides a source of funds to the Borrowers for temporary and emergency purposes, including the ability to meet future unanticipated or unusually large redemption requests.
36 | Annual Report
Templeton Global Investment Trust
Notes to Financial Statements (continued)
Templeton Emerging Markets Small Cap Fund
10. CREDIT FACILITY (continued)
Under the terms of the Global Credit Facility, the Fund shall, in addition to interest charged on any borrowings made by the Fund and other costs incurred by the Fund, pay its share of fees and expenses incurred in connection with the implementation and maintenance of the Global Credit Facility, based upon its relative share of the aggregate net assets of all of the Borrowers, including an annual commitment fee of 0.07% based upon the unused portion of the Global Credit Facility. These fees are reflected in other expenses on the Statement of Operations. During the year ended March 31, 2013, the Fund did not use the Global Credit Facility.
11. FAIR VALUE MEASUREMENTS
The Fund follows a fair value hierarchy that distinguishes between market data obtained from independent sources (observable inputs) and the Fund’s own market assumptions (unobservable inputs). These inputs are used in determining the value of the Fund’s financial instruments and are summarized in the following fair value hierarchy:
- Level 1 – quoted prices in active markets for identical financial instruments
- Level 2 – other significant observable inputs (including quoted prices for similar financial instruments, interest rates, prepayment speed, credit risk, etc.)
- Level 3 – significant unobservable inputs (including the Fund’s own assumptions in determining the fair value of financial instruments)
The inputs or methodology used for valuing financial instruments are not an indication of the risk associated with investing in those financial instruments.
For movements between the levels within the fair value hierarchy, the Fund has adopted a policy of recognizing the transfers as of the date of the underlying event which caused the movement.
A summary of inputs used as of March 31, 2013, in valuing the Fund’s assets carried at fair value, is as follows:
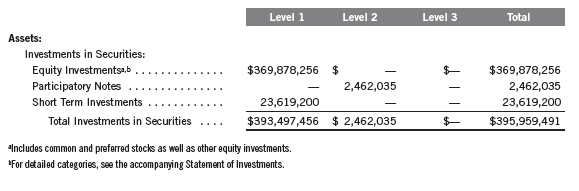
Annual Report | 37
Templeton Global Investment Trust
Notes to Financial Statements (continued)
Templeton Emerging Markets Small Cap Fund
12. NEW ACCOUNTING PRONOUNCEMENTS
In December 2011, the Financial Accounting Standards Board (FASB) issued Accounting Standards Update (ASU) No. 2011-11, Balance Sheet (Topic 210): Disclosures about Offsetting Assets and Liabilities. The amendments in the ASU enhance disclosures about offsetting of financial assets and liabilities to enable investors to understand the effect of these arrangements on a fund’s financial position. In January 2013, FASB issued ASU No. 2013-01, Balance Sheet (Topic 210): Clarifying the Scope of Disclosures about Offsetting Assets and Liabilities. The amendments in ASU No. 2013-01 clarify the intended scope of disclosures required by ASU
No. 2011-11. These ASUs are effective for interim and annual reporting periods beginning on or after January 1, 2013. The Fund believes the adoption of these ASUs will not have a material impact on its financial statements.
13. SUBSEQUENT EVENTS
The Fund has evaluated subsequent events through the issuance of the financial statements and determined that no events have occurred that require disclosure.
ABBREVIATIONS
Selected Portfolio
GDR - Global Depositary Receipt
SDR - Swedish Depositary Receipt
38 | Annual Report
Templeton Global Investment Trust
Report of Independent Registered Public Accounting Firm
To the Board of Trustees and Shareholders of Templeton Emerging Markets Small Cap Fund
In our opinion, the accompanying statement of assets and liabilities, including the statement of investments, and the related statements of operations and of changes in net assets and the financial highlights present fairly, in all material respects, the financial position of Templeton Emerging Markets Small Cap Fund (the “Fund”) at March 31, 2013, the results of its operations for the year then ended, the changes in its net assets for each of the two years in the period then ended and the financial highlights for each of the five years in the period then ended, in conformity with accounting principles generally accepted in the United States of America. These financial statements and financial highlights (hereafter referred to as “financial statements”) are the responsibility of the Fund’s management. Our responsibility is to express an opinion on these financial statements based on our audits. We conducted our audits of these financial statements in accordance with the standards of the Public Company Accounting Oversight Board (United States). Those standards require that we plan and perform the audit to obtain reasonable assurance about whether the financial statements are free of material misstatement. An audit includes examining, on a test basis, evidence supporting the amounts and disclosures in the financial statements, assessing the accounting principles used and significant estimates made by management, and evaluating the overall financial statement presentation. We believe that our audits, which included confirmation of securities at March 31, 2013 by correspondence with the custodian, transfer agent and brokers, provide a reasonable basis for our opinion.
PricewaterhouseCoopers LLP
San Francisco, California
May 22, 2013
Annual Report | 39
Templeton Global Investment Trust
Tax Information (unaudited)
Under Section 852(b)(3)(C) of the Internal Revenue Code (Code), the Fund hereby reports the maximum amount allowable but no less than $1,950,146 as a long term capital gain dividend for the fiscal year ended March 31, 2013.
Under Section 854(b)(1)(A) of the Code, the Fund hereby reports 22.45% of the ordinary income dividends as income qualifying for the dividends received deduction for the fiscal year ended March 31, 2013.
Under Section 854(b)(1)(B) of the Code, the Fund hereby reports the maximum amount allowable but no less than $3,522,058 as qualified dividends for purposes of the maximum rate under Section 1(h)(11) of the Code for the fiscal year ended March 31, 2013. Distributions, including qualified dividend income, paid during calendar year 2013 will be reported to shareholders on Form 1099-DIV by mid-February 2014. Shareholders are advised to check with their tax advisors for information on the treatment of these amounts on their individual income tax returns.
At March 31, 2012, more than 50% of the Fund’s total assets were invested in securities of foreign issuers. In most instances, foreign taxes were withheld from income paid to the Fund on these investments. As shown in the table below, the Fund hereby reports to shareholders the foreign source income and foreign taxes paid, pursuant to Section 853 of the Code. This written statement will allow shareholders of record on December 7, 2012, to treat their proportionate share of foreign taxes paid by the Fund as having been paid directly by them. The shareholder shall consider these amounts as foreign taxes paid in the tax year in which they receive the Fund distribution.
The following table provides a detailed analysis of foreign tax paid, foreign source income, and foreign qualified dividends as reported by the Fund, to Class A, Class C, Class R and Advisor Class shareholders of record.
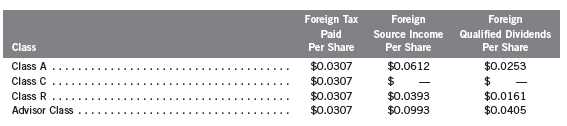
Foreign Tax Paid Per Share (Column 1) is the amount per share available to you, as a tax credit (assuming you held your shares in the Fund for a minimum of 16 days during the 31-day period beginning 15 days before the ex-dividend date of the Fund’s distribution to which the foreign taxes relate), or, as a tax deduction.
40 | Annual Report
Templeton Global Investment Trust
Tax Information (unaudited) (continued)
Foreign Source Income Per Share (Column 2) is the amount per share of income dividends attributable to foreign securities held by the Fund, plus any foreign taxes withheld on these dividends. The amounts reported include foreign source qualified dividends that have not been adjusted for the rate differential applicable to such dividend income.1
Foreign Qualified Dividends Per Share (Column 3) is the amount per share of foreign source qualified dividends, plus any foreign taxes withheld on these dividends. These amounts represent the portion of the Foreign Source Income reported to you in column 2 that were derived from qualified foreign securities held by the Fund.1
By mid-February 2013, shareholders received Form 1099-DIV which included their share of taxes paid and foreign source income distributed during the calendar year 2012. The Foreign Source Income reported on Form 1099-DIV has not been adjusted for the rate differential on foreign source qualified dividend income. Shareholders are advised to check with their tax advisors for information on the treatment of these amounts on their 2012 individual income tax returns.
1Qualified dividends are taxed at reduced long term capital gains tax rates. In determining the amount of foreign tax credit that may be applied
against the U.S. tax liability of individuals receiving foreign source qualified dividends, adjustments may be required to the foreign tax credit limita-
tion calculation to reflect the rate differential applicable to such dividend income. The rules however permit certain individuals to elect not to apply
the rate differential adjustments for capital gains and/or dividends for any taxable year. Please consult your tax advisor and the instructions to
Form 1116 for more information.
Annual Report | 41
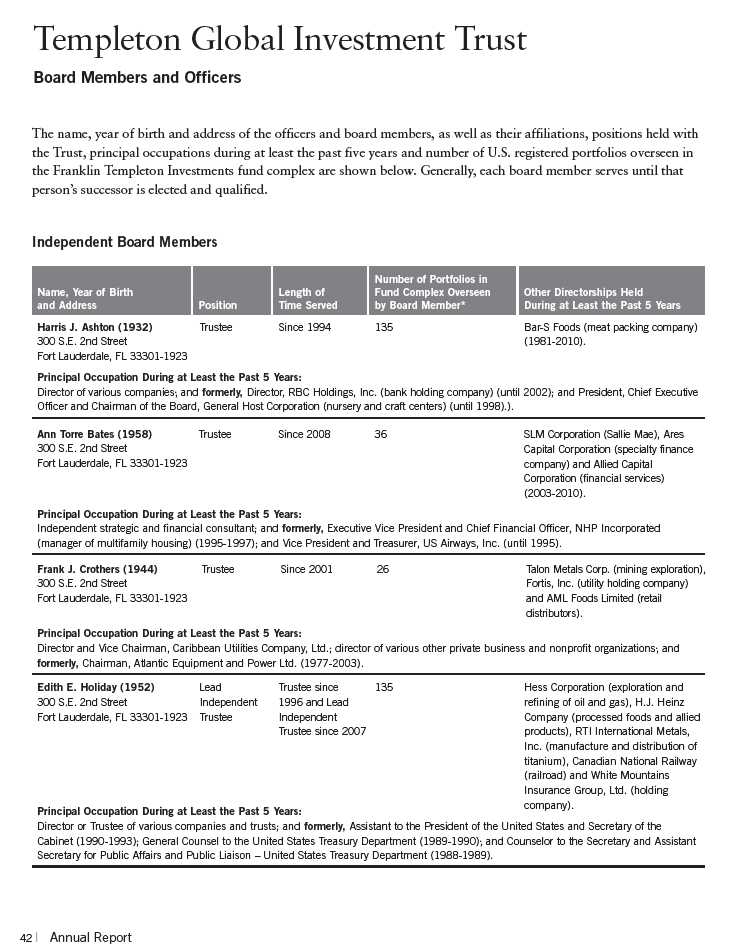
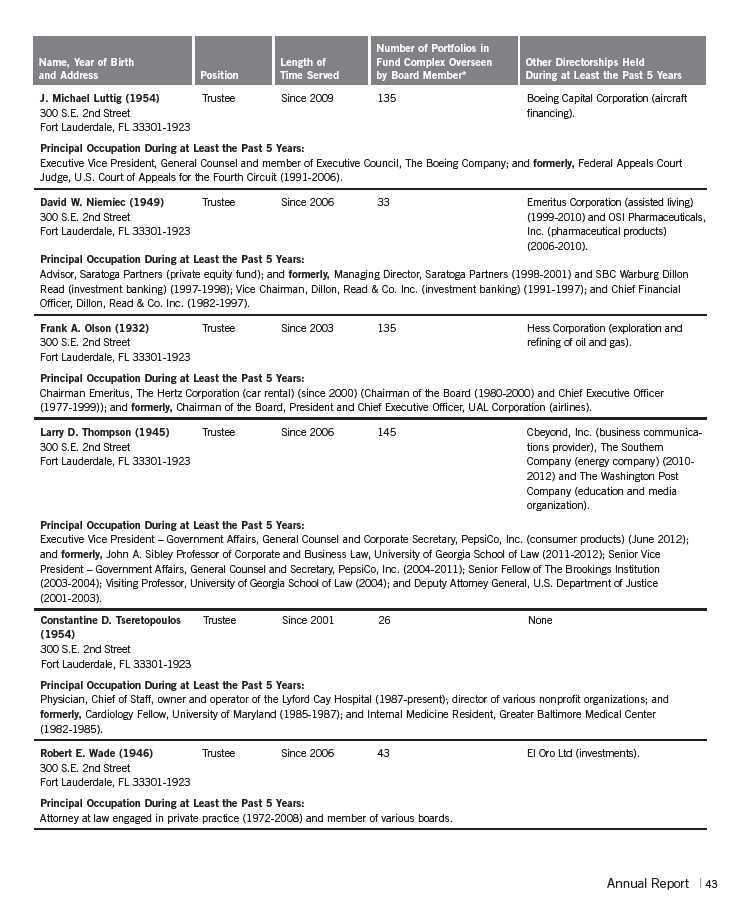

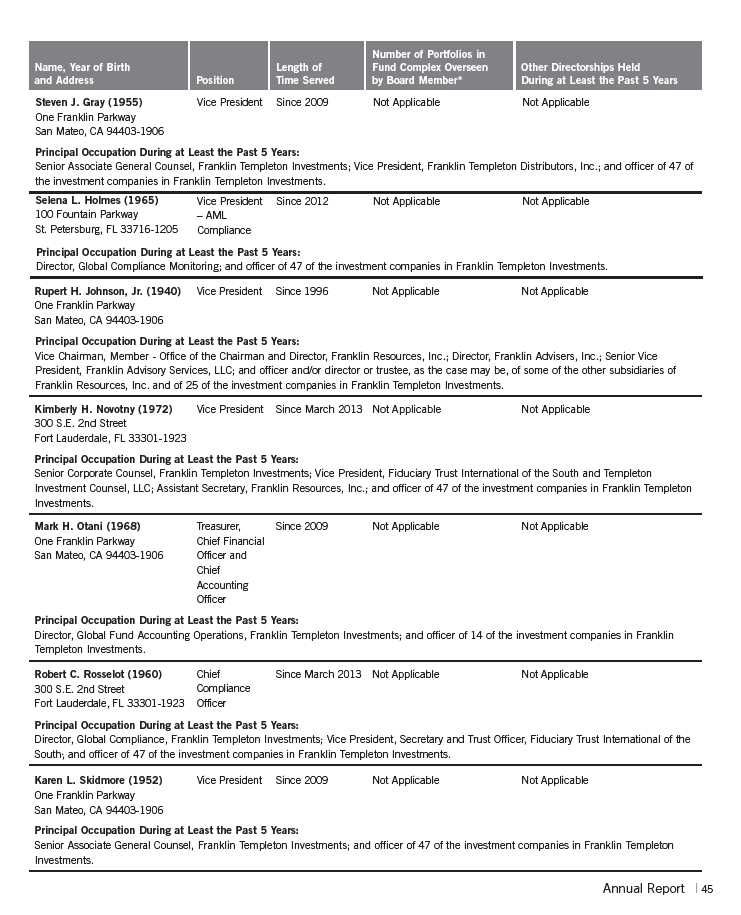
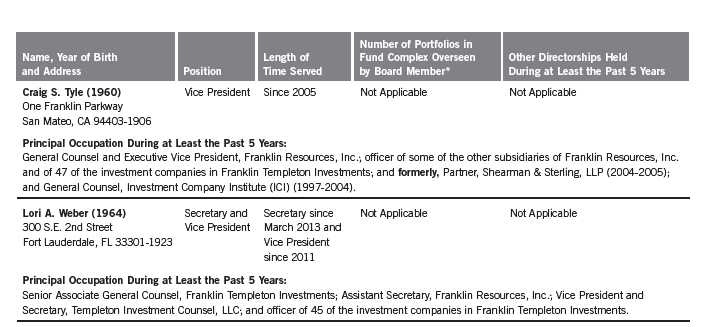
*We base the number of portfolios on each separate series of the U.S. registered investment companies within the Franklin Templeton Investments fund complex. These portfolios
have a common investment manager or affiliated investment managers.
**Charles B. Johnson is considered to be an interested person of the Trust under the federal securities laws due to his position as officer and director and major shareholder of
Franklin Resources, Inc. (Resources), which is the parent company of the Trust’s investment manager and distributor. Gregory E. Johnson is considered to be an interested person of
the Trust under the federal securities laws due to his position as officer and director of Resources.
Note 1: Charles B. Johnson and Rupert H. Johnson, Jr. are brothers and the father and uncle, respectively, of Gregory E. Johnson.
Note 2: Officer information is current as of the date of this report. It is possible that after this date, information about officers may change.
The Sarbanes-Oxley Act of 2002 and Rules adopted by the U.S. Securities and Exchange Commission require the Fund to disclose whether the Fund’s Audit Committee
includes at least one member who is an audit committee financial expert within the meaning of such Act and Rules. The Fund’s Board has determined that there is at least
one such financial expert on the Audit Committee and has designated each of Ann Torre Bates and David W. Niemiec as an audit committee financial expert. The Board
believes that Ms. Bates and Mr. Niemiec qualify as such an expert in view of their extensive business background and experience. Ms. Bates has served as a member of the
Fund Audit Committee since 2008. She currently serves as a director of SLM Corporation and Ares Capital Corporation and was formerly a director of Allied Capital
Corporation from 2003 to 2010, Executive Vice President and Chief Financial Officer of NHP Incorporated and Vice President and Treasurer of US Airways, Inc. Mr. Niemiec
has served as a member of the Fund Audit Committee since 2006, currently serves as an Advisor to Saratoga Partners and was formerly its Managing Director from 1998 to
2001. Mr. Niemiec is formerly a director of Emeritus Corporation from 1999 to 2010 and OSI Pharmaceuticals, Inc. from 2006 to 2010, Managing Director of SBC Warburg
Dillon Read from 1997 to 1998, and was Vice Chairman from 1991 to 1997 and Chief Financial Officer from 1982 to 1997 of Dillon, Read & Co. Inc. As a result of such back-
ground and experience, the Board believes that Ms. Bates and Mr. Niemiec have each acquired an understanding of generally accepted accounting principles and financial
statements, the general application of such principles in connection with the accounting estimates, accruals and reserves, and analyzing and evaluating financial state-
ments that present a breadth and level of complexity of accounting issues generally comparable to those of the Fund, as well as an understanding of internal controls and
procedures for financial reporting and an understanding of audit committee functions. Ms. Bates and Mr. Niemiec are independent Board members as that term is defined
under the applicable U.S. Securities and Exchange Commission Rules and Releases or the listing standards applicable to the Fund.
The Statement of Additional Information (SAI) includes additional information about the board members and is available, without charge, upon request. Shareholders may call
(800) DIAL BEN/342-5236 to request the SAI.
46 | Annual Report
Templeton Global Investment Trust
Shareholder Information
Templeton Emerging Markets Small Cap Fund
Board Review of Investment Management Agreement
At a meeting held February 26, 2013, the Board of Trustees (Board), including a majority of non-interested or independent Trustees, approved renewal of the investment management agreements for each of the separate funds within Templeton Global Investment Trust, including Templeton Emerging Markets Small Cap Fund (Fund(s)). In reaching this decision, the Board took into account information furnished throughout the year at regular Board meetings, as well as information prepared specifically in connection with the annual renewal review process. Information furnished and discussed throughout the year included investment performance reports and related financial information for each Fund, along with periodic reports on expenses, shareholder services, legal and compliance matters, pricing, brokerage commissions and execution and other services provided by the Investment Manager (Manager) and its affiliates, as well as a third-party survey of transfer agent fees charged funds within the Franklin Templeton Investments complex in comparison with those charged other fund complexes deemed comparable. Information furnished specifically in connection with the renewal process included a report for each Fund prepared by Lipper, Inc. (Lipper), an independent organization, as well as additional material, including a Fund profitability analysis prepared by management. The Lipper reports compared each Fund’s investment performance and expenses with those of other mutual funds deemed comparable to the Fund as selected by Lipper. The Fund profitability analysis discussed the profitability to Franklin Templeton Investments from its overall U.S. fund operations, as well as on an individual fund-by-fund basis. Additional material accompanying such profitability analysis included information on a fund-by-fund basis listing portfolio managers and other accounts they manage, as well as information on management fees charged by the Manager and its affiliates to U.S. mutual funds and other accounts, including management’s explanation of differences where relevant. Such material also included a memorandum prepared by management describing project initiatives and capital investments relating to the services provided to the Funds by the Franklin Templeton Investments organization, as well as a memorandum relating to economies of scale and an analysis concerning transfer agent fees charged by an affiliate of the Manager.
In considering such materials, the independent Trustees received assistance and advice from and met separately with independent counsel. While the investment management agreements for all Funds were considered at the same Board meeting, the Board dealt with each Fund separately. In approving continuance of the investment management agreement for each Fund, the Board, including a majority of independent Trustees, determined that the management fee structure was fair and reasonable and that continuance of the investment management agreement was in the best interests of each Fund and its shareholders. While attention was given to all information furnished, the following discusses some primary factors relevant to the Board’s decision.
NATURE, EXTENT AND QUALITY OF SERVICES. The Board was satisfied with the nature and quality of the overall services provided by the Manager and its affiliates to the Fund and its shareholders. In addition to investment performance and expenses discussed later, the Board’s
Annual Report | 47
Templeton Global Investment Trust
Shareholder Information (continued)
Templeton Emerging Markets Small Cap Fund
Board Review of Investment Management Agreement (continued)
opinion was based, in part, upon periodic reports furnished it showing that the investment policies and restrictions for the Fund were consistently complied with as well as other reports periodically furnished the Board covering matters such as the compliance of portfolio managers and other management personnel with the code of ethics adopted throughout the Franklin Templeton fund complex, the adherence to fair value pricing procedures established by the Board, and the accuracy of net asset value calculations. The Board also noted the extent of benefits provided Fund shareholders from being part of the Franklin Templeton family of funds, including the right to exchange investments between the same class of funds without a sales charge, the ability to reinvest Fund dividends into other funds and the right to combine holdings in other funds to obtain a reduced sales charge. Favorable consideration was given to management’s continuous efforts and expenditures in establishing back-up systems and recovery procedures to function in the event of a natural disaster, it being noted that such systems and procedures had functioned well during the Florida hurricanes and blackouts experienced in previous years, and that those operations in the New York/New Jersey area ran smoothly during the more recent Hurricane Sandy. Among other factors taken into account by the Board were the Manager’s best execution trading policies, including a favorable report by an independent portfolio trading analytical firm, which also covered FOREX transactions. Consideration was also given to the experience of the Fund’s portfolio management team, the number of accounts managed and general method of compensation. In this latter respect, the Board noted that a primary factor in management’s determination of a portfolio manager’s bonus compensation was the relative investment performance of the funds he or she managed and that a portion of such bonus was required to be invested in a predesignated list of funds within such person’s fund management area so as to be aligned with the interests of shareholders. The Board also took into account the quality of transfer agent and shareholder services provided Fund shareholders by an affiliate of the Manager and the continuous enhancements to the Franklin Templeton website. Particular attention was given to management’s conservative approach and diligent risk management procedures, including continuous monitoring of counterparty credit risk and attention given to derivatives and other complex instruments including expanded collateralization requirements. The Board also took into account, among other things, management’s efforts in establishing a global credit facility for the benefit of the Fund and other accounts managed by Franklin Templeton Investments to provide a source of cash for temporary and emergency purposes or to meet unusual redemption requests as well as the strong financial position of the Manager’s parent company and its commitment to the mutual fund business as evidenced by its subsidization of money market funds.
INVESTMENT PERFORMANCE. While consideration was given to performance reports and discussions with portfolio managers at Board meetings during the year, particular attention in assessing performance was given to the Lipper reports furnished for the agreement renewal. The Lipper reports prepared for the Fund showed the investment performance of its Class A shares during 2012 and previous years of operations. The Lipper performance universe for the Fund consisted of all
48 | Annual Report
Templeton Global Investment Trust
Shareholder Information (continued)
Templeton Emerging Markets Small Cap Fund
Board Review of Investment Management Agreement (continued)
retail and institutional emerging markets funds as designated by Lipper. The Lipper report showed the Fund’s total return in 2012 to be in the highest or best performing quintile of such universe and on an annualized basis to be in the highest performing quintile and second-highest performing quin-tile of such universe for the previous three- and five-year periods, respectively. The Board observed that the performance universe was broad and not limited to funds investing in small cap stocks, but noted that the Fund’s total return was comparable to those of the three other U.S. small cap funds included within such performance universe. The Board found the Fund’s performance as set forth in the Lipper report to be satisfactory.
COMPARATIVE EXPENSES. Consideration was given to a comparative analysis of the management fees and total expense ratio of the Fund compared with those of a group of other funds selected by Lipper as its appropriate Lipper expense group. Lipper expense data is based upon historical information taken from each fund’s most recent annual report, which reflects historical asset levels that may be quite different from those currently existing, particularly in a period of market volatility. While recognizing such inherent limitation and the fact that expense ratios generally increase as assets decline and decrease as assets grow, the Board believed the independent analysis conducted by Lipper to be an appropriate measure of comparative expenses. In reviewing comparative costs, Lipper provides information on the Fund’s contractual investment management fee in comparison with the effective management fee that would have been charged by other funds within its Lipper expense group assuming they were similar in size to the Fund, as well as the actual total expense ratio of the Fund in comparison with those of its Lipper expense group. The Lipper contractual investment management fee analysis includes administrative charges as being part of a management fee, and actual total expenses, for comparative consistency, are shown by Lipper for Fund Class A shares. The Lipper reports for the Fund showed both the contractual management fee rate and actual total expense ratio to be among the highest within its Lipper expense group. The Board found the expenses of the Fund to be acceptable in view of its relatively small size and specialized nature and noted that the expenses had been subsidized by management fee waivers.
MANAGEMENT PROFITABILITY. The Board also considered the level of profits realized by the Manager and its affiliates in connection with the operation of the Fund. In this respect, the Board reviewed the Fund profitability analysis that addresses the overall profitability of Franklin Templeton’s U.S. fund business, as well as its profits in providing management and other services to each of the individual funds during the 12-month period ended September 30, 2012, being the most recent fiscal year-end for Franklin Resources, Inc., the Manager’s parent. In reviewing the analysis, attention was given to the methodology followed in allocating costs to the Fund, it being recognized that allocation methodologies are inherently subjective and various allocation methodologies may each be reasonable while producing different results. In this respect, the Board noted that, while being continuously refined and reflecting changes in the Manager’s own cost accounting, the cost allocation methodology was consistent with that followed in profitability report
Annual Report | 49
Templeton Global Investment Trust
Shareholder Information (continued)
Templeton Emerging Markets Small Cap Fund
Board Review of Investment Management Agreement (continued)
presentations for the Fund made in prior years and that the Fund’s independent registered public accounting firm had been engaged by the Manager to periodically review the reasonableness of the allocation methodologies solely for use by the Fund’s Board in reference to the profitability analysis. In reviewing and discussing such analysis, management discussed with the Board its belief that costs incurred in establishing the infrastructure necessary for the type of mutual fund operations conducted by the Manager and its affiliates may not be fully reflected in the expenses allocated to the Fund in determining its profitability, as well as the fact that the level of profits, to a certain extent, reflected operational cost savings and efficiencies initiated by management. The Board also took into account management’s expenditures in improving shareholder services provided the Fund, as well as the need to implement systems to meet additional regulatory and compliance requirements resulting from statutes such as the Sarbanes-Oxley and Dodd Frank Acts and recent SEC and other regulatory requirements. In addition, the Board considered a third-party study comparing the profitability of the Manager’s parent on an overall basis to other publicly held managers broken down to show profitability from management operations exclusive of distribution expenses, as well as profitability including distribution expenses. The Board also considered the extent to which the Manager and its affiliates might derive ancillary benefits from fund operations, including revenues generated from transfer agent services and potential benefits resulting from allocation of fund brokerage and the use of commission dollars to pay for research. Based upon its consideration of all these factors, the Board determined that the level of profits realized by the Manager and its affiliates from providing services to the Fund was not excessive in view of the nature, quality and extent of services provided.
ECONOMIES OF SCALE. The Board also considered whether economies of scale are realized by the Manager as the Fund grows larger and the extent to which this is reflected in the level of management fees charged. While recognizing that any precise determination is inherently subjective, the Board noted that based upon the Fund profitability analysis, it appears that as some funds get larger, at some point economies of scale do result in the Manager realizing a larger profit margin on management services provided such a fund. The Board also noted that economies of scale are shared with the Fund and its shareholders through management fee breakpoints so that as a Fund grows in size, its effective management fee rate declines. In view of the specialized nature and size of the Fund, whose expenses are also being subsidized by management, the Board questioned whether economies of scale existed. The investment management advisory agreement for the Fund provides for breakpoints that are above the Fund’s existing asset size, and to the extent economies of scale may be realized by the Manager and its affiliates, the Board believes the schedule of fees for the Fund provides a sharing of benefits with the Fund and its shareholders.
In addition to the investment advisory services provided the Fund under its investment management agreement, administrative services are provided the Fund under a separate agreement at a fixed charge of 20 basis points. At the February 26, 2013, Board meeting, the Board eliminated
50 | Annual Report
Templeton Global Investment Trust
Shareholder Information (continued)
Templeton Emerging Markets Small Cap Fund
Board Review of Investment Management Agreement (continued)
the separate agreements and approved a new form of investment management agreement for the Fund combining such services. In approving the new form of investment management agreement, the Board took into account the fact that the types of services and aggregate fee, including breakpoints, would be the same as provided under the previous separate agreements and that combining such services was consistent with Lipper’s methodology of considering contractual investment management fees to include any separately charged administrative fee. The Board also noted that combining the services under the new form of investment management agreement would have no impact on management’s existing subsidization of expenses of the Fund.
Proxy Voting Policies and Procedures
The Fund’s investment manager has established Proxy Voting Policies and Procedures (Policies) that the Fund uses to determine how to vote proxies relating to portfolio securities. Shareholders may view the Fund’s complete Policies online at franklintempleton.com. Alternatively, shareholders may request copies of the Policies free of charge by calling the Proxy Group collect at (954) 527-7678 or by sending a written request to: Franklin Templeton Companies, LLC, 300 S.E. 2nd Street, Fort Lauderdale, FL 33301, Attention: Proxy Group. Copies of the Fund’s proxy voting records are also made available online at franklintempleton.com and posted on the U.S. Securities and Exchange Commission’s website at sec.gov and reflect the most recent 12-month period ended June 30.
Quarterly Statement of Investments
The Fund files a complete statement of investments with the U.S. Securities and Exchange Commission for the first and third quarters for each fiscal year on Form N-Q. Shareholders may view the filed Form N-Q by visiting the Commission’s website at sec.gov. The filed form may also be viewed and copied at the Commission’s Public Reference Room in Washington, DC. Information regarding the operations of the Public Reference Room may be obtained by calling (800) SEC-0330.
Householding of Reports and Prospectuses
You will receive the Fund’s financial reports every six months as well as an annual updated summary prospectus (prospectus available upon request). To reduce Fund expenses, we try to identify related shareholders in a household and send only one copy of the financial reports and summary prospectus. This process, called “householding,” will continue indefinitely unless you instruct us otherwise. If you prefer not to have these documents householded, please call us at (800) 632-2301. At any time you may view current prospectuses/summary prospectuses and financial reports on our website. If you choose, you may receive these documents through electronic delivery.
Annual Report | 51
This page intentionally left blank.

Annual Report
Templeton Frontier Markets Fund
Your Fund’s Goal and Main Investments: Templeton Frontier Markets Fund seeks long-
term capital appreciation. Under normal market conditions, the Fund invests at least 80% of its net assets
in securities of companies located in “frontier market countries” as defined in the prospectus. Such com-
panies are organized under the laws of, have a principal office in, or have their principal trading market in
frontier market countries; or derive at least 50% of their total revenue or profit from either goods or services
produced or sales made in frontier market countries; or have at least 50% of their assets in, or are linked
to currencies of, frontier market countries.

We are pleased to bring you Templeton Frontier Markets Fund’s annual report
for the fiscal year ended March 31, 2013.
Economic and Market Overview
The global economy grew at a moderate but uneven pace during the 12 months
under review, with many frontier and emerging market economies continuing
to grow faster than developed market economies. Driven largely by the non-oil
sector, Nigeria’s gross domestic product (GDP) grew 7.0% year-over-year in
The dollar value, number of shares or principal amount, and names of all portfolio holdings are listed in the
Fund’s Statement of Investments (SOI). The SOI begins on page 20.
Annual Report | 3
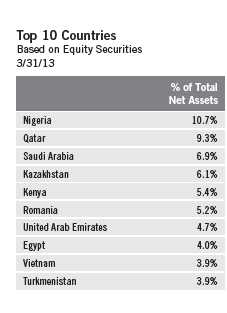
the fourth quarter of 2012, compared to 6.5% in the third quarter.1 For calendar year 2012, Nigeria’s GDP grew 6.9%.1 Nigeria’s 2012 total tax revenue collection not only surpassed that of 2011 and the government’s 2012 target, but was the highest in the history of the country’s Federal Inland Revenue Service. The country’s foreign exchange reserves rose to a four-year high in March 2013, driven primarily by crude oil and gas exports.
Qatar’s GDP grew 6.6% year-over-year in the fourth quarter of 2012, compared to 5.2% in the third quarter.2 For calendar year 2012, the country’s GDP grew 6.2%.2 Qatar’s banking sector continued to record robust growth, driven by an increase in credit facilities, particularly bank financing for public infrastructure projects, real estate and construction. Saudi Arabia’s GDP grew 6.8% in 2012.3 In March 2013, independent credit rating agency Fitch Ratings affirmed Saudi Arabia’s AA- rating and revised its outlook to positive from negative, citing progress in the country’s labor market reforms and home financing access, as well as reinforcement of fiscal and external buffers.4
Frontier market stocks, as measured by the MSCI Frontier Markets Index, continued the uptrend that began in mid-June, outperforming emerging market stocks, as measured by the MSCI Emerging Markets (EM) Index, and performing in line with developed market stocks, as measured by the MSCI World Index, during the 12-month period. With the exception of a sharp sell-off in May through mid-June that was triggered by investor anxiety about slowing global economic growth and Europe’s recurring sovereign debt crisis, most frontier markets continued to do well. For the 12 months ended March 31, 2013, the MSCI Frontier Markets Index delivered a total return of +11.97%, compared with the MSCI EM Index’s +2.31% total return and the MSCI World Index’s +12.53% total return.5
Kenya and Nigeria were among the top performers, with each producing total returns of more than 70%, as measured by their MSCI country indexes, driven by generally solid corporate results and an improving economic backdrop that led investors to become increasingly confident in these markets’ growth prospects.5 Peaceful elections in Kenya and foreign direct investment inflows into Nigeria, driven by progress in banking and power sector reforms,
1. Source: Nigeria National Bureau of Statistics.
2. Source: Qatar Statistics Authority.
3. Source: Central Department of Statistics and Information, Saudi Arabia.
4. This does not indicate Fitch’s rating of the Fund.
5. Source: © 2013 Morningstar. All Rights Reserved. The information contained herein: (1) is proprietary to Morningstar
and/or its content providers; (2) may not be copied or distributed; and (3) is not warranted to be accurate, complete or
timely. Neither Morningstar nor its content providers are responsible for any damages or losses arising from any use of
this information. The indexes are unmanaged and include reinvested dividends. One cannot invest directly in an index,
and an index is not representative of the Fund’s portfolio.
4 | Annual Report
further supported equity prices. Stocks in the United Arab Emirates benefited from strong signs that the Dubai economy, particularly its property market, was recovering from its debt-related difficulties. In Europe, Estonia and Lithuania produced strong returns that more than offset significant weakness in Ukraine. Argentina underperformed as many investors avoided its stocks following the government’s decision to nationalize the country’s largest oil and gas company.
Investment Strategy
Our investment strategy employs a fundamental research, value-oriented, long-term approach. We focus on the market price of a company’s securities relative to our evaluation of the company’s long-term (typically five years) earnings, asset value and cash flow potential. We also consider a company’s profit and loss outlook, balance sheet strength, cash flow trends and asset value in relation to the current price. The analysis considers the company’s corporate governance behavior as well as its position in its sector, the economic framework and political environment.
Performance Overview
Templeton Frontier Markets Fund – Class A delivered a +16.06% cumulative total return for the 12 months ended March 31, 2013. For comparison, the MSCI Frontier Markets Index posted a total return of +11.97%.5 Also for comparison, the Standard & Poor’s® (S&P®) Frontier Broad Market Index (BMI), which tracks performance of relatively small and illiquid frontier market stocks, posted a total return of +11.32%.6 Please note index performance information is provided for reference and we do not attempt to track any index but rather undertake investments on the basis of fundamental research. In addition, the Fund’s return reflects the effect of fees and expenses for professional management, while an index does not have such costs. You can find more of the Fund’s performance data in the Performance Summary beginning on page 9.
Manager’s Discussion
During the 12 months under review, major contributors to the Fund’s absolute performance included investments in three of Nigeria’s leading banks — First Bank of Nigeria (FBN Holdings), Zenith Bank and United Bank for Africa.
6. Source: © 2013 Morningstar. STANDARD & POOR’S®, S&P® and S&P 500® are registered trademarks of Standard & Poor’s Financial Services LLC. The index is unmanaged and includes reinvested dividends. One cannot invest directly in an index, and an index is not representative of the Fund’s portfolio.
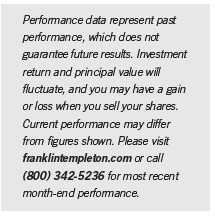
Annual Report | 5
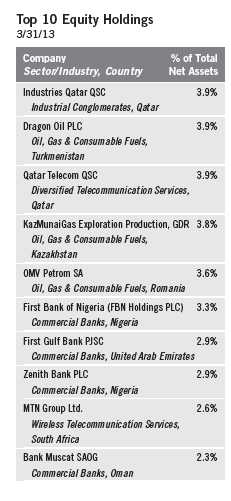
Nigerian stocks overall performed strongly during the 12-month period, driven by the country’s strong economic growth, increased foreign fund inflows and an improved regulatory environment. Nigerian banking stocks staged a sharp rally during the period as they benefited from the structural reforms the government implemented in 2009 and 2010. First Bank of Nigeria’s and United Bank for Africa’s stocks delivered triple-digit gains and Zenith Bank’s stock generated high double-digit gains. Favorable rating actions and comments from independent credit rating agencies S&P, Moody’s Investors Service and Fitch regarding Nigeria’s and its banks’ long-term credit ratings and outlooks further supported banking stocks. In November, S&P upgraded Nigeria’s long-term sovereign credit rating, citing the country’s improved financial stability, reform momentum and expected strong economic growth. In March, S&P commented that Nigeria’s political stability and economic growth following a loan clean-up by a government-created company to buy non-performing loans from the country’s banks, as well as increasing competition and relatively clean balance sheets, will likely boost the banking sector’s expansion in 2013. We maintained our favorable view of Nigeria’s banking sector because of robust deposit growth, lower non-performing loans and valuations we considered to be attractive, leading us to increase the Fund’s holdings in First Bank of Nigeria, Zenith Bank and United Bank for Africa during the period.
In contrast, key detractors from the Fund’s absolute performance included Kazakhstan-based Kazakhmys, one of the world’s leading natural resources groups and lowest-cost copper producers; Ferrexpo, a new holding and one of the top global iron ore companies by reserves, with its main assets located in Ukraine; and Pacific Rubiales Energy, Colombia’s largest independent oil and gas exploration and production company.These companies’ share prices declined along with those of many metals and mining companies and energy companies as investor concerns about slowing global economic growth led to overall commodity price weakness. Further pressuring Kazakhmys’ share price was the company’s dividend reduction and 2012 loss resulting from lower copper prices, higher production costs and a write-off in the value of the company’s shares in ENRC (Eurasian Natural Resources Corp.). In our longer term view, Kazakhmys remained fundamentally attractive, and we used the price decline as an opportunity to add to our investment in the company. General iron ore market weakness and weak corporate results stemming from lower iron ore prices and higher raw material costs drove Ferrexpo’s share price lower. We maintained a long-term positive view of the company because of its upcoming growth projects, strong management and what we considered
6 | Annual Report
to be its attractive valuations and healthy balance sheet. As a result, we sought to take advantage of the stock price correction to increase the Fund’s holdings in Ferrexpo at prices we considered to be more attractive. Lower oil prices, higher production costs and weaker-than-expected 2012 production growth hurt Pacific Rubiales’ share price. In our assessment, the company’s implementation of cost-cutting measures that could lower production costs and its target to double production in the next three to four years could potentially strengthen its long-term profit growth potential. Pacific Rubiales remained attractively valued, in our view, leading us to increase the Fund’s position in the company during the period.
Substantial portfolio inflows and our continued search for investment opportunities we considered to be attractively valued led us to increase the Fund’s holdings in most markets. We undertook some of the largest additions in Qatar, Saudi Arabia, Romania and Kazakhstan and made some purchases in Nigeria, Ukraine and Colombia. As a result, we increased the Fund’s investments in diversified banking, oil and gas, chemicals, metals and mining, and diversified telecommunication services companies. Key purchases included a new position in Romania-based Petrom (OMV Petrom), Southeastern Europe’s largest oil and gas group, as well as additional investments in Dragon Oil, an independent oil company operating oilfields in the Caspian Sea off the shores of Turkmenistan, and Qtel (Qatar Telecom), Qatar’s primary telecommunication services provider with operations in the Middle East, North Africa and Southeast Asia.
Conversely, we undertook some sales as certain stocks reached their price targets and as we identified companies we considered to be more attractively valued within our investment universe. As a result, we eliminated the Fund’s exposure to real estate management and development companies and trimmed investments in casinos and gaming, agricultural products and wireless telecommunication services companies. Key sales included Emaar Properties, a Gulf region real estate developer based in the United Arab Emirates, and Orascom TMT (Telecom Media and Technology) Holding, an Egypt-based media and telecommunications holding company. We also reduced the Fund’s position in NagaCorp, an integrated hotel and casino operator with an exclusive license in the Cambodian capital of Phnom Penh.
Annual Report | 7
Thank you for your continued participation in Templeton Frontier Markets Fund. We look forward to serving your future investment needs.
The foregoing information reflects our analysis, opinions and portfolio holdings as of March 31, 2013, the end of the
reporting period. The way we implement our main investment strategies and the resulting portfolio holdings may
change depending on factors such as market and economic conditions. These opinions may not be relied upon as
investment advice or an offer for a particular security. The information is not a complete analysis of every aspect of
any market, country, industry, security or the Fund. Statements of fact are from sources considered reliable, but the
investment manager makes no representation or warranty as to their completeness or accuracy. Although historical
performance is no guarantee of future results, these insights may help you understand our investment management
philosophy.
8 | Annual Report
Performance Summary as of 3/31/13
Your dividend income will vary depending on dividends or interest paid by securities in the Fund’s
portfolio, adjusted for operating expenses of each class. Capital gain distributions are net profits
realized from the sale of portfolio securities. The performance table and graphs do not reflect any
taxes that a shareholder would pay on Fund dividends, capital gain distributions, if any, or any
realized gains on the sale of Fund shares. Total return reflects reinvestment of the Fund’s dividends
and capital gain distributions, if any, and any unrealized gains or losses.
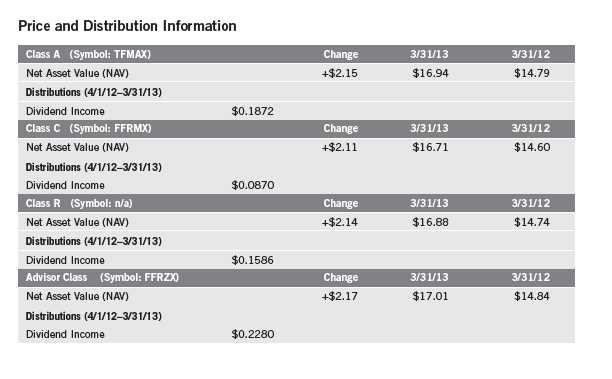
Annual Report | 9
Performance Summary (continued)
Performance1
Cumulative total return excludes sales charges. Average annual total return and value of $10,000 investment include
maximum sales charges. Class A: 5.75% maximum initial sales charge; Class C: 1% contingent deferred sales charge
in first year only; Class R/Advisor Class: no sales charges.

Performance data represent past performance, which does not guarantee future results. Investment return and principal
value will fluctuate, and you may have a gain or loss when you sell your shares. Current performance may differ from
figures shown. For most recent month-end performance, go to franklintempleton.com or call (800) 342-5236.
The investment manager and administrator have contractually agreed to waive or assume certain expenses so that common
expenses (excluding Rule 12b-1 fees and acquired fund fees and expenses) for each class of the Fund do not exceed
1.85% (other than certain nonroutine expenses) until 4/30/14.
10 | Annual Report
Performance Summary (continued)
Total Return Index Comparison for a Hypothetical $10,000 Investment1
Total return represents the change in value of an investment over the periods shown. It includes
any applicable maximum sales charge, Fund expenses, account fees and reinvested distributions.
The unmanaged indexes include reinvestment of any income or distributions. They differ from the
Fund in composition and do not pay management fees or expenses. One cannot invest directly in
an index.

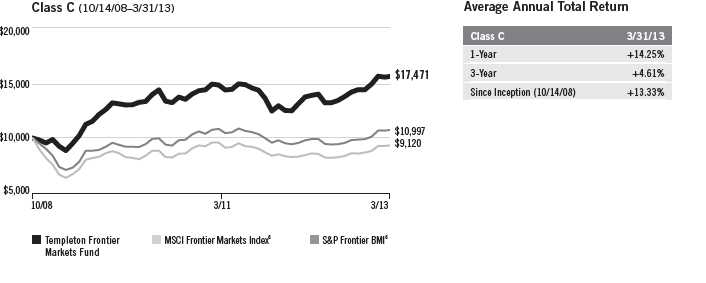
Annual Report | 11

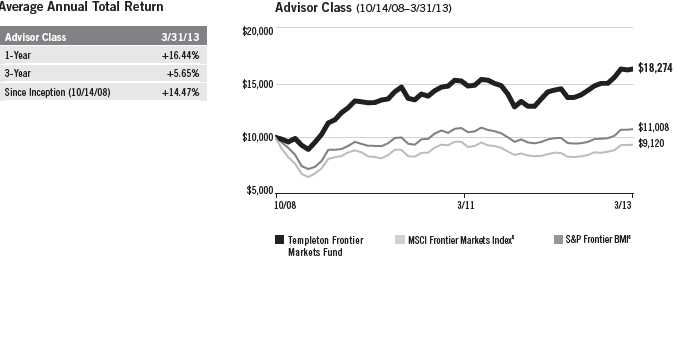
12 | Annual Report
Performance Summary (continued)
Endnotes
All investments involve risks, including possible loss of principal. Special risks are associated with foreign investing, including currency fluctuations, economic instability and political developments. Investments in emerging market countries, of which frontier markets are a subset, involve heightened risks related to the same factors, in addition to those associated with these markets’ smaller size, lesser liquidity and lack of established legal, political, business and social frameworks to support securities markets. The Fund’s ability to invest in smaller company securities that may have limited liquidity involves additional risks, such as relatively small revenues, limited product lines and small market share. Historically, these stocks have exhibited greater price volatility than larger company stocks, especially over the short term. Because the Fund is nondiversified and may invest a greater portion of its assets in the securities of one issuer than a diversified fund, it may be more sensitive to economic, business, political or other changes affecting similar issuers or securities. All investments in the Fund should be thought of as long-term investments that could experience significant price volatility in any given year. The Fund is designed for the aggressive portion of a well-diversified portfolio. The Fund is actively managed but there is no guarantee that the manager’s investment decisions will produce the desired results. The Fund’s prospectus also includes a description of the main investment risks.
| |
Class C: Class R: | These shares have higher annual fees and expenses than Class A shares. Shares are available to certain eligible investors as described in the prospectus. These shares have higher annual fees and expenses than Class A shares. |
Advisor Class: | Shares are available to certain eligible investors as described in the prospectus. |
1. Fund investment results reflect the expense reduction, without which the results would have been lower.
2. Cumulative total return represents the change in value of an investment over the periods indicated.
3. Average annual total return represents the average annual change in value of an investment over the periods indicated.
4. These figures represent the value of a hypothetical $10,000 investment in the Fund over the periods indicated.
5. Figures are as stated in the Fund’s prospectus current as of the date of this report. In periods of market volatility, assets may decline significantly,
causing total annual Fund operating expenses to become higher than the figures shown.
6. Source: © 2013 Morningstar. The MSCI Frontier Markets Index is a free float-adjusted, market capitalization-weighted index designed to measure
equity market performance in frontier markets. The S&P Frontier BMI is a free float-adjusted, market capitalization-weighted index designed to
measure equity performance of relatively small and illiquid frontier market securities. Due to data availability, performance for the S&P Frontier BMI
is shown starting 11/3/08 using the Fund’s value on that date.
Annual Report | 13
Your Fund’s Expenses
As a Fund shareholder, you can incur two types of costs:
- Transaction costs, including sales charges (loads) on Fund purchases; and
- Ongoing Fund costs, including management fees, distribution and service (12b-1) fees, and other Fund expenses. All mutual funds have ongoing costs, sometimes referred to as operating expenses.
The following table shows ongoing costs of investing in the Fund and can help you understand these costs and compare them with those of other mutual funds. The table assumes a $1,000 investment held for the six months indicated.
Actual Fund Expenses
The first line (Actual) for each share class listed in the table provides actual account values and expenses. The “Ending Account Value” is derived from the Fund’s actual return, which includes the effect of Fund expenses.
You can estimate the expenses you paid during the period by following these steps. Of course, your account value and expenses will differ from those in this illustration:
| 1. | Divide your account value by $1,000. |
| | If an account had an $8,600 value, then $8,600 ÷ $1,000 = 8.6. |
| 2. | Multiply the result by the number under the heading “Expenses Paid During Period.” |
| | If Expenses Paid During Period were $7.50, then 8.6 x $7.50 = $64.50. |
In this illustration, the estimated expenses paid this period are $64.50.
Hypothetical Example for Comparison with Other Funds
Information in the second line (Hypothetical) for each class in the table can help you compare ongoing costs of investing in the Fund with those of other mutual funds. This information may not be used to estimate the actual ending account balance or expenses you paid during the period. The hypothetical “Ending Account Value” is based on the actual expense ratio for each class and an assumed 5% annual rate of return before expenses, which does not represent the Fund’s actual return. The figure under the heading “Expenses Paid During Period” shows the hypothetical expenses your account would have incurred under this scenario. You can compare this figure with the 5% hypothetical examples that appear in shareholder reports of other funds.
14 | Annual Report
Your Fund’s Expenses (continued)
Please note that expenses shown in the table are meant to highlight ongoing costs and do not reflect
any transaction costs, such as sales charges. Therefore, the second line for each class is useful in
comparing ongoing costs only, and will not help you compare total costs of owning different
funds. In addition, if transaction costs were included, your total costs would have been higher.
Please refer to the Fund prospectus for additional information on operating expenses.

*Expenses are calculated using the most recent six-month expense ratio, annualized for each class (A: 2.12%; C: 2.82%; R: 2.32%; and
Advisor: 1.82%), multiplied by the average account value over the period, multiplied by 182/365 to reflect the one-half year period.
Annual Report | 15
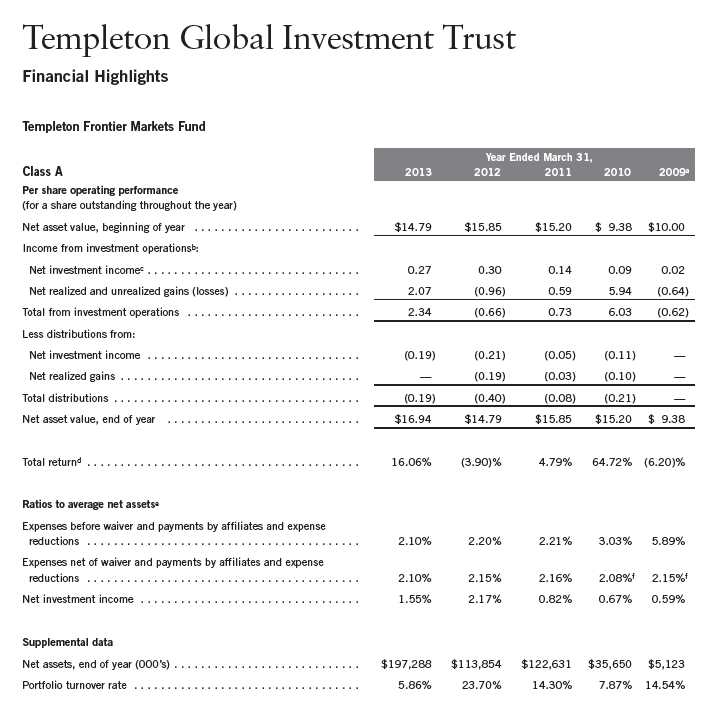
aFor the period October 14, 2008 (commencement of operations) to March 31, 2009.
bThe amount shown for a share outstanding throughout the period may not correlate with the Statement of Operations for the period due to the timing of sales and repurchases of
the Fund shares in relation to income earned and/or fluctuating market value of the investments of the Fund.
cBased on average daily shares outstanding.
dTotal return does not reflect sales commissions or contingent deferred sales charges, if applicable, and is not annualized for periods less than one year.
eRatios are annualized for periods less than one year.
fBenefit of expense reduction rounds to less than 0.01%.
16 | The accompanying notes are an integral part of these financial statements. | Annual Report
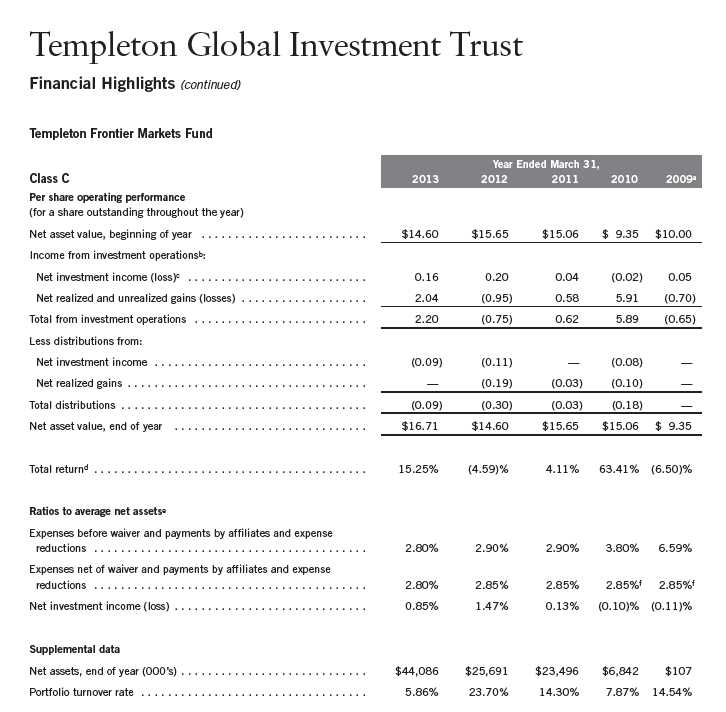
aFor the period October 14, 2008 (commencement of operations) to March 31, 2009.
bThe amount shown for a share outstanding throughout the period may not correlate with the Statement of Operations for the period due to the timing of sales and repurchases of
the Fund shares in relation to income earned and/or fluctuating market value of the investments of the Fund.
cBased on average daily shares outstanding.
dTotal return does not reflect sales commissions or contingent deferred sales charges, if applicable, and is not annualized for periods less than one year.
eRatios are annualized for periods less than one year.
fBenefit of expense reduction rounds to less than 0.01%.
Annual Report | The accompanying notes are an integral part of these financial statements. | 17

aFor the period October 14, 2008 (commencement of operations) to March 31, 2009.
bThe amount shown for a share outstanding throughout the period may not correlate with the Statement of Operations for the period due to the timing of sales and repurchases of
the Fund shares in relation to income earned and/or fluctuating market value of the investments of the Fund.
cBased on average daily shares outstanding.
dTotal return does not reflect sales commissions or contingent deferred sales charges, if applicable, and is not annualized for periods less than one year.
eRatios are annualized for periods less than one year.
fBenefit of expense reduction rounds to less than 0.01%.
18 | The accompanying notes are an integral part of these financial statements. | Annual Report
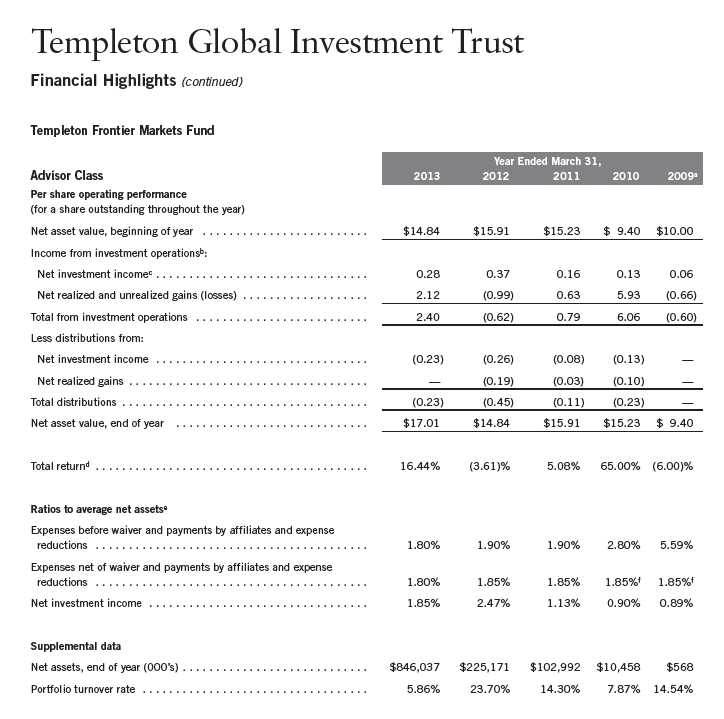
aFor the period October 14, 2008 (commencement of operations) to March 31, 2009.
bThe amount shown for a share outstanding throughout the period may not correlate with the Statement of Operations for the period due to the timing of sales and repurchases of
the Fund shares in relation to income earned and/or fluctuating market value of the investments of the Fund.
cBased on average daily shares outstanding.
dTotal return is not annualized for periods less than one year.
eRatios are annualized for periods less than one year.
fBenefit of expense reduction rounds to less than 0.01%.
Annual Report | The accompanying notes are an integral part of these financial statements. | 19
Templeton Global Investment Trust
Statement of Investments, March 31, 2013

20 | Annual Report
Templeton Global Investment Trust
Statement of Investments, March 31, 2013 (continued)
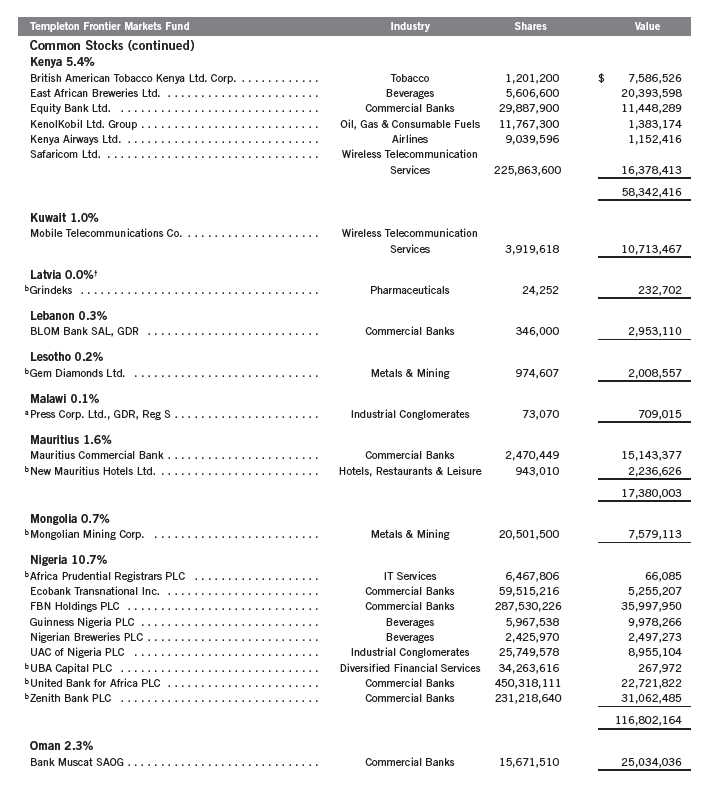
Annual Report | 21

22 | Annual Report
Templeton Global Investment Trust
Statement of Investments, March 31, 2013 (continued)

Annual Report | 23
Templeton Global Investment Trust
Statement of Investments, March 31, 2013 (continued)
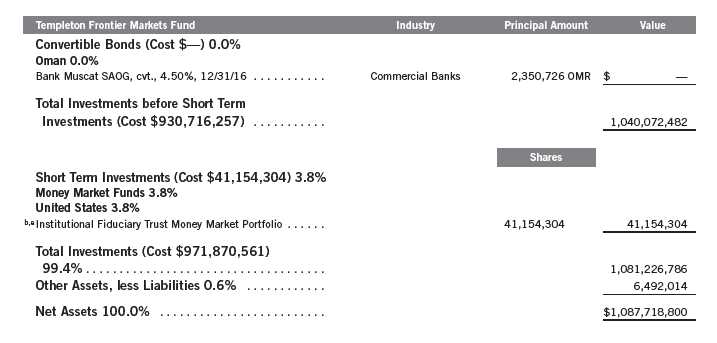
See Abbreviations on page 40.
†Rounds to less than 0.1% of net assets.
aSecurity was purchased pursuant to Regulation S under the Securities Act of 1933, which exempts from registration securities offered and sold outside of the United States. Such
a security cannot be sold in the United States without either an effective registration statement filed pursuant to the Securities Act of 1933, or pursuant to an exemption from
registration. These securities have been deemed liquid under guidelines approved by the Trust’s Board of Trustees. At March 31, 2013, the aggregate value of these securities was
$30,806,349, representing 2.83% of net assets.
bNon-income producing.
cSecurity was purchased pursuant to Rule 144A under the Securities Act of 1933 and may be sold in transactions exempt from registration only to qualified institutional buyers or in
a public offering registered under the Securities Act of 1933. These securities have been deemed liquid under guidelines approved by the Trust’s Board of Trustees. At March 31,
2013, the aggregate value of these securities was $28,091,924, representing 2.58% of net assets.
dSee Note 1(c) regarding Participatory Notes.
eSee Note 7 regarding investments in the Institutional Fiduciary Trust Money Market Portfolio.
24 | The accompanying notes are an integral part of these financial statements. | Annual Report
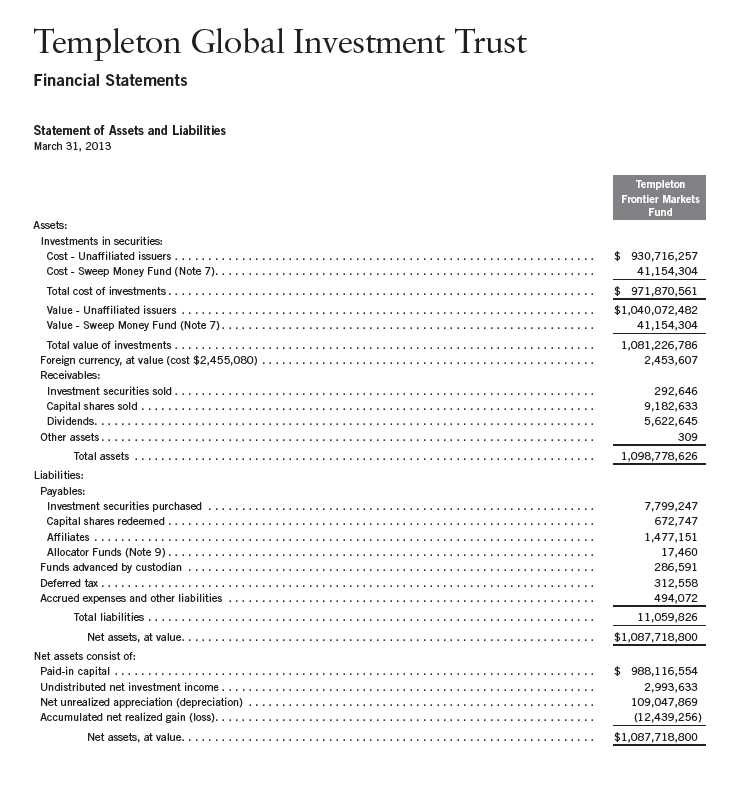
Annual Report | The accompanying notes are an integral part of these financial statements. | 25
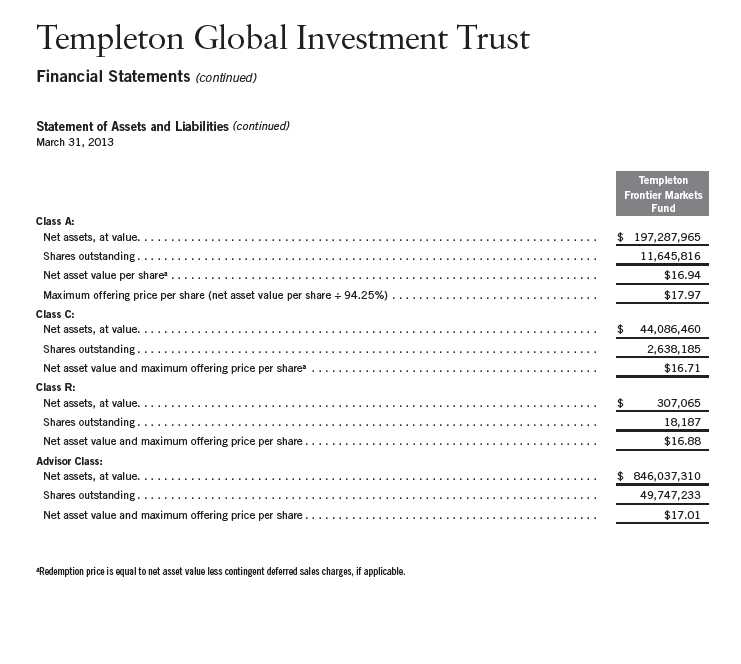
26 | The accompanying notes are an integral part of these financial statements. | Annual Report
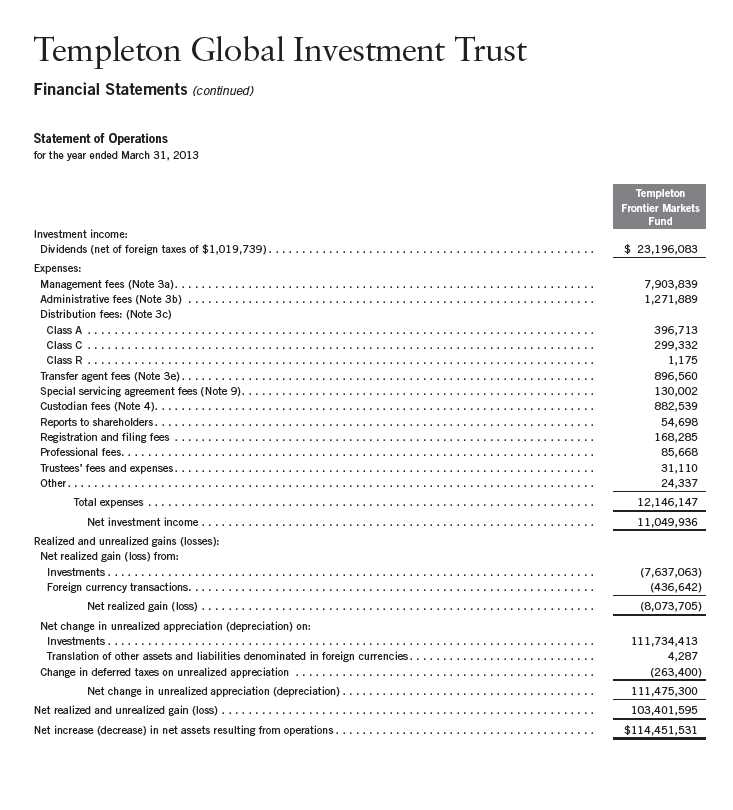
Annual Report | The accompanying notes are an integral part of these financial statements. | 27
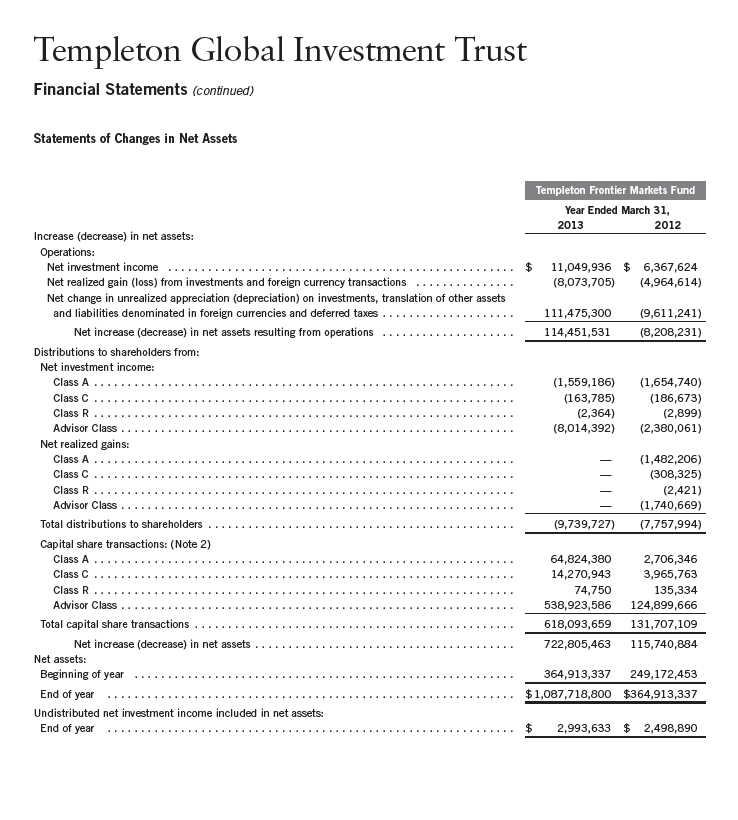
28 | The accompanying notes are an integral part of these financial statements. | Annual Report
Templeton Global Investment Trust
Notes to Financial Statements
Templeton Frontier Markets Fund
1. ORGANIZATION AND SIGNIFICANT ACCOUNTING POLICIES
Templeton Global Investment Trust (Trust) is registered under the Investment Company Act of 1940, as amended, (1940 Act) as an open-end investment company, consisting of six separate funds. The Templeton Frontier Markets Fund (Fund) is included in this report. The financial statements of the remaining funds in the Trust are presented separately. The Fund offers four classes of shares: Class A, Class C, Class R, and Advisor Class. Effective May 1, 2013, the Fund began offering a new class of shares, Class R6. Each class of shares differs by its initial sales load, contingent deferred sales charges, voting rights on matters affecting a single class, its exchange privilege and fees primarily due to differing arrangements for distribution and transfer agent fees. On May 21, 2013, the Board of Trustees (the Board) approved the proposal to close the Fund to new investors. Existing shareholders and select retirement plans can continue adding to their accounts. The effective date of the closure is June 28, 2013.
The following summarizes the Fund’s significant accounting policies.
a. Financial Instrument Valuation
The Fund’s investments in financial instruments are carried at fair value daily. Fair value is the price that would be received to sell an asset or paid to transfer a liability in an orderly transaction between market participants on the measurement date. Under procedures approved by the Board, the Fund’s administrator, investment manager and other affiliates have formed the Valuation and Liquidity Oversight Committee (VLOC). The VLOC provides administration and oversight of the Fund’s valuation policies and procedures, which are approved annually by the Board. Among other things, these procedures allow the Fund to utilize independent pricing services, quotations from securities and financial instrument dealers, and other market sources to determine fair value.
Equity securities listed on an exchange or on the NASDAQ National Market System are valued at the last quoted sale price or the official closing price of the day, respectively. Foreign equity securities are valued as of the close of trading on the foreign stock exchange on which the security is primarily traded, or the NYSE, whichever is earlier. The value is then converted into its U.S. dollar equivalent at the foreign exchange rate in effect at the close of the NYSE on the day that the value of the security is determined. Over-the-counter (OTC) securities are valued within the range of the most recent quoted bid and ask prices. Securities that trade in multiple markets or on multiple exchanges are valued according to the broadest and most representative market. Certain equity securities are valued based upon fundamental characteristics or relationships to similar securities. Investments in open-end mutual funds are valued at the closing net asset value.
Debt securities generally trade in the OTC market rather than on a securities exchange. The Fund’s pricing services use multiple valuation techniques to determine fair value. In instances where sufficient market activity exists, the pricing services may utilize a market-based approach through which quotes from market makers are used to determine fair value. In instances where sufficient market activity may not exist or is limited, the pricing services also utilize proprietary
Annual Report | 29
Templeton Global Investment Trust
Notes to Financial Statements (continued)
Templeton Frontier Markets Fund
| 1. | ORGANIZATION AND SIGNIFICANT ACCOUNTING POLICIES (continued) |
| a. | Financial Instrument Valuation (continued) |
valuation models which may consider market characteristics such as benchmark yield curves, credit spreads, estimated default rates, anticipated market interest rate volatility, coupon rates, anticipated timing of principal repayments, underlying collateral, and other unique security features in order to estimate the relevant cash flows, which are then discounted to calculate the fair value. Securities denominated in a foreign currency are converted into their U.S. dollar equivalent at the foreign exchange rate in effect at the close of the NYSE on the date that the values of the foreign debt securities are determined.
The Fund has procedures to determine the fair value of financial instruments for which market prices are not reliable or readily available. Under these procedures, the VLOC convenes on a regular basis to review such financial instruments and considers a number of factors, including significant unobservable valuation inputs, when arriving at fair value. The VLOC primarily employs a market-based approach which may use related or comparable assets or liabilities, recent transactions, market multiples, book values, and other relevant information for the investment to determine the fair value of the investment. An income-based valuation approach may also be used in which the anticipated future cash flows of the investment are discounted to calculate fair value. Discounts may also be applied due to the nature or duration of any restrictions on the disposition of the investments. Due to the inherent uncertainty of valuations of such investments, the fair values may differ significantly from the values that would have been used had an active market existed. The VLOC employs various methods for calibrating these valuation approaches including a regular review of key inputs and assumptions, transactional back-testing or disposition analysis, and reviews of any related market activity.
Trading in securities on foreign securities stock exchanges and OTC markets may be completed before the daily close of business on the NYSE. Occasionally, events occur between the time at which trading in a foreign security is completed and the close of the NYSE that might call into question the reliability of the value of a portfolio security held by the Fund. As a result, differences may arise between the value of the Fund’s portfolio securities as determined at the foreign market close and the latest indications of value at the close of the NYSE. In order to minimize the potential for these differences, the VLOC monitors price movements following the close of trading in foreign stock markets through a series of country specific market proxies (such as baskets of American Depositary Receipts, futures contracts and exchange traded funds). These price movements are measured against established trigger thresholds for each specific market proxy to assist in determining if an event has occurred that may call into question the reliability of the values of the foreign securities held by the Fund. If such an event occurs, the securities may be valued using fair value procedures, which may include the use of independent pricing services.
In addition, certain foreign markets may be open on days that the NYSE is closed, which could result in differences between the value of the Fund’s portfolio securities on the last business day
30 | Annual Report
Templeton Global Investment Trust
Notes to Financial Statements (continued)
Templeton Frontier Markets Fund
| 1. | ORGANIZATION AND SIGNIFICANT ACCOUNTING POLICIES (continued) |
| a. | Financial Instrument Valuation (continued) |
and the last calendar day of the reporting period. Any significant security valuation changes due to an open foreign market are adjusted and reflected by the Fund for financial reporting purposes. The Fund’s financial statements have been adjusted to reflect investment values as of March 31, 2013.
b. Foreign Currency Translation
Portfolio securities and other assets and liabilities denominated in foreign currencies are translated into U.S. dollars based on the exchange rate of such currencies against U.S. dollars on the date of valuation. The Fund may enter into foreign currency exchange contracts to facilitate transactions denominated in a foreign currency. Purchases and sales of securities, income and expense items denominated in foreign currencies are translated into U.S. dollars at the exchange rate in effect on the transaction date. Portfolio securities and assets and liabilities denominated in foreign currencies contain risks that those currencies will decline in value relative to the U.S. dollar. Occasionally, events may impact the availability or reliability of foreign exchange rates used to convert the U.S. dollar equivalent value. If such an event occurs, the foreign exchange rate will be valued at fair value using procedures established and approved by the Board.
The Fund does not separately report the effect of changes in foreign exchange rates from changes in market prices on securities held. Such changes are included in net realized and unrealized gain or loss from investments on the Statement of Operations.
Realized foreign exchange gains or losses arise from sales of foreign currencies, currency gains or losses realized between the trade and settlement dates on securities transactions and the difference between the recorded amounts of dividends, interest, and foreign withholding taxes and the U.S. dollar equivalent of the amounts actually received or paid. Net unrealized foreign exchange gains and losses arise from changes in foreign exchange rates on foreign denominated assets and liabilities other than investments in securities held at the end of the reporting period.
c. Participatory Notes
The Fund invests in Participatory Notes (P-Notes). P-notes are promissory notes that are designed to offer a return linked to the performance of a particular underlying equity security or market. P-Notes are issued by banks or broker-dealers and allow the fund to gain exposure to common stocks in markets where direct investment is not allowed. Income received from P-Notes is recorded as dividend income in the Statement of Operations. P-Notes may contain various risks including the potential inability of the counterparty to fulfill their obligations under the terms of the contract. These securities may be more volatile and less liquid than other investments held by the Fund.
Annual Report | 31
Templeton Global Investment Trust
Notes to Financial Statements (continued)
Templeton Frontier Markets Fund
| 1. | ORGANIZATION AND SIGNIFICANT ACCOUNTING POLICIES (continued) |
| d. | Income and Deferred Taxes |
It is the Fund’s policy to qualify as a regulated investment company under the Internal Revenue Code. The Fund intends to distribute to shareholders substantially all of its taxable income and net realized gains to relieve it from federal income and excise taxes. As a result, no provision for U.S. federal income taxes is required.
The Fund may be subject to foreign taxation related to income received, capital gains on the sale of securities and certain foreign currency transactions in the foreign jurisdictions in which it invests. Foreign taxes, if any, are recorded based on the tax regulations and rates that exist in the foreign markets in which the Fund invests. When a capital gain tax is determined to apply the Fund records an estimated deferred tax liability in an amount that would be payable if the securities were disposed of on the valuation date.
The Fund recognizes the tax benefits of uncertain tax positions only when the position is “more likely than not” to be sustained upon examination by the tax authorities based on the technical merits of the tax position. As of March 31, 2013, and for all open tax years, the Fund has determined that no liability for unrecognized tax benefits is required in the Fund’s financial statements related to uncertain tax positions taken on a tax return (or expected to be taken on future tax returns). Open tax years are those that remain subject to examination and are based on each tax jurisdiction statute of limitation.
e. Security Transactions, Investment Income, Expenses and Distributions
Security transactions are accounted for on trade date. Realized gains and losses on security transactions are determined on a specific identification basis. Estimated expenses are accrued daily. Dividend income is recorded on the ex-dividend date except that certain dividends from foreign securities are recognized as soon as the Fund is notified of the ex-dividend date. Distributions to shareholders are recorded on the ex-dividend date and are determined according to income tax regulations (tax basis). Distributable earnings determined on a tax basis may differ from earnings recorded in accordance with accounting principles generally accepted in the United States of America. These differences may be permanent or temporary. Permanent differences are reclassified among capital accounts to reflect their tax character. These reclassifications have no impact on net assets or the results of operations. Temporary differences are not reclassified, as they may reverse in subsequent periods.
Common expenses incurred by the Trust are allocated among the funds based on the ratio of net assets of each fund to the combined net assets of the Trust. Fund specific expenses are charged directly to the fund that incurred the expense.
32 | Annual Report
Templeton Global Investment Trust
Notes to Financial Statements (continued)
Templeton Frontier Markets Fund
| 1. | ORGANIZATION AND SIGNIFICANT ACCOUNTING POLICIES (continued) |
| e. | Security Transactions, Investment Income, Expenses and Distributions (continued) |
Realized and unrealized gains and losses and net investment income, not including class specific expenses, are allocated daily to each class of shares based upon the relative proportion of net assets of each class. Differences in per share distributions, by class, are generally due to differences in class specific expenses.
f. Accounting Estimates
The preparation of financial statements in accordance with accounting principles generally accepted in the United States of America requires management to make estimates and assumptions that affect the reported amounts of assets and liabilities at the date of the financial statements and the amounts of income and expenses during the reporting period. Actual results could differ from those estimates.
g. Guarantees and Indemnifications
Under the Trust’s organizational documents, its officers and trustees are indemnified by the Trust against certain liabilities arising out of the performance of their duties to the Trust. Additionally, in the normal course of business, the Trust, on behalf of the Fund, enters into contracts with service providers that contain general indemnification clauses. The Trust’s maximum exposure under these arrangements is unknown as this would involve future claims that may be made against the Trust that have not yet occurred. Currently, the Trust expects the risk of loss to be remote.
2. SHARES OF BENEFICIAL INTEREST
At March 31, 2013, there were an unlimited number of shares authorized ($0.01 par value).
Transactions in the Fund’s shares were as follows:

Annual Report | 33
Templeton Global Investment Trust
Notes to Financial Statements (continued)

3. TRANSACTIONS WITH AFFILIATES
Franklin Resources, Inc. is the holding company for various subsidiaries that together are referred
to as Franklin Templeton Investments. Certain officers and trustees of the Trust are also officers
and/or directors of the following subsidiaries:

The Fund pays an investment management fee to TAML based on the average daily net assets of
the Fund as follows:
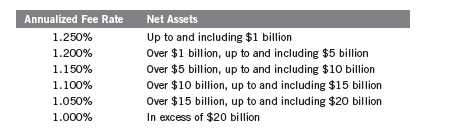
34 | Annual Report
Templeton Global Investment Trust
Notes to Financial Statements (continued)
Templeton Frontier Markets Fund
| 3. | TRANSACTIONS WITH AFFILIATES (continued) |
| b. | Administrative Fees |
The Fund pays an administrative fee to FT Services of 0.20% per year of the average daily net assets of the Fund.
On February 26, 2013, the Board approved the proposal to combine the Fund’s investment management and administration agreements. The fees to be paid under the new combined agreement will not exceed the aggregate fees that would have been paid under the separate agreements. The new agreement went into effect on May 1, 2013.
c. Distribution Fees
The Board has adopted distribution plans for each share class, with the exception of Advisor Class shares, pursuant to Rule 12b-1 under the 1940 Act. Distribution fees are not charged on shares held by affiliates. Under the Fund’s Class A reimbursement distribution plan, the Fund reimburses Distributors for costs incurred in connection with the servicing, sale and distribution of the Fund’s shares up to the maximum annual plan rate. Under the Class A reimbursement distribution plan, costs exceeding the maximum for the current plan year cannot be reimbursed in subsequent periods. In addition, under the Fund’s Class C and R compensation distribution plans, the Fund pays Distributors for costs incurred in connection with the servicing, sale and distribution of the Fund’s shares up to the maximum annual plan rate for each class.
The maximum annual plan rates, based on the average daily net assets, for each class, are as follows:
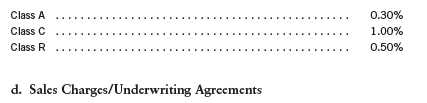
Front-end sales charges and contingent deferred sales charges (CDSC) do not represent expenses of the Fund. These charges are deducted from the proceeds of sales of Fund shares prior to investment or from redemption proceeds prior to remittance, as applicable. Distributors has advised the Fund of the following commission transactions related to the sales and redemptions of the Fund’s shares for the year:

Annual Report | 35
Templeton Global Investment Trust
Notes to Financial Statements (continued)
Templeton Frontier Markets Fund
| 3. | TRANSACTIONS WITH AFFILIATES (continued) |
| e. | Transfer Agent Fees |
Each class of shares, except for the R6 share class, pays transfer agent fees to Investor Services for its performance of shareholder servicing obligations and reimburses Investor Services for out of pocket expenses incurred, including shareholding servicing fees paid to third parties. These fees are allocated daily to such classes based upon the relative proportion of net assets. The R6 share class pays Investor Services transfer agent fees specific to that class.
For the year ended March 31, 2013, the Fund paid transfer agent fees of $896,560, of which $358,785 was retained by Investor Services.
f. Waiver and Expense Reimbursements
TAML and FT Services have contractually agreed in advance to waive or limit their respective fees and to assume as their own expense certain expenses otherwise payable by the Fund so that the expenses (excluding distribution fees, and acquired fund fees and expenses) for Class A, Class C, Class R and Advisor Class of the Fund do not exceed 1.85%, and Class R6 does not exceed 1.69% (other than certain non-routine expenses or costs, including those relating to litigation, indemnification, reorganizations, and liquidations) until April 30, 2014. There were no expenses waived during the year ended March 31, 2013.
4. EXPENSE OFFSET ARRANGEMENT
The Fund has entered into an arrangement with its custodian whereby credits realized as a result of uninvested cash balances are used to reduce a portion of the Fund’s custodian expenses. During the year ended March 31, 2013, there were no credits earned.
5. INCOME TAXES
For tax purposes, capital losses may be carried over to offset future capital gains, if any. At March 31, 2013, the Fund had long-term capital loss carryforwards of $12,270,633.
The tax character of distributions paid during the years ended March 31, 2013 and 2012, was as follows:
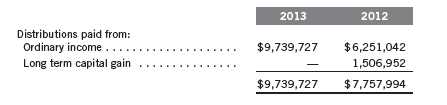
36 | Annual Report
Templeton Global Investment Trust
Notes to Financial Statements (continued)
Templeton Frontier Markets Fund
5. INCOME TAXES (continued)
At March 31, 2013, the cost of investments, net unrealized appreciation (depreciation) and undistributed ordinary income for income tax purposes were as follows:

Differences between income and/or capital gains as determined on a book basis and a tax basis are primarily due to differing treatments of foreign capital gain tax, passive foreign investment company shares and corporate actions.
6. INVESTMENT TRANSACTIONS
Purchases and sales of investments (excluding short term securities) for the year ended March 31, 2013, aggregated $625,436,118 and $35,858,888, respectively.
7. INVESTMENTS IN INSTITUTIONAL FIDUCIARY TRUST MONEY MARKET PORTFOLIO
The Fund invests in the Institutional Fiduciary Trust Money Market Portfolio (Sweep Money Fund), an open-end investment company managed by Franklin Advisers, Inc. (an affiliate of the investment manager). Management fees paid by the Fund are reduced on assets invested in the Sweep Money Fund, in an amount not to exceed the management and administrative fees paid by the Sweep Money Fund.
8. CONCENTRATION OF RISK
Investing in foreign securities may include certain risks and considerations not typically associated with investing in U.S. securities, such as fluctuating currency values and changing local and regional economic, political and social conditions, which may result in greater market volatility. In addition, certain foreign securities may not be as liquid as U.S. securities.
9. SPECIAL SERVICING AGREEMENT
On May 1, 2012, the Fund, which is an eligible underlying investment of one or more of the Franklin Templeton Fund Allocator Series Funds (Allocator Funds), entered into a Special Servicing Agreement (SSA) with the Allocator Funds and certain service providers of the Fund
Annual Report | 37
Templeton Global Investment Trust
Notes to Financial Statements (continued)
Templeton Frontier Markets Fund
9. SPECIAL SERVICING AGREEMENT (continued)
and the Allocator Funds. Under the SSA, the Fund may pay a portion of the Allocator Funds’ expenses (other than any asset allocation, administrative, and distribution fees) to the extent such payments are less than the amount of the benefits realized or expected to be realized by the Fund (e.g., due to reduced costs associated with servicing accounts) from the investment in the Fund by the Allocator Funds. The Allocator Funds are either managed by Franklin Advisers, Inc. or administered by FT Services, affiliates of TAML. For the year ended March 31, 2013, the Fund was held by one or more of the Allocator Funds and the amount of expenses borne by the Fund is noted in the Statement of Operations. At March 31, 2013, 12.73% of the Fund’s outstanding shares was held by one or more of the Allocator Funds. Effective May 1, 2013, the SSA was discontinued until further notice and approval by the Board.
10. CREDIT FACILITY
The Fund, together with other U.S. registered and foreign investment funds (collectively, Borrowers), managed by Franklin Templeton Investments, are borrowers in a joint syndicated senior unsecured credit facility totaling $1.5 billion (Global Credit Facility) which matures on January 17, 2014. This Global Credit Facility provides a source of funds to the Borrowers for temporary and emergency purposes, including the ability to meet future unanticipated or unusually large redemption requests.
Under the terms of the Global Credit Facility, the Fund shall, in addition to interest charged on any borrowings made by the Fund and other costs incurred by the Fund, pay its share of fees and expenses incurred in connection with the implementation and maintenance of the Global Credit Facility, based upon its relative share of the aggregate net assets of all of the Borrowers, including an annual commitment fee of 0.07% based upon the unused portion of the Global Credit Facility. These fees are reflected in other expenses on the Statement of Operations. During the year ended March 31, 2013, the Fund did not use the Global Credit Facility.
11. FAIR VALUE MEASUREMENTS
The Fund follows a fair value hierarchy that distinguishes between market data obtained from independent sources (observable inputs) and the Fund’s own market assumptions (unobservable inputs). These inputs are used in determining the value of the Fund’s financial instruments and are summarized in the following fair value hierarchy:
- Level 1 – quoted prices in active markets for identical financial instruments
- Level 2 – other significant observable inputs (including quoted prices for similar financial instruments, interest rates, prepayment speed, credit risk, etc.)
- Level 3 – significant unobservable inputs (including the Fund’s own assumptions in determining the fair value of financial instruments)
38 | Annual Report
Templeton Global Investment Trust
Notes to Financial Statements (continued)
Templeton Frontier Markets Fund
11. FAIR VALUE MEASUREMENTS (continued)
The inputs or methodology used for valuing financial instruments are not an indication of the risk associated with investing in those financial instruments.
For movements between the levels within the fair value hierarchy, the Fund has adopted a policy of recognizing the transfers as of the date of the underlying event which caused the movement.
A summary of inputs used as of March 31, 2013, in valuing the Fund’s assets carried at fair value, is as follows:

aIncludes common stocks.
bFor detailed categories, see the accompanying Statement of Investments.
cIncludes securities determined to have no value at March 31, 2013.
12. NEW ACCOUNTING PRONOUNCEMENTS
In December 2011, the Financial Accounting Standards Board (FASB) issued Accounting Standards Update (ASU) No. 2011-11, Balance Sheet (Topic 210): Disclosures about Offsetting Assets and Liabilities. The amendments in the ASU enhance disclosures about offsetting of financial assets and liabilities to enable investors to understand the effect of these arrangements on a fund’s financial position. In January 2013, FASB issued ASU No. 2013-01, Balance Sheet (Topic 210): Clarifying the Scope of Disclosures about Offsetting Assets and Liabilities. The amendments in ASU No. 2013-01 clarify the intended scope of disclosures required by ASU No. 2011-11. These ASUs are effective for interim and annual reporting periods beginning on or after January 1, 2013. The Fund believes the adoption of these ASUs will not have a material impact on its financial statements.
Annual Report | 39
Templeton Global Investment Trust
Notes to Financial Statements (continued)
Templeton Frontier Markets Fund
13. SUBSEQUENT EVENTS
The Fund has evaluated subsequent events through the issuance of the financial statements and determined that no events have occurred that require disclosure other than those already disclosed in the financial statements.
40 | Annual Report
Templeton Global Investment Trust
Report of Independent Registered Public Accounting Firm
To the Board of Trustees and Shareholders of Templeton Frontier Markets Fund
In our opinion, the accompanying statement of assets and liabilities, including the statement of investments, and the related statements of operations and of changes in net assets and the financial highlights present fairly, in all material respects, the financial position of Templeton Frontier Markets Fund (the “Fund”) at March 31, 2013, the results of its operations for the year then ended, the changes in its net assets for each of the two years in the period then ended and the financial highlights for the periods presented, in conformity with accounting principles generally accepted in the United States of America. These financial statements and financial highlights (hereafter referred to as “financial statements”) are the responsibility of the Fund’s management. Our responsibility is to express an opinion on these financial statements based on our audits.
We conducted our audits of these financial statements in accordance with the standards of the Public Company Accounting Oversight Board (United States). Those standards require that we plan and perform the audit to obtain reasonable assurance about whether the financial statements are free of material misstatement. An audit includes examining, on a test basis, evidence supporting the amounts and disclosures in the financial statements, assessing the accounting principles used and significant estimates made by management, and evaluating the overall financial statement presentation. We believe that our audits, which included confirmation of securities at March 31, 2013 by correspondence with the custodian, transfer agent and brokers, provide a reasonable basis for our opinion.
PricewaterhouseCoopers LLP
San Francisco, California
May 22, 2013
Annual Report | 41
Templeton Global Investment Trust
Tax Information (unaudited)
Templeton Frontier Markets Fund
Under Section 854(b)(1)(B) of the Internal Revenue Code (Code), the Fund hereby reports the maximum amount allowable but no less than $6,715,349 as qualified dividends for purposes of the maximum rate under Section 1(h)(11) of the Code for the fiscal year ended March 31, 2013. Distributions, including qualified dividend income, paid during calendar year 2013 will be reported to shareholders on Form 1099-DIV by mid-February 2014. Shareholders are advised to check with their tax advisors for information on the treatment of these amounts on their individual income tax returns.
At March 31, 2012, more than 50% of the Fund’s total assets were invested in securities of foreign issuers. In most instances, foreign taxes were withheld from income paid to the Fund on these investments. As shown in the table below, the Fund hereby reports to shareholders the foreign source income and foreign taxes paid, pursuant to Section 853 of the Code. This written statement will allow shareholders of record on December 7, 2012, to treat their proportionate share of foreign taxes paid by the Fund as having been paid directly by them. The shareholder shall consider these amounts as foreign taxes paid in the tax year in which they receive the Fund distribution.
The following table provides a detailed analysis of foreign tax paid, foreign source income, and foreign qualified dividends as reported by the Fund, to Class A, Class C, Class R, and Advisor Class shareholders of record.

Foreign Tax Paid Per Share (Column 1) is the amount per share available to you, as a tax credit (assuming you held your shares in the Fund for a minimum of 16 days during the 31-day period beginning 15 days before the ex-dividend date of the Fund’s distribution to which the foreign taxes relate), or, as a tax deduction.
Foreign Source Income Per Share (Column 2) is the amount per share of income dividends attributable to foreign securities held by the Fund, plus any foreign taxes withheld on these dividends. The amounts reported include foreign source qualified dividends that have not been adjusted for the rate differential applicable to such dividend income.1
42 | Annual Report
Templeton Global Investment Trust
Tax Information (unaudited) (continued)
Templeton Frontier Markets Fund
Foreign Qualified Dividends Per Share (Column 3) is the amount per share of foreign source qualified dividends, plus any foreign taxes withheld on these dividends. These amounts represent the portion of the Foreign Source Income reported to you in column 2 that were derived from qualified foreign securities held by the Fund.1
By mid-February 2013, shareholders received Form 1099-DIV which included their share of taxes paid and foreign source income distributed during the calendar year 2012. The Foreign Source Income reported on Form 1099-DIV has not been adjusted for the rate differential on foreign source qualified dividend income. Shareholders are advised to check with their tax advisors for information on the treatment of these amounts on their 2012 individual income tax returns.
1Qualified dividends are taxed at reduced long term capital gains tax rates. In determining the amount of foreign tax credit that may be applied
against the U.S. tax liability of individuals receiving foreign source qualified dividends, adjustments may be required to the foreign tax credit limita-
tion calculation to reflect the rate differential applicable to such dividend income. The rules however permit certain individuals to elect not to apply
the rate differential adjustments for capital gains and/or dividends for any taxable year. Please consult your tax advisor and the instructions to
Form 1116 for more information.
Annual Report | 43

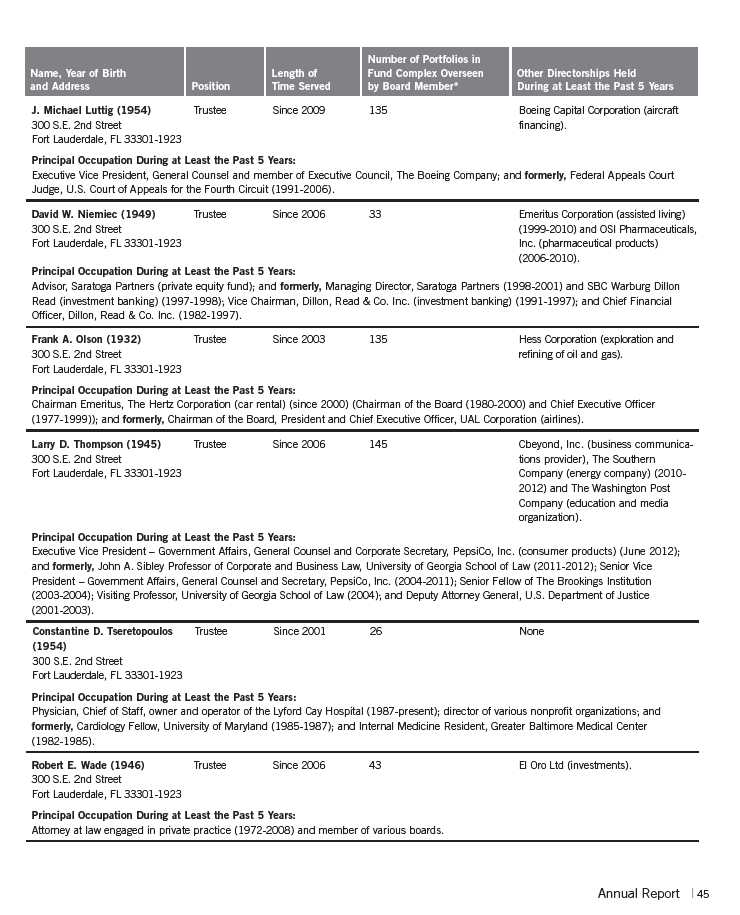
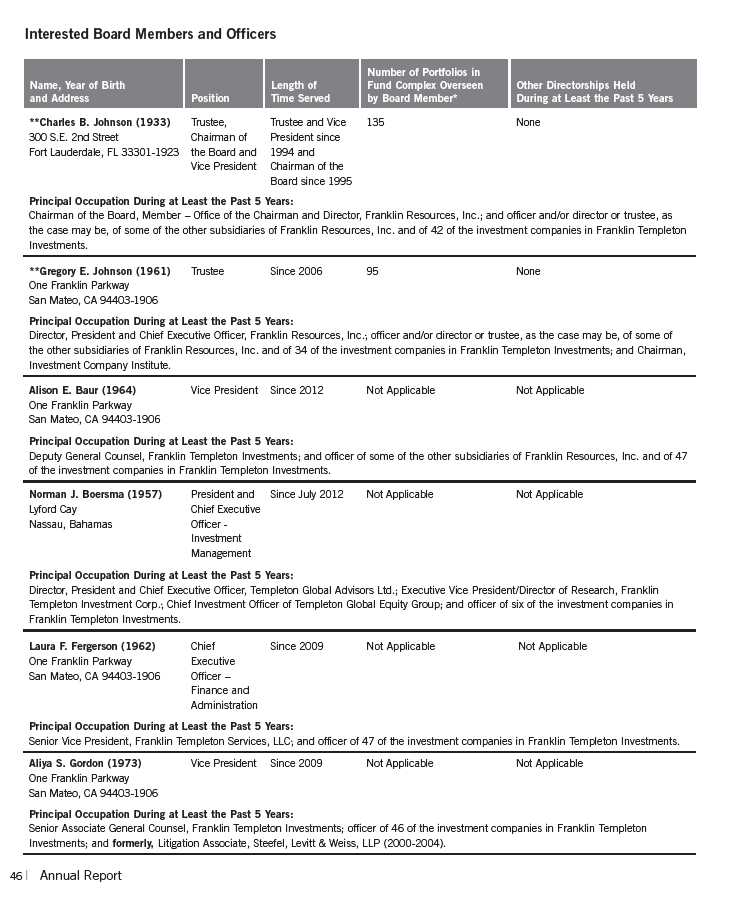

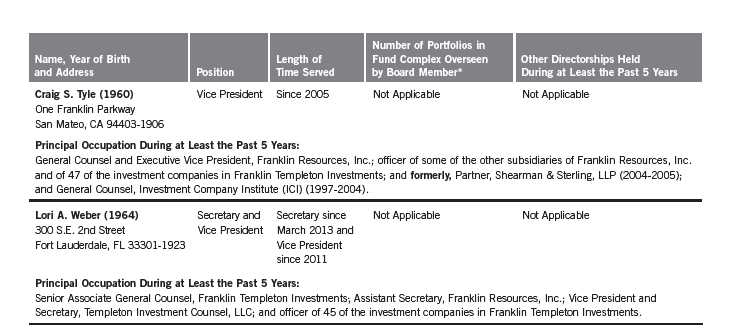
*We base the number of portfolios on each separate series of the U.S. registered investment companies within the Franklin Templeton Investments fund complex. These portfolios
have a common investment manager or affiliated investment managers.
**Charles B. Johnson is considered to be an interested person of the Trust under the federal securities laws due to his position as officer and director and major shareholder of
Franklin Resources, Inc. (Resources), which is the parent company of the Trust’s investment manager and distributor. Gregory E. Johnson is considered to be an interested person of
the Fund under the federal securities laws due to his position as officer and director of Resources.
Note 1: Charles B. Johnson and Rupert H. Johnson, Jr. are brothers and the father and uncle, respectively, of Gregory E. Johnson.
Note 2: Officer information is current as of the date of this report. It is possible that after this date, information about officers may change.
The Sarbanes-Oxley Act of 2002 and Rules adopted by the U.S. Securities and Exchange Commission require the Fund to disclose whether the Fund’s Audit Committee includes at
least one member who is an audit committee financial expert within the meaning of such Act and Rules. The Fund’s Board has determined that there is at least one such financial
expert on the Audit Committee and has designated each of Ann Torre Bates and David W. Niemiec as an audit committee financial expert. The Board believes that Ms. Bates and
Mr. Niemiec qualify as such an expert in view of their extensive business background and experience. Ms. Bates has served as a member of the Fund Audit Committee since
2008. She currently serves as a director of SLM Corporation and Ares Capital Corporation and was formerly a director of Allied Capital Corporation from 2003 to 2010, Executive
Vice President and Chief Financial Officer of NHP Incorporated and Vice President and Treasurer of US Airways, Inc. Mr. Niemiec has served as a member of the Fund Audit
Committee since 2006, currently serves as an Advisor to Saratoga Partners and was formerly its Managing Director from 1998 to 2001. Mr. Niemiec is formerly a director of
Emeritus Corporation from 1999 to 2010 and OSI Pharmaceuticals, Inc. from 2006 to 2010, Managing Director of SBC Warburg Dillon Read from 1997 to 1998, and was Vice
Chairman from 1991 to 1997 and Chief Financial Officer from 1982 to 1997 of Dillon, Read & Co. Inc. As a result of such background and experience, the Board believes that
Ms. Bates and Mr. Niemiec have each acquired an understanding of generally accepted accounting principles and financial statements, the general application of such principles
in connection with the accounting estimates, accruals and reserves, and analyzing and evaluating financial statements that present a breadth and level of complexity of
accounting issues generally comparable to those of the Fund, as well as an understanding of internal controls and procedures for financial reporting and an understanding of
audit committee functions. Ms. Bates and Mr. Niemiec are independent Board members as that term is defined under the applicable U.S. Securities and Exchange Commission
Rules and Releases or the listing standards applicable to the Fund.
The Statement of Additional Information (SAI) includes additional information about the board members and is available, without charge, upon request. Shareholders may call
(800) DIAL BEN/342-5236 to request the SAI.
48 | Annual Report
Templeton Global Investment Trust
Shareholder Information
Templeton Frontier Markets Fund
Board Review of Investment Management Agreement
At a meeting held February 26, 2013, the Board of Trustees (Board), including a majority of non-interested or independent Trustees, approved renewal of the investment management agreements for each of the separate funds within Templeton Global Investment Trust, including Templeton Frontier Markets Fund (Fund(s)). In reaching this decision, the Board took into account information furnished throughout the year at regular Board meetings, as well as information prepared specifically in connection with the annual renewal review process. Information furnished and discussed throughout the year included investment performance reports and related financial information for each Fund, along with periodic reports on expenses, shareholder services, legal and compliance matters, pricing, brokerage commissions and execution and other services provided by the Investment Manager (Manager) and its affiliates, as well as a third-party survey of transfer agent fees charged funds within the Franklin Templeton Investments complex in comparison with those charged other fund complexes deemed comparable. Information furnished specifically in connection with the renewal process included a report for each Fund prepared by Lipper, Inc. (Lipper), an independent organization, as well as additional material, including a Fund profitability analysis prepared by management. The Lipper reports compared each Fund’s investment performance and expenses with those of other mutual funds deemed comparable to the Fund as selected by Lipper. The Fund profitability analysis discussed the profitability to Franklin Templeton Investments from its overall U.S. fund operations, as well as on an individual fund-by-fund basis. Additional material accompanying such profitability analysis included information on a fund-by-fund basis listing portfolio managers and other accounts they manage, as well as information on management fees charged by the Manager and its affiliates to U.S. mutual funds and other accounts, including management’s explanation of differences where relevant. Such material also included a memorandum prepared by management describing project initiatives and capital investments relating to the services provided to the Funds by the Franklin Templeton Investments organization, as well as a memorandum relating to economies of scale and an analysis concerning transfer agent fees charged by an affiliate of the Manager.
In considering such materials, the independent Trustees received assistance and advice from and met separately with independent counsel. While the investment management agreements for all Funds were considered at the same Board meeting, the Board dealt with each Fund separately. In approving continuance of the investment management agreement for each Fund, the Board, including a majority of independent Trustees, determined that the management fee structure was fair and reasonable and that continuance of the investment management agreement was in the best interests of each Fund and its shareholders. While attention was given to all information furnished, the following discusses some primary factors relevant to the Board’s decision.
NATURE, EXTENT AND QUALITY OF SERVICES. The Board was satisfied with the nature and quality of the overall services provided by the Manager and its affiliates to the Fund and its shareholders. In addition to investment performance and expenses discussed later, the Board’s opinion was based, in part, upon periodic reports furnished it showing that the investment policies and
Annual Report | 49
Templeton Global Investment Trust
Shareholder Information (continued)
Templeton Frontier Markets Fund
Board Review of Investment Management Agreement (continued)
restrictions for the Fund were consistently complied with as well as other reports periodically furnished the Board covering matters such as the compliance of portfolio managers and other management personnel with the code of ethics adopted throughout the Franklin Templeton fund complex, the adherence to fair value pricing procedures established by the Board, and the accuracy of net asset value calculations. The Board also noted the extent of benefits provided Fund shareholders from being part of the Franklin Templeton family of funds, including the right to exchange investments between the same class of funds without a sales charge, the ability to reinvest Fund dividends into other funds and the right to combine holdings in other funds to obtain a reduced sales charge. Favorable consideration was given to management’s continuous efforts and expenditures in establishing back-up systems and recovery procedures to function in the event of a natural disaster, it being noted that such systems and procedures had functioned well during the Florida hurricanes and blackouts experienced in previous years, and that those operations in the New York/New Jersey area ran smoothly during the more recent Hurricane Sandy. Among other factors taken into account by the Board were the Manager’s best execution trading policies, including a favorable report by an independent portfolio trading analytical firm, which also covered FOREX transactions. Consideration was also given to the experience of the Fund’s portfolio management team, the number of accounts managed and general method of compensation. In this latter respect, the Board noted that a primary factor in management’s determination of a portfolio manager’s bonus compensation was the relative investment performance of the funds he or she managed and that a portion of such bonus was required to be invested in a predesignated list of funds within such person’s fund management area so as to be aligned with the interests of shareholders. The Board also took into account the quality of transfer agent and shareholder services provided Fund shareholders by an affiliate of the Manager and the continuous enhancements to the Franklin Templeton website. Particular attention was given to management’s conservative approach and diligent risk management procedures, including continuous monitoring of counterparty credit risk and attention given to derivatives and other complex instruments including expanded collateralization requirements. The Board also took into account, among other things, management’s efforts in establishing a global credit facility for the benefit of the Fund and other accounts managed by Franklin Templeton Investments to provide a source of cash for temporary and emergency purposes or to meet unusual redemption requests as well as the strong financial position of the Manager’s parent company and its commitment to the mutual fund business as evidenced by its subsidization of money market funds.
INVESTMENT PERFORMANCE. While consideration was given to performance reports and discussions with portfolio managers at Board meetings during the year, particular attention in assessing performance was given to the Lipper reports furnished for the agreement renewal. The Lipper reports prepared for the Fund showed the investment performance of its Class A shares during 2012 and previous years of operations. The Lipper report for the Fund consisted of all retail and institutional emerging markets funds as designated by Lipper. The Fund has been in operation for only
50 | Annual Report
Templeton Global Investment Trust
Shareholder Information (continued)
Templeton Frontier Markets Fund
Board Review of Investment Management Agreement (continued)
four years and the Lipper report showed its total return for 2012 to be in the highest or best performing quintile of such universe, to be in the middle performing quintiles of such universe in 2011 and 2010, and to be in the lowest performing quintile of such universe for 2009. The performance universe was broad and not limited to funds investing in “Frontier Markets” and the Board also considered the Fund’s comparative performance within a supplementary universe consisting of all “Frontier Markets” funds that had been included in the Lipper report at management’s request. The Board noted that the Fund’s total return was in the highest performing quintiles of such supplemental universe during 2012, 2011 and 2009, and the second-lowest performing quintile in 2010. The Board found the Fund’s comparative performance as shown in the Lipper report to be satisfactory.
COMPARATIVE EXPENSES. Consideration was given to a comparative analysis of the management fees and total expense ratio of the Fund compared with those of a group of other funds selected by Lipper as its appropriate Lipper expense group. Lipper expense data is based upon historical information taken from each fund’s most recent annual report, which reflects historical asset levels that may be quite different from those currently existing, particularly in a period of market volatility. While recognizing such inherent limitation and the fact that expense ratios generally increase as assets decline and decrease as assets grow, the Board believed the independent analysis conducted by Lipper to be an appropriate measure of comparative expenses. In reviewing comparative costs, Lipper provides information on the Fund’s contractual investment management fee in comparison with the effective management fee that would have been charged by other funds within its Lipper expense group assuming they were similar in size to the Fund, as well as the actual total expense ratio of the Fund in comparison with those of its Lipper expense group. The Lipper contractual investment management fee analysis includes administrative charges as being part of a management fee, and actual total expenses, for comparative consistency, are shown by Lipper for Fund Class A shares. The Lipper reports for the Fund showed both the contractual management fee rate and actual total expense ratio to be among the highest within its Lipper expense group. The Board found the expenses of the Fund to be acceptable in view of its relatively small size and specialized nature and noted that the expenses had been subsidized by management fee waivers.
MANAGEMENT PROFITABILITY. The Board also considered the level of profits realized by the Manager and its affiliates in connection with the operation of the Fund. In this respect, the Board reviewed the Fund profitability analysis that addresses the overall profitability of Franklin Templeton’s U.S. fund business, as well as its profits in providing management and other services to each of the individual funds during the 12-month period ended September 30, 2012, being the most recent fiscal year-end for Franklin Resources, Inc., the Manager’s parent. In reviewing the analysis, attention was given to the methodology followed in allocating costs to the Fund, it being recognized that allocation methodologies are inherently subjective and various allocation methodologies may each be reasonable while producing different results. In this respect, the Board noted that, while being continuously refined and reflecting changes in the Manager’s own cost accounting, the cost
Annual Report | 51
Templeton Global Investment Trust
Shareholder Information (continued)
Templeton Frontier Markets Fund
Board Review of Investment Management Agreement (continued)
allocation methodology was consistent with that followed in profitability report presentations for the Fund made in prior years and that the Fund’s independent registered public accounting firm had been engaged by the Manager to periodically review the reasonableness of the allocation methodologies solely for use by the Fund’s Board in reference to the profitability analysis. In reviewing and discussing such analysis, management discussed with the Board its belief that costs incurred in establishing the infrastructure necessary for the type of mutual fund operations conducted by the Manager and its affiliates may not be fully reflected in the expenses allocated to the Fund in determining its profitability, as well as the fact that the level of profits, to a certain extent, reflected operational cost savings and efficiencies initiated by management. The Board also took into account management’s expenditures in improving shareholder services provided the Fund, as well as the need to implement systems to meet additional regulatory and compliance requirements resulting from statutes such as the Sarbanes-Oxley and Dodd Frank Acts and recent SEC and other regulatory requirements. In addition, the Board considered a third-party study comparing the profitability of the Manager’s parent on an overall basis to other publicly held managers broken down to show profitability from management operations exclusive of distribution expenses, as well as profitability including distribution expenses. The Board also considered the extent to which the Manager and its affiliates might derive ancillary benefits from fund operations, including revenues generated from transfer agent services and potential benefits resulting from allocation of fund brokerage and the use of commission dollars to pay for research. Based upon its consideration of all these factors, the Board determined that the level of profits realized by the Manager and its affiliates from providing services to the Fund was not excessive in view of the nature, quality and extent of services provided.
ECONOMIES OF SCALE. The Board also considered whether economies of scale are realized by the Manager as the Fund grows larger and the extent to which this is reflected in the level of management fees charged. While recognizing that any precise determination is inherently subjective, the Board noted that based upon the Fund profitability analysis, it appears that as some funds get larger, at some point economies of scale do result in the Manager realizing a larger profit margin on management services provided such a fund. The Board also noted that economies of scale are shared with the Fund and its shareholders through management fee breakpoints so that as a Fund grows in size, its effective management fee rate declines. In view of the specialized nature and size of the Fund, whose expenses are also being subsidized by management, the Board questioned whether economies of scale existed. The investment management advisory agreement for the Fund provides for breakpoints that are above the Fund’s existing asset size, and to the extent economies of scale may be realized by the Manager and its affiliates, the Board believes the schedule of fees for the Fund provides a sharing of benefits with the Fund and its shareholders.
In addition to the investment advisory services provided the Fund under its investment management agreement, administrative services are provided the Fund under a separate agreement at a fixed
52 | Annual Report
Templeton Global Investment Trust
Shareholder Information (continued)
Templeton Frontier Markets Fund
Board Review of Investment Management Agreement (continued)
charge of 20 basis points. At the February 26, 2013, Board meeting, the Board eliminated the separate agreements and approved a new form of investment management agreement for the Fund combining such services. In approving the new form of investment management agreement, the Board took into account the fact that the types of services and aggregate fee, including breakpoints, would be the same as provided under the previous separate agreements and that combining such services was consistent with Lipper’s methodology of considering contractual investment management fees to include any separately charged administrative fee. The Board also noted that combining the services under the new form of investment management agreement would have no impact on management’s existing subsidization of expenses of the Fund
Proxy Voting Policies and Procedures
The Fund’s investment manager has established Proxy Voting Policies and Procedures (Policies) that the Fund uses to determine how to vote proxies relating to portfolio securities. Shareholders may view the Fund’s complete Policies online at franklintempleton.com. Alternatively, shareholders may request copies of the Policies free of charge by calling the Proxy Group collect at (954) 527-7678 or by sending a written request to: Franklin Templeton Companies, LLC, 300 S.E. 2nd Street, Fort Lauderdale, FL 33301, Attention: Proxy Group. Copies of the Fund’s proxy voting records are also made available online at franklintempleton.com and posted on the U.S. Securities and Exchange Commission’s website at sec.gov and reflect the most recent 12-month period ended June 30.
Quarterly Statement of Investments
The Fund files a complete statement of investments with the U.S. Securities and Exchange Commission for the first and third quarters for each fiscal year on Form N-Q. Shareholders may view the filed Form N-Q by visiting the Commission’s website at sec.gov. The filed form may also be viewed and copied at the Commission’s Public Reference Room in Washington, DC. Information regarding the operations of the Public Reference Room may be obtained by calling (800) SEC-0330.
Householding of Reports and Prospectuses
You will receive the Fund’s financial reports every six months as well as an annual updated summary prospectus (prospectus available upon request). To reduce Fund expenses, we try to identify related shareholders in a household and send only one copy of the financial reports and summary prospectus. This process, called “householding,” will continue indefinitely unless you instruct us otherwise. If you prefer not to have these documents householded, please call us at (800) 632-2301. At any time you may view current prospectuses/summary prospectuses and financial reports on our website. If you choose, you may receive these documents through electronic delivery.
Annual Report | 53
This page intentionally left blank.
This page intentionally left blank.
This page intentionally left blank.


Annual Report
Templeton BRIC Fund
Your Fund’s Goal and Main Investments: Templeton BRIC Fund seeks long-term capital
appreciation. Under normal market conditions, the Fund invests at least 80% of its net assets in securities
of BRIC companies — those companies that are organized under the laws of, have a principal office in, or
whose principal trading market is in Brazil, Russia, India or China (including the People’s Republic of
China, Hong Kong and Taiwan); or derive 50% or more of their total revenue or profit from, or have 50% or
more of their assets in, BRIC countries.

This annual report for Templeton BRIC Fund covers the fiscal year ended
March 31, 2013.
Economic and Market Overview
The global economy grew at a moderate but uneven pace during the 12 months
under review as monetary easing and fiscal stimulus measures undertaken by
many central banks and governments gained traction. Solid growth in many
emerging market economies, including China and India, offset weakness in
several developed market economies, particularly the eurozone. In addition to
measures by major developed market countries, China, Brazil and India
announced fiscal and monetary easing measures. China introduced a fiscal
stimulus package to fund infrastructure projects, Brazil unveiled an economic
stimulus plan to encourage investment in the country’s infrastructure, and
India implemented a series of reforms to boost investor confidence. China,
Brazil and India also cut interest rates during the 12-month period. Russia,
however, raised rates in 2012 in an effort to control rising inflation.
Investor anxiety about Europe’s recurring financial crisis and slower global
economic growth led stock markets worldwide to sell off sharply in May.
After reaching a period low in early June, BRIC markets embarked on an
upward trend that lasted until early February, more than offsetting earlier
losses. However, renewed investor anxiety about eurozone stability caused by
Cyprus’s banking crisis, combined with recurring concerns about slower global
economic growth, contributed to the price correction of BRIC country stocks
The dollar value, number of shares or principal amount, and names of all portfolio holdings are listed in the
Fund’s Statement of Investments (SOI). The SOI begins on page 17.
Annual Report | 3
in February and March. For the 12 months ended March 31, 2013, the MSCI BRIC Index had a -2.05% total return.1
The Brazilian economy, as measured by gross domestic product (GDP), grew 0.9% in 2012 despite the government’s implementation of fiscal stimulus measures and the central bank’s record-low interest rate policy intended to stimulate growth.2 Weak investment growth, a high inflation rate and interventionist government policies dampened investor confidence in Brazilian stocks. Lower commodity prices and the Brazilian real’s depreciation against the U.S. dollar further hampered Brazilian stock prices in U.S. dollar terms, leading the MSCI Brazil Index to post a -12.52% total return, making it the worst BRIC performer for the 12 months ended March 31, 2013.1
At the other end of the spectrum, China was the strongest BRIC performer for the 12-month period. Encouraging reports of solid economic growth and recovery in exports and industrial production drove Chinese stocks to reach a period high in late January. The government’s implementation of tightening measures in the property sector and higher inflation in February, when the Lunar New Year celebration caused a surge in food prices, helped lead Chinese stocks to end the period off their 12-month high.
Indian stocks performed well for the 12-month period as the government’s unexpected announcement of a series of reforms in September boosted investor confidence and drove stocks to a period high at the end of January. However, reduced economic growth forecasts, persistently high inflation and a lack of hoped-for commitments to economic reform in the government budget statement led many investors to avoid the Indian market near period-end.
The Russian stock market, which is heavily dependent on commodities, was negatively affected by lower oil and metal prices, weaker investor confidence and a depreciating ruble. However, based on our analysis, the overall valuation of Russian stocks remained attractive. With a low single-digit forward price-to-earnings ratio at period-end, Russia remained one of the cheapest markets in the global investment universe.
In our view, BRIC countries have generally remained economically healthier than many developed market countries. In recent years, BRIC stocks, as measured by the MSCI BRIC Index, have underperformed developed market stocks, as measured by the MSCI World Index, but in eight of the past 12
1. Source: © 2013 Morningstar. All Rights Reserved. The information contained herein: (1) is proprietary to Morningstar
and/or its content providers; (2) may not be copied or distributed; and (3) is not warranted to be accurate, complete or
timely. Neither Morningstar nor its content providers are responsible for any damages or losses arising from any use of
this information. The index is unmanaged and includes reinvested dividends. One cannot invest directly in an index, and
an index is not representative of the Fund’s portfolio.
2. Source: Brazilian Institute of Geography and Statistics (IBGE).
4 | Annual Report
calendar years, BRIC stocks outperformed, reinforcing our favorable longer term view of BRIC stocks. Please remember, past performance does not guarantee future results.
Investment Strategy
Our investment strategy employs a fundamental research, value-oriented, long-term approach. We focus on the market price of a company’s securities relative to our evaluation of the company’s long-term (typically five years) earnings, asset value and cash flow potential. We also consider a company’s profit and loss outlook, balance sheet strength, cash flow trends and asset value in relation to the current price. The analysis considers the company’s corporate governance behavior as well as its position in its sector, the economic framework and political environment.
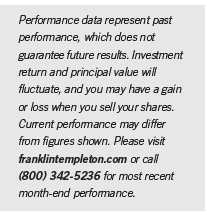
Performance Overview
Templeton BRIC Fund – Class A had a -7.15% cumulative total return for the 12 months ended March 31, 2013. In comparison, the MSCI BRIC Index had a -2.05% total return.1 Please note index performance information is provided for reference and we do not attempt to track any index but rather undertake investments on the basis of fundamental research. In addition, the Fund’s return reflects the effect of fees and expenses for professional management, while an index does not have such costs. You can find the Fund’s long-term performance data in the Performance Summary beginning on page 9.
Manager’s Discussion
During the 12 months under review, key contributors to the Fund’s absolute performance included MindTree, an Indian information technology (IT) consulting services provider; Brazil-based AmBev (Companhia de Bebidas das Americas), one of the world’s biggest beer and soft drink producers; and Luk Fook Holdings (International), a major jewelry store chain in Hong Kong and China. MindTree’s share price rose significantly during the period as the company recorded improved revenues and strong profits driven by better operating margins. In our view, the company remained well positioned to capitalize on the Indian rupee’s weakness against the U.S. dollar and the euro, as well as the growing trend of outsourcing by U.S. and European corporations to Indian IT consulting services firms. AmBev’s strong market position has allowed the company to achieve robust returns and build market share as consumers become wealthier and more discerning. The company’s substantial exposure to Canada and to the rest of Latin America further supported its business. AmBev’s strong operations, high profit margins and popular brands make it an attractive investment, in our view. Luk Fook benefited from a
Annual Report | 5

solid market position, high return on equity, strong balance sheet and increasing presence in mainland China. In our assessment, the company has positioned itself well to benefit from robust spending on luxury products in Hong Kong and Macau, as well as the Chinese government’s efforts to boost income and consumption growth.
In contrast, key detractors from the Fund’s absolute performance included Russia-based global energy company Gazprom, the world’s largest natural gas producer; Petrobras (Petroleo Brasileiro), Brazil’s national integrated energy company; and Brazil-based Vale, one of the top global iron ore and nickel producers. These companies’ share prices corrected along with those of many energy companies and metals and mining companies globally as a result of weak demand concerns and lower commodity prices. We believe that global energy demand could likely rise over the long term and lead to secular strength in oil and gas prices, which could benefit Gazprom. Additionally, domestic gas market liberalization and deregulation of gas tariffs could help improve Gazprom’s long-term profit growth. We maintained a favorable view of Gazprom at period-end, based on our analysis that the recent price correction made the company undervalued given its long-term growth potential. Petrobras’ share price fell because of disappointing corporate results and the delay in regulated petroleum and diesel price increases, which negatively affected earnings estimates. We eliminated the Fund’s position in Petrobras during the period. Vale’s share price declined because of investor uncertainty about iron ore prices and fears that Brazil might impose a special participation tax on mining companies. In our assessment, Vale remained fundamentally attractive. As one of the world’s largest iron ore and nickel producers, the company could be a major beneficiary of long-term steel demand growth in emerging market countries, particularly China.
Our continued search for what we considered to be underappreciated stocks with attractive valuations led us to increase our holdings in India, Hong Kong and Russia. We added television broadcast and machinery companies and increased the Fund’s holdings in IT consulting services, apparel retail and wireless telecommunication services companies because of fundamentals we considered to be attractive. Key purchases included new positions in CTC Media, Russia’s leading independent broadcaster, and BOC Hong Kong (Holdings), a leading commercial banking group in Hong Kong. We also increased the Fund’s investments in Gazprom and in Infosys, one of India’s top IT consulting firms.
Conversely, we undertook some sales as we received redemptions and as we strategically repositioned the Fund’s portfolio. As a result, we reduced investments in diversified banking, oil and gas, construction materials, and coal and consumable fuels companies. Geographically, we reduced the Fund’s holdings in
6 | Annual Report
Brazil and China via China H and Red Chip shares.3 Key sales included elimi-
nation of the Fund’s position in Petrobras and reduction of investments in
PetroChina, one of China’s largest integrated oil and gas companies, and
Yanzhou Coal Mining, one of China’s biggest coal producers.
Thank you for your continued participation in Templeton BRIC Fund. We look
forward to serving your future investment needs.

Portfolio Management Team
Templeton BRIC Fund
3. “China H” denotes shares of China-incorporated, Hong Kong Stock Exchange-listed companies with most busi-
nesses in China. “Red Chip” denotes shares of Hong Kong Stock Exchange-listed companies with significant exposure
to China.
Annual Report | 7
The foregoing information reflects our analysis, opinions and portfolio holdings as of March 31, 2013, the end of
the reporting period. The way we implement our main investment strategies and the resulting portfolio holdings
may change depending on factors such as market and economic conditions. These opinions may not be relied upon
as investment advice or an offer for a particular security. The information is not a complete analysis of every
aspect of any market, country, industry, security or the Fund. Statements of fact are from sources considered reli-
able, but the investment manager makes no representation or warranty as to their completeness or accuracy.
Although historical performance is no guarantee of future results, these insights may help you understand our
investment management philosophy.
8 | Annual Report
Performance Summary as of 3/31/13
Your dividend income will vary depending on dividends or interest paid by securities in the Fund’s
portfolio, adjusted for operating expenses of each class. Capital gain distributions are net profits
realized from the sale of portfolio securities. The performance table and graphs do not reflect any
taxes that a shareholder would pay on Fund dividends, capital gain distributions, if any, or any
realized gains on the sale of Fund shares. Total return reflects reinvestment of the Fund’s dividends
and capital gain distributions, if any, and any unrealized gains or losses.
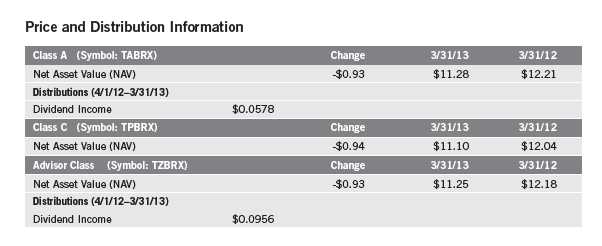
Performance1
Cumulative total return excludes sales charges. Average annual total return and value of $10,000 investment include
maximum sales charges. Class A: 5.75% maximum initial sales charge; Class C: 1% contingent deferred sales charge in
first year only; Advisor Class: no sales charges.

Performance data represent past performance, which does not guarantee future results. Investment return and principal
value will fluctuate, and you may have a gain or loss when you sell your shares. Current performance may differ from
figures shown. For most recent month-end performance, go to franklintempleton.com or call (800) 342-5236.
Annual Report | 9
Performance Summary (continued)
Total Return Index Comparison for a Hypothetical $10,000 Investment1
Total return represents the change in value of an investment over the periods shown. It includes
any applicable maximum sales charge, Fund expenses, account fees and reinvested distributions.
The unmanaged index includes reinvestment of any income or distributions. It differs from the
Fund in composition and does not pay management fees or expenses. One cannot invest directly in
an index.
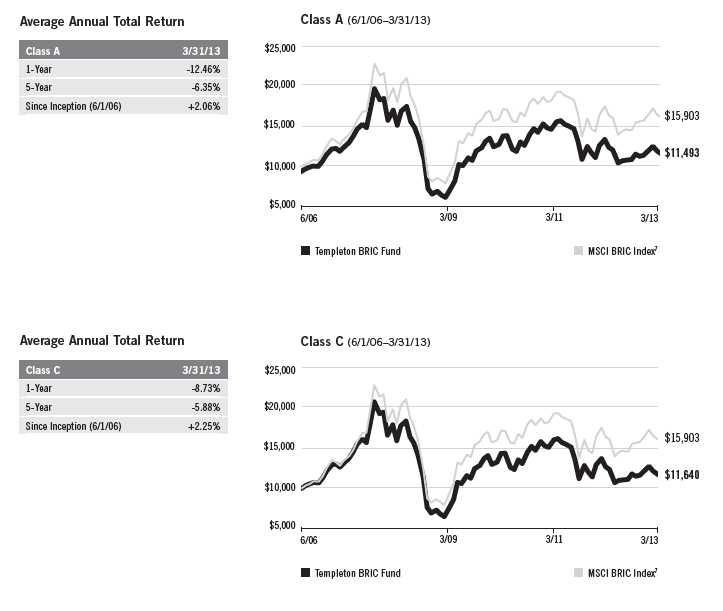
10 | Annual Report
Performance Summary (continued)
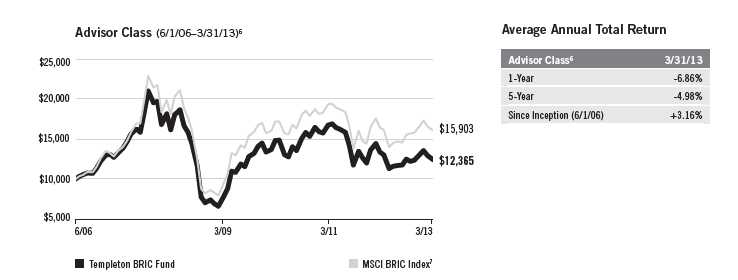
Endnotes
All investments involve risks, including possible loss of principal. Special risks are associated with foreign invest-
ing, including currency fluctuations, economic instability and political developments. Investments in BRIC
companies, which are located in, or operate in, emerging market countries, involve heightened risks related to
the same factors, in addition to those associated with these companies’ smaller size, lesser liquidity and the lack
of established legal, political, business and social frameworks to support securities markets in the countries in
which they operate. The Fund is a nondiversified fund. It may invest a greater portion of its assets in the securities
of one issuer than a diversified fund, which may result in greater fluctuation in the value of the Fund’s shares. All
investments in emerging markets should be considered long-term investments that could experience significant
price volatility in any given year. The Fund is designed for the aggressive portion of a well-diversified portfolio.
The Fund is actively managed but there is no guarantee that the manager’s investment decisions will produce the
desired results. The Fund’s prospectus also includes a description of the main investment risks.
Class C: These shares have higher annual fees and expenses than Class A shares.
Advisor Class: Shares are available to certain eligible investors as described in the prospectus.
1. Fund investment results reflect past expense reductions, without which the results would have been lower.
2. Cumulative total return represents the change in value of an investment over the periods indicated.
3. Average annual total return represents the average annual change in value of an investment over the periods
indicated.
4. These figures represent the value of a hypothetical $10,000 investment in the Fund over the periods indicated.
5. Figures are as stated in the Fund’s prospectus current as of the date of this report. In periods of market volatility,
assets may decline significantly, causing total annual Fund operating expenses to become higher than the figures
shown.
6. Effective 8/1/08, the Fund began offering Advisor Class shares, which do not have sales charges or a Rule 12b-1
plan. Performance quotations for this class reflect the following methods of calculation: (a) For periods prior to 8/1/08,
a restated figure is used based upon the Fund’s Class A performance, excluding the effect of Class A’s maximum initial
sales charge, but reflecting the effect of the Class A Rule 12b-1 fees; and (b) for periods after 8/1/08, actual Advisor
Class performance is used reflecting all charges and fees applicable to that class. Since 8/1/08 (commencement of
sales), the cumulative and average annual total returns of Advisor Class shares were -20.46% and -4.79%.
7. Source: © 2013 Morningstar. The MSCI BRIC Index is a free float-adjusted, market capitalization-weighted index
designed to measure equity market performance in Brazil, Russia, India and China.
Annual Report | 11
Your Fund’s Expenses
As a Fund shareholder, you can incur two types of costs:
- Transaction costs, including sales charges (loads) on Fund purchases; and
- Ongoing Fund costs, including management fees, distribution and service (12b-1) fees, and other Fund expenses. All mutual funds have ongoing costs, sometimes referred to as operating expenses.
The following table shows ongoing costs of investing in the Fund and can help you understand these costs and compare them with those of other mutual funds. The table assumes a $1,000 investment held for the six months indicated.
Actual Fund Expenses
The first line (Actual) for each share class listed in the table provides actual account values and expenses. The “Ending Account Value” is derived from the Fund’s actual return, which includes the effect of Fund expenses.
You can estimate the expenses you paid during the period by following these steps. Of course, your account value and expenses will differ from those in this illustration:
| 1. | Divide your account value by $1,000. |
| | If an account had an $8,600 value, then $8,600 ÷ $1,000 = 8.6. |
| 2. | Multiply the result by the number under the heading “Expenses Paid During Period.” |
| | If Expenses Paid During Period were $7.50, then 8.6 x $7.50 = $64.50. |
In this illustration, the estimated expenses paid this period are $64.50.
Hypothetical Example for Comparison with Other Funds
Information in the second line (Hypothetical) for each class in the table can help you compare ongoing costs of investing in the Fund with those of other mutual funds. This information may not be used to estimate the actual ending account balance or expenses you paid during the period. The hypothetical “Ending Account Value” is based on the actual expense ratio for each class and an assumed 5% annual rate of return before expenses, which does not represent the Fund’s actual return. The figure under the heading “Expenses Paid During Period” shows the hypothetical expenses your account would have incurred under this scenario. You can compare this figure with the 5% hypothetical examples that appear in shareholder reports of other funds.
12 | Annual Report
Your Fund’s Expenses (continued)
Please note that expenses shown in the table are meant to highlight ongoing costs and do not reflect
any transaction costs, such as sales charges. Therefore, the second line for each class is useful in
comparing ongoing costs only, and will not help you compare total costs of owning different
funds. In addition, if transaction costs were included, your total costs would have been higher.
Please refer to the Fund prospectus for additional information on operating expenses.
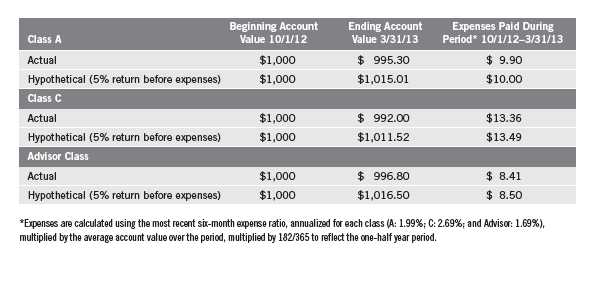
Annual Report | 13

aThe amount shown for a share outstanding throughout the period may not correlate with the Statement of Operations for the period due to the timing of sales and repurchases of
the Fund shares in relation to income earned and/or fluctuating market value of the investments of the Fund.
bBased on average daily shares outstanding.
cTotal return does not reflect sales commissions or contingent deferred sales charges, if applicable.
dBenefit of expense reduction rounds to less than 0.01%.
14 | The accompanying notes are an integral part of these financial statements. | Annual Report

aThe amount shown for a share outstanding throughout the period may not correlate with the Statement of Operations for the period due to the timing of sales and repurchases of
the Fund shares in relation to income earned and/or fluctuating market value of the investments of the Fund.
bBased on average daily shares outstanding.
cTotal return does not reflect sales commissions or contingent deferred sales charges, if applicable.
dBenefit of expense reduction rounds to less than 0.01%.
Annual Report | The accompanying notes are an integral part of these financial statements. | 15
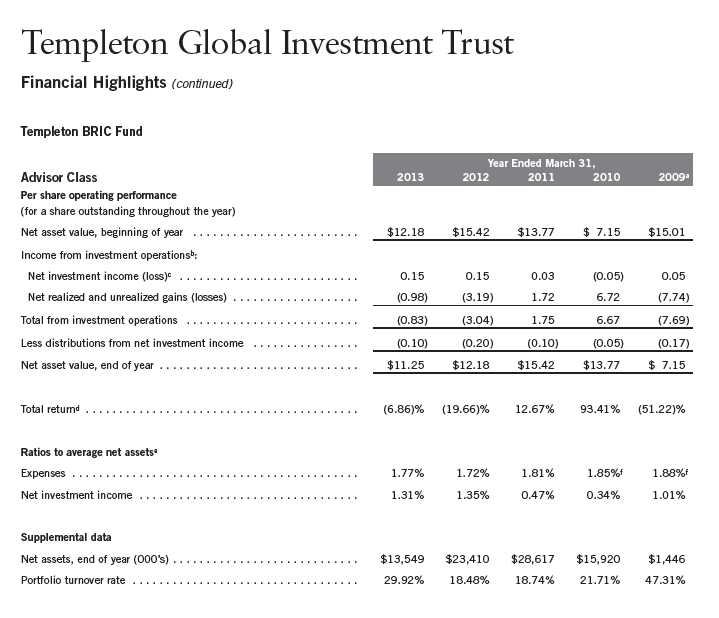
aFor the period August 1, 2008 (effective date) to March 31, 2009.
bThe amount shown for a share outstanding throughout the period may not correlate with the Statement of Operations for the period due to the timing of sales and repurchases of
the Fund shares in relation to income earned and/or fluctuating market value of the investments of the Fund.
cBased on average daily shares outstanding.
dTotal return is not annualized for periods less than one year.
eRatios are annualized for periods less than one year.
fBenefit of expense reduction rounds to less than 0.01%.
16 | The accompanying notes are an integral part of these financial statements. | Annual Report
Templeton Global Investment Trust
Statement of Investments, March 31, 2013
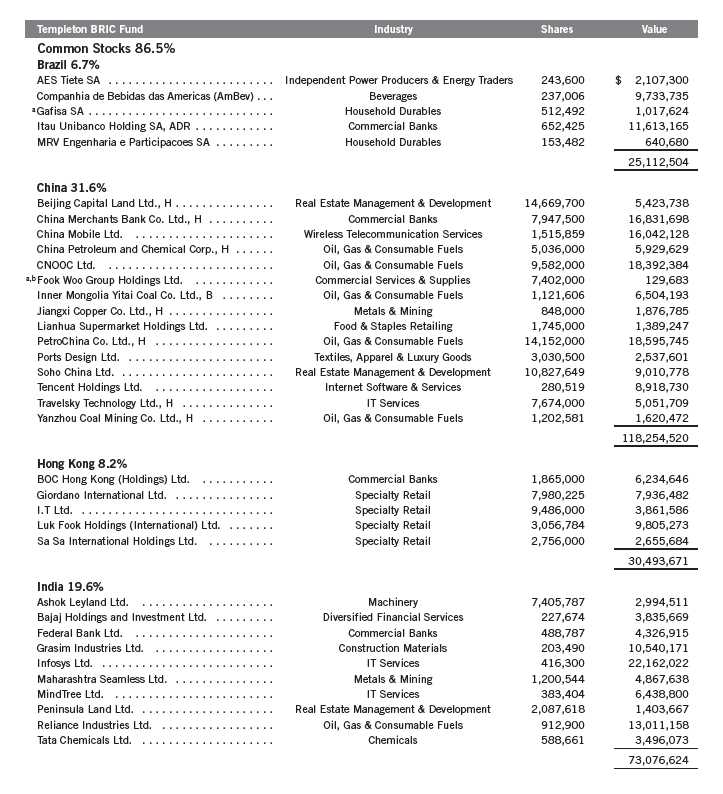
Annual Report | 17
Templeton Global Investment Trust
Statement of Investments, March 31, 2013 (continued)
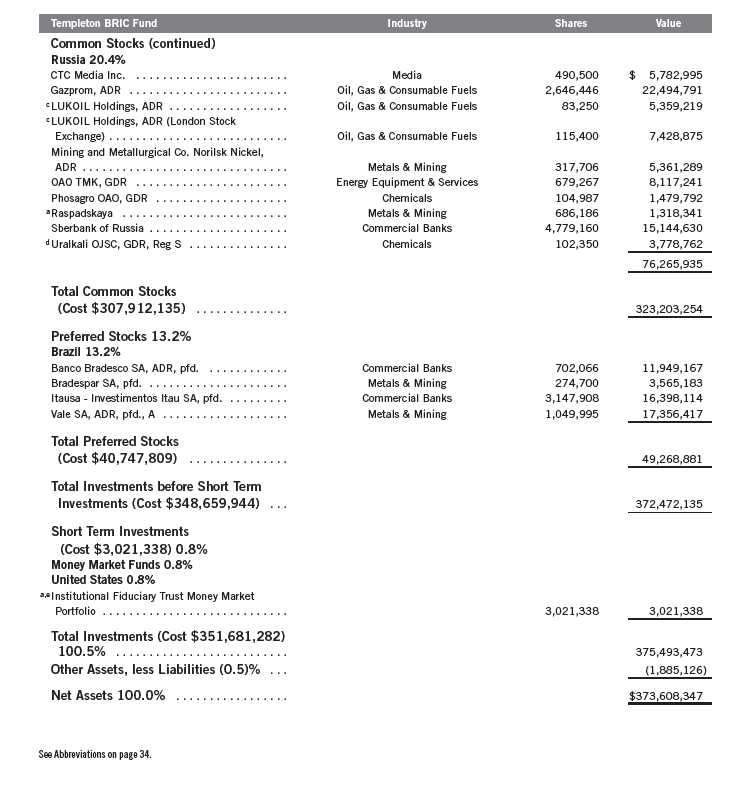
18 | Annual Report
Templeton Global Investment Trust
Statement of Investments, March 31, 2013 (continued)
Templeton BRIC Fund
aNon-income producing.
bSecurity has been deemed illiquid because it may not be able to be sold within seven days. At March 31, 2013, the value of this security was $ 129,683, representing 0.03% of net
assets.
cAt March 31, 2013, pursuant to the Fund’s policies and the requirements of applicable securities law, the Fund may be restricted from trading these securities for a limited or
extended period of time due to ownership limits and/or potential possession of material non-public information.
dSecurity was purchased pursuant to Regulation S under the Securities Act of 1933, which exempts from registration securities offered and sold outside of the United States. Such a
security cannot be sold in the United States without either an effective registration statement filed pursuant to the Securities Act of 1933, or pursuant to an exemption from regis-
tration. This security has been deemed liquid under guidelines approved by the Trust’s Board of Trustees. At March 31, 2013, the value of this security was $3,778,762, representing
1.01% of net assets.
eSee Note 7 regarding investments in the Institutional Fiduciary Trust Money Market Portfolio.
Annual Report | The accompanying notes are an integral part of these financial statements. | 19

20 | The accompanying notes are an integral part of these financial statements. | Annual Report
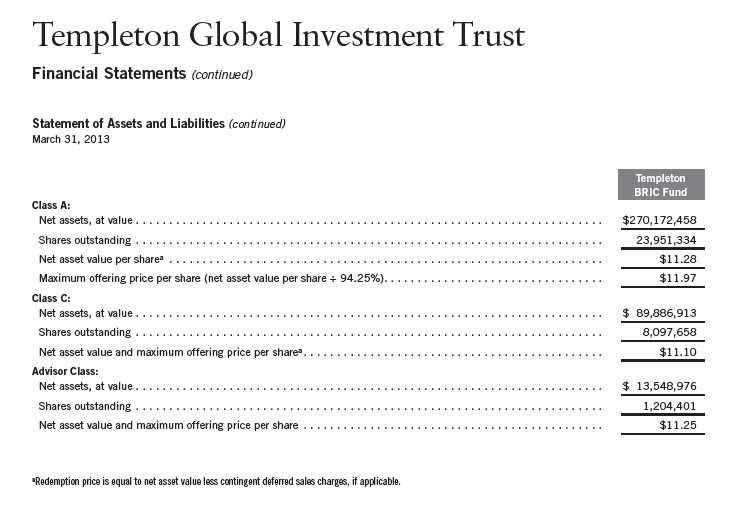
Annual Report | The accompanying notes are an integral part of these financial statements. | 21

22 | The accompanying notes are an integral part of these financial statements. | Annual Report
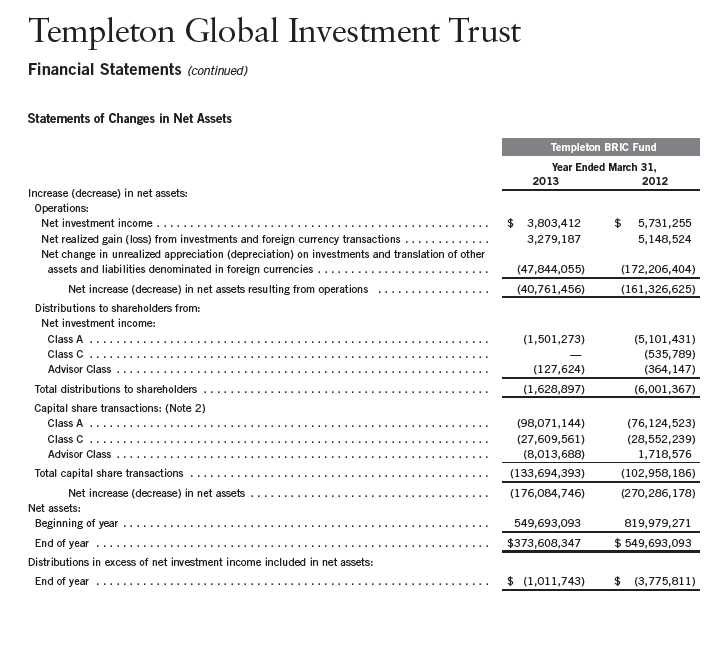
Annual Report | The accompanying notes are an integral part of these financial statements. | 23
Templeton Global Investment Trust
Notes to Financial Statements
Templeton BRIC Fund
1. ORGANIZATION AND SIGNIFICANT ACCOUNTING POLICIES
Templeton Global Investment Trust (Trust) is registered under the Investment Company Act of 1940, as amended, (1940 Act) as an open-end investment company, consisting of six separate funds. The Templeton BRIC Fund (Fund) is included in this report. The financial statements of the remaining funds in the Trust are presented separately. The Fund offers three classes of shares: Class A, Class C and Advisor Class. Each class of shares differs by its initial sales load, contingent deferred sales charges, voting rights on matters affecting a single class, its exchange privilege and fees primarily due to differing arrangements for distribution and transfer agent fees.
The following summarizes the Fund’s significant accounting policies.
a. Financial Instrument Valuation
The Fund’s investments in financial instruments are carried at fair value daily. Fair value is the price that would be received to sell an asset or paid to transfer a liability in an orderly transaction between market participants on the measurement date. Under procedures approved by the Trust’s Board of Trustees (the Board), the Fund’s administrator, investment manager and other affiliates have formed the Valuation and Liquidity Oversight Committee (VLOC). The VLOC provides administration and oversight of the Fund’s valuation policies and procedures, which are approved annually by the Board. Among other things, these procedures allow the Fund to utilize independent pricing services, quotations from securities and financial instrument dealers, and other market sources to determine fair value.
Equity securities listed on an exchange or on the NASDAQ National Market System are valued at the last quoted sale price or the official closing price of the day, respectively. Foreign equity securities are valued as of the close of trading on the foreign stock exchange on which the security is primarily traded, or the NYSE, whichever is earlier. The value is then converted into its U.S. dollar equivalent at the foreign exchange rate in effect at the close of the NYSE on the day that the value of the security is determined. Over-the-counter (OTC) securities are valued within the range of the most recent quoted bid and ask prices. Securities that trade in multiple markets or on multiple exchanges are valued according to the broadest and most representative market. Certain equity securities are valued based upon fundamental characteristics or relationships to similar securities. Investments in open-ended mutual funds are valued at the closing net asset value.
The Fund has procedures to determine the fair value of financial instruments for which market prices are not reliable or readily available. Under these procedures, the VLOC convenes on a regular basis to review such financial instruments and considers a number of factors, including significant unobservable valuation inputs, when arriving at fair value. The VLOC primarily employs a market-based approach which may use related or comparable assets or liabilities, recent transactions, market multiples, book values, and other relevant information for the investment to determine the fair value of the investment. An income-based valuation approach
24 | Annual Report
Templeton Global Investment Trust
Notes to Financial Statements (continued)
Templeton BRIC Fund
| 1. | ORGANIZATION AND SIGNIFICANT ACCOUNTING POLICIES (continued) |
| a. | Financial Instrument Valuation (continued) |
may also be used in which the anticipated future cash flows of the investment are discounted to calculate fair value. Discounts may also be applied due to the nature or duration of any restrictions on the disposition of the investments. Due to the inherent uncertainty of valuations of such investments, the fair values may differ significantly from the values that would have been used had an active market existed. The VLOC employs various methods for calibrating these valuation approaches including a regular review of key inputs and assumptions, transactional back-testing or disposition analysis, and reviews of any related market activity.
Trading in securities on foreign securities stock exchanges and OTC markets may be completed before the daily close of business on the NYSE. Occasionally, events occur between the time at which trading in a foreign security is completed and the close of the NYSE that might call into question the reliability of the value of a portfolio security held by the Fund. As a result, differences may arise between the value of the Fund’s portfolio securities as determined at the foreign market close and the latest indications of value at the close of the NYSE. In order to minimize the potential for these differences, the VLOC monitors price movements following the close of trading in foreign stock markets through a series of country specific market proxies (such as baskets of American Depositary Receipts, futures contracts and exchange traded funds). These price movements are measured against established trigger thresholds for each specific market proxy to assist in determining if an event has occurred that may call into question the reliability of the values of the foreign securities held by the Fund. If such an event occurs, the securities may be valued using fair value procedures, which may include the use of independent pricing services.
In addition, certain foreign markets may be open on days that the NYSE is closed, which could result in differences between value of the Fund’s portfolio securities on the last business day and the last calendar day of the reporting period. Any significant security valuation changes due to an open foreign market are adjusted and reflected by the Fund for financial reported purposes.
b. Foreign Currency Translation
Portfolio securities and other assets and liabilities denominated in foreign currencies are translated into U.S. dollars based on the exchange rate of such currencies against U.S. dollars on the date of valuation. The Fund may enter into foreign currency exchange contracts to facilitate transactions denominated in a foreign currency. Purchases and sales of securities, income and expense items denominated in foreign currencies are translated into U.S. dollars at the exchange rate in effect on the transaction date. Portfolio securities and assets and liabilities denominated in foreign currencies contain risks that those currencies will decline in value relative to the U.S. dollar. Occasionally, events may impact the availability or reliability of foreign exchange rates used to convert the U.S. dollar equivalent value. If such an event occurs, the foreign exchange rate will be valued at fair value using procedures established and approved by the Board.
Annual Report | 25
Templeton Global Investment Trust
Notes to Financial Statements (continued)
Templeton BRIC Fund
| 1. | ORGANIZATION AND SIGNIFICANT ACCOUNTING POLICIES (continued) |
| b. | Foreign Currency Translation (continued) |
The Fund does not separately report the effect of changes in foreign exchange rates from changes in market prices on securities held. Such changes are included in net realized and unrealized gain or loss from investments on the Statement of Operations.
Realized foreign exchange gains or losses arise from sales of foreign currencies, currency gains or losses realized between the trade and settlement dates on securities transactions and the difference between the recorded amounts of dividends, interest, and foreign withholding taxes and the U.S. dollar equivalent of the amounts actually received or paid. Net unrealized foreign exchange gains and losses arise from changes in foreign exchange rates on foreign denominated assets and liabilities other than investments in securities held at the end of the reporting period.
c. Income and Deferred Taxes
It is the Fund’s policy to qualify as a regulated investment company under the Internal Revenue Code. The Fund intends to distribute to shareholders substantially all of its taxable income and net realized gains to relieve it from federal income and excise taxes. As a result, no provision for U.S. federal income taxes is required.
The Fund may be subject to foreign taxation related to income received, capital gains on the sale of securities and certain foreign currency transactions in the foreign jurisdictions in which it invests. Foreign taxes, if any, are recorded based on the tax regulations and rates that exist in the foreign markets in which the Fund invests. When a capital gain tax is determined to apply the Fund records an estimated deferred tax liability in an amount that would be payable if the securities were disposed of on the valuation date.
The Fund recognizes the tax benefits of uncertain positions only when the position is “more likely than not” to be sustained upon examination by the tax authorities based on the technical merits of the tax position. As of March 31, 2013, and for all open tax years, the Fund has determined that no liability for unrecognized tax benefits is required in the Fund’s financial statements related to uncertain tax positions taken on a tax return (or expected to be taken on future tax returns). Open tax years are those that remain subject to examination and are based on each tax jurisdiction statute of limitations.
d. Security Transactions, Investment Income, Expenses and Distributions
Security transactions are accounted for on trade date. Realized gains and losses on security transactions are determined on a specific identification basis Estimated expenses are accrued daily. Dividend income is recorded on the ex-dividend date except that certain dividends from foreign
26 | Annual Report
Templeton Global Investment Trust
Notes to Financial Statements (continued)
Templeton BRIC Fund
| 1. | ORGANIZATION AND SIGNIFICANT ACCOUNTING POLICIES (continued) |
| d. | Security Transactions, Investment Income, Expenses and Distributions (continued) |
securities are recognized as soon as the Fund is notified of the ex-dividend date. Distributions to shareholders are recorded on the ex-dividend date and are determined according to income tax regulations (tax basis). Distributable earnings determined on a tax basis may differ from earnings recorded in accordance with accounting principles generally accepted in the United States of America. These differences may be permanent or temporary. Permanent differences are reclassified among capital accounts to reflect their tax character. These reclassifications have no impact on net assets or the results of operations. Temporary differences are not reclassified, as they may reverse in subsequent periods.
Common expenses incurred by the Trust are allocated among the funds based on the ratio of net assets of each fund to the combined net assets of the Trust. Fund specific expenses are charged directly to the fund that incurred the expense.
Realized and unrealized gains and losses and net investment income, not including class specific expenses, are allocated daily to each class of shares based upon the relative proportion of net assets of each class. Differences in per share distributions, by class, are generally due to differences in class specific expenses.
e. Accounting Estimates
The preparation of financial statements in accordance with accounting principles generally accepted in the United States of America requires management to make estimates and assumptions that affect the reported amounts of assets and liabilities at the date of the financial statements and the amounts of income and expenses during the reporting period. Actual results could differ from those estimates.
f. Guarantees and Indemnifications
Under the Trust’s organizational documents, its officers and trustees are indemnified by the Trust against certain liabilities arising out of the performance of their duties to the Trust. Additionally, in the normal course of business, the Trust, on behalf of the Fund, enters into contracts with service providers that contain general indemnification clauses. The Trust’s maximum exposure under these arrangements is unknown as this would involve future claims that may be made against the Trust that have not yet occurred. Currently, the Trust expects the risk of loss to be remote.
Annual Report | 27
Templeton Global Investment Trust
Notes to Financial Statements (continued)
Templeton BRIC Fund
2. SHARES OF BENEFICIAL INTEREST
At March 31, 2013, there were an unlimited number of shares authorized ($0.01 par value).
Transactions in the Fund’s shares were as follows:
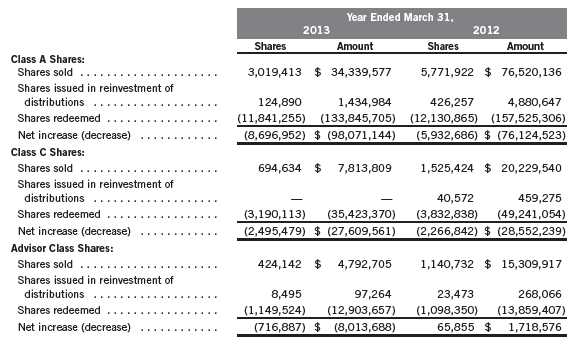
3. TRANSACTIONS WITH AFFILIATES
Franklin Resources, Inc. is the holding company for various subsidiaries that together are
referred to as Franklin Templeton Investments. Certain officers and trustees of the Trust are also
officers and/or directors of the following subsidiaries:
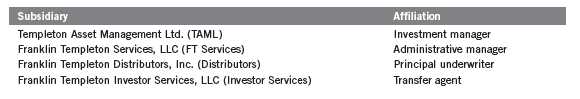
28 | Annual Report
Templeton Global Investment Trust
Notes to Financial Statements (continued)
Templeton BRIC Fund
| 3. | TRANSACTIONS WITH AFFILIATES (continued) |
| a. | Management Fees |
The Fund pays an investment management fee to TAML based on the average daily net assets of
the Fund as follows:
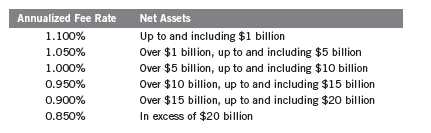
b. Administrative Fees
The Fund pays an administrative fee to FT Services of 0.20% per year of the average daily net assets of the Fund.
On February 26, 2013, the Board approved the proposal to combine the Fund’s investment management and administration agreements. The fees to be paid under the new combined agreement will not exceed the aggregate fees that would have been paid under the separate agreements. The new agreement went into effect on May 1, 2013.
c. Distribution Fees
The Board has adopted distribution plans for each share class, with the exception of Advisor Class shares, pursuant to Rule 12b-1 under the 1940 Act. Distribution fees are not charged on shares held by affiliates. Under the Fund’s Class A reimbursement distribution plan, the Fund reimburses Distributors for costs incurred in connection with the servicing, sale and distribution of the Fund’s shares up to the maximum annual plan rate. Under the Class A reimbursement distribution plan, costs exceeding the maximum for the current plan year cannot be reimbursed in subsequent periods. In addition, under the Fund’s Class C compensation distribution plan, the Fund pays Distributors for costs incurred in connection with the servicing, sale and distribution of the Fund’s shares up to the maximum annual plan rate.
The maximum annual plan rates, based on the average daily net assets, for each class, are as follows:
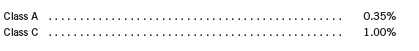
The Board has set the current rate at 0.30% per year for Class A shares until further notice and approval by the Board.
Annual Report | 29
Templeton Global Investment Trust
Notes to Financial Statements (continued)
Templeton BRIC Fund
| 3. | TRANSACTIONS WITH AFFILIATES (continued) |
| d. | Sales Charges/Underwriting Agreements |
Front-end sales charges and contingent deferred sales charges (CDSC) do not represent expenses of the Fund. These charges are deducted from the proceeds of sales of Fund shares prior to investment or from redemption proceeds prior to remittance, as applicable. Distributors has advised the Fund of the following commission transactions related to the sales and redemptions of the Fund’s shares for the year:
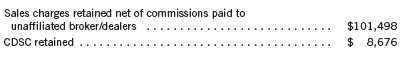
e. Transfer Agent Fees
Each class of shares pays transfer agent fees to Investor Services for its performance of shareholder servicing obligations and reimburses Investor Services for out of pocket expenses incurred, including shareholding servicing fees paid to third parties. These fees are allocated daily to such classes based upon the relative proportion of net assets.
For the year ended March 31, 2013, the Fund paid transfer agent fees of $1,556,410, of which $732,368 was retained by Investor Services.
f. Waiver and Expense Reimbursements
Effective, April 1, 2013, TAML, FT Services, and Distributors have voluntarily agreed in advance to waive or limit their respective fees and to assume as their own expense certain expenses otherwise payable by the Fund so that the expenses (excluding distribution fees and acquired fund fees and expenses) for Class A, Class C, and Advisor Class of the Fund do not exceed 1.72% (other than certain non-routine expenses or costs, including those relating to litigation, indemnification, reorganizations, and liquidations) until after July 31, 2014.
4. EXPENSE OFFSET ARRANGEMENT
The Fund has entered into an arrangement with its custodian whereby credits realized as a result of uninvested cash balances are used to reduce a portion of the Fund’s custodian expenses. During the year ended March 31, 2013, there were no credits earned.
30 | Annual Report
Templeton Global Investment Trust
Notes to Financial Statements (continued)
Templeton BRIC Fund
5. INCOME TAXES
For tax purposes, capital losses may be carried over to offset future capital gains. Capital loss carry-forwards with no expiration, if any, must be fully utilized before those losses with expiration dates.
At March 31, 2013, capital loss carryforwards were as follows:
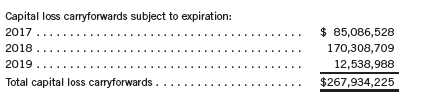
During the year ended March 31, 2013, the Fund utilized $5,101,366 of capital loss carryforwards.
For tax purposes, the Fund may elect to defer any portion of a post-October capital loss to the first day of the following fiscal year. At March 31, 2013, the Fund deferred post-October capital losses of $4,142,637.
The tax character of distributions paid during the years ended March 31, 2013 and 2012, was as follows:

At March 31, 2013, the cost of investments, net unrealized appreciation (depreciation) and undistributed ordinary income for income tax purposes were as follows:
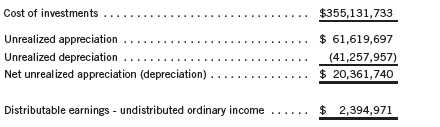
Differences between income and/or capital gains as determined on a book basis and a tax basis are primarily due to differing treatments of foreign currency transactions, corporate actions, and wash sales, which impacted the characterization of the distributions.
Annual Report | 31
Templeton Global Investment Trust
Notes to Financial Statements (continued)
Templeton BRIC Fund
6. INVESTMENT TRANSACTIONS
Purchases and sales of investments (excluding short term securities) for the year ended March 31, 2013, aggregated $126,938,448 and $237,968,783, respectively.
7. INVESTMENTS IN INSTITUTIONAL FIDUCIARY TRUST MONEY MARKET PORTFOLIO
The Fund invests in the Institutional Fiduciary Trust Money Market Portfolio (Sweep Money Fund), an open-end investment company managed by Franklin Advisers, Inc. (an affiliate of the investment manager). Management fees paid by the Fund are reduced on assets invested in the Sweep Money Fund, in an amount not to exceed the management and administrative fees paid by the Sweep Money Fund.
8. CONCENTRATION OF RISK
Investing in foreign securities may include certain risks and considerations not typically associated with investing in U.S. securities, such as fluctuating currency values and changing local and regional economic, political and social conditions, which may result in greater market volatility. In addition, certain foreign securities may not be as liquid as U.S. securities.
9. CREDIT FACILITY
The Fund, together with other U.S. registered and foreign investment funds (collectively, Borrowers), managed by Franklin Templeton Investments, are borrowers in a joint syndicated senior unsecured credit facility totaling $1.5 billion (Global Credit Facility) which matures on January 17, 2014. This Global Credit Facility provides a source of funds to the Borrowers for temporary and emergency purposes, including the ability to meet future unanticipated or unusually large redemption requests.
Under the terms of the Global Credit Facility, the Fund shall, in addition to interest charged on any borrowings made by the Fund and other costs incurred by the Fund, pay its share of fees and expenses incurred in connection with the implementation and maintenance of the Global Credit Facility, based upon its relative share of the aggregate net assets of all of the Borrowers, including an annual commitment fee of 0.07% based upon the unused portion of the Global Credit Facility. These fees are reflected in other expenses on the Statement of Operations. During the year ended March 31, 2013, the Fund did not use the Global Credit Facility.
32 | Annual Report
Templeton Global Investment Trust
Notes to Financial Statements (continued)
Templeton BRIC Fund
10. FAIR VALUE MEASUREMENTS
The Fund follows a fair value hierarchy that distinguishes between market data obtained from independent sources (observable inputs) and the Fund’s own market assumptions (unobservable inputs). These inputs are used in determining the value of the Fund’s financial instruments and are summarized in the following fair value hierarchy:
- Level 1 – quoted prices in active markets for identical financial instruments
- Level 2 – other significant observable inputs (including quoted prices for similar financial instruments, interest rates, prepayment speed, credit risk, etc.)
- Level 3 – significant unobservable inputs (including the Fund’s own assumptions in determining the fair value of financial investments)
The inputs or methodology used for valuing financial instruments are not an indication of the risk associated with investing in those financial instruments.
For movements between the levels within the fair value hierarchy, the Fund has adopted a policy of recognizing the transfers as of the date of the underlying event which caused the movement.
A summary of inputs used as of March 31, 2013, in valuing the Fund’s assets carried at fair value, is as follows:
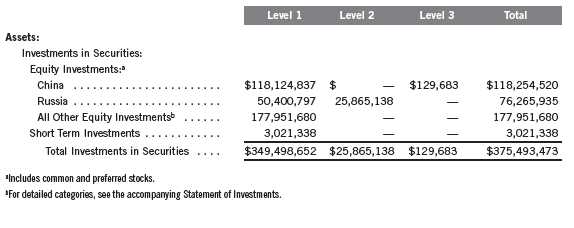
Annual Report | 33
Templeton Global Investment Trust
Notes to Financial Statements (continued)
Templeton BRIC Fund
10. FAIR VALUE MEASUREMENTS (continued)
During the year ended March 31, 2013, the Fund recorded significant transfers of assets between Level 1 and Level 2 within the fair value hierarchy due to a refinement in price valuation methodology, as follows:
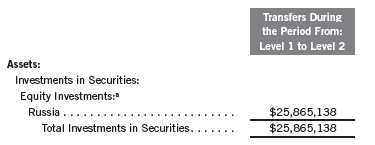
aIncludes common stocks.
A reconciliation of assets in which Level 3 inputs are used in determining fair value is presented when there are significant Level 3 investments at the end of the year.
11. NEW ACCOUNTING PRONOUNCEMENTS
In December 2011, the Financial Accounting Standards Board (FASB) issued Accounting Standards Update (ASU) No. 2011-11, Balance Sheet (Topic 210): Disclosures about Offsetting Assets and Liabilities. The amendments in the ASU enhance disclosures about offsetting of financial assets and liabilities to enable investors to understand the effect of these arrangements on a fund’s financial position. In January 2013, FASB issued ASU No. 2013-01, Balance Sheet (Topic 210): Clarifying the Scope of Disclosures about Offsetting Assets and Liabilities. The amendments in ASU No. 2013-01 clarify the intended scope of disclosures required by ASU No. 2011-11. These ASUs are effective for interim and annual reporting periods beginning on or after January 1, 2013. The Fund believes the adoption of these ASUs will not have a material impact on its financial statements.
12. SUBSEQUENT EVENTS
The Fund has evaluated subsequent events through the issuance of the financial statements and determined that no events have occurred that require disclosure.
ABBREVIATIONS
Selected Portfolio
ADR - American Depositary Receipt
GDR - Global Depositary Receipt
34 | Annual Report
Templeton Global Investment Trust
Report of Independent Registered Public Accounting Firm
To the Board of Trustees and Shareholders of Templeton BRIC Fund
In our opinion, the accompanying statement of assets and liabilities, including the statement of investments, and the related statements of operations and of changes in net assets and the financial highlights present fairly, in all material respects, the financial position of Templeton BRIC Fund (the “Fund”) at March 31, 2013, the results of its operations for the year then ended, the changes in its net assets for each of the two years in the period then ended and the financial highlights for each of the periods presented, in conformity with accounting principles generally accepted in the United States of America. These financial statements and financial highlights (hereafter referred to as “financial statements”) are the responsibility of the Fund’s management. Our responsibility is to express an opinion on these financial statements based on our audits. We conducted our audits of these financial statements in accordance with the standards of the Public Company Accounting Oversight Board (United States). Those standards require that we plan and perform the audit to obtain reasonable assurance about whether the financial statements are free of material misstatement. An audit includes examining, on a test basis, evidence supporting the amounts and disclosures in the financial statements, assessing the accounting principles used and significant estimates made by management, and evaluating the overall financial statement presentation. We believe that our audits, which included confirmation of securities at March 31, 2013 by correspondence with the custodian, transfer agent and brokers, provide a reasonable basis for our opinion.
PricewaterhouseCoopers LLP
San Francisco, California
May 22, 2013
Annual Report | 35
Templeton Global Investment Trust
Tax Information (unaudited)
Templeton BRIC Fund
Under Section 854(b)(1)(A) of the Internal Revenue Code (Code), the Fund hereby reports 8.43% of the ordinary income dividends as income qualifying for the dividends received deduction for the fiscal year ended March 31, 2013.
Under Section 854(b)(1)(B) of the Code, the Fund hereby reports the maximum amount allowable but no less than $6,545,234 as qualified dividends for purposes of the maximum rate under Section 1(h)(11) of the Code for the fiscal year ended March 31, 2013. Distributions, including qualified dividend income, paid during calendar year 2013 will be reported to shareholders on Form 1099-DIV by mid-February 2014. Shareholders are advised to check with their tax advisors for information on the treatment of these amounts on their individual income tax returns.
At March 31, 2012, more than 50% of the Fund’s total assets were invested in securities of foreign issuers. In most instances, foreign taxes were withheld from income paid to the Fund on these investments. As shown in the table below, the Fund hereby reports to shareholders the foreign source income and foreign taxes paid, pursuant to Section 853 of the Code. This written statement will allow shareholders of record on December 7, 2012, to treat their proportionate share of foreign taxes paid by the Fund as having been paid directly by them. The shareholder shall consider these amounts as foreign taxes paid in the tax year in which they receive the Fund distribution.
The following table provides a detailed analysis of foreign tax paid, foreign source income, and foreign qualified dividends as reported by the Fund, to Class A, Class C, and Advisor Class shareholders of record.
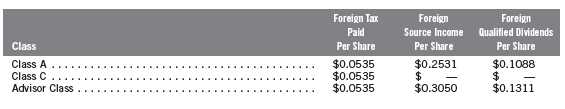
Foreign Tax Paid Per Share (Column 1) is the amount per share available to you, as a tax credit (assuming you held your shares in the Fund for a minimum of 16 days during the 31-day period beginning 15 days before the ex-dividend date of the Fund’s distribution to which the foreign taxes relate), or, as a tax deduction.
Foreign Source Income Per Share (Column 2) is the amount per share of income dividends attributable to foreign securities held by the Fund, plus any foreign taxes withheld on these dividends. The amounts reported include foreign source qualified dividends that have not been adjusted for the rate differential applicable to such dividend income.1
36 | Annual Report
Templeton Global Investment Trust
Tax Information (unaudited) (continued)
Templeton BRIC Fund
Foreign Qualified Dividends Per Share (Column 3) is the amount per share of foreign source qualified dividends, plus any foreign taxes withheld on these dividends. These amounts represent the portion of the Foreign Source Income reported to you in column 2 that were derived from qualified foreign securities held by the Fund.1
By mid-February, 2013, shareholders received Form 1099-DIV which included their share of taxes paid and foreign source income distributed during the calendar year 2012. The Foreign Source Income reported on Form 1099-DIV has not been adjusted for the rate differential on foreign source qualified dividend income. Shareholders are advised to check with their tax advisors for information on the treatment of these amounts on their 2012 individual income tax returns.
1Qualified dividends are taxed at reduced long term capital gains tax rates. In determining the amount of foreign tax credit that may be applied against the U.S. tax liability of individuals receiving foreign source qualified dividends, adjustments may be required to the foreign tax credit limitation calculation to reflect the rate differential applicable to such dividend income. The rules however permit certain individuals to elect not to apply the rate differential adjustments for capital gains and/or dividends for any taxable year. Please consult your tax advisor and the instructions to Form 1116 for more information.
Annual Report | 37
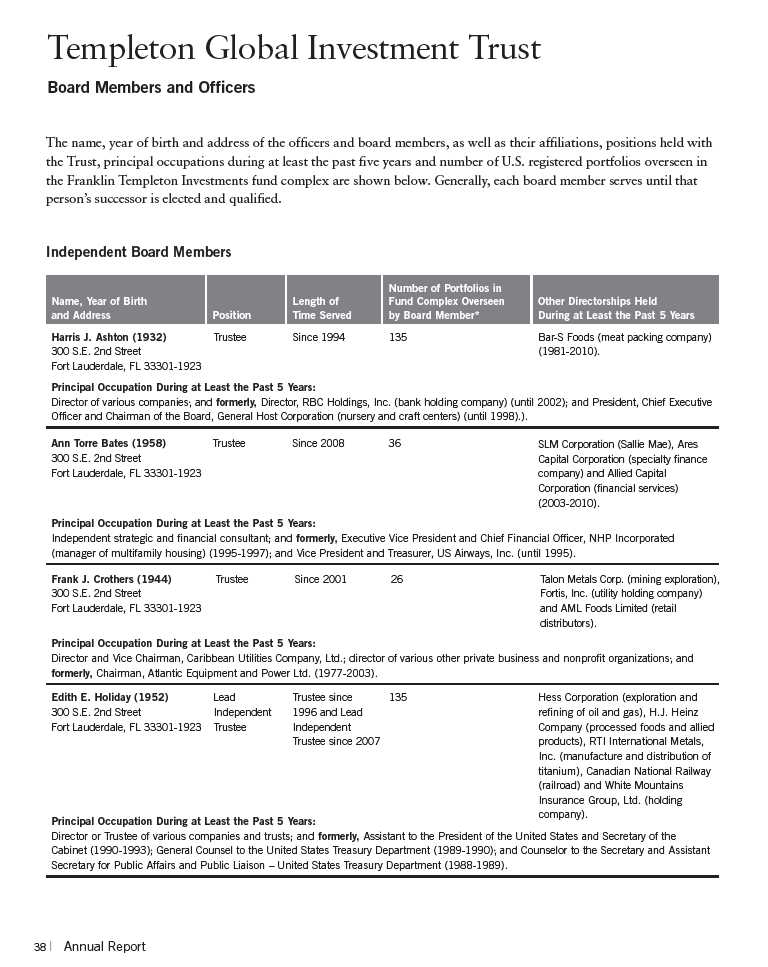
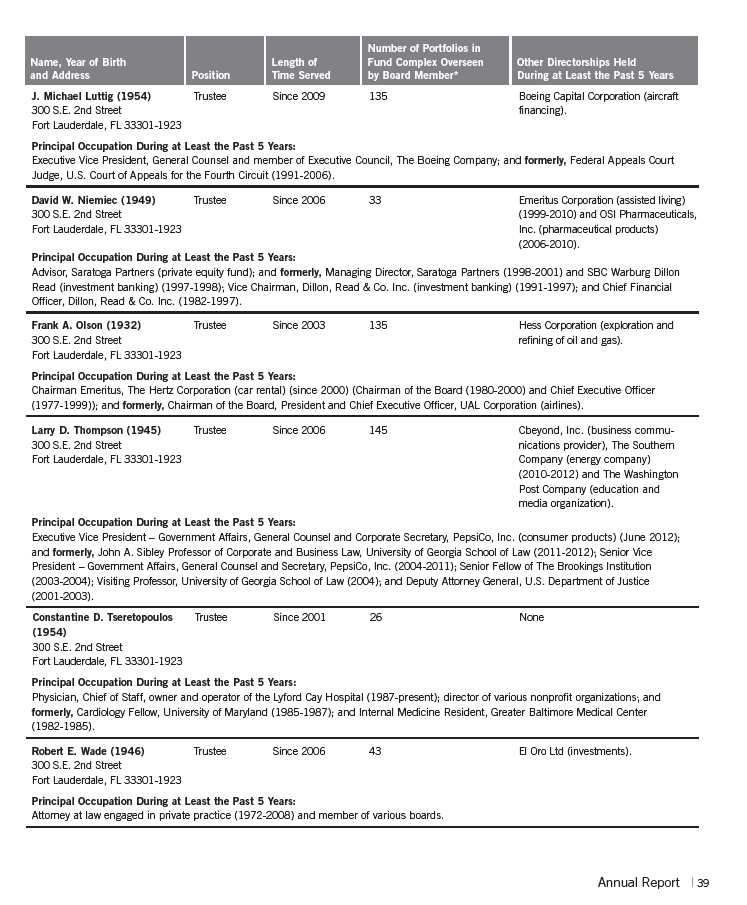
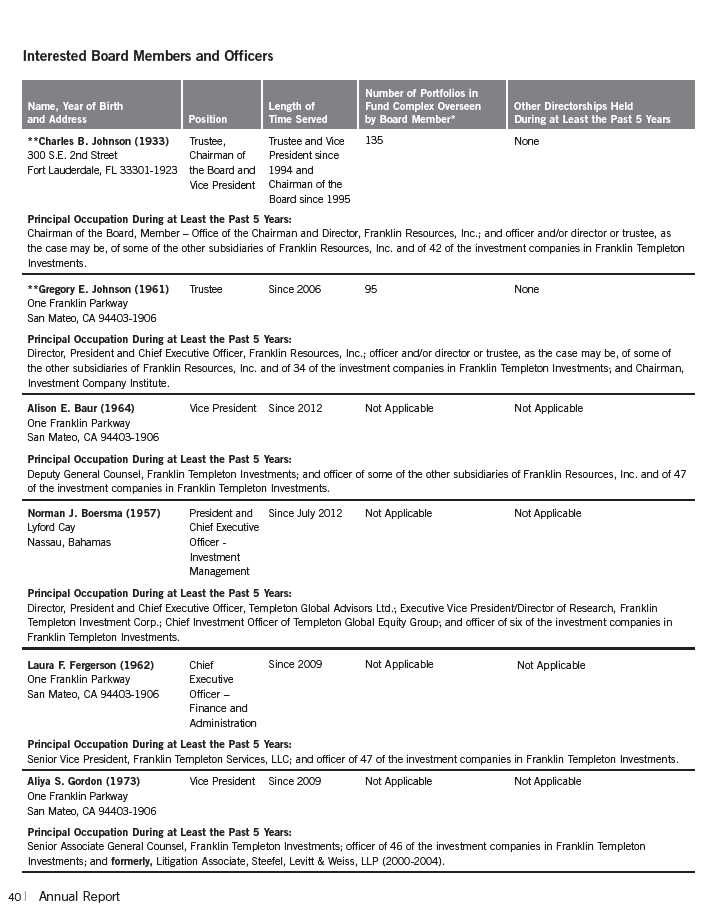
*We base the number of portfolios on each separate series of the U.S. registered investment companies within the Franklin Templeton Investments fund complex. These portfolios
have a common investment manager or affiliated investment managers.
**Charles B. Johnson is considered to be an interested person of the Trust under the federal securities laws due to his position as officer and director and major shareholder of
Franklin Resources, Inc. (Resources), which is the parent company of the Trust’s investment manager and distributor. Gregory E. Johnson is considered to be an interested person of
the Fund under the federal securities laws due to his position as officer and director of Resources.
Note 1: Charles B. Johnson and Rupert H. Johnson, Jr. are brothers and the father and uncle, respectively, of Gregory E. Johnson.
Note 2: Officer information is current as of the date of this report. It is possible that after this date, information about officers may change.
The Sarbanes-Oxley Act of 2002 and Rules adopted by the U.S. Securities and Exchange Commission require the Fund to disclose whether the Fund’s Audit Committee
includes at least one member who is an audit committee financial expert within the meaning of such Act and Rules. The Fund’s Board has determined that there is at least
one such financial expert on the Audit Committee and has designated each of Ann Torre Bates and David W. Niemiec as an audit committee financial expert. The Board
believes that Ms. Bates and Mr. Niemiec qualify as such an expert in view of their extensive business background and experience. Ms. Bates has served as a member of the
Fund Audit Committee since 2008. She currently serves as a director of SLM Corporation and Ares Capital Corporation and was formerly a director of Allied Capital
Corporation from 2003 to 2010, Executive Vice President and Chief Financial Officer of NHP Incorporated and Vice President and Treasurer of US Airways, Inc. Mr. Niemiec
has served as a member of the Fund Audit Committee since 2006, currently serves as an Advisor to Saratoga Partners and was formerly its Managing Director from 1998 to
2001. Mr. Niemiec was formerly a director of Emeritus Corporation from 1999 to 2010 and OSI Pharmaceuticals, Inc. from 2006 to 2010, Managing Director of SBC Warburg
Dillon Read from 1997 to 1998, and was Vice Chairman from 1991 to 1997 and Chief Financial Officer from 1982 to 1997 of Dillon, Read & Co. Inc. As a result of such back-
ground and experience, the Board believes that Ms. Bates and Mr. Niemiec have each acquired an understanding of generally accepted accounting principles and financial
statements, the general application of such principles in connection with the accounting estimates, accruals and reserves, and analyzing and evaluating financial state-
ments that present a breadth and level of complexity of accounting issues generally comparable to those of the Fund, as well as an understanding of internal controls and
procedures for financial reporting and an understanding of audit committee functions. Ms. Bates and Mr. Niemiec are independent Board members as that term is defined
under the applicable U.S. Securities and Exchange Commission Rules and Releases.
The Statement of Additional Information (SAI) includes additional information about the board members and is available, without charge, upon request. Shareholders may
call (800) DIAL BEN/342-5236 to request the SAI.
42 | Annual Report
Templeton Global Investment Trust
Shareholder Information
Templeton BRIC Fund
Board Review of Investment Management Agreement
At a meeting held February 26, 2013, the Board of Trustees (Board), including a majority of non-interested or independent Trustees, approved renewal of the investment management agreements for each of the separate funds within Templeton Global Investment Trust, including Templeton BRIC Fund (Fund(s)). In reaching this decision, the Board took into account information furnished throughout the year at regular Board meetings, as well as information prepared specifically in connection with the annual renewal review process. Information furnished and discussed throughout the year included investment performance reports and related financial information for each Fund, along with periodic reports on expenses, shareholder services, legal and compliance matters, pricing, brokerage commissions and execution and other services provided by the Investment Manager (Manager) and its affiliates, as well as a third-party survey of transfer agent fees charged funds within the Franklin Templeton Investments complex in comparison with those charged other fund complexes deemed comparable. Information furnished specifically in connection with the renewal process included a report for each Fund prepared by Lipper, Inc. (Lipper), an independent organization, as well as additional material, including a Fund profitability analysis prepared by management. The Lipper reports compared each Fund’s investment performance and expenses with those of other mutual funds deemed comparable to the Fund as selected by Lipper. The Fund profitability analysis discussed the profitability to Franklin Templeton Investments from its overall U.S. fund operations, as well as on an individual fund-by-fund basis. Additional material accompanying such profitability analysis included information on a fund-by-fund basis listing portfolio managers and other accounts they manage, as well as information on management fees charged by the Manager and its affiliates to U.S. mutual funds and other accounts, including management’s explanation of differences where relevant. Such material also included a memorandum prepared by management describing project initiatives and capital investments relating to the services provided to the Funds by the Franklin Templeton Investments organization, as well as a memorandum relating to economies of scale and an analysis concerning transfer agent fees charged by an affiliate of the Manager.
In considering such materials, the independent Trustees received assistance and advice from and met separately with independent counsel. While the investment management agreements for all Funds were considered at the same Board meeting, the Board dealt with each Fund separately. In approving continuance of the investment management agreement for each Fund, the Board, including a majority of independent Trustees, determined that the management fee structure was fair and reasonable and that continuance of the investment management agreement was in the best interests of each Fund and its shareholders. While attention was given to all information furnished, the following discusses some primary factors relevant to the Board’s decision.
NATURE, EXTENT AND QUALITY OF SERVICES. The Board was satisfied with the nature and quality of the overall services provided by the Manager and its affiliates to the Fund and its shareholders. In addition to investment performance and expenses discussed later, the Board’s opinion was based, in part, upon periodic reports furnished it showing that the investment policies and restrictions for the Fund were consistently complied with as well as other reports periodically
Annual Report | 43
Templeton Global Investment Trust
Shareholder Information (continued)
Templeton BRIC Fund
Board Review of Investment Management Agreement (continued)
furnished the Board covering matters such as the compliance of portfolio managers and other management personnel with the code of ethics adopted throughout the Franklin Templeton fund complex, the adherence to fair value pricing procedures established by the Board, and the accuracy of net asset value calculations. The Board also noted the extent of benefits provided Fund shareholders from being part of the Franklin Templeton family of funds, including the right to exchange investments between the same class of funds without a sales charge, the ability to reinvest Fund dividends into other funds and the right to combine holdings in other funds to obtain a reduced sales charge. Favorable consideration was given to management’s continuous efforts and expenditures in establishing back-up systems and recovery procedures to function in the event of a natural disaster, it being noted that such systems and procedures had functioned well during the Florida hurricanes and blackouts experienced in previous years, and that those operations in the New York/New Jersey area ran smoothly during the more recent Hurricane Sandy. Among other factors taken into account by the Board were the Manager’s best execution trading policies, including a favorable report by an independent portfolio trading analytical firm, which also covered FOREX transactions. Consideration was also given to the experience of the Fund’s portfolio management team, the number of accounts managed and general method of compensation. In this latter respect, the Board noted that a primary factor in management’s determination of a portfolio manager’s bonus compensation was the relative investment performance of the funds he or she managed and that a portion of such bonus was required to be invested in a predesignated list of funds within such person’s fund management area so as to be aligned with the interests of shareholders. The Board also took into account the quality of transfer agent and shareholder services provided Fund shareholders by an affiliate of the Manager and the continuous enhancements to the Franklin Templeton website. Particular attention was given to management’s conservative approach and diligent risk management procedures, including continuous monitoring of counterparty credit risk and attention given to derivatives and other complex instruments including expanded collateralization requirements. The Board also took into account, among other things, management’s efforts in establishing a global credit facility for the benefit of the Fund and other accounts managed by Franklin Templeton Investments to provide a source of cash for temporary and emergency purposes or to meet unusual redemption requests as well as the strong financial position of the Manager’s parent company and its commitment to the mutual fund business as evidenced by its subsidization of money market funds.
INVESTMENT PERFORMANCE. While consideration was given to performance reports and discussions with portfolio managers at Board meetings during the year, particular attention in assessing performance was given to the Lipper reports furnished for the agreement renewal. The Lipper reports prepared for the Fund showed the investment performance of its Class A shares during 2012 and previous years of operations. The Lipper performance universe for the Fund consisted of all retail and institutional emerging markets funds as designated by Lipper. The Lipper report showed the Fund’s total return in 2012 to be in the lowest performing quintile of the performance universe,
44 | Annual Report
Templeton Global Investment Trust
Shareholder Information (continued)
Templeton BRIC Fund
Board Review of Investment Management Agreement (continued)
and on an annualized basis to also be in the lowest performing quintiles of such universe for the previous three- and five-year periods. The performance universe was broad and not limited to funds investing in the BRIC countries, but the Board noted that the Fund’s total return had also underper-formed that of the only other U.S. BRIC fund included in such universe during 2012 as well as the previous annualized three- and five-year periods. The Board was not satisfied with the Fund’s performance and discussed with management the reasons for such underperformance, as well as the appropriateness of some change in its portfolio management team. During such discussions, management expressed its confidence in the existing portfolio management team based on their experience as well as success with other investment products. Based on such discussions and management’s confidence in the Fund’s portfolio managers, the Board did not feel any change in portfolio management should be made at present, but intends to monitor the Fund’s ongoing performance.
COMPARATIVE EXPENSES. Consideration was given to a comparative analysis of the management fees and total expense ratio of the Fund compared with those of a group of other funds selected by Lipper as its appropriate Lipper expense group. Lipper expense data is based upon historical information taken from each fund’s most recent annual report, which reflects historical asset levels that may be quite different from those currently existing, particularly in a period of market volatility. While recognizing such inherent limitation and the fact that expense ratios generally increase as assets decline and decrease as assets grow, the Board believed the independent analysis conducted by Lipper to be an appropriate measure of comparative expenses. In reviewing comparative costs, Lipper provides information on the Fund’s contractual investment management fee in comparison with the effective management fee that would have been charged by other funds within its Lipper expense group assuming they were similar in size to the Fund, as well as the actual total expense ratio of the Fund in comparison with those of its Lipper expense group. The Lipper contractual investment management fee analysis includes administrative charges as being part of a management fee, and actual total expenses, for comparative consistency, are shown by Lipper for Fund Class A shares. The Lipper report for the Fund showed its contractual investment management fee rate to be within 20 basis points above the Lipper expense group median, and its actual total expense ratio to be the highest in its Lipper expense group. After discussion, management agreed to a voluntary limit on expenses, which based on the Fund’s expense ratio at year-end would have resulted in an approximate 10 basis point reduction. Such limitation was effected through voluntary fee waivers beginning April 1, 2013, and continuing through July 31, 2014.
MANAGEMENT PROFITABILITY. The Board also considered the level of profits realized by the Manager and its affiliates in connection with the operation of the Fund. In this respect, the Board reviewed the Fund profitability analysis that addresses the overall profitability of Franklin Templeton’s U.S. fund business, as well as its profits in providing management and other services to each of the individual funds during the 12-month period ended September 30, 2012, being the most recent fiscal year-end for Franklin Resources, Inc., the Manager’s parent. In reviewing the analysis,
Annual Report | 45
Templeton Global Investment Trust
Shareholder Information (continued)
Templeton BRIC Fund
Board Review of Investment Management Agreement (continued)
attention was given to the methodology followed in allocating costs to the Fund, it being recognized that allocation methodologies are inherently subjective and various allocation methodologies may each be reasonable while producing different results. In this respect, the Board noted that, while being continuously refined and reflecting changes in the Manager’s own cost accounting, the cost allocation methodology was consistent with that followed in profitability report presentations for the Fund made in prior years and that the Fund’s independent registered public accounting firm had been engaged by the Manager to periodically review the reasonableness of the allocation methodologies solely for use by the Fund’s Board in reference to the profitability analysis. In reviewing and discussing such analysis, management discussed with the Board its belief that costs incurred in establishing the infrastructure necessary for the type of mutual fund operations conducted by the Manager and its affiliates may not be fully reflected in the expenses allocated to the Fund in determining its profitability, as well as the fact that the level of profits, to a certain extent, reflected operational cost savings and efficiencies initiated by management. The Board also took into account management’s expenditures in improving shareholder services provided the Fund, as well as the need to implement systems to meet additional regulatory and compliance requirements resulting from statutes such as the Sarbanes-Oxley and Dodd Frank Acts and recent SEC and other regulatory requirements. In addition, the Board considered a third-party study comparing the profitability of the Manager’s parent on an overall basis to other publicly held managers broken down to show profitability from management operations exclusive of distribution expenses, as well as profitability including distribution expenses. The Board also considered the extent to which the Manager and its affiliates might derive ancillary benefits from fund operations, including revenues generated from transfer agent services and potential benefits resulting from allocation of fund brokerage and the use of commission dollars to pay for research. Based upon its consideration of all these factors, the Board determined that the level of profits realized by the Manager and its affiliates from providing services to the Fund was not excessive in view of the nature, quality and extent of services provided.
ECONOMIES OF SCALE. The Board also considered whether economies of scale are realized by the Manager as the Fund grows larger and the extent to which this is reflected in the level of management fees charged. While recognizing that any precise determination is inherently subjective, the Board noted that based upon the Fund profitability analysis, it appears that as some funds get larger, at some point economies of scale do result in the Manager realizing a larger profit margin on management services provided such a fund. The Board also noted that economies of scale are shared with the Fund and its shareholders through management fee breakpoints so that as a Fund grows in size, its effective management fee rate declines. In view of the specialized nature and size of the Fund, the Board questioned whether economies of scale existed. The investment management advisory agreement for the Fund provides for breakpoints that are above the Fund’s existing asset size, and to the extent economies of scale may be realized by the Manager and its affiliates, the Board believes the schedule of fees for the Fund provides a sharing of benefits with the Fund and its shareholders.
46 | Annual Report
Templeton Global Investment Trust
Shareholder Information (continued)
Templeton BRIC Fund
Board Review of Investment Management Agreement (continued)
In addition to the investment advisory services provided the Fund under its investment management agreement, administrative services are provided the Fund under a separate agreement at a fixed charge of 20 basis points. At the February 26, 2013, Board meeting, the Board eliminated the separate agreements and approved a new form of investment management agreement for the Fund combining such services. In approving the new form of investment management agreement, the Board took into account the fact that the types of services and aggregate fee, including breakpoints, would be the same as provided under the previous separate agreements and that combining such services was consistent with Lipper’s methodology of considering contractual investment management fees to include any separately charged administrative fee. The Board also noted that combining the services under the new form of investment management agreement would have no impact on management’s existing subsidization of expenses of the Fund.
Proxy Voting Policies and Procedures
The Fund’s investment manager has established Proxy Voting Policies and Procedures (Policies) that the Fund uses to determine how to vote proxies relating to portfolio securities. Shareholders may view the Fund’s complete Policies online at franklintempleton.com. Alternatively, shareholders may request copies of the Policies free of charge by calling the Proxy Group collect at (954) 527-7678 or by sending a written request to: Franklin Templeton Companies, LLC, 300 S.E. 2nd Street, Fort Lauderdale, FL 33301, Attention: Proxy Group. Copies of the Fund’s proxy voting records are also made available online at franklintempleton.com and posted on the U.S. Securities and Exchange Commission’s website at sec.gov and reflect the most recent 12-month period ended June 30.
Quarterly Statement of Investments
The Fund files a complete statement of investments with the U.S. Securities and Exchange Commission for the first and third quarters for each fiscal year on Form N-Q. Shareholders may view the filed Form N-Q by visiting the Commission’s website at sec.gov. The filed form may also be viewed and copied at the Commission’s Public Reference Room in Washington, DC. Information regarding the operations of the Public Reference Room may be obtained by calling (800) SEC-0330.
Annual Report | 47
Templeton Global Investment Trust
Shareholder Information (continued)
Templeton BRIC Fund
Householding of Reports and Prospectuses
You will receive the Fund’s financial reports every six months as well as an annual updated summary prospectus (prospectus available upon request). To reduce Fund expenses, we try to identify related shareholders in a household and send only one copy of the financial reports and summary prospectus. This process, called “householding,” will continue indefinitely unless you instruct us otherwise. If you prefer not to have these documents householded, please call us at (800) 632-2301. At any time you may view current prospectuses/summary prospectuses and financial reports on our website. If you choose, you may receive these documents through electronic delivery.
48 | Annual Report
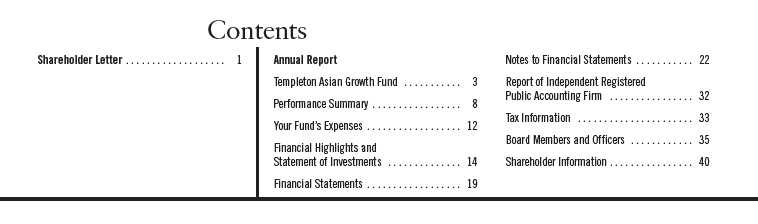
Annual Report
Templeton Asian Growth Fund
Your Fund’s Goal and Main Investments: Templeton Asian Growth Fund seeks long-
term capital appreciation by investing, under normal market conditions, at least 80% of its net assets in
securities of companies located in the Asia region (excluding Australia, New Zealand and Japan) as
defined in the prospectus. Such companies have their principal securities trading markets in, derive at
least 50% of their total revenues or profits from either goods or services produced or sales made in, have
at least 50% of their assets in, are linked to currencies of, or are organized under the laws of, or have
principal offices in, Asia region countries.

This annual report for Templeton Asian Growth Fund covers the fiscal year
ended March 31, 2013.
Economic and Market Overview
The global economy grew at a moderate but uneven pace during the 12 months
under review as monetary easing and fiscal stimulus measures undertaken by
many central banks and governments gained traction. Solid growth in many
Asian economies, particularly China and Indonesia, offset weakness in several
developed market economies, especially the eurozone. In addition to meas-
ures by major developed market countries, China, South Korea and India
implemented fiscal and monetary easing measures. China announced a fiscal
stimulus package to fund infrastructure projects, South Korea followed its
June stimulus package with another package in September, and India intro-
duced a series of reforms to boost investor confidence. Some countries such
as China, Thailand, India and South Korea also cut interest rates during the
12-month period.
The effects of monetary easing and fiscal stimulus measures undertaken by
central banks and governments globally were evident during the 12-month
period as financial markets remained awash with liquidity. Asian stocks, as
measured by the MSCI All Country (AC) Asia ex Japan Index, continued the
uptrend that began in June and outperformed their emerging market coun-
terparts, as measured by the MSCI Emerging Markets Index, during the
The dollar value, number of shares or principal amount, and names of all portfolio holdings are listed in the
Fund’s Statement of Investments (SOI). The SOI begins on page 17.
Annual Report | 3
12 months under review. With the exception of a sharp sell-off in May triggered by investor anxiety about slowing global economic growth and Europe’s recurring sovereign debt crisis, Asian stocks performed well. For the 12 months ended March 31, 2013, the MSCI AC Asia ex Japan Index generated a +7.41% total return, with all 10 countries in the index posting positive returns.1 Supported by strong domestic consumption and investment growth, Southeast Asia, particularly the Philippines, Thailand, Indonesia and Singapore, outperformed many of their Asian peers. The sovereign debt rating upgrades of the Philippines and Thailand further drove these countries’ stock performance. Pakistan (not an index component) and Hong Kong also produced double-digit returns for the 12-month period.
In our view, Asian countries have generally remained economically healthier than many developed countries, and Asian stocks could continue to outperform developed market stocks for the longer term. In 10 of the past 12 calendar years, Asian stocks, as measured by the MSCI AC Asia ex Japan Index, outperformed developed market stocks, as measured by the MSCI World Index, but past performance does not guarantee future results.
Investment Strategy
When choosing equity investments for the Fund, we apply a fundamental research, value-oriented, long-term approach, focusing on the market price of a company’s securities relative to our evaluation of the company’s long-term earnings, asset value and cash flow potential. As we look for investments, we consider specific companies, rather than sectors, while doing in-depth research to assess factors such as management strength and local conditions. We also consider a company’s profit and loss outlook, balance sheet strength, cash flow trends and asset value in relation to the current price. The analysis considers the company’s corporate governance behavior as well as its position in its sector, the economic framework and political environment.
Performance Overview
Templeton Asian Growth Fund – Class A delivered a +6.33% cumulative total return for the 12 months ended March 31, 2013. In comparison, the MSCI AC Asia ex Japan Index posted a +7.41% total return.1 Please note index performance information is provided for reference and we do not attempt to track any index but rather undertake investments on the basis of
1. Source: © 2013 Morningstar. All Rights Reserved. The information contained herein: (1) is proprietary to Morningstar
and/or its content providers; (2) may not be copied or distributed; and (3) is not warranted to be accurate, complete or
timely. Neither Morningstar nor its content providers are responsible for any damages or losses arising from any use of
this information. The index is unmanaged and includes reinvested dividends. One cannot invest directly in an index,
and an index is not representative of the Fund’s portfolio.
4 | Annual Report
fundamental research. In addition, the Fund’s return reflects the effect of fees and expenses for professional management, while an index does not have such costs. You can find more of the Fund’s performance data in the Performance Summary beginning on page 8.
Manager’s Discussion
During the 12 months under review, significant contributors to the Fund’s absolute performance included Land and Houses, Thailand’s largest residential real estate developer focused on the Greater Bangkok area and other major Thai cities; Kiatnakin Bank, a mid-sized Thai commercial bank; and Bank Danamon Indonesia, one of the country’s 10 largest commercial banks. Land and Houses benefited from its reputable brand name; a conducive, low interest rate environment; and strong corporate results that showed solid revenue growth and a robust balance sheet. We believe the continued recovery in Bangkok’s real estate market and Land and Houses’ future property launches outside of Bangkok could support the company’s growth in the years ahead. Kiatnakin Bank’s diversified revenue structure, combined with the ongoing growth of its auto and commercial loan businesses, could improve the bank’s profitability and outlook. The bank is attractively valued, in our view, and its merger with Phatra Capital, one of Thailand’s leading investment, brokerage and wealth management firms, could make the bank a more appealing merger and acquisition target and further unlock its value. Bank Danamon’s share price surged early in the period following a bid for a controlling stake from Singapore-based DBS Group Holdings, one of Southeast Asia’s largest banks. However, the Indonesian central bank’s latest regulation that requires a two-step process for foreign investors’ acquisitions of the country’s banks raised uncertainty about the timing and completion of the deal. Bank Danamon continued to report strong earnings growth in 2012, driven by continued loan growth in the mass market, small- and medium-sized companies, and wholesale segments. We believe that Bank Danamon, as one of Indonesia’s largest lenders, remained well positioned to benefit from the country’s expanding economy, growing middle class, strong loan demand and underserved banking sector.
In contrast, key detractors from the Fund’s absolute performance included United Tractors, Indonesia’s leading heavy equipment distributor; Tata Steel, India’s largest steelmaker and one of the world’s largest steel companies; and Chalco (Aluminum Corp. of China), one of China’s major alumina and aluminum producers. United Tractors’ short-term performance was negatively affected by slower demand from the mining sector and tight competition, which resulted in weak heavy equipment sales. In the longer term, we believe that United Tractors’ involvement in coal mining and its dominance in heavy equipment and mining contracting make it well positioned to potentially
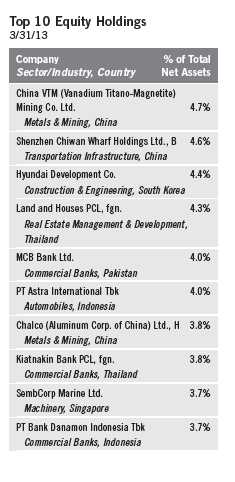
Annual Report | 5
benefit from growing coal demand. Despite the Reserve Bank of India’s recent interest rate cuts, many Indian stocks were pressured by persistently high inflation, reduced economic growth forecasts and a government budget statement that lacked hoped-for commitments to economic reform. Tata Steel’s shares declined in value along with those of other steel companies as a weak demand environment hampered earnings results. Chalco reported a worse-than-expected loss in 2012 resulting largely from higher raw material costs and lower aluminum prices. In our longer term view, the company is well positioned to benefit from China’s economic recovery, which should drive aluminum demand. At period-end, we maintained our positive long-term outlook for commodity-related companies because of Asia’s continued industrialization, rising per-capita incomes and increasing domestic demand. In this light, we viewed recent commodity price declines and the resulting share price corrections of select commodity-related companies as bargain opportunities to invest in what we considered to be quality companies. The valuations of United Tractors, Tata Steel and Chalco became more attractive to us after recent share price corrections, leading us to increase the Fund’s investments in these industry leaders.
Portfolio inflows and our continued search for companies we considered to be attractively valued led us to undertake some purchases in Thailand, Indonesia, India and China via China H and Red Chip shares.2 We added oil and gas exploration and production, automobile manufacturing and industrial machinery companies because of fundamentals we considered to be attractive. Key purchases included a new position in PTTEP (PTT Exploration and Production), Thailand’s national oil and gas exploration and production company. We also increased the Fund’s investment in Brilliance China Automotive Holdings, a major Chinese automobile manufacturer that has a joint venture with BMW.
Conversely, we undertook some sales in South Korea, Indonesia, Thailand and China via China H shares to focus on companies we considered to be more attractively valued within our investment universe. We eliminated the Fund’s exposure to South Korea’s textile, apparel and luxury goods industry and reduced the Fund’s holdings in some Indonesian and Thai commercial banks. Key sales included elimination of the Fund’s position in Avista, a South Korean fashion apparel manufacturer and retailer. We also reduced the Fund’s investments in Bank Danamon; Siam Commercial Bank, a leading Thai commercial bank; and PetroChina, one of China’s largest oil and gas companies.
2. “China H” denotes shares of China-incorporated, Hong Kong Stock Exchange-listed companies with most businesses
in China. “Red Chip” denotes shares of Hong Kong Stock Exchange-listed companies with significant exposure to China.
6 | Annual Report
Thank you for your participation in Templeton Asian Growth Fund. We look forward to serving your future investment needs.
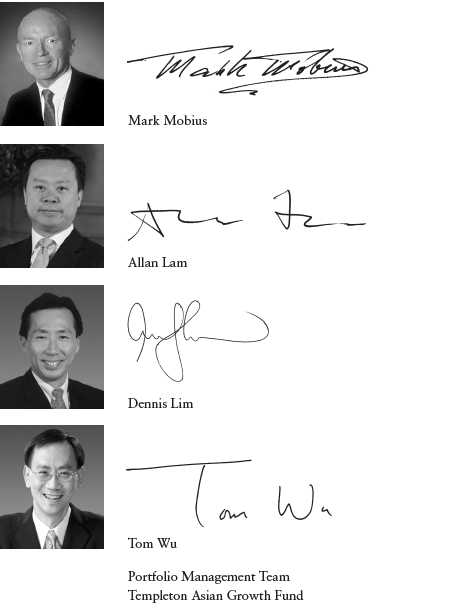
The foregoing information reflects our analysis, opinions and portfolio holdings as of March 31, 2013, the end of the
reporting period. The way we implement our main investment strategies and the resulting portfolio holdings may
change depending on factors such as market and economic conditions. These opinions may not be relied upon as
investment advice or an offer for a particular security. The information is not a complete analysis of every aspect of
any market, country, industry, security or the Fund. Statements of fact are from sources considered reliable, but the
investment manager makes no representation or warranty as to their completeness or accuracy. Although historical
performance is no guarantee of future results, these insights may help you understand our investment management
philosophy.
Annual Report | 7
Performance Summary as of 3/31/13
Your dividend income will vary depending on dividends or interest paid by securities in the Fund’s
portfolio, adjusted for operating expenses of each class. Capital gain distributions are net profits
realized from the sale of portfolio securities. The performance table and graphs do not reflect any
taxes that a shareholder would pay on Fund dividends, capital gain distributions, if any, or any
realized gains on the sale of Fund shares. Total return reflects reinvestment of the Fund’s dividends
and capital gain distributions, if any, and any unrealized gains or losses.

8 | Annual Report
Performance Summary (continued)
Performance1
Cumulative total return excludes sales charges. Average annual total return and value of $10,000 investment include max-
imum sales charges. Class A: 5.75% maximum initial sales charge; Class C: 1% contingent deferred sales charge in first
year only; Advisor Class: no sales charges.
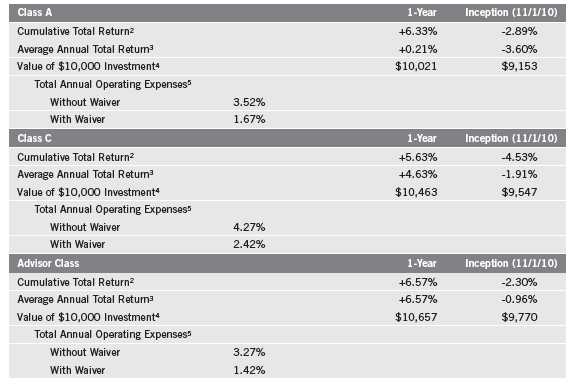
Performance data represent past performance, which does not guarantee future results. Investment return and principal
value will fluctuate, and you may have a gain or loss when you sell your shares. Current performance may differ from
figures shown. For most recent month-end performance, go to franklintempleton.com or call (800) 342-5236.
The investment manager and/or administrator have contractually agreed to waive or assume certain expenses so that
common expenses (excluding Rule 12b-1 fees) for each class do not exceed 1.42% (other than certain nonroutine
expenses) until 7/31/14.
Annual Report | 9
Performance Summary (continued)
Total Return Index Comparison for a Hypothetical $10,000 Investment1
Total return represents the change in value of an investment over the periods shown. It includes
any applicable, maximum sales charge, Fund expenses, account fees and reinvested distributions.
The unmanaged index includes reinvestment of any income or distributions. It differs from the
Fund in composition and does not pay management fees or expenses. One cannot invest directly in
an index.


10 | Annual Report
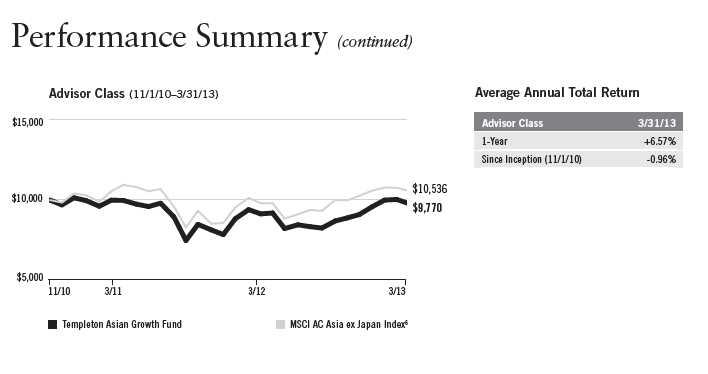
Endnotes
All investments involve risks, including possible loss of principal. Special risks are associated with foreign invest-
ing, including currency fluctuations, economic instability and political developments. Investments in emerging
market countries involve heightened risks related to the same factors, in addition to those associated with these
markets’ smaller size, lesser liquidity and lack of established legal, political, business and social frameworks to
support securities markets. The Fund may also experience greater volatility than a fund that is more broadly
diversified geographically. Smaller company stocks have historically had more price volatility than large-company
stocks, particularly over the short term. The Fund is designed for the aggressive portion of a well-diversified port-
folio. The Fund is actively managed but there is no guarantee that the manager’s investment decisions will
produce the desired results. The Fund’s prospectus also includes a description of the main investment risks.
Class C: These shares have higher annual fees and expenses than Class A shares.
Advisor Class: Shares are available to certain eligible investors as described in the prospectus.
1. Fund investment results reflect the expense reduction, without which the results would have been lower.
2. Cumulative total return represents the change in value of an investment over the periods indicated.
3. Average annual total return represents the average annual change in value of an investment over the periods
indicated.
4. These figures represent the value of a hypothetical $10,000 investment in the Fund over the periods indicated.
5. Figures are as stated in the Fund’s prospectus current as of the date of this report. In periods of market volatility,
assets may decline significantly, causing total annual Fund operating expenses to become higher than the figures
shown.
6. Source: © 2013 Morningstar. The MSCI AC Asia ex Japan Index is a free float-adjusted, market capitalization-
weighted index designed to measure equity market performance of Asia, excluding Japan.
Annual Report | 11
Your Fund’s Expenses
As a Fund shareholder, you can incur two types of costs:
- Transaction costs, including sales charges (loads) on Fund purchases; and
- Ongoing Fund costs, including management fees, distribution and service (12b-1) fees, and other Fund expenses. All mutual funds have ongoing costs, sometimes referred to as operating expenses.
The following table shows ongoing costs of investing in the Fund and can help you understand these costs and compare them with those of other mutual funds. The table assumes a $1,000 investment held for the six months indicated.
Actual Fund Expenses
The first line (Actual) for each share class listed in the table provides actual account values and expenses. The “Ending Account Value” is derived from the Fund’s actual return, which includes the effect of Fund expenses.
You can estimate the expenses you paid during the period by following these steps. Of course, your account value and expenses will differ from those in this illustration:
| 1. | Divide your account value by $1,000. |
| | If an account had an $8,600 value, then $8,600 ÷ $1,000 = 8.6. |
| 2. | Multiply the result by the number under the heading “Expenses Paid During Period.” |
| | If Expenses Paid During Period were $7.50, then 8.6 x $7.50 = $64.50. |
In this illustration, the estimated expenses paid this period are $64.50.
Hypothetical Example for Comparison with Other Funds
Information in the second line (Hypothetical) for each class in the table can help you compare ongoing costs of investing in the Fund with those of other mutual funds. This information may not be used to estimate the actual ending account balance or expenses you paid during the period. The hypothetical “Ending Account Value” is based on the actual expense ratio for each class and an assumed 5% annual rate of return before expenses, which does not represent the Fund’s actual return. The figure under the heading “Expenses Paid During Period” shows the hypothetical expenses your account would have incurred under this scenario. You can compare this figure with the 5% hypothetical examples that appear in shareholder reports of other funds.
12 | Annual Report
Your Fund’s Expenses (continued)
Please note that expenses shown in the table are meant to highlight ongoing costs and do not reflect
any transaction costs, such as sales charges. Therefore, the second line for each class is useful in
comparing ongoing costs only, and will not help you compare total costs of owning different
funds. In addition, if transaction costs were included, your total costs would have been higher.
Please refer to the Fund prospectus for additional information on operating expenses.
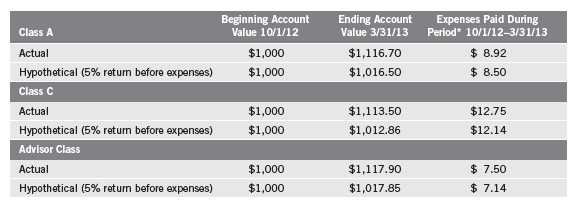
*Expenses are calculated using the most recent six-month expense ratio, net of expense waivers, annualized for each class (A: 1.69%; C: 2.42%;
and Advisor: 1.42%), multiplied by the average account value over the period, multiplied by 182/365 to reflect the one-half year period.
Annual Report | 13
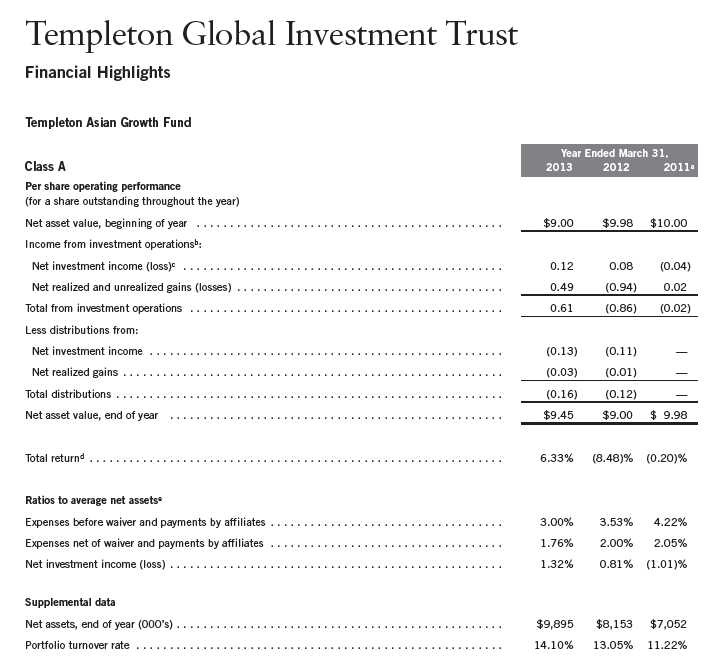
aFor the period November 1, 2010 (commencement of operations) to March 31, 2011.
bThe amount shown for a share outstanding throughout the period may not correlate with the Statement of Operations for the period due to the timing of sales and repurchases of
the Fund shares in relation to income earned and/or fluctuating market value of the investments of the Fund.
cBased on average daily shares outstanding.
dTotal return does not reflect sales commissions or contingent deferred sales charges, if applicable, and is not annualized for periods less than one year.
eRatios are annualized for periods less than one year.
14 | The accompanying notes are an integral part of these financial statements. | Annual Report
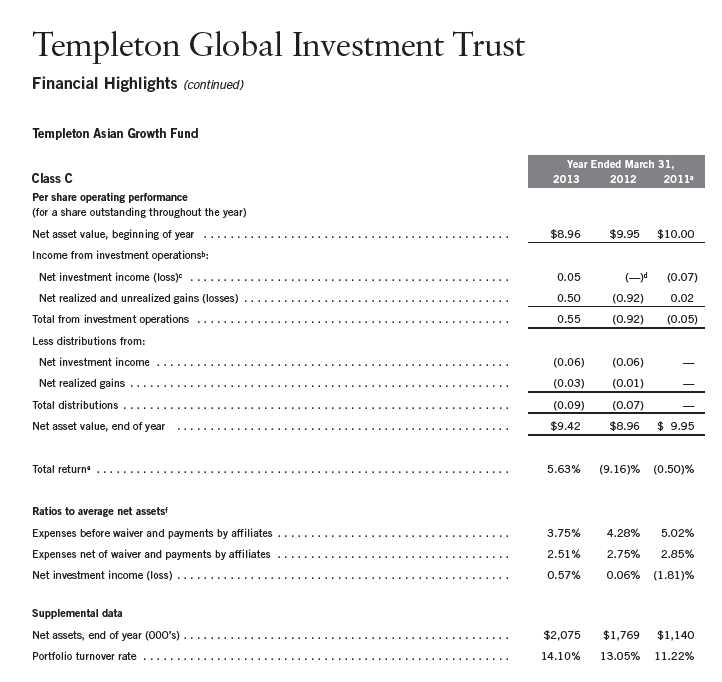
aFor the period November 1, 2010 (commencement of operations) to March 31, 2011.
bThe amount shown for a share outstanding throughout the period may not correlate with the Statement of Operations for the period due to the timing of sales and repurchases of
the Fund shares in relation to income earned and/or fluctuating market value of the investments of the Fund.
cBased on average daily shares outstanding.
dAmount rounds to less than $0.01 per share.
eTotal return does not reflect sales commissions or contingent deferred sales charges, if applicable, and is not annualized for periods less than one year.
fRatios are annualized for periods less than one year.
Annual Report | The accompanying notes are an integral part of these financial statements. | 15
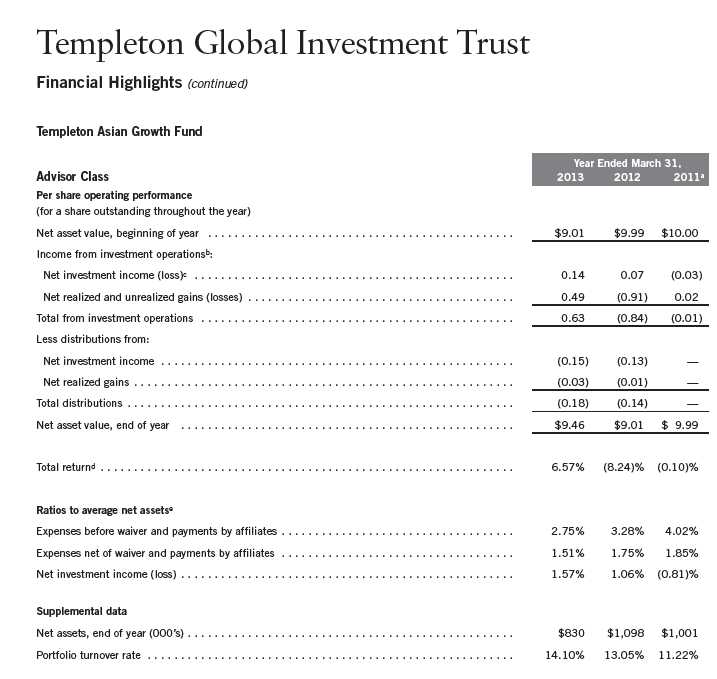
aFor the period November 1, 2010 (commencement of operations) to March 31, 2011.
bThe amount shown for a share outstanding throughout the period may not correlate with the Statement of Operations for the period due to the timing of sales and repurchases of
the Fund shares in relation to income earned and/or fluctuating market value of the investments of the Fund.
cBased on average daily shares outstanding.
dTotal return is not annualized for periods less than one year.
eRatios are annualized for periods less than one year.
16 | The accompanying notes are an integral part of these financial statements. | Annual Report
Templeton Global Investment Trust
Statement of Investments, March 31, 2013
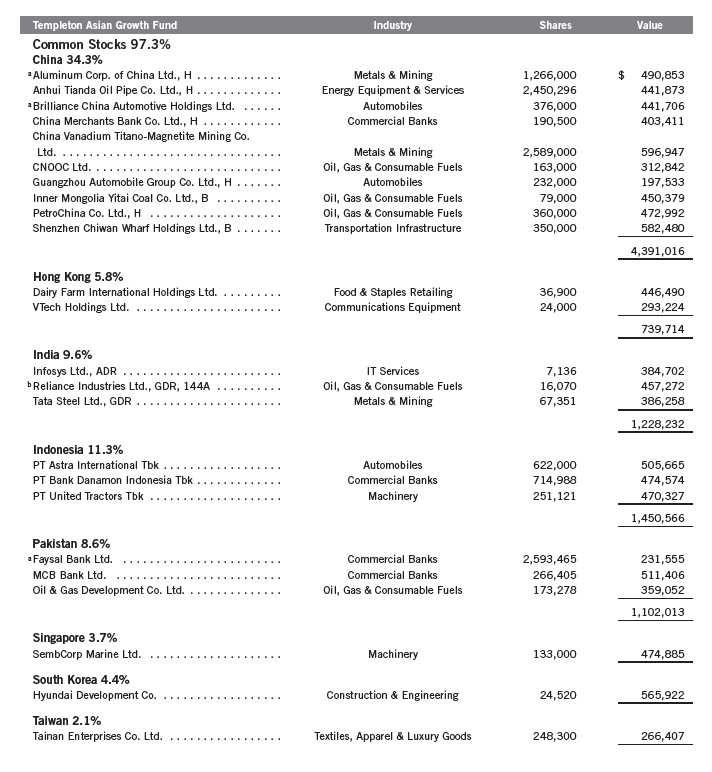
Annual Report | 17
Templeton Global Investment Trust
Statement of Investments, March 31, 2013 (continued)
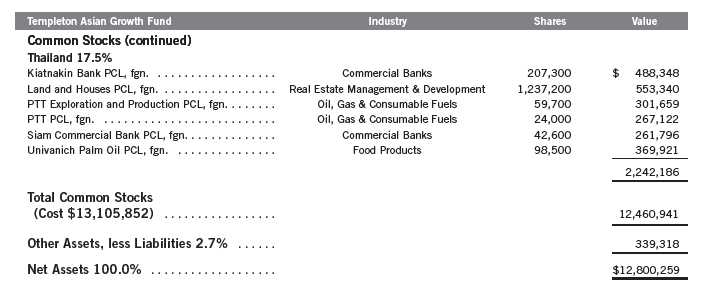
See Abbreviations on page 31.
aNon-income producing.
bSecurity was purchased pursuant to Rule 144A under the Securities Act of 1933 and may be sold in transactions exempt from registration only to qualified institutional buyers or in
a public offering registered under the Securities Act of 1933. This security has been deemed liquid under guidelines approved by the Trust’s Board of Trustees. At March 31, 2013,
the value of this security was $457,272, representing 3.57% of net assets.
18 | The accompanying notes are an integral part of these financial statements. | Annual Report

Annual Report | The accompanying notes are an integral part of these financial statements. | 19

20 | The accompanying notes are an integral part of these financial statements. | Annual Report
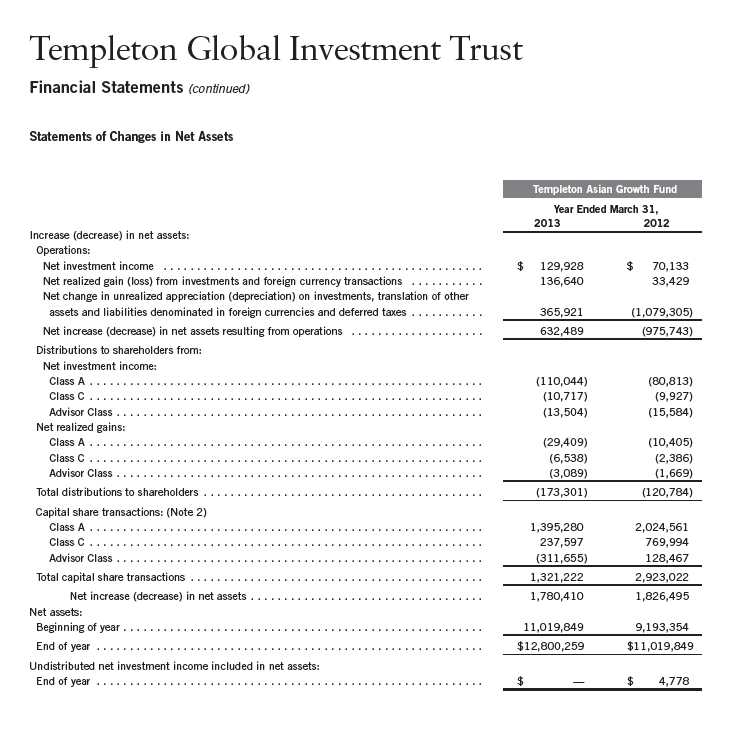
Annual Report | The accompanying notes are an integral part of these financial statements. | 21
Templeton Global Investment Trust
Notes to Financial Statements
Templeton Asian Growth Fund
1. ORGANIZATION AND SIGNIFICANT ACCOUNTING POLICIES
Templeton Global Investment Trust (Trust) is registered under the Investment Company Act of 1940, as amended, (1940 Act) as an open-end investment company, consisting of six separate funds. The Templeton Asian Growth Fund (Fund) is included in this report. The financial statements of the remaining funds in the Trust are presented separately. The Fund offers three classes of shares: Class A, Class C, and Advisor Class. Effective May 1, 2013, the Fund began offering a new class of shares, Class R6. Each class of shares differs by its initial sales load, contingent deferred sales charges, voting rights on matters affecting a single class, its exchange privilege and fees primarily due to differing arrangements for distribution and transfer agent fees.
The following summarizes the Fund’s significant accounting policies.
a. Financial Instrument Valuation
The Fund’s investments in financial instruments are carried at fair value daily. Fair value is the price that would be received to sell an asset or paid to transfer a liability in an orderly transaction between market participants on the measurement date. Under procedures approved by the Trust’s Board of Trustees (the Board), the Fund’s administrator, investment manager and other affiliates have formed the Valuation and Liquidity Oversight Committee (VLOC). The VLOC provides administration and oversight of the Fund’s valuation policies and procedures, which are approved annually by the Board. Among other things, these procedures allow the Fund to utilize independent pricing services, quotations from securities and financial instrument dealers, and other market sources to determine fair value.
Equity securities listed on an exchange or on the NASDAQ National Market System are valued at the last quoted sale price or the official closing price of the day, respectively. Foreign equity securities are valued as of the close of trading on the foreign stock exchange on which the security is primarily traded, or the NYSE, whichever is earlier. The value is then converted into its U.S. dollar equivalent at the foreign exchange rate in effect at the close of the NYSE on the day that the value of the security is determined. Over-the-counter (OTC) securities are valued within the range of the most recent quoted bid and ask prices. Securities that trade in multiple markets or on multiple exchanges are valued according to the broadest and most representative market. Certain equity securities are valued based upon fundamental characteristics or relationships to similar securities.
The Fund has procedures to determine the fair value of financial instruments for which market prices are not reliable or readily available. Under these procedures, the VLOC convenes on a regular basis to review such financial instruments and considers a number of factors, including significant unobservable valuation inputs, when arriving at fair value. The VLOC primarily employs a market-based approach which may use related or comparable assets or liabilities, recent transactions, market multiples, book values, and other relevant information for the investment to determine the fair value of the investment. An income-based valuation approach may
22 | Annual Report
Templeton Global Investment Trust
Notes to Financial Statements (continued)
Templeton Asian Growth Fund
| 1. | ORGANIZATION AND SIGNIFICANT ACCOUNTING POLICIES (continued) |
| a. | Financial Instrument Valuation (continued) |
also be used in which the anticipated future cash flows of the investment are discounted to calculate fair value. Discounts may also be applied due to the nature or duration of any restrictions on the disposition of the investments. Due to the inherent uncertainty of valuations of such investments, the fair values may differ significantly from the values that would have been used had an active market existed. The VLOC employs various methods for calibrating these valuation approaches including a regular review of key inputs and assumptions, transactional back-testing or disposition analysis, and reviews of any related market activity.
Trading in securities on foreign securities stock exchanges and OTC markets may be completed before the daily close of business on the NYSE. Occasionally, events occur between the time at which trading in a foreign security is completed and the close of the NYSE that might call into question the reliability of the value of a portfolio security held by the Fund. As a result, differences may arise between the value of the Fund’s portfolio securities as determined at the foreign market close and the latest indications of value at the close of the NYSE. In order to minimize the potential for these differences, the VLOC monitors price movements following the close of trading in foreign stock markets through a series of country specific market proxies (such as baskets of American Depositary Receipts, futures contracts and exchange traded funds). These price movements are measured against established trigger thresholds for each specific market proxy to assist in determining if an event has occurred that may call into question the reliability of the values of the foreign securities held by the Fund. If such an event occurs, the securities may be valued using fair value procedures, which may include the use of independent pricing services.
In addition, certain foreign markets may be open on days that the NYSE is closed, which could result in differences between the value of the Fund’s portfolio securities on the last business day and the last calendar day of the reporting period. Any significant security valuation changes due to an open foreign market are adjusted and reflected by the Fund for financial reporting purposes. The Fund’s financial statements have been adjusted to reflect investment values as of March 31, 2013.
b. Foreign Currency Translation
Portfolio securities and other assets and liabilities denominated in foreign currencies are translated into U.S. dollars based on the exchange rate of such currencies against U.S. dollars on the date of valuation. The Fund may enter into foreign currency exchange contracts to facilitate transactions denominated in a foreign currency. Purchases and sales of securities, income and expense items denominated in foreign currencies are translated into U.S. dollars at the exchange rate in effect on the transaction date. Portfolio securities and assets and liabilities denominated in foreign currencies contain risks that those currencies will decline in value relative to the U.S.
Annual Report | 23
Templeton Global Investment Trust
Notes to Financial Statements (continued)
Templeton Asian Growth Fund
| 1. | ORGANIZATION AND SIGNIFICANT ACCOUNTING POLICIES (continued) |
| b. | Foreign Currency Translation (continued) |
dollar. Occasionally, events may impact the availability or reliability of foreign exchange rates used to convert the U.S. dollar equivalent value. If such an event occurs, the foreign exchange rate will be valued at fair value using procedures established and approved by the Board.
The Fund does not separately report the effect of changes in foreign exchange rates from changes in market prices on securities held. Such changes are included in net realized and unrealized gain or loss from investments on the Statement of Operations.
Realized foreign exchange gains or losses arise from sales of foreign currencies, currency gains or losses realized between the trade and settlement dates on securities transactions and the difference between the recorded amounts of dividends, interest, and foreign withholding taxes and the U.S. dollar equivalent of the amounts actually received or paid. Net unrealized foreign exchange gains and losses arise from changes in foreign exchange rates on foreign denominated assets and liabilities other than investments in securities held at the end of the reporting period.
c. Income and Deferred Taxes
It is the Fund’s policy to qualify as a regulated investment company under the Internal Revenue Code. The Fund intends to distribute to shareholders substantially all of its taxable income and net realized gains to relieve it from federal income and excise taxes. As a result, no provision for U.S. federal income taxes is required.
The Fund may be subject to foreign taxation related to income received, capital gains on the sale of securities and certain foreign currency transactions in the foreign jurisdictions in which it invests. Foreign taxes, if any, are recorded based on the tax regulations and rates that exist in the foreign markets in which the Fund invests. When a capital gain tax is determined to apply the Fund records an estimated deferred tax liability in an amount that would be payable if the securities were disposed of on the valuation date.
The Fund recognizes the tax benefits of uncertain tax positions only when the position is “more likely than not” to be sustained upon examination by the tax authorities based on the technical merits of the tax position. As of March 31, 2013, and for all open tax years, the Fund has determined that no liability for unrecognized tax benefits is required in the Fund’s financial statements related to uncertain tax positions taken on a tax return (or expected to be taken on future tax returns). Open tax years are those that remain subject to examination and are based on each tax jurisdiction statute of limitation.
24 | Annual Report
Templeton Global Investment Trust
Notes to Financial Statements (continued)
Templeton Asian Growth Fund
| 1. | ORGANIZATION AND SIGNIFICANT ACCOUNTING POLICIES (continued) |
| d. | Security Transactions, Investment Income, Expenses and Distributions |
Security transactions are accounted for on trade date. Realized gains and losses on security transactions are determined on a specific identification basis. Estimated expenses are accrued daily. Dividend income is recorded on the ex-dividend date except that certain dividends from foreign securities are recognized as soon as the Fund is notified of the ex-dividend date. Distributions to shareholders are recorded on the ex-dividend date and are determined according to income tax regulations (tax basis). Distributable earnings determined on a tax basis may differ from earnings recorded in accordance with accounting principles generally accepted in the United States of America. These differences may be permanent or temporary. Permanent differences are reclassified among capital accounts to reflect their tax character. These reclassifications have no impact on net assets or the results of operations. Temporary differences are not reclassified, as they may reverse in subsequent periods.
Common expenses incurred by the Trust are allocated among the funds based on the ratio of net assets of each fund to the combined net assets of the Trust. Fund specific expenses are charged directly to the fund that incurred the expense.
Realized and unrealized gains and losses and net investment income, not including class specific expenses, are allocated daily to each class of shares based upon the relative proportion of net assets of each class. Differences in per share distributions, by class, are generally due to differences in class specific expenses.
e. Accounting Estimates
The preparation of financial statements in accordance with accounting principles generally accepted in the United States of America requires management to make estimates and assumptions that affect the reported amounts of assets and liabilities at the date of the financial statements and the amounts of income and expenses during the reporting period. Actual results could differ from those estimates.
f. Guarantees and Indemnifications
Under the Trust’s organizational documents, its officers and trustees are indemnified by the Trust against certain liabilities arising out of the performance of their duties to the Trust. Additionally, in the normal course of business, the Trust, on behalf of the Fund, enters into contracts with service providers that contain general indemnification clauses. The Trust’s maximum exposure under these arrangements is unknown as this would involve future claims that may be made against the Trust that have not yet occurred. Currently, the Trust expects the risk of loss to be remote.
Annual Report | 25
Templeton Global Investment Trust
Notes to Financial Statements (continued)
Templeton Asian Growth Fund
2. SHARES OF BENEFICIAL INTEREST
At March 31, 2013, there were an unlimited number of shares authorized ($0.01 par value).
Transactions in the Fund’s shares were as follows:
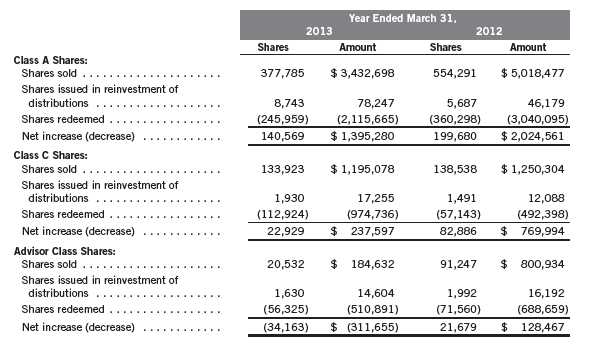
3. TRANSACTIONS WITH AFFILIATES
Franklin Resources, Inc. is the holding company for various subsidiaries that together are referred to as Franklin Templeton Investments. Certain officers and trustees of the Trust are also officers, and/or directors of the following subsidiaries:
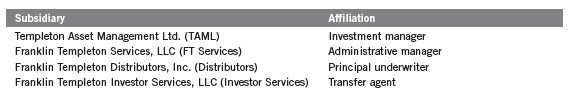
26 | Annual Report
Templeton Global Investment Trust
Notes to Financial Statements (continued)
Templeton Asian Growth Fund
| 3. | TRANSACTIONS WITH AFFILIATES (continued) |
| a. | Management Fees |
The Fund pays an investment management fee to TAML based on the average daily net assets of the Fund as follows:
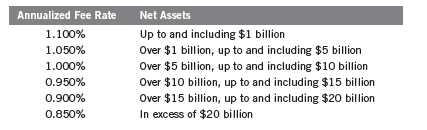
b. Administrative Fees
The Fund pays an administrative fee to FT Services of 0.20% per year of the average daily net assets of the Fund.
On February 26, 2013, the Board approved the proposal to combine the Fund’s investment management and administration agreements. The fees to be paid under the new combined agreement will not exceed the aggregate fees that would have been paid under the separate agreements. The new agreement went into effect on May 1, 2013.
c. Distribution Fees
The Board has adopted distribution plans for each share class, with the exception of Advisor Class shares, pursuant to Rule 12b-1 under the 1940 Act. Distribution fees are not charged on shares held by affiliates. Under the Fund’s Class A reimbursement distribution plan, the Fund reimburses Distributors for costs incurred in connection with the servicing, sale and distribution of the Fund’s shares up to the maximum annual plan rate. Under the Class A reimbursement distribution plan, costs exceeding the maximum for the current plan year cannot be reimbursed in subsequent periods. In addition, under the Fund’s Class C compensation distribution plan, the Fund pays Distributors for costs incurred in connection with the servicing, sale and distribution of the Fund’s shares up to the maximum annual plan rate.
The maximum annual plan rates, based on the average daily net assets, for each class, are as follows:
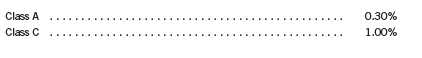
Annual Report | 27
Templeton Global Investment Trust
Notes to Financial Statements (continued)
Templeton Asian Growth Fund
| 3. | TRANSACTIONS WITH AFFILIATES (continued) |
| d. | Sales Charges/Underwriting Agreements |
Front-end sales charges and contingent deferred sales charges (CDSC) do not represent expenses of the Fund. These charges are deducted from the proceeds of sales of Fund shares prior to investment or from redemption proceeds prior to remittance, as applicable. Distributors has advised the Fund of the following commission transactions related to the sales and redemptions of the Fund’s shares for the year:
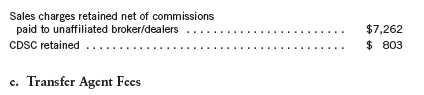
Each class of shares, except for the R6 share class, pays transfer agent fees to Investor Services for its performance of shareholder servicing obligations and reimburses Investor Services for out of pocket expenses incurred, including shareholding servicing fees paid to third parties. These fees are allocated daily to such classes based upon the relative proportion of net assets. The R6 share class pays Investor Services transfer agent fees specific to that class.
For the year ended March 31, 2013, the Fund paid transfer agent fees of $23,113, of which $14,002 was retained by Investor Services.
f. Waiver and Expense Reimbursements
TAML and FT Services have contractually agreed in advance to waive or limit their respective fees and to assume as their own expense certain expenses otherwise payable by the Fund so that the expenses (excluding distribution fees, and acquired fund fees and expenses) for Class A, Class C and Advisor Class of the Fund do not exceed 1.42%, and Class R6 does not exceed 1.20% (other than certain non-routine expenses or costs, including those relating to litigation, indemnification, reorganizations, and liquidations) until July 31, 2014. Prior to August 1, 2012, expenses were limited to 1.70%.
g. Other Affiliated Transactions
At March 31, 2013, Franklin Advisors Inc., (an affiliate of the investment manager) owned 27.48% of the Fund’s outstanding shares.
4. EXPENSE OFFSET ARRANGEMENT
The Fund has entered into an arrangement with its custodian whereby credits realized as a result of uninvested cash balances are used to reduce a portion of the Fund’s custodian expenses. During the year ended March 31, 2013, there were no credits earned.
28 | Annual Report
Templeton Global Investment Trust
Notes to Financial Statements (continued)
Templeton Asian Growth Fund
5. INCOME TAXES
The tax character of distributions paid during the years ended March 31, 2013 and 2012 was as follows:

At March 31, 2013, the cost of investments, net unrealized appreciation (depreciation) and undistributed long term capital gains for income tax purposes were as follows:

Differences between income and/or capital gains as determined on a book basis and a tax basis are primarily due to differing treatments of wash sales.
6. INVESTMENT TRANSACTIONS
Purchases and sales of investments (excluding short term securities) for the year ended March 31, 2013, aggregated $2,462,489 and $1,483,656, respectively.
7. CONCENTRATION OF RISK
Investing in foreign securities may include certain risks and considerations not typically associated with investing in U.S. securities, such as fluctuating currency values and changing local and regional economic, political and social conditions, which may result in greater market volatility. In addition, certain foreign securities may not be as liquid as U.S. securities.
Annual Report | 29
Templeton Global Investment Trust
Notes to Financial Statements (continued)
Templeton Asian Growth Fund
8. CREDIT FACILITY
The Fund, together with other U.S. registered and foreign investment funds (collectively, Borrowers), managed by Franklin Templeton Investments, are borrowers in a joint syndicated senior unsecured credit facility totaling $1.5 billion (Global Credit Facility) which matures on January 17, 2014. This Global Credit Facility provides a source of funds to the Borrowers for temporary and emergency purposes, including the ability to meet future unanticipated or unusually large redemption requests.
Under the terms of the Global Credit Facility, the Fund shall, in addition to interest charged on any borrowings made by the Fund and other costs incurred by the Fund, pay its share of fees and expenses incurred in connection with the implementation and maintenance of the Global Credit Facility, based upon its relative share of the aggregate net assets of all of the Borrowers, including an annual commitment fee of 0.07% based upon the unused portion of the Global Credit Facility. These fees are reflected in other expenses on the Statement of Operations. During the year ended March 31, 2013, the Fund did not use the Global Credit Facility.
9. FAIR VALUE MEASUREMENTS
The Fund follows a fair value hierarchy that distinguishes between market data obtained from independent sources (observable inputs) and the Fund’s own market assumptions (unobservable inputs). These inputs are used in determining the value of the Fund’s financial instruments and are summarized in the following fair value hierarchy:
- Level 1 – quoted prices in active markets for identical financial instruments
- Level 2 – other significant observable inputs (including quoted prices for similar financial instruments, interest rates, prepayment speed, credit risk, etc.)
- Level 3 – significant unobservable inputs (including the Fund’s own assumptions in determining the fair value of financial instruments)
The inputs or methodology used for valuing financial instruments are not an indication of the risk associated with investing in those financial instruments.
For movements between the levels within the fair value hierarchy, the Fund has adopted a policy of recognizing the transfers as of the date of the underlying event which caused the movement.
At March 31, 2013, all of the Fund’s investments in financial instruments carried at fair value were valued using Level 1 inputs. For detailed categories, see the accompanying Statement of Investments.
30 | Annual Report
Templeton Global Investment Trust
Notes to Financial Statements (continued)
Templeton Asian Growth Fund
10. NEW ACCOUNTING PRONOUNCEMENTS
In December 2011, the Financial Accounting Standards Board (FASB) issued Accounting Standards Update (ASU) No. 2011-11, Balance Sheet (Topic 210): Disclosures about Offsetting Assets and Liabilities. The amendments in the ASU enhance disclosures about offsetting of financial assets and liabilities to enable investors to understand the effect of these arrangements on a fund’s financial position. In January 2013, FASB issued ASU No. 2013-01, Balance Sheet (Topic 210): Clarifying the Scope of Disclosures about Offsetting Assets and Liabilities. The amendments in ASU No. 2013-01 clarify the intended scope of disclosures required by ASU
No. 2011-11. These ASUs are effective for interim and annual reporting periods beginning on or after January 1, 2013. The Fund believes the adoption of these ASUs will not have a material impact on its financial statements.
11. SUBSEQUENT EVENTS
The Fund has evaluated subsequent events through the issuance of the financial statements and determined that no events have occurred that require disclosure other than those already disclosed in the financial statements.
ABBREVIATIONS
Selected Portfolio
ADR - American Depositary Receipt
GDR - Global Depositary Receipt
Annual Report | 31
Templeton Global Investment Trust
Report of Independent Registered Public Accounting Firm
To the Board of Trustees and Shareholders of Templeton Asian Growth Fund
In our opinion, the accompanying statement of assets and liabilities, including the statement of investments, and the related statements of operations and of changes in net assets and the financial highlights present fairly, in all material respects, the financial position of Templeton Asian Growth Fund (the “Fund”) at March 31, 2013, the results of its operations for the year then ended, the changes in its net assets for each of the two years in the period then ended and the financial highlights for the periods presented, in conformity with accounting principles generally accepted in the United States of America. These financial statements and financial highlights (hereafter referred to as “financial statements”) are the responsibility of the Fund’s management. Our responsibility is to express an opinion on these financial statements based on our audits. We conducted our audits of these financial statements in accordance with the standards of the Public Company Accounting Oversight Board (United States). Those standards require that we plan and perform the audit to obtain reasonable assurance about whether the financial statements are free of material misstatement. An audit includes examining, on a test basis, evidence supporting the amounts and disclosures in the financial statements, assessing the accounting principles used and significant estimates made by management, and evaluating the overall financial statement presentation. We believe that our audits, which included confirmation of securities at March 31, 2013 by correspondence with the custodian, transfer agent and brokers, provide a reasonable basis for our opinion.
PricewaterhouseCoopers LLP
San Francisco, California
May 22, 2013
32 | Annual Report
Templeton Global Investment Trust
Tax Information (unaudited)
Templeton Asian Growth Fund
Under Section 852(b)(3)(C) of the Internal Revenue Code (Code), the Fund hereby reports the maximum amount allowable but no less than $40,636 as a long term capital gain dividend for the fiscal year ended March 31, 2013.
Under Section 871(k)(2)(C) of the Code, the Fund hereby reports the maximum amount allowable but no less than $9,191 as a short term capital gain dividend for purposes of the tax imposed under Section 871(a)(1)(A) of the Code for the fiscal year ended March 31, 2013.
Under Section 854(b)(1)(B) of the Code, the Fund hereby reports the maximum amount allowable but no less than $177,250 as qualified dividends for purposes of the maximum rate under Section 1(h)(11) of the Code for the fiscal year ended March 31, 2013. Distributions, including qualified dividend income, paid during calendar year 2013 will be reported to shareholders on Form 1099-DIV by mid-February 2014. Shareholders are advised to check with their tax advisors for information on the treatment of these amounts on their individual income tax returns.
At March 31, 2012, more than 50% of the Fund’s total assets were invested in securities of foreign issuers. In most instances, foreign taxes were withheld from income paid to the Fund on these investments. As shown in the table below, the Fund hereby reports to shareholders the foreign source income and foreign taxes paid, pursuant to Section 853 of the Code. This written statement will allow shareholders of record on December 7, 2012, to treat their proportionate share of foreign taxes paid by the Fund as having been paid directly by them. The shareholder shall consider these amounts as foreign taxes paid in the tax year in which they receive the Fund distribution.
The following table provides a detailed analysis of foreign tax paid, and foreign source income, and foreign qualified dividends as reported by the Fund, to Class A, Class C and Advisor Class shareholders of record.
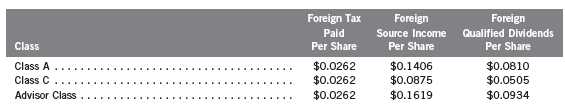
Foreign Tax Paid Per Share (Column 1) is the amount per share available to you, as a tax credit (assuming you held your shares in the Fund for a minimum of 16 days during the 31-day period beginning 15 days before the ex-dividend date of the Fund’s distribution to which the foreign taxes relate), or, as a tax deduction.
Annual Report | 33
Templeton Global Investment Trust
Tax Information (unaudited) (continued)
Templeton Asian Growth Fund
Foreign Source Income Per Share (Column 2) is the amount per share of income dividends attributable to foreign securities held by the Fund, plus any foreign taxes withheld on these dividends. The amounts reported include foreign source qualified dividends that have not been adjusted for the rate differential applicable to such dividend income.1
Foreign Qualified Dividends Per Share (Column 3) is the amount per share of foreign source qualified dividends, plus any foreign taxes withheld on these dividends. These amounts represent the portion of the Foreign Source Income reported to you in column 2 that were derived from qualified foreign securities held by the Fund.1
By mid-February 2013, shareholders received Form 1099-DIV which included their share of taxes paid and foreign source income distributed during the calendar year 2012. The Foreign Source Income reported on Form 1099-DIV has not been adjusted for the rate differential on foreign source qualified dividend income. Shareholders are advised to check with their tax advisors for information on the treatment of these amounts on their 2012 individual income tax returns.
1Qualified dividends are taxed at reduced long term capital gains tax rates. In determining the amount of foreign tax credit that may be applied
against the U.S. tax liability of individuals receiving foreign source qualified dividends, adjustments may be required to the foreign tax credit limita-
tion calculation to reflect the rate differential applicable to such dividend income. The rules however permit certain individuals to elect not to apply
the rate differential adjustments for capital gains and/or dividends for any taxable year. Please consult your tax advisor and the instructions to
Form 1116 for more information.
34 | Annual Report
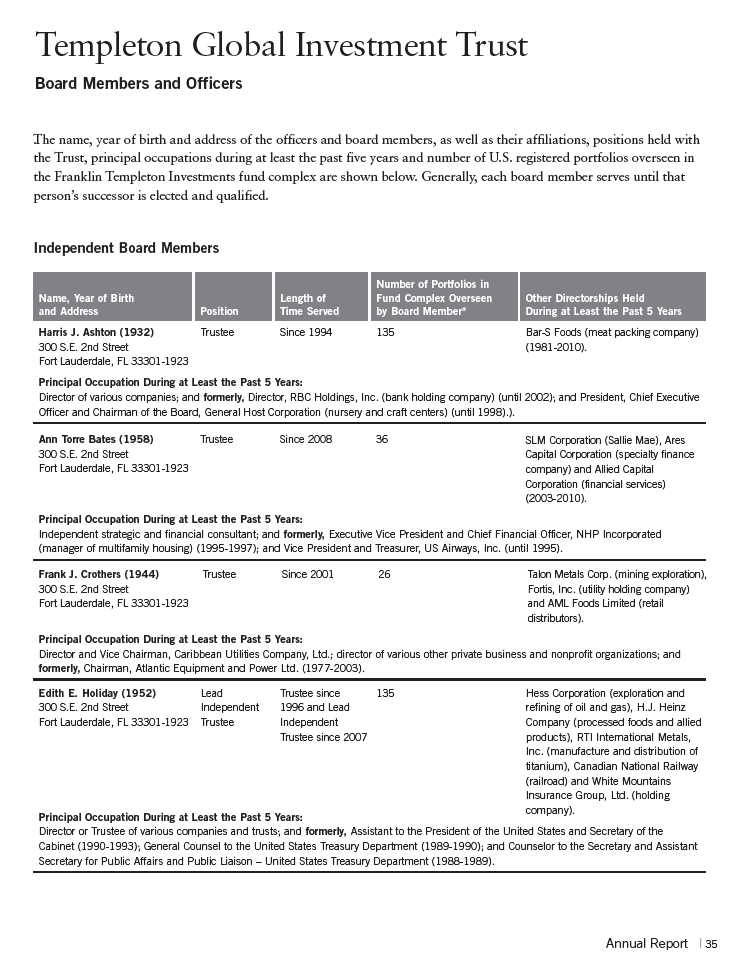
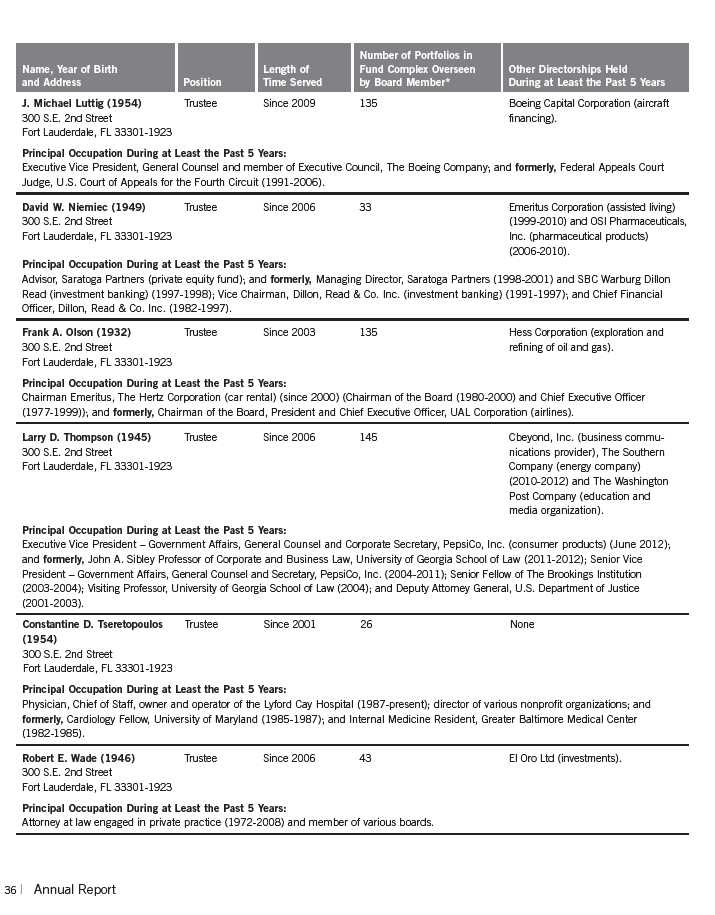


*We base the number of portfolios on each separate series of the U.S. registered investment companies within the Franklin Templeton Investments fund complex. These portfolios
have a common investment manager or affiliated investment managers.
**Charles B. Johnson is considered to be an interested person of the Trust under the federal securities laws due to his position as officer and director and major shareholder of
Franklin Resources, Inc. (Resources), which is the parent company of the Trust’s investment manager and distributor. Gregory E. Johnson is considered to be an interested person of
the Fund under the federal securities laws due to his position as officer and director of Resources.
Note 1: Charles B. Johnson and Rupert H. Johnson, Jr. are brothers and the father and uncle, respectively, of Gregory E. Johnson.
Note 2: Officer information is current as of the date of this report. It is possible that after this date, information about officers may change.
The Sarbanes-Oxley Act of 2002 and Rules adopted by the U.S. Securities and Exchange Commission require the Fund to disclose whether the Fund’s Audit Committee
includes at least one member who is an audit committee financial expert within the meaning of such Act and Rules. The Fund’s Board has determined that there is at least
one such financial expert on the Audit Committee and has designated each of Ann Torre Bates and David W. Niemiec as an audit committee financial expert. The Board
believes that Ms. Bates and Mr. Niemiec qualify as such an expert in view of their extensive business background and experience. Ms. Bates has served as a member of
the Fund Audit Committee since 2008. She currently serves as a director of SLM Corporation and Ares Capital Corporation and was formerly a director of Allied Capital
Corporation from 2003 to 2010, Executive Vice President and Chief Financial Officer of NHP Incorporated and Vice President and Treasurer of US Airways, Inc. Mr. Niemiec
has served as a member of the Fund Audit Committee since 2006, currently serves as an Advisor to Saratoga Partners and was formerly its Managing Director from 1998 to
2001. Mr. Niemiec is formerly a director of Emeritus Corporation from 1999 to 2010 and OSI Pharmaceuticals, Inc. from 2006 to 2010, Managing Director of SBC Warburg
Dillon Read from 1997 to 1998, and was Vice Chairman from 1991 to 1997 and Chief Financial Officer from 1982 to 1997 of Dillon, Read & Co. Inc. As a result of such back-
ground and experience, the Board believes that Ms. Bates and Mr. Niemiec have each acquired an understanding of generally accepted accounting principles and financial
statements, the general application of such principles in connection with the accounting estimates, accruals and reserves, and analyzing and evaluating financial state-
ments that present a breadth and level of complexity of accounting issues generally comparable to those of the Fund, as well as an understanding of internal controls and
procedures for financial reporting and an understanding of audit committee functions. Ms. Bates and Mr. Niemiec are independent Board members as that term is defined
under the applicable U.S. Securities and Exchange Commission Rules and Releases or the listing standards applicable to the Fund.
The Statement of Additional Information (SAI) includes additional information about the board members and is available, without charge, upon request. Shareholders may
call (800) DIAL BEN/342-5236 to request the SAI.
Annual Report | 39
Templeton Global Investment Trust
Shareholder Information
Templeton Asian Growth Fund
Board Review of Investment Management Agreement
At a meeting held February 26, 2013, the Board of Trustees (Board), including a majority of non-interested or independent Trustees, approved renewal of the investment management agreements for each of the separate funds within Templeton Global Investment Trust, including Templeton Asian Growth Fund (Fund(s)). In reaching this decision, the Board took into account information furnished throughout the year at regular Board meetings, as well as information prepared specifically in connection with the annual renewal review process. Information furnished and discussed throughout the year included investment performance reports and related financial information for each Fund, along with periodic reports on expenses, shareholder services, legal and compliance matters, pricing, brokerage commissions and execution and other services provided by the Investment Manager (Manager) and its affiliates, as well as a third-party survey of transfer agent fees charged funds within the Franklin Templeton Investments complex in comparison with those charged other fund complexes deemed comparable. Information furnished specifically in connection with the renewal process included a report for each Fund prepared by Lipper, Inc. (Lipper), an independent organization, as well as additional material, including a Fund profitability analysis prepared by management. The Lipper reports compared each Fund’s investment performance and expenses with those of other mutual funds deemed comparable to the Fund as selected by Lipper. The Fund profitability analysis discussed the profitability to Franklin Templeton Investments from its overall U.S. fund operations, as well as on an individual fund-by-fund basis. Additional material accompanying such profitability analysis included information on a fund-by-fund basis listing portfolio managers and other accounts they manage, as well as information on management fees charged by the Manager and its affiliates to U.S. mutual funds and other accounts, including management’s explanation of differences where relevant. Such material also included a memorandum prepared by management describing project initiatives and capital investments relating to the services provided to the Funds by the Franklin Templeton Investments organization, as well as a memorandum relating to economies of scale and an analysis concerning transfer agent fees charged by an affiliate of the Manager.
In considering such materials, the independent Trustees received assistance and advice from and met separately with independent counsel. While the investment management agreements for all Funds were considered at the same Board meeting, the Board dealt with each Fund separately. In approving continuance of the investment management agreement for each Fund, the Board, including a majority of independent Trustees, determined that the management fee structure was fair and reasonable and that continuance of the investment management agreement was in the best interests of each Fund and its shareholders. While attention was given to all information furnished, the following discusses some primary factors relevant to the Board’s decision.
NATURE, EXTENT AND QUALITY OF SERVICES. The Board was satisfied with the nature and quality of the overall services provided by the Manager and its affiliates to the Fund and its shareholders. In addition to investment performance and expenses discussed later, the Board’s
40 | Annual Report
Templeton Global Investment Trust
Shareholder Information (continued)
Templeton Asian Growth Fund
Board Review of Investment Management Agreement (continued)
opinion was based, in part, upon periodic reports furnished it showing that the investment policies and restrictions for the Fund were consistently complied with as well as other reports periodically furnished the Board covering matters such as the compliance of portfolio managers and other management personnel with the code of ethics adopted throughout the Franklin Templeton fund complex, the adherence to fair value pricing procedures established by the Board, and the accuracy of net asset value calculations. The Board also noted the extent of benefits provided Fund shareholders from being part of the Franklin Templeton family of funds, including the right to exchange investments between the same class of funds without a sales charge, the ability to reinvest Fund dividends into other funds and the right to combine holdings in other funds to obtain a reduced sales charge. Favorable consideration was given to management’s continuous efforts and expenditures in establishing back-up systems and recovery procedures to function in the event of a natural disaster, it being noted that such systems and procedures had functioned well during the Florida hurricanes and blackouts experienced in previous years, and that those operations in the New York/New Jersey area ran smoothly during the more recent Hurricane Sandy. Among other factors taken into account by the Board were the Manager’s best execution trading policies, including a favorable report by an independent portfolio trading analytical firm, which also covered FOREX transactions. Consideration was also given to the experience of the Fund’s portfolio management team, the number of accounts managed and general method of compensation. In this latter respect, the Board noted that a primary factor in management’s determination of a portfolio manager’s bonus compensation was the relative investment performance of the funds he or she managed and that a portion of such bonus was required to be invested in a predesignated list of funds within such person’s fund management area so as to be aligned with the interests of shareholders. The Board also took into account the quality of transfer agent and shareholder services provided Fund shareholders by an affiliate of the Manager and the continuous enhancements to the Franklin Templeton website. Particular attention was given to management’s conservative approach and diligent risk management procedures, including continuous monitoring of counter-party credit risk and attention given to derivatives and other complex instruments including expanded collateralization requirements. The Board also took into account, among other things, management’s efforts in establishing a global credit facility for the benefit of the Fund and other accounts managed by Franklin Templeton Investments to provide a source of cash for temporary and emergency purposes or to meet unusual redemption requests as well as the strong financial position of the Manager’s parent company and its commitment to the mutual fund business as evidenced by its subsidization of money market funds.
INVESTMENT PERFORMANCE. While consideration was given to performance reports and discussions with portfolio managers at Board meetings during the year, particular attention in assessing performance was given to the Lipper reports furnished for the agreement renewal. The Lipper reports prepared for the Fund showed the investment performance of its Class A shares during 2012 and previous years of operations. The Lipper performance universe for the Fund
Annual Report | 41
Templeton Global Investment Trust
Shareholder Information (continued)
Templeton Asian Growth Fund
Board Review of Investment Management Agreement (continued)
consisted of all retail and institutional Pacific ex-Japan funds as designated by Lipper. The Fund has been in operation for only two full years, and both its 2012 and 2011 total returns as shown in the Lipper report were in the second-lowest performing quintile of such universe. The Board also reviewed the Fund’s performance within a supplementary universe consisting of funds in the Pacific/Asia ex-Japan Morningstar category included in the Lipper report at management’s request, and found the Fund’s comparative performance within such category to be comparable to its performance with the Lipper designated performance universe. In view of the Fund’s short period of operation, the Board did not believe the Fund’s performance as shown in the Lipper report to be particularly meaningful.
COMPARATIVE EXPENSES. Consideration was given to a comparative analysis of the management fees and total expense ratio of the Fund compared with those of a group of other funds selected by Lipper as its appropriate Lipper expense group. Lipper expense data is based upon historical information taken from each fund’s most recent annual report, which reflects historical asset levels that may be quite different from those currently existing, particularly in a period of market volatility. While recognizing such inherent limitation and the fact that expense ratios generally increase as assets decline and decrease as assets grow, the Board believed the independent analysis conducted by Lipper to be an appropriate measure of comparative expenses. In reviewing comparative costs, Lipper provides information on the Fund’s contractual investment management fee in comparison with the effective management fee that would have been charged by other funds within its Lipper expense group assuming they were similar in size to the Fund, as well as the actual total expense ratio of the Fund in comparison with those of its Lipper expense group. The Lipper contractual investment management fee analysis includes administrative charges as being part of a management fee, and actual total expenses, for comparative consistency, are shown by Lipper for Fund Class A shares. The Lipper reports for the Fund showed both the contractual management fee rate and actual total expense ratio to be among the highest within its Lipper expense group. The Board found the expenses of the Fund to be acceptable in view of its relatively small size and specialized nature and noted that the expenses had been subsidized by management fee waivers.
MANAGEMENT PROFITABILITY. The Board also considered the level of profits realized by the Manager and its affiliates in connection with the operation of the Fund. In this respect, the Board reviewed the Fund profitability analysis that addresses the overall profitability of Franklin Templeton’s U.S. fund business, as well as its profits in providing management and other services to each of the individual funds during the 12-month period ended September 30, 2012, being the most recent fiscal year-end for Franklin Resources, Inc., the Manager’s parent. In reviewing the analysis, attention was given to the methodology followed in allocating costs to the Fund, it being recognized that allocation methodologies are inherently subjective and various allocation methodologies may each be reasonable while producing different results. In this respect, the Board noted
42 | Annual Report
Templeton Global Investment Trust
Shareholder Information (continued)
Templeton Asian Growth Fund
Board Review of Investment Management Agreement (continued)
that, while being continuously refined and reflecting changes in the Manager’s own cost accounting, the cost allocation methodology was consistent with that followed in profitability report presentations for the Fund made in prior years and that the Fund’s independent registered public accounting firm had been engaged by the Manager to periodically review the reasonableness of the allocation methodologies solely for use by the Fund’s Board in reference to the profitability analysis. In reviewing and discussing such analysis, management discussed with the Board its belief that costs incurred in establishing the infrastructure necessary for the type of mutual fund operations conducted by the Manager and its affiliates may not be fully reflected in the expenses allocated to the Fund in determining its profitability, as well as the fact that the level of profits, to a certain extent, reflected operational cost savings and efficiencies initiated by management. The Board also took into account management’s expenditures in improving shareholder services provided the Fund, as well as the need to implement systems to meet additional regulatory and compliance requirements resulting from statutes such as the Sarbanes-Oxley and Dodd Frank Acts and recent SEC and other regulatory requirements. In addition, the Board considered a third-party study comparing the profitability of the Manager’s parent on an overall basis to other publicly held managers broken down to show profitability from management operations exclusive of distribution expenses, as well as profitability including distribution expenses. The Board also considered the extent to which the Manager and its affiliates might derive ancillary benefits from fund operations, including revenues generated from transfer agent services and potential benefits resulting from allocation of fund brokerage and the use of commission dollars to pay for research. Based upon its consideration of all these factors, the Board determined that the level of profits realized by the Manager and its affiliates from providing services to the Fund was not excessive in view of the nature, quality and extent of services provided.
ECONOMIES OF SCALE. The Board also considered whether economies of scale are realized by the Manager as the Fund grows larger and the extent to which this is reflected in the level of management fees charged. While recognizing that any precise determination is inherently subjective, the Board noted that based upon the Fund profitability analysis, it appears that as some funds get larger, at some point economies of scale do result in the Manager realizing a larger profit margin on management services provided such a fund. The Board also noted that economies of scale are shared with the Fund and its shareholders through management fee breakpoints so that as a Fund grows in size, its effective management fee rate declines. In view of the specialized nature and size of the Fund, whose expenses are also being subsidized by management, the Board questioned whether economies of scale existed. The investment management advisory agreement for the Fund provides for breakpoints that are above the Fund’s existing asset size, and to the extent economies of scale may be realized by the Manager and its affiliates, the Board believes the schedule of fees for the Fund provides a sharing of benefits with the Fund and its shareholders.
Annual Report | 43
Templeton Global Investment Trust
Shareholder Information (continued)
Templeton Asian Growth Fund
Board Review of Investment Management Agreement (continued)
In addition to the investment advisory services provided the Fund under its investment management agreement, administrative services are provided the Fund under a separate agreement at a fixed charge of 20 basis points. At the February 26, 2013, Board meeting, the Board eliminated the separate agreements and approved a new form of investment management agreement for the Fund combining such services. In approving the new form of investment management agreement, the Board took into account the fact that the types of services and aggregate fee, including breakpoints, would be the same as provided under the previous separate agreements and that combining such services was consistent with Lipper’s methodology of considering contractual investment management fees to include any separately charged administrative fee. The Board also noted that combining the services under the new form of investment management agreement would have no impact on management’s existing subsidization of expenses of the Fund.
Proxy Voting Policies and Procedures
The Fund’s investment manager has established Proxy Voting Policies and Procedures (Policies) that the Fund uses to determine how to vote proxies relating to portfolio securities. Shareholders may view the Fund’s complete Policies online at franklintempleton.com. Alternatively, shareholders may request copies of the Policies free of charge by calling the Proxy Group collect at (954) 527-7678 or by sending a written request to: Franklin Templeton Companies, LLC, 300 S.E. 2nd Street, Fort Lauderdale, FL 33301, Attention: Proxy Group. Copies of the Fund’s proxy voting records are also made available online at franklintempleton.com and posted on the U.S. Securities and Exchange Commission’s website at sec.gov and reflect the most recent 12-month period ended June 30.
Quarterly Statement of Investments
The Fund files a complete statement of investments with the U.S. Securities and Exchange Commission for the first and third quarters for each fiscal year on Form N-Q. Shareholders may view the filed Form N-Q by visiting the Commission’s website at sec.gov. The filed form may also be viewed and copied at the Commission’s Public Reference Room in Washington, DC. Information regarding the operations of the Public Reference Room may be obtained by calling (800) SEC-0330.
44 | Annual Report
Templeton Global Investment Trust
Shareholder Information (continued)
Templeton Asian Growth Fund
Householding of Reports and Prospectuses
You will receive the Fund’s financial reports every six months as well as an annual updated summary prospectus (prospectus available upon request). To reduce Fund expenses, we try to identify related shareholders in a household and send only one copy of the financial reports and summary prospectus. This process, called “householding,” will continue indefinitely unless you instruct us otherwise. If you prefer not to have these documents householded, please call us at (800) 632-2301. At any time you may view current prospectuses/summary prospectuses and financial reports on our website. If you choose, you may receive these documents through electronic delivery.
Annual Report | 45
This page intentionally left blank.
This page intentionally left blank.
This page intentionally left blank.

Annual Report
Templeton Emerging Markets
Balanced Fund
Your Fund’s Goal and Main Investments: The Fund seeks both income and capital
appreciation. Under normal market conditions, the Fund invests at least 80% of its net assets plus any
borrowings in a diversified portfolio of equity securities and fixed and floating rate debt obligations issued
by governments, government-related entities and corporate entities that are located, incorporated or have
significant business activities in or are impacted by economic developments in developing or emerging
market countries. The Fund normally invests at least 25% of its net assets in equity securities and at least
25% of its net assets in fixed income senior securities.

This annual report for Templeton Emerging Markets Balanced Fund covers
the fiscal year ended March 31, 2013.
The dollar value, number of shares or principal amount, and names of all portfolio holdings are listed in the
Fund’s Statement of Investments (SOI). The SOI begins on page 21.
Annual Report | 3
Economic and Market Overview
The global economy grew at a moderate but uneven pace during the 12 months under review as monetary easing and fiscal stimulus measures undertaken by many central banks and governments gained traction. Solid growth in many emerging market economies, particularly China and Indonesia, offset weakness in several developed market economies, especially the eurozone. In addition to measures by major developed market countries, emerging market countries, including China, South Korea, Brazil and India implemented fiscal and monetary easing measures. China announced a fiscal stimulus package to fund infrastructure projects, South Korea followed its June stimulus package with another package in September, Brazil unveiled an economic stimulus plan to encourage investment in the country’s infrastructure, and India introduced a series of reforms to boost investor confidence. Some emerging market countries such as China, Brazil, Thailand, India, South Korea and Turkey also cut interest rates during the 12-month period.
The effects of monetary easing and fiscal stimulus measures implemented by central banks and governments globally were evident during the 12-month period as financial markets remained awash with liquidity. Net inflows to emerging market stock and bond funds for the 12 months ended March 31, 2013, significantly exceeded the net inflows for the prior 12-month period. Investor anxiety about Europe’s recurring financial crisis and slower global economic growth led stock markets worldwide to sell off sharply in May. After reaching a period low in early June, emerging market stocks embarked on an upward trend, more than offsetting earlier losses and ending the period with gains.
For the 12 months ended March 31, 2013, the MSCI Emerging Markets (EM) Index, which measures stock performance in emerging markets, generated a +2.31% total return.1 The J.P. Morgan (JPM) Emerging Markets Bond Index (EMBI) Global, which measures performance of U.S. dollar-denominated emerging market bonds, delivered a +10.44% total return for the same period.1 Among emerging market stocks, Asian markets generally outperformed their global peers as strong economic growth, robust consumption and substantial investment inflows supported equity prices in the region. Although European and Latin American equity markets overall had negative returns, there were some notable outperformers such as Turkey and
1. Source: © 2013 Morningstar. All Rights Reserved. The information contained herein: (1) is proprietary to Morningstar
and/or its content providers; (2) may not be copied or distributed; and (3) is not warranted to be accurate, complete or
timely. Neither Morningstar nor its content providers are responsible for any damages or losses arising from any use of
this information. The index is unmanaged and includes reinvestment of any income or distributions. One cannot invest
directly in an index, and an index is not representative of the Fund’s portfolio.
4 | Annual Report

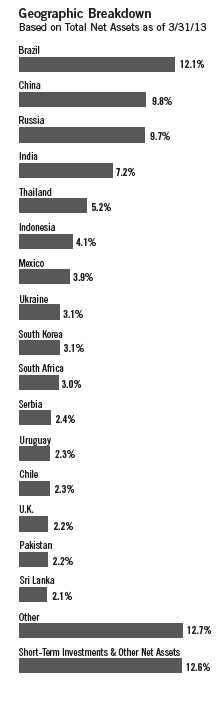
JPM EMBI Global posted a +6.49% total return.2 Please note index performance information is provided for reference and we do not attempt to track any index but rather undertake investments on the basis of fundamental research. In addition, the Fund’s return reflects the effect of fees and expenses for professional management, while an index does not have such costs. You can find more of the Fund’s performance data in the Performance Summary beginning on page 10.
Manager’s Discussion
Emerging market equities underperformed emerging market bonds during the reporting period, leading the Fund’s overweighted allocation to emerging market equities to detract from performance.
Equity
During the 12 months under review, key contributors to the Fund’s absolute performance included Land and Houses, Thailand’s largest residential real estate developer focused on the Greater Bangkok area and other major Thai cities; Akbank, one of Turkey’s leading commercial banks; and Bank Danamon Indonesia, one of the country’s 10 largest commercial banks. Land and Houses benefited from its reputable brand name; a conducive, low interest rate environment; and strong corporate results that showed solid revenue growth and a robust balance sheet. We believe the continued recovery in Bangkok’s real estate market and Land and Houses’ future property launches outside of Bangkok could support the company’s growth in the years ahead. Turkish stocks generally outperformed most of their emerging market peers, driven by Turkey’s economic recovery and independent credit rating agency Fitch Ratings’ upgrade of the country’s long-term credit rating to investment grade in November. In December, Fitch upgraded the long-term credit ratings of Turkey’s three largest private banks, including Akbank for its particularly strong capital ratio. In our view, Akbank is well positioned to potentially benefit from Turkey’s economic growth, sound banking system and increasing demand for financial and banking services. Bank Danamon’s share price surged early in the period following a bid for a controlling stake from Singapore-based DBS Group Holdings, one of Southeast Asia’s largest banks. However, the Indonesian central bank’s latest regulation that requires a two-step process for foreign investors’ acquisitions of the country’s banks raised uncertainty about the timing and completion of the deal. Bank Danamon continued to report strong earnings growth in 2012, driven by continued loan
2. Source: © 2013 Morningstar. The Fund’s blended benchmark is currently weighted 50% for the MSCI EM Index and
50% for the JPM EMBI Global and is rebalanced monthly. For the 12 months ended 3/31/13, the MSCI EM Index posted
a +2.31% total return and the JPM EMBI Global generated a +10.44% total return. The indexes are unmanaged and
include reinvestment of any income or distributions. One cannot invest directly in an index, and an index is not repre-
sentative of the Fund’s portfolio.
6 | Annual Report
growth in the mass market, small- and medium-sized companies, and wholesale segments. We believe that Bank Danamon, as one of Indonesia’s largest lenders, remained well positioned to potentially benefit from the country’s expanding economy, growing middle class, strong loan demand and under-served banking sector.
In contrast, major detractors from the Fund’s absolute performance included Russia-based global energy company Gazprom, the world’s largest natural gas producer; Brazil-based Vale, one of the top global iron ore and nickel producers; and Tata Steel, India’s largest steelmaker and one of the world’s largest steel companies. Gazprom’s share price declined because of lower gas prices and Russia’s unfavorable regulations. We believe that global energy demand could likely rise over the long term and lead to secular strength in oil and gas prices, which could benefit Gazprom. Additionally, domestic gas market liberalization and deregulation of gas tariffs could help improve Gazprom’s long-term profit growth. We maintained a favorable view of Gazprom at period-end, based on the company’s strong market position and valuations we considered to be attractive. Vale’s share price declined because of investor uncertainty about iron ore prices and fears that Brazil might impose a special participation tax on mining companies. Despite these challenges, Vale remained attractively valued, in our assessment. As one of the world’s largest iron ore and nickel producers, the company could be a major beneficiary of potential long-term steel demand growth in emerging market countries, particularly China. Despite the Reserve Bank of India’s recent interest rate cuts, many Indian stocks were pressured by persistently high inflation, reduced economic growth forecasts and a government budget statement that lacked hoped-for commitments to economic reform. Tata Steel’s shares declined in value along with those of other steel companies as a weak demand environment hampered earnings results.
Portfolio inflows and our continued search for companies with valuations we considered to be attractive led us to make additional investments in Brazil, Russia and India and initiate positions in Jordan and Turkey. We also undertook purchases in South Africa, Chile and China via China H and Red Chip shares because of fundamentals we considered to be attractive.3 We added coal and agricultural chemical companies and increased the Fund’s investments in diversified bank, oil and gas, and metals and mining companies. Key purchases included new positions in Akbank and in Inner Mongolia Yitai Coal, one of China’s largest coal producers, as well as additional shares in Gazprom and Vale.

3. “China H” denotes shares of China-incorporated, Hong Kong Stock Exchange-listed companies with most businesses
in China. “Red Chip” denotes shares of Hong Kong Stock Exchange-listed companies with significant exposure to China.
Annual Report | 7
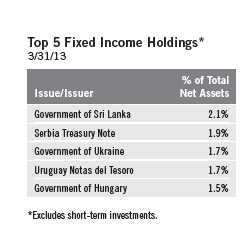
Fixed Income
The Fund purchased investment-grade and subinvestment-grade hard and local currency-denominated government and corporate debt. Emerging market sovereign debt typically compensates for greater credit risk by offering higher yields relative to U.S. Treasury and European benchmark bonds. Spreads narrowed between higher yielding emerging market sovereign credits and assets often considered safer, such as U.S. Treasuries. As financial markets began reflecting the underlying strength of emerging market economies, governments of some countries traditionally considered emerging markets could borrow more cheaply than some eurozone members and, in several cases, U.S. states. During the period, emerging market sovereign credit spreads narrowed 35 basis points (bps; 100 bps equal one percentage point) while emerging market corporate credit spreads narrowed 54 bps.4 Meanwhile, the 10-year U.S. Treasury yield decreased 36 bps. Regionally, Latin American sovereign debt posted a total return of +10.05%, Asian debt +8.37%, and central and eastern European debt +12.67%, as measured by subindexes of the JPM EMBI Global.4
The Fund’s duration exposures in Latin America contributed to absolute performance. The period under review was favorable for the region as economic recovery continued. Performance of Latin American currencies was mixed against the U.S. dollar during the period. Consequently, contributions from currency exposures in the region were limited. Over the period, the Brazilian real depreciated 9.52% while the Mexican peso gained 3.82% and the Chilean peso appreciated 3.48% against the U.S. dollar.5 Hard-currency credit positions in the region contributed to absolute performance.
The Fund’s sovereign and corporate credit exposures in the Europe-Middle East-Africa region benefited performance as narrowing credit spreads led several holdings to appreciate. The continued recovery in global economic activity supported the region as a whole. Currency positions in the region detracted from absolute performance. Meanwhile, positive contributions from duration strategies were notable.
Asian economies continued to lead the global recovery as fears of “hard landings” in the region subsided in the face of strong domestic demand. Growth in China helped support economic activity in the region as a whole. Currency exposures in Asia ex-Japan were largely neutral with respect to performance as currency movements were mixed in the region. Several currencies appreciated against the U.S. dollar over the period, including the South Korean won and Philippine peso, which appreciated 1.84% and 5.21%.5 Other currencies in the region depreciated against the U.S. dollar during the period, including the Indonesian rupiah and Malaysian ringgit,
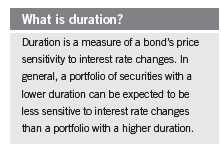
4. Source: J.P. Morgan.
5. Source: IDC/Exshare.
8 | Annual Report
which depreciated 5.90% and 1.07%.5 The Fund maintained little overall
duration exposure in Asia. Nevertheless, select duration exposures con-
tributed to performance. Contributions from hard-currency credit exposures
in the region were limited.
With interest rates in the U.S. at historically low levels, significant central bank
balance sheet expansion and unprecedented fiscal expenditures that drove
record funding needs, we remained cautious regarding U.S. dollar interest rate
exposure over the medium term.
Thank you for your participation in Templeton Emerging Markets Balanced
Fund. We look forward to serving your future investment needs.
The foregoing information reflects our analysis, opinions and portfolio holdings as of March 31, 2013, the end of the
reporting period. The way we implement our main investment strategies and the resulting portfolio holdings may
change depending on factors such as market and economic conditions. These opinions may not be relied upon as
investment advice or an offer for a particular security. The information is not a complete analysis of every aspect of
any market, country, industry, security or the Fund. Statements of fact are from sources considered reliable, but the
investment manager makes no representation or warranty as to their completeness or accuracy. Although historical
performance is no guarantee of future results, these insights may help you understand our investment management
philosophy.
Annual Report | 9
Performance Summary as of 3/31/13
Your dividend income will vary depending on dividends or interest paid by securities in the Fund’s
portfolio, adjusted for operating expenses of each class. Capital gain distributions are net profits
realized from the sale of portfolio securities. The performance table and graphs do not reflect any
taxes that a shareholder would pay on Fund dividends, capital gain distributions, if any, or any
realized gains on the sale of Fund shares. Total return reflects reinvestment of the Fund’s dividends
and capital gain distributions, if any, and any unrealized gains or losses.

10 | Annual Report
Performance Summary (continued)
Performance1
Cumulative total return excludes sales charges. Average annual total return and value of $10,000 investment include max-
imum sales charges. Class A: 5.75% maximum initial sales charge; Class C: 1% contingent deferred sales charge in first
year only; Class R/Advisor Class: no sales charges.
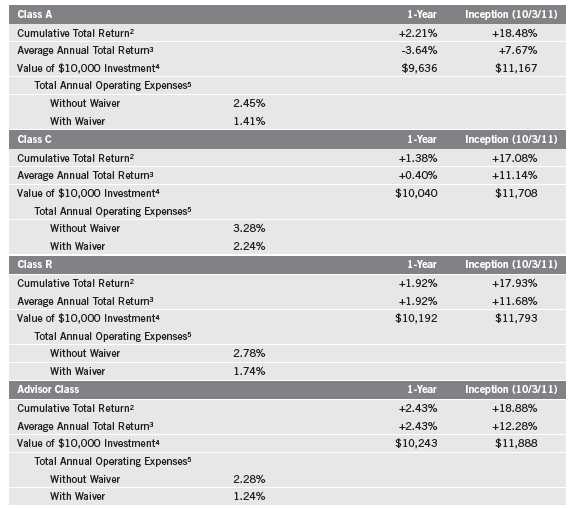
Performance data represent past performance, which does not guarantee future results. Investment return and principal
value will fluctuate, and you may have a gain or loss when you sell your shares. Current performance may differ from
figures shown. For most recent month-end performance, go to franklintempleton.com or call (800) 342-5236.
The investment manager and administrator have contractually agreed to waive or assume certain expenses so that common
expenses (excluding Rule 12b-1 fees and acquired fund fees and expenses) for each class of the Fund do not exceed
1.23% (other than certain nonroutine expenses) until 7/31/13.
Annual Report | 11
Performance Summary (continued)
Total Return Index Comparison for a Hypothetical $10,000 Investment1
Total return represents the change in value of an investment over the periods shown. It includes
any applicable maximum sales charge, Fund expenses, account fees and reinvested distributions.
The unmanaged indexes include reinvestment of any income or distributions. They differ from the
Fund in composition and do not pay management fees or expenses. One cannot invest directly in
an index.
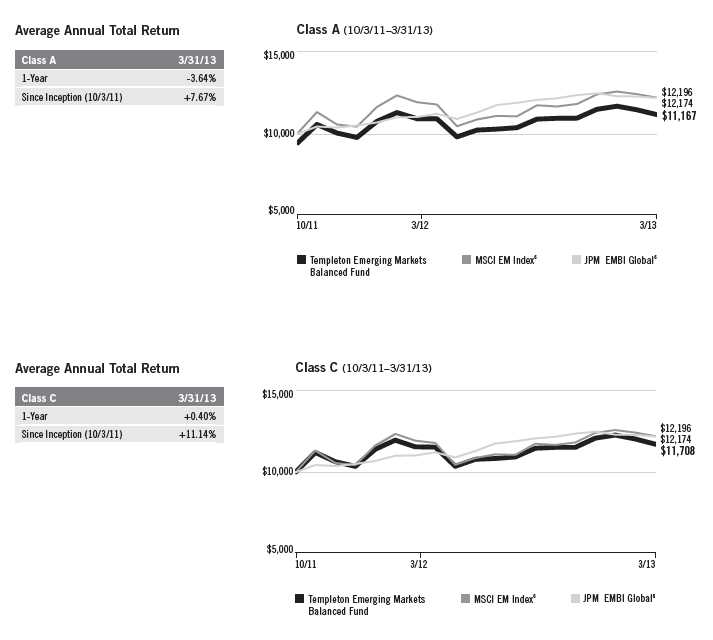
12 | Annual Report

Annual Report | 13
Performance Summary (continued)
Endnotes
All investments involve risks, including possible loss of principal. Stock prices fluctuate, sometimes rapidly and dramatically, due to factors affecting individual companies, particular industries or sectors, or general market conditions. Bond prices generally move in the opposite direction of interest rates. Thus, as prices of bonds in the Fund adjust to a rise in interest rates, the Fund’s share price may decline. Investments in emerging market countries involve special risks including currency fluctuations, economic and political uncertainties, in addition to those associated with these markets’ smaller size, lesser liquidity and lack of established legal and political, business and social frameworks to support securities markets. The risks associated with higher yielding, lower rated securities include higher risks of default and loss of principal. The Fund’s use of foreign currency techniques involves special risks, as such techniques may not achieve the anticipated benefits and/or may result in losses to the Fund. The Fund is actively managed but there is no guarantee that the manager’s investment decisions will produce the desired results. The Fund’s prospectus also includes a description of the main investment risks.
| |
Class C: Class R: | These shares have higher annual fees and expenses than Class A shares. Shares are available to certain eligible investors as described in the prospectus. These shares have higher annual fees and expenses than Class A shares. |
Advisor Class: | Shares are available to certain eligible investors as described in the prospectus. |
1. Fund investment results reflect the expense reduction, without which the results would have been lower.
2. Cumulative total return represents the change in value of an investment over the periods indicated.
3. Average annual total return represents the average annual change in value of an investment over the periods indicated.
4. These figures represent the value of a hypothetical $10,000 investment in the Fund over the periods indicated.
5. Figures are as stated in the Fund’s prospectus current as of the date of this report. In periods of market volatility, assets may decline significantly,
causing total annual Fund operating expenses to become higher than the figures shown.
6. Source: © 2013 Morningstar. The MSCI EM index is a free float-adjusted, market capitalization-weighted index designed to measure the equity
market performance of global emerging markets. The JP EMBI Global tracks total returns for U.S. dollar denominated debt instruments issued by
emerging market sovereign and quasi-sovereign entities: Brady bonds, loans and Eurobonds.
14 | Annual Report
Your Fund’s Expenses
As a Fund shareholder, you can incur two types of costs:
- Transaction costs, including sales charges (loads) on Fund purchases; and
- Ongoing Fund costs, including management fees, distribution and service (12b-1) fees, and other Fund expenses. All mutual funds have ongoing costs, sometimes referred to as operating expenses.
The following table shows ongoing costs of investing in the Fund and can help you understand these costs and compare them with those of other mutual funds. The table assumes a $1,000 investment held for the six months indicated.
Actual Fund Expenses
The first line (Actual) for each share class listed in the table provides actual account values and expenses. The “Ending Account Value” is derived from the Fund’s actual return, which includes the effect of Fund expenses.
You can estimate the expenses you paid during the period by following these steps. Of course, your account value and expenses will differ from those in this illustration:
| 1. | Divide your account value by $1,000. |
| | If an account had an $8,600 value, then $8,600 ÷ $1,000 = 8.6. |
| 2. | Multiply the result by the number under the heading “Expenses Paid During Period.” |
| | If Expenses Paid During Period were $7.50, then 8.6 x $7.50 = $64.50. |
In this illustration, the estimated expenses paid this period are $64.50.
Hypothetical Example for Comparison with Other Funds
Information in the second line (Hypothetical) for each class in the table can help you compare ongoing costs of investing in the Fund with those of other mutual funds. This information may not be used to estimate the actual ending account balance or expenses you paid during the period. The hypothetical “Ending Account Value” is based on the actual expense ratio for each class and an assumed 5% annual rate of return before expenses, which does not represent the Fund’s actual return. The figure under the heading “Expenses Paid During Period” shows the hypothetical expenses your account would have incurred under this scenario. You can compare this figure with the 5% hypothetical examples that appear in shareholder reports of other funds.
Annual Report | 15
Your Fund’s Expenses (continued)
Please note that expenses shown in the table are meant to highlight ongoing costs and do not reflect
any transaction costs, such as sales charges. Therefore, the second line for each class is useful in
comparing ongoing costs only, and will not help you compare total costs of owning different
funds. In addition, if transaction costs were included, your total costs would have been higher.
Please refer to the Fund prospectus for additional information on operating expenses.

*Expenses are calculated using the most recent six-month expense ratio, net of expense waivers, annualized for each class (A: 1.49%; C: 2.23%;
R: 1.73%; and Advisor: 1.23%), multiplied by the average account value over the period, multiplied by 182/365 to reflect the one-half year period.
16 | Annual Report
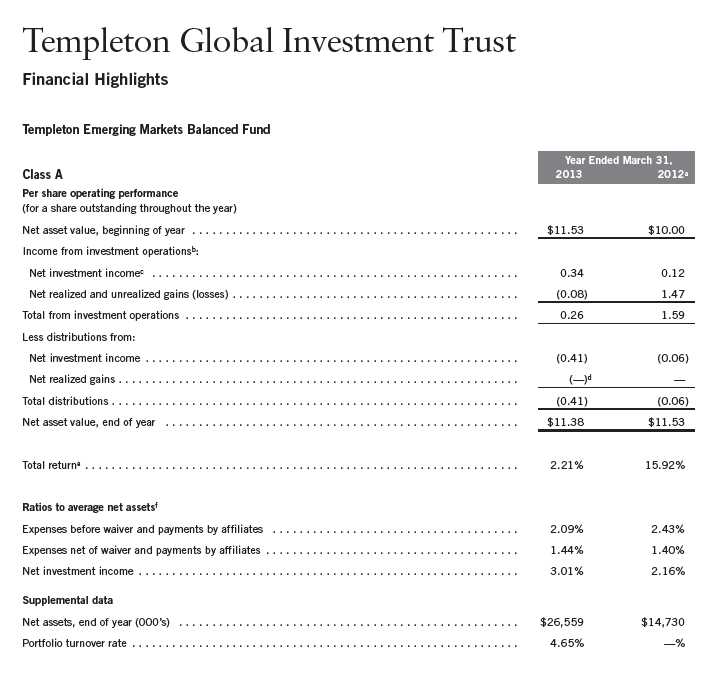
aFor the period October 3, 2011 (commencement of operations) to March 31, 2012.
bThe amount shown for a share outstanding throughout the period may not correlate with the Statement of Operations for the period due to the timing of sales and repurchases of
the Fund shares in relation to income earned and/or fluctuating market value of the investments of the Fund.
cBased on average daily shares outstanding.
dAmount rounds to less than $0.01 per share.
eTotal return does not reflect sales commissions or contingent deferred sales charges, if applicable, and is not annualized for periods less than one year.
fRatios are annualized for periods less than one year.
Annual Report | The accompanying notes are an integral part of these financial statements. | 17

aFor the period October 3, 2011 (commencement of operations) to March 31, 2012.
bThe amount shown for a share outstanding throughout the period may not correlate with the Statement of Operations for the period due to the timing of sales and repurchases of
the Fund shares in relation to income earned and/or fluctuating market value of the investments of the Fund.
cBased on average daily shares outstanding.
dAmount rounds to less than $0.01 per share.
eTotal return does not reflect sales commissions or contingent deferred sales charges, if applicable, and is not annualized for periods less than one year.
fRatios are annualized for periods less than one year.
18 | The accompanying notes are an integral part of these financial statements. | Annual Report

aFor the period October 3, 2011 (commencement of operations) to March 31, 2012.
bThe amount shown for a share outstanding throughout the period may not correlate with the Statement of Operations for the period due to the timing of sales and repurchases of
the Fund shares in relation to income earned and/or fluctuating market value of the investments of the Fund.
cBased on average daily shares outstanding.
dAmount rounds to less than $0.01 per share.
eTotal return does not reflect sales commissions or contingent deferred sales charges, if applicable, and is not annualized for periods less than one year.
fRatios are annualized for periods less than one year.
Annual Report | The accompanying notes are an integral part of these financial statements. | 19

aFor the period October 3, 2011 (commencement of operations) to March 31, 2012.
bThe amount shown for a share outstanding throughout the period may not correlate with the Statement of Operations for the period due to the timing of sales and repurchases of
the Fund shares in relation to income earned and/or fluctuating market value of the investments of the Fund.
cBased on average daily shares outstanding.
dAmount rounds to less than $0.01 per share.
eTotal return is not annualized for periods less than one year.
fRatios are annualized for periods less than one year.
20 | The accompanying notes are an integral part of these financial statements. | Annual Report
Templeton Global Investment Trust
Statement of Investments, March 31, 2013

Templeton Global Investment Trust
Statement of Investments, March 31, 2013 (continued)
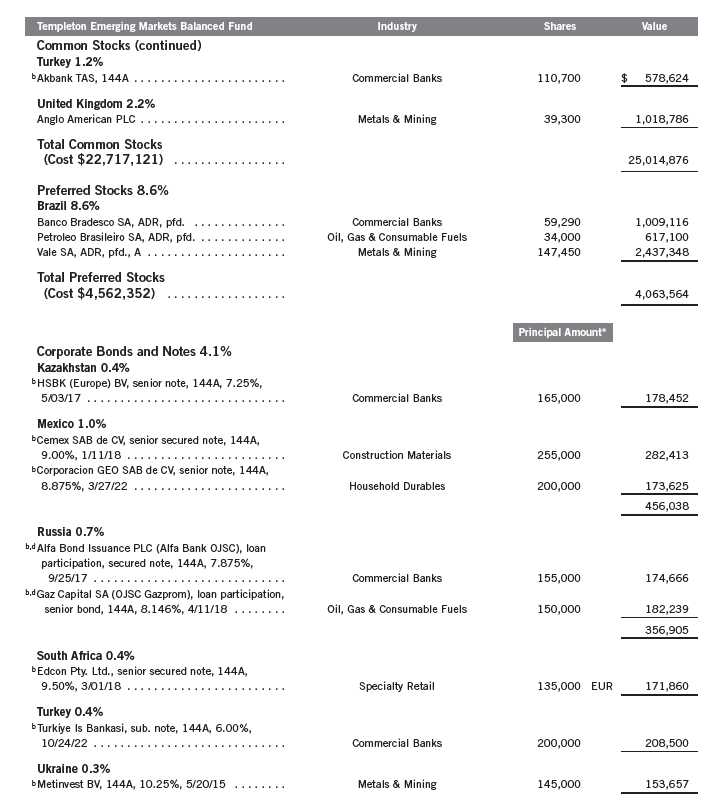
22 | Annual Report
Templeton Global Investment Trust
Statement of Investments, March 31, 2013 (continued)
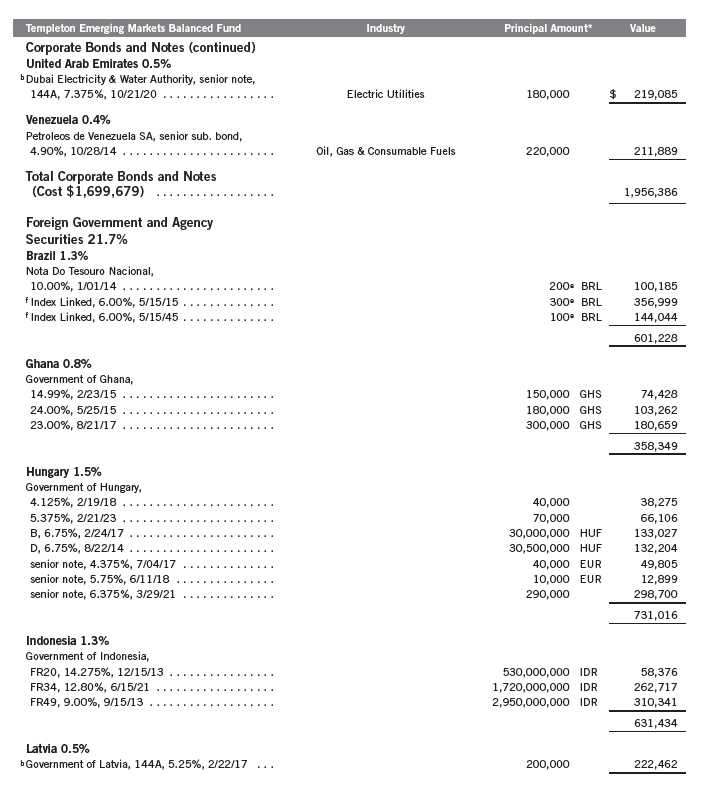
Annual Report | 23
Templeton Global Investment Trust
Statement of Investments, March 31, 2013 (continued)
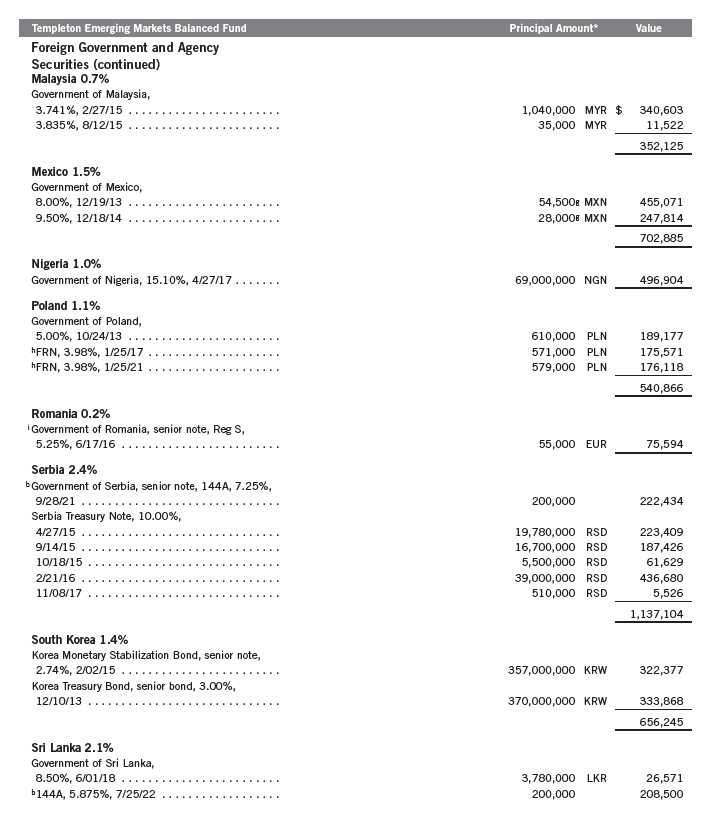
24 | Annual Report
Templeton Global Investment Trust
Statement of Investments, March 31, 2013 (continued)
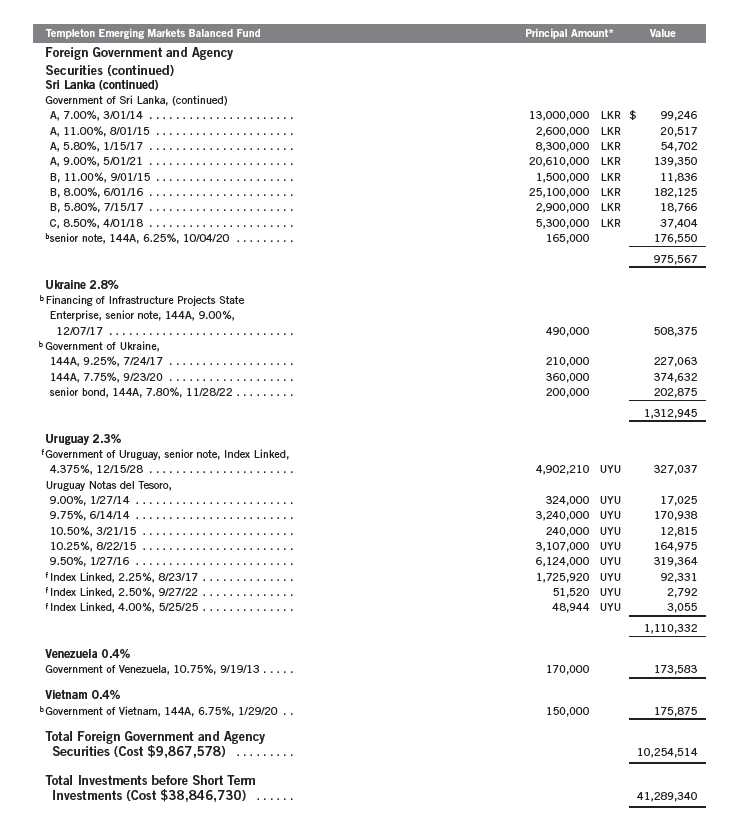
Annual Report | 25
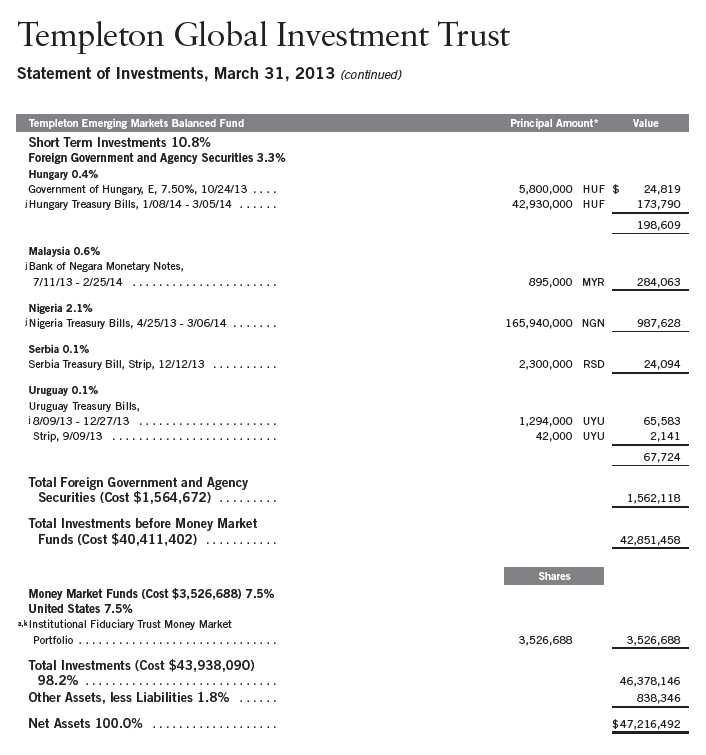
*The principal amount is stated in U.S. dollars unless otherwise indicated.
aNon-income producing.
bSecurity was purchased pursuant to Rule 144A under the Securities Act of 1933 and may be sold in transactions exempt from registration only to qualified institutional buyers or in
a public offering registered under the Securities Act of 1933. These securities have been deemed liquid under guidelines approved by the Trust’s Board of Trustees. At March 31,
2013, the aggregate value of these securities was $5,779,802, representing 12.24% of net assets.
cAt March 31, 2013, pursuant to the Fund’s policies and the requirements of applicable securities law, the Fund may be restricted from trading this security for a limited or extended
period of time due to ownership limits and/or potential possession of material non-public information.
dSee Note 1(d) regarding loan participation notes.
26 | Annual Report

28 | The accompanying notes are an integral part of these financial statements. | Annual Report

Annual Report | The accompanying notes are an integral part of these financial statements. | 29

30 | The accompanying notes are an integral part of these financial statements. | Annual Report
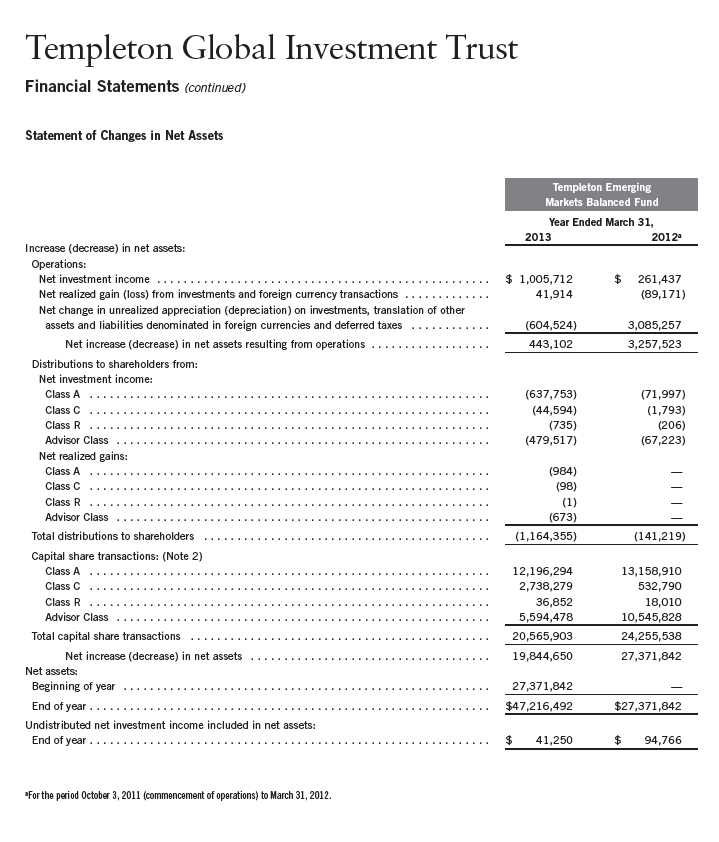
Annual Report | The accompanying notes are an integral part of these financial statements. | 31
Templeton Global Investment Trust
Notes to Financial Statements
Templeton Emerging Markets Balanced Fund
1. ORGANIZATION AND SIGNIFICANT ACCOUNTING POLICIES
Templeton Global Investment Trust (Trust) is registered under the Investment Company Act of 1940, as amended, (1940 Act) as an open-end investment company, consisting of six separate funds. The Templeton Emerging Markets Balanced Fund (Fund) is included in this report. The financial statements of the remaining funds in the Trust are presented separately. The Fund offers four classes of shares: Class A, Class C, Class R, and Advisor Class. Each class of shares differs by its initial sales load, contingent deferred sales charges, voting rights on matters affecting a single class, its exchange privilege and fees primarily due to differing arrangements for distribution and transfer agent fees.
The following summarizes the Fund’s significant accounting policies.
a. Financial Instrument Valuation
The Fund’s investments in financial instruments are carried at fair value daily. Fair value is the price that would be received to sell an asset or paid to transfer a liability in an orderly transaction between market participants on the measurement date. Under procedures approved by the Trust’s Board of Trustees (the Board), the Fund’s administrator, investment manager and other affiliates have formed the Valuation and Liquidity Oversight Committee (VLOC). The VLOC provides administration and oversight of the Fund’s valuation policies and procedures, which are approved annually by the Board. Among other things, these procedures allow the Fund to utilize independent pricing services, quotations from securities and financial instrument dealers, and other market sources to determine fair value.
Equity securities and derivative financial instruments (derivatives) listed on an exchange or on the NASDAQ National Market System are valued at the last quoted sale price or the official closing price of the day, respectively. Foreign equity securities are valued as of the close of trading on the foreign stock exchange on which the security is primarily traded, or the NYSE, whichever is earlier. The value is then converted into its U.S. dollar equivalent at the foreign exchange rate in effect at the close of the NYSE on the day that the value of the security is determined. Over-the-counter (OTC) securities are valued within the range of the most recent quoted bid and ask prices. Securities that trade in multiple markets or on multiple exchanges are valued according to the broadest and most representative market. Certain equity securities are valued based upon fundamental characteristics or relationships to similar securities. Investments in open-end mutual funds are valued at the closing net asset value.
Debt securities generally trade in the OTC market rather than on a securities exchange. The Fund’s pricing services use multiple valuation techniques to determine fair value. In instances where sufficient market activity exists, the pricing services may utilize a market-based approach through which quotes from market makers are used to determine fair value. In instances where sufficient market activity may not exist or is limited, the pricing services also utilize proprietary valuation models which may consider market characteristics such as benchmark yield curves,
32 | Annual Report
Templeton Global Investment Trust
Notes to Financial Statements (continued)
Templeton Emerging Markets Balanced Fund
| 1. | ORGANIZATION AND SIGNIFICANT ACCOUNTING POLICIES (continued) |
| a. | Financial Instrument Valuation (continued) |
credit spreads, estimated default rates, anticipated market interest rate volatility, coupon rates, anticipated timing of principal repayments, underlying collateral, and other unique security features in order to estimate the relevant cash flows, which are then discounted to calculate the fair value. Securities denominated in a foreign currency are converted into their U.S. dollar equivalent at the foreign exchange rate in effect at the close of the NYSE on the date that the values of the foreign debt securities are determined.
Certain derivatives trade in the OTC market. The Fund’s pricing services use various techniques including industry standard option pricing models and proprietary discounted cash flow models to determine the fair value of those instruments. The Fund’s net benefit or obligation under the derivative contract, as measured by the fair market value of the contract, is included in net assets.
The Fund has procedures to determine the fair value of financial instruments for which market prices are not reliable or readily available. Under these procedures, the VLOC convenes on a regular basis to review such financial instruments and considers a number of factors, including significant unobservable valuation inputs, when arriving at fair value. The VLOC primarily employs a market-based approach which may use related or comparable assets or liabilities, recent transactions, market multiples, book values, and other relevant information for the investment to determine the fair value of the investment. An income-based valuation approach may also be used in which the anticipated future cash flows of the investment are discounted to calculate fair value. Discounts may also be applied due to the nature or duration of any restrictions on the disposition of the investments. Due to the inherent uncertainty of valuations of such investments, the fair values may differ significantly from the values that would have been used had an active market existed. The VLOC employs various methods for calibrating these valuation approaches including a regular review of key inputs and assumptions, transactional back-testing or disposition analysis, and reviews of any related market activity.
Trading in securities on foreign securities stock exchanges and OTC markets may be completed before the daily close of business on the NYSE. Occasionally, events occur between the time at which trading in a foreign security is completed and the close of the NYSE that might call into question the reliability of the value of a portfolio security held by the Fund. As a result, differences may arise between the value of the Fund’s portfolio securities as determined at the foreign market close and the latest indications of value at the close of the NYSE. In order to minimize the potential for these differences, the VLOC monitors price movements following the close of trading in foreign stock markets through a series of country specific market proxies (such as baskets of American Depositary Receipts, futures contracts and exchange traded funds). These price movements are measured against established trigger thresholds for each specific market proxy to
Annual Report | 33
Templeton Global Investment Trust
Notes to Financial Statements (continued)
Templeton Emerging Markets Balanced Fund
| 1. | ORGANIZATION AND SIGNIFICANT ACCOUNTING POLICIES (continued) |
| a. | Financial Instrument Valuation (continued) |
assist in determining if an event has occurred that may call into question the reliability of the values of the foreign securities held by the Fund. If such an event occurs, the securities may be valued using fair value procedures, which may include the use of independent pricing services.
In addition, certain foreign markets may be open on days that the NYSE is closed, which could result in differences between the value of the Fund’s portfolio securities on the last business day and the last calendar day of the reporting period. Any significant security valuation changes due to an open foreign market are adjusted and reflected by the Fund for financial reporting purposes. The Fund’s financial statements have been adjusted to reflect investment values as of March 31, 2013.
b. Foreign Currency Translation
Portfolio securities and other assets and liabilities denominated in foreign currencies are translated into U.S. dollars based on the exchange rate of such currencies against U.S. dollars on the date of valuation. The Fund may enter into foreign currency exchange contracts to facilitate transactions denominated in a foreign currency. Purchases and sales of securities, income and expense items denominated in foreign currencies are translated into U.S. dollars at the exchange rate in effect on the transaction date. Portfolio securities and assets and liabilities denominated in foreign currencies contain risks that those currencies will decline in value relative to the U.S. dollar. Occasionally, events may impact the availability or reliability of foreign exchange rates used to convert the U.S. dollar equivalent value. If such an event occurs, the foreign exchange rate will be valued at fair value using procedures established and approved by the Board.
The Fund does not separately report the effect of changes in foreign exchange rates from changes in market prices on securities held. Such changes are included in net realized and unrealized gain or loss from investments on the Statement of Operations.
Realized foreign exchange gains or losses arise from sales of foreign currencies, currency gains or losses realized between the trade and settlement dates on securities transactions and the difference between the recorded amounts of dividends, interest, and foreign withholding taxes and the U.S. dollar equivalent of the amounts actually received or paid. Net unrealized foreign exchange gains and losses arise from changes in foreign exchange rates on foreign denominated assets and liabilities other than investments in securities held at the end of the reporting period.
c. Derivative Financial Instruments
The Fund invested in derivatives in order to manage risk or gain exposure to various other investments or markets. Derivatives are financial contracts based on an underlying or notional amount, require no initial investment or an initial net investment that is smaller than would normally be
34 | Annual Report
Templeton Global Investment Trust
Notes to Financial Statements (continued)
Templeton Emerging Markets Balanced Fund
| 1. | ORGANIZATION AND SIGNIFICANT ACCOUNTING POLICIES (continued) |
| c. | Derivative Financial Instruments (continued) |
required to have a similar response to changes in market factors, and require or permit net settlement. Derivatives contain various risks including the potential inability of the counterparty to fulfill their obligations under the terms of the contract, the potential for an illiquid secondary market, and/or the potential for market movements which expose the Fund to gains or losses in excess of the amounts shown on the Statement of Assets and Liabilities. Realized gain and loss and unrealized appreciation and depreciation on these contracts for the period are included in the Statement of Operations.
The Fund’s investments in OTC derivatives are subject to the terms of International Swaps and Derivatives Association Master Agreements and other related agreements between the Fund and certain derivatice counterparties. These agreements contain various provisions, including but not limited to collateral requirements, events of default, requirements for the Fund to maintain certain net asset levels and/or limit the decline in net assets over various periods of time. Should the Fund fail to meet any of these provisions, the derivative counterparty has the right to terminate the derivative contract and require immediate payment by the Fund for those OTC derivatives with that particular counterparty that are that are in a net liability position. At March 31, 2013, the Fund had no OTC derivatives in a net liability position for such contracts.
The Fund entered into OTC forward exchange contracts primarily to manage and/or gain exposure to certain foreign currencies. A forward exchange contract is an agreement between the Fund and a counterparty to buy or sell a foreign currency for a specific exchange rate on a future date. Pursuant to the terms of the forward exchange contracts, cash or securities may be required to be deposited as collateral. Unrestricted cash may be invested according to the Fund’s investment objectives.
See Note 10 regarding other derivative information.
d. Loan Participation Notes
The Fund invests in loan participation notes (“Participations”). Participations are loans originally issued to a borrower by one or more financial institutions (the “Lender”) and subsequently sold to other investors, such as the Fund. Participations typically result in the Fund having a contractual relationship only with the Lender, and not with the borrower. The Fund has the right to receive from the Lender any payments of principal, interest and fees which the Lender received from the borrower. The Fund generally has no rights to either enforce compliance by the borrower with the terms of the loan agreement or to any collateral relating to the original loan. As a result, the Fund assumes the credit risk of both the borrower and the Lender that is selling the Participation. The Participations may also involve interest rate risk and liquidity risk, including the potential default or insolvency of the borrower and/or the Lender.
Annual Report | 35
Templeton Global Investment Trust
Notes to Financial Statements (continued)
Templeton Emerging Markets Balanced Fund
| 1. | ORGANIZATION AND SIGNIFICANT ACCOUNTING POLICIES (continued) |
| e. | Income and Deferred Taxes |
It is the Fund’s policy to qualify as a regulated investment company under the Internal Revenue Code. The Fund intends to distribute to shareholders substantially all of its taxable income and net realized gains to relieve it from federal income and excise taxes. As a result, no provision for U.S. federal income taxes is required.
The Fund may be subject to foreign taxation related to income received, capital gains on the sale of securities and certain foreign currency transactions in the foreign jurisdictions in which it invests. Foreign taxes, if any, are recorded based on the tax regulations and rates that exist in the foreign markets in which the Fund invests. When a capital gain tax is determined to apply the Fund records an estimated deferred tax liability in an amount that would be payable if the securities were disposed of on the valuation date.
The Fund recognizes the tax benefits of uncertain tax positions only when the position is “more likely than not” to be sustained upon examination by the tax authorities based on the technical merits of the tax position. As of March 31, 2013, and for all open tax years, the Fund has determined that no liability for unrecognized tax benefits is required in the Fund’s financial statements related to uncertain tax positions taken on a tax return (or expected to be taken on future tax returns). Open tax years are those that remain subject to examination and are based on each tax jurisdiction statute of limitation.
f. Security Transactions, Investment Income, Expenses and Distributions
Security transactions are accounted for on trade date. Realized gains and losses on security transactions are determined on a specific identification basis. Interest income and estimated expenses are accrued daily. Amortization of premium and accretion of discount on debt securities are included in interest income. Dividend income is recorded on the ex-dividend date except that certain dividends from foreign securities are recognized as soon as the Fund is notified of the ex-dividend date. Distributions to shareholders are recorded on the ex-dividend date and are determined according to income tax regulations (tax basis). Distributable earnings determined on a tax basis may differ from earnings recorded in accordance with accounting principles generally accepted in the United States of America. These differences may be permanent or temporary. Permanent differences are reclassified among capital accounts to reflect their tax character. These reclassifications have no impact on net assets or the results of operations. Temporary differences are not reclassified, as they may reverse in subsequent periods.
36 | Annual Report
Templeton Global Investment Trust
Notes to Financial Statements (continued)
Templeton Emerging Markets Balanced Fund
| 1. | ORGANIZATION AND SIGNIFICANT ACCOUNTING POLICIES (continued) |
| f. | Security Transactions, Investment Income, Expenses and Distributions (continued) |
Common expenses incurred by the Trust are allocated among the funds based on the ratio of net assets of each fund to the combined net assets of the Trust. Fund specific expenses are charged directly to the fund that incurred the expense.
Realized and unrealized gains and losses and net investment income, not including class specific expenses, are allocated daily to each class of shares based upon the relative proportion of net assets of each class. Differences in per share distributions, by class, are generally due to differences in class specific expenses.
Inflation-indexed bonds are adjusted for inflation through periodic increases or decreases in the security’s interest accruals, face amount, or principal redemption value, by amounts corresponding to the rate of inflation as measured by an index. Any increase or decrease in the face amount or principal redemption value will be included as interest income on the Statement of Operations.
g. Offering Costs
Offering costs are amortized on a straight line basis over twelve months.
h. Accounting Estimates
The preparation of financial statements in accordance with accounting principles generally accepted in the United States of America requires management to make estimates and assumptions that affect the reported amounts of assets and liabilities at the date of the financial statements and the amounts of income and expenses during the reporting period. Actual results could differ from those estimates.
i. Guarantees and Indemnifications
Under the Trust’s organizational documents, its officers and trustees are indemnified by the Trust against certain liabilities arising out of the performance of their duties to the Trust. Additionally, in the normal course of business, the Trust, on behalf of the Fund, enters into contracts with service providers that contain general indemnification clauses. The Trust’s maximum exposure under these arrangements is unknown as this would involve future claims that may be made against the Trust that have not yet occurred. Currently, the Trust expects the risk of loss to be remote.
Annual Report | 37
Templeton Global Investment Trust
Notes to Financial Statements (continued)
Templeton Emerging Markets Balanced Fund
2. SHARES OF BENEFICIAL INTEREST
At March 31, 2013, there were an unlimited number of shares authorized ($0.01 par value).
Transactions in the Fund’s shares were as follows:

38 | Annual Report
Templeton Global Investment Trust
Notes to Financial Statements (continued)
Templeton Emerging Markets Balanced Fund
3. TRANSACTIONS WITH AFFILIATES
Franklin Resources, Inc. is the holding company for various subsidiaries that together are referred
to as Franklin Templeton Investments. Certain officers and trustees of the Trust are also officers,
and/or directors of the following subsidiaries:
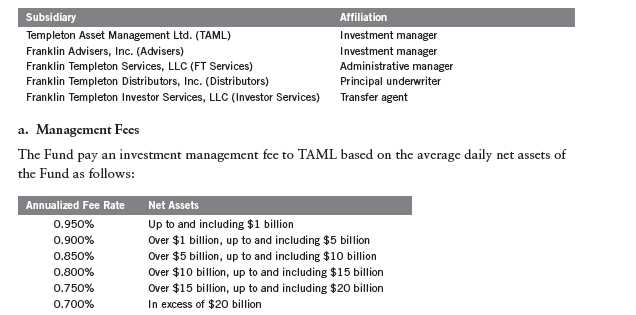
Under a subadvisory agreement, Advisers, an affiliate of TAML, provides subadvisory services
to the Fund. The subadvisory fee is paid by TAML based on the average daily net assets, and is
not an additional expense of the Fund.
b. Administrative Fees
The Fund pays an administrative fee to FT Services of 0.20% per year of the average daily net
assets of the Fund.
On February 26, 2013, the Board approved the proposal to combine the Fund’s investment man-
agement and administration agreements. The fees to be paid under the new combined agreement
will not exceed the aggregate fees that would have been paid under the separate agreements. The
new agreement went into effect on May 1, 2013.
Annual Report | 39
Templeton Global Investment Trust
Notes to Financial Statements (continued)
Templeton Emerging Markets Balanced Fund
| 3. | TRANSACTIONS WITH AFFILIATES (continued) |
| c. | Distribution Fees |
The Board has adopted distribution plans for each share class, with the exception of Advisor Class shares, pursuant to Rule 12b-1 under the 1940 Act. Distribution fees are not charged on shares held by affiliates. Under the Fund’s Class A reimbursement distribution plan, the Fund reimburses Distributors for costs incurred in connection with the servicing, sale and distribution of the Fund’s shares up to the maximum annual plan rate. Under the Class A reimbursement distribution plan, costs exceeding the maximum for the current plan year cannot be reimbursed in subsequent periods. In addition, under the Fund’s Class C and R compensation distribution plans, the Fund pays Distributors for costs incurred in connection with the servicing, sale and distribution of the Fund’s shares up to the maximum annual plan rate for each class.
The maximum annual plan rates, based on the average daily net assets, for each class, are as follows:
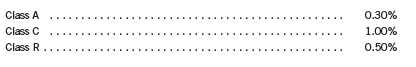
Distribution fees were not charged on shares held by affiliates.
d. Sales Charges/Underwriting Agreements
Front-end sales charges and contingent deferred sales charges (CDSC) do not represent expenses of the Fund. These charges are deducted from the proceeds of sales of Fund shares prior to investment or from redemption proceeds prior to remittance, as applicable. Distributors has advised the Fund of the following commission transactions related to the sales and redemptions of the Fund’s shares for the year:
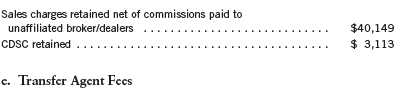
Each class of shares pays transfer agent fees to Investor Services for its performance of shareholder servicing obligations and reimburses Investor Services for out of pocket expenses incurred, including shareholding servicing fees paid to third parties. These fees are allocated daily to such classes based upon the relative proportion of net assets.
For the year ended March 31, 2013, the Fund paid transfer agent fees of $25,749, of which $13,974 was retained by Investor Services.
40 | Annual Report
Templeton Global Investment Trust
Notes to Financial Statements (continued)
Templeton Emerging Markets Balanced Fund
| 3. | TRANSACTIONS WITH AFFILIATES (continued) |
| f. | Waiver and Expense Reimbursements |
TAML and FT Services have contractually agreed in advance to waive or limit their respective fees and to assume as their own expense certain expenses otherwise payable by the Fund so that the expenses (excluding distribution fees, and acquired fund fees and expenses) for Class A, Class C, Class R and Advisor Class of the Fund do not exceed 1.23%, (other than certain non-routine expenses or costs, including those relating to litigation, indemnification, reorganizations, and liquidations) until July 31, 2013.
g. Other Affiliated Transactions
At March 31, 2013, Advisers owned 48.19% of the Fund’s outstanding shares.
4. EXPENSE OFFSET ARRANGEMENT
The Fund has entered into an arrangement with its custodian whereby credits realized as a result of uninvested cash balances are used to reduce a portion of the Fund’s custodian expenses. During the year ended March 31, 2013, there were no credits earned.
5. INCOME TAXES
For tax purposes, capital losses may be carried over to offset future capital gains, if any. At March 31, 2013, the Fund had long-term capital loss carryforwards of $4,125.
The tax character of distributions paid during the years ended March 31, 2013 and 2012, was as follows:
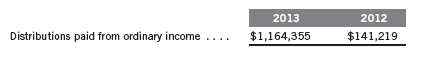
At March 31, 2013, the cost of investments, net unrealized appreciation (depreciation) and undistributed ordinary income for income tax purposes were as follows:
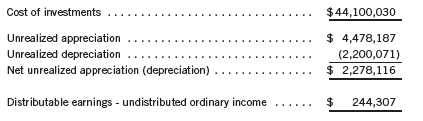
Annual Report | 41
Templeton Global Investment Trust
Notes to Financial Statements (continued)
Templeton Emerging Markets Balanced Fund
5. INCOME TAXES (continued)
Differences between income and/or capital gains as determined on a book basis and a tax basis are primarily due to differing treatments of bond discounts and premiums, corporate actions, and offering costs.
6. INVESTMENT TRANSACTIONS
Purchases and sales of investments (excluding short term securities) for the year ended March 31, 2013, aggregated $17,757,217 and $1,408,015, respectively.
7. INVESTMENTS IN INSTITUTIONAL FIDUCIARY TRUST MONEY MARKET PORTFOLIO
The Fund invests in the Institutional Fiduciary Trust Money Market Portfolio (Sweep Money Fund), an open-end investment company managed by Advisers. Management fees paid by the Fund are reduced on assets invested in the Sweep Money Fund, in an amount not to exceed the management and administrative fees paid by the Sweep Money Fund.
8. CREDIT RISK
At March 31, 2013, the Fund had 17.52% of its portfolio invested in high yield or other securities rated below investment grade. These securities may be more sensitive to economic conditions causing greater price volatility and are potentially subject to a greater risk of loss due to default than higher rated securities.
9. CONCENTRATION OF RISK
Investing in foreign securities may include certain risks and considerations not typically associated with investing in U.S. securities, such as fluctuating currency values and changing local and regional economic, political and social conditions, which may result in greater market volatility. In addition, certain foreign securities may not be as liquid as U.S. securities.
42 | Annual Report
Templeton Global Investment Trust
Notes to Financial Statements (continued)
Templeton Emerging Markets Balanced Fund
10. OTHER DERIVATIVE INFORMATION
At March 31, 2013, the Fund’s investments in derivative contracts are reflected on the Statement
of Assets and Liabilities as follows:

For the year ended March 31, 2013, the average month end market value of derivatives
represented 0.26% of average month end net assets. The average month end number of open
derivative contracts for the period was 15.
See Note 1(c) regarding derivative financial instruments.
11. CREDIT FACILITY
The Fund, together with other U.S. registered and foreign investment funds (collectively,
Borrowers), managed by Franklin Templeton Investments, are borrowers in a joint syndicated
senior unsecured credit facility totaling $1.5 billion (Global Credit Facility) which matures on
January 17, 2014. This Global Credit Facility provides a source of funds to the Borrowers for tem-
porary and emergency purposes, including the ability to meet future unanticipated or unusually
large redemption requests.
Annual Report | 43
Templeton Global Investment Trust
Notes to Financial Statements (continued)
Templeton Emerging Markets Balanced Fund
11. CREDIT FACILITY (continued)
Under the terms of the Global Credit Facility, the Fund shall, in addition to interest charged on any borrowings made by the Fund and other costs incurred by the Fund, pay its share of fees and expenses incurred in connection with the implementation and maintenance of the Global Credit Facility, based upon its relative share of the aggregate net assets of all of the Borrowers, including an annual commitment fee of 0.07% based upon the unused portion of the Global Credit Facility. These fees are reflected in other expenses on the Statement of Operations. During the year ended March 31, 2013, the Fund did not use the Global Credit Facility.
12. FAIR VALUE MEASUREMENTS
The Fund follows a fair value hierarchy that distinguishes between market data obtained from independent sources (observable inputs) and the Fund’s own market assumptions (unobservable inputs). These inputs are used in determining the value of the Fund’s financial instruments and are summarized in the following fair value hierarchy:
- Level 1 – quoted prices in active markets for identical financial instruments
- Level 2 – other significant observable inputs (including quoted prices for similar financial instruments, interest rates, prepayment speed, credit risk, etc.)
- Level 3 – significant unobservable inputs (including the Fund’s own assumptions in determining the fair value of financial instruments)
The inputs or methodology used for valuing financial instruments are not an indication of the risk associated with investing in those financial instruments.
For movements between the levels within the fair value hierarchy, the Fund has adopted a policy of recognizing the transfers as of the date of the underlying event which caused the movement.
A summary of inputs used as of March 31, 2013, in valuing the Fund’s assets and liabilities carried at fair value, is as follows:
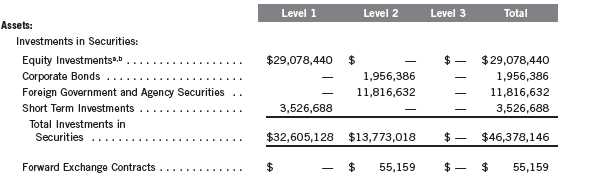
44 | Annual Report
Templeton Global Investment Trust
Notes to Financial Statements (continued)

13. NEW ACCOUNTING PRONOUNCEMENTS
In December 2011, the Financial Accounting Standards Board (FASB) issued Accounting Standards Update (ASU) No. 2011-11, Balance Sheet (Topic 210): Disclosures about Offsetting Assets and Liabilities. The amendments in the ASU enhance disclosures about offsetting of financial assets and liabilities to enable investors to understand the effect of these arrangements on a fund’s financial position. In January 2013, FASB issued ASU No. 2013-01, Balance Sheet (Topic 210): Clarifying the Scope of Disclosures about Offsetting Assets and Liabilities. The amendments in ASU No. 2013-01 clarify the intended scope of disclosures required by ASU No. 2011-11. These ASUs are effective for interim and annual reporting periods beginning on or after January 1, 2013. The Fund believes the adoption of these ASUs will not have a material impact on its financial statements.
14. SUBSEQUENT EVENTS
The Fund has evaluated subsequent events through the issuance of the financial statements and determined that no events have occurred that require disclosure.
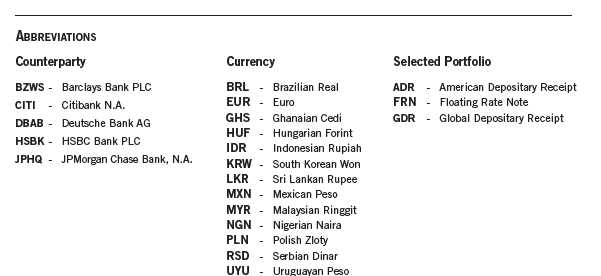
Annual Report | 45
Templeton Global Investment Trust
Report of Independent Registered Public Accounting Firm
To the Board of Trustees and Shareholders of Templeton Emerging Markets Balanced Fund
In our opinion, the accompanying statement of assets and liabilities, including the statement of investments, and the related statements of operations and of changes in net assets and the financial highlights present fairly, in all material respects, the financial position of Templeton Emerging Markets Balanced Fund (the “Fund”) at March 31, 2013, and results of its operations, the changes in its net assets and the financial highlights for the periods presented, in conformity with accounting principles generally accepted in the United States of America. These financial statements and financial highlights (hereafter referred to as “financial statements”) are the responsibility of the Fund’s management. Our responsibility is to express an opinion on these financial statements based on our audits. We conducted our audits of these financial statements in accordance with the standards of the Public Company Accounting Oversight Board (United States). Those standards require that we plan and perform the audit to obtain reasonable assurance about whether the financial statements are free of material misstatement. An audit includes examining, on a test basis, evidence supporting the amounts and disclosures in the financial statements, assessing the accounting principles used and significant estimates made by management, and evaluating the overall financial statement presentation. We believe that our audits, which included confirmation of securities at March 31, 2013 by correspondence with the custodian, transfer agent and brokers, provide a reasonable basis for our opinion.
PricewaterhouseCoopers LLP
San Francisco, California
May 22, 2013
46 | Annual Report
Templeton Global Investment Trust
Tax Information (unaudited)
Templeton Emerging Markets Balanced Fund
Under Section 854(b)(1)(B) of the Internal Revenue Code (Code), the Fund hereby reports the maximum amount allowable but no less than $284,985 as qualified dividends for purposes of the maximum rate under Section 1(h)(11) of the Code for the fiscal year ended March 31, 2013. Distributions, including qualified dividend income, paid during calendar year 2013 will be reported to shareholders on Form 1099-DIV by mid-February 2014. Shareholders are advised to check with their tax advisors for information on the treatment of these amounts on their individual income tax returns.
At March 31, 2013, more than 50% of the Fund’s total assets were invested in securities of foreign issuers. In most instances, foreign taxes were withheld from income paid to the Fund on these investments. As shown in the table below, the Fund hereby reports to shareholders the foreign source income and foreign taxes paid, pursuant to Section 853 of the Code. This written statement will allow shareholders of record on March 14, 2013, to treat their proportionate share of foreign taxes paid by the Fund as having been paid directly by them. The shareholder shall consider these amounts as foreign taxes paid in the tax year in which they receive the Fund distribution.
The following table provides a detailed analysis of foreign tax paid, foreign source income, and foreign qualified dividends as reported by the Fund, to Class A, Class C, Class R and Advisor Class shareholders of record.

Foreign Tax Paid Per Share (Column 1) is the amount per share available to you, as a tax credit (assuming you held your shares in the Fund for a minimum of 16 days during the 31-day period beginning 15 days before the ex-dividend date of the Fund’s distribution to which the foreign taxes relate), or, as a tax deduction.
Foreign Source Income Per Share (Column 2) is the amount per share of income dividends attributable to foreign securities held by the Fund, plus any foreign taxes withheld on these dividends. The amounts reported include foreign source qualified dividends that have not been adjusted for the rate differential applicable to such dividend income.1
Annual Report | 47
Templeton Global Investment Trust
Tax Information (unaudited) (continued)
Templeton Emerging Markets Balanced Fund
Foreign Qualified Dividends Per Share (Column 3) is the amount per share of foreign source qualified dividends, plus any foreign taxes withheld on these dividends. These amounts represent the portion of the Foreign Source Income reported to you in column 2 that were derived from qualified foreign securities held by the Fund.1
By mid-February 2014, shareholders will receive Form 1099-DIV which will include their share of taxes paid and foreign source income distributed during the calendar year 2013. The Foreign Source Income reported on Form 1099-DIV has not been adjusted for the rate differential on foreign source qualified dividend income. Shareholders are advised to check with their tax advisors for information on the treatment of these amounts on their 2013 individual income tax returns.
1 Qualified dividends are taxed at reduced long term capital gains tax rates. In determining the amount of foreign tax credit that may be applied against the U.S. tax liability of individuals receiving foreign source qualified dividends, adjustments may be required to the foreign tax credit limitation calculation to reflect the rate differential applicable to such dividend income. The rules however permit certain individuals to elect not to apply the rate differential adjustments for capital gains and/or dividends for any taxable year. Please consult your tax advisor and the instructions to Form 1116 for more information.
48 | Annual Report
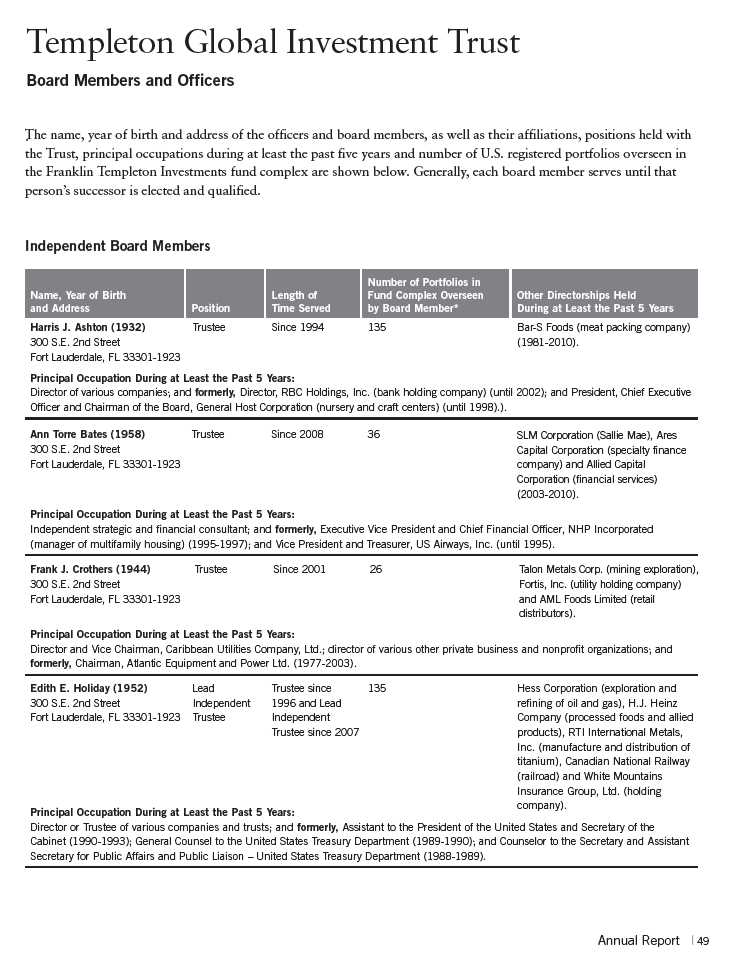


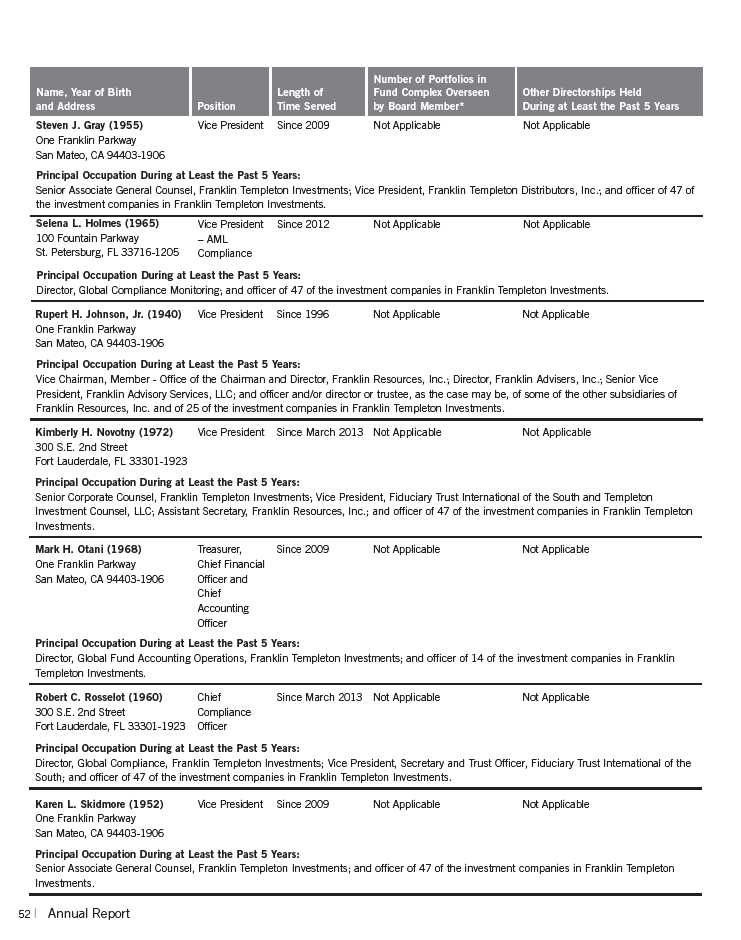

*We base the number of portfolios on each separate series of the U.S. registered investment companies within the Franklin Templeton Investments fund complex. These portfolios
have a common investment manager or affiliated investment managers.
**Charles B. Johnson is considered to be an interested person of the Trust under the federal securities laws due to his position as officer and director and major shareholder of
Franklin Resources, Inc. (Resources), which is the parent company of the Trust’s investment manager and distributor. Gregory E. Johnson is considered to be an interested person of
the Fund under the federal securities laws due to his position as officer and director of Resources.
Note 1: Charles B. Johnson and Rupert H. Johnson, Jr. are brothers and the father and uncle, respectively, of Gregory E. Johnson.
Note 2: Officer information is current as of the date of this report. It is possible that after this date, information about officers may change.
The Sarbanes-Oxley Act of 2002 and Rules adopted by the U.S. Securities and Exchange Commission require the Fund to disclose whether the Fund’s Audit Committee
includes at least one member who is an audit committee financial expert within the meaning of such Act and Rules. The Fund’s Board has determined that there is at least
one such financial expert on the Audit Committee and has designated each of Ann Torre Bates and David W. Niemiec as an audit committee financial expert. The Board
believes that Ms. Bates and Mr. Niemiec qualify as such an expert in view of their extensive business background and experience. Ms. Bates has served as a member of the
Fund Audit Committee since 2008. She currently serves as a director of SLM Corporation and Ares Capital Corporation and was formerly a director of Allied Capital
Corporation from 2003 to 2010, Executive Vice President and Chief Financial Officer of NHP Incorporated and Vice President and Treasurer of US Airways, Inc. Mr. Niemiec
has served as a member of the Fund Audit Committee since 2006, currently serves as an Advisor to Saratoga Partners and was formerly its Managing Director from 1998 to
2001. Mr. Niemiec was formerly a director of Emeritus Corporation from 1999 to 2010 and OSI Pharmaceuticals, Inc. from 2006 to 2010, Managing Director of SBC Warburg
Dillon Read from 1997 to 1998, and was Vice Chairman from 1991 to 1997 and Chief Financial Officer from 1982 to 1997 of Dillon, Read & Co. Inc. As a result of such back-
ground and experience, the Board believes that Ms. Bates and Mr. Niemiec have each acquired an understanding of generally accepted accounting principles and financial
statements, the general application of such principles in connection with the accounting estimates, accruals and reserves, and analyzing and evaluating financial state-
ments that present a breadth and level of complexity of accounting issues generally comparable to those of the Fund, as well as an understanding of internal controls and
procedures for financial reporting and an understanding of audit committee functions. Ms. Bates and Mr. Niemiec are independent Board members as that term is defined
under the applicable U.S. Securities and Exchange Commission Rules and Releases.
The Statement of Additional Information (SAI) includes additional information about the board members and is available, without charge, upon request. Shareholders may
call (800) DIAL BEN/342-5236 to request the SAI.
Annual Report | 53
Templeton Global Investment Trust
Shareholder Information
Templeton Emerging Markets Balanced Fund
Board Review of Investment Management Agreement
At a meeting held February 26, 2013, the Board of Trustees (Board), including a majority of non-interested or independent Trustees, approved renewal of the investment management agreements for each of the separate funds within Templeton Global Investment Trust, including Templeton Emerging Markets Balanced Fund (Fund(s)). In reaching this decision, the Board took into account information furnished throughout the year at regular Board meetings, as well as information prepared specifically in connection with the annual renewal review process. Information furnished and discussed throughout the year included investment performance reports and related financial information for each Fund, along with periodic reports on expenses, shareholder services, legal and compliance matters, pricing, brokerage commissions and execution and other services provided by the Investment Manager (Manager) and its affiliates, as well as a third-party survey of transfer agent fees charged funds within the Franklin Templeton Investments complex in comparison with those charged other fund complexes deemed comparable. Information furnished specifically in connection with the renewal process included a report for each Fund prepared by Lipper, Inc. (Lipper), an independent organization, as well as additional material, including a Fund profitability analysis prepared by management. The Lipper reports compared each Fund’s investment performance and expenses with those of other mutual funds deemed comparable to the Fund as selected by Lipper. The Fund profitability analysis discussed the profitability to Franklin Templeton Investments from its overall U.S. fund operations, as well as on an individual fund-by-fund basis. Additional material accompanying such profitability analysis included information on a fund-by-fund basis listing portfolio managers and other accounts they manage, as well as information on management fees charged by the Manager and its affiliates to U.S. mutual funds and other accounts, including management’s explanation of differences where relevant. Such material also included a memorandum prepared by management describing project initiatives and capital investments relating to the services provided to the Funds by the Franklin Templeton Investments organization, as well as a memorandum relating to economies of scale and an analysis concerning transfer agent fees charged by an affiliate of the Manager.
In considering such materials, the independent Trustees received assistance and advice from and met separately with independent counsel. While the investment management agreements for all Funds were considered at the same Board meeting, the Board dealt with each Fund separately. In approving continuance of the investment management agreement for each Fund, the Board, including a majority of independent Trustees, determined that the management fee structure was fair and reasonable and that continuance of the investment management agreement was in the best interests of each Fund and its shareholders. While attention was given to all information furnished, the following discusses some primary factors relevant to the Board’s decision.
NATURE, EXTENT AND QUALITY OF SERVICES. The Board was satisfied with the nature and quality of the overall services provided by the Manager and its affiliates to the Fund and its shareholders. In addition to investment performance and expenses discussed later, the Board’s
54 | Annual Report
Templeton Global Investment Trust
Shareholder Information (continued)
Templeton Emerging Markets Balanced Fund
Board Review of Investment Management Agreement (continued)
opinion was based, in part, upon periodic reports furnished it showing that the investment policies and restrictions for the Fund were consistently complied with as well as other reports periodically furnished the Board covering matters such as the compliance of portfolio managers and other management personnel with the code of ethics adopted throughout the Franklin Templeton fund complex, the adherence to fair value pricing procedures established by the Board, and the accuracy of net asset value calculations. The Board also noted the extent of benefits provided Fund shareholders from being part of the Franklin Templeton family of funds, including the right to exchange investments between the same class of funds without a sales charge, the ability to reinvest Fund dividends into other funds and the right to combine holdings in other funds to obtain a reduced sales charge. Favorable consideration was given to management’s continuous efforts and expenditures in establishing back-up systems and recovery procedures to function in the event of a natural disaster, it being noted that such systems and procedures had functioned well during the Florida hurricanes and blackouts experienced in previous years, and that those operations in the New York/New Jersey area ran smoothly during the more recent Hurricane Sandy. Among other factors taken into account by the Board were the Manager’s best execution trading policies, including a favorable report by an independent portfolio trading analytical firm, which also covered FOREX transactions. Consideration was also given to the experience of the Fund’s portfolio management team, the number of accounts managed and general method of compensation. In this latter respect, the Board noted that a primary factor in management’s determination of a portfolio manager’s bonus compensation was the relative investment performance of the funds he or she managed and that a portion of such bonus was required to be invested in a predesignated list of funds within such person’s fund management area so as to be aligned with the interests of shareholders. The Board also took into account the quality of transfer agent and shareholder services provided Fund shareholders by an affiliate of the Manager and the continuous enhancements to the Franklin Templeton website. Particular attention was given to management’s conservative approach and diligent risk management procedures, including continuous monitoring of counterparty credit risk and attention given to derivatives and other complex instruments including expanded collateralization requirements. The Board also took into account, among other things, management’s efforts in establishing a global credit facility for the benefit of the Fund and other accounts managed by Franklin Templeton Investments to provide a source of cash for temporary and emergency purposes or to meet unusual redemption requests as well as the strong financial position of the Manager’s parent company and its commitment to the mutual fund business as evidenced by its subsidization of money market funds.
INVESTMENT PERFORMANCE. While consideration was given to performance reports and discussions with portfolio managers at Board meetings during the year, particular attention in assessing performance was given to the Lipper reports furnished for the agreement renewal. The Lipper reports prepared for the Fund showed the investment performance of its Class A shares during 2012
Annual Report | 55
Templeton Global Investment Trust
Shareholder Information (continued)
Templeton Emerging Markets Balanced Fund
Board Review of Investment Management Agreement (continued)
and previous years of operations. The Lipper performance universe for the Fund consisted of all retail and institutional emerging markets funds. The Fund, whose investment objective is combination of income and capital appreciation, has been in existence for only one full year and the Lipper report showed its income return to be in the highest performing quintile of the performance universe, and its total return to be in the second-lowest quintile of such universe. The Board also reviewed the Fund’s performance within a supplementary universe consisting of all retail and institutional mixed asset target allocation moderate funds included in the Lipper report at management’s request and found both the Fund’s income and total return in 2012 to be in the best performing quintile within such universe. In view of the Fund’s short period of operations, the Board did not believe the Fund’s performance as shown in the Lipper report to be meaningful.
COMPARATIVE EXPENSES. Consideration was given to a comparative analysis of the management fees and total expense ratio of the Fund compared with those of a group of other funds selected by Lipper as its appropriate Lipper expense group. Lipper expense data is based upon historical information taken from each fund’s most recent annual report, which reflects historical asset levels that may be quite different from those currently existing, particularly in a period of market volatility. While recognizing such inherent limitation and the fact that expense ratios generally increase as assets decline and decrease as assets grow, the Board believed the independent analysis conducted by Lipper to be an appropriate measure of comparative expenses. In reviewing comparative costs, Lipper provides information on the Fund’s contractual investment management fee in comparison with the effective management fee that would have been charged by other funds within its Lipper expense group assuming they were similar in size to the Fund, as well as the actual total expense ratio of the Fund in comparison with those of its Lipper expense group. The Lipper contractual investment management fee analysis includes administrative charges as being part of a management fee, and actual total expenses, for comparative consistency, are shown by Lipper for Fund Class A shares. The Lipper report for the Fund showed its contractual investment management fee rate to be two-and-one-half basis points higher than the median of its Lipper expense group, but its actual total expense ratio was below the median of such group. The Board found such comparative expenses as shown in the Lipper report to be acceptable and noted that this Fund’s expenses had been subsidized by management fee waivers.
MANAGEMENT PROFITABILITY. The Board also considered the level of profits realized by the Manager and its affiliates in connection with the operation of the Fund. In this respect, the Board reviewed the Fund profitability analysis that addresses the overall profitability of Franklin Templeton’s U.S. fund business, as well as its profits in providing management and other services to each of the individual funds during the 12-month period ended September 30, 2012, being the most recent fiscal year-end for Franklin Resources, Inc., the Manager’s parent. In reviewing the analysis, attention was given to the methodology followed in allocating costs to the Fund, it being recognized that allocation methodologies are inherently subjective and various allocation methodologies may each be reasonable while producing different results. In this respect, the Board noted
56 | Annual Report
Templeton Global Investment Trust
Shareholder Information (continued)
Templeton Emerging Markets Balanced Fund
Board Review of Investment Management Agreement (continued)
that, while being continuously refined and reflecting changes in the Manager’s own cost accounting, the cost allocation methodology was consistent with that followed in profitability report presentations for the Fund made in prior years and that the Fund’s independent registered public accounting firm had been engaged by the Manager to periodically review the reasonableness of the allocation methodologies solely for use by the Fund’s Board in reference to the profitability analysis. In reviewing and discussing such analysis, management discussed with the Board its belief that costs incurred in establishing the infrastructure necessary for the type of mutual fund operations conducted by the Manager and its affiliates may not be fully reflected in the expenses allocated to the Fund in determining its profitability, as well as the fact that the level of profits, to a certain extent, reflected operational cost savings and efficiencies initiated by management. The Board also took into account management’s expenditures in improving shareholder services provided the Fund, as well as the need to implement systems to meet additional regulatory and compliance requirements resulting from statutes such as the Sarbanes-Oxley and Dodd Frank Acts and recent SEC and other regulatory requirements. In addition, the Board considered a third-party study comparing the profitability of the Manager’s parent on an overall basis to other publicly held managers broken down to show profitability from management operations exclusive of distribution expenses, as well as profitability including distribution expenses. The Board also considered the extent to which the Manager and its affiliates might derive ancillary benefits from fund operations, including revenues generated from transfer agent services and potential benefits resulting from allocation of fund brokerage and the use of commission dollars to pay for research. Based upon its consideration of all these factors, the Board determined that the level of profits realized by the Manager and its affiliates from providing services to the Fund was not excessive in view of the nature, quality and extent of services provided.
ECONOMIES OF SCALE. The Board also considered whether economies of scale are realized by the Manager as the Fund grows larger and the extent to which this is reflected in the level of management fees charged. While recognizing that any precise determination is inherently subjective, the Board noted that based upon the Fund profitability analysis, it appears that as some funds get larger, at some point economies of scale do result in the Manager realizing a larger profit margin on management services provided such a fund. The Board also noted that economies of scale are shared with the Fund and its shareholders through management fee breakpoints so that as a Fund grows in size, its effective management fee rate declines. In view of the specialized nature and size of the Fund, whose expenses are also being subsidized by management, the Board questioned whether economies of scale existed. The investment management advisory agreement for the Fund provides for breakpoints that are above the Fund’s existing asset size, and to the extent economies of scale may be realized by the Manager and its affiliates, the Board believes the schedule of fees for the Fund provides a sharing of benefits with the Fund and its shareholders.
In addition to the investment advisory services provided the Fund under its investment management agreement, administrative services are provided the Fund under a separate agreement at a fixed
Annual Report | 57
Templeton Global Investment Trust
Shareholder Information (continued)
Templeton Emerging Markets Balanced Fund
Board Review of Investment Management Agreement (continued)
charge of 20 basis points. At the February 26, 2013, Board meeting, the Board eliminated the separate agreements and approved a new form of investment management agreement for the Fund combining such services. In approving the new form of investment management agreement, the Board took into account the fact that the types of services and aggregate fee, including breakpoints, would be the same as provided under the previous separate agreements and that combining such services was consistent with Lipper’s methodology of considering contractual investment management fees to include any separately charged administrative fee. The Board also noted that combining the services under the new form of investment management agreement would have no impact on management’s existing subsidization of expenses of the Fund.
Proxy Voting Policies and Procedures
The Fund’s investment manager has established Proxy Voting Policies and Procedures (Policies) that the Fund uses to determine how to vote proxies relating to portfolio securities. Shareholders may view the Fund’s complete Policies online at franklintempleton.com. Alternatively, shareholders may request copies of the Policies free of charge by calling the Proxy Group collect at (954) 527-7678 or by sending a written request to: Franklin Templeton Companies, LLC, 300 S.E. 2nd Street, Fort Lauderdale, FL 33301, Attention: Proxy Group. Copies of the Fund’s proxy voting records are also made available online at franklintempleton.com and posted on the U.S. Securities and Exchange Commission’s website at sec.gov and reflect the most recent 12-month period ended June 30.
Quarterly Statement of Investments
The Fund files a complete statement of investments with the U.S. Securities and Exchange Commission for the first and third quarters for each fiscal year on Form N-Q. Shareholders may view the filed Form N-Q by visiting the Commission’s website at sec.gov. The filed form may also be viewed and copied at the Commission’s Public Reference Room in Washington, DC. Information regarding the operations of the Public Reference Room may be obtained by calling (800) SEC-0330.
Householding of Reports and Prospectuses
You will receive the Fund’s financial reports every six months as well as an annual updated summary prospectus (prospectus available upon request). To reduce Fund expenses, we try to identify related shareholders in a household and send only one copy of the financial reports and summary prospectus. This process, called “householding,” will continue indefinitely unless you instruct us otherwise. If you prefer not to have these documents householded, please call us at (800) 632-2301. At any time you may view current prospectuses/summary prospectuses and financial reports on our website. If you choose, you may receive these documents through electronic delivery.
58 | Annual Report
This page intentionally left blank.
This page intentionally left blank.

Item 2. Code of Ethics.
| (a) | The Registrant has adopted a code of ethics that applies to its principal executive officers and principal financial and accounting officer. |
| (c) | N/A |
| (d) | N/A |
| (f) | Pursuant to Item 12(a)(1), the Registrant is attaching as an exhibit a copy of its code of ethics that applies to its principal executive officers and principal financial and accounting officer. |
Item 3. Audit Committee Financial Expert.
(a)(1) The Registrant has an audit committee financial expert serving on its audit committee.
(2) The audit committee financial expert is David W. Niemiec and he is "independent" as defined under the relevant Securities and Exchange Commission Rules and Releases.
Item 4. Principal Accountant Fees and Services.
(a) Audit Fees
The aggregate fees paid to the principal accountant for professional services rendered by the principal accountant for the audit of the registrant’s annual financial statements or for services that are normally provided by the principal accountant in connection with statutory and regulatory filings or engagements were $271,666 for the fiscal year ended March 31, 2013 and $241,665 for the fiscal year ended March 31, 2012.
(b) Audit-Related Fees
There were no fees paid to the principal accountant for assurance and related services rendered by the principal accountant to the registrant that are reasonably related to the performance of the audit of the registrant's financial statements and are not reported under paragraph (a) of Item 4.
There were no fees paid to the principal accountant for assurance and related services rendered by the principal accountant to the registrant's investment adviser and any entity controlling, controlled by or under common control with the investment adviser that provides ongoing services to the registrant that are reasonably related to the performance of the audit of their financial statements.
(c) Tax Fees
The aggregate fees paid to the principal accountant for professional services rendered by the principal accountant to the registrant for tax compliance, tax advice and tax planning were $5,304 the fiscal year ended March 31, 2013 and $11,285 for the fiscal year ended March 31, 2012. The services for which these fees were paid include preparation of tax returns for foreign governments.
The aggregate fees paid to the principal accountant for professional services rendered by the principal accountant to the registrant’s investment adviser and
any entity controlling, controlled by or under common control with the investment adviser that provides ongoing services to the registrant for tax compliance, tax advice and tax planning were $4,600 for the fiscal year ended March 31, 2013 and $75,000 for the fiscal year ended March 31, 2012. The services for which these fees were paid include technical tax consultation for capital gain tax reporting to foreign governments, application of local country tax laws to investments and licensing securities with local country offices.
(d) All Other Fees
The aggregate fees paid to the principal accountant for products and services rendered by the principal accountant to the registrant not reported in paragraphs (a)-(c) of Item 4 were $0 for the fiscal year ended March 31, 2013 and $815 for the fiscal year ended March 31, 2012. The services for which these fees were paid include review of materials provided to the fund Board in connection with the investment management contract renewal process.
The aggregate fees paid to the principal accountant for products and services rendered by the principal accountant to the registrant’s investment adviser and any entity controlling, controlled by or under common control with the investment adviser that provides ongoing services to the registrant other than services reported in paragraphs (a)-(c) of Item 4 were $39,194 for the fiscal year ended March 31, 2013 and $151,635 for the fiscal year ended March 31, 2012. The services for which these fees were paid include preparation and review of materials provided to the fund Board in connection with the investment management contract renewal process.
(e) (1) The registrant’s audit committee is directly responsible for approving the services to be provided by the auditors, including:
| (i) | pre-approval of all audit and audit related services; |
| (ii) | pre-approval of all non-audit related services to be provided to |
the Fund by the auditors;
(iii) pre-approval of all non-audit related services to be provided to the registrant by the auditors to the registrant’s investment adviser or to any entity that controls, is controlled by or is under common control with the registrant’s investment adviser and that provides ongoing services to the registrant where the non-audit services relate directly to the operations or financial reporting of the registrant; and (iv) establishment by the audit committee, if deemed necessary or appropriate, as an alternative to committee pre-approval of services to be provided by the auditors, as required by paragraphs (ii) and (iii) above, of policies and procedures to permit such services to be pre-approved by other means, such as through establishment of guidelines or by action of a designated member or members of the committee; provided the policies and procedures are detailed as to the particular service and the committee is informed of each service and such policies and procedures do not include delegation of audit committee responsibilities, as contemplated under the Securities Exchange Act of 1934, to management; subject, in the case of (ii) through (iv), to any waivers, exceptions or exemptions that may be available under applicable law or rules.
| (e) | (2) None of the services provided to the registrant described in paragraphs |
| (b) | -(d) of Item 4 were approved by the audit committee pursuant to paragraph |
(c)(7)(i)(C) of Rule 2-01 of regulation S-X.
(f) No disclosures are required by this Item 4(f).
(g) The aggregate non-audit fees paid to the principal accountant for services rendered by the principal accountant to the registrant and the registrant’s investment adviser and any entity controlling, controlled by or under common control with the investment adviser that provides ongoing services to the registrant were $49,098 for the fiscal year ended March 31, 2013 and $238,735 for the fiscal year ended March 31, 2012.
(h) The registrant’s audit committee of the board has considered whether the provision of non-audit services that were rendered to the registrant’s investment adviser (not including any sub-adviser whose role is primarily portfolio management and is subcontracted with or overseen by another investment adviser), and any entity controlling, controlled by, or under common control with the investment adviser that provides ongoing services to the registrant that were not pre-approved pursuant to paragraph (c)(7)(ii) of Rule 2-01 of Regulation S-X is compatible with maintaining the principal accountant’s independence.
Item 5. Audit Committee of Listed Registrants. N/A
Item 6. Schedule of Investments. N/A
Item 7. Disclosure of Proxy Voting Policies and Procedures for Closed-End Management Investment Companies. N/A
Item 8. Portfolio Managers of Closed-End Management Investment Companies. N/A
Item 9. Purchases of Equity Securities by Closed-End Management Investment Company and Affiliated Purchasers. N/A
Item 10. Submission of Matters to a Vote of Securities Holders.
There have been no changes to the procedures by which shareholders may recommend nominees to the Registrant's Board of Trustees that would require disclosure herein.
Item 11. Controls and Procedures.
(a) Evaluation of Disclosure Controls and Procedures. The Registrant maintains disclosure controls and procedures that are designed to ensure that information required to be disclosed in the Registrant’s filings under the Securities Exchange Act of 1934 and the Investment Company Act of 1940 is recorded, processed, summarized and reported within the periods specified in the rules and forms of the Securities and Exchange Commission. Such information is accumulated and communicated to the Registrant’s management, including its principal executive officer and principal financial officer, as appropriate, to allow timely decisions regarding required disclosure. The Registrant’s management, including the principal executive officer and the principal financial officer, recognizes that any set of controls and procedures, no
matter how well designed and operated, can provide only reasonable assurance of achieving the desired control objectives.
Within 90 days prior to the filing date of this Shareholder Report on Form N-CSR, the Registrant had carried out an evaluation, under the supervision and with the participation of the Registrant’s management, including the Registrant’s principal executive officer and the Registrant’s principal financial officer, of the effectiveness of the design and operation of the Registrant’s disclosure controls and procedures. Based on such evaluation, the Registrant’s principal executive officer and principal financial officer concluded that the Registrant’s disclosure controls and procedures are effective.
(b) Changes in Internal Controls.
There have been no changes in the
Registrant’s internal controls or in other factors that could materially affect the internal controls over financial reporting subsequent to the date of their evaluation in connection with the preparation of this Shareholder Report on Form N-CSR.
Item 12. Exhibits.
(a)(1) Code of Ethics
(a)(2) Certifications pursuant to Section 302 of the Sarbanes-Oxley Act of 2002 of Laura F. Fergerson, Chief Executive Officer - Finance and Administration, and Mark H. Otani, Chief Financial Officer and Chief Accounting Officer
(b) Certifications pursuant to Section 906 of the Sarbanes-Oxley Act of 2002 of Laura F. Fergerson, Chief Executive Officer - Finance and Administration, and Mark H. Otani, Chief Financial Officer and Chief Accounting Officer