UNITED STATES
SECURITIES AND EXCHANGE COMMISSION
Washington, DC 20549
FORMN-CSR
CERTIFIED SHAREHOLDER REPORT OF REGISTERED
MANAGEMENT INVESTMENT COMPANIES
Investment Company Act file number 811-08226
Templeton Global Investment Trust
(Exact name of registrant as specified in charter)
300 S.E. 2nd Street, Fort Lauderdale, FL 33301-1923
(Address of principal executive offices) (Zip code)
Craig S. Tyle, One Franklin Parkway, San Mateo, CA 94403-1906
(Name and address of agent for service)
Registrant’s telephone number, including area code: (954)527-7500
Date of fiscal year end: 3/31
Date of reporting period: 3/31/20
| Item 1. | Reports to Stockholders. |
Sign up for electronic delivery at franklintempleton.com/edelivery
Internet Delivery of Fund Reports Unless You Request Paper Copies:Effective January 1, 2021, as permitted by the SEC, paper copies of the Fund’s shareholder reports will no longer be sent by mail, unless you specifically request them from the Fund or your financial intermediary. Instead, the reports will be made available on a website, and you will be notified by mail each time a report is posted and provided with a website link to access the report.
If you already elected to receive shareholder reports electronically, you will not be affected by this change and you need not take any action. If you have not signed up for electronic delivery, we would encourage you to join fellow shareholders who have. You may elect to receive shareholder reports and other communications electronically from the Fund by calling (800)632-2301 or by contacting your financial intermediary.
You may elect to continue to receive paper copies of all your future shareholder reports free of charge by contacting your financial intermediary or, if you invest directly with a Fund, calling (800)632-2301 to let the Fund know of your request. Your election to receive reports in paper will apply to all funds held in your account.
SHAREHOLDER LETTER
Dear Shareholder:
Emerging market countries, like the rest of the world, have been significantly impacted by the global novel coronavirus(COVID-19) pandemic. In an effort to control the pandemic, many governments issuedstay-at-home orders and closednon-essential businesses, which severely impacted economic activity. Although the crisis has negatively affected companies across industries, select businesses involved in areas such ase-commerce, remote work and online health care have benefited. We also believe companies reliant on domestic demand could fare better than those dependent on exports, as the prospect of a global economic reopening remain uncertain. In our view, the duration and degree of demand destruction in developed countries will determine when a global economic recovery could begin.
From an economic standpoint, we see potential bright spots in certain Asian emerging market countries. Decisive government action has allowed several Asian countries hit earliest byCOVID-19 to control the outbreak and, as a result, loosen restrictions before other parts of the world. China in particular appears to have started recovering economically. Other large emerging market countries, such as India and Brazil, face a more challenging short-term future, although they are in better fiscal positions than in past crises.
Despite the global upheaval the pandemic has caused, we believe key emerging market themes will continue. These include a decline in the relative dominance of export- and commodity-oriented industries, growth in consumer spending and innovation in the information technology sector. Indeed, theCOVID-19 disruption could accelerate some of these trends. In our long-term view, emerging markets will continue to be driven by urbanization, increases in the demand for skilled labor, and the need to sell to new markets. We believe globalization is here to stay.
We are committed to our long-term perspective and disciplined investment approach as we conduct a rigorous, fundamental analysis of securities with a regular emphasis on investment risk management.
Historically, patient investors have achieved rewarding results by evaluating their goals, diversifying their assets globally and maintaining a disciplined investment program, all hallmarks of the Templeton investment philosophy. We continue to recommend investors consult their financial advisors and review their portfolios to design a long-term strategy and portfolio allocation that meet their individual needs, goals and risk tolerance.
Templeton Emerging Markets Small Cap Fund’s annual report includes more detail about prevailing conditions and a discussion about investment decisions during the period. Please remember all securities markets fluctuate, as do mutual fund share prices.
We thank you for investing with Franklin Templeton, welcome your questions and comments, and look forward to serving your investment needs in the years ahead.
Sincerely,

Manraj S. Sekhon, CFA
Chief Investment Officer
Franklin Templeton Emerging Markets Equity
This letter reflects our analysis and opinions as of March 31, 2020, unless otherwise indicated. The information is not a complete analysis of every aspect of any market, country, industry, security or fund. Statements of fact are from sources considered reliable.
CFA® is a trademark owned by CFA Institute.
|
| |
| Not FDIC Insured | May Lose Value | No Bank Guarantee |
| | | | |
| | | |
| franklintempleton.com | | Not part of the annual report | | 1 |
|
| Visitfranklintempleton.comfor fund updates, to access your account, or to find helpful financial planning tools. |
| | | | |
| | | |
2 | | Annual Report | | franklintempleton.com |
ANNUAL REPORT
Templeton Emerging Markets Small Cap Fund
This annual report for Templeton Emerging Markets Small Cap Fund covers the fiscal year ended March 31, 2020.
Your Fund’s Goal and Main Investments
The Fund seeks long-term capital appreciation. Under normal market conditions, the Fund invests at least 80% of its net assets in securities of small cap companies located in emerging market countries, as defined in the Fund’s prospectus.
Performance Overview
The Fund’s Class A shares posted a-35.73% cumulative total return for the 12 months under review. For comparison, the MSCI Emerging Markets (EM) Small Cap Index, which measures performance of small cap stocks in emerging markets, posted a-28.17% total return for the same period.1 Please note index performance information is provided for reference and we do not attempt to track any index but rather undertake investments on the basis of fundamental research. In addition, the Fund’s return reflects the effect of fees and expenses for professional management, while an index does not have such costs. You can find the Fund’s long-term performance data in the Performance Summary beginning on page 7.
Performance data represent past performance, which does not guarantee future results. Investment return and principal value will fluctuate, and you may have a gain or loss when you sell your shares. Current performance may differ from figures shown. For most recentmonth-end performance, go tofranklintempleton.comor call(800)342-5236.
Economic and Market Overview
Emerging market economies in general continued to grow moderately during the period’s first nine months. However, growth projections for 2020’s first quarter were reduced by many forecasters due to the global outbreak of the novel coronavirus(COVID-19). Weak economic growth, U.S.-China trade tensions and uncertainty about the economic impact of theCOVID-19 pandemic resulted in many emerging market central banks adopting more accommodative monetary policies. Emerging market equities rose during the period’s
first nine months, but ultimately fell for the period due to investor concerns about the global economic slowdown exacerbated by the pandemic.
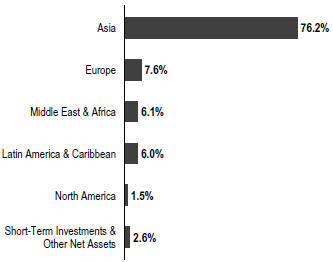
Geographic Composition
Based on Total Net Assets as of 3/31/20
Regarding individual countries’ economies more specifically, China’s economy contracted in 2020’s first quarter for the first time on record, reflecting the significant disruption caused by the pandemic after the government shut down nonessential businesses for nearly two months. Taiwan’syear-on-year growth rate accelerated in 2019’s second, third and fourth quarters, supported by household spending and fixed investment. South Korea’syear-on-year growth rate also accelerated through all of 2019, aided by services and construction. India’syear-on-year growth rate moderated in 2019’s fourth quarter to its lowest level since 2013, due partly to contractions in exports and manufacturing. Russia’syear-on-year growth rate accelerated in 2019’s second, third and fourth quarters, boosted by fixed gross capital formation, manufacturing, real estate activities, and financial and insurance activities. Brazil’syear-on-year growth rate accelerated in 2019’s second, third and fourth quarters, aided by construction, industrial activity, information and communication, and financial services.
1. Source: Morningstar.
The index is unmanaged and includes reinvestment of any income or distributions. It does not reflect any fees, expenses or sales charges. One cannot invest directly in an index, and an index is not representative of the Fund’s portfolio.
The dollar value, number of shares or principal amount, and names of all portfolio holdings are listed in the Fund’s Statement of Investments (SOI).
The SOI begins on page 16.
| | | | |
| | | |
| franklintempleton.com | | Annual Report | | 3 |
TEMPLETON EMERGING MARKETS SMALL CAP FUND
Turning to monetary policies, the People’s Bank of China (PBOC) implemented an interest-rate reform in August 2019 designating the loan prime rate (LPR) as the new benchmark for household and business loans, effectively lowering interest rates. The PBOC subsequently lowered the LPR three times. Taiwan’s central bank lowered its benchmark interest rate for the first time in four years, while South Korea’s central bank cut its benchmark rate three times to anall-time low. India’s central bank cut its benchmark interest rate five times. The central banks of Russia and Brazil each cut their respective benchmark rates six times, with Brazil’s rate hitting a record low.
In this environment,small-cap emerging market stocks, as measured by the MSCI Emerging Markets Small Cap Index, posted a-28.17% total return for the 12 months ended March 31, 2020.1 Chinese equities fell for the period, but less so than other major emerging market stocks as investors seemed somewhat reassured by the government’s aggressive actions to contain the spread ofCOVID-19. Export-oriented Taiwan’ssmall-cap equities also declined, despite the benefits of strongpre-orders of the new iPhone in 2019. Russian equities posted losses due to pandemic concerns, a drop in oil prices and devaluation of the ruble. Brazilian equities fell significantly due to the Brazilian real’s depreciation to anall-time low against the U.S. dollar. These negative effects outweighed strong returns in the period’s first nine months spurred by investors’ positive response to President Jair Bolsonaro’s economic policies.
Investment Strategy
Our investment strategy employs a fundamental research, value-oriented, long-term approach. We focus on the market price of a company’s securities relative to our evaluation of the company’s long-term earnings, asset value and cash flow potential. This includes an assessment by the investment manager of the potential impacts of material environmental, social and governance (ESG) factors on the long-term risk and return profile of a company. We also consider a company’s profit and loss outlook, balance sheet strength, cash flow trends and asset value in relation to the current price of the company’s securities. The analysis considers the company’s corporate governance behavior as well as its position in its sector, the economic framework and political environment.
Manager’s Discussion
During the 12 months under review, major detractors from absolute performance included Bajaj Holdings & Investment, Fila Holdings (formerly Fila Korea) and Federal Bank.
Diversified financial company Bajaj Holdings and Federal Bank are both based in India. The Indian equity market remained steady over most of the reporting period as optimism over Prime Minister Narendra Modi’s business-friendly reform agenda was offset by a continuing economic slowdown, financial sector problems and nationwide protests against a proposed change to India’s citizenship laws. However, the escalation of theCOVID-19 outbreak and resulting nationwide lockdown coupled with a crisis in a major private-sector bank, which resulted in a government bailout, sparked a broad-based rout in domestic stocks in the final two months of the reporting period.
Top 10 Countries
3/31/20
| | |
| | | % of Total Net Assets |
| |
China | | 19.0% |
| |
Taiwan | | 17.9% |
| |
India | | 13.7% |
| |
South Korea | | 11.4% |
| |
Vietnam | | 5.2% |
| |
Brazil | | 3.1% |
| |
Hungary | | 2.9% |
| |
Hong Kong | | 2.6% |
| |
Saudi Arabia | | 2.1% |
| |
Egypt | | 2.0% |
Bajaj Holdings’ key holdings include Bajaj Auto, a major manufacturer oftwo- and three-wheel vehicles, and Bajaj Finserv, which is involved in insurance as well as consumer financing. Following solid operational performances, concerns of a material impact fromCOVID-19-related factors on Bajaj Finserv’s growth and asset quality compounded fears, while increased demand uncertainty weighed on Bajaj Auto.
Federal Bank is amid-sized regional bank with a strong product portfolio. Although weaker margins and credit growth weighed on fourth-quarter 2019 operating profits,year-on-year net profit rose substantially, supported by lower provisions and a cut in corporate tax rates. Concerns about the economic impact ofCOVID-19 and the private bank bailout caused shares to fall sharply late in the period.
Fila is one of the leading sportswear companies in South Korea. It also licenses the FILA brand around the world and owns a stake in U.S. golf product manufacturer Acushnet (not a Fund holding). Shares reached a record-high in May 2019 before declining in the latter part of the period following the publication of quarterly results, which were slightly below
| | | | |
| | | |
4 | | Annual Report | | franklintempleton.com |
TEMPLETON EMERGING MARKETS SMALL CAP FUND
expectations. An inventorybuild-up in the first quarter of 2019 resulted in lower orders in the second quarter, which hurt the company’s share price. Investor sentiment was boosted by solid third-quarter corporate results, Fila’s adoption of a holding company structure to improve managerial efficiency, and management’s commitment to strengthening corporate governance and increasing shareholder value. However, shares fell after reports of lower-than-expected fourth-quarter earnings, likely due to weakness in the U.S. TheCOVID-19 outbreak also curbed general retail store traffic and weighed on the outlook for sales.
In contrast, key contributors to the Fund’s absolute performance included Sunny Optical Technology Group, Huaxin Cement and Richter Gedeon.
Sunny Optical Technology designs and manufactures optical and optical-related products. It is the world’s largest supplier of automotive lenses and China’s largest maker of smartphone camera modules and lenses. Following a period of share-price volatility for technology-related stocks, driven by the U.S.-China trade conflict early in the reporting period, confidence in the sector improved in the second half of 2019 following the announcement of a partial trade agreement. Shares in Sunny Optical Technology were further supported by resilient monthly shipment data and better-than-expected first- and second-half 2019 revenue and net income. The Fund used this opportunity to liquidate its position in the company in late-2019 before the onset of theCOVID-19 crisis.
One of the top five cement producers in China, Huaxin Cement reported healthy corporate results during the period, including double-digit revenue and net profit growth in the first nine months of 2019. Strong cement demand and higher cement prices in late-2019 further supported sentiment in the sector. A relaxation in capital requirements for infrastructure projects such as railways, ports and toll roads by the central government in December also raised demand expectations. Share prices corrected in the first quarter of 2020 due to a disruption in activity and reduced demand as a result of theCOVID-19 outbreak, which resulted in a lockdown in affected regions across China. Expectations that government stimulus measures could boost infrastructure development, however, provided investors with some comfort.
Based in Hungary, Richter Gedeon is an innovation-driven specialty pharmaceutical company. The company’s shares were boosted by better-than expected third-quarter 2019 net profit and high expectations for its antipsychotic drug Vraylar, which is sold through Allergan (not a Fund holding) in the
Top 10 Holdings
3/31/20
| | |
Company Sector/Industry, Country | | % of Total Net Assets |
| |
Health & Happiness H&H International Holdings Ltd. Food Products, China | | 4.1% |
| |
Novatek Microelectronics Corp. Ltd. Semiconductors & Semiconductor Equipment, Taiwan | | 3.5% |
| |
Bajaj Holdings & Investment Ltd. Diversified Financial Services, India | | 3.5% |
| |
Richter Gedeon Nyrt Pharmaceuticals, Hungary | | 2.9% |
| |
Merida Industry Co. Ltd. Leisure Products, Taiwan | | 2.5% |
| |
Primax Electronics Ltd. Technology Hardware, Storage & Peripherals, Taiwan | | 2.5% |
| |
Mouwasat Medical Services Co. Health Care Providers & Services, Saudi Arabia | | 2.1% |
| |
Baozun Inc. Internet & Direct Marketing Retail, China | | 2.1% |
| |
Xinyi Solar Holdings Ltd. Semiconductors & Semiconductor Equipment, China | | 2.1% |
| |
Luk Fook Holdings (International) Ltd. Specialty Retail, Hong Kong | | 2.0% |
U.S. Royalty income from Vraylar more than doubled from a year earlier in the final quarter of 2019, and the use of the drug to treat bipolar depression could further boost demand in the longer term. In March 2019, the company reached a licensing agreement with Switzerland-based biopharmaceu-tical company Myovant Sciences (not a Fund holding) to commercialize relugolix combination tablet for uterine fibroids and endometriosis in Europe, the Commonwealth of Independent States (including Russia), Latin America, Australia, and New Zealand. This agreement further strengthened Richter Gedeon’s women’s health offerings and drove shares up. As a vertically integrated company and manufacturer of most of the active pharmaceutical ingredients for its products, management successfully eased fears of disruptions to operations from theCOVID-19 outbreak.
In the past 12 months, we decreased the Fund’s investments across most markets to raise funds for redemptions and in favor of opportunities we found more compelling. Holdings in China, India, South Korea and Taiwan were reduced the most. Reductions were also undertaken in the consumer discretionary, financials, information technology and
| | | | |
| | | |
| franklintempleton.com | | Annual Report | | 5 |
TEMPLETON EMERGING MARKETS SMALL CAP FUND
consumer staples sectors.2 In terms of key sales, we closed positions in the aforementioned Sunny Optical Technology,low-cost Hungarian airline Wizz Air Holdings and Thai electronics exporter Delta Electronics. We also reduced holdings in the previously mentioned Bajaj Holdings and Fila, as well as Indian tire manufacturer Apollo Tyres.
Meanwhile, we added a number of new positions to the Fund as we continued to identify attractive companies with sustainable earnings power, and which trade at what we believe to be a discount to their intrinsic worth within the small cap investment universe in emerging markets. Key additions included Huami, a Chinese biometric and activity data-driven company with significant expertise in smart wearable technology, and Zinus, a South Koreane-commerce mattress and furniture company. We also added to existing investments in Health & Happiness H&H International Holdings, a nutrition products company in China; JNBY Design, a Hong Kong-listed leading designer brand; and Xtep International Holdings, a Chinese designer, manufacturer and distributor of branded sports footwear and apparel.
Thank you for your continued participation in Templeton Emerging Markets Small Cap Fund. We look forward to serving your future investment needs.
| | |
 | |  |
| | Chetan Sehgal, CFA Portfolio Manager |
The foregoing information reflects our analysis, opinions and portfolio holdings as of March 31, 2020, the end of the reporting period. The way we implement our main investment strategies and the resulting portfolio holdings may change depending on factors such as market and economic conditions. These opinions may not be relied upon as investment advice or an offer for a particular security. The information is not a complete analysis of every aspect of any market, country, industry, security or the Fund.
Statements of fact are from sources considered reliable, but the investment manager makes no representation or warranty as to their completeness or accuracy. Although historical performance is no guarantee of future results, these insights may help you understand our investment management philosophy.
2. The consumer discretionary sector comprises auto components; diversified consumer services; hotels, restaurants and leisure; household durables; internet and direct marketing retail; leisure products; specialty retail; and textiles, apparel and luxury goods in the SOI. The financials sector comprises banks, capital markets, diversified financial services and insurance in the SOI. The information technology sector comprises electronic equipment, instruments and components; IT services; semiconductors and semiconductor equipment; and technology hardware, storage and peripherals in the SOI. The consumer staples sector comprises beverages, food and staples retailing, food products and tobacco in the SOI.
See www.franklintempletondatasources.com for additional data provider information.
| | | | |
| | | |
6 | | Annual Report | | franklintempleton.com |
TEMPLETON EMERGING MARKETS SMALL CAP FUND
Performance Summary as of March 31, 2020
The performance table and graphs do not reflect any taxes that a shareholder would pay on Fund dividends, capital gain distributions, if any, or any realized gains on the sale of Fund shares. Total return reflects reinvestment of the Fund’s dividends and capital gain distributions, if any, and any unrealized gains or losses. Your dividend income will vary depending on dividends or interest paid by securities in the Fund’s portfolio, adjusted for operating expenses of each class. Capital gain distributions are net profits realized from the sale of portfolio securities.
Performance as of 3/31/201
Cumulative total return excludes sales charges. Average annual total return includes maximum sales charges. Sales charges will vary depending on the size of the investment and the class of share purchased. The maximum is 5.50% and the minimum is 0%.Class A:5.50% maximum initial sales charge;Advisor Class:no sales charges. For other share classes, visitfranklintempleton.com.
| | | | | | | | |
| Share Class | | Cumulative Total Return2 | | | Average Annual Total Return3 | |
| |
A4 | | | | | | | | |
| | |
1-Year | | | -35.73% | | | | -39.26% | |
| |
| | |
5-Year | | | -24.17% | | | | -6.44% | |
| |
| | |
10-Year | | | -11.89% | | | | -1.81% | |
| |
| | |
Advisor | | | | | | | | |
1-Year | | | -35.61% | | | | -35.61% | |
| |
| | |
5-Year | | | -23.22% | | | | -5.15% | |
| |
| | |
10-Year | | | -9.46% | | | | -0.99% | |
| |
Performance data represent past performance, which does not guarantee future results. Investment return and principal value will fluctuate, and you may have a gain or loss when you sell your shares. Current performance may differ from figures shown. For most recentmonth-end performance, go tofranklintempleton.comor call(800)342-5236.
See page 9 for Performance Summary footnotes.
| | | | |
| | | |
| franklintempleton.com | | Annual Report | | 7 |
TEMPLETON EMERGING MARKETS SMALL CAP FUND
PERFORMANCE SUMMARY
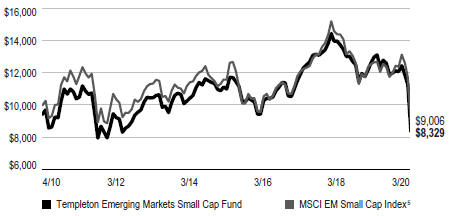
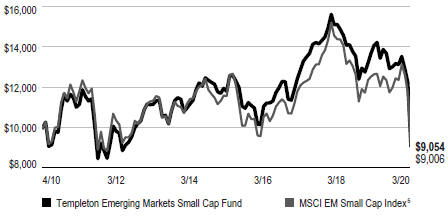
Total Return Index Comparison for a Hypothetical $10,000 Investment1
Total return represents the change in value of an investment over the periods shown. It includes any applicable maximum sales charge, Fund expenses, account fees and reinvested distributions. The unmanaged index includes reinvestment of any income or distributions. It differs from the Fund in composition and does not pay management fees or expenses. One cannot invest directly in an index.
Class A(4/1/10–3/31/20)
Advisor Class(4/1/10–3/31/20)
See page 9 for Performance Summary footnotes.
| | | | |
| | | |
8 | | Annual Report | | franklintempleton.com |
TEMPLETON EMERGING MARKETS SMALL CAP FUND
PERFORMANCE SUMMARY
Distributions(4/1/19–3/31/20)
| | | | | | | | | | | | | | | | |
| Share Class | | Net Investment Income | | | Short-Term Capital Gain | | | Long-Term Capital Gain | | | Total | |
| | | | |
A | | | $0.0039 | | | | $0.0112 | | | | $0.2283 | | | | $0.2434 | |
| | | | |
C | | | $ — | | | | $0.0112 | | | | $0.2283 | | | | $0.2395 | |
| | | | |
R | | | $ — | | | | $0.0112 | | | | $0.2283 | | | | $0.2395 | |
| | | | |
R6 | | | $0.0579 | | | | $0.0112 | | | | $0.2283 | | | | $0.2974 | |
| | | | |
Advisor | | | $0.0361 | | | | $0.0112 | | | | $0.2283 | | | | $0.2756 | |
Total Annual Operating Expenses6
| | | | | | | | |
| Share Class | | With Fee Waiver | | | Without Fee Waiver | |
| | |
A | | | 1.82% | | | | 1.88% | |
| | |
Advisor | | | 1.57% | | | | 1.63% | |
Each class of shares is available to certain eligible investors and has different annual fees and expenses, as described in the prospectus.
All investments involve risks, including possible loss of principal. Special risks are associated with foreign investing, including currency fluctuations, economic instability and political developments. Investments in emerging markets, of which frontier markets are a subset, involve heightened risks related to the same factors, in addition to those associated with these markets’ smaller size, lesser liquidity and lack of established legal, political, business and social frameworks to support securities markets. Because these frameworks are typically even less developed in frontier markets, as well as various factors including the increased potential for extreme price volatility, illiquidity, trade barriers and exchange controls, the risks associated with emerging markets are magnified in frontier markets.Small-cap company stocks have historically had more price volatility than large-company stocks, particularly over the short term. All investments in the Fund should be thought of as long-term investments that could experience significant price volatility in any given year. The Fund is designed for the aggressive portion of a well-diversified portfolio. Unexpected events and their aftermaths, such as the spread of deadly diseases; natural, environmental orman-made disasters; financial, political or social disruptions; terrorism and war; and other tragedies or catastrophes, can cause investor fear and panic, which can adversely affect the economies of many companies, sectors, nations, regions and the market in general, in ways that cannot necessarily be foreseen. The Fund’s prospectus also includes a description of the main investment risks.
1. The Fund has an expense reduction and a fee waiver associated with any investments it makes in a Franklin Templeton money fund and/or other Franklin Templeton fund, contractually guaranteed through 7/31/20. Fund investment results reflect the expense reduction and fee waiver; without these reductions, the results would have been lower.
2. Cumulative total return represents the change in value of an investment over the periods indicated.
3. Average annual total return represents the average annual change in value of an investment over the periods indicated. Return for less than one year, if any, has not been annualized.
4. Prior to 9/10/18, these shares were offered at a higher initial sales charge of 5.75%, thus actual returns (with sales charges) would have differed. Average annual total returns (with sales charges) have been restated to reflect the current maximum initial sales charge of 5.50%.
5. Source: Morningstar. The MSCI EM Small Cap Index is a free float-adjusted, market capitalization-weighted index designed to measure performance of small cap equities in emerging markets.
6. Figures are effective as of 4/1/20 (as stated in the Fund’s current prospectus supplement dated 4/7/20) and may differ from the expense ratios disclosed in the Your Fund’s Expenses and Financial Highlights sections in this report. In periods of market volatility, assets may decline significantly, causing total annual Fund operating expenses to become higher than the figures shown.
See www.franklintempletondatasources.com for additional data provider information.
| | | | |
| | | |
| franklintempleton.com | | Annual Report | | 9 |
TEMPLETON EMERGING MARKETS SMALL CAP FUND
Your Fund’s Expenses
As a Fund shareholder, you can incur two types of costs: (1) transaction costs, including sales charges (loads) on Fund purchases and redemptions; and (2) ongoing Fund costs, including management fees, distribution and service(12b-1) fees, and other Fund expenses. All mutual funds have ongoing costs, sometimes referred to as operating expenses. The table below shows ongoing costs of investing in the Fund and can help you understand these costs and compare them with those of other mutual funds. The table assumes a $1,000 investment held for the six months indicated.
Actual Fund Expenses
The table below provides information about actual account values and actual expenses in the columns under the heading “Actual.” In these columns the Fund’s actual return, which includes the effect of Fund expenses, is used to calculate the “Ending Account Value” for each class of shares. You can estimate the expenses you paid during the period by following these steps (of course, your account value and expenses will differ from those in this illustration): Divide your account value by $1,000 (if your account had an $8,600 value, then $8,600÷ $1,000 = 8.6). Then multiply the result by the number in the row for your class of shares under the headings “Actual” and “Expenses Paid During Period” (if Actual Expenses Paid During Period were $7.50, then 8.6 x $7.50 = $64.50). In this illustration, the actual expenses paid this period are $64.50.
Hypothetical Example for Comparison with Other Funds
Under the heading “Hypothetical” in the table, information is provided about hypothetical account values and hypothetical expenses based on the Fund’s actual expense ratio and an assumed rate of return of 5% per year before expenses, which is not the Fund’s actual return. This information may not be used to estimate the actual ending account balance or expenses you paid for the period, but it can help you compare ongoing costs of investing in the Fund with those of other funds. To do so, compare this 5% hypothetical example for the class of shares you hold with the 5% hypothetical examples that appear in the shareholder reports of other funds.
Please note that expenses shown in the table are meant to highlight ongoing costs and do not reflect any transactional costs. Therefore, information under the heading “Hypothetical” is useful in comparing ongoing costs only, and will not help you compare total costs of owning different funds. In addition, if transactional costs were included, your total costs would have been higher.
| | | | | | | | | | | | |
| | | | | Actual (actual return after expenses) | | Hypothetical (5% annual return before expenses) | | |
| | | | | | | | |
Share Class | | Beginning Account Value 10/1/19 | | Ending Account Value 3/31/20 | | Expenses Paid During Period 10/1/19–3/31/201, 2 | | Ending Account Value 3/31/20 | | Expenses Paid During Period 10/1/19–3/31/201,2 | | Net Annualized Expense Ratio2 |
| | | | | | |
| A | | $1,000 | | $695.70 | | $ 8.31 | | $1,015.20 | | $ 9.87 | | 1.96% |
| C | | $1,000 | | $693.10 | | $11.43 | | $1,011.50 | | $13.58 | | 2.70% |
| R | | $1,000 | | $694.50 | | $ 9.36 | | $1,013.95 | | $11.13 | | 2.21% |
| R6 | | $1,000 | | $697.20 | | $ 6.58 | | $1,017.25 | | $ 7.82 | | 1.55% |
| Advisor | | $1,000 | | $696.20 | | $ 7.25 | | $1,016.45 | | $ 8.62 | | 1.71% |
1. Expenses are equal to the annualized expense ratio for thesix-month period as indicated above—in the far right column—multiplied by the simple average account value over the period indicated, and then multiplied by 183/366 to reflect theone-half year period.
2. Reflects expenses after fee waivers and expense reimbursements. Does not include acquired fund fees and expenses.
| | | | |
| | | |
10 | | Annual Report | | franklintempleton.com |
TEMPLETON GLOBAL INVESTMENT TRUST
Financial Highlights
Templeton Emerging Markets Small Cap Fund
| | | | | | | | | | | | | | | | | | | | |
| | | | | | Year Ended March 31, | | | | |
| | | 2020 | | | 2019 | | | 2018 | | | 2017 | | | 2016 | |
| | | | | |
Class A | | | | | | | | | | | | | | | | | | | | |
| | | | | |
Per share operating performance | | | | | | | | | | | | | | | | | | | | |
(for a share outstanding throughout the year) | | | | | | | | | | | | | | | | | | | | |
Net asset value, beginning of year | | | $13.78 | | | | $15.25 | | | | $13.02 | | | | $11.41 | | | | $12.25 | |
| | | | | |
Income from investment operationsa: | | | | | | | | | | | | | | | | | | | | |
Net investment incomeb | | | 0.10 | | | | 0.03 | | | | — | c | | | 0.16 | d | | | 0.04 | |
Net realized and unrealized gains (losses) | | | (4.96 | ) | | | (1.15 | ) | | | 2.23 | | | | 1.65 | | | | (0.85 | ) |
| | | | | |
Total from investment operations | | | (4.86 | ) | | | (1.12 | ) | | | 2.23 | | | | 1.81 | | | | (0.81 | ) |
| | | | | |
Less distributions from: | | | | | | | | | | | | | | | | | | | | |
Net investment income | | | (— | )c | | | — | | | | — | | | | (0.20 | ) | | | (0.03 | ) |
Net realized gains | | | (0.24 | ) | | | (0.35 | ) | | | — | | | | — | | | | — | |
| | | | | |
Total distributions | | | (0.24 | ) | | | (0.35 | ) | | | — | | | | (0.20 | ) | | | (0.03 | ) |
| | | | | |
Net asset value, end of year | | | $ 8.68 | | | | $13.78 | | | | $15.25 | | | | $13.02 | | | | $11.41 | |
| | | | | |
Total returne | | | (35.73)% | | | | (7.09)% | | | | 17.13% | | | | 16.09% | | | | (6.60)% | |
| | | | | |
Ratios to average net assets | | | | | | | | | | | | | | | | | | | | |
Expenses before waiver and payments by affiliates | | | 1.93% | | | | 1.94% | | | | 1.96% | | | | 1.98% | | | | 2.00% | |
Expenses net of waiver and payments by affiliates | | | 1.91% | | | | 1.92% | | | | 1.94% | | | | 1.97% | | | | 1.99% | |
Net investment income (loss) | | | 0.94% | | | | 0.19% | | | | (0.01)% | | | | 1.25% | d | | | 0.33% | |
| | | | | |
Supplemental data | | | | | | | | | | | | | | | | | | | | |
Net assets, end of year (000’s) | | | $143,312 | | | | $268,761 | | | | $315,469 | | | | $257,388 | | | | $257,977 | |
Portfolio turnover rate | | | 4.72% | | | | 12.22% | | | | 7.57% | | | | 21.26% | | | | 18.09% | |
aThe amount shown for a share outstanding throughout the period may not correlate with the Statement of Operations for the period due to the timing of sales and repurchases of the Fund’s shares in relation to income earned and/or fluctuating fair value of the investments of the Fund.
bBased on average daily shares outstanding.
cAmount rounds to less than $0.01 per share.
dNet investment income per share includes approximately $0.09 per share related to income received in the form of special dividends in connection with certain Fund holdings. Excluding this amount, the ratio of net investment income to average net assets would have been 0.48%.
eTotal return does not reflect sales commissions or contingent deferred sales charges, if applicable.
| | | | |
| | | |
| franklintempleton.com | | The accompanying notes are an integral part of these financial statements. | Annual Report | | 11 |
TEMPLETON GLOBAL INVESTMENT TRUST
FINANCIAL HIGHLIGHTS
Templeton Emerging Markets Small Cap Fund(continued)
| | | | | | | | | | | | | | | | | | | | |
| | | | | | Year Ended March 31, | | | | |
| | | 2020 | | | 2019 | | | 2018 | | | 2017 | | | 2016 | |
| | | | | |
Class C | | | | | | | | | | | | | | | | | | | | |
| | | | | |
Per share operating performance | | | | | | | | | | | | | | | | | | | | |
(for a share outstanding throughout the year) | | | | | | | | | | | | | | | | | | | | |
Net asset value, beginning of year | | | $13.02 | | | | $14.54 | | | | $12.51 | | | | $10.96 | | | | $11.82 | |
| | | | | |
Income from investment operationsa: | | | | | | | | | | | | | | | | | | | | |
Net investment income (loss)b | | | 0.02 | | | | (0.06 | ) | | | (0.10 | ) | | | 0.07 | c | | | (0.04 | ) |
Net realized and unrealized gains (losses) | | | (4.66 | ) | | | (1.11 | ) | | | 2.13 | | | | 1.59 | | | | (0.82 | ) |
| | | | | |
Total from investment operations | | | (4.64 | ) | | | (1.17 | ) | | | 2.03 | | | | 1.66 | | | | (0.86 | ) |
| | | | | |
Less distributions from: | | | | | | | | | | | | | | | | | | | | |
Net investment income | | | — | | | | — | | | | — | | | | (0.11 | ) | | | — | |
Net realized gains | | | (0.24 | ) | | | (0.35 | ) | | | — | | | | — | | | | — | |
| | | | | |
Total distributions | | | (0.24 | ) | | | (0.35 | ) | | | — | | | | (0.11 | ) | | | — | |
| | | | | |
Net asset value, end of year | | | $ 8.14 | | | | $13.02 | | | | $14.54 | | | | $12.51 | | | | $10.96 | |
| | | | | |
Total returnd | | | (36.23)% | | | | (7.85)% | | | | 16.23% | | | | 15.29% | | | | (7.28)% | |
| | | | | |
Ratios to average net assets | | | | | | | | | | | | | | | | | | | | |
Expenses before waiver and payments by affiliates | | | 2.68% | | | | 2.69% | | | | 2.71% | | | | 2.72% | | | | 2.73% | |
Expenses net of waiver and payments by affiliates | | | 2.66% | | | | 2.67% | | | | 2.69% | | | | 2.71% | | | | 2.72% | |
Net investment income (loss) | | | 0.19% | | | | (0.56)% | | | | (0.76)% | | | | 0.51% | c | | | (0.40)% | |
| | | | | |
Supplemental data | | | | | | | | | | | | | | | | | | | | |
Net assets, end of year (000’s) | | | $23,168 | | | | $52,300 | | | | $78,836 | | | | $62,889 | | | | $62,148 | |
Portfolio turnover rate | | | 4.72% | | | | 12.22% | | | | 7.57% | | | | 21.26% | | | | 18.09% | |
aThe amount shown for a share outstanding throughout the period may not correlate with the Statement of Operations for the period due to the timing of sales and repurchases of the Fund’s shares in relation to income earned and/or fluctuating fair value of the investments of the Fund.
bBased on average daily shares outstanding.
cNet investment income per share includes approximately $0.09 per share related to income received in the form of special dividends in connection with certain Fund holdings. Excluding this amount, the ratio of net investment income to average net assets would have been (0.26)%.
dTotal return does not reflect sales commissions or contingent deferred sales charges, if applicable.
| | | | |
| | | |
12 | | Annual Report | The accompanying notes are an integral part of these financial statements. | | franklintempleton.com |
TEMPLETON GLOBAL INVESTMENT TRUST
FINANCIAL HIGHLIGHTS
Templeton Emerging Markets Small Cap Fund(continued)
| | | | | | | | | | | | | | | | | | | | |
| | | | | | Year Ended March 31, | | | | |
| | | 2020 | | | 2019 | | | 2018 | | | 2017 | | | 2016 | |
| | | | | |
Class R | | | | | | | | | | | | | | | | | | | | |
| | | | | |
Per share operating performance | | | | | | | | | | | | | | | | | | | | |
(for a share outstanding throughout the year) | | | | | | | | | | | | | | | | | | | | |
| | | | | |
Net asset value, beginning of year | | | $13.62 | | | | $15.11 | | | | $12.93 | | | | $11.33 | | | | $12.16 | |
| | | | | |
Income from investment operationsa: | | | | | | | | | | | | | | | | | | | | |
Net investment income (loss)b | | | 0.04 | | | | (0.05 | ) | | | (0.04 | ) | | | 0.12 | c | | | 0.02 | |
Net realized and unrealized gains (losses) | | | (4.86 | ) | | | (1.09 | ) | | | 2.22 | | | | 1.65 | | | | (0.85 | ) |
| | | | | |
Total from investment operations | | | (4.82 | ) | | | (1.14 | ) | | | 2.18 | | | | 1.77 | | | | (0.83 | ) |
| | | | | |
Less distributions from: | | | | | | | | | | | | | | | | | | | | |
Net investment income | | | — | | | | — | | | | — | | | | (0.17 | ) | | | (— | )d |
Net realized gains | | | (0.24 | ) | | | (0.35 | ) | | | — | | | | — | | | | — | |
| | | | | |
Total distributions | | | (0.24 | ) | | | (0.35 | ) | | | — | | | | (0.17 | ) | | | (— | )d |
| | | | | |
Net asset value, end of year | | | $ 8.56 | | | | $13.62 | | | | $15.11 | | | | $12.93 | | | | $11.33 | |
| | | | | |
Total return | | | (35.95)% | | | | (7.29)% | | | | 16.86% | | | | 15.84% | | | | (6.82)% | |
| | | | | |
Ratios to average net assets | | | | | | | | | | | | | | | | | | | | |
Expenses before waiver and payments by affiliates | | | 2.18% | | | | 2.19% | | | | 2.21% | | | | 2.23% | | | | 2.23% | |
Expenses net of waiver and payments by affiliates | | | 2.16% | | | | 2.17% | | | | 2.19% | | | | 2.22% | | | | 2.22% | |
Net investment income (loss) | | | 0.69% | | | | (0.06)% | | | | (0.26)% | | | | 1.00% | c | | | 0.10% | |
| | | | | |
Supplemental data | | | | | | | | | | | | | | | | | | | | |
Net assets, end of year (000’s) | | | $1,365 | | | | $1,728 | | | | $929 | | | | $532 | | | | $477 | |
Portfolio turnover rate | | | 4.72% | | | | 12.22% | | | | 7.57% | | | | 21.26% | | | | 18.09% | |
aThe amount shown for a share outstanding throughout the period may not correlate with the Statement of Operations for the period due to the timing of sales and repurchases of the Fund’s shares in relation to income earned and/or fluctuating fair value of the investments of the Fund.
bBased on average daily shares outstanding.
cNet investment income per share includes approximately $0.09 per share related to income received in the form of special dividends in connection with certain Fund holdings. Excluding this amount, the ratio of net investment income to average net assets would have been 0.23%.
dAmount rounds to less than $0.01 per share.
| | | | |
| | | |
| franklintempleton.com | | The accompanying notes are an integral part of these financial statements. | Annual Report | | 13 |
TEMPLETON GLOBAL INVESTMENT TRUST
FINANCIAL HIGHLIGHTS
Templeton Emerging Markets Small Cap Fund(continued)
| | | | | | | | | | | | |
| | | Year Ended March 31, | |
| | | 2020 | | | 2019 | | | 2018a | |
| | | |
Class R6 | | | | | | | | | | | | |
| | | |
Per share operating performance | | | | | | | | | | | | |
(for a share outstanding throughout the year) | | | | | | | | | | | | |
| | | |
Net asset value, beginning of year | | | $13.94 | | | | $15.41 | | | | $14.41 | |
| | | |
Income from investment operationsb: | | | | | | | | | | | | |
Net investment income (loss)c | | | 0.22 | | | | (0.07 | ) | | | (0.04 | ) |
Net realized and unrealized gains (losses) | | | (5.07 | ) | | | (1.01 | ) | | | 1.08 | |
| | | |
Total from investment operations | | | (4.85 | ) | | | (1.08 | ) | | | 1.04 | |
| | | |
Less distributions from: | | | | | | | | | | | | |
Net investment income | | | (0.06 | ) | | | (0.04 | ) | | | (0.04 | ) |
Net realized gains | | | (0.24 | ) | | | (0.35 | ) | | | — | |
| | | |
Total distributions | | | (0.30 | ) | | | (0.39 | ) | | | (0.04 | ) |
| | | |
Net asset value, end of year | | | $ 8.79 | | | | $13.94 | | | | $15.41 | |
| | | |
Total returnd | | | (35.48)% | | | | (6.76)% | | | | 7.27% | |
| | | |
Ratios to average net assetse | | | | | | | | | | | | |
Expenses before waiver and payments by affiliates | | | 1.53% | | | | 1.57% | | | | 1.59% | |
Expenses net of waiver and payments by affiliates | | | 1.51% | | | | 1.55% | | | | 1.54% | |
Net investment income | | | 1.34% | | | | 0.56% | f | | | 0.39% | f |
| | | |
Supplemental data | | | | | | | | | | | | |
Net assets, end of year (000’s) | | | $47,904 | | | | $198,106 | | | | $23,964 | |
Portfolio turnover rate | | | 4.72% | | | | 12.22% | | | | 7.57% | |
aFor the period August 1, 2017 (effective date) to March 31, 2018.
bThe amount shown for a share outstanding throughout the period may not correlate with the Statement of Operations for the period due to the timing of sales and repurchases of the Fund’s shares in relation to income earned and/or fluctuating fair value of the investments of the Fund.
cBased on average daily shares outstanding.
dTotal return is not annualized for periods less than one year.
eRatios are annualized for periods less than one year.
fRatio is calculated based on the Fund level net investment income, as reflected in the Statement of Operations, and adjusted for class specific expenses. The amount may not correlate with the per share amount due to the timing of income earned and/or fluctuating fair value of the investments of the Fund in relation to the timing of sales and repurchases of Fund shares.
| | | | |
| | | |
14 | | Annual Report | The accompanying notes are an integral part of these financial statements. | | franklintempleton.com |
TEMPLETON GLOBAL INVESTMENT TRUST
FINANCIAL HIGHLIGHTS
Templeton Emerging Markets Small Cap Fund(continued)
| | | | | | | | | | | | | | | | | | | | |
| | | | | | Year Ended March 31, | | | | |
| | | 2020 | | | 2019 | | | 2018 | | | 2017 | | | 2016 | |
| | | | | |
Advisor Class | | | | | | | | | | | | | | | | | | | | |
| | | | | |
Per share operating performance | | | | | | | | | | | | | | | | | | | | |
(for a share outstanding throughout the year) | | | | | | | | | | | | | | | | | | | | |
| | | | | |
Net asset value, beginning of year | | | $13.96 | | | | $15.42 | | | | $13.15 | | | | $11.52 | | | | $12.37 | |
| | | | | |
Income from investment operationsa: | | | | | | | | | | | | | | | | | | | | |
Net investment incomeb | | | 0.15 | | | | 0.09 | | | | 0.03 | | | | 0.18 | c | | | 0.07 | |
Net realized and unrealized gains (losses) | | | (5.03 | ) | | | (1.19 | ) | | | 2.26 | | | | 1.68 | | | | (0.86 | ) |
| | | | | |
Total from investment operations | | | (4.88 | ) | | | (1.10 | ) | | | 2.29 | | | | 1.86 | | | | (0.79 | ) |
| | | | | |
Less distributions from: | | | | | | | | | | | | | | | | | | | | |
Net investment income | | | (0.04 | ) | | | (0.01 | ) | | | (0.02 | ) | | | (0.23 | ) | | | (0.06 | ) |
Net realized gains | | | (0.24 | ) | | | (0.35 | ) | | | — | | | | — | | | | — | |
| | | | | |
Total distributions | | | (0.28 | ) | | | (0.36 | ) | | | (0.02 | ) | | | (0.23 | ) | | | (0.06 | ) |
| | | | | |
Net asset value, end of year | | | $ 8.80 | | | | $13.96 | | | | $15.42 | | | | $13.15 | | | | $11.52 | |
| | | | | |
Total return | | | (35.61)% | | | | (6.90)% | | | | 17.48% | | | | 16.42% | | | | (6.35)% | |
| | | | | |
Ratios to average net assets | | | | | | | | | | | | | | | | | | | | |
Expenses before waiver and payments by affiliates | | | 1.68% | | | | 1.69% | | | | 1.71% | | | | 1.73% | | | | 1.73% | |
Expenses net of waiver and payments by affiliates | | | 1.66% | | | | 1.67% | | | | 1.69% | | | | 1.72% | | | | 1.72% | |
Net investment income | | | 1.19% | | | | 0.44% | | | | 0.24% | | | | 1.50% | c | | | 0.60% | |
| | | | | |
Supplemental data | | | | | | | | | | | | | | | | | | | | |
Net assets, end of year (000’s) | | | $168,808 | | | | $387,850 | | | | $668,474 | | | | $442,583 | | | | $361,128 | |
Portfolio turnover rate | | | 4.72% | | | | 12.22% | | | | 7.57% | | | | 21.26% | | | | 18.09% | |
aThe amount shown for a share outstanding throughout the period may not correlate with the Statement of Operations for the period due to the timing of sales and repurchases of the Fund’s shares in relation to income earned and/or fluctuating fair value of the investments of the Fund.
bBased on average daily shares outstanding.
cNet investment income per share includes approximately $0.09 per share related to income received in the form of special dividends in connection with certain Fund holdings. Excluding this amount, the ratio of net investment income to average net assets would have been 0.73%.
| | | | |
| | | |
| franklintempleton.com | | The accompanying notes are an integral part of these financial statements. | Annual Report | | 15 |
TEMPLETON GLOBAL INVESTMENT TRUST
Statement of Investments, March 31, 2020
Templeton Emerging Markets Small Cap Fund
| | | | | | | | | | |
| | | Industry | | Shares | | | Value | |
| | | |
Common Stocks 96.8% | | | | | | | | | | |
Brazil 3.1% | | | | | | | | | | |
Arezzo Industria e Comercio SA | | Textiles, Apparel & Luxury Goods | | | 236,100 | | | $ | 1,675,216 | |
Duratex SA | | Paper & Forest Products | | | 2,889,000 | | | | 5,198,293 | |
Grendene SA | | Textiles, Apparel & Luxury Goods | | | 1,544,611 | | | | 2,238,287 | |
Ser Educacional SA | | Diversified Consumer Services | | | 902,500 | | | | 2,627,772 | |
| | | | | | | | | | |
| | | | | | | | | 11,739,568 | |
| | | | | | | | | | |
China 19.0% | | | | | | | | | | |
Amvig Holdings Ltd. | | Containers & Packaging | | | 5,484,000 | | | | 1,046,909 | |
a,bBaozun Inc., ADR | | Internet & Direct Marketing Retail | | | 290,861 | | | | 8,126,656 | |
Chinasoft International Ltd. | | IT Services | | | 8,008,000 | | | | 4,183,395 | |
COSCO SHIPPING Ports Ltd. | | Transportation Infrastructure | | | 3,807,506 | | | | 1,836,801 | |
Fanhua Inc., ADR | | Insurance | | | 64,600 | | | | 1,299,752 | |
Health & Happiness H&H International Holdings Ltd. | | Food Products | | | 4,268,300 | | | | 15,773,548 | |
aHuami Corp., ADR | | Electronic Equipment, Instruments & Components | | | 257,184 | | | | 3,374,254 | |
Huaxin Cement Co. Ltd., B | | Construction Materials | | | 4,500,579 | | | | 6,894,887 | |
JNBY Design Ltd. | | Textiles, Apparel & Luxury Goods | | | 3,229,000 | | | | 2,819,724 | |
Ju Teng International Holdings Ltd. | | Electronic Equipment, Instruments & Components | | | 16,938,000 | | | | 3,124,266 | |
Luye Pharma Group Ltd. | | Pharmaceuticals | | | 9,551,500 | | | | 4,657,075 | |
aNoah Holdings Ltd., ADR | | Capital Markets | | | 174,682 | | | | 4,517,276 | |
TravelSky Technology Ltd., H. | | IT Services | | | 584,200 | | | | 1,030,855 | |
Uni-President China Holdings Ltd. | | Food Products | | | 2,944,000 | | | | 2,855,653 | |
Xinyi Solar Holdings Ltd. | | Semiconductors & Semiconductor Equipment | | | 13,965,247 | | | | 7,907,933 | |
Xtep International Holdings Ltd. | | Textiles, Apparel & Luxury Goods | | | 11,349,937 | | | | 3,733,219 | |
| | | | | | | | | | |
| | | | | | | | | 73,182,203 | |
| | | | | | | | | | |
Czech Republic 0.7% | | | | | | | | | | |
Moneta Money Bank AS | | Banks | | | 1,278,684 | | | | 2,643,779 | |
| | | | | | | | | | |
Egypt 2.0% | | | | | | | | | | |
Eastern Co. SAE | | Tobacco | | | 5,233,095 | | | | 4,109,343 | |
Egyptian International Pharmaceuticals EIPICO | | Pharmaceuticals | | | 297,837 | | | | 1,135,338 | |
Integrated Diagnostics Holdings PLC | | Health Care Providers & Services | | | 708,529 | | | | 2,344,287 | |
| | | | | | | | | | |
| | | | | | | | | 7,588,968 | |
| | | | | | | | | | |
Georgia 0.5% | | | | | | | | | | |
aGeorgia Capital PLC | | Capital Markets | | | 163,865 | | | | 867,626 | |
Georgia Healthcare Group PLC | | Food & Staples Retailing | | | 1,097,145 | | | | 1,052,834 | |
| | | | | | | | | | |
| | | | | | | | | 1,920,460 | |
| | | | | | | | | | |
Hong Kong 2.6% | | | | | | | | | | |
I.T Ltd. | | Specialty Retail | | | 12,576,295 | | | | 2,173,738 | |
Luk Fook Holdings (International) Ltd. | | Specialty Retail | | | 3,888,000 | | | | 7,833,523 | |
| | | | | | | | | | |
| | | | | | | | | 10,007,261 | |
| | | | | | | | | | |
Hungary 2.9% | | | | | | | | | | |
Richter Gedeon Nyrt | | Pharmaceuticals | | | 581,870 | | | | 10,945,736 | |
| | | | | | | | | | |
| | | | |
| | | |
16 | | Annual Report | | franklintempleton.com |
TEMPLETON GLOBAL INVESTMENT TRUST
STATEMENT OF INVESTMENTS
Templeton Emerging Markets Small Cap Fund(continued)
| | | | | | | | | | | | |
| | | Industry | | | Shares | | | Value | |
| | | |
Common Stocks(continued) | | | | | | | | | | | | |
India 13.7% | | | | | | | | | | | | |
Apollo Tyres Ltd. | | | Auto Components | | | | 2,309,524 | | | $ | 2,427,484 | |
Bajaj Holdings & Investment Ltd. | | | Diversified Financial Services | | | | 555,344 | | | | 13,253,497 | |
Dalmia Bharat Ltd. | | | Construction Materials | | | | 349,776 | | | | 2,282,940 | |
aEquitas Holdings Ltd. | | | Banks | | | | 3,074,611 | | | | 1,736,435 | |
Federal Bank Ltd. | | | Banks | | | | 7,756,637 | | | | 4,209,120 | |
Glenmark Pharmaceuticals Ltd. | | | Pharmaceuticals | | | | 1,197,798 | | | | 3,259,221 | |
JK Cement Ltd. | | | Construction Materials | | | | 424,370 | | | | 5,273,908 | |
Redington India Ltd. | |
| Electronic Equipment, Instruments
& Components |
| | | 5,749,387 | | | | 5,208,040 | |
Tata Chemicals Ltd. | | | Chemicals | | | | 1,534,000 | | | | 4,518,446 | |
Tata Consumer Products Ltd. | | | Food Products | | | | 1,748,760 | | | | 6,816,546 | |
Vardhman Textiles Ltd. | | | Textiles, Apparel & Luxury Goods | | | | 468,044 | | | | 3,849,267 | |
| | | | | | | | | | | | |
| | | | | | | | | | | 52,834,904 | |
| | | | | | | | | | | | |
Indonesia 0.5% | | | | | | | | | | | | |
Hexindo Adiperkasa Tbk PT | | | Trading Companies & Distributors | | | | 13,003,900 | | | | 1,801,889 | |
| | | | | | | | | | | | |
Malaysia 0.7% | | | | | | | | | | | | |
7-Eleven Malaysia Holdings Bhd | | | Food & Staples Retailing | | | | 7,817,103 | | | | 2,463,506 | |
| | | | | | | | | | | | |
Mexico 1.0% | | | | | | | | | | | | |
Grupo Herdez SAB de CV | | | Food Products | | | | 2,262,319 | | | | 2,798,254 | |
Nemak SAB de CV | | | Auto Components | | | | 6,720,300 | | | | 1,120,380 | |
| | | | | | | | | | | | |
| | | | | | | | | | | 3,918,634 | |
| | | | | | | | | | | | |
Nigeria 0.2% | | | | | | | | | | | | |
UAC of Nigeria PLC | | | Food Products | | | | 45,432,007 | | | | 864,520 | |
| | | | | | | | | | | | |
Peru 1.3% | | | | | | | | | | | | |
Intercorp Financial Services Inc. | | | Banks | | | | 162,200 | | | | 4,857,890 | |
| | | | | | | | | | | | |
Philippines 1.5% | | | | | | | | | | | | |
DMCI Holdings Inc. | | | Industrial Conglomerates | | | | 15,192,600 | | | | 1,127,261 | |
International Container Terminal Services Inc. | | | Transportation Infrastructure | | | | 3,211,720 | | | | 4,721,816 | |
| | | | | | | | | | | | |
| | | | | | | | | | | 5,849,077 | |
| | | | | | | | | | | | |
Poland 1.2% | | | | | | | | | | | | |
Amica SA | | | Household Durables | | | | 43,554 | | | | 887,611 | |
Stock Spirits Group PLC | | | Beverages | | | | 1,929,725 | | | | 3,839,255 | |
| | | | | | | | | | | | |
| | | | | | | | | | | 4,726,866 | |
| | | | | | | | | | | | |
Russia 0.5% | | | | | | | | | | | | |
aMail.Ru Group Ltd., GDR | | | Interactive Media & Services | | | | 123,126 | | | | 1,979,045 | |
| | | | | | | | | | | | |
Saudi Arabia 2.1% | | | | | | | | | | | | |
Mouwasat Medical Services Co. | | | Health Care Providers & Services | | | | 368,974 | | | | 8,183,089 | |
| | | | | | | | | | | | |
South Africa 0.3% | | | | | | | | | | | | |
aMassmart Holdings Ltd. | | | Food & Staples Retailing | | | | 801,259 | | | | 1,218,033 | |
| | | | | | | | | | | | |
South Korea 11.4% | | | | | | | | | | | | |
Fila Holdings Corp. | | | Textiles, Apparel & Luxury Goods | | | | 297,663 | | | | 7,092,737 | |
Hankook Technology Group Co. Ltd. | | | Auto Components | | | | 656,000 | | | | 4,600,582 | |
Hans Biomed Corp. | | | Biotechnology | | | | 317,758 | | | | 4,978,204 | |
Interojo Co. Ltd. | | | Health Care Equipment & Supplies | | | | 117,982 | | | | 2,129,028 | |
| | | | |
| | | |
| franklintempleton.com | | Annual Report | | 17 |
TEMPLETON GLOBAL INVESTMENT TRUST
STATEMENT OF INVESTMENTS
Templeton Emerging Markets Small Cap Fund(continued)
| | | | | | | | | | |
| | | Industry | | Shares | | | Value | |
| | | |
Common Stocks(continued) | | | | | | | | | | |
South Korea(continued) | | | | | | | | | | |
I-Sens Inc. | | Health Care Equipment & Supplies | | | 181,746 | | | $ | 3,026,243 | |
Mando Corp. | | Auto Components | | | 156,920 | | | | 2,664,351 | |
Medy-tox Inc. | | Biotechnology | | | 28,008 | | | | 4,532,649 | |
Sebang Global Battery Co. Ltd. | | Auto Components | | | 147,555 | | | | 3,146,807 | |
Silicon Works Co. Ltd. | | Semiconductors & Semiconductor Equipment | | | 259,984 | | | | 5,875,043 | |
Vieworks Co. Ltd. | | Health Care Equipment & Supplies | | | 151,355 | | | | 3,811,343 | |
aZinus Inc. | | Household Durables | | | 38,941 | | | | 1,989,931 | |
| | | | | | | | | | |
| | | | | | | | | 43,846,918 | |
| | | | | | | | | | |
Sri Lanka 1.8% | | | | | | | | | | |
Hatton National Bank PLC | | Banks | | | 3,525,392 | | | | 1,901,829 | |
Hemas Holdings PLC | | Industrial Conglomerates | | | 15,513,186 | | | | 5,060,972 | |
| | | | | | | | | | |
| | | | | | | | | 6,962,801 | |
| | | | | | | | | | |
Taiwan 17.9% | | | | | | | | | | |
Eclat Textile Co. Ltd. | | Textiles, Apparel & Luxury Goods | | | 544,400 | | | | 4,304,618 | |
FIT Hon Teng Ltd. | | Electronic Equipment, Instruments & Components | | | 25,437,900 | | | | 5,446,772 | |
Flytech Technology Co. Ltd. | | Electronic Equipment, Instruments & Components | | | 1,920,220 | | | | 3,768,825 | |
Merida Industry Co. Ltd. | | Leisure Products | | | 2,680,100 | | | | 9,789,793 | |
Novatek Microelectronics Corp. Ltd. | | Semiconductors & Semiconductor Equipment | | | 2,370,000 | | | | 13,346,861 | |
Pacific Hospital Supply Co. Ltd. | | Health Care Equipment & Supplies | | | 822,000 | | | | 2,048,084 | |
aPChome Online Inc. | | Internet & Direct Marketing Retail | | | 2,081,035 | | | | 4,780,082 | |
aPharmaEssentia Corp. | | Biotechnology | | | 2,369,200 | | | | 5,223,871 | |
Primax Electronics Ltd. | | Technology Hardware, Storage & Peripherals | | | 7,701,100 | | | | 9,743,428 | |
Shin Zu Shing Co. Ltd. | | Machinery | | | 1,464,000 | | | | 5,583,440 | |
St. Shine Optical Co. Ltd. | | Health Care Equipment & Supplies | | | 236,000 | | | | 2,398,025 | |
TTY Biopharm Co. Ltd. | | Pharmaceuticals | | | 1,228,900 | | | | 2,504,278 | |
| | | | | | | | | | |
| | | | | | | | | 68,938,077 | |
| | | | | | | | | | |
Thailand 1.9% | | | | | | | | | | |
Dynasty Ceramic PCL, fgn | | Building Products | | | 23,444,540 | | | | 956,258 | |
Major Cineplex Group PCL, fgn | | Entertainment | | | 5,920,300 | | | | 2,423,749 | |
TISCO Financial Group PCL, fgn | | Banks | | | 1,843,400 | | | | 3,931,677 | |
| | | | | | | | | | |
| | | | | | | | | 7,311,684 | |
| | | | | | | | | | |
Turkey 1.8% | | | | | | | | | | |
DO & CO Restaurants & Catering AG | | Hotels, Restaurants & Leisure | | | 45,714 | | | | 1,823,535 | |
aMavi Giyim Sanayi Ve Ticaret AS, B | | Textiles, Apparel & Luxury Goods | | | 521,341 | | | | 2,634,548 | |
Soda Sanayii AS | | Chemicals | | | 3,397,306 | | | | 2,616,971 | |
| | | | | | | | | | |
| | | | | | | | | 7,075,054 | |
| | | | | | | | | | |
United Arab Emirates 1.5% | | | | | | | | | | |
Aramex PJSC | | Air Freight & Logistics | | | 9,576,064 | | | | 5,891,920 | |
| | | | | | | | | | |
United States 1.5% | | | | | | | | | | |
aIMAX Corp. | | Entertainment | | | 620,831 | | | | 5,618,520 | |
| | | | | | | | | | |
| | | | |
| | | |
18 | | Annual Report | | franklintempleton.com |
TEMPLETON GLOBAL INVESTMENT TRUST
STATEMENT OF INVESTMENTS
Templeton Emerging Markets Small Cap Fund(continued)
| | | | | | | | | | | | |
| | | Industry | | | Shares | | | Value | |
| | | |
Common Stocks(continued) | | | | | | | | | | | | |
Vietnam 5.2% | | | | | | | | | | | | |
FPT Corp. | |
| Electronic Equipment, Instruments &
Components |
| | | 3,056,198 | | | $ | 5,318,615 | |
aHoa Phat Group JSC | | | Metals & Mining | | | | 10,410,208 | | | | 7,427,362 | |
aMasan Group Corp. | | | Food Products | | | | 902,560 | | | | 1,872,610 | |
Vietnam Container Shipping JSC | | | Marine | | | | 1,604,710 | | | | 1,392,918 | |
Vincom Retail JSC | | | Real Estate Management & Development | | | | 5,031,402 | | | | 4,079,746 | |
| | | | | | | | | | | | |
| | | | | | | | | | | 20,091,251 | |
| | | | | | | | | | | | |
Total Common Stocks (Cost $514,764,655) | | | | | | | | | | | 372,461,653 | |
| | | | | | | | | | | | |
| | | |
Preferred Stocks (Cost $4,139,414) 0.6% | | | | | | | | | | | | |
Chile 0.6% | | | | | | | | | | | | |
cEmbotelladora Andina SA, 5.807%, pfd., A | | | Beverages | | | | 1,250,500 | | | | 2,191,412 | |
| | | | | | | | | | | | |
Total Investments before Short Term
Investments (Cost $518,904,069) | | | | | | | | | | | 374,653,065 | |
| | | | | | | | | | | | |
| | | |
Short Term Investments 1.3% | | | | | | | | | | | | |
| | | |
Money Market Funds (Cost $1,958,014) 0.5% | | | | | | | | | | | | |
United States 0.5% | | | | | | | | | | | | |
d,eInstitutional Fiduciary Trust Money Market Portfolio, 0.32% | | | | | | | 1,958,014 | | | | 1,958,014 | |
| | | | | | | | | | | | |
fInvestments from Cash Collateral Received for Loaned
Securities 0.8% | | | | | | | | | | | | |
Money Market Funds (Cost $2,811,982) 0.8% | | | | | | | | | | | | |
United States 0.8% | | | | | | | | | | | | |
d,eInstitutional Fiduciary Trust Money Market Portfolio, 0.32% | | | | | | | 2,811,982 | | | | 2,811,982 | |
| | | | | | | | | | | | |
Total Investments (Cost $523,674,065) 98.7% | | | | | | | | | | | 379,423,061 | |
Other Assets, less Liabilities 1.3% | | | | | | | | | | | 5,133,316 | |
| | | | | | | | | | | | |
Net Assets 100.0% | | | | | | | | | | $ | 384,556,377 | |
| | | | | | | | | | | | |
See Abbreviations on page 32.
aNon-income producing.
bA portion or all of the security is on loan at March 31, 2020. See Note 1(c).
cVariable rate security. The rate shown represents the yield at period end.
dSee Note 3(f) regarding investments in affiliated management investment companies.
eThe rate shown is the annualizedseven-day effective yield at period end.
fSee Note 1(c) regarding securities on loan.
| | | | |
| | | |
| franklintempleton.com | | The accompanying notes are an integral part of these financial statements. | Annual Report | | 19 |
TEMPLETON GLOBAL INVESTMENT TRUST
FINANCIAL STATEMENTS
Statement of Assets and Liabilities
March 31, 2020
Templeton Emerging Markets Small Cap Fund
| | | | |
Assets: | | | | |
Investments in securities: | | | | |
Cost - Unaffiliated issuers | | | $ 518,904,069 | |
Cost -Non-controlled affiliates (Note 3f and 9) | | | 4,769,996 | |
| | | | |
Value - Unaffiliated issuers+ | | | $ 374,653,065 | |
Value -Non-controlled affiliates (Note 3f and 9) | | | 4,769,996 | |
Foreign currency, at value (cost $599,428) | | | 600,076 | |
Receivables: | | | | |
Investment securities sold | | | 8,980,380 | |
Capital shares sold | | | 593,128 | |
Dividends | | | 1,021,034 | |
European Union tax reclaims | | | 254,152 | |
Other assets | | | 713 | |
| | | | |
Total assets | | | 390,872,544 | |
| | | | |
Liabilities: | | | | |
Payables: | | | | |
Capital shares redeemed. | | | 2,503,098 | |
Management fees. | | | 552,237 | |
Distribution fees | | | 59,415 | |
Transfer agent fees | | | 172,382 | |
Payable upon return of securities loaned. | | | 2,811,982 | |
Accrued expenses and other liabilities | | | 217,053 | |
| | | | |
Total liabilities | | | 6,316,167 | |
| | | | |
Net assets, at value | | | $ 384,556,377 | |
| | | | |
Net assets consist of: | | | | |
Paid-in capital | | | $ 527,476,337 | |
Total distributable earnings (losses) | | | (142,919,960 | ) |
| | | | |
Net assets, at value | | | $ 384,556,377 | |
| | | | |
| |
| | | | |
+Includes securities loaned | | | $ 2,883,184 | |
| | | | |
| | | |
20 | | Annual Report | The accompanying notes are an integral part of these financial statements. | | franklintempleton.com |
TEMPLETON GLOBAL INVESTMENT TRUST
FINANCIAL STATEMENTS
Statement of Assets and Liabilities(continued)
March 31, 2020
Templeton Emerging Markets Small Cap Fund
| | | | |
Class A: | | | | |
Net assets, at value | | | $143,311,799 | |
| | | | |
Shares outstanding | | | 16,501,275 | |
| | | | |
Net asset value per sharea | | | $8.68 | |
| | | | |
Maximum offering price per share (net asset value per share ÷ 94.50%) | | | $9.19 | |
| | | | |
Class C: | | | | |
Net assets, at value | | | $ 23,167,896 | |
| | | | |
Shares outstanding | | | 2,846,823 | |
| | | | |
Net asset value and maximum offering price per sharea | | | $8.14 | |
| | | | |
Class R: | | | | |
Net assets, at value | | | $ 1,365,115 | |
| | | | |
Shares outstanding | | | 159,471 | |
| | | | |
Net asset value and maximum offering price per share | | | $8.56 | |
| | | | |
Class R6: | | | | |
Net assets, at value | | | $ 47,904,022 | |
| | | | |
Shares outstanding | | | 5,452,922 | |
| | | | |
Net asset value and maximum offering price per share | | | $8.79 | |
| | | | |
Advisor Class: | | | | |
Net assets, at value | | | $168,807,545 | |
| | | | |
Shares outstanding | | | 19,182,889 | |
| | | | |
Net asset value and maximum offering price per share | | | $8.80 | |
| | | | |
aRedemption price is equal to net asset value less contingent deferred sales charges, if applicable.
| | | | |
| | | |
| franklintempleton.com | | The accompanying notes are an integral part of these financial statements. | Annual Report | | 21 |
TEMPLETON GLOBAL INVESTMENT TRUST
FINANCIAL STATEMENTS
Statement of Operations
for the year ended March 31, 2020
Templeton Emerging Markets Small Cap Fund
| | | | |
Investment income: | | | | |
Dividends: (net of foreign taxes)* | | | | |
Unaffiliated issuers | | $ | 20,577,072 | |
Non-controlled affiliates (Note 3f and 9) | | | 587,237 | |
Income from securities loaned: | | | | |
Unaffiliated entities (net of fees and rebates) | | | 247,961 | |
Non-controlled affiliates (Note 3f) | | | 193,665 | |
| | | | |
Total investment income | | | 21,605,935 | |
| | | | |
Expenses: | | | | |
Management fees (Note 3a) | | | 10,378,228 | |
Distribution fees: (Note 3c) | | | | |
Class A | | | 597,339 | |
Class C | | | 413,538 | |
Class R | | | 9,213 | |
Transfer agent fees: (Note 3e) | | | | |
Class A | | | 428,677 | |
Class C | | | 74,789 | |
Class R | | | 3,306 | |
Class R6 | | | 44,888 | |
Advisor Class | | | 602,938 | |
Custodian fees (Note 4) | | | 453,689 | |
Reports to shareholders | | | 97,424 | |
Registration and filing fees | | | 139,469 | |
Professional fees | | | 118,593 | |
Trustees’ fees and expenses | | | 95,824 | |
Other | | | 42,089 | |
| | | | |
Total expenses | | | 13,500,004 | |
Expenses waived/paid by affiliates (Note 3f and 3g) | | | (122,044 | ) |
| | | | |
Net expenses | | | 13,377,960 | |
| | | | |
Net investment income | | | 8,227,975 | |
| | | | |
Realized and unrealized gains (losses): | | | | |
Net realized gain (loss) from: | | | | |
Investments:# | | | | |
Unaffiliated issuers | | | 19,770,634 | |
Non-controlled affiliates (Note 3f and 9) | | | (21,003,133 | ) |
Foreign currency transactions | | | (270,834 | ) |
| | | | |
Net realized gain (loss) | | | (1,503,333 | ) |
| | | | |
Net change in unrealized appreciation (depreciation) on: | | | | |
Investments: | | | | |
Unaffiliated issuers | | | (277,525,398 | ) |
Non-controlled affiliates (Note 3f and 9) | | | 21,327,336 | |
Translation of other assets and liabilities denominated in foreign currencies | | | (54,475 | ) |
| | | | |
Net change in unrealized appreciation (depreciation) | | | (256,252,537 | ) |
| | | | |
Net realized and unrealized gain (loss) | | | (257,755,870 | ) |
| | | | |
Net increase (decrease) in net assets resulting from operations | | $ | (249,527,895 | ) |
| | | | |
| |
*Foreign taxes withheld on dividends | | $ | 1,999,471 | |
#Net of foreign taxes | | $ | 329,948 | |
| | | | |
| | | |
22 | | Annual Report | The accompanying notes are an integral part of these financial statements. | | franklintempleton.com |
TEMPLETON GLOBAL INVESTMENT TRUST
FINANCIAL STATEMENTS
Statements of Changes in Net Assets
Templeton Emerging Markets Small Cap Fund
| | | | | | | | |
| | | Year Ended March 31, | |
| | | 2020 | | | 2019 | |
| |
Increase (decrease) in net assets: | | | | | | | | |
Operations: | | | | | | | | |
Net investment income | | $ | 8,227,975 | | | $ | 3,019,277 | |
Net realized gain (loss) | | | (1,503,333 | ) | | | 30,025,183 | |
Net change in unrealized appreciation (depreciation) | | | (256,252,537 | ) | | | (116,579,817 | ) |
| | | | |
Net increase (decrease) in net assets resulting from operations | | | (249,527,895 | ) | | | (83,535,357 | ) |
| | | | |
Distributions to shareholders: | | | | | | | | |
Class A | | | (4,331,906 | ) | | | (6,717,881 | ) |
Class C | | | (742,939 | ) | | | (1,434,319 | ) |
Class R | | | (36,147 | ) | | | (39,533 | ) |
Class R6 | | | (2,317,331 | ) | | | (5,744,038 | ) |
Advisor Class | | | (6,504,854 | ) | | | (9,688,379 | ) |
| | | | |
Total distributions to shareholders | | | (13,933,177 | ) | | | (23,624,150 | ) |
| | | | |
Capital share transactions: (Note 2) | | | | | | | | |
Class A | | | (35,053,048 | ) | | | (16,996,707 | ) |
Class C | | | (13,914,156 | ) | | | (17,761,926 | ) |
Class R | | | 416,927 | | | | 906,129 | |
Class R6 | | | (109,346,254 | ) | | | 160,233,040 | |
Advisor Class | | | (102,829,365 | ) | | | (198,149,225 | ) |
| | | | |
Total capital share transactions | | | (260,725,896 | ) | | | (71,768,689 | ) |
| | | | |
Net increase (decrease) in net assets | | | (524,186,968 | ) | | | (178,928,196 | ) |
Net assets: | | | | | | | | |
Beginning of year | | | 908,743,345 | | | | 1,087,671,541 | |
| | | | |
End of year | | $ | 384,556,377 | | | $ | 908,743,345 | |
| | | | |
| | | | |
| | | |
| franklintempleton.com | | The accompanying notes are an integral part of these financial statements. | Annual Report | | 23 |
TEMPLETON GLOBAL INVESTMENT TRUST
Notes to Financial Statements
Templeton Emerging Markets Small Cap Fund
1. Organization and Significant Accounting Policies
Templeton Global Investment Trust (Trust) is registered under the Investment Company Act of 1940 (1940 Act) as anopen-end management investment company, consisting of two separate funds and applies the specialized accounting and reporting guidance in U.S. Generally Accepted Accounting Principles (U.S. GAAP). Templeton Emerging Markets Small Cap Fund (Fund) is included in this report. The Fund offers five classes of shares: Class A, Class C, Class R, Class R6 and Advisor Class. Class C shares automatically convert to Class A shares after they have been held for 10 years. Each class of shares may differ by its initial sales load, contingent deferred sales charges, voting rights on matters affecting a single class, its exchange privilege and fees due to differing arrangements for distribution and transfer agent fees.
The following summarizes the Fund’s significant accounting policies.
a. Financial Instrument Valuation
The Fund’s investments in financial instruments are carried at fair value daily. Fair value is the price that would be received to sell an asset or paid to transfer a liability in an orderly transaction between market participants on the measurement date. The Fund calculates the net asset value (NAV) per share each business day as of 4 p.m. Eastern time or the regularly scheduled close of the New York Stock Exchange (NYSE), whichever is earlier. Under compliance policies and procedures approved by the Trust’s Board of Trustees (the Board), the Fund’s administrator has responsibility for oversight of valuation, including leading the cross-functional Valuation Committee (VC). The Fund may utilize independent pricing services, quotations from securities and financial instrument dealers, and other market sources to determine fair value.
Equity securities listed on an exchange or on the NASDAQ National Market System are valued at the last quoted sale price or the official closing price of the day, respectively. Foreign equity securities are valued as of the close of trading on the foreign stock exchange on which the security is primarily traded, or as of 4 p.m. Eastern time. The value is then converted into its U.S. dollar equivalent at the foreign exchange rate in effect at 4 p.m. Eastern time on the day that the value of the security is determined.Over-the-counter (OTC) securities are valued within the range of the most recent quoted bid and ask prices. Securities that trade in
multiple markets or on multiple exchanges are valued according to the broadest and most representative market. Certain equity securities are valued based upon fundamental characteristics or relationships to similar securities.
Investments inopen-end mutual funds are valued at the closing NAV.
The Fund has procedures to determine the fair value of financial instruments for which market prices are not reliable or readily available. Under these procedures, the Fund primarily employs a market-based approach which may use related or comparable assets or liabilities, recent transactions, market multiples, book values, and other relevant information for the investment to determine the fair value of the investment. An income-based valuation approach may also be used in which the anticipated future cash flows of the investment are discounted to calculate fair value. Discounts may also be applied due to the nature or duration of any restrictions on the disposition of the investments. Due to the inherent uncertainty of valuations of such investments, the fair values may differ significantly from the values that would have been used had an active market existed.
Trading in securities on foreign securities stock exchanges and OTC markets may be completed before 4 p.m. Eastern time. In addition, trading in certain foreign markets may not take place on every Fund’s business day. Occasionally, events occur between the time at which trading in a foreign security is completed and 4 p.m. Eastern time that might call into question the reliability of the value of a portfolio security held by the Fund. As a result, differences may arise between the value of the Fund’s portfolio securities as determined at the foreign market close and the latest indications of value at 4 p.m. Eastern time. In order to minimize the potential for these differences, the VC monitors price movements following the close of trading in foreign stock markets through a series of country specific market proxies (such as baskets of American Depositary Receipts, futures contracts and exchange traded funds). These price movements are measured against established trigger thresholds for each specific market proxy to assist in determining if an event has occurred that may call into question the reliability of the values of the foreign securities held by the Fund. If such an event occurs, the securities may be valued using fair value procedures, which may include the use of independent pricing services. At March 31, 2020, a market event occurred resulting in a portion of the securities held by the Fund being valued using fair value procedures.
| | | | |
| | | |
24 | | Annual Report | | franklintempleton.com |
TEMPLETON GLOBAL INVESTMENT TRUST
NOTES TO FINANCIAL STATEMENTS
Templeton Emerging Markets Small Cap Fund(continued)
When the last day of the reporting period is anon-business day, certain foreign markets may be open on those days that the Fund’s NAV is not calculated, which could result in differences between the value of the Fund’s portfolio securities on the last business day and the last calendar day of the reporting period. Any significant security valuation changes due to an open foreign market are adjusted and reflected by the Fund for financial reporting purposes.
b. Foreign Currency Translation
Portfolio securities and other assets and liabilities denominated in foreign currencies are translated into U.S. dollars based on the exchange rate of such currencies against U.S. dollars on the date of valuation. The Fund may enter into foreign currency exchange contracts to facilitate transactions denominated in a foreign currency. Purchases and sales of securities, income and expense items denominated in foreign currencies are translated into U.S. dollars at the exchange rate in effect on the transaction date. Portfolio securities and assets and liabilities denominated in foreign currencies contain risks that those currencies will decline in value relative to the U.S. dollar. Occasionally, events may impact the availability or reliability of foreign exchange rates used to convert the U.S. dollar equivalent value. If such an event occurs, the foreign exchange rate will be valued at fair value using procedures established and approved by the Board.
The Fund does not separately report the effect of changes in foreign exchange rates from changes in market prices on securities held. Such changes are included in net realized and unrealized gain or loss from investments in the Statement of Operations.
Realized foreign exchange gains or losses arise from sales of foreign currencies, currency gains or losses realized between the trade and settlement dates on securities transactions and the difference between the recorded amounts of dividends, interest, and foreign withholding taxes and the U.S. dollar equivalent of the amounts actually received or paid. Net unrealized foreign exchange gains and losses arise from changes in foreign exchange rates on foreign denominated assets and liabilities other than investments in securities held at the end of the reporting period.
c. Securities Lending
The Fund participates in an agency based securities lending program to earn additional income. The Fund receives cash collateral against the loaned securities in an amount equal to at least 102% of the fair value of the loaned securities. Collateral is maintained over the life of the loan in an amount not less than 100% of the fair value of loaned securities, as determined at the close of Fund business each day; any additional collateral required due to changes in security values is delivered to the Fund on the next business day. The collateral is deposited into a joint cash account with other funds and is used to invest in a money market fund managed by Franklin Advisers, Inc., an affiliate of the Fund, and/or uninvested cash as included in due from custodian in the Statement of Assets and Liabilities. The Fund may receive income from the investment of cash collateral, in addition to lending fees and rebates paid by the borrower. Income from securities loaned, net of fees paid to the securities lending agent and/or third-party vendor, is reported separately in the Statement of Operations. The Fund bears the market risk with respect to the collateral investment, securities loaned, and the risk that the agent may default on its obligations to the Fund. If the borrower defaults on its obligation to return the securities loaned, the Fund has the right to repurchase the securities in the open market using the collateral received. The securities lending agent has agreed to indemnify the Fund in the event of default by a third party borrower.
d. Income and Deferred Taxes
It is the Fund’s policy to qualify as a regulated investment company under the Internal Revenue Code. The Fund intends to distribute to shareholders substantially all of its taxable income and net realized gains to relieve it from federal income and excise taxes. As a result, no provision for U.S. federal income taxes is required.
The Fund may be subject to foreign taxation related to income received, capital gains on the sale of securities and certain foreign currency transactions in the foreign jurisdictions in which it invests. Foreign taxes, if any, are recorded based on the tax regulations and rates that exist in the foreign markets in which the Fund invests. When a capital gain tax is determined to apply, the Fund records an estimated deferred tax liability in an amount that would be payable if the securities were disposed of on the valuation date.
| | | | |
| | | |
| franklintempleton.com | | Annual Report | | 25 |
TEMPLETON GLOBAL INVESTMENT TRUST
NOTES TO FINANCIAL STATEMENTS
Templeton Emerging Markets Small Cap Fund(continued)
1. Organization and Significant Accounting Policies(continued)
d. Income and Deferred Taxes(continued)
As a result of several court cases, in certain countries across the European Union, the Fund filed additional tax reclaims for previously withheld taxes on dividends earned in those countries (EU reclaims). These additional filings are subject to various administrative proceedings by the local jurisdictions’ tax authorities within the European Union, as well as a number of related judicial proceedings. Income recognized, if any, for EU reclaims is reflected as other income in the Statement of Operations and any related receivable, if any, is reflected as European Union tax reclaims in the Statement of Assets and Liabilities. When uncertainty exists as to the ultimate resolution of these proceedings, the likelihood of receipt of these EU reclaims, and the potential timing of payment, no amounts are reflected in the financial statements. For U.S. income tax purposes, EU reclaims received by the Fund, if any, reduce the amounts of foreign taxes Fund shareholders can use as tax credits in their individual income tax returns.
The Fund may recognize an income tax liability related to its uncertain tax positions under U.S. GAAP when the uncertain tax position has a less than 50% probability that it will be sustained upon examination by the tax authorities based on its technical merits. As of March 31, 2020, the Fund has determined that no tax liability is required in its financial statements related to uncertain tax positions for any open tax years (or expected to be taken in future tax years). Open tax years are those that remain subject to examination and are based on the statute of limitations in each jurisdiction in which the Fund invests.
e. Security Transactions, Investment Income, Expenses and Distributions
Security transactions are accounted for on trade date. Realized gains and losses on security transactions are determined on a specific identification basis. Estimated expenses are accrued daily. Dividend income is recorded on theex-dividend date except for certain dividends from securities where the dividend rate is not available. In such cases, the dividend is recorded as soon as the information is received by the Fund. Distributions to shareholders are
recorded on theex-dividend date. Distributable earnings are determined according to income tax regulations (tax basis) and may differ from earnings recorded in accordance with U.S. GAAP. These differences may be permanent or temporary. Permanent differences are reclassified among capital accounts to reflect their tax character. These reclassifications have no impact on net assets or the results of operations. Temporary differences are not reclassified, as they may reverse in subsequent periods.
Common expenses incurred by the Trust are allocated among the Funds based on the ratio of net assets of each Fund to the combined net assets of the Trust or based on the ratio of number of shareholders of each Fund to the combined number of shareholders of the Trust. Fund specific expenses are charged directly to the Fund that incurred the expense.
Realized and unrealized gains and losses and net investment income, excluding class specific expenses, are allocated daily to each class of shares based upon the relative proportion of net assets of each class. Differences in per share distributions by class are generally due to differences in class specific expenses.
f. Accounting Estimates
The preparation of financial statements in accordance with U.S. GAAP requires management to make estimates and assumptions that affect the reported amounts of assets and liabilities at the date of the financial statements and the amounts of income and expenses during the reporting period. Actual results could differ from those estimates.
g. Guarantees and Indemnifications
Under the Trust’s organizational documents, its officers and trustees are indemnified by the Trust against certain liabilities arising out of the performance of their duties to the Trust. Additionally, in the normal course of business, the Trust, on behalf of the Fund, enters into contracts with service providers that contain general indemnification clauses. The Trust’s maximum exposure under these arrangements is unknown as this would involve future claims that may be made against the Trust that have not yet occurred. Currently, the Trust expects the risk of loss to be remote.
| | | | |
| | | |
26 | | Annual Report | | franklintempleton.com |
TEMPLETON GLOBAL INVESTMENT TRUST
NOTES TO FINANCIAL STATEMENTS
Templeton Emerging Markets Small Cap Fund(continued)
2. Shares of Beneficial Interest
At March 31, 2020, there were an unlimited number of shares authorized ($0.01 par value). Transactions in the Fund’s shares were as follows:
| | | | | | | | | | | | | | | | |
| | | | | | Year Ended March 31, | | | | |
| | | | |
| | | 2020 | | | 2019 | |
| | | | |
| | | Shares | | | Amount | | | Shares | | | Amount | |
| |
Class A Shares: | | | | | | | | | | | | | | | | |
Shares solda | | | 3,221,121 | | | $ | 40,743,117 | | | | 4,559,656 | | | $ | 61,671,184 | |
Shares issued in reinvestment of distributions | | | 305,041 | | | | 3,877,065 | | | | 491,583 | | | | 6,056,301 | |
Shares redeemed | | | (6,528,281 | ) | | | (79,673,230 | ) | | | (6,236,473 | ) | | | (84,724,192 | ) |
| | | | |
Net increase (decrease) | | | (3,002,119 | ) | | $ | (35,053,048 | ) | | | (1,185,234 | ) | | $ | (16,996,707 | ) |
| | | | |
Class C Shares: | | | | | | | | | | | | | | | | |
Shares sold | | | 426,130 | | | $ | 4,963,769 | | | | 652,102 | | | $ | 8,498,060 | |
Shares issued in reinvestment of distributions | | | 59,857 | | | | 714,694 | | | | 118,314 | | | | 1,380,727 | |
Shares redeemeda | | | (1,655,253 | ) | | | (19,592,619 | ) | | | (2,176,204 | ) | | | (27,640,713 | ) |
| | | | |
Net increase (decrease) | | | (1,169,266 | ) | | $ | (13,914,156 | ) | | | (1,405,788 | ) | | $ | (17,761,926 | ) |
| | | | |
Class R Shares: | | | | | | | | | | | | | | | | |
Shares sold | | | 70,844 | | | $ | 908,240 | | | | 91,192 | | | $ | 1,249,355 | |
Shares issued in reinvestment of distributions | | | 2,883 | | | | 36,147 | | | | 3,246 | | | | 39,533 | |
Shares redeemed | | | (41,136 | ) | | | (527,460 | ) | | | (29,077 | ) | | | (382,759 | ) |
| | | | |
Net increase (decrease) | | | 32,591 | | | $ | 416,927 | | | | 65,361 | | | $ | 906,129 | |
| | | | |
Class R6 Shares: | | | | | | | | | | | | | | | | |
Shares sold | | | 2,043,837 | | | $ | 26,938,707 | | | | 15,209,693 | | | $ | 194,031,276 | |
Shares issued in reinvestment of distributions | | | 31,681 | | | | 406,790 | | | | 52,152 | | | | 649,299 | |
Shares redeemed | | | (10,835,962 | ) | | | (136,691,751 | ) | | | (2,603,401 | ) | | | (34,447,535 | ) |
| | | | |
Net increase (decrease) | | | (8,760,444 | ) | | $ | (109,346,254 | ) | | | 12,658,444 | | | $ | 160,233,040 | |
| | | | |
Advisor Class Shares: | | | | | | | | | | | | | | | | |
Shares sold | | | 6,620,262 | | | $ | 86,116,265 | | | | 12,339,723 | | | $ | 170,703,200 | |
Shares issued in reinvestment of distributions | | | 437,732 | | | | 5,633,610 | | | | 699,114 | | | | 8,717,946 | |
Shares redeemed | | | (15,660,224 | ) | | | (194,579,240 | ) | | | (28,602,272 | ) | | | (377,570,371 | ) |
| | | | |
Net increase (decrease) | | | (8,602,230 | ) | | $ | (102,829,365 | ) | | | (15,563,435 | ) | | $ | (198,149,225 | ) |
| | | | |
aMay include a portion of Class C shares that were automatically converted to Class A.
3. Transactions with Affiliates
Franklin Resources, Inc. is the holding company for various subsidiaries that together are referred to as Franklin Templeton. Certain officers and trustees of the Trust are also officers and/or directors of the following subsidiaries:
| | | | |
| Subsidiary | | Affiliation | | |
Templeton Asset Management Ltd. (Asset Management) | | Investment manager | | |
Franklin Templeton Services, LLC (FT Services) | | Administrative manager | | |
Franklin Templeton Distributors, Inc. (Distributors) | | Principal underwriter | | |
Franklin Templeton Investor Services, LLC (Investor Services) | | Transfer agent | | |
| | | | |
| | | |
| franklintempleton.com | | Annual Report | | 27 |
TEMPLETON GLOBAL INVESTMENT TRUST
NOTES TO FINANCIAL STATEMENTS
Templeton Emerging Markets Small Cap Fund(continued)
3. Transactions with Affiliates(continued)
a. Management Fees
The Fund pays an investment management fee to Asset Management based on the average daily net assets of the Fund as follows:
| | | | |
Annualized Fee Rate | | Net Assets | | |
1.400% | | Up to and including $500 million | | |
1.300% | | Over $500 million, up to and including $1 billion | | |
1.200% | | In excess of $1 billion | | |
For the year ended March 31, 2020, the gross effective investment management fee rate was 1.368% of the Fund’s average daily net assets.
b. Administrative Fees
Under an agreement with Asset Management, FT Services provides administrative services to the Fund. The fee is paid by Asset Management based on the Fund’s average daily net assets, and is not an additional expense of the Fund.
c. Distribution Fees
The Board has adopted distribution plans for each share class, with the exception of Class R6 and Advisor Class shares, pursuant to Rule12b-1 under the 1940 Act. Under the Fund’s Class A reimbursement distribution plan, the Fund reimburses Distributors for costs incurred in connection with the servicing, sale and distribution of the Fund’s shares up to the maximum annual plan rate. Under the Class A reimbursement distribution plan, costs exceeding the maximum for the current plan year cannot be reimbursed in subsequent periods. In addition, under the Fund’s Class C and R compensation distribution plans, the Fund pays Distributors for costs incurred in connection with the servicing, sale and distribution of the Fund’s shares up to the maximum annual plan rate for each class. The plan year, for purposes of monitoring compliance with the maximum annual plan rates, is February 1 through January 31.
The maximum annual plan rates, based on the average daily net assets, for each class, are as follows:
| | | | |
Class A | | | 0.35 | % |
Class C | | | 1.00 | % |
Class R | | | 0.50 | % |
The Board has set the current rate at 0.25% per year for Class A shares until further notice and approval by the Board.
d. Sales Charges/Underwriting Agreements
Front-end sales charges and contingent deferred sales charges (CDSC) do not represent expenses of the Fund. These charges are deducted from the proceeds of sales of Fund shares prior to investment or from redemption proceeds prior to remittance, as applicable. Distributors has advised the Fund of the following commission transactions related to the sales and redemptions of the Fund’s shares for the year:
| | | | |
Sales charges retained net of commissions paid to unaffiliated brokers/dealers | | $ | 28,384 | |
CDSC retained | | $ | 2,751 | |
| | | | |
| | | |
28 | | Annual Report | | franklintempleton.com |
TEMPLETON GLOBAL INVESTMENT TRUST
NOTES TO FINANCIAL STATEMENTS
Templeton Emerging Markets Small Cap Fund(continued)
e. Transfer Agent Fees
Each class of shares pays transfer agent fees to Investor Services for its performance of shareholder servicing obligations. The fees are based on an annualized asset based fee of 0.02% plus a transaction based fee. In addition, each class reimburses Investor Services for out of pocket expenses incurred and, except for Class R6, reimburses shareholder servicing fees paid to third parties. These fees are allocated daily based upon their relative proportion of such classes’ aggregate net assets. Class R6 pays Investor Services transfer agent fees specific to that class.
For the year ended March 31, 2020, the Fund paid transfer agent fees of $1,154,598, of which $412,398 was retained by Investor Services.
f. Investments in Affiliated Management Investment Companies
The Fund invests in one or more affiliated management investment companies for purposes other than exercising a controlling influence over the management or policies. Management fees paid by the Fund are waived on assets invested in the affiliated management investment companies, as noted in the Statement of Operations, in an amount not to exceed the management and administrative fees paid directly or indirectly by each affiliate. During the year ended March 31, 2020, the Fund held investments in affiliated management investment companies as follows:
| | | | | | | | | | | | | | | | | | | | | | | | | | | | | | | | |
| | | Value at
Beginning of Year | | | Purchases | | | Sales | | | Realized Gain (Loss) | | | Net Change in Unrealized
Appreciation (Depreciation) | | | Value at
End of Year | | | Number of Shares Held at End of Year | | | Investment Income | |
Non-Controlled Affiliates | | | | | | | | | | | | | | | | | | | | | | | | | | | | | | | | |
| | | | | | | | |
| | | | | | | | | | | | | | | | | | | | | | | | Dividends | |
| | | | | | | | | | | | | | | | | | | | | | | | | | | | | | | | |
Institutional Fiduciary Trust Money Market Portfolio, 0.32% | | | $30,542,529 | | | $ | 172,410,545 | | | $ | (200,995,060 | ) | | | $ — | | | | $ — | | | $ | 1,958,014 | | | | 1,958,014 | | | | $419,784 | |
| | | | | | | | |
| | | | | | | | | | | | | | | | | | | | | | | | Income from securities loaned | |
| | | | | | | | | | | | | | | | | | | | | | | | | | | | | | | | |
Institutional Fiduciary Trust Money Market Portfolio, 0.32% | | | 8,321,720 | | | | 67,849,445 | | | | (73,359,183 | ) | | | — | | | | — | | | | 2,811,982 | | | | 2,811,982 | | | | 193,665 | |
| | | | | | | | | | | | |
Total Affiliated Securities | | | $38,864,249 | | | $ | 240,259,990 | | | $ | (274,354,243 | ) | | | $ — | | | | $ — | | | $ | 4,769,996 | | | | | | | | $613,449 | |
| | | | | | | | | | | | |
g. Waiver and Expense Reimbursements
Investor Services has contractually agreed in advance to waive or limit its fees so that the Class R6 transfer agent fees do not exceed 0.03% based on the average net assets of the class until July 31, 2020.
Effective April 1, 2020, Investment manager and Investor Services have contractually agreed in advance to waive or limit their fees and to assume as their own expense certain expenses otherwise payable by the Fund so that the expenses (excluding distribution fees, acquired fund fees and expenses and certainnon-routine expenses or costs, including those relating to litigation, indemnification, reorganizations, and liquidations) for Class A, Class C, Class R and Advisor Class of the Fund do not exceed 1.55% and for Class R6 do not exceed 1.43%, based on the average net assets of each class. Total expenses waived or paid are not subject to recapture subsequent to the Fund’s fiscal year end.
4. Expense Offset Arrangement
The Fund has entered into an arrangement with its custodian whereby credits realized as a result of uninvested cash balances are used to reduce a portion of the Fund’s custodian expenses. During the year ended March 31, 2020, there were no credits earned.
| | | | |
| | | |
| franklintempleton.com | | Annual Report | | 29 |
TEMPLETON GLOBAL INVESTMENT TRUST
NOTES TO FINANCIAL STATEMENTS
Templeton Emerging Markets Small Cap Fund(continued)
5. Income Taxes
For tax purposes, capital losses may be carried over to offset future capital gains.
At March 31, 2020, the capital loss carryforwards were as follows:
| | | | |
Capital loss carryforwards not subject to expiration: | | | | |
Long term | | | 2,263,736 | |
| | | | |
The tax character of distributions paid during the years ended March 31, 2020 and 2019, was as follows:
| | | | | | | | |
| | | 2020 | | | 2019 | |
| | | | |
Distributions paid from: | | | | | | | | |
Ordinary income | | $ | 1,965,243 | | | $ | 1,150,591 | |
Long term capital gain | | | 11,967,934 | | | | 22,473,559 | |
| | | | |
| | $ | 13,933,177 | | | $ | 23,624,150 | |
| | | | |
At March 31, 2020, the cost of investments, net unrealized appreciation (depreciation) and undistributed ordinary income for income tax purposes were as follows:
| | | | |
Cost of investments | | $ | 532,470,731 | |
| | | | |
| |
Unrealized appreciation | | $ | 37,308,877 | |
Unrealized depreciation | | | (190,356,547 | ) |
| | | | |
Net unrealized appreciation (depreciation) | | $ | (153,047,670 | ) |
| | | | |
| |
Distributable earnings: | | | | |
Undistributed ordinary income | | $ | 12,189,516 | |
| | | | |
Differences between income and/or capital gains as determined on a book basis and a tax basis are primarily due to differing treatment of corporate actions.
6. Investment Transactions
Purchases and sales of investments (excluding short term securities) for the year ended March 31, 2020, aggregated $34,236,314 and $281,391,401, respectively.
At March 31, 2020, in connection with securities lending transactions, the Fund loaned equity investments and received $2,811,982 of cash collateral. The gross amount of recognized liability for such transactions is included in payable upon return of securities loaned in the Statement of Assets and Liabilities. The agreements can be terminated at any time.
7. Concentration of Risk
Investing in foreign securities may include certain risks and considerations not typically associated with investing in U.S. securities, such as fluctuating currency values and changing local, regional and global economic, political and social conditions, which may result in greater market volatility. Current political and financial uncertainty surrounding the European Union may increase market volatility and the economic risk of investing in securities in Europe. In addition, certain foreign securities may not be as liquid as U.S. securities.
| | | | |
| | | |
30 | | Annual Report | | franklintempleton.com |
TEMPLETON GLOBAL INVESTMENT TRUST
NOTES TO FINANCIAL STATEMENTS
Templeton Emerging Markets Small Cap Fund(continued)
8. Novel Coronavirus Pandemic
The global outbreak of the novel coronavirus disease, known asCOVID-19, has caused adverse effects on many companies, sectors, nations, regions and the markets in general, and may continue for an unpredictable duration. The effects of this pandemic may materially impact the value and performance of the Fund, its ability to buy and sell fund investments at appropriate valuations and its ability to achieve its investment objectives.
9. Holdings of 5% Voting Securities of Portfolio Companies
The 1940 Act defines “affiliated companies” to include investments in portfolio companies in which a fund owns 5% or more of the outstanding voting securities. During the year ended March 31, 2020, investments in “affiliated companies” were as follows:
| | | | | | | | | | | | | | | | | | | | | | | | | | | | | | | | |
| Name of Issuer | | Value at Beginning of Year | | | Purchases | | | Sales | | | Realized Gain (Loss) | | | Net Change in Unrealized
Appreciation (Depreciation) | | | Value at End of Year | | | Number of Shares Held at End of Year | | | Dividend Income | |
Non-Controlled Affiliates | | | | | | | | | | | | | | | | | | | | | | | | | | | | | | | | |
Pinar Sut Mamulleri Sanayii AS | | | $3,542,439 | | | | $ — | | | $ | (3,548,448 | ) | | $ | (15,234,342 | ) | | | $15,240,351 | | | | $ —a | | | | —a | | | | $167,453 | |
Reysas Gayrimenkul Yatirim Ortakligi AS | | | 3,843,668 | | | | — | | | | (4,161,862 | ) | | | (5,768,791 | ) | | | $ 6,086,985 | | | | —a | | | | —a | | | | — | |
| | | | | | | | | | | | | | | | | | | | |
Total Affiliated Securities(Value is 0.0% of Net Assets) | | | $7,386,107 | | | | $ — | | | $ | (7,710,310 | ) | | $ | (21,003,133 | ) | | | $21,327,336 | | | | $ — | | | | | | | | $167,453 | |
| | | | | | | | | | | | |
aAs of March 31, 2020, no longer held by the fund.
10. Credit Facility
The Fund, together with other U.S. registered and foreign investment funds (collectively, Borrowers), managed by Franklin Templeton, are borrowers in a joint syndicated senior unsecured credit facility totaling $2 billion (Global Credit Facility) which matures on February 5, 2021. This Global Credit Facility provides a source of funds to the Borrowers for temporary and emergency purposes, including the ability to meet future unanticipated or unusually large redemption requests.
Under the terms of the Global Credit Facility, the Fund shall, in addition to interest charged on any borrowings made by the Fund and other costs incurred by the Fund, pay its share of fees and expenses incurred in connection with the implementation and maintenance of the Global Credit Facility, based upon its relative share of the aggregate net assets of all of the Borrowers, including an annual commitment fee of 0.15% based upon the unused portion of the Global Credit Facility. These fees are reflected in other expenses in the Statement of Operations. During the year ended March 31, 2020, the Fund did not use the Global Credit Facility.
11. Fair Value Measurements
The Fund follows a fair value hierarchy that distinguishes between market data obtained from independent sources (observable inputs) and the Fund’s own market assumptions (unobservable inputs). These inputs are used in determining the value of the Fund’s financial instruments and are summarized in the following fair value hierarchy:
| | • | | Level 1 – quoted prices in active markets for identical financial instruments |
| | • | | Level 2 – other significant observable inputs (including quoted prices for similar financial instruments, interest rates, prepayment speed, credit risk, etc.) |
| | • | | Level 3 – significant unobservable inputs (including the Fund’s own assumptions in determining the fair value of financial instruments) |
| | | | |
| | | |
| franklintempleton.com | | Annual Report | | 31 |
TEMPLETON GLOBAL INVESTMENT TRUST
NOTES TO FINANCIAL STATEMENTS
Templeton Emerging Markets Small Cap Fund(continued)
11. Fair Value Measurements(continued)
The input levels are not necessarily an indication of the risk or liquidity associated with financial instruments at that level.
A summary of inputs used as of March 31, 2020, in valuing the Fund’s assets carried at fair value, is as follows:
| | | | | | | | | | | | | | | | |
| | | Level 1 | | | Level 2 | | | Level 3 | | | Total | |
| | | | |
Assets: | | | | | | | | | | | | | | | | |
Investments in Securities:a | | | | | | | | | | | | | | | | |
Equity Investments:b | | | | | | | | | | | | | | | | |
Egypt | | $ | 5,244,681 | | | $ | 2,344,287 | | | $ | — | | | $ | 7,588,968 | |
Georgia | | | — | | | | 1,920,460 | | | | — | | | | 1,920,460 | |
India | | | — | | | | 52,834,904 | | | | — | | | | 52,834,904 | |
Poland | | | 887,611 | | | | 3,839,255 | | | | — | | | | 4,726,866 | |
Russia | | | — | | | | 1,979,045 | | | | — | | | | 1,979,045 | |
South Africa | | | — | | | | 1,218,033 | | | | — | | | | 1,218,033 | |
Sri Lanka | | | — | | | | 6,962,801 | | | | — | | | | 6,962,801 | |
Taiwan | | | 5,446,772 | | | | 63,491,305 | | | | — | | | | 68,938,077 | |
Thailand | | | — | | | | 7,311,684 | | | | — | | | | 7,311,684 | |
Turkey | | | — | | | | 7,075,054 | | | | — | | | | 7,075,054 | |
All Other Equity Investments | | | 214,097,173 | | | | — | | | | — | | | | 214,097,173 | |
Short Term Investments | | | 4,769,996 | | | | — | | | | — | | | | 4,769,996 | |
| | | | |
Total Investments in Securities | | $ | 230,446,233 | | | $ | 148,976,828 | | | $ | — | | | $ | 379,423,061 | |
| | | | |
aFor detailed categories, see the accompanying Statement of Investments.
bIncludes common and preferred stocks.
12. New Accounting Prouncements
In March 2020, the Financial Accounting Standards Board issued Accounting Standards Update (ASU)No. 2020-04, Reference Rate Reform (Topic 848) – Facilitation of the Effects of Reference Rate Reform on Financial Reporting. The amendments in the ASU provides optional temporary financial reporting relief from the effect of certain types of contract modifications due to the planned discontinuation of the London Interbank Offered Rate and other interbank-offered based reference rates as of the end of 2021. The ASU is effective for certain reference rate-related contract modifications that occur during the period March 12, 2020 through December 31, 2022. Management is currently evaluating the impact, if any, of applying this ASU.
13. Subsequent Events
The Fund has evaluated subsequent events through the issuance of the financial statements and determined that no events have occurred that require disclosure other than those already disclosed in the financial statements.
Abbreviations
| | |
Selected Portfolio |
| |
ADR | | American Depositary Receipt |
GDR | | Global Depositary Receipt |
| | | | |
| | | |
32 | | Annual Report | | franklintempleton.com |
TEMPLETON GLOBAL INVESTMENT TRUST
Report of Independent Registered Public Accounting Firm
To the Board of Trustees of Templeton Global Investment Trust and Shareholders of Templeton Emerging Markets Small Cap Fund
Opinion on the Financial Statements
We have audited the accompanying statement of assets and liabilities, including the statement of investments, of Templeton Emerging Markets Small Cap Fund (the “Fund”) as of March 31, 2020, the related statement of operations for the year ended March 31, 2020, the statement of changes in net assets for each of the two years in the period ended March 31, 2020, including the related notes, and the financial highlights for each of the periods indicated therein (collectively referred to as the “financial statements”). In our opinion, the financial statements present fairly, in all material respects, the financial position of the Fund as of March 31, 2020, the results of its operations for the year then ended, the changes in its net assets for each of the two years in the period ended March 31, 2020 and the financial highlights for each of the periods indicated therein in conformity with accounting principles generally accepted in the United States of America.
Basis for Opinion
These financial statements are the responsibility of the Fund’s management. Our responsibility is to express an opinion on the Fund’s financial statements based on our audits. We are a public accounting firm registered with the Public Company Accounting Oversight Board (United States) (PCAOB) and are required to be independent with respect to the Fund in accordance with the U.S. federal securities laws and the applicable rules and regulations of the Securities and Exchange Commission and the PCAOB.
We conducted our audits of these financial statements in accordance with the standards of the PCAOB. Those standards require that we plan and perform the audit to obtain reasonable assurance about whether the financial statements are free of material misstatement, whether due to error or fraud.
Our audits included performing procedures to assess the risks of material misstatement of the financial statements, whether due to error or fraud, and performing procedures that respond to those risks. Such procedures included examining, on a test basis, evidence regarding the amounts and disclosures in the financial statements. Our audits also included evaluating the accounting principles used and significant estimates made by management, as well as evaluating the overall presentation of the financial statements. Our procedures included confirmation of securities owned as of March 31, 2020 by correspondence with the custodian, transfer agent, and brokers; when replies were not received from the brokers, we performed other auditing procedures. We believe that our audits provide a reasonable basis for our opinion.
PricewaterhouseCoopers LLP
San Francisco, California
May 19, 2020
We have served as the auditor of one or more investment companies in the Franklin Templeton Group of Funds since 1948.
| | | | |
| | | |
| franklintempleton.com | | Annual Report | | 33 |
TEMPLETON GLOBAL INVESTMENT TRUST
Tax Information (unaudited)
Templeton Emerging Markets Small Cap Fund
Under Section 852(b)(3)(C) of the Internal Revenue Code, the Fund hereby reports the maximum amount allowable but no less than $11,967,934 as a long term capital gain dividend for the fiscal year ended March 31, 2020.
Under Section 871(k)(2)(C) of the Internal Revenue Code, the Fund hereby reports the maximum amount allowable but no less than $586,332 as a short term capital gain dividend for purposes of the tax imposed under Section 871(a)(1)(A) of the Internal Revenue Code for the fiscal year ended March 31, 2020.
Under Section 854(b)(1)(B) of the Internal Revenue Code, the Fund hereby reports the maximum amount allowable but no less than $8,698,275 as qualified dividends for purposes of the maximum rate under Section 1(h)(11) of the Internal Revenue Code for the fiscal year ended March 31, 2020. Distributions, including qualified dividend income, paid during calendar year 2020 will be reported to shareholders on Form1099-DIV bymid-February 2021. Shareholders are advised to check with their tax advisors for information on the treatment of these amounts on their individual income tax returns.
At March 31, 2019, more than 50% of the Fund’s total assets were invested in securities of foreign issuers. In most instances, foreign taxes were withheld from income paid to the Fund on these investments. As shown in the table below, the Fund hereby reports to shareholders the foreign source income and foreign taxes paid, pursuant to Section 853 of the Internal Revenue Code. This written statement will allow shareholders of record on December 19, 2019, to treat their proportionate share of foreign taxes paid by the Fund as having been paid directly by them. The shareholder shall consider these amounts as foreign taxes paid in the tax year in which they receive the Fund distribution.
The following table provides a detailed analysis of foreign tax paid, foreign source income, and foreign source qualified dividends as reported by the Fund to shareholders of record.
| | | | | | | | | | | | |
| | | Foreign Tax Paid | | | Foreign Source | | | Foreign Source Qualified | |
| Class | | Per Share | | | Income Per Share | | | Dividends Per Share | |
| |
Class A | | | $0.0673 | | | | $0.0797 | | | | $0.0341 | |
Class C | | | $0.0673 | | | | $ — | | | | $ — | |
Class R | | | $0.0673 | | | | $0.0825 | | | | $0.0356 | |
Class R6 | | | $0.0673 | | | | $0.1334 | | | | $0.0574 | |
Advisor Class | | | $0.0673 | | | | $0.1068 | | | | $0.0459 | |
Foreign Tax Paid Per Share is the amount per share available to you, as a tax credit (assuming you held your shares in the Fund for a minimum of 16 days during the31-day period beginning 15 days before theex-dividend date of the Fund’s distribution to which the foreign taxes relate), or, as a tax deduction.
Foreign Source Income Per Share is the amount per share of income dividends attributable to foreign securities held by the Fund, plus any foreign taxes withheld on these dividends. The amounts reported include foreign source qualified dividends that have not been adjusted for the rate differential applicable to such dividend income.1
Foreign Source Qualified Dividends Per Share is the amount per share of foreign source qualified dividends, plus any foreign taxes withheld on these dividends. These amounts represent the portion of the Foreign Source Income Per Share that were derived from qualified foreign securities held by the Fund.1
At the beginning of each calendar year, shareholders will receive Form1099-DIV which will include their share of taxes paid and foreign source income distributed during the prior calendar year. The Foreign Source Income reported on Form1099-DIV has not been adjusted for the rate differential on foreign source qualified dividend income. Shareholders are advised to check with their tax advisors for information on the treatment of these amounts on their individual income tax returns.
1. Qualified dividends are taxed at reduced long term capital gains tax rates. In determining the amount of foreign tax credit that may be applied against the U.S. tax liability of individuals receiving foreign source qualified dividends, adjustments may be required to the foreign tax credit limitation calculation to reflect the rate differential applicable to such dividend income. The rules however permit certain individuals to elect not to apply the rate differential adjustments for capital gains and/or dividends for any taxable year. Please consult your tax advisor and the instructions to Form 1116 for more information.
| | | | |
| | | |
34 | | Annual Report | | franklintempleton.com |
TEMPLETON GLOBAL INVESTMENT TRUST
Board Members and Officers
The name, year of birth and address of the officers and board members, as well as their affiliations, positions held with the Trust, principal occupations during at least the past five years and number of U.S. registered portfolios overseen in the Franklin Templeton fund complex, are shown below. Generally, each board member serves until that person’s successor is elected and qualified.
Independent Board Members
| | | | | | | | |
Name, Year of Birth and Address | | Position | | Length of Time Served | | Number of Portfolios in Fund Complex Overseen by Board Member* | | Other Directorships Held
During at Least the Past 5 Years |
| | | | | |
Harris J. Ashton (1932) 300 S.E. 2nd Street Fort Lauderdale, FL 33301-1923 | | Trustee | | Since 1994 | | 130 | | Bar-S Foods (meat packing company) (1981-2010). |
|
| Principal Occupation During at Least the Past 5 Years: |
Director of various companies; andformerly, Director, RBC Holdings, Inc. (bank holding company) (until 2002); and President, Chief Executive Officer and Chairman of the Board, General Host Corporation (nursery and craft centers) (until 1998). |
| | | | | |
Ann Torre Bates (1958) 300 S.E. 2nd Street Fort Lauderdale, FL 33301-1923 | | Trustee | | Since 2008 | | 31 | | Ares Capital Corporation (specialty finance company) (2010-present), United Natural Foods, Inc. (distributor of natural, organic and specialty foods) (2013-present), Allied Capital Corporation (financial services) (2003-2010), SLM Corporation (Sallie Mae) (1997-2014) and Navient Corporation (loan management, servicing and asset recovery) (2014-2016). |
|
| Principal Occupation During at Least the Past 5 Years: |
Director of various companies; andformerly, Executive Vice President and Chief Financial Officer, NHP Incorporated (manager of multifamily housing) (1995-1997); and Vice President and Treasurer, US Airways, Inc. (until 1995). |
| | | | | |
Mary C. Choksi (1950) 300 S.E. 2nd Street Fort Lauderdale, FL 33301-1923 | | Trustee | | Since 2017 | | 130 | | Avis Budget Group Inc. (car rental) (2007-present), Omnicom Group Inc. (advertising and marketing communications services) (2011-present) and White Mountains Insurance Group, Ltd. (holding company) (2017-present). |
|
| Principal Occupation During at Least the Past 5 Years: |
Director of various companies; andformerly, Founder and Senior Advisor, Strategic Investment Group (investment management group) (2015-2017); Founding Partner and Senior Managing Director, Strategic Investment Group (1987-2015); Founding Partner and Managing Director, Emerging Markets Management LLC (investment management firm) (1987-2011); and Loan Officer/Senior Loan Officer/Senior Pension Investment Officer, World Bank Group (international financial institution) (1977-1987). |
| | | | |
| | | |
| franklintempleton.com | | Annual Report | | 35 |
TEMPLETON GLOBAL INVESTMENT TRUST
Independent Board Members(continued)
| | | | | | | | |
Name, Year of Birth and Address | | Position | | Length of Time Served | | Number of Portfolios in Fund Complex Overseen by Board Member* | | Other Directorships Held During at Least the Past 5 Years |
| | | | | |
Edith E. Holiday (1952) 300 S.E. 2nd Street Fort Lauderdale, FL 33301-1923 | | Lead Independent Trustee | | Trustee since 1996 and Lead Independent Trustee since 2007 | | 130 | | Hess Corporation (exploration of oil and gas) (1993-present), Canadian National Railway (railroad) (2001-present), White Mountains Insurance Group, Ltd. (holding company) (2004-present), Santander Consumer USA Holdings, Inc. (consumer finance) (2016-present), RTI International Metals, Inc. (manufacture and distribution of titanium) (1999-2015) and H.J. Heinz Company (processed foods and allied products) (1994-2013). |
|
| Principal Occupation During at Least the Past 5 Years: |
Director or Trustee of various companies and trusts; andformerly, Assistant to the President of the United States and Secretary of the Cabinet (1990-1993); General Counsel to the United States Treasury Department (1989-1990); and Counselor to the Secretary and Assistant Secretary for Public Affairs and Public Liaison–United States Treasury Department (1988-1989). |
| | | | | |
J. Michael Luttig (1954) 300 S.E. 2nd Street Fort Lauderdale, FL 33301-1923 | | Trustee | | Since 2009 | | 130 | | Boeing Capital Corporation (aircraft financing) (2006-2010). |
|
| Principal Occupation During at Least the Past 5 Years: |
Private investor; andformerly, Counselor and Senior Advisor to the Chairman, CEO, and Board of Directors, of The Boeing Company (aerospace company), and member of the Executive Council (May 2019-January 1, 2020); Executive Vice President, General Counsel and member of the Executive Council, The Boeing Company (2006-2019); and Federal Appeals Court Judge, United States Court of Appeals for the Fourth Circuit (1991-2006). |
| | | | | |
David W. Niemiec (1949) 300 S.E. 2nd Street Fort Lauderdale, FL 33301-1923 | | Trustee | | Since 2006 | | 31 | | Hess Midstream LP (oil and gas midstream infrastructure) (2017-present). |
|
| Principal Occupation During at Least the Past 5 Years: |
Advisor, Saratoga Partners (private equity fund); andformerly, Managing Director, Saratoga Partners (1998-2001) and SBC Warburg Dillon Read (investment banking) (1997-1998); Vice Chairman, Dillon, Read & Co. Inc. (investment banking) (1991-1997); and Chief Financial Officer, Dillon, Read & Co. Inc. (1982-1997). |
| | | | | |
Larry D. Thompson (1945) 300 S.E. 2nd Street Fort Lauderdale, FL 33301-1923 | | Trustee | | Since 2006 | | 130 | | The Southern Company (energy company) (2014-present; previously 2010-2012), Graham Holdings Company (education and media organization) (2011-present) and Cbeyond, Inc. (business communications provider) (2010-2012). |
Principal Occupation During at Least the Past 5 Years: |
Director of various companies; Counsel, Finch McCranie, LLP (law firm) (2015-present); Independent Compliance Monitor and Auditor, Volkswagen AG (manufacturer of automobiles and commercial vehicles) (2017-present); John A. Sibley Professor of Corporate and Business Law, University of Georgia School of Law (2015-present; previously 2011-2012); andformerly, Executive Vice President – Government Affairs, General Counsel and Corporate Secretary, PepsiCo, Inc. (consumer products) (2012-2014); Senior Vice President – Government Affairs, General Counsel and Secretary, PepsiCo, Inc. (2004-2011); Senior Fellow of The Brookings Institution (2003-2004); Visiting Professor, University of Georgia School of Law (2004); and Deputy Attorney General, U.S. Department of Justice (2001-2003). |
| | | | |
| | | |
36 | | Annual Report | | franklintempleton.com |
TEMPLETON GLOBAL INVESTMENT TRUST
Independent Board Members(continued)
| | | | | | | | |
Name, Year of Birth and Address | | Position | | Length of Time Served | | Number of Portfolios in Fund Complex Overseen by Board Member* | | Other Directorships Held During at Least the Past 5 Years |
| | | | |
Constantine D. Tseretopoulos (1954) 300 S.E. 2nd Street Fort Lauderdale, FL 33301-1923 | | Trustee | | Since 2001 | | 20 | | None |
|
Principal Occupation During at Least the Past 5 Years: Physician, Chief of Staff, owner and operator of the Lyford Cay Hospital (1987-present); director of various nonprofit organizations; andformerly, Cardiology Fellow, University of Maryland (1985-1987); and Internal Medicine Resident, Greater Baltimore Medical Center (1982-1985). |
| | | | |
Robert E. Wade (1946) 300 S.E. 2nd Street Fort Lauderdale, FL 33301-1923 | | Trustee | | Since 2006 | | 31 | | El Oro Ltd (investments) (2003-2019). |
|
Principal Occupation During at Least the Past 5 Years: Attorney at law engaged in private practice as a sole practitioner (1972-2008) and member of various boards. |
|
| Interested Board Members and Officers |
Name, Year of Birth and Address | | Position | | Length of Time Served | | Number of Portfolios in Fund Complex Overseen by Board Member* | | Other Directorships Held During at Least the Past 5 Years |
| | | | |
**Gregory E. Johnson (1961) One Franklin Parkway San Mateo, CA 94403-1906 | | Trustee | | Since 2006 | | 141 | | None |
|
Principal Occupation During at Least the Past 5 Years: Executive Chairman, Chairman of the Board and Director, Franklin Resources, Inc.; officer and/or director or trustee, as the case may be, of some of the other subsidiaries of Franklin Resources, Inc. and of 39 of the investment companies in Franklin Templeton; Vice Chairman, Investment Company Institute; andformerly, Chief Executive Officer (2013-2020) and President (1994-2015), Franklin Resources, Inc. |
| | | | |
**Rupert H. Johnson, Jr. (1940) One Franklin Parkway San Mateo, CA 94403-1906 | | Chairman of the Board, Trustee and Vice President | | Chairman of the Board and Trustee since 2013 and Vice President since 1996 | | 130 | | None |
|
Principal Occupation During at Least the Past 5 Years: Director (Vice Chairman), Franklin Resources, Inc.; Director, Franklin Advisers, Inc.; and officer and/or director or trustee, as the case may be, of some of the other subsidiaries of Franklin Resources, Inc. and of 37 of the investment companies in Franklin Templeton. |
| | | | |
Alan Bartlett (1970) Lyford Cay Nassau, Bahamas | | President and Chief Executive Office – Investment Management | | Since December 2019 | | Not Applicable | | Not Applicable |
|
Principal Occupation During at Least the Past 5 Years: President and Director, Templeton Global Advisors Limited; Chief Investment Officer of Templeton Global Equity Group; officer of five of the investment companies in Franklin Templeton; Chairman of the Board, Goodhart Partners; andformerly, Chief Executive Officer, Goodhart Partners (2009-2019). |
| | | | |
Alison E. Baur (1964) One Franklin Parkway San Mateo, CA 94403-1906 | | Vice President | | Since 2012 | | Not Applicable | | Not Applicable |
|
Principal Occupation During at Least the Past 5 Years: Deputy General Counsel, Franklin Templeton; and officer of some of the other subsidiaries of Franklin Resources, Inc. and of 41 of the investment companies in Franklin Templeton. |
| | | | |
| | | |
| franklintempleton.com | | Annual Report | | 37 |
TEMPLETON GLOBAL INVESTMENT TRUST
Interested Board Members and Officers(continued)
| | | | | | | | |
Name, Year of Birth and Address | | Position | | Length of Time Served | | Number of Portfolios in Fund Complex Overseen by Board Member* | | Other Directorships Held During at Least the Past 5 Years |
Breda M. Beckerle (1958) 280 Park Avenue New York, NY 10017 | | Interim Chief Compliance Officer | | Since January 2020 | | Not Applicable | | Not Applicable |
| | |
| Principal Occupation During at Least the Past 5 Years: | | | | |
Chief Compliance Officer, Fiduciary Investment Management International, Inc., Franklin Advisers, Inc., Franklin Advisory Services, LLC, Franklin Mutual Advisers, LLC, Franklin Templeton Institutional, LLC; and officer of 41 of the investment companies in Franklin Templeton. |
| | | | |
Steven J. Gray (1955) One Franklin Parkway San Mateo, CA 94403-1906 | | Vice President | | Since 2009 | | Not Applicable | | Not Applicable |
| | |
| Principal Occupation During at Least the Past 5 Years: | | | | |
Senior Associate General Counsel, Franklin Templeton; Vice President, Franklin Templeton Distributors, Inc. and FASA, LLC; and officer of 41 of the investment companies in Franklin Templeton. |
| | | | |
Matthew T. Hinkle (1971) One Franklin Parkway San Mateo, CA 94403-1906 | | Chief Executive Officer – Finance and Administration | | Since 2017 | | Not Applicable | | Not Applicable |
|
Principal Occupation During at Least the Past 5 Years: Senior Vice President, Franklin Templeton Services, LLC; officer of 41 of the investment companies in Franklin Templeton; andformerly, Vice President, Global Tax (2012-April 2017) and Treasurer/Assistant Treasurer, Franklin Templeton (2009-2017). |
| | | | |
Robert G. Kubilis (1973) 300 S.E. 2nd Street Fort Lauderdale, FL 33301-1923 | | Chief Financial Officer, Chief Accounting Officer and Treasurer | | Since 2017 | | Not Applicable | | Not Applicable |
|
Principal Occupation During at Least the Past 5 Years: Treasurer, U.S. Fund Administration & Reporting and officer of 15 of the investment companies in Franklin Templeton. |
| | | | |
Robert Lim (1948) One Franklin Parkway San Mateo, CA 94403-1906 | | Vice President –AML Compliance | | Since 2016 | | Not Applicable | | Not Applicable |
| | |
| Principal Occupation During at Least the Past 5 Years: | | | | |
Vice President, Franklin Templeton Companies, LLC; Chief Compliance Officer, Franklin Templeton Distributors, Inc. and Franklin Templeton Investor Services, LLC; and officer of 41 of the investment companies in Franklin Templeton. |
| | | | |
Navid J. Tofigh (1972) One Franklin Parkway San Mateo, CA 94403-1906 | | Vice President | | Since 2015 | | Not Applicable | | Not Applicable |
|
Principal Occupation During at Least the Past 5 Years: Associate General Counsel and officer of 41 of the investment companies in Franklin Templeton. |
| | | | |
Craig S. Tyle (1960) One Franklin Parkway San Mateo, CA 94403-1906 | | Vice President | | Since 2005 | | Not Applicable | | Not Applicable |
|
Principal Occupation During at Least the Past 5 Years: General Counsel and Executive Vice President, Franklin Resources, Inc.; and officer of some of the other subsidiaries of Franklin Resources, Inc. and of 41 of the investment companies in Franklin Templeton. |
| | | | |
| | | |
38 | | Annual Report | | franklintempleton.com |
TEMPLETON GLOBAL INVESTMENT TRUST
Interested Board Members and Officers(continued)
| | | | | | | | |
Name, Year of Birth and Address | | Position | | Length of Time Served | | Number of Portfolios in Fund Complex Overseen by Board Member* | | Other Directorships Held During at Least the Past 5 Years |
| | | | |
Lori A. Weber (1964) 300 S.E. 2nd Street Fort Lauderdale, FL 33301-1923 | | Vice President and Secretary | | Vice President since 2011 and Secretary since 2013 | | Not Applicable | | Not Applicable |
|
Principal Occupation During at Least the Past 5 Years: Senior Associate General Counsel, Franklin Templeton; Assistant Secretary, Franklin Resources, Inc.; Vice President and Secretary, Templeton Investment Counsel, LLC; and officer of 41 of the investment companies in Franklin Templeton. |
*We base the number of portfolios on each separate series of the U.S. registered investment companies within the Franklin Templeton fund complex. These portfolios have a common investment manager or affiliated investment managers.
**Gregory E. Johnson is considered to be an interested person of the Fund under the federal securities laws due to his position as an officer and director of Franklin Resources, Inc. (Resources), which is the parent company of the Fund’s investment manager and distributor. Rupert H. Johnson, Jr. is considered to be an interested person of the Fund under the federal securities laws due to his position as an officer and director and major shareholder of Resources.
Note 1: Rupert H. Johnson, Jr. is the uncle of Gregory E. Johnson.
Note 2: Officer information is current as of the date of this report. It is possible that after this date, information about officers may change.
The Sarbanes-Oxley Act of 2002 and Rules adopted by the US Securities and Exchange Commission require the Fund to disclose whether the Fund’s Audit Committee includes at least one member who is an audit committee financial expert within the meaning of such Act and Rules. The Fund’s Board has determined that there is at least one such financial expert on the Audit Committee and has designated each of Ann Torre Bates and David W. Niemiec as an audit committee financial expert. The Board believes that Ms. Bates and Mr. Niemiec qualify as such an expert in view of their extensive business background and experience. Ms. Bates has served as a member of the Fund Audit Committee since 2008. She currently serves as a director of Ares Capital Corporation (2010-present) and United Natural Foods, Inc. (2013-present) and was formerly a director of Navient Corporation from 2014 to 2016, SLM Corporation from 1997 to 2014 and Allied Capital Corporation from 2003 to 2010, Executive Vice President and Chief Financial Officer of NHP Incorporated from 1995 to 1997 and Vice President and Treasurer of US Airways, Inc. until 1995. Mr. Niemiec has served as a member of the Fund Audit Committee since 2006, currently serves as an Advisor to Saratoga Partners and was formerly its Managing Director from 1998 to 2001 and serves as a director of Hess Midstream Partners LP (2017-present). Mr. Niemiec was formerly a director of Emeritus Corporation from 1999 to 2010 and OSI Pharmaceuticals, Inc. from 2006 to 2010, Managing Director of SBC Warburg Dillon Read from 1997 to 1998, and was Vice Chairman from 1991 to 1997 and Chief Financial Officer from 1982 to 1997 of Dillon, Read & Co. Inc. As a result of such background and experience, the Board believes that Ms. Bates and Mr. Niemiec have each acquired an understanding of generally accepted accounting principles and financial statements, the general application of such principles in connection with the accounting estimates, accruals and reserves, and analyzing and evaluating financial statements that present a breadth and level of complexity of accounting issues generally comparable to those of the Fund, as well as an understanding of internal controls and procedures for financial reporting and an understanding of audit committee functions. Ms. Bates and Mr. Niemiec are independent Board members as that term is defined under the applicable US Securities and Exchange Commission Rules and Releases.
The Statement of Additional Information (SAI) includes additional information about the board members and is available, without charge, upon request. Shareholders may call (800) DIALBEN/342-5236 to request the SAI.
| | | | |
| | | |
| franklintempleton.com | | Annual Report | | 39 |
TEMPLETON GLOBAL INVESTMENT TRUST
TEMPLETON EMERGING MARKETS SMALL CAP FUND
Shareholder Information
Board Approval of Investment Management Agreements
TEMPLETON GLOBAL INVESTMENT TRUST
Templeton Emerging Markets Small Cap Fund
(Fund)
At anin-person meeting held on February 25, 2020 (Meeting), the Board of Trustees (Board) of Templeton Global Investment Trust (Trust), including a majority of the trustees who are not “interested persons” as defined in the Investment Company Act of 1940 (Independent Trustees), reviewed and approved the continuance of the investment management agreement between Templeton Asset Management Ltd. (Manager) and the Trust, on behalf of the Fund (Management Agreement) for an additionalone-year period. The Independent Trustees received advice from and met separately with Independent Trustee counsel in considering whether to approve the continuation of the Management Agreement.
In considering the continuation of the Management Agreement, the Board reviewed and considered information provided by the Manager at the Meeting and throughout the year at meetings of the Board and its committees. The Board also reviewed and considered information provided in response to a detailed set of requests for information submitted to the Manager by Independent Trustee counsel on behalf of the Independent Trustees in connection with the annual contract renewal process. In addition, prior to the Meeting, the Independent Trustees held a telephonic contract renewal meeting at which the Independent Trustees conferred amongst themselves and Independent Trustee counsel about contract renewal matters and, in some cases, requested additional information from the Manager relating to the contract. The Board reviewed and considered all of the factors it deemed relevant in approving the continuance of the Management Agreement, including, but not limited to: (i) the nature, extent and quality of the services provided by the Manager; (ii) the investment performance of the Fund; (iii) the costs of the services provided and profits realized by the Manager and its affiliates from the relationship with the Fund; (iv) the extent to which economies of scale are realized as the Fund grows; and (v) whether fee levels reflect these economies of scale for the benefit of Fund investors.
In approving the continuance of the Management Agreement, the Board, including a majority of the Independent Trustees, determined that the terms of the Management Agreement are fair and reasonable and that the continuance of such Management Agreement is in the
interests of the Fund and its shareholders. While attention was given to all information furnished, the following discusses some primary factors relevant to the Board’s determination.
Nature, Extent and Quality of Services
The Board reviewed and considered information regarding the nature, extent and quality of investment management services provided by the Manager and its affiliates to the Fund and its shareholders. This information included, among other things, the qualifications, background and experience of the senior management and investment personnel of the Manager, as well as information on succession planning where appropriate; the structure of investment personnel compensation; oversight of third-party service providers; investment performance reports and related financial information for the Fund; reports on expenses and shareholder services; legal and compliance matters; risk controls; pricing and other services provided by the Manager and its affiliates; and management fees charged by the Manager and its affiliates to US funds and other accounts, including management’s explanation of differences among accounts where relevant. The Board also reviewed and considered an annual report on payments made by Franklin Templeton (FT) or the Fund to financial intermediaries, as well as a memorandum relating to third-party servicing arrangements, which included discussion of the changing distribution landscape for the Fund. The Board noted management’s continuing efforts and expenditures in establishing effective business continuity plans and developing strategies to address areas of heightened concern in the mutual fund industry, such as cybersecurity and liquidity risk management.
The Board also reviewed and considered the benefits provided to Fund shareholders of investing in a fund that is part of the FT family of funds. The Board noted the financial position of Franklin Resources, Inc. (FRI), the Manager’s parent, and its commitment to the mutual fund business as evidenced by its continued introduction of new funds, reassessment of the fund offerings in response to the market environment and project initiatives and capital investments relating to the services provided to the Fund by the FT organization. The Board specifically noted FT’s commitment to enhancing services and controlling costs, as reflected in its plan to outsource certain administrative functions, and growth opportunities, as evidenced by its upcoming acquisition of the Legg Mason companies. The Board acknowledged the change in leadership at FRI and the opportunity to hear from Jennifer Johnson, President and
| | | | |
| | | |
40 | | Annual Report | | franklintempleton.com |
TEMPLETON GLOBAL INVESTMENT TRUST
TEMPLETON EMERGING MARKETS SMALL CAP FUND
SHAREHOLDER INFORMATION
Chief Executive Officer of FRI, about goals she has for the company that will benefit the Fund.
Following consideration of such information, the Board was satisfied with the nature, extent and quality of services provided by the Manager and its affiliates to the Fund and its shareholders.
Fund Performance
The Board reviewed and considered the performance results of the Fund over various time periods ended December 31, 2019. The Board considered the performance returns for the Fund in comparison to the performance returns of mutual funds deemed comparable to the Fund included in a universe (Performance Universe) selected by Broadridge Financial Solutions, Inc. (Broadridge), an independent provider of investment company data. The Board received a description of the methodology used by Broadridge to select the mutual funds included in a Performance Universe. The Board also considered the performance returns for the Fund in comparison to the performance returns of a customized peer group (Performance Customized Peer Group) selected by the Manager. The Board further reviewed and considered Fund performance reports provided and discussions that occurred with portfolio managers at Board meetings throughout the year. A summary of the Fund’s performance results is below.
The Performance Universe for the Fund included the Fund and all retail and institutional emerging markets funds. The Performance Customized Peer Group for this Fund included only emerging markets funds that invest only in stocks that have total market cap within the range of the market capitalizations of companies in the MSCI Emerging Markets Small Cap Index at the time of purchase. The Board noted that the Fund’s annualized total return for theone-,three-and five-year periods was below the median and in the fifth quintile (worst) of its Performance Universe, but for the10-year period was above the median of its Performance Universe. The Board also noted that the Fund’s annualized total return for theone-, three- and five-year periods was below the median of its Performance Customized Peer Group, and for the10-year period was equal to the median of its Performance Customized Peer Group. The Board discussed this performance with management and management explained that the Performance Universe was not directly comparable to the Fund as the Performance Universe included global emerging market funds and was not limited to small cap funds. Management further explained that in comparison to the Performance Customized Peer
Group, the Fund’s investments had the lowest average market capitalization. Management noted that during the past four calendar years emerging marketmid-capitalization securities outperformed emerging market small-capitalization securities, which has been a headwind for the Fund’s performance. Management also explained that the Fund’s underperformance was primarily due to the Fund’s stock selection in Brazil, Taiwan, healthcare and consumer staples. The Board noted management’s steps to address the underperformance of the Fund during the past five calendar years, including making enhancements to the Fund’s investment process. The Board concluded that the Fund’s Management Agreement should be continued for an additionalone-year period, and management’s efforts should continue to be monitored.
Comparative Fees and Expenses
The Board reviewed and considered information regarding the Fund’s actual total expense ratio and its various components, including, as applicable, management fees; transfer agent expenses; underlying fund expenses; Rule12b-1 andnon-Rule12b-1 service fees; and othernon-management fees. The Board also noted the quarterly and annual reports it receives on all marketing support payments made by FT to financial intermediaries. The Board considered the actual total expense ratio and, separately, the contractual management fee rate, without the effect of fee waivers, if any (Management Rate) of the Fund in comparison to the median expense ratio and median Management Rate, respectively, of other mutual funds deemed comparable to and with a similar expense structure to the Fund selected by Broadridge (Expense Group). Broadridge fee and expense data is based upon information taken from each fund’s most recent annual report, which reflects historical asset levels that may be quite different from those currently existing, particularly in a period of market volatility. While recognizing such inherent limitation and the fact that expense ratios and Management Rates generally increase as assets decline and decrease as assets grow, the Board believed the independent analysis conducted by Broadridge to be an appropriate measure of comparative fees and expenses. The Broadridge Management Rate includes administrative charges, and the actual total expense ratio, for comparative consistency, was shown for Class A shares for the Fund and for Class A shares and Investor Class shares for each other fund in the Expense Group. The Board received a description of the methodology used by Broadridge to select the mutual funds included in an Expense Group.
| | | | |
| | | |
| franklintempleton.com | | Annual Report | | 41 |
TEMPLETON GLOBAL INVESTMENT TRUST
TEMPLETON EMERGING MARKETS SMALL CAP FUND
SHAREHOLDER INFORMATION
The Expense Group for the Fund included the Fund and 16 other emerging markets funds. The Board noted that the Management Rate and the actual total expense ratio for the Fund were above the medians of and the highest (most expensive) in its Expense Group. The Board discussed the expenses of this Fund with management and noted the Fund’s specialized focus on the small capitalization segment of the market, which generally carried higher management costs. The Board also noted that the Management Rate charged to the Fund was reduced effective April 1, 2019, and concluded that the fee was reasonable.
Profitability
The Board reviewed and considered information regarding the profits realized by the Manager and its affiliates in connection with the operation of the Fund. In this respect, the Board considered the Fund profitability analysis provided by the Manager that addresses the overall profitability of FT’s US fund business, as well as its profits in providing investment management and other services to each of the individual funds during the12-month period ended September 30, 2019, being the most recent fiscalyear-end for FRI. The Board noted that although management continually makes refinements to its methodologies used in calculating profitability in response to organizational and product-related changes, the overall methodology has remained consistent with that used in the Fund’s profitability report presentations from prior years. Additionally, PricewaterhouseCoopers LLP, auditor to FRI and certain FT funds, was engaged by the Manager to review and assess the allocation methodologies to be used solely by the Fund’s Board with respect to the profitability analysis.
The Board noted management’s belief that costs incurred in establishing the infrastructure necessary for the type of mutual fund operations conducted by the Manager and its affiliates may not be fully reflected in the expenses allocated to the Fund in determining its profitability, as well as the fact that the level of profits, to a certain extent, reflected operational cost savings and efficiencies initiated by management. As part of this evaluation, the Board considered the initiative currently underway to outsource certain operations, which effort would require considerable upfront expenditures by the Manager but, over the long run is expected to result in greater efficiencies. The Board also noted management’s expenditures in improving shareholder services provided to the Fund, as well as the need to implement systems and meet additional regulatory and compliance requirements resulting from recent US Securities and Exchange Commission and other regulatory
requirements, notably in the area of cybersecurity protections.
The Board also considered the extent to which the Manager and its affiliates might derive ancillary benefits from fund operations, including revenues generated from transfer agent services, potential benefits resulting from personnel and systems enhancements necessitated by fund growth, as well as increased leverage with service providers and counterparties. Based upon its consideration of all these factors, the Board concluded that the level of profits realized by the Manager and its affiliates from providing services to the Fund was not excessive in view of the nature, extent and quality of services provided to the Fund.
Economies of Scale
The Board reviewed and considered the extent to which the Manager may realize economies of scale, if any, as the Fund grows larger and whether the Fund’s management fee structure reflects any economies of scale for the benefit of shareholders. With respect to possible economies of scale, the Board noted the existence of management fee breakpoints, which operate generally to share any economies of scale with the Fund’s shareholders by reducing the Fund’s effective management fees as the Fund grows in size. The Board considered the Manager’s view that any analyses of potential economies of scale in managing a particular fund are inherently limited in light of the joint and common costs and investments the Manager incurs across the FT family of funds as a whole. The Board concluded that, to the extent economies of scale may be realized by the Manager and its affiliates, the Fund’s management fee structure provided a sharing of benefits with the Fund and its shareholders as the Fund grows.
Conclusion
Based on its review, consideration and evaluation of all factors it believed relevant, including the above-described factors and conclusions, the Board unanimously approved the continuation of the Management Agreement for an additionalone-year period.
Proxy Voting Policies and Procedures
The Fund’s investment manager has established Proxy Voting Policies and Procedures (Policies) that the Fund uses to determine how to vote proxies relating to portfolio securities. Shareholders may view the Fund’s complete Policies online at franklintempleton.com. Alternatively, shareholders may request copies of the Policies free of
| | | | |
| | | |
42 | | Annual Report | | franklintempleton.com |
TEMPLETON GLOBAL INVESTMENT TRUST
TEMPLETON EMERGING MARKETS SMALL CAP FUND
SHAREHOLDER INFORMATION
charge by calling the Proxy Group collect at (954)527-7678 or by sending a written request to: Franklin Templeton Companies, LLC, 300 S.E. 2nd Street, Fort Lauderdale, FL 33301, Attention: Proxy Group. Copies of the Fund’s proxy voting records are also made available online at franklintempleton.com and posted on the U.S. Securities and Exchange Commission’s website at sec.gov and reflect the most recent12-month period ended June 30.
Quarterly Statement of Investments
The Trust, on behalf of the Fund, files a complete statement of investments with the U.S. Securities and Exchange Commission for the first and third quarters for each fiscal year as an exhibit to its report on FormN-PORT. Shareholders may view the filed FormN-PORT by visiting the Commission’s website at sec.gov. The filed form may also be viewed and copied at the Commission’s Public Reference Room in Washington, DC. Information regarding the operations of the Public Reference Room may be obtained by calling(800) SEC-0330.
Householding of Reports and Prospectuses
You will receive the Fund’s financial reports every six months as well as an annual updated summary prospectus (prospectus available upon request). To reduce Fund expenses, we try to identify related shareholders in a household and send only one copy of the financial reports and summary prospectus. This process, called “house-holding,” will continue indefinitely unless you instruct us otherwise. If you prefer not to have these documents householded, please call us at (800)632-2301. At any time you may view current prospectuses/summary prospectuses and financial reports on our website. If you choose, you may receive these documents through electronic delivery.
| | | | |
| | | |
| franklintempleton.com | | Annual Report | | 43 |
This page intentionally left blank.
Authorized for distribution only when accompanied or preceded by a summary prospectus and/or prospectus. Investors should carefully consider a fund’s investment goals, risks, charges and expenses before investing. A prospectus contains this and other information; please read it carefully before investing.
To help ensure we provide you with quality service, all calls to and from our service areas are monitored and/or recorded.
| | | | | | |
 | | Annual Report and Shareholder Letter Templeton Emerging Markets Small Cap Fund |
| | | |
| | Investment Manager Templeton Asset Management Ltd. | | Distributor Franklin Templeton Distributors, Inc. (800) DIAL BEN®/342-5236 franklintempleton.com | | Shareholder Services (800)632-2301 |
| | |
| © 2020 Franklin Templeton Investments. All rights reserved. | | 426 A 05/20 |
| (a) | The Registrant has adopted a code of ethics that applies to its principal executive officers and principal financial and accounting officer. |
| (f) | Pursuant to Item 13(a)(1), the Registrant is attaching as an exhibit a copy of its code of ethics that applies to its principal executive officers and principal financial and accounting officer. |
| Item 3. | Audit Committee Financial Expert. |
| (a)(1) | The Registrant has an audit committee financial expert serving on its audit committee. |
| (2) | The audit committee financial experts are Ann Torre Bates and David W. Niemiec and they are “independent” as defined under the relevant Securities and Exchange Commission Rules and Releases. |
| Item 4. | Principal Accountant Fees and Services. |
(a) Audit Fees
The aggregate fees paid to the principal accountant for professional services rendered by the principal accountant for the audit of the registrant’s annual financial statements or for services that are normally provided by the principal accountant in connection with statutory and regulatory filings or engagements were $50,730 for the fiscal year ended March 31, 2020 and $149,234 for the fiscal year ended March 31, 2019.
(b) Audit-Related Fees
There were no fees paid to the principal accountant for assurance and related services rendered by the principal accountant to the registrant that are reasonably related to the performance of the audit of the registrant’s financial statements and are not reported under paragraph (a) of Item 4.
There were no fees paid to the principal accountant for assurance and related services rendered by the principal accountant to the registrant’s investment adviser and any entity controlling, controlled by or under common control with the investment adviser that provides ongoing services to the registrant that are reasonably related to the performance of the audit of their financial statements.
(c) Tax Fees
There were no fees paid to the principal accountant for professional services rendered by the principal accountant to the registrant for tax compliance, tax advice and tax planning.
The aggregate fees paid to the principal accountant for professional services rendered by the principal accountant to the registrant’s investment adviser and any entity controlling, controlled by or under common control with the investment adviser that provides ongoing services to the registrant for tax compliance, tax advice and tax planning were $10,000 for the fiscal year ended March 31, 2020 and $10,000 for the fiscal year ended March 31, 2019. The
services for which these fees were paid included professional fees in connection with tax treatment of equipment lease transactions and professional fees in connection with an Indonesia withholding tax refund claim.
(d) All Other Fees
The aggregate fees paid to the principal accountant for products and services rendered by the principal accountant to the registrant not reported in paragraphs (a)-(c) of Item 4 were $303 for the fiscal year ended March 31, 2020 and $0 for the fiscal year ended March 31, 2019. The services for which these fees were paid included review of materials provided to the fund Board in connection with the investment management contract renewal process.
The aggregate fees paid to the principal accountant for products and services rendered by the principal accountant to the registrant’s investment adviser and any entity controlling, controlled by or under common control with the investment adviser that provides ongoing services to the registrant not reported in paragraphs (a)-(c) of Item 4 were $160,144 for the fiscal year ended March 31, 2020 and $15,000 for the fiscal year ended March 31, 2019. The services for which these fees were paid included professional fees in connection with determining the feasibility of a U.S. direct lending structure, valuation services related to a fair value engagement, the issuance of an Auditor’s Certificate for South Korean regulatory shareholders disclosures, benchmarking services in connection with the ICI TA Survey and assets under management certification.
(e) (1) The registrant’s audit committee is directly responsible for approving the services to be provided by the auditors, including:
(i) pre-approval of all audit and audit related services;
(ii) pre-approval of allnon-audit related services to be provided to the Fund by the auditors;
(iii) pre-approval of allnon-audit related services to be provided to the registrant by the auditors to the registrant’s investment adviser or to any entity that controls, is controlled by or is under common control with the registrant’s investment adviser and that provides ongoing services to the registrant where thenon-audit services relate directly to the operations or financial reporting of the registrant; and
(iv) establishment by the audit committee, if deemed necessary or appropriate, as an alternative to committeepre-approval of services to be provided by the auditors, as required by paragraphs (ii) and (iii) above, of policies and procedures to permit such services to bepre-approved by other means, such as through establishment of guidelines or by action of a designated member or members of the committee; provided the policies and procedures are detailed as to the particular service and the committee is informed of each service and such policies and procedures do not include delegation of audit committee responsibilities, as contemplated under the Securities Exchange Act of 1934, to management; subject, in the case of (ii) through (iv), to any waivers, exceptions or exemptions that may be available under applicable law or rules.
(e) (2) None of the services provided to the registrant described in paragraphs (b)-(d) of Item 4 were approved by the audit committee pursuant to paragraph (c)(7)(i)(C) of Rule2-01 of regulationS-X.
(f) No disclosures are required by this Item 4(f).
(g) The aggregatenon-audit fees paid to the principal accountant for services rendered by the principal accountant to the registrant and the registrant’s investment adviser and any entity controlling, controlled by or under common control with the investment adviser that provides ongoing services to the registrant were $170,447 for the fiscal year ended March 31, 2020 and $25,000 for the fiscal year ended March 31, 2019.
(h) The registrant’s audit committee of the board has considered whether the provision ofnon-audit services that were rendered to the registrant’s investment adviser (not including anysub-adviser whose role is primarily portfolio management and is subcontracted with or overseen by another investment adviser), and any entity controlling, controlled by, or under common control with the investment adviser that provides ongoing services to the registrant that were notpre-approved pursuant to paragraph (c)(7)(ii) of Rule2-01 of RegulationS-X is compatible with maintaining the principal accountant’s independence.
| Item 5. | Audit Committee of Listed Registrants. N/A |
| Item 6. | Schedule of Investments. N/A |
| Item 7. | Disclosure of Proxy Voting Policies and Procedures forClosed-End Management Investment Companies. N/A |
| Item 8. | Portfolio Managers ofClosed-End Management Investment Companies. N/A |
| Item 9. | Purchases of Equity Securities byClosed-End Management Investment Company and Affiliated Purchasers. N/A |
| Item 10. | Submission of Matters to a Vote of Security Holders. |
There have been no changes to the procedures by which shareholders may recommend nominees to the Registrant’s Board of Trustees that would require disclosure herein.
| Item 11. | Controls and Procedures. |
(a) Evaluation of Disclosure Controls and Procedures. The Registrant maintains disclosure controls and procedures that are designed to provide reasonable assurance that information required to be disclosed in the Registrant’s filings under the Securities Exchange Act of 1934, as amended, and the Investment Company Act of 1940 is recorded, processed, summarized and reported within the periods specified in the rules and forms of the Securities and Exchange
Commission. Such information is accumulated and communicated to the Registrant’s management, including its principal executive officer and principal financial officer, as appropriate, to allow timely decisions regarding required disclosure. The Registrant’s management, including the principal executive officer and the principal financial officer, recognizes that any set of controls and procedures, no matter how well designed and operated, can provide only reasonable assurance of achieving the desired control objectives.
Within 90 days prior to the filing date of this Shareholder Report onForm N-CSR, the Registrant had carried out an evaluation, under the supervision and with the participation of the Registrant’s management, including the Registrant’s principal executive officer and the Registrant’s principal financial officer, of the effectiveness of the design and operation of the Registrant’s disclosure controls and procedures. Based on such evaluation, the Registrant’s principal executive officer and principal financial officer concluded that the Registrant’s disclosure controls and procedures are effective.
(b) Changes in Internal Controls. There have been no changes in the Registrant’s internal control over financial reporting that occurred during the period covered by this report that has materially affected, or is reasonably likely to materially affect the internal control over financial reporting.
| Item 12. | Disclosure of Securities Lending Activities forClosed-End Management Investment Company. N/A |
(a)(1)Code of Ethics
(a)(2)Certifications pursuant to Section 302 of the Sarbanes-Oxley Act of 2002 of Matthew T. Hinkle, Chief Executive Officer - Finance and Administration, and Robert G. Kubilis, Chief Financial Officer and Chief Accounting Officer
(b)Certifications pursuant to Section 906 of the Sarbanes-Oxley Act of 2002 of Matthew T. Hinkle, Chief Executive Officer - Finance and Administration, and Robert G. Kubilis, Chief Financial Officer and Chief Accounting Officer
SIGNATURES
Pursuant to the requirements of the Securities Exchange Act of 1934 and the Investment Company Act of 1940, the registrant has duly caused this report to be signed on its behalf by the undersigned, thereunto duly authorized.
| | |
| TEMPLETON GLOBAL INVESTMENT TRUST |
| |
| By | | S\MATTHEW T. HINKLE |
| | Matthew T. Hinkle |
| | Chief Executive Officer - Finance and Administration |
| | Date May 29, 2020 |
Pursuant to the requirements of the Securities Exchange Act of 1934 and the Investment Company Act of 1940, this report has been signed below by the following persons on behalf of the registrant and in the capacities and on the dates indicated.
| | |
| By | | S\MATTHEW T. HINKLE |
| | Matthew T. Hinkle |
| | Chief Executive Officer - Finance and Administration |
| | Date May 29, 2020 |
| |
By | | S\ROBERT G. KUBILIS |
| | Robert G. Kubilis |
| | Chief Financial Officer and Chief Accounting Officer |
| | Date May 29, 2020 |