UNITED STATES
SECURITIES AND EXCHANGE COMMISSION
Washington, DC 20549
FORMN-CSR
CERTIFIED SHAREHOLDER REPORT OF REGISTERED
MANAGEMENT INVESTMENT COMPANIES
Investment Company Act file number811-08226
Templeton Global Investment Trust
(Exact name of registrant as specified in charter)
300 S.E. 2nd Street, Fort Lauderdale, FL 33301-1923
(Address of principal executive offices) (Zip code)
Craig S. Tyle, One Franklin Parkway, San Mateo, CA 94403-1906
(Name and address of agent for service)
Registrant’s telephone number, including area code: (954)527-7500
Date of fiscal year end: 12/31
Date of reporting period: 12/31/19
| Item 1. | Reports to Stockholders. |
Sign up for electronic delivery at franklintempleton.com/edelivery
Internet Delivery of Fund Reports Unless You Request Paper Copies:Effective January 1, 2021, as permitted by the SEC, paper copies of the Fund’s shareholder reports will no longer be sent by mail, unless you specifically request them from the Fund or your financial intermediary. Instead, the reports will be made available on a website, and you will be notified by mail each time a report is posted and provided with a website link to access the report.
If you already elected to receive shareholder reports electronically, you will not be affected by this change and you need not take any action. If you have not signed up for electronic delivery, we would encourage you to join fellow shareholders who have. You may elect to receive shareholder reports and other communications electronically from the Fund by calling (800) 632-2301 or by contacting your financial intermediary.
You may elect to continue to receive paper copies of all your future shareholder reports free of charge by contacting your financial intermediary or, if you invest directly with a Fund, calling (800) 632-2301 to let the Fund know of your request. Your election to receive reports in paper will apply to all funds held in your account.
FRANKLIN TEMPLETON
Successful investing begins with ambition. And achievement only comes when you reach for it. That’s why we continually strive to deliver better outcomes for investors. No matter what your goals are, our deep, global investment expertise allows us to offer solutions that can help.
During our more than 70 years of experience, we’ve managed through all kinds of markets—up, down and those in between. We’re always preparing for what may come next. It’s because of this, combined with our strength as one of the world’s largest asset managers that we’ve earned the trust of millions of investors around the world.
Dear Shareholder:
During the 12 months ended December 31, 2019, global economic growth moderated amid ongoing U.S.-China trade disputes, but interest-rate reductions by many central banks and easing trade tensions near period-end contributed to a generally positive investment environment for stocks and bonds worldwide. Among major central banks, the U.S. Federal Reserve reduced its federal funds rate range by 0.25% three times in 2019, and the European Central Bank announced new stimulus measures including a cut to its deposit rate and a restart of its quantitative easing program. In this environment, global developed and emerging market stocks, as measured by the MSCI All Country World Index, posted a +27.30% total return.1 Global government and corporate bonds, as measured by the Bloomberg Barclays Multiverse Index, posted a +7.13% total return.1
We are committed to our long-term perspective and disciplined investment approach as we conduct a rigorous, fundamental analysis of securities with a regular emphasis on investment risk management.
Historically, patient investors have achieved rewarding results by evaluating their goals, diversifying their assets globally and maintaining a disciplined investment program, all hallmarks of the Templeton investment philosophy. We continue to recommend investors consult their financial advisors and review their portfolios to design a long-term strategy and portfolio allocation that meet their individual needs, goals and risk tolerance.
1. Source: Morningstar.
See www.franklintempletondatasources.com for additional data provider information.
Templeton Global Balanced Fund’s annual report includes more detail about prevailing conditions and a discussion about investment decisions during the period. Please remember all securities markets fluctuate, as do mutual fund share prices.
We thank you for investing with Franklin Templeton, welcome your questions and comments, and look forward to serving your investment needs in the years ahead.
Sincerely,

Alan Bartlett
Chief Investment Officer
Templeton Equity Group
This letter reflects our analysis and opinions as of December 31, 2019, unless otherwise indicated. The information is not a complete analysis of every aspect of any market, country, industry, security or fund. Statements of fact are from sources considered reliable.
| Not FDIC Insured | May Lose Value | No Bank Guarantee | ||
| franklintempleton.com | Not part of the annual report | 1 | ||
| Visitfranklintempleton.comfor fund updates, to access your account, or to find helpful financial planning tools. |
2 | Annual Report | franklintempleton.com | ||
Templeton Global Balanced Fund
This annual report for Templeton Global Balanced Fund covers the fiscal year ended December 31, 2019.
Your Fund’s Goal and Main Investments
The Fund seeks both income and capital appreciation. Under normal market conditions, the Fund invests in a diversified portfolio of debt and equity securities worldwide. The Fund normally invests at least 25% of its assets in fixed income securities and at least 25% of its assets in equity securities. The Fund’s equity component generally consists of primarily of common stocks of companies from a variety of industries located anywhere in the world, including developing markets, that offer or could offer the opportunity to realize capital appreciation and/or attractive dividend yields. The Fund’s fixed income component primarily consists of developed and developing country government and agency bonds and investment-grade and below investment-grade corporate debt securities that offer the opportunity to realize income.
Performance Overview
The Fund’s Class A shares posted a +6.96% cumulative total return for the 12 months under review. In comparison, the MSCI ACWI posted a +27.30% total return and the Bloomberg Barclays Multiverse Index posted a +7.13% total return.1 For the same period, the Custom 50% MSCI All Country World Index (ACWI) + 50% Bloomberg Barclays Multiverse Index (Blended Benchmark), posted a +17.04% cumulative total return.1 You can find the Fund’s long-term performance data in the Performance Summary beginning on page 10.
Performance data represent past performance, which does not guarantee future results. Investment return and principal value will fluctuate, and you may have a gain or loss when you sell your shares. Current performance may differ from figures shown. For most recent month-end performance, go tofranklintempleton.com or call(800) 342-5236.
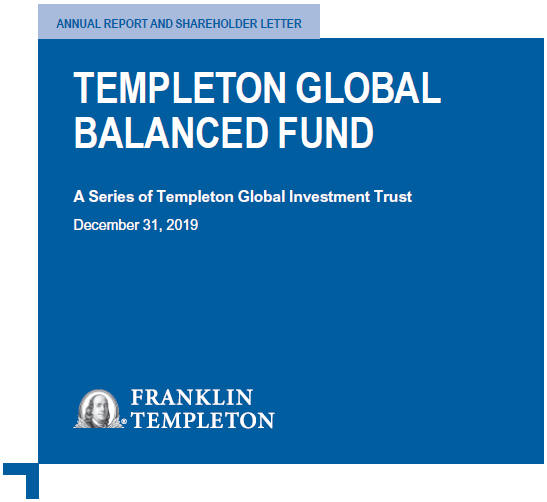
Asset Allocation*
Based on Total Net Assets as of 12/31/19
*Figures represent the net Fund exposure and include certain derivatives held in the portfolio (or their underlying reference assets) or unsettled trades and may not total 100% or may be negative due to rounding, use of any derivatives or other factors.
Economic and Market Overview
Global developed and emerging market stocks, as measured by the MSCI All Country World Index, posted strong returns during the reporting period. Although global economic growth slowed from 2018, interest-rate cuts from many central banks and the easing of trade tensions near period-end contributed to the generally positive environment for equities worldwide. Reflecting investor optimism and slowing but resilient economic growth, stocks advanced in every major region of the globe.
In the U.S., solid economic growth also supported equities, as healthy consumer spending and a strong labor market kept the economy afloat. The unemployment rate fell during the year, reaching 3.5% in September, November and December 2019, the lowest recorded unemployment rate in 50 years.2 Wages also grew, albeit at a moderate pace, and inflation remained persistently low. In addition, deficit spending by the U.S. government boosted current growth at the expense of long-term debt. Despite the strength in the consumer sector, some parts of the economy struggled, particularly heavy industry. Annual industrial production contracted late in the reporting period, manufacturing output stalled and capital spending declined.
1. Source: Morningstar. The Fund’s Blended Benchmark was calculated internally and rebalanced monthly.
The indexes are unmanaged and include reinvestment of any income or distributions. They do not reflect any fees, expenses or sales charges. One cannot invest directly in an index, and an index is not representative of the Fund’s portfolio.
2. U.S. Bureau of Labor Statistics.
The dollar value, number of shares or principal amount, and names of all portfolio holdings are listed in the Fund’s Consolidated Statement of Investments (SOI). The Consolidated SOI begins on page 21.
| franklintempleton.com | Annual Report | 3 | ||
TEMPLETON GLOBAL BALANCED FUND
The U.S. Federal Reserve (Fed) provided a substantial boost to equity markets early in the reporting period as it shifted to a more accommodative monetary policy. In January 2019, the Fed signaled the end of its tightening cycle and cut the federal funds rate three times thereafter, lowering it to a range of 1.50%–1.75%. Stocks responded positively to the interest-rate cuts and gained further in December 2019 after the Fed indicated it would likely leave interest rates unchanged in 2020.
Growth slowed overall in the eurozone, particularly in Germany and Italy. Germany, which is heavily reliant on exports, was adversely affected by the trade conflict between the U.S. and China and the resulting slowdown in global trade. In Italy, political uncertainty and budget concerns caused the country’s annual gross domestic product (GDP) growth to stall in 2019’s first quarter before accelerating in the second quarter. Despite sluggish economic conditions, European developed market equities, as measured by the MSCI Europe Index, posted strong returns overall, as easing trade tensions buoyed investor optimism and an electoral victory by the Conservative Party in the U.K. alleviated uncertainty surrounding Brexit. Although the European Central Bank left its headline refinancing rate unchanged, it lowered the deposit rate and restarted its bond-buying stimulus program, further supporting stocks.
Economic growth in Asia was relatively solid overall, despite slowdowns in several large emerging market countries, such as China and India. Japan’s economy grew amid the Bank of Japan’s sizable stimulus program. The trade war between the U.S. and China provided the backdrop for Asian stocks, which rose and fell in sync with investor sentiment regarding a trade deal. A phase one trade agreement between the two countries reached in December 2019 propelled Asian developed and emerging market stocks, which ultimately ended with strong returns over the 12-month period, as measured by the MSCI All Country Asia Index.
Emerging market stocks overall experienced several sharp selloffs and subsequent rebounds throughout the reporting period before ending with gains. In aggregate, economic growth slowed somewhat from 2018 but remained solid, although there was some variation among individual countries. Many central banks in emerging markets cut interest rates throughout the reporting period which, along with resilient GDP growth, provided a supportive environment for equities. Russian stocks posted the highest returns among emerging markets as the threat of further sanctions receded and a solid fiscal environment reassured investors. Overall, global emerging markets, as measured by
the MSCI Emerging Markets Index, posted robust returns for the period.
Global financial markets started 2019 on a positive note, with rallies in risk assets through much of the first quarter after a volatile end to 2018. However, escalating trade tensions between the U.S. and China sporadically resurfaced throughout the year, leading to broad resurgences in global risk aversion that intermittently affected market valuations. Both the U.S. Federal Reserve (Fed) and the European Central Bank (ECB) increasingly cited trade uncertainties and global risks as policy concerns during the year, with the Fed building a case for rate cuts and the ECB signaling that additional monetary accommodation could arrive in the Fall.
The Fed took a dovish turn at its January 2019 meeting, halting its series of rate hikes from 2018 and removing its prior statement that “some further gradual increases in the target range for the federal funds rate” would be consistent with economic activity and inflation objectives. Policy guidance turned even further dovish at the March meeting as the Fed kept rates unchanged and moderately downgraded U.S. growth forecasts for 2019 and 2020. The Fed ultimately kept the federal funds target rate unchanged at its May and June meetings before cutting rates for the first time in more than a decade at its July meeting. The rate cut was 25 basis points (bps). In August, the Fed discontinued its monthly pace of balance sheet unwinding, two months earlier than originally forecast. It then consecutively cut rates 25 bps at its September and October meetings to a range of 1.50% to 1.75%, before signaling that it would likely keep rates unchanged going forward, barring a material change in the economic outlook.
The shifts in monetary policy affected the shape of the U.S. Treasury (UST) yield curve throughout the year. A yield curve inversion from the three-month UST bill to the 10-year UST note took hold in May, reaching a low of 50 bps of spread inversion in late August. However, the Fed provided updated forward guidance in September and October that enabled the curve to steepen, erasing the inversion as the front end rallied lower while longer-term UST yields rose. The curve continued to steepen through the end of the year, as the Fed kept rates unchanged at its December meeting with the first 10-0 consensus policy vote since May. The updated dot plot in December indicated that a strong majority of Fed officials expected rates to remain unchanged through the end of 2020.
In our view, longer-term USTs appeared vulnerable to a potential rate shock given rising deficit spending, rising debt issuance and over-levered financial markets. Additionally, inflation risks remained significantly underpriced, in our view,
4 | Annual Report | franklintempleton.com | ||
TEMPLETON GLOBAL BALANCED FUND
given supply chain disruptions, immigration restrictions and exceptional tightness in the labor market. Given each of these factors, we believed longer-term USTs remained highly overvalued. The Fed can control short-term rates, but it cannot always control the economic and technical pressures on the longer end of the curve. We believed the yield curve inversion was overdone and that longer-term UST yields would rise.
Despite escalating trade disputes between the U.S. and China during much of the year, including a peak in retaliatory measures by each country in August, the U.S. and China appeared to reach agreement on a “phase one” trade deal in December, expected to be ratified on January 15. The potential resolution bolstered market sentiment, driving risk asset valuations higher in several markets across the globe. However, we continued to monitor the broader implications of trade tensions on multiple fronts and the potential ramifications to risk assets in various regions. Despite the positive developments on trade policy, risks for additional disputes remained elevated, in our view.
In Europe, the ECB kept its policy rate unchanged (0.0% main refinancing operations, -0.40% deposit facility) for most of the reporting period, but delivered on an anticipated stimulus package at its September meeting, dropping the deposit rate to -0.5% and scheduling the re-start of its quantitative easing (QE) program in November, at a pace of€20 billion in bond purchases per month. Mario Draghi kept rates unchanged at his final meeting as ECB president in October, before Christine Lagarde took over the post in November. Lagarde held her first policy meeting in December, keeping rates and the QE program unchanged, as largely expected. During the reporting period, it appeared Lagarde would maintain continuity with the policy framework she inherited from her predecessor, indicating her support for negative rates by commenting that the ECB has “done the right thing to act in favor of jobs and growth rather than the protection of savers.” We expected the euro to weaken against the U.S. dollar during the period on continued monetary accommodation from the ECB, as well as unresolved structural vulnerabilities in the eurozone.
The Bank of Japan (BOJ) kept monetary policy unchanged during the reporting period, retaining its 0.0% yield target on the 10-year Japanese government bond and its -0.1% target on the overnight rate. However, BOJ Governor Haruhiko Kuroda increasingly indicated a willingness to cut rates at future meetings if there were risks to achieving the 2.0% inflation target. We expected monetary policy to remain highly accommodative during the reporting period, but our expectations for weakness in the Japanese yen against the
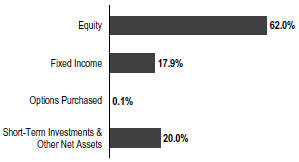
Geographic Composition*
Based on Total Net Assets as of 12/31/19
*Figures represent the net Fund exposure and include certain derivatives held in the portfolio (or their underlying reference assets) and may not total 100% or may be negative due to rounding, use of any derivatives or other factors.
U.S. dollar shifted to expectations for strength on softer policy divergence between the Fed and BOJ, and the yen’s potential to rally as a perceived safe haven during periods of risk aversion, given Japan’s strong external balances.
| franklintempleton.com | Annual Report | 5 | ||
TEMPLETON GLOBAL BALANCED FUND
A number of central banks around the world followed the dovish directions of the Fed and the ECB in 2019, taking the opportunity to cut their own domestic rates. Notably, Mexico and Indonesia cut their policy rates by 100 bps, India cut by 135 bps and Brazil cut by 200 bps. Overall, sovereign bond yields declined across much of the world during the reporting period. The yield on the 10-year UST note finished the period 77 bps lower at 1.92%, and the yield on the 10-year German Bund fell 43 bps to finish at -0.19%, after reaching its lowest level on record in August (-0.71%). On the whole, long-duration exposures tended to perform well in most markets, while currency valuations were more idiosyncratic to individual country dynamics.
Investment Strategy
We search for undervalued or out-of-favor debt and equity securities and for equity securities that offer or may offer current income. When choosing equity securities for the Fund, we use a fundamental research, value-oriented, long-term approach, focusing on the market price of a security relative to our evaluation of the company’s long-term earnings, asset value and cash flow potential, as reflected by various metrics. Because this is a global fund, we analyze global economic trends to identify global macro trends (for example, regions with strong economic growth), and evaluate market inefficiencies to identify investment opportunities stemming from market mispricings.
When choosing fixed income investments for the Fund, we perform an independent analysis of the securities being considered for the Fund’s portfolio, rather than relying principally on their ratings assigned by rating agencies. In our analysis of corporate debt securities, we consider a variety of factors, including a company’s experience and managerial strength; responsiveness to changes in interest rates and business conditions; debt maturity schedules and borrowing requirements; a company’s changing financial condition and market recognition of the change; and a security’s relative value based on such factors as anticipated cash flow, interest or dividend coverage, asset coverage and earnings prospects. With respect to sovereign debt securities, we consider market, political and economic conditions, and evaluate interest and currency exchange rate changes and credit risks. We regularly enter into currency-related transactions involving certain derivative instruments, including currency and cross currency forwards, but we may also use other derivative instruments, to provide a hedge against risks associated with other securities held in the Fund or to implement a currency investment strategy. The use of these derivative transactions may allow the Fund to obtain net long or net short exposures to selected
Top Five Equity Holdings
12/31/19
Company Sector/Industry, Country | % of Total Net Assets | |
Bayer AG Pharmaceuticals, Germany | 1.9% | |
Royal Dutch Shell PLC Oil, Gas & Consumable Fuels, U.K. | 1.9% | |
Veolia Environnement SA Multi-Utilities, France | 1.8% | |
Samsung Electronics Co. Ltd. Technology Hardware, Storage & Peripherals, South Korea | 1.8% | |
Kirin Holdings Co. Ltd. Beverages, Japan | 1.8% | |
currencies, interest rates, countries, durations or credit risks, and may be used for hedging or investment purposes.
What is a currency forward contract? |
A currency forward contract is an agreement between the Fund and a counterparty to buy or sell a foreign currency in exchange for another currency at a specific exchange rate on a future date. Currency forward contracts are privately traded in the interbank market, not on a centralized exchange.
|
Manager’s Discussion
We continued to allocate in favor of equities during the period as we sought to take advantage of valuation opportunities within emerging market equities. Within fixed income, we sought to take advantage of valuation opportunities in emerging market countries with favorable growth prospects, low indebtedness and higher reserves.
Equity
Global equities, as measured by the MSCI ACWI, rose during the 12-month period under review. Equities were supported by signs of easing U.S.-China trade tensions, including news of a “phase one” deal, as well as greater clarity on Brexit and hopes for continued accommodative policies by major central banks. International value stocks continued to underperform growth stocks during the period, which proved to be a headwind for the Fund.
In this environment, the equity portion of the Fund underperformed its benchmark index for the period, primarily due to stock selection in communication services, stock
6 | Annual Report | franklintempleton.com | ||
TEMPLETON GLOBAL BALANCED FUND
selection and an overweight in energy, and an underweight and stock selection in information technology (IT).3
In communication services, shares of Luxembourg-based satellite operator SES slumped late in 2019 after U.S. regulators opted for a public auction of C-band spectrum. Spectrum owners like SES and telecommunications firms generally prefer private auctions, which are quicker and not open to public scrutiny. Our analysis suggests SES’s period-end share price inaccurately reflected little or no upside from spectrum monetization, a situation which left the core business trading at what we viewed as attractive valuations. We remain constructive on the stock given the firm’s strong balance sheet, the healthy dividend yield, and our expectation of stabilization and renewed growth in SES’s core business over a long-term investment horizon.
In energy, investors punished Royal Dutch Shell for disappointing earnings in the second quarter of 2019. The report showed poor performance across all divisions of the Netherlands-based oil and gas company, and caused concerns about whether Shell’s cash flow is sufficient to cover capital spending, dividends and share repurchases. We believe the stock will remain at relatively low levels until the company demonstrates consistent performance. We still see upside due to the company’s resilient natural gas operations and new projects coming online, which is improving cash flow and returns.
We sold out of several IT holdings that looked fairly valued and subject to risks associated with slowing revenue growth and greater regulatory scrutiny. With sector strength driven by an increase in price-to-earnings ratios, not earnings growth, we have continued to view high-flying tech stocks as especially vulnerable to a shift in sentiment or inflection in the cycle. Within the sector, we have avoided expensive, momentum-driven stocks, finding opportunities instead among hardware companies with restructuring potential and semiconductor manufacturers excessively pressured by supply concerns. We have more occasionally found opportunities among mature software firms with healthy cash flows and new growth levers.
In contrast, an underweight in the materials sector and stock selection in the industrials sector contributed to relative performance.4
In industrials, shares of United Parcel Service (UPS), the world’s largest package delivery company, rose after the company reported record profits, ending an 11-quarter slump in operating margins. Looking ahead, UPS has been investing in new automated distribution centers that should help lower overall operating costs. Ecommerce giant Amazon.com is expected to remain a large customer due to the extensive global shipping network that UPS has established.
Regionally, stock selection and overweights in Europe and Asia detracted significantly from relative performance. We believe political risks in Europe are largely reflected in depressed valuations and that regional stocks would likely respond positively to even modest signs of conciliation. Stock selection and an underweight in North America also detracted. While no regions contributed to relative performance, stock selection in Switzerland, France and South Korea did help relative results.
Top Five Fixed Income Holdings*
12/31/19
Issue/Issuer
| % of Total Net Assets
| |
Government of Mexico | 3.2% | |
Nota do Tesouro Nacional | 3.1% | |
Government of India | 2.7% | |
Government of Indonesia | 2.5% | |
Korea Treasury Bond | 2.3% | |
*Excludes short-term investments.
Fixed Income
During the reporting period, the strategy continued to seek select duration exposures in countries that have attractive risk-adjusted yields, strong or improving economic fundamentals and prudent fiscal and monetary policies. Several emerging markets continued to offer significantly higher yields than those available in the developed markets. The strategy also maintained negative duration exposure to longer-term U.S. Treasuries as the team believed that inflation pressures, rising deficit spending and surging levels of debt issuance were significantly underpriced risks in the longer-term U.S. Treasury markets. The strategy also increased its allocations to undervalued safe-haven assets
3. The communication services sector comprises diversified telecommunication services, interactive media and services, media, and wireless telecommunication services in the SOI. The energy sector comprises energy equipment and services and oil, gas and consumable fuels in the SOI. The information technology sector comprises electronic equipment, instruments and components; semiconductors and semiconductor equipment; software; and technology hardware, storage and peripherals in the SOI.
4. The materials sector comprises metals and mining in the SOI. The industrials sector comprises air freight and logistics, industrial conglomerates, machinery and marine in the SOI.
See www.franklintempletondatasources.com for additional data provider information.
| franklintempleton.com | Annual Report | 7 | ||
TEMPLETON GLOBAL BALANCED FUND
to hedge against global financial market risks associated with geopolitical tensions and price distortions from ongoing loose monetary policy across the developed world, notably including the Japanese yen, Swiss franc, Swedish krona and Norwegian krone. The strategy held a net-negative position in the euro to hedge against broad-based U.S. dollar strength and unresolved structural risks across Europe, and a net-negative position in the Australian dollar to hedge against broad emerging market risks. During the period, we used forward currency exchange contracts to actively manage currencies. We also used interest-rate swaps to tactically manage duration exposures.
What is duration? |
Duration is a measure of a bond’s price sensitivity to interest-rate changes. In general, a portfolio of securities with a lower duration can be expected to be less sensitive to interest-rate changes than a portfolio with a higher duration.
|
What is an interest-rate swap? |
An interest-rate swap is an agreement between two parties to exchange interest-rate payment obligations, generally one based on an interest rate fixed to maturity and the other based on an interest rate that changes in accordance with changes in a designated benchmark (for example, LIBOR, prime, commercial paper or other benchmarks).
|
During the period, the Fund’s positive absolute performance was primarily attributable to currency positions. Interest-rate strategies and overall credit exposures had largely neutral effects on absolute results. Among currencies, the Fund’s net-negative position in the euro contributed to absolute performance, as did currency positions in Asia ex-Japan (the Indonesian rupiah). However, currency positions in Africa and Latin America detracted from absolute results (the Argentine peso and Ghanaian cedi detracted, while the Mexican peso contributed). The Fund maintained a defensive approach regarding interest rates in developed markets, while holding duration exposures in select emerging markets. Negative duration exposure to USTs detracted from absolute performance, while select duration exposures in Asia ex-Japan (Indonesia and India), Africa (Ghana) and Latin America (Brazil) contributed.
On a relative basis, the Fund underperformed its benchmark due to interest-rate strategies, followed by overall credit exposures. Currency positions contributed to relative results. The Fund maintained a defensive approach regarding interest rates in developed markets, while holding duration exposures in select emerging markets. Underweighted duration exposure in the U.S. detracted from relative
performance, as did select underweighted duration exposures in Europe. However, select overweighted duration exposures in Asia ex-Japan (Indonesia and India), Africa (Ghana) and Latin America (Brazil) contributed to relative results. Among credit exposures, underweighted exposure to investment-grade corporate bonds detracted from relative return. Among currencies, the Fund’s underweighted position in the euro contributed to relative performance, as did overweighted currency positions in Asia ex-Japan (the Indonesian rupiah). However, overweighted currency positions in Latin America and Africa detracted from relative results (the Argentine peso and Ghanaian cedi detracted, while the Mexican peso contributed).
Subsequent to fiscal year-end December 31, 2019, Heather Arnold and Norman J. Boersma stepped off the Fund effective January 1, 2020. Herbert Arnett Jr. was added as portfolio manager also effective January 1, 2020.
Thank you for your continued participation in Templeton Global Balanced Fund. We look forward to serving your future investment needs.
 |
Michael Hasenstab, Ph.D.Co-Lead Portfolio Manager | |
 |
Heather Arnold, CFA Co-Lead Portfolio Manager | |
| Warren Pustam, CFA | ||
| Co-Lead Portfolio Manager | ||
| Norman J. Boersma, CFA | ||
| Co-Lead Portfolio Manager | ||


8 | Annual Report | franklintempleton.com | ||
TEMPLETON GLOBAL BALANCED FUND
The foregoing information reflects our analysis, opinions and portfolio holdings as of December 31, 2019, the end of the reporting period. The way we implement our main investment strategies and the resulting portfolio holdings may change depending on factors such as market and economic conditions. These opinions may not be relied upon as investment advice or an offer for a particular security. The information is not a complete analysis of every aspect of any market, country, industry, security or the Fund. Statements of fact are from sources considered reliable, but the investment manager makes no representation or warranty as to their completeness or accuracy. Although historical performance is no guarantee of future results, these insights may help you understand our investment management philosophy.
| franklintempleton.com | Annual Report | 9 | ||
TEMPLETON GLOBAL BALANCED FUND
Performance Summary as of December 31, 20191
The performance table and graphs do not reflect any taxes that a shareholder would pay on Fund dividends, capital gain distributions, if any, or any realized gains on the sale of Fund shares. Total return reflects reinvestment of the Fund’s dividends and capital gain distributions, if any, and any unrealized gains or losses. Your dividend income will vary depending on dividends or interest paid by securities in the Fund’s portfolio, adjusted for operating expenses of each class. Capital gain distributions are net profits realized from the sale of portfolio securities.
Performance as of 12/31/191
Cumulative total return excludes sales charges. Average annual total return includes maximum sales charges. Sales charges will vary depending on the size of the investment and the class of share purchased. The maximum is 5.50% and the minimum is 0%.Class A:5.50% maximum initial sales charge;Advisor Class:no sales charges. For other share classes, visitfranklintempleton.com.
| Share Class | | Cumulative Total Return | 2 | | Average Annual Total Return | 3 | ||
| ||||||||
A4 | ||||||||
1-Year | +6.96% | +1.12% | ||||||
| ||||||||
5-Year | +11.83% | +1.09% | ||||||
| ||||||||
10-Year | +62.96% | +4.42% | ||||||
| ||||||||
Advisor | ||||||||
1-Year | +7.57% | +7.57% | ||||||
| ||||||||
5-Year | +13.59% | +2.58% | ||||||
| ||||||||
10-Year | +67.86% | +5.32% | ||||||
| ||||||||
Performance data represent past performance, which does not guarantee future results. Investment return and principal value will fluctuate, and you may have a gain or loss when you sell your shares. Current performance may differ from figures shown. For most recent month-end performance, go tofranklintempleton.comor call(800) 342-5236.
See page 12 for Performance Summary footnotes.
10 | Annual Report | franklintempleton.com | ||
TEMPLETON GLOBAL BALANCED FUND
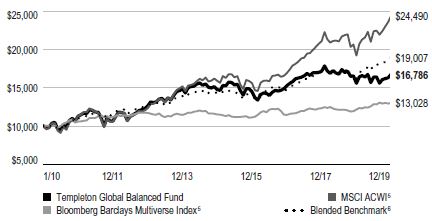
PERFORMANCE SUMMARY
Total Return Index Comparison for a Hypothetical $10,000 Investment
Total return represents the change in value of an investment over the periods shown. It includes any applicable maximum sales charge, Fund expenses, account fees and reinvested distributions. The unmanaged indexes include reinvestment of any income or distributions. They differ from the Fund in composition and do not pay management fees or expenses. One cannot invest directly in an index.
Class A(1/1/10–12/31/19)
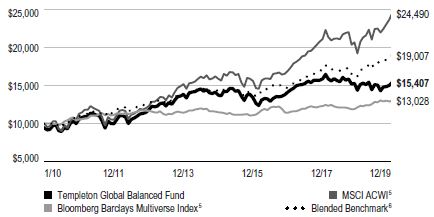
Advisor Class(1/1/10–12/31/19)
| franklintempleton.com | Annual Report | 11 | ||
TEMPLETON GLOBAL BALANCED FUND
PERFORMANCE SUMMARY
Distributions(1/1/19–12/31/19)
| Share Class | Net Investment Income | |
A | $0.1195 | |
A1 | $0.1195 | |
C | $0.0975 | |
C1 | $0.1060 | |
R | $0.1123 | |
R6 | $0.1296 | |
Advisor | $0.1267 | |
Total Annual Operating Expenses6
| Share Class | With Fee Waiver | Without Fee Waiver | ||||
A | 1.19% | 1.22% | ||||
Advisor | 0.94% | 0.97% | ||||
Each class of shares is available to certain eligible investors and has different annual fees and expenses, as described in the prospectus.
All investments involve risks, including possible loss of principal. Special risks are associated with foreign investing, including currency fluctuations, economic instability and political developments; investments in emerging markets involve heightened risks related to the same factors. Stock prices fluctuate, sometimes rapidly and dramatically, due to factors affecting individual companies, particular industries or sectors, or general market conditions. Bond prices generally move in the opposite direction of interest rates. Thus, as the prices of bonds in the Fund adjust to a rise in interest rates, the Fund’s share price may decline. The risks associated with higher yielding, lower rated debt securities include higher risk of default and loss of principal. The markets for a particular security or instrument or type of security or instrument are or may become relatively illiquid. Reduced liquidity will have an adverse impact on the security’s value and on the Fund’s ability to sell such securities or instruments when necessary to meet the Fund’s liquidity needs or in response to a specific market event. The Fund’s investment in derivative securities, such as swaps, financial futures and option contracts, and use of foreign currency techniques involve special risks as such may not achieve the anticipated benefits and/or may result in losses to the Fund. The Fund’s prospectus also includes a description of the main investment risks.
1. The Fund has a fee waiver associated with any investment it makes in a Franklin Templeton money fund and/or other Franklin Templeton fund, contractually guaranteed through 4/30/20. Fund investment results reflect the fee waiver; without this waiver, the results would have been lower.
2. Cumulative total return represents the change in value of an investment over the periods indicated.
3. Average annual total return represents the average annual change in value of an investment over the periods indicated. Return for less than one year, if any, has not been annualized.
4. Prior to 9/10/18, these shares were offered at a higher initial sales charge of 5.75%, thus actual returns (with sales charges) would have differed. Average annual total returns (with sales charges) have been restated to reflect the current maximum initial sales charge of 5.50%.
5. Source: Morningstar. The MSCI ACWI is a free float-adjusted, market capitalization-weighted index designed to measure equity market performance in global developed and emerging markets. The Bloomberg Barclays Multiverse Index provides a broad-based measure of the global fixed income bond market. The index represents the union of the Global Aggregate Index and the Global High Yield Index and captures investment-grade and high yield securities in all eligible currencies.
6. Source: FactSet. The Blended Benchmark was calculated internally and rebalanced monthly and was composed of 50% for the MSCI ACWI and 50% for the Bloomberg Barclays Multiverse Index.
7. Figures are as stated in the Fund’s current prospectus and may differ from the expense ratios disclosed in the Your Fund’s Expenses and Financial Highlights sections in this report. In periods of market volatility, assets may decline significantly, causing total annual Fund operating expenses to become higher than the figures shown.
See www.franklintempletondatasources.com for additional data provider information.
12 | Annual Report | franklintempleton.com | ||
TEMPLETON GLOBAL BALANCED FUND
As a Fund shareholder, you can incur two types of costs: (1) transaction costs, including sales charges (loads) on Fund purchases and redemptions; and (2) ongoing Fund costs, including management fees, distribution and service (12b-1) fees, and other Fund expenses. All mutual funds have ongoing costs, sometimes referred to as operating expenses. The table below shows ongoing costs of investing in the Fund and can help you understand these costs and compare them with those of other mutual funds. The table assumes a $1,000 investment held for the six months indicated.
Actual Fund Expenses
The table below provides information about actual account values and actual expenses in the columns under the heading “Actual.” In these columns the Fund’s actual return, which includes the effect of Fund expenses, is used to calculate the “Ending Account Value” for each class of shares. You can estimate the expenses you paid during the period by following these steps (of course, your account value and expenses will differ from those in this illustration): Divide your account value by $1,000 (if your account had an $8,600 value, then $8,600 ÷ $1,000 = 8.6). Then multiply the result by the number in the row for your class of shares under the headings “Actual” and “Expenses Paid During Period” (if Actual Expenses Paid During Period were $7.50, then 8.6 x $7.50 = $64.50). In this illustration, the actual expenses paid this period are $64.50.
Hypothetical Example for Comparison with Other Funds
Under the heading “Hypothetical” in the table, information is provided about hypothetical account values and hypothetical expenses based on the Fund’s actual expense ratio and an assumed rate of return of 5% per year before expenses, which is not the Fund’s actual return. This information may not be used to estimate the actual ending account balance or expenses you paid for the period, but it can help you compare ongoing costs of investing in the Fund with those of other funds. To do so, compare this 5% hypothetical example for the class of shares you hold with the 5% hypothetical examples that appear in the shareholder reports of other funds.
Please note that expenses shown in the table are meant to highlight ongoing costs and do not reflect any transactional costs. Therefore, information under the heading “Hypothetical” is useful in comparing ongoing costs only, and will not help you compare total costs of owning different funds. In addition, if transactional costs were included, your total costs would have been higher.
Actual (actual return after expenses) | Hypothetical (5% annual return before expenses) | |||||||||||||||||
Share Class | Beginning Account Value 7/1/19 | Ending Account Value 12/31/19 | Expenses Paid During Period 7/1/19–12/31/191, 2 | Ending Account Value 12/31/19 | Expenses Paid During Period 7/1/19–12/31/191, 2 | Net Annualized Expense Ratio2 | ||||||||||||
| A | $1,000 | $1,017.30 | $5.95 | $1,019.31 | $5.96 | 1.17% | ||||||||||||
| A1 | $1,000 | $1,017.30 | $5.95 | $1,019.31 | $5.96 | 1.17% | ||||||||||||
| C | $1,000 | $1,013.30 | $9.74 | $1,015.53 | $9.75 | 1.92% | ||||||||||||
| C1 | $1,000 | $1,014.80 | $7.97 | $1,017.29 | $7.98 | 1.57% | ||||||||||||
| R | $1,000 | $1,015.90 | $7.16 | $1,018.10 | $7.17 | 1.41% | ||||||||||||
| R6 | $1,000 | $1,019.10 | $4.22 | $1,021.02 | $4.23 | 0.83% | ||||||||||||
| Advisor | $1,000 | $1,022.10 | $4.69 | $1,020.57 | $4.69 | 0.92% | ||||||||||||
1. Expenses are equal to the annualized expense ratio for the six-month period as indicated above—in the far right column—multiplied by the simple average account value over the period indicated, and then multiplied by 184/365 to reflect the one-half year period.
2. Reflects expenses after fee waivers and expense reimbursements. Does not include acquired fund fees and expenses.
| franklintempleton.com | Annual Report | 13 | ||
TEMPLETON GLOBAL INVESTMENT TRUST
Consolidated Financial Highlights
Templeton Global Balanced Fund
| Year Ended December 31, | Year Ended March 31, | |||||||||||||||||||||||
2019 | 2018 | 2017 | 2016a | 2016 | 2015 | |||||||||||||||||||
Class A | ||||||||||||||||||||||||
Per share operating performance (for a share outstanding throughout the year) | ||||||||||||||||||||||||
Net asset value, beginning of year | $ 2.77 | $ 3.17 | $ 2.91 | $ 2.72 | $ 3.13 | $ 3.30 | ||||||||||||||||||
Income from investment operationsb: | ||||||||||||||||||||||||
Net investment incomec | 0.11 | 0.10 | 0.09 | 0.07 | 0.08 | 0.08 | ||||||||||||||||||
Net realized and unrealized gains (losses) | 0.08 | (0.38 | ) | 0.25 | 0.15 | (0.32 | ) | (0.07 | ) | |||||||||||||||
Total from investment operations | 0.19 | (0.28 | ) | 0.34 | 0.22 | (0.24 | ) | 0.01 | ||||||||||||||||
Less distributions from: | ||||||||||||||||||||||||
Net investment income | (0.12 | ) | (0.12 | ) | (0.08 | ) | (0.03 | ) | (0.09 | ) | (0.18 | ) | ||||||||||||
Net realized gains | — | — | — | — | (0.08 | ) | — | |||||||||||||||||
Total distributions | (0.12 | ) | (0.12 | ) | (0.08 | ) | (0.03 | ) | (0.17 | ) | (0.18 | ) | ||||||||||||
Net asset value, end of year | $ 2.84 | $ 2.77 | $ 3.17 | $ 2.91 | $ 2.72 | $ 3.13 | ||||||||||||||||||
Total returnd | 6.96% | (9.44)% | 12.18% | 7.97% | (7.74)% | 0.38% | ||||||||||||||||||
Ratios to average net assetse | ||||||||||||||||||||||||
Expenses before waiver and payments by affiliates and expense reduction | 1.22% | 1.19% | 1.17% | 1.16% | 1.11% | 1.11% | ||||||||||||||||||
Expenses net of waiver and payments by affiliates and expense reductionf | 1.19% | 1.16% | 1.14% | 1.15% | 1.10% | 1.11% | g | |||||||||||||||||
Net investment income | 3.81% | 3.17% | 2.82% | 3.28% | 2.55% | 2.55% | ||||||||||||||||||
Supplemental data | ||||||||||||||||||||||||
Net assets, end of year (000’s) | $465,915 | $557,604 | $745,957 | $780,810 | $987,949 | $1,117,109 | ||||||||||||||||||
Portfolio turnover rate | 26.62% | 45.92% | 34.25% | 16.66% | 44.25% | 20.90% | ||||||||||||||||||
aFor the period April 1, 2016 to December 31, 2016.
bThe amount shown for a share outstanding throughout the period may not correlate with the Consolidated Statement of Operations for the period due to the timing of sales and repurchases of the Fund’s shares in relation to income earned and/or fluctuating fair value of the investments of the Fund.
cBased on average daily shares outstanding.
dTotal return does not reflect sales commissions or contingent deferred sales charges, if applicable, and is not annualized for periods less than one year.
eRatios are annualized for periods less than one year.
fBenefit of expense reduction rounds to less than 0.01%.
gBenefit of waiver and payments by affiliates rounds to less than 0.01%.
14 | Annual Report | The accompanying notes are an integral part of these consolidated financial statements. | franklintempleton.com | ||
TEMPLETON GLOBAL INVESTMENT TRUST
CONSOLIDATED FINANCIAL HIGHLIGHTS
Templeton Global Balanced Fund(continued)
| Year Ended December 31, | Year Ended March 31, | |||||||||||||||||||||||
2019 | 2018 | 2017 | 2016a | 2016 | 2015 | |||||||||||||||||||
Class A1 | ||||||||||||||||||||||||
Per share operating performance (for a share outstanding throughout the year) | ||||||||||||||||||||||||
Net asset value, beginning of year | $ 2.77 | $ 3.18 | $ 2.91 | $ 2.72 | $ 3.13 | $ 3.30 | ||||||||||||||||||
Income from investment operationsb: | ||||||||||||||||||||||||
Net investment incomec | 0.11 | 0.10 | 0.09 | 0.07 | 0.08 | 0.08 | ||||||||||||||||||
Net realized and unrealized gains (losses) | 0.08 | (0.39 | ) | 0.26 | 0.15 | (0.32 | ) | (0.07 | ) | |||||||||||||||
Total from investment operations | 0.19 | (0.29 | ) | 0.35 | 0.22 | (0.24 | ) | 0.01 | ||||||||||||||||
Less distributions from: | ||||||||||||||||||||||||
Net investment income | (0.12 | ) | (0.12 | ) | (0.08 | ) | (0.03 | ) | (0.09 | ) | (0.18 | ) | ||||||||||||
Net realized gains | — | — | — | — | (0.08 | ) | — | |||||||||||||||||
Total distributions | (0.12 | ) | (0.12 | ) | (0.08 | ) | (0.03 | ) | (0.17 | ) | (0.18 | ) | ||||||||||||
Net asset value, end of year | $ 2.84 | $ 2.77 | $ 3.18 | $ 2.91 | $ 2.72 | $ 3.13 | ||||||||||||||||||
Total returnd | 7.33% | (9.45)% | 12.18% | 7.97% | (7.76)% | 0.36% | ||||||||||||||||||
Ratios to average net assetse | ||||||||||||||||||||||||
Expenses before waiver and payments by affiliates and expense reduction | 1.22% | 1.19% | 1.17% | 1.16% | 1.11% | 1.11% | ||||||||||||||||||
Expenses net of waiver and payments by affiliates and expense reductionf | 1.19% | 1.16% | 1.14% | 1.15% | 1.10% | 1.11% | g | |||||||||||||||||
Net investment income | 3.81% | 3.17% | 2.82% | 3.28% | 2.55% | 2.55% | ||||||||||||||||||
Supplemental data | ||||||||||||||||||||||||
Net assets, end of year (000’s) | $252,990 | $285,358 | $293,488 | $319,161 | $370,212 | $467,765 | ||||||||||||||||||
Portfolio turnover rate | 26.62% | 45.92% | 34.25% | 16.66% | 44.25% | 20.90% | ||||||||||||||||||
aFor the period April 1, 2016 to December 31, 2016.
bThe amount shown for a share outstanding throughout the period may not correlate with the Consolidated Statement of Operations for the period due to the timing of sales and repurchases of the Fund’s shares in relation to income earned and/or fluctuating fair value of the investments of the Fund.
cBased on average daily shares outstanding.
dTotal return does not reflect sales commissions or contingent deferred sales charges, if applicable, and is not annualized for periods less than one year.
eRatios are annualized for periods less than one year.
fBenefit of expense reduction rounds to less than 0.01%.
gBenefit of waiver and payments by affiliates rounds to less than 0.01%.
| franklintempleton.com | The accompanying notes are an integral part of these consolidated financial statements. | Annual Report | 15 | ||
TEMPLETON GLOBAL INVESTMENT TRUST
CONSOLIDATED FINANCIAL HIGHLIGHTS
Templeton Global Balanced Fund(continued)
| Year Ended December 31, | Year Ended March 31, | |||||||||||||||||||||||
2019 | 2018 | 2017 | 2016a | 2016 | 2015 | |||||||||||||||||||
Class C | ||||||||||||||||||||||||
Per share operating performance (for a share outstanding throughout the year) | ||||||||||||||||||||||||
Net asset value, beginning of year | $ 2.75 | $ 3.16 | $ 2.90 | $ 2.70 | $ 3.12 | $ 3.28 | ||||||||||||||||||
Income from investment operationsb: | ||||||||||||||||||||||||
Net investment incomec | 0.09 | 0.08 | 0.06 | 0.05 | 0.05 | 0.06 | ||||||||||||||||||
Net realized and unrealized gains (losses) | 0.08 | (0.40 | ) | 0.26 | 0.16 | (0.31 | ) | (0.07 | ) | |||||||||||||||
Total from investment operations | 0.17 | (0.32 | ) | 0.32 | 0.21 | (0.26 | ) | (0.01 | ) | |||||||||||||||
Less distributions from: | ||||||||||||||||||||||||
Net investment income | (0.10 | ) | (0.09 | ) | (0.06 | ) | (0.01 | ) | (0.08 | ) | (0.15 | ) | ||||||||||||
Net realized gains | — | — | — | — | (0.08 | ) | — | |||||||||||||||||
Total distributions | (0.10 | ) | (0.09 | ) | (0.06 | ) | (0.01 | ) | (0.16 | ) | (0.15 | ) | ||||||||||||
Net asset value, end of year | $ 2.82 | $ 2.75 | $ 3.16 | $ 2.90 | $ 2.70 | $ 3.12 | ||||||||||||||||||
Total returnd | 6.55% | (10.23)% | 11.03% | 7.74% | (8.68)% | (0.04)% | ||||||||||||||||||
Ratios to average net assetse | ||||||||||||||||||||||||
Expenses before waiver and payments by affiliates and expense reduction | 1.97% | 1.94% | 1.92% | 1.89% | 1.86% | 1.83% | ||||||||||||||||||
Expenses net of waiver and payments by affiliates and expense reductionf | 1.94% | 1.91% | 1.89% | 1.88% | 1.85% | 1.83% | g | |||||||||||||||||
Net investment income | 3.06% | 2.42% | 2.07% | 2.55% | 1.80% | 1.83% | ||||||||||||||||||
Supplemental data | ||||||||||||||||||||||||
Net assets, end of year (000’s) | $ | 139,231 | $ | 203,587 | $ | 317,374 | $ | 340,265 | $ | 464,899 | $ | 507,888 | ||||||||||||
Portfolio turnover rate | 26.62% | 45.92% | 34.25% | 16.66% | 44.25% | 20.90% | ||||||||||||||||||
aFor the period April 1, 2016 to December 31, 2016.
bThe amount shown for a share outstanding throughout the period may not correlate with the Consolidated Statement of Operations for the period due to the timing of sales and repurchases of the Fund’s shares in relation to income earned and/or fluctuating fair value of the investments of the Fund.
cBased on average daily shares outstanding.
dTotal return does not reflect sales commissions or contingent deferred sales charges, if applicable, and is not annualized for periods less than one year.
eRatios are annualized for periods less than one year.
fBenefit of expense reduction rounds to less than 0.01%.
gBenefit of waiver and payments by affiliates rounds to less than 0.01%.
16 | Annual Report | The accompanying notes are an integral part of these consolidated financial statements. | franklintempleton.com | ||
TEMPLETON GLOBAL INVESTMENT TRUST
CONSOLIDATED FINANCIAL HIGHLIGHTS
Templeton Global Balanced Fund(continued)
| Year Ended December 31, | Year Ended March 31, | |||||||||||||||||||||||
2019 | 2018 | 2017 | 2016a | 2016 | 2015 | |||||||||||||||||||
Class C1 | ||||||||||||||||||||||||
Per share operating performance (for a share outstanding throughout the year) | ||||||||||||||||||||||||
Net asset value, beginning of year | $2.77 | $3.17 | $2.91 | $2.72 | $3.13 | $3.29 | ||||||||||||||||||
Income from investment operationsb: | ||||||||||||||||||||||||
Net investment incomec | 0.10 | 0.09 | 0.08 | 0.06 | 0.06 | 0.07 | ||||||||||||||||||
Net realized and unrealized gains (losses) | 0.08 | (0.39 | ) | 0.25 | 0.15 | (0.31 | ) | (0.07 | ) | |||||||||||||||
Total from investment operations | 0.18 | (0.30 | ) | 0.33 | 0.21 | (0.25 | ) | — | ||||||||||||||||
Less distributions from: | ||||||||||||||||||||||||
Net investment income | (0.11 | ) | (0.10 | ) | (0.07 | ) | (0.02 | ) | (0.08 | ) | (0.16 | ) | ||||||||||||
Net realized gains | — | — | — | — | (0.08 | ) | — | |||||||||||||||||
Total distributions | (0.11 | ) | (0.10 | ) | (0.07 | ) | (0.02 | ) | (0.16 | ) | (0.16 | ) | ||||||||||||
Net asset value, end of year | $2.84 | $2.77 | $3.17 | $2.91 | $2.72 | $3.13 | ||||||||||||||||||
Total returnd | 6.82% | (9.88)% | 11.71% | 7.62% | (8.07)% | 0.26% | ||||||||||||||||||
Ratios to average net assetse | ||||||||||||||||||||||||
Expenses before waiver and payments by affiliates and expense reduction | 1.62% | 1.59% | 1.57% | 1.56% | 1.51% | 1.51% | ||||||||||||||||||
Expenses net of waiver and payments by affiliates and expense reductionf | 1.59% | 1.56% | 1.54% | 1.55% | 1.50% | 1.51% | g | |||||||||||||||||
Net investment income | 3.41% | 2.77% | 2.42% | 2.88% | 2.15% | 2.15% | ||||||||||||||||||
Supplemental data | ||||||||||||||||||||||||
Net assets, end of year (000’s) | $27,765 | $62,418 | $173,079 | $202,929 | $233,840 | $296,672 | ||||||||||||||||||
Portfolio turnover rate | 26.62% | 45.92% | 34.25% | 16.66% | 44.25% | 20.90% | ||||||||||||||||||
aFor the period April 1, 2016 to December 31, 2016.
bThe amount shown for a share outstanding throughout the period may not correlate with the Consolidated Statement of Operations for the period due to the timing of sales and repurchases of the Fund’s shares in relation to income earned and/or fluctuating fair value of the investments of the Fund.
cBased on average daily shares outstanding.
dTotal return does not reflect sales commissions or contingent deferred sales charges, if applicable, and is not annualized for periods less than one year.
eRatios are annualized for periods less than one year.
fBenefit of expense reduction rounds to less than 0.01%.
gBenefit of waiver and payments by affiliates rounds to less than 0.01%.
| franklintempleton.com | The accompanying notes are an integral part of these consolidated financial statements. | Annual Report | 17 | ||
TEMPLETON GLOBAL INVESTMENT TRUST
CONSOLIDATED FINANCIAL HIGHLIGHTS
Templeton Global Balanced Fund(continued)
| Year Ended December 31, | Year Ended March 31, | |||||||||||||||||||||||
2019 | 2018 | 2017 | 2016a | 2016 | 2015 | |||||||||||||||||||
Class R | ||||||||||||||||||||||||
Per share operating performance (for a share outstanding throughout the year) | ||||||||||||||||||||||||
Net asset value, beginning of year | $2.78 | $3.18 | $2.92 | $2.72 | $3.14 | $3.30 | ||||||||||||||||||
Income from investment operationsb: | ||||||||||||||||||||||||
Net investment incomec | 0.10 | 0.09 | 0.08 | 0.06 | 0.07 | 0.07 | ||||||||||||||||||
Net realized and unrealized gains (losses) | 0.08 | (0.38 | ) | 0.25 | 0.16 | (0.32 | ) | (0.06 | ) | |||||||||||||||
Total from investment operations | 0.18 | (0.29 | ) | 0.33 | 0.22 | (0.25 | ) | 0.01 | ||||||||||||||||
Less distributions from: | ||||||||||||||||||||||||
Net investment income | (0.11 | ) | (0.11 | ) | (0.07 | ) | (0.02 | ) | (0.09 | ) | (0.17 | ) | ||||||||||||
Net realized gains | — | — | — | — | (0.08 | ) | — | |||||||||||||||||
Total distributions | (0.11 | ) | (0.11 | ) | (0.07 | ) | (0.02 | ) | (0.17 | ) | (0.17 | ) | ||||||||||||
Net asset value, end of year | $2.85 | $2.78 | $3.18 | $2.92 | $2.72 | $3.14 | ||||||||||||||||||
Total returnd | 6.66% | (9.67)% | 11.84% | 8.11% | (8.24)% | 0.43% | ||||||||||||||||||
Ratios to average net assetse | ||||||||||||||||||||||||
Expenses before waiver and payments by affiliates and expense reduction | 1.47% | 1.44% | 1.42% | 1.41% | 1.36% | 1.36% | ||||||||||||||||||
Expenses net of waiver and payments by affiliates and expense reductionf | 1.44% | 1.41% | 1.39% | 1.40% | 1.35% | 1.36% | g | |||||||||||||||||
Net investment income | 3.56% | 2.92% | 2.57% | 3.03% | 2.30% | 2.30% | ||||||||||||||||||
Supplemental data | ||||||||||||||||||||||||
Net assets, end of year (000’s) | $2,348 | $2,778 | $4,944 | $5,487 | $6,498 | $6,357 | ||||||||||||||||||
Portfolio turnover rate | 26.62% | 45.92% | 34.25% | 16.66% | 44.25% | 20.90% | ||||||||||||||||||
aFor the period April 1, 2016 to December 31, 2016.
bThe amount shown for a share outstanding throughout the period may not correlate with the Consolidated Statement of Operations for the period due to the timing of sales and repurchases of the Fund’s shares in relation to income earned and/or fluctuating fair value of the investments of the Fund.
cBased on average daily shares outstanding.
dTotal return is not annualized for periods less than one year.
eRatios are annualized for periods less than one year.
fBenefit of expense reduction rounds to less than 0.01%.
gBenefit of waiver and payments by affiliates rounds to less than 0.01%.
18 | Annual Report | The accompanying notes are an integral part of these consolidated financial statements. | franklintempleton.com | ||
TEMPLETON GLOBAL INVESTMENT TRUST
CONSOLIDATED FINANCIAL HIGHLIGHTS
Templeton Global Balanced Fund(continued)
| Year Ended December 31, | Year Ended March 31, | |||||||||||||||||||||||
2019 | 2018 | 2017 | 2016a | 2016 | 2015 | |||||||||||||||||||
Class R6 | ||||||||||||||||||||||||
Per share operating performance (for a share outstanding throughout the year) | ||||||||||||||||||||||||
Net asset value, beginning of year | $2.78 | $3.18 | $2.92 | $2.73 | $3.14 | $3.30 | ||||||||||||||||||
Income from investment operationsb: | ||||||||||||||||||||||||
Net investment incomec | 0.12 | 0.11 | 0.09 | 0.08 | 0.08 | 0.07 | ||||||||||||||||||
Net realized and unrealized gains (losses) | 0.08 | (0.38 | ) | 0.26 | 0.15 | (0.31 | ) | (0.04 | ) | |||||||||||||||
Total from investment operations | 0.20 | (0.27 | ) | 0.35 | 0.23 | (0.23 | ) | 0.03 | ||||||||||||||||
Less distributions from: | ||||||||||||||||||||||||
Net investment income | (0.13 | ) | (0.13 | ) | (0.09 | ) | (0.04 | ) | (0.10 | ) | (0.19 | ) | ||||||||||||
Net realized gains | — | — | — | — | (0.08 | ) | — | |||||||||||||||||
Total distributions | (0.13 | ) | (0.13 | ) | (0.09 | ) | (0.04 | ) | (0.18 | ) | (0.19 | ) | ||||||||||||
Net asset value, end of year | $2.85 | $2.78 | $3.18 | $2.92 | $2.73 | $3.14 | ||||||||||||||||||
Total returnd | 7.32% | (9.09)% | 12.56% | 8.35% | (7.44)% | 1.02% | ||||||||||||||||||
Ratios to average net assetse | ||||||||||||||||||||||||
Expenses before waiver and payments by affiliates and expense reduction | 0.92% | 0.89% | 0.84% | 0.81% | 0.81% | 0.92% | ||||||||||||||||||
Expenses net of waiver and payments by affiliates and expense reductionf | 0.84% | 0.82% | 0.77% | 0.79% | 0.75% | 0.76% | ||||||||||||||||||
Net investment income | 4.16% | 3.51% | 3.19% | 3.64% | 2.90% | 2.90% | ||||||||||||||||||
Supplemental data | ||||||||||||||||||||||||
Net assets, end of year (000’s) | $6,080 | $7,933 | $11,254 | $752 | $1,089 | $660 | ||||||||||||||||||
Portfolio turnover rate | 26.62% | 45.92% | 34.25% | 16.66% | 44.25% | 20.90% | ||||||||||||||||||
aFor the period April 1, 2016 to December 31, 2016.
bThe amount shown for a share outstanding throughout the period may not correlate with the Consolidated Statement of Operations for the period due to the timing of sales and repurchases of the Fund’s shares in relation to income earned and/or fluctuating fair value of the investments of the Fund.
cBased on average daily shares outstanding.
dTotal return is not annualized for periods less than one year.
eRatios are annualized for periods less than one year.
fBenefit of expense reduction rounds to less than 0.01%.
| franklintempleton.com | The accompanying notes are an integral part of these consolidated financial statements. | Annual Report | 19 | ||
TEMPLETON GLOBAL INVESTMENT TRUST
CONSOLIDATED FINANCIAL HIGHLIGHTS
Templeton Global Balanced Fund(continued)
| Year Ended December 31, | Year Ended March 31, | |||||||||||||||||||||||
2019 | 2018 | 2017 | 2016a | 2016 | 2015 | |||||||||||||||||||
Advisor Class | ||||||||||||||||||||||||
Per share operating performance (for a share outstanding throughout the year) | ||||||||||||||||||||||||
Net asset value, beginning of year | $2.78 | $3.19 | $2.92 | $2.73 | $3.14 | $3.31 | ||||||||||||||||||
Income from investment operationsb: | ||||||||||||||||||||||||
Net investment incomec | 0.12 | 0.11 | 0.10 | 0.08 | 0.08 | 0.09 | ||||||||||||||||||
Net realized and unrealized gains (losses) | 0.08 | (0.39 | ) | 0.26 | 0.14 | (0.31 | ) | (0.08 | ) | |||||||||||||||
Total from investment operations | 0.20 | (0.28 | ) | 0.36 | 0.22 | (0.23 | ) | 0.01 | ||||||||||||||||
Less distributions from: | ||||||||||||||||||||||||
Net investment income | (0.13 | ) | (0.13 | ) | (0.09 | ) | (0.03 | ) | (0.10 | ) | (0.18 | ) | ||||||||||||
Net realized gains | — | — | — | — | (0.08 | ) | — | |||||||||||||||||
Total distributions | (0.13 | ) | (0.13 | ) | (0.09 | ) | (0.03 | ) | (0.18 | ) | (0.18 | ) | ||||||||||||
Net asset value, end of year | $2.85 | $2.78 | $3.19 | $2.92 | $2.73 | $3.14 | ||||||||||||||||||
Total returnd | 7.57% | (9.19)% | 12.42% | 8.22% | (7.52)% | 0.62% | ||||||||||||||||||
Ratios to average net assetse | ||||||||||||||||||||||||
Expenses before waiver and payments by affiliates and expense reduction | 0.97% | 0.94% | 0.92% | 0.91% | 0.86% | 0.86% | ||||||||||||||||||
Expenses net of waiver and payments by affiliates and expense reductionf | 0.94% | 0.91% | 0.89% | 0.90% | 0.85% | 0.86% | g | |||||||||||||||||
Net investment income | 4.06% | 3.42% | 3.07% | 3.53% | 2.80% | 2.80% | ||||||||||||||||||
Supplemental data | ||||||||||||||||||||||||
Net assets, end of year (000’s) | $ | 141,277 | $ | 207,346 | $ | 246,044 | $ | 212,161 | $ | 299,226 | $ | 405,877 | ||||||||||||
Portfolio turnover rate | 26.62% | 45.92% | 34.25% | 16.66% | 44.25% | 20.90% | ||||||||||||||||||
aFor the period April 1, 2016 to December 31, 2016.
bThe amount shown for a share outstanding throughout the period may not correlate with the Consolidated Statement of Operations for the period due to the timing of sales and repurchases of the Fund’s shares in relation to income earned and/or fluctuating fair value of the investments of the Fund.
cBased on average daily shares outstanding.
dTotal return is not annualized for periods less than one year.
eRatios are annualized for periods less than one year.
fBenefit of expense reduction rounds to less than 0.01%.
gBenefit of waiver and payments by affiliates rounds to less than 0.01%.
20 | Annual Report | The accompanying notes are an integral part of these consolidated financial statements. | franklintempleton.com | ||
TEMPLETON GLOBAL INVESTMENT TRUST
Consolidated Statement of Investments, December 31, 2019
Templeton Global Balanced Fund
| Industry | Shares | Value | ||||||||||
| ||||||||||||
Common Stocks 62.0% | ||||||||||||
Canada 0.9% | ||||||||||||
Husky Energy Inc. | Oil, Gas & Consumable Fuels | 1,095,100 | $ | 8,787,111 | ||||||||
|
| |||||||||||
China 2.0% | ||||||||||||
aBaidu Inc., ADR | Interactive Media & Services | 80,900 | 10,225,760 | |||||||||
China Telecom Corp. Ltd., H | Diversified Telecommunication Services | 26,030,000 | 10,722,932 | |||||||||
|
| |||||||||||
| 20,948,692 | ||||||||||||
|
| |||||||||||
Denmark 0.7% | ||||||||||||
A.P. Moeller-Maersk AS, B | Marine | 5,213 | 7,516,884 | |||||||||
|
| |||||||||||
France 4.3% | ||||||||||||
BNP Paribas SA | Banks | 232,324 | 13,764,315 | |||||||||
Sanofi | Pharmaceuticals | 120,224 | 12,083,035 | |||||||||
Veolia Environnement SA | Multi-Utilities | 706,638 | 18,789,207 | |||||||||
|
| |||||||||||
| 44,636,557 | ||||||||||||
|
| |||||||||||
Germany 7.2% | ||||||||||||
Bayer AG | Pharmaceuticals | 243,986 | 19,922,134 | |||||||||
Deutsche Telekom AG | Diversified Telecommunication Services | 977,062 | 15,964,730 | |||||||||
E.ON SE | Multi-Utilities | 1,577,724 | 16,851,181 | |||||||||
Merck KGaA | Pharmaceuticals | 120,229 | 14,204,426 | |||||||||
Siemens AG | Industrial Conglomerates | 60,341 | 7,886,194 | |||||||||
|
| |||||||||||
| 74,828,665 | ||||||||||||
|
| |||||||||||
Hong Kong 3.3% | ||||||||||||
CK Asset Holdings Ltd. | Real Estate Management & Development | 1,186,500 | 8,564,945 | |||||||||
CK Hutchison Holdings Ltd. | Industrial Conglomerates | 1,839,852 | 17,543,088 | |||||||||
Swire Pacific Ltd., A | Real Estate Management & Development | 714,300 | 6,636,721 | |||||||||
Value Partners Group Ltd. | Capital Markets | 1,433,100 | 882,779 | |||||||||
|
| |||||||||||
| 33,627,533 | ||||||||||||
|
| |||||||||||
Italy 2.1% | ||||||||||||
Eni SpA | Oil, Gas & Consumable Fuels | 994,891 | 15,448,266 | |||||||||
Tenaris SA | Energy Equipment & Services | 589,215 | 6,640,791 | |||||||||
|
| |||||||||||
| 22,089,057 | ||||||||||||
|
| |||||||||||
Japan 7.9% | ||||||||||||
Hosokawa Micron Corp. | Machinery | 12,200 | 527,067 | |||||||||
Isuzu Motors Ltd. | Automobiles | 579,700 | 6,929,195 | |||||||||
Kirin Holdings Co. Ltd. | Beverages | 838,500 | 18,440,441 | |||||||||
Kyocera Corp. | Electronic Equipment, Instruments & Components | 121,700 | 8,376,499 | |||||||||
Seria Co. Ltd. | Multiline Retail | 196,000 | 5,356,522 | |||||||||
Sumitomo Metal Mining Co. Ltd. | Metals & Mining | 315,000 | 10,272,464 | |||||||||
Sumitomo Mitsui Financial Group Inc. | Banks | 269,700 | 10,021,151 | |||||||||
Suntory Beverage & Food Ltd. | Beverages | 172,700 | 7,222,650 | |||||||||
Takeda Pharmaceutical Co. Ltd. | Pharmaceuticals | 372,900 | 14,864,530 | |||||||||
|
| |||||||||||
| 82,010,519 | ||||||||||||
|
| |||||||||||
Luxembourg 1.3% | ||||||||||||
SES SA, IDR | Media | 923,412 | 12,944,505 | |||||||||
|
| |||||||||||
| franklintempleton.com | Annual Report | 21 | ||||
TEMPLETON GLOBAL INVESTMENT TRUST
CONSOLIDATED STATEMENT OF INVESTMENTS
Templeton Global Balanced Fund(continued)
| Industry | Shares | Value | ||||||||||
| ||||||||||||
Common Stocks(continued) | ||||||||||||
Netherlands 3.3% | ||||||||||||
Flow Traders | Capital Markets | 459,861 | $ | 11,108,418 | ||||||||
ING Groep NV | Banks | 1,052,683 | 12,617,519 | |||||||||
NXP Semiconductors NV | Semiconductors & Semiconductor Equipment | 78,800 | 10,028,088 | |||||||||
|
| |||||||||||
| 33,754,025 | ||||||||||||
|
| |||||||||||
Norway 0.9% | ||||||||||||
Equinor ASA | Oil, Gas & Consumable Fuels | 447,682 | 8,951,090 | |||||||||
|
| |||||||||||
South Africa 0.0%† | ||||||||||||
a,b,c K2016470219 South Africa Ltd., A | Specialty Retail | 32,900,733 | 23,493 | |||||||||
a,b,cK2016470219 South Africa Ltd., B | Specialty Retail | 4,646,498 | 3,318 | |||||||||
|
| |||||||||||
| 26,811 | ||||||||||||
|
| |||||||||||
South Korea 3.6% | ||||||||||||
Hana Financial Group Inc. | Banks | 287,475 | 9,176,401 | |||||||||
KB Financial Group Inc. | Banks | 231,009 | 9,522,210 | |||||||||
Samsung Electronics Co. Ltd. | Technology Hardware, Storage & Peripherals | 386,012 | 18,632,920 | |||||||||
|
| |||||||||||
| 37,331,531 | ||||||||||||
|
| |||||||||||
United Kingdom 8.7% | ||||||||||||
BP PLC | Oil, Gas & Consumable Fuels | 2,487,877 | 15,539,544 | |||||||||
Kingfisher PLC | Specialty Retail | 3,339,503 | 9,597,920 | |||||||||
aLivaNova PLC | Health Care Equipment & Supplies | 99,600 | 7,512,828 | |||||||||
aM&G PLC | Diversified Financial Services | 506,557 | 1,591,397 | |||||||||
Prudential PLC | Insurance | 506,557 | 9,721,477 | |||||||||
Royal Dutch Shell PLC, B | Oil, Gas & Consumable Fuels | 646,296 | 19,169,823 | |||||||||
Standard Chartered PLC | Banks | 981,358 | 9,259,487 | |||||||||
Vodafone Group PLC | Wireless Telecommunication Services | 9,329,074 | 18,133,507 | |||||||||
|
| |||||||||||
| 90,525,983 | ||||||||||||
|
| |||||||||||
United States 15.8% | ||||||||||||
Allergan PLC | Pharmaceuticals | 83,132 | 15,892,344 | |||||||||
aBerkshire Hathaway Inc., B | Diversified Financial Services | 56,900 | 12,887,850 | |||||||||
Citigroup Inc. | Banks | 183,947 | 14,695,526 | |||||||||
Comcast Corp., A | Media | 337,624 | 15,182,951 | |||||||||
Gilead Sciences Inc. | Biotechnology | 124,400 | 8,083,512 | |||||||||
Kellogg Co. | Food Products | 172,000 | 11,895,520 | |||||||||
The Kroger Co. | Food & Staples Retailing | 483,500 | 14,016,665 | |||||||||
aLaboratory Corp. of America Holdings | Health Care Providers & Services | 46,900 | 7,934,073 | |||||||||
Oracle Corp. | Software | 233,610 | 12,376,658 | |||||||||
a,b,dTurtle Bay Resort | Hotels, Restaurants & Leisure | 1,587,888 | 34,934 | |||||||||
United Parcel Service Inc., B | Air Freight & Logistics | 99,700 | 11,670,882 | |||||||||
Verizon Communications Inc. | Diversified Telecommunication Services | 214,100 | 13,145,740 | |||||||||
Walgreens Boots Alliance Inc. | Food & Staples Retailing | 239,700 | 14,132,712 | |||||||||
Wells Fargo & Co. | Banks | 218,600 | 11,760,680 | |||||||||
|
| |||||||||||
| 163,710,047 | ||||||||||||
|
| |||||||||||
Total Common Stocks | 641,689,010 | |||||||||||
|
| |||||||||||
22 | Annual Report | franklintempleton.com | ||
TEMPLETON GLOBAL INVESTMENT TRUST
CONSOLIDATED STATEMENT OF INVESTMENTS
Templeton Global Balanced Fund(continued)
| Industry | Principal Amount* | Value | ||||||||||||||
| ||||||||||||||||
Corporate Bonds 0.0%† | ||||||||||||||||
South Africa 0.0%† | ||||||||||||||||
e,f K2016470219 South Africa Ltd., | Multiline Retail | 2,646,669 | $ | 3,308 | ||||||||||||
b senior secured note, 144A, PIK, 3.00%, 12/31/22 | ||||||||||||||||
senior secured note, 144A, PIK, 8.00%, 12/31/22 | Multiline Retail | 2,407,691 | EUR | 6,750 | ||||||||||||
b,e,fK2016470260 South Africa Ltd., senior secured note, 144A, PIK, 25.00%, 12/31/22 | Multiline Retail | 989,139 | 4,946 | |||||||||||||
|
| |||||||||||||||
Total Corporate Bonds | 15,004 | |||||||||||||||
|
| |||||||||||||||
Foreign Government and Agency Securities 17.9% | ||||||||||||||||
Argentina 1.0% | ||||||||||||||||
g Argentina Treasury Bill, | ||||||||||||||||
Strip, 3/30/20 | 262,502,000 | ARS | 3,144,753 | |||||||||||||
Strip, 4/28/20 | 78,475,400 | ARS | 1,201,276 | |||||||||||||
Strip, 5/28/20 | 4,037,600 | ARS | 54,282 | |||||||||||||
Strip, 7/29/20 | 40,562,200 | ARS | 577,719 | |||||||||||||
Strip, 10/29/20 | 24,139,930 | ARS | 258,668 | |||||||||||||
gArgentine Bonos del Tesoro, | ||||||||||||||||
18.20%, 10/03/21 | 193,279,000 | ARS | 1,031,374 | |||||||||||||
16.00%, 10/17/23 | 298,989,000 | ARS | 1,435,719 | |||||||||||||
senior note, 15.50%, 10/17/26 | 243,952,000 | ARS | 1,099,708 | |||||||||||||
Government of Argentina, | ||||||||||||||||
g,hFRN, 52.564%, (ARS Badlar + 2.00%), 4/03/22 | 37,519,000 | ARS | 323,335 | |||||||||||||
g,iIndex Linked, 4.00%, 3/06/20 | 1,106,000 | ARS | 21,266 | |||||||||||||
senior note, 4.50%, 2/13/20 | 3,021,000 | 1,530,408 | ||||||||||||||
|
| |||||||||||||||
| 10,678,508 | ||||||||||||||||
|
| |||||||||||||||
Brazil 3.4% | ||||||||||||||||
Letra Tesouro Nacional, | ||||||||||||||||
Strip, 4/01/21 | 5,020 | j | BRL | 1,179,284 | ||||||||||||
Strip, 7/01/21 | 9,890 | j | BRL | 2,291,115 | ||||||||||||
Nota do Tesouro Nacional, | ||||||||||||||||
10.00%, 1/01/21 | 79,011 | j | BRL | 20,666,278 | ||||||||||||
10.00%, 1/01/23 | 33,230 | j | BRL | 9,192,012 | ||||||||||||
10.00%, 1/01/25 | 6,251 | j | BRL | 1,786,922 | ||||||||||||
|
| |||||||||||||||
| 35,115,611 | ||||||||||||||||
|
| |||||||||||||||
Colombia 0.8% | ||||||||||||||||
Government of Colombia, | ||||||||||||||||
senior bond, 7.75%, 4/14/21 | 689,000,000 | COP | 216,323 | |||||||||||||
senior bond, 4.375%, 3/21/23 | 52,000,000 | COP | 15,499 | |||||||||||||
senior bond, 9.85%, 6/28/27 | 83,000,000 | COP | 31,746 | |||||||||||||
| franklintempleton.com | Annual Report | 23 | ||
TEMPLETON GLOBAL INVESTMENT TRUST
CONSOLIDATED STATEMENT OF INVESTMENTS
Templeton Global Balanced Fund(continued)
Principal Amount* | Value | |||||||||||
| ||||||||||||
Foreign Government and Agency Securities(continued) | ||||||||||||
Colombia(continued) | ||||||||||||
Titulos de Tesoreria, | ||||||||||||
senior bond, B, 11.00%, 7/24/20 | 677,000,000 | COP | $ | 214,271 | ||||||||
senior bond, B, 7.00%, 5/04/22 | 844,000,000 | COP | 268,623 | |||||||||
senior bond, B, 10.00%, 7/24/24 | 1,738,000,000 | COP | 627,195 | |||||||||
senior bond, B, 7.50%, 8/26/26 | 19,829,000,000 | COP | 6,592,801 | |||||||||
|
| |||||||||||
| 7,966,458 | ||||||||||||
|
| |||||||||||
El Salvador 0.0%† | ||||||||||||
e Government of El Salvador, 144A, 7.65%, 6/15/35 | 100,000 | 114,343 | ||||||||||
|
| |||||||||||
Ghana 1.5% | ||||||||||||
Government of Ghana, | ||||||||||||
24.75%, 3/01/21 | 110,000 | GHS | 20,685 | |||||||||
24.50%, 6/21/21 | 600,000 | GHS | 111,982 | |||||||||
24.75%, 7/19/21 | 6,550,000 | GHS | 1,199,294 | |||||||||
18.75%, 1/24/22 | 7,110,000 | GHS | 1,212,893 | |||||||||
19.75%, 3/25/24 | 7,250,000 | GHS | 1,227,563 | |||||||||
19.00%, 11/02/26 | 27,470,000 | GHS | 4,377,263 | |||||||||
senior bond, 19.75%, 3/15/32 | 20,850,000 | GHS | 3,351,436 | |||||||||
senior note, 21.50%, 3/09/20 | 130,000 | GHS | 22,884 | |||||||||
senior note, 18.50%, 6/01/20 | 1,210,000 | GHS | 210,264 | |||||||||
senior note, 18.25%, 9/21/20 | 4,990,000 | GHS | 890,196 | |||||||||
senior note, 24.00%, 11/23/20 | 7,760,000 | GHS | 1,392,355 | |||||||||
senior note, 16.50%, 3/22/21 | 50,000 | GHS | 8,659 | |||||||||
senior note, 18.25%, 7/25/22 | 7,580,000 | GHS | 1,267,978 | |||||||||
|
| |||||||||||
| 15,293,452 | ||||||||||||
|
| |||||||||||
India 2.7% | ||||||||||||
Government of India, | ||||||||||||
senior note, 7.16%, 5/20/23 | 307,000,000 | INR | 4,402,157 | |||||||||
senior note, 8.83%, 11/25/23 | 756,500,000 | INR | 11,464,280 | |||||||||
senior note, 7.68%, 12/15/23 | 465,000,000 | INR | 6,786,454 | |||||||||
senior note, 6.79%, 5/15/27 | 402,500,000 | INR | 5,626,708 | |||||||||
|
| |||||||||||
| 28,279,599 | ||||||||||||
|
| |||||||||||
Indonesia 2.5% | ||||||||||||
Government of Indonesia, | ||||||||||||
senior bond, FR35, 12.90%, 6/15/22 | 10,168,000,000 | IDR | �� | 845,374 | ||||||||
senior bond, FR39, 11.75%, 8/15/23 | 1,616,000,000 | IDR | 136,654 | |||||||||
senior bond, FR43, 10.25%, 7/15/22 | 154,000,000 | IDR | 12,178 | |||||||||
senior bond, FR46, 9.50%, 7/15/23 | 73,000,000,000 | IDR | 5,783,732 | |||||||||
senior bond, FR63, 5.625%, 5/15/23 | 2,150,000,000 | IDR | 151,944 | |||||||||
senior bond, FR70, 8.375%, 3/15/24 | 242,601,000,000 | IDR | 18,695,076 | |||||||||
|
| |||||||||||
| 25,624,958 | ||||||||||||
|
| |||||||||||
24 | Annual Report | franklintempleton.com | ||||
TEMPLETON GLOBAL INVESTMENT TRUST
CONSOLIDATED STATEMENT OF INVESTMENTS
Templeton Global Balanced Fund(continued)
| Principal Amount* | Value | |||||||||||||
| ||||||||||||||
Foreign Government and Agency Securities(continued) |
| |||||||||||||
Mexico 3.2% | ||||||||||||||
Government of Mexico, | ||||||||||||||
senior bond, M, 6.50%, 6/10/21 | 2,105,100 | k | MXN | $ | 11,090,564 | |||||||||
senior bond, M, 6.50%, 6/09/22 | 1,838,700 | k | MXN | 9,671,653 | ||||||||||
senior bond, M, 8.00%, 12/07/23 | 154,000 | k | MXN | 847,959 | ||||||||||
senior bond, M 20, 10.00%, 12/05/24 | 85,300 | k | MXN | 511,931 | ||||||||||
senior note, M, 7.25%, 12/09/21 | 2,012,900 | k | MXN | 10,731,038 | ||||||||||
|
| |||||||||||||
| 32,853,145 | ||||||||||||||
|
| |||||||||||||
South Korea 2.5% | ||||||||||||||
Korea Monetary Stabilization Bond, | ||||||||||||||
senior note, 2.16%, 2/02/20 | 1,991,600,000 | KRW | 1,724,058 | |||||||||||
senior note, 2.14%, 6/02/20 | 681,000,000 | KRW | 591,036 | |||||||||||
senior note, 2.05%, 10/05/20 | 460,000,000 | KRW | 400,017 | |||||||||||
senior note, 1.18%, 8/02/21 | 208,000,000 | KRW | 179,401 | |||||||||||
Korea Treasury Bond, | ||||||||||||||
senior bond, 4.25%, 6/10/21 | 3,380,800,000 | KRW | 3,045,288 | |||||||||||
senior note, 1.75%, 6/10/20 | 113,000,000 | KRW | 97,922 | |||||||||||
senior note, 2.00%, 3/10/21 | 8,058,200,000 | KRW | 7,024,678 | |||||||||||
senior note, 1.375%, 9/10/21 | 8,462,200,000 | KRW | 7,323,043 | |||||||||||
senior note, 2.00%, 12/10/21 | 380,000,000 | KRW | 332,698 | |||||||||||
senior note, 2.25%, 9/10/23 | 876,000,000 | KRW | 779,025 | |||||||||||
senior note, 1.875%, 3/10/24 | 2,205,000,000 | KRW | 1,936,732 | |||||||||||
senior note, 1.375%, 9/10/24 | 2,673,000,000 | KRW | 2,301,595 | |||||||||||
senior note, 3.00%, 9/10/24 | 745,000,000 | KRW | 687,445 | |||||||||||
|
| |||||||||||||
| 26,422,938 | ||||||||||||||
|
| |||||||||||||
lSupranational 0.3% | ||||||||||||||
Inter-American Development Bank, senior bond, 7.50%, 12/05/24 | 60,000,000 | MXN | 3,250,668 | |||||||||||
|
| |||||||||||||
Total Foreign Government and Agency Securities |
| 185,599,680 | ||||||||||||
|
| |||||||||||||
| Number of Contracts | Notional Amount* | |||||||||||||
Options Purchased 0.1% | ||||||||||||||
Calls - Over-the-Counter | ||||||||||||||
Currency Options 0.1% | ||||||||||||||
AUD/JPY, Counterparty CITI, January Strike Price 79.00 JPY, Expires 1/23/20 | 1 | 4,027,000 | AUD | 596 | ||||||||||
AUD/JPY, Counterparty CITI, February Strike Price 79.45 JPY, Expires 2/12/20 | 1 | 2,153,000 | AUD | 834 | ||||||||||
AUD/JPY, Counterparty CITI, February Strike Price 82.35 JPY, Expires 2/12/20 | 1 | 340,000 | AUD | 9 | ||||||||||
AUD/JPY, Counterparty CITI, April Strike Price 79.30 JPY, Expires 4/22/20 | 1 | 1,816,000 | AUD | 4,183 | ||||||||||
| franklintempleton.com | Annual Report | 25 | ||
TEMPLETON GLOBAL INVESTMENT TRUST
CONSOLIDATED STATEMENT OF INVESTMENTS
Templeton Global Balanced Fund(continued)
Number of Contracts | Notional Amount* | Value | ||||||||||||||
| ||||||||||||||||
Options Purchased(continued) |
| |||||||||||||||
Calls - Over-the-Counter(continued) |
| |||||||||||||||
Currency Options(continued) | ||||||||||||||||
AUD/JPY, Counterparty CITI, May Strike Price 84.00 JPY, Expires 5/06/20 | 1 | 1,511,000 | AUD | $ | 322 | |||||||||||
AUD/JPY, Counterparty CITI, May Strike Price 86.63 JPY, Expires 5/06/20 | 1 | 1,661,000 | AUD | 128 | ||||||||||||
AUD/JPY, Counterparty CITI, May Strike Price 78.75 JPY, Expires 5/07/20 | 1 | 1,511,000 | AUD | 5,588 | ||||||||||||
AUD/JPY, Counterparty CITI, May Strike Price 85.50 JPY, Expires 5/07/20 | 1 | 6,042,000 | AUD | 670 | ||||||||||||
AUD/JPY, Counterparty CITI, November Strike Price 84.33 JPY, Expires 11/12/20 | 1 | 1,133,000 | AUD | 1,724 | ||||||||||||
AUD/JPY, Counterparty CITI, December Strike Price 82.15 JPY, Expires 12/21/20 | 1 | 4,531,000 | AUD | 16,742 | ||||||||||||
AUD/USD, Counterparty HSBK, April Strike Price $0.77, Expires 4/30/20 | 1 | 1,888,000 | AUD | 429 | ||||||||||||
AUD/USD, Counterparty HSBK, May Strike Price $0.77, Expires 5/04/20 | 1 | 2,379,000 | AUD | 679 | ||||||||||||
AUD/USD, Counterparty HSBK, May Strike Price $0.77, Expires 5/07/20 | 1 | 1,511,000 | AUD | 324 | ||||||||||||
AUD/USD, Counterparty MSCO, May Strike Price $0.77, Expires 5/12/21 | 1 | 2,719,000 | AUD | 14,860 | ||||||||||||
USD/MXN, Counterparty CITI, March Strike Price 20.78 MXN, Expires 3/09/20 | 1 | 2,209,000 | 1,741 | |||||||||||||
USD/MXN, Counterparty CITI, March Strike Price 18.40 MXN, Expires 3/30/20 | 1 | 1,325,000 | 54,785 | |||||||||||||
USD/MXN, Counterparty CITI, March Strike Price 21.92 MXN, Expires 3/30/20 | 1 | 1,988,000 | 869 | |||||||||||||
USD/MXN, Counterparty CITI, May Strike Price 20.50 MXN, Expires 5/11/20 | 1 | 2,745,000 | 12,180 | |||||||||||||
USD/MXN, Counterparty CITI, May Strike Price 20.09 MXN, Expires 5/12/20 | 1 | 2,513,000 | 17,342 | |||||||||||||
USD/MXN, Counterparty CITI, May Strike Price 20.92 MXN, Expires 5/12/20 | 1 | 980,000 | 2,955 | |||||||||||||
USD/MXN, Counterparty CITI, May Strike Price 20.87 MXN, Expires 5/14/20 | 1 | 5,529,000 | 18,041 | |||||||||||||
USD/MXN, Counterparty CITI, May Strike Price 20.58 MXN, Expires 5/15/20 | 1 | 1,725,000 | 7,499 | |||||||||||||
USD/MXN, Counterparty CITI, July Strike Price 21.03 MXN, Expires 7/30/20 | 1 | 1,413,000 | 9,478 | |||||||||||||
USD/MXN, Counterparty CITI, September Strike Price 21.94 MXN, Expires 9/03/20 | 1 | 5,523,000 | 26,720 | |||||||||||||
USD/MXN, Counterparty CITI, September Strike Price 21.70 MXN, Expires 9/08/20 | 1 | 5,517,000 | 32,004 | |||||||||||||
USD/MXN, Counterparty CITI, September Strike Price 20.85 MXN, Expires 9/17/20 | 1 | 5,497,000 | 59,703 | |||||||||||||
USD/MXN, Counterparty GSCO, March Strike Price 21.20 MXN, Expires 3/12/20 | 1 | 5,300,000 | 2,783 | |||||||||||||
USD/MXN, Counterparty JPHQ, March Strike Price 20.89 MXN, Expires 3/05/20 | 1 | 2,082,000 | 1,233 | |||||||||||||
USD/MXN, Counterparty JPHQ, April Strike Price 20.11 MXN, Expires 4/24/20 | 1 | 2,765,000 | 14,878 | |||||||||||||
26 | Annual Report | franklintempleton.com | ||||
TEMPLETON GLOBAL INVESTMENT TRUST
CONSOLIDATED STATEMENT OF INVESTMENTS
Templeton Global Balanced Fund(continued)
| Number of Contracts | Notional Amount* | Value | ||||||||||||||
| ||||||||||||||||
Options Purchased(continued) | ||||||||||||||||
Calls - Over-the-Counter(continued) | ||||||||||||||||
Currency Options(continued) | ||||||||||||||||
USD/MXN, Counterparty JPHQ, May Strike Price 20.47 MXN, Expires 5/13/20 | 1 | 3,160,000 | $ | 14,811 | ||||||||||||
USD/MXN, Counterparty JPHQ, June Strike Price 20.70 MXN, Expires 6/12/20 | 1 | 1,039,000 | 5,494 | |||||||||||||
USD/MXN, Counterparty JPHQ, July Strike Price 20.90 MXN, Expires 7/27/20 | 1 | 1,580,000 | 11,319 | |||||||||||||
USD/MXN, Counterparty MSCO, February Strike Price 18.94 MXN, Expires 2/06/20 | 1 | 8,327,000 | 87,359 | |||||||||||||
USD/MXN, Counterparty MSCO, February Strike Price 20.67 MXN, Expires 2/06/20 | 1 | 4,163,000 | 878 | |||||||||||||
USD/MXN, Counterparty MSCO, February Strike Price 19.65 MXN, Expires 2/20/20 | 1 | 8,837,000 | 23,286 | |||||||||||||
USD/MXN, Counterparty MSCO, February Strike Price 20.98 MXN, Expires 2/20/20 | 1 | 4,419,000 | 1,114 | |||||||||||||
USD/MXN, Counterparty MSCO, March Strike Price 21.58 MXN, Expires 3/05/20 | 1 | 4,418,000 | 1,175 | |||||||||||||
USD/MXN, Counterparty MSCO, March Strike Price 24.81 MXN, Expires 3/05/20 | 1 | 2,209,000 | 44 | |||||||||||||
USD/MXN, Counterparty MSCO, March Strike Price 21.36 MXN, Expires 3/10/20 | 1 | 8,284,000 | 3,372 | |||||||||||||
USD/MXN, Counterparty MSCO, March Strike Price 20.90 MXN, Expires 3/12/20 | 1 | 1,400,000 | 1,054 | |||||||||||||
USD/MXN, Counterparty MSCO, June Strike Price 21.45 MXN, Expires 6/15/20 | 1 | 1,400,000 | 4,040 | |||||||||||||
USD/MXN, Counterparty MSCO, September Strike Price 22.33 MXN, Expires 9/04/20 | 1 | 4,418,000 | 17,257 | |||||||||||||
USD/MXN, Counterparty MSCO, September Strike Price 25.97 MXN, Expires 9/04/20 | 1 | 4,418,000 | 3,481 | |||||||||||||
|
| |||||||||||||||
Puts - Over-the-Counter | ||||||||||||||||
Currency Options 0.0%† | ||||||||||||||||
AUD/JPY, Counterparty CITI, May Strike Price 69.54 JPY, Expires 5/06/20 | 1 | 1,208,000 | AUD | 2,682 | ||||||||||||
AUD/JPY, Counterparty CITI, May Strike Price 70.65 JPY, Expires 5/06/20 | 1 | 755,000 | AUD | 2,258 | ||||||||||||
AUD/JPY, Counterparty CITI, May Strike Price 74.48 JPY, Expires 5/06/20 | 1 | 1,208,000 | AUD | 10,753 | ||||||||||||
AUD/JPY, Counterparty CITI, May Strike Price 75.05 JPY, Expires 5/06/20 | 1 | 755,000 | AUD | 7,965 | ||||||||||||
AUD/JPY, Counterparty CITI, May Strike Price 65.55 JPY, Expires 5/07/20 | 1 | 755,000 | AUD | 622 | ||||||||||||
AUD/JPY, Counterparty CITI, May Strike Price 73.25 JPY, Expires 5/07/20 | 1 | 2,518,000 | AUD | 15,763 | ||||||||||||
AUD/JPY, Counterparty CITI, July Strike Price 72.00 JPY, Expires 7/21/20 | 1 | 9,062,000 | AUD | 68,606 | ||||||||||||
AUD/JPY, Counterparty CITI, November Strike Price 66.78 JPY, Expires 11/12/20 | 1 | 566,000 | AUD | 2,910 | ||||||||||||
AUD/JPY, Counterparty CITI, November Strike Price 69.18 JPY, Expires 11/12/20 | 1 | 340,000 | AUD | 2,593 | ||||||||||||
| franklintempleton.com | Annual Report | 27 | ||
TEMPLETON GLOBAL INVESTMENT TRUST
CONSOLIDATED STATEMENT OF INVESTMENTS
Templeton Global Balanced Fund(continued)
| Number of Contracts | Notional Amount* | Value | ||||||||||||||
Options Purchased(continued) | ||||||||||||||||
Puts - Over-the-Counter(continued) | ||||||||||||||||
Currency Options(continued) | ||||||||||||||||
AUD/JPY, Counterparty CITI, November Strike Price 72.78 JPY, Expires 11/12/20 | 1 | 1,416,000 | AUD | $ | 20,039 | |||||||||||
AUD/JPY, Counterparty CITI, November Strike Price 74.00 JPY, Expires 11/12/20 | 1 | 1,020,000 | AUD | 17,900 | ||||||||||||
AUD/JPY, Counterparty CITI, December Strike Price 65.85 JPY, Expires 12/21/20 | 1 | 2,267,000 | AUD | 12,084 | ||||||||||||
AUD/USD, Counterparty HSBK, April Strike Price $0.68, Expires 4/30/20 | 1 | 2,518,000 | AUD | 8,235 | ||||||||||||
AUD/USD, Counterparty HSBK, May Strike Price $0.68, Expires 5/04/20 | 1 | 3,147,000 | AUD | 8,762 | ||||||||||||
AUD/USD, Counterparty HSBK, May Strike Price $0.66, Expires 5/05/20 | 1 | 2,517,000 | AUD | 4,124 | ||||||||||||
AUD/USD, Counterparty HSBK, May Strike Price $0.65, Expires 5/07/20 | 1 | 3,021,000 | AUD | 2,904 | ||||||||||||
AUD/USD, Counterparty HSBK, May Strike Price $0.68, Expires 5/07/20 | 1 | 1,511,000 | AUD | 4,559 | ||||||||||||
AUD/USD, Counterparty MSCO, August Strike Price $0.67, Expires 8/12/20 | 1 | 8,561,000 | AUD | 41,375 | ||||||||||||
USD/MXN, Counterparty CITI, March Strike Price 18.35 MXN, Expires 3/06/20 | 1 | 2,354,000 | 2,650 | |||||||||||||
USD/MXN, Counterparty CITI, March Strike Price 18.68 MXN, Expires 3/09/20 | 1 | 1,657,000 | 6,030 | |||||||||||||
USD/MXN, Counterparty CITI, May Strike Price 18.31 MXN, Expires 5/14/20 | 1 | 1,382,000 | 3,364 | |||||||||||||
USD/MXN, Counterparty CITI, September Strike Price 19.11 MXN, Expires 9/03/20 | 1 | 2,761,000 | 39,579 | |||||||||||||
USD/MXN, Counterparty GSCO, March Strike Price 18.57 MXN, Expires 3/12/20 | 1 | 880,000 | 2,238 | |||||||||||||
USD/MXN, Counterparty JPHQ, January Strike Price 18.50 MXN, Expires 1/27/20 | 1 | 1,185,000 | 685 | |||||||||||||
USD/MXN, Counterparty JPHQ, March Strike Price 18.74 MXN, Expires 3/05/20 | 1 | 1,561,000 | 6,583 | |||||||||||||
USD/MXN, Counterparty MSCO, March Strike Price 18.92 MXN, Expires 3/10/20 | 1 | 1,105,000 | 8,526 | |||||||||||||
|
| |||||||||||||||
Total Options Purchased | 787,772 | |||||||||||||||
|
| |||||||||||||||
Total Investments before Short | 828,091,466 | |||||||||||||||
|
| |||||||||||||||
28 | Annual Report | franklintempleton.com | ||
TEMPLETON GLOBAL INVESTMENT TRUST
CONSOLIDATED STATEMENT OF INVESTMENTS
Templeton Global Balanced Fund(continued)
| | Principal Amount | * | Value | |||||||||||
| ||||||||||||||
Short Term Investments 14.8% | ||||||||||||||
Foreign Government and Agency Securities 2.1% | ||||||||||||||
Argentina 0.1% | ||||||||||||||
gArgentina Treasury Bill, | ||||||||||||||
m 2/26/20 - 5/13/20 | 43,527,710 | ARS | $ | 505,449 | ||||||||||
Strip, 8/27/20 | 10,156,090 | ARS | 116,262 | |||||||||||
g,hGovernment of Argentina, FRN, 70.253%, (ARPP7DRR), 6/21/20 | 9,233,630 | ARS | 80,766 | |||||||||||
|
| |||||||||||||
| 702,477 | ||||||||||||||
|
| |||||||||||||
Japan 1.4% | ||||||||||||||
mJapan Treasury Discount Bill, 1/14/20 - 9/23/20 | 1,567,000,000 | JPY | 14,423,171 | |||||||||||
|
| |||||||||||||
Mexico 0.6% | ||||||||||||||
mMexico Treasury Bill, 1/02/20 - 4/02/20 | 11,601,000 | n | MXN | 6,080,945 | ||||||||||
|
| |||||||||||||
South Korea 0.0%† | ||||||||||||||
Korea Monetary Stabilization Bond, senior note, 1.715%, 5/09/20 | 440,000,000 | KRW | 381,127 | |||||||||||
|
| |||||||||||||
Total Foreign Government and Agency Securities (Cost $21,503,585) | 21,587,720 | |||||||||||||
|
| |||||||||||||
Total Investments before Money | 849,679,186 | |||||||||||||
|
| |||||||||||||
| Shares | ||||||||||||||
Money Market Funds (Cost $131,795,067) 12.7% | ||||||||||||||
United States 12.7% | ||||||||||||||
o,pInstitutional Fiduciary Trust Money Market Portfolio, 1.26% | 131,795,067 | 131,795,067 | ||||||||||||
|
| |||||||||||||
Total Investments | 981,474,253 | |||||||||||||
Options Written (0.1)% | (1,475,077 | ) | ||||||||||||
Other Assets, less Liabilities 5.3% | 55,606,496 | |||||||||||||
|
| |||||||||||||
Net Assets 100.0% | $ | 1,035,605,672 | ||||||||||||
|
| |||||||||||||
| franklintempleton.com | Annual Report | 29 | ||
TEMPLETON GLOBAL INVESTMENT TRUST
CONSOLIDATED STATEMENT OF INVESTMENTS
Templeton Global Balanced Fund(continued)
| Number of Contracts | Notional Amount | Value | ||||||||||||||
| ||||||||||||||||
qOptions Written (0.1)% | ||||||||||||||||
Calls - Over-the-Counter | ||||||||||||||||
Currency Options (0.0)%† | ||||||||||||||||
AUD/JPY, Counterparty CITI, January Strike Price 76.70 JPY, Expires 1/23/20 | 1 | 3,521,000 | AUD | $ | (11,359 | ) | ||||||||||
AUD/JPY, Counterparty CITI, February Strike Price 75.90 JPY, Expires 2/12/20 | 1 | 2,153,000 | AUD | (19,444 | ) | |||||||||||
AUD/JPY, Counterparty CITI, February Strike Price 77.28 JPY, Expires 2/12/20 | 1 | 1,133,000 | AUD | (3,666 | ) | |||||||||||
AUD/JPY, Counterparty CITI, February Strike Price 78.18 JPY, Expires 2/12/20 | 1 | 680,000 | AUD | (949 | ) | |||||||||||
AUD/JPY, Counterparty CITI, April Strike Price 75.95 JPY, Expires 4/22/20 | 1 | 1,816,000 | AUD | (23,636 | ) | |||||||||||
AUD/JPY, Counterparty CITI, May Strike Price 76.00 JPY, Expires 5/06/20 | 1 | 3,173,000 | AUD | (42,454 | ) | |||||||||||
AUD/JPY, Counterparty CITI, May Strike Price 76.50 JPY, Expires 5/07/20 | 1 | 3,021,000 | AUD | (33,245 | ) | |||||||||||
AUD/JPY, Counterparty CITI, May Strike Price 77.35 JPY, Expires 5/07/20 | 1 | 1,510,000 | AUD | (11,402 | ) | |||||||||||
AUD/JPY, Counterparty CITI, December Strike Price 75.70 JPY, Expires 12/21/20 | 1 | 4,531,000 | AUD | (100,958 | ) | |||||||||||
AUD/USD, Counterparty HSBK, April Strike Price $0.71, Expires 4/30/20 | 1 | 1,888,000 | AUD | (14,545 | ) | |||||||||||
AUD/USD, Counterparty HSBK, May Strike Price $0.71, Expires 5/04/20 | 1 | 2,379,000 | AUD | (22,476 | ) | |||||||||||
AUD/USD, Counterparty HSBK, November Strike Price $0.71, Expires 11/05/20 | 1 | 1,511,000 | AUD | (21,937 | ) | |||||||||||
AUD/USD, Counterparty HSBK, November Strike Price $0.80, Expires 11/05/20 | 1 | 3,021,000 | AUD | (2,575 | ) | |||||||||||
AUD/USD, Counterparty HSBK, May Strike Price $0.78, Expires 5/05/21 | 1 | 2,518,000 | AUD | (10,846 | ) | |||||||||||
AUD/USD, Counterparty MSCO, August Strike Price $0.74, Expires 8/12/20 | 1 | 3,210,000 | AUD | (13,858 | ) | |||||||||||
AUD/USD, Counterparty MSCO, May Strike Price $0.74, Expires 5/12/21 | 1 | 5,438,000 | AUD | (61,412 | ) | |||||||||||
USD/MXN, Counterparty CITI, January Strike Price 19.96 MXN, Expires 1/30/20 | 1 | 707,000 | (325 | ) | ||||||||||||
USD/MXN, Counterparty CITI, March Strike Price 21.82 MXN, Expires 3/06/20 | 1 | 1,373,000 | (298 | ) | ||||||||||||
USD/MXN, Counterparty CITI, March Strike Price 19.95 MXN, Expires 3/30/20 | 1 | 2,651,000 | (11,092 | ) | ||||||||||||
USD/MXN, Counterparty CITI, May Strike Price 19.34 MXN, Expires 5/12/20 | 1 | 1,257,000 | (21,032 | ) | ||||||||||||
USD/MXN, Counterparty CITI, May Strike Price 22.85 MXN, Expires 5/14/20 | 1 | 2,765,000 | (2,041 | ) | ||||||||||||
USD/MXN, Counterparty CITI, May Strike Price 22.91 MXN, Expires 5/21/20 | 1 | 529,000 | (413 | ) | ||||||||||||
USD/MXN, Counterparty CITI, September Strike Price 23.00 MXN, Expires 9/03/20 | 1 | 2,761,000 | (7,488 | ) | ||||||||||||
USD/MXN, Counterparty CITI, September Strike Price 24.30 MXN, Expires 9/08/20 | 1 | 1,839,000 | (2,845 | ) | ||||||||||||
USD/MXN, Counterparty CITI, September Strike Price 20.06 MXN, Expires 9/17/20 | 1 | 2,748,000 | (53,421 | ) | ||||||||||||
30 | Annual Report | franklintempleton.com | ||
TEMPLETON GLOBAL INVESTMENT TRUST
CONSOLIDATED STATEMENT OF INVESTMENTS
Templeton Global Balanced Fund(continued)
| Number of Contracts | Notional Amount | Value | ||||||||||||||
| ||||||||||||||||
qOptions Written(continued) | ||||||||||||||||
Calls - Over-the-Counter(continued) | ||||||||||||||||
Currency Options(continued) | ||||||||||||||||
USD/MXN, Counterparty CITI, September Strike Price 22.40 MXN, Expires 9/17/20 | 1 | 2,748,000 | $ | (11,517 | ) | |||||||||||
USD/MXN, Counterparty GSCO, March Strike Price 19.49 MXN, Expires 3/12/20 | 1 | 1,770,000 | (10,974 | ) | ||||||||||||
USD/MXN, Counterparty GSCO, March Strike Price 22.11 MXN, Expires 3/12/20 | 1 | 1,770,000 | (365 | ) | ||||||||||||
USD/MXN, Counterparty JPHQ, May Strike Price 21.54 MXN, Expires 5/13/20 | 1 | 1,975,000 | (3,575 | ) | ||||||||||||
USD/MXN, Counterparty JPHQ, July Strike Price 22.30 MXN, Expires 7/27/20 | 1 | 1,580,000 | (4,484 | ) | ||||||||||||
USD/MXN, Counterparty MSCO, February Strike Price 19.98 MXN, Expires 2/06/20 | 1 | 12,490,000 | (9,380 | ) | ||||||||||||
USD/MXN, Counterparty MSCO, February Strike Price 20.15 MXN, Expires 2/20/20 | 1 | 13,256,000 | (12,819 | ) | ||||||||||||
USD/MXN, Counterparty MSCO, March Strike Price 22.56 MXN, Expires 3/05/20 | 1 | 3,314,000 | (341 | ) | ||||||||||||
USD/MXN, Counterparty MSCO, March Strike Price 20.49 MXN, Expires 3/10/20 | 1 | 2,762,000 | (3,298 | ) | ||||||||||||
USD/MXN, Counterparty MSCO, March Strike Price 22.87 MXN, Expires 3/12/20 | 1 | 1,100,000 | (117 | ) | ||||||||||||
USD/MXN, Counterparty MSCO, June Strike Price 24.20 MXN, Expires 6/15/20 | 1 | 700,000 | (362 | ) | ||||||||||||
USD/MXN, Counterparty MSCO, September Strike Price 24.56 MXN, Expires 9/04/20 | 1 | 6,627,000 | (8,887 | ) | ||||||||||||
USD/MXN, Counterparty MSCO, September Strike Price 22.46 MXN, Expires 9/10/20 | 1 | 552,000 | (2,101 | ) | ||||||||||||
|
| |||||||||||||||
Puts - Over-the-Counter | ||||||||||||||||
Currency Options (0.1)% | ||||||||||||||||
AUD/JPY, Counterparty CITI, July Strike Price 68.00 JPY, Expires 7/21/20 | 1 | 4,027,000 | AUD | (12,916 | ) | |||||||||||
AUD/USD, Counterparty MSCO, August Strike Price $0.64, Expires 8/12/20 | 1 | 2,140,000 | AUD | (3,327 | ) | |||||||||||
USD/MXN, Counterparty CITI, March Strike Price 18.96 MXN, Expires 3/06/20 | 1 | 2,207,000 | (18,159 | ) | ||||||||||||
USD/MXN, Counterparty CITI, March Strike Price 19.38 MXN, Expires 3/06/20 | 1 | 1,324,000 | (28,804 | ) | ||||||||||||
USD/MXN, Counterparty CITI, March Strike Price 19.37 MXN, Expires 3/09/20 | 1 | 3,314,000 | (70,704 | ) | ||||||||||||
USD/MXN, Counterparty CITI, May Strike Price 19.55 MXN, Expires 5/11/20 | 1 | 2,745,000 | (74,107 | ) | ||||||||||||
USD/MXN, Counterparty CITI, May Strike Price 19.69 MXN, Expires 5/12/20 | 1 | 980,000 | (31,551 | ) | ||||||||||||
USD/MXN, Counterparty CITI, May Strike Price 19.24 MXN, Expires 5/14/20 | 1 | 4,147,000 | (70,151 | ) | ||||||||||||
USD/MXN, Counterparty CITI, May Strike Price 20.58 MXN, Expires 5/15/20 | 1 | 1,725,000 | (121,763 | ) | ||||||||||||
USD/MXN, Counterparty CITI, May Strike Price 19.09 MXN, Expires 5/21/20 | 1 | 529,000 | (6,839 | ) | ||||||||||||
| franklintempleton.com | Annual Report | 31 | ||
TEMPLETON GLOBAL INVESTMENT TRUST
CONSOLIDATED STATEMENT OF INVESTMENTS
Templeton Global Balanced Fund(continued)
| Number of Contracts | Notional Amount | Value | ||||||||||||
| ||||||||||||||
qOptions Written(continued) | ||||||||||||||
Puts - Over-the-Counter(continued) | ||||||||||||||
Currency Options(continued) | ||||||||||||||
USD/MXN, Counterparty CITI, September Strike Price 19.76 MXN, Expires 9/03/20 | 1 | 5,523,000 | $ | (169,037 | ) | |||||||||
USD/MXN, Counterparty GSCO, March Strike Price 19.40 MXN, Expires 3/12/20 | 1 | 2,200,000 | (48,963 | ) | ||||||||||
USD/MXN, Counterparty JPHQ, January Strike Price 19.00 MXN, Expires 1/27/20 | 1 | 3,160,000 | (24,408 | ) | ||||||||||
USD/MXN, Counterparty JPHQ, March Strike Price 19.45 MXN, Expires 3/05/20 | 1 | 3,122,000 | (76,717 | ) | ||||||||||
USD/MXN, Counterparty JPHQ, April Strike Price 19.36 MXN, Expires 4/24/20 | 1 | 2,765,000 | (56,262 | ) | ||||||||||
USD/MXN, Counterparty JPHQ, June Strike Price 19.40 MXN, Expires 6/12/20 | 1 | 1,039,000 | (22,173 | ) | ||||||||||
USD/MXN, Counterparty MSCO, March Strike Price 19.05 MXN, Expires 3/12/20 | 1 | 1,100,000 | (11,610 | ) | ||||||||||
USD/MXN, Counterparty MSCO, June Strike Price 19.05 MXN, Expires 6/15/20 | 1 | 1,100,000 | (13,780 | ) | ||||||||||
USD/MXN, Counterparty MSCO, September Strike Price 19.76 MXN, Expires 9/10/20 | 1 | 1,657,000 | (51,869 | ) | ||||||||||
|
| |||||||||||||
Total Options Written (Premiums | $ | (1,475,077 | ) | |||||||||||
|
| |||||||||||||
†Rounds to less than 0.1% of net assets.
*The principal/notional amount is stated in U.S. dollars unless otherwise indicated.
aNon-income producing.
bFair valued using significant unobservable inputs. See Note 12 regarding fair value measurements.
cSee Note 9 regarding restricted securities.
dThe security is owned by FT Holdings Corporation IV, a wholly-owned subsidiary of the Fund. See Note 1(f).
eSecurity was purchased pursuant to Rule 144A under the Securities Act of 1933 and may be sold in transactions exempt from registration only to qualified institutional buyers or in a public offering registered under the Securities Act of 1933. At December 31, 2019, the aggregate value of these securities was $129,347, representing less than 0.1% of net assets.
fIncome may be received in additional securities and/or cash.
gSecurities denominated in Argentine Peso have been designated as Level 3 investments. See Note 12 regarding fair value measurements.
hThe coupon rate shown represents the rate at period end.
iRedemption price at maturity and coupon payment are adjusted for inflation. See Note 1(h).
jPrincipal amount is stated in 1,000 Brazilian Real Units.
kPrincipal amount is stated in 100 Mexican Peso Units.
lA supranational organization is an entity formed by two or more central governments through international treaties.
mThe security was issued on a discount basis with no stated coupon rate.
nPrincipal amount is stated in 10 Mexican Peso Units.
oSee Note 3(f) regarding investments in affiliated management investment companies.
pThe rate shown is the annualized seven-day effective yield at period end.
qSee Note 1(c) regarding written options.
32 | Annual Report | franklintempleton.com | ||
TEMPLETON GLOBAL INVESTMENT TRUST
CONSOLIDATED STATEMENT OF INVESTMENTS
Templeton Global Balanced Fund(continued)
At December 31, 2019, the Fund had the following forward exchange contracts outstanding. See Note 1(c).
Forward Exchange Contracts
| Currency | Counterpartya | Type | Quantity | Contract Amount* | Settlement Date | Unrealized Appreciation | Unrealized Depreciation | |||||||||||||||||||||||
| ||||||||||||||||||||||||||||||
OTC Forward Exchange Contracts |
| |||||||||||||||||||||||||||||
Norwegian Krone | DBAB | Buy | 6,689,000 | 732,728 | 1/03/20 | $ | 29,345 | $ | — | |||||||||||||||||||||
Norwegian Krone | DBAB | Sell | 6,689,000 | 747,635 | 1/03/20 | — | (14,438 | ) | ||||||||||||||||||||||
Indian Rupee | BNDP | Sell | 211,011,700 | 2,942,775 | 1/07/20 | — | (13,535 | ) | ||||||||||||||||||||||
South Korean Won | HSBK | Sell | 9,458,966,732 | 7,921,419 | 1/08/20 | — | (262,451 | ) | ||||||||||||||||||||||
Indian Rupee | BNDP | Sell | 233,148,000 | 3,196,107 | 1/13/20 | — | (69,486 | ) | ||||||||||||||||||||||
Australian Dollar | JPHQ | Buy | �� | 2,515,750 | 1,715,835 | 1/15/20 | 50,028 | — | ||||||||||||||||||||||
Australian Dollar | JPHQ | Sell | 2,515,750 | 1,762,572 | 1/15/20 | — | (3,290 | ) | ||||||||||||||||||||||
Indian Rupee | CITI | Buy | 139,000,000 | 1,932,434 | 1/16/20 | 14,219 | — | |||||||||||||||||||||||
Indian Rupee | CITI | Sell | 328,532,000 | 4,486,303 | 1/16/20 | — | (114,689 | ) | ||||||||||||||||||||||
South Korean Won | HSBK | Sell | 5,354,972,927 | 4,459,319 | 1/17/20 | — | (174,618 | ) | ||||||||||||||||||||||
South Korean Won | HSBK | Sell | 5,885,027,073 | 5,035,825 | 1/28/20 | — | (57,911 | ) | ||||||||||||||||||||||
South Korean Won | HSBK | Sell | 4,594,897,268 | 3,926,256 | 1/30/20 | — | (50,977 | ) | ||||||||||||||||||||||
Brazilian Real | JPHQ | Sell | 9,557,700 | 2,321,690 | 2/04/20 | — | (54,439 | ) | ||||||||||||||||||||||
Euro | JPHQ | Sell | 106,237,479 | 119,136,834 | 2/05/20 | — | (276,041 | ) | ||||||||||||||||||||||
Indian Rupee | HSBK | Sell | 179,312,000 | 2,473,781 | 2/05/20 | — | (34,255 | ) | ||||||||||||||||||||||
Indian Rupee | BNDP | Sell | 212,773,300 | 2,968,315 | 2/06/20 | — | (7,417 | ) | ||||||||||||||||||||||
Indian Rupee | HSBK | Sell | 81,583,060 | 1,142,860 | 2/06/20 | 1,883 | — | |||||||||||||||||||||||
Swiss Franc | UBSW | Buy | 1,820,175 | 1,656,512 | EUR | 2/10/20 | 24,035 | — | ||||||||||||||||||||||
Swiss Franc | GSCO | Buy | 1,786,326 | 1,626,239 | EUR | 2/12/20 | 23,019 | — | ||||||||||||||||||||||
British Pound | JPHQ | Sell | 41,511,965 | 53,555,001 | 2/13/20 | — | (1,494,202 | ) | ||||||||||||||||||||||
Swedish Krona | DBAB | Buy | 24,942,100 | 2,336,321 | EUR | 2/13/20 | 41,370 | — | ||||||||||||||||||||||
Indian Rupee | HSBK | Sell | 88,330,094 | 1,220,164 | 2/14/20 | — | (14,092 | ) | ||||||||||||||||||||||
Indian Rupee | HSBK | Sell | 229,352,000 | 3,163,694 | 2/18/20 | — | (39,688 | ) | ||||||||||||||||||||||
Indian Rupee | CITI | Sell | 281,865,000 | 3,881,369 | 2/20/20 | — | (54,606 | ) | ||||||||||||||||||||||
Indian Rupee | JPHQ | Sell | 227,610,880 | 3,141,302 | 2/20/20 | — | (37,066 | ) | ||||||||||||||||||||||
Australian Dollar | JPHQ | Sell | 9,763,938 | 698,722,016 | JPY | 2/21/20 | — | (411,249 | ) | |||||||||||||||||||||
Australian Dollar | CITI | Sell | 5,235,270 | 374,275,995 | JPY | 2/25/20 | — | (223,455 | ) | |||||||||||||||||||||
Euro | HSBK | Sell | 2,803,525 | 330,826,092 | JPY | 2/25/20 | — | (101,170 | ) | |||||||||||||||||||||
Japanese Yen | CITI | Buy | 310,987,600 | 2,960,943 | 2/26/20 | — | (90,054 | ) | ||||||||||||||||||||||
Japanese Yen | CITI | Sell | 310,987,600 | 2,961,674 | 2/26/20 | 90,784 | — | |||||||||||||||||||||||
Norwegian Krone | DBAB | Buy | 16,393,500 | 1,830,715 | 2/26/20 | 37,342 | — | |||||||||||||||||||||||
Japanese Yen | CITI | Buy | 212,053,600 | 2,016,992 | 2/27/20 | — | (59,302 | ) | ||||||||||||||||||||||
Japanese Yen | CITI | Sell | 112,930,400 | 1,075,563 | 2/27/20 | 32,984 | — | |||||||||||||||||||||||
Japanese Yen | JPHQ | Buy | 209,585,600 | 1,993,451 | 2/27/20 | — | (58,547 | ) | ||||||||||||||||||||||
Japanese Yen | CITI | Buy | 407,229,000 | 3,900,715 | 2/28/20 | — | (140,943 | ) | ||||||||||||||||||||||
Japanese Yen | CITI | Sell | 407,229,000 | 3,878,593 | 2/28/20 | 118,821 | — | |||||||||||||||||||||||
Brazilian Real | JPHQ | Sell | 11,984,100 | 2,902,113 | 3/03/20 | — | (72,277 | ) | ||||||||||||||||||||||
Australian Dollar | CITI | Sell | 17,534,250 | 1,255,759,745 | JPY | 3/06/20 | — | (724,281 | ) | |||||||||||||||||||||
Japanese Yen | HSBK | Buy | 308,598,830 | 2,908,796 | 3/06/20 | — | (58,467 | ) | ||||||||||||||||||||||
Japanese Yen | HSBK | Sell | 308,598,830 | 2,943,438 | 3/06/20 | 93,109 | — | |||||||||||||||||||||||
Japanese Yen | JPHQ | Buy | 293,091,520 | 2,765,616 | 3/06/20 | — | (58,518 | ) | ||||||||||||||||||||||
Japanese Yen | JPHQ | Sell | 293,091,520 | 2,785,945 | 3/06/20 | 78,847 | — | |||||||||||||||||||||||
Euro | DBAB | Buy | 5,532,158 | 6,173,943 | 3/09/20 | 56,970 | — | |||||||||||||||||||||||
Euro | DBAB | Sell | 5,532,158 | 6,164,760 | 3/09/20 | — | (66,153 | ) | ||||||||||||||||||||||
South Korean Won | GSCO | Sell | 5,211,000,000 | 4,487,019 | 3/09/20 | — | (28,788 | ) | ||||||||||||||||||||||
| franklintempleton.com | Annual Report | 33 | ||
TEMPLETON GLOBAL INVESTMENT TRUST
CONSOLIDATED STATEMENT OF INVESTMENTS
Templeton Global Balanced Fund(continued)
Forward Exchange Contracts(continued)
| Currency | Counterpartya | Type | Quantity | Contract Amount* | Settlement Date | Unrealized Appreciation | Unrealized Depreciation | |||||||||||||||||||||||||
| ||||||||||||||||||||||||||||||||
OTC Forward Exchange Contracts(continued) |
| |||||||||||||||||||||||||||||||
Swedish Krona | DBAB | Buy | 24,942,200 | 2,335,456 | EUR | 3/13/20 | $ | 41,249 | $ | — | ||||||||||||||||||||||
Indian Rupee | JPHQ | Sell | 108,239,120 | 1,482,220 | 3/16/20 | — | (24,554 | ) | ||||||||||||||||||||||||
Euro | GSCO | Buy | 974,548 | 1,088,970 | 3/23/20 | 9,670 | — | |||||||||||||||||||||||||
Euro | GSCO | Sell | 974,548 | 1,092,254 | 3/23/20 | — | (6,385 | ) | ||||||||||||||||||||||||
Japanese Yen | HSBK | Buy | 740,597,560 | 6,970,096 | 3/23/20 | — | (122,828 | ) | ||||||||||||||||||||||||
Japanese Yen | JPHQ | Buy | 501,343,490 | 4,714,594 | 3/23/20 | — | (79,373 | ) | ||||||||||||||||||||||||
Japanese Yen | JPHQ | Sell | 501,343,490 | 4,769,920 | 3/23/20 | 134,699 | — | |||||||||||||||||||||||||
Norwegian Krone | DBAB | Buy | 13,389,000 | 1,497,534 | 3/23/20 | 28,199 | — | |||||||||||||||||||||||||
Japanese Yen | JPHQ | Buy | 130,119,720 | 1,235,270 | 3/24/20 | — | (32,164 | ) | ||||||||||||||||||||||||
Japanese Yen | JPHQ | Sell | 130,119,720 | 1,238,061 | 3/24/20 | 34,955 | — | |||||||||||||||||||||||||
Norwegian Krone | DBAB | Buy | 10,071,000 | 1,119,983 | 3/24/20 | 27,651 | — | |||||||||||||||||||||||||
Euro | HSBK | Sell | 2,803,598 | 331,441,392 | JPY | 3/25/20 | — | (96,262 | ) | |||||||||||||||||||||||
Euro | SCNY | Buy | 909,501 | 1,012,904 | 3/31/20 | 12,936 | — | |||||||||||||||||||||||||
Euro | SCNY | Sell | 909,501 | 1,008,218 | 3/31/20 | — | (17,622 | ) | ||||||||||||||||||||||||
Euro | DBAB | Buy | 2,568,908 | 2,861,249 | 4/08/20 | 37,701 | — | |||||||||||||||||||||||||
Euro | DBAB | Sell | 2,568,908 | 2,857,139 | 4/08/20 | — | (41,811 | ) | ||||||||||||||||||||||||
Mexican Peso | CITI | Sell | 11,739,000 | 584,515 | 4/08/20 | — | (26,802 | ) | ||||||||||||||||||||||||
Euro | UBSW | Buy | 943,744 | 1,051,171 | 4/09/20 | 13,887 | — | |||||||||||||||||||||||||
Euro | UBSW | Sell | 943,744 | 1,050,010 | 4/09/20 | — | (15,049 | ) | ||||||||||||||||||||||||
Euro | JPHQ | Buy | 2,915,063 | 3,248,041 | 4/14/20 | 42,764 | — | |||||||||||||||||||||||||
Euro | JPHQ | Sell | 2,915,063 | 3,239,465 | 4/14/20 | — | (51,340 | ) | ||||||||||||||||||||||||
Euro | BOFA | Buy | 7,619,000 | 8,493,433 | 4/15/20 | 108,169 | — | |||||||||||||||||||||||||
Euro | BOFA | Sell | 7,619,000 | 8,500,290 | 4/15/20 | — | (101,312 | ) | ||||||||||||||||||||||||
Euro | GSCO | Buy | 1,651,995 | 1,848,632 | 4/15/20 | 16,416 | — | |||||||||||||||||||||||||
Euro | GSCO | Sell | 1,651,995 | 1,842,933 | 4/15/20 | — | (22,116 | ) | ||||||||||||||||||||||||
Swedish Krona | DBAB | Buy | 24,942,200 | 2,294,781 | EUR | 4/15/20 | 85,834 | — | ||||||||||||||||||||||||
Euro | GSCO | Buy | 974,786 | 1,091,331 | 4/23/20 | 9,718 | — | |||||||||||||||||||||||||
Euro | GSCO | Sell | 974,786 | 1,100,630 | 4/23/20 | — | (418 | ) | ||||||||||||||||||||||||
Euro | DBAB | Buy | 100,000 | 111,510 | 4/27/20 | 1,471 | — | |||||||||||||||||||||||||
Euro | DBAB | Sell | 100,000 | 112,560 | 4/27/20 | — | (421 | ) | ||||||||||||||||||||||||
Euro | GSCO | Buy | 110,159 | 123,297 | 4/29/20 | 1,177 | — | |||||||||||||||||||||||||
Euro | GSCO | Sell | 110,159 | 123,788 | 4/29/20 | — | (686 | ) | ||||||||||||||||||||||||
Euro | SCNY | Buy | 3,343,195 | 3,730,109 | 4/29/20 | 47,537 | — | |||||||||||||||||||||||||
Euro | SCNY | Sell | 3,343,195 | 3,756,464 | 4/29/20 | — | (21,183 | ) | ||||||||||||||||||||||||
Euro | DBAB | Buy | 6,229,151 | 6,950,419 | 4/30/20 | 88,656 | — | |||||||||||||||||||||||||
Euro | DBAB | Sell | 6,229,151 | 6,994,714 | 4/30/20 | — | (44,360 | ) | ||||||||||||||||||||||||
Euro | CITI | Buy | 3,767,000 | 4,218,094 | 5/04/20 | 39,756 | — | |||||||||||||||||||||||||
Euro | CITI | Sell | 3,767,000 | 4,246,633 | 5/04/20 | — | (11,218 | ) | ||||||||||||||||||||||||
Brazilian Real | JPHQ | Sell | 10,840,200 | 2,615,190 | 5/05/20 | — | (67,297 | ) | ||||||||||||||||||||||||
Euro | JPHQ | Buy | 2,214,250 | 2,480,480 | 5/08/20 | 22,916 | — | |||||||||||||||||||||||||
Euro | JPHQ | Sell | 2,214,250 | 2,483,503 | 5/08/20 | — | (19,894 | ) | ||||||||||||||||||||||||
Swiss Franc | UBSW | Buy | 1,820,175 | 1,657,915 | EUR | 5/08/20 | 24,021 | — | ||||||||||||||||||||||||
Swiss Franc | GSCO | Buy | 1,786,325 | 1,627,631 | EUR | 5/12/20 | 23,019 | — | ||||||||||||||||||||||||
Swedish Krona | DBAB | Buy | 24,942,200 | 2,343,113 | EUR | 5/13/20 | 30,109 | — | ||||||||||||||||||||||||
Norwegian Krone | DBAB | Buy | 5,468,000 | 594,529 | 5/18/20 | 28,581 | — | |||||||||||||||||||||||||
Norwegian Krone | DBAB | Buy | 22,113,500 | 2,433,639 | 5/19/20 | 86,322 | — | |||||||||||||||||||||||||
34 | Annual Report | franklintempleton.com | ||
TEMPLETON GLOBAL INVESTMENT TRUST
CONSOLIDATED STATEMENT OF INVESTMENTS
Templeton Global Balanced Fund(continued)
Forward Exchange Contracts(continued)
| Currency | Counterpartya | Type | Quantity | Contract Amount* | Settlement Date | Unrealized Appreciation | Unrealized Depreciation | |||||||||||||||||||||||||
| ||||||||||||||||||||||||||||||||
OTC Forward Exchange Contracts(continued) |
| |||||||||||||||||||||||||||||||
Euro | BOFA | Buy | 500,000 | 561,458 | 5/20/20 | $ | 4,257 | $ | — | |||||||||||||||||||||||
Euro | BOFA | Sell | 4,110,760 | 4,598,830 | 5/20/20 | — | (52,207 | ) | ||||||||||||||||||||||||
Euro | GSCO | Buy | 47,872 | 53,654 | 5/20/20 | 510 | — | |||||||||||||||||||||||||
Euro | GSCO | Sell | 47,872 | 53,564 | 5/20/20 | — | (600 | ) | ||||||||||||||||||||||||
Australian Dollar | JPHQ | Sell | 19,527,876 | 1,416,211,688 | JPY | 5/21/20 | — | (610,106 | ) | |||||||||||||||||||||||
Euro | JPHQ | Sell | 3,912,953 | 4,384,737 | 5/21/20 | — | (42,771 | ) | ||||||||||||||||||||||||
Euro | HSBK | Sell | 5,607,050 | 667,772,560 | JPY | 5/22/20 | — | (149,851 | ) | |||||||||||||||||||||||
Euro | DBAB | Sell | 6,231,599 | 6,970,667 | 5/26/20 | — | (82,590 | ) | ||||||||||||||||||||||||
Japanese Yen | JPHQ | Buy | 209,581,500 | 1,951,774 | 5/26/20 | — | (7,049 | ) | ||||||||||||||||||||||||
Norwegian Krone | DBAB | Buy | 16,393,500 | 1,799,797 | 5/27/20 | 68,338 | — | |||||||||||||||||||||||||
Euro | JPHQ | Sell | 13,255,813 | 14,855,193 | 6/04/20 | — | (156,867 | ) | ||||||||||||||||||||||||
Euro | UBSW | Sell | 943,744 | 1,057,843 | 6/05/20 | — | (11,004 | ) | ||||||||||||||||||||||||
Japanese Yen | HSBK | Buy | 308,598,830 | 2,925,673 | 6/08/20 | — | (60,060 | ) | ||||||||||||||||||||||||
Japanese Yen | JPHQ | Buy | 293,091,510 | 2,781,891 | 6/08/20 | — | (60,277 | ) | ||||||||||||||||||||||||
Japanese Yen | JPHQ | Sell | 293,091,510 | 2,800,640 | 6/08/20 | 79,026 | — | |||||||||||||||||||||||||
Euro | JPHQ | Sell | 13,255,813 | 15,404,845 | 6/15/20 | 382,476 | — | |||||||||||||||||||||||||
Norwegian Krone | JPHQ | Buy | 13,577,400 | 1,483,715 | 6/15/20 | 63,514 | — | |||||||||||||||||||||||||
Swedish Krona | DBAB | Buy | 24,942,100 | 2,332,476 | EUR | 6/15/20 | 40,777 | — | ||||||||||||||||||||||||
Swedish Krona | DBAB | Buy | 24,942,200 | 2,376,806 | EUR | 6/15/20 | — | (9,450 | ) | |||||||||||||||||||||||
Norwegian Krone | JPHQ | Buy | 13,494,800 | 1,483,718 | 6/16/20 | 54,098 | — | |||||||||||||||||||||||||
Mexican Peso | CITI | Sell | 40,252,000 | 1,979,880 | 6/17/20 | — | (94,928 | ) | ||||||||||||||||||||||||
Norwegian Krone | DBAB | Buy | 22,113,500 | 2,455,937 | 6/19/20 | 64,035 | — | |||||||||||||||||||||||||
Norwegian Krone | JPHQ | Buy | 13,824,100 | 1,533,847 | 6/19/20 | 41,496 | — | |||||||||||||||||||||||||
Japanese Yen | JPHQ | Buy | 250,941,500 | 2,372,927 | 6/22/20 | — | (40,874 | ) | ||||||||||||||||||||||||
Japanese Yen | JPHQ | Sell | 250,941,500 | 2,399,624 | 6/22/20 | 67,571 | — | |||||||||||||||||||||||||
Japanese Yen | BNDP | Buy | 634,154,280 | 6,056,920 | 6/24/20 | — | (162,924 | ) | ||||||||||||||||||||||||
Norwegian Krone | DBAB | Buy | 6,689,000 | 747,785 | 6/30/20 | 14,465 | — | |||||||||||||||||||||||||
Euro | UBSW | Buy | 3,114,000 | 3,510,007 | 7/23/20 | 27,359 | — | |||||||||||||||||||||||||
Euro | UBSW | Sell | 3,506,930 | 3,981,944 | 7/23/20 | — | (1,773 | ) | ||||||||||||||||||||||||
Swiss Franc | UBSW | Buy | 1,820,175 | 1,659,230 | EUR | 8/10/20 | 24,043 | — | ||||||||||||||||||||||||
Swiss Franc | GSCO | Buy | 1,786,325 | 1,628,967 | EUR | 8/12/20 | 22,951 | — | ||||||||||||||||||||||||
Australian Dollar | JPHQ | Sell | 9,763,937 | 693,922,051 | JPY | 8/21/20 | — | (416,566 | ) | |||||||||||||||||||||||
Australian Dollar | CITI | Sell | 5,221,330 | 370,602,955 | JPY | 8/24/20 | — | (226,853 | ) | |||||||||||||||||||||||
Euro | HSBK | Sell | 2,803,525 | 331,284,750 | JPY | 8/24/20 | — | (101,379 | ) | |||||||||||||||||||||||
Japanese Yen | CITI | Buy | 255,150,000 | 2,468,806 | 8/31/20 | — | (88,251 | ) | ||||||||||||||||||||||||
Norwegian Krone | JPHQ | Buy | 12,113,700 | 1,342,635 | 9/21/20 | 37,464 | — | |||||||||||||||||||||||||
Norwegian Krone | DBAB | Buy | 13,389,000 | 1,483,875 | 9/24/20 | 41,506 | — | |||||||||||||||||||||||||
Mexican Peso | CITI | Sell | 12,045,000 | 584,516 | 10/08/20 | — | (26,375 | ) | ||||||||||||||||||||||||
Mexican Peso | CITI | Sell | 9,047,000 | 438,398 | 10/09/20 | — | (20,380 | ) | ||||||||||||||||||||||||
Euro | HSBK | Sell | 3,767,000 | 4,233,129 | 10/13/20 | — | (68,030 | ) | ||||||||||||||||||||||||
Mexican Peso | CITI | Sell | 30,162,000 | 1,458,638 | 10/13/20 | — | (70,061 | ) | ||||||||||||||||||||||||
Euro | DBAB | Sell | 975,303 | 1,100,161 | 10/15/20 | — | (13,579 | ) | ||||||||||||||||||||||||
Mexican Peso | CITI | Sell | 44,398,000 | 2,154,845 | 10/15/20 | — | (94,763 | ) | ||||||||||||||||||||||||
Mexican Peso | CITI | Sell | 40,653,000 | 1,991,262 | 10/16/20 | — | (68,310 | ) | ||||||||||||||||||||||||
Swiss Franc | UBSW | Buy | 1,820,175 | 1,660,501 | EUR | 11/09/20 | 24,076 | — | ||||||||||||||||||||||||
Swiss Franc | GSCO | Buy | 1,786,326 | 1,630,157 | EUR | 11/12/20 | 23,066 | — | ||||||||||||||||||||||||
| franklintempleton.com | Annual Report | 35 | ||
TEMPLETON GLOBAL INVESTMENT TRUST
CONSOLIDATED STATEMENT OF INVESTMENTS
Templeton Global Balanced Fund(continued)
Forward Exchange Contracts(continued)
| Currency | Counterpartya | Type | Quantity | Contract Amount* | Settlement Date | Unrealized Appreciation | Unrealized Depreciation | |||||||||||||||||||||||||
| ||||||||||||||||||||||||||||||||
OTC Forward Exchange Contracts(continued) |
| |||||||||||||||||||||||||||||||
Norwegian Krone | DBAB | Buy | 13,252,000 | 1,449,573 | 11/16/20 | $ | 60,110 | $ | — | |||||||||||||||||||||||
|
| |||||||||||||||||||||||||||||||
Total Forward Exchange Contracts |
|
$ |
2,831,307 |
| $ | (8,407,378 | ) | |||||||||||||||||||||||||
|
| |||||||||||||||||||||||||||||||
Net unrealized appreciation (depreciation) |
|
$ |
(5,576,071 |
) | ||||||||||||||||||||||||||||
|
| |||||||||||||||||||||||||||||||
*In U.S. dollars unless otherwise indicated.
aMay be comprised of multiple contracts with the same counterparty, currency and settlement date.
At December 31, 2019, the Fund had the following interest rate swap contracts outstanding. See Note 1(c).
Interest Rate Swap Contracts
| Description | Payment Frequency | Maturity Date | Notional Amount | Value/ Unrealized Appreciation (Depreciation) | ||||||||||||
| ||||||||||||||||
Centrally Cleared Swap Contracts | ||||||||||||||||
Receive Floating 3-month USD LIBOR | | Quarterly Semi-Annual | | 4/13/47 | $ | 24,590,000 | $ | (2,383,733 | ) | |||||||
Receive Floating 3-month USD LIBOR | | Quarterly Semi-Annual | | 2/20/48 | 4,440,000 | (905,308 | ) | |||||||||
Receive Floating 3-month USD LIBOR | | Quarterly Semi-Annual | | 2/22/48 | 4,440,000 | (927,375 | ) | |||||||||
Receive Floating 3-month USD LIBOR | | Quarterly Semi-Annual | | 2/23/48 | 4,440,000 | (944,401 | ) | |||||||||
|
| |||||||||||||||
Total Interest Rate Swap Contracts |
$ |
(5,160,817 |
) | |||||||||||||
|
| |||||||||||||||
See Note 10 regarding other derivative information.
See Abbreviations on page 59.
36 | Annual Report | The accompanying notes are an integral part of these consolidated financial statements. | franklintempleton.com | ||
TEMPLETON GLOBAL INVESTMENT TRUST
CONSOLIDATED FINANCIAL STATEMENTS
Consolidated Statement of Assets and Liabilities
December 31, 2019
Templeton Global Balanced Fund
Assets: | ||||
Investments in securities: | ||||
Cost - Unaffiliated issuers | $ | 886,252,566 | ||
Cost - Non-controlled affiliates (Note 3f) | 131,795,067 | |||
|
| |||
Value - Unaffiliated issuers | $ | 849,679,186 | ||
Value - Non-controlled affiliates (Note 3f) | 131,795,067 | |||
Cash | 6,068,709 | |||
Restricted currency, at value (cost $2,496,282) (Note 1d) | 2,466,942 | |||
Foreign currency, at value (cost $40,238,941) | 40,301,868 | |||
Receivables: | ||||
Capital shares sold | 273,935 | |||
Dividends and interest | 6,538,634 | |||
European Union tax reclaims | 88,140 | |||
Deposits with brokers for: | ||||
OTC derivative contracts | 5,563,000 | |||
Centrally cleared swap contracts | 4,858,612 | |||
Variation margin on centrally cleared swap contracts | 423,990 | |||
Unrealized appreciation on OTC forward exchange contracts | 2,831,307 | |||
FT Subsidiary deferred tax benefit (Note 1f) | 143,814 | |||
Other assets | 164 | |||
|
| |||
Total assets | 1,051,033,368 | |||
|
| |||
Liabilities: | ||||
Payables: | ||||
Investment securities purchased | 422,637 | |||
Capital shares redeemed | 2,561,563 | |||
Management fees | 640,328 | |||
Distribution fees | 288,738 | |||
Transfer agent fees | 243,238 | |||
Deposits from brokers for: | ||||
OTC derivative contracts | 700,000 | |||
Options written, at value (premiums received $2,063,473) | 1,475,077 | |||
Unrealized depreciation on OTC forward exchange contracts | 8,407,378 | |||
Deferred tax. | 294,611 | |||
Accrued expenses and other liabilities. | 394,126 | |||
|
| |||
Total liabilities | 15,427,696 | |||
|
| |||
Net assets, at value | $ | 1,035,605,672 | ||
|
| |||
Net assets consist of: | ||||
Paid-in capital | $ | 1,157,365,043 | ||
Total distributable earnings (losses) | (121,759,371 | ) | ||
|
| |||
Net assets, at value | $ | 1,035,605,672 | ||
|
|
| franklintempleton.com | The accompanying notes are an integral part of these consolidated financial statements. | Annual Report | 37 | ||||
TEMPLETON GLOBAL INVESTMENT TRUST
CONSOLIDATED FINANCIAL STATEMENTS
Consolidated Statement of Assets and Liabilities(continued)
December 31, 2019
Templeton Global Balanced Fund
Class A: | ||||
Net assets, at value | $465,915,073 | |||
|
| |||
Shares outstanding | 164,164,829 | |||
|
| |||
Net asset value per sharea | $2.84 | |||
|
| |||
Maximum offering price per share (net asset value per share ÷ 94.50%) | $3.01 | |||
|
| |||
Class A1: | ||||
Net assets, at value | $252,989,903 | |||
|
| |||
Shares outstanding | 89,005,149 | |||
|
| |||
Net asset value per sharea | $2.84 | |||
|
| |||
Maximum offering price per share (net asset value per share ÷ 96.25%) | $2.95 | |||
|
| |||
Class C: | ||||
Net assets, at value | $139,230,559 | |||
|
| |||
Shares outstanding | 49,312,533 | |||
|
| |||
Net asset value and maximum offering price per sharea | $2.82 | |||
|
| |||
Class C1: | ||||
Net assets, at value | $ 27,764,907 | |||
|
| |||
Shares outstanding | 9,764,751 | |||
|
| |||
Net asset value and maximum offering price per sharea | $2.84 | |||
|
| |||
Class R: | ||||
Net assets, at value | $ 2,348,042 | |||
|
| |||
Shares outstanding | 823,794 | |||
|
| |||
Net asset value and maximum offering price per share | $2.85 | |||
|
| |||
Class R6: | ||||
Net assets, at value | $ 6,080,359 | |||
|
| |||
Shares outstanding | 2,136,969 | |||
|
| |||
Net asset value and maximum offering price per share | $2.85 | |||
|
| |||
Advisor Class: | ||||
Net assets, at value | $141,276,829 | |||
|
| |||
Shares outstanding | 49,538,227 | |||
|
| |||
Net asset value and maximum offering price per share | $2.85 | |||
|
|
aRedemption price is equal to net asset value less contingent deferred sales charges, if applicable.
38 | Annual Report | The accompanying notes are an integral part of these consolidated financial statements. | franklintempleton.com | ||
TEMPLETON GLOBAL INVESTMENT TRUST
CONSOLIDATED FINANCIAL STATEMENTS
Consolidated Statement of Operations
for the year ended December 31, 2019
Templeton Global Balanced Fund
Investment income: | ||||
Dividends: (net of foreign taxes)* | ||||
Unaffiliated issuers | $ | 28,796,266 | ||
Non-controlled affiliates (Note 3f) | 1,837,062 | |||
Interest: (net of foreign taxes)~ | ||||
Unaffiliated issuers | 30,009,337 | |||
Income from securities loaned: | ||||
Unaffiliated issuers (net of fees and rebates) | 35,570 | |||
Non-controlled affiliates (Note 3f) | 10,268 | |||
|
| |||
Total investment income | 60,688,503 | |||
|
| |||
Expenses: | ||||
Management fees (Note 3a) | 9,202,118 | |||
Distribution fees: (Note 3c) | ||||
Class A | 1,310,541 | |||
Class A1 | 691,718 | |||
Class C | 1,758,197 | |||
Class C1 | 303,960 | |||
Class R | 13,142 | |||
Transfer agent fees: (Note 3e) | ||||
Class A | 658,776 | |||
Class A1 | 347,815 | |||
Class C | 221,744 | |||
Class C1 | 58,804 | |||
Class R | 3,321 | |||
Class R6 | 5,605 | |||
Advisor Class | 226,982 | |||
Custodian fees (Note 4) | 306,985 | |||
Reports to shareholders | 131,430 | |||
Registration and filing fees | 153,172 | |||
Professional fees | 161,871 | |||
Trustees’ fees and expenses | 143,435 | |||
Other | 140,419 | |||
|
| |||
Total expenses | 15,840,035 | |||
Expense reductions (Note 4) | (63,463 | ) | ||
Expenses waived/paid by affiliates (Note 3f and 3g) | (370,411 | ) | ||
|
| |||
Net expenses | 15,406,161 | |||
|
| |||
Net investment income | 45,282,342 | |||
|
| |||
Realized and unrealized gains (losses): | ||||
Net realized gain (loss) from: | ||||
Investments:# | ||||
Unaffiliated issuers | (65,520,889 | ) | ||
Written options | (622,180 | ) | ||
Foreign currency transactions | (1,285,956 | ) | ||
Forward exchange contracts | 21,219,956 | |||
Swap contracts | (7,645,873 | ) | ||
|
| |||
Net realized gain (loss) | (53,854,942 | ) | ||
|
| |||
Net change in unrealized appreciation (depreciation) on: | ||||
Investments: | ||||
Unaffiliated issuers | 104,193,643 | |||
Translation of other assets and liabilities denominated in foreign currencies | 131,802 | |||
| franklintempleton.com | The accompanying notes are an integral part of these consolidated financial statements. | Annual Report | 39 | ||
TEMPLETON GLOBAL INVESTMENT TRUST
CONSOLIDATED FINANCIAL STATEMENTS
Consolidated Statement of Operations(continued)
for the year ended December 31, 2019
Templeton Global Balanced Fund
Forward exchange contracts | (4,795,210 | ) | ||
Written options | 588,396 | |||
Swap contracts | (10,842,434 | ) | ||
Change in FT Subsidiary deferred tax benefit (Note 1f) | (36,749 | ) | ||
Change in deferred taxes on unrealized appreciation | 112,920 | |||
|
| |||
Net change in unrealized appreciation (depreciation) | 89,352,368 | |||
|
| |||
Net realized and unrealized gain (loss) | 35,497,426 | |||
|
| |||
Net increase (decrease) in net assets resulting from operations | $ | 80,779,768 | ||
|
| |||
*Foreign taxes withheld on dividends | $ | 2,967,729 | ||
~Foreign taxes withheld on interest | $ | 725,246 | ||
#Net of foreign taxes | $ | 183,576 |
40 | Annual Report | The accompanying notes are an integral part of these consolidated financial statements. | franklintempleton.com | ||
TEMPLETON GLOBAL INVESTMENT TRUST
CONSOLIDATED FINANCIAL STATEMENTS
Consolidated Statements of Changes in Net Assets
Templeton Global Balanced Fund
| Year Ended December 31, | ||||||||
| 2019 | 2018 | |||||||
| ||||||||
Increase (decrease) in net assets: | ||||||||
Operations: | ||||||||
Net investment income | $ | 45,282,342 | $ | 49,784,022 | ||||
Net realized gain (loss) | (53,854,942 | ) | 89,212,768 | |||||
Net change in unrealized appreciation (depreciation) | 89,352,368 | (283,328,472 | ) | |||||
|
| |||||||
Net increase (decrease) in net assets resulting from operations | 80,779,768 | (144,331,682 | ) | |||||
|
| |||||||
Distributions to shareholders: | ||||||||
Class A | (21,685,405 | ) | (25,802,835 | ) | ||||
Class A1 | (11,542,983 | ) | (10,704,077 | ) | ||||
Class C | (5,974,221 | ) | (8,544,090 | ) | ||||
Class C1 | (1,648,499 | ) | (4,649,410 | ) | ||||
Class R | (102,554 | ) | (139,046 | ) | ||||
Class R6 | (310,749 | ) | (407,692 | ) | ||||
Advisor Class | (7,809,150 | ) | (9,464,026 | ) | ||||
|
| |||||||
Total distributions to shareholders | (49,073,561 | ) | (59,711,176 | ) | ||||
|
| |||||||
Capital share transactions: (Note 2) | ||||||||
Class A | (105,366,578 | ) | (102,427,954 | ) | ||||
Class A1 | (39,225,200 | ) | 30,686,781 | |||||
Class C | (69,062,384 | ) | (80,380,431 | ) | ||||
Class C1 | (36,115,316 | ) | (96,785,897 | ) | ||||
Class R | (494,695 | ) | (1,662,951 | ) | ||||
Class R6 | (2,056,106 | ) | (2,090,954 | ) | ||||
Advisor Class | (70,805,226 | ) | (8,411,483 | ) | ||||
|
| |||||||
Total capital share transactions | (323,125,505 | ) | (261,072,889 | ) | ||||
|
| |||||||
Net increase (decrease) in net assets | (291,419,298 | ) | (465,115,747 | ) | ||||
Net assets: | ||||||||
Beginning of year | 1,327,024,970 | 1,792,140,717 | ||||||
|
| |||||||
End of year | $ | 1,035,605,672 | $ | 1,327,024,970 | ||||
|
| |||||||
| franklintempleton.com | The accompanying notes are an integral part of these consolidated financial statements. | Annual Report | 41 | ||
TEMPLETON GLOBAL INVESTMENT TRUST
Notes to Consolidated Financial Statements
Templeton Global Balanced Fund
1. Organization and Significant Accounting Policies
Templeton Global Investment Trust (Trust) is registered under the Investment Company Act of 1940 (1940 Act) as an open-end management investment company, consisting of three separate funds and applies the specialized accounting and reporting guidance in U.S. Generally Accepted Accounting Principles (U.S. GAAP). Templeton Global Balanced Fund (Fund) is included in this report. The Fund offers seven classes of shares: Class A, Class A1, Class C, Class C1, Class R, Class R6, and Advisor Class. Class C and Class C1 shares automatically convert to Class A shares after they have been held for 10 years. Each class of shares may differ by its initial sales load, contingent deferred sales charges, voting rights on matters affecting a single class, its exchange privilege and fees due to differing arrangements for distribution and transfer agent fees.
The following summarizes the Fund’s significant accounting policies.
a. Financial Instrument Valuation
The Fund’s investments in financial instruments are carried at fair value daily. Fair value is the price that would be received to sell an asset or paid to transfer a liability in an orderly transaction between market participants on the measurement date. The Fund calculates the net asset value (NAV) per share each business day as of 4 p.m. Eastern time or the regularly scheduled close of the New York Stock Exchange (NYSE), whichever is earlier. Under compliance policies and procedures approved by the Trust’s Board of Trustees (the Board), the Fund’s administrator has responsibility for oversight of valuation, including leading the cross-functional Valuation Committee (VC). The Fund may utilize independent pricing services, quotations from securities and financial instrument dealers, and other market sources to determine fair value.
Equity securities and derivative financial instruments listed on an exchange or on the NASDAQ National Market System are valued at the last quoted sale price or the official closing price of the day, respectively. Foreign equity securities are valued as of the close of trading on the foreign stock exchange on which the security is primarily traded, or as of 4 p.m. Eastern time. The value is then converted into its U.S. dollar equivalent at the foreign exchange rate in effect at 4 p.m. Eastern time on the day that the value of the security is determined. Over-the-counter (OTC) securities are valued within the range of the most recent quoted bid and ask
prices. Securities that trade in multiple markets or on multiple exchanges are valued according to the broadest and most representative market. Certain equity securities are valued based upon fundamental characteristics or relationships to similar securities.
Debt securities generally trade in the OTC market rather than on a securities exchange. The Fund’s pricing services use multiple valuation techniques to determine fair value. In instances where sufficient market activity exists, the pricing services may utilize a market-based approach through which quotes from market makers are used to determine fair value. In instances where sufficient market activity may not exist or is limited, the pricing services also utilize proprietary valuation models which may consider market characteristics such as benchmark yield curves, credit spreads, estimated default rates, anticipated market interest rate volatility, coupon rates, anticipated timing of principal repayments, underlying collateral, and other unique security features in order to estimate the relevant cash flows, which are then discounted to calculate the fair value. Securities denominated in a foreign currency are converted into their U.S. dollar equivalent at the foreign exchange rate in effect at 4 p.m. Eastern time on the date that the values of the foreign debt securities are determined.
Investments in open-end mutual funds are valued at the closing NAV.
Certain derivative financial instruments are centrally cleared or trade in the OTC market. The Fund’s pricing services use various techniques including industry standard option pricing models and proprietary discounted cash flow models to determine the fair value of those instruments. The Fund’s net benefit or obligation under the derivative contract, as measured by the fair value of the contract, is included in net assets.
The Fund has procedures to determine the fair value of financial instruments for which market prices are not reliable or readily available. Under these procedures, the Fund primarily employs a market-based approach which may use related or comparable assets or liabilities, recent transactions, market multiples, book values, and other relevant information for the investment to determine the fair value of the investment. An income-based valuation approach may also be used in which the anticipated future cash flows of the investment are discounted to calculate fair value. Discounts may also be applied due to the nature or duration of any
42 | Annual Report | franklintempleton.com | ||
TEMPLETON GLOBAL INVESTMENT TRUST
NOTES TO CONSOLIDATED FINANCIAL STATEMENTS
Templeton Global Balanced Fund(continued)
restrictions on the disposition of the investments. Due to the inherent uncertainty of valuations of such investments, the fair values may differ significantly from the values that would have been used had an active market existed.
Trading in securities on foreign securities stock exchanges and OTC markets may be completed before 4 p.m. Eastern time. In addition, trading in certain foreign markets may not take place on every Fund’s business day. Occasionally, events occur between the time at which trading in a foreign security is completed and 4 p.m. Eastern time that might call into question the reliability of the value of a portfolio security held by the Fund. As a result, differences may arise between the value of the Fund’s portfolio securities as determined at the foreign market close and the latest indications of value at 4 p.m. Eastern time. In order to minimize the potential for these differences, the VC monitors price movements following the close of trading in foreign stock markets through a series of country specific market proxies (such as baskets of American Depositary Receipts, futures contracts and exchange traded funds). These price movements are measured against established trigger thresholds for each specific market proxy to assist in determining if an event has occurred that may call into question the reliability of the values of the foreign securities held by the Fund. If such an event occurs, the securities may be valued using fair value procedures, which may include the use of independent pricing services.
When the last day of the reporting period is a non-business day, certain foreign markets may be open on those days that the Fund’s NAV is not calculated, which could result in differences between the value of the Fund’s portfolio securities on the last business day and the last calendar day of the reporting period. Any significant security valuation changes due to an open foreign market are adjusted and reflected by the Fund for financial reporting purposes.
b. Foreign Currency Translation
Portfolio securities and other assets and liabilities denominated in foreign currencies are translated into U.S. dollars based on the exchange rate of such currencies against U.S. dollars on the date of valuation. The Fund may enter into foreign currency exchange contracts to facilitate transactions denominated in a foreign currency. Purchases and sales of securities, income and expense items denominated in foreign currencies are translated into U.S. dollars at the exchange rate in effect on the transaction date.
Portfolio securities and assets and liabilities denominated in foreign currencies contain risks that those currencies will decline in value relative to the U.S. dollar. Occasionally, events may impact the availability or reliability of foreign exchange rates used to convert the U.S. dollar equivalent value. If such an event occurs, the foreign exchange rate will be valued at fair value using procedures established and approved by the Board.
The Fund does not separately report the effect of changes in foreign exchange rates from changes in market prices on securities held. Such changes are included in net realized and unrealized gain or loss from investments in the Consolidated Statement of Operations.
Realized foreign exchange gains or losses arise from sales of foreign currencies, currency gains or losses realized between the trade and settlement dates on securities transactions and the difference between the recorded amounts of dividends, interest, and foreign withholding taxes and the U.S. dollar equivalent of the amounts actually received or paid. Net unrealized foreign exchange gains and losses arise from changes in foreign exchange rates on foreign denominated assets and liabilities other than investments in securities held at the end of the reporting period.
c. Derivative Financial Instruments
The Fund invested in derivative financial instruments in order to manage risk or gain exposure to various other investments or markets. Derivatives are financial contracts based on an underlying or notional amount, require no initial investment or an initial net investment that is smaller than would normally be required to have a similar response to changes in market factors, and require or permit net settlement. Derivatives contain various risks including the potential inability of the counterparty to fulfill their obligations under the terms of the contract, the potential for an illiquid secondary market, and/or the potential for market movements which expose the Fund to gains or losses in excess of the amounts shown in the Consolidated Statement of Assets and Liabilities. Realized gain and loss and unrealized appreciation and depreciation on these contracts for the period are included in the Consolidated Statement of Operations.
Derivative counterparty credit risk is managed through a formal evaluation of the creditworthiness of all potential counterparties. The Fund attempts to reduce its exposure to counterparty credit risk on OTC derivatives, whenever possible, by entering into International Swaps and Derivatives
| franklintempleton.com | Annual Report | 43 | ||
TEMPLETON GLOBAL INVESTMENT TRUST
NOTES TO CONSOLIDATED FINANCIAL STATEMENTS
Templeton Global Balanced Fund(continued)
1. Organization and Significant Accounting Policies(continued)
c. Derivative Financial Instruments(continued)
Association (ISDA) master agreements with certain counterparties. These agreements contain various provisions, including but not limited to collateral requirements, events of default, or early termination. Termination events applicable to the counterparty include certain deteriorations in the credit quality of the counterparty. Termination events applicable to the Fund include failure of the Fund to maintain certain net asset levels and/or limit the decline in net assets over various periods of time. In the event of default or early termination, the ISDA master agreement gives the non-defaulting party the right to net and close-out all transactions traded, whether or not arising under the ISDA agreement, to one net amount payable by one counterparty to the other. However, absent an event of default or early termination, OTC derivative assets and liabilities are presented gross and not offset in the Consolidated Statement of Assets and Liabilities. Early termination by the counterparty may result in an immediate payment by the Fund of any net liability owed to that counterparty under the ISDA agreement.
Collateral requirements differ by type of derivative. Collateral or initial margin requirements are set by the broker or exchange clearing house for exchange traded and centrally cleared derivatives. Initial margin deposited is held at the exchange and can be in the form of cash and/or securities. For OTC derivatives traded under an ISDA master agreement, posting of collateral is required by either the Fund or the applicable counterparty if the total net exposure of all OTC derivatives with the applicable counterparty exceeds the minimum transfer amount, which typically ranges from $100,000 to $250,000, and can vary depending on the counterparty and the type of the agreement. Generally, collateral is determined at the close of Fund business each day and any additional collateral required due to changes in derivative values may be delivered by the Fund or the counterparty the next business day, or within a few business days. Collateral pledged and/or received by the Fund for OTC derivatives, if any, is held in segregated accounts with the Fund’s custodian/counterparty broker and can be in the form of cash and/or securities. Unrestricted cash may be invested according to the Fund’s investment objectives. To the extent that the amounts due to the Fund from its counterparties are not subject to collateralization or are not fully collateralized, the Fund bears the risk of loss from counterparty non-performance.
The Fund entered into OTC forward exchange contracts primarily to manage and/or gain exposure to certain foreign currencies. A forward exchange contract is an agreement between the Fund and a counterparty to buy or sell a foreign currency at a specific exchange rate on a future date.
The Fund entered into interest rate swap contracts primarily to manage interest rate risk. An interest rate swap is an agreement between the Fund and a counterparty to exchange cash flows based on the difference between two interest rates, applied to a notional amount. These agreements may be privately negotiated in the over-the-counter market (OTC interest rate swaps) or may be executed on a registered exchange (centrally cleared interest rate swaps). For centrally cleared interest rate swaps, required initial margins are pledged by the Fund, and the daily change in fair value is accounted for as a variation margin payable or receivable in the Consolidated Statement of Assets and Liabilities. Over the term of the contract, contractually required payments to be paid and to be received are accrued daily and recorded as unrealized depreciation and appreciation until the payments are made, at which time they are realized.
The Fund purchased or wrote OTC option contracts primarily to manage and/or gain exposure to foreign exchange rate risk. An option is a contract entitling the holder to purchase or sell a specific amount of shares or units of an asset or notional amount of a swap (swaption), at a specified price. When an option is purchased or written, an amount equal to the premium paid or received is recorded as an asset or liability, respectively. Upon exercise of an option, the acquisition cost or sales proceeds of the underlying investment is adjusted by any premium received or paid. Upon expiration of an option, any premium received or paid is recorded as a realized gain or loss. Upon closing an option other than through expiration or exercise, the difference between the premium received or paid and the cost to close the position is recorded as a realized gain or loss.
The Fund invests in value recovery instruments (VRI) primarily to gain exposure to economic growth. Periodic payments from VRI are dependent on established benchmarks for underlying variables. VRI has a notional amount, which is used to calculate amounts of payments to holders. Payments are recorded upon receipt as realized
44 | Annual Report | franklintempleton.com | ||
TEMPLETON GLOBAL INVESTMENT TRUST
NOTES TO CONSOLIDATED FINANCIAL STATEMENTS
Templeton Global Balanced Fund(continued)
gains in the Consolidated Statement of Operations. The risks of investing in VRI include growth risk, liquidity, and the potential loss of investment.
See Note 10 regarding other derivative information.
d. Restricted Currency
At December 31, 2019, the Fund held currencies in certain markets in which the ability to repatriate such currency is limited. As a result of such limitations on repatriation, the Fund may incur substantial delays in gaining access to these assets and may be exposed to potential adverse movements in currency value.
e. Securities Lending
The Fund participates in an agency based securities lending program to earn additional income. The Fund receives cash collateral against the loaned securities in an amount equal to at least 102% of the fair value of the loaned securities. Collateral is maintained over the life of the loan in an amount not less than 100% of the fair value of loaned securities, as determined at the close of Fund business each day; any additional collateral required due to changes in security values is delivered to the Fund on the next business day. The collateral is deposited into a joint cash account with other funds and is used to invest in a money market fund managed by Franklin Advisers, Inc., an affiliate of the Fund, and/or a joint repurchase agreement. The Fund may receive income from the investment of cash collateral, in addition to lending fees and rebates paid by the borrower. Income from securities loaned, net of fees paid to the securities lending agent and/or third-party vendor, is reported separately in the Consolidated Statement of Operations. The Fund bears the market risk with respect to the collateral investment, securities loaned, and the risk that the agent may default on its obligations to the Fund. If the borrower defaults on its obligation to return the securities loaned, the Fund has the right to repurchase the securities in the open market using the collateral received. The securities lending agent has agreed to indemnify the Fund in the event of default by a third party borrower. At December 31, 2019, the Fund had no securities on loan.
f. Investments in FT Holdings Corporation IV (FT Subsidiary)
The Fund invests in certain financial instruments through its investment in FT Subsidiary. FT Subsidiary is a Delaware Corporation, is a wholly-owned subsidiary of the Fund, and is
able to invest in certain financial instruments consistent with the investment objective of the Fund. At December 31, 2019, FT Subsidiary’s investment, Turtle Bay Resort, as well as any other assets and liabilities of FT Subsidiary are reflected in the Fund’s Consolidated Statement of Investments and Consolidated Statement of Assets and Liabilities.
At December 31, 2019, FT Subsidiary, which is a tax paying entity, recognized an unrealized loss on its Turtle Bay investment. An estimated deferred tax asset based on such unrealized loss is reflected as FT Subsidiary deferred tax benefit in the Consolidated Statement of Assets and Liabilities. The estimated benefit was calculated using a federal rate of 21%. When the Turtle Bay investment liquidates, FT Subsidiary will recognize a capital loss which can be carried-back to offset prior year capital gains, resulting in a tax refund which will relieve the deferred tax asset.
All intercompany transactions and balances have been eliminated. At December 31, 2019, the net assets of FT Subsidiary were $5,327,031, representing 0.5% of the Fund’s consolidated net assets. The Fund’s investment in FT Subsidiary is limited to 25% of consolidated assets.
g. Income and Deferred Taxes
It is the Fund’s policy to qualify as a regulated investment company under the Internal Revenue Code. The Fund intends to distribute to shareholders substantially all of its taxable income and net realized gains to relieve it from federal income and excise taxes. As a result, no provision for U.S. federal income taxes is required.
The Fund may be subject to foreign taxation related to income received, capital gains on the sale of securities and certain foreign currency transactions in the foreign jurisdictions in which it invests. Foreign taxes, if any, are recorded based on the tax regulations and rates that exist in the foreign markets in which the Fund invests. When a capital gain tax is determined to apply, the Fund records an estimated deferred tax liability in an amount that would be payable if the securities were disposed of on the valuation date.
As a result of several court cases, in certain countries across the European Union, the Fund filed additional tax reclaims for previously withheld taxes on dividends earned in those countries (EU reclaims). These additional filings are subject to various administrative proceedings by the local jurisdictions’ tax authorities within the European Union, as
| franklintempleton.com | Annual Report | 45 | ||
TEMPLETON GLOBAL INVESTMENT TRUST
NOTES TO CONSOLIDATED FINANCIAL STATEMENTS
Templeton Global Balanced Fund(continued)
1. Organization and Significant Accounting Policies(continued)
g. Income and Deferred Taxes(continued)
well as a number of related judicial proceedings. Income recognized, if any, for EU reclaims is reflected as other income in the Consolidated Statement of Operations and any related receivable, if any, is reflected as European Union tax reclaims in the Consolidated Statement of Assets and Liabilities. When uncertainty exists as to the ultimate resolution of these proceedings, the likelihood of receipt of these EU reclaims, and the potential timing of payment, no amounts are reflected in the consolidated financial statements. For U.S. income tax purposes, EU reclaims received by the Fund, if any, reduce the amounts of foreign taxes Fund shareholders can use as tax credits in their individual income tax returns.
The Fund may recognize an income tax liability related to its uncertain tax positions under U.S. GAAP when the uncertain tax position has a less than 50% probability that it will be sustained upon examination by the tax authorities based on its technical merits. As of December 31, 2019, the Fund has determined that no tax liability is required in its consolidated financial statements related to uncertain tax positions for any open tax years (or expected to be taken in future tax years). Open tax years are those that remain subject to examination and are based on the statute of limitations in each jurisdiction in which the Fund invests.
h. Security Transactions, Investment Income, Expenses and Distributions
Security transactions are accounted for on trade date. Realized gains and losses on security transactions are determined on a specific identification basis. Interest income and estimated expenses are accrued daily. Amortization of premium and accretion of discount on debt securities are included in interest income. Dividend income is recorded on the ex-dividend date except for certain dividends from securities where the dividend rate is not available. In such cases, the dividend is recorded as soon as the information is received by the Fund. Distributions to shareholders are recorded on the ex-dividend date. Distributable earnings are determined according to income tax regulations (tax basis) and may differ from earnings recorded in accordance with U.S. GAAP. These differences may be permanent or temporary. Permanent differences are reclassified among capital accounts to reflect their tax character. These
reclassifications have no impact on net assets or the results of operations. Temporary differences are not reclassified, as they may reverse in subsequent periods.
Common expenses incurred by the Trust are allocated among the Funds based on the ratio of net assets of each Fund to the combined net assets of the Trust or based on the ratio of number of shareholders of each Fund to the combined number of shareholders of the Trust. Fund specific expenses are charged directly to the Fund that incurred the expense.
Realized and unrealized gains and losses and net investment income, excluding class specific expenses, are allocated daily to each class of shares based upon the relative proportion of net assets of each class. Differences in per share distributions by class are generally due to differences in class specific expenses.
Inflation-indexed bonds are adjusted for inflation through periodic increases or decreases in the security’s interest accruals, face amount, or principal redemption value, by amounts corresponding to the rate of inflation as measured by an index. Any increase or decrease in the face amount or principal redemption value will be included as inflation principal adjustments in the Consolidated Statement of Operations.
i. Accounting Estimates
The preparation of financial statements in accordance with U.S. GAAP requires management to make estimates and assumptions that affect the reported amounts of the consolidated assets and liabilities at the date of the financial statements and the amounts of income and expenses during the reporting period. Actual results could differ from those estimates.
j. Guarantees and Indemnifications
Under the Trust’s organizational documents, its officers and trustees are indemnified by the Trust against certain liabilities arising out of the performance of their duties to the Trust. Additionally, in the normal course of business, the Trust, on behalf of the Fund, enters into contracts with service providers that contain general indemnification clauses. The Trust’s maximum exposure under these arrangements is unknown as this would involve future claims that may be made against the Trust that have not yet occurred. Currently, the Trust expects the risk of loss to be remote.
46 | Annual Report | franklintempleton.com | ||
TEMPLETON GLOBAL INVESTMENT TRUST
NOTES TO CONSOLIDATED FINANCIAL STATEMENTS
Templeton Global Balanced Fund(continued)
2. Shares of Beneficial Interest
At December 31, 2019, there were an unlimited number of shares authorized ($0.01 par value). Transactions in the Fund’s shares were as follows:
| Year Ended December 31, | ||||||||||||||||
2019 | 2018 | |||||||||||||||
Shares | Amount | Shares | Amount | |||||||||||||
Class A Shares: | ||||||||||||||||
Shares solda | 15,457,226 | $ | 43,595,980 | 34,179,367 | $ | 105,672,882 | ||||||||||
Shares issued in reinvestment of distributions | 7,443,835 | 20,890,310 | 8,191,278 | 24,826,534 | ||||||||||||
Shares redeemed | (60,106,395 | ) | (169,852,868 | ) | (76,008,616 | ) | (232,927,370 | ) | ||||||||
Net increase (decrease) | (37,205,334 | ) | $ | (105,366,578 | ) | (33,637,971 | ) | $ | (102,427,954 | ) | ||||||
Class A1 Shares: | ||||||||||||||||
Shares sold | 9,105,301 | $ | 25,895,514 | 26,725,090 | $ | 80,318,885 | ||||||||||
Shares issued in reinvestment of distributions | 3,954,661 | 11,127,734 | 3,388,828 | 10,255,359 | ||||||||||||
Shares redeemed | (26,966,275 | ) | (76,248,448 | ) | (19,564,284 | ) | (59,887,463 | ) | ||||||||
Net increase (decrease) | (13,906,313 | ) | $ | (39,225,200 | ) | 10,549,634 | $ | 30,686,781 | ||||||||
Class C Shares: | ||||||||||||||||
Shares sold | 3,745,169 | $ | 10,592,333 | 15,951,230 | $ | 49,456,970 | ||||||||||
Shares issued in reinvestment of distributions | 2,035,382 | 5,686,049 | 2,679,582 | 8,116,943 | ||||||||||||
Shares redeemed | (30,382,070 | ) | (85,340,766 | ) | (45,243,255 | ) | (137,954,344 | ) | ||||||||
Net increase (decrease) | (24,601,519 | ) | $ | (69,062,384 | ) | (26,612,443 | ) | $ | (80,380,431 | ) | ||||||
Class C1 Shares: | ||||||||||||||||
Shares sold | 311,079 | $ | 881,750 | 1,544,449 | $ | 4,667,755 | ||||||||||
Shares issued in reinvestment of distributions | 560,212 | 1,577,535 | 1,470,313 | 4,501,085 | ||||||||||||
Shares redeemeda | (13,620,596 | ) | (38,574,601 | ) | (35,032,803 | ) | (105,954,737 | ) | ||||||||
Net increase (decrease) | (12,749,305 | ) | $ | (36,115,316 | ) | (32,018,041 | ) | $ | (96,785,897 | ) | ||||||
Class R Shares: | ||||||||||||||||
Shares sold | 94,956 | $ | 268,890 | 132,220 | $ | 414,418 | ||||||||||
Shares issued in reinvestment of distributions | 23,796 | 67,155 | 30,770 | 93,593 | ||||||||||||
Shares redeemed | (294,355 | ) | (830,740 | ) | (716,748 | ) | (2,170,962 | ) | ||||||||
Net increase (decrease) | (175,603 | ) | $ | (494,695 | ) | (553,758 | ) | $ | (1,662,951 | ) | ||||||
Class R6 Shares: | ||||||||||||||||
Shares sold | 448,072 | $ | 1,272,111 | 892,133 | $ | 2,809,748 | ||||||||||
Shares issued in reinvestment of distributions | 110,227 | 310,365 | 134,072 | 407,551 | ||||||||||||
Shares redeemed | (1,279,143 | ) | (3,638,582 | ) | (1,704,891 | ) | (5,308,253 | ) | ||||||||
Net increase (decrease) | (720,844 | ) | $ | (2,056,106 | ) | (678,686 | ) | $ | (2,090,954 | ) | ||||||
Advisor Class Shares: | ||||||||||||||||
Shares sold | 8,325,950 | $ | 23,723,126 | 23,403,505 | $ | 71,514,992 | ||||||||||
Shares issued in reinvestment of distributions | 2,440,632 | 6,892,913 | 2,672,118 | 8,130,400 | ||||||||||||
Shares redeemed | (35,767,251 | ) | (101,421,265 | ) | (28,697,722 | ) | (88,056,875 | ) | ||||||||
Net increase (decrease) | (25,000,669 | ) | $ | (70,805,226 | ) | (2,622,099 | ) | $ | (8,411,483 | ) | ||||||
aMay include a portion of Class C1 shares that were automatically converted to Class A.
| franklintempleton.com | Annual Report | 47 | ||
TEMPLETON GLOBAL INVESTMENT TRUST
NOTES TO CONSOLIDATED FINANCIAL STATEMENTS
Templeton Global Balanced Fund(continued)
3. Transactions with Affiliates
Franklin Resources, Inc. is the holding company for various subsidiaries that together are referred to as Franklin Templeton. Certain officers and trustees of the Fund are also officers and/or directors of the following subsidiaries:
| Subsidiary | Affiliation | |||
Templeton Global Advisors Limited (Global Advisors) | Investment manager | |||
Franklin Advisers, Inc. (Advisers) | Investment manager | |||
Franklin Templeton Services, LLC (FT Services) | Administrative manager | |||
Franklin Templeton Distributors, Inc. (Distributors) | Principal underwriter | |||
Franklin Templeton Investor Services, LLC (Investor Services) | Transfer agent |
a. Management Fees
The Fund pays an investment management fee to Global Advisors based on the average daily net assets of the Fund as follows:
| Annualized Fee Rate | Net Assets | |||
0.825% | Up to and including $500 million | |||
0.725% | Over $500 million, up to and including $1 billion | |||
0.675% | Over $1 billion, up to and including $1.5 billion | |||
0.625% | Over $1.5 billion, up to and including $6.5 billion | |||
0.600% | Over $6.5 billion, up to and including $11.5 billion | |||
0.578% | Over $11.5 billion, up to and including $16.5 billion | |||
0.565% | Over $16.5 billion, up to and including $19.0 billion | |||
0.555% | Over $19.0 billion, up to and including $21.5 billion | |||
0.545% | In excess of $21.5 billion |
For the year ended December 31, 2019, the gross effective investment management fee rate was 0.758% of the Fund’s average daily net assets.
Under a subadvisory agreement, Advisers, an affiliate of Global Advisors, provides subadvisory services to the Fund. The subadvisory fee is paid by Global Advisors based on the Fund’s average daily net assets, and is not an additional expense of the Fund.
b. Administrative Fees
Under an agreement with Global Advisors, FT Services provides administrative services to the Fund. The fee is paid by Global Advisors based on the Fund’s average daily net assets, and is not an additional expense of the Fund.
c. Distribution Fees
The Board has adopted distribution plans for each share class, with the exception of Class R6 and Advisor Class shares, pursuant to Rule 12b-1 under the 1940 Act. Under the Fund’s Class A and A1 reimbursement distribution plan, the Fund reimburses Distributors for costs incurred in connection with the servicing, sale and distribution of the Fund’s shares up to the maximum annual plan rate. Under the Class A and A1 reimbursement distribution plan, costs exceeding the maximum for the current plan year cannot be reimbursed in subsequent periods. In addition, under the Fund’s Class C, C1 and R compensation
48 | Annual Report | franklintempleton.com | ||
TEMPLETON GLOBAL INVESTMENT TRUST
NOTES TO CONSOLIDATED FINANCIAL STATEMENTS
Templeton Global Balanced Fund(continued)
distribution plans, the Fund pays Distributors for costs incurred in connection with the servicing, sale and distribution of the Fund’s shares up to the maximum annual plan rate for each class. The plan year, for purposes of monitoring compliance with the maximum annual plan rates, is February 1 through January 31.
The maximum annual plan rates, based on the average daily net assets, for each class, are as follows:
Class A | 0.25 | % | ||
Class A1 | 0.25 | % | ||
Class C | 1.00 | % | ||
Class C1 | 0.65 | % | ||
Class R | 0.50 | % |
d. Sales Charges/Underwriting Agreements
Front-end sales charges and contingent deferred sales charges (CDSC) do not represent expenses of the Fund. These charges are deducted from the proceeds of sales of Fund shares prior to investment or from redemption proceeds prior to remittance, as applicable. Distributors has advised the Fund of the following commission transactions related to the sales and redemptions of the Fund’s shares for the year:
Sales charges retained net of commissions paid to unaffiliated brokers/dealers. | $ | 34,864 | ||
CDSC retained | $ | 4,647 |
Effective March 1, 2019, certain front-end sales charges on Class A1 shares, if any, were lowered. Further details are disclosed in the Fund’s Prospectus.
e. Transfer Agent Fees
Each class of shares pays transfer agent fees to Investor Services for its performance of shareholder servicing obligations. The fees are based on an annualized asset based fee of 0.02% plus a transaction based fee. In addition, each class reimburses Investor Services for out of pocket expenses incurred and, except for Class R6, reimburses shareholder servicing fees paid to third parties. These fees are allocated daily based upon their relative proportion of such classes’ aggregate net assets. Class R6 pays Investor Services transfer agent fees specific to that class.
For the year ended December 31, 2019, the Fund paid transfer agent fees of $1,523,047, of which $613,615 was retained by Investor Services.
| franklintempleton.com | Annual Report | 49 | ||
TEMPLETON GLOBAL INVESTMENT TRUST
NOTES TO CONSOLIDATED FINANCIAL STATEMENTS
Templeton Global Balanced Fund(continued)
3. Transactions with Affiliates(continued)
f. Investments in Affiliated Management Investment Companies
The Fund invests in one or more affiliated management investment companies for purposes other than exercising a controlling influence over the management or policies. Management fees paid by the Fund are waived on assets invested in the affiliated management investment companies, as noted in the Consolidated Statement of Operations, in an amount not to exceed the management and administrative fees paid directly or indirectly by each affiliate. During the year ended December 31, 2019, the Fund held investments in affiliated management investment companies as follows:
Value at Beginning of Year | Purchases | Sales | Realized Gain (Loss) | Net Change in Unrealized Appreciation (Depreciation) | Value at End of Year | Number of Shares Held at End of Year | Investment Income | |||||||||||||||||||||||||
| ||||||||||||||||||||||||||||||||
Non-Controlled Affiliates | ||||||||||||||||||||||||||||||||
| Dividends | ||||||||||||||||||||||||||||||||
|
| |||||||||||||||||||||||||||||||
Institutional Fiduciary Trust Money Market Portfolio, 1.26% | $105,243,850 | $420,829,618 | $(394,278,401 | ) | $ — | $ — | $131,795,067 | 131,795,067 | $1,837,062 | |||||||||||||||||||||||
| | Income from securities loaned | | ||||||||||||||||||||||||||||||
|
| |||||||||||||||||||||||||||||||
Institutional Fiduciary Trust Money Market Portfolio, 1.26% | 9,561,000 | 1,672,000 | (11,233,000 | ) | — | — | — | — | 10,268 | |||||||||||||||||||||||
|
|
|
| |||||||||||||||||||||||||||||
Total Affiliated Securities | $114,804,850 | $422,501,618 | $(405,511,401 | ) | $ — | $ — | $131,795,067 | $1,847,330 | ||||||||||||||||||||||||
|
|
|
| |||||||||||||||||||||||||||||
g. Waiver and Expense Reimbursements
Investor Services has contractually agreed in advance to waive or limit its fees so that the Class R6 transfer agent fees do not exceed 0.03% based on the average net assets of the class until April 30, 2020.
4. Expense Offset Arrangement
The Fund has entered into an arrangement with its custodian whereby credits realized as a result of uninvested cash balances are used to reduce a portion of the Fund’s custodian expenses. During the year ended December 31, 2019, the custodian fees were reduced as noted in the Consolidated Statement of Operations.
5. Income Taxes
For tax purposes, capital losses may be carried over to offset future capital gains, if any.
At December 31, 2019, the capital loss carryforwards were as follows:
Capital loss carryforwards not subject to expiration: | ||||
Short term | $ | 19,920,202 | ||
Long term | 72,942,004 | |||
|
| |||
Total capital loss carryforwards |
$ |
92,862,206 |
| |
|
|
50 | Annual Report | franklintempleton.com | ||
TEMPLETON GLOBAL INVESTMENT TRUST
NOTES TO CONSOLIDATED FINANCIAL STATEMENTS
Templeton Global Balanced Fund(continued)
The tax character of distributions paid during the years ended December 31, 2019 and 2018, was as follows:
| 2019 | 2018 | |||||||
|
| |||||||
Distributions paid from ordinary income | $ | 49,073,561 | $ | 59,711,176 | ||||
|
| |||||||
At December 31, 2019, the cost of investments, net unrealized appreciation (depreciation) and undistributed ordinary income for income tax purposes were as follows:
Cost of investments | $ | 1,015,838,040 | ||
|
| |||
Unrealized appreciation | $ | 86,431,221 | ||
Unrealized depreciation | (132,865,564 | ) | ||
|
| |||
Net unrealized appreciation (depreciation) | $ | (46,434,343 | ) | |
|
| |||
Distributable earnings: | ||||
Undistributed ordinary income | $ | 12,492,997 | ||
|
| |||
Differences between income and/or capital gains as determined on a book basis and a tax basis are primarily due to differing treatments of foreign currency transactions, bond discounts and premiums, tax straddles, and corporate actions.
6. Investment Transactions
Purchases and sales of investments (excluding short term securities) for the year ended December 31, 2019, aggregated $275,196,192 and $642,052,649, respectively.
7. Credit Risk
At December 31, 2019, the Fund had 6.3% of its portfolio invested in high yield, senior secured floating rate loans, or other securities rated below investment grade and unrated securities, if any. These securities may be more sensitive to economic conditions causing greater price volatility and are potentially subject to a greater risk of loss due to default than higher rated securities.
8. Concentration of Risk
Investments in issuers domiciled or with significant operations in developing or emerging market countries may be subject to higher risks than investments in developed countries. These risks include fluctuating currency values, underdeveloped legal or business systems, and changing local and regional economic, political and social conditions, which may result in greater market volatility. In addition, certain foreign securities may not be as liquid as U.S. securities. Currencies of developing or emerging market countries may be subject to significantly greater risks than currencies of developed countries, including the potential inability to repatriate those currencies into U.S. dollars.
At December 31, 2019, the Fund had 1.2% of its net assets denominated in Argentine Pesos, which has restricted currency repatriation since September 2019, and had restructured certain issues of its debt. Political and economic conditions in Argentina could continue to affect the value of the Fund’s holdings.
| franklintempleton.com | Annual Report | 51 | ||||
TEMPLETON GLOBAL INVESTMENT TRUST
NOTES TO CONSOLIDATED FINANCIAL STATEMENTS
Templeton Global Balanced Fund(continued)
9. Restricted Securities
The Fund invests in securities that are restricted under the Securities Act of 1933 (1933 Act). Restricted securities are often purchased in private placement transactions, and cannot be sold without prior registration unless the sale is pursuant to an exemption under the 1933 Act. Disposal of these securities may require greater effort and expense, and prompt sale at an acceptable price may be difficult. The Fund may have registration rights for restricted securities. The issuer generally incurs all registration costs.
At December 31, 2019, investments in restricted securities, excluding securities exempt from registration under the 1933 Act, were as follows:
| Shares | Issuer | Acquisition Date | Cost | Value | ||||||||||||
| 32,900,733 | K2016470219 South Africa Ltd., A | 2/08/13 - 2/01/17 | $ | 81,025 | $ | 23,493 | ||||||||||
| 4,646,498 | K2016470219 South Africa Ltd., B | 2/01/17 | 3,450 | 3,318 | ||||||||||||
| Total Restricted Securities(Value is 0.0%†of Net Assets) |
$ |
84,475 |
| $ | 26,811 | |||||||||||
†Rounds to less than 0.1% of net assets.
10. Other Derivative Information
At December 31, 2019, investments in derivative contracts are reflected in the Consolidated Statement of Assets and Liabilities as follows:
Asset Derivatives | Liability Derivatives | |||||||||||
Derivative Contracts Not Accounted for as Hedging Instruments |
Consolidated Statement of Assets and Liabilities Location | Fair Value | Consolidated Statement of Assets and Liabilities Location | Fair Value | ||||||||
| ||||||||||||
Interest rate contracts | Variation margin on centrally cleared swap contracts | $ | — | Variation margin on centrally cleared swap contracts | $ | 5,160,817 | a | |||||
Foreign exchange contracts | Investments in securities, at value | 787,772 | b | Options written, at value | 1,475,077 | |||||||
Unrealized appreciation on OTC forward exchange contracts | 2,831,307 | Unrealized depreciation on OTC forward exchange contracts | 8,407,378 | |||||||||
|
|
|
| |||||||||
Totals | $ | 3,619,079 | $ | 15,043,272 | ||||||||
|
|
|
| |||||||||
aThis amount reflects the cumulative appreciation (depreciation) of centrally cleared swap contracts as reported in the Consolidated Statement of Investments. Only the variation margin receivable/payable at year end is separately reported within the Consolidated Statement of Assets and Liabilities. Prior variation margin movements were recorded to cash upon receipt or payment.
bPurchased option contracts are included in investments in securities, at value in the Consolidated Statement of Assets and Liabilities.
52 | Annual Report | franklintempleton.com | ||
TEMPLETON GLOBAL INVESTMENT TRUST
NOTES TO CONSOLIDATED FINANCIAL STATEMENTS
Templeton Global Balanced Fund(continued)
For the year ended December 31, 2019, the effect of derivative contracts in the Consolidated Statement of Operations was as follows:
Derivative Contracts Not Accounted for as Hedging Instruments | Consolidated Statement of Operations Location | Net Realized Gain (Loss) for the Year | Consolidated Statement of Operations Location | Net Change in Unrealized Appreciation (Depreciation) for the Year | ||||||||
| ||||||||||||
| Net realized gain (loss) from: | Net change in unrealized appreciation (depreciation) on: | |||||||||||
Interest rate contracts | Swap contracts | $ | (7,645,873 | ) | Swap contracts | $(10,842,434 | ) | |||||
Foreign exchange contracts | Investments | 722,413 | a | Investments | (2,213,500 | )a | ||||||
Written options | (622,180 | ) | Written options | 588,396 | ||||||||
Forward exchange contracts | 21,219,956 | Forward exchange contracts | (4,795,210 | ) | ||||||||
Value recovery instruments | Investments | 1,663,903 | a | Investments | (1,372,233 | )a | ||||||
|
|
|
| |||||||||
Totals | $ | 15,338,219 | $(18,634,981 | ) | ||||||||
|
|
|
| |||||||||
aPurchased option contracts and VRI are included in net realized gain (loss) from investments and net change in unrealized appreciation (depreciation) on investments in the Consolidated Statement of Operations.
For the year ended December 31, 2019, the average month end notional amount of options and swap contracts, and the average month end contract value for forward exchange contracts, and average month end fair value of VRI, were as follows:
Options | $ | 145,457,674 | ||
Swap contracts | $ | 128,390,769 | ||
Forward exchange contracts | $ | 701,234,952 | ||
VRI | $ | 1,553,067 |
See Note 1(c) regarding derivative financial instruments.
At December 31, 2019, OTC derivative assets and liabilities are as follows:
Gross Amounts of Assets and Liabilities Presented in the Consolidated Statement of Assets and Liabilities | ||||||||
Assetsa | Liabilitiesa | |||||||
Derivatives | ||||||||
Forward exchange contracts | $2,831,307 | $8,407,378 | ||||||
Options purchased | 787,772 | — | ||||||
Options written | — | 1,475,077 | ||||||
|
|
| ||||||
Total |
|
$3,619,079 |
| $9,882,455 | ||||
|
|
| ||||||
aAbsent an event of default or early termination, OTC derivative assets and liabilities are presented gross and not offset in the Consolidated Statement of Assets and Liabilities.
| franklintempleton.com | Annual Report | 53 | ||
TEMPLETON GLOBAL INVESTMENT TRUST
NOTES TO CONSOLIDATED FINANCIAL STATEMENTS
Templeton Global Balanced Fund(continued)
10. Other Derivative Information(continued)
At December 31, 2019, OTC derivative assets, which may be offset against OTC derivative liabilities and collateral received from the counterparty, are as follows:
Amounts Not Offset in the Consolidated Statement of Assets and Liabilities | ||||||||||||||||||||
Gross Amounts of Assets Presented in the Statement of Assets and Liabilities | Financial Instruments Available for Offset | Financial Instruments Collateral Receiveda,b | Cash Collateral Receivedb | Net Amount (Not less than zero) | ||||||||||||||||
Counterparty | ||||||||||||||||||||
BNDP | $ — | $ — | $ — | $ — | $ — | |||||||||||||||
BOFA | 112,426 | (112,426 | ) | — | — | — | ||||||||||||||
CITI | 786,475 | (786,475 | ) | — | — | — | ||||||||||||||
DBAB | 910,031 | (272,802 | ) | — | (637,229 | ) | — | |||||||||||||
GSCO | 134,567 | (119,295 | ) | — | — | 15,272 | ||||||||||||||
HSBK | 125,008 | (125,008 | ) | — | — | — | ||||||||||||||
JPHQ | 1,144,857 | (1,144,857 | ) | — | — | — | ||||||||||||||
MSCO | 207,821 | (193,161 | ) | — | (14,660 | ) | — | |||||||||||||
SCNY | 60,473 | (38,805 | ) | — | — | 21,668 | ||||||||||||||
UBSW | 137,421 | (27,826 | ) | (109,595 | ) | — | — | |||||||||||||
Total | $3,619,079 | $(2,820,655 | ) | $(109,595 | ) | $(651,889 | ) | $36,940 | ||||||||||||
54 | Annual Report | franklintempleton.com | ||
TEMPLETON GLOBAL INVESTMENT TRUST
NOTES TO CONSOLIDATED FINANCIAL STATEMENTS
Templeton Global Balanced Fund(continued)
At December 31, 2019, OTC derivative liabilities, which may be offset against OTC derivative assets and collateral pledged to the counterparty, are as follows:
| Amounts Not Offset in the | ||||||||||||||||||||
Consolidated Statement of Assets and Liabilities | ||||||||||||||||||||
Gross Amounts of Liabilities Presented in the Statement of Assets and Liabilities | Financial Instruments Available for Offset | Financial Instruments Collateral Pledged | Cash Collateral Pledgedb | Net Amount (Not less than zero) | ||||||||||||||||
Counterparty | ||||||||||||||||||||
BNDP | $ 253,362 | $ — | $ — | $ (253,362 | ) | — | ||||||||||||||
BOFA | 153,519 | (112,426 | ) | — | — | 41,093 | ||||||||||||||
CITI | 3,096,887 | (786,475 | ) | — | (1,870,000 | ) | 440,412 | |||||||||||||
DBAB | 272,802 | (272,802 | ) | — | — | — | ||||||||||||||
GSCO | 119,295 | (119,295 | ) | — | — | — | ||||||||||||||
HSBK | 1,464,418 | (125,008 | ) | — | (1,113,000 | ) | 226,410 | |||||||||||||
JPHQ | 4,262,380 | (1,144,857 | ) | — | (2,320,000 | ) | 797,523 | |||||||||||||
MSCO | 193,161 | (193,161 | ) | — | — | — | ||||||||||||||
SCNY | 38,805 | (38,805 | ) | — | — | — | ||||||||||||||
UBSW | 27,826 | (27,826 | ) | — | — | — | ||||||||||||||
Total |
|
$9,882,455 |
|
|
$(2,820,655 |
) |
|
$ — |
|
|
$(5,556,362 |
) |
|
$1,505,438 |
| |||||
aAt December 31, 2019, the Fund received U.S. Treasury Bills as collateral for derivatives.
b In some instances, the collateral amounts disclosed in the table above were adjusted due to the requirement to limit collateral amounts to avoid the effect of overcollateralization. Actual collateral received and/or pledged may be more than the amounts disclosed herein.
See Note 1(c) regarding derivative financial instruments.
See Abbreviations on page 59.
11. Credit Facility
The Fund, together with other U.S. registered and foreign investment funds (collectively, Borrowers), managed by Franklin Templeton, are borrowers in a joint syndicated senior unsecured credit facility totaling $2 billion (Global Credit Facility) which matured on February 7, 2020. This Global Credit Facility provides a source of funds to the Borrowers for temporary and emergency purposes, including the ability to meet future unanticipated or unusually large redemption requests. Effective February 7, 2020, the Borrowers renewed the Global Credit Facility for a one year term, maturing February 5, 2021, for a total of $2 billion.
Under the terms of the Global Credit Facility, the Fund shall, in addition to interest charged on any borrowings made by the Fund and other costs incurred by the Fund, pay its share of fees and expenses incurred in connection with the implementation and maintenance of the Global Credit Facility, based upon its relative share of the aggregate net assets of all of the Borrowers, including an annual commitment fee of 0.15% based upon the unused portion of the Global Credit Facility. These fees are reflected in other expenses in the Consolidated Statement of Operations. During the year ended December 31, 2019, the Fund did not use the Global Credit Facility.
| franklintempleton.com | Annual Report | 55 | ||
TEMPLETON GLOBAL INVESTMENT TRUST
NOTES TO CONSOLIDATED FINANCIAL STATEMENTS
Templeton Global Balanced Fund(continued)
12. Fair Value Measurements
The Fund follows a fair value hierarchy that distinguishes between market data obtained from independent sources (observable inputs) and the Fund’s own market assumptions (unobservable inputs). These inputs are used in determining the value of the Fund’s financial instruments and are summarized in the following fair value hierarchy:
| • | Level 1 – quoted prices in active markets for identical financial instruments |
| • | Level 2 – other significant observable inputs (including quoted prices for similar financial instruments, interest rates, prepayment speed, credit risk, etc.) |
| • | Level 3 – significant unobservable inputs (including the Fund’s own assumptions in determining the fair value of financial instruments) |
The input levels are not necessarily an indication of the risk or liquidity associated with financial instruments at that level.
A summary of inputs used as of December 31, 2019, in valuing the Fund’s assets and liabilities carried at fair value, is as follows:
| Level 1 | Level 2 | Level 3 | Total | |||||||||||||
Assets: | ||||||||||||||||
Investments in Securities:a | ||||||||||||||||
Equity Investments: | ||||||||||||||||
South Africa | $ | — | $ | — | $ | 26,811 | $ | 26,811 | ||||||||
United States | 163,675,113 | — | 34,934 | 163,710,047 | ||||||||||||
All Other Equity Investments | 477,952,152 | — | — | 477,952,152 | ||||||||||||
Corporate Bonds: | ||||||||||||||||
South Africa | — | 6,750 | 8,254 | 15,004 | ||||||||||||
Foreign Government and Agency Securities | ||||||||||||||||
Argentina | — | 1,530,408 | 9,148,100 | 10,678,508 | ||||||||||||
All other Foreign Government and Agency Securities | — | 174,921,172 | — | 174,921,172 | ||||||||||||
Options Purchased | — | 787,772 | — | 787,772 | ||||||||||||
Short Term Investments: | ||||||||||||||||
Argentina | — | — | 702,477 | 702,477 | ||||||||||||
All other Short TermInvestments | 131,795,067 | 20,885,243 | — | 152,680,310 | ||||||||||||
|
| |||||||||||||||
Total Investments in Securities | $ | 773,422,332 | $ | 198,131,345 | $ | 9,920,576 | $ | 981,474,253 | ||||||||
|
| |||||||||||||||
Other Financial Instruments: | ||||||||||||||||
Forward Exchange Contracts | $ | — | $ | 2,831,307 | $ | — | $ | 2,831,307 | ||||||||
Restricted Currency (ARS) | — | — | 2,466,942 | 2,466,942 | ||||||||||||
|
| |||||||||||||||
Total Other Financial Instruments | $ | — | $ | 2,831,307 | $ | 2,466,942 | $ | 5,298,249 | ||||||||
|
| |||||||||||||||
Receivables: | ||||||||||||||||
Interest (ARS) | $ | — | $ | — | $ | 419,240 | $ | 419,240 | ||||||||
|
| |||||||||||||||
56 | Annual Report | franklintempleton.com | ||
TEMPLETON GLOBAL INVESTMENT TRUST
NOTES TO CONSOLIDATED FINANCIAL STATEMENTS
Templeton Global Balanced Fund(continued)
| Level 1 | Level 2 | Level 3 | Total | |||||||||||||
Liabilities: | ||||||||||||||||
Other Financial Instruments: | ||||||||||||||||
Options Written | $ | — | $ | 1,475,077 | $ | — | $ | 1,475,077 | ||||||||
Forward Exchange Contracts | — | 8,407,378 | — | 8,407,378 | ||||||||||||
Swap Contracts | — | 5,160,817 | — | 5,160,817 | ||||||||||||
|
| |||||||||||||||
Total Other Financial Instruments | $ | — | $ | 15,043,272 | $ | — | $ | 15,043,272 | ||||||||
|
| |||||||||||||||
Payables: | ||||||||||||||||
Deferred Tax (ARS) | $ | — | $ | — | $ | 1,002 | $ | 1,002 | ||||||||
|
| |||||||||||||||
aFor detailed categories, see the accompanying Statement of Investments.
A reconciliation of assets and/or liabilities in which Level 3 inputs are used in determining fair value is presented when there are significant Level 3 assets and/or liabilities at the beginning and/or end of the year. At December 31, 2019, the reconciliation of assets and/or liabilities is as follows:
Balance at Beginning of Year | Purchases | Sales | Transfer Into Level 3a | Transfer Out of Level 3b | Cost Basis Adjustmentsc | Net Realized Gain (Loss) | Net Unrealized Appreciation (Depreciation) | Balance at End of Year | Net Change in Unrealized Appreciation (Depreciation) on Assets Held at Year End | |||||||||||||||||||||||||||||||
Assets: | ||||||||||||||||||||||||||||||||||||||||
Investments in Securities: | ||||||||||||||||||||||||||||||||||||||||
Common Stocks | ||||||||||||||||||||||||||||||||||||||||
South Africa | $26,132 | d | $ — | $ | — | d | $ | — | $ — | $ — | $ | (10,993,713 | ) | $10,994,392 | $ 26,811 | $ 679 | ||||||||||||||||||||||||
United States | 34,934 | — | — | — | — | — | — | — | 34,934 | — | ||||||||||||||||||||||||||||||
Corporate Bonds | ||||||||||||||||||||||||||||||||||||||||
South Africa | 52,214 | — | — | 4,396 | (6,750 | ) | 285,778 | — | (327,384 | ) | 8,254 | — | ||||||||||||||||||||||||||||
Escrows and Litigation Trusts | — | d | — | — | — | — | (727 | ) | 727 | — | — | — | ||||||||||||||||||||||||||||
Foreign Government and Agency Securities Argentina | — | 331,392 | — | 8,738,238 | — | 1,724,558 | — | (1,646,088 | ) | 9,148,100 | 97,907 | |||||||||||||||||||||||||||||
Short Term Investments Argentina | — | 581,239 | (67,294 | ) | 16,526 | — | 119,778 | (105,346 | ) | 157,574 | 702,477 | 86,336 | ||||||||||||||||||||||||||||
|
| |||||||||||||||||||||||||||||||||||||||
Total Investment in Securities | $113,280 | $ 912,631 | $ | (67,294 | ) | $ | 8,759,160 | $(6,750 | ) | $2,129,387 | $ | (11,098,332 | ) | $ 9,178,494 | $9,920,576 | $184,922 | ||||||||||||||||||||||||
|
| |||||||||||||||||||||||||||||||||||||||
Other Financial Instruments: | ||||||||||||||||||||||||||||||||||||||||
Restricted Currency (ARS) | $ — | $3,616,263 | $ | (922,546 | ) | $ | 482 | $ — | $ — | $ | (227,587 | ) | $ 330 | $2,466,942 | $(29,340 | ) | ||||||||||||||||||||||||
|
| |||||||||||||||||||||||||||||||||||||||
Receivables: | ||||||||||||||||||||||||||||||||||||||||
Interest (ARS) | $ — | $ 626,433 | $ | (973,181 | ) | $ | 797,090 | $ — | $ — | $ | (426,071 | ) | $ 394,969 | $ 419,240 | $ 320 | |||||||||||||||||||||||||
|
| |||||||||||||||||||||||||||||||||||||||
| franklintempleton.com | Annual Report | 57 | ||
TEMPLETON GLOBAL INVESTMENT TRUST
NOTES TO CONSOLIDATED FINANCIAL STATEMENTS
Templeton Global Balanced Fund(continued)
12. Fair Value Measurements(continued)
Balance at Beginning of Year | Purchases | Sales | Transfer Into Level 3a | Transfer Out of Level 3b | Cost Basis Adjustmentsc | Net Realized Gain (Loss) | Net Unrealized Appreciation (Depreciation) | Balance at End of Year | Net Change in Unrealized Appreciation (Depreciation) on Assets Held at Year End | |||||||||||||||||||||||||||||||
Liabilities: | ||||||||||||||||||||||||||||||||||||||||
Payables: | ||||||||||||||||||||||||||||||||||||||||
Deferred Tax (ARS) | $ — | $ | — | $ | — | $ | 1,340 | $ | — | $ | — | $ | — | $ | (338 | ) | $ | 1,002 | $ (338 | ) | ||||||||||||||||||||
|
| |||||||||||||||||||||||||||||||||||||||
aTransferred into Level 3 as a result of the unavailability of a quoted market price in an active market for identical securities or as a result of the unreliability of the foreign exchange rate and other significant observable valuation inputs.
bThe investment was transferred out of Level 3 as a result of the availability of a quoted price in an active market for identical securities and other significant observable valuation inputs.
cMay include accretion, amortization, partnership adjustments, and/or other cost basis adjustments.
dIncludes securities determined to have no value.
Significant unobservable valuation inputs for material Level 3 assets and/or liabilities and impact to fair value as a result of changes in unobservable valuation inputs as of December 31, 2019, are as follows:
Description
| Fair Value at End of Year
| Valuation Technique
| Unobservable Input
| Amount
| Impact to Fair Value if Input Increasesa
| |||||||||||||
Assets: | ||||||||||||||||||
Investments in Securities: | ||||||||||||||||||
Foreign Government and Agency Securities Argentina | $9,148,100 | Market Comparables | Implied Foreign exchange rate | 75.1 ARS/USD | Decrease | b | ||||||||||||
| ||||||||||||||||||
Short Term Investments Argentina | 702,477 | Market Comparables | Implied Foreign exchange rate | 75.1 ARS/USD | Decrease | b | ||||||||||||
| ||||||||||||||||||
Other Financial Instruments: | ||||||||||||||||||
Restricted Currency (ARS) | 2,466,942 | Market Comparables | Implied Foreign exchange rate | 75.1 ARS/USD | Decrease | b | ||||||||||||
| ||||||||||||||||||
All otherc | 489,239 | |||||||||||||||||
| ||||||||||||||||||
Liabilities: | ||||||||||||||||||
All otherc | 1,002 | |||||||||||||||||
| ||||||||||||||||||
aRepresents the directional change in the fair value that would result from a significant and reasonable increase in the corresponding input. A significant and reasonable decrease in the input would have the opposite effect. Significant impacts, if any, to fair value and/or net assets have been indicated.
bRepresents a significant impact to fair value and net assets.
cIncludes fair value of immaterial assets and/or liabilities developed using various valuation techniques and unobservable inputs. May also include values derived using private transaction prices or non-public third party pricing information which is unobservable.
13. Subsequent Events
The Fund has evaluated subsequent events through the issuance of the financial statements and determined that no events have occurred that require disclosure, other than those already disclosed in the financial statements.
58 | Annual Report | franklintempleton.com | ||
TEMPLETON GLOBAL INVESTMENT TRUST
NOTES TO CONSOLIDATED FINANCIAL STATEMENTS
Templeton Global Balanced Fund(continued)
Abbreviations
| Counterparty | Currency | Selected Portfolio | ||||||||
| BNDP | BNP Paribas SA | ARS | Argentine Peso | ADR | American Depositary Receipt | |||||
| BOFA | Bank of America Corp. | AUD | Australian Dollar | ARPP7DRR | Argentina Central Bank 7 Day Repo Rate | |||||
| CITI | Citigroup, Inc. | BRL | Brazilian Real | BADLAR | Argentina Deposit Rates Badlar Private | |||||
| DBAB | Deutsche Bank AG | COP | Colombian Peso | Banks ARS | ||||||
| GSCO | The Goldman Sachs Group, Inc. | EUR | Euro | FRN | Floating Rate Note | |||||
| HSBK | HSBC Bank PLC | GHS | Ghanaian Cedi | IDR | International Depositary Receipt | |||||
| JPHQ | JP Morgan Chase & Co. | IDR | Indonesian Rupiah | LIBOR | London InterBank Offered Rate | |||||
| MSCO | Morgan Stanley | INR | Indian Rupee | PIK | Payment-In-Kind | |||||
| SCNY | Standard Chartered Bank | JPY | Japanese yen | VRI | Value Recovery Instrument | |||||
| UBSW | UBS AG | KRW | South Korean Won | |||||||
| MXN | Mexican Peso | |||||||||
| USD | United States Dollar | |||||||||
| franklintempleton.com | Annual Report | 59 | ||
TEMPLETON GLOBAL INVESTMENT TRUST
Report of Independent Registered Public Accounting Firm
To the Board of Trustees of Templeton Global Investment Trust and Shareholders of Templeton Global Balanced Fund
Opinion on the Financial Statements
We have audited the accompanying consolidated statement of assets and liabilities, including the consolidated statement of investments, of Templeton Global Balanced Fund and its subsidiary (the “Fund”) as of December 31, 2019, the related consolidated statements of operations for the year ended December 31, 2019, the consolidated statement of changes in net assets for each of the two years in the period ended December 31, 2019, including the related notes, and the consolidated financial highlights for each of the periods indicated therein (collectively referred to as the “consolidated financial statements”). In our opinion, the consolidated financial statements present fairly, in all material respects, the financial position of the Fund as of December 31, 2019, the results of its operations for the year then ended, the changes in its net assets for each of the two years in the period ended December 31, 2019 and the financial highlights for each of the periods indicated therein in conformity with accounting principles generally accepted in the United States of America.
Basis for Opinion
These consolidated financial statements are the responsibility of the Fund’s management. Our responsibility is to express an opinion on the Fund’s consolidated financial statements based on our audits. We are a public accounting firm registered with the Public Company Accounting Oversight Board (United States) (PCAOB) and are required to be independent with respect to the Fund in accordance with the U.S. federal securities laws and the applicable rules and regulations of the Securities and Exchange Commission and the PCAOB.
We conducted our audits of these consolidated financial statements in accordance with the standards of the PCAOB. Those standards require that we plan and perform the audit to obtain reasonable assurance about whether the consolidated financial statements are free of material misstatement, whether due to error or fraud.
Our audits included performing procedures to assess the risks of material misstatement of the consolidated financial statements, whether due to error or fraud, and performing procedures that respond to those risks. Such procedures included examining, on a test basis, evidence regarding the amounts and disclosures in the consolidated financial statements. Our audits also included evaluating the accounting principles used and significant estimates made by management, as well as evaluating the overall presentation of the consolidated financial statements. Our procedures included confirmation of securities owned as of December 31, 2019 by correspondence with the custodian, transfer agent and brokers; when replies were not received from brokers, we performed other auditing procedures. We believe that our audits provide a reasonable basis for our opinion.
PricewaterhouseCoopers LLP
San Francisco, California
February 20, 2020
We have served as the auditor of one or more investment companies in the Franklin Templeton Group of Funds since 1948.
60 | Annual Report | franklintempleton.com | ||
TEMPLETON GLOBAL INVESTMENT TRUST
Under Section 854(b)(1)(A) of the Internal Revenue Code, the Fund hereby reports 11.18% of the ordinary income dividends as income qualifying for the dividends received deduction for the fiscal year ended December 31, 2019.
Under Section 854(b)(1)(B) of the Internal Revenue Code, the Fund hereby reports the maximum amount allowable but no less than $26,400,193 as qualified dividends for purposes of the maximum rate under Section 1(h)(11) of the Internal Revenue Code for the fiscal year ended December 31, 2019. Distributions, including qualified dividend income, paid during calendar year 2019 will be reported to shareholders on Form1099-DIV bymid-February 2020. Shareholders are advised to check with their tax advisors for information on the treatment of these amounts on their individual income tax returns.
At December 31, 2019, more than 50% of the Fund’s total assets were invested in securities of foreign issuers. In most instances, foreign taxes were withheld from income paid to the Fund on these investments. The Fund elects to treat foreign taxes paid as allowed under Section 853 of the Internal Revenue Code. This election will allow shareholders of record as of the 2020 distribution date, to treat their proportionate share of foreign taxes paid by the Fund as having been paid directly by them. The shareholder shall consider these amounts as foreign taxes paid in the tax year in which they receive the Fund distribution.
| franklintempleton.com | Annual Report | 61 | ||||
TEMPLETON GLOBAL INVESTMENT TRUST
The name, year of birth and address of the officers and board members, as well as their affiliations, positions held with the Trust, principal occupations during at least the past five years and number of U.S. registered portfolios overseen in the Franklin Templeton fund complex, are shown below. Generally, each board member serves until that person’s successor is elected and qualified.
Independent Board Members
Name, Year of Birth and Address | Position | Length of Time Served | Number of Portfolios in Fund Complex Overseen by Board Member* | Other Directorships Held During at Least the Past 5 Years | ||||
Harris J. Ashton (1932) 300 S.E. 2nd Street Fort Lauderdale, FL 33301-1923 |
Trustee |
Since 1994 |
132 |
Bar-S Foods (meat packing company) (1981-2010). | ||||
| Principal Occupation During at Least the Past 5 Years: | ||||||||
Director of various companies; andformerly, Director, RBC Holdings, Inc. (bank holding company) (until 2002); and President, Chief Executive Officer and Chairman of the Board, General Host Corporation (nursery and craft centers) (until 1998).
| ||||||||
Ann Torre Bates (1958) 300 S.E. 2nd Street Fort Lauderdale, FL 33301-1923 |
Trustee |
Since 2008 |
33 |
Ares Capital Corporation (specialty finance company) (2010-present), United Natural Foods, Inc. (distributor of natural, organic and specialty foods) (2013-present), Allied Capital Corporation (financial services)(2003-2010), SLM Corporation (Sallie Mae) (1997-2014) and Navient Corporation (loan management, servicing and asset recovery)(2014-2016). | ||||
| Principal Occupation During at Least the Past 5 Years: | ||||||||
Director of various companies; andformerly, Executive Vice President and Chief Financial Officer, NHP Incorporated (manager of multifamily housing) (1995-1997); and Vice President and Treasurer, US Airways, Inc. (until 1995).
| ||||||||
Mary C. Choksi (1950) 300 S.E. 2nd Street Fort Lauderdale, FL 33301-1923 |
Trustee |
Since 2017 |
132 |
Avis Budget Group Inc. (car rental) (2007-present), Omnicom Group Inc. (advertising and marketing communications services)(2011-present) and White Mountains Insurance Group, Ltd. (holding company) (2017-present). | ||||
| Principal Occupation During at Least the Past 5 Years: | ||||||||
Director of various companies; andformerly, Founder and Senior Advisor, Strategic Investment Group (investment management group) (2015-2017); Founding Partner and Senior Managing Director, Strategic Investment Group (1987-2015); Founding Partner and Managing Director, Emerging Markets Management LLC (investment management firm) (1987-2011); and Loan Officer/Senior Loan Officer/Senior Pension Investment Officer, World Bank Group (international financial institution) (1977-1987).
| ||||||||
62 | Annual Report | franklintempleton.com | ||
TEMPLETON GLOBAL INVESTMENT TRUST
Independent Board Members(continued)
Name, Year of Birth and Address | Position | Length of Time Served | Number of Portfolios in Fund Complex Overseen by Board Member* | Other Directorships Held During at Least the Past 5 Years | ||||
Edith E. Holiday (1952) 300 S.E. 2nd Street Fort Lauderdale, FL 33301-1923 | Lead Independent Trustee | Trustee since 1996 and Lead Independent Trustee since 2007 | 132 | Hess Corporation (exploration of oil and gas) (1993-present), Canadian National Railway (railroad)(2001-present), White Mountains Insurance Group, Ltd. (holding company) (2004-present), Santander Consumer USA Holdings, Inc. (consumer finance) (2016-present), RTI International Metals, Inc. (manufacture and distribution of titanium) (1999-2015) and H.J. Heinz Company (processed foods and allied products) (1994-2013). | ||||
| Principal Occupation During at Least the Past 5 Years: | ||||||||
Director or Trustee of various companies and trusts; andformerly, Assistant to the President of the United States and Secretary of the Cabinet
| ||||||||
J. Michael Luttig (1954) 300 S.E. 2nd Street Fort Lauderdale, FL 33301-1923 |
Trustee |
Since 2009 |
132 |
Boeing Capital Corporation (aircraft financing) (2006-2010). | ||||
| Principal Occupation During at Least the Past 5 Years: | ||||||||
Private investor; and formerly, Counselor and Senior Advisor to the Chairman, CEO, and Board of Directors, of The Boeing Company (aerospace
| ||||||||
David W. Niemiec (1949) 300 S.E. 2nd Street Fort Lauderdale, FL 33301-1923 |
Trustee |
Since 2006 |
33 |
Hess Midstream LP (oil and gas midstream infrastructure)(2017-present). | ||||
| Principal Occupation During at Least the Past 5 Years: | ||||||||
Advisor, Saratoga Partners (private equity fund); andformerly, Managing Director, Saratoga Partners (1998-2001) and SBC Warburg Dillon Read (investment banking) (1997-1998); Vice Chairman, Dillon, Read & Co. Inc. (investment banking) (1991-1997); and Chief Financial Officer, Dillon, Read & Co. Inc. (1982-1997).
| ||||||||
Larry D. Thompson (1945) 300 S.E. 2nd Street Fort Lauderdale, FL 33301-1923 |
Trustee |
Since 2006 |
132 |
The Southern Company (energy company) (2014-present; previously 2010-2012), Graham Holdings Company (education and media organization) (2011-present) and Cbeyond, Inc. (business communications provider)(2010-2012). | ||||
| Principal Occupation During at Least the Past 5 Years: | ||||||||
Director of various companies; Counsel, Finch McCranie, LLP (law firm) (2015-present); Independent Compliance Monitor and Auditor, Volkswagen AG
| ||||||||
| franklintempleton.com | Annual Report | 63 | ||
TEMPLETON GLOBAL INVESTMENT TRUST
Independent Board Members(continued)
Name, Year of Birth and Address | Position | Length of Time Served | Number of Portfolios in Fund Complex Overseen by Board Member* | Other Directorships Held During at Least the Past 5 Years | ||||
Constantine D. Tseretopoulos(1954) 300 S.E. 2nd Street Fort Lauderdale, FL 33301-1923 |
Trustee |
Since 2001 |
21 |
None | ||||
| Principal Occupation During at Least the Past 5 Years: | ||||||||
Physician, Chief of Staff, owner and operator of the Lyford Cay Hospital (1987-present); director of various nonprofit organizations; andformerly, Cardiology Fellow, University of Maryland (1985-1987); and Internal Medicine Resident, Greater Baltimore Medical Center (1982-1985).
| ||||||||
Robert E. Wade (1946) 300 S.E. 2nd Street Fort Lauderdale, FL 33301-1923 |
Trustee |
Since 2006 |
33 |
El Oro Ltd (investments) (2003-2019). | ||||
| Principal Occupation During at Least the Past 5 Years: | ||||||||
Attorney at law engaged in private practice as a sole practitioner (1972-2008) and member of various boards.
| ||||||||
| Interested Board Members and Officers | ||||||||
Name, Year of Birth and Address | Position | Length of Time Served | Number of Portfolios in Fund Complex Overseen by Board Member* | Other Directorships Held During at Least the Past 5 Years | ||||
**Gregory E. Johnson (1961) One Franklin Parkway San Mateo, CA 94403-1906 |
Trustee |
Since 2006 |
144 |
None | ||||
| Principal Occupation During at Least the Past 5 Years: | ||||||||
Chairman of the Board, Member – Office of the Chairman, Director and Chief Executive Officer, Franklin Resources, Inc.; officer and/or director or trustee, as the case may be, of some of the other subsidiaries of Franklin Resources, Inc. and of 39 of the investment companies in Franklin Templeton; Vice Chairman, Investment Company Institute; andformerly, President, Franklin Resources, Inc. (1994-2015).
| ||||||||
**Rupert H. Johnson, Jr. (1940) One Franklin Parkway San Mateo, CA 94403-1906 |
Chairman of the Board, Trustee and Vice President |
Chairman of the Board and Trustee since 2013 and Vice President since 1996 |
132 |
None | ||||
| Principal Occupation During at Least the Past 5 Years: | ||||||||
Vice Chairman, Member – Office of the Chairman and Director, Franklin Resources, Inc.; Director, Franklin Advisers, Inc.; and officer and/or director or trustee, as the case may be, of some of the other subsidiaries of Franklin Resources, Inc. and of 37 of the investment companies in Franklin Templeton.
| ||||||||
Alan Bartlett (1970) Lyford Cay Nassau, Bahamas |
President and Chief Executive Office – Investment Management |
Since December 2019 |
Not Applicable |
Not Applicable | ||||
| Principal Occupation During at Least the Past 5 Years: | ||||||||
President and Director, Templeton Global Advisors Limited; Chief Investment Officer of Templeton Global Equity Group; officer of five of the investment companies in Franklin Templeton; Chairman of the Board, Goodhart Partners; andformerly, Chief Executive Officer, Goodhart Partners (2009-2019).
| ||||||||
64 | Annual Report | franklintempleton.com | ||
TEMPLETON GLOBAL INVESTMENT TRUST
Interested Board Members and Officers(continued)
Name, Year of Birth and Address | Position | Length of Time Served | Number of Portfolios in Fund Complex Overseen by Board Member* | Other Directorships Held During at Least the Past 5 Years | ||||
Alison E. Baur (1964) One Franklin Parkway San Mateo, CA 94403-1906 | Vice President | Since 2012 | Not Applicable | Not Applicable | ||||
| Principal Occupation During at Least the Past 5 Years: | ||||||||
Deputy General Counsel, Franklin Templeton; and officer of some of the other subsidiaries of Franklin Resources, Inc. and of 41 of the investment companies in Franklin Templeton.
| ||||||||
Breda M. Beckerle (1958) 280 Park Avenue New York, NY 10017 | Interim Chief Compliance Officer | Since January 2020 | Not Applicable | Not Applicable | ||||
| Principal Occupation During at Least the Past 5 Years: | ||||||||
Chief Compliance Officer, Fiduciary Investment Management International, Inc., Franklin Advisers, Inc., Franklin Advisory Services, LLC, Franklin Mutual Advisers, LLC, Franklin Templeton Institutional, LLC; and officer of 41 of the investment companies in Franklin Templeton.
| ||||||||
Steven J. Gray (1955) One Franklin Parkway San Mateo, CA 94403-1906 | Vice President | Since 2009 | Not Applicable | Not Applicable | ||||
| Principal Occupation During at Least the Past 5 Years: | ||||||||
Senior Associate General Counsel, Franklin Templeton; Vice President, Franklin Templeton Distributors, Inc. and FASA, LLC; and officer of 41 of the investment companies in Franklin Templeton.
| ||||||||
Matthew T. Hinkle (1971) One Franklin Parkway San Mateo, CA 94403-1906 | Chief Executive Officer – Finance and Administration | Since 2017 | Not Applicable | Not Applicable | ||||
| Principal Occupation During at Least the Past 5 Years: | ||||||||
Senior Vice President, Franklin Templeton Services, LLC; officer of 41 of the investment companies in Franklin Templeton; andformerly, Vice President, Global Tax (2012-April 2017) and Treasurer/Assistant Treasurer, Franklin Templeton (2009-2017).
| ||||||||
Robert G. Kubilis (1973) 300 S.E. 2nd Street Fort Lauderdale, FL 33301-1923 | Chief Financial Officer, Chief Accounting Officer and Treasurer | Since 2017 | Not Applicable | Not Applicable | ||||
| Principal Occupation During at Least the Past 5 Years: | ||||||||
Treasurer, U.S. Fund Administration & Reporting and officer of 15 of the investment companies in Franklin Templeton.
| ||||||||
Robert Lim (1948) One Franklin Parkway San Mateo, CA 94403-1906 | Vice President – AML Compliance | Since 2016 | Not Applicable | Not Applicable | ||||
| Principal Occupation During at Least the Past 5 Years: | ||||||||
Vice President, Franklin Templeton Companies, LLC; Chief Compliance Officer, Franklin Templeton Distributors, Inc. and Franklin Templeton Investor Services, LLC; and officer of 41 of the investment companies in Franklin Templeton.
| ||||||||
Navid J. Tofigh (1972) One Franklin Parkway San Mateo, CA 94403-1906 | Vice President | Since 2015 | Not Applicable | Not Applicable | ||||
| Principal Occupation During at Least the Past 5 Years: | ||||||||
Associate General Counsel and officer of 41 of the investment companies in Franklin Templeton.
| ||||||||
| franklintempleton.com | Annual Report | 65 | ||
TEMPLETON GLOBAL INVESTMENT TRUST
Interested Board Members and Officers(continued)
Name, Year of Birth and Address | Position | Length of Time Served | Number of Portfolios in Fund Complex Overseen by Board Member* | Other Directorships Held During at Least the Past 5 Years | ||||
Craig S. Tyle (1960) One Franklin Parkway San Mateo, CA 94403-1906 | Vice President | Since 2005 | Not Applicable | Not Applicable | ||||
| Principal Occupation During at Least the Past 5 Years: | ||||||||
General Counsel and Executive Vice President, Franklin Resources, Inc.; and officer of some of the other subsidiaries of Franklin Resources, Inc. and of 41 of the investment companies in Franklin Templeton.
| ||||||||
Lori A. Weber (1964) 300 S.E. 2nd Street Fort Lauderdale, FL 33301-1923 | Vice President and Secretary | Vice President since 2011 and Secretary since 2013 | Not Applicable | Not Applicable | ||||
| Principal Occupation During at Least the Past 5 Years: | ||||||||
| Senior Associate General Counsel, Franklin Templeton; Assistant Secretary, Franklin Resources, Inc.; Vice President and Secretary, Templeton | ||||||||
Investment Counsel, LLC; and officer of 41 of the investment companies in Franklin Templeton.
| ||||||||
*We base the number of portfolios on each separate series of the U.S. registered investment companies within the Franklin Templeton fund complex. These portfolios have a common investment manager or affiliated investment managers.
**Gregory E. Johnson is considered to be an interested person of the Fund under the federal securities laws due to his position as an officer and director of Franklin Resources, Inc. (Resources), which is the parent company of the Fund’s investment manager and distributor. Rupert H. Johnson, Jr. is considered to be an interested person of the Fund under the federal securities laws due to his position as an officer and director and major shareholder of Resources.
Note 1: Rupert H. Johnson, Jr. is the uncle of Gregory E. Johnson.
Note 2: Officer information is current as of the date of this report. It is possible that after this date, information about officers may change.
The Sarbanes-Oxley Act of 2002 and Rules adopted by the U.S. Securities and Exchange Commission require the Fund to disclose whether the Fund’s Audit Committee includes at least one member who is an audit committee financial expert within the meaning of such Act and Rules. The Fund’s Board has determined that there is at least one such financial expert on the Audit Committee and has designated each of Ann Torre Bates and David W. Niemiec as an audit committee financial expert. The Board believes that Ms. Bates and Mr. Niemiec qualify as such an expert in view of their extensive business background and experience. Ms. Bates has served as a member of the Fund Audit Committee since 2008. She currently serves as a director of Ares Capital Corporation (2010-present) and United Natural Foods, Inc. (2013-present) and was formerly a director of Navient Corporation from 2014 to 2016, SLM Corporation from 1997 to 2014 and Allied Capital Corporation from 2003 to 2010, Executive Vice President and Chief Financial Officer of NHP Incorporated from 1995 to 1997 and Vice President and Treasurer of US Airways, Inc. until 1995. Mr. Niemiec has served as a member of the Fund Audit Committee since 2006, currently serves as an Advisor to Saratoga Partners and was formerly its Managing Director from 1998 to 2001 and serves as a director of Hess Midstream LP (2017-present). Mr. Niemiec was formerly a director of Emeritus Corporation from 1999 to 2010 and OSI Pharmaceuticals, Inc. from 2006 to 2010, Managing Director of SBC Warburg Dillon Read from 1997 to 1998, and was Vice Chairman from 1991 to 1997 and Chief Financial Officer from 1982 to 1997 of Dillon, Read & Co. Inc. As a result of such background and experience, the Board believes that Ms. Bates and Mr. Niemiec have each acquired an understanding of generally accepted accounting principles and financial statements, the general application of such principles in connection with the accounting estimates, accruals and reserves, and analyzing and evaluating financial statements that present a breadth and level of complexity of accounting issues generally comparable to those of the Fund, as well as an understanding of internal controls and procedures for financial reporting and an understanding of audit committee functions. Ms. Bates and Mr. Niemiec are independent Board members as that term is defined under the applicable U.S. Securities and Exchange Commission Rules and Releases.
The Statement of Additional Information (SAI) includes additional information about the board members and is available, without charge, upon request. Shareholders may call (800) DIALBEN/342-5236 to request the SAI.
66 | Annual Report | franklintempleton.com | ||
TEMPLETON GLOBAL INVESTMENT TRUST
TEMPLETON GLOBAL BALANCED FUND
Proxy Voting Policies and Procedures
The Fund’s investment manager has established Proxy Voting Policies and Procedures (Policies) that the Fund uses to determine how to vote proxies relating to portfolio securities. Shareholders may view the Fund’s complete Policies online at franklintempleton.com. Alternatively, shareholders may request copies of the Policies free of charge by calling the Proxy Group collect at (954)527-7678 or by sending a written request to: Franklin Templeton Companies, LLC, 300 S.E. 2nd Street, Fort Lauderdale, FL 33301, Attention: Proxy Group. Copies of the Fund’s proxy voting records are also made available online at franklintempleton.com and posted on the U.S. Securities and Exchange Commission’s website at sec.gov and reflect the most recent12-month period ended June 30.
Quarterly Consolidated Statement of Investments
The Trust, on behalf of the Fund, files a complete consolidated statement of investments with the U.S. Securities and Exchange Commission for the first and third quarters for each fiscal year as an exhibit to its report on FormN-PORT. Shareholders may view the filed FormN-PORT by visiting the Commission’s website at sec.gov. The filed form may also be viewed and copied at the Commission’s Public Reference Room in Washington, DC. Information regarding the operations of the Public Reference Room may be obtained by calling(800) SEC-0330.
Householding of Reports and Prospectuses
You will receive the Fund’s financial reports every six months as well as an annual updated summary prospectus (prospectus available upon request). To reduce Fund expenses, we try to identify related shareholders in a household and send only one copy of the financial reports and summary prospectus. This process, called “householding,” will continue indefinitely unless you instruct us otherwise. If you prefer not to have these documents householded, please call us at (800)632-2301. At any time you may view current prospectuses/summary prospectuses and financial reports on our website. If you choose, you may receive these documents through electronic delivery.
| franklintempleton.com | Annual Report | 67 | ||
This page intentionally left blank.
Authorized for distribution only when accompanied or preceded by a summary prospectus and/or prospectus. Investors should carefully consider a fund’s investment goals, risks, charges and expenses before investing. A prospectus contains this and other information; please read it carefully before investing.
To help ensure we provide you with quality service, all calls to and from our service areas are monitored and/or recorded.
 |
Annual Report and Shareholder Letter Templeton Global Balanced Fund | |||||||
| Investment Manager | Subadvisor | Distributor | Shareholder Services | |||||
| Templeton Global | Franklin Advisers, Inc. | Franklin Templeton | (800)632-2301 | |||||
| Advisors Limited | Distributors, Inc. | |||||||
| (800) DIAL BEN®/ | ||||||||
| 342-5236 | ||||||||
| franklintempleton.com | ||||||||
© 2020 Franklin Templeton Investments. All rights reserved. | 325 A 02/20 |
| Item 2. | Code of Ethics. |
| (a) | The Registrant has adopted a code of ethics that applies to its principal executive officers and principal financial and accounting officer. |
| (c) | N/A |
| (d) | N/A |
| (f) | Pursuant to Item 13(a)(1), the Registrant is attaching as an exhibit a copy of its code of ethics that applies to its principal executive officers and principal financial and accounting officer. |
| Item 3. | Audit Committee Financial Expert. |
| (a)(1) | The Registrant has an audit committee financial expert serving on its audit committee. |
| (2) | The audit committee financial experts are Ann Torre Bates andDavid W. Niemiec and they are “independent” as defined under the relevant Securities and Exchange Commission Rules and Releases. |
| Item 4. | Principal Accountant Fees and Services. |
(a) Audit Fees
The aggregate fees paid to the principal accountant for professional services rendered by the principal accountant for the audit of the registrant’s annual financial statements or for services that are normally provided by the principal accountant in connection with statutory and regulatory filings or engagements were $73,997 for the fiscal year ended December 31, 2019 and $125,547 for the fiscal year ended December 31, 2018.
(b) Audit-Related Fees
There were no fees paid to the principal accountant for assurance and related services rendered by the principal accountant to the registrant that are reasonably related to the performance of the audit of the registrant’s financial statements and are not reported under paragraph (a) of Item 4.
There were no fees paid to the principal accountant for assurance and related services rendered by the principal accountant to the registrant’s investment adviser and any entity controlling, controlled by or under common control with the investment adviser that provides ongoing services to the registrant that are reasonably related to the performance of the audit of their financial statements.
(c) Tax Fees
There were no fees paid to the principal accountant for professional services rendered by the principal accountant to the registrant for tax compliance, tax advice and tax planning.
The aggregate fees paid to the principal accountant for professional services rendered by the principal accountant to the registrant’s investment adviser and any entity controlling, controlled by or under common control with the investment adviser that provides ongoing services to the registrant for tax compliance, tax advice and tax planning were $20,000 for the fiscal year ended December 31, 2019 and $5,000 for the fiscal year ended December 31, 2018. The services for which these fees were paid included professional fees in connection with tax treatment of equipment lease transactions and professional fees in connection with an Indonesia withholding tax refund claim, and tax consulting services related to the operating agreement and term sheet for the launch of a new fund.
(d) All Other Fees
The aggregate fees paid to the principal accountant for products and services rendered by the principal accountant to the registrant not reported in paragraphs (a)-(c) of Item 4 were $0 for the fiscal year ended December 31, 2019 and $650 for the fiscal year ended December 31, 2018. The services for which these fees were paid included review of materials provided to the fund Board in connection with the investment management contract renewal process.
The aggregate fees paid to the principal accountant for products and services rendered by the principal accountant to the registrant’s investment adviser and any entity controlling, controlled by or under common control with the investment adviser that provides ongoing services to the registrant not reported in paragraphs (a)-(c) of Item 4 were $175,544 for the fiscal year ended December 31, 2019 and $31,500 for the fiscal year ended December 31, 2018. The services for which these fees were paid included issuance of an Auditors’ Certificate for South Korean regulatory shareholder disclosures, valuation Services related to Fair Value engagement, issuance of an Auditors’ Certificate for South Korean regulatory shareholder disclosures, assets under management certification, and benchmarking services in connection with ICI survey.
(e) (1) The registrant’s audit committee is directly responsible for approving the services to be provided by the auditors, including:
(i) pre-approval of all audit and audit related services;
(ii) pre-approval of allnon-audit related services to be provided to the Fund by the auditors;
(iii) pre-approval of allnon-audit related services to be provided to the registrant by the auditors to the registrant’s investment adviser or to any entity that controls, is controlled by or is under common control with the registrant’s investment adviser and that provides ongoing services to the registrant where thenon-audit services relate directly to the operations or financial reporting of the registrant; and
(iv) establishment by the audit committee, if deemed necessary or appropriate, as an alternative to committeepre-approval of services to be provided by the auditors, as required by paragraphs (ii) and (iii) above, of policies and procedures to permit such services to bepre-approved by other means, such as through establishment of guidelines or by action of a designated member or members of the committee; provided the policies and procedures are detailed as to the particular service and the committee is informed of each service and such policies and procedures do not include delegation of audit committee responsibilities, as contemplated under the Securities Exchange Act of 1934, to management; subject, in the case of (ii) through (iv), to any waivers, exceptions or exemptions that may be available under applicable law or rules.
(e) (2) None of the services provided to the registrant described in paragraphs (b)-(d) of Item 4 were approved by the audit committee pursuant to paragraph (c)(7)(i)(C) of Rule2-01 of regulationS-X.
(f) No disclosures are required by this Item 4(f).
(g) The aggregatenon-audit fees paid to the principal accountant for services rendered by the principal accountant to the registrant and the registrant’s investment adviser and any entity controlling, controlled by or under common control with the investment adviser that provides ongoing services to the registrant were $195,544 for the fiscal year ended December 31, 2019 and $37,150 for the fiscal year ended December 31, 2018.
(h) The registrant’s audit committee of the board has considered whether the provision ofnon-audit services that were rendered to the registrant’s investment adviser (not including anysub-adviser whose role is primarily portfolio management and is subcontracted with or overseen by another investment adviser), and any entity controlling, controlled by, or under common control with the investment adviser that provides ongoing services to the registrant that were notpre-approved pursuant to paragraph (c)(7)(ii) of Rule2-01 of RegulationS-X is compatible with maintaining the principal accountant’s independence.
| Item 5. | Audit Committee of Listed Registrants. N/A |
| Item 6. | Schedule of Investments. N/A |
| Item 7. | Disclosure of Proxy Voting Policies and Procedures forClosed-End Management Investment Companies. N/A |
| Item 8. | Portfolio Managers ofClosed-End Management Investment Companies. N/A |
| Item 9. | Purchases of Equity Securities byClosed-End Management Investment Company and Affiliated Purchasers. N/A |
| Item 10. | Submission of Matters to a Vote of Security Holders. |
There have been no changes to the procedures by which shareholders may recommend nominees to the Registrant’s Board of Trustees that would require disclosure herein.
| Item 11. | Controls and Procedures. |
(a)Evaluation of Disclosure Controls and Procedures. The Registrant maintains disclosure controls and procedures that are designed to provide reasonable assurance that information required to be disclosed in the Registrant’s filings under the Securities Exchange Act of 1934, as amended, and the Investment Company Act of 1940 is recorded, processed, summarized and reported within the periods specified in the rules and forms of the Securities and Exchange Commission. Such information is accumulated and communicated to the Registrant’s management, including its principal executive officer and principal financial officer, as appropriate, to allow timely decisions regarding required disclosure. The Registrant’s management, including the principal executive officer and the principal financial officer, recognizes that any set of controls and procedures, no matter how well designed and operated, can provide only reasonable assurance of achieving the desired control objectives.
Within 90 days prior to the filing date of this Shareholder Report onForm N-CSR, the Registrant had carried out an evaluation, under the supervision and with the participation of the Registrant’s management, including the Registrant’s principal executive officer and the Registrant’s principal financial officer, of the effectiveness of the design and operation of the Registrant’s disclosure controls and procedures. Based on such evaluation, the Registrant’s principal executive officer and principal financial officer concluded that the Registrant’s disclosure controls and procedures are effective.
(b)Changes in Internal Controls.There have been no changes in the Registrant’s internal control over financial reporting that occurred during the period covered by this report that has materially affected, or is reasonably likely to materially affect the internal control over financial reporting.
| Item 12. | Disclosure of Securities Lending Activities forClosed-End Management Investment Company. N/A |
| Item 13. | Exhibits. |
(a)(1)Code of Ethics
(a)(2) Certifications pursuant to Section 302 of the Sarbanes-Oxley Act of 2002 of Matthew T. Hinkle, Chief ExecutiveOfficer - Finance and Administration, and Robert G. Kubilis, Chief Financial Officer and Chief Accounting Officer
(b)Certifications pursuant to Section 906 of the Sarbanes-Oxley Act of 2002 of Matthew T. Hinkle, Chief ExecutiveOfficer - Finance and Administration, and Robert G. Kubilis, Chief Financial Officer and Chief Accounting Officer
SIGNATURES
Pursuant to the requirements of the Securities Exchange Act of 1934 and the Investment Company Act of 1940, the registrant has duly caused this report to be signed on its behalf by the undersigned, thereunto duly authorized.
TEMPLETON GLOBAL INVESTMENT TRUST
| By | S\MATTHEW T. HINKLE | |
| Matthew T. Hinkle | ||
| Chief Executive Officer – Finance and Administration | ||
| Date February 28, 2020 | ||
Pursuant to the requirements of the Securities Exchange Act of 1934 and the Investment Company Act of 1940, this report has been signed below by the following persons on behalf of the registrant and in the capacities and on the dates indicated.
| By | S\MATTHEW T. HINKLE | |
| Matthew T. Hinkle | ||
| Chief Executive Officer – Finance and Administration | ||
| Date February 28, 2020 | ||
| By | S\ROBERT G. KUBILIS | |
| Robert G. Kubilis | ||
| Chief Financial Officer and Chief Accounting Officer | ||
| Date February 28, 2020 | ||