UNITED STATES
SECURITIES AND EXCHANGE COMMISSION
Washington, DC 20549
FORM N-CSR
CERTIFIED SHAREHOLDER REPORT OF REGISTERED
MANAGEMENT INVESTMENT COMPANIES
Investment Company Act file number 811-08226
Templeton Global Investment Trust
(Exact name of registrant as specified in charter)
300 S.E. 2nd Street, Fort Lauderdale, FL 33301-1923
(Address of principal executive offices) (Zip code)
Craig S. Tyle, One Franklin Parkway, San Mateo, CA 94403-1906
(Name and address of agent for service)
Registrant’s telephone number, including area code: (954) 527-7500
Date of fiscal year end: 3/31
Date of reporting period: 3/31/18
| Item 1. | Reports to Stockholders. |
| | |
 | | Annual Report
and Shareholder Letter March 31, 2018 |
|
Templeton Frontier Markets Fund A SERIES OF TEMPLETON GLOBAL INVESTMENT TRUST |

Sign up for electronic delivery at franklintempleton.com/edelivery
Franklin Templeton Investments
Why choose Franklin Templeton Investments?
Successful investing begins with ambition. And achievement only comes when you reach for it. That’s why we continually strive to deliver better outcomes for investors. No matter what your goals are, our deep, global investment expertise allows us to offer solutions that can help.
During our more than 70 years of experience, we’ve managed through all kinds of markets—up, down and those in between. We’re always preparing for what may come next. It’s because of this, combined with our strength as one of the world’s largest asset managers that we’ve earned the trust of millions of investors around the world.
Dear Shareholder:
During the 12 months ended March 31, 2018, frontier and emerging market economies overall continued to grow faster than developed market economies. Encouraging economic data and growth in corporate earnings in many frontier and emerging market economies helped offset investor concerns about geopolitical tensions in certain regions, US government protectionist trade measures and escalating trade tensions between the US and China. Generally higher commodity prices further supported frontier market equities. In this environment, frontier market stocks delivered a strong total return, as measured by the MSCI Frontier Markets Index.
We are committed to our long-term perspective and disciplined investment approach as we conduct a rigorous, fundamental analysis of securities with a regular emphasis on investment risk management.
Historically, patient investors have achieved rewarding results by evaluating their goals, diversifying their assets globally and maintaining a disciplined investment program, all hallmarks of the Templeton investment philosophy developed more than 60 years ago. We continue to recommend investors consult their financial advisors and review their portfolios to design a long-term strategy and portfolio allocation that meet their individual needs, goals and risk tolerance.
Templeton Frontier Markets Fund’s annual report includes more detail about prevailing conditions and a discussion about investment decisions during the period. Please remember all securities markets fluctuate, as do mutual fund share prices.
We thank you for investing with Franklin Templeton, welcome your questions and comments, and look forward to serving your investment needs in the years ahead.
Sincerely,

Manraj S. Sekhon, CFA
Chief Investment Officer
Franklin Templeton Emerging Markets Equity
This letter reflects our analysis and opinions as of March 31, 2018, unless otherwise indicated. The information is not a complete analysis of every aspect of any market, country, industry, security or fund. Statements of fact are from sources considered reliable.
CFA® is a trademark owned by CFA Institute.
| | | | | | |
| | | Not FDIC Insured | | | May Lose Value | | | No Bank Guarantee |
| | | | |
franklintempleton.com | | Not part of the annual report | | 1 |
Contents
Visit franklintempleton.com for fund updates, to access your account, or to find helpful financial planning tools.
| | | | |
2 | | Annual Report | | franklintempleton.com |
Annual Report
Templeton Frontier Markets Fund
This annual report for Templeton Frontier Markets Fund covers the fiscal year ended March 31, 2018. Effective May 31, 2017, the Fund reopened to new investors.
Your Fund’s Goal and Main Investments
The Fund seeks long-term capital appreciation. Under normal market conditions, the Fund invests at least 80% of its net assets in securities of companies located in “frontier market countries” as defined in the prospectus. Such companies are organized under the laws of, have principal offices in, or have their principal securities trading markets in, frontier market countries; or derive at least 50% of their total revenue or profit from either goods or services produced or sales made in frontier market countries; or have at least 50% of their assets in, or are linked to currencies of, frontier market countries.
Performance Overview
The Fund’s Class A shares delivered a +14.08% cumulative total return for the 12 months under review. For comparison, the MSCI Frontier Markets Index, which measures stock performance in frontier markets, generated a +27.59% total return for the same period.1 Also for comparison, the Fund’s new secondary benchmark, the MSCI Frontier Emerging Markets (FEM) Select Countries Capped Index, a capped version of the MSCI FEM Index that measures stock performance in predominantly frontier market countries, produced a +24.30% total return.2 Finally, the Fund’s prior secondary benchmark, the Standard & Poor’s® Frontier Broad Market Index (BMI), which tracks performance of relatively small and illiquid frontier market stocks, posted a +24.18% total return for the same period.3 We believe the new second benchmark’s composition more accurately reflects the Fund’s holdings. Please note index performance information is provided for reference and we do not attempt to track any index but rather undertake investments on the basis of fundamental research. In addition, the Fund’s return reflects the effect of
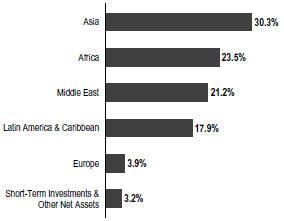
Geographic Composition
Based on Total Net Assets as of 3/31/18
fees and expenses for professional management, while an index does not have such costs. You can find the Fund’s long-term performance data in the Performance Summary beginning on page 7.
Performance data represent past performance, which does not guarantee future results. Investment return and principal value will fluctuate, and you may have a gain or loss when you sell your shares. Current performance may differ from figures shown. For most recent month-end performance, go to franklintempleton.com or call (800) 342-5236.
Economic and Market Overview
The global economy grew during the 12 months under review, as many frontier and emerging market economies expanded and many developed market economies continued to recover.
Vietnam’s economy grew during the period, driven by increased domestic demand, manufacturing and exports. Domestic demand was supported by rising wages and relatively low inflation, while an improving global economy and foreign
1. Source: Morningstar.
2. Source: FactSet. The MSCI FEM Select Countries Capped Index was developed by MSCI for the Fund’s investment manager and represents a capped version of the MSCI FEM Index. MSCI applies caps on the exposure of the MSCI FEM Index to emerging market and frontier market countries to create the MSCI FEM Select Countries Capped Index so that the index reflects predominantly frontier market countries.
3. Source: Copyright © 2018, S&P Dow Jones Indices LLC. All rights reserved.
The indexes are unmanaged and include reinvestment of any income or distributions. They do not reflect any fees, expenses or sales charges. One cannot invest directly in an index, and an index is not representative of the Fund’s portfolio.
The dollar value, number of shares or principal amount, and names of all portfolio holdings are listed in the Fund’s Statement of Investments (SOI). The SOI begins on page 16.
| | | | |
franklintempleton.com | | Annual Report | | 3 |
TEMPLETON FRONTIER MARKETS FUND
direct investment supported manufacturing and exports. The services sector also contributed to the economy as private consumption and tourism grew. The central bank cut its benchmark interest rate during the period to support economic growth. In this environment, Vietnamese stocks delivered strong gains for the 12-month period.
Argentina’s economy grew in 2017. The fourth quarter rate of growth, compared to the prior-year period, was the fastest in 10 quarters. Growth was spurred by an increase in gross fixed capital and private consumption. MSCI’s decision in June to delay the reclassification of Argentina from the MSCI Frontier Markets Index to the MSCI Emerging Markets Index led to a stock market correction. However, stocks recovered following favorable August 2017 mid-term legislative primary election results for Mauricio Macri, who has since passed business-friendly reforms. The central bank raised its benchmark interest rate several times during the period to curb inflation during the period before lowering it in the first quarter of 2018. Argentine stocks ended the 12-month period with strong gains.
Kuwait’s economy was hampered by lower oil outputs and exports resulting from the production cuts by the Organization of the Petroleum Exporting Countries, though this was partially offset by increased oil prices and growth in the non-oil sector. Anticipation of FTSE Russell’s inclusion of Kuwait as a Secondary Emerging Market also supported investor sentiment. The country’s central bank raised its benchmark interest rate in March 2018, following the US Federal Reserve’s rate increase. In this environment, Kuwaiti stocks overall delivered positive returns for the 12-month period.
Kenya’s economy moderated in 2017 as it was weighed down by drought, low growth in private sector credit and political instability due to disputed elections. However, growth in the first quarter of 2018 was supported by eased political tensions, as well as increased domestic and international demand, which has led to a growth in export orders. Kenya’s central bank unexpectedly lowered its benchmark interest rate in March in order to spur credit growth amid slowing inflation and an improving business environment. In this environment, Kenyan stocks delivered strong returns during the 12-month period.
Frontier market stocks rose during the 12 months under review as corporate earnings growth and encouraging economic data from many frontier and emerging market economies helped offset investor concerns about geopolitical tensions in certain regions, the US administration’s protectionist trade measures and escalating trade tensions between the US and China. Further supporting frontier market stocks were generally higher commodity prices. In this environment, frontier market stocks,
Top 10 Countries*
3/31/18
| | | | |
| | | % of Total
Net Assets | |
Vietnam | | | 13.3% | |
Argentina | | | 10.8% | |
Kuwait | | | 10.3% | |
Saudi Arabia | | | 7.5% | |
Egypt | | | 6.8% | |
Philippines | | | 6.6% | |
Zimbabwe | | | 5.6% | |
Kenya | | | 5.4% | |
Peru | | | 4.5% | |
Sri Lanka | | | 4.4% | |
*Figures exclude Short-Term Investments and Other Net Assets.
as measured by the MSCI Frontier Markets Index, generated a +27.59% total return for the 12 months ended March 31, 2018.1
Investment Strategy
Our investment strategy employs a fundamental research, value-oriented, long-term approach. We focus on the market price of a company’s securities relative to our evaluation of the company’s long-term earnings, asset value and cash flow potential. We also consider a company’s profit and loss outlook, balance sheet strength, cash flow trends and asset value in relation to the current price of the company’s securities. The analysis considers the company’s corporate governance behavior as well as its position in its sector, the economic framework and political environment.
Manager’s Discussion
During the 12 months under review, key contributors to the Fund’s absolute performance included investments in KCB Group, DHG Pharmaceutical and Telecom Argentina.
KCB Group is one of Kenya’s largest banks, in terms of assets, and provides both retail and commercial banking services. 2017 earnings remained resilient, in line with those in 2016. Non-performing loans, however, increased slightly, amidst the prolonged 2017 elections, delayed government payments and the impact of the interest rate cap law implemented in 2016. Speculation about a reversal or amendment to the interest rate cap regulation supported a rally in the country’s banking stocks, including KCB.
DHG Pharmaceutical is one of the largest pharmaceutical companies in Vietnam. Expectations of a tender offer at above market prices from a major shareholder, merger and acquisition speculation, and plans to increase the foreign limit ownership
| | | | |
4 | | Annual Report | | franklintempleton.com |
TEMPLETON FRONTIER MARKETS FUND
(FOL) supported the share price. However, after a strong 2016, the company reported disappointing 2017 corporate results, including weak sales growth and a decline in earnings partly due to higher tax rates.
Telecom Argentina is a major fixed-line telecommunications services provider in Argentina. The company also provides telecom-related services such as long-distance phone services, data transmission, information technology solutions outsourcing as well as internet services. Telecom Argentina reported solid quarterly corporate results during 2017. Announcement of a merger with Cablevisión, a leading Argentine-listed cable television and internet services provider, further drove investor sentiment.
In contrast, key detractors from the Fund’s performance included Binh Minh Plastics, United Bank and Saudi Dairy & Foodstuff Co.4 (SADAFCO).
Despite a double-digit growth in sales for 2017, Binh Minh Plastics’ earnings and gross margins declined due to high material costs and discounts extended to distributors amid increased competition. Major shareholder Nawaplastic Industries, an affiliate of Thailand’s SCG Group,5 increased its stake in Binh Minh Plastics in March, purchasing the stake from the State Securities Commission (SSC). The company also received approval from the SSC to increase their FOL to 100%.
United Bank is one of the biggest banks in Pakistan and also has a significant presence in international markets. Since MSCI upgraded Pakistan to emerging-market status in May 2017, Pakistani stocks have generally corrected due to weaker-than-expected foreign inflows, concerns about a ballooning current account deficit and political uncertainty. The company reported a decline in 2017 earnings due to multiple factors, including lower net interest income, a substantial increase in provisions and lower non-interest income.
SADAFCO has been a leading producer and distributor of long life milk, milk products and foodstuff items under the “Saudia” brand name since 1976. SADAFCO is based in Saudi Arabia but also has sales and distribution depots in Qatar, Bahrain and Jordan. SADAFCO also exports to neighboring markets. The company reported a decline in net profit in the final two quarters of 2017, pressuring share price returns. Price
| | | | |
| Top 10 Holdings | | | | |
| 3/31/18 | | | | |
| |
Company
Sector/Industry, Country | | % of Total
Net Assets | |
Delta Corp. Ltd. Beverages, Zimbabwe | | | 5.6% | |
DHG Pharmaceutical JSC Pharmaceuticals, Vietnam | | | 5.2% | |
National Bank of Kuwait SAKP Banks, Kuwait | | | 4.2% | |
Sonatel Diversified Telecommunication Services, Senegal | | | 3.3% | |
YPF Sociedad Anonima Oil, Gas & Consumable Fuels, Argentina | | | 3.2% | |
KCB Group Ltd. Banks, Kenya | | | 3.1% | |
Global Telecom Holding SAE Wireless Telecommunication Services, Egypt | | | 3.1% | |
Binh Minh Plastics JSC Building Products, Vietnam | | | 2.8% | |
Telecom Argentina SA Diversified Telecommunication Services, Argentina | | | 2.5% | |
Saudi Dairy & Foodstuff Co.4 Food Products, Saudi Arabia | | | 2.5% | |
competition, weaker consumer spending and an increase in raw material prices hampered earnings.
During the period, our continued search for investments we considered attractively valued led to investments in the Philippines, Peru, Colombia and Egypt. Key purchases included SADAFCO; Metropolitan Bank & Trust, a major bank in the Philippines; and Global Telecom Holding, one of the biggest mobile operators in the Middle East and North Africa region.
Conversely, we reduced the Fund’s holdings in Pakistan, Argentina, Vietnam and Kenya due to share redemptions, and as we focused on opportunities we considered to be more attractively valued within our investment universe. Lesser reductions were also undertaken in Nigeria, Sri Lanka, Saudi Arabia and the United Arab Emirates. In sector terms, we reduced holdings in financials, health care, consumer
4. Investments were made through participatory notes, which are equity access products structured as debt obligations and are issued or backed by banks and broker-dealers and designed to replicate equity market exposure in markets where direct investment is either impossible or difficult due to local investment restrictions.
5. Not a Fund holding.
| | | | | | |
franklintempleton.com | | | | Annual Report | | 5 |
TEMPLETON FRONTIER MARKETS FUND
discretionary and telecommunication services.6 Key sales included Pakistani banks United Bank and Habib Bank, as well as DHG Pharmaceutical.
It is important to recognize the effect of currency movements on the Fund’s performance. In general, if the value of the US dollar goes up compared with a foreign currency, an investment traded in that foreign currency will go down in value because it will be worth fewer US dollars. This can have a negative effect on Fund performance. Conversely, when the US dollar weakens in relation to a foreign currency, an investment traded in that foreign currency will increase in value, which can contribute to Fund performance. For the 12 months ended March 31, 2018, the US dollar rose in value relative to many currencies in which the Fund’s investments were traded. As a result, the Fund’s performance was negatively affected by the portfolio’s investment predominantly in securities with non-US currency exposure.
Effective May 1, 2018, Bassel Khatoun was added as co-lead portfolio manager, joining current co-lead portfolio manager Tom Wu.
Thank you for your continued participation in Templeton Frontier Markets Fund. We look forward to serving your future investment needs.
| | |
 | | 
Tom Wu Portfolio Manager |
The foregoing information reflects our analysis, opinions and portfolio holdings as of March 31, 2018, the end of the reporting period. The way we implement our main investment strategies and the resulting portfolio holdings may change depending on factors such as market and economic conditions. These opinions may not be relied upon as investment advice or an offer for a particular security. The information is not a complete analysis of every aspect of any market, country, industry, security or the Fund. Statements of fact are from sources considered reliable, but the investment manager makes no representation or warranty as to their completeness or accuracy. Although historical performance is no guarantee of future results, these insights may help you understand our investment management philosophy.
6. The financials sector comprises banks and diversified financial services in the SOI. The health care sector comprises health care providers and services and pharmaceuticals in the SOI. The consumer discretionary sector comprises automobiles and diversified consumer services in the SOI. The telecommunication services sector comprises diversified telecommunication services and wireless telecommunication services in the SOI.
See www.franklintempletondatasources.com for additional data provider information.
| | | | |
6 | | Annual Report | | franklintempleton.com |
TEMPLETON FRONTIER MARKETS FUND
Performance Summary as of March 31, 2018
The performance table and graphs do not reflect any taxes that a shareholder would pay on Fund dividends, capital gain distributions, if any, or any realized gains on the sale of Fund shares. Total return reflects reinvestment of the Fund’s dividends and capital gain distributions, if any, and any unrealized gains or losses. Your dividend income will vary depending on dividends or interest paid by securities in the Fund’s portfolio, adjusted for operating expenses of each class. Capital gain distributions are net profits realized from the sale of portfolio securities.
Performance as of 3/31/181
Cumulative total return excludes sales charges. Average annual total return includes maximum sales charges. Sales charges will vary depending on the size of the investment and the class of share purchased. The maximum is 5.75% and the minimum is 0%. Class A: 5.75% maximum initial sales charge; Advisor Class: no sales charges. For other share classes, visit franklintempleton.com.
| | | | | | | | |
| Share Class | | Cumulative
Total Return2 | | | Average Annual
Total Return3 | |
A | | | | | | | | |
1-Year | | | +14.08% | | | | +7.53% | |
5-Year | | | -5.11% | | | | -2.20% | |
Since Inception (10/14/08) | | | +71.17% | | | | +5.19% | |
Advisor | | | | | | | | |
1-Year | | | +14.37% | | | | +14.37% | |
5-Year | | | -4.01% | | | | -0.82% | |
Since Inception (10/14/08) | | | +75.40% | | | | +6.12% | |
Performance data represent past performance, which does not guarantee future results. Investment return and principal value will fluctuate, and you may have a gain or loss when you sell your shares. Current performance may differ from figures shown. For most recent month-end performance, go to franklintempleton.com or call (800) 342-5236.
See page 9 for Performance Summary footnotes.
| | | | | | |
franklintempleton.com | | | | Annual Report | | 7 |
TEMPLETON FRONTIER MARKETS FUND
PERFORMANCE SUMMARY
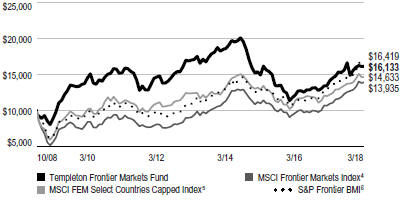
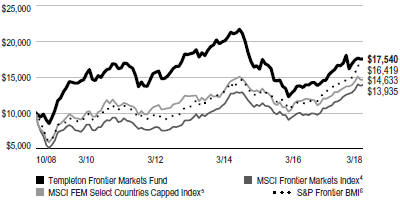
Total Return Index Comparison for a Hypothetical $10,000 Investment1
Total return represents the change in value of an investment over the periods shown. It includes any applicable maximum sales charge, Fund expenses, account fees and reinvested distributions. The unmanaged indexes include reinvestment of any income or distributions. They differ from the Fund in composition and do not pay management fees or expenses. One cannot invest directly in an index.
Class A (10/14/08–3/31/18)
Advisor Class (10/14/08–3/31/18)
See page 9 for Performance Summary footnotes.
| | | | |
8 | | Annual Report | | franklintempleton.com |
TEMPLETON FRONTIER MARKETS FUND
PERFORMANCE SUMMARY
Distributions (4/1/17–3/31/18)
| | |
Share Class | | Net Investment
Income |
A | | $0.0719 |
C | | $0.0458 |
R | | $0.0561 |
R6 | | $0.0785 |
Advisor | | $0.0825 |
Total Annual Operating Expenses7
| | | | | | | | |
| Share Class | | With Waiver | | | Without Waiver | |
A | | | 1.99% | | | | 2.09% | |
Advisor | | | 1.75% | | | | 1.85% | |
Each class of shares is available to certain eligible investors and has different annual fees and expenses, as described in the prospectus.
All investments involve risks, including possible loss of principal. Special risks are associated with foreign investing, including currency fluctuations, economic instability and political developments. Investments in emerging markets, of which frontier markets are a subset, involve heightened risks related to the same factors, in addition to those associated with these markets’ smaller size, lesser liquidity and lack of established legal, political, business and social frameworks to support securities markets. Because these frameworks are typically even less developed in frontier markets, as well as various factors including the increased potential for extreme price volatility, illiquidity, trade barriers and exchange controls, the risks associated with emerging markets are magnified in frontier markets. To the extent the Fund focuses on particular countries, regions, industries, sectors or types of investment from time to time, it may be subject to greater risks of adverse developments in such areas of focus than a fund that invests in a wider variety of countries, regions, industries, sectors or investments. The Fund’s ability to invest in smaller company securities that may have limited liquidity involves additional risks, such as relatively small revenues, limited product lines and small market share. The Fund is designed for the aggressive portion of a well-diversified portfolio. The Fund is actively managed but there is no guarantee that the manager’s investment decisions will produce the desired results. The Fund’s prospectus also includes a description of the main investment risks.
1. The Fund has an expense reduction and a fee waiver associated with any investments it makes in a Franklin Templeton money fund and/or other Franklin Templeton fund, contractually guaranteed through 7/31/18. Fund investment results reflect the expense reduction and fee waiver; without these reductions, the results would have been lower.
2. Cumulative total return represents the change in value of an investment over the periods indicated.
3. Average annual total return represents the average annual change in value of an investment over the periods indicated. Return for less than one year, if any, has not been annualized.
4. Source: Morningstar. The MSCI Frontier Markets Index is a free float-adjusted, market capitalization-weighted index designed to measure equity market performance in frontier markets.
5. Source: FactSet. The MSCI FEM Select Countries Capped Index was developed by MSCI for the Fund’s investment manager and represents a capped version of the MSCI FEM Index. MSCI applies caps on the exposure of the MSCI FEM Index to emerging market and frontier market countries to create the MSCI FEM Select Countries Capped Index so that the index reflects predominantly frontier market countries.
6. Source: Copyright © 2018, S&P Dow Jones Indices LLC. All rights reserved.
7. Figures are as stated in the Fund’s current prospectus and may differ from the expense ratios disclosed in the Your Fund’s Expenses and Financial Highlights sections in this report. In periods of market volatility, assets may decline significantly, causing total annual Fund operating expenses to become higher than the figures shown.
See www.franklintempletondatasources.com for additional data provider information.
| | | | | | |
franklintempleton.com | | | | Annual Report | | 9 |
TEMPLETON FRONTIER MARKETS FUND
Your Fund’s Expenses
As a Fund shareholder, you can incur two types of costs: (1) transaction costs, including sales charges (loads) on Fund purchases and redemptions; and (2) ongoing Fund costs, including management fees, distribution and service (12b-1) fees, and other Fund expenses. All mutual funds have ongoing costs, sometimes referred to as operating expenses. The table below shows ongoing costs of investing in the Fund and can help you understand these costs and compare them with those of other mutual funds. The table assumes a $1,000 investment held for the six months indicated.
Actual Fund Expenses
The table below provides information about actual account values and actual expenses in the columns under the heading “Actual.” In these columns the Fund’s actual return, which includes the effect of Fund expenses, is used to calculate the “Ending Account Value” for each class of shares. You can estimate the expenses you paid during the period by following these steps (of course, your account value and expenses will differ from those in this illustration): Divide your account value by $1,000 (if your account had an $8,600 value, then $8,600 ÷ $1,000 = 8.6). Then multiply the result by the number in the row for your class of shares under the headings “Actual” and “Expenses Paid During Period” (if Actual Expenses Paid During Period were $7.50, then 8.6 x $7.50 = $64.50). In this illustration, the actual expenses paid this period are $64.50.
Hypothetical Example for Comparison with Other Funds
Under the heading “Hypothetical” in the table, information is provided about hypothetical account values and hypothetical expenses based on the Fund’s actual expense ratio and an assumed rate of return of 5% per year before expenses, which is not the Fund’s actual return. This information may not be used to estimate the actual ending account balance or expenses you paid for the period, but it can help you compare ongoing costs of investing in the Fund with those of other funds. To do so, compare this 5% hypothetical example for the class of shares you hold with the 5% hypothetical examples that appear in the shareholder reports of other funds.
Please note that expenses shown in the table are meant to highlight ongoing costs and do not reflect any transactional costs. Therefore, information under the heading “Hypothetical” is useful in comparing ongoing costs only, and will not help you compare total costs of owning different funds. In addition, if transactional costs were included, your total costs would have been higher.
| | | | | | | | | | | | |
| | | | | Actual
(actual return after expenses) | | Hypothetical
(5% annual return before expenses) | | |
| | | Expenses | | | | Expenses | | Net |
| | | Beginning | | Ending | | Paid During | | Ending | | Paid During | | Annualized |
| Share | | Account | | Account | | Period | | Account | | Period | | Expense |
| Class | | Value 10/1/17 | | Value 3/31/18 | | 10/1/17–3/31/181,2 | | Value 3/31/18 | | 10/1/17–3/31/181,2 | | Ratio2 |
| | | | | | |
A | | $1,000 | | $970.00 | | $12.01 | | $1,012.74 | | $12.27 | | 2.45% |
C | | $1,000 | | $966.70 | | $15.66 | | $1,008.98 | | $16.00 | | 3.19% |
R | | $1,000 | | $968.60 | | $13.26 | | $1,011.42 | | $13.55 | | 2.70% |
R6 | | $1,000 | | $973.40 | | $ 9.05 | | $1,015.76 | | $ 9.25 | | 1.84% |
Advisor | | $1,000 | | $971.70 | | $10.87 | | $1,013.86 | | $11.10 | | 2.21% |
1. Expenses are equal to the annualized expense ratio for the six-month period as indicated above—in the far right column—multiplied by the simple average account value over the period indicated, and then multiplied by 182/365 to reflect the one-half year period.
2. Reflects expenses after fee waivers and expense reimbursements. Does not include acquired fund fees and expenses.
| | | | |
10 | | Annual Report | | franklintempleton.com |
TEMPLETON GLOBAL INVESTMENT TRUST
Financial Highlights
Templeton Frontier Markets Fund
| | | | | | | | | | | | | | | | | | | | |
| | | Year Ended March 31, | |
| | | | |
| | | 2018 | | | 2017 | | | 2016 | | | 2015 | | | 2014 | |
| |
| | | | | |
Class A | | | | | | | | | | | | | | | | | | | | |
| | | | | |
Per share operating performance | | | | | | | | | | | | | | | | | | | | |
(for a share outstanding throughout the year) | | | | | | | | | | | | | | | | | | | | |
| | | | | |
Net asset value, beginning of year | | | $11.81 | | | | $10.19 | | | | $13.47 | | | | $18.10 | | | | $16.94 | |
| | | | |
| | | | | |
Income from investment operationsa: | | | | | | | | | | | | | | | | | | | | |
| | | | | |
| Net investment incomeb | | | 0.18 | | | | 0.23 | | | | 0.27 | | | | 0.37 | | | | 0.42 | |
| | | | | |
Net realized and unrealized gains (losses) | | | 1.49 | | | | 1.46 | | | | (2.77 | ) | | | (3.89 | ) | | | 1.21 | |
| | | | |
| | | | | |
Total from investment operations | | | 1.67 | | | | 1.69 | | | | (2.50 | ) | | | (3.52 | ) | | | 1.63 | |
| | | | |
| | | | | |
| Less distributions from: | | | | | | | | | | | | | | | | | | | | |
| | | | | |
| Net investment income | | | (0.07 | ) | | | (0.07 | ) | | | (0.78 | ) | | | (0.55 | ) | | | (0.32) | |
| | | | | |
Net realized gains | | | — | | | | — | | | | — | | | | (0.56 | ) | | | (0.15) | |
| | | | |
| | | | | |
Total distributions | | | (0.07 | ) | | | (0.07 | ) | | | (0.78 | ) | | | (1.11 | ) | | | (0.47) | |
| | | | |
| | | | | |
Net asset value, end of year | | | $13.41 | | | | $11.81 | | | | $10.19 | | | | $13.47 | | | | $18.10 | |
| | | | |
| | | | | |
Total returnc | | | 14.08% | | | | 16.62% | | | | (18.75)% | | | | (19.91)% | | | | 9.60% | |
| | | | | |
Ratios to average net assets | | | | | | | | | | | | | | | | | | | | |
| | | | | |
Expenses before waiver and payments by affiliates | | | 2.39% | | | | 2.08% | | | | 2.15% | | | | 1.98% | | | | 1.99% | |
| | | | | |
Expenses net of waiver and payments by affiliates | | | 2.28% | | | | 1.98% | | | | 2.15%d | | | | 1.98%d | | | | 1.99%d | |
| | | | | |
Net investment income | | | 1.37% | | | | 2.07% | | | | 2.24% | | | | 2.09% | | | | 2.28% | |
| | | | | |
Supplemental data | | | | | | | | | | | | | | | | | | | | |
| | | | | |
Net assets, end of year (000’s) | | | $47,288 | | | | $50,737 | | | | $58,720 | | | | $148,693 | | | | $248,218 | |
| | | | | |
Portfolio turnover rate | | | 30.94% | | | | 29.11% | | | | 19.12% | | | | 19.14% | | | | 12.65% | |
aThe amount shown for a share outstanding throughout the period may not correlate with the Statement of Operations for the period due to the timing of sales and repurchases of the Fund’s shares in relation to income earned and/or fluctuating fair value of the investments of the Fund.
bBased on average daily shares outstanding.
cTotal return does not reflect sales commissions or contingent deferred sales charges, if applicable.
dBenefit of waiver and payments by affiliates rounds to less than 0.01%.
| | | | | | |
franklintempleton.com | | | | The accompanying notes are an integral part of these financial statements. | Annual Report | | 11 |
TEMPLETON GLOBAL INVESTMENT TRUST
FINANCIAL HIGHLIGHTS
Templeton Frontier Markets Fund (continued)
| | | | | | | | | | | | | | | | | | | | |
| | | Year Ended March 31, | |
| | | | |
| | | 2018 | | | 2017 | | | 2016 | | | 2015 | | | 2014 | |
| |
| | | | | |
Class C | | | | | | | | | | | | | | | | | | | | |
| | | | | |
Per share operating performance | | | | | | | | | | | | | | | | | | | | |
(for a share outstanding throughout the year) | | | | | | | | | | | | | | | | | | | | |
| | | | | |
Net asset value, beginning of year | | | $11.63 | | | | $10.05 | | | | $13.27 | | | | $17.82 | | | | $16.71 | |
| | | | |
| | | | | |
Income from investment operationsa: | | | | | | | | | | | | | | | | | | | | |
| | | | | |
| Net investment incomeb | | | 0.08 | | | | 0.15 | | | | 0.18 | | | | 0.23 | | | | 0.26 | |
| | | | | |
Net realized and unrealized gains (losses) | | | 1.48 | | | | 1.43 | | | | (2.72 | ) | | | (3.81 | ) | | | 1.21 | |
| | | | |
| | | | | |
Total from investment operations | | | 1.56 | | | | 1.58 | | | | (2.54 | ) | | | (3.58 | ) | | | 1.47 | |
| | | | |
| | | | | |
| Less distributions from: | | | | | | | | | | | | | | | | | | | | |
| | | | | |
| Net investment income | | | (0.05 | ) | | | — | | | | (0.68 | ) | | | (0.41 | ) | | | (0.21) | |
| | | | | |
Net realized gains | | | — | | | | — | | | | — | | | | (0.56 | ) | | | (0.15) | |
| | | | |
| | | | | |
Total distributions | | | (0.05 | ) | | | — | | | | (0.68 | ) | | | (0.97 | ) | | | (0.36) | |
| | | | |
| | | | | |
Net asset value, end of year | | | $13.14 | | | | $11.63 | | | | $10.05 | | | | $13.27 | | | | $17.82 | |
| | | | |
| | | | | |
Total returnc | | | 13.20% | | | | 15.82% | | | | (19.32)% | | | | (20.53)% | | | | 8.78% | |
| | | | | |
Ratios to average net assets | | | | | | | | | | | | | | | | | | | | |
| | | | | |
Expenses before waiver and payments by affiliates | | | 3.14% | | | | 2.83% | | | | 2.88% | | | | 2.74% | | | | 2.74% | |
| | | | | |
Expenses net of waiver and payments by affiliates | | | 3.03% | | | | 2.73% | | | | 2.88%d | | | | 2.74%d | | | | 2.74%d | |
| | | | | |
Net investment income | | | 0.62% | | | | 1.32% | | | | 1.51% | | | | 1.33% | | | | 1.53% | |
| | | | | |
Supplemental data | | | | | | | | | | | | | | | | | | | | |
| | | | | |
Net assets, end of year (000’s) | | | $18,133 | | | | $20,188 | | | | $22,466 | | | | $37,770 | | | | $60,182 | |
| | | | | |
Portfolio turnover rate | | | 30.94% | | | | 29.11% | | | | 19.12% | | | | 19.14% | | | | 12.65% | |
aThe amount shown for a share outstanding throughout the period may not correlate with the Statement of Operations for the period due to the timing of sales and repurchases of the Fund’s shares in relation to income earned and/or fluctuating fair value of the investments of the Fund.
bBased on average daily shares outstanding.
cTotal return does not reflect sales commissions or contingent deferred sales charges, if applicable.
dBenefit of waiver and payments by affiliates rounds to less than 0.01%.
| | | | | | |
12 | | Annual Report | | | The accompanying notes are an integral part of these financial statements. | | franklintempleton.com |
TEMPLETON GLOBAL INVESTMENT TRUST
FINANCIAL HIGHLIGHTS
Templeton Frontier Markets Fund (continued)
| | | | | | | | | | | | | | | | | | | | |
| | | Year Ended March 31, | |
| | | | |
| | | 2018 | | | 2017 | | | 2016 | | | 2015 | | | 2014 | |
| |
| | | | | |
Class R | | | | | | | | | | | | | | | | | | | | |
| | | | | |
Per share operating performance | | | | | | | | | | | | | | | | | | | | |
(for a share outstanding throughout the year) | | | | | | | | | | | | | | | | | | | | |
| | | | | |
Net asset value, beginning of year | | | $11.73 | | | | $10.13 | | | | $13.40 | | | | $18.03 | | | | $16.88 | |
| | | | |
| | | | | |
Income from investment operationsa: | | | | | | | | | | | | | | | | | | | | |
| | | | | |
| Net investment incomeb | | | 0.15 | | | | 0.19 | | | | 0.27 | | | | 0.28 | | | | 0.35 | |
| | | | | |
Net realized and unrealized gains (losses) | | | 1.49 | | | | 1.46 | | | | (2.78 | ) | | | (3.84 | ) | | | 1.23 | |
| | | | |
| | | | | |
Total from investment operations | | | 1.64 | | | | 1.65 | | | | (2.51 | ) | | | (3.56 | ) | | | 1.58 | |
| | | | |
| | | | | |
| Less distributions from: | | | | | | | | | | | | | | | | | | | | |
| | | | | |
| Net investment income | | | (0.06 | ) | | | (0.05 | ) | | | (0.76 | ) | | | (0.51 | ) | | | (0.28) | |
| | | | | |
Net realized gains | | | — | | | | — | | | | — | | | | (0.56 | ) | | | (0.15) | |
| | | | |
| | | | | |
Total distributions | | | (0.06 | ) | | | (0.05 | ) | | | (0.76 | ) | | | (1.07 | ) | | | (0.43) | |
| | | | |
| | | | | |
Net asset value, end of year | | | $13.31 | | | | $11.73 | | | | $10.13 | | | | $13.40 | | | | $18.03 | |
| | | | |
| | | | | |
Total return | | | 13.69% | | | | 16.41% | | | | (18.89)% | | | | (20.17)% | | | | 9.30% | |
| | | | | |
Ratios to average net assets | | | | | | | | | | | | | | | | | | | | |
| | | | | |
Expenses before waiver and payments by affiliates | | | 2.64% | | | | 2.34% | | | | 2.40% | | | | 2.24% | | | | 2.24% | |
| | | | | |
Expenses net of waiver and payments by affiliates | | | 2.53% | | | | 2.24% | | | | 2.40%c | | | | 2.24%c | | | | 2.24%c | |
| | | | | |
Net investment income | | | 1.12% | | | | 1.81% | | | | 2.00% | | | | 1.83% | | | | 2.03% | |
| | | | | |
Supplemental data | | | | | | | | | | | | | | | | | | | | |
| | | | | |
Net assets, end of year (000’s) | | | $74 | | | | $129 | | | | $118 | | | | $302 | | | | $388 | |
| | | | | |
Portfolio turnover rate | | | 30.94% | | | | 29.11% | | | | 19.12% | | | | 19.14% | | | | 12.65% | |
aThe amount shown for a share outstanding throughout the period may not correlate with the Statement of Operations for the period due to the timing of sales and repurchases of the Fund’s shares in relation to income earned and/or fluctuating fair value of the investments of the Fund.
bBased on average daily shares outstanding.
cBenefit of waiver and payments by affiliates rounds to less than 0.01%.
| | | | | | |
franklintempleton.com | | | | The accompanying notes are an integral part of these financial statements. | Annual Report | | 13 |
TEMPLETON GLOBAL INVESTMENT TRUST
FINANCIAL HIGHLIGHTS
Templeton Frontier Markets Fund (continued)
| | | | | | | | | | | | | | | | | | | | |
| | | Year Ended March 31, | |
| | | | |
| | | 2018 | | | 2017 | | | 2016 | | | 2015 | | | 2014a | |
| |
| | | | | |
Class R6 | | | | | | | | | | | | | | | | | | | | |
| | | | | |
Per share operating performance | | | | | | | | | | | | | | | | | | | | |
(for a share outstanding throughout the year) | | | | | | | | | | | | | | | | | | | | |
| | | | | |
Net asset value, beginning of year | | | $11.81 | | | | $10.21 | | | | $13.51 | | | | $18.18 | | | | $17.11 | |
| | | | |
| | | | | |
Income from investment operationsb: | | | | | | | | | | | | | | | | | | | | |
| Net investment incomec | | | 0.25 | | | | 0.23 | | | | 0.30 | | | | 0.40 | | | | 0.36 | |
| | | | | |
Net realized and unrealized gains (losses) | | | 1.51 | | | | 1.50 | | | | (2.75 | ) | | | (3.88 | ) | | | 1.24 | |
| | | | |
| | | | | |
Total from investment operations | | | 1.76 | | | | 1.73 | | | | (2.45 | ) | | | (3.48 | ) | | | 1.60 | |
| | | | |
| | | | | |
| Less distributions from: | | | | | | | | | | | | | | | | | | | | |
| | | | | |
| Net investment income | | | (0.08) | | | | (0.13) | | | | (0.85) | | | | (0.63) | | | | (0.38) | |
| | | | | |
Net realized gains | | | — | | | | — | | | | — | | | | (0.56) | | | | (0.15) | |
| | | | |
| | | | | |
Total distributions | | | (0.08) | | | | (0.13) | | | | (0.85) | | | | (1.19) | | | | (0.53) | |
| | | | |
Net asset value, end of year | | | $13.49 | | | | $11.81 | | | | $10.21 | | | | $13.51 | | | | $18.18 | |
| | | | |
| | | | | |
Total returnd | | | 14.64% | | | | 17.13% | | | | (18.29)% | | | | (19.63)% | | | | 9.41% | |
| | | | | |
Ratios to average net assetse | | | | | | | | | | | | | | | | | | | | |
| | | | | |
Expenses before waiver and payments by affiliates | | | 1.88% | | | | 1.71% | | | | 1.65% | | | | 1.60% | | | | 1.61% | |
| | | | | |
Expenses net of waiver and payments by affiliates | | | 1.75% | | | | 1.61% | | | | 1.65%f | | | | 1.60%f | | | | 1.61%f | |
| | | | | |
Net investment income | | | 1.90% | | | | 2.44% | | | | 2.74% | | | | 2.47% | | | | 2.66% | |
| | | | | |
Supplemental data | | | | | | | | | | | | | | | | | | | | |
| | | | | |
Net assets, end of year (000’s) | | | $5,898 | | | | $4,898 | | | | $62,640 | | | | $139,104 | | | | $161,459 | |
| | | | | |
Portfolio turnover rate | | | 30.94% | | | | 29.11% | | | | 19.12% | | | | 19.14% | | | | 12.65% | |
aFor the period May 1, 2013 (effective date) to March 31, 2014.
bThe amount shown for a share outstanding throughout the period may not correlate with the Statement of Operations for the period due to the timing of sales and repurchases of the Fund’s shares in relation to income earned and/or fluctuating fair value of the investments of the Fund.
cBased on average daily shares outstanding.
dTotal return is not annualized for periods less than one year.
eRatios are annualized for periods less than one year.
fBenefit of waiver and payments by affiliates rounds to less than 0.01%.
| | | | | | |
14 | | Annual Report | | | The accompanying notes are an integral part of these financial statements. | | franklintempleton.com |
TEMPLETON GLOBAL INVESTMENT TRUST
FINANCIAL HIGHLIGHTS
Templeton Frontier Markets Fund (continued)
| | | | | | | | | | | | | | | | | | | | |
| | | Year Ended March 31, | |
| | | | |
| | | 2018 | | | 2017 | | | 2016 | | | 2015 | | | 2014 | |
| |
| | | | | |
Advisor Class | | | | | | | | | | | | | | | | | | | | |
| | | | | |
Per share operating performance | | | | | | | | | | | | | | | | | | | | |
(for a share outstanding throughout the year) | | | | | | | | | | | | | | | | | | | | |
| | | | | |
Net asset value, beginning of year | | | $11.86 | | | | $10.22 | | | | $13.51 | | | | $18.18 | | | | $17.01 | |
| | | | |
| | | | | |
Income from investment operationsa: | | | | | | | | | | | | | | | | | | | | |
| | | | | |
| Net investment incomeb | | | 0.20 | | | | 0.27 | | | | 0.34 | | | | 0.41 | | | | 0.45 | |
| | | | | |
Net realized and unrealized gains (losses) | | | 1.52 | | | | 1.45 | | | | (2.82 | ) | | | (3.92 | ) | | | 1.23 | |
| | | | |
| | | | | |
Total from investment operations | | | 1.72 | | | | 1.72 | | | | (2.48 | ) | | | (3.51 | ) | | | 1.68 | |
| | | | |
| | | | | |
| Less distributions from: | | | | | | | | | | | | | | | | | | | | |
| | | | | |
| Net investment income | | | (0.08 | ) | | | (0.08 | ) | | | (0.81 | ) | | | (0.60 | ) | | | (0.36) | |
| | | | | |
Net realized gains | | | — | | | | — | | | | — | | | | (0.56 | ) | | | (0.15) | |
| | | | |
| | | | | |
Total distributions | | | (0.08 | ) | | | (0.08 | ) | | | (0.81 | ) | | | (1.16 | ) | | | (0.51) | |
| | | | |
| | | | | |
Net asset value, end of year | | | $13.50 | | | | $11.86 | | | | $10.22 | | | | $13.51 | | | | $18.18 | |
| | | | |
| | | | | |
Total return | | | 14.37% | | | | 16.85% | | | | (18.53)% | | | | (19.78)% | | | | 9.90% | |
| | | | | |
Ratios to average net assets | | | | | | | | | | | | | | | | | | | | |
| | | | | |
Expenses before waiver and payments by affiliates | | | 2.14% | | | | 1.84% | | | | 1.90% | | | | 1.74% | | | | 1.74% | |
| | | | | |
Expenses net of waiver and payments by affiliates | | | 2.03% | | | | 1.74% | | | | 1.90%c | | | | 1.74%c | | | | 1.74%c | |
| | | | | |
Net investment income | | | 1.62% | | | | 2.31% | | | | 2.49% | | | | 2.33% | | | | 2.53% | |
| | | | | |
Supplemental data | | | | | | | | | | | | | | | | | | | | |
| | | | | |
Net assets, end of year (000’s) | | | $30,352 | | | | $54,164 | | | | $79,380 | | | | $523,037 | | | | $1,037,057 | |
| | | | | |
Portfolio turnover rate | | | 30.94% | | | | 29.11% | | | | 19.12% | | | | 19.14% | | | | 12.65% | |
aThe amount shown for a share outstanding throughout the period may not correlate with the Statement of Operations for the period due to the timing of sales and repurchases of the Fund’s shares in relation to income earned and/or fluctuating fair value of the investments of the Fund.
bBased on average daily shares outstanding.
cBenefit of waiver and payments by affiliates rounds to less than 0.01%.
| | | | | | |
franklintempleton.com | | | | The accompanying notes are an integral part of these financial statements. | Annual Report | | 15 |
TEMPLETON GLOBAL INVESTMENT TRUST
Statement of Investments, March 31, 2018
Templeton Frontier Markets Fund
| | | | | | | | | | | | |
| | | | | Industry | | Shares/
Rights | | | Value | |
| | Common Stocks and Other Equity Interests 88.0% | | | | | |
| | Argentina 10.8% | | | | | | | | | | |
| | Banco Macro SA, ADR | | Banks | | | 14,387 | | | $ | 1,553,364 | |
| | BBVA Banco Frances SA, ADR | | Banks | | | 56,401 | | | | 1,286,507 | |
| | Grupo Financiero Galicia SA, ADR | | Banks | | | 35,631 | | | | 2,343,095 | |
| | Telecom Argentina SA, B, ADR | | Diversified Telecommunication Services | | | 82,495 | | | | 2,584,568 | |
| | YPF Sociedad Anonima, D, ADR | | Oil, Gas & Consumable Fuels | | | 148,809 | | | | 3,217,251 | |
| | | | | | | | | | | | |
| | | | |
| | | | | | | | | | | 10,984,785 | |
| | | | | | | | | | | | |
| | Bangladesh 3.5% | | | | | | | | | | |
| | Beximco Pharmaceuticals Ltd. | | Pharmaceuticals | | | 497,798 | | | | 614,491 | |
| | Brac Bank Ltd. | | Banks | | | 2,060,659 | | | | 2,402,262 | |
| | Islami Bank Bangladesh Ltd. | | Banks | | | 1,740,800 | | | | 572,335 | |
| | | | | | | | | | | | |
| | | | |
| | | | | | | | | | | 3,589,088 | |
| | | | | | | | | | | | |
| | Colombia 1.3% | | | | | | | | | | |
| | Grupo Nutresa SA | | Food Products | | | 144,085 | | | | 1,344,313 | |
| | | | | | | | | | | | |
| | Egypt 6.8% | | | | | | | | | | |
| | Commercial International Bank Egypt SAE | | Banks | | | 353,800 | | | | 1,787,463 | |
| | Egyptian International Pharmaceuticals EIPICO | | Pharmaceuticals | | | 247,939 | | | | 2,039,203 | |
| a | | Global Telecom Holding SAE | | Wireless Telecommunication Services | | | 8,456,826 | | | | 3,117,945 | |
| | | | | | | | | | | | |
| | | | |
| | | | | | | | | | | 6,944,611 | |
| | | | | | | | | | | | |
| | Kenya 5.4% | | | | | | | | | | |
| | East African Breweries Ltd. | | Beverages | | | 882,887 | | | | 2,325,227 | |
| | KCB Group Ltd. | | Banks | | | 5,996,069 | | | | 3,146,452 | |
| | | | | | | | | | | | |
| | | | |
| | | | | | | | | | | 5,471,679 | |
| | | | | | | | | | | | |
| | Kuwait 10.3% | | | | | | | | | | |
| | Agility Public Warehousing Co. KSC | | Air Freight & Logistics | | | 284,821 | | | | 822,316 | |
| | Human Soft Holding Co. KSC | | Diversified Consumer Services | | | 149,836 | | | | 1,950,936 | |
| | Mezzan Holding Co. | | Food Products | | | 268,601 | | | | 698,387 | |
| | Mobile Telecommunications Co. KSC | | Wireless Telecommunication Services | | | 1,503,572 | | | | 2,408,887 | |
| | National Bank of Kuwait SAKP | | Banks | | | 1,688,386 | | | | 4,226,530 | |
| b | | National Gulf Holding | | Diversified Financial Services | | | 1,051,819 | | | | 372,835 | |
| | | | | | | | | | | | |
| | | | |
| | | | | | | | | | | 10,479,891 | |
| | | | | | | | | | | | |
| | Nigeria 2.2% | | | | | | | | | | |
| | Guaranty Trust Bank PLC | | Banks | | | 3,446,151 | | | | 429,333 | |
| | Nigerian Breweries PLC | | Beverages | | | 2,764,965 | | | | 998,459 | |
| | UAC of Nigeria PLC | | Food Products | | | 15,680,314 | | | | 794,905 | |
| | | | | | | | | | | | |
| | | | |
| | | | | | | | | | | 2,222,697 | |
| | | | | | | | | | | | |
| | Oman 1.2% | | | | | | | | | | |
| | Bank Muscat SAOG | | Banks | | | 1,297,175 | | | | 1,239,913 | |
| | | | | | | | | | | | |
| | Pakistan 2.5% | | | | | | | | | | |
| | Habib Bank Ltd. | | Banks | | | 286,800 | | | | 525,466 | |
| | Indus Motor Co. Ltd. | | Automobiles | | | 50,614 | | | | 768,986 | |
| | United Bank Ltd. | | Banks | | | 657,900 | | | | 1,185,483 | |
| | | | | | | | | | | | |
| | | | |
| | | | | | | | | | | 2,479,935 | |
| | | | | | | | | | | | |
| | Peru 4.5% | | | | | | | | | | |
| | Alicorp SA | | Food Products | | | 257,788 | | | | 898,759 | |
| | Compania de Minas Buenaventura SA, ADR | | Metals & Mining | | | 51,690 | | | | 787,239 | |
| c | | InRetail Peru Corp., Reg S | | Food & Staples Retailing | | | 71,862 | | | | 1,597,031 | |
| | | | | | |
16 | | Annual Report | | | | franklintempleton.com |
TEMPLETON GLOBAL INVESTMENT TRUST
STATEMENT OF INVESTMENTS
Templeton Frontier Markets Fund (continued)
| | | | | | | | | | | | |
| | | | | Industry | | Shares/
Rights | | | Value | |
| | Common Stocks and Other Equity Interests (continued) | | | | | |
| | Peru (continued) | | | | | | | | | | |
| c | | Intercorp Financial Services Inc., Reg S | | Banks | | | 31,260 | | | $ | 1,266,844 | |
| | | | | | | | | | | | |
| | | | |
| | | | | | | | | | | 4,549,873 | |
| | | | | | | | | | | | |
| | Philippines 6.6% | | | | | | | | | | |
| | BDO Unibank Inc. | | Banks | | | 734,700 | | | | 1,970,279 | |
| | DMCI Holdings Inc. | | Industrial Conglomerates | | | 2,799,700 | | | | 655,419 | |
| | GT Capital Holdings Inc. | | Diversified Financial Services | | | 22,790 | | | | 512,327 | |
| | Metropolitan Bank & Trust Co. | | Banks | | | 1,195,260 | | | | 1,968,409 | |
| a | | Metropolitan Bank & Trust Co., rts., 4/04/18 | | Banks | | | 300,618 | | | | 62,926 | |
| | Puregold Price Club Inc. | | Food & Staples Retailing | | | 29,800 | | | | 29,941 | |
| | Robinsons Retail Holdings Inc. | | Food & Staples Retailing | | | 904,450 | | | | 1,542,907 | |
| | | | | | | | | | | | |
| | | | |
| | | | | | | | | | | 6,742,208 | |
| | | | | | | | | | | | |
| | Romania 2.2% | | | | | | | | | | |
| | Banca Transilvania | | Banks | | | 1,484,782 | | | | 1,029,693 | |
| | OMV Petrom SA | | Oil, Gas & Consumable Fuels | | | 14,474,297 | | | | 1,218,340 | |
| | | | | | | | | | | | |
| | | | |
| | | | | | | | | | | 2,248,033 | |
| | | | | | | | | | | | |
| | Senegal 3.3% | | | | | | | | | | |
| | Sonatel | | Diversified Telecommunication Services | | | 78,675 | | | | 3,363,276 | |
| | | | | | | | | | | | |
| | Sri Lanka 4.4% | | | | | | | | | | |
| | Commercial Bank of Ceylon PLC | | Banks | | | 930,294 | | | | 817,966 | |
| | Hatton National Bank PLC | | Banks | | | 1,327,730 | | | | 2,089,235 | |
| | Hatton National Bank PLC, non-voting | | Banks | | | 639,704 | | | | 764,604 | |
| | Hemas Holdings PLC | | Industrial Conglomerates | | | 1,021,284 | | | | 819,913 | |
| | | | | | | | | | | | |
| | | | |
| | | | | | | | | | | 4,491,718 | |
| | | | | | | | | | | | |
| | Togo 0.2% | | | | | | | | | | |
| | Ecobank Transnational Inc. | | Banks | | | 4,241,840 | | | | 199,131 | |
| | | | | | | | | | | | |
| | Ukraine 1.7% | | | | | | | | | | |
| a,c | | MHP SE, GDR, Reg S | | Food Products | | | 127,097 | | | | 1,734,874 | |
| | | | | | | | | | | | |
| | United Arab Emirates 2.2% | | | | | | | | | | |
| | Aramex PJSC | | Air Freight & Logistics | | | 1,841,948 | | | | 2,206,586 | |
| | | | | | | | | | | | |
| | Vietnam 13.3% | | | | | | | | | | |
| | Binh Minh Plastics JSC | | Building Products | | | 955,767 | | | | 2,884,828 | |
| | DHG Pharmaceutical JSC | | Pharmaceuticals | | | 1,085,128 | | | | 5,284,251 | |
| | FPT Corp | | Electronic Equipment, Instruments & Components | | | 78,220 | | | | 208,299 | |
| a | | Hoa Phat Group JSC | | Metals & Mining | | | 529,541 | | | | 1,403,188 | |
| | Imexpharm Pharmaceutical JSC | | Pharmaceuticals | | | 199,538 | | | | 551,500 | |
| | Vietnam Container Shipping JSC | | Marine | | | 421,443 | | | | 746,964 | |
| | Vietnam Dairy Products JSC | | Food Products | | | 275,227 | | | | 2,451,131 | |
| | | | | | | | | | | | |
| | | | |
| | | | | | | | | | | 13,530,161 | |
| | | | | | | | | | | | |
| | Zimbabwe 5.6% | | | | | | | | | | |
| b | | Delta Corp. Ltd. | | Beverages | | | 5,908,770 | | | | 5,685,578 | |
| | | | | | | | | | | | |
| | | | |
| | Total Common Stocks and Other Equity Interests (Cost $67,215,871) | | | | | | | | | 89,508,350 | |
| | | | | | | | | | | | |
| | | | | | |
franklintempleton.com | | | | Annual Report | | 17 |
TEMPLETON GLOBAL INVESTMENT TRUST
STATEMENT OF INVESTMENTS
Templeton Frontier Markets Fund (continued)
| | | | | | | | | | | | |
| | | | | Industry | | Shares | | | Value | |
d | | Participatory Notes 7.5% | | | | | |
| | Saudi Arabia 7.5% | | | | | | | | | | |
| | HSBC Bank PLC, | | | | | | | | | | |
| | a Mouwasat Medical Services Co., 2/24/21 | | Health Care Providers & Services | | | 38,818 | | | $ | 1,823,928 | |
| | a National Commercial Bank, 11/09/20 | | Banks | | | 29,961 | | | | 520,123 | |
| | e Samba Financial Group, 144A, 5/06/20 | | Banks | | | 277,867 | | | | 1,985,823 | |
a,e | | Morgan Stanley BV, | | | | | | | | | | |
| | Saudi Dairy & Foodstuff Co., 144A, 1/28/19 | | Food Products | | | 80,633 | | | | 2,532,951 | |
| | Savola Al-Azizia United Co., 144A, 7/23/18 | | Food Products | | | 70,909 | | | | 835,781 | |
| | | | | | | | | | | | |
| | Total Participatory Notes
(Cost $7,483,956) | | | | 7,698,606 | |
| | | | | | | | | | | | |
| | Preferred Stocks (Cost $1,346,306) 1.3% | | | | | |
| | Colombia 1.3% | | | | | | | | | | |
f | | Bancolombia SA, 3.125%, ADR, pfd | | Banks | | | 31,200 | | | | 1,311,024 | |
| | | | | | | | | | | | |
| | Total Investments before Short Term Investments
(Cost $76,046,133) | | | | 98,517,980 | |
| | | | | | | | | | | | |
| | |
| | Short Term Investments (Cost $3,189,047) 3.2% | | | | | |
| | Money Market Funds 3.2% | | | | | | | | | | |
| | United States 3.2% | | | | | | | | | | |
g,h | | Institutional Fiduciary Trust Money Market Portfolio, 1.24% | | | | | 3,189,047 | | | | 3,189,047 | |
| | | | | | | | | | | | |
| | Total Investments (Cost $79,235,180) 100.0% | | | | 101,707,027 | |
| | Other Assets, less Liabilities 0.0%† | | | | 37,547 | |
| | | | | | | | | | | | |
| | Net Assets 100.0% | | | $ | 101,744,574 | |
| | | | | | | | | | | | |
See Abbreviations on page 31.
†Rounds to less than 0.1% of net assets.
aNon-income producing.
bFair valued using significant unobservable inputs. See Note 9 regarding fair value measurements.
cSecurity was purchased pursuant to Regulation S under the Securities Act of 1933, which exempts from registration securities offered and sold outside of the United States. Such a security cannot be sold in the United States without either an effective registration statement filed pursuant to the Securities Act of 1933, or pursuant to an exemption from registration. These securities have been deemed liquid under guidelines approved by the Trust’s Board of Trustees. At March 31, 2018, the aggregate value of these securities was $4,598,749, representing 4.5% of net assets.
dSee Note 1(d) regarding Participatory Notes.
eSecurity was purchased pursuant to Rule 144A under the Securities Act of 1933 and may be sold in transactions exempt from registration only to qualified institutional buyers or in a public offering registered under the Securities Act of 1933. These securities have been deemed liquid under guidelines approved by the Trust’s Board of Trustees. At March 31, 2018, the aggregate value of these securities was $5,354,555, representing 5.3% of net assets.
fVariable rate security. The rate shown represents the yield at period end.
gSee Note 3(f) regarding investments in affiliated management investment companies.
hThe rate shown is the annualized seven-day effective yield at period end.
| | | | | | |
18 | | Annual Report | | | The accompanying notes are an integral part of these financial statements. | | franklintempleton.com |
TEMPLETON GLOBAL INVESTMENT TRUST
Financial Statements
Statement of Assets and Liabilities
March 31, 2018
Templeton Frontier Markets Fund
| | | | |
| |
Assets: | | | | |
Investments in securities: | | | | |
Cost - Unaffiliated issuers | | $ | 76,046,133 | |
Cost - Non-controlled affiliates (Note 3f) | | | 3,189,047 | |
| | | | |
| |
Value - Unaffiliated issuers | | $ | 98,517,980 | |
Value - Non-controlled affiliates (Note 3f) | | | 3,189,047 | |
Cash | | | 9,863 | |
Restricted currency, at value (cost $1,594,015) (Note 1c) | | | 966,176 | |
Foreign currency, at value (cost $1,222,428) | | | 1,217,790 | |
Receivables: | | | | |
Investment securities sold | | | 497,612 | |
Capital shares sold | | | 239,545 | |
Dividends | | | 1,585,171 | |
Other assets | | | 98 | |
| | | | |
| |
Total assets | | | 106,223,282 | |
| | | | |
Liabilities: | | | | |
Payables: | | | | |
Investment securities purchased | | | 232,552 | |
Capital shares redeemed | | | 2,159,926 | |
Management fees | | | 118,245 | |
Distribution fees | | | 50,239 | |
Transfer agent fees | | | 123,525 | |
Deferred tax | | | 1,629,502 | |
Accrued expenses and other liabilities | | | 164,719 | |
| | | | |
| |
Total liabilities | | | 4,478,708 | |
| | | | |
| |
Net assets, at value | | $ | 101,744,574 | |
| | | | |
Net assets consist of: | | | | |
Paid-in capital | | $ | 359,931,756 | |
Distributions in excess of net investment income | | | (411,002 | ) |
Net unrealized appreciation (depreciation) | | | 20,143,491 | |
Accumulated net realized gain (loss) | | | (277,919,671 | ) |
| | | | |
| |
Net assets, at value | | $ | 101,744,574 | |
| | | | |
| | | | | | |
franklintempleton.com | | | | The accompanying notes are an integral part of these financial statements. | Annual Report | | 19 |
TEMPLETON GLOBAL INVESTMENT TRUST
FINANCIAL STATEMENTS
Statement of Assets and Liabilities (continued)
March 31, 2018
Templeton Frontier Markets Fund
| | | | |
| |
Class A: | | | | |
Net assets, at value | | | $47,287,686 | |
Shares outstanding | | | 3,525,009 | |
Net asset value per sharea | | | $13.41 | |
Maximum offering price per share (net asset value per share ÷ 94.25%) | | | $14.23 | |
| |
Class C: | | | | |
Net assets, at value | | | $18,133,360 | |
Shares outstanding | | | 1,379,779 | |
Net asset value and maximum offering price per sharea | | | $13.14 | |
| |
Class R: | | | | |
Net assets, at value | | | $ 74,066 | |
Shares outstanding | | | 5,565 | |
Net asset value and maximum offering price per share | | | $13.31 | |
| |
Class R6: | | | | |
Net assets, at value | | | $ 5,897,823 | |
Shares outstanding | | | 437,332 | |
Net asset value and maximum offering price per share | | | $13.49 | |
| |
Advisor Class: | | | | |
Net assets, at value | | | $30,351,639 | |
Shares outstanding | | | 2,248,962 | |
Net asset value and maximum offering price per share | | | $13.50 | |
aRedemption price is equal to net asset value less contingent deferred sales charges, if applicable.
| | | | | | |
20 | | Annual Report | | | The accompanying notes are an integral part of these financial statements. | | franklintempleton.com |
TEMPLETON GLOBAL INVESTMENT TRUST
FINANCIAL STATEMENTS
Statement of Operations
for the year ended March 31, 2018
Templeton Frontier Markets Fund
| | | | |
Investment income: | | | | |
Dividends: (net of foreign taxes)* | | | | |
Unaffiliated issuers | | $ | 4,299,122 | |
Non-controlled affiliates (Note 3f) | | | 24,152 | |
Interest: | | | | |
Unaffiliated issuers | | | 2,950 | |
| | | | |
| |
Total investment income | | | 4,326,224 | |
| | | | |
| |
Expenses: | | | | |
Management fees (Note 3a) | | | 1,722,247 | |
Distribution fees: (Note 3c) | | | | |
Class A | | | 127,311 | |
Class C | | | 197,415 | |
Class R | | | 458 | |
Transfer agent fees: (Note 3e) | | | | |
Class A | | | 150,008 | |
Class C | | | 58,127 | |
Class R | | | 271 | |
Class R6 | | | 1,677 | |
Advisor Class | | | 124,538 | |
Custodian fees (Note 4) | | | 164,327 | |
Reports to shareholders | | | 35,290 | |
Registration and filing fees | | | 82,701 | |
Professional fees | | | 169,387 | |
Trustees’ fees and expenses | | | 6,801 | |
Other | | | 14,294 | |
| | | | |
Total expenses | | | 2,854,852 | |
Expenses waived/paid by affiliates (Note 3f and 3g) | | | (132,677 | ) |
| | | | |
Net expenses | | | 2,722,175 | |
| | | | |
Net investment income | | | 1,604,049 | |
| | | | |
| |
Realized and unrealized gains (losses): | | | | |
Net realized gain (loss) from: | | | | |
Investments:# | | | | |
Unaffiliated issuers. | | | 14,050,159 | |
Foreign currency transactions | | | (1,482,326 | ) |
| | | | |
| |
Net realized gain (loss) | | | 12,567,833 | |
| | | | |
Net change in unrealized appreciation (depreciation) on: | | | | |
Investments: | | | | |
Unaffiliated issuers. | | | 1,177,502 | |
Translation of other assets and liabilities | | | | |
denominated in foreign currencies | | | (478,001 | ) |
Change in deferred taxes on unrealized appreciation | | | 743,178 | |
| | | | |
| |
Net change in unrealized appreciation (depreciation) | | | 1,442,679 | |
| | | | |
| |
Net realized and unrealized gain (loss) | | | 14,010,512 | |
| | | | |
| |
Net increase (decrease) in net assets resulting from operations | | $ | 15,614,561 | |
| | | | |
| |
*Foreign taxes withheld on dividends | | $ | 451,882 | |
#Net of foreign taxes | | $ | 520,877 | |
| | | | | | |
franklintempleton.com | | | | The accompanying notes are an integral part of these financial statements. | Annual Report | | 21 |
TEMPLETON GLOBAL INVESTMENT TRUST
FINANCIAL STATEMENTS
Statements of Changes in Net Assets
Templeton Frontier Markets Fund
| | | | | | | | |
| | | Year Ended March 31, | |
| | | 2018 | | | 2017 | |
| |
Increase (decrease) in net assets: | | | | | | | | |
Operations: | | | | | | | | |
Net investment income | | $ | 1,604,049 | | | $ | 4,173,992 | |
Net realized gain (loss) | | | 12,567,833 | | | | (16,651,320 | ) |
Net change in unrealized appreciation (depreciation) | | | 1,442,679 | | | | 40,466,765 | |
| | | | |
| | |
Net increase (decrease) in net assets resulting from operations | | | 15,614,561 | | | | 27,989,437 | |
| | | | |
Distributions to shareholders from: | | | | | | | | |
Net investment income: | | | | | | | | |
Class A | | | (264,370) | | | | (335,961 | ) |
Class C | | | (66,485) | | | | — | |
Class R | | | (383) | | | | (561 | ) |
Class R6 | | | (35,567) | | | | (623,678 | ) |
Advisor Class | | | (208,322) | | | | (411,436 | ) |
| | | | |
| | |
Total distributions to shareholders | | | (575,127) | | | | (1,371,636 | ) |
| | | | |
| | |
Capital share transactions: (Note 2) | | | | | | | | |
Class A | | | (9,824,787) | | | | (15,967,017 | ) |
Class C | | | (4,489,086) | | | | (5,376,370 | ) |
Class R | | | (67,924) | | | | (8,467 | ) |
Class R6 | | | 278,490 | | | | (63,834,092 | ) |
Advisor Class | | | (29,307,296) | | | | (34,640,098 | ) |
| | | | |
| | |
Total capital share transactions | | | (43,410,603) | | | | (119,826,044 | ) |
| | | | |
Net increase (decrease) in net assets | | | (28,371,169) | | | | (93,208,243 | ) |
Net assets: | | | | | | | | |
Beginning of year | | | 130,115,743 | | | | 223,323,986 | |
| | | | |
| | |
End of year | | $ | 101,744,574 | | | $ | 130,115,743 | |
| | | | |
Distributions in excess of net investment income included in net assets: | | | | | | | | |
End of year | | $ | (411,002) | | | $ | (476,115 | ) |
| | | | |
| | | | | | |
22 | | Annual Report | | | The accompanying notes are an integral part of these financial statements. | | franklintempleton.com |
TEMPLETON GLOBAL INVESTMENT TRUST
Notes to Financial Statements
Templeton Frontier Markets Fund
1. Organization and Significant Accounting Policies
Templeton Global Investment Trust (Trust) is registered under the Investment Company Act of 1940 (1940 Act) as an open-end management investment company, consisting of six separate funds and applies the specialized accounting and reporting guidance in U.S. Generally Accepted Accounting Principles (U.S. GAAP). Templeton Frontier Markets Fund (Fund) is included in this report. The Fund offers five classes of shares: Class A, Class C, Class R, Class R6, and Advisor Class. Each class of shares may differ by its initial sales load, contingent deferred sales charges, voting rights on matters affecting a single class, its exchange privilege and fees due to differing arrangements for distribution and transfer agent fees. The Fund was closed to new investors with limited exceptions effective at the close of market June 28, 2013. On February 28, 2017, the Trust’s Board of Trustees (the Board) approved the reopening of the Fund to new investors effective May 31, 2017.
The following summarizes the Fund’s significant accounting policies.
a. Financial Instrument Valuation
The Fund’s investments in financial instruments are carried at fair value daily. Fair value is the price that would be received to sell an asset or paid to transfer a liability in an orderly transaction between market participants on the measurement date. The Fund calculates the net asset value (NAV) per share as of 4 p.m. Eastern time each day the New York Stock Exchange (NYSE) is open for trading. Under compliance policies and procedures approved by the Board, the Fund’s administrator has responsibility for oversight of valuation, including leading the cross-functional Valuation Committee (VC). The VC provides administration and oversight of the Fund’s valuation policies and procedures, which are approved annually by the Board. Among other things, these procedures allow the Fund to utilize independent pricing services, quotations from securities and financial instrument dealers, and other market sources to determine fair value.
Equity securities listed on an exchange or on the NASDAQ National Market System are valued at the last quoted sale price or the official closing price of the day, respectively. Foreign equity securities are valued as of the close of trading on the foreign stock exchange on which the security is primarily traded, or as of 4 p.m. Eastern time. The value is then converted
into its U.S. dollar equivalent at the foreign exchange rate in effect at 4 p.m. Eastern time on the day that the value of the security is determined. Over-the-counter (OTC) securities are valued within the range of the most recent quoted bid and ask prices. Securities that trade in multiple markets or on multiple exchanges are valued according to the broadest and most representative market. Certain equity securities are valued based upon fundamental characteristics or relationships to similar securities.
Investments in open-end mutual funds are valued at the closing NAV.
The Fund has procedures to determine the fair value of financial instruments for which market prices are not reliable or readily available. Under these procedures, the VC convenes on a regular basis to review such financial instruments and considers a number of factors, including significant unobservable valuation inputs, when arriving at fair value. The VC primarily employs a market-based approach which may use related or comparable assets or liabilities, recent transactions, market multiples, book values, and other relevant information for the investment to determine the fair value of the investment. An income-based valuation approach may also be used in which the anticipated future cash flows of the investment are discounted to calculate fair value. Discounts may also be applied due to the nature or duration of any restrictions on the disposition of the investments. Due to the inherent uncertainty of valuations of such investments, the fair values may differ significantly from the values that would have been used had an active market existed. The VC employs various methods for calibrating these valuation approaches including a regular review of key inputs and assumptions, transactional back-testing or disposition analysis, and reviews of any related market activity.
Trading in securities on foreign securities stock exchanges and OTC markets may be completed before 4 p.m. Eastern time. In addition, trading in certain foreign markets may not take place on every Fund’s business day. Occasionally, events occur between the time at which trading in a foreign security is completed and 4 p.m. Eastern time that might call into question the reliability of the value of a portfolio security held by the Fund. As a result, differences may arise between the value of the Fund’s portfolio securities as determined at the foreign market close and the latest indications of value at 4 p.m. Eastern time. In order to minimize the potential for these differences, the VC monitors price movements following the close of trading in foreign stock markets through a series of country
| | | | | | |
franklintempleton.com | | | | Annual Report | | 23 |
TEMPLETON GLOBAL INVESTMENT TRUST
NOTES TO FINANCIAL STATEMENTS
Templeton Frontier Markets Fund (continued)
1. Organization and Significant Accounting
Policies (continued)
a. Financial Instrument Valuation (continued)
specific market proxies (such as baskets of American Depositary Receipts, futures contracts and exchange traded funds). These price movements are measured against established trigger thresholds for each specific market proxy to assist in determining if an event has occurred that may call into question the reliability of the values of the foreign securities held by the Fund. If such an event occurs, the securities may be valued using fair value procedures, which may include the use of independent pricing services. At March 31, 2018, a market event occurred resulting in a portion of the securities held by the Fund being valued using fair value procedures.
When the last day of the reporting period is a non-business day, certain foreign markets may be open on those days that the Fund’s NAV is not calculated, which could result in differences between the value of the Fund’s portfolio securities on the last business day and the last calendar day of the reporting period. Any significant security valuation changes due to an open foreign market are adjusted and reflected by the Fund for financial reporting purposes.
b. Foreign Currency Translation
Portfolio securities and other assets and liabilities denominated in foreign currencies are translated into U.S. dollars based on the exchange rate of such currencies against U.S. dollars on the date of valuation. The Fund may enter into foreign currency exchange contracts to facilitate transactions denominated in a foreign currency. Purchases and sales of securities, income and expense items denominated in foreign currencies are translated into U.S. dollars at the exchange rate in effect on the transaction date. Portfolio securities and assets and liabilities denominated in foreign currencies contain risks that those currencies will decline in value relative to the U.S. dollar. Occasionally, events may impact the availability or reliability of foreign exchange rates used to convert the U.S. dollar equivalent value. If such an event occurs, the foreign exchange rate will be valued at fair value using procedures established and approved by the Board.
The Fund does not separately report the effect of changes in foreign exchange rates from changes in market prices on securities held. Such changes are included in net realized and unrealized gain or loss from investments in the Statement of Operations.
Realized foreign exchange gains or losses arise from sales of foreign currencies, currency gains or losses realized between the trade and settlement dates on securities transactions and the difference between the recorded amounts of dividends, interest, and foreign withholding taxes and the U.S. dollar equivalent of the amounts actually received or paid. Net unrealized foreign exchange gains and losses arise from changes in foreign exchange rates on foreign denominated assets and liabilities other than investments in securities held at the end of the reporting period.
c. Restricted Currency
At March 31, 2018, the Fund held currencies in certain markets in which the ability to repatriate such currency is limited. As a result of such limitations on repatriation the Fund may incur substantial delays in gaining access to these assets and may be exposed to potential adverse movements in currency value.
d. Participatory Notes
The Fund invests in Participatory Notes (P-Notes). P-Notes are promissory notes that are designed to offer a return linked to the performance of a particular underlying equity security or market. P-Notes are issued by banks or broker-dealers and allow the Fund to gain exposure to common stocks in certain foreign markets without registering with the market regulator. Income received from P-Notes is recorded as dividend income in the Statement of Operations. P-Notes may contain various risks including the potential inability of the counterparty to fulfill their obligations under the terms of the contract. These securities may be more volatile and less liquid than other investments held by the Fund.
e. Income and Deferred Taxes
It is the Fund’s policy to qualify as a regulated investment company under the Internal Revenue Code. The Fund intends to distribute to shareholders substantially all of its taxable income and net realized gains to relieve it from federal income and excise taxes. As a result, no provision for U.S. federal income taxes is required.
The Fund may be subject to foreign taxation related to income received, capital gains on the sale of securities and certain foreign currency transactions in the foreign jurisdictions in which it invests. Foreign taxes, if any, are recorded based on the tax regulations and rates that exist in the foreign markets in which the Fund invests. When a capital gain tax is determined
| | | | | | |
24 | | Annual Report | | | | franklintempleton.com |
TEMPLETON GLOBAL INVESTMENT TRUST
NOTES TO FINANCIAL STATEMENTS
Templeton Frontier Markets Fund (continued)
to apply, the Fund records an estimated deferred tax liability in an amount that would be payable if the securities were disposed of on the valuation date.
The Fund may recognize an income tax liability related to its uncertain tax positions under U.S. GAAP when the uncertain tax position has a less than 50% probability that it will be sustained upon examination by the tax authorities based on its technical merits. As of March 31, 2018, the Fund has determined that no tax liability is required in its financial statements related to uncertain tax positions for any open tax years (or expected to be taken in future tax years). Open tax years are those that remain subject to examination and are based on the statute of limitations in each jurisdiction in which the Fund invests.
f. Security Transactions, Investment Income, Expenses and Distributions
Security transactions are accounted for on trade date. Realized gains and losses on security transactions are determined on a specific identification basis. Estimated expenses are accrued daily. Dividend income is recorded on the ex-dividend date except for certain dividends from securities where the dividend rate is not available. In such cases, the dividend is recorded as soon as the information is received by the Fund. Distributions to shareholders are recorded on the ex-dividend date. Distributable earnings are determined according to income tax regulations (tax basis) and may differ from earnings recorded in accordance with U.S. GAAP. These differences may be permanent or temporary. Permanent differences are reclassified among capital accounts to reflect their tax character. These reclassifications have no impact on net assets or the results of operations. Temporary differences are not reclassified, as they may reverse in subsequent periods.
Common expenses incurred by the Trust are allocated among the Funds based on the ratio of net assets of each Fund to the combined net assets of the Trust. Fund specific expenses are charged directly to the Fund that incurred the expense.
Realized and unrealized gains and losses and net investment income, excluding class specific expenses, are allocated daily to each class of shares based upon the relative proportion of net assets of each class. Differences in per share distributions by class are generally due to differences in class specific expenses.
g. Accounting Estimates
The preparation of financial statements in accordance with U.S. GAAP requires management to make estimates and assumptions that affect the reported amounts of assets and liabilities at the date of the financial statements and the amounts of income and expenses during the reporting period. Actual results could differ from those estimates.
h. Guarantees and Indemnifications
Under the Trust’s organizational documents, its officers and trustees are indemnified by the Trust against certain liabilities arising out of the performance of their duties to the Trust. Additionally, in the normal course of business, the Trust, on behalf of the Fund, enters into contracts with service providers that contain general indemnification clauses. The Trust’s maximum exposure under these arrangements is unknown as this would involve future claims that may be made against the Trust that have not yet occurred. Currently, the Trust expects the risk of loss to be remote.
2. Shares of Beneficial Interest
At March 31, 2018, there were an unlimited number of shares authorized ($0.01 par value). Transactions in the Fund’s shares were as follows:
| | | | | | | | | | | | | | | | |
| | | Year Ended March 31, | |
| | | 2018 | | | 2017 | |
| | | Shares | | | Amount | | | Shares | | | Amount | |
| | | | |
Class A Shares: | | | | | | | | | | | | | | | | |
Shares sold | | | 514,015 | | | $ | 6,666,467 | | | | 358,479 | | | $ | 3,890,215 | |
Shares issued in reinvestment of distributions | | | 19,127 | | | | 251,132 | | | | 29,439 | | | | 317,868 | |
Shares redeemed | | | (1,304,503 | ) | | | (16,742,386 | ) | | | (1,853,385 | ) | | | (20,175,100 | ) |
Net increase (decrease) | | | (771,361 | ) | | $ | (9,824,787 | ) | | | (1,465,467 | ) | | $ | (15,967,017 | ) |
| | | | | | |
franklintempleton.com | | | | Annual Report | | 25 |
TEMPLETON GLOBAL INVESTMENT TRUST
NOTES TO FINANCIAL STATEMENTS
Templeton Frontier Markets Fund (continued)
2. Shares of Beneficial Interest (continued)
| | | | | | | | | | | | | | | | |
| | | Year Ended March 31, | |
| | | 2018 | | | 2017 | |
| | | Shares | | | Amount | | | Shares | | | Amount | |
| | | | |
Class C Shares: | | | | | | | | | | | | | | | | |
| | | | |
Shares sold | | | 107,080 | | | $ | 1,363,635 | | | | 86,969 | | | $ | 931,579 | |
| | | | |
Shares issued in reinvestment of distributions | | | 5,036 | | | | 64,912 | | | | — | | | | — | |
| | | | |
Shares redeemed | | | (467,538 | ) | | | (5,917,633 | ) | | | (586,495 | ) | | | (6,307,949) | |
| | | | |
| | | | |
Net increase (decrease) | | | (355,422 | ) | | $ | (4,489,086 | ) | | | (499,526 | ) | | $ | (5,376,370) | |
| | | | |
| | | | |
Class R Shares: | | | | | | | | | | | | | | | | |
Shares sold | | | 1,040 | | | $ | 13,360 | | | | 910 | | | $ | 9,879 | |
| | | | |
Shares issued in reinvestment of distributions | | | 29 | | | | 383 | | | | 52 | | | | 561 | |
| | | | |
Shares redeemed | | | (6,476 | ) | | | (81,667 | ) | | | (1,676 | ) | | | (18,907) | |
| | | | |
| | | | |
Net increase (decrease) | | | (5,407 | ) | | $ | (67,924 | ) | | | (714 | ) | | $ | (8,467) | |
| | | | |
| | | | |
Class R6 Shares: | | | | | | | | | | | | | | | | |
Shares sold | | | 124,962 | | | $ | 1,620,063 | | | | 276,381 | | | $ | 2,979,940 | |
| | | | |
Shares issued in reinvestment of distributions | | | 11 | | | | 146 | | | | 53,023 | | | | 572,810 | |
| | | | |
Shares redeemed | | | (102,241 | ) | | | (1,341,719 | ) | | | (6,047,602 | ) | | | (67,386,842) | |
| | | | |
| | | | |
Net increase (decrease) | | | 22,732 | | | $ | 278,490 | | | | (5,718,198 | ) | | $ | (63,834,092) | |
| | | | |
| | | | |
Advisor Class Shares: | | | | | | | | | | | | | | | | |
Shares sold | | | 613,319 | | | $ | 7,888,277 | | | | 812,285 | | | $ | 8,902,044 | |
| | | | |
Shares issued in reinvestment of distributions | | | 12,708 | | | | 167,753 | | | | 28,625 | | | | 310,287 | |
| | | | |
Shares redeemed | | | (2,943,536 | ) | | | (37,363,326 | ) | | | (4,044,314 | ) | | | (43,852,429) | |
| | | | |
| | | | |
Net increase (decrease) | | | (2,317,509 | ) | | $ | (29,307,296 | ) | | | (3,203,404 | ) | | $ | (34,640,098) | |
| | | | |
3. Transactions with Affiliates
Franklin Resources, Inc. is the holding company for various subsidiaries that together are referred to as Franklin Templeton Investments. Certain officers and trustees of the Fund are also officers and/or directors of the following subsidiaries:
| | | | |
Subsidiary | | Affiliation | | |
| Templeton Asset Management Ltd. (TAML) | | Investment manager | | |
| Franklin Templeton Services, LLC (FT Services) | | Administrative manager | | |
| Franklin Templeton Distributors, Inc. (Distributors) | | Principal underwriter | | |
| Franklin Templeton Investor Services, LLC (Investor Services) | | Transfer agent | | |
| | | | | | |
26 | | Annual Report | | | | franklintempleton.com |
TEMPLETON GLOBAL INVESTMENT TRUST
NOTES TO FINANCIAL STATEMENTS
Templeton Frontier Markets Fund (continued)
a. Management Fees
The Fund pays an investment management fee to TAML based on the average daily net assets of the Fund as follows:
| | | | |
| Annualized Fee Rate | | Net Assets | | |
1.450% | | Up to and including $500 million | | |
1.400% | | Over $500 million, up to and including $5 billion | | |
1.350% | | Over $5 billion, up to and including $10 billion | | |
1.300% | | Over $10 billion, up to and including $15 billion | | |
1.250% | | Over $15 billion, up to and including $20 billion | | |
1.200% | | In excess of $20 billion | | |
For the year ended March 31, 2018, the gross effective investment management fee rate was 1.450% of the Fund’s average daily net assets.
b. Administrative Fees
Under an agreement with TAML, FT Services provides administrative services to the Fund. The fee is paid by TAML based on the Fund’s average daily net assets, and is not an additional expense of the Fund.
c. Distribution Fees
The Board has adopted distribution plans for each share class, with the exception of Class R6 and Advisor Class shares, pursuant to Rule 12b-1 under the 1940 Act. Under the Fund’s Class A reimbursement distribution plan, the Fund reimburses Distributors for costs incurred in connection with the servicing, sale and distribution of the Fund’s shares up to the maximum annual plan rate. Under the Class A reimbursement distribution plan, costs exceeding the maximum for the current plan year cannot be reimbursed in subsequent periods. In addition, under the Fund’s Class C and R compensation distribution plans, the Fund pays Distributors for costs incurred in connection with the servicing, sale and distribution of the Fund’s shares up to the maximum annual plan rate for each class. The plan year, for purposes of monitoring compliance with the maximum annual plan rates, is February 1 through January 31.
The maximum annual plan rates, based on the average daily net assets, for each class, are as follows:
| | | | |
Class A | | | 0.30 | % |
Class C | | | 1.00 | % |
Class R | | | 0.50 | % |
Effective August 1, 2015, the Board has set the current rate at 0.25% per year for Class A shares until further notice and approval by the Board.
d. Sales Charges/Underwriting Agreements
Front-end sales charges and contingent deferred sales charges (CDSC) do not represent expenses of the Fund. These charges are deducted from the proceeds of sales of Fund shares prior to investment or from redemption proceeds prior to remittance, as applicable. Distributors has advised the Fund of the following commission transactions related to the sales and redemptions of the Fund’s shares for the year:
| | | | |
Sales charges retained net of commissions paid to unaffiliated
brokers/dealers | | $ | 5,879 | |
CDSC retained | | $ | 556 | |
| | | | | | |
franklintempleton.com | | | | Annual Report | | 27 |
TEMPLETON GLOBAL INVESTMENT TRUST
NOTES TO FINANCIAL STATEMENTS
Templeton Frontier Markets Fund (continued)
3. Transactions with Affiliates (continued)
e. Transfer Agent Fees
Each class of shares pays transfer agent fees to Investor Services for its performance of shareholder servicing obligations. Effective November 1, 2017, the fees are based on an annualized asset based fee of 0.02% plus a transaction based fee. Prior to November 1, 2017, the fees were account based fees that varied based on fund or account type. In addition, each class reimburses Investor Services for out of pocket expenses incurred and, except for Class R6, reimburses shareholder servicing fees paid to third parties. These fees are allocated daily based upon their relative proportion of such classes’ aggregate net assets. Class R6 pays Investor Services transfer agent fees specific to that class.
For the year ended March 31, 2018, the Fund paid transfer agent fees of $334,621, of which $69,676 was retained by Investor Services.
f. Investments in Affiliated Management Investment Companies
The Fund invests in one or more affiliated management investment companies for purposes other than exercising a controlling influence over the management or policies. Management fees paid by the Fund are waived on assets invested in the affiliated management investment companies, as noted in the Statement of Operations, in an amount not to exceed the management and administrative fees paid directly or indirectly by each affiliate. During the year ended March 31, 2018, the Fund held investments in affiliated management investment companies as follows:
| | | | | | | | | | | | | | | | | | | | | | | | | | | | | | |
| | | Number of
Shares Held
at Beginning
of Year | | | Gross
Additions | | | Gross
Reductions | | | Number of
Shares
Held at End
of Year | | | Value at End of Year | | | Dividend
Income | | | Realized
Gain (Loss) | | | Net Change in
Unrealized
Appreciation
(Depreciation) |
| | | | | | | | |
Non-Controlled Affiliates | | | | | | | | | | | | | | | | | | | | | | | | | | | | | | |
Institutional Fiduciary Trust Money Market Portfolio, 1.24% | | | 3,905,877 | | | | 41,396,213 | | | | (42,113,043 | ) | | | 3,189,047 | | | | $3,189,047 | | | | $24,152 | | | | $ — | | | $ — |
g. Waiver and Expense Reimbursements
TAML has contractually agreed in advance to limit the investment management fees to 1.35% of the average daily net assets of the Fund until July 31, 2018. Total expenses waived or paid are not subject to recapture subsequent to the Fund’s fiscal year end.
Investor Services has voluntarily agreed in advance to waive or limit its fees so that the Class R6 transfer agent fees do not exceed 0.02% until July 31, 2018. Investor Services may discontinue this waiver in the future.
4. Expense Offset Arrangement
The Fund has entered into an arrangement with its custodian whereby credits realized as a result of uninvested cash balances are used to reduce a portion of the Fund’s custodian expenses. During the year ended March 31, 2018, there were no credits earned.
5. Income Taxes
For tax purposes, capital losses may be carried over to offset future capital gains. Capital loss carryforwards with no expiration, if any, must be fully utilized before those losses with expiration dates.
| | | | | | |
28 | | Annual Report | | | | franklintempleton.com |
TEMPLETON GLOBAL INVESTMENT TRUST
NOTES TO FINANCIAL STATEMENTS
Templeton Frontier Markets Fund (continued)
At March 31, 2018, capital loss carryforwards were as follows:
| | | | |
Capital loss carryforwards not subject to expiration: | | | | |
Short term | | $ | 30,993,993 | |
Long term | | | 245,403,371 | |
| | | | |
Total capital loss carryforwards | | $ | 276,397,364 | |
| | | | |
During the year ended March 31, 2018, the Fund utilized $12,164,482 of capital loss carryforwards.
For tax purposes, the Fund may elect to defer any portion of a late-year ordinary loss to the first day of the following fiscal year. At March 31, 2018, the Fund deferred late-year ordinary losses of $197,728.
The tax character of distributions paid during the years ended March 31, 2018 and 2017, was as follows:
| | | | | | | | |
| | | 2018 | | | 2017 | |
| | |
Ordinary income | | $ | 574,639 | | | $ | 1,371,636 | |
At March 31, 2018, the cost of investments and net unrealized appreciation (depreciation) for income tax purposes were as follows:
| | | | |
Cost of investments | | $ | 80,792,879 | |
| | | | |
| |
Unrealized appreciation | | $ | 26,419,157 | |
Unrealized depreciation | | | (5,505,009 | ) |
| | | | |
Net unrealized appreciation (depreciation) | | $ | 20,914,148 | |
| | | | |
Differences between income and/or capital gains as determined on a book basis and a tax basis are primarily due to differing treatments of foreign capital gains tax and corporate actions.
6. Investment Transactions
Purchases and sales (excluding short term securities) for the year ended March 31, 2018, aggregated $35,516,407 and $73,127,136, respectively.
7. Concentration of Risk
Investing in foreign securities may include certain risks and considerations not typically associated with investing in U.S. securities, such as fluctuating currency values and changing local and regional economic, political and social conditions, which may result in greater market volatility. Such risks may be greater when investing in emerging markets securities, of which frontier markets are a sub-set, due to underdeveloped legal, business, political or other frameworks necessary to support securities markets. Frontier markets generally have smaller economies and magnify the risks of investing in developing markets and may include the potential for extreme price volatility, government ownership, protectionist measures and unsettled securities laws. In addition, certain foreign securities may not be as liquid as U.S. securities, or may have restrictions or delays in repatriation into U.S. dollars.
Zimbabwe adopted the US dollar as its official currency in 2009 after a period of severe hyperinflation and economic decline. Since that time, its economy has continued to struggle and, despite the government’s issuance of bond notes in August 2017, liquidity conditions have continued to deteriorate. Currency restrictions and other concerns have led investors to seek alternative stores of value, causing severe inflationary pressures. These economic conditions could affect the value of the Fund’s portfolio. At March 31, 2018, the Fund had 6.5% of its net assets invested in Zimbabwe.
| | | | | | |
franklintempleton.com | | | | Annual Report | | 29 |
TEMPLETON GLOBAL INVESTMENT TRUST
NOTES TO FINANCIAL STATEMENTS
Templeton Frontier Markets Fund (continued)
8. Credit Facility
The Fund, together with other U.S. registered and foreign investment funds (collectively, Borrowers), managed by Franklin Templeton Investments, are borrowers in a joint syndicated senior unsecured credit facility totaling $2 billion (Global Credit Facility) which matures on February 8, 2019. This Global Credit Facility provides a source of funds to the Borrowers for temporary and emergency purposes, including the ability to meet future unanticipated or unusually large redemption requests.
Under the terms of the Global Credit Facility, the Fund shall, in addition to interest charged on any borrowings made by the Fund and other costs incurred by the Fund, pay its share of fees and expenses incurred in connection with the implementation and maintenance of the Global Credit Facility, based upon its relative share of the aggregate net assets of all of the Borrowers, including an annual commitment fee of 0.15% based upon the unused portion of the Global Credit Facility. These fees are reflected in other expenses in the Statement of Operations. During the year ended March 31, 2018, the Fund did not use the Global Credit Facility.
9. Fair Value Measurements
The Fund follows a fair value hierarchy that distinguishes between market data obtained from independent sources (observable inputs) and the Fund’s own market assumptions (unobservable inputs). These inputs are used in determining the value of the Fund’s financial instruments and are summarized in the following fair value hierarchy:
| | • | | Level 1 – quoted prices in active markets for identical financial instruments |
| | • | | Level 2 – other significant observable inputs (including quoted prices for similar financial instruments, interest rates, prepayment speed, credit risk, etc.) |
| | • | | Level 3 – significant unobservable inputs (including the Fund’s own assumptions in determining the fair value of financial instruments) |
The input levels are not necessarily an indication of the risk or liquidity associated with financial instruments at that level.
For movements between the levels within the fair value hierarchy, the Fund has adopted a policy of recognizing the transfers as of the date of the underlying event which caused the movement. Additionally, at March 31, 2018, due to market events, the Fund employed fair value procedures to value a portion of its holdings. Such procedures resulted in a temporary transfer of financial instruments valued at $11,849,155 from Level 1 to Level 2 within the fair value hierarchy.
A summary of inputs used as of March 31, 2018, in valuing the Fund’s assets carried at fair value, is as follows:
| | | | | | | | | | | | | | | | |
| | | Level 1 | | | Level 2 | | | Level 3 | | | Total | |
Assets: | | | | | | | | | | | | | | | | |
Investments in Securities:a | | | | | | | | | | | | | | | | |
Equity Investments:b | | | | | | | | | | | | | | | | |
Colombia | | $ | 1,311,024 | | | $ | 1,344,313 | | | $ | — | | | $ | 2,655,337 | |
Kuwait | | | 10,107,056 | | | | — | | | | 372,835 | | | | 10,479,891 | |
Peru | | | 787,239 | | | | 3,762,634 | | | | — | | | | 4,549,873 | |
Philippines | | | — | | | | 6,742,208 | | | | — | | | | 6,742,208 | |
Zimbabwe | | | — | | | | — | | | | 5,685,578 | | | | 5,685,578 | |
All Other Equity Investments | | | 60,706,487 | | | | — | | | | — | | | | 60,706,487 | |
Participatory Notes | | | — | | | | 7,698,606 | | | | — | | | | 7,698,606 | |
Short Term Investments | | | 3,189,047 | | | | — | | | | — | | | | 3,189,047 | |
| | | | |
Total Investments in Securities | | $ | 76,100,853 | | | $ | 19,547,761 | | | $ | 6,058,413 | | | $ | 101,707,027 | |
aFor detailed categories, see the accompanying Statement of Investments.
bIncludes includes common and preferred stocks as well as other equity investments.
| | | | |
30 | | Annual Report | | franklintempleton.com |
TEMPLETON GLOBAL INVESTMENT TRUST
NOTES TO FINANCIAL STATEMENTS
Templeton Frontier Markets Fund (continued)
A reconciliation of assets in which Level 3 inputs are used in determining fair value is presented when there are significant Level 3 financial instruments at the beginning and/or end of the year. At March 31, 2018, the reconciliation of assets, is as follows:
| | | | | | | | | | | | | | | | | | | | | | | | | | | | | | | | | | | | |
| | | Balance at
Beginning of
Year | | | Purchases
(sales) | | | Transfer
Into
Level 3a | | | Transfer
Out of
Level 3 | | | Cost Basis
Adjustments | | | Net
Realized
Gain
(Loss) | | | Net
Unrealized
Appreciation
(Depreciation) | | | Balance
at End
of Year | | | Net Change in
Unrealized
Appreciation
(Depreciation)
on Assets
Held at
YearEnd | |
Assets: | | | | | | | | | | | | | | | | | | | | | | | | | | | | | | | | | | | | |
Investments in Securities: | | | | | | | | | | | | | | | | | | | | | | | | | | | | | | | | | | | | |
Equity Investments:b | | | | | | | | | | | | | | | | | | | | | | | | | | | | | | | | | | | | |
Kuwait | | | $803,679 | | | | $— | | | | $ — | | | | $— | | | | $— | | | | $— | | | | $ (430,844 | ) | | | $ 372,835 | | | | $ (430,844 | ) |
Zimbabwe | | | — | | | | — | | | | 4,391,250 | | | | — | | | | — | | | | — | | | | 1,294,328 | | | | 5,685,578 | | | | 1,294,328 | |
Total | | | $803,679 | | | | $— | | | | $4,391,250 | | | | $— | | | | $— | | | | $— | | | | $ 863,484 | | | | $6,058,413 | | | | $ 863,484 | |
aThe investment was transferred into Level 3 as a result of the unavailability of a foreign exchange rate to translate the value into the U.S. dollar equivalent.
bIncludes common and preferred stocks as well as other equity investments.
Significant unobservable valuation inputs for material Level 3 financial instruments and impact to fair value as a result of changes in unobservable valuation inputs as of March 31, 2018, are as follows:
| | | | | | | | | | | | | | | | | | |
| Description | | Fair Value at
End of Year | | | Valuation Technique | | | Unobservable Inputs | | Amount | | | Impact to Fair Value if
Input Increasesa | |
Assets: | | | | | | | | | | | | | | | | | | |
Investments in Securities: | | | | | | | | | | | | | | | | | | |
Equity Investments: | | | | | | | | | | | | | | | | | | |
Kuwait | | $ | 372,835 | | | | Market Comparables | | | Discount for lack of marketability | | | 50.0% | | | | Decrease | b |
| | | | | |
Zimbabwe | | | 5,685,578 | | | | Market Comparables | | | Implied foreign exchange ratec | | | 1.6 | | | | Decrease | b |
| | | | | |
Total | | $ | 6,058,413 | | | | | | | | | | | | | | | |
aRepresents the directional change in the fair value of the Level 3 financial instruments that would result from a significant and reasonable increase in the corresponding input. A significant and reasonable decrease in the input would have the opposite effect. Significant impacts, if any, to fair value and/or net assets have been indicated.
bRepresents a significant impact to fair value and net assets.
cVarious forms of currency exist within Zimbabwe, including US Dollars and several alternative forms of currency (electronic cash and bond notes). These alternative forms of currency are not directly fungible with US Dollars and therefore an implied foreign exchange rate is necessary to translate the values into the US Dollar equivalent.
10. Subsequent Events
The Fund has evaluated subsequent events through the issuance of the financial statements and determined that no events have occurred that require disclosure.
Abbreviations
| | |
Selected Portfolio |
ADR | | American Depositary Receipt |
| GDR | | Global Depositary Receipt |
| | | | | | |
franklintempleton.com | | | | Annual Report | | 31 |
TEMPLETON FRONTIER MARKETS FUND
Report of Independent Registered Public Accounting Firm
To the Board of Trustees of Templeton Global Investment Trust and Shareholders of Templeton Frontier Markets Fund
Opinion on the Financial Statements
We have audited the accompanying statement of assets and liabilities, including the statement of investments, of Templeton Frontier Markets Fund (the “Fund”) as of March 31, 2018, the related statement of operations for the year ended March 31, 2018, the statement of changes in net assets for each of the two years in the period ended March 31, 2018, including the related notes, and the financial highlights for each of the periods indicated therein (collectively referred to as the “financial statements”). In our opinion, the financial statements present fairly, in all material respects, the financial position of the Fund as of March 31, 2018, the results of its operations for the year then ended, the changes in its net assets for each of the two years in the period ended March 31, 2018 and the financial highlights for each of the periods indicated therein in conformity with accounting principles generally accepted in the United States of America.
Basis for Opinion
These financial statements are the responsibility of the Fund’s management. Our responsibility is to express an opinion on the Fund’s financial statements based on our audits. We are a public accounting firm registered with the Public Company Accounting Oversight Board (United States) (“PCAOB”) and are required to be independent with respect to the Fund in accordance with the U.S. federal securities laws and the applicable rules and regulations of the Securities and Exchange Commission and the PCAOB.
We conducted our audits of these financial statements in accordance with the standards of the PCAOB. Those standards require that we plan and perform the audit to obtain reasonable assurance about whether the financial statements are free of material misstatement, whether due to error or fraud.
Our audits included performing procedures to assess the risks of material misstatement of the financial statements, whether due to error or fraud, and performing procedures that respond to those risks. Such procedures included examining, on a test basis, evidence regarding the amounts and disclosures in the financial statements. Our audits also included evaluating the accounting principles used and significant estimates made by management, as well as evaluating the overall presentation of the financial statements. Our procedures included confirmation of securities owned as of March 31, 2018 by correspondence with the custodian, transfer agent, and brokers; when replies were not received from brokers, we performed other auditing procedures. We believe that our audits provide a reasonable basis for our opinion.
PricewaterhouseCoopers LLP
San Francisco, California
May 17, 2018
We have served as the auditor of one or more investment companies in the Franklin Templeton funds since 1948.
| | | | |
32 | | Annual Report | | franklintempleton.com |
TEMPLETON GLOBAL INVESTMENT TRUST
Tax Information (unaudited)
Templeton Frontier Markets Fund
Under Section 854(b)(1)(B) of the Internal Revenue Code (Code), the Fund hereby reports the maximum amount allowable but no less than $738,116 as qualified dividends for purposes of the maximum rate under Section 1(h)(11) of the Code for the fiscal year ended March 31, 2018. Distributions, including qualified dividend income, paid during calendar year 2018 will be reported to shareholders on Form 1099-DIV by mid-February 2019. Shareholders are advised to check with their tax advisors for information on the treatment of these amounts on their individual income tax returns.
At March 31, 2017, more than 50% of the Fund’s total assets were invested in securities of foreign issuers. In most instances, foreign taxes were withheld from income paid to the Fund on these investments. As shown in the table below, the Funds hereby reports to shareholders the foreign source income and foreign taxes paid, pursuant to Section 853 of the Code. This written statement will allow shareholders of record on December 21, 2017, to treat their proportionate share of foreign taxes paid by the Fund as having been paid directly by them. The shareholder shall consider these amounts as foreign taxes paid in the tax year in which they receive the Fund distribution.
The following table provides a detailed analysis of foreign tax paid, foreign source income, and foreign source qualified dividends as reported by the Fund, to Class A, Class C, Class R, Class R6 and Advisor Class shareholders of record.
| | | | | | | | | | | | |
Class | | Foreign Tax Paid Per Share | | | Foreign Source Income Per Share | | | Foreign Source Qualified Dividends Per Share | |
| | | |
| |
| | | |
Class A | | | $0.0897 | | | | $0.6340 | | | | $0.0927 | |
Class C | | | $0.0897 | | | | $0.5256 | | | | $0.0769 | |
Class R | | | $0.0897 | | | | $0.5726 | | | | $0.0838 | |
Class R6 | | | $0.0897 | | | | $0.6895 | | | | $0.1009 | |
Advisor Class | | | $0.0897 | | | | $0.6557 | | | | $0.0960 | |
Foreign Tax Paid Per Share (Column 1) is the amount per share available to you, as a tax credit (assuming you held your shares in the Fund for a minimum of 16 days during the 31-day period beginning 15 days before the ex-dividend date of the Fund’s distribution to which the foreign taxes relate), or, as a tax deduction.
Foreign Source Income Per Share (Column 2) is the amount per share of income dividends attributable to foreign securities held by the Fund, plus any foreign taxes withheld on these dividends. The amounts reported include foreign source qualified dividends that have not been adjusted for the rate differential applicable to such dividend income.1
Foreign Source Qualified Dividends Per Share (Column 3) is the amount per share of foreign source qualified dividends, plus any foreign taxes withheld on these dividends. These amounts represent the portion of the Foreign Source Income reported to you in column 2 that were derived from qualified foreign securities held by the Fund.1
By mid-February 2018, shareholders received Form 1099-DIV which included their share of taxes paid and foreign source income distributed during the calendar year 2017. The Foreign Source Income reported on Form 1099-DIV has not been adjusted for the rate differential on foreign source qualified dividend income. Shareholders are advised to check with their tax advisors for information on the treatment of these amounts on their 2017 individual income tax returns.
1. Qualified dividends are taxed at reduced long term capital gains tax rates. In determining the amount of foreign tax credit that may be applied against the U.S. tax liability of individuals receiving foreign source qualified dividends, adjustments may be required to the foreign tax credit limitation calculation to reflect the rate differential applicable to such dividend income. The rules however permit certain individuals to elect not to apply the rate differential adjustments for capital gains and/or dividends for any taxable year. Please consult your tax advisor and the instructions to Form 1116 for more information.
| | | | | | |
franklintempleton.com | | | | Annual Report | | 33 |
TEMPLETON GLOBAL INVESTMENT TRUST
Special Meeting of Shareholders
MEETING OF SHAREHOLDERS: OCTOBER 30, 2017 AND RECONVENED ON DECEMBER 15, 2017 AND DECEMBER 29, 2017
(UNAUDITED)
A Special Meeting of Shareholders of Templeton Global Investment Trust was held at the offices of Franklin Templeton Investments, One Franklin Parkway, San Mateo, California on October 30, 2017 and reconvened on December 15, 2017 and December 29, 2017. The purpose of the meeting was to elect Trustees of Templeton Global Investment Trust and to vote on the following proposals for the Fund: to approve the use of a “manager of managers” structure whereby the Fund’s investment manager would be able to hire and replace subadvisers without shareholder approval; to approve a new investment management agreement with Franklin Templeton Investment Management Limited; to approve a new subadvisory agreement with Franklin Templeton Investments (ME) Limited; to approve an amended fundamental investment policy regarding industry concentration; and to approve an amended fundamental investment restriction regarding investments in commodities. At the meeting, (i) the following persons were elected by the shareholders to serve as Trustees of Templeton Global Investment Trust: Harris J. Ashton, Ann Torre Bates, Mary C. Choksi, Edith E. Holiday, Gregory E. Johnson, Rupert H. Johnson, Jr., J. Michael Luttig, David W. Niemiec, Larry D. Thompson, Constantine D. Tseretopoulos and Robert E. Wade; and (ii) sufficient votes were not received to pass the proposals to use a “manager of managers” structure; to approve a new investment management agreement with Franklin Templeton Investment Management Limited; to approve a new sub-advisory agreement with Franklin Templeton Investments (ME) Limited; to approve an amended fundamental investment policy regarding industry concentration; and to approve an amended fundamental investment restriction regarding investments in commodities. No other business was transacted at the meeting.
In connection with the meeting, management is aware that some shareholders received from the proxy solicitor numerous calls and mailings that may have been distracting. Management is taking steps to ensure that, in the future, for any new shareholder meeting solicitations that occur, such activity is not repeated. Management apologizes for any inconvenience that may have been caused as a result of such calls and mailings.
The results of the voting at the meeting are as follows:
| Proposal 1. | To elect a Board of Trustees: |
| | | | | | | | |
| Name | | For | | | Withheld | |
| |
| | |
Harris J. Ashton | | | 377,048,086 | | | | 10,385,715 | |
Ann Torre Bates | | | 377,050,303 | | | | 10,383,500 | |
Mary C. Choksi | | | 377,051,104 | | | | 10,382,699 | |
Edith E. Holiday | | | 377,043,078 | | | | 10,390,725 | |
Gregory E. Johnson | | | 377,072,684 | | | | 10,361,119 | |
Rupert H. Johnson, Jr. | | | 377,077,137 | | | | 10,356,666 | |
J. Michael Luttig | | | 377,087,793 | | | | 10,346,010 | |
David W. Niemiec | | | 377,066,180 | | | | 10,367,622 | |
Larry D. Thompson | | | 377,085,550 | | | | 10,348,252 | |
Constantine D. Tseretopoulos | | | 377,094,478 | | | | 10,339,323 | |
Robert E. Wade | | | 377,100,799 | | | | 10,333,003 | |
Total Trust Shares Outstanding*: 656,789,328
* As of the record date.
| | | | | | |
34 | | Annual Report | | | | | franklintempleton.com |
TEMPLETON GLOBAL INVESTMENT TRUST
SPECIAL MEETING OF SHAREHOLDERS
| Proposal 2. | To approve the use of a “manager of managers” structure whereby the Fund’s investment manager would be able to hire and replace subadvisers without shareholder approval: |
| | | | |
| | | Shares | |
| |
| |
For | | | 4,121,482 | |
| |
Against | | | 154,780 | |
| |
Abstain | | | 89,230 | |
| |
Broker Non-Votes | | | 1,986,472 | |
| |
Total Fund Shares Voted | | | 6,351,964 | |
| |
Total Fund Shares Outstanding* | | | 9,793,977 | |
| Proposal 3. | To approve a new investment management agreement with Franklin Templeton Investment Management Limited: |
| | | | |
| | | Shares | |
| |
| |
For | | | 4,195,017 | |
| |
Against | | | 78,901 | |
| |
Abstain | | | 91,574 | |
| |
Broker Non-Votes | | | 1,986,472 | |
| |
Total Fund Shares Voted | | | 6,351,964 | |
| |
Total Fund Shares Outstanding* | | | 9,793,977 | |
| Proposal 4. | To approve a new subadvisory agreement with Franklin Templeton Investments (ME) Limited: |
| | | | |
| | | Shares | |
| |
| |
For | | | 4,191,212 | |
| |
Against | | | 76,659 | |
| |
Abstain | | | 97,621 | |
| |
Broker Non-Votes | | | 1,986,472 | |
| |
Total Fund Shares Voted | | | 6,351,964 | |
| |
Total Fund Shares Outstanding* | | | 9,793,977 | |
| Proposal 5. | To approve an amended fundamental investment policy regarding industry concentration: |
| | | | |
| | | Shares | |
| |
| |
For | | | 4,164,495 | |
| |
Against | | | 86,250 | |
| |
Abstain | | | 114,746 | |
| |
Broker Non-Votes | | | 1,986,472 | |
| |
Total Fund Shares Voted | | | 6,351,964 | |
| |
Total Fund Shares Outstanding* | | | 9,793,977 | |
| | | | | | |
franklintempleton.com | | | | Annual Report | | 35 |
TEMPLETON GLOBAL INVESTMENT TRUST
SPECIAL MEETING OF SHAREHOLDERS
| Proposal 6. | To approve an amended fundamental investment restriction regarding investments in commodities: |
| | | | |
| | | Shares | |
| |
| |
For | | | 4,165,157 | |
| |
Against | | | 92,046 | |
| |
Abstain | | | 108,290 | |
| |
Broker Non-Votes | | | 1,986,472 | |
| |
Total Fund Shares Voted | | | 6,351,964 | |
| |
Total Fund Shares Outstanding* | | | 9,793,977 | |
| | | | |
36 | | Annual Report | | franklintempleton.com |
TEMPLETON GLOBAL INVESTMENT TRUST
Board Members and Officers
The name, year of birth and address of the officers and board members, as well as their affiliations, positions held with the Trust, principal occupations during at least the past five years and number of US registered portfolios overseen in the Franklin Templeton Investments fund complex, are shown below. Generally, each board member serves until that person’s successor is elected and qualified.
Independent Board Members
| | | | | | | | |
Name, Year of Birth and Address | | Position | | Length of
Time Served | | Number of Portfolios in
Fund Complex Overseen
by Board Member* | | Other Directorships Held During at Least the Past 5 Years |
| | | | |
Harris J. Ashton (1932) 300 S.E. 2nd Street Fort Lauderdale, FL 33301-1923 | | Trustee | | Since 1994 | | 139 | | Bar-S Foods (meat packing company) (1981-2010). |
Principal Occupation During at Least the Past 5 Years: Director of various companies; and formerly, Director, RBC Holdings, Inc. (bank holding company) (until 2002); and President, Chief Executive Officer and Chairman of the Board, General Host Corporation (nursery and craft centers) (until 1998). |
| | | | |
Ann Torre Bates (1958) 300 S.E. 2nd Street Fort Lauderdale, FL 33301-1923 | | Trustee | | Since 2008 | | 40 | | Ares Capital Corporation (specialty finance company) (2010-present), United Natural Foods, Inc. (distributor of natural, organic and specialty foods) (2013-present), Allied Capital Corporation (financial services) (2003-2010), SLM Corporation (Sallie Mae) (1997-2014) and Navient Corporation (loan management, servicing and asset recovery) (2014-2016). |
Principal Occupation During at Least the Past 5 Years: Director of various companies; and formerly, Executive Vice President and Chief Financial Officer, NHP Incorporated (manager of multifamily housing) (1995-1997); and Vice President and Treasurer, US Airways, Inc. (until 1995). |
| | | | |
Mary C. Choksi (1950) 300 S.E. 2nd Street Fort Lauderdale, FL 33301-1923 | | Trustee | | Since December 2017 | | 139 | | Avis Budget Group Inc. (car rental) (2007-present), Omnicom Group Inc. (advertising and marketing communications services) (2011-present) and White Mountains Insurance Group, Ltd. (holding company) (2017-present). |
Principal Occupation During at Least the Past 5 Years: Director of various companies; and formerly, Founder and Senior Advisor, Strategic Investment Group (investment management group) (2015-2017); Founding Partner and Senior Managing Director, Strategic Investment Group (1987-2015); Founding Partner and Managing Director, Emerging Markets Management LLC (investment management firm) (1987-2011); and Loan Officer/Senior Loan Officer/Senior Pension Investment Officer, World Bank Group (international financial institution) (1977-1987). |
| | | | |
Edith E. Holiday (1952) 300 S.E. 2nd Street Fort Lauderdale, FL 33301-1923 | | Lead
Independent
Trustee | | Trustee since 1996 and Lead Independent Trustee since 2007 | | 139 | | Hess Corporation (exploration of oil and gas) (1993-present), Canadian National Railway (railroad) (2001-present), White Mountains Insurance Group, Ltd. (holding company) (2004-present), Santander Consumer USA Holdings, Inc. (consumer finance) (2016-present), RTI International Metals, Inc. (manufacture and distribution of titanium) (1999-2015) and H.J. Heinz Company (processed foods and allied products) (1994-2013). |
Principal Occupation During at Least the Past 5 Years: Director or Trustee of various companies and trusts; and formerly, Assistant to the President of the United States and Secretary of the Cabinet (1990-1993); General Counsel to the United States Treasury Department (1989-1990); and Counselor to the Secretary and Assistant Secretary for Public Affairs and Public Liaison-United States Treasury Department (1988-1989). |
| | | | |
franklintempleton.com | | Annual Report | | 37 |
TEMPLETON GLOBAL INVESTMENT TRUST
Independent Board Members (continued)
| | | | | | | | |
Name, Year of Birth and Address | | Position | | Length of
Time Served | | Number of Portfolios in
Fund Complex Overseen
by Board Member* | | Other Directorships Held
During at Least the Past 5 Years |
| | | | |
J. Michael Luttig (1954) 300 S.E. 2nd Street Fort Lauderdale, FL 33301-1923 | | Trustee | | Since 2009 | | 139 | | Boeing Capital Corporation (aircraft financing) (2006-2013). |
Principal Occupation During at Least the Past 5 Years: Executive Vice President, General Counsel and member of the Executive Council, The Boeing Company (aerospace company) (2006-present); and formerly, Federal Appeals Court Judge, U.S. Court of Appeals for the Fourth Circuit (1991-2006). |
| | | | |
David W. Niemiec (1949) 300 S.E. 2nd Street Fort Lauderdale, FL 33301-1923 | | Trustee | | Since 2006 | | 40 | | Hess Midstream Partners LP (oil and gas midstream infrastructure) (2017-present). |
Principal Occupation During at Least the Past 5 Years: Advisor, Saratoga Partners (private equity fund); and formerly, Managing Director, Saratoga Partners (1998-2001) and SBC Warburg Dillon Read (investment banking) (1997-1998); Vice Chairman, Dillon, Read & Co. Inc. (investment banking) (1991-1997); and Chief Financial Officer, Dillon, Read & Co. Inc. (1982-1997). |
| | | | |
Larry D. Thompson (1945) 300 S.E. 2nd Street Fort Lauderdale, FL 33301-1923 | | Trustee | | Since 2006 | | 139 | | The Southern Company (energy company) (2014-present; previously 2010-2012), Graham Holdings Company (education and media organization) (2011-present) and Cbeyond, Inc. (business communications provider) (2010-2012). |
Principal Occupation During at Least the Past 5 Years: Director of various companies; Counsel, Finch McCranie, LLP (law firm) (2015-present); Independent Compliance Monitor and Auditor, Volkswagen AG (manufacturer of automobiles and commercial vehicles) (2017-present ); John A. Sibley Professor of Corporate and Business Law, University of Georgia School of Law (2015-present; previously 2011-2012); and formerly, Executive Vice President - Government Affairs, General Counsel and Corporate Secretary, PepsiCo, Inc. (consumer products) (2012-2014); Senior Vice President - Government Affairs, General Counsel and Secretary, PepsiCo, Inc. (2004-2011); Senior Fellow of The Brookings Institution (2003-2004); Visiting Professor, University of Georgia School of Law (2004); and Deputy Attorney General, U.S. Department of Justice (2001-2003). |
| | | | |
Constantine D. Tseretopoulos (1954) 300 S.E. 2nd Street Fort Lauderdale, FL 33301-1923 | | Trustee | | Since 2001 | | 26 | | None |
Principal Occupation During at Least the Past 5 Years: Physician, Chief of Staff, owner and operator of the Lyford Cay Hospital (1987-present); director of various nonprofit organizations; and formerly, Cardiology Fellow, University of Maryland (1985-1987); and Internal Medicine Resident, Greater Baltimore Medical Center (1982-1985). |
| | | | |
Robert E. Wade (1946) 300 S.E. 2nd Street Fort Lauderdale, FL 33301-1923 | | Trustee | | Since 2006 | | 40 | | El Oro Ltd (investments) (2003-present). |
Principal Occupation During at Least the Past 5 Years: Attorney at law engaged in private practice as a sole practitioner (1972-2008) and member of various boards. |
| | | | |
38 | | Annual Report | | franklintempleton.com |
TEMPLETON GLOBAL INVESTMENT TRUST
Interested Board Members and Officers
| | | | | | | | |
Name, Year of Birth
and Address | | Position | | Length of
Time Served | | Number of Portfolios in
Fund Complex Overseen
by Board Member* | | Other Directorships Held
During at Least the Past 5 Years |
**Gregory E. Johnson (1961) One Franklin Parkway San Mateo, CA 94403-1906 | | Trustee | | Since 2006 | | 153 | | None |
Principal Occupation During at Least the Past 5 Years: Chairman of the Board, Member - Office of the Chairman, Director and Chief Executive Officer, Franklin Resources, Inc.; officer and/or director or trustee, as the case may be, of some of the other subsidiaries of Franklin Resources, Inc. and of 43 of the investment companies in Franklin Templeton Investments; Vice Chairman, Investment Company Institute; and formerly, President, Franklin Resources, Inc. (1994-2015). |
| | | | |
**Rupert H. Johnson, Jr. (1940) One Franklin Parkway San Mateo, CA 94403-1906 | | Chairman of the Board, Trustee and Vice President | | Chairman of the Board and Trustee since 2013 and Vice President since 1996 | | 139 | | None |
Principal Occupation During at Least the Past 5 Years: Vice Chairman, Member - Office of the Chairman and Director, Franklin Resources, Inc.; Director, Franklin Advisers, Inc.; Senior Vice President, Franklin Advisory Services, LLC; and officer and/or director or trustee, as the case may be, of some of the other subsidiaries of Franklin Resources, Inc. and of 41 of the investment companies in Franklin Templeton Investments. |
| | | | |
Alison E. Baur (1964) One Franklin Parkway San Mateo, CA 94403-1906 | | Vice President | | Since 2012 | | Not Applicable | | Not Applicable |
Principal Occupation During at Least the Past 5 Years: Deputy General Counsel, Franklin Templeton Investments; and officer of some of the other subsidiaries of Franklin Resources, Inc. and of 45 of the investment companies in Franklin Templeton Investments. |
| | | | |
Norman J. Boersma (1957) Lyford Cay Nassau, Bahamas | | President and Chief Executive Officer – Investment Management | | Since 2012 | | Not Applicable | | Not Applicable |
Principal Occupation During at Least the Past 5 Years: Chairman of the Board, President and Chief Executive Officer, Templeton Global Advisors Ltd.; Chief Investment Officer of Templeton Global Equity Group; officer of six of the investment companies in Franklin Templeton Investments; and formerly, Executive Vice President, Franklin Templeton Investments Corp. (1993-2014). |
| | | | |
Aliya S. Gordon (1973) One Franklin Parkway San Mateo, CA 94403-1906 | | Vice President | | Since 2009 | | Not Applicable | | Not Applicable |
Principal Occupation During at Least the Past 5 Years: Senior Associate General Counsel, Franklin Templeton Investments; and officer of 45 of the investment companies in Franklin Templeton Investments. |
| | | | |
Steven J. Gray (1955) One Franklin Parkway San Mateo, CA 94403-1906 | | Vice President | | Since 2009 | | Not Applicable | | Not Applicable |
Principal Occupation During at Least the Past 5 Years: Senior Associate General Counsel, Franklin Templeton Investments; Vice President, Franklin Templeton Distributors, Inc. and FASA, LLC; and officer of 45 of the investment companies in Franklin Templeton Investments. |
| | | | |
Matthew T. Hinkle (1971) One Franklin Parkway San Mateo, CA 94403-1906 | | Chief Executive Officer – Finance and Administration | | Since June 2017 | | Not Applicable | | Not Applicable |
Principal Occupation During at Least the Past 5 Years: Senior Vice President, Franklin Templeton Services, LLC; officer of 45 of the investment companies in Franklin Templeton Investments; and formerly, Vice President, Global Tax (2012-April 2017) and Treasurer/Assistant Treasurer, Franklin Templeton Investments (2009-2017). |
| | | | |
franklintempleton.com | | Annual Report | | 39 |
TEMPLETON GLOBAL INVESTMENT TRUST
Interested Board Members and Officers (continued)
| | | | | | | | |
Name, Year of Birth
and Address | | Position | | Length of
Time Served | | Number of Portfolios in
Fund Complex Overseen
by Board Member* | | Other Directorships Held
During at Least the Past 5 Years |
| | | | |
Robert G. Kubilis (1973) 300 S.E. 2nd Street Fort Lauderdale, FL 33301-1923 | | Chief Financial Officer, Chief Accounting Officer and Treasurer | | Since June 2017 | | Not Applicable | | Not Applicable |
Principal Occupation During at Least the Past 5 Years: Treasurer, U.S. Fund Administration & Reporting, Franklin Templeton Investments; and officer of 17 of the investment companies in Franklin Templeton Investments. |
| | | | |
Robert Lim (1948) One Franklin Parkway San Mateo, CA 94403-1906 | | Vice President – AML Compliance | | Since 2016 | | Not Applicable | | Not Applicable |
Principal Occupation During at Least the Past 5 Years: Vice President, Franklin Templeton Companies, LLC; Chief Compliance Officer, Franklin Templeton Distributors, Inc. and Franklin Templeton Investor Services, LLC; and officer of 45 of the investment companies in Franklin Templeton Investments. |
| | | | |
Kimberly H. Novotny (1972) 300 S.E. 2nd Street Fort Lauderdale, FL 33301-1923 | | Vice President | | Since 2013 | | Not Applicable | | Not Applicable |
Principal Occupation During at Least the Past 5 Years: Associate General Counsel, Franklin Templeton Investments; Vice President and Corporate Secretary, Fiduciary Trust International of the South; Vice President, Templeton Investment Counsel, LLC; Assistant Secretary, Franklin Resources, Inc.; and officer of 45 of the investment companies in Franklin Templeton Investments. |
| | | | |
Robert C. Rosselot (1960) 300 S.E. 2nd Street Fort Lauderdale, FL 33301-1923 | | Chief Compliance Officer | | Since 2013 | | Not Applicable | | Not Applicable |
Principal Occupation During at Least the Past 5 Years: Director, Global Compliance, Franklin Templeton Investments; Vice President, Franklin Templeton Companies, LLC; officer of 45 of the investment companies in Franklin Templeton Investments; and formerly, Senior Associate General Counsel, Franklin Templeton Investments (2007-2013); and Secretary and Vice President, Templeton Group of Funds (2004-2013). |
| | | | |
Karen L. Skidmore (1952) One Franklin Parkway San Mateo, CA 94403-1906 | | Vice President | | Since 2009 | | Not Applicable | | Not Applicable |
Principal Occupation During at Least the Past 5 Years: Senior Associate General Counsel, Franklin Templeton Investments; and officer of 45 of the investment companies in Franklin Templeton Investments. |
| | | | |
Navid J. Tofigh (1972) One Franklin Parkway San Mateo, CA 94403-1906 | | Vice President | | Since 2015 | | Not Applicable | | Not Applicable |
Principal Occupation During at Least the Past 5 Years: Associate General Counsel, Franklin Templeton Investments; and officer of 45 of the investment companies in Franklin Templeton Investments. |
| | | | |
Craig S. Tyle (1960) One Franklin Parkway San Mateo, CA 94403-1906 | | Vice President | | Since 2005 | | Not Applicable | | Not Applicable |
Principal Occupation During at Least the Past 5 Years: General Counsel and Executive Vice President, Franklin Resources, Inc.; and officer of some of the other subsidiaries of Franklin Resources, Inc. and of 45 of the investment companies in Franklin Templeton Investments. |
| | | | |
40 | | Annual Report | | franklintempleton.com |
TEMPLETON GLOBAL INVESTMENT TRUST
Interested Board Members and Officers (continued)
| | | | | | | | |
Name, Year of Birth and Address | | Position | | Length of
Time Served | | Number of Portfolios in
Fund Complex Overseen
by Board Member* | | Other Directorships Held
During at Least the Past 5 Years |
| | | | |
Lori A. Weber (1964) 300 S.E. 2nd Street Fort Lauderdale, FL 33301-1923 | | Secretary
and Vice
President | | Secretary since
2013 and Vice
President since
2011 | | Not Applicable | | Not Applicable |
|
Principal Occupation During at Least the Past 5 Years: Senior Associate General Counsel, Franklin Templeton Investments; Assistant Secretary, Franklin Resources, Inc.; Vice President and Secretary, Templeton Investment Counsel, LLC; and officer of 45 of the investment companies in Franklin Templeton Investments. |
*We base the number of portfolios on each separate series of the US registered investment companies within the Franklin Templeton Investments fund complex. These portfolios have a common investment manager or affiliated investment managers.
**Gregory E. Johnson is considered to be an interested person of the Fund under the federal securities laws due to his position as an officer and director of Franklin Resources, Inc. (Resources), which is the parent company of the Fund’s investment manager and distributor. Rupert H. Johnson, Jr. is considered to be an interested person of the Fund under the federal securities laws due to his position as officer and director and major shareholder of Resources.
Note 1: Rupert H. Johnson, Jr. is the uncle of Gregory E. Johnson.
Note 2: Officer information is current as of the date of this report. It is possible that after this date, information about officers may change.
The Sarbanes-Oxley Act of 2002 and Rules adopted by the US Securities and Exchange Commission require the Fund to disclose whether the Fund’s Audit Committee includes at least one member who is an audit committee financial expert within the meaning of such Act and Rules. The Fund’s Board has determined that there is at least one such financial expert on the Audit Committee and has designated each of Ann Torre Bates and David W. Niemiec as an audit committee financial expert. The Board believes that Ms. Bates and Mr. Niemiec qualify as such an expert in view of their extensive business background and experience. Ms. Bates has served as a member of the Fund Audit Committee since 2008. She currently serves as a director of Ares Capital Corporation (2010-present) and United Natural Foods, Inc. (2013-present) and was formerly a director of Navient Corporation from 2014 to 2016, SLM Corporation from 1997 to 2014 and Allied Capital Corporation from 2003 to 2010, Executive Vice President and Chief Financial Officer of NHP Incorporated from 1995 to 1997 and Vice President and Treasurer of US Airways, Inc. until 1995. Mr. Niemiec has served as a member of the Fund Audit Committee since 2006, currently serves as an Advisor to Saratoga Partners and was formerly its Managing Director from 1998 to 2001 and serves as a director of Hess Midstream Partners LP (2017-present). Mr. Niemiec was formerly a director of Emeritus Corporation from 1999 to 2010 and OSI Pharmaceuticals, Inc. from 2006 to 2010, Managing Director of SBC Warburg Dillon Read from 1997 to 1998, and was Vice Chairman from 1991 to 1997 and Chief Financial Officer from 1982 to 1997 of Dillon, Read & Co. Inc. As a result of such background and experience, the Board believes that Ms. Bates and Mr. Niemiec have each acquired an understanding of generally accepted accounting principles and financial statements, the general application of such principles in connection with the accounting estimates, accruals and reserves, and analyzing and evaluating financial statements that present a breadth and level of complexity of accounting issues generally comparable to those of the Fund, as well as an understanding of internal controls and procedures for financial reporting and an understanding of audit committee functions. Ms. Bates and Mr. Niemiec are independent Board members as that term is defined under the applicable US Securities and Exchange Commission Rules and Releases.
The Statement of Additional Information (SAI) includes additional information about the board members and is available, without charge, upon request. Shareholders may call (800) DIAL BEN/342-5236 to request the SAI.
| | | | | | |
franklintempleton.com | | | | Annual Report | | 41 |
TEMPLETON GLOBAL INVESTMENT TRUST
TEMPLETON FRONTIER MARKETS FUND
Shareholder Information
Board Approval of Investment Management Agreements
TEMPLETON GLOBAL INVESTMENT TRUST
Templeton Frontier Markets Fund
(Fund)
At an in-person meeting held on February 27, 2018 (Meeting), the Board of Trustees (Board) of Templeton Global Investment Trust (Trust), including a majority of the trustees who are not “interested persons” as defined in the Investment Company Act of 1940 (Independent Trustees), reviewed and approved the continuance of the investment management agreement between Templeton Asset Management Ltd. (Manager) and the Trust, on behalf of the Fund (Management Agreement) for an additional one-year period. The Independent Trustees received advice from and met separately with Independent Trustee counsel in considering whether to approve the continuation of the Management Agreement.
In considering the continuation of the Management Agreement, the Board reviewed and considered information provided by the Manager at the Meeting and throughout the year at meetings of the Board and its committees. The Board also reviewed and considered information provided in response to a detailed set of requests for information submitted to the Manager by Independent Trustee counsel on behalf of the Independent Trustees in connection with the annual contract renewal process. In addition, prior to the Meeting, the Independent Trustees held a telephonic contract renewal meeting at which the Independent Trustees conferred amongst themselves and Independent Trustee counsel about contract renewal matters. The Board reviewed and considered all of the factors it deemed relevant in approving the continuance of the Management Agreement, including, but not limited to: (i) the nature, extent and quality of the services provided by the Manager; (ii) the investment performance of the Fund; (iii) the costs of the services provided and profits realized by the Manager and its affiliates from the relationship with the Fund; (iv) the extent to which economies of scale are realized as the Fund grows; and (v) whether fee levels reflect these economies of scale for the benefit of Fund investors.
In approving the continuance of the Management Agreement, the Board, including a majority of the Independent Trustees, determined that the terms of the Management Agreement are fair and reasonable and that the continuance of such Management Agreement is in the interests of the Fund and its shareholders. While attention was given to all information
furnished, the following discusses some primary factors relevant to the Board’s determination.
Nature, Extent and Quality of Services
The Board reviewed and considered information regarding the nature, extent and quality of investment management services provided by the Manager and its affiliates to the Fund and its shareholders. This information included, among other things, the qualifications, background and experience of the senior management and investment personnel of the Manager; the structure of investment personnel compensation; oversight of third-party service providers; investment performance reports and related financial information for the Fund; reports on expenses, shareholder services, marketing support payments made to financial intermediaries and third party servicing arrangements; legal and compliance matters; risk controls; pricing and other services provided by the Manager and its affiliates; and management fees charged by the Manager and its affiliates to U.S. funds and other accounts, including management’s explanation of differences among accounts where relevant. The Board also reviewed and considered an annual report on payments made by Franklin Templeton Investments (FTI) or the Fund to financial intermediaries, as well as a memorandum relating to third-party servicing arrangements in response to a guidance update in 2016 from the U.S. Securities and Exchange Commission (SEC) relating to mutual fund distribution and sub-accounting fees. The Board noted management’s continuing efforts and expenditures in establishing effective business continuity plans and developing strategies to address areas of heightened concern in the mutual fund industry, such as cybersecurity and liquidity risk management. The Board also recognized management’s commitment to facilitating Board oversight of particular areas, including derivatives and payments to intermediaries, by enhanced reporting.
The Board also reviewed and considered the benefits provided to Fund shareholders of investing in a fund that is part of the Franklin Templeton family of funds. The Board noted the financial position of Franklin Resources, Inc. (FRI), the Manager’s parent, and its commitment to the mutual fund business as evidenced by its continued introduction of new funds, reassessment of the fund offerings in response to the market environment and project initiatives and capital investments relating to the services provided to the Fund by the FTI organization.
Following consideration of such information, the Board was satisfied with the nature, extent and quality of services provided
| | | | |
42 | | Annual Report | | franklintempleton.com |
TEMPLETON GLOBAL INVESTMENT TRUST
TEMPLETON FRONTIER MARKETS FUND
SHAREHOLDER INFORMATION
by the Manager and its affiliates to the Fund and its shareholders.
Fund Performance
The Board reviewed and considered the performance results of the Fund over various time periods ended December 31, 2017. The Board considered the performance returns for the Fund in comparison to the performance returns of mutual funds deemed comparable to the Fund included in a universe (Performance Universe) selected by Broadridge Financial Solutions, Inc. (Broadridge), an independent provider of investment company data. The Board received a description of the methodology used by Broadridge to select the mutual funds included in a Performance Universe. The Board also reviewed and considered Fund performance reports provided and discussions that occurred with portfolio managers at Board meetings throughout the year. A summary of the Fund’s performance results is below.
The Performance Universe for the Fund included the Fund and all retail and institutional emerging markets funds. The Board noted that the Fund’s annualized total return for the one-, three-and five-year periods was below the median of its Performance Universe and fell within the fifth quintile (the worst) of the Performance Universe. The Board discussed this performance with management and management explained that the Performance Universe was broad and not limited to funds investing in “frontier markets.” Management further explained that it was continuing to focus on enhancements to the Fund’s portfolio management team, noting in particular enhancements it has made and continues to make to the Templeton Emerging Markets Group. In light of these discussions and management’s continued attention to the Fund’s underperformance, the Board determined that additional time is needed to evaluate the effectiveness of management’s actions. In doing so, the Board noted that the Fund’s annualized total return for the one-year period, while below the median, exceeded 22%. The Board also noted that the Fund reopened to new investors on May 31, 2017.
Comparative Fees and Expenses
The Board reviewed and considered information regarding the Fund’s actual total expense ratio and its various components, including, as applicable, management fees; transfer agent expenses; underlying fund expenses; Rule 12b-1 and non-Rule 12b-1 service fees; and other non-management fees. The Board also noted the quarterly and annual reports it receives on all marketing support payments made by FTI to financial intermediaries. The Board considered the actual total
expense ratio and, separately, the contractual management fee rate, without the effect of fee waivers (Management Rate), if any, of the Fund in comparison to the median expense ratio and median Management Rate, respectively, of other mutual funds deemed comparable to and with a similar expense structure as the Fund selected by Broadridge (Expense Group). Broadridge fee and expense data is based upon information taken from each fund’s most recent annual report, which reflects historical asset levels that may be quite different from those currently existing, particularly in a period of market volatility. While recognizing such inherent limitation and the fact that expense ratios and Management Rates generally increase as assets decline and decrease as assets grow, the Board believed the independent analysis conducted by Broadridge to be an appropriate measure of comparative fees and expenses. The Broadridge Management Rate includes administrative charges, and the actual total expense ratio, for comparative consistency, was shown for Class A shares for funds with multiple classes of shares. The Board received a description of the methodology used by Broadridge to select the mutual funds included in an Expense Group.
The Expense Group for the Fund included the Fund and 17 other emerging markets funds. The Board noted that the Management Rate and actual total expense ratio for the Fund were above the medians of its Expense Group. In light of the specialized focus of the Fund on difficult-to-research frontier markets, the Board concluded that the Management Rate charged to the Fund is reasonable. In doing so, the Board noted that effective April 1, 2017, the first tier of the investment management fee paid by the Fund was changed from 1.450% for assets up to and including $1 billion to 1.450% for assets up to and including $500 million.
Profitability
The Board reviewed and considered information regarding the profits realized by the Manager and its affiliates in connection with the operation of the Fund. In this respect, the Board considered the Fund profitability analysis provided by the Manager that addresses the overall profitability of FTI’s U.S. fund business, as well as its profits in providing investment management and other services to each of the individual funds during the 12-month period ended September 30, 2017, being the most recent fiscal year-end for FRI. The Board noted that although management continually makes refinements to its methodologies used in calculating profitability in response to organizational and product related changes, the overall methodology has remained consistent with that used in the Fund’s profitability report presentations from prior years.
| | | | |
franklintempleton.com | | Annual Report | | 43 |
TEMPLETON GLOBAL INVESTMENT TRUST
TEMPLETON FRONTIER MARKETS FUND
SHAREHOLDER INFORMATION
Additionally, PricewaterhouseCoopers LLP, auditor to Franklin Resources, Inc. and certain Franklin Templeton funds, has been engaged by the Manager to periodically review and assess the allocation methodologies to be used solely by the Fund’s Board with respect to the profitability analysis.
The Board noted management’s belief that costs incurred in establishing the infrastructure necessary for the type of mutual fund operations conducted by the Manager and its affiliates may not be fully reflected in the expenses allocated to the Fund in determining its profitability, as well as the fact that the level of profits, to a certain extent, reflected operational cost savings and efficiencies initiated by management. The Board also noted management’s expenditures in improving shareholder services provided to the Fund, as well as the need to implement systems and meet additional regulatory and compliance requirements resulting from recent SEC and other regulatory requirements.
The Board also considered the extent to which the Manager and its affiliates might derive ancillary benefits from fund operations, including revenues generated from transfer agent services, potential benefits resulting from personnel and systems enhancements necessitated by fund growth, as well as increased leverage with service providers and counterparties. Based upon its consideration of all these factors, the Board concluded that the level of profits realized by the Manager and its affiliates from providing services to the Fund was not excessive in view of the nature, extent and quality of services provided to the Fund.
Economies of Scale
The Board reviewed and considered the extent to which the Manager may realize economies of scale, if any, as the Fund grows larger and whether the Fund’s management fee structure reflects any economies of scale for the benefit of shareholders. With respect to possible economies of scale, the Board noted the existence of management fee breakpoints, which operate generally to share any economies of scale with a Fund’s shareholders by reducing the Fund’s effective management fees as the Fund grows in size. The Board considered the Manager’s view that any analyses of potential economies of scale in managing a particular fund are inherently limited in light of the joint and common costs and investments the Manager incurs across the Franklin Templeton family of funds as a whole. In response to prior Board discussions, the Manager lowered the initial Management Rate fee breakpoint effective April 1, 2017. In light of this change, the Board concluded that to the extent economies of scale may be realized by the Manager and its affiliates, the Fund’s management fee structure provided a
sharing of benefits with the Fund and its shareholders as the Fund grows.
Conclusion
Based on its review, consideration and evaluation of all factors it believed relevant, including the above-described factors and conclusions, the Board unanimously approved the continuation of the Management Agreement for an additional one-year period.
Proxy Voting Policies and Procedures
The Fund’s investment manager has established Proxy Voting Policies and Procedures (Policies) that the Fund uses to determine how to vote proxies relating to portfolio securities. Shareholders may view the Fund’s complete Policies online at franklintempleton.com. Alternatively, shareholders may request copies of the Policies free of charge by calling the Proxy Group collect at (954) 527-7678 or by sending a written request to: Franklin Templeton Companies, LLC, 300 S.E. 2nd Street, Fort Lauderdale, FL 33301, Attention: Proxy Group. Copies of the Fund’s proxy voting records are also made available online at franklintempleton.com and posted on the US Securities and Exchange Commission’s website at sec.gov and reflect the most recent 12-month period ended June 30.
Quarterly Statement of Investments
The Trust, on behalf of the Fund, files a complete statement of investments with the US Securities and Exchange Commission for the first and third quarters for each fiscal year on Form N-Q. Shareholders may view the filed Form N-Q by visiting the Commission’s website at sec.gov. The filed form may also be viewed and copied at the Commission’s Public Reference Room in Washington, DC. Information regarding the operations of the Public Reference Room may be obtained by calling (800) SEC-0330.
Householding of Reports and Prospectuses
You will receive the Fund’s financial reports every six months as well as an annual updated summary prospectus (prospectus available upon request). To reduce Fund expenses, we try to identify related shareholders in a household and send only one copy of the financial reports and summary prospectus. This process, called “householding,” will continue indefinitely unless you instruct us otherwise. If you prefer not to have these documents householded, please call us at (800) 632-2301. At any time you may view current prospectuses/summary
| | | | |
44 | | Annual Report | | franklintempleton.com |
TEMPLETON GLOBAL INVESTMENT TRUST
TEMPLETON FRONTIER MARKETS FUND
SHAREHOLDER INFORMATION
prospectuses and financial reports on our website. If you choose, you may receive these documents through electronic delivery.
| | | | |
franklintempleton.com | | Annual Report | | 45 |
This page intentionally left blank.
This page intentionally left blank.
This page intentionally left blank.
| | |

| | Annual Report and Shareholder Letter Templeton Frontier Markets Fund |
| | Investment Manager |
| | Templeton Asset Management Ltd. |
| | Distributor |
| | Franklin Templeton Distributors, Inc. (800) DIAL BEN® / 342-5236 franklintempleton.com |
| | Shareholder Services |
| | (800) 632-2301 |
Authorized for distribution only when accompanied or preceded by a summary prospectus and/or prospectus. Investors should carefully consider a fund’s investment goals, risks, charges and expenses before investing. A prospectus contains this and other information; please read it carefully before investing.
To help ensure we provide you with quality service, all calls to and from our service areas are monitored and/or recorded.
| | |
| © 2018 Franklin Templeton Investments. All rights reserved. | | 096 A 05/18 |
| | |
| | Annual Report
and Shareholder Letter March 31, 2018 |
|
Templeton Emerging Markets Small Cap Fund A SERIES OF TEMPLETON GLOBAL INVESTMENT TRUST |
Sign up for electronic delivery at franklintempleton.com/edelivery
Franklin Templeton Investments
Why choose Franklin Templeton Investments?
Successful investing begins with ambition. And achievement only comes when you reach for it. That’s why we continually strive to deliver better outcomes for investors. No matter what your goals are, our deep, global investment expertise allows us to offer solutions that can help.
During our more than 70 years of experience, we’ve managed through all kinds of markets—up, down and those in between. We’re always preparing for what may come next. It’s because of this, combined with our strength as one of the world’s largest asset managers that we’ve earned the trust of millions of investors around the world.
Dear Shareholder:
During the 12 months ended March 31, 2018, the global economy continued to expand, with emerging market economies overall growing faster than developed market economies.
Improving corporate earnings growth and encouraging economic data from China and other emerging market countries helped offset investor concerns about China’s ability to continue growing its economy while restructuring and the US Federal Reserve’s monetary policy under a new chairman. Further supporting emerging market equities were generally higher commodity prices and emerging market currencies’ overall strength against the US dollar. However, escalating trade tensions between the US and China dampened investor sentiment near period-end. In this environment, emerging market small cap stocks delivered a strong total return, as measured by the MSCI Emerging Markets Small Cap Index.
We are committed to our long-term perspective and disciplined investment approach as we conduct a rigorous, fundamental analysis of securities with a regular emphasis on investment risk management.
Historically, patient investors have achieved rewarding results by evaluating their goals, diversifying their assets globally and maintaining a disciplined investment program, all hallmarks of the Templeton investment philosophy developed more than 60 years ago. We continue to recommend investors consult their financial advisors and review their portfolios to design a
long-term strategy and portfolio allocation that meet their individual needs, goals and risk tolerance.
Templeton Emerging Markets Small Cap Fund’s annual report includes more detail about prevailing conditions and a discussion about investment decisions during the period. Please remember all securities markets fluctuate, as do mutual fund share prices.
We thank you for investing with Franklin Templeton, welcome your questions and comments, and look forward to serving your investment needs in the years ahead.
Sincerely,
Manraj S. Sekhon, CFA
Chief Investment Officer
Franklin Templeton Emerging Markets Equity
This letter reflects our analysis and opinions as of March 31, 2018, unless otherwise indicated. The information is not a complete analysis of every aspect of any market, country, industry, security or fund. Statements of fact are from sources considered reliable.
CFA® is a trademark owned by CFA Institute.
| | | | | | |
| | | Not FDIC Insured | | | May Lose Value | | | No Bank Guarantee |
| | | | |
franklintempleton.com | | Not part of the annual report | | 1 |
Contents
Visit franklintempleton.com for fund updates, to access your account, or to find helpful financial planning tools.
| | | | |
2 | | Annual Report | | franklintempleton.com |
Annual Report
Templeton Emerging Markets Small Cap Fund
This annual report for Templeton Emerging Markets Small Cap Fund covers the fiscal year ended March 31, 2018.
Your Fund’s Goal and Main Investments
The Fund seeks long-term capital appreciation. Under normal market conditions, the Fund invests at least 80% of its net assets in securities of small cap companies located in emerging market countries, as defined in the Fund’s prospectus.
Performance Overview
The Fund’s Class A shares delivered a +17.13% cumulative total return for the 12 months under review. For comparison, the MSCI Emerging Markets (EM) Small Cap Index, which measures performance of small cap stocks in emerging markets, generated a +18.97% total return for the same period.1 Please note index performance information is provided for reference and we do not attempt to track any index but rather undertake investments on the basis of fundamental research. In addition, the Fund’s return reflects the effect of fees and expenses for professional management, while an index does not have such costs. You can find the Fund’s long-term performance data in the Performance Summary beginning on page 7.
Performance data represent past performance, which does not guarantee future results. Investment return and principal value will fluctuate, and you may have a gain or loss when you sell your shares. Current performance may differ from figures shown. For most recent month-end performance, go to franklintempleton.com or call (800) 342-5236.
Economic and Market Overview
Emerging market economies in general continued to grow faster than developed market economies during the 12 months under review. China’s economy grew faster in 2018’s first quarter compared to the prior-year period, driven by growth in industrial production, services, fixed-asset investment and real estate, and full-year 2017 growth exceeded the government’s target. India’s economy grew faster in 2017’s fourth quarter compared to the prior-year period, driven by investment and
Geographic Composition
Based on Total Net Assets as of 3/31/18
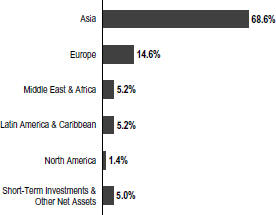
public spending growth. Russia’s economy grew in 2017 after two years of contraction, driven by growth in mining, manufacturing, transportation and storage, and wholesale and retail trade. Brazil’s economy grew in 2017’s fourth quarter compared to the prior-year period, supported by growth in household spending, fixed-asset investment and exports. South Africa’s economy expanded in 2017’s fourth quarter at the fastest annualized rate in nearly three years, amid robust growth in services and a recovery in manufacturing and utilities. South Korea’s economy grew in 2017’s fourth quarter compared to the prior-year period; however, it contracted compared to the third quarter due to declines in manufacturing and construction. Among other emerging markets, Taiwan’s and Turkey’s economies continued to grow.
Monetary policies varied among emerging market central banks. South Korea’s, Mexico’s and the Czech Republic’s central banks raised their benchmark interest rates during the 12-month period, while some, including those of South Africa and Chile, lowered their benchmark interest rates. The Bank of Russia reduced its key rate several times, and noted in March that it expects additional rate reductions in 2018. Brazil’s central bank cut its benchmark interest rate several times during the period to support economic growth. India’s central bank
1. Source: Morningstar.
The index is unmanaged and includes reinvestment of any income or distributions. It does not reflect any fees, expenses or sales charges. One cannot invest directly in an index, and an index is not representative of the Fund’s portfolio.
The dollar value, number of shares or principal amount, and names of all portfolio holdings are listed in the Fund’s Statement of Investments (SOI). The SOI begins on page 16.
| | | | |
franklintempleton.com | | Annual Report | | 3 |
TEMPLETON EMERGING MARKETS SMALL CAP FUND
reduced its benchmark interest rate in August due to slower inflation growth. China’s, Taiwan’s and Turkey’s central banks left their benchmark interest rates unchanged during the period.
Emerging market stocks rose during the 12 months under review, as improving corporate earnings growth and encouraging economic data from China and other emerging market countries helped offset investor concerns about China’s ability to continue its economic growth while making structural adjustments, the direction of the US Federal Reserve’s monetary policy under a new chairman, and geopolitical tensions in the Korean peninsula and other regions. Further supporting emerging market stocks were generally higher commodity prices, emerging market currencies’ overall strength against the US dollar, investment inflows and easing tensions in the Korean peninsula near period-end. However, the Trump administration’s protectionist policy and escalating trade tensions between the US and China dampened investor sentiment near period-end. In this environment, emerging market small cap stocks, as measured by the MSCI EM Small Cap Index, generated a +18.97% total return for the 12 months ended March 31, 2018.1
Investment Strategy
Our investment strategy employs a fundamental research, value-oriented, long-term approach. We focus on the market price of a company’s securities relative to our evaluation of the company’s long-term earnings, asset value and cash flow potential. We also consider a company’s profit and loss outlook, balance sheet strength, cash flow trends and asset value in relation to the current price of the company’s securities. The analysis considers the company’s corporate governance behavior as well as its position in its sector, the economic framework and political environment.
Manager’s Discussion
During the 12 months under review, key contributors to the Fund’s absolute performance included Sunny Optical Technology Group, Hoa Phat Group and Baozun.
Sunny Optical Technology, based in China, is a leading manufacturer of optical-related products with strong design and production capabilities. The company is one of the world’s largest suppliers of automotive lenses as well as one of mainland China’s leading makers of smartphone camera modules and lenses. Sunny Optical Technology reported better-than-expected 2017 corporate results, with double-digit percentage growth in sales and triple-digit percentage growth in
| | | | |
| Top 10 Countries | | | | |
| 3/31/18 | | | | |
| | | % of Total
Net Assets | |
India | | | 17.1% | |
China | | | 14.7% | |
South Korea | | | 10.7% | |
Taiwan | | | 8.6% | |
Vietnam | | | 7.2% | |
Turkey | | | 4.0% | |
Russia | | | 3.7% | |
Egypt | | | 2.9% | |
Brazil | | | 2.4% | |
Hong Kong | | | 2.4% | |
net profit. Growth in the company’s optoelectronics products, optical components and optical instruments segments supported earnings.
Hoa Phat is a major industrial company in Vietnam. The company is one of the country’s largest domestic steel producers and is also engaged in mining, furniture manufacturing, construction equipment manufacturing, real estate development and other businesses. Hoa Phat’s share prices surged in the second half of the reporting period on record-high 2017 earnings, supported by strength in its core steel production business.
Baozun is a Chinese e-commerce solutions provider. The company partners with brands to execute their e-commerce strategies, providing services such as online store construction, site operation, digital marketing and supply chain management. Shares in Baozun generally remained on an upward trend over the year, buoyed by better-than-expected quarterly corporate results throughout 2017. Management’s positive outlook for 2018 sales further supported sentiment in the stock.
In contrast, key detractors from the Fund’s absolute performance included Vieworks, Green Seal Holding and Glenmark Pharmaceuticals.
Vieworks develops and produces digital medical systems based on digital image acquisition, digital image processing and digital communication. The South Korea-based company reported a double-digit percentage decline in sales and operating profits in the last two quarters of 2017, primarily due to increased internal sourcing of products at key clients and intensifying competition. A decline in selling prices and appreciation in the South Korean won also impacted fourth quarter results. Expectations of a short-term slowdown in
| | | | | | |
4 | | Annual Report | | | | franklintempleton.com |
TEMPLETON EMERGING MARKETS SMALL CAP FUND
digital x-ray detector sales also impacted sentiment over the reporting period.
Green Seal is a Taiwan-based specialty chemicals business that produces biaxial-oriented polyamide films for a wide range of packaging products. The company reported weak third-quarter corporate results with a double-digit percentage decline in revenues and deterioration in gross margin largely due to lower selling prices, a temporary shutdown of the company’s production facilities for upgrades, lower utilization rates and renminbi appreciation. For 2017 as a whole, revenues and profit also declined. News that a major shareholder, an investment company held by Green Seal’s chairman, disposed of its stake in the business at a discount to the market price hurt investor sentiment.
Glenmark Pharmaceuticals is an Indian manufacturer of generic drugs and pharmaceutical ingredients. Glenmark produces formulation products in areas such as oncology, respiratory and cardiac. The company also researches and develops its own chemical and biological entities. In addition to India, the US is a major market. The share price declined sharply in May 2017 as the company announced weaker-than-expected first-quarter operating performance with disappointing revenue growth. Sales in India were impacted by the government’s demonetization efforts, with price pressures also evident in other key markets.
During the period, our continued search for investments we believed to be undervalued and trading at what we considered attractive valuations and fund inflows led us to purchases in Vietnam, China, Taiwan and South Korea. Some additions were also made in India, Russia and the Philippines due to their solid fundamentals. Investments in the consumer discretionary, health care, information technology and financials sectors were also increased.2 Key purchases included new investments in Baozun, a Chinese e-commerce solutions provider, and Vincom Retail, one of the largest shopping mall operators in Vietnam, as well as increased holdings in Primax Electronics, a leading Taiwanese electronics component manufacturer.
Conversely, the attainment of sell targets for certain investments and the availability of opportunities we considered to be more attractively valued within the investment universe
| | | | |
| Top 10 Holdings | | | | |
| 3/31/18 | | | | |
Company Sector/Industry, Country | | % of Total
Net Assets | |
Bajaj Holdings & Investment Ltd. | | | 3.5% | |
Diversified Financial Services, India | | | | |
Baozun Inc. | | | 2.5% | |
Internet Software & Services, China | | | | |
Apollo Tyres Ltd. | | | 2.5% | |
Auto Components, India | | | | |
Hoa Phat Group JSC | | | 2.0% | |
Metals & Mining, Vietnam | | | | |
Medy-tox Inc. | | | 1.9% | |
Biotechnology, South Korea | | | | |
Sunny Optical Technology Group Co. Ltd. | | | 1.7% | |
Electronic Equipment, Instruments & Components, China | | | | |
Fila Korea Ltd. | | | 1.6% | |
Textiles, Apparel & Luxury Goods, South Korea | | | | |
Tata Chemicals Ltd. | | | 1.6% | |
Chemicals, India | | | | |
Federal Bank Ltd. | | | 1.6% | |
Banks, India | | | | |
Mail.Ru Group Ltd. | | | 1.5% | |
Internet Software & Services, Russia | | | | |
led us to sell a number of holdings. Key sales included Fortuna Entertainment,3 a Polish-listed sports betting company; Bloomage Biotechnology,3 a Chinese manufacturer and distributor of sodium hyaluronic acid; and Balkrishna Tires, a specialty Indian tire manufacturer. We also reduced investments in Poland, Malaysia, the Czech Republic and Botswana.
It is important to recognize the effect of currency movements on the Fund’s performance. In general, if the value of the US dollar goes up compared with a foreign currency, an investment traded in that foreign currency will go down in value because it will be worth fewer US dollars. This can have a negative effect on Fund performance. Conversely, when the US dollar weakens in relation to a foreign currency, an investment traded in that foreign currency will increase in value, which can contribute to Fund performance. For the 12 months ended March 31, 2018, the US dollar declined in value relative to most currencies. As a result, the Fund’s performance was
2. The consumer discretionary sector comprises auto components; automobiles; diversified consumer services; hotels, restaurants and leisure; household durables; internet and direct marketing retail; leisure products; media; specialty retail; and textiles, apparel and luxury goods in the SOI. The health care sector comprises biotechnology, health care equipment and supplies, health care providers and services, and pharmaceuticals in the SOI. The information technology sector comprises electronic equipment, instruments and components; internet software and services; IT services; semiconductors and semiconductor equipment; and technology hardware, storage and peripherals in the SOI. The financials sector comprises banks, consumer finance, diversified financial services and insurance in the SOI.
3. Not held at period-end.
See www.franklintempletondatasources.com for additional data provider information.
| | | | | | |
franklintempleton.com | | | | Annual Report | | 5 |
TEMPLETON EMERGING MARKETS SMALL CAP FUND
positively affected by the portfolio’s investment predominantly in securities with non-US currency exposure. However, one cannot expect the same result in future periods.
Thank you for your continued participation in Templeton Emerging Markets Small Cap Fund. We look forward to serving your future investment needs.
| | |
 | | 
Chetan Sehgal, CFA Portfolio Manager |
The foregoing information reflects our analysis, opinions and portfolio holdings as of March 31, 2018, the end of the reporting period. The way we implement our main investment strategies and the resulting portfolio holdings may change depending on factors such as market and economic conditions. These opinions may not be relied upon as investment advice or an offer for a particular security. The information is not a complete analysis of every aspect of any market, country, industry, security or the Fund. Statements of fact are from sources considered reliable, but the investment manager makes no representation or warranty as to their completeness or accuracy. Although historical performance is no guarantee of future results, these insights may help you understand our investment management philosophy.
| | | | | | |
6 | | Annual Report | | | | franklintempleton.com |
TEMPLETON EMERGING MARKETS SMALL CAP FUND
Performance Summary as of March 31, 2018
The performance table and graphs do not reflect any taxes that a shareholder would pay on Fund dividends, capital gain distributions, if any, or any realized gains on the sale of Fund shares. Total return reflects reinvestment of the Fund’s dividends and capital gain distributions, if any, and any unrealized gains or losses. Your dividend income will vary depending on dividends or interest paid by securities in the Fund’s portfolio, adjusted for operating expenses of each class. Capital gain distributions are net profits realized from the sale of portfolio securities.
Performance as of 3/31/181
Cumulative total return excludes sales charges. Average annual total return includes maximum sales charges. Sales charges will vary depending on the size of the investment and the class of share purchased. The maximum is 5.75% and the minimum is 0%. Class A: 5.75% maximum initial sales charge; Advisor Class: no sales charges. For other share classes, visit franklintempleton.com.
| | | | | | | | |
Share Class | | Cumulative
Total Return2 | | | Average Annual
Total Return3 | |
A | | | | | | | | |
1-Year | | | +17.13% | | | | +10.43% | |
5-Year | | | +33.51% | | | | +4.70% | |
10-Year | | | +57.57% | | | | +4.03% | |
Advisor | | | | | | | | |
1-Year | | | +17.48% | | | | +17.48% | |
5-Year | | | +35.52% | | | | +6.27% | |
10-Year | | | +62.23% | | | | +4.96% | |
Performance data represent past performance, which does not guarantee future results. Investment return and principal value will fluctuate, and you may have a gain or loss when you sell your shares. Current performance may differ from figures shown. For most recent month-end performance, go to franklintempleton.com or call (800) 342-5236.
See page 9 for Performance Summary footnotes.
| | | | | | |
franklintempleton.com | | | | Annual Report | | 7 |
TEMPLETON EMERGING MARKETS SMALL CAP FUND
PERFORMANCE SUMMARY
Total Return Index Comparison for a Hypothetical $10,000 Investment1
Total return represents the change in value of an investment over the periods shown. It includes any applicable maximum sales charge, Fund expenses, account fees and reinvested distributions. The unmanaged index includes reinvestment of any income or distributions. It differs from the Fund in composition and does not pay management fees or expenses. One cannot invest directly in an index.
Class A (4/1/08–3/31/18)
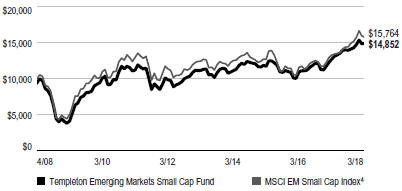
Advisor Class (4/1/08–3/31/18)
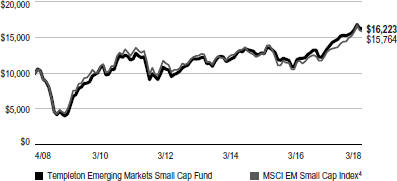
See page 9 for Performance Summary footnotes.
| | | | | | |
8 | | Annual Report | | | | franklintempleton.com |
TEMPLETON EMERGING MARKETS SMALL CAP FUND
PERFORMANCE SUMMARY
Distributions (4/1/17–3/31/18)
| | | | |
Share Class | | Net Investment
Income | |
R6 | | | $0.0374 | |
Advisor | | | $0.0188 | |
Total Annual Operating Expenses5
| | | | | | | | |
Share Class | | With Waiver | | | Without Waiver | |
A | | | 1.97% | | | | 1.98% | |
Advisor | | | 1.72% | | | | 1.73% | |
Each class of shares is available to certain eligible investors and has different annual fees and expenses, as described in the prospectus.
All investments involve risks, including possible loss of principal. Special risks are associated with foreign investing, including currency fluctuations, economic instability and political developments. Investments in emerging markets, of which frontier markets are a subset, involve heightened risks related to the same factors, in addition to those associated with these markets’ smaller size, lesser liquidity and lack of established legal, political, business and social frameworks to support securities markets. Because these frameworks are typically even less developed in frontier markets, as well as various factors including the increased potential for extreme price volatility, illiquidity, trade barriers and exchange controls, the risks associated with emerging markets are magnified in frontier markets. Small-cap company stocks have historically had more price volatility than large-company stocks, particularly over the short term. All investments in the Fund should be thought of as long-term investments that could experience significant price volatility in any given year. The Fund is designed for the aggressive portion of a well-diversified portfolio. The Fund is actively managed but there is no guarantee that the manager’s investment decisions will produce the desired results. The Fund’s prospectus also includes a description of the main investment risks.
1. The Fund has a fee waiver associated with any investment it makes in a Franklin Templeton money fund and/or other Franklin Templeton fund, contractually guaranteed through 7/31/18. Fund investment results reflect the fee waiver; without this waiver, the results would have been lower.
2. Cumulative total return represents the change in value of an investment over the periods indicated.
3. Average annual total return represents the average annual change in value of an investment over the periods indicated. Return for less than one year, if any, has not been annualized.
4. Source: Morningstar. The MSCI EM Small Cap Index is a free float-adjusted, market capitalization-weighted index designed to measure performance of small cap equities in emerging markets.
5. Figures are as stated in the Fund’s current prospectus and may differ from the expense ratios disclosed in the Your Fund’s Expenses and Financial Highlights sections in this report. In periods of market volatility, assets may decline significantly, causing total annual Fund operating expenses to become higher than the figures shown.
See www.franklintempletondatasources.com for additional data provider information.
| | | | | | |
franklintempleton.com | | | | Annual Report | | 9 |
TEMPLETON EMERGING MARKETS SMALL CAP FUND
Your Fund’s Expenses
As a Fund shareholder, you can incur two types of costs: (1) transaction costs, including sales charges (loads) on Fund purchases and redemptions; and (2) ongoing Fund costs, including management fees, distribution and service (12b-1) fees, and other Fund expenses. All mutual funds have ongoing costs, sometimes referred to as operating expenses. The table below shows ongoing costs of investing in the Fund and can help you understand these costs and compare them with those of other mutual funds. The table assumes a $1,000 investment held for the six months indicated.
Actual Fund Expenses
The table below provides information about actual account values and actual expenses in the columns under the heading “Actual.” In these columns the Fund’s actual return, which includes the effect of Fund expenses, is used to calculate the “Ending Account Value” for each class of shares. You can estimate the expenses you paid during the period by following these steps (of course, your account value and expenses will differ from those in this illustration): Divide your account value by $1,000 (if your account had an $8,600 value, then $8,600 ÷ $1,000 = 8.6). Then multiply the result by the number in the row for your class of shares under the headings “Actual” and “Expenses Paid During Period” (if Actual Expenses Paid During Period were $7.50, then 8.6 x $7.50 = $64.50). In this illustration, the actual expenses paid this period are $64.50.
Hypothetical Example for Comparison with Other Funds
Under the heading “Hypothetical” in the table, information is provided about hypothetical account values and hypothetical expenses based on the Fund’s actual expense ratio and an assumed rate of return of 5% per year before expenses, which is not the Fund’s actual return. This information may not be used to estimate the actual ending account balance or expenses you paid for the period, but it can help you compare ongoing costs of investing in the Fund with those of other funds. To do so, compare this 5% hypothetical example for the class of shares you hold with the 5% hypothetical examples that appear in the shareholder reports of other funds.
Please note that expenses shown in the table are meant to highlight ongoing costs and do not reflect any transactional costs. Therefore, information under the heading “Hypothetical” is useful in comparing ongoing costs only, and will not help you compare total costs of owning different funds. In addition, if transactional costs were included, your total costs would have been higher.
| | | | | | | | | | | | |
| | | | | Actual
(actual return after expenses) | | Hypothetical
(5% annual return before expenses) | | |
| | | Expenses | | | | Expenses | | Net |
| | | Beginning | | Ending | | Paid During | | Ending | | Paid During | | Annualized |
| Share | | Account | | Account | | Period | | Account | | Period | | Expense |
| Class | | Value 10/1/17 | | Value 3/31/18 | | 10/1/17–3/31/181,2 | | Value 3/31/18 | | 10/1/17–3/31/181,2 | | Ratio2 |
| | | | | | |
A | | $1,000 | | $1,066.40 | | $ 9.84 | | $1,015.41 | | $ 9.60 | | 1.91% |
C | | $1,000 | | $1,062.80 | | $13.68 | | $1,011.67 | | $13.34 | | 2.66% |
R | | $1,000 | | $1,064.80 | | $11.17 | | $1,014.11 | | $10.90 | | 2.17% |
R6 | | $1,000 | | $1,068.30 | | $ 7.94 | | $1,017.25 | | $ 7.75 | | 1.54% |
Advisor | | $1,000 | | $1,067.70 | | $ 8.56 | | $1,016.65 | | $ 8.35 | | 1.66% |
1. Expenses are equal to the annualized expense ratio for the six-month period as indicated above—in the far right column—multiplied by the simple average account value over the period indicated, and then multiplied by 182/365 to reflect the one-half year period.
2. Reflects expenses after fee waivers and expense reimbursements. Does not include acquired fund fees and expenses.
| | | | | | |
10 | | Annual Report | | | | franklintempleton.com |
TEMPLETON GLOBAL INVESTMENT TRUST
Financial Highlights
Templeton Emerging Markets Small Cap Fund
| | | | | | | | | | | | | | | | | | | | |
| | | Year Ended March 31, | |
| | | | |
| | | 2018 | | | 2017 | | | 2016 | | | 2015 | | | 2014 | |
| |
| | | | | |
Class A | | | | | | | | | | | | | | | | | | | | |
| | | | | |
Per share operating performance | | | | | | | | | | | | | | | | | | | | |
(for a share outstanding throughout the year) | | | | | | | | | | | | | | | | | | | | |
| | | | | |
Net asset value, beginning of year | | | $13.02 | | | | $11.41 | | | | $12.25 | | | | $11.64 | | | | $11.75 | |
| | | | |
| | | | | |
Income from investment operationsa: | | | | | | | | | | | | | | | | | | | | |
| Net investment incomeb | | | — | c | | | 0.16 | d | | | 0.04 | | | | — | c | | | 0.06 | |
| | | | | |
Net realized and unrealized gains (losses) | | | 2.23 | | | | 1.65 | | | | (0.85 | ) | | | 0.63 | | | | (0.09) | |
| | | | |
| | | | | |
Total from investment operations | | | 2.23 | | | | 1.81 | | | | (0.81 | ) | | | 0.63 | | | | (0.03) | |
| | | | |
| | | | | |
| Less distributions from net investment income | | | — | | | | (0.20 | ) | | | (0.03 | ) | | | (0.02 | ) | | | (0.08) | |
| | | | |
| | | | | |
| Net asset value, end of year | | | $15.25 | | | | $13.02 | | | | $11.41 | | | | $12.25 | | | | $11.64 | |
| | | | |
| | | | | |
Total returne | | | 17.13% | | | | 16.09% | | | | (6.60)% | | | | 5.40% | | | | (0.26)% | |
| | | | | |
Ratios to average net assets | | | | | | | | | | | | | | | | | | | | |
| | | | | |
Expenses before waiver and payments by affiliates | | | 1.96% | | | | 1.98% | | | | 2.00% | | | | 2.04% | | | | 2.11% | |
| | | | | |
Expenses net of waiver and payments by affiliates | | | 1.94% | | | | 1.97% | | | | 1.99% | | | | 2.02% | | | | 2.10% | |
| | | | | |
Net investment income (loss) | | | (0.01)% | | | | 1.25% | d | | | 0.33% | | | | (0.05)% | | | | 0.39% | |
| | | | | |
Supplemental data | | | | | | | | | | | | | | | | | | | | |
| | | | | |
Net assets, end of year (000’s) | | | $315,469 | | | | $257,388 | | | | $257,977 | | | | $277,148 | | | | $235,046 | |
| | | | | |
Portfolio turnover rate | | | 7.57% | | | | 21.26% | | | | 18.09% | | | | 19.21% | | | | 22.47% | |
aThe amount shown for a share outstanding throughout the period may not correlate with the Statement of Operations for the period due to the timing of sales and repurchases of the Fund’s shares in relation to income earned and/or fluctuating fair value of the investments of the Fund.
bBased on average daily shares outstanding.
cAmount rounds to less than $0.01 per share.
dNet investment income per share includes approximately $0.09 per share related to income received in the form of special dividends in connection with certain Fund holdings. Excluding this amount, the ratio of net investment income to average net assets would have been 0.48%.
eTotal return does not reflect sales commissions or contingent deferred sales charges, if applicable.
| | | | | | |
franklintempleton.com | | | | The accompanying notes are an integral part of these financial statements. | Annual Report | | 11 |
TEMPLETON GLOBAL INVESTMENT TRUST
FINANCIAL HIGHLIGHTS
Templeton Emerging Markets Small Cap Fund (continued)
| | | | | | | | | | | | | | | | | | | | |
| | | Year Ended March 31, | |
| | | | |
| | | 2018 | | | 2017 | | | 2016 | | | 2015 | | | 2014 | |
| |
| | | | | |
Class C | | | | | | | | | | | | | | | | | | | | |
| | | | | |
Per share operating performance | | | | | | | | | | | | | | | | | | | | |
(for a share outstanding throughout the year) | | | | | | | | | | | | | | | | | | | | |
| | | | | |
Net asset value, beginning of year | | | $12.51 | | | | $10.96 | | | | $11.82 | | | | $11.30 | | | | $11.42 | |
| | | | |
| | | | | |
Income from investment operationsa: | | | | | | | | | | | | | | | | | | | | |
| Net investment income (loss)b | | | (0.10 | ) | | | 0.07 | c | | | (0.04 | ) | | | (0.08 | ) | | | (0.02) | |
| | | | | |
Net realized and unrealized gains (losses) | | | 2.13 | | | | 1.59 | | | | (0.82 | ) | | | 0.60 | | | | (0.09) | |
| | | | |
| | | | | |
Total from investment operations | | | 2.03 | | | | 1.66 | | | | (0.86 | ) | | | 0.52 | | | | (0.11) | |
| | | | |
| | | | | |
| Less distributions from net investment income | | | — | | | | (0.11 | ) | | | — | | | | — | | | | (0.01) | |
| | | | |
| | | | | |
| Net asset value, end of year | | | $14.54 | | | | $12.51 | | | | $10.96 | | | | $11.82 | | | | $11.30 | |
| | | | |
| | | | | |
Total returnd | | | 16.23% | | | | 15.29% | | | | (7.28)% | | | | 4.60% | | | | (0.91)% | |
| | | | | |
Ratios to average net assets | | | | | | | | | | | | | | | | | | | | |
| | | | | |
Expenses before waiver and payments by affiliates | | | 2.71% | | | | 2.72% | | | | 2.73% | | | | 2.74% | | | | 2.81% | |
| | | | | |
Expenses net of waiver and payments by affiliates | | | 2.69% | | | | 2.71% | | | | 2.72% | | | | 2.72% | | | | 2.80% | |
| | | | | |
Net investment income (loss) | | | (0.76)% | | | | 0.51% | c | | | (0.40)% | | | | (0.75)% | | | | (0.31)% | |
| | | | | |
Supplemental data | | | | | | | | | | | | | | | | | | | | |
| | | | | |
Net assets, end of year (000’s) | | | $78,836 | | | | $62,889 | | | | $62,148 | | | | $73,687 | | | | $62,917 | |
| | | | | |
Portfolio turnover rate | | | 7.57% | | | | 21.26% | | | | 18.09% | | | | 19.21% | | | | 22.47% | |
aThe amount shown for a share outstanding throughout the period may not correlate with the Statement of Operations for the period due to the timing of sales and repurchases of the Fund’s shares in relation to income earned and/or fluctuating fair value of the investments of the Fund.
bBased on average daily shares outstanding.
cNet investment income per share includes approximately $0.09 per share related to income received in the form of special dividends in connection with certain Fund holdings. Excluding this amount, the ratio of net investment income to average net assets would have been (0.26)%.
dTotal return does not reflect sales commissions or contingent deferred sales charges, if applicable.
| | | | | | |
12 | | Annual Report | | | The accompanying notes are an integral part of these financial statements. | | franklintempleton.com |
TEMPLETON GLOBAL INVESTMENT TRUST
FINANCIAL HIGHLIGHTS
Templeton Emerging Markets Small Cap Fund (continued)
| | | | | | | | | | | | | | | | | | | | |
| | | Year Ended March 31, | |
| | | | |
| | | 2018 | | | 2017 | | | 2016 | | | 2015 | | | 2014 | |
| |
| | | | | |
Class R | | | | | | | | | | | | | | | | | | | | |
| | | | | |
Per share operating performance | | | | | | | | | | | | | | | | | | | | |
(for a share outstanding throughout the year) | | | | | | | | | | | | | | | | | | | | |
| | | | | |
Net asset value, beginning of year | | | $12.93 | | | | $11.33 | | | | $12.16 | | | | $11.56 | | | | $11.67 | |
| | | | |
| | | | | |
Income from investment operationsa: | | | | | | | | | | | | | | | | | | | | |
| Net investment income (loss)b | | | (0.04 | ) | | | 0.12 | c | | | 0.02 | | | | — | | | | 0.06 | |
| | | | | |
Net realized and unrealized gains (losses) | | | 2.22 | | | | 1.65 | | | | (0.85 | ) | | | 0.60 | | | | (0.12) | |
| | | | |
| | | | | |
Total from investment operations | | | 2.18 | | | | 1.77 | | | | (0.83 | ) | | | 0.60 | | | | (0.06) | |
| | | | |
| | | | | |
| Less distributions from net investment income | | | — | | | | (0.17 | ) | | | (— | )d | | | — | | | | (0.05) | |
| | | | |
| | | | | |
| Net asset value, end of year | | | $15.11 | | | | $12.93 | | | | $11.33 | | | | $12.16 | | | | $11.56 | |
| | | | |
| | | | | |
Total return | | | 16.86 | % | | | 15.84 | % | | | (6.82 | )% | | | 5.19 | % | | | (0.37)% | |
| | | | | |
Ratios to average net assets | | | | | | | | | | | | | | | | | | | | |
| | | | | |
Expenses before waiver and payments by affiliates | | | 2.21 | % | | | 2.23 | % | | | 2.23 | % | | | 2.24 | % | | | 2.31% | |
| | | | | |
Expenses net of waiver and payments by affiliates | | | 2.19 | % | | | 2.22 | % | | | 2.22 | % | | | 2.22 | % | | | 2.30% | |
| | | | | |
Net investment income (loss) | | | (0.26) | % | | | 1.00 | %c | | | 0.10 | % | | | (0.25) | % | | | 0.19% | |
| | | | | |
Supplemental data | | | | | | | | | | | | | | | | | | | | |
| | | | | |
Net assets, end of year (000’s) | | | $929 | | | | $532 | | | | $477 | | | | $579 | | | | $659 | |
| | | | | |
Portfolio turnover rate | | | 7.57 | % | | | 21.26 | % | | | 18.09 | % | | | 19.21 | % | | | 22.47% | |
aThe amount shown for a share outstanding throughout the period may not correlate with the Statement of Operations for the period due to the timing of sales and repurchases of the Fund’s shares in relation to income earned and/or fluctuating fair value of the investments of the Fund.
bBased on average daily shares outstanding.
cNet investment income per share includes approximately $0.09 per share related to income received in the form of special dividends in connection with certain Fund holdings. Excluding this amount, the ratio of net investment income to average net assets would have been 0.23%.
dAmount rounds to less than $0.01 per share.
| | | | | | |
franklintempleton.com | | | | The accompanying notes are an integral part of these financial statements. | Annual Report | | 13 |
TEMPLETON GLOBAL INVESTMENT TRUST
FINANCIAL HIGHLIGHTS
Templeton Emerging Markets Small Cap Fund (continued)
| | |
| | | Year Ended
March 31,
2018a |
Class R6 | | |
| |
Per share operating performance | | |
(for a share outstanding throughout the year) | | |
| |
Net asset value, beginning of year | | $14.41 |
| |
Income from investment operationsb: | | |
| |
Net investment income (loss)c | | (0.04) |
| |
Net realized and unrealized gains (losses) | | 1.08 |
| |
Total from investment operations | | 1.04 |
| |
Less distributions from net investment income | | (0.04) |
| |
Net asset value, end of year | | $15.41 |
| |
Total returnd | | 7.27% |
| |
Ratios to average net assetse | | |
| |
Expenses before waiver and payments by affiliates | | 1.59% |
| |
Expenses net of waiver and payments by affiliates | | 1.54% |
| |
Net investment income | | 0.39%f |
| |
Supplemental data | | |
| |
Net assets, end of year (000’s) | | $23,964 |
| |
Portfolio turnover rate | | 7.57% |
aFor the period August 1, 2017 (effective date) to March 31, 2018.
bThe amount shown for a share outstanding throughout the period may not correlate with the Statement of Operations for the period due to the timing of sales and repurchases of the Fund’s shares in relation to income earned and/or fluctuating fair value of the investments of the Fund.
cBased on average daily shares outstanding.
dTotal return is not annualized for periods less than one year.
eRatios are annualized for periods less than one year.
fRatio is calculated based on the Fund level net investment income, as reflected in the Statement of Operations, and adjusted for class specific expenses. The amount may not correlate with the per share amount due to the timing of income earned and/or fluctuating fair value of the investments of the Fund in relation to the timing of sales and repurchases of Fund shares.
| | | | | | |
14 | | Annual Report | | | The accompanying notes are an integral part of these financial statements. | | franklintempleton.com |
TEMPLETON GLOBAL INVESTMENT TRUST
FINANCIAL HIGHLIGHTS
Templeton Emerging Markets Small Cap Fund (continued)
| | | | | | | | | | | | | | | | | | | | |
| | | Year Ended March 31, | |
| | | | |
| | | 2018 | | | 2017 | | | 2016 | | | 2015 | | | 2014 | |
| |
| | | | | |
Advisor Class | | | | | | | | | | | | | | | | | | | | |
| | | | | |
Per share operating performance | | | | | | | | | | | | | | | | | | | | |
(for a share outstanding throughout the year) | | | | | | | | | | | | | | | | | | | | |
| | | | | |
Net asset value, beginning of year | | | $13.15 | | | | $11.52 | | | | $12.37 | | | | $11.76 | | | | $11.87 | |
| | | | |
| | | | | |
Income from investment operationsa: | | | | | | | | | | | | | | | | | | | | |
| Net investment incomeb | | | 0.03 | | | | 0.18 | c | | | 0.07 | | | | 0.02 | | | | 0.05 | |
| | | | | |
Net realized and unrealized gains (losses) | | | 2.26 | | | | 1.68 | | | | (0.86 | ) | | | 0.65 | | | | (0.04) | |
| | | | |
| | | | | |
Total from investment operations | | | 2.29 | | | | 1.86 | | | | (0.79 | ) | | | 0.67 | | | | 0.01 | |
| | | | |
| | | | | |
| Less distributions from net investment income | | | (0.02 | ) | | | (0.23 | ) | | | (0.06 | ) | | | (0.06 | ) | | | (0.12) | |
| | | | |
| | | | | |
| Net asset value, end of year | | | $15.42 | | | | $13.15 | | | | $11.52 | | | | $12.37 | | | | $11.76 | |
| | | | |
| | | | | |
Total return | | | 17.48% | | | | 16.42% | | | | (6.35)% | | | | 5.66% | | | | 0.13% | |
| | | | | |
Ratios to average net assets | | | | | | | | | | | | | | | | | | | | |
| | | | | |
Expenses before waiver and payments by affiliates | | | 1.71% | | | | 1.73% | | | | 1.73% | | | | 1.74% | | | | 1.81% | |
| | | | | |
Expenses net of waiver and payments by affiliates | | | 1.69% | | | | 1.72% | | | | 1.72% | | | | 1.72% | | | | 1.80% | |
| | | | | |
Net investment income | | | 0.24% | | | | 1.50% | c | | | 0.60% | | | | 0.25% | | | | 0.69% | |
| | | | | |
Supplemental data | | | | | | | | | | | | | | | | | | | | |
| | | | | |
Net assets, end of year (000’s) | | | $668,474 | | | | $442,583 | | | | $361,128 | | | | $363,848 | | | | $241,453 | |
| | | | | |
Portfolio turnover rate | | | 7.57% | | | | 21.26% | | | | 18.09% | | | | 19.21% | | | | 22.47% | |
aThe amount shown for a share outstanding throughout the period may not correlate with the Statement of Operations for the period due to the timing of sales and repurchases of the Fund’s shares in relation to income earned and/or fluctuating fair value of the investments of the Fund.
bBased on average daily shares outstanding.
cNet investment income per share includes approximately $0.09 per share related to income received in the form of special dividends in connection with certain Fund holdings. Excluding this amount, the ratio of net investment income to average net assets would have been 0.73%.
| | | | | | |
franklintempleton.com | | | | The accompanying notes are an integral part of these financial statements. | Annual Report | | 15 |
TEMPLETON GLOBAL INVESTMENT TRUST
Statement of Investments, March 31, 2018
Templeton Emerging Markets Small Cap Fund
| | | | | | | | | | |
| | | Industry | | Shares | | | Value | |
Common Stocks 93.1% | | | | | | | | |
Austria 0.5% | | | | | | | | | | |
DO & CO Restaurants & Catering AG | | Hotels, Restaurants & Leisure | | | 92,774 | | | | $ 5,745,268 | |
| | | | | | | | | | |
Botswana 0.1% | | | | | | | | | | |
Letshego Holdings Ltd. | | Consumer Finance | | | 3,915,783 | | | | 765,117 | |
| | | | | | | | | | |
Brazil 2.0% | | | | | | | | | | |
Arezzo Industria e Comercio SA | | Textiles, Apparel & Luxury Goods | | | 236,100 | | | | 3,611,042 | |
Grendene SA | | Textiles, Apparel & Luxury Goods | | | 1,022,612 | | | | 8,465,300 | |
aSer Educacional SA, Reg S | | Diversified Consumer Services | | | 1,036,500 | | | | 6,275,261 | |
Wiz Solucoes e Corretagem de seguros SA | | Insurance | | | 983,685 | | | | 3,303,653 | |
| | | | | | | | | | |
| | | |
| | | | | | | | | 21,655,256 | |
| | | | | | | | | | |
China 14.7% | | | | | | | | | | |
bBaozun Inc., ADR | | Internet Software & Services | | | 601,384 | | | | 27,591,498 | |
Chinasoft International Ltd. | | IT Services | | | 8,008,000 | | | | 7,182,795 | |
Chongqing Machinery & Electric Co. Ltd., H | | Industrial Conglomerates | | | 25,310,000 | | | | 2,483,016 | |
COSCO Shipping Ports Ltd. | | Transportation Infrastructure | | | 7,149,951 | | | | 6,012,343 | |
Green Seal Holding Ltd. | | Chemicals | | | 952,600 | | | | 1,589,659 | |
bHealth and Happiness H&H International Holdings Ltd. | | Food Products | | | 1,851,500 | | | | 14,094,782 | |
Huaxin Cement Co. Ltd., B | | Construction Materials | | | 9,955,953 | | | | 13,450,492 | |
Jiangling Motors Corp. Ltd., B | | Automobiles | | | 3,948,718 | | | | 6,037,180 | |
cLuye Pharma Group Ltd. | | Pharmaceuticals | | | 10,634,000 | | | | 10,174,975 | |
bNoah Holdings Ltd., ADR | | Capital Markets | | | 214,154 | | | | 10,110,210 | |
bSohu.com Inc. | | Internet Software & Services | | | 77,722 | | | | 2,403,164 | |
Sunny Optical Technology Group Co. Ltd. | | Electronic Equipment, Instruments & Components | | | 1,002,000 | | | | 18,498,344 | |
TravelSky Technology Ltd., H | | IT Services | | | 4,567,200 | | | | 13,238,176 | |
Uni-President China Holdings Ltd | | Food Products | | | 11,454,000 | | | | 9,908,860 | |
Weifu High-Technology Co. Ltd., B | | Auto Components | | | 1,988,000 | | | | 4,209,632 | |
Xinyi Solar Holdings Ltd. | | Semiconductors & Semiconductor Equipment | | | 18,680,200 | | | | 7,544,623 | |
Xtep International Holdings Ltd. | | Textiles, Apparel & Luxury Goods | | | 8,836,600 | | | | 4,908,722 | |
| | | | | | | | | | |
| | | |
| | | | | | | | | 159,438,471 | |
| | | | | | | | | | |
Czech Republic 1.0% | | | | | | | | | | |
dMoneta Money Bank AS, 144A | | Banks | | | 2,567,132 | | | | 10,669,605 | |
| | | | | | | | | | |
Egypt 2.9% | | | | | | | | | | |
bArabian Food Industries Co. DOMTY | | Food Products | | | 2,409,850 | | | | 1,469,421 | |
Eastern Tobacco | | Tobacco | | | 232,582 | | | | 7,846,311 | |
Egyptian International Pharmaceuticals EIPICO | | Pharmaceuticals | | | 1,373,432 | | | | 11,295,952 | |
bGlobal Telecom Holding SAE | | Wireless Telecommunication Services | | | 15,222,239 | | | | 5,612,283 | |
Integrated Diagnostics Holdings PLC | | Health Care Providers & Services | | | 1,049,430 | | | | 4,879,850 | |
| | | | | | | | | | |
| | | |
| | | | | | | | | 31,103,817 | |
| | | | | | | | | | |
Georgia 0.8% | | | | | | | | | | |
bGeorgia Healthcare Group PLC | | Health Care Providers & Services | | | 1,950,607 | | | | 8,457,011 | |
| | | | | | | | | | |
Hong Kong 2.4% | | | | | | | | | | |
Amvig Holdings Ltd. | | Containers & Packaging | | | 6,108,000 | | | | 1,673,147 | |
I.T Ltd. | | Specialty Retail | | | 12,510,395 | | | | 5,801,885 | |
Ju Teng International Holdings Ltd. | | Electronic Equipment, Instruments & Components | | | 17,608,000 | | | | 4,352,197 | |
Luk Fook Holdings (International) Ltd. | | Specialty Retail | | | 3,888,000 | | | | 14,117,827 | |
| | | | | | | | | | |
| | | |
| | | | | | | | | 25,945,056 | |
| | | | | | | | | | |
Hungary 0.6% | | | | | | | | | | |
Richter Gedeon Nyrt | | Pharmaceuticals | | | 330,880 | | | | 6,918,329 | |
| | | | | | | | | | |
| | | | |
16 | | Annual Report | | franklintempleton.com |
TEMPLETON GLOBAL INVESTMENT TRUST
STATEMENT OF INVESTMENTS
Templeton Emerging Markets Small Cap Fund (continued)
| | | | | | | | | | |
| | | Industry | | Shares | | | Value | |
Common Stocks (continued) | | | | | | | | |
India 17.1% | | | | | | | | | | |
Apollo Tyres Ltd. | | Auto Components | | | 6,432,450 | | | | $ 27,577,346 | |
Bajaj Holdings & Investment Ltd. | | Diversified Financial Services | | | 922,172 | | | | 37,809,723 | |
Balkrishna Industries Ltd. | | Auto Components | | | 729,202 | | | | 12,038,005 | |
Biocon Ltd. | | Biotechnology | | | 1,393,872 | | | | 12,795,488 | |
Dalmia Bharat Ltd. | | Construction Materials | | | 182,460 | | | | 8,093,851 | |
b Equitas Holdings Ltd. | | Consumer Finance | | | 3,113,000 | | | | 6,959,107 | |
Federal Bank Ltd. | | Banks | | | 12,610,038 | | | | 17,447,016 | |
Glenmark Pharmaceuticals Ltd. | | Pharmaceuticals | | | 1,197,798 | | | | 9,735,546 | |
Great Eastern Shipping Co. Ltd. | | Oil, Gas & Consumable Fuels | | | 262,500 | | | | 1,334,664 | |
JK Cement Ltd. | | Construction Materials | | | 761,388 | | | | 11,941,674 | |
Redington India Ltd. | | Electronic Equipment, Instruments & Components | | | 6,117,598 | | | | 13,870,780 | |
Tata Chemicals Ltd. | | Chemicals | | | 1,700,500 | | | | 17,810,528 | |
Vardhman Textiles Ltd. | | Textiles, Apparel & Luxury Goods | | | 468,044 | | | | 8,770,444 | |
| | | | | | | | | | |
| | | |
| | | | | | | | | 186,184,172 | |
| | | | | | | | | | |
Indonesia 1.4% | | | | | | | | | | |
b Bank Permata Tbk PT | | Banks | | | 52,896,897 | | | | 2,253,366 | |
Hexindo Adiperkasa Tbk PT | | Trading Companies & Distributors | | | 13,008,000 | | | | 2,843,992 | |
Mandom Indonesia Tbk PT | | Personal Products | | | 2,341,500 | | | | 3,024,526 | |
b Panin Financial Tbk PT | | Insurance | | | 396,600,700 | | | | 7,166,575 | |
| | | | | | | | | | |
| | | |
| | | | | | | | | 15,288,459 | |
| | | | | | | | | | |
Kuwait 0.0%† | | | | | | | | | | |
e National Gulf Holding | | Diversified Financial Services | | | 510,819 | | | | 181,068 | |
| | | | | | | | | | |
Malaysia 0.8% | | | | | | | | | | |
7-Eleven Malaysia Holdings Bhd. | | Food & Staples Retailing | | | 16,197,500 | | | | 6,288,663 | |
Hartalega Holdings Bhd. | | Health Care Equipment & Supplies | | | 1,402,500 | | | | 2,196,228 | |
| | | | | | | | | | |
| | | |
| | | | | | | | | 8,484,891 | |
| | | | | | | | | | |
Mexico 1.6% | | | | | | | | | | |
Grupo Herdez SAB de CV | | Food Products | | | 4,483,374 | | | | 11,424,141 | |
Nemak SAB de CV | | Auto Components | | | 6,720,300 | | | | 5,570,414 | |
| | | | | | | | | | |
| | | |
| | | | | | | | | 16,994,555 | |
| | | | | | | | | | |
Nigeria 0.2% | | | | | | | | | | |
UAC of Nigeria PLC | | Food Products | | | 45,432,007 | | | | 2,303,150 | |
| | | | | | | | | | |
Pakistan 0.6% | | | | | | | | | | |
Habib Bank Ltd. | | Banks | | | 2,963,600 | | | | 5,429,809 | |
The Hub Power Co. Ltd. | | Independent Power & Renewable Electricity Producers | | | 600,000 | | | | 521,130 | |
United Bank Ltd. | | Banks | | | 434,000 | | | | 782,033 | |
| | | | | | | | | | |
| | | |
| | | | | | | | | 6,732,972 | |
| | | | | | | | | | |
Peru 0.7% | | | | | | | | | | |
a Intercorp Financial Services Inc., Reg S | | Banks | | | 200,780 | | | | 8,136,819 | |
| | | | | | | | | | |
Philippines 1.3% | | | | | | | | | | |
DMCI Holdings Inc. | | Industrial Conglomerates | | | 15,192,600 | | | | 3,556,637 | |
International Container Terminal Services Inc. | | Transportation Infrastructure | | | 4,953,880 | | | | 9,538,600 | |
Pepsi-Cola Products Philippines Inc. | | Beverages | | | 21,736,200 | | | | 1,210,374 | |
| | | | | | | | | | |
| | | |
| | | | | | | | | 14,305,611 | |
| | | | | | | | | | |
| | | | | | |
franklintempleton.com | | | | Annual Report | | 17 |
TEMPLETON GLOBAL INVESTMENT TRUST
STATEMENT OF INVESTMENTS
Templeton Emerging Markets Small Cap Fund (continued)
| | | | | | | | | | |
| | | Industry | | Shares | | | Value | |
Common Stocks (continued) | | | | | | | | |
Poland 1.7% | | | | | | | | | | |
Amica SA | | Household Durables | | | 112,408 | | | $ | 4,194,488 | |
Fabryki Mebli Forte SA | | Household Durables | | | 363,000 | | | | 5,679,256 | |
Prime Car Management SA | | Road & Rail | | | 323,178 | | | | 2,239,861 | |
Wawel SA | | Food Products | | | 15,078 | | | | 4,916,428 | |
b Work Service SA | | Professional Services | | | 1,517,548 | | | | 1,797,333 | |
| | | | | | | | | | |
| | | |
| | | | | | | | | 18,827,366 | |
| | | | | | | | | | |
Russia 3.7% | | | | | | | | | | |
Detsky Mir PJSC | | Specialty Retail | | | 1,793,288 | | | | 3,028,123 | |
a Globaltrans Investment PLC, GDR, Reg S | | Road & Rail | | | 117,550 | | | | 1,394,143 | |
a,b Lenta Ltd., GDR, Reg S | | Food & Staples Retailing | | | 842,420 | | | | 5,012,399 | |
a,b Mail.Ru Group Ltd., GDR, Reg S | | Internet Software & Services | | | 464,316 | | | | 16,241,774 | |
a TMK PAO, GDR, Reg S | | Energy Equipment & Services | | | 1,079,600 | | | | 6,088,944 | |
a,b X5 Retail Group NV, GDR, Reg S | | Food & Staples Retailing | | | 247,043 | | | | 8,300,645 | |
| | | | | | | | | | |
| | | |
| | | | | | | | | 40,066,028 | |
| | | | | | | | | | |
South Korea 10.7% | | | | | | | | | | |
Bukwang Pharmaceutical Co. Ltd. | | Pharmaceuticals | | | 124,816 | | | | 2,969,133 | |
Cosmecca Korea Co. Ltd. | | Personal Products | | | 115,229 | | | | 6,611,157 | |
Fila Korea Ltd. | | Textiles, Apparel & Luxury Goods | | | 175,259 | | | | 17,914,656 | |
Hankook Tire Worldwide Co. Ltd. | | Diversified Financial Services | | | 484,000 | | | | 8,503,988 | |
Hans Biomed Corp. | | Biotechnology | | | 435,466 | | | | 11,958,900 | |
Interojo Co. Ltd. | | Health Care Equipment & Supplies | | | 111,211 | | | | 4,211,828 | |
Interpark Holdings Corp. | | Internet & Direct Marketing Retail | | | 170,863 | | | | 582,713 | |
I-Sens Inc. | | Health Care Equipment & Supplies | | | 181,746 | | | | 4,888,430 | |
LF Corp. | | Textiles, Apparel & Luxury Goods | | | 204,751 | | | | 5,372,169 | |
Mando Corp. | | Auto Components | | | 48,590 | | | | 10,620,215 | |
Medy-tox Inc. | | Biotechnology | | | 29,386 | | | | 20,267,925 | |
Sebang Global Battery Co. Ltd. | | Auto Components | | | 238,646 | | | | 7,306,947 | |
Silicon Works Co. Ltd. | | Semiconductors & Semiconductor Equipment | | | 213,959 | | | | 7,518,614 | |
Vieworks Co. Ltd. | | Health Care Equipment & Supplies | | | 151,355 | | | | 5,603,866 | |
Youngone Corp. | | Textiles, Apparel & Luxury Goods | | | 61,846 | | | | 1,634,342 | |
| | | | | | | | | | |
| | | |
| | | | | | | | | 115,964,883 | |
| | | | | | | | | | |
Sri Lanka 1.6% | | | | | | | | | | |
Hatton National Bank PLC | | Banks | | | 3,397,647 | | | | 5,346,329 | |
Hemas Holdings PLC | | Industrial Conglomerates | | | 14,964,257 | | | | 12,013,694 | |
| | | | | | | | | | |
| | | |
| | | | | | | | | 17,360,023 | |
| | | | | | | | | | |
Switzerland 1.3% | | | | | | | | | | |
b Wizz Air Holdings PLC | | Airlines | | | 315,667 | | | | 14,412,368 | |
| | | | | | | | | | |
Taiwan 8.6% | | | | | | | | | | |
ADLINK Technology Inc. | | Technology Hardware, Storage & Peripherals | | | 4,328,797 | | | | 9,061,259 | |
Eclat Textile Co. Ltd. | | Textiles, Apparel & Luxury Goods | | | 581,400 | | | | 6,834,475 | |
FIT Hon Teng Ltd. | | Electronic Equipment, Instruments & Components | | | 5,249,000 | | | | 2,400,865 | |
Flytech Technology Co. Ltd. | | Electronic Equipment, Instruments & Components | | | 2,181,220 | | | | 6,140,269 | |
Merida Industry Co. Ltd. | | Leisure Products | | | 2,188,000 | | | | 10,039,975 | |
Novatek Microelectronics Corp. Ltd. | | Semiconductors & Semiconductor Equipment | | | 1,976,000 | | | | 8,999,261 | |
Pacific Hospital Supply Co. Ltd. | | Health Care Equipment & Supplies | | | 1,552,000 | | | | 4,032,901 | |
PChome Online Inc. | | Internet Software & Services | | | 1,250,035 | | | | 7,239,792 | |
b PharmaEssentia Corp. | | Biotechnology | | | 1,021,000 | | | | 6,158,953 | |
Primax Electronics Ltd. | | Technology Hardware, Storage & Peripherals | | | 7,269,500 | | | | 15,616,676 | |
| | | | | | |
18 | | Annual Report | | | | franklintempleton.com |
TEMPLETON GLOBAL INVESTMENT TRUST
STATEMENT OF INVESTMENTS
Templeton Emerging Markets Small Cap Fund (continued)
| | | | | | | | | | |
| | | Industry | | Shares | | | Value | |
Common Stocks (continued) | | | | | | | | |
Taiwan (continued) | | | | | | | | | | |
Shin Zu Shing Co. Ltd. | | Machinery | | | 1,793,000 | | | $ | 5,515,785 | |
St. Shine Optical Co. Ltd. | | Health Care Equipment & Supplies | | | 189,000 | | | | 5,508,859 | |
TTY Biopharm Co. Ltd. | | Pharmaceuticals | | | 1,626,900 | | | | 5,619,931 | |
| | | | | | | | | | |
| | | |
| | | | | | | | | 93,169,001 | |
| | | | | | | | | | |
Thailand 2.2% | | | | | | | | | | |
Delta Electronics Thailand PCL, fgn | | Electronic Equipment, Instruments & Components | | | 950,900 | | | | 2,021,923 | |
Dynasty Ceramic PCL, fgn | | Building Products | | | 16,746,100 | | | | 1,590,062 | |
Major Cineplex Group PCL, fgn | | Media | | | 5,920,300 | | | | 5,427,578 | |
TISCO Financial Group PCL, fgn | | Banks | | | 5,172,000 | | | | 14,625,046 | |
| | | | | | | | | | |
| | | |
| | | | | | | | | 23,664,609 | |
| | | | | | | | | | |
Turkey 4.0% | | | | | | | | | | |
b Bizim Toptan Satis Magazalari AS | | Food & Staples Retailing | | | 426,456 | | | | 847,988 | |
b Mavi Giyim Sanayi Ve Ticaret AS, B | | Textiles, Apparel & Luxury Goods | | | 521,341 | | | | 7,113,057 | |
b Ozak Gayrimenkul Yatirim Ortakligi | | Equity Real Estate Investment Trusts (REITs) | | | 7,266,311 | | | | 4,589,810 | |
Pinar Entegre Et ve Un Sanayi AS | | Food Products | | | 781,877 | | | | 1,949,828 | |
f Pinar Sut Mamulleri Sanayii AS | | Food Products | | | 3,279,170 | | | | 10,025,129 | |
b,f Reysas Gayrimenkul Yatirim Ortakligi AS | | Equity Real Estate Investment Trusts (REITs) | | | 24,575,397 | | | | 9,065,548 | |
Soda Sanayii AS | | Chemicals | | | 4,687,818 | | | | 6,538,084 | |
Tekfen Holding AS | | Construction & Engineering | | | 773,695 | | | | 3,332,996 | |
| | | | | | | | | | |
| | | |
| | | | | | | | | 43,462,440 | |
| | | | | | | | | | |
United Arab Emirates 1.0% | | | | | | | | | | |
Agthia Group PJSC | | Food Products | | | 1,299,581 | | | | 1,556,850 | |
Aramex PJSC | | Air Freight & Logistics | | | 7,672,868 | | | | 9,191,815 | |
| | | | | | | | | | |
| | | |
| | | | | | | | | 10,748,665 | |
| | | | | | | | | | |
United Kingdom 1.0% | | | | | | | | | | |
Stock Spirits Group PLC | | Beverages | | | 3,181,741 | | | | 11,093,787 | |
| | | | | | | | | | |
| | | |
United States 1.4% | | | | | | | | | | |
b IMAX Corp. | | Media | | | 490,183 | | | | 9,411,514 | |
b Luxoft Holding Inc. | | IT Services | | | 141,513 | | | | 5,794,957 | |
| | | | | | | | | | |
| | | |
| | | | | | | | | 15,206,471 | |
| | | | | | | | | | |
Vietnam 7.2% | | | | | | | | | | |
DHG Pharmaceutical JSC | | Pharmaceuticals | | | 1,677,648 | | | | 8,169,647 | |
FPT Corp. | | Electronic Equipment, Instruments & Components | | | 2,145,880 | | | | 5,714,439 | |
b Hoa Phat Group JSC | | Metals & Mining | | | 8,420,237 | | | | 22,312,113 | |
Imexpharm Pharmaceutical JSC | | Pharmaceuticals | | | 559,484 | | | | 1,546,350 | |
b Masan Group Corp. | | Food Products | | | 1,570,580 | | | | 7,820,515 | |
Vietnam Container Shipping JSC | | Marine | | | 1,459,582 | | | | 2,586,958 | |
Vietnam Dairy Products JSC | | Food Products | | | 340,169 | | | | 3,029,495 | |
b Vincom Retail JSC | | Real Estate Management & Development | | | 6,697,210 | | | | 15,043,307 | |
b Vingroup JSC | | Real Estate Management & Development | | | 2,465,660 | | | | 12,677,694 | |
| | | | | | | | | | |
| | | |
| | | | | | | | | 78,900,518 | |
| | | | | | | | | | |
Total Common Stocks (Cost $784,633,372) | | | | | | | 1,012,185,786 | |
| | | | | | | | | | |
| | | | | | |
franklintempleton.com | | | | Annual Report | | 19 |
TEMPLETON GLOBAL INVESTMENT TRUST
STATEMENT OF INVESTMENTS
Templeton Emerging Markets Small Cap Fund (continued)
| | | | | | | | | | |
| | | Industry | | Shares | | | Value | |
g Participatory Notes 1.0% | | | | | | | | | | |
Saudi Arabia 1.0% | | | | | | | | | | |
d Deutsche Bank AG/London, Saudi Dairy & Foodstuff Co., 144A, 4/12/28 | | Food Products | | | 40,309 | | | $ | 1,266,240 | |
b HSBC Bank PLC, Mouwasat Medical Services Co., 2/24/21 | | Health Care Providers & Services | | | 213,070 | | | | 10,011,449 | |
| | | | | | | | | | |
| | | |
Total Participatory Notes
(Cost $11,300,965) | | | | | | | | | 11,277,689 | |
| | | | | | | | | | |
Preferred Stocks 0.9% | | | | | | | | | | |
Brazil 0.4% | | | | | | | | | | |
h Marcopolo SA, 1.013%, pfd | | Machinery | | | 3,636,826 | | | | 4,291,435 | |
| | | | | | | | | | |
Chile 0.5% | | | | | | | | | | |
h Embotelladora Andina SA, 3.019%, pfd., A. | | Beverages | | | 1,250,500 | | | | 5,383,838 | |
| | | | | | | | | | |
| | |
Total Preferred Stocks (Cost $6,261,008) | | | | | | | 9,675,273 | |
| | | | | | | �� | | | |
Total Investments before Short Term Investments
(Cost $802,195,345) | | | | | | | | | 1,033,138,748 | |
| | | | | | | | | | |
| | | |
Short Term Investments 5.9% | | | | | | | | | | |
Money Market Funds (Cost $59,360,840) 5.4% | | | | | | | | | | |
United States 5.4% | | | | | | | | | | |
i,j Institutional Fiduciary Trust Money Market Portfolio, 1.24 % | | | | | 59,360,840 | | | | 59,360,840 | |
| | | | | | | | | | |
k Investments from Cash Collateral Received for Loaned Securities
(Cost $5,503,340) 0.5 % | | | | | | | | | | |
Money Market Funds 0.5% | | | | | | | | | | |
United States 0.5% | | | | | | | | | | |
i,j Institutional Fiduciary Trust Money Market Portfolio,
1.24 % | | | 5,503,340 | | | | 5,503,340 | |
| | | | | | | | | | |
Total Investments
(Cost $867,059,525) 100.9 % | | | | | | | | | 1,098,002,928 | |
| | | |
Other Assets, less Liabilities (0.9)% | | | | | | | | | (10,331,387 | ) |
| | | | | | | | | | |
| | | |
Net Assets 100.0% | | | | | | | | $ | 1,087,671,541 | |
| | | | | | | | | | |
| | | | | | |
20 | | Annual Report | | | | franklintempleton.com |
TEMPLETON GLOBAL INVESTMENT TRUST
STATEMENT OF INVESTMENTS
Templeton Emerging Markets Small Cap Fund (continued)
See Abbreviations on page 34.
†Rounds to less than 0.1% of net assets.
aSecurity was purchased pursuant to Regulation S under the Securities Act of 1933, which exempts from registration securities offered and sold outside of the United States. Such a security cannot be sold in the United States without either an effective registration statement filed pursuant to the Securities Act of 1933, or pursuant to an exemption from registration. These securities have been deemed liquid under guidelines approved by the Trust’s Board of Trustees. At March 31, 2018, the aggregate value of these securities was $51,449,985, representing 4.7% of net assets.
bNon-income producing.
cA portion or all of the security is on loan at March 31, 2018. See Note 1(d).
dSecurity was purchased pursuant to Rule 144A under the Securities Act of 1933 and may be sold in transactions exempt from registration only to qualified institutional buyers or in a public offering registered under the Securities Act of 1933. These securities have been deemed liquid under guidelines approved by the Trust’s Board of Trustees. At March 31, 2018, the aggregate value of these securities was $11,935,845, representing 1.1% of net assets.
eFair valued using significant unobservable inputs. See Note 10 regarding fair value measurements.
fSee Note 8 regarding holdings of 5% voting securities.
gSee Note 1(c) regarding Participatory Notes.
hVariable rate security. The rate shown represents the yield at period end.
iSee Note 3(f) regarding investments in affiliated management investment companies.
jThe rate shown is the annualized seven-day effective yield at period end.
kSee Note 1(d) regarding securities on loan.
| | | | | | |
franklintempleton.com | | | | The accompanying notes are an integral part of these financial statements. | Annual Report | | 21 |
TEMPLETON GLOBAL INVESTMENT TRUST
Financial Statements
Statement of Assets and Liabilities
March 31, 2018
Templeton Emerging Markets Small Cap Fund
| | | | |
| |
Assets: | | | | |
+Investments in securities: | | | | |
Cost - Unaffiliated issuers | | $ | 770,575,925 | |
Cost - Non-controlled affiliates (Note 3f and 8) | | | 96,483,600 | |
| | | | |
| |
Value - Unaffiliated issuers | | $ | 1,014,048,071 | |
Value - Non-controlled affiliates (Note 3f and 8) | | | 83,954,857 | |
Foreign currency, at value (cost $8,689,605) | | | 8,685,845 | |
Receivables: | | | | |
Investment securities sold | | | 1,085,477 | |
Capital shares sold | | | 1,169,666 | |
Dividends. | | | 2,937,300 | |
European Union tax reclaims | | | 308,678 | |
Other assets | | | 1,003 | |
| | | | |
| |
Total assets | | | 1,112,190,897 | |
| | | | |
Liabilities: | | | | |
Payables: | | | | |
Investment securities purchased | | | 5,992,358 | |
Capital shares redeemed | | | 1,452,462 | |
Management fees | | | 1,294,638 | |
Distribution fees | | | 257,136 | |
Transfer agent fees | | | 416,126 | |
Funds advanced by custodian | | | 6,677,794 | |
Payable upon return of securities loaned | | | 5,503,340 | |
Deferred tax. | | | 2,506,995 | |
Accrued expenses and other liabilities. | | | 418,507 | |
| | | | |
| |
Total liabilities | | | 24,519,356 | |
| | | | |
| |
Net assets, at value | | $ | 1,087,671,541 | |
| | | | |
Net assets consist of: | | | | |
Paid-in capital | | $ | 854,450,154 | |
Distributions in excess of net investment income | | | (5,858,205 | ) |
Net unrealized appreciation (depreciation) | | | 228,476,085 | |
Accumulated net realized gain (loss) | | | 10,603,507 | |
| | | | |
| |
Net assets, at value | | $ | 1,087,671,541 | |
| | | | |
| |
| | | | |
+Includes securities loaned | | $ | 5,030,472 | |
| | | | | | |
22 | | Annual Report | | | The accompanying notes are an integral part of these financial statements. | | franklintempleton.com |
TEMPLETON GLOBAL INVESTMENT TRUST
FINANCIAL STATEMENTS
Statement of Assets and Liabilities (continued)
March 31, 2018
Templeton Emerging Markets Small Cap Fund
| | | | |
| |
Class A: | | | | |
Net assets, at value | | $ | 315,468,891 | |
Shares outstanding. | | | 20,688,628 | |
Net asset value per sharea | | | $15.25 | |
Maximum offering price per share (net asset value per share ÷ 94.25%) | | | $16.18 | |
| |
Class C: | | | | |
Net assets, at value | | $ | 78,835,520 | |
Shares outstanding. | | | 5,421,877 | |
Net asset value and maximum offering price per sharea | | | $14.54 | |
| |
Class R: | | | | |
Net assets, at value | | $ | 929,339 | |
Shares outstanding. | | | 61,519 | |
Net asset value and maximum offering price per share | | | $15.11 | |
| |
Class R6: | | | | |
Net assets, at value | | $ | 23,964,088 | |
Shares outstanding. | | | 1,554,922 | |
Net asset value and maximum offering price per share | | | $15.41 | |
| |
Advisor Class: | | | | |
Net assets, at value | | $ | 668,473,703 | |
Shares outstanding. | | | 43,348,554 | |
Net asset value and maximum offering price per share | | | $15.42 | |
aRedemption price is equal to net asset value less contingent deferred sales charges, if applicable.
| | | | | | |
franklintempleton.com | | | | The accompanying notes are an integral part of these financial statements. | Annual Report | | 23 |
TEMPLETON GLOBAL INVESTMENT TRUST
FINANCIAL STATEMENTS
Statement of Operations
for the year ended March 31, 2018
Templeton Emerging Markets Small Cap Fund
| | | | |
Investment income: | | | | |
Dividends: (net of foreign taxes)* | | | | |
Unaffiliated issuers | | $ | 16,786,940 | |
Non-controlled affiliates (Note 3f and 8) | | | 1,002,969 | |
Income from securities loaned (net of fees and rebates) | | | 286,064 | |
Other income (Note 1e) | | | 336,009 | |
| | | | |
| |
Total investment income | | | 18,411,982 | |
| | | | |
| |
Expenses: | | | | |
Management fees (Note 3a) | | | 13,544,611 | |
Distribution fees: (Note 3c) | | | | |
Class A | | | 737,495 | |
Class C | | | 731,799 | |
Class R | | | 3,026 | |
Transfer agent fees: (Note 3e) | | | | |
Class A | | | 534,230 | |
Class C | | | 132,553 | |
Class R | | | 1,096 | |
Class R6 | | | 4,740 | |
Advisor Class | | | 1,038,713 | |
Custodian fees (Note 4) | | | 569,341 | |
Reports to shareholders | | | 109,162 | |
Registration and filing fees | | | 131,336 | |
Professional fees | | | 123,795 | |
Trustees’ fees and expenses | | | 49,717 | |
Other | | | 36,085 | |
| | | | |
| |
Total expenses | | | 17,747,699 | |
Expenses waived/paid by affiliates (Note 3f and 3g) | | | (163,096 | ) |
| | | | |
| |
Net expenses | | | 17,584,603 | |
| | | | |
| |
Net investment income | | | 827,379 | |
| | | | |
| |
Realized and unrealized gains (losses): | | | | |
Net realized gain (loss) from: | | | | |
Investments: | | | | |
Unaffiliated issuers | | | 12,449,319 | |
Foreign currency transactions | | | (54,140 | ) |
| | | | |
| |
Net realized gain (loss) | | | 12,395,179 | |
| | | | |
Net change in unrealized appreciation (depreciation) on: | | | | |
Investments: | | | | |
Unaffiliated issuers | | | 132,531,121 | |
Non-controlled affiliates (Note 3f and 8) | | | (279,010 | ) |
Translation of other assets and liabilities | | | | |
denominated in foreign currencies | | | 40,645 | |
Change in deferred taxes on unrealized appreciation | | | (1,095,184 | ) |
| | | | |
| |
Net change in unrealized appreciation (depreciation) | | | 131,197,572 | |
| | | | |
| |
Net realized and unrealized gain (loss) | | | 143,592,751 | |
| | | | |
| |
Net increase (decrease) in net assets resulting from operations | | $ | 144,420,130 | |
| | | | |
| |
| | | | |
*Foreign taxes withheld on dividends | | $ | 1,787,058 | |
| | | | | | |
24 | | Annual Report | | | The accompanying notes are an integral part of these financial statements. | | franklintempleton.com |
TEMPLETON GLOBAL INVESTMENT TRUST
FINANCIAL STATEMENTS
Statements of Changes in Net Assets
Templeton Emerging Markets Small Cap Fund
| | | | | | | | |
| | | Year Ended March 31, | |
| | | 2018 | | | 2017 | |
| |
Increase (decrease) in net assets: | | | | | | | | |
Operations: | | | | | | | | |
Net investment income | | $ | 827,379 | | | $ | 9,223,235 | |
Net realized gain (loss) | | | 12,395,179 | | | | 20,022,469 | |
Net change in unrealized appreciation (depreciation) | | | 131,197,572 | | | | 76,240,429 | |
| | | | |
| | |
Net increase (decrease) in net assets resulting from operations | | | 144,420,130 | | | | 105,486,133 | |
| | | | |
Distributions to shareholders from: | | | | | | | | |
Net investment income: | | | | | | | | |
Class A | | | — | | | | (4,275,179 | ) |
Class C | | | — | | | | (570,468 | ) |
Class R | | | — | | | | (7,229 | ) |
Class R6 | | | (50,428 | ) | | | — | |
Advisor Class | | | (778,809 | ) | | | (7,150,764 | ) |
| | | | |
| | |
Total distributions to shareholders. | | | (829,237 | ) | | | (12,003,640 | ) |
| | | | |
| | |
Capital share transactions: (Note 2) | | | | | | | | |
Class A | | | 12,744,662 | | | | (34,097,168 | ) |
Class C | | | 5,363,285 | | | | (7,220,410 | ) |
Class R | | | 313,422 | | | | (11,310 | ) |
Class R6 | | | 23,056,768 | | | | — | |
Advisor Class | | | 139,211,483 | | | | 29,507,773 | |
| | | | |
| | |
Total capital share transactions | | | 180,689,620 | | | | (11,821,115 | ) |
| | | | |
Net increase (decrease) in net assets | | | 324,280,513 | | | | 81,661,378 | |
Net assets: | | | | | | | | |
Beginning of year | | | 763,391,028 | | | | 681,729,650 | |
| | | | |
| | |
End of year | | $ | 1,087,671,541 | | | $ | 763,391,028 | |
| | | | |
Distributions in excess of net investment income included in net assets: | | | | | | | | |
End of year | | $ | (5,858,205 | ) | | $ | (6,194,874 | ) |
| | | | |
| | | | | | |
franklintempleton.com | | | | The accompanying notes are an integral part of these financial statements. | Annual Report | | 25 |
TEMPLETON GLOBAL INVESTMENT TRUST
Notes to Financial Statements
Templeton Emerging Markets Small Cap Fund
1. Organization and Significant Accounting Policies
Templeton Global Investment Trust (Trust) is registered under the Investment Company Act of 1940 (1940 Act) as an open-end management investment company, consisting of six separate funds and applies the specialized accounting and reporting guidance in U.S. Generally Accepted Accounting Principles (U.S. GAAP). Templeton Emerging Markets Small Cap Fund (Fund) is included in this report. The Fund offers five classes of shares: Class A, Class C, Class R, Class R6 and Advisor Class. Each class of shares may differ by its initial sales load, contingent deferred sales charges, voting rights on matters affecting a single class, its exchange privilege and fees due to differing arrangements for distribution and transfer agent fees. Effective August 1, 2017, the Fund began offering a new class of shares, Class R6.
The following summarizes the Fund’s significant accounting policies.
a. Financial Instrument Valuation
The Fund’s investments in financial instruments are carried at fair value daily. Fair value is the price that would be received to sell an asset or paid to transfer a liability in an orderly transaction between market participants on the measurement date. The Fund calculates the net asset value (NAV) per share as of 4 p.m. Eastern time each day the New York Stock Exchange (NYSE) is open for trading. Under compliance policies and procedures approved by the Trust’s Board of Trustees (the Board), the Fund’s administrator has responsibility for oversight of valuation, including leading the cross-functional Valuation Committee (VC). The VC provides administration and oversight of the Fund’s valuation policies and procedures, which are approved annually by the Board. Among other things, these procedures allow the Fund to utilize independent pricing services, quotations from securities and financial instrument dealers, and other market sources to determine fair value.
Equity securities listed on an exchange or on the NASDAQ National Market System are valued at the last quoted sale price or the official closing price of the day, respectively. Foreign equity securities are valued as of the close of trading on the foreign stock exchange on which the security is primarily traded, or as of 4 p.m. Eastern time. The value is then converted into its U.S. dollar equivalent at the foreign exchange rate in effect at 4 p.m. Eastern time on the day that the value of the
security is determined. Over-the-counter (OTC) securities are valued within the range of the most recent quoted bid and ask prices. Securities that trade in multiple markets or on multiple exchanges are valued according to the broadest and most representative market. Certain equity securities are valued based upon fundamental characteristics or relationships to similar securities.
Investments in open-end mutual funds are valued at the closing NAV.
The Fund has procedures to determine the fair value of financial instruments for which market prices are not reliable or readily available. Under these procedures, the VC convenes on a regular basis to review such financial instruments and considers a number of factors, including significant unobservable valuation inputs, when arriving at fair value. The VC primarily employs a market-based approach which may use related or comparable assets or liabilities, recent transactions, market multiples, book values, and other relevant information for the investment to determine the fair value of the investment. An income-based valuation approach may also be used in which the anticipated future cash flows of the investment are discounted to calculate fair value. Discounts may also be applied due to the nature or duration of any restrictions on the disposition of the investments. Due to the inherent uncertainty of valuations of such investments, the fair values may differ significantly from the values that would have been used had an active market existed. The VC employs various methods for calibrating these valuation approaches including a regular review of key inputs and assumptions, transactional back-testing or disposition analysis, and reviews of any related market activity.
Trading in securities on foreign securities stock exchanges and OTC markets may be completed before 4 p.m. Eastern time. In addition, trading in certain foreign markets may not take place on every Fund’s business day. Occasionally, events occur between the time at which trading in a foreign security is completed and 4 p.m. Eastern time that might call into question the reliability of the value of a portfolio security held by the Fund. As a result, differences may arise between the value of the Fund’s portfolio securities as determined at the foreign market close and the latest indications of value at 4 p.m. Eastern time. In order to minimize the potential for these differences, the VC monitors price movements following the close of trading in foreign stock markets through a series of country specific market proxies (such as baskets of American Depositary Receipts, futures contracts and exchange traded
| | | | | | |
26 | | | | Annual Report | | franklintempleton.com |
TEMPLETON GLOBAL INVESTMENT TRUST
NOTES TO FINANCIAL STATEMENTS
Templeton Emerging Markets Small Cap Fund (continued)
funds). These price movements are measured against established trigger thresholds for each specific market proxy to assist in determining if an event has occurred that may call into question the reliability of the values of the foreign securities held by the Fund. If such an event occurs, the securities may be valued using fair value procedures, which may include the use of independent pricing services. At March 31, 2018, a market event occurred resulting in a portion of the securities held by the Fund being valued using fair value procedures.
When the last day of the reporting period is a non-business day, certain foreign markets may be open on those days that the Fund’s NAV is not calculated, which could result in differences between the value of the Fund’s portfolio securities on the last business day and the last calendar day of the reporting period. Any significant security valuation changes due to an open foreign market are adjusted and reflected by the Fund for financial reporting purposes.
b. Foreign Currency Translation
Portfolio securities and other assets and liabilities denominated in foreign currencies are translated into U.S. dollars based on the exchange rate of such currencies against U.S. dollars on the date of valuation. The Fund may enter into foreign currency exchange contracts to facilitate transactions denominated in a foreign currency. Purchases and sales of securities, income and expense items denominated in foreign currencies are translated into U.S. dollars at the exchange rate in effect on the transaction date. Portfolio securities and assets and liabilities denominated in foreign currencies contain risks that those currencies will decline in value relative to the U.S. dollar. Occasionally, events may impact the availability or reliability of foreign exchange rates used to convert the U.S. dollar equivalent value. If such an event occurs, the foreign exchange rate will be valued at fair value using procedures established and approved by the Board.
The Fund does not separately report the effect of changes in foreign exchange rates from changes in market prices on securities held. Such changes are included in net realized and unrealized gain or loss from investments in the Statement of Operations.
Realized foreign exchange gains or losses arise from sales of foreign currencies, currency gains or losses realized between the trade and settlement dates on securities transactions and the difference between the recorded amounts of dividends, interest, and foreign withholding taxes and the U.S. dollar equivalent of
the amounts actually received or paid. Net unrealized foreign exchange gains and losses arise from changes in foreign exchange rates on foreign denominated assets and liabilities other than investments in securities held at the end of the reporting period.
c. Participatory Notes
The Fund invests in Participatory Notes (P-Notes). P-Notes are promissory notes that are designed to offer a return linked to the performance of a particular underlying equity security or market. P-Notes are issued by banks or broker-dealers and allow the Fund to gain exposure to common stocks in certain foreign markets without registering with the market regulator. Income received from P-Notes is recorded as dividend income in the Statement of Operations. P-Notes may contain various risks including the potential inability of the counterparty to fulfill their obligations under the terms of the contract. These securities may be more volatile and less liquid than other investments held by the Fund.
d. Securities Lending
The Fund participates in an agency based securities lending program to earn additional income. The Fund receives cash collateral against the loaned securities in an amount equal to at least 102% of the fair value of the loaned securities. Collateral is maintained over the life of the loan in an amount not less than 100% of the fair value of loaned securities, as determined at the close of Fund business each day; any additional collateral required due to changes in security values is delivered to the Fund on the next business day. The collateral is deposited into a joint cash account with other funds and is used to invest in a money market fund managed by Franklin Advisers, Inc., an affiliate of the Fund. The Fund may receive income from the investment of cash collateral, in addition to lending fees and rebates paid by the borrower. Income from securities loaned, net of fees paid to the securities lending agent and/or third-party vendor, is reported separately in the Statement of Operations. The Fund bears the market risk with respect to the collateral investment, securities loaned, and the risk that the agent may default on its obligations to the Fund. If the borrower defaults on its obligation to return the securities loaned, the Fund has the right to repurchase the securities in the open market using the collateral received. The securities lending agent has agreed to indemnify the Fund in the event of default by a third party borrower.
| | | | | | |
franklintempleton.com | | | | Annual Report | | 27 |
TEMPLETON GLOBAL INVESTMENT TRUST
NOTES TO FINANCIAL STATEMENTS
Templeton Emerging Markets Small Cap Fund (continued)
1. Organization and Significant Accounting
Policies (continued)
e. Income and Deferred Taxes
It is the Fund’s policy to qualify as a regulated investment company under the Internal Revenue Code. The Fund intends to distribute to shareholders substantially all of its taxable income and net realized gains to relieve it from federal income and excise taxes. As a result, no provision for U.S. federal income taxes is required.
The Fund may be subject to foreign taxation related to income received, capital gains on the sale of securities and certain foreign currency transactions in the foreign jurisdictions in which it invests. Foreign taxes, if any, are recorded based on the tax regulations and rates that exist in the foreign markets in which the Fund invests. When a capital gain tax is determined to apply, the Fund records an estimated deferred tax liability in an amount that would be payable if the securities were disposed of on the valuation date.
As a result of several court cases, in certain countries across the European Union, the Fund filed additional tax reclaims for previously withheld taxes on dividends earned in those countries (EU reclaims). These additional filings are subject to various administrative proceedings by the local jurisdictions’ tax authorities within the European Union, as well as a number of related judicial proceedings. Income recognized, if any, for EU reclaims is reflected as other income in the Statement of Operations and any related receivable, if any, is reflected as European Union tax reclaims in the Statement of Assets and Liabilities. When uncertainty exists as to the ultimate resolution of these proceedings, the likelihood of receipt of these EU reclaims, and the potential timing of payment, no amounts are reflected in the financial statements. For U.S. income tax purposes, EU reclaims received by the Fund, if any, reduce the amounts of foreign taxes Fund shareholders can use as tax credits in their individual income tax returns.
The Fund may recognize an income tax liability related to its uncertain tax positions under U.S. GAAP when the uncertain tax position has a less than 50% probability that it will be sustained upon examination by the tax authorities based on its technical merits. As of March 31, 2018, the Fund has determined that no tax liability is required in its financial statements related to uncertain tax positions for any open tax years (or expected to be taken in future tax years). Open tax
years are those that remain subject to examination and are based on the statute of limitations in each jurisdiction in which the Fund invests.
f. Security Transactions, Investment Income, Expenses and Distributions
Security transactions are accounted for on trade date. Realized gains and losses on security transactions are determined on a specific identification basis. Estimated expenses are accrued daily. Dividend income is recorded on the ex-dividend date except for certain dividends from securities where the dividend rate is not available. In such cases, the dividend is recorded as soon as the information is received by the Fund. Distributions to shareholders are recorded on the ex-dividend date. Distributable earnings are determined according to income tax regulations (tax basis) and may differ from earnings recorded in accordance with U.S. GAAP. These differences may be permanent or temporary. Permanent differences are reclassified among capital accounts to reflect their tax character. These reclassifications have no impact on net assets or the results of operations. Temporary differences are not reclassified, as they may reverse in subsequent periods.
Common expenses incurred by the Trust are allocated among the Funds based on the ratio of net assets of each Fund to the combined net assets of the Trust. Fund specific expenses are charged directly to the Fund that incurred the expense.
Realized and unrealized gains and losses and net investment income, excluding class specific expenses, are allocated daily to each class of shares based upon the relative proportion of net assets of each class. Differences in per share distributions by class are generally due to differences in class specific expenses.
g. Accounting Estimates
The preparation of financial statements in accordance with U.S. GAAP requires management to make estimates and assumptions that affect the reported amounts of assets and liabilities at the date of the financial statements and the amounts of income and expenses during the reporting period. Actual results could differ from those estimates.
h. Guarantees and Indemnifications
Under the Trust’s organizational documents, its officers and trustees are indemnified by the Trust against certain liabilities arising out of the performance of their duties to the Trust. Additionally, in the normal course of business, the Trust, on
| | | | | | |
| 28 | | Annual Report | | | | franklintempleton.com |
TEMPLETON GLOBAL INVESTMENT TRUST
NOTES TO FINANCIAL STATEMENTS
Templeton Emerging Markets Small Cap Fund (continued)
behalf of the Fund, enters into contracts with service providers that contain general indemnification clauses. The Trust’s maximum exposure under these arrangements is unknown as
this would involve future claims that may be made against the Trust that have not yet occurred. Currently, the Trust expects the risk of loss to be remote.
2. Shares of Beneficial Interest
At March 31, 2018, there were an unlimited number of shares authorized ($0.01 par value). Transactions in the Fund’s shares were as follows:
| | | | | | | | | | | | | | | | |
| | | Year Ended March 31, | |
| | | | |
| | | 2018 | | | 2017 | |
| | | | |
| | | Shares | | | Amount | | | Shares | | | Amount | |
| | | | |
Class A Shares: | | | | | | | | | | | | | | | | |
Shares sold | | | 8,632,233 | | | $ | 123,429,279 | | | | 7,505,213 | | | $ | 90,572,064 | |
Shares issued in reinvestment of distributions | | | — | | | | — | | | | 332,461 | | | | 3,876,492 | |
Shares redeemed | | | (7,710,771 | ) | | | (110,684,617 | ) | | | (10,682,368 | ) | | | (128,545,724 | ) |
| | | | |
Net increase (decrease) | | | 921,462 | | | $ | 12,744,662 | | | | (2,844,694 | ) | | $ | (34,097,168 | ) |
| | | | |
Class C Shares: | | | | | | | | | | | | | | | | |
Shares sold | | | 1,546,280 | | | $ | 21,319,791 | | | | 910,468 | | | $ | 10,579,163 | |
Shares issued in reinvestment of distributions | | | — | | | | — | | | | 47,350 | | | | 531,743 | |
Shares redeemed | | | (1,151,578 | ) | | | (15,956,506 | ) | | | (1,599,114 | ) | | | (18,331,316 | ) |
| | | | |
Net increase (decrease) | | | 394,702 | | | $ | 5,363,285 | | | | (641,296 | ) | | $ | (7,220,410 | ) |
| | | | |
Class R Shares: | | | | | | | | | | | | | | | | |
Shares sold | | | 37,163 | | | $ | 550,698 | | | | 8,293 | | | $ | 99,174 | |
Shares issued in reinvestment of distributions | | | — | | | | — | | | | 624 | | | | 7,230 | |
Shares redeemed | | | (16,767 | ) | | | (237,276 | ) | | | (9,876 | ) | | | (117,714 | ) |
| | | | |
Net increase (decrease) | | | 20,396 | | | $ | 313,422 | | | | (959 | ) | | $ | (11,310 | ) |
| | | | |
Class R6 Sharesa: | | | | | | | | | | | | | | | | |
Shares sold | | | 1,681,734 | | | $ | 25,001,671 | | | | | | | | | |
Shares issued in reinvestment of distributions | | | 3,348 | | | | 50,415 | | | | | | | | | |
Shares redeemed | | | (130,160 | ) | | | (1,995,318 | ) | | | | | | | | |
| | | | |
Net increase (decrease) | | | 1,554,922 | | | $ | 23,056,768 | | | | | | | | | |
| | | | |
Advisor Class Shares: | | | | | | | | | | | | | | | | |
Shares sold | | | 20,056,212 | | | $ | 291,593,199 | | | | 13,683,801 | | | $ | 166,316,823 | |
Shares issued in reinvestment of distributions | | | 30,373 | | | | 457,729 | | | | 328,192 | | | | 3,862,825 | |
Shares redeemed | | | (10,389,954 | ) | | | (152,839,445 | ) | | | (11,699,501 | ) | | | (140,671,875 | ) |
| | | | |
Net increase (decrease) | | | 9,696,631 | | | $ | 139,211,483 | | | | 2,312,492 | | | $ | 29,507,773 | |
aFor the period August 1, 2017 (effective date) to March 31, 2018.
| | | | | | |
franklintempleton.com | | | | Annual Report | | 29 |
TEMPLETON GLOBAL INVESTMENT TRUST
NOTES TO FINANCIAL STATEMENTS
Templeton Emerging Markets Small Cap Fund (continued)
3. Transactions with Affiliates
Franklin Resources, Inc. is the holding company for various subsidiaries that together are referred to as Franklin Templeton Investments. Certain officers and trustees of the Trust are also officers and/or directors of the following subsidiaries:
| | |
Subsidiary | | Affiliation |
| Templeton Asset Management Ltd. (TAML) | | Investment manager |
| Franklin Templeton Services, LLC (FT Services) | | Administrative manager |
| Franklin Templeton Distributors, Inc. (Distributors) | | Principal underwriter |
| Franklin Templeton Investor Services, LLC (Investor Services) | | Transfer agent |
a. Management Fees
The Fund pays an investment management fee to TAML based on the average daily net assets of the Fund as follows:
| | |
| Annualized Fee Rate | | Net Assets |
1.450% | | Up to and including $500 million |
1.400% | | Over $500 million, up to and including $5 billion |
1.350% | | Over $5 billion, up to and including $10 billion |
1.300% | | Over $10 billion, up to and including $15 billion |
1.250% | | Over $15 billion, up to and including $20 billion |
1.200% | | In excess of $20 billion |
For the year ended March 31, 2018, the gross effective investment management fee rate was 1.418% of the Fund’s average daily net assets.
b. Administrative Fees
Under an agreement with TAML, FT Services provides administrative services to the Fund. The fee is paid by TAML based on the Fund’s average daily net assets, and is not an additional expense of the Fund.
c. Distribution Fees
The Board has adopted distribution plans for each share class, with the exception of Class R6 and Advisor Class shares, pursuant to Rule 12b-1 under the 1940 Act. Under the Fund’s Class A reimbursement distribution plan, the Fund reimburses Distributors for costs incurred in connection with the servicing, sale and distribution of the Fund’s shares up to the maximum annual plan rate. Under the Class A reimbursement distribution plan, costs exceeding the maximum for the current plan year cannot be reimbursed in subsequent periods. In addition, under the Fund’s Class C and R compensation distribution plans, the Fund pays Distributors for costs incurred in connection with the servicing, sale and distribution of the Fund’s shares up to the maximum annual plan rate for each class. The plan year, for purposes of monitoring compliance with the maximum annual plan rates, is February 1 through January 31.
The maximum annual plan rates, based on the average daily net assets, for each class, are as follows:
| | | | |
Class A | | | 0.35 | % |
Class C | | | 1.00 | % |
Class R | | | 0.50 | % |
Effective August 1, 2015, the Board has set the current rate at 0.25% per year for Class A shares until further notice and approval by the Board.
| | | | | | |
| 30 | | Annual Report | | | | franklintempleton.com |
TEMPLETON GLOBAL INVESTMENT TRUST
NOTES TO FINANCIAL STATEMENTS
Templeton Emerging Markets Small Cap Fund (continued)
d. Sales Charges/Underwriting Agreements
Front-end sales charges and contingent deferred sales charges (CDSC) do not represent expenses of the Fund. These charges are deducted from the proceeds of sales of Fund shares prior to investment or from redemption proceeds prior to remittance, as applicable. Distributors has advised the Fund of the following commission transactions related to the sales and redemptions of the Fund’s shares for the year:
| | | | |
Sales charges retained net of commissions paid to
unaffiliated brokers/dealers | | $ | 127,924 | |
CDSC retained | | $ | 21,308 | |
e. Transfer Agent Fees
Each class of shares pays transfer agent fees to Investor Services for its performance of shareholder servicing obligations. Effective November 1, 2017, the fees are based on an annualized asset based fee of 0.02% plus a transaction based fee. Prior to November 1, 2017, the fees were account based fees that varied based on fund or account type. In addition, each class reimburses Investor Services for out of pocket expenses incurred and, except for Class R6, reimburses shareholder servicing fees paid to third parties. These fees are allocated daily based upon their relative proportion of such classes’ aggregate net assets. Class R6 pays Investor Services transfer agent fees specific to that class.
For the year ended March 31, 2018, the Fund paid transfer agent fees of $1,711,332, of which $423,964 was retained by Investor Services.
f. Investments in Affiliated Management Investment Companies
The Fund invests in one or more affiliated management investment companies for purposes other than exercising a controlling influence over the management or policies. Management fees paid by the Fund are waived on assets invested in the affiliated management investment companies, as noted in the Statement of Operations, in an amount not to exceed the management and administrative fees paid directly or indirectly by each affiliate. During the year ended March 31, 2018, the Fund held investments in affiliated management investment companies as follows:
| | | | | | | | | | | | | | | | | | | | | | | | | | | | | | |
| | | Number of
Shares Held
at Beginning
of Year | | | Gross
Additions | | | Gross
Reductions | | | Number of
Shares
Held at End
of Year | | | Value at End of Year | | | Dividend
Income | | | Realized
Gain (Loss) | | | Net Change in
Unrealized
Appreciation
(Depreciation) |
Non-Controlled Affiliates | | | | | | | | | | | | | | | | | | | | | | | | | | | | | | |
Institutional Fiduciary Trust Money Market Portfolio, 1.24% | | | 50,565,897 | | | | 262,543,108 | | | | (248,244,825 | ) | | | 64,864,180 | | | | $64,864,180 | | | | $288,590 | | | | $ — | | | $ — |
g. Waiver and Expense Reimbursements
Investor Services has voluntarily agreed in advance to waive or limit its fees so that the Class R6 transfer agent fees do not exceed 0.03%. Investor Services may discontinue this waiver in the future.
4. Expense Offset Arrangement
The Fund has entered into an arrangement with its custodian whereby credits realized as a result of uninvested cash balances are used to reduce a portion of the Fund’s custodian expenses. During the year ended March 31, 2018, there were no credits earned.
5. Income Taxes
For tax purposes, the Fund may elect to defer any portion of a late-year ordinary loss to the first day of the following fiscal year. At March 31, 2018, the Fund deferred late-year ordinary losses of $1,853,480.
| | | | | | |
franklintempleton.com | | | | Annual Report | | 31 |
TEMPLETON GLOBAL INVESTMENT TRUST
NOTES TO FINANCIAL STATEMENTS
Templeton Emerging Markets Small Cap Fund (continued)
5. Income Taxes (continued)
The tax character of distributions paid during the years ended March 31, 2018 and 2017, was as follows:
| | | | | | | | |
| | | 2018 | | | 2017 | |
| | | | |
Distributions paid from ordinary income | | $ | 829,237 | | | $ | 12,003,640 | |
| | | | |
At March 31, 2018, the cost of investments and net unrealized appreciation (depreciation) for income tax purposes were as follows:
| | | | |
Cost of investments | | $ | 871,531,131 | |
| | | | |
Unrealized appreciation | | $ | 307,820,329 | |
Unrealized depreciation | | | (81,348,532 | ) |
| | | | |
Net unrealized appreciation (depreciation) | | $ | 226,471,797 | |
| | | | |
Undistributed ordinary income | | | 141,118 | |
Undistributed long term capital gains | | | 10,620,589 | |
| | | | |
Distributable earnings. | | $ | 10,761,707 | |
| | | | |
Differences between income and/or capital gains as determined on a book basis and a tax basis are primarily due to differing treatment of EU reclaims and passive foreign investment company shares.
The Fund utilized a tax accounting practice to treat a portion of the proceeds from capital shares redeemed as a distribution from realized capital gains.
6. Investment Transactions
Purchases and sales of investments (excluding short term securities) for the year ended March 31, 2018, aggregated $243,958,037 and $68,784,761, respectively.
At March 31, 2018, in connection with securities lending transactions, the Fund loaned equity investments and received $5,503,340 of cash collateral. The gross amount of recognized liability for such transactions is included in payable upon return of securities loaned in the Statement of Assets and Liabilities. The agreements can be terminated at any time.
7. Concentration of Risk
Investing in foreign securities may include certain risks and considerations not typically associated with investing in U.S. securities, such as fluctuating currency values and changing local and regional economic, political and social conditions, which may result in greater market volatility. In addition, certain foreign securities may not be as liquid as U.S. securities.
8. Holdings of 5% Voting Securities of Portfolio Companies
The 1940 Act defines “affiliated companies” to include investments in portfolio companies in which a fund owns 5% or more of the outstanding voting securities. During the year ended March 31, 2018, investments in “affiliated companies” were as follows:
| | | | | | | | | | | | | | | | | | | | | | | | | | | | | | |
| Name of Issuer | | Number of
Shares Held
at Beginning
of Year | | | Gross
Additions | | | Gross
Reductions | | | Number of
Shares Held
at End
of Year | | | Value at End of Year | | | Dividend
Income | | | Realized
Gain (Loss) | | | Net Change in
Unrealized
Appreciation
(Depreciation) |
Non-Controlled Affiliates | | | | | | | | | | | | | | | | | | | | | | | | | | | | | | |
Pinar Sut Mamulleri Sanayii AS | | | 3,279,170 | | | | — | | | | — | | | | 3,279,170 | | | | $10,025,129 | | | | $714,379 | | | | $ — | | | $(4,069,707) |
| | | | |
| 32 | | Annual Report | | franklintempleton.com |
TEMPLETON GLOBAL INVESTMENT TRUST
NOTES TO FINANCIAL STATEMENTS
| | | | | | | | | | | | | | | | | | | | | | | | | | | | | | | | |
Templeton Emerging Markets Small Cap Fund (continued) | | | | | | | | | | | | | | | | | |
| Name of Issuer | | Number of
Shares Held
at Beginning
of Year | | | Gross
Additions | | | Gross
Reductions | | | Number of
Shares Held
at End of Year | | | Value at End of Year | | | Dividend
Income | | | Realized
Gain
(Loss) | | | Net Change in
Unrealized
Appreciation
(Depreciation) | |
Non-Controlled Affiliates (continued) | | | | | | | | | | | | | | | | | | | | | | | | | | | | | | | | |
Reysas Gayrimenkul Yatirim Ortakligi AS | | | 24,575,397 | | | | — | | | | — | | | | 24,575,397 | | | $ | 9,065,548 | | | $ | — | | | | $ — | | | | $3,790,697 | |
Total Affiliated Securities (Value is 1.8% of Net Assets) | | | | | | | | | | | | | | | $ | 19,090,677 | | | $ | 714,379 | | | | $ — | | | | $ (279,010) | |
9. Credit Facility
The Fund, together with other U.S. registered and foreign investment funds (collectively, Borrowers), managed by Franklin Templeton Investments, are borrowers in a joint syndicated senior unsecured credit facility totaling $2 billion (Global Credit Facility) which matures on February 8, 2019. This Global Credit Facility provides a source of funds to the Borrowers for temporary and emergency purposes, including the ability to meet future unanticipated or unusually large redemption requests.
Under the terms of the Global Credit Facility, the Fund shall, in addition to interest charged on any borrowings made by the Fund and other costs incurred by the Fund, pay its share of fees and expenses incurred in connection with the implementation and maintenance of the Global Credit Facility, based upon its relative share of the aggregate net assets of all of the Borrowers, including an annual commitment fee of 0.15% based upon the unused portion of the Global Credit Facility. These fees are reflected in other expenses in the Statement of Operations. During the year ended March 31, 2018, the Fund did not use the Global Credit Facility.
10. Fair Value Measurements
The Fund follows a fair value hierarchy that distinguishes between market data obtained from independent sources (observable inputs) and the Fund’s own market assumptions (unobservable inputs). These inputs are used in determining the value of the Fund’s financial instruments and are summarized in the following fair value hierarchy:
| | • | | Level 1 – quoted prices in active markets for identical financial instruments |
| | • | | Level 2 – other significant observable inputs (including quoted prices for similar financial instruments, interest rates, prepayment speed, credit risk, etc.) |
| | • | | Level 3 – significant unobservable inputs (including the Fund’s own assumptions in determining the fair value of financial instruments) |
The input levels are not necessarily an indication of the risk or liquidity associated with financial instruments at that level.
For movements between the levels within the fair value hierarchy, the Fund has adopted a policy of recognizing the transfers as of the date of the underlying event which caused the movement. Additionally, at March 31, 2018, due to market events, the Fund employed fair value procedures to value a portion of its holdings. Such procedures resulted in a temporary transfer of financial instruments valued at $240,909,616 from Level 1 to Level 2 within the fair value hierarchy.
| | | | | | |
franklintempleton.com | | | | Annual Report | | 33 |
TEMPLETON GLOBAL INVESTMENT TRUST
NOTES TO FINANCIAL STATEMENTS
Templeton Emerging Markets Small Cap Fund (continued)
10. Fair Value Measurements (continued)
A summary of inputs used as of March 31, 2018, in valuing the Fund’s assets carried at fair value, is as follows:
| | | | | | | | | | | | | | | | |
| | | Level 1 | | | Level 2 | | | Level 3 | | | Total | |
Assets: | | | | | | | | | | | | | | | | |
Investments in Securities:a | | | | | | | | | | | | | | | | |
Equity Investments:b | | | | | | | | | | | | | | | | |
India | | $ | — | | | $ | 186,184,172 | | | $ | — | | | $ | 186,184,172 | |
Indonesia | | | — | | | | 15,288,459 | | | | — | | | | 15,288,459 | |
Kuwait | | | — | | | | — | | | | 181,068 | | | | 181,068 | |
Mexico | | | — | | | | 16,994,555 | | | | — | | | | 16,994,555 | |
Peru | | | — | | | | 8,136,819 | | | | — | | | | 8,136,819 | |
Philippines | | | — | | | | 14,305,611 | | | | — | | | | 14,305,611 | |
All Other Equity Investments. | | | 780,770,375 | | | | — | | | | — | | | | 780,770,375 | |
Participatory Notes | | | — | | | | 11,277,689 | | | | — | | | | 11,277,689 | |
Short Term Investments | | | 64,864,180 | | | | — | | | | — | | | | 64,864,180 | |
| | | | |
Total Investments in Securities | | $ | 845,634,555 | | | $ | 252,187,305 | | | $ | 181,068 | | | $ | 1,098,002,928 | |
aFor detailed categories, see the accompanying Statement of Investments.
bIncludes common and preferred stocks.
A reconciliation of assets in which Level 3 inputs are used in determining fair value is presented when there are significant Level 3 financial instruments at the beginning and/or end of the year.
11. Subsequent Events
The Fund has evaluated subsequent events through the issuance of the financial statements and determined that no events have occurred that require disclosure.
Abbreviations
| | | | | | | | | | |
| Selected Portfolio | | | | | | | | |
| ADR | | American Depositary Receipt | | | | | | | | |
| GDR | | Global Depositary Receipt | | | | | | | | |
| | | | |
34 | | Annual Report | | franklintempleton.com |
TEMPLETON GLOBAL INVESTMENT TRUST
Report of Independent Registered Public Accounting Firm
To the Board of Trustees of Templeton Global Investment Trust and Shareholders of Templeton Emerging Markets Small Cap Fund
Opinion on the Financial Statements
We have audited the accompanying statement of assets and liabilities, including the statement of investments, of Templeton Emerging Markets Small Cap Fund (the “Fund”) as of March 31, 2018, the related statement of operations for the year ended March 31, 2018, the statement of changes in net assets for each of the two years in the period ended March 31, 2018, including the related notes, and the financial highlights for each of the periods indicated therein (collectively referred to as the “financial statements”). In our opinion, the financial statements present fairly, in all material respects, the financial position of the Fund as of March 18, 2018, the results of its operations for the year then ended, the changes in its net assets for each of the two years in the period ended March 31, 2018 and the financial highlights for each of the periods indicated therein in conformity with accounting principles generally accepted in the United States of America.
Basis for Opinion
These financial statements are the responsibility of the Fund’s management. Our responsibility is to express an opinion on the Fund’s financial statements based on our audits. We are a public accounting firm registered with the Public Company Accounting Oversight Board (United States) (“PCAOB”) and are required to be independent with respect to the Fund in accordance with the U.S. federal securities laws and the applicable rules and regulations of the Securities and Exchange Commission and the PCAOB.
We conducted our audits of these financial statements in accordance with the standards of the PCAOB. Those standards require that we plan and perform the audit to obtain reasonable assurance about whether the financial statements are free of material misstatement, whether due to error or fraud.
Our audits included performing procedures to assess the risks of material misstatement of the financial statements, whether due to error or fraud, and performing procedures that respond to those risks. Such procedures included examining, on a test basis, evidence regarding the amounts and disclosures in the financial statements. Our audits also included evaluating the accounting principles used and significant estimates made by management, as well as evaluating the overall presentation of the financial statements. Our procedures included confirmation of securities owned as of March 31, 2018 by correspondence with the custodian and transfer agent, and broker; when replies were not received from brokers, we performed other auditing procedures. We believe that our audits provide a reasonable basis for our opinion.
PricewaterhouseCoopers LLP
San Francisco, California
May 17, 2018
We have served as the auditor of one or more investment companies in the Franklin Templeton funds since 1948.
| | | | | | |
franklintempleton.com | | | | Annual Report | | 35 |
TEMPLETON GLOBAL INVESTMENT TRUST
Tax Information (unaudited)
Templeton Emerging Markets Small Cap Fund
Under Section 852(b)(3)(C) of the Internal Revenue Code (Code), the Fund hereby reports the maximum amount allowable but no less than $1,294,945 as a long term capital gain dividend for the fiscal year ended March 31, 2018.
Under Section 854(b)(1)(B) of the Code, the Fund hereby reports the maximum amount allowable but no less than $9,142,255 as qualified dividends for purposes of the maximum rate under Section 1(h)(11) of the Code for the fiscal year ended March 31, 2018. Distributions, including qualified dividend income, paid during calendar year 2018 will be reported to shareholders on Form 1099-DIV by mid-February 2019. Shareholders are advised to check with their tax advisors for information on the treatment of these amounts on their individual income tax returns.
At March 31, 2017, more than 50% of the Fund’s total assets were invested in securities of foreign issuers. In most instances, foreign taxes were withheld from income paid to the Fund on these investments. As shown in the table below, the Fund hereby reports to shareholders the foreign source income and foreign taxes paid, pursuant to Section 853 of the Code. This written statement will allow shareholders of record on December 21, 2017, to treat their proportionate share of foreign taxes paid by the Fund as having been paid directly by them. The shareholder shall consider these amounts as foreign taxes paid in the tax year in which they receive the Fund distribution.
The following table provides a detailed analysis of foreign tax paid, foreign source income and foreign source qualified dividends as reported by the Fund, to Class A, Class C, Class R, Class R6, and Advisor Class shareholders of record.
| | | | | | | | | | | | |
| Class | | Foreign Tax Paid
Per Share | | | Foreign Source
Income Per Share | | | Foreign Source Qualified
Dividends Per Share | |
| Class A | | | $0.0265 | | | | $0.1648 | | | | $0.0543 | |
| Class C | | | $0.0265 | | | | $0.0961 | | | | $0.0318 | |
| Class R | | | $0.0265 | | | | $0.1465 | | | | $0.0482 | |
| Class R6 | | | $0.0265 | | | | $0.2111 | | | | $0.0693 | |
| Advisor Class | | | $0.0265 | | | | $0.1977 | | | | $0.0653 | |
Foreign Tax Paid Per Share (Column 1) is the amount per share available to you, as a tax credit (assuming you held your shares in the Fund for a minimum of 16 days during the 31-day period beginning 15 days before the ex-dividend date of the Fund’s distribution to which the foreign taxes relate), or, as a tax deduction.
Foreign Source Income Per Share (Column 2) is the amount per share of income dividends attributable to foreign securities held by the Fund, plus any foreign taxes withheld on these dividends. The amounts reported include foreign source qualified dividends that have not been adjusted for the rate differential applicable to such dividend income.1
Foreign Source Qualified Dividends Per Share (Column 3) is the amount per share of foreign source qualified dividends, plus any foreign taxes withheld on these dividends. These amounts represent the portion of the Foreign Source Income reported to you in column 2 that were derived from qualified foreign securities held by the Fund.1
By mid-February 2018, shareholders received Form 1099-DIV which included their share of taxes paid and foreign source income distributed during the calendar year 2017. The Foreign Source Income reported on Form 1099-DIV was not adjusted for the rate differential on foreign source qualified dividend income. Shareholders are advised to check with their tax advisors for information on the treatment of these amounts on their 2017 individual income tax returns.
1. Qualified dividends are taxed at reduced long term capital gains tax rates. In determining the amount of foreign tax credit that may be applied against the U.S. tax liability of individuals receiving foreign source qualified dividends, adjustments may be required to the foreign tax credit limitation calculation to reflect the rate differential applicable to such dividend income. The rules however permit certain individuals to elect not to apply the rate differential adjustments for capital gains and/or dividends for any taxable year. Please consult your tax advisor and the instructions to Form 1116 for more information.
| | | | |
36 | | Annual Report | | franklintempleton.com |
TEMPLETON EMERGING MARKETS SMALL CAP FUND
Special Meeting of Shareholders
MEETING OF SHAREHOLDERS: OCTOBER 30, 2017 AND RECONVENED ON DECEMBER 15, 2017 AND DECEMBER 29, 2017
(UNAUDITED)
A Special Meeting of Shareholders of Templeton Global Investment Trust was held at the offices of Franklin Templeton Investments, One Franklin Parkway, San Mateo, California on October 30, 2017 and reconvened on December 15, 2017 and December 29, 2017. The purpose of the meeting was to elect Trustees of Templeton Global Investment Trust and to vote on the following proposals for the Fund: to approve the use of a “manager of managers” structure whereby the Fund’s investment manager would be able to hire and replace subadvisers without shareholder approval; to approve an amended fundamental investment restriction regarding investments in commodities; and to approve an amended fundamental investment restriction regarding lending. At the meeting, (i) the following persons were elected by the shareholders to serve as Trustees of Templeton Global Investment Trust: Harris J. Ashton, Ann Torre Bates, Mary C. Choksi, Edith E. Holiday, Gregory E. Johnson, Rupert H. Johnson, Jr., J. Michael Luttig, David W. Niemiec, Larry D. Thompson, Constantine D. Tseretopoulos and Robert E. Wade; and (ii) the proposals to use a “manager of managers” structure; to approve an amended fundamental investment restriction regarding investments in commodities; and to approve an amended fundamental investment restriction regarding lending were approved by shareholders of the Fund. No other business was transacted at the meeting.
In connection with the meeting, management is aware that some shareholders received from the proxy solicitor numerous calls and mailings that may have been distracting. Management is taking steps to ensure that, in the future, for any new shareholder meeting solicitations that occur, such activity is not repeated. Management apologizes for any inconvenience that may have been caused as a result of such calls and mailings.
The results of the voting at the meeting are as follows:
| Proposal 1. | To elect a Board of Trustees: |
| | | | | | | | |
| Name | | For | | | Withheld | |
| | |
| Harris J. Ashton | | | 377,048,086 | | | | 10,385,715 | |
| Ann Torre Bates | | | 377,050,303 | | | | 10,383,500 | |
| Mary C. Choksi | | | 377,051,104 | | | | 10,382,699 | |
| Edith E. Holiday | | | 377,043,078 | | | | 10,390,725 | |
| Gregory E. Johnson | | | 377,072,684 | | | | 10,361,119 | |
| Rupert H. Johnson, Jr | | | 377,077,137 | | | | 10,356,666 | |
| J. Michael Luttig | | | 377,087,793 | | | | 10,346,010 | |
| David W. Niemiec | | | 377,066,180 | | | | 10,367,622 | |
| Larry D. Thompson. | | | 377,085,550 | | | | 10,348,252 | |
| Constantine D. Tseretopoulos | | | 377,094,478 | | | | 10,339,323 | |
| Robert E. Wade | | | 377,100,799 | | | | 10,333,003 | |
Total Trust Shares Outstanding*: 656,789,328
* As of the record date.
| | | | | | |
franklintempleton.com | | | | Annual Report | | 37 |
TEMPLETON EMERGING MARKETS SMALL CAP FUND
SPECIAL MEETING OF SHAREHOLDERS
| Proposal 2. | To approve the use of a “manager of managers” structure whereby the Fund’s investment manager would be able to hire and replace subadvisers without shareholder approval: |
| | | | |
| | | Shares | |
| |
For | | | 31,289,241 | |
| |
Against | | | 717,059 | |
| |
Abstain | | | 467,830 | |
| |
Broker Non-Votes | | | 12,068,744 | |
| |
Total Fund Shares Voted | | | 44,542,876 | |
| |
Total Fund Shares Outstanding* | | | 63,456,468 | |
| Proposal 3. | To approve an amended fundamental investment restriction regarding investments in commodities: |
| | | | |
| | | Shares | |
| |
For | | | 31,459,889 | |
| |
Against | | | 490,887 | |
| |
Abstain | | | 523,355 | |
| |
Broker Non-Votes | | | 12,068,744 | |
| |
Total Fund Shares Voted | | | 44,542,876 | |
| |
Total Fund Shares Outstanding* | | | 63,456,468 | |
| Proposal 4. | To approve an amended fundamental investment restriction regarding lending: |
| | | | |
| | | Shares | |
| |
For | | | 31,350,152 | |
| |
Against | | | 608,880 | |
| |
Abstain | | | 515,095 | |
| |
Broker Non-Votes | | | 12,068,744 | |
| |
Total Fund Shares Voted | | | 44,542,876 | |
| |
Total Fund Shares Outstanding* | | | 63,456,468 | |
| | | | |
38 | | Annual Report | | franklintempleton.com |
TEMPLETON GLOBAL INVESTMENT TRUST
Board Members and Officers
The name, year of birth and address of the officers and board members, as well as their affiliations, positions held with the Trust, principal occupations during at least the past five years and number of US registered portfolios overseen in the Franklin Templeton Investments fund complex, are shown below. Generally, each board member serves until that person’s successor is elected and qualified.
Independent Board Members
| | | | | | | | |
Name, Year of Birth and Address | | Position | | Length of
Time Served | | Number of Portfolios in
Fund Complex Overseen
by Board Member* | | Other Directorships Held During at Least the Past 5 Years |
| | | | |
Harris J. Ashton (1932) 300 S.E. 2nd Street Fort Lauderdale, FL 33301-1923 | | Trustee | | Since 1994 | | 139 | | Bar-S Foods (meat packing company) (1981-2010). |
Principal Occupation During at Least the Past 5 Years: Director of various companies; and formerly, Director, RBC Holdings, Inc. (bank holding company) (until 2002); and President, Chief Executive Officer and Chairman of the Board, General Host Corporation (nursery and craft centers) (until 1998). |
| | | | | |
Ann Torre Bates (1958) 300 S.E. 2nd Street Fort Lauderdale, FL 33301-1923 | | Trustee | | Since 2008 | | 40 | | Ares Capital Corporation (specialty finance company) (2010-present), United Natural Foods, Inc. (distributor of natural, organic and specialty foods) (2013-present), Allied Capital Corporation (financial services) (2003-2010), SLM Corporation (Sallie Mae) (1997-2014) and Navient Corporation (loan management, servicing and asset recovery) (2014-2016). |
Principal Occupation During at Least the Past 5 Years: Director of various companies; and formerly, Executive Vice President and Chief Financial Officer, NHP Incorporated (manager of multifamily housing) (1995-1997); and Vice President and Treasurer, US Airways, Inc. (until 1995). |
| | | | |
Mary C. Choksi (1950) 300 S.E. 2nd Street Fort Lauderdale, FL 33301-1923 | | Trustee | | Since December 2017 | | 139 | | Avis Budget Group Inc. (car rental) (2007-present), Omnicom Group Inc. (advertising and marketing communications services) (2011-present) and White Mountains Insurance Group, Ltd. (holding company) (2017-present). |
Principal Occupation During at Least the Past 5 Years: Director of various companies; and formerly, Founder and Senior Advisor, Strategic Investment Group (investment management group) (2015-2017); Founding Partner and Senior Managing Director, Strategic Investment Group (1987-2015); Founding Partner and Managing Director, Emerging Markets Management LLC (investment management firm) (1987-2011); and Loan Officer/Senior Loan Officer/Senior Pension Investment Officer, World Bank Group (international financial institution) (1977-1987). |
| | | | |
Edith E. Holiday (1952) 300 S.E. 2nd Street Fort Lauderdale, FL 33301-1923 | | Lead
Independent
Trustee | | Trustee since 1996 and Lead Independent Trustee since 2007 | | 139 | | Hess Corporation (exploration of oil and gas) (1993-present), Canadian National Railway (railroad) (2001-present), White Mountains Insurance Group, Ltd. (holding company) (2004-present), Santander Consumer USA Holdings, Inc. (consumer finance) (2016-present), RTI International Metals, Inc. (manufacture and distribution of titanium) (1999-2015) and H.J. Heinz Company (processed foods and allied products) (1994-2013). |
Principal Occupation During at Least the Past 5 Years: Director or Trustee of various companies and trusts; and formerly, Assistant to the President of the United States and Secretary of the Cabinet (1990-1993); General Counsel to the United States Treasury Department (1989-1990); and Counselor to the Secretary and Assistant Secretary for Public Affairs and Public Liaison-United States Treasury Department (1988-1989). |
| | | | |
franklintempleton.com | | Annual Report | | 39 |
TEMPLETON GLOBAL INVESTMENT TRUST
Independent Board Members (continued)
| | | | | | | | |
Name, Year of Birth and Address | | Position | | Length of
Time Served | | Number of Portfolios in
Fund Complex Overseen
by Board Member* | | Other Directorships Held
During at Least the Past
5 Years |
| | | | |
J. Michael Luttig (1954) 300 S.E. 2nd Street Fort Lauderdale, FL 33301-1923 | | Trustee | | Since 2009 | | 139 | | Boeing Capital Corporation (aircraft financing) (2006-2013). |
Principal Occupation During at Least the Past 5 Years: Executive Vice President, General Counsel and member of the Executive Council, The Boeing Company (aerospace company) (2006-present); and formerly, Federal Appeals Court Judge, U.S. Court of Appeals for the Fourth Circuit (1991-2006). |
| | | | | |
David W. Niemiec (1949) 300 S.E. 2nd Street Fort Lauderdale, FL 33301-1923 | | Trustee | | Since 2006 | | 40 | | Hess Midstream Partners LP (oil and gas midstream infrastructure) (2017-present). |
Principal Occupation During at Least the Past 5 Years: Advisor, Saratoga Partners (private equity fund); and formerly, Managing Director, Saratoga Partners (1998-2001) and SBC Warburg Dillon Read (investment banking) (1997-1998); Vice Chairman, Dillon, Read & Co. Inc. (investment banking) (1991-1997); and Chief Financial Officer, Dillon, Read & Co. Inc. (1982-1997). |
| | | | |
Larry D. Thompson (1945) 300 S.E. 2nd Street Fort Lauderdale, FL 33301-1923 | | Trustee | | Since 2006 | | 139 | | The Southern Company (energy company) (2014-present; previously 2010-2012), Graham Holdings Company (education and media organization) (2011-present) and Cbeyond, Inc. (business communications provider) (2010-2012). |
Principal Occupation During at Least the Past 5 Years: Director of various companies; Counsel, Finch McCranie, LLP (law firm) (2015-present); Independent Compliance Monitor and Auditor, Volkswagen AG (manufacturer of automobiles and commercial vehicles) (2017-present ); John A. Sibley Professor of Corporate and Business Law, University of Georgia School of Law (2015-present; previously 2011-2012); and formerly, Executive Vice President - Government Affairs, General Counsel and Corporate Secretary, PepsiCo, Inc. (consumer products) (2012-2014); Senior Vice President - Government Affairs, General Counsel and Secretary, PepsiCo, Inc. (2004-2011); Senior Fellow of The Brookings Institution (2003-2004); Visiting Professor, University of Georgia School of Law (2004); and Deputy Attorney General, U.S. Department of Justice (2001-2003). |
| | | | |
Constantine D. Tseretopoulos (1954) 300 S.E. 2nd Street Fort Lauderdale, FL 33301-1923 | | Trustee | | Since 2001 | | 26 | | None |
Principal Occupation During at Least the Past 5 Years: Physician, Chief of Staff, owner and operator of the Lyford Cay Hospital (1987-present); director of various nonprofit organizations; and formerly, Cardiology Fellow, University of Maryland (1985-1987); and Internal Medicine Resident, Greater Baltimore Medical Center (1982-1985). |
| | | | |
Robert E. Wade (1946) 300 S.E. 2nd Street Fort Lauderdale, FL 33301-1923 | | Trustee | | Since 2006 | | 40 | | El Oro Ltd (investments) (2003-present). |
Principal Occupation During at Least the Past 5 Years: Attorney at law engaged in private practice as a sole practitioner (1972-2008) and member of various boards. |
| | | | |
40 | | Annual Report | | franklintempleton.com |
TEMPLETON GLOBAL INVESTMENT TRUST
Interested Board Members and Officers
| | | | | | | | |
Name, Year of Birth and Address | | Position | | Length of Time Served | | Number of Portfolios in
Fund Complex Overseen
by Board Member* | | Other Directorships Held
During at Least the Past 5 Years |
| | | | |
**Gregory E. Johnson (1961) One Franklin Parkway San Mateo, CA 94403-1906 | | Trustee | | Since 2006 | | 153 | | None |
Principal Occupation During at Least the Past 5 Years: Chairman of the Board, Member - Office of the Chairman, Director and Chief Executive Officer, Franklin Resources, Inc.; officer and/or director or trustee, as the case may be, of some of the other subsidiaries of Franklin Resources, Inc. and of 43 of the investment companies in Franklin Templeton Investments; Vice Chairman, Investment Company Institute; and formerly, President, Franklin Resources, Inc. (1994-2015). |
| | | | |
**Rupert H. Johnson, Jr. (1940) One Franklin Parkway San Mateo, CA 94403-1906 | | Chairman of the Board, Trustee and Vice President | | Chairman of the Board and Trustee since 2013 and Vice President since 1996 | | 139 | | None |
Principal Occupation During at Least the Past 5 Years: Vice Chairman, Member - Office of the Chairman and Director, Franklin Resources, Inc.; Director, Franklin Advisers, Inc.; Senior Vice President, Franklin Advisory Services, LLC; and officer and/or director or trustee, as the case may be, of some of the other subsidiaries of Franklin Resources, Inc. and of 41 of the investment companies in Franklin Templeton Investments. |
| | | | |
Alison E. Baur (1964) One Franklin Parkway San Mateo, CA 94403-1906 | | Vice President | | Since 2012 | | Not Applicable | | Not Applicable |
Principal Occupation During at Least the Past 5 Years: Deputy General Counsel, Franklin Templeton Investments; and officer of some of the other subsidiaries of Franklin Resources, Inc. and of 45 of the investment companies in Franklin Templeton Investments. |
| | | | |
Norman J. Boersma (1957) Lyford Cay Nassau, Bahamas | | President and Chief Executive Officer – Investment Management | | Since 2012 | | Not Applicable | | Not Applicable |
Principal Occupation During at Least the Past 5 Years: Chairman of the Board, President and Chief Executive Officer, Templeton Global Advisors Ltd.; Chief Investment Officer of Templeton Global Equity Group; officer of six of the investment companies in Franklin Templeton Investments; and formerly, Executive Vice President, Franklin Templeton Investments Corp. (1993-2014). |
| | | | |
Aliya S. Gordon (1973) One Franklin Parkway San Mateo, CA 94403-1906 | | Vice President | | Since 2009 | | Not Applicable | | Not Applicable |
Principal Occupation During at Least the Past 5 Years:
Senior Associate General Counsel, Franklin Templeton Investments; and officer of 45 of the investment companies in Franklin Templeton
Investments.
| | | | | | | | |
| | | | | |
Steven J. Gray (1955) One Franklin Parkway San Mateo, CA 94403-1906 | | Vice President | | Since 2009 | | Not Applicable | | Not Applicable |
Principal Occupation During at Least the Past 5 Years: Senior Associate General Counsel, Franklin Templeton Investments; Vice President, Franklin Templeton Distributors, Inc. and FASA, LLC; and officer of 45 of the investment companies in Franklin Templeton Investments. |
| | | | |
Matthew T. Hinkle (1971) One Franklin Parkway San Mateo, CA 94403-1906 | | Chief Executive Officer – Finance and Administration | | Since June 2017 | | Not Applicable | | Not Applicable |
| | | | |
franklintempleton.com | | Annual Report | | 41 |
TEMPLETON GLOBAL INVESTMENT TRUST
Interested Board Members and Officers (continued)
| | | | | | | | |
Name, Year of Birth and Address | | Position | | Length of
Time Served | | Number of Portfolios in
Fund Complex Overseen
by Board Member* | | Other Directorships Held
During at Least the Past 5 Years |
| | | | |
Robert G. Kubilis (1973) 300 S.E. 2nd Street Fort Lauderdale, FL 33301-1923 | | Chief Financial Officer, Chief Accounting Officer and Treasurer | | Since June 2017 | | Not Applicable | | Not Applicable |
Principal Occupation During at Least the Past 5 Years: Treasurer, U.S. Fund Administration & Reporting, Franklin Templeton Investments; and officer of 17 of the investment companies in Franklin Templeton Investments. |
| | | | |
Robert Lim (1948) One Franklin Parkway San Mateo, CA 94403-1906 | | Vice President – AML Compliance | | Since 2016 | | Not Applicable | | Not Applicable |
Principal Occupation During at Least the Past 5 Years: Vice President, Franklin Templeton Companies, LLC; Chief Compliance Officer, Franklin Templeton Distributors, Inc. and Franklin Templeton Investor Services, LLC; and officer of 45 of the investment companies in Franklin Templeton Investments. |
| | | | |
Kimberly H. Novotny (1972) 300 S.E. 2nd Street Fort Lauderdale, FL 33301-1923 | | Vice President | | Since 2013 | | Not Applicable | | Not Applicable |
Principal Occupation During at Least the Past 5 Years: Associate General Counsel, Franklin Templeton Investments; Vice President and Corporate Secretary, Fiduciary Trust International of the South; Vice President, Templeton Investment Counsel, LLC; Assistant Secretary, Franklin Resources, Inc.; and officer of 45 of the investment companies in Franklin Templeton Investments. |
| | | | |
Robert C. Rosselot (1960) 300 S.E. 2nd Street Fort Lauderdale, FL 33301-1923 | | Chief Compliance Officer | | Since 2013 | | Not Applicable | | Not Applicable |
Principal Occupation During at Least the Past 5 Years: Director, Global Compliance, Franklin Templeton Investments; Vice President, Franklin Templeton Companies, LLC; officer of 45 of the investment companies in Franklin Templeton Investments; and formerly, Senior Associate General Counsel, Franklin Templeton Investments (2007-2013); and Secretary and Vice President, Templeton Group of Funds (2004-2013). |
| | | | |
Karen L. Skidmore (1952) One Franklin Parkway San Mateo, CA 94403-1906 | | Vice President | | Since 2009 | | Not Applicable | | Not Applicable |
Principal Occupation During at Least the Past 5 Years: Senior Associate General Counsel, Franklin Templeton Investments; and officer of 45 of the investment companies in Franklin Templeton Investments. |
| | | | |
Navid J. Tofigh (1972) One Franklin Parkway San Mateo, CA 94403-1906 | | Vice President | | Since 2015 | | Not Applicable | | Not Applicable |
Principal Occupation During at Least the Past 5 Years: Associate General Counsel, Franklin Templeton Investments; and officer of 45 of the investment companies in Franklin Templeton Investments. |
| | | | |
Craig S. Tyle (1960) One Franklin Parkway San Mateo, CA 94403-1906 | | Vice President | | Since 2005 | | Not Applicable | | Not Applicable |
Principal Occupation During at Least the Past 5 Years: General Counsel and Executive Vice President, Franklin Resources, Inc.; and officer of some of the other subsidiaries of Franklin Resources, Inc. and of 45 of the investment companies in Franklin Templeton Investments. |
| | | | |
42 | | Annual Report | | franklintempleton.com |
TEMPLETON GLOBAL INVESTMENT TRUST
Interested Board Members and Officers (continued)
| | | | | | | | |
Name, Year of Birth and Address | | Position | | Length of
Time Served | | Number of Portfolios in
Fund Complex Overseen
by Board Member* | | Other Directorships Held
During at Least the Past 5 Years |
| | | | |
Lori A. Weber (1964) 300 S.E. 2nd Street Fort Lauderdale, FL 33301-1923 | | Secretary and Vice President | | Secretary since 2013 and Vice President since 2011 | | Not Applicable | | Not Applicable |
Principal Occupation During at Least the Past 5 Years: Senior Associate General Counsel, Franklin Templeton Investments; Assistant Secretary, Franklin Resources, Inc.; Vice President and Secretary, Templeton Investment Counsel, LLC; and officer of 45 of the investment companies in Franklin Templeton Investments. |
*We base the number of portfolios on each separate series of the US registered investment companies within the Franklin Templeton Investments fund complex. These portfolios have a common investment manager or affiliated investment managers.
**Gregory E. Johnson is considered to be an interested person of the Fund under the federal securities laws due to his position as an officer and director of Franklin Resources, Inc. (Resources), which is the parent company of the Fund’s investment manager and distributor. Rupert H. Johnson, Jr. is considered to be an interested person of the Fund under the federal securities laws due to his position as officer and director and major shareholder of Resources.
Note 1: Rupert H. Johnson, Jr. is the uncle of Gregory E. Johnson.
Note 2: Officer information is current as of the date of this report. It is possible that after this date, information about officers may change.
The Sarbanes-Oxley Act of 2002 and Rules adopted by the US Securities and Exchange Commission require the Fund to disclose whether the Fund’s Audit Committee includes at least one member who is an audit committee financial expert within the meaning of such Act and Rules. The Fund’s Board has determined that there is at least one such financial expert on the Audit Committee and has designated each of Ann Torre Bates and David W. Niemiec as an audit committee financial expert. The Board believes that Ms. Bates and Mr. Niemiec qualify as such an expert in view of their extensive business background and experience. Ms. Bates has served as a member of the Fund Audit Committee since 2008. She currently serves as a director of Ares Capital Corporation (2010-present) and United Natural Foods, Inc. (2013-present) and was formerly a director of Navient Corporation from 2014 to 2016, SLM Corporation from 1997 to 2014 and Allied Capital Corporation from 2003 to 2010, Executive Vice President and Chief Financial Officer of NHP Incorporated from 1995 to 1997 and Vice President and Treasurer of US Airways, Inc. until 1995. Mr. Niemiec has served as a member of the Fund Audit Committee since 2006, currently serves as an Advisor to Saratoga Partners and was formerly its Managing Director from 1998 to 2001 and serves as a director of Hess Midstream Partners LP (2017-present). Mr. Niemiec was formerly a director of Emeritus Corporation from 1999 to 2010 and OSI Pharmaceuticals, Inc. from 2006 to 2010, Managing Director of SBC Warburg Dillon Read from 1997 to 1998, and was Vice Chairman from 1991 to 1997 and Chief Financial Officer from 1982 to 1997 of Dillon, Read & Co. Inc. As a result of such background and experience, the Board believes that Ms. Bates and Mr. Niemiec have each acquired an understanding of generally accepted accounting principles and financial statements, the general application of such principles in connection with the accounting estimates, accruals and reserves, and analyzing and evaluating financial statements that present a breadth and level of complexity of accounting issues generally comparable to those of the Fund, as well as an understanding of internal controls and procedures for financial reporting and an understanding of audit committee functions. Ms. Bates and Mr. Niemiec are independent Board members as that term is defined under the applicable US Securities and Exchange Commission Rules and Releases.
The Statement of Additional Information (SAI) includes additional information about the board members and is available, without charge, upon request. Shareholders may call (800) DIAL BEN/342-5236 to request the SAI.
| | | | |
franklintempleton.com | | Annual Report | | 43 |
TEMPLETON GLOBAL INVESTMENT TRUST
TEMPLETON EMERGING MARKETS SMALL CAP FUND
Shareholder Information
Board Approval of Investment Management Agreements
TEMPLETON GLOBAL INVESTMENT TRUST
Templeton Emerging Markets Small Cap Fund
(Fund)
At an in-person meeting held on February 27, 2018 (Meeting), the Board of Trustees (Board) of Templeton Global Investment Trust (Trust), including a majority of the trustees who are not “interested persons” as defined in the Investment Company Act of 1940 (Independent Trustees), reviewed and approved the continuance of the investment management agreement between Templeton Asset Management Ltd. (Manager) and the Trust, on behalf of the Fund (Management Agreement) for an additional one-year period. The Independent Trustees received advice from and met separately with Independent Trustee counsel in considering whether to approve the continuation of the Management Agreement.
In considering the continuation of the Management Agreement, the Board reviewed and considered information provided by the Manager at the Meeting and throughout the year at meetings of the Board and its committees. The Board also reviewed and considered information provided in response to a detailed set of requests for information submitted to the Manager by Independent Trustee counsel on behalf of the Independent Trustees in connection with the annual contract renewal process. In addition, prior to the Meeting, the Independent Trustees held a telephonic contract renewal meeting at which the Independent Trustees conferred amongst themselves and Independent Trustee counsel about contract renewal matters. The Board reviewed and considered all of the factors it deemed relevant in approving the continuance of the Management Agreement, including, but not limited to: (i) the nature, extent and quality of the services provided by the Manager; (ii) the investment performance of the Fund; (iii) the costs of the services provided and profits realized by the Manager and its affiliates from the relationship with the Fund; (iv) the extent to which economies of scale are realized as the Fund grows; and (v) whether fee levels reflect these economies of scale for the benefit of Fund investors.
In approving the continuance of the Management Agreement, the Board, including a majority of the Independent Trustees, determined that the terms of the Management Agreement are fair and reasonable and that the continuance of such Management Agreement is in the interests of the Fund and its shareholders. While attention was given to all information
furnished, the following discusses some primary factors relevant to the Board’s determination.
Nature, Extent and Quality of Services
The Board reviewed and considered information regarding the nature, extent and quality of investment management services provided by the Manager and its affiliates to the Fund and its shareholders. This information included, among other things, the qualifications, background and experience of the senior management and investment personnel of the Manager; the structure of investment personnel compensation; oversight of third-party service providers; investment performance reports and related financial information for the Fund; reports on expenses, shareholder services, marketing support payments made to financial intermediaries and third party servicing arrangements; legal and compliance matters; risk controls; pricing and other services provided by the Manager and its affiliates; and management fees charged by the Manager and its affiliates to U.S. funds and other accounts, including management’s explanation of differences among accounts where relevant. The Board also reviewed and considered an annual report on payments made by Franklin Templeton Investments (FTI) or the Fund to financial intermediaries, as well as a memorandum relating to third-party servicing arrangements in response to a guidance update in 2016 from the U.S. Securities and Exchange Commission (SEC) relating to mutual fund distribution and sub-accounting fees. The Board noted management’s continuing efforts and expenditures in establishing effective business continuity plans and developing strategies to address areas of heightened concern in the mutual fund industry, such as cybersecurity and liquidity risk management. The Board also recognized management’s commitment to facilitating Board oversight of particular areas, including derivatives and payments to intermediaries, by enhanced reporting.
The Board also reviewed and considered the benefits provided to Fund shareholders of investing in a fund that is part of the Franklin Templeton family of funds. The Board noted the financial position of Franklin Resources, Inc. (FRI), the Manager’s parent, and its commitment to the mutual fund business as evidenced by its continued introduction of new funds, reassessment of the fund offerings in response to the market environment and project initiatives and capital investments relating to the services provided to the Fund by the FTI organization.
Following consideration of such information, the Board was satisfied with the nature, extent and quality of services provided
| | | | | | |
44 | | Annual Report | | | | franklintempleton.com |
TEMPLETON GLOBAL INVESTMENT TRUST
TEMPLETON EMERGING MARKETS SMALL CAP FUND
SHAREHOLDER INFORMATION
by the Manager and its affiliates to the Fund and its shareholders.
Fund Performance
The Board reviewed and considered the performance results of the Fund over various time periods ended December 31, 2017. The Board considered the performance returns for the Fund in comparison to the performance returns of mutual funds deemed comparable to the Fund included in a universe (Performance Universe) selected by Broadridge Financial Solutions, Inc. (Broadridge), an independent provider of investment company data. The Board received a description of the methodology used by Broadridge to select the mutual funds included in a Performance Universe. The Board also reviewed and considered Fund performance reports provided and discussions that occurred with portfolio managers at Board meetings throughout the year. A summary of the Fund’s performance results is below.
The Performance Universe for the Fund included the Fund and all retail and institutional emerging markets funds. The Board noted that the Fund’s annualized total return for the one- and three-year periods was below the median of its Performance Universe, but for the five- and 10-year periods was above the median and in the first quintile (the best) of its Performance Universe. The Board discussed with management the reasons for the shorter-term underperformance of the Fund during which management explained that comparing the Fund, an emerging market small cap fund, to the Performance Universe is not an apt comparison as the funds that comprise the Performance Universe include all retail and institutional emerging markets funds, and not just emerging market small cap funds. Management also explained that the Fund’s stock selection in Taiwan and the Information Technology sector hurt the Fund’s one- and three-year performance. The Board also discussed with management the enhancements management has made and continues to make to the Templeton Emerging Markets Group. The Board concluded that the Fund’s performance was satisfactory. In doing so, the Board noted that the Fund’s annualized total return for the one-year period, while below the median, exceeded 31%. The Board further noted management’s continued attention to the portfolio management team and the investment strategies of the Fund.
Comparative Fees and Expenses
The Board reviewed and considered information regarding the Fund’s actual total expense ratio and its various components, including, as applicable, management fees; transfer agent expenses; underlying fund expenses; Rule 12b-1 and
non-Rule 12b-1 service fees; and other non-management fees. The Board also noted the quarterly and annual reports it receives on all marketing support payments made by FTI to financial intermediaries. The Board considered the actual total expense ratio and, separately, the contractual management fee rate, without the effect of fee waivers (Management Rate), if any, of the Fund in comparison to the median expense ratio and median Management Rate, respectively, of other mutual funds deemed comparable to and with a similar expense structure as the Fund selected by Broadridge (Expense Group). Broadridge fee and expense data is based upon information taken from each fund’s most recent annual report, which reflects historical asset levels that may be quite different from those currently existing, particularly in a period of market volatility. While recognizing such inherent limitation and the fact that expense ratios and Management Rates generally increase as assets decline and decrease as assets grow, the Board believed the independent analysis conducted by Broadridge to be an appropriate measure of comparative fees and expenses. The Broadridge Management Rate includes administrative charges, and the actual total expense ratio, for comparative consistency, was shown for Class A shares for funds with multiple classes of shares. The Board received a description of the methodology used by Broadridge to select the mutual funds included in an Expense Group.
The Expense Group for the Fund included the Fund and 15 other emerging markets funds. The Board noted that the Management Rate for the Fund was above the median of and the second-highest in its Expense Group. The Board also noted that the actual total expense ratio for the Fund was above the median of and the highest in its Expense Group. The Board discussed the expenses of this Fund with management. The Board concluded that the Management Rate charged to the Fund is reasonable, given the Fund’s specialized focus on the small capitalization segment of the market, the Fund’s first quintile (the best) five- and ten-year performance and efforts by the Fund’s portfolio management team to mitigate the Fund’s risk exposures. The Board also noted that effective April 1, 2017, the first tier of the investment management fee paid by the Fund was changed from 1.450% for assets up to and including $1 billion to 1.450% for assets up to and including $500 million.
Profitability
The Board reviewed and considered information regarding the profits realized by the Manager and its affiliates in connection with the operation of the Fund. In this respect, the Board considered the Fund profitability analysis provided by the
| | | | | | |
franklintempleton.com | | | | Annual Report | | 45 |
TEMPLETON GLOBAL INVESTMENT TRUST
TEMPLETON EMERGING MARKETS SMALL CAP FUND
SHAREHOLDER INFORMATION
Manager that addresses the overall profitability of FTI’s U.S. fund business, as well as its profits in providing investment management and other services to each of the individual funds during the 12-month period ended September 30, 2017, being the most recent fiscal year-end for FRI. The Board noted that although management continually makes refinements to its methodologies used in calculating profitability in response to organizational and product related changes, the overall methodology has remained consistent with that used in the Fund’s profitability report presentations from prior years. Additionally, PricewaterhouseCoopers LLP, auditor to Franklin Resources, Inc. and certain Franklin Templeton funds, has been engaged by the Manager to periodically review and assess the allocation methodologies to be used solely by the Fund’s Board with respect to the profitability analysis.
The Board noted management’s belief that costs incurred in establishing the infrastructure necessary for the type of mutual fund operations conducted by the Manager and its affiliates may not be fully reflected in the expenses allocated to the Fund in determining its profitability, as well as the fact that the level of profits, to a certain extent, reflected operational cost savings and efficiencies initiated by management. The Board also noted management’s expenditures in improving shareholder services provided to the Fund, as well as the need to implement systems and meet additional regulatory and compliance requirements resulting from recent SEC and other regulatory requirements.
The Board also considered the extent to which the Manager and its affiliates might derive ancillary benefits from fund operations, including revenues generated from transfer agent services, potential benefits resulting from personnel and systems enhancements necessitated by fund growth, as well as increased leverage with service providers and counterparties. Based upon its consideration of all these factors, the Board concluded that the level of profits realized by the Manager and its affiliates from providing services to the Fund was not excessive in view of the nature, extent and quality of services provided to the Fund.
Economies of Scale
The Board reviewed and considered the extent to which the Manager may realize economies of scale, if any, as the Fund grows larger and whether the Fund’s management fee structure reflects any economies of scale for the benefit of shareholders. With respect to possible economies of scale, the Board noted the existence of management fee breakpoints, which operate generally to share any economies of scale with a Fund’s shareholders by reducing the Fund’s effective management fees
as the Fund grows in size. The Board considered the Manager’s view that any analyses of potential economies of scale in managing a particular fund are inherently limited in light of the joint and common costs and investments the Manager incurs across the Franklin Templeton family of funds as a whole. In response to prior Board discussions, the Manager lowered the initial Management Rate fee breakpoint effective April 1, 2017. In light of this change, the Board concluded that to the extent economies of scale may be realized by the Manager and its affiliates, the Fund’s management fee structure provided a sharing of benefits with the Fund and its shareholders as the Fund grows.
Conclusion
Based on its review, consideration and evaluation of all factors it believed relevant, including the above-described factors and conclusions, the Board unanimously approved the continuation of the Management Agreement for an additional one-year period.
Proxy Voting Policies and Procedures
The Fund’s investment manager has established Proxy Voting Policies and Procedures (Policies) that the Fund uses to determine how to vote proxies relating to portfolio securities. Shareholders may view the Fund’s complete Policies online at franklintempleton.com. Alternatively, shareholders may request copies of the Policies free of charge by calling the Proxy Group collect at (954) 527-7678 or by sending a written request to: Franklin Templeton Companies, LLC, 300 S.E. 2nd Street, Fort Lauderdale, FL 33301, Attention: Proxy Group. Copies of the Fund’s proxy voting records are also made available online at franklintempleton.com and posted on the US Securities and Exchange Commission’s website at sec.gov and reflect the most recent 12-month period ended June 30.
Quarterly Statement of Investments
The Trust, on behalf of the Fund, files a complete statement of investments with the US Securities and Exchange Commission for the first and third quarters for each fiscal year on Form N-Q. Shareholders may view the filed Form N-Q by visiting the Commission’s website at sec.gov. The filed form may also be viewed and copied at the Commission’s Public Reference Room in Washington, DC. Information regarding the operations of the Public Reference Room may be obtained by calling (800) SEC-0330.
| | | | | | |
46 | | Annual Report | | | | franklintempleton.com |
TEMPLETON GLOBAL INVESTMENT TRUST
TEMPLETON EMERGING MARKETS SMALL CAP FUND
SHAREHOLDER INFORMATION
Householding of Reports and Prospectuses
You will receive the Fund’s financial reports every six months as well as an annual updated summary prospectus (prospectus available upon request). To reduce Fund expenses, we try to identify related shareholders in a household and send only one copy of the financial reports and summary prospectus. This process, called “householding,” will continue indefinitely unless you instruct us otherwise. If you prefer not to have these documents householded, please call us at (800) 632-2301. At any time you may view current prospectuses/summary prospectuses and financial reports on our website. If you choose, you may receive these documents through electronic delivery.
| | | | | | |
franklintempleton.com | | | | Annual Report | | 47 |
This page intentionally left blank.
| | |
| | Annual Report and Shareholder Letter Templeton Emerging Markets Small Cap Fund |
| | Investment Manager |
| | Templeton Asset Management Ltd. |
| | Distributor |
| | Franklin Templeton Distributors, Inc. (800) DIAL BEN® / 342-5236 franklintempleton.com |
| | Shareholder Services |
| | (800) 632-2301 |
Authorized for distribution only when accompanied or preceded by a summary prospectus and/or prospectus. Investors should carefully consider a fund’s investment goals, risks, charges and expenses before investing. A prospectus contains this and other information; please read it carefully before investing.
To help ensure we provide you with quality service, all calls to and from our service areas are monitored and/or recorded.
| | |
| © 2018 Franklin Templeton Investments. All rights reserved. | | 426 A 05/18 |
Annual Report
Templeton Dynamic Equity Fund
This annual report for Templeton Dynamic Equity Fund covers the fiscal year ended March 31, 2018.
Your Fund’s Goal and Main Investments
The Fund seeks risk-adjusted total return over the longer term. Under normal market conditions, the Fund seeks to achieve its investment goal by investing its assets in a global equity portfolio, while managing sector exposure by monitoring its allocation to various sectors compared to its benchmark, the MSCI All Country World Index (ACWI), and adjusting its overall exposure to certain sectors through long and short positions in various sector-focused exchange-traded funds (ETFs). Additionally, the Fund may hedge its exposure to the overall global equity market through a combination of cash, ETFs and equity index futures. The Fund’s global equity portfolio consists primarily of equity securities of companies located anywhere in the world, including developing markets. The Fund normally invests at least 80% of its net assets (plus the amount of any borrowing for investment purposes) in equity securities and investments that provide exposure to equity securities. For purposes of this 80% policy, equity securities include, but are not limited to: common stock, preferred stock, convertible securities, depositary receipts, ETFs and certain derivative instruments. The Fund may invest in companies of any size, including small and medium capitalization companies.
What is a futures contract?
A futures contract is an agreement between the Fund and a counterparty made through a US or foreign futures exchange to buy or sell an underlying instrument or asset at a specific price on a future date.
Performance Overview
For the 12-month period under review, the Fund’s Advisor Class shares delivered a +12.11% cumulative total return. In comparison, the Fund’s benchmark, the MSCI ACWI, which measures stock performance in global developed and emerging markets, generated a +15.44% total return.1 You can find more
Geographic Composition
Based on Total Net Assets as of 3/31/18
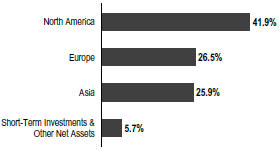
of the Fund’s performance data in the Performance Summary on page 8.
Performance data represent past performance, which does not guarantee future results. Investment return and principal value will fluctuate, and you may have a gain or loss when you sell your shares. Current performance may differ from figures shown.
Economic and Market Overview
The global economy expanded during the 12-month period under review amid generally upbeat economic data across regions. In this environment, global developed and emerging market stocks reached a new all-time high in January 2018 and generated a +15.44% total return for the period, as measured by the MSCI ACWI.1 Global markets were also aided by price gains in oil and other commodities, as well as the European Central Bank’s (ECB’s) extension of its monetary easing program. Further supporting global stocks were the prospect for reforms in the European Union (EU) with Emmanuel Macron’s election as France’s president, the passage of the US tax reform and encouraging corporate earnings reports.
However, global markets reflected investor concerns about geopolitical tensions in the Korean peninsula and political uncertainties in the US and the EU. Global stocks declined in February amid concerns that strong economic growth and rising inflation in some parts of the world, particularly the US,
1. Source: Morningstar.
The index is unmanaged and includes reinvestment of any income or distributions. It does not reflect any fees, expenses or sales charges. One cannot invest directly in an index, and an index is not representative of the Fund’s portfolio.
The dollar value, number of shares or principal amount, and names of all portfolio holdings are listed in the Fund’s Statement of Investments (SOI). The SOI begins on page 13.
TEMPLETON DYNAMIC EQUITY FUND
would lead central banks to increase interest rates sooner than expected. In March, global markets were pressured further by a broad sell-off in information technology stocks due to a potential for tighter regulation in the sector arising from concerns about consumer data privacy. The Trump administration’s protectionist policy and escalating trade tensions between the US and China further dampened investor sentiment near period-end.
After accelerating in 2017’s second and third quarters, the US economy moderated in the next two quarters. The slower growth in 2018’s first quarter reflected a slowdown in consumer spending, residential fixed investment, exports, and state and local government spending. The unemployment rate declined from 4.5% in March 2017 to 4.1% at period-end.2 Annual inflation, as measured by the Consumer Price Index, was 2.4% in March 2017, and while it varied over the 12-month period, remained unchanged at period-end.2 The US Federal Reserve (Fed) raised its target range for the federal funds rate three times during the period and began reducing its balance sheet in October as part of its ongoing plan to normalize its monetary policy. At its March 2018 meeting, the Fed raised its forecast for US economic growth in 2018 and 2019, while maintaining its projection of three rate increases in 2018. However, the Fed’s rate projections indicated the number of rate hikes would increase in 2019 and 2020.
In Europe, the UK’s economic growth accelerated in 2017’s third quarter over the previous quarter but moderated in the fourth quarter. In November, the Bank of England raised its key policy rate for the first time in a decade. The eurozone’s growth accelerated in 2017’s second quarter over the previous quarter and held steady in the third quarter, but it moderated in the fourth quarter. The bloc’s annual inflation rate ended the period lower than in March 2017. The ECB kept its benchmark interest rate unchanged during the period. However, at its October meeting, the ECB extended the time frame for its massive bond-buying program from December 2017 to at least September 2018, while reducing the amount of monthly bond purchases in half beginning in January 2018.
In Asia, Japan’s quarterly gross domestic product (GDP) growth slowed in 2017’s fourth quarter compared to the third quarter, as contractions in private residential investment offset a recovery in private consumption. The Bank of Japan left its benchmark interest rate unchanged during the period and continued its monetary stimulus measures.
Top 10 Countries
3/31/18
| | |
| | | % of Total Net Assets |
US | | 41.0% |
South Korea | | 9.7% |
UK | | 7.2% |
China | | 6.0% |
Japan | | 5.8% |
Denmark | | 4.4% |
Switzerland | | 4.2% |
France | | 4.0% |
Netherlands | | 3.6% |
Thailand | | 2.2% |
In emerging markets, Brazil’s quarterly GDP grew in 2017’s second, third and fourth quarters, but it slowed in each succeeding quarter. The country’s central bank cut its benchmark interest rate several times during the period to spur economic growth. Russia’s annual GDP growth rate remained positive in 2017’s second, third and fourth quarters, amid the Bank of Russia’s continued policy support. China’s GDP moderated in 2017’s third quarter compared to the prior-year period, but grew at a stable rate in the fourth quarter. The People’s Bank of China left its benchmark interest rate unchanged during the period. Overall, emerging market stocks, as measured by the MSCI Emerging Markets Index, rose substantially during the period.
Investment Strategy
In selecting equity securities eligible for the Fund’s global equity portfolio, we apply a bottom-up, value-oriented, long-term approach. We focus on the market price of a company’s securities relative to our evaluation of the company’s long-term earnings, asset value and cash flow potential. After establishing a universe of potential investments, we generally apply a proprietary quantitative screen to assist in selecting the specific securities to buy or sell for the Fund.
| | |
| |
| | What is a currency forward contract? A currency forward contract is an agreement between the Fund and a counterparty to buy or sell a foreign currency in exchange for another currency at a specific exchange rate on a future date. Currency forward contracts are privately traded in the interbank market, not on a centralized exchange. |
2. Source: US Bureau of Labor Statistics.
TEMPLETON DYNAMIC EQUITY FUND
| | |
| |
| | What is an option? An option is a contract to buy or sell a specific financial product known as the option’s underlying instrument at a specific price. The buyer of an option has the right, but not the obligation, to buy or sell the underlying instrument at or until a specified expiration date. Conversely, the seller (“writer”) of an option who opens a transaction is obligated to buy or sell the underlying instrument should the option holder exercise that right. |
We also monitor the Fund’s allocation to various sectors compared to the Fund’s benchmark, the MSCI ACWI, and adjust the Fund’s overall exposure to certain sectors by taking long (buying) or short (selling) positions on various sector-focused, passively managed ETFs. A long position in a sector-focused ETF would increase the Fund’s exposure to that particular sector, while a short position in a sector-focused ETF would decrease the Fund’s exposure to that sector. We use various technical and quantitative indicators for each sector to determine whether to increase or decrease the Fund’s exposure to specific sectors.
In addition to monitoring and adjusting the Fund’s exposure to specific sectors in the global equity market, we also monitor and adjust the Fund’s exposure to the overall global equity market. We use a model that studies various macroeconomic and market factors believed to have an impact on the global equity markets as a guide to determine when it is appropriate to hedge the global equity market. However, we make the ultimate decision on whether to hedge the Fund’s global equity market exposure based on our review of the market and the Fund’s current portfolio. When we determine that the Fund should increase its exposure to the global equity market, we will invest the Fund’s cash in one or more ETFs that provide global equity market exposure. When we expect global equity market returns to be negative and the Fund’s exposure should be decreased, we may use derivative instruments—specifically, selling equity index futures—to hedge the Fund’s exposure to overall global equity markets.
We may, from time to time, seek to hedge against market risk, gain exposure to individual securities or generate additional income for the Fund by buying and selling (writing) exchange traded and over-the-counter equity put and call options on individual securities held in its portfolio in an amount up to
10% of its net assets. Additionally, we may, from time to time, seek to hedge (protect) against currency risks, using certain derivative instruments, including currency and cross currency forwards and currency futures contracts.
Manager’s Discussion
During the 12-month period under review, the Fund was able to mitigate risk, but underperformed relative to its benchmark, the MSCI ACWI. Overall, sector allocation detracted from the Fund’s relative performance, but the volatility incurred was slightly less than that of the benchmark. Nevertheless, we maintained our stance of seeking undervalued companies, while focusing on a long-term investment horizon and maximizing risk-adjusted returns. We believe that undervalued companies with strong prospects for fundamental recovery should continue to offer exceptional investment opportunities.
Stock selection contributed to relative performance in the utilities, energy, real estate, materials, consumer staples, telecommunication services and industrials sectors, while an underweighting in the financials sector supported relative results.3
The utilities sector was a large contributor to relative performance during the period due to stock selection. Orsted, previously named DONG Energy, was one of our top contributors in the sector. Orsted is a large energy company in Denmark that develops, operates and owns offshore wind farms. The company’s stock benefited as it divested of its fossil fuel assets and focused on building its offshore wind power generation. We believe the market recognized the value and growth potential of Orsted’s clean energy assets during the period and that the stock price then benefited from this realization. However, we believe the company is fairly valued and we remained relatively in line with the benchmark weighting in the sector at period-end.
Our overweighted allocation in the energy sector was more than offset by stock selection, which supported relative results due to our oil, gas and consumables holdings. PTT, a Thailand-based integrated gas company with strong exposure to natural gas, was a top performer in the sector. The majority of its business has to do with gas infrastructure as it focuses on gas pipelines, gas separation plants and liquefied natural gas terminals. We invested in PTT when concerns regarding its low
3. The utilities sector comprises electric utilities in the SOI. The energy sector comprises oil, gas and consumable fuels in the SOI. The real estate sector comprises real estate management and development in the SOI. The materials sector comprises chemicals in the SOI. The consumer staples sector comprises beverages and household products in the SOI. The telecommunication services sector comprises wireless telecommunication services in the SOI. The industrials sector comprises aerospace and defense, construction and engineering, electrical equipment, trading companies and distributors, and transportation infrastructure in the SOI. The financials sector comprises banks, capital markets, consumer finance and insurance in the SOI.
TEMPLETON DYNAMIC EQUITY FUND
reserve life and collapsing oil prices pushed the stock to bargain level valuations. The company used its strong balance sheet and positive cash flow to buy assets and increase reserves at bargain-level prices throughout the period. In our view, investor sentiment has improved and we believe the stock was fairly valued at the period-end.
Despite an underweighted allocation in real estate, stock selection in the sector contributed to relative performance, largely due to our position in Jones Lang LaSalle (JLL). JLL is a US-domiciled company with a global footprint in real estate services, such as leasing and property/facility management, in addition to investment management. Early in the period, JLL traded at what we considered discounted valuations. The stock price reflected concerns over a possible real estate market correction in the face of rising interest rates and uncertainty in the UK following the Brexit vote. However, JLL demonstrated its ability to gain market share and grow its cyclical leasing and capital markets revenue in a market experiencing revenue stagnation. The company’s recurring incomes from property and facility management also expanded, which, in our view, led to higher stock prices. We remained holders of JLL at period-end as we believe more upside potential exists, but we remained underweighted in the sector.
Within the materials sector, the chemicals companies we invested in such as US-based Eastman Chemical and South Korea-based Lotte Chemical contributed to relative performance. Eastman Chemical is an integrated producer of intermediate and specialty chemicals, plastics and polymers. Eastman was able to overcome some ill-timed hedges and one-off incidents to grow earnings per share significantly. Increased profits from its advanced materials and additives and function products division also supported the company’s results. We identified what we deemed as several undervalued investments in the materials sector and remained overweighted relative to the benchmark at period-end.
An underweighted allocation and stock selection contributed to relative performance in the consumer staples sector, led by beverages. Japan-based Kirin Holdings was a notable contributor. Kirin engages in the sale and manufacture of beverages and pharmaceutical products. The company boosted margins and increased its 2017 earnings over 2016 numbers. Despite marginal growth in sales, Kirin’s management was able to improve distribution and reduce operating costs.
Nevertheless, the company traded near what we considered fair value at period-end and we remained underweighted in the sector.
In the telecommunications services sector, underweighted exposure and stock selection contributed to relative results, with Telefonica Deutschland Holding a notable contributor.4 Telefonica Deutschland is a large mobile network operator in Germany. Our investment in the company proved to be profitable during a time when the market underestimated the company’s ability to generate modest but steady free cash flow. However, more recently the stock price declined due to concerns of higher spending needs and lower profits from regulated abolishment of roaming fees. We continued to see value in the stock at period-end, but maintained an underweighted position in the sector.
Stock selection in the industrials sector more than offset the impact of an underweighted allocation, contributing to the Fund’s relative performance overall. Our airline holdings offered strong returns, with German-based Deutsche Lufthansa a notable contributor.4 Lufthansa is the second largest airline in Europe in terms of fleet size and it operates through three main hubs: Frankfurt, Munich and Zurich. During the period, the stock benefited from multiple factors that resulted in strong traffic numbers and resilient pricing ability as its competitors faced issues. We purchased the stock during a time when the company faced issues with union labor and the strength of its balance sheet was, in our analysis, being discounted. We remained underweighted in the sector even though we bought small positions in multiple holdings.
Lastly, the Fund’s underweighted exposure to the financials sector offset stock selection and contributed to relative performance. Our European insurance stocks contributed to the sector, while a short position we took in a financial ETF to mitigate risk adversely affected relative returns.
It is important to recognize the effect of currency movements on the Fund’s performance. In general, if the value of the US dollar goes up compared with a foreign currency, an investment traded in that foreign currency will go down in value because it will be worth fewer US dollars. This can have a negative effect on Fund performance. Conversely, when the US dollar weakens in relation to a foreign currency, an investment traded in that foreign currency will increase in value, which can contribute to Fund performance. For the 12 months ended March 31, 2018, the US dollar declined in value relative to
4. No longer held at period-end.
TEMPLETON DYNAMIC EQUITY FUND
most currencies. As a result, the Fund’s performance was positively affected by the portfolio’s substantial investment in securities with non-US currency exposure. However, one cannot expect the same result in future periods.
Top 10 Holdings
3/31/18
| | | | |
Company Sector/Industry, Country | | % of Total
Net Assets | |
Orsted AS | | | 3.4% | |
Electric Utilities, Denmark | | | | |
Microsoft Corp. | | | 3.0% | |
Software, US | | | | |
Total SA | | | 2.9% | |
Oil, Gas & Consumable Fuels, France | | | | |
Apple Inc. | | | 2.8% | |
Technology Hardware, Storage & Peripherals, US | | | | |
LyondellBasell Industries NV | | | 2.7% | |
Chemicals, US | | | | |
Oracle Corp. | | | 2.6% | |
Software, US | | | | |
Alphabet Inc. | | | 2.4% | |
Internet Software & Services, US | | | | |
Kirin Holdings Co. Ltd. | | | 2.4% | |
Beverages, Japan | | | | |
Eastman Chemical Co. | | | 2.4% | |
Chemicals, US | | | | |
Novartis AG | | | 2.4% | |
Pharmaceuticals, Switzerland | | | | |
Stock selection in the information technology, health care and consumer discretionary sectors detracted from relative performance during the period.5
Stock selection more than offset an overweighted allocation in the information technology sector and detracted from relative performance. Several holdings in different industries led to disappointing results, including Taiwan-based Pegatron. Pegatron is involved in electronic and computing design, manufacturing and service; its main customer is Apple. Disappointing iPhone 8 sales led to Pegatron’s poor performance during the period. The company’s margins also suffered as labor costs rose leading up to the launch of iPhone X. Despite a few disappointments, we continued to see value in Pegatron and the information technology sector. We maintained a relatively overweighted position in the sector during the period and continued to be overweighted at period-end.
Within the health care sector, stock selection and an overweighted position detracted from relative results. Despite identifying what we considered several value stocks in the health care sector, Israel-base Teva4 and Switzerland-based Roche Holding were notable detractors. Teva is a global pharmaceutical company that produces generic drugs and active ingredients for the pharmaceutical industry and therapeutic products. Teva’s stock plummeted from its peak as it battled a barrage of disappointing news during the period. The company faced increased competition in its US generic business, while losing challenges against patents for its high earnings drug Capaxone. The resulting drop in cash came at a time where the balance sheet contained a high amount of debt after an expensive acquisition. Lastly, the company experienced a change at the top management level. Despite disappointing results during the period, we continued to see value in health care and remained relatively overweighted to the sector at period-end.
Stock selection and an underweighted position in the consumer discretionary sector hindered relative performance. We maintained an underweighted allocation at period-end.
In addition, our cash holdings and hedging activities hindered relative performance during the period, mainly due to hedges in the euro, British pound and South Korean won that worked against our favor.
The Fund delivered reasonable absolute returns during the period, while incurring less volatility than the benchmark. The Fund also held a sizeable position of cash in multiple currencies as part of its effort to minimize volatility. We took long and short positions in ETFs as a risk reducing measure to seek better risk-adjusted returns.
5. The IT sector comprises electronic equipment; instruments and components; internet software and services; software; and technology hardware, storage and peripherals in the SOI. The health care sector comprises biotechnology, health care providers and services, and pharmaceuticals in the SOI. The consumer discretionary sector comprises auto components, automobiles, media and specialty retail in the SOI.
See www.franklintempletondatasources.com for additional data provider information.
TEMPLETON DYNAMIC EQUITY FUND
| | |
 | | 
James Harper, CFA |
| |
 | | 
Norman J. Boersma, CFA |
| |
| | Heather Arnold, CFA Portfolio Management Team |
The foregoing information reflects our analysis, opinions and portfolio holdings as of March 31, 2018, the end of the reporting period. The way we implement our main investment strategies and the resulting portfolio holdings may change depending on factors such as market and economic conditions. These opinions may not be relied upon as investment advice or an offer for a particular security. The information is not a complete analysis of every aspect of any market, country, industry, security or the Fund. Statements of fact are from sources considered reliable, but the investment manager makes no representation or warranty as to their completeness or accuracy. Although historical performance is no guarantee of future results, these insights may help you understand our investment management philosophy.
TEMPLETON DYNAMIC EQUITY FUND
Performance Summary as of March 31, 2018
The performance table and graph do not reflect any taxes that a shareholder would pay on Fund dividends, capital gain distributions, if any, or any realized gains on the sale of Fund shares. Total return reflects reinvestment of the Fund’s dividends and capital gain distributions, if any, and any unrealized gains or losses. Your dividend income will vary depending on dividends or interest paid by securities in the Fund’s portfolio, adjusted for operating expenses. Capital gain distributions are net profits realized from the sale of portfolio securities.
Performance as of 3/31/181
Cumulative total return excludes sales charges. Average annual total return includes maximum sales charges. Sales charges will vary depending on the size of the investment and the class of share purchased. Advisor Class shares are offered without sales charges.
| | | | | | | | |
| Share Class | | Cumulative
Total Return2 | | | Average Annual
Total Return3 | |
| | |
Advisor | | | | | | | | |
1-Year | | | +12.11% | | | | +12.11% | |
Since Inception (5/2/16) | | | +27.77% | | | | +13.67% | |
Performance data represent past performance, which does not guarantee future results. Investment return and principal value will fluctuate, and you may have a gain or loss when you sell your shares. Current performance may differ from figures shown.
See page 10 for Performance Summary footnotes.
TEMPLETON DYNAMIC EQUITY FUND
PERFORMANCE SUMMARY
Total Return Index Comparison for a Hypothetical $10,000 Investment1
Total return represents the change in value of an investment over the periods shown. It includes any applicable maximum sales charge, Fund expenses, account fees and reinvested distributions. The unmanaged index includes reinvestment of any income or distributions. It differs from the Fund in composition and does not pay management fees or expenses. One cannot invest directly in an index.
Advisor Class (5/2/16–3/31/18)
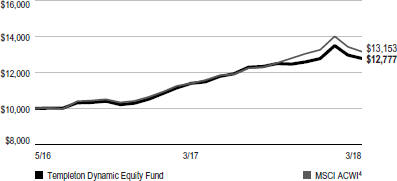
See page 10 for Performance Summary footnotes.
TEMPLETON DYNAMIC EQUITY FUND
PERFORMANCE SUMMARY
Distributions (4/1/17–3/31/18)
| | | | | | | | | | | | | | | | |
Share Class | | Net Investment
Income | | | Short-Term
Capital Gain | | | Long-Term
Capital Gain | | | Total | |
Advisor | | | $0.2100 | | | | $0.7721 | | | | $0.3691 | | | | $1.3512 | |
Total Annual Operating Expenses5 | |
Share Class | | With Waiver | | | Without Waiver | | | | | | | |
Advisor | | | 1.23% | | | | 1.90% | | | | | | | | | |
All investments involve risks, including possible loss of principal. Special risks are associated with foreign investing, including currency fluctuations, economic instability and political developments; investments in emerging markets involve heightened risks related to the same factors. In addition, smaller company stocks have historically experienced more price volatility than larger company stocks, especially over the short term. To the extent the Fund focuses on particular countries, regions, industries, sectors or types of investment from time to time, it may be subject to greater risks of adverse developments in such areas of focus than a fund that invests in a wider variety of countries, regions, industries, sectors or investments. Derivatives, including equity index futures, equity options and currency management strategies, involve costs and can create economic leverage in the portfolio, which may result in significant volatility and cause the Fund to participate in losses (as well as enable gains) on an amount that exceeds the Fund’s initial investment. To the extent the Fund invests in ETFs, its performance is directly related to the performance of such ETFs. The Fund is actively managed but there is no guarantee that the manager’s investment decisions will produce the desired results. The Fund’s prospectus also includes a description of the main investment risks.
1. The Fund has an expense reduction and a fee waiver associated with any investments it makes in a Franklin Templeton money fund and/or other Franklin Templeton fund, contractually guaranteed through 7/31/18. Fund investment results reflect the expense reduction and fee waiver; without these reductions, the results would have been lower.
2. Cumulative total return represents the change in value of an investment over the periods indicated.
3. Average annual total return represents the average annual change in value of an investment over the periods indicated. Return for less than one year, if any, has not been annualized.
4. Source: Morningstar. The MSCI ACWI is a free float-adjusted, market capitalization-weighted index designed to measure equity market performance in global developed and emerging markets.
5. Figures are as stated in the Fund’s current prospectus and may differ from the expense ratios disclosed in the Your Fund’s Expenses and Financial Highlights sections in this report. In periods of market volatility, assets may decline significantly, causing total annual Fund operating expenses to become higher than the figures shown.
See www.franklintempletondatasources.com for additional data provider information.
TEMPLETON DYNAMIC EQUITY FUND
Your Fund’s Expenses
As a Fund shareholder, you can incur two types of costs: (1) transaction costs, including sales charges (loads) on Fund purchases and redemptions; and (2) ongoing Fund costs, including management fees, distribution and service (12b-1) fees, and other Fund expenses. All mutual funds have ongoing costs, sometimes referred to as operating expenses. The table below shows ongoing costs of investing in the Fund and can help you understand these costs and compare them with those of other mutual funds. The table assumes a $1,000 investment held for the six months indicated.
Actual Fund Expenses
The table below provides information about actual account values and actual expenses in the columns under the heading “Actual.” In these columns the Fund’s actual return, which includes the effect of Fund expenses, is used to calculate the “Ending Account Value” for each class of shares. You can estimate the expenses you paid during the period by following these steps (of course, your account value and expenses will differ from those in this illustration): Divide your account value by $1,000 (if your account had an $8,600 value, then $8,600 ÷ $1,000 = 8.6). Then multiply the result by the number in the row for your class of shares under the headings “Actual” and “Expenses Paid During Period” (if Actual Expenses Paid During Period were $7.50, then 8.6 x $7.50 = $64.50). In this illustration, the actual expenses paid this period are $64.50.
Hypothetical Example for Comparison with Other Funds
Under the heading “Hypothetical” in the table, information is provided about hypothetical account values and hypothetical expenses based on the Fund’s actual expense ratio and an assumed rate of return of 5% per year before expenses, which is not the Fund’s actual return. This information may not be used to estimate the actual ending account balance or expenses you paid for the period, but it can help you compare ongoing costs of investing in the Fund with those of other funds. To do so, compare this 5% hypothetical example for the class of shares you hold with the 5% hypothetical examples that appear in the shareholder reports of other funds.
Please note that expenses shown in the table are meant to highlight ongoing costs and do not reflect any transactional costs. Therefore, information under the heading “Hypothetical” is useful in comparing ongoing costs only, and will not help you compare total costs of owning different funds. In addition, if transactional costs were included, your total costs would have been higher.
| | | | | | | | | | | | |
| | | | | Actual
(actual return after expenses) | | Hypothetical
(5% annual return before expenses) | | |
Share Class | | Beginning
Account Value 10/1/17 | | Ending Account Value 3/31/18 | | Expenses Paid During
Period 10/1/17–3/31/181,2 | | Ending Account Value 3/31/18 | | Expenses Paid During
Period 10/1/17–3/31/181,2 | | Net Annualized
Expense Ratio2 |
| | | | | | |
Advisor | | $1,000 | | $1,022.20 | | $5.04 | | $1,019.95 | | $5.04 | | 1.00% |
1. Expenses are equal to the annualized expense ratio for the six-month period as indicated above—in the far right column—multiplied by the simple average account value over the period indicated, and then multiplied by 182/365 to reflect the one-half year period.
2. Reflects expenses after fee waivers and expense reimbursements. Does not include acquired fund fees and expenses.
TEMPLETON GLOBAL INVESTMENT TRUST
Financial Highlights
Templeton Dynamic Equity Fund
| | | | | | | | |
| | | Year Ended March 31, | |
| | | | |
| | | 2018 | | | 2017a | |
| |
| | |
Advisor Class | | | | | | | | |
| | |
Per share operating performance | | | | | | | | |
(for a share outstanding throughout the year) | | | | | | | | |
| | |
Net asset value, beginning of year | | | $11.17 | | | | $10.00 | |
| | | | |
| | |
Income from investment operationsb: | | | | | | | | |
| | |
| Net investment incomec | | | 0.17 | | | | 0.12 | |
| | |
Net realized and unrealized gains (losses) | | | 1.17 | | | | 1.26 | |
| | | | |
| | |
Total from investment operations | | | 1.34 | | | | 1.38 | |
| | | | |
| | |
| Less distributions from: | | | | | | | | |
| | |
| Net investment income | | | (0.21) | | | | (0.11) | |
| | |
Net realized gains | | | (1.14) | | | | (0.10) | |
| | | | |
| | |
Total distributions | | | (1.35 | ) | | | (0.21 | ) |
| | | | |
| | |
Net asset value, end of year. | | | $11.16 | | | | $11.17 | |
| | | | |
| | |
Total returnd | | | 12.11% | | | | 13.97% | |
| | |
Ratios to average net assetse | | | | | | | | |
| | |
Expenses before waiver and payments by affiliatesf | | | 1.83% | | | | 2.41% | |
| | |
Expenses net of waiver and payments by affiliatesf | | | 1.03%g | | | | 1.22% | |
| | |
Expenses incurred in connection with securities sold short | | | 0.03% | | | | 0.22% | |
| | |
Net investment income | | | 1.43% | | | | 1.31% | |
| | |
Supplemental data | | | | | | | | |
| | |
Net assets, end of year (000’s) | | | $11,158 | | | | $11,170 | |
| | |
Portfolio turnover rate | | | 104.87% | | | | 86.10% | |
aFor the period May 2, 2016 (commencement of operations) to March 31, 2017.
bThe amount shown for a share outstanding throughout the period may not correlate with the Statement of Operations for the period due to the timing of sales and repurchases of the Fund’s shares in relation to income earned and/or fluctuating fair value of the investments of the Fund.
cBased on average daily shares outstanding.
dTotal return is not annualized for periods less than one year.
eRatios are annualized for periods less than one year, except for non-recurring expenses, if any.
fIncludes dividend and/or interest expense on securities sold short and security borrowing fees, if any. See below for the ratios of such expenses to average net assets for the periods presented. See Note 1(d).
gBenefit of expense reduction rounds to less than 0.01%.
| | | | | | |
| | | | | The accompanying notes are an integral part of these financial statements. | Annual Report | | 12 |
TEMPLETON GLOBAL INVESTMENT TRUST
Statement of Investments, March 31, 2018
Templeton Dynamic Equity Fund
| | | | | | | | | | |
| | | Industry | | | Shares | | | | Value | |
Common Stocks 94.3% | | | | | |
Belgium 1.3% | | | | | | | | | | |
UCB SA | | Pharmaceuticals | | | 1,777 | | | $ | 144,891 | |
| | | | | | | | | | |
Canada 0.9% | | | | | | | | | | |
Suncor Energy Inc. | | Oil, Gas & Consumable Fuels | | | 2,900 | | | | 100,036 | |
| | | | | | | | | | |
China 6.0% | | | | | | | | | | |
aBaidu Inc., ADR | | Internet Software & Services | | | 439 | | | | 97,980 | |
China Merchants Port Holdings Co. Ltd. | | Transportation Infrastructure | | | 63,981 | | | | 141,024 | |
China Mobile Ltd. | | Wireless Telecommunication Services | | | 24,206 | | | | 221,897 | |
Kunlun Energy Co. Ltd. | | Oil, Gas & Consumable Fuels | | | 124,000 | | | | 106,957 | |
Sinopec Engineering Group Co. Ltd. | | Construction & Engineering | | | 102,000 | | | | 101,496 | |
| | | | | | | | | | |
| | | | | | | | | 669,354 | |
| | | | | | | | | | |
Denmark 4.4% | | | | | | | | | | |
Orsted AS | | Electric Utilities | | | 5,862 | | | | 379,812 | |
Vestas Wind Systems AS | | Electrical Equipment | | | 1,609 | | | | 114,304 | |
| | | | | | | | | | |
| | | | | | | | | 494,116 | |
| | | | | | | | | | |
France 4.0% | | | | | | | | | | |
AXA SA | | Insurance | | | 4,379 | | | | 116,535 | |
Total SA. | | Oil, Gas & Consumable Fuels | | | 5,699 | | | | 323,900 | |
| | | | | | | | | | |
| | | | | | | | | 440,435 | |
| | | | | | | | | | |
Italy 1.8% | | | | | | | | | | |
aUniCredit SpA | | Banks | | | 9,375 | | | | 196,219 | |
| | | | | | | | | | |
Japan 5.8% | | | | | | | | | | |
ITOCHU Corp. | | Trading Companies & Distributors | | | 8,100 | | | | 157,518 | |
Kirin Holdings Co. Ltd. | | Beverages | | | 10,050 | | | | 267,883 | |
Mazda Motor Corp. | | Automobiles | | | 9,700 | | | | 128,387 | |
Sumitomo Mitsui Financial Group Inc. | | Banks | | | 2,300 | | | | 96,489 | |
| | | | | | | | | | |
| | | | | | | | | 650,277 | |
| | | | | | | | | | |
Netherlands 3.6% | | | | | | | | | | |
Aegon NV | | Insurance | | | 21,030 | | | | 141,883 | |
NN Group NV | | Insurance | | | 5,876 | | | | 260,913 | |
| | | | | | | | | | |
| | | | | | | | | 402,796 | |
| | | | | | | | | | |
South Korea 9.7% | | | | | | | | | | |
DB Insurance Co. Ltd. | | Insurance | | | 1,879 | | | | 115,064 | |
Hana Financial Group Inc. | | Banks | | | 3,854 | | | | 166,112 | |
KB Financial Group Inc. | | Banks | | | 2,589 | | | | 148,054 | |
Lotte Chemical Corp. | | Chemicals | | | 326 | | | | 132,985 | |
Samsung Electronics Co. Ltd. | | Technology Hardware, Storage & Peripherals | | | 113 | | | | 261,992 | |
Shinhan Financial Group Co. Ltd. | | Banks | | | 6,065 | | | | 261,123 | |
| | | | | | | | | | |
| | | | | | | | | 1,085,330 | |
| | | | | | | | | | |
Switzerland 4.2% | | | | | | | | | | |
Novartis AG | | Pharmaceuticals | | | 3,253 | | | | 263,528 | |
Roche Holding AG | | Pharmaceuticals | | | 908 | | | | 208,601 | |
| | | | | | | | | | |
| | | | | | | | | 472,129 | |
| | | | | | | | | | |
Taiwan 2.2% | | | | | | | | | | |
Catcher Technology Co. Ltd. | | Technology Hardware, Storage & Peripherals | | | 10,000 | | | | 122,021 | |
Pegatron Corp. | | Technology Hardware, Storage & Peripherals | | | 47,000 | | | | 118,253 | |
| | | | | | | | | | |
| | | | | | | | | 240,274 | |
| | | | | | | | | | |
TEMPLETON GLOBAL INVESTMENT TRUST
STATEMENT OF INVESTMENTS
Templeton Dynamic Equity Fund (continued)
| | | | | | | | | | |
| | | Industry | | | Shares | | | | Value | |
Common Stocks (continued) | | | | | | | | | | |
Thailand 2.2% | | | | | | | | | | |
PTT Global Chemical PCL, fgn. | | Chemicals | | | 37,700 | | | $ | 114,929 | |
PTT PCL, fgn. | | Oil, Gas & Consumable Fuels | | | 7,400 | | | | 130,705 | |
| | | | | | | | | | |
| | | |
| | | | | | | | | 245,634 | |
| | | | | | | | | | |
United Kingdom 7.2% | | | | | | | | | | |
BAE Systems PLC | | Aerospace & Defense | | | 22,665 | | | | 184,893 | |
GKN PLC | | Auto Components | | | 25,390 | | | | 164,942 | |
Kingfisher PLC | | Specialty Retail | | | 23,755 | | | | 97,492 | |
Man Group PLC | | Capital Markets | | | 37,984 | | | | 91,455 | |
Prudential PLC | | Insurance | | | 7,024 | | | | 175,278 | |
Travis Perkins PLC | | Trading Companies & Distributors | | | 5,185 | | | | 89,774 | |
| | | | | | | | | | |
| | | |
| | | | | | | | | 803,834 | |
| | | | | | | | | | |
United States 41.0% | | | | | | | | | | |
Advance Auto Parts Inc. | | Specialty Retail | | | 988 | | | | 117,127 | |
Ally Financial Inc. | | Consumer Finance | | | 4,997 | | | | 135,669 | |
aAlphabet Inc., A | | Internet Software & Services | | | 260 | | | | 269,656 | |
American Express Co. | | Consumer Finance | | | 1,080 | | | | 100,742 | |
AmerisourceBergen Corp. | | Health Care Providers & Services | | | 1,432 | | | | 123,453 | |
Amgen Inc. | | Biotechnology | | | 711 | | | | 121,211 | |
Apple Inc. | | Technology Hardware, Storage & Peripherals | | | 1,882 | | | | 315,762 | |
Avnet Inc. | | Electronic Equipment, Instruments | | | | | | | | |
| | & Components | | | 3,455 | | | | 144,281 | |
Capital One Financial Corp. | | Consumer Finance | | | 1,780 | | | | 170,560 | |
aCelgene Corp. | | Biotechnology | | | 1,000 | | | | 89,210 | |
Comcast Corp., A | | Media | | | 6,656 | | | | 227,436 | |
Devon Energy Corp. | | Oil, Gas & Consumable Fuels | | | 5,190 | | | | 164,990 | |
Eastman Chemical Co. | | Chemicals | | | 2,521 | | | | 266,167 | |
aeBay Inc. | | Internet Software & Services | | | 5,300 | | | | 213,272 | |
Eli Lilly & Co. | | Pharmaceuticals | | | 3,020 | | | | 233,656 | |
Gilead Sciences Inc. | | Biotechnology | | | 1,400 | | | | 105,546 | |
Jones Lang LaSalle Inc. | | Real Estate Management & Development | | | 958 | | | | 167,305 | |
JPMorgan Chase & Co. | | Banks | | | 2,046 | | | | 224,999 | |
LyondellBasell Industries NV, A | | Chemicals | | | 2,851 | | | | 301,294 | |
Microsoft Corp. | | Software | | | 3,656 | | | | 333,683 | |
Oracle Corp. | | Software | | | 6,331 | | | | 289,643 | |
Perrigo Co. PLC | | Pharmaceuticals | | | 1,469 | | | | 122,427 | |
Pfizer Inc. | | Pharmaceuticals | | | 4,700 | | | | 166,803 | |
The Procter & Gamble Co. | | Household Products | | | 2,161 | | | | 171,324 | |
| | | | | | | | | | |
| | | |
| | | | | | | | | 4,576,216 | |
| | | | | | | | | | |
| | |
Total Common Stocks (Cost $9,588,378) | | | | | | | 10,521,541 | |
| | | | | | | | | | |
Short Term Investments (Cost $636,370) 5.7% | | | | | | | | |
Money Market Funds 5.7% | | | | | | | | | | |
United States 5.7% | | | | | | | | | | |
b,c Institutional Fiduciary Trust Money Market Portfolio, 1.24% | | | 636,370 | | | | 636,370 | |
| | | | | | | | | | |
| | |
Total Investments (Cost $10,224,748) 100.0% | | | | | | | 11,157,911 | |
Other Assets, less Liabilities (0.0)%† | | | | | | | (382 | ) |
| | | | | | | | | | |
| | | |
Net Assets 100.0% | | | | | | | | $ | 11,157,529 | |
| | | | | | | | | | |
TEMPLETON GLOBAL INVESTMENT TRUST
STATEMENT OF INVESTMENTS
Templeton Dynamic Equity Fund (continued)
See Abbreviations on page 27.
†Rounds to less than 0.1% of net assets.
aNon-income producing.
bSee Note 3(e) regarding investments in affiliated management investment companies.
cThe rate shown is the annualized seven-day effective yield at period end.
| | | | | | |
15 | | Annual Report | | | The accompanying notes are an integral part of these financial statements. | | |
TEMPLETON GLOBAL INVESTMENT TRUST
Financial Statements
Statement of Assets and Liabilities
March 31, 2018
Templeton Dynamic Equity Fund
| | | | |
| |
Assets: | | | | |
Investments in securities: | | | | |
Cost - Unaffiliated issuers | | | $ 9,588,378 | |
Cost - Non-controlled affiliates (Note 3e) | | | 636,370 | |
| | | | |
| |
Value - Unaffiliated issuers | | | $10,521,541 | |
Value - Non-controlled affiliates (Note 3e) | | | 636,370 | |
Cash | | | 5,072 | |
Receivables: | | | | |
Dividends | | | 49,922 | |
Affiliates | | | 9,720 | |
Other assets | | | 11 | |
| | | | |
| |
Total assets | | | 11,222,636 | |
| | | | |
Liabilities: | | | | |
Payables: | | | | |
Reports to shareholders | | | 5,514 | |
Professional fees | | | 57,159 | |
Accrued expenses and other liabilities | | | 2,434 | |
| | | | |
| |
Total liabilities | | | 65,107 | |
| | | | |
Net assets, at value | | | $11,157,529 | |
| | | | |
Net assets consist of: | | | | |
Paid-in capital | | | $ 9,951,916 | |
Net unrealized appreciation (depreciation) | | | 933,668 | |
Accumulated net realized gain (loss) | | | 271,945 | |
| | | | |
| |
Net assets, at value | | | $11,157,529 | |
| | | | |
Shares outstanding | | | 1,000,000 | |
| | | | |
Net asset value and maximum offering price per share | | | $11.16 | |
| | | | |
| | | | | | |
| | | | | The accompanying notes are an integral part of these financial statements. | Annual Report | | 16 |
TEMPLETON GLOBAL INVESTMENT TRUST
FINANCIAL STATEMENTS
Statement of Operations
for the year ended March 31, 2018
Templeton Dynamic Equity Fund
| | | | |
Investment income: | | | | |
Dividends: (net of foreign taxes)* | | | | |
Unaffiliated issuers | | | $ 284,764 | |
Non-controlled affiliates (Note 3e) | | | 4,206 | |
| | | | |
Total investment income | | | 288,970 | |
| | | | |
Expenses: | | | | |
Management fees (Note 3a) | | | 105,818 | |
Transfer agent fees (Note 3d) | | | 992 | |
Custodian fees (Note 4) | | | 2,472 | |
Reports to shareholders | | | 11,186 | |
Registration and filing fees | | | 56 | |
Professional fees | | | 71,885 | |
Amortization of offering costs | | | 5,263 | |
Security borrowing fees | | | 3,507 | |
Other | | | 13,249 | |
| | | | |
Total expenses | | | 214,428 | |
Expense reductions (Note 4) | | | (16 | ) |
Expenses waived/paid by affiliates (Note 3e and 3f) | | | (93,331 | ) |
| | | | |
Net expenses | | | 121,081 | |
| | | | |
Net investment income | | | 167,889 | |
| | | | |
Realized and unrealized gains (losses): | | | | |
Net realized gain (loss) from: | | | | |
Investments: | | | | |
Unaffiliated issuers | | | 1,513,782 | |
Foreign currency transactions | | | (8,064 | ) |
Forward exchange contracts | | | (99,283 | ) |
Securities sold short | | | (39,982 | ) |
| | | | |
Net realized gain (loss) | | | 1,366,453 | |
| | | | |
Net change in unrealized appreciation (depreciation) on: | | | | |
Investments: | | | | |
Unaffiliated issuers | | | (210,263 | ) |
Translation of other assets and liabilities | | | | |
denominated in foreign currencies | | | 385 | |
Securities sold short | | | 14,553 | |
| | | | |
Net change in unrealized appreciation (depreciation) | | | (195,325 | ) |
| | | | |
Net realized and unrealized gain (loss) | | | 1,171,128 | |
| | | | |
Net increase (decrease) in net assets resulting from operations | | | $1,339,017 | |
| | | | |
| | | | |
*Foreign taxes withheld on dividends | | | $ 23,438 | |
| | | | | | |
17 | | Annual Report | | | The accompanying notes are an integral part of these financial statements. | | |
TEMPLETON GLOBAL INVESTMENT TRUST
FINANCIAL STATEMENTS
Statements of Changes in Net Assets
Templeton Dynamic Equity Fund
| | | | | | | | |
| | | Year Ended March 31, | |
| | | 2018 | | | 2017a | |
| |
Increase (decrease) in net assets: | | | | | | | | |
Operations: | | | | | | | | |
Net investment income | | $ | 167,889 | | | $ | 124,371 | |
Net realized gain (loss) | | | 1,366,453 | | | | 125,648 | |
Net change in unrealized appreciation (depreciation) | | | (195,325 | ) | | | 1,128,993 | |
| | | | |
Net increase (decrease) in net assets resulting from operations | | | 1,339,017 | | | | 1,379,012 | |
| | | | |
Distributions to shareholders from: | | | | | | | | |
Net investment income | | | (210,000 | ) | | | (109,000 | ) |
Net realized gains | | | (1,141,200 | ) | | | (100,300 | ) |
| | | | |
Total distributions to shareholders | | | (1,351,200 | ) | | | (209,300 | ) |
| | | | |
Capital share transactions (Note 2) | | | — | | | | 10,000,000 | |
| | | | |
| | |
Net increase (decrease) in net assets | | | (12,183 | ) | | | 11,169,712 | |
Net assets: | | | | | | | | |
Beginning of year | | | 11,169,712 | | | | — | |
| | | | |
End of year | | $ | 11,157,529 | | | $ | 11,169,712 | |
| | | | |
Undistributed net investment income included in net assets: | | | | | | | | |
End of year | | $ | — | | | $ | 55,088 | |
| | | | |
aFor the period May 2, 2016 (commencement of operations) to March 31, 2017.
| | | | | | |
| | | | | The accompanying notes are an integral part of these financial statements. | Annual Report | | 18 |
TEMPLETON GLOBAL INVESTMENT TRUST
Notes to Financial Statements
Templeton Dynamic Equity Fund
1. Organization and Significant Accounting Policies
Templeton Global Investment Trust (Trust) is registered under the Investment Company Act of 1940 (1940 Act) as an open-end management investment company, consisting of six separate funds and applies the specialized accounting and reporting guidance in U.S. Generally Accepted Accounting Principles (U.S. GAAP). Templeton Dynamic Equity Fund (Fund) is included in this report. The Fund has five classes of shares: Class A, Class C, Class R, Class R6 and Advisor Class. Each class of shares may differ by its initial sales load, contingent deferred sales charges, voting rights on matters affecting a single class, its exchange privilege and fees due to differing arrangements for distribution and transfer agent fees.
The Fund currently operates with one class of shares, Advisor Class.
The following summarizes the Fund’s significant accounting policies.
a. Financial Instrument Valuation
The Fund’s investments in financial instruments are carried at fair value daily. Fair value is the price that would be received to sell an asset or paid to transfer a liability in an orderly transaction between market participants on the measurement date. The Fund calculates the net asset value (NAV) per share as of 4 p.m. Eastern time each day the New York Stock Exchange (NYSE) is open for trading. Under compliance policies and procedures approved by the Trust’s Board of Trustees (the Board), the Fund’s administrator has responsibility for oversight of valuation, including leading the cross-functional Valuation Committee (VC). The VC provides administration and oversight of the Fund’s valuation policies and procedures, which are approved annually by the Board. Among other things, these procedures allow the Fund to utilize independent pricing services, quotations from securities and financial instrument dealers, and other market sources to determine fair value.
Equity securities and exchange traded funds listed on an exchange or on the NASDAQ National Market System are valued at the last quoted sale price or the official closing price of the day, respectively. Foreign equity securities are valued as of the close of trading on the foreign stock exchange on which the security is primarily traded, or as of 4 p.m. Eastern time. The value is then converted into its U.S. dollar equivalent at the
foreign exchange rate in effect at 4 p.m. Eastern time on the day that the value of the security is determined. Over-the-counter (OTC) securities are valued within the range of the most recent quoted bid and ask prices. Securities that trade in multiple markets or on multiple exchanges are valued according to the broadest and most representative market. Certain equity securities are valued based upon fundamental characteristics or relationships to similar securities.
Investments in open-end mutual funds are valued at the closing NAV.
Certain derivative financial instruments trade in the OTC market. The Fund’s pricing services use various techniques including industry standard option pricing models and proprietary discounted cash flow models to determine the fair value of those instruments. The Fund’s net benefit or obligation under the derivative contract, as measured by the fair value of the contract, is included in net assets.
The Fund has procedures to determine the fair value of financial instruments for which market prices are not reliable or readily available. Under these procedures, the VC convenes on a regular basis to review such financial instruments and considers a number of factors, including significant unobservable valuation inputs, when arriving at fair value. The VC primarily employs a market-based approach which may use related or comparable assets or liabilities, recent transactions, market multiples, book values, and other relevant information for the investment to determine the fair value of the investment. An income-based valuation approach may also be used in which the anticipated future cash flows of the investment are discounted to calculate fair value. Discounts may also be applied due to the nature or duration of any restrictions on the disposition of the investments. Due to the inherent uncertainty of valuations of such investments, the fair values may differ significantly from the values that would have been used had an active market existed. The VC employs various methods for calibrating these valuation approaches including a regular review of key inputs and assumptions, transactional back-testing or disposition analysis, and reviews of any related market activity.
Trading in securities on foreign securities stock exchanges and OTC markets may be completed before 4 p.m. Eastern time. In addition, trading in certain foreign markets may not take place on every Fund’s business day. Occasionally, events occur between the time at which trading in a foreign security is completed and 4 p.m. Eastern time that might call into question
TEMPLETON GLOBAL INVESTMENT TRUST
NOTES TO FINANCIAL STATEMENTS
Templeton Dynamic Equity Fund (continued)
the reliability of the value of a portfolio security held by the Fund. As a result, differences may arise between the value of the Fund’s portfolio securities as determined at the foreign market close and the latest indications of value at 4 p.m. Eastern time. In order to minimize the potential for these differences, the VC monitors price movements following the close of trading in foreign stock markets through a series of country specific market proxies (such as baskets of American Depositary Receipts, futures contracts and exchange traded funds). These price movements are measured against established trigger thresholds for each specific market proxy to assist in determining if an event has occurred that may call into question the reliability of the values of the foreign securities held by the Fund. If such an event occurs, the securities may be valued using fair value procedures, which may include the use of independent pricing services.
When the last day of the reporting period is a non-business day, certain foreign markets may be open on those days that the Fund’s NAV is not calculated, which could result in differences between the value of the Fund’s portfolio securities on the last business day and the last calendar day of the reporting period. Any significant security valuation changes due to an open foreign market are adjusted and reflected by the Fund for financial reporting purposes.
b. Foreign Currency Translation
Portfolio securities and other assets and liabilities denominated in foreign currencies are translated into U.S. dollars based on the exchange rate of such currencies against U.S. dollars on the date of valuation. The Fund may enter into foreign currency exchange contracts to facilitate transactions denominated in a foreign currency. Purchases and sales of securities, income and expense items denominated in foreign currencies are translated into U.S. dollars at the exchange rate in effect on the transaction date. Portfolio securities and assets and liabilities denominated in foreign currencies contain risks that those currencies will decline in value relative to the U.S. dollar. Occasionally, events may impact the availability or reliability of foreign exchange rates used to convert the U.S. dollar equivalent value. If such an event occurs, the foreign exchange rate will be valued at fair value using procedures established and approved by the Board.
The Fund does not separately report the effect of changes in foreign exchange rates from changes in market prices on securities held. Such changes are included in net realized and unrealized gain or loss from investments in the Statement of Operations.
Realized foreign exchange gains or losses arise from sales of foreign currencies, currency gains or losses realized between the trade and settlement dates on securities transactions and the difference between the recorded amounts of dividends, interest, and foreign withholding taxes and the U.S. dollar equivalent of the amounts actually received or paid. Net unrealized foreign exchange gains and losses arise from changes in foreign exchange rates on foreign denominated assets and liabilities other than investments in securities held at the end of the reporting period.
c. Derivative Financial Instruments
The Fund invested in derivative financial instruments in order to manage risk or gain exposure to various other investments or markets. Derivatives are financial contracts based on an underlying or notional amount, require no initial investment or an initial net investment that is smaller than would normally be required to have a similar response to changes in market factors, and require or permit net settlement. Derivatives contain various risks including the potential inability of the counterparty to fulfill their obligations under the terms of the contract, the potential for an illiquid secondary market, and/or the potential for market movements which expose the Fund to gains or losses in excess of the amounts shown in the Statement of Assets and Liabilities. Realized gain and loss and unrealized appreciation and depreciation on these contracts for the period are included in the Statement of Operations.
The Fund entered into OTC forward exchange contracts primarily to manage exposure to certain foreign currencies. A forward exchange contract is an agreement between the Fund and a counterparty to buy or sell a foreign currency at a specific exchange rate on a future date.
d. Securities Sold Short
The Fund is engaged in selling securities short, which obligates the Fund to replace a borrowed security with the same security at current fair value. The Fund incurs a loss if the price of the security increases between the date of the short sale and the date on which the Fund replaces the borrowed security. The Fund
TEMPLETON GLOBAL INVESTMENT TRUST
NOTES TO FINANCIAL STATEMENTS
Templeton Dynamic Equity Fund (continued)
1. Organization and Significant Accounting Policies (continued)
d. Securities Sold Short (continued)
realizes a gain if the price of the security declines between those dates. Gains are limited to the price at which the Fund sold the security short, while losses are potentially unlimited in size.
The Fund is required to establish a margin account with the broker lending the security sold short. While the short sale is outstanding, the broker retains the proceeds of the short sale to the extent necessary to meet margin requirements until the short position is closed out. A deposit must also be maintained with the Fund’s custodian/counterparty broker consisting of cash and/or securities having a value equal to a specified percentage of the value of the securities sold short. The Fund is obligated to pay fees for borrowing the securities sold short and is required to pay the counterparty any dividends and/or interest due on securities sold short. Such dividends and/or interest and any security borrowing fees are recorded as an expense to the Fund. At March 31, 2018, the Fund had no securities sold short.
e. Income and Deferred Taxes
It is the Fund’s policy to qualify as a regulated investment company under the Internal Revenue Code. The Fund intends to distribute to shareholders substantially all of its taxable income and net realized gains to relieve it from federal income and excise taxes. As a result, no provision for U.S. federal income taxes is required.
The Fund may be subject to foreign taxation related to income received, capital gains on the sale of securities and certain foreign currency transactions in the foreign jurisdictions in which it invests. Foreign taxes, if any, are recorded based on the tax regulations and rates that exist in the foreign markets in which the Fund invests. When a capital gain tax is determined to apply, the Fund records an estimated deferred tax liability in an amount that would be payable if the securities were disposed of on the valuation date.
The Fund may recognize an income tax liability related to its uncertain tax positions under U.S. GAAP when the uncertain tax position has a less than 50% probability that it will be sustained upon examination by the tax authorities based on its technical merits. As of March 31, 2018, the Fund has determined that no tax liability is required in its financial statements related to uncertain tax positions for any open tax years (or expected to be taken in future tax years). Open tax
years are those that remain subject to examination and are based on the statute of limitations in each jurisdiction in which the Fund invests.
f. Security Transactions, Investment Income, Expenses and Distributions
Security transactions are accounted for on trade date. Realized gains and losses on security transactions are determined on a specific identification basis. Estimated expenses are accrued daily. Dividend income is recorded on the ex-dividend date except for certain dividends from securities where the dividend rate is not available. In such cases, the dividend is recorded as soon as the information is received by the Fund. Distributions to shareholders are recorded on the ex-dividend date. Distributable earnings are determined according to income tax regulations (tax basis) and may differ from earnings recorded in accordance with U.S. GAAP. These differences may be permanent or temporary. Permanent differences are reclassified among capital accounts to reflect their tax character. These reclassifications have no impact on net assets or the results of operations. Temporary differences are not reclassified, as they may reverse in subsequent periods.
Common expenses incurred by the Trust are allocated among the Funds based on the ratio of net assets of each Fund to the combined net assets of the Trust. Fund specific expenses are charged directly to the Fund that incurred the expense.
Realized and unrealized gains and losses and net investment income, excluding class specific expenses, are allocated daily to each class of shares based upon the relative proportion of net assets of each class. Differences in per share distributions by class are generally due to differences in class specific expenses.
g. Offering Costs
Offering costs are amortized on a straight line basis over the first twelve months of operations.
h. Accounting Estimates
The preparation of financial statements in accordance with U.S. GAAP requires management to make estimates and assumptions that affect the reported amounts of assets and liabilities at the date of the financial statements and the amounts of income and expenses during the reporting period. Actual results could differ from those estimates.
TEMPLETON GLOBAL INVESTMENT TRUST
NOTES TO FINANCIAL STATEMENTS
Templeton Dynamic Equity Fund (continued)
i. Guarantees and Indemnifications
Under the Trust’s organizational documents, its officers and trustees are indemnified by the Trust against certain liabilities arising out of the performance of their duties to the Trust. Additionally, in the normal course of business, the Trust, on behalf of the Fund, enters into contracts with service providers
that contain general indemnification clauses. The Trust’s maximum exposure under these arrangements is unknown as this would involve future claims that may be made against the Trust that have not yet occurred. Currently, the Trust expects the risk of loss to be remote.
2. Shares of Beneficial Interest
At March 31, 2018, there were an unlimited number of shares authorized ($0.01 par value). Transactions in the Fund’s shares were as follows:
| | | | | | | | | | | | | | | | | | | | |
| | | Year Ended March 31, |
| | | 2018 | | 2017a |
| | | Shares | | Amount | | Shares | | Amount |
Shares sold | | | | — | | | | | $— | | | | | 1,000,001 | | | | | $10,000,010 | |
Shares redeemed | | | | — | | | | | — | | | | | (1 | ) | | | | (10) | |
Net increase (decrease) | | | | — | | | | | $— | | | | | 1,000,000 | | | | | $10,000,000 | |
aFor the period May 2, 2016 (commencement of operations) to March 31, 2017.
3. Transactions with Affiliates
Franklin Resources, Inc. is the holding company for various subsidiaries that together are referred to as Franklin Templeton Investments. Certain officers and trustees of the Fund are also officers and/or directors of the following subsidiaries:
| | | | |
Subsidiary | | Affiliation | | |
| Templeton Global Advisors Ltd. (Global Advisors) | | Investment manager | | |
| Franklin Templeton Services, LLC (FT Services) | | Administrative manager | | |
| Franklin Templeton Distributors, Inc. (Distributors) | | Principal underwriter | | |
| Franklin Templeton Investor Services, LLC (Investor Services) | | Transfer agent | | |
a. Management Fees
The Fund pays an investment management fee to Global Advisors of 0.90% per year of the average daily net assets of the Fund.
b. Administrative Fees
Under an agreement with Global Advisors, FT Services provides administrative services to the Fund. The fee is paid by Global Advisors based on the Fund’s average daily net assets, and is not an additional expense of the Fund.
c. Distribution Fees
The Board has adopted distribution plans for each share class, with the exception of Class R6 and Advisor Class shares, pursuant to Rule 12b-1 under the 1940 Act. Under the Fund’s Class A reimbursement distribution plan, the Fund reimburses Distributors for costs incurred in connection with the servicing, sale and distribution of the Fund’s shares up to the maximum annual plan rate. Under the Class A reimbursement distribution plan, costs exceeding the maximum for the current plan year cannot be reimbursed in
TEMPLETON GLOBAL INVESTMENT TRUST
NOTES TO FINANCIAL STATEMENTS
Templeton Dynamic Equity Fund (continued)
3. Transactions with Affiliates (continued)
c. Distribution Fees (continued)
subsequent periods. In addition, under the Fund’s Class C and R compensation distribution plans, the Fund pays Distributors for costs incurred in connection with the servicing, sale and distribution of the Fund’s shares up to the maximum annual plan rate for each class. The plan year, for purposes of monitoring compliance with the maximum annual plan rates, is February 1 through January 31.
The maximum annual plan rates, based on the average daily net assets, for each class, are as follows:
| | | | |
Class A | | | 0.25 | % |
Class C | | | 1.00 | % |
Class R | | | 0.50 | % |
d. Transfer Agent Fees
Each class of shares pays transfer agent fees to Investor Services for its performance of shareholder servicing obligations. Effective November 1, 2017, the fees are based on an annualized asset based fee of 0.02% plus a transaction based fee. Prior to November 1, 2017, the fees were account based fees that varied based on fund or account type. In addition, each class reimburses Investor Services for out of pocket expenses incurred and, except for Class R6 reimburses shareholder servicing fees paid to third parties. These fees are allocated daily based upon their relative proportion of such classes’ aggregate net assets. Class R6 pays Investor Services transfer agent fees specific to that class.
For the year ended March 31, 2018, the Fund paid transfer agent fees of $992, which were retained by Investor Services.
e. Investments in Affiliated Management Investment Companies
The Fund invests in one or more affiliated management investment companies for purposes other than exercising a controlling influence over the management or policies. Management fees paid by the Fund are waived on assets invested in the affiliated management investment companies, as noted in the Statement of Operations, in an amount not to exceed the management and administrative fees paid directly or indirectly by each affiliate. During the year ended March 31, 2018, the Fund held investments in affiliated management investment companies as follows:
| | | | | | | | | | | | | | | | | | | | | | | | | | | | | | | | |
| | | Number of
Shares Held
at Beginning
of Year | | | Gross
Additions | | | Gross
Reductions | | | Number of
Shares
Held at End
of Year | | | Value
at End
of Year | | | Dividend
Income | | | Realized
Gain
(Loss) | | | Net Change in
Unrealized
Appreciation
(Depreciation) | |
Non-Controlled Affiliates | | | | | | | | | | | | | | | | | | | | | | | | | | | | | | | | |
Institutional Fiduciary Trust Money Market Portfolio, 1.24 % | | | 177,439 | | | | 3,677,498 | | | | (3,218,567 | ) | | | 636,370 | | | | $636,370 | | | | $4,206 | | | | $ — | | | | $ — | |
f. Waiver and Expense Reimbursements
Global Advisors has contractually agreed in advance to waive or limit its fees and to assume as its own expense certain expenses otherwise payable by the Fund so that the expenses (excluding distribution fees, acquired fund fees and expenses and expenses related to securities sold short) of the Fund does not exceed 1.00% based on the average net assets of each class (other than certain non-routine expenses or costs, including those relating to litigation, indemnification, reorganizations, and liquidations) until July 31, 2018. Total expenses waived or paid are not subject to recapture subsequent to the Fund’s fiscal year end.
g. Other Affiliated Transactions
At March 31, 2018, Franklin Resources, Inc., owned 100% of the Fund’s outstanding shares. Investment activities of this shareholder could have a material impact on the Fund.
TEMPLETON GLOBAL INVESTMENT TRUST
NOTES TO FINANCIAL STATEMENTS
Templeton Dynamic Equity Fund (continued)
4. Expense Offset Arrangement
The Fund has entered into an arrangement with its custodian whereby credits realized as a result of uninvested cash balances are used to reduce a portion of the Fund’s custodian expenses. During the year ended March 31, 2018, the custodian fees were reduced as noted in the Statement of Operations.
5. Income Taxes
The tax character of distributions paid during the years ended March 31, 2018 and 2017, was as follows:
| | | | | | | | |
| | | 2018 | | | 2017 | |
Distributions paid from: | | | | | | | | |
Ordinary income | | $ | 982,100 | | | $ | 209,300 | |
Long term capital gain | | | 369,100 | | | | — | |
| | $ | 1,351,200 | | | $ | 209,300 | |
At March 31, 2018, the cost of investments, net unrealized appreciation (depreciation), undistributed ordinary income and undistributed long term capital gains for income tax purposes were as follows:
| | | | |
Cost of investments | | $ | 10,225,643 | |
| | | | |
| |
Unrealized appreciation | | $ | 1,309,692 | |
Unrealized depreciation | | | (377,424 | ) |
| | | | |
| |
Net unrealized appreciation (depreciation) | | $ | 932,268 | |
| | | | |
| |
Undistributed ordinary income | | | 114,441 | |
Undistributed long term capital gains | | | 158,398 | |
| | | | |
| |
Distributable earnings | | $ | 272,839 | |
| | | | |
Differences between income and/or capital gains as determined on a book basis and a tax basis are primarily due to differing treatments of passive foreign investment company shares and offering costs.
6. Investment Transactions
Purchases and sales of investments (excluding short term securities and securities sold short) for the year ended March 31, 2018, aggregated $11,674,119 and $13,485,013, respectively.
7. Concentration of Risk
Investing in foreign securities may include certain risks and considerations not typically associated with investing in U.S. securities, such as fluctuating currency values and changing local and regional economic, political and social conditions, which may result in greater market volatility. In addition, certain foreign securities may not be as liquid as U.S. securities.
TEMPLETON GLOBAL INVESTMENT TRUST
NOTES TO FINANCIAL STATEMENTS
Templeton Dynamic Equity Fund (continued)
8. Other Derivative Information
For the year ended March 31, 2018, the effect of derivative contracts in the Fund’s Statement of Operations was as follows:
| | | | | | | | | | | | |
Derivative Contracts
Not Accounted for as
Hedging Instruments | | Statement of
Operations Location | | Net Realized
Gain (Loss)
for the Year | | | Statement of
Operations Location | | Net Change
in Unrealized
Appreciation
(Depreciation)
for the Year | |
| |
| | Net realized gain (loss) from: | | | | | | Net change in unrealized | | | | |
| | | | | | | | appreciation (depreciation) on: | | | | |
Foreign exchange contracts | | Forward exchange contracts | | | $(99,283) | | | Forward exchange contracts | | | $— | |
| | | | | | | | | | | | |
For the year ended March 31, 2018, the average month end contract value of forward exchange contracts was $773,824.
See Note 1(c) regarding derivative financial instruments.
9. Credit Facility
The Fund, together with other U.S. registered and foreign investment funds (collectively, Borrowers), managed by Franklin Templeton Investments, are borrowers in a joint syndicated senior unsecured credit facility totaling $2 billion (Global Credit Facility) which matures on February 8, 2019. This Global Credit Facility provides a source of funds to the Borrowers for temporary and emergency purposes, including the ability to meet future unanticipated or unusually large redemption requests.
Under the terms of the Global Credit Facility, the Fund shall, in addition to interest charged on any borrowings made by the Fund and other costs incurred by the Fund, pay its share of fees and expenses incurred in connection with the implementation and maintenance of the Global Credit Facility, based upon its relative share of the aggregate net assets of all of the Borrowers, including an annual commitment fee of 0.15% based upon the unused portion of the Global Credit Facility. These fees are reflected in other expenses in the Statement of Operations. During the year ended March 31, 2018, the Fund did not use the Global Credit Facility.
10. Fair Value Measurements
The Fund follows a fair value hierarchy that distinguishes between market data obtained from independent sources (observable inputs) and the Fund’s own market assumptions (unobservable inputs). These inputs are used in determining the value of the Fund’s financial instruments and are summarized in the following fair value hierarchy:
| | • | | Level 1 – quoted prices in active markets for identical financial instruments |
| | • | | Level 2 – other significant observable inputs (including quoted prices for similar financial instruments, interest rates, prepayment speed, credit risk, etc.) |
| | • | | Level 3 – significant unobservable inputs (including the Fund’s own assumptions in determining the fair value of financial instruments) |
The input levels are not necessarily an indication of the risk or liquidity associated with financial instruments at that level.
For movements between the levels within the fair value hierarchy, the Fund has adopted a policy of recognizing the transfers as of the date of the underlying event which caused the movement.
At March 31, 2018, all of the Fund’s investments in financial instruments carried at fair value were valued using Level 1 inputs. For detailed categories, see the accompanying Statement of Investments.
TEMPLETON GLOBAL INVESTMENT TRUST
NOTES TO FINANCIAL STATEMENTS
Templeton Dynamic Equity Fund (continued)
11. Subsequent Events
The Fund has evaluated subsequent events through the issuance of the financial statements and determined that no events have occurred that require disclosure.
TEMPLETON GLOBAL INVESTMENT TRUST
NOTES TO FINANCIAL STATEMENTS
Templeton Dynamic Equity Fund (continued)
Abbreviations
| | |
| Selected Portfolio |
ADR | | American Depositary Receipt |
TEMPLETON GLOBAL INVESTMENT TRUST
Report of Independent Registered Public Accounting Firm
To the Board of Trustees of Templeton Global Investment Trust and Shareholders of Templeton Dynamic Equity Fund
Opinion on the Financial Statements
We have audited the accompanying statement of assets and liabilities, including the statement of investments, of Templeton Dynamic Equity Fund (the “Fund”) as of March 31, 2018, the related statement of operations for the year ended March 31, 2018, and the statement of changes in net assets and the financial highlights for the periods indicated therein, including the related notes (collectively referred to as the “financial statements”). In our opinion, the financial statements present fairly, in all material respects, the financial position of the Fund as of March 31, 2018, the results of its operations for the year ended March 31, 2018, and the changes in its net assets and the financial highlights for the periods indicated therein in conformity with accounting principles generally accepted in the United States of America.
Basis for Opinion
These financial statements are the responsibility of the Fund’s management. Our responsibility is to express an opinion on the Fund’s financial statements based on our audits. We are a public accounting firm registered with the Public Company Accounting Oversight Board (United States) (“PCAOB”) and are required to be independent with respect to the Fund in accordance with the U.S. federal securities laws and the applicable rules and regulations of the Securities and Exchange Commission and the PCAOB.
We conducted our audits of these financial statements in accordance with the standards of the PCAOB. Those standards require that we plan and perform the audit to obtain reasonable assurance about whether the financial statements are free of material misstatement, whether due to error or fraud.
Our audits included performing procedures to assess the risks of material misstatement of the financial statements, whether due to error or fraud, and performing procedures that respond to those risks. Such procedures included examining, on a test basis, evidence regarding the amounts and disclosures in the financial statements. Our audits also included evaluating the accounting principles used and significant estimates made by management, as well as evaluating the overall presentation of the financial statements. Our procedures included confirmation of securities owned as of March 31, 2018 by correspondence with the custodian and transfer agent. We believe that our audits provide a reasonable basis for our opinion.
PricewaterhouseCoopers LLP
San Francisco, California
May 17, 2018
We have served as the auditor of one or more investment companies in the Franklin Templeton funds since 1948.
TEMPLETON GLOBAL INVESTMENT TRUST
Tax Information (unaudited)
Under Section 852(b)(3)(C) of the Internal Revenue Code (Code), the Fund hereby reports the maximum amount allowable but no less than $369,100 as a long term capital gain dividend for the fiscal year ended March 31, 2018.
Under Section 871(k)(2)(C) of the Code, the Fund hereby reports the maximum amount allowable but no less than $861,210 as a short term capital gain dividend for purposes of the tax imposed under Section 871(a)(1)(A) of the Code for the fiscal year ended March 31, 2018.
Under Section 854(b)(1)(A) of the Code, the Fund hereby reports 7.03% of the ordinary income dividends as income qualifying for the dividends received deduction for the fiscal year ended March 31, 2018.
Under Section 854(b)(1)(B) of the Code, the Fund hereby reports the maximum amount allowable but no less than $233,542 as qualified dividends for purposes of the maximum rate under Section 1(h)(11) of the Code for the fiscal year ended March 31, 2018. Distributions, including qualified dividend income, paid during calendar year 2018 will be reported to shareholders on Form 1099-DIV by mid-February 2019. Shareholders are advised to check with their tax advisors for information on the treatment of these amounts on their individual income tax returns.
At March 31, 2017, more than 50% of the Fund’s total assets were invested in securities of foreign issuers. In most instances, foreign taxes were withheld from income paid to the Fund on these investments. As shown in the table below, the Fund hereby reports to shareholders the foreign source income and foreign taxes paid, pursuant to Section 853 of the Code. This written statement will allow shareholders of record on December 21, 2017, to treat their proportionate share of foreign taxes paid by the Fund as having been paid directly by them. The shareholder shall consider these amounts as foreign taxes paid in the tax year in which they receive the Fund distribution.
The following table provides a detailed analysis of foreign tax paid, foreign source income, and foreign source qualified dividends as reported by the Fund, to Advisor Class shareholders of record.
| | | | | | | | | | | | |
| Class | | Foreign Tax Paid
Per Share | | | Foreign Source
Income Per Share | | | Foreign Source Qualified
Dividends Per Share | |
| | | |
Advisor Class | | | $0.0161 | | | | $0.1401 | | | | $0.1186 | |
Foreign Tax Paid Per Share (Column 1) is the amount per share available to you, as a tax credit (assuming you held your shares in the Fund for a minimum of 16 days during the 31-day period beginning 15 days before the ex-dividend date of the Fund’s distribution to which the foreign taxes relate), or, as a tax deduction.
Foreign Source Income Per Share (Column 2) is the amount per share of income dividends attributable to foreign securities held by the Fund, plus any foreign taxes withheld on these dividends. The amounts reported include foreign source qualified dividends that have not been adjusted for the rate differential applicable to such dividend income.1
Foreign Source Qualified Dividends Per Share (Column 3) is the amount per share of foreign source qualified dividends, plus any foreign taxes withheld on these dividends. These amounts represent the portion of the Foreign Source Income reported to you in column 2 that were derived from qualified foreign securities held by the Fund.1
In February 2018, shareholders received Form 1099-DIV which included their share of taxes paid and foreign source income distributed during the calendar year 2017. The Foreign Source Income reported on Form 1099-DIV was not adjusted for the rate differential on foreign source qualified dividend income. Shareholders are advised to check with their tax advisors for information on the treatment of these amounts on their 2017 individual income tax returns.
1. Qualified dividends are taxed at reduced long term capital gains tax rates. In determining the amount of foreign tax credit that may be applied against the U.S. tax liability of individuals receiving foreign source qualified dividends, adjustments may be required to the foreign tax credit limitation calculation to reflect the rate differential applicable to such dividend income. The rules however permit certain individuals to elect not to apply the rate differential adjustments for capital gains and/or dividends for any taxable year. Please consult your tax advisor and the instructions to Form 1116 for more information.
TEMPLETON GLOBAL INVESTMENT TRUST
Special Meeting of Shareholders
MEETING OF SHAREHOLDERS: OCTOBER 30, 2017 AND RECONVENED ON DECEMBER 15, 2017 AND DECEMBER 29, 2017
(UNAUDITED)
A Special Meeting of Shareholders of Templeton Global Investment Trust was held at the offices of Franklin Templeton Investments, One Franklin Parkway, San Mateo, California on October 30, 2017 and reconvened on December 15, 2017 and December 29, 2017. The purpose of the meeting was to elect Trustees of Templeton Global Investment Trust and to vote on the following proposals for the Fund: to approve the use of a “manager of managers” structure whereby the Fund’s investment manager would be able to hire and replace subadvisers without shareholder approval; and to approve an amended fundamental investment restriction regarding investments in commodities. At the meeting, (i) the following persons were elected by the shareholders to serve as Trustees of Templeton Global Investment Trust: Harris J. Ashton, Ann Torre Bates, Mary C. Choksi, Edith E. Holiday, Gregory E. Johnson, Rupert H. Johnson, Jr., J. Michael Luttig, David W. Niemiec, Larry D. Thompson, Constantine D. Tseretopoulos and Robert E. Wade; and (ii) the proposals to use a “manager of managers” structure and to approve an amended fundamental investment restriction regarding investments in commodities were approved by shareholders of the Fund. No other business was transacted at the meeting.
In connection with the meeting, management is aware that some shareholders received from the proxy solicitor numerous calls and mailings that may have been distracting. Management is taking steps to ensure that, in the future, for any new shareholder meeting solicitations that occur, such activity is not repeated. Management apologizes for any inconvenience that may have been caused as a result of such calls and mailings.
The results of the voting at the meeting are as follows:
Proposal 1. To elect a Board of Trustees:
| | | | |
| Name | | For | | Withheld |
| Harris J. Ashton | | 377,048,086 | | 10,385,715 |
| | |
| Ann Torre Bates | | 377,050,303 | | 10,383,500 |
| | |
| Mary C. Choksi | | 377,051,104 | | 10,382,699 |
| | |
| Edith E. Holiday | | 377,043,078 | | 10,390,725 |
| | |
| Gregory E. Johnson | | 377,072,684 | | 10,361,119 |
| | |
| Rupert H. Johnson, Jr. | | 377,077,137 | | 10,356,666 |
| | |
| J. Michael Luttig | | 377,087,793 | | 10,346,010 |
| | |
| David W. Niemiec | | 377,066,180 | | 10,367,622 |
| | |
| Larry D. Thompson. | | 377,085,550 | | 10,348,252 |
| | |
| Constantine D. Tseretopoulos | | 377,094,478 | | 10,339,323 |
| | |
| Robert E. Wade | | 377,100,799 | | 10,333,003 |
Total Trust Shares Outstanding*: 656,789,328
* As of the record date.
TEMPLETON GLOBAL INVESTMENT TRUST
SPECIAL MEETING OF SHAREHOLDERS
| Proposal 2. | To approve the use of a “manager of managers” structure whereby the Fund’s investment manager would be able to hire and replace subadvisers without shareholder approval: |
| | |
| | | Shares |
| |
For | | 1,000,000 |
| |
Against | | 0 |
| |
Abstain | | 0 |
| |
Broker Non-Votes | | 0 |
| |
Total Fund Shares Voted | | 1,000,000 |
| |
Total Fund Shares Outstanding* | | 1,000,000 |
| Proposal 3. | To approve an amended fundamental investment restriction regarding investments in commodities: |
| | |
| | | Shares |
| |
For | | 1,000,000 |
| |
Against | | 0 |
| |
Abstain | | 0 |
| |
Broker Non-Votes | | 0 |
| |
Total Fund Shares Voted | | 1,000,000 |
| |
Total Fund Shares Outstanding* | | 1,000,000 |
TEMPLETON GLOBAL INVESTMENT TRUST
Board Members and Officers
The name, year of birth and address of the officers and board members, as well as their affiliations, positions held with the Trust, principal occupations during at least the past five years and number of US registered portfolios overseen in the Franklin Templeton Investments fund complex, are shown below. Generally, each board member serves until that person’s successor is elected and qualified.
Independent Board Members
| | | | | | | | |
Name, Year of Birth
and Address | | Position | | Length of
Time Served | | Number of Portfolios in
Fund Complex Overseen
by Board Member* | | Other Directorships Held
During at Least the Past 5 Years |
Harris J. Ashton (1932) 300 S.E. 2nd Street Fort Lauderdale, FL 33301-1923 | | Trustee | | Since 1994 | | 139 | | Bar-S Foods (meat packing company) (1981-2010). |
Principal Occupation During at Least the Past 5 Years: Director of various companies; and formerly, Director, RBC Holdings, Inc. (bank holding company) (until 2002); and President, Chief Executive Officer and Chairman of the Board, General Host Corporation (nursery and craft centers) (until 1998). |
Ann Torre Bates (1958) 300 S.E. 2nd Street Fort Lauderdale, FL 33301-1923 | | Trustee | | Since 2008 | | 40 | | Ares Capital Corporation (specialty finance company) (2010-present), United Natural Foods, Inc. (distributor of natural, organic and specialty foods) (2013-present), Allied Capital Corporation (financial services) (2003-2010), SLM Corporation (Sallie Mae) (1997-2014) and Navient Corporation (loan management, servicing and asset recovery) (2014-2016). |
Principal Occupation During at Least the Past 5 Years: Director of various companies; and formerly, Executive Vice President and Chief Financial Officer, NHP Incorporated (manager of multifamily housing) (1995-1997); and Vice President and Treasurer, US Airways, Inc. (until 1995). |
Mary C. Choksi (1950) 300 S.E. 2nd Street Fort Lauderdale, FL 33301-1923 | | Trustee | | Since December 2017 | | 139 | | Avis Budget Group Inc. (car rental) (2007-present), Omnicom Group Inc. (advertising and marketing communications services) (2011-present) and White Mountains Insurance Group, Ltd. (holding company) (2017-present). |
Principal Occupation During at Least the Past 5 Years: |
Director of various companies; and formerly, Founder and Senior Advisor, Strategic Investment Group (investment management group) (2015-2017); Founding Partner and Senior Managing Director, Strategic Investment Group (1987-2015); Founding Partner and Managing Director, Emerging Markets Management LLC (investment management firm) (1987-2011); and Loan Officer/Senior Loan Officer/Senior Pension Investment Officer, World Bank Group (international financial institution) (1977-1987). |
Edith E. Holiday (1952) 300 S.E. 2nd Street Fort Lauderdale, FL 33301-1923 | | Lead
Independent
Trustee | | Trustee since 1996 and Lead Independent Trustee since 2007 | | 139 | | Hess Corporation (exploration of oil and gas) (1993-present), Canadian National Railway (railroad) (2001-present), White Mountains Insurance Group, Ltd. (holding company) (2004-present), Santander Consumer USA Holdings, Inc. (consumer finance) (2016-present), RTI International Metals, Inc. (manufacture and distribution of titanium) (1999-2015) and H.J. Heinz Company (processed foods and allied products) (1994-2013). |
|
| Principal Occupation During at Least the Past 5 Years: |
Director or Trustee of various companies and trusts; and formerly, Assistant to the President of the United States and Secretary of the Cabinet (1990-1993); General Counsel to the United States Treasury Department (1989-1990); and Counselor to the Secretary and Assistant Secretary for Public Affairs and Public Liaison-United States Treasury Department (1988-1989). |
TEMPLETON GLOBAL INVESTMENT TRUST
Independent Board Members (continued)
| | | | | | | | |
Name, Year of Birth
and Address | | Position | | Length of
Time Served | | Number of Portfolios in
Fund Complex Overseen
by Board Member* | | Other Directorships Held
During at Least the Past 5 Years |
J. Michael Luttig (1954) 300 S.E. 2nd Street Fort Lauderdale, FL 33301-1923 | | Trustee | | Since 2009 | | 139 | | Boeing Capital Corporation (aircraft financing) (2006-2013). |
Principal Occupation During at Least the Past 5 Years: |
Executive Vice President, General Counsel and member of the Executive Council, The Boeing Company (aerospace company) (2006-present); and formerly, Federal Appeals Court Judge, U.S. Court of Appeals for the Fourth Circuit (1991-2006). |
David W. Niemiec (1949) 300 S.E. 2nd Street Fort Lauderdale, FL 33301-1923 | | Trustee | | Since 2006 | | 40 | | Hess Midstream Partners LP (oil and gas midstream infrastructure) (2017-present). |
Principal Occupation During at Least the Past 5 Years: |
Advisor, Saratoga Partners (private equity fund); and formerly, Managing Director, Saratoga Partners (1998-2001) and SBC Warburg Dillon Read (investment banking) (1997-1998); Vice Chairman, Dillon, Read & Co. Inc. (investment banking) (1991-1997); and Chief Financial Officer, Dillon, Read & Co. Inc. (1982-1997). |
Larry D. Thompson (1945) 300 S.E. 2nd Street Fort Lauderdale, FL 33301-1923 | | Trustee | | Since 2006 | | 139 | | The Southern Company (energy company) (2014-present; previously 2010-2012), Graham Holdings Company (education and media organization) (2011-present) and Cbeyond, Inc. (business communications provider) (2010-2012). |
Principal Occupation During at Least the Past 5 Years: |
Director of various companies; Counsel, Finch McCranie, LLP (law firm) (2015-present); Independent Compliance Monitor and Auditor, Volkswagen AG (manufacturer of automobiles and commercial vehicles) (2017-present ); John A. Sibley Professor of Corporate and Business Law, University of Georgia School of Law (2015-present; previously 2011-2012); and formerly, Executive Vice President - Government Affairs, General Counsel and Corporate Secretary, PepsiCo, Inc. (consumer products) (2012-2014); Senior Vice President - Government Affairs, General Counsel and Secretary, PepsiCo, Inc. (2004-2011); Senior Fellow of The Brookings Institution (2003-2004); Visiting Professor, University of Georgia School of Law (2004); and Deputy Attorney General, U.S. Department of Justice (2001-2003). |
Constantine D. Tseretopoulos (1954) 300 S.E. 2nd Street Fort Lauderdale, FL 33301-1923 | | Trustee | | Since 2001 | | 26 | | None |
Principal Occupation During at Least the Past 5 Years: |
Physician, Chief of Staff, owner and operator of the Lyford Cay Hospital (1987-present); director of various nonprofit organizations; and formerly, Cardiology Fellow, University of Maryland (1985-1987); and Internal Medicine Resident, Greater Baltimore Medical Center (1982-1985). |
Robert E. Wade (1946) 300 S.E. 2nd Street Fort Lauderdale, FL 33301-1923 | | Trustee | | Since 2006 | | 40 | | El Oro Ltd (investments) (2003-present). |
Principal Occupation During at Least the Past 5 Years: |
Attorney at law engaged in private practice as a sole practitioner (1972-2008) and member of various boards. |
TEMPLETON GLOBAL INVESTMENT TRUST
Interested Board Members and Officers
| | | | | | | | |
Name, Year of Birth
and Address | | Position | | Length of
Time Served | | Number of Portfolios in
Fund Complex Overseen
by Board Member* | | Other Directorships Held
During at Least the Past 5 Years |
**Gregory E. Johnson (1961) One Franklin Parkway San Mateo, CA 94403-1906 | | Trustee | | Since 2006 | | 153 | | None |
Principal Occupation During at Least the Past 5 Years: |
Chairman of the Board, Member - Office of the Chairman, Director and Chief Executive Officer, Franklin Resources, Inc.; officer and/or director or trustee, as the case may be, of some of the other subsidiaries of Franklin Resources, Inc. and of 43 of the investment companies in Franklin Templeton Investments; Vice Chairman, Investment Company Institute; and formerly, President, Franklin Resources, Inc. (1994-2015). |
**Rupert H. Johnson, Jr. (1940) One Franklin Parkway San Mateo, CA 94403-1906 | | Chairman of
the Board,
Trustee and
Vice President | | Chairman of the Board and Trustee since 2013 and Vice President since 1996 | | 139 | | None |
Principal Occupation During at Least the Past 5 Years: |
Vice Chairman, Member - Office of the Chairman and Director, Franklin Resources, Inc.; Director, Franklin Advisers, Inc.; Senior Vice President, Franklin Advisory Services, LLC; and officer and/or director or trustee, as the case may be, of some of the other subsidiaries of Franklin Resources, Inc. and of 41 of the investment companies in Franklin Templeton Investments. |
Alison E. Baur (1964) One Franklin Parkway San Mateo, CA 94403-1906 | | Vice President | | Since 2012 | | Not Applicable | | Not Applicable |
Principal Occupation During at Least the Past 5 Years: |
Deputy General Counsel, Franklin Templeton Investments; and officer of some of the other subsidiaries of Franklin Resources, Inc. and of 45 of the investment companies in Franklin Templeton Investments. |
Norman J. Boersma (1957) Lyford Cay Nassau, Bahamas | | President and
Chief Executive
Officer –
Investment
Management | | Since 2012 | | Not Applicable | | Not Applicable |
Principal Occupation During at Least the Past 5 Years: |
Chairman of the Board, President and Chief Executive Officer, Templeton Global Advisors Ltd.; Chief Investment Officer of Templeton Global Equity Group; officer of six of the investment companies in Franklin Templeton Investments; and formerly, Executive Vice President, Franklin Templeton Investments Corp. (1993-2014). |
Aliya S. Gordon (1973) One Franklin Parkway San Mateo, CA 94403-1906 | | Vice President | | Since 2009 | | Not Applicable | | Not Applicable |
Principal Occupation During at Least the Past 5 Years: |
Senior Associate General Counsel, Franklin Templeton Investments; and officer of 45 of the investment companies in Franklin Templeton Investments. |
Steven J. Gray (1955) One Franklin Parkway San Mateo, CA 94403-1906 | | Vice President | | Since 2009 | | Not Applicable | | Not Applicable |
Principal Occupation During at Least the Past 5 Years: |
Senior Associate General Counsel, Franklin Templeton Investments; Vice President, Franklin Templeton Distributors, Inc. and FASA, LLC; and officer of 45 of the investment companies in Franklin Templeton Investments. |
Matthew T. Hinkle (1971) One Franklin Parkway San Mateo, CA 94403-1906 | | Chief Executive
Officer –
Finance and
Administration | | Since June 2017 | | Not Applicable | | Not Applicable |
Principal Occupation During at Least the Past 5 Years: |
Senior Vice President, Franklin Templeton Services, LLC; officer of 45 of the investment companies in Franklin Templeton Investments; and formerly, Vice President, Global Tax (2012-April 2017) and Treasurer/Assistant Treasurer, Franklin Templeton Investments (2009-2017). |
TEMPLETON GLOBAL INVESTMENT TRUST
Interested Board Members and Officers (continued)
| | | | | | | | |
Name, Year of Birth
and Address | | Position | | Length of
Time Served | | Number of Portfolios in
Fund Complex Overseen
by Board Member* | | Other Directorships Held
During at Least the Past 5 Years |
Robert G. Kubilis (1973) 300 S.E. 2nd Street Fort Lauderdale, FL 33301-1923 | | Chief Financial
Officer, Chief
Accounting
Officer and
Treasurer | | Since June 2017 | | Not Applicable | | Not Applicable |
Principal Occupation During at Least the Past 5 Years: |
Treasurer, U.S. Fund Administration & Reporting, Franklin Templeton Investments; and officer of 17 of the investment companies in Franklin Templeton Investments. |
Robert Lim (1948) One Franklin Parkway San Mateo, CA 94403-1906 | | Vice President
– AML
Compliance | | Since 2016 | | Not Applicable | | Not Applicable |
Principal Occupation During at Least the Past 5 Years: |
Vice President, Franklin Templeton Companies, LLC; Chief Compliance Officer, Franklin Templeton Distributors, Inc. and Franklin Templeton Investor Services, LLC; and officer of 45 of the investment companies in Franklin Templeton Investments. |
Kimberly H. Novotny (1972) 300 S.E. 2nd Street Fort Lauderdale, FL 33301-1923 | | Vice President | | Since 2013 | | Not Applicable | | Not Applicable |
Principal Occupation During at Least the Past 5 Years: |
Associate General Counsel, Franklin Templeton Investments; Vice President and Corporate Secretary, Fiduciary Trust International of the South; Vice President, Templeton Investment Counsel, LLC; Assistant Secretary, Franklin Resources, Inc.; and officer of 45 of the investment companies in Franklin Templeton Investments. |
Robert C. Rosselot (1960) 300 S.E. 2nd Street Fort Lauderdale, FL 33301-1923 | | Chief
Compliance
Officer | | Since 2013 | | Not Applicable | | Not Applicable |
Principal Occupation During at Least the Past 5 Years: |
Director, Global Compliance, Franklin Templeton Investments; Vice President, Franklin Templeton Companies, LLC; officer of 45 of the investment companies in Franklin Templeton Investments; and formerly, Senior Associate General Counsel, Franklin Templeton Investments (2007-2013); and Secretary and Vice President, Templeton Group of Funds (2004-2013). |
Karen L. Skidmore (1952) One Franklin Parkway San Mateo, CA 94403-1906 | | Vice President | | Since 2009 | | Not Applicable | | Not Applicable |
Principal Occupation During at Least the Past 5 Years: |
Senior Associate General Counsel, Franklin Templeton Investments; and officer of 45 of the investment companies in Franklin Templeton Investments. |
Navid J. Tofigh (1972) One Franklin Parkway San Mateo, CA 94403-1906 | | Vice President | | Since 2015 | | Not Applicable | | Not Applicable |
Principal Occupation During at Least the Past 5 Years: |
Associate General Counsel, Franklin Templeton Investments; and officer of 45 of the investment companies in Franklin Templeton Investments. |
Craig S. Tyle (1960) One Franklin Parkway San Mateo, CA 94403-1906 | | Vice President | | Since 2005 | | Not Applicable | | Not Applicable |
Principal Occupation During at Least the Past 5 Years: |
General Counsel and Executive Vice President, Franklin Resources, Inc.; and officer of some of the other subsidiaries of Franklin Resources, Inc. and of 45 of the investment companies in Franklin Templeton Investments. |
TEMPLETON GLOBAL INVESTMENT TRUST
Interested Board Members and Officers (continued)
| | | | | | | | |
Name, Year of Birth
and Address | | Position | | Length of
Time Served | | Number of Portfolios in
Fund Complex Overseen
by Board Member* | | Other Directorships Held
During at Least the Past 5 Years |
Lori A. Weber (1964) 300 S.E. 2nd Street Fort Lauderdale, FL 33301-1923 | | Secretary and
Vice President | | Secretary since 2013 and Vice President since 2011 | | Not Applicable | | Not Applicable |
Principal Occupation During at Least the Past 5 Years: |
Senior Associate General Counsel, Franklin Templeton Investments; Assistant Secretary, Franklin Resources, Inc.; Vice President and Secretary, Templeton Investment Counsel, LLC; and officer of 45 of the investment companies in Franklin Templeton Investments. |
*We base the number of portfolios on each separate series of the US registered investment companies within the Franklin Templeton Investments fund complex. These portfolios have a common investment manager or affiliated investment managers.
**Gregory E. Johnson is considered to be an interested person of the Fund under the federal securities laws due to his position as an officer and director of Franklin Resources, Inc. (Resources), which is the parent company of the Fund’s investment manager and distributor. Rupert H. Johnson, Jr. is considered to be an interested person of the Fund under the federal securities laws due to his position as officer and director and major shareholder of Resources.
Note 1: Rupert H. Johnson, Jr. is the uncle of Gregory E. Johnson.
Note 2: Officer information is current as of the date of this report. It is possible that after this date, information about officers may change.
The Sarbanes-Oxley Act of 2002 and Rules adopted by the US Securities and Exchange Commission require the Fund to disclose whether the Fund’s Audit Committee includes at least one member who is an audit committee financial expert within the meaning of such Act and Rules. The Fund’s Board has determined that there is at least one such financial expert on the Audit Committee and has designated each of Ann Torre Bates and David W. Niemiec as an audit committee financial expert. The Board believes that Ms. Bates and Mr. Niemiec qualify as such an expert in view of their extensive business background and experience. Ms. Bates has served as a member of the Fund Audit Committee since 2008. She currently serves as a director of Ares Capital Corporation (2010-present) and United Natural Foods, Inc. (2013-present) and was formerly a director of Navient Corporation from 2014 to 2016, SLM Corporation from 1997 to 2014 and Allied Capital Corporation from 2003 to 2010, Executive Vice President and Chief Financial Officer of NHP Incorporated from 1995 to 1997 and Vice President and Treasurer of US Airways, Inc. until 1995. Mr. Niemiec has served as a member of the Fund Audit Committee since 2006, currently serves as an Advisor to Saratoga Partners and was formerly its Managing Director from 1998 to 2001 and serves as a director of Hess Midstream Partners LP (2017-present). Mr. Niemiec was formerly a director of Emeritus Corporation from 1999 to 2010 and OSI Pharmaceuticals, Inc. from 2006 to 2010, Managing Director of SBC Warburg Dillon Read from 1997 to 1998, and was Vice Chairman from 1991 to 1997 and Chief Financial Officer from 1982 to 1997 of Dillon, Read & Co. Inc. As a result of such background and experience, the Board believes that Ms. Bates and Mr. Niemiec have each acquired an understanding of generally accepted accounting principles and financial statements, the general application of such principles in connection with the accounting estimates, accruals and reserves, and analyzing and evaluating financial statements that present a breadth and level of complexity of accounting issues generally comparable to those of the Fund, as well as an understanding of internal controls and procedures for financial reporting and an understanding of audit committee functions. Ms. Bates and Mr. Niemiec are independent Board members as that term is defined under the applicable US Securities and Exchange Commission Rules and Releases.
The Statement of Additional Information (SAI) includes additional information about the board members and is available, without charge, upon request. Shareholders may call (800) DIAL BEN/342-5236 to request the SAI.
TEMPLETON GLOBAL INVESTMENT TRUST
TEMPLETON DYNAMIC EQUITY FUND
Shareholder Information
Board Approval of Investment Management Agreements
TEMPLETON GLOBAL INVESTMENT TRUST
Templeton Dynamic Equity Fund
(Fund)
At an in-person meeting held on February 27, 2018 (Meeting), the Board of Trustees (Board) of Templeton Global Investment Trust (Trust), including a majority of the trustees who are not “interested persons” as defined in the Investment Company Act of 1940 (Independent Trustees), reviewed and approved the continuance of the investment management agreement between Templeton Global Advisors Limited (Manager) and the Trust, on behalf of the Fund (Management Agreement) for an additional one-year period. The Independent Trustees received advice from and met separately with Independent Trustee counsel in considering whether to approve the continuation of the Management Agreement.
In considering the continuation of the Management Agreement, the Board reviewed and considered information provided by the Manager at the Meeting and throughout the year at meetings of the Board and its committees. The Board also reviewed and considered information provided in response to a detailed set of requests for information submitted to the Manager by Independent Trustee counsel on behalf of the Independent Trustees in connection with the annual contract renewal process. In addition, prior to the Meeting, the Independent Trustees held a telephonic contract renewal meeting at which the Independent Trustees conferred amongst themselves and Independent Trustee counsel about contract renewal matters. The Board reviewed and considered all of the factors it deemed relevant in approving the continuance of the Management Agreement, including, but not limited to: (i) the nature, extent and quality of the services provided by the Manager; (ii) the investment performance of the Fund; (iii) the costs of the services provided and profits realized by the Manager and its affiliates from the relationship with the Fund; and (iv) the extent to which economies of scale may be realized as the Fund grows. The Board noted that the Fund commenced operations on May 2, 2016, but is not currently available for public sale. The Board also noted that Franklin Resources, Inc. (FRI) owns 100% of the Fund’s outstanding shares.
In approving the continuance of the Management Agreement, the Board, including a majority of the Independent Trustees, determined that the terms of the Management Agreement are fair and reasonable and that the continuance of such Management Agreement is in the interests of the Fund and its
shareholder(s). While attention was given to all information furnished, the following discusses some primary factors relevant to the Board’s determination.
Nature, Extent and Quality of Services
The Board reviewed and considered information regarding the nature, extent and quality of investment management services provided by the Manager and its affiliates to the Fund and its shareholder(s). This information included, among other things, the qualifications, background and experience of the senior management and investment personnel of the Manager; the structure of investment personnel compensation; oversight of third-party service providers; investment performance reports and related financial information for the Fund; reports on expenses, shareholder services, and third party servicing arrangements; legal and compliance matters; risk controls; pricing and other services provided by the Manager and its affiliates; and management fees charged by the Manager and its affiliates to U.S. funds and other accounts, including management’s explanation of differences among accounts where relevant. The Board noted management’s continuing efforts and expenditures in establishing effective business continuity plans and developing strategies to address areas of heightened concern in the mutual fund industry, such as cybersecurity and liquidity risk management. The Board also recognized management’s commitment to facilitating Board oversight of particular areas, including derivatives and payments to intermediaries, by enhanced reporting.
The Board also reviewed and considered the benefits provided to Fund shareholder(s) of investing in a fund that is part of the Franklin Templeton family of funds. The Board noted the financial position of FRI, the Manager’s parent, and its commitment to the mutual fund business as evidenced by its continued introduction of new funds, reassessment of the fund offerings in response to the market environment and project initiatives and capital investments relating to the services provided to the Fund by the FTI organization.
Following consideration of such information, the Board was satisfied with the nature, extent and quality of services provided by the Manager and its affiliates to the Fund and its shareholder(s).
Fund Performance
The Board reviewed and considered the performance results of the Fund over various time periods ended December 31, 2017. The Board considered the performance returns for the Fund in comparison to the performance returns of mutual funds deemed comparable to the Fund included in a universe (Performance
TEMPLETON GLOBAL INVESTMENT TRUST
TEMPLETON DYNAMIC EQUITY FUND
SHAREHOLDER INFORMATION
Universe) selected by Broadridge Financial Solutions, Inc. (Broadridge), an independent provider of investment company data. The Board received a description of the methodology used by Broadridge to select the mutual funds included in a Performance Universe. The Board also reviewed and considered Fund performance reports provided and discussions that occurred with portfolio managers at Board meetings throughout the year. A summary of the Fund’s performance results is below.
The Performance Universe for the Fund included the Fund and all retail and institutional alternative long/short equity funds. The Board noted that the Fund’s annualized total return for the one-year period was above the median of its Performance Universe. The Board concluded that the Fund’s performance was satisfactory.
Comparative Fees and Expenses
The Board reviewed and considered information regarding the Fund’s actual total expense ratio and its various components, including, as applicable, management fees; transfer agent expenses; underlying fund expenses; Rule 12b-1 and non-Rule 12b-1 service fees; and other non-management fees. The Board also noted the quarterly and annual reports it receives on all marketing support payments made by FTI to financial intermediaries. The Board considered the actual total expense ratio and, separately, the contractual management fee rate, without the effect of fee waivers (Management Rate), if any, of the Fund in comparison to the median expense ratio and median Management Rate, respectively, of other mutual funds deemed comparable to and with a similar expense structure as the Fund selected by Broadridge (Expense Group). Broadridge fee and expense data is based upon information taken from each fund’s most recent annual report, which reflects historical asset levels that may be quite different from those currently existing, particularly in a period of market volatility. While recognizing such inherent limitation and the fact that expense ratios and Management Rates generally increase as assets decline and decrease as assets grow, the Board believed the independent analysis conducted by Broadridge to be an appropriate measure of comparative fees and expenses. The Broadridge Management Rate includes administrative charges, and the actual total expense ratio, for comparative consistency, was shown for Advisor Class shares for the Fund and for Institutional Class, Class I, Class I2, Class S and Class Y shares for funds with multiple classes of shares. The Board received a description of the methodology used by Broadridge to select the mutual funds included in an Expense Group.
The Expense Group for the Fund included the Fund and 14 other alternative long/short equity funds. The Board noted that the Management Rate and actual total expense ratio for the Fund were below the medians of its Expense Group. The Board further noted that the Fund invests in third-party mutual funds or exchange-traded funds in excess of the statutory limitations under the Investment Company Act of 1940 by relying on exemptive relief provided by the U.S. Securities and Exchange Commission to each underlying fund. Pursuant to the conditions of the exemptive relief, the Board determined that the Management Rate paid by the Fund is based on services provided that are in addition to, rather than duplicative of, the services provided under the investment management agreements of the underlying funds in which the Fund invests. The Board concluded that the Management Rate charged to the Fund is reasonable. In doing so, the Board noted that the Fund has a cap on operating expenses.
Profitability
The Board reviewed and considered information regarding the profits realized by the Manager and its affiliates in connection with the operation of the Fund, noting that the Fund incepted on May 2, 2016, but is not currently available for public sale. In this respect, the Board considered the Fund profitability analysis provided by the Manager that addresses the overall profitability of FTI’s U.S. fund business, as well as its profits in providing investment management and other services to each of the individual funds during the 12-month period ended September 30, 2017, being the most recent fiscal year-end for FRI. The Board noted that although management continually makes refinements to its methodologies used in calculating profitability in response to organizational and product related changes, the overall methodology has remained consistent with that used in the Fund’s profitability report presentations from prior years. Additionally, PricewaterhouseCoopers LLP, auditor to Franklin Resources, Inc. and certain Franklin Templeton funds, has been engaged by the Manager to periodically review and assess the allocation methodologies to be used solely by the Fund’s Board with respect to the profitability analysis.
The Board noted management’s belief that costs incurred in establishing the infrastructure necessary for the type of mutual fund operations conducted by the Manager and its affiliates may not be fully reflected in the expenses allocated to the Fund in determining its profitability, as well as the fact that the level of profits, to a certain extent, reflected operational cost savings and efficiencies initiated by management. The Board also noted management’s need to implement systems and meet additional
TEMPLETON GLOBAL INVESTMENT TRUST
TEMPLETON DYNAMIC EQUITY FUND
SHAREHOLDER INFORMATION
regulatory and compliance requirements resulting from recent SEC and other regulatory requirements.
The Board also considered the extent to which the Manager and its affiliates might derive ancillary benefits from fund operations, including revenues generated from transfer agent services, potential benefits resulting from personnel and systems enhancements necessitated by fund growth, as well as increased leverage with service providers and counterparties. Based upon its consideration of all these factors, the Board concluded that the level of profits realized/expected to be realized by the Manager and its affiliates from providing services to the Fund was not excessive in view of the nature, extent and quality of services provided to the Fund.
Economies of Scale
The Board reviewed and considered the extent to which the Manager may realize economies of scale, if any, as the Fund grows larger and whether the Fund’s management fee structure reflects any economies of scale for the benefit of share-holder(s). With respect to possible economies of scale, the Board noted the existence of management fee breakpoints, which operate generally to share any economies of scale with a Fund’s shareholder(s) by reducing the Fund’s effective management fees as the Fund grows in size. The Board considered the Manager’s view that any analyses of potential economies of scale in managing a particular fund are inherently limited in light of the joint and common costs and investments the Manager incurs across the Franklin Templeton family of funds as a whole. The Board concluded that to the extent economies of scale may be realized by the Manager and its affiliates, the Fund’s management fee structure provided a sharing of benefits with the Fund and its shareholder(s) as the Fund grows.
Conclusion
Based on its review, consideration and evaluation of all factors it believed relevant, including the above-described factors and conclusions, the Board unanimously approved the continuation of the Management Agreement for an additional one-year period.
Proxy Voting Policies and Procedures
The Fund’s investment manager has established Proxy Voting Policies and Procedures (Policies) that the Fund uses to determine how to vote proxies relating to portfolio securities. Shareholders may view the Fund’s complete Policies online at franklintempleton.com. Alternatively, shareholders may request copies of the Policies free of charge by calling the Proxy Group
collect at (954) 527-7678 or by sending a written request to: Franklin Templeton Companies, LLC, 300 S.E. 2nd Street, Fort Lauderdale, FL 33301, Attention: Proxy Group. Copies of the Fund’s proxy voting records are also made available online at franklintempleton.com and posted on the US Securities and Exchange Commission’s website at sec.gov and reflect the most recent 12-month period ended June 30.
Quarterly Statement of Investments
The Trust, on behalf of the Fund, files a complete statement of investments with the US Securities and Exchange Commission for the first and third quarters for each fiscal year on Form N-Q. Shareholders may view the filed Form N-Q by visiting the Commission’s website at sec.gov. The filed form may also be viewed and copied at the Commission’s Public Reference Room in Washington, DC. Information regarding the operations of the Public Reference Room may be obtained by calling (800) SEC-0330.
| (a) | The Registrant has adopted a code of ethics that applies to its principal executive officers and principal financial and accounting officer. |
| (f) | Pursuant to Item 12(a)(1), the Registrant is attaching as an exhibit a copy of its code of ethics that applies to its principal executive officers and principal financial and accounting officer. |
| Item 3. | Audit Committee Financial Expert. |
| (a) (1) | The Registrant has an audit committee financial expert serving on its audit committee. |
| (2) | The audit committee financial expert is David W. Niemiec and he is “independent” as defined under the relevant Securities and Exchange Commission Rules and Releases. |
| Item 4. | Principal Accountant Fees and Services. |
The aggregate fees paid to the principal accountant for professional services rendered by the principal accountant for the audit of the registrant’s annual financial statements or for services that are normally provided by the principal accountant in connection with statutory and regulatory filings or engagements were $142,745 for the fiscal year ended March 31, 2018 and $139,769 for the fiscal year ended March 31, 2017.
There were no fees paid to the principal accountant for assurance and related services rendered by the principal accountant to the registrant that are reasonably related to the performance of the audit of the registrant’s financial statements and are not reported under paragraph (a) of Item 4.
There were no fees paid to the principal accountant for assurance and related services rendered by the principal accountant to the registrant’s investment adviser and any entity controlling, controlled by or under common control with the investment adviser that provides ongoing services to the registrant that are reasonably related to the performance of the audit of their financial statements.
There were no fees paid to the principal accountant for professional services rendered by the principal accountant to the registrant for tax compliance, tax advice and tax planning.
There were no fees paid to the principal accountant for professional services rendered by the principal accountant to the registrant’s investment adviser and any entity controlling, controlled by or under common control with the investment adviser that provides ongoing services to the registrant for tax compliance, tax advice and tax planning.
The aggregate fees paid to the principal accountant for products and services rendered by the principal accountant to the registrant not reported in paragraphs (a)-(c) of Item 4 were $379 for the fiscal year ended March 31, 2018 and $0 for the fiscal year ended March 31, 2017. The services for which these fees were paid include review of materials provided to the fund Board in connection with the investment management contract renewal process.
The aggregate fees paid to the principal accountant for products and services rendered by the principal accountant to the registrant’s investment adviser and any entity controlling, controlled by or under common control with the investment adviser that provides ongoing services to the registrant other than services reported in paragraphs (a)-(c) of Item 4 were $14,000 for the fiscal year ended March 31, 2018 and $0 for the fiscal year ended March 31, 2017. The services for which these fees were paid included benchmarking services in connection with the 2015 ICI TA Survey.
(e) (1) The registrant’s audit committee is directly responsible for approving the services to be provided by the auditors, including:
(i) pre-approval of all audit and audit related services;
(ii) pre-approval of all non-audit related services to be provided to the Fund by the auditors;
(iii) pre-approval of all non-audit related services to be provided to the registrant by the auditors to the registrant’s investment adviser or to any entity that controls, is controlled by or is under common control with the registrant’s investment adviser and that provides ongoing services to the registrant where the non-audit services relate directly to the operations or financial reporting of the registrant; and
(iv) establishment by the audit committee, if deemed necessary or appropriate, as an alternative to committee pre-approval of services to be provided by the auditors, as required by paragraphs (ii) and (iii) above, of policies and procedures to permit such services to be pre-approved by other means, such as through establishment of guidelines or by action of a designated member or members of the committee; provided the policies and procedures are detailed as to the particular service and the committee is informed of each service and such policies and procedures do not include delegation of audit committee responsibilities, as contemplated under the Securities Exchange Act of 1934, to management; subject, in the case of (ii) through (iv), to any waivers, exceptions or exemptions that may be available under applicable law or rules.
(e) (2) None of the services provided to the registrant described in paragraphs (b)-(d) of Item 4 were approved by the audit committee pursuant to paragraph (c)(7)(i)(C) of Rule 2-01 of regulation S-X.
(f) No disclosures are required by this Item 4(f).
(g) The aggregate non-audit fees paid to the principal accountant for services rendered by the principal accountant to the registrant and the registrant’s investment adviser and any entity controlling, controlled by or under common control with the investment adviser that provides ongoing services to the registrant were $14,379 for the fiscal year ended March 31, 2018 and $0 for the fiscal year ended March 31, 2017.
(h) The registrant’s audit committee of the board has considered whether the provision of non-audit services that were rendered to the registrant’s investment adviser (not including any sub-adviser whose role is primarily portfolio management and is subcontracted with or overseen by another investment adviser), and any entity controlling, controlled by, or under common control with the investment adviser that provides ongoing services to the registrant that were not pre-approved pursuant to paragraph (c)(7)(ii) of Rule 2-01 of Regulation S-X is compatible with maintaining the principal accountant’s independence.
| Item 5. | Audit Committee of Listed Registrants. N/A |
| Item 6. | Schedule of Investments. N/A |
| Item 7. | Disclosure of Proxy Voting Policies and Procedures for Closed-End Management Investment Companies. N/A |
| Item 8. | Portfolio Managers of Closed-End Management Investment Companies. N/A |
| Item 9. | Purchases of Equity Securities by Closed-End Management Investment Company and Affiliated Purchasers. N/A |
| Item 10. | Submission of Matters to a Vote of Security Holders. |
There have been no changes to the procedures by which shareholders may recommend nominees to the Registrant’s Board of Trustees that would require disclosure herein.
| Item 11. | Controls and Procedures. |
(a) Evaluation of Disclosure Controls and Procedures. The Registrant maintains disclosure controls and procedures that are designed to ensure that information required to be disclosed in the Registrant’s filings under the Securities Exchange Act of 1934 and the Investment Company Act of 1940, is recorded, processed, summarized and reported within the periods specified in the rules and forms of the Securities and Exchange Commission. Such information is accumulated and communicated to the Registrant’s management, including its principal executive officer and principal financial officer, as appropriate, to allow timely decisions regarding required disclosure. The Registrant’s management, including the principal executive officer and the principal financial officer, recognizes that any set of controls and procedures, no matter how well designed and operated, can provide only reasonable assurance of achieving the desired control objectives.
Within 90 days prior to the filing date of this Shareholder Report on Form N-CSR, the Registrant had carried out an evaluation, under the supervision and with the participation of the Registrant’s management, including the Registrant’s principal executive officer and the Registrant’s principal
financial officer, of the effectiveness of the design and operation of the Registrant’s disclosure controls and procedures. Based on such evaluation, the Registrant’s principal executive officer and principal financial officer concluded that the Registrant’s disclosure controls and procedures are effective.
(b) Changes in Internal Controls. There have been no changes in the Registrant’s internal controls or in other factors that could materially affect the internal controls over financial reporting subsequent to the date of their evaluation in connection with the preparation of this Shareholder Report on Form N-CSR.
(a) (1) Code of Ethics
(a) (2) Certifications pursuant to Section 302 of the Sarbanes-Oxley Act of 2002 of Matthew T. Hinkle, Chief Executive Officer – Finance and Administration, and Robert G. Kubilis, Chief Financial Officer and Chief Accounting Officer
(b) Certifications pursuant to Section 906 of the Sarbanes-Oxley Act of 2002 of Matthew T. Hinkle, Chief Executive Officer – Finance and Administration, and Robert G. Kubilis, Chief Financial Officer and Chief Accounting Officer
SIGNATURES
Pursuant to the requirements of the Securities Exchange Act of 1934 and the Investment Company Act of 1940, the registrant has duly caused this report to be signed on its behalf by the undersigned, thereunto duly authorized.
TEMPLETON GLOBAL INVESTMENT TRUST
| | |
| By | | /s/ MATTHEW T. HINKLE |
| | Matthew T. Hinkle |
| | Chief Executive Officer – Finance and Administration |
| | Date May 24, 2018 |
Pursuant to the requirements of the Securities Exchange Act of 1934 and the Investment Company Act of 1940, this report has been signed below by the following persons on behalf of the registrant and in the capacities and on the dates indicated.
| | |
| By | | /s/ MATTHEW T. HINKLE |
| | Matthew T. Hinkle |
| | Chief Executive Officer – Finance and Administration |
| | Date May 24, 2018 |
| | |
| By | | /s/ ROBERT G. KUBILIS |
| | Robert G. Kubilis |
| | Chief Financial Officer and Chief Accounting Officer |
| | Date May 24, 2018 |