UNITED STATES
SECURITIES AND EXCHANGE COMMISSION
Washington, DC 20549
FORM N-CSR
CERTIFIED SHAREHOLDER REPORT OF REGISTERED
MANAGEMENT INVESTMENT COMPANIES
Investment Company Act file number 811-08226
Templeton Global Investment Trust
(Exact name of registrant as specified in charter)
300 S.E. 2nd Street, Fort Lauderdale, FL 33301-1923
(Address of principal executive offices) (Zip code)
Craig S. Tyle, One Franklin Parkway, San Mateo, CA 94403-1906
(Name and address of agent for service)
Registrant’s telephone number, including area code: (954) 527-7500
Date of fiscal year end: 12/31
Date of reporting period: 12/31/17
Item 1. Reports to Stockholders.
Annual Report and Shareholder Letter December 31, 2017 Sign up for electronic delivery at franklintempleton.com/edelivery
Franklin Templeton Investments
Gain From Our Perspective®
At Franklin Templeton Investments, we’re dedicated to one goal: delivering exceptional asset management for our clients. By bringing together multiple, world-class investment teams in a single firm, we’re able to offer specialized expertise across styles and asset classes, all supported by the strength and resources of one of the world’s largest asset managers. This has helped us to become a trusted partner to individual and institutional investors across the globe.
Dear Shareholder:
During the 12 months ended December 31, 2017, the global economy continued to expand, with emerging market economies overall growing faster than developed market economies. Among major emerging market countries, Brazil’s, India’s and Russia’s central banks lowered their benchmark interest rates during the period, while China’s central bank left its benchmark interest rate unchanged. Encouraging economic data from many emerging market countries and corporate earnings growth helped offset investor concerns about interest rate increases in the US and geopolitical tensions in the Korean peninsula and other regions. Further supporting investor sentiment were a rebound in global commodities, emerging market currencies’ overall strength against the US dollar and investment inflows. In this environment, emerging market stocks generated a +37.75% total return, as measured by the MSCI Emerging Markets Index, while emerging market bonds posted a +9.32% total return, as measured by the J.P. Morgan Emerging Markets Bond Index Global.1
We are committed to our long-term perspective and disciplined investment approach as we conduct a rigorous, fundamental analysis of securities with a regular emphasis on investment risk management.
Historically, patient investors have achieved rewarding results by evaluating their goals, diversifying their assets globally and maintaining a disciplined investment program, all hallmarks of the Templeton investment philosophy developed more than 60 years ago. We continue to recommend investors consult
their financial advisors and review their portfolios to design a long-term strategy and portfolio allocation that meet their individual needs, goals and risk tolerance.
Templeton Emerging Markets Balanced Fund’s annual report includes more detail about prevailing conditions and a discussion about investment decisions during the period. Please remember all securities markets fluctuate, as do mutual fund share prices.
We thank you for investing with Franklin Templeton, welcome your questions and comments, and look forward to serving your investment needs in the years ahead.
Sincerely,

Norman J. Boersma, CFA
President and Chief Executive Officer –
Investment Management
Templeton Global Investment Trust
This letter reflects our analysis and opinions as of December 31, 2017, unless otherwise indicated. The information is not a complete analysis of every aspect of any market, country, industry, security or fund. Statements of fact are from sources considered reliable.
CFA® is a trademark owned by CFA Institute.
1. Source: Morningstar.
See www.franklintempletondatasources.com for additional data provider information.
| | | | | | |
| | | Not FDIC Insured | | | May Lose Value | | | No Bank Guarantee |
| | | | |
franklintempleton.com | | Not part of the annual report | | 1 |
Contents
Visit franklintempleton.com for fund updates, to access your account, or to find helpful financial planning tools.
| | | | |
2 | | Annual Report | | franklintempleton.com |
Annual Report
Templeton Emerging Markets Balanced Fund
We are pleased to bring you Templeton Emerging Markets Balanced Fund’s annual report for the fiscal year ended December 31, 2017.
Your Fund’s Goal and Main Investments
The Fund seeks both income and capital appreciation. Under normal market conditions, the Fund invests at least 80% of its net assets plus any borrowings in a diversified portfolio of equity securities and fixed and floating rate debt obligations issued by governments, government-related entities and corporate entities that are located, incorporated or have significant business activities in or are impacted by economic developments in developing or emerging market countries. The Fund normally invests at least 25% of its net assets in equity securities and at least 25% of its net assets in fixed income senior securities.
Performance Overview
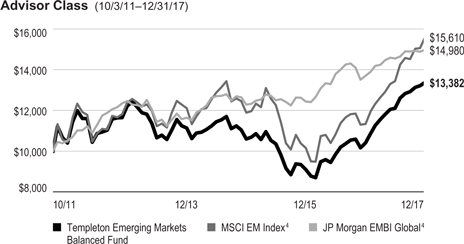
The Fund’s Class A shares delivered a +28.31% cumulative total return for the 12 months under review. For comparison, an equally weighted combination of the MSCI Emerging Markets (EM) Index and the J.P. Morgan (JPM) Emerging Markets Bond Index (EMBI) Global generated a +22.84% total return for the same period.1 Please note, index performance information is provided for reference and we do not attempt to track any index but rather undertake investments on the basis of fundamental research. In addition, the Fund’s return reflects the effect of fees and expenses for professional management, while an index does not have such costs. You can find the Fund’s long-term performance data in the Performance Summary beginning on page 9.
Performance data represent past performance, which does not guarantee future results. Investment return and principal value will fluctuate, and you may have a gain or loss when you sell your shares. Current performance may differ from figures shown. For most recent month-end performance, go to franklintempleton.com or call (800) 342-5236.
Asset Allocation*
Based on Total Net Assets as of 12/31/17
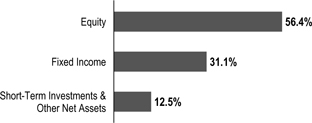
*Figures represent the net Fund exposure and include certain derivatives held in the portfolio (or their underlying reference assets) or unsettled trades and may not total 100% or may be negative due to rounding, use of any derivatives or other factors.
Economic and Market Overview
Emerging market economies in general continued to grow faster than developed market economies during the 12 months under review. China’s economy grew faster in 2017 compared to the previous year, driven by solid growth in industrial production, services, fixed-asset investment, retail sales, and imports and exports. After moderating for two quarters, India’s economy grew faster in 2017’s third quarter compared to the prior-year period, as investment and inventory growth offset private and public spending slowdowns. Russia’s economy grew at the fastest annualized rate in nearly five years in 2017’s second quarter, but it grew slower in the third quarter as industrial production declined. Brazil’s economy grew in 2017’s third quarter compared to the prior-year period, supported by growth in household spending and exports. South Africa’s economic growth moderated in 2017’s third quarter compared to the prior-year period amid faster mining growth and manufacturing decline. South Korea’s economy grew in 2017’s fourth quarter compared to the prior-year period; however, it contracted compared to the third quarter due to declines in manufacturing and construction.
Several central banks, including those of South Korea and Mexico, raised their benchmark interest rates during the 12-month period, while some, including those of South Africa
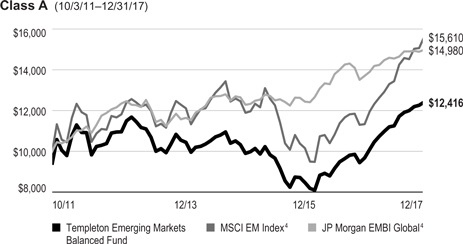
1. Source: Morningstar. The Fund’s blended benchmark is currently weighted 50% for the MSCI EM Index and 50% for the JPM EMBI Global and is rebalanced monthly. For the 12 months ended 12/31/17, the MSCI EM Index posted a +37.75% total return and the JPM EMBI Global posted a +9.32% total return.
The indexes are unmanaged and include reinvestment of any income or distributions. They do not reflect any fees, expenses or sales charges. One cannot invest directly in an index, and an index is not representative of the Fund’s portfolio.
The dollar value, number of shares or principal amount, and names of all portfolio holdings are listed in the Fund’s Statement of Investments (SOI). The SOI begins on page 18.
| | | | |
franklintempleton.com | | Annual Report | | 3 |
TEMPLETON EMERGING MARKETS BALANCED FUND
and Chile, lowered their benchmark interest rates. Russia’s central bank reduced its key rate several times as the inflation rate continued to miss its target. Brazil’s central bank cut its benchmark interest rate several times during the period to support economic growth. India’s central bank reduced its benchmark interest rate in August due to slower inflation growth. China’s central bank left its benchmark interest rate unchanged during the period.
Emerging market stocks rose significantly during the 12 months under review, as improving corporate earnings growth and encouraging economic data from China and other emerging market countries helped offset investor concerns about the US Federal Reserve’s (Fed’s) interest rate increases and geopolitical tensions in the Korean peninsula and other regions. Further supporting emerging market stocks were generally higher commodity prices, subsiding concerns about the potential for a protectionist US trade policy, emerging market currencies’ overall strength against the US dollar, and robust investment inflows. In this environment, emerging market stocks, as measured by the MSCI EM Index, generated a +37.75% total return for the 12 months ended December 31, 2017.1
The year began with a rally in EM bonds, as fourth-quarter 2016 fears for potential trade shocks dissipated. Capital moved into several markets we considered undervalued at a pace not seen in a number of years. The strengthening trends in specific EMs largely continued throughout much of 2017, particularly in select areas of Latin America and Asia.
Duration exposures around the world generally performed well during the year, as rates in developed markets remained relatively low or range-bound, while a number of EM local-currency markets saw declining yields and strengthening valuations.
The 10-year US Treasury note reached its highest yield of 2017 at 2.62% on March 13, two days before the Fed made its first rate hike of 2017. However, yields declined in the second and third quarters as policy setbacks from the Trump administration and subdued inflation figures appeared to dampen expectations for higher rates.
Those negative trends began to reverse in the fall months as Fed Chair Janet Yellen returned from Jackson Hole, Wyoming, with more hawkish-sounding comments on the need to normalize monetary policy. Additionally, a moderate pickup in inflation, exceptional strength in US labor markets, progress on tax reform and a new Fed chair nomination (Jay Powell) appeared to push rate expectations higher, in our opinion. The
Geographic Composition*
Based on Total Net Assets as of 12/31/17
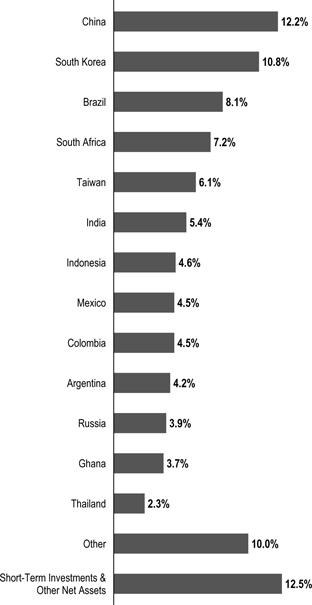
*Figures represent the net Fund exposure and include certain derivatives held in the portfolio (or their underlying reference assets) and may not total 100% or may be negative due to rounding, use of any derivatives or other factors.
Fed also began unwinding its nearly $4.5 trillion balance sheet in October. Ultimately, the Fed raised rates 25 basis points three times in 2017, as it indicated it would.
On the currency front, the US dollar broadly weakened during much of the year, with notable weakness against the euro and Mexican peso during the summer months. Those trends moderately reversed in September and October, before resuming over the final two months of the year, leaving the US dollar broadly weaker in 2017.
| | | | | | |
4 | | Annual Report | | | | franklintempleton.com |
TEMPLETON EMERGING MARKETS BALANCED FUND
In Europe, economic optimism surged in the summer months, driven by the cyclical upswing in eurozone growth as well as some political refortifying after Emmanuel Macron’s victory in the French election in May. The euro appreciated 13.85% against the US dollar during the year. However, growing populist/nationalist movements in a number of countries continued to test the political cohesion across the eurozone.2 Angela Merkel’s win in the German election in September came with new uncertainties around forming a coalition government.
In October, European Central Bank (ECB) President Mario Draghi announced a reduction in the ECB’s bond-buying program, as expected, to €30 billion per month, down from a €60 billion monthly pace, scheduled to begin in January 2018. Draghi also indicated that rates would not be hiked until quantitative easing (QE) ends, implying that rates would likely remain unchanged in the upcoming year.
In Japan, Prime Minister Shinzo Abe’s political mandate was reaffirmed after his political coalition maintained its supermajority in October elections. The Bank of Japan (BOJ) continued to deploy massive levels of QE throughout 2017; however, the yen appreciated 3.54% against the US dollar during the year.2
Investment Strategy
When allocating assets between the equity portion and the fixed income portion of the Fund, we apply a bottom up, fundamental research approach, considering the opportunity set within each asset class based on both absolute and relative valuations available within each asset class. We consider the relative valuation of equities versus bonds and the volatility and near-term risk of loss in each asset class.
When choosing equity investments for the Fund, we apply a fundamental research, value-oriented, long-term approach, focusing on the market price of a company’s securities relative to our evaluation of the company’s long-term earnings, asset value and cash flow potential. We also consider a company’s profit and loss outlook, balance sheet strength, cash flow trends and asset value in relation to the current price of the company’s securities.
When choosing fixed income investments for the Fund, we allocate the Fund’s assets based upon our assessment of changing market, political and economic conditions. We consider various factors, including evaluation of interest and
currency exchange rate changes and credit risks. We regularly enter into currency-related transactions involving certain derivative instruments, principally currency and cross currency forwards, but we may also use other derivative instruments, to provide a hedge against risks associated with other fixed income securities held in the Fund or to implement a currency investment strategy. The Fund may also enter into various other transactions involving derivatives from time to time, including swap agreements (which may include credit default and interest-rate swaps). The use of these derivative transactions may allow the Fund to obtain net long or net short exposures to selected currencies, interest rates, countries, durations or credit risks, or may be used for hedging purposes.
What is a currency forward contract?
A currency forward contract is an agreement between the Fund and a counterparty to buy or sell a foreign currency in exchange for another currency at a specific exchange rate on a future date. Currency forward contracts are privately traded in the interbank market, not on a centralized exchange.
What are swap agreements?
Swap agreements, such as interest-rate, currency and credit default swaps, are contracts between the Fund and another party (the swap counterparty). In a basic swap transaction, the Fund agrees with the swap counterparty to exchange the returns (or differentials in rates of return) earned or realized on a particular “notional amount” of underlying instruments. The notional amount is the set amount selected by the parties as the basis on which to calculate the obligations that they have agreed to exchange. The parties typically do not actually exchange the notional amount. Instead, they agree to exchange the returns that would be earned or realized if the notional amount were invested in given instruments or at given interest rates.
What is duration?
Duration is a measure of a bond’s price sensitivity to interest-rate changes. In general, a portfolio of securities with a lower duration can be expected to be less sensitive to interest-rate changes than a portfolio with a higher duration.
Manager’s Discussion
We continued to allocate in favor of equities during the period as we sought to take advantage of valuation opportunities within emerging market equities. Within fixed income, we sought to take advantage of valuation opportunities in emerging
2. Source: FactSet.
| | | | | | |
franklintempleton.com | | | | Annual Report | | 5 |
TEMPLETON EMERGING MARKETS BALANCED FUND
market countries with favorable growth prospects, low indebtedness and higher reserves.
Equity
During the 12 months under review, key stock contributors to the Fund’s absolute performance included investments in Brilliance China Automotive Holdings, Naspers and Samsung Electronics.
Brilliance China Automotive manufactures and sells automobiles for the Chinese domestic market, predominantly through its joint venture with BMW,3 a German luxury car manufacturer. The company reported strong sales volume and profit growth in 2017, supported by generally robust demand. The rise of China’s upper middle class has continued to drive luxury car demand in the country, as buyers pay more attention to vehicle performance and product quality. The announcement of a joint venture between Brilliance China Automotive and French automobile manufacturer Groupe Renault3 to manufacture and sell light commercial vehicles under the Jinbei, Renault and Huasong brands further supported share price performance.
Naspers is an internet and media group based in South Africa. It has sizable investments in some of the world’s leading technology companies, including China-based Tencent Holdings4 and Russia-based Mail.Ru Group.4 Shares of Naspers rose during the 12-month period, largely driven by positive sentiment in Tencent, one of the world’s largest and most widely used internet service portals. Tencent reported strong year-over-year growth in quarterly earnings throughout 2017, driven by its online gaming, advertising and social networking segments. Investors also viewed positively Naspers’s addition of new investments in the online food delivery segment in 2017.
Samsung Electronics is a major South Korea-based manufacturer of consumer electronics. It is one of the world’s largest manufacturers of mobile phones, smartphones, tablets and televisions. The company is also a leading supplier of memory chips for high-end phones and is a key provider of OLED (organic light-emitting diode) displays. Its share price increase was driven by solid quarterly corporate sales and earnings results reported in 2017, a new shareholder return policy for 2018-2020, including plans to boost its dividends, and a cancelation of existing company-held treasury shares. News that Samsung Electronics dethroned Intel3 to become the
| | | | |
| Top Five Equity Holdings | | | | |
12/31/17 | | | | |
Company Sector/Industry, Country | | % of Total
Net Assets | |
Samsung Electronics Co. Ltd. Technology Hardware, Storage & Peripherals, South Korea | | | 4.8% | |
Naspers Ltd. Media, South Africa | | | 4.5% | |
Brilliance China Automotive Holdings Ltd. Automobiles, China | | | 3.3% | |
Taiwan Semiconductor Manufacturing Co. Ltd. Semiconductors & Semiconductor Equipment, Taiwan | | | 3.1% | |
Alibaba Group Holding Ltd. Internet Software & Services, China | | | 2.3% | |
world’s largest chip producer in 2017 in revenue terms also contributed to investor sentiment.
In contrast, key detractors from the Fund’s absolute performance included positions in Habib Bank, IMAX and Perusahaan Gas Negara.
Habib Bank is Pakistan’s biggest bank and one of the country’s largest companies in asset terms. News of a significant fine by the New York State Department of Financial Services on the bank’s New York branch for failure to comply with New York laws and regulations designed to combat money laundering, terrorist financing and other illicit financial transactions weighed on the bank’s profits and share price. Additionally, following Pakistan’s upgrade from the MSCI Frontier Markets Index to the MSCI EM Index, the Pakistani market corrected sharply due to political turmoil and weaker-than-expected foreign investment inflows.
IMAX is one of the world’s leading entertainment technology companies, specializing in immersive motion picture technologies. Its systems are used globally, and it has a notable market position in China. Disappointing corporate results for the first two quarters of 2017 pressured the US-based company’s shares. Revenues and gross profit margin declined in the second quarter compared to the year-ago period, following a decline in first-quarter gross margin. Third-quarter results, however, were better than expected, with revenue, earnings and gross margin all exceeding market forecasts, driven by a successful cost-cutting program and higher sales, leading its share price to rebound from period lows. The company also announced a new share-repurchase program to enhance shareholder value.
3. Not a Fund holding.
4. Also a Fund holding.
| | | | | | |
6 | | Annual Report | | | | franklintempleton.com |
TEMPLETON EMERGING MARKETS BALANCED FUND
Perusahaan Gas Negara is Indonesia’s principal natural gas utility and is involved in the distribution and transmission of natural gas to industrial, commercial and household users across the country. The government is a majority stakeholder in the company. Its shares recorded a sharp decline in September following the release of disappointing second-quarter 2017 corporate results. The company reported an unexpected loss partly due to softer gas volume, lower profit margins, and higher depreciation and amortization costs. Investor concerns about changes in government regulations, which could further pressure earnings, also impacted sentiment in the stock.
It is important to recognize the effect of currency movements on the Fund’s performance. In general, if the value of the US dollar goes up compared with a foreign currency, an investment traded in that foreign currency will go down in value because it will be worth fewer US dollars. This can have a negative effect on Fund performance. Conversely, when the US dollar weakens in relation to a foreign currency, an investment traded in that foreign currency will increase in value, which can contribute to Fund performance. For the 12 months ended December 31, 2017, the US dollar declined in value relative to most currencies. As a result, the Fund’s equity performance was positively affected by the equity portfolio’s investment predominantly in securities with non-US currency exposure. However, one cannot expect the same result in future periods.
During the 12-month period, we increased the Fund’s equity holdings in Russia, South Korea, Mexico and Peru as we identified companies in these countries with what we considered solid fundamentals. In sector terms, we increased equity holdings in financials and energy and made some purchases in materials.5 Key purchases included additional investment in the aforementioned Samsung Electronics and in Grupo Financiero Santander Mexico, a major financial services company in Mexico. Additionally, we initiated investment in Sberbank of Russia, Russia’s leading bank.
Conversely, we reduced the Fund’s equity investments in India, Hong Kong and Saudi Arabia6 to focus on securities we considered to be more attractively valued within our investment
| | | | |
| Top Five Fixed Income Holdings* | | | | |
| 12/31/17 | | | | |
Issue/Issuer | | % of Total
Net Assets | |
Titulos de Tesoreria | | | 4.4% | |
Argentine Bonos del Tesoro | | | 4.1% | |
Government of Ghana | | | 3.7% | |
Government of Mexico | | | 3.6% | |
Nota Do Tesouro Nacional | | | 3.5% | |
*Excludes short-term investments. | | | | |
universe. In sector terms, some of the largest sales were in consumer discretionary, industrials, consumer staples and information technology (IT).7 Key sales included reducing the Fund’s position in the aforementioned Tencent Holdings and Brilliance China Automotive Holdings, as well as in Indian IT consulting company Infosys.
Fixed Income
On the whole, we continued to position the Fund for rising rates by maintaining low portfolio duration and aiming at a negative correlation with US Treasury returns. We also continued to actively seek select duration exposures that we believe can offer positive real yields without taking undue interest-rate risk, favoring countries that we believe have solid underlying fundamentals and prudent fiscal, monetary and financial policies. When investing globally, investment opportunities may take time to materialize, which may require weathering short-term volatility as the longer term investing theses develop. During the period, we added to some of our strongest investment convictions as prices became cheaper during periods of heightened volatility. We also maintained exposures to a number of emerging-market currencies that we believe remained fundamentally undervalued. Overall, we were positioned for depreciation of the euro and Japanese yen, rising US Treasury yields, and currency appreciation in select emerging markets. During the period, we used forward currency exchange contracts to actively manage currencies. We
5. The financials sector comprises banks, diversified financial services and insurance in the equity section of the SOI. The energy sector comprises oil, gas and consumable fuels in the equity section of the SOI. The materials sector comprises chemicals, construction materials, and metals and mining in the equity section of the SOI.
6. Investments were made through participatory notes, which are equity access products structured as debt obligations and are issued or backed by banks and broker-dealers and designed to replicate equity market exposure in markets where direct investment is either impossible or difficult due to local investment restrictions.
7. The consumer discretionary sector comprises auto components; automobiles; hotels, restaurants and leisure; household durables; internet and direct marketing retail; media; multiline retail; specialty retail; and textiles, apparel and luxury goods in the equity section of the SOI. The industrials sector comprises construction and engineering, industrial conglomerates, and trading companies and distributors in the equity section of the SOI. The consumer staples sector comprises beverages, food and staples retailing, food products and personal products in the equity section of the SOI. The IT sector comprises electronic equipment, instruments and components; internet software and services; IT services; semiconductors and semiconductor equipment; and technology hardware, storage and peripherals in the equity section of the SOI.
See www.franklintempletondatasources.com for additional data provider information.
| | | | | | |
franklintempleton.com | | | | Annual Report | | 7 |
TEMPLETON EMERGING MARKETS BALANCED FUND
also used interest-rate swaps to tactically manage duration exposures.
What is an interest-rate swap?
An interest-rate swap is an agreement between two parties to exchange interest-rate payment obligations, generally one based on an interest rate fixed to maturity and the other based on an interest rate that changes in accordance with changes in a designated benchmark (for example, LIBOR, prime, commercial paper or other benchmarks).
During the period, the Fund’s positive absolute performance was primarily attributable to interest-rate strategies, followed by overall credit exposures. Currency positions detracted from absolute results. The Fund maintained a defensive approach regarding interest rates in developed markets, while holding duration exposures in select emerging markets. Select duration exposures in Latin America (Brazil), Asia ex-Japan (Indonesia) and Africa contributed to absolute performance, while negative duration exposure to US Treasuries detracted. Among currencies, the Fund’s net-negative positions in the euro, the Japanese yen and the Australian dollar detracted from absolute results. However, currency positions in Latin America (the Mexican peso and Brazilian real) and Asia ex-Japan (the Indian rupee) contributed to absolute performance. Among credit exposures, subinvestment-grade sovereign credits contributed to absolute return.
On a relative basis, currency positions were the Fund’s top detractor. Interest-rate strategies contributed to relative results, while overall credit exposures had a largely neutral effect. Among currencies, the Fund’s underweighted positions in the euro, the Japanese yen and the Australian dollar detracted from relative performance. However, overweighted currency positions in Latin America (the Mexican peso and Brazilian real) and Asia ex-Japan (the Indian rupee) contributed to relative results. The Fund maintained a defensive approach regarding interest rates in developed markets, while holding duration exposures in select emerging markets. Select overweighted duration exposures in Latin America (Brazil), Asia ex-Japan (Indonesia) and Africa contributed to relative performance, while underweighted duration exposure in the US detracted. Among credit exposures, overweighted positioning in subinvestment-grade sovereign credits contributed to relative return, while underweighted positioning in corporate credit detracted.
Thank you for your continued participation in Templeton Emerging Markets Balanced Fund. We look forward to serving your future investment needs.
| | |
 | | 
Chetan Sehgal, CFA |
| |
 | | 
Michael Hasenstab Ph.D. |
| |
| | Laura Burakreis |
| |
| | Portfolio Management Team |
The foregoing information reflects our analysis, opinions and portfolio holdings as of December 31, 2017, the end of the reporting period. The way we implement our main investment strategies and the resulting portfolio holdings may change depending on factors such as market and economic conditions. These opinions may not be relied upon as investment advice or an offer for a particular security. The information is not a complete analysis of every aspect of any market, country, industry, security or the Fund. Statements of fact are from sources considered reliable, but the investment manager makes no representation or warranty as to their completeness or accuracy. Although historical performance is no guarantee of future results, these insights may help you understand our investment management philosophy.
| | | | | | |
8 | | Annual Report | | | | franklintempleton.com |
TEMPLETON EMERGING MARKETS BALANCED FUND
Performance Summary as of December 31, 2017
The performance table and graphs do not reflect any taxes that a shareholder would pay on Fund dividends, capital gain distributions, if any, or any realized gains on the sale of Fund shares. Total return reflects reinvestment of the Fund’s dividends and capital gain distributions, if any, and any unrealized gains or losses. Your dividend income will vary depending on dividends or interest paid by securities in the Fund’s portfolio, adjusted for operating expenses of each class. Capital gain distributions are net profits realized from the sale of portfolio securities.
Performance as of 12/31/171
Cumulative total return excludes sales charges. Average annual total return includes maximum sales charges. Sales charges will vary depending on the size of the investment and the class of share purchased. The maximum is 5.75% and the minimum is 0%. Class A: 5.75% maximum initial sales charge; Advisor Class: no sales charges. For other share classes, visit franklintempleton.com.
| | | | | | | | |
| Share Class | | Cumulative
Total Return2 | | | Average Annual
Total Return3 | |
A | | | | | | | | |
1-Year | | | +28.31% | | | | +20.95% | |
5-Year | | | +8.04% | | | | +0.37% | |
Since Inception (10/3/11) | | | +31.73% | | | | +3.53% | |
Advisor | | | | | | | | |
1-Year | | | +28.60% | | | | +28.60% | |
5-Year | | | +9.51% | | | | +1.83% | |
Since Inception (10/3/11) | | | +33.82% | | | | +4.78% | |
Performance data represent past performance, which does not guarantee future results. Investment return and principal value will fluctuate, and you may have a gain or loss when you sell your shares. Current performance may differ from figures shown. For most recent month-end performance, go to franklintempleton.com or call (800) 342-5236.
See page 11 for Performance Summary footnotes.
| | | | | | |
franklintempleton.com | | | | Annual Report | | 9 |
TEMPLETON EMERGING MARKETS BALANCED FUND
PERFORMANCE SUMMARY
Total Return Index Comparison for a Hypothetical $10,000 Investment1
Total return represents the change in value of an investment over the periods shown. It includes any applicable maximum sales charge, Fund expenses, account fees and reinvested distributions. The unmanaged indexes include reinvestment of any income or distributions. They differ from the Fund in composition and do not pay management fees or expenses. One cannot invest directly in an index.
See page 11 for Performance Summary footnotes.
| | | | | | |
10 | | Annual Report | | | | franklintempleton.com |
TEMPLETON EMERGING MARKETS BALANCED FUND
PERFORMANCE SUMMARY
Distributions (1/1/17–12/31/17)
| | |
Share Class | | Net Investment Income |
A | | $0.3078 |
C | | $0.2363 |
R | | $0.2833 |
R6 | | $0.2253 |
Advisor | | $0.3346 |
Total Annual Operating Expenses4
| | | | | | | | |
| Share Class | | With Waiver | | | Without Waiver | |
A | | | 1.50% | | | | 2.51% | |
Advisor | | | 1.25% | | | | 2.26% | |
Each class of shares is available to certain eligible investors and has different annual fees and expenses, as described in the prospectus.
All investments involve risks, including possible loss of principal. Stock prices fluctuate due to factors affecting individual companies, particular industries or sectors, or general market conditions. Investments in emerging market countries involve special risks including currency fluctuations, economic and political uncertainties, in addition to those associated with these markets’ smaller size, lesser liquidity and lack of established legal, political, business and social frameworks to support securities markets. Smaller company stocks have historically exhibited greater price volatility than large company stocks. Bond prices generally move in the opposite direction of interest rates. Thus, as the prices of bonds in the Fund adjust to a rise in interest rates, the Fund’s share price may decline. The risks associated with higher yielding, lower rated securities include higher risks of default and loss of principal. Sovereign debt securities are subject to various risks in addition to those relating to debt securities and foreign securities generally, including, but not limited to, the risk that a government entity may be unwilling or unable to pay interest and repay principal on its sovereign debt, or otherwise meet its obligations when due. The Fund’s investments in derivative securities and use of foreign currency techniques involve special risks, as such techniques may not achieve the anticipated benefits and/or may result in losses to the fund. The markets for particular securities or types of securities are or may become relatively illiquid. The Fund is actively managed but there is no guarantee that the manager’s investment decisions will produce the desired results. The Fund’s prospectus also includes a description of the main investment risks.
1. The Fund has an expense reduction and a fee waiver associated with any investments it makes in a Franklin Templeton money fund and/or other Franklin Templeton fund, contractually guaranteed through 4/30/2018. Fund investment results reflect the expense reduction and fee waiver; without these reductions, the results would have been lower.
2. Cumulative total return represents the change in value of an investment over the periods indicated.
3. Average annual total return represents the average annual change in value of an investment over the periods indicated. Return for less than one year, if any, has not been annualized.
4. Source: Morningstar. The MSCI EM Index is a free float-adjusted, market capitalization-weighted index designed to measure the equity market performance of global emerging markets. The JPM EMBI Global tracks total returns for US dollar-denominated debt instruments issued by emerging market sovereign and quasi-sovereign entities: Brady bonds, loans and Eurobonds.
5. Figures are as stated in the Fund’s current prospectus and may differ from the expense ratios disclosed in the Your Fund’s Expenses and Financial Highlights sections in this report. In periods of market volatility, assets may decline significantly, causing total annual Fund operating expenses to become higher than the figures shown.
See www.franklintempletondatasources.com for additional data provider information.
| | | | | | |
franklintempleton.com | | | | Annual Report | | 11 |
TEMPLETON EMERGING MARKETS BALANCED FUND
Your Fund’s Expenses
As a Fund shareholder, you can incur two types of costs: (1) transaction costs, including sales charges (loads) on Fund purchases and redemptions; and (2) ongoing Fund costs, including management fees, distribution and service (12b-1) fees, and other Fund expenses. All mutual funds have ongoing costs, sometimes referred to as operating expenses. The table below shows ongoing costs of investing in the Fund and can help you understand these costs and compare them with those of other mutual funds. The table assumes a $1,000 investment held for the six months indicated.
Actual Fund Expenses
The table below provides information about actual account values and actual expenses in the columns under the heading “Actual.” In these columns the Fund’s actual return, which includes the effect of Fund expenses, is used to calculate the “Ending Account Value” for each class of shares. You can estimate the expenses you paid during the period by following these steps (of course, your account value and expenses will differ from those in this illustration): Divide your account value by $1,000 (if your account had an $8,600 value, then $8,600 ÷ $1,000 = 8.6). Then multiply the result by the number in the row for your class of shares under the headings “Actual” and “Expenses Paid During Period” (if Actual Expenses Paid During Period were $7.50, then 8.6 x $7.50 = $64.50). In this illustration, the actual expenses paid this period are $64.50.
Hypothetical Example for Comparison with Other Funds
Under the heading “Hypothetical” in the table, information is provided about hypothetical account values and hypothetical expenses based on the Fund’s actual expense ratio and an assumed rate of return of 5% per year before expenses, which is not the Fund’s actual return. This information may not be used to estimate the actual ending account balance or expenses you paid for the period, but it can help you compare ongoing costs of investing in the Fund with those of other funds. To do so, compare this 5% hypothetical example for the class of shares you hold with the 5% hypothetical examples that appear in the shareholder reports of other funds.
Please note that expenses shown in the table are meant to highlight ongoing costs and do not reflect any transactional costs. Therefore, information under the heading “Hypothetical” is useful in comparing ongoing costs only, and will not help you compare total costs of owning different funds. In addition, if transactional costs were included, your total costs would have been higher.
| | | | | | | | | | | | |
| | | | | Actual
(actual return after expenses) | | Hypothetical
(5% annual return before expenses) | | |
| | | | | | | Expenses | | Net |
| | | Beginning | | Ending | | Expenses | | Ending | | Paid During | | Annualized |
| Share | | Account | | Account | | Paid During | | Account | | Period | | Expense |
| Class | | Value1 | | Value 12/31/17 | | Period2,3,4 | | Value 12/31/17 | | 7/1/17–12/31/173,4 | | Ratio4 |
| | | | | | |
A | | $1,000 | | $1,103.60 | | $ 7.85 | | $1,017.74 | | $ 7.53 | | 1.48% |
C | | $1,000 | | $1,100.10 | | $11.80 | | $1,013.96 | | $11.32 | | 2.23% |
R | | $1,000 | | $1,102.30 | | $ 9.17 | | $1,016.48 | | $ 8.79 | | 1.73% |
R6 | | $1,000 | | $1,061.90 | | $ 4.94 | | $1,019.51 | | $ 5.75 | | 1.15% |
Advisor | | $1,000 | | $1,105.20 | | $ 6.53 | | $1,019.00 | | $ 6.26 | | 1.23% |
1. For Classes A, C, R and Advisor, 7/1/17 for Actual and Hypothetical. For Class R6, 8/1/17 for Actual and 7/1/17 for Hypothetical.
2. For Classes A, C, R and Advisor, 7/1/17–12/31/17. For Class R6, 8/1/17–12/31/17.
3. Expenses are equal to the annualized expense ratio for the six-month period as indicated above—in the far right column—multiplied by the simple average account value over the period indicated, and then multiplied by 184/365 to reflect the one-half year period. The multiplier is 152/365 for Actual Class R6 expenses to reflect the number of days since inception.
4. Reflects expenses after fee waivers and expense reimbursements. Does not include acquired fund fees and expenses.
| | | | | | |
12 | | Annual Report | | | | franklintempleton.com |
TEMPLETON GLOBAL INVESTMENT TRUST
Financial Highlights
Templeton Emerging Markets Balanced Fund
| | | | | | | | | | | | | | | | | | | | | | | | |
| | | Year Ended December 31, | | | Year Ended March 31, | |
| | | | | | | | |
| | | 2017 | | | 2016a | | | 2016 | | | 2015 | | | 2014 | | | 2013 | |
| |
| | | | | | |
Class A | | | | | | | | | | | | | | | | | | | | | | | | |
| | | | | | |
Per share operating performance | | | | | | | | | | | | | | | | | | | | | | | | |
(for a share outstanding throughout the year) | | | | | | | | | | | | | | | | | | | | | | | | |
| | | | | | |
Net asset value, beginning of year | | | $ 9.03 | | | | $ 8.33 | | | | $ 9.36 | | | | $ 10.10 | | | | $ 11.38 | | | | $ 11.53 | |
| | | | |
| | | | | | |
Income from investment operationsb: | | | | | | | | | | | | | | | | | | | | | | | | |
| Net investment incomec | | | 0.40 | | | | 0.20 | | | | 0.23 | | | | 0.30 | | | | 0.36 | | | | 0.34 | |
| | | | | | |
Net realized and unrealized gains (losses) | | | 2.14 | | | | 0.60 | | | | (1.22 | ) | | | (0.67 | ) | | | (1.32 | ) | | | (0.08) | |
| | | | |
| | | | | | |
Total from investment operations | | | 2.54 | | | | 0.80 | | | | (0.99 | ) | | | (0.37 | ) | | | (0.96 | ) | | | 0.26 | |
| | | | |
| | | | | | |
| Less distributions from: | | | | | | | | | | | | | | | | | | | | | | | | |
| | | | | | |
| Net investment income | | | (0.31) | | | | (0.10) | | | | (0.04) | | | | (0.37) | | | | (0.31) | | | | (0.41) | |
| | | | | | |
Net realized gains | | | — | | | | — | | | | — | | | | — | | | | (0.01) | | | | (—) | d |
| | | | |
| | | | | | |
Total distributions | | | (0.31 | ) | | | (0.10 | ) | | | (0.04 | ) | | | (0.37 | ) | | | (0.32 | ) | | | (0.41) | |
| | | | |
Net asset value, end of year | | | $11.26 | | | | $9.03 | | | | $8.33 | | | | $9.36 | | | | $10.10 | | | | $11.38 | |
| | | | |
| | | | | | |
Total returne | | | 28.31% | | | | 9.64% | | | | (10.57)% | | | | (3.66)% | | | | (8.27)% | | | | 2.21% | |
| | | | | | |
Ratios to average net assetsf | | | | | | | | | | | | | | | | | | | | | | | | |
| | | | | | |
Expenses before waiver and payments by affiliates | | | 2.33% | | | | 2.49% | | | | 2.25% | | | | 2.10% | | | | 2.04% | | | | 2.09% | |
| | | | | | |
Expenses net of waiver and payments by affiliates | | | 1.48%g | | | | 1.48% | | | | 1.50% | | | | 1.53% | | | | 1.54% | | | | 1.44% | |
| | | | | | |
Net investment income | | | 3.74% | | | | 3.00% | | | | 2.65% | | | | 3.00% | | | | 3.52% | | | | 3.01% | |
| | | | | | |
Supplemental data | | | | | | | | | | | | | | | | | | | | | | | | |
| | | | | | |
Net assets, end of year (000’s) | | | $28,572 | | | | $20,316 | | | | $23,171 | | | | $30,151 | | | | $29,971 | | | | $26,559 | |
| | | | | | |
Portfolio turnover rate | | | 23.96% | | | | 26.32% | | | | 65.41% | | | | 48.32% | | | | 69.27% | | | | 4.65% | |
aFor the period April 1, 2016 to December 31, 2016.
bThe amount shown for a share outstanding throughout the period may not correlate with the Statement of Operations for the period due to the timing of sales and repurchases of the Fund’s shares in relation to income earned and/or fluctuating fair value of the investments of the Fund.
cBased on average daily shares outstanding.
dAmount rounds to less than $0.01 per share.
eTotal return does not reflect sales commissions or contingent deferred sales charges, if applicable, and is not annualized for periods less than one year.
fRatios are annualized for periods less than one year.
gBenefit of expense reduction rounds to less than 0.01%.
| | | | | | |
franklintempleton.com | | | | The accompanying notes are an integral part of these financial statements. | Annual Report | | 13 |
TEMPLETON GLOBAL INVESTMENT TRUST
FINANCIAL HIGHLIGHTS
Templeton Emerging Markets Balanced Fund (continued)
| | | | | | | | | | | | | | | | | | | | | | | | |
| | | Year Ended December 31, | | | Year Ended March 31, | |
| | | 2017 | | | 2016a | | | 2016 | | | 2015 | | | 2014 | | | 2013 | |
| | | | | | |
Class C | | | | | | | | | | | | | | | | | | | | | | | | |
| | | | | | |
Per share operating performance | | | | | | | | | | | | | | | | | | | | | | | | |
(for a share outstanding throughout the year) | | | | | | | | | | | | | | | | | | | | | | | | |
| | | | | | |
Net asset value, beginning of year | | | $ 8.96 | | | | $ 8.25 | | | | $ 9.30 | | | | $ 10.03 | | | | $ 11.32 | | | | $ 11.49 | |
| | | | | | |
Income from investment operationsb: | | | | | | | | | | | | | | | | | | | | | | | | |
| | | | | | |
Net investment incomec | | | 0.32 | | | | 0.14 | | | | 0.16 | | | | 0.23 | | | | 0.28 | | | | 0.24 | |
| | | | | | |
Net realized and unrealized gains (losses) | | | 2.13 | | | | 0.60 | | | | (1.21) | | | | (0.66) | | | | (1.31) | | | | (0.07) | |
| | | | | | |
Total from investment operations | | | 2.45 | | | | 0.74 | | | | (1.05) | | | | (0.43) | | | | (1.03) | | | | 0.17 | |
| | | | | | |
Less distributions from: | | | | | | | | | | | | | | | | | | | | | | | | |
| | | | | | |
Net investment income | | | (0.24) | | | | (0.03) | | | | — | | | | (0.30) | | | | (0.25) | | | | (0.34) | |
| | | | | | |
Net realized gains | | | — | | | | — | | | | — | | | | — | | | | (0.01) | | | | (—) | d |
| | | | | | |
Total distributions | | | (0.24) | | | | (0.03) | | | | — | | | | (0.30) | | | | (0.26) | | | | (0.34) | |
| | | | | | |
Net asset value, end of year | | | $11.17 | | | | $ 8.96 | | | | $ 8.25 | | | | $ 9.30 | | | | $10.03 | | | | $11.32 | |
| | | | | | |
Total returne | | | 27.46% | | | | 9.02% | | | | (11.29)% | | | | (4.27)% | | | | (8.96)% | | | | 1.38% | |
| | | | | | |
Ratios to average net assetsf | | | | | | | | | | | | | | | | | | | | | | | | |
| | | | | | |
Expenses before waiver and payments by affiliates | | | 3.08% | | | | 3.24% | | | | 2.98% | | | | 2.80% | | | | 2.73% | | | | 2.88% | |
| | | | | | |
Expenses net of waiver and payments by affiliates | | | 2.23% | g | | | 2.23% | | | | 2.23% | | | | 2.23% | | | | 2.23% | | | | 2.23% | |
| | | | | | |
Net investment income | | | 2.99% | | | | 2.25% | | | | 1.92% | | | | 2.30% | | | | 2.83% | | | | 2.22% | |
| | | | | | |
Supplemental data | | | | | | | | | | | | | | | | | | | | | | | | |
| | | | | | |
Net assets, end of year (000’s) | | | $5,024 | | | | $3,143 | | | | $3,462 | | | | $4,079 | | | | $4,250 | | | | $3,256 | |
| | | | | | |
Portfolio turnover rate | | | 23.96% | | | | 26.32% | | | | 65.41% | | | | 48.32% | | | | 69.27% | | | | 4.65% | |
aFor the period April 1, 2016 to December 31, 2016.
bThe amount shown for a share outstanding throughout the period may not correlate with the Statement of Operations for the period due to the timing of sales and repurchases of the Fund’s shares in relation to income earned and/or fluctuating fair value of the investments of the Fund.
cBased on average daily shares outstanding.
dAmount rounds to less than $0.01 per share.
eTotal return does not reflect sales commissions or contingent deferred sales charges, if applicable, and is not annualized for periods less than one year.
fRatios are annualized for periods less than one year.
gBenefit of expense reduction rounds to less than 0.01%.
| | | | | | |
14 | | Annual Report | | | The accompanying notes are an integral part of these financial statements. | | franklintempleton.com |
TEMPLETON GLOBAL INVESTMENT TRUST
FINANCIAL HIGHLIGHTS
Templeton Emerging Markets Balanced Fund (continued)
| | | | | | | | | | | | | | | | | | | | | | | | |
| | | Year Ended December 31, | | | Year Ended March 31, | |
| | | | | | | | |
| | | 2017 | | | 2016a | | | 2016 | | | 2015 | | | 2014 | | | 2013 | |
| |
Class R | | | | | | | | | | | | | | | | | | | | | | | | |
| | | | | | |
Per share operating performance | | | | | | | | | | | | | | | | | | | | | | | | |
(for a share outstanding throughout the year) | | | | | | | | | | | | | | | | | | | | | | | | |
| | | | | | |
Net asset value, beginning of year | | | $ 9.01 | | | | $ 8.32 | | | | $ 9.35 | | | | $10.09 | | | | $11.37 | | | | $11.51 | |
| | | | |
| | | | | | |
Income from investment operationsb: | | | | | | | | | | | | | | | | | | | | | | | | |
| | | | | | |
Net investment incomec | | | 0.37 | | | | 0.17 | | | | 0.16 | | | | 0.29 | | | | 0.36 | | | | 0.30 | |
| | | | | | |
Net realized and unrealized gains (losses) | | | 2.14 | | | | 0.61 | | | | (1.17) | | | | (0.68) | | | | (1.34) | | | | (0.07) | |
| | | | |
| | | | | | |
Total from investment operations | | | 2.51 | | | | 0.78 | | | | (1.01) | | | | (0.39) | | | | (0.98) | | | | 0.23 | |
| | | | |
| | | | | | |
Less distributions from: | | | | | | | | | | | | | | | | | | | | | | | | |
| | | | | | |
Net investment income | | | (0.28) | | | | (0.09) | | | | (0.02) | | | | (0.35) | | | | (0.29) | | | | (0.37) | |
| | | | | | |
Net realized gains | | | — | | | | — | | | | — | | | | — | | | | (0.01) | | | | (—) | d |
| | | | |
| | | | | | |
Total distributions | | | (0.28) | | | | (0.09) | | | | (0.02) | | | | (0.35) | | | | (0.30) | | | | (0.37) | |
| | | | |
| | | | | | |
Net asset value, end of year | | | $11.24 | | | | $ 9.01 | | | | $ 8.32 | | | | $ 9.35 | | | | $10.09 | | | | $11.37 | |
| | | | |
| | | | | | |
Total returne | | | 28.08% | | | | 9.36% | | | | (10.79)% | | | | (3.85)% | | | | (8.45)% | | | | 1.92% | |
| | | | | | |
Ratios to average net assetsf | | | | | | | | | | | | | | | | | | | | | | | | |
| | | | | | |
Expenses before waiver and payments by affiliates | | | 2.58% | | | | 2.74% | | | | 2.48% | | | | 2.30% | | | | 2.23% | | | | 2.38% | |
| | | | | | |
Expenses net of waiver and payments by affiliates | | | 1.73%g | | | | 1.73% | | | | 1.73% | | | | 1.73% | | | | 1.73% | | | | 1.73% | |
| | | | | | |
Net investment income | | | 3.49% | | | | 2.75% | | | | 2.42% | | | | 2.80% | | | | 3.33% | | | | 2.72% | |
| | | | | | |
Supplemental data | | | | | | | | | | | | | | | | | | | | | | | | |
| | | | | | |
Net assets, end of year (000’s) | | | $262 | | | | $190 | | | | $149 | | | | $52 | | | | $53 | | | | $56 | |
| | | | | | |
Portfolio turnover rate | | | 23.96% | | | | 26.32% | | | | 65.41% | | | | 48.32% | | | | 69.27% | | | | 4.65% | |
aFor the period April 1, 2016 to December 31, 2016.
bThe amount shown for a share outstanding throughout the period may not correlate with the Statement of Operations for the period due to the timing of sales and repurchases of the Fund’s shares in relation to income earned and/or fluctuating fair value of the investments of the Fund.
cBased on average daily shares outstanding.
dAmount rounds to less than $0.01 per share.
eTotal return is not annualized for periods less than one year.
fRatios are annualized for periods less than one year.
gBenefit of expense reduction rounds to less than 0.01%.
| | | | | | |
franklintempleton.com | | | | The accompanying notes are an integral part of these financial statements. | Annual Report | | 15 |
TEMPLETON GLOBAL INVESTMENT TRUST
FINANCIAL HIGHLIGHTS
Templeton Emerging Markets Balanced Fund (continued)
| | |
| | | Year Ended
December 31,
2017a |
Class R6 | | |
| |
Per share operating performance | | |
(for a share outstanding throughout the year) | | |
| |
Net asset value, beginning of year | | $10.83 |
| |
Income from investment operationsb: | | |
| |
Net investment incomec | | 0.19 |
| |
Net realized and unrealized gains (losses) | | 0.48 |
| |
Total from investment operations | | 0.67 |
| |
Less distributions from net investment income | | (0.23) |
| |
Net asset value, end of year | | $11.27 |
| |
Total returnd | | 6.19% |
| |
Ratios to average net assetse | | |
| |
Expenses before waiver and payments by affiliates | | 1.91% |
| |
Expenses net of waiver and payments by affiliates | | 1.15%f |
| |
Net investment income | | 4.07% |
| |
Supplemental data | | |
| |
Net assets, end of year (000’s) | | $838 |
| |
Portfolio turnover rate | | 23.96% |
aFor the period August 1, 2017 (effective date) to December 31, 2017.
bThe amount shown for a share outstanding throughout the period may not correlate with the Statement of Operations for the period due to the timing of sales and repurchases of the Fund’s shares in relation to income earned and/or fluctuating fair value of the investments of the Fund.
cBased on average daily shares outstanding.
dTotal return is not annualized for periods less than one year.
eRatios are annualized for periods less than one year.
fBenefit of expense reduction rounds to less than 0.01%.
| | | | | | |
16 | | Annual Report | | | The accompanying notes are an integral part of these financial statements. | | franklintempleton.com |
TEMPLETON GLOBAL INVESTMENT TRUST
FINANCIAL HIGHLIGHTS
Templeton Emerging Markets Balanced Fund (continued)
| | | | | | | | | | | | | | | | | | | | | | | | |
| | | Year Ended December 31, | | | Year Ended March 31, | |
| | | 2017 | | | 2016a | | | 2016 | | | 2015 | | | 2014 | | | 2013 | |
| | | | | | |
Advisor Class | | | | | | | | | | | | | | | | | | | | | | | | |
| | | | | | |
Per share operating performance | | | | | | | | | | | | | | | | | | | | | | | | |
| | | | | | |
(for a share outstanding throughout the year) | | | | | | | | | | | | | | | | | | | | | | | | |
| | | | | | |
Net asset value, beginning of year | | | $ 9.04 | | | | $ 8.35 | | | | $ 9.38 | | | | $10.11 | | | | $11.40 | | | | $11.54 | |
| | | | | | |
Income from investment operationsb: | | | | | | | | | | | | | | | | | | | | | | | | |
| | | | | | |
Net investment incomec | | | 0.42 | | | | 0.22 | | | | 0.25 | | | | 0.34 | | | | 0.42 | | | | 0.37 | |
| | | | | | |
Net realized and unrealized gains (losses) | | | 2.14 | | | | 0.59 | | | | (1.22) | | | | (0.67) | | | | (1.36) | | | | (0.08) | |
| | | | | | |
Total from investment operations | | | 2.56 | | | | 0.81 | | | | (0.97) | | | | (0.33) | | | | (0.94) | | | | 0.29 | |
| | | | | | |
Less distributions from: | | | | | | | | | | | | | | | | | | | | | | | | |
| | | | | | |
Net investment income | | | (0.33) | | | | (0.12) | | | | (0.06) | | | | (0.40) | | | | (0.34) | | | | (0.43) | |
| | | | | | |
Net realized gains | | | — | | | | — | | | | — | | | | — | | | | (0.01) | | | | (—) | d |
| | | | | | |
Total distributions | | | (0.33) | | | | (0.12) | | | | (0.06) | | | | (0.40) | | | | (0.35) | | | | (0.43) | |
| | | | | | |
Net asset value, end of year | | | $11.27 | | | | $ 9.04 | | | | $ 8.35 | | | | $ 9.38 | | | | $10.11 | | | | $11.40 | |
| | | | | | |
Total returne | | | 28.60% | | | | 9.78% | | | | (10.32)% | | | | (3.28)% | | | | (8.07)% | | | | 2.43% | |
| | | | | | |
Ratios to average net assetsf | | | | | | | | | | | | | | | | | | | | | | | | |
| | | | | | |
Expenses before waiver and payments by affiliates | | | 2.08% | | | | 2.24% | | | | 1.98% | | | | 1.80% | | | | 1.73% | | | | 1.88% | |
| | | | | | |
Expenses net of waiver and payments by affiliates | | | 1.23%g | | | | 1.23% | | | | 1.23% | | | | 1.23% | | | | 1.23% | | | | 1.23% | |
| | | | | | |
Net investment income | | | 3.99% | | | | 3.25% | | | | 2.92% | | | | 3.30% | | | | 3.83% | | | | 3.22% | |
| | | | | | |
Supplemental data | | | | | | | | | | | | | | | | | | | | | | | | |
| | | | | | |
Net assets, end of year (000’s) | | | $8,177 | | | | $4,060 | | | | $6,522 | | | | $8,068 | | | | $8,911 | | | | $17,346 | |
| | | | | | |
Portfolio turnover rate | | | 23.96% | | | | 26.32% | | | | 65.41% | | | | 48.32% | | | | 69.27% | | | | 4.65% | |
aFor the period April 1, 2016 to December 31, 2016.
bThe amount shown for a share outstanding throughout the period may not correlate with the Statement of Operations for the period due to the timing of sales and repurchases of the Fund’s shares in relation to income earned and/or fluctuating fair value of the investments of the Fund.
cBased on average daily shares outstanding.
dAmount rounds to less than $0.01 per share.
eTotal return is not annualized for periods less than one year.
fRatios are annualized for periods less than one year.
gBenefit of expense reduction rounds to less than 0.01%.
| | | | | | |
franklintempleton.com | | | | The accompanying notes are an integral part of these financial statements. | Annual Report | | 17 |
TEMPLETON GLOBAL INVESTMENT TRUST
Statement of Investments, December 31, 2017
Templeton Emerging Markets Balanced Fund
| | | | | | | | | | | | |
| | | | | Industry | | Shares/
Warrants | | | Value | |
| | Common Stocks and Other Equity Interests 54.2% | | | | | |
| | Belgium 0.2% | | | | | | | | | | |
| | Anheuser-Busch InBev SA/NV | | Beverages | | | 839 | | | $ | 93,748 | |
| | | | | | | | | | | | |
| | Brazil 1.5% | | | | | | | | | | |
| a | | B2W Cia Digital | | Internet & Direct Marketing Retail | | | 8,700 | | | | 53,842 | |
| | B3 SA - Brasil Bolsa Balcao | | Capital Markets | | | 29,600 | | | | 203,562 | |
| | Lojas Americanas SA | | Multiline Retail | | | 42,900 | | | | 170,049 | |
| | M. Dias Branco SA | | Food Products | | | 8,100 | | | | 127,401 | |
| | Mahle-Metal Leve SA | | Auto Components | | | 10,300 | | | | 74,223 | |
| | | | | | | | | | | | |
| | | | |
| | | | | | | | | | | 629,077 | |
| | | | | | | | | | | | |
| | Cambodia 0.5% | | | | | | | | | | |
| | NagaCorp Ltd. | | Hotels, Restaurants & Leisure | | | 260,000 | | | | 201,668 | |
| | | | | | | | | | | | |
| | China 12.2% | | | | | | | | | | |
| a | | Alibaba Group Holding Ltd., ADR | | Internet Software & Services | | | 5,662 | | | | 976,299 | |
| | BAIC Motor Corp. Ltd., H | | Automobiles | | | 105,500 | | | | 137,464 | |
| a | | Baidu Inc., ADR | | Internet Software & Services | | | 794 | | | | 185,963 | |
| | Brilliance China Automotive Holdings Ltd. | | Automobiles | | | 524,600 | | | | 1,403,347 | |
| | China Mobile Ltd. | | Wireless Telecommunication Services | | | 10,500 | | | | 106,507 | |
| | China Petroleum & Chemical Corp., H | | Oil, Gas & Consumable Fuels | | | 338,000 | | | | 247,892 | |
| | CNOOC Ltd. | | Oil, Gas & Consumable Fuels | | | 214,900 | | | | 308,617 | |
| | NetEase Inc., ADR | | Internet Software & Services | | | 462 | | | | 159,422 | |
| | Ping An Bank Co. Ltd., A. | | Banks | | | 169,800 | | | | 347,082 | |
| | Ping An Insurance Group Co. of China Ltd., A | | Insurance | | | 32,448 | | | | 349,033 | |
| | Poly Culture Group Corp. Ltd., H | | Media | | | 17,600 | | | | 35,548 | |
| | Tencent Holdings Ltd. | | Internet Software & Services | | | 14,800 | | | | 769,092 | |
| | Uni-President China Holdings Ltd. | | Food Products | | | 148,000 | | | | 123,888 | |
| | Weifu High-Technology Co. Ltd., B | | Auto Components | | | 28,126 | | | | 60,155 | |
| | | | | | | | | | | | |
| | | | |
| | | | | | | | | | | 5,210,309 | |
| | | | | | | | | | | | |
| | Czech Republic 0.3% | | | | | | | | | | |
| | Moneta Money Bank AS | | Banks | | | 38,699 | | | | 149,758 | |
| | | | | | | | | | | | |
| | Hong Kong 0.8% | | | | | | | | | | |
| | MGM China Holdings Ltd. | | Hotels, Restaurants & Leisure | | | 76,000 | | | | 230,057 | |
| | Sands China Ltd. | | Hotels, Restaurants & Leisure | | | 21,600 | | | | 111,555 | |
| | | | | | | | | | | | |
| | | | |
| | | | | | | | | | | 341,612 | |
| | | | | | | | | | | | |
| | Hungary 1.0% | | | | | | | | | | |
| | MOL Hungarian Oil and Gas PLC | | Oil, Gas & Consumable Fuels | | | 9,450 | | | | 109,625 | |
| | Richter Gedeon Nyrt | | Pharmaceuticals | | | 12,080 | | | | 316,177 | |
| | | | | | | | | | | | |
| | | | |
| | | | | | | | | | | 425,802 | |
| | | | | | | | | | | | |
| | India 2.4% | | | | | | | | | | |
| | Glenmark Pharmaceuticals Ltd. | | Pharmaceuticals | | | 14,002 | | | | 130,446 | |
| | ICICI Bank Ltd., ADR | | Banks | | | 63,470 | | | | 617,563 | |
| | Infosys Ltd., ADR | | IT Services | | | 4,370 | | | | 70,881 | |
| | Tata Investment Corp. Ltd. | | Capital Markets | | | 7,600 | | | | 105,905 | |
| a | | Tata Motors Ltd., ADR | | Automobiles | | | 2,798 | | | | 92,530 | |
| | | | | | | | | | | | |
| | | | |
| | | | | | | | | | | 1,017,325 | |
| | | | | | | | | | | | |
| | Indonesia 2.3% | | | | | | | | | | |
| | Astra International Tbk PT | | Automobiles | | | 763,100 | | | | 466,831 | |
| | Bank Danamon Indonesia Tbk PT | | Banks | | | 672,600 | | | | 344,541 | |
| | Perusahaan Gas Negara (Persero) Tbk PT | | Gas Utilities | | | 470,000 | | | | 60,623 | |
| | Semen Indonesia (Persero) Tbk PT | | Construction Materials | | | 162,000 | | | | 118,209 | |
| | | | | | | | | | | | |
| | | | |
| | | | | | | | | | | 990,204 | |
| | | | | | | | | | | | |
| | Kenya 0.2% | | | | | | | | | | |
| | Equity Group Holdings Ltd. | | Banks | | | 264,200 | | | | 102,403 | |
| | | | | | | | | | | | |
| | | | | | |
18 | | Annual Report | | | | franklintempleton.com |
TEMPLETON GLOBAL INVESTMENT TRUST
STATEMENT OF INVESTMENTS
Templeton Emerging Markets Balanced Fund (continued)
| | | | | | | | | | |
| | | Industry | | Shares/
Warrants | | | Value | |
Common Stocks and Other Equity Interests (continued) | | | | | | | | |
Mexico 1.0% | | | | | | | | | | |
a Corporacion GEO SAB de CV, B | | Household Durables | | | 5,256 | | | $ | 340 | |
a,b Corporacion GEO SAB de CV, wts., 12/30/27 | | Household Durables | | | 8,223 | | | | — | |
Grupo Financiero Santander Mexico SAB de CV, B, | | | | | | | | | | |
ADR | | Banks | | | 47,917 | | | | 350,273 | |
Nemak SAB de CV | | Auto Components | | | 100,021 | | | | 72,590 | |
| | | | | | | | | | |
| | | |
| | | | | | | | | 423,203 | |
| | | | | | | | | | |
Nigeria 0.0%† | | | | | | | | | | |
Nigerian Breweries PLC | | Beverages | | | 12,313 | | | | 4,617 | |
| | | | | | | | | | |
Pakistan 0.6% | | | | | | | | | | |
Habib Bank Ltd. | | Banks | | | 93,900 | | | | 141,656 | |
United Bank Ltd. | | Banks | | | 61,000 | | | | 103,595 | |
| | | | | | | | | | |
| | | |
| | | | | | | | | 245,251 | |
| | | | | | | | | | |
Peru 0.7% | | | | | | | | | | |
Compania de Minas Buenaventura SA, ADR | | Metals & Mining | | | 16,456 | | | | 231,700 | |
c Intercorp Financial Services Inc., Reg S | | Banks | | | 1,730 | | | | 66,173 | |
| | | | | | | | | | |
| | | |
| | | | | | | | | 297,873 | |
| | | | | | | | | | |
Russia 3.9% | | | | | | | | | | |
Gazprom PJSC, ADR | | Oil, Gas & Consumable Fuels | | | 5,600 | | | | 24,696 | |
LUKOIL PJSC, ADR | | Oil, Gas & Consumable Fuels | | | 8,500 | | | | 486,370 | |
a,c Mail.Ru Group Ltd., GDR, Reg S | | Internet Software & Services | | | 12,720 | | | | 367,608 | |
Sberbank of Russia PJSC, ADR | | Banks | | | 26,604 | | | | 450,406 | |
a Yandex NV, A | | Internet Software & Services | | | 10,780 | | | | 353,045 | |
| | | | | | | | | | |
| | | |
| | | | | | | | | 1,682,125 | |
| | | | | | | | | | |
Singapore 0.1% | | | | | | | | | | |
DBS Group Holdings Ltd. | | Banks | | | 1,456 | | | | 27,052 | |
| | | | | | | | | | |
South Africa 5.2% | | | | | | | | | | |
a,b,d Edcon Holdings Ltd., F wts., 2/20/49 | | Specialty Retail | | | 84 | | | | — | |
a,b,d Edcon Holdings Ltd., F1 wts., 2/20/49 | | Specialty Retail | | | 1,503,436 | | | | — | |
a,b,d Edcon Holdings Ltd., F2 wts., 2/20/49 | | Specialty Retail | | | 121,748 | | | | — | |
a,b,d Holdco 2, A | | Specialty Retail | | | 1,390,834 | | | | 1,124 | |
a,b,d Holdco 2, B | | Specialty Retail | | | 437,269 | | | | 354 | |
Massmart Holdings Ltd. | | Food & Staples Retailing | | | 21,982 | | | | 247,920 | |
MTN Group Ltd. | | Wireless Telecommunication Services | | | 4,739 | | | | 52,322 | |
Naspers Ltd., N | | Media | | | 6,929 | | | | 1,932,687 | |
| | | | | | | | | | |
| | | |
| | | | | | | | | 2,234,407 | |
| | | | | | | | | | |
South Korea 10.8% | | | | | | | | | | |
Daelim Industrial Co. Ltd. | | Construction & Engineering | | | 2,892 | | | | 223,259 | |
Fila Korea Ltd. | | Textiles, Apparel & Luxury Goods | | | 2,587 | | | | 197,774 | |
Hankook Tire Co. Ltd. | | Auto Components | | | 1,135 | | | | 58,059 | |
Hankook Tire Worldwide Co. Ltd. | | Diversified Financial Services | | | 2,667 | | | | 47,225 | |
Hanon Systems | | Auto Components | | | 16,523 | | | | 215,172 | |
Hite Jinro Co. Ltd. | | Beverages | | | 3,640 | | | | 82,187 | |
Hyundai Development Co-Engineering & Construction | | Construction & Engineering | | | 7,380 | | | | 266,541 | |
iMarketKorea Inc. | | Trading Companies & Distributors | | | 5,050 | | | | 42,628 | |
Interpark Holdings Corp. | | Internet & Direct Marketing Retail | | | 10,111 | | | | 37,323 | |
KT Skylife Co. Ltd. | | Media | | | 11,724 | | | | 147,734 | |
LG Corp. | | Industrial Conglomerates | | | 2,325 | | | | 198,220 | |
Naver Corp. | | Internet Software & Services | | | 290 | | | | 236,374 | |
POSCO | | Metals & Mining | | | 1,210 | | | | 376,929 | |
Samsung Electronics Co. Ltd. | | Technology Hardware, Storage & Peripherals | | | 867 | | | | 2,069,672 | |
SK Hynix Inc. | | Semiconductors & Semiconductor Equipment | | | 5,180 | | | | 371,256 | |
Youngone Corp. | | Textiles, Apparel & Luxury Goods | | | 1,610 | | | | 47,514 | |
| | | | | | | | | | |
| | | |
| | | | | | | | | 4,617,867 | |
| | | | | | | | | | |
| | | | | | |
franklintempleton.com | | | | Annual Report | | 19 |
TEMPLETON GLOBAL INVESTMENT TRUST
STATEMENT OF INVESTMENTS
Templeton Emerging Markets Balanced Fund (continued)
| | | | | | | | | | |
| | | Industry | | Shares/
Warrants | | | Value | |
Common Stocks and Other Equity Interests (continued) | | | | | | | | |
Taiwan 6.1% | | | | | | | | | | |
Catcher Technology Co. Ltd. | | Technology Hardware, Storage & Peripherals | | | 18,000 | | | $ | 199,009 | |
FIT Hon Teng Ltd. | | Electronic Equipment, Instruments | | | | | | | | |
| | & Components | | | 125,100 | | | | 84,704 | |
Hon Hai Precision Industry Co. Ltd. | | Electronic Equipment, Instruments | | | | | | | | |
| | & Components | | | 140,990 | | | | 452,430 | |
Largan Precision Co. Ltd. | | Electronic Equipment, Instruments | | | | | | | | |
| | & Components | | | 2,000 | | | | 271,008 | |
PChome Online Inc. | | Internet Software & Services | | | 14,000 | | | | 64,651 | |
Pegatron Corp. | | Technology Hardware, Storage & Peripherals | | | 48,200 | | | | 116,979 | |
Primax Electronics Ltd. | | Technology Hardware, Storage & Peripherals | | | 43,100 | | | | 114,771 | |
Taiwan Semiconductor Manufacturing Co. Ltd. | | Semiconductors & Semiconductor Equipment | | | 171,000 | | | | 1,322,833 | |
| | | | | | | | | | |
| | | | | | | | | 2,626,385 | |
| | | | | | | | | | |
Thailand 2.3% | | | | | | | | | | |
Kasikornbank PCL, fgn | | Banks | | | 44,000 | | | | 322,874 | |
Kiatnakin Bank PCL, fgn | | Banks | | | 48,800 | | | | 118,741 | |
Land and Houses PCL, fgn | | Real Estate Management & Development | | | 413,460 | | | | 133,292 | |
PTT Exploration and Production PCL, fgn | | Oil, Gas & Consumable Fuels | | | 38,900 | | | | 119,435 | |
Siam Commercial Bank PCL, fgn | | Banks | | | 13,200 | | | | 60,792 | |
Thai Beverage PCL, fgn | | Beverages | | | 214,100 | | | | 147,269 | |
Univanich Palm Oil PCL, fgn | | Food Products | | | 353,500 | | | | 89,542 | |
| | | | | | | | | | |
| | | | | | | | | 991,945 | |
| | | | | | | | | | |
United Kingdom 1.6% | | | | | | | | | | |
Unilever PLC | | Personal Products | | | 12,551 | | | | 699,251 | |
| | | | | | | | | | |
United States 0.5% | | | | | | | | | | |
a IMAX Corp. | | Media | | | 9,841 | | | | 227,819 | |
| | | | | | | | | | |
| | | |
Total Common Stocks and Other Equity Interests (Cost $16,392,612) | | | | | | | | | 23,239,701 | |
| | | | | | | | | | |
e Participatory Notes (Cost $91,630) 0.3% | | | | | | | | | | |
Saudi Arabia 0.3% | | | | | | | | | | |
HSBC Bank PLC, Saudi Basic Industries Corp., 1/22/18 | | Chemicals | | | 4,141 | | | | 112,626 | |
| | | | | | | | | | |
| | | |
Preferred Stocks 1.9% | | | | | | | | | | |
Brazil 1.9% | | | | | | | | | | |
f Banco Bradesco SA, 3.687%, ADR, pfd | | Banks | | | 38,051 | | | | 389,642 | |
f Itau Unibanco Holding SA, 3.67%, ADR, pfd | | Banks | | | 32,892 | | | | 427,596 | |
| | | | | | | | | | |
Total Preferred Stocks (Cost $410,140) | | | | | | | | | 817,238 | |
| | | | | | | | | | |
| | | | | Principal
Amount* | | | | |
| | | |
Corporate Bonds and Notes 0.5% | | | | | | | | | | |
Bermuda 0.4% | | | | | | | | | | |
g Digicel Group Ltd., senior note, 144A, 7.125%, 4/01/22 | | Wireless Telecommunication Services | | | 200,000 | | | | 186,466 | |
| | | | | | | | | | |
South Africa 0.1% | | | | | | | | | | |
d,h K2016470219 South Africa Ltd., senior secured note, 144A, PIK, 3.00%, 12/31/22 | | Multiline Retail | | | 105,417 | | | | 1,581 | |
b senior secured note, 144A, PIK, 8.00%, 12/31/22 | | Multiline Retail | | | 38,934 | | | EUR | 234 | |
| | | | | | |
20 | | Annual Report | | | | franklintempleton.com |
TEMPLETON GLOBAL INVESTMENT TRUST
STATEMENT OF INVESTMENTS
Templeton Emerging Markets Balanced Fund (continued)
| | | | | | | | | | | | | | | | |
| | | Industry | | | Principal
Amount* | | | | | | Value | |
Corporate Bonds and Notes (continued) | | | | | | | | | | | | | | | | |
South Africa (continued) | | | | | | | | | | | | | | | | |
d,h K2016470260 South Africa Ltd., senior secured | | | | | | | | | | | | | | | | |
note, 144A, PIK, 25.00%, 12/31/22 | |
| Multiline
Retail |
| | | 58,113 | | | | | | | $ | 44,747 | |
| | | | | | | | | | | | | | | | |
| | | | |
| | | | | | | | | | | | | | | 46,562 | |
| | | | | | | | | | | | | | | | |
| | | | |
Total Corporate Bonds and Notes (Cost $405,201) | | | | | | | | | | | | | | | 233,028 | |
| | | | | | | | | | | | | | | | |
| | | | |
Foreign Government and Agency | | | | | | | | | | | | | | | | |
Securities 30.6% | | | | | | | | | | | | | | | | |
Argentina 4.2% | | | | | | | | | | | | | | | | |
Argentine Bonos del Tesoro, | | | | | | | | | | | | | | | | |
18.20%, 10/03/21 | | | | | | | 9,176,000 | | | | ARS | | | | 506,251 | |
16.00%, 10/17/23 | | | | | | | 14,903,000 | | | | ARS | | | | 797,388 | |
senior note, 15.50%, 10/17/26 | | | | | | | 8,074,000 | | | | ARS | | | | 439,444 | |
i Government of Argentina, FRN, 24.225%, (ARS Badlar + 2.00%), 4/03/22 | | | | | | | 752,000 | | | | ARS | | | | 40,325 | |
| | | | | | | | | | | | | | | | |
| | | | |
| | | | | | | | | | | | | | | 1,783,408 | |
| | | | | | | | | | | | | | | | |
| | | | |
Brazil 4.7% | | | | | | | | | | | | | | | | |
Letra Tesouro Nacional, | | | | | | | | | | | | | | | | |
Strip, 7/01/20 | | | | | | | 1,814 | j | | | BRL | | | | 445,794 | |
Strip, 7/01/21 | | | | | | | 220 | j | | | BRL | | | | 48,653 | |
Nota Do Tesouro Nacional, | | | | | | | | | | | | | | | | |
10.00%, 1/01/21 | | | | | | | 370 | j | | | BRL | | | | 114,982 | |
10.00%, 1/01/23 | | | | | | | 867 | j | | | BRL | | | | 264,883 | |
10.00%, 1/01/25 | | | | | | | 3,060 | j | | | BRL | | | | 921,648 | |
10.00%, 1/01/27 | | | | | | | 105 | j | | | BRL | | | | 31,310 | |
k Index Linked, 6.00%, 5/15/19 | | | | | | | 17 | j | | | BRL | | | | 16,276 | |
k Index Linked, 6.00%, 8/15/22 | | | | | | | 58 | j | | | BRL | | | | 55,623 | |
k Index Linked, 6.00%, 5/15/23 | | | | | | | 101 | j | | | BRL | | | | 97,436 | |
k Index Linked, 6.00%, 8/15/24 | | | | | | | 10 | j | | | BRL | | | | 9,670 | |
| | | | | | | | | | | | | | | | |
| | | | |
| | | | | | | | | | | | | | | 2,006,275 | |
| | | | | | | | | | | | | | | | |
| | | | |
Colombia 4.5% | | | | | | | | | | | | | | | | |
Government of Colombia, | | | | | | | | | | | | | | | | |
senior bond, 7.75%, 4/14/21 | | | | | | | 52,000,000 | | | | COP | | | | 18,435 | |
senior bond, 9.85%, 6/28/27 | | | | | | | 12,000,000 | | | | COP | | | | 5,043 | |
| | | | |
Titulos de Tesoreria, | | | | | | | | | | | | | | | | |
B, 7.75%, 9/18/30 | | | | | | | 1,048,900,000 | | | | COP | | | | 383,846 | |
B, 7.00%, 6/30/32 | | | | | | | 121,000,000 | | | | COP | | | | 41,169 | |
senior bond, B, 11.25%, 10/24/18 | | | | | | | 93,000,000 | | | | COP | | | | 32,804 | |
senior bond, B, 11.00%, 7/24/20 | | | | | | | 51,000,000 | | | | COP | | | | 19,412 | |
senior bond, B, 7.00%, 5/04/22 | | | | | | | 2,301,000,000 | | | | COP | | | | 811,462 | |
senior bond, B, 10.00%, 7/24/24 | | | | | | | 415,000,000 | | | | COP | | | | 167,678 | |
senior bond, B, 7.50%, 8/26/26 | | | | | | | 781,000,000 | | | | COP | | | | 279,550 | |
senior bond, B, 6.00%, 4/28/28 | | | | | | | 440,100,000 | | | | COP | | | | 141,825 | |
senior note, B, 7.00%, 9/11/19 | | | | | | | 56,000,000 | | | | COP | | | | 19,424 | |
| | | | | | | | | | | | | | | | |
| | | | |
| | | | | | | | | | | | | | | 1,920,648 | |
| | | | | | | | | | | | | | | | |
| | | | |
Ghana 3.7% | | | | | | | | | | | | | | | | |
Ghana Treasury Note, | | | | | | | | | | | | | | | | |
24.25%, 6/11/18 | | | | | | | 60,000 | | | | GHS | | | | 13,622 | |
17.24%, 11/11/19 | | | | | | | 70,000 | | | | GHS | | | | 15,474 | |
Government of Ghana, | | | | | | | | | | | | | | | | |
23.23%, 2/19/18 | | | | | | | 140,000 | | | | GHS | | | | 31,087 | |
23.47%, 5/21/18 | | | | | | | 280,000 | | | | GHS | | | | 63,135 | |
24.50%, 10/22/18 | | | | | | | 409,000 | | | | GHS | | | | 94,971 | |
24.50%, 5/27/19 | | | | | | | 50,000 | | | | GHS | | | | 12,025 | |
21.00%, 3/23/20 | | | | | | | 50,000 | | | | GHS | | | | 11,884 | |
| | | | | | |
franklintempleton.com | | | | Annual Report | | 21 |
TEMPLETON GLOBAL INVESTMENT TRUST
STATEMENT OF INVESTMENTS
Templeton Emerging Markets Balanced Fund (continued)
| | | | | | | | | | | | |
| | | Principal
Amount* | | | | | | Value | |
Foreign Government and Agency | | | | | | | | | | | | |
| Securities (continued) | | | | | | | | | | | | |
Ghana (continued) | | | | | | | | | | | | |
Government of Ghana, (continued) | | | | | | | | | | | | |
24.50%, 6/21/21 | | | 120,000 | | | | GHS | | | $ | 31,871 | |
24.75%, 7/19/21 | | | 60,000 | | | | GHS | | | | 16,063 | |
18.75%, 1/24/22 | | | 420,000 | | | | GHS | | | | 98,247 | |
19.75%, 3/25/24 | | | 470,000 | | | | GHS | | | | 115,311 | |
19.00%, 11/02/26 | | | 1,380,000 | | | | GHS | | | | 336,861 | |
senior bond, 19.75%, 3/15/32 | | | 1,492,000 | | | | GHS | | | | 362,269 | |
senior note, 24.00%, 11/23/20 | | | 1,470,000 | | | | GHS | | | | 377,371 | |
senior note, 18.25%, 7/25/22 | | | 50,000 | | | | GHS | | | | 11,634 | |
senior note, 18.25%, 9/21/20 | | | 50,000 | | | | GHS | | | | 11,467 | |
| | | | | | | | | | | | |
| | | |
| | | | | | | | | | | 1,603,292 | |
| | | | | | | | | | | | |
India 3.0% | | | | | | | | | | | | |
Government of India, senior bond, 8.08%, 8/02/22 | | | 80,000,000 | | | | INR | | | | 1,292,769 | |
| | | | | | | | | | | | |
Indonesia 2.3% | | | | | | | | | | | | |
Government of Indonesia, | | | | | | | | | | | | |
senior bond, FR31, 11.00%, 11/15/20 | | | 31,000,000 | | | | IDR | | | | 2,609 | |
senior bond, FR34, 12.80%, 6/15/21 | | | 1,775,000,000 | | | | IDR | | | | 159,380 | |
senior bond, FR35, 12.90%, 6/15/22 | | | 35,000,000 | | | | IDR | | | | 3,271 | |
senior bond, FR36, 11.50%, 9/15/19 | | | 63,000,000 | | | | IDR | | | | 5,092 | |
senior bond, FR43, 10.25%, 7/15/22 | | | 43,000,000 | | | | IDR | | | | 3,707 | |
senior bond, FR53, 8.25%, 7/15/21 | | | 208,000,000 | | | | IDR | | | | 16,475 | |
senior bond, FR56, 8.375%, 9/15/26 | | | 759,000,000 | | | | IDR | | | | 63,327 | |
senior bond, FR61, 7.00%, 5/15/22 | | | 24,000,000 | | | | IDR | | | | 1,844 | |
senior bond, FR63, 5.625%, 5/15/23 | | | 9,000,000 | | | | IDR | | | | 655 | |
senior bond, FR68, 8.375%, 3/15/34 | | | 890,000,000 | | | | IDR | | | | 73,388 | |
senior bond, FR70, 8.375%, 3/15/24 | | | 7,738,000,000 | | | | IDR | | | | 634,068 | |
senior note, FR69, 7.875%, 4/15/19 | | | 36,000,000 | | | | IDR | | | | 2,741 | |
| | | | | | | | | | | | |
| | | |
| | | | | | | | | | | 966,557 | |
| | | | | | | | | | | | |
Mexico 3.5% | | | | | | | | | | | | |
Government of Mexico, | | | | | | | | | | | | |
senior bond, M, 8.00%, 6/11/20 | | | 148,500 | l | | | MXN | | | | 762,246 | |
senior note, M 10, 8.50%, 12/13/18 | | | 6,500 | l | | | MXN | | | | 33,308 | |
senior note, M, 5.00%, 12/11/19 | | | 149,800 | l | | | MXN | | | | 726,544 | |
| | | | | | | | | | | | |
| | | |
| | | | | | | | | | | 1,522,098 | |
| | | | | | | | | | | | |
Philippines 0.4% | | | | | | | | | | | | |
Government of the Philippines, | | | | | | | | | | | | |
senior note, 3.375%, 8/20/20 | | | 10,000 | | | | PHP | | | | 196 | |
senior note, 5-72, 2.125%, 5/23/18 | | | 718,000 | | | | PHP | | | | 14,316 | |
senior note, 7-51, 5.00%, 8/18/18 | | | 650,000 | | | | PHP | | | | 13,119 | |
senior note, 7-56, 3.875%, 11/22/19 | | | 7,040,000 | | | | PHP | | | | 140,528 | |
| | | | | | | | | | | | |
| | | |
| | | | | | | | | | | 168,159 | |
| | | | | | | | | | | | |
Senegal 0.5% | | | | | | | | | | | | |
g Government of Senegal, 144A, 6.25%, 7/30/24 | | | 200,000 | | | | | | | | 216,920 | |
| | | | | | | | | | | | |
South Africa 1.9% | | | | | | | | | | | | |
Government of South Africa, | | | | | | | | | | | | |
8.00%, 1/31/30 | | | 490,000 | | | | ZAR | | | | 36,251 | |
7.00%, 2/28/31 | | | 100,000 | | | | ZAR | | | | 6,745 | |
8.25%, 3/31/32 | | | 1,170,000 | | | | ZAR | | | | 86,570 | |
8.875%, 2/28/35 | | | 670,000 | | | | ZAR | | | | 51,150 | |
9.00%, 1/31/40 | | | 470,000 | | | | ZAR | | | | 35,469 | |
8.75%, 1/31/44 | | | 830,000 | | | | ZAR | | | | 60,643 | |
8.75%, 2/28/48 | | | 460,000 | | | | ZAR | | | | 33,701 | |
R186, 10.50%, 12/21/26 | | | 5,520,000 | | | | ZAR | | | | 498,642 | |
| | | | | | | | | | | | |
| | | |
| | | | | | | | | | | 809,171 | |
| | | | | | | | | | | | |
| | | | | | |
22 | | Annual Report | | | | franklintempleton.com |
TEMPLETON GLOBAL INVESTMENT TRUST
STATEMENT OF INVESTMENTS
Templeton Emerging Markets Balanced Fund (continued)
| | | | | | | | | | | | |
| | | Principal
Amount* | | | | | | Value | |
Foreign Government and Agency | | | | | | | | | | | | |
Securities (continued) | | | | | | | | | | | | |
Ukraine 0.3% | | | | | | | | | | | | |
a,g,m Government of Ukraine, 144A, VRI, GDP Linked | | | | | | | | | | | | |
Security, 5/31/40. | | | 252,000 | | | | | | | $ | 140,427 | |
| | | | | | | | | | | | |
| | | |
Zambia 1.6% | | | | | | | | | | | | |
g Government of Zambia, senior bond, 144A, 8.97%, 7/30/27 | | | 230,000 | | | | | | | | 258,946 | |
g Government of Zambia International Bond, | | | | | | | | | | | | |
144A, 5.375%, 9/20/22 | | | 200,000 | | | | | | | | 195,814 | |
144A, 8.50%, 4/14/24 | | | 200,000 | | | | | | | | 221,666 | |
| | | | | | | | | | | | |
| | | |
| | | | | | | | | | | 676,426 | |
| | | | | | | | | | | | |
Total Foreign Government and Agency Securities
(Cost $12,896,182) | | | | | | | | | | | 13,106,150 | |
| | | | | | | | | | | | |
Total Investments before Short Term Investments
(Cost $30,195,765) | | | | | | | | | | | 37,508,743 | |
| | | | | | | | | | | | |
| | | |
Short Term Investments 11.3% | | | | | | | | | | | | |
Foreign Government and Agency Securities 6.3% | | | | | | | | | | | | |
Colombia 0.1% | | | | | | | | | | | | |
Colombian Tes Corto Plazo, Strip, 3/13/18 | | | 63,000,000 | | | | COP | | | | 20,894 | |
| | | | | | | | | | | | |
| | | |
Egypt 6.2% | | | | | | | | | | | | |
n Egypt Treasury Bill, | | | | | | | | | | | | |
1/02/18 - 7/10/18 | | | 37,975,000 | | | | EGP | | | | 2,050,006 | |
4/24/18. | | | 11,500,000 | | | | EGP | | | | 615,281 | |
| | | | | | | | | | | | |
| | | |
| | | | | | | | | | | 2,665,287 | |
| | | | | | | | | | | | |
Total Foreign Government and Agency Securities
(Cost $2,664,791) | | | | | | | | | | | 2,686,181 | |
| | | | | | | | | | | | |
Total Investments before Money Market Funds
(Cost $32,860,556) | | | | | | | | | | | 40,194,924 | |
| | | | | | | | | | | | |
| | | Shares | | | | | | | |
Money Market Funds (Cost $2,168,631) 5.0% | | | | | | | | | | | | |
United States 5.0% | | | | | | | | | | | | |
o,p Institutional Fiduciary Trust Money Market Portfolio, 0.89% | | | 2,168,631 | | | | | | | | 2,168,631 | |
| | | | | | | | | | | | |
Total Investments (Cost $35,029,187) 98.8% | | | | | | | | | | | 42,363,555 | |
Other Assets, less Liabilities 1.2% | | | | | | | | | | | 509,707 | |
| | | | | | | | | | | | |
Net Assets 100.0% | | | | | | | | | | $ | 42,873,262 | |
| | | | | | | | | | | | |
| | | | | | |
franklintempleton.com | | | | Annual Report | | 23 |
TEMPLETON GLOBAL INVESTMENT TRUST
STATEMENT OF INVESTMENTS
Templeton Emerging Markets Balanced Fund (continued)
†Rounds to less than 0.1% of net assets.
*The principal amount is stated in U.S. dollars unless otherwise indicated.
aNon-income producing.
bFair valued using significant unobservable inputs. See Note 12 regarding fair value measurements.
cSecurity was purchased pursuant to Regulation S under the Securities Act of 1933, which exempts from registration securities offered and sold outside of the United States. Such a security cannot be sold in the United States without either an effective registration statement filed pursuant to the Securities Act of 1933, or pursuant to an exemption from registration. These securities have been deemed liquid under guidelines approved by the Trust’s Board of Trustees. At December 31, 2017, the aggregate value of these securities was $433,781, representing 1.0% of net assets.
dSee Note 9 regarding restricted securities.
eSee Note 1(d) regarding Participatory Notes.
fVariable rate security. The rate shown represents the yield at period end.
gSecurity was purchased pursuant to Rule 144A under the Securities Act of 1933 and may be sold in transactions exempt from registration only to qualified institutional buyers or in a public offering registered under the Securities Act of 1933. These securities have been deemed liquid under guidelines approved by the Trust’s Board of Trustees. At December 31, 2017, the aggregate value of these securities was $1,220,239, representing 2.8% of net assets.
hIncome may be received in additional securities and/or cash.
iThe coupon rate shown represents the rate at period end.
jPrincipal amount is stated in 1,000 Brazilian Real Units.
kRedemption price at maturity and coupon payment is adjusted for inflation. See Note 1(f).
lPrincipal amount is stated in 100 Mexican Peso Units.
mThe principal represents the notional amount. See Note 1(c) regarding value recovery instruments.
nThe security was issued on a discount basis with no stated coupon rate.
oSee Note 3(f) regarding investments in affiliated management investment companies.
pThe rate shown is the annualized seven-day yield at period end.
At December 31, 2017, the Fund had the following forward exchange contracts outstanding. See Note 1(c).
| | | | | | | | | | | | | | | | | | | | | | | | | | | | |
Forward Exchange Contracts | | | | | | | | | | | | | | | | | | | | | | | | | | | | |
| Currency | | Counterpartya | | | Type | | | Quantity | | | Contract
Amount | | | Settlement
Date | | | Unrealized
Appreciation | | | Unrealized
Depreciation | |
| | | | | | | |
OTC Forward Exchange Contracts | | | | | | | | | | | | | | | | | | | | | | | | | | | | |
Euro | | | CITI | | | | Sell | | | | 28,595 | | | $ | 33,715 | | | | 1/10/18 | | | $ | — | | | $ | (618 | ) |
Euro | | | DBAB | | | | Sell | | | | 107,375 | | | | 127,117 | | | | 1/16/18 | | | | — | | | | (1,858 | ) |
Euro | | | BOFA | | | | Sell | | | | 48,370 | | | | 57,720 | | | | 1/17/18 | | | | — | | | | (384 | ) |
Euro | | | GSCO | | | | Sell | | | | 60,500 | | | | 71,798 | | | | 1/18/18 | | | | — | | | | (882 | ) |
Euro | | | JPHQ | | | | Sell | | | | 86,350 | | | | 102,492 | | | | 1/18/18 | | | | — | | | | (1,242 | ) |
Euro | | | UBSW | | | | Sell | | | | 51,630 | | | | 61,247 | | | | 1/18/18 | | | | — | | | | (777 | ) |
Euro | | | DBAB | | | | Sell | | | | 66,600 | | | | 78,560 | | | | 1/22/18 | | | | — | | | | (1,468 | ) |
Euro | | | JPHQ | | | | Sell | | | | 68,683 | | | | 81,127 | | | | 1/22/18 | | | | — | | | | (1,404 | ) |
Indian Rupee | | | JPHQ | | | | Buy | | | | 54,072,000 | | | | 825,579 | | | | 1/23/18 | | | | 19,813 | | | | — | |
Indian Rupee | | | JPHQ | | | | Sell | | | | 54,072,000 | | | | 820,267 | | | | 1/23/18 | | | | — | | | | (25,125 | ) |
Euro | | | DBAB | | | | Sell | | | | 154,000 | | | | 182,553 | | | | 1/24/18 | | | | — | | | | (2,519 | ) |
Indian Rupee | | | JPHQ | | | | Buy | | | | 28,922,000 | | | | 440,935 | | | | 1/29/18 | | | | 11,031 | | | | — | |
Indian Rupee | | | JPHQ | | | | Sell | | | | 28,922,000 | | | | 438,411 | | | | 1/29/18 | | | | — | | | | (13,554 | ) |
Japanese Yen | | | BOFA | | | | Sell | | | | 104,410,000 | | | | 962,322 | | | | 1/29/18 | | | | 34,317 | | | | — | |
Euro | | | DBAB | | | | Sell | | | | 340,000 | | | | 400,693 | | | | 1/30/18 | | | | — | | | | (8,056 | ) |
Euro | | | BOFA | | | | Sell | | | | 68,000 | | | | 79,742 | | | | 2/06/18 | | | | — | | | | (2,039 | ) |
Mexican Peso | | | CITI | | | | Buy | | | | 7,208,000 | | | | 390,043 | | | | 2/06/18 | | | | — | | | | (26,250 | ) |
Mexican Peso | | | CITI | | | | Sell | | | | 7,208,000 | | | | 373,133 | | | | 2/06/18 | | | | 9,340 | | | | — | |
Euro | | | DBAB | | | | Sell | | | | 100,000 | | | | 116,798 | | | | 2/07/18 | | | | — | | | | (3,475 | ) |
Euro | | | CITI | | | | Sell | | | | 203,000 | | | | 236,262 | | | | 2/09/18 | | | | — | | | | (7,920 | ) |
Euro | | | DBAB | | | | Sell | | | | 623,000 | | | | 730,668 | | | | 2/15/18 | | | | — | | | | (18,962 | ) |
Euro | | | GSCO | | | | Sell | | | | 60,500 | | | | 71,697 | | | | 2/20/18 | | | | — | | | | (1,120 | ) |
Euro | | | JPHQ | | | | Sell | | | | 68,683 | | | | 81,265 | | | | 2/20/18 | | | | — | | | | (1,402 | ) |
Euro | | | DBAB | | | | Sell | | | | 339,000 | | | | 400,569 | | | | 2/22/18 | | | | — | | | | (7,492 | ) |
Euro | | | JPHQ | | | | Sell | | | | 66,000 | | | | 78,005 | | | | 2/22/18 | | | | — | | | | (1,441 | ) |
Euro | | | JPHQ | | | | Sell | | | | 27,000 | | | | 31,832 | | | | 2/26/18 | | | | — | | | | (676 | ) |
Mexican Peso | | | CITI | | | | Buy | | | | 7,253,572 | | | | 396,333 | | | | 3/05/18 | | | | — | | | | (31,872 | ) |
Mexican Peso | | | CITI | | | | Sell | | | | 6,750,000 | | | | 351,151 | | | | 3/05/18 | | | | 11,992 | | | | — | |
| | | | | | |
24 | | | | | Annual Report | | franklintempleton.com |
TEMPLETON GLOBAL INVESTMENT TRUST
STATEMENT OF INVESTMENTS
Templeton Emerging Markets Balanced Fund (continued)
Forward Exchange Contracts (continued)
| | | | | | | | | | | | | | | | | | | | | | | | |
| Currency | | Counterpartya | | Type | | Quantity | | | Contract
Amount | | | Settlement
Date | | | Unrealized
Appreciation | | | Unrealized
Depreciation | |
| |
OTC Forward Exchange Contracts (continued) | | | | | | | | | | | | | | | | | | | | | | |
Euro | | BOFA | | Sell | | | 68,000 | | | $ | 80,849 | | | | 3/07/18 | | | $ | — | | | $ | (1,070 | ) |
Australian Dollar | | CITI | | Sell | | | 233,000 | | | | 173,039 | | | | 3/13/18 | | | | — | | | | (8,720 | ) |
Australian Dollar | | JPHQ | | Sell | | | 349,000 | | | | 258,260 | | | | 3/13/18 | | | | — | | | | (13,987 | ) |
Euro | | DBAB | | Sell | | | 107,375 | | | | 127,530 | | | | 3/13/18 | | | | — | | | | (1,875 | ) |
Mexican Peso | | CITI | | Buy | | | 8,872,126 | | | | 484,922 | | | | 3/14/18 | | | | — | | | | (39,809 | ) |
Euro | | JPHQ | | Sell | | | 68,683 | | | | 81,253 | | | | 3/15/18 | | | | — | | | | (1,533 | ) |
Australian Dollar | | BOFA | | Sell | | | 696,000 | | | | 526,253 | | | | 3/28/18 | | | | — | | | | (16,650 | ) |
Mexican Peso | | CITI | | Buy | | | 3,666,807 | | | | 196,175 | | | | 4/02/18 | | | | — | | | | (12,806 | ) |
Japanese Yen | | BOFA | | Sell | | | 104,410,000 | | | | 923,165 | | | | 4/27/18 | | | | — | | | | (9,472 | ) |
Brazilian Real | | HSBK | | Buy | | | 300,000 | | | | 89,804 | | | | 5/21/18 | | | | — | | | | (645 | ) |
Mexican Peso | | CITI | | Buy | | | 5,103,220 | | | | 269,432 | | | | 6/29/18 | | | | — | | | | (18,223 | ) |
| | | | | | | | | | | | | | | | | | | | |
Total Forward Exchange Contracts | | | | | | | | | | | $ | 86,493 | | | $ | (285,326 | ) |
| | | | | | | | | | | | | | | | | | | | |
Net unrealized appreciation (depreciation) | | | | | | | | | | | | | | | $ | (198,833 | ) |
| | | | | | | | | | | | | | | | | | | | | | | | |
a May be comprised of multiple contracts with the same counterparty, currency and settlement date.
| | | | | | |
franklintempleton.com | | | | Annual Report | | 25 |
TEMPLETON GLOBAL INVESTMENT TRUST
STATEMENT OF INVESTMENTS
Templeton Emerging Markets Balanced Fund (continued)
At December 31, 2017, the Fund had the following interest rate swap contracts outstanding. See Note 1(c).
Interest Rate Swap Contracts
| | | | | | | | | | | | | | | | |
Description | | Payment
Frequency | | | Maturity
Date | | | Notional
Amount | | | Value/
Unrealized
Appreciation
(Depreciation) | |
| | | | |
Centrally Cleared Swap Contracts | | | | | | | | | | | | | | | | |
Receive Floating 3-month USD LIBOR | | | Quarterly | | | | | | | | | | | | | |
Pay Fixed 2.775% | | | Semi-Annual | | | | 10/04/23 | | | $ | 20,000 | | | | $ (622 | ) |
Receive Floating 3-month USD LIBOR | | | Quarterly | | | | | | | | | | | | | |
Pay Fixed 2.795% | | | Semi-Annual | | | | 10/04/23 | | | | 20,000 | | | | (645 | ) |
Receive Floating 3-month USD LIBOR | | | Quarterly | | | | | | | | | | | | | |
Pay Fixed 2.765% | | | Semi-Annual | | | | 10/07/23 | | | | 20,000 | | | | (607 | ) |
Receive Floating 3-month USD LIBOR | | | Quarterly | | | | | | | | | | | | | |
Pay Fixed 1.914% | | | Semi-Annual | | | | 1/22/25 | | | | 680,000 | | | | 13,582 | |
Receive Floating 3-month USD LIBOR | | | Quarterly | | | | | | | | | | | | | |
Pay Fixed 1.970% | | | Semi-Annual | | | | 1/23/25 | | | | 850,000 | | | | 13,693 | |
Receive Floating 3-month USD LIBOR | | | Quarterly | | | | | | | | | | | | | |
Pay Fixed 1.973% | | | Semi-Annual | | | | 1/27/25 | | | | 510,000 | | | | 8,114 | |
Receive Floating 3-month USD LIBOR | | | Quarterly | | | | | | | | | | | | | |
Pay Fixed 1.937% | | | Semi-Annual | | | | 1/29/25 | | | | 130,000 | | | | 2,397 | |
Receive Floating 3-month USD LIBOR | | | Quarterly | | | | | | | | | | | | | |
Pay Fixed 1.942% | | | Semi-Annual | | | | 1/30/25 | | | | 110,000 | | | | 1,992 | |
Receive Floating 3-month USD LIBOR | | | Quarterly | | | | | | | | | | | | | |
Pay Fixed 1.817% | | | Semi-Annual | | | | 2/03/25 | | | | 160,000 | | | | 4,320 | |
Receive Floating 3-month USD LIBOR | | | Quarterly | | | | | | | | | | | | | |
Pay Fixed 3.668% | | | Semi-Annual | | | | 10/04/43 | | | | 10,000 | | | | (2,274 | ) |
Receive Floating 3-month USD LIBOR | | | Quarterly | | | | | | | | | | | | | |
Pay Fixed 3.687% | | | Semi-Annual | | | | 10/04/43 | | | | 10,000 | | | | (2,311 | ) |
Receive Floating 3-month USD LIBOR | | | Quarterly | | | | | | | | | | | | | |
Pay Fixed 3.675% | | | Semi-Annual | | | | 10/07/43 | | | | 10,000 | | | | (2,285 | ) |
Receive Floating 3-month USD LIBOR | | | Quarterly | | | | | | | | | | | | | |
Pay Fixed 2.794% | | | Semi-Annual | | | | 3/13/47 | | | | 200,000 | | | | (12,806 | ) |
| | | | | | | | | | | | | | | | |
Total Interest Rate Swap Contracts | | | | | | | | | | | | | | | $22,548 | |
| | | | | | | | | | | | | | | | |
See Note 10 regarding other derivative information.
See Abbreviations on page 43.
| | | | | | |
26 | | Annual Report | | | The accompanying notes are an integral part of these financial statements. | | franklintempleton.com |
TEMPLETON GLOBAL INVESTMENT TRUST
Financial Statements
Statement of Assets and Liabilities
December 31, 2017
Templeton Emerging Markets Balanced Fund
| | | | |
| |
Assets: | | | | |
Investments in securities: | | | | |
Cost - Unaffiliated issuers | | | $32,860,556 | |
Cost - Non-controlled affiliates (Note 3f) | | | 2,168,631 | |
| | | | |
| |
Value - Unaffiliated issuers | | | $40,194,924 | |
Value - Non-controlled affiliates (Note 3f) | | | 2,168,631 | |
Foreign currency, at value (cost $111,220) | | | 111,197 | |
Receivables: | | | | |
Capital shares sold | | | 218,132 | |
Dividends and interest | | | 432,319 | |
Affiliates | | | 11,374 | |
Deposits with brokers for: | | | | |
Centrally cleared swap contracts | | | 108,515 | |
Unrealized appreciation on OTC forward exchange contracts | | | 86,493 | |
| | | | |
| |
Total assets | | | 43,331,585 | |
| | | | |
Liabilities: | | | | |
Payables: | | | | |
Capital shares redeemed | | | 10,060 | |
Management fees | | | 22,197 | |
Distribution fees | | | 19,741 | |
Professional fees | | | 56,209 | |
Variation margin on centrally cleared swap contracts | | | 4,115 | |
Unrealized depreciation on OTC forward exchange contracts | | | 285,326 | |
Deferred tax | | | 37,652 | |
Accrued expenses and other liabilities | | | 23,023 | |
| | | | |
| |
Total liabilities | | | 458,323 | |
| | | | |
| |
Net assets, at value | | | $42,873,262 | |
| | | | |
Net assets consist of: | | | | |
Paid-in capital | | | $43,444,265 | |
Undistributed net investment income | | | 120,624 | |
Net unrealized appreciation (depreciation) | | | 7,113,003 | |
Accumulated net realized gain (loss) | | | (7,804,630 | ) |
| | | | |
| |
Net assets, at value | | | $42,873,262 | |
| | | | |
| | | | | | |
franklintempleton.com | | | | The accompanying notes are an integral part of these financial statements. | Annual Report | | 27 |
TEMPLETON GLOBAL INVESTMENT TRUST
FINANCIAL STATEMENTS
Statement of Assets and Liabilities (continued)
December 31, 2017
Templeton Emerging Markets Balanced Fund
| | | | |
| |
Class A: | | | | |
Net assets, at value | | $ | 28,572,435 | |
Shares outstanding | | | 2,536,645 | |
Net asset value per sharea | | $ | 11.26 | |
Maximum offering price per share (net asset value per share ÷ 94.25%) | | $ | 11.95 | |
| |
Class C: | | | | |
Net assets, at value | | $ | 5,024,347 | |
Shares outstanding | | | 449,912 | |
Net asset value and maximum offering price per sharea | | $ | 11.17 | |
| |
Class R: | | | | |
Net assets, at value | | $ | 261,785 | |
Shares outstanding | | | 23,292 | |
Net asset value and maximum offering price per share | | $ | 11.24 | |
| |
Class R6: | | | | |
Net assets, at value | | $ | 837,676 | |
Shares outstanding | | | 74,354 | |
Net asset value and maximum offering price per share | | $ | 11.27 | |
| |
Advisor Class: | | | | |
Net assets, at value | | $ | 8,177,019 | |
Shares outstanding | | | 725,322 | |
Net asset value and maximum offering price per share | | $ | 11.27 | |
aRedemption price is equal to net asset value less contingent deferred sales charges, if applicable.
| | | | | | |
28 | | Annual Report | | | The accompanying notes are an integral part of these financial statements. | | franklintempleton.com |
TEMPLETON GLOBAL INVESTMENT TRUST
FINANCIAL STATEMENTS
Statement of Operations
for the year ended December 31, 2017
Templeton Emerging Markets Balanced Fund
| | | | |
Investment income: | | | | |
Dividends: (net of foreign taxes)* | | | | |
Unaffiliated issuers | | $ | 433,765 | |
Non-controlled affiliates (Note 3f) | | | 12,909 | |
Interest: (net of foreign taxes)~ | | | | |
Unaffiliated issuers | | | 1,388,318 | |
| | | | |
| |
Total investment income | | | 1,834,992 | |
| | | | |
| |
Expenses: | | | | |
Management fees (Note 3a) | | | 401,867 | |
Distribution fees: (Note 3c) | | | | |
Class A | | | 61,208 | |
Class C | | | 40,016 | |
Class R | | | 1,086 | |
Transfer agent fees: (Note 3e) | | | | |
Class A | | | 73,412 | |
Class C | | | 12,002 | |
Class R | | | 652 | |
Class R6 | | | 219 | |
Advisor Class | | | 18,138 | |
Custodian fees (Note 4) | | | 16,488 | |
Reports to shareholders | | | 34,352 | |
Registration and filing fees | | | 68,441 | |
Professional fees | | | 81,264 | |
Other | | | 23,111 | |
| | | | |
| |
Total expenses | | | 832,256 | |
Expense reductions (Note 4) | | | (30 | ) |
Expenses waived/paid by affiliates (Note 3f and 3g) | | | (300,249 | ) |
| | | | |
| |
Net expenses | | | 531,977 | |
| | | | |
| |
Net investment income | | | 1,303,015 | |
| | | | |
| |
Realized and unrealized gains (losses): | | | | |
Net realized gain (loss) from: | | | | |
Investments: | | | | |
Unaffiliated issuers | | | 542,137 | |
Foreign currency transactions | | | (29,958 | ) |
Forward exchange contracts | | | 155,717 | |
Swap contracts | | | (21,682 | ) |
| | | | |
| |
Net realized gain (loss) | | | 646,214 | |
| | | | |
Net change in unrealized appreciation (depreciation) on: | | | | |
Investments: | | | | |
Unaffiliated issuers | | | 6,571,246 | |
Translation of other assets and liabilities denominated in foreign currencies | | | (5,150 | ) |
Forward exchange contracts | | | (247,116 | ) |
Swap contracts | | | (5,234 | ) |
Change in deferred taxes on unrealized appreciation | | | (9,328 | ) |
| | | | |
| |
Net change in unrealized appreciation (depreciation) | | | 6,304,418 | |
| | | | |
| |
Net realized and unrealized gain (loss) | | | 6,950,632 | |
| | | | |
| |
Net increase (decrease) in net assets resulting from operations | | $ | 8,253,647 | |
| | | | |
| |
*Foreign taxes withheld on dividends | | $ | 66,819 | |
~Foreign taxes withheld on interest | | $ | 33,768 | |
| | | | | | |
franklintempleton.com | | | | The accompanying notes are an integral part of these financial statements. | Annual Report | | 29 |
TEMPLETON GLOBAL INVESTMENT TRUST
FINANCIAL STATEMENTS
Statements of Changes in Net Assets
Templeton Emerging Markets Balanced Fund
| | | | | | | | | | | | |
| | | Year Ended December 31, | | | Year Ended | |
| | | 2017 | | | 2016a | | | March 31, 2016 | |
| |
Increase (decrease) in net assets: | | | | | | | | | | | | |
Operations: | | | | | | | | | | | | |
Net investment income | | $ | 1,303,015 | | | $ | 761,155 | | | $ | 953,634 | |
Net realized gain (loss) | | | 646,214 | | | | (507,144) | | | | (5,013,763) | |
Net change in unrealized appreciation (depreciation) | | | 6,304,418 | | | | 2,813,192 | | | | (472,613) | |
| | | | |
| | | |
Net increase (decrease) in net assets resulting from operations | | | 8,253,647 | | | | 3,067,203 | | | | (4,532,742 | ) |
| | | | |
Distributions to shareholders from: | | | | | | | | | | | | |
Net investment income: | | | | | | | | | | | | |
Class A | | | (728,722) | | | | (248,949) | | | | (123,817) | |
Class C | | | (97,169) | | | | (12,649) | | | | — | |
Class R | | | (6,122) | | | | (1,721) | | | | (112) | |
Class R6 | | | (10,627) | | | | — | | | | — | |
Advisor Class | | | (212,342) | | | | (103,366) | | | | (49,737) | |
| | | | |
| | | |
Total distributions to shareholders | | | (1,054,982) | | | | (366,685) | | | | (173,666) | |
| | | | |
| | | |
Capital share transactions: (Note 2) | | | | | | | | | | | | |
Class A | | | 3,119,005 | | | | (4,671,708) | | | | (3,612,998) | |
Class C | | | 1,067,732 | | | | (600,672) | | | | (135,553) | |
Class R | | | 26,290 | | | | 28,533 | | | | 91,670 | |
Class R6 | | | 832,036 | | | | — | | | | — | |
Advisor Class | | | 2,920,637 | | | | (3,051,936) | | | | (682,747) | |
| | | | |
| | | |
Total capital share transactions | | | 7,965,700 | | | | (8,295,783) | | | | (4,339,628) | |
| | | | |
Net increase (decrease) in net assets | | | 15,164,365 | | | | (5,595,265 | ) | | | (9,046,036 | ) |
Net assets: | | | | | | | | | | | | |
Beginning of year | | | 27,708,897 | | | | 33,304,162 | | | | 42,350,198 | |
| | | | |
| | | |
End of year | | $ | 42,873,262 | | | $ | 27,708,897 | | | $ | 33,304,162 | |
| | | | |
Undistributed net investment income included in net assets: | | | | | | | | | | | | |
End of year | | $ | 120,624 | | | $ | 42,177 | | | $ | 136,389 | |
| | | | |
aFor the period April 1, 2016 to December 31, 2016.
| | | | | | |
30 | | Annual Report | | | The accompanying notes are an integral part of these financial statements. | | franklintempleton.com |
TEMPLETON GLOBAL INVESTMENT TRUST
Notes to Financial Statements
Templeton Emerging Markets Balanced Fund
1. Organization and Significant Accounting Policies
Templeton Global Investment Trust (Trust) is registered under the Investment Company Act of 1940 (1940 Act) as an open-end management investment company, consisting of six separate funds and applies the specialized accounting and reporting guidance in U.S. Generally Accepted Accounting Principles (U.S. GAAP). Templeton Emerging Markets Balanced Fund (Fund) is included in this report. The Fund offers five classes of shares: Class A, Class C, Class R, Class R6, and Advisor Class. Each class of shares may differ by its initial sales load, contingent deferred sales charges, voting rights on matters affecting a single class, its exchange privilege and fees due to differing arrangements for distribution and transfer agent fees. Effective August 1, 2017, the Fund began offering a new class of shares, Class R6.
Subsequent to March 31, 2016, the Fund’s fiscal year end changed to December 31.
The following summarizes the Fund’s significant accounting policies.
a. Financial Instrument Valuation
The Fund’s investments in financial instruments are carried at fair value daily. Fair value is the price that would be received to sell an asset or paid to transfer a liability in an orderly transaction between market participants on the measurement date. The Fund calculates the net asset value (NAV) per share as of 4 p.m. Eastern time each day the New York Stock Exchange (NYSE) is open for trading. Under compliance policies and procedures approved by the Trust’s Board of Trustees (the Board), the Fund’s administrator has responsibility for oversight of valuation, including leading the cross-functional Valuation Committee (VC). The VC provides administration and oversight of the Fund’s valuation policies and procedures, which are approved annually by the Board. Among other things, these procedures allow the Fund to utilize independent pricing services, quotations from securities and financial instrument dealers, and other market sources to determine fair value.
Equity securities and derivative financial instruments listed on an exchange or on the NASDAQ National Market System are valued at the last quoted sale price or the official closing price of the day, respectively. Foreign equity securities are valued as of the close of trading on the foreign stock exchange on which
the security is primarily traded, or as of 4 p.m. Eastern time. The value is then converted into its U.S. dollar equivalent at the foreign exchange rate in effect at 4 p.m. Eastern time on the day that the value of the security is determined. Over-the-counter (OTC) securities are valued within the range of the most recent quoted bid and ask prices. Securities that trade in multiple markets or on multiple exchanges are valued according to the broadest and most representative market. Certain equity securities are valued based upon fundamental characteristics or relationships to similar securities.
Debt securities generally trade in the OTC market rather than on a securities exchange. The Fund’s pricing services use multiple valuation techniques to determine fair value. In instances where sufficient market activity exists, the pricing services may utilize a market-based approach through which quotes from market makers are used to determine fair value. In instances where sufficient market activity may not exist or is limited, the pricing services also utilize proprietary valuation models which may consider market characteristics such as benchmark yield curves, credit spreads, estimated default rates, anticipated market interest rate volatility, coupon rates, anticipated timing of principal repayments, underlying collateral, and other unique security features in order to estimate the relevant cash flows, which are then discounted to calculate the fair value. Securities denominated in a foreign currency are converted into their U.S. dollar equivalent at the foreign exchange rate in effect at 4 p.m. Eastern time on the date that the values of the foreign debt securities are determined.
Investments in open-end mutual funds are valued at the closing NAV.
Certain derivative financial instruments are centrally cleared or trade in the OTC market. The Fund’s pricing services use various techniques including industry standard option pricing models and proprietary discounted cash flow models to determine the fair value of those instruments. The Fund’s net benefit or obligation under the derivative contract, as measured by the fair value of the contract, is included in net assets.
The Fund has procedures to determine the fair value of financial instruments for which market prices are not reliable or readily available. Under these procedures, the VC convenes on a regular basis to review such financial instruments and considers a number of factors, including significant unobservable valuation inputs, when arriving at fair value. The VC primarily employs a market-based approach which may use related or
| | | | | | |
franklintempleton.com | | | | Annual Report | | 31 |
TEMPLETON GLOBAL INVESTMENT TRUST
NOTES TO FINANCIAL STATEMENTS
Templeton Emerging Markets Balanced Fund (continued)
1. Organization and Significant Accounting
Policies (continued)
a. Financial Instrument Valuation (continued)
comparable assets or liabilities, recent transactions, market multiples, book values, and other relevant information for the investment to determine the fair value of the investment. An income-based valuation approach may also be used in which the anticipated future cash flows of the investment are discounted to calculate fair value. Discounts may also be applied due to the nature or duration of any restrictions on the disposition of the investments. Due to the inherent uncertainty of valuations of such investments, the fair values may differ significantly from the values that would have been used had an active market existed. The VC employs various methods for calibrating these valuation approaches including a regular review of key inputs and assumptions, transactional back-testing or disposition analysis, and reviews of any related market activity.
Trading in securities on foreign securities stock exchanges and OTC markets may be completed before 4 p.m. Eastern time. In addition, trading in certain foreign markets may not take place on every Fund’s business day. Occasionally, events occur between the time at which trading in a foreign security is completed and 4 p.m. Eastern time that might call into question the reliability of the value of a portfolio security held by the Fund. As a result, differences may arise between the value of the Fund’s portfolio securities as determined at the foreign market close and the latest indications of value at 4 p.m. Eastern time. In order to minimize the potential for these differences, the VC monitors price movements following the close of trading in foreign stock markets through a series of country specific market proxies (such as baskets of American Depositary Receipts, futures contracts and exchange traded funds). These price movements are measured against established trigger thresholds for each specific market proxy to assist in determining if an event has occurred that may call into question the reliability of the values of the foreign securities held by the Fund. If such an event occurs, the securities may be valued using fair value procedures, which may include the use of independent pricing services.
When the last day of the reporting period is a non-business day, certain foreign markets may be open on those days that the Fund’s NAV is not calculated, which could result in differences between the value of the Fund’s portfolio securities on the last business day and the last calendar day of the reporting period.
Any significant security valuation changes due to an open foreign market are adjusted and reflected by the Fund for financial reporting purposes.
b. Foreign Currency Translation
Portfolio securities and other assets and liabilities denominated in foreign currencies are translated into U.S. dollars based on the exchange rate of such currencies against U.S. dollars on the date of valuation. The Fund may enter into foreign currency exchange contracts to facilitate transactions denominated in a foreign currency. Purchases and sales of securities, income and expense items denominated in foreign currencies are translated into U.S. dollars at the exchange rate in effect on the transaction date. Portfolio securities and assets and liabilities denominated in foreign currencies contain risks that those currencies will decline in value relative to the U.S. dollar. Occasionally, events may impact the availability or reliability of foreign exchange rates used to convert the U.S. dollar equivalent value. If such an event occurs, the foreign exchange rate will be valued at fair value using procedures established and approved by the Board.
The Fund does not separately report the effect of changes in foreign exchange rates from changes in market prices on securities held. Such changes are included in net realized and unrealized gain or loss from investments in the Statement of Operations.
Realized foreign exchange gains or losses arise from sales of foreign currencies, currency gains or losses realized between the trade and settlement dates on securities transactions and the difference between the recorded amounts of dividends, interest, and foreign withholding taxes and the U.S. dollar equivalent of the amounts actually received or paid. Net unrealized foreign exchange gains and losses arise from changes in foreign exchange rates on foreign denominated assets and liabilities other than investments in securities held at the end of the reporting period.
c. Derivative Financial Instruments
The Fund invested in derivative financial instruments in order to manage risk or gain exposure to various other investments or markets. Derivatives are financial contracts based on an underlying or notional amount, require no initial investment or an initial net investment that is smaller than would normally be required to have a similar response to changes in market factors, and require or permit net settlement. Derivatives contain various risks including the potential inability of the counterparty to
| | | | | | |
32 | | Annual Report | | | | franklintempleton.com |
TEMPLETON GLOBAL INVESTMENT TRUST
NOTES TO FINANCIAL STATEMENTS
Templeton Emerging Markets Balanced Fund (continued)
fulfill their obligations under the terms of the contract, the potential for an illiquid secondary market, and/or the potential for market movements which expose the Fund to gains or losses in excess of the amounts shown in the Statement of Assets and Liabilities. Realized gain and loss and unrealized appreciation and depreciation on these contracts for the period are included in the Statement of Operations.
Derivative counterparty credit risk is managed through a formal evaluation of the creditworthiness of all potential counter-parties. The Fund attempts to reduce its exposure to counterparty credit risk on OTC derivatives, whenever possible, by entering into International Swaps and Derivatives Association (ISDA) master agreements with certain counterparties. These agreements contain various provisions, including but not limited to collateral requirements, events of default, or early termination. Termination events applicable to the counterparty include certain deteriorations in the credit quality of the counterparty. Termination events applicable to the Fund include failure of the Fund to maintain certain net asset levels and/or limit the decline in net assets over various periods of time. In the event of default or early termination, the ISDA master agreement gives the non-defaulting party the right to net and close-out all transactions traded, whether or not arising under the ISDA agreement, to one net amount payable by one counterparty to the other. However, absent an event of default or early termination, OTC derivative assets and liabilities are presented gross and not offset in the Statement of Assets and Liabilities. Early termination by the counterparty may result in an immediate payment by the Fund of any net liability owed to that counterparty under the ISDA agreement. At December 31, 2017, the Fund had OTC derivatives in a net liability position of $203,535 and the aggregate value of collateral pledged for such contracts was $0.
Collateral requirements differ by type of derivative. Collateral or initial margin requirements are set by the broker or exchange clearing house for exchange traded and centrally cleared derivatives. Initial margin deposited is held at the exchange and can be in the form of cash and/or securities. For OTC derivatives traded under an ISDA master agreement, posting of collateral is required by either the Fund or the applicable counterparty if the total net exposure of all OTC derivatives with the applicable counterparty exceeds the minimum transfer amount, which typically ranges from $100,000 to $250,000, and can vary depending on the counterparty and the type of the agreement. Generally, collateral is determined at the close of
Fund business each day and any additional collateral required due to changes in derivative values may be delivered by the Fund or the counterparty the next business day, or within a few business days. Collateral pledged and/or received by the Fund for OTC derivatives, if any, is held in segregated accounts with the Fund’s custodian/counterparty broker and can be in the form of cash and/or securities. Unrestricted cash may be invested according to the Fund’s investment objectives. To the extent that the amounts due to the Fund from its counterparties are not subject to collateralization or are not fully collateralized, the Fund bears the risk of loss from counterparty non-performance.
The Fund entered into OTC forward exchange contracts primarily to manage and/or gain exposure to certain foreign currencies. A forward exchange contract is an agreement between the Fund and a counterparty to buy or sell a foreign currency at a specific exchange rate on a future date.
The Fund entered into interest rate swap contracts primarily to manage interest rate risk. An interest rate swap is an agreement between the Fund and a counterparty to exchange cash flows based on the difference between two interest rates, applied to a notional amount. These agreements may be privately negotiated in the over-the-counter market (OTC interest rate swaps) or may be executed on a registered exchange (centrally cleared interest rate swaps). For centrally cleared interest rate swaps, required initial margins are pledged by the Fund, and the daily change in fair value is accounted for as a variation margin payable or receivable in the Statement of Assets and Liabilities. Over the term of the contract, contractually required payments to be paid and to be received are accrued daily and recorded as unrealized depreciation and appreciation until the payments are made, at which time they are realized.
The Fund invests in value recovery instruments (VRI) primarily to gain exposure to economic growth. Periodic payments from VRI are dependent on established benchmarks for underlying variables. VRI has a notional amount, which is used to calculate amounts of payments to holders. Payments are recorded upon receipt as realized gains in the Statement of Operations. The risks of investing in VRI include growth risk, liquidity, and the potential loss of investment.
See Note 10 regarding other derivative information.
| | | | | | |
franklintempleton.com | | | | Annual Report | | 33 |
TEMPLETON GLOBAL INVESTMENT TRUST
NOTES TO FINANCIAL STATEMENTS
Templeton Emerging Markets Balanced Fund (continued)
1. Organization and Significant Accounting
Policies (continued)
d. Participatory Notes
The Fund invests in Participatory Notes (P-Notes). P-Notes are promissory notes that are designed to offer a return linked to the performance of a particular underlying equity security or market. P-Notes are issued by banks or broker-dealers and allow the Fund to gain exposure to common stocks in certain foreign markets without registering with the market regulator. Income received from P-Notes is recorded as dividend income in the Statement of Operations. P-Notes may contain various risks including the potential inability of the counterparty to fulfill their obligations under the terms of the contract. These securities may be more volatile and less liquid than other investments held by the Fund.
e. Income and Deferred Taxes
It is the Fund’s policy to qualify as a regulated investment company under the Internal Revenue Code. The Fund intends to distribute to shareholders substantially all of its taxable income and net realized gains to relieve it from federal income and excise taxes. As a result, no provision for U.S. federal income taxes is required.
The Fund may be subject to foreign taxation related to income received, capital gains on the sale of securities and certain foreign currency transactions in the foreign jurisdictions in which it invests. Foreign taxes, if any, are recorded based on the tax regulations and rates that exist in the foreign markets in which the Fund invests. When a capital gain tax is determined to apply, the Fund records an estimated deferred tax liability in an amount that would be payable if the securities were disposed of on the valuation date.
The Fund may recognize an income tax liability related to its uncertain tax positions under U.S. GAAP when the uncertain tax position has a less than 50% probability that it will be sustained upon examination by the tax authorities based on its technical merits. As of December 31, 2017, the Fund has determined that no tax liability is required in its financial statements related to uncertain tax positions for any open tax years (or expected to be taken in future tax years). Open tax years are those that remain subject to examination and are based on the statute of limitations in each jurisdiction in which the Fund invests.
f. Security Transactions, Investment Income, Expenses and Distributions
Security transactions are accounted for on trade date. Realized gains and losses on security transactions are determined on a specific identification basis. Interest income and estimated expenses are accrued daily. Amortization of premium and accretion of discount on debt securities are included in interest income. Dividend income is recorded on the ex-dividend date except for certain dividends from securities where the dividend rate is not available. In such cases, the dividend is recorded as soon as the information is received by the Fund. Distributions to shareholders are recorded on the ex-dividend date. Distributable earnings are determined according to income tax regulations (tax basis) and may differ from earnings recorded in accordance with U.S. GAAP. These differences may be permanent or temporary. Permanent differences are reclassified among capital accounts to reflect their tax character. These reclassifications have no impact on net assets or the results of operations. Temporary differences are not reclassified, as they may reverse in subsequent periods.
Common expenses incurred by the Trust are allocated among the Funds based on the ratio of net assets of each Fund to the combined net assets of the Trust. Fund specific expenses are charged directly to the Fund that incurred the expense.
Realized and unrealized gains and losses and net investment income, excluding class specific expenses, are allocated daily to each class of shares based upon the relative proportion of net assets of each class. Differences in per share distributions by class are generally due to differences in class specific expenses.
Inflation-indexed bonds are adjusted for inflation through periodic increases or decreases in the security’s interest accruals, face amount, or principal redemption value, by amounts corresponding to the rate of inflation as measured by an index. Any increase or decrease in the face amount or principal redemption value will be included as interest income in the Statement of Operations.
g. Accounting Estimates
The preparation of financial statements in accordance with U.S. GAAP requires management to make estimates and assumptions that affect the reported amounts of assets and liabilities at the date of the financial statements and the amounts of income and expenses during the reporting period. Actual results could differ from those estimates.
| | | | | | |
34 | | Annual Report | | | | franklintempleton.com |
TEMPLETON GLOBAL INVESTMENT TRUST
NOTES TO FINANCIAL STATEMENTS
Templeton Emerging Markets Balanced Fund (continued)
h. Guarantees and Indemnifications
Under the Trust’s organizational documents, its officers and trustees are indemnified by the Trust against certain liabilities arising out of the performance of their duties to the Trust. Additionally, in the normal course of business, the Trust, on behalf of the Fund, enters into contracts with service providers
that contain general indemnification clauses. The Trust’s maximum exposure under these arrangements is unknown as this would involve future claims that may be made against the Trust that have not yet occurred. Currently, the Trust expects the risk of loss to be remote.
2. Shares of Beneficial Interest
At December 31, 2017, there were an unlimited number of shares authorized ($0.01 par value). Transactions in the Fund’s shares were as follows:
| | | | | | | | |
| | | Year Ended | |
| | | December 31, 2017 | |
| | | Shares | | | Amount | |
| | |
Class A Shares: | | | | | | | | |
Shares sold | | | 1,120,344 | | | $ | 11,790,630 | |
Shares issued in reinvestment of distributions | | | 67,251 | | | | 721,811 | |
Shares redeemed | | | (901,248 | ) | | | (9,393,436 | ) |
| | | | |
| | |
Net increase (decrease) | | | 286,347 | | | $ | 3,119,005 | |
| | | | |
| | |
Class C Shares: | | | | | | | | |
Shares sold | | | 221,248 | | | $ | 2,315,133 | |
Shares issued in reinvestment of distributions | | | 8,994 | | | | 96,023 | |
Shares redeemed | | | (131,080 | ) | | | (1,343,424 | ) |
| | | | |
| | |
Net increase (decrease) | | | 99,162 | | | $ | 1,067,732 | |
| | | | |
| | |
Class R Shares: | | | | | | | | |
Shares sold | | | 3,159 | | | $ | 34,505 | |
Shares issued in reinvestment of distributions | | | 571 | | | | 6,122 | |
Shares redeemed | | | (1,548 | ) | | | (14,337 | ) |
| | | | |
| | |
Net increase (decrease) | | | 2,182 | | | $ | 26,290 | |
| | | | |
| | |
Class R6 Sharesa: | | | | | | | | |
Shares sold | | | 77,854 | | | $ | 871,524 | |
Shares issued in reinvestment of distributions | | | 953 | | | | 10,523 | |
Shares redeemed | | | (4,453 | ) | | | (50,011 | ) |
| | | | |
| | |
Net increase (decrease) | | | 74,354 | | | $ | 832,036 | |
| | | | |
| | |
Advisor Class Shares: | | | | | | | | |
Shares sold | | | 653,669 | | | $ | 6,937,088 | |
Shares issued in reinvestment of distributions | | | 18,465 | | | | 200,069 | |
Shares redeemed | | | (395,928 | ) | | | (4,216,520 | ) |
| | | | |
| | |
Net increase (decrease) | | | 276,206 | | | $ | 2,920,637 | |
| | | | |
aFor the period August 1, 2017 (effective date) to December 31, 2017.
| | | | | | |
franklintempleton.com | | | | Annual Report | | 35 |
TEMPLETON GLOBAL INVESTMENT TRUST
NOTES TO FINANCIAL STATEMENTS
Templeton Emerging Markets Balanced Fund (continued)
2. Shares of Beneficial Interest (continued)
| | | | | | | | | | | | | | | | |
| | | Year Ended | | | Year Ended | |
| | | December 31, 2016a | | | March 31, 2016 | |
| | | | |
| | | Shares | | | Amount | | | Shares | | | Amount | |
| | | | |
Class A Shares: | | | | | | | | | | | | | | | | |
Shares sold | | | 480,337 | | | $ | 4,284,803 | | | | 659,544 | | | $ | 5,625,747 | |
| | | | |
Shares issued in reinvestment of distributions | | | 26,248 | | | | 230,590 | | | | 13,494 | | | | 112,221 | |
| | | | |
Shares redeemed | | | (1,037,583 | ) | | | (9,187,101 | ) | | | (1,112,325 | ) | | | (9,350,966 | ) |
| | | | |
Net increase (decrease) | | | (530,998 | ) | | $ | (4,671,708 | ) | | | (439,287 | ) | | $ | (3,612,998 | ) |
| | | | |
Class C Shares: | | | | | | | | | | | | | | | | |
Shares sold | | | 73,567 | | | $ | 646,346 | | | | 125,643 | | | $ | 1,088,240 | |
| | | | |
Shares issued in reinvestment of distributions | | | 1,412 | | | | 12,541 | | | | — | | | | — | |
| | | | |
Shares redeemed | | | (143,741 | ) | | | (1,259,559 | ) | | | (144,639 | ) | | | (1,223,793 | ) |
| | | | |
Net increase (decrease) | | | (68,762 | ) | | $ | (600,672 | ) | | | (18,996 | ) | | $ | (135,553 | ) |
| | | | |
Class R Shares: | | | | | | | | | | | | | | | | |
Shares sold | | | 3,173 | | | $ | 27,959 | | | | 14,473 | | | $ | 109,928 | |
| | | | |
Shares issued in reinvestment of distributions | | | 196 | | | | 1,720 | | | | 13 | | | | 112 | |
| | | | |
Shares redeemed | | | (138 | ) | | | (1,146 | ) | | | (2,197 | ) | | | (18,370 | ) |
| | | | |
Net increase (decrease) | | | 3,231 | | | $ | 28,533 | | | | 12,289 | | | $ | 91,670 | |
| | | | |
Advisor Class Shares: | | | | | | | | | | | | | | | | |
Shares sold | | | 331,664 | | | $ | 2,904,393 | | | | 63,892 | | | $ | 556,058 | |
| | | | |
Shares issued in reinvestment of distributions | | | 4,805 | | | | 42,153 | | | | 1,768 | | | | 14,847 | |
| | | | |
Shares redeemed | | | (668,774 | ) | | | (5,998,482 | ) | | | (144,453 | ) | | | (1,253,652 | ) |
| | | | |
Net increase (decrease) | | | (332,305 | ) | | $ | (3,051,936 | ) | | | (78,793 | ) | | $ | (682,747 | ) |
aFor the period April 1, 2016 to December 31, 2016.
3. Transactions with Affiliates
Franklin Resources, Inc. is the holding company for various subsidiaries that together are referred to as Franklin Templeton Investments. Certain officers and trustees of the Trust are also officers and/or directors of the following subsidiaries:
| | | | |
Subsidiary | | Affiliation | | |
| Templeton Asset Management Ltd. (TAML) | | Investment manager | | |
| Franklin Advisers, Inc. (Advisers) | | Investment manager | | |
| Franklin Templeton Services, LLC (FT Services) | | Administrative manager | | |
| Franklin Templeton Distributors, Inc. (Distributors) | | Principal underwriter | | |
| Franklin Templeton Investor Services, LLC (Investor Services) | | Transfer agent | | |
| | | | | | |
36 | | Annual Report | | | | franklintempleton.com |
TEMPLETON GLOBAL INVESTMENT TRUST
NOTES TO FINANCIAL STATEMENTS
Templeton Emerging Markets Balanced Fund (continued)
a. Management Fees
The Fund pays an investment management fee to TAML based on the average daily net assets of the Fund as follows:
| | | | |
| Annualized Fee Rate | | Net Assets | | |
1.150% | | Up to and including $1 billion | | |
1.100% | | Over $1 billion, up to and including $5 billion | | |
1.050% | | Over $5 billion, up to and including $10 billion | | |
1.000% | | Over $10 billion, up to and including $15 billion | | |
0.950% | | Over $15 billion, up to and including $20 billion | | |
0.900% | | In excess of $20 billion | | |
For the year ended December 31, 2017, the gross effective investment management fee rate was 1.150% of the Fund’s average daily net assets.
Under a subadvisory agreement, Advisers, an affiliate of TAML, provides subadvisory services to the Fund. The subadvisory fee is paid by TAML based on the Fund’s average daily net assets, and is not an additional expense of the Fund.
b. Administrative Fees
Under an agreement with TAML, FT Services provides administrative services to the Fund. The fee is paid by TAML based on the Fund’s average daily net assets, and is not an additional expense of the Fund.
c. Distribution Fees
The Board has adopted distribution plans for each share class, with the exception of Class R6 and Advisor Class shares, pursuant to Rule 12b-1 under the 1940 Act. Under the Fund’s Class A reimbursement distribution plan, the Fund reimburses Distributors for costs incurred in connection with the servicing, sale and distribution of the Fund’s shares up to the maximum annual plan rate. Under the Class A reimbursement distribution plan, costs exceeding the maximum for the current plan year cannot be reimbursed in subsequent periods. In addition, under the Fund’s Class C and R compensation distribution plans, the Fund pays Distributors for costs incurred in connection with the servicing, sale and distribution of the Fund’s shares up to the maximum annual plan rate for each class. The plan year, for purposes of monitoring compliance with the maximum annual plan rates, is February 1 through January 31.
The maximum annual plan rates, based on the average daily net assets, for each class, are as follows:
| | | | |
Class A | | | 0.30 | % |
Class C | | | 1.00 | % |
Class R | | | 0.50 | % |
The Board has set the current rate at 0.25% per year for Class A shares until further notice and approval by the Board.
d. Sales Charges/Underwriting Agreements
Front-end sales charges and contingent deferred sales charges (CDSC) do not represent expenses of the Fund. These charges are deducted from the proceeds of sales of Fund shares prior to investment or from redemption proceeds prior to remittance, as applicable. Distributors has advised the Fund of the following commission transactions related to the sales and redemptions of the Fund’s shares for the year:
| | | | |
Sales charges retained net of commissions paid to unaffiliated brokers/dealers. | | $ | 14,479 | |
CDSC retained | | $ | 680 | |
| | | | | | |
franklintempleton.com | | | | Annual Report | | 37 |
TEMPLETON GLOBAL INVESTMENT TRUST
NOTES TO FINANCIAL STATEMENTS
Templeton Emerging Markets Balanced Fund (continued)
3. Transactions with Affiliates (continued)
e. Transfer Agent Fees
Each class of shares pays transfer agent fees to Investor Services for its performance of shareholder servicing obligations. Effective November 1, 2017, the fees are based on an annualized asset based fee of 0.02% plus a transaction based fee. Prior to November 1, 2017, the fees were account based fees that varied based on fund or account type. In addition, each class reimburses Investor Services for out of pocket expenses incurred and, except for Class R6, reimburses shareholder servicing fees paid to third parties. These fees are allocated daily based upon their relative proportion of such classes’ aggregate net assets. Class R6 pays Investor Services transfer agent fees specific to that class.
For the year ended December 31, 2017, the Fund paid transfer agent fees of $104,423, of which $43,017 was retained by Investor Services.
f. Investments in Affiliated Management Investment Companies
The Fund invests in one or more affiliated management investment companies for purposes other than exercising a controlling influence over the management or policies. Management fees paid by the Fund are waived on assets invested in the affiliated management investment companies, as noted in the Statement of Operations, in an amount not to exceed the management and administrative fees paid directly or indirectly by each affiliate. Prior to April, 2013, the waiver was accounted for as a reduction to management fee. During the year ended December 31, 2017, the Fund held investments in affiliated management investment companies as follows:
| | | | | | | | | | | | | | | | | | | | | | | | | | | | | | |
| | | Number of
Shares Held
at Beginning
of Year | | | Gross
Additions | | | Gross
Reductions | | | Number of
Shares Held at End
of Year | | | Value at End of Year | | | Dividend
Income | | | Realized Gain (Loss) | | | Net Change in Unrealized
Appreciation (Depreciation) |
Non-Controlled Affiliates | | | | | | | | | | | | | | | | | | | | | | | | | | | | | | |
Institutional Fiduciary Trust Money Market Portfolio, 0.89% | | | 763,605 | | | | 15,379,637 | | | | (13,974,611 | ) | | | 2,168,631 | | | | $2,168,631 | | | | $12,909 | | | | $ — | | | $ — |
g. Waiver and Expense Reimbursements
TAML has contractually agreed in advance to waive or limit its fees and to assume as its own expense certain expenses otherwise payable by the Fund so that the expenses (excluding distribution fees, and acquired fund fees and expenses) for Class A, Class C, Class R and Advisor Class of the Fund does not exceed 1.23%, and Class R6 does not exceed 1.15% based on the average net assets of each class (other than certain non-routine expenses or costs, including those relating to litigation, indemnification, reorganizations, and liquidations) until April 30, 2018.
4. Expense Offset Arrangement
The Fund has entered into an arrangement with its custodian whereby credits realized as a result of uninvested cash balances are used to reduce a portion of the Fund’s custodian expenses. During the year ended December 31, 2017, the custodian fees were reduced as noted in the Statement of Operations.
5. Income Taxes
For tax purposes, capital losses may be carried over to offset future capital gains, if any.
| | | | | | |
38 | | Annual Report | | | | franklintempleton.com |
TEMPLETON GLOBAL INVESTMENT TRUST
NOTES TO FINANCIAL STATEMENTS
Templeton Emerging Markets Balanced Fund (continued)
At December 31, 2017, the capital loss carryforwards were as follows:
| | | | |
Capital loss carryforwards not subject to expiration: | | | | |
Short term | | $ | 4,152,174 | |
Long term | | | 3,445,805 | |
| |
Total capital loss carryforwards | | $ | 7,597,979 | |
During the year ended December 31, 2017, the Fund utilized $811,858 of capital loss carryforwards.
The tax character of distributions paid during the years ended December 31, 2017, December 31, 2016 and March 31, 2016, was as follows:
| | | | | | | | | | | | |
| | | December 31, | | | March 31, | |
| | | 2017 | | | 2016 | | | 2016 | |
Distributions paid from ordinary income | | $ | 1,054,982 | | | $ | 366,685 | | | $ | 173,573 | |
At December 31, 2017, the cost of investments, net unrealized appreciation (depreciation) and undistributed ordinary income for income tax purposes were as follows:
| | | | |
Cost of investments | | $ | 35,175,156 | |
| | | | |
| |
Unrealized appreciation | | $ | 9,321,926 | |
Unrealized depreciation | | | (2,293,829 | ) |
| | | | |
| |
Net unrealized appreciation (depreciation) | | $ | 7,028,097 | |
| | | | |
| |
Distributable earnings - undistributed ordinary income | | $ | 49,117 | |
| | | | |
Differences between income and/or capital gains as determined on a book basis and a tax basis are primarily due to differing treatments of foreign currency transactions, bond discounts and premiums, and corporate actions.
6. Investment Transactions
Purchases and sales of investments (excluding short term securities) for the year ended December 31, 2017, aggregated $11,217,680 and $7,281,306, respectively.
7. Credit Risk and Defaulted Securities
At December 31, 2017, the Fund had 17.6% of its portfolio invested in high yield or other securities rated below investment grade and unrated securities, if any. These securities may be more sensitive to economic conditions causing greater price volatility and are potentially subject to a greater risk of loss due to default than higher rated securities.
8. Concentration of Risk
Investing in foreign securities may include certain risks and considerations not typically associated with investing in U.S. securities, such as fluctuating currency values and changing local and regional economic, political and social conditions, which may result in greater market volatility. In addition, certain foreign securities may not be as liquid as U.S. securities.
| | | | | | |
franklintempleton.com | | | | Annual Report | | 39 |
TEMPLETON GLOBAL INVESTMENT TRUST
NOTES TO FINANCIAL STATEMENTS
Templeton Emerging Markets Balanced Fund (continued)
9. Restricted Securities
The Fund invests in securities that are restricted under the Securities Act of 1933 (1933 Act). Restricted securities are often purchased in private placement transactions, and cannot be sold without prior registration unless the sale is pursuant to an exemption under the 1933 Act. Disposal of these securities may require greater effort and expense, and prompt sale at an acceptable price may be difficult. The Fund may have registration rights for restricted securities. The issuer generally incurs all registration costs.
At December 31, 2017, investments in restricted securities, excluding securities exempt from registration under the 1933 Act deemed to be liquid, were as follows:
| | | | | | | | | | | | | | |
Principal
Amount*/
Shares/
Warrants | | | | Issuer | | Acquisition Date | | Cost | | | Value | |
84 | | | | Edcon Holdings Ltd., F wts., 2/20/49 | | 11/27/15 | | $ | 1 | | | $ | — | |
1,503,436 | | | | Edcon Holdings Ltd., F1 wts., 2/20/49 | | 11/27/15 | | | 15,930 | | | | — | |
121,748 | | | | Edcon Holdings Ltd., F2 wts., 2/20/49 | | 11/27/15 | | | 1,290 | | | | — | |
1,390,834 | | | | Holdco 2, A | | 10/11/11 - 2/01/17 | | | 8,179 | | | | 1,124 | |
437,269 | | | | Holdco 2, B | | 2/01/17 | | | 325 | | | | 354 | |
105,417 | | | | K2016470219 South Africa Ltd., senior secured note, 144A, PIK, 3.00%, 12/31/22 | | 10/11/11 - 12/29/17 | | | 146,731 | | | | 1,581 | |
38,934 | | EUR | | K2016470219 South Africa Ltd., senior secured note, 144A, PIK, 8.00%, 12/31/22 | | 2/01/17 - 12/29/17 | | | 22,235 | | | | 234 | |
58,113 | | | | K2016470260 South Africa Ltd., senior secured note, 144A, PIK, 25.00%, 12/31/22 | | 2/01/17 - 12/29/17 | | | 53,661 | | | | 44,747 | |
| | | | | | | | | | |
| | | | | |
| | | | Total Restricted Securities (Value is 0.1% of Net Assets) | | | | $ | 248,35 2 | | | $ | 48,040 | |
| | | | | | | | | | |
*In U.S. dollars unless otherwise indicated.
10. Other Derivative Information
At December 31, 2017, the Fund’s investments in derivative contracts are reflected in the Statement of Assets and Liabilities as follows:
| | | | | | | | | | | | |
| | | Asset Derivatives | | | Liability Derivatives | |
Derivative Contracts Not Accounted for as
Hedging Instruments | | Statement of Assets and Liabilities
Location | | Fair Value | | | Statement of Assets and Liabilities
Location | | Fair Value | |
Interest rate contracts | | Variation margin on centrally | | $ | 44,098 | a | | Variation margin on centrally | | $ | 21,550 | a |
| | cleared swap contracts | | | | | | cleared swap contracts | | | | |
Foreign exchange contracts | | Unrealized appreciation on OTC | | | 86,493 | | | Unrealized depreciation on OTC | | | 285,326 | |
| | forward exchange contracts | | | | | | forward exchange contracts | | | | |
Value Recovery Instruments | | Investments in securities, at value | | | 140,427 | b | | | | | | |
| | | | | | | | | | | | |
Totals | | | | $ | 271,018 | | | | | $ | 306,876 | |
| | | | | | | | | | | | |
aThis amount reflects the cumulative appreciation (depreciation) of centrally cleared swap contracts as reported in the Statement of Investments. Only the variation margin receivable/payable at year end is separately reported within the Statement of Assets and Liabilities. Prior variation margin movements were recorded to cash upon receipt or payment.
bVRI are included in investments in securities, at value in the Statement of Assets and Liabilities.
| | | | |
40 | | Annual Report | | franklintempleton.com |
TEMPLETON GLOBAL INVESTMENT TRUST
NOTES TO FINANCIAL STATEMENTS
Templeton Emerging Markets Balanced Fund (continued)
For the year ended December 31, 2017, the effect of derivative contracts in the Fund’s Statement of Operations was as follows:
| | | | | | | | | | | | |
Derivative Contracts Not Accounted for as Hedging Instruments | | Statement of Operations Location | | Net Realized
Gain (Loss) for
the Year | | | Statement of Operations Location | | Net Change in
Unrealized
Appreciation
(Depreciation)
for the Year | |
| | | | |
| | Net realized gain (loss) from: | | | | | | Net change in unrealized appreciation (depreciation) on: | | | | |
Interest rate contracts | | Swap contracts | | $ | (21,682 | ) | | Swap contracts | | $ | (5,234 | ) |
Foreign exchange contracts | | Forward exchange contracts | | | 155,717 | | | Forward exchange contracts | | | (247,116 | ) |
Value Recovery Instruments | | Investments | | | — | | | Investments | | | 63,567 | a |
| | | | | | | | | | | | |
Totals | | | | $ | 134,035 | | | | | $ | (188,783 | ) |
| | | | | | | | | | | | |
aVRI are included in net change in unrealized appreciation (depreciation) on investments in the Statement of Operations.
For the year ended December 31, 2017, the average month end notional amount of swap contracts represented $2,746,154. The average month end contract value and fair value of forward exchange contracts and VRI, was $9,372,544 and $109,618, respectively.
See Note 1(c) regarding derivative financial instruments.
See Abbreviations on page 43.
11. Credit Facility
The Fund, together with other U.S. registered and foreign investment funds (collectively, Borrowers), managed by Franklin Templeton Investments, are borrowers in a joint syndicated senior unsecured credit facility totaling $2 billion (Global Credit Facility) which matured on February 9, 2018. This Global Credit Facility provides a source of funds to the Borrowers for temporary and emergency purposes, including the ability to meet future unanticipated or unusually large redemption requests. Effective February 9, 2018, the Borrowers renewed the Global Credit Facility for a one year term, maturing February 8, 2019, for a total of $2 billion.
Under the terms of the Global Credit Facility, the Fund shall, in addition to interest charged on any borrowings made by the Fund and other costs incurred by the Fund, pay its share of fees and expenses incurred in connection with the implementation and maintenance of the Global Credit Facility, based upon its relative share of the aggregate net assets of all of the Borrowers, including an annual commitment fee of 0.15% based upon the unused portion of the Global Credit Facility. These fees are reflected in other expenses in the Statement of Operations. During the year ended December 31, 2017, the Fund did not use the Global Credit Facility.
12. Fair Value Measurements
The Fund follows a fair value hierarchy that distinguishes between market data obtained from independent sources (observable inputs) and the Fund’s own market assumptions (unobservable inputs). These inputs are used in determining the value of the Fund’s financial instruments and are summarized in the following fair value hierarchy:
| | • | | Level 1 – quoted prices in active markets for identical financial instruments |
| | • | | Level 2 – other significant observable inputs (including quoted prices for similar financial instruments, interest rates, prepayment speed, credit risk, etc.) |
| | • | | Level 3 – significant unobservable inputs (including the Fund’s own assumptions in determining the fair value of financial instruments) |
| | | | | | |
franklintempleton.com | | | | Annual Report | | 41 |
TEMPLETON GLOBAL INVESTMENT TRUST
NOTES TO FINANCIAL STATEMENTS
Templeton Emerging Markets Balanced Fund (continued)
12. Fair Value Measurements (continued)
The input levels are not necessarily an indication of the risk or liquidity associated with financial instruments at that level.
For movements between the levels within the fair value hierarchy, the Fund has adopted a policy of recognizing the transfers as of the date of the underlying event which caused the movement.
A summary of inputs used as of December 31, 2017, in valuing the Fund’s assets and liabilities carried at fair value, is as follows:
| | | | | | | | | | | | | | | | |
| | | Level 1 | | | Level 2 | | | Level 3 | | | Total | |
Assets: | | | | | | | | | | | | | | | | |
Investments in Securities:a | | | | | | | | | | | | | | | | |
Equity Investments:b | | | | | | | | | | | | | | | | |
Mexico | | $ | 423,203 | | | $ | — | | | $ | — | c �� | | $ | 423,203 | |
South Africa | | | 2,232,929 | | | | — | | | | 1,478 | c | | | 2,234,407 | |
All Other Equity Investments | | | 21,399,329 | | | | — | | | | — | | | | 21,399,329 | |
Participatory Notes | | | — | | | | 112,626 | | | | — | | | | 112,626 | |
Corporate Bonds and Notes: | | | | | | | | | | | | | | | | |
Bermuda | | | — | | | | 186,466 | | | | — | | | | 186,466 | |
South Africa | | | — | | | | 46,328 | | | | 234 | | | | 46,562 | |
Foreign Government and Agency Securities | | | — | | | | 13,106,150 | | | | — | | | | 13,106,150 | |
Short Term Investments | | | 2,168,631 | | | | 2,686,181 | | | | — | | | | 4,854,812 | |
| | | | |
Total Investments in Securities | | $ | 26,224,092 | | | $ | 16,137,751 | | | $ | 1,712 | | | $ | 42,363,555 | |
Other Financial Instruments: | | | | | | | | | | | | | | | | |
Forward Exchange Contracts | | $ | — | | | $ | 86,493 | | | $ | — | | | $ | 86,493 | |
Swap Contracts | | | — | | | | 44,098 | | | | — | | | | 44,098 | |
| | | | |
Total Other Financial Instruments | | $ | — | | | $ | 130,591 | | | $ | — | | | $ | 130,591 | |
Liabilities: | | | | | | | | | | | | | | | | |
Other Financial Instruments: | | | | | | | | | | | | | | | | |
Forward Exchange Contracts | | $ | — | | | $ | 285,326 | | | $ | — | | | $ | 285,326 | |
Swap Contracts | | | — | | | | 21,550 | | | | — | | | | 21,550 | |
| | | | |
Total Other Financial Instruments | | $ | — | | | $ | 306,876 | | | $ | — | | | $ | 306,876 | |
aFor detailed categories, see the accompanying Statement of Investments.
bIncludes common and preferred stocks as well as other equity interests.
cIncludes securities determined to have no value at December 31, 2017.
13. Subsequent Events
The Fund has evaluated subsequent events through the issuance of the financial statements and determined that no events have occurred that require disclosure other than those that have already been disclosed in the financial statements.
| | | | |
42 | | Annual Report | | franklintempleton.com |
TEMPLETON GLOBAL INVESTMENT TRUST
NOTES TO FINANCIAL STATEMENTS
Templeton Emerging Markets Balanced Fund (continued)
Abbreviations
| | | | | | | | | | |
| Counterparty | | Currency | | Selected Portfolio |
| BOFA | | Bank of America Corp. | | ARS | | Argentine Peso | | ADR | | American Depositary Receipt |
| CITI | | Citigroup, Inc. | | BRL | | Brazilian Real | | BADLAR | | Argentina Deposit Rates Badlar Private |
| DBAB | | Deutsche Bank AG | | COP | | Colombian Peso | | | | Banks ARS |
| GSCO | | The Goldman Sachs Group, Inc. | | EGP | | Egyptian Pound | | FRN | | Floating Rate Note |
| HSBK | | HSBC Bank PLC | | EUR | | Euro | | GDP | | Gross Domestic Product |
| JPHQ | | JP Morgan Chase & Co. | | GHS | | Ghanaian Cedi | | GDR | | Global Depositary Receipt |
| UBSW | | UBS AG | | IDR | | Indonesian Rupiah | | LIBOR | | London InterBank Offered Rate |
| | | | INR | | Indian Rupee | | PIK | | Payment-In-Kind |
| | | | MXN | | Mexican Peso | | VRI | | Value Recovery Instruments |
| | | | PHP | | Philippine Peso | | | | |
| | | | USD | | United States Dollar | | | | |
| | | | ZAR | | South African Rand | | | | |
| | | | | | |
franklintempleton.com | | | | Annual Report | | 43 |
TEMPLETON GLOBAL INVESTMENT TRUST
Report of Independent Registered Public Accounting Firm
To the Board of Trustees of Templeton Global Investment Trust and Shareholders of Templeton Emerging Markets Balanced Fund
Opinion on the Financial Statements
We have audited the accompanying statement of assets and liabilities, including the statement of investments, of Templeton Emerging Markets Balanced Fund (the “Fund”) as of December 31, 2017, the related statement of operations for the year ended December 31, 2017, the statements of changes in net assets for the year ended December 31, 2017, the period April 1, 2016 through December 31, 2016, and the year ended March 31, 2016, including the related notes, and the financial highlights for each of the periods indicated therein (collectively referred to as the “financial statements”). In our opinion, the financial statements present fairly, in all material respects, the financial position of the Fund as of December 31, 2017, the results of its operations for the year ended December 31, 2017, the changes in its net assets for the year ended December 31, 2017, the period April 1, 2016 through December 31, 2016, and the year ended March 31, 2016, and the financial highlights for each of the periods indicated therein in conformity with accounting principles generally accepted in the United States of America.
Basis for Opinion
These financial statements are the responsibility of the Fund’s management. Our responsibility is to express an opinion on the Fund’s financial statements based on our audits. We are a public accounting firm registered with the Public Company Accounting Oversight Board (United States) (“PCAOB”) and are required to be independent with respect to the Fund in accordance with the U.S. federal securities laws and the applicable rules and regulations of the Securities and Exchange Commission and the PCAOB.
We conducted our audits of these financial statements in accordance with the standards of the PCAOB. Those standards require that we plan and perform the audit to obtain reasonable assurance about whether the financial statements are free of material misstatement, whether due to error or fraud.
Our audits included performing procedures to assess the risks of material misstatement of the financial statements, whether due to error or fraud, and performing procedures that respond to those risks. Such procedures included examining, on a test basis, evidence regarding the amounts and disclosures in the financial statements. Our audits also included evaluating the accounting principles used and significant estimates made by management, as well as evaluating the overall presentation of the financial statements. Our procedures included confirmation of securities owned as of December 31, 2017 by correspondence with the custodian, transfer agent, and brokers; when replies were not received from brokers, we performed other auditing procedures. We believe that our audits provide a reasonable basis for our opinion.
PricewaterhouseCoopers LLP
San Francisco, California
February 20, 2018
We have served as the auditor of one or more investment companies in the Franklin Templeton Group of Funds since 1948.
| | | | |
44 | | Annual Report | | franklintempleton.com |
TEMPLETON GLOBAL INVESTMENT TRUST
Tax Information (unaudited)
Templeton Emerging Markets Balanced Fund
Under Section 854(b)(1)(B) of the Internal Revenue Code (Code), the Fund hereby reports the maximum amount allowable but no less than $318,730 as qualified dividends for purposes of the maximum rate under Section 1(h)(11) of the Code for the fiscal year ended December 31, 2017. Distributions, including qualified dividend income, paid during calendar year 2017 will be reported to shareholders on Form 1099-DIV by mid-February 2018. Shareholders are advised to check with their tax advisors for information on the treatment of these amounts on their individual income tax returns.
At December 31, 2016, more than 50% of the Fund’s total assets were invested in securities of foreign issuers. In most instances, foreign taxes were withheld from income paid to the Fund on these investments. As shown in the table below, the Fund hereby reports to shareholders the foreign source income and foreign taxes paid, pursuant to Section 853 of the Code. This written statement will allow shareholders of record on March 14, 2017, to treat their proportionate share of foreign taxes paid by the Fund as having been paid directly by them. The shareholder shall consider these amounts as foreign taxes paid in the tax year in which they receive the Fund distribution.
The following table provides a detailed analysis of foreign tax paid, foreign source income, and foreign source qualified dividends as reported by the Fund, to Class A, Class C, Class R, and Advisor Class shareholders of record.
| | | | | | | | | | | | |
| Class | | Foreign Tax Paid
Per Share | | | Foreign Source
Income Per Share | | | Foreign Source Qualified
Dividends Per Share | |
| | | |
| Class A | | | $0.0157 | | | | $0.2860 | | | | $0.0711 | |
| Class C | | | $0.0157 | | | | $0.2320 | | | | $0.0574 | |
| Class R | | | $0.0157 | | | | $0.2762 | | | | $0.0684 | |
| Advisor Class | | | $0.0157 | | | | $0.2983 | | | | $0.0742 | |
Foreign Tax Paid Per Share (Column 1) is the amount per share available to you, as a tax credit (assuming you held your shares in the Fund for a minimum of 16 days during the 31-day period beginning 15 days before the ex-dividend date of the Fund’s distribution to which the foreign taxes relate), or, as a tax deduction.
Foreign Source Income Per Share (Column 2) is the amount per share of income dividends attributable to foreign securities held by the Fund, plus any foreign taxes withheld on these dividends. The amounts reported include foreign source qualified dividends that have not been adjusted for the rate differential applicable to such dividend income.1
Foreign Source Qualified Dividends Per Share (Column 3) is the amount per share of foreign source qualified dividends, plus any foreign taxes withheld on these dividends. These amounts represent the portion of the Foreign Source Income reported to you in column 2 that were derived from qualified foreign securities held by the Fund.1
By mid-February 2018, shareholders will receive Form 1099-DIV which will include their share of taxes paid and foreign source income distributed during the calendar year 2017. The Foreign Source Income reported on Form 1099-DIV has not been adjusted for the rate differential on foreign source qualified dividend income. Shareholders are advised to check with their tax advisors for information on the treatment of these amounts on their 2017 individual income tax returns.
1. Qualified dividends are taxed at reduced long term capital gains tax rates. In determining the amount of foreign tax credit that may be applied against the U.S. tax liability of individuals receiving foreign source qualified dividends, adjustments may be required to the foreign tax credit limitation calculation to reflect the rate differential applicable to such dividend income. The rules however permit certain individuals to elect not to apply the rate differential adjustments for capital gains and/or dividends for any taxable year. Please consult your tax advisor and the instructions to Form 1116 for more information.
| | | | | | |
franklintempleton.com | | | | Annual Report | | 45 |
TEMPLETON GLOBAL INVESTMENT TRUST
TAX INFORMATION (UNAUDITED)
At December 31, 2017, more than 50% of the Fund’s total assets were invested in securities of foreign issuers. In most instances, foreign taxes were withheld from income paid to the Fund on these investments. The Fund elects to treat foreign taxes paid as allowed under Section 853 of the Code. This election will allow shareholders of record as of the first distribution in 2018, to treat their proportionate share of foreign taxes paid by the Fund as having been paid directly by them. The shareholder shall consider these amounts as foreign taxes paid in the tax year in which they receive the Fund distribution.
| | | | |
46 | | Annual Report | | franklintempleton.com |
TEMPLETON GLOBAL INVESTMENT TRUST
Special Meeting of Shareholders
MEETING OF SHAREHOLDERS: OCTOBER 30, 2017 AND RECONVENED ON DECEMBER 15, 2017 AND DECEMBER 29, 2017
(UNAUDITED)
A Special Meeting of Shareholders of Templeton Global Investment Trust was held at the offices of Franklin Templeton Investments, One Franklin Parkway, San Mateo, California on October 30, 2017 and reconvened on December 15, 2017 and December 29, 2017. The purpose of the meeting was to elect Trustees of Templeton Global Investment Trust and to vote on the following proposals: to approve the use of a “manager of managers” structure whereby the Fund’s investment manager would be able to hire and replace subadvisers without shareholder approval and to approve an amended fundamental investment restriction regarding investments in commodities for the Fund. At the meeting, (i) the following persons were elected by the shareholders to serve as Trustees of Templeton Global Investment Trust: Harris J. Ashton, Ann Torre Bates, Mary C. Choksi, Edith E. Holiday, Gregory E. Johnson, Rupert H. Johnson, Jr., J. Michael Luttig, David W. Niemiec, Larry D. Thompson, Constantine D. Tseretopoulos and Robert E. Wade and (ii) the proposals to use a “manager of managers” structure and to approve the amended fundamental investment restriction regarding investments in commodities were approved by shareholders. No other business was transacted at the meeting.
The results of the voting at the meeting are as follows:
| Proposal 1. | To elect a Board of Trustees: |
| | | | | | | | |
| Name | | For | | | Withheld | |
| | |
| Harris J. Ashton | | | 377,048,086 | | | | 10,385,715 | |
| Ann Torre Bates | | | 377,050,303 | | | | 10,383,500 | |
| Mary C. Choksi | | | 377,051,104 | | | | 10,382,699 | |
| Edith E. Holiday | | | 377,043,078 | | | | 10,390,725 | |
| Gregory E. Johnson | | | 377,072,684 | | | | 10,361,119 | |
| Rupert H. Johnson, Jr. | | | 377,077,137 | | | | 10,356,666 | |
| J. Michael Luttig | | | 377,087,793 | | | | 10,346,010 | |
| David W. Niemiec | | | 377,066,180 | | | | 10,367,622 | |
| Larry D. Thompson | | | 377,085,550 | | | | 10,348,252 | |
| Constantine D. Tseretopoulos | | | 377,094,478 | | | | 10,339,323 | |
| Robert E. Wade | | | 377,100,799 | | | | 10,333,003 | |
Total Trust Shares Outstanding*: 656,789,328
* As of the record date.
| | | | | | |
franklintempleton.com | | | | Annual Report | | 47 |
TEMPLETON GLOBAL INVESTMENT TRUST
SPECIAL MEETING OF SHAREHOLDERS
| Proposal 2. | To approve the use of a “manager of managers” structure whereby the Fund’s investment manager would be able to hire and replace subadvisers without shareholder approval: |
| | | | |
| | | Shares | |
| |
For | | | 1,361,089 | |
| |
Against | | | 93,054 | |
| |
Abstain | | | 27,720 | |
| |
Broker Non-Votes | | | 530,622 | |
| |
Total Fund Shares Voted | | | 2,012,484 | |
| |
Total Fund Shares Outstanding* | | | 3,364,038 | |
| Proposal 3. | To approve an amended fundamental investment restriction regarding investments in commodities: |
| | | | |
| | | Shares | |
| |
For | | | 1,384,836 | |
| |
Against | | | 59,988 | |
| |
Abstain | | | 37,037 | |
| |
Broker Non-Votes | | | 530,622 | |
| |
Total Fund Shares Voted | | | 2,012,484 | |
| |
Total Fund Shares Outstanding* | | | 3,364,038 | |
| | | | |
48 | | Annual Report | | franklintempleton.com |
TEMPLETON GLOBAL INVESTMENT TRUST
Board Members and Officers
The name, year of birth and address of the officers and board members, as well as their affiliations, positions held with the Trust, principal occupations during at least the past five years and number of US registered portfolios overseen in the Franklin Templeton Investments fund complex, are shown below. Generally, each board member serves until that person’s successor is elected and qualified.
Independent Board Members
| | | | | | | | |
Name,Year of Birth and Address | | Position | | Length of
Time Served | | Number of Portfolios in
Fund Complex Overseen
by Board Member* | | Other Directorships Held During at Least the Past 5 Years |
| | | | |
Harris J. Ashton (1932) 300 S.E. 2nd Street Fort Lauderdale, FL 33301-1923 | | Trustee | | Since 1994 | | 139 | | Bar-S Foods (meat packing company) (1981-2010). |
Principal Occupation During at Least the Past 5 Years: Director of various companies; and formerly, Director, RBC Holdings, Inc. (bank holding company) (until 2002); and President, Chief Executive Officer and Chairman of the Board, General Host Corporation (nursery and craft centers) (until 1998). |
| | | | |
Ann Torre Bates (1958) 300 S.E. 2nd Street Fort Lauderdale, FL 33301-1923 | | Trustee | | Since 2008 | | 40 | | Ares Capital Corporation (specialty finance company) (2010-present), United Natural Foods, Inc. (distributor of natural, organic and specialty foods) (2013-present), Allied Capital Corporation (financial services) (2003-2010), SLM Corporation (Sallie Mae) (1997-2014) and Navient Corporation (loan management, servicing and asset recovery) (2014-2016). |
Principal Occupation During at Least the Past 5 Years: Director of various companies; and formerly, Executive Vice President and Chief Financial Officer, NHP Incorporated (manager of multifamily housing) (1995-1997); and Vice President and Treasurer, US Airways, Inc. (until 1995). |
| | | | |
Mary C. Choksi (1950) 300 S.E. 2nd Street Fort Lauderdale, FL 33301-1923 | | Trustee | | Since December 2017 | | 139 | | Avis Budget Group Inc. (car rental) (2007-present), Omnicom group Inc. (advertising and marketing communications services) (2011-present) and White Mountains Insurance Group, Ltd. (holding company) (2017-present). |
Principal Occupation During at Least the Past 5 Years: Director of various companies; and formerly, Founder and Senior Advisor, Strategic Investment Group (investment management group) (2015-2017); Founding Partner and Senior Managing Director, Strategic Investment Group (1987-2015); Founding Partner and Managing Director, Emerging Markets Management LLC (investment management firm) (1987-2011); and Loan Officer/Senior Loan Officer/Senior Pension Investment Officer, World Bank Group (international financial institution) (1977-1987). |
| | | | |
Edith E. Holiday (1952) 300 S.E. 2nd Street Fort Lauderdale, FL 33301-1923 | | Lead
Independent
Trustee | | Trustee since 1996 and Lead Independent Trustee since 2007 | | 139 | | Hess Corporation (exploration of oil and gas) (1993-present), Canadian National Railway (railroad) (2001-present), White Mountains Insurance Group, Ltd. (holding company) (2004-present), Santander Consumer USA Holdings, Inc. (consumer finance) (2016-present), RTI International Metals, Inc. (manufacture and distribution of titanium (1999-2015) and H.J. Heinz Company (processed foods and allied products) (1994-2013). |
Principal Occupation During at Least the Past 5 Years: Director or Trustee of various companies and trusts; and formerly, Assistant to the President of the United States and Secretary of the Cabinet (1990-1993); General Counsel to the United States Treasury Department (1989-1990); and Counselor to the Secretary and Assistant Secretary for Public Affairs and Public Liaison-United States Treasury Department (1988-1989). |
| | | | |
franklintempleton.com | | Annual Report | | 49 |
TEMPLETON GLOBAL INVESTMENT TRUST
Independent Board Members (continued)
| | | | | | | | |
Name, Year of Birth and Address | | Position | | Length of
Time Served | | Number of Portfolios in
Fund Complex Overseen
by Board Member* | | Other Directorships Held
During at Least the Past 5 Years |
| | | | |
J. Michael Luttig (1954) 300 S.E. 2nd Street Fort Lauderdale, FL 33301-1923 | | Trustee | | Since 2009 | | 139 | | Boeing Capital Corporation (aircraft financing) (2006-2013). |
Principal Occupation During at Least the Past 5 Years: Executive Vice President, General Counsel and member of the Executive Council, The Boeing Company (aerospace company) (2006-present); and formerly, Federal Appeals Court Judge, U.S. Court of Appeals for the Fourth Circuit (1991-2006). |
| | | | |
David W. Niemiec (1949) 300 S.E. 2nd Street Fort Lauderdale, FL 33301-1923 | | Trustee | | Since 2006 | | 40 | | Hess Midstream Partners LP (oil and gas midstream infrastructure) (2017-present). |
Principal Occupation During at Least the Past 5 Years: Advisor, Saratoga Partners (private equity fund); and formerly, Managing Director, Saratoga Partners (1998-2001) and SBC Warburg Dillon Read (investment banking) (1997-1998); Vice Chairman, Dillon, Read & Co. Inc. (investment banking) (1991-1997); and Chief Financial Officer, Dillon, Read & Co. Inc. (1982-1997). |
| | | | |
Larry D. Thompson (1945) 300 S.E. 2nd Street Fort Lauderdale, FL 33301-1923 | | Trustee | | Since 2006 | | 139 | | The Southern Company (energy company) (2014-present; previously 2010-2012), Graham Holdings Company (education and media organization) (2011-present) and Cbeyond, Inc. (business communications provider) (2010-2012). |
Principal Occupation During at Least the Past 5 Years: Director of various companies; Counsel, Finch McCranie, LLP (law firm) (2015-present); Independent Compliance Monitor and Auditor, Volkswagen AG (manufacturer of automobiles and commercial vehicles) (2017-present ); John A. Sibley Professor of Corporate and Business Law, University of Georgia School of Law (2015-present; previously 2011-2012); and formerly, Executive Vice President - Government Affairs, General Counsel and Corporate Secretary, PepsiCo, Inc. (consumer products) (2012-2014); Senior Vice President - Government Affairs, General Counsel and Secretary, PepsiCo, Inc. (2004-2011); Senior Fellow of The Brookings Institution (2003-2004); Visiting Professor, University of Georgia School of Law (2004); and Deputy Attorney General, U.S. Department of Justice (2001-2003). |
| | | | |
Constantine D. Tseretopoulos (1954) 300 S.E. 2nd Street Fort Lauderdale, FL 33301-1923 | | Trustee | | Since 2001 | | 26 | | None |
Principal Occupation During at Least the Past 5 Years: Physician, Chief of Staff, owner and operator of the Lyford Cay Hospital (1987-present); director of various nonprofit organizations; and formerly, Cardiology Fellow, University of Maryland (1985-1987); and Internal Medicine Resident, Greater Baltimore Medical Center (1982-1985). |
| | | | |
Robert E. Wade (1946) 300 S.E. 2nd Street Fort Lauderdale, FL 33301-1923 | | Trustee | | Since 2006 | | 40 | | El Oro Ltd (investments) (2003-present). |
Principal Occupation During at Least the Past 5 Years: Attorney at law engaged in private practice as a sole practitioner (1972-2008) and member of various boards. |
| | | | |
50 | | Annual Report | | franklintempleton.com |
TEMPLETON GLOBAL INVESTMENT TRUST
Interested Board Members and Officers
| | | | | | | | |
Name,Year of Birth
and Address | | Position | | Length of
Time Served | | Number of Portfolios in
Fund Complex Overseen
by Board Member* | | Other Directorships Held
During at Least the Past 5 Years |
**Gregory E. Johnson (1961) One Franklin Parkway San Mateo, CA 94403-1906 | | Trustee | | Since 2006 | | 153 | | None |
Principal Occupation During at Least the Past 5 Years: Chairman of the Board, Member – Office of the Chairman, Director and Chief Executive Officer, Franklin Resources, Inc.; officer and/or director or trustee, as the case may be, of some of the other subsidiaries of Franklin Resources, Inc. and of 43 of the investment companies in Franklin Templeton Investments; Vice Chairman, Investment Company Institute; and formerly, President, Franklin Resources, Inc. (1994-2015). |
| | | | |
**Rupert H. Johnson, Jr. (1940) One Franklin Parkway San Mateo, CA 94403-1906 | | Chairman of the Board, Trustee and Vice President | | Chairman of the Board and Trustee since 2013 and Vice President since 1996 | | 139 | | None |
Principal Occupation During at Least the Past 5 Years: Vice Chairman, Member – Office of the Chairman and Director, Franklin Resources, Inc.; Director, Franklin Advisers, Inc.; Senior Vice President, Franklin Advisory Services, LLC; and officer and/or director or trustee, as the case may be, of some of the other subsidiaries of Franklin Resources, Inc. and of 41 of the investment companies in Franklin Templeton Investments. |
| | | | |
Alison E. Baur (1964) One Franklin Parkway San Mateo, CA 94403-1906 | | Vice President | | Since 2012 | | Not Applicable | | Not Applicable |
Principal Occupation During at Least the Past 5 Years: Deputy General Counsel, Franklin Templeton Investments; and officer of some of the other subsidiaries of Franklin Resources, Inc. and of 45 of the investment companies in Franklin Templeton Investments. |
| | | | |
Norman J. Boersma (1957) Lyford Cay Nassau, Bahamas | | President and Chief Executive Officer – Investment Management | | Since 2012 | | Not Applicable | | Not Applicable |
Principal Occupation During at Least the Past 5 Years: Chairman of the Board, President and Chief Executive Officer, Templeton Global Advisors Ltd.; Chief Investment Officer of Templeton Global Equity Group; officer of six of the investment companies in Franklin Templeton Investments; and formerly, Executive Vice President, Franklin Templeton Investments Corp. (1993-2014). |
| | | | |
Aliya S. Gordon (1973) One Franklin Parkway San Mateo, CA 94403-1906 | | Vice President | | Since 2009 | | Not Applicable | | Not Applicable |
Principal Occupation During at Least the Past 5 Years: Senior Associate General Counsel, Franklin Templeton Investments; and officer of 45 of the investment companies in Franklin Templeton Investments. |
| | | | |
Steven J. Gray (1955) One Franklin Parkway San Mateo, CA 94403-1906 | | Vice President | | Since 2009 | | Not Applicable | | Not Applicable |
Principal Occupation During at Least the Past 5 Years: Senior Associate General Counsel, Franklin Templeton Investments; Vice President, Franklin Templeton Distributors, Inc. and FASA, LLC; and officer of 45 of the investment companies in Franklin Templeton Investments. |
| | | | |
Matthew T. Hinkle (1971) One Franklin Parkway San Mateo, CA 94403-1906 | | Chief Executive Officer – Finance and Administration | | Since June 2017 | | Not Applicable | | Not Applicable |
Principal Occupation During at Least the Past 5 Years: Senior Vice President, Franklin Templeton Services, LLC; officer of 45 of the investment companies in Franklin Templeton Investments; and formerly, Vice President, Global Tax (2012-April 2017) and Treasurer/Assistant Treasurer, Franklin Templeton Investments (2009-2017). |
| | | | |
franklintempleton.com | | Annual Report | | 51 |
TEMPLETON GLOBAL INVESTMENT TRUST
Interested Board Members and Officers (continued)
| | | | | | | | |
Name,Year of Birth
and Address | | Position | | Length of
Time Served | | Number of Portfolios in
Fund Complex Overseen
by Board Member* | | Other Directorships Held
During at Least the Past 5 Years |
| | | | |
Robert G. Kubilis (1973) 300 S.E. 2nd Street Fort Lauderdale, FL 33301-1923 | | Chief Financial Officer, Chief Accounting Officer and Treasurer | | Since June 2017 | | Not Applicable | | Not Applicable |
Principal Occupation During at Least the Past 5 Years: Treasurer, U.S. Fund Administration & Reporting, Franklin Templeton Investments; and officer of 17 of the investment companies in Franklin Templeton Investments. |
| | | | |
Robert Lim (1948) One Franklin Parkway San Mateo, CA 94403-1906 | | Vice President –AML Compliance | | Since 2016 | | Not Applicable | | Not Applicable |
Principal Occupation During at Least the Past 5 Years: Vice President, Franklin Templeton Companies, LLC; Chief Compliance Officer, Franklin Templeton Distributors, Inc. and Franklin Templeton Investor Services, LLC; and officer of 45 of the investment companies in Franklin Templeton Investments. |
| | | | |
Kimberly H. Novotny (1972) 300 S.E. 2nd Street Fort Lauderdale, FL 33301-1923 | | Vice President | | Since 2013 | | Not Applicable | | Not Applicable |
Principal Occupation During at Least the Past 5 Years: Associate General Counsel, Franklin Templeton Investments; Vice President and Corporate Secretary, Fiduciary Trust International of the South; Vice President, Templeton Investment Counsel, LLC; Assistant Secretary, Franklin Resources, Inc.; and officer of 45 of the investment companies in Franklin Templeton Investments. |
| | | | |
Robert C. Rosselot (1960) 300 S.E. 2nd Street Fort Lauderdale, FL 33301-1923 | | Chief Compliance Officer | | Since 2013 | | Not Applicable | | Not Applicable |
Principal Occupation During at Least the Past 5 Years: Director, Global Compliance, Franklin Templeton Investments; Vice President, Franklin Templeton Companies, LLC; officer of 45 of the investment companies in Franklin Templeton Investments; and formerly, Senior Associate General Counsel, Franklin Templeton Investments (2007-2013); and Secretary and Vice President, Templeton Group of Funds (2004-2013). |
| | | | |
Karen L. Skidmore (1952) One Franklin Parkway San Mateo, CA 94403-1906 | | Vice President | | Since 2009 | | Not Applicable | | Not Applicable |
Principal Occupation During at Least the Past 5 Years: Senior Associate General Counsel, Franklin Templeton Investments; and officer of 45 of the investment companies in Franklin Templeton Investments. |
| | | | |
Navid J. Tofigh (1972) One Franklin Parkway San Mateo, CA 94403-1906 | | Vice President | | Since 2015 | | Not Applicable | | Not Applicable |
Principal Occupation During at Least the Past 5 Years: Associate General Counsel, Franklin Templeton Investments; and officer of 45 of the investment companies in Franklin Templeton Investments. |
| | | | |
Craig S. Tyle (1960) One Franklin Parkway San Mateo, CA 94403-1906 | | Vice President | | Since 2005 | | Not Applicable | | Not Applicable |
Principal Occupation During at Least the Past 5 Years: General Counsel and Executive Vice President, Franklin Resources, Inc.; and officer of some of the other subsidiaries of Franklin Resources, Inc. and of 45 of the investment companies in Franklin Templeton Investments. |
| | | | |
52 | | Annual Report | | franklintempleton.com |
TEMPLETON GLOBAL INVESTMENT TRUST
Interested Board Members and Officers (continued)
| | | | | | | | |
Name, Year of Birth and Address | | Position | | Length of
Time Served | | Number of Portfolios in
Fund Complex Overseen
by Board Member* | | Other Directorships Held
During at Least the Past 5 Years |
| | | | |
Lori A. Weber (1964) 300 S.E. 2nd Street Fort Lauderdale, FL 33301-1923 | | Secretary
and Vice
President | | Secretary since
2013 and Vice
President since
2011 | | Not Applicable | | Not Applicable |
|
Principal Occupation During at Least the Past 5 Years: Senior Associate General Counsel, Franklin Templeton Investments; Assistant Secretary, Franklin Resources, Inc.; Vice President and Secretary, Templeton Investment Counsel, LLC; and officer of 45 of the investment companies in Franklin Templeton Investments. |
*We base the number of portfolios on each separate series of the US registered investment companies within the Franklin Templeton Investments fund complex. These portfolios have a common investment manager or affiliated investment managers.
**Gregory E. Johnson is considered to be an interested person of the Fund under the federal securities laws due to his position as an officer and director of Franklin Resources, Inc. (Resources), which is the parent company of the Fund’s investment manager and distributor. Rupert H. Johnson, Jr. is considered to be an interested person of the Fund under the federal securities laws due to his position as officer and director and major shareholder of Resources.
Note 1: Rupert H. Johnson, Jr. is the uncle of Gregory E. Johnson.
Note 2: Officer information is current as of the date of this report. It is possible that after this date, information about officers may change.
The Sarbanes-Oxley Act of 2002 and Rules adopted by the US Securities and Exchange Commission require the Fund to disclose whether the Fund’s Audit Committee includes at least one member who is an audit committee financial expert within the meaning of such Act and Rules. The Fund’s Board has determined that there is at least one such financial expert on the Audit Committee and has designated each of Ann Torre Bates and David W. Niemiec as an audit committee financial expert. The Board believes that Ms. Bates and Mr. Niemiec qualify as such an expert in view of their extensive business background and experience. Ms. Bates has served as a member of the Fund Audit Committee since 2008. She currently serves as a director of Ares Capital Corporation (2010-present) and United Natural Foods, Inc. (2013-present) and was formerly a director of Navient Corporation from 2014 to 2016, SLM Corporation from 1997 to 2014 and Allied Capital Corporation from 2003 to 2010, Executive Vice President and Chief Financial Officer of NHP Incorporated from 1995 to 1997 and Vice President and Treasurer of US Airways, Inc. until 1995. Mr. Niemiec has served as a member of the Fund Audit Committee since 2006, currently serves as an Advisor to Saratoga Partners and was formerly its Managing Director from 1998 to 2001 and serves as a director of Hess Midstream Partners LP (2017-present). Mr. Niemiec was formerly a director of Emeritus Corporation from 1999 to 2010 and OSI Pharmaceuticals, Inc. from 2006 to 2010, Managing Director of SBC Warburg Dillon Read from 1997 to 1998, and was Vice Chairman from 1991 to 1997 and Chief Financial Officer from 1982 to 1997 of Dillon, Read & Co. Inc. As a result of such background and experience, the Board believes that Ms. Bates and Mr. Niemiec have each acquired an understanding of generally accepted accounting principles and financial statements, the general application of such principles in connection with the accounting estimates, accruals and reserves, and analyzing and evaluating financial statements that present a breadth and level of complexity of accounting issues generally comparable to those of the Fund, as well as an understanding of internal controls and procedures for financial reporting and an understanding of audit committee functions. Ms. Bates and Mr. Niemiec are independent Board members as that term is defined under the applicable US Securities and Exchange Commission Rules and Releases.
The Statement of Additional Information (SAI) includes additional information about the board members and is available, without charge, upon request. Shareholders may call (800) DIAL BEN/342-5236 to request the SAI.
| | | | | | |
franklintempleton.com | | | | Annual Report | | 53 |
TEMPLETON GLOBAL INVESTMENT TRUST
TEMPLETON EMERGING MARKETS BALANCED FUND
Shareholder Information
Proxy Voting Policies and Procedures
The Fund’s investment manager has established Proxy Voting Policies and Procedures (Policies) that the Fund uses to determine how to vote proxies relating to portfolio securities. Shareholders may view the Fund’s complete Policies online at franklintempleton.com. Alternatively, shareholders may request copies of the Policies free of charge by calling the Proxy Group collect at (954) 527-7678 or by sending a written request to: Franklin Templeton Companies, LLC, 300 S.E. 2nd Street, Fort Lauderdale, FL 33301, Attention: Proxy Group. Copies of the Fund’s proxy voting records are also made available online at franklintempleton.com and posted on the US Securities and Exchange Commission’s website at sec.gov and reflect the most recent 12-month period ended June 30.
Quarterly Statement of Investments
The Trust, on behalf of the Fund, files a complete statement of investments with the US Securities and Exchange Commission for the first and third quarters for each fiscal year on Form N-Q. Shareholders may view the filed Form N-Q by visiting the Commission’s website at sec.gov. The filed form may also be viewed and copied at the Commission’s Public Reference Room in Washington, DC. Information regarding the operations of the Public Reference Room may be obtained by calling (800) SEC-0330.
Householding of Reports and Prospectuses
You will receive the Fund’s financial reports every six months as well as an annual updated summary prospectus (prospectus available upon request). To reduce Fund expenses, we try to identify related shareholders in a household and send only one copy of the financial reports and summary prospectus. This process, called “householding,” will continue indefinitely unless you instruct us otherwise. If you prefer not to have these documents householded, please call us at (800) 632-2301. At any time you may view current prospectuses/summary prospectuses and financial reports on our website. If you choose, you may receive these documents through electronic delivery.
| | | | |
54 | | Annual Report | | franklintempleton.com |
This page intentionally left blank.
This page intentionally left blank.
| | |

| | Annual Report and Shareholder Letter Templeton Emerging Markets Balanced Fund |
| | Investment Manager |
| | Templeton Asset Management Ltd. |
| | Subadvisor |
| | Franklin Advisers, Inc. |
| | Distributor |
| | Franklin Templeton Distributors, Inc. (800) DIAL BEN® / 342-5236 franklintempleton.com |
| | Shareholder Services |
| | (800) 632-2301 |
Authorized for distribution only when accompanied or preceded by a summary prospectus and/or prospectus. Investors should carefully consider a fund’s investment goals, risks, charges and expenses before investing. A prospectus contains this and other information; please read it carefully before investing.
To help ensure we provide you with quality service, all calls to and from our service areas are monitored and/or recorded.
| | |
| © 2018 Franklin Templeton Investments. All rights reserved. | | 080 A 02/18 |

Annual Report and Shareholder Letter December 31, 2017 Tampleton Global Balanced Fund A SERIES OF TEMPLETON GLOBAL INVESTMENT TRUST Sign up for electronic delivery at franklintempleton.com/edelivery
Franklin Templeton Investments
Gain From Our Perspective®
At Franklin Templeton Investments, we’re dedicated to one goal: delivering exceptional asset management for our clients. By bringing together multiple, world-class investment teams in a single firm, we’re able to offer specialized expertise across styles and asset classes, all supported by the strength and resources of one of the world’s largest asset managers. This has helped us to become a trusted partner to individual and institutional investors across the globe.
Dear Shareholder:
During the 12 months ended December 31, 2017, the global economy generally expanded amid improved commodity prices, generally upbeat economic data, encouraging corporate earnings and the European Central Bank’s (ECB’s) extension of its monetary easing time frame. The ECB kept its benchmark interest rate unchanged, while the US Federal Reserve (Fed) raised its target range for the federal funds rate 0.25% three times in 2017 to 1.25%–1.50% amid signs of a growing US economy. In this environment, global developed and emerging market stocks, as measured by the MSCI All Country World Index, generated a +24.62% total return.1 Global government and corporate bonds, as measured by the Bloomberg Barclays Multiverse Index, posted a +7.69% total return.1
We are committed to our long-term perspective and disciplined investment approach as we conduct a rigorous, fundamental analysis of securities with a regular emphasis on investment risk management.
Historically, patient investors have achieved rewarding results by evaluating their goals, diversifying their assets globally and maintaining a disciplined investment program, all hallmarks of the Templeton investment philosophy developed more than 60 years ago. We continue to recommend investors consult their financial advisors and review their portfolios to design a long-term strategy and portfolio allocation that meet their individual needs, goals and risk tolerance.
Templeton Global Balanced Fund’s annual report includes more detail about prevailing conditions and a discussion about investment decisions during the period. Please remember all securities markets fluctuate, as do mutual fund share prices.
We thank you for investing with Franklin Templeton, welcome your questions and comments, and look forward to serving your investment needs in the years ahead.
Sincerely,

Norman J. Boersma, CFA
President and Chief Executive Officer –
Investment Management
Templeton Global Investment Trust
This letter reflects our analysis and opinions as of December 31, 2017, unless otherwise indicated. The information is not a complete analysis of every aspect of any market, country, industry, security or fund. Statements of fact are from sources considered reliable.
CFA® is a trademark owned by CFA Institute.
1. Source: Morningstar.
See www.franklintempletondatasources.com for additional data provider information.
| | | | | | |
| | | Not FDIC Insured | | | May Lose Value | | | No Bank Guarantee |
| | | | |
| | | |
franklintempleton.com | | Not part of the annual report | | 1 |
Contents
Visit franklintempleton.com for fund updates, to access your account, or to find helpful financial planning tools.
| | | | |
| | | |
2 | | Annual Report | | franklintempleton.com |
Annual Report
Templeton Global Balanced Fund
This annual report for Templeton Global Balanced Fund covers the fiscal year ended December 31, 2017.
Your Fund’s Goal and Main Investments
The Fund seeks both income and capital appreciation. Under normal market conditions, the Fund invests in a diversified portfolio of debt and equity securities worldwide. The Fund normally invests at least 25% of its assets in fixed income securities and at least 25% of its assets in equity securities. The Fund’s equity component generally consists of stocks of companies from a variety of industries located anywhere in the world, including developing markets, that offer or could offer the opportunity to realize capital appreciation and/or attractive dividend yields. The Fund’s fixed income component primarily consists of developed and developing country government and agency bonds and investment-grade and below investment-grade corporate and emerging market debt securities that offer the opportunity to realize income.
Performance Overview
The Fund’s Class A shares delivered a +12.18% cumulative total return for the 12 months under review. In comparison, global equity and fixed income markets, as measured by the Fund’s benchmark, an equally weighted combination of the MSCI All Country World Index (ACWI) and the Bloomberg Barclays Multiverse Index, posted a +15.89% cumulative total return for the same period.1 You can find the Fund’s long-term performance data in the Performance Summary beginning on page 9.
Performance data represent past performance, which does not guarantee future results. Investment return and principal value will fluctuate, and you may have a gain or loss when you sell your shares. Current performance may differ from figures shown. For most recent month-end performance, go to franklintempleton.com or call (800) 342-5236.
Asset Allocation*
Based on Total Net Assets as of 12/31/17
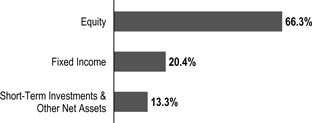
*Figures represent the net Fund exposure and include certain derivatives held in the portfolio (or their underlying reference assets) or unsettled trades and may not total 100% or may be negative due to rounding, use of any derivatives or other factors.
Economic and Market Overview
The global economy grew moderately during the 12-month period under review. In this environment, global developed and emerging market stocks generated a +24.62% total return, as measured by the MSCI ACWI.2 Global markets were aided by price gains in oil and other commodities, generally upbeat economic data across regions, the European Central Bank’s (ECB’s) extension of its monetary easing program, and investor optimism about pro-growth and pro-business policies in the US. The prospect for reforms in the European Union (EU) with Emmanuel Macron’s election as France’s president, encouraging corporate earnings reports and the passage of the US tax reform bill also supported global stocks.
However, global markets reflected investor concerns about the terms of the UK’s exit from the EU, political uncertainty in the US and the EU, and geopolitical tensions in the Korean peninsula and other regions. Other concerns included the health of European banks, global oil oversupply despite a pact by major oil-producing countries to extend production cuts, and comments from key central bankers around the world about potentially raising interest rates.
After strengthening in 2017’s second and third quarters, the US economy moderated in the fourth quarter. The economy grew
1. Source: Morningstar. The Fund’s benchmark is currently weighted 50% for the MSCI ACWI and 50% for the Bloomberg Barclays Multiverse Index and is rebalanced monthly. For the 12 months ended 12/31/17, the MSCI ACWI posted a +24.62% total return and the Bloomberg Barclays Multiverse Index posted a +7.69% total return. The indexes are unmanaged and include reinvestment of any income or distributions. They do not reflect any fees, expenses or sales charges. One cannot invest directly in an index, and an index is not representative of the Fund’s portfolio.
2. Source: US Bureau of Labor Statistics.
The dollar value, number of shares or principal amount, and names of all portfolio holdings are listed in the Fund’s Consolidated Statement of Investments (SOI). The Consolidated SOI begins on page 20.
| | | | |
| | | |
franklintempleton.com | | Annual Report | | 3 |
TEMPLETON GLOBAL BALANCED FUND
faster in 2017 than in 2016, however, largely due to growth in consumer spending, business investment and exports. The unemployment rate decreased from 4.7% in December 2016 to 4.1% at period-end.2 Annual inflation, as measured by the Consumer Price Index, was 2.1% in December 2016, and while it varied over the 12-month period, remained unchanged at period-end.2 The US Federal Reserve (Fed) raised its target range for the federal funds rate 0.25% three times during the period, amid signs of a growing US economy, strengthening labor market and improving business spending. At its December meeting, the Fed confirmed that the monthly balance sheet reduction would increase from US$10 billion to US$20 billion beginning in January 2018.
In Europe, the UK’s economic growth moderated in 2017 compared to 2016, largely due to slower growth in the services sector. In November, the Bank of England raised its key policy rate 0.25%, its first increase in a decade. The eurozone’s growth accelerated in 2017’s second and third quarters, but moderated in the fourth quarter. However, the eurozone’s 2017 economic growth rate was the fastest in a decade. The bloc’s annual inflation rate, while low, ended higher than in December 2016. The ECB kept its benchmark interest rate unchanged during the period. However, at its October meeting, the ECB extended the time frame for its massive bond-buying program from December 2017 to at least September 2018, while reducing the amount of monthly bond purchases in half beginning in January 2018.
In Asia, Japan’s quarterly gross domestic product (GDP) grew for the seventh consecutive quarter, although third-quarter 2017 growth was lower than the previous quarter. The Bank of Japan (BOJ) left its benchmark interest rate unchanged during the period and continued its monetary stimulus measures.
In emerging markets, Brazil’s quarterly GDP grew for the third consecutive quarter, although third-quarter 2017 growth slowed from the previous quarter. The country’s central bank cut its benchmark interest rate several times during the period to spur economic growth. Russia’s GDP grew in 2017’s first three quarters compared to the prior-year periods, amid the Bank of Russia’s continued policy support. China’s GDP grew faster in 2017 than in 2016, supported by solid growth in industrial production, services, fixed-asset investment, retail sales, and imports and exports. The People’s Bank of China left its benchmark interest rate unchanged during the period. Overall, emerging market stocks, as measured by the MSCI Emerging Markets (EM) Index, rose substantially during the period.
The year began with a rally in EM bonds, as fourth-quarter 2016 fears for potential trade shocks dissipated. Capital moved into several markets we considered undervalued at a pace not seen in a number of years. The strengthening trends in specific EMs largely continued throughout much of 2017, particularly in select areas of Latin America and Asia.
Duration exposures around the world generally performed well during the year, as rates in developed markets remained relatively low or range-bound, while a number of EM local-currency markets saw declining yields and strengthening valuations.
The 10-year US Treasury note reached its highest yield of 2017 at 2.62% on March 13, two days before the Fed made its first rate hike of 2017. However, yields declined in the second and third quarters as policy setbacks from the Trump administration and subdued inflation figures appeared to dampen expectations for higher rates.
Those negative trends began to reverse in the fall months as Fed Chair Janet Yellen returned from Jackson Hole, Wyoming, with more hawkish-sounding comments on the need to normalize monetary policy. Additionally, a moderate pickup in inflation, exceptional strength in US labor markets, progress on tax reform and a new Fed chair nomination (Jay Powell) appeared to push rate expectations higher, in our opinion. The Fed also began unwinding its nearly $4.5 trillion balance sheet in October. Ultimately, the Fed raised rates 25 basis points three times in 2017, as it indicated it would.
On the currency front, the US dollar broadly weakened during much of the year, with notable weakness against the euro and Mexican peso during the summer months. Those trends moderately reversed in September and October, before resuming over the final two months of the year, leaving the US dollar broadly weaker in 2017.
In Europe, economic optimism surged in the summer months, driven by the cyclical upswing in eurozone growth as well as some political refortifying after Emmanuel Macron’s victory in the French election in May. The euro appreciated 13.85% against the US dollar during the year.3 However, growing populist/nationalist movements in a number of countries continued to test the political cohesion across the eurozone. Angela Merkel’s win in the German election in September came with new uncertainties around forming a coalition government.
3. Source: FactSet.
| | | | | | |
4 | | Annual Report | | | | franklintempleton.com |
TEMPLETON GLOBAL BALANCED FUND
In October, ECB President Mario Draghi announced a reduction in the ECB’s bond-buying program, as expected, to €30 billion per month, down from a €60 billion monthly pace, scheduled to begin in January 2018. Draghi also indicated that rates would not be hiked until quantitative easing (QE) ends, implying that rates would likely remain unchanged in the upcoming year.
In Japan, Prime Minister Shinzo Abe’s political mandate was reaffirmed after his political coalition maintained its supermajority in October elections. The BOJ continued to deploy massive levels of QE throughout 2017; however, the yen appreciated 3.54% against the US dollar during the year.3
Investment Strategy
We search for undervalued or out-of-favor debt and equity securities and for equity securities that offer or may offer current income. When choosing equity securities for the Fund, we use a bottom-up, value-oriented, long-term approach, focusing on the market price of a security relative to our evaluation of the company’s long-term earnings, asset value and cash flow potential, as reflected by various metrics, including the company’s price/earnings ratio, price/cash flow ratio, price/book value and discounted cash flow. Because this is a global fund, we analyze global economic trends to identify global macro trends (for example, regions with strong economic growth), and evaluate market inefficiencies to identify investment opportunities stemming from market mispricings.
When choosing fixed income investments for the Fund, we perform an independent analysis of the securities being considered for the Fund’s portfolio, rather than relying principally on their ratings assigned by rating agencies. In our analysis of corporate debt securities, we consider a variety of factors, including a company’s experience and managerial strength; responsiveness to changes in interest rates and business conditions; debt maturity schedules and borrowing requirements; a company’s changing financial condition and market recognition of the change; and a security’s relative value based on such factors as anticipated cash flow, interest or dividend coverage, asset coverage and earnings prospects. With respect to sovereign debt securities, we consider market, political and economic conditions, and evaluate interest and currency exchange rate changes and credit risks. We regularly enter into currency-related transactions involving certain derivative instruments, principally currency and cross currency forwards, but we may also use other derivative instruments, to provide a hedge against risks associated with other securities held in the Fund or to implement a currency investment
Geographic Composition*
Based on Total Net Assets as of 12/31/17
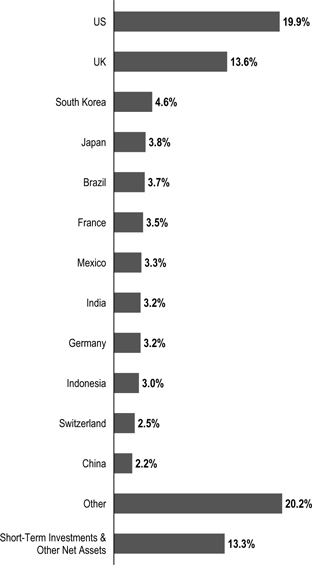
*Figures represent the net Fund exposure and include certain derivatives held in the portfolio (or their underlying reference assets) and may not total 100% or may be negative due to rounding, use of any derivatives or other factors.
strategy. The use of these derivative transactions may allow the Fund to obtain net long or net short exposures to selected currencies, interest rates, countries, durations or credit risks, and may be used for hedging purposes.
| | |
| |
| | \What is a currency forward contract? A currency forward contract is an agreement between the Fund and a counterparty to buy or sell a foreign currency in exchange for another currency at a specific exchange rate on a future date. Currency forward contracts are privately traded in the interbank market, not on a centralized exchange.
|
| | | | | | |
franklintempleton.com | | | | Annual Report | | 5 |
TEMPLETON GLOBAL BALANCED FUND
Manager’s Discussion
We maintained the Fund’s asset allocation in favor of equities during the period given what we considered attractive valuation and yield opportunities in the equity markets. Within fixed income, we sought to take advantage of valuation opportunities in countries with favorable growth prospects, low indebtedness and higher reserves.
Equity
The Fund’s equity portion delivered strong absolute gains during the 12 months under review. However, it underperformed its benchmark, the MSCI ACWI, primarily due to stock selection and an overweighting in the health care sector, as well as underweightings and stock selection in the information technology (IT) and consumer discretionary sectors.4
In the health care sector, continued concerns about generic competition, increasing regulatory and political scrutiny on drug pricing and a consolidating payor industry broadly pressured health care stocks throughout 2017. We view such concerns as both short-term focused and overstated. Generic competition is common in the pharmaceuticals industry, and one best addressed through innovation, which has accelerated following the doubling of research and development investment over the past 30 years. In our analysis, the regulatory and political concerns about pricing ignore data indicating prescription drugs represent a relatively modest portion of US health care costs and actually reduce costs elsewhere in the health care system. Moreover, the structure of the pharmacy benefits management industry has long been dominated by a small number of firms, and drug companies are accustomed to dealing with this structure; thus, we think a bit more merger and acquisition (M&A) activity in the industry would be unlikely to meaningfully change bargaining power dynamics. The overblown concerns have depressed valuations such that the sector today has rarely been cheaper historically based on free cash flow multiples, according to our analysis. It is rare to find highly cash-generative, innovative businesses with enormous growth potential trading in what we consider deep value territory, but we see select biotechnology and specialty pharmaceuticals firms offering just such potential opportunities. Key detractors within the sector included
Top Five Equity Holdings
12/31/17
| | | | |
Company Sector/Industry, Country | | % of Total
Net Assets | |
BP PLC | | | 1.9% | |
Oil, Gas & Consumable Fuels, UK | | | | |
Royal Dutch Shell PLC | | | 1.9% | |
Oil, Gas & Consumable Fuels, UK | | | | |
Oracle Corp. | | | 1.7% | |
Software, US | | | | |
Eni SpA | | | 1.5% | |
Oil, Gas & Consumable Fuels, Italy | | | | |
Samsung Electronics Co. Ltd. | | | 1.4% | |
Technology Hardware, Storage & Peripherals, South Korea | |
Israel-based generic drug manufacturer Teva Pharmaceutical Industries and US biotechnology firm Allergan.
In the IT sector, Japan-based Konica Minolta significantly detracted from relative results as the company forecast a drop in operating profit for 2018. We closed the Fund’s position in the company during the period.
In the consumer discretionary sector, shares of Luxembourg-based satellite and network services provider SES declined after management delivered two consecutive quarters of disappointing results, citing one-off headwinds and delayed revenues attributable to a changing business model. The string of disappointing results cast doubts on management’s credibility and led to a stock price decline and lower valuation multiples. We see the decline as implying the stock is trading at replacement cost for a business with very high barriers to entry and valuable orbital satellite slots that cannot be replicated. Additionally, the company’s solid dividend and free cash flow yields, as well as a contract backlog equivalent to four years of revenue, lead us to believe the stock has remained undervalued.
Conversely, stock selection in the financials and telecommunication services sectors and an underweighting in the consumer staples sector contributed to relative performance during the 12-month period.5
In the financials sector, shares of Bangkok Bank, Thailand’s second-largest bank, rose amid signs of the country’s
4. The health care sector comprises biotechnology, health care providers and services, and pharmaceuticals in the equity portion of the Consolidated SOI. The IT sector comprises electronic equipment, instruments and components; internet software and services; semiconductors and semiconductor equipment; software; and technology hardware, storage and peripherals in the equity portion of the Consolidated SOI. The consumer discretionary sector comprises auto components; hotels, restaurants and leisure; household durables; leisure products; media; and specialty retail in the equity portion of the Consolidated SOI.
5. The financials sector comprises banks, capital markets and insurance in the equity portion of the Consolidated SOI. The telecommunication services sector comprises diversified telecommunication services and wireless telecommunication services in the equity portion of the Consolidated SOI. The consumer staples sector comprises beverages, food and staples retailing and personal products in the equity portion of the Consolidated SOI.
See www.franklintempletondatasources.com for additional data provider information.
| | | | | | |
6 | | Annual Report | | | | franklintempleton.com |
TEMPLETON GLOBAL BALANCED FUND
improving economy and investor’s better sentiment toward banks overall. Over the long term, we believe the bank’s market-leading position in corporate lending and strong funding profile could make it a key beneficiary of increased business and government spending when the country’s economy picks up again. South Korea-based Hana Financial Group’s shares rose amid the company’ improved risk management, which resulted in lower loan losses, while net interest income growth and profitability have increased strongly. UK-based Man Group (not part of the index), an alternative investment manager, was another financials contributor. Man Group continued to experience positive business momentum with sustained net inflows, and we view favorably management’s diversification of the business through M&A activity.
Within the telecommunication services sector, Telenor, Norway’s leading telecommunication services provider, was the largest performance contributor. The company has a strong footprint in emerging Asia and has benefited from exiting loss-making Indian operations and from increased spectrum supply for auctions in Thailand. These developments improved balance-sheet flexibility and eased investor concerns about Telenor’s ability to increase dividends over the medium term. More broadly, valuations in the European telecommunication services sector reached multi-decade lows in 2017, creating, in our view, select opportunities to increase holdings in high-yielding stocks that could potentially benefit from industry consolidation, regulatory backdrop improvement and cash flow recovery. We believe select opportunities also exist among Asian telecommunication services companies with undervalued growth prospects, data exposure and/or stakes in attractive affiliated businesses.
In the consumer staples sector, we have continued to find what we view as scarce long-term value in a competitive, low-margin industry where valuation multiples increased as investors searched for trades that they considered to be safe.
Regionally, stock selection in Europe detracted from relative performance during the 12-month review period. We see fewer risks and greater scope for outperformance in Europe than in the US going into 2018. The backdrop of easier fiscal policy, still accommodative monetary policy, a falling savings ratio and accelerating investment supported by a high capacity utilization looks attractive to us.
In Asia, an overweighting and stock selection in South Korea contributed significantly to relative performance. South Korea’s recovery has been fundamentally driven, with corporate earnings rising and the South Korean won
appreciating amid a strong export growth, which bolstered the country’s current account surplus and foreign reserves. With a solid economic and corporate profit cycle taking hold and the Bank of Korea raising interest rates for the first time in six years, we continue to see significant upside potential for select companies in this lowly valued market.
It is important to recognize the effect of currency movements on the Fund’s performance. In general, if the value of the US dollar goes up compared with a foreign currency, an investment traded in that foreign currency will go down in value because it will be worth fewer US dollars. This can have a negative effect on Fund performance. Conversely, when the US dollar weakens in relation to a foreign currency, an investment traded in that foreign currency will increase in value, which can contribute to Fund performance. For the 12 months ended December 31, 2017, the US dollar declined in value relative to most currencies. As a result, the Fund’s equity performance was positively affected by the equity portfolio’s substantial investment in securities with non-US currency exposure. However, one cannot expect the same result in future periods.
Top Five Fixed Income Holdings*
12/31/17
| | | | |
| Issue/Issuer | | % of Total
Net Assets | |
| |
Government of Mexico | | | 3.3% | |
| |
Nota Do Tesouro Nacional | | | 3.2% | |
| |
Government of India | | | 3.2% | |
| |
Government of Indonesia | | | 3.0% | |
| |
Government of Ghana | | | 1.5% | |
*Excludes short-term investments.
Fixed Income
On the whole, we continued to position the Fund for rising rates by maintaining low portfolio duration and aiming at a negative correlation with US Treasury returns. We also continued to actively seek select duration exposures that we believe can offer positive real yields without taking undue interest-rate risk, favoring countries that we believe have solid underlying fundamentals and prudent fiscal, monetary and financial policies. When investing globally, investment opportunities may take time to materialize, which may require weathering short-term volatility as the longer term investing theses develop. During the period, we added to some of our strongest investment convictions as prices became cheaper during periods of heightened volatility. We also maintained exposures to a number of emerging market currencies that we believe remained fundamentally undervalued. Overall, we were
| | | | | | |
| | | | |
franklintempleton.com | | | | Annual Report | | 7 |
TEMPLETON GLOBAL BALANCED FUND
positioned for depreciation of the euro and Japanese yen, rising US Treasury yields, and currency appreciation in select emerging markets. During the period, we used forward currency exchange contracts to actively manage currencies. We also used interest-rate swaps to tactically manage duration exposures.
| | |
| |
| | What is an interest-rate swap? An interest-rate swap is an agreement between two parties to exchange interest-rate payment obligations, generally one based on an interest rate fixed to maturity and the other based on an interest rate that changes in accordance with changes in a designated benchmark (for example, LIBOR, prime, commercial paper or other benchmarks).
|
| | |
| |
| | What is duration? Duration is a measure of a bond’s price sensitivity to interest-rate changes. In general, a portfolio of securities with a lower duration can be expected to be less sensitive to interest-rate changes than a portfolio with a higher duration.
|
During the period, top contributors to the Fund’s positive absolute performance included interest-rate strategies, followed by currency positions. Overall credit exposures had a largely neutral effect on absolute results. The Fund maintained a defensive approach regarding interest rates in developed and emerging markets. Select duration exposures in Latin America (Brazil) and Asia ex-Japan (Indonesia) contributed to absolute performance, while negative duration exposure to US Treasuries detracted. Among currencies, positions in Latin America (Mexican peso) and Asia ex-Japan (Indian rupee) contributed to absolute results. However, the Fund’s net-negative positions in the euro, the Japanese yen and the Australian dollar detracted from absolute performance.
On a relative basis, currency positions were the Fund’s top detractor. Interest-rate strategies contributed to relative results, while overall credit exposures had a largely neutral effect. Among currencies, the Fund’s underweighted positions in the euro, the Japanese yen and the Australian dollar detracted from relative performance. However, overweighted currency positions in Latin America (Mexican peso) and Asia ex-Japan (Indian rupee) contributed to relative results. The Fund maintained a defensive approach regarding interest rates in developed and emerging markets. Select overweighted duration exposures in Latin America (Brazil) and Asia ex-Japan (Indonesia) contributed to relative performance. However, underweighted duration exposure in the US detracted from relative results. Underweighted exposure to corporate credit
detracted from relative return, while select overweighted subinvestment-grade credit exposures contributed.
Thank you for your continued participation in Templeton Global Balanced Fund. We look forward to serving your future investment needs.
| | |
 | | 
Heather Arnold, CFA |
| |
| |
Michael Hasenstab Ph.D. |
| |
| | Norman J. Boersma, CFA James Harper, CFA Christopher J. Molumphy, CFA |
| |
| | Portfolio Management Team |
The foregoing information reflects our analysis, opinions and portfolio holdings as of December 31, 2017, the end of the reporting period. The way we implement our main investment strategies and the resulting portfolio holdings may change depending on factors such as market and economic conditions. These opinions may not be relied upon as investment advice or an offer for a particular security. The information is not a complete analysis of every aspect of any market, country, industry, security or the Fund. Statements of fact are from sources considered reliable, but the investment manager makes no representation or warranty as to their completeness or accuracy. Although historical performance is no guarantee of future results, these insights may help you understand our investment management philosophy.
| | | | | | |
8 | | Annual Report | | | | franklintempleton.com |
TEMPLETON GLOBAL BALANCED FUND
Performance Summary as of December 31, 2017
The performance tables and graphs do not reflect any taxes that a shareholder would pay on Fund dividends, capital gain distributions, if any, or any realized gains on the sale of Fund shares. Total return reflects reinvestment of the Fund’s dividends and capital gain distributions, if any, and any unrealized gains or losses. Your dividend income will vary depending on dividends or interest paid by securities in the Fund’s portfolio, adjusted for operating expenses of each class. Capital gain distributions are net profits realized from the sale of portfolio securities.
Performance as of 12/31/171
Cumulative total return excludes sales charges. Average annual total return includes maximum sales charges. Sales charges will vary depending on the size of the investment and the class of share purchased. The maximum is 5.75% and the minimum is 0%. Class A: 5.75% maximum initial sales charge; Advisor Class: no sales charges. For other share classes, visit franklintempleton.com.
| | | | | | |
| Share Class | | Cumulative
Total Return2 | | | Average Annual
Total Return3 |
A4 | | | | | | |
1-Year | | | +12.18% | | | +5.64% |
5-Year | | | +34.60% | | | +4.90% |
10-Year | | | +62.36% | | | +4.34% |
Advisor | | | | | | |
1-Year | | | +12.42% | | | +12.42% |
5-Year | | | +36.08% | | | +6.35% |
10-Year | | | +66.09% | | | +5.20% |
| | | | | | | | | | | | |
| | | | | | 30-Day Standardized Yield6 | |
| Share Class | | Distribution
Rate5 | | | (with waiver) | | | (without waiver) | |
A | | | 2.97 | % | | | 2.46 | % | | | 2.42 | % |
Advisor | | | 3.47 | % | | | 2.86 | % | | | 2.82 | % |
Performance data represent past performance, which does not guarantee future results. Investment return and principal value will fluctuate, and you may have a gain or loss when you sell your shares. Current performance may differ from figures shown. For most recent month-end performance, go to franklintempleton.com or call (800) 342-5236.
See page 11 for Performance Summary footnotes.
| | | | | | |
franklintempleton.com | | | | Annual Report | | 9 |
TEMPLETON GLOBAL BALANCED FUND
PERFORMANCE SUMMARY
Total Return Index Comparison for a Hypothetical $10,000 Investment1
Total return represents the change in value of an investment over the periods shown. It includes any applicable maximum sales charge, Fund expenses, account fees and reinvested distributions. The unmanaged indexes include reinvestment of any income or distributions. They differ from the Fund in composition and do not pay management fees or expenses. One cannot invest directly in an index.
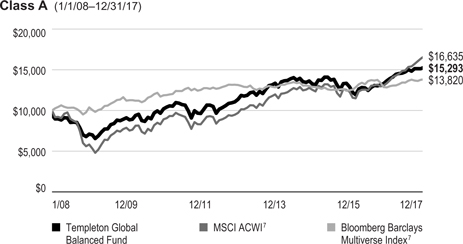
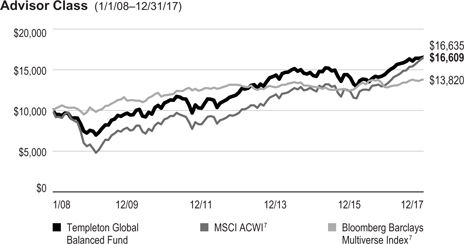
See page 11 for Performance Summary footnotes.
| | | | | | |
10 | | Annual Report | | | | franklintempleton.com |
TEMPLETON GLOBAL BALANCED FUND
PERFORMANCE SUMMARY
Distributions (1/1/17–12/31/17)
| | | | |
| Share Class | | Net Investment Income | |
A | | | $0.0820 | |
A1 | | | $0.0820 | |
C | | | $0.0584 | |
C1 | | | $0.0688 | |
R | | | $0.0737 | |
R6 | | | $0.0939 | |
Advisor | | | $0.0900 | |
Total Annual Operating Expenses8
| | | | | | | | |
| Share Class | | With Waiver | | | Without Waiver | |
A | | | 1.16% | | | | 1.17% | |
Advisor | | | 0.91% | | | | 0.92% | |
Each class of shares is available to certain eligible investors and has different annual fees and expenses, as described in the prospectus.
All investments involve risks, including possible loss of principal. Special risks are associated with foreign investing, including currency fluctuations, economic instability and political developments; investments in emerging markets involve heightened risks related to the same factors. Stock prices fluctuate, sometimes rapidly and dramatically, due to factors affecting individual companies, particular industries or sectors, or general market conditions. Bond prices generally move in the opposite direction of interest rates. Thus, as the prices of bonds in the Fund adjust to a rise in interest rates, the Fund’s share price may decline. The risks associated with higher yielding, lower rated debt securities include higher risk of default and loss of principal. The markets for a particular security or instrument or type of security or instrument are or may become relatively illiquid. Reduced liquidity will have an adverse impact on the security’s value and on the Fund’s ability to sell such securities or instruments when necessary to meet the Fund’s liquidity needs or in response to a specific market event. The Fund’s investment in derivative securities, such as swaps, financial futures and option contracts, and use of foreign currency techniques involve special risks as such may not achieve the anticipated benefits and/or may result in losses to the Fund. The Fund is actively managed but there is no guarantee that the manager’s investment decisions will produce the desired results. The Fund’s prospectus also includes a description of the main investment risks.
1. The Fund has a fee waiver associated with any investment it makes in a Franklin Templeton money fund and/or other Franklin Templeton fund, contractually guaranteed through 4/30/18. Fund investment results reflect the fee waiver; without this waiver, the results would have been lower.
2. Cumulative total return represents the change in value of an investment over the periods indicated.
3. Average annual total return represents the average annual change in value of an investment over the periods indicated. Return for less than one year, if any, has not been annualized.
4. Total returns have been calculated based upon the returns for Class A1 shares prior to 7/1/11 and are restated to reflect the current, maximum 5.75% initial sales charge.
5. Distribution rate is based on an annualization of the respective class’s most recent quarterly dividend and the maximum offering price (NAV for Advisor Class) per share on 12/31/17.
6. The Fund’s 30-day standardized yield is calculated over a trailing 30-day period using the yield to maturity on bonds and/or the dividends accrued on stocks. It may not equal the Fund’s actual income distribution rate, which reflects the Fund’s past dividends paid to shareholders.
7. Source: Morningstar. The MSCI ACWI is a free float-adjusted, market capitalization-weighted index designed to measure equity market performance in global developed and emerging markets. The Bloomberg Barclays Multiverse Index provides a broad-based measure of the global fixed income bond market. The index represents the union of the Global Aggregate Index and the Global High Yield Index and captures investment-grade and high yield securities in all eligible currencies.
8. Figures are as stated in the Fund’s current prospectus and may differ from the expense ratios disclosed in the Your Fund’s Expenses and Financial Highlights sections in this report. In periods of market volatility, assets may decline significantly, causing total annual Fund operating expenses to become higher than the figures shown.
See www.franklintempletondatasources.com for additional data provider information.
| | | | | | |
franklintempleton.com | | | | Annual Report | | 11 |
TEMPLETON GLOBAL BALANCED FUND
Your Fund’s Expenses
As a Fund shareholder, you can incur two types of costs: (1) transaction costs, including sales charges (loads) on Fund purchases and redemptions; and (2) ongoing Fund costs, including management fees, distribution and service (12b-1) fees, and other Fund expenses. All mutual funds have ongoing costs, sometimes referred to as operating expenses. The table below shows ongoing costs of investing in the Fund and can help you understand these costs and compare them with those of other mutual funds. The table assumes a $1,000 investment held for the six months indicated.
Actual Fund Expenses
The table below provides information about actual account values and actual expenses in the columns under the heading “Actual.” In these columns the Fund’s actual return, which includes the effect of Fund expenses, is used to calculate the “Ending Account Value” for each class of shares. You can estimate the expenses you paid during the period by following these steps (of course, your account value and expenses will differ from those in this illustration): Divide your account value by $1,000 (if your account had an $8,600 value, then $8,600 ÷ $1,000 = 8.6). Then multiply the result by the number in the row for your class of shares under the headings “Actual” and “Expenses Paid During Period” (if Actual Expenses Paid During Period were $7.50, then 8.6 x $7.50 = $64.50). In this illustration, the actual expenses paid this period are $64.50.
Hypothetical Example for Comparison with Other Funds
Under the heading “Hypothetical” in the table, information is provided about hypothetical account values and hypothetical expenses based on the Fund’s actual expense ratio and an assumed rate of return of 5% per year before expenses, which is not the Fund’s actual return. This information may not be used to estimate the actual ending account balance or expenses you paid for the period, but it can help you compare ongoing costs of investing in the Fund with those of other funds. To do so, compare this 5% hypothetical example for the class of shares you hold with the 5% hypothetical examples that appear in the shareholder reports of other funds.
Please note that expenses shown in the table are meant to highlight ongoing costs and do not reflect any transactional costs. Therefore, information under the heading “Hypothetical” is useful in comparing ongoing costs only, and will not help you compare total costs of owning different funds. In addition, if transactional costs were included, your total costs would have been higher.
| | | | | | | | | | | | |
| | | | | Actual
(actual return after expenses) | | Hypothetical
(5% annual return before expenses) | | |
| | | Beginning | | Ending | | Expenses Paid During | | Ending | | Expenses Paid During | | Net Annualized |
| Share | | Account | | Account | | Period | | Account | | Period | | Expense |
| Class | | Value 7/1/17 | | Value 12/31/17 | | 7/1/17–12/31/171,2 | | Value 12/31/17 | | 7/1/17–12/31/171,2 | | Ratio2 |
| | | | | | |
A | | $1,000 | | $1,038.60 | | $5.70 | | $1,019.61 | | $5.65 | | 1.11% |
A1 | | $1,000 | | $1,035.20 | | $5.69 | | $1,019.61 | | $5.65 | | 1.11% |
C | | $1,000 | | $1,030.90 | | $9.52 | | $1,015.83 | | $9.45 | | 1.86% |
C1 | | $1,000 | | $1,036.00 | | $7.75 | | $1,017.59 | | $7.68 | | 1.51% |
R | | $1,000 | | $1,036.80 | | $6.98 | | $1,018.35 | | $6.92 | | 1.36% |
R6 | | $1,000 | | $1,040.80 | | $3.86 | | $1,021.42 | | $3.82 | | 0.75% |
Advisor | | $1,000 | | $1,036.60 | | $4.41 | | $1,020.87 | | $4.38 | | 0.86% |
1. Expenses are equal to the annualized expense ratio for the six-month period as indicated above—in the far right column—multiplied by the simple average account value over the period indicated, and then multiplied by 184/365 to reflect the one-half year period.
2. Reflects expenses after fee waivers and expense reimbursements. Does not include acquired fund fees and expenses.
| | | | | | |
12 | | Annual Report | | | | franklintempleton.com |
TEMPLETON GLOBAL INVESTMENT TRUST
Consolidated Financial Highlights
Templeton Global Balanced Fund
| | | | | | | | | | | | | | | | | | | | | | | | | | | | |
| | | Year Ended December 31, | | | | | | Year Ended March 31, | |
| | | 2017 | | | 2016a | | | | | | 2016 | | | 2015 | | | 2014 | | | 2013 | |
| | | | | | | |
Class A | | | | | | | | | | | | | | | | | | | | | | | | | | | | |
| | | | | | | |
Per share operating performance | | | | | | | | | | | | | | | | | | | | | | | | | | | | |
(for a share outstanding throughout the year) | | | | | | | | | | | | | | | | | | | | | | | | | | | | |
| | | | | | | |
Net asset value, beginning of year | | | $ 2.91 | | | | $ 2.72 | | | | | | | | $ 3.13 | | | | $ 3.30 | | | | $ 2.94 | | | | $ 2.80 | |
| | | | | | | |
Income from investment operationsb: | | | | | | | | | | | | | | | | | | | | | | | | | | | | |
| | | | | | | |
Net investment incomec | | | 0.09 | | | | 0.07 | | | | | | | | 0.08 | | | | 0.08 | | | | 0.09 | d | | | 0.07 | |
| | | | | | | |
Net realized and unrealized gains (losses) | | | 0.25 | | | | 0.15 | | | | | | | | (0.32 | ) | | | (0.07 | ) | | | 0.35 | | | | 0.23 | |
| | | | | | | |
Total from investment operations | | | 0.34 | | | | 0.22 | | | | | | | | (0.24 | ) | | | 0.01 | | | | 0.44 | | | | 0.30 | |
| | | | | | | |
Less distributions from: | | | | | | | | | | | | | | | | | | | | | | | | | | | | |
| | | | | | | |
Net investment income | | | (0.08 | ) | | | (0.03 | ) | | | | | | | (0.09 | ) | | | (0.18 | ) | | | (0.08 | ) | | | (0.16 | ) |
| | | | | | | |
Net realized gains | | | — | | | | — | | | | | | | | (0.08 | ) | | | — | | | | — | | | | — | |
| | | | | | | |
Total distributions | | | (0.08 | ) | | | (0.03 | ) | | | | | | | (0.17 | ) | | | (0.18 | ) | | | (0.08 | ) | | | (0.16 | ) |
| | | | | | | |
Net asset value, end of year | | | $ 3.17 | | | | $ 2.91 | | | | | | | | $ 2.72 | | | | $ 3.13 | | | | $ 3.30 | | | | $ 2.94 | |
| | | | | | | |
Total returne | | | 12.18% | | | | 7.97% | | | | | | | | (7.74)% | | | | 0.38% | | | | 15.06% | | | | 11.31% | |
| | | | | | | |
Ratios to average net assetsf | | | | | | | | | | | | | | | | | | | | | | | | | | | | |
| | | | | | | |
Expenses before waiver and payments by affiliates | | | 1.17% | | | | 1.16% | | | | | | | | 1.11% | | | | 1.11% | | | | 1.13% | | | | 1.21% | |
| | | | | | | |
Expenses net of waiver and payments by affiliates | | | 1.14% | g | | | 1.15% | g | | | | | | | 1.10% | g | | | 1.11% | g,h | | | 1.12% | g | | | 1.20% | |
| | | | | | | |
Net investment income | | | 2.82% | | | | 3.28% | | | | | | | | 2.55% | | | | 2.55% | | | | 2.76% | d | | | 2.84% | |
| | | | | | | |
Supplemental data | | | | | | | | | | | | | | | | | | | | | | | | | | | | |
| | | | | | | |
Net assets, end of year (000’s) | | | $745,957 | | | | $780,810 | | | | | | | | $987,949 | | | | $1,117,109 | | | | $1,055,121 | | | | $238,319 | |
| | | | | | | |
Portfolio turnover rate | | | 34.25% | | | | 16.66% | | | | | | | | 44.25% | | | | 20.90% | | | | 13.33% | | | | 30.44% | |
aFor the period April 1, 2016 to December 31, 2016.
bThe amount shown for a share outstanding throughout the period may not correlate with the Consolidated Statement of Operations for the period due to the timing of sales and repurchases of the Fund’s shares in relation to income earned and/or fluctuating fair value of the investments of the Fund.
cBased on average daily shares outstanding.
dNet investment income per share includes approximately $0.02 per share related to income received in the form of a special dividend in connection with certain Fund holdings. Excluding this amount, the ratio of net investment income to average net assets would have been 2.24%.
eTotal return does not reflect sales commissions or contingent deferred sales charges, if applicable, and is not annualized for periods less than one year.
fRatios are annualized for periods less than one year.
gBenefit of expense reduction rounds to less than 0.01%.
hBenefit of waiver and payments by affiliates rounds to less than 0.01%.
| | | | | | |
franklintempleton.com | | | | The accompanying notes are an integral part of these consolidated financial statements. | Annual Report | | 13 |
TEMPLETON GLOBAL INVESTMENT TRUST
CONSOLIDATED FINANCIAL HIGHLIGHTS
Templeton Global Balanced Fund (continued)
| | | | | | | | | | | | | | | | | | | | | | | | | | | | |
| | | Year Ended December 31, | | | | | | Year Ended March 31, | |
| | | 2017 | | | 2016a | | | | | | 2016 | | | 2015 | | | 2014 | | | 2013 | |
Class A1 | | | | | | | | | | | | | | | | | | | | | | | | | | | | |
Per share operating performance | | | | | | | | | | | | | | | | | | | | | | | | | | | | |
(for a share outstanding throughout the year) | | | | | | | | | | | | | | | | | | | | | | | | | | | | |
| | | | | | | |
Net asset value, beginning of year | | | $ 2.91 | | | | $ 2.72 | | | | | | | | $ 3.13 | | | | $ 3.30 | | | | $ 2.94 | | | | $ 2.79 | |
| | | | | | | |
Income from investment operationsb: | | | | | | | | | | | | | | | | | | | | | | | | | | | | |
| | | | | | | |
Net investment incomec | | | 0.09 | | | | 0.07 | | | | | | | | 0.08 | | | | 0.08 | | | | 0.09 | d | | | 0.08 | |
| | | | | | | |
Net realized and unrealized gains (losses) | | | 0.26 | | | | 0.15 | | | | | | | | (0.32 | ) | | | (0.07 | ) | | | 0.34 | | | | 0.23 | |
| | | | | | | |
Total from investment operations | | | 0.35 | | | | 0.22 | | | | | | | | (0.24 | ) | | | 0.01 | | | | 0.43 | | | | 0.31 | |
| | | | | | | |
Less distributions from: | | | | | | | | | | | | | | | | | | | | | | | | | | | | |
| | | | | | | |
Net investment income | | | (0.08 | ) | | | (0.03 | ) | | | | | | | (0.09 | ) | | | (0.18 | ) | | | (0.07 | ) | | | (0.16 | ) |
| | | | | | | |
Net realized gains | | | — | | | | — | | | | | | | | (0.08 | ) | | | — | | | | — | | | | — | |
| | | | | | | |
Total distributions | | | (0.08 | ) | | | (0.03 | ) | | | | | | | (0.17 | ) | | | (0.18 | ) | | | (0.07 | ) | | | (0.16 | ) |
| | | | | | | |
Net asset value, end of year | | | $ 3.18 | | | | $ 2.91 | | | | | | | | $ 2.72 | | | | $ 3.13 | | | | $ 3.30 | | | | $ 2.94 | |
| | | | | | | |
Total returne | | | 12.18% | | | | 7.97% | | | | | | | | (7.76)% | | | | 0.36% | | | | 14.98% | | | | 11.67% | |
| | | | | | | |
Ratios to average net assetsf | | | | | | | | | | | | | | | | | | | | | | | | | | | | |
| | | | | | | |
Expenses before waiver and payments by affiliates | | | 1.17% | | | | 1.16% | | | | | | | | 1.11% | | | | 1.11% | | | | 1.13% | | | | 1.21% | |
| | | | | | | |
Expenses net of waiver and payments by affiliates | | | 1.14% | g | | | 1.15% | g | | | | | | | 1.10% | g | | | 1.11% | g,h | | | 1.12% | g | | | 1.20% | |
| | | | | | | |
Net investment income | | | 2.82% | | | | 3.28% | | | | | | | | 2.55% | | | | 2.55% | | | | 2.76% | d | | | 2.84% | |
| | | | | | | |
Supplemental data | | | | | | | | | | | | | | | | | | | | | | | | | | | | |
| | | | | | | |
Net assets, end of year (000’s) | | | $293,488 | | | | $319,161 | | | | | | | | $370,212 | | | | $467,765 | | | | $538,901 | | | | $533,538 | |
| | | | | | | |
Portfolio turnover rate | | | 34.25% | | | | 16.66% | | | | | | | | 44.25% | | | | 20.90% | | | | 13.33% | | | | 30.44% | |
aFor the period April 1, 2016 to December 31, 2016.
bThe amount shown for a share outstanding throughout the period may not correlate with the Consolidated Statement of Operations for the period due to the timing of sales and repurchases of the Fund’s shares in relation to income earned and/or fluctuating fair value of the investments of the Fund.
cBased on average daily shares outstanding.
dNet investment income per share includes approximately $0.02 per share related to income received in the form of a special dividend in connection with certain Fund holdings. Excluding this amount, the ratio of net investment income to average net assets would have been 2.24%.
eTotal return does not reflect sales commissions or contingent deferred sales charges, if applicable, and is not annualized for periods less than one year.
fRatios are annualized for periods less than one year.
gBenefit of expense reduction rounds to less than 0.01%.
hBenefit of waiver and payments by affiliates rounds to less than 0.01%.
| | | | | | |
| 14 | | Annual Report | | | The accompanying notes are an integral part of these consolidated financial statements. | | franklintempleton.com |
TEMPLETON GLOBAL INVESTMENT TRUST
CONSOLIDATED FINANCIAL HIGHLIGHTS
Templeton Global Balanced Fund (continued)
| | | | | | | | | | | | | | | | | | | | | | | | | | | | |
| | | Year Ended December 31, | | | | | | Year Ended March 31, | |
| | | 2017 | | | 2016a | | | | | | 2016 | | | 2015 | | | 2014 | | | 2013 | |
| | | | | | | |
Class C | | | | | | | | | | | | | | | | | | | | | | | | | | | | |
| | | | | | | |
Per share operating performance | | | | | | | | | | | | | | | | | | | | | | | | | | | | |
(for a share outstanding throughout the year) | | | | | | | | | | | | | | | | | | | | | | | | | | | | |
| | | | | | | |
Net asset value, beginning of year | | | $ 2.90 | | | | $ 2.70 | | | | | | | | $ 3.12 | | | | $ 3.28 | | | | $ 2.93 | | | | $ 2.79 | |
| | | | | | | |
Income from investment operationsb: | | | | | | | | | | | | | | | | | | | | | | | | | | | | |
| | | | | | | |
Net investment incomec | | | 0.06 | | | | 0.05 | | | | | | | | 0.05 | | | | 0.06 | | | | 0.06 | d | | | 0.05 | |
| | | | | | | |
Net realized and unrealized gains (losses) | | | 0.26 | | | | 0.16 | | | | | | | | (0.31 | ) | | | (0.07 | ) | | | 0.35 | | | | 0.23 | |
| | | | | | | |
Total from investment operations | | | 0.32 | | | | 0.21 | | | | | | | | (0.26 | ) | | | (0.01 | ) | | | 0.41 | | | | 0.28 | |
| | | | | | | |
Less distributions from: | | | | | | | | | | | | | | | | | | | | | | | | | | | | |
| | | | | | | |
Net investment income | | | (0.06 | ) | | | (0.01 | ) | | | | | | | (0.08 | ) | | | (0.15 | ) | | | (0.06 | ) | | | (0.14 | ) |
| | | | | | | |
Net realized gains | | | — | | | | — | | | | | | | | (0.08 | ) | | | — | | | | — | | | | — | |
| | | | | | | |
Total distributions | | | (0.06 | ) | | | (0.01 | ) | | | | | | | (0.16 | ) | | | (0.15 | ) | | | (0.06 | ) | | | (0.14 | ) |
| | | | | | | |
Net asset value, end of year | | | $ 3.16 | | | | $ 2.90 | | | | | | | | $ 2.70 | | | | $ 3.12 | | | | $ 3.28 | | | | $ 2.93 | |
| | | | | | | |
Total returne | | | 11.03% | | | | 7.74% | | | | | | | | (8.68 | )% | | | (0.04 | )% | | | 14.11% | | | | 10.66% | |
| | | | | | | |
Ratios to average net assetsf | | | | | | | | | | | | | | | | | | | | | | | | | | | | |
| | | | | | | |
Expenses before waiver and payments by affiliates | | | 1.92% | | | | 1.89% | | | | | | | | 1.86% | | | | 1.83% | | | | 1.88% | | | | 1.96% | |
| | | | | | | |
Expenses net of waiver and payments by affiliates | | | 1.89% | g | | | 1.88% | g | | | | | | | 1.85% | g | | | 1.83% | g,h | | | 1.87% | g | | | 1.95% | |
| | | | | | | |
Net investment income | | | 2.07% | | | | 2.55% | | | | | | | | 1.80% | | | | 1.83% | | | | 2.01% | d | | | 2.09% | |
| | | | | | | |
Supplemental data | | | | | | | | | | | | | | | | | | | | | | | | | | | | |
| | | | | | | |
Net assets, end of year (000’s) | | | $317,374 | | | | $340,265 | | | | | | | | $464,899 | | | | $507,888 | | | | $480,700 | | | | $88,988 | |
| | | | | | | |
Portfolio turnover rate | | | 34.25% | | | | 16.66% | | | | | | | | 44.25% | | | | 20.90% | | | | 13.33% | | | | 30.44% | |
aFor the period April 1, 2016 to December 31, 2016.
bThe amount shown for a share outstanding throughout the period may not correlate with the Consolidated Statement of Operations for the period due to the timing of sales and repurchases of the Fund’s shares in relation to income earned and/or fluctuating fair value of the investments of the Fund.
cBased on average daily shares outstanding.
dNet investment income per share includes approximately $0.02 per share related to income received in the form of a special dividend in connection with certain Fund holdings. Excluding this amount, the ratio of net investment income to average net assets would have been 1.49%.
eTotal return does not reflect sales commissions or contingent deferred sales charges, if applicable, and is not annualized for periods less than one year.
fRatios are annualized for periods less than one year.
gBenefit of expense reduction rounds to less than 0.01%.
hBenefit of waiver and payments by affiliates rounds to less than 0.01%.
| | | | | | |
franklintempleton.com | | | | The accompanying notes are an integral part of these consolidated financial statements. | Annual Report | | 15 |
TEMPLETON GLOBAL INVESTMENT TRUST
CONSOLIDATED FINANCIAL HIGHLIGHTS
Templeton Global Balanced Fund (continued)
| | | | | | | | | | | | | | | | | | | | | | | | | | | | |
| | | Year Ended December 31, | | | | | | Year Ended March 31, | |
| | | 2017 | | | 2016a | | | | | | 2016 | | | 2015 | | | 2014 | | | 2013 | |
| | | | | | | |
Class C1 | | | | | | | | | | | | | | | | | | | | | | | | | | | | |
| | | | | | | |
Per share operating performance | | | | | | | | | | | | | | | | | | | | | | | | | | | | |
(for a share outstanding throughout the year) | | | | | | | | | | | | | | | | | | | | | | | | | | | | |
| | | | | | | |
Net asset value, beginning of year | | | $ 2.91 | | | | $ 2.72 | | | | | | | | $ 3.13 | | | | $ 3.29 | | | | $ 2.93 | | | | $ 2.79 | |
| | | | | | | |
Income from investment operationsb: | | | | | | | | | | | | | | | | | | | | | | | | | | | | |
| | | | | | | |
Net investment incomec | | | 0.08 | | | | 0.06 | | | | | | | | 0.06 | | | | 0.07 | | | | 0.07 | d | | | 0.07 | |
| | | | | | | |
Net realized and unrealized gains (losses) | | | 0.25 | | | | 0.15 | | | | | | | | (0.31 | ) | | | (0.07 | ) | | | 0.35 | | | | 0.22 | |
| | | | | | | |
Total from investment operations | | | 0.33 | | | | 0.21 | | | | | | | | (0.25 | ) | | | — | | | | 0.42 | | | | 0.29 | |
| | | | | | | |
Less distributions from: | | | | | | | | | | | | | | | | | | | | | | | | | | | | |
| | | | | | | |
Net investment income | | | (0.07 | ) | | | (0.02 | ) | | | | | | | (0.08 | ) | | | (0.16 | ) | | | (0.06 | ) | | | (0.15 | ) |
| | | | | | | |
Net realized gains | | | — | | | | — | | | | | | | | (0.08 | ) | | | — | | | | — | | | | — | |
| | | | | | | |
Total distributions | | | (0.07 | ) | | | (0.02 | ) | | | | | | | (0.16 | ) | | | (0.16 | ) | | | (0.06 | ) | | | (0.15 | ) |
| | | | | | | |
Net asset value, end of year | | | $ 3.17 | | | | $ 2.91 | | | | | | | | $ 2.72 | | | | $ 3.13 | | | | $ 3.29 | | | | $ 2.93 | |
| | | | | | | |
Total returne | | | 11.71% | | | | 7.62% | | | | | | | | (8.07)% | | | | 0.26% | | | | 14.57% | | | | 10.86% | |
| | | | | | | |
Ratios to average net assetsf | | | | | | | | | | | | | | | | | | | | | | | | | | | | |
| | | | | | | |
Expenses before waiver and payments by affiliates | | | 1.57% | | | | 1.56% | | | | | | | | 1.51% | | | | 1.51% | | | | 1.53% | | | | 1.61% | |
| | | | | | | |
Expenses net of waiver and payments by affiliates | | | 1.54% | g | | | 1.55% | g | | | | | | | 1.50% | g | |
| 1.51%
| g,h
| | | 1.52% | g | | | 1.60% | |
| | | | | | | |
Net investment income | | | 2.42% | | | | 2.88% | | | | | | | | 2.15% | | | | 2.15% | | | | 2.36% | d | | | 2.44% | |
| | | | | | | |
Supplemental data | | | | | | | | | | | | | | | | | | | | | | | | | | | | |
| | | | | | | |
Net assets, end of year (000’s) | | | 173,079 | | | | 202,929 | | | | | | | | 233,840 | | | | 296,672 | | | | 341,690 | | | | 322,243 | |
| | | | | | | |
Portfolio turnover rate | | | 34.25% | | | | 16.66% | | | | | | | | 44.25% | | | | 20.90% | | | | 13.33% | | | | 30.44% | |
aFor the period April 1, 2016 to December 31, 2016.
bThe amount shown for a share outstanding throughout the period may not correlate with the Consolidated Statement of Operations for the period due to the timing of sales and repurchases of the Fund’s shares in relation to income earned and/or fluctuating fair value of the investments of the Fund.
cBased on average daily shares outstanding.
dNet investment income per share includes approximately $0.02 per share related to income received in the form of a special dividend in connection with certain Fund holdings. Excluding this amount, the ratio of net investment income to average net assets would have been 1.84%.
eTotal return does not reflect sales commissions or contingent deferred sales charges, if applicable, and is not annualized for periods less than one year.
fRatios are annualized for periods less than one year.
gBenefit of expense reduction rounds to less than 0.01%.
hBenefit of waiver and payments by affiliates rounds to less than 0.01%.
| | | | | | |
16 | | Annual Report | | | The accompanying notes are an integral part of these consolidated financial statements. | | franklintempleton.com |
TEMPLETON GLOBAL INVESTMENT TRUST
CONSOLIDATED FINANCIAL HIGHLIGHTS
Templeton Global Balanced Fund (continued)
| | | | | | | | | | | | | | | | | | | | | | | | | | | | |
| | | Year Ended December 31, | | | | | | Year Ended March 31, | |
| | | 2017 | | | 2016a | | | | | | 2016 | | | 2015 | | | 2014 | | | 2013 | |
| | | | | | | |
Class R | | | | | | | | | | | | | | | | | | | | | | | | | | | | |
| | | | | | | |
Per share operating performance | | | | | | | | | | | | | | | | | | | | | | | | | | | | |
(for a share outstanding throughout the year) | | | | | | | | | | | | | | | | | | | | | | | | | | | | |
| | | | | | | |
Net asset value, beginning of year | | | $ 2.92 | | | | $ 2.72 | | | | | | | | $ 3.14 | | | | $ 3.30 | | | | $ 2.94 | | | | $ 2.80 | |
| | | | | | | |
Income from investment operationsb: | | | | | | | | | | | | | | | | | | | | | | | | | | | | |
| | | | | | | |
Net investment incomec | | | 0.08 | | | | 0.06 | | | | | | | | 0.07 | | | | 0.07 | | | | 0.08 | d | | | 0.07 | |
| | | | | | | |
Net realized and unrealized gains (losses) | | | 0.25 | | | | 0.16 | | | | | | | | (0.32 | ) | | | (0.06 | ) | | | 0.35 | | | | 0.22 | |
| | | | | | | |
Total from investment operations | | | 0.33 | | | | 0.22 | | | | | | | | (0.25 | ) | | | 0.01 | | | | 0.43 | | | | 0.29 | |
| | | | | | | |
Less distributions from: | | | | | | | | | | | | | | | | | | | | | | | | | | | | |
| | | | | | | |
Net investment income | | | (0.07 | ) | | | (0.02 | ) | | | | | | | (0.09 | ) | | | (0.17 | ) | | | (0.07 | ) | | | (0.15 | ) |
| | | | | | | |
Net realized gains | | | — | | | | — | | | | | | | | (0.08 | ) | | | — | | | | — | | | | — | |
| | | | | | | |
Total distributions | | | (0.07 | ) | | | (0.02 | ) | | | | | | | (0.17 | ) | | | (0.17 | ) | | | (0.07 | ) | | | (0.15 | ) |
| | | | | | | |
Net asset value, end of year | | | $ 3.18 | | | | $ 2.92 | | | | | | | | $ 2.72 | | | | $ 3.14 | | | | $ 3.30 | | | | $ 2.94 | |
| | | | | | | |
Total returne | | | 11.84% | | | | 8.11% | | | | | | | | (8.24)% | | | | 0.43% | | | | 14.70% | | | | 10.99% | |
| | | | | | | |
Ratios to average net assetsf | | | | | | | | | | | | | | | | | | | | | | | | | | | | |
| | | | | | | |
Expenses before waiver and payments by affiliates | | | 1.42% | | | | 1.41% | | | | | | | | 1.36% | | | | 1.36% | | | | 1.38% | | | | 1.46% | |
| | | | | | | |
Expenses net of waiver and payments by affiliates | | | 1.39% | g | | | 1.40% | g | | | | | | | 1.35% | g | |
| 1.36%
| g,h
| | | 1.37% | g | | | 1.45% | |
| | | | | | | |
Net investment income | | | 2.57% | | | | 3.03% | | | | | | | | 2.30% | | | | 2.30% | | | | 2.51% | d | | | 2.59% | |
| | | | | | | |
Supplemental data | | | | | | | | | | | | | | | | | | | | | | | | | | | | |
| | | | | | | |
Net assets, end of year (000’s) | | | $4,944 | | | | $5,487 | | | | | | | | $6,498 | | | | $6,357 | | | | $5,757 | | | | $3,864 | |
| | | | | | | |
Portfolio turnover rate | | | 34.25% | | | | 16.66% | | | | | | | | 44.25% | | | | 20.90% | | | | 13.33% | | | | 30.44% | |
aFor the period April 1, 2016 to December 31, 2016.
bThe amount shown for a share outstanding throughout the period may not correlate with the Consolidated Statement of Operations for the period due to the timing of sales and repurchases of the Fund’s shares in relation to income earned and/or fluctuating fair value of the investments of the Fund.
cBased on average daily shares outstanding.
dNet investment income per share includes approximately $0.02 per share related to income received in the form of a special dividend in connection with certain Fund holdings. Excluding this amount, the ratio of net investment income to average net assets would have been 1.99%.
eTotal return is not annualized for periods less than one year.
fRatios are annualized for periods less than one year.
gBenefit of expense reduction rounds to less than 0.01%.
hBenefit of waiver and payments by affiliates rounds to less than 0.01%.
| | | | | | |
franklintempleton.com | | | | The accompanying notes are an integral part of these consolidated financial statements. | Annual Report | | 17 |
TEMPLETON GLOBAL INVESTMENT TRUST
CONSOLIDATED FINANCIAL HIGHLIGHTS
Templeton Global Balanced Fund (continued)
| | | | | | | | | | | | | | | | | | | | | | | | |
| | | Year Ended December 31, | | | | | | Year Ended March 31, | |
| | | 2017 | | | 2016a | | | | | | 2016 | | | 2015 | | | 2014b | |
| | | | | | |
Class R6 | | | | | | | | | | | | | | | | | | | | | | | | |
| | | | | | |
Per share operating performance | | | | | | | | | | | | | | | | | | | | | | | | |
(for a share outstanding throughout the year) | | | | | | | | | | | | | | | | | | | | | | | | |
| | | | | | |
Net asset value, beginning of year | | | $ 2.92 | | | | $ 2.73 | | | | | | | | $ 3.14 | | | | $ 3.30 | | | | $ 3.02 | |
| | | | | | |
Income from investment operationsc: | | | | | | | | | | | | | | | | | | | | | | | | |
| | | | | | |
Net investment incomed | | | 0.09 | | | | 0.08 | | | | | | | | 0.08 | | | | 0.07 | | | | 0.09 | e |
| | | | | | |
Net realized and unrealized gains (losses) | | | 0.26 | | | | 0.15 | | | | | | | | (0.31 | ) | | | (0.04 | ) | | | 0.28 | |
| | | | | | |
Total from investment operations | | | 0.35 | | | | 0.23 | | | | | | | | (0.23 | ) | | | 0.03 | | | | 0.37 | |
| | | | | | |
Less distributions from: | | | | | | | | | | | | | | | | | | | | | | | | |
| | | | | | |
Net investment income | | | (0.09 | ) | | | (0.04 | ) | | | | | | | (0.10 | ) | | | (0.19 | ) | | | (0.09 | ) |
| | | | | | |
Net realized gains | | | — | | | | — | | | | | | | | (0.08 | ) | | | — | | | | — | |
| | | | | | |
Total distributions | | | (0.09 | ) | | | (0.04 | ) | | | | | | | (0.18 | ) | | | (0.19 | ) | | | (0.09 | ) |
| | | | | | |
Net asset value, end of year | | | $ 3.18 | | | | $ 2.92 | | | | | | | | $ 2.73 | | | | $ 3.14 | | | | $ 3.30 | |
| | | | | | |
Total returnf | | | 12.56% | | | | 8.35% | | | | | | | | (7.44 | )% | | | 1.02% | | | | 12.32% | |
| | | | | | |
Ratios to average net assetsg | | | | | | | | | | | | | | | | | | | | | | | | |
| | | | | | |
Expenses before waiver and payments by affiliates | | | 0.84% | | | | 0.81% | | | | | | | | 0.81% | | | | 0.92% | | | | 2.31% | |
| | | | | | |
Expenses net of waiver and payments by affiliatesh | | | 0.77% | | | | 0.79% | | | | | | | | 0.75% | | | | 0.76% | | | | 0.77% | |
| | | | | | |
Net investment income | | | 3.19% | | | | 3.64% | | | | | | | | 2.90% | | | | 2.90% | | | | 3.11% | e |
| | | | | | |
Supplemental data | | | | | | | | | | | | | | | | | | | | | | | | |
| | | | | | |
Net assets, end of year (000’s) | | | $11,254 | | | | $752 | | | | | | | | $1,089 | | | | $660 | | | | $5 | |
| | | | | | |
Portfolio turnover rate | | | 34.25% | | | | 16.66% | | | | | | | | 44.25% | | | | 20.90% | | | | 13.33% | |
aFor the period April 1, 2016 to December 31, 2016.
bFor the period May 1, 2013 (effective date) to March 31, 2014.
cThe amount shown for a share outstanding throughout the period may not correlate with the Consolidated Statement of Operations for the period due to the timing of sales and repurchases of the Fund’s shares in relation to income earned and/or fluctuating fair value of the investments of the Fund.
dBased on average daily shares outstanding.
eNet investment income per share includes approximately $0.02 per share related to income received in the form of a special dividend in connection with certain Fund holdings. Excluding this amount, the ratio of net investment income to average net assets would have been 2.59%.
fTotal return is not annualized for periods less than one year.
gRatios are annualized for periods less than one year.
hBenefit of expense reduction rounds to less than 0.01%.
| | | | | | |
18 | | Annual Report | | | The accompanying notes are an integral part of these consolidated financial statements. | | franklintempleton.com |
TEMPLETON GLOBAL INVESTMENT TRUST
CONSOLIDATED FINANCIAL HIGHLIGHTS
Templeton Global Balanced Fund (continued)
| | | | | | | | | | | | | | | | | | | | | | | | | | | | |
| | | Year Ended December 31, | | | | | | Year Ended March 31, | |
| | | 2017 | | | 2016a | | | | | | 2016 | | | 2015 | | | 2014 | | | 2013 | |
| | | | | | | |
Advisor Class | | | | | | | | | | | | | | | | | | | | | | | | | | | | |
| | | | | | | |
Per share operating performance | | | | | | | | | | | | | | | | | | | | | | | | | | | | |
(for a share outstanding throughout the year) | | | | | | | | | | | | | | | | | | | | | | | | | | | | |
| | | | | | | |
Net asset value, beginning of year | | | $ 2.92 | | | | $ 2.73 | | | | | | | | $ 3.14 | | | | $ 3.31 | | | | $ 2.95 | | | | $ 2.80 | |
| | | | | | | |
Income from investment operationsb: | | | | | | | | | | | | | | | | | | | | | | | | | | | | |
| | | | | | | |
Net investment incomec | | | 0.10 | | | | 0.08 | | | | | | | | 0.08 | | | | 0.09 | | | | 0.09 | d | | | 0.08 | |
| | | | | | | |
Net realized and unrealized gains (losses) | | | 0.26 | | | | 0.14 | | | | | | | | (0.31 | ) | | | (0.08 | ) | | | 0.35 | | | | 0.24 | |
| | | | | | | |
Total from investment operations | | | 0.36 | | | | 0.22 | | | | | | | | (0.23 | ) | | | 0.01 | | | | 0.44 | | | | 0.32 | |
| | | | | | | |
Less distributions from: | | | | | | | | | | | | | | | | | | | | | | | | | | | | |
| | | | | | | |
Net investment income | | | (0.09 | ) | | | (0.03 | ) | | | | | | | (0.10 | ) | | | (0.18 | ) | | | (0.08 | ) | | | (0.17 | ) |
| | | | | | | |
Net realized gains | | | — | | | | — | | | | | | | | (0.08 | ) | | | — | | | | — | | | | — | |
| | | | | | | |
Total distributions | | | (0.09 | ) | | | (0.03 | ) | | | | | | | (0.18 | ) | | | (0.18 | ) | | | (0.08 | ) | | | (0.17 | ) |
| | | | | | | |
Net asset value, end of year | | | $ 3.19 | | | | $ 2.92 | | | | | | | | $ 2.73 | | | | $ 3.14 | | | | $ 3.31 | | | | $ 2.95 | |
| | | | | | | |
Total returne | | | 12.42% | | | | 8.22% | | | | | | | | (7.52)% | | | | 0.62% | | | | 15.23% | | | | 11.92% | |
| | | | | | | |
Ratios to average net assetsf | | | | | | | | | | | | | | | | | | | | | | | | | | | | |
| | | | | | | |
Expenses before waiver and payments by affiliates | | | 0.92% | | | | 0.91% | | | | | | | | 0.86% | | | | 0.86% | | | | 0.88% | | | | 0.96% | |
| | | | | | | |
Expenses net of waiver and payments by affiliates | | | 0.89% | g | | | 0.90% | g | | | | | | | 0.85% | g | | | 0.86% | g,h | | | 0.87% | g | | | 0.95% | |
| | | | | | | |
Net investment income | | | 3.07% | | | | 3.53% | | | | | | | | 2.80% | | | | 2.80% | | | | 3.01% | d | | | 3.09% | |
| | | | | | | |
Supplemental data | | | | | | | | | | | | | | | | | | | | | | | | | | | | |
| | | | | | | |
Net assets, end of year (000’s) | | | $246,044 | | | | $212,161 | | | | | | | | $299,226 | | | | $405,877 | | | | $421,583 | | | | $146,013 | |
| | | | | | | |
Portfolio turnover rate | | | 34.25% | | | | 16.66% | | | | | | | | 44.25% | | | | 20.90% | | | | 13.33% | | | | 30.44% | |
aFor the period April 1, 2016 to December 31, 2016.
bThe amount shown for a share outstanding throughout the period may not correlate with the Consolidated Statement of Operations for the period due to the timing of sales and repurchases of the Fund’s shares in relation to income earned and/or fluctuating fair value of the investments of the Fund.
cBased on average daily shares outstanding.
dNet investment income per share includes approximately $0.02 per share related to income received in the form of a special dividend in connection with certain Fund holdings. Excluding this amount, the ratio of net investment income to average net assets would have been 2.49%.
eTotal return is not annualized for periods less than one year.
fRatios are annualized for periods less than one year.
gBenefit of expense reduction rounds to less than 0.01%.
hBenefit of waiver and payments by affiliates rounds to less than 0.01%.
| | | | | | |
franklintempleton.com | | | | The accompanying notes are an integral part of these consolidated financial statements. | Annual Report | | 19 |
TEMPLETON GLOBAL INVESTMENT TRUST
Consolidated Statement of Investments, December 31, 2017
Templeton Global Balanced Fund
| | | | | | | | | | | | |
| | | | | Industry | |
| Shares/
Warrants |
| | | Value | |
| | Common Stocks and Other Equity Interests 63.6% | | | | | |
| | Belgium 0.8% | | | | | | | | | | |
| | UCB SA | | Pharmaceuticals | | | 169,428 | | | $ | 13,453,052 | |
| | | | | | | | | | | | |
| | Canada 0.9% | | | | | | | | | | |
| a | | Husky Energy Inc. | | Oil, Gas & Consumable Fuels | | | 550,500 | | | | 7,772,949 | |
| | Wheaton Precious Metals Corp. | | Metals & Mining | | | 349,900 | | | | 7,735,042 | |
| | | | | | | | | | | | |
| | | | |
| | | | | | | | | | | 15,507,991 | |
| | | | | | | | | | | | |
| | China 2.2% | | | | | | | | | | |
| | China Life Insurance Co. Ltd., H | | Insurance | | | 3,015,000 | | | | 9,473,912 | |
| | China Mobile Ltd. | | Wireless Telecommunication Services | | | 1,656,000 | | | | 16,797,711 | |
| | China Telecom Corp. Ltd., H | | Diversified Telecommunication Services | | | 26,602,000 | | | | 12,666,241 | |
| | | | | | | | | | | | |
| | | | |
| | | | | | | | | | | 38,937,864 | |
| | | | | | | | | | | | |
| | France 3.5% | | | | | | | | | | |
| | AXA SA | | Insurance | | | 503,560 | | | | 14,944,177 | |
| | BNP Paribas SA | | Banks | | | 195,410 | | | | 14,594,695 | |
| | Compagnie de Saint-Gobain | | Building Products | | | 167,931 | | | | 9,264,217 | |
| | Credit Agricole SA | | Banks | | | 259,288 | | | | 4,293,094 | |
| | Sanofi | | Pharmaceuticals | | | 95,421 | | | | 8,225,828 | |
| | Veolia Environnement SA | | Multi-Utilities | | | 453,992 | | | | 11,588,485 | |
| | | | | | | | | | | | |
| | | | |
| | | | | | | | | | | 62,910,496 | |
| | | | | | | | | | | | |
| | Germany 3.2% | | | | | | | | | | |
| | Bayer AG | | Pharmaceuticals | | | 117,100 | | | | 14,611,645 | |
| | Fresenius Medical Care AG & Co. KGaA | | Health Care Providers & Services | | | 105,341 | | | | 11,094,351 | |
| | innogy SE | | Multi-Utilities | | | 349,400 | | | | 13,697,691 | |
| | Siemens AG | | Industrial Conglomerates | | | 69,218 | | | | 9,645,998 | |
| | Telefonica Deutschland Holding AG | | Diversified Telecommunication Services | | | 1,578,980 | | | | 7,930,211 | |
| | | | | | | | | | | | |
| | | | |
| | | | | | | | | | | 56,979,896 | |
| | | | | | | | | | | | |
| | Hong Kong 1.1% | | | | | | | | | | |
| | CK Hutchison Holdings Ltd. | | Industrial Conglomerates | | | 1,560,352 | | | | 19,592,150 | |
| | | | | | | | | | | | |
| | Ireland 0.5% | | | | | | | | | | |
| | CRH PLC | | Construction Materials | | | 262,332 | | | | 9,428,215 | |
| | | | | | | | | | | | |
| | Israel 1.1% | | | | | | | | | | |
| | Teva Pharmaceutical Industries Ltd., ADR | | Pharmaceuticals | | | 1,014,019 | | | | 19,215,660 | |
| | | | | | | | | | | | |
| | Italy 1.8% | | | | | | | | | | |
| | Azimut Holding SpA | | Capital Markets | | | 357,476 | | | | 6,849,528 | |
| | Eni SpA | | Oil, Gas & Consumable Fuels | | | 1,582,500 | | | | 26,201,834 | |
| | | | | | | | | | | | |
| | | | |
| | | | | | | | | | | 33,051,362 | |
| | | | | | | | | | | | |
| | Japan 3.8% | | | | | | | | | | |
| | Kirin Holdings Co. Ltd. | | Beverages | | | 480,400 | | | | 12,109,652 | |
| | Murata Manufacturing Co. Ltd. | | Electronic Equipment, Instruments | | | | | | | | |
| | | | & Components | | | 45,800 | | | | 6,145,414 | |
| | Omron Corp. | | Electronic Equipment, Instruments | | | | | | | | |
| | | | & Components | | | 149,600 | | | | 8,921,436 | |
| | Panasonic Corp. | | Household Durables | | | 863,000 | | | | 12,632,724 | |
| | SoftBank Group Corp. | | Wireless Telecommunication Services | | | 139,700 | | | | 11,058,473 | |
| | Sumitomo Rubber Industries Ltd. | | Auto Components | | | 380,800 | | | | 7,083,079 | |
| | Suntory Beverage & Food Ltd. | | Beverages | | | 219,800 | | | | 9,772,357 | |
| | | | | | | | | | | | |
| | | | |
| | | | | | | | | | | 67,723,135 | |
| | | | | | | | | | | | |
| | | | | | |
20 | | Annual Report | | | | franklintempleton.com |
TEMPLETON GLOBAL INVESTMENT TRUST
CONSOLIDATED STATEMENT OF INVESTMENTS
Templeton Global Balanced Fund (continued)
| | | | | | | | | | | | | | |
| | | | | | | Industry | |
| Shares/
Warrants |
| | | Value | |
| | | | Common Stocks and Other Equity Interests (continued) | | | | | |
| | | | Luxembourg 1.0% | | | | | | | | | | |
| | | | SES SA, IDR | | Media | | | 1,138,925 | | | $ | 17,777,935 | |
| | | | | | | | | | | | | | |
| | | | Netherlands 1.2% | | | | | | | | | | |
| | | | Aegon NV | | Insurance | | | 2,489,835 | | | | 15,877,522 | |
| | | | ING Groep NV | | Banks | | | 353,633 | | | | 6,502,227 | |
| | | | | | | | | | | | | | |
| | | | |
| | | | | | | | | | | | | 22,379,749 | |
| | | | New Zealand 0.5% | | | | | . | | | | | |
| | | | Sky Network Television Ltd. | | Media | | | 4,786,566 | | | | 9,532,192 | |
| | | | | | | | | | | | | | |
| | | | Norway 1.1% | | | | | | | | | | |
| | | | Telenor ASA | | Diversified Telecommunication Services | | | 542,631 | | | | 11,627,335 | |
| | | | Yara International ASA | | Chemicals | | | 178,130 | | | | 8,174,147 | |
| | | | | | | | | | | | | | |
| | | | |
| | | | | | | | | | | | | 19,801,482 | |
| | | | | | | | | | | | | | |
| | | | Portugal 0.7% | | | | | | | | | | |
| | | | Galp Energia SGPS SA, B | | Oil, Gas & Consumable Fuels | | | 684,258 | | | | 12,581,408 | |
| | | | | | | | | | | | | | |
| | | | Singapore 1.5% | | | | | | | | | | |
| | | | Singapore Telecommunications Ltd. | | Diversified Telecommunication Services | | | 6,779,999 | | | | 18,096,895 | |
| | | | United Overseas Bank Ltd. | | Banks | | | 463,100 | | | | 9,158,127 | |
| | | | | | | | | | | | | | |
| | | | |
| | | | | | | | | | | | | 27,255,022 | |
| | | | | | | | | | | | | | |
| | | | South Africa 0.0%† | | | | | | | | | | |
| | a,b,c | | | Edcon Holdings Ltd., F wts., 2/20/49 | | Specialty Retail | | | 4,441 | | | | — | |
| | a,b,c | | | Edcon Holdings Ltd., F1 wts., 2/20/49 | | Specialty Retail | | | 79,464,087 | | | | — | |
| | a,b,c | | | Edcon Holdings Ltd., F2 wts., 2/20/49 | | Specialty Retail | | | 6,435,002 | | | | — | |
| | a,b,c | | | Holdco 2, A | | Specialty Retail | | | 32,900,733 | | | | 26,592 | |
| | a,b,c | | | Holdco 2, B | | Specialty Retail | | | 4,646,498 | | | | 3,756 | |
| | | | | | | | | | | | | | |
| | | | |
| | | | | | | | | | | | | 30,348 | |
| | | | | | | | | | | | | | |
| | | | South Korea 3.1% | | | | | | | | | | |
| | | | Hana Financial Group Inc. | | Banks | | | 230,138 | | | | 10,737,438 | |
| | | | KB Financial Group Inc. | | Banks | | | 149,821 | | | | 8,899,076 | |
| | | | LG Chem Ltd. | | Chemicals | | | 27,075 | | | | 10,273,217 | |
| | | | Samsung Electronics Co. Ltd. | | Technology Hardware, Storage & Peripherals | | | 10,859 | | | | 25,922,222 | |
| | | | | | | | | | | | | | |
| | | | |
| | | | | | | | | | | | | 55,831,953 | |
| | | | | | | | | | | | | | |
| | | | Switzerland 2.5% | | | | | | | | | | |
| | a | | | Landis+Gyr Group AG | | Electronic Equipment, Instruments | | | | | | | | |
| | | | | | & Components | | | 133,765 | | | | 10,653,424 | |
| | | | Roche Holding AG | | Pharmaceuticals | | | 55,750 | | | | 14,104,147 | |
| | | | UBS Group AG | | Capital Markets | | | 1,118,890 | | | | 20,601,310 | |
| | | | | | | | | | | | | | |
| | | | |
| | | | | | | | | | | | | 45,358,881 | |
| | | | | | | | | | | | | | |
| | | | Taiwan 0.9% | | | | | | | | | | |
| | d | | | Pegatron Corp., GDR, Reg S | | Technology Hardware, Storage & Peripherals | | | 645,632 | | | | 7,834,548 | |
| | | | Quanta Computer Inc. | | Technology Hardware, Storage & Peripherals | | | 3,879,000 | | | | 8,093,508 | |
| | | | | | | | | | | | | | |
| | | | |
| | | | | | | | | | | | | 15,928,056 | |
| | | | | | | | | | | | | | |
| | | | Thailand 1.6% | | | | | | | | | | |
| | | | Bangkok Bank PCL, fgn | | Banks | | | 2,878,600 | | | | 19,355,646 | |
| | | | PTT Global Chemical PCL, fgn | | Chemicals | | | 3,759,900 | | | | 9,812,450 | |
| | | | | | | | | | | | | | |
| | | | |
| | | | | | | | | | | | | 29,168,096 | |
| | | | | | | | | | | | | | |
| | | | | | |
franklintempleton.com | | | | Annual Report | | 21 |
TEMPLETON GLOBAL INVESTMENT TRUST
CONSOLIDATED STATEMENT OF INVESTMENTS
Templeton Global Balanced Fund (continued)
| | | | | | | | | | |
| | | Industry | |
| Shares/
Warrants |
| | | Value | |
Common Stocks and Other Equity Interests (continued) | | | | | | | | |
United Kingdom 12.8% | | | | | | | | | | |
BAE Systems PLC | | Aerospace & Defense | | | 2,276,125 | | | $ | 17,612,834 | |
Barclays PLC | | Banks | | | 3,393,423 | | | | 9,307,358 | |
BP PLC | | Oil, Gas & Consumable Fuels | | | 4,870,360 | | | | 34,378,908 | |
a Cobham PLC | | Aerospace & Defense | | | 5,707,293 | | | | 9,734,464 | |
HSBC Holdings PLC | | Banks | | | 2,252,092 | | | | 23,045,976 | |
Johnson Matthey PLC | | Chemicals | | | 226,840 | | | | 9,419,835 | |
Kingfisher PLC | | Specialty Retail | | | 4,348,469 | | | | 19,831,061 | |
Man Group PLC | | Capital Markets | | | 2,419,168 | | | | 6,756,085 | |
Prudential PLC | | Insurance | | | 475,140 | | | | 12,226,694 | |
Rolls-Royce Holdings PLC | | Aerospace & Defense | | | 689,080 | | | | 7,881,912 | |
a Rolls-Royce Holdings PLC, interim line | | Aerospace & Defense | | | 31,697,680 | | | | 42,806 | |
Royal Dutch Shell PLC, B | | Oil, Gas & Consumable Fuels | | | 991,187 | | | | 33,577,489 | |
Shire PLC | | Biotechnology | | | 264,054 | | | | 13,907,077 | |
a Standard Chartered PLC | | Banks | | | 534,464 | | | | 5,630,504 | |
Vodafone Group PLC | | Wireless Telecommunication Services | | | 8,009,446 | | | | 25,418,438 | |
| | | | | | | | | | |
| | | |
| | | | | | | | | 228,771,441 | |
| | | | | | | | | | |
United States 17.8% | | | | | | | | | | |
Allergan PLC | | Pharmaceuticals | | | 77,660 | | | | 12,703,623 | |
a Alphabet Inc., A | | Internet Software & Services | | | 16,310 | | | | 17,180,954 | |
Amgen Inc. | | Biotechnology | | | 109,800 | | | | 19,094,220 | |
Apple Inc. | | Technology Hardware, Storage & Peripherals | | | 84,690 | | | | 14,332,089 | |
Cardinal Health Inc. | | Health Care Providers & Services | | | 202,300 | | | | 12,394,921 | |
a CEVA Holdings LLC | | Air Freight & Logistics | | | 247 | | | | 111,019 | |
CF Industries Holdings Inc. | | Chemicals | | | 159,690 | | | | 6,793,213 | |
Citigroup Inc. | | Banks | | | 153,087 | | | | 11,391,204 | |
Comcast Corp., A | | Media | | | 561,124 | | | | 22,473,016 | |
ConocoPhillips | | Oil, Gas & Consumable Fuels | | | 196,120 | | | | 10,765,027 | |
Coty Inc., A | | Personal Products | | | 1,219,100 | | | | 24,247,899 | |
Devon Energy Corp. | | Oil, Gas & Consumable Fuels | | | 202,490 | | | | 8,383,086 | |
Eli Lilly & Co. | | Pharmaceuticals | | | 246,710 | | | | 20,837,126 | |
Gilead Sciences Inc. | | Biotechnology | | | 228,800 | | | | 16,391,232 | |
Helmerich & Payne Inc. | | Energy Equipment & Services | | | 122,200 | | | | 7,899,008 | |
Intel Corp. | | Semiconductors & Semiconductor Equipment | | | 299,200 | | | | 13,811,072 | |
JPMorgan Chase & Co. | | Banks | | | 164,206 | | | | 17,560,190 | |
Mattel Inc. | | Leisure Products | | | 401,900 | | | | 6,181,222 | |
Microsoft Corp. | | Software | | | 295,339 | | | | 25,263,298 | |
Oracle Corp. | | Software | | | 654,410 | | | | 30,940,505 | |
Perrigo Co. PLC | | Pharmaceuticals | | | 124,570 | | | | 10,857,521 | |
a,b,e Turtle Bay Resort | | Hotels, Restaurants & Leisure | | | 1,587,888 | | | | 287,165 | |
Walgreens Boots Alliance Inc. | | Food & Staples Retailing | | | 113,610 | | | | 8,250,358 | |
| | | | | | | | | | |
| | | |
| | | | | | | | | 318,148,968 | |
| | | | | | | | | | |
Total Common Stocks and Other Equity Interests
(Cost $990,866,000) | | | | | | | | | 1,139,365,352 | |
| | | | | | | | | | |
| | | |
f Equity-Linked Securities 2.7% | | | | | | | | | | |
United Kingdom 0.8% | | | | | | | | | | |
g Royal Bank of Canada into Standard | | | | | | | | | | |
Chartered PLC, 4.00%, 144A | | Banks | | | 1,478,465 | | | | 14,495,436 | |
| | | | | | | | | | |
| | | | | | |
22 | | Annual Report | | | | franklintempleton.com |
TEMPLETON GLOBAL INVESTMENT TRUST
CONSOLIDATED STATEMENT OF INVESTMENTS
Templeton Global Balanced Fund (continued)
| | | | | | | | | | | | | | | | |
| | | | | Industry | | | Shares | | | | | | | | Value | |
| f | | Equity-Linked Securities (continued) | | | | | | | | | |
| | United States 1.9% | | | | | | | | | | | | | | |
| g | | Royal Bank of Canada into Citigroup Inc., 4.50%, 144A | | Banks | | | 13,100,000 | | | | | | | $ | 15,787,050 | |
| g | | Royal Bank of Canada into Ionis Pharmaceuticals Inc., 6.00%, 144A | | Biotechnology | | | 143,186 | | | | | | | | 7,531,485 | |
| g | | Royal Bank of Canada into Knowles Corp., 5.00%, 144A | | Electronic Equipment, Instruments & Components | | | 12,110,000 | | | | | | | | 10,417,338 | |
| | | | | | | | | | | | | | | | |
| | | | | |
| | | | | | | | | | | | | | | 33,735,873 | |
| | | | | | | | | | | | | | | | |
| | Total Equity-Linked Securities (Cost $48,624,045) | | | | | | | | | | | | | 48,231,309 | |
| | | | | | | | | | | | | | | | |
| | Convertible Preferred Stocks 0.0%† | | | | | | | | | | | | | | |
| | United States 0.0%† | | | | | | | | | | | | | | |
| ` | | CEVA Holdings LLC, cvt. pfd., A-1 | | Air Freight & Logistics | | | 12 | | | | | | | | 7,320 | |
| a | | CEVA Holdings LLC, cvt. pfd., A-2 | | Air Freight & Logistics | | | 534 | | | | | | | | 240,327 | |
| | | | | | | | | | | | | | | | |
| | Total Convertible Preferred Stocks (Cost $802,629) | | | | | | | | | | | | | 247,647 | |
| | | | | | | | | | | | | | | | |
| | | | | |
| Principal
Amount |
* | | | | | | | | |
| | Corporate Bonds and Notes 0.2% | | | | | | | | | | | | | | |
| | South Africa 0.0%† | | | | | | | | | | | | | | |
| | K2016470219 South Africa Ltd., | | | | | | | | | | | | | | |
| c,h | | senior secured note, 144A, PIK, 3.00%, 12/31/22 | | Multiline Retail | | | 2,493,652 | | | | | | | | 37,405 | |
| b | | senior secured note, 144A, PIK, 8.00%, 12/31/22 | | Multiline Retail | | | 2,058,106 | | | | EUR | | | | 12,347 | |
| c,h | | K2016470260 South Africa Ltd., senior secured note, 144A, PIK, 25.00%, 12/31/22 | | Multiline Retail | | | 617,516 | | | | | | | | 475,487 | |
| | | | | | | | | | | | | | | | |
| | | | | |
| | | | | | | | | | | | | | | 525,239 | |
| | | | | | | | | | | | | | | | |
| | United States 0.2% | | | | | | | | | | | | | | |
| b,i | | BreitBurn Energy Partners LP/BreitBurn Finance Corp., senior bond, 7.875%, 4/15/22. | | Oil, Gas & Consumable Fuels | | | 500,000 | | | | | | | | 1,850 | |
| | General Electric Co., senior note, A, 8.50%, 4/06/18 | | Industrial Conglomerates | | | 59,000,000 | | | | MXN | | | | 3,001,416 | |
| | | | | | | | | | | | | | | | |
| | | | | |
| | | | | | | | | | | | | | | 3,003,266 | |
| | | | | | | | | | | | | | | | |
| | Total Corporate Bonds and Notes (Cost $9,439,189) | | | | | | | | | | | | | 3,528,505 | |
| | | | | | | | | | | | | | | | |
| | Foreign Government and Agency | | | | | | | | | | | | | | |
| | Securities 20.2% | | | | | | | | | | | | | | |
| | Argentina 1.2% | | | | | | | | | | | | | | |
| | Argentine Bonos del Tesoro, | | | | | | | | | | | | | | |
| | 18.20%, 10/03/21 | | | | | 180,256,000 | | | | ARS | | | | 9,944,947 | |
| | 16.00%, 10/17/23 | | | | | 117,073,000 | | | | ARS | | | | 6,264,011 | |
| | senior note, 15.50%, 10/17/26 | | | | | 65,894,000 | | | | ARS | | | | 3,586,418 | |
| j | | Government of Argentina, FRN, 24.225%, (ARS Badlar + 2.00%), 4/03/22 | | | | | 37,519,000 | | | | ARS | | | | 2,011,901 | |
| | | | | | | | | | | | | | | | |
| | | | | |
| | | | | | | | | | | | | | | 21,807,277 | |
| | | | | | | | | | | | | | | | |
| | | | | | |
franklintempleton.com | | | | Annual Report | | 23 |
TEMPLETON GLOBAL INVESTMENT TRUST
CONSOLIDATED STATEMENT OF INVESTMENTS
Templeton Global Balanced Fund (continued)
| | | | | | | | | | |
| | | Principal
Amount* | | | | | | Value |
Foreign Government and Agency | | | | | | | | | | |
Securities (continued) | | | | | | | | | | |
Brazil 3.7% | | | | | | | | | | |
Letra Tesouro Nacional, | | | | | | | | | | |
Strip, 7/01/19 | | | 28,060 | k | | | BRL | | | $ 7,620,566 |
Strip, 7/01/20 | | | 1,200 | k | | | BRL | | | 294,902 |
Strip, 7/01/21 | | | 7,960 | k | | | BRL | | | 1,760,351 |
Nota Do Tesouro Nacional, | | | | | | | | | | |
10.00%, 1/01/21 | | | 109,195 | k | | | BRL | | | 33,933,604 |
10.00%, 1/01/23 | | | 33,230 | k | | | BRL | | | 10,152,313 |
10.00%, 1/01/25 | | | 38,951 | k | | | BRL | | | 11,731,734 |
senior note, 10.00%, 1/01/19 | | | 5,490 | k | | | BRL | | | 1,706,151 |
| | | |
| | | | | | | | | | 67,199,621 |
Colombia 1.3% | | | | | | | | | | |
Government of Colombia, | | | | | | | | | | |
senior bond, 7.75%, 4/14/21 | | | 689,000,000 | | | | COP | | | 244,266 |
senior bond, 4.375%, 3/21/23 | | | 52,000,000 | | | | COP | | | 16,556 |
senior bond, 9.85%, 6/28/27 | | | 83,000,000 | | | | COP | | | 34,878 |
Titulos de Tesoreria, | | | | | | | | | | |
B, 5.00%, 11/21/18 | | | 126,000,000 | | | | COP | | | 42,363 |
B, 7.75%, 9/18/30 | | | 22,949,000,000 | | | | COP | | | 8,398,203 |
B, 7.00%, 6/30/32 | | | 452,000,000 | | | | COP | | | 153,787 |
senior bond, B, 11.25%, 10/24/18 | | | 736,000,000 | | | | COP | | | 259,613 |
senior bond, B, 11.00%, 7/24/20 | | | 677,000,000 | | | | COP | | | 257,682 |
senior bond, B, 7.00%, 5/04/22 | | | 844,000,000 | | | | COP | | | 297,642 |
senior bond, B, 10.00%, 7/24/24 | | | 1,738,000,000 | | | | COP | | | 702,225 |
senior bond, B, 7.50%, 8/26/26 | | | 32,054,000,000 | | | | COP | | | 11,473,351 |
senior bond, B, 6.00%, 4/28/28 | | | 5,961,000,000 | | | | COP | | | 1,920,976 |
senior note, B, 7.00%, 9/11/19 | | | 481,000,000 | | | | COP | | | 166,842 |
| | | |
| | | | | | | | | | 23,968,384 |
El Salvador 0.0%† | | | | | | | | | | |
g Government of El Salvador, 144A, 7.65%, 6/15/35 | | | 100,000 | | | | | | | 109,028 |
Ghana 1.5% | | | | | | | | | | |
Ghana Treasury Note, 24.25%, 6/11/18 | | | 3,060,000 | | | | GHS | | | 694,710 |
Government of Ghana, | | | | | | | | | | |
22.49%, 4/23/18 | | | 50,000 | | | | GHS | | | 11,189 |
23.47%, 5/21/18 | | | 5,050,000 | | | | GHS | | | 1,138,691 |
19.04%, 9/24/18 | | | 3,220,000 | | | | GHS | | | 720,093 |
24.50%, 10/22/18 | | | 6,021,000 | | | | GHS | | | 1,398,088 |
24.50%, 4/22/19 | | | 3,310,000 | | | | GHS | | | 791,644 |
24.50%, 5/27/19 | | | 270,000 | | | | GHS | | | 64,936 |
24.50%, 6/21/21 | | | 600,000 | | | | GHS | | | 159,353 |
24.75%, 7/19/21 | | | 5,840,000 | | | | GHS | | | 1,563,483 |
18.75%, 1/24/22 | | | 7,110,000 | | | | GHS | | | 1,663,189 |
19.75%, 3/25/24 | | | 7,250,000 | | | | GHS | | | 1,778,729 |
19.00%, 11/02/26 | | | 27,470,000 | | | | GHS | | | 6,705,480 |
senior bond, 19.75%, 3/15/32 | | | 20,850,000 | | | | GHS | | | 5,062,536 |
senior note, 21.50%, 3/09/20 | | | 130,000 | | | | GHS | | | 31,109 |
senior note, 18.50%, 6/01/20 | | | 1,210,000 | | | | GHS | | | 276,344 |
senior note, 18.25%, 9/21/20 | | | 4,990,000 | | | | GHS | | | 1,144,409 |
senior note, 24.00%, 11/23/20 | | | 7,760,000 | | | | GHS | | | 1,992,110 |
| | | | | | |
24 | | Annual Report | | | | franklintempleton.com |
TEMPLETON GLOBAL INVESTMENT TRUST
CONSOLIDATED STATEMENT OF INVESTMENTS
Templeton Global Balanced Fund (continued)
| | | | | | | | | | |
| | | Principal
Amount* | | | | | | Value |
Foreign Government and Agency Securities (continued) | | | | | | | | | | |
Ghana (continued) | | | | | | | | | | |
Government of Ghana, (continued) | | | | | | | | | | |
senior note, 18.25%, 7/25/22 | | | 7,580,000 | | | | GHS | | | $ 1,763,770 |
| | | |
| | | | | | | | | | 26,959,863 |
India 3.2% | | | | | | | | | | |
Government of India, | | | | | | | | | | |
senior bond, 7.80%, 5/03/20 | | | 302,000,000 | | | | INR | | | 4,829,398 |
senior bond, 8.20%, 2/15/22 | | | 400,000,000 | | | | INR | | | 6,480,263 |
senior bond, 8.35%, 5/14/22 | | | 210,100,000 | | | | INR | | | 3,425,051 |
senior bond, 8.08%, 8/02/22 | | | 133,000,000 | | | | INR | | | 2,149,229 |
senior bond, 8.13%, 9/21/22 | | | 268,000,000 | | | | INR | | | 4,329,728 |
senior note, 7.28%, 6/03/19 | | | 11,700,000 | | | | INR | | | 184,483 |
senior note, 8.12%, 12/10/20 | | | 226,800,000 | | | | INR | | | 3,675,198 |
senior note, 7.80%, 4/11/21 | | | 404,400,000 | | | | INR | | | 6,485,667 |
senior note, 6.84%, 12/19/22 | | | 44,000,000 | | | | INR | | | 680,664 |
senior note, 7.16%, 5/20/23 | | | 307,000,000 | | | | INR | | | 4,804,064 |
senior note, 8.83%, 11/25/23 | | | 756,500,000 | | | | INR | | | 12,662,843 |
senior note, 7.68%, 12/15/23 | | | 465,000,000 | | | | INR | | | 7,437,487 |
| | | |
| | | | | | | | | | 57,144,075 |
Indonesia 3.0% | | | | | | | | | | |
Government of Indonesia, | | | | | | | | | | |
senior bond, FR35, 12.90%, 6/15/22 | | | 10,168,000,000 | | | | IDR | | | 950,287 |
senior bond, FR39, 11.75%, 8/15/23 | | | 1,616,000,000 | | | | IDR | | | 150,702 |
senior bond, FR42, 10.25%, 7/15/27 | | | 2,150,000,000 | | | | IDR | | | 199,589 |
senior bond, FR43, 10.25%, 7/15/22 | | | 154,000,000 | | | | IDR | | | 13,277 |
senior bond, FR44, 10.00%, 9/15/24 | | | 968,000,000 | | | | IDR | | | 85,299 |
senior bond, FR46, 9.50%, 7/15/23 | | | 73,000,000,000 | | | | IDR | | | 6,225,243 |
senior bond, FR56, 8.375%, 9/15/26 | | | 103,978,000,000 | | | | IDR | | | 8,675,373 |
senior bond, FR63, 5.625%, 5/15/23 | | | 2,150,000,000 | | | | IDR | | | 156,468 |
senior bond, FR70, 8.375%, 3/15/24 | | | 380,674,000,000 | | | | IDR | | | 31,193,227 |
senior bond, FR71, 9.00%, 3/15/29 | | | 64,873,000,000 | | | | IDR | | | 5,664,879 |
| | | |
| | | | | | | | | | 53,314,344 |
Mexico 3.3% | | | | | | | | | | |
Government of Mexico, | | | | | | | | | | |
senior bond, M, 8.00%, 6/11/20 | | | 1,003,800 | l | | | MXN | | | 5,152,474 |
senior bond, M, 6.50%, 6/10/21 | | | 2,105,100 | l | | | MXN | | | 10,358,912 |
senior note, M, 4.75%, 6/14/18 | | | 96,800 | l | | | MXN | | | 486,486 |
senior note, M, 5.00%, 12/11/19 | | | 2,432,600 | l | | | MXN | | | 11,798,342 |
senior note, M 10, 8.50%, 12/13/18 | | | 6,026,300 | l | | | MXN | | | 30,880,554 |
| | | |
| | | | | | | | | | 58,676,768 |
Peru 0.1% | | | | | | | | | | |
Government of Peru, senior bond, 7.84%, 8/12/20 | | | 6,988,000 | | | | PEN | | | 2,406,756 |
Philippines 0.0%† | | | | | | | | | | |
Government of the Philippines, | | | | | | | | | | |
senior note, 5.875%, 1/31/18 | | | 1,000,000 | | | | PHP �� | | | 20,026 |
senior note, 5-72, 2.125%, 5/23/18 | | | 562,000 | | | | PHP | | | 11,205 |
| | | |
| | | | | | | | | | 31,231 |
| | | | | | |
franklintempleton.com | | | | Annual Report | | 25 |
TEMPLETON GLOBAL INVESTMENT TRUST
CONSOLIDATED STATEMENT OF INVESTMENTS
Templeton Global Balanced Fund (continued)
| | | | | | | | | | | | | | | | |
| | | | | | | | Principal
Amount* | | | | | | Value |
| | Foreign Government and Agency Securities (continued) | | | | | | | | | | | | | | |
| | South Africa 0.6% | | | | | | | | | | | | | | |
| | Government of South Africa, | | | | | | | | | | | | | | |
| | 8.00%, 1/31/30 | | | | | | | 27,506,000 | | | | ZAR | | | $ 2,034,963 |
| | 7.00%, 2/28/31 | | | | | | | 26,205,000 | | | | ZAR | | | 1,767,385 |
| | 8.25%, 3/31/32 | | | | | | | 42,602,000 | | | | ZAR | | | 3,152,198 |
| | 8.875%, 2/28/35 | | | | | | | 14,180,000 | | | | ZAR | | | 1,082,542 |
| | 8.50%, 1/31/37 | | | | | | | 12,074,000 | | | | ZAR | | | 879,768 |
| | R186, 10.50%, 12/21/26 | | | | | | | 8,817,000 | | | | ZAR | | | 796,473 |
| | senior bond, 6.25%, 3/31/36 | | | | | | | 25,401,000 | | | | ZAR | | | 1,483,352 |
| | | | | |
| | | | | | | | | | | | | | | | 11,196,681 |
| | South Korea 1.5% | | | | | | | | | | | | | | |
| | Korea Monetary Stabilization Bond, | | | | | | | | | | | | | | |
| | senior note, 1.49%, 2/02/18 | | | | | | | 1,879,400,000 | | | | KRW | | | 1,760,703 |
| | senior note, 1.72%, 12/02/18 | | | | | | | 910,000,000 | | | | KRW | | | 851,803 |
| | Korea Treasury Bond, | | | | | | | | | | | | | | |
| | senior bond, 4.25%, 6/10/21 | | | | | | | 3,380,800,000 | | | | KRW | | | 3,374,006 |
| | senior note, 1.50%, 6/10/19 | | | | | | | 2,645,300,000 | | | | KRW | | | 2,460,995 |
| | senior note, 1.25%, 12/10/19 | | | | | | | 2,503,000,000 | | | | KRW | | | 2,308,383 |
| | senior note, 2.00%, 3/10/21 | | | | | | | 8,058,200,000 | | | | KRW | | | 7,496,808 |
| | senior note, 1.375%, 9/10/21 | | | | | | | 8,151,200,000 | | | | KRW | | | 7,394,199 |
| | senior note, 3.00%, 9/10/24 | | | | | | | 745,000,000 | | | | KRW | | | 722,851 |
| | | | | |
| | | | | | | | | | | | | | | | 26,369,748 |
| m | | Supranational 0.2% | | | | | | | | | | | | | | |
| | Inter-American Development Bank, senior bond, 7.50%, 12/05/24 | | | | | | | 60,000,000 | | | | MXN | | | 2,950,764 |
| | Ukraine 0.4% | | | | | | | | | | | | | | |
| a,g,n | | Government of Ukraine, 144A, VRI, GDP | | | | | | | | | | | | | | |
| | Linked Security, 5/31/40 | | | | | | | 12,038,000 | | | | | | | 6,708,176 |
| | Zambia 0.2% | | | | | | | | | | | | | | |
| g | | Government of Zambia International Bond, | | | | | | | | | | | | | | |
| | 144A, 8.50%, 4/14/24 | | | | | | | 3,100,000 | | | | | | | 3,435,823 |
| | Total Foreign Government and Agency Securities
(Cost $350,610,683) | | | | | | | | | | | | | | 362,278,539 |
| | | | | Industry | | | Shares | | | | | | |
| | | | | | | | | | | | | | | | |
| | Escrows and Litigation Trusts
(Cost $—) 0.0% | | | | | | | | | | | | | | |
| | United States 0.0% | | | | | | | | | | | | | | |
| a,b | | NewPage Corp., Litigation Trust | | | Paper & Forest Products | | | | 1,100,000 | | | | | | | — |
| | Total Investments before Short Term Investments
(Cost $1,400,342,546) | | | | | | | | | | | | | | 1,553,651,352 |
| | | | | | |
26 | | Annual Report | | | | franklintempleton.com |
TEMPLETON GLOBAL INVESTMENT TRUST
CONSOLIDATED STATEMENT OF INVESTMENTS
Templeton Global Balanced Fund (continued)
| | | | | | | | | | | | | | |
| | | | | Principal
Amount* | | | | | | Value | |
| | Short Term Investments 12.1% | | | | | | | | | | | | |
| | Foreign Government and Agency Securities 1.9% | | | | | | | | | | | | |
| | Colombia 0.0%† | | | | | | | | | | | | |
| | Colombian Tes Corto Plazo, Strip, 3/13/18 | | | 230,000,000 | | | | COP | | | $ | 76,280 | |
| | | | | | | | | | | | | | |
| | Mexico 1.7% | | | | | | | | | | | | |
| o | | Mexico Treasury Bill, 1/04/18 - 12/06/18 | | | 62,365,130 | p | | | MXN | | | | 30,867,672 | |
| | | | | | | | | | | | | | |
| | | | | | | | | | | | | | |
| | South Korea 0.2% | | | | | | | | | | | | |
| | Korea Monetary Stabilization Bond, | | | | | | | | | | | | |
| | senior note, 1.33%10/02/18 | | | 910,000,000 | | | | KRW | | | | 849,570 | |
| | senior note, 1.82%12/09/18 | | | 1,594,000,000 | | | | KRW | | | | 1,493,156 | |
| | | | | | | | | | | | | | |
| | | | |
| | | | | | | | | | | | | 2,342,726 | |
| | | | | | | | | | | | | | |
| | Total Foreign Government and Agency Securities
(Cost $35,042,488) | | | | | | | | | | | 33,286,678 | |
| | | | | | | | | | | | | | |
| | Total Investments before Money Market Funds
(Cost $1,435,385,034) | | | | | | | | | | | 1,586,938,030 | |
| | | | | | | | | | | | | | |
| | | | | Shares | | | | | | | |
| | Money Market Funds
(Cost $183,175,079) 10.2% | | | | | | | | | | | | |
| | United States 10.2% | | | | | | | | | | | | |
q,r
| | Institutional Fiduciary Trust Money Market Portfolio, 0.89% | | | 183,175,079 | | | | | | | | 183,175,079 | |
| | | | | | | | | | | | | | |
| | Total Investments
(Cost $1,618,560,113) 98.8% | | | | | | | | | | | 1,770,113,109 | |
| | Other Assets, less Liabilities 1.2% | | | | | | | | | | | 22,027,608 | |
| | | | | | | | | | | | | | |
| | | | |
| | Net Assets 100.0% | | | | | | | | | | $ | 1,792,140,717 | |
| | | | | | | | | | | | | | |
| | | | | | |
franklintempleton.com | | | | Annual Report | | 27 |
TEMPLETON GLOBAL INVESTMENT TRUST
CONSOLIDATED STATEMENT OF INVESTMENTS
Templeton Global Balanced Fund (continued)
†Rounds to less than 0.1% of net assets.
*The principal amount is stated in U.S. dollars unless otherwise indicated.
aNon-income producing.
bFair valued using significant unobservable inputs. See Note 12 regarding fair value measurements.
cSee Note 9 regarding restricted securities.
dSecurity was purchased pursuant to Regulation S under the Securities Act of 1933, which exempts from registration securities offered and sold outside of the United States. Such a security cannot be sold in the United States without either an effective registration statement filed pursuant to the Securities Act of 1933, or pursuant to an exemption from registration. This security has been deemed liquid under guidelines approved by the Trust’s Board of Trustees. At December 31, 2017, the value of this security was $7,834,548, representing 0.4% of net assets.
eThe security is owned by FT Holdings Corporation lV, a wholly-owned subsidiary of the Fund. See Note 1(g).
fSee Note 1(e) regarding equity-linked securities.
gSecurity was purchased pursuant to Rule 144A under the Securities Act of 1933 and may be sold in transactions exempt from registration only to qualified institutional buyers or in a public offering registered under the Securities Act of 1933. These securities have been deemed liquid under guidelines approved by the Trust’s Board of Trustees. At December 31, 2017, the aggregate value of these securities was $58,484,336, representing 3.3% of net assets.
hIncome may be received in additional securities and/or cash.
iSee Note 7 regarding defaulted securities.
jThe coupon rate shown represents the rate at period end.
kPrincipal amount is stated in 1,000 Brazilian Real Units.
lPrincipal amount is stated in 100 Mexican Peso Units.
mA supranational organization is an entity formed by two or more central governments through international treaties.
nThe principal represents the notional amount. See Note 1(c) regarding value recovery instruments.
oThe security was issued on a discount basis with no stated coupon rate.
pPrincipal amount is stated in 10 Mexican Peso Units.
qSee Note 3(f) regarding investments in affiliated management investment companies.
rThe rate shown is the annualized seven-day yield at period end.
At December 31, 2017, the Fund had the following forward exchange contracts outstanding. See Note 1(c).
Forward Exchange Contracts
| | | | | | | | | | | | | | | | | | | | | | | | | | | | |
| Currency | | Counterpartya | | | Type | | | Quantity | | | Contract
Amount | | | Settlement
Date | | | Unrealized
Appreciation | | | Unrealized
Depreciation | |
| | | | | | | |
OTC Forward Exchange Contracts | | | | | | | | | | | | | | | | | | | | | | | | | | | | |
Euro | | | UBSW | | | | Sell | | | | 943,744 | | | $ | 1,115,713 | | | | 1/08/18 | | | $ | — | | | $ | (17,305 | ) |
Euro | | | HSBK | | | | Sell | | | | 3,767,000 | | | | 4,455,043 | | | | 1/10/18 | | | | — | | | | (68,025 | ) |
Euro | | | JPHQ | | | | Sell | | | | 4,428,500 | | | | 5,152,073 | | | | 1/10/18 | | | | — | | | | (165,264 | ) |
South Korean Won | | | HSBK | | | | Sell | | | | 5,575,102,732 | | | | 4,936,559 | | | | 1/10/18 | | | | — | | | | (287,757 | ) |
Euro | | | JPHQ | | | | Sell | | | | 1,476,168 | | | | 1,745,310 | | | | 1/11/18 | | | | — | | | | (27,249 | ) |
Japanese Yen | | | BZWS | | | | Sell | | | | 86,450,000 | | | | 766,044 | | | | 1/11/18 | | | | — | | | | (1,640 | ) |
Japanese Yen | | | DBAB | | | | Sell | | | | 160,839,000 | | | | 1,426,510 | | | | 1/11/18 | | | | — | | | | (1,755 | ) |
Japanese Yen | | | GSCO | | | | Sell | | | | 228,991,000 | | | | 2,028,138 | | | | 1/11/18 | | | | — | | | | (5,323 | ) |
Japanese Yen | | | JPHQ | | | | Sell | | | | 608,450,000 | | | | 5,395,065 | | | | 1/11/18 | | | | — | | | | (8,026 | ) |
Indian Rupee | | | JPHQ | | | | Buy | | | | 38,898,000 | | | | 588,561 | | | | 1/12/18 | | | | 20,098 | | | | — | |
Euro | | | BOFA | | | | Sell | | | | 7,619,000 | | | | 8,975,182 | | | | 1/16/18 | | | | — | | | | (176,478 | ) |
Euro | | | DBAB | | | | Sell | | | | 487,652 | | | | 577,311 | | | | 1/16/18 | | | | — | | | | (8,438 | ) |
Japanese Yen | | | BZWS | | | | Sell | | | | 306,400,000 | | | | 2,705,949 | | | | 1/16/18 | | | | — | | | | (15,594 | ) |
Japanese Yen | | | CITI | | | | Sell | | | | 63,300,000 | | | | 558,921 | | | | 1/16/18 | | | | — | | | | (3,330 | ) |
Japanese Yen | | | HSBK | | | | Sell | | | | 209,990,000 | | | | 1,853,235 | | | | 1/16/18 | | | | — | | | | (11,964 | ) |
Euro | | | BOFA | | | | Sell | | | | 6,166,140 | | | | 7,358,055 | | | | 1/17/18 | | | | — | | | | (48,951 | ) |
Euro | | | GSCO | | | | Sell | | | | 1,651,995 | | | | 1,956,855 | | | | 1/17/18 | | | | — | | | | (27,586 | ) |
Euro | | | JPHQ | | | | Sell | | | | 40,000,000 | | | | 47,741,360 | | | | 1/17/18 | | | | — | | | | (308,185 | ) |
Euro | | | GSCO | | | | Sell | | | | 47,872 | | | | 56,812 | | | | 1/18/18 | | | | — | | | | (698 | ) |
Euro | | | JPHQ | | | | Sell | | | | 5,382,620 | | | | 6,388,820 | | | | 1/18/18 | | | | — | | | | (77,399 | ) |
| | | | | | |
28 | | Annual Report | | | | franklintempleton.com |
TEMPLETON GLOBAL INVESTMENT TRUST
CONSOLIDATED STATEMENT OF INVESTMENTS
Templeton Global Balanced Fund (continued)
Forward Exchange Contracts (continued)
| | | | | | | | | | | | | | | | | | | | | | | | | | | | |
| Currency | | Counterpartya
| | | Type | | | Quantity | | | Contract
Amount | | | Settlement
Date | | | Unrealized
Appreciation | | | Unrealized
Depreciation | |
| | | | |
OTC Forward Exchange Contracts (continued) | | | | | | | | | | | | | | | | | |
Euro | | | UBSW | | | | Sell | | | | 6,580,860 | | | $ | 7,806,677 | | | | 1/18/18 | | | $ | — | | | $ | (99,005 | ) |
Euro | | | DBAB | | | | Sell | | | | 200,000 | | | | 235,916 | | | | 1/22/18 | | | | — | | | | (4,408 | ) |
Euro | | | JPHQ | | | | Sell | | | | 2,443,285 | | | | 2,885,935 | | | | 1/22/18 | | | | — | | | | (49,960 | ) |
Japanese Yen | | | SCNY | | | | Sell | | | | 260,930,000 | | | | 2,353,371 | | | | 1/22/18 | | | | 35,008 | | | | — | |
Indian Rupee | | | DBAB | | | | Buy | | | | 115,951,000 | | | | 1,773,493 | | | | 1/23/18 | | | | 39,350 | | | | — | |
Indian Rupee | | | JPHQ | | | | Buy | | | | 93,886,000 | | | | 1,435,566 | | | | 1/23/18 | | | | 32,301 | | | | — | |
Japanese Yen | | | DBAB | | | | Sell | | | | 63,500,000 | | | | 571,619 | | | | 1/24/18 | | | | 7,365 | | | | — | |
South Korean Won | | | HSBK | | | | Sell | | | | 7,077,000,000 | | | | 6,260,893 | | | | 1/24/18 | | | | — | | | | (372,489 | ) |
Euro | | | JPHQ | | | | Sell | | | | 72,962,457 | | | | 86,490,572 | | | | 1/29/18 | | | | — | | | | (1,220,434 | ) |
Japanese Yen | | | DBAB | | | | Sell | | | | 242,274,032 | | | | 2,186,273 | | | | 1/29/18 | | | | 32,921 | | | | — | |
Euro | | | DBAB | | | | Sell | | | | 12,460,751 | | | | 14,685,119 | | | | 1/30/18 | | | | — | | | | (295,254 | ) |
Euro | | | GSCO | | | | Sell | | | | 146,478 | | | | 172,673 | | | | 1/30/18 | | | | — | | | | (3,424 | ) |
Indian Rupee | | | JPHQ | | | | Buy | | | | 13,818,000 | | | | 211,349 | | | | 1/30/18 | | | | 4,563 | | | | — | |
Euro | | | SCNY | | | | Sell | | | | 3,343,195 | | | | 3,989,267 | | | | 1/31/18 | | | | — | | | | (30,157 | ) |
Japanese Yen | | | BZWS | | | | Sell | | | | 291,270,000 | | | | 2,637,837 | | | | 1/31/18 | | | | 48,769 | | | | — | |
Japanese Yen | | | HSBK | | | | Sell | | | | 313,645,839 | | | | 2,834,576 | | | | 1/31/18 | | | | 46,612 | | | | — | |
Indian Rupee | | | JPHQ | | | | Buy | | | | 39,418,000 | | | | 598,876 | | | | 2/01/18 | | | | 16,918 | | | | — | |
Euro | | | JPHQ | | | | Sell | | | | 3,768,000 | | | | 4,409,381 | | | | 2/02/18 | | | | — | | | | (121,270 | ) |
Euro | | | CITI | | | | Sell | | | | 3,767,000 | | | | 4,408,482 | | | | 2/05/18 | | | | — | | | | (121,711 | ) |
Euro | | | DBAB | | | | Sell | | | | 11,064,315 | | | | 12,922,899 | | | | 2/07/18 | | | | — | | | | (384,503 | ) |
Indian Rupee | | | HSBK | | | | Buy | | | | 19,369,500 | | | | 296,805 | | | | 2/08/18 | | | | 5,568 | | | | — | |
Japanese Yen | | | BZWS | | | | Sell | | | | 2,840,000,000 | | | | 25,037,203 | | | | 2/08/18 | | | | — | | | | (216,449 | ) |
Japanese Yen | | | JPHQ | | | | Sell | | | | 209,300,000 | | | | 1,900,973 | | | | 2/08/18 | | | | 39,850 | | | | — | |
Japanese Yen | | | SCNY | | | | Sell | | | | 209,310,000 | | | | 1,905,286 | | | | 2/08/18 | | | | 44,074 | | | | — | |
Euro | | | DBAB | | | | Sell | | | | 10,992,563 | | | | 12,793,969 | | | | 2/09/18 | | | | — | | | | (428,583 | ) |
Japanese Yen | | | BZWS | | | | Sell | | | | 209,340,000 | | | | 1,896,539 | | | | 2/09/18 | | | | 34,976 | | | | — | |
Japanese Yen | | | JPHQ | | | | Sell | | | | 209,790,000 | | | | 1,912,206 | | | | 2/09/18 | | | | 46,641 | | | | — | |
Euro | | | JPHQ | | | | Sell | | | | 1,476,166 | | | | 1,748,600 | | | | 2/12/18 | | | | — | | | | (27,318 | ) |
Japanese Yen | | | CITI | | | | Sell | | | | 255,214,000 | | | | 2,324,936 | | | | 2/13/18 | | | | 55,023 | | | | — | |
Indian Rupee | | | JPHQ | | | | Buy | | | | 77,306,000 | | | | 1,186,403 | | | | 2/15/18 | | | | 19,525 | | | | — | |
Euro | | | GSCO | | | | Sell | | | | 1,703,882 | | | | 2,022,251 | | | | 2/20/18 | | | | — | | | | (28,523 | ) |
Euro | | | JPHQ | | | | Sell | | | | 2,443,285 | | | | 2,890,846 | | | | 2/20/18 | | | | — | | | | (49,865 | ) |
Euro | | | UBSW | | | | Sell | | | | 433,000 | | | | 514,361 | | | | 2/20/18 | | | | — | | | | (6,793 | ) |
Japanese Yen | | | DBAB | | | | Sell | | | | 284,714,000 | | | | 2,597,637 | | | | 2/20/18 | | | | 64,539 | | | | — | |
Euro | | | GSCO | | | | Sell | | | | 1,220,000 | | | | 1,446,944 | | | | 2/21/18 | | | | — | | | | (21,515 | ) |
Euro | | | DBAB | | | | Sell | | | | 16,570,000 | | | | 19,579,443 | | | | 2/22/18 | | | | — | | | | (366,212 | ) |
Euro | | | JPHQ | | | | Sell | | | | 8,901,000 | | | | 10,520,003 | | | | 2/22/18 | | | | — | | | | (194,317 | ) |
Japanese Yen | | | HSBK | | | | Sell | | | | 547,340,000 | | | | 5,030,699 | | | | 2/22/18 | | | | 160,575 | | | | — | |
Japanese Yen | | | JPHQ | | | | Sell | | | | 385,615,000 | | | | 3,559,896 | | | | 2/22/18 | | | | 128,769 | | | | — | |
Japanese Yen | | | DBAB | | | | Sell | | | | 126,234,000 | | | | 1,165,273 | | | | 2/26/18 | | | | 41,863 | | | | — | |
Japanese Yen | | | HSBK | | | | Sell | | | | 253,342,000 | | | | 2,291,651 | | | | 2/27/18 | | | | 36,950 | | | | — | |
South Korean Won | | | HSBK | | | | Sell | | | | 4,163,000,000 | | | | 3,777,334 | | | | 2/27/18 | | | | — | | | | (126,271 | ) |
Euro | | | GSCO | | | | Sell | | | | 146,478 | | | | 175,664 | | | | 2/28/18 | | | | — | | | | (715 | ) |
Euro | | | SCNY | | | | Sell | | | | 3,409,501 | | | | 4,075,036 | | | | 2/28/18 | | | | — | | | | (30,449 | ) |
Japanese Yen | | | BZWS | | | | Sell | | | | 302,200,000 | | | | 2,803,496 | | | | 2/28/18 | | | | 113,798 | | | | — | |
Japanese Yen | | | DBAB | | | | Sell | | | | 228,669,000 | | | | 2,113,841 | | | | 2/28/18 | | | | 78,598 | | | | — | |
Japanese Yen | | | JPHQ | | | | Sell | | | | 608,734,000 | | | | 5,601,109 | | | | 2/28/18 | | | | 183,140 | | | | — | |
Japanese Yen | | | HSBK | | | | Sell | | | | 420,281,000 | | | | 3,848,375 | | | | 3/01/18 | | | | 107,474 | | | | — | |
South Korean Won | | | HSBK | | | | Sell | | | | 5,024,000,000 | | | | 4,650,560 | | | | 3/05/18 | | | | — | | | | (60,618 | ) |
| | | | | | |
franklintempleton.com | | | | Annual Report | | 29 |
TEMPLETON GLOBAL INVESTMENT TRUST
CONSOLIDATED STATEMENT OF INVESTMENTS
Templeton Global Balanced Fund (continued)
Forward Exchange Contracts (continued)
| | | | | | | | | | | | | | | | | | | | | | | | | | | | |
| Currency | | Counterpartya | | | Type | | | Quantity | | | Contract
Amount | | | Settlement
Date | | | Unrealized
Appreciation | | | Unrealized
Depreciation | |
| | | | |
OTC Forward Exchange Contracts (continued) | | | | | | | | | | | | | | | | | |
Euro | | | UBSW | | | | Sell | | | | 943,744 | | | $ | 1,123,357 | | | | 3/06/18 | | | $ | — | | | $ | (13,486 | ) |
South Korean Won | | | GSCO | | | | Sell | | | | 5,211,000,000 | | | | 4,639,010 | | | | 3/07/18 | | | | — | | | | (247,600 | ) |
Australian Dollar | | | CITI | | | | Sell | | | | 10,456,600 | | | | 7,851,896 | | | | 3/09/18 | | | | — | | | | (305,193 | ) |
Mexican Peso | | | CITI | | | | Buy | | | | 197,094,000 | | | | 9,583,953 | | | | 3/09/18 | | | | 312,526 | | | | — | |
Euro | | | JPHQ | | | | Sell | | | | 1,476,166 | | | | 1,751,456 | | | | 3/12/18 | | | | — | | | | (27,455 | ) |
Mexican Peso | | | CITI | | | | Buy | | | | 177,301,000 | | | | 8,580,811 | | | | 3/12/18 | | | | 317,338 | | | | — | |
Australian Dollar | | | JPHQ | | | | Sell | | | | 10,063,000 | | | | 7,446,620 | | | | 3/13/18 | | | | — | | | | (403,305 | ) |
Euro | | | DBAB | | | | Sell | | | | 487,652 | | | | 579,189 | | | | 3/13/18 | | | | — | | | | (8,514 | ) |
Japanese Yen | | | DBAB | | | | Sell | | | | 30,500,000 | | | | 282,585 | | | | 3/13/18 | | | | 10,901 | | | | — | |
Indian Rupee | | | DBAB | | | | Buy | | | | 58,856,000 | | | | 905,547 | | | | 3/14/18 | | | | 10,001 | | | | — | |
Euro | | | JPHQ | | | | Sell | | | | 2,443,285 | | | | 2,890,419 | | | | 3/15/18 | | | | — | | | | (54,542 | ) |
Australian Dollar | | | JPHQ | | | | Sell | | | | 17,500,000 | | | | 13,043,625 | | | | 3/16/18 | | | | — | | | | (607,582 | ) |
Euro | | | GSCO | | | | Sell | | | | 1,651,995 | | | | 1,960,357 | | | | 3/19/18 | | | | — | | | | (31,368 | ) |
Indian Rupee | | | CITI | | | | Buy | | | | 15,811,000 | | | | 242,537 | | | | 3/19/18 | | | | 3,287 | | | | — | |
Japanese Yen | | | BZWS | | | | Sell | | | | 312,460,000 | | | | 2,850,486 | | | | 3/19/18 | | | | 66,140 | | | | — | |
Australian Dollar | | | JPHQ | | | | Sell | | | | 29,027,000 | | | | 21,789,118 | | | | 3/20/18 | | | | — | | | | (853,596 | ) |
South Korean Won | | | HSBK | | | | Sell | | | | 2,734,897,268 | | | | 2,424,554 | | | | 3/27/18 | | | | — | | | | (140,494 | ) |
Japanese Yen | | | JPHQ | | | | Sell | | | | 59,426,000 | | | | 530,348 | | | | 3/30/18 | | | | 434 | | | | — | |
Japanese Yen | | | DBAB | | | | Sell | | | | 419,230,800 | | | | 3,753,521 | | | | 4/05/18 | | | | 13,784 | | | | — | |
Japanese Yen | | | JPHQ | | | | Sell | | | | 608,450,000 | | | | 5,449,058 | | | | 4/06/18 | | | | 21,065 | | | | — | |
Japanese Yen | | | SCNY | | | | Sell | | | | 189,880,000 | | | | 1,702,196 | | | | 4/10/18 | | | | 7,860 | | | | — | |
Japanese Yen | | | HSBK | | | | Sell | | | | 605,200,000 | | | | 5,418,084 | | | | 4/11/18 | | | | 17,438 | | | | — | |
Japanese Yen | | | DBAB | | | | Sell | | | | 302,200,000 | | | | 2,783,483 | | | | 4/13/18 | | | | 86,401 | | | | — | |
Indian Rupee | | | DBAB | | | | Buy | | | | 18,126,000 | | | | 273,703 | | | | 4/25/18 | | | | 6,998 | | | | — | |
Japanese Yen | | | GSCO | | | | Sell | | | | 254,830,000 | | | | 2,258,270 | | | | 4/27/18 | | | | — | | | | (17,987 | ) |
South Korean Won | | | HSBK | | | | Sell | | | | 1,860,000,000 | | | | 1,652,305 | | | | 4/30/18 | | | | — | | | | (93,023 | ) |
Japanese Yen | | | BOFA | | | | Sell | | | | 540,647,250 | | | | 4,852,771 | | | | 5/18/18 | | | | 17,267 | | | | — | |
Japanese Yen | | | CITI | | | | Sell | | | | 488,778,900 | | | | 4,384,591 | | | | 5/18/18 | | | | 12,993 | | | | — | |
Japanese Yen | | | BOFA | | | | Sell | | | | 539,529,250 | | | | 4,914,305 | | | | 5/21/18 | | | | 87,915 | | | | — | |
Japanese Yen | | | CITI | | | | Sell | | | | 488,779,000 | | | | 4,369,052 | | | | 5/21/18 | | | | — | | | | (3,348 | ) |
Japanese Yen | | | DBAB | | | | Sell | | | | 166,350,000 | | | | 1,488,457 | | | | 5/21/18 | | | | 364 | | | | — | |
Japanese Yen | | | HSBK | | | | Sell | | | | 541,429,400 | | | | 4,942,304 | | | | 5/21/18 | | | | 98,916 | | | | — | |
Japanese Yen | | | BOFA | | | | Sell | | | | 540,995,000 | | | | 4,957,799 | | | | 5/22/18 | | | | 118,001 | | | | — | |
Japanese Yen | | | CITI | | | | Sell | | | | 127,736,000 | | | | 1,148,996 | | | | 5/22/18 | | | | 6,257 | | | | — | |
Japanese Yen | | | JPHQ | | | | Sell | | | | 149,426,000 | | | | 1,369,405 | | | | 5/22/18 | | | | 32,624 | | | | — | |
Japanese Yen | | | SCNY | | | | Sell | | | | 312,386,000 | | | | 2,809,510 | | | | 5/24/18 | | | | 14,530 | | | | — | |
Japanese Yen | | | BOFA | | | | Sell | | | | 366,311,000 | | | | 3,354,496 | | | | 5/25/18 | | | | 76,839 | | | | — | |
Japanese Yen | | | HSBK | | | | Sell | | | | 43,408,000 | | | | 390,641 | | | | 5/29/18 | | | | 2,142 | | | | — | |
Japanese Yen | | | CITI | | | | Sell | | | | 62,440,000 | | | | 556,115 | | | | 6/12/18 | | | | — | | | | (3,198 | ) |
Japanese Yen | | | CITI | | | | Sell | | | | 64,869,000 | | | | 578,258 | | | | 6/13/18 | | | | — | | | | (2,848 | ) |
Japanese Yen | | | HSBK | | | | Sell | | | | 92,070,000 | | | | 820,661 | | | | 6/13/18 | | | | — | | | | (4,116 | ) |
Japanese Yen | | | JPHQ | | | | Sell | | | | 85,300,000 | | | | 760,429 | | | | 6/13/18 | | | | — | | | | (3,701 | ) |
Japanese Yen | | | JPHQ | | | | Sell | | | | 36,000,000 | | | | 321,572 | | | | 6/15/18 | | | | — | | | | (961 | ) |
Japanese Yen | | | HSBK | | | | Sell | | | | 618,650,000 | | | | 5,762,925 | | | | 6/18/18 | | | | 219,268 | | | | — | |
Japanese Yen | | | MSCO | | | | Sell | | | | 100,400,000 | | | | 897,535 | | | | 6/18/18 | | | | — | | | | (2,139 | ) |
Japanese Yen | | | DBAB | | | | Sell | | | | 617,700,000 | | | | 5,695,397 | | | | 6/19/18 | | | | 159,914 | | | | — | |
Japanese Yen | | | CITI | | | | Sell | | | | 487,440,000 | | | | 4,462,510 | | | | 6/20/18 | | | | 94,077 | | | | — | |
| | | | | | |
30 | | Annual Report | | | | franklintempleton.com |
TEMPLETON GLOBAL INVESTMENT TRUST
CONSOLIDATED STATEMENT OF INVESTMENTS
Templeton Global Balanced Fund (continued)
Forward Exchange Contracts (continued)
| | | | | | | | | | | | | | | | | | | | | | | | | | | | |
| Currency | | Counterpartya | | | Type | | | Quantity | | | Contract
Amount | | | Settlement
Date | | | Unrealized
Appreciation | | | Unrealized
Depreciation | |
OTC Forward Exchange Contracts (continued) | | | | | | | | | | | | | | | | | |
Japanese Yen | | | DBAB | | | | Sell | | | | 618,770,000 | | | $ | 5,642,623 | | | | 6/22/18 | | | $ | 96,531 | | | $ | — | |
Total Forward Exchange Contracts | | | | | | | | | | | | | | | | | | | | | | $ | 3,357,079 | | | $ | (8,345,666 | ) |
| | | | | | |
Net unrealized appreciation (depreciation) | | | | | | | | | | | | | | | | | | | | | | | $ | (4,988,587 | ) |
aMay be comprised of multiple contracts with the same counterparty, currency and settlement date.
At December 31, 2017, the Fund had the following interest rate swap contracts outstanding. See Note 1(c).
Interest Rate Swap Contracts
| | | | | | | | | | | | | | | | |
| Description | | Payment
Frequency | | | Maturity
Date | | | Notional
Amount | | | Value/
Unrealized
Appreciation
(Depreciation) | |
Centrally Cleared Swap Contracts | | | | | | | | | | | | | | | | |
Receive Floating 3-month USD LIBOR | | | Quarterly | | | | | | | | | | | | | |
Pay Fixed 2.775% | | | Semi-Annual | | | | 10/04/23 | | | $ | 1,690,000 | | | $ | (52,689 | ) |
Receive Floating 3-month USD LIBOR | | | Quarterly | | | | | | | | | | | | | |
Pay Fixed 2.795% | | | Semi-Annual | | | | 10/04/23 | | | | 1,690,000 | | | | (54,606 | ) |
Receive Floating 3-month USD LIBOR | | | Quarterly | | | | | | | | | | | | | |
Pay Fixed 2.765% | | | Semi-Annual | | | | 10/07/23 | | | | 1,690,000 | | | | (51,392 | ) |
Receive Floating 3-month USD LIBOR | | | Quarterly | | | | | | | | | | | | | |
Pay Fixed 1.914% | | | Semi-Annual | | | | 1/22/25 | | | | 21,800,000 | | | | 434,874 | |
Receive Floating 3-month USD LIBOR | | | Quarterly | | | | | | | | | | | | | |
Pay Fixed 1.970% | | | Semi-Annual | | | | 1/23/25 | | | | 27,250,000 | | | | 438,221 | |
Receive Floating 3-month USD LIBOR | | | Quarterly | | | | | | | | | | | | | |
Pay Fixed 1.973% | | | Semi-Annual | | | | 1/27/25 | | | | 16,080,000 | | | | 255,273 | |
Receive Floating 3-month USD LIBOR | | | Quarterly | | | | | | | | | | | | | |
Pay Fixed 1.937% | | | Semi-Annual | | | | 1/29/25 | | | | 4,020,000 | | | | 74,020 | |
Receive Floating 3-month USD LIBOR | | | Quarterly | | | | | | | | | | | | | |
Pay Fixed 1.942% | | | Semi-Annual | | | | 1/30/25 | | | | 3,400,000 | | | | 61,467 | |
Receive Floating 3-month USD LIBOR | | | Quarterly | | | | | | | | | | | | | |
Pay Fixed 1.817% | | | Semi-Annual | | | | 2/03/25 | | | | 5,360,000 | | | | 144,819 | |
Receive Floating 3-month USD LIBOR | | | Quarterly | | | | | | | | | | | | | |
Pay Fixed 1.982% | | | Semi-Annual | | | | 10/20/25 | | | | 46,520,000 | | | | 1,101,781 | |
Receive Floating 3-month USD LIBOR | | | Quarterly | | | | | | | | | | | | | |
Pay Fixed 3.668% | | | Semi-Annual | | | | 10/04/43 | | | | 820,000 | | | | (186,590 | ) |
Receive Floating 3-month USD LIBOR | | | Quarterly | | | | | | | | | | | | | |
Pay Fixed 3.687% | | | Semi-Annual | | | | 10/04/43 | | | | 820,000 | | | | (189,625 | ) |
Receive Floating 3-month USD LIBOR | | | Quarterly | | | | | | | | | | | | | |
Pay Fixed 3.675% | | | Semi-Annual | | | | 10/07/43 | | | | 820,000 | | | | (187,440 | ) |
Receive Floating 3-month USD LIBOR | | | Quarterly | | | | | | | | | | | | | |
Pay Fixed 2.537% | | | Semi-Annual | | | | 4/13/47 | | | | 36,200,000 | | | | (78,475 | ) |
| | | | |
Total Interest Rate Swap Contracts | | | | | | | | | | | | | | | $1,709,638 | |
See Note 10 regarding other derivative information.
See Abbreviations on page 52.
| | | | | | |
franklintempleton.com | | | | The accompanying notes are an integral part of these consolidated financial statements. | Annual Report | | 31 |
TEMPLETON GLOBAL INVESTMENT TRUST
Consolidated Financial Statements
Consolidated Statement of Assets and Liabilities
December 31, 2017
Templeton Global Balanced Fund
| | | | |
Assets: | | | | |
Investments in securities: | | | | |
Cost - Unaffiliated issuers | | | $1,435,385,034 | |
Cost - Non-controlled affiliates (Note 3f) | | | 183,175,079 | |
| | | | |
| |
Value - Unaffiliated issuers | | | $1,586,938,030 | |
Value - Non-controlled affiliates (Note 3f) | | | 183,175,079 | |
Cash | | | 7,024,593 | |
Restricted cash for OTC derivative contracts (Note 1d) | | | 560,000 | |
Receivables: | | | | |
Investment securities sold | | | 1,546,633 | |
Capital shares sold | | | 1,505,264 | |
Dividends and interest | | | 12,162,276 | |
European Union tax reclaims | | | 100,636 | |
Deposits with brokers for: | | | | |
OTC derivative contracts | | | 3,820,000 | |
Centrally cleared swap contracts | | | 9,453,411 | |
Unrealized appreciation on OTC forward exchange contracts | | | 3,357,079 | |
Other assets | | | 507 | |
| | | | |
| |
Total assets | | | 1,809,643,508 | |
| | | | |
Liabilities: | | | | |
Payables: | | | | |
Investment securities purchased | | | 345,395 | |
Capital shares redeemed | | | 1,703,036 | |
Management fees | | | 1,048,261 | |
Distribution fees | | | 1,154,109 | |
Transfer agent fees | | | 493,269 | |
Variation margin on centrally cleared swap contracts | | | 279,930 | |
Deposits from brokers for: | | | | |
OTC derivative contracts | | | 560,000 | |
Unrealized depreciation on OTC forward exchange contracts | | | 8,345,666 | |
Deferred tax | | | 1,002,370 | |
FT Subsidiary income taxes (Note 1g) | | | 2,149,917 | |
Accrued expenses and other liabilities | | | 420,838 | |
| | | | |
| |
Total liabilities | | | 17,502,791 | |
| | | | |
| |
Net assets, at value | | | $1,792,140,717 | |
| | | | |
| |
Net assets consist of: | | | | |
Paid-in capital | | | $1,741,563,438 | |
Distributions in excess of net investment income | | | (11,543,977 | ) |
Net unrealized appreciation (depreciation) | | | 147,146,711 | |
Accumulated net realized gain (loss) | | | (85,025,455 | ) |
| | | | |
| |
Net assets, at value | | | $1,792,140,717 | |
| | | | |
| | | | | | |
32 | | Annual Report | | | The accompanying notes are an integral part of these consolidated financial statements. | | franklintempleton.com |
TEMPLETON GLOBAL INVESTMENT TRUST
CONSOLIDATED FINANCIAL STATEMENTS
Consolidated Statement of Assets and Liabilities (continued)
December 31, 2017
Templeton Global Balanced Fund
| | | | |
| |
Class A: | | | | |
Net assets, at value | | | $745,957,486 | |
| | | | |
Shares outstanding | | | 235,008,134 | |
| | | | |
Net asset value per sharea | | | $3.17 | |
| | | | |
Maximum offering price per share (net asset value per share ÷ 94.25%) | | | $3.36 | |
| | | | |
| |
Class A1: | | | | |
Net assets, at value | | | $293,487,942 | |
| | | | |
Shares outstanding | | | 92,361,828 | |
| | | | |
Net asset value per sharea | | | $3.18 | |
| | | | |
Maximum offering price per share (net asset value per share ÷ 95.75%) | | | $3.32 | |
| | | | |
| |
Class C: | | | | |
Net assets, at value | | | $317,373,659 | |
| | | | |
Shares outstanding | | | 100,526,495 | |
| | | | |
Net asset value and maximum offering price per sharea | | | $3.16 | |
| | | | |
| |
Class C1: | | | | |
Net assets, at value | | | $173,079,495 | |
| | | | |
Shares outstanding | | | 54,532,097 | |
| | | | |
Net asset value and maximum offering price per sharea | | | $3.17 | |
| | | | |
| |
Class R: | | | | |
Net assets, at value | | | $ 4,944,212 | |
| | | | |
Shares outstanding | | | 1,553,155 | |
| | | | |
Net asset value and maximum offering price per share | | | $3.18 | |
| | | | |
| |
Class R6: | | | | |
Net assets, at value | | | $ 11,254,062 | |
| | | | |
Shares outstanding | | | 3,536,499 | |
| | | | |
Net asset value and maximum offering price per share | | | $3.18 | |
| | | | |
| |
Advisor Class: | | | | |
Net assets, at value | | | $246,043,861 | |
| | | | |
Shares outstanding | | | 77,160,995 | |
| | | | |
Net asset value and maximum offering price per share | | | $3.19 | |
| | | | |
a Redemption price is equal to net asset value less contingent deferred sales charges, if applicable.
| | | | | | |
franklintempleton.com | | | | The accompanying notes are an integral part of these consolidated financial statements. | Annual Report | | 33 |
TEMPLETON GLOBAL INVESTMENT TRUST
CONSOLIDATED FINANCIAL STATEMENTS
Consolidated Statement of Operations
for the year ended December 31, 2017
Templeton Global Balanced Fund
| | | | |
Investment income: | | | | |
Dividends: (net of foreign taxes)* | | | | |
Unaffiliated issuers | | | $35,775,353 | |
Non-controlled affiliates (Note 3f) | | | 766,864 | |
Interest: (net of foreign taxes)~ | | | | |
Unaffiliated issuers | | | 35,378,969 | |
Income from securities loaned (net of fees and rebates) | | | 21,962 | |
Other income (net of taxes of $115,606) (Note 1g) | | | 216,287 | |
| | | | |
| |
Total investment income | | | 72,159,435 | |
| | | | |
Expenses: | | | | |
Management fees (Note 3a) | | | 13,145,733 | |
Distribution fees: (Note 3c) | | | | |
Class A | | | 1,886,226 | |
Class A1 | | | 760,445 | |
Class C | | | 3,249,415 | |
Class C1 | | | 1,230,768 | |
Class R | | | 25,886 | |
Transfer agent fees: (Note 3e) | | | | |
Class A | | | 998,147 | |
Class A1 | | | 405,217 | |
Class C | | | 430,235 | |
Class C1 | | | 250,385 | |
Class R | | | 6,846 | |
Class R6 | | | 1,349 | |
Advisor Class | | | 315,378 | |
Custodian fees (Note 4) | | | 528,698 | |
Reports to shareholders | | | 133,398 | |
Registration and filing fees | | | 111,241 | |
Professional fees | | | 148,237 | |
Trustees’ fees and expenses | | | 93,290 | |
Other | | | 237,900 | |
| | | | |
| |
Total expenses | | | 23,958,794 | |
Expense reductions (Note 4) | | | (48,114 | ) |
Expenses waived/paid by affiliates (Note 3f and 3g) | | | (488,522 | ) |
| | | | |
| |
Net expenses | | | 23,422,158 | |
| | | | |
| |
Net investment income | | | 48,737,277 | |
| | | | |
| |
Realized and unrealized gains (losses): | | | | |
Net realized gain (loss) from: | | | | |
Investments:# | | | | |
Unaffiliated issuers | | | 4,733,614 | |
Written options | | | 821,024 | |
Foreign currency transactions | | | (367,997 | ) |
Forward exchange contracts | | | 181,199 | |
Swap contracts | | | (1,357,449 | ) |
Capital gain distribution received in FT Subsidiary (net of taxes of $2,034,311) (Note 1g) | | | 4,785,009 | |
| | | | |
| |
Net realized gain (loss) | | | 8,795,400 | |
| | | | |
| | | | | | |
34 | | Annual Report | | | The accompanying notes are an integral part of these consolidated financial statements. | | franklintempleton.com |
TEMPLETON GLOBAL INVESTMENT TRUST
CONSOLIDATED FINANCIAL STATEMENTS
Consolidated Statement of Operations (continued)
for the year ended December 31, 2017
Templeton Global Balanced Fund
| | | | |
Net change in unrealized appreciation (depreciation) on: | | | | |
Investments: | | | | |
Unaffiliated issuers | | | 191,204,592 | |
Translation of other assets and liabilities
denominated in foreign currencies | | | 230,769 | |
Forward exchange contracts | | | (44,898,724 | ) |
Swap contracts | | | 278,326 | |
Change in deferred taxes on unrealized appreciation | | | (449,069 | ) |
| | | | |
| |
Net change in unrealized appreciation (depreciation) | | | 146,365,894 | |
| | | | |
| |
Net realized and unrealized gain (loss) | | | 155,161,294 | |
| | | | |
| |
Net increase (decrease) in net assets resulting from operations | | $ | 203,898,571 | |
| | | | |
| |
*Foreign taxes withheld on dividends | | $ | 2,946,328 | |
~Foreign taxes withheld on interest | | $ | 966,777 | |
#Net of foreign taxes | | $ | 78,007 | |
| | | | | | |
franklintempleton.com | | | | The accompanying notes are an integral part of these consolidated financial statements. | Annual Report | | 35 |
TEMPLETON GLOBAL INVESTMENT TRUST
CONSOLIDATED FINANCIAL STATEMENTS
Consolidated Statements of Changes in Net Assets
Templeton Global Balanced Fund
| | | | | | | | | | | | |
| | | Year Ended December 31, | | | Year Ended March 31, 2016 | |
| | | 2017 | | | 2016a | | |
| |
Increase (decrease) in net assets: | | | | | | | | | | | | |
Operations: | | | | | | | | | | | | |
Net investment income | | $ | 48,737,277 | | | $ | 49,338,018 | | | $ | 65,166,285 | |
Net realized gain (loss) | | | 8,795,400 | | | | (155,241,243) | | | | 137,370,875 | |
Net change in unrealized appreciation (depreciation) | | | 146,365,894 | | | | 260,131,644 | | | | (443,557,889) | |
| | | | |
Net increase (decrease) in net assets resulting from operations | | | 203,898,571 | | | | 154,228,419 | | | | (241,020,729 | ) |
| | | | |
Distributions to shareholders from: | | | | | | | | | | | | |
Net investment income: | | | | | | | | | | | | |
Class A | | | (19,556,305) | | | | (7,872,542) | | | | (35,015,294) | |
Class A1 | | | (7,881,382) | | | | (3,079,348) | | | | (13,444,726) | |
Class C | | | (6,016,527) | | | | (1,188,790) | | | | (13,468,496) | |
Class C1 | | | (4,035,340) | | | | (1,260,532) | | | | (7,562,234) | |
Class R | | | (118,333) | | | | (40,958) | | | | (195,409) | |
Class R6 | | | (131,823) | | | | (16,668) | | | | (29,094) | |
Advisor Class | | | (6,962,602) | | | | (2,819,943) | | | | (13,365,698) | |
Net realized gains: | | | | | | | | | | | | |
Class A | | | — | | | | — | | | | (29,395,257) | |
Class A1 | | | — | | | | — | | | | (11,145,626) | |
Class C | | | — | | | | — | | | | (14,351,472) | |
Class C1 | | | — | | | | — | | | | (7,044,397) | |
Class R | | | — | | | | — | | | | (184,044) | |
Class R6 | | | — | | | | — | | | | (29,030) | |
Advisor Class | | | — | | | | — | | | | (10,349,144) | |
| | | | |
Total distributions to shareholders | | | (44,702,312) | | | | (16,278,781) | | | | (155,579,921) | |
| | | | |
Capital share transactions: (Note 2) | | | | | | | | | | | | |
Class A | | | (100,988,932) | | | | (265,314,827) | | | | 31,532,036 | |
Class A1 | | | (52,714,442) | | | | (73,869,308) | | | | (37,675,817) | |
Class C | | | (51,576,304) | | | | (150,612,584) | | | | 35,379,162 | |
Class C1 | | | (46,925,471) | | | | (45,505,800) | | | | (24,806,317) | |
Class R | | | (1,000,230) | | | | (1,413,901) | | | | 1,100,658 | |
Class R6 | | | 10,399,429 | | | | (419,173) | | | | 559,968 | |
Advisor Class | | | 14,185,682 | | | | (102,961,701) | | | | (48,104,065) | |
| | | | |
Total capital share transactions | | | (228,620,268 | ) | | | (640,097,294 | ) | | | (42,014,375 | ) |
| | | | |
Net increase (decrease) in net assets | | | (69,424,009 | ) | | | (502,147,656 | ) | | | (438,615,025 | ) |
Net assets: | | | | | | | | | | | | |
Beginning of year | | | 1,861,564,726 | | | | 2,363,712,382 | | | | 2,802,327,407 | |
| | | | |
End of year | | $ | 1,792,140,717 | | | $ | 1,861,564,726 | | | $ | 2,363,712,382 | |
| | | | |
Undistributed net investment income included in net assets: | | | | | | | | | | | | |
End of year | | $ | — | | | $ | 4,751,522 | | | $ | 36,109,664 | |
| | | | |
Distributions in excess of net investment income included in net assets: | | | | | | | | | | | | |
End of year | | $ | (11,543,977) | | | $ | — | | | $ | — | |
| | | | |
| | | |
a For the period April 1, 2016 to December 31, 2016. | | | | | | | | | | | | |
| | | | | | |
36 | | Annual Report | | | The accompanying notes are an integral part of these consolidated financial statements. | | franklintempleton.com |
TEMPLETON GLOBAL INVESTMENT TRUST
Notes to Consolidated Financial Statements
Templeton Global Balanced Fund
1. Organization and Significant Accounting Policies
Templeton Global Investment Trust (Trust) is registered under the Investment Company Act of 1940 (1940 Act) as an open-end management investment company, consisting of six separate funds and applies the specialized accounting and reporting guidance in U.S. Generally Accepted Accounting Principles (U.S. GAAP). Templeton Global Balanced Fund (Fund) is included in this report. The Fund offers seven classes of shares: Class A, Class A1, Class C, Class C1, Class R, Class R6, and Advisor Class. Each class of shares may differ by its initial sales load, contingent deferred sales charges, voting rights on matters affecting a single class, its exchange privilege and fees due to differing arrangements for distribution and transfer agent fees.
Subsequent to March 31, 2016, the Fund’s fiscal year end changed to December 31.
The following summarizes the Fund’s significant accounting policies.
a. Financial Instrument Valuation
The Fund’s investments in financial instruments are carried at fair value daily. Fair value is the price that would be received to sell an asset or paid to transfer a liability in an orderly transaction between market participants on the measurement date. The Fund calculates the net asset value (NAV) per share as of 4 p.m. Eastern time each day the New York Stock Exchange (NYSE) is open for trading. Under compliance policies and procedures approved by the Trust’s Board of Trustees (the Board), the Fund’s administrator has responsibility for oversight of valuation, including leading the cross-functional Valuation Committee (VC). The VC provides administration and oversight of the Fund’s valuation policies and procedures, which are approved annually by the Board. Among other things, these procedures allow the Fund to utilize independent pricing services, quotations from securities and financial instrument dealers, and other market sources to determine fair value.
Equity securities and derivative financial instruments listed on an exchange or on the NASDAQ National Market System are valued at the last quoted sale price or the official closing price of the day, respectively. Foreign equity securities are valued as of the close of trading on the foreign stock exchange on which the security is primarily traded, or as of 4 p.m. Eastern time.
The value is then converted into its U.S. dollar equivalent at the foreign exchange rate in effect at 4 p.m. Eastern time on the day that the value of the security is determined. Over-the-counter (OTC) securities are valued within the range of the most recent quoted bid and ask prices. Securities that trade in multiple markets or on multiple exchanges are valued according to the broadest and most representative market. Certain equity securities are valued based upon fundamental characteristics or relationships to similar securities.
Debt securities generally trade in the OTC market rather than on a securities exchange. The Fund’s pricing services use multiple valuation techniques to determine fair value. In instances where sufficient market activity exists, the pricing services may utilize a market-based approach through which quotes from market makers are used to determine fair value. In instances where sufficient market activity may not exist or is limited, the pricing services also utilize proprietary valuation models which may consider market characteristics such as benchmark yield curves, credit spreads, estimated default rates, anticipated market interest rate volatility, coupon rates, anticipated timing of principal repayments, underlying collateral, and other unique security features in order to estimate the relevant cash flows, which are then discounted to calculate the fair value. Securities denominated in a foreign currency are converted into their U.S. dollar equivalent at the foreign exchange rate in effect at 4 p.m. Eastern time on the date that the values of the foreign debt securities are determined.
Investments in open-end mutual funds are valued at the closing NAV.
Certain derivative financial instruments are centrally cleared or trade in the OTC market. The Fund’s pricing services use various techniques including industry standard option pricing models and proprietary discounted cash flow models to determine the fair value of those instruments. The Fund’s net benefit or obligation under the derivative contract, as measured by the fair value of the contract, is included in net assets.
The Fund has procedures to determine the fair value of financial instruments for which market prices are not reliable or readily available. Under these procedures, the VC convenes on a regular basis to review such financial instruments and considers a number of factors, including significant unobservable valuation inputs, when arriving at fair value. The VC primarily employs a market-based approach which may use related or comparable assets or liabilities, recent transactions, market
| | | | | | |
franklintempleton.com | | | | Annual Report | | 37 |
TEMPLETON GLOBAL INVESTMENT TRUST
NOTES TO CONSOLIDATED FINANCIAL STATEMENTS
Templeton Global Balanced Fund (continued)
1. Organization and Significant Accounting Policies (continued)
a. Financial Instrument Valuation (continued)
multiples, book values, and other relevant information for the investment to determine the fair value of the investment. An income-based valuation approach may also be used in which the anticipated future cash flows of the investment are discounted to calculate fair value. Discounts may also be applied due to the nature or duration of any restrictions on the disposition of the investments. Due to the inherent uncertainty of valuations of such investments, the fair values may differ significantly from the values that would have been used had an active market existed. The VC employs various methods for calibrating these valuation approaches including a regular review of key inputs and assumptions, transactional back-testing or disposition analysis, and reviews of any related market activity.
Trading in securities on foreign securities stock exchanges and OTC markets may be completed before 4 p.m. Eastern time. In addition, trading in certain foreign markets may not take place on every Fund’s business day. Occasionally, events occur between the time at which trading in a foreign security is completed and 4 p.m. Eastern time that might call into question the reliability of the value of a portfolio security held by the Fund. As a result, differences may arise between the value of the Fund’s portfolio securities as determined at the foreign market close and the latest indications of value at 4 p.m. Eastern time. In order to minimize the potential for these differences, the VC monitors price movements following the close of trading in foreign stock markets through a series of country specific market proxies (such as baskets of American Depositary Receipts, futures contracts and exchange traded funds). These price movements are measured against established trigger thresholds for each specific market proxy to assist in determining if an event has occurred that may call into question the reliability of the values of the foreign securities held by the Fund. If such an event occurs, the securities may be valued using fair value procedures, which may include the use of independent pricing services.
When the last day of the reporting period is a non-business day, certain foreign markets may be open on those days that the Fund’s NAV is not calculated, which could result in differences between the value of the Fund’s portfolio securities on the last business day and the last calendar day of the reporting period.
Any significant security valuation changes due to an open foreign market are adjusted and reflected by the Fund for financial reporting purposes.
b. Foreign Currency Translation
Portfolio securities and other assets and liabilities denominated in foreign currencies are translated into U.S. dollars based on the exchange rate of such currencies against U.S. dollars on the date of valuation. The Fund may enter into foreign currency exchange contracts to facilitate transactions denominated in a foreign currency. Purchases and sales of securities, income and expense items denominated in foreign currencies are translated into U.S. dollars at the exchange rate in effect on the transaction date. Portfolio securities and assets and liabilities denominated in foreign currencies contain risks that those currencies will decline in value relative to the U.S. dollar. Occasionally, events may impact the availability or reliability of foreign exchange rates used to convert the U.S. dollar equivalent value. If such an event occurs, the foreign exchange rate will be valued at fair value using procedures established and approved by the Board.
The Fund does not separately report the effect of changes in foreign exchange rates from changes in market prices on securities held. Such changes are included in net realized and unrealized gain or loss from investments in the Consolidated Statement of Operations.
Realized foreign exchange gains or losses arise from sales of foreign currencies, currency gains or losses realized between the trade and settlement dates on securities transactions and the difference between the recorded amounts of dividends, interest, and foreign withholding taxes and the U.S. dollar equivalent of the amounts actually received or paid. Net unrealized foreign exchange gains and losses arise from changes in foreign exchange rates on foreign denominated assets and liabilities other than investments in securities held at the end of the reporting period.
c. Derivative Financial Instruments
The Fund invested in derivative financial instruments in order to manage risk or gain exposure to various other investments or markets. Derivatives are financial contracts based on an underlying or notional amount, require no initial investment or an initial net investment that is smaller than would normally be required to have a similar response to changes in market factors, and require or permit net settlement. Derivatives contain various risks including the potential inability of the counterparty to
| | | | | | |
38 | | Annual Report | | | | franklintempleton.com |
TEMPLETON GLOBAL INVESTMENT TRUST
NOTES TO CONSOLIDATED FINANCIAL STATEMENTS
Templeton Global Balanced Fund (continued)
fulfill their obligations under the terms of the contract, the potential for an illiquid secondary market, and/or the potential for market movements which expose the Fund to gains or losses in excess of the amounts shown in the Consolidated Statement of Assets and Liabilities. Realized gain and loss and unrealized appreciation and depreciation on these contracts for the period are included in the Consolidated Statement of Operations.
Derivative counterparty credit risk is managed through a formal evaluation of the creditworthiness of all potential counter-parties. The Fund attempts to reduce its exposure to counterparty credit risk on OTC derivatives, whenever possible, by entering into International Swaps and Derivatives Association (ISDA) master agreements with certain counterparties. These agreements contain various provisions, including but not limited to collateral requirements, events of default, or early termination. Termination events applicable to the counterparty include certain deteriorations in the credit quality of the counterparty. Termination events applicable to the Fund include failure of the Fund to maintain certain net asset levels and/or limit the decline in net assets over various periods of time. In the event of default or early termination, the ISDA master agreement gives the non-defaulting party the right to net and close-out all transactions traded, whether or not arising under the ISDA agreement, to one net amount payable by one counterparty to the other. However, absent an event of default or early termination, OTC derivative assets and liabilities are presented gross and not offset in the Consolidated Statement of Assets and Liabilities. Early termination by the counterparty may result in an immediate payment by the Fund of any net liability owed to that counterparty under the ISDA agreement. At December 31, 2017, the Fund had OTC derivatives in a net liability position of $5,495,919 and the aggregate value of collateral pledged for such contracts was $3,820,000.
Collateral requirements differ by type of derivative. Collateral or initial margin requirements are set by the broker or exchange clearing house for exchange traded and centrally cleared derivatives. Initial margin deposited is held at the exchange and can be in the form of cash and/or securities. For OTC derivatives traded under an ISDA master agreement, posting of collateral is required by either the Fund or the applicable counterparty if the total net exposure of all OTC derivatives with the applicable counterparty exceeds the minimum transfer amount, which typically ranges from $100,000 to $250,000, and can vary depending on the counterparty and the type of the agreement. Generally, collateral is determined at the close of
Fund business each day and any additional collateral required due to changes in derivative values may be delivered by the Fund or the counterparty the next business day, or within a few business days. Collateral pledged and/or received by the Fund for OTC derivatives, if any, is held in segregated accounts with the Fund’s custodian/counterparty broker and can be in the form of cash and/or securities. Unrestricted cash may be invested according to the Fund’s investment objectives. To the extent that the amounts due to the Fund from its counterparties are not subject to collateralization or are not fully collateralized, the Fund bears the risk of loss from counterparty non-performance.
The Fund entered into OTC forward exchange contracts primarily to manage and/or gain exposure to certain foreign currencies. A forward exchange contract is an agreement between the Fund and a counterparty to buy or sell a foreign currency at a specific exchange rate on a future date.
The Fund entered into interest rate swap contracts primarily to manage interest rate risk. An interest rate swap is an agreement between the Fund and a counterparty to exchange cash flows based on the difference between two interest rates, applied to a notional amount. These agreements may be privately negotiated in the over-the-counter market (OTC interest rate swaps) or may be executed on a registered exchange (centrally cleared interest rate swaps). For centrally cleared interest rate swaps, required initial margins are pledged by the Fund, and the daily change in fair value is accounted for as a variation margin payable or receivable in the Consolidated Statement of Assets and Liabilities. Over the term of the contract, contractually required payments to be paid and to be received are accrued daily and recorded as unrealized depreciation and appreciation until the payments are made, at which time they are realized.
The Fund purchased or wrote OTC option contracts primarily to manage and/or gain exposure to equity price risk. An option is a contract entitling the holder to purchase or sell a specific amount of shares or units of an asset or notional amount of a swap (swaption), at a specified price. When an option is purchased or written, an amount equal to the premium paid or received is recorded as an asset or liability, respectively. Upon exercise of an option, the acquisition cost or sales proceeds of the underlying investment is adjusted by any premium received or paid. Upon expiration of an option, any premium received or paid is recorded as a realized gain or loss. Upon closing an option other than through expiration or exercise, the difference between the premium received or paid and the cost to close the position is recorded as a realized gain or loss.
| | | | | | |
franklintempleton.com | | | | Annual Report | | 39 |
TEMPLETON GLOBAL INVESTMENT TRUST
NOTES TO CONSOLIDATED FINANCIAL STATEMENTS
Templeton Global Balanced Fund (continued)
1. Organization and Significant Accounting Policies (continued)
c. Derivative Financial Instruments (continued)
The Fund invests in value recovery instruments (VRI) primarily to gain exposure to economic growth. Periodic payments from VRI are dependent on established benchmarks for underlying variables. VRI has a notional amount, which is used to calculate amounts of payments to holders. Payments are recorded upon receipt as realized gains in the Consolidated Statement of Operations. The risks of investing in VRI include growth risk, liquidity, and the potential loss of investment.
See Note 10 regarding other derivative information.
d. Restricted Cash
At December 31, 2017, the Fund held restricted cash in connection with investments in certain derivative securities. Restricted cash is held in a segregated account with the Fund’s custodian and is reflected in the Consolidated Statement of Assets and Liabilities.
e. Equity-Linked Securities
The Fund invests in equity-linked securities. Equity-linked securities are hybrid financial instruments that generally combine both debt and equity characteristics into a single note form. Income received from equity-linked securities is recorded as realized gains in the Consolidated Statement of Operations and may be based on the performance of an underlying equity security, an equity index, or an option position. The risks of investing in equity-linked securities include unfavorable price movements in the underlying security and the credit risk of the issuing financial institution. There may be no guarantee of a return of principal with equity-linked securities and the appreciation potential may be limited. Equity-linked securities may be more volatile and less liquid than other investments held by the Fund.
f. Securities Lending
The Fund participates in an agency based securities lending program to earn additional income. The Fund receives cash collateral against the loaned securities in an amount equal to at least 102% of the fair value of the loaned securities. Collateral is maintained over the life of the loan in an amount not less than 100% of the fair value of loaned securities, as determined at the close of Fund business each day; any additional collateral required due to changes in security values is delivered to the
Fund on the next business day. The collateral is deposited into a joint cash account with other funds and is used to invest in a money market fund managed by Franklin Advisers, Inc., an affiliate of the Fund. The Fund may receive income from the investment of cash collateral, in addition to lending fees and rebates paid by the borrower. Income from securities loaned, net of fees paid to the securities lending agent and/or third-party vendor, is reported separately in the Consolidated Statement of Operations. The Fund bears the market risk with respect to the collateral investment, securities loaned, and the risk that the agent may default on its obligations to the Fund. If the borrower defaults on its obligation to return the securities loaned, the Fund has the right to repurchase the securities in the open market using the collateral received. The securities lending agent has agreed to indemnify the Fund in the event of default by a third party borrower. At December 31, 2017, the Fund had no securities on loan.
g. Investments in FT Holdings Corporation IV (FT Subsidiary)
The Fund invests in certain financial instruments through its investment in FT Subsidiary. FT Subsidiary is a Delaware Corporation, is a wholly-owned subsidiary of the Fund, and is able to invest in certain financial instruments consistent with the investment objective of the Fund. At December 31, 2017, FT Subsidiary’s investment, Turtle Bay Resort, as well as any other assets and liabilities of FT Subsidiary are reflected in the Fund’s Consolidated Statement of Investments and Consolidated Statement of Assets and Liabilities. During the year ended December 31, 2017, Turtle Bay Resort paid a distribution to FT Subsidiary upon the sale of a majority of its assets to a third party. The distribution received is reflected net of taxes as other income and capital gain distribution received in FT Subsidiary in the Consolidated Statement of Operations. For U.S. income tax purposes, this distribution is taxable to FT Subsidiary, and as such an estimated tax liability was recorded in the FT Subsidiary. The estimated tax liability was calculated using the FT Subsidiary’s prior year effective federal rate of 33.7%, and a blended Hawaii state rate of 4% of the 2017 estimated capital gain and 6.4% of the 2017 estimated ordinary income. The tax liability is reflected as FT Subsidiary income taxes in the Consolidated Statement of Assets and Liabilities. The financial statements have been consolidated and include the accounts of the Fund and FT Subsidiary. All intercompany transactions and balances have been eliminated. At December 31, 2017, the net
| | | | | | |
40 | | Annual Report | | | | franklintempleton.com |
TEMPLETON GLOBAL INVESTMENT TRUST
NOTES TO CONSOLIDATED FINANCIAL STATEMENTS
Templeton Global Balanced Fund (continued)
assets of FT Subsidiary were $5,172,234, representing 0.3% of the Fund’s consolidated net assets. The Fund’s investment in FT Subsidiary is limited to 25% of consolidated assets.
h. Senior Floating Rate Interests
The Fund invests in senior secured corporate loans that pay interest at rates which are periodically reset by reference to a base lending rate plus a spread. These base lending rates are generally the prime rate offered by a designated U.S. bank or the London InterBank Offered Rate (LIBOR). Senior secured corporate loans often require prepayment of principal from excess cash flows or at the discretion of the borrower. As a result, actual maturity may be substantially less than the stated maturity. Senior secured corporate loans in which the Fund invests are generally readily marketable, but may be subject to certain restrictions on resale.
i. Income and Deferred Taxes
It is the Fund’s policy to qualify as a regulated investment company under the Internal Revenue Code. The Fund intends to distribute to shareholders substantially all of its taxable income and net realized gains to relieve it from federal income and excise taxes. As a result, no provision for U.S. federal income taxes is required.
The Fund may be subject to foreign taxation related to income received, capital gains on the sale of securities and certain foreign currency transactions in the foreign jurisdictions in which it invests. Foreign taxes, if any, are recorded based on the tax regulations and rates that exist in the foreign markets in which the Fund invests. When a capital gain tax is determined to apply, the Fund records an estimated deferred tax liability in an amount that would be payable if the securities were disposed of on the valuation date.
As a result of several court cases, in certain countries across the European Union, the Fund filed additional tax reclaims for previously withheld taxes on dividends earned in those countries (EU reclaims). These additional filings are subject to various administrative proceedings by the local jurisdictions’ tax authorities within the European Union, as well as a number of related judicial proceedings. Income recognized, if any, for EU reclaims is reflected as other income in the Consolidated Statement of Operations and any related receivable, if any, is reflected as European Union tax reclaims in the Consolidated Statement of Assets and Liabilities. When uncertainty exists as to the ultimate resolution of these proceedings, the likelihood of
receipt of these EU reclaims, and the potential timing of payment, no amounts are reflected in the Consolidated financial statements. For U.S. income tax purposes, EU reclaims received by the Fund, if any, reduce the amounts of foreign taxes Fund shareholders can use as tax credits in their individual income tax returns.
The Fund may recognize an income tax liability related to its uncertain tax positions under U.S. GAAP when the uncertain tax position has a less than 50% probability that it will be sustained upon examination by the tax authorities based on its technical merits. As of December 31, 2017, the Fund has determined that no tax liability is required in its Consolidated financial statements related to uncertain tax positions for any open tax years (or expected to be taken in future tax years). Open tax years are those that remain subject to examination and are based on the statute of limitations in each jurisdiction in which the Fund invests.
j. Security Transactions, Investment Income, Expenses and Distributions
Security transactions are accounted for on trade date. Realized gains and losses on security transactions are determined on a specific identification basis. Interest income and estimated expenses are accrued daily. Amortization of premium and accretion of discount on debt securities are included in interest income. Facility fees are recognized as income over the expected term of the loan. Dividend income is recorded on the ex-dividend date except for certain dividends from securities where the dividend rate is not available. In such cases, the dividend is recorded as soon as the information is received by the Fund. Distributions to shareholders are recorded on the ex-dividend date. Distributable earnings are determined according to income tax regulations (tax basis) and may differ from earnings recorded in accordance with U.S. GAAP. These differences may be permanent or temporary. Permanent differences are reclassified among capital accounts to reflect their tax character. These reclassifications have no impact on net assets or the results of operations. Temporary differences are not reclassified, as they may reverse in subsequent periods.
Common expenses incurred by the Trust are allocated among the Funds based on the ratio of net assets of each Fund to the combined net assets of the Trust. Fund specific expenses are charged directly to the Fund that incurred the expense.
| | | | | | |
franklintempleton.com | | | | Annual Report | | 41 |
TEMPLETON GLOBAL INVESTMENT TRUST
NOTES TO CONSOLIDATED FINANCIAL STATEMENTS
Templeton Global Balanced Fund (continued)
1. Organization and Significant Accounting Policies (continued)
j. Security Transactions, Investment Income, Expenses and Distributions (continued)
Realized and unrealized gains and losses and net investment income, excluding class specific expenses, are allocated daily to each class of shares based upon the relative proportion of net assets of each class. Differences in per share distributions by class are generally due to differences in class specific expenses.
Inflation-indexed bonds are adjusted for inflation through periodic increases or decreases in the security’s interest accruals, face amount, or principal redemption value, by amounts corresponding to the rate of inflation as measured by an index. Any increase or decrease in the face amount or principal redemption value will be included as interest income in the Consolidated Statement of Operations.
k. Accounting Estimates
The preparation of financial statements in accordance with U.S. GAAP requires management to make estimates and assumptions that affect the reported amounts of assets and
liabilities at the date of the consolidated financial statements and the amounts of income and expenses during the reporting period. Actual results could differ from those estimates.
l. Guarantees and Indemnifications
Under the Trust’s organizational documents, its officers and trustees are indemnified by the Trust against certain liabilities arising out of the performance of their duties to the Trust. Additionally, in the normal course of business, the Trust, on behalf of the Fund, enters into contracts with service providers that contain general indemnification clauses. The Trust’s maximum exposure under these arrangements is unknown as this would involve future claims that may be made against the Trust that have not yet occurred. Currently, the Trust expects the risk of loss to be remote.
2. Shares of Beneficial Interest
At December 31, 2017, there were an unlimited number of shares authorized ($0.01 par value). Transactions in the Fund’s shares were as follows:
| | | | | | | | |
| | | Year Ended December 31, 2017 | |
| | | Shares | | | Amount | |
| | |
Class A Shares: | | | | | | | | |
| Shares sold | | | 34,729,536 | | | $ | 108,430,155 | |
| Shares issued in reinvestment of distributions | | | 6,047,566 | | | | 18,862,967 | |
| Shares redeemed | | | (73,922,109 | ) | | | (228,282,054 | ) |
| | | | |
| | |
| Net increase (decrease) | | | (33,145,007 | ) | | $ | (100,988,932 | ) |
| | | | |
| | |
Class A1 Shares: | | | | | | | | |
| Shares sold | | | 1,986,661 | | | $ | 6,154,902 | |
| Shares issued in reinvestment of distributions | | | 2,412,694 | | | | 7,531,521 | |
| Shares redeemed | | | (21,536,335 | ) | | | (66,400,865 | ) |
| | | | |
| | |
| Net increase (decrease) | | | (17,136,980 | ) | | $ | (52,714,442 | ) |
| | | | |
| | |
Class C Shares: | | | | | | | | |
| Shares sold | | | 16,700,342 | | | $ | 51,826,308 | |
| Shares issued in reinvestment of distributions | | | 1,825,027 | | | | 5,662,032 | |
| Shares redeemed | | | (35,475,233 | ) | | | (109,064,644 | ) |
| | | | |
| | |
| Net increase (decrease) | | | (16,949,864 | ) | | $ | (51,576,304 | ) |
| | | | |
| | | | | | |
42 | | Annual Report | | | | franklintempleton.com |
TEMPLETON GLOBAL INVESTMENT TRUST
NOTES TO CONSOLIDATED FINANCIAL STATEMENTS
Templeton Global Balanced Fund (continued)
| | | | | | | | | | | | | | | | |
| | | Year Ended December 31, 2017 | | | | | | | |
| | | Shares | | | Amount | | | | | | | |
| | | | | | | | | |
| | | | |
Class C1 Shares: | | | | | | | | | | | | | | | | |
Shares sold | | | 1,176,262 | | | $ | 3,646,376 | | | | | | | | | |
Shares issued in reinvestment of distributions | | | 1,232,506 | | | | 3,841,363 | | | | | | | | | |
Shares redeemed | | | (17,587,696) | | | | (54,413,210) | | | | | | | | | |
| | | | | | | | | | | | |
Net increase (decrease) | | | (15,178,928) | | | $ | (46,925,471) | | | | | | | | | |
| | | | | | | | | | | | |
| | | | |
Class R Shares: | | | | | | | | | | | | | | | | |
Shares sold | | | 312,180 | | | $ | 961,847 | | | | | | | | | |
Shares issued in reinvestment of distributions | | | 23,787 | | | | 74,304 | | | | | | | | | |
Shares redeemed | | | (662,610) | | | | (2,036,381) | | | | | | | | | |
| | | | | | | | | | | | |
Net increase (decrease) | | | (326,643) | | | $ | (1,000,230) | | | | | | | | | |
| | | | | | | | | | | | |
| | | | |
Class R6 Shares: | | | | | | | | | | | | | | | | |
Shares sold | | | 3,786,925 | | | $ | 11,997,394 | | | | | | | | | |
Shares issued in reinvestment of distributions | | | 41,849 | | | | 131,823 | | | | | | | | | |
Shares redeemed | | | (549,941) | | | | (1,729,788) | | | | | | | | | |
| | | | | | | | | | | | |
Net increase (decrease) | | | 3,278,833 | | | $ | 10,399,429 | | | | | | | | | |
| | | | | | | | | | | | |
| | | | |
Advisor Class Shares: | | | | | | | | | | | | | | | | |
Shares sold | | | 32,216,392 | | | $ | 99,986,656 | | | | | | | | | |
Shares issued in reinvestment of distributions | | | 1,909,153 | | | | 5,987,303 | | | | | | | | | |
Shares redeemed | | | (29,505,833) | | | | (91,788,277) | | | | | | | | | |
| | | | | | | | | | | | |
Net increase (decrease) | | | 4,619,712 | | | $ | 14,185,682 | | | | | | | | | |
| | | | | | | | | | | | |
| | |
| | | Year Ended December 31, 2016a | | | Year Ended March 31, 2016 | |
| | | | |
| | | Shares | | | Amount | | | Shares | | | Amount | |
| | | | |
Class A Shares: | | | | | | | | | | | | | | | | |
Shares sold | | | 15,918,706 | | | $ | 43,999,244 | | | | 100,914,333 | | | $ | 301,467,863 | |
Shares issued in reinvestment of distributions | | | 2,766,311 | | | | 7,634,352 | | | | 21,595,075 | | | | 61,355,083 | |
Shares redeemed | | | (114,125,112) | | | | (316,948,423) | | | | (115,694,596) | | | | (331,290,910) | |
| | | | |
Net increase (decrease) | | | (95,440,095) | | | $ | (265,314,827) | | | | 6,814,812 | | | $ | 31,532,036 | |
| | | | |
| | | | |
Class A1 Shares: | | | | | | | | | | | | | | | | |
Shares sold | | | 1,998,699 | | | $ | 5,555,384 | | | | 4,966,226 | | | $ | 14,693,174 | |
Shares issued in reinvestment of distributions | | | 1,056,922 | | | | 2,923,074 | | | | 8,180,308 | | | | 23,324,987 | |
Shares redeemed | | | (29,653,300) | | | | (82,347,766) | | | | (26,316,531) | | | | (75,693,978) | |
| | | | |
Net increase (decrease) | | | (26,597,679) | | | $ | (73,869,308) | | | | (13,169,997) | | | $ | (37,675,817) | |
| | | | |
| | | | |
Class C Shares: | | | | | | | | | | | | | | | | |
Shares sold | | | 6,176,236 | | | $ | 17,045,242 | | | | 57,619,439 | | | $ | 173,369,154 | |
Shares issued in reinvestment of distributions | | | 399,955 | | | | 1,098,832 | | | | 9,067,294 | | | | 25,605,937 | |
Shares redeemed | | | (61,192,660) | | | | (168,756,658) | | | | (57,524,663) | | | | (163,595,929) | |
| | | | |
Net increase (decrease) | | | (54,616,469) | | | $ | (150,612,584) | | | | 9,162,070 | | | $ | 35,379,162 | |
| | | | |
| | | | |
Class C1 Shares: | | | | | | | | | | | | | | | | |
Shares sold | | | 689,579 | | | $ | 1,909,426 | | | | 2,008,579 | | | $ | 5,961,461 | |
Shares issued in reinvestment of distributions | | | 414,592 | | | | 1,147,144 | | | | 4,653,334 | | | | 13,219,451 | |
Shares redeemed | | | (17,488,544) | | | | (48,562,370) | | | | (15,322,615) | | | | (43,987,229) | |
| | | | |
Net increase (decrease) | | | (16,384,373) | | | $ | (45,505,800) | | | | (8,660,702) | | | $ | (24,806,317) | |
| | | | |
| | | | | | |
franklintempleton.com | | | | Annual Report | | 43 |
TEMPLETON GLOBAL INVESTMENT TRUST
NOTES TO CONSOLIDATED FINANCIAL STATEMENTS
Templeton Global Balanced Fund (continued)
2. Shares of Beneficial Interest (continued)
| | | | | | | | | | | | | | | | |
| | | Year Ended December 31, 2016a | | | Year Ended March 31, 2016 | |
| | | | |
| | | Shares | | | Amount | | | Shares | | | Amount | |
| | | | |
Class R Shares: | | | | | | | | | | | | | | | | |
Shares sold | | | 854,699 | | | $ | 2,375,172 | | | | 896,012 | | | $ | 2,680,383 | |
Shares issued in reinvestment of distributions | | | 9,818 | | | | 27,077 | | | | 84,872 | | | | 241,607 | |
Shares redeemed | | | (1,371,117 | ) | | | (3,816,150 | ) | | | (619,684 | ) | | | (1,821,332 | ) |
| | | | |
Net increase (decrease) | | | (506,600 | ) | | $ | (1,413,901 | ) | | | 361,200 | | | $ | 1,100,658 | |
| | | | |
| | | | |
Class R6 Shares: | | | | | | | | | | | | | | | | |
Shares sold | | | 355,735 | | | $ | 987,361 | | | | 291,404 | | | $ | 850,215 | |
Shares issued in reinvestment of distributions | | | 6,116 | | | | 16,668 | | | | 20,526 | | | | 58,124 | |
Shares redeemed | | | (503,457 | ) | | | (1,423,202 | ) | | | (122,823 | ) | | | (348,371 | ) |
| | | | |
Net increase (decrease) | | | (141,606 | ) | | $ | (419,173 | ) | | | 189,107 | | | $ | 559,968 | |
| | | | |
| | | | |
Advisor Class Shares: | | | | | | | | | | | | | | | | |
Shares sold | | | 24,997,118 | | | $ | 70,004,224 | | | | 40,587,714 | | | $ | 122,422,298 | |
Shares issued in reinvestment of distributions | | | 878,455 | | | | 2,429,799 | | | | 7,247,637 | | | | 20,700,862 | |
Shares redeemed | | | (62,899,720 | ) | | | (175,395,724 | ) | | | (67,339,602 | ) | | | (191,227,225 | ) |
| | | | |
Net increase (decrease) | | | (37,024,147 | ) | | $ | (102,961,701 | ) | | | (19,504,251 | ) | | $ | (48,104,065 | ) |
| | | | |
a For the period April 1, 2016 to December 31, 2016.
3. Transactions with Affiliates
Franklin Resources, Inc. is the holding company for various subsidiaries that together are referred to as Franklin Templeton Investments. Certain officers and trustees of the Trust are also officers and directors of the following subsidiaries:
| | | | |
Subsidiary | | Affiliation | | |
Templeton Global Advisors Limited (TGAL) | | Investment manager | | |
Franklin Advisers, Inc. (Advisers) | | Investment manager | | |
Franklin Templeton Services, LLC (FT Services) | | Administrative manager | | |
Franklin Templeton Distributors, Inc. (Distributors) | | Principal underwriter | | |
Franklin Templeton Investor Services, LLC (Investor Services) | | Transfer agent | | |
| | | | | | |
44 | | Annual Report | | franklintempleton.com |
TEMPLETON GLOBAL INVESTMENT TRUST
NOTES TO CONSOLIDATED FINANCIAL STATEMENTS
Templeton Global Balanced Fund (continued)
a. Management Fees
The Fund pays an investment management fee to TGAL based on the average daily net assets of the Fund as follows:
| | | | |
| Annualized Fee Rate | | Net Assets | | |
| 0.825% | | Up to and including $500 million | | |
| 0.725% | | Over $500 million, up to and including $1 billion | | |
| 0.675% | | Over $1 billion, up to and including $1.5 billion | | |
| 0.625% | | Over $1.5 billion, up to and including $6.5 billion | | |
| 0.600% | | Over $6.5 billion, up to and including $11.5 billion | | |
| 0.578% | | Over $11.5 billion, up to and including $16.5 billion | | |
| 0.565% | | Over $16.5 billion, up to and including $19.0 billion | | |
| 0.555% | | Over $19.0 billion, up to and including $21.5 billion | | |
| 0.545% | | In excess of $21.5 billion | | |
For the year ended December 31, 2017, the gross effective investment management fee rate was 0.721% of the Fund’s average daily net assets.
Under a subadvisory agreement, Advisers, an affiliate of TGAL, provides subadvisory services to the Fund. The subadvisory fee is paid by TGAL based on the Fund’s average daily net assets, and is not an additional expense of the Fund.
b. Administrative Fees
Under an agreement with TGAL, FT Services provides administrative services to the Fund. The fee is paid by TGAL based on the Fund’s average daily net assets, and is not an additional expense of the Fund.
c. Distribution Fees
The Board has adopted distribution plans for each share class, with the exception of Class R6 and Advisor Class shares, pursuant to Rule 12b-1 under the 1940 Act. Under the Fund’s Class A reimbursement distribution plan, the Fund reimburses Distributors for costs incurred in connection with the servicing, sale and distribution of the Fund’s shares up to the maximum annual plan rate. Under the Class A and A1 reimbursement distribution plan, costs exceeding the maximum for the current plan year cannot be reimbursed in subsequent periods. In addition, under the Fund’s Class C, C1 and R compensation distribution plans, the Fund pays Distributors for costs incurred in connection with the servicing, sale and distribution of the Fund’s shares up to the maximum annual plan rate for each class. The plan year, for purposes of monitoring compliance with the maximum annual plan rates, is February 1 through January 31.
The maximum annual plan rates, based on the average daily net assets, for each class, are as follows:
| | | | |
Class A | | | 0.25 | % |
Class A1 | | | 0.25 | % |
Class C | | | 1.00 | % |
Class C1 | | | 0.65 | % |
Class R | | | 0.50 | % |
| | | | | | |
franklintempleton.com | | | | Annual Report | | 45 |
TEMPLETON GLOBAL INVESTMENT TRUST
NOTES TO CONSOLIDATED FINANCIAL STATEMENTS
Templeton Global Balanced Fund (continued)
3. Transactions with Affiliates (continued)
d. Sales Charges/Underwriting Agreements
Front-end sales charges and contingent deferred sales charges (CDSC) do not represent expenses of the Fund. These charges are deducted from the proceeds of sales of Fund shares prior to investment or from redemption proceeds prior to remittance, as applicable. Distributors has advised the Fund of the following commission transactions related to the sales and redemptions of the Fund’s shares for the year:
| | | | |
Sales charges retained net of commissions paid to unaffiliated brokers/dealers | | $ | 148,732 | |
CDSC retained | | $ | 19,772 | |
e. Transfer Agent Fees
Each class of shares pays transfer agent fees to Investor Services for its performance of shareholder servicing obligations. Effective November 1, 2017, the fees are based on an annualized asset based fee of 0.02% plus a transaction based fee. Prior to November 1, 2017, the fees were account based fees that varied based on fund or account type. In addition, each class reimburses Investor Services for out of pocket expenses incurred and, except for Class R6, reimburses shareholder servicing fees paid to third parties. These fees are allocated daily based upon their relative proportion of such classes’ aggregate net assets. Class R6 pays Investor Services transfer agent fees specific to that class.
For the year ended December 31, 2017, the Fund paid transfer agent fees of $2,407,557, of which $778,011 was retained by Investor Services.
f. Investments in Affiliated Management Investment Companies
The Fund invests in one or more affiliated management investment companies for purposes other than exercising a controlling influence over the management or policies. Management fees paid by the Fund are waived on assets invested in the affiliated management investment companies, as noted in the Consolidated Statement of Operations, in an amount not to exceed the management and administrative fees paid directly or indirectly by each affiliate. Prior to April 1, 2013, the waiver was accounted for as a reduction to management fees. During the year ended December 31, 2017, the Fund held investments in affiliated management investment companies as follows:
| | | | | | | | | | | | | | | | | | | | | | | | | | | | | | |
| | | Number of
Shares Held
at Beginning
of Year | | | Gross
Additions | | | Gross
Reductions | | | Number of
Shares
Held at End
of Year | | | Value at End of Year | | | Dividend
Income | | | Realized
Gain
(Loss) | | | Net Change in Unrealized
Appreciation
(Depreciation) |
Non-Controlled Affiliates | | | | | | | | | | | | | | | | | | | | | | | | | | | | | | |
Institutional Fiduciary Trust Money Market Portfolio, 0.89% | | | 93,720,049 | | | | 536,995,886 | | | | (447,540,856 | ) | | | 183,175,079 | | | | $183,175,079 | | | | $766,864 | | | | $ — | | | $ — |
g. Waiver and Expense Reimbursements
Investor Services has contractually agreed in advance to waive or limit its fees so that the Class R6 transfer agent fees do not exceed 0.01% until April 30, 2018.
4. Expense Offset Arrangement
The Fund has entered into an arrangement with its custodian whereby credits realized as a result of uninvested cash balances are used to reduce a portion of the Fund’s custodian expenses. During the year ended December 31, 2017, the custodian fees were reduced as noted in the Consolidated Statement of Operations.
| | | | |
46 | | Annual Report | | franklintempleton.com |
TEMPLETON GLOBAL INVESTMENT TRUST
NOTES TO CONSOLIDATED FINANCIAL STATEMENTS
Templeton Global Balanced Fund (continued)
5. Income Taxes
For tax purposes, capital losses may be carried over to offset future capital gains, if any. At December 31, 2017, the Fund had long-term capital loss carryforwards of $79,149,515.
During the year ended December 31, 2017, the Fund utilized $22,442,772 of capital loss carryforwards.
For tax purposes, the Fund may elect to defer any portion of a late-year ordinary loss to the first day of the following fiscal year. At December 31, 2017, the Fund deferred late-year ordinary losses of $11,869,997.
The tax character of distributions paid during the years ended December 31, 2017 and 2016 and March 31, 2016, was as follows:
| | | | | | | | | | | | |
| | | December 31, | | | March 31, | |
| | | 2017 | | | 2016 | | | 2016 | |
Distributions paid from: | | | | | | | | | | | | |
Ordinary income | | $ | 44,702,312 | | | $ | 16,278,781 | | | $ | 83,080,951 | |
Long term capital gain | | | — | | | | — | | | | 72,498,970 | |
| | $ | 44,702,312 | | | $ | 16,278,781 | | | $ | 155,579,921 | |
At December 31, 2017, the cost of investments and net unrealized appreciation (depreciation) for income tax purposes were as follows:
| | | | |
Cost of investments | | $ | 1,629,192,989 | |
| |
Unrealized appreciation | | $ | 262,606,053 | |
Unrealized depreciation | | | (124,334,069 | ) |
| |
Net unrealized appreciation (depreciation) | | $ | 138,271,984 | |
Differences between income and/or capital gains as determined on a book basis and a tax basis are primarily due to differing treatments of foreign currency transactions and investments in the FT Subsidiary.
6. Investment Transactions
Purchases and sales of investments (excluding short term securities) for the year ended December 31, 2017, aggregated $552,750,734 and $826,284,787, respectively.
7. Credit Risk and Defaulted Securities
At December 31, 2017, the Fund had 7.8% of its portfolio invested in high yield, senior secured floating rate notes, or other securities rated below investment grade and unrated securities, if any. These securities may be more sensitive to economic conditions causing greater price volatility and are potentially subject to a greater risk of loss due to default than higher rated securities.
The Fund held a defaulted security and/or other securities for which the income has been deemed uncollectible. At December 31, 2017, the value of this security represents less than 0.1% of the Fund’s net assets. The Fund discontinues accruing income on securities for which income has been deemed uncollectible and provides an estimate for losses on interest receivable. The security has been identified in the accompanying Consolidated Statement of Investments.
| | | | | | |
franklintempleton.com | | | | Annual Report | | 47 |
TEMPLETON GLOBAL INVESTMENT TRUST
NOTES TO CONSOLIDATED FINANCIAL STATEMENTS
Templeton Global Balanced Fund (continued)
8. Concentration of Risk
Investing in foreign securities may include certain risks and considerations not typically associated with investing in U.S. securities, such as fluctuating currency values and changing local and regional economic, political and social conditions, which may result in greater market volatility. In addition, certain foreign securities may not be as liquid as U.S. securities.
9. Restricted Securities
The Fund invests in securities that are restricted under the Securities Act of 1933 (1933 Act). Restricted securities are often purchased in private placement transactions, and cannot be sold without prior registration unless the sale is pursuant to an exemption under the 1933 Act. Disposal of these securities may require greater effort and expense, and prompt sale at an acceptable price may be difficult. The Fund may have registration rights for restricted securities. The issuer generally incurs all registration costs.
At December 31, 2017, investments in restricted securities, excluding securities exempt from registration under the 1933 Act deemed to be liquid, were as follows:
| | | | | | | | | | | | | | | | |
Principal
Amount*/
Shares/
Warrants | | | | Issuer | | Acquisition Date | | | Cost | | | Value | |
4,441 | | | | Edcon Holdings Ltd., F wts., 2/20/49 | | | 11/27/15 | | | $ | 47 | | | $ | — | |
79,464,087 | | | | Edcon Holdings Ltd., F1 wts., 2/20/49 | | | 11/27/15 | | | | 841,962 | | | | — | |
6,435,002 | | | | Edcon Holdings Ltd., F2 wts., 2/20/49 | | | 11/27/15 | | | | 68,182 | | | | — | |
32,900,733 | | | | Holdco 2, A | | | 2/08/13 - 2/01/17 | | | | 81,025 | | | | 26,592 | |
4,646,498 | | | | Holdco 2, B | | | 2/01/17 | | | | 3,450 | | | | 3,756 | |
2,493,652 | | | | K2016470219 South Africa Ltd., senior secured note, 144A, PIK,
3.00%, 12/31/22 | | | 2/08/13 - 12/29/17 | | | | 1,603,624 | | | | 37,405 | |
2,058,106 | | EUR | | K2016470219 South Africa Ltd., senior secured note, 144A, PIK,
8.00%, 12/31/22 | | | 2/01/17 - 12/29/17 | | | | 1,175,790 | | | | 12,347 | |
617,516 | | | | K2016470260 South Africa Ltd., senior secured note, 144A, PIK,
25.00%, 12/31/22 | | | 2/01/17 - 12/29/17 | | | | 599,235 | | | | 475,487 | |
| | | | Total Restricted Securities (Value is 0.0%† of Net Assets) | | | | | | $ | 4,373,315 | | | $ | 555,587 | |
*In U.S. dollars unless otherwise indicated.
†Rounds to less than 0.1% of net assets.
| | | | |
48 | | Annual Report | | franklintempleton.com |
TEMPLETON GLOBAL INVESTMENT TRUST
NOTES TO CONSOLIDATED FINANCIAL STATEMENTS
Templeton Global Balanced Fund (continued)
10. Other Derivative Information
At December 31, 2017, the Fund’s investments in derivative contracts are reflected in the Consolidated Statement of Assets and Liabilities as follows:
| | | | | | | | | | | | |
| | | Asset Derivatives | | | | | Liability Derivatives | | | |
Derivative Contracts Not Accounted for as
Hedging Instruments | | Consolidated Statement of Assets and Liabilities Location | | Fair Value | | | Consolidated Statement of
Assets and Liabilities
Location | | Fair Value | |
Interest rate contracts | | Variation margin on centrally cleared swap contracts | | $ | 2,510,455 | a | | Variation margin on centrally cleared swap contracts | | $ | 800,817 | a |
Foreign exchange contracts | | Unrealized appreciation on OTC forward exchange contracts | | | 3,357,079 | | | Unrealized depreciation on OTC | | | 8,345,666 | |
| | | | | | | | forward exchange contracts | | | | |
Value recovery instruments | | Investments in securities, at value | | | 6,708,176 | b | | | | | | |
| | | | | | | | | | | | |
Totals | | | | $ | 12,575,710 | | | | | $ | 9,146,483 | |
| | | | | | | | | | | | |
aThis amount reflects the cumulative appreciation (depreciation) of centrally cleared swap contracts as reported in the Consolidated Statement of Investments. Only the variation margin receivable/payable at year end is separately reported within the Consolidated Statement of Assets and Liabilities. Prior variation margin movements were recorded to cash upon receipt or payment.
bVRI are included in investments in securities, at value in the Consolidated Statement of Assets and Liabilities.
For the year ended December 31, 2017, the effect of derivative contracts in the Fund’s Consolidated Statement of Operations was as follows:
| | | | | | | | | | |
Derivative Contracts Not Accounted for as
Hedging Instruments | | Consolidated Statement of Operations Location | | Net Realized
Gain (Loss) for
the Year | | | Consolidated Statement of
Operations Location | | Net Change in
Unrealized
Appreciation
(Depreciation)
for the Year |
| | Net realized gain (loss) from: | | | | | | Net change in unrealized appreciation (depreciation) on: | | |
Interest rate contracts | | Swap contracts | | $ | (1,357,449 | ) | | Swap contracts | | $278,326 |
| | | | |
Foreign exchange contracts | | Forward exchange contracts | | | 181,199 | | | Forward exchange contracts | | (44,898,724) |
| | | | |
Equity contracts | | Written options | | | 821,024 | | | Written options | | — |
| | | | |
Value recovery instruments | | Investments | | | — | | | Investments | | 3,036,586a |
| | | | | | | | | | |
Totals | | | | $ | (355,226 | ) | | | | $(41,583,812) |
| | | | | | | | | | |
a VRI are included in net change in unrealized appreciation (depreciation) on investments in the Consolidated Statement of Operations.
For the year ended December 31, 2017, the average month end notional amount of options and swap contracts, and the average month end contract value for forward exchange contracts, and average month end fair value of VRI, were as follows:
| | | | |
Options | | $ | 793,372 | |
Swap contracts | | | 190,213,846 | |
Forward exchange contracts | | | 699,046,566 | |
VRI | | | 5,236,436 | |
See Note 1(c) regarding derivative financial instruments.
See Abbreviations on page 52.
| | | | | | |
franklintempleton.com | | | | Annual Report | | 49 |
TEMPLETON GLOBAL INVESTMENT TRUST
NOTES TO CONSOLIDATED FINANCIAL STATEMENTS
Templeton Global Balanced Fund (continued)
11. Credit Facility
The Fund, together with other U.S. registered and foreign investment funds (collectively, Borrowers), managed by Franklin Templeton Investments, are borrowers in a joint syndicated senior unsecured credit facility totaling $2 billion (Global Credit Facility) which matured on February 9, 2018. This Global Credit Facility provides a source of funds to the Borrowers for temporary and emergency purposes, including the ability to meet future unanticipated or unusually large redemption requests. Effective February 9, 2018, the Borrowers renewed the Global Credit Facility for a one year term, maturing February 8, 2019, for a total of $2 billion.
Under the terms of the Global Credit Facility, the Fund shall, in addition to interest charged on any borrowings made by the Fund and other costs incurred by the Fund, pay its share of fees and expenses incurred in connection with the implementation and maintenance of the Global Credit Facility, based upon its relative share of the aggregate net assets of all of the Borrowers, including an annual commitment fee of 0.15% based upon the unused portion of the Global Credit Facility. These fees are reflected in other expenses in the Statement of Operations. During the year ended December 31, 2017, the Fund did not use the Global Credit Facility.
12. Fair Value Measurements
The Fund follows a fair value hierarchy that distinguishes between market data obtained from independent sources (observable inputs) and the Fund’s own market assumptions (unobservable inputs). These inputs are used in determining the value of the Fund’s financial instruments and are summarized in the following fair value hierarchy:
• Level 1 – quoted prices in active markets for identical financial instruments
• Level 2 – other significant observable inputs (including quoted prices for similar financial instruments, interest rates, prepayment speed, credit risk, etc.)
• Level 3 – significant unobservable inputs (including the Fund’s own assumptions in determining the fair value of financial instruments)
The input levels are not necessarily an indication of the risk or liquidity associated with financial instruments at that level.
For movements between the levels within the fair value hierarchy, the Fund has adopted a policy of recognizing the transfers as of the date of the underlying event which caused the movement.
| | | | |
50 | | Annual Report | | franklintempleton.com |
TEMPLETON GLOBAL INVESTMENT TRUST
NOTES TO CONSOLIDATED FINANCIAL STATEMENTS
Templeton Global Balanced Fund (continued)
A summary of inputs used as of December 31, 2017, in valuing the Fund’s assets and liabilities carried at fair value, is as follows:
| | | | | | | | | | | | | | | | |
| | | Level 1 | | | Level 2 | | | Level 3 | | | Total | |
Assets: | | | | | | | | | | | | | | | | |
Investments in Securities:a | | | | | | | | | | | | | | | | |
Equity Investments:b | | | | | | | | | | | | | | | | |
South Africa | | $ | — | | | $ | — | | | $ | 30,348 | c | | $ | 30,348 | |
United Kingdom | | | 228,728,635 | | | | 42,806 | | | | — | | | | 228,771,441 | |
United States | | | 317,750,784 | | | | 358,666 | | | | 287,165 | | | | 318,396,615 | |
All Other Equity Investments | | | 592,414,595 | | | | — | | | | — | | | | 592,414,595 | |
Equity-Linked Securities | | | — | | | | 48,231,309 | | | | — | | | | 48,231,309 | |
Corporate Bonds and Notes: | | | | | | | | | | | | | | | | |
South Africa | | | — | | | | 512,892 | | | | 12,347 | | | | 525,239 | |
United States | | | — | | | | 3,001,416 | | | | 1,850 | | | | 3,003,266 | |
Foreign Government and Agency Securities | | | — | | | | 362,278,539 | | | | — | | | | 362,278,539 | |
Escrows and Litigation Trusts | | | — | | | | — | | | | — | c | | | — | |
Short Term Investments | | | 183,175,079 | | | | 33,286,678 | | | | — | | | | 216,461,757 | |
Total Investments in Securities | | $ | 1,322,069,093 | | | $ | 447,712,306 | | | $ | 331,710 | | | $ | 1,770,113,109 | |
Other Financial Instruments: | | | | | | | | | | | | | | | | |
Forward Exchange Contracts | | $ | — | | | $ | 3,357,079 | | | $ | — | | | $ | 3,357,079 | |
Swap Contracts | | | — | | | | 2,510,455 | | | | — | | | | 2,510,455 | |
Total Other Financial Instruments | | $ | — | | | $ | 5,867,534 | | | $ | — | | | $ | 5,867,534 | |
Liabilities: | | | | | | | | | | | | | | | | |
Other Financial Instruments: | | | | | | | | | | | | | | | | |
Forward Exchange Contracts | | $ | — | | | $ | 8,345,666 | | | $ | — | | | $ | 8,345,666 | |
Swap Contracts | | | — | | | | 800,817 | | | | — | | | | 800,817 | |
Total Other Financial Instruments | | $ | — | | | $ | 9,146,483 | | | $ | — | | | $ | 9,146,483 | |
aFor detailed categories, see the accompanying Consolidated Statement of Investments.
bIncludes common and convertible preferred stocks as well as other equity investments.
cIncludes securities determined to have no value at December 31, 2017.
A reconciliation of assets in which Level 3 inputs are used in determining fair value is presented when there are significant Level 3 financial instruments at the beginning and/or end of the year.
13. Subsequent Events
The Fund has evaluated subsequent events through the issuance of the financial statements and determined that no events have occurred that require disclosure other than those already disclosed in the financial statements.
| | | | | | |
franklintempleton.com | | | | Annual Report | | 51 |
TEMPLETON GLOBAL INVESTMENT TRUST
NOTES TO CONSOLIDATED FINANCIAL STATEMENTS
Templeton Global Balanced Fund (continued)
Abbreviations
| | | | | | | | | | |
| Counterparty | | Currency | | Selected Portfolio |
| BOFA | | Bank of America Corp. | | ARS | | Argentine Peso | | ADR | | American Depositary Receipt |
| BZWS | | Barclays Bank PLC | | BRL | | Brazilian Real | | BADLAR | | Argentina Deposit Rates Badlar Private Banks ARS |
| CITI | | Citigroup, Inc. | | COP | | Colombian Peso | | | | |
| DBAB | | Deutsche Bank AG | | EUR | | Euro | | FRN | | Floating Rate Note |
| GSCO | | The Goldman Sachs Group, Inc. | | GHS | | Ghanaian Cedi | | GDP | | Gross Domestic Product |
| HSBK | | HSBC Bank PLC | | IDR | | Indonesian Rupiah | | GDR | | Global Depositary Receipt |
| JPHQ | | JP Morgan Chase & Co. | | INR | | Indian Rupee | | IDR | | International Depositary Receipt |
| MSCO | | Morgan Stanley | | KRW | | South Korean Won | | LIBOR | | London InterBank Offered Rate |
| SCNY | | Standard Chartered Bank | | MXN | | Mexican Peso | | PIK | | Payment-In-Kind |
| UBSW | | UBS AG | | PEN | | Peruvian Nuevo Sol | | VRI | | Value Recovery Instrument |
| | | | PHP | | Philippine Peso | | | | |
| | | | USD | | United States Dollar | | | | |
| | | | ZAR | | South African Rand | | | | |
| | | | |
52 | | Annual Report | | franklintempleton.com |
TEMPLETON GLOBAL INVESTMENT TRUST
Report of Independent Registered Public Accounting Firm
To the Board of Trustees of Templeton Global Investment Trust and Shareholders of Templeton Global Balanced Fund
Opinion on the Financial Statements
We have audited the accompanying consolidated statement of assets and liabilities, including the consolidated statement of investments, of Templeton Global Balanced Fund and its subsidiary (the “Fund”) as of December 31, 2017, the related consolidated statement of operations for the year ended December 31, 2017, the consolidated statements of changes in net assets for the year ended December 31, 2017, the period April 1, 2016 through December 31, 2016, and the year ended March 31, 2016, including the related notes, and the consolidated financial highlights for each of the periods indicated therein (collectively referred to as the “consolidated financial statements”). In our opinion, the consolidated financial statements present fairly, in all material respects, the financial position of the Fund as of December 31, 2017, the results of their operations for the year ended December 31, 2017, the changes in their net assets for the year ended December 31, 2017, the period April 1, 2016 through December 31, 2016, and the year ended March 31, 2016, and the consolidated financial highlights for each of the periods indicated therein in conformity with accounting principles generally accepted in the United States of America.
Basis for Opinion
These consolidated financial statements are the responsibility of the Fund’s management. Our responsibility is to express an opinion on the Fund’s consolidated financial statements based on our audits. We are a public accounting firm registered with the Public Company Accounting Oversight Board (United States) (“PCAOB”) and are required to be independent with respect to the Fund in accordance with the U.S. federal securities laws and the applicable rules and regulations of the Securities and Exchange Commission and the PCAOB.
We conducted our audits of these consolidated financial statements in accordance with the standards of the PCAOB. Those standards require that we plan and perform the audit to obtain reasonable assurance about whether the consolidated financial statements are free of material misstatement, whether due to error or fraud.
Our audits included performing procedures to assess the risks of material misstatement of the consolidated financial statements, whether due to error or fraud, and performing procedures that respond to those risks. Such procedures included examining, on a test basis, evidence regarding the amounts and disclosures in the consolidated financial statements. Our audits also included evaluating the accounting principles used and significant estimates made by management, as well as evaluating the overall presentation of the consolidated financial statements. Our procedures included confirmation of securities owned as of December 31, 2017 by correspondence with the custodian, transfer agent, and brokers; when replies were not received from brokers, we performed other auditing procedures. We believe that our audits provide a reasonable basis for our opinion.
PricewaterhouseCoopers LLP
San Francisco, California
February 20, 2018
We have served as the auditor of one or more investment companies in the Franklin Templeton Group of Funds since 1948.
| | | | | | |
franklintempleton.com | | | | Annual Report | | 53 |
TEMPLETON GLOBAL INVESTMENT TRUST
Tax Information (unaudited)
Templeton Global Balanced Fund
Under Section 854(b)(1)(A) of the Internal Revenue Code (Code), the Fund hereby reports 12.16% of the ordinary income dividends as income qualifying for the dividends received deduction for the fiscal year ended December 31, 2017.
Under Section 854(b)(1)(B) of the Code, the Fund hereby reports the maximum amount allowable but no less than $29,491,507 as qualified dividends for purposes of the maximum rate under Section 1(h)(11) of the Code for the fiscal year ended December 31, 2017. Distributions, including qualified dividend income, paid during calendar year 2017 will be reported to shareholders on Form 1099-DIV by mid-February 2018. Shareholders are advised to check with their tax advisors for information on the treatment of these amounts on their individual income tax returns.
At December 31, 2016, more than 50% of the Fund’s total assets were invested in securities of foreign issuers. In most instances, foreign taxes were withheld from income paid to the Funds on these investments. As shown in the table below, the Fund hereby reports to shareholders the foreign source income and foreign taxes paid, pursuant to Section 853 of the Code. This written statement will allow shareholders of record on March 14, 2017, to treat their proportionate share of foreign taxes paid by the Fund as having been paid directly by them. The shareholder shall consider these amounts as foreign taxes paid in the tax year in which they receive the Fund distribution.
The following table provides a detailed analysis of foreign tax paid, foreign source income, and foreign source qualified dividends as reported by the Fund, to Class A, Class A1, Class C, Class C1, Class R, Class R6, and Advisor Class shareholders of record.
| | | | | | | | | | | | |
| Class | | Foreign Tax Paid
Per Share | | | Foreign Source
Income Per Share | | | Foreign Source Qualified
Dividends Per Share | |
| | | |
Class A | | | $0.0063 | | | | $0.0875 | | | | $0.0342 | |
Class A1 | | | $0.0063 | | | | $0.0877 | | | | $0.0342 | |
Class C | | | $0.0063 | | | | $0.0717 | | | | $0.0279 | |
Class C1 | | | $0.0063 | | | | $0.0798 | | | | $0.0310 | |
Class R | | | $0.0063 | | | | $0.0835 | | | | $0.0325 | |
Class R6 | | | $0.0063 | | | | $0.0948 | | | | $0.0371 | |
Advisor Class | | | $0.0063 | | | | $0.0929 | | | | $0.0362 | |
Foreign Tax Paid Per Share (Column 1) is the amount per share available to you, as a tax credit (assuming you held your shares in the Fund for a minimum of 16 days during the 31-day period beginning 15 days before the ex-dividend date of the Fund’s distribution to which the foreign taxes relate), or, as a tax deduction.
Foreign Source Income Per Share (Column 2) is the amount per share of income dividends attributable to foreign securities held by the Fund, plus any foreign taxes withheld on these dividends. The amounts reported include foreign source qualified dividends that have not been adjusted for the rate differential applicable to such dividend income.1
Foreign Source Qualified Dividends Per Share (Column 3) is the amount per share of foreign source qualified dividends, plus any foreign taxes withheld on these dividends. These amounts represent the portion of the Foreign Source Income reported to you in column 2 that were derived from qualified foreign securities held by the Fund.1
By mid-February 2018, shareholders will receive Form 1099-DIV which will include their share of taxes paid and foreign source income distributed during the calendar year 2017. The Foreign Source Income reported on Form 1099-DIV has not been adjusted for the rate differential on foreign source qualified dividend income. Shareholders are advised to check with their tax advisors for information on the treatment of these amounts on their 2017 individual income tax returns.
At December 31, 2017, more than 50% of the Fund’s total assets were invested in securities of foreign issuers. In most instances, foreign taxes were withheld from income paid to the Fund on these investments. The Fund elects to treat foreign taxes paid as allowed under Section 853 of the Code. This election will allow shareholders of record as of the first distribution in 2018, to treat their proportionate share of foreign taxes paid by the Fund as having been paid directly by them. The shareholder shall consider these amounts as foreign taxes paid in the tax year in which they receive the Fund distribution.
1Qualified dividends are taxed at reduced long term capital gains tax rates. In determining the amount of foreign tax credit that may be applied against the U.S. tax liability of individuals receiving foreign source qualified dividends, adjustments may be required to the foreign tax credit limitation calculation to reflect the rate differential applicable to such dividend income. The rules however permit certain individuals to elect not to apply the rate differential adjustments for capital gains and/or dividends for any taxable year. Please consult your tax advisor and the instructions to Form 1116 for more information.
| | | | | | |
54 | | Annual Report | | | | franklintempleton.com |
TEMPLETON GLOBAL INVESTMENT TRUST
Special Meeting of Shareholders
MEETING OF SHAREHOLDERS: OCTOBER 30, 2017 AND RECONVENED ON DECEMBER 15, 2017 AND DECEMBER 29, 2017
(UNAUDITED)
A Special Meeting of Shareholders of Templeton Global Investment Trust was held at the offices of Franklin Templeton Investments, One Franklin Parkway, San Mateo, California on October 30, 2017 and reconvened on December 15, 2017 and December 29, 2017. The purpose of the meeting was to elect Trustees of Templeton Global Investment Trust and to vote on the following proposals: to approve the use of a “manager of managers” structure whereby the Fund’s investment manager would be able to hire and replace subadvisers without shareholder approval; to approve an amended fundamental investment restriction regarding investments in commodities for the Fund; and to approve an amended fundamental investment restriction regarding lending for the Fund. At the meeting, (i) the following persons were elected by the shareholders to serve as Trustees of Templeton Global Investment Trust: Harris J. Ashton, Ann Torre Bates, Mary C. Choksi, Edith E. Holiday, Gregory E. Johnson, Rupert H. Johnson, Jr., J. Michael Luttig, David W. Niemiec, Larry D. Thompson, Constantine D. Tseretopoulos and Robert E. Wade and (ii) the proposals to use a “manager of managers” structure, to approve the amended fundamental investment restriction regarding investments in commodities and to approve the amended fundamental investment restriction regarding lending were approved by shareholders. No other business was transacted at the meeting.
The results of the voting at the meeting are as follows:
Proposal 1. To elect a Board of Trustees:
| | | | |
| Name | | For | | Withheld |
| Harris J. Ashton | | 377,048,086 | | 10,385,715 |
| | |
| Ann Torre Bates | | 377,050,303 | | 10,383,500 |
| | |
| Mary C. Choksi | | 377,051,104 | | 10,382,699 |
| | |
| Edith E. Holiday | | 377,043,078 | | 10,390,725 |
| | |
| Gregory E. Johnson | | 377,072,684 | | 10,361,119 |
| | |
| Rupert H. Johnson, Jr. | | 377,077,137 | | 10,356,666 |
| | |
| J. Michael Luttig | | 377,087,793 | | 10,346,010 |
| | |
| David W. Niemiec | | 377,066,180 | | 10,367,622 |
| | |
| Larry D. Thompson | | 377,085,550 | | 10,348,252 |
| | |
| Constantine D. Tseretopoulos | | 377,094,478 | | 10,339,323 |
| | |
| Robert E. Wade | | 377,100,799 | | 10,333,003 |
Total Trust Shares Outstanding*: 656,789,328
*As of the record date.
| | | | | | |
franklintempleton.com | | | | Annual Report | | 55 |
TEMPLETON GLOBAL INVESTMENT TRUST
SPECIAL MEETING OF SHAREHOLDERS
| Proposal 2. | To approve the use of a “manager of managers” structure whereby the Fund’s investment manager would be able to hire and replace subadvisers without shareholder approval: |
| | |
| | | Shares |
For | | 222,334,369 |
| |
Against | | 13,570,444 |
| |
Abstain | | 11,665,814 |
| |
Broker Non-Votes | | 82,842,139 |
| |
Total Fund Shares Voted | | 330,412,778 |
| |
Total Fund Shares Outstanding* | | 573,977,182 |
| Proposal 3. | To approve an amended fundamental investment restriction regarding investments in commodities: |
| | |
| | | Shares |
For | | 224,433,390 |
| |
Against | | 9,143,826 |
| |
Abstain | | 13,993,422 |
| |
Broker Non-Votes | | 82,842,139 |
| |
Total Fund Shares Voted | | 330,412,778 |
| |
Total Fund Shares Outstanding* | | 573,977,182 |
| Proposal 4. | To approve an amended fundamental investment restriction regarding lending: |
| | |
| | | Shares |
For | | 223,045,079 |
| |
Against | | 10,418,684 |
| |
Abstain | | 14,106,878 |
| |
Broker Non-Votes | | 82,842,139 |
| |
Total Fund Shares Voted | | 330,412,778 |
| |
Total Fund Shares Outstanding* | | 573,977,182 |
| | | | | | |
56 | | Annual Report | | | | franklintempleton.com |
TEMPLETON GLOBAL INVESTMENT TRUST
Board Members and Officers
The name, year of birth and address of the officers and board members, as well as their affiliations, positions held with the Trust, principal occupations during at least the past five years and number of US registered portfolios overseen in the Franklin Templeton Investments fund complex, are shown below. Generally, each board member serves until that person’s successor is elected and qualified.
Independent Board Members
| | | | | | | | |
Name, Year of Birth
and Address | | Position | | Length of
Time Served | | Number of Portfolios in
Fund Complex Overseen
by Board Member* | | Other Directorships Held
During at Least the Past 5 Years |
Harris J. Ashton (1932) 300 S.E. 2nd Street Fort Lauderdale, FL 33301-1923 | | Trustee | | Since 1994 | | 139 | | Bar-S Foods (meat packing company) (1981-2010). |
Principal Occupation During at Least the Past 5 Years: Director of various companies; and formerly, Director, RBC Holdings, Inc. (bank holding company) (until 2002); and President, Chief Executive Officer and Chairman of the Board, General Host Corporation (nursery and craft centers) (until 1998). |
Ann Torre Bates (1958) 300 S.E. 2nd Street Fort Lauderdale, FL 33301-1923 | | Trustee | | Since 2008 | | 40 | | Ares Capital Corporation (specialty finance company) (2010-present), United Natural Foods, Inc. (distributor of natural, organic and specialty foods) (2013-present), Allied Capital Corporation (financial services) (2003-2010), SLM Corporation (Sallie Mae) (1997-2014) and Navient Corporation (loan management, servicing and asset recovery) (2014-2016). |
Principal Occupation During at Least the Past 5 Years: Director of various companies; and formerly, Executive Vice President and Chief Financial Officer, NHP Incorporated (manager of multifamily housing) (1995-1997); and Vice President and Treasurer, US Airways, Inc. (until 1995). |
Mary C. Choksi (1950) 300 S.E. 2nd Street Fort Lauderdale, FL 33301-1923 | | Trustee | | Since December 2017 | | 139 | | Avis Budget Group Inc. (car rental) (2007-present), Omnicom group Inc. (advertising and marketing communications services) (2011-present) and White Mountains Insurance Group, Ltd. (holding company) (2017-present). |
Principal Occupation During at Least the Past 5 Years: |
Director of various companies; and formerly, Founder and Senior Advisor, Strategic Investment Group (investment management group) (2015-2017); Founding Partner and Senior Managing Director, Strategic Investment Group (1987-2015); Founding Partner and Managing Director, Emerging Markets Management LLC (investment management firm) (1987-2011); and Loan Officer/Senior Loan Officer/Senior Pension Investment Officer, World Bank Group (international financial institution) (1977-1987). |
Edith E. Holiday (1952) 300 S.E. 2nd Street Fort Lauderdale, FL 33301-1923 | | Lead
Independent
Trustee | | Trustee since 1996 and Lead Independent Trustee since 2007 | | 139 | | Hess Corporation (exploration of oil and gas) (1993-present), Canadian National Railway (railroad) (2001-present), White Mountains Insurance Group, Ltd. (holding company) (2004-present), Santander Consumer USA Holdings, Inc. (consumer finance) (2016-present), RTI International Metals, Inc. (manufacture and distribution of titanium (1999-2015) and H.J. Heinz Company (processed foods and allied products) (1994-2013). |
|
| Principal Occupation During at Least the Past 5 Years: |
Director or Trustee of various companies and trusts; and formerly, Assistant to the President of the United States and Secretary of the Cabinet (1990-1993); General Counsel to the United States Treasury Department (1989-1990); and Counselor to the Secretary and Assistant Secretary for Public Affairs and Public Liaison-United States Treasury Department (1988-1989). |
| | | | | | |
franklintempleton.com | | | | Annual Report | | 57 |
TEMPLETON GLOBAL INVESTMENT TRUST
Independent Board Members (continued)
| | | | | | | | |
Name, Year of Birth and Address | | Position | | Length of Time Served | | Number of Portfolios in
Fund Complex Overseen
by Board Member* | | Other Directorships Held
During at Least the Past 5 Years |
J. Michael Luttig (1954) 300 S.E. 2nd Street Fort Lauderdale, FL 33301-1923 | | Trustee | | Since 2009 | | 139 | | Boeing Capital Corporation (aircraft financing) (2006-2013). |
Principal Occupation During at Least the Past 5 Years: |
Executive Vice President, General Counsel and member of the Executive Council, The Boeing Company (aerospace company) (2006-present); and formerly, Federal Appeals Court Judge, U.S. Court of Appeals for the Fourth Circuit (1991-2006). |
David W. Niemiec (1949) 300 S.E. 2nd Street Fort Lauderdale, FL 33301-1923 | | Trustee | | Since 2006 | | 40 | | Hess Midstream Partners LP (oil and gas midstream infrastructure) (2017-present). |
Principal Occupation During at Least the Past 5 Years: |
Advisor, Saratoga Partners (private equity fund); and formerly, Managing Director, Saratoga Partners (1998-2001) and SBC Warburg Dillon Read (investment banking) (1997-1998); Vice Chairman, Dillon, Read & Co. Inc. (investment banking) (1991-1997); and Chief Financial Officer, Dillon, Read & Co. Inc. (1982-1997). |
Larry D. Thompson (1945) 300 S.E. 2nd Street Fort Lauderdale, FL 33301-1923 | | Trustee | | Since 2006 | | 139 | | The Southern Company (energy company) (2014-present; previously 2010-2012), Graham Holdings Company (education and media organization) (2011-present) and Cbeyond, Inc. (business communications provider) (2010-2012). |
Principal Occupation During at Least the Past 5 Years: |
Director of various companies; Counsel, Finch McCranie, LLP (law firm) (2015-present); Independent Compliance Monitor and Auditor, Volkswagen AG (manufacturer of automobiles and commercial vehicles) (2017-present ); John A. Sibley Professor of Corporate and Business Law, University of Georgia School of Law (2015-present; previously 2011-2012); and formerly, Executive Vice President - Government Affairs, General Counsel and Corporate Secretary, PepsiCo, Inc. (consumer products) (2012-2014); Senior Vice President - Government Affairs, General Counsel and Secretary, PepsiCo, Inc. (2004-2011); Senior Fellow of The Brookings Institution (2003-2004); Visiting Professor, University of Georgia School of Law (2004); and Deputy Attorney General, U.S. Department of Justice (2001-2003). |
Constantine D. Tseretopoulos (1954) 300 S.E. 2nd Street Fort Lauderdale, FL 33301-1923 | | Trustee | | Since 2001 | | 26 | | None |
Principal Occupation During at Least the Past 5 Years: |
Physician, Chief of Staff, owner and operator of the Lyford Cay Hospital (1987-present); director of various nonprofit organizations; and formerly, Cardiology Fellow, University of Maryland (1985-1987); and Internal Medicine Resident, Greater Baltimore Medical Center (1982-1985). |
Robert E. Wade (1946) 300 S.E. 2nd Street Fort Lauderdale, FL 33301-1923 | | Trustee | | Since 2006 | | 40 | | El Oro Ltd (investments) (2003-present). |
Principal Occupation During at Least the Past 5 Years: |
Attorney at law engaged in private practice as a sole practitioner (1972-2008) and member of various boards. |
| | | | |
58 | | Annual Report | | franklintempleton.com |
TEMPLETON GLOBAL INVESTMENT TRUST
Interested Board Members and Officers
| | | | | | | | |
Name, Year of Birth and Address | | Position | | Length of
Time Served | | Number of Portfolios in
Fund Complex Overseen
by Board Member* | | Other Directorships Held During at Least the Past 5 Years |
**Gregory E. Johnson (1961) One Franklin Parkway San Mateo, CA 94403-1906 | | Trustee | | Since 2006 | | 153 | | None |
Principal Occupation During at Least the Past 5 Years: |
Chairman of the Board, Member - Office of the Chairman, Director and Chief Executive Officer, Franklin Resources, Inc.; officer and/or director or trustee, as the case may be, of some of the other subsidiaries of Franklin Resources, Inc. and of 43 of the investment companies in Franklin Templeton Investments; Vice Chairman, Investment Company Institute; and formerly, President, Franklin Resources, Inc. (1994-2015). |
**Rupert H. Johnson, Jr. (1940) One Franklin Parkway San Mateo, CA 94403-1906 | | Chairman of
the Board,
Trustee and
Vice President | | Chairman of the Board and Trustee since 2013 and Vice President since 1996 | | 139 | | None |
Principal Occupation During at Least the Past 5 Years: |
Vice Chairman, Member - Office of the Chairman and Director, Franklin Resources, Inc.; Director, Franklin Advisers, Inc.; Senior Vice President, Franklin Advisory Services, LLC; and officer and/or director or trustee, as the case may be, of some of the other subsidiaries of Franklin Resources, Inc. and of 41 of the investment companies in Franklin Templeton Investments. |
Alison E. Baur (1964) One Franklin Parkway San Mateo, CA 94403-1906 | | Vice President | | Since 2012 | | Not Applicable | | Not Applicable |
Principal Occupation During at Least the Past 5 Years: | | |
Deputy General Counsel, Franklin Templeton Investments; and officer of some of the other subsidiaries of Franklin Resources, Inc. and of 45 of the investment companies in Franklin Templeton Investments. |
Norman J. Boersma (1957) Lyford Cay Nassau, Bahamas | | President and
Chief
Executive
Officer –
Investment
Management | | Since 2012 | | Not Applicable | | Not Applicable |
Principal Occupation During at Least the Past 5 Years: | | |
Chairman of the Board, President and Chief Executive Officer, Templeton Global Advisors Ltd.; Chief Investment Officer of Templeton Global Equity Group; officer of six of the investment companies in Franklin Templeton Investments; and formerly, Executive Vice President, Franklin Templeton Investments Corp. (1993-2014). |
Aliya S. Gordon (1973) One Franklin Parkway San Mateo, CA 94403-1906 | | Vice President | | Since 2009 | | Not Applicable | | Not Applicable |
Principal Occupation During at Least the Past 5 Years: | | |
Senior Associate General Counsel, Franklin Templeton Investments; and officer of 45 of the investment companies in Franklin Templeton Investments. |
Steven J. Gray (1955) One Franklin Parkway San Mateo, CA 94403-1906 | | Vice President | | Since 2009 | | Not Applicable | | Not Applicable |
Principal Occupation During at Least the Past 5 Years: | | |
Senior Associate General Counsel, Franklin Templeton Investments; Vice President, Franklin Templeton Distributors, Inc. and FASA, LLC; and officer of 45 of the investment companies in Franklin Templeton Investments. |
Matthew T. Hinkle (1971) One Franklin Parkway San Mateo, CA 94403-1906 | | Chief
Executive
Officer –
Finance and
Administration | | Since June 2017 | | Not Applicable | | Not Applicable |
Principal Occupation During at Least the Past 5 Years: | | |
Senior Vice President, Franklin Templeton Services, LLC; officer of 45 of the investment companies in Franklin Templeton Investments; and formerly, Vice President, Global Tax (2012-April 2017) and Treasurer/Assistant Treasurer, Franklin Templeton Investments (2009-2017). |
| | | | |
franklintempleton.com | | Annual Report | | 59 |
TEMPLETON GLOBAL INVESTMENT TRUST
Interested Board Members and Officers (continued)
| | | | | | | | |
Name,Year of Birth and Address | | Position | | Length of Time Served | | Number of Portfolios in
Fund Complex Overseen
by Board Member* | | Other Directorships Held During at Least the Past 5 Years |
Robert G. Kubilis (1973) 300 S.E. 2nd Street Fort Lauderdale, FL 33301-1923 | | Chief Financial
Officer, Chief
Accounting
Officer and Treasurer | | Since June 2017 | | Not Applicable | | Not Applicable |
Principal Occupation During at Least the Past 5 Years:
Treasurer, U.S. Fund Administration & Reporting, Franklin Templeton Investments; and officer of 17 of the investment companies in Franklin Templeton Investments.
| | | | | | | | |
Robert Lim (1948) One Franklin Parkway San Mateo, CA 94403-1906 | | Vice President –AML
Compliance | | Since 2016 | | Not Applicable | | Not Applicable |
Principal Occupation During at Least the Past 5 Years:
Vice President, Franklin Templeton Companies, LLC; Chief Compliance Officer, Franklin Templeton Distributors, Inc. and Franklin Templeton Investor Services, LLC; and officer of 45 of the investment companies in Franklin Templeton Investments.
| | | | | | | | |
Kimberly H. Novotny (1972) 300 S.E. 2nd Street Fort Lauderdale, FL 33301-1923 | | Vice
President | | Since 2013 | | Not Applicable | | Not Applicable |
Principal Occupation During at Least the Past 5 Years:
Associate General Counsel, Franklin Templeton Investments; Vice President and Corporate Secretary, Fiduciary Trust International of the South; Vice President, Templeton Investment Counsel, LLC; Assistant Secretary, Franklin Resources, Inc.; and officer of 45 of the investment companies in Franklin Templeton Investments.
| | | | | | | | |
Robert C. Rosselot (1960) 300 S.E. 2nd Street Fort Lauderdale, FL 33301-1923 | | Chief
Compliance
Officer | | Since 2013 | | Not Applicable | | Not Applicable |
Principal Occupation During at Least the Past 5 Years:
Director, Global Compliance, Franklin Templeton Investments; Vice President, Franklin Templeton Companies, LLC; officer of 45 of the investment companies in Franklin Templeton Investments; and formerly, Senior Associate General Counsel, Franklin Templeton Investments (2007-2013); and Secretary and Vice President, Templeton Group of Funds (2004-2013).
| | | | | | | | |
Karen L. Skidmore (1952) One Franklin Parkway San Mateo, CA 94403-1906 | | Vice President | | Since 2009 | | Not Applicable | | Not Applicable |
Principal Occupation During at Least the Past 5 Years:
Senior Associate General Counsel, Franklin Templeton Investments; and officer of 45 of the investment companies in Franklin Templeton Investments.
| | | | | | | | |
Navid J. Tofigh (1972) One Franklin Parkway San Mateo, CA 94403-1906 | | Vice President | | Since 2015 | | Not Applicable | | Not Applicable |
Principal Occupation During at Least the Past 5 Years:
Associate General Counsel, Franklin Templeton Investments; and officer of 45 of the investment companies in Franklin Templeton Investments.
| | | | | | | | |
Craig S. Tyle (1960) One Franklin Parkway San Mateo, CA 94403-1906 | | Vice President | | Since 2005 | | Not Applicable | | Not Applicable |
Principal Occupation During at Least the Past 5 Years:
General Counsel and Executive Vice President, Franklin Resources, Inc.; and officer of some of the other subsidiaries of Franklin Resources, Inc. and of 45 of the investment companies in Franklin Templeton Investments.
| | | | |
60 | | Annual Report | | franklintempleton.com |
TEMPLETON GLOBAL INVESTMENT TRUST
Interested Board Members and Officers (continued)
| | | | | | | | |
Name,Year of Birth and Address | | Position | | Length of
Time Served | | Number of Portfolios in
Fund Complex Overseen
by Board Member* | | Other Directorships Held During at Least the Past 5 Years |
Lori A. Weber (1964) 300 S.E. 2nd Street Fort Lauderdale, FL 33301-1923 | | Secretary and
Vice President | | Secretary since 2013 and Vice President since 2011 | | Not Applicable | | Not Applicable |
Principal Occupation During at Least the Past 5 Years:
Senior Associate General Counsel, Franklin Templeton Investments; Assistant Secretary, Franklin Resources, Inc.; Vice President and Secretary, Templeton Investment Counsel, LLC; and officer of 45 of the investment companies in Franklin Templeton Investments.
*We base the number of portfolios on each separate series of the US registered investment companies within the Franklin Templeton Investments fund complex. These portfolios have a common investment manager or affiliated investment managers.
**Gregory E. Johnson is considered to be an interested person of the Fund under the federal securities laws due to his position as an officer and director of Franklin Resources, Inc. (Resources), which is the parent company of the Fund’s investment manager and distributor. Rupert H. Johnson, Jr. is considered to be an interested person of the Fund under the federal securities laws due to his position as officer and director and major shareholder of Resources.
Note 1: Rupert H. Johnson, Jr. is the uncle of Gregory E. Johnson.
Note 2: Officer information is current as of the date of this report. It is possible that after this date, information about officers may change.
The Sarbanes-Oxley Act of 2002 and Rules adopted by the US Securities and Exchange Commission require the Fund to disclose whether the Fund’s Audit Committee includes at least one member who is an audit committee financial expert within the meaning of such Act and Rules. The Fund’s Board has determined that there is at least one such financial expert on the Audit Committee and has designated each of Ann Torre Bates and David W. Niemiec as an audit committee financial expert. The Board believes that Ms. Bates and Mr. Niemiec qualify as such an expert in view of their extensive business background and experience. Ms. Bates has served as a member of the Fund Audit Committee since 2008. She currently serves as a director of Ares Capital Corporation (2010-present) and United Natural Foods, Inc. (2013-present) and was formerly a director of Navient Corporation from 2014 to 2016, SLM Corporation from 1997 to 2014 and Allied Capital Corporation from 2003 to 2010, Executive Vice President and Chief Financial Officer of NHP Incorporated from 1995 to 1997 and Vice President and Treasurer of US Airways, Inc. until 1995. Mr. Niemiec has served as a member of the Fund Audit Committee since 2006, currently serves as an Advisor to Saratoga Partners and was formerly its Managing Director from 1998 to 2001 and serves as a director of Hess Midstream Partners LP (2017-present). Mr. Niemiec was formerly a director of Emeritus Corporation from 1999 to 2010 and OSI Pharmaceuticals, Inc. from 2006 to 2010, Managing Director of SBC Warburg Dillon Read from 1997 to 1998, and was Vice Chairman from 1991 to 1997 and Chief Financial Officer from 1982 to 1997 of Dillon, Read & Co. Inc. As a result of such background and experience, the Board believes that Ms. Bates and Mr. Niemiec have each acquired an understanding of generally accepted accounting principles and financial statements, the general application of such principles in connection with the accounting estimates, accruals and reserves, and analyzing and evaluating financial statements that present a breadth and level of complexity of accounting issues generally comparable to those of the Fund, as well as an understanding of internal controls and procedures for financial reporting and an understanding of audit committee functions. Ms. Bates and Mr. Niemiec are independent Board members as that term is defined under the applicable US Securities and Exchange Commission Rules and Releases.
The Statement of Additional Information (SAI) includes additional information about the board members and is available, without charge, upon request. Shareholders may call (800) DIAL BEN/342-5236 to request the SAI.
| | | | |
franklintempleton.com | | Annual Report | | 61 |
TEMPLETON GLOBAL INVESTMENT TRUST
TEMPLETON GLOBAL BALANCED FUND
Shareholder Information
Proxy Voting Policies and Procedures
The Fund’s investment manager has established Proxy Voting Policies and Procedures (Policies) that the Fund uses to determine how to vote proxies relating to portfolio securities. Shareholders may view the Fund’s complete Policies online at franklintempleton.com. Alternatively, shareholders may request copies of the Policies free of charge by calling the Proxy Group collect at (954) 527-7678 or by sending a written request to: Franklin Templeton Companies, LLC, 300 S.E. 2nd Street, Fort Lauderdale, FL 33301, Attention: Proxy Group. Copies of the Fund’s proxy voting records are also made available online at franklintempleton.com and posted on the US Securities and Exchange Commission’s website at sec.gov and reflect the most recent 12-month period ended June 30.
Quarterly Consolidated Statement of Investments
The Trust, on behalf of the Fund, files a complete consolidated statement of investments with the US Securities and Exchange Commission for the first and third quarters for each fiscal year on Form N-Q. Shareholders may view the filed Form N-Q by visiting the Commission’s website at sec.gov. The filed form may also be viewed and copied at the Commission’s Public Reference Room in Washington, DC. Information regarding the operations of the Public Reference Room may be obtained by calling (800) SEC-0330.
Householding of Reports and Prospectuses
You will receive the Fund’s financial reports every six months as well as an annual updated summary prospectus (prospectus available upon request). To reduce Fund expenses, we try to identify related shareholders in a household and send only one copy of the financial reports and summary prospectus. This process, called “householding,” will continue indefinitely unless you instruct us otherwise. If you prefer not to have these documents householded, please call us at (800) 632-2301. At any time you may view current prospectuses/summary prospectuses and financial reports on our website. If you choose, you may receive these documents through electronic delivery.
| | | | | | |
62 | | Annual Report | | | | franklintempleton.com |
This page intentionally left blank.
This page intentionally left blank.
| | |

| | Annual Report and Shareholder Letter Templeton Global Balanced Fund |
| | Investment Manager |
| | Templeton Global Advisors Limited |
| | Subadvisor Franklin Advisers, Inc. Distributor |
| | Franklin Templeton Distributors, Inc. (800) DIAL BEN® / 342-5236 franklintempleton.com |
| | Shareholder Services |
| | (800) 632-2301 |
Authorized for distribution only when accompanied or preceded by a summary prospectus and/or prospectus. Investors should carefully consider a fund’s investment goals, risks, charges and expenses before investing. A prospectus contains this and other information; please read it carefully before investing.
To help ensure we provide you with quality service, all calls to and from our service areas are monitored and/or recorded.
| | |
| © 2018 Franklin Templeton Investments. All rights reserved. | | 325 A 02/18 |
| (a) | The Registrant has adopted a code of ethics that applies to its principal executive officers and principal financial and accounting officer. |
| (f) | Pursuant to Item 12(a)(1), the Registrant is attaching as an exhibit a copy of its code of ethics that applies to its principal executive officers and principal financial and accounting officer. |
| Item 3. | Audit Committee Financial Expert. |
| (a) (1) | The Registrant has an audit committee financial expert serving on its audit committee. |
| (2) | The audit committee financial expert is David W. Niemiec and he is “independent” as defined under the relevant Securities and Exchange Commission Rules and Releases. |
| Item 4. | Principal Accountant Fees and Services. |
(a) Audit Fees
The aggregate fees paid to the principal accountant for professional services rendered by the principal accountant for the audit of the registrant’s annual financial statements or for services that are normally provided by the principal accountant in connection with statutory and regulatory filings or engagements were $123,186 for the fiscal year ended December 31, 2017 and $124,354 for the fiscal year ended December 31, 2016.
(b) Audit-Related Fees
There were no fees paid to the principal accountant for assurance and related services rendered by the principal accountant to the registrant that are reasonably related to the performance of the audit of the registrant’s financial statements and are not reported under paragraph (a) of Item 4.
There were no fees paid to the principal accountant for assurance and related services rendered by the principal accountant to the registrant’s investment adviser and any entity controlling, controlled by or under common control with the investment adviser that provides ongoing services to the registrant that are reasonably related to the performance of the audit of their financial statements.
(c) Tax Fees
The aggregate fees paid to the principal accountant for professional services rendered by the principal accountant to the registrant for tax compliance, tax advice and tax planning were $0 the fiscal year ended December 31, 2017 and $4,682 for the fiscal year ended December 31, 2016. The services for which these fees were paid include consulting and preparation of tax returns.
There were no fees paid to the principal accountant for professional services rendered by the principal accountant to the registrant’s investment adviser and any entity controlling, controlled by or under common control with the
investment adviser that provides ongoing services to the registrant for tax compliance, tax advice and tax planning.
(d) All Other Fees
There were no fees paid to the principal accountant for products and services rendered by the principal accountant to the registrant, other than the services reported in paragraphs (a)-(c) of Item 4.
The aggregate fees paid to the principal accountant for products and services rendered by the principal accountant to the registrant’s investment adviser and any entity controlling, controlled by or under common control with the investment adviser that provides ongoing services to the registrant other than services reported in paragraphs (a)-(c) of Item 4 were $14,000 for the fiscal year ended December 31, 2017 and $255,000 for the fiscal year ended December 31, 2016. The services for which these fees were paid included review of materials provided to the fund Board in connection with the investment management contract renewal process and derivatives assessments, review of system processes related to fixed income securities, compliance examination for Investment Advisor Act rule 204-2 and 206-4(2), and benchmarking services in connection with the 2015 ICI TA Survey.
(e) (1) The registrant’s audit committee is directly responsible for approving the services to be provided by the auditors, including:
(i) pre-approval of all audit and audit related services;
(ii) pre-approval of all non-audit related services to be provided to the Fund by the auditors;
(iii) pre-approval of all non-audit related services to be provided to the registrant by the auditors to the registrant’s investment adviser or to any entity that controls, is controlled by or is under common control with the registrant’s investment adviser and that provides ongoing services to the registrant where the non-audit services relate directly to the operations or financial reporting of the registrant; and
(iv) establishment by the audit committee, if deemed necessary or appropriate, as an alternative to committee pre-approval of services to be provided by the auditors, as required by paragraphs (ii) and (iii) above, of policies and procedures to permit such services to be pre-approved by other means, such as through establishment of guidelines or by action of a designated member or members of the committee; provided the policies and procedures are detailed as to the particular service and the committee is informed of each service and such policies and procedures do not include delegation of audit committee responsibilities, as contemplated under the Securities Exchange Act of 1934, to management; subject, in the case of (ii) through (iv), to any waivers, exceptions or exemptions that may be available under applicable law or rules.
(e) (2) None of the services provided to the registrant described in paragraphs (b)-(d) of Item 4 were approved by the audit committee pursuant to paragraph (c)(7)(i)(C) of Rule 2-01 of regulation S-X.
(f) No disclosures are required by this Item 4(f).
(g) The aggregate non-audit fees paid to the principal accountant for services rendered by the principal accountant to the registrant and the registrant’s
investment adviser and any entity controlling, controlled by or under common control with the investment adviser that provides ongoing services to the registrant were $14,000 for the fiscal year ended December 31, 2017 and $259,682 for the fiscal year ended December 31, 2016.
(h) The registrant’s audit committee of the board has considered whether the provision of non-audit services that were rendered to the registrant’s investment adviser (not including any sub-adviser whose role is primarily portfolio management and is subcontracted with or overseen by another investment adviser), and any entity controlling, controlled by, or under common control with the investment adviser that provides ongoing services to the registrant that were not pre-approved pursuant to paragraph (c)(7)(ii) of Rule 2-01 of Regulation S-X is compatible with maintaining the principal accountant’s independence.
| Item 5. | Audit Committee of Listed Registrants. N/A |
| Item 6. | Schedule of Investments. N/A |
| Item 7. | Disclosure of Proxy Voting Policies and Procedures for Closed-End Management Investment Companies. N/A |
| Item 8. | Portfolio Managers of Closed-End Management Investment Companies. N/A |
| Item 9. | Purchases of Equity Securities by Closed-End Management Investment Company and Affiliated Purchasers. N/A |
| Item 10. | Submission of Matters to a Vote of Security Holders. |
There have been no changes to the procedures by which shareholders may recommend nominees to the Registrant’s Board of Trustees that would require disclosure herein.
| Item 11. | Controls and Procedures. |
(a) Evaluation of Disclosure Controls and Procedures. The Registrant maintains disclosure controls and procedures that are designed to ensure that information required to be disclosed in the Registrant’s filings under the Securities Exchange Act of 1934 and the Investment Company Act of 1940, is recorded, processed, summarized and reported within the periods specified in the rules and forms of the Securities and Exchange Commission. Such information is accumulated and communicated to the Registrant’s management, including its principal executive officer and principal financial officer, as appropriate, to allow timely decisions regarding required disclosure. The Registrant’s management, including the principal executive officer and the principal financial officer, recognizes that any set of controls and procedures, no matter how well designed and operated, can provide only reasonable assurance of achieving the desired control objectives.
Within 90 days prior to the filing date of this Shareholder Report on Form N-CSR, the Registrant had carried out an evaluation, under the supervision and with the participation of the Registrant’s management, including the Registrant’s principal executive officer and the Registrant’s principal financial officer, of the effectiveness of the design and operation of the Registrant’s disclosure controls and procedures. Based on such evaluation, the Registrant’s principal executive officer and principal financial officer concluded that the Registrant’s disclosure controls and procedures are effective.
(b) Changes in Internal Controls. There have been no changes in the Registrant’s internal controls or in other factors that could materially affect the internal controls over financial reporting subsequent to the date of their evaluation in connection with the preparation of this Shareholder Report on Form N-CSR.
(a) (1) Code of Ethics
(a) (2) Certifications pursuant to Section 302 of the Sarbanes-Oxley Act of 2002 of Matthew T. Hinkle, Chief Executive Officer—Finance and Administration, and Robert G. Kubilis, Chief Financial Officer and Chief Accounting Officer
(b) Certifications pursuant to Section 906 of the Sarbanes-Oxley Act of 2002 of Matthew T. Hinkle, Chief Executive Officer—Finance and Administration, and Robert G. Kubilis, Chief Financial Officer and Chief Accounting Officer
SIGNATURES
Pursuant to the requirements of the Securities Exchange Act of 1934 and the Investment Company Act of 1940, the registrant has duly caused this report to be signed on its behalf by the undersigned, thereunto duly authorized.
TEMPLETON GLOBAL INVESTMENT TRUST
| | |
| By | | /s/ MATTHEW T. HINKLE |
| | Matthew T. Hinkle |
| | Chief Executive Officer—Finance and Administration |
| | Date February 26, 2018 |
Pursuant to the requirements of the Securities Exchange Act of 1934 and the Investment Company Act of 1940, this report has been signed below by the following persons on behalf of the registrant and in the capacities and on the dates indicated.
| | |
| By | | /s/ MATTHEW T. HINKLE |
| | Matthew T. Hinkle |
| | Chief Executive Officer—Finance and Administration |
| | Date February 26, 2018 |
| | |
By | | /s/ ROBERT G. KUBILIS |
| | Robert G. Kubilis |
| | Chief Financial Officer and Chief Accounting Officer |
| | Date February 26, 2018 |