UNITED STATES
SECURITIES AND EXCHANGE COMMISSION
Washington, DC 20549
FORMN-CSR
CERTIFIED SHAREHOLDER REPORT OF REGISTERED
MANAGEMENT INVESTMENT COMPANIES
Investment Company Act file number811-08226
Templeton Global Investment Trust
(Exact name of registrant as specified in charter)
300 S.E. 2nd Street, Fort Lauderdale, FL 33301-1923
(Address of principal executive offices) (Zip code)
Craig S. Tyle, One Franklin Parkway, San Mateo, CA 94403-1906
(Name and address of agent for service)
Registrant’s telephone number, including area code: (954)527-7500
Date of fiscal year end: 3/31
Date of reporting period: 3/31/19
| Item 1. | Reports to Stockholders. |
| | |

| | Annual Report
and Shareholder Letter March 31, 2019 |
|
Templeton Frontier Markets Fund A SERIES OF TEMPLETON GLOBAL INVESTMENT TRUST |
|
| |

Sign up for electronic delivery at franklintempleton.com/edelivery
Internet Delivery of Fund Reports Unless You Request Paper Copies: Effective January 1, 2021, as permitted by the SEC, paper copies of the Fund’s shareholder reports will no longer be sent by mail, unless you specifically request them from the Fund or your financial intermediary. Instead, the reports will be made available on a website, and you will be notified by mail each time a report is posted and provided with a website link to access the report.
If you already elected to receive shareholder reports electronically, you will not be affected by this change and you need not take any action. If you have not signed up for electronic delivery, we would encourage you to join fellow shareholders who have. You may elect to receive shareholder reports and other communications electronically from the Fund by calling (800)632-2301 or by contacting your financial intermediary.
You may elect to continue to receive paper copies of all your future shareholder reports free of charge by contacting your financial intermediary or, if you invest directly with a Fund, calling (800)632-2301 to let the Fund know of your request. Your election to receive reports in paper will apply to all funds held in your account.
Franklin Templeton
Successful investing begins with ambition. And achievement only comes when you reach for it. That’s why we continually strive to deliver better outcomes for investors. No matter what your goals are, our deep, global investment expertise allows us to offer solutions that can help.
During our more than 70 years of experience, we’ve managed through all kinds of markets—up, down and those in between. We’re always preparing for what may come next. It’s because of this, combined with our strength as one of the world’s largest asset managers that we’ve earned the trust of millions of investors around the world.
Dear Shareholder:
During the 12 months ended March 31, 2019, frontier and emerging market economies’ growth moderated, though they still grew faster than developed market economies. In this environment, frontier market stocks declined, as measured by the MSCI Frontier Markets Index. Factors hurting investor sentiment in 2018 included slowing global economic growth, rising U.S. interest rates, a strengthening U.S. dollar and escalating global trade tensions. Rapid currency depreciation in Turkey and Argentina and fears of contagion also hindered frontier market stocks. Frontier market equities rallied in 2019’s first quarter due to easing U.S.-China trade tensions, indications the U.S. Federal Reserve would not raise interest rates in 2019, decreased concerns about a global economic slowdown and increased commodity prices.
We are committed to our long-term perspective and disciplined investment approach as we conduct a rigorous, fundamental analysis of securities with a regular emphasis on investment risk management.
Historically, patient investors have achieved rewarding results by evaluating their goals, diversifying their assets globally and maintaining a disciplined investment program, all hallmarks of the Templeton investment philosophy developed more than 60 years ago. We continue to recommend investors consult their financial advisors and review their portfolios to design a long-term strategy and portfolio allocation that meet their individual needs, goals and risk tolerance.
Templeton Frontier Markets Fund’s annual report includes more detail about prevailing conditions and a discussion about investment decisions during the period. Please remember all securities markets fluctuate, as do mutual fund share prices.
We thank you for investing with Franklin Templeton, welcome your questions and comments, and look forward to serving your investment needs in the years ahead.
Sincerely,

Manraj S. Sekhon, CFA
Chief Investment Officer
Franklin Templeton Emerging Markets Equity
This letter reflects our analysis and opinions as of March 31, 2019, unless otherwise indicated. The information is not a complete analysis of every aspect of any market, country, industry, security or fund. Statements of fact are from sources considered reliable.
CFA® is a trademark owned by CFA Institute.
| | | | |
Not FDIC Insured | May Lose Value | No Bank Guarantee |
| | | | |
| | | |
| franklintempleton.com | | Not part of the annual report | | 1 |
Contents
Visitfranklintempleton.comfor fund updates, to access your account, or to find helpful financial planning tools.
| | | | |
| | | |
2 | | Annual Report | | franklintempleton.com |
Annual Report
Templeton Frontier Markets Fund
This annual report for Templeton Frontier Markets Fund covers the fiscal year ended March 31, 2019.
Your Fund’s Goal and Main Investments
The Fund seeks long-term capital appreciation. Under normal market conditions, the Fund invests at least 80% of its net assets in securities of companies located in “frontier market countries” as defined in the prospectus. Such companies are organized under the laws of, have principal offices in, or have their principal securities trading markets in, frontier market countries; or derive at least 50% of their total revenue or profit from either goods or services produced or sales made in frontier market countries; or have at least 50% of their assets in, or are linked to currencies of, frontier market countries.
Performance Overview
The Fund’s Class A shares posted a-16.41% cumulative total return for the 12 months under review. For comparison, the MSCI Frontier Markets Index, which measures stock performance in frontier markets, posted a-14.81% total return for the same period.1 Also for comparison, the Fund’s secondary benchmark, the MSCI Frontier Emerging Markets (FEM) Select Countries Capped Index, a capped version of the MSCI FEM Index that measures stock performance in predominantly frontier market countries (index includes some emerging,non-frontier market countries), posted a-8.91% total return.2 Please note index performance information is provided for reference and we do not attempt to track any index but rather undertake investments on the basis of fundamental research. In addition, the Fund’s return reflects the effect of fees and expenses for professional management, while an index does not have such costs. You can find the Fund’s long-term performance data in the Performance Summary beginning on page 7.
Performance data represent past performance, which does not guarantee future results. Investment return and principal value will fluctuate, and you may have a gain or loss when you sell
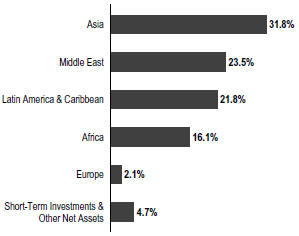
Geographic Composition
Based on Total Net Assets as of 3/31/19
your shares. Current performance may differ from figures shown. For most recentmonth-end performance, go tofranklintempleton.comor call(800)342-5236.
Economic and Market Overview
The global economy grew during the 12 months under review, as many frontier and emerging market economies expanded and many developed market economies continued to recover.
The Philippine economy expanded in 2018 at the slowest rate in three years, though it still grew faster than many economies in the region. Weak growth in government spending, private consumption, investment, agriculture and manufacturing contributed to the soft expansion. The central bank raised its benchmark interest rate several times during the period to curb inflation, which slipped out of the bank’s target range due partly to temporary increases in some food prices. In this environment, Philippine stocks rose slightly for the12-month period.
Kuwait’s economy expanded in 2018, following a contraction in the prior year. Economic growth accelerated in the second
1. Source: Morningstar.
2. Source: FactSet. The MSCI FEM Select Countries Capped Index was developed by MSCI for the Fund’s investment manager and represents a capped version of the MSCI FEM Index. MSCI applies caps on the exposure of the MSCI FEM Index to emerging market and frontier market countries to create the MSCI FEM Select Countries Capped Index so that the index reflects predominantly frontier market countries.
The indexes are unmanaged and include reinvestment of any income or distributions. They do not reflect any fees, expenses or sales charges. One cannot invest directly in an index, and an index is not representative of the Fund’s portfolio.
The dollar value, number of shares or principal amount, and names of all portfolio holdings are listed in the Fund’s Statement of Investments (SOI).
The SOI begins on page 16.
| | | | |
| | | |
| franklintempleton.com | | Annual Report | | 3 |
TEMPLETON FRONTIER MARKETS FUND
and third quarters of 2018 compared to the prior-year periods, driven by thenon-oil sector and government investment. However, growth moderated in the fourth quarter as the oil sector notably slowed and thenon-oil sector eased. Investor confidence grew due to the country’s inclusion in the FTSE Emerging Index and hopes of future inclusion in the MSCI Emerging Markets (EM) Index. The central bank left its benchmark interest rate unchanged during the period to support its currency. In this environment, Kuwaiti stocks rose for the12-month period.
Peru’s economic growth accelerated in 2018. After accelerating in the second quarter, growth moderated in the third quarter and rebounded in the fourth quarter due to increased manufacturing, construction and utilities output, as well as stronger domestic demand. A peaceful transition of power and relative political stability also increased investor confidence. The central bank kept its benchmark interest rate unchanged during the period. In this environment, Peruvian stocks ended the12-month period relatively flat.
Kenya’s economy expanded in 2018, although it moderated in the fourth quarter. Growth drivers in the second and third quarters included manufacturing, wholesale and retail trade, accommodations and restaurants, and information and communication. The economy also benefited from export growth and decreased political uncertainty following the completion of an election cycle. In the fourth quarter, growth slowed in agriculture, manufacturing and real estate, while mining contracted. The economic expansion appeared to continue moderating in 2019’s first quarter, as growth in private credit and exports slowed, and remittances weakened. Throughout the period, discussions to repeal a controversial cap on lenders’ interest rates failed to result in action. The central bank cut its benchmark interest rate during the period to boost lending to the private sector and support economic growth. In this environment, Kenyan stocks declined for the12-month period.
Frontier market stocks declined during the 12 months under review. Investor concerns included slowing global economic growth, rising U.S. interest rates in the second half of 2018, a strengthening U.S. dollar and escalating global trade tensions, particularly between the U.S. and China. The Turkish lira’s and Argentine peso’s rapid depreciation and accompanying fears of a contagion effect also contributed to frontier market stocks’ decline. Asian stocks were hurt by weakness in technology stocks and heightened tensions in the Korean peninsula early in the period, though investor concerns eased later in the period. Markets were somewhat supported by easing U.S.-China trade tensions and indications the U.S. Federal Reserve would raise
| | |
| | | % of Total Net Assets |
| |
Philippines | | 15.1% |
| |
Kuwait | | 12.0% |
| |
Vietnam | | 11.1% |
| |
Saudi Arabia | | 8.6% |
| |
Peru | | 8.2% |
| |
Argentina | | 7.5% |
| |
Colombia | | 6.1% |
| |
Egypt | | 5.4% |
| |
Kenya | | 4.1% |
| |
Bangladesh | | 3.4% |
the federal funds target rate in 2019. In this environment, frontier market stocks, as measured by the MSCI Frontier Markets Index, posted a-14.81% total return for the 12 months ended March 31, 2019.1
Investment Strategy
Our investment strategy employs a fundamental research, value-oriented, long-term approach. We focus on the market price of a company’s securities relative to our evaluation of the company’s long-term earnings, asset value and cash flow potential. We also consider a company’s profit and loss outlook, balance sheet strength, cash flow trends and asset value in relation to the current price of the company’s securities. The analysis considers the company’s corporate governance behavior as well as its position in its sector, the economic framework and political environment.
Manager’s Discussion
During the 12 months under review, key contributors to the Fund’s absolute performance included National Bank of Kuwait (NBK), InRetail Peru and Samba Financial Group.
Positive sentiment in Kuwait was driven by the country’s inclusion in the FTSE Emerging Index and hopes of inclusion in the MSCI EM Index in 2019. NBK, the largest bank in the country, has been a key beneficiary of the resulting fund inflows spurred by these developments. NBK has also benefited from MSCI’s decision to increase Kuwait’s weighting in the MSCI Frontier Markets Index as well as reforms to the country’s capital markets, which have included easing restriction on foreign ownership of Kuwaiti lenders. The bank also benefited from accelerated economic growth and higher interest rates in 2018. NBK reported double-digit percentage earnings growth in 2018, largely supported by its
| | | | |
| | | |
4 | | Annual Report | | franklintempleton.com |
TEMPLETON FRONTIER MARKETS FUND
international operations and retail banking segment, which included record-high profits in the fourth quarter.
InRetail Peru is a multi-format retailer with leading market positions in the country’s supermarkets, pharmacies and shopping centers. The company’s stock rose due to anticipated synergies from the acquisition of its main domestic drug retail competitor and Peru’s continued economic recovery. The company continued to report solid quarterly corporate results during 2018. Fourth-quarter sales and earnings results showed strong growth supported by the pharmaceutical and supermarket segments.
Samba Financial Group, one of the largest banks in Saudi Arabia, benefited from margin expansion due to higher interest rates in 2018. Moreover, the Saudi market saw an increase in interest from international investors as a result of decisions by key index providers MSCI and FTSE to upgrade the country to EM status. Samba reported better-than-expected 2018 fourth-quarter net profit driven by higher net funded income and lower operating costs. Investor expectations that recent changes to top management could lead to an acceleration in loan growth in 2019 also supported sentiment in the stock.
Key detractors from the Fund’s absolute performance included Grupo Financiero Galicia, YPF Sociedad Anonima and Hatton National Bank.
Grupo Financiero Galicia is a financial services holding company. Its key asset is a 100% stake in Banco Galicia, one of Argentina’s leading private sector banks. In 2018, Argentina experience a significant devaluation of the peso, high interest rates and inflation, large stock market losses and political instability. Despite this, Grupo Financiero Galicia reported better-than-expected 2018 fourth-quarter corporate results, supported by higher income from government securities.
One of the cheapest companies of its kind in Latin America, YPF is Argentina’s leading energy company, operating a fully integrated oil and gas upstream and downstream business. Argentina’s volatile economic situation hurt the company’s stock, but fourth-quarter corporate results largely met expectations.
Hatton National Bank is one of the largest and most diversified banks in Sri Lanka, with a focus on corporate, small and medium enterprise, individual and development banking. It also
Top 10 Holdings
3/31/19
| | |
Company Sector/Industry, Country | | % of Total Net Assets |
| |
National Bank of Kuwait SAKP Banks, Kuwait | | 6.4% |
| |
YPF Sociedad Anonima Oil, Gas & Consumable Fuels, Argentina | | 3.8% |
| |
Global Telecom Holding SAE Wireless Telecommunication Services, Egypt | | 3.5% |
| |
BDO Unibank Inc. Banks, Philippines | | 3.2% |
| |
InRetail Peru Corp. Food & Staples Retailing, Peru | | 3.2% |
| |
Human Soft Holding Co. KSC Diversified Consumer Services, Kuwait | | 2.6% |
| |
Samba Financial Group Banks, Saudi Arabia | | 2.6% |
| |
International Container Terminal Services Inc. Transportation Infrastructure, Philippines | | 2.4% |
| |
Al-Rajhi Bank Banks, Saudi Arabia | | 2.4% |
| |
Metropolitan Bank & Trust Co. Banks, Philippines | | 2.4% |
has subsidiaries in the insurance, investment banking and remittance industries. Fourth-quarter 2018 earnings declined largely due to elevated impairment costs from the adoption of new accounting standards along with weaker asset quality. Net interest income, however, recorded a double-digit percentage growth due to higher margins and credit growth.
During the period, redemptions received from Fund investors led us to reduce our investments across most markets and sectors. Geographically, we significantly reduced holdings in Vietnam, Kuwait and Sri Lanka. We also undertook some sales in Saudi Arabia and Kenya to allow the Fund to focus on stocks deemed to be relatively more attractively valued within our investment universe. In sector terms, reductions were made in consumer staples, health care and communication services.3 Key sales included reducing DHG Pharmaceutical, a pharmaceutical company in Vietnam, liquidating Mobile Telecommunications, a Kuwaiti mobile telecommunications company, and reducing Saudi Dairy and Foodstuff Co. (SADAFCO), a Saudi Arabian dairy products producer. The continued search for attractive investment opportunities in frontier markets led to investments in the Philippines,
3. The consumer staples sector comprises beverages, food and staples retailing, and food products in the SOI. The health care sector comprises health care providers and services and pharmaceuticals in the SOI. The communication services sector comprises diversified telecommunication services and wireless telecommunication services in the SOI.
See www.franklintempletondatasources.com for additional data provider information.
| | | | |
| | | |
| franklintempleton.com | | Annual Report | | 5 |
TEMPLETON FRONTIER MARKETS FUND
Colombia and Nigeria. Key purchases included new positions in Vietnam Technological and Commercial Joint Stock Bank, one of the largest private commercial banks in Vietnam; Saudi Arabia-basedAl-Rajhi Bank, one of the largest Islamic banks in the world; and Banco Davivienda, a major Colombian bank.
It is important to recognize the effect of currency movements on the Fund’s performance. In general, if the value of the U.S. dollar goes up compared with a foreign currency, an investment traded in that foreign currency will go down in value because it will be worth fewer U.S. dollars. This can have a negative effect on Fund performance. Conversely, when the U.S. dollar weakens in relation to a foreign currency, an investment traded in that foreign currency will increase in value, which can contribute to Fund performance. For the 12 months ended March 31, 2019, the U.S. dollar rose in value relative to most currencies. As a result, the Fund’s performance was negatively affected by the portfolio’s investment predominantly in securities withnon-U.S. currency exposure.
Thank you for your continued participation in Templeton Frontier Markets Fund. We look forward to serving your future investment needs.
| | |
 | | 
|
| | Bassel Khatoun |
| | |
 | |  |
| | Ahmed Awny |
| |
| | David Haglund Portfolio Management Team |
The foregoing information reflects our analysis, opinions and portfolio holdings as of March 31, 2019, the end of the reporting period. The way we implement our main investment strategies and the resulting portfolio holdings may change depending on factors such as market and economic conditions. These opinions may not be relied upon as investment advice or an offer for a particular security. The information is not a complete analysis of every aspect of any market, country, industry, security or the Fund. Statements of fact are from sources considered reliable, but the investment manager makes no representation or warranty as to their completeness or accuracy. Although historical performance is no guarantee of future results, these insights may help you understand our investment management philosophy.
| | | | |
| | | |
6 | | Annual Report | | franklintempleton.com |
TEMPLETON FRONTIER MARKETS FUND
Performance Summary as of March 31, 2019
The performance table and graphs do not reflect any taxes that a shareholder would pay on Fund dividends, capital gain distributions, if any, or any realized gains on the sale of Fund shares. Total return reflects reinvestment of the Fund’s dividends and capital gain distributions, if any, and any unrealized gains or losses. Your dividend income will vary depending on dividends or interest paid by securities in the Fund’s portfolio, adjusted for operating expenses of each class. Capital gain distributions are net profits realized from the sale of portfolio securities.
Performance as of 3/31/191
Cumulative total return excludes sales charges. Average annual total return includes maximum sales charges. Sales charges will vary depending on the size of the investment and the class of share purchased. The maximum is 5.50% and the minimum is 0%.Class A:5.50% maximum initial sales charge;Advisor Class:no sales charges. For other share classes, visitfranklintempleton.com.
| | | | | | |
| Share Class | | Cumulative Total Return2 | | | Average Annual Total Return3 |
| | |
A4 | | | | | | |
1-Year | | | -16.41% | | | -20.94% |
5-Year | | | -27.57% | | | -7.30% |
10-Year | | | +52.82% | | | +3.74% |
| | |
Advisor | | | | | | |
1-Year | | | -16.08% | | | -16.08% |
5-Year | | | -26.70% | | | -6.02% |
10-Year | | | +56.75% | | | +4.60% |
Performance data represent past performance, which does not guarantee future results. Investment return and principal value will fluctuate, and you may have a gain or loss when you sell your shares. Current performance may differ from figures shown. For most recentmonth-end performance, go tofranklintempleton.comor call(800)342-5236.
See page 9 for Performance Summary footnotes.
| | | | |
| | | |
| franklintempleton.com | | Annual Report | | 7 |
TEMPLETON FRONTIER MARKETS FUND
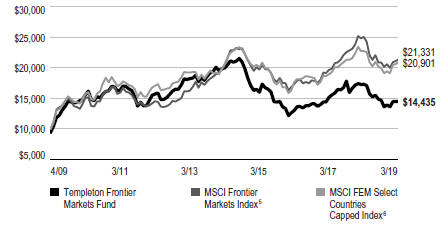
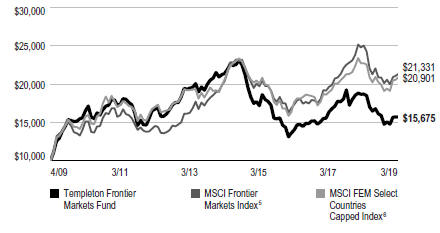
PERFORMANCE SUMMARY
Total Return Index Comparison for a Hypothetical $10,000 Investment1
Total return represents the change in value of an investment over the periods shown. It includes any applicable maximum sales charge, Fund expenses, account fees and reinvested distributions. The unmanaged indexes include reinvestment of any income or distributions. They differ from the Fund in composition and do not pay management fees or expenses. One cannot invest directly in an index.
Class A(4/1/09–3/31/19)
Advisor Class(4/1/09–3/31/19)
See page 9 for Performance Summary footnotes.
| | | | |
| | | |
8 | | Annual Report | | franklintempleton.com |
TEMPLETON FRONTIER MARKETS FUND
PERFORMANCE SUMMARY
Distributions(4/1/18–3/31/19)
| | | | |
| Share Class | | Net Investment
Income | |
| |
A | | | $ — | |
| |
C | | | $ — | |
| |
R | | | $ — | |
| |
R6 | | | $0.0547 | |
| |
Advisor | | | $0.0205 | |
| | | | | | | | |
| |
| Total Annual Operating Expenses7 | | | | | |
| Share Class | | With Fee
Waiver | | | Without Fee
Waiver | |
| | |
A | | | 2.01% | | | | 2.31% | |
| | |
Advisor | | | 1.76% | | | | 2.06% | |
Each class of shares is available to certain eligible investors and has different annual fees and expenses, as described in the prospectus.
All investments involve risks, including possible loss of principal. Special risks are associated with foreign investing, including currency fluctuations, economic instability and political developments. Investments in emerging markets, of which frontier markets are a subset, involve heightened risks related to the same factors, in addition to those associated with these markets’ smaller size, lesser liquidity and lack of established legal, political, business and social frameworks to support securities markets. Because these frameworks are typically even less developed in frontier markets, as well as various factors including the increased potential for extreme price volatility, illiquidity, trade barriers and exchange controls, the risks associated with emerging markets are magnified in frontier markets. To the extent the Fund focuses on particular countries, regions, industries, sectors or types of investment from time to time, it may be subject to greater risks of adverse developments in such areas of focus than a fund that invests in a wider variety of countries, regions, industries, sectors or investments. The Fund’s ability to invest in smaller company securities that may have limited liquidity involves additional risks, such as relatively small revenues, limited product lines and small market share. The Fund is designed for the aggressive portion of a well-diversified portfolio. The Fund is actively managed but there is no guarantee that the manager’s investment decisions will produce the desired results. The Fund’s prospectus also includes a description of the main investment risks.
1. The Fund has an expense reduction and a fee waiver associated with any investments it makes in a Franklin Templeton money fund and/or other Franklin Templeton fund, contractually guaranteed through 7/31/19. Fund investment results reflect the expense reduction and fee waiver; without these reductions, the results would have been lower.
2. Cumulative total return represents the change in value of an investment over the periods indicated.
3. Average annual total return represents the average annual change in value of an investment over the periods indicated. Return for less than one year, if any, has not been annualized.
4. Prior to 9/10/18, these shares were offered at a higher initial sales charge of 5.75%, thus actual returns would have differed. Total returns with sales charges have been restated to reflect the current maximum initial sales charge of 5.50%.
5. Source: Morningstar. The MSCI Frontier Markets Index is a free float-adjusted, market capitalization-weighted index designed to measure equity market performance in frontier markets.
6. Source: FactSet. The MSCI FEM Select Countries Capped Index was developed by MSCI for the Fund’s investment manager and represents a capped version of the MSCI FEM Index. MSCI applies caps on the exposure of the MSCI FEM Index to emerging market and frontier market countries to create the MSCI FEM Select Countries Capped Index so that the index reflects predominantly frontier market countries.
7. Figures are as stated in the Fund’s current prospectus and may differ from the expense ratios disclosed in the Your Fund’s Expenses and Financial Highlights sections in this report. In periods of market volatility, assets may decline significantly, causing total annual Fund operating expenses to become higher than the figures shown.
See www.franklintempletondatasources.com for additional data provider information.
| | | | |
| | | |
| franklintempleton.com | | Annual Report | | 9 |
TEMPLETON FRONTIER MARKETS FUND
Your Fund’s Expenses
As a Fund shareholder, you can incur two types of costs: (1) transaction costs, including sales charges (loads) on Fund purchases and redemptions; and (2) ongoing Fund costs, including management fees, distribution and service(12b-1) fees, and other Fund expenses. All mutual funds have ongoing costs, sometimes referred to as operating expenses. The table below shows ongoing costs of investing in the Fund and can help you understand these costs and compare them with those of other mutual funds. The table assumes a $1,000 investment held for the six months indicated.
Actual Fund Expenses
The table below provides information about actual account values and actual expenses in the columns under the heading “Actual.” In these columns the Fund’s actual return, which includes the effect of Fund expenses, is used to calculate the “Ending Account Value” for each class of shares. You can estimate the expenses you paid during the period by following these steps (of course, your account value and expenses will differ from those in this illustration): Divide your account value by $1,000 (if your account had an $8,600 value, then $8,600÷ $1,000 = 8.6). Then multiply the result by the number in the row for your class of shares under the headings “Actual” and “Expenses Paid During Period” (if Actual Expenses Paid During Period were $7.50, then 8.6 x $7.50 =$64.50). In this illustration, the actual expenses paid this period are $64.50.
Hypothetical Example for Comparison with Other Funds
Under the heading “Hypothetical” in the table, information is provided about hypothetical account values and hypothetical expenses based on the Fund’s actual expense ratio and an assumed rate of return of 5% per year before expenses, which is not the Fund’s actual return. This information may not be used to estimate the actual ending account balance or expenses you paid for the period, but it can help you compare ongoing costs of investing in the Fund with those of other funds. To do so, compare this 5% hypothetical example for the class of shares you hold with the 5% hypothetical examples that appear in the shareholder reports of other funds.
Please note that expenses shown in the table are meant to highlight ongoing costs and do not reflect any transactional costs. Therefore, information under the heading “Hypothetical” is useful in comparing ongoing costs only, and will not help you compare total costs of owning different funds. In addition, if transactional costs were included, your total costs would have been higher.
| | | | | | | | | | | | | | | | | | |
| | | | | | | Actual (actual return after expenses) | | | | Hypothetical (5% annual return before expenses) | | | | |
Share Class | | Beginning Account Value 10/1/18 | | | | Ending Account Value 3/31/19 | | Expenses Paid During Period 10/1/18–3/31/191,2
| | | | Ending Account Value 3/31/19 | | Expenses Paid During Period 10/1/18–3/31/191,2
| | | | Net Annualized Expense Ratio2 |
A | | $1,000 | | | | $985.90 | | $ 8.96 | | | | $1,015.91 | | $ 9.10 | | | | 1.81% |
C | | $1,000 | | | | $982.90 | | $12.66 | | | | $1,012.17 | | $12.84 | | | | 2.56% |
R | | $1,000 | | | | $984.90 | | $10.19 | | | | $1,014.66 | | $10.35 | | | | 2.06% |
R6 | | $1,000 | | | | $987.70 | | $ 7.58 | | | | $1,017.30 | | $ 7.70 | | | | 1.53% |
Advisor | | $1,000 | | | | $988.00 | | $ 7.73 | | | | $1,017.15 | | $ 7.85 | | | | 1.56% |
1. Expenses are equal to the annualized expense ratio for thesix-month period as indicated above—in the far right column—multiplied by the simple average account value over the period indicated, and then multiplied by 182/365 to reflect theone-half year period.
2. Reflects expenses after fee waivers and expense reimbursements. Does not include acquired fund fees and expenses.
| | | | |
| | | |
10 | | Annual Report | | franklintempleton.com |
TEMPLETON GLOBAL INVESTMENT TRUST
Financial Highlights
Templeton Frontier Markets Fund
| | | | | | | | | | | | | | | | | | | | |
| | | Year Ended March 31, | |
| | | 2019 | | | 2018 | | | 2017 | | | 2016 | | | 2015 | |
| | | | | |
Class A | | | | | | | | | | | | | | | | | | | | |
| | | | | |
Per share operating performance (for a share outstanding throughout the year) | | | | | | | | | | | | | | | | | | | | |
| | | | | |
Net asset value, beginning of year | | | $13.41 | | | | $11.81 | | | | $10.19 | | | | $13.47 | | | | $18.10 | |
| | | | | |
Income from investment operationsa: | | | | | | | | | | | | | | | | | | | | |
| | | | | |
Net investment incomeb | | | 0.16 | | | | 0.18 | | | | 0.23 | | | | 0.27 | | | | 0.37 | |
| | | | | |
Net realized and unrealized gains (losses) | | | (2.36 | ) | | | 1.49 | | | | 1.46 | | | | (2.77 | ) | | | (3.89 | ) |
| | | | | |
Total from investment operations | | | (2.20 | ) | | | 1.67 | | | | 1.69 | | | | (2.50 | ) | | | (3.52 | ) |
| | | | | |
Less distributions from: | | | | | | | | | | | | | | | | | | | | |
| | | | | |
Net investment income | | | — | | | | (0.07 | ) | | | (0.07 | ) | | | (0.78 | ) | | | (0.55 | ) |
| | | | | |
Net realized gains | | | — | | | | — | | | | — | | | | — | | | | (0.56 | ) |
| | | | | |
Total distributions | | | — | | | | (0.07 | ) | | | (0.07 | ) | | | (0.78 | ) | | | (1.11 | ) |
| | | | | |
Net asset value, end of year | | | $11.21 | | | | $13.41 | | | | $11.81 | | | | $10.19 | | | | $13.47 | |
| | | | | | | | | | | | | | | | | | | | |
Total returnc | | | (16.41)% | | | | 14.08% | | | | 16.62% | | | | (18.75)% | | | | (19.91)% | |
| | | | | |
Ratios to average net assets | | | | | | | | | | | | | | | | | | | | |
| | | | | |
Expenses before waiver and payments by affiliates | | | 2.34% | | | | 2.39% | | | | 2.08% | | | | 2.15% | | | | 1.98% | |
| | | | | |
Expenses net of waiver and payments by affiliates | | | 1.96% | | | | 2.28% | | | | 1.98% | | | | 2.15% | d | | | 1.98% | d |
| | | | | |
Net investment income | | | 1.44% | | | | 1.37% | | | | 2.07% | | | | 2.24% | | | | 2.09% | |
| | | | | |
Supplemental data | | | | | | | | | | | | | | | | | | | | |
| | | | | |
Net assets, end of year (000’s) | | | $31,248 | | | | $47,288 | | | | $50,737 | | | | $58,720 | | | | $148,693 | |
| | | | | |
Portfolio turnover rate | | | 48.62% | | | | 30.94% | | | | 29.11% | | | | 19.12% | | | | 19.14% | |
aThe amount shown for a share outstanding throughout the period may not correlate with the Statement of Operations for the period due to the timing of sales and repurchases of the Fund’s shares in relation to income earned and/or fluctuating fair value of the investments of the Fund.
bBased on average daily shares outstanding.
cTotal return does not reflect sales commissions or contingent deferred sales charges, if applicable.
dBenefit of waiver and payments by affiliates rounds to less than 0.01%.
| | | | |
| | | |
| franklintempleton.com | | The accompanying notes are an integral part of these financial statements. | Annual Report | | 11 |
TEMPLETON GLOBAL INVESTMENT TRUST
FINANCIAL HIGHLIGHTS
Templeton Frontier Markets Fund(continued)
| | | | | | | | | | | | | | | | | | | | |
| | | Year Ended March 31, | |
| | | 2019 | | | 2018 | | | 2017 | | | 2016 | | | 2015 | |
| | | | | |
Class C | | | | | | | | | | | | | | | | | | | | |
| | | | | |
Per share operating performance (for a share outstanding throughout the year) | | | | | | | | | | | | | | | | | | | | |
| | | | | |
Net asset value, beginning of year | | | $13.14 | | | | $11.63 | | | | $10.05 | | | | $13.27 | | | | $17.82 | |
| | | | | |
Income from investment operationsa: | | | | | | | | | | | | | | | | | | | | |
| | | | | |
Net investment incomeb | | | 0.08 | | | | 0.08 | | | | 0.15 | | | | 0.18 | | | | 0.23 | |
| | | | | |
Net realized and unrealized gains (losses) | | | (2.31 | ) | | | 1.48 | | | | 1.43 | | | | (2.72 | ) | | | (3.81 | ) |
| | | | | |
Total from investment operations | | | (2.23 | ) | | | 1.56 | | | | 1.58 | | | | (2.54 | ) | | | (3.58 | ) |
| | | | | |
Less distributions from: | | | | | | | | | | | | | | | | | | | | |
| | | | | |
Net investment income | | | — | | | | (0.05 | ) | | | — | | | | (0.68 | ) | | | (0.41 | ) |
| | | | | |
Net realized gains | | | — | | | | — | | | | — | | | | — | | | | (0.56 | ) |
| | | | | |
Total distributions | | | — | | | | (0.05 | ) | | | — | | | | (0.68 | ) | | | (0.97 | ) |
| | | | | |
Net asset value, end of year | | | $10.91 | | | | $13.14 | | | | $11.63 | | | | $10.05 | | | | $13.27 | |
| | | | | | | | | | | | | | | | | | | | |
Total returnc | | | (16.97)% | | | | 13.20% | | | | 15.82% | | | | (19.32)% | | | | (20.53)% | |
| | | | | |
Ratios to average net assets | | | | | | | | | | | | | | | | | | | | |
| | | | | |
Expenses before waiver and payments by affiliates | | | 3.09% | | | | 3.14% | | | | 2.83% | | | | 2.88% | | | | 2.74% | |
| | | | | |
Expenses net of waiver and payments by affiliates | | | 2.71% | | | | 3.03% | | | | 2.73% | | | | 2.88% | d | | | 2.74% | d |
| | | | | |
Net investment income | | | 0.69% | | | | 0.62% | | | | 1.32% | | | | 1.51% | | | | 1.33% | |
| | | | | |
Supplemental data | | | | | | | | | | | | | | | | | | | | |
| | | | | |
Net assets, end of year (000’s) | | | $10,107 | | | | $18,133 | | | | $20,188 | | | | $22,466 | | | | $37,770 | |
| | | | | |
Portfolio turnover rate | | | 48.62% | | | | 30.94% | | | | 29.11% | | | | 19.12% | | | | 19.14% | |
aThe amount shown for a share outstanding throughout the period may not correlate with the Statement of Operations for the period due to the timing of sales and repurchases of the Fund’s shares in relation to income earned and/or fluctuating fair value of the investments of the Fund.
bBased on average daily shares outstanding.
cTotal return does not reflect sales commissions or contingent deferred sales charges, if applicable.
dBenefit of waiver and payments by affiliates rounds to less than 0.01%.
| | | | |
| | | |
12 | | Annual Report | The accompanying notes are an integral part of these financial statements. | | franklintempleton.com |
TEMPLETON GLOBAL INVESTMENT TRUST
FINANCIAL HIGHLIGHTS
Templeton Frontier Markets Fund(continued)
| | | | | | | | | | | | | | | | | | | | |
| | | Year Ended March 31, | |
| | | 2019 | | | 2018 | | | 2017 | | | 2016 | | | 2015 | |
| | | | | |
Class R | | | | | | | | | | | | | | | | | | | | |
| | | | | |
Per share operating performance (for a share outstanding throughout the year) | | | | | | | | | | | | | | | | | | | | |
| | | | | |
Net asset value, beginning of year | | | $13.31 | | | | $11.73 | | | | $10.13 | | | | $13.40 | | | | $18.03 | |
| | | | | |
Income from investment operationsa: | | | | | | | | | | | | | | | | | | | | |
| | | | | |
Net investment incomeb | | | 0.12 | | | | 0.15 | | | | 0.19 | | | | 0.27 | | | | 0.28 | |
| | | | | |
Net realized and unrealized gains (losses) | | | (2.33 | ) | | | 1.49 | | | | 1.46 | | | | (2.78 | ) | | | (3.84 | ) |
| | | | | |
Total from investment operations | | | (2.21 | ) | | | 1.64 | | | | 1.65 | | | | (2.51 | ) | | | (3.56 | ) |
| | | | | |
Less distributions from: | | | | | | | | | | | | | | | | | | | | |
| | | | | |
Net investment income | | | — | | | | (0.06 | ) | | | (0.05 | ) | | | (0.76 | ) | | | (0.51 | ) |
| | | | | |
Net realized gains | | | — | | | | — | | | | — | | | | — | | | | (0.56 | ) |
| | | | | |
Total distributions | | | — | | | | (0.06 | ) | | | (0.05 | ) | | | (0.76 | ) | | | (1.07 | ) |
| | | | | |
Net asset value, end of year | | | $11.10 | | | | $13.31 | | | | $11.73 | | | | $10.13 | | | | $13.40 | |
| | | | | | | | | | | | | | | | | | | | |
Total return | | | (16.60)% | | | | 13.69% | | | | 16.41% | | | | (18.89)% | | | | (20.17)% | |
| | | | | |
Ratios to average net assets | | | | | | | | | | | | | | | | | | | | |
| | | | | |
Expenses before waiver and payments by affiliates | | | 2.59% | | | | 2.64% | | | | 2.34% | | | | 2.40% | | | | 2.24% | |
| | | | | |
Expenses net of waiver and payments by affiliates | | | 2.21% | | | | 2.53% | | | | 2.24% | | | | 2.40% | c | | | 2.24% | c |
| | | | | |
Net investment income | | | 1.19% | | | | 1.12% | | | | 1.81% | | | | 2.00% | | | | 1.83% | |
| | | | | |
Supplemental data | | | | | | | | | | | | | | | | | | | | |
| | | | | |
Net assets, end of year (000’s) | | | $64 | | | | $74 | | | | $129 | | | | $118 | | | | $302 | |
| | | | | |
Portfolio turnover rate | | | 48.62% | | | | 30.94% | | | | 29.11% | | | | 19.12% | | | | 19.14% | |
aThe amount shown for a share outstanding throughout the period may not correlate with the Statement of Operations for the period due to the timing of sales and repurchases of the Fund’s shares in relation to income earned and/or fluctuating fair value of the investments of the Fund.
bBased on average daily shares outstanding.
cBenefit of waiver and payments by affiliates rounds to less than 0.01%.
| | | | |
| | | |
| franklintempleton.com | | The accompanying notes are an integral part of these financial statements. | Annual Report | | 13 |
TEMPLETON GLOBAL INVESTMENT TRUST
FINANCIAL HIGHLIGHTS
Templeton Frontier Markets Fund(continued)
| | | | | | | | | | | | | | | | | | | | |
| | | Year Ended March 31, | |
| | | 2019 | | | 2018 | | | 2017 | | | 2016 | | | 2015 | |
| | | | | |
Class R6 | | | | | | | | | | | | | | | | | | | | |
| | | | | |
Per share operating performance (for a share outstanding throughout the year) | | | | | | | | | | | | | | | | | | | | |
| | | | | |
Net asset value, beginning of year | | | $13.49 | | | | $11.81 | | | | $10.21 | | | | $13.51 | | | | $18.18 | |
| | | | | |
Income from investment operationsa: | | | | | | | | | | | | | | | | | | | | |
| | | | | |
Net investment incomeb | | | 0.20 | | | | 0.25 | | | | 0.23 | | | | 0.30 | | | | 0.40 | |
| | | | | |
Net realized and unrealized gains (losses) | | | (2.39 | ) | | | 1.51 | | | | 1.50 | | | | (2.75 | ) | | | (3.88 | ) |
| | | | | |
Total from investment operations | | | (2.19 | ) | | | 1.76 | | | | 1.73 | | | | (2.45 | ) | | | (3.48 | ) |
| | | | | |
Less distributions from: | | | | | | | | | | | | | | | | | | | | |
| | | | | |
Net investment income | | | (0.05 | ) | | | (0.08 | ) | | | (0.13 | ) | | | (0.85 | ) | | | (0.63 | ) |
| | | | | |
Net realized gains | | | — | | | | — | | | | — | | | | — | | | | (0.56 | ) |
| | | | | |
Total distributions | | | (0.05 | ) | | | (0.08 | ) | | | (0.13 | ) | | | (0.85 | ) | | | (1.19 | ) |
| | | | | |
Net asset value, end of year | | | $11.25 | | | | $13.49 | | | | $11.81 | | | | $10.21 | | | | $13.51 | |
| | | | | | | | | | | | | | | | | | | | |
Total return | | | (16.04)% | | | | 14.64% | | | | 17.13% | | | | (18.29)% | | | | (19.63)% | |
| | | | | |
Ratios to average net assets | | | | | | | | | | | | | | | | | | | | |
| | | | | |
Expenses before waiver and payments by affiliates | | | 2.03% | | | | 1.88% | | | | 1.71% | | | | 1.65% | | | | 1.60% | |
| | | | | |
Expenses net of waiver and payments by affiliates | | | 1.64% | | | | 1.75% | | | | 1.61% | | | | 1.65% | c | | | 1.60% | c |
| | | | | |
Net investment income | | | 1.76% | | | | 1.90% | | | | 2.44% | | | | 2.74% | | | | 2.47% | |
| | | | | |
Supplemental data | | | | | | | | | | | | | | | | | | | | |
| | | | | |
Net assets, end of year (000’s) | | | $4,766 | | | | $5,898 | | | | $4,898 | | | | $62,640 | | | | $139,104 | |
| | | | | |
Portfolio turnover rate | | | 48.62% | | | | 30.94% | | | | 29.11% | | | | 19.12% | | | | 19.14% | |
aThe amount shown for a share outstanding throughout the period may not correlate with the Statement of Operations for the period due to the timing of sales and repurchases of the Fund’s shares in relation to income earned and/or fluctuating fair value of the investments of the Fund.
bBased on average daily shares outstanding.
cBenefit of waiver and payments by affiliates rounds to less than 0.01%.
| | | | |
| | | |
14 | | Annual Report | The accompanying notes are an integral part of these financial statements. | | franklintempleton.com |
TEMPLETON GLOBAL INVESTMENT TRUST
FINANCIAL HIGHLIGHTS
Templeton Frontier Markets Fund(continued)
| | | | | | | | | | | | | | | | | | | | |
| | | Year Ended March 31, | |
| | | 2019 | | | 2018 | | | 2017 | | | 2016 | | | 2015 | |
| | | | | |
Advisor Class | | | | | | | | | | | | | | | | | | | | |
| | | | | |
Per share operating performance (for a share outstanding throughout the year) | | | | | | | | | | | | | | | | | | | | |
| | | | | |
Net asset value, beginning of year | | | $13.50 | | | | $11.86 | | | | $10.22 | | | | $13.51 | | | | $18.18 | |
| | | | | |
Income from investment operationsa: | | | | | | | | | | | | | | | | | | | | |
| | | | | |
Net investment incomeb | | | 0.20 | | | | 0.20 | | | | 0.27 | | | | 0.34 | | | | 0.41 | |
| | | | | |
Net realized and unrealized gains (losses) | | | (2.39 | ) | | | 1.52 | | | | 1.45 | | | | (2.82 | ) | | | (3.92 | ) |
| | | | | |
Total from investment operations | | | (2.19 | ) | | | 1.72 | | | | 1.72 | | | | (2.48 | ) | | | (3.51 | ) |
| | | | | |
Less distributions from: | | | | | | | | | | | | | | | | | | | | |
| | | | | |
Net investment income | | | (0.02 | ) | | | (0.08 | ) | | | (0.08 | ) | | | (0.81 | ) | | | (0.60 | ) |
| | | | | |
Net realized gains | | | — | | | | — | | | | — | | | | — | | | | (0.56 | ) |
| | | | | |
Total distributions | | | (0.02 | ) | | | (0.08 | ) | | | (0.08 | ) | | | (0.81 | ) | | | (1.16 | ) |
| | | | | |
Net asset value, end of year | | | $11.29 | | | | $13.50 | | | | $11.86 | | | | $10.22 | | | | $13.51 | |
| | | | | | | | | | | | | | | | | | | | |
Total return | | | (16.08)% | | | | 14.37% | | | | 16.85% | | | | (18.53)% | | | | (19.78)% | |
| | | | | |
Ratios to average net assets | | | | | | | | | | | | | | | | | | | | |
| | | | | |
Expenses before waiver and payments by affiliates | | | 2.09% | | | | 2.14% | | | | 1.84% | | | | 1.90% | | | | 1.74% | |
| | | | | |
Expenses net of waiver and payments by affiliates | | | 1.71% | | | | 2.03% | | | | 1.74% | | | | 1.90% | c | | | 1.74% | c |
| | | | | |
Net investment income | | | 1.69% | | | | 1.62% | | | | 2.31% | | | | 2.49% | | | | 2.33% | |
| | | | | |
Supplemental data | | | | | | | | | | | | | | | | | | | | |
| | | | | |
Net assets, end of year (000’s) | | | $18,009 | | | | $30,352 | | | | $54,164 | | | | $79,380 | | | | $523,037 | |
| | | | | |
Portfolio turnover rate | | | 48.62% | | | | 30.94% | | | | 29.11% | | | | 19.12% | | | | 19.14% | |
aThe amount shown for a share outstanding throughout the period may not correlate with the Statement of Operations for the period due to the timing of sales and repurchases of the Fund’s shares in relation to income earned and/or fluctuating fair value of the investments of the Fund.
bBased on average daily shares outstanding.
cBenefit of waiver and payments by affiliates rounds to less than 0.01%.
| | | | |
| | | |
| franklintempleton.com | | The accompanying notes are an integral part of these financial statements. | Annual Report | | 15 |
TEMPLETON GLOBAL INVESTMENT TRUST
Statement of Investments, March 31, 2019
Templeton Frontier Markets Fund
| | | | | | | | | | |
| | | Industry | | Shares | | | Value | |
| |
Common Stocks 91.5% | | | | | | | | | | |
Argentina 7.5% | | | | | | | | | | |
BBVA Banco Frances SA, ADR | | Banks | | | 100,501 | | | $ | 955,765 | |
Grupo Financiero Galicia SA, ADR | | Banks | | | 56,231 | | | | 1,435,016 | |
YPF Sociedad Anonima, D, ADR | | Oil, Gas & Consumable Fuels | | | 174,409 | | | | 2,443,470 | |
| | | | | | | | | 4,834,251 | |
Bangladesh 3.4% | | | | | | | | | | |
Beximco Pharmaceuticals Ltd. | | Pharmaceuticals | | | 745,815 | | | | 757,899 | |
aBrac Bank Ltd. | | Banks | | | 1,521,935 | | | | 1,403,357 | |
| | | | | | | | | 2,161,256 | |
Colombia 2.3% | | | | | | | | | | |
Grupo Nutresa SA | | Food Products | | | 178,977 | | | | 1,447,297 | |
Egypt 5.4% | | | | | | | | | | |
Commercial International Bank Egypt SAE | | Banks | | | 314,150 | | | | 1,242,642 | |
aGlobal Telecom Holding SAE | | Wireless Telecommunication Services | | | 8,456,826 | | | | 2,225,223 | |
| | | | | | | | | 3,467,865 | |
Kenya 4.1% | | | | | | | | | | |
East African Breweries Ltd. | | Beverages | | | 370,077 | | | | 757,226 | |
KCB Group Ltd. | | Banks | | | 2,449,199 | | | | 1,072,740 | |
Safaricom PLC | | Wireless Telecommunication Services | | | 3,040,260 | | | | 832,452 | |
| | | | | | | | | 2,662,418 | |
Kuwait 12.0% | | | | | | | | | | |
Agility Public Warehousing Co. KSC | | Air Freight & Logistics | | | 250,116 | | | | 706,638 | |
Gulf Bank KSCP | | Banks | | | 802,256 | | | | 820,608 | |
Human Soft Holding Co. KSC | | Diversified Consumer Services | | | 159,757 | | | | 1,692,963 | |
Mezzan Holding Co. | | Food Products | | | 268,601 | | | | 426,694 | |
National Bank of Kuwait SAKP | | Banks | | | 1,381,031 | | | | 4,087,973 | |
| | | | | | | | | 7,734,876 | |
Nigeria 3.0% | | | | | | | | | | |
Guaranty Trust Bank PLC | | Banks | | | 7,296,088 | | | | 728,598 | |
Nigerian Breweries PLC | | Beverages | | | 2,195,675 | | | | 380,746 | |
UAC of Nigeria PLC | | Food Products | | | 15,680,314 | | | | 340,971 | |
Zenith Bank PLC | | Banks | | | 8,057,491 | | | | 486,574 | |
| | | | | | | | | 1,936,889 | |
Pakistan 1.2% | | | | | | | | | | |
United Bank Ltd. | | Banks | | | 753,900 | | | | 746,939 | |
Peru 8.2% | | | | | | | | | | |
Alicorp SA | | Food Products | | | 247,771 | | | | 810,099 | |
Credicorp Ltd. | | Banks | | | 5,143 | | | | 1,234,063 | |
| a,bInRetail Peru Corp., Reg S | | Food & Staples Retailing | | | 56,927 | | | | 2,032,294 | |
bIntercorp Financial Services Inc., Reg S | | Banks | | | 26,500 | | | | 1,205,750 | |
| | | | | | | | | 5,282,206 | |
Philippines 15.1% | | | | | | | | | | |
Ayala Corp. | | Diversified Financial Services | | | 40,090 | | | | 715,349 | |
BDO Unibank Inc. | | Banks | | | 804,400 | | | | 2,043,066 | |
DMCI Holdings Inc. | | Industrial Conglomerates | | | 2,731,800 | | | | 622,278 | |
International Container Terminal Services Inc. | | Transportation Infrastructure | | | 619,900 | | | | 1,537,983 | |
Metropolitan Bank & Trust Co. | | Banks | | | 998,178 | | | | 1,513,941 | |
Puregold Price Club Inc. | | Food & Staples Retailing | | | 1,516,500 | | | | 1,384,656 | |
Robinsons Retail Holdings Inc. | | Food & Staples Retailing | | | 710,840 | | | | 1,065,990 | |
| | | | |
| | | |
16 | | Annual Report | | franklintempleton.com |
TEMPLETON GLOBAL INVESTMENT TRUST
STATEMENT OF INVESTMENTS
Templeton Frontier Markets Fund(continued)
| | | | | | | | | | |
| | | Industry | | Shares | | | Value | |
| |
Common Stocks (continued) | | | | | | | | | | |
Philippines(continued) | | | | | | | | | | |
Wilcon Depot Inc. | | Specialty Retail | | | 2,686,255 | | | $ | 789,355 | |
| | | | | | | | | | |
| | | | | | | | | 9,672,618 | |
Romania 1.1% | | | | | | | | | | |
OMV Petrom SA | | Oil, Gas & Consumable Fuels | | | 8,105,297 | | | | 680,013 | |
Saudi Arabia 8.6% | | | | | | | | | | |
Al-Rajhi Bank | | Banks | | | 53,858 | | | | 1,530,861 | |
Mouwasat Medical Services Co. | | Health Care Providers & Services | | | 44,456 | | | | 948,306 | |
National Commercial Bank | | Banks | | | 46,802 | | | | 685,117 | |
Samba Financial Group | | Banks | | | 164,447 | | | | 1,683,780 | |
Saudi Dairy & Foodstuff Co. | | Food Products | | | 23,266 | | | | 645,184 | |
| | | | | | | | | 5,493,248 | |
Senegal 1.6% | | | | | | | | | | |
Sonatel | | Diversified Telecommunication Services | | | 30,928 | | | | 1,038,528 | |
South Africa 0.3% | | | | | | | | | | |
Old Mutual Ltd. | | Insurance | | | 145,869 | | | | 220,995 | |
Sri Lanka 1.1% | | | | | | | | | | |
Hatton National Bank PLC | | Banks | | | 819,325 | | | | 718,102 | |
Togo 0.1% | | | | | | | | | | |
aEcobank Transnational Inc. | | Banks | | | 1,165,969 | | | | 42,634 | |
Ukraine 1.0% | | | | | | | | | | |
bMHP SE, GDR, Reg S | | Food Products | | | 62,457 | | | | 640,184 | |
United Arab Emirates 2.9% | | | | | | | | | | |
Aramex PJSC | | Air Freight & Logistics | | | 1,156,364 | | | | 1,498,521 | |
DP World PLC | | Transportation Infrastructure | | | 20,857 | | | | 333,712 | |
| | | | | | | | | 1,832,233 | |
Vietnam 11.1% | | | | | | | | | | |
Binh Minh Plastics JSC | | Building Products | | | 620,677 | | | | 1,298,650 | |
DHG Pharmaceutical JSC | | Pharmaceuticals | | | 183,448 | | | | 935,265 | |
FPT Corp. | | Electronic Equipment, Instruments & Components | | | 89,953 | | | | 176,386 | |
aHoa Phat Group JSC | | Metals & Mining | | | 953,207 | | | | 1,322,758 | |
aImexpharm Pharmaceutical JSC | | Pharmaceuticals | | | 229,468 | | | | 524,125 | |
aMasan Group Corp. | | Food Products | | | 90,020 | | | | 327,042 | |
Vietnam Container Shipping JSC | | Marine | | | 258,553 | | | | 460,190 | |
Vietnam Dairy Products JSC | | Food Products | | | 89,428 | | | | 519,518 | |
aVietnam Technological and Commercial Joint Stock Bank | | Banks | | | 819,000 | | | | 903,568 | |
aVincom Retail JSC | �� | Real Estate Management & Development | | | 435,350 | | | | 649,160 | |
| | | | | | | | | 7,116,662 | |
Zimbabwe 1.5% | | | | | | | | | | |
cDelta Corp. Ltd. | | Beverages | | | 2,192,380 | | | | 985,898 | |
Total Common Stocks (Cost $57,588,873) | | | | | | | | | 58,715,112 | |
| | | | |
| | | |
| franklintempleton.com | | Annual Report | | 17 |
TEMPLETON GLOBAL INVESTMENT TRUST
STATEMENT OF INVESTMENTS
Templeton Frontier Markets Fund(continued)
| | | | | | | | | | |
| | | Industry | | Shares | | | Value | |
| |
Preferred Stocks 3.8% | | | | | | | | | | |
Colombia 3.8% | | | | | | | | | | |
dBanco Davivienda SA, 2.193%, pfd | | Banks | | | 113,040 | | | $ | 1,326,115 | |
dBancolombia SA, 1.997%, ADR, pfd | | Banks | | | 21,900 | | | | 1,118,214 | |
| | | | | | | | | | |
Total Preferred Stocks (Cost $2,367,803) | | | | | | | | | 2,444,329 | |
| | | | | | | | | | |
Total Investments before Short Term Investments (Cost $59,956,676) | | | | | | | | | 61,159,441 | |
| | | | | | | | | | |
| | | | | | | | | | |
Short Term Investments (Cost $2,357,813) 3.6% | | | | | | | | | | |
| | | |
Money Market Funds 3.6% | | | | | | | | | | |
United States 3.6% | | | | | | | | | | |
e,fInstitutional Fiduciary Trust Money Market Portfolio, 2.10% | | | | | 2,357,813 | | | | 2,357,813 | |
| | | | | | | | | | |
Total Investments (Cost $62,314,489) 98.9% | | | | | | | | | 63,517,254 | |
Other Assets, less Liabilities 1.1% | | | | | | | | | 675,983 | |
| | | | | | | | | | |
Net Assets 100.0% | | | | | | | | $ | 64,193,237 | |
| | | | | | | | | | |
See Abbreviations on page 32.
aNon-income producing.
bSecurity was purchased pursuant to Regulation S under the Securities Act of 1933, which exempts from registration securities offered and sold outside of the United States. Such a security cannot be sold in the United States without either an effective registration statement filed pursuant to the Securities Act of 1933, or pursuant to an exemption from registration. These securities have been deemed liquid under guidelines approved by the Trust’s Board of Trustees. At March 31, 2019, the aggregate value of these securities was $3,878,228, representing 6.0% of net assets.
cFair valued using significant unobservable inputs. See Note 9 regarding fair value measurements.
dVariable rate security. The rate shown represents the yield at period end.
eSee Note 3(f) regarding investments in affiliated management investment companies.
fThe rate shown is the annualizedseven-day effective yield at period end.
| | | | |
| | | |
18 | | Annual Report | The accompanying notes are an integral part of these financial statements. | | franklintempleton.com |
TEMPLETON GLOBAL INVESTMENT TRUST
Financial Statements
Statement of Assets and Liabilities
March 31, 2019
Templeton Frontier Markets Fund
| | | | |
Assets: | | | | |
Investments in securities: | | | | |
Cost - Unaffiliated issuers | | $ | 59,956,676 | |
Cost -Non-controlled affiliates (Note 3f) | | | 2,357,813 | |
| | | | |
Value - Unaffiliated issuers | | $ | 61,159,441 | |
Value -Non-controlled affiliates (Note 3f) | | | 2,357,813 | |
Restricted currency, at value (cost $27,584) (Note 1c) | | | 28,423 | |
Foreign currency, at value (cost $1,033,577) | | | 1,033,441 | |
Receivables: | | | | |
Investment securities sold | | | 26,777 | |
Capital shares sold | | | 31,673 | |
Dividends | | | 675,007 | |
Other assets | | | 66 | |
| | | | |
Total assets | | | 65,312,641 | |
| | | | |
Liabilities: | | | | |
Payables: | | | | |
Investment securities purchased | | | 29,085 | |
Capital shares redeemed | | | 50,236 | |
Management fees | | | 23,236 | |
Distribution fees | | | 29,776 | |
Transfer agent fees | | | 17,989 | |
Deferred tax | | | 845,678 | |
Accrued expenses and other liabilities | | | 123,404 | |
| | | | |
Total liabilities | | | 1,119,404 | |
| | | | |
Net assets, at value | | $ | 64,193,237 | |
| | | | |
Net assets consist of: | | | | |
Paid-in capital | | $ | 338,759,993 | |
Total distributable earnings (loss) | | | (274,566,756 | ) |
| | | | |
Net assets, at value | | $ | 64,193,237 | |
| | | | |
| | | | |
| | | |
| franklintempleton.com | | The accompanying notes are an integral part of these financial statements. | Annual Report | | 19 |
TEMPLETON GLOBAL INVESTMENT TRUST
FINANCIAL STATEMENTS
Statement of Assets and Liabilities(continued)
March 31, 2019
Templeton Frontier Markets Fund
| | | | |
Class A: | | | | |
Net assets, at value | | | $31,247,987 | |
| | | | |
Shares outstanding | | | 2,786,374 | |
| | | | |
Net asset value per sharea | | | $11.21 | |
| | | | |
Maximum offering price per share (net asset value per share÷ 94.50%) | | | $11.86 | |
| | | | |
Class C: | | | | |
Net assets, at value | | | $10,107,304 | |
| | | | |
Shares outstanding | | | 926,727 | |
| | | | |
Net asset value and maximum offering price per sharea | | | $10.91 | |
| | | | |
Class R: | | | | |
Net assets, at value | | | $ 63,708 | |
| | | | |
Shares outstanding | | | 5,739 | |
| | | | |
Net asset value and maximum offering price per share | | | $11.10 | |
| | | | |
Class R6: | | | | |
Net assets, at value | | | $ 4,765,703 | |
| | | | |
Shares outstanding | | | 423,531 | |
| | | | |
Net asset value and maximum offering price per share | | | $11.25 | |
| | | | |
Advisor Class: | | | | |
Net assets, at value | | | $18,008,535 | |
| | | | |
Shares outstanding | | | 1,595,652 | |
| | | | |
Net asset value and maximum offering price per share | | | $11.29 | |
| | | | |
aRedemption price is equal to net asset value less contingent deferred sales charges, if applicable.
| | | | |
| | | |
20 | | Annual Report | The accompanying notes are an integral part of these financial statements. | | franklintempleton.com |
TEMPLETON GLOBAL INVESTMENT TRUST
FINANCIAL STATEMENTS
Statement of Operations
for the year ended March 31, 2019
Templeton Frontier Markets Fund
| | | | |
Investment income: | | | | |
Dividends: (net of foreign taxes)* | | | | |
Unaffiliated issuers | | $ | 2,568,772 | |
Non-controlled affiliates (Note 3f) | | | 43,131 | |
Interest: | | | | |
Unaffiliated issuers | | | 20,680 | |
| | | | |
Total investment income | | | 2,632,583 | |
| | | | |
Expenses: | | | | |
Management fees (Note 3a) | | | 1,122,785 | |
Distribution fees: (Note 3c) | | | | |
Class A | | | 92,613 | |
Class C | | | 130,594 | |
Class R | | | 325 | |
Transfer agent fees: (Note 3e) | | | | |
Class A | | | 38,343 | |
Class C | | | 13,597 | |
Class R | | | 67 | |
Class R6 | | | 2,035 | |
Advisor Class | | | 23,003 | |
Custodian fees (Note 4) | | | 99,785 | |
Reports to shareholders | | | 25,600 | |
Registration and filing fees | | | 86,105 | |
Professional fees | | | 181,075 | |
Trustees’ fees and expenses | | | 7,705 | |
Other | | | 20,667 | |
| | | | |
Total expenses | | | 1,844,299 | |
Expenses waived/paid by affiliates (Note 3f and 3g) | | | (296,090 | ) |
Net expenses | | | 1,548,209 | |
| | | | |
Net investment income | | | 1,084,374 | |
| | | | |
Realized and unrealized gains (losses): | | | | |
Net realized gain (loss) from: | | | | |
Investments:# | | | | |
Unaffiliated issuers | | | 3,142,345 | |
Foreign currency transactions | | | (495,604 | ) |
| | | | |
Net realized gain (loss) | | | 2,646,741 | |
| | | | |
Net change in unrealized appreciation (depreciation) on: | | | | |
Investments: | | | | |
Unaffiliated issuers | | | (21,269,082 | ) |
Translation of other assets and liabilities denominated in foreign currencies | | | 432,234 | |
Change in deferred taxes on unrealized appreciation | | | 783,824 | |
| | | | |
Net change in unrealized appreciation (depreciation) | | | (20,053,024 | ) |
| | | | |
Net realized and unrealized gain (loss) | | | (17,406,283 | ) |
| | | | |
Net increase (decrease) in net assets resulting from operations | | $ | (16,321,909 | ) |
| | | | |
| |
| | | | |
*Foreign taxes withheld on dividends | | $ | 607,203 | |
#Net of foreign taxes | | $ | 453,741 | |
| | | | |
| | | |
| franklintempleton.com | | The accompanying notes are an integral part of these financial statements. | Annual Report | | 21 |
TEMPLETON GLOBAL INVESTMENT TRUST
FINANCIAL STATEMENTS
Statements of Changes in Net Assets
Templeton Frontier Markets Fund
| | | | | | | | |
| | | Year Ended
March 31, 2019 | | | Year Ended
March 31, 2018 | |
| |
Increase (decrease) in net assets: | | | | | | | | |
Operations: | | | | | | | | |
Net investment income | | $ | 1,084,374 | | | $ | 1,604,049 | |
Net realized gain (loss) | | | 2,646,741 | | | | 12,567,833 | |
Net change in unrealized appreciation (depreciation) | | | (20,053,024 | ) | | | 1,442,679 | |
| | | | |
Net increase (decrease) in net assets resulting from operations | | | (16,321,909 | ) | | | 15,614,561 | |
| | | | |
Distributions to shareholders: (Note 1e) | | | | | | | | |
Class A | | | — | | | | (264,370 | ) |
Class C | | | — | | | | (66,485 | ) |
Class R | | | — | | | | (383 | ) |
Class R6 | | | (23,660 | ) | | | (35,567 | ) |
Advisor Class | | | (34,005 | ) | | | (208,322 | ) |
| | | | |
Total distributions to shareholders | | | (57,665 | ) | | | (575,127 | ) |
| | | | |
Capital share transactions: (Note 2) | | | | | | | | |
Class A | | | (8,415,546 | ) | | | (9,824,787 | ) |
Class C | | | (4,980,442 | ) | | | (4,489,086 | ) |
Class R | | | 2,085 | | | | (67,924 | ) |
Class R6 | | | (152,896 | ) | | | 278,490 | |
Advisor Class | | | (7,624,964 | ) | | | (29,307,296 | ) |
| | | | |
Total capital share transactions | | | (21,171,763 | ) | | | (43,410,603 | ) |
| | | | |
Net increase (decrease) in net assets | | | (37,551,337 | ) | | | (28,371,169 | ) |
Net assets: | | | | | | | | |
Beginning of year | | | 101,744,574 | | | | 130,115,743 | |
| | | | |
End of year (Note 1e) | | $ | 64,193,237 | | | $ | 101,744,574 | |
| | | | |
| | | | |
| | | |
22 | | Annual Report | The accompanying notes are an integral part of these financial statements. | | franklintempleton.com |
TEMPLETON GLOBAL INVESTMENT TRUST
Notes to Financial Statements
Templeton Frontier Markets Fund
1. Organization and Significant Accounting Policies
Templeton Global Investment Trust (Trust) is registered under the Investment Company Act of 1940 (1940 Act) as anopen-end management investment company, consisting of five separate funds and applies the specialized accounting and reporting guidance in U.S. Generally Accepted Accounting Principles (U.S. GAAP). Templeton Frontier Markets Fund (Fund) is included in this report. The Fund offers five classes of shares: Class A, Class C, Class R, Class R6, and Advisor Class. Beginning on October 19, 2018, Class C shares automatically convert to Class A shares after they have been held for 10 years. Each class of shares may differ by its initial sales load, contingent deferred sales charges, voting rights on matters affecting a single class, its exchange privilege and fees due to differing arrangements for distribution and transfer agent fees.
The following summarizes the Fund’s significant accounting policies.
a. Financial Instrument Valuation
The Fund’s investments in financial instruments are carried at fair value daily. Fair value is the price that would be received to sell an asset or paid to transfer a liability in an orderly transaction between market participants on the measurement date. The Fund calculates the net asset value (NAV) per share each business day as of 4 p.m. Eastern time or the regularly scheduled close of the New York Stock Exchange (NYSE), whichever is earlier. Under compliance policies and procedures approved by the Trust’s Board of Trustees (the Board), the Fund’s administrator has responsibility for oversight of valuation, including leading the cross-functional Valuation Committee (VC). The Fund may utilize independent pricing services, quotations from securities and financial instrument dealers, and other market sources to determine fair value.
Equity securities listed on an exchange or on the NASDAQ National Market System are valued at the last quoted sale price or the official closing price of the day, respectively. Foreign equity securities are valued as of the close of trading on the foreign stock exchange on which the security is primarily traded, or as of 4 p.m. Eastern time. The value is then converted into its U.S. dollar equivalent at the foreign exchange rate in effect at 4 p.m. Eastern time on the day that the value of the security is determined.Over-the-counter (OTC) securities are valued within the range of the most recent quoted bid and ask prices. Securities that trade in multiple markets or on multiple
exchanges are valued according to the broadest and most representative market. Certain equity securities are valued based upon fundamental characteristics or relationships to similar securities.
Investments inopen-end mutual funds are valued at the closing NAV.
The Fund has procedures to determine the fair value of financial instruments for which market prices are not reliable or readily available. Under these procedures, the Fund primarily employs a market-based approach which may use related or comparable assets or liabilities, recent transactions, market multiples, book values, and other relevant information for the investment to determine the fair value of the investment. An income-based valuation approach may also be used in which the anticipated future cash flows of the investment are discounted to calculate fair value. Discounts may also be applied due to the nature or duration of any restrictions on the disposition of the investments. Due to the inherent uncertainty of valuations of such investments, the fair values may differ significantly from the values that would have been used had an active market existed.
Trading in securities on foreign securities stock exchanges and OTC markets may be completed before 4 p.m. Eastern time. In addition, trading in certain foreign markets may not take place on every Fund’s business day. Occasionally, events occur between the time at which trading in a foreign security is completed and 4 p.m. Eastern time that might call into question the reliability of the value of a portfolio security held by the Fund. As a result, differences may arise between the value of the Fund’s portfolio securities as determined at the foreign market close and the latest indications of value at 4 p.m. Eastern time. In order to minimize the potential for these differences, the VC monitors price movements following the close of trading in foreign stock markets through a series of country specific market proxies (such as baskets of American Depositary Receipts, futures contracts and exchange traded funds). These price movements are measured against established trigger thresholds for each specific market proxy to assist in determining if an event has occurred that may call into question the reliability of the values of the foreign securities held by the Fund. If such an event occurs, the securities may be valued using fair value procedures, which may include the use of independent pricing services.
| | | | |
| | | |
| franklintempleton.com | | Annual Report | | 23 |
TEMPLETON GLOBAL INVESTMENT TRUST
NOTES TO FINANCIAL STATEMENTS
Templeton Frontier Markets Fund(continued)
1. Organization and Significant Accounting Policies(continued)
a. Financial Instrument Valuation(continued)
When the last day of the reporting period is anon-business day, certain foreign markets may be open on those days that the Fund’s NAV is not calculated, which could result in differences between the value of the Fund’s portfolio securities on the last business day and the last calendar day of the reporting period. Any significant security valuation changes due to an open foreign market are adjusted and reflected by the Fund for financial reporting purposes.
b. Foreign Currency Translation
Portfolio securities and other assets and liabilities denominated in foreign currencies are translated into U.S. dollars based on the exchange rate of such currencies against U.S. dollars on the date of valuation. The Fund may enter into foreign currency exchange contracts to facilitate transactions denominated in a foreign currency. Purchases and sales of securities, income and expense items denominated in foreign currencies are translated into U.S. dollars at the exchange rate in effect on the transaction date. Portfolio securities and assets and liabilities denominated in foreign currencies contain risks that those currencies will decline in value relative to the U.S. dollar. Occasionally, events may impact the availability or reliability of foreign exchange rates used to convert the U.S. dollar equivalent value. If such an event occurs, the foreign exchange rate will be valued at fair value using procedures established and approved by the Board.
The Fund does not separately report the effect of changes in foreign exchange rates from changes in market prices on securities held. Such changes are included in net realized and unrealized gain or loss from investments in the Statement of Operations.
Realized foreign exchange gains or losses arise from sales of foreign currencies, currency gains or losses realized between the trade and settlement dates on securities transactions and the difference between the recorded amounts of dividends, interest, and foreign withholding taxes and the U.S. dollar equivalent of the amounts actually received or paid. Net unrealized foreign exchange gains and losses arise from changes in foreign exchange rates on foreign denominated assets and liabilities other than investments in securities held at the end of the reporting period.
c. Restricted Currency
At March 31, 2019, the Fund held currencies in certain markets in which the ability to repatriate such currency is limited. As a result of such limitations on repatriation the Fund may incur substantial delays in gaining access to these assets and may be exposed to potential adverse movements in currency value.
d. Income and Deferred Taxes
It is the Fund’s policy to qualify as a regulated investment company under the Internal Revenue Code. The Fund intends to distribute to shareholders substantially all of its taxable income and net realized gains to relieve it from federal income and excise taxes. As a result, no provision for U.S. federal income taxes is required.
The Fund may be subject to foreign taxation related to income received, capital gains on the sale of securities and certain foreign currency transactions in the foreign jurisdictions in which it invests. Foreign taxes, if any, are recorded based on the tax regulations and rates that exist in the foreign markets in which the Fund invests. When a capital gain tax is determined to apply, the Fund records an estimated deferred tax liability in an amount that would be payable if the securities were disposed of on the valuation date.
The Fund may recognize an income tax liability related to its uncertain tax positions under U.S. GAAP when the uncertain tax position has a less than 50% probability that it will be sustained upon examination by the tax authorities based on its technical merits. As of March 31, 2019, the Fund has determined that no tax liability is required in its financial statements related to uncertain tax positions for any open tax years (or expected to be taken in future tax years). Open tax years are those that remain subject to examination and are based on the statute of limitations in each jurisdiction in which the Fund invests.
e. Security Transactions, Investment Income, Expenses and Distributions
Security transactions are accounted for on trade date. Realized gains and losses on security transactions are determined on a specific identification basis. Estimated expenses are accrued daily. Dividend income is recorded on theex-dividend date except for certain dividends from securities where the dividend rate is not available. In such cases, the dividend is recorded as soon as the information is received by the Fund. Distributions to shareholders are recorded on theex-dividend date. Distributable
| | | | |
| | | |
24 | | Annual Report | | franklintempleton.com |
TEMPLETON GLOBAL INVESTMENT TRUST
NOTES TO FINANCIAL STATEMENTS
Templeton Frontier Markets Fund(continued)
earnings are determined according to income tax regulations (tax basis) and may differ from earnings recorded in accordance with U.S. GAAP. These differences may be permanent or temporary. Permanent differences are reclassified among capital accounts to reflect their tax character. These reclassifications have no impact on net assets or the results of operations. Temporary differences are not reclassified, as they may reverse in subsequent periods.*
Common expenses incurred by the Trust are allocated among the Funds based on the ratio of net assets of each Fund to the combined net assets of the Trust or based on the ratio of number of shareholders of each Fund to the combined number of shareholders of the Trust. Fund specific expenses are charged directly to the Fund that incurred the expense.
Realized and unrealized gains and losses and net investment income, excluding class specific expenses, are allocated daily to each class of shares based upon the relative proportion of net assets of each class. Differences in per share distributions by class are generally due to differences in class specific expenses.
f. Accounting Estimates
The preparation of financial statements in accordance with U.S. GAAP requires management to make estimates and assumptions that affect the reported amounts of assets and liabilities at the date of the financial statements and the amounts of income and expenses during the reporting period. Actual results could differ from those estimates.
g. Guarantees and Indemnifications
Under the Trust’s organizational documents, its officers and trustees are indemnified by the Trust against certain liabilities arising out of the performance of their duties to the Trust. Additionally, in the normal course of business, the Trust, on behalf of the Fund, enters into contracts with service providers that contain general indemnification clauses. The Trust’s maximum exposure under these arrangements is unknown as this would involve future claims that may be made against the Trust that have not yet occurred. Currently, the Trust expects the risk of loss to be remote.
*Effective during the current reporting period, it is no longer required to present certain line items in the Statements of Changes in Net Assets. The below prior period amounts affected by this change are shown as they were in the prior year Statements of Changes in Net Assets.
For the year ended March 31, 2018, distributions to shareholders were as follows:
| | | | |
Distributions from net investment income: | | | | |
Class A | | $ | (264,370 | ) |
Class C | | | (66,485 | ) |
Class R | | | (383 | ) |
Class R6 | | | (35,567 | ) |
Advisor Class | | | (208,322 | ) |
For the year ended March 31, 2018, distributions in excess of net investment income included in net assets was $(411,002).
2. Shares of Beneficial Interest
At March 31, 2019, there were an unlimited number of shares authorized ($0.01 par value). Transactions in the Fund’s shares were as follows:
| | | | | | | | | | | | | | | | |
| | | Year Ended | | | Year Ended | |
| | | March 31, 2019 | | | March 31, 2018 | |
| | | Shares | | | Amount | | | Shares | | | Amount | |
Class A Shares: | | | | | | | | | | | | | | | | |
Shares solda | | | 503,403 | | | $ | 5,633,691 | | | | 514,015 | | | $ | 6,666,467 | |
Shares issued in reinvestment of distributions | | | — | | | | — | | | | 19,127 | | | | 251,132 | |
Shares redeemed | | | (1,242,038 | ) | | | (14,049,237 | ) | | | (1,304,503 | ) | | | (16,742,386 | ) |
Net increase (decrease) | | | (738,635 | ) | | $ | (8,415,546 | ) | | | (771,361 | ) | | $ | (9,824,787 | ) |
| | | | |
| | | |
| franklintempleton.com | | Annual Report | | 25 |
TEMPLETON GLOBAL INVESTMENT TRUST
NOTES TO FINANCIAL STATEMENTS
Templeton Frontier Markets Fund(continued)
2. Shares of Beneficial Interest(continued)
| | | | | | | | | | | | | | | | |
| | | Year Ended | | | Year Ended | |
| | | March 31, 2019 | | | March 31, 2018 | |
| | | Shares | | | Amount | | | Shares | | | Amount | |
Class C Shares: | | | | | | | | | | | | | | | | |
Shares sold | | | 51,528 | | | $ | 567,411 | | | | 107,080 | | | $ | 1,363,635 | |
Shares issued in reinvestment of distributions | | | — | | | | — | | | | 5,036 | | | | 64,912 | |
Shares redeemeda | | | (504,580 | ) | | | (5,547,853 | ) | | | (467,538 | ) | | | (5,917,633 | ) |
Net increase (decrease) | | | (453,052 | ) | | $ | (4,980,442 | ) | | | (355,422 | ) | | $ | (4,489,086 | ) |
Class R Shares: | | | | | | | | | | | | | | | | |
Shares sold | | | 174 | | | $ | 2,089 | | | | 1,040 | | | $ | 13,360 | |
Shares issued in reinvestment of distributions | | | — | | | | — | | | | 29 | | | | 383 | |
Shares redeemed | | | (— | )* | | | (4 | ) | | | (6,476 | ) | | | (81,667 | ) |
Net increase (decrease) | | | 174 | | | $ | 2,085 | | | | (5,407 | ) | | $ | (67,924 | ) |
Class R6 Shares: | | | | | | | | | | | | | | | | |
Shares sold | | | 72,821 | | | $ | 845,750 | | | | 124,962 | | | $ | 1,620,063 | |
Shares issued in reinvestment of distributions | | | 5 | | | | 49 | | | | 11 | | | | 146 | |
Shares redeemed | | | (86,627 | ) | | | (998,695 | ) | | | (102,241 | ) | | | (1,341,719 | ) |
Net increase (decrease) | | | (13,801 | ) | | $ | (152,896 | ) | | | 22,732 | | | $ | 278,490 | |
Advisor Class Shares: | | | | | | | | | | | | | | | | |
Shares sold | | | 412,557 | | | $ | 4,786,590 | | | | 613,319 | �� | | $ | 7,888,277 | |
Shares issued in reinvestment of distributions | | | 2,862 | | | | 29,875 | | | | 12,708 | | | | 167,753 | |
Shares redeemed | | | (1,068,729 | ) | | | (12,441,429 | ) | | | (2,943,536 | ) | | | (37,363,326 | ) |
Net increase (decrease) | | | (653,310 | ) | | $ | (7,624,964 | ) | | | (2,317,509 | ) | | $ | (29,307,296 | ) |
*Rounds to less than 1 share.
aMay include a portion of Class C shares that were automatically converted to Class A.
3. Transactions with Affiliates
Franklin Resources, Inc. is the holding company for various subsidiaries that together are referred to as Franklin Templeton. Certain officers and trustees of the Fund are also officers and/or directors of the following subsidiaries:
| | |
| Subsidiary | | Affiliation |
| Franklin Templeton Investments (ME) Limited (FTIME) | | Investment manager |
| Templeton Asset Management Ltd. (Asset Management) | | Investment manager |
| Franklin Templeton Services, LLC (FT Services) | | Administrative manager |
| Franklin Templeton Distributors, Inc. (Distributors) | | Principal underwriter |
| Franklin Templeton Investor Services, LLC (Investor Services) | | Transfer agent |
a. Management Fees
Effective October 26, 2018, FTIME began serving as the Fund’s investment manager. Prior to October 26, 2018, Asset Management served as the Fund’s investment manager.
| | | | |
| | | |
26 | | Annual Report | | franklintempleton.com |
TEMPLETON GLOBAL INVESTMENT TRUST
NOTES TO FINANCIAL STATEMENTS
Templeton Frontier Markets Fund(continued)
The Fund pays an investment management fee based on the average daily net assets of the Fund as follows:
| | |
| Annualized Fee Rate | | Net Assets |
| 1.450% | | Up to and including $500 million |
| 1.400% | | Over $500 million, up to and including $5 billion |
| 1.350% | | Over $5 billion, up to and including $10 billion |
| 1.300% | | Over $10 billion, up to and including $15 billion |
| 1.250% | | Over $15 billion, up to and including $20 billion |
| 1.200% | | In excess of $20 billion |
Effective April 1, 2019, the Fund will pay fees based on the average daily net assets of the Fund as follows:
| | |
| Annualized Fee Rate | | Net Assets |
| 1.400% | | Up to and including $500 million |
| 1.300% | | Over $500 million, up to and including $1 billion |
| 1.200% | | In excess of $1 billion |
b. Administrative Fees
Effective October 26, 2018, under an agreement with FTIME, FT Services provides administrative services to the Fund. The fee is paid by FTIME based on the Fund’s average daily net assets, and is not an additional expense of the Fund. Prior to October 26, 2018, the fee was paid by Asset Management.
c. Distribution Fees
The Board has adopted distribution plans for each share class, with the exception of Class R6 and Advisor Class shares, pursuant to Rule12b-1 under the 1940 Act. Under the Fund’s Class A reimbursement distribution plan, the Fund reimburses Distributors for costs incurred in connection with the servicing, sale and distribution of the Fund’s shares up to the maximum annual plan rate. Under the Class A reimbursement distribution plan, costs exceeding the maximum for the current plan year cannot be reimbursed in subsequent periods. In addition, under the Fund’s Class C and R compensation distribution plans, the Fund pays Distributors for costs incurred in connection with the servicing, sale and distribution of the Fund’s shares up to the maximum annual plan rate for each class. The plan year, for purposes of monitoring compliance with the maximum annual plan rates, is February 1 through January 31.
The maximum annual plan rates, based on the average daily net assets, for each class, are as follows:
| | | | |
Class A | | | 0.30 | % |
Class C | | | 1.00 | % |
Class R | | | 0.50 | % |
The Board has set the current rate at 0.25% per year for Class A shares until further notice and approval by the Board.
| | | | |
| | | |
| franklintempleton.com | | Annual Report | | 27 |
TEMPLETON GLOBAL INVESTMENT TRUST
NOTES TO FINANCIAL STATEMENTS
Templeton Frontier Markets Fund(continued)
3. Transactions with Affiliates(continued)
d. Sales Charges/Underwriting Agreements
Front-end sales charges and contingent deferred sales charges (CDSC) do not represent expenses of the Fund. These charges are deducted from the proceeds of sales of Fund shares prior to investment or from redemption proceeds prior to remittance, as applicable. Distributors has advised the Fund of the following commission transactions related to the sales and redemptions of the Fund’s shares for the year:
| | | | |
Sales charges retained net of commissions paid to unaffiliated brokers/dealers | | $ | 2,502 | |
CDSC retained | | $ | 1,993 | |
Effective September 10, 2018, the Board approved changes to certainfront-end sales charges and dealer commissions on Class A shares. Further details are disclosed in the Fund’s Prospectus.
e. Transfer Agent Fees
Each class of shares pays transfer agent fees to Investor Services for its performance of shareholder servicing obligations. The fees are based on an annualized asset based fee of 0.02% plus a transaction based fee. In addition, each class reimburses Investor Services for out of pocket expenses incurred and, except for Class R6, reimburses shareholder servicing fees paid to third parties. These fees are allocated daily based upon their relative proportion of such classes’ aggregate net assets. Class R6 pays Investor Services transfer agent fees specific to that class.
For the year ended March 31, 2019, the Fund paid transfer agent fees of $77,045, of which $56,027 was retained by Investor Services.
f. Investments in Affiliated Management Investment Companies
The Fund invests in one or more affiliated management investment companies for purposes other than exercising a controlling influence over the management or policies. Management fees paid by the Fund are waived on assets invested in the affiliated management investment companies, as noted in the Statement of Operations, in an amount not to exceed the management and administrative fees paid directly or indirectly by each affiliate. During the year ended March 31, 2019, the Fund held investments in affiliated management investment companies as follows:
| | | | | | | | | | | | | | | | | | | | | | | | | | | | | | | | |
| | | Number of Shares Held at Beginning of Year | | | Gross Additions | | | Gross Reductions | | | Number of Shares Held at End of Year | | | Value at End of Year | | | Dividend Income | | | Realized Gain (Loss) | | | Net Change in Unrealized Appreciation (Depreciation) | |
| |
Non-Controlled Affiliates | | | | | | | | | | | | | | | | | | | | | | | | | | | | | | | | |
Institutional Fiduciary Trust Money Market Portfolio, 2.10% | | | 3,189,047 | | | | 30,465,955 | | | | (31,297,189 | ) | | | 2,357,813 | | | | $2,357,813 | | | | $43,131 | | | | $ — | | | | $ — | |
| | | | | | | | | | | | | | | | | | | | |
g. Waiver and Expense Reimbursements
Effective August 1, 2018, FTIME, Asset Management and Investor Services have contractually agreed in advance to waive or limit their respective fees and to assume as their own expense certain expenses otherwise payable by the Fund so that the expenses (excluding distribution fees, acquired fund fees and expenses, and certainnon-routine expenses or costs, including those relating to litigation, indemnification, reorganizations, and liquidations) for Class A, Class C, Class R and Advisor Class of the Fund do not exceed 1.75%, and for Class R6 do not exceed 1.53%, based on the average net assets of each class until July 31, 2019. Total expenses waived or paid are not subject to recapture subsequent to the Fund’s fiscal year end.
| | | | |
| | | |
28 | | Annual Report | | franklintempleton.com |
TEMPLETON GLOBAL INVESTMENT TRUST
NOTES TO FINANCIAL STATEMENTS
Templeton Frontier Markets Fund(continued)
Additionally, FTIME and Asset Management have contractually agreed in advance to limit the investment management fees to 1.35% of the average daily net assets of the Fund until July 31, 2019. Total expenses waived or paid are not subject to recapture subsequent to the Fund’s fiscal year end.
4. Expense Offset Arrangement
The Fund has entered into an arrangement with its custodian whereby credits realized as a result of uninvested cash balances are used to reduce a portion of the Fund’s custodian expenses. During the year ended March 31, 2019, there were no credits earned.
5. Income Taxes
For tax purposes, capital losses may be carried over to offset future capital gains.
At March 31, 2019, capital loss carryforwards were as follows:
| | | | |
Capital loss carryforwards not subject to expiration: | | | | |
Short term | | $ | 39,761,432 | |
Long term | | | 233,007,424 | |
| |
Total capital loss carryforwards | | $ | 272,768,856 | |
During the year ended March 31, 2019, the Fund utilized $3,628,508 of capital loss carryforwards.
For tax purposes, the Fund may elect to defer any portion of a post-October capital loss or late-year ordinary loss to the first day of the following fiscal year. At March 31, 2019 , the Fund deferred late-year ordinary losses of $ 261,011.
The tax character of distributions paid during the years ended March 31, 2019 and 2018, was as follows:
| | | | | | | | |
| | | 2019 | | | 2018 | |
Distributions paid from ordinary income | | $ | 57,665 | | | $ | 574,639 | |
At March 31, 2019, the cost of investments and net unrealized appreciation (depreciation) for income tax purposes were as follows:
| | | | |
Cost of investments | | $ | 63,904,610 | |
| |
Unrealized appreciation | | $ | 10,249,616 | |
Unrealized depreciation | | | (10,636,972 | ) |
| |
Net unrealized appreciation (depreciation) | | $ | (387,356 | ) |
Differences between income and/or capital gains as determined on a book basis and a tax basis are primarily due to differing treatments of foreign capital gains tax and wash sales.
6. Investment Transactions
Purchases and sales of investments (excluding short term securities) for the year ended March 31, 2019, aggregated $36,449,235 and $55,321,655, respectively.
| | | | |
| | | |
| franklintempleton.com | | Annual Report | | 29 |
TEMPLETON GLOBAL INVESTMENT TRUST
NOTES TO FINANCIAL STATEMENTS
Templeton Frontier Markets Fund(continued)
7. Concentration of Risk
Investing in foreign securities may include certain risks and considerations not typically associated with investing in U.S. securities, such as fluctuating currency values and changing local and regional economic, political and social conditions, which may result in greater market volatility. Such risks may be greater when investing in emerging markets securities, of which frontier markets are asub-set, due to underdeveloped legal, business, political or other frameworks necessary to support securities markets. Frontier markets generally have smaller economies and magnify the risks of investing in developing markets and may include the potential for extreme price volatility, government ownership, protectionist measures and unsettled securities laws. In addition, certain foreign securities may not be as liquid as U.S. securities, or may have restrictions or delays in repatriation into U.S. dollars.
Zimbabwe adopted the U.S. dollar as its official currency in 2009 after a period of severe hyperinflation and economic decline. Since that time, the economy has continued to struggle and despite the government’s issuance of bond notes in August 2017, liquidity conditions have continued to be challenged. In February 2019, Zimbabwe redenominated its currency from the U.S. dollar to the real time gross settlement (RTGS) dollar or ZWL. The central bank is expected to establish an interbank market to formalize trade in this currency, however repatriation continues to be restricted. Currency restrictions and other concerns have led investors to seek alternative stores of value, causing severe inflationary pressures and extreme price volatility. These economic conditions could affect the value of the Fund’s portfolio. At March 31, 2019, the Fund had 1.6 % of its net assets invested in Zimbabwe.
8. Credit Facility
The Fund, together with other U.S. registered and foreign investment funds (collectively, Borrowers), managed by Franklin Templeton, are borrowers in a joint syndicated senior unsecured credit facility totaling $2 billion (Global Credit Facility) which matures on February 7, 2020. This Global Credit Facility provides a source of funds to the Borrowers for temporary and emergency purposes, including the ability to meet future unanticipated or unusually large redemption requests.
Under the terms of the Global Credit Facility, the Fund shall, in addition to interest charged on any borrowings made by the Fund and other costs incurred by the Fund, pay its share of fees and expenses incurred in connection with the implementation and maintenance of the Global Credit Facility, based upon its relative share of the aggregate net assets of all of the Borrowers, including an annual commitment fee of 0.15% based upon the unused portion of the Global Credit Facility. These fees are reflected in other expenses in the Statement of Operations. During the year ended March 31, 2019, the Fund did not use the Global Credit Facility.
9. Fair Value Measurements
The Fund follows a fair value hierarchy that distinguishes between market data obtained from independent sources (observable inputs) and the Fund’s own market assumptions (unobservable inputs). These inputs are used in determining the value of the Fund’s financial instruments and are summarized in the following fair value hierarchy:
| | • | | Level 1 – quoted prices in active markets for identical financial instruments |
| | • | | Level 2 – other significant observable inputs (including quoted prices for similar financial instruments, interest rates, prepayment speed, credit risk, etc.) |
| | • | | Level 3 – significant unobservable inputs (including the Fund’s own assumptions in determining the fair value of financial instruments) |
The input levels are not necessarily an indication of the risk or liquidity associated with financial instruments at that level.
| | | | |
| | | |
30 | | Annual Report | | franklintempleton.com |
TEMPLETON GLOBAL INVESTMENT TRUST
NOTES TO FINANCIAL STATEMENTS
Templeton Frontier Markets Fund(continued)
A summary of inputs used as of March 31, 2019, in valuing the Fund’s assets carried at fair value, is as follows:
| | | | | | | | | | | | | | | | |
| | | Level 1 | | | Level 2 | | | Level 3 | | | Total | |
| |
Assets: | | | | | | | | | | | | | | | | |
Investments in Securities:a | | | | | | | | | | | | | | | | |
Equity Investments:b | | | | | | | | | | | | | | | | |
South Africa | | $ | — | | | $ | 220,995 | | | $ | — | | | $ | 220,995 | |
Zimbabwe | | | — | | | | — | | | | 985,898 | | | | 985,898 | |
All Other Equity Investments | | | 59,952,548 | | | | — | | | | — | | | | 59,952,548 | |
Short Term Investments | | | 2,357,813 | | | | — | | | | — | | | | 2,357,813 | |
| | | | |
Total Investments in Securities | | $ | 62,310,361 | | | $ | 220,995 | | | $ | 985,898 | | | $ | 63,517,254 | |
| | | | |
| | | | | | | | | | | | | | | | |
Other Financial Instruments: | | | | | | | | | | | | | | | | |
Restricted currency | | $ | — | | | $ | — | | | $ | 28,423 | | | $ | 28,423 | |
| | | | |
aFor detailed categories, see the accompanying Statement of Investments.
bIncludes common and preferred stocks.
A reconciliation of assets in which Level 3 inputs are used in determining fair value is presented when there are significant Level 3 financial instruments at the beginning and/or end of the year. At March 31, 2019, the reconciliation of assets is as follows:
| | | | | | | | | | | | | | | | | | | | | | | | | | | | | | | | | | | | |
| | | Balance at
Beginning of
Year | | | Purchases | | | Sales | | | Transfer
Into (Out of)
Level 3 | | | Cost Basis
Adjustments | | | Net
Realized
Gain
(Loss) | | | Net
Unrealized
Appreciation
(Depreciation) | | | Balance
at End
of Year | | | Net Change in
Unrealized
Appreciation
(Depreciation)
on Assets
Held at Year End | |
| |
Assets: | | | | | | | | | | | | | | | | | | | | | | | | | | | | | | | | | | | | |
Investments in Securities: | | | | | | | | | | | | | | | | | | | | | | | | | | | | | | | | | | | | |
Equity Investments: | | | | | | | | | | | | | | | | | | | | | | | | | | | | | | | | | | | | |
Kuwait | | $ | 372,835 | | | $ | — | | | $ | (238,102 | ) | | | $ — | | | | $ — | | | $ | (362,797 | ) | | $ | 228,064 | | | $ | — | | | $ | — | |
Zimbabwe | | | 5,685,578 | | | | — | | | | (2,442,547 | ) | | | — | | | | — | | | | (208,680 | ) | | | (2,048,453 | ) | | | 985,898 | | | | (1,123,669 | ) |
| | | | |
Total Investments in Securities | | $ | 6,058,413 | | | $ | — | | | $ | (2,680,649 | ) | | | $ — | | | | $ — | | | $ | (571,477 | ) | | $ | (1,820,389 | ) | | $ | 985,898 | | | $ | (1,123,669 | ) |
| | | | |
Other Financial Instruments | | | | | | | | | | | | | | | | | | | | | | | | | | | | | | | | | | | | |
Restricted currency | | $ | 966,176 | | | $ | 2,248,669 | | | $ | (2,190,472 | ) | | | $ — | | | | $ — | | | $ | (359,379 | ) | | $ | (636,571 | ) | | $ | 28,423 | | | $ | (57,775 | ) |
| | | | |
| | | | |
| | | |
| franklintempleton.com | | Annual Report | | 31 |
TEMPLETON GLOBAL INVESTMENT TRUST
NOTES TO FINANCIAL STATEMENTS
Templeton Frontier Markets Fund (continued)
9. Fair Value Measurements(continued)
Significant unobservable valuation inputs for material Level 3 financial instruments and impact to fair value as a result of changes in unobservable valuation inputs as of March 31, 2019, are as follows:
| | | | | | | | | | | | | | | | | | | | |
| Description | | Fair Value at
End of Period | | | Valuation Technique | | | Unobservable Inputs | | | Amount | | | Impact to Fair
Value if Input
Increasesa | |
| |
Assets: | | | | | | | | | | | | | | | | | | | | |
Investments in Securities: | | | | | | | | | | | | | | | | | | | | |
Equity Investments: | | | | | | | | | | | | | | | | | | | | |
Zimbabwe | | $ | 985,898 | | | | Market Comparables | | | | Implied foreign exchange rateb | | | | 5.0 | | | | Decrease | c |
| |
All Other Investmentsd | | $ | 28,423 | | | | | | | | | | | | | | | | | |
| |
| | | | | |
Total | | $ | 1,014,321 | | | | | | | | | | | | | | | | | |
| |
aRepresents the directional change in the fair value of the Level 3 financial instruments that would result from a significant and reasonable increase in the corresponding input. A significant and reasonable decrease in the input would have the opposite effect. Significant impacts, if any, to fair value and/or net assets have been indicated.
bVarious forms of currency exist within Zimbabwe, including RTGS and several alternative forms of currency (electronic cash and bonds notes). These alternative forms of currency are not directly fungible with US Dollars and therefore an implied foreign exchange rate is necessary to translate the values into the US Dollar equivalent.
cRepresents a significant impact to fair value and net assets.
dIncludes fair value of immaterial investments developed using various valuation techniques and unobservable inputs. May also include investments with values derived using prior transaction prices or third party pricing information without adjustment for which such inputs are also unobservable.
10. Subsequent Events
The Fund has evaluated subsequent events through the issuance of the financial statements and determined that no events have occurred that require disclosure, other than those already disclosed in the financial statements.
Abbreviations
|
Selected Portfolio |
| ADR American Depositary Receipt |
| GDR Global Depositary Receipt |
| | | | |
| | | |
32 | | Annual Report | | franklintempleton.com |
TEMPLETON GLOBAL INVESTMENT TRUST
Report of Independent Registered Public Accounting Firm
To the Board of Trustees of Templeton Global Investment Trust and Shareholders of Templeton Frontier Markets Fund
Opinion on the Financial Statements
We have audited the accompanying statement of assets and liabilities, including the statement of investments, of Templeton Frontier Markets Fund (the “Fund”) as of March 31, 2019, the related statement of operations for the year ended March 31, 2019, the statement of changes in net assets for each of the two years in the period ended March 31, 2019, including the related notes, and the financial highlights for each of the five years in the period ended March 31, 2019 (collectively referred to as the “financial statements”). In our opinion, the financial statements present fairly, in all material respects, the financial position of the Fund as of March 31, 2019, the results of its operations for the year then ended, the changes in its net assets for each of the two years in the period ended March 31, 2019 and the financial highlights for each of the five years in the period ended March 31, 2019 in conformity with accounting principles generally accepted in the United States of America.
Basis for Opinion
These financial statements are the responsibility of the Fund’s management. Our responsibility is to express an opinion on the Fund’s financial statements based on our audits. We are a public accounting firm registered with the Public Company Accounting Oversight Board (United States) (“PCAOB”) and are required to be independent with respect to the Fund in accordance with the U.S. federal securities laws and the applicable rules and regulations of the Securities and Exchange Commission and the PCAOB.
We conducted our audits of these financial statements in accordance with the standards of the PCAOB. Those standards require that we plan and perform the audit to obtain reasonable assurance about whether the financial statements are free of material misstatement, whether due to error or fraud.
Our audits included performing procedures to assess the risks of material misstatement of the financial statements, whether due to error or fraud, and performing procedures that respond to those risks. Such procedures included examining, on a test basis, evidence regarding the amounts and disclosures in the financial statements. Our audits also included evaluating the accounting principles used and significant estimates made by management, as well as evaluating the overall presentation of the financial statements. Our procedures included confirmation of securities owned as of March 31, 2019 by correspondence with the custodian, transfer agent, and brokers; when replies were not received from brokers, we performed other auditing procedures. We believe that our audits provide a reasonable basis for our opinion.
PricewaterhouseCoopers LLP
San Francisco, California
May 20, 2019
We have served as the auditor of one or more investment companies in the Franklin Templeton Group of Funds since 1948.
| | | | |
| | | |
| franklintempleton.com | | Annual Report | | 33 |
TEMPLETON GLOBAL INVESTMENT TRUST
Tax Information (unaudited)
Templeton Frontier Markets Fund
Under Section 854(b)(1)(B) of the Internal Revenue Code, the Fund hereby reports the maximum amount allowable but no less than $316,616 as qualified dividends for purposes of the maximum rate under Section 1(h)(11) of the Internal Revenue Code for the fiscal year ended March 31, 2019. Distributions, including qualified dividend income, paid during calendar year 2019 will be reported to shareholders on Form1099-DIV bymid-February 2020. Shareholders are advised to check with their tax advisors for information on the treatment of these amounts on their individual income tax returns.
At March 31, 2018, more than 50% of the Fund’s total assets were invested in securities of foreign issuers. In most instances, foreign taxes were withheld from income paid to the Fund on these investments. As shown in the table below, the Funds hereby reports to shareholders the foreign source income and foreign taxes paid, pursuant to Section 853 of the Internal Revenue Code. This written statement will allow shareholders of record on December 20, 2018, to treat their proportionate share of foreign taxes paid by the Fund as having been paid directly by them. The shareholder shall consider these amounts as foreign taxes paid in the tax year in which they receive the Fund distribution.
The following table provides a detailed analysis of foreign tax paid, foreign source income, and foreign source qualified dividends as reported by the Fund to shareholders of record.
| | | | | | | | | | | | |
| Class | | Foreign Tax Paid
Per Share | | | Foreign Source
Income Per Share | | | Foreign Source Qualified
Dividends Per Share | |
Class A | | | $0.1872 | | | | $0.3319 | | | | $0.0514 | |
Class C | | | $0.1872 | | | | $0.1630 | | | | $0.0253 | |
Class R | | | $0.1872 | | | | $0.2971 | | | | $0.0460 | |
Class R6 | | | $0.1872 | | | | $0.4269 | | | | $0.0663 | |
Advisor Class | | | $0.1872 | | | | $0.3509 | | | | $0.0545 | |
Foreign Tax Paid Per Share is the amount per share available to you, as a tax credit (assuming you held your shares in the Fund for a minimum of 16 days during the31-day period beginning 15 days before theex-dividend date of the Fund’s distribution to which the foreign taxes relate), or, as a tax deduction.
Foreign Source Income Per Share is the amount per share of income dividends attributable to foreign securities held by the Fund, plus any foreign taxes withheld on these dividends. The amounts reported include foreign source qualified dividends that have not been adjusted for the rate differential applicable to such dividend income.1
Foreign Source Qualified Dividends Per Share is the amount per share of foreign source qualified dividends, plus any foreign taxes withheld on these dividends. These amounts represent the portion of the Foreign Source Income that were derived from qualified foreign securities held by the Fund.1
In February 2019, shareholders received Form1099-DIV which included their share of taxes paid and foreign source income distributed during the calendar year 2018. The Foreign Source Income reported on Form1099-DIV was not adjusted for the rate differential on foreign source qualified dividend income. Shareholders are advised to check with their tax advisors for information on the treatment of these amounts on their 2018 individual income tax returns.
1. Qualified dividends are taxed at reduced long term capital gains tax rates. In determining the amount of foreign tax credit that may be applied against the U.S. tax liability of individuals receiving foreign source qualified dividends, adjustments may be required to the foreign tax credit limitation calculation to reflect the rate differential applicable to such dividend income. The rules however permit certain individuals to elect not to apply the rate differential adjustments for capital gains and/or dividends for any taxable year. Please consult your tax advisor and the instructions to Form 1116 for more information.
| | | | |
| | | |
34 | | Annual Report | | franklintempleton.com |
TEMPLETON GLOBAL INVESTMENT TRUST
Board Members and Officers
The name, year of birth and address of the officers and board members, as well as their affiliations, positions held with the Trust, principal occupations during at least the past five years and number of U.S. registered portfolios overseen in the Franklin Templeton fund complex, are shown below. Generally, each board member serves until that person’s successor is elected and qualified.
Independent Board Members
| | | | | | | | |
Name, Year of Birth and Address | | Position | | Length of Time Served | | Number of Portfolios in Fund Complex Overseen by Board Member* | | Other Directorships Held During at Least the Past 5 Years |
Harris J. Ashton (1932) 300 S.E. 2nd Street | | Trustee | | Since 1994 | | 136 | | Bar-S Foods (meat packing company) (1981-2010). |
| Fort Lauderdale, FL 33301-1923 | | | | | | | | |
| | |
| Principal Occupation During at Least the Past 5 Years: | | | | |
| Director of various companies; andformerly, Director, RBC Holdings, Inc. (bank holding company) (until 2002); and President, Chief Executive Officer and Chairman of the Board, General Host Corporation (nursery and craft centers) (until 1998). |
| | | | |
Ann Torre Bates (1958) 300 S.E. 2nd Street Fort Lauderdale, FL 33301-1923 | | Trustee | | Since 2008 | | 38 | | Ares Capital Corporation (specialty finance company) (2010-present), United Natural Foods, Inc. (distributor of natural, organic and specialty foods) (2013-present), Allied Capital Corporation (financial services) (2003-2010), SLM Corporation (Sallie Mae) (1997-2014) and Navient Corporation (loan management, servicing and asset recovery) (2014-2016). |
| | |
| Principal Occupation During at Least the Past 5 Years: | | | | |
| Director of various companies; andformerly, Executive Vice President and Chief Financial Officer, NHP Incorporated (manager of multifamily housing) (1995-1997); and Vice President and Treasurer, US Airways, Inc. (until 1995). |
| | | | |
Mary C. Choksi (1950) 300 S.E. 2nd Street Fort Lauderdale, FL 33301-1923 | | Trustee | | Since 2017 | | 136 | | Avis Budget Group Inc. (car rental) (2007-present), Omnicom Group Inc. (advertising and marketing communications services) (2011-present) and White Mountains Insurance Group, Ltd. (holding company) (2017-present). |
| | |
| Principal Occupation During at Least the Past 5 Years: | | | | |
| Director of various companies; andformerly, Founder and Senior Advisor, Strategic Investment Group (investment management group) (2015-2017); Founding Partner and Senior Managing Director, Strategic Investment Group (1987-2015); Founding Partner and Managing Director, Emerging Markets Management LLC (investment management firm) (1987-2011); and Loan Officer/Senior Loan Officer/Senior Pension Investment Officer, World Bank Group (international financial institution) (1977-1987). |
| | | | |
Edith E. Holiday (1952) 300 S.E. 2nd Street Fort Lauderdale, FL 33301-1923 | | Lead Independent Trustee | | Trustee since 1996 and Lead Independent Trustee since 2007 | | 136 | | Hess Corporation (exploration of oil and gas) (1993-present), Canadian National Railway (railroad) (2001-present), White Mountains Insurance Group, Ltd. (holding company) (2004-present), Santander Consumer USA Holdings, Inc. (consumer finance) (2016-present), RTI International Metals, Inc. (manufacture and distribution of titanium) (1999-2015) and H.J. Heinz Company (processed foods and allied products) (1994-2013). |
| | |
| Principal Occupation During at Least the Past 5 Years: | | | | |
| Director or Trustee of various companies and trusts; andformerly, Assistant to the President of the United States and Secretary of the Cabinet (1990-1993); General Counsel to the United States Treasury Department (1989-1990); and Counselor to the Secretary and Assistant Secretary for Public Affairs and Public Liaison-United States Treasury Department (1988-1989). |
| | | | |
| | | |
| franklintempleton.com | | Annual Report | | 35 |
TEMPLETON GLOBAL INVESTMENT TRUST
Independent Board Members(continued)
| | | | | | | | |
Name, Year of Birth and Address | | Position | | Length of Time Served | | Number of Portfolios in Fund Complex Overseen by Board Member* | | Other Directorships Held During at Least the Past 5 Years |
| | | | |
J. Michael Luttig (1954) 300 S.E. 2nd Street | | Trustee | | Since 2009 | | 136 | | Boeing Capital Corporation (aircraft financing) (2006-2013). |
| Fort Lauderdale, FL 33301-1923 | | | | | | | | |
| | |
| Principal Occupation During at Least the Past 5 Years: | | | | |
| Executive Vice President, General Counsel and member of the Executive Council, The Boeing Company (aerospace company) (2006-present); andformerly, Federal Appeals Court Judge, U.S. Court of Appeals for the Fourth Circuit (1991-2006). |
| | | | |
David W. Niemiec (1949) 300 S.E. 2nd Street Fort Lauderdale, FL 33301-1923 | | Trustee | | Since 2006 | | 38 | | Hess Midstream Partners LP (oil and gas midstream infrastructure) (2017-present). |
| | |
| Principal Occupation During at Least the Past 5 Years: | | | | |
| Advisor, Saratoga Partners (private equity fund); andformerly, Managing Director, Saratoga Partners (1998-2001) and SBC Warburg Dillon Read (investment banking) (1997-1998); Vice Chairman, Dillon, Read & Co. Inc. (investment banking) (1991-1997); and Chief Financial Officer, |
| Dillon, Read & Co. Inc. (1982-1997). | | | | | | |
| | | | |
Larry D. Thompson (1945) 300 S.E. 2nd Street Fort Lauderdale, FL 33301-1923 | | Trustee | | Since 2006 | | 136 | | The Southern Company (energy company) (2014-present; previously 2010-2012), Graham Holdings Company (education and media organization) (2011-present) and Cbeyond, Inc. (business communications provider) (2010-2012). |
| | |
| Principal Occupation During at Least the Past 5 Years: | | | | |
| Director of various companies; Counsel, Finch McCranie, LLP (law firm) (2015-present); Independent Compliance Monitor and Auditor, Volkswagen AG (manufacturer of automobiles and commercial vehicles) (2017-present); John A. Sibley Professor of Corporate and Business Law, University of Georgia School of Law (2015-present; previously 2011-2012); andformerly, Executive Vice President – Government Affairs, General Counsel and Corporate Secretary, PepsiCo, Inc. (consumer products) (2012-2014); Senior Vice President – Government Affairs, General Counsel and Secretary, PepsiCo, Inc. (2004-2011); Senior Fellow of The Brookings Institution (2003-2004); Visiting Professor, University of Georgia School of Law (2004); and Deputy Attorney General, U.S. Department of Justice (2001-2003). |
| | | | |
| Constantine D. Tseretopoulos | | Trustee | | Since 2001 | | 24 | | None |
| (1954) | | | | | | | | |
| 300 S.E. 2nd Street | | | | | | | | |
| Fort Lauderdale, FL 33301-1923 | | | | | | | | |
| | |
| Principal Occupation During at Least the Past 5 Years: | | | | |
| Physician, Chief of Staff, owner and operator of the Lyford Cay Hospital (1987-present); director of various nonprofit organizations; andformerly, Cardiology Fellow, University of Maryland (1985-1987); and Internal Medicine Resident, Greater Baltimore Medical Center (1982-1985). |
| | | | |
Robert E. Wade (1946) 300 S.E. 2nd Street | | Trustee | | Since 2006 | | 38 | | El Oro Ltd (investments) (2003-present). |
| Fort Lauderdale, FL 33301-1923 | | | | | | | | |
| | |
| Principal Occupation During at Least the Past 5 Years: | | | | |
| Attorney at law engaged in private practice as a sole practitioner (1972-2008) and member of various boards. |
| | | | |
| | | |
36 | | Annual Report | | franklintempleton.com |
TEMPLETON GLOBAL INVESTMENT TRUST
Interested Board Members and Officers
| | | | | | | | |
Name, Year of Birth and Address | | Position | | Length of Time Served | | Number of Portfolios in Fund Complex Overseen by Board Member* | | Other Directorships Held During at Least the Past 5 Years |
| | | | |
**Gregory E. Johnson (1961) | | Trustee | | Since 2006 | | 150 | | None |
One Franklin Parkway | | | | | | | | |
San Mateo, CA 94403-1906 | | | | | | | | |
| | |
Principal Occupation During at Least the Past 5 Years: | | | | |
| Chairman of the Board, Member – Office of the Chairman, Director and Chief Executive Officer, Franklin Resources, Inc.; officer and/or director or trustee, as the case may be, of some of the other subsidiaries of Franklin Resources, Inc. and of 42 of the investment companies in Franklin Templeton; Vice Chairman, Investment Company Institute; andformerly, President, Franklin Resources, Inc. (1994-2015). |
| | | | |
**Rupert H. Johnson, Jr. (1940) One Franklin Parkway San Mateo, CA 94403-1906 | | Chairman of the Board, Trustee and Vice President | | Chairman of the Board and Trustee since 2013 and Vice President since 1996 | | 136 | | None |
| | |
| Principal Occupation During at Least the Past 5 Years: | | | | |
| Vice Chairman, Member – Office of the Chairman and Director, Franklin Resources, Inc.; Director, Franklin Advisers, Inc.; and officer and/or director or trustee, as the case may be, of some of the other subsidiaries of Franklin Resources, Inc. and of 40 of the investment companies in Franklin Templeton. |
| | | | |
| Alison E. Baur (1964) | | Vice President | | Since 2012 | | Not Applicable | | Not Applicable |
| One Franklin Parkway | | | | | | | | |
| San Mateo, CA 94403-1906 | | | | | | | | |
| | |
| Principal Occupation During at Least the Past 5 Years: | | | | |
| Deputy General Counsel, Franklin Templeton; and officer of some of the other subsidiaries of Franklin Resources, Inc. and of 44 of the investment companies in Franklin Templeton. |
| | | | |
Norman J. Boersma (1957) Lyford Cay Nassau, Bahamas | | President and Chief Executive Officer – Investment Management | | Since 2012 | | Not Applicable | | Not Applicable |
| | |
| Principal Occupation During at Least the Past 5 Years: | | | | |
| Chairman of the Board, President and Chief Executive Officer, Templeton Global Advisors Ltd.; Chief Investment Officer of Templeton Global Equity Group; officer of five of the investment companies in Franklin Templeton; andformerly, Executive Vice President, Franklin Templeton Investments Corp. (1993-2014). |
| | | | |
| Aliya S. Gordon (1973) | | Vice President | | Since 2009 | | Not Applicable | | Not Applicable |
| One Franklin Parkway | | | | | | | | |
| San Mateo, CA 94403-1906 | | | | | | | | |
| | |
| Principal Occupation During at Least the Past 5 Years: | | | | |
| Senior Associate General Counsel and officer of 44 of the investment companies in Franklin Templeton. |
| | | | |
| Steven J. Gray (1955) | | Vice President | | Since 2009 | | Not Applicable | | Not Applicable |
| One Franklin Parkway | | | | | | | | |
| San Mateo, CA 94403-1906 | | | | | | | | |
| | |
| Principal Occupation During at Least the Past 5 Years: | | | | |
| Senior Associate General Counsel, Franklin Templeton; Vice President, Franklin Templeton Distributors, Inc. and FASA, LLC; and officer of 44 of the investment companies in Franklin Templeton. |
| | | | |
Matthew T. Hinkle (1971) One Franklin Parkway San Mateo, CA 94403-1906 | | Chief Executive Officer – Finance and Administration | | Since 2017 | | Not Applicable | | Not Applicable |
| | |
| Principal Occupation During at Least the Past 5 Years: | | | | |
| Senior Vice President, Franklin Templeton Services, LLC; officer of 44 of the investment companies in Franklin Templeton; and formerly, Vice President, Global Tax (2012-April 2017) and Treasurer/Assistant Treasurer, Franklin Templeton (2009-2017). |
| | | | |
| | | |
| franklintempleton.com | | Annual Report | | 37 |
TEMPLETON GLOBAL INVESTMENT TRUST
Interested Board Members and Officers(continued)
| | | | | | | | |
Name, Year of Birth and Address | | Position | | Length of Time Served | | Number of Portfolios in Fund Complex Overseen by Board Member* | | Other Directorships Held During at Least the Past 5 Years |
Robert G. Kubilis (1973) 300 S.E. 2nd Street Fort Lauderdale, FL 33301-1923 | | Chief Financial Officer, Chief Accounting Officer and Treasurer | | Since 2017 | | Not Applicable | | Not Applicable |
| | |
| Principal Occupation During at Least the Past 5 Years: | | | | |
| Treasurer, U.S. Fund Administration & Reporting and officer of 16 of the investment companies in Franklin Templeton. |
| | | | |
Robert Lim (1948) One Franklin Parkway San Mateo, CA 94403-1906 | | Vice President – AML Compliance | | Since 2016 | | Not Applicable | | Not Applicable |
| | |
| Principal Occupation During at Least the Past 5 Years: | | | | |
| Vice President, Franklin Templeton Companies, LLC; Chief Compliance Officer, Franklin Templeton Distributors, Inc. and Franklin Templeton Investor Services, LLC; and officer of 44 of the investment companies in Franklin Templeton. |
| | | | |
| Kimberly H. Novotny (1972) | | Vice President | | Since 2013 | | Not Applicable | | Not Applicable |
| 300 S.E. 2nd Street | | | | | | | | |
| Fort Lauderdale, FL 33301-1923 | | | | | | | | |
| | |
| Principal Occupation During at Least the Past 5 Years: | | | | |
| Associate General Counsel, Franklin Templeton; Vice President and Corporate Secretary, Fiduciary Trust International of the South; Vice President, Templeton Investment Counsel, LLC; Assistant Secretary, Franklin Resources, Inc.; and officer of 44 of the investment companies in Franklin Templeton. |
| | | | |
Robert C. Rosselot (1960) 300 S.E. 2nd Street Fort Lauderdale, FL 33301-1923 | | Chief Compliance Officer | | Since 2013 | | Not Applicable | | Not Applicable |
| | |
| Principal Occupation During at Least the Past 5 Years: | | | | |
| Director, Global Compliance, Franklin Templeton; Vice President, Franklin Templeton Companies, LLC; officer of 44 of the investment companies in Franklin Templeton; andformerly, Senior Associate General Counsel, Franklin Templeton (2007-2013); and Secretary and Vice President, Templeton Group of Funds (2004-2013). |
| | | | |
| Navid J. Tofigh (1972) | | Vice President | | Since 2015 | | Not Applicable | | Not Applicable |
| One Franklin Parkway | | | | | | | | |
| San Mateo, CA 94403-1906 | | | | | | | | |
| | |
| Principal Occupation During at Least the Past 5 Years: | | | | |
| Associate General Counsel and officer of 44 of the investment companies in Franklin Templeton. | | |
| | | | |
| Craig S. Tyle (1960) | | Vice President | | Since 2005 | | Not Applicable | | Not Applicable |
| One Franklin Parkway | | | | | | | | |
| San Mateo, CA 94403-1906 | | | | | | | | |
| | |
| Principal Occupation During at Least the Past 5 Years: | | | | |
| General Counsel and Executive Vice President, Franklin Resources, Inc.; and officer of some of the other subsidiaries of Franklin Resources, Inc. and of 44 of the investment companies in Franklin Templeton. |
| | | | |
Lori A. Weber (1964) 300 S.E. 2nd Street Fort Lauderdale, FL 33301-1923 | | Vice President and Secretary | | Vice President since 2011 and Secretary since 2013 | | Not Applicable | | Not Applicable |
| | |
| Principal Occupation During at Least the Past 5 Years: | | | | |
| Senior Associate General Counsel, Franklin Templeton; Assistant Secretary, Franklin Resources, Inc.; Vice President and Secretary, Templeton Investment Counsel, LLC; and officer of 44 of the investment companies in Franklin Templeton. |
| | | | |
| | | |
38 | | Annual Report | | franklintempleton.com |
TEMPLETON GLOBAL INVESTMENT TRUST
*We base the number of portfolios on each separate series of the U.S. registered investment companies within the Franklin Templeton fund complex. These portfolios have a common investment manager or affiliated investment managers.
**Gregory E. Johnson is considered to be an interested person of the Fund under the federal securities laws due to his position as an officer and director of Franklin Resources, Inc. (Resources), which is the parent company of the Fund’s investment manager and distributor. Rupert H. Johnson, Jr. is considered to be an interested person of the Fund under the federal securities laws due to his position as an officer and director and major shareholder of Resources.
Note 1: Rupert H. Johnson, Jr. is the uncle of Gregory E. Johnson.
Note 2: Officer information is current as of the date of this report. It is possible that after this date, information about officers may change.
The Sarbanes-Oxley Act of 2002 and Rules adopted by the US Securities and Exchange Commission require the Fund to disclose whether the Fund’s Audit Committee includes at least one member who is an audit committee financial expert within the meaning of such Act and Rules. The Fund’s Board has determined that there is at least one such financial expert on the Audit Committee and has designated each of Ann Torre Bates and David W. Niemiec as an audit committee financial expert. The Board believes that Ms. Bates and Mr. Niemiec qualify as such an expert in view of their extensive business background and experience. Ms. Bates has served as a member of the Fund Audit Committee since 2008. She currently serves as a director of Ares Capital Corporation (2010-present) and United Natural Foods, Inc. (2013-present) and was formerly a director of Navient Corporation from 2014 to 2016, SLM Corporation from 1997 to 2014 and Allied Capital Corporation from 2003 to 2010, Executive Vice President and Chief Financial Officer of NHP Incorporated from 1995 to 1997 and Vice President and Treasurer of US Airways, Inc. until 1995. Mr. Niemiec has served as a member of the Fund Audit Committee since 2006, currently serves as an Advisor to Saratoga Partners and was formerly its Managing Director from 1998 to 2001 and serves as a director of Hess Midstream Partners LP (2017-present). Mr. Niemiec was formerly a director of Emeritus Corporation from 1999 to 2010 and OSI Pharmaceuticals, Inc. from 2006 to 2010, Managing Director of SBC Warburg Dillon Read from 1997 to 1998, and was Vice Chairman from 1991 to 1997 and Chief Financial Officer from 1982 to 1997 of Dillon, Read & Co. Inc. As a result of such background and experience, the Board believes that Ms. Bates and Mr. Niemiec have each acquired an understanding of generally accepted accounting principles and financial statements, the general application of such principles in connection with the accounting estimates, accruals and reserves, and analyzing and evaluating financial statements that present a breadth and level of complexity of accounting issues generally comparable to those of the Fund, as well as an understanding of internal controls and procedures for financial reporting and an understanding of audit committee functions. Ms. Bates and Mr. Niemiec are independent Board members as that term is defined under the applicable US Securities and Exchange Commission Rules and Releases.
The Statement of Additional Information (SAI) includes additional information about the board members and is available, without charge, upon request. Shareholders may call (800) DIALBEN/342-5236 to request the SAI.
| | | | |
| | | |
| franklintempleton.com | | Annual Report | | 39 |
TEMPLETON GLOBAL INVESTMENT TRUST
TEMPLETON FRONTIER MARKETS FUND
Shareholder Information
Board Approval of Investment Management Agreements
TEMPLETON GLOBAL INVESTMENT TRUST
Templeton Frontier Markets Fund
(Fund)
At anin-person meeting held on February 26, 2019 (Meeting), the Board of Trustees (Board) of Templeton Global Investment Trust (Trust), including a majority of the trustees who are not “interested persons” as defined in the Investment Company Act of 1940 (Independent Trustees), reviewed and approved the continuance of the investment management agreement between Franklin Templeton Investments (ME) Limited (Manager) and the Trust, on behalf of the Fund (Management Agreement) for an additionalone-year period. The Independent Trustees received advice from and met separately with Independent Trustee counsel in considering whether to approve the continuation of the Management Agreement.
In considering the continuation of the Management Agreement, the Board reviewed and considered information provided by the Manager at the Meeting and throughout the year at meetings of the Board and its committees. The Board also reviewed and considered information provided in response to a detailed set of requests for information submitted to the Manager by Independent Trustee counsel on behalf of the Independent Trustees in connection with the annual contract renewal process. In addition, prior to the Meeting, the Independent Trustees held a telephonic contract renewal meeting at which the Independent Trustees conferred amongst themselves and Independent Trustee counsel about contract renewal matters. The Board reviewed and considered all of the factors it deemed relevant in approving the continuance of the Management Agreement, including, but not limited to: (i) the nature, extent and quality of the services provided by the Manager; (ii) the investment performance of the Fund; (iii) the costs of the services provided and profits realized by the Manager and its affiliates from the relationship with the Fund; (iv) the extent to which economies of scale are realized as the Fund grows; and (v) whether fee levels reflect these economies of scale for the benefit of Fund investors.
In approving the continuance of the Management Agreement, the Board, including a majority of the Independent Trustees, determined that the terms of the Management Agreement are fair and reasonable and that the continuance of such Management Agreement is in the interests of the Fund and its shareholders. While attention was given to all information
furnished, the following discusses some primary factors relevant to the Board’s determination.
Nature, Extent and Quality of Services
The Board reviewed and considered information regarding the nature, extent and quality of investment management services provided by the Manager and its affiliates to the Fund and its shareholders. This information included, among other things, the qualifications, background and experience of the senior management and investment personnel of the Manager; the structure of investment personnel compensation; oversight of third-party service providers; investment performance reports and related financial information for the Fund; reports on expenses, shareholder services, marketing support payments made to financial intermediaries and third party servicing arrangements; legal and compliance matters; risk controls; pricing and other services provided by the Manager and its affiliates; and management fees charged by the Manager and its affiliates to US funds and other accounts, including management’s explanation of differences among accounts where relevant. The Board also reviewed and considered an annual report on payments made by Franklin Templeton Investments (FTI) or the Fund to financial intermediaries, as well as a memorandum relating to third-party servicing arrangements in response to a guidance update in 2016 from the US Securities and Exchange Commission (SEC) relating to mutual fund distribution andsub-accounting fees. The Board noted management’s continuing efforts and expenditures in establishing effective business continuity plans and developing strategies to address areas of heightened concern in the mutual fund industry, such as cybersecurity and liquidity risk management. The Board also recognized management’s commitment to facilitating Board oversight of liquidity through the designation of a liquidity/risk administrator and the development of reports that highlight the amount of illiquid investments for the Fund.
The Board also reviewed and considered the benefits provided to Fund shareholders of investing in a fund that is part of the Franklin Templeton family of funds. The Board noted the financial position of Franklin Resources, Inc. (FRI), the Manager’s parent, and its commitment to the mutual fund business as evidenced by its continued introduction of new funds, reassessment of the fund offerings in response to the market environment and project initiatives and capital investments relating to the services provided to the Fund by the FTI organization.
| | | | |
| | | |
40 | | Annual Report | | franklintempleton.com |
TEMPLETON GLOBAL INVESTMENT TRUST
TEMPLETON FRONTIER MARKETS FUND
SHAREHOLDER INFORMATION
Following consideration of such information, the Board was satisfied with the nature, extent and quality of services provided by the Manager and its affiliates to the Fund and its shareholders.
Fund Performance
The Board reviewed and considered the performance results of the Fund over various time periods ended December 31, 2018. The Board considered the performance returns for the Fund in comparison to the performance returns of mutual funds deemed comparable to the Fund included in a universe (Performance Universe) selected by Broadridge Financial Solutions, Inc. (Broadridge), an independent provider of investment company data. The Board received a description of the methodology used by Broadridge to select the mutual funds included in a Performance Universe. The Board also considered the performance returns for the Fund in comparison to the performance returns of a customized peer group (Performance Customized Peer Group) selected by the Manager. The Board further reviewed and considered Fund performance reports provided and discussions that occurred with portfolio managers at Board meetings throughout the year. A summary of the Fund’s performance results is below.
The Performance Universe for the Fund included the Fund and all retail and institutional emerging markets funds. The Performance Customized Peer Group for this Fund included funds that invest at least 80% of their assets in frontier market countries. The Board noted that the Fund’s annualized total returns for theone-, three-, five- and10-year periods were below the medians of their Performance Universe and Performance Customized Peer Group and fell within the fourth quintile and fifth quintile (the worst). The Board discussed this performance with management and management explained that the Fund’s portfolio management team was replaced in 2018 with a new portfolio management team and that, in light of this change, management expected to see future improvement in the Fund’s performance. In light of these discussions and management’s continued attention to the Fund’s underperformance, the Board determined that additional time is needed to evaluate the effectiveness of management’s actions.
Comparative Fees and Expenses
The Board reviewed and considered information regarding the Fund’s actual total expense ratio and its various components, including, as applicable, management fees; transfer agent expenses; underlying fund expenses; Rule12b-1 andnon-Rule12b-1 service fees; and othernon-management fees. The Board also noted the quarterly and annual reports it
receives on all marketing support payments made by FTI to financial intermediaries. The Board considered the actual total expense ratio and, separately, the contractual management fee rate, without the effect of fee waivers, if any (Management Rate) of the Fund in comparison to the median expense ratio and median Management Rate, respectively, of other mutual funds deemed comparable to and with a similar expense structure to the Fund selected by Broadridge (Expense Group). Broadridge fee and expense data is based upon information taken from each fund’s most recent annual report, which reflects historical asset levels that may be quite different from those currently existing, particularly in a period of market volatility. While recognizing such inherent limitation and the fact that expense ratios and Management Rates generally increase as assets decline and decrease as assets grow, the Board believed the independent analysis conducted by Broadridge to be an appropriate measure of comparative fees and expenses. The Broadridge Management Rate includes administrative charges, and the actual total expense ratio, for comparative consistency, was shown for Class A shares for the Fund and Class A shares and Investor A shares for funds with multiple classes of shares. The Board received a description of the methodology used by Broadridge to select the mutual funds included in an Expense Group.
The Expense Group for the Fund included the Fund and 17 other emerging markets funds. The Board noted that the Management Rate and actual total expense ratio for the Fund were above the medians of and the second most expensive in its Expense Group. The Board discussed the expenses of this Fund with management and noted the Fund’s specialized focus of the Fund ondifficult-to-research frontier markets. The Board concluded that the Management Rate charged to the Fund is reasonable, given the factor noted above and management’s proposal to reduce the Management Rate of the Fund in response to a request from the Independent Trustees. Accordingly, effective April 1, 2019, the investment management fee paid by the Fund was changed to 1.400% for assets up to and including $500 million, 1.300% for assets over $500 million and up to and including $1 billion and 1.200% for assets exceeding $1 billion.
Profitability
The Board reviewed and considered information regarding the profits realized by the Manager and its affiliates in connection with the operation of the Fund. In this respect, the Board considered the Fund profitability analysis provided by the Manager that addresses the overall profitability of FTI’s US fund business, as well as its profits in providing investment
| | | | |
| | | |
| franklintempleton.com | | Annual Report | | 41 |
TEMPLETON GLOBAL INVESTMENT TRUST
TEMPLETON FRONTIER MARKETS FUND
SHAREHOLDER INFORMATION
management and other services to each of the individual funds during the12-month period ended September 30, 2018, being the most recent fiscalyear-end for FRI. The Board noted that although management continually makes refinements to its methodologies used in calculating profitability in response to organizational and product related changes, the overall methodology has remained consistent with that used in the Fund’s profitability report presentations from prior years. Additionally, PricewaterhouseCoopers LLP, auditor to FRI and certain Franklin Templeton funds, has been engaged by the Manager to periodically review and assess the allocation methodologies to be used solely by the Fund’s Board with respect to the profitability analysis.
The Board noted management’s belief that costs incurred in establishing the infrastructure necessary for the type of mutual fund operations conducted by the Manager and its affiliates may not be fully reflected in the expenses allocated to the Fund in determining its profitability, as well as the fact that the level of profits, to a certain extent, reflected operational cost savings and efficiencies initiated by management. The Board also noted management’s expenditures in improving shareholder services provided to the Fund, as well as the need to implement systems and meet additional regulatory and compliance requirements resulting from recent SEC and other regulatory requirements.
The Board also considered the extent to which the Manager and its affiliates might derive ancillary benefits from fund operations, including revenues generated from transfer agent services, potential benefits resulting from personnel and systems enhancements necessitated by fund growth, as well as increased leverage with service providers and counterparties. Based upon its consideration of all these factors, the Board concluded that the level of profits realized by the Manager and its affiliates from providing services to the Fund was not excessive in view of the nature, extent and quality of services provided to the Fund.
Economies of Scale
The Board reviewed and considered the extent to which the Manager may realize economies of scale, if any, as the Fund grows larger and whether the Fund’s management fee structure reflects any economies of scale for the benefit of shareholders. With respect to possible economies of scale, the Board noted the existence of management fee breakpoints, which operate generally to share any economies of scale with the Fund’s shareholders by reducing the Fund’s effective management fees as the Fund grows in size. The Board considered the Manager’s view that any analyses of potential economies of scale in
managing a particular fund are inherently limited in light of the joint and common costs and investments the Manager incurs across the Franklin Templeton family of funds as a whole. The Board noted that the Fund does not have an asset size that would likely enable the Fund to achieve economies of scale, but concluded that to the extent economies of scale may be realized by the Manager and its affiliates, the Fund’s management fee structure provided a sharing of benefits with the Fund and its shareholders as the Fund grows.
Conclusion
Based on its review, consideration and evaluation of all factors it believed relevant, including the above-described factors and conclusions, the Board unanimously approved the continuation of the Management Agreement for an additionalone-year period.
Proxy Voting Policies and Procedures
The Fund’s investment manager has established Proxy Voting Policies and Procedures (Policies) that the Fund uses to determine how to vote proxies relating to portfolio securities. Shareholders may view the Fund’s complete Policies online at franklintempleton.com. Alternatively, shareholders may request copies of the Policies free of charge by calling the Proxy Group collect at (954)527-7678 or by sending a written request to: Franklin Templeton Companies, LLC, 300 S.E. 2nd Street, Fort Lauderdale, FL 33301, Attention: Proxy Group. Copies of the Fund’s proxy voting records are also made available online at franklintempleton.com and posted on the U.S. Securities and Exchange Commission’s website at sec.gov and reflect the most recent12-month period ended June 30.
Quarterly Statement of Investments
The Trust, on behalf of the Fund, files a complete statement of investments with the U.S. Securities and Exchange Commission for the first and third quarters for each fiscal year as an exhibit to its report on FormN-PORT. Shareholders may view the filed FormN-PORT by visiting the Commission’s website at sec.gov. The filed form may also be viewed and copied at the Commission’s Public Reference Room in Washington, DC. Information regarding the operations of the Public Reference Room may be obtained by calling(800) SEC-0330.
Householding of Reports and Prospectuses
You will receive the Fund’s financial reports every six months as well as an annual updated summary prospectus (prospectus available upon request). To reduce Fund expenses, we try to
| | | | |
| | | |
42 | | Annual Report | | franklintempleton.com |
TEMPLETON GLOBAL INVESTMENT TRUST
TEMPLETON FRONTIER MARKETS FUND
SHAREHOLDER INFORMATION
identify related shareholders in a household and send only one copy of the financial reports and summary prospectus. This process, called “householding,” will continue indefinitely unless you instruct us otherwise. If you prefer not to have these documents householded, please call us at (800)632-2301. At any time you may view current prospectuses/summary prospectuses and financial reports on our website. If you choose, you may receive these documents through electronic delivery.
| | | | |
| | | |
| franklintempleton.com | | Annual Report | | 43 |
This page intentionally left blank.
| | |

| | Annual Report and Shareholder Letter Templeton Frontier Markets Fund Investment Manager Franklin Templeton Investments (ME) Limited Distributor Franklin Templeton Distributors, Inc. (800) DIAL BEN®/342-5236 franklintempleton.com Shareholder Services (800)632-2301 |
Authorized for distribution only when accompanied or preceded by a summary prospectus and/or prospectus. Investors should carefully consider a fund’s investment goals, risks, charges and expenses before investing. A prospectus contains this and other information; please read it carefully before investing.
To help ensure we provide you with quality service, all calls to and from our service areas are monitored and/or recorded.
| | |
| © 2019 Franklin Templeton Investments. All rights reserved. | | 096 A 05/19 |
| | |

| | Annual Report and Shareholder Letter March 31, 2019 |
|
Templeton Emerging Markets Small Cap Fund A SERIES OF TEMPLETON GLOBAL INVESTMENT TRUST |
|
| |

Sign up for electronic delivery at franklintempleton.com/edelivery
Internet Delivery of Fund Reports Unless You Request Paper Copies:Effective January 1, 2021, as permitted by the SEC, paper copies of the Fund’s shareholder reports will no longer be sent by mail, unless you specifically request them from the Fund or your financial intermediary. Instead, the reports will be made available on a website, and you will be notified by mail each time a report is posted and provided with a website link to access the report.
If you already elected to receive shareholder reports electronically, you will not be affected by this change and you need not take any action. If you have not signed up for electronic delivery, we would encourage you to join fellow shareholders who have. You may elect to receive shareholder reports and other communications electronically from the Fund by calling (800)632-2301 or by contacting your financial intermediary.
You may elect to continue to receive paper copies of all your future shareholder reports free of charge by contacting your financial intermediary or, if you invest directly with a Fund, calling (800)632-2301 to let the Fund know of your request. Your election to receive reports in paper will apply to all funds held in your account.
Franklin Templeton
Successful investing begins with ambition. And achievement only comes when you reach for it. That’s why we continually strive to deliver better outcomes for investors. No matter what your goals are, our deep, global investment expertise allows us to offer solutions that can help.
During our more than 70 years of experience, we’ve managed through all kinds of markets—up, down and those in between. We’re always preparing for what may come next. It’s because of this, combined with our strength as one of the world’s largest asset managers that we’ve earned the trust of millions of investors around the world.
Dear Shareholder:
During the 12 months ended March 31, 2019, emerging market economies’ growth moderated, though they still grew at a faster rate than developed market economies. In this environment, emerging market small cap stocks declined, as measured by the MSCI Emerging Markets Small Cap Index.
Investor sentiment in emerging markets declined in 2018 due to concerns about global economic growth, rising U.S. interest rates, a strengthening U.S. dollar, global trade tensions and economic crises in Turkey and Argentina. Chinese economic growth also moderated throughout the year. Emerging market stocks rallied in 2019’s first quarter due to easing U.S.-China trade tensions, indications the U.S. Federal Reserve would halt interest rate hikes in 2019, decreased concerns about a global economic slowdown and increased commodity prices. Asian equities in particular performed well, in part due to investor perceptions that China’s economy has stabilized.
We are committed to our long-term perspective and disciplined investment approach as we conduct a rigorous, fundamental analysis of securities with a regular emphasis on investment risk management.
Historically, patient investors have achieved rewarding results by evaluating their goals, diversifying their assets globally and maintaining a disciplined investment program, all hallmarks of the Templeton investment philosophy developed more than 60 years ago. We continue to recommend investors consult their financial advisors and review their portfolios to design a
long-term strategy and portfolio allocation that meet their individual needs, goals and risk tolerance.
Templeton Emerging Markets Small Cap Fund’s annual report includes more detail about prevailing conditions and a discussion about investment decisions during the period. Please remember all securities markets fluctuate, as do mutual fund share prices.
We thank you for investing with Franklin Templeton, welcome your questions and comments, and look forward to serving your investment needs in the years ahead.
Sincerely,

Manraj S. Sekhon, CFA
Chief Investment Officer
Franklin Templeton Emerging Markets Equity
This letter reflects our analysis and opinions as of March 31, 2019, unless otherwise indicated. The information is not a complete analysis of every aspect of any market, country, industry, security or fund. Statements of fact are from sources considered reliable.
CFA® is a trademark owned by CFA Institute.
|
Not FDIC Insured| May Lose Value| No Bank Guarantee |
| | | | |
| | | |
| franklintempleton.com | | Not part of the annual report | | 1 |
Contents
Visitfranklintempleton.comfor fund updates, to access your account, or to find helpful financial planning tools.
| | | | |
| | | |
2 | | Annual Report | | franklintempleton.com |
Annual Report
Templeton Emerging Markets Small Cap Fund
This annual report for Templeton Emerging Markets Small Cap Fund covers the fiscal year ended March 31, 2019.
Your Fund’s Goal and Main Investments
The Fund seeks long-term capital appreciation. Under normal market conditions, the Fund invests at least 80% of its net assets in securities of small cap companies located in emerging market countries, as defined in the Fund’s prospectus.
Performance Overview
The Fund’s Class A shares posted a-7.09% cumulative total return for the 12 months under review. For comparison, the MSCI Emerging Markets (EM) Small Cap Index, which measures performance of small cap stocks in emerging markets, posted a-12.11% total return for the same period.1 Please note index performance information is provided for reference and we do not attempt to track any index but rather undertake investments on the basis of fundamental research. In addition, the Fund’s return reflects the effect of fees and expenses for professional management, while an index does not have such costs. You can find the Fund’s long-term performance data in the Performance Summary beginning on page 7.
Performance data represent past performance, which does not guarantee future results. Investment return and principal value will fluctuate, and you may have a gain or loss when you sell your shares. Current performance may differ from figures shown. For most recentmonth-end performance, go tofranklintempleton.comor call(800)342-5236.
Economic and Market Overview
Emerging market economies in general continued to grow faster than developed market economies during the 12 months under review. China’s annual growth rate declined in each of the final three quarters of 2018 before stabilizing in the first quarter of 2019. The moderated growth came amid heightened trade tensions with the U.S., though tensions eased nearperiod-end, and slowdowns in domestic demand, industrial production, fixed-asset investment, and exports and imports.
Geographic Composition
Based on Total Net Assets as of 3/31/19
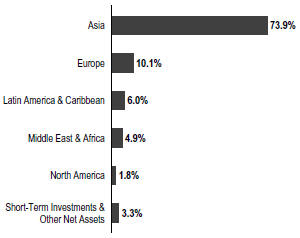
India’s economy grew at the fastest rate of any major emerging market economy in 2018, though growth moderated in the third and fourth quarters due partly to high oil prices, a depreciated rupee, declining growth in financial services, and weak household demand and government spending. Russia’s annual growth rate in 2018’s fourth quarter was the highest of the year, mainly due to faster expansion of the information and communication, financial and insurance, and real estate sectors, as well as increased mining output. Brazil’s annual growth rate slowed in 2018’s second quarter, but accelerated in the third quarter before easing in the fourth quarter. Faster growth in the services, transportation and financial services sectors was partly offset by a contraction in government spending and slower growth in fixed investment and household spending. Following accelerated growth in 2018’s fourth quarter, South Korea’s economy grew in 2019’s first quarter at its slowest annual rate since 2009.
Monetary policies varied among emerging market central banks. India’s central bank unexpectedly lowered its benchmark interest rate in February 2019 in an effort to boost a slowing economy after raising it twice earlier in the period. Russia’s central bank surprised markets with two benchmark interest rate hikes during the period, citing increased
1. Source: Morningstar.
The index is unmanaged and includes reinvestment of any income or distributions. It does not reflect any fees, expenses or sales charges. One cannot invest directly in an index, and an index is not representative of the Fund’s portfolio.
The dollar value, number of shares or principal amount, and names of all portfolio holdings are listed in the Fund’s Statement of Investments (SOI). The SOI begins on page 16.
| | | | |
| | | |
| franklintempleton.com | | Annual Report | | 3 |
TEMPLETON EMERGING MARKETS SMALL CAP FUND
inflationary risks. Central banks in Mexico, Chile, Turkey and South Korea also raised their benchmark interest rates. Brazil’s and Taiwan’s central banks left their benchmark interest rates unchanged. The People’s Bank of China also left its benchmark interest rate unchanged during the period, but it took measures to improve financial liquidity to mitigate the negative effects of the U.S.-China trade dispute and support economic growth.
Emerging market small cap stocks declined during the12-month period due to concerns about global economic growth, rising U.S. interest rates in the second half of 2018, a strengthening U.S. dollar and heightened international trade tensions, particularly between the U.S. and China. Contagion concerns about economic crises in Turkey and Argentina also weighed on investor sentiment. Emerging market equities reversed some of their losses in the latter part of the period, however, as markets responded positively to easing U.S.-China trade tensions and indications the U.S. Federal Reserve would not raise the federal funds target rate in 2019. European stocks were pressured by economic and political uncertainty concerning Turkey, Italy and Brexit, though some political tensions eased nearperiod-end. Asian equities were hobbled by weakness in technology stocks early in the period, though this was partly offset by a rebound in 2019 as well as easing tensions in the Korean peninsula. In this environment, emerging market small cap stocks, as measured by the MSCI EM Small Cap Index, posted a-12.11% total return for the 12 months ended March 31, 2019.1
Investment Strategy
Our investment strategy employs a fundamental research, value-oriented, long-term approach. We focus on the market price of a company’s securities relative to our evaluation of the company’s long-term earnings, asset value and cash flow potential. We also consider a company’s profit and loss outlook, balance sheet strength, cash flow trends and asset value in relation to the current price of the company’s securities. The analysis considers the company’s corporate governance behavior as well as its position in its sector, the economic framework and political environment.
Manager’s Discussion
During the 12 months under review, key contributors to the Fund’s absolute performance included Fila Korea, Bajaj Holdings & Investment and Novatek Microelectronics.
Fila Korea is one of the leading sportswear companies in South Korea. It also licenses the FILA brand around the world and owns a stake in U.S. golf product manufacturer Acushnet (not a Fund holding). Shares of Fila Korea generally remained on an
Top 10 Countries
3/31/19
| | |
| | | % of Total Net Assets |
| |
China | | 16.9% |
| |
India | | 15.2% |
| |
Taiwan | | 14.3% |
| |
South Korea | | 12.8% |
| |
Vietnam | | 5.1% |
| |
Thailand | | 3.1% |
| |
Brazil | | 3.1% |
| |
Turkey | | 2.8% |
| |
Hungary | | 2.3% |
| |
Hong Kong | | 2.2% |
upward trend during the period, supported by significantly better-than-expected quarterly operating profits during 2018. Earnings were supported by the company’s efforts to revitalize its domestic business and expand in China, as well as global sales growth and improved sales in high-margin products. A recovery in the company’s footwear business due to new premium products and distribution channels signaled a revival in the FILA brand.
Bajaj Holdings’ key holdings include Bajaj Auto, one of the world’s largest manufacturers oftwo- and three-wheeled vehicles, and Bajaj Finserv, which is involved in insurance and consumer financing. The improved performance at Bajaj Finserv and expectations of its future growth supported the holding company’s share price. Bajaj Finserv continues to have substantial loan growth with increasing profitability. An aggressive pricing strategy and new model launches from Bajaj Auto also supported investor confidence in the stock.
Novatek Microelectronics is a major Taiwanese integrated circuit (IC) designer. These ICs are primarily used in flat-screen displays in a variety of applications, including televisions, tablets, smartphones and cars. Shares rallied in the latter part of the period due to solid corporate results and easing global trade tensions. The company’s fourth-quarter 2018 sales exceeded expectations due to strong demand for display driver and touch and display integration chips for smartphones. Expectations that Novatek could benefit from the rising adoption of organic light-emitting diode (OLED) displays for smartphones further supported sentiment in the stock.
In contrast, key detractors from the Fund’s absolute performance included Sunny Optical Technology Group, Hoa Phat Group and Apollo Tyres.
| | | | |
| | | |
4 | | Annual Report | | franklintempleton.com |
TEMPLETON EMERGING MARKETS SMALL CAP FUND
Sunny Optical Technology designs and manufactures optical and optical-related products. The company is a major global supplier of automotive lenses and one of China’s largest makers of smartphone camera modules and lenses. Disappointing second-half 2018 operating profits, driven by lower average selling prices and an increase in research and development costs, hurt share-price performance. Pressure on gross margins due to intensifying competition in the handset camera segment also raised investor concerns. Shares rebounded in the final few months of the period due to expectations that a better product mix and continuing factory automation could support earnings.
Hoa Phat is one of the largest industrial manufacturing conglomerates and steel producers in Vietnam. It also has other income streams from real estate projects and agriproducts, among others. While the company reported solid sales and earnings growth for the first nine months of 2018, signs of weakening demand and lower steel prices negatively impacted share price performance. An annualized decline in fourth-quarter 2018 earnings hurt the company’s full-year earnings growth largely due to lower steel prices and higher-than-expected raw material (iron ore) prices. Shares rebounded late in the period due to the company’s strong market position, a rebound in steel prices and anticipated additional capacity following the start of construction of a new mega plant.
Apollo Tyres is a leading Indian tire company with a dominant market position in the truck and bus tires segments. In 2018, floods in the state of Kerala, a major rubber producer, disrupted the company’s local operations and raised concerns about higher input costs for India’s tire makers. The company’s European operations, however, helped offset weaker-than-expected results in India in the final quarter of 2018, where margins were impacted by a rollback of price hikes. Concerns that higher oil prices could impact profitability along with plans to increase capital expenditure in the near term hurt share price performance. Investor sentiment was also negatively impacted when shareholders rejected there-appointment of the managing director in September 2018 due to high compensation, but concerns eased when shareholders reversed their decision in December 2018.
Top 10 Holdings
3/31/19
| | |
Company Sector/Industry, Country | | % of Total
Net Assets |
| |
Bajaj Holdings & Investment Ltd. Diversified Financial Services, India | | 4.6% |
| |
Fila Korea Ltd. Textiles, Apparel & Luxury Goods, South Korea | | 3.7% |
| |
Novatek Microelectronics Corp. Ltd. Semiconductors & Semiconductor Equipment, Taiwan | | 2.3% |
| |
Apollo Tyres Ltd. Auto Components, India | | 2.3% |
| |
Health & Happiness H&H International Holdings Ltd. Food Products, China | | 2.0% |
| |
Baozun Inc. Internet & Direct Marketing Retail, China | | 1.9% |
| |
Merida Industry Co. Ltd. Leisure Products, Taiwan | | 1.8% |
| |
Hoa Phat Group JSC Metals & Mining, Vietnam | | 1.8% |
| |
IMAX Corp. Entertainment, U.S. | | 1.8% |
| |
Medy-tox Inc. Biotechnology, South Korea | | 1.7% |
During the period, our continued search for investments we believe to be undervalued and trading at what we considered attractive valuations led to purchases in Taiwan and Brazil. Some additions were also made in Thailand and Hungary due to their solid fundamentals, and a new position was established in South Africa. Holdings in the communication services and materials sectors were also increased.2 Key purchases included increased investments in FIT Hon Teng, a Hong Kong-listed electronics components company, and St. Shine Optical, one of the world’s largest disposable contact lens producers, as well as establishing a new position in Duratex, one of Brazil’s leading processed wood and metal fixtures and ceramics producers.
Some sales were also undertaken in India, Vietnam and Russia to allow the Fund to focus on stocks deemed to be relatively more attractively valued within our investment universe. In terms of sectors, holdings were reduced in real estate, industrials and consumer staples.3 We liquidated our positions in Vingroup, a Vietnamese conglomerate, and Biocon, an Indian biopharmaceuticals company.
2. The communication services sector comprises entertainment, interactive media and services, and wireless telecommunication services in the SOI. The materials sector comprises chemicals, construction materials, containers and packaging, metals and mining, and paper and forest products in the SOI.
3. The real estate sector comprises equity real estate investment trusts and real estate management and development in the SOI. The industrials sector comprises air freight and logistics, airlines, building products, industrial conglomerates, machinery, marine, trading companies and distributors, and transportation infrastructure in the SOI. The consumer staples sector comprises beverages, food and staples retailing, food products, personal products and tobacco in the SOI.
See www.franklintempletondatasources.com for additional data provider information.
| | | | |
| | | |
| franklintempleton.com | | Annual Report | | 5 |
TEMPLETON EMERGING MARKETS SMALL CAP FUND
It is important to recognize the effect of currency movements on the Fund’s performance. In general, if the value of the U.S. dollar goes up compared with a foreign currency, an investment traded in that foreign currency will go down in value because it will be worth fewer U.S. dollars. This can have a negative effect on Fund performance. Conversely, when the U.S. dollar weakens in relation to a foreign currency, an investment traded in that foreign currency will increase in value, which can contribute to Fund performance. For the 12 months ended March 31, 2019, the U.S. dollar rose in value relative to most currencies. As a result, the Fund’s performance was negatively affected by the portfolio’s investment predominantly in securities withnon-U.S. currency exposure.
Thank you for your continued participation in Templeton Emerging Markets Small Cap Fund. We look forward to serving your future investment needs.
| | |
 | | 
Chetan Sehgal, CFA Portfolio Manager |
The foregoing information reflects our analysis, opinions and portfolio holdings as of March 31, 2019, the end of the reporting period. The way we implement our main investment strategies and the resulting portfolio holdings may change depending on factors such as market and economic conditions. These opinions may not be relied upon as investment advice or an offer for a particular security. The information is not a complete analysis of every aspect of any market, country, industry, security or the Fund. Statements of fact are from sources considered reliable, but the investment manager makes no representation or warranty as to their completeness or accuracy. Although historical performance is no guarantee of future results, these insights may help you understand our investment management philosophy.
| | | | |
| | | |
6 | | Annual Report | | franklintempleton.com |
TEMPLETON EMERGING MARKETS SMALL CAP FUND
Performance Summary as of March 31, 2019
The performance table and graphs do not reflect any taxes that a shareholder would pay on Fund dividends, capital gain distributions, if any, or any realized gains on the sale of Fund shares. Total return reflects reinvestment of the Fund’s dividends and capital gain distributions, if any, and any unrealized gains or losses. Your dividend income will vary depending on dividends or interest paid by securities in the Fund’s portfolio, adjusted for operating expenses of each class. Capital gain distributions are net profits realized from the sale of portfolio securities.
Performance as of 3/31/191
Cumulative total return excludes sales charges. Average annual total return includes maximum sales charges. Sales charges will vary depending on the size of the investment and the class of share purchased. The maximum is 5.50% and the minimum is 0%.Class A:5.50% maximum initial sales charge;Advisor Class:no sales charges. For other share classes, visitfranklintempleton.com.
| | | | |
| Share Class | | Cumulative
Total Return2 | | Average Annual Total Return3 |
| | |
A4 | | | | |
| | |
1-Year | | -7.09% | | -12.21% |
| | |
5-Year | | +24.37% | | +3.28% |
| | |
10-Year | | +236.58% | | +12.26% |
| | |
Advisor | | | | |
| | |
1-Year | | -6.90% | | -6.90% |
| | |
5-Year | | +26.00% | | +4.73% |
| | |
10-Year | | +246.18% | | +13.22% |
Performance data represent past performance, which does not guarantee future results. Investment return and principal value will fluctuate, and you may have a gain or loss when you sell your shares. Current performance may differ from figures shown. For most recentmonth-end performance, go tofranklintempleton.comor call(800)342-5236.
See page 9 for Performance Summary footnotes.
| | | | |
| | | |
| franklintempleton.com | | Annual Report | | 7 |
TEMPLETON EMERGING MARKETS SMALL CAP FUND
PERFORMANCE SUMMARY
Total Return Index Comparison for a Hypothetical $10,000 Investment1
Total return represents the change in value of an investment over the periods shown. It includes any applicable maximum sales charge, Fund expenses, account fees and reinvested distributions. The unmanaged index includes reinvestment of any income or distributions. It differs from the Fund in composition and does not pay management fees or expenses. One cannot invest directly in an index.
Class A(4/1/09–3/31/19)
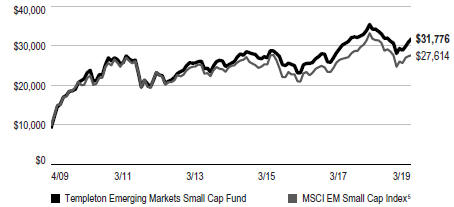
Advisor Class(4/1/09–3/31/19)
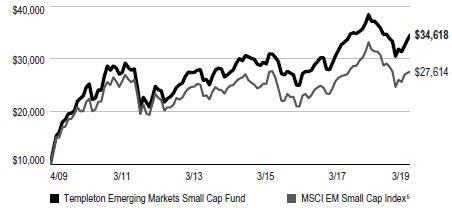
See page 9 for Performance Summary footnotes.
| | | | |
| | | |
8 | | Annual Report | | franklintempleton.com |
TEMPLETON EMERGING MARKETS SMALL CAP FUND
PERFORMANCE SUMMARY
Distributions(4/1/18–3/31/19)
| | | | | | | | | | | | | | | | |
| Share Class | | Net Investment
Income | | | Short-Term
Capital Gain | | | Long-Term
Capital Gain | | | Total | |
A | | | $ — | | | | $0.0022 | | | | $0.3454 | | | | $0.3476 | |
C | | | $ — | | | | $0.0022 | | | | $0.3454 | | | | $0.3476 | |
R | | | $ — | | | | $0.0022 | | | | $0.3454 | | | | $0.3476 | |
R6 | | | $0.0430 | | | | $0.0022 | | | | $0.3454 | | | | $0.3906 | |
Advisor | | | $0.0140 | | | | $0.0022 | | | | $0.3454 | | | | $0.3616 | |
Total Annual Operating Expenses6
| | | | |
| Share Class | | With Fee Waiver | | Without Fee Waiver |
A | | 1.85% | | 1.87% |
| Advisor | | 1.60% | | 1.62% |
Each class of shares is available to certain eligible investors and has different annual fees and expenses, as described in the prospectus.
All investments involve risks, including possible loss of principal. Special risks are associated with foreign investing, including currency fluctuations, economic instability and political developments. Investments in emerging markets, of which frontier markets are a subset, involve heightened risks related to the same factors, in addition to those associated with these markets’ smaller size, lesser liquidity and lack of established legal, political, business and social frameworks to support securities markets. Because these frameworks are typically even less developed in frontier markets, as well as various factors including the increased potential for extreme price volatility, illiquidity, trade barriers and exchange controls, the risks associated with emerging markets are magnified in frontier markets.Small-cap company stocks have historically had more price volatility than large-company stocks, particularly over the short term. All investments in the Fund should be thought of as long-term investments that could experience significant price volatility in any given year. The Fund is designed for the aggressive portion of a well-diversified portfolio. The Fund is actively managed but there is no guarantee that the manager’s investment decisions will produce the desired results. The Fund’s prospectus also includes a description of the main investment risks.
1. The Fund has a fee waiver associated with any investment it makes in a Franklin Templeton money fund and/or other Franklin Templeton fund, contractually guaranteed through 7/31/19. Fund investment results reflect the fee waiver; without this reduction, the results would have been lower.
2. Cumulative total return represents the change in value of an investment over the periods indicated.
3. Average annual total return represents the average annual change in value of an investment over the periods indicated. Return for less than one year, if any, has not been annualized.
4. Prior to 9/10/18, these shares were offered at a higher initial sales charge of 5.75%, thus actual returns would have differed. Total returns with sales charges have been restated to reflect the current maximum initial sales charge of 5.50%.
5. Source: Morningstar. The MSCI EM Small Cap Index is a free float-adjusted, market capitalization-weighted index designed to measure performance of small cap equities in emerging markets.
6. Figures are as stated in the Fund’s current prospectus and may differ from the expense ratios disclosed in the Your Fund’s Expenses and Financial Highlights sections in this report. In periods of market volatility, assets may decline significantly, causing total annual Fund operating expenses to become higher than the figures shown.
See www.franklintempletondatasources.com for additional data provider information.
| | | | |
| | | |
| franklintempleton.com | | Annual Report | | 9 |
TEMPLETON EMERGING MARKETS SMALL CAP FUND
Your Fund’s Expenses
As a Fund shareholder, you can incur two types of costs: (1) transaction costs, including sales charges (loads) on Fund purchases and redemptions; and (2) ongoing Fund costs, including management fees, distribution and service(12b-1) fees, and other Fund expenses. All mutual funds have ongoing costs, sometimes referred to as operating expenses. The table below shows ongoing costs of investing in the Fund and can help you understand these costs and compare them with those of other mutual funds. The table assumes a $1,000 investment held for the six months indicated.
Actual Fund Expenses
The table below provides information about actual account values and actual expenses in the columns under the heading “Actual.” In these columns the Fund’s actual return, which includes the effect of Fund expenses, is used to calculate the “Ending Account Value” for each class of shares. You can estimate the expenses you paid during the period by following these steps (of course, your account value and expenses will differ from those in this illustration): Divide your account value by $1,000 (if your account had an $8,600 value, then $8,600÷ $1,000 = 8.6). Then multiply the result by the number in the row for your class of shares under the headings “Actual” and “Expenses Paid During Period” (if Actual Expenses Paid During Period were $7.50, then 8.6 x $7.50 =$64.50). In this illustration, the actual expenses paid this period are $64.50.
Hypothetical Example for Comparison with Other Funds
Under the heading “Hypothetical” in the table, information is provided about hypothetical account values and hypothetical expenses based on the Fund’s actual expense ratio and an assumed rate of return of 5% per year before expenses, which is not the Fund’s actual return. This information may not be used to estimate the actual ending account balance or expenses you paid for the period, but it can help you compare ongoing costs of investing in the Fund with those of other funds. To do so, compare this 5% hypothetical example for the class of shares you hold with the 5% hypothetical examples that appear in the shareholder reports of other funds.
Please note that expenses shown in the table are meant to highlight ongoing costs and do not reflect any transactional costs. Therefore, information under the heading “Hypothetical” is useful in comparing ongoing costs only, and will not help you compare total costs of owning different funds. In addition, if transactional costs were included, your total costs would have been higher.
| | | | | | | | | | | | |
| | | | | Actual (actual return after expenses) | | Hypothetical (5% annual return before expenses) | | |
| | | | | | | | |
Share
Class | | Beginning
Account
Value 10/1/18 | | Ending
Account
Value 3/31/19 | | Expenses Paid During
Period 10/1/18–3/31/191,2
| | Ending Account Value 3/31/19 | | Expenses Paid During Period 10/1/18–3/31/191,2 | | Net Annualized Expense Ratio2 |
| | | | | | |
A | | $1,000 | | $1,038.00 | | $ 9.86 | | $1,015.26 | | $9.75 | | 1.94% |
C | | $1,000 | | $1,033.80 | | $13.59 | | $1,011.57 | | $13.44 | | 2.68% |
R | | $1,000 | | $1,036.90 | | $11.12 | | $1,014.01 | | $11.00 | | 2.19% |
R6 | | $1,000 | | $1,040.30 | | $ 7.88 | | $1,017.20 | | $7.80 | | 1.55% |
Advisor | | $1,000 | | $1,039.40 | | $ 8.59 | | $1,016.50 | | $8.50 | | 1.69% |
1. Expenses are equal to the annualized expense ratio for thesix-month period as indicated above—in the far right column—multiplied by the simple average account value over the period indicated, and then multiplied by 182/365 to reflect theone-half year period.
2. Reflects expenses after fee waivers and expense reimbursements. Does not include acquired fund fees and expenses.
| | | | |
| | | |
10 | | Annual Report | | franklintempleton.com |
TEMPLETON GLOBAL INVESTMENT TRUST
Financial Highlights
Templeton Emerging Markets Small Cap Fund
| | | | | | | | | | | | | | | | | | | | |
| | | | | | Year Ended March 31, | | | | |
| | | 2019 | | | 2018 | | | 2017 | | | 2016 | | | 2015 | |
| | | | | |
Class A | | | | | | | | | | | | | | | | | | | | |
| | | | | |
Per share operating performance (for a share outstanding throughout the year) | | | | | | | | | | | | | | | | | | | | |
| | | | | |
Net asset value, beginning of year | | | $15.25 | | | | $13.02 | | | | $11.41 | | | | $12.25 | | | | $11.64 | |
| | | | | |
Income from investment operationsa: | | | | | | | | | | | | | | | | | | | | |
| | | | | |
Net investment incomeb | | | 0.03 | | | | —c | | | | 0.16d | | | | 0.04 | | | | —c | |
| | | | | |
Net realized and unrealized gains (losses) | | | (1.15 | ) | | | 2.23 | | | | 1.65 | | | | (0.85 | ) | | | 0.63 | |
| | | | | |
Total from investment operations | | | (1.12 | ) | | | 2.23 | | | | 1.81 | | | | (0.81 | ) | | | 0.63 | |
| | | | | |
Less distributions from: | | | | | | | | | | | | | | | | | | | | |
| | | | | |
Net investment income | | | — | | | | — | | | | (0.20 | ) | | | (0.03 | ) | | | (0.02) | |
| | | | | |
Net realized gains | | | (0.35 | ) | | | — | | | | — | | | | — | | | | — | |
| | | | | |
Total distributions | | | (0.35 | ) | | | — | | | | (0.20 | ) | | | (0.03 | ) | | | (0.02) | |
| | | | | |
Net asset value, end of year | | | $13.78 | | | | $15.25 | | | | $13.02 | | | | $11.41 | | | | $12.25 | |
| | | | | | | | | | | | | | | | | | | | |
Total returne | | | (7.09)% | | | | 17.13% | | | | 16.09% | | | | (6.60)% | | | | 5.40% | |
| | | | | |
| | | | | | | | | | | | | | | | | | | | |
Ratios to average net assets | | | | | | | | | | | | | | | | | | | | |
| | | | | |
Expenses before waiver and payments by affiliates | | | 1.94% | | | | 1.96% | | | | 1.98% | | | | 2.00% | | | | 2.04% | |
| | | | | |
Expenses net of waiver and payments by affiliates | | | 1.92% | | | | 1.94% | | | | 1.97% | | | | 1.99% | | | | 2.02% | |
| | | | | |
Net investment income (loss) | | | 0.19% | | | | (0.01)% | | | | 1.25%d | | | | 0.33% | | | | (0.05)% | |
| | | | | |
| | | | | | | | | | | | | | | | | | | | |
Supplemental data | | | | | | | | | | | | | | | | | | | | |
| | | | | |
Net assets, end of year (000’s) | | | $268,761 | | | | $315,469 | | | | $257,388 | | | | $257,977 | | | | $277,148 | |
| | | | | |
Portfolio turnover rate | | | 12.22% | | | | 7.57% | | | | 21.26% | | | | 18.09% | | | | 19.21% | |
aThe amount shown for a share outstanding throughout the period may not correlate with the Statement of Operations for the period due to the timing of sales and repurchases of the Fund’s shares in relation to income earned and/or fluctuating fair value of the investments of the Fund.
bBased on average daily shares outstanding.
cAmount rounds to less than $0.01 per share.
dNet investment income per share includes approximately $0.09 per share related to income received in the form of special dividends in connection with certain Fund holdings. Excluding this amount, the ratio of net investment income to average net assets would have been 0.48%.
eTotal return does not reflect sales commissions or contingent deferred sales charges, if applicable.
| | | | |
| | | |
| franklintempleton.com | | The accompanying notes are an integral part of these financial statements. | Annual Report | | 11 |
TEMPLETON GLOBAL INVESTMENT TRUST
FINANCIAL HIGHLIGHTS
Templeton Emerging Markets Small Cap Fund(continued)
| | | | | | | | | | | | | | | | | | | | |
| | | | | | Year Ended March 31, | | | | |
| | | 2019 | | | 2018 | | | 2017 | | | 2016 | | | 2015 | |
| | | | | |
Class C | | | | | | | | | | | | | | | | | | | | |
| | | | | |
Per share operating performance (for a share outstanding throughout the year) | | | | | | | | | | | | | | | | | | | | |
| | | | | |
Net asset value, beginning of year | | | $14.54 | | | | $12.51 | | | | $10.96 | | | | $11.82 | | | | $11.30 | |
| | | | | |
Income from investment operationsa: | | | | | | | | | | | | | | | | | | | | |
| | | | | |
Net investment income (loss)b | | | (0.06) | | | | (0.10) | | | | 0.07c | | | | (0.04) | | | | (0.08) | |
| | | | | |
Net realized and unrealized gains (losses) | | | (1.11) | | | | 2.13 | | | | 1.59 | | | | (0.82) | | | | 0.60 | |
| | | | | |
Total from investment operations | | | (1.17) | | | | 2.03 | | | | 1.66 | | | | (0.86) | | | | 0.52 | |
| | | | | |
Less distributions from: | | | | | | | | | | | | | | | | | | | | |
| | | | | |
Net investment income | | | — | | | | — | | | | (0.11) | | | | — | | | | — | |
| | | | | |
Net realized gains | | | (0.35) | | | | — | | | | — | | | | — | | | | — | |
| | | | | |
Total distributions | | | (0.35) | | | | — | | | | (0.11) | | | | — | | | | — | |
| | | | | |
Net asset value, end of year | | | $13.02 | | | | $14.54 | | | | $12.51 | | | | $10.96 | | | | $11.82 | |
| | | | | | | | | | | | | | | | | | | | |
| | | | | |
Total returnd | | | (7.85)% | | | | 16.23% | | | | 15.29% | | | | (7.28)% | | | | 4.60% | |
| | | | | |
| | | | | | | | | | | | | | | | | | | | |
Ratios to average net assets | | | | | | | | | | | | | | | | | | | | |
| | | | | |
Expenses before waiver and payments by affiliates | | | 2.69% | | | | 2.71% | | | | 2.72% | | | | 2.73% | | | | 2.74% | |
| | | | | |
Expenses net of waiver and payments by affiliates | | | 2.67% | | | | 2.69% | | | | 2.71% | | | | 2.72% | | | | 2.72% | |
| | | | | |
Net investment income (loss) | | | (0.56)% | | | | (0.76)% | | | | 0.51%c | | | | (0.40)% | | | | (0.75)% | |
| | | | | |
| | | | | | | | | | | | | | | | | | | | |
Supplemental data | | | | | | | | | | | | | | | | | | | | |
| | | | | |
Net assets, end of year (000’s) | | | $52,300 | | | | $78,836 | | | | $62,889 | | | | $62,148 | | | | $73,687 | |
| | | | | |
Portfolio turnover rate | | | 12.22% | | | | 7.57% | | | | 21.26% | | | | 18.09% | | | | 19.21% | |
aThe amount shown for a share outstanding throughout the period may not correlate with the Statement of Operations for the period due to the timing of sales and repurchases of the Fund’s shares in relation to income earned and/or fluctuating fair value of the investments of the Fund.
bBased on average daily shares outstanding.
cNet investment income per share includes approximately $0.09 per share related to income received in the form of special dividends in connection with certain Fund holdings. Excluding this amount, the ratio of net investment income to average net assets would have been (0.26)%.
dTotal return does not reflect sales commissions or contingent deferred sales charges, if applicable.
| | | | |
| | | |
12 | | Annual Report | The accompanying notes are an integral part of these financial statements. | | franklintempleton.com |
TEMPLETON GLOBAL INVESTMENT TRUST
FINANCIAL HIGHLIGHTS
Templeton Emerging Markets Small Cap Fund(continued)
| | | | | | | | | | | | | | | | | | | | |
| | | | | | Year Ended March 31, | | | | |
| | | 2019 | | | 2018 | | | 2017 | | | 2016 | | | 2015 | |
| | | | | |
Class R | | | | | | | | | | | | | | | | | | | | |
| | | | | |
Per share operating performance
(for a share outstanding throughout the year) | | | | | | | | | | | | | | | | | | | | |
| | | | | |
Net asset value, beginning of year | | | $15.11 | | | | $12.93 | | | | $11.33 | | | | $12.16 | | | | $11.56 | |
| | | | | |
Income from investment operationsa: | | | | | | | | | | | | | | | | | | | | |
| | | | | |
Net investment income (loss)b | | | (0.05 | ) | | | (0.04 | ) | | | 0.12 | c | | | 0.02 | | | | —d | |
| | | | | |
Net realized and unrealized gains (losses) | | | (1.09 | ) | | | 2.22 | | | | 1.65 | | | | (0.85 | ) | | | 0.60 | |
| | | | | |
Total from investment operations | | | (1.14 | ) | | | 2.18 | | | | 1.77 | | | | (0.83 | ) | | | 0.60 | |
| | | | | |
Less distributions from: | | | | | | | | | | | | | | | | | | | | |
| | | | | |
Net investment income | | | — | | | | — | | | | (0.17 | ) | | | (— | )d | | | — | |
| | | | | |
Net realized gains | | | (0.35 | ) | | | — | | | | — | | | | — | | | | — | |
| | | | | |
Total distributions | | | (0.35 | ) | | | — | | | | (0.17 | ) | | | (— | )d | | | — | |
| | | | | |
Net asset value, end of year | | | $13.62 | | | | $15.11 | | | | $12.93 | | | | $11.33 | | | | $12.16 | |
| | | | | | | | | | | | | | | | | | | | |
Total return | | | (7.29)% | | | | 16.86% | | | | 15.84% | | | | (6.82)% | | | | 5.19% | |
| | | | | | | | | | | | | | | | | | | | |
Ratios to average net assets | | | | | | | | | | | | | | | | | | | | |
| | | | | |
Expenses before waiver and payments by affiliates | | | 2.19% | | | | 2.21% | | | | 2.23% | | | | 2.23% | | | | 2.24% | |
| | | | | |
Expenses net of waiver and payments by affiliates | | | 2.17% | | | | 2.19% | | | | 2.22% | | | | 2.22% | | | | 2.22% | |
| | | | | |
Net investment income (loss) | | | (0.06)% | | | | (0.26)% | | | | 1.00%c | | | | 0.10% | | | | (0.25)% | |
| | | | | | | | | | | | | | | | | | | | |
Supplemental data | | | | | | | | | | | | | | | | | | | | |
| | | | | |
Net assets, end of year (000’s) | | | $1,728 | | | | $929 | | | | $532 | | | | $477 | | | | $579 | |
| | | | | |
Portfolio turnover rate | | | 12.22% | | | | 7.57% | | | | 21.26% | | | | 18.09% | | | | 19.21% | |
aThe amount shown for a share outstanding throughout the period may not correlate with the Statement of Operations for the period due to the timing of sales and repurchases of the Fund’s shares in relation to income earned and/or fluctuating fair value of the investments of the Fund.
bBased on average daily shares outstanding.
cNet investment income per share includes approximately $0.09 per share related to income received in the form of special dividends in connection with certain Fund holdings. Excluding this amount, the ratio of net investment income to average net assets would have been 0.23%.
dAmount rounds to less than $0.01 per share.
| | | | |
| | | |
| franklintempleton.com | | The accompanying notes are an integral part of these financial statements. | Annual Report | | 13 |
TEMPLETON GLOBAL INVESTMENT TRUST
FINANCIAL HIGHLIGHTS
Templeton Emerging Markets Small Cap Fund(continued)
| | | | | | | | |
| | | Year Ended March 31, | |
| | | 2019 | | | 2018a | |
| | |
Class R6 | | | | | | | | |
| | |
Per share operating performance (for a share outstanding throughout the year) | | | | | | | | |
| | |
Net asset value, beginning of year | | | $15.41 | | | | $14.41 | |
| | |
Income from investment operationsb: | | | | | | | | |
| | |
Net investment income (loss)c | | | (0.07 | ) | | | (0.04 | ) |
| | |
Net realized and unrealized gains (losses) | | | (1.01 | ) | | | 1.08 | |
| | |
Total from investment operations | | | (1.08 | ) | | | 1.04 | |
| | |
Less distributions from: | | | | | | | | |
| | |
Net investment income | | | (0.04 | ) | | | (0.04 | ) |
| | |
Net realized gains | | | (0.35 | ) | | | — | |
| | |
Total distributions | | | (0.39 | ) | | | (0.04 | ) |
| | |
Net asset value, end of year | | | $13.94 | | | | $15.41 | |
| | | | | | | | |
Total returnd | | | (6.76)% | | | | 7.27% | |
| | | | | | | | |
Ratios to average net assetse | | | | | | | | |
| | |
Expenses before waiver and payments by affiliates | | | 1.57% | | | | 1.59% | |
| | |
Expenses net of waiver and payments by affiliates | | | 1.55% | | | | 1.54% | |
| | |
Net investment incomef | | | 0.56% | | | | 0.39% | |
| | | | | | | | |
Supplemental data | | | | | | | | |
| | |
Net assets, end of year (000’s) | | | $198,106 | | | | $23,964 | |
| | |
Portfolio turnover rate | | | 12.22% | | | | 7.57% | |
aFor the period August 1, 2017 (effective date) to March 31, 2018.
bThe amount shown for a share outstanding throughout the period may not correlate with the Statement of Operations for the period due to the timing of sales and repurchases of the Fund’s shares in relation to income earned and/or fluctuating fair value of the investments of the Fund.
cBased on average daily shares outstanding.
dTotal return is not annualized for periods less than one year.
eRatios are annualized for periods less than one year.
fRatio is calculated based on the Fund level net investment income, as reflected in the Statement of Operations, and adjusted for class specific expenses. The amount may not correlate with the per share amount due to the timing of income earned and/or fluctuating fair value of the investments of the Fund in relation to the timing of sales and repurchases of Fund shares.
| | | | |
| | | |
14 | | Annual Report | The accompanying notes are an integral part of these financial statements. | | franklintempleton.com |
TEMPLETON GLOBAL INVESTMENT TRUST
FINANCIAL HIGHLIGHTS
Templeton Emerging Markets Small Cap Fund(continued)
| | | | | | | | | | | | | | | | | | | | |
| | | | | | Year Ended March 31, | | | | |
| | | 2019 | | | 2018 | | | 2017 | | | 2016 | | | 2015 | |
| | | | | |
Advisor Class | | | | | | | | | | | | | | | | | | | | |
| | | | | |
Per share operating performance (for a share outstanding throughout the year) | | | | | | | | | | | | | | | | | | | | |
| | | | | |
Net asset value, beginning of year | | | $15.42 | | | | $13.15 | | | | $11.52 | | | | $12.37 | | | | $11.76 | |
| | | | | |
Income from investment operationsa: | | | | | | | | | | | | | | | | | | | | |
| | | | | |
Net investment incomeb | | | 0.09 | | | | 0.03 | | | | 0.18 | c | | | 0.07 | | | | 0.02 | |
| | | | | |
Net realized and unrealized gains (losses) | | | (1.19 | ) | | | 2.26 | | | | 1.68 | | | | (0.86 | ) | | | 0.65 | |
| | | | | |
Total from investment operations | | | (1.10 | ) | | | 2.29 | | | | 1.86 | | | | (0.79 | ) | | | 0.67 | |
| | | | | |
Less distributions from: | | | | | | | | | | | | | | | | | | | | |
| | | | | |
Net investment income | | | (0.01 | ) | | | (0.02 | ) | | | (0.23 | ) | | | (0.06 | ) | | | (0.06) | |
| | | | | |
Net realized gains | | | (0.35 | ) | | | — | | | | — | | | | — | | | | — | |
| | | | | |
Total distributions | | | (0.36 | ) | | | (0.02 | ) | | | (0.23 | ) | | | (0.06 | ) | | | (0.06) | |
| | | | | |
Net asset value, end of year | | | $13.96 | | | | $15.42 | | | | $13.15 | | | | $11.52 | | | | $12.37 | |
| | | | | | | | | | | | | | | | | | | | |
Total return | | | (6.90)% | | | | 17.48% | | | | 16.42% | | | | (6.35)% | | | | 5.66% | |
| | | | | | | | | | | | | | | | | | | | |
Ratios to average net assets | | | | | | | | | | | | | | | | | | | | |
| | | | | |
Expenses before waiver and payments by affiliates | | | 1.69% | | | | 1.71% | | | | 1.73% | | | | 1.73% | | | | 1.74% | |
| | | | | |
Expenses net of waiver and payments by affiliates | | | 1.67% | | | | 1.69% | | | | 1.72% | | | | 1.72% | | | | 1.72% | |
| | | | | |
Net investment income | | | 0.44% | | | | 0.24% | | | | 1.50%c | | | | 0.60% | | | | 0.25% | |
| | | | | | | | | | | | | | | | | | | | |
Supplemental data | | | | | | | | | | | | | | | | | | | | |
| | | | | |
Net assets, end of year (000’s) | | | $387,850 | | | | $668,474 | | | | $442,583 | | | | $361,128 | | | | $363,848 | |
| | | | | |
Portfolio turnover rate | | | 12.22% | | | | 7.57% | | | | 21.26% | | | | 18.09% | | | | 19.21% | |
aThe amount shown for a share outstanding throughout the period may not correlate with the Statement of Operations for the period due to the timing of sales and repurchases of the Fund’s shares in relation to income earned and/or fluctuating fair value of the investments of the Fund.
bBased on average daily shares outstanding.
cNet investment income per share includes approximately $0.09 per share related to income received in the form of special dividends in connection with certain Fund holdings. Excluding this amount, the ratio of net investment income to average net assets would have been 0.73%.
| | | | |
| | | |
| franklintempleton.com | | The accompanying notes are an integral part of these financial statements. | Annual Report | | 15 |
TEMPLETON GLOBAL INVESTMENT TRUST
Statement of Investments, March 31, 2019
Templeton Emerging Markets Small Cap Fund
| | | | | | | | | | |
| | | Industry | | Shares/
Warrants | | | Value | |
| |
Common Stocks and Other Equity Interests 95.9% | | | | | | | | |
Brazil 2.7% | | | | | | | | | | |
Arezzo Industria e Comercio SA | | Textiles, Apparel & Luxury Goods | | | 236,100 | | | $ | 3,012,004 | |
Duratex SA | | Paper & Forest Products | | | 2,802,000 | | | | 7,845,815 | |
Grendene SA | | Textiles, Apparel & Luxury Goods | | | 3,067,836 | | | | 6,562,048 | |
aSer Educacional SA, Reg S | | Diversified Consumer Services | | | 902,500 | | | | 4,690,167 | |
Wiz Solucoes e Corretagem de seguros SA | | Insurance | | | 983,685 | | | | 2,134,215 | |
| | | | | | | | | 24,244,249 | |
China 16.9% | | | | | | | | | | |
b,cBaozun Inc., ADR | | Internet & Direct Marketing Retail | | | 416,505 | | | | 17,301,618 | |
China Everbright Ltd. | | Capital Markets | | | 3,480,000 | | | | 6,897,980 | |
Chinasoft International Ltd. | | IT Services | | | 8,008,000 | | | | 4,947,649 | |
COSCO Shipping Ports Ltd. | | Transportation Infrastructure | | | 7,149,951 | | | | 7,723,818 | |
Fanhua Inc., ADR | | Insurance | | | 201,020 | | | | 5,278,785 | |
bHealth & Happiness H&H International Holdings Ltd. | | Food Products | | | 2,935,000 | | | | 18,376,582 | |
Huaxin Cement Co. Ltd., B | | Construction Materials | | | 6,726,053 | | | | 13,633,709 | |
JNBY Design Ltd. | | Textiles, Apparel & Luxury Goods | | | 2,188,400 | | | | 4,399,130 | |
Ju Teng International Holdings Ltd. | | Electronic Equipment, Instruments & Components | | | 17,608,000 | | | | 5,002,050 | |
Luye Pharma Group Ltd. | | Pharmaceuticals | | | 10,634,000 | | | | 9,292,956 | |
bNoah Holdings Ltd., ADR | | Capital Markets | | | 214,154 | | | | 10,377,903 | |
Sunny Optical Technology Group Co. Ltd. | | Electronic Equipment, Instruments & Components | | | 787,000 | | | | 9,398,945 | |
TravelSky Technology Ltd., H | | IT Services | | | 3,627,200 | | | | 9,587,883 | |
Uni-President China Holdings Ltd. | | Food Products | | | 11,454,000 | | | | 11,235,205 | |
Weifu High-Technology Co. Ltd., B | | Auto Components | | | 1,988,000 | | | | 4,247,003 | |
Xinyi Solar Holdings Ltd. | | Semiconductors & Semiconductor Equipment | | | 19,412,756 | | | | 9,347,858 | |
Xtep International Holdings Ltd. | | Textiles, Apparel & Luxury Goods | | | 8,836,600 | | | | 6,315,114 | |
| | | | | | | | | 153,364,188 | |
Czech Republic 1.0% | | | | | | | | | | |
Moneta Money Bank AS | | Banks | | | 2,567,132 | | | | 8,858,142 | |
Egypt 1.9% | | | | | | | | | | |
Eastern Tobacco | | Tobacco | | | 5,233,095 | | | | 5,556,200 | |
Egyptian International Pharmaceuticals EIPICO | | Pharmaceuticals | | | 669,304 | | | | 2,896,198 | |
bGlobal Telecom Holding SAE | | Wireless Telecommunication Services | | | 15,222,239 | | | | 4,005,390 | |
Integrated Diagnostics Holdings PLC | | Health Care Providers & Services | | | 1,049,430 | | | | 4,827,378 | |
| | | | | | | | | 17,285,166 | |
Georgia 0.6% | | | | | | | | | | |
bGeorgia Healthcare Group PLC | | Food & Staples Retailing | | | 1,950,607 | | | | 5,082,306 | |
Hong Kong 2.2% | | | | | | | | | | |
Amvig Holdings Ltd. | | Containers & Packaging | | | 6,108,000 | | | | 1,455,036 | |
I.T Ltd. | | Specialty Retail | | | 12,510,395 | | | | 5,785,098 | |
Luk Fook Holdings (International) Ltd. | | Specialty Retail | | | 3,888,000 | | | | 13,100,415 | |
| | | | | | | | | 20,340,549 | |
Hungary 2.3% | | | | | | | | | | |
Richter Gedeon Nyrt | | Pharmaceuticals | | | 564,050 | | | | 10,636,692 | |
bWizz Air Holdings PLC | | Airlines | | | 254,155 | | | | 9,966,123 | |
| | | | | | | | | 20,602,815 | |
| | | | |
| | | |
16 | | Annual Report | | franklintempleton.com |
TEMPLETON GLOBAL INVESTMENT TRUST
STATEMENT OF INVESTMENTS
Templeton Emerging Markets Small Cap Fund(continued)
| | | | | | | | | | |
| | | Industry | | Shares/
Warrants | | | Value | |
| |
Common Stocks and Other Equity Interests(continued) | | | | | | | | |
India 15.2% | | | | | | | | | | |
Apollo Tyres Ltd. | | Auto Components | | | 6,432,450 | | | $ | 20,710,100 | |
Bajaj Holdings & Investment Ltd. | | Diversified Financial Services | | | 845,882 | | | | 41,772,034 | |
bEquitas Holdings Ltd. | | Consumer Finance | | | 3,113,000 | | | | 6,159,857 | |
Federal Bank Ltd. | | Banks | | | 9,476,047 | | | | 13,210,446 | |
Glenmark Pharmaceuticals Ltd. | | Pharmaceuticals | | | 1,197,798 | | | | 11,204,956 | |
JK Cement Ltd. | | Construction Materials | | | 761,388 | | | | 9,538,122 | |
Odisha Cement Ltd. | | Construction Materials | | | 364,920 | | | | 5,219,171 | |
Redington India Ltd. | | Electronic Equipment, Instruments & Components | | | 5,749,387 | | | | 8,522,073 | |
Tata Chemicals Ltd. | | Chemicals | | | 1,700,500 | | | | 14,472,131 | |
Vardhman Textiles Ltd. | | Textiles, Apparel & Luxury Goods | | | 468,044 | | | | 7,361,452 | |
| | | | | | | | | 138,170,342 | |
Indonesia 0.3% | | | | | | | | | | |
Hexindo Adiperkasa Tbk PT | | Trading Companies & Distributors | | | 13,008,000 | | | | 2,786,124 | |
Malaysia 0.8% | | | | | | | | | | |
7-Eleven Malaysia Holdings Bhd | | Food & Staples Retailing | | | 16,467,458 | | | | 5,969,831 | |
Hartalega Holdings Bhd | | Health Care Equipment & Supplies | | | 1,052,300 | | | | 1,193,423 | |
| | | | | | | | | 7,163,254 | |
Mexico 1.5% | | | | | | | | | | |
Grupo Herdez SAB de CV | | Food Products | | | 4,483,374 | | | | 9,989,087 | |
Nemak SAB de CV | | Auto Components | | | 6,720,300 | | | | 3,889,592 | |
| | | | | | | | | 13,878,679 | |
Nigeria 0.1% | | | | | | | | | | |
UAC of Nigeria PLC | | Food Products | | | 45,432,007 | | | | 987,926 | |
Pakistan 0.4% | | | | | | | | | | |
Habib Bank Ltd. | | Banks | | | 2,963,600 | | | | 2,788,899 | |
United Bank Ltd. | | Banks | | | 434,000 | | | | 429,993 | |
| | | | | | | | | 3,218,892 | |
Peru 1.0% | | | | | | | | | | |
aIntercorp Financial Services Inc., Reg S | | Banks | | | 200,780 | | | | 9,135,490 | |
Philippines 1.7% | | | | | | | | | | |
DMCI Holdings Inc. | | Industrial Conglomerates | | | 15,192,600 | | | | 3,460,729 | |
International Container Terminal Services Inc. | | Transportation Infrastructure | | | 4,953,880 | | | | 12,290,663 | |
| | | | | | | | | 15,751,392 | |
Poland 1.5% | | | | | | | | | | |
Amica SA | | Household Durables | | | 112,408 | | | | 4,275,460 | |
Stock Spirits Group PLC | | Beverages | | | 3,181,741 | | | | 9,533,530 | |
| | | | | | | | | 13,808,990 | |
Russia 1.9% | | | | | | | | | | |
a,bLenta Ltd., GDR, Reg S | | Food & Staples Retailing | | | 842,420 | | | | 2,822,107 | |
a,bMail.Ru Group Ltd., GDR, Reg S | | Interactive Media & Services | | | 464,316 | | | | 11,496,464 | |
aTMK PAO, GDR, Reg S | | Energy Equipment & Services | | | 895,595 | | | | 3,031,589 | |
| | | | | | | | | 17,350,160 | |
Saudi Arabia 1.1% | | | | | | | | | | |
Mouwasat Medical Services Co. | | Health Care Providers & Services | | | 426,140 | | | | 9,090,138 | |
Saudi Dairy & Foodstuff Co. | | Food Products | | | 40,309 | | | | 1,117,799 | |
| | | | | | | | | 10,207,937 | |
| | | | |
| | | |
| franklintempleton.com | | Annual Report | | 17 |
TEMPLETON GLOBAL INVESTMENT TRUST
STATEMENT OF INVESTMENTS
Templeton Emerging Markets Small Cap Fund(continued)
| | | | | | | | | | |
| | | Industry | | Shares/
Warrants | | | Value | |
| |
Common Stocks and Other Equity Interests (continued) | | | | | | | | |
South Africa 0.4% | | | | | | | | | | |
Massmart Holdings Ltd. | | Food & Staples Retailing | | | 599,011 | | | | $3,298,919 | |
South Korea 12.8% | | | | | | | | | | |
Cosmecca Korea Co. Ltd. | | Personal Products | | | 226,111 | | | | 4,629,554 | |
Fila Korea Ltd. | | Textiles, Apparel & Luxury Goods | | | 487,613 | | | | 33,421,923 | |
Hankook Tire Worldwide Co. Ltd. | | Diversified Financial Services | | | 656,000 | | | | 8,963,875 | |
Hans Biomed Corp. | | Biotechnology | | | 435,466 | | | | 10,944,145 | |
Interojo Co. Ltd. | | Health Care Equipment & Supplies | | | 114,546 | | | | 2,305,038 | |
Interpark Holdings Corp. | | Internet & Direct Marketing Retail | | | 170,863 | | | | 357,344 | |
I-Sens Inc. | | Health Care Equipment & Supplies | | | 181,746 | | | | 4,152,406 | |
Mando Corp. | | Auto Components | | | 377,931 | | | | 9,498,174 | |
Medy-tox Inc. | | Biotechnology | | | 30,268 | | | | 15,527,565 | |
Sebang Global Battery Co. Ltd. | | Auto Components | | | 238,646 | | | | 9,688,525 | |
Silicon Works Co. Ltd. | | Semiconductors & Semiconductor Equipment | | | 291,623 | | | | 10,827,047 | |
Vieworks Co. Ltd. | | Health Care Equipment & Supplies | | | 151,355 | | | | 4,482,169 | |
Youngone Corp. | | Textiles, Apparel & Luxury Goods | | | 61,846 | | | | 1,771,702 | |
| | | | | | | | | 116,569,467 | |
Sri Lanka 1.1% | | | | | | | | | | |
Hatton National Bank PLC | | Banks | | | 3,397,647 | | | | 3,446,538 | |
Hemas Holdings PLC | | Industrial Conglomerates | | | 15,513,186 | | | | 6,630,511 | |
| | | | | | | | | 10,077,049 | |
Taiwan 14.3% | | | | | | | | | | |
ADLINK Technology Inc. | | Technology Hardware, Storage & Peripherals | | | 4,328,797 | | | | 6,039,497 | |
Eclat Textile Co. Ltd. | | Textiles, Apparel & Luxury Goods | | | 581,400 | | | | 7,819,581 | |
FIT Hon Teng Ltd. | | Electronic Equipment, Instruments & Components | | | 24,772,700 | | | | 11,991,957 | |
Flytech Technology Co. Ltd. | | Electronic Equipment, Instruments & Components | | | 2,181,220 | | | | 5,520,913 | |
Merida Industry Co. Ltd. | | Leisure Products | | | 3,007,100 | | | | 16,762,419 | |
Novatek Microelectronics Corp. Ltd. | | Semiconductors & Semiconductor Equipment | | | 3,234,000 | | | | 20,752,269 | |
Pacific Hospital Supply Co. Ltd. | | Health Care Equipment & Supplies | | | 1,552,000 | | | | 3,772,362 | |
bPChome Online Inc. | | Internet & Direct Marketing Retail | | | 2,081,035 | | | | 8,767,648 | |
bPharmaEssentia Corp. | | Biotechnology | | | 2,206,000 | | | | 11,510,435 | |
Primax Electronics Ltd. | | Technology Hardware, Storage & Peripherals | | | 7,808,100 | | | | 15,360,114 | |
Shin Zu Shing Co. Ltd. | | Machinery | | | 1,793,000 | | | | 6,362,895 | |
St. Shine Optical Co. Ltd. | | Health Care Equipment & Supplies | | | 537,000 | | | | 10,442,053 | |
TTY Biopharm Co. Ltd. | | Pharmaceuticals | | | 1,626,900 | | | | 4,397,312 | |
| | | | | | | | | 129,499,455 | |
Thailand 3.1% | | | | | | | | | | |
Delta Electronics Thailand PCL, fgn | | Electronic Equipment, Instruments & Components | | | 5,046,100 | | | | 11,291,305 | |
Dynasty Ceramic PCL, fgn | | Building Products | | | 16,746,100 | | | | 1,139,980 | |
bDynasty Ceramic PCL, wts., 5/07/21 | | Building Products | | | 6,698,440 | | | | 175,219 | |
Major Cineplex Group PCL, fgn | | Entertainment | | | 5,920,300 | | | | 5,224,343 | |
TISCO Financial Group PCL, fgn | | Banks | | | 3,722,100 | | | | 10,352,201 | |
| | | | | | | | | 28,183,048 | |
Turkey 2.8% | | | | | | | | | | |
DO & CO Restaurants & Catering AG | | Hotels, Restaurants & Leisure | | | 92,774 | | | | 7,621,993 | |
Mavi Giyim Sanayi Ve Ticaret AS, B | | Textiles, Apparel & Luxury Goods | | | 521,341 | | | | 3,613,974 | |
dPinar Sut Mamulleri Sanayii AS | | Food Products | | | 2,972,096 | | | | 3,542,439 | |
| | | | |
| | | |
18 | | Annual Report | | franklintempleton.com |
TEMPLETON GLOBAL INVESTMENT TRUST
STATEMENT OF INVESTMENTS
Templeton Emerging Markets Small Cap Fund(continued)
| | | | | | | | | | |
| | | Industry | | Shares/
Warrants | | | Value | |
| |
Common Stocks and Other Equity Interests(continued) | | | | | | | | |
Turkey(continued) | | | | | | | | | | |
b,dReysas Gayrimenkul Yatirim Ortakligi AS | | Equity Real Estate Investment Trusts (REITs) | | | 24,575,397 | | | $ | 3,843,668 | |
Soda Sanayii AS | | Chemicals | | | 5,208,686 | | | | 7,022,884 | |
| | | | | | | | | 25,644,958 | |
United Arab Emirates 1.4% | | | | | | | | | | |
Agthia Group PJSC | | Food Products | | | 1,299,581 | | | | 1,348,000 | |
Aramex PJSC | | Air Freight & Logistics | | | 8,899,423 | | | | 11,532,677 | |
| | | | | | | | | 12,880,677 | |
United States 1.8% | | | | | | | | | | |
bIMAX Corp. | | Entertainment | | | 700,708 | | | | 15,892,057 | |
Vietnam 5.1% | | | | | | | | | | |
FPT Corp. | | Electronic Equipment, Instruments | | | | | | | | |
| | & Components | | | 2,778,362 | | | | 5,448,003 | |
bHoa Phat Group JSC | | Metals & Mining | | | 11,788,331 | | | | 16,358,570 | |
bImexpharm Pharmaceutical JSC | | Pharmaceuticals | | | 643,406 | | | | 1,469,597 | |
bMasan Group Corp. | | Food Products | | | 2,374,060 | | | | 8,624,946 | |
Vietnam Container Shipping JSC | | Marine | | | 1,459,582 | | | | 2,597,860 | |
bVincom Retail JSC | | Real Estate Management & Development | | | 8,204,082 | | | | 12,233,289 | |
| | | | | | | | | 46,732,265 | |
Total Common Stocks and Other Equity Interests
(Cost $760,469,512) | | | | | | | | | 871,014,496 | |
| | | |
Preferred Stocks 0.8% | | | | | | | | | | |
Brazil 0.4% | | | | | | | | | | |
eMarcopolo SA, 2.308%, pfd | | Machinery | | | 3,636,826 | | | | 3,620,349 | |
Chile 0.4% | | | | | | | | | | |
eEmbotelladora Andina SA, 3.909%, pfd., A | | Beverages | | | 1,250,500 | | | | 4,042,733 | |
Total Preferred Stocks (Cost $6,261,008) | | | | | | | | | 7,663,082 | |
Total Investments before Short Term Investments
(Cost $766,730,520) | | | | | | | | | 878,677,578 | |
| | | | | | | | | | |
Short Term Investments 4.3% | | | | | | | | | | |
| | | |
Money Market Funds (Cost $30,542,529) 3.4% | | | | | | | | | | |
United States 3.4% | | | | | | | | | | |
f,gInstitutional Fiduciary Trust Money Market Portfolio, 2.10% | | | | | 30,542,529 | | | | 30,542,529 | |
| | | | | | | | | | |
h Investments from Cash Collateral Received for Loaned Securities 0.9% | | | | | | | | | | |
Money Market Funds (Cost $8,321,720) 0.9% | | | | | | | | | | |
United States 0.9% | | | | | | | | | | |
f,gInstitutional Fiduciary Trust Money Market Portfolio, 2.10% | | | | | 8,321,720 | | | | 8,321,720 | |
| | | | | | | | | | |
Total Investments (Cost $805,594,769) 101.0% | | | | | | | | | 917,541,827 | |
Other Assets, less Liabilities (1.0)% | | | | | | | | | (8,798,482 | ) |
| | | | | | | | | | |
Net Assets 100.0% | | | | | | | | $ | 908,743,345 | |
| | | | | | | | | | |
| | | | |
| | | |
| franklintempleton.com | | Annual Report | | 19 |
TEMPLETON GLOBAL INVESTMENT TRUST
STATEMENT OF INVESTMENTS
Templeton Emerging Markets Small Cap Fund(continued)
See Abbreviations on page 33.
aSecurity was purchased pursuant to Regulation S under the Securities Act of 1933, which exempts from registration securities offered and sold outside of the United States. Such a security cannot be sold in the United States without either an effective registration statement filed pursuant to the Securities Act of 1933, or pursuant to an exemption from registration. These securities have been deemed liquid under guidelines approved by the Trust’s Board of Trustees. At March 31, 2019, the aggregate value of these securities was $31,175,817, representing 3.4% of net assets.
bNon-income producing.
cA portion or all of the security is on loan at March 31, 2019. See Note 1(c).
dSee Note 8 regarding holdings of 5% voting securities.
eVariable rate security. The rate shown represents the yield at period end.
fSee Note 3(f) regarding investments in affiliated management investment companies.
gThe rate shown is the annualizedseven-day effective yield at period end.
hSee Note 1(c) regarding securities on loan.
| | | | |
| | | |
| 20 | | Annual Report | The accompanying notes are an integral part of these financial statements. | | franklintempleton.com |
TEMPLETON GLOBAL INVESTMENT TRUST
Financial Statements
Statement of Assets and Liabilities
March 31, 2019
Templeton Emerging Markets Small Cap Fund
| | | | |
Assets: | | | | |
Investments in securities: | | | | |
Cost - Unaffiliated issuers | | | $736,655,893 | |
Cost -Non-controlled affiliates (Note 3f and 8) | | | 68,938,876 | |
| | | | |
Value - Unaffiliated issuers+ | | | $871,291,471 | |
Value -Non-controlled affiliates (Note 3f and 8) | | | 46,250,356 | |
Foreign currency, at value (cost $166) | | | 166 | |
Receivables: | | | | |
Investment securities sold | | | 5,156 | |
Capital shares sold | | | 1,600,785 | |
Dividends | | | 1,540,828 | |
European Union tax reclaims | | | 273,879 | |
Other assets | | | 856 | |
| | | | |
Total assets | | | 920,963,497 | |
| | | | |
Liabilities: | | | | |
Payables: | | | | |
Investment securities purchased | | | 615,464 | |
Capital shares redeemed | | | 1,505,202 | |
Management fees | | | 1,074,340 | |
Distribution fees | | | 190,187 | |
Transfer agent fees | | | 189,406 | |
Payable upon return of securities loaned | | | 8,321,720 | |
Accrued expenses and other liabilities | | | 323,833 | |
| | | | |
Total liabilities | | | 12,220,152 | |
| | | | |
Net assets, at value | | | $908,743,345 | |
| | | | |
Net assets consist of: | | | | |
Paid-in capital | | | $788,202,233 | |
Total distributable earnings (loss) | | | 120,541,112 | |
| | | | |
Net assets, at value | | | $908,743,345 | |
| | | | |
| |
+Includes securities loaned | | | $ 8,642,106 | |
| | | | |
| | | |
| franklintempleton.com | | The accompanying notes are an integral part of these financial statements. | Annual Report | | 21 |
TEMPLETON GLOBAL INVESTMENT TRUST
FINANCIAL STATEMENTS
Statement of Assets and Liabilities(continued)
March 31, 2019
Templeton Emerging Markets Small Cap Fund
| | | | |
Class A: | | | | |
Net assets, at value | | | $268,760,611 | |
| | | | |
Shares outstanding | | | 19,503,394 | |
| | | | |
Net asset value per sharea | | | $13.78 | |
| | | | |
Maximum offering price per share (net asset value per share ÷ 94.50%) | | | $14.58 | |
| | | | |
Class C: | | | | |
Net assets, at value | | | $ 52,299,667 | |
| | | | |
Shares outstanding | | | 4,016,089 | |
| | | | |
Net asset value and maximum offering price per sharea | | | $13.02 | |
| | | | |
Class R: | | | | |
Net assets, at value | | | $ 1,727,538 | |
| | | | |
Shares outstanding | | | 126,880 | |
| | | | |
Net asset value and maximum offering price per share | | | $13.62 | |
| | | | |
Class R6: | | | | |
Net assets, at value | | | $198,105,736 | |
| | | | |
Shares outstanding | | | 14,213,366 | |
| | | | |
Net asset value and maximum offering price per share | | | $13.94 | |
| | | | |
Advisor Class: | | | | |
Net assets, at value | | | $387,849,793 | |
| | | | |
Shares outstanding | | | 27,785,119 | |
| | | | |
Net asset value and maximum offering price per share | | | $13.96 | |
| | | | |
aRedemption price is equal to net asset value less contingent deferred sales charges, if applicable.
| | | | |
| | | |
22 | | Annual Report | The accompanying notes are an integral part of these financial statements. | | franklintempleton.com |
TEMPLETON GLOBAL INVESTMENT TRUST
FINANCIAL STATEMENTS
Statement of Operations
for the year ended March 31, 2019
Templeton Emerging Markets Small Cap Fund
| | | | |
Investment income: | | | | |
Dividends: (net of foreign taxes)* | | | | |
Unaffiliated issuers | | $ | 18,716,538 | |
Non-controlled affiliates (Note 3f and 8) | | | 1,001,379 | |
Income from securities loaned: | | | | |
Unaffiliated issuers (net of fees and rebates) | | | 145,855 | |
Non-controlled affiliates (Note 3f) | | | 78,007 | |
| | | | |
| |
Total investment income | | | 19,941,779 | |
| | | | |
| |
Expenses: | | | | |
Management fees (Note 3a) | | | 13,484,221 | |
Distribution fees: (Note 3c) | | | | |
Class A | | | 683,118 | |
Class C | | | 616,977 | |
Class R | | | 6,761 | |
Transfer agent fees: (Note 3e) | | | | |
Class A | | | 402,792 | |
Class C | | | 91,239 | |
Class R | | | 1,993 | |
Class R6 | | | 32,906 | |
Advisor Class | | | 756,122 | |
Custodian fees (Note 4) | | | 513,799 | |
Reports to shareholders | | | 109,865 | |
Registration and filing fees | | | 127,003 | |
Professional fees | | | 145,275 | |
Trustees’ fees and expenses | | | 89,431 | |
Other | | | 58,782 | |
| | | | |
Total expenses | | | 17,120,284 | |
Expenses waived/paid by affiliates (Note 3f and 3g) | | | (197,782 | ) |
| | | | |
| |
Net expenses | | | 16,922,502 | |
| | | | |
| |
Net investment income | | | 3,019,277 | |
| | | | |
Realized and unrealized gains (losses): | | | | |
Net realized gain (loss) from: | | | | |
Investments:# | | | | |
Unaffiliated issuers | | | 32,666,098 | |
Non-controlled affiliates (Note 3f and 8) | | | (2,487,891 | ) |
Foreign currency transactions | | | (153,024 | ) |
| | | | |
| |
Net realized gain (loss) | | | 30,025,183 | |
| | | | |
| |
Net change in unrealized appreciation (depreciation) on: | | | | |
Investments: | | | | |
Unaffiliated issuers | | | (110,197,752 | ) |
Non-controlled affiliates (Note 3f and 8) | | | (8,798,593 | ) |
Translation of other assets and liabilities denominated in foreign currencies | | | (90,467 | ) |
Change in deferred taxes on unrealized appreciation | | | 2,506,995 | |
| | | | |
Net change in unrealized appreciation (depreciation) | | | (116,579,817 | ) |
| | | | |
| |
Net realized and unrealized gain (loss) | | | (86,554,634 | ) |
| | | | |
| |
Net increase (decrease) in net assets resulting from operations | | $ | (83,535,357 | ) |
| | | | |
| | | | |
*Foreign taxes withheld on dividends | | $ | 1,894,744 | |
| |
#Net of foreign taxes | | $ | 1,677,820 | |
| | | | |
| | | |
| franklintempleton.com | | The accompanying notes are an integral part of these financial statements. | Annual Report | | 23 |
TEMPLETON GLOBAL INVESTMENT TRUST
FINANCIAL STATEMENTS
Statements of Changes in Net Assets
Templeton Emerging Markets Small Cap Fund
| | | | | | | | |
| | | Year Ended March 31, | |
| | | 2019 | | | 2018 | |
| |
| | |
Increase (decrease) in net assets: | | | | | | | | |
Operations: | | | | | | | | |
Net investment income | | $ | 3,019,277 | | | $ | 827,379 | |
Net realized gain (loss) | | | 30,025,183 | | | | 12,395,179 | |
Net change in unrealized appreciation (depreciation) | | | (116,579,817 | ) | | | 131,197,572 | |
| | | | |
Net increase (decrease) in net assets resulting from operations | | | (83,535,357 | ) | | | 144,420,130 | |
| | | | |
| | |
Distributions to shareholders: (Note 1e) | | | | | | | | |
Class A | | | (6,717,881 | ) | | | — | |
Class C | | | (1,434,319 | ) | | | — | |
Class R | | | (39,533 | ) | | | — | |
Class R6 | | | (5,744,038 | ) | | | (50,428 | ) |
Advisor Class | | | (9,688,379 | ) | | | (778,809 | ) |
| | | | |
| | |
Total distributions to shareholders | | | (23,624,150 | ) | | | (829,237 | ) |
| | | | |
| | |
Capital share transactions: (Note 2) | | | | | | | | |
Class A | | | (16,996,707 | ) | | | 12,744,662 | |
Class C | | | (17,761,926 | ) | | | 5,363,285 | |
Class R | | | 906,129 | | | | 313,422 | |
Class R6 | | | 160,233,040 | | | | 23,056,768 | |
Advisor Class | | | (198,149,225 | ) | | | 139,211,483 | |
| | | | |
Total capital share transactions | | | (71,768,689 | ) | | | 180,689,620 | |
| | | | |
Net increase (decrease) in net assets | | | (178,928,196 | ) | | | 324,280,513 | |
Net assets: | | | | | | | | |
Beginning of year | | | 1,087,671,541 | | | | 763,391,028 | |
| | | | |
End of year (Note 1e) | | $ | 908,743,345 | | | $ | 1,087,671,541 | |
| | | | |
| | | | |
| | | |
24 | | Annual Report | The accompanying notes are an integral part of these financial statements. | | franklintempleton.com |
TEMPLETON GLOBAL INVESTMENT TRUST
Notes to Financial Statements
Templeton Emerging Markets Small Cap Fund
1. Organization and Significant Accounting Policies
Templeton Global Investment Trust (Trust) is registered under the Investment Company Act of 1940 (1940 Act) as anopen-end management investment company, consisting of five separate funds and applies the specialized accounting and reporting guidance in U.S. Generally Accepted Accounting Principles (U.S. GAAP). Templeton Emerging Markets Small Cap Fund (Fund) is included in this report. The Fund offers five classes of shares: Class A, Class C, Class R, Class R6 and Advisor Class. Beginning on October 19, 2018, Class C shares automatically convert to Class A shares after they have been held for 10 years. Each class of shares may differ by its initial sales load, contingent deferred sales charges, voting rights on matters affecting a single class, its exchange privilege and fees due to differing arrangements for distribution and transfer agent fees.
The following summarizes the Fund’s significant accounting policies.
a. Financial Instrument Valuation
The Fund’s investments in financial instruments are carried at fair value daily. Fair value is the price that would be received to sell an asset or paid to transfer a liability in an orderly transaction between market participants on the measurement date. The Fund calculates the net asset value (NAV) per share each business day as of 4 p.m. Eastern time or the regularly scheduled close of the New York Stock Exchange (NYSE), whichever is earlier. Under compliance policies and procedures approved by the Trust’s Board of Trustees (the Board), the Fund’s administrator has responsibility for oversight of valuation, including leading the cross-functional Valuation Committee (VC). The Fund may utilize independent pricing services, quotations from securities and financial instrument dealers, and other market sources to determine fair value.
Equity securities listed on an exchange or on the NASDAQ National Market System are valued at the last quoted sale price or the official closing price of the day, respectively. Foreign equity securities are valued as of the close of trading on the foreign stock exchange on which the security is primarily traded, or as of 4 p.m. Eastern time. The value is then converted into its U.S. dollar equivalent at the foreign exchange rate in effect at 4 p.m. Eastern time on the day that the value of the security is determined.Over-the-counter (OTC) securities are valued within the range of the most recent quoted bid and ask
prices. Securities that trade in multiple markets or on multiple exchanges are valued according to the broadest and most representative market. Certain equity securities are valued based upon fundamental characteristics or relationships to similar securities.
Investments inopen-end mutual funds are valued at the closing NAV.
The Fund has procedures to determine the fair value of financial instruments for which market prices are not reliable or readily available. Under these procedures, the Fund primarily employs a market-based approach which may use related or comparable assets or liabilities, recent transactions, market multiples, book values, and other relevant information for the investment to determine the fair value of the investment. An income-based valuation approach may also be used in which the anticipated future cash flows of the investment are discounted to calculate fair value. Discounts may also be applied due to the nature or duration of any restrictions on the disposition of the investments. Due to the inherent uncertainty of valuations of such investments, the fair values may differ significantly from the values that would have been used had an active market existed.
Trading in securities on foreign securities stock exchanges and OTC markets may be completed before 4 p.m. Eastern time. In addition, trading in certain foreign markets may not take place on every Fund’s business day. Occasionally, events occur between the time at which trading in a foreign security is completed and 4 p.m. Eastern time that might call into question the reliability of the value of a portfolio security held by the Fund. As a result, differences may arise between the value of the Fund’s portfolio securities as determined at the foreign market close and the latest indications of value at 4 p.m. Eastern time. In order to minimize the potential for these differences, the VC monitors price movements following the close of trading in foreign stock markets through a series of country specific market proxies (such as baskets of American Depositary Receipts, futures contracts and exchange traded funds). These price movements are measured against established trigger thresholds for each specific market proxy to assist in determining if an event has occurred that may call into question the reliability of the values of the foreign securities held by the Fund. If such an event occurs, the securities may be valued using fair value procedures, which may include the use of independent pricing services.
| | | | |
| | | |
| franklintempleton.com | | Annual Report | | 25 |
TEMPLETON GLOBAL INVESTMENT TRUST
NOTES TO FINANCIAL STATEMENTS
Templeton Emerging Markets Small Cap Fund(continued)
1. Organization and Significant Accounting Policies(continued)
a. Financial Instrument Valuation(continued)
When the last day of the reporting period is anon-business day, certain foreign markets may be open on those days that the Fund’s NAV is not calculated, which could result in differences between the value of the Fund’s portfolio securities on the last business day and the last calendar day of the reporting period. Any significant security valuation changes due to an open foreign market are adjusted and reflected by the Fund for financial reporting purposes.
b. Foreign Currency Translation
Portfolio securities and other assets and liabilities denominated in foreign currencies are translated into U.S. dollars based on the exchange rate of such currencies against U.S. dollars on the date of valuation. The Fund may enter into foreign currency exchange contracts to facilitate transactions denominated in a foreign currency. Purchases and sales of securities, income and expense items denominated in foreign currencies are translated into U.S. dollars at the exchange rate in effect on the transaction date. Portfolio securities and assets and liabilities denominated in foreign currencies contain risks that those currencies will decline in value relative to the U.S. dollar. Occasionally, events may impact the availability or reliability of foreign exchange rates used to convert the U.S. dollar equivalent value. If such an event occurs, the foreign exchange rate will be valued at fair value using procedures established and approved by the Board.
The Fund does not separately report the effect of changes in foreign exchange rates from changes in market prices on securities held. Such changes are included in net realized and unrealized gain or loss from investments in the Statement of Operations.
Realized foreign exchange gains or losses arise from sales of foreign currencies, currency gains or losses realized between the trade and settlement dates on securities transactions and the difference between the recorded amounts of dividends, interest, and foreign withholding taxes and the U.S. dollar equivalent of the amounts actually received or paid. Net unrealized foreign exchange gains and losses arise from changes in foreign exchange rates on foreign denominated assets and liabilities other than investments in securities held at the end of the reporting period.
c. Securities Lending
The Fund participates in an agency based securities lending program to earn additional income. The Fund receives cash collateral against the loaned securities in an amount equal to at least 102% of the fair value of the loaned securities. Collateral is maintained over the life of the loan in an amount not less than 100% of the fair value of loaned securities, as determined at the close of Fund business each day; any additional collateral required due to changes in security values is delivered to the Fund on the next business day. The collateral is deposited into a joint cash account with other funds and is used to invest in a money market fund managed by Franklin Advisers, Inc., an affiliate of the Fund. The Fund may receive income from the investment of cash collateral, in addition to lending fees and rebates paid by the borrower. Income from securities loaned, net of fees paid to the securities lending agent and/or third-party vendor, is reported separately in the Statement of Operations. The Fund bears the market risk with respect to the collateral investment, securities loaned, and the risk that the agent may default on its obligations to the Fund. If the borrower defaults on its obligation to return the securities loaned, the Fund has the right to repurchase the securities in the open market using the collateral received. The securities lending agent has agreed to indemnify the Fund in the event of default by a third party borrower.
d. Income and Deferred Taxes
It is the Fund’s policy to qualify as a regulated investment company under the Internal Revenue Code. The Fund intends to distribute to shareholders substantially all of its taxable income and net realized gains to relieve it from federal income and excise taxes. As a result, no provision for U.S. federal income taxes is required.
The Fund may be subject to foreign taxation related to income received, capital gains on the sale of securities and certain foreign currency transactions in the foreign jurisdictions in which it invests. Foreign taxes, if any, are recorded based on the tax regulations and rates that exist in the foreign markets in which the Fund invests. When a capital gain tax is determined to apply, the Fund records an estimated deferred tax liability in an amount that would be payable if the securities were disposed of on the valuation date.
As a result of several court cases, in certain countries across the European Union, the Fund filed additional tax reclaims for previously withheld taxes on dividends earned in those
| | | | |
| | | |
26 | | Annual Report | | franklintempleton.com |
TEMPLETON GLOBAL INVESTMENT TRUST
NOTES TO FINANCIAL STATEMENTS
Templeton Emerging Markets Small Cap Fund(continued)
countries (EU reclaims). These additional filings are subject to various administrative proceedings by the local jurisdictions’ tax authorities within the European Union, as well as a number of related judicial proceedings. Income recognized, if any, for EU reclaims is reflected as other income in the Statement of Operations and any related receivable, if any, is reflected as European Union tax reclaims in the Statement of Assets and Liabilities. When uncertainty exists as to the ultimate resolution of these proceedings, the likelihood of receipt of these EU reclaims, and the potential timing of payment, no amounts are reflected in the financial statements. For U.S. income tax purposes, EU reclaims received by the Fund, if any, reduce the amounts of foreign taxes Fund shareholders can use as tax credits in their individual income tax returns.
The Fund may recognize an income tax liability related to its uncertain tax positions under U.S. GAAP when the uncertain tax position has a less than 50% probability that it will be sustained upon examination by the tax authorities based on its technical merits. As of March 31, 2019, the Fund has determined that no tax liability is required in its financial statements related to uncertain tax positions for any open tax years (or expected to be taken in future tax years). Open tax years are those that remain subject to examination and are based on the statute of limitations in each jurisdiction in which the Fund invests.
e. Security Transactions, Investment Income, Expenses and Distributions
Security transactions are accounted for on trade date. Realized gains and losses on security transactions are determined on a specific identification basis. Estimated expenses are accrued daily. Dividend income is recorded on theex-dividend date except for certain dividends from securities where the dividend rate is not available. In such cases, the dividend is recorded as soon as the information is received by the Fund. Distributions to shareholders are recorded on theex-dividend date. Distributable earnings are determined according to income tax regulations (tax basis) and may differ from earnings recorded in accordance
with U.S. GAAP. These differences may be permanent or temporary. Permanent differences are reclassified among capital accounts to reflect their tax character. These reclassifications have no impact on net assets or the results of operations. Temporary differences are not reclassified, as they may reverse in subsequent periods.*
Common expenses incurred by the Trust are allocated among the Funds based on the ratio of net assets of each Fund to the combined net assets of the Trust or based on the ratio of number of shareholders of each Fund to the combined number of shareholders of the Trust. Fund specific expenses are charged directly to the Fund that incurred the expense.
Realized and unrealized gains and losses and net investment income, excluding class specific expenses, are allocated daily to each class of shares based upon the relative proportion of net assets of each class. Differences in per share distributions by class are generally due to differences in class specific expenses.
f. Accounting Estimates
The preparation of financial statements in accordance with U.S. GAAP requires management to make estimates and assumptions that affect the reported amounts of assets and liabilities at the date of the financial statements and the amounts of income and expenses during the reporting period. Actual results could differ from those estimates.
g. Guarantees and Indemnifications
Under the Trust’s organizational documents, its officers and trustees are indemnified by the Trust against certain liabilities arising out of the performance of their duties to the Trust. Additionally, in the normal course of business, the Trust, on behalf of the Fund, enters into contracts with service providers that contain general indemnification clauses. The Trust’s maximum exposure under these arrangements is unknown as this would involve future claims that may be made against the Trust that have not yet occurred. Currently, the Trust expects the risk of loss to be remote.
*Effective during the current reporting period, it is no longer required to present certain line items in the Statements of Changes in Net Assets. The below prior period amounts affected by this change are shown as they were in the prior year Statements of Changes in Net Assets.
| | | | |
| | | |
| franklintempleton.com | | Annual Report | | 27 |
TEMPLETON GLOBAL INVESTMENT TRUST
NOTES TO FINANCIAL STATEMENTS
Templeton Emerging Markets Small Cap Fund(continued)
1. Organization and Significant Accounting Policies(continued)
For the year ended March 31, 2018, distributions to shareholders were as follows:
| | | | |
Distributions from net investment income: | | | | |
Class R6 | | $ | (50,428 | ) |
Advisor Class | | | (778,809 | ) |
For the year ended March 31, 2018, distributions in excess of net investment income included in net assets was $(5,858,205).
2. Shares of Beneficial Interest
At March 31, 2019, there were an unlimited number of shares authorized ($0.01 par value). Transactions in the Fund’s shares were as follows:
| | | | | | | | | | | | | | | | | | | | |
| | | Year Ended March 31, | |
| | | 2019 | | | | | | 2018a | |
| | | | |
| | | Shares | | | Amount | | | | | | Shares | | | Amount |
| |
| | | | | |
Class A Shares: | | | | | | | | | | | | | | | | | | | | |
Shares soldb | | | 4,559,656 | | | $ | 61,671,184 | | | | | | | | 8,632,233 | | | $ | 123,429,279 | |
Shares issued in reinvestment of distributions | | | 491,583 | | | | 6,056,301 | | | | | | | | — | | | | — | |
| | | | |
Shares redeemed | | | (6,236,473 | ) | | | (84,724,192 | ) | | | | | | | (7,710,771 | ) | | | (110,684,617) | |
| | | | |
Net increase (decrease) | | | (1,185,234 | ) | | $ | (16,996,707 | ) | | | | | | | 921,462 | | | $ | 12,744,662 | |
Class C Shares: | | | | | | | | | | | | | | | | | | | | |
Shares sold | | | 652,102 | | | $ | 8,498,060 | | | | | | | | 1,546,280 | | | $ | 21,319,791 | |
Shares issued in reinvestment of distributions | | | 118,314 | | | | 1,380,727 | | | | | | | | — | | | | — | |
Shares redeemedb | | | (2,176,204 | ) | | | (27,640,713 | ) | | | | | | | (1,151,578 | ) | | | (15,956,506) | |
| | | | |
Net increase (decrease) | | | (1,405,788 | ) | | $ | (17,761,926 | ) | | | | | | | 394,702 | | | $ | 5,363,285 | |
| | | | |
| | | | | |
Class R Shares: | | | | | | | | | | | | | | | | | | | | |
Shares sold | | | 91,192 | | | $ | 1,249,355 | | | | | | | | 37,163 | | | $ | 550,698 | |
Shares issued in reinvestment of distributions | | | 3,246 | | | | 39,533 | | | | | | | | — | | | | — | |
Shares redeemed | | | (29,077 | ) | | | (382,759 | ) | | | | | | | (16,767 | ) | | | (237,276) | |
| | | | |
Net increase (decrease) | | | 65,361 | | | $ | 906,129 | | | | | | | | 20,396 | | | $ | 313,422 | |
| | | | |
Class R6 Shares: | | | | | | | | | | | | | | | | | | | | |
Shares sold | | | 15,209,693 | | | $ | 194,031,276 | | | | | | | | 1,681,734 | | | $ | 25,001,671 | |
Shares issued in reinvestment of distributions | | | 52,152 | | | | 649,299 | | | | | | | | 3,348 | | | | 50,415 | |
Shares redeemed | | | (2,603,401 | ) | | | (34,447,535 | ) | | | | | | | (130,160 | ) | | | (1,995,318) | |
| | | | |
Net increase (decrease) | | | 12,658,444 | | | $ | 160,233,040 | | | | | | | | 1,554,922 | | | $ | 23,056,768 | |
| | | | |
| | | | | |
Advisor Class Shares: | | | | | | | | | | | | | | | | | | | | |
Shares sold | | | 12,339,723 | | | $ | 170,703,200 | | | | | | | | 20,056,212 | | | $ | 291,593,199 | |
Shares issued in reinvestment of distributions | | | 699,114 | | | | 8,717,946 | | | | | | | | 30,373 | | | | 457,729 | |
Shares redeemed | | | (28,602,272 | ) | | | (377,570,371 | ) | | | | | | | (10,389,954 | ) | | | (152,839,445) | |
| | | | |
Net increase (decrease) | | | (15,563,435 | ) | | $ | (198,149,225 | ) | | | | | | | 9,696,631 | | | $ | 139,211,483 | |
| | | | |
aFor the period August 1, 2017 (effective date) to March 31, 2018 for class R6.
bMay include a portion of Class C shares that were automatically converted to Class A.
| | | | |
| | | |
28 | | Annual Report | | franklintempleton.com |
TEMPLETON GLOBAL INVESTMENT TRUST
NOTES TO FINANCIAL STATEMENTS
Templeton Emerging Markets Small Cap Fund(continued)
3. Transactions with Affiliates
Franklin Resources, Inc. is the holding company for various subsidiaries that together are referred to as Franklin Templeton. Certain officers and trustees of the Trust are also officers and/or directors of the following subsidiaries:
| | | | |
| Subsidiary | | Affiliation | | |
| Templeton Asset Management Ltd. (Asset Management) | | Investment manager | | |
| Franklin Templeton Services, LLC (FT Services) | | Administrative manager | | |
| Franklin Templeton Distributors, Inc. (Distributors) | | Principal underwriter | | |
| Franklin Templeton Investor Services, LLC (Investor Services) | | Transfer agent | | |
a. Management Fees
The Fund pays an investment management fee to Asset Management based on the average daily net assets of the Fund as follows:
| | | | |
| Annualized Fee Rate | | Net Assets | | |
| 1.450% | | Up to and including $500 million | | |
| 1.400% | | Over $500 million, up to and including $5 billion | | |
| 1.350% | | Over $5 billion, up to and including $10 billion | | |
| 1.300% | | Over $10 billion, up to and including $15 billion | | |
| 1.250% | | Over $15 billion, up to and including $20 billion | | |
| 1.200% | | In excess of $20 billion | | |
Effective April 1, 2019, the Fund will pay fees based on the average daily net assets of the Fund as follows:
| | | | |
| Annualized Fee Rate | | Net Assets | | |
| 1.400% | | Up to and including $500 million | | |
| 1.300% | | Over $500 million, up to and including $1 billion | | |
| 1.200% | | In excess of $1 billion | | |
For the year ended March 31, 2019, the gross effective investment management fee rate was 1.427% of the Fund’s average daily net assets.
b. Administrative Fees
Under an agreement with Asset Management, FT Services provides administrative services to the Fund. The fee is paid by Asset Management based on the Fund’s average daily net assets, and is not an additional expense of the Fund.
c. Distribution Fees
The Board has adopted distribution plans for each share class, with the exception of Class R6 and Advisor Class shares, pursuant to Rule12b-1 under the 1940 Act. Under the Fund’s Class A reimbursement distribution plan, the Fund reimburses Distributors for costs incurred in connection with the servicing, sale and distribution of the Fund’s shares up to the maximum annual plan rate. Under the Class A reimbursement distribution plan, costs exceeding the maximum for the current plan year cannot be reimbursed in subsequent periods. In addition, under the Fund’s Class C and R compensation distribution plans, the Fund pays Distributors for costs incurred in connection with the servicing, sale and distribution of the Fund’s shares up to the maximum annual plan rate for each class. The plan year, for purposes of monitoring compliance with the maximum annual plan rates, is February 1 through January 31.
| | | | |
| | | |
| franklintempleton.com | | Annual Report | | 29 |
TEMPLETON GLOBAL INVESTMENT TRUST
NOTES TO FINANCIAL STATEMENTS
Templeton Emerging Markets Small Cap Fund(continued)
3. Transactions with Affiliates(continued)
c. Distribution Fees(continued)
The maximum annual plan rates, based on the average daily net assets, for each class, are as follows:
| | | | |
Class A | | | 0.35 | % |
Class C | | | 1.00 | % |
Class R | | | 0.50 | % |
The Board has set the current rate at 0.25% per year for Class A shares until further notice and approval by the Board.
d. Sales Charges/Underwriting Agreements
Front-end sales charges and contingent deferred sales charges (CDSC) do not represent expenses of the Fund. These charges are deducted from the proceeds of sales of Fund shares prior to investment or from redemption proceeds prior to remittance, as applicable. Distributors has advised the Fund of the following commission transactions related to the sales and redemptions of the Fund’s shares for the year:
| | | | |
Sales charges retained net of commissions paid to unaffiliated brokers/dealers | | $ | 63,390 | |
CDSC retained | | $ | 11,075 | |
Effective September 10, 2018, the Board approved changes to certainfront-end sales charges and dealer commissions on Class A shares. Further details are disclosed in the Fund’s Prospectus.
e. Transfer Agent Fees
Each class of shares pays transfer agent fees to Investor Services for its performance of shareholder servicing obligations. The fees are based on an annualized asset based fee of 0.02% plus a transaction based fee. In addition, each class reimburses Investor Services for out of pocket expenses incurred and, except for Class R6, reimburses shareholder servicing fees paid to third parties. These fees are allocated daily based upon their relative proportion of such classes’ aggregate net assets. Class R6 pays Investor Services transfer agent fees specific to that class.
For the year ended March 31, 2019, the Fund paid transfer agent fees of $1,285,052, of which $516,619 was retained by Investor Services.
f. Investments in Affiliated Management Investment Companies
The Fund invests in one or more affiliated management investment companies for purposes other than exercising a controlling influence over the management or policies. Management fees paid by the Fund are waived on assets invested in the affiliated management investment companies, as noted in the Statement of Operations, in an amount not to exceed the management and administrative fees paid directly or indirectly by each affiliate. During the year ended March 31, 2019, the Fund held investments in affiliated management investment companies as follows:
| | | | |
| | | |
30 | | Annual Report | | franklintempleton.com |
TEMPLETON GLOBAL INVESTMENT TRUST
NOTES TO FINANCIAL STATEMENTS
Templeton Emerging Markets Small Cap Fund(continued)
| | | | | | | | | | | | | | | | | | | | | | | | | | | | | | | | |
| | | Number of
Shares Held
at Beginning
of Year | | | Gross
Additions | | | Gross
Reductions | | | Number of
Shares
Held at End
of Year | | | Value at End of Year | | | Investment Income | | | Realized
Gain
(Loss) | | | Net Change in Unrealized
Appreciation
(Depreciation) | |
Non-Controlled Affiliates | | | | | | | | | | | | | | | | | | | | | | | | | | | | | | | | |
| | | | | | | | |
| | | | | | | | | | | | | | | | | | Dividends | | | | | | | |
| | | | | | | | |
Institutional Fiduciary Trust Money Market Portfolio, 2.10% | | | 59,360,840 | | | | 152,221,927 | | | | (181,040,238 | ) | | | 30,542,529 | | | | $30,542,529 | | | | $739,256 | | | | $ — | | | | $ — | |
| | | | | | | | |
| | | | | | | | | | | | | | | | | | Income from | | | | | | | |
| | | | | | | | | | | | | | | | | | securities | | | | | | | |
| | | | | | | | | | | | | | | | | | loaned | | | | | | | |
| | | | | | | | |
Institutional Fiduciary Trust Money Market Portfolio, 2.10% | | | 5,503,340 | | | | 199,353,809 | | | | (196,535,429 | ) | | | 8,321,720 | | | | 8,321,720 | | | | 78,007 | | | | — | | | | — | |
Total Affiliated Securities | | | | | | | | | | | | | | | | | | | $38,864,249 | | | | $817,263 | | | | $ — | | | | $ — | |
g. Waiver and Expense Reimbursements
Investor Services has contractually agreed in advance to waive or limit its fees so that the Class R6 transfer agent fees do not exceed 0.03% based on the average net assets of the class until July 31, 2019.
4. Expense Offset Arrangement
The Fund has entered into an arrangement with its custodian whereby credits realized as a result of uninvested cash balances are used to reduce a portion of the Fund’s custodian expenses. During the year ended March 31, 2019, there were no credits earned.
5. Income Taxes
For tax purposes, the Fund may elect to defer any portion of a post-October capital loss or late-year ordinary loss to the first day of the following fiscal year. At March 31, 2019, the Fund deferred late-year ordinary losses of $1,147,730.
The tax character of distributions paid during the years ended March 31, 2019 and 2018, was as follows:
| | | | | | | | |
| | | 2019 | | | 2018 | |
| | | | |
Distributions paid from: | | | | | | | | |
Ordinary income | | $ | 1,150,591 | | | $ | 829,237 | |
Long term capital gain | | | 22,473,559 | | | | — | |
| | | | |
| | $ | 23,624,150 | | | $ | 829,237 | |
| | | | |
At March 31, 2019, the cost of investments, net unrealized appreciation (depreciation), undistributed ordinary income and undistributed long term capital gains for income tax purposes were as follows:
| | | | |
Cost of investments | | $ | 808,663,652 | |
| | | | |
| |
Unrealized appreciation | | $ | 214,353,003 | |
Unrealized depreciation | | | (105,474,828 | ) |
| | | | |
Net unrealized appreciation (depreciation) | | $ | 108,878,175 | |
| | | | |
Distributable earnings: | | | | |
Undistributed ordinary income | | $ | 586,332 | |
Undistributed long term capital gains | | | 11,967,934 | |
| | | | |
Total distributable earnings | | $ | 12,554,266 | |
| | | | |
| | | | |
| | | |
| franklintempleton.com | | Annual Report | | 31 |
TEMPLETON GLOBAL INVESTMENT TRUST
NOTES TO FINANCIAL STATEMENTS
Templeton Emerging Markets Small Cap Fund(continued)
5. Income Taxes(continued)
Differences between income and/or capital gains as determined on a book basis and a tax basis are primarily due to differing treatments of foreign capital gains tax and corporate actions.
The Fund utilized a tax accounting practice to treat a portion of the proceeds from capital shares redeemed as a distribution from realized capital gains.
6. Investment Transactions
Purchases and sales of investments (excluding short term securities) for the year ended March 31, 2019, aggregated $110,843,847 and $176,670,243, respectively.
At March 31, 2019, in connection with securities lending transactions, the Fund loaned equity investments and received $8,321,720 of cash collateral. The gross amount of recognized liability for such transactions is included in payable upon return of securities loaned in the Statement of Assets and Liabilities. The agreements can be terminated at any time.
7. Concentration of Risk
Investing in foreign securities may include certain risks and considerations not typically associated with investing in U.S. securities, such as fluctuating currency values and changing local and regional economic, political and social conditions, which may result in greater market volatility. Current political and financial uncertainty surrounding the European Union may increase market volatility and the economic risk of investing in securities in Europe. In addition, certain foreign securities may not be as liquid as U.S. securities.
8. Holdings of 5% Voting Securities of Portfolio Companies
The 1940 Act defines “affiliated companies” to include investments in portfolio companies in which a fund owns 5% or more of the outstanding voting securities. During the year ended March 31, 2019, investments in “affiliated companies” were as follows:
| | | | | | | | | | | | | | | | | | | | | | | | | | | | | | | | |
| | | Number of | | | | | | | | | Number of | | | | | | | | | | | | Net Change in | |
| | | Shares Held | | | | | | | | | Shares Held | | | Value | | | | | | | | | Unrealized | |
| | | at Beginning | | | Gross | | | Gross | | | at End | | | at End | | | Dividend | | | Realized | | | Appreciation | |
| Name of Issuer | | of Year | | | Additions | | | Reductions | | | of Year | | | of Year | | | Income | | | Gain (Loss) | | | (Depreciation) | |
| |
Non-Controlled Affiliates | | | | | | | | | | | | | | | | | | | | | | | | | | | | | | | | |
Pinar Sut Mamulleri Sanayii AS | | | 3,279,170 | | | | — | | | | (307,074 | ) | | | 2,972,096 | | | $ | 3,542,439 | | | $ | 262,123 | | | | $(2,487,891) | | | | $(3,576,713) | |
Reysas Gayrimenkul Yatirim Ortakligi AS | | | 24,575,397 | | | | — | | | | — | | | | 24,575,397 | | | | 3,843,668 | | | | — | | | | — | | | | (5,221,880 | ) |
| | | | | | | | | | | | | | | | | | | | |
Total Affiliated Securities(Value is 0.8% of Net Assets) | | | | | | | | | | | $ | 7,386,107 | | | $ | 262,123 | | | | $(2,487,891) | | | | $(8,798,593) | |
| | | | | | | | | | | | | | | | | | | | |
9. Credit Facility
The Fund, together with other U.S. registered and foreign investment funds (collectively, Borrowers), managed by Franklin Templeton, are borrowers in a joint syndicated senior unsecured credit facility totaling $2 billion (Global Credit Facility) which matures on February 7, 2020. This Global Credit Facility provides a source of funds to the Borrowers for temporary and emergency purposes, including the ability to meet future unanticipated or unusually large redemption requests.
| | | | |
| | | |
32 | | Annual Report | | franklintempleton.com |
TEMPLETON GLOBAL INVESTMENT TRUST
NOTES TO FINANCIAL STATEMENTS
Templeton Emerging Markets Small Cap Fund(continued)
Under the terms of the Global Credit Facility, the Fund shall, in addition to interest charged on any borrowings made by the Fund and other costs incurred by the Fund, pay its share of fees and expenses incurred in connection with the implementation and maintenance of the Global Credit Facility, based upon its relative share of the aggregate net assets of all of the Borrowers, including an annual commitment fee of 0.15% based upon the unused portion of the Global Credit Facility. These fees are reflected in other expenses in the Statement of Operations. During the year ended March 31, 2019, the Fund did not use the Global Credit Facility.
10. Fair Value Measurements
The Fund follows a fair value hierarchy that distinguishes between market data obtained from independent sources (observable inputs) and the Fund’s own market assumptions (unobservable inputs). These inputs are used in determining the value of the Fund’s financial instruments and are summarized in the following fair value hierarchy:
| | • | | Level 1 – quoted prices in active markets for identical financial instruments |
| | • | | Level 2 – other significant observable inputs (including quoted prices for similar financial instruments, interest rates, prepayment speed, credit risk, etc.) |
| | • | | Level 3 – significant unobservable inputs (including the Fund’s own assumptions in determining the fair value of financial instruments) |
The input levels are not necessarily an indication of the risk or liquidity associated with financial instruments at that level.
A summary of inputs used as of March 31, 2019, in valuing the Fund’s assets carried at fair value, is as follows:
| | | | | | | | | | | | | | | | |
| | | Level 1 | | | Level 2 | | | Level 3 | | | Total | |
| |
Assets: | | | | | | | | | | | | | | | | |
Investments in Securities:a | | | | | | | | | | | | | | | | |
Equity Investments:b | | | | | | | | | | | | | | | | |
United Arab Emirates | | $ | 11,532,677 | | | $ | 1,348,000 | | | | $ — | | | $ | 12,880,677 | |
All Other Equity Investments | | | 865,796,901 | | | | — | | | | — | | | | 865,796,901 | |
Short Term Investments | | | 38,864,249 | | | | — | | | | — | | | | 38,864,249 | |
| | | | |
Total Investments in Securities | | $ | 916,193,827 | | | $ | 1,348,000 | | | | $ — | | | $ | 917,541,827 | |
| | | | |
aFor detailed categories, see the accompanying Statement of Investments.
bIncludes common and preferred stocks as well as other equity interests.
11. Subsequent Events
The Fund has evaluated subsequent events through the issuance of the financial statements and determined that no events have occurred that require disclosure other than those already disclosed in the financial statements.
| | | | |
| Abbreviations | | |
| |
Selected Portfolio | | |
| | |
ADR | | American Depositary Receipt | | |
GDR | | Global Depositary Receipt | | |
| | | | |
| | | |
| franklintempleton.com | | Annual Report | | 33 |
TEMPLETON GLOBAL INVESTMENT TRUST
Report of Independent Registered Public Accounting Firm
To the Board of Trustees of Templeton Global Investment Trust and Shareholders of Templeton Emerging Markets Small Cap Fund
Opinion on the Financial Statements
We have audited the accompanying statement of assets and liabilities, including the statement of investments, of Templeton Emerging Markets Small Cap Fund (the “Fund”) as of March 31, 2019, the related statement of operations for the year ended March 31, 2019, the statement of changes in net assets for each of the two years in the period ended March 31, 2019, including the related notes, and the financial highlights for each of the periods indicated therein (collectively referred to as the “financial statements”). In our opinion, the financial statements present fairly, in all material respects, the financial position of the Fund as of March 31, 2019, the results of its operations for the year then ended, the changes in its net assets for each of the two years in the period ended March 31, 2019 and the financial highlights for each of the periods indicated therein in conformity with accounting principles generally accepted in the United States of America.
Basis for Opinion
These financial statements are the responsibility of the Fund’s management. Our responsibility is to express an opinion on the Fund’s financial statements based on our audits. We are a public accounting firm registered with the Public Company Accounting Oversight Board (United States) (“PCAOB”) and are required to be independent with respect to the Fund in accordance with the U.S. federal securities laws and the applicable rules and regulations of the Securities and Exchange Commission and the PCAOB.
We conducted our audits of these financial statements in accordance with the standards of the PCAOB. Those standards require that we plan and perform the audit to obtain reasonable assurance about whether the financial statements are free of material misstatement, whether due to error or fraud.
Our audits included performing procedures to assess the risks of material misstatement of the financial statements, whether due to error or fraud, and performing procedures that respond to those risks. Such procedures included examining, on a test basis, evidence regarding the amounts and disclosures in the financial statements. Our audits also included evaluating the accounting principles used and significant estimates made by management, as well as evaluating the overall presentation of the financial statements. Our procedures included confirmation of securities owned as of March 31, 2019 by correspondence with the custodian, transfer agent, and brokers; when replies were not received from brokers, we performed other auditing procedures. We believe that our audits provide a reasonable basis for our opinion.
PricewaterhouseCoopers LLP
San Francisco, California
May 20, 2019
We have served as the auditor of one or more investment companies in the Franklin Templeton Group of Funds since 1948.
| | | | |
| | | |
34 | | Annual Report | | franklintempleton.com |
TEMPLETON GLOBAL INVESTMENT TRUST
Tax Information (unaudited)
Templeton Emerging Markets Small Cap Fund
Under Section 852(b)(3)(C) of the Internal Revenue Code, the Fund hereby reports the maximum amount allowable but no less than $27,994,327 as a long term capital gain dividend for the fiscal year ended March 31, 2019.
Under Section 871(k)(2)(C) of the Internal Revenue Code, the Fund hereby reports the maximum amount allowable but no less than $143,144 as a short term capital gain dividend for purposes of the tax imposed under Section 871(a)(1)(A) of the Internal Revenue Code for the fiscal year ended March 31, 2019.
Under Section 854(b)(1)(B) of the Internal Revenue Code, the Fund hereby reports the maximum amount allowable but no less than $8,968,327 as qualified dividends for purposes of the maximum rate under Section 1(h)(11) of the Internal Revenue Code for the fiscal year ended March 31, 2019. Distributions, including qualified dividend income, paid during calendar year 2019 will be reported to shareholders on Form1099-DIV bymid-February 2020. Shareholders are advised to check with their tax advisors for information on the treatment of these amounts on their individual income tax returns.
At March 31, 2018, more than 50% of the Fund’s total assets were invested in securities of foreign issuers. In most instances, foreign taxes were withheld from income paid to the Fund on these investments. As shown in the table below, the Fund hereby reports to shareholders the foreign source income and foreign taxes paid, pursuant to Section 853 of the Internal Revenue Code. This written statement will allow shareholders of record on Decemeber 20, 2018, to treat their proportionate share of foreign taxes paid by the Fund as having been paid directly by them. The shareholder shall consider these amounts as foreign taxes paid in the tax year in which they receive the Fund distribution.
The following table provides a detailed analysis of foreign tax paid, foreign source income, and foreign source qualified dividends as reported by the Fund to shareholders of record.
| | | | | | | | | | | | |
| Class | | Foreign Tax Paid
Per Share | | | Foreign Source
Income Per Share | | | Foreign Source Qualified
Dividends Per Share | |
| | | |
Class A | | | $0.0254 | | | | $0.0144 | | | | $0.0067 | |
Class C | | | $0.0254 | | | | $ — | | | | $ — | |
Class R | | | $0.0254 | | | | $0.0425 | | | | $0.0202 | |
Class R6 | | | $0.0254 | | | | $0.0768 | | | | $0.0364 | |
Advisor Class | | | $0.0254 | | | | $0.0402 | | | | $0.0190 | |
Foreign Tax Paid Per Share is the amount per share available to you, as a tax credit (assuming you held your shares in the Fund for a minimum of 16 days during the31-day period beginning 15 days before theex-dividend date of the Fund’s distribution to which the foreign taxes relate), or, as a tax deduction.
Foreign Source Income Per Share is the amount per share of income dividends attributable to foreign securities held by the Fund, plus any foreign taxes withheld on these dividends. The amounts reported include foreign source qualified dividends that have not been adjusted for the rate differential applicable to such dividend income.1
Foreign Source Qualified Dividends Per Share is the amount per share of foreign source qualified dividends, plus any foreign taxes withheld on these dividends. These amounts represent the portion of the Foreign Source Income Per Share that were derived from qualified foreign securities held by the Fund.1
In February 2019, shareholders received Form1099-DIV which included their share of taxes paid and foreign source income distributed during the calendar year 2018. The Foreign Source Income reported on Form1099-DIV was not adjusted for the rate differential on foreign source qualified dividend income. Shareholders are advised to check with their tax advisors for information on the treatment of these amounts on their 2018 individual income tax returns.
1. Qualified dividends are taxed at reduced long term capital gains tax rates. In determining the amount of foreign tax credit that may be applied against the U.S. tax liability of individuals receiving foreign source qualified dividends, adjustments may be required to the foreign tax credit limitation calculation to reflect the rate differential applicable to such dividend income. The rules however permit certain individuals to elect not to apply the rate differential adjustments for capital gains and/or dividends for any taxable year. Please consult your tax advisor and the instructions to Form 1116 for more information.
| | | | |
| | | |
| franklintempleton.com | | Annual Report | | 35 |
TEMPLETON GLOBAL INVESTMENT TRUST
Board Members and Officers
The name, year of birth and address of the officers and board members, as well as their affiliations, positions held with the Trust, principal occupations during at least the past five years and number of U.S. registered portfolios overseen in the Franklin Templeton fund complex, are shown below. Generally, each board member serves until that person’s successor is elected and qualified.
Independent Board Members
| | | | | | | | |
Name, Year of Birth and Address | | Position | | Length of Time Served | | Number of Portfolios in Fund Complex Overseen by Board Member* | | Other Directorships Held During at Least the Past 5 Years |
Harris J. Ashton (1932) 300 S.E. 2nd Street Fort Lauderdale, FL 33301-1923 | | Trustee | | Since 1994 | | 136 | | Bar-S Foods (meat packing company) (1981-2010). |
| | |
| Principal Occupation During at Least the Past 5 Years: | | | | |
| Director of various companies; andformerly, Director, RBC Holdings, Inc. (bank holding company) (until 2002); and President, Chief Executive Officer and Chairman of the Board, General Host Corporation (nursery and craft centers) (until 1998). |
| | | | |
Ann Torre Bates (1958) 300 S.E. 2nd Street Fort Lauderdale, FL 33301-1923 | | Trustee | | Since 2008 | | 38 | | Ares Capital Corporation (specialty finance company) (2010-present), United Natural Foods, Inc. (distributor of natural, organic and specialty foods) (2013-present), Allied Capital Corporation (financial services) (2003-2010), SLM Corporation (Sallie Mae) (1997-2014) and Navient Corporation (loan management, servicing and asset recovery) (2014-2016). |
| | |
| Principal Occupation During at Least the Past 5 Years: | | | | |
| Director of various companies; andformerly, Executive Vice President and Chief Financial Officer, NHP Incorporated (manager of multifamily housing) (1995-1997); and Vice President and Treasurer, US Airways, Inc. (until 1995). |
Mary C. Choksi (1950) 300 S.E. 2nd Street Fort Lauderdale, FL 33301-1923 | | Trustee | | Since 2017 | | 136 | | Avis Budget Group Inc. (car rental) (2007-present), Omnicom Group Inc. (advertising and marketing communications services) (2011-present) and White Mountains Insurance Group, Ltd. (holding company) (2017-present). |
| | |
| Principal Occupation During at Least the Past 5 Years: | | | | |
| Director of various companies; andformerly, Founder and Senior Advisor, Strategic Investment Group (investment management group) (2015-2017); Founding Partner and Senior Managing Director, Strategic Investment Group (1987-2015); Founding Partner and Managing Director, Emerging Markets Management LLC (investment management firm) (1987-2011); and Loan Officer/Senior Loan Officer/Senior Pension Investment Officer, World Bank Group (international financial institution) (1977-1987). |
Edith E. Holiday (1952) 300 S.E. 2nd Street Fort Lauderdale, FL 33301-1923 | | Lead Independent Trustee | | Trustee since 1996 and Lead Independent Trustee since 2007 | | 136 | | Hess Corporation (exploration of oil and gas) (1993-present), Canadian National Railway (railroad) (2001-present), White Mountains Insurance Group, Ltd. (holding company) (2004-present), Santander Consumer USA Holdings, Inc. (consumer finance) (2016-present), RTI International Metals, Inc. (manufacture and distribution of titanium) (1999-2015) and H.J. Heinz Company (processed foods and allied products) (1994-2013). |
| | |
| Principal Occupation During at Least the Past 5 Years: | | | | |
| Director or Trustee of various companies and trusts; andformerly, Assistant to the President of the United States and Secretary of the Cabinet (1990-1993); General Counsel to the United States Treasury Department (1989-1990); and Counselor to the Secretary and Assistant Secretary for Public Affairs and Public Liaison-United States Treasury Department (1988-1989). |
| | | | |
| | | |
36 | | Annual Report | | franklintempleton.com |
TEMPLETON GLOBAL INVESTMENT TRUST
Independent Board Members(continued)
| | | | | | | | |
Name, Year of Birth and Address | | Position | | Length of Time Served | | Number of Portfolios in Fund Complex Overseen by Board Member* | | Other Directorships Held During at Least the Past 5 Years |
| | | | |
J. Michael Luttig (1954) 300 S.E. 2nd Street Fort Lauderdale, FL 33301-1923 | | Trustee | | Since 2009 | | 136 | | Boeing Capital Corporation (aircraft financing) (2006-2013). |
| | |
| Principal Occupation During at Least the Past 5 Years: | | | | |
| Executive Vice President, General Counsel and member of the Executive Council, The Boeing Company (aerospace company) (2006-present); andformerly, Federal Appeals Court Judge, U.S. Court of Appeals for the Fourth Circuit (1991-2006). |
| | | | |
David W. Niemiec (1949) 300 S.E. 2nd Street Fort Lauderdale, FL 33301-1923 | | Trustee | | Since 2006 | | 38 | | Hess Midstream Partners LP (oil and gas midstream infrastructure) (2017-present). |
| | |
| Principal Occupation During at Least the Past 5 Years: | | | | |
| Advisor, Saratoga Partners (private equity fund); andformerly, Managing Director, Saratoga Partners (1998-2001) and SBC Warburg Dillon Read (investment banking) (1997-1998); Vice Chairman, Dillon, Read & Co. Inc. (investment banking) (1991-1997); and Chief Financial Officer, Dillon, Read & Co. Inc. (1982-1997). |
| | | | |
Larry D. Thompson (1945) 300 S.E. 2nd Street Fort Lauderdale, FL 33301-1923 | | Trustee | | Since 2006 | | 136 | | The Southern Company (energy company) (2014-present; previously 2010-2012), Graham Holdings Company (education and media organization) (2011-present) and Cbeyond, Inc. (business communications provider) (2010-2012). |
| | |
| Principal Occupation During at Least the Past 5 Years: | | | | |
| Director of various companies; Counsel, Finch McCranie, LLP (law firm) (2015-present); Independent Compliance Monitor and Auditor, Volkswagen AG (manufacturer of automobiles and commercial vehicles) (2017-present); John A. Sibley Professor of Corporate and Business Law, University of Georgia School of Law (2015-present; previously 2011-2012); andformerly, Executive Vice President – Government Affairs, General Counsel and Corporate Secretary, PepsiCo, Inc. (consumer products) (2012-2014); Senior Vice President – Government Affairs, General Counsel and Secretary, PepsiCo, Inc. (2004-2011); Senior Fellow of The Brookings Institution (2003-2004); Visiting Professor, University of Georgia School of Law (2004); and Deputy Attorney General, U.S. Department of Justice (2001-2003). |
| | | | |
Constantine D. Tseretopoulos (1954) 300 S.E. 2nd Street Fort Lauderdale, FL 33301-1923 | | Trustee | | Since 2001 | | 24 | | None |
| | |
| Principal Occupation During at Least the Past 5 Years: | | | | |
| Physician, Chief of Staff, owner and operator of the Lyford Cay Hospital (1987-present); director of various nonprofit organizations; andformerly, Cardiology Fellow, University of Maryland (1985-1987); and Internal Medicine Resident, Greater Baltimore Medical Center (1982-1985). |
| | | | |
Robert E. Wade (1946) 300 S.E. 2nd Street Fort Lauderdale, FL 33301-1923 | | Trustee | | Since 2006 | | 38 | | El Oro Ltd (investments) (2003-present). |
| | |
| Principal Occupation During at Least the Past 5 Years: | | | | |
| Attorney at law engaged in private practice as a sole practitioner (1972-2008) and member of various boards. |
| | | | |
| | | |
| franklintempleton.com | | Annual Report | | 37 |
TEMPLETON GLOBAL INVESTMENT TRUST
Interested Board Members and Officers
| | | | | | | | |
Name, Year of Birth and Address | | Position | | Length of Time Served | | Number of Portfolios in Fund Complex Overseen by Board Member* | | Other Directorships Held During at Least the Past 5 Years |
| | | | |
**Gregory E. Johnson (1961) One Franklin Parkway San Mateo, CA 94403-1906 | | Trustee | | Since 2006 | | 150 | | None |
| | |
| Principal Occupation During at Least the Past 5 Years: | | | | |
| Chairman of the Board, Member – Office of the Chairman, Director and Chief Executive Officer, Franklin Resources, Inc.; officer and/or director or trustee, as the case may be, of some of the other subsidiaries of Franklin Resources, Inc. and of 42 of the investment companies in Franklin Templeton; Vice Chairman, Investment Company Institute; andformerly, President, Franklin Resources, Inc. (1994-2015). |
| | | | |
**Rupert H. Johnson, Jr. (1940) One Franklin Parkway San Mateo, CA 94403-1906 | | Chairman of the Board, Trustee and Vice President | | Chairman of the Board and Trustee since 2013 and Vice President since 1996 | | 136 | | None |
| | |
| Principal Occupation During at Least the Past 5 Years: | | | | |
| Vice Chairman, Member – Office of the Chairman and Director, Franklin Resources, Inc.; Director, Franklin Advisers, Inc.; and officer and/or director or trustee, as the case may be, of some of the other subsidiaries of Franklin Resources, Inc. and of 40 of the investment companies in Franklin Templeton. |
| | | | |
Alison E. Baur (1964) One Franklin Parkway San Mateo, CA 94403-1906 | | Vice President | | Since 2012 | | Not Applicable | | Not Applicable |
| | |
| Principal Occupation During at Least the Past 5 Years: | | | | |
| Deputy General Counsel, Franklin Templeton; and officer of some of the other subsidiaries of Franklin Resources, Inc. and of 44 of the investment companies in Franklin Templeton. |
| | | | |
Norman J. Boersma (1957) Lyford Cay Nassau, Bahamas | | President and Chief Executive Officer – Investment Management | | Since 2012 | | Not Applicable | | Not Applicable |
| | |
| Principal Occupation During at Least the Past 5 Years: | | | | |
| Chairman of the Board, President and Chief Executive Officer, Templeton Global Advisors Ltd.; Chief Investment Officer of Templeton Global Equity Group; officer of five of the investment companies in Franklin Templeton; andformerly, Executive Vice President, Franklin Templeton Investments Corp. (1993-2014). |
| | | | |
Aliya S. Gordon (1973) One Franklin Parkway San Mateo, CA 94403-1906 | | Vice President | | Since 2009 | | Not Applicable | | Not Applicable |
| | |
| Principal Occupation During at Least the Past 5 Years: | | | | |
| Senior Associate General Counsel and officer of 44 of the investment companies in Franklin Templeton. |
| | | | |
Steven J. Gray (1955) One Franklin Parkway San Mateo, CA 94403-1906 | | Vice President | | Since 2009 | | Not Applicable | | Not Applicable |
| | |
| Principal Occupation During at Least the Past 5 Years: | | | | |
| Senior Associate General Counsel, Franklin Templeton; Vice President, Franklin Templeton Distributors, Inc. and FASA, LLC; and officer of 44 of the investment companies in Franklin Templeton. |
| | | | |
Matthew T. Hinkle (1971) One Franklin Parkway San Mateo, CA 94403-1906 | | Chief Executive Officer – Finance and Administration | | Since 2017 | | Not Applicable | | Not Applicable |
| | |
| Principal Occupation During at Least the Past 5 Years: | | | | |
| Senior Vice President, Franklin Templeton Services, LLC; officer of 44 of the investment companies in Franklin Templeton; andformerly, Vice President, Global Tax (2012-April 2017) and Treasurer/Assistant Treasurer, Franklin Templeton (2009-2017). |
| | | | |
| | | |
38 | | Annual Report | | franklintempleton.com |
TEMPLETON GLOBAL INVESTMENT TRUST
Interested Board Members and Officers(continued)
| | | | | | | | |
Name, Year of Birth and Address | | Position | | Length of Time Served | | Number of Portfolios in Fund Complex Overseen by Board Member* | | Other Directorships Held During at Least the Past 5 Years |
| | | | |
Robert G. Kubilis (1973) 300 S.E. 2nd Street Fort Lauderdale, FL 33301-1923 | | Chief Financial Officer, Chief Accounting Officer and Treasurer | | Since 2017 | | Not Applicable | | Not Applicable |
| | |
| Principal Occupation During at Least the Past 5 Years: | | | | |
| Treasurer, U.S. Fund Administration & Reporting and officer of 16 of the investment companies in Franklin Templeton. |
| | | | |
Robert Lim (1948) One Franklin Parkway San Mateo, CA 94403-1906 | | Vice President –AML Compliance | | Since 2016 | | Not Applicable | | Not Applicable |
| | |
| Principal Occupation During at Least the Past 5 Years: | | | | |
| Vice President, Franklin Templeton Companies, LLC; Chief Compliance Officer, Franklin Templeton Distributors, Inc. and Franklin Templeton Investor Services, LLC; and officer of 44 of the investment companies in Franklin Templeton. |
| | | | |
Kimberly H. Novotny (1972) 300 S.E. 2nd Street Fort Lauderdale, FL 33301-1923 | | Vice President | | Since 2013 | | Not Applicable | | Not Applicable |
| | |
| Principal Occupation During at Least the Past 5 Years: | | | | |
| Associate General Counsel, Franklin Templeton; Vice President and Corporate Secretary, Fiduciary Trust International of the South; Vice President, Templeton Investment Counsel, LLC; Assistant Secretary, Franklin Resources, Inc.; and officer of 44 of the investment companies in Franklin Templeton. |
| | | | |
Robert C. Rosselot (1960) 300 S.E. 2nd Street Fort Lauderdale, FL 33301-1923 | | Chief Compliance Officer | | Since 2013 | | Not Applicable | | Not Applicable |
| | |
| Principal Occupation During at Least the Past 5 Years: | | | | |
| Director, Global Compliance, Franklin Templeton; Vice President, Franklin Templeton Companies, LLC; officer of 44 of the investment companies in Franklin Templeton; andformerly, Senior Associate General Counsel, Franklin Templeton (2007-2013); and Secretary and Vice President, Templeton Group of Funds (2004-2013). |
| | | | |
Navid J. Tofigh (1972) One Franklin Parkway San Mateo, CA 94403-1906 | | Vice President | | Since 2015 | | Not Applicable | | Not Applicable |
| | |
| Principal Occupation During at Least the Past 5 Years: | | | | |
| Associate General Counsel and officer of 44 of the investment companies in Franklin Templeton. |
| | | | |
Craig S. Tyle (1960) One Franklin Parkway San Mateo, CA 94403-1906 | | Vice President | | Since 2005 | | Not Applicable | | Not Applicable |
| | |
| Principal Occupation During at Least the Past 5 Years: | | | | |
| General Counsel and Executive Vice President, Franklin Resources, Inc.; and officer of some of the other subsidiaries of Franklin Resources, Inc. and of 44 of the investment companies in Franklin Templeton. |
| | | | |
Lori A. Weber (1964) 300 S.E. 2nd Street Fort Lauderdale, FL 33301-1923 | | Vice President and Secretary | | Vice President since 2011 and Secretary since 2013 | | Not Applicable | | Not Applicable |
| | |
| Principal Occupation During at Least the Past 5 Years: | | | | |
| Senior Associate General Counsel, Franklin Templeton; Assistant Secretary, Franklin Resources, Inc.; Vice President and Secretary, Templeton Investment Counsel, LLC; and officer of 44 of the investment companies in Franklin Templeton. |
| | | | |
| | | |
| franklintempleton.com | | Annual Report | | 39 |
TEMPLETON GLOBAL INVESTMENT TRUST
*We base the number of portfolios on each separate series of the U.S. registered investment companies within the Franklin Templeton fund complex. These portfolios have a common investment manager or affiliated investment managers.
**Gregory E. Johnson is considered to be an interested person of the Fund under the federal securities laws due to his position as an officer and director of Franklin Resources, Inc. (Resources), which is the parent company of the Fund’s investment manager and distributor. Rupert H. Johnson, Jr. is considered to be an interested person of the Fund under the federal securities laws due to his position as an officer and director and major shareholder of Resources.
Note 1: Rupert H. Johnson, Jr. is the uncle of Gregory E. Johnson.
Note 2: Officer information is current as of the date of this report. It is possible that after this date, information about officers may change.
The Sarbanes-Oxley Act of 2002 and Rules adopted by the US Securities and Exchange Commission require the Fund to disclose whether the Fund’s Audit Committee includes at least one member who is an audit committee financial expert within the meaning of such Act and Rules. The Fund’s Board has determined that there is at least one such financial expert on the Audit Committee and has designated each of Ann Torre Bates and David W. Niemiec as an audit committee financial expert. The Board believes that Ms. Bates and Mr. Niemiec qualify as such an expert in view of their extensive business background and experience. Ms. Bates has served as a member of the Fund Audit Committee since 2008. She currently serves as a director of Ares Capital Corporation (2010-present) and United Natural Foods, Inc. (2013-present) and was formerly a director of Navient Corporation from 2014 to 2016, SLM Corporation from 1997 to 2014 and Allied Capital Corporation from 2003 to 2010, Executive Vice President and Chief Financial Officer of NHP Incorporated from 1995 to 1997 and Vice President and Treasurer of US Airways, Inc. until 1995. Mr. Niemiec has served as a member of the Fund Audit Committee since 2006, currently serves as an Advisor to Saratoga Partners and was formerly its Managing Director from 1998 to 2001 and serves as a director of Hess Midstream Partners LP (2017-present). Mr. Niemiec was formerly a director of Emeritus Corporation from 1999 to 2010 and OSI Pharmaceuticals, Inc. from 2006 to 2010, Managing Director of SBC Warburg Dillon Read from 1997 to 1998, and was Vice Chairman from 1991 to 1997 and Chief Financial Officer from 1982 to 1997 of Dillon, Read & Co. Inc. As a result of such background and experience, the Board believes that Ms. Bates and Mr. Niemiec have each acquired an understanding of generally accepted accounting principles and financial statements, the general application of such principles in connection with the accounting estimates, accruals and reserves, and analyzing and evaluating financial statements that present a breadth and level of complexity of accounting issues generally comparable to those of the Fund, as well as an understanding of internal controls and procedures for financial reporting and an understanding of audit committee functions. Ms. Bates and Mr. Niemiec are independent Board members as that term is defined under the applicable US Securities and Exchange Commission Rules and Releases.
The Statement of Additional Information (SAI) includes additional information about the board members and is available, without charge, upon request. Shareholders may call (800) DIALBEN/342-5236 to request the SAI.
| | | | |
| | | |
40 | | Annual Report | | franklintempleton.com |
TEMPLETON GLOBAL INVESTMENT TRUST
TEMPLETON EMERGING MARKETS SMALL CAP FUND
Shareholder Information
Board Approval of Investment Management Agreements
TEMPLETON GLOBAL INVESTMENT TRUST
Templeton Emerging Markets Small Cap Fund
(Fund)
At anin-person meeting held on February 26, 2019 (Meeting), the Board of Trustees (Board) of Templeton Global Investment Trust (Trust), including a majority of the trustees who are not “interested persons” as defined in the Investment Company Act of 1940 (Independent Trustees), reviewed and approved the continuance of the investment management agreement between Templeton Asset Management Ltd. (Manager) and the Trust, on behalf of the Fund (Management Agreement) for an additionalone-year period. The Independent Trustees received advice from and met separately with Independent Trustee counsel in considering whether to approve the continuation of the Management Agreement.
In considering the continuation of the Management Agreement, the Board reviewed and considered information provided by the Manager at the Meeting and throughout the year at meetings of the Board and its committees. The Board also reviewed and considered information provided in response to a detailed set of requests for information submitted to the Manager by Independent Trustee counsel on behalf of the Independent Trustees in connection with the annual contract renewal process. In addition, prior to the Meeting, the Independent Trustees held a telephonic contract renewal meeting at which the Independent Trustees conferred amongst themselves and Independent Trustee counsel about contract renewal matters. The Board reviewed and considered all of the factors it deemed relevant in approving the continuance of the Management Agreement, including, but not limited to: (i) the nature, extent and quality of the services provided by the Manager; (ii) the investment performance of the Fund; (iii) the costs of the services provided and profits realized by the Manager and its affiliates from the relationship with the Fund; (iv) the extent to which economies of scale are realized as the Fund grows; and (v) whether fee levels reflect these economies of scale for the benefit of Fund investors.
In approving the continuance of the Management Agreement, the Board, including a majority of the Independent Trustees, determined that the terms of the Management Agreement are fair and reasonable and that the continuance of such Management Agreement is in the interests of the Fund and its shareholders. While attention was given to all information
furnished, the following discusses some primary factors relevant to the Board’s determination.
Nature, Extent and Quality of Services
The Board reviewed and considered information regarding the nature, extent and quality of investment management services provided by the Manager and its affiliates to the Fund and its shareholders. This information included, among other things, the qualifications, background and experience of the senior management and investment personnel of the Manager; the structure of investment personnel compensation; oversight of third-party service providers; investment performance reports and related financial information for the Fund; reports on expenses, shareholder services, marketing support payments made to financial intermediaries and third party servicing arrangements; legal and compliance matters; risk controls; pricing and other services provided by the Manager and its affiliates; and management fees charged by the Manager and its affiliates to US funds and other accounts, including management’s explanation of differences among accounts where relevant. The Board also reviewed and considered an annual report on payments made by Franklin Templeton Investments (FTI) or the Fund to financial intermediaries, as well as a memorandum relating to third-party servicing arrangements in response to a guidance update in 2016 from the US Securities and Exchange Commission (SEC) relating to mutual fund distribution andsub-accounting fees. The Board noted management’s continuing efforts and expenditures in establishing effective business continuity plans and developing strategies to address areas of heightened concern in the mutual fund industry, such as cybersecurity and liquidity risk management. The Board also recognized management’s commitment to facilitating Board oversight of liquidity through the designation of a liquidity/risk administrator and the development of reports that highlight the amount of illiquid investments for the Fund.
The Board also reviewed and considered the benefits provided to Fund shareholders of investing in a fund that is part of the Franklin Templeton family of funds. The Board noted the financial position of Franklin Resources, Inc. (FRI), the Manager’s parent, and its commitment to the mutual fund business as evidenced by its continued introduction of new funds, reassessment of the fund offerings in response to the market environment and project initiatives and capital investments relating to the services provided to the Fund by the FTI organization.
| | | | |
| | | |
| franklintempleton.com | | Annual Report | | 41 |
TEMPLETON GLOBAL INVESTMENT TRUST
TEMPLETON EMERGING MARKETS SMALL CAP FUND
SHAREHOLDER INFORMATION
Following consideration of such information, the Board was satisfied with the nature, extent and quality of services provided by the Manager and its affiliates to the Fund and its shareholders.
Fund Performance
The Board reviewed and considered the performance results of the Fund over various time periods ended December 31, 2018. The Board considered the performance returns for the Fund in comparison to the performance returns of mutual funds deemed comparable to the Fund included in a universe (Performance Universe) selected by Broadridge Financial Solutions, Inc. (Broadridge), an independent provider of investment company data. The Board received a description of the methodology used by Broadridge to select the mutual funds included in a Performance Universe. The Board also considered the performance returns for the Fund in comparison to the performance returns of a customized peer group (Performance Customized Peer Group) selected by the Manager. The Board further reviewed and considered Fund performance reports provided and discussions that occurred with portfolio managers at Board meetings throughout the year. A summary of the Fund’s performance results is below.
The Performance Universe for the Fund included the Fund and all retail and institutional emerging markets funds. The Performance Customized Peer Group for this Fund included only emerging markets funds that invest only in stocks that have total market cap within the range of the market capitalizations of companies in the MSCI Emerging Markets Small Cap Index at the time of purchase. The Board noted that the Fund’s annualized total return for the three-year period was below the median of its Performance Universe, but for theone-, five- and10-year periods was above the median of its Performance Universe. The Board also noted that the Fund’s annualized total return for the10-year period was below the median of its Performance Customized Peer Group, but for theone-, three- and five-year periods was above the median of its Performance Customized Peer Group. The Board concluded that the Fund’s performance was satisfactory.
Comparative Fees and Expenses
The Board reviewed and considered information regarding the Fund’s actual total expense ratio and its various components, including, as applicable, management fees; transfer agent expenses; underlying fund expenses; Rule12b-1 andnon-Rule12b-1 service fees; and othernon-management fees. The Board also noted the quarterly and annual reports it receives on all marketing support payments made by FTI to
financial intermediaries. The Board considered the actual total expense ratio and, separately, the contractual management fee rate, without the effect of fee waivers, if any (Management Rate) of the Fund in comparison to the median expense ratio and median Management Rate, respectively, of other mutual funds deemed comparable to and with a similar expense structure to the Fund selected by Broadridge (Expense Group). Broadridge fee and expense data is based upon information taken from each fund’s most recent annual report, which reflects historical asset levels that may be quite different from those currently existing, particularly in a period of market volatility. While recognizing such inherent limitation and the fact that expense ratios and Management Rates generally increase as assets decline and decrease as assets grow, the Board believed the independent analysis conducted by Broadridge to be an appropriate measure of comparative fees and expenses. The Broadridge Management Rate includes administrative charges, and the actual total expense ratio, for comparative consistency, was shown for Class A shares for funds with multiple classes of shares. The Board received a description of the methodology used by Broadridge to select the mutual funds included in an Expense Group.
The Expense Group for the Fund included the Fund and 16 other emerging markets funds. The Board noted that the Management Rate for the Fund was above the median of and the second-highest in its Expense Group. The Board also noted that the actual total expense ratio for the Fund was above the median of and the highest (most expensive) in its Expense Group. The Board discussed the expenses of this Fund with management and noted the Fund’s specialized focus on the small capitalization segment of the market, the Fund’s first quintile (the best) five- andten-year and second quintileone-year annualized total return performance compared to its Performance Universe and efforts by the Fund’s portfolio management team to mitigate the Fund’s risk exposures. The Board concluded that the Management Rate charged to the Fund is reasonable, given the factors noted above and management’s proposal to reduce the Management Rate of the Fund in response to a request from the Independent Trustees. Accordingly, effective April 1, 2019, the investment management fee paid by the Fund was changed to 1.400% for assets up to and including $500 million, 1.300% for assets over $500 million and up to and including $1 billion and 1.200% for assets exceeding $1 billion.
Profitability
The Board reviewed and considered information regarding the profits realized by the Manager and its affiliates in connection
| | | | |
| | | |
42 | | Annual Report | | franklintempleton.com |
TEMPLETON GLOBAL INVESTMENT TRUST
TEMPLETON EMERGING MARKETS SMALL CAP FUND
SHAREHOLDER INFORMATION
with the operation of the Fund. In this respect, the Board considered the Fund profitability analysis provided by the Manager that addresses the overall profitability of FTI’s US fund business, as well as its profits in providing investment management and other services to each of the individual funds during the12-month period ended September 30, 2018, being the most recent fiscalyear-end for FRI. The Board noted that although management continually makes refinements to its methodologies used in calculating profitability in response to organizational and product-related changes, the overall methodology has remained consistent with that used in the Fund’s profitability report presentations from prior years. Additionally, PricewaterhouseCoopers LLP, auditor to FRI and certain Franklin Templeton funds, has been engaged by the Manager to periodically review and assess the allocation methodologies to be used solely by the Fund’s Board with respect to the profitability analysis.
The Board noted management’s belief that costs incurred in establishing the infrastructure necessary for the type of mutual fund operations conducted by the Manager and its affiliates may not be fully reflected in the expenses allocated to the Fund in determining its profitability, as well as the fact that the level of profits, to a certain extent, reflected operational cost savings and efficiencies initiated by management. The Board also noted management’s expenditures in improving shareholder services provided to the Fund, as well as the need to implement systems and meet additional regulatory and compliance requirements resulting from recent SEC and other regulatory requirements.
The Board also considered the extent to which the Manager and its affiliates might derive ancillary benefits from fund operations, including revenues generated from transfer agent services, potential benefits resulting from personnel and systems enhancements necessitated by fund growth, as well as increased leverage with service providers and counterparties. Based upon its consideration of all these factors, the Board concluded that the level of profits realized by the Manager and its affiliates from providing services to the Fund was not excessive in view of the nature, extent and quality of services provided to the Fund.
Economies of Scale
The Board reviewed and considered the extent to which the Manager may realize economies of scale, if any, as the Fund grows larger and whether the Fund’s management fee structure reflects any economies of scale for the benefit of shareholders. With respect to possible economies of scale, the Board noted the existence of management fee breakpoints, which operate
generally to share any economies of scale with the Fund’s shareholders by reducing the Fund’s effective management fees as the Fund grows in size. The Board considered the Manager’s view that any analyses of potential economies of scale in managing a particular fund are inherently limited in light of the joint and common costs and investments the Manager incurs across the Franklin Templeton family of funds as a whole. In response to Board discussions, the Manager lowered the initial Management Rate fee breakpoint effective April 1, 2019. In light of this change, the Board concluded that to the extent economies of scale may be realized by the Manager and its affiliates, the Fund’s management fee structure provided a sharing of benefits with the Fund and its shareholders as the Fund grows.
Conclusion
Based on its review, consideration and evaluation of all factors it believed relevant, including the above-described factors and conclusions, the Board unanimously approved the continuation of the Management Agreement for an additionalone-year period.
Proxy Voting Policies and Procedures
The Fund’s investment manager has established Proxy Voting Policies and Procedures (Policies) that the Fund uses to determine how to vote proxies relating to portfolio securities. Shareholders may view the Fund’s complete Policies online at franklintempleton.com. Alternatively, shareholders may request copies of the Policies free of charge by calling the Proxy Group collect at (954)527-7678 or by sending a written request to: Franklin Templeton Companies, LLC, 300 S.E. 2nd Street, Fort Lauderdale, FL 33301, Attention: Proxy Group. Copies of the Fund’s proxy voting records are also made available online at franklintempleton.com and posted on the U.S. Securities and Exchange Commission’s website at sec.gov and reflect the most recent12-month period ended June 30.
Quarterly Statement of Investments
The Trust, on behalf of the Fund, files a complete statement of investments with the U.S. Securities and Exchange Commission for the first and third quarters for each fiscal year as an exhibit to its report on FormN-PORT. Shareholders may view the filed FormN-PORT by visiting the Commission’s website at sec.gov. The filed form may also be viewed and copied at the Commission’s Public Reference Room in Washington, DC. Information regarding the operations of the Public Reference Room may be obtained by calling(800) SEC-0330.
| | | | |
| | | |
| franklintempleton.com | | Annual Report | | 43 |
TEMPLETON GLOBAL INVESTMENT TRUST
TEMPLETON EMERGING MARKETS SMALL CAP FUND
SHAREHOLDER INFORMATION
Householding of Reports and Prospectuses
You will receive the Fund’s financial reports every six months as well as an annual updated summary prospectus (prospectus available upon request). To reduce Fund expenses, we try to identify related shareholders in a household and send only one copy of the financial reports and summary prospectus. This process, called “householding,” will continue indefinitely unless you instruct us otherwise. If you prefer not to have these documents householded, please call us at (800)632-2301. At any time you may view current prospectuses/summary prospectuses and financial reports on our website. If you choose, you may receive these documents through electronic delivery.
| | | | |
| | | |
44 | | Annual Report | | franklintempleton.com |
| | |

| | Annual Report and Shareholder Letter Templeton Emerging Markets Small Cap Fund Investment Manager Templeton Asset Management Ltd. Distributor Franklin Templeton Distributors, Inc. (800) DIAL BEN®/342-5236 franklintempleton.com Shareholder Services (800)632-2301 |
Authorized for distribution only when accompanied or preceded by a summary prospectus and/or prospectus. Investors should carefully consider a fund’s investment goals, risks, charges and expenses before investing. A prospectus contains this and other information; please read it carefully before investing.
To help ensure we provide you with quality service, all calls to and from our service areas are monitored and/or recorded.
| | |
| © 2019 Franklin Templeton Investments. All rights reserved. | | 426 A 05/19 |
Annual Report
Templeton Dynamic Equity Fund
This annual report for Templeton Dynamic Equity Fund covers the fiscal year ended March 31, 2019.
Your Fund’s Goal and Main Investments
The Fund seeks risk-adjusted total return over the longer term. Under normal market conditions, the Fund seeks to achieve its investment goal by investing its assets in a global equity portfolio, while managing sector exposure by monitoring its allocation to various sectors compared to its benchmark, the MSCI All Country World Index (ACWI), and adjusting its overall exposure to certain sectors through long and short positions in various sector-focused exchange-traded funds (ETFs). Additionally, the Fund may hedge its exposure to the overall global equity market through a combination of cash, ETFs and equity index futures. The Fund’s global equity portfolio consists primarily of equity securities of companies located anywhere in the world, including developing markets. The Fund normally invests at least 80% of its net assets (plus the amount of any borrowing for investment purposes) in equity securities and investments that provide exposure to equity securities. For purposes of this 80% policy, equity securities include, but are not limited to: common stock, preferred stock, convertible securities, depositary receipts, ETFs and certain derivative instruments. The Fund may invest in companies of any size, including small and medium capitalization companies.
|
What is a futures contract? A futures contract is an agreement between the Fund and a counterparty made through a U.S. or foreign futures exchange to buy or sell an underlying instrument or asset at a specific price on a future date. |
Performance Overview
For the12-month period under review, the Fund’s Advisor Class shares posted a-3.04% cumulative total return. In comparison, the Fund’s benchmark, the MSCI ACWI, which measures stock performance in global developed and emerging
Geographic Composition
Based on Total Net Assets as of 3/31/19
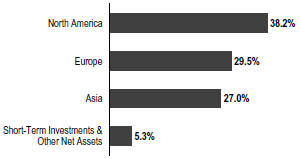
markets, posted a +3.16% total return.1 You can find more of the Fund’s performance data in the Performance Summary on page 6.
Performance data represent past performance, which does not guarantee future results. Investment return and principal value will fluctuate, and you may have a gain or loss when you sell your shares. Current performance may differ from figures shown.
Economic and Market Overview
The global economy expanded during the 12 months under review, despite weakness in certain regions. Global developed and emerging market stocks were aided by upbeat economic data in some regions, encouraging corporate earnings reports, the U.S. Federal Reserve’s (Fed’s) indications of a patient approach to its monetary policy decisions and optimism about a potential U.S.-China trade deal. In this environment, global stocks, as measured by the MSCI ACWI, posted a +3.16% total return for the 12 months ended March 31, 2019.1
However, various factors weighed on global markets, including concerns about regulation of technology companies, political uncertainties in the U.S. and the European Union, the Fed’s interest-rate path and the European Central Bank’s (ECB’s) unwinding of its bond purchase program. Markets were also
1. Source: Morningstar.
The index is unmanaged and includes reinvestment of any income or distributions. It does not reflect any fees, expenses or sales charges. One cannot invest directly in an index, and an index is not representative of the Fund’s portfolio.
The dollar value, number of shares or principal amount, and names of all portfolio holdings are listed in the Fund’s Statement of Investments (SOI).
The SOI begins on page 11.
TEMPLETON DYNAMIC EQUITY FUND
pressured by U.S. trade disputes with China and other trading partners, and their impact on global growth and corporate earnings.
The U.S. economy grew during the12-month period. The economy expanded at a faster rate in 2019’s first quarter after moderating in the previous two quarters. Growth in consumer spending, business investment, exports, government spending and inventory investment was partly offset by a decrease in housing investment. The unemployment rate decreased from 4.0% in March 2018 to 3.8% atperiod-end.2 The annual inflation rate, as measured by the Consumer Price Index, decreased from 2.4% in March 2018 to 1.9% atperiod-end.2
The Fed raised its target range for the federal funds rate by 0.25% three times during the period, to 2.25%–2.50%, and continued reducing its balance sheet as part of its plan to normalize monetary policy. At its March 2019 meeting, the Fed held its target range for the federal funds rate unchanged, signaled no rate hikes in 2019 and mentioned it would end its balance sheet normalization by the end of September 2019.
In Europe, the U.K.’s quarterly gross domestic product (GDP) growth accelerated in 2018’s second and third quarters, but it moderated in the fourth quarter. The Bank of England raised its key policy rate once during the review period. The eurozone’s quarterly GDP moderated in the third quarter but accelerated in the following two quarters. The bloc’s annual inflation varied throughout the 12 months under review but ended the period unchanged from the March 2018 level. The ECB kept its benchmark interest rate unchanged during the period and concluded its bond purchase program at the end of 2018. In March 2019, the ECB mentioned it expected key interest rates to remain unchanged at least through the end of 2019 and announced the launch of a new stimulus measure beginning in September 2019.
In Asia, Japan’s quarterly GDP expanded in 2018’s second quarter, contracted in the third quarter and returned to growth in the fourth quarter. The Bank of Japan left its benchmark interest rate unchanged during the period and continued its monetary stimulus measures.
In emerging markets, Brazil’s quarterly GDP growth slowed in 2018’s second quarter, but it accelerated in the third quarter before easing in the fourth quarter. After accelerating in 2018’s second quarter, Russia’s annual GDP growth held steady in 2018’s third quarter and accelerated in the fourth quarter. The Bank of Russia increased its key rate twice during the period.
Top 10 Countries
3/31/19
| | |
| | | % of Total
Net Assets |
| |
U.S. | | 33.6% |
| |
Netherlands | | 8.2% |
| |
South Korea | | 7.8% |
| |
China | | 7.8% |
| |
France | | 7.3% |
| |
Japan | | 5.7% |
| |
U.K. | | 5.5% |
| |
Canada | | 4.5% |
| |
Switzerland | | 4.5% |
| |
Hong Kong | | 3.8% |
China’s annual GDP growth stabilized in 2019’s first quarter after moderating in the previous three quarters. The People’s Bank of China left its benchmark interest rate unchanged, but it took measures to improve financial liquidity to mitigate the effects of the U.S.-China trade dispute and support economic growth. Overall, emerging market stocks, as measured by the MSCI Emerging Markets Index, posted a-7.06% total return during the12-month period.1
Investment Strategy
In selecting equity securities eligible for the Fund’s global equity portfolio, we apply abottom-up, value-oriented, long-term approach. We focus on the market price of a company’s securities relative to our evaluation of the company’s long-term earnings, asset value and cash flow potential. After establishing a universe of potential investments, we generally apply a proprietary quantitative screen to assist in selecting the specific securities to buy or sell for the Fund.
We also monitor the Fund’s allocation to various sectors compared to the Fund’s benchmark, the MSCI ACWI, and adjust the Fund’s overall exposure to certain sectors by taking long (buying) or short (selling) positions on various sector-focused, passively managed ETFs. A long position in a sector-focused ETF would increase the Fund’s exposure to that particular sector, while a short position in a sector-focused ETF would decrease the Fund’s exposure to that sector. We use various technical and quantitative indicators for each sector to determine whether to increase or decrease the Fund’s exposure to specific sectors.
In addition to monitoring and adjusting the Fund’s exposure to specific sectors in the global equity market, we also monitor
2. Source: U.S. Bureau of Labor Statistics.
TEMPLETON DYNAMIC EQUITY FUND
and adjust the Fund’s exposure to the overall global equity market. We use a model that studies various macroeconomic and market factors believed to have an impact on the global equity markets as a guide to determine when it is appropriate to hedge the global equity market. However, we make the ultimate decision on whether to hedge the Fund’s global equity market exposure based on our review of the market and the Fund’s current portfolio. When we determine that the Fund should increase its exposure to the global equity market, we will invest the Fund’s cash in one or more ETFs that provide global equity market exposure. When we expect global equity market returns to be negative and the Fund’s exposure should be decreased, we may use derivative instruments—specifically, selling equity index futures—to hedge the Fund’s exposure to overall global equity markets.
We may, from time to time, seek to hedge against market risk, gain exposure to individual securities or generate additional income for the Fund by buying and selling (writing) exchange traded andover-the-counter equity put and call options on individual securities held in its portfolio. Additionally, we may, from time to time, seek to hedge (protect) against currency risks, using certain derivative instruments, including currency and cross currency forwards and currency futures contracts.
|
What is an option? An option is a contract to buy or sell a specific financial product known as the option’s underlying instrument at a specific price. The buyer of an option has the right, but not the obligation, to buy or sell the underlying instrument at or until a specified expiration date. Conversely, the seller (“writer”) of an option who opens a transaction is obligated to buy or sell the underlying instrument should the option holder exercise that right. |
|
What is a currency forward contract? A currency forward contract is an agreement between the Fund and a counterparty to buy or sell a foreign currency in exchange for another currency at a specific exchange rate on a future date. Currency forward contracts are privately traded in the interbank market, not on a centralized exchange. |
Manager’s Discussion
During the12-month period under review, stock selection and favorable overweights in the health care and communication services sectors contributed to the Fund’s relative performance.3
In the health care sector, U.S. pharmaceuticals developer Eli Lilly & Co. contributed to relative results. Shares steadily rose throughout the period given investors’ perceptions of the firm’s managerial acumen, product diversification, limited patent risk and overall growth potential. U.S.-based medical technology firm LivaNova also contributed due to broad-based sector strength and better-than-expected revenue growth, which buoyed the firm’s earnings outlook. We reduced our position in the company to realize profits from its elevated stock price and limit exposure.
In the communications sector, U.S. media services provider Comcast was a leading contributor to relative performance.
Elsewhere, U.S. automotive products retailer Advance Auto Parts also contributed to relative results. The company’s shares rallied as analysts became increasingly bullish following strong guidance and a string of better-than-expected earnings reports.
Conversely, stock selection among underweight information technology (IT) holdings and stock selection and overweight financials, materials and energy stocks detracted from the Fund’s relative performance.4
In the IT sector, our underweight position and stock selection meant the Fund failed to benefit from the sector’s significant recovery in the first quarter of 2019. Chinese internet search firm Baidu was a major relative detractor. The company’s stock was hurt by broad-based concerns about economic uncertainty in China, offsetting better-than-expected sales growth and a rapid increase in users.
In the financials sector, significant relative detractors included banks. Shares of Italian lender UniCredit declined as macroeconomic and political concerns in Europe offset better-than-expected earnings driven by robust commercial banking activities and lower expenses. We remained constructive on European banks overall. When taking into accountprice-to-earnings andprice-to-book ratios along with
3. The health care sector comprises biotechnology, health care equipment and supplies, life sciences tools and services, and pharmaceuticals in the SOI. The communication services sector comprises interactive media and services, media and wireless telecommunication services in the SOI.
4. The IT sector comprises communications equipment; semiconductors and semiconductor equipment; software; and technology hardware, storage and peripherals in the SOI.
The financials sector comprises banks, consumer finance, diversified financial services and insurance in the SOI. The materials sector comprises chemicals and metals and mining in the SOI. The energy sector comprises oil, gas and consumable fuels in the SOI.
See www.franklintempletondatasources.com for additional data provider information.
TEMPLETON DYNAMIC EQUITY FUND
dividend yields, the sector traded at a significant discount to the wider market. Atperiod-end, the discount reached levels only seen during the 2008 financial crisis and in 2016, when German bund yields first turned negative. Likewise, the sector’s dividend yield during the period has rarely been exceeded, and the gap between double-digit percentage returns on tangible equity and the tangible book value multiple was the widest in recent memory.
In the materials sector, U.S.-based chemicals firm Eastman Chemical was a major relative detractor. Company shares fell after the firm reported lowearning-per-share guidance, citing concerns about rising input costs and a potential slowdown in Chinese demand.
In the energy sector, Canadian integrated energy company Husky Energy was a significant relative detractor.
From a regional standpoint, Europe contributed to relative results as stock selection overcame an unfavorable overweight allocation. In contrast, stock-specific weakness among underweight U.S. holdings detracted from relative performance, while in Asia, the relative contribution by Hong Kong was offset by weakness in South Korea, Japan and China.
Top 10 Holdings
3/31/19
| | |
Company Sector/Industry, Country | | % of Total
Net Assets |
| |
Novartis AG Pharmaceuticals, Switzerland | | 3.2% |
| |
Samsung Electronics Co. Ltd. Technology Hardware, Storage & Peripherals, South Korea | | 3.0% |
| |
NXP Semiconductors NV Semiconductors & Semiconductor Equipment, Netherlands | | 3.0% |
| |
Total SA Oil, Gas & Consumable Fuels, France | | 2.8% |
| |
Comcast Corp. Media, U.S. | | 2.8% |
| |
Oracle Corp. Software, U.S. | | 2.6% |
| |
United Parcel Service Inc. Air Freight & Logistics, U.S. | | 2.6% |
| |
AIA Group Ltd. Insurance, Hong Kong | | 2.6% |
| |
China Mobile Ltd. Wireless Telecommunication Services, China | | 2.5% |
| |
Baidu Inc. Interactive Media & Services, China | | 2.4% |
It is important to recognize the effect of currency movements on the Fund’s performance. In general, if the value of the U.S. dollar goes up compared with a foreign currency, an investment traded in that foreign currency will go down in value because it will be worth fewer U.S. dollars. This can have a negative effect on Fund performance. Conversely, when the U.S. dollar weakens in relation to a foreign currency, an investment traded in that foreign currency will increase in value, which can contribute to Fund performance. For the 12 months ended March 31, 2019, the U.S. dollar rose in value relative to most currencies. As a result, the Fund’s performance was negatively affected by the portfolio’s substantial investment in securities withnon-U.S. currency exposure.
| | |
 | | 
|
| | Norman J. Boersma, CFA |
| | |
 | |  |
| | Heather Arnold, CFA |
| |
| | Portfolio Management Team |
The foregoing information reflects our analysis, opinions and portfolio holdings as of March 31, 2019, the end of the reporting period. The way we implement our main investment strategies and the resulting portfolio holdings may change depending on factors such as market and economic conditions. These opinions may not be relied upon as investment advice or an offer for a particular security. The information is not a complete analysis of every aspect of any market, country, industry, security or the Fund. Statements of fact are from sources considered reliable, but the investment manager makes no representation or warranty as to their completeness or accuracy. Although historical performance is no guarantee of future results, these insights may help you understand our investment management philosophy.
TEMPLETON DYNAMIC EQUITY FUND
Performance Summary as of March 31, 2019
The performance table and graph do not reflect any taxes that a shareholder would pay on Fund dividends, capital gain distributions, if any, or any realized gains on the sale of Fund shares. Total return reflects reinvestment of the Fund’s dividends and capital gain distributions, if any, and any unrealized gains or losses. Your dividend income will vary depending on dividends or interest paid by securities in the Fund’s portfolio, adjusted for operating expenses. Capital gain distributions are net profits realized from the sale of portfolio securities.
Performance as of 3/31/191
Cumulative total return excludes sales charges. Average annual total return includes maximum sales charges. Sales charges will vary depending on the size of the investment and the class of share purchased. Advisor Class shares are offered without sales charges.
| | | | | | |
| Share Class | | Cumulative Total Return2 | | | Average Annual Total Return3 |
| | |
Advisor | | | | | | |
1-Year | | | -3.04% | | | -3.04% |
| | |
Since Inception (5/2/16) | | | +23.89% | | | +7.63% |
Performance data represent past performance, which does not guarantee future results. Investment return and principal value will fluctuate, and you may have a gain or loss when you sell your shares. Current performance may differ from figures shown.
See page 8 for Performance Summary footnotes.
TEMPLETON DYNAMIC EQUITY FUND
PERFORMANCE SUMMARY
Total Return Index Comparison for a Hypothetical $10,000 Investment1
Total return represents the change in value of an investment over the periods shown. It includes any applicable maximum sales charge, Fund expenses, account fees and reinvested distributions. The unmanaged index includes reinvestment of any income or distributions. It differs from the Fund in composition and does not pay management fees or expenses. One cannot invest directly in an index.
Advisor Class(5/2/16–3/31/19)
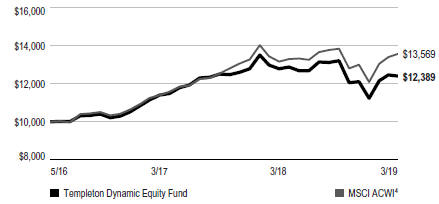
See page 8 for Performance Summary footnotes.
TEMPLETON DYNAMIC EQUITY FUND
PERFORMANCE SUMMARY
Distributions(4/1/18–3/31/19)
| | | | | | | | | | | | | | | | |
| Share Class | | Net Investment
Income | | | Short-Term
Capital Gain | | | Long-Term
Capital Gain | | | Total | |
| Advisor | | | $0.1261 | | | | $0.2849 | | | | $0.8579 | | | | $1.2689 | |
| | | |
Total Annual Operating Expenses5 | | | | | | | | | | | | | |
| Share Class | | With Fee
Waiver | | | Without Fee
Waiver | | | | | | | |
Advisor | | | 1.05% | | | | 1.86% | | | | | | | | | |
All investments involve risks, including possible loss of principal. Special risks are associated with foreign investing, including currency fluctuations, economic instability and political developments; investments in emerging markets involve heightened risks related to the same factors. In addition, smaller-company stocks have historically experienced more price volatility than larger-company stocks, especially over the short term. To the extent the Fund focuses on particular countries, regions, industries, sectors or types of investment from time to time, it may be subject to greater risks of adverse developments in such areas of focus than a fund that invests in a wider variety of countries, regions, industries, sectors or investments. Derivatives, including equity index futures, equity options and currency management strategies, involve costs and can create economic leverage in the portfolio, which may result in significant volatility and cause the Fund to participate in losses (as well as enable gains) on an amount that exceeds the Fund’s initial investment. To the extent the Fund invests in ETFs, its performance is directly related to the performance of such ETFs. The Fund is actively managed but there is no guarantee that the manager’s investment decisions will produce the desired results. The Fund’s prospectus also includes a description of the main investment risks.
1. The Fund has an expense reduction and a fee waiver associated with any investments it makes in a Franklin Templeton money fund and/or other Franklin Templeton fund, contractually guaranteed through 7/31/19. Fund investment results reflect the expense reduction and fee waiver; without these reductions, the results would have been lower.
2. Cumulative total return represents the change in value of an investment over the periods indicated.
3. Average annual total return represents the average annual change in value of an investment over the periods indicated. Return for less than one year, if any, has not been annualized.
4. Source: Morningstar. The MSCI ACWI is a free float-adjusted, market capitalization-weighted index designed to measure equity market performance in global developed and emerging markets.
5. Figures are as stated in the Fund’s current prospectus and may differ from the expense ratios disclosed in the Your Fund’s Expenses and Financial Highlights sections in this report. In periods of market volatility, assets may decline significantly, causing total annual Fund operating expenses to become higher than the figures shown.
See www.franklintempletondatasources.com for additional data provider information.
TEMPLETON DYNAMIC EQUITY FUND
Your Fund’s Expenses
As a Fund shareholder, you can incur two types of costs: (1) transaction costs, including sales charges (loads) on Fund purchases and redemptions; and (2) ongoing Fund costs, including management fees, distribution and service(12b-1) fees, and other Fund expenses. All mutual funds have ongoing costs, sometimes referred to as operating expenses. The table below shows ongoing costs of investing in the Fund and can help you understand these costs and compare them with those of other mutual funds. The table assumes a $1,000 investment held for the six months indicated.
Actual Fund Expenses
The table below provides information about actual account values and actual expenses in the columns under the heading “Actual.” In these columns the Fund’s actual return, which includes the effect of Fund expenses, is used to calculate the “Ending Account Value” for each class of shares. You can estimate the expenses you paid during the period by following these steps (of course, your account value and expenses will differ from those in this illustration): Divide your account value by $1,000 (if your account had an $8,600 value, then $8,600÷ $1,000 = 8.6). Then multiply the result by the number in the row for your class of shares under the headings “Actual” and “Expenses Paid During Period” (if Actual Expenses Paid During Period were $7.50, then 8.6 x $7.50 =$64.50). In this illustration, the actual expenses paid this period are $64.50.
Hypothetical Example for Comparison with Other Funds
Under the heading “Hypothetical” in the table, information is provided about hypothetical account values and hypothetical expenses based on the Fund’s actual expense ratio and an assumed rate of return of 5% per year before expenses, which is not the Fund’s actual return. This information may not be used to estimate the actual ending account balance or expenses you paid for the period, but it can help you compare ongoing costs of investing in the Fund with those of other funds. To do so, compare this 5% hypothetical example for the class of shares you hold with the 5% hypothetical examples that appear in the shareholder reports of other funds.
Please note that expenses shown in the table are meant to highlight ongoing costs and do not reflect any transactional costs. Therefore, information under the heading “Hypothetical” is useful in comparing ongoing costs only, and will not help you compare total costs of owning different funds. In addition, if transactional costs were included, your total costs would have been higher.
| | | | | | | | | | | | | | | | | | |
| | | | | | | Actual (actual return after expenses) | | | | Hypothetical (5% annual return before expenses) | | | | |
| Share Class | | Beginning
Account
Value 10/1/18 | | | | Ending Account
Value 3/31/19 | | Expenses Paid During
Period
10/1/18–3/31/191,2 | | | | Ending Account
Value 3/31/19 | | Expenses Paid During
Period
10/1/18–3/31/191,2 | | | | Net Annualized
Expense Ratio2 |
Advisor | | $1,000 | | | | $938.50 | | $4.83 | | | | $1,019.95 | | $5.04 | | | | 1.00% |
1. Expenses are equal to the annualized expense ratio for thesix-month period as indicated above—in the far right column—multiplied by the simple average account value over the period indicated, and then multiplied by 182/365 to reflect theone-half year period.
2. Reflects expenses after fee waivers and expense reimbursements. Does not include acquired fund fees and expenses.
TEMPLETON GLOBAL INVESTMENT TRUST
Financial Highlights
Templeton Dynamic Equity Fund
| | | | | | | | | | | | |
| | | Year Ended March 31, | |
| | | | 2019 | | | | 2018 | | | | 2017a | |
| | | |
Advisor Class | | | | | | | | | | | | |
| | | |
Per share operating performance (for a share outstanding throughout the year) | | | | | | | | | | | | |
| | | |
Net asset value, beginning of year | | | $11.16 | | | | $11.17 | | | | $10.00 | |
| | | |
Income from investment operationsb: | | | | | | | | | | | | |
| | | |
Net investment incomec | | | 0.16 | | | | 0.17 | | | | 0.12 | |
| | | |
Net realized and unrealized gains (losses) | | | (0.65 | ) | | | 1.17 | | | | 1.26 | |
| | | |
Total from investment operations. | | | (0.49 | ) | | | 1.34 | | | | 1.38 | |
| | | |
Less distributions from: | | | | | | | | | | | | |
| | | |
Net investment income | | | (0.13 | ) | | | (0.21 | ) | | | (0.11 | ) |
| | | |
Net realized gains | | | (1.14 | ) | | | (1.14 | ) | | | (0.10 | ) |
| | | |
Total distributions | | | (1.27 | ) | | | (1.35 | ) | | | (0.21 | ) |
| | | |
Net asset value, end of year | | | $ 9.40 | | | | $11.16 | | | | $11.17 | |
| | | | | | | | | | | | |
Total returnd | | | (3.04)% | | | | 12.11% | | | | 13.97% | |
| | | | | | | | | | | | |
Ratios to average net assetse | | | | | | | | | | | | |
| | | |
Expenses before waiver and payments by affiliatesf | | | 1.87% | | | | 1.83% | | | | 2.41% | |
| | | |
Expenses net of waiver and payments by affiliatesf | | | 1.00%g | | | | 1.03%g | | | | 1.22% | |
| | | |
Expenses incurred in connection with securities sold short | | | —% | | | | 0.03% | | | | 0.22% | |
| | | |
Net investment income | | | 1.54% | | | | 1.43% | | | | 1.31% | |
| | | | | | | | | | | | |
Supplemental data | | | | | | | | | | | | |
| | | |
Net assets, end of year (000’s) | | | $9,395 | | | | $11,158 | | | | $11,170 | |
| | | |
Portfolio turnover rate | | | 72.88% | | | | 104.87% | | | | 86.10% | |
aFor the period May 2, 2016 (commencement of operations) to March 31, 2017.
bThe amount shown for a share outstanding throughout the period may not correlate with the Statement of Operations for the period due to the timing of sales and repurchases of the Fund’s shares in relation to income earned and/or fluctuating fair value of the investments of the Fund.
cBased on average daily shares outstanding.
dTotal return is not annualized for periods less than one year.
eRatios are annualized for periods less than one year, except fornon-recurring expenses, if any.
fIncludes dividend and/or interest expense on securities sold short and security borrowing fees, if any. See below for the ratios of such expenses to average net assets for the periods presented. See Note 1(c).
gBenefit of expense reduction rounds to less than 0.01%.
| | | | |
| | | |
| | The accompanying notes are an integral part of these financial statements. | Annual Report | | 10 |
TEMPLETON GLOBAL INVESTMENT TRUST
Statement of Investments, March 31, 2019
Templeton Dynamic Equity Fund
| | | | | | | | | | |
| | | Industry | | Shares | | | Value | |
| |
Common Stocks 94.7% | | | | | | | | | | |
Belgium 1.6% | | | | | | | | | | |
UCB SA | | Pharmaceuticals | | | 1,711 | | | $ | 146,969 | |
| | | | | | | | | | |
Canada 4.5% | | | | | | | | | | |
Goldcorp Inc. | | Metals & Mining | | | 9,600 | | | | 109,877 | |
Husky Energy Inc. | | Oil, Gas & Consumable Fuels | | | 12,100 | | | | 120,013 | |
Wheaton Precious Metals Corp. | | Metals & Mining | | | 8,100 | | | | 192,874 | |
| | | | | | | | | 422,764 | |
China 7.8% | | | | | | | | | | |
aBaidu Inc., ADR | | Interactive Media & Services | | | 1,389 | | | | 228,977 | |
China Longyuan Power Group Corp. | | Independent Power & Renewable | | | | | | | | |
| | Electricity Producers | | | 200,000 | | | | 139,109 | |
China Mobile Ltd. | | Wireless Telecommunication Services | | | 23,206 | | | | 236,496 | |
Kunlun Energy Co. Ltd. | | Oil, Gas & Consumable Fuels | | | 120,000 | | | | 125,351 | |
| | | | | | | | | 729,933 | |
Denmark 1.0% | | | | | | | | | | |
Vestas Wind Systems AS | | Electrical Equipment | | | 1,140 | | | | 95,921 | |
France 7.3% | | | | | | | | | | |
BNP Paribas SA | | Banks | | | 2,374 | | | | 113,492 | |
Cie Generale des Etablissements Michelin SCA | | Auto Components | | | 818 | | | | 96,731 | |
Compagnie de Saint-Gobain | | Building Products | | | 2,338 | | | | 84,753 | |
Credit Agricole SA | | Banks | | | 6,835 | | | | 82,590 | |
Sanofi | | Pharmaceuticals | | | 528 | | | | 46,645 | |
Total SA | | Oil, Gas & Consumable Fuels | | | 4,725 | | | | 262,516 | |
| | | | | | | | | 686,727 | |
Germany 0.4% | | | | | | | | | | |
Bayer AG | | Pharmaceuticals | | | 620 | | | | 40,067 | |
Hong Kong 3.8% | | | | | | | | | | |
AIA Group Ltd. | | Insurance | | | 24,200 | | | | 240,923 | |
CK Asset Holdings Ltd. | | Real Estate Management & Development | | | 12,870 | | | | 114,437 | |
| | | | | | | | | 355,360 | |
Italy 1.0% | | | | | | | | | | |
UniCredit SpA | | Banks | | | 6,974 | | | | 89,418 | |
Japan 5.7% | | | | | | | | | | |
IHI Corp. | | Machinery | | | 2,700 | | | | 64,786 | |
INPEX Corp. | | Oil, Gas & Consumable Fuels | | | 8,300 | | | | 79,056 | |
Panasonic Corp. | | Household Durables | | | 11,700 | | | | 100,746 | |
Seven & i Holdings Co. Ltd. | | Food & Staples Retailing | | | 2,270 | | | | 85,544 | |
Sumitomo Mitsui Financial Group Inc. | | Banks | | | 2,470 | | | | 86,394 | |
Takeda Pharmaceutical Co. Ltd. | | Pharmaceuticals | | | 2,840 | | | | 115,865 | |
| | | | | | | | | 532,391 | |
Netherlands 8.2% | | | | | | | | | | |
ING Groep NV | | Banks | | | 7,725 | | | | 93,465 | |
NN Group NV | | Insurance | | | 4,217 | | | | 175,199 | |
NXP Semiconductors NV | | Semiconductors & Semiconductor Equipment | | | 3,220 | | | | 284,616 | |
aQIAGEN NV | | Life Sciences Tools & Services | | | 5,300 | | | | 215,604 | |
| | | | | | | | | 768,884 | |
TEMPLETON GLOBAL INVESTMENT TRUST
STATEMENT OF INVESTMENTS
Templeton Dynamic Equity Fund(continued)
| | | | | | | | | | |
| | | Industry | | Shares | | | Value | |
| |
Common Stocks (continued) | | | | | | | | | | |
South Korea 7.8% | | | | | | | | | | |
Hana Financial Group Inc. | | Banks | | | 4,535 | | | $ | 145,058 | |
KB Financial Group Inc. | | Banks | | | 2,191 | | | | 80,575 | |
Samsung Electronics Co. Ltd. | | Technology Hardware, Storage & Peripherals | | | 7,278 | | | | 285,558 | |
Shinhan Financial Group Co. Ltd. | | Banks | | | 5,971 | | | | 220,373 | |
| | | | | | | | | 731,564 | |
Switzerland 4.5% | | | | | | | | | | |
Novartis AG | | Pharmaceuticals | | | 3,133 | | | | 301,390 | |
Roche Holding AG | | Pharmaceuticals | | | 435 | | | | 119,863 | |
| | | | | | | | | 421,253 | |
Taiwan 2.0% | | | | | | | | | | |
Taiwan Semiconductor Manufacturing Co. Ltd. | | Semiconductors & Semiconductor Equipment | | | 23,970 | | | | 190,713 | |
United Kingdom 5.5% | | | | | | | | | | |
BP PLC | | Oil, Gas & Consumable Fuels | | | 13,640 | | | | 99,243 | |
Kingfisher PLC | | Specialty Retail | | | 28,611 | | | | 87,517 | |
aLivaNova PLC | | Health Care Equipment & Supplies | | | 450 | | | | 43,763 | |
Prudential PLC | | Insurance | | | 9,209 | | | | 184,454 | |
Vodafone Group PLC | | Wireless Telecommunication Services | | | 58,369 | | | | 106,304 | |
| | | | | | | | | 521,281 | |
United States 33.6% | | | | | | | | | | |
Advance Auto Parts Inc. | | Specialty Retail | | | 260 | | | | 44,338 | |
Ally Financial Inc. | | Consumer Finance | | | 4,797 | | | | 131,870 | |
Amgen Inc. | | Biotechnology | | | 661 | | | | 125,577 | |
Apache Corp. | | Oil, Gas & Consumable Fuels | | | 2,200 | | | | 76,252 | |
Capital One Financial Corp. | | Consumer Finance | | | 2,360 | | | | 192,788 | |
aCelgene Corp. | | Biotechnology | | | 1,500 | | | | 141,510 | |
Comcast Corp., A | | Media | | | 6,456 | | | | 258,111 | |
aCommScope Holding Co. Inc. | | Communications Equipment | | | 3,200 | | | | 69,536 | |
Coty Inc., A | | Personal Products | | | 8,200 | | | | 94,300 | |
Devon Energy Corp. | | Oil, Gas & Consumable Fuels | | | 5,090 | | | | 160,640 | |
Eastman Chemical Co. | | Chemicals | | | 2,721 | | | | 206,469 | |
Eli Lilly & Co. | | Pharmaceuticals | | | 1,540 | | | | 199,830 | |
Gilead Sciences Inc. | | Biotechnology | | | 1,450 | | | | 94,265 | |
Jones Lang LaSalle Inc. | | Real Estate Management & Development | | | 1,018 | | | | 156,955 | |
Kellogg Co. | | Food Products | | | 3,970 | | | | 227,799 | |
The Kroger Co. | | Food & Staples Retailing | | | 1,670 | | | | 41,082 | |
LyondellBasell Industries NV, A. | | Chemicals | | | 1,321 | | | | 111,070 | |
Oracle Corp. | | Software | | | 4,511 | | | | 242,286 | |
Perrigo Co. PLC | | Pharmaceuticals | | | 859 | | | | 41,369 | |
Tapestry Inc. | | Textiles, Apparel & Luxury Goods | | | 1,980 | | | | 64,330 | |
United Parcel Service Inc., B | | Air Freight & Logistics | | | 2,160 | | | | 241,358 | |
Voya Financial Inc. | | Diversified Financial Services | | | 2,060 | | | | 102,918 | |
Walgreens Boots Alliance Inc. | | Food & Staples Retailing | | | 677 | | | | 42,834 | |
Wells Fargo & Co. | | Banks | | | 1,920 | | | | 92,774 | |
| | | | | | | | | 3,160,261 | |
| | | |
Total Common Stocks (Cost $9,283,427) | | | | | | | | | 8,893,506 | |
TEMPLETON GLOBAL INVESTMENT TRUST
STATEMENT OF INVESTMENTS
Templeton Dynamic Equity Fund(continued)
| | | | | | | | |
| | | Shares | | | Value | |
| |
Short Term Investments (Cost $491,859) 5.2% | | | | | | | | |
| | |
Money Market Funds 5.2% | | | | | | | | |
United States 5.2% | | | | | | | | |
b,cInstitutional Fiduciary Trust Money Market Portfolio, 2.10% | | | 491,859 | | | $ | 491,859 | |
| | | | | | | | |
Total Investments (Cost $9,775,286) 99.9% | | | | | | | 9,385,365 | |
Other Assets, less Liabilities 0.1% | | | | | | | 10,025 | |
| | | | | | | | |
Net Assets 100.0% | | | | | | $ | 9,395,390 | |
| | | | | | | | |
See Abbreviations on page 24.
aNon-income producing.
bSee Note 3(e) regarding investments in affiliated management investment companies.
cThe rate shown is the annualizedseven-day effective yield at period end.
| | | | |
| | | |
13 | | Annual Report | The accompanying notes are an integral part of these financial statements. | | |
TEMPLETON GLOBAL INVESTMENT TRUST
Financial Statements
Statement of Assets and Liabilities
March 31, 2019
Templeton Dynamic Equity Fund
| | | | |
Assets: | | | | |
Investments in securities: | | | | |
Cost - Unaffiliated issuers | | | $9,283,427 | |
Cost -Non-controlled affiliates (Note 3e) | | | 491,859 | |
| | | | |
Value - Unaffiliated issuers | | | $8,893,506 | |
Value -Non-controlled affiliates (Note 3e) | | | 491,859 | |
Cash | | | 1,374 | |
Receivables: | | | | |
Investment securities sold | | | 6,981 | |
Dividends | | | 48,717 | |
Affiliates | | | 17,067 | |
Other assets | | | 9 | |
| | | | |
Total assets | | | 9,459,513 | |
| | | | |
Liabilities: | | | | |
Payables: | | | | |
Transfer agent fees | | | 165 | |
Professional fees | | | 58,702 | |
Accrued expenses and other liabilities | | | 5,256 | |
| | | | |
Total liabilities | | | 64,123 | |
| | | | |
Net assets, at value | | | $9,395,390 | |
| | | | |
Net assets consist of: | | | | |
Paid-in capital | | | $9,951,916 | |
Total distributable earnings (loss) | | | (556,526 | ) |
| | | | |
Net assets, at value | | | $9,395,390 | |
| | | | |
Shares outstanding | | | 1,000,000 | |
| | | | |
Net asset value and maximum offering price per share | | | $9.40 | |
| | | | |
| | | | |
| | | |
| | The accompanying notes are an integral part of these financial statements. | Annual Report | | 14 |
TEMPLETON GLOBAL INVESTMENT TRUST
FINANCIAL STATEMENTS
Statement of Operations
for the year ended March 31, 2019
Templeton Dynamic Equity Fund
| | | | |
Investment income: | | | | |
Dividends: (net of foreign taxes)* | | | | |
Unaffiliated issuers | | $ | 257,349 | |
Non-controlled affiliates (Note 3e) | | | 10,353 | |
| | | | |
Total investment income | | | 267,702 | |
| | | | |
Expenses: | | | | |
Management fees (Note 3a) | | | 94,961 | |
Transfer agent fees (Note 3d) | | | 2,114 | |
Custodian fees (Note 4) | | | 2,216 | |
Reports to shareholders | | | 2,625 | |
Registration and filing fees | | | 340 | |
Professional fees | | | 75,131 | |
Trustees’ fees and expenses | | | 48 | |
Other | | | 19,585 | |
| | | | |
Total expenses | | | 197,020 | |
Expense reductions (Note 4) | | | (67 | ) |
Expenses waived/paid by affiliates (Note 3e and 3f) | | | (91,441 | ) |
| | | | |
Net expenses | | | 105,512 | |
| | | | |
Net investment income | | | 162,190 | |
| | | | |
Realized and unrealized gains (losses): | | | | |
Net realized gain (loss) from: | | | | |
Investments: | | | | |
Unaffiliated issuers | | | 675,535 | |
Foreign currency transactions | | | (6,773 | ) |
| | | | |
Net realized gain (loss) | | | 668,762 | |
| | | | |
Net change in unrealized appreciation (depreciation) on: | | | | |
Investments: | | | | |
Unaffiliated issuers | | | (1,323,084 | ) |
Translation of other assets and liabilities denominated in foreign currencies | | | (1,107 | ) |
| | | | |
Net change in unrealized appreciation (depreciation) | | | (1,324,191 | ) |
| | | | |
Net realized and unrealized gain (loss) | | | (655,429 | ) |
| | | | |
Net increase (decrease) in net assets resulting from operations | | $ | (493,239 | ) |
| | | | |
| | | | |
*Foreign taxes withheld on dividends | | $ | 24,666 | |
| | | | |
| | | |
15 | | Annual Report | The accompanying notes are an integral part of these financial statements. | | |
TEMPLETON GLOBAL INVESTMENT TRUST
FINANCIAL STATEMENTS
Statements of Changes in Net Assets
Templeton Dynamic Equity Fund
| | | | | | | | |
| | | Year Ended March 31, | |
| | | | |
| | | 2019 | | | 2018 | |
| |
Increase (decrease) in net assets: | | | | | | | | |
Operations: | | | | | | | | |
Net investment income | | | $ 162,190 | | | | $ 167,889 | |
Net realized gain (loss) | | | 668,762 | | | | 1,366,453 | |
Net change in unrealized appreciation (depreciation) | | | (1,324,191 | ) | | | (195,325 | ) |
| | | | |
Net increase (decrease) in net assets resulting from operations | | | (493,239 | ) | | | 1,339,017 | |
| | | | |
Distributions to shareholders (Note 1e) | | | (1,268,900 | ) | | | (1,351,200 | ) |
| | | | |
Net increase (decrease) in net assets | | | (1,762,139 | ) | | | (12,183 | ) |
Net assets: | | | | | | | | |
Beginning of year | | | 11,157,529 | | | | 11,169,712 | |
| | | | |
End of year (Note 1e) | | | $ 9,395,390 | | | | $11,157,529 | |
| | | | |
| | | | |
| | | |
| | The accompanying notes are an integral part of these financial statements. | Annual Report | | 16 |
TEMPLETON GLOBAL INVESTMENT TRUST
Notes to Financial Statements
Templeton Dynamic Equity Fund
1. Organization and Significant Accounting Policies
Templeton Global Investment Trust (Trust) is registered under the Investment Company Act of 1940 (1940 Act) as anopen-end management investment company, consisting of five separate funds and applies the specialized accounting and reporting guidance in U.S. Generally Accepted Accounting Principles (U.S. GAAP). Templeton Dynamic Equity Fund (Fund) is included in this report. The Fund has five classes of shares: Class A, Class C, Class R, Class R6 and Advisor Class. Each class of shares may differ by its initial sales load, contingent deferred sales charges, voting rights on matters affecting a single class, its exchange privilege and fees due to differing arrangements for distribution and transfer agent fees.
The Fund currently operates with one class of shares, Advisor Class.
The following summarizes the Fund’s significant accounting policies.
a. Financial Instrument Valuation
The Fund’s investments in financial instruments are carried at fair value daily. Fair value is the price that would be received to sell an asset or paid to transfer a liability in an orderly transaction between market participants on the measurement date. The Fund calculates the net asset value (NAV) per share each business day as of 4 p.m. Eastern time or the regularly scheduled close of the New York Stock Exchange (NYSE), whichever is earlier. Under compliance policies and procedures approved by the Trust’s Board of Trustees (the Board), the Fund’s administrator has responsibility for oversight of valuation, including leading the cross-functional Valuation Committee (VC). The Fund may utilize independent pricing services, quotations from securities and financial instrument dealers, and other market sources to determine fair value.
Equity securities listed on an exchange or on the NASDAQ National Market System are valued at the last quoted sale price or the official closing price of the day, respectively. Foreign equity securities are valued as of the close of trading on the foreign stock exchange on which the security is primarily traded, or as of 4 p.m. Eastern time. The value is then converted into its U.S. dollar equivalent at the foreign exchange rate in effect at 4 p.m. Eastern time on the day that the value of the security is determined.Over-the-counter (OTC) securities are valued within the range of the most recent quoted bid and ask
prices. Securities that trade in multiple markets or on multiple exchanges are valued according to the broadest and most representative market. Certain equity securities are valued based upon fundamental characteristics or relationships to similar securities.
Investments inopen-end mutual funds are valued at the closing NAV.
The Fund has procedures to determine the fair value of financial instruments for which market prices are not reliable or readily available. Under these procedures, the Fund primarily employs a market-based approach which may use related or comparable assets or liabilities, recent transactions, market multiples, book values, and other relevant information for the investment to determine the fair value of the investment. An income-based valuation approach may also be used in which the anticipated future cash flows of the investment are discounted to calculate fair value. Discounts may also be applied due to the nature or duration of any restrictions on the disposition of the investments. Due to the inherent uncertainty of valuations of such investments, the fair values may differ significantly from the values that would have been used had an active market existed.
Trading in securities on foreign securities stock exchanges and OTC markets may be completed before 4 p.m. Eastern time. In addition, trading in certain foreign markets may not take place on every Fund’s business day. Occasionally, events occur between the time at which trading in a foreign security is completed and 4 p.m. Eastern time that might call into question the reliability of the value of a portfolio security held by the Fund. As a result, differences may arise between the value of the Fund’s portfolio securities as determined at the foreign market close and the latest indications of value at 4 p.m. Eastern time. In order to minimize the potential for these differences, the VC monitors price movements following the close of trading in foreign stock markets through a series of country specific market proxies (such as baskets of American Depositary Receipts, futures contracts and exchange traded funds). These price movements are measured against established trigger thresholds for each specific market proxy to assist in determining if an event has occurred that may call into question the reliability of the values of the foreign securities held by the Fund. If such an event occurs, the securities may be valued using fair value procedures, which may include the use of independent pricing services.
TEMPLETON GLOBAL INVESTMENT TRUST
NOTES TO FINANCIAL STATEMENTS
Templeton Dynamic Equity Fund(continued)
When the last day of the reporting period is anon-business day, certain foreign markets may be open on those days that the Fund’s NAV is not calculated, which could result in differences between the value of the Fund’s portfolio securities on the last business day and the last calendar day of the reporting period. Any significant security valuation changes due to an open foreign market are adjusted and reflected by the Fund for financial reporting purposes.
b. Foreign Currency Translation
Portfolio securities and other assets and liabilities denominated in foreign currencies are translated into U.S. dollars based on the exchange rate of such currencies against U.S. dollars on the date of valuation. The Fund may enter into foreign currency exchange contracts to facilitate transactions denominated in a foreign currency. Purchases and sales of securities, income and expense items denominated in foreign currencies are translated into U.S. dollars at the exchange rate in effect on the transaction date. Portfolio securities and assets and liabilities denominated in foreign currencies contain risks that those currencies will decline in value relative to the U.S. dollar. Occasionally, events may impact the availability or reliability of foreign exchange rates used to convert the U.S. dollar equivalent value. If such an event occurs, the foreign exchange rate will be valued at fair value using procedures established and approved by the Board.
The Fund does not separately report the effect of changes in foreign exchange rates from changes in market prices on securities held. Such changes are included in net realized and unrealized gain or loss from investments in the Statement of Operations.
Realized foreign exchange gains or losses arise from sales of foreign currencies, currency gains or losses realized between the trade and settlement dates on securities transactions and the difference between the recorded amounts of dividends, interest, and foreign withholding taxes and the U.S. dollar equivalent of the amounts actually received or paid. Net unrealized foreign exchange gains and losses arise from changes in foreign exchange rates on foreign denominated assets and liabilities other than investments in securities held at the end of the reporting period.
c. Securities Sold Short
The Fund is engaged in selling securities short, which obligates the Fund to replace a borrowed security with the same security at current fair value. The Fund incurs a loss if the price of the
security increases between the date of the short sale and the date on which the Fund replaces the borrowed security. The Fund realizes a gain if the price of the security declines between those dates. Gains are limited to the price at which the Fund sold the security short, while losses are potentially unlimited in size.
The Fund is required to establish a margin account with the broker lending the security sold short. While the short sale is outstanding, the broker retains the proceeds of the short sale to the extent necessary to meet margin requirements until the short position is closed out. A deposit must also be maintained with the Fund’s custodian/counterparty broker consisting of cash and/or securities having a value equal to a specified percentage of the value of the securities sold short. The Fund is obligated to pay fees for borrowing the securities sold short and is required to pay the counterparty any dividends and/or interest due on securities sold short. Such dividends and/or interest and any security borrowing fees are recorded as an expense to the Fund. At March 31, 2019, the Fund had no securities sold short.
d. Income and Deferred Taxes
It is the Fund’s policy to qualify as a regulated investment company under the Internal Revenue Code. The Fund intends to distribute to shareholders substantially all of its taxable income and net realized gains to relieve it from federal income and excise taxes. As a result, no provision for U.S. federal income taxes is required.
The Fund may be subject to foreign taxation related to income received, capital gains on the sale of securities and certain foreign currency transactions in the foreign jurisdictions in which it invests. Foreign taxes, if any, are recorded based on the tax regulations and rates that exist in the foreign markets in which the Fund invests. When a capital gain tax is determined to apply, the Fund records an estimated deferred tax liability in an amount that would be payable if the securities were disposed of on the valuation date.
The Fund may recognize an income tax liability related to its uncertain tax positions under U.S. GAAP when the uncertain tax position has a less than 50% probability that it will be sustained upon examination by the tax authorities based on its technical merits. As of March 31, 2019, the Fund has determined that no tax liability is required in its financial statements related to uncertain tax positions for any open tax years (or expected to be taken in future tax years). Open tax
TEMPLETON GLOBAL INVESTMENT TRUST
NOTES TO FINANCIAL STATEMENTS
Templeton Dynamic Equity Fund(continued)
1. Organization and Significant Accounting Policies(continued)
d. Income and Deferred Taxes(continued)
years are those that remain subject to examination and are based on the statute of limitations in each jurisdiction in which the Fund invests.
e. Security Transactions, Investment Income, Expenses and Distributions
Security transactions are accounted for on trade date. Realized gains and losses on security transactions are determined on a specific identification basis. Estimated expenses are accrued daily. Dividend income is recorded on theex-dividend date except for certain dividends from securities where the dividend rate is not available. In such cases, the dividend is recorded as soon as the information is received by the Fund. Distributions to shareholders are recorded on theex-dividend date. Distributable earnings are determined according to income tax regulations (tax basis) and may differ from earnings recorded in accordance with U.S. GAAP. These differences may be permanent or temporary. Permanent differences are reclassified among capital accounts to reflect their tax character. These reclassifications have no impact on net assets or the results of operations. Temporary differences are not reclassified, as they may reverse in subsequent periods.*
Common expenses incurred by the Trust are allocated among the Funds based on the ratio of net assets of each Fund to the combined net assets of the Trust or based on the ratio of number
of shareholders of each Fund to the combined number of shareholders of the Trust. Fund specific expenses are charged directly to the Fund that incurred the expense.
Realized and unrealized gains and losses and net investment income, excluding class specific expenses, are allocated daily to each class of shares based upon the relative proportion of net assets of each class. Differences in per share distributions by class are generally due to differences in class specific expenses.
f. Accounting Estimates
The preparation of financial statements in accordance with U.S. GAAP requires management to make estimates and assumptions that affect the reported amounts of assets and liabilities at the date of the financial statements and the amounts of income and expenses during the reporting period. Actual results could differ from those estimates.
g. Guarantees and Indemnifications
Under the Trust’s organizational documents, its officers and trustees are indemnified by the Trust against certain liabilities arising out of the performance of their duties to the Trust. Additionally, in the normal course of business, the Trust, on behalf of the Fund, enters into contracts with service providers that contain general indemnification clauses. The Trust’s maximum exposure under these arrangements is unknown as this would involve future claims that may be made against the Trust that have not yet occurred. Currently, the Trust expects the risk of loss to be remote.
*Effective during the current reporting period, it is no longer required to present certain line items in the Statements of Changes in Net Assets. The below prior period amounts affected by this change are shown as they were in the prior year Statements of Changes in Net Assets.
For the year ended March 31, 2018, distributions to shareholders were as follows:
| | | | |
Net investment income | | $ | (210,000 | ) |
Net realized gains | | | (1,141,200 | ) |
2. Shares of Beneficial Interest
At March 31, 2019, there were an unlimited number of shares authorized ($0.01 par value). During the years ended March 31, 2019 and 2018, there were no transactions of the Fund’s shares.
TEMPLETON GLOBAL INVESTMENT TRUST
NOTES TO FINANCIAL STATEMENTS
Templeton Dynamic Equity Fund(continued)
3. Transactions with Affiliates
Franklin Resources, Inc. is the holding company for various subsidiaries that together are referred to as Franklin Templeton. Certain officers and trustees of the Fund are also officers and/or directors of the following subsidiaries:
| | |
| Subsidiary | | Affiliation |
| Templeton Global Advisors Ltd. (Global Advisors) | | Investment manager |
| Franklin Templeton Services, LLC (FT Services) | | Administrative manager |
| Franklin Templeton Distributors, Inc. (Distributors) | | Principal underwriter |
| Franklin Templeton Investor Services, LLC (Investor Services) | | Transfer agent |
a. Management Fees
The Fund pays an investment management fee to Global Advisors of 0.90% per year of the average daily net assets of the Fund.
b. Administrative Fees
Under an agreement with Global Advisors, FT Services provides administrative services to the Fund. The fee is paid by Global Advisors based on the Fund’s average daily net assets, and is not an additional expense of the Fund.
c. Distribution Fees
The Board has adopted distribution plans for each share class, with the exception of Class R6 and Advisor Class shares, pursuant to Rule12b-1 under the 1940 Act. Under the Fund’s Class A reimbursement distribution plan, the Fund reimburses Distributors for costs incurred in connection with the servicing, sale and distribution of the Fund’s shares up to the maximum annual plan rate. Under the Class A reimbursement distribution plan, costs exceeding the maximum for the current plan year cannot be reimbursed in subsequent periods. In addition, under the Fund’s Class C and R compensation distribution plans, the Fund pays Distributors for costs incurred in connection with the servicing, sale and distribution of the Fund’s shares up to the maximum annual plan rate for each class. The plan year, for purposes of monitoring compliance with the maximum annual plan rates, is February 1 through January 31.
The maximum annual plan rates, based on the average daily net assets, for each class, are as follows:
| | | | |
Class A | | | 0.25 | % |
Class C | | | 1.00 | % |
Class R | | | 0.50 | % |
d. Transfer Agent Fees
Each class of shares pays transfer agent fees to Investor Services for its performance of shareholder servicing obligations. The fees are based on an annualized asset based fee of 0.02% plus a transaction based fee. In addition, each class reimburses Investor Services for out of pocket expenses incurred and, except for Class R6, reimburses shareholder servicing fees paid to third parties. These fees are allocated daily based upon their relative proportion of such classes’ aggregate net assets. Class R6 pays Investor Services transfer agent fees specific to that class.
For the year ended March 31, 2019, the Fund paid transfer agent fees of $2,114, which were retained by Investor Services.
TEMPLETON GLOBAL INVESTMENT TRUST
NOTES TO FINANCIAL STATEMENTS
Templeton Dynamic Equity Fund(continued)
3. Transactions with Affiliates(continued)
e. Investments in Affiliated Management Investment Companies
The Fund invests in one or more affiliated management investment companies for purposes other than exercising a controlling influence over the management or policies. Management fees paid by the Fund are waived on assets invested in the affiliated management investment companies, as noted in the Statement of Operations, in an amount not to exceed the management and administrative fees paid directly or indirectly by each affiliate. During the year ended March 31, 2019, the Fund held investments in affiliated management investment companies as follows:
| | | | | | | | | | | | | | | | | | | | | | | | | | | | | | | | |
| | | Number of
Shares Held
at Beginning
of Year | | | Gross
Additions | | | Gross
Reductions | | | Number of
Shares
Held at End
of Year | | | Value at End
of Year | | | Dividend
Income | | | Realized
Gain
(Loss) | | | Net Change in
Unrealized
Appreciation
(Depreciation) | |
| |
Non-Controlled Affiliates | | | | | | | | | | | | | | | | | | | | | | | | | | | | | | | | |
Institutional Fiduciary Trust Money Market Portfolio, 2.10% | | | 636,370 | | | | 2,476,087 | | | | (2,620,598 | ) | | | 491,859 | | | | $491,859 | | | | $10,353 | | | | $ — | | | | $ — | |
| | | | | | | | | | | | | | | | | | | | |
f. Waiver and Expense Reimbursements
Global Advisors has contractually agreed in advance to waive or limit its fees and to assume as its own expense certain expenses otherwise payable by the Fund so that the expenses (excluding distribution fees, acquired fund fees and expenses, expenses related to securities sold short, and certainnon-routine expenses or costs, including those relating to litigation, indemnification, reorganizations, and liquidations) of the Fund does not exceed 1.00%, based on the average net assets of each class until July 31, 2019. Total expenses waived or paid are not subject to recapture subsequent to the Fund’s fiscal year end.
g. Other Affiliated Transactions
At March 31, 2019, Franklin Resources, Inc., owned 100% of the Fund’s outstanding shares. Investment activities of this shareholder could have a material impact on the Fund.
4. Expense Offset Arrangement
The Fund has entered into an arrangement with its custodian whereby credits realized as a result of uninvested cash balances are used to reduce a portion of the Fund’s custodian expenses. During the year ended March 31, 2019, the custodian fees were reduced as noted in the Statement of Operations.
5. Income Taxes
For tax purposes, the Fund may elect to defer any portion of a post-October capital loss or late-year ordinary loss to the first day of the following fiscal year. At March 31, 2019, the Fund deferred post-October capital losses of $187,065.
The tax character of distributions paid during the years ended March 31, 2019 and 2018, was as follows:
| | | | | | | | |
| | | 2019 | | | 2018 | |
| | | | |
Distributions paid from: | | | | | | | | |
Ordinary income | | $ | 411,038 | | | $ | 982,100 | |
Long term capital gain | | | 857,862 | | | | 369,100 | |
| | | | |
| | $ | 1,268,900 | | | $ | 1,351,200 | |
| | | | |
TEMPLETON GLOBAL INVESTMENT TRUST
NOTES TO FINANCIAL STATEMENTS
Templeton Dynamic Equity Fund(continued)
At March 31, 2019, the cost of investments, net unrealized appreciation (depreciation) and undistributed ordinary income for income tax purposes were as follows:
| | | | |
Cost of investments | | $ | 9,783,455 | |
| |
Unrealized appreciation | | $ | 516,771 | |
Unrealized depreciation | | | (914,861 | ) |
Net unrealized appreciation (depreciation) | | $ | (398,090 | ) |
| |
Distributable earnings-undistributed ordinary income | | $ | 29,235 | |
Differences between income and/or capital gains as determined on a book basis and a tax basis are primarily due to differing treatment of wash sales.
6. Investment Transactions
Purchases and sales of investments (excluding short term securities) for the year ended March 31, 2019, aggregated $7,234,804 and $8,219,024, respectively.
7. Concentration of Risk
Investing in foreign securities may include certain risks and considerations not typically associated with investing in U.S. securities, such as fluctuating currency values and changing local and regional economic, political and social conditions, which may result in greater market volatility. Current political and financial uncertainty surrounding the European Union may increase market volatility and the economic risk of investing in securities in Europe. In addition, certain foreign securities may not be as liquid as U.S. securities.
8. Credit Facility
The Fund, together with other U.S. registered and foreign investment funds (collectively, Borrowers), managed by Franklin Templeton, are borrowers in a joint syndicated senior unsecured credit facility totaling $2 billion (Global Credit Facility) which matures on February 7, 2020. This Global Credit Facility provides a source of funds to the Borrowers for temporary and emergency purposes, including the ability to meet future unanticipated or unusually large redemption requests.
Under the terms of the Global Credit Facility, the Fund shall, in addition to interest charged on any borrowings made by the Fund and other costs incurred by the Fund, pay its share of fees and expenses incurred in connection with the implementation and maintenance of the Global Credit Facility, based upon its relative share of the aggregate net assets of all of the Borrowers, including an annual commitment fee of 0.15% based upon the unused portion of the Global Credit Facility. These fees are reflected in other expenses in the Statement of Operations. During the year ended March 31, 2019, the Fund did not use the Global Credit Facility.
9. Fair Value Measurements
The Fund follows a fair value hierarchy that distinguishes between market data obtained from independent sources (observable inputs) and the Fund’s own market assumptions (unobservable inputs). These inputs are used in determining the value of the Fund’s financial instruments and are summarized in the following fair value hierarchy:
| | • | | Level 1 – quoted prices in active markets for identical financial instruments |
TEMPLETON GLOBAL INVESTMENT TRUST
NOTES TO FINANCIAL STATEMENTS
Templeton Dynamic Equity Fund(continued)
9. Fair Value Measurements(continued)
| | • | | Level 2 – other significant observable inputs (including quoted prices for similar financial instruments, interest rates, prepayment speed, credit risk, etc.) |
| | • | | Level 3 – significant unobservable inputs (including the Fund’s own assumptions in determining the fair value of financial instruments) |
The input levels are not necessarily an indication of the risk or liquidity associated with financial instruments at that level.
At March 31, 2019, all of the Fund’s investments in financial instruments carried at fair value were valued using Level 1 inputs. For detailed categories, see the accompanying Statement of Investments.
10. Subsequent Events
The Fund has evaluated subsequent events through the issuance of the financial statements and determined that no events have occurred that require disclosure.
TEMPLETON GLOBAL INVESTMENT TRUST
NOTES TO FINANCIAL STATEMENTS
Templeton Dynamic Equity Fund(continued)
Abbreviations
|
Selected Portfolio |
ADR American Depositary Receipt |
TEMPLETON GLOBAL INVESTMENT TRUST
Report of Independent Registered Public Accounting Firm
To the Board of Trustees of Templeton Global Investment Trust and Shareholders of Templeton Dynamic Equity Fund
Opinion on the Financial Statements
We have audited the accompanying statement of assets and liabilities, including the statement of investments, of Templeton Dynamic Equity Fund (the “Fund”) as of March 31, 2019, the related statement of operations for the year ended March 31, 2019, the statement of changes in net assets for each of the two years in the period ended March 31, 2019, including the related notes, and the financial highlights for each of the periods indicated therein (collectively referred to as the “financial statements”). In our opinion, the financial statements present fairly, in all material respects, the financial position of the Fund as of March 31, 2019, the results of its operations for the year then ended, the changes in its net assets for each of the two years in the period ended March 31, 2019 and the financial highlights for each of the periods indicated therein in conformity with accounting principles generally accepted in the United States of America.
Basis for Opinion
These financial statements are the responsibility of the Fund’s management. Our responsibility is to express an opinion on the Fund’s financial statements based on our audits. We are a public accounting firm registered with the Public Company Accounting Oversight Board (United States) (“PCAOB”) and are required to be independent with respect to the Fund in accordance with the U.S. federal securities laws and the applicable rules and regulations of the Securities and Exchange Commission and the PCAOB.
We conducted our audits of these financial statements in accordance with the standards of the PCAOB. Those standards require that we plan and perform the audit to obtain reasonable assurance about whether the financial statements are free of material misstatement, whether due to error or fraud.
Our audits included performing procedures to assess the risks of material misstatement of the financial statements, whether due to error or fraud, and performing procedures that respond to those risks. Such procedures included examining, on a test basis, evidence regarding the amounts and disclosures in the financial statements. Our audits also included evaluating the accounting principles used and significant estimates made by management, as well as evaluating the overall presentation of the financial statements. Our procedures included confirmation of securities owned as of March 31, 2019 by correspondence with the custodian and transfer agent. We believe that our audits provide a reasonable basis for our opinion.
PricewaterhouseCoopers LLP
San Francisco, California
May 20, 2019
We have served as the auditor of one or more investment companies in the Franklin Templeton Group of Funds since 1948.
TEMPLETON DYNAMIC EQUITY FUND
Tax Information (unaudited)
Under Section 852(b)(3)(C) of the Internal Revenue Code, the Fund hereby reports the maximum amount allowable but no less than $857,862 as a long term capital gain dividend for the fiscal year ended March 31, 2019.
Under Section 871(k)(2)(C) of the Internal Revenue Code, the Fund hereby reports the maximum amount allowable but no less than $284,854 as a short term capital gain dividend for purposes of the tax imposed under Section 871(a)(1)(A) of the Internal Revenue Code for the fiscal year ended March 31, 2019.
Under Section 854(b)(1)(A) of the Internal Revenue Code, the Fund hereby reports 17.64% of the ordinary income dividends as income qualifying for the dividends received deduction for the fiscal year ended March 31, 2019.
Under Section 854(b)(1)(B) of the Internal Revenue Code, the Fund hereby reports the maximum amount allowable but no less than $210,306 as qualified dividends for purposes of the maximum rate under Section 1(h)(11) of the Internal Revenue Code for the fiscal year ended March 31, 2019. Distributions, including qualified dividend income, paid during calendar year 2019 will be reported to shareholders on Form1099-DIV bymid-February 2020. Shareholders are advised to check with their tax advisors for information on the treatment of these amounts on their individual income tax returns.
At March 31, 2018, more than 50% of the Fund’s total assets were invested in securities of foreign issuers. In most instances, foreign taxes were withheld from income paid to the Fund on these investments. As shown in the table below, the Fund hereby reports to shareholders the foreign source income and foreign taxes paid, pursuant to Section 853 of the Internal Revenue Code. This written statement will allow shareholders of record on December 20, 2018, to treat their proportionate share of foreign taxes paid by the Fund as having been paid directly by them. The shareholder shall consider these amounts as foreign taxes paid in the tax year in which they receive the Fund distribution.
The following table provides a detailed analysis of foreign tax paid, foreign source income, and foreign source qualified dividends as reported by the Fund, to Advisor Class shareholders of record.
| | | | | | | | | | | | |
| Class | | Foreign Tax Paid
Per Share | | | Foreign Source
Income Per Share | | | Foreign Source Qualified
Dividends Per Share | |
Advisor Class | | | $0.0234 | | | | $0.2084 | | | | $0.1492 | |
Foreign Tax Paid Per Share is the amount per share available to you, as a tax credit (assuming you held your shares in the Fund for a minimum of 16 days during the31-day period beginning 15 days before theex-dividend date of the Fund’s distribution to which the foreign taxes relate), or, as a tax deduction.
Foreign Source Income Per Share is the amount per share of income dividends attributable to foreign securities held by the Fund, plus any foreign taxes withheld on these dividends. The amounts reported include foreign source qualified dividends that have not been adjusted for the rate differential applicable to such dividend income.1
Foreign Source Qualified Dividends Per Share is the amount per share of foreign source qualified dividends, plus any foreign taxes withheld on these dividends. These amounts represent the portion of the Foreign Source Income Per Share that were derived from qualified foreign securities held by the Fund.1
At the beginning of each calendar year, shareholders will receive Form1099-DIV which will include their share of taxes paid and foreign source income distributed during the prior calendar year. The Foreign Source Income reported on Form1099-DIV has not been adjusted for the rate differential on foreign source qualified dividend income. Shareholders are advised to check with their tax advisors for information on the treatment of these amounts on their individual income tax returns.
1Qualified dividends are taxed at reduced long term capital gains tax rates. In determining the amount of foreign tax credit that may be applied against the U.S. tax liability of individuals receiving foreign source qualified dividends, adjustments may be required to the foreign tax credit limitation calculation to reflect the rate differential applicable to such dividend income. The rules however permit certain individuals to elect not to apply the rate differential adjustments for capital gains and/or dividends for any taxable year. Please consult your tax advisor and the instructions to Form 1116 for more information.
TEMPLETON GLOBAL INVESTMENT TRUST
Board Members and Officers
The name, year of birth and address of the officers and board members, as well as their affiliations, positions held with the Trust, principal occupations during at least the past five years and number of U.S. registered portfolios overseen in the Franklin Templeton fund complex, are shown below. Generally, each board member serves until that person’s successor is elected and qualified.
Independent Board Members
| | | | | | | | |
Name, Year of Birth and Address | | Position | | Length of Time Served | | Number of Portfolios in
Fund Complex Overseen
by Board Member* | | Other Directorships Held During at Least the Past 5 Years |
Harris J. Ashton (1932) 300 S.E. 2nd Street Fort Lauderdale, FL 33301-1923 | | Trustee | | Since 1994 | | 136 | | Bar-S Foods (meat packing company) (1981-2010). |
| | |
Principal Occupation During at Least the Past 5 Years: | | | | |
| Director of various companies; andformerly, Director, RBC Holdings, Inc. (bank holding company) (until 2002); and President, Chief Executive Officer and Chairman of the Board, General Host Corporation (nursery and craft centers) (until 1998). |
| | | | |
Ann Torre Bates (1958) 300 S.E. 2nd Street Fort Lauderdale, FL 33301-1923 | | Trustee | | Since 2008 | | 38 | | Ares Capital Corporation (specialty finance company) (2010-present), United Natural Foods, Inc. (distributor of natural, organic and specialty foods) (2013-present), Allied Capital Corporation (financial services) (2003-2010), SLM Corporation (Sallie Mae) (1997-2014) and Navient Corporation (loan management, servicing and asset recovery) (2014-2016). |
| | |
Principal Occupation During at Least the Past 5 Years: | | | | |
| Director of various companies; andformerly, Executive Vice President and Chief Financial Officer, NHP Incorporated (manager of multifamily housing) (1995-1997); and Vice President and Treasurer, US Airways, Inc. (until 1995). |
| | | | |
Mary C. Choksi (1950) 300 S.E. 2nd Street Fort Lauderdale, FL 33301-1923 | | Trustee | | Since 2017 | | 136 | | Avis Budget Group Inc. (car rental) (2007-present), Omnicom Group Inc. (advertising and marketing communications services) (2011-present) and White Mountains Insurance Group, Ltd. (holding company) (2017-present). |
| | |
Principal Occupation During at Least the Past 5 Years: | | | | |
| Director of various companies; andformerly, Founder and Senior Advisor, Strategic Investment Group (investment management group) (2015-2017); Founding Partner and Senior Managing Director, Strategic Investment Group (1987-2015); Founding Partner and Managing Director, Emerging Markets Management LLC (investment management firm) (1987-2011); and Loan Officer/Senior Loan Officer/Senior Pension Investment Officer, World Bank Group (international financial institution) (1977-1987). |
| | | | |
Edith E. Holiday (1952) 300 S.E. 2nd Street Fort Lauderdale, FL 33301-1923 | | Lead Independent Trustee | | Trustee since 1996 and Lead Independent Trustee since 2007 | | 136 | | Hess Corporation (exploration of oil and gas) (1993-present), Canadian National Railway (railroad) (2001-present), White Mountains Insurance Group, Ltd. (holding company) (2004-present), Santander Consumer USA Holdings, Inc. (consumer finance) (2016-present), RTI International Metals, Inc. (manufacture and distribution of titanium) (1999-2015) and H.J. Heinz Company (processed foods and allied products) (1994-2013). |
| | |
Principal Occupation During at Least the Past 5 Years: | | | | |
| Director or Trustee of various companies and trusts; andformerly, Assistant to the President of the United States and Secretary of the Cabinet (1990-1993); General Counsel to the United States Treasury Department (1989-1990); and Counselor to the Secretary and Assistant Secretary for Public Affairs and Public Liaison-United States Treasury Department (1988-1989). |
TEMPLETON GLOBAL INVESTMENT TRUST
Independent Board Members (continued)
| | | | | | | | |
Name, Year of Birth and Address | | Position | | Length of Time Served | | Number of Portfolios in
Fund Complex Overseen
by Board Member* | | Other Directorships Held During at Least the Past 5 Years |
| | | | |
J. Michael Luttig (1954) 300 S.E. 2nd Street Fort Lauderdale, FL 33301-1923 | | Trustee | | Since 2009 | | 136 | | Boeing Capital Corporation (aircraft financing) (2006-2013). |
| | |
Principal Occupation During at Least the Past 5 Years: | | | | |
| Executive Vice President, General Counsel and member of the Executive Council, The Boeing Company (aerospace company) (2006-present); andformerly, Federal Appeals Court Judge, U.S. Court of Appeals for the Fourth Circuit (1991-2006). |
| | | | |
David W. Niemiec (1949) 300 S.E. 2nd Street Fort Lauderdale, FL 33301-1923 | | Trustee | | Since 2006 | | 38 | | Hess Midstream Partners LP (oil and gas midstream infrastructure) (2017-present). |
| | |
Principal Occupation During at Least the Past 5 Years: | | | | |
| Advisor, Saratoga Partners (private equity fund); andformerly, Managing Director, Saratoga Partners (1998-2001) and SBC Warburg Dillon Read (investment banking) (1997-1998); Vice Chairman, Dillon, Read & Co. Inc. (investment banking) (1991-1997); and Chief Financial Officer, Dillon, Read & Co. Inc. (1982-1997). |
| | | | |
Larry D. Thompson (1945) 300 S.E. 2nd Street Fort Lauderdale, FL 33301-1923 | | Trustee | | Since 2006 | | 136 | | The Southern Company (energy company) (2014-present; previously 2010-2012), Graham Holdings Company (education and media organization) (2011-present) and Cbeyond, Inc. (business communications provider) (2010-2012). |
| | |
Principal Occupation During at Least the Past 5 Years: | | | | |
| Director of various companies; Counsel, Finch McCranie, LLP (law firm) (2015-present); Independent Compliance Monitor and Auditor, Volkswagen AG (manufacturer of automobiles and commercial vehicles) (2017-present); John A. Sibley Professor of Corporate and Business Law, University of Georgia School of Law (2015-present; previously 2011-2012); andformerly, Executive Vice President – Government Affairs, General Counsel and Corporate Secretary, PepsiCo, Inc. (consumer products) (2012-2014); Senior Vice President – Government Affairs, General Counsel and Secretary, PepsiCo, Inc. (2004-2011); Senior Fellow of The Brookings Institution (2003-2004); Visiting Professor, University of Georgia School of Law (2004); and Deputy Attorney General, U.S. Department of Justice (2001-2003). |
| | | | |
Constantine D. Tseretopoulos (1954) 300 S.E. 2nd Street Fort Lauderdale, FL 33301-1923 | | Trustee | | Since 2001 | | 24 | | None |
| | |
Principal Occupation During at Least the Past 5 Years: | | | | |
| Physician, Chief of Staff, owner and operator of the Lyford Cay Hospital (1987-present); director of various nonprofit organizations; andformerly, Cardiology Fellow, University of Maryland (1985-1987); and Internal Medicine Resident, Greater Baltimore Medical Center (1982-1985). |
| | | | |
Robert E. Wade (1946) 300 S.E. 2nd Street Fort Lauderdale, FL 33301-1923 | | Trustee | | Since 2006 | | 38 | | El Oro Ltd (investments) (2003-present). |
| | |
Principal Occupation During at Least the Past 5 Years: | | | | |
| Attorney at law engaged in private practice as a sole practitioner (1972-2008) and member of various boards. |
TEMPLETON GLOBAL INVESTMENT TRUST
Interested Board Members and Officers
| | | | | | | | |
Name, Year of Birth and Address | | Position | | Length of Time Served | | Number of Portfolios in
Fund Complex Overseen
by Board Member* | | Other Directorships Held During at Least the Past 5 Years |
**Gregory E. Johnson (1961) One Franklin Parkway San Mateo, CA 94403-1906 | | Trustee | | Since 2006 | | 150 | | None |
| | |
Principal Occupation During at Least the Past 5 Years: | | | | |
| Chairman of the Board, Member – Office of the Chairman, Director and Chief Executive Officer, Franklin Resources, Inc.; officer and/or director or trustee, as the case may be, of some of the other subsidiaries of Franklin Resources, Inc. and of 42 of the investment companies in Franklin Templeton; Vice Chairman, Investment Company Institute; andformerly, President, Franklin Resources, Inc. (1994-2015). |
**Rupert H. Johnson, Jr. (1940) One Franklin Parkway San Mateo, CA 94403-1906 | | Chairman of the Board, Trustee and Vice President | | Chairman of the Board and Trustee since 2013 and Vice President since 1996 | | 136 | | None |
| | |
Principal Occupation During at Least the Past 5 Years: | | | | |
| Vice Chairman, Member – Office of the Chairman and Director, Franklin Resources, Inc.; Director, Franklin Advisers, Inc.; and officer and/or director or trustee, as the case may be, of some of the other subsidiaries of Franklin Resources, Inc. and of 40 of the investment companies in Franklin Templeton. |
Alison E. Baur (1964) One Franklin Parkway San Mateo, CA 94403-1906 | | Vice President | | Since 2012 | | Not Applicable | | Not Applicable |
| | |
Principal Occupation During at Least the Past 5 Years: | | | | |
| Deputy General Counsel, Franklin Templeton; and officer of some of the other subsidiaries of Franklin Resources, Inc. and of 44 of the investment companies in Franklin Templeton. |
Norman J. Boersma (1957) Lyford Cay Nassau, Bahamas | | President and Chief Executive Officer – Investment Management | | Since 2012 | | Not Applicable | | Not Applicable |
| | |
Principal Occupation During at Least the Past 5 Years: | | | | |
| Chairman of the Board, President and Chief Executive Officer, Templeton Global Advisors Ltd.; Chief Investment Officer of Templeton Global Equity Group; officer of five of the investment companies in Franklin Templeton; andformerly, Executive Vice President, Franklin Templeton Investments Corp. (1993-2014). |
Aliya S. Gordon (1973) One Franklin Parkway San Mateo, CA 94403-1906 | | Vice President | | Since 2009 | | Not Applicable | | Not Applicable |
| | |
Principal Occupation During at Least the Past 5 Years: | | | | |
| Senior Associate General Counsel and officer of 44 of the investment companies in Franklin Templeton. |
Steven J. Gray (1955) One Franklin Parkway San Mateo, CA 94403-1906 | | Vice President | | Since 2009 | | Not Applicable | | Not Applicable |
| | |
Principal Occupation During at Least the Past 5 Years: | | | | |
| Senior Associate General Counsel, Franklin Templeton; Vice President, Franklin Templeton Distributors, Inc. and FASA, LLC; and officer of 44 of the investment companies in Franklin Templeton. |
Matthew T. Hinkle (1971) One Franklin Parkway San Mateo, CA 94403-1906 | | Chief Executive Officer – Finance and Administration | | Since 2017 | | Not Applicable | | Not Applicable |
| | |
Principal Occupation During at Least the Past 5 Years: | | | | |
| Senior Vice President, Franklin Templeton Services, LLC; officer of 44 of the investment companies in Franklin Templeton; andformerly, Vice President, Global Tax (2012-April 2017) and Treasurer/Assistant Treasurer, Franklin Templeton (2009-2017). |
TEMPLETON GLOBAL INVESTMENT TRUST
Interested Board Members and Officers(continued)
| | | | | | | | |
Name, Year of Birth and Address | | Position | | Length of Time Served | | Number of Portfolios in
Fund Complex Overseen
by Board Member* | | Other Directorships Held During at Least the Past 5 Years |
Robert G. Kubilis (1973) 300 S.E. 2nd Street Fort Lauderdale, FL 33301-1923 | | Chief Financial Officer, Chief Accounting Officer and Treasurer | | Since 2017 | | Not Applicable | | Not Applicable |
| | |
Principal Occupation During at Least the Past 5 Years: | | | | |
| Treasurer, U.S. Fund Administration & Reporting and officer of 16 of the investment companies in Franklin Templeton. |
Robert Lim (1948) One Franklin Parkway San Mateo, CA 94403-1906 | | Vice President –AML Compliance | | Since 2016 | | Not Applicable | | Not Applicable |
| | |
Principal Occupation During at Least the Past 5 Years: | | | | |
| Vice President, Franklin Templeton Companies, LLC; Chief Compliance Officer, Franklin Templeton Distributors, Inc. and Franklin Templeton Investor Services, LLC; and officer of 44 of the investment companies in Franklin Templeton. |
Kimberly H. Novotny (1972) 300 S.E. 2nd Street Fort Lauderdale, FL 33301-1923 | | Vice President | | Since 2013 | | Not Applicable | | Not Applicable |
| | |
Principal Occupation During at Least the Past 5 Years: | | | | |
| Associate General Counsel, Franklin Templeton; Vice President and Corporate Secretary, Fiduciary Trust International of the South; Vice President, Templeton Investment Counsel, LLC; Assistant Secretary, Franklin Resources, Inc.; and officer of 44 of the investment companies in Franklin Templeton. |
Robert C. Rosselot (1960)
300 S.E. 2nd Street Fort Lauderdale, FL 33301-1923 | | Chief Compliance Officer | | Since 2013 | | Not Applicable | | Not Applicable |
| | |
Principal Occupation During at Least the Past 5 Years: | | | | |
| Director, Global Compliance, Franklin Templeton; Vice President, Franklin Templeton Companies, LLC; officer of 44 of the investment companies in Franklin Templeton; andformerly, Senior Associate General Counsel, Franklin Templeton (2007-2013); and Secretary and Vice President, Templeton Group of Funds (2004-2013). |
Navid J. Tofigh (1972) One Franklin Parkway San Mateo, CA 94403-1906 | | Vice President | | Since 2015 | | Not Applicable | | Not Applicable |
| | |
Principal Occupation During at Least the Past 5 Years: | | | | |
| Associate General Counsel and officer of 44 of the investment companies in Franklin Templeton. |
Craig S. Tyle (1960) One Franklin Parkway San Mateo, CA 94403-1906 | | Vice President | | Since 2005 | | Not Applicable | | Not Applicable |
| | |
Principal Occupation During at Least the Past 5 Years: | | | | |
| General Counsel and Executive Vice President, Franklin Resources, Inc.; and officer of some of the other subsidiaries of Franklin Resources, Inc. and of 44 of the investment companies in Franklin Templeton. |
Lori A. Weber (1964) 300 S.E. 2nd Street Fort Lauderdale, FL 33301-1923 | | Vice President and Secretary | | Vice President since 2011 and Secretary since 2013 | | Not Applicable | | Not Applicable |
| | |
Principal Occupation During at Least the Past 5 Years: | | | | |
| Senior Associate General Counsel, Franklin Templeton; Assistant Secretary, Franklin Resources, Inc.; Vice President and Secretary, Templeton Investment Counsel, LLC; and officer of 44 of the investment companies in Franklin Templeton. |
TEMPLETON GLOBAL INVESTMENT TRUST
*We base the number of portfolios on each separate series of the U.S. registered investment companies within the Franklin Templeton fund complex. These portfolios have a common investment manager or affiliated investment managers.
**Gregory E. Johnson is considered to be an interested person of the Fund under the federal securities laws due to his position as an officer and director of Franklin Resources, Inc. (Resources), which is the parent company of the Fund’s investment manager and distributor. Rupert H. Johnson, Jr. is considered to be an interested person of the Fund under the federal securities laws due to his position as an officer and director and major shareholder of Resources.
Note 1: Rupert H. Johnson, Jr. is the uncle of Gregory E. Johnson.
Note 2: Officer information is current as of the date of this report. It is possible that after this date, information about officers may change.
The Sarbanes-Oxley Act of 2002 and Rules adopted by the US Securities and Exchange Commission require the Fund to disclose whether the Fund’s Audit Committee includes at least one member who is an audit committee financial expert within the meaning of such Act and Rules. The Fund’s Board has determined that there is at least one such financial expert on the Audit Committee and has designated each of Ann Torre Bates and David W. Niemiec as an audit committee financial expert. The Board believes that Ms. Bates and Mr. Niemiec qualify as such an expert in view of their extensive business background and experience. Ms. Bates has served as a member of the Fund Audit Committee since 2008. She currently serves as a director of Ares Capital Corporation (2010-present) and United Natural Foods, Inc. (2013-present) and was formerly a director of Navient Corporation from 2014 to 2016, SLM Corporation from 1997 to 2014 and Allied Capital Corporation from 2003 to 2010, Executive Vice President and Chief Financial Officer of NHP Incorporated from 1995 to 1997 and Vice President and Treasurer of US Airways, Inc. until 1995. Mr. Niemiec has served as a member of the Fund Audit Committee since 2006, currently serves as an Advisor to Saratoga Partners and was formerly its Managing Director from 1998 to 2001 and serves as a director of Hess Midstream Partners LP (2017-present). Mr. Niemiec was formerly a director of Emeritus Corporation from 1999 to 2010 and OSI Pharmaceuticals, Inc. from 2006 to 2010, Managing Director of SBC Warburg Dillon Read from 1997 to 1998, and was Vice Chairman from 1991 to 1997 and Chief Financial Officer from 1982 to 1997 of Dillon, Read & Co. Inc. As a result of such background and experience, the Board believes that Ms. Bates and Mr. Niemiec have each acquired an understanding of generally accepted accounting principles and financial statements, the general application of such principles in connection with the accounting estimates, accruals and reserves, and analyzing and evaluating financial statements that present a breadth and level of complexity of accounting issues generally comparable to those of the Fund, as well as an understanding of internal controls and procedures for financial reporting and an understanding of audit committee functions. Ms. Bates and Mr. Niemiec are independent Board members as that term is defined under the applicable US Securities and Exchange Commission Rules and Releases.
The Statement of Additional Information (SAI) includes additional information about the board members and is available, without charge, upon request. Shareholders may call (800) DIALBEN/342-5236 to request the SAI.
TEMPLETON GLOBAL INVESTMENT TRUST
TEMPLETON DYNAMIC EQUITY FUND
Shareholder Information
Board Approval of Investment Management Agreements
TEMPLETON GLOBAL INVESTMENT TRUST
Templeton Dynamic Equity Fund
(Fund)
At anin-person meeting held on February 26, 2019 (Meeting), the Board of Trustees (Board) of Templeton Global Investment Trust (Trust), including a majority of the trustees who are not “interested persons” as defined in the Investment Company Act of 1940 (Independent Trustees), reviewed and approved the continuance of the investment management agreement between Templeton Global Advisors Limited (Manager) and the Trust, on behalf of the Fund (Management Agreement) for an additionalone-year period. The Independent Trustees received advice from and met separately with Independent Trustee counsel in considering whether to approve the continuation of the Management Agreement.
In considering the continuation of the Management Agreement, the Board reviewed and considered information provided by the Manager at the Meeting and throughout the year at meetings of the Board and its committees. The Board also reviewed and considered information provided in response to a detailed set of requests for information submitted to the Manager by Independent Trustee counsel on behalf of the Independent Trustees in connection with the annual contract renewal process. In addition, prior to the Meeting, the Independent Trustees held a telephonic contract renewal meeting at which the Independent Trustees conferred amongst themselves and Independent Trustee counsel about contract renewal matters. The Board reviewed and considered all of the factors it deemed relevant in approving the continuance of the Management Agreement, including, but not limited to: (i) the nature, extent and quality of the services provided by the Manager; (ii) the investment performance of the Fund; (iii) the costs of the services provided and profits realized by the Manager and its affiliates from the relationship with the Fund; and (iv) the extent to which economies of scale may be realized as the Fund grows. The Board noted that the Fund commenced operations on May 2, 2016, but is not currently available for public sale. The Board also noted that Franklin Resources, Inc. (FRI) owns 100% of the Fund’s outstanding shares.
In approving the continuance of the Management Agreement, the Board, including a majority of the Independent Trustees, determined that the terms of the Management Agreement are fair and reasonable and that the continuance of such Management Agreement is in the interests of the Fund and its
shareholder(s). While attention was given to all information furnished, the following discusses some primary factors relevant to the Board’s determination.
Nature, Extent and Quality of Services
The Board reviewed and considered information regarding the nature, extent and quality of investment management services provided by the Manager and its affiliates to the Fund and its shareholder(s). This information included, among other things, the qualifications, background and experience of the senior management and investment personnel of the Manager; the structure of investment personnel compensation; oversight of third-party service providers; investment performance reports and related financial information for the Fund; reports on expenses, shareholder services, and third party servicing arrangements; legal and compliance matters; risk controls; pricing and other services provided by the Manager and its affiliates; and management fees charged by the Manager and its affiliates to US funds and other accounts, including management’s explanation of differences among accounts where relevant. The Board noted management’s continuing efforts and expenditures in establishing effective business continuity plans and developing strategies to address areas of heightened concern in the mutual fund industry, such as cybersecurity and liquidity risk management. The Board also recognized management’s commitment to facilitating Board oversight of liquidity through the designation of a liquidity/risk administrator and the development of reports that highlight the amount of illiquid investments for the Fund.
The Board also reviewed and considered the benefits provided to Fund shareholder(s) of investing in a fund that is part of the Franklin Templeton family of funds. The Board noted the financial position of FRI, the Manager’s parent, and its commitment to the mutual fund business as evidenced by its continued introduction of new funds, reassessment of the fund offerings in response to the market environment and project initiatives and capital investments relating to the services provided to the Fund by the FTI organization.
Following consideration of such information, the Board was satisfied with the nature, extent and quality of services provided by the Manager and its affiliates to the Fund and its shareholder(s).
Fund Performance
The Board reviewed and considered the performance results of the Fund over various time periods ended December 31, 2018. The Board considered the performance returns for the Fund in comparison to the performance returns of mutual funds deemed
TEMPLETON GLOBAL INVESTMENT TRUST
TEMPLETON DYNAMIC EQUITY FUND
SHAREHOLDER INFORMATION
comparable to the Fund included in a universe (Performance Universe) selected by Broadridge Financial Solutions, Inc. (Broadridge), an independent provider of investment company data. The Board received a description of the methodology used by Broadridge to select the mutual funds included in a Performance Universe. The Board also reviewed and considered Fund performance reports provided and discussions that occurred with portfolio managers at Board meetings throughout the year. A summary of the Fund’s performance results is below.
The Performance Universe for the Fund included the Fund and all retail and institutional alternative long/short equity funds. The Board noted that the Fund’s annualized total return for theone-year period was below the median of its Performance Universe. The Board concluded that it would need additional time to evaluate the Fund’s performance given its short operating history.
Comparative Fees and Expenses
The Board reviewed and considered information regarding the Fund’s actual total expense ratio and its various components, including, as applicable, management fees; transfer agent expenses; underlying fund expenses; Rule12b-1 andnon-Rule12b-1 service fees; and othernon-management fees. The Board also noted the quarterly and annual reports it receives on all marketing support payments made by FTI to financial intermediaries. The Board considered the actual total expense ratio and, separately, the contractual management fee rate, without the effect of fee waivers, if any (Management Rate) of the Fund in comparison to the median expense ratio and median Management Rate, respectively, of other mutual funds deemed comparable to and with a similar expense structure to the Fund selected by Broadridge (Expense Group). Broadridge fee and expense data is based upon information taken from each fund’s most recent annual report, which reflects historical asset levels that may be quite different from those currently existing, particularly in a period of market volatility. While recognizing such inherent limitation and the fact that expense ratios and Management Rates generally increase as assets decline and decrease as assets grow, the Board believed the independent analysis conducted by Broadridge to be an appropriate measure of comparative fees and expenses. The Broadridge Management Rate includes administrative charges, and the actual total expense ratio, for comparative consistency, was shown for Advisor Class shares for the Fund and for Institutional Class, Class I, Class I2, Class R6 and Class S shares for funds with multiple classes of shares. The Board received a description of the methodology
used by Broadridge to select the mutual funds included in an Expense Group.
The Expense Group for the Fund included the Fund and 13 other alternative long/short equity funds. The Board noted that the Management Rate and actual total expense ratio for the Fund were below the medians of its Expense Group. The Board further noted that the Fund invests in third-party mutual funds or exchange-traded funds in excess of the statutory limitations under the Investment Company Act of 1940 by relying on exemptive relief provided by the U.S. Securities and Exchange Commission to each underlying fund. Pursuant to the conditions of the exemptive relief, the Board determined that the Management Rate paid by the Fund is based on services provided that are in addition to, rather than duplicative of, the services provided under the investment management agreements of the underlying funds in which the Fund invests. The Board concluded that the Management Rate charged to the Fund is reasonable. In doing so, the Board noted that the Fund has a cap on operating expenses.
Profitability
The Board reviewed and considered information regarding the profits realized by the Manager and its affiliates in connection with the operation of the Fund, noting that the Fund incepted on May 2, 2016, but is not currently available for public sale. In this respect, the Board considered the Fund profitability analysis provided by the Manager that addresses the overall profitability of FTI’s US fund business, as well as its profits in providing investment management and other services to each of the individual funds during the12-month period ended September 30, 2018, being the most recent fiscalyear-end for FRI. The Board noted that although management continually makes refinements to its methodologies used in calculating profitability in response to organizational and product related changes, the overall methodology has remained consistent with that used in the Fund’s profitability report presentations from prior years. Additionally, PricewaterhouseCoopers LLP, auditor to FRI and certain Franklin Templeton funds, has been engaged by the Manager to periodically review and assess the allocation methodologies to be used solely by the Fund’s Board with respect to the profitability analysis.
The Board noted management’s belief that costs incurred in establishing the infrastructure necessary for the type of mutual fund operations conducted by the Manager and its affiliates may not be fully reflected in the expenses allocated to the Fund in determining its profitability, as well as the fact that the level of profits, to a certain extent, reflected operational cost savings
TEMPLETON GLOBAL INVESTMENT TRUST
TEMPLETON DYNAMIC EQUITY FUND
SHAREHOLDER INFORMATION
and efficiencies initiated by management. The Board also noted management’s need to implement systems and meet additional regulatory and compliance requirements resulting from recent SEC and other regulatory requirements.
The Board also considered the extent to which the Manager and its affiliates might derive ancillary benefits from fund operations, including revenues generated from transfer agent services, potential benefits resulting from personnel and systems enhancements necessitated by fund growth, as well as increased leverage with service providers and counterparties. Based upon its consideration of all these factors, the Board concluded that the level of profits realized/expected to be realized by the Manager and its affiliates from providing services to the Fund was not excessive in view of the nature, extent and quality of services provided to the Fund.
Economies of Scale
The Board reviewed and considered the extent to which the Manager may realize economies of scale, if any, as the Fund grows larger and whether the Fund’s management fee structure reflects any economies of scale for the benefit of shareholder(s). The Board considered the Manager’s view that any analyses of potential economies of scale in managing a particular fund are inherently limited in light of the joint and common costs and investments the Manager incurs across the Franklin Templeton family of funds as a whole. The Board noted that the Manager did not include the Fund in this year’seconomies-of-scale analysis given the Fund’s short operating history.
Conclusion
Based on its review, consideration and evaluation of all factors it believed relevant, including the above-described factors and conclusions, the Board unanimously approved the continuation of the Management Agreement for an additionalone-year period.
Proxy Voting Policies and Procedures
The Fund’s investment manager has established Proxy Voting Policies and Procedures (Policies) that the Fund uses to determine how to vote proxies relating to portfolio securities. Shareholders may view the Fund’s complete Policies online at franklintempleton.com. Alternatively, shareholders may request copies of the Policies free of charge by calling the Proxy Group collect at (954)527-7678 or by sending a written request to: Franklin Templeton Companies, LLC, 300 S.E. 2nd Street, Fort Lauderdale, FL 33301, Attention: Proxy Group. Copies of the Fund’s proxy voting records are also made available online
at franklintempleton.com and posted on the U.S. Securities and Exchange Commission’s website at sec.gov and reflect the most recent12-month period ended June 30.
Quarterly Statement of Investments
The Trust, on behalf of the Fund, files a complete statement of investments with the U.S. Securities and Exchange Commission for the first and third quarters for each fiscal year as an exhibit to its report on FormN-PORT. Shareholders may view the filed FormN-PORT by visiting the Commission’s website at sec.gov. The filed form may also be viewed and copied at the Commission’s Public Reference Room in Washington, DC. Information regarding the operations of the Public Reference Room may be obtained by calling(800) SEC-0330.
| (a) | The Registrant has adopted a code of ethics that applies to its principal executive officers and principal financial and accounting officer. |
| (f) | Pursuant to Item 12(a)(1), the Registrant is attaching as an exhibit a copy of its code of ethics that applies to its principal executive officers and principal financial and accounting officer. |
| Item 3. | Audit Committee Financial Expert. |
| (a) (1) | The Registrant has an audit committee financial expert serving on its audit committee. |
| (2) | The audit committee financial expert is David W. Niemiec and he is “independent” as defined under the relevant Securities and Exchange Commission Rules and Releases. |
| Item 4. | Principal Accountant Fees and Services. |
The aggregate fees paid to the principal accountant for professional services rendered by the principal accountant for the audit of the registrant’s annual financial statements or for services that are normally provided by the principal accountant in connection with statutory and regulatory filings or engagements were $144,149 for the fiscal year ended March 31, 2019 and $142,745 for the fiscal year ended March 31, 2018.
There were no fees paid to the principal accountant for assurance and related services rendered by the principal accountant to the registrant that are reasonably related to the performance of the audit of the registrant’s financial statements and are not reported under paragraph (a) of Item 4.
There were no fees paid to the principal accountant for assurance and related services rendered by the principal accountant to the registrant’s investment adviser and any entity controlling, controlled by or under common control with the investment adviser that provides ongoing services to the registrant that are reasonably related to the performance of the audit of their financial statements.
There were no fees paid to the principal accountant for professional services rendered by the principal accountant to the registrant for tax compliance, tax advice and tax planning.
The aggregate fees paid to the principal accountant for professional services rendered by the principal accountant to the registrant’s investment adviser and any entity controlling, controlled by or under common control with the investment adviser that provides ongoing services to the registrant for tax compliance, tax advice and tax planning were $10,000 for the fiscal year ended
March 31, 2019 and $0 for the fiscal year ended March 31, 2018. The services for which these fees were paid included professional fees in connection with an Indonesia withholding tax refund claim.
The aggregate fees paid to the principal accountant for products and services rendered by the principal accountant to the registrant not reported in paragraphs (a)-(c) of Item 4 were $0 for the fiscal year ended March 31, 2019 and $379 for the fiscal year ended March 31, 2018. The services for which these fees were paid include review of materials provided to the fund Board in connection with the investment management contract renewal process.
The aggregate fees paid to the principal accountant for products and services rendered by the principal accountant to the registrant’s investment adviser and any entity controlling, controlled by or under common control with the investment adviser that provides ongoing services to the registrant not reported in paragraphs (a)-(c) of Item 4 were $15,000 for the fiscal year ended March 31, 2019 and $14,000 for the fiscal year ended March 31, 2018. The services for which these fees were paid included the issuance of an Auditor’s Certificate for South Korean regulatory shareholders disclosures and benchmarking services in connection with the 2015 ICI TA Survey.
(e) (1) The registrant’s audit committee is directly responsible for approving the services to be provided by the auditors, including:
(i)pre-approval of all audit and audit related services;
(ii)pre-approval of allnon-audit related services to be provided to the Fund by the auditors;
(iii)pre-approval of allnon-audit related services to be provided to the registrant by the auditors to the registrant’s investment adviser or to any entity that controls, is controlled by or is under common control with the registrant’s investment adviser and that provides ongoing services to the registrant where thenon-audit services relate directly to the operations or financial reporting of the registrant; and
(iv) establishment by the audit committee, if deemed necessary or appropriate, as an alternative to committeepre-approval of services to be provided by the auditors, as required by paragraphs (ii) and (iii) above, of policies and procedures to permit such services to bepre-approved by other means, such as through establishment of guidelines or by action of a designated member or members of the committee; provided the policies and procedures are detailed as to the particular service and the committee is informed of each service and such policies and procedures do not include delegation of audit committee responsibilities, as contemplated under the Securities Exchange Act of 1934, to management; subject, in the case of (ii) through (iv), to any waivers, exceptions or exemptions that may be available under applicable law or rules.
(e) (2) None of the services provided to the registrant described in paragraphs (b)-(d) of Item 4 were approved by the audit committee pursuant to paragraph (c)(7)(i)(C) of Rule2-01 of regulationS-X.
(f) No disclosures are required by this Item 4(f).
(g) The aggregatenon-audit fees paid to the principal accountant for services rendered by the principal accountant to the registrant and the registrant’s investment adviser and any entity controlling, controlled by or under common control with the investment adviser that provides ongoing services to the registrant were $25,000 for the fiscal year ended March 31, 2019 and $14,379 for the fiscal year ended March 31, 2018.
(h) The registrant’s audit committee of the board has considered whether the provision ofnon-audit services that were rendered to the registrant’s investment adviser (not including anysub-adviser whose role is primarily portfolio management and is subcontracted with or overseen by another investment adviser), and any entity controlling, controlled by, or under common control with the investment adviser that provides ongoing services to the registrant that were notpre-approved pursuant to paragraph (c)(7)(ii) of Rule2-01 of RegulationS-X is compatible with maintaining the principal accountant’s independence.
| Item 5. | Audit Committee of Listed Registrants. N/A |
| Item 6. | Schedule of Investments. N/A |
| Item 7. | Disclosure of Proxy Voting Policies and Procedures forClosed-End Management Investment Companies. N/A |
| Item 8. | Portfolio Managers ofClosed-End Management Investment Companies. N/A |
| Item 9. | Purchases of Equity Securities byClosed-End Management Investment Company and Affiliated Purchasers. N/A |
| Item 10. | Submission of Matters to a Vote of Security Holders. |
There have been no changes to the procedures by which shareholders may recommend nominees to the Registrant’s Board of Trustees that would require disclosure herein.
| Item 11. | Controls and Procedures. |
(a) Evaluation of Disclosure Controls and Procedures. The Registrant maintains disclosure controls and procedures that are designed to provide reasonable assurance that information required to be disclosed in the Registrant’s filings under the Securities Exchange Act of 1934, as amended, and the Investment Company Act of 1940 is recorded, processed, summarized and reported within the periods specified in the rules and forms of the Securities and Exchange Commission. Such information is accumulated and communicated to the Registrant’s management, including its principal executive officer and principal financial officer, as appropriate, to allow timely decisions regarding required disclosure. The Registrant’s management, including the principal executive officer and the principal financial officer, recognizes
that any set of controls and procedures, no matter how well designed and operated, can provide only reasonable assurance of achieving the desired control objectives.
Within 90 days prior to the filing date of this Shareholder Report on FormN-CSRS, the Registrant had carried out an evaluation, under the supervision and with the participation of the Registrant’s management, including the Registrant’s principal executive officer and the Registrant’s principal financial officer, of the effectiveness of the design and operation of the Registrant’s disclosure controls and procedures. Based on such evaluation, the Registrant’s principal executive officer and principal financial officer concluded that the Registrant’s disclosure controls and procedures are effective.
(b) Changes in Internal Controls: Effective November 1, 2018, the Registrant’s controls were enhanced through the implementation of a daily secondary review of market events following the close of trading on foreign stock markets to ensure the appropriate application of market level fair value.
| Item 12. | Disclosure of Securities Lending Activities forClosed-End Management Investment Company. N/A |
| (a) (2) | Certifications pursuant to Section 302 of the Sarbanes-Oxley Act of 2002 of Matthew T. Hinkle, Chief Executive Officer - Finance and Administration, and Robert G. Kubilis, Chief Financial Officer and Chief Accounting Officer |
| (b) | Certifications pursuant to Section 906 of the Sarbanes-Oxley Act of 2002 of Matthew T. Hinkle, Chief Executive Officer - Finance and Administration, and Robert G. Kubilis, Chief Financial Officer and Chief Accounting Officer |
SIGNATURES
Pursuant to the requirements of the Securities Exchange Act of 1934 and the Investment Company Act of 1940, the registrant has duly caused this report to be signed on its behalf by the undersigned, thereunto duly authorized.
TEMPLETON GLOBAL INVESTMENT TRUST
| | |
| By | | /s/ MATTHEW T. HINKLE |
| | Matthew T. Hinkle |
| | Chief Executive Officer – Finance and Administration |
| | Date May 24, 2019 |
Pursuant to the requirements of the Securities Exchange Act of 1934 and the Investment Company Act of 1940, this report has been signed below by the following persons on behalf of the registrant and in the capacities and on the dates indicated.
| | |
| By | | /s/ MATTHEW T. HINKLE |
| | Matthew T. Hinkle |
| | Chief Executive Officer – Finance and Administration |
| | Date May 24, 2019 |
| |
| By | | /s/ ROBERT G. KUBILIS |
| | Robert G. Kubilis |
| | Chief Financial Officer and Chief Accounting Officer |
| | Date May 24, 2019 |