UNITED STATES
SECURITIES AND EXCHANGE COMMISSION
Washington, D.C. 20549
FORM N-CSR
CERTIFIED SHAREHOLDER REPORT OF REGISTERED
MANAGEMENT INVESTMENT COMPANIES
Investment Company Act file number: 811-8268
______________________________________________
FIRSTHAND FUNDS
______________________________________________________________________________
(Exact name of registrant as specified in charter)
125 SOUTH MARKET
SUITE 1200
SAN JOSE, CALIFORNIA 95113
______________________________________________________________________________
(Address of principal executive offices)(Zip code)
(Name and Address of Agent for Service) | Copy to: |
Kevin M. Landis
Firsthand Capital Management, Inc.
125 South Market, Suite 1200
San Jose, California 95113 | Kelvin K. Leung, Esq.
Firsthand Capital Management, Inc.
125 South Market, Suite 1200
San Jose, California 95113 |
| Scott M. Zoltowski, Esq.
State Street Bank and Trust Company
One Federal Street
Boston, Massachusetts 02110 |
| Steven G. Cravath, Esq.
Morrison & Foerster LLP
2000 Pennsylvania Avenue, NW
Washington, DC 20006-1888 |
Registrant's telephone number, including area code: (408) 294-2200
Date of fiscal year end: December 31
Date of reporting period: December 31, 2004
Item 1. Reports to Shareholders.


This report is provided for the general information of the shareholders of Firsthand Funds.
This report is not intended for distribution to prospective investors in the Funds,
unless preceded or accompanied by an effective prospectus. For more complete
information about Firsthand Funds, please call toll free 1.888.884.2675 or
visit www.firsthandfunds.com for a prospectus, which contains more information,
including risks, fees, and expenses. Read the prospectus carefully before
investing or sending money.
Firsthand Funds are distributed by ALPS Distributors, Inc.

| 2004 Annual Report - 1 |
PERFORMANCE SUMMARY
| Period Returns | | | | | | | | | |
| (average annual total returns as of 12/31/04) | | | | | | | | | |
| | | | | | | | | | |
| | Q4 '04 | | 1-YEAR | | 3-YEAR | | 5-YEAR | | 10-YEAR |
| FUND | TOTAL* | | | | | | | | |
|
| |
| |
| |
| |
|
| | | | | | | | | | |
| Firsthand Technology Value Fund® | 10.70% | | -6.62% | | -10.59% | | -18.47% | | 13.56% |
| Firsthand Technology Leaders Fund | 13.87% | | -2.79% | | -3.88% | | -17.81% | | • |
| Firsthand Technology Innovators Fund | 14.94% | | -12.80% | | -14.98% | | -23.01% | | • |
| Firsthand e-Commerce Fund | 16.19% | | 5.56% | | -1.01% | | -26.20% | | • |
| Firsthand Global Technology Fund | 17.91% | | -7.16% | | -5.92% | | • | | • |
| Nasdaq | 14.87% | | 9.15% | | 4.20% | | -11.42% | | 11.65% |
| DJIA | 7.59% | | 5.31% | | 4.70% | | 0.68% | | 13.09% |
| S&P 500 | 9.23% | | 10.88% | | 3.58% | | -2.30% | | 12.05% |
| * Not annualized. | | | | | | | | | |
Returns assume reinvestment of all dividends and distributions but do not reflect the impact of taxes. The performance data quoted represent past performance. Past performance cannot guarantee future results, and current performance may be lower or higher than the performance quoted. Both the return from and the principal value of an investment in the Funds will fluctuate so that an investor's shares, when redeemed, may be worth more or less than their original cost. To obtain performance as of the most recent month-end, please contact Firsthand Funds by calling 1.888.884.2675 or go to www.firsthandfunds.com.
Each Fund may invest in small-capitalization companies and Initial Public Offerings ("IPOs"). These investments are more volatile than investments in large-capitalization companies and loss of principal could be greater. The Funds may invest in foreign securities, which are subject to greater risks than investing in domestic securities. Because the Funds are not diversified, they can take larger positions in fewer companies, increasing their risk profile. The Funds invest in several industries within the technology sector and the relative weightings of these industries in a Fund's portfolio may change at any time.
The Dow Jones Industrial Average (DJIA) is a group of 30 stocks tracked by the Dow Jones Company. The Nasdaq Composite Index (Nasdaq) is a capitalization-weighted index of all common stocks listed with Nasdaq. The Standard & Poor's 500 Index (S&P 500) is a market-weighted index of 500 stocks of well-established companies. Each index represents an unmanaged, broad-based basket of stocks. These indices are typically used as benchmarks for overall market performance. The Lipper Science and Technology Fund Index includes the largest 30 mutual funds in the group, which, by prospectus or portfolio practice, invest at least 80% of their equity portfolios in science and technology stocks.
| 2004 Annual Report - 2 |
| Returns Since Inception | | | | | | | |
| (average annual total returns as of 12/31/04) | | | | | | | |
| | AVERAGE | | | | | | |
| | ANNUAL | | | | | | |
| | TOTAL | | | | | | S&P |
| FUND (INCEPTION DATE) | RETURN | | NASDAQ | | DJIA | | 500 |
|
| |
| |
| |
|
| | | | | | | | |
| Firsthand Technology Value Fund® (5/20/94) | 15.14% | | 11.28% | | 12.68% | | 11.58% |
| Firsthand Technology Leaders Fund (12/10/97) | 7.80% | | 4.63% | | 6.20% | | 4.66% |
| Firsthand Technology Innovators Fund (5/20/98) | 4.67% | | 2.88% | | 4.63% | | 2.85% |
| Firsthand e-Commerce Fund (9/30/99) | -19.25% | | -3.99% | | 2.77% | | 0.43% |
| Firsthand Global Technology Fund (9/29/00) | -18.00% | | -11.21% | | 2.35% | | -2.37% |
| 2004 Annual Report - 3 |
 DEAR FELLOW SHAREHOLDERS,
2004 was a year defined by fear: We heard that the real estate bubble was going to burst (it didn't), that China was growing too fast (then that it was growing too slowly), that interest rates were going to soar (they were up just 1%), and that there would be terrorist attacks at the Olympics in Greece and the political conventions in the United States (there weren't).
It's a testament to the steady improvement in the fundamentals of corporate profits that, despite this poor psychological backdrop, the major indices were able to eek out modest gains for the year. Unfortunately, the same can't be said for many tech stocks. I am disappointed to report that only one of our funds, Firsthand e-Commerce Fund, enjoyed a positive return this year. The other four Firsthand Funds each underperformed both the Nasdaq Composite Index and the Lipper Science & Technology Fund Index (see the Performance Summary on pages 2 and 3 and the Financial Highlights on pages 41 to 45 of this report for more information).
Within the technology sector, there was a dramatic polarization in stock performance in 2004. The Goldman Sachs Internet Index, for example, was up 23.25% for the year, while the Philadelphia Stock Exchange Semiconductor Index was down 14.47%. The Goldman Sachs Software Index was up 13.66%, while the American Stock Exchange Networking Index was up just 0.10% for the year. As these index comparisons suggest, many technology companies and industries had a great year in 2004. A host of software and Internet stocks, for example, posted tremendous gains this year as demand for certain flavors of enterprise software and Internet advertising flourished. On the flip side, however, semiconductor stocks were hammered in 2004, despite 30% revenue growth in the industry. Our funds' tendency to carry relatively heavy semiconductor weightings generally hurt performance this year. The Performance and Portfolio Discussions on the pages that follow share specific performance attribution for each fund.
Despite the sector's mixed results, we saw the strengthening of several trends in 2004 that we expect to keep delivering positive news. Shipments of cellular telephone handsets grew sharply in 2004, reaching an estimated 560 million units worldwide. Benefitting from this growth, QUAL-COMM (QCOM) was Firsthand Technology Leaders Fund's biggest single mover. This market was thought to be stalled at just over 400 million units in 2002, but is expected to exceed 600 million units in 2005-a 50% increase in only three years. More importantly, handset users seem eager to adopt new features, particularly embedded digital cameras. In 2003, cameraphones were just 16% of all cellphones sold (a total of 84 million units). In 2004, that percentage grew to more than 30%, with cameraphone shipments exploding to nearly 180 million units last year. While some investors may be scared off by projections that the handset market could plateau in 2005, we see a great deal of potential growth in a nearly 600-million-unit market, and there are a number of new features and technologies on the horizon, including GPS and digital music, poised for adoption by users hungry for more capabilities.
Digital music was another hot area in 2004, with Apple's handheld digital music player-the iPod-selling an estimated eight million units. While Apple's iPod and iTunes grabbed most of the headlines, several other providers were flourishing more quietly. One of these was Napster (NAPS), formerly Roxio, which was the leading positive contributor to Firsthand Technology Innovators Fund in 2004. Now that the music industry has jumped on board the online bandwagon, we are finally seeing digital music distribution becoming a viable, growing business. It's a business that stands to gain tremendously from the continued growth in the cellphone market: Imagine songs being downloaded onto hundreds of millions of cellphones instead of just a few million iPods.
| 2004 Annual Report - 4 |
This past year was also one of phenomenal growth for broadband wireless technologies, particularly WiFi and the rapidly emerging WiMax technology. Israel's Alvarion (ALVR) rode the WiMax trend in 2004 and was Firsthand Global Technology Fund's top performer for the year. Wireless networking continues to grow at a rapid pace, driven largely by residential consumers, and we expect to see large-scale rollouts of WiMax technology by telecommunications service providers starting in 2005.
Consumers continued to purchase more goods and services via the Internet in 2004. A recent study by Goldman Sachs, Harris Interactive, and Nielsen/NetRatings reported that U.S. online retailers reported a 25% increase in holiday sales over 2003, with total sales of more than $23 billion. Consumers are increasingly comfortable with purchasing products online, which we believe bodes well for the future of e-commerce. Furthermore, with increased Internet usage has come increased Internet advertising expenditures as marketers seek to follow consumers' migration from TV to Internet viewing. Internet leaders such as Ebay and Yahoo! enjoyed solid growth in 2004.
You've no doubt noticed that I'm talking a lot about consumer electronics. That's because we are witnessing a consumer-driven market for technology products today, quite unlike the corporate IT-focused growth in the late 1990s. That's not to say that corporate spending is not significant any more. However, much of the growth in the tech sector is coming from consumer spending, while corporate America continues to absorb the technology purchases of four and five years ago.
I would be remiss if I didn't address the Funds' Achilles heel in 2004-semiconductor stocks. As many of you know, we have long been big fans of semiconductor companies because semiconductors are at the core of all electronic products today. Furthermore, owning chip stocks is often a great way to invest in a particular trend without having to own the well-known, and often over-priced, companies with their names on the boxes that are shipped to consumers.
Despite outstanding sales and earnings growth in the industry, semiconductor stocks took a beating in 2004, with investors seemingly anticipating a tougher market environment in 2005. As long-time industry participants and observers, we know that supply/demand imbalances occur often, which can drive stock prices to dizzying heights and breathtaking lows. Our long-term investment discipline, however, tells us to stick with a trend or company if we believe the trend has legs. In the case of semiconductor stocks, we know that we are currently in the midst of some oversupply situations, but we also know that markets tend to be self-correcting. We are not buying stocks because of next quarter's or next year's earnings, but because we believe in the companies' growth over the next 3 to 5 years. And we believe that economic expansion in the U.S. is just getting started.
Overall, I am encouraged by the progress being made by our portfolio companies, and I am hopeful for continued growth in 2005. We realize this has not been an easy time to be an investor in technology stocks or technology mutual funds, but we're encouraged by the healthy growth in much of the technology sector.
I wish you a very happy and prosperous 2005.
Sincerely,

| 2004 Annual Report - 5 |
SHAREHOLDER FEE EXAMPLE (Unaudited)
Example-In general, mutual fund shareholders may incur two types of costs: (1) transaction costs, including sales charges (loads), redemption fees, and exchange fees; and (2) ongoing costs, including management fees, 12b-1 distribution and service fees, non-12b-1 service fees, and other Fund expenses. This example is intended to help you understand your ongoing costs (in dollars) of investing in a Fund and to compare these costs with the ongoing costs of investing in other mutual funds. Note that Firsthand Funds does not charge transaction fees or 12b-1 distribution and service fees, though you may incur transaction fees if you purchase shares through a broker.
The example below is based on an investment of $1,000 made at the beginning of the period and held for the entire period from July 1, 2004 to December 31, 2004.
Actual Expenses-The section of the table at right entitled "Actual" provides information about actual account values and actual expenses. You may use this information, together with the amount you invested, to estimate the expenses that you paid over the period. Simply divide your account value by $1,000 (for example, an $8,600 account value divided by $1,000 = 8.6), and multiply the result by the number in the section entitled "Actual" under the heading "Expenses Paid During Period" to estimate the expenses you paid on your account during this period. If your account is an IRA or other tax-qualified savings plan, your expenses may also have included a $10 annual fee. In either case, the amount of any fee paid through your account would increase the estimate of expenses you paid during the period and decrease your ending account value.
Hypothetical Example for Comparison Purposes-The section of the table at right entitled "Hypothetical" provides information about hypothetical account values and hypothetical expenses based on a Fund's actual expense ratio and an assumed rate of return of 5% per year before expenses, which is not the Fund's actual return. The hypothetical account values and expenses may not be used to estimate your actual ending account balance or the expenses you paid for the period. However, you may use this information to compare the ongoing costs of investing in the Fund and other funds. To do so, compare this 5% hypothetical example with the 5% hypothetical examples that appear in the shareholder reports of the other funds. As in the case of the actual expense example, if your account is subject to an IRA fee, the amount of the fee paid through your account would increase the hypothetical expenses you would have paid during the period and decrease the hypothetical ending account value.
Please note that the expenses shown in the table at right are meant to highlight your ongoing costs only and do not reflect any transactional costs, such as sales charges (loads), redemption fees, or exchange fees. Therefore, the table is useful in comparing ongoing costs only, and will not help you determine the relative total costs of owning different funds. If these transactional costs were included, your costs would have been higher. The examples also assume all dividends and distributions have been reinvested.
| 2004 Annual Report - 6 |
Firsthand Technology Value Fund
| | Beginning | | Ending | | Expenses Paid | | |
| | Account Value | | Account Value | | During Period* | | Annualized |
| | 7/1/04 | | 12/31/04 | | 7/1/04-12/31/04 | | Expense Ratio |
| Actual | $ | 1,000 | | $ | 992.93 | | $ | 8.64 | | 1.91% |
| Hypothetical** | $ | 1,000 | | $ | 1,015.09 | | $ | 9.68 | | 1.91% |
| | | | | | | | | | | | |
| Firsthand Technology Leaders Fund | | | | | | | | |
| | | | | | | | | | | | |
| | Beginning | | | Ending | | Expenses Paid | | |
| | Account Value | | Account Value | | During Period* | | Annualized |
| | 7/1/04 | | 12/31/04 | | 7/1/04-12/31/04 | | Expense Ratio |
| Actual | $ | 1,000 | | $ | 1,016.38 | | $ | 9.05 | | 1.95% |
| Hypothetical** | $ | 1,000 | | $ | 1,014.89 | | $ | 9.88 | | 1.95% |
| | | | | | | | | | | | |
| Firsthand Technology Innovators Fund | | | | | | | |
| | | | | | | | | | | | |
| | Beginning | | | Ending | | Expenses Paid | | |
| | Account Value | | Account Value | | During Period* | | Annualized |
| | 7/1/04 | | 12/31/04 | | 7/1/04-12/31/04 | | Expense Ratio |
| Actual | $ | 1,000 | | $ | | 950.05 | | $ | 8.33 | | 1.95% |
| Hypothetical** | $ | 1,000 | | $ | 1,014.89 | | $ | 9.88 | | 1.95% |
| | | | | | | | | | | | |
| Firsthand e-Commerce Fund | | | | | | | | | |
| | | | | | | | | | | | |
| | Beginning | | | Ending | | Expenses Paid | | |
| | Account Value | | Account Value | | During Period* | | Annualized |
| | 7/1/04 | | 12/31/04 | | 7/1/04-12/31/04 | | Expense Ratio |
| Actual | $ | 1,000 | | $ | 1,006.23 | | $ | 8.67 | | 1.95% |
| Hypothetical** | $ | 1,000 | | $ | 1,014.89 | | $ | 9.88 | | 1.95% |
| | | | | | | | | | | | |
| Firsthand Global Technology Fund | | | | | | | |
| | | | | | | | | | | | |
| | Beginning | | | Ending | | Expenses Paid | | |
| | Account Value | | Account Value | | During Period* | | Annualized |
| | 7/1/04 | | 12/31/04 | | 7/1/04-12/31/04 | | Expense Ratio |
| Actual | $ | 1,000 | | $ | 1,019.05 | | $ | 8.75 | | 1.95% |
| Hypothetical** | $ | 1,000 | | $ | 1,014.89 | | $ | 9.88 | | 1.95% |
*
| Expenses are calculated by multiplying the Fund's annualized expense ratio listed above by the average account value over the period and multiplying that number by 184/366 (to reflect the one-half year period). |
**
| 5% return per year before expenses.
The expenses shown in the table do not reflect any fees that may be charged to you by brokers, financial intermediaries or other financial institutions. |
| 2004 Annual Report - 7 |
Firsthand Technology Value Fund
Performance and Portfolio Discussion
How did the Fund perform in 2004?
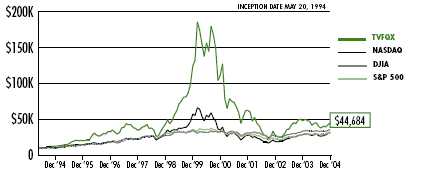
In 2004, Firsthand Technology Value Fund (TVFQX) posted a 6.62% loss, versus a 9.15% gain for the Nasdaq Composite Index and a 4.11% gain for the Lipper Science and Technology Fund Index. For the six months ended December 31, 2004, Firsthand Technology Value Fund declined 0.71% as compared to 6.56% and 3.57% gains for the Nasdaq and the Lipper peer group benchmarks, respectively.
Which industries had the greatest impact on the Fund's performance?
Despite the post-election rally in the stock market, the Fund was unable to recoup its losses and trailed its benchmarks in 2004. While the portfolio's software and defense and aerospace investments were bright spots, the Fund's large weightings in semiconductors and communications equipment significantly hurt its performance.
Which individual holdings were the largest contributors to the Fund's performance?
The Fund's largest contributor in 2004 was employee Internet management software vendor Websense (WBSN). Websense's stock performance reflected strong demand for its products, as well as the investor appeal of the company's subscription-based business model, which resulted in a steady revenue stream throughout the year.
Shares of Wind River Systems (WIND) advanced 55% in 2004 as the company continued its impressive turnaround. Wind River Systems is a leading provider of embedded operating system software, which is used in a number of different markets including defense and aerospace, automotive, consumer electronics, and communications. The primary catalyst for Wind River's turnaround was the company's decision to reduce its dependence on the beleaguered telecom sector and look to other markets for growth. Other software positions helping Fund performance in 2004 included tele-com software provider Comverse Technology (CMVT), online music provider Napster (NAPS), and VeriSign (VRSN), a provider of Internet infrastructure and communications services.
Shares of FLIR Systems (FLIR) and L-3 Communications (LLL) both fared well during the period despite worries that the defense and aerospace industry would be hurt by a cutback in goverment spending. FLIR Systems makes imaging and heat-detection systems for security and surveillance applications. Similarly, L-3 Communications is a defense electronics firm that provides intelligence, surveillance, and reconnaissance (ISR) systems; aircraft modernization; and aviation products primarily to the U.S. military.
Which holdings were the greatest detractors from the Fund's performance?
Our holdings in flash memory suppliers Lexar Media (LEXR) and SanDisk (SNDK) were among the Fund's largest detractors in 2004. Flash memory supply grew faster than demand, which led to several price cuts in an attempt to balance supply and demand. The sharp decline in average selling prices took its toll on revenue growth and profit margins. Other semiconductor stocks that hurt Fund performance included Texas Instruments (TXN), Zoran (ZRAN), PMC-Sierra (PMCS), and TriQuint Semiconductor (TQNT).
Telecom equipment provider UTStarcom (UTSI) declined 40% as investors worried about slowing growth in the Chinese market, a region that accounts for the majority of UTStarcom's sales. However, UTStarcom is working to broaden its customer base and geographic distribution of revenue. In 2004, for example, the company bought Audiovox's wireless handset business to gain exposure to the Code Division Multiple Access (CDMA) cell phone market. Other communications equipment holdings that hurt fund performance included Stratex Networks (STXN) and Powerwave Technologies (PWAV).
| 2004 Annual Report - 8 |
Fund Performance and Holding Information (as of December 31, 2004)
Firsthand Technology Value Fund vs. Market Indices
| | TVFQX | | NASDAQ | | DJIA | | S&P 500 |
| Since Inception (5/20/94) | 15.14% | | 11.28% | | 12.68% | | 11.58% |
| 10-Year | 13.56% | | 11.65% | | 13.09% | | 12.05% |
| 5-Year | -18.47% | | -11.42% | | 0.68% | | -2.30% |
| 3-Year | -10.59% | | 4.20% | | 4.70% | | 3.58% |
| 1-Year | -6.62% | | 9.15% | | 5.31% | | 10.88% |
| Q4 '04 Total Return (not annualized) | 10.70% | | 14.87% | | 7.59% | | 9.23% |
Growth of a Hypothetical $10,000 Investment
| Holdings by Industry* | | Top 10 Holdings** |
| | | | | |
| | % of Net Assets | | | % of Net Assets |
| Semiconductors | 35.4% | | SanDisk Corp. | 10.4% |
|
| |
|
|
| Software | 24.0% | | Comverse Technology, Inc. | 7.0% |
|
| |
|
|
| Communications Equipment | 15.5% | | Wind River Systems, Inc. | 6.1% |
|
| |
|
|
| Defense & Aerospace | 5.7% | | FLIR Systems, Inc. | 5.1% |
|
| |
|
|
| Photonics | 4.5% | | UTStarcom, Inc. | 4.8% |
|
| |
|
|
| Internet | 4.4% | | Corning, Inc. | 4.3% |
|
| |
|
|
| Other | 4.1% | | Websense, Inc. | 3.9% |
|
| |
|
|
| Peripherals | 4.0% | | Western Digital Corp. | 3.4% |
|
| |
|
|
| Services | 1.8% | | Netflix, Inc. | 3.4% |
|
| |
|
|
| Net Cash | 0.6% | | Tekelec, Inc. | 3.1% |
|
| |
|
|
| * Based on percentage of net assets as of December 31, 2004. | | ** Top 10 stock holdings total 51.5% of net assets. These holdings are current as of December 31, 2004, and may not be representative of current or future investments. |
| 2004 Annual Report - 9 |
Firsthand Technology Leaders Fund
Performance and Portfolio Discussion
How did the Fund perform in 2004?
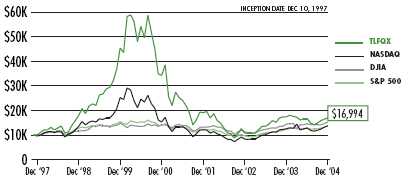
In 2004, Firsthand Technology Leaders Fund (TLFQX) posted a 2.79% loss, versus a 9.15% gain for the Nasdaq Composite Index and a 4.11% gain for the Lipper Science and Technology Fund Index. For the six months ended December 31, 2004, Firsthand Technology Leaders Fund rose 1.64% as compared to 6.56% and 3.57% gains for the Nasdaq and the Lipper peer group benchmarks, respectively.
Which industries had the greatest impact on the Fund's performance?
Firsthand Technology Leaders Fund underperformed its benchmarks in 2004, as the portfolio's exposure to the software industry was not enough to offset the poor results contributed by the Fund's semiconductor and networking positions.
Which individual holdings were the largest contributors to the Fund's performance?
For the period, the Fund's top contributor was wireless communications firm QUALCOMM (QCOM). QUALCOMM, which licenses its Code Division Multiple Access (CDMA) wireless technology and makes chips for cell phones, benefitted from record sales of cell phones in 2004 as consumers rapidly replaced older phones with new ones equipped with color screens and digital cameras. In the Internet segment, shares of eBay (EBAY) rose 80% in 2004 as business remained strong for the online auctioneer. During the year, the eBay franchise continued to grow as the company acquired several smaller firms in a bid to expand its international presence.
Among our software holdings, Adobe Systems (ADBE) enjoyed another solid year. The software giant continued to set the standard in both the professional and consumer markets with its Acrobat and Illustrator applications that enable users to create, publish, and print digital content. Growth in digital camera sales also helped promote sales of photo imaging programs like Adobe Photoshop. Also boosting Fund performance in 2004 were holdings in anti-virus software giant Symantec (SYMC) and Business Objects (BOBJ), a provider of business intelligence software that the Fund began buying in August.
Which holdings were the greatest detractors from the Fund's performance?
Technology bellwethers Cisco Systems (CSCO) and Intel (INTC) each experienced reversals of fortune in 2004. Increased competition from rival Juniper Networks (JNPR) had investors concerned that Cisco was struggling to maintain its stronghold on the networking market. Cisco is the dominant supplier of routers, switches, and software that enable computer networks to communicate over the Internet. However, a price war between the two companies put pressure on Cisco's market share in its core router business and ended up costing the company two key customers-America Online and China Telecom-in 2004.
In the case of Intel, the company suffered several uncharacteristic setbacks in 2004, including execution missteps and product delays, that contributed to the company's weak showing. Rising inventories also hurt the company by forcing it to take large inventory reserves and accept lower prices, both of which put pressure on profits. Similar inventory problems befell other semiconductor companies including flash memory provider SanDisk (SNDK), chipmaker Texas Instruments (TXN), and Altera (ALTR) and Xilinx (XLNX), makers of programmable logic devices.
| 2004 Annual Report - 10 |
Fund Performance and Holding Information (as of December 31, 2004)
Firsthand Technology Leaders Fund vs. Market Indices
| | TLFQX | | NASDAQ | | DJIA | | S&P 500 |
| Since Inception (12/10/97) | 7.80% | | 4.63% | | 6.20% | | 4.66% |
| 5-Year | -17.81% | | -11.42% | | 0.68% | | -2.30% |
| 3-Year | -3.88% | | 4.20% | | 4.70% | | 3.58% |
| 1-Year | -2.79% | | 9.15% | | 5.31% | | 10.88% |
| Q4 '04 Total Return (not annualized) | 13.87% | | 14.87% | | 7.59% | | 9.23% |
Growth of a Hypothetical $10,000 Investment
| Holdings by Industry* | | Top 10 Holdings** |
| | % of Net Assets | | | % of Net Assets |
| Software | 33.6% | | VERITAS Software Corp. | 6.0% |
|
| |
|
|
| Semiconductors | 27.8% | | SanDisk Corp. | 5.8% |
|
| |
|
|
| Internet | 7.7% | | Business Objects SA - ADR | 5.0% |
|
| |
|
|
| Semiconductor Equipment | 7.0% | | Cisco Systems, Inc. | 4.9% |
|
| |
|
|
| Communications Equipment | 5.3% | | Amdocs Ltd. | 4.7% |
|
| |
|
|
| Networking | 4.9% | | QUALCOMM, Inc. | 4.7% |
|
| |
|
|
| Media | 4.3% | | Mercury Interactive Corp. | 4.6% |
|
| |
|
|
| Peripherals | 3.3% | | Adobe Systems, Inc. | 4.4% |
|
| |
|
|
| Other Electronics | 2.9% | | Texas Instruments, Inc. | 4.4% |
|
| |
|
|
| Photonics | 2.8% | | Taiwan Semiconductor | |
|
| | | |
| Net Cash | 0.4% | | Manufacturing Co. - ADR | 4.3% |
|
| |
|
|
| * Based on percentage of net assets as of December 31, 2004. | | ** Top 10 stock holdings total 48.8% of net assets. These holdings are current as of December 31, 2004, and may not be representative of current or future investments. |
| 2004 Annual Report - 11 |
Firsthand Technology Innovators Fund
Performance and Portfolio Discussion
How did the Fund perform in 2004?
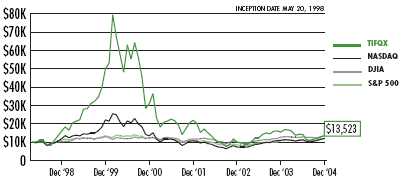
In 2004, Firsthand Technology Innovators Fund (TIFQX) posted a 12.80% loss, versus a 9.15% gain for the Nasdaq Composite Index and a 4.11% gain for the Lipper Science and Technology Fund Index. For the six months ended December 31, 2004, Firsthand Technology Innovators Fund declined 5.00% as compared to 6.56% and 3.57% gains for the Nasdaq and the Lipper peer group benchmarks, respectively.
Which industries had the greatest impact on the Fund's performance?
The Fund underperformed its benchmarks by a substantial margin primarily due to its sizable exposure to the semiconductor industry. Firsthand Technology Innovators Fund has traditionally held a large percentage of its assets in semiconductor stocks because semiconductors are the cornerstone of the electronics industry, integral to nearly every electronic device today. While most of our semiconductor holdings were a drag on Fund performance, there were a few standouts in the chip industry that managed to buck the trend.
Which individual holdings were the largest contributors to the Fund's performance?
The buzz about downloading music got louder in 2004 and Napster (NAPS) was one of the beneficiaries of this growing trend. Napster offers a subscription service that allows users to either listen to or download music over the Internet. Shares of Napster rallied toward the end of the year after the company chose to sell its software division to focus solely on its online music business.
Early in the year we realized a nice gain in shares of memory chip designer Monolithic System Technology (MOSY), after Synopsys (SNPS) announced its intention to acquire the company at a hefty premium. Closing our position in Monolithic turned out to be the right move as Synopsys subsequently walked away from the proposed deal two months later, sending Monolithic's stock price down. Other portfolio holdings that positively contributed to Fund performance included electronic design automation software maker PDF Solutions (PDFS), embedded microprocessor designer MIPS Technologies (MIPS), and Witness Systems (WITS), a provider of customer and workforce management software for call centers.
Which holdings were the greatest detractors from the Fund's performance?
The Fund's biggest money-loser during the period was flash memory supplier Lexar Media (LEXR). Removable flash memory cards have rapidly become the primary form of portable storage for various electronic devices, including digital cameras, PDAs, and MP3 players. While demand for flash memory remains strong, an industry-wide oversupply situation for flash memory in 2004 led to a sharp decline in average selling prices, which hurt Lexar's earnings and revenue growth.
The disk-drive industry also experienced similar problems with high inventory levels that resulted in the top three disk-drive manufacturers engaging in a brutal price war to clear out excess inventory. This not only negatively impacted the major drive manufacturers but also smaller component suppliers, including Intevac (IVAC). Other disappointing stocks included microdisplay manufacturer Kopin (KOPN), camera-chip maker OmniVision Technologies (OVTI), and flat-panel component suppliers Applied Films (AFCO) and Universal Display (PANL).
| 2004 Annual Report - 12 |
Fund Performance and Holding Information (as of December 31, 2004)
Firsthand Technology Innovators Fund vs. Market Indices
| | TIFQX | | NASDAQ | | DJIA | | S&P 500 |
| Since Inception (5/20/98) | 4.67% | | 2.88% | | 4.63% | | 2.85% |
| 5-Year | -23.01% | | -11.42% | | 0.68% | | -2.30% |
| 3-Year | -14.98% | | 4.20% | | 4.70% | | 3.58% |
| 1-Year | -12.80% | | 9.15% | | 5.31% | | 10.88% |
| Q4 '04 Total Return (not annualized) | 14.94% | | 14.87% | | 7.59% | | 9.23% |
Growth of a Hypothetical $10,000 Investment
| Holdings by Industry* | | Top 10 Holdings** |
| | % of Net Assets | | | % of Net Assets |
| Semiconductors | 28.0% | | PDF Solutions, Inc. | 9.2% |
|
| |
|
|
| Communications Equipment | 13.4% | | Napster, Inc. | 5.9% |
|
| |
|
|
| Other Electronics | 10.1% | | Avici Systems, Inc. | 4.7% |
|
| |
|
|
| Electronic Design Automation | 9.1% | | OmniVision Technologies, Inc. | 4.5% |
|
| |
|
|
| Photonics | 8.1% | | Power Integrations, Inc. | 4.3% |
|
| |
|
|
| Software | 8.0% | | Aeroflex, Inc. | 4.2% |
|
| |
|
|
| Intellectual Property | 6.9% | | Lexar Media, Inc. | 4.0% |
|
| |
|
|
| Services | 5.1% | | Vyyo, Inc. | 3.8% |
|
| |
|
|
| Networking | 3.2% | | Kopin Corp. | 3.5% |
|
| |
|
|
| Computer Storage Devices | 2.2% | | Applied Films Corp. | 3.4% |
|
| |
|
|
| Other | 1.2% | | |
|
| | | |
| Net Cash | 4.7% | | | |
|
| | | |
| * Based on percentage of net assets as of December 31, 2004. | | **Top 10 stock holdings total 47.5% of net assets. These holdings are current as of December 31, 2004, and may not be representative of current or future investments. |
| 2004 Annual Report - 13 |
Firsthand e-Commerce Fund
Performance and Portfolio Discussion
How did the Fund perform in 2004?
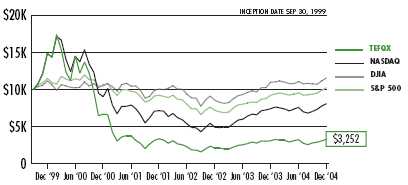
In 2004, Firsthand e-Commerce Fund (TEFQX) posted a 5.56% gain, versus a 9.15% gain for the Nasdaq Composite Index and a 4.11% gain for the Lipper Science and Technology Fund Index. For the six months ended December 31, 2004, Firsthand e-Commerce Fund rose 0.62% as compared to 6.56% and 3.57% gains for the Nasdaq and the Lipper peer group benchmarks, respectively.
Which industries had the greatest impact on the Fund's performance?
The Fund's exposure to the software industry and Internet stocks helped the Fund finish 2004 in positive territory, ahead of its peer-group benchmark. We continue to believe that e-commerce is still in its infancy, accounting for just two percent of all U.S. retail sales, according to the U.S. Census Bureau. We believe this limited penetration underscores the vast growth potential for online commerce.
Which individual holdings were the largest contributors to the Fund's performance?
Employee Internet management software vendor Websense (WBSN) was the Fund's best performer in 2004. The company's software enables employers to monitor Internet usage by employees and to block access to inappropriate websites, thereby limiting the potential for misuse of the Internet. Despite a sluggish corporate IT spending environment, Websense's business has thrived because the company offers its customers an affordable, easy-to-implement solution to Internet management in the workplace. Other software stocks that helped Fund performance included anti-virus software maker Symantec (SYMC), online music provider Napster (NAPS), and Macromedia (MACR), a provider of Internet software development tools and applications.
With more households shifting to faster broadband connections and consumers becoming increasingly comfortable with shopping online, Internet stocks generally enjoyed another good year. Solid growth in online sales led to strong gains for many of the Fund's Internet holdings, including eBay (EBAY) and Yahoo! (YHOO). Yahoo! also benefitted from surging demand in online advertising as major brand advertisers allocated more of their budgets to the Web.
Which holdings were the greatest detractors from the Fund's performance?
One of the Fund's larger losses was in online DVD rental company Netflix (NFLX). Despite having more than 2.5 million subscribers, Netflix's business model has very few barriers to entry and has attracted several new competitors. With Wal-Mart, Blockbuster, and possibly Amazon.com entering the fray, Netflix lowered its monthly fee to attract new customers and retain current ones. However, investors were not happy about the potential revenue loss with the lower subscriber fee and, as a result, shares of Netflix plummeted more than 40% on the day of the announcement.
Chordiant Software (CHRD) was also a significant drag on Fund performance in 2004. Chordiant makes software that enables various departments within a company to share information and collaborate on projects. Shares of Chordiant dropped after the company reported disappointing license revenue growth in Q3. License revenue is often seen as a key measure of business strength at software companies. Other portfolio holdings that disappointed during 2004 included data storage management firm VERITAS Software (VRTS), BEA Systems (BEAS), and e-commerce conglomerate IAC/InterActiveCorp (IACI), parent company of popular Internet sites such as Expedia, Ticketmaster, and Hotwire.
| 2004 Annual Report - 14 |
Fund Performance and Holding Information (as of December 31, 2004)
Firsthand e-Commerce Fund vs. Market Indices
| | TEFQX | | NASDAQ | | DJIA | | S&P 500 |
| Since Inception (9/30/99) | -19.25% | | -3.99% | | 2.77% | | 0.43% |
| 5-Year | -26.20% | | -11.42% | | 0.68% | | -2.30% |
| 3-Year | -1.01% | | 4.20% | | 4.70% | | 3.58% |
| 1-Year | 5.56% | | 9.15% | | 5.31% | | 10.88% |
| Q4 '04 Total Return (not annualized) | 16.19% | | 14.87% | | 7.59% | | 9.23% |
Growth of a Hypothetical $10,000 Investment
Holdings by Industry* | | Top 10 Holdings** |
| | % of Net Assets | | | % of Net Assets |
| Software | 39.0% | | Websense, Inc. | 11.0% |
|
| |
|
|
| Internet | 30.3% | | Yahoo! Inc. | 6.8% |
|
| |
|
|
| Services | 20.4% | | Macromedia, Inc. | 5.5% |
|
| |
|
|
| Financial | 2.9% | | CNET Networks, Inc. | 5.2% |
|
| |
|
|
| Other | 1.6% | | WebEx Communications, Inc. | 4.9% |
|
| |
|
|
| Net Cash | 5.8% | | IAC/InterActiveCorp | 4.3% |
|
| |
|
|
| | | | Napster, Inc. | 4.3% |
| | | |
|
|
| | | | eBay, Inc. | 3.7% |
| | | |
|
|
| | | | Netflix, Inc. | 3.6% |
| | | |
|
|
| | | | Monster Worldwide, Inc. | 3.6% |
| | | |
|
|
| * Based on percentage of net assets as of December 31, 2004. | | ** Top 10 stock holdings total 52.9% of net assets. These holdings are current as of December 31, 2004, and may not be representative of current or future investments. |
| 2004 Annual Report - 15 |
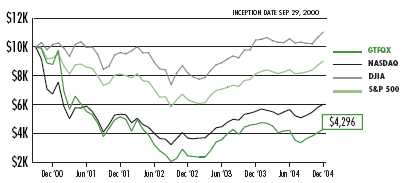
Firsthand Global Technology Fund
Performance and Portfolio Discussion
How did the Fund perform in 2004?
In 2004, Firsthand Global Technology Fund (GTFQX) posted a 7.16% loss, versus a 9.15% gain for the Nasdaq Composite Index and a 4.11% gain for the Lipper Science and Technology Fund Index. For the six months ended December 31, 2004, Firsthand Global Technology Fund rose 1.90% as compared to 6.56% and 3.57% gains for the Nasdaq and the Lipper peer group benchmarks, respectively.
Which industries had the greatest impact on the Fund's performance?
The Fund underperformed its benchmarks during 2004 due to its weightings in the semiconductor and telecommunications industries. Impressive year-over-year growth in worldwide semiconductor sales reflected continued economic growth, especially in the U.S. and China. However, despite such strong sales, semiconductor stocks slipped as rising inventories squeezed profit margins and negatively impacted chipmakers' earnings.
Which holdings were the largest contributors to the Fund's performance?
Israel-based Alvarion (ALVR) saw business improve after an increase in demand for the company's wireless broadband equipment, such as base stations that are used to make voice and data transmission possible over wireless networks. Alvarion is also enjoying modest success in rolling out WiMax networks to rural and urban areas. WiMax is a technology that offers wireless data access rates of up to 75 megabits per second-compared with 11 megabits per second for a typical Wi-Fi network-over larger distances.
Standouts in the software industry included telecom software provider Comverse Technology (CMVT), customer management and billing software supplier Amdocs (DOX), and Cognos (COGN), a provider of business intelligence (BI) software. Business intelligence is a broad category of software applications and technologies for gathering, storing, and analyzing data to help corporations make better business decisions. Cognos' prospects have brightened as demand for BI software has increased over the last few years.
Which holdings were the greatest detractors from the Fund's performance?
After enjoying a robust year in 2003, UTStarcom (UTSI) reversed course and ended 2004 as the Fund's worst performer. UTStarcom provides telecom equipment for wireline and wireless networks in China and other emerging markets. Most of UTStarcom's troubles started in late July, when the company missed second-quarter estimates due to supply-chain problems that crimped the company's profit margins.
Our positions in Amkor Technology (AMKR), ASML Holding (ASML), and STMicroelectronics (STM) all declined as the outlook for continued robust growth in 2005 dimmed. Other semiconductor positions that hurt Fund performance included camera-chip maker OmniVision Technologies (OVTI), microdisplay manufacturer Kopin (KOPN), and semiconductor manufacturer Zoran (ZRAN). The Fund also realized a sizable loss after closing its position in disk-drive manufacturer Maxtor (MXO).
| 2004 Annual Report - 16 |
Fund Performance and Holding Information (as of December 31, 2004)
Firsthand Global Technology Fund vs. Market Indices
| | GTFQX | | NASDAQ | | DJIA | | S&P 500 |
| Since Inception (9/29/00) | -18.00% | | -11.21% | | 2.35% | | -2.37% |
| 3-Year | -5.92% | | 4.20% | | 4.70% | | 3.58% |
| 1-Year | -7.16% | | 9.15% | | 5.31% | | 10.88% |
| Q4 '04 Total Return (not annualized) | 17.91% | | 14.87% | | 7.59% | | 9.23% |
Growth of a Hypothetical $10,000 Investment
| Holdings by Industry* | | Top 10 Holdings** |
| | % of Net Assets | | | % of Net Assets |
| Communications Equipment | 21.2% | | UTStarcom, Inc. | 8.0% |
|
| |
|
|
| Software | 19.9% | | Alvarion Ltd. | 6.1% |
|
| |
|
|
| Semiconductors | 18.4% | | Samsung Electronics Co., | |
|
| | | |
| Other Electronics | 15.6% | | Ltd. - GDR | 5.9% |
|
| |
|
|
| Services | 6.9% | | Ceragon Networks Ltd. | 5.5% |
|
| |
|
|
| Semiconductor Equipment | 6.8% | | Fujitsu Ltd. | 4.5% |
|
| |
|
|
| Electronic Design Automation | 4.4% | | PDF Solutions, Inc. | 4.4% |
|
| |
|
|
| Peripherals | 3.6% | | Comverse Technology, Inc. | 4.1% |
|
| |
|
|
| Internet | 1.6% | | Amdocs Ltd. | 4.0% |
|
| |
|
|
| Other | 0.4% | | TDK Corp. | 4.0% |
|
| |
|
|
| Net Cash | 1.2% | | Western Digital Corp. | 3.6% |
|
| |
|
|
| * Based on percentage of net assets as of December 31, 2004. | | ** Top 10 stock holdings total 50.1% of net assets. These holdings are current as of December 31, 2004, and may not be representative of current or future investments. |
| 2004 Annual Report - 17 |
REPORT OF INDEPENDENT REGISTERED PUBLIC ACCOUNTING FIRMTo the Shareholders and Board of Trustees
Firsthand Funds
San Jose, California
We have audited the accompanying statements of assets and liabilities of Firsthand Funds comprising, respectively, Firsthand Technology Value Fund, Firsthand Technology Leaders Fund, Firsthand Technology Innovators Fund, Firsthand e-Commerce Fund, and Firsthand Global Technology Fund, including the portfolios of investments as of December 31, 2004, and the related statements of operations for the year then ended, changes in net assets for each of the two years in the period then ended, and the financial highlights for the periods indicated thereon. These financial statements and financial highlights are the responsibility of the Funds' management. Our responsibility is to express an opinion on these financial statements and financial highlights based on our audits.
We conducted our audits in accordance with standards of the Public Company Accounting Oversight Board (United States). Those standards require that we plan and perform the audits to obtain reasonable assurance about whether the financial statements and financial highlights are free of material misstatement. An audit includes examining, on a test basis, evidence supporting the amounts and disclosures in the financial statements. Our procedures included confirmation of securities owned as of December 31, 2004, by correspondence with the custodian and brokers. An audit also includes assessing the accounting principles used and significant estimates made by management, as well as evaluating the overall financial statement presentation. We believe that our audits provide a reasonable basis for our opinion.
In our opinion, the financial statements and financial highlights referred to above present fairly, in all material respects, the financial position of Firsthand Funds as of December 31, 2004, the results of their operations, the changes in their net assets, and the financial highlights for the periods referred to above, in conformity with accounting principles generally accepted in the United States of America.
TAIT, WELLER & BAKER
Philadelphia, Pennsylvania
January 21, 2005
| 2004 Annual Report - 18 |
Firsthand Technology Value Fund
PORTFOLIO OF INVESTMENTS
December 31, 2004
| | | | | | MARKET |
| | | | PERCENT | SHARES | VALUE |
| COMMON STOCK | 99.2% | | | $ 582,523,492 |
| | (Cost $952,866,377) | | | | |
| | | | | | | | |
| | ADVANCED MATERIALS | 0.9% | | | 5,000,000 |
| | | | | |
|
| | * | | Universal Chemical Technologies, | | | | |
| | | | Inc. - B (2) | | 500,000 | | 5,000,000 |
| | | | | | | | |
| | COMMUNICATIONS | 0.6% | | | 3,744,862 |
| | | | | |
|
| | * | | ViaSat, Inc. | | 154,300 | | 3,744,862 |
| | | | | | | | |
| | COMMUNICATIONS EQUIPMENT | 15.4% | | | 90,351,612 |
| | | | | |
|
| | * | | Anaren, Inc. (1) | | 1,111,900 | | 14,410,224 |
| | | | Harris Corp. | | 50,000 | | 3,089,500 |
| | | | Motorola, Inc. | | 690,200 | | 11,871,440 |
| | * | | REMEC, Inc. | | 240,000 | | 1,730,400 |
| | | | SpectraLink Corp. | | 180,000 | | 2,552,400 |
| | * | | Stratex Networks, Inc. | | 4,687,036 | | 10,592,701 |
| | * | | Tekelec, Inc. | | 875,800 | | 17,901,352 |
| | * | | UTStarcom, Inc. | | 1,273,300 | | 28,203,595 |
| | | | | | | | |
| | DEFENSE & AEROSPACE | 5.7% | | | 33,681,574 |
| | | | | |
|
| | * | | FLIR Systems, Inc. | | 470,600 | | 30,019,574 |
| | | | L-3 Communications Holdings, Inc. | | 50,000 | | 3,662,000 |
| | | | | | | | |
| | INTELLECTUAL PROPERTY | 0.9% | | | 5,072,515 |
| | | | | |
|
| | * | | Silicon Genesis Corp. - 1-D (1) (2) | | 850,830 | | 749,751 |
| | * | | Silicon Genesis Corp. - 1-E (1) (2) | | 4,071,226 | | 4,315,500 |
| | * | | Silicon Genesis Corp. - | | | | |
| | | | Common Stock (1) (2) | | 726,424 | | 7,264 |
| | | | | | | | |
| | INTERNET | 4.4% | | | 25,695,740 |
| | | | | |
|
| | * | | Akamai Technologies, Inc. | | 458,000 | | 5,967,740 |
| | * | | Netflix, Inc. | | 1,600,000 | | 19,728,000 |
| | | | | | | | |
| | NETWORKING | 1.0% | | | 5,983,088 |
| | | | | |
|
| | * | | Caspian Networks, Inc. - | | | | |
| | | | Common Stock (2) | | 33,781 | | 0 |
| | * | | Cisco Systems, Inc. | | 200,000 | | 3,860,000 |
| | * | | IP Unity, Inc. - C (2) | | 1,104,265 | | 1,792,863 |
| | * | | IP Unity, Inc. - E (2) | | 193,042 | | 313,307 |
| | * | | Polaris Networks, Inc. - A (2) | | 297,848 | | 16,918 |
| | | | | | | | |
| | OTHER ELECTRONICS | 0.4% | | | 2,586,350 |
| | | | | | |
|
| | * | | NanoMuscle, Inc. - A-1 (2) | | 1,250,000 | | 0 |
| | | | | |
*Non-income producing
see accompanying notes to financial statements
| 2004 Annual Report - 19 |
Firsthand Technology Value Fund
PORTFOLIO OF INVESTMENTS (continued)
December 31, 2004
| | | | | | MARKET |
| | | PERCENT | SHARES | | VALUE |
* | NanoMuscle, Inc. - Common Stock (2) | | 1,250,000 | | $ | | 0 |
| | PerkinElmer, Inc. | | 115,000 | | | 2,586,350 |
| | | | | | | | |
| PERIPHERALS | 4.0% | | | | 23,319,200 |
| | | | | |
|
| * | Electronics For Imaging, Inc. | | 200,000 | | | 3,482,000 |
| * | Western Digital Corp. | | 1,830,000 | | | 19,837,200 |
| | | | | | | | |
| PHOTONICS | 4.5% | | | | 26,427,552 |
| | | | | |
|
| * | Celox Networks, Inc. - A-1 (2) | | 1,000,000 | | | | 0 |
| * | Celox Networks, Inc. - Common | | | | | | |
| | Stock (2) | | 138,121 | | | | 0 |
| * | Corning, Inc. | | 2,150,000 | | | 25,305,500 |
| * | Luminous Networks, Inc. - D (2) | | 868,710 | | | 937,642 |
| * | Luminous Networks, Inc. - E (2) | | 434,724 | | | 184,410 |
| * | Maple Optical Systems, Inc. - | | | | | | |
| | A-1 (1) (2) | | 10,352,054 | | | | 0 |
| | | | | | | | |
| SEMICONDUCTOR EQUIPMENT | 0.2% | | | | 1,018,000 |
| | | | | |
|
| * | Asyst Technologies, Inc. | | 200,000 | | | 1,018,000 |
| | | | | | | | |
| SEMICONDUCTORS | 35.4% | | | | 208,049,947 |
| | | | | |
|
| * | Aeroflex, Inc. | | 1,250,600 | | | 15,157,272 |
| * | Applied Micro Circuits Corp. | | 1,499,900 | | | 6,314,579 |
| * | AuthenTec, Inc. - C (2) | | 1,472,495 | | | 1,179,881 |
| * | AuthenTec, Inc. - D (2) | | 290,958 | | | 232,766 |
| | Celeritek, Inc. | | 232,200 | | | 355,266 |
| * | Clarisay, Inc. - B (1) (2) | | 2,605,306 | | | | 0 |
| * | Clarisay, Inc. - C (1) (2) | | 7,194,244 | | | | 0 |
| * | Freescale Semiconductor, Inc. - B | | 76,208 | | | 1,399,179 |
| * | Global Locate, Inc. - A (1) (2) | | 6,030,896 | | | 7,794,209 |
| * | Global Locate, Inc. - C (1) (2) | | 1,111,111 | | | 1,000,000 |
| * | Global Locate, Inc. - D (1) (2) | | 555,555 | | | 500,000 |
| * | Kopin Corp. | | 299,100 | | | 1,157,517 |
| * | Lexar Media, Inc. | | 1,899,200 | | | 14,889,728 |
| * | Marvell Technology Group Ltd. | | 500,000 | | | 17,735,000 |
| * | PMC-Sierra, Inc. | | 1,155,700 | | | 13,001,625 |
| * | SanDisk Corp. | | 2,437,400 | | | 60,861,878 |
| * | Skyworks Solutions, Inc. | | 898,300 | | | 8,470,969 |
| | STMicroelectronics N.V. - ADR | | 783,400 | | | 15,135,288 |
| | Texas Instruments, Inc. | | 690,000 | | | 16,987,800 |
| * | TranSwitch Corp. | | 3,593,000 | | | 5,533,220 |
| * | TriQuint Semiconductor, Inc. | | 2,332,400 | | | 10,379,180 |
| * | Zoran Corp. | | 860,500 | | | 9,964,590 |
* Non-income producing
see accompanying notes to financial statements
| 2004 Annual Report - 20 |
Firsthand Technology Value Fund
PORTFOLIO OF INVESTMENTS (continued)
December 31, 2004
| | | | | | MARKET |
| | | | PERCENT | SHARES | VALUE |
| | SERVICES | 1.8% | | | $ 10,662,810 |
| | * | Anteon International Corp. | | 120,900 | | 5,060,874 |
| | * | Intrado, Inc. | | 309,100 | | 3,740,110 |
| | * | TeleCommunication Systems, Inc. - A | | 557,600 | | 1,861,826 |
| | | | | | | |
| | SOFTWARE | 24.0% | | | 140,930,242 |
| | | | | |
|
| | * | Comverse Technology, Inc. | | 1,670,900 | | 40,853,505 |
| | * | Concord Communications, Inc. (1) | | 1,089,300 | | 12,069,444 |
| | * | Napster, Inc. (1) (3) | | 1,750,000 | | 16,450,000 |
| | | SAP AG - ADR | | 100,000 | | 4,421,000 |
| | * | VERITAS Software Corp. | | 312,900 | | 8,933,295 |
| | * | Websense, Inc. | | 446,900 | | 22,666,768 |
| | * | Wind River Systems, Inc. | | 2,622,600 | | 35,536,230 |
| | | | | | | |
| WARRANTS | 0.2% | | | 929,009 |
| | | | |
|
| | (Cost $192) | | | | |
| | | | | | | |
| | ADVANCED MATERIALS | 0.0% | | | 200 |
| | | | | |
|
| | * | Universal Chemical Technologies, | | | | |
| | | Inc. - B Warrants (2) | | 200,000 | | 200 |
| | | | | | | |
| | COMMUNICATIONS EQUIPMENT | 0.1% | | | 470,734 |
| | | | | |
|
| | * | Lucent Technologies, Inc. - Warrants | | 297,933 | | 470,734 |
| | | | | | | |
| | INTELLECTUAL PROPERTY | 0.1% | | | 334,436 |
| | | | | |
|
| | * | Silicon Genesis Corp. - 1-E | | | | |
| | | Warrants (1) (2) | | 1,257,859 | | 334,339 |
| | * | Silicon Genesis Corp. - Common | | | | |
| | | Stock Warrants (1) (2) | | 59,147 | | 59 |
| | * | Silicon Genesis Corp. - Common | | | | |
| | | Stock Warrants (1) (2) | | 37,982 | | 38 |
| | | | | | | |
| | NETWORKING | 0.0% | | | 145 |
| | | | | |
|
| | * | IP Unity, Inc. - E Warrants (2) | | 69,496 | | 69 |
| | * | Polaris Networks, Inc. - Convertible | | | | |
| | | Warrants (2) | | 75,712 | | 76 |
| | | | | | | |
| | OTHER ELECTRONICS | 0.0% | | | 0 |
| | | | | | |
|
| | * | NanoMuscle, Inc. - B-1 Warrants (2) | | 306,757 | | 0 |
| | | | | | | |
| | PHOTONICS | 0.0% | | | 0 |
| | | | | |
|
| | * | Celox Networks, Inc. - A-1 | | | | |
| | | Warrants (2) | | 500,000 | | 0 |
* Non-income producing
see accompanying notes to financial statements
| 2004 Annual Report - 21 |
Firsthand Technology Value Fund
PORTFOLIO OF INVESTMENTS (continued)
December 31, 2004
| | | SHARES/ | | | |
| | | | | PRINCIPAL | | | | MARKET |
| | | | PERCENT | AMOUNT | | | | VALUE |
| | * | Luminous Networks, Inc. - D | | | | | | |
| | | Warrants (2) | | 144,785 | | $ | | 0 |
| | | | | | | | | |
| SEMICONDUCTORS | 0.0% | | | | 123,494 |
| | | | |
|
| | * | AuthenTec, Inc. - C Warrants (2) | | 392,665 | | | 117,835 |
| | * | Clarisay, Inc. Warrants | | | | | | |
| | | 06/03/2005- | | | | | | |
| | | 11/10/2005 (1) (2) | | 2,350,000 | | | | 0 |
| | * | Global Locate, Inc. - Board | | | | | | |
| | | Warrants (1) (2) | | 18,750 | | | | 94 |
| | * | Global Locate, Inc. - Board | | | | | | |
| | | Warrants (1) (2) | | 75,000 | | | | 375 |
| | * | Global Locate, Inc. - Board | | | | | | |
| | | Warrants (1) (2) | | 75,000 | | | | 375 |
| | * | Global Locate, Inc. - C | | | | | | |
| | | Warrants (1) (2) | | 370,370 | | | 3,704 |
| | * | Global Locate, Inc. - D | | | | | | |
| | | Warrants (1) (2) | | 111,111 | | | 1,111 |
| | | | | | | | | |
| CONVERTIBLE BONDS | 0.0% | | | | 151,435 |
| (Cost $2,900,074) | | | |
|
| | | | | | | |
| | | | | | | | | |
| NETWORKING | 0.0% | | | | 151,435 |
| | | | |
|
| | | Polaris Networks, Inc. 10.00% (2) | | 100,949 | | | 100,949 |
| | | Polaris Networks, Inc., | | | | | | |
| | | Escrow 0.56% (2) | | 50,486 | | | 50,486 |
| | | | | | | | | |
| OTHER ELECTRONICS | 0.0% | | | | | 0 |
| | | | |
|
| | * | NanoMuscle, Inc. 8.00% | | | | | | |
| | | 02/16/2005 (2) | | 398,639 | | | | 0 |
| | | | | | | | | |
| SEMICONDUCTORS | 0.0% | | | | | 0 |
| | | | |
|
| | * | Clarisay, Inc. 8.00% 06/03/2005- | | | | | | |
| | | 11/10/2005 (1) (2) | | 2,350,000 | | | | 0 |
| | | | | | | | | |
| TOTAL INVESTMENT SECURITIES | 99.4% | | | | 583,603,936 |
| (Cost $955,766,643) | | | | | | |
| | | | | | | | | |
| OTHER ASSETS IN EXCESS OF LIABILITIES | 0.6% | | | | 3,326,005 |
| | | | |
|
| | | | | | | | | |
| NET ASSETS | 100.0% | | | $ | 586,929,941 |
| | | | | | |
|
| * | Non-income producing |
| (1) | Affiliated issuer |
| (2) | Restricted security |
| (3) | Napster, Inc. has the right to put a restriction of public sale on 800,000 shares of the Fund's Napster, |
| | Inc. holding. As of December 31, 2004, there are no restrictions on the Fund's shares of Napster, Inc. |
| ADR | American Depositary Receipts |
see accompanying notes to financial statements
| 2004 Annual Report - 22 |
Firsthand Technology Leaders Fund
PORTFOLIO OF INVESTMENTS
December 31, 2004
| | | | | | | MARKET |
| | | | PERCENT | | SHARES | VALUE |
| COMMON STOCK | 99.4% | | | | $ 113,258,833 |
| | (Cost $114,741,939) | | | | | |
| | | | | | | | | |
| | COMMUNICATIONS EQUIPMENT | 5.1% | | | | 5,760,698 |
| | | | | | |
|
| | | | Nokia Corp. - ADR | | | 29,400 | | 460,698 |
| | | | QUALCOMM, Inc. | | | 125,000 | | 5,300,000 |
| | | | | | | | | |
| | INTERNET | 7.7% | | | | 8,808,010 |
| | | | | | |
|
| | * | | eBay, Inc. | | | 40,000 | | 4,651,200 |
| | * | | IAC/InterActiveCorp | | | 150,500 | | 4,156,810 |
| | | | | | | | | |
| | MEDIA | | 4.3% | | | | 4,888,331 |
| | | | | | | |
|
| | * | | Pixar Animation Studios | | | 57,100 | | 4,888,331 |
| | | | | | | | | |
| | NETWORKING | 4.9% | | | | 5,575,770 |
| | | | | | |
|
| | * | | Cisco Systems, Inc. | | | 288,900 | | 5,575,770 |
| | | | | | | | | |
| | OTHER ELECTRONICS | 2.9% | | | | 3,298,230 |
| | | | | | | |
|
| | * | | Agilent Technologies, Inc. | | | 136,856 | | 3,298,230 |
| | | | | | | | | |
| | PERIPHERALS | 3.3% | | | | 3,772,519 |
| | | | | | |
|
| | * | | EMC Corp. | | | 253,700 | | 3,772,519 |
| | | | | | | | | |
| | PHOTONICS | 2.8% | | | | 3,249,697 |
| | | | | | |
|
| | * | | Corning, Inc. | | | 276,100 | | 3,249,697 |
| | | | | | | | | |
| | SEMICONDUCTOR EQUIPMENT | 7.0% | | | | 8,004,771 |
| | | | | | |
|
| | * | | Applied Materials, Inc. | | | 138,800 | | 2,373,480 |
| | * | | ASML Holding N.V. | | | 130,300 | | 2,073,073 |
| | * | | KLA-Tencor Corp. | | | 44,800 | | 2,086,784 |
| | * | | Teradyne, Inc. | | | 86,200 | | 1,471,434 |
| | | | | | | | | |
| | SEMICONDUCTORS | 27.8% | | | | 31,655,919 |
| | | | | | |
|
| | * | | Altera Corp. | | | 188,000 | | 3,891,600 |
| | | | Intel Corp. | | | 97,300 | | 2,275,847 |
| | | | Samsung Electronics | | | | | |
| | | | Co., Ltd. - GDR (144A) | | | 22,600 | | 4,917,552 |
| | * | | SanDisk Corp. | | | 264,800 | | 6,612,056 |
* Non-income producing
see accompanying notes to financial statements
| 2004 Annual Report - 23 |
Firsthand Technology Leaders Fund
PORTFOLIO OF INVESTMENTS (continued)
December 31, 2004
| | | | | | | MARKET |
| | | PERCENT | | SHARES | | VALUE |
| | Taiwan Semiconductor | | | | | | |
| | Manufacturing Co. - ADR | | | 580,592 | | $ | 4,929,226 |
| | Texas Instruments, Inc. | | | 201,650 | | | 4,964,623 |
| | Xilinx, Inc. | | | 137,100 | | | 4,065,015 |
| | | | | | | | |
| SOFTWARE | 33.6% | | | | | 38,244,888 |
| | | | | |
|
| | Adobe Systems, Inc. | | | 80,500 | | | 5,050,570 |
| * | Amdocs Ltd. | | | 203,600 | | | 5,344,500 |
| * | BEA Systems, Inc. | | | 276,280 | | | 2,447,841 |
| * | Business Objects SA - ADR | | | 225,100 | | | 5,704,034 |
| * | Mercury Interactive Corp. | | | 113,700 | | | 5,179,035 |
| | Microsoft Corp. | | | 78,900 | | | 2,107,419 |
| | SAP AG - ADR | | | 105,300 | | | 4,655,313 |
| * | Symantec Corp. | | | 35,100 | | | 904,176 |
| * | VERITAS Software Corp. | | | 240,000 | | | 6,852,000 |
| | | | | | | | |
| WARRANTS | 0.2% | | | | | 195,109 |
| (Cost $0) | | | | |
|
| | | | | | | |
| | | | | | | | |
| COMMUNICATIONS EQUIPMENT | 0.2% | | | | | 195,109 |
| | | | | |
|
* | Lucent Technologies, Inc. | | | 123,487 | | | 195,109 |
| | | | | | | | |
| TOTAL INVESTMENT SECURITIES | 99.6% | | | | | 113,453,942 |
| (Cost $114,741,939) | | | | | | |
| | | | | | | | |
| OTHER ASSETS IN EXCESS OF LIABILITIES | 0.4% | | | | | 460,907 |
| | | | | |
|
| | | | | | | | |
| NET ASSETS | 100.0% | | | | $ | 113,914,849 |
| | | | | |
|
* Non-income producing
ADR American Depositary Receipts
GDR Global Depositary Receipts
see accompanying notes to financial statements
| 2004 Annual Report - 24 |
Firsthand Technology Innovators Fund
PORTFOLIO OF INVESTMENTS
December 31, 2004
| | | | | | MARKET |
| | | | PERCENT | SHARES | VALUE |
| COMMON STOCK | 94.2% | | | $ 54,751,851 |
| | (Cost $78,644,705) | | | | |
| | | | | | | |
| | COMMUNICATIONS EQUIPMENT | 13.4% | | | 7,775,471 |
| | | | | |
|
| | * | Airspan Networks, Inc. | | 284,000 | | 1,542,120 |
| | * | Finisar Corp. | | 536,500 | | 1,223,220 |
| | * | Powerwave Technologies, Inc. | | 139,400 | | 1,182,112 |
| | * | Proxim Corp. - A | | 21,630 | | 88,467 |
| | | SpectraLink Corp. | | 106,700 | | 1,513,006 |
| | * | Vyyo, Inc. | | 258,600 | | 2,226,546 |
| | | | | | | |
| | COMPUTER STORAGE DEVICES | 2.2% | | | 1,281,800 |
| | | | | |
|
| | * | M-Systems Flash Disk Pioneers Ltd. | | 65,000 | | 1,281,800 |
| | | | | | | |
| | ELECTRONIC DESIGN AUTOMATION | 9.1% | | | 5,319,522 |
| | | | | |
|
| | * | PDF Solutions, Inc. | | 330,200 | | 5,319,522 |
| | | | | | | |
| | INTELLECTUAL PROPERTY | 6.9% | | | 4,003,049 |
| | | | | |
|
| | * | MIPS Technologies, Inc. | | 200,000 | | 1,970,000 |
| | * | Silicon Genesis Corp. - 1-C (1) (2) | | 82,914 | | 300,779 |
| | * | Silicon Genesis Corp. - 1-E (1) (2) | | 1,633,254 | | 1,731,249 |
| | * | Silicon Genesis Corp. - | | | | |
| | | Common Stock (1) (2) | | 102,135 | | 1,021 |
| | | | | | | |
| | NETWORKING | 3.2% | | | 1,854,975 |
| | | | | |
|
| | * | IP Unity, Inc. - C (2) | | 1,117,957 | | 1,815,093 |
| | * | Polaris Networks, Inc. - A (2) | | 702,152 | | 39,882 |
| | | | | | | |
| | OTHER ELECTRONICS | 10.1% | | | 5,870,440 |
| | | | | |
|
| | * | Applied Films Corp. | | 92,800 | | 2,000,768 |
| | * | Intevac, Inc. | | 263,700 | | 1,993,572 |
| | * | LeapFrog Enterprises, Inc. | | 40,000 | | 544,000 |
| | * | Microvision, Inc. | | 190,300 | | 1,332,100 |
| | * | NanoMuscle, Inc. - A-1 (2) | | 1,250,000 | | 0 |
| | * | NanoMuscle, Inc. - Common Stock (2) | | 1,250,000 | | 0 |
| | | | | | | |
| | PERIPHERALS | 1.2% | | | 720,000 |
| | | | | |
|
| | * | Universal Display Corp. | | 80,000 | | 720,000 |
* Non-income producing
see accompanying notes to financial statements
| 2004 Annual Report - 25 |
Firsthand Technology Innovators Fund
PORTFOLIO OF INVESTMENTS (continued)
December 31, 2004
| | | | | | MARKET |
| | | | PERCENT | SHARES | VALUE |
| | PHOTONICS | 8.1% | | | $ 4,681,791 |
| | * | Avici Systems, Inc. | | 300,000 | | 2,715,000 |
| | * | Luminous Networks, Inc. - D (2) | | 1,522,719 | | 1,643,547 |
| | * | Luminous Networks, Inc. - E (2) | | 762,008 | | 323,244 |
| | * | Maple Optical Systems, Inc. - | | | | |
| | | A-1 (1) (2) | | 9,647,945 | | 0 |
| | | | | | | |
| | SEMICONDUCTORS | 27.9% | | | 16,199,118 |
| | | | | |
|
| | * | Aeroflex, Inc. | | 202,700 | | 2,456,723 |
| | * | Agere Systems, Inc. - A | | 500,000 | | 685,000 |
| | * | AuthenTec, Inc. - C (2) | | 736,248 | | 589,941 |
| | * | Clarisay, Inc. - B (1) (2) | | 2,861,519 | | 0 |
| | * | Kopin Corp. | | 518,500 | | 2,006,595 |
| | * | Lexar Media, Inc. | | 296,000 | | 2,320,640 |
| | * | O2Micro International Ltd. | | 35,000 | | 400,400 |
| | * | OmniVision Technologies, Inc. | | 141,000 | | 2,587,350 |
| | * | Power Integrations, Inc. | | 127,300 | | 2,517,994 |
| | * | Silicon Optix, Inc. - B (2) | | 1,111,111 | | 1,000,000 |
| | * | Volterra Semiconductor Corp. | | 30,000 | | 664,650 |
| | * | Zoran Corp. | | 83,750 | | 969,825 |
| | | | | | | |
| | SERVICES | 4.1% | | | 2,392,549 |
| | | | | |
|
| | * | Innovion Corp. - C (1) (2) | | 1,500,000 | | 1,489,350 |
| | * | TeleCommunication Systems, Inc. - A | | 270,500 | | 903,199 |
| | | | | | | |
| | SOFTWARE | 8.0% | | | 4,653,136 |
| | | | | |
|
| | * | Napster, Inc. | | 366,700 | | 3,446,980 |
| | * | Verint Systems, Inc. | | 33,200 | | 1,206,156 |
| | | | | | | |
| WARRANTS | 0.1% | | | 60,464 |
| (Cost $0) | | | |
|
| | | | | | |
| | | | | | | |
| | INTELLECTUAL PROPERTY | 0.0% | | | 944 |
| | | | | |
|
| | * | Silicon Genesis Corp. - 1-E (1) (2) | | 94,339 | | 944 |
| | | | | | | |
| | PHOTONICS | 0.0% | | | 0 |
| | | | | |
|
| | * | Luminous Networks, Inc. - D | | | | |
| | | Warrants (2) | | 253,787 | | 0 |
| | | | | | | |
| | SEMICONDUCTORS | 0.1% | | | 58,917 |
| | | | | |
|
| | * | AuthenTec, Inc. - C Warrants (2) | | 196,333 | | 58,917 |
* Non-income producing
see accompanying notes to financial statements
| 2004 Annual Report - 26 |
Firsthand Technology Innovators Fund
PORTFOLIO OF INVESTMENTS (continued)
December 31, 2004
| | | SHARES/ | |
| | | | PRINCIPAL | | MARKET |
| | | PERCENT | AMOUNT | | VALUE |
* | Clarisay, Inc. Warrants | | | | |
| | 05/08/2005-12/31/2010 (1) (2) | | 1,259,290 | | $ 0 |
| | | | | | |
| SERVICES | 0.0% | | | 603 |
| | | | |
|
* | Innovion Corp. Warrants (1) (2) | | 602,577 | | 603 |
| | | | | | |
| CONVERTIBLE BONDS | 1.0% | | | 602,577 |
| | | | |
|
| (Cost $1,752,577) | | | | |
| | | | | | |
| SEMICONDUCTORS | 0.0% | | | 0 |
| | | | |
|
* | Clarisay, Inc. 8.00% 05/08/2005- | | | | |
| | 10/10/2005 (1) (2) | | 1,150,000 | | 0 |
| | | | | | |
| SERVICES | 1.0% | | | 602,577 |
| | | | |
|
* | Innovion Corp. 8.00% 03/07/2005 | | | | |
| | (1) (2) | | 602,577 | | 602,577 |
| | | | | | |
| CASH EQUIVALENTS | 4.1% | | | 2,369,786 |
| | | | |
|
| (Cost $2,369,786) | | | | |
| SSgA Prime Money Market Portfolio | | 2,340,094 | | 2,340,094 |
| State Street Bank and Trust Company | | | | |
| | Repurchase Agreement, 1.300% | | | | |
| | dated 12/31/2004, to be | | | | |
| | repurchased at $29,695 on | | | | |
| | 01/03/2005, collateralized by | | | | |
| | $30,000 U.S. Treasury Bond, | | | | |
| | 10.375% maturing 11/15/2012 | | | | |
| | (value $36,594) | | 29,692 | | 29,692 |
| | | | | | |
| TOTAL INVESTMENT SECURITIES | 99.4% | | | 57,784,678 |
| (Cost $82,767,068) | | | | |
| | | | | | |
| OTHER ASSETS IN EXCESS OF LIABILITIES | 0.6% | | | 371,371 |
| | | | |
|
| | | | | | |
| NET ASSETS | 100.0% | | | $ 58,156,049 |
| | | | | |
|
*
| Non-income producing
|
(1)
| Affiliated issuer
|
(2)
| Restricted security
|
see accompanying notes to financial statements
| 2004 Annual Report - 27 |
Firsthand e-Commerce Fund
PORTFOLIO OF INVESTMENTS
December 31, 2004
| | | | | | MARKET |
| | | | PERCENT | SHARES | VALUE |
| COMMON STOCK | 94.2% | | | $ 52,328,059 |
| | (Cost $ 45,614,896) | | | | |
| | | | | | | | |
| | BROADCASTING & CABLE TV | 0.6% | | | 346,725 |
| | | | | |
|
| | * | | Liberty Media International, Inc. - A | | 7,500 | | 346,725 |
| | | | | | | | |
| | FINANCIAL | 2.9% | | | 1,608,000 |
| | | | | |
|
| | * | | Ameritrade Holding Corp. | | 50,000 | | 711,000 |
| | * | | E*TRADE FINANCIAL Corp. | | 60,000 | | 897,000 |
| | | | | | | | |
| | INTERNET | 30.3% | | | 16,802,173 |
| | | | | |
|
| | * | | 1-800-FLOWERS.COM, Inc. - A | | 10,000 | | 84,100 |
| | * | | Akamai Technologies, Inc. | | 22,500 | | 293,175 |
| | * | | Amazon.com, Inc. | | 30,000 | | 1,328,700 |
| | * | | Ask Jeeves, Inc. | | 10,000 | | 267,500 |
| | * | | Autobytel, Inc. | | 60,000 | | 362,400 |
| | * | | Drugstore.com, Inc. | | 222,700 | | 757,180 |
| | * | | eBay, Inc. | | 17,600 | | 2,046,528 |
| | * | | IAC/InterActiveCorp | | 86,700 | | 2,394,654 |
| | * | | LivePerson, Inc. | | 100,000 | | 314,000 |
| | * | | Monster Worldwide, Inc. | | 58,900 | | 1,981,396 |
| | * | | Netflix, Inc. | | 161,200 | | 1,987,596 |
| | * | | Time Warner, Inc. | | 62,600 | | 1,216,944 |
| | * | | Yahoo! Inc. | | 100,000 | | 3,768,000 |
| | | | | | | | |
| | NETWORKING | 1.0% | | | 579,000 |
| | | | | |
|
| | * | | Cisco Systems, Inc. | | 30,000 | | 579,000 |
| | | | | | | | |
| | SERVICES | 20.4% | | | 11,307,020 |
| | | | | |
|
| | * | | Anteon International Corp. | | 11,700 | | 489,762 |
| | * | | CNET Networks, Inc. | | 255,400 | | 2,868,142 |
| | | | Fair, Issac Corp. | | 15,000 | | 550,200 |
| | | | First Data Corp. | | 35,000 | | 1,488,900 |
| | * | | PEC Solutions, Inc. | | 115,400 | | 1,635,218 |
| | * | | Sportsman' s Guide, Inc. | | 15,000 | | 337,500 |
| | * | | WebEx Communications, Inc. | | 114,100 | | 2,713,298 |
| | * | | WebMD Corp. | | 150,000 | | 1,224,000 |
| | | | | | | | |
| | SOFTWARE | 39.0% | | | 21,685,141 |
| | | | | |
|
| | * | | BEA Systems, Inc. | | 193,100 | | 1,710,866 |
| | * | | Chordiant Software, Inc. | | 588,285 | | 1,341,290 |
| | * | | Cognizant Technology Solutions | | | | |
| | | | Corp. - A | | 45,900 | | 1,942,947 |
| | * | | Digital Insight Corp. | | 65,000 | | 1,196,000 |
| | | | | |
* Non-income producing
see accompanying notes to financial statements
| 2004 Annual Report - 28 |
Firsthand e-Commerce Fund
PORTFOLIO OF INVESTMENTS (continued)
December 31, 2004
| | | SHARES/ | | |
| | | | | PRINCIPAL | | | MARKET |
| | | | PERCENT | AMOUNT | | | VALUE |
| * | Macromedia, Inc. | | 98,900 | | $ | 3,077,768 |
| * | Mercury Interactive Corp. | | 15,700 | | | 715,135 |
| * | Napster, Inc. | | 254,500 | | | 2,392,300 |
| * | Novell, Inc. | | 122,600 | | | 827,550 |
| * | Red Hat, Inc. | | 20,000 | | | 267,000 |
| * | Symantec Corp. | | 14,000 | | | 360,640 |
| * | VERITAS Software Corp. | | 61,900 | | | 1,767,245 |
| * | Websense, Inc. | | 120,000 | | | 6,086,400 |
| | | | | | | | |
| CASH EQUIVALENTS | 5.5% | | | | 3,069,709 |
| | | | |
|
| (Cost $3,069,709) | | | | | |
| SSgA Prime Money Market Portfolio | | 2,235,592 | | | 2,235,592 |
| State Street Bank and Trust Company | | | | | |
| | Repurchase Agreement, 1.300% | | | | | |
| | dated 12/31/2004, to be | | | | | |
| | repurchased at $834,207 on | | | | | |
| | 01/03/2005, collateralized by | | | | | |
| | $790,000 U.S. Treasury Note, | | | | | |
| | 5.000% maturing 08/15/2011 | | | | | |
| | (value $869,988) | | 834,117 | | | 834,117 |
| | | | | | | | |
| TOTAL INVESTMENT SECURITIES | 99.7% | | | | 55,397,768 |
| (cost $48,684,605) | | | | | |
| | | | | | | | |
| OTHER ASSETS IN EXCESS OF LIABILITIES | 0.3% | | | | 154,858 |
| | | | |
|
| | | | | | | | |
| NET ASSETS | | 100.0% | | | $ | 55,552,626 |
| | | | | |
|
| | | | | | | | |
| OPTIONS WRITTEN | | | | | |
| | | | | Number of | | | Market |
| Call Options | | Contracts | | | Value |
| Websense, Inc., expiring Jan. 2005 | | | | | |
| @ $45. | | 600 | | | (420,000) |
| Websense, Inc., expiring Jan. 2005 | | | | | |
| @ $50. | | 600 | | | (156,000) |
| | | | | | |
|
| | | | | | | | |
| Total (premiums received $187,286) | | | | | |
| (Note 2) | | | | $ | (576,000) |
| | | | | |
|
* Non-income producing
see accompanying notes to financial statements
| 2004 Annual Report - 29 |
Firsthand Global Technology Fund
PORTFOLIO OF INVESTMENTS
December 31, 2004
| | | | | MARKET |
| | | PERCENT | SHARES | VALUE |
| COMMON STOCK | 98.8% | | | $ 32,144,565 |
| (Cost $31,511,907) | | | | |
| | | | | | | |
| COMMUNICATIONS EQUIPMENT | 21.2% | | | 6,891,491 |
| | | | |
|
| * | | Alvarion Ltd. | | 148,900 | | 1,977,392 |
| * | | Ceragon Networks Ltd. | | 265,900 | | 1,789,507 |
| | | Nokia Corp. - ADR | | 7,100 | | 111,257 |
| | | QUALCOMM, Inc. | | 10,000 | | 424,000 |
| * | | UTStarcom, Inc. | | 116,900 | | 2,589,335 |
| | | | | | | |
| ELECTRONIC DESIGN AUTOMATION | 4.4% | | | 1,417,680 |
| | | | |
|
* | | PDF Solutions, Inc. | | 88,000 | | 1,417,680 |
| | | | | | | |
| ELECTRONICS MANUFACTURING | | | | |
| SERVICES | 0.4% | | | 121,089 |
| | | | |
|
| | | Elcoteq Network Corp. - A | | 5,000 | | 121,089 |
| | | | | | | |
| INTERNET | 1.6% | | | 522,600 |
| | | | |
|
* | | RADWARE Ltd. | | 20,000 | | 522,600 |
| | | | | | | |
| OTHER ELECTRONICS | 15.6% | | | 5,082,878 |
| | | | |
|
| | | Alps Electric Co., Ltd. | | 65,000 | | 966,173 |
| | | Fujitsu Ltd. | | 223,000 | | 1,447,883 |
* | | Intevac, Inc. | | 69,000 | | 521,640 |
| | | Sharp Corp. | | 52,000 | | 846,841 |
| | | TDK Corp. | | 17,600 | | 1,300,341 |
| | | | | | | |
| PERIPHERALS | 3.6% | | | 1,183,728 |
| | | | |
|
* | | Western Digital Corp. | | 109,200 | | 1,183,728 |
| | | | | | | |
| SEMICONDUCTOR EQUIPMENT | 6.8% | | | 2,222,024 |
| | | | |
|
* | | ASML Holding N.V. | | 66,758 | | 1,062,120 |
| | | Hoya Corp. | | 1,900 | | 213,988 |
| | | Tokyo Electron Ltd. | | 15,400 | | 945,916 |
| | | | | | | |
| SEMICONDUCTORS | 18.4% | | | 5,983,356 |
| | | | |
|
| * | | Agere Systems, Inc. - A | | 200,000 | | 274,000 |
| * | | Infineon Technologies AG - ADR | | 28,700 | | 312,830 |
| * | | Kopin Corp. | | 156,000 | | 603,720 |
* Non-income producing
see accompanying notes to financial statements
| 2004 Annual Report - 30 |
Firsthand Global Technology Fund
PORTFOLIO OF INVESTMENTS (continued)
December 31, 2004
| | | | | | | MARKET |
| | | PERCENT | | SHARES | | VALUE |
* | OmniVision Technologies, Inc. | | | 55,000 | | $ | 1,009,250 |
| | Samsung Electronics Co., Ltd. - | | | | | | |
| | GDR (144A) | | | 8,800 | | | 1,914,799 |
| | STMicroelectronics N.V. - ADR | | | 32,400 | | | 625,968 |
| | Taiwan Semiconductor | | | | | | |
| | Manufacturing Co. - ADR | | | 105,464 | | | 895,389 |
* | Zoran Corp. | | | 30,000 | | | 347,400 |
| | | | | | | | |
| SERVICES | 6.9% | | | | | 2,243,006 |
| | | | | |
|
* | Amkor Technology, Inc. | | | 125,500 | | | 838,340 |
* | j2 Global Communications, Inc. | | | 12,900 | | | 445,050 |
* | Lionbridge Technologies, Inc. | | | 142,800 | | | 959,616 |
| | | | | | | | |
| SOFTWARE | 19.9% | | | | | 6,476,713 |
| | | | | |
|
| * | A mdocs Ltd. | | | 50,000 | | | 1,312,500 |
| * | Business Objects SA - ADR | | | 20,000 | | | 506,800 |
| * | Cognos, Inc. | | | 25,000 | | | 1,101,500 |
| * | Comverse Technology, Inc. | | | 55,000 | | | 1,344,750 |
| * | Mercury Interactive Corp. | | | 20,000 | | | 911,000 |
| | SAP AG - ADR | | | 25,300 | | | 1,118,513 |
* | Verint Systems, Inc. | | | 5,000 | | | 181,650 |
| | | | | | | | |
| CASH EQUIVALENTS | 3.7% | | | | | 1,199,965 |
| | | | | |
|
| (Cost $1,199,965) | | | | | | |
| SSgA Prime Money Market Portfolio | | | 1,199,965 | | | 1,199,965 |
| | | | | | | | |
| TOTAL INVESTMENT SECURITIES | 102.5% | | | | | 33,344,530 |
| (Cost $32,711,872) | | | | | | |
| | | | | | | | |
| LIABILITIES IN EXCESS OF OTHER ASSETS | (2.5)% | | | | | (820,428) |
| | | | | |
|
| | | | | | | | |
| NET ASSETS | 100.0% | | | | $ | 32,524,102 |
| | | | | |
|
* Non-income producing
ADR American Depositary Receipts
GDR Global Depositary Receipts
see accompanying notes to financial statements
| 2004 Annual Report - 31 |
STATEMENTS OF ASSETS AND LIABILITIES
December 31, 2004
| | FIRSTHAND | | FIRSTHAND | | FIRSTHAND |
| | TECHNOLOGY | | TECHNOLOGY | | TECHNOLOGY |
| | VALUE | | LEADERS | | INNOVATORS |
| | FUND | | FUND | | FUND |
| ASSETS | | | | | | | | |
| Investment securities: | | | | | | | | |
| Unaffiliated issuers at acquisition cost | $ | 857,035,371 | | $ | 114,741,939 | | $ | 67,040,148 |
| Affiliated issuers at acquisition cost | | 98,731,272 | | | - | | | 15,726,920 |
| | |
| | |
| | |
|
| Total acquisition cost | $ | 955,766,643 | | $ | 114,741,939 | | $ | 82,767,068 |
| | |
| | |
| | |
|
| Unaffiliated issuers at market value | $ | 525,967,449 | | $ | 113,453,942 | | $ | 53,658,155 |
| Affiliated issuers at market value | | 57,636,487 | | | - | | | 4,126,523 |
| | |
| | |
| | |
|
| Total market value (Note 2) | | 583,603,936 | | | 113,453,942 | | | 57,784,678 |
| Cash | | - | | | - | | | 2,697 |
| Receivable for securities sold | | 10,666,407 | | | 2,377,811 | | | 697,596 |
| Receivables from dividends and interest | | 45,369 | | | 9,756 | | | 48,604 |
| Receivable for capital shares sold | | 185,354 | | | 16,540 | | | 1,944 |
| Other receivables | | 251,569 | | | 104,268 | | | - |
| Deferred trustee compensation (Note 6) | | 94,750 | | | 55,333 | | | 55,333 |
| | |
| | |
| | |
|
| TOTAL ASSETS | | 594,847,385 | | | 116,017,650 | | | 58,590,852 |
| | |
| | |
| | |
|
| | | | | | | | | |
| LIABILITIES | | | | | | | | |
| Payable for securities purchased | | - | | | 462,839 | | | - |
| Payable to affiliates (Note 4) | | 984,913 | | | 191,820 | | | 95,213 |
| Payable for capital shares redeemed | | 1,816,536 | | | 389,049 | | | 284,257 |
| Payable for trustee compensation (Note 6) | | 94,750 | | | 55,333 | | | 55,333 |
| Payable to custodian | | 5,021,245 | | | 1,003,760 | | | - |
| | |
| | |
| | |
|
| TOTAL LIABILITIES | | 7,917,444 | | | 2,102,801 | | | 434,803 |
| | |
| | |
| | |
|
| | | | | | | | | |
| NET ASSETS | $ | 586,929,941 | | $ | 113,914,849 | | $ | 58,156,049 |
| | |
| | |
| | |
|
| | | | | | | | | |
| Net assets consist of: | | | | | | | | |
| Paid-in-capital | $ | 3,418,608,974 | | $ | 455,701,564 | | $ | 435,836,077 |
| Accumulated net realized losses from | | | | | | | | |
| security transactions and foreign currency | | (2,459,516,326) | | | (340,498,718) | | | (352,697,638) |
| Net unrealized depreciation on | | | | | | | | |
| investments and foreign currency | | (372,162,707) | | | (1,287,997) | | | (24,982,390) |
| | |
| | |
| | |
|
| | | | | | | | | |
| NET ASSETS | $ | 586,929,941 | | $ | 113,914,849 | | $ | 58,156,049 |
| | |
| | |
| | |
|
| | | | | | | | | |
| Shares of beneficial interest | | | | | | | | |
| outstanding (unlimited number of | | | | | | | | |
| shares authorized, no par value) | | 19,909,940 | | | 6,802,415 | | | 5,770,397 |
| | |
| | |
| | |
|
| Net asset value, redemption price | | | | | | | | |
| and offering price per share (Note 2) | $ | 29.48 | | $ | 16.75 | | $ | 10.08 |
| | |
| | |
| | |
|
see accompanying notes to financial statements
| 2004 Annual Report - 32 |
STATEMENTS OF ASSETS AND LIABILITIES (continued)
December 31, 2004
| | | | FIRSTHAND |
| | FIRSTHAND | | GLOBAL |
| | E-COMMERCE | | TECHNOLOGY |
| | FUND | | FUND |
| ASSETS | | | | | |
| Investment securities: | | | | | |
| Unaffiliated issuers at acquisition cost | $ | 48,684,605 | | $ | 32,711,872 |
| Affiliated issuers at acquisition cost | | - | | | - |
| | |
| | |
|
| Total acquisition cost | $ | 48,684,605 | | $ | 32,711,872 |
| | |
| | |
|
| Unaffiliated issuers at market value | $ | 55,397,768 | | $ | 33,344,530 |
| Affiliated issuers at market value | | - | | | - |
| | |
| | |
|
| Total market value (Note 2) | | 55,397,768 | | | 33,344,530 |
| Cash | | 3,231 | | | 360 |
| Receivable for securities sold | | 1,015,902 | | | - |
| Receivables from dividends and interest | | 856 | | | 768 |
| Receivable for capital shares sold | | 57,335 | | | 5,443 |
| Deferred trustee compensation (Note 6) | | 55,333 | | | 41,507 |
| | |
| | |
|
| TOTAL ASSETS | | 56,530,425 | | | 33,392,608 |
| | |
| | |
|
| | | | | | |
| LIABILITIES | | | | | |
| Payable for securities purchased | | 102,251 | | | 111,773 |
| Payable to affiliates (Note 4) | | 92,926 | | | 56,420 |
| Payable for capital shares redeemed | | 151,289 | | | 658,806 |
| Payable for trustee compensation (Note 6) | | 55,333 | | | 41,507 |
| Outstanding options written, at value (premiums | | | | | |
| received - $187,286) | | 576,000 | | | - |
| Payable to custodian | | - | | | - |
| | |
| | |
|
| TOTAL LIABILITIES | | 977,799 | | | 868,506 |
| | |
| | |
|
| | | | | | |
| NET ASSETS | $ | 55,552,626 | | $ | 32,524,102 |
| | |
| | |
|
| | | | | | |
| Net assets consist of: | | | | | |
| Paid-in-capital | $ | 458,717,858 | | $ | 109,318,915 |
| Accumulated net realized losses from | | | | | |
| security transactions and foreign currency | | (409,489,681) | | | (77,427,471) |
| Net unrealized appreciation on | | | | | |
| investments and foreign currency | | 6,324,449 | | | 632,658 |
| | |
| | |
|
| | | | | | |
| NET ASSETS | $ | 55,552,626 | | $ | 32,524,102 |
| | |
| | |
|
| | | | | | |
| Shares of beneficial interest | | | | | |
| outstanding (unlimited number of | | | | | |
| shares authorized, no par value) | | 17,220,233 | | | 7,600,224 |
| | |
| | |
|
| Net asset value, redemption price | | | | | |
| and offering price per share (Note 2) | $ | 3.23 | | $ | 4.28 |
| | |
| | |
|
see accompanying notes to financial statements
| 2004 Annual Report - 33 |
STATEMENTS OF OPERATIONS
For the year ended December 31, 2004
| | | FIRSTHAND | | FIRSTHAND | | FIRSTHAND |
| | | TECHNOLOGY | | TECHNOLOGY | | TECHNOLOGY |
| | | VALUE | | LEADERS | | INNOVATORS |
| | | FUND | | FUND | | FUND |
| INVESTMENT INCOME | | | | | | | | |
| | Interest | $ | 9,655 | | $ | 15,049 | | $ | 27,650 |
| | Dividends * | | 3,399,882 | | | 460,727 | | | 51,430 |
| | | |
| | |
| | |
|
| | TOTAL INVESTMENT INCOME | | 3,409,537 | | | 475,776 | | | 79,080 |
| | | |
| | |
| | |
|
| | | | | | | | | | |
| EXPENSES | | | | | | | | |
| | Investment advisory fees (Note 4) | | 10,399,726 | | | 1,937,156 | | | 1,024,569 |
| | Administrative fees (Note 4) | | 2,776,585 | | | 581,147 | | | 307,371 |
| | | |
| | |
| | |
|
| | TOTAL EXPENSES | | 13,176,311 | | | 2,518,303 | | | 1,331,940 |
| | | |
| | |
| | |
|
| | | | | | | | | | |
| NET INVESTMENT LOSS | | (9,766,774) | | | (2,042,527) | | | (1,252,860) |
| | |
| | |
| | |
|
| | | | | | | | | | |
| REALIZED AND UNREALIZED GAINS | | | | | | | | |
| | (LOSSES) ON INVESTMENTS | | | | | | | | |
| | Net realized losses from security transactions | | | | | | | | |
| | and foreign currency (including realized | | | | | | | | |
| | loss of $(13,467,402), $0 and $0, | | | | | | | | |
| | respectively, on sales of investments in | | | | | | | | |
| | affiliated issuers) | | (258,926,742) | | | (11,851,283) | | | (8,641,233) |
| | Net change in unrealized appreciation | | | | | | | | |
| | (depreciation) on investments and | | | | | | | | |
| | foreign currency | | 204,966,127 | | | 8,177,778 | | | (707,775) |
| | Written options | | - | | | - | | | - |
| | | |
| | |
| | |
|
| | | | | | | | | | |
| NET REALIZED AND UNREALIZED | | | | | | | | |
| | LOSSES ON INVESTMENTS | | (53,960,615) | | | (3,673,505) | | | (9,349,008) |
| | | |
| | |
| | |
|
| | | | | | | | | | |
| NET DECREASE IN NET | | | | | | | | |
| | ASSETS FROM OPERATIONS | $ | (63,727,389) | | $ | (5,716,032) | | $ | (10,601,868) |
| | | |
| | |
| | |
|
| | | | | | | | | | |
| * | Net of foreign tax withholding | $ | 17,365 | | $ | 23,731 | | $ | - |
| | | |
| | |
| | |
|
see accompanying notes to financial statements
| 2004 Annual Report - 34 |
STATEMENTS OF OPERATIONS (continued)
For the year ended December 31, 2004
| | | | | FIRSTHAND |
| | | FIRSTHAND | | GLOBAL |
| | | E-COMMERCE | | TECHNOLOGY |
| | | FUND | | FUND |
| INVESTMENT INCOME | | | | | |
| | Interest | $ | 17,138 | | $ | 8,059 |
| | Dividends * | | 10,482 | | | 107,776 |
| | | |
| | |
|
| | TOTAL INVESTMENT INCOME | | 27,620 | | | 115,835 |
| | | |
| | |
|
| | | | | | | |
| EXPENSES | | | | | |
| | Investment advisory fees (Note 4) | | 871,570 | | | 667,100 |
| | Administrative fees (Note 4) | | 261,471 | | | 200,130 |
| | | |
| | |
|
| | TOTAL EXPENSES | | 1,133,041 | | | 867,230 |
| | | |
| | |
|
| | | | | | | |
| NET INVESTMENT LOSS | | (1,105,421) | | | (751,395) |
| | |
| | |
|
| | | | | | | |
| REALIZED AND UNREALIZED GAINS | | | | | |
| | (LOSSES) ON INVESTMENTS | | | | | |
| | Net realized gains from security | | | | | |
| | transactions and foreign currency | | | | | |
| | (including realized loss of $0 and $0, | | | | | |
| | respectively, on sales of investments in | | | | | |
| | affiliated issuers) | | 5,762,830 | | | 2,012,583 |
| | Net change in unrealized depreciation | | | | | |
| | on investments and | | | | | |
| | foreign currency | | (1,688,034) | | | (6,944,463) |
| | Written options | | (388,714) | | | - |
| | | |
| | |
|
| | | | | | | |
| NET REALIZED AND UNREALIZED | | | | | |
| | GAINS (LOSSES) ON INVESTMENTS | | 3,686,082 | | | (4,931,880) |
| | | |
| | |
|
| | | | | | | |
| NET INCREASE (DECREASE) IN NET | | | | | |
| | ASSETS FROM OPERATIONS | $ | 2,580,661 | | $ | (5,683,275) |
| | | |
| | |
|
| | | | | | | |
| * | Net of foreign tax withholding | $ | - | | $ | 18,242 |
| | | |
| | |
|
see accompanying notes to financial statements
| 2004 Annual Report - 35 |
STATEMENTS OF CHANGES IN NET ASSETS
For the years ended December 31, 2004, and December 31, 2003
| | FIRSTHAND TECHNOLOGY |
| | VALUE FUND |
| | | Year | | | Year | |
| | | Ended | | | Ended | |
| | | 12/31/04 | | | 12/31/03 | |
| FROM OPERATIONS: | | | | | | |
| Net investment loss | $ | (9,766,774) | | $ | (11,096,461) | |
| Net realized losses from security transactions | | | | | | |
| and foreign currency | | (258,926,742) | | | (350,024,846) | |
| Net change in unrealized appreciation on | | | | | | |
| investments | | 204,966,127 | | | 718,573,278 | |
| | |
| | |
| |
| Net increase (decrease) in net assets from operations | | (63,727,389) | | | 357,451,971 | |
| | |
| | |
| |
| | | | | | | |
| FROM CAPITAL SHARE TRANSACTIONS: | | | | | | |
| Proceeds from shares sold | | 91,603,669 | | | 255,958,697 | (B) |
| Payments for shares redeemed | | (318,385,285) | | | (228,652,238) | (A) (B) |
| | |
| | |
| |
| Net increase (decrease) in net assets from capital | | | | | | |
| share transactions | | (226,781,616) | | | 27,306,459 | |
| | |
| | |
| |
| | | | | | | |
| TOTAL INCREASE (DECREASE) IN NET ASSETS | | (290,509,005) | | | 384,758,430 | |
| | | | | | | |
| NET ASSETS: | | | | | | |
| Beginning of year | | 877,438,946 | | | 492,680,516 | |
| | |
| | |
| |
| End of year | $ | 586,929,941 | | $ | 877,438,946 | |
| | |
| | |
| |
| | | | | | | |
| CAPITAL SHARE ACTIVITY: | | | | | | |
| Shares sold | | 2,988,191 | | | 9,387,545 | (B) |
| Shares redeemed | | (10,869,703) | | | (8,835,656) | (B) |
| | |
| | |
| |
| Net increase (decrease) in shares outstanding | | (7,881,512) | | | 551,889 | |
| Shares outstanding, beginning of year | | 27,791,452 | | | 27,239,563 | |
| | |
| | |
| |
| Shares outstanding, end of year | | 19,909,940 | | | 27,791,452 | |
| | |
| | |
| |
(A) Net of redemption fees of $82,976.
(B) See Note 5 of notes to financial statements.
see accompanying notes to financial statements
| 2004 Annual Report - 36 |
STATEMENTS OF CHANGES IN NET ASSETS (continued)
For the years ended December 31, 2004, and December 31, 2003
| | FIRSTHAND TECHNOLOGY |
| | LEADERS FUND |
| | | Year | | | Year | |
| | | Ended | | | Ended | |
| | | 12/31/04 | | | 12/31/03 | |
| FROM OPERATIONS: | | | | | | |
| Net investment loss | $ | (2,042,527) | | $ | (2,147,781) | |
| Net realized losses from security transactions | | | | | | |
| and foreign currency | | (11,851,283) | | | (60,900,509) | |
| Net change in unrealized appreciation on | | | | | | |
| investments | | 8,177,778 | | | 125,196,291 | |
| | |
| | |
| |
| Net increase (decrease) in net assets from operations | | (5,716,032) | | | 62,148,001 | |
| | |
| | |
| |
| | | | | | | |
| FROM CAPITAL SHARE TRANSACTIONS: | | | | | | |
| Proceeds from shares sold | | 9,383,379 | | | 24,579,927 | |
| Payments for shares redeemed | | (45,894,167) | | | (35,578,744) | (A) |
| | |
| | |
| |
| Net decrease in net assets from | | | | | | |
| capital share transactions | | (36,510,788) | | | (10,998,817) | |
| | |
| | |
| |
| | | | | | | |
| TOTAL INCREASE (DECREASE) IN NET ASSETS | | (42,226,820) | | | 51,149,184 | |
| | | | | | | |
| NET ASSETS: | | | | | | |
| Beginning of year | | 156,141,669 | | | 104,992,485 | |
| | |
| | |
| |
| End of year | $ | 113,914,849 | | $ | 156,141,669 | |
| | |
| | |
| |
| | | | | | | |
| CAPITAL SHARE ACTIVITY: | | | | | | |
| Shares sold | | 564,475 | | | 1,727,472 | |
| Shares redeemed | | (2,823,820) | | | (2,526,281) | |
| | |
| | |
| |
| Net decrease in shares outstanding | | (2,259,345) | | | (798,809) | |
| Shares outstanding, beginning of year | | 9,061,760 | | | 9,860,569 | |
| | |
| | |
| |
| Shares outstanding, end of year | | 6,802,415 | | | 9,061,760 | |
| | |
| | |
| |
(A) Net of redemption fees of $17,446.
see accompanying notes to financial statements
| 2004 Annual Report - 37 |
STATEMENTS OF CHANGES IN NET ASSETS (continued)
For the years ended December 31, 2004, and December 31, 2003
| | FIRSTHAND TECHNOLOGY |
| | INNOVATORS FUND |
| | | Year | | | Year | |
| | | Ended | | | Ended | |
| | | 12/31/04 | | | 12/31/03 | |
| FROM OPERATIONS: | | | | | | |
| Net investment loss | $ | (1,252,860) | | $ | (1,269,468) | |
| Net realized losses from security transactions | | | | | | |
| and foreign currency | | (8,641,233) | | | (49,128,316) | |
| Net change in unrealized appreciation | | | | | | |
| (depreciation) on investments | | (707,775) | | | 83,337,829 | |
| | |
| | |
| |
| Net increase (decrease) in net assets from operations | | (10,601,868) | | | 32,940,045 | |
| | |
| | |
| |
| | | | | | | |
| FROM CAPITAL SHARE TRANSACTIONS: | | | | | | |
| Proceeds from shares sold | | 21,438,690 | | | 18,073,624 | |
| Payments for shares redeemed | | (40,785,516) | | | (25,530,349) | (A) |
| | |
| | |
| |
| Net decrease in net assets from capital | | | | | | |
| share transactions | | (19,346,826) | | | (7,456,725) | |
| | |
| | |
| |
| | | | | | | |
| TOTAL INCREASE (DECREASE) IN NET ASSETS | | (29,948,694) | | | 25,483,320 | |
| | | | | | | |
| NET ASSETS: | | | | | | |
| Beginning of year | | 88,104,743 | | | 62,621,423 | |
| | |
| | |
| |
| End of year | $ | 58,156,049 | | $ | 88,104,743 | |
| | |
| | |
| |
| | | | | | | |
| CAPITAL SHARE ACTIVITY: | | | | | | |
| Shares sold | | 1,943,599 | | | 1,778,585 | |
| Shares redeemed | | (3,793,112) | | | (2,602,998) | |
| | |
| | |
| |
| Net decrease in shares outstanding | | (1,849,513) | | | (824,413) | |
| Shares outstanding, beginning of year | | 7,619,910 | | | 8,444,323 | |
| | |
| | |
| |
| Shares outstanding, end of year | | 5,770,397 | | | 7,619,910 | |
| | |
| | |
| |
(A) Net of redemption fees of $24,200.
see accompanying notes to financial statements
| 2004 Annual Report - 38 |
STATEMENTS OF CHANGES IN NET ASSETS (continued)
For the years ended December 31, 2004, and December 31, 2003
| | FIRSTHAND |
| | E-COMMERCE FUND |
| | | Year | | | Year | |
| | | Ended | | | Ended | |
| | | 12/31/04 | | | 12/31/03 | |
| FROM OPERATIONS: | | | | | | |
| Net investment loss | $ | (1,105,421) | | $ | (1,027,927) | |
| Net realized gains (losses) from security transactions | | | | | | |
| and foreign currency | | 5,762,830 | | | (6,028,799) | |
| Net change in unrealized appreciation | | | | | | |
| (depreciation) on investments, written options, | | | | | | |
| and foreign currency | | (2,076,748) | | | 30,614,322 | |
| | |
| | |
| |
| Net increase in net assets from operations | | 2,580,661 | | | 23,557,596 | |
| | |
| | |
| |
| | | | | | | |
| FROM CAPITAL SHARE TRANSACTIONS: | | | | | | |
| Proceeds from shares sold | | 9,715,349 | | | 11,440,088 | |
| Payments for shares redeemed | | (23,141,295) | | | (20,434,064) | (A) |
| | |
| | |
| |
| Net decrease in net assets from capital | | | | | | |
| share transactions | | (13,425,946) | | | (8,993,976) | |
| | |
| | |
| |
| | | | | | | |
| TOTAL INCREASE (DECREASE) IN NET ASSETS | | (10,845,285) | | | 14,563,620 | |
| | | | | | | |
| NET ASSETS: | | | | | | |
| Beginning of year | | 66,397,911 | | | 51,834,291 | |
| | |
| | |
| |
| End of year | $ | 55,552,626 | | $ | 66,397,911 | |
| | |
| | |
| |
| | | | | | | |
| CAPITAL SHARE ACTIVITY: | | | | | | |
| Shares sold | | 3,137,874 | | | 4,320,048 | |
| Shares redeemed | | (7,586,633) | | | (7,623,899) | |
| | |
| | |
| |
| Net decrease in shares outstanding | | (4,448,759) | | | (3,303,851) | |
| Shares outstanding, beginning of year | | 21,668,992 | | | 24,972,843 | |
| | |
| | |
| |
| Shares outstanding, end of year | | 17,220,233 | | | 21,668,992 | |
| | |
| | |
| |
(A) Net of redemption fees of $7,309.
see accompanying notes to financial statements
| 2004 Annual Report - 39 |
STATEMENTS OF CHANGES IN NET ASSETS (continued)
For the years ended December 31, 2004, and December 31, 2003
| | FIRSTHAND GLOBAL | |
| | TECHNOLOGY FUND | |
| | | Year | | | Year | |
| | | Ended | | | Ended | |
| | | 12/31/04 | | | 12/31/03 | |
| FROM OPERATIONS: | | | | | | |
| Net investment loss | $ | (751,395) | | $ | (664,664) | |
| Net realized gains (losses) from security transactions | | | | | | |
| and foreign currency | | 2,012,583 | | | (8,818,502) | |
| Net change in unrealized appreciation (depreciation) on | | | | | | |
| investments and foreign currency | | (6,944,463) | | | 30,956,070 | |
| | |
| | |
| |
| Net increase (decrease) in net assets from operations | | (5,683,275) | | | 21,472,904 | |
| | |
| | |
| |
| | | | | | | |
| FROM CAPITAL SHARE TRANSACTIONS: | | | | | | |
| Proceeds from shares sold | | 27,899,673 | | | 46,141,349 | |
| Payments for shares redeemed | | (47,030,264) | | | (30,500,852) | (A) |
| | |
| | |
| |
| Net increase (decrease) in net assets from capital | | | | | | |
| share transactions | | (19,130,591) | | | 15,640,497 | |
| | |
| | |
| |
| | | | | | | |
| TOTAL INCREASE (DECREASE) IN NET ASSETS | | (24,813,866) | | | 37,113,401 | |
| | | | | | | |
| NET ASSETS: | | | | | | |
| Beginning of year | | 57,337,968 | | | 20,224,567 | |
| | |
| | |
| |
| End of year | $ | 32,524,102 | | $ | 57,337,968 | |
| | |
| | |
| |
| | | | | | | |
| CAPITAL SHARE ACTIVITY: | | | | | | |
| Shares sold | | 6,368,151 | | | 11,641,914 | |
| Shares redeemed | | (11,197,824) | | | (7,553,371) | |
| | |
| | |
| |
| Net increase (decrease) in shares outstanding | | (4,829,673) | | | 4,088,543 | |
| Shares outstanding, beginning of year | | 12,429,897 | | | 8,341,354 | |
| | |
| | |
| |
| Shares outstanding, end of year | | 7,600,224 | | | 12,429,897 | |
| | |
| | |
| |
(A) Net of redemption fees of $1,216.
see accompanying notes to financial statements
| 2004 Annual Report - 40 |
Firsthand Technology Value Fund
FINANCIAL HIGHLIGHTS
Selected per share data and ratios for a share outstanding
throughout each year
| | | Year | | | Year | | | Year | | | Year | | | Year |
| | | Ended | | | Ended | | | Ended | | | Ended | | | Ended |
| | | 12/31/04 | | | 12/31/03 | | 12/31/02 | | | 12/31/01 | | 12/31/00 |
| Net asset value at beginning of year | $ | 31.57 | | $ | 18.09 | | $ | 41.25 | | $ | 74.33 | | $ | 90.52 |
| | |
| | |
| | |
| | |
| | |
|
| | | | | | | | | | | | | | | |
| Income from investment operations: | | | | | | | | | | | | | | |
| Net investment loss | | (0.49) | | | (0.40) | | | (0.46) | | | (0.65) | | | (1.14) |
| Net realized and unrealized | | | | | | | | | | | | | | |
| gains (losses) on investments | | (1.60) | | | 13.88 | | | (22.72) | | | (32.16) | | | (7.29) |
| | |
| | |
| | |
| | |
| | |
|
| Total from investment operations | | (2.09) | | | 13.48 | | | (23.18) | | | (32.81) | | | (8.43) |
| | |
| | |
| | |
| | |
| | |
|
| | | | | | | | | | | | | | | |
| Less distributions: | | | | | | | | | | | | | | |
| Dividends from net | | | | | | | | | | | | | | |
| investment income | | - | | | - | | | - | | | - | | | - |
| Distributions from net | | | | | | | | | | | | | | |
| realized gains | | - | | | - | | | - | | | (0.38) | | | (7.86) |
| Distributions in excess of net | | | | | | | | | | | | | | |
| realized gains | | - | | | - | | | - | | | - | | | - |
| | |
| | |
| | |
| | |
| | |
|
| Total distributions | | - | | | - | | | - | | | (0.38) | | | (7.86) |
| | |
| | |
| | |
| | |
| | |
|
| | | | | | | | | | | | | | | |
| Paid-in-capital from redemption | | | | | | | | | | | | | | |
| fees (Note 2) | | - | | | 0.00 (A) | | | 0.02 | | | 0.11 | | | 0.10 |
| | |
| | |
| | |
| | |
| | |
|
| | | | | | | | | | | | | | | |
| Net asset value at end of year | $ | 29.48 | | $ | 31.57 | | $ | 18.09 | | $ | 41.25 | | $ | 74.33 |
| | |
| | |
| | |
| | |
| | |
|
| | | | | | | | | | | | | | | |
| Total return | | (6.62%) | | | 74.52% | | | (56.15%) | | | (44.00%) | | | (9.97%) |
| | |
| | |
| | |
| | |
| | |
|
| | | | | | | | | | | | | | | |
| Net assets at end of year (millions) | $ | 586.9 | | $ | 877.4 | | $ | 492.7 | | $ | 1,449.9 | | $ | 3,030.8 |
| | |
| | |
| | |
| | |
| | |
|
| | | | | | | | | | | | | | | |
| Ratio of expenses to average | | | | | | | | | | | | | | |
| net assets | | 1.90% | | | 1.90% | | | 1.89% | | | 1.84% | | | 1.83% |
| Ratio of net investment loss to | | | | | | | | | | | | | | |
| average net assets | | (1.41%) | | | (1.64%) | | | (1.56%) | | | (1.20%) | | | (1.29%) |
| Portfolio turnover rate | | 17% | | | 38% | | | 44% | | | 57% | | | 59% |
(A) Amount is less than $0.01.
see accompanying notes to financial statements
| 2004 Annual Report - 41 |
Firsthand Technology Leaders Fund
FINANCIAL HIGHLIGHTS
Selected per share data and ratios for a share outstanding
throughout each year
| | | Year | | | Year | | | Year | | | Year | | | Year |
| | | Ended | | | Ended | | | Ended | | | Ended | | | Ended |
| | | 12/31/04 | | | 12/31/03 | | 12/31/02 | | | 12/31/01 | | | 12/31/00 |
| Net asset value at beginning of year | $ | 17.23 | | $ | 10.65 | | $ | 18.86 | | $ | 33.84 | | $ | 44.68 |
| | |
| | |
| | |
| | |
| | |
|
| | | | | | | | | | | | | | | |
| Income from investment operations: | | | | | | | | | | | | | | |
| Net investment loss | | (0.30) | | | (0.24) | | | (0.26) | | | (0.41) | | | (0.67) |
| Net realized and unrealized | | | | | | | | | | | | | | |
| gains (losses) on investments | | (0.18) | | | 6.82 | | | (7.96) | | | (14.62) | | | (10.19) |
| | |
| | |
| | |
| | |
| | |
|
| Total from investment operations | | (0.48) | | | 6.58 | | | (8.22) | | | (15.03) | | | (10.86) |
| | |
| | |
| | |
| | |
| | |
|
| | | | | | | | | | | | | | | |
| Less distributions: | | | | | | | | | | | | | | |
| Dividends from net investment | | | | | | | | | | | | | | |
| income | | - | | | - | | | - | | | - | | | - |
| Distributions from net | | | | | | | | | | | | | | |
| realized gains | | - | | | - | | | - | | | - | | | (0.01) |
| Distributions in excess of net | | | | | | | | | | | | | | |
| realized gains | | - | | | - | | | - | | | - | | | - |
| | |
| | |
| | |
| | |
| | |
|
| Total distributions | | - | | | - | | | - | | | - | | | (0.01) |
| | |
| | |
| | |
| | |
| | |
|
| | | | | | | | | | | | | | | |
| Paid-in-capital from redemption | | | | | | | | | | | | | | |
| fees (Note 2) | | - | | | 0.00 (A) | | | 0.01 | | | 0.05 | | | 0.03 |
| | |
| | |
| | |
| | |
| | |
|
| | | | | | | | | | | | | | | |
| Net asset value at end of year | $ | 16.75 | | $ | 17.23 | | $ | 10.65 | | $ | 18.86 | | $ | 33.84 |
| | |
| | |
| | |
| | |
| | |
|
| | | | | | | | | | | | | | | |
| Total return | | (2.79%) | | | 61.78% | | | (43.53%) | | | (44.27%) | | | (24.23%) |
| | |
| | |
| | |
| | |
| | |
|
| | | | | | | | | | | | | | | |
| Net assets at end of year (millions) | $ | 113.9 | | $ | 156.1 | | $ | 105.0 | | $ | 241.3 | | $ | 517.2 |
| | |
| | |
| | |
| | |
| | |
|
| | | | | | | | | | | | | | | |
| Ratio of expenses to average | | | | | | | | | | | | | | |
| net assets | | 1.95% | | | 1.95% | | | 1.95% | | | 1.93% | | | 1.90% |
| Ratio of net investment loss to | | | | | | | | | | | | | | |
| average net assets | | (1.58%) | | | (1.65%) | | | (1.63%) | | | (1.54%) | | | (1.44%) |
| Portfolio turnover rate | | 22% | | | 28% | | | 46% | | | 44% | | | 35% |
(A) Amount is less than $0.01.
see accompanying notes to financial statements
| 2004 Annual Report - 42 |
Firsthand Technology Innovators Fund
FINANCIAL HIGHLIGHTS
Selected per share data and ratios for a share outstanding
throughout each year
| | | Year | | | Year | | | Year | | | Year | | | Year |
| | | Ended | | | Ended | | | Ended | | | Ended | | | Ended |
| | | 12/31/04 | | | 12/31/03 | | 12/31/02 | | | 12/31/01 | | | 12/31/00 |
| Net asset value at beginning of year | $ | 11.56 | | $ | 7.42 | | $ | 16.40 | | $ | 23.13 | | $ | 49.36 |
| | |
| | |
| | |
| | |
| | |
|
| | | | | | | | | | | | | | | |
| Income from investment operations: | | | | | | | | | | | | | | |
| Net investment loss | | (0.22) | | | (0.17) | | | (0.20) | | | (0.24) | | | (0.85) |
| Net realized and unrealized | | | | | | | | | | | | | | |
| gains (losses) on investments | | (1.26) | | | 4.31 | | | (8.80) | | | (6.51) | | | (16.84) |
| | |
| | |
| | |
| | |
| | |
|
| Total from investment operations | | (1.48) | | | 4.14 | | | (9.00) | | | (6.75) | | | (17.69) |
| | |
| | |
| | |
| | |
| | |
|
| | | | | | | | | | | | | | | |
| Less distributions: | | | | | | | | | | | | | | |
| Dividends from net investment | | | | | | | | | | | | | | |
| income | | - | | | - | | | - | | | - | | | - |
| Distributions from net | | | | | | | | | | | | | | |
| realized gains | | - | | | - | | | - | | | - | | | (8.55) |
| Distributions in excess of net | | | | | | | | | | | | | | |
| realized gains | | - | | | - | | | - | | | - | | | - |
| | |
| | |
| | |
| | |
| | |
|
| Total distributions | | - | | | - | | | - | | | - | | | (8.55) |
| | |
| | |
| | |
| | |
| | |
|
| | | | | | | | | | | | | | | |
| Paid-in-capital from redemption | | | | | | | | | | | | | | |
| fees (Note 2) | | - | | | 0.00 (A) | | | 0.02 | | | 0.02 | | | 0.01 |
| | |
| | |
| | |
| | |
| | |
|
| | | | | | | | | | | | | | | |
| Net asset value at end of year | $ | 10.08 | | $ | 11.56 | | $ | 7.42 | | $ | 16.40 | | $ | 23.13 |
| | |
| | |
| | |
| | |
| | |
|
| | | | | | | | | | | | | | | |
| Total return | | (12.80%) | | | 55.80% | | | (54.76%) | | | (29.10%) | | | (37.94%) |
| | |
| | |
| | |
| | |
| | |
|
| | | | | | | | | | | | | | | |
| Net assets at end of year (millions) | $ | 58.2 | | $ | 88.1 | | $ | 62.6 | | $ | 204.9 | | $ | 300.4 |
| | |
| | |
| | |
| | |
| | |
|
| | | | | | | | | | | | | | | |
| Ratio of expenses to average | | | | | | | | | | | | | | |
| net assets | | 1.95% | | | 1.95% | | | 1.95% | | | 1.94% | | | 1.90% |
| Ratio of net investment loss to | | | | | | | | | | | | | | |
| average net assets | | (1.83%) | | | (1.67%) | | | (1.66%) | | | (1.43%) | | | (1.51%) |
| Portfolio turnover rate | | 41% | | | 64% | | | 53% | | | 63% | | | 89% |
(A) Amount is less than $0.01.
see accompanying notes to financial statements
| 2004 Annual Report - 43 |
Firsthand e-Commerce Fund
FINANCIAL HIGHLIGHTS
Selected per share data and ratios for a share outstanding
throughout each year
| | | Year | | | Year | | | Year | | | Year | | | Year | |
| | | Ended | | | Ended | | | Ended | | | Ended | | | Ended | |
| | | 12/31/04 | | | 12/31/03 | | 12/31/02 | | | 12/31/01 | | | 12/31/00 | |
| Net asset value at beginning of year | $ | 3.06 | | $ | 2.08 | | $ | 3.33 | | $ | 6.63 | | $ | 14.86 | |
| | |
| | |
| | |
| | |
| | |
| |
| | | | | | | | | | | | | | | | |
| Income from investment operations: | | | | | | | | | | | | | | | |
| Net investment loss | | (0.06) | | | (0.05) | | | (0.04) | | | (0.04) | | | (0.21) | |
| Net realized and unrealized | | | | | | | | | | | | | | | |
| gains (losses) on investments | | 0.23 | | | 1.03 | | | (1.21) | | | (3.26) | | | (7.99) | |
| | |
| | |
| | |
| | |
| | |
| |
| Total from investment operations | | 0.17 | | | 0.98 | | | (1.25) | | | (3.30) | | | (8.20) | |
| | |
| | |
| | |
| | |
| | |
| |
| | | | | | | | | | | | | | | | |
| Less distributions: | | | | | | | | | | | | | | | |
| Dividends from net investment | | | | | | | | | | | | | | | |
| income | | - | | | - | | | - | | | - | | | (0.00) | (A) |
| Distributions from net realized | | | | | | | | | | | | | | | |
| gains | | - | | | - | | | - | | | - | | | (0.05) | |
| Distributions in excess of net | | | | | | | | | | | | | | | |
| realized gains | | - | | | - | | | - | | | - | | | - | |
| | |
| | |
| | |
| | |
| | |
| |
| Total distributions | | - | | | - | | | - | | | - | | | (0.05) | |
| | |
| | |
| | |
| | |
| | |
| |
| | | | | | | | | | | | | | | | |
| Paid-in-capital from redemption | | | | | | | | | | | | | | | |
| fees (Note 2) | | - | | | 0.00 (A) | | | 0.00(A) | | | 0.00 (A) | | | 0.02 | |
| | |
| | |
| | |
| | |
| | |
| |
| | | | | | | | | | | | | | | | |
| Net asset value at end of year | $ | 3.23 | | $ | 3.06 | | $ | 2.08 | | $ | 3.33 | | $ | 6.63 | |
| | |
| | |
| | |
| | |
| | |
| |
| | | | | | | | | | | | | | | | |
| Total return | | 5.56% | | | 47.12% | | | (37.54%) | | | (49.77%) | | | (55.08%) | |
| | |
| | |
| | |
| | |
| | |
| |
| | | | | | | | | | | | | | | | |
| Net assets at end of year (millions) | $ | 55.6 | | $ | 66.4 | | $ | 51.8 | | $ | 99.5 | | $ | 216.5 | |
| | |
| | |
| | |
| | |
| | |
| |
| | | | | | | | | | | | | | | | |
| Ratio of expenses to average | | | | | | | | | | | | | | | |
| net assets | | 1.95% | | | 1.95% | | | 1.95% | | | 1.95% | | | 1.92% | |
| Ratio of net investment loss to | | | | | | | | | | | | | | | |
| average net assets | | (1.90%) | | | (1.72%) | | | (1.69%) | | | (1.13%) | | | (1.44%) | |
| Portfolio turnover rate | | 22% | | | 46% | | | 61% | | | 67% | | | 73% | |
(A) Amount is less than $0.01.
see accompanying notes to financial statements
| 2004 Annual Report- 44 |
Firsthand Global Technology Fund
FINANCIAL HIGHLIGHTS
Selected per share data and ratios for a share outstanding
throughout each period
| | | Year | | | Year | | | Year | | | Year | | | Period | |
| | | Ended | | | Ended | | | Ended | | | Ended | | | Ended | |
| | | 12/31/04 | | | 12/31/03 | | | 12/31/02 | | | 12/31/01 | | 12/31/00 | (A) |
| Net asset value at beginning of period | $ | 4.61 | | $ | 2.42 | | $ | 5.14 | | $ | 8.75 | | $ | 10.00 | |
| | |
| | |
| | |
| | |
| | |
| |
| | | | | | | | | | | | | | | | |
| Income from investment operations: | | | | | | | | | | | | | | | |
| Net investment income (loss) | | (0.10) | | | (0.05) | | | (0.07) | | | (0.07) | | | 0.04 | |
| Net realized and unrealized | | | | | | | | | | | | | | | |
| gains (losses) on investments | | (0.23) | | | 2.24 | | | (2.65) | | | (3.57) | | | (1.28) | |
| | |
| | |
| | |
| | |
| | |
| |
| Total from investment operations | | (0.33) | | | 2.19 | | | (2.72) | | | (3.64) | | | (1.24) | |
| | |
| | |
| | |
| | |
| | |
| |
| | | | | | | | | | | | | | | | |
| Less distributions: | | | | | | | | | | | | | | | |
| Dividends from net | | | | | | | | | | | | | | | |
| investment income | | - | | | - | | | - | | | - | | | (0.03) | |
| Distributions from net | | | | | | | | | | | | | | | |
| realized gains | | - | | | - | | | - | | | - | | | - | |
| Distributions in excess of net | | | | | | | | | | | | | | | |
| realized gains | | - | | | - | | | - | | | - | | | - | |
| | |
| | |
| | |
| | |
| | |
| |
| Total distributions | | - | | | - | | | - | | | - | | | (0.03) | |
| | |
| | |
| | |
| | |
| | |
| |
| | | | | | | | | | | | | | | | |
| Paid-in-capital from redemption | | | | | | | | | | | | | | | |
| fees (Note 2) | | - | | | 0.00 | (B) | | 0.00 | (B) | | 0.03 | | | 0.02 | |
| | |
| | |
| | |
| | |
| | |
| |
| | | | | | | | | | | | | | | | |
| Net asset value at end of period | $ | 4.28 | | $ | 4.61 | | $ | 2.42 | | $ | 5.14 | | $ | 8.75 | |
| | |
| | |
| | |
| | |
| | |
| |
| | | | | | | | | | | | | | | | |
| Total return | | (7.16%) | | | 90.50% | | | (52.92%) | | | (41.26%) | | | (12.18%) | (C) |
| | |
| | |
| | |
| | |
| | |
| |
| | | | | | | | | | | | | | | | |
| Net assets at end of period (millions) | $ | 32.5 | | $ | 57.3 | | $ | 20.2 | | $ | 53.0 | | $ | 125.3 | |
| | |
| | |
| | |
| | |
| | |
| |
| | | | | | | | | | | | | | | | |
| Ratio of expenses to average | | | | | | | | | | | | | | | |
| net assets | | 1.95% | | | 1.95% | | | 1.95% | | | 1.95% | | | 1.95% | (D) |
| Ratio of net investment income | | | | | | | | | | | | | | | |
| (loss) to average net assets | | (1.69%) | | | (1.77%) | | | (1.73%) | | | (0.95%) | | | 1.66% | (D) |
| Portfolio turnover rate | | 15% | | | 50% | | | 26% | | | 67% | | | 0% | (C) |
(A) Represents the period from the commencement of operations (September 29, 2000) through December 31, 2000.
(B) Amount is less than $0.01.
(C) Not annualized.
(D) Annualized.
see accompanying notes to financial statements
| 2004 Annual Report - 45 |
NOTES TO FINANCIAL STATEMENTS
December 31, 2004
1. Organization
Each of Firsthand Technology Value Fund, Firsthand Technology Leaders Fund, Firsthand Technology Innovators Fund, Firsthand e-Commerce Fund, and Firsthand Global Technology Fund (the "Funds") is a non-diversified series of Firsthand Funds (the "Trust"), an open-end management investment company registered under the Investment Company Act of 1940, as amended (the "1940 Act"). The Trust, a Delaware statutory trust, was organized on November 8, 1993. The inception date for each Fund (the date on which a net asset value was first determined for that Fund) is as follows:
| Fund | Inception Date |
| | |
| Firsthand Technology Value Fund | May 20, 1994* |
|
| Firsthand Technology Leaders Fund | December 10, 1997 |
|
| Firsthand Technology Innovators Fund | May 20, 1998 |
|
| Firsthand e-Commerce Fund | September 30, 1999 |
|
| Firsthand Global Technology Fund | September 29, 2000 |
|
* Firsthand Technology Value Fund Investor Class commenced operations on May 20, 1994; the SEC effective date for the Investor Class is December 15, 1994. Firsthand Technology Value Fund Advisor Class commenced operations on February 1, 2002, and liquidated on February 28, 2003. Each Fund currently offers one class of shares-Investor Class shares.
Each Fund's investment objective is long-term growth of capital.
Firsthand Technology Value Fund seeks to achieve its investment objective by investing, under normal circumstances, at least 80% of its assets in high-technology companies that Firsthand Capital Management, Inc. (the "Investment Adviser") believes are undervalued and have potential for capital appreciation.
Firsthand Technology Leaders Fund seeks to achieve its investment objective by investing, under normal circumstances, at least 80% of its assets in high-technology companies that the Investment Adviser believes hold dominant competitive positions in high-growth industries.
Firsthand Technology Innovators Fund seeks to achieve its investment objective by investing, under normal circumstances, at least 80% of its assets in high-technology companies that the Investment Adviser considers to be best positioned to introduce "breakthrough" products in the fastest-growing markets in the technology sector.
Firsthand e-Commerce Fund seeks to achieve its investment objective by investing, under normal circumstances, at least 80% of its assets in equity securities of companies that provide the products, services, and technologies to facilitate the growth of electronic commerce.
Firsthand Global Technology Fund seeks to achieve its investment objective by investing, under normal circumstances, at least 80% of its assets in high-technology companies, both domestic and foreign, that the Investment Adviser considers best positioned to benefit significantly from the adoption of new technologies worldwide.
| 2004 Annual Report - 46 |
NOTES TO FINANCIAL STATEMENTS (continued)
December 31, 2004
2. Significant Accounting Policies
The following is a summary of the Funds' significant accounting policies:
Securities Valuation-A Fund's portfolio of securities is valued as follows:
1.
| Securities traded on stock exchanges, or quoted by Nasdaq, are valued according to the Nasdaq official closing price, if applicable, or at their last reported sale price as of the close of trading on the New York Stock Exchange ("NYSE") (normally 4:00 P.M. Eastern Time). If a security is not traded that day, the security will be valued at its most recent bid price.
|
2.
| Securities traded in the over-the-counter market, but not quoted by Nasdaq, are valued at the last sale price (or, if the last sale price is not readily available, at the most recent closing bid price as quoted by brokers that make markets in the securities) at the close of trading on the NYSE.
|
3.
| Securities traded both in the over-the-counter market and on a stock exchange are valued according to the broadest and most representative market.
|
4.
| Securities and other assets that do not have market quotations readily available are valued at their fair value as determined in good faith using procedures established by the Board of Trustees.
|
Share Valuation-The net asset value ("NAV") per share of each Fund is calculated by dividing the sum of the value of the securities held by the Fund, plus cash or other assets, minus all liabilities (including estimated accrued expenses) by the total number of shares outstanding of the Fund, rounded to the nearest cent. A Fund's shares will not be priced on the days on which the NYSE is closed for trading. The offering and redemption price per share of each Fund is equal to a Fund's net asset value per share. Prior to April 30, 2003, shares of each Fund were charged a 2% redemption fee on shares redeemed or exchanged within 180 days of purchase. These fees were deducted from the redemption proceeds otherwise payable to the shareholder. Each Fund retained the fee charged as paid-in capital and such fees became part of that Fund's daily NAV calculation.
Repurchase Agreements-Repurchase agreements, which must be secured with collateral of a credit quality at least equal to a Fund's investment criteria for its portfolio securities, are valued at cost, which, together with accrued interest, approximates market value. At the time a Fund enters into a repurchase agreement, the value of the underlying securities, including accrued interest, will equal or exceed the value of the repurchase agreement, and in the case of a repurchase agreement exceeding one day, the seller will agree that the value of the underlying securities, including accrued interest, will at all times equal or exceed the value of the repurchase agreement. In the event of a bankruptcy or other default by the seller of a repurchase agreement, a Fund could experience delays in liquidating the underlying securities and losses.
Investment Income-Dividend income is recorded on the ex-dividend date. Interest income is accrued as earned. Discounts and premiums on securities purchased are amortized over the lives of the respective securities.
| 2004 Annual Report - 47 |
NOTES TO FINANCIAL STATEMENTS (continued)
December 31, 2004
Foreign Securities-Each Fund may invest in companies that trade on U.S. exchanges as American Depositary Receipts ("ADRs"), on foreign exchanges, or on foreign over-the-counter markets. Investing in the securities of foreign companies exposes your investment in a Fund to risk. Foreign stock markets tend to be more volatile than the U.S. market due to economic and/or political instability and the regulatory conditions in some countries. In addition, some of the securities in which the Fund may invest may be denominated in foreign currencies, the value of which may decline against the U.S. dollar. An investment in foreign securities may be subject to high levels of foreign taxation, including foreign taxes withheld at the source.
Options-The Funds (other than Firsthand Technology Value Fund) may purchase put and call options to attempt to provide protection against adverse price effects from anticipated changes in prevailing prices of securities or stock indices. When the Fund writes an option, an amount equal to the premium received by the Fund is recorded as a liability and is subsequently adjusted to the current fair value of the option written. Premiums received from writing options that expire unexercised are treated by the Fund on the expiration date as realized gains from investments. The difference between the premium and the amount paid on effecting a closing purchase transaction, including brokerage commissions, is also treated as a realized gain, or, if the premium is less than the amount paid for the closing purchase transaction, as a realized loss. If a call option is exercised, the premium is added to the proceeds from the sale of the underlying security or currency in determining whether the Fund has realized a gain or loss. The Fund as writer of an option bears the market risk of an unfavorable change in the price of the security underlying the written option.
Distributions to Shareholders-Each Fund expects to distribute its net investment income and net realized gains, if any, annually. Distributions from net investment income and capital gains are determined in accordance with income tax regulations, which may differ from accounting principles generally accepted in the United States.
Reclassification of Capital Accounts-The funds account and report for distributions to shareholders in accordance with the American Institute of Certified Public Accountant's Statement of Position 93-2: Determination, Disclosure, and Financial Statement Presentation of Income, Capital and Return of Capital Distributions by Investment Companies. For the year ended December 31, 2004, each Fund recorded the following reclassifications to the accounts listed below:
| | | | Increase (Decrease) | | |
| | | Paid-in-Capital | | Accumulated Net | | | Accumulated Net |
| | | | | Investment Loss | | | Realized Loss |
| Firsthand Technology | | | | | | | | |
| Value Fund | $ | (9,766,774) | | $ | 9,766,774 | | $ | - |
| Firsthand Technology | | | | | | | | |
| Leaders Fund | | (2,042,527) | | | 2,042,527 | | | - |
| Firsthand Technology | | | | | | | | |
| Innovators Fund | | (1,252,860) | | | 1,252,860 | | | - |
| Firsthand e-Commerce | | | | | | | | |
| Fund | | (1,105,421) | | | 1,105,421 | | | - |
| Firsthand Global | | | | | | | | |
| Technology Fund | | (750,491) | | | 751,395 | | | (904) |
| 2004 Annual Report - 48 |
NOTES TO FINANCIAL STATEMENTS (continued)
December 31, 2004
Security Transactions-Security transactions are accounted for on the trade date. Securities sold are valued on a specific identification basis.
Estimates-The preparation of financial statements in conformity with accounting principles generally accepted in the United States of America requires management to make estimates and assumptions that affect the reported amounts of assets and liabilities at the date of the financial statements and the reported amounts of income and expenses during the reporting period. Actual results could differ from those estimates.
Federal Income Tax-Each Fund has elected, and intends to qualify annually, for the special tax treatment afforded regulated investment companies under the Internal Revenue Code of 1986, as amended (the "Code"). As provided in the Code, in any fiscal year in which a Fund so qualifies and distributes at least 90% of its taxable net income, the Fund (but not the shareholders) will be relieved of federal income tax on the income distributed. Accordingly, no provision for income taxes has been made.
To avoid imposition of the excise tax applicable to regulated investment companies, each Fund intends to declare as dividends in each calendar year at least 98% of its net investment income (earned during the calendar year) and 98% of its net realized capital gains (earned during the 12 months ended October 31) plus undistributed amounts, if any, from prior years.
The following information is based upon the federal income tax cost of portfolio investments as of December 31, 2004.
| | | Firsthand | | | Firsthand | | | Firsthand | | | | | | Firsthand |
| | | Technology | | | Technology | | | Technology | | | Firsthand | | | Global |
| | | Value | | | Leaders | | | Innovators | | | e-Commerce | | | Technology |
| | | Fund | | | Fund | | | Fund | | | Fund | | | Fund |
| | | | | | | | | | | | | | | |
| Gross unrealized | | | | | | | | | | | | | | |
| appreciation | $ | 141,770,374 | | $ | 24,207,174 | | $ | 7,873,791 | | $ | 16,982,049 | | $ | 6,467,589 |
| | | | | | | | | | | | | | | |
| Gross unrealized | | | | | | | | | | | | | | |
| depreciation | | (565,342,052) | | | (25,610,479) | | | (32,856,181) | | | (10,426,112) | | | (5,834,931) |
| | |
| | |
| | |
| | |
| | |
|
| | | | | | | | | | | | | | | |
| Net unrealized | | | | | | | | | | | | | | |
| appreciation | | | | | | | | | | | | | | |
| (depreciation) | $ | (423,571,678) | | $ | (1,403,305) | | $ | (24,982,390) | | $ | 6,555,937 | | $ | 632,658 |
| | |
| | |
| | |
| | |
| | |
|
| | | | | | | | | | | | | | | |
| Federal income | | | | | | | | | | | | | | |
| tax cost | $ | 1,007,175,614 | | $ | 114,857,247 | | $ | 82,767,068 | | $ | 48,841,831 | | $ | 32,711,872 |
| | |
| | |
| | |
| | |
| | |
|
| 2004 Annual Report - 49 |
NOTES TO FINANCIAL STATEMENTS (continued)
December 31, 2004
The difference between the acquisition cost and the federal income tax cost of portfolio investments is due to certain timing differences in the recognition of capital losses under accounting principles generally accepted in the United States and income tax regulations. As of December 31, 2004, the Funds had capital loss carryforwards for federal income tax purposes as follows:
| | Expiring 2008 | | Expiring 2009 | | | Expiring 2010 | | | Expiring 2011 | | | Expiring 2012 |
| | | | | | | | | | | | | |
| Firsthand Technology | | | | | | | | | | | | |
| Value Fund | $ - | $ | 1,092,189,416 | | $ | 634,016,220 | | $ | 330,969,371 | | $ | 333,067,019 |
| Firsthand Technology | | | | | | | | | | | | |
| Leaders Fund | 7,699,026 | | 134,863,157 | | | 109,312,900 | | | 53,324,264 | | | 33,348,418 |
| Firsthand Technology | | | | | | | | | | | | |
| Innovators Fund | - | | 195,444,987 | | | 87,067,727 | | | 61,543,691 | | | 7,252,266 |
| Firsthand e-Commerce | | | | | | | | | | | | |
| Fund | - | | 262,005,645 | | | 141,312,315 | | | 6,014,495 | | | - |
| Firsthand Global | | | | | | | | | | | | |
| Technology Fund | - | | 47,790,468 | | | 13,149,532 | | | 16,183,628 | | | - |
For Firsthand Technology Value Fund, $7,924,308 of the $1,092,189,416 capital loss carryforward expiring in 2009 was acquired in the reorganization with Firsthand Communications Fund.
Components of distributable earnings:
| | | Firsthand | | | Firsthand | | | Firsthand | | | | | | Firsthand |
| | | Technology | | | Technology | | | Technology | | | Firsthand | | | Global |
| | | Value | | Leaders | | | Innovators | | | e-Commerce | | | Technology |
| | | Fund | | | Fund | | | Fund | | | Fund | | | Fund |
| | | | | | | | | | | | | | | |
| Net Unrealized | | | | | | | | | | | | | | |
| Appreciation | | | | | | | | | | | | | | |
| (Depreciation)* | $ | (423,571,678) | | $ | (1,403,305) | | $ | (24,982,390) | | $ | 6,167,223 | | $ | 632,658 |
| Post October Capital/ | | | | | | | | | | | | | | |
| Currency Loss | | (17,865,329) | | | (1,835,645) | | | (1,388,967) | | | - | | | (303,843) |
| Accumulated Capital | | | | | | | | | | | | | | |
| Loss Carryforward | | (2,390,242,026) | | | (338,547,765) | | | (351,308,671) | | | (409,332,455) | | | (77,123,628) |
| | |
| | |
| | |
| | |
| | |
|
| Total Distributable | | | | | | | | | | | | | | |
| Earnings | $ | (2,831,679,033) | | $ | (341,786,715) | | $ | (377,680,028) | | $ | (403,165,232) | | $ | (76,794,813) |
| | |
| | |
| | |
| | |
| | |
|
*On investments, derivative and foreign currency denominated assets and liabilities.
| 2004 Annual Report - 50 |
NOTES TO FINANCIAL STATEMENTS (continued)
December 31, 2004
3. Investment Transactions
Investment transactions (excluding short-term investments) were as follows for the year ended December 31, 2004.
| | | Firsthand | | | Firsthand | | | Firsthand | | | | | | Firsthand |
| | | Technology | | | Technology | | | Technology | | | Firsthand | | | Global |
| | | Value | | | Leaders | | | Innovators | | | e-Commerce | | | Technology |
| | | Fund | | | Fund | | | Fund | | | Fund | | | Fund |
| | | | | | | | | | | | | | | |
| Purchase of | | | | | | | | | | | | | | |
| investment | | | | | | | | | | | | | | |
| securities | $ | 115,803,353 | | $ | 28,293,350 | | $ | 27,268,554 | | $ | 12,289,230 | | $ | 6,284,409 |
| | |
| | |
| | |
| | |
| | |
|
| Proceeds from sales | | | | | | | | | | | | | | |
| and maturities of | | | | | | | | | | | | | | |
| investment securities | $ | 336,680,423 | | $ | 66,714,070 | | $ | 47,850,556 | | $ | 29,586,360 | | $ | 25,314,984 |
| | |
| | |
| | |
| | |
| | |
|
Transactions in options written during the year ended December 31, 2004, were as follows:
| Firsthand e-Commerce Fund | Number of Contracts | | Premiums Received |
| Options outstanding at December 31, 2003 | - | | $ | - |
| Options written | 1,200 | | | 187,286 |
| Options expired | - | | | - |
| Options outstanding at December 31, 2004 | 1,200 | | $ | 187,286 |
| |
| | |
|
4. Investment Advisory and Administration Agreements
Certain trustees and officers of the Trust are also officers of the Investment Adviser, or State Street Bank and Trust Company ("State Street"), which is the sub-administrator, shareholder servicing and transfer agent, investment accounting agent, and custodian for the Trust.
INVESTMENT ADVISORY AGREEMENT
Each Fund's investments are managed by the Investment Adviser pursuant to the terms of an Investment Advisory Agreement (the "Advisory Agreement"). Under the Advisory Agreement, the Investment Adviser provides each Fund with investment research, advice, management, and supervision and manages the investment and reinvestment of assets of each Fund consistent with each Fund's investment objectives, policies, and limitations. The Investment Adviser is responsible for (i) compensation of any of the Fund's trustees, officers, and employees who are interested persons of the Investment Adviser; and (ii) compensation of the Investment Adviser's personnel and other expenses incurred in connection with the provision of portfolio management services under the Advisory Agreement.
For the services it provides under the Advisory Agreement, the Investment Adviser receives from each Fund, on a monthly basis, an advisory fee at the annual rate of 1.50% of its average daily net assets. The Advisory Agreement requires the Investment Adviser to waive fees and, if necessary, to reimburse expenses of each such Fund to the extent necessary to limit a Fund's total
| 2004 Annual Report - 51 |
NOTES TO FINANCIAL STATEMENTS (continued)
December 31, 2004
operating expenses to 1.95% of its average net assets up to $200 million, 1.90% of such assets from $200 million to $500 million, 1.85% of such assets from $500 million to $1 billion, and 1.80% of such assets in excess of $1 billion.
ADMINISTRATION AGREEMENT
The Trust has entered into a separate Administration Agreement with the Investment Adviser. The agreement obligates the Investment Adviser to provide administrative and general supervisory services to each Fund (the "Administration Agreement"). Under the Administration Agreement, the Investment Adviser renders supervisory and corporate administrative services to the Trust, as well as oversees the maintenance of all books and records with respect to each Fund's securities transactions and each Fund's book of accounts in accordance with all applicable federal and state laws and regulations. The Investment Adviser also arranges for the preservation of journals, ledgers, corporate documents, brokerage account records, and other records as required by the 1940 Act.
The Investment Adviser is responsible for the equipment, staff, office space, and facilities necessary to perform its obligations under the Administration Agreement. Under the Administration Agreement, the Investment Adviser has assumed responsibility for payment of all of each Fund's operating expenses excluding independent trustees' compensation; brokerage and commission expenses; fees payable under "Rule 12b-1 plans", if any, and shareholder servicing plans, if any; litigation costs; and any extraordinary and non-recurring expenses.
For the services it provides under the Administration Agreement, the Investment Adviser receives a fee from each Fund at the annual rate of 0.45% of its average daily net assets up to $200 million, 0.40% of such assets from $200 million to $500 million, 0.35% of such assets from $500 million to $1 billion, and 0.30% of such assets in excess of $1 billion.
The Investment Adviser has entered into a Sub-Administration Agreement with State Street. Under this agreement, the Investment Adviser (not the Funds) pays to State Street the fees for the administrative services provided by State Street.
5. Capital Shares
Capital share transactions for Firsthand Technology Value Fund for the period ended December 31, 2003, are noted below:
| | INVESTOR CLASS | | ADVISOR CLASS |
| | Shares | | | Amount | | Shares | | | Amount |
| Shares sold | 9,387,545 | | $ | 255,958,697 | | - | | $ | - |
| Shares redeemed | (8,835,652) | | | (228,652,163) | | (4.486) | | | (75.18) |
| |
| | |
| |
| | |
|
| Net increase (decrease) | | | | | | | | | |
| from capital share transactions | 551,893 | | $ | 27,306,534 | | (4.486) | | $ | (75.18) |
| |
| | |
| |
| | |
|
6. Deferred Compensation Agreement With Trustees
During the fiscal year ended December 31, 2000, the Trust entered into a deferred compensation agreement with the independent trustees of the Trust.
| 2004 Annual Report - 52 |
NOTES TO FINANCIAL STATEMENTS (continued)
December 31, 2004
Under the deferred compensation agreement, each independent trustee may elect to defer some or all of his trustee fees. Each independent trustee is paid an annual retainer of $24,000, $6,000 for each regular meeting attended in person, and $1,000 for each special meeting attended. Deferred fees may be deemed invested in the Firsthand Funds selected by each independent trustee on a tax-deferred basis and deferred fees (and the income, gains, and losses credited during the deferral period) are payable at least two years after deferral date. Upon payment of any deferred fees (and the income, gains, and losses credited during the deferral period), each Fund will expense its pro rata share of those fees.
7. Investments in Affiliates and Restricted Securities
Affiliated issuers, as defined by the 1940 Act, are those in which a Fund's holdings represent 5% or more of the outstanding voting securities of the issuer. A summary of each Fund's investments in affiliates, if any, for the period ended December 31, 2004, is noted below:
| | | SHARE ACTIVITY | | | | | | | |
| | | | | | | | | | | |
| | Balance | Purchases | Sales | Balance | | | Realized | | | Value | | | Acquisition |
| Affiliate | 12/31/03 | | | 12/31/04 | | | Gain (Loss) | | | 12/31/04 | | | Cost |
| | | | | | | | | | | | | | |
| Firsthand Technology Value Fund | | | | | | | | | | | | | |
| | | | | | | | | | | | | | |
| Anaren, Inc.* | 1,211,900 | - | 100,000 | 1,111,900 | | $ | (183,833) | | $ | 14,410,224 | | $ | 17,837,394 |
| | | | | | | | | | | | | | |
| Clarisay, Inc. Series B * | 2,605,306 | - | - | 2,605,306 | | | - | | | - | | | 2,383,855 |
| | | | | | | | | | | | | | |
| Clarisay, Inc. Series C | 7,194,244 | - | - | 7,194,244 | | | - | | | - | | | 2,000,000 |
| | | | | | | | | | | | | | |
| Clarisay, Inc. Warrants 06/03/2005 | 500,000 | - | - | 500,000 | | | - | | | - | | | - |
| | | | | | | | | | | | | | |
| Clarisay, Inc. Warrants 07/07/2005 | 500,000 | - | - | 500,000 | | | - | | | - | | | - |
| | | | | | | | | | | | | | |
| Clarisay, Inc. Warrants 08/07/2005 | 500,000 | - | - | 500,000 | | | - | | | - | | | - |
| | | | | | | | | | | | | | |
| Clarisay, Inc. Warrants 09/12/2005 | 250,000 | - | - | 250,000 | | | - | | | - | | | - |
| | | | | | | | | | | | | | |
| Clarisay, Inc. Warrants 09/19/2005 | 100,000 | - | - | 100,000 | | | - | | | - | | | - |
| | | | | | | | | | | | | | |
| Clarisay, Inc. Warrants 11/10/2005 | 500,000 | - | - | 500,000 | | | - | | | - | | | - |
| | | | | | | | | | | | | | |
| Clarisay, Inc. 8.00% 06/03/2005 | 500,000 | - | - | 500,000 | | | - | | | - | | | 500,000 |
| | | | | | | | | | | | | | |
| Clarisay, Inc. 8.00% 07/07/2005 | 500,000 | - | - | 500,000 | | | - | | | - | | | 500,000 |
| | | | | | | | | | | | | | |
| Clarisay, Inc. 8.00% 08/07/2005 | 500,000 | - | - | 500,000 | | | - | | | - | | | 500,000 |
| | | | | | | | | | | | | | |
| Clarisay, Inc. 8.00% 09/12/2005 | 250,000 | - | - | 250,000 | | | - | | | - | | | 250,000 |
| | | | | | | | | | | | | | |
| Clarisay, Inc. 8.00% 09/19/2005 | 100,000 | - | - | 100,000 | | | - | | | - | | | 100,000 |
| | | | | | | | | | | | | | |
| Clarisay, Inc. 8.00% 11/10/2005 | 500,000 | - | - | 500,000 | | | - | | | - | | | 500,000 |
| 2004 Annual Report - 53 |
NOTES TO FINANCIAL STATEMENTS (continued)
December 31, 2004
| | | | SHARE ACTIVITY | | | | | | | |
| | | | | | | | | | | | |
| | Balance | | Purchases | Sales | Balance | | | Realized | | | Value | | | Acquisition |
| Affiliate | 12/31/03 | | | | 12/31/04 | | | Gain (Loss) | | | 12/31/04 | | | Cost |
| Firsthand Technology Value | | | | | | | | | | | | | | |
| Fund (continued) | | | | | | | | | | | | | | |
| Concord Communications, Inc. | 1,189,300 | | - | 100,000 | 1,089,300 | | $ | (3,740,720) | | $ | 12,069,444 | | $ | 42,650,119 |
| | | | | | | | | | | | | | | |
| Global Locate, Inc. Series A* | 6,030,896 | | - | - | 6,030,896 | | | - | | | 7,794,209 | | | 5,144,355 |
| | | | | | | | | | | | | | | |
| Global Locate, Inc. Series C | 1,111,111 | | - | - | 1,111,111 | | | - | | | 1,000,000 | | | 1,000,000 |
| | | | | | | | | | | | | | | |
| Global Locate, Inc. Series D | - | | 555,555 | - | 555,555 | | | - | | | 500,000 | | | 500,000 |
| | | | | | | | | | | | | | | |
| Global Locate, Inc. Board Warrants | - | | 18,750 | - | 18,750 | | | - | | | 94 | | | - |
| | | | | | | | | | | | | | | |
| Global Locate, Inc. Board Warrants | 75,000 | | - | - | 75,000 | | | - | | | 375 | | | - |
| | | | | | | | | | | | | | | |
| Global Locate, Inc. Board Warrants | - | | 75,000 | - | 75,000 | | | - | | | 375 | | | - |
| | | | | | | | | | | | | | | |
| Global Locate, Inc. Series C Warrants | 370,370 | | - | - | 370,370 | | | - | | | 3,704 | | | - |
| | | | | | | | | | | | | | | |
| Global Locate, Inc. Series D Warrants | - | | 111,111 | - | 111,111 | | | - | | | 1,111 | | | - |
| | | | | | | | | | | | | | | |
| Maple Optical Systems, Inc. | | | | | | | | | | | | | | |
| Series A-1 | 10,352,054 | | - | - | 10,352,054 | | | - | | | - | | | 3,623,219 |
| | | | | | | | | | | | | | | |
| Napster, Inc. | - | | 1,800,000*** | 50,000 | 1,750,000 | | | 196,114 | | | 16,450,000 | | | 8,926,836 |
| | | | | | | | | | | | | | | |
| Silicon Genesis Corp. Series 1-D | 850,830** | | - | - | 850,830 | | | - | | | 749,751 | | | 4,315,500 |
| | | | | | | | | | | | | | | |
| Silicon Genesis Corp. Series 1-E | 4,071,226 | | - | - | 4,071,226 | | | - | | | 4,315,500 | | | 4,315,500 |
| | | | | | | | | | | | | | | |
| Silicon Genesis Corp. Common Stock | 726,424** | | - | - | 726,424 | | | - | | | 7,264 | | | 3,684,494 |
| | | | | | | | | | | | | | | |
| Silicon Genesis Corp. Series | | | | | | | | | | | | | | |
| 1-E Warrants | 1,257,859 | | - | - | 1,257,859 | | | - | | | 334,339 | | | - |
| | | | | | | | | | | | | | | |
| Silicon Genesis Corp. | | | | | | | | | | | | | | |
| Common Stock Warrants | 37,982 | | - | - | 37,982 | | | - | | | 38 | | | - |
| | | | | | | | | | | | | | | |
| Silicon Genesis Corp. | | | | | | | | | | | | | | |
| Common Stock Warrants | 59,147** | | - | - | 59,147 | | | - | | | 59 | | | - |
| | | | | | | | | | | | | | | |
| Stratex Networks, Inc. | 4,832,036 | | - | 145,000 | 4,687,036 | | | (4,132,106) | | | 10,592,701 | | | 64,585,518 |
| | | | | | | | | | | | | | | |
| Zoran Corp. | 1,460,500 | | - | 600,000 | 860,500 | | | (5,606,857) | | | 9,964,590 | | | 8,312,360 |
| 2004 Annual Report - 54 |
NOTES TO FINANCIAL STATEMENTS (continued)
December 31, 2004
| | | SHARE ACTIVITY | | | | | |
| | | | | | | | | |
| | Balance | Purchases | Sales | Balance | | Realized | | Value | | Acquisition |
| Affiliate | 12/31/03 | | | 12/31/04 | | Gain (Loss) | | 12/31/04 | | Cost |
| | | | | | | | | | | |
| Firsthand Technology | | | | | | | | | | |
| Innovators Fund | | | | | | | | | | |
| Clarisay, Inc. Series B | 2,861,519 | - | - | 2,861,519 | | $ - | | $ - | | $ 2,618,290 |
| | | | | | | | | | | |
| Clarisay, Inc. Warrants | | | | | | | | | | |
| 05/08/2005 | 500,000 | - | - | 500,000 | | - | | - | | - |
| | | | | | | | | | | |
| Clarisay, Inc. Warrants | | | | | | | | | | |
| 09/19/2005 | 150,000 | - | - | 150,000 | | - | | - | | - |
| | | | | | | | | | | |
| Clarisay, Inc. Warrants | | | | | | | | | | |
| 10/10/2005 | 500,000 | - | - | 500,000 | | - | | - | | - |
| | | | | | | | | | | |
| Clarisay, Inc. Warrants | | | | | | | | | | |
| 12/31/2010 | 109,290 | - | - | 109,290 | | - | | - | | - |
| | | | | | | | | | | |
| Clarisay, Inc. 8.00% 05/08/2005 | 500,000 | - | - | 500,000 | | - | | - | | 500,000 |
| | | | | | | | | | | |
| Clarisay, Inc. 8.00% 09/19/2005 | 150,000 | - | - | 150,000 | | - | | - | | 150,000 |
| | | | | | | | | | | |
| Clarisay, Inc. 8.00% 10/10/2005 | 500,000 | - | - | 500,000 | | - | | - | | 500,000 |
| | | | | | | | | | | |
| Innovion Corp. Series C | 1,500,000 | - | - | 1,500,000 | | - | | 1,489,350 | | 3,000,000 |
| | | | | | | | | | | |
| Innovion Corp. Warrants | 602,577 | - | - | 602,577 | | - | | 603 | | - |
| | | | | | | | | | | |
| Innovion Corp. 8.00% 03/07/2005 | 602,577 | - | - | 602,577 | | - | | 602,577 | | 602,577 |
| | | | | | | | | | | |
| Maple Optical Systems, Inc. | | | | | | | | | | |
| Series A-1 | 9,647,945 | - | - | 9,647,945 | | - | | - | | 3,376,781 |
| | | | | | | | | | | |
| Silicon Genesis Corp. Series 1-C | 82,914** | - | - | 82,914 | | - | | 300,779 | | 1,731,250 |
| | | | | | | | | | | |
| Silicon Genesis Corp. Series 1-E | 1,633,254 | - | - | 1,633,254 | | - | | 1,731,249 | | 1,731,249 |
| | | | | | | | | | | |
| Silicon Genesis Corp. Common Stock | 102,135** | - | - | 102,135 | | - | | 1,021 | | 1,516,773 |
| | | | | | | | | | | |
| Silicon Genesis Corp. Series | | | | | | | | | | |
| 1-E Warrants | 94,339 | - | - | 94,339 | | - | | 944 | | - |
| * | Amounts include shares from the merger of Firsthand Communications Fund into Firsthand
Technology Value Fund. |
| ** | The beginning share balance is a result of a Silicon Genesis Corp. share restructure. |
| *** | Balance is a result of Roxio, Inc., being acquired by Napster, Inc. |
| 2004 Annual Report - 55 |
NOTES TO FINANCIAL STATEMENTS (continued)
December 31, 2004
Restricted securities include securities that have not been registered under the Securities Act of 1933, as amended, and securities that are subject to restrictions on resale. A Fund may invest in restricted securities that are consistent with a Fund's investment objective and investment strategies. A Fund will not invest in a restricted security if, immediately after and as a result of the investment in such security, more than 15% of the Fund's net assets would be invested in illiquid securities. In some cases, the issuer of restricted securities has agreed to register such securities for resale, at the issuer's expense either upon demand by the Fund or in connection with another registered offering of the securities. Investments in restricted securities are valued at fair value as determined in good faith in accordance with procedures adopted by the Board of Trustees. It is possible that the estimated value may differ significantly from the amount that might ultimately be realized in the near term, and the difference could be material. As of December 31, 2004, the Funds were invested in the following restricted securities:
| Security | Acquisition Date | Shares | | Cost | | Value | | % Net Assets |
| | | | | | | | | |
| Firsthand Technology Value Fund | | | | | | | | | | |
| | | | | | | | | | | |
| AuthenTec, Inc. Series C P/S | April 4, 2003 | 1,472,495 | | $ | 738,000 | | $ | 1,179,881 | | 0.20% |
| AuthenTec, Inc. Series C Warrants | April 4, 2003 | 392,665 | | | - | | | 117,835 | | 0.02% |
| AuthenTec, Inc. Series D P/S | June 14, 2004 | 290,958 | | | 290,958 | | | 232,766 | | 0.04% |
| Caspian Networks, Inc. C/S | February 21, 2002 | 33,781* | | | 3,378,104 | | | - | | 0.00% |
| Celox Networks, Inc. Series A-1 P/S | August 23, 2002 | 1,000,000 | | | 1,200,000 | | | - | | 0.00% |
| Celox Networks, Inc. C/S | April 17, 2001 | 138,121 | | | 14,999,941 | | | - | | 0.00% |
| Celox Networks, Inc. Series | | | | | | | | | | |
| A-1 Warrants | August 23, 2002 | 500,000 | | | - | | | - | | 0.00% |
| Clarisay, Inc. Series B P/S | January 24, 2001 | 2,605,306 | | | 2,383,855 | | | - | | 0.00% |
| Clarisay, Inc. Series C P/S | August 28, 2002 | 7,194,244 | | | 2,000,000 | | | - | | 0.00% |
| Clarisay, Inc. 8.00% | | | | | | | | | | |
| 06/03/2005 C/N | June 3, 2003 | 500,000 | | | 500,000 | | | - | | 0.00% |
| Clarisay, Inc. 8.00% | | | | | | | | | | |
| 07/07/2005 C/N | July 7, 2003 | 500,000 | | | 500,000 | | | - | | 0.00% |
| Clarisay, Inc. 8.00% | | | | | | | | | | |
| 08/07/2005 C/N | August 7, 2003 | 500,000 | | | 500,000 | | | - | | 0.00% |
| Clarisay, Inc. 8.00% | | | | | | | | | | |
| 09/12/2005 C/N | September 12, 2003 | 250,000 | | | 250,000 | | | - | | 0.00% |
| Clarisay, Inc. 8.00% | | | | | | | | | | |
| 09/19/2005 C/N | September 19, 2003 | 100,000 | | | 100,000 | | | - | | 0.00% |
| Clarisay, Inc. 8.00% | | | | | | | | | | |
| 11/10/2005 C/N | November 10, 2003 | 500,000 | | | 500,000 | | | - | | 0.00% |
| Clarisay, Inc. Warrants | June 3, 2003 | 500,000 | | | - | | | - | | 0.00% |
| Clarisay, Inc. Warrants | July 7, 2003 | 500,000 | | | - | | | - | | 0.00% |
| Clarisay, Inc. Warrants | August 7, 2003 | 500,000 | | | - | | | - | | 0.00% |
| Clarisay, Inc. Warrants | September 12, 2003 | 250,000 | | | - | | | - | | 0.00% |
| Clarisay, Inc. Warrants | September 19, 2003 | 100,000 | | | - | | | - | | 0.00% |
| Clarisay, Inc. Warrants | November 10, 2003 | 500,000 | | | - | | | - | | 0.00% |
| Global Locate, Inc. Series A P/S | October 5, 2001 | 5,861,664 | | | 5,000,000 | | | 7,575,497 | | 1.29% |
| Global Locate, Inc. Series A P/S | March 28, 2002 | 169,232 | | | 144,355 | | | 218,712 | | 0.04% |
| 2004 Annual Report - 56 |
NOTES TO FINANCIAL STATEMENTS (continued)
December 31, 2004
| Security | Acquisition Date | Shares | | Cost | | Value | | % Net Assets |
| | | | | | | | | |
| Firsthand Technology Value | | | | | | | | | | |
| Fund (continued) | | | | | | | | | | |
| Global Locate, Inc. Series C P/S | May 15, 2003 | 1,111,111 | | $ | 1,000,000 | | $ | 1,000,000 | | 0.17% |
| Global Locate, Inc. Series D P/S | April 2, 2004 | 555,555 | | | 500,000 | | | 500,000 | | 0.09% |
| Global Locate, Inc. Series C Warrants | May 15, 2003 | 370,370 | | | - | | | 3,704 | | 0.00% |
| Global Locate, Inc. Board Warrants | May 4, 2004 | 18,750 | | | - | | | 94 | | 0.00% |
| Global Locate, Inc. Board Warrants | July 7, 2004 | 75,000 | | | - | | | 375 | | 0.00% |
| Global Locate, Inc. Board Warrants | September 8, 2003 | 75,000 | | | - | | | 375 | | 0.00% |
| Global Locate, Inc. Series D Warrants | April 2, 2004 | 111,111 | | | - | | | 1,111 | | 0.00% |
| IP Unity, Inc. Series C P/S | July 27, 2001 | 1,104,265 | | | 1,987,677 | | | 1,792,863 | | 0.31% |
| IP Unity, Inc. Series E P/S | August 4, 2004 | 193,042 | | | 313,307 | | | 313,307 | | 0.05% |
| IP Unity, Inc. Series E Warrants | August 4, 2004 | 69,496 | | | 69 | | | 69 | | 0.00% |
| Luminous Networks, Inc. Series D P/S | May 31, 2001 | 868,710 | | | 1,816,299 | | | 937,642 | | 0.16% |
| Luminous Networks, Inc. Series E P/S | October 16, 2003 | 434,724 | | | 184,410 | | | 184,410 | | 0.03% |
| Luminous Networks, Inc. | | | | | | | | | | |
| Series D Warrants | December 31, 2003 | 144,785 | | | - | | | - | | 0.00% |
| Maple Optical Systems, Inc. | | | | | | | | | | |
| Series A-1 P/S | July 31, 2002 | 5,714,285 | | | 2,000,000 | | | - | | 0.00% |
| Maple Optical Systems, Inc. | | | | | | | | | | |
| Series A-1 P/S | August 9, 2001 | 4,637,769 | | | 1,623,219 | | | - | | 0.00% |
| NanoMuscle, Inc. 8.00% | | | | | | | | | | |
| 02/16/2005 C/N | August 17, 2004 | 122,549 | | | 122,549 | | | - | | 0.00% |
| NanoMuscle, Inc. 8.00% | | | | | | | | | | |
| 02/16/2005 C/N | September 7, 2004 | 245,422 | | | 245,422 | | | - | | 0.00% |
| NanoMuscle, Inc. 8.00% | | | | | | | | | | |
| 02/16/2005 C/N | November 12, 2004 | 30,668 | | | 30,668 | | | - | | 0.00% |
| NanoMuscle, Inc. C/S | August 29, 2003 | 1,250,000 | | | 1,250,000 | | | - | | 0.00% |
| NanoMuscle, Inc. | | | | | | | | | | |
| Series B-1 Warrants | August 17, 2004 | 306,757 | | | 123 | | | - | | 0.00% |
| NanoMuscle, Inc. | | | | | | | | | | |
| Series A-1 P/S | August 17, 2004 | 1,250,000 | | | - | | | - | | 0.00% |
| Polaris Networks, Inc. | | | | | | | | | | |
| Series A P/S | November 16, 2001 | 297,848 | | | 297,848 | | | 16,918 | | 0.00% |
| Polaris Networks, Inc. | | | | | | | | | | |
| Warrants | March 29, 2004 | 75,712 | | | - | | | 76 | | 0.00% |
| Polaris Networks, Inc., | | | | | | | | | | |
| Escrow 0.56% | March 29, 2004 | 50,486 | | | 50,486 | | | 50,486 | | 0.01% |
| Polaris Networks, Inc. | | | | | | | | | | |
| 10.00% C/N | April 12, 2004 | 50,475 | | | 50,475 | | | 50,475 | | 0.01% |
| Polaris Networks, Inc. | | | | | | | | | | |
| 10.00% C/N | July 14, 2004 | 50,474 | | | 50,474 | | | 50,474 | | 0.01% |
| Silicon Genesis Corp. | | | | | | | | | | |
| Series 1-D P/S | April 30, 2002 | 850,830 | | | 4,315,500 | | | 749,751 | | 0.13% |
| Silicon Genesis Corp. | | | | | | | | | | |
| Common Stock Warrants | April 30, 2002 | 59,147 | | | - | | | 59 | | 0.00% |
| 2004 Annual Report - 57 |
NOTES TO FINANCIAL STATEMENTS (continued)
December 31, 2004
| Security | Acquisition Date | Shares | | Cost | | Value | | % Net Assets |
| | | | | | | | | |
| Firsthand Technology Value | | | | | | | | | | |
| Fund (continued) | | | | | | | | | | |
| Silicon Genesis Corp. Series 1-E P/S | November 4, 2003 | 4,071,226 | | $ | 4,315,500 | | $ | 4,315,500 | | 0.74% |
| Silicon Genesis Corp. | | | | | | | | | | |
| Series 1-E Warrants | October 31, 2003 | 1,257,859 | | | - | | | 334,339 | | 0.06% |
| Silicon Genesis Corp. | | | | | | | | | | |
| Common Stock Warrants | November 4, 2003 | 37,982 | | | - | | | 38 | | 0.00% |
| Silicon Genesis Corp. C/S | April 30, 2002 | 726,424 | | | 3,684,494 | | | 7,264 | | 0.00% |
| Universal Chemical | | | | | | | | | | |
| Technologies, Inc. - Series B P/S | October 5, 2004 | 500,000 | | | 5,000,000 | | | 5,000,000 | | 0.85% |
| Universal Chemical Technologies, | | | | | | | | | | |
| Inc. - Series B Warrants | October 5, 2004 | 200,000 | | | - | | | 200 | | 0.00% |
| | | | | |
| | |
| |
|
| | | | | $ | 61,323,733 | | $ | 24,634,221 | | 4.21% |
| | | | | |
| | |
| |
|
| | | | | | | | | | | |
| Firsthand Technology Innovators Fund | | | | | | | | | | |
| | | | | | | | | | | |
| AuthenTec, Inc. Series C P/S | April 4, 2003 | 736,248 | | $ | 369,000 | | $ | 589,941 | | 1.01% |
| AuthenTec, Inc. Series C Warrants | April 4, 2003 | 196,333 | | | - | | | 58,917 | | 0.10% |
| Clarisay, Inc. Series B P/S | January 24, 2001 | 2,861,519 | | | 2,618,290 | | | - | | 0.00% |
| Clarisay, Inc. 8.00% | | | | | | | | | | |
| 05/08/2005 C/N | May 8, 2003 | 500,000 | | | 500,000 | | | - | | 0.00% |
| Clarisay, Inc. Warrants | May 8, 2003 | 500,000 | | | - | | | - | | 0.00% |
| Clarisay, Inc. 8.00% | | | | | | | | | | |
| 09/19/2005 C/N | September 19, 2003 | 150,000 | | | 150,000 | | | - | | 0.00% |
| Clarisay, Inc. Warrants | September 19, 2003 | 150,000 | | | - | | | - | | 0.00% |
| Clarisay, Inc. 8.00% | | | | | | | | | | |
| 10/10/2005 C/N | October 10, 2003 | 500,000 | | | 500,000 | | | - | | 0.00% |
| Clarisay, Inc. Warrants | October 10, 2003 | 500,000 | | | - | | | - | | 0.00% |
| Clarisay, Inc. Warrants | December 31, 2003 | 109,290 | | | - | | | - | | 0.00% |
| Innovion Corp. Series C P/S | February 23, 2001 | 1,500,000 | | | 3,000,000 | | | 1,489,350 | | 2.56% |
| Innovion Corp. 8.00% | | | | | | | | | | |
| 03/07/2005 C/N | December 30, 2003 | 602,577 | | | 602,577 | | | 602,577 | | 1.04% |
| Innovion Corp. Warrants | December 30, 2003 | 602,577 | | | - | | | 603 | | 0.00% |
| IP Unity, Inc. Series C P/S | July 27, 2001 | 1,117,957 | | | 2,012,323 | | | 1,815,093 | | 3.12% |
| Luminous Networks, Inc. Series D P/S | May 31, 2001 | 1,522,719 | | | 3,183,701 | | | 1,643,547 | | 2.83% |
| Luminous Networks, Inc. Series E P/S | October 16, 2003 | 762,008 | | | 323,244 | | | 323,244 | | 0.56% |
| Luminous Networks, Inc. | | | | | | | | | | |
| Series D Warrants | December 31, 2003 | 253,787 | | | - | | | - | | 0.00% |
| Maple Optical Systems, Inc. | | | | | | | | | | |
| Series A-1 P/S | August 9, 2001 | 9,647,945 | | | 3,376,781 | | | - | | 0.00% |
| NanoMuscle, Inc. Series A-1 P/S | August 17, 2004 | 1,250,000 | | | - | | | - | | 0.00% |
| NanoMuscle, Inc. C/S | August 29, 2003 | 1,250,000 | | | 1,250,000 | | | - | | 0.00% |
| 2004 Annual Report - 58 |
NOTES TO FINANCIAL STATEMENTS (continued)
December 31, 2004
| Security | Acquisition Date | Shares | | Cost | | Value | | % Net Assets |
| | | | | | | | | |
| Firsthand Technology Innovators | | | | | | | | | | |
| Fund (continued) | | | | | | | | | | |
| Polaris Networks, Inc. Series A P/S | November 16, 2001 | 702,152 | | $ | 702,152 | | $ | 39,882 | | 0.07% |
| Silicon Optix, Inc. Series B P/S | November 7, 2003 | 1,111,111 | | | 1,000,000 | | | 1,000,000 | | 1.72% |
| Silicon Genesis Corp. C/S | March 8, 2001 | 102,135 | | | 1,516,773 | | | 1,021 | | 0.00% |
| Silicon Genesis Corp. Series 1-C P/S | March 8, 2001 | 82,914 | | | 1,731,250 | | | 300,779 | | 0.52% |
| Silicon Genesis Corp. Series 1-E P/S | November 4, 2003 | 1,633,254 | | | 1,731,249 | | | 1,731,249 | | 2.98% |
| Silicon Genesis Corp. | | | | | | | | | | |
| Series 1-E Warrants | February 26, 2003 | 94,339 | | | - | | | 944 | | 0.00% |
| | | | | |
| | |
| |
|
| | | | | $ | 24,567,340 | | $ | 9,597,147 | | 16.51% |
| | | | | |
| | |
| |
|
* The share balance changed as a result of a Caspian Networks, Inc. share restructure. C/S Common Stock P/S Preferred Stock C/N Convertible Note
8. Risks
Because the return on and value of an investment in each Fund will fluctuate in response to stock market movements, the most significant risk of investing in a Fund is that you may lose money. Stocks and other equity securities are subject to market risks and fluctuations in value due to earnings, as well as economic, political, or regulatory events, and other factors beyond the Investment Adviser's control. The Funds are designed for long-term investors who can accept the risks of investing in a fund with significant common stock holdings in high-technology industries.
Each Fund is non-diversified. A risk of being non-diversified is that a significant change in the value of one company will have a greater impact on the Fund than it would if the Fund diversified its investments. Another risk for the Fund is its concentration of investments in companies within high-technology industries. The value of high-technology companies can, and often does, fluctuate dramatically and may expose you to greater-than-average financial and market risk.
9. Proxy Voting Policy and Procedures (unaudited)
The Funds have adopted proxy voting procedures pursuant to which the Funds delegate the responsibility for voting proxies relating to portfolio securities held by the Funds to the Investment Adviser as part of the Investment Adviser's general management of the Funds, subject to the Board of Trustees' continuing oversight. A copy of the Funds' proxy voting policy and procedures is available without charge, upon request, by calling 1.888.884.2675. Information regarding how the Investment Adviser voted these proxies for the one-year period ended June 30, 2004, is available by calling the same number and on the website of the U.S. Securities and Exchange Commission at http://www.sec.gov on Form N-PX, which was filed on August 19, 2004. The Funds' voting record is also available on the Funds' website at www.firsthandfunds.com/proxy.
| 2004 Annual Report - 59 |
NOTES TO FINANCIAL STATEMENTS (continued)
December 31, 2004
10. Portfolio Holdings (unaudited)
The Funds file their complete schedule of portfolio holdings with the SEC for the first and third quarters of each fiscal year on Form N-Q. The Funds' Forms N-Q will be available on the SEC's website at http://www.sec.gov and may be reviewed and copied at the SEC's Public Reference Room in Washington, D.C. Information on the operation of the Public Reference Room may be obtained by calling 1.800.SEC.0330.
ADDITIONAL INFORMATION
December 31, 2004 (unaudited)
Information about the trustees and officers* of the Funds is set forth in the following table. The Statement of Additional Information (the "SAI") includes additional information about the Funds' trustees and officers and is available free of charge, upon request, by calling 1.888.884.2675, option 2. The address for each of the persons named below is 125 South Market, Suite 1200, San Jose, CA 95113.
| Name, Year | Term of | | Number of | |
| of Birth, | Office | Principal | Funds in Fund | Other |
| Position(s) | and Length | Occupation(s) | Complex | Trusteeships |
| Held With | of Time | During Past Five | Overseen by | Held by |
| Funds | Served (1) | Years | Trustee | Trustees |
| | | | | |
| DISINTERESTED TRUSTEES |
| | | | | |
| MICHAEL T. | SINCE | Mr. Lynch is a principal of | FIVE | NONE |
| LYNCH | 1994 | Rainier Wine (wine distribution) | | |
| (1961) | | from March 2004 to the present. | | |
| TRUSTEE | | Mr. Lynch served as VP of Sales | | |
| | | and Business Development of | | |
| | | AlphaOmega Soft, Inc. (a | | |
| | | manufacturer of software) from | | |
| | | 2002 through 2003. Mr. Lynch | | |
| | | served as VP of Sales and | | |
| | | Business Development at Picture | | |
| | | IQ Corporation (a manufacturer | | |
| | | of digital imaging software) from | | |
| | | 1999 through 2002. | | |
| | | | | |
| | | | | |
| JERRY WONG | SINCE | Mr. Wong is CFO for | FIVE | NONE |
| (1951) | 1999 | Companion Worlds, Inc. (a | | |
| TRUSTEE | | manufacturer of | | |
| | | hardware/software to facilitate | | |
| | | fitness and health maintenance) | | |
| | | from June 2003 to present. Mr. | | |
| | | Wong also serves as a | | |
| | | consultant from October 2002 to | | |
| | | present. Mr. Wong served as VP | | |
| | | of Finance and EVP of U.S. | | |
| | | Operations of Poet Holdings, | | |
| | | Inc. (a manufacturer of software) | | |
| | | from 1995 to 2002. | | |
| 2004 Annual Report - 60 |
ADDITIONAL INFORMATION (continued)
December 31, 2004 (unaudited)
| | Term of | | | |
| Name, Year | Office | | Number of | |
| of Birth, | and | Principal | Funds in Fund | Other |
| Position(s) | Length of | Occupation(s) | Complex | Trusteeships |
| Held With | Time | During Past Five | Overseen by | Held by |
| Funds | Served (1) | Years | Trustee | Trustees |
| |
| INTERESTED TRUSTEES |
| | | | | |
| KEVIN M. | SINCE | Mr. Landis is President and Chief | FIVE | NONE |
| LANDIS (2) | 1994 | Investment Officer and a | | |
| (1961) | | Director of Firsthand Capital | | |
| TRUSTEE/ | | Management, Inc. and has been | | |
| PRESIDENT | | a portfolio manager with | | |
| | | Firsthand Capital Management, | | |
| | | Inc. since May 1994. From | | |
| | | 1998 through 2001, he was | | |
| | | also the President and CEO of | | |
| | | Silicon Capital Management | | |
| | | LLC. | | |
| | | | | |
| OFFICERS WHO ARE NOT TRUSTEES |
| | | | | |
| YAKOUB | SINCE | Mr. Bellawala is VP of Business | N/A | NONE |
| BELLAWALA (3) | 2003 | Process Development for | | |
| (1965) | | Firsthand Capital Management, | | |
| SECRETARY | | Inc. (FCM) from August 2002 to | | |
| | | present. He was VP of Business | | |
| | | Development for FCM from 1999 | | |
| | | to 2002. He was Treasurer of | | |
| | | FCM's Board of Trustees from | | |
| | | 1996 to 2003. | | |
| | | | | |
| | | | | |
| OMAR | SINCE | Mr. Billawala is COO and CFO | | |
| BILLAWALA (3) | 2003 | of Firsthand Capital | N/A | NONE |
| (1961) | | Management, Inc. (FCM) from | | |
| TREASURER | | 1999 to present. He was also | | |
| | | Secretary of FCM's Board of | | |
| | | Trustees from 2000 to 2003. He | | |
| | | was the COO and CFO of | | |
| | | Silicon Capital Management LLC | | |
| | | from 1999 to 2001. | | |
| | | | | |
| | | | | |
| NICK PETREDIS | SINCE | Mr. Petredis is a principal of | | |
| (1961) | 2004 | Petredis Law Offices from 1993 | N/A | NONE |
| CHIEF | | to present. He was Managing | | |
| COMPLIANCE | | Director and Senior Counsel of | | |
| OFFICER | | Firsthand Capital Management, | | |
| | | Inc. from 2000 to 2001. | | |
*
| The term "officer" means the president, vice president, secretary, treasurer, chief compliance officer, controller, or any other officer who performs policy-making functions.
|
1
| Each trustee shall serve for the lifetime of Firsthand Funds or until he dies, resigns, or is removed. Each officer shall serve a one-year term subject to annual reappointment by the trustees.
|
2
| Mr. Landis is an interested person of the Funds by reason of his position with the Adviser.
|
3
| Mr. Bellawala and Mr. Billawala are brothers.
|
| 2004 Annual Report - 61 |
Firsthand Funds
P.O. Box 8356
Boston, MA 02266-8356
1.888.884.2675
www.firsthandfunds.com
Investment Adviser
Firsthand Capital Management, Inc.
125 South Market
Suite 1200 San Jose, CA 95113
www.firsthandcapital.com
Distributor
ALPS Distributors, Inc.
1625 Broadway
Suite 2200
Denver, CO 80202
Transfer Agent
State Street Bank and Trust Company
P.O. Box 8356 Boston, MA 02266-8356
1.888.884.2675
Item 2. Code of Ethics.
As of the end of the period, December 31, 2004, the registrant has adopted a code of ethics, as defined in Item 2(b) of Form N-CSR, that applies to the registrant's principal executive officer and principal financial officer. The registrant has not made any amendment to its code of ethics during the covered period. The registrant has not granted any waivers from any provisions of the code of ethics during the covered period. A copy of the registrant's code of ethics is filed as Exhibit 11(a)(1) to this Form N-CSR.
Item 3. Audit Committee Financial Expert.
The registrant's Board of Trustees (the "Board") has determined that the registrant has at least one "audit committee financial expert" as defined in Item 3 of Form N-CSR serving on its Audit Committee. Mr. Jerry Wong, an independent trustee for purposes of this Item 3, was deemed qualified and agreed to serve.
Item 4. Principal Accountant Fees and Services.
(a) Audit Fees
For the fiscal years ending December 31, 2004 and December 31, 2003, the aggregate audit fees billed for professional services rendered by the principal accountant were $96,000 and $96,000, respectively. The nature of the services are: (1) auditing of the statements of assets and liabilities, related statements of operations and changes in net assets, and the financial highlights of each series of the registrant; (2) auditing and reporting on the financial statements to be included in the amendment to the registrant's registration statement on Form N-1A to be filed with the Securities and Exchange Commission; (3) review of the amendment to the registration statement; and (4) issuance of a Report on Internal Control for inclusion in the registrant's Form N-SAR.
(b) Audit-Related Fees
For the fiscal years ending December 31, 2004 and December 31, 2003, the principal accountant did not bill the registrant any fees for assurances and related services that are reasonably related to the performance of the audit of the registrant's financial statements and are not reported under paragraph (a) of this Item.
(c) Tax Fees
For the fiscal years ending December 31, 2004 and December 31, 2003, the aggregate tax fees billed for professional services rendered by the principal accountant were $10,000 and $10,000, respectively. Services include the review of income and excise tax returns for the registrant.
(d) All Other Fees
For the fiscal year ending December 31, 2004, the aggregate fees billed for professional services rendered by the principal accounting in connection with its audit of the registrant's anti-money laundering program was $1,500.
(e)(1) Audit Committee Pre-Approval Policies and Procedures
The registrant's Audit Committee Charter states the following with respect to pre-approval procedures:
The Committee hereby delegates to the Chairman of the Committee the authority to grant pre-approvals of audit and "permissible" non-audit services to be provided by the Auditors to the Funds, subject to the ratification of the full Committee at its next regularly scheduled meeting. Both the Auditors and Fund counsel will be responsible for informing the Committee whether they believe that a particular non-audit service is permissible or prohibited pursuant to applicable regulations and standards.
The specific types of non-audit services that the Chairman may pre-approve include, but are not limited to: reviewing the Funds' internal controls over financial reporting; providing tax-related services; reviewing and/or developing an anti-money laundering program; and issuing comfort letters, based on agreed-upon procedures, in connection with any Fund reorganization.
Pre-approval for a non-audit service provided to a Fund is not required if: (i) the aggregate amount of all such non-audit services provided to the Fund constitutes not more than 5% of the total amount of revenues paid by the Fund to the Auditors during the fiscal year in which the non-audit services are provided; (ii) such services were not recognized by the Fund at the time of the engagement to be non-audit services; and (iii) such services are promptly brought to the attention of the Committee and are approved by the Committee or by one or more members of the Committee to whom authority to grant such approvals has been delegated by the Committee prior to the completion of the audit (the "De Minimus Exceptions").
The Committee shall also pre-approve any non-audit services proposed to be provided by the Auditors to (i) a Fund's investment adviser and (ii) any entity controlling, controlled by, or under common control with the investment adviser that provides ongoing services to the Fund, if the Auditors' engagement with the investment adviser or any such control persons relates directly to the operations and financial reporting of the Fund. The De Minimus Exceptions applies to pre-approvals under this paragraph as well, except that the "total amount of revenues" calculation is based on the total amount of revenues paid to the Auditors by the Fund and any other entity that has its services approved under this paragraph (i.e., the investment adviser or any control person).
(e)(2) Percentages of Services
One hundred percent of the services described in each of paragraphs (b) through (d) of this Item were approved by the registrant's Audit Committee pursuant to paragraph (c)(7)(i)(C) of Rule 2-01 of Regulation S-X.
(f) Not applicable.
(g) For the fiscal years ending December 31, 2004 and December 31, 2003, the aggregate non-audit fees billed for services rendered to the registrant by the principal accountant were $11,500 and $11,500, respectively.
(h) Not applicable.
Item 5. Disclosure of Audit Committees for Listed Companies.
Not applicable to the registrant.
Item 6. Schedule of Investments.
Please see Item 1 of this Form.
Item 7. Disclosure of Proxy Voting Policies and Procedures for Closed-End Management Investment Companies.
Not applicable to the registrant.
Item 8. Portfolio Managers of Closed-End Management Investment Companies.
Not applicable to the registrant.
Item 9. Purchase of Equity Securities by Closed-End Management Investment Company and Affiliated Purchasers.
Not applicable to the registrant.
Item 10. Submission of Matters to a Vote of Security Holders.
Registrant has not adopted any material changes to the procedures by which shareholders may recommend nominees to the registrant's Board of Trustees.
Item 11. Controls and Procedures.
(a) The registrant's principal executive officer and principal financial officer have concluded that the registrant's disclosure controls and procedures (as defined in Rule 30a-3(c) under the Investment Company Act of 1940, as amended (the "1940 Act")) are effective, as of a date within 90 days of the filing date of the report that includes the disclosure required by this paragraph, based on their evaluation of these controls and procedures required by Rule 30a-3(b) under the 1940 Act and Rules 13a-15(b) or 15d-15(b) under the Securities Exchange Act of 1934.
(b) There were no changes in the registrant's internal control over financial reporting (as defined in Rule 30a-3(d) under the 1940 Act that occurred during the registrant's most recent fiscal half-year that has materially affected, or is reasonably likely to materially affect, the registrant's internal control over financial reporting.
Item 12. Exhibits.
(a)(1) Code of Ethics referred to in Item 2.
(a)(2) Certifications of principal executive officer and principal financial officer of the registrant as required by Rule 30a-2(a) under the 1940 Act.
(b) Certifications of principal executive officer and principal financial officer as required by Rule 30a-2(b) under the 1940 Act.
SIGNATURES
Pursuant to the requirements of the Securities Exchange Act of 1934 and the Investment Company Act of 1940, the registrant has duly caused this report to be signed on its behalf by the undersigned, thereunto duly authorized.
FIRSTHAND FUNDS
By: /s/ Kevin M. Landis
Kevin M. Landis
President
Date: February 25, 2005
Pursuant to the requirements of the Securities Exchange Act of 1934 and the Investment Company Act of 1940, this report has been signed below by the following persons on behalf of the registrant and in the capacities and on the dates indicated.
By: /s/ Kevin M. Landis
Kevin M. Landis
President
Date: February 25, 2005
By: /s/ Omar Billawala
Omar Billawala
Treasurer
Date: February 25, 2005
EXHIBIT INDEX
Item 12
(a)(1) Code of Ethics referred to in Item 2.
(a)(2) Certifications of principal executive officer and principal financial officer of the registrant as required by Rule 30a-2(a) under the 1940 Act. (EX-99.CERT)
(b) Certifications of principal executive officer and principal financial officer of the registrant as required by Rule 30a-2(b) under the 1940 Act. (EX-99.906CERT)