UNITED STATES
SECURITIES AND EXCHANGE COMMISSION
Washington, D.C. 20549
FORM N-CSR
CERTIFIED SHAREHOLDER REPORT OF REGISTERED
MANAGEMENT INVESTMENT COMPANIES
Investment Company Act file number | 811-8268 |
|
Firsthand Funds |
(Exact name of registrant as specified in charter) |
|
125 South Market, Suite 1200
San Jose, CA | | 95113 |
(Address of principal executive offices) | | (Zip code) |
|
Firsthand Capital Management, Inc.
125 South Market, Suite 1200
San Jose, CA 95113 |
(Name and address of agent for service) |
|
Registrant’s telephone number, including area code: | (408) 294-2200 | |
|
Date of fiscal year end: | December 31, 2006 | |
|
Date of reporting period: | December 31, 2006 | |
| | | | | | | |
Form N-CSR is to be used by management investment companies to file reports with the Commission not later than 10 days after the transmission to stockholders of any report that is required to be transmitted to stockholders under Rule 30e-1 under the Investment Company Act of 1940 (17 CFR 270.30e-1). The Commission may use the information provided on Form N-CSR in its regulatory, disclosure review, inspection, and policymaking roles.
A registrant is required to disclose the information specified by Form N-CSR, and the Commission will make this information public. A registrant is not required to respond to the collection of information contained in Form N-CSR unless the Form displays a currently valid Office of Management and Budget (“OMB’’) control number. Please direct comments concerning the accuracy of the information collection burden estimate and any suggestions for reducing the burden to Secretary, Securities and Exchange Commission, 450 Fifth Street, NW, Washington, DC 20549-0609. The OMB has reviewed this collection of information under the clearance requirements of 44 U.S.C. § 3507.
Item 1. Reports to Stockholders.
Include a copy of the report transmitted to stockholders pursuant to Rule 30e-1 under the Act (17 CFR 270.30e-1).
Firsthand Funds
Annual Report to Shareholders
Firsthand Technology Value Fund ®
Firsthand Technology Leaders Fund
Firsthand Technology Innovators Fund
Firsthand e-Commerce Fund
Firsthand Global Technology Fund
Firsthand Health Sciences Fund
December 31, 2006

This report is provided for the general information of the shareholders of Firsthand Funds. This report is not intended for distribution to prospective investors in the Funds, unless preceded or accompanied by an effective prospectus. For more complete information about Firsthand Funds, please call toll free 1.888.884.2675, option 2, or visit www.firsthandfunds.com for a prospectus, which contains more information, including risks, fees, and expenses. Read the prospectus carefully before investing or sending money.
Firsthand Funds are distributed by ALPS Distributors, Inc.
CONTENTS
Performance Summary | | 4 |
President’s Letter | | 6 |
Shareholder Fee Example | | 8 |
Performance and Portfolio Discussions | | 10 |
Report of Independent Registered Public | | |
Accounting Firm | | 22 |
Financial Statements | | |
Portfolio of Investments | | |
Firsthand Technology Value Fund | | 23 |
Firsthand Technology Leaders Fund | | 27 |
Firsthand Technology Innovators Fund | | 29 |
Firsthand e-Commerce Fund | | 32 |
Firsthand Global Technology Fund | | 34 |
Firsthand Health Sciences Fund | | 36 |
Statements of Assets and Liabilities | | 40 |
Statements of Operations | | 42 |
Statements of Changes in Net Assets | | 44 |
Financial Highlights | | |
Firsthand Technology Value Fund | | 50 |
Firsthand Technology Leaders Fund | | 51 |
Firsthand Technology Innovators Fund | | 52 |
Firsthand e-Commerce Fund | | 53 |
Firsthand Global Technology Fund | | 54 |
Firsthand Health Sciences Fund | | 55 |
Notes to Financial Statements | | 56 |
Additional Information | | 70 |
PERFORMANCE SUMMARY
Period Returns (average annual total returns as of 12/31/06)
| | | | | | | | | | Since | |
Fund | | 1-Year | | 3-Year | | 5-Year | | 10-Year | | Inception | |
| | | | | | | | | | | |
Firsthand Technology Value Fund® | | 8.97 | % | 4.56 | % | -2.64 | % | 5.37 | % | 14.42 | % |
Firsthand Technology Leaders Fund | | 6.75 | % | 5.50 | % | 1.41 | % | · | | 8.26 | % |
Firsthand Technology Innovators Fund | | 13.06 | % | -4.59 | % | -9.35 | % | · | | 3.52 | % |
Firsthand e-Commerce Fund | | 19.12 | % | 9.79 | % | 3.99 | % | · | | -11.63 | % |
Firsthand Global Technology Fund | | 14.83 | % | -0.88 | % | -2.67 | % | · | | -11.96 | % |
Firsthand Health Sciences Fund | | 9.90 | % | · | | · | | · | | 9.84 | % |
| | | | | | | | | | | |
NASDAQ | | 10.39 | % | 7.16 | % | 4.99 | % | 6.95 | % | · | |
S&P 500 | | 15.79 | % | 10.44 | % | 6.19 | % | 8.42 | % | · | |
Returns assume reinvestment of all dividends and distributions but do not reflect the impact of taxes. The performance data quoted represent past performance. Past performance cannot guarantee future results, and current performance may be lower or higher than the performance quoted. Both the return from and the principal value of an investment in the Funds will fluctuate so that an investor’s shares, when redeemed, may be worth more or less than their original cost. To obtain performance as of the most recent month-end, please contact Firsthand Funds by calling 1.888.884.2675 or go to www.firsthandfunds.com.
Each Fund may invest in small-capitalization companies and Initial Public Offerings (“IPOs”). These investments may be more volatile than investments in large-capitalization companies and loss of principal could be greater. The Funds may invest in foreign securities, which may be subject to greater risks than investing in domestic securities. Because the Funds are not diversified, they can take larger positions in fewer companies, increasing their risk profile. The Funds invest in several industries within the technology sector and the relative weightings of these industries in a Fund’s portfolio may change at any time.
The Nasdaq Composite Index (NASDAQ) is a capitalization-weighted index of all common stocks listed with NASDAQ. The Standard & Poor’s 500 Index (S&P 500) is a market-weighted index of 500 stocks of well-established companies. Each index represents an unmanaged, broad-based basket of stocks. These indices are typically used as benchmarks for overall market performance. The Lipper Science and Technology Fund Index includes the 30 largest mutual funds in the group, which, by prospectus or portfolio practice, invest at least 80% of their equity portfolios in science and technology stocks. The Lipper Health/Biotech Index is an equal-weight index that includes the 30 largest mutual funds in the Lipper Health/Biotech Fund category. The Goldman Sachs Health Care Index is a market capitalization-weighted index of stocks designed to measure the performance of companies in the health care sector. Investments cannot be made directly in an index.
This page intentionally left blank
PRESIDENT’S LETTER

Fellow Shareholders,
2006 was a good year for investors. U.S. companies achieved double-digit profit growth for the fourth consecutive year, and the major market indices, the Nasdaq Composite, the S&P 500, and the Dow, registered healthy gains of 10.39%, 15.79% and 19.04%, respectively.
While technology stocks did gain ground, they failed to keep pace with the broader market. Most technology indices finished in the high single digits, but I am pleased to report that several Firsthand Funds fared substantially better than that. Firsthand e-Commerce Fund, Firsthand Global Technology Fund, and Firsthand Technology Innovators Fund posted gains of 19.12%, 14.83%, 13.06%, respectively. The fund discussions on the pages that follow detail each fund’s relative performance versus its benchmarks for the 6- and 12-month periods ended December 31, 2006.
The technology sector’s relative under-performance can largely be explained by the year’s most unpleasant surprise: the options backdating scandal, which hit the tech sector harder than others. Over 100 companies have been investigated for backdating employee stock option grants. The fallout from these investigations has varied widely, but some companies have lost entire management teams as a result. Many others were forced to re-state earnings. For nearly every company involved it has become a significant distraction and the stocks have suffered accordingly.
Although some abusers of the practice probably knew they were cheating, others probably believed they were simply following standard industry practice. In viewing stock options as a free lunch, and in stretching the available rationale, many management teams were guilty of simply trying to be too clever for their own good. It cost some of them their jobs. Interestingly, the Silicon Valley audit and law firms that blessed the practice seem to have escaped relatively unscathed. Still, 2006 was a good year for the industry. Many companies were much more successful than their stock charts might lead you to believe. This means we are entering 2007 with a healthy business climate and attractive valuations. Add to that a growing interest in technology among asset allocators, and we believe you have a very promising outlook.
Some of the specific trends we are following in our technology investments include:
Globalization
By now the mega-trend of globalization is apparent to us all. The key insights come not just from observing that China and India have become fast-growing powerhouses, but from following the implications of that growth. The sustained surge in energy demand is a good example. It’s no coincidence that crude oil prices have skyrocketed as many millions of people around the world have joined the ranks of the consumer class.
Higher energy prices may hurt us as consumers, but they also open up new alternative energy investment opportunities. Some of our best performing and most promising investments today are in the solar power area. We expect many other alternative and “clean” technology opportunities to present themselves in the coming years.
Globalization has clearly re-ignited growth in the consumer electronics industry as well. Remember when total cellphone shipments “peaked” at 400 million units in 2000? It now appears 2006 was the first year with over 1 billion cellphones sold. Yes, that’s approximately one new cellphone for every six people on the planet. Now that’s a big number.
But technology investors prefer tech companies that can still grow. It’s going to be difficult for Motorola or Nokia to offer a compelling rate of growth in an increasingly saturated and brutally competitive market. An approach that has worked well for us is to focus on the new features that are likely to move from niche to mainstream status. A few years ago this meant investing in CMOS sensor suppliers as camera phones became popular. This year and next, we’re looking at location-based technologies and services.
Basic process technologies: SOI & perpendicular recording
As exciting as it is to watch new technologies open up new markets, it’s also important to pay attention to the breakthroughs that enable established industries to keep advancing. For instance, several leading edge semiconductor manufacturers have begun to adopt silicon-on-insulator (SOI) technology as a way to better isolate neighboring circuits from one another. SOI-based devices are expected to have fewer problems with power consumption and electrical noise.
The disk drive industry faces similar challenges. Every year competitive pressures force companies’ price per megabyte to decline anywhere from 35% to 45%. This year drive manufacturers will begin wide-scale deployment of a technology called perpendicular recording. It will enable these manufacturers to increase both their “tracks per inch” and their “bits per inch” to record much more data per given area. If they can control the cost side of the equation, perpendicular recording could be the answer for the next several years.
Health sciences
Health care stocks generally kept pace with the broad market for the first three quarters, but lagged substantially in the fourth quarter. We believe that one significant factor at play was the change in control to a Democratic U.S. congress. Equity markets tend to price in the possibility of congressional action towards health care price controls whenever the Democrats manage the agenda. (Whether that is rational is another discussion.)
Against this backdrop, I am pleased to report that Firsthand Health Sciences Fund had a stellar year in 2006, returning 9.90%. The Fund’s overweight position in biotech served it well, particularly in the fourth quarter, when some high-profile acquisitions boosted valuations across the industry.
The pendulum of investor sentiment seems to be swinging back toward technology stocks, particularly among institutional investors. While this is certainly welcome, it doesn’t affect how and what we do here at Firsthand. Our focus is on finding solid companies that are well positioned to take advantage of the most powerful technology trends and to value them appropriately.
Sincerely,

Kevin Landis
President, Firsthand Funds
SHAREHOLDER FEE EXAMPLE
Example—In general, mutual fund shareholders may incur two types of costs: (1) transaction costs, including sales charges (loads), redemption fees, and exchange fees; and (2) ongoing costs, including management fees, 12b-1 distribution and service fees, non-12b-1 service fees, and other Fund expenses. This example is intended to help you understand your ongoing costs (in dollars) of investing in a Fund and to compare these costs with the ongoing costs of investing in other mutual funds. Note that Firsthand Funds (“Trust”) does not charge transaction fees or 12b-1 distribution and service fees, though you may incur transaction fees if you purchase shares through a broker.
The example below is based on an investment of $1,000 made at the beginning of the period and held for the entire period from July 1, 2006, to December 31, 2006.
Actual Expenses—The section of the table at right entitled “Actual” provides information about actual account values and actual expenses. You may use this information, together with the amount you invested, to estimate the expenses that you paid over the period. Simply divide your account value by $1,000 (for example, an $8,600 account value divided by $1,000 = 8.6), and multiply the result by the number in the section entitled “Actual” under the heading “Expenses Paid During Period” to estimate the expenses you paid on your account during this period. If your account is an IRA or other tax-qualified savings plan, your expenses may also have included a $10 annual fee. In either case, the amount of any fee paid through your account would increase the estimate of expenses you paid during the period and decrease your ending account value.
Hypothetical Example for Comparison Purposes—The section of the table at right entitled “Hypothetical” provides information about hypothetical account values and hypothetical expenses based on a Fund’s actual expense ratio and an assumed rate of return of 5% per year before expenses, which is not the Fund’s actual return. The hypothetical account values and expenses may not be used to estimate your actual ending account balance or the expenses you paid for the period. However, you may use this information to compare the ongoing costs of investing in the Fund and other funds. To do so, compare this 5% hypothetical example with the 5% hypothetical examples that appear in the shareholder reports of the other funds. As in the case of the actual expense example, if your account is subject to an IRA fee, the amount of the fee paid through your account would increase the hypothetical expenses you would have paid during the period and decrease the hypothetical ending account value.
Please note that the expenses shown in the table at right are meant to highlight your ongoing costs only and do not reflect any transactional costs, such as sales charges (loads), redemption fees, or exchange fees. Therefore, the table is useful in comparing ongoing costs only, and will not help you determine the relative total costs of owning different funds. If these transactional costs were included, your costs would have been higher. The examples also assume all dividends and distributions have been reinvested.
Firsthand Technology Value Fund
| | Beginning | | Ending | | Expenses Paid | | | |
| | Account Value | | Account Value | | During Period* | | Annualized | |
| | 7/1/06 | | 12/31/06 | | 7/1/06-12/31/06 | | Expense Ratio | |
Actual | | $ | 1,000 | | $ | 1,042.16 | | $ | 9.60 | | 1.92 | % |
Hypothetical** | | $ | 1,000 | | $ | 1,015.08 | | $ | 9.75 | | 1.92 | % |
Firsthand Technology Leaders Fund
| | Beginning | | Ending | | Expenses Paid | | | |
| | Account Value | | Account Value | | During Period* | | Annualized | |
| | 7/1/06 | | 12/31/06 | | 7/1/06-12/31/06 | | Expense Ratio | |
Actual | | $ | 1,000 | | $ | 1,082.98 | | $ | 10.04 | | 1.95 | % |
Hypothetical** | | $ | 1,000 | | $ | 1,014.93 | | $ | 9.90 | | 1.95 | % |
Firsthand Technology Innovators Fund
| | Beginning | | Ending | | Expenses Paid | | | |
| | Account Value | | Account Value | | During Period* | | Annualized | |
| | 7/1/06 | | 12/31/06 | | 7/1/06-12/31/06 | | Expense Ratio | |
Actual | | $ | 1,000 | | $ | 1,039.34 | | $ | 9.66 | | 1.95 | % |
Hypothetical** | | $ | 1,000 | | $ | 1,014.93 | | $ | 9.90 | | 1.95 | % |
Firsthand e-Commerce Fund
| | Beginning | | Ending | | Expenses Paid | | | |
| | Account Value | | Account Value | | During Period* | | Annualized | |
| | 7/1/06 | | 12/31/06 | | 7/1/06-12/31/06 | | Expense Ratio | |
Actual | | $ | 1,000 | | $ | 1,147.31 | | $ | 10.17 | | 1.95 | % |
Hypothetical** | | $ | 1,000 | | $ | 1,014.93 | | $ | 9.90 | | 1.95 | % |
Firsthand Global Technology Fund
| | Beginning | | Ending | | Expenses Paid | | | |
| | Account Value | | Account Value | | During Period* | | Annualized | |
| | 7/1/06 | | 12/31/06 | | 7/1/06-12/31/06 | | Expense Ratio | |
Actual | | $ | 1,000 | | $ | 1,154.24 | | $ | 10.29 | | 1.95 | % |
Hypothetical** | | $ | 1,000 | | $ | 1,014.93 | | $ | 9.90 | | 1.95 | % |
Firsthand Health Sciences Fund
| | Beginning | | Ending | | Expenses Paid | | | |
| | Account Value | | Account Value | | During Period* | | Annualized | |
| | 7/1/06 | | 12/31/06 | | 7/1/06-12/31/06 | | Expense Ratio | |
Actual | | $ | 1,000 | | $ | 1,107.86 | | $ | 10.36 | | 1.95 | % |
Hypothetical** | | $ | 1,000 | | $ | 1,014.93 | | $ | 9.90 | | 1.95 | % |
* Expenses are calculated by multiplying the Fund’s annualized expense ratio listed above by the average account value over the period and multiplying that number by 184/365 (to reflect the one-half year period).
** 5% return per year before expenses.
The expenses shown in the table do not reflect any fees that may be charged to you by brokers, financial intermediaries, or other financial institutions.
FIRSTHAND TECHNOLOGY VALUE FUND
Performance and Portfolio Discussion
How did the Fund perform in 2006?
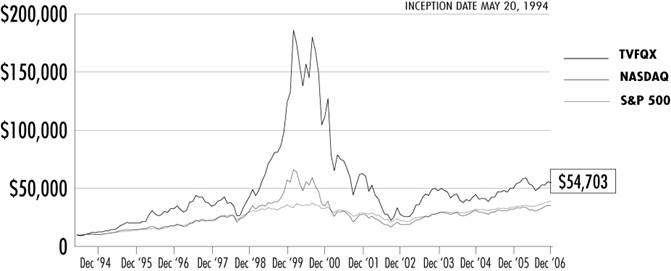
In 2006, Firsthand Technology Value Fund (TVFQX) posted an 8.97% gain, versus a 10.39% increase for the NASDAQ Composite Index and a 6.73% gain for the Lipper Science and Technology Fund Index. For the six months ending December 31, 2006, Firsthand Technology Value Fund rose 4.22% as compared to 11.60% and 9.93% gains for the NASDAQ and the Lipper peer group benchmarks, respectively.
Which industries had the greatest impact on the Fund’s performance?
For the period ending December 31, 2006, semiconductor and Internet stocks represented the portfolio’s largest weightings, followed by semiconductor equipment and communications equipment holdings. Despite strong results from the latter, as well as good returns from some of our networking stocks, Firsthand Technology Value Fund slightly underperformed its benchmarks in 2006 due to several disappointments in the software industry.
Which individual holdings were the largest contributors to the Fund’s performance?
The Fund’s largest contributor in 2006 was Web content delivery firm Akamai Technologies (AKAM). Akamai survived the dot-com collapse by building a vast global network of servers to bring Web content and applications physically closer to users, thus enabling online data to be delivered faster and more efficiently. Akamai finished 2006 with an impressive gain of 167%, as demand grew for more robust multimedia online content, such as video, music, and software downloads.
Disk drive manufacturing equipment maker Intevac (IVAC) saw its shares nearly double during 2006. The company provides equipment used to deposit specialized materials onto hard disks, and it profited from growing consumer demand for data storage devices and an industry-wide shift to a new recording technology (known as perpendicular recording). Disk drive manufacturer Seagate Technology (STX) also benefited from increasing storage demand, which sent its shares higher during 2006.
After languishing for the past few years, shares of networking giant Cisco Systems (CSCO) rallied more than 59%, due in part to its acquisition of Scientific Atlanta early in the year. The purchase of the set-top box maker enables Cisco to broaden its customer base by selling its networking products directly to consumers.
Shares of Soitec (no U.S. symbol) jumped shortly after we established a position in the French company in the fourth quarter. Soitec has experienced strong demand for its 300mm silicon-on-insulator (SOI) wafers, used in making high-performance semiconductors.
Which holdings were the greatest detractors from the Fund’s performance?
The Fund’s largest detractor during the period was Openwave Systems (OPWV), a provider of applications for wireline and wireless devices, including Internet browsers for cellphones. Although large growth was projected for Web-enabled phones, that growth has not yet materialized, and Openwave has suffered as a result. We closed our position in the software developer shortly after the company unexpectedly cut its revenue forecast for its fiscal fourth-quarter.
Shares of Wind River Systems (WIND) dropped after the software company fell short of Wall Street expectations and lowered its full-year outlook during the first quarter of 2006. After several years of lackluster performance with Wind River, we chose to close our position at a significant loss. Verisign (VRSN) was another notable laggard among our software holdings, which we sold for a loss in the third quarter of 2006.
We liquidated our position in Netflix (NFLX) during the year, realizing sizeable gains since acquiring the stock in 2004. While we managed to sell a good portion of the Fund’s position in the first half of the year, the stock’s subsequent decline hurt the Fund prior to our closing out the position in the fourth quarter.
Fund Performance and Holdings Information (as of 12/31/06)
Firsthand Technology Value Fund vs. Market Indices
| | TVFQX | | NASDAQ | | S&P 500 | |
Since Inception (5/20/04) | | 14.42 | % | 10.45 | % | 11.36 | % |
10-Year | | 5.37 | % | 6.95 | % | 8.42 | % |
5-Year | | -2.64 | % | 4.99 | % | 6.19 | % |
3-Year | | 4.56 | % | 7.16 | % | 10.44 | % |
1-Year | | 8.97 | % | 10.39 | % | 15.79 | % |
Growth of a Hypothetical $10,000 Investment
Returns assume reinvestment of all dividends and distributions but do not reflect the impact of taxes. The performance data quoted represent past performance. Past performance cannot guarantee future results, and current performance may be lower or higher than the performance quoted. Both the return from and the principal value of an investment in the Funds will fluctuate so that an investor’s shares, when redeemed, may be worrth more or less than their original cost. To obtain performance as of the most recent month-end, please contact Firsthand Funds by calling 1.888.884.2675 or go to www.firsthandfunds.com.
Holdings by Industry*
| | % Net Assets | |
Semiconductors | | 31.5 | % |
Internet | | 8.6 | % |
Semiconductor Equipment | | 8.2 | % |
Communications Equipment | | 7.6 | % |
Photonics | | 6.5 | % |
Peripherals | | 5.6 | % |
Other Electronics | | 5.5 | % |
Alternative Energy | | 4.5 | % |
Networking | | 3.8 | % |
Software | | 3.7 | % |
Electronic Entertainment | | 3.6 | % |
Intellectual Property | | 3.2 | % |
Communications | | 1.6 | % |
Computer | | 1.6 | % |
Services | | 1.5 | % |
Other | | 2.2 | % |
Net Cash | | 0.8 | % |
Top 10 Holdings**
| | % Net Assets | |
Cypress Semiconductor Corp. | | 8.1 | % |
Seagate Technology, Inc. | | 5.6 | % |
Corning, Inc. | | 5.2 | % |
MEMC Electronic Materials, Inc. | | 4.5 | % |
Intevac, Inc. | | 4.3 | % |
Akamai Technologies, Inc. | | 4.1 | % |
Applied Materials, Inc. | | 4.0 | % |
Nintendo Co. Ltd. - ADR | | 3.6 | % |
Cisco Systems, Inc. | | 3.5 | % |
ASML Holding N.V. | | 3.3 | % |
* Based on percentage of net assets as of 12/31/06.
** Top 10 stock holdings total 46.2% of net assets. These holdings are current as of 12/31/06, and may not be representative of current or future investments. Firsthand includes only public companies in top 10 holdings.
FIRSTHAND TECHNOLOGY LEADERS FUND
Performance and Portfolio Discussion
How did the Fund perform in 2006?
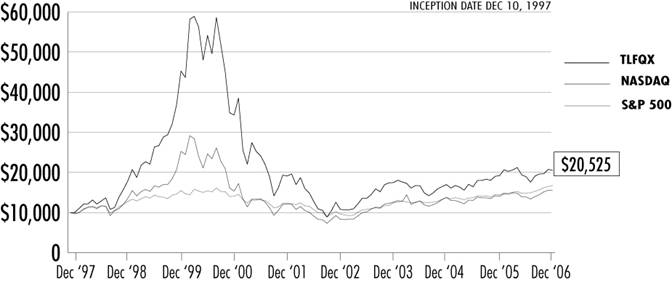
In 2006, Firsthand Technology Leaders Fund (TLFQX) posted a 6.75% gain, versus a 10.39% increase for the NASDAQ Composite Index and a 6.73% gain for the Lipper Science and Technology Fund Index. For the six months ended December 31, 2006, Firsthand Technology Leaders Fund rose 8.30% as compared to 11.60% and 9.93% gains for the NASDAQ and the Lipper peer group benchmarks, respectively.
Which industries had the greatest impact on the Fund’s performance?
For the year ended December 31, 2006, semiconductor and software stocks represented the portfolio’s largest weightings, followed by semiconductor equipment and communications equipment. Despite having a number of winners in the semiconductor sector, Firsthand Technology Leaders Fund underperformed its benchmarks in 2006 due to stock selection in the software and Internet industries.
Which individual holdings were the largest contributors to the Fund’s performance?
For the period, the Fund’s top contributor was networking giant Cisco Systems (CSCO). After languishing for the past few years, shares of Cisco rallied more than 59%, due in part to its acquisition of Scientific Atlanta early in the year. The purchase of the set-top box maker enabled Cisco to broaden its customer base by selling its networking products to the consumer market.
One of the bright spots among our software holdings was Amdocs (DOX), which provides billing and customer relationship management software. The company benefited from the telecom and cable industries move toward bundling high-speed Internet access with cable, wireless, and wireline services.
The rapid growth in both the number of cellphone subscribers and the average revenue per user helped boost shares of China Mobile (CHL) during the period. The telecom giant is China’s leading wireless carrier and has yet to tap into China’s rural areas where cellphone adoption remains low.
Shares of Dutch semiconductor equipment maker ASML Holding N.V. (ASML) rose 23% in 2006 after the company raised its outlook, citing strong customer demand for its lithography equipment.
Which holdings were the greatest detractors from the Fund’s performance?
VeriSign (VRSN) represented the Fund’s largest detractor during the period. Disappointing guidance and an ongoing stock options investigation pushed shares of the Internet infrastructure provider lower and led us to close our position during the third quarter of 2006.
Sales of videogames remained in a slump as consumers continued to put off purchasing new games until the next generation of gaming consoles was released. This news affected the short-term financial results for Electronic Arts (ERTS), the world’s largest videogame publisher.
Also detracting from performance were the Fund’s Internet holdings. Shares of eBay (EBAY) declined by 30% in 2006 as the online auction giant struggled with decelerating growth in several of its key markets. The company decided to cut its losses in China by shutting down its website and replacing it with a joint venture run by a Chinese Internet company.
Shares of Intel (INTC) slipped as weaker-than-expected sales and increasing competition from Advanced Micro Devices (AMD) hurt Intel’s profit margins. This news, along with a less-than-robust near-term outlook, led us to liquidate our position in Intel at a loss during the first quarter of 2006.
Fund Performance and Holdings Information (as of 12/31/06)
Firsthand Technology Leaders Fund vs. Market Indices
| | TLFQX | | NASDAQ | | S&P 500 | |
Since Inception (12/10/97) | | 8.26 | % | 4.97 | % | 5.86 | % |
5-Year | | 1.41 | % | 4.99 | % | 6.19 | % |
3-Year | | 5.50 | % | 7.16 | % | 10.44 | % |
1-Year | | 6.75 | % | 10.39 | % | 15.79 | % |
Growth of a Hypothetical $10,000 Investment
Returns assume reinvestment of all dividends and distributions but do not reflect the impact of taxes. The performance data quoted represent past performance. Past performance cannot guarantee future results, and current performance may be lower or higher than the performance quoted. Both the return from and the principal value of an investment in the Funds will fluctuate so that an investor’s shares, when redeemed, may be worrth more or less than their original cost. To obtain performance as of the most recent month-end, please contact Firsthand Funds by calling 1.888.884.2675 or go to www.firsthandfunds.com.
Holdings by Industry*
| | % Net Assets | |
Semiconductors | | 23.3 | % |
Software | | 20.9 | % |
Semiconductor Equipment | | 10.2 | % |
Communications Equipment | | 8.9 | % |
Internet | | 8.7 | % |
Networking | | 5.5 | % |
Photonics | | 5.2 | % |
Other Electronics | | 4.7 | % |
Peripherals | | 4.3 | % |
Computer | | 3.6 | % |
Communications | | 2.5 | % |
Net Cash | | 2.2 | % |
Top 10 Holdings**
| | % Net Assets | |
QUALCOMM, Inc. | | 6.3 | % |
Microsoft Corp. | | 6.1 | % |
Adobe Systems, Inc. | | 6.0 | % |
Taiwan Semi. Mfg. Co. - ADR | | 5.9 | % |
Cisco Systems, Inc. | | 5.5 | % |
Texas Instruments, Inc. | | 5.3 | % |
Applied Materials, Inc. | | 5.3 | % |
Corning, Inc. | | 5.2 | % |
Amdocs Ltd. | | 5.0 | % |
ASML Holding N.V. | | 4.9 | % |
* Based on percentage of net assets as of 12/31/06.
** Top 10 stock holdings total 55.5% of net assets. These holdings are current as of 12/31/06, and may not be representative of current or future investments. Firsthand includes only public companies in top 10 holdings.
FIRSTHAND TECHNOLOGY INNOVATORS FUND
Performance and Portfolio Discussion
How did the Fund perform in 2006?
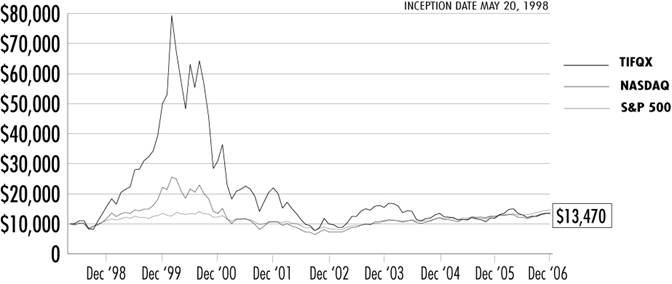
In 2006, Firsthand Technology Innovators Fund (TIFQX) posted a 13.06% gain, versus a 10.39% increase for the NASDAQ Composite Index and a 6.73% gain for the Lipper Science and Technology Fund Index. For the six months ended December 31, 2006, Firsthand Technology Innovators Fund rose 3.93% as compared to 11.60% and 9.93% gains for the NASDAQ and the Lipper peer group benchmarks, respectively.
Which industries had the greatest impact on the Fund’s performance?
For the year ended December 31, 2006, semiconductor stocks represented the portfolio’s largest weighting, followed by intellectual property and electronics. The Fund outperformed its benchmarks due to its holdings in electronics, communications equipment, and photonics companies.
Which individual holdings were the largest contributors to the Fund’s performance?
For the second straight year, the largest contributor to Fund performance was disk drive equipment supplier Intevac (IVAC), which saw its shares nearly double during 2006. The company provides equipment used to deposit specialized materials onto hard disks, and it profited from growing consumer demand for data storage devices and an industry-wide shift to a new recording technology (known as perpendicular recording).
After suffering through several lean years following the telecom collapse, optical equipment maker Finisar (FNSR) began to see its business turn around in 2006. Finisar returned to profitability as the company saw increased spending from phone companies upgrading their existing infrastructure, which included the push to rollout fiber optics to the home. Avici Systems (AVCI) also benefited from telecom spending growth after strong demand for its core networking router products resulted in the company’s highest quarterly revenue since mid-2001. Investors responded to the news by bidding up shares more than 84% on the day of the announcement and Avici finished the year up 98%.
Applied Films also helped Fund performance after the supplier of thin-film deposition equipment agreed to be acquired by Applied Materials (AMAT) for approximately $464 million during the second quarter of 2006. We also took profits and closed our position in Vyyo Inc. (VYYO) after the broadband access equipment maker saw its stock jump more than 60% in the first quarter of 2006.
Which holdings were the greatest detractors from the Fund’s performance?
Airspan Networks (AIRN) was the largest detractor from Fund performance in 2006. The company revealed late in the second quarter that a contract to supply WiMAX wireless-networking equipment to one of its biggest customers would be delayed. WiMAX is a technology similar to Wi-Fi, but offering faster wireless data access over distances as great as 30 miles. Better relative investment opportunities led us to close our position in Airspan Networks at a loss.
We also exited our position in Neoware (NWRE) after the software services company failed to meet analysts’ revenue expectations in the second quarter of 2006. The company blamed lower-than-expected sales during the last two weeks of the quarter for the revenue shortfall. Investors reacted swiftly to the news, knocking shares of Neoware down more than 40%.
Chipmaker Monolithic Power Systems (MPWR) struggled throughout 2006 as fears over a negative outcome from ongoing patent litigation kept its shares from advancing. Additionally, Monolithic revised its revenue guidance below analysts’ estimates on more than one occasion, shaking investors’ confidence in the company.
Fund Performance and Holdings Information (as of 12/31/06)
Firsthand Technology Innovators Fund vs. Market Indices
| | TIFQX | | NASDAQ | | S&P 500 | |
Since Inception (5/20/98) | | 3.52 | % | 3.64 | % | 4.52 | % |
5-Year | | -9.35 | % | 4.99 | % | 6.19 | % |
3-Year | | -4.59 | % | 7.16 | % | 10.44 | % |
1-Year | | 13.06 | % | 10.39 | % | 15.79 | % |
Growth of a Hypothetical $10,000 Investment
Returns assume reinvestment of all dividends and distributions but do not reflect the impact of taxes. The performance data quoted represent past performance. Past performance cannot guarantee future results, and current performance may be lower or higher than the performance quoted. Both the return from and the principal value of an investment in the Funds will fluctuate so that an investor’s shares, when redeemed, may be worrth more or less than their original cost. To obtain performance as of the most recent month-end, please contact Firsthand Funds by calling 1.888.884.2675 or go to www.firsthandfunds.com.
Holdings by Industry*
| | % Net Assets | |
Semiconductors | | 26.1 | % |
Intellectual Property | | 16.9 | % |
Other Electronics | | 15.1 | % |
Services | | 8.9 | % |
Networking | | 6.1 | % |
Photonics | | 5.7 | % |
Software | | 4.9 | % |
Electronic Design Automation | | 4.2 | % |
Internet | | 4.0 | % |
Communications | | 3.3 | % |
Communications Equipment | | 1.5 | % |
Other | | 2.6 | % |
Net Cash | | 0.7 | % |
Top 10 Holdings**
| | % Net Assets | |
Intevac, Inc. | | 7.9 | % |
VASCO Data Security Int’l, Inc. | | 4.4 | % |
PDF Solutions, Inc. | | 4.2 | % |
iGATE Corp. | | 4.1 | % |
Echelon Corp. | | 4.0 | % |
Microtune, Inc. | | 4.0 | % |
Synaptics, Inc. | | 3.1 | % |
Verint Systems, Inc. | | 3.0 | % |
Avici Systems, Inc. | | 2.8 | % |
Netlogic Microsystems, Inc. | | 2.5 | % |
* Based on percentage of net assets as of 12/31/06.
** Top 10 stock holdings total 40.0% of net assets. These holdings are current as of 12/31/06, and may not be representative of current or future investments. Firsthand includes only public companies in top 10 holdings.
FIRSTHAND E-COMMERCE FUND
Performance and Portfolio Discussion
How did the Fund perform in 2006?
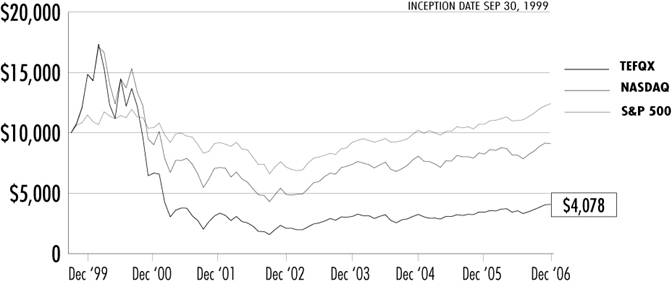
In 2006, Firsthand e-Commerce Fund (TEFQX) posted a 19.12% gain, versus a 10.39% increase for the NASDAQ Composite Index and a 6.73% gain for the Lipper Science and Technology Fund Index. For the six months ending December 31, 2006, Firsthand e-Commerce Fund rose 14.73% as compared to 11.60% and 9.93% gains for the NASDAQ and the Lipper peer group benchmarks, respectively.
Which industries had the greatest impact on the Fund’s performance?
For the period ending December 31, 2006, Internet stocks represented nearly half of the Fund’s portfolio, followed by holdings in the software industry. The Fund handily outperformed its benchmarks in 2006 due to its overweighting in these two categories.
Which individual holdings were the largest contributors to the Fund’s performance?
The Fund’s largest contributor in 2006 was Web content delivery firm Akamai Technologies (AKAM). Akamai survived the dot-com collapse by building a vast global network of servers to bring Web content and applications physically closer to users, thus enabling online data to be delivered faster and more efficiently. Akamai finished 2006 with an impressive gain of 167%, as demand grew for more robust multimedia online content, such as video, music, and software downloads.
2006 was a record year for merger and acquisition activity, and several of our portfolios benefited from acquisitions in the technology sector. We realized a nice gain in our position in RSA Security after the maker of identity management and encryption products agreed to be acquired by EMC (EMC) for approximately $2.1 billion in cash.
The diverse business model of Internet conglomerate IAC/InterActiveCorp (IACI) helped lift the company’s shares 31% during the period as strong results from Ticketmaster, Ask.com and Citysearch offset weakness in its real estate, lending, and retail websites. The stock also got a boost from its inclusion in the S&P 500 index in November 2006.
Shares of Adobe Systems (ADBE) helped lift Fund performance as investors welcomed the release of a new version of Adobe Acrobat, a program used to view and create PDF files, and the impending release of Creative Suite 3, a design software package that is expected to help drive sales in 2007.
Which holdings were the greatest detractors from the Fund’s performance?
Yahoo! (YHOO) was the largest detractor from Fund performance in 2006. The Internet portal stumbled amid increasing competition with Google in its online advertising business and was also affected by the delay of its new search platform, code-named “Panama,” which eventually was rolled out in the fourth quarter. These missteps weighed heavily on its forecast earnings and revenue and resulted in Yahoo! shares ending the period lower by 35%.
We liquidated our position in Netflix (NFLX) during the year, realizing sizeable gains since acquiring the stock in 2003. While we managed to sell a good portion of the Fund’s position in the first half of the year, the stock’s subsequent decline hurt the Fund prior to our closing out the position in the third quarter.
We also closed our position in CNET Networks (CNET) after the online media company, citing slowing online advertising sales, lowered its revenue guidance for two consecutive quarters in 2006.
Fund Performance and Holdings Information (as of 12/31/06)
Firsthand e-Commerce Fund vs. Market Indices
| | TEFQX | | NASDAQ | | S&P 500 | |
Since Inception (9/30/99) | | -11.63 | % | -1.28 | % | 3.04 | % |
5-Year | | 3.99 | % | 4.99 | % | 6.19 | % |
3-Year | | 9.79 | % | 7.16 | % | 10.44 | % |
1-Year | | 19.12 | % | 10.39 | % | 15.79 | % |
Growth of a Hypothetical $10,000 Investment
Returns assume reinvestment of all dividends and distributions but do not reflect the impact of taxes. The performance data quoted represent past performance. Past performance cannot guarantee future results, and current performance may be lower or higher than the performance quoted. Both the return from and the principal value of an investment in the Funds will fluctuate so that an investor’s shares, when redeemed, may be worrth more or less than their original cost. To obtain performance as of the most recent month-end, please contact Firsthand Funds by calling 1.888.884.2675 or go to www.firsthandfunds.com.
Holdings by Industry*
| | % Net Assets | |
Internet | | 48.9 | % |
Software | | 16.2 | % |
Communications | | 7.5 | % |
Other Electronics | | 6.3 | % |
Services | | 5.9 | % |
Computer | | 4.5 | % |
Networking | | 2.4 | % |
Other | | 1.2 | % |
Net Cash | | 7.1 | % |
Top 10 Holdings**
| | % Net Assets | |
Akamai Technologies, Inc. | | 6.0 | % |
Microsoft Corp. | | 5.9 | % |
eBay, Inc. | | 5.4 | % |
Yahoo! Inc. | | 4.6 | % |
IAC/InterActiveCorp | | 4.6 | % |
WebSideStory, Inc. | | 4.4 | % |
Adobe Systems, Inc. | | 4.2 | % |
Monster Worldwide, Inc. | | 4.0 | % |
NeuStar, Inc. | | 3.1 | % |
Dell, Inc. | | 3.1 | % |
* Based on percentage of net assets as of 12/31/06.
** Top 10 stock holdings total 45.3% of net assets. These holdings are current as of 12/31/06, and may not be representative of current or future investments. Firsthand includes only public companies in top 10 holdings.
FIRSTHAND GLOBAL TECHNOLOGY FUND
Performance and Portfolio Discussion
How did the Fund perform in 2006?
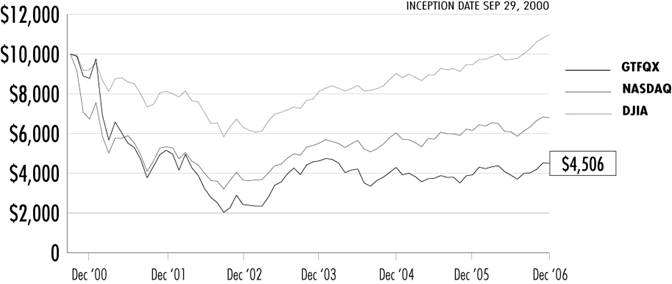
In 2006, Firsthand Global Technology Fund (GTFQX) posted a 14.83% gain, versus a 10.39% increase for the NASDAQ Composite Index and a 6.73% gain for the Lipper Science and Technology Fund Index. For the six months ended December 31, 2006, Firsthand Global Technology Fund rose 15.42% as compared to 11.60% and 9.93% gains for the NASDAQ and the Lipper peer group benchmarks, respectively.
Which industries had the greatest impact on the Fund’s performance?
For the year ended December 31, 2006, semiconductor and semiconductor equipment stocks represented the portfolio’s largest weightings, followed by electronics and services. The Fund outperformed its benchmarks due to its holdings in electronics, Internet, and communications companies.
Which holdings were the largest contributors to the Fund’s performance?
For the second straight year, the largest contributor to Fund performance was disk drive equipment supplier Intevac (IVAC), which saw its shares nearly double during 2006. The company provides equipment used to deposit specialized materials onto hard disks, and it profited from growing consumer demand for data storage devices and an industry-wide shift to a new recording technology (known as perpendicular recording).
The rapid growth in both the number of cellphone subscribers and the average revenue per user helped boost shares of China Mobile (CHL) during the period. The telecom giant is China’s leading wireless carrier and has yet to tap into China’s rural areas where cellphone adoption remains low. After seeing its share price rapidly ascend during the second half of the year, we decided to take our profits and close our position.
Baidu.com (BIDU) was another China holding that performed well in 2006. We closed our position in Baidu.com at a significant gain during Q4 after shares of the Chinese online search company rose as a result of increasing market share, strengthening quarterly earnings, and an announcement that the company would enter the Japanese search market in 2007.
Other holdings that aided Fund performance during the period included Taiwanese electronics manufacturer Hon Hai Precision Industry (no U.S. symbol), software vendor Amdocs (DOX), and semiconductor manufacturer ASML Holding N.V. (ASML).
Which holdings were the greatest detractors from the Fund’s performance?
UTStarcom (UTSI) was the greatest detractor from Fund performance in 2006. The company provides telecommunications equipment for wireline and wireless networks in China and other emerging markets and has struggled with slowing growth in China. UTStarcom’s recent foray into the handset market has yet to pay off, as the better-established handset manufacturers continue to dominate the market. After several years of lackluster performance with UTStarcom, we decided to close our position at a loss in the first quarter.
Another telecom holding that hurt Fund performance was Israel-based Alvarion (ALVR). Alvarion is a provider of broadband wireless equipment and saw its stock lose about a quarter of its value in 2006 as the company continues its rollout of WiMAX. WiMAX is similar to Wi-Fi, but offers faster wireless data access over distances as great as 30 miles. Alvarion has made a big investment on the adoption of WiMAX, which to this point has not panned out.
WiMAX troubles also befell wireless equipment maker Airspan Networks (AIRN). Airspan slumped after the company revealed late in the second quarter that a contract to supply WiMAX products to one of its biggest customers would be delayed. Better relative investment opportunities led us to close our position in Airspan Networks at a loss.
Fund Performance and Holdings Information (as of 12/31/06)
Firsthand Global Technology Fund vs. Market Indices
| | GTFQX | | NASDAQ | | S&P 500 | |
Since Inception (9/29/00) | | -11.96 | % | -5.99 | % | 1.49 | % |
5-Year | | -2.67 | % | 4.99 | % | 6.19 | % |
3-Year | | -0.88 | % | 7.16 | % | 10.44 | % |
1-Year | | 14.83 | % | 10.39 | % | 15.79 | % |
Growth of a Hypothetical $10,000 Investment
Returns assume reinvestment of all dividends and distributions but do not reflect the impact of taxes. The performance data quoted represent past performance. Past performance cannot guarantee future results, and current performance may be lower or higher than the performance quoted. Both the return from and the principal value of an investment in the Funds will fluctuate so that an investor’s shares, when redeemed, may be worrth more or less than their original cost. To obtain performance as of the most recent month-end, please contact Firsthand Funds by calling 1.888.884.2675 or go to www.firsthandfunds.com.
Holdings by Industry*
| | % Net Assets | |
Semiconductors | | 20.8 | % |
Semiconductor Equipment | | 15.2 | % |
Other Electronics | | 13.7 | % |
Services | | 9.1 | % |
Electronics Manufacturing Services | | 8.9 | % |
Internet | | 7.7 | % |
Software | | 7.4 | % |
Communications Equipment | | 5.4 | % |
Computer | | 2.3 | % |
Communications | | 2.3 | % |
Alternative Energy | | 2.0 | % |
Net Cash | | 5.2 | % |
Top 10 Holdings**
| | % Net Assets | |
ASML Holding N.V. | | 6.8 | % |
Sharp Corp. | | 5.6 | % |
SiRF Technology Holdings, Inc. | | 4.7 | % |
Tokyo Electron Ltd. | | 4.4 | % |
Hon Hai Precision - GDR | | 4.3 | % |
Alvarion Ltd. | | 4.3 | % |
Intevac, Inc. | | 4.0 | % |
Applied Materials, Inc. | | 4.0 | % |
Ctrip.com International, Ltd. - ADR | | 3.7 | % |
Chartered Semi. Mnfg., Ltd. - ADR | | 3.5 | % |
* Based on percentage of net assets as of 12/31/06.
** Top 10 stock holdings total 45.3% of net assets. These holdings are current as of 12/31/06, and may not be representative of current or future investments. Firsthand includes only public companies in top 10 holdings.
FIRSTHAND HEALTH SCIENCES FUND
Performance and Portfolio Discussion
How did the Fund perform in 2006?
In 2006, Firsthand Health Sciences Fund (HSFQX) posted a 9.90% gain, versus a 4.07% increase for the Goldman Sachs Healthcare Index, a 4.80% gain for the Lipper Health and Biotech Fund Index, and a 15.79% gain for the S&P 500 Index. For the six months ended December 31, 2006, Firsthand Health Sciences Fund rose 10.79% as compared to 9.17% and 8.10% gains for the Goldman Sachs and Lipper peer group benchmarks, and a 12.74% gain for the S&P 500 Index.
Which industries had the greatest impact on the Fund’s performance?
For the year ended December 31, 2006, drug manufacturers represented the portfolio’s largest industry weighting followed by biotechnology and medical appliances holdings. The portfolio benefited from its diversification across market capitalizations, geographies and industry groups within the health care sector. Firsthand Health Sciences Fund outperformed its benchmarks primarily due to its overweight positions in the pharmaceutical and biotech industries.
Which individual holdings were the largest contributors to the Fund’s performance?
The Fund’s biggest contributor to performance in 2006 was Alexion Pharmaceuticals (ALXN). Shares of the biotech firm jumped after it announced promising results from a late-stage trial of one of its lead drug candidates for a rare type of anemia. Within the medical products industry, two foreign companies were performance stand-outs: Genmab A/S (no U.S. symbol), a Danish developer of human antibodies, and Ipsen (no U.S. symbol), a French pharmaceutical company. Wright Medical Group (WMGI) and Smith & Nephew (SNN), two relatively small orthopedics device companies, saw stock prices rebound after slumping in 2005.
The unprecedented wave of mergers and acquisitions of biotech firms by pharmaceutical companies confirmed the attractiveness of these innovative companies in terms of both products and valuation. The Fund held several stocks that were acquired at significant premiums during the year.
The more significant deals included Kos Pharmaceutical’s acquisition by Abbott Laboratories (ABT), Watson Pharmaceuticals’ (WPI) acquisition of Andrx, Myogen’s acquisition by Gilead Sciences (GILD), and the pending acquisitions of Tanox (TNOX) and ICOS (ICOS) by Genentech (DNA) and Eli Lilly (LLY) respectively.
Which holdings were the greatest detractors from the Fund’s performance?
Due to favorable market conditions in the health care sector, there were only a few portfolio holdings that significantly hurt Fund performance on an absolute basis in 2006. The largest detractor was biotech firm Onyx Pharmaceuticals (ONXX). Onyx hit a multi-year low after data showed that its kidney cancer drug Nexavar was ineffective in treating patients with advanced skin cancer.
Similar disappointing clinical trial results for Critical Therapeutics’ (CRTX) anti-inflammatory drug also sent shares of the small-cap biotech firm significantly lower in 2006.
Fund Performance and Holdings Information (as of 12/31/06)
Firsthand Health Sciences Fund vs. Market Indices
| | | | Goldman Sachs | | | |
| | | | Health Care | | | |
| | HSFQX | | Index | | S&P 500 | |
Since Inception (12/30/05) | | 9.84 | % | 4.04 | % | 15.70 | % |
1-Year | | 9.90 | % | 4.07 | % | 15.79 | % |
Growth of a Hypothetical $10,000 Investment
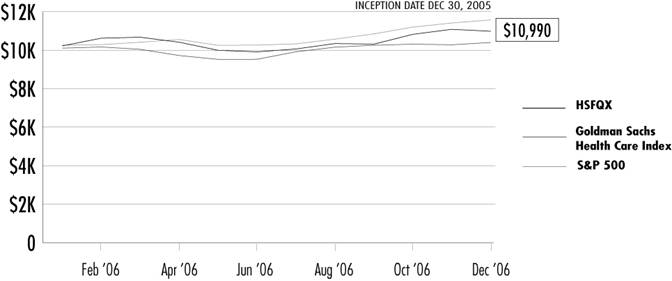
Returns assume reinvestment of all dividends and distributions but do not reflect the impact of taxes. The performance data quoted represent past performance. Past performance cannot guarantee future results, and current performance may be lower or higher than the performance quoted. Both the return from and the principal value of an investment in the Funds will fluctuate so that an investor’s shares, when redeemed, may be worrth more or less than their original cost. To obtain performance as of the most recent month-end, please contact Firsthand Funds by calling 1.888.884.2675 or go to www.firsthandfunds.com.
Holdings by Industry*
| | % Net Assets | |
Drug Manufacturers | | 48.9 | % |
Biotechnology | | 26.2 | % |
Medical Appliances & Equipment | | 5.0 | % |
Health Care Plans | | 2.3 | % |
Medical Instruments & Supplies | | 2.0 | % |
Drug Delivery | | 1.5 | % |
Other | | 6.6 | % |
Net Cash | | 7.5 | % |
Top 10 Holdings**
| | % Net Assets | |
Pfizer, Inc. | | 4.4 | % |
Glaxosmithkline PLC - ADR | | 3.8 | % |
Eli Lilly & Co. | | 3.7 | % |
Amgen, Inc. | | 3.4 | % |
Novartis AG - ADR | | 3.1 | % |
Schering-Plough Corp. | | 3.0 | % |
ICOS Corp. | | 2.5 | % |
Biogen Idec, Inc. | | 2.5 | % |
Gilead Sciences, Inc. | | 2.5 | % |
Alexion Pharmaceuticals, Inc. | | 2.5 | % |
* Based on percentage of net assets as of 12/31/06.
** Top 10 stock holdings total 31.4% of net assets. These holdings are current as of 12/31/06, and may not be representative of current or future investments. Firsthand includes only public companies in top 10 holdings.
REPORT OF INDEPENDENT REGISTERED PUBLIC ACCOUNTING FIRM
To the Shareholders and Board of Trustees
Firsthand Funds
San Jose, California
We have audited the accompanying statements of assets and liabilities of Firsthand Funds (the “Funds”) comprising, respectively, Firsthand Technology Value Fund, Firsthand Technology Leaders Fund, Firsthand Technology Innovators Fund, Firsthand e-Commerce Fund, Firsthand Global Technology Fund, and Firsthand Health Sciences Fund, including the portfolios of investments as of December 31, 2006, and the related statements of operations for the year then ended, statements of changes in net assets and the financial highlights for the periods indicated thereon. These financial statements and financial highlights are the responsibility of the Funds’ management. Our responsibility is to express an opinion on these financial statements and financial highlights based on our audits.
We conducted our audits in accordance with standards of the Public Company Accounting Oversight Board (United States). Those standards require that we plan and perform the audits to obtain reasonable assurance about whether the financial statements and financial highlights are free of material misstatement. The Funds are not required to have, nor were we engaged to perform, an audit of the Funds’ internal control over financial reporting. Our audits included consideration of internal control over financial reporting as a basis for designing audit procedures that are appropriate in the circumstances, but not for the purpose of expressing an opinion on the effectiveness of the Funds’ internal control over financial reporting. Accordingly, we express no such opinion. An audit also includes examining, on a test basis, evidence supporting the amounts and disclosures in the financial statements. Our procedures included confirmation of securities owned as of December 31, 2006, by correspondence with the custodian, brokers, and by other auditing procedures as deemed necessary. An audit also includes assessing the accounting principles used and significant estimates made by management, as well as evaluating the overall financial statement presentation. We believe that our audits provide a reasonable basis for our opinion.
In our opinion, the financial statements and financial highlights referred to above present fairly, in all material respects, the financial position of Firsthand Funds as of December 31, 2006, the results of their operations, the changes in their net assets, and the financial highlights for the periods referred to above, in conformity with accounting principles generally accepted in the United States of America.
TAIT, WELLER & BAKER, LLP
Philadelphia, Pennsylvania
February 15, 2007
FIRSTHAND TECHNOLOGY VALUE FUND
Portfolio of Investments (as of 12/31/06)
| | SHARES | | MARKET VALUE | |
| | | | | |
COMMON STOCK - 98.5% | | | | | |
ADVANCED MATERIALS - 1.3% | | | | | |
UCT Coatings, Inc., Series B (2) * | | 500,000 | | $ | 5,000,000 | |
| | | | | |
ALTERNATIVE ENERGY - 4.1% | | | | | |
Evergreen Solar, Inc. * | | 500,000 | | 3,785,000 | |
Solaicx, Series B (1) (2) * | | 6,000,000 | | 7,247,400 | |
SoloPower, Series A (1) (2) * | | 2,721,088 | | 3,999,999 | |
| | | | 15,032,399 | |
COMMUNICATIONS - 1.6% | | | | | |
ViaSat, Inc. * | | 194,300 | | 5,792,083 | |
| | | | | |
COMMUNICATIONS EQUIPMENT - 7.6% | | | | | |
Harris Corp. | | 100,000 | | 4,586,000 | |
Stratex Networks, Inc. * | | 1,417,036 | | 6,844,284 | |
Tekelec, Inc. * | | 651,800 | | 9,666,194 | |
Tellabs, Inc. * | | 335,000 | | 3,437,100 | |
UTStarcom, Inc. * | | 403,300 | | 3,528,875 | |
| | | | 28,062,453 | |
COMPUTER - 1.6% | | | | | |
Sun Microsystems, Inc. * | | 1,100,000 | | 5,962,000 | |
| | | | | |
DEFENSE & AEROSPACE - 0.9% | | | | | |
FLIR Systems, Inc. * | | 103,456 | | 3,293,004 | |
| | | | | |
ELECTRONIC ENTERTAINMENT - 3.6% | | | | | |
Nintendo Co., Ltd. - ADR | | 413,407 | | 13,435,728 | |
| | | | | |
INTELLECTUAL PROPERTY - 3.0% | | | | | |
Silicon Genesis Corp., Common (1) (2) * | | 743,077 | | 41,612 | |
Silicon Genesis Corp., Series 1-D (1) (2) * | | 850,830 | | 4,363,141 | |
Silicon Genesis Corp., Series 1-E (1) (2) * | | 4,071,226 | | 6,701,239 | |
| | | | 11,105,992 | |
INTERNET - 8.6% | | | | | |
Akamai Technologies, Inc. * | | 285,800 | | 15,181,696 | |
Ctrip.com International Ltd. - ADR | | 79,400 | | 4,960,912 | |
Napster, Inc. (3) * | | 984,900 | | 3,575,187 | |
Yahoo! Inc. * | | 321,422 | | 8,209,118 | |
| | | | 31,926,913 | |
NETWORKING - 3.8% | | | | | |
Caspian Networks, Inc., Common (2) * | | 337 | | 0 | |
Cisco Systems, Inc. * | | 480,000 | | 13,118,400 | |
| | | | | | |
See accompanying notes to financial statements
| | SHARES | | MARKET VALUE | |
| | | | | |
IP Unity, Inc., Series C (2) * | | 1,104,265 | | $ | 753,970 | |
IP Unity, Inc., Series E (2) * | | 193,042 | | 118,844 | |
Polaris Networks, Inc., Series A (2) * | | 297,848 | | 0 | |
| | | | 13,991,214 | |
OTHER ELECTRONICS - 5.5% | | | | | |
Intevac, Inc. * | | 621,400 | | 16,125,330 | |
Zebra Technologies Corp., Class A * | | 124,500 | | 4,331,355 | |
| | | | 20,456,685 | |
PERIPHERALS - 5.6% | | | | | |
Seagate Technology, Inc. | | 789,700 | | 20,927,050 | |
| | | | | |
PHOTONICS - 6.5% | | | | | |
Celox Networks, Inc., Common (2) * | | 138,121 | | 0 | |
Celox Networks, Inc., Series A-1 (2) * | | 1,000,000 | | 0 | |
Corning, Inc. * | | 1,029,500 | | 19,261,945 | |
JDS Uniphase Corp. * | | 300,000 | | 4,998,000 | |
Luminous Networks, Inc., Common (2) * | | 28,513 | | 0 | |
Luminous Networks, Inc., Series A1 (2) * | | 129,664 | | 0 | |
Luminous Networks, Inc., Series B1 (2) * | | 259,236 | | 0 | |
| | | | 24,259,945 | |
SEMICONDUCTOR EQUIPMENT - 8.2% | | | | | |
Applied Materials, Inc. | | 800,000 | | 14,760,000 | |
ASML Holding N.V. * | | 500,000 | | 12,315,000 | |
FormFactor, Inc. * | | 94,594 | | 3,523,627 | |
| | | | 30,598,627 | |
SEMICONDUCTORS - 31.4% | | | | | |
Advanced Micro Devices, Inc. * | | 100,000 | | 2,035,000 | |
AuthenTec, Inc., Series C (2) * | | 1,472,495 | | 1,474,866 | |
AuthenTec, Inc., Series D (2) * | | 290,958 | | 290,958 | |
Chartered Semiconductor Manufacturing Ltd. - ADR * | | 926,100 | | 7,732,935 | |
Clarisay, Inc., Series B (1) (2) * | | 2,605,306 | | 0 | |
Clarisay, Inc., Series C (1) (2) * | | 7,194,244 | | 0 | |
Cypress Semiconductor Corp. * | | 1,785,100 | | 30,114,636 | |
Global Locate, Inc., Series A (1) (2) * | | 6,030,896 | | 2,052,917 | |
Global Locate, Inc., Series C (1) (2) * | | 1,111,111 | | 378,222 | |
Global Locate, Inc., Series D (1) (2) * | | 932,835 | | 749,999 | |
Ikanos Communications, Inc. * | | 100,000 | | 869,000 | |
Kopin Corp. * | | 299,100 | | 1,067,787 | |
MEMC Electronic Materials, Inc. * | | 428,300 | | 16,763,662 | |
PMC-Sierra, Inc. * | | 655,700 | | 4,399,747 | |
Semiconductor Manufacturing International Corp. * | | 1,000,000 | | 6,440,000 | |
SiRF Technology Holdings, Inc. * | | 457,500 | | 11,675,400 | |
| | | | | | |
See accompanying notes to financial statements
| | SHARES | | MARKET VALUE | |
| | | | | |
Skyworks Solutions, Inc. * | | 498,300 | | $ | 3,527,964 | |
Soitec S.A. * | | 72,740 | | 2,584,704 | |
Texas Instruments, Inc. | | 140,000 | | 4,032,000 | |
TranSwitch Corp. * | | 2,383,000 | | 3,336,200 | |
TriQuint Semiconductor, Inc. * | | 1,432,400 | | 6,445,800 | |
Zoran Corp. * | | 710,500 | | 10,359,090 | |
| | | | 116,330,887 | |
SERVICES - 1.5% | | | | | |
aQuantive, Inc. * | | 158,300 | | 3,903,678 | |
TeleCommunication Systems, Inc., Class A * | | 557,600 | | 1,728,560 | |
| | | | 5,632,238 | |
SOFTWARE - 3.7% | | | | | |
Citrix Systems, Inc. * | | 127,000 | | 3,435,350 | |
Comverse Technology, Inc. * | | 304,500 | | 6,427,995 | |
Witness Systems, Inc. * | | 215,003 | | 3,769,003 | |
| | | | 13,632,348 | |
Total COMMON STOCK | | | | 365,439,566 | |
| | | | | |
WARRANTS - 0.3% | | | | | |
ADVANCED MATERIALS - 0.0% | | | | | |
UCT Coatings, Inc., Common Warrant (2) * | | 600,000 | | 200 | |
| | | | | |
INTELLECTUAL PROPERTY - 0.2% | | | | | |
Silicon Genesis Corp., 1-E Warrant (1) (2) * | | 1,257,859 | | 1,070,439 | |
Silicon Genesis Corp., Common Warrant (1) (2) * | | 59,147 | | 59 | |
Silicon Genesis Corp., Common Warrant (1) (2) * | | 37,982 | | 38 | |
| | | | 1,070,536 | |
NETWORKING - 0.0% | | | | | |
IP Unity, Inc., E Warrant (2) * | | 69,496 | | 69 | |
Polaris Networks, Inc., Convertible Warrant (2) * | | 75,712 | | 0 | |
| | | | 69 | |
PHOTONICS - 0.0% | | | | | |
Celox Networks, Inc., A-1 Warrant (2) * | | 500,000 | | 0 | |
Luminous Networks, Inc., Common Warrant (2) * | | 3,822 | | 0 | |
| | | | 0 | |
SEMICONDUCTORS - 0.1% | | | | | |
AuthenTec, Inc., C Warrant (2) * | | 392,665 | | 196,497 | |
Clarisay, Inc., Warrants (1) (2) * | | 2,350,000 | | 0 | |
Global Locate, Inc., Board Warrants (1) (2) * | | 75,000 | | 375 | |
Global Locate, Inc., Board Warrants (1) (2) * | | 75,000 | | 375 | |
Global Locate, Inc., Board Warrants (1) (2) * | | 18,750 | | 94 | |
Global Locate, Inc., Board Warrants (1) (2) * | | 75,000 | | 375 | |
| | | | | | |
See accompanying notes to financial statements
| | SHARES/
PRINCIPAL | | MARKET VALUE | |
| | | | | |
Global Locate, Inc., C Warrant (1) (2) * | | 370,370 | | $ | 1,852 | |
Global Locate, Inc., D Warrant (1) (2) * | | 233,208 | | 2,332 | |
| | | | 201,900 | |
Total WARRANTS | | | | 1,272,705 | |
| | | | | |
CONVERTIBLE BONDS - 0.4% | | | | | |
ALTERNATIVE ENERGY - 0.4% | | | | | |
Solaicx, 10.25% (1) (2) | | 1,333,334 | | 1,333,334 | |
| | | | | |
NETWORKING - 0.0% | | | | | |
Polaris Networks, Inc., 10.00% (2) * | | 100,949 | | 0 | |
| | | | | |
SEMICONDUCTORS - 0.0% | | | | | |
Clarisay, Inc., 8.00% (1) (2) * | | 2,350,000 | | 0 | |
| | | | | |
Total CONVERTIBLE BONDS | | | | 1,333,334 | |
| | | | | |
CASH EQUIVALENTS - 0.1% | | | | | |
PNC Bank Money Market Portfolio | | 423,225 | | 423,225 | |
Total CASH EQUIVALENTS | | | | 423,225 | |
| | | | | |
Total Investments (Cost $462,543,743) - 99.3% | | | | 368,468,830 | |
Other assets in excess of liabilities - 0.7% | | | | 2,470,812 | |
NET ASSETS - 100.0% | | | | $ | 370,939,642 | |
*Non-income producing security
(1)Affiliated issuer
(2)Restricted security
(3)Napster, Inc. has the right to put a restriction of public sale on 600,000 shares of the Fund’s Napster, Inc. holding. As of December 31, 2006 there are no restrictions on the Fund’s shares of Napster, Inc.
ADR American Depositary Receipt
See accompanying notes to financial statements
FIRSTHAND TECHNOLOGY LEADERS FUND
Portfolio of Investments (as of 12/31/06)
| | SHARES | | MARKET VALUE | |
| | | | | |
COMMON STOCK - 97.8% | | | | | |
COMMUNICATIONS - 2.5% | | | | | |
China Mobile Hong Kong Ltd. - ADR | | 42,383 | | $ | 1,831,793 | |
| | | | | |
COMMUNICATIONS EQUIPMENT - 8.9% | | | | | |
Nokia Corp. - ADR | | 94,490 | | 1,920,037 | |
QUALCOMM, Inc. | | 123,235 | | 4,657,050 | |
| | | | 6,577,087 | |
COMPUTER - 3.6% | | | | | |
Apple Computer, Inc. * | | 31,484 | | 2,671,103 | |
| | | | | |
INTERNET - 8.7% | | | | | |
eBay, Inc. * | | 103,695 | | 3,118,109 | |
Google, Inc., Class A * | | 7,255 | | 3,340,782 | |
| | | | 6,458,891 | |
NETWORKING - 5.5% | | | | | |
Cisco Systems, Inc. * | | 149,770 | | 4,093,214 | |
| | | | | |
OTHER ELECTRONICS - 4.7% | | | | | |
Gemstar-TV Guide International, Inc. * | | 7,191 | | 28,836 | |
L-1 Identity Solutions, Inc. * | | 228,600 | | 3,458,718 | |
| | | | 3,487,554 | |
PERIPHERALS - 4.3% | | | | | |
Seagate Technology, Inc. | | 118,957 | | 3,152,361 | |
| | | | | |
PHOTONICS - 5.2% | | | | | |
Corning, Inc. * | | 207,527 | | 3,882,830 | |
| | | | | |
SEMICONDUCTOR EQUIPMENT - 10.2% | | | | | |
Applied Materials, Inc. | | 212,000 | | 3,911,400 | |
ASML Holding N.V. * | | 147,296 | | 3,627,900 | |
| | | | 7,539,300 | |
SEMICONDUCTORS - 23.3% | | | | | |
Altera Corp. * | | 146,987 | | 2,892,704 | |
Broadcom Corp., Class A * | | 111,825 | | 3,613,066 | |
Taiwan Semiconductor Manufacturing Co. - ADR | | 401,275 | | 4,385,936 | |
Texas Instruments, Inc. | | 136,611 | | 3,934,397 | |
Xilinx, Inc. | | 101,395 | | 2,414,215 | |
| | | | 17,240,318 | |
SOFTWARE - 20.9% | | | | | |
Adobe Systems, Inc. * | | 108,130 | | 4,446,306 | |
Amdocs Ltd. * | | 95,909 | | 3,716,474 | |
| | | | | | |
See accompanying notes to financial statements
| | | | SHARES | | MARKET VALUE | |
| | | | | | | |
Electronic Arts, Inc. * | | | | 54,200 | | $ | 2,729,512 | |
Microsoft Corp. | | | | 152,250 | | 4,546,184 | |
| | | | | | 15,438,476 | |
Total COMMON STOCK | | | | | | 72,372,927 | |
| | | | | | | |
CASH EQUIVALENTS - 1.8% | | | | | | | |
PNC Bank Money Market Portfolio | | | | 1,314,665 | | 1,314,665 | |
Total CASH EQUIVALENTS | | | | | | 1,314,665 | |
| | | | | | | |
Total Investments (Cost $59,377,588) - 99.6% | | | | | | 73,687,592 | |
Other assets in excess of liabilities - 0.4% | | | | | | 305,630 | |
NET ASSETS - 100.0% | | | | | | $ | 73,993,222 | |
*Non-income producing security
ADR American Depositary Receipt
See accompanying notes to financial statements
FIRSTHAND TECHNOLOGY INNOVATORS FUND
Portfolio of Investments (as of 12/31/06)
| | SHARES | | MARKET VALUE | |
| | | | | |
COMMON STOCK - 96.7% | | | | | |
COMMUNICATIONS - 3.3% | | | | | |
NeuStar, Inc. * | | 18,752 | | $ | 608,315 | |
Symmetricom, Inc. * | | 30,000 | | 267,600 | |
| | | | 875,915 | |
COMMUNICATIONS EQUIPMENT - 1.5% | | | | | |
Finisar Corp. * | | 121,855 | | 393,592 | |
| | | | | |
COMPUTER - 1.1% | | | | | |
Rackable Systems, Inc. * | | 9,377 | | 290,406 | |
| | | | | |
ELECTRONIC DESIGN AUTOMATION - 4.2% | | | | | |
PDF Solutions, Inc. * | | 76,400 | | 1,103,980 | |
| | | | | |
INTELLECTUAL PROPERTY - 16.7% | | | | | |
Silicon Genesis Corp., Common (1) (2) * | | 108,815 | | 6,094 | |
Silicon Genesis Corp., Series 1-C (1) (2) * | | 82,914 | | 1,731,244 | |
Silicon Genesis Corp., Series 1-E (1) (2) * | | 1,633,254 | | 2,688,336 | |
| | | | 4,425,674 | |
INTERNET - 4.0% | | | | | |
LivePerson, Inc. * | | 102,400 | | 535,552 | |
WebSideStory, Inc. * | | 42,400 | | 536,784 | |
| | | | 1,072,336 | |
NETWORKING - 6.1% | | | | | |
Echelon Corp. * | | 131,198 | | 1,049,584 | |
IP Unity, Inc., Series C (2) * | | 827,957 | | 565,312 | |
| | | | 1,614,896 | |
OTHER ELECTRONICS - 15.1% | | | | | |
3D Systems Corp. * | | 11,900 | | 189,924 | |
Intevac, Inc. * | | 80,300 | | 2,083,785 | |
Microvision, Inc. * | | 180,300 | | 575,157 | |
VASCO Data Security International, Inc. * | | 98,100 | | 1,162,485 | |
| | | | 4,011,351 | |
PERIPHERALS - 1.1% | | | | | |
Universal Display Corp. * | | 20,000 | | 300,200 | |
| | | | | |
PHOTONICS - 5.7% | | | | | |
Avanex Corp. * | | 50,000 | | 94,500 | |
Avici Systems, Inc. * | | 95,000 | | 736,250 | |
EXFO Electro-Optical Engineering, Inc. * | | 50,100 | | 281,562 | |
Luminous Networks, Inc., Common (2) * | | 49,979 | | 0 | |
Luminous Networks, Inc., Series A1 (2) * | | 227,282 | | 0 | |
| | | | | | |
See accompanying notes to financial statements
| | SHARES | | MARKET VALUE | |
| | | | | |
Oplink Communications, Inc. * | | 20,000 | | $ | 411,200 | |
| | | | 1,523,512 | |
SEMICONDUCTOR EQUIPMENT - 0.4% | | | | | |
Therma-Wave, Inc. * | | 91,300 | | 108,647 | |
| | | | | |
SEMICONDUCTORS - 25.7% | | | | | |
AuthenTec, Inc., Series C (2) * | | 736,248 | | 737,433 | |
EMCORE Corp. * | | 84,353 | | 466,472 | |
Kopin Corp. * | | 68,700 | | 245,259 | |
Microtune, Inc. * | | 223,050 | | 1,048,335 | |
Monolithic Power Systems, Inc. * | | 39,800 | | 442,178 | |
Netlogic Microsystems, Inc. * | | 30,000 | | 650,700 | |
Nextest Systems Corp. * | | 25,200 | | 284,004 | |
PLX Technology, Inc. * | | 38,000 | | 495,520 | |
Ramtron International Corp. * | | 80,000 | | 297,600 | |
Silicon Optix, Inc., Series B (2) * | | 1,111,111 | | 700,000 | |
Synaptics, Inc. * | | 27,300 | | 810,537 | |
Trident Microsystems, Inc. * | | 20,000 | | 363,600 | |
Zygo Corp. * | | 15,000 | | 246,750 | |
| | | | 6,788,388 | |
SERVICES - 6.9% | | | | | |
iGATE Corp. * | | 157,720 | | 1,085,114 | |
Innovion Corp., Series C (1) (2) * | | 1,500,000 | | 744,675 | |
| | | | 1,829,789 | |
SOFTWARE - 4.9% | | | | | |
Verint Systems, Inc. * | | 23,200 | | 795,296 | |
Witness Systems, Inc. * | | 29,400 | | 515,382 | |
| | | | 1,310,678 | |
Total COMMON STOCK | | | | 25,649,364 | |
| | | | | |
WARRANTS - 0.6% | | | | | |
INTELLECTUAL PROPERTY - 0.2% | | | | | |
Silicon Genesis Corp., 1-E Warrant (1) (2) * | | 94,339 | | 55,283 | |
| | | | | |
PHOTONICS - 0.0% | | | | | |
Luminous Networks, Inc., Common Warrant (2) * | | 6,699 | | 0 | |
| | | | | |
SEMICONDUCTORS - 0.4% | | | | | |
AuthenTec, Inc., C Warrant (2) * | | 196,333 | | 98,248 | |
| | | | | | |
See accompanying notes to financial statements
| | SHARES/
PRINCIPAL | | MARKET VALUE | |
| | | | | |
SERVICES - 0.0% | | | | | |
Innovion Corp., Warrant (1) (2) * | | 30,129 | | $ | 30 | |
Innovion Corp., Warrant (1) (2) * | | 602,577 | | 603 | |
| | | | 633 | |
Total WARRANTS | | | | 154,164 | |
| | | | | |
CONVERTIBLE BONDS - 2.0% | | | | | |
SERVICES - 2.0% | | | | | |
Innovion Corp., 9.50% (1) (2) * | | 602,577 | | 542,319 | |
Total CONVERTIBLE BONDS | | | | 542,319 | |
| | | | | |
CASH EQUIVALENTS - 1.2% | | | | | |
PNC Bank Money Market Portfolio | | 325,001 | | 325,001 | |
Total CASH EQUIVALENTS | | | | 325,001 | |
| | | | | |
Total Investments (Cost $32,775,220) - 100.5% | | | | 26,670,848 | |
Liabilities in excess of other assets - (0.5)% | | | | (140,795 | ) |
NET ASSETS - 100.0% | | | | $ | 26,530,053 | |
*Non-income producing security
(1)Affiliated issuer
(2)Restricted security
See accompanying notes to financial statements
FIRSTHAND E-COMMERCE FUND
Portfolio of Investments (as of 12/31/06)
| | SHARES | | MARKET VALUE | |
| | | | | |
COMMON STOCK - 92.9% | | | | | |
COMMUNICATIONS - 7.5% | | | | | |
Comcast Corp., Special Class A * | | 15,000 | | $ | 628,200 | |
Equinix, Inc. * | | 15,000 | | 1,134,300 | |
NeuStar, Inc. * | | 38,400 | | 1,245,696 | |
| | | | 3,008,196 | |
COMPUTER - 4.5% | | | | | |
Apple Computer, Inc. * | | 7,000 | | 593,880 | |
Dell, Inc. * | | 49,200 | | 1,234,428 | |
| | | | 1,828,308 | |
INTERNET - 48.9% | | | | | |
51job, Inc. - ADR * | | 17,368 | | 296,472 | |
Akamai Technologies, Inc. * | | 45,500 | | 2,416,960 | |
Amazon.com, Inc. * | | 23,700 | | 935,202 | |
Baidu.com, Inc. - ADR * | | 4,873 | | 549,285 | |
Ctrip.com International Ltd. - ADR | | 14,499 | | 905,898 | |
CyberSource Corp. * | | 41,814 | | 460,790 | |
eBay, Inc. * | | 71,904 | | 2,162,153 | |
Google, Inc., Class A * | | 1,000 | | 460,480 | |
IAC/InterActiveCorp * | | 49,684 | | 1,846,257 | |
LivePerson, Inc. * | | 140,000 | | 732,200 | |
Monster Worldwide, Inc. * | | 34,900 | | 1,627,736 | |
Napster, Inc. * | | 104,500 | | 379,335 | |
RedEnvelope, Inc. * | | 42,700 | | 301,462 | |
The9 Ltd. - ADR * | | 30,000 | | 966,600 | |
ValueClick, Inc. * | | 46,300 | | 1,094,069 | |
VistaPrint Ltd. * | | 14,137 | | 468,076 | |
VitalStream Holdings, Inc. * | | 46,212 | | 463,968 | |
WebSideStory, Inc. * | | 138,967 | | 1,759,322 | |
Yahoo! Inc. * | | 72,534 | | 1,852,518 | |
| | | | 19,678,783 | |
MEDIA - 1.2% | | | | | |
News Corp., Class B | | 21,960 | | 488,830 | |
| | | | | |
NETWORKING - 2.4% | | | | | |
Cisco Systems, Inc. * | | 35,000 | | 956,550 | |
| | | | | |
OTHER ELECTRONICS - 6.3% | | | | | |
L-1 Identity Solutions, Inc. * | | 60,000 | | 907,800 | |
VASCO Data Security International, Inc. * | | 40,000 | | 474,000 | |
VeriFone Holdings, Inc. * | | 33,185 | | 1,174,749 | |
| | | | 2,556,549 | |
| | | | | | |
See accompanying notes to financial statements
| | SHARES | | MARKET VALUE | |
| | | | | |
SERVICES - 5.9% | | | | | |
aQuantive, Inc. * | | 42,713 | | $ | 1,053,303 | |
First Data Corp. | | 35,000 | | 893,200 | |
Western Union Co. | | 20,000 | | 448,400 | |
| | | | 2,394,903 | |
SOFTWARE - 16.2% | | | | | |
Adobe Systems, Inc. * | | 40,869 | | 1,680,533 | |
CheckFree Corp. * | | 21,277 | | 854,484 | |
Digital Insight Corp. * | | 25,095 | | 965,907 | |
Microsoft Corp. | | 80,000 | | 2,388,800 | |
RightNow Technologies, Inc. * | | 24,730 | | 425,851 | |
VeriSign, Inc. * | | 8,200 | | 197,210 | |
| | | | 6,512,785 | |
Total COMMON STOCK | | | | 37,424,904 | |
| | | | | |
CASH EQUIVALENTS - 7.5% | | | | | |
PNC Bank Money Market Portfolio | | 3,031,958 | | 3,031,958 | |
Total CASH EQUIVALENTS | | | | 3,031,958 | |
| | | | | |
Total Investments (Cost $32,417,399) - 100.4% | | | | 40,456,862 | |
Liabilities in excess of other assets - (0.4)% | | | | (152,051 | ) |
NET ASSETS - 100.0% | | | | $ | 40,304,811 | |
| | | | | | | |
*Non-income producing security
ADR American Depositary Receipt
See accompanying notes to financial statements
FIRSTHAND GLOBAL TECHNOLOGY FUND
Portfolio of Investments (as of 12/31/06)
| | SHARES | | MARKET VALUE | |
| | | | | |
COMMON STOCK - 94.8% | | | | | |
ALTERNATIVE ENERGY - 2.0% | | | | | |
Suntech Power Holdings Co., Ltd. - ADR * | | 8,000 | | $ | 272,080 | |
| | | | | |
COMMUNICATIONS - 2.3% | | | | | |
Singapore Telecommunications Ltd. - ADR | | 14,100 | | 301,427 | |
| | | | | |
COMMUNICATIONS EQUIPMENT - 5.4% | | | | | |
Alvarion Ltd. * | | 85,335 | | 573,451 | |
Nokia Corp. - ADR | | 7,200 | | 146,304 | |
| | | | 719,755 | |
COMPUTER - 2.3% | | | | | |
Lenovo Group Ltd. - ADR | | 38,000 | | 308,799 | |
| | | | | |
ELECTRONICS MANUFACTURING SERVICES - 8.9% | | | | | |
Flextronics International Ltd. * | | 29,800 | | 342,104 | |
Hon Hai Precision - GDR | | 40,270 | | 574,669 | |
Quanta Computer, Inc. - GDR | | 29,984 | | 271,913 | |
| | | | 1,188,686 | |
INTERNET - 7.7% | | | | | |
51job, Inc. - ADR * | | 8,880 | | 151,582 | |
Ctrip.com International Ltd. - ADR | | 7,855 | | 490,780 | |
The9 Ltd. - ADR * | | 12,000 | | 386,640 | |
| | | | 1,029,002 | |
OTHER ELECTRONICS - 13.7% | | | | | |
Intevac, Inc. * | | 20,400 | | 529,380 | |
LG.Philips LCD Co., Ltd. - ADR * | | 14,600 | | 220,022 | |
NIDEC Corp. | | 17,200 | | 333,336 | |
Sharp Corp. | | 43,288 | | 744,841 | |
| | | | 1,827,579 | |
SEMICONDUCTOR EQUIPMENT - 15.2% | | | | | |
Applied Materials, Inc. | | 28,672 | | 528,998 | |
ASML Holding N.V. * | | 36,758 | | 905,350 | |
Tokyo Electron Ltd. | | 7,500 | | 590,482 | |
| | | | 2,024,830 | |
SEMICONDUCTORS - 20.8% | | | | | |
Actions Semiconductor Co., Ltd. - ADR * | | 12,444 | | 103,285 | |
Chartered Semiconductor Manufacturing Ltd. - ADR * | | 55,942 | | 467,116 | |
MEMC Electronic Materials, Inc. * | | 9,900 | | 387,486 | |
Qimonda AG - ADR * | | 13,396 | | 234,564 | |
Samsung Electronics Co., Ltd. - GDR (1) | | 399 | | 131,498 | |
Silicon Motion Technology Corp. - ADR * | | 9,422 | | 149,527 | |
| | | | | | |
See accompanying notes to financial statements
| | SHARES | | MARKET VALUE | |
| | | | | |
SiRF Technology Holdings, Inc. * | | 24,413 | | $ | 623,020 | |
STMicroelectronics N.V. - ADR | | 10,582 | | 194,709 | |
Taiwan Semiconductor Manufacturing Co. - ADR | | 27,698 | | 302,739 | |
Zoran Corp. * | | 11,951 | | 174,246 | |
| | | | 2,768,190 | |
SERVICES - 9.1% | | | | | |
Accenture Ltd. | | 5,000 | | 184,650 | |
iGATE Corp. * | | 43,389 | | 298,516 | |
Lionbridge Technologies, Inc. * | | 33,831 | | 217,872 | |
Navteq Corp. * | | 7,400 | | 258,778 | |
Tele Atlas N.V. * | | 11,900 | | 247,119 | |
| | | | 1,206,935 | |
SOFTWARE - 7.4% | | | | | |
Amdocs Ltd. * | | 9,500 | | 368,125 | |
Cognizant Technology Solutions Corp., Class A * | | 1,763 | | 136,033 | |
NICE-Systems Ltd. - ADR * | | 4,300 | | 132,354 | |
Verint Systems, Inc. * | | 10,000 | | 342,800 | |
| | | | 979,312 | |
Total COMMON STOCK | | | | 12,626,595 | |
| | | | | |
CASH EQUIVALENTS - 13.3% | | | | | |
PNC Bank Money Market Portfolio | | 1,765,362 | | 1,765,362 | |
Total CASH EQUIVALENTS | | | | 1,765,362 | |
| | | | | |
Total Investments (Cost $12,605,447) - 108.1% | | | | 14,391,957 | |
Liabilities in excess of other assets - (8.1)% | | | | (1,072,569 | ) |
NET ASSETS - 100.0% | | | | $ | 13,319,388 | |
*Non-income producing security
(1)Rule 144A, Section 4(2), or other security that is restricted as to resale to institutional investors. The Investment Advisor, using Board-approved procedures has deemed these securities to be liquid.
ADR American Depositary Receipt
GDR Global Depositary Receipt
See accompanying notes to financial statements
FIRSTHAND HEALTH SCIENCES FUND
Portfolio of Investments (as of 12/31/06)
| | SHARES | | MARKET VALUE | |
| | | | | |
COMMON STOCK - 92.5% | | | | | |
AGRICULTURAL CHEMICALS - 0.4% | | | | | |
Syngenta AG | | 35 | | $ | 6,502 | |
| | | | | |
BIOTECHNOLOGY - 26.2% | | | | | |
Achillion Pharmaceuticals, Inc. * | | 730 | | 11,768 | |
Alnylam Pharmaceuticals, Inc. * | | 500 | | 10,700 | |
Amgen, Inc. * | | 743 | | 50,753 | |
Amylin Pharmaceuticals, Inc. * | | 360 | | 12,985 | |
Anadys Pharmaceuticals, Inc. * | | 810 | | 3,985 | |
ARIAD Pharmaceuticals, Inc. * | | 86 | | 442 | |
BioCryst Pharmaceuticals, Inc. * | | 193 | | 2,231 | |
Biogen Idec, Inc. * | | 764 | | 37,581 | |
BioMarin Pharmaceutical, Inc. * | | 129 | | 2,114 | |
CoTherix, Inc. * | | 257 | | 3,467 | |
Critical Therapeutics, Inc. * | | 2,770 | | 5,651 | |
CV Therapeutics, Inc. * | | 1,000 | | 13,960 | |
Cytokinetics, Inc. * | | 138 | | 1,032 | |
Genentech, Inc. * | | 227 | | 18,417 | |
Genzyme Corp. * | | 516 | | 31,775 | |
Gilead Sciences, Inc. * | | 570 | | 37,010 | |
Hana Biosciences, Inc. * | | 2,224 | | 14,167 | |
Illumina, Inc. * | | 290 | | 11,400 | |
Imclone Systems, Inc. * | | 81 | | 2,168 | |
Incyte Corp. * | | 515 | | 3,008 | |
Insmed, Inc. * | | 683 | | 601 | |
Martek Biosciences Corp. * | | 213 | | 4,971 | |
Medarex, Inc. * | | 297 | | 4,393 | |
MedImmune, Inc. * | | 810 | | 26,220 | |
Momenta Pharmaceuticals, Inc. * | | 1,791 | | 28,172 | |
Neurocrine Biosciences, Inc. * | | 33 | | 344 | |
NPS Pharmaceuticals, Inc. * | | 143 | | 648 | |
Onyx Pharmaceuticals, Inc. * | | 920 | | 9,734 | |
PDL BioPharma, Inc. * | | 118 | | 2,377 | |
Regeneron Pharmaceuticals, Inc. * | | 306 | | 6,141 | |
Savient Pharmaceuticals, Inc. * | | 1,863 | | 20,884 | |
Tercica, Inc. * | | 141 | | 705 | |
Theravance, Inc. * | | 81 | | 2,502 | |
Trimeris, Inc. * | | 343 | | 4,360 | |
ViroPharma, Inc. * | | 80 | | 1,171 | |
ZymoGenetics, Inc. * | | 254 | | 3,955 | |
| | | | 391,792 | |
| | | | | | |
See accompanying notes to financial statements
| | SHARES | | MARKET VALUE | |
| | | | | |
CHEMICALS - SPECIALTY - 0.2% | | | | | |
Sigma-Aldrich Corp. | | 45 | | $ | 3,497 | |
| | | | | |
CONGLOMERATES - 0.6% | | | | | |
Tyco International Ltd. | | 296 | | 8,998 | |
| | | | | |
DIAGNOSTIC SUBSTANCES - 1.3% | | | | | |
Human Genome Sciences, Inc. * | | 396 | | 4,926 | |
QLT, Inc. * | | 1,354 | | 11,455 | |
Valera Pharmaceuticals, Inc. * | | 284 | | 2,292 | |
| | | | 18,673 | |
DRUG DELIVERY - 1.5% | | | | | |
Alkermes, Inc. * | | 959 | | 12,822 | |
Elan Corp. Plc - ADR * | | 111 | | 1,637 | |
Hospira, Inc. * | | 136 | | 4,567 | |
Nektar Therapeutics * | | 194 | | 2,951 | |
| | | | 21,977 | |
DRUG MANUFACTURERS - 48.9% | | | | | |
Abbott Laboratories | | 437 | | 21,286 | |
Adolor Corp. * | | 99 | | 744 | |
Alexion Pharmaceuticals, Inc. * | | 910 | | 36,755 | |
Alpharma, Inc. | | 137 | | 3,302 | |
Angiotech Pharmaceuticals, Inc. * | | 311 | | 2,555 | |
Arena Pharmaceuticals, Inc. * | | 164 | | 2,117 | |
ArQule, Inc. * | | 331 | | 1,960 | |
AstraZeneca Plc | | 298 | | 16,002 | |
AtheroGenics, Inc. * | | 202 | | 2,002 | |
Barr Pharmaceuticals, Inc. * | | 280 | | 14,034 | |
Bayer AG | | 153 | | 8,237 | |
Bristol-Myers Squibb Co. | | 967 | | 25,451 | |
Celgene Corp. * | | 476 | | 27,384 | |
Chugai Pharmaceutical Co., Ltd. | | 400 | | 8,242 | |
Cubist Pharmaceuticals, Inc. * | | 197 | | 3,568 | |
Daiichi Sankyo Co., Ltd. | | 300 | | 9,367 | |
Dynavax Technologies Corp. * | | 1,810 | | 16,616 | |
Eli Lilly & Co. | | 1,050 | | 54,705 | |
Genmab A/S * | | 200 | | 13,446 | |
Geron Corp. * | | 207 | | 1,817 | |
GlaxoSmithKline Plc - ADR | | 1,083 | | 57,140 | |
ICOS Corp. * | | 1,125 | | 38,014 | |
Ipsen AG | | 250 | | 11,609 | |
Johnson & Johnson | | 326 | | 21,523 | |
| | | | | | |
See accompanying notes to financial statements
| | SHARES | | MARKET VALUE | |
| | | | | |
Merck & Co., Inc. | | 260 | | $ | 11,336 | |
Merck KGaA | | 60 | | 6,228 | |
MGI Pharma, Inc. * | | 105 | | 1,933 | |
Millenium Pharmaceuticals, Inc. * | | 208 | | 2,267 | |
Mylan Laboratories, Inc. | | 95 | | 1,896 | |
Novartis AG - ADR | | 796 | | 45,722 | |
Novartis AG - Registered Shares | | 260 | | 14,966 | |
Novo Nordisk A/S - ADR | | 190 | | 15,890 | |
Novo Nordisk A/S - Class B | | 200 | | 16,648 | |
Par Pharmaceutical Cos., Inc. * | | 187 | | 4,183 | |
Pfizer, Inc. | | 2,563 | | 66,383 | |
Progenics Pharmaceuticals, Inc. * | | 560 | | 14,414 | |
Roche Holdings - Genus | | 62 | | 11,100 | |
Sanofi-Aventis - ADR | | 106 | | 4,894 | |
Schering-Plough Corp. | | 1,877 | | 44,372 | |
Sepracor, Inc. * | | 119 | | 7,328 | |
Sorin SpA * | | 634 | | 1,364 | |
Tanox, Inc. * | | 366 | | 7,283 | |
Taro Pharmaceutical Industries Ltd. * | | 803 | | 8,030 | |
Teva Pharmaceutical Industries Ltd. - ADR | | 590 | | 18,337 | |
United Therapeutics Corp. * | | 68 | | 3,697 | |
Valeant Pharmaceuticals International | | 178 | | 3,069 | |
Vertex Pharmaceuticals, Inc. * | | 49 | | 1,834 | |
Watson Pharmaceuticals, Inc. * | | 82 | | 2,134 | |
Wyeth | | 331 | | 16,855 | |
| | | | 730,039 | |
DRUG RELATED PRODUCTS - 0.7% | | | | | |
Labopharm, Inc. * | | 1,850 | | 10,860 | |
| | | | | |
DRUG STORES - 0.6% | | | | | |
CVS Corp. | | 295 | | 9,118 | |
| | | | | |
HEALTH CARE PLANS - 2.3% | | | | | |
Aetna, Inc. | | 78 | | 3,368 | |
CIGNA Corp. | | 82 | | 10,789 | |
WellPoint, Inc. * | | 256 | | 20,144 | |
| | | | 34,301 | |
LONG-TERM CARE FACILITIES - 0.2% | | | | | |
Manor Care, Inc. | | 52 | | 2,440 | |
| | | | | |
MEDICAL APPLIANCES & EQUIPMENT - 5.0% | | | | | |
Biomet, Inc. | | 190 | | 7,841 | |
Cyberonics, Inc. * | | 111 | | 2,291 | |
| | | | | | |
See accompanying notes to financial statements
| | SHARES | | MARKET VALUE | |
| | | | | |
Kinetic Concepts, Inc. * | | 44 | | $ | 1,740 | |
Medtronic, Inc. | | 423 | | 22,635 | |
Smith & Nephew Plc | | 668 | | 6,967 | |
St. Jude Medical, Inc. * | | 269 | | 9,835 | |
Wright Medical Group, Inc. * | | 456 | | 10,616 | |
Zimmer Holdings, Inc. * | | 161 | | 12,619 | |
| | | | 74,544 | |
MEDICAL INSTRUMENTS & SUPPLIES - 2.0% | | | | | |
Bausch & Lomb, Inc. | | 161 | | 8,382 | |
Baxter International, Inc. | | 86 | | 3,990 | |
Fresenius AG | | 44 | | 8,800 | |
Fresenius Medical Care AG | | 34 | | 4,531 | |
Kyphon, Inc. * | | 30 | | 1,212 | |
Vital Signs, Inc. | | 46 | | 2,296 | |
| | | | 29,211 | |
MEDICAL LABORATORIES & RESEARCH - 1.1% | | | | | |
OSI Pharmaceuticals, Inc. * | | 261 | | 9,130 | |
Quest Diagnostics, Inc. | | 149 | | 7,897 | |
| | | | 17,027 | |
RESEARCH SERVICES - 0.1% | | | | | |
Maxygen, Inc. * | | 115 | | 1,239 | |
| | | | | |
SCIENTIFIC & TECHNICAL INSTRUMENTS - 0.9% | | | | | |
Applera Corp. - Applied Biosystems Group | | 124 | | 4,550 | |
Applera Corp. - Celera Genomics Group * | | 138 | | 1,931 | |
Bio-Rad Laboratories, Inc., Class A * | | 67 | | 5,528 | |
Cepheid, Inc. * | | 125 | | 1,063 | |
| | | | 13,072 | |
SPECIALIZED HEALTH SERVICES - 0.5% | | | | | |
Caremark Rx, Inc. | | 120 | | 6,853 | |
Total COMMON STOCK | | | | 1,380,143 | |
| | | | | |
CASH EQUIVALENTS - 6.0% | | | | | |
PNC Bank Money Market Portfolio | | 89,933 | | 89,933 | |
Total CASH EQUIVALENTS | | | | 89,933 | |
| | | | | |
Total Investments (Cost $1,381,318) - 98.5% | | | | 1,470,076 | |
Other assets in excess of liabilities - 1.5% | | | | 22,654 | |
NET ASSETS - 100.0% | | | | $ | 1,492,730 | |
*Non-income producing security
ADR American Depositary Receipt
See accompanying notes to financial statements
STATEMENTS OF ASSETS AND LIABILITIES
December 31, 2006
| | Firsthand | | Firsthand | | Firsthand | |
| | Technology | | Technology | | Technology | |
| | Value | | Leaders | | Innovators | |
| | Fund | | Fund | | Fund | |
| | | | | | | |
ASSETS | | | | | | | |
Investment securities: | | | | | | | |
Unaffiliated issuers at acquisition cost | | $ | 428,266,708 | | $ | 59,377,588 | | $ | 24,193,371 | |
Affiliated issuers at acquisition cost | | 34,277,035 | | — | | 8,581,849 | |
Total acquisition cost | | $ | 462,543,743 | | $ | 59,377,588 | | $ | 32,775,220 | |
Unaffiliated issuers at market value | | $ | 340,525,028 | | $ | 73,687,592 | | $ | 20,902,264 | |
Affiliated issuers at market value | | 27,943,802 | | — | | 5,768,584 | |
Total market value (Note 2) | | 368,468,830 | | 73,687,592 | | 26,670,848 | |
Cash | | 1 | | 1 | | — | |
Receivable for securities sold | | 4,904,094 | | 750,465 | | — | |
Receivable from dividends, interest, and reclaims | | 76,302 | | 21,816 | | 4,488 | |
Receivable for capital shares sold | | 41,512 | | 5,587 | | 544 | |
Deferred trustee compensation (Note 5) | | 84,503 | | 51,627 | | 51,627 | |
TOTAL ASSETS | | 373,575,242 | | 74,517,088 | | 26,727,507 | |
| | | | | | | |
LIABILITIES | | | | | | | |
Payable for securities purchased | | — | | — | | — | |
Payable to affiliates (Note 4) | | 630,723 | | 126,022 | | 45,124 | |
Payable for capital shares redeemed | | 1,920,374 | | 346,217 | | 100,703 | |
Payable for trustee compensation (Note 5) | | 84,503 | | 51,627 | | 51,627 | |
TOTAL LIABILITIES | | 2,635,600 | | 523,866 | | 197,454 | |
| | | | | | | |
NET ASSETS | | $ | 370,939,642 | | $ | 73,993,222 | | $ | 26,530,053 | |
| | | | | | | |
Net assets consist of: | | | | | | | |
Paid-in-capital | | $ | 3,108,928,587 | | $ | 394,641,914 | | $ | 406,974,346 | |
Accumulated net investment loss | | (5,859 | ) | — | | — | |
Accumulated net realized losses from security transactions, and foreign currency | | (2,643,908,173 | ) | (334,958,696 | ) | (374,339,921 | ) |
Net unrealized appreciation (depreciation) on investments and foreign currency | | (94,074,913 | ) | 14,310,004 | | (6,104,372 | |
NET ASSETS | | $ | 370,939,642 | | $ | 73,993,222 | | $ | 26,530,053 | |
| | | | | | | |
Shares of beneficial interest outstanding (unlimited number of shares authorized, no par value) | | 10,278,992 | | 3,657,875 | | 2,643,684 | |
| | | | | | | |
Net asset value, redemption price and offering price per share (Note 2) | | $ | 36.09 | | $ | 20.23 | | $ | 10.04 | |
See accompanying notes to financial statements
STATEMENTS OF ASSETS AND LIABILITIES
December 31, 2006 - continued
| | | | Firsthand | | Firsthand | |
| | Firsthand | | Global | | Health | |
| | e-Commerce | | Technology | | Sciences | |
| | Fund | | Fund | | Fund | |
| | | | | | | |
ASSETS | | | | | | | |
Investment securities: | | | | | | | |
Unaffiliated issuers at acquisition cost | | $ | 32,417,399 | | $ | 12,605,447 | | $ | 1,381,318 | |
Affiliated issuers at acquisition cost | | — | | — | | — | |
Total acquisition cost | | $ | 32,417,399 | | $ | 12,605,447 | | $ | 1,381,318 | |
Unaffiliated issuers at market value | | $ | 40,456,862 | | $ | 14,391,957 | | $ | 1,470,076 | |
Affiliated issuers at market value | | — | | — | | — | |
Total market value (Note 2) | | 40,456,862 | | 14,391,957 | | 1,470,076 | |
Cash | | 1 | | 1 | | 1 | |
Receivable for securities sold | | 16,723 | | — | | 1,953 | |
Receivable from dividends, interest, and reclaims | | 10,737 | | 8,581 | | 1,130 | |
Receivable for capital shares sold | | 3,078 | | — | | 22,000 | |
Deferred trustee compensation (Note 5) | | 51,627 | | 40,094 | | 5,475 | |
TOTAL ASSETS | | 40,539,028 | | 14,440,633 | | 1,500,635 | |
| | | | | | | |
LIABILITIES | | | | | | | |
Payable for securities purchased | | — | | 942,991 | | — | |
Payable to affiliates (Note 4) | | 67,396 | | 22,690 | | 2,430 | |
Payable for capital shares redeemed | | 115,194 | | 115,470 | | — | |
Payable for trustee compensation (Note 5) | | 51,627 | | 40,094 | | 5,475 | |
TOTAL LIABILITIES | | 234,217 | | 1,121,245 | | 7,905 | |
| | | | | | | |
NET ASSETS | | $ | 40,304,811 | | $ | 13,319,388 | | $ | 1,492,730 | |
| | | | | | | |
Net assets consist of: | | | | | | | |
Paid-in-capital | | $ | 433,518,139 | | $ | 90,649,549 | | $ | 1,392,465 | |
Accumulated net investment loss | | — | | (41 | ) | — | |
Accumulated net realized gains (losses) from security transactions, and foreign currency | | (401,252,791 | ) | (79,116,704 | ) | 11,497 | |
Net unrealized appreciation on investments and foreign currency | | 8,039,463 | | 1,786,584 | | 88,768 | |
NET ASSETS | | $ | 40,304,811 | | $ | 13,319,388 | | $ | 1,492,730 | |
| | | | | | | |
Shares of beneficial interest outstanding (unlimited number of shares authorized, no par value) | | 9,959,978 | | 2,968,988 | | 135,868 | |
| | | | | | | |
Net asset value, redemption price and offering price per share
(Note 2) | | $ | 4.05 | | $ | 4.49 | | $ | 10.99 | |
See accompanying notes to financial statements
STATEMENTS OF OPERATIONS
For the year ended December 31, 2006
| | Firsthand | | Firsthand | | Firsthand | |
| | Technology | | Technology | | Technology | |
| | Value | | Leaders | | Innovators | |
| | Fund | | Fund | | Fund | |
| | | | | | | |
INVESTMENT INCOME | | | | | | | |
Interest * | | $ | 60,872 | | $ | — | | $ | (105,742 | )(A) |
Dividends ** | | 918,029 | | 767,187 | | 54,075 | |
TOTAL INVESTMENT INCOME | | 978,901 | | 767,187 | | (51,667 | ) |
| | | | | | | |
EXPENSES | | | | | | | |
Investment advisory fees (Note 4) | | 6,500,430 | | 1,396,462 | | 467,587 | |
Administrative fees (Note 4) | | 1,832,289 | | 418,940 | | 140,276 | |
Trustees fees | | 17,388 | | 13,795 | | 13,795 | |
GROSS EXPENSES | | 8,350,107 | | 1,829,197 | | 621,658 | |
Investment advisory fees waived | | (17,388 | ) | (13,795 | ) | (13,795 | ) |
TOTAL NET EXPENSES | | 8,332,719 | | 1,815,402 | | 607,863 | |
| | | | | | | |
NET INVESTMENT LOSS | | (7,353,818 | ) | (1,048,215 | ) | (659,530 | ) |
| | | | | | | |
REALIZED AND UNREALIZED GAINS (LOSSES) ON INVESTMENTS | | | | | | | |
Net realized gains (losses) from security transactions and foreign currency | | | | | | | |
Non-affiliated | | (37,630,718 | ) | 6,421,035 | | (1,669,773 | ) |
Affiliated | | (3,623,219 | ) | — | | — | |
Net change in unrealized appreciation/depreciation on investments and foreign currency | | 84,354,819 | | 1,296,937 | | 5,294,190 | |
| | | | | | | |
NET REALIZED AND UNREALIZED GAINS ON INVESTMENTS | | 43,100,882 | | 7,717,972 | | 3,624,417 | |
| | | | | | | |
NET INCREASE IN NET ASSETS FROM OPERATIONS | | $ | 35,747,064 | | $ | 6,669,757 | | $ | 2,964,887 | |
| | | | | | | | |
* Including interest from affiliated security | | $ | 56,164 | | $ | — | | $ | — | | |
** Net of foreign tax withholding | | $ | — | | $ | 71,475 | | $ | — | | |
| | | | | | | | | | | | | | | | | |
(A) Write-off of affiliated security interest from prior fiscal years.
See accompanying notes to financial statements
| | | | Firsthand | | Firsthand | |
| | Firsthand | | Global | | Health | |
| | e-Commerce | | Technology | | Sciences | |
| | Fund | | Fund | | Fund | |
| | | | | | | |
INVESTMENT INCOME | | | | | | | |
Interest | | $ | — | | $ | — | | $ | — | |
Dividends ** | | 174,870 | | 152,137 | | 13,800 | |
TOTAL INVESTMENT INCOME | | 174,870 | | 152,137 | | 13,800 | |
| | | | | | | |
EXPENSES | | | | | | | |
Investment advisory fees (Note 4) | | 597,690 | | 217,720 | | 18,613 | |
Administrative fees (Note 4) | | 179,307 | | 65,316 | | 5,584 | |
Trustees fees | | 13,795 | | 12,536 | | 8,753 | |
GROSS EXPENSES | | 790,792 | | 295,572 | | 32,950 | |
Investment advisory fees waived | | (13,795 | ) | (12,536 | ) | (8,753 | ) |
TOTAL NET EXPENSES | | 776,997 | | 283,036 | | 24,197 | |
| | | | | | | |
NET INVESTMENT LOSS | | (602,127 | ) | (130,899 | ) | (10,397 | ) |
| | | | | | | |
REALIZED AND UNREALIZED GAINS ON INVESTMENTS | | | | | | | |
Net realized gains from security transactions and foreign currency | | | | | | | |
Non-affiliated | | 6,071,777 | | 939,292 | | 21,894 | |
Affiliated | | — | | — | | — | |
Net change in unrealized appreciation on investments and foreign currency | | 1,453,550 | | 1,190,808 | | 88,768 | |
| | | | | | | |
NET REALIZED AND UNREALIZED GAINS ON INVESTMENTS | | 7,525,327 | | 2,130,100 | | 110,662 | |
| | | | | | | |
NET INCREASE IN NET ASSETS FROM OPERATIONS | | $ | 6,923,200 | | $ | 1,999,201 | | $ | 100,265 | |
| | | | | | | |
** Net of foreign tax withholding | | $ | 168 | | $ | 14,062 | | $ | 336 | |
See accompanying notes to financial statements
statementS of changes in net assets
For the years ended December 31, 2006, and December 31, 2005
| | Firsthand��Technology
Value Fund | |
| | Year Ended | | Year Ended | |
| | 12/31/06 | | 12/31/05 | |
| | | | | |
FROM OPERATIONS: | | | | | |
Net investment loss | | $ | (7,353,818 | ) | $ | (8,355,438 | ) |
Net realized losses from security transactions and foreign currency | | (41,253,937 | ) | (143,155,265 | ) |
Net change in unrealized appreciation on investments and foreign currency | | 84,354,819 | | 193,732,975 | |
Net increase in net assets from operations | | 35,747,064 | | 42,222,272 | |
| | | | | |
FROM CAPITAL SHARE TRANSACTIONS: | | | | | |
Proceeds from shares sold | | 74,780,962 | | 29,662,063 | |
Payment for shares redeemed | | (186,195,469 | ) | (212,207,191 | ) |
Net decrease in net assets from capital share transactions | | (111,414,507 | ) | (182,545,128 | ) |
| | | | | |
TOTAL DECREASE IN NET ASSETS | | (75,667,443 | ) | (140,322,856 | ) |
| | | | | |
NET ASSETS: | | | | | |
Beginning of year | | 446,607,085 | | 586,929,941 | |
End of year | | $ | 370,939,642 | | $ | 446,607,085 | |
| | | | | |
Accumulated Net Investment Loss | | $ | (5,859 | ) | $ | — | |
| | | | | |
CAPITAL SHARE ACTIVITY: | | | | | |
Shares sold | | 2,061,368 | | 993,682 | |
Shares redeemed | | (5,265,528 | ) | (7,420,470 | ) |
Net decrease in shares outstanding | | (3,204,160 | ) | (6,426,788 | ) |
Shares outstanding, beginning of year | | 13,483,152 | | 19,909,940 | |
Shares outstanding, end of year | | 10,278,992 | | 13,483,152 | |
| | | | | | | | |
See accompanying notes to financial statements
| | Firsthand Technology | |
| | Leaders Fund | |
| | Year Ended | | Year Ended | | |
| | 12/31/06 | | 12/31/05 | | |
FROM OPERATIONS: | | | | | | |
Net investment loss | | $ | (1,048,215 | ) | $ | (1,460,567 | ) | |
Net realized gains (losses) from security transactions and foreign currency | | 6,421,035 | | (881,013 | ) | |
Net change in unrealized appreciation on investments and foreign currency | | 1,296,937 | | 14,301,064 | | |
Net increase in net assets from operations | | 6,669,757 | | 11,959,484 | | |
| | | | | | |
FROM CAPITAL SHARE TRANSACTIONS: | | | | | | |
Proceeds from shares sold | | 16,888,756 | | 35,038,398 | | |
Payment for shares redeemed | | (70,574,184 | ) | (39,903,838 | ) | |
Net decrease in net assets from capital share transactions | | (53,685,428 | ) | (4,865,440 | ) | |
| | | | | | |
TOTAL INCREASE (DECREASE) IN NET ASSETS | | (47,015,671 | ) | 7,094,044 | | |
| | | | | | |
NET ASSETS: | | | | | | |
Beginning of year | | 121,008,893 | | 113,914,849 | | |
End of year | | $ | 73,993,222 | | $ | 121,008,893 | | |
| | | | | | |
CAPITAL SHARE ACTIVITY: | | | | | | |
Shares sold | | 831,474 | | 1,955,489 | | |
Shares redeemed | | (3,558,712 | ) | (2,372,791 | ) | |
Net decrease in shares outstanding | | (2,727,238 | ) | (417,302 | ) | |
Shares outstanding, beginning of year | | 6,385,113 | | 6,802,415 | | |
Shares outstanding, end of year | | 3,657,875 | | 6,385,113 | | |
See accompanying notes to financial statements
| | Firsthand Technology | |
| | Innovators Fund | |
| | Year Ended | | Year Ended | |
| | 12/31/06 | | 12/31/05 | |
FROM OPERATIONS: | | | | | |
Net investment loss | | $ | (659,530 | ) | $ | (638,933 | ) |
Net realized losses from security transactions and foreign currency | | (1,669,773 | ) | (19,972,510 | ) |
Net change in unrealized appreciation on investments and foreign currency | | 5,294,190 | | 13,583,828 | |
Net increase (decrease) in net assets from operations | | 2,964,887 | | (7,027,615 | ) |
| | | | | |
FROM CAPITAL SHARE TRANSACTIONS: | | | | | |
Proceeds from shares sold | | 15,161,725 | | 3,579,870 | |
Payment for shares redeemed | | (21,072,083 | ) | (25,232,780 | ) |
Net decrease in net assets from capital share transactions | | (5,910,358 | ) | (21,652,910 | ) |
| | | | | |
TOTAL DECREASE IN NET ASSETS | | (2,945,471 | ) | (28,680,525 | ) |
| | | | | |
NET ASSETS: | | | | | |
Beginning of year | | 29,475,524 | | 58,156,049 | |
End of year | | $ | 26,530,053 | | $ | 29,475,524 | |
| | | | | |
CAPITAL SHARE ACTIVITY: | | | | | |
Shares sold | | 1,418,225 | | 395,792 | |
Shares redeemed | | (2,095,438 | ) | (2,845,292 | ) |
Net decrease in shares outstanding | | (677,213 | ) | (2,449,500 | ) |
Shares outstanding, beginning of year | | 3,320,897 | | 5,770,397 | |
Shares outstanding, end of year | | 2,643,684 | | 3,320,897 | |
See accompanying notes to financial statements
| | Firsthand e-Commerce | |
| | Fund | |
| | Year Ended | | Year Ended | | |
| | 12/31/06 | | 12/31/05 | | |
FROM OPERATIONS: | | | | | | |
Net investment loss | | $ | (602,127 | ) | $ | (763,059 | ) | |
Net realized gains from security transactions, written options and foreign currency | | 6,071,777 | | 2,165,113 | | |
Net change in unrealized appreciation on investments, written options and foreign currency | | 1,453,550 | | 261,464 | | |
Net increase in net assets from operations | | 6,923,200 | | 1,663,518 | | |
| | | | | | |
FROM CAPITAL SHARE TRANSACTIONS: | | | | | | |
Proceeds from shares sold | | 1,874,047 | | 1,368,881 | | |
Payment for shares redeemed | | (11,435,881 | ) | (15,641,580 | ) | |
Net decrease in net assets from capital share transactions | | (9,561,834 | ) | (14,272,699 | ) | |
| | | | | | |
TOTAL DECREASE IN NET ASSETS | | (2,638,634 | ) | (12,609,181 | ) | |
| | | | | | |
NET ASSETS: | | | | | | |
Beginning of year | | 42,943,445 | | 55,552,626 | | |
End of year | | $ | 40,304,811 | | $ | 42,943,445 | | |
| | | | | | |
CAPITAL SHARE ACTIVITY: | | | | | | |
Shares sold | | 497,725 | | 445,763 | | |
Shares redeemed | | (3,159,194 | ) | (5,044,549 | ) | |
Net decrease in shares outstanding | | (2,661,469 | ) | (4,598,786 | ) | |
Shares outstanding, beginning of year | | 12,621,447 | | 17,220,233 | | |
Shares outstanding, end of year | | 9,959,978 | | 12,621,447 | | |
See accompanying notes to financial statements
| | Firsthand Global | |
| | Technology Fund | |
| | Year Ended | | Year Ended | |
| | 12/31/06 | | 12/31/05 | |
FROM OPERATIONS: | | | | | |
Net investment loss | | $ | (130,899 | ) | $ | (235,456 | ) |
Net realized gains (losses) from security transactions and foreign currency | | 939,292 | | (2,629,847 | ) |
Net change in unrealized appreciation (depreciation) on investments and foreign currency | | 1,190,808 | | (36,882 | ) |
Net increase (decrease) in net assets from operations | | 1,999,201 | | (2,902,185 | ) |
| | | | | |
FROM CAPITAL SHARE TRANSACTIONS: | | | | | |
Proceeds from shares sold | | 923,944 | | 2,179,106 | |
Payment for shares redeemed | | (6,032,464 | ) | (15,372,316 | ) |
Net decrease in net assets from capital share transactions | | (5,108,520 | ) | (13,193,210 | ) |
| | | | | |
TOTAL DECREASE IN NET ASSETS | | (3,109,319 | ) | (16,095,395 | ) |
| | | | | |
NET ASSETS: | | | | | |
Beginning of year | | 16,428,707 | | 32,524,102 | |
End of year | | $ | 13,319,388 | | $ | 16,428,707 | |
| | | | | |
Accumulated Net Investment Loss | | $ | (41 | ) | $ | — | |
| | | | | |
CAPITAL SHARE ACTIVITY: | | | | | |
Shares sold | | 221,017 | | 571,676 | |
Shares redeemed | | (1,450,092 | ) | (3,973,837 | ) |
Net decrease in shares outstanding | | (1,229,075 | ) | (3,402,161 | ) |
Shares outstanding, beginning of year | | 4,198,063 | | 7,600,224 | |
Shares outstanding, end of year | | 2,968,988 | | 4,198,063 | |
See accompanying notes to financial statements
| | Firsthand Health | |
| | Sciences Fund | |
| | YearEnded | |
| | 12/31/06* | |
| | | |
FROM OPERATIONS: | | | |
Net investment loss | | $ | (10,397 | ) |
Net realized gains from security transactions and foreign currency | | 21,894 | |
Net change in unrealized appreciation on investments and foreign currency | | 88,768 | |
Net increase in net assets from operations | | 100,265 | |
| | | |
FROM CAPITAL SHARE TRANSACTIONS: | | | |
Proceeds from shares sold | | 1,197,394 | |
Payment for shares redeemed | | (304,929 | ) |
Net increase in net assets from capital share transactions | | 892,465 | |
| | | |
TOTAL INCREASE IN NET ASSETS | | 992,730 | |
| | | |
NET ASSETS: | | | |
Beginning of year | | 500,000 | |
End of year | | $ | 1,492,730 | |
| | | |
CAPITAL SHARE ACTIVITY: | | | |
Shares sold | | 115,350 | |
Shares redeemed | | (29,482 | ) |
Net increase in shares outstanding | | 85,868 | |
Shares outstanding, beginning of year | | 50,000 | |
Shares outstanding, end of year | | 135,868 | |
* There was no income earned or expenses incurred from the date of initial capitalization (December 30, 2005) to December 31, 2005.
See accompanying notes to financial statements
financial highlights - FIRSTHAND TECHNOLOGY VALUE FUND
Selected per share data and ratios for a share outstanding throughout each year
| | Year | | Year | | Year | | Year | | Year | |
| | Ended | | Ended | | Ended | | Ended | | Ended | |
| | 12/31/06 | | 12/31/05 | | 12/31/04 | | 12/31/03 | | 12/31/02 | |
| | | | | | | | | | | |
Net asset value at beginning of year | | $ | 33.12 | | $ | 29.48 | | $ | 31.57 | | $ | 18.09 | | $ | 41.25 | |
| | | | | | | | | | | |
Income from investment operations: | | | | | | | | | | | |
Net investment loss | | (0.72 | ) | (0.62 | ) | (0.49 | ) | (0.40 | ) | (0.46 | ) |
Net realized and unrealized gains (losses) on investments | | 3.69 | | 4.26 | | (1.60 | ) | 13.88 | | (22.72 | ) |
Total from investment operations | | 2.97 | | 3.64 | | (2.09 | ) | 13.48 | | (23.18 | ) |
| | | | | | | | | | | |
Paid-in-capital from redemption fees (Note 2) | | — | | — | | — | | 0.00 | (A) | 0.02 | |
| | | | | | | | | | | |
Net asset value at end of year | | $ | 36.09 | | $ | 33.12 | | $ | 29.48 | | $ | 31.57 | | $ | 18.09 | |
| | | | | | | | | | | |
Total return | | 8.97 | % | 12.35 | % | (6.62% | ) | 74.52 | % | (56.15% | ) |
| | | | | | | | | | | |
Net assets at end of year (millions) | | $ | 370.9 | | $ | 446.6 | | $ | 586.9 | | $ | 877.4 | | $ | 492.7 | |
| | | | | | | | | | | |
Ratio of gross expenses to average net assets before waiver | | 1.93 | % | 1.92 | % | 1.90 | % | 1.90 | % | 1.89 | % |
| | | | | | | | | | | |
Ratio of net expenses to average net assets after waiver | | 1.92 | % | 1.92 | % | 1.90 | % | 1.90 | % | 1.89 | % |
| | | | | | | | | | | |
Ratio of net investment loss to average net assets | | (1.70 | )% | (1.81 | )% | (1.41 | )% | (1.64 | )% | (1.56 | )% |
| | | | | | | | | | | |
Portfolio turnover rate | | 47 | % | 42 | % | 17 | % | 38 | % | 44 | % |
(A) Amount is less than $0.01.
See accompanying notes to financial statements
FINANCIAL HIGHLIGHTS - FIRSTHAND TECHNOLOGY LEADERS FUND
Selected per share data and ratios for a share outstanding throughout each year
| | Year | | Year | | Year | | Year | | Year | |
| | Ended | | Ended | | Ended | | Ended | | Ended | |
| | 12/31/06 | | 12/31/05 | | 12/31/04 | | 12/31/03 | | 12/31/02 | |
| | | | | | | | | | | |
Net asset value at beginning of year | | $ | 18.95 | | $ | 16.75 | | $ | 17.23 | | $ | 10.65 | | $ | 18.86 | |
| | | | | | | | | | | |
Income from investment operations: | | | | | | | | | | | |
Net investment loss | | (0.29 | ) | (0.23 | ) | (0.30 | ) | (0.24 | ) | (0.26 | ) |
Net realized and unrealized gains (losses) on investments | | 1.57 | | 2.43 | | (0.18 | ) | 6.82 | | (7.96 | ) |
Total from investment operations | | 1.28 | | 2.20 | | (0.48 | ) | 6.58 | | (8.22 | ) |
| | | | | | | | | | | |
Paid-in-capital from redemption fees (Note 2) | | — | | — | | — | | 0.00 | (A) | 0.01 | |
| | | | | | | | | | | |
Net asset value at end of year | | $ | 20.23 | | $ | 18.95 | | $ | 16.75 | | $ | 17.23 | | $ | 10.65 | |
| | | | | | | | | | | |
Total return | | 6.75 | % | 13.13 | % | (2.79 | )% | 61.78 | % | (43.53 | )% |
| | | | | | | | | | | |
Net assets at end of year (millions) | | $ | 74.0 | | $ | 121.0 | | $ | 113.9 | | $ | 156.1 | | $ | 105.0 | |
| | | | | | | | | | | |
Ratio of gross expenses to average net assets before waiver | | 1.96 | % | 1.95 | % | 1.95 | % | 1.95 | % | 1.95 | % |
| | | | | | | | | | | |
Ratio of net expenses to average net assets after waiver | | 1.95 | % | 1.95 | % | 1.95 | % | 1.95 | % | 1.95 | % |
| | | | | | | | | | | |
Ratio of net investment loss to average net assets | | (1.13 | )% | (1.43 | )% | (1.58 | )% | (1.65 | )% | (1.63 | )% |
| | | | | | | | | | | |
Portfolio turnover rate | | 53 | % | 43 | % | 22 | % | 28 | % | 46 | % |
(A) Amount is less than $0.01.
See accompanying notes to financial statements
FINANCIAL HIGHLIGHTS - FIRSTHAND TECHNOLOGY INNOVATORS FUND
Selected per share data and ratios for a share outstanding throughout each year
| | Year | | Year | | Year | | Year | | Year | |
| | Ended | | Ended | | Ended | | Ended | | Ended | |
| | 12/31/06 | | 12/31/05 | | 12/31/04 | | 12/31/03 | | 12/31/02 | |
| | | | | | | | | | | |
Net asset value at beginning of year | | $ | 8.88 | | $ | 10.08 | | $ | 11.56 | | $ | 7.42 | | $ | 16.40 | |
| | | | | | | | | | | |
Income from investment operations: | | | | | | | | | | | |
Net investment loss | | (0.25 | ) | (0.19 | ) | (0.22 | ) | (0.17 | ) | (0.20 | ) |
Net realized and unrealized gains (losses) on investments | | 1.41 | | (1.01 | ) | (1.26 | ) | 4.31 | | (8.80 | ) |
Total from investment operations | | 1.16 | | (1.20 | ) | (1.48 | ) | 4.14 | | (9.00 | ) |
| | | | | | | | | | | |
Paid-in-capital from redemption fees (Note 2) | | — | | — | | — | | 0.00 | (A) | 0.02 | |
| | | | | | | | | | | |
Net asset value at end of year | | $ | 10.04 | | $ | 8.88 | | $ | 10.08 | | $ | 11.56 | | $ | 7.42 | |
| | | | | | | | | | | |
Total return | | 13.06 | % | (11.90 | )% | (12.80 | )% | 55.80 | % | (54.76 | )% |
| | | | | | | | | | | |
Net assets at end of year (millions) | | $ | 26.5 | | $ | 29.5 | | $ | 58.2 | | $ | 88.1 | | $ | 62.6 | |
| | | | | | | | | | | |
Ratio of gross expenses to average net assets before waiver | | 1.99 | % | 1.95 | % | 1.95 | % | 1.95 | % | 1.95 | % |
| | | | | | | | | | | |
Ratio of net expenses to average net assets after waiver | | 1.95 | % | 1.95 | % | 1.95 | % | 1.95 | % | 1.95 | % |
| | | | | | | | | | | |
Ratio of net investment loss to average net assets | | (2.12 | )% | (1.68 | )% | (1.83 | )% | (1.67 | )% | (1.66 | )% |
| | | | | | | | | | | |
Portfolio turnover rate | | 64 | % | 41 | % | 41 | % | 64 | % | 53 | % |
(A) Amount is less than $0.01.
See accompanying notes to financial statements
FINANCIAL HIGHLIGHTS - FIRSTHAND E-COMMERCE FUND
Selected per share data and ratios for a share outstanding throughout each year
| | Year | | Year | | Year | | Year | | Year | |
| | Ended | | Ended | | Ended | | Ended | | Ended | |
| | 12/31/06 | | 12/31/05 | | 12/31/04 | | 12/31/03 | | 12/31/02 | |
| | | | | | | | | | | |
Net asset value at beginning of year | | $ | 3.40 | | $ | 3.23 | | $ | 3.06 | | $ | 2.08 | | $ | 3.33 | |
| | | | | | | | | | | |
Income from investment operations: | | | | | | | | | | | |
Net investment loss | | (0.06 | ) | (0.06 | ) | (0.06 | ) | (0.05 | ) | (0.04 | ) |
Net realized and unrealized gains (losses) on investments | | 0.71 | | 0.23 | | 0.23 | | 1.03 | | (1.21 | ) |
Total from investment operations | | 0.65 | | 0.17 | | 0.17 | | 0.98 | | (1.25 | ) |
| | | | | | | | | | | |
Paid-in-capital from redemption fees (Note 2) | | — | | — | | — | | 0.00 | (A) | 0.00 | (A) |
| | | | | | | | | | | |
Net asset value at end of year | | $ | 4.05 | | $ | 3.40 | | $ | 3.23 | | $ | 3.06 | | $ | 2.08 | |
| | | | | | | | | | | |
Total return | | 19.12 | % | 5.26 | % | 5.56 | % | 47.12 | % | (37.54 | )% |
| | | | | | | | | | | |
Net assets at end of year (millions) | | $ | 40.3 | | $ | 42.9 | | $ | 55.6 | | $ | 66.4 | | $ | 51.8 | |
| | | | | | | | | | | |
Ratio of gross expenses to average net assets before waiver | | 1.98 | % | 1.95 | % | 1.95 | % | 1.95 | % | 1.95 | % |
| | | | | | | | | | | |
Ratio of net expenses to average net assets after waiver | | 1.95 | % | 1.95 | % | 1.95 | % | 1.95 | % | 1.95 | % |
| | | | | | | | | | | |
Ratio of net investment loss to average net assets | | (1.51 | )% | (1.66 | )% | (1.90 | )% | (1.72 | )% | (1.69 | )% |
| | | | | | | | | | | |
Portfolio turnover rate | | 59 | % | 55 | % | 22 | % | 46 | % | 61 | % |
(A) Amount is less than $0.01.
See accompanying notes to financial statements
FINANCIAL HIGHLIGHTS - FIRSTHAND GLOBAL TECHNOLOGY FUND
Selected per share data and ratios for a share outstanding throughout each year
| | Year | | Year | | Year | | Year | | Year | |
| | Ended | | Ended | | Ended | | Ended | | Ended | |
| | 12/31/06 | | 12/31/05 | | 12/31/04 | | 12/31/03 | | 12/31/02 | |
| | | | | | | | | | | |
Net asset value at beginning of year | | $ | 3.91 | | $ | 4.28 | | $ | 4.61 | | $ | 2.42 | | $ | 5.14 | |
| | | | | | | | | | | |
Income from investment operations: | | | | | | | | | | | |
Net investment loss | | (0.04 | ) | (0.06 | ) | (0.10 | ) | (0.05 | ) | (0.07 | ) |
Net realized and unrealized gains (losses) on investments | | 0.62 | | (0.31 | ) | (0.23 | ) | 2.24 | | (2.65 | ) |
Total from investment operations | | 0.58 | | (0.37 | ) | (0.33 | ) | 2.19 | | (2.72 | ) |
| | | | | | | | | | | |
Paid-in-capital from redemption fees (Note 2) | | — | | — | | — | | 0.00 | (A) | 0.00 | (A) |
| | | | | | | | | | | |
Net asset value at end of year | | $ | 4.49 | | $ | 3.91 | | $ | 4.28 | | $ | 4.61 | | $ | 2.42 | |
| | | | | | | | | | | |
Total return | | 14.83 | % | (8.64 | )% | (7.16 | )% | 90.50 | % | (52.92 | )% |
| | | | | | | | | | | |
Net assets at end of year (millions) | | $ | 13.3 | | $ | 16.4 | | $ | 32.5 | | $ | 57.3 | | $ | 20.2 | |
| | | | | | | | | | | |
Ratio of gross expenses to average net assets before waiver | | 2.04 | % | 1.95 | % | 1.95 | % | 1.95 | % | 1.95 | % |
| | | | | | | | | | | |
Ratio of net expenses to average net assets after waiver | | 1.95 | % | 1.95 | % | 1.95 | % | 1.95 | % | 1.95 | % |
| | | | | | | | | | | |
Ratio of net investment loss to average net assets | | (0.90 | )% | (1.20 | )% | (1.69 | )% | (1.77 | )% | (1.73 | )% |
| | | | | | | | | | | |
Portfolio turnover rate | | 70 | % | 23 | % | 15 | % | 50 | % | 26 | % |
(A) Amount is less than $0.01.
See accompanying notes to financial statements
FINANCIAL HIGHLIGHTS - FIRSTHAND HEALTH SCIENCES FUND
Selected per share data and ratios for a share outstanding throughout the year
| | Year | |
| | Ended | |
| | 12/31/06* | |
Net asset value at beginning of year | | $ | 10.00 | |
| | | |
Income from investment operations: | | | |
Net investment loss | | (0.08 | ) |
Net realized and unrealized gains on investments | | 1.07 | |
Total from investment operations | | 0.99 | |
| | | |
Net asset value at end of year | | $ | 10.99 | |
| | | |
Total return | | 9.90 | % |
| | | |
Net assets at end of year (millions) | | $ | 1.5 | |
| | | |
Ratio of gross expenses to average net assets before waiver | | 2.66 | % |
| | | |
Ratio of net expenses to average net assets after waiver | | 1.95 | % |
| | | |
Ratio of net investment loss to average net assets | | (0.84 | )% |
| | | |
Portfolio turnover rate | | 53 | % |
*There was no income earned or expenses incurred from the date of initial capitalization (December 30, 2005) to December 31, 2005.
See accompanying notes to financial statements
NOTES TO FINANCIAL STATEMENTS
December 31, 2006
1. Organization
Each of Firsthand Technology Value Fund, Firsthand Technology Leaders Fund, Firsthand Technology Innovators Fund, Firsthand e-Commerce Fund, Firsthand Global Technology Fund, and Firsthand Health Sciences Fund (individually the “Fund”, and collectively the “Funds”) is a non-diversified series of Firsthand Funds (the “Trust”), an open-end management investment company registered under the Investment Company Act of 1940, as amended (the “1940 Act”). The Trust, a Delaware statutory trust, was organized on November 8, 1993. The inception dates for the Funds (the date on which a net asset value was first determined for that Fund) follow:
Fund | | Inception Date |
Firsthand Technology Value Fund | | May 20, 1994* |
Firsthand Technology Leaders Fund | | December 10, 1997 |
Firsthand Technology Innovators Fund | | May 20, 1998 |
Firsthand e-Commerce Fund | | September 30, 1999 |
Firsthand Global Technology Fund | | September 29, 2000 |
Firsthand Health Sciences Fund | | December 30, 2005 |
* Firsthand Technology Value Fund Investor Class commenced operations on May 20, 1994; the SEC effective date for the Investor Class is December 15, 1994. Each Fund currently offers one class of shares-Investor Class shares.
Each Fund’s investment objective is long-term growth of capital.
Firsthand Technology Value Fund seeks to achieve its investment objective by investing, under normal circumstances, at least 80% of its assets in high-technology companies that Firsthand Capital Management, Inc. (the “Investment Adviser”) believes are undervalued and have potential for capital appreciation.
Firsthand Technology Leaders Fund seeks to achieve its investment objective by investing, under normal circumstances, at least 80% of its assets in high-technology companies that the Investment Adviser believes hold dominant competitive positions in high-growth industries.
Firsthand Technology Innovators Fund seeks to achieve its investment objective by investing, under normal circumstances, at least 80% of its assets in high-technology companies that the Investment Adviser considers to be best positioned to introduce “breakthrough” products in the fastest growing markets in the technology sector.
Firsthand e-Commerce Fund seeks to achieve its investment objective by investing, under normal circumstances, at least 80% of its assets in equity securities of companies that provide the products, services, and technologies to facilitate the growth of electronic commerce.
Firsthand Global Technology Fund seeks to achieve its investment objective by investing, under normal circumstances, at least 80% of its assets in high-technology companies, both domestic and foreign, that the Investment Adviser considers best positioned to benefit significantly from the adoption of new technologies worldwide.
Firsthand Health Sciences Fund seeks to achieve its investment objective by investing, under normal circumstances, at least 80% of its assets in companies principally engaged in the research, development, production or distribution of products and services in the biotechnology, pharmaceutical, health care and medical industries.
2. Significant Accounting Policies
The following is a summary of the Funds’ significant accounting policies:
Securities Valuation—A Fund’s portfolio of securities is valued as follows:
1. Securities traded on stock exchanges, or quoted by NASDAQ, are valued according to the NASDAQ official closing price, if applicable, or at their last reported sale price as of the close of trading on the New York Stock Exchange (“NYSE”) (normally 4:00 P.M. Eastern Time). If a security is not traded that day, the security will be valued at its most recent bid price.
2. Securities traded in the over-the-counter market, but not quoted by NASDAQ, are valued at the last sale price (or, if the last sale price is not readily available, at the most recent closing bid price as quoted by brokers that make markets in the securities) at the close of trading on the NYSE.
3. Securities traded both in the over-the-counter market and on a stock exchange are valued according to the broadest and most representative market.
4. Securities and other assets that do not have market quotations readily available are valued at their fair value as determined in good faith using procedures established by the Board of Trustees.
In September 2006, the Financial Accounting Standards Board (“FASB”) issued Statement on Financial Accounting Standards (“SFAS”) No. 157, “Fair Value Measurements.” This standard establishes a single authoritative definition of fair value, sets out a framework for measuring fair value and requires additional disclosures about fair value measurements. SFAS No. 157 applies to fair value measurements already required or permitted by existing standards. SFAS No. 157 is effective for financial statements issued for fiscal years beginning after November 15, 2007 and interim periods within those fiscal years. The changes to current accounting principles generally accepted in the United States of America from the application of this Statement relate to the definition of fair value, the methods used to measure fair value, and the expanded disclosures about fair value measurements. As of December 31, 2006, the Funds do not believe the adoption of SFAS No. 157 will impact the financial statement amounts, however, additional disclosures may be required about the inputs used to develop the measurements and the effect of certain of the measurements on changes in net assets for the period.
Share Valuation—The net asset value (“NAV”) per share of each Fund is calculated by dividing the sum of the value of the securities held by the Fund, plus cash or other assets, minus all liabilities (including estimated accrued expenses) by the total number of shares outstanding of the Fund, rounded to the nearest cent. A Fund’s shares will not be priced on the days on which the NYSE is closed for trading. The offering and redemption price per share of each Fund is equal to a Fund’s net asset value per share. Prior to April 30, 2003, shares of each Fund were charged a 2% redemption fee on shares redeemed or exchanged within 180 days of purchase. These fees were deducted from the redemption proceeds otherwise payable to the shareholder. Each Fund retained the fee charged as paid-in capital and such fees became part of that Fund’s daily NAV calculation.
Repurchase Agreements—Repurchase agreements, which must be secured with collateral of a credit quality at least equal to a Fund’s investment criteria for its portfolio securities, are valued at cost, which, together with accrued interest, approximates market value. At the time a Fund enters into a repurchase agreement, the value of the underlying securities, including accrued interest, will equal or exceed the value of the repurchase agreement, and in the case of a repurchase agreement exceeding one day, the seller will agree that the value of the underlying securities, including accrued interest, will at all times equal or exceed the value of the repurchase agreement. In the event of a bankruptcy or other default by the seller of a repurchase agreement, a Fund could experience delays in liquidating the underlying securities and losses.
Investment Income—Dividend income is recorded on the ex-dividend date. Interest income is accrued as earned. Discounts and premiums on securities purchased are amortized over the lives of the respective securities. Other non-cash dividends are recognized as investment income at the fair value of the property received. Withholding taxes on foreign dividends have been provided for in accordance with the company’s understanding of the applicable country’s tax rules and rates.
Foreign Securities—Each Fund may invest in companies that trade on U.S. exchanges as American Depositary Receipts (“ADRs”), on foreign exchanges, or on foreign over-the-counter markets. Investing in the securities of foreign companies exposes your investment in a Fund to risk. Foreign stock markets tend to be more volatile than the U.S. market due to economic and/or political instability and the regulatory conditions in some countries. In addition, some of the securities in which the Fund may invest may be denominated in foreign currencies, the value of which may decline against the U.S. dollar. An investment in foreign securities may be subject to high levels of foreign taxation, including foreign taxes withheld at the source.
Options—The Funds (other than Firsthand Technology Value Fund) may purchase or write put and call options to attempt to provide protection against adverse price effects from anticipated changes in prevailing prices of securities or stock indices. When the Fund writes an option, an amount equal to the premium received by the Fund is recorded as a liability and is subsequently adjusted to the current fair value of the option written. Premiums received from writing options that expire unexercised are treated by the Fund on the expiration date as realized gains from investments. The difference between the premium and the amount paid on effecting a closing purchase transaction, including brokerage commissions, is also treated as a realized gain, or, if the premium is less than the amount paid for the closing purchase transaction, as a realized loss. If a call option is exercised, the premium is added to the proceeds from the sale of the underlying security or currency in determining whether the Fund has realized a gain or loss. The Fund as writer of an option bears the market risk of an unfavorable change in the price of the security underlying the written option. The Funds did not write any options during the year ended December 31, 2006.
Distributions to Shareholders—Each Fund expects to distribute its net investment income and net realized gains, if any, annually. Distributions from net investment income and capital gains are recorded on the ex-dividend date and are
determined in accordance with income tax regulations, which may differ from accounting principles generally accepted in the United States of America.
Reclassification of Capital Accounts—The Funds account and report for distributions to shareholders in accordance with the American Institute of Certified Public Accountant’s Statement of Position 93-2: Determination, Disclosure, and Financial Statement Presentation of Income, Capital and Return of Capital Distributions by Investment Companies. For the year ended December 31, 2006, each Fund recorded the following reclassifications to the accounts listed below:
| | Increase (Decrease) | |
| | | | Accumulated Net | | Accumulated Net | |
| | Paid-in-Capital | | Investment Loss | | Realized Gain (Loss) | |
Firsthand Technology Value Fund | | $ | (7,365,314 | ) | $ | 7,347,959 | | $ | 17,355 | |
Firsthand Technology Leaders Fund | | (1,048,215 | ) | 1,048,215 | | — | |
Firsthand Technology Innovators Fund | | (659,530 | ) | 659,530 | | — | |
Firsthand e-Commerce Fund | | (602,127 | ) | 602,127 | | — | |
Firsthand Global Technology Fund | | (134,793 | ) | 130,858 | | 3,935 | |
Firsthand Health Sciences fund | | — | | 10,397 | | (10,397 | ) |
| | | | | | | | | | |
Security Transactions—Security transactions are accounted for no later than one business day following the trade date, however, for financial reporting purposes, security transactions are accounted for on trade date. Securities sold are valued on a specific identification basis.
Estimates—The preparation of financial statements in conformity with accounting principles generally accepted in the United States of America requires management to make estimates and assumptions that affect the reported amounts of assets and liabilities at the date of the financial statements and the reported amounts of income and expenses during the reporting period. Actual results could differ from those estimates.
Federal Income Tax—Each Fund has elected, and intends to qualify annually, for the special tax treatment afforded regulated investment companies under the Internal Revenue Code of 1986, as amended (the “Code”). As provided in the Code, in any fiscal year in which a Fund so qualifies and distributes at least 90% of its taxable net income, the Fund (but not the shareholders) will be relieved of federal income tax on the income distributed. Accordingly, no provision for income taxes has been made. To avoid imposition of the excise tax applicable to regulated investment companies, each Fund intends to declare as dividends in each calendar year at least 98% of its net investment income (earned during the calendar year) and 98% of its net realized capital gains (earned during the 12 months ended October 31) plus undistributed amounts, if any, from prior years. The following information is based upon the federal income tax cost of portfolio investments as of December 31, 2006.
| | Firsthand | | Firsthand | | Firsthand | | | | Firsthand | | Firsthand | |
| | Technology | | Technology | | Technology | | Firsthand | | Global | | Health | |
| | Value | | Leaders | | Innovators | | e-Commerce | | Technology | | Sciences | |
| | Fund | | Fund | | Fund | | Fund | | Fund | | Fund | |
Gross unrealized appreciation | | $ | 47,185,979 | | $ | 18,480,206 | | $ | 4,703,575 | | $ | 9,260,863 | | $ | 2,359,084 | | $ | 150,952 | |
Gross unrealized depreciation | | (160,204,340 | ) | (4,385,488 | ) | (10,808,221 | ) | (1,224,121 | ) | (624,332 | ) | (75,022 | ) |
Net unrealized appreciation (depreciation) | | $ | (113,018,361 | ) | $ | 14,094,718 | | $ | (6,104,646 | ) | $ | 8,036,742 | | $ | 1,734,752 | | $ | 75,930 | |
Federal income tax cost | | $ | 481,487,191 | | $ | 59,592,874 | | $ | 32,775,494 | | $ | 32,420,120 | | $ | 12,657,205 | | $ | 1,394,146 | |
The difference between the acquisition cost and the federal income tax cost of portfolio investments is due to certain timing differences in the recognition of capital losses under accounting principles generally accepted in the United States and income tax regulations. As of December 31, 2006, the Funds had capital loss carryforwards for federal income tax purposes as follows:
| | Expiring | | Expiring | | Expiring | | Expiring | | Expiring | | Expiring | | Expiring | |
| | 2008 | | 2009 | | 2010 | | 2011 | | 2012 | | 2013 | | 2014 | |
Firsthand Technology Value Fund | | $ | — | | $ | 1,092,189,416 | | $ | 634,016,220 | | $ | 330,969,371 | | $ | 333,067,019 | | $ | 165,213,285 | | $ | 61,327,300 | |
Firsthand Technology Leaders Fund | | 1,393,299 | | 134,863,157 | | 109,312,900 | | 53,324,264 | | 33,348,418 | | 2,501,372 | | — | |
Firsthand Technology Innovators Fund | | — | | 195,444,987 | | 87,067,727 | | 61,543,691 | | 7,252,266 | | 11,273,401 | | 11,757,575 | |
Firsthand e-Commerce Fund | | — | | 253,923,260 | | 141,312,315 | | 6,014,495 | | — | | — | | — | |
Firsthand Global Technology Fund | | — | | 46,795,483 | | 13,149,532 | | 16,183,628 | | — | | 2,936,303 | | — | |
Firsthand Health Sciences Fund | | — | | — | | — | | — | | — | | — | | — | |
| | | | | | | | | | | | | | | | | | | | | | |
For Firsthand Technology Value Fund, $7,924,308 of the $1,092,189,416 capital loss carryforward expiring in 2009 was acquired in the reorganization with Firsthand Communications Fund.
Components of Distributable Earnings
| | Firsthand | | Firsthand | | Firsthand | | | | Firsthand | | Firsthand | |
| | Technology | | Technology | | Technology | | Firsthand | | Global | | Health | |
| | Value | | Leaders | | Innovators | | e-Commerce | | Technology | | Sciences | |
| | Fund | | Fund | | Fund | | Fund | | Fund | | Fund | |
| | | | | | | | | | | | | |
Undistributed Ordinary Income | | $ | — | | $ | — | | $ | — | | $ | — | | $ | — | | $ | 24,325 | |
Accumulated Earnings | | — | | — | | — | | — | | — | | 24,325 | |
Net Unrealized Appreciation/(Depreciation)* | | (113,018,361 | ) | 14,094,718 | | (6,104,646 | ) | 8,036,742 | | 1,734,826 | | 75,940 | |
Post October Capital/Currency Loss** | | (8,187,973 | ) | — | | — | | — | | (41 | ) | — | |
Accumulated Capital Loss Carryforward | | (2,616,782,611 | ) | (334,743,410 | ) | (374,339,647 | ) | (401,250,070 | ) | (79,064,946 | ) | — | |
Total Distributable Earnings | | $ | (2,737,988,945 | ) | $ | (320,648,692 | ) | $ | (380,444,293 | ) | $ | (393,213,328 | ) | $ | (77,330,161 | ) | $ | 100,265 | |
* The difference between book-basis and tax-basis unrealized appreciation (depreciation) is attributable primarily to tax deferral of losses on wash sales, post-October capital and currency loss and foreign currency exchange gain (loss).
** Under current tax law, capital and currency losses realized after October 31 and prior to the Fund’s fiscal year end may be deferred as occuring on the first day of the following fiscal year.
In July 2006, the Financial Accounting Standards Board released FASB Interpretation No. 48 “Accounting for Uncertainty in Income Taxes” (“FIN 48”). FIN 48 provides guidance for how uncertain tax positions should be recognized, measured, presented and disclosed in the financial statements. FIN 48 requires the evaluation of tax positions taken or expected to be taken in the course of preparing the Fund’s tax return to determine whether the tax positions are “more-likely-than-not” of being sustained by the applicable tax authority. Tax positions not deemed to meet the more-likely-than-not threshold would be recorded as a tax benefit or expense in the year of determination. Adoption of FIN 48 is required no later than the last business day of the first financial statement reporting period for fiscal years beginning after December 15, 2006 and is to be applied to all open tax years as of the effective date. Management has not completed their analysis on whether the adoption of FIN 48 will have an impact to the financial statements.
3. Investment Transactions
Investment transactions (excluding short-term investments) were as follows for the year ended December 31, 2006.
| | Firsthand | | Firsthand | | Firsthand | | | | Firsthand | | Firsthand | |
| | Technology | | Technology | | Technology | | Firsthand | | Global | | Health | |
| | Value | | Leaders | | Innovators | | e-Commerce | | Technology | | Sciences | |
| | Fund | | Fund | | Fund | | Fund | | Fund | | Fund | |
Purchase of investment securities | | $ | 196,300,799 | | $ | 47,817,609 | | $ | 19,020,379 | | $ | 21,876,529 | | $ | 9,566,326 | | $ | 1,927,695 | |
Proceeds from sales and maturities of investment securities | | $ | 308,598,689 | | $ | 99,794,806 | | $ | 23,921,343 | | $ | 32,558,586 | | $ | 14,033,415 | | $ | 658,301 | |
4. Investment Advisory and Administration Agreements
Certain trustees and officers of the Trust are also officers of the Investment Adviser or BISYS Fund Services Ohio, Inc. (“BISYS”). BISYS serves as the sub-administrator, investment accounting agent and shareholder servicing and transfer agent. PFPC Trust Company serves as the custodian for the Trust. Prior to August 7, 2006, State Street Bank and Trust Company served as the shareholder servicing and transfer agent.
INVESTMENT ADVISORY AGREEMENT
Each Fund’s investments are managed by the Investment Adviser pursuant to the terms of a master investment advisory agreement (for all Funds except Firsthand Health Sciences Fund) and an investment advisory agreement (with respect to Firsthand Health Sciences Fund) (the “Advisory Agreements”). Under the Advisory Agreements, the Investment Adviser provides each Fund with investment research, advice, management, and supervision and manages the investment and reinvestment of assets of each Fund consistent with each Fund’s investment objective, policies, and limitations. Subject to certain exceptions set forth in the Advisory Agreement, the Investment Adviser is responsible for (i) compensation of any of the Fund’s trustees, officers, and employees who are interested persons of the Investment Adviser; and (ii) compensation of the Investment Adviser’s personnel and other expenses incurred in connection with the provision of portfolio management services under the Advisory Agreements.
For the services it provides under the Advisory Agreements, the Investment Adviser receives from each Fund, on a monthly basis, an advisory fee at the annual rate of 1.50% of its average daily net assets. The Advisory Agreements require the Investment Adviser to waive fees and, if necessary, to reimburse expenses of each such Fund to the extent necessary to limit a Fund’s total operating expenses to 1.95% of its average net assets up to $200 million, 1.90% of such assets from $200 million to $500 million, 1.85% of such assets from $500 million to $1 billion, and 1.80% of such assets in excess of $1 billion.
The Investment Adviser has appointed Sectoral Asset Management, Inc. as the sub-adviser for Firsthand Health Sciences Fund. Evergreen Investment Management Company, LLC served as the second sub-adviser for Firsthand Health Sciences Fund until December 31, 2006. Under this agreement, the Investment Adviser (not the Funds) pays the fees for the sub-advisory services.
ADMINISTRATION AGREEMENT
The Trust has entered into a separate Administration Agreement with the Investment Adviser. The agreement obligates the Investment Adviser to provide administrative and general supervisory services to each Fund (the “Administration Agreement”). Under the Administration Agreement, the Investment Adviser renders supervisory and corporate administrative services to the Trust, as well as oversees the maintenance of all books and records with respect to each Fund’s securities transactions and each Fund’s book of accounts in accordance with all applicable federal and state laws and regulations. The Investment Adviser also arranges for the preservation of journals, ledgers, corporate documents, brokerage account records, and other records as required by the 1940 Act.
The Investment Adviser is responsible for the equipment, staff, office space, and facilities necessary to perform its obligations under the Administration Agreement. Under the Administration Agreement, the Investment Adviser has assumed responsibility for payment of all of each Fund’s operating expenses excluding independent trustees’ compensation; brokerage and commission expenses; fees payable under “Rule 12b-1 plans”, if any, and shareholder servicing plans, if any; litigation costs; and any extraordinary and non-recurring expenses. For the services it provides under the Administration Agreement, the Investment Adviser receives a fee from each Fund at the annual rate of 0.45% of its average daily net assets up to $200 million, 0.40% of such assets from $200 million to $500 million, 0.35% of such assets from $500 million to $1 billion, and 0.30% of such assets in excess of $1 billion. The Investment Adviser has entered into a Sub-Administration Agreement with BISYS. Under this agreement, the Investment Adviser (not the Funds) pays to BISYS the fees for the administrative services provided by BISYS.
5. Deferred Compensation Agreement With Trustees
During the fiscal year ended December 31, 2000, the Trust entered into a deferred compensation agreement with the independent trustees of the Trust.
Under the deferred compensation agreement, each independent trustee may elect to defer some or all of his trustee fees. Each independent trustee is paid an annual retainer of $24,000, $6,000 for each regular meeting attended in person, and $1,000 for each special meeting attended. Deferred fees may be deemed invested in the Firsthand Funds selected by each independent trustee on a tax-deferred basis and deferred fees (and the income, gains, and losses credited during the deferral period) are payable at least two years after deferral date. Upon payment of any deferred fees (and the income, gains, and losses credited during the deferral period), each Fund will expense its pro rata share of those fees.
6. Investments in Affiliates and Restricted Securities
Affiliated issuers, as defined by the 1940 Act, are those in which a Fund’s holdings represent 5% or more of the outstanding voting securities of the issuer. A summary of each Fund’s investments in affiliates, if any, for the period ended December 31, 2006, is noted in the following table:
| | SHARE ACTIVITY | | | | | | | |
| | Balance | | | | | | Balance | | Realized | | Value | | Acquisition | |
Affiliate | | 12/31/05 | | Purchases | | Sales | | 12/31/06 | | Gain (Loss) | | 12/31/06 | | Cost | |
Firsthand Technology Value Fund | | | | | | | | | | | | | | | |
Clarisay, Inc., Series B * | | 2,605,306 | | — | | — | | 2,605,306 | | $ | — | | $ | — | | $ | 2,383,855 | |
Clarisay, Inc., Series C | | 7,194,244 | | — | | — | | 7,194,244 | | — | | — | | 2,000,000 | |
Clarisay, Inc., Warrant | | 500,000 | | — | | — | | 500,000 | | — | | — | | — | |
Clarisay, Inc., Warrant | | 500,000 | | — | | — | | 500,000 | | — | | — | | — | |
Clarisay, Inc., Warrant | | 250,000 | | — | | — | | 250,000 | | — | | — | | — | |
Clarisay, Inc., Warrant | | 100,000 | | — | | — | | 100,000 | | — | | — | | — | |
Clarisay, Inc., Warrant | | 500,000 | | — | | — | | 500,000 | | — | | — | | — | |
Clarisay, Inc., Warrant | | 500,000 | | — | | — | | 500,000 | | — | | — | | — | |
Clarisay, Inc., 8.00% | | 500,000 | | — | | — | | 500,000 | | — | | — | | 500,000 | |
Clarisay, Inc., 8.00% | | 500,000 | | — | | — | | 500,000 | | — | | — | | 500,000 | |
Clarisay, Inc., 8.00% | | 250,000 | | — | | — | | 250,000 | | — | | — | | 250,000 | |
Clarisay, Inc., 8.00% | | 100,000 | | — | | — | | 100,000 | | — | | — | | 100,000 | |
Clarisay, Inc., 8.00% | | 500,000 | | — | | — | | 500,000 | | — | | — | | 500,000 | |
Clarisay, Inc., 8.00% | | 500,000 | | — | | — | | 500,000 | | — | | — | | 500,000 | |
Global Locate, Inc., Series A * | | 6,030,896 | | — | | — | | 6,030,896 | | — | | 2,052,917 | | 5,144,354 | |
Global Locate, Inc., Series C | | 1,111,111 | | — | | — | | 1,111,111 | | — | | 378,222 | | 1,000,000 | |
Global Locate, Inc., Series D | | 932,835 | | — | | — | | 932,835 | | — | | 749,999 | | 749,999 | |
Global Locate, Inc., Board Warrant | | 75,000 | | — | | — | | 75,000 | | — | | 375 | | — | |
Global Locate, Inc., Board Warrant | | 18,750 | | — | | — | | 18,750 | | — | | 94 | | — | |
Global Locate, Inc., Board Warrant | | 75,000 | | — | | — | | 75,000 | | — | | 375 | | — | |
Global Locate, Inc., Board Warrant | | 75,000 | | — | | — | | 75,000 | | — | | 375 | | — | |
Global Locate, Inc., Series C Warrant | | 370,370 | | — | | — | | 370,370 | | — | | 1,852 | | — | |
Global Locate, Inc., Series D Warrant | | 233,208 | | — | | — | | 233,208 | | — | | 2,332 | | — | |
Maple Optical Systems, Inc., Series A-1 | | 10,352,054 | | — | | 10,352,054 | | — | | (3,623,219 | ) | — | | — | |
Silicon Genesis Corp., Series 1-D | | 850,830 | | — | | — | | 850,830 | | — | | 4,363,141 | | 4,315,500 | |
Silicon Genesis Corp., Series 1-E | | 4,071,226 | | — | | — | | 4,071,226 | | — | | 6,701,239 | | 4,315,500 | |
Silicon Genesis Corp., Common | | 743,077 | | — | | — | | 743,077 | | — | | 41,612 | | 3,684,494 | |
Silicon Genesis Corp., Series 1-E Warrant | | 1,257,859 | | — | | — | | 1,257,859 | | — | | 1,070,439 | | — | |
Silicon Genesis Corp., Common Warrant | | 37,982 | | — | | — | | 37,982 | | — | | 38 | | — | |
Silicon Genesis Corp., Common Warrant | | 59,147 | | — | | — | | 59,147 | | — | | 59 | | — | |
Solaicx, Series B | | 6,000,000 | | — | | — | | 6,000,000 | | — | | 7,247,400 | | 3,000,000 | |
| | | | | | | | | | | | | | | | | | |
| | SHARE ACTIVITY | | | | | | | |
| | Balance | | | | | | Balance | | Realized | | Value | | Acquisition | |
Affiliate | | 12/31/05 | | Purchases | | Sales | | 12/31/06 | | Gain (Loss) | | 12/31/06 | | Cost | |
Firsthand Technology Value Fund (continued) | | | | | | | | | | | | | | | |
Solaicx, 10.25% | | — | | 1,333,334 | | — | | 1,333,334 | | $ | — | | $ | 1,333,334 | | $ | 1,333,334 | |
SoloPower, Series A | | — | | 2,721,088 | | — | | 2,721,088 | | — | | 3,999,999 | | 3,999,999 | |
| | | | | | | | | | | | | | | |
Firsthand Technology Innovators Fund | | | | | | | | | | | | | | | |
Innovion Corp., Series C | | 1,500,000 | | — | | — | | 1,500,000 | | — | | 744,675 | | 3,000,000 | |
Innovion Corp., Warrant | | 602,577 | | — | | — | | 602,577 | | — | | 603 | | — | |
Innovion Corp., 9.50% | | 602,577 | | — | | — | | 602,577 | | — | | 542,319 | | 602,577 | |
Innovion Corp., Warrant | | 30,129 | | — | | — | | 30,129 | | — | | 30 | | — | |
Silicon Genesis Corp., Series 1-C | | 82,914 | | — | | — | | 82,914 | | — | | 1,731,244 | | 1,731,250 | |
Silicon Genesis Corp., Series 1-E | | 1,633,254 | | — | | — | | 1,633,254 | | — | | 2,688,336 | | 1,731,249 | |
Silicon Genesis Corp., Common | | 108,815 | | — | | — | | 108,815 | | — | | 6,094 | | 1,516,773 | |
Silicon Genesis Corp., Series 1-E Warrant | | 94,339 | | — | | — | | 94,339 | | — | | 55,283 | | — | |
| | | | | | | | | | | | | | | | | | |
* Amounts include shares from the merger of Firsthand Communications Fund into Firsthand Technology Value Fund.
Restricted securities include securities that have not been registered under the Securities Act of 1933, as amended, and securities that are subject to restrictions on resale. A Fund may invest in restricted securities that are consistent with a Fund’s investment objective and investment strategies. A Fund will not invest in a restricted security if, immediately after and as a result of the investment in such security, more than 15% of the Fund’s net assets would be invested in illiquid securities. In some cases, the issuer of restricted securities has agreed to register such securities for resale, at the issuer’s expense either upon demand by the Fund or in connection with another registered offering of the securities. Investments in restricted securities are valued at fair value as determined in good faith in accordance with procedures adopted by the Board of Trustees. It is possible that the estimated value may differ significantly from the amount that might ultimately be realized in the near term, and the difference could be material. As of December 31, 2006, the Funds were invested in the following restricted securities:
Security | | Acquisition Date | | Shares | | Cost | | Value | | % Net Assets | |
Firsthand Technology Value Fund | | | | | | | | | | | |
AuthenTec, Inc., Series C P/S | | April 4, 2003 | | 1,472,495 | | $ | 738,000 | | $ | 1,474,866 | | 0.40 | % |
AuthenTec, Inc., Series C Warrants | | April 4, 2003 | | 392,665 | | — | | 196,497 | | 0.05 | % |
AuthenTec, Inc., Series D P/S | | June 14, 2004 | | 290,958 | | 290,958 | | 290,958 | | 0.08 | % |
Caspian Networks, Inc., Common | | February 21, 2002 | | 337 | | 3,378,104 | | — | | 0.00 | % |
Celox Networks, Inc., Common | | April 17, 2001 | | 138,121 | | 14,999,941 | | — | | 0.00 | % |
Celox Networks, Inc., Series A-1 P/S | | August 23, 2002 | | 1,000,000 | | 1,200,000 | | — | | 0.00 | % |
Celox Networks, Inc., Series A-1 Warrants | | August 23, 2002 | | 500,000 | | — | | — | | 0.00 | % |
Clarisay, Inc., 8.00% C/N | | July 7, 2003 | | 500,000 | | 500,000 | | — | | 0.00 | % |
Clarisay, Inc., 8.00% C/N | | August 7, 2003 | | 500,000 | | 500,000 | | — | | 0.00 | % |
Clarisay, Inc., 8.00% C/N | | November 10, 2003 | | 500,000 | | 500,000 | | — | | 0.00 | % |
Clarisay, Inc., 8.00% C/N | | June 3, 2003 | | 500,000 | | 500,000 | | — | | 0.00 | % |
Clarisay, Inc., 8.00% C/N | | September 12, 2003 | | 250,000 | | 250,000 | | — | | 0.00 | % |
Clarisay, Inc., 8.00% C/N | | September 19, 2003 | | 100,000 | | 100,000 | | — | | 0.00 | % |
Clarisay, Inc., Series B P/S | | January 24, 2001 | | 2,605,306 | | 2,383,855 | | — | | 0.00 | % |
Clarisay, Inc., Series C P/S | | August 28, 2002 | | 7,194,244 | | 2,000,000 | | — | | 0.00 | % |
| | | | | | | | | | | | | |
Security | | Acquisition Date | | Shares | | Cost | | Value | | % Net Assets | |
Firsthand Technology Value Fund (continued) | | | | | | | | | | | |
Clarisay, Inc., Warrants | | September 19, 2003 | | 100,000 | | $ | — | | $ | — | | 0.00 | % |
Clarisay, Inc., Warrants | | August 7, 2003 | | 500,000 | | — | | — | | 0.00 | % |
Clarisay, Inc., Warrants | | June 3, 2003 | | 500,000 | | — | | — | | 0.00 | % |
Clarisay, Inc., Warrants | | November 10, 2003 | | 500,000 | | — | | — | | 0.00 | % |
Clarisay, Inc., Warrants | | September 12, 2003 | | 250,000 | | — | | — | | 0.00 | % |
Clarisay, Inc., Warrants | | July 7, 2003 | | 500,000 | | — | | — | | 0.00 | % |
Global Locate, Inc., Board Warrants | | September 8, 2003 | | 75,000 | | — | | 375 | | 0.00 | % |
Global Locate, Inc., Board Warrants | | May 4, 2004 | | 18,750 | | — | | 94 | | 0.00 | % |
Global Locate, Inc., Board Warrants | | July 7, 2004 | | 75,000 | | — | | 375 | | 0.00 | % |
Global Locate, Inc., Board Warrants | | July 1, 2005 | | 75,000 | | — | | 375 | | 0.00 | % |
Global Locate, Inc., Series A P/S | | October 5, 2001 | | 5,861,664 | | 5,000,000 | | 1,995,310 | | 0.54 | % |
Global Locate, Inc., Series A P/S | | March 28, 2002 | | 169,232 | | 144,355 | | 57,607 | | 0.02 | % |
Global Locate, Inc., Series C P/S | | May 15, 2003 | | 1,111,111 | | 1,000,000 | | 378,222 | | 0.10 | % |
Global Locate, Inc., Series C Warrants | | May 15, 2003 | | 370,370 | | — | | 1,852 | | 0.00 | % |
Global Locate, Inc., Series D P/S | | April 2, 2004 | | 621,890 | | 500,000 | | 500,000 | | 0.13 | % |
Global Locate, Inc., Series D P/S | | April 26, 2005 | | 310,945 | | 249,999 | | 249,999 | | 0.07 | % |
Global Locate, Inc., Series D Warrants | | April 26, 2005 | | 233,208 | | — | | 2,332 | | 0.00 | % |
IP Unity, Inc., Series E Warrants | | August 4, 2004 | | 69,496 | | 69 | | 69 | | 0.00 | % |
IP Unity, Inc., Series C P/S | | July 27, 2001 | | 1,104,265 | | 1,987,677 | | 753,970 | | 0.20 | % |
IP Unity, Inc., Series E P/S | | August 4, 2004 | | 193,042 | | 313,307 | | 118,844 | | 0.03 | % |
Luminous Networks, Inc., Common * | | Various | | 28,513 | | 1,800,638 | | — | | 0.00 | % |
Luminous Networks, Inc., Common Warrants | | December 31, 2003 | | 3,822 | | — | | — | | 0.00 | % |
Luminous Networks, Inc., Series A1 P/S * | | Various | | 129,664 | | 200,071 | | — | | 0.00 | % |
Luminous Networks, Inc., Series B1 P/S | | June 9, 2005 | | 259,236 | | 400,000 | | — | | 0.00 | % |
Polaris Networks, Inc., 10.00% C/N | | April 12, 2004 | | 50,475 | | 50,475 | | — | | 0.00 | % |
Polaris Networks, Inc., 10.00% C/N | | July 14, 2004 | | 50,474 | | 50,474 | | — | | 0.00 | % |
Polaris Networks, Inc., Convertible Warrants | | March 29, 2004 | | 75,712 | | — | | — | | 0.00 | % |
Polaris Networks, Inc., Series A P/S | | November 16, 2001 | | 297,848 | | 297,848 | | — | | 0.00 | % |
Silicon Genesis Corp., Series 1-E Warrants | | October 31, 2003 | | 1,257,859 | | — | | 1,070,439 | | 0.29 | % |
Silicon Genesis Corp., Common | | April 30, 2002 | | 726,424 | | 3,684,494 | | 40,680 | | 0.01 | % |
Silicon Genesis Corp., Common** | | November 21, 2005 | | 16,653 | | — | | 932 | | 0.00 | % |
Silicon Genesis Corp., Common Warrants | | April 30, 2002 | | 59,147 | | — | | 59 | | 0.00 | % |
Silicon Genesis Corp., Common Warrants | | November 4, 2003 | | 37,982 | | — | | 38 | | 0.00 | % |
Silicon Genesis Corp., Series 1-D P/S | | April 30, 2002 | | 850,830 | | 4,315,500 | | 4,363,141 | | 1.18 | % |
Silicon Genesis Corp., Series 1-E P/S | | November 4, 2003 | | 4,071,226 | | 4,315,500 | | 6,701,239 | | 1.81 | % |
Solaicx, Series B P/S | | December 16, 2005 | | 6,000,000 | | 3,000,000 | | 7,247,400 | | 1.95 | % |
Solaicx, 10.25%, C/N | | August 4, 2006 | | 1,333,334 | | 1,333,334 | | 1,333,334 | | 0.36 | % |
SoloPower, Series A P/S | | June 29, 2006 | | 2,721,088 | | 3,999,999 | | 3,999,999 | | 1.08 | % |
UCT Coatings, Inc., Series B P/S | | October 5, 2004 | | 500,000 | | 5,000,000 | | 5,000,000 | | 1.35 | % |
UCT Coatings, Inc., Common Warrants*** | | October 5, 2004 | | 600,000 | | — | | 200 | | 0.00 | % |
| | | | | | $ | 64,984,598 | | $ | 35,779,206 | | 9.65 | % |
| | | | | | | | | | | |
Firsthand Technology Innovators Fund | | | | | | | | | | | |
AuthenTec, Inc., Series C P/S | | April 4, 2003 | | 736,248 | | $ | 369,000 | | $ | 737,433 | | 2.78 | % |
AuthenTec, Inc., Series C Warrants | | April 4, 2003 | | 196,333 | | — | | 98,248 | | 0.37 | % |
Innovion Corp., 9.50%, C/N | | December 30, 2003 | | 602,577 | | 602,577 | | 542,319 | | 2.04 | % |
Innovion Corp., Series C P/S | | February 23, 2001 | | 1,500,000 | | 3,000,000 | | 744,675 | | 2.81 | % |
Innovion Corp., Warrant | | December 30, 2003 | | 602,577 | | — | | 603 | | 0.00 | % |
Innovion Corp., Warrant | | March 7, 2005 | | 30,129 | | — | | 30 | | 0.00 | % |
IP Unity, Inc., Series C P/S | | July 27, 2001 | | 827,957 | | 1,490,323 | | 565,312 | | 2.13 | % |
Luminous Networks, Inc., Common * | | Various | | 49,979 | | 3,156,250 | | — | | 0.00 | % |
Luminous Networks, Inc., Common Warrants | | December 31, 2003 | | 6,699 | | — | | — | | 0.00 | % |
Luminous Networks, Inc., Series A1 P/S * | | Various | | 227,282 | | 350,694 | | — | | 0.00 | % |
Silicon Genesis Corp., Series 1-E Warrant | | February 26, 2003 | | 94,339 | | — | | 55,283 | | 0.21 | % |
Security | | Acquisition Date | | Shares | | Cost | | Value | | % Net Assets | |
Firsthand Technology Innovators Fund (continued) | | | | | | | | | | | |
Silicon Genesis Corp., Common | | March 8, 2001 | | 102,135 | | 1,516,773 | | 5,720 | | 0.02 | % |
Silicon Genesis Corp., Common** | | November 21, 2005 | | 6,680 | | — | | 374 | | 0.00 | % |
Silicon Genesis Corp., Series 1-C P/S | | March 8, 2001 | | 82,914 | | 1,731,250 | | 1,731,244 | | 6.53 | % |
Silicon Genesis Corp., Series 1-E P/S | | November 4, 2003 | | 1,633,254 | | 1,731,249 | | 2,688,336 | | 10.13 | % |
Silicon Optix, Inc., Series B P/S | | November 7, 2003 | | 1,111,111 | | 1,000,000 | | 700,000 | | 2.64 | % |
| | | | | | $ 14,948,116 | | $ | 7,869,577 | | 29.66 | % |
| | | | | | | | | | | | |
* | | As a result of a new round of financing on June 9, 2005, certain shares of Luminous Series D P/S and Series E P/S were converted into certain Common and Series A1 P/S shares. The original acquisition date for the Series D P/S shares was May 31, 2001, and the original acquisition date for the Series E P/S shares was October 16, 2003. The new Common and Series A1 P/S will carry the original acquisition date of the Series D and Series E P/S. |
** | | Shares granted at no cost by issuer. |
*** | | 3:1 stock split |
P/S | | Preferred Stock |
C/N | | Convertible Note |
7. Approval of Investment Advisory and Administration Agreements (Unaudited)
Below is a description of the specific materials provided, factors considered, and conclusions reached by the Board, including a majority of non-interested Trustees, relating to the selection of the Investment Adviser and the re-approval of the Advisory Agreement.
Nature, Extent and Quality of Services—The Board received and considered various data and information regarding the nature, extent and quality of services provided to the Funds by the Investment Adviser. The most recent investment adviser registration form (“Form ADV”) for the Investment Adviser was provided to the Board, as were written and oral responses of the Investment Adviser to an information request submitted by independent counsel on behalf of the non-interested Trustees. The Board reviewed these responses, which included, among other things, information about the background and experience of the investment personnel of the Investment Adviser primarily responsible for day-to-day portfolio management services for the Funds. The Board also considered the Investment Adviser’s separate administration agreement with the Funds and the Investment Adviser’s overall ability to manage and administer the Funds, as well as to oversee the sub-advisers to the Firsthand Health Sciences Fund and the other service providers to the Funds.
The Board evaluated the ability of the Investment Adviser, considering its financial condition, resources, reputation and other attributes, to attract and retain highly qualified investment professionals, including research, advisory, supervisory and administrative personnel. In this regard, the Board considered information regarding the Investment Adviser’s compensation program for its personnel involved in the management of the Funds, including incentive and retirement plans.
The Board considered the effectiveness of policies of the Funds in achieving the best execution of portfolio transactions, whether and to what extent “soft dollar” benefits are sought, the extent to which efforts are made to recapture transaction costs, and the controls applicable to brokerage allocation procedures. The Board reviewed the policies of the Investment Adviser regarding the allocation of portfolio investment opportunities among the Funds and other clients. The Board noted the Investment Adviser’s representation that it does not use soft-dollars to obtain third-party research.
The Board also considered the markets for the Funds, including the principal channels through which the Funds’ shares are offered and sold, and the activities of the Investment Adviser in connection with the marketing of the Funds.
In addition, the Board received and reviewed information on SEC and other inquiries, examinations and proceedings relating to the Funds and the Investment Adviser. The Board considered the investment and legal compliance programs of the Investment Adviser, including its implementation of enhanced compliance policies and procedures in response to SEC rule changes and other regulatory initiatives, and the level of compliance attained by the Investment Adviser.
Based on the above factors, together with those referenced below, the Board, including a majority of non-interested Trustees, concluded that it was generally satisfied with the nature, extent and quality of the investment advisory services provided to each of the Funds by the Investment Adviser.
Fund Performance—The Board considered each Fund’s performance results over one-year, three-year, five-year and ten-year periods, or shorter periods, as relevant. It also considered these results in comparison to the performance results of various benchmark indices and of the funds in relevant Morningstar sectors. The Board noted that the Firsthand Technology Value Fund, Firsthand Technology Leaders Fund, Firsthand e-Commerce Fund and Firsthand Health Sciences Fund generally had been good performers, but that Firsthand Global Technology Fund and Firsthand Technology Innovators Fund generally had lagged behind the performance of their peers. It was noted that the Firsthand Health Sciences Fund had been in operation for only seven months.
Investment Advisory Fee Rates and Other Expenses—The Board reviewed and considered the proposed contractual investment advisory fee rates (the “Advisory Agreement Rates”) payable by the Funds to the Investment Adviser for investment advisory services. Additionally, the Board received and considered information comparing the Advisory Agreement Rates (both on a stand-alone basis and on a combined basis with the Funds’ administration fee rates) and the total expense ratios of the Funds with those of the other funds in appropriate peer universes provided by Lipper Inc. The Board concluded that the respective Advisory Agreement Rates were significantly higher than the median rates of each Fund’s peer universe but that the total expense ratio of each Fund was not appreciably above the median total expense ratio of the respective peer universe. The Board deemed the comparison of total expense ratios to be more relevant than the comparison of Advisory Agreement Rates because of the unitary fee structure of the Funds.
Profitability—The Board received and considered a profitability analysis of the Investment Adviser with respect to the Funds. The Board also considered that the Investment Adviser’s net income is negative with respect to the Firsthand Health Sciences Fund. The Board concluded that, in light of the costs of providing investment management and other services to the Funds, the profits and other ancillary benefits that the Investment Adviser received with regard to providing these services to the Funds were not excessive.
Economies of Scale—The Board received and considered information regarding whether there have been economies of scale with respect to the management of the Funds, whether the Funds have appropriately benefited from any economies of scale, and whether there is potential for realization of any further economies of scale. The Board observed that the investment advisory agreements limit each Fund’s total annual operating expenses to a percentage of the Fund’s assets and that this percentage is reduced as the Funds assets grow (known as “breakpoints”). The Board also observed that the total assets of the Funds had declined during the year. The Board concluded that no change was necessary to the current breakpoints to reflect any economies of scale.
Information About Services to Other Clients—The Board also received and considered information about the services and fee rates offered by the Investment Adviser to its other clients, including other registered and unregistered investment companies, private accounts and institutional investors. The Board concluded that the investment advisory rates charged by the Investment Adviser to the Funds were within a reasonable range of the fee rates offered to other clients of the Investment Adviser. Where rates offered to other clients were lower, the Board concluded that, based on information provided by the Investment Adviser, the costs associated with managing and operating a registered open-end fund, compared with an unregistered investment company, private account or institutional investor account, provided a justification for higher fee rates to the Funds.
Other Benefits to the Investment Adviser—The Board received and considered information regarding potential “fall-out” or ancillary benefits received by the Investment Adviser as a result of its relationship with the Funds. Such benefits could include, among others, benefits directly attributable to the relationship of the Investment Adviser with the Funds (such as “soft dollar” benefits) and benefits potentially derived from an increase in the business of the Investment Adviser as a result of its relationship with the Funds (such as the ability to market to shareholders other financial products offered by the Investment Adviser).
Other Factors and Broader Review—Throughout the year, the Board regularly reviews and assesses the quality of the services that the Funds receive from the Investment Adviser. In this regard, the Board reviews reports of the Investment Adviser at least in each of its quarterly meetings, which include, among other things, a detailed portfolio review and detailed fund performance reports. In addition, the Board interviews the portfolio managers of the Funds at various times throughout the year.
8. Risks (unaudited)
Because the return on and value of an investment in each Fund will fluctuate in response to stock market movements, the most significant risk of investing in a Fund is that you may lose money. Stocks and other equity securities are subject to market risks and fluctuations in value due to earnings, as well as economic, political, or regulatory events, and other factors beyond the Investment Adviser’s control. The Funds are designed for long-term investors who can accept the risks of investing in a fund with significant common stock holdings in high-technology industries.
Each Fund is non-diversified. A risk of being non-diversified is that a significant change in the value of one company will have a greater impact on the Fund than it would if the Fund diversified its investments. Another risk for the Fund is its concentration of investments in companies within high-technology industries. The value of high-technology companies can, and often does, fluctuate dramatically and may expose you to greater-than-average financial and market risk.
9. Proxy Voting Policy and Procedures (Unaudited)
The Funds have adopted proxy voting procedures pursuant to which the Funds delegate the responsibility for voting proxies relating to portfolio securities held by the Funds to the Investment Adviser as part of the Investment Adviser’s general management of the Funds, subject to the Board of Trustees’ continuing oversight. A copy of the Funds’ proxy voting policy and procedures is available without charge, upon request, by calling 1.888.884.2675. Information regarding how the Investment Adviser voted these proxies for the one-year period ended June 30, 2006, is available by calling the same number and on the website of the U.S. Securities and Exchange Commission at http://www.sec.gov on Form N-PX. The Funds’ voting record is also available on the Funds’ website at www.firsthandfunds.com/proxy.
10. Portfolio Holdings (Unaudited)
The Funds file their complete schedule of portfolio holdings with the SEC for the first and third quarters of each fiscal year on Form N-Q. The Funds’ Forms N-Q are available on the SEC’s website at http://www.sec.gov and may be reviewed and copied at the SEC’s Public Reference Room in Washington, D.C. Information on the operation of the Public Reference Room may be obtained by calling 1.800.SEC.0330.
11. Subsequent Event (Unaudited)
Effective December 31, 2006, Evergreen Investment Management Company, LLC (“EIMC”) ceased serving as a sub-adviser to Firsthand Health Sciences Fund (the “Fund”). Beginning on January 1, 2007, Sectoral Asset Management, LLC, the other of the Fund’s two sub-advisers, manages all of the assets of the Fund.
The Investment Adviser is considering whether to recommend to the Board that it hire a second sub-adviser for the Fund to replace EIMC. Should the Investment Adviser decide to make that recommendation to the Board, the retention of the new sub-adviser must be approved by the Fund’s Board of Trustees. If and when that happens, Fund shareholders will be notified.
ADDITIONAL INFORMATION
December 31, 2006
Information about the trustees and officers* of the Funds is set forth in the following table. The Statement of Additional Information (the “SAI”) includes additional information about the Funds’ trustees and officers and is available free of charge, upon request, by calling 1.888.884.2675, option 2.
Name, Year of Birth,
Position(s) Held With
Funds | | Term of
Office
and
Length of
Time
Served (1) | | Principal Occupation(s) During Past Five Years | | Number of
Funds in Fund
Complex
Overseen by
Trustee | | Other Trusteeships
Held by
Trustees |
Disinterested Trustees | | | | | | | | |
Michael T. Lynch
(1961)
Trustee
125 South Market
Ste. 1200
San Jose, CA 95113 | | Since 1994 | | Mr. Lynch is a principal of Rainier Wine (wine distribution) from March 2004 to present. Mr. Lynch served as VP of Sales and Business Development of AlphaOmega Soft, Inc. (a manufacturer of software) from 2002 through 2003. Mr. Lynch served as VP of Sales and Business Development at Picture IQ Corporation (a manufacturer of digital imaging software) from 1999 through 2002. | | Six | | None |
| | | | | | | | |
Jerry Wong
(1951)
Trustee
125 South Market
Ste. 1200
San Jose, CA 95113 | | Since 1999 | | Mr. Wong is CFO, VP - Finance and Secretary of Versant Corporation, a publicly traded international provider of object-oriented database products from June 2006 to present. Mr. Wong served as a consultant from June 2003 to June 2006. From June 2003 to December 2005, he served as CFO for Companion Worlds, Inc., a manufacturer of hardware and software facilitating fitness and health maintenance. Additionally, Mr. Wong served as VP of Finance and EVP of U.S. operations for Poet Holdings, Inc., a publicly traded international software provider, from 1995 through 2002. | | Six | | None |
Interested Trustees | | | | | | | | |
Kevin M. Landis (2)
(1961)
Trustee/President
125 South Market
Ste. 1200
San Jose, CA 95113 | | Since 1994 | | Mr. Landis is President and Chief Investment Officer and a Director of Firsthand Capital Management, Inc. and has been a portfolio manager with Firsthand Capital Management, Inc. since May 1994. From 1998 through 2001, he was also the President and CEO of Silicon Capital Management LLC | | Six | | Mr. Landis is a trustee of Black Pearl Funds, a registered investment company. |
| | | | | | | | |
Officers Who Are Not Trustees | | | | | | |
Yakoub Bellawala (3)
(1965)
Secretary
125 South Market
Ste. 1200
San Jose, CA 95113 | | Since 2003 | | Mr. Bellawala is a VP of Firsthand Capital Management, Inc. (FCM) from 1999 to present. He was Treasurer of FCM’s Board of Trustees from 1996 to 2003. | | N/A | | N/A |
| | | | | | | | |
Aaron Masek
(1974)
Treasurer
125 South Market
Ste. 1200
San Jose, CA 95113 | | Since 2005 | | Mr. Masek has been a Director of BISYS Fund Services, Inc. since 2005 and has been employed by BISYS in various other roles since 1997. | | N/A | | N/A |
| | | | | | | | |
Nick Petredis
(1961)
Chief Compliance Officer
125 South Market
Ste. 1200
San Jose, CA 95113 | | Since 2004 | | Mr. Petredis is a principal of Petredis Law Offices from 1993 to present. He was Managing Director and Senior Counsel of Firsthand Capital Management, Inc. from 2000 to 2001. | | N/A | | N/A |
* | | The term “officer” means the president, vice president, secretary, treasurer, chief compliance officer, controller, or any other officer who performs policy-making functions. |
(1) | | Each trustee shall serve for the lifetime of Firsthand Funds or until he dies, resigns, or is removed. Each officer shall serve a one-year term subject to annual reappointment by the trustees. |
(2) | | Mr. Landis is an interested person of the Funds by reason of his position with the Investment Adviser. |

Firsthand Funds
P.O. Box 183120
Columbus, OH 43218-3120
1.888.884.2675
www.firsthandfunds.com
Investment Adviser
Firsthand Capital Management, Inc.
125 South Market
Suite 1200
San Jose, CA 95113
www.firsthandcapital.com
Distributor
ALPS Distributors, Inc.
1625 Broadway
Suite 2200
Denver, CO 80202
Transfer Agent
BISYS Fund Services Ohio, Inc.
P.O. Box 183120
Columbus, OH 43218-3120
1.888.884.2675
Item 2. Code of Ethics.
Disclose whether, as of the end of the period covered by the report, the registrant has adopted a code of ethics that applies to the registrant’s principal executive officer, principal financial officer, principal accounting officer or controller, or persons performing similar functions, regardless of whether these individuals are employed by the registrant or a third party. If the registrant has not adopted such a code of ethics, explain why it has not done so.
The registrant has adopted a code of ethics that applies to the registrant’s principal executive officer, principal financial officer, principal accounting officer or controller, or persons performing similar functions. This code of ethics is included as an Exhibit.
The registrant must briefly describe the nature of any amendment, during the period covered by the report, to a provision of its code of ethics that applies to the registrant’s principal executive officer, principal financial officer, principal accounting officer or controller, or persons performing similar functions, regardless of whether these individuals are employed by the registrant or a third party, and that relates to any element of the code of ethics definition enumerated in paragraph (b) of this Item. The registrant must file a copy of any such amendment as an exhibit pursuant to Item 12(a)(1), unless the registrant has elected to satisfy paragraph (f) of this Item by posting its code of ethics on its website pursuant to paragraph (f)(2) of this Item, or by undertaking to provide its code of ethics to any person without charge, upon request, pursuant to paragraph (f)(3) of this Item.
If the registrant has, during the period covered by the report, granted a waiver, including an implicit waiver, from a provision of the code of ethics that applies to the registrant’s principal executive officer, principal financial officer, principal accounting officer or controller, or persons performing similar functions, regardless of whether these individuals are employed by the registrant or a third party, that relates to one or more items set forth in paragraph (b) of this Item, the registrant must briefly describe the nature of the waiver, the name of the person to whom the waiver was granted, and the date of the waiver.
During the period covered by the report, with respect to the registrant’s code of ethics that applies to its principal executive officer, principal financial officer, principal accounting officer or controller, or persons performing similar functions; there have been no amendments to, nor any waivers granted from, a provision that relates to any element of the code of ethics definition enumerated in paragraph (b) of this Item 2.
Item 3. Audit Committee Financial Expert.
(a) (1) Disclose that the registrant’s board of directors has determined that the registrant either:
(i) Has at least one audit committee financial expert serving on its audit committee; or
(ii) Does not have an audit committee financial expert serving on its audit committee.
(2) If the registrant provides the disclosure required by paragraph (a)(1)(i) of this Item, it must disclose the name of the audit committee financial expert and whether that person is “independent.” In order to be considered “independent” for purposes of this Item, a member of an audit committee may not, other than in his or her capacity as a member of the audit committee, the board of directors, or any other board committee:
(i) Accept directly or indirectly any consulting, advisory, or other compensatory fee from the issuer; or
(ii) Be an “interested person” of the investment company as defined in Section 2(a)(19) of the Act (15 U.S.C.
80a-2(a)(19)).
(3) If the registrant provides the disclosure required by paragraph (a)(1)(ii) of this Item, it must explain why it does not have an audit committee financial expert.
3(a)(1) The registrant’s board of trustees has determined that the registrant has at least one audit committee financial expert serving on its audit committee.
3(a)(2) The audit committee financial expert is Mr. Jerry Wong, who is “independent” for purposes of this Item 3 of Form
N-CSR.
Item 4. Principal Accountant Fees and Services.
(a) Disclose, under the caption Audit Fees, the aggregate fees billed for each of the last two fiscal years for professional services rendered by the principal accountant for the audit of the registrant’s annual financial statements or services that are normally provided by the accountant in connection with statutory and regulatory filings or engagements for those fiscal years.
2005 - $96,000
2006 - $113,000
(b) Disclose, under the caption Audit-Related Fees, the aggregate fees billed in each of the last two fiscal years for assurance and related services by the principal accountant that are reasonably related to the performance of the audit of the registrant’s financial statements and are not reported under paragraph (a) of this Item. Registrants shall describe the nature of the services comprising the fees disclosed under this category.
Not applicable.
(c) Disclose, under the caption Tax Fees, the aggregate fees billed in each of the last two fiscal years for professional services rendered by the principal accountant for tax compliance, tax advice, and tax planning. Registrants shall describe the nature of the services comprising the fees disclosed under this category.
2005 - $10,000
2006 - $12,000
(d) Disclose, under the caption All Other Fees, the aggregate fees billed in each of the last two fiscal years for products and services provided by the principal accountant, other than the services reported in paragraphs (a) through (c) of this Item. Registrants shall describe the nature of the services comprising the fees disclosed under this category.
2005 - $2,500 (audit of the registrant’s anti-money laundering program)
2006 - $2,500 (audit of the registrant’s anti-money laundering program)
(e) (1) Disclose the audit committee’s pre-approval policies and procedures described in paragraph (c)(7) of Rule 2-01 of Regulation S-X.
The registrant’s Audit Committee Charter states the following with respect to pre-approval procedures:
The Committee hereby delegates to the Chairman of the Committee the authority to grant pre-approvals of audit and “permissible” non-audit services to be provided by the Auditors to the Funds, subject to the ratification of the full Committee at its next regularly scheduled meeting. Both the Auditors and Fund counsel will be responsible for informing the Committee whether they believe that a particular non-audit service is permissible or prohibited pursuant to applicable regulations and standards.
The specific types of non-audit services that the Chairman may pre-approve include, but are not limited to: reviewing the Funds’ internal controls over financial reporting; providing tax-related services; reviewing and/or developing an anti-money laundering program; and issuing comfort letters, based on agreed-upon procedures, in connection with any Fund reorganization.
Pre-approval for a non-audit service provided to a Fund is not required if: (i) the aggregate amount of all such non-audit services provided to the Fund constitutes not more than 5% of the total amount of revenues paid by the Fund to the Auditors during the fiscal year in which the non-audit services are provided; (ii) such services were not recognized by the Fund at the time of the engagement to be non-audit services; and (iii) such services are promptly brought to the attention of the Committee and are approved by the Committee or by one or more members of the Committee to whom authority to grant such approvals has been delegated by the Committee prior to the completion of the audit (the “De Minimus Exceptions”).
The Committee shall also pre-approve any non-audit services proposed to be provided by the Auditors to (i) a Fund’s investment adviser and (ii) any entity controlling, controlled by, or under common control with the investment adviser that provides ongoing services to the Fund, if the Auditors’ engagement with the investment adviser or any such control persons relates directly to the operations and financial reporting of the Fund. The De Minimus Exceptions applies to pre-approvals under this paragraph as well, except that the “total amount of revenues” calculation is based on the total amount of revenues paid to the Auditors by the Fund and any other entity that has its services approved under this paragraph (i.e., the investment adviser or any control person).
(2) Disclose the percentage of services described in each of paragraphs (b) through (d) of this Item that were approved by the audit committee pursuant to paragraph (c)(7)(i)(C) of Rule 2-01 of Regulation S-X.
100%
(f) If greater than 50 percent, disclose the percentage of hours expended on the principal accountant’s engagement to audit the registrant’s financial statements for the most recent fiscal year that were attributed to work performed by persons other than the principal accountant’s full-time, permanent employees.
Not applicable.
(g) Disclose the aggregate non-audit fees billed by the registrant’s accountant for services rendered to the registrant, and rendered to the registrant’s investment adviser (not including any sub-adviser whose role is primarily portfolio management and is
subcontracted with or overseen by another investment adviser), and any entity controlling, controlled by, or under common control with the adviser that provides ongoing services to the registrant for each of the last two fiscal years of the registrant.
2005 - $22,000
2006 - $24,500
(h) Disclose whether the registrant’s audit committee of the board of directors has considered whether the provision of nonaudit services that were rendered to the registrant’s investment adviser (not including any subadviser whose role is primarily portfolio management and is subcontracted with or overseen by another investment adviser), and any entity controlling, controlled by, or under common control with the investment adviser that provides ongoing services to the registrant that were not pre-approved pursuant to paragraph (c)(7)(ii) of Rule 2-01 of Regulation S-X is compatible with maintaining the principal accountant’s independence.
Not applicable.
Item 5. Audit Committee of Listed Registrants.
(a) If the registrant is a listed issuer as defined in Rule 10A-3 under the Exchange Act (17CFR 240.10A-3), state whether or not the registrant has a separately-designated standing audit committee established in accordance with Section 3(a)(58)(A) of the Exchange Act (15 U.S.C. 78c(a)(58)(A)). If the registrant has such a committee, however designated, identify each committee member. If the entire board of directors is acting as the registrant’s audit committee as specified in Section 3(a)(58)(B) of the Exchange Act (15 U.S.C. 78c(a)(58)(B)), so state.
(b) If applicable, provide the disclosure required by Rule 10A-3(d) under the Exchange Act (17CFR 240.10A-3(d)) regarding an exemption from the listing standards for all audit committees.
Not applicable.
Item 6. Schedule of Investments.
File Schedule I – Investments in securities of unaffiliated issuers as of the close of the reporting period as set forth in § 210.12-12 of Regulation S-X, unless the schedule is included as part of the report to shareholders filed under Item 1 of this Form.
Not applicable.
Item 7. Disclosure of Proxy Voting Policies and Procedures for Closed-End Management Investment Companies.
A closed-end management investment company that is filing an annual report on this Form N-CSR must, unless it invests exclusively in non-voting securities, describe the policies and procedures that it uses to determine how to vote proxies relating to portfolio securities, including the procedures that the company uses when a vote presents a conflict between the interests of its shareholders, on the one hand, and those of the company’s investment adviser; principal underwriter; or any affiliated person (as defined in Section 2(a)(3) of the Investment Company Act of 1940 (15 U.S.C. 80a-2(a)(3)) and the rules thereunder) of the company, its investment adviser, or its principal underwriter, on the other. Include any policies and procedures of the company’s investment adviser, or any other third party, that the company uses, or that are used on the company’s behalf, to determine how to vote proxies relating to portfolio securities.
Not applicable.
Item 8. Portfolio Managers of Closed-End Management Investment Companies.
If the registrant is a closed-end management investment company that is filing an annual report on this Form N-CSR, provide the information specified in paragraphs (a) and (b) of this Item with respect to portfolio managers.
Not applicable.
Item 9. Purchases of Equity Securities by Closed-End Management Investment Company and Affiliated Purchasers.
If the registrant is a closed-end management investment company, provide the information specified in paragraph (b) of this Item with respect to any purchase made by or on behalf of the registrant or any “affiliated purchaser,” as defined in Rule 10b-18(a)(3) under the Exchange Act (17 CFR 240.10b-18(a)(3)), of shares or other units of any class of the registrant’s equity securities that is registered by the registrant pursuant to Section 12 of the Exchange Act (15 U.S.C. 781).
Not applicable.
Item 10. Submission of Matters to a Vote of Security Holders.
Describe any material changes to the procedures by which shareholders may recommend nominees to the registrant’s board of directors, where those changes were implemented after the registrant last provided disclosure in response to the requirements of Item 7(d)(2)(ii)(G) of Schedule 14A (17 CFR 240.14a-101), or this Item.
Not applicable.
Item 11. Controls and Procedures.
(a) Disclose the conclusions of the registrant’s principal executive and principal financial officers, or persons performing similar functions, regarding the effectiveness of the registrant’s disclosure controls and procedures (as defined in Rule 30a-3(c) under the Act (17 CFR 270.30a-3(c))) as of a date within 90 days of the filing date of the report that includes the disclosure required by this paragraph, based on the evaluation of these controls and procedures required by Rule 30a-3(b) under the Act (17 CFR 270.30a-3(b)) and Rules 13a-15(b) or 15d-15(b) under the Exchange Act (17 CFR 240.13a-15(b) or 240.15d-15(b)).
The registrant’s principal executive officer and principal financial officer have concluded, based on their evaluation of the registrant’s disclosure controls and procedures as conducted within 90 days of the filing date of this report, that these disclosure controls and procedures are adequately designed and are operating effectively to ensure that information required to be disclosed by the registrant on Form N-CSR is recorded, processed, summarized and reported within the time periods specified in the Securities and Exchange Commission’s rules and forms.
(b) Disclose any change in the registrant’s internal control over financial reporting (as defined in Rule 30a-3(d) under the Act (17 CFR 270.30a-3(d)) that occurred during the second fiscal quarter of the period covered by this report that has materially affected, or is reasonably likely to materially affect, the registrant’s internal control over financial reporting.
There were no changes in the registrant’s internal control over financial reporting that occurred during the second fiscal quarter of the period covered by this report that have materially affected or are reasonably likely to materially affect, the registrant’s internal control over financial reporting.
Item 12. Exhibits.
(a) File the exhibits listed below as part of this Form. Letter or number the exhibits in the sequence indicated.
(a)(1) Any code of ethics, or amendment thereto, that is the subject of the disclosure required by Item 2, to the extent that the registrant intends to satisfy the Item 2 requirements through filing of an exhibit.
The code of ethics that is the subject of the disclosure required by Item 2 is attached hereto.
(a)(2) A separate certification for each principal executive officer and principal financial officer of the registrant as required by Rule 30a-2(a) under the Act (17 CFR 270.30a-2).
Certifications pursuant to Rule 30a-2(a) are attached hereto.
(a)(3) Any written solicitation to purchase securities under Rule 23c-1 under the Act (17 CFR 270.23c-1) sent or given during the period covered by the report by or on behalf of the registrant to 10 or more persons.
Not applicable.
(b) If the report is filed under Section 13(a) or 15(d) of the Exchange Act, provide the certifications required by rule 30a-2(b) under the Act as an exhibit. A certification furnished pursuant to this paragraph will not be deemed “filed” for purposes of Section 18 of the Exchange Act, or otherwise subject to the liability of that section. Such certification will not be deemed to be incorporated by reference into any filing under the Securities Act of 1933 or the Exchange Act, except to the extent that the registrant incorporates it by reference.
Certifications pursuant to Rule 30a-2(b) are furnished herewith.
SIGNATURES
Pursuant to the requirements of the Securities Exchange Act of 1934 and the Investment Company Act of 1940, the registrant has duly caused this report to be signed on its behalf by the undersigned, thereunto duly authorized.
(Registrant) | Firsthand Funds |
| |
| |
By (Signature and Title)* | /s/ Kevin M. Landis |
| Kevin M. Landis |
| President |
| |
Date | 2/24/2007 | |
| | | | |
Pursuant to the requirements of the Securities Exchange Act of 1934 and the Investment Company Act of 1940, this report has been signed below by the following persons on behalf of the registrant and in the capacities and on the dates indicated.
By (Signature and Title)* | /s/ Kevin M. Landis |
| Kevin M. Landis |
| President |
| |
Date | 2/24/2007 | |
| |
| |
By (Signature and Title)* | /s/ Aaron Masek |
| Aaron Masek |
| Treasurer |
| |
Date | 2/24/2007 | |
| | | |
* Print the name and title of each signing officer under his or her signature.