UNITED STATES
SECURITIES AND EXCHANGE COMMISSION
Washington, D.C. 20549
FORM N-CSR
CERTIFIED SHAREHOLDER REPORT OF REGISTERED
MANAGEMENT INVESTMENT COMPANIES
| Investment Company Act file number | 811-8268 |
Firsthand Funds
(Exact name of registrant as specified in charter)
125 South Market, Suite 1200
San Jose, CA 95113
(Address of principal executive offices) (Zip code)
Firsthand Capital Management, Inc.
125 South Market, Suite 1200
San Jose, CA 95113
(Name and address of agent for service)
| Registrant’s telephone number, including area code: | (408) 294-2200 |
| | |
| Date of fiscal year end: | December 31, 2007 |
| | |
| Date of reporting period: | December 31, 2007 |
Form N-CSR is to be used by management investment companies to file reports with the Commission not later than 10 days after the transmission to stockholders of any report that is required to be transmitted to stockholders under Rule 30e-1 under the Investment Company Act of 1940 (17 CFR 270.30e-1). The Commission may use the information provided on Form N-CSR in its regulatory, disclosure review, inspection, and policymaking roles.
A registrant is required to disclose the information specified by Form N-CSR, and the Commission will make this information public. A registrant is not required to respond to the collection of information contained in Form N-CSR unless the Form displays a currently valid Office of Management and Budget (“OMB”) control number. Please direct comments concerning the accuracy of the information collection burden estimate and any suggestions for reducing the burden to Secretary, Securities and Exchange Commission, 450 Fifth Street, NW, Washington, DC 20549-0609. The OMB has reviewed this collection of information under the clearance requirements of 44 U.S.C. § 3507.
Item 1. Reports to Stockholders.
Include a copy of the report transmitted to stockholders pursuant to Rule 30e-1 under the Act (17 CFR 270.30e-1).
Firsthand Funds
ANNUAL REPORT TO SHAREHOLDERS
Firsthand Technology Value Fund®
Firsthand Technology Leaders Fund
Firsthand Technology Innovators Fund
Firsthand e-Commerce Fund
Firsthand Global Technology Fund
Firsthand Alternative Energy Fund
December 31, 2007
CONTENTS
| Performance Summary | 2 |
| President’s Letter | 4 |
| Shareholder Fee Example | 6 |
| Performance and Portfolio Discussion | 8 |
| Audit Letter | 20 |
| Portfolio of Investments | 21 |
| Statements of Assets and Liabilities | 28 |
| Statements of Operations | 29 |
| Statements of Changes in Net Assets | 30 |
| Financial Highlights | 32 |
| Notes to Financial Statements | 35 |
| Additional Information | 46 |
PERFORMANCE SUMMARY
PERIOD RETURNS (average annual total returns as of 12/31/07)
| Fund | | 1-Year | | | 3-Year | | | 5-Year | | | 10-Year | | | Exp. Ratio | |
| Firsthand Technology Value Fund | | | 23.39 | % | | | 14.74 | % | | | 19.74 | % | | | 6.94 | % | | | 1.93 | % |
| Firsthand Technology Leaders Fund | | | 13.99 | % | | | 11.25 | % | | | 16.71 | % | | | 8.80 | % | | | 1.95 | % |
| Firsthand Technology Innovators Fund | | | 17.13 | % | | | 5.27 | % | | | 9.65 | % | | | • | | | | 1.95 | % |
| Firsthand e-Commerce Fund | | | 15.31 | % | | | 13.08 | % | | | 17.56 | % | | | • | | | | 1.95 | % |
| Firsthand Global Technology Fund | | | 16.93 | % | | | 7.05 | % | | | 16.75 | % | | | • | | | | 1.95 | % |
| Firsthand Alternative Energy Fund | | | • | | | | • | | | | • | | | | • | | | | 2.10 | % |
| | | | | | | | | | | | | | | | | | | | | |
| Lipper Science and Technology Fund Index | | | 16.76 | % | | | 9.51 | % | | | 15.65 | % | | | 5.67 | % | | | • | |
| NASDAQ Composite Index | | | 10.66 | % | | | 7.65 | % | | | 15.46 | % | | | 5.90 | % | | | • | |
| S&P 500 Index | | | 5.49 | % | | | 8.61 | % | | | 12.81 | % | | | 5.90 | % | | | • | |
Returns assume reinvestment of all dividends and distributions but do not reflect the impact of taxes. The performance data quoted represent past performance. Past performance cannot guarantee future results, and current performance may be lower or higher than the performance quoted. Both the return from and the principal value of an investment in the Funds will fluctuate so that an investor’s shares, when redeemed, may be worth more or less than their original cost. To obtain performance as of the most recent month-end, please contact Firsthand Funds by calling 1.888.884.2675 or go to www.firsthandfunds.com.
The Nasdaq Composite Index (NASDAQ) is a capitalization-weighted index of all common stocks listed with Nasdaq. The Standard & Poor’s 500 Index (S&P 500) is a market-weighted index of 500 stocks of well-established companies. Each index represents an unmanaged, broad-based basket of stocks. These indices are typically used as benchmarks for overall market performance. The Lipper Science and Technology Fund Index includes the largest 30 mutual funds in the group, which, by prospectus or portfolio practice, invest at least 80% of their equity portfolios in science and technology stocks. The Wilder Hill Clean Energy Index is a market-weighted index of 40 companies in the cleaner fuel, energy conversion, energy storage, greener utilities, power delivery and conservation, and renewable energy harvesting sectors.
RETURNS SINCE INCEPTION (average annual total returns as of 12/31/07)
| Fund (Inception Date) | | Avg Annual Total Return | | | NASDAQ | | | S&P 500 | |
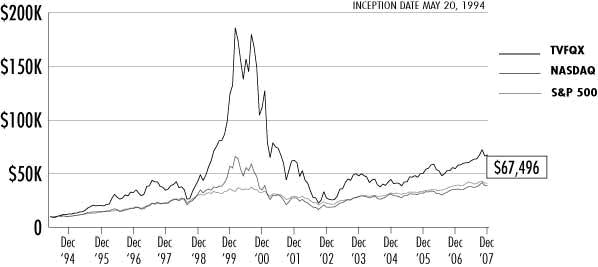
| Firsthand Technology Value Fund (5/20/94) | | | 15.05 | % | | | 10.47 | % | | | 10.92 | % |
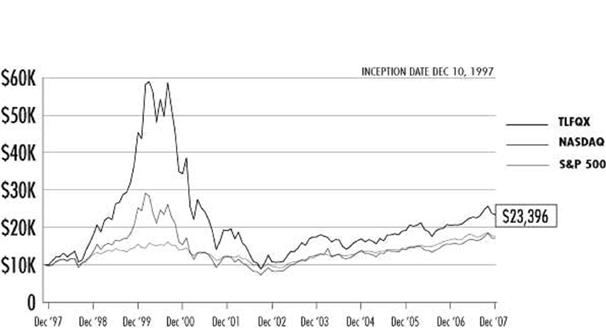
| Firsthand Technology Leaders Fund (12/10/97) | | | 8.82 | % | | | 5.52 | % | | | 5.83 | % |
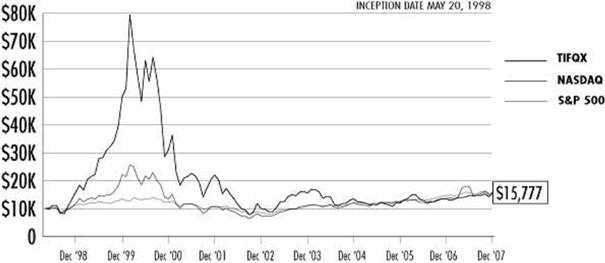
| Firsthand Technology Innovators Fund (5/20/98) | | | 4.85 | % | | | 4.35 | % | | | 4.62 | % |
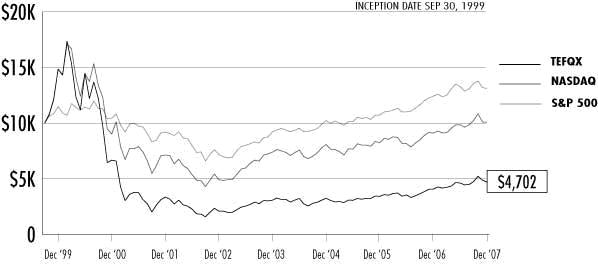
| Firsthand e-Commerce Fund (9/30/99) | | | -8.74 | % | | | 0.09 | % | | | 3.33 | % |
| Firsthand Global Technology Fund (9/29/00) | | | -8.45 | % | | | -3.85 | % | | | 2.03 | % |
| Firsthand Alternative Energy Fund (10/29/07)* | | | 8.90 | % | | | -5.71 | % | | | -4.32 | % |
Each Fund may invest in small-capitalization companies and Initial Public Offerings (“IPOs”). These investments will be more volatile than investments in large-capitalization companies and loss of principal could be greater. The Funds may invest in foreign securities, which will be subject to greater risks than investing in domestic securities. Because the Funds are not diversified, they can take larger positions in fewer companies, increasing their risk profile. The Funds invest in several industries within the technology sector and the relative weightings of these industries in a Fund’s portfolio may change at any time.
HOLDINGS BY INDUSTRY - % of net assets (as of 12/31/07)
| Industry | | TVFQX | | | TLFQX | | | TIFQX | | | TEFQX | | | GTFQX | | | ALTEX | |
| Advanced Materials | | | 3.1 | % | | | • | | | | • | | | | • | | | | • | | | | • | |
| Alternative Energy | | | 11.1 | % | | | • | | | | 2.4 | % | | | • | | | | 10.9 | % | | | 37.3 | % |
| Communications | | | 2.6 | % | | | 5.3 | % | | | 1.9 | % | | | 7.9 | % | | | 7.5 | % | | | • | |
| Communications Equipment | | | 1.1 | % | | | 6.1 | % | | | 2.3 | % | | | • | | | | 5.9 | % | | | • | |
| Computer | | | 1.2 | % | | | 7.2 | % | | | • | | | | 4.5 | % | | | 4.6 | % | | | • | |
| Electronic Entertainment | | | 7.2 | % | | | • | | | | • | | | | • | | | | 4.0 | % | | | • | |
| Electronic Manufacturing Services | | | • | | | | • | | | | • | | | | • | | | | 4.4 | % | | | • | |
Intellectual Property | | | 5.9 | % | | | • | | | | 32.5 | % | | | • | | | | • | | | | • | |
| Internet | | | 6.3 | % | | | 10.5 | % | | | 1.4 | % | | | 39.5 | % | | | 6.0 | % | | | • | |
| Media | | | • | | | | • | | | | • | | | | 2.9 | % | | | • | | | | • | |
| Networking | | | 8.0 | % | | | 5.6 | % | | | 5.6 | % | | | 3.5 | % | | | • | | | | 4.0 | % |
| Other Electronics | | | 3.8 | % | | | 9.8 | % | | | 7.5 | % | | | 6.5 | % | | | 16.6 | % | | | 14.1 | % |
| Peripherals | | | 4.9 | % | | | 9.6 | % | | | • | | | | • | | | | • | | | | • | |
| Photonics | | | 6.2 | % | | | 5.8 | % | | | • | | | | • | | | | • | | | | 3.3 | % |
Semiconductors | | | 32.2 | % | | | 20.6 | % | | | 31.4 | % | | | 4.2 | % | | | 14.3 | % | | | 11.5 | % |
| Semiconductor Equipment | | | 3.5 | % | | | 4.8 | % | | | • | | | | • | | | | 6.4 | % | | | 3.5 | % |
| Services | | | • | | | | • | | | | 4.2 | % | | | • | | | | 6.9 | % | | | • | |
| Software | | | 1.3 | % | | | 13.8 | % | | | 10.1 | % | | | 23.7 | % | | | 8.5 | % | | | • | |
| Net Cash | | | 1.6 | % | | | 0.9 | % | | | 0.7 | % | | | 7.3 | % | | | 4.0 | % | | | 26.3 | % |
TVFQX: Firsthand Technology Value Fund, TLFQX: Firsthand Technology Leaders Fund, TIFQX: Firsthand Technology Innovators Fund, TEFQX: Firsthand e-Commerce Fund, GTFQX: Firsthand Global Technology Fund, ALTEX: Firsthand Alternative Energy Fund.
PRESIDENT’S LETTER
Dear Fellow Shareholders,
2007 was a good year for technology investors. While the broad market, as measured by the S&P 500, was up a modest 5.49%, the NASDAQ Composite gained 10.66%. Technology benchmarks fared better still: The Russell 1000 Technology Index appreciated 16.66%, while the Lipper index of technology mutual funds gained 16.76%. The lone disappointment was the Russell 2000 Technology Index, which returned just 4.61%—reflecting the struggles of many small-cap technology companies.
I am pleased to report that each of the Firsthand technology funds outperformed the NASDAQ, and that three of the five beat the Lipper peer-group benchmark. Our two laggards, Firsthand Technology Leaders Fund and Firsthand e-Commerce Fund, beat the market but modestly underperformed the peer-group benchmark. The fund discussions in the following pages detail each fund’s relative performance against those benchmarks for the period ended December 31, 2007. The bottom line: Firsthand had a good 2007. Our broad investment themes still seem to be on the mark, and our fundamental approach to selecting individual stocks is working well.
Globalization
Technology investing has become a worldwide exercise. This was demonstrated by the strong performance of our investments in Nintendo, Lenovo, China Mobile, Nokia, and Suntech Power Holdings. Although these firms are all based far from San Jose, they have strong Silicon Valley connections. Similarly, some of the most successful U.S. companies, such as Apple, Hewlett Packard, Cisco, and Intel, have been case studies in successful globalization: Each company has established operations around the world, taking advantage of the growth in overseas markets.
At Firsthand, adaptation has meant taking a much more global view in our research process. Paradoxically, Silicon Valley has become a great place to get that global view, as our industry contacts offer us insights from their own far-flung networks. I still cannot imagine a better vantage point from which to follow technology than here.
Alternative Energy
Growing prosperity in China, India, and other developing nations has put tremendous strains on the world’s supply of basic resources. Prices for copper, nickel, cement, lumber, and many other basic materials have surged in recent years as hundreds of millions of people race for “first-world” status. But no other resource seems to pack the psychological punch that energy does. Personally, I can recall dozens of headlines about the price of oil in 2007. I did not see any headlines about zinc.
Combine anxieties over an energy shortage with increasing concerns about climate change, and it’s understandable that alternative energy is suddenly the hot (and seemingly inescapable) topic. At Firsthand, we’ve noticed that a steadily increasing portion of our top-performing investments have come from the alternative energy sector, and our investments in solar, wind, and efficiency technologies comprise an increasing portion of our technology portfolios.
This fall we launched Firsthand Alternative Energy Fund (ALTEX), specifically dedicated to renewable energy and clean technologies. Because we recognize that investing in alternative energy companies is only part of the long-term solution, Firsthand has pledged to donate a portion of our management fee* for the Fund to several non-profit organizations that support renewable energy, based on the expressed preferences of our shareholders. The current list of organizations we support includes Audubon, Defenders of Wildlife, National Wildlife Federation, Sierra Club, and World Resources Institute.
Looking Ahead
As I write this in early 2008, the markets are again in the midst of a sharp decline. To make sense of the current situation, it helps to look back a bit: Five years ago, things looked pretty bleak. We were worried about terrorism, recession, and an impending war. Investor confidence was undermined by a weakening dollar, the offshore migration of American jobs, and waves of corporate scandals. We fretted over the price of oil at $40 per barrel, then $50, then $60…
And in the face of so much bad news and anxiety the market went…up! Not spectacularly, but steadily and impressively. Over the past five years the S&P 500 returned more than 10% annually, on average, while the various technology indices posted returns in the mid-teens. Why? We think it’s because human behavior is adaptable, and that adaptability makes economies resilient.
Today we are facing a new set of fears, mostly centered around the oft-predicted yet not-adequately-prepared-for bursting of the housing bubble. In an admirable display of consistency, pessimists continue to predict a recession—as they have every year since we emerged from the last one. 2008 may indeed be the year in which they are correct. After all, predicting a recession is a bit like predicting rain: Eventually, it will happen.
But whether we are in for a deep recession, a mild recession, or simply a brief pause in growth, we believe that the equity markets have a good deal of bad news priced into them already. It is also worth noting that over the past two decades our recessions have been shallow and short, according to the U.S. Department of Commerce. In any case, we can count on this: Recessions end. I believe there is an excellent chance that a year from now the discussion will have moved on to the timing and nature of the recovery.
At Firsthand, our focus will continue to be on finding the best-positioned companies associated with the most powerful technology trends, and on making solid long-term investments. Difficult markets can provide excellent opportunities for investors willing to look beyond short-term market turbulence.
Sincerely,
Kevin Landis
President and Chief Executive Officer
| * | Firsthand will donate a portion of its management fee for the Fund, equal to 0.20% of average daily net assets, to these organizations in proportion to an asset-weighted tally of shareholder votes. |
SHAREHOLDER FEE EXAMPLE (unaudited)
Example—In general, mutual fund shareholders may incur two types of costs: (1) transaction costs, including sales charges (loads), redemption fees, and exchange fees; and (2) ongoing costs, including management fees, 12b-1 distribution and service fees, non-12b-1 service fees, and other Fund expenses. This example is intended to help you understand your ongoing costs (in dollars) of investing in a Fund and to compare these costs with the ongoing costs of investing in other mutual funds. Note that Firsthand Funds (“Trust”) does not charge transaction fees for 12b-1 distribution and service fees, though you may incur transaction fees if you purchase shares through a broker.
The example on the following page is based on an investment of $1,000 invested at the beginning of the period and held for the entire period from July 1, 2007 through December 31, 2007.
Actual Expenses—The section of the table at right entitled “Actual” provides information about actual account values and actual expenses. You may use this information, together with the amount you invested, to estimate the expenses that you paid over the period. Simply divide your account value by $1,000 (for example, an $8,600 account value divided by $1,000 = 8.6), then multiply the result by the number in the section entitled “Actual” under the heading “Expenses Paid During Period” to estimate the expenses you paid on your account during this period. If your account is an IRA or other tax-qualified savings plan, your expenses may also have included a $10 annual fee. In either case, the amount of any fee paid through your account would increase the estimate of expenses you paid during the period and decrease your ending account value.
Hypothetical Example for Comparison Purposes—The section of the table at right entitled “Hypothetical” provides information about hypothetical account values and hypothetical expenses based on a Fund’s actual expense ratio and an assumed rate of return of 5% per year before expenses, which is not the Fund’s actual return. The hypothetical account values and expenses may not be used to estimate your actual ending account balance or the expenses you paid for the period. However, you may use this information to compare the ongoing costs of investing in the Trust to other funds. To do so, compare this 5% hypothetical example with the 5% hypothetical examples that appear in the shareholder reports of the other funds. As in the case of the actual expense example, if your account is subject to an IRA fee, the amount of the fee paid through your account would increase the hypothetical expenses you would have paid during the period and decrease the hypothetical ending account value.
Please note that the expenses shown in the table at right are meant to highlight your ongoing costs only and do not reflect any transactional costs, such as sales charges (loads), redemption fees, or exchange fees. Therefore, the table is useful in comparing ongoing costs only, and will not help you determine the relative total costs of owning different funds. In addition, if these transactional costs were included, your costs would have been higher. The examples also assume all dividends and distributions have been reinvested.
Firsthand Technology Value Fund
| | Beginning Account Value 7/1/07 | Ending Account Value 12/31/07 | Expenses Paid During Period *7/1/07 - 12/31/07 | Annualized Expense Ratio |
| Actual | $1,000 | $1,085.04 | $10.32 | 1.93% |
| Hypothetical** | $1,000 | $1,015.03 | $9.80 | 1.93% |
Firsthand Technology Leaders Fund
| | Beginning Account Value 7/1/07 | Ending Account Value 12/31/07 | Expenses Paid During Period *7/1/07 - 12/31/07 | Annualized Expense Ratio |
| Actual | $1,000 | $1,027.63 | $10.24 | 1.95% |
| Hypothetical** | $1,000 | $1,014.93 | $9.90 | 1.95% |
Firsthand Technology Innovators Fund
| | Beginning Account Value 7/1/07 | Ending Account Value 12/31/07 | Expenses Paid During Period *7/1/07 - 12/31/07 | Annualized Expense Ratio |
| Actual | $1,000 | $1,072.99 | $9.97 | 1.95% |
| Hypothetical** | $1,000 | $1,014.93 | $9.90 | 1.95% |
Firsthand e-Commerce Fund
| | Beginning Account Value 7/1/07 | Ending Account Value 12/31/07 | Expenses Paid During Period *7/1/07 - 12/31/07 | Annualized Expense Ratio |
| Actual | $1,000 | $1,017.43 | $10.03 | 1.95% |
| Hypothetical** | $1,000 | $1,014.93 | $9.90 | 1.95% |
Firsthand Global Technology Fund
| | Beginning Account Value 7/1/07 | Ending Account Value 12/31/07 | Expenses Paid During Period *7/1/07 - 12/31/07 | Annualized Expense Ratio |
| Actual | $1,000 | $1,045.82 | $10.11 | 1.95% |
| Hypothetical** | $1,000 | $1,014.93 | $9.90 | 1.95% |
Firsthand Alternative Energy Fund
| | Beginning Account Value 7/1/07 | Ending Account Value 12/31/07 | Expenses Paid During Period *7/1/07 - 12/31/07 | Annualized Expense Ratio |
| Actual*** | $1,000 | $1,089.00 | $3.73 | 2.10% |
| Hypothetical** | $1,000 | $1,014.17 | $10.66 | 2.10% |
| * | Expenses are calculated by multiplying the Fund’s annualized expense ratio listed above by the average account value over the period and multiplying that number by 184/365 (to reflect the one-half year period). |
| ** | 5% return per year before expenses. |
| *** | Because Firsthand Alternative Energy Fund commenced operations on 10/29/07, expenses shown here reflect only 64 days of activity, compared with 184 days for the other funds. |
The expenses shown in the table do not reflect any fees that may be charged to you by brokers, financial intermediaries, or other financial institutions.
FIRSTHAND TECHNOLOGY VALUE FUND
Performance and Portfolio Discussion
How did the Fund perform in 2007?
In 2007, Firsthand Technology Value Fund (TVFQX) posted a 23.39% gain, versus a 10.66% increase for the NASDAQ Composite Index and a 16.76% gain for the Lipper Science and Technology Fund Index. For the six months ending December 31, 2007, Firsthand Technology Value Fund rose 8.50% as compared to 2.29% and 5.81% gains for the NASDAQ and the Lipper peer group benchmarks, respectively.
Which industries had the greatest impact on the Fund's performance?
For the period ending December 31, 2007, semiconductor and alternative energy stocks represented the portfolio's largest weightings, followed by networking and electronic entertainment holdings. The portfolio's exposure to the semiconductor and electronic entertainment industries contributed most to the Fund's strong performance versus its benchmarks in 2007. In particular, semiconductor stocks that had exposure to the solar industry benefited greatly from the blossoming demand for solar panels.
Which individual holdings were the largest contributors to the Fund's performance?
Cypress Semiconductor (CY) was the Fund's top contributor during 2007. Despite weakness in chip demand, the company managed to increase its revenue above analysts' estimates because of strong sales from its SunPower division, which makes solar cells and panels. Similarly, MEMC Electronic Materials (WFR) was also a profitable investment for the Fund. MEMC, which supplies polysilicon wafers to the semiconductor and solar cell industries, benefited from robust solar panel sales. We liquidated our position in MEMC for a nice gain mid-year, after it hit our price target.
Shares of Nintendo (NTDOY) rose sharply during the year as the videogame maker saw brisk sales of its popular DS portable handheld complemented by strong demand for its Wii game console. The Wii continued to be in short supply throughout the year as it consistently outsold Sony's PlayStation3 and Microsoft's Xbox 360 game systems in 2007 helping drive Nintendo shares higher by more than 125% during the period.
The Fund received a nice boost in performance from aQuantive (AQNT). Shares of the online advertising firm rocketed after Microsoft (MSFT) announced that it would buy the company for approximately $6 billion in May 2007. The all-cash deal represented a sizable premium over aQuantive's closing price and was the largest acquisition in Microsoft's history.
We are also pleased to report that one of the private companies in which we invested in 2003 had its initial public offering in June. AuthenTec (AUTH) manufactures chips that provide fingerprint identification for PCs and wireless devices and finished the period among the top contributors to the Fund's performance. After going public at $11.00 per share, the stock closed 2007 at $14.53, a 32% gain in just over six months.
Which holdings were the greatest detractors from the Fund's performance?
For the period, the portfolio's largest detractor was disk drive manufacturing equipment maker Intevac (IVAC). Shares fell after one of Intevac's key customers revealed that weak demand and price declines for hard drives hurt its profit margins and earnings. These concerns weighed heavily on the industry and affected all hard drive component suppliers, including Intevac, which provides equipment used to deposit specialized materials onto hard disks.
Despite growing demand for robust multimedia online content, such as video, music, and software downloads, shares of Web content delivery firm Akamai Technologies (AKAM) declined more than 34% during the period as investors worried that increasing competition in the content delivery segment would result in lower prices and shrinking profit margins.
SanDisk (SNDK) lost nearly 40% of its market cap during Q4 over concerns that a larger-than-expected decline in the average selling price for NAND flash would crimp future profits for the flash memory manufacturer.
Fund Performance and Holdings (as of 12/31/07)
Firsthand Technology Value Fund vs. Market Indices
| | | TVFQX | | | NASDAQ | | | S&P 500 | |
| Since Inception (5/20/94) | | | 15.05 | % | | | 10.47 | % | | | 10.92 | % |
| 10-Year | | | 6.94 | % | | | 5.90 | % | | | 5.90 | % |
| 5 -Year | | | 19.74 | % | | | 15.46 | % | | | 12.81 | % |
| 3 -Year | | | 14.74 | % | | | 7.65 | % | | | 8.61 | % |
| 1 -Year | | | 23.39 | % | | | 10.66 | % | | | 5.49 | % |
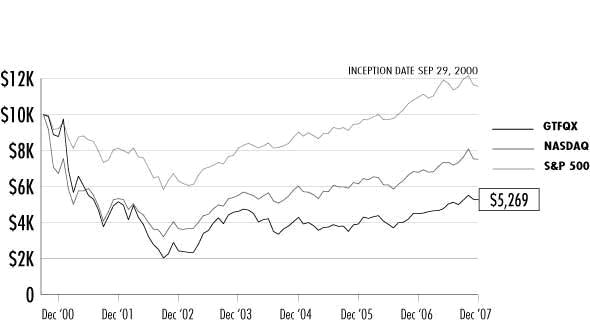
Growth of a Hypothetical $10,000 Investment
Returns assume reinvestment of all dividends and distributions but do not reflect the impact of taxes. The performance data quoted represent past performance. Past performance cannot guarantee future results, and current performance may be lower or higher than the performance quoted. Both the return from and the principal value of an investment in the Funds will fluctuate so that an investor’s shares, when redeemed, may be worrth more or less than their original cost. To obtain performance as of the most recent month-end, please contact Firsthand Funds by calling 1.888.884.2675 or go to www.firsthandfunds.com.
| Holdings by Industry* | % Net Assets |
| Semiconductors | 32.2% |
| Alternative Energy | 11.1% |
| Networking | 8.0% |
| Electronic Entertainment | 7.2% |
| Internet | 6.3% |
| Photonics | 6.2% |
| Intellectual Property | 5.9% |
| Peripherals | 4.9% |
| Other Electronics | 3.8% |
| Other | 3.6% |
| Semiconductor Equipment | 3.5% |
| Advanced Materials | 3.1% |
| Communications | 2.6% |
| Net Cash | 1.6% |
| * | Based on percentage of net assets as of 12/31/07. |
| Top 10 Holdings** | % Net Assets |
| Cypresss Semiconductor Corp. | 8.7% |
| Nintendo Co. Ltd. - ADR | 7.2% |
| Cisco Systems, Inc. | 6.2% |
| Corning, Inc. | 6.2% |
| Rambus, Inc. | 5.4% |
| SiRF Technology Holdings, Inc. | 4.9% |
| AuthenTec, Inc. | 2.8% |
| Seagate Technology, Inc. | 2.6% |
| Netflix, Inc. | 2.4% |
| Zoran Corp. | 2.4% |
| ** | Top 10 stock holdings total 48.8% of net assets. These holdings are current as of 12/31/07, and may not be representative of current or future investments. Firsthand includes only public companies in top 10 holdings. |
FIRSTHAND TECHNOLOGY LEADERS FUND
Performance and Portfolio Discussion
How did the Fund perform in 2007?
In 2007, Firsthand Technology Leaders Fund (TLFQX) posted a 13.99% gain, versus a 10.66% increase for the NASDAQ Composite Index and a 16.76% gain for the Lipper Science and Technology Fund Index. For the six months ending December 31, 2007, Firsthand Technology Leaders Fund rose 2.76% as compared to 2.29% and 5.81% gains for the NASDAQ and the Lipper peer group benchmarks, respectively.
Which industries had the greatest impact on the Fund's performance?
For the period ending December 31, 2007, semiconductor and software stocks represented the portfolio's largest weightings, followed by Internet and electronics holdings. The portfolio's exposure to the computer, communications, and Internet industries contributed most to the Fund's performance, while the net contribution of our semiconductor holdings was essentially flat for the year.
Which individual holdings were the largest contributors to the Fund's performance?
Apple (AAPL) was the top contributor to Fund performance in 2007. Shares of the consumer electronics company hit an all-time high toward the end of the year on strong holiday sales of notebook computers, iPods, and its popular new iPhone handset. The success of the iPod has helped revitalize sales of Mac computers, pushing Apple into third place in market share in the U.S. personal computer market.
China Mobile (CHL) was also a very profitable investment for the Fund. Shares of the world's largest cell phone carrier nearly doubled in 2007, as the service provider continued to enjoy robust business by adding more than five million new customers each month, ending the year with more than 360 million subscribers.
Google (GOOG) continued its dominance in the Internet search market in 2007, keeping the company well ahead of rivals Yahoo! (YHOO) and Microsoft (MSFT). Google also said that it may target the cell phone market to get a piece of the rapidly growing mobile ad market. The stock responded by finishing the year higher by more than 48%.
Nokia (NOK) widened its lead in the global handset market by selling aggressively in emerging markets like China and India and enjoying strong demand for its high-end smartphones. Nokia also made a bid for digital mapmaker Navteq (NVT) for approximately $8 billion in October 2007. This acquisition will give Nokia a foothold in the highly competitive GPS navigation business.
Which holdings were the greatest detractors from the Fund's performance?
The Fund's largest detractor in 2007 was Broadcom (BRCM). Shares of the chipmaker tumbled following a disappointing third-quarter earnings report. Although revenues met Wall Street's estimates, research and development expenses unexpectedly rose. Broadcom management explained that higher R&D spending was necessary to strengthen its presence in the lucrative handset chip market.
VeriFone Holdings (PAY) announced in early December that it would restate some of its financial results due to errors in accounting related to inventory, and said that it would also delay reporting of its upcoming quarterly numbers. News of accounting discrepancies sent shares of the payment processing equipment maker down more than 40% during the fourth quarter.
SanDisk (SNDK) lost nearly 40% of its market cap in Q4 over concerns that a larger-than-expected decline in the average selling price for NAND flash would potentially crimp future profits for the flash memory manufacturer.
Fund Performance and Holdings (as of 12/31/07)
Firsthand Technology Leaders Fund vs. Market Indices
| | | TLFQX | | | NASDAQ | | | S&P 500 | |
| Since Inception (12/10/97) | | | 8.82 | % | | | 5.52 | % | | | 5.83 | % |
| 10-Year | | | 8.80 | % | | | 5.90 | % | | | 5.90 | % |
| 5 -Year | | | 16.71 | % | | | 15.46 | % | | | 12.81 | % |
| 3 -Year | | | 11.25 | % | | | 7.65 | % | | | 8.61 | % |
| 1 -Year | | | 13.99 | % | | | 10.66 | % | | | 5.49 | % |
Growth of a Hypothetical $10,000 Investment
Returns assume reinvestment of all dividends and distributions but do not reflect the impact of taxes. The performance data quoted represent past performance. Past performance cannot guarantee future results, and current performance may be lower or higher than the performance quoted. Both the return from and the principal value of an investment in the Funds will fluctuate so that an investor’s shares, when redeemed, may be worrth more or less than their original cost. To obtain performance as of the most recent month-end, please contact Firsthand Funds by calling 1.888.884.2675 or go to www.firsthandfunds.com.
| Holdings by Industry* | % Net Assets |
| Semiconductors | 20.6% |
| Software | 13.8% |
| Internet | 10.5% |
| Other Electronics | 9.8% |
| Peripherals | 9.6% |
| Computer | 7.2% |
| Communications Equipment | 6.1% |
| Photonics | 5.8% |
| Networking | 5.6% |
| Communications | 5.3% |
| Semiconductor Equipment | 4.8% |
| Net Cash | 0.9% |
| | |
| * | Based on percentage of net assets as of 12/31/07. |
| Top 10 Holdings** | % Net Assets |
| Corning, Inc. | 5.8% |
| Cisco Systems, Inc. | 5.6% |
| eBay, Inc. | 5.4% |
| China Mobile Hong Kong Ltd. | 5.3% |
| L-1 Identity Solutions, Inc. | 5.2% |
| Google, Inc. | 5.1% |
| Microsoft Corp. | 5.0% |
| EMC Corp. | 4.8% |
| Intel Corp. | 4.8% |
| Seagate Technology, Inc. | 4.8% |
| ** | Top 10 stock holdings total 51.8% of net assets. These holdings are current as of 12/31/07, and may not be representative of current or future investments. Firsthand includes only public companies in top 10 holdings. |
FIRSTHAND TECHNOLOGY INNOVATORS FUND
Performance and Portfolio Discussion
How did the Fund perform in 2007?
In 2007, Firsthand Technology Innovators Fund (TIFQX) posted a 17.13% gain, versus a 10.66% increase for the Nasdaq Composite Index and a 16.76% gain for the Lipper Science and Technology Fund Index. For the six months ending December 31, 2007, Firsthand Technology Innovators Fund rose 7.30% as compared to 2.29% and 5.81% gains for the Nasdaq and the Lipper peer group benchmarks, respectively.
Which industries had the greatest impact on the Fund's performance?
For the period ending December 31, 2007, intellectual property (IP) represented the portfolio's largest weighting, followed by our semiconductor and software holdings. The Fund outperformed its benchmarks due to its holdings in the semiconductor, IP, networking, and software industries.
Which individual holdings were the largest contributors to the Fund's performance?
Our position in Echelon (ELON) more than doubled in value during 2007 as rising energy costs helped boost interest in energy efficiency. Echelon provides automation technologies that help businesses reduce energy usage by more effectively controlling lighting, HVACs, and other energy-intensive appliances.
Improving financial results for database management software vendor Versant (VSNT) helped shares more than double in 2007. The company experienced a pickup in demand in its core business from the telecommunications sector, helping drive growth in licensing revenue.
We are pleased to report that one of the private companies in which we invested in 2003 had its initial public offering in June. AuthenTec (AUTH) manufactures chips that provide fingerprint identification for PCs and wireless devices and finished the period as the number one contributor to Fund performance. After going public at $11.00 per share, the stock closed 2007 at $14.53, a 32% gain in just over six months.
The value of the Fund's position in Silicon Genesis appreciated significantly after the company received a large contract from a key customer. Silicon Genesis is a privately held company that licenses its layer transfer technology to companies manufacturing silicon wafers for the semiconductor and solar industries. The company's technology helps minimize the amount of silicon that is wasted during the wafer manufacturing process.
Which holdings were the greatest detractors from the Fund's performance?
For the period, the portfolio's largest detractor was disk drive manufacturing equipment maker Intevac (IVAC). Shares fell after one of Intevac's key customers revealed that weak demand and price declines for hard drives hurt its profit margins and earnings. These concerns weighed heavily on the industry and affected all hard drive component suppliers, including Intevac, which provides equipment used to deposit specialized materials onto hard disks.
2007 started out on an ominous note for Verint Systems (VRNT.PK) with the NASDAQ delisting the security and analytics software company for not filing the required financial reports with the Securities and Exchange Commission for more than a year. Shares drifted down further in Q4 after the company said that the completion of an internal audit would be delayed, which has kept potential investors away from the stock.
We liquidated our position in PDF Solutions (PDFS) after the software company lowered its guidance due to a softer sales environment that was projected to remain weak for the rest of the year.
Fund Performance and Holdings (as of 12/31/07)
Firsthand Technology Innovators Fund vs. Market Indices
| | | TIFQX | | | NASDAQ | | | S&P 500 | |
| Since Inception (5/20/98) | | | 4.85 | % | | | 4.35 | % | | | 4.62 | % |
| 5 -Year | | | 9.65 | % | | | 15.46 | % | | | 12.81 | % |
| 3 -Year | | | 5.27 | % | | | 7.65 | % | | | 8.61 | % |
| 1 -Year | | | 17.13 | % | | | 10.66 | % | | | 5.49 | % |
Growth of a Hypothetical $10,000 Investment
Returns assume reinvestment of all dividends and distributions but do not reflect the impact of taxes. The performance data quoted represent past performance. Past performance cannot guarantee future results, and current performance may be lower or higher than the performance quoted. Both the return from and the principal value of an investment in the Funds will fluctuate so that an investor’s shares, when redeemed, may be worrth more or less than their original cost. To obtain performance as of the most recent month-end, please contact Firsthand Funds by calling 1.888.884.2675 or go to www.firsthandfunds.com.
| Holdings by Industry* | % Net Assets |
| Intellectual Property | 32.5% |
| Semiconductors | 31.4% |
| Software | 10.1% |
| Other Electronics | 7.5% |
| Networking | 5.6% |
| Services | 4.2% |
| Alternative Energy | 2.4% |
| Communications Equipment | 2.3% |
| Communications | 1.9% |
| Internet | 1.4% |
| Net Cash | 0.7% |
| * | Based on percentage of net assets as of 12/31/07. |
| Top 10 Holdings** | % Net Assets |
| AuthenTec, Inc. | 16.5% |
| Echelon Corp. | 5.6% |
| Intevac, Inc. | 4.9% |
| Versant Corp. | 3.7% |
| Synaptics, Inc. | 2.8% |
| Akeena Solar, Inc. | 2.5% |
| Concur Technologies, Inc. | 2.3% |
| Verint Systems, Inc. | 2.1% |
| EMCORE Corp. | 1.9% |
| MIPS Technologies, Inc. | 1.8% |
| | |
| ** | Top 10 stock holdings total 44.1% of net assets. These holdings are current as of 12/31/07, and may not be representative of current or future investments. Firsthand includes only public companies in top 10 holdings. |
FIRSTHAND E-COMMERCE FUND
Performance and Portfolio Discussion
How did the Fund perform in 2007?
In 2007, Firsthand e-Commerce Fund (TEFQX) posted a 15.31% gain, versus a10.66% increase for the NASDAQ Composite Index and a 16.76% gain for the Lipper Science and Technology Fund Index. For the six months ending December 31, 2007, Firsthand e-Commerce Fund rose 1.74% as compared to 2.29% and 5.81% gains for the NASDAQ and the Lipper peer group benchmarks, respectively.
Which industries had the greatest impact on the Fund's performance?
For the period ending December 31, 2007, Internet and software stocks represented the portfolio's largest weightings, followed by communications and electronics holdings. The portfolio's exposure to the Internet, software and computer industries contributed most to the Fund's performance in 2007.
Which individual holdings were the largest contributors to the Fund's performance?
Chinese search engine Baidu (BIDU) was one of the best-performing stocks in 2007 and was also the top contributor to Fund performance during the period. Baidu, which is considered to be the Chinese equivalent of Google (GOOG), is benefiting from being the dominant search engine in a large market that is regarded by many to still be in the early stages of growth. Baidu also expanded its presence by entering the Japanese market in March 2007 and by creating a search engine for users that offers e-commerce opportunities.
Shares of Apple (AAPL) hit an all-time high toward the end of the year on strong holiday sales of notebook computers, iPods, and its popular new iPhone device. The success of the iPod has helped revitalize sales of Mac computers, pushing Apple into third place in market share in the U.S. personal computer market.
Google (GOOG) continued its dominance in the Internet search market in 2007, keeping the company well ahead of rivals Yahoo! (YHOO) and Microsoft (MSFT). Google also said that it may target the cell phone market to get a piece of the rapidly growing mobile ad market. The stock responded by finishing the year higher by more than 48%.
The Fund also got a nice boost in performance from Visual Sciences (VSCN) in October 2007. Shares of the online advertising company jumped after Omniture (OMTR) said it planned to buy the company in a stock and cash deal valued at approximately $372 million.
Which holdings were the greatest detractors from the Fund's performance?
Despite growing demand for robust multimedia online content, such as video, music, and software downloads, Web content delivery firm Akamai Technologies (AKAM) was the Fund's largest detractor in 2007. Shares declined more than 34% during the period as investors worried that increasing competition in the content delivery segment would result in lower prices and shrinking profit margins.
VeriFone Holdings (PAY) announced in early December that it would restate some of its financial results due to errors in accounting related to inventory, and said that it would also delay reporting of its upcoming quarterly numbers. News of accounting discrepancies sent shares of the payment processing equipment maker down more than 40% during the fourth quarter.
Monster Worldwide (MNST) experienced a pair of negative events in 2007 that negatively impacted its share price. The parent company of the online job search site Monster.com said it would cut 15% of its workforce after reporting disappointing quarterly results. Monster also suffered a hacker attack that resulted in the theft of personal user data, further damaging the company's reputation.
Fund Performance and Holdings (as of 12/31/07)
Firsthand e-Commerce Fund vs. Market Indices
| | | TEFQX | | | NASDAQ | | | S&P 500 | |
| Since Inception (9/30/99) | | | -8.74 | % | | | 0.09 | % | | | 3.33 | % |
| 5 -Year | | | 17.56 | % | | | 15.46 | % | | | 12.81 | % |
| 3 -Year | | | 13.08 | % | | | 7.65 | % | | | 8.61 | % |
| 1 -Year | | | 15.31 | % | | | 10.66 | % | | | 5.49 | % |
Growth of a Hypothetical $10,000 Investment
Returns assume reinvestment of all dividends and distributions but do not reflect the impact of taxes. The performance data quoted represent past performance. Past performance cannot guarantee future results, and current performance may be lower or higher than the performance quoted. Both the return from and the principal value of an investment in the Funds will fluctuate so that an investor’s shares, when redeemed, may be worrth more or less than their original cost. To obtain performance as of the most recent month-end, please contact Firsthand Funds by calling 1.888.884.2675 or go to www.firsthandfunds.com.
| Holdings by Industry* | % Net Assets |
| Internet | 39.5% |
| Software | 23.7% |
| Communications | 7.9% |
| Other Electronics | 6.5% |
| Computer | 4.5% |
| Semiconductors | 4.2% |
| Networking | 3.5% |
| Media | 2.9% |
| Net Cash | 7.3% |
| * | Based on percentage of net assets as of 12/31/07. |
| Top 10 Holdings** | % Net Assets |
| Microsoft Corp. | 6.1% |
| Oracle Corp. | 5.1% |
| Adobe Systems, Inc. | 5.1% |
| eBay, Inc. | 4.9% |
| Google, Inc. | 4.6% |
| Yahoo! Inc. | 4.4% |
| Akamai Technologies, Inc. | 4.3% |
| Baidu.com, Inc. | 3.9% |
| L-1 Identity Solutions, Inc. | 3.7% |
| Equinix, Inc. | 3.7% |
| ** | Top 10 stock holdings total 45.8% of net assets. These holdings are current as of 12/31/07, and may not be representative of current or future investments. Firsthand includes only public companies in top 10 holdings. |
FIRSTHAND GLOBAL TECHNOLOGY FUND
Performance and Portfolio Discussion
How did the Fund perform in 2007?
In 2007, Firsthand Global Technology Fund (GTFQX) posted a 16.93% gain, versus a 10.66% increase for the NASDAQ Composite Index and a 16.76% gain for the Lipper Science and Technology Fund Index. For the six months ending December 31, 2007, Firsthand Global Technology Fund rose 4.58% as compared to 2.29% and 5.81% gains for the NASDAQ and the Lipper peer group benchmarks, respectively.
Which industries had the greatest impact on the Fund's performance?
For the period ending December 31, 2007, other electronics, semiconductors and alternative energy stocks together represented the portfolio's largest weighting, followed by software and communications. The Fund’s positive performance was due to its holdings in alternative energy, computer, electronics, and communications equipment. One trend in particular that the Fund benefited from was the surge in demand for global positioning system (GPS) devices and digital mapping services.
Which holdings were the largest contributors to the Fund's performance?
Suntech Power Holdings (STP) was the Fund's top contributor to performance during 2007. China-based Suntech manufactures photovoltaic cells and modules for use in solar panels. The company enjoyed strong demand for its products due to rising energy prices and ongoing government incentives in Europe and the United States.
Lenovo Group (no U.S. symbol) was another Chinese company that performed well in 2007. The computer maker returned to profitability by showing strong gains in market share, revenue, and profit in both its laptop and desktop divisions. Lenovo has benefited from several key acquisitions and by expanding its existing businesses in emerging markets.
Fears about a possible slowdown in the hot flat-panel TV market proved to be a bit premature as LG.Philips LCD (LPL) reported its best quarterly profit in more than three years. Results for the liquid crystal display manufacturer were driven by strong sales for larger-size flat-screen televisions and moderate price declines.
GPS devices were one of the "must have" gifts during the recent holiday season and companies that had exposure to this trend enjoyed nice stock gains in 2007. Portfolio holdings including Tele Atlas (no U.S. symbol), Navteq (NVT), and TomTom (no U.S. symbol) all contributed positively to Fund performance. We liquidated our position in Navteq shortly after the digital mapping company received a bid from Nokia (NOK) to buy the company for approximately $8 billion in cash.
Which holdings were the greatest detractors from the Fund's performance?
For the period, the portfolio's largest detractor from Fund performance was disk drive manufacturing equipment maker Intevac (IVAC). Shares fell after one of Intevac's key customers revealed that weak demand and price declines for hard drives hurt its profit margins and earnings. These concerns weighed heavily on the industry and impacted all hard drive component suppliers, including Intevac, which provides equipment used to deposit specialized materials onto hard disks.
2007 started out on an ominous note for Verint Systems (VRNT.PK) with the NASDAQ delisting the security and analytics software company for not filing the required financial reports with the Securities and Exchange Commission for more than a year. Shares drifted down further in Q4 after the company said that the completion of an internal audit would be delayed, which has kept potential investors away from the stock.
Despite receiving a large capital infusion from Electronic Arts (ERTS) in May 2007, shares of The9 Limited (NCTY) slumped after the Chinese online gaming company reported higher operating expenses due mainly to higher sales and marketing costs that dampened its quarterly earnings results.
Fund Performance and Holdings (as of 12/31/07)
Firsthand Global Technology Fund vs. Market Indices
| | | GTFQX | | | NASDAQ | | | S&P 500 | |
| Since Inception (9/29/00) | | | -8.45 | % | | | -3.85 | % | | | 2.03 | % |
| 5 -Year | | | 16.75 | % | | | 15.46 | % | | | 12.81 | % |
| 3 -Year | | | 7.05 | % | | | 7.65 | % | | | 8.61 | % |
| 1 -Year | | | 16.93 | % | | | 10.66 | % | | | 5.49 | % |
Growth of a Hypothetical $10,000 Investment
Returns assume reinvestment of all dividends and distributions but do not reflect the impact of taxes. The performance data quoted represent past performance. Past performance cannot guarantee future results, and current performance may be lower or higher than the performance quoted. Both the return from and the principal value of an investment in the Funds will fluctuate so that an investor’s shares, when redeemed, may be worrth more or less than their original cost. To obtain performance as of the most recent month-end, please contact Firsthand Funds by calling 1.888.884.2675 or go to www.firsthandfunds.com.
| Holdings by Industry* | % Net Assets |
| Other Electronics | 16.6% |
| Semiconductors | 14.3% |
| Alternative Energy | 10.9% |
| Software | 8.5% |
| Communications | 7.5% |
| Services | 6.9% |
| Semiconductor Equipment | 6.4% |
| Internet | 6.0% |
| Communications Equipment | 5.9% |
| Computer | 4.6% |
| Electronics Manufacturing Services | 4.4% |
| Electronic Entertainment | 4.0% |
| Net Cash | 4.0% |
| * | Based on percentage of net assets as of 12/31/07. |
| Top 10 Holdings** | % Net Assets |
| Suntech Power Holdings Co., Ltd - ADR | 7.0% |
| Tele Atlas NV | 5.6% |
| Sharp Corp. | 4.7% |
| Lenovo Group Ltd ADR | 4.6% |
| Applied Materials, Inc. | 4.4% |
| Samsung Electronics Co., Ltd. - GDR | 4.3% |
| Nintendo Co Ltd. ADR | 4.0% |
| Koninklijke (Royal) Philips Electronics N.V. | 4.0% |
| Alvarion Ltd. | 3.4% |
| Singapore Telecom - ADR | 3.4% |
| | |
| ** | Top 10 stock holdings total 45.4% of net assets. These holdings are current as of 12/31/07, and may not be representative of current or future investments. Firsthand includes only public companies in top 10 holdings. |
FIRSTHAND ALTERNATIVE ENERGY FUND
Performance and Portfolio Discussion
How did the Fund perform in 2007?
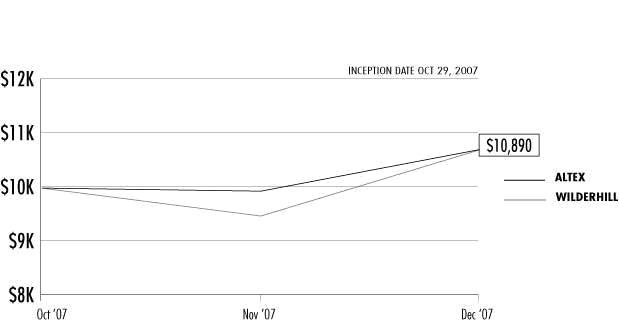
Firsthand Alternative Energy Fund (ALTEX) began operations on October 29, 2007. Since inception of the Fund, Firsthand Alternative Energy Fund posted a 8.90% gain, versus a 4.32% decrease for the S&P 500 Index and an 8.84% gain for the WilderHill Clean Energy Index.
Which industries had the greatest impact on the Fund's performance?
For the period ending December 31, 2007, solar and energy efficiency stocks represented the portfolio's largest weightings. The portfolio's exposure to solar and energy efficiency technologies contributed most to the Fund's outperformance versus its benchmarks in 2007. Solar was a particularly profitable area to have exposure to with many stocks ending the year with significant gains.
Which individual holdings were the largest contributors to the Fund's performance?
Akeena Solar (AKNS) was the Fund's top contributor during the period. The Fund’s position in this solar system manufacturer resulted in significant gains after the company received a vote of confidence from a lender by increasing its existing credit line to $25 million from $7.5 million. Akeena plans to use the additional borrowing capacity to further expand upon its growth opportunities in the solar market.
Shares of EMCORE (EMKR) rose more than 40% during the period after an agreement was made to supply solar power systems to Canada over the next three years. EMCORE is a manufacturer that uses compound semiconductor materials, such as gallium arsenide, to develop highly efficient solar cells. This reduces the risk of being dependent on silicon, which is a key component used in manufacturing solar cells.
The Fund also got a nice boost in performance from China-based Suntech Power Holdings (STP). Suntech manufactures photovoltaic cells and modules for use in solar panels. The company enjoyed strong demand for its products due to rising energy prices and ongoing government incentives in Europe and the United States.
Our position in Echelon (ELON) also contributed to Fund performance as higher energy costs helped boost interest in energy efficiency. Echelon provides automation technologies that help businesses reduce energy usage by more effectively controlling lighting, HVACs, and other energy-intensive appliances.
Which holdings were the greatest detractors from the Fund's performance?
Due to the recent launch of the Fund (October 29, 2007), and the strong relative returns in the alternative energy sector, there were only a few stocks that hurt Fund performance during the period. Included among the detractors were German solar panel manufacturer Conergy (no U.S. symbol), lithium-ion rechargeable battery maker Valence Technology (VLNC), Spanish wind turbine supplier Gamesa (no U.S. symbol), and manufacturing equipment maker Applied Materials (AMAT).
Fund Performance and Holdings (as of 12/31/07)
Firsthand Alternative Energy Fund vs. Market Indices
| | | ALTEX | | | WilderHill Clean Energy | | | S&P 500 | |
| Since Inception (10/29/07) | | | 8.90 | % | | | 8.84 | % | | | -4.32 | % |
Growth of a Hypothetical $10,000 Investment
Returns assume reinvestment of all dividends and distributions but do not reflect the impact of taxes. The performance data quoted represent past performance. Past performance cannot guarantee future results, and current performance may be lower or higher than the performance quoted. Both the return from and the principal value of an investment in the Funds will fluctuate so that an investor’s shares, when redeemed, may be worrth more or less than their original cost. To obtain performance as of the most recent month-end, please contact Firsthand Funds by calling 1.888.884.2675 or go to www.firsthandfunds.com.
| Holdings by Industry* | % Net Assets |
| Alternative Energy | 37.3% |
| Other Electronics | 14.1% |
| Semiconductors | 11.5% |
| Networking | 4.0% |
| Semiconductor Equipment | 3.5% |
| Photonics | 3.3% |
| Net Cash | 26.3% |
| * | Based on percentage of net assets as of 12/31/07. |
| Top 10 Holdings** | % Net Assets |
| Suntech Power Holdings Co., Ltd - ADR | 4.9% |
| Koninklijke (Royal) Philips Electronics N.V. | 4.0% |
| Echelon Corp. | 4.0% |
| Honeywell International, Inc. | 3.9% |
| Akeena Solar, Inc. | 3.8% |
| Itron, Inc. | 3.7% |
| Aixtron AG - ADR | 3.7% |
| Applied Materials, Inc. | 3.5% |
| Valence Technology, Inc. | 3.4% |
| Power Integrations, Inc. | 3.4% |
| ** | Top 10 stock holdings total 38.3% of net assets. These holdings are current as of 12/31/07, and may not be representative of current or future investments. Firsthand includes only public companies in top 10 holdings. |
REPORT OF INDEPENDENT REGISTERED PUBLIC ACCOUNTING FIRM
To the Shareholders and Board of Trustees
Firsthand Funds
San Jose, California
We have audited the accompanying statements of assets and liabilities of Firsthand Funds (the “Funds”) comprising, respectively, Firsthand Technology Value Fund, Firsthand Technology Leaders Fund, Firsthand Technology Innovators Fund, Firsthand e-Commerce Fund, Firsthand Global Technology Fund, and Firsthand Alternative Energy Fund, including the portfolios of investments as of December 31, 2007, and the related statements of operations for the year then ended and for the period then ended for Firsthand Alternative Energy Fund, statements of changes in net assets and the financial highlights for the periods indicated thereon. These financial statements and financial highlights are the responsibility of the Funds’ management. Our responsibility is to express an opinion on these financial statements and financial highlights based on our audits.
We conducted our audits in accordance with standards of the Public Company Accounting Oversight Board (United States). Those standards require that we plan and perform the audits to obtain reasonable assurance about whether the financial statements and financial highlights are free of material misstatement. The Funds are not required to have, nor were we engaged to perform, an audit of the Funds’ internal control over financial reporting. Our audits included consideration of internal control over financial reporting as a basis for designing audit procedures that are appropriate in the circumstances, but not for the purpose of expressing an opinion on the effectiveness of the Funds’ internal control over financial reporting. Accordingly, we express no such opinion. An audit also includes examining, on a test basis, evidence supporting the amounts and disclosures in the financial statements. Our procedures included confirmation of securities owned as of December 31, 2007, by correspondence with the custodian, brokers, and by other auditing procedures as deemed necessary. An audit also includes assessing the accounting principles used and significant estimates made by management, as well as evaluating the overall financial statement presentation. We believe that our audits provide a reasonable basis for our opinion.
In our opinion, the financial statements and financial highlights referred to above present fairly, in all material respects, the financial position of Firsthand Funds as of December 31, 2007, the results of their operations, the changes in their net assets, and the financial highlights for the periods referred to above, in conformity with accounting principles generally accepted in the United States of America.
TAIT, WELLER & BAKER, LLP
Philadelphia, Pennsylvania
February 22, 2008
PORTFOLIO OF INVESTMENTS, December 31, 2007
Firsthand Technology Value Fund
| | | SHARES | | | MARKET VALUE | |
COMMON STOCKS- 96.7% ($370,279,826) | | | | | | |
Advanced Materials- 2.9% ($11,250,000) | | | | | | |
| UCT Coatings, Inc., Series B* (1) | | | 500,000 | | | $ | 11,250,000 | |
Alternative Energy- 10.3% ($39,301,065) | | | | | | | | |
| Honeywell International, Inc. | | | 71,300 | | | | 4,389,942 | |
| Itron, Inc.* | | | 80,000 | | | | 7,677,600 | |
| Solaicx, Series B* (1)(2) | | | 7,396,238 | | | | 4,137,752 | |
| Solaicx, Series C* (1)(2) | | | 2,916,581 | | | | 2,915,210 | |
| SoloPower, Series A* (1)(2) | | | 2,721,088 | | | | 10,726,529 | |
| SoloPower, Series B* (1)(2) | | | 228,779 | | | | 1,002,052 | |
| Trina Solar Ltd. - ADR* | | | 157,100 | | | | 8,451,980 | |
Communications- 2.6% ($10,117,249) | | | | | | | | |
| Clearwire Corp.* | | | 250,000 | | | | 3,427,500 | |
| ViaSat, Inc.* | | | 194,300 | | | | 6,689,749 | |
Communications Equipment- 1.1% ($4,324,400) | | | | | | | | |
| Alvarion Ltd.* | | | 455,200 | | | | 4,324,400 | |
| Computer- 1.2% ($4,532,500) | | | | | | | | |
| Sun Microsystems, Inc.* | | | 250,000 | | | | 4,532,500 | |
Electronic Entertainment- 7.2% ($27,650,788) | | | | | | | | |
| Nintendo Co. Ltd. - ADR | | | 373,407 | | | | 27,650,788 | |
Intellectual Property- 5.2% ($19,720,379) | | | | | | | | |
Silicon Genesis Corp., Common* (1)(2) | | | 743,077 | | | | 1,505,036 | |
Silicon Genesis Corp., Series 1-D* (1)(2) | | | 850,830 | | | | 3,881,027 | |
Silicon Genesis Corp., Series 1-E* (1)(2) | | | 4,071,226 | | | | 11,482,526 | |
Silicon Genesis Corp., Series 1-F* (1)(2) | | | 912,453 | | | | 2,851,790 | |
| Internet- 6.3% ($24,182,956) | | | | | | | | |
| Akamai Technologies, Inc.* | | | 145,800 | | | | 5,044,680 | |
| Napster, Inc.* (3) | | | 600,000 | | | | 1,182,000 | |
| Netflix, Inc.* | | | 350,000 | | | | 9,317,000 | |
| Yahoo! Inc.* | | | 371,422 | | | | 8,639,276 | |
| Networking- 8.0% ($30,612,162) | | | | | | | | |
| Cisco Systems, Inc.* | | | 882,900 | | | | 23,900,103 | |
| Echelon Corp.* | | | 311,000 | | | | 6,419,040 | |
| IP Unity, Inc., Series C* (1) | | | 1,104,265 | | | | 11,043 | |
| IP Unity, Inc., Series E* (1) | | | 193,042 | | | | 281,976 | |
| Polaris Networks, Inc., Series A* (1) | | | 297,848 | | | | 0 | |
Other Electronics- 3.8% ($14,358,741) | | | | | | | | |
| Intevac, Inc.* | | | 626,400 | | | | 9,107,856 | |
| Microvision, Inc.* | | | 50,000 | | | | 195,000 | |
| NCR Corp.* | | | 117,600 | | | | 2,951,760 | |
| VeriFone Holdings, Inc.* | | | 90,500 | | | | 2,104,125 | |
| Peripherals- 4.9% ($18,922,700) | | | | | | | | |
| EMC Corp.* | | | 490,000 | | | | 9,079,700 | |
PORTFOLIO OF INVESTMENTS, December 31, 2007
Firsthand Technology Value Fund (continued)
| | | SHARES/
PRINCIPAL | | | MARKET VALUE | |
| Seagate Technology, Inc. | | | 386,000 | | | $ | 9,843,000 | |
| Photonics- 6.2% ($23,678,130) | | | | | | | | |
| Celox Networks, Inc., Common* (1) | | | 138,121 | | | | 0 | |
| Celox Networks, Inc., Series A-1* (1) | | | 1,000,000 | | | | 0 | |
| Corning, Inc. | | | 987,000 | | | | 23,678,130 | |
Luminous Networks, Inc., Common* (1) | | | 28,513 | | | | 0 | |
Luminous Networks, Inc., Series A1* (1) | | | 129,664 | | | | 0 | |
Luminous Networks, Inc., Series B1* (1) | | | 259,236 | | | | 0 | |
Semiconductor Equipment- 3.5% ($13,545,061) | | | | | | | | |
| Applied Materials, Inc. | | | 400,000 | | | | 7,104,000 | |
| FormFactor, Inc.* | | | 194,594 | | | | 6,441,061 | |
Semiconductors- 32.2% ($123,256,425) | | | | | | | | |
| AuthenTec, Inc.* (4) | | | 743,930 | | | | 10,666,660 | |
Chartered Semiconductor Manufacturing Ltd. - ADR* | | | 1,126,100 | | | | 7,556,131 | |
| Clarisay, Inc., Series B* (1)(2) | | | 2,605,306 | | | | 0 | |
| Clarisay, Inc., Series C* (1)(2) | | | 7,194,244 | | | | 0 | |
| Cypress Semiconductor Corp.* | | | 923,000 | | | | 33,255,690 | |
| Intel Corp. | | | 296,500 | | | | 7,904,690 | |
| Qimonda AG - ADR* | | | 312,600 | | | | 2,235,090 | |
| Rambus, Inc.* | | | 991,500 | | | | 20,762,010 | |
| SanDisk Corp.* | | | 250,000 | | | | 8,292,500 | |
Semiconductor Manufacturing International Corp.* | | | 700,000 | | | | 3,633,000 | |
| SiRF Technology Holdings, Inc.* | | | 749,000 | | | | 18,822,370 | |
| Soitec S.A.* | | | 72,740 | | | | 887,929 | |
| Zoran Corp.* | | | 410,500 | | | | 9,240,355 | |
| Software- 1.3% ($4,827,270) | | | | | | | | |
| Citrix Systems, Inc.* | | | 127,000 | | | | 4,827,270 | |
| WARRANTS- 1.1% ($4,269,100) | | | | | | | | |
Advanced Materials- 0.2% ($1,000,002) | | | | | | | | |
| UCT Coatings, Inc., B Warrant* (1) | | | 600,000 | | | | 1,000,002 | |
Alternative Energy- 0.2% ($663,791) | | | | | | | | |
| Solaicx, Series C Warrant* (1)(2) | | | 670,814 | | | | 663,791 | |
Intellectual Property- 0.7% ($2,605,238) | | | | | | | | |
Silicon Genesis Corp., 1-E Warrant* (1)(2) | | | 1,257,859 | | | | 2,547,680 | |
Silicon Genesis Corp., Common Warrant* (1)(2) | | | 37,982 | | | | 57,558 | |
| Networking- 0.0% ($69) | | | | | | | | |
| IP Unity, Inc., E Warrant* (1) | | | 69,496 | | | | 69 | |
Polaris Networks, Inc., Convertible Warrant* (1) | | | 75,712 | | | | 0 | |
| Photonics- 0.0% ($0) | | | | | | | | |
Celox Networks, Inc., A-1 Warrant* (1) | | | 500,000 | | | | 0 | |
Luminous Networks, Inc., Common Warrant* (1) | | | 3,822 | | | | 0 | |
| Semiconductors- 0.0% ($0) | | | | | | | | |
| Clarisay, Inc., D Warrant* (1)(2) | | | 2,350,000 | | | | 0 | |
CONVERTIBLE BONDS- 0.0% ($0) | | | | | | | | |
PORTFOLIO OF INVESTMENTS, December 31, 2007
Firsthand Technology Value Fund (continued)
| | | SHARES/
PRINCIPAL | | | MARKET VALUE | |
| Networking- 0.0% ($0) | | | | | | |
| Polaris Networks, Inc., 10.00%* (1) | | | 100,949 | | | $ | 0 | |
| Semiconductors- 0.0% ($0) | | | | | | | | |
| Clarisay, Inc., 8.00%* (1)(2) | | | 2,350,000 | | | | 0 | |
PARTICIPATION NOTE- 0.6% ($2,250,612) | | | | | | | | |
Alternative Energy- 0.6% ($2,250,612) | | | | | | | | |
Suzlon Energy Ltd., 0.00%, 09/16/10* | | | 45,800 | | | | 2,250,612 | |
CASH EQUIVALENTS- 1.6% ($5,894,880) | | | | | | | | |
| PNC Bank Money Market Portfolio | | | 5,894,880 | | | | 5,894,880 | |
Total Investments (Cost $363,052,423) - 100.0% | | | | | | | 382,694,418 | |
Other assets in excess of liabilities - 0.0% | | | | | | | 84,013 | |
| | | | | | | | | |
| NET ASSETS - 100.0% | | | | | | $ | 382,778,431 | |
| (3) | Napster, Inc. has the right to put a restriction of public sale on 600,000 shares of the Fund's Napster, Inc. holding. As of December 31, 2007 there are no restrictions on the Fund's shares of Napster, Inc. |
| (4) | AuthenTec, Inc. issued an initial public offering on June 27, 2007, as a result 98,166 of the fund's shares may be restricted from resale for an agreed upon period of time. |
| * | Non-income producing security. |
| ADR | American Depositary Receipt |
see accompanying notes to financial statements
PORTFOLIO OF INVESTMENTS, December 31, 2007
Firsthand Technology Leaders Fund
| | | SHARES | | | MARKET VALUE | |
COMMON STOCKS- 99.1% ($62,960,952) | | | | | | |
Communications- 5.3% ($3,360,392) | | | | | | |
| China Mobile Hong Kong Ltd. - ADR | | | 38,683 | | | $ | 3,360,392 | |
Communications Equipment- 6.1% ($3,894,227) | | | | | | | | |
| Nokia Corp. - ADR | | | 68,090 | | | | 2,613,975 | |
| QUALCOMM, Inc. | | | 32,535 | | | | 1,280,252 | |
| Computer- 7.2% ($4,585,680) | | | | | | | | |
| Apple Computer, Inc.* | | | 12,600 | | | | 2,495,808 | |
| Hewlett-Packard Co. | | | 41,400 | | | | 2,089,872 | |
| Internet- 10.5% ($6,660,477) | | | | | | | | |
| eBay, Inc.* | | | 103,695 | | | | 3,441,637 | |
| Google, Inc., Class A* | | | 4,655 | | | | 3,218,840 | |
| Networking- 5.6% ($3,583,256) | | | | | | | | |
| Cisco Systems, Inc.* | | | 132,370 | | | | 3,583,256 | |
Other Electronics- 9.8% ($6,194,007) | | | | | | | | |
Koninklijke (Royal) Philips Electronics N.V. | | | 31,700 | | | | 1,355,175 | |
| L-1 Identity Solutions, Inc.* | | | 184,100 | | | | 3,304,595 | |
| Sharp Corp. | | | 35,000 | | | | 629,812 | |
| VeriFone Holdings, Inc.* | | | 38,900 | | | | 904,425 | |
| Peripherals- 9.6% ($6,098,266) | | | | | | | | |
| EMC Corp.* | | | 165,400 | | | | 3,064,862 | |
| Seagate Technology, Inc. | | | 118,957 | | | | 3,033,404 | |
| Photonics- 5.8% ($3,687,911) | | | | | | | | |
| Corning, Inc. | | | 153,727 | | | | 3,687,911 | |
Semiconductor Equipment- 4.8% ($3,055,901) | | | | | | | | |
| Applied Materials, Inc. | | | 99,800 | | | | 1,772,448 | |
| ASML Holding N.V., NY Shares | | | 41,018 | | | | 1,283,453 | |
Semiconductors- 20.6% ($13,083,340) | | | | | | | | |
| Broadcom Corp., Class A* | | | 98,025 | | | | 2,562,373 | |
| Intel Corp. | | | 114,000 | | | | 3,039,240 | |
Samsung Electronics Co. Ltd. - GDR (1) | | | 6,900 | | | | 2,049,250 | |
| SanDisk Corp.* | | | 47,300 | | | | 1,568,941 | |
Taiwan Semiconductor Manufacturing Co. - ADR | | | 193,035 | | | | 1,922,629 | |
| Texas Instruments, Inc. | | | 58,111 | | | | 1,940,907 | |
Software- 13.8% ($8,757,495) | | | | | | | | |
| Adobe Systems, Inc.* | | | 33,130 | | | | 1,415,645 | |
| Amdocs Ltd.* | | | 76,809 | | | | 2,647,606 | |
| Microsoft Corp. | | | 89,250 | | | | 3,177,300 | |
| NICE-Systems Ltd. - ADR* | | | 44,200 | | | | 1,516,944 | |
PORTFOLIO OF INVESTMENTS, December 31, 2007
Firsthand Technology Leaders Fund (continued)
| | | SHARES/ PRINCIPAL | | | MARKET VALUE | |
CASH EQUIVALENTS- 0.4% ($278,370) | | | | | | |
| PNC Bank Money Market Portfolio | | | 278,370 | | | $ | 278,370 | |
| | | | | | | | | |
Total Investments (Cost $50,387,978) - 99.5% | | | | | | | 63,239,322 | |
| | | | | | | | | |
Other assets in excess of liabilities - 0.5% | | | | | | | 302,189 | |
| | | | | | | | | |
| NET ASSETS - 100.0% | | | | | | $ | 63,541,511 | |
| (1) | Rule 144A, Section 4(2), or other security that is restricted as to resale to institutional investors. The Investment Advisor, using Board-approved procedures has deemed these securities to be liquid. |
| * | Non-income producing security. |
| ADR | American Depositary Receipt |
| GDR | Global Depositary Receipt |
see accompanying notes to financial statements
PORTFOLIO OF INVESTMENTS, December 31, 2007
Firsthand Technology Innovators Fund
| | | SHARES | | MARKET VALUE | |
COMMON STOCKS- 97.0% ($18,905,020) | | | | | | |
Alternative Energy- 2.4% ($477,600) | | | | | | |
| Akeena Solar, Inc* | | | 60,000 | | | $ | 477,600 | |
Communications- 1.9% ($362,884) | | | | | | | | |
| Acme Packet, Inc.* | | | 17,600 | | | | 221,584 | |
| Symmetricom, Inc.* | | | 30,000 | | | | 141,300 | |
Communications Equipment- 2.3% ($444,690) | | | | | | | | |
| Finisar Corp.* | | | 101,855 | | | | 147,690 | |
| Sierra Wireless, Inc.* | | | 20,000 | | | | 297,000 | |
Intellectual Property- 31.6% ($6,152,545) | | | | | | | | |
| MIPS Technologies, Inc.* | | | 70,000 | | | | 347,200 | |
Silicon Genesis Corp., Common* (1)(2) | | | 108,815 | | | | 220,395 | |
Silicon Genesis Corp., Series 1-C* (1)(2) | | | 82,914 | | | | 978,504 | |
Silicon Genesis Corp., Series 1-E* (1)(2) | | | 1,633,254 | | | | 4,606,446 | |
| Internet- 1.4% ($279,816) | | | | | | | | |
| LivePerson, Inc.* | | | 52,400 | | | | 279,816 | |
| Networking- 5.6% ($1,093,944) | | | | | | | | |
| Echelon Corp.* | | | 52,600 | | | | 1,085,664 | |
| IP Unity, Inc., Series C* (1) | | | 827,957 | | | | 8,280 | |
Other Electronics- 7.5% ($1,455,696) | | | | | | | | |
| Intevac, Inc.* | | | 65,300 | | | | 949,462 | |
| iRobot Corp.* | | | 11,800 | | | | 213,344 | |
| Microvision, Inc.* | | | 75,100 | | | | 292,890 | |
| Photonics- 0.0% ($0) | | | | | | | | |
Luminous Networks, Inc., Common* (1) | | | 49,979 | | | | 0 | |
Luminous Networks, Inc., Series A1* (1) | | | 227,282 | | | | 0 | |
Semiconductors- 31.4% ($6,124,089) | | | | | | | | |
| AuthenTec, Inc.* (3) | | | 225,945 | | | | 3,211,666 | |
| EMCORE Corp.* | | | 24,100 | | | | 368,730 | |
| Netlogic Microsystems, Inc.* | | | 8,000 | | | | 257,600 | |
| Nextest Systems Corp.* | | | 10,200 | | | | 202,878 | |
| PLX Technology, Inc.* | | | 10,000 | | | | 93,000 | |
| Power Integrations, Inc.* | | | 9,000 | | | | 309,870 | |
| Ramtron International Corp.* | | | 60,000 | | | | 258,000 | |
| SigmaTel, Inc.* | | | 122,500 | | | | 258,475 | |
| Silicon Optix, Inc., Series B* (1) | | | 1,111,111 | | | | 350,000 | |
| Synaptics, Inc.* | | | 13,300 | | | | 547,428 | |
| Techwell, Inc* | | | 24,200 | | | | 266,442 | |
| Services- 2.8% ($554,737) | | | | | | | | |
| iGATE Corp.* | | | 12,000 | | | | 101,640 | |
| Innovion Corp., Series C* (1)(2) | | | 1,575,322 | | | | 147,753 | |
| Net 1 UEPS Technologies, Inc.* | | | 10,400 | | | | 305,344 | |
| Software- 10.1% ($1,959,019) | | | | | | | | |
PORTFOLIO OF INVESTMENTS, December 31, 2007
Firsthand Technology Innovators Fund (continued)
| | | SHARES/ PRINCIPAL | | | MARKET VALUE | |
| Concur Technologies, Inc* | | | 12,300 | | | $ | 445,383 | |
| Saba Software, Inc* | | | 30,300 | | | | 155,742 | |
| Synchronoss Technologies, Inc.* | | | 6,100 | | | | 216,184 | |
| Verint Systems, Inc.* | | | 21,200 | | | | 414,460 | |
| Versant Corp.* | | | 25,000 | | | | 727,250 | |
| WARRANTS- 0.9% ($166,708) | | | | | | | | |
Intellectual Property- 0.9% ($166,075) | | | | | | | | |
Silicon Genesis Corp., 1-E Warrant* (1)(2) | | | 94,339 | | | | 166,075 | |
| Photonics- 0.0% ($0) | | | | | | | | |
Luminous Networks, Inc., Common Warrant* (1) | | | 6,699 | | | | 0 | |
| Services- 0.0% ($633) | | | | | | | | |
| Innovion Corp., Warrant* (1)(2) | | | 602,577 | | | | 603 | |
| Innovion Corp., Warrant* (1)(2) | | | 30,129 | | | | 30 | |
CONVERTIBLE BOND- 1.4% ($271,751) | | | | | | | | |
| Services- 1.4% ($271,751) | | | | | | | | |
| Innovion Corp., 9.50%* (1)(2) | | | 543,502 | | | | 271,751 | |
CASH EQUIVALENTS- 0.5% ($103,186) | | | | | | | | |
| PNC Bank Money Market Portfolio | | | 103,186 | | | | 103,186 | |
Total Investments (Cost $23,780,863) - 99.8% | | | | | | | 19,446,665 | |
Other assets in excess of liabilities - 0.2% | | | | | | | 43,756 | |
| | | | | | | | | |
| NET ASSETS - 100.0% | | | | | | $ | 19,490,421 | |
| (3) | AuthenTec, Inc. issued an initial public offering on June 27, 2007, as a result a portion or all of the fund's shares may be restricted from resale for an agreed upon period of time. |
| * | Non-income producing security. |
see accompanying notes to financial statements
PORTFOLIO OF INVESTMENTS, December 31, 2007
Firsthand e-Commerce Fund
| | | SHARES | | | MARKET VALUE | |
COMMON STOCKS- 92.7% ($37,705,401) | | | | | | |
Communications- 7.9% ($3,222,608) | | | | | | |
| Comcast Corp., Special Class A* | | | 22,500 | | | $ | 407,700 | |
| Equinix, Inc.* | | | 15,000 | | | | 1,516,050 | |
| Internap Network Services Corp.* | | | 23,715 | | | | 197,546 | |
| NeuStar, Inc.* | | | 38,400 | | | | 1,101,312 | |
| Computer- 4.5% ($1,831,697) | | | | | | | | |
| Apple Computer, Inc.* | | | 3,400 | | | | 673,472 | |
| Dell, Inc.* | | | 15,500 | | | | 379,905 | |
| International Business Machines Corp. | | | 7,200 | | | | 778,320 | |
| Internet- 39.5% ($16,053,912) | | | | | | | | |
| 51job, Inc. - ADR* | | | 17,368 | | | | 312,971 | |
| Akamai Technologies, Inc.* | | | 50,800 | | | | 1,757,680 | |
| Baidu.com, Inc. - ADR* | | | 4,100 | | | | 1,600,599 | |
| Ctrip.com International Ltd. - ADR | | | 23,000 | | | | 1,321,810 | |
| CyberSource Corp.* | | | 41,814 | | | | 743,035 | |
| eBay, Inc.* | | | 60,000 | | | | 1,991,400 | |
| Gmarket, Inc. - ADR* | | | 22,100 | | | | 550,290 | |
| Google, Inc., Class A* | | | 2,700 | | | | 1,866,996 | |
| LivePerson, Inc.* | | | 140,000 | | | | 747,600 | |
| Monster Worldwide, Inc.* | | | 34,900 | | | | 1,130,760 | |
| Napster, Inc.* | | | 64,400 | | | | 126,868 | |
| ValueClick, Inc.* | | | 46,300 | | | | 1,013,970 | |
| Visual Sciences, Inc.* | | | 58,667 | | | | 1,084,166 | |
| Yahoo! Inc.* | | | 77,634 | | | | 1,805,767 | |
| Media- 2.9% ($1,178,525) | | | | | | | | |
| News Corp., Class B | | | 55,460 | | | | 1,178,525 | |
Networking- 3.5% ($1,426,589) | | | | | | | | |
| Cisco Systems, Inc.* | | | 52,700 | | | $ | 1,426,589 | |
Other Electronics- 6.5% ($2,623,126) | | | | | | | | |
| L-1 Identity Solutions, Inc.* | | | 84,500 | | | | 1,516,775 | |
| VeriFone Holdings, Inc.* | | | 47,585 | | | | 1,106,351 | |
Semiconductors- 4.2% ($1,727,992) | | | | | | | | |
| AuthenTec, Inc.* | | | 82,400 | | | | 1,197,272 | |
| SanDisk Corp.* | | | 16,000 | | | | 530,720 | |
Software- 23.7% ($9,640,952) | | | | | | | | |
| Adobe Systems, Inc.* | | | 48,069 | | | | 2,053,989 | |
| Amdocs Ltd.* | | | 16,000 | | | | 551,520 | |
| Microsoft Corp. | | | 70,000 | | | | 2,492,000 | |
| Omniture, Inc.* | | | 41,700 | | | | 1,388,193 | |
PORTFOLIO OF INVESTMENTS, December 31, 2007
Firsthand e-Commerce Fund (continued)
| | | SHARES/ PRINCIPAL | | | MARKET VALUE | |
| Oracle Corp.* | | | 91,100 | | | $ | 2,057,038 | |
| VeriSign, Inc.* | | | 29,200 | | | | 1,098,212 | |
CASH EQUIVALENTS- 7.8% ($3,161,900) | | | | | | | | |
| PNC Bank Money Market Portfolio | | | 3,161,900 | | | | 3,161,900 | |
Total Investments (Cost $32,668,160) – 100.5% | | | | | | | 40,867,301 | |
Liabilities in excess of other assets - (0.5)% | | | | | | | (199,372 | ) |
| NET ASSETS - 100.0% | | | | | | $ | 40,667,929 | |
| * | Non-income producing security. |
| ADR | American Depositary Receipt |
see accompanying notes to financial statements
PORTFOLIO OF INVESTMENTS, December 31, 2007
Firsthand Global Technology Fund
| | | SHARES | | | MARKET VALUE | |
COMMON STOCKS- 93.6% ($10,865,978) | | | | | | |
Alternative Energy- 8.5% ($984,705) | | | | | | |
| Renewable Energy Corp. A.S.* | | | 3,500 | | | $ | 177,969 | |
Suntech Power Holdings Co., Ltd. - ADR* | | | 9,800 | | | | 806,736 | |
Communications- 7.5% ($869,003) | | | | | | | | |
America Movil SAB de C.V., Series L - ADR | | | 3,700 | | | | 227,143 | |
Singapore Telecommunications Ltd. - ADR | | | 14,100 | | | | 391,816 | |
| Vodafone Group PLC - ADR | | | 6,700 | | | | 250,044 | |
Communications Equipment-5.9% ($684,369) | | | | | | | | |
| Alvarion Ltd.* | | | 42,135 | | | | 400,283 | |
| Nokia Corp. - ADR | | | 7,400 | | | | 284,086 | |
| Computer- 4.6% ($539,412) | | | | | | | | |
| Lenovo Group Ltd. - ADR | | | 30,000 | | | | 539,412 | |
Electronic Entertainment- 4.0% ($466,515) | | | | | | | | |
| Nintendo Co. Ltd. - ADR | | | 6,300 | | | | 466,515 | |
Electronics Manufacturing Services - 4.4% ($508,125) | | | | | | | | |
| Hon Hai Precision - GDR | | | 23,364 | | | | 291,019 | |
| Quanta Computer, Inc. - GDR | | | 30,583 | | | | 217,106 | |
| Internet- 6.0% ($697,304) | | | | | | | | |
| 51job, Inc. - ADR* | | | 8,880 | | | | 160,018 | |
| The9 Ltd. - ADR* | | | 12,000 | | | | 255,840 | |
| Yahoo! Inc.* | | | 12,100 | | | | 281,446 | |
Other Electronics - 16.6% ($1,923,377) | | | | | | | | |
| Aixtron AG - ADR* | | | 19,600 | | | | 274,400 | |
| Intevac, Inc.* | | | 20,400 | | | | 296,616 | |
Koninklijke (Royal) Philips Electronics N.V. | | | 10,800 | | | | 461,700 | |
| Sharp Corp. | | | 30,288 | | | | 545,021 | |
| ULVAC, Inc. | | | 7,600 | | | | 345,640 | |
Semiconductor Equipment- 6.4% ($745,611) | | | | | | | | |
| Applied Materials, Inc. | | | 28,672 | | | | 509,215 | |
| ASML Holding N.V., NY Shares | | | 7,555 | | | | 236,396 | |
Semiconductors- 14.3% ($1,661,064) | | | | | | | | |
Chartered Semiconductor Manufacturing Ltd. - ADR* | | | 55,942 | | | | 375,371 | |
| Hynix Semiconductor, Inc.* | | | 5,500 | | | | 152,533 | |
| Samsung Electronics Co. Ltd. - GDR (1) | | | 1,699 | | | | 504,590 | |
Spreadtrum Communications, Inc. - ADR* | | | 16,500 | | | | 202,290 | |
Taiwan Semiconductor Manufacturing Co. - ADR | | | 21,002 | | | | 209,180 | |
| Texas Instruments, Inc. | | | 6,500 | | | | 217,100 | |
PORTFOLIO OF INVESTMENTS, December 31, 2007
Firsthand Global Technology Fund (continued)
| | | SHARES/ PRINCIPAL | | | MARKET VALUE | |
| Services- 6.9% ($798,003) | | | | | | |
| iGATE Corp.* | | | 17,989 | | | $ | 152,367 | |
| Tele Atlas N.V.* | | | 15,700 | | | | 645,636 | |
| Software- 8.5% ($988,490) | | | | | | | | |
| Amdocs Ltd.* | | | 9,500 | | | | 327,465 | |
Cognizant Technology Solutions Corp., Class A* | | | 3,526 | | | | 119,673 | |
| Dassault Systemes S.A. - ADR | | | 3,900 | | | | 229,164 | |
| NICE-Systems Ltd. - ADR* | | | 3,400 | | | | 116,688 | |
| Verint Systems, Inc.* | | | 10,000 | | | | 195,500 | |
PARTICIPATION NOTE- 2.4% ($275,184) | | | | | | | | |
Alternative Energy- 2.4% ($275,184) | | | | | | | | |
Suzlon Energy Ltd., 0.00%, 09/16/10* | | | 5,600 | | | | 275,184 | |
CASH EQUIVALENTS- 4.3% ($495,537) | | | | | | | | |
| PNC Bank Money Market Portfolio | | | 495,537 | | | | 495,537 | |
Total Investments (Cost $9,677,769) - 100.3% | | | | | | | 11,636,699 | |
Liabilities in excess of other - (0.3)% | | | | | | | (30,912 | ) |
| | | | | | | | | |
| NET ASSETS - 100.0% | | | | | | $ | 11,605,787 | |
| (1) | Rule 144A, Section 4(2), or other security that is restricted as to resale to institutional investors. The Investment Advisor, using Board-approved procedures has deemed these securities to be liquid. |
| * | Non-income producing security. |
| ADR | American Depositary Receipt |
| GDR | Global Depositary Receipt |
see accompanying notes to financial statements
PORTFOLIO OF INVESTMENTS, December 31, 2007
Firsthand Alternative Energy Fund
| | | SHARES | | | MARKET VALUE | |
COMMON STOCKS- 73.7% ($1,386,883) | | | | | | |
Alternative Energy- 37.3% ($702,930) | | | | | | |
| Akeena Solar, Inc.* | | | 8,995 | | | $ | 71,600 | |
| Conergy AG | | | 1,500 | | | | 53,769 | |
| Gamesa Corp. Tecnologica S.A. | | | 700 | | | | 32,726 | |
| Hoku Scientific, Inc. | | | 3,800 | | | | 43,320 | |
| Honeywell International, Inc. | | | 1,180 | | | | 72,653 | |
| Itron, Inc.* | | | 735 | | | | 70,538 | |
| LDK Solar Co. Ltd. - ADR* | | | 930 | | | | 43,719 | |
| Lime Energy Co. | | | 8,000 | | | | 10,800 | |
| Renewable Energy Corp. A.S.* | | | 210 | | | | 10,678 | |
Suntech Power Holdings Co., Ltd. - ADR* | | | 1,120 | | | | 92,198 | |
| Trina Solar Ltd. - ADR* | | | 1,100 | | | | 59,180 | |
| U.S. Geothermal, Inc. | | | 4,500 | | | | 17,775 | |
| Valence Technology, Inc. | | | 31,900 | | | | 63,481 | |
| Vestas Wind Systems A.S. | | | 310 | | | | 33,403 | |
Yingli Green Energy Holding Co. - ADR* | | | 700 | | | | 27,090 | |
| Networking- 4.0% ($74,407) | | | | | | | | |
| Echelon Corp.* | | | 3,605 | | | | 74,407 | |
Other Electronics- 14.1% ($266,208) | | | | | | | | |
| Aixtron AG - ADR* | | | 5,000 | | | | 70,000 | |
Koninklijke (Royal) Philips Electronics N.V. | | | 1,770 | | | | 75,667 | |
| KYOCERA Corp. - ADR | | | 550 | | | | 47,971 | |
| Sharp Corp. | | | 1,000 | | | | 17,995 | |
| ULVAC, Inc. | | | 1,200 | | | | 54,575 | |
| Photonics- 3.3% ($61,414) | | | | | | | | |
| Corning, Inc. | | | 2,560 | | | | 61,414 | |
Semiconductor Equipment- 3.5% ($66,334) | | | | | | | | |
| Applied Materials, Inc. | | | 3,735 | | | | 66,334 | |
Semiconductors- 11.5% ($215,590) | | | | | | | | |
| Cypress Semiconductor Corp.* | | | 1,310 | | | | 47,199 | |
| EMCORE Corp.* | | | 3,800 | | | | 58,140 | |
| MEMC Electronic Materials, Inc.* | | | 530 | | | | 46,900 | |
| Power Integrations, Inc.* | | | 1,840 | | | | 63,351 | |
CASH EQUIVALENTS- 33.3% ($626,921) | | | | | | | | |
| PNC Bank Money Market Portfolio | | | 626,921 | | | | 626,921 | |
Total Investments (Cost $1,898,319) - 107.0% | | | | | | | 2,013,804 | |
| Liabilities in excess of other assets - (7.0)% | | | | | | | (131,720 | |
| | | | | | | | | |
| NET ASSETS - 100.0% | | | | | | $ | 1,882,084 | |
| * | Non-income producing security. |
| ADR | American Depositary Receipt |
see accompanying notes to financial statements
STATEMENTS OF ASSETS AND LIABILITIES
December 31, 2007
| | | Firsthand Technology Value Fund | | | Firsthand Technology Leaders Fund | | | Firsthand Technology Innovators Fund | | | e-Commerce Fund | | | Firsthand Global Technology Fund | | | Firsthand Alternative Energy Fund | |
| ASSETS | | | | | | | | | | | | | | | | | | |
| Investment securities: | | | | | | | | | | | | | | | | | | |
Unaffiliated issuers at acquisition cost | | $ | 329,018,393 | | | $ | 50,387,978 | | | $ | 15,258,014 | | | $ | 32,668,160 | | | $ | 9,677,769 | | | $ | 1,898,319 | |
Affiliated issuers at acquisition cost | | | 34,034,030 | | | | — | | | | 8,522,849 | | | | — | | | | — | | | | — | |
| Total acquisition cost | | $ | 363,052,423 | | | $ | 50,387,978 | | | $ | 23,780,863 | | | $ | 32,668,160 | | | $ | 9,677,769 | | | $ | 1,898,319 | |
Unaffiliated issuers at market value | | $ | 340,923,467 | | | $ | 63,239,322 | | | $ | 13,055,108 | | | $ | 40,867,301 | | | $ | 11,636,699 | | | $ | 2,013,804 | |
| Affiliated issuers at market value | | | 41,770,951 | | | | — | | | | 6,391,557 | | | | — | | | | — | | | | — | |
| Total market value* | | | 382,694,418 | | | | 63,239,322 | | | | 19,446,665 | | | | 40,867,301 | | | | 11,636,699 | | | | 2,013,804 | |
| Cash | | | 1 | | | | — | | | | — | | | | — | | | | — | | | | — | |
| Receivable for securities sold | | | — | | | | 503,695 | | | | 106,144 | | | | — | | | | — | | | | — | |
Receivable from dividends, interest, and reclaims | | | 13,997 | | | | 9,911 | | | | 498 | | | | 17,029 | | | | 10,459 | | | | 1,505 | |
| Receivable for capital shares sold | | | 179,618 | | | | 3,841 | | | | 9,000 | | | | 12,254 | | | | 450 | | | | 193,807 | |
| Deferred trustee compensation*** | | | 113,191 | | | | 74,424 | | | | 74,424 | | | | 74,424 | | | | 60,825 | | | | — | |
| Other Assets**** | | | 2,363,510 | | | | — | | | | — | | | | — | | | | — | | | | — | |
| TOTAL ASSETS | | | 385,364,735 | | | | 63,831,193 | | | | 19,636,731 | | | | 40,971,008 | | | | 11,708,433 | | | | 2,209,116 | |
| LIABILITIES | | | | | | | | | | | | | | | | | | | | | | | | |
| Payable for securities purchased | | | — | | | | — | | | | — | | | | — | | | | — | | | | 324,734 | |
| Payable to affiliates** | | | 634,216 | | | | 107,921 | | | | 31,586 | | | | 70,630 | | | | 19,574 | | | | 2,298 | |
Payable for capital shares redeemed | | | 1,838,897 | | | | 107,337 | | | | 40,300 | | | | 158,025 | | | | 22,247 | | | | — | |
Payable for trustee compensation*** | | | 113,191 | | | | 74,424 | | | | 74,424 | | | | 74,424 | | | | 60,825 | | | | — | |
| TOTAL LIABILITIES | | | 2,586,304 | | | | 289,682 | | | | 146,310 | | | | 303,079 | | | | 102,646 | | | | 327,032 | |
| NET ASSETS | | $ | 382,778,431 | | | $ | 63,541,511 | | | $ | 19,490,421 | | | $ | 40,667,929 | | | $ | 11,605,787 | | | $ | 1,882,084 | |
| Net Assets consist of: | | | | | | | | | | | | | | | | | | | | | | | | |
| Paid-in-capital | | $ | 3,036,271,613 | | | $ | 374,309,330 | | | $ | 396,270,509 | | | $ | 427,680,208 | | | $ | 86,856,135 | | | $ | 1,766,810 | |
Accumulated net investment loss | | | — | | | | — | | | | — | | | | — | | | | — | | | | (211 | ) |
Accumulated net realized losses from security trans- actions, foreign currency and options | | | (2,675,498,687 | ) | | | (323,619,163 | ) | | | (372,445,890 | ) | | | (395,211,420 | ) | | | (77,209,278 | ) | | | — | |
Net unrealized appreciation on other assets | | | 2,363,510 | | | | — | | | | — | | | | — | | | | — | | | | — | |
Net unrealized appreciation (depreciation) on investments, foreign currency and options | | | 19,641,995 | | | | 12,851,344 | | | | (4,334,198 | ) | | | 8,199,141 | | | | 1,958,930 | | | | 115,485 | |
| NET ASSETS | | $ | 382,778,431 | | | $ | 63,541,511 | | | $ | 19,490,421 | | | $ | 40,667,929 | | | $ | 11,605,787 | | | $ | 1,882,084 | |
Shares of beneficial interest outstanding (unlimited number of shares authorized, no par value) | | | 8,596,505 | | | | 2,755,016 | | | | 1,657,623 | | | | 8,707,759 | | | | 2,212,031 | | | | 172,760 | |
Net asset value, redemption price and offering price per share* | | $ | 44.53 | | | $ | 23.06 | | | $ | 11.76 | | | $ | 4.67 | | | $ | 5.25 | | | $ | 10.89 | |
*Note 2, ** Note 4, *** Note 5, **** Note 7.
see accompanying notes to financial statements
STATEMENTS OF OPERATIONS
For the Year ended December 31, 2007
| | | Firsthand Technology Value Fund | | | Firsthand Technology Leaders Fund | | | Firsthand Technology Innovators Fund | | | Firsthand e-Commerce Fund | | | Firsthand Global Technology Fund | | | Firsthand Alternative Energy Fund | |
| INVESTMENT INCOME | | | | | | | | | | | | | | | | | | |
| Interest | | $ | — | | | $ | — | | | $ | — | | | $ | — | | | $ | — | | | $ | — | |
| Interest from affiliated security | | | 16,191 | | | | — | | | | — | | | | — | | | | — | | | | — | |
| Dividends | | | 1,370,009 | | | | 566,663 | | | | 75,080 | | | | 288,543 | | | | 136,333 | | | | 3,626 | |
| Foreign tax withholding | | | (25,372 | ) | | | (24,733 | ) | | | — | | | | — | | | | (7,530 | ) | | | — | |
| TOTAL INVESTMENT INCOME | | | 1,360,828 | | | | 541,930 | | | | 75,080 | | | | 288,543 | | | | 128,803 | | | | 3,626 | |
| EXPENSES | | | | | | | | | | | | | | | | | | | | | | | | |
| Investment advisory fees** | | | 5,744,669 | | | | 1,027,644 | | | | 326,455 | | | | 648,498 | | | | 188,504 | | | | 2,950 | |
| Administration fees** | | | 1,631,913 | | | | 308,294 | | | | 97,936 | | | | 194,550 | | | | 56,551 | | | | 804 | |
| Trustees fees | | | 9,162 | | | | 5,915 | | | | 5,915 | | | | 5,915 | | | | 4,776 | | | | — | |
| GROSS EXPENSES | | | 7,385,744 | | | | 1,341,853 | | | | 430,306 | | | | 848,963 | | | | 249,831 | | | | 3,754 | |
| Investment advisory fees waived | | | (9,162 | ) | | | (5,915 | ) | | | (5,915 | ) | | | (5,915 | ) | | | (4,776 | ) | | | — | |
| TOTAL NET EXPENSES | | | 7,376,582 | | | | 1,335,938 | | | | 424,391 | | | | 843,048 | | | | 245,055 | | | | 3,754 | |
| NET INVESTMENT LOSS | | | (6,015,754 | ) | | | (794,008 | ) | | | (349,311 | ) | | | (554,505 | ) | | | (116,252 | ) | | | (128 | ) |
| REALIZED AND UNREALIZED | | | | | | | | | | | | | | | | | | | | | | | | |
GAINS (LOSSES) ON INVESTMENTS | | | | | | | | | | | | | | | | | | | | | | | | |
Net realized gains (losses) from security transactions | | | | | | | | | | | | | | | | | | | | | | | | |
| Non-affliliated | | | (32,532,907 | ) | | | 11,339,533 | | | | 1,894,031 | | | | 6,041,371 | | | | 1,897,125 | | | | — | |
| Affiliated | | | 942,393 | | | | — | | | | — | | | | — | | | | — | | | | — | |
Net realized gains (losses) from foreign currency | | | 66,009 | | | | 6,253 | | | | — | | | | — | | | | 3,437 | | | | (211 | ) |
Net realized gains from options transactions | | | — | | | | — | | | | — | | | | — | | | | 10,301 | | | | — | |
Net change in unrealized appreciation on other assets | | | 2,363,510 | | | | — | | | | — | | | | — | | | | — | | | | — | |
Net change in unrealized appreciation/depreciation on investments, options and foreign currency | | | 113,716,908 | | | | (1,458,660 | ) | | | 1,770,174 | | | | 159,678 | | | | 172,346 | | | | 115,485 | |
NET REALIZED AND UNREALIZED GAINS ON INVESTMENTS | | | 84,555,913 | | | | 9,887,126 | | | | 3,664,205 | | | | 6,201,049 | | | | 2,083,209 | | | | 115,274 | |
CHANGE IN NET ASSETS FROM OPERATIONS | | $ | 78,540,159 | | | $ | 9,093,118 | | | $ | 3,314,894 | | | $ | 5,646,544 | | | $ | 1,966,957 | | | $ | 115,146 | |
| * | For the period October 29, 2007 (inception) through December 31, 2007. |
see accompanying notes to financial statements
STATEMENTS OF CHANGES IN NET ASSETS
December 31, 2007
| | | Firsthand Technology
Value Fund | | | Firsthand Technology
Leaders Fund | | | Firsthand Technology
Innovators Fund | |
| | | Year Ended
12/31/07 | | | Year Ended
12/31/06 | | | Year Ended
12/31/07 | | | Year Ended
12/31/06 | | | Year Ended
12/31/07 | | | Year Ended
12/31/06 | |
| FROM OPERATIONS: | | | | | | | | | | | | | | | | | | |
| Net investment loss | | $ | (6,015,754 | ) | | $ | (7,353,818 | ) | | $ | (794,008 | ) | | $ | (1,048,215 | ) | | $ | (349,311 | ) | | $ | (659,530 | ) |
Net realized gains (losses) from security transactions and foreign currency | | | (31,524,505 | ) | | | (41,253,937 | ) | | | 11,345,786 | | | | 6,421,035 | | | | 1,894,031 | | | | (1,669,773 | ) |
Net change in unrealized appreciation (depreciation) on investments, other assets, and foreign currency | | | 116,080,418 | | | | 84,354,819 | | | | (1,458,660 | ) | | | 1,296,937 | | | | 1,770,174 | | | | 5,294,190 | |
Net increase in net assets from operations | | | 78,540,159 | | | | 35,747,064 | | | | 9,093,118 | | | | 6,669,757 | | | | 3,314,894 | | | | 2,964,887 | |
| | | | | | | | | | | | | | | | | | | | | | | | | |
FROM CAPITAL SHARE TRANSACTIONS: | | | | | | | | | | | | | | | | | | | | | | | | |
| Proceeds from shares sold | | | 94,372,812 | | | | 74,780,962 | | | | 3,632,363 | | | | 16,888,756 | | | | 2,818,337 | | | | 15,161,725 | |
| Payment for shares redeemed | | | (161,074,182 | ) | | | (186,195,469 | ) | | | (23,177,192 | ) | | | (70,574,184 | ) | | | (13,172,863 | ) | | | (21,072,083 | ) |
Net decrease in net assets from capital share transactions | | | (66,701,370 | ) | | | (111,414,507 | ) | | | (19,544,829 | ) | | | (53,685,428 | ) | | | (10,354,526 | ) | | | (5,910,358 | ) |
| TOTAL INCREASE (DECREASE) | | | | | | | | | | | | | | | | | | | | | | | | |
| IN NET ASSETS | | | 11,838,789 | | | | (75,667,443 | ) | | | (10,451,711 | ) | | | (47,015,671 | ) | | | (7,039,632 | ) | | | (2,945,471 | ) |
| | | | | | | | | | | | | | | | | | | | | | | | | |
| NET ASSETS: | | | | | | | | | | | | | | | | | | | | | | | | |
| Beginning of year | | | 370,939,642 | | | | 446,607,085 | | | | 73,993,222 | | | | 121,008,893 | | | | 26,530,053 | | | | 29,475,524 | |
| End of year | | $ | 382,778,431 | | | $ | 370,939,642 | | | $ | 63,541,511 | | | $ | 73,993,222 | | | $ | 19,490,421 | | | $ | 26,530,053 | |
Accumulated Net Investment Income (Loss) | | $ | — | | | $ | (5,859 | ) | | $ | — | | | $ | — | | | $ | — | | | $ | — | |
| | | | | | | | | | | | | | | | | | | | | | | | | |
| CAPITAL SHARE ACTIVITY: | | | | | | | | | | | | | | | | | | | | | | | | |
| Shares sold | | | 2,289,099 | | | | 2,061,368 | | | | 160,504 | | | | 831,474 | | | | 257,351 | | | | 1,418,225 | |
| Shares redeemed | | | (3,971,586 | ) | | | (5,265,528 | ) | | | (1,063,363 | ) | | | (3,558,712 | ) | | | (1,243,412 | ) | | | (2,095,438 | ) |
Net decrease in shares outstanding | | | (1,682,487 | ) | | | (3,204,160 | ) | | | (902,859 | ) | | | (2,727,238 | ) | | | (986,061 | ) | | | (677,213 | ) |
Shares outstanding, beginning of period | | | 10,278,992 | | | | 13,483,152 | | | | 3,657,875 | | | | 6,385,113 | | | | 2,643,684 | | | | 3,320,897 | |
Shares outstanding, end of period | | | 8,596,505 | | | | 10,278,992 | | | | 2,755,016 | | | | 3,657,875 | | | | 1,657,623 | | | | 2,643,684 | |
see accompanying notes to financial statements
STATEMENTS OF CHANGES IN NET ASSETS (continued)
December 31, 2007
| | | Firsthand e-Commerce Fund | | | Firsthand Global Technology Fund | | | Firsthand
Alternative
Energy Fund* | |
| | | Year Ended
12/31/07 | | | Year Ended
12/31/07 | | | Year Ended
12/31/06 | | | Year Ended
12/31/06 | | | Period Ended
12/31/07 | |
| FROM OPERATIONS: | | | | | | | | | | | | | | | |
| Net investment loss | | $ | (554,505 | ) | | $ | (602,127 | ) | | $ | (116,252 | ) | | $ | (130,899 | ) | | $ | (128 | ) |
Net realized gains (losses) from security transactions, written options, and foreign currency | | | 6,041,371 | | | | 6,071,777 | | | | 1,910,863 | | | | 939,292 | | | | (211 | ) |
Net change in unrealized appreciation (depreciation) on investments and foreign currency | | | 159,678 | | | | 1,453,550 | | | | 172,346 | | | | 1,190,808 | | | | 115,485 | |
Net increase in net assets from operations | | | 5,646,544 | | | | 6,923,200 | | | | 1,966,957 | | | | 1,999,201 | | | | 115,146 | |
| | | | | | | | | | | | | | | | | | | | | |
FROM CAPITAL SHARE TRANSACTIONS: | | | | | | | | | | | | | | | | | | | | |
| Proceeds from shares sold | | | 12,235,244 | | | | 1,874,047 | | | | 817,913 | | | | 923,944 | | | | 1,847,450 | |
| Payment for shares redeemed | | | (17,518,670 | ) | | | (11,435,881 | ) | | | (4,498,471 | ) | | | (6,032,464 | ) | | | (80,512 | ) |
Net increase (decrease) in net assets from capital share transactions | | | (5,283,426 | ) | | | (9,561,834 | ) | | | (3,680,558 | ) | | | (5,108,520 | ) | | | 1,766,938 | |
TOTAL INCREASE (DECREASE) IN NET ASSETS | | | 363,118 | | | | (2,638,634 | ) | | | (1,713,601 | ) | | | (3,109,319 | ) | | | 1,882,084 | |
| | | | | | | | | | | | | | | | | | | | | |
| NET ASSETS: | | | | | | | | | | | | | | | | | | | | |
| Beginning of period | | | 40,304,811 | | | | 42,943,445 | | | | 13,319,388 | | | | 16,428,707 | | | | — | |
| End of period | | $ | 40,667,929 | | | $ | 40,304,811 | | | $ | 11,605,787 | | | $ | 13,319,388 | | | $ | 1,882,084 | |
Accumulated Net Investment Income (Loss) | | $ | — | | | $ | — | | | $ | — | | | $ | (41 | ) | | $ | (211 | ) |
| | | | | | | | | | | | | | | | | | | | | |
| CAPITAL SHARE ACTIVITY: | | | | | | | | | | | | | | | | | | | | |
| Shares sold | | | 2,764,369 | | | | 497,725 | | | | 168,254 | | | | 221,017 | | | | 180,409 | |
| Shares redeemed | | | (4,016,588 | ) | | | (3,159,194 | ) | | | (925,211 | ) | | | (1,450,092 | ) | | | (7,649 | ) |
Net increase (decrease) in shares outstanding | | | (1,252,219 | ) | | | (2,661,469 | ) | | | (756,957 | ) | | | (1,229,075 | ) | | | 172,760 | |
| Shares outstanding, beginning of period | | | 9,959,978 | | | | 12,621,447 | | | | 2,968,988 | | | | 4,198,063 | | | | — | |
Shares outstanding, end of period | | | 8,707,759 | | | | 9,959,978 | | | | 2,212,031 | | | | 2,968,988 | | | | 172,760 | |
| * | For the period October 29, 2007 (inception) through December 31, 2007. |
see accompanying notes to financial statements
FINANCIAL HIGHLIGHTS
Selected per share data and ratios for a share outstanding throughout each year
Firsthand Technology Value Fund
| | | Year Ended 12/31/07 | | | Year Ended 12/31/06 | | | Year Ended 12/31/05 | | | Year Ended 12/31/04 | | | Year Ended 12/31/03 | |
| Net asset value at beginning of year | | $ | 36.09 | | | $ | 33.12 | | | $ | 29.48 | | | $ | 31.57 | | | $ | 18.09 | |
| Income from investment operations: | | | | | | | | | | | | | | | | | | | | |
| Net investment loss | | | (0.70 | ) | | | (0.72 | ) | | | (0.62 | ) | | | (0.49 | ) | | | (0.40 | ) |
Net realized and unrealized gains (losses) on investments | | | 9.14 | | | | 3.69 | | | | 4.26 | | | | (1.60 | ) | | | 13.88 | |
| Total from investment operations | | | 8.44 | | | | 2.97 | | | | 3.64 | | | | (2.09 | ) | | | 13.48 | |
Paid-in capital from redemption fees (Note 2) | | | — | | | | — | | | | — | | | | — | | | | 0.00 | (A) |
| Net asset value at end of year | | $ | 44.53 | | | $ | 36.09 | | | $ | 33.12 | | | $ | 29.48 | | | $ | 31.57 | |
| Total return | | | 23.39 | % | | | 8.97 | % | | | 12.35 | % | | | (6.62 | %) | | | 74.52 | % |
| Net assets at end of year (millions) | | $ | 382.8 | | | $ | 370.9 | | | $ | 446.6 | | | $ | 586.9 | | | $ | 877.4 | |
Ratio of gross expenses to average net assets before waiver | | | 1.93 | % | | | 1.93 | % | | | 1.92 | % | | | 1.90 | % | | | 1.90 | % |
Ratio of net expenses to average net assets after waiver | | | 1.93 | % | | | 1.92 | % | | | 1.92 | % | | | 1.90 | % | | | 1.90 | % |
Ratio of net investment loss to average net assets | | | (1.57 | %) | | | (1.70 | %) | | | (1.81 | %) | | | (1.41 | %) | | | (1.64 | %) |
| Portfolio turnover rate | | | 50 | % | | | 47 | % | | | 42 | % | | | 17 | % | | | 38 | % |
Firsthand Technology Leaders Fund
| | | Year Ended 12/31/07 | | | Year Ended 12/31/06 | | | Year Ended 12/31/05 | | | Year Ended 12/31/04 | | | Year Ended 12/31/03 | |
| Net asset value at beginning of year | | $ | 20.23 | | | $ | 18.95 | | | $ | 16.75 | | | $ | 17.23 | | | $ | 10.65 | |
| Income from investment operations: | | | | | | | | | | | | | | | | | | | | |
| Net investment loss | | | (0.29 | ) | | | (0.29 | ) | | | (0.23 | ) | | | (0.30 | ) | | | (0.24 | ) |
Net realized and unrealized gains (losses) on investments | | | 3.12 | | | | 1.57 | | | | 2.43 | | | | (0.18 | ) | | | 6.82 | |
| Total from investment operations | | | 2.83 | | | | 1.28 | | | | 2.20 | | | | (0.48 | ) | | | 6.58 | |
Paid-in capital from redemption fees (Note 2) | | | — | | | | — | | | | — | | | | — | | | | 0.00 | (A) |
| Net asset value at end of year | | $ | 23.06 | | | $ | 20.23 | | | $ | 18.95 | | | $ | 16.75 | | | $ | 17.23 | |
| Total return | | | 13.99 | % | | | 6.75 | % | | | 13.13 | % | | | (2.79 | %) | | | 61.78 | % |
| Net assets at end of year (millions) | | $ | 63.5 | | | $ | 74.0 | | | $ | 121.0 | | | $ | 113.9 | | | $ | 156.1 | |
Ratio of gross expenses to average net assets before waiver | | | 1.96 | % | | | 1.96 | % | | | 1.95 | % | | | 1.95 | % | | | 1.95 | % |
Ratio of net expenses to average net assets after waiver | | | 1.95 | % | | | 1.95 | % | | | 1.95 | % | | | 1.95 | % | | | 1.95 | % |
Ratio of net investment loss to average net assets | | | (1.16 | %) | | | (1.13 | %) | | | (1.43 | %) | | | (1.58 | %) | | | (1.65 | %) |
| Portfolio turnover rate | | | 35 | % | | | 53 | % | | | 43 | % | | | 22 | % | | | 28 | % |
| (A) | Amount is less than $0.01. |
see accompanying notes to financial statements
FINANCIAL HIGHLIGHTS (continued)
Selected per share data and ratios for a share outstanding throughout each year
Firsthand Technology Innovators Fund
| | | Year Ended 12/31/07 | | | Year Ended 12/31/06 | | | Year Ended 12/31/05 | | | Year Ended 12/31/04 | | | Year Ended 12/31/03 | |
| Net asset value at beginning of year | | $ | 10.04 | | | $ | 8.88 | | | $ | 10.08 | | | $ | 11.56 | | | $ | 7.42 | |
| Income from investment operations: | | | | | | | | | | | | | | | | | | | | |
| Net investment loss | | | (0.21 | ) | | | (0.25 | ) | | | (0.19 | ) | | | (0.22 | ) | | | (0.17 | ) |
Net realized and unrealized gains (losses) on investments | | | 1.93 | | | | 1.41 | | | | (1.01 | ) | | | (1.26 | ) | | | 4.31 | |
| Total from investment operations | | | 1.72 | | | | 1.16 | | | | (1.20 | ) | | | (1.48 | ) | | | 4.14 | |
Paid-in capital from redemption fees (Note 2) | | | — | | | | — | | | | — | | | | — | | | | 0.00 | (A) |
| Net asset value at end of year | | $ | 11.76 | | | $ | 10.04 | | | $ | 8.88 | | | $ | 10.08 | | | $ | 11.56 | |
| Total return | | | 17.13 | % | | | 13.06 | % | | | (11.90 | %) | | | (12.80 | %) | | | 55.80 | % |
| Net assets at end of year (millions) | | $ | 19.5 | | | $ | 26.5 | | | $ | 29.5 | | | $ | 58.2 | | | $ | 88.1 | |
Ratio of gross expenses to average net assets before waiver | | | 1.98 | % | | | 1.99 | % | | | 1.95 | % | | | 1.95 | % | | | 1.95 | % |
Ratio of net expenses to average net assets after waiver | | | 1.95 | % | | | 1.95 | % | | | 1.95 | % | | | 1.95 | % | | | 1.95 | % |
Ratio of net investment loss to average net assets | | | (1.61 | %) | | | (2.12 | %) | | | (1.68 | %) | | | (1.83 | %) | | | (1.67 | %) |
| Portfolio turnover rate | | | 32 | % | | | 64 | % | | | 41 | % | | | 41 | % | | | 64 | % |
Firsthand e-Commerce Fund
| | | Year Ended 12/31/07 | | | Year Ended 12/31/06 | | | Year Ended 12/31/05 | | | Year Ended 12/31/04 | | | Year Ended 12/31/03 | |
| Net asset value at beginning of year | | $ | 4.05 | | | $ | 3.40 | | | $ | 3.23 | | | $ | 3.06 | | | $ | 2.08 | |
| Income from investment operations: | | | | | | | | | | | | | | | | | | | | |
| Net investment loss | | | (0.06 | ) | | | (0.06 | ) | | | (0.06 | ) | | | (0.06 | ) | | | (0.05 | ) |
Net realized and unrealized gains (losses) on investments | | | 0.68 | | | | 0.71 | | | | 0.23 | | | | 0.23 | | | | 1.03 | |
| Total from investment operations | | | 0.62 | | | | 0.65 | | | | 0.17 | | | | 0.17 | | | | 0.98 | |
Paid-in capital from redemption fees (Note 2) | | | — | | | | — | | | | — | | | | — | | | | 0.00 | (A) |
| Net asset value at end of year | | $ | 4.67 | | | $ | 4.05 | | | $ | 3.40 | | | $ | 3.23 | | | $ | 3.06 | |
| Total return | | | 15.31 | % | | | 19.12 | % | | | 5.26 | % | | | 5.56 | % | | | 47.12 | % |
| Net assets at end of year (millions) | | $ | 40.7 | | | $ | 40.3 | | | $ | 42.9 | | | $ | 55.6 | | | $ | 66.4 | |
Ratio of gross expenses to average net assets before waiver | | | 1.96 | % | | | 1.98 | % | | | 1.95 | % | | | 1.95 | % | | | 1.95 | % |
Ratio of net expenses to average net assets after waiver | | | 1.95 | % | | | 1.95 | % | | | 1.95 | % | | | 1.95 | % | | | 1.95 | % |
Ratio of net investment loss to average net assets | | | (1.28 | %) | | | (1.51 | %) | | | (1.66 | %) | | | (1.90 | %) | | | (1.72 | %) |
| Portfolio turnover rate | | | 44 | % | | | 59 | % | | | 55 | % | | | 22 | % | | | 46 | % |
| (A) | Amount is less than $0.01. |
see accompanying notes to financial statements
FINANCIAL HIGHLIGHTS (continued)
Selected per share data and ratios for a share outstanding throughout each year
Firsthand Global Technology Fund
| | | Year Ended 12/31/07 | | | Year Ended 12/31/06 | | | Year Ended 12/31/05 | | | Year Ended 12/31/04 | | | Year Ended 12/31/03 | |
| Net asset value at beginning of year | | $ | 4.49 | | | $ | 3.91 | | | $ | 4.28 | | | $ | 4.61 | | | $ | 2.42 | |
| Income from investment operations: | | | | | | | | | | | | | | | | | | | | |
| Net investment loss | | | (0.05 | ) | | | (0.04 | ) | | | (0.06 | ) | | | (0.10 | ) | | | (0.05 | ) |
Net realized and unrealized gains (losses) on investments | | | 0.81 | | | | 0.62 | | | | (0.31 | ) | | | (0.23 | ) | | | 2.24 | |
| Total from investment operations | | | 0.76 | | | | 0.58 | | | | (0.37 | ) | | | (0.33 | ) | | | 2.19 | |
Paid-in capital from redemption fees (Note 2) | | | — | | | | — | | | | — | | | | — | | | | 0.00 | (A) |
| Net asset value at end of year | | $ | 5.25 | | | $ | 4.49 | | | $ | 3.91 | | | $ | 4.28 | | | $ | 4.61 | |
| Total return | | | 16.93 | % | | | 14.83 | % | | | (8.64 | %) | | | (7.16 | %) | | | 90.50 | % |
| Net assets at end of year (millions) | | $ | 11.6 | | | $ | 13.3 | | | $ | 16.4 | | | $ | 32.5 | | | $ | 57.3 | |
Ratio of gross expenses to average net assets before waiver | | | 1.99 | % | | | 2.04 | % | | | 1.95 | % | | | 1.95 | % | | | 1.95 | % |
Ratio of net expenses to average net assets after waiver | | | 1.95 | % | | | 1.95 | % | | | 1.95 | % | | | 1.95 | % | | | 1.95 | % |
Ratio of net investment loss to average net assets | | | (0.93 | %) | | | (0.90 | %) | | | (1.20 | %) | | | (1.69 | %) | | | (1.77 | %) |
| Portfolio turnover rate | | | 53 | % | | | 70 | % | | | 23 | % | | | 15 | % | | | 50 | % |
Firsthand Alternative Energy Fund
| | | Period Ended 12/31/07* | |
| Net asset value at beginning of period | | $ | 10.00 | |
| Income from investment operations: | | | | |
| Net investment income (loss) | | | — | (A) |
| Net realized and unrealized gains on investments | | | 0.89 | |
| Total from investment operations | | | 0.89 | |
| Net asset value at end of period | | $ | 10.89 | |
| Total return | | | 8.90 | %(B) |
| Net assets at end of period (millions) | | $ | 1.9 | |
Ratio of gross expenses to average net assets before waiver | | | 2.10 | %(C) |
Ratio of net expenses to average net assets after waiver | | | 2.10 | %(C) |
| Ratio of net investment loss to average net assets | | | (0.07 | %)(C) |
| Portfolio turnover rate | | | 0 | %(B) |
| * | For the period October 29, 2007 (inception) through December 31, 2007. |
| (A) | Amount is less than $0.005. |
see accompanying notes to financial statements
NOTES TO FINANCIAL STATEMENTS, December 31, 2007
1. Organization
Each of Firsthand Technology Value Fund, Firsthand Technology Leaders Fund, Firsthand Technology Innovators Fund, Firsthand e-Commerce Fund, Firsthand Global Technology Fund, and Firsthand Alternative Energy Fund (individually the "Fund", and collectively the "Funds") is a non-diversified series of Firsthand Funds (the "Trust"), an open-end management investment company registered under the Investment Company Act of 1940, as amended (the "1940 Act"). The Trust, a Delaware statutory trust, was organized on November 8, 1993. The inception dates for the Funds (the date on which a net asset value was first determined for that Fund) follow:
| Fund | Inception Date |
| Firsthand Technology Value Fund | May 20, 1994* |
| Firsthand Technology Leaders Fund | December 10, 1997 |
| Firsthand Technology Innovators Fund | May 20, 1998 |
| Firsthand e-Commerce Fund | September 30, 1999 |
| Firsthand Global Technology Fund | September 29, 2000 |
| Firsthand Alternative Energy Fund | October 29, 2007 |
| * | Firsthand Technology Value Fund Investor Class commenced operations on May 20, 1994; the SEC effective date for the Investor Class is December 15, 1994. Each Fund currently offers one class of shares-Investor Class shares. |
Each Fund's investment objective is long-term growth of capital.
Firsthand Technology Value Fund seeks to achieve its investment objective by investing, under normal circumstances, at least 80% of its assets in high-technology companies that Firsthand Capital Management, Inc. (the "Investment Adviser") believes are undervalued and have potential for capital appreciation.
Firsthand Technology Leaders Fund seeks to achieve its investment objective by investing, under normal circumstances, at least 80% of its assets in high-technology companies that the Investment Adviser believes hold dominant competitive positions in high-growth industries.
Firsthand Technology Innovators Fund seeks to achieve its investment objective by investing, under normal circumstances, at least 80% of its assets in high-technology companies that the Investment Adviser considers to be best positioned to introduce "breakthrough" products in the fastest growing markets in the technology sector.
Firsthand e-Commerce Fund seeks to achieve its investment objective by investing, under normal circumstances, at least 80% of its assets in equity securities of companies that provide the products, services, and technologies to facilitate the growth of electronic commerce.
Firsthand Global Technology Fund seeks to achieve its investment objective by investing, under normal circumstances, at least 80% of its assets in high-technology companies, both domestic and foreign, that the Investment Adviser considers best positioned to benefit significantly from the adoption of new technologies worldwide.
Firsthand Alternative Energy Fund seeks to achieve its investment objective by investing, under normal circumstances, at least 80% of its assets in alternative energy and energy technology companies, both U.S. and international.
2. Significant Accounting Policies
The following is a summary of the Funds' significant accounting policies:
Securities Valuation—A Fund's portfolio of securities is valued as follows:
| 1. | Securities traded on stock exchanges, or quoted by NASDAQ, are valued according to the NASDAQ official closing price, if applicable, or at their last reported sale price as of the close of trading on the New York Stock Exchange ("NYSE") (normally 4:00 P.M. Eastern Time). If a security is not traded that day, the security will be valued at its most recent bid price. |
| 2. | Securities traded in the over-the-counter market, but not quoted by NASDAQ, are valued at the last sale price (or, if the last sale price is not readily available, at the most recent closing bid price as quoted by brokers that make markets in the securities) at the close of trading on the NYSE. |
| 3. | Securities traded both in the over-the-counter market and on a stock exchange are valued according to the broadest and most representative market. |
| 4. | Securities and other assets that do not have market quotations readily available are valued at their fair value as determined in good faith using procedures established by the Board of Trustees. |
In September 2006, the Financial Accounting Standards Board ("FASB") issued Statement on Financial Accounting Standards ("SFAS") No. 157, "Fair Value Measurements." This standard establishes a single authoritative definition of fair value, sets out a framework for measuring fair value and requires additional disclosures about fair value measurements. SFAS No. 157 applies to fair value measurements already required or permitted by existing standards. SFAS No. 157 is effective for financial statements issued for fiscal years beginning after November 15, 2007 and interim periods within those fiscal years. The changes to current accounting principles generally accepted in the United States of America from the application of this Statement relate to the definition of fair value, the methods used to measure fair value, and the expanded disclosures about fair value measurements. As of December 31, 2007, the Funds do not believe the adoption of SFAS No. 157 will impact the financial statement amounts, however, additional disclosures may be required about the inputs used to develop the measurements and the effect of certain of the measurements on changes in net assets for the period.
Share Valuation—The net asset value ("NAV") per share of each Fund is calculated by dividing the sum of the value of the securities held by the Fund, plus cash or other assets, minus all liabilities (including estimated accrued expenses) by the total number of shares outstanding of the Fund, rounded to the nearest cent. A Fund's shares will not be priced on the days on which the NYSE is closed for trading. The offering and redemption price per share of each Fund is equal to a Fund's net asset value per share. Prior to April 30, 2003, shares of each Fund were charged a 2% redemption fee on shares redeemed or exchanged within 180 days of purchase. These fees were deducted from the redemption proceeds otherwise payable to the shareholder. Each Fund retained the fee charged as paid-in capital and such fees became part of that Fund's daily NAV calculation.
Repurchase Agreements—Repurchase agreements, which must be secured with collateral of a credit quality at least equal to a Fund's investment criteria for its portfolio securities, are valued at cost, which, together with accrued interest, approximates market value. At the time a Fund enters into a repurchase agreement, the value of the underlying securities, including accrued interest, will equal or exceed the value of the repurchase agreement, and in the case of a repurchase agreement exceeding one day, the seller will agree that the value of the underlying securities, including accrued interest, will at all times equal or exceed the value of the repurchase agreement. In the event of a bankruptcy or other default by the seller of a repurchase agreement, a Fund could experience delays in liquidating the underlying securities and losses.
Investment Income—Dividend income is recorded on the ex-dividend date. Interest income is accrued as earned. Discounts and premiums on securities purchased are amortized over the lives of the respective securities. Other non-cash dividends are recognized as investment income at the fair value of the property received. Withholding taxes on foreign dividends have been provided for in accordance with the company’s understanding of the applicable country’s tax rules and rates.
Foreign Securities—Each Fund may invest in companies that trade on U.S. exchanges as American Depositary Receipts ("ADRs"), on foreign exchanges, or on foreign over-the-counter markets. Investing in the securities of foreign companies exposes your investment in a Fund to risk. Foreign stock markets tend to be more volatile than the U.S. market due to economic and/or political instability and the regulatory conditions in some countries. In addition, some of the securities in which the Fund may invest may be denominated in foreign currencies, the value of which may decline against the U.S. dollar. An investment in foreign securities may be subject to high levels of foreign taxation, including foreign taxes withheld at the source. The Fund isolates that portion of the results of operations resulting from changes in foreign exchange rates on investments from the fluctuations arising from changes in market prices of securities held. Reported net realized foreign exchange gains or losses arise from sales of portfolio securities, currency gains or losses realized between the trade and settlement dates on securities transactions, and the difference between the amounts of dividends, interest, and foreign withholding taxes recorded on the company’s books and the U.S. dollar equivalent of the amounts actually received or paid.
Options—The Funds (other than Firsthand Technology Value Fund) may purchase put and call options to attempt to provide protection against adverse price effects from anticipated changes in prevailing prices of securities or stock indices. When the Fund writes an option, an amount equal to the premium received by the Fund is recorded as a liability and is subsequently adjusted to the current fair value of the option written. Premiums received from writing options that expire unexercised are treated by the Fund on the expiration date as realized gains from investments. The difference between the premium and the amount paid on effecting a closing purchase transaction, including brokerage commissions, is also treated as a realized gain, or, if the premium is less than the amount paid for the closing purchase transaction, as a realized loss. If a call option is exercised, the premium is added to the proceeds from the sale of the underlying security or currency in determining whether the Fund has realized a gain or loss. The Fund as writer of an option bears the market risk of an unfavorable change in the price of the security underlying the written option.
The number of option contracts written and the premiums received during the year ended December 31, 2007, were as follows:
| | | Firsthand Technology Leaders Fund | | | Firsthand Global Technology Fund | |
| | | Number of Contracts | | | Premiums Received | | | Number of Contracts | | | Premiums Received | |
| | | | | | | | | | | | | |
| Options outstanding, beginning of period | | | — | | | $ | — | | | | — | | | $ | — | |
| Options written during period | | | 990 | | | | 57,309 | | | | 349 | | | | 24,551 | |
| Options expired during period | | | — | | | | — | | | | (99 | ) | | | (10,301 | ) |
| Options closed during period | | | — | | | | — | | | | — | | | | | |
| Options exercised during period | | | (990 | ) | | | (57,309 | ) | | | (250 | ) | | | (14,250 | ) |
| Options outstanding, end of period | | | — | | | $ | — | | | | — | | | $ | — | |
Distributions to Shareholders—Each Fund expects to distribute its net investment income and net realized gains, if any, annually. Distributions from net investment income and capital gains are recorded on the ex-dividend date and are determined in accordance with income tax regulations, which may differ from accounting principles generally accepted in the United States.
Reclassification of Capital Accounts—The Funds account and report for distributions to shareholders in accordance with the American Institute of Certified Public Accountant's Statement of Position 93-2: Determination, Disclosure, and Financial Statement Presentation of Income, Capital and Return of Capital Distributions by Investment Companies. For the year ended December 31, 2007, each Fund recorded the following reclassifications to the accounts listed below:
| | | | | | Increase (Decrease) |
| | | Paid-in-Capital Investment Loss | | | Accumulated Net Realized Loss | | | Accumulated Net | |
| | | | | | | | | | |
| Firsthand Technology Value Fund | | $ | (5,955,604 | ) | | $ | 6,021,613 | | | $ | (66,009 | ) |
| Firsthand Technology Leaders Fund | | | (787,755 | ) | | | 794,008 | | | | (6,253 | ) |
| Firsthand Technology Innovators Fund | | | (349,311 | ) | | | 349,311 | | | | 0 | |
| Firsthand e-Commerce Fund | | | (554,505 | ) | | | 554,505 | | | | 0 | |
| Firsthand Global Technology Fund | | | (112,856 | ) | | | 116,293 | | | | (3,437 | ) |
| Firsthand Alternative Energy Fund | | | (128 | ) | | | (83 | ) | | | 211 | |
Security Transactions—Security transactions are accounted for no later than one business day following the trade date, however, for financial reporting purposes, security transactions are accounted for on trade date. Securities sold are valued on a specific identification basis.
Estimates—The preparation of financial statements in conformity with accounting principles generally accepted in the United States of America requires management to make estimates and assumptions that affect the reported amounts of assets and liabilities at the date of the financial statements and the reported amounts of income and expenses during the reporting period. Actual results could differ from those estimates.
Federal Income Tax—Each Fund has elected, and intends to qualify annually, for the special tax treatment afforded regulated investment companies under the Internal Revenue Code of 1986, as amended (the "Code"). As provided in the Code, in any fiscal year in which a Fund so qualifies and distributes at least 90% of its taxable net income, the Fund (but not the shareholders) will be relieved of federal income tax on the income distributed. Accordingly, no provision for income taxes has been made. To avoid imposition of the excise tax applicable to regulated investment companies, each Fund intends to declare as dividends in each calendar year at least 98% of its net investment income (earned during the calendar year) and 98% of its net realized capital gains (earned during the 12 months ended October 31) plus undistributed amounts, if any, from prior years. The following information is based upon the federal income tax cost of portfolio investments as of December 31, 2007.
| | | Firsthand Technology Value Fund | | | Firsthand Technology Leaders Fund | | | Firsthand Technology Innovators Fund | | | Firsthand Firsthand e-Commerce Fund | | | Firsthand Global Technology Fund | | | Alternative Energy Fund | |
| | | | | | | | | | | | | | | | | | | |
| Gross unrealized appreciation | | $ | 105,879,195 | | | $ | 16,469,480 | | | $ | 7,959,569 | | | $ | 9,933,814 | | | $ | 2,192,188 | | | $ | 130,561 | |
| Gross unrealized depreciation | | | (87,255,809 | ) | | | (3,618,136 | ) | | | (12,342,380 | ) | | | (1,734,673 | ) | | | (233,258 | ) | | | (15,076 | ) |
Net unrealized appreciation (depreciation) | | $ | 18,623,386 | | | $ | 12,851,344 | | | $ | (4,382,811 | ) | | $ | 8,199,141 | | | $ | 1,958,930 | | | $ | 115,485 | |
| Federal income tax cost | | $ | 364,071,032 | | | $ | 50,387,978 | | | $ | 23,829,476 | | | $ | 32,668,160 | | | $ | 9,677,769 | | | $ | 1,898,319 | |
The difference between the acquisition cost and the federal income tax cost of portfolio investments is due to certain timing differences in the recognition of capital losses under accounting principles generally accepted in the United States and income tax regulations. As of December 31, 2007, the Funds had capital loss carryforwards for federal income tax purposes as follows:
| | | Expiring 2009 | | | Expiring 2010 | | | Expiring 2011 | | | Expiring 2012 | | | Expiring 2013 | | | Expiring 2014 | | | Expiring 2015 | |
| | | | | | | | | | | | | | | | | | | | | | |
| TVFQX | | $ | 1,092,189,416 | | | $ | 634,016,220 | | | $ | 330,969,371 | | | $ | 333,067,019 | | | $ | 165,213,285 | | | $ | 61,327,300 | | | $ | 57,697,467 | |
| TLFQX | | | 125,132,209 | | | | 109,312,900 | | | | 53,324,264 | | | | 33,348,418 | | | | 2,501,372 | | | | — | | | | — | |
| TIFQX | | | 193,502,617 | | | | 87,067,727 | | | | 61,543,691 | | | | 7,252,266 | | | | 11,273,401 | | | | 11,757,575 | | | | — | |
| TEFQX | | | 247,884,610 | | | | 141,312,315 | | | | 6,014,495 | | | | — | | | | — | | | | — | | | | — | |
| GTFQX | | | 44,939,815 | | | | 13,149,532 | | | | 16,183,628 | | | | — | | | | 2,936,303 | | | | — | | | | — | |
| ALTEX | | | — | | | | — | | | | — | | | | — | | | | — | | | | — | | | | — | |
TVFQX: Firsthand Technology Value Fund, TLFQX: Firsthand Technology Leaders Fund, TIFQX: Firsthand Technology Innovators Fund, TEFQX: Firsthand e-Commerce Fund, GTFQX: Firsthand Global Technology Fund, ALTEX: Firsthand Alternative Energy Fund.
For Firsthand Technology Value Fund, $7,924,308 of the $1,092,189,416 capital loss carryforward expiring in 2009 was acquired in the reorganization with Firsthand Communications Fund.
Components of Distributable Earnings
| | | Firsthand Technology Value Fund | | | Firsthand Technology Leaders Fund | | | Firsthand Technology Innovators Fund | | | Firsthand Firsthand e-Commerce Fund | | | Firsthand Global Technology Fund | | | Alternative Energy Fund | |
| | | | | | | | | | | | | | | | | | | |
Undistributed Ordinary Income | | $ | — | | | $ | — | | | $ | — | | | $ | — | | | $ | — | | | $ | — | |
| Accumulated Earnings | | | — | | | | — | | | | — | | | | — | | | | — | | | | — | |
Net Unrealized Appreciation (Depreciation)* | | | 20,986,896 | | | | 12,851,344 | | | | (4,382,811 | ) | | | 8,199,141 | | | | 1,958,930 | | | | 115,485 | |
Post October Capital/ Currency Loss** | | | — | | | | — | | | | — | | | | — | | | | — | | | | (211 | ) |
Accumulated Capital Loss Carryforward | | | (2,674,480,078 | ) | | | (323,619,163 | ) | | | (372,397,277 | ) | | | (395,211,420 | ) | | | (77,209,278 | ) | | | — | |
| Total Distributable Earnings | | $ | (2,653,493,182 | ) | | $ | (310,767,819 | ) | | $ | (376,780,088 | ) | | $ | (387,012,279 | ) | | $ | (75,250,348 | ) | | $ | 115,274 | |
| * | The differences between book-basis and tax-basis unrealized appreciation (depreciation) is attributable primarily to tax deferral of losses on wash sales and foreign currency exchange gain (loss). |
| ** | Under current tax law, capital and currency losses realized after October 31 and prior to the Fund’s fiscal year end may be deferred as occurring on the first day of the following fiscal year. |
In July 2006, the Financial Accounting Standards Board released FASB Interpretation No. 48 “Accounting for Uncertainty in Income Taxes” (“FIN 48”). FIN 48 provides guidance for how uncertain tax positions should be recognized, measured, presented and disclosed in the financial statements. FIN 48 requires the evaluation of tax positions taken or expected to be taken in the course of preparing the Fund’s tax return to determine whether the tax positions are “more-likely-than-not" of being sustained by the applicable tax authority. Tax positions not deemed to meet the more-likely-than-not threshold would be recorded as a tax benefit or expense in the year of determination. Adoption of FIN 48 is required no later than the last business day of the first financial statement reporting period for fiscal years beginning after December 15, 2006 and is to be applied to all open tax years (December 31, 2003, through December 31, 2007) as of the effective date. Management has completed their analysis and the adoption of FIN 48 did not impact the Funds’ net assets or results of operations.
3. Investment Transactions
Investment transactions (excluding short-term investments) were as follows for the year ended December 31, 2007.
| | | Firsthand Technology Value Fund | | | Firsthand Technology Leaders Fund | | | Firsthand Technology Innovators Fund | | | Firsthand e-Commerce Fund | | | Firsthand Global Technology Fund | | | Firsthand Alternative Energy Fund | |
| | | | | | | | | | | | | | | | | | | |
Purchase of investment securities | | $ | 187,966,787 | | | $ | 23,282,422 | | | $ | 6,921,669 | | | $ | 16,632,621 | | | $ | 6,107,396 | | | $ | 1,271,398 | |
Proceeds from sales and maturities of investment securities | | $ | 259,237,883 | | | $ | 42,289,193 | | | $ | 17,587,922 | | | $ | 22,510,325 | | | $ | 9,623,962 | | | $ | 0 | |
4. Investment Advisory and Administration Agreements
Certain trustees and officers of the Trust are also officers of the Investment Adviser or Citi Fund Services Ohio, Inc. ("Citi"). Citi serves as the sub-administrator, investment accounting agent and shareholder servicing and transfer agent. PFPC Trust Company serves as the custodian for the Trust.
Effective August 1, 2007, The BISYS Group, Inc., and its subsidiaries, was acquired by and became a wholly-owned subsidiary of Citi.
INVESTMENT ADVISORY AGREEMENT
Each Fund's investments are managed by the Investment Adviser pursuant to the terms of a master investment advisory agreement (the "Advisory Agreement"). Under the Advisory Agreement, the Investment Adviser provides each Fund with investment research, advice, management, and supervision and manages the investment and reinvestment of assets of each Fund consistent with each Fund's investment objectives, policies, and limitations. Subject to certain exceptions set forth in the Advisory Agreement, the Investment Adviser is responsible for (i) compensation of any of the Fund's trustees, officers, and employees who are interested persons of the Investment Adviser; and (ii) compensation of the Investment Adviser's personnel and other expenses incurred in connection with the provision of portfolio management services under the Advisory Agreements.
For the services it provides under the Advisory Agreement, the Investment Adviser receives from each Fund except Firsthand Alternative Energy Fund, on a monthly basis, an advisory fee at the annual rate of 1.50% (1.65% for ALTEX) of its average daily net assets . The Advisory Agreement requires the Investment Adviser to waive fees and, if necessary, to reimburse expenses of each such Fund to the extent necessary to limit a Fund's total operating expenses to 1.95% (2.10% for ALTEX) of its average net assets up to $200 million, 1.90% (2.05% for ALTEX) of such assets from $200 million to $500 million, 1.85% (2.00% for ALTEX) of such assets from $500 million to $1 billion, and 1.80% (1.95% for ALTEX) of such assets in excess of $1 billion.
ADMINISTRATION AGREEMENT
The Trust has entered into a separate Administration Agreement with the Investment Adviser. The agreement obligates the Investment Adviser to provide administrative and general supervisory services to each Fund (the "Administration Agreement"). Under the Administration Agreement, the Investment Adviser renders supervisory and corporate administrative services to the Trust, as well as oversees the maintenance of all books and records with respect to each Fund's securities transactions and each Fund's book of accounts in accordance with all applicable federal and state laws and regulations. The Investment Adviser also arranges for the preservation of journals, ledgers, corporate documents, brokerage account records, and other records as required by the 1940 Act.
The Investment Adviser is responsible for the equipment, staff, office space, and facilities necessary to perform its obligations under the Administration Agreement. Under the Administration Agreement, the Investment Adviser has assumed responsibility for payment of all of each Fund's operating expenses excluding brokerage and commission expenses; short sale expenses, fees payable under "Rule 12b-1 plans", if any, and shareholder servicing plans, if any; litigation costs; and any extraordinary and non-recurring expenses. For the services it provides under the Administration Agreement, the Investment Adviser receives a fee from each Fund at the annual rate of 0.45% of its average daily net assets up to $200 million, 0.40% of such assets from $200 million to $500 million, 0.35% of such assets from $500 million to $1 billion, and 0.30% of such assets in excess of $1 billion. The Investment Adviser has entered into a Sub-Administration Agreement with Citi. Under this agreement, the Investment Adviser (not the Funds) pays to Citi the fees for the administrative services provided by Citi. In the case of Firsthand Alternative Energy Fund, the Investment Adviser has also agreed to donate a portion of its management fees allocated, amounting to 0.20% of Firsthand Alternative Energy Fund’s average daily net assets, to various non-profit organizations as elected by Fund shareholders.
5. Deferred Compensation Agreement With Trustees
During the fiscal year ended December 31, 2000, the Trust entered into a deferred compensation agreement with the independent trustees of the Trust.
Under the deferred compensation agreement, each independent trustee may elect to defer some or all of his trustee fees. Each independent trustee is paid an annual retainer of $24,000, $6,000 for each regular meeting attended in person, and $1,000 for each special meeting attended. Deferred fees may be deemed invested in the Firsthand Funds selected by each independent trustee on a tax-deferred basis and deferred fees (and the income, gains, and losses credited during the deferral period) are payable at least two years after deferral date. Upon payment of any deferred fees (and the income, gains, and losses credited during the deferral period), each Fund will expense its pro rata share of those fees.
6. Investments in Affiliates and Restricted Securities
Affiliated issuers, as defined by the 1940 Act, are those in which a Fund's holdings represent 5% or more of the outstanding voting securities of the issuer. A summary of each Fund's investments in affiliates, if any, for the year ended December 31, 2007, is noted below:
| | | SHARE ACTIVITY | | | | | | | | | | |
| Affiliate | | Balance 12/31/06 | | | Sales/ Purchases Expiration | | | Maturity/ 12/31/07 | | | Balance Gain(Loss) | | | Realized 12/31/07 | | | Value Cost | | | Acquition | |
| | | | | | | | | | | | | | | | | | | | | | |
| Firsthand Technology Value Fund (continued) |
| | | | | | | | | | | | | | | | | | | | | | |
| Silicon Genesis Corp., Series 1-D | | | 850,830 | | | | — | | | | — | | | | 850,830 | | | | — | | | | 3,881,027 | | | | 4,315,500 | |
| Silicon Genesis Corp., Series 1-E | | | 4,071,226 | | | | — | | | | — | | | | 4,071,226 | | | | — | | | | 11,482,526 | | | | 4,315,500 | |
| Silicon Genesis Corp., Series 1-F (2) | | | — | | | | 912,453 | | | | — | | | | 912,453 | | | | — | | | | 2,851,790 | | | | 2,007,397 | |
| Silicon Genesis Corp., Common | | | 743,077 | | | | — | | | | — | | | | 743,077 | | | | — | | | | 1,505,036 | | | | 3,684,494 | |
Silicon Genesis Corp., Series 1-E Warrant | | | 1,257,859 | | | | — | | | | — | | | | 1,257,859 | | | | — | | | | 2,547,680 | | | | — | |
Silicon Genesis Corp., Common Warrant | | | 37,982 | | | | — | | | | — | | | | 37,982 | | | | — | | | | 57,558 | | | | — | |
Silicon Genesis Corp., Common Warrant (3) | | | 59,147 | | | | — | | | | 59,147 | | | | — | | | | — | | | | — | | | | — | |
| Silicon Genesis Corp., 5.00% | | | — | | | | 2,000,000 | | | | 2,000,000 | | | | — | | | | — | | | | — | | | | — | |
| Solaicx, Series B (4) | | | 6,000,000 | | | | 1,396,238 | | | | — | | | | 7,396,238 | | | | — | | | | 4,137,752 | | | | 4,396,238 | |
| Solaicx, Series C | | | — | | | | 2,916,581 | | | | — | | | | 2,916,581 | | | | — | | | | 2,915,210 | | | | 3,578,995 | |
| Solaicx, Series C Warrant | | | — | | | | 670,814 | | | | — | | | | 670,814 | | | | — | | | | 663,791 | | | | — | |
| Solaicx, 10.25% | | | 1,333,334 | | | | — | | | | 1,333,334 | | | | — | | | | — | | | | — | | | | — | |
| SoloPower, Series A | | | 2,721,088 | | | | — | | | | — | | | | 2,721,088 | | | | — | | | | 10,726,529 | | | | 3,999,999 | |
| SoloPower, Series B | | | — | | | | 228,779 | | | | — | | | | 228,779 | | | | — | | | | 1,002,052 | | | | 1,002,052 | |
| SoloPower, 5.00% | | | — | | | | 1,000,000 | | | | 1,000,000 | | | | — | | | | — | | | | — | | | | — | |
| | | | | | | | | | | | | | | | | | | | | | | | | | |
Firsthand Technology Innovators Fund | | | | | | | | | | | | | | | | | | | | | | | | | |
| Innovion Corp., Series C | | | 1,500,000 | | | | 75,322 | | | | — | | | | 1,575,322 | | | | — | | | | 147,753 | | | | 3,000,075 | |
| Innovion Corp., Warrant | | | 602,577 | | | | — | | | | — | | | | 602,577 | | | | — | | | | 603 | | | | — | |
| Innovion Corp., 9.50% | | | 602,577 | | | | — | | | | 59,075 | | | | 543,502 | | | | — | | | | 271,751 | | | | 543,502 | |
| Innovion Corp., Warrant | | | 30,129 | | | | — | | | | — | | | | 30,129 | | | | — | | | | 30 | | | | — | |
| Innovion Corp., C Warrant | | | — | | | | 75,322 | | | | 75,322 | | | | — | | | | — | | | | — | | | | — | |
| Silicon Genesis Corp., Series 1-C | | | 82,914 | | | | — | | | | — | | | | 82,914 | | | | — | | | | 978,504 | | | | 1,731,250 | |
| Silicon Genesis Corp., Series 1-E | | | 1,633,254 | | | | — | | | | — | | | | 1,633,254 | | | | — | | | | 4,606,446 | | | | 1,731,249 | |
| Silicon Genesis Corp., Common | | | 108,815 | | | | — | | | | — | | | | 108,815 | | | | — | | | | 220,395 | | | | 1,516,773 | |
| Silicon Genesis Corp., Series 1-E Warrant | | | 94,339 | | | | — | | | | — | | | | 94,339 | | | | — | | | | 166,075 | | | | — | |
| (1) | Amounts include shares from the merger of Firsthand Communications Fund into Firsthand Technology Value Fund. |
| (2) | 912,453 shares of Silicon Genesis, Series 1-F purchased at $2.20 with matured principal and interest of Silicon Genesis, 5.00% Note. |
| (4) | Additional 1,396,238 shares of Solaicx, Series B purchased at $1.00 with matured principal and interest of Solaicx, 10.25% Note. |
Restricted securities include securities that have not been registered under the Securities Act of 1933, as amended, and securities that are subject to restrictions on resale. A Fund may invest in restricted securities that are consistent with a Fund's investment objective and investment strategies. A Fund will not invest in a restricted security if, immediately after and as a result of the investment in such security, more than 15% of the Fund's net assets would be invested in illiquid securities. In some cases, the issuer of restricted securities has agreed to register such securities for resale, at the issuer's expense either upon demand by the Fund or in connection with another registered offering of the securities. Investments in restricted securities are valued at fair value as determined in good faith in accordance with procedures adopted by the Board of Trustees. It is possible that the estimated value may differ significantly from the amount that might ultimately be realized in the near term, and the difference could be material. As of December 31, 2007, the Funds were invested in the following restricted securities:
| Security | Acquisition Date | | Shares | | | Cost | | | Value | | | % of Net Assets | |
| Firsthand Technology Value Fund | | | | | | | | | | | | |
| | | | | | | | | | | | | | |
| AuthenTec, Inc. (1) | June 26, 2007 | | | 98,166 | | | $ | 196,800 | | | $ | 1,283,720 | | | | 0.34 | % |
| Celox Networks, Inc., Common | April 17, 2001 | | | 138,121 | | | | 14,999,941 | | | | — | | | | 0.00 | % |
| Celox Networks, Inc., Series A-1 P/S | August 23, 2002 | | | 1,000,000 | | | | 1,200,000 | | | | — | | | | 0.00 | % |
| Celox Networks, Inc., Series A-1 Warrants | August 23, 2002 | | | 500,000 | | | | — | | | | — | | | | 0.00 | % |
| Clarisay, Inc., 8.00% C/N | July 7, 2003 | | | 500,000 | | | | 500,000 | | | | — | | | | 0.00 | % |
| Clarisay, Inc., 8.00% C/N | August 7, 2003 | | | 500,000 | | | | 500,000 | | | | — | | | | 0.00 | % |
| Clarisay, Inc., 8.00% C/N | November 10, 2003 | | | 500,000 | | | | 500,000 | | | | — | | | | 0.00 | % |
| Clarisay, Inc., 8.00% C/N | June 3, 2003 | | | 500,000 | | | | 500,000 | | | | — | | | | 0.00 | % |
| Clarisay, Inc., 8.00% C/N | September 12, 2003 | | | 250,000 | | | | 250,000 | | | | — | | | | 0.00 | % |
| Clarisay, Inc., 8.00% C/N | September 19, 2003 | | | 100,000 | | | | 100,000 | | | | — | | | | 0.00 | % |
| Clarisay, Inc., Series B P/S | January 24, 2001 | | | 2,605,306 | | | | 2,383,855 | | | | — | | | | 0.00 | % |
| Clarisay, Inc., Series C P/S | August 28, 2002 | | | 7,194,244 | | | | 2,000,000 | | | | — | | | | 0.00 | % |
| Clarisay, Inc., D Warrants | September 19, 2003 | | | 100,000 | | | | — | | | | — | | | | 0.00 | % |
| Clarisay, Inc., D Warrants | August 7, 2003 | | | 500,000 | | | | — | | | | — | | | | 0.00 | % |
| Clarisay, Inc., D Warrants | June 3, 2003 | | | 500,000 | | | | — | | | | — | | | | 0.00 | % |
| Clarisay, Inc., D Warrants | November 10, 2003 | | | 500,000 | | | | — | | | | — | | | | 0.00 | % |
| Clarisay, Inc., D Warrants | September 12, 2003 | | | 250,000 | | | | — | | | | — | | | | 0.00 | % |
| Clarisay, Inc., D Warrants | July 7, 2003 | | | 500,000 | | | | — | | | | — | | | | 0.00 | % |
| IP Unity, Inc., Series E Warrants | August 4, 2004 | | | 69,496 | | | | 69 | | | | 69 | | | | 0.00 | % |
| IP Unity, Inc., Series C P/S | July 27, 2001 | | | 1,104,265 | | | | 1,987,677 | | | | 11,043 | | | | 0.00 | % |
| IP Unity, Inc., Series E P/S | August 4, 2004 | | | 193,042 | | | | 313,307 | | | | 281,976 | | | | 0.07 | % |
| Luminous Networks, Inc., Common (2) | Various | | | 28,513 | | | | 1,800,638 | | | | — | | | | 0.00 | % |
| Luminous Networks, Inc., Common Warrants | December 31, 2003 | | | 3,822 | | | | — | | | | — | | | | 0.00 | % |
| Luminous Networks, Inc., Series A1 P/S (2) | Various | | | 129,664 | | | | 200,071 | | | | — | | | | 0.00 | % |
| Luminous Networks, Inc., Series B1 P/S | June 9, 2005 | | | 259,236 | | | | 400,000 | | | | — | | | | 0.00 | % |
| Polaris Networks, Inc., 10.00% C/N | April 12, 2004 | | | 50,475 | | | | 50,475 | | | | — | | | | 0.00 | % |
| Polaris Networks, Inc., 10.00% C/N | July 14, 2004 | | | 50,474 | | | | 50,474 | | | | — | | | | 0.00 | % |
| Polaris Networks, Inc., Convertible Warrants | March 29, 2004 | | | 75,712 | | | | — | | | | — | | | | 0.00 | % |
| Polaris Networks, Inc., Series A P/S | November 16, 2001 | | | 297,848 | | | | 297,848 | | | | — | | | | 0.00 | % |
| Silicon Genesis Corp., Series 1-E Warrants | October 31, 2003 | | | 1,257,859 | | | | — | | | | 2,547,680 | | | | 0.67 | % |
| Silicon Genesis Corp., Common | April 30, 2002 | | | 726,424 | | | | 3,684,494 | | | | 1,471,307 | | | | 0.38 | % |
| Silicon Genesis Corp., Common (3) | November 21, 2005 | | | 16,653 | | | | — | | | | 33,729 | | | | 0.01 | % |
| Silicon Genesis Corp., Common Warrants | November 4, 2003 | | | 37,982 | | | | — | | | | 57,558 | | | | 0.02 | % |
| Silicon Genesis Corp., Series 1-D P/S | April 30, 2002 | | | 850,830 | | | | 4,315,500 | | | | 3,881,027 | | | | 1.01 | % |
| Silicon Genesis Corp., Series 1-E P/S | November 4, 2003 | | | 4,071,226 | | | | 4,315,500 | | | | 11,482,526 | | | | 3.00 | % |
| Silicon Genesis Corp., Series 1-F P/S | June 29, 2007 | | | 912,453 | | | | 2,007,397 | | | | 2,851,790 | | | | 0.75 | % |
| Solaicx, Series B P/S | December 16, 2005 | | | 6,000,000 | | | | 3,000,000 | | | | 3,356,640 | | | | 0.88 | % |
| Solaicx, Series B P/S | January 19, 2007 | | | 1,396,238 | | | | 1,396,238 | | | | 781,112 | | | | 0.20 | % |
| Solaicx, Series C P/S | April 23, 2007 | | | 2,916,581 | | | | 3,578,995 | | | | 2,915,210 | | | | 0.76 | % |
| Solaicx, Series C Warrants | April 23, 2007 | | | 670,814 | | | | — | | | | 663,791 | | | | 0.17 | % |
| SoloPower, Series A P/S | June 29, 2006 | | | 2,721,088 | | | | 3,999,999 | | | | 10,726,529 | | | | 2.80 | % |
| SoloPower, Series B P/S | July 9, 2007 | | | 228,779 | | | | 1,002,052 | | | | 1,002,052 | | | | 0.26 | % |
| UCT Coatings, Inc., Series B P/S | October 5, 2004 | | | 500,000 | | | | 5,000,000 | | | | 11,250,000 | | | | 2.94 | % |
| UCT Coatings, Inc., Series Common Warrants (4) | October 5, 2004 | | | 600,000 | | | | — | | | | 1,000,002 | | | | 0.26 | % |
| | | | | | | | $ | 60,531,330 | | | $ | 55,597,761 | | | | 14.52 | % |
| Security | Acquisition Date | | Shares | | | Cost | | | Value | | | % of Net Assets | |
| Firsthand Technology Innovators Fund | | | | | | | | | | | | |
| AuthenTec, Inc. (1) | June 26, 2007 | | | 49,083 | | | $ | 98,400 | | | $ | 641,862 | | | | 3.29 | % |
| Innovion Corp., 9.50%, C/N | December 30, 2003 | | | 543,502 | | | | 543,502 | | | | 271,751 | | | | 1.39 | % |
| Innovion Corp., Series C P/S | February 23, 2001 | | | 1,500,000 | | | | 3,000,000 | | | | 140,688 | | | | 0.72 | % |
| Innovion Corp., Series C P/S | November 20, 2007 | | | 75,322 | | | | 75 | | | | 7,065 | | | | 0.04 | % |
| Innovion Corp., Warrant | December 30, 2003 | | | 602,577 | | | | — | | | | 603 | | | | 0.00 | % |
| Innovion Corp., Warrant | March 7, 2005 | | | 30,129 | | | | — | | | | 30 | | | | 0.00 | % |
| IP Unity, Inc., Series C P/S | July 27, 2001 | | | 827,957 | | | | 1,490,323 | | | | 8,280 | | | | 0.04 | % |
| Luminous Networks, Inc., Common (2) | Various | | | 49,979 | | | | 3,156,250 | | | | — | | | | 0.00 | % |
| Luminous Networks, Inc., Common Warrants | December 31, 2003 | | | 6,699 | | | | — | | | | — | | | | 0.00 | % |
| Luminous Networks, Inc., Series A1 P/S (2) | Various | | | 227,282 | | | | 350,694 | | | | — | | | | 0.00 | % |
| Silicon Genesis Corp., Series 1-E Warrant | February 26, 2003 | | | 94,339 | | | | — | | | | 166,075 | | | | 0.85 | % |
| Silicon Genesis Corp., Common | March 8, 2001 | | | 102,135 | | | | 1,516,773 | | | | 206,865 | | | | 1.06 | % |
| Silicon Genesis Corp., Common (3) | November 21, 2005 | | | 6,680 | | | | — | | | | 13,530 | | | | 0.07 | % |
| Silicon Genesis Corp., Series 1-C P/S | March 8, 2001 | | | 82,914 | | | | 1,731,250 | | | | 978,504 | | | | 5.02 | % |
| Silicon Genesis Corp., Series 1-E P/S | November 4, 2003 | | | 1,633,254 | | | | 1,731,249 | | | | 4,606,446 | | | | 23.63 | % |
| Silicon Optix, Inc., Series B P/S | November 7, 2003 | | | 1,111,111 | | | | 1,000,000 | | | | 350,000 | | | | 1.80 | % |
| | | | | | | | $ | 14,618,516 | | | $ | 7,391,699 | | | | 37.91 | % |
| (1) | Shares restricted for 180 days pursuant to Rule 144. |
| (2) | As a result of a new round of financing on June 9, 2005, certain shares of Luminous Series D P/S and Series E P/S were converted into certain Common and Series A1 P/S shares. The original acquisition date for the Series D P/S shares was May 31, 2001, and the original acquisition date for the Series E P/S shares was October 16, 2003. The new Common and Series A1 P/S will carry the original acquisition date of the Series D and Series E P/S. |
| (3) | Shares granted at no cost by issuer. |
| (4) | 3:1 stock split. P/S Preferred Stock. C/N Convertible Note. |
7. Other Assets
Other assets consist of a contingent receivable from the sale of Global Locate, Inc. to Broadcom. Part of the sale has shareholders receiving additional earn outs based on future contingencies. The Board of Trustees is fair valuing this asset.
8. Subsequent Events
On February 11, 2008, the Board of Trustees for Firsthand Funds met and approved the following reorganization for submission to shareholders: Firsthand Technology Innovators Fund and Firsthand Global Technology Fund into Firsthand Technology Value Fund.
9. Investment Advisory and Administration Agreements (Unaudited)
Below is a description of the specific materials provided, factors considered, and conclusions reached by the Board, including a majority of non-interested Trustees, relating to the selection of the Investment Adviser and the re-approval of the Advisory Agreement.
Nature, Extent and Quality of Services—The Board received and considered various data and information regarding the nature, extent and quality of services provided to the Funds (and to be provided to the New Fund) by the Adviser. The most recent investment adviser registration form (“Form ADV”) for the Adviser was provided to the Board, as were written and oral responses of the Adviser to an information request submitted by independent counsel on behalf of the Independent Trustees. The Board reviewed these responses, which included, among other things, information about the background and experience of the investment personnel of the Adviser primarily responsible for day-to-day portfolio management services for the Funds. The Board also considered the Adviser’s separate administration agreement with the Funds and the Adviser’s overall ability to manage and administer the Funds, as well as to oversee the service providers to the Funds.
The Board evaluated the ability of the Adviser, considering its financial condition, resources, reputation and other attributes, to attract and retain highly qualified investment professionals, including research, advisory, supervisory and administrative personnel. In this regard, the Board considered information regarding the Adviser’s compensation program for its personnel involved in the management of the Funds, including incentive and retirement plans.
The Board considered the effectiveness of policies of the Funds in achieving the best execution of portfolio transactions, whether and to what extent “soft dollar” benefits are sought, the extent to which efforts are made to recapture transaction costs, and the controls applicable to brokerage allocation procedures. The Board reviewed the policies of the Adviser regarding the allocation of portfolio investment opportunities among the Funds and other clients. The Board noted that the Adviser does not use soft-dollar arrangements, where soft-dollar credits are generated based on the level of commissions earned by broker-dealers that execute client trades and then are used to pay for products or services from third parties. The Board also noted that the Adviser, from time to time, enters into arrangements where it receives proprietary research (including invitations to conferences) from broker-dealers that the Adviser uses to execute client trades.
The Board also considered the markets for the Funds, including the principal channels through which the Funds’ shares are offered and sold, and the activities of the Adviser in connection with the marketing of the Funds.
In addition, the Board received and reviewed information on SEC and other inquiries, examinations and proceedings relating to the Funds and the Adviser. The Board considered the investment and legal compliance programs of the Adviser, including its implementation of enhanced compliance policies and procedures in response to SEC rule changes and other regulatory initiatives, and the level of compliance attained by the Adviser.
Based on the above factors, together with those referenced below, the Board, including a majority of Independent Trustees, concluded that it was generally satisfied with the nature, extent and quality of the investment advisory services provided to each of the Funds by the Adviser and that the Adviser was capable of providing comparable services to the New Fund.
Fund Performance—The Board considered each Fund’s performance results over one-year, three-year, five-year and ten-year periods as relevant. It also considered these results in comparison to the performance results of various benchmark indices and of the funds in the Morningstar Technology sector. The Board noted that Firsthand e-Commerce Fund had outperformed the median fund in the Technology sector for all periods; Firsthand Technology Leaders Fund had outperformed for the three- and five-year periods, but underperformed for the one-year period; Firsthand Technology Value Fund had outperformed for the three- and five-year periods, but underperformed for the one- and ten-year periods; Firsthand Global Technology Fund had outperformed for the one-year period, but underperformed for the three- and five-year periods; and Firsthand Technology Innovators Fund had significantly underperformed for all periods.
Investment Advisory Fee Rates and Other Expenses—The Board reviewed and considered the proposed contractual investment advisory fee rates (the “Advisory Agreement Rates”) payable by the Funds to the Adviser for investment advisory services. Additionally, the Board received and considered information comparing the Advisory Agreement Rates (both on a stand-alone basis and on a combined basis with the Funds’ administration fee rates) and the total expense ratios of the Funds with those of the other funds in appropriate peer universes provided by Lipper Inc. The Board concluded that the respective Advisory Agreement Rates were significantly higher than the median rates of each Fund’s peer universe, but that the total expense ratio of each Fund (except the New Fund) was not appreciably above the median total expense ratio of the respective peer universe. The Board deemed the comparison of total expense ratios to be more relevant than the comparison of Advisory Agreement Rates because of the unitary fee structure of the Funds. With respect to the New Fund, the Board concluded that its total expense ratio was appreciably above the median total expense ratio of the Fund’s peer universe consisting of natural resource funds but less so with respect to a much smaller peer universe consisting of alternative energy funds and below the average total expense ratio of other funds that engage in a long/short strategy. The Board also noted that alternative energy funds are a relatively new type of fund that may require special expertise and that the New Fund is the only fund in the Trust that uses a long/short strategy, which typically is more difficult and more costly to manage.
Profitability—The Board received and considered a profitability analysis of the Adviser with respect to the Funds. The Board also noted that the Adviser will donate a portion of its management fees from the New Fund to various non-profit organizations as elected by that Fund’s shareholders. The Board concluded that, in light of the costs of providing investment management and other services to the Funds, the profits and other ancillary benefits that the Adviser received with regard to providing these services to the Funds (or would receive with respect to the New Fund) were not excessive. The Board further determined that with respect to the New Fund, the profits and other ancillary benefits were not excessive even if the Adviser were to terminate the management fee contribution program.
Economies of Scale—The Board received and considered information regarding whether there have been economies of scale with respect to the management of the Funds, whether the Funds have appropriately benefited from any economies of scale, and whether there is potential for realization of any further economies of scale with respect to the existing Funds. In addition, the Board considered whether the New Fund would benefit from any economies of scale as the Fund grows. The Board observed that the investment advisory agreement limits each Fund’s total annual operating expenses to a percentage of the Fund’s assets and that this percentage is reduced as the Funds assets grow (known as “breakpoints”). The Board also observed that the total assets of the Funds had declined during the year. The Board concluded that no change was necessary to the current breakpoints to reflect any economies of scale.
Information About Services to Other Clients—The Board also received and considered information about the services and fee rates offered by the Adviser to its other clients using similar investment strategies, including other registered and unregistered investment companies, private accounts and institutional investors. The Board concluded that the investment advisory rates charged by the Adviser to the Funds were within a reasonable range of the fee rates offered to other clients of the Adviser. Where rates offered to other clients were lower, the Board concluded that the costs associated with managing and operating a registered open-end fund, compared with an unregistered investment company, private account or institutional investor account, provided a justification for higher fee rates to the Funds.
Other Benefits to the Investment Adviser—The Board received and considered information regarding potential “fall-out” or ancillary benefits to the Adviser as a result of its relationship with the Funds. Such benefits could include, among others, benefits directly attributable to the relationship of the Adviser with the Funds (such as “soft dollar” benefits) and benefits potentially derived from an increase in the business of the Adviser as a result of its relationship with the Funds (such as the ability to market to shareholders other financial products offered by the Adviser).
Other Factors and Broader Review—Throughout the year, the Board regularly reviews and assesses the quality of the services that the Funds receive from the Adviser. In this regard, the Board reviews reports of the Adviser at least in each of its quarterly meetings, which include, among other things, a detailed portfolio review and detailed fund performance reports. In addition, the Board interviews the portfolio manager of the Funds at various times throughout the year.
Conclusion—After full consideration of the above factors as well as other factors, the Trustees, including all of the Independent Trustees, concluded the approval of the agreements was in the best interests of the Funds and their shareholders.
10. Risks
Because the return on and value of an investment in each Fund will fluctuate in response to stock market movements, the most significant risk of investing in a Fund is that you may lose money. Stocks and other equity securities are subject to market risks and fluctuations in value due to earnings, as well as economic, political, or regulatory events, and other factors beyond the Investment Adviser's control. The Funds are designed for long-term investors who can accept the risks of investing in a fund with significant common stock holdings in high-technology industries.
Each Fund is non-diversified. A risk of being non-diversified is that a significant change in the value of one company will have a greater impact on the Fund than it would if the Fund diversified its investments. Another risk for the Fund is its concentration of investments in companies within high-technology industries. The value of high-technology companies can, and often does, fluctuate dramatically and may expose you to greater-than-average financial and market risk.
11. Proxy Voting Policy and Procedures
The Funds have adopted proxy voting procedures pursuant to which the Funds delegate the responsibility for voting proxies relating to portfolio securities held by the Funds to the Investment Adviser as part of the Investment Adviser's general management of the Funds, subject to the Board of Trustees' continuing oversight. A copy of the Funds' proxy voting policy and procedures is available without charge, upon request, by calling 1.888.884.2675. Information regarding how the Investment Adviser voted these proxies for the one-year period ended June 30, 2007, is available by calling the same number and on the website of the U.S. Securities and Exchange Commission at http://www.sec.gov on Form N-PX. The Funds' voting record is also available on the Funds' website at www.firsthandfunds.com/proxy.
12. Portfolio Holdings
The Funds file their complete schedule of portfolio holdings with the SEC for the first and third quarters of each fiscal year on Form N-Q. The Funds' Forms N-Q will be available on the SEC's website at http://www.sec.gov and may be reviewed and copied at the SEC's Public Reference Room in Washington, D.C. Information on the operation of the Public Reference Room may be obtained by calling 1.800.SEC.0330.
ADDITIONAL INFORMATION
December 31, 2007
Information about the trustees and officers* of the Funds is set forth in the following table. The Statement of Additional Information (the “SAI”) includes additional information about the Funds’ trustees and officers and is available free of charge, upon request, by calling 1.888.884.2675, option 2.
Name, Year of Birth, Position(s) Held With Funds | Term of Office and Length of Time Served (1) | Principal Occupation(s) During Past Five Years | Number of Funds in Fund Complex Overseen by Trustee | Other Trusteeships Held by Trustees |
| DISINTERESTED TRUSTEES | | | | |
Michael T. Lynch (1961) Trustee 125 South Market Ste. 1200 San Jose, CA 95113 | Since 1994 | Mr. Lynch is a consultant to Rainier Wine (wine distribution) from 2007 to present. Mr. Lynch was a principal of Rainier Wine from March 2004 to 2007. Mr. Lynch served as VP of Sales and Business Development of AlphaOmega Soft, Inc. (a manufacturer of software) from 2002 through 2003. Mr. Lynch served as VP of Sales and Business Development at Picture IQ Corporation (a manufacturer of digital imaging software) from 1999 through 2002. | SIX | NONE |
| | | | | |
Jerry Wong (1951) Trustee 125 South Market Ste. 1200 San Jose, CA 95113 | Since 1999 | Mr. Wong is CFO, VP - Finance and Secretary of Versant Corporation, a publicly traded international provider of object-oriented database products from June 2006 to present. Mr. Wong served as a consultant from June 2003 to June 2006. From June 2003 to December 2005, he served as CFO for Companion Worlds, Inc., a manufacturer of hardware and software facilitating fitness and health maintenance. Additionally, Mr. Wong served as VP of Finance and EVP of U.S. operations for Poet Holdings, Inc., a publicly traded international software provider, from 1995 through 2002. | SIX | NONE |
ADDITIONAL INFORMATION
December 31, 2007 (continued)
Name, Year of Birth, Position(s) Held With Funds | Term of Office and Length of Time Served (1) | Principal Occupation(s) During Past Five Years | Number of Funds in Fund Complex Overseen by Trustee | Other Trusteeships Held by Trustees |
| INTERESTED TRUSTEES | | | | |
Kevin M. Landis (2) (1961) Trustee/President 125 South Market Ste. 1200 San Jose, CA 95113 | Since 1994 | Mr. Landis is President and Chief Investment Officer and a Director of Firsthand Capital Management, Inc. and has been a portfolio manager with Firsthand Capital Management, Inc. since May 1994. | SIX | Mr. Landis is a trustee of Black Pearl Funds, a registered investment company. |
| | | | |
| OFFICERS WHO ARE NOT TRUSTEES | | | |
Yakoub Bellawala (1965) Secretary/Chief Compliance Officer 125 South Market Ste. 1200 San Jose, CA 95113 | Since 2003 | Mr. Bellawala is a Vice President of Firsthand Capital Management, Inc. (FCM) from 1999 to present. | N/A | N/A |
| | | | | |
Aaron Masek (1974) Treasurer 125 South Market Ste. 1200 San Jose, CA 95113 | Since 2005 | Mr. Masek is a Vice President of Citi Fund Services, Inc. (formerly called BISYS Fund Services, Inc.) since 2005 and has been employed by Citi in various other roles since 1997. | N/A | N/A |
| * | The term “officer” means the president, vice president, secretary, treasurer, chief compliance officer, controller, or any other officer who performs policy-making functions. |
| (1) | Each trustee shall serve for the lifetime of Firsthand Funds or until he dies, resigns, or is removed. Each officer shall serve a one-year term subject to annual reappointment by the trustees. |
| (2) | Mr. Landis is an interested person of the Funds by reason of his position with the Investment Adviser. |
Firsthand Funds
P.O. Box 183120
Columbus, OH 43218-3120
1.888.884.2675
www.firsthandfunds.com
Investment Adviser
Firsthand Capital Management, Inc.
125 South Market
Suite 1200
San Jose, CA 95113
www.firsthandcapital.com
Distributor
ALPS Distributors, Inc.
1290 Broadway
Suite 1100
Denver, CO 80203
Transfer Agent
Citi Fund Services Ohio, Inc.
P.O. Box 183120
Columbus, OH 43218-3120
1.888.884.2675
This report is provided for the general information of the shareholders of Firsthand Funds. This report is not intended for distribution to prospective investors in the Funds, unless preceded or accompanied by an effective prospectus. For more complete information about Firsthand Funds, please call toll free 1.888.884.2675 or visit www.firsthandfunds.com for a prospectus, which contains more information, including risks, fees, and expenses. Read the prospectus carefully before investing or sending money.
Firsthand Funds are distributed by ALPS Distributors, Inc.
Firsthand, Technology Value Fund, and the interlocking “F” design are registered trademarks of Firsthand Capital Management, Inc.
Printed on chlorine-free paper.
FHF000349, exp.3/15/2009
Item 2. Code of Ethics.
Disclose whether, as of the end of the period covered by the report, the registrant has adopted a code of ethics that applies to the registrant’s principal executive officer, principal financial officer, principal accounting officer or controller, or persons performing similar functions, regardless of whether these individuals are employed by the registrant or a third party. If the registrant has not adopted such a code of ethics, explain why it has not done so.
The registrant has adopted a code of ethics that applies to the registrant’s principal executive officer, principal financial officer, principal accounting officer or controller, or persons performing similar functions. This code of ethics is included as an Exhibit.
The registrant must briefly describe the nature of any amendment, during the period covered by the report, to a provision of its code of ethics that applies to the registrant’s principal executive officer, principal financial officer, principal accounting officer or controller, or persons performing similar functions, regardless of whether these individuals are employed by the registrant or a third party, and that relates to any element of the code of ethics definition enumerated in paragraph (b) of this Item. The registrant must file a copy of any such amendment as an exhibit pursuant to Item 12(a)(1), unless the registrant has elected to satisfy paragraph (f) of this Item by posting its code of ethics on its website pursuant to paragraph (f)(2) of this Item, or by undertaking to provide its code of ethics to any person without charge, upon request, pursuant to paragraph (f)(3) of this Item.
If the registrant has, during the period covered by the report, granted a waiver, including an implicit waiver, from a provision of the code of ethics that applies to the registrant’s principal executive officer, principal financial officer, principal accounting officer or controller, or persons performing similar functions, regardless of whether these individuals are employed by the registrant or a third party, that relates to one or more items set forth in paragraph (b) of this Item, the registrant must briefly describe the nature of the waiver, the name of the person to whom the waiver was granted, and the date of the waiver.
During the period covered by the report, with respect to the registrant's code of ethics that applies to its principal executive officer, principal financial officer, principal accounting officer or controller, or persons performing similar functions; there have been no amendments to, nor any waivers granted from, a provision that relates to any element of the code of ethics definition enumerated in paragraph (b) of this Item 2.
Item 3. Audit Committee Financial Expert.
(a) (1) Disclose that the registrant’s board of directors has determined that the registrant either:
(i) Has at least one audit committee financial expert serving on its audit committee; or
(ii) Does not have an audit committee financial expert serving on its audit committee.
(2) If the registrant provides the disclosure required by paragraph (a)(1)(i) of this Item, it must disclose the name of the audit committee financial expert and whether that person is “independent.” In order to be considered “independent” for purposes of this Item, a member of an audit committee may not, other than in his or her capacity as a member of the audit committee, the board of directors, or any other board committee:
(i) Accept directly or indirectly any consulting, advisory, or other compensatory fee from the issuer; or
(ii) Be an “interested person” of the investment company as defined in Section 2(a)(19) of the Act (15 U.S.C. 80a-
2(a)(19)).
(3) If the registrant provides the disclosure required by paragraph (a)(1)(ii) of this Item, it must explain why it does not
have an audit committee financial expert.
3(a)(1) The registrant’s board of trustees has determined that the registrant has at least one audit committee financial expert serving on its audit committee.
3(a)(2) The audit committee financial expert is Mr. Jerry Wong, who is “independent” for purposes of this Item 3 of Form N-CSR.
Item 4. Principal Accountant Fees and Services.
(a) Disclose, under the caption Audit Fees, the aggregate fees billed for each of the last two fiscal years for professional services rendered by the principal accountant for the audit of the registrant’s annual financial statements or services that are normally provided by the accountant in connection with statutory and regulatory filings or engagements for those fiscal years.
2006 - $113,000
2007 - $113,000
(b) Disclose, under the caption Audit-Related Fees, the aggregate fees billed in each of the last two fiscal years for assurance and related services by the principal accountant that are reasonably related to the performance of the audit of the registrant’s financial statements and are not reported under paragraph (a) of this Item. Registrants shall describe the nature of the services comprising the fees disclosed under this category.
Not applicable.
(c) Disclose, under the caption Tax Fees, the aggregate fees billed in each of the last two fiscal years for professional services rendered by the principal accountant for tax compliance, tax advice, and tax planning. Registrants shall describe the nature of the services comprising the fees disclosed under this category.
2006 - $12,000
2007 - $12,000
(d) Disclose, under the caption All Other Fees, the aggregate fees billed in each of the last two fiscal years for products and services provided by the principal accountant, other than the services reported in paragraphs (a) through (c) of this Item. Registrants shall describe the nature of the services comprising the fees disclosed under this category.
2006 - $2,500 (audit of the registrant's anti-money laundering program)
2007 - $2,500 (audit of the registrant's anti-money laundering program)
(e) (1) Disclose the audit committee’s pre-approval policies and procedures described in paragraph (c)(7) of Rule 2-01 of Regulation S-X.
The registrant's Audit Committee Charter states the following with respect to pre-approval procedures:
The Committee hereby delegates to the Chairman of the Committee the authority to grant pre-approvals of audit and "permissible" non-audit services to be provided by the Auditors to the Funds, subject to the ratification of the full Committee at its next regularly scheduled meeting. Both the Auditors and Fund counsel will be responsible for informing the Committee whether they believe that a particular non-audit service is permissible or prohibited pursuant to applicable regulations and standards.
The specific types of non-audit services that the Chairman may pre-approve include, but are not limited to: reviewing the Funds' internal controls over financial reporting; providing tax-related services; reviewing and/or developing an anti-money laundering program; and issuing comfort letters, based on agreed-upon procedures, in connection with any Fund reorganization.
Pre-approval for a non-audit service provided to a Fund is not required if: (i) the aggregate amount of all such non-audit services provided to the Fund constitutes not more than 5% of the total amount of revenues paid by the Fund to the Auditors during the fiscal year in which the non-audit services are provided; (ii) such services were not recognized by the Fund at the time of the engagement to be non-audit services; and (iii) such services are promptly brought to the attention of the Committee and are approved by the Committee or by one or more members of the Committee to whom authority to grant such approvals has been delegated by the Committee prior to the completion of the audit (the "De Minimus Exceptions").
The Committee shall also pre-approve any non-audit services proposed to be provided by the Auditors to (i) a Fund's investment adviser and (ii) any entity controlling, controlled by, or under common control with the investment adviser that provides ongoing services to the Fund, if the Auditors' engagement with the investment adviser or any such control persons relates directly to the operations and financial reporting of the Fund. The De Minimus Exceptions applies to pre-approvals under this paragraph as well, except that the "total amount of revenues" calculation is based on the total amount of revenues paid to the Auditors by the Fund and any other entity that has its services approved under this paragraph (i.e., the investment adviser or any control person).
(2) Disclose the percentage of services described in each of paragraphs (b) through (d) of this Item that were approved by the audit committee pursuant to paragraph (c)(7)(i)(C) of Rule 2-01 of Regulation S-X.
100%
(f) If greater than 50 percent, disclose the percentage of hours expended on the principal accountant’s engagement to audit the registrant’s financial statements for the most recent fiscal year that were attributed to work performed by persons other than the principal accountant’s full-time, permanent employees.
Not applicable.
(g) Disclose the aggregate non-audit fees billed by the registrant’s accountant for services rendered to the registrant, and rendered to the registrant’s investment adviser (not including any sub-adviser whose role is primarily portfolio management and is subcontracted with or overseen by another investment adviser), and any entity controlling, controlled by, or under common control with the adviser that provides ongoing services to the registrant for each of the last two fiscal years of the registrant.
2006 - $12,500
2007 - $12,500
(h) Disclose whether the registrant’s audit committee of the board of directors has considered whether the provision of nonaudit services that were rendered to the registrant’s investment adviser (not including any subadviser whose role is primarily portfolio management and is subcontracted with or overseen by another investment adviser), and any entity controlling, controlled by, or under common control with the investment adviser that provides ongoing services to the registrant that were not pre-approved pursuant to paragraph (c)(7)(ii) of Rule 2-01 of Regulation S-X is compatible with maintaining the principal accountant’s independence.
Not applicable.
Item 5. Audit Committee of Listed Registrants.
(a) | If the registrant is a listed issuer as defined in Rule 10A-3 under the Exchange Act (17CFR 240.10A-3), state whether or not the registrant has a separately-designated standing audit committee established in accordance with Section 3(a)(58)(A) of the Exchange Act (15 U.S.C. 78c(a)(58)(A)). If the registrant has such a committee, however designated, identify each committee member. If the entire board of directors is acting as the registrant’s audit committee as specified in Section 3(a)(58)(B) of the Exchange Act (15 U.S.C. 78c(a)(58)(B)), so state. |
(b) | If applicable, provide the disclosure required by Rule 10A-3(d) under the Exchange Act (17CFR 240.10A-3(d)) regarding an exemption from the listing standards for all audit committees. |
Not applicable.
Item 6. Schedule of Investments.
File Schedule I – Investments in securities of unaffiliated issuers as of the close of the reporting period as set forth in § 210.12-12 of Regulation S-X, unless the schedule is included as part of the report to shareholders filed under Item 1 of this Form.
Not applicable.
Item 7. Disclosure of Proxy Voting Policies and Procedures for Closed-End Management Investment Companies.
A closed-end management investment company that is filing an annual report on this Form N-CSR must, unless it invests exclusively in non-voting securities, describe the policies and procedures that it uses to determine how to vote proxies relating to portfolio securities, including the procedures that the company uses when a vote presents a conflict between the interests of its shareholders, on the one hand, and those of the company’s investment adviser; principal underwriter; or any affiliated person (as defined in Section 2(a)(3) of the Investment Company Act of 1940 (15 U.S.C. 80a-2(a)(3)) and the rules thereunder) of the company, its investment adviser, or its principal underwriter, on the other. Include any policies and procedures of the company’s investment adviser, or any other third party, that the company uses, or that are used on the company’s behalf, to determine how to vote proxies relating to portfolio securities.
Not applicable.
Item 8. Portfolio Managers of Closed-End Management Investment Companies.
If the registrant is a closed-end management investment company that is filing an annual report on this Form N-CSR, provide the information specified in paragraphs (a) and (b) of this Item with respect to portfolio managers.
Not applicable.
Item 9. Purchases of Equity Securities by Closed-End Management Investment Company and Affiliated Purchasers.
If the registrant is a closed-end management investment company, provide the information specified in paragraph (b) of this Item with respect to any purchase made by or on behalf of the registrant or any "affiliated purchaser," as defined in Rule 10b-18(a)(3) under the Exchange Act (17 CFR 240.10b-18(a)(3)), of shares or other units of any class of the registrant's equity securities that is registered by the registrant pursuant to Section 12 of the Exchange Act (15 U.S.C. 781).
Not applicable.
Item 10. Submission of Matters to a Vote of Security Holders.
Describe any material changes to the procedures by which shareholders may recommend nominees to the registrant's board of directors, where those changes were implemented after the registrant last provided disclosure in response to the requirements of Item 7(d)(2)(ii)(G) of Schedule 14A (17 CFR 240.14a-101), or this Item.
Not applicable.
Item 11. Controls and Procedures.
(a) Disclose the conclusions of the registrant’s principal executive and principal financial officers, or persons performing similar functions, regarding the effectiveness of the registrant’s disclosure controls and procedures (as defined in Rule 30a-3(c) under the Act (17 CFR 270.30a-3(c))) as of a date within 90 days of the filing date of the report that includes the disclosure required by this paragraph, based on the evaluation of these controls and procedures required by Rule 30a-3(b) under the Act (17 CFR 270.30a-3(b)) and Rules 13a-15(b) or 15d-15(b) under the Exchange Act (17 CFR 240.13a-15(b) or 240.15d-15(b)).
The registrant’s principal executive officer and principal financial officer have concluded, based on their evaluation of the registrant's disclosure controls and procedures as conducted within 90 days of the filing date of this report, that these disclosure controls and procedures are adequately designed and are operating effectively to ensure that information required to be disclosed by the registrant on Form N-CSR is recorded, processed, summarized and reported within the time periods specified in the Securities and Exchange Commission's rules and forms.
(b) Disclose any change in the registrant’s internal control over financial reporting (as defined in Rule 30a-3(d) under the Act (17 CFR 270.30a-3(d)) that occurred during the second fiscal quarter of the period covered by this report that has materially affected, or is reasonably likely to materially affect, the registrant's internal control over financial reporting.
There were no changes in the registrant’s internal control over financial reporting that occurred during the second fiscal quarter of the period covered by this report that have materially affected or are reasonably likely to materially affect, the registrant’s internal control over financial reporting.
Item 12. Exhibits.
(a) File the exhibits listed below as part of this Form. Letter or number the exhibits in the sequence indicated.
(a)(1) Any code of ethics, or amendment thereto, that is the subject of the disclosure required by Item 2, to the extent that the
registrant intends to satisfy the Item 2 requirements through filing of an exhibit.
The code of ethics that is the subject of the disclosure required by Item 2 is attached hereto.
(a)(2) A separate certification for each principal executive officer and principal financial officer of the registrant as required by Rule 30a-2(a) under the Act (17 CFR 270.30a-2).
Certifications pursuant to Rule 30a-2(a) are attached hereto.
(a)(3) Any written solicitation to purchase securities under Rule 23c-1 under the Act (17 CFR 270.23c-1) sent or given during the period covered by the report by or on behalf of the registrant to 10 or more persons.
Not applicable.
(b) If the report is filed under Section 13(a) or 15(d) of the Exchange Act, provide the certifications required by rule 30a-2(b) under the Act as an exhibit. A certification furnished pursuant to this paragraph will not be deemed “filed” for purposes of Section 18 of the Exchange Act, or otherwise subject to the liability of that section. Such certification will not be deemed to be incorporated by reference into any filing under the Securities Act of 1933 or the Exchange Act, except to the extent that the registrant incorporates it by reference.
Certifications pursuant to Rule 30a-2(b) are furnished herewith.
SIGNATURES
Pursuant to the requirements of the Securities Exchange Act of 1934 and the Investment Company Act of 1940, the registrant
has duly caused this report to be signed on its behalf by the undersigned, thereunto duly authorized.
| (Registrant) | Firsthand Funds |
| | |
| By (Signature and Title)* | /s/ Kevin M. Landis |
| | Kevin M. Landis |
| | President�� | |
| | | |
| Date | February 29, 2008 | |
Pursuant to the requirements of the Securities Exchange Act of 1934 and the Investment Company Act of 1940, this report has been signed below by the following persons on behalf of the registrant and in the capacities and on the dates indicated.
| By (Signature and Title)* | /s/ Kevin M. Landis |
| | Kevin M. Landis |
| | President |
| | | |
| Date | February 29, 2008 | |
| | | |
| By (Signature and Title)* | /s/ Aaron Masek |
| | Aaron Masek |
| | Treasurer |
| | | |
| Date | February 29, 2008 | |
* Print the name and title of each signing officer under his or her signature.