Washington, D.C. 20549
Form N-CSR is to be used by management investment companies to file reports with the Commission not later than 10 days after the transmission to stockholders of any report that is required to be transmitted to stockholders under Rule 30e-1 under the Investment Company Act of 1940 (17 CFR 270.30e-1). The Commission may use the information provided on Form N-CSR in its regulatory, disclosure review, inspection, and policymaking roles.
The Report to Shareholders is attached herewith.
CONTENTS
| Performance Summary | 2 |
| President’s Letter | 4 |
| Shareholder Fee Example | 6 |
| Performance and Portfolio Discussion | 8 |
| Audit Letter | 16 |
| Portfolio of Investments | 17 |
| Statements of Assets and Liabilities | 25 |
| Statements of Operations | 26 |
| Statements of Changes in Net Assets | 27 |
| Statement of Cash Flows | 29 |
| Financial Highlights | 30 |
| Notes to Financial Statements | 32 |
| Additional Information | 52 |
PERFORMANCE SUMMARY
Period Returns (Average Annual Total Returns as of 12/31/10)
| | | | | | EXPENSE |
| FUND | 1-YEAR | 3-YEAR | 5-YEAR | 10-YEAR | RATIO |
Firsthand Technology Value Fund® | -5.74% | -13.74% | -2.91% | -9.03% | 1.85% |
| Firsthand Technology Leaders Fund | 8.42% | -3.50% | 1.80% | -4.79% | 1.85% |
| Firsthand Technology Opportunities Fund* | 29.27% | 9.01% | 12.22% | -0.91% | 1.85% |
| Firsthand Alternative Energy Fund | -9.24% | -12.60% | • | • | 2.09% |
| | | | | | |
| NASDAQ Composite Index | 18.16% | 1.02% | 4.71% | 1.43% | • |
| S&P 500 Index | 15.09% | -2.84% | 2.29% | 1.41% | • |
| WilderHill Clean Energy Index | -4.75% | -28.05% | • | • | • |
Returns assume reinvestment of all dividends and distributions but do not reflect the impact of taxes. The performance data quoted represent past performance. Past performance cannot guarantee future results, and current performance may be lower or higher than the performance quoted. Both the return from and the principal value of an investment in the Funds will fluctuate so that an investor’s shares, when redeemed, may be worth more or less than their original cost. To obtain performance as of the most recent month-end, please contact Firsthand Funds by calling 1.888.884.2675 or go to www.firsthandfunds.com.
The NASDAQ Composite Index (NASDAQ) is a capitalization-weighted index of all common stocks listed with NASDAQ. The Standard & Poor’s 500 Index (S&P 500) is a market-weighted index of 500 stocks of well-established companies. Each index represents an unmanaged, broad-based basket of stocks. These indices are typically used as benchmarks for overall market performance. The WilderHill Clean Energy Index is a market-weighted index of 40 companies in the cleaner fuel, energy conversion, energy storage, greener utilities, power delivery and conservation, and renewable energy harvesting sectors. You cannot invest directly in an index.
| * | Prior to May 1, 2010, Firsthand Technology Opportunities Fund was named Firsthand e-Commerce Fund. |
Returns Since Inception (Average Annual Total Returns as of 12/31/10)
| | AVERAGE | | | WILDERHILL |
| | ANNUAL | NASDAQ | | CLEAN |
| | TOTAL | COMPOSITE | S&P 500 | ENERGY |
| FUND | RETURNS | INDEX | INDEX | INDEX |
| Firsthand Technology Value Fund® (5/20/94) | 9.22% | 8.70% | 8.30% | • |
| Firsthand Technology Leaders Fund (12/10/97) | 5.85% | 4.47% | 3.77% | • |
| Firsthand Technology Opportunities Fund (9/30/99) | -4.31% | 0.34% | 1.64% | • |
| Firsthand Alternative Energy Fund (10/29/07) | -9.55% | • | -4.04% | -24.77% |
The Funds may invest in foreign securities, which may be subject to greater risks than investing in domestic securities. Because the Funds are not diversified, they can take larger positions in fewer companies, increasing their risk profile. The Funds invest in several industries within the technology sector and the relative weightings of these industries in a Fund’s portfolio may change at any time.
Holdings by Industry - % of Net Assets (as of 12/31/10)
| | FIRSTHAND | FIRSTHAND | FIRSTHAND | FIRSTHAND |
| | TECHNOLOGY | TECHNOLOGY | TECHNOLOGY | ALTERNATIVE |
| INDUSTRY | VALUE FUND | LEADERS FUND | OPPORTUNITIES FUND | ENERGY FUND |
| Advanced Materials | 8.0% | 6.0% | • | 7.7% |
| Basic Materials | • | • | • | 1.2% |
| Battery | 3.7% | • | 1.2% | 4.9% |
| Building Automation | • | • | • | 1.4% |
| Business Services | • | • | 4.4% | • |
| Communications | 3.1% | • | 1.9% | • |
| Communications Equipment | 9.7% | 13.9% | 4.0% | • |
| Computer | • | 11.6% | 3.0% | • |
| Computer-Integrated | 0.3% | • | • | • |
| Consumer Electronics | 2.7% | • | 2.0% | • |
| Data Processing/Management | • | • | 0.7% | • |
| Defense & Aerospace | 2.7% | • | • | • |
| Electronics Manufacturing Services | 0.3% | • | • | • |
| Energy Efficiency | 3.5% | • | • | 9.0% |
| Environmental Services | • | • | • | 1.8% |
| Industrials | • | • | • | 1.8% |
| Intellectual Property | 2.7% | • | • | • |
| Internet | 4.0% | 6.2% | 25.4% | • |
| Internet Security | 4.1% | 4.0% | 3.8% | • |
| Networking | 4.7% | 3.0% | 2.1% | • |
| Other | • | • | 2.6% | • |
| Other Electronics | 6.4% | 12.7% | 6.9% | 6.7% |
| Peripherals | • | • | 1.0% | • |
| Photonics | 2.9% | • | • | • |
| Power Conversion/Supply Equipment | • | • | • | 2.7% |
| Renewable Energy | 7.0% | 1.1% | 2.9% | 53.3% |
| Semiconductor Equipment | • | 1.7% | 0.4% | • |
| Semiconductors | 17.8% | 16.8% | 10.0% | 7.5% |
| Services | 0.1% | • | 1.0% | • |
| Software | 3.5% | 13.3% | 11.2% | • |
| Net Other Assets and Liabilities | 12.8% | 9.7% | 15.5% | 2.0% |
PRESIDENT’S LETTER
Fellow Shareholders,
Following an up-and-down first half of the year, U.S. equity markets began a steady ascent in August 2010 and finished the year with solid gains. While effects of the recession remain, notably high unemployment and a weak housing market, we are thankful that talk of a “double-dip” recession has faded.
As confidence in the economy increased, investors began to seek out growth and the potential for greater capital appreciation by shifting money from low-yield treasuries and bonds to growth-oriented equities. This represented a significant reversal of the “flight to safety” trend that had gripped the markets for the previous two years. Technology stocks have fared well in this market environment, as many high-tech firms have successfully demonstrated revenue and earnings growth over the past two years.
Firsthand Funds returned mixed results in 2010. On the plus side, Firsthand Technology Opportunities Fund dramatically outperformed its benchmarks, posting a gain of 29.27%, versus 15.09% for the S&P 500 Index and 18.16% for the NASDAQ Composite Index. Unfortunately, we cannot say the same for our other funds. I am disappointed to report that our other technology funds, Firsthand Technology Value Fund and Firsthand Technology Leaders Fund, underperformed their benchmarks in 2010, and although Firsthand Alternative Energy Fund gained nearly 19% in the second half of the year, it underperformed the WilderHill Clean Energy Index and the broad market. For additional data and discussion of the individual funds’ performance, please turn to the Performance and Portfolio Discussions beginning on page 8.
Technology
Any review of the tech sector in 2010 has to start with Apple (AAPL). The iPhone continues to be the benchmark in the smartphone market since transforming the business with its revolutionary hardware, software, and App Store. Apple’s 2010 launch of the iPad tablet computer has similarly changed the game in the portable computer market, and may have some consumers wondering whether they even need a PC anymore. Companies that hitched their wagons to the iPhone and iPad, including ARM Holdings (ARMH), Citrix Systems (CTXS), and SkyWorks Solutions (SWKS) also had a very good year.
Consumers also appear to be reassessing the need for their cable/satellite TV providers. Cable TV operators began suffering significant subscriber losses in 2010. While the jury is still out as to all the reasons why, rapidly improving access to online content has clearly opened the eyes of more and more consumers. The rapid growth of Netflix’s streaming service, for example, highlighted consumers’ newfound range of choices. In addition to Netflix, which had a blockbuster year, other companies benefitting from this trend include Akamai (AKAM) and Amazon (AMZN), and many fascinating Silicon Valley start-ups.
It was a challenging year for many household names in the tech sector, including Microsoft (MSFT), Intel (INTC), Seagate (STX), and Nokia (NOK). For years we have noted the difficulty that companies such as these face in either finding new growth markets or in reigniting growth through innovation. Though still generating impressive cash flows, all are widely regarded as having been left behind by the latest trends in tablet computers, smartphones, and cloud computing. The PC market, for example, is still huge, but clearly mature and no longer the epicenter of new ideas. The incumbency advantages that worked so well in the past for Microsoft and Intel are largely irrelevant when it comes to smartphones and tablets.
Nonetheless, Microsoft’s Kinect gaming technology was a clear standout at the recent Consumer Electronics Show in Las Vegas. Just as Nintendo’s Wii revolutionized the game console with its then-unique motion controller, the Kinect has the potential to change the “man/machine interface” in the gaming industry and beyond. It is easy to envision many applications for the Kinect’s advanced gesture recognition technology all around you.
Alternative Energy
One consequence of the great recession was a pause in the growth of world-wide energy consumption. The macro headwinds combined with tight credit conditions to slow what had been an explosive growth story for alternative energy. Still, 2010 was yet another record year for solar photovoltaic shipments – a testament to the power of the underlying trend.
Total installed wind power capacity continues to grow strongly on a global basis, though analysts estimate that capacity added in 2010 fell just short of what was added in 2009. During 2010, China took the lead in installed wind capacity, surpassing the U.S. with 41.8 gigawatts (GW). U.S. installations were hampered by the lack of clarity over government financial support of wind power.
Looking Forward
While we are happy to see equity markets moving toward a more “normal” state, we note the continued scarcity of tech IPOs with some concern. Until recently, this was the great untold story about what wasn’t happening. Lately, Facebook has grabbed most of the headlines, but it’s just the most prominent example of an increasingly common story: successful companies are taking a long, skeptical look at the decision to go public. Avoiding or delaying an IPO may be in the best interest of a young company, but the trend has resulted in a challenging environment in which mutual funds are denied the opportunity to invest in some of today’s most innovative and exciting companies.
In all, 2010 was a very good year for technology stocks, though we regret that only one of our funds fully capitalized on the opportunities. It is our belief that, from a macro standpoint, the worst is behind us, and that the next three to five years should be characterized by a robust recovery. But it is not just the improving economy that makes us optimistic. It is the emergence of several powerful new trends that we expect will provide us with exceptional growth opportunities for years to come.
Think of it this way, today you may feel dependent on your PC, your cable company, and your debit card. Each of those dependencies is about to be broken, as you become a “networked consumer.” Armed with a smartphone, a tablet computer, or just looking at your Internet-connected TV, you’ll shed the constraints of the intermediaries, and connect yourself to what you need. At Firsthand, our task is to identify and understand the companies at the forefront of those changes – and make that work for each of you. Thank you for your support.
Sincerely,
Kevin Landis
President, Firsthand Funds
SHAREHOLDER FEE EXAMPLE
Example — In general, mutual fund shareholders may incur two types of costs: (1) transaction costs, including sales charges (loads), redemption fees, and exchange fees; and (2) ongoing costs, including management fees, 12b-1 distribution and service fees, non-12b-1 service fees, and other Fund expenses. This example is intended to help you understand your ongoing costs (in dollars) of investing in a Fund and to compare these costs with the ongoing costs of investing in other mutual funds. Note that Firsthand Funds (“Trust”) does not charge transaction fees for 12b-1 distribution and service fees, though you may incur transaction fees if you purchase shares through a broker.
The example on the following page is based on an investment of $1,000 invested at the beginning of the period and held for the entire period from July 1, 2010 through December 31, 2010.
Actual Expenses — The section of the table at right entitled “Actual” provides information about actual account values and actual expenses. You may use this information, together with the amount you invested, to estimate the expenses that you paid over the period. Simply divide your account value by $1,000 (for example, an $8,600 account value divided by $1,000 = 8.6), then multiply the result by the number in the section entitled “Actual” under the heading “Expenses Paid During Period” to estimate the expenses you paid on your account during this period. If your account is an IRA or other tax-qualified savings plan, your expenses may also have included a $10 annual fee. In either case, the amount of any fee paid through your account would increase the estimate of expenses you paid during the period and decrease your ending account value.
Hypothetical Example for Comparison Purposes — The section of the table at right entitled “Hypothetical” provides information about hypothetical account values and hypothetical expenses based on a Fund’s actual expense ratio and an assumed rate of return of 5% per year before expenses, which is not the Fund’s actual return. The hypothetical account values and expenses may not be used to estimate your actual ending account balance or the expenses you paid for the period. However, you may use this information to compare the ongoing costs of investing in the Trust to other funds. To do so, compare this 5% hypothetical example with the 5% hypothetical examples that appear in the shareholder reports of the other funds. As in the case of the actual expense example, if your account is subject to an IRA fee, the amount of the fee paid through your account would increase the hypothetical expenses you would have paid during the period and decrease the hypothetical ending account value.
Please note that the expenses shown in the table at right are meant to highlight your ongoing costs only and do not reflect any transactional costs, such as sales charges (loads), redemption fees, or exchange fees. Therefore, the table is useful in comparing ongoing costs only, and will not help you determine the relative total costs of owning different funds. In addition, if these transactional costs were included, your costs would have been higher. The examples also assume all dividends and distributions have been reinvested.
Firsthand Technology Value Fund
| | BEGINNING | ENDING | EXPENSES PAID | |
| | ACCOUNT VALUE | ACCOUNT VALUE | DURING PERIOD* | ANNUALIZED |
| | 7/1/10 | 12/31/10 | 7/1/10 - 12/31/10 | EXPENSE RATIO |
| | | | | |
| Actual | $1,000 | $1,084.60 | $10.25 | 1.95% |
Hypothetical** | $1,000 | $1,015.38 | $9.91 | 1.95% |
Firsthand Technology Leaders Fund
| | BEGINNING | ENDING | EXPENSES PAID | |
| | ACCOUNT VALUE | ACCOUNT VALUE | DURING PERIOD* | ANNUALIZED |
| | 7/1/10 | 12/31/10 | 7/1/10 - 12/31/10 | EXPENSE RATIO |
| | | | | |
| Actual | $1,000 | $1,149.80 | $10.02 | 1.85% |
Hypothetical** | $1,000 | $1,015.88 | $9.40 | 1.85% |
Firsthand Technology Opportunities Fund
| | BEGINNING | ENDING | EXPENSES PAID | |
| | ACCOUNT VALUE | ACCOUNT VALUE | DURING PERIOD* | ANNUALIZED |
| | 7/1/10 | 12/31/10 | 7/1/10 - 12/31/10 | EXPENSE RATIO |
| | | | | |
| Actual | $1,000 | $1,252.60 | $10.50 | 1.85% |
Hypothetical** | $1,000 | $1,015.88 | $9.40 | 1.85% |
Firsthand Alternative Energy Fund
| | BEGINNING | ENDING | EXPENSES PAID | |
| | ACCOUNT VALUE | ACCOUNT VALUE | DURING PERIOD* | ANNUALIZED |
| | 7/1/10 | 12/31/10 | 7/1/09 - 12/31/10 | EXPENSE RATIO |
| | | | | |
| Actual | $1,000 | $1,187.90 | $10.92 | 1.98% |
Hypothetical** | $1,000 | $1,015.22 | $10.06 | 1.98% |
| * | Expenses are calculated by multiplying the Fund’s annualized expense ratio listed above by the average account value over the period and multiplying that number by 184/365 (to reflect the one-half year period). |
| ** | 5% return per year before expenses. |
| | The expenses shown in the table do not reflect any fees that may be charged to you by brokers, financial intermediaries, or other financial institutions. |
FIRSTHAND TECHNOLOGY VALUE FUND
Performance and Portfolio Discussion
How did the Fund perform in 2010?
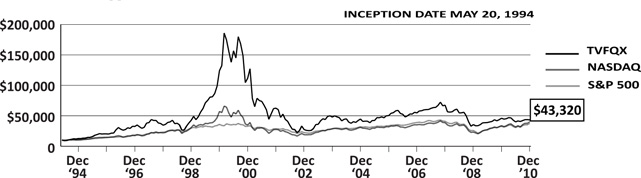
Firsthand Technology Value Fund (TVFQX) posted a loss of 5.74%, versus a 18.16% increase for the NASDAQ Composite Index and a 15.09% gain for the S&P 500 Index. For the six months ended December 31, 2010, Firsthand Technology Value Fund rose 8.46% as compared to 26.52% and 23.26% increases for the NASDAQ and the S&P 500 indices, respectively.
Which industries had the greatest impact on the Fund’s performance?
As of December 31, 2010, semiconductors and communications equipment represented the portfolio’s largest weightings, followed by holdings in the advanced materials and renewable energy industries. The portfolio’s exposure to the renewable energy and consumer electronics industries contributed most to the Fund’s underperformance versus its benchmarks in 2010.
Which individual holdings were the largest contributors to the Fund’s performance?
One of the Fund’s top contributors for the year was online movie rental giant Netflix (NFLX), which returned 218.93% in 2010. However, we believe the stock has become overvalued and closed out our position in early December.
The Fund’s investment in VeriFone (PAY) was another significant contributor to performance, as the market for smart point-of-sale terminals continued to grow strongly. VeriFone shares more than doubled in 2010, finishing the year up 135.41%.
In March, fabless semiconductor company Techwell was acquired by Intersil (ISIL). Intersil’s acquisition price represented a 49% premium over Techwell’s market value at the time, making the company a significant contributor to Fund performance for the period. We sold the Intersil shares upon the completion of the transaction.
Communications chip-maker Broadcom, which enjoys a strong competitive position in the smartphone market, benefitted from the continued success of Apple (AAPL) in 2010. Broadcom’s (BCRM) third-quarter earnings showed a 44% jump in profits, with management offering stronger-than-expected guidance, which helped shares end the year up 39.65%.
Other companies contributing positively to performance in 2010 included Entropic Communications (ENTR), maker of chipsets for multi-room DVR use, which finished the year up 293.49%; optical equipment maker Newport Corp. (NEWP), up 89.66%; and hard-disk equipment manufacturer Intevac (IVAC), up 22.14%.
Which holdings were the greatest detractors from the Fund’s performance?
The Fund’s top detractors were both privately held companies in the solar energy market. The largest detractor was Silicon Genesis, a company that has developed a unique technology for manufacturing silicon wafers at a much lower cost than conventional means. Declining silicon costs have created a more challenging environment for the company. SoloPower is a thin-film solar company. The value of our investment in the company declined in 2010, reflecting the changing dynamics of the solar market.
Another poor performer for the Fund in 2010 was electronic television programming giant TiVo (TIVO), which fell sharply in late 2010 on news of worse-than-expected losses in Q3 and an announcement that even larger losses would follow in Q4. The company’s stock finished the year down 15.23%. Echelon Corp. (ELON), maker of networking technology for automation systems, had a rocky year, starting out with poor Q4 2009 results that sent the stock down 10% in February. The stock finished the year down 11.85%.
Fund Performance and Holdings Information (as of 12/31/10)
Firsthand Technology Value Fund vs. Market Indices
| | FIRSTHAND TECHNOLOGY | NASDAQ | S&P 500 |
| | VALUE FUND | COMPOSITE INDEX | INDEX |
| Since Inception (5/20/94) | 9.22% | 8.70% | 8.30% |
| 10-Year | -9.03% | 1.43% | 1.41% |
| 5-Year | -2.91% | 4.71% | 2.29% |
| 3-Year | -13.74% | 1.02% | -2.84% |
| 1-Year | -5.74% | 18.16% | 15.09% |
Growth of a Hypothetical $10,000 Investment
Returns assume reinvestment of all dividends and distributions but do not reflect the impact of taxes. The performance data quoted represent past performance. Past performance cannot guarantee future results, and current performance may be lower or higher than the performance quoted. Both the return from and the principal value of an investment in the Fund will fluctuate so that an investor’s shares, when redeemed, may be worth more or less than their original cost. To obtain performance as of the most recent month-end, please contact Firsthand Funds by calling 1.888.884.2675 or go to www.firsthandfunds.com.
| Holdings by Industry* | | Top 10 Holdings** | |
| | % Net Assets | | % Net Assets |
| Semiconductors | 17.8% | QUALCOMM, Inc. | 6.8% |
| Communications Equipment | 9.7% | Intevac, Inc. | 6.2% |
| Advanced Materials | 8.0% | Broadcom Corp., Class A | 5.1% |
| Renewable Energy | 7.0% | Intel Corp. | 4.8% |
| Other Electronics | 6.4% | Cisco Systems, Inc. | 4.7% |
| Networking | 4.7% | McAfee, Inc. | 4.1% |
| Internet Security | 4.1% | Corning, Inc. | 3.9% |
| Internet | 4.0% | A123 Systems, Inc. | 3.7% |
| Battery | 3.7% | Echelon Corp. | 3.5% |
| Energy Efficiency | 3.5% | ZTE Corp. | 3.0% |
| Software | 3.5% | | |
| Communications | 3.1% | | |
| Photonics | 2.9% | | |
| Consumer Electronics | 2.7% | | |
| Defense & Aerospace | 2.7% | | |
| Intellectual Property | 2.7% | | |
| Computer - Integrated | 0.3% | | |
| Electronics Manufacturing Services | 0.3% | | |
| Services | 0.1% | | |
| Net Other Assets and Liabilities | 12.8% | | |
| * | Based on percentage of net assets as of 12/31/10. |
| ** | Top 10 stock holdings total 45.8% of net assets. These holdings are current as of 12/31/10, and may not be representative of current or future investments. |
FIRSTHAND TECHNOLOGY LEADERS FUND
Performance and Portfolio Discussion
How did the Fund perform in 2010?
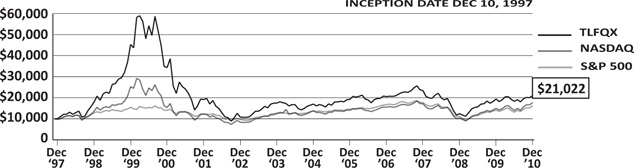
Firsthand Technology Leaders Fund (TLFQX) posted a gain of 8.42%, versus a 18.16% increase for the NASDAQ Composite Index and a 15.09% gain for the S&P 500 Index. For the six months ended December 31, 2010, Firsthand Technology Leaders Fund rose 14.98% as compared to 26.52% and 23.26% increases for the NASDAQ and the S&P 500 indices, respectively.
Which industries had the greatest impact on the Fund’s performance?
As of December 31, 2010, semiconductors and communications equipment represented the portfolio’s largest weightings, followed by holdings in the software and other electronics industries. The portfolio’s exposure to the renewable energy and software industries contributed most to the Fund’s underperformance versus its benchmarks in 2010.
Which individual holdings were the largest contributors to the Fund’s performance?
The Fund’s top contributor for the year was flash memory maker SanDisk (SNDK), which ended the period up 71.99%. Prospects for flash memory are improving, thanks to the popularity of smartphones, tablets, and solid-state drives (SSDs) in computing applications.
Another top performer for the Fund in 2010 was Apple (AAPL), which had phenomenal success with the launch of its iPad. Apple stock was up 53.07% in 2010.
The Fund’s investment in VeriFone (PAY) was another significant contributor to performance, as the market for smart point-of-sale terminals continued to grow strongly. The provider of electronic payment systems already has significant market share in the U.S. and has been seeking to expand its presence into Europe. In November, the company announced an agreement to acquire competitor Hypercom as well as its intention to form a strategic partnership with Dutch digital security company Gemalto (no U.S. symbol). VeriFone shares more than doubled in 2010, finishing the year up 135.41%.
Other top contributors to Fund performance included security company McAfee (MFE), which gained 14.15%; and telecommunications giant LM Ericsson (ERIC), a major infrastructure supplier for Verizon (VZ), which is gearing up for the iPhone. Ericsson finished the year up 27.83%.
Which holdings were the greatest detractors from the Fund’s performance?
Suntech Power Holdings (STP) suffered in 2010 from excess supply and falling prices in the solar panel market. Additionally, cuts to solar feed-in tariffs in Germany and Spain soured solar demand expectations and hit most solar stocks hard in 2010. Suntech was no exception, finishing the year down 16.63%.
Shares of Adobe (ADBE) were down throughout most of 2010, then rebounded slightly toward year-end to finish lower by 16.31%. The software giant has been in a protracted battle with Apple (AAPL) over the latter’s refusal to include Flash support on its mobile devices including the iPad, iPhone, and iPod. In addition, Apple announced in April that it would not allow developers to write programs for Apple products using Adobe software.
Nokia (NOK) finished the period down 15.48% due in large part to the company’s lack of competitive offerings in the smartphone segment, and the replacement of its CEO in September.
Fund Performance and Holdings Information (as of 12/31/10)
Firsthand Technology Leaders Fund vs. Market Indices
| | FIRSTHAND TECHNOLOGY | NASDAQ | S&P 500 |
| | LEADERS FUND | COMPOSITE INDEX | INDEX |
| Since Inception (12/10/97) | 5.85% | 4.47% | 3.77% |
| 10-Year | -4.79% | 1.43% | 1.41% |
| 5-Year | 1.80% | 4.71% | 2.29% |
| 3-Year | -3.50% | 1.02% | -2.84% |
| 1-Year | 8.42% | 18.16% | 15.09% |
Growth of a Hypothetical $10,000 Investment
Returns assume reinvestment of all dividends and distributions but do not reflect the impact of taxes. The performance data quoted represent past performance. Past performance cannot guarantee future results, and current performance may be lower or higher than the performance quoted. Both the return from and the principal value of an investment in the Fund will fluctuate so that an investor’s shares, when redeemed, may be worth more or less than their original cost. To obtain performance as of the most recent month-end, please contact Firsthand Funds by calling 1.888.884.2675 or go to www.firsthandfunds.com.
| Holdings by Industry* | | Top 10 Holdings** | |
| | % Net Assets | | % Net Assets |
| Semiconductors | 16.8% | Apple, Inc. | 10.4% |
| Communications Equipment | 13.9% | SanDisk Corp. | 7.1% |
| Software | 13.3% | QUALCOMM, Inc. | 6.9% |
| Other Electronics | 12.7% | Intel Corp. | 6.3% |
| Computer | 11.6% | Google, Inc., Class A | 6.2% |
| Internet | 6.2% | Corning, Inc. | 6.0% |
| Advanced Materials | 6.0% | VeriFone Holdings, Inc. | 5.8% |
| Internet Security | 4.0% | McAfee, Inc. | 3.9% |
| Networking | 3.0% | LM Ericsson Telephone Co. | 3.9% |
| Semiconductor Equipment | 1.7% | Microsoft Corp. | 3.9% |
| Renewable Energy | 1.1% | | |
| Net Other Assets and Liabilities | 9.7% | | |
| * | Based on percentage of net assets as of 12/31/10. |
| ** | Top 10 stock holdings total 60.4% of net assets. These holdings are current as of 12/31/10, and may not be representative of current or future investments. |
| www.firsthandfunds.com | 11 |
| FIRSTHAND TECHNOLOGY OPPORTUNITIES FUND |
Performance and Portfolio Discussion
How did the Fund perform in 2010?
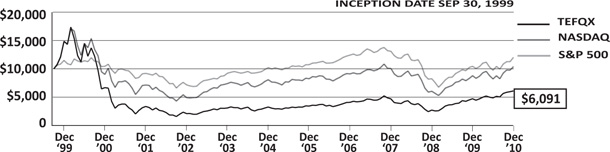
Firsthand Technology Opportunities Fund (TEFQX), formerly called Firsthand e-Commerce Fund, posted a gain of 29.27%, versus a 18.16% increase for the NASDAQ Composite Index and a 15.09% gain for the S&P 500 Index. For the six months ended December 31, 2010, Firsthand Technology Opportunities Fund rose 25.26% as compared to 26.52% and 23.26% increases for the NASDAQ and the S&P 500 indices, respectively.
Which industries had the greatest impact on the Fund’s performance?
As of December 31, 2010, Internet and software industries represented the portfolio’s largest weightings, followed by holdings in the semiconductor and other electronics industries. The portfolio’s exposure to the Internet industry contributed most to the Fund’s outperformance versus its benchmarks in 2010.
Which individual holdings were the largest contributors to the Fund’s performance?
Two of the Fund’s top contributors for the year were based in China: 51job Inc. (JOBS), a human resources service company that sells recruitment advertising space in print publications and online, and search engine Baidu (BIDU). The booming Chinese economy helped lift 51job 177.00% and Baidu 134.75% in 2010.
The Fund’s investment in VeriFone (PAY) was another significant contributor to performance, as the market for smart point-of-sale terminals continued to grow strongly. VeriFone shares more than doubled in 2010, finishing the year up 135.41%.
Another of the Fund’s top contributors for the year was online movie rental giant Netflix (NFLX), which returned 218.93% in 2010. The company saw an average net increase of 1.9 million subscribers per quarter in 2010, and we believe that trend will continue in 2011 as Netflix adds additional streaming capabilities to its product offerings. However, we believe the stock has become overvalued and closed out our position in early December.
Shutterfly (SFLY), which offers a place for users to host photos as well as put them on merchandise like mugs, calendars, and mousepads has benefitted from the growth in popularity of online photo sharing and finished the period up 95.90%.
Another top contributor for the Fund in 2010 was Apple (AAPL), which had phenomenal success with the launch of its iPad. Apple stock was up 53.07% in 2010.
Which holdings were the greatest detractors from the Fund’s performance?
Data center specialist Equinix (EQIX) fell 33% in October after lowering its full-year sales forecast, but recovered slightly to finish down 23.45%.
Beijing-based Shanda Interactive Entertainment (SNDA), which specializes in developing and operating online games in China, was down 24.65% in 2010. The company’s fundamentals are strong and online gaming is increasingly popular in China and Shanda is one of the top three players in the space. However, Shanda’s latest generation of games didn’t live up to the expectations set by the previous one.
Fund Performance and Holdings Information (as of 12/31/10)
Firsthand Technology Opportunities Fund vs. Market Indices
| | FIRSTHAND TECHNOLOGY | NASDAQ | S&P 500 |
| | OPPORTUNITIES FUND | COMPOSITE INDEX | INDEX |
| Since Inception (9/30/99) | -4.31% | 0.34% | 1.64% |
| 10-Year | -0.91% | 1.43% | 1.41% |
| 5-Year | 12.22% | 4.71% | 2.29% |
| 3-Year | 9.01% | 1.02% | -2.84% |
| 1-Year | 29.27% | 18.16% | 15.09% |
Growth of a Hypothetical $10,000 Investment
Returns assume reinvestment of all dividends and distributions but do not reflect the impact of taxes. The performance data quoted represent past performance. Past performance cannot guarantee future results, and current performance may be lower or higher than the performance quoted. Both the return from and the principal value of an investment in the Fund will fluctuate so that an investor’s shares, when redeemed, may be worth more or less than their original cost. To obtain performance as of the most recent month-end, please contact Firsthand Funds by calling 1.888.884.2675 or go to www.firsthandfunds.com.
| Holdings by Industry* | | Top 10 Holdings** | |
| | % Net Assets | | % Net Assets |
| Internet | 25.4% | McAfee, Inc. | 3.8% |
| Software | 11.2% | Baidu, Inc. - SP ADR | 3.7% |
| Semiconductors | 10.0% | 51job, Inc. - ADR | 3.5% |
| Other Electronics | 6.9% | VeriFone Systems, Inc. | 3.2% |
| Business Services | 4.4% | DG FastChannel, Inc. | 3.1% |
| Communications Equipment | 4.0% | Apple, Inc. | 3.0% |
| Internet Security | 3.8% | Google, Inc., Class A | 2.8% |
| Computer | 3.0% | Cavium Networks, Inc. | 2.7% |
| Renewable Energy | 2.9% | PowerShares QQQ | 2.6% |
| Other | 2.6% | Akamai Technologies, Inc. | 2.6% |
| Networking | 2.1% | | |
| Consumer Electronics | 2.0% | | |
| Communications | 1.9% | | |
| Battery | 1.2% | | |
| Peripherals | 1.0% | | |
| Services | 1.0% | | |
| Data Processing/Management | 0.7% | | |
| Semiconductor Equipment | 0.4% | | |
| Net Other Assets and Liabilities | 15.5% | | |
| * | Based on percentage of net assets as of 12/31/10. |
| ** | Top 10 stock holdings total 31.0% of net assets. These holdings are current as of 12/31/10, and may not be representative of current or future investments. |
| www.firsthandfunds.com | 13 |
FIRSTHAND ALTERNATIVE ENERGY FUND
Performance and Portfolio Discussion
How did the Fund perform in 2010?
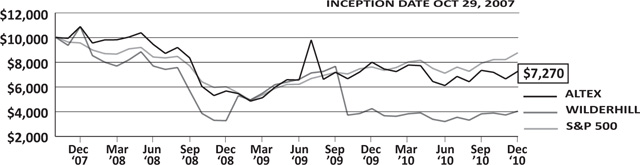
Firsthand Alternative Energy Fund (ALTEX) posted a loss of 9.24%, versus a 4.75% loss for the WilderHill Clean Energy Index and a 15.09% gain for the S&P 500 Index. For the six months ended December 31, 2010, Firsthand Alternative Energy Fund rose 18.79% as compared to 26.24% and 23.26% increases for the WilderHill Clean Energy and the S&P 500 indices, respectively.
Which industries had the greatest impact on the Fund’s performance?
As of December 31, 2010, renewable energy and energy efficiency represented the portfolio’s largest weightings, followed by holdings in the advanced materials and semiconductor industries. The portfolio’s exposure to the renewable energy industry contributed most to the Fund’s underperformance versus its benchmarks in 2010.
Which individual holdings were the largest contributors to the Fund’s performance?
Performance of solar companies was mixed in 2010, with a few contributing positively to Fund performance and others detracting from it. Companies that did well were those that benefitted from the growth of the industry, while being shielded from the intense price pressure in the solar panel market. Equipment companies GT Solar, Amtech Systems, and Meyer Burger are three examples.
The Fund’s top contributor for the year was GT Solar International (SOLR). The company won several large orders, including a $24 million ingot-making equipment contract from Trina Solar (TSL.N) in China. The company finished the year up 64.03%.
Amtech Systems (ASYS), a maker of solar diffusion furnaces used in the production of solar cells, experienced strong demand in 2010, and finished the period up 127.19%.
Meyer Burger Technology (no U.S. symbol), which provides manufacturing equipment to the solar industry, received a record order in March worth roughly $260 million dollars that helped lead the company’s shares up 22.08% in 2010. Chinese solar company JA Solar Holdings (JASO) also did well in 2010 (up 21.40%), thanks in part to a $4.4 billion loan from the Chinese government to help increase the company’s production capacity.
Which holdings were the greatest detractors from the Fund’s performance?
Vestas Wind Systems (VWSYF.PK), a giant European supplier of wind turbines, fell 48.43% during the period. Delays in Vestas shipments to the U.S., Germany, and Spain meant that the company could not recognize a significant amount of revenue until 2011.
A variety of factors contributed to a challenging year for solar companies. Chinese manufacturers are flooding the market with cheap solar panels, which is putting tremendous downward pressure on prices worldwide. Uncertainty surrounding feed-in tariffs in Europe compounded investor worries.
Several solar companies contributed to Fund underperformance this year, including Suntech Power Holdings (STP), which was down 51.83%. Canadian Solar (CSIQ) saw its shares slip mid-way through the year when the SEC launched an investigation into the company’s reported 2009 Q4 sales. Combined with poor earnings, the investigation helped push Canadian Solar down 57.01% for the year. Two other solar companies that had a negative impact on performance were SunPower Corp. (SPWRB), down 40.72%, and Yingli Green Energy Holding Co. (YGE), down 37.51%.
Fund Performance and Holdings Information (as of 12/31/10)
Firsthand Alternative Energy Fund vs. Market Indices
| | FIRSTHAND ALTERNATIVE | WILDERHILL | S&P 500 |
| | ENERGY FUND | CLEAN ENERGY INDEX | INDEX |
| Since Inception (10/29/07) | -9.55% | -24.77% | -4.04% |
| 3-Year | -12.60% | -28.05% | -2.84% |
| 1-Year | -9.24% | -4.75% | 15.09% |
Growth of a Hypothetical $10,000 Investment
Returns assume reinvestment of all dividends and distributions but do not reflect the impact of taxes. The performance data quoted represent past performance. Past performance cannot guarantee future results, and current performance may be lower or higher than the performance quoted. Both the return from and the principal value of an investment in the Fund will fluctuate so that an investor’s shares, when redeemed, may be worth more or less than their original cost. To obtain performance as of the most recent month-end, please contact Firsthand Funds by calling 1.888.884.2675 or go to www.firsthandfunds.com.
| Holdings by Industry* | | Top 10 Holdings** | |
| | % Net Assets | | % Net Assets |
| Renewable Energy | 53.3% | JA Solar Holdings Co., Ltd. - ADR | 7.6% |
| Energy Efficiency | 9.0% | GT Solar International, Inc. | 6.5% |
| Advanced Materials | 7.7% | Meyer Burger Technology AG | 5.3% |
| Semiconductors | 7.5% | A123 Systems, Inc. | 4.9% |
| Other Electronics | 6.7% | Intevac, Inc. | 4.2% |
| Battery | 4.9% | Power Integrations, Inc. | 3.9% |
| Power Conv./Supply Equipment | 2.7% | SunPower Corp. , Class B | 3.6% |
| Industrials | 1.8% | Rubicon Technology, Inc. | 3.6% |
| Environmental Services | 1.8% | Echelon Corp. | 3.4% |
| Building Automation | 1.4% | Yingli Green Energy Holding Co. - ADR | 3.3% |
| Basic Materials | 1.2% | | |
| Net Other Assets and Liabilities | 2.0% | | |
| * | Based on percentage of net assets as of 12/31/10. |
| ** | Top 10 stock holdings total 46.3% of net assets. These holdings are current as of 12/31/10, and may not be representative of current or future investments. |
| www.firsthandfunds.com | 15 |
REPORT OF INDEPENDENT REGISTERED PUBLIC ACCOUNTING FIRM
To the Shareholders and Board of Trustees
Firsthand Funds, San Jose, California
We have audited the accompanying statements of assets and liabilities of Firsthand Funds (the “Funds”), comprising respectively, the Firsthand Technology Value Fund, Firsthand Technology Leaders Fund, Technology Opportunities Fund and Firsthand Alternative Energy Fund, including the portfolios of investments as of December 31, 2010, and the related statements of operations for the year then ended, the statements of changes in net assets for each of the two years in the period then ended, the statement of cash flows (with respect to the Firsthand Technology Fund) for the year then ended and the financial highlights for the periods indicated thereon. These financial statements and financial highlights are the responsibility of the Funds’ management. Our responsibility is to express an opinion on those financial statements and financial highlights based on our audits.
We conducted our audits in accordance with the standards of the Public Company Accounting Oversight Board (United States). Those standards require that we plan and perform the audit to obtain reasonable assurance about whether the financial statements and financial highlights are free of material misstatement. The Fund is not required to have, nor were we engaged to perform, an audit of its internal control over financial reporting. Our audits included consideration of internal control over financial reporting as a basis for designing audit procedures that are appropriate in the circumstances, but not for the purpose of expressing an opinion on the effectiveness of the Fund’s internal control over financial reporting. Accordingly, we express no such opinion. An audit includes examining, on a test basis, evidence supporting the amounts and disclosures in the financial statements. Our procedures included confirmation of securities owned as of December 31, 2010 by correspondence with the custodian, issuers and brokers or by other appropriate auditing procedures as deemed necessary. As described in Note 5, Firsthand Technology Value Fund has restricted securities, representing 7.84% of the Fund’s net assets, that do not have market quotations readily available and are valued at their fair value as determined in good faith using procedures established by the Board of Trustees. Amounts ultimately realized from the disposal of such restricted securities may vary significantly from the fair values presented. An audit also includes assessing the accounting principles used and significant estimates made by management, as well as evaluating the overall financial statement presentation. We believe that our audits provide a reasonable basis for our opinion.
In our opinion, the financial statements and financial highlights referred to above present fairly, in all material respects, the financial position of Firsthand Funds as of December 31, 2010, the results of their operations for the year then ended, the changes in their net assets for each of the two years in the period then ended, the statement of cash flows (with respect to the Firsthand Technology Value Fund) for the year then ended and the financial highlights for the periods indicated thereon, in conformity with accounting principles generally accepted in the United States of America.
TAIT, WELLER & BAKER, LLP
Philadelphia, Pennsylvania
February 19, 2011
FIRSTHAND TECHNOLOGY VALUE FUND
Portfolio of Investments (as of 12/31/10)
| | | | | | MARKET | |
| | | SHARES | | | VALUE | |
| COMMON STOCKS — 80.8% ($103,840,094) | | | | | | |
| Advanced Materials — 8.0% ($10,249,152) | | | | | | |
| Corning, Inc. | | | 258,600 | | | $ | 4,996,152 | |
| MEMC Electronic Materials, Inc. * | | | 300,000 | | | | 3,378,000 | |
UCT Coatings, Inc., Common Stock *(1) | | | 1,500,000 | | | | 1,875,000 | |
| Battery — 3.7% ($4,789,080) | | | | | | | | |
| A123 Systems, Inc. * | | | 502,000 | | | | 4,789,080 | |
| Communications — 3.1% ($3,975,590) | | | | | | | | |
| Clearwire Corp., Class A * | | | 298,600 | | | | 1,537,790 | |
| Equinix, Inc. * | | | 30,000 | | | | 2,437,800 | |
| Communications Equipment — 9.7% ($12,511,859) | | | | | | | | |
| QUALCOMM, Inc. | | | 175,300 | | | | 8,675,597 | |
| ZTE Corp. | | | 965,000 | | | | 3,836,262 | |
| Computer-Integrated — 0.3% ($394,000) | | | | | | | | |
| Wave Systems Corp., Class A * | | | 100,000 | | | | 394,000 | |
| Consumer Electronics — 2.7% ($3,412,302) | | | | | | | | |
| TiVo, Inc. * | | | 395,400 | | | | 3,412,302 | |
| Defense & Aerospace — 2.7% ($3,480,750) | | | | | | | | |
| FLIR Systems, Inc. * | | | 117,000 | | | | 3,480,750 | |
| Electronics Manufacturing Services — 0.3% ($333,902) | | | | | | | | |
| Quanta Computer, Inc. - GDR | | | 31,815 | | | | 333,902 | |
| Energy Efficiency — 3.5% ($4,479,524) | | | | | | | | |
| Echelon Corp. * | | | 439,600 | | | | 4,479,524 | |
| | | | | | MARKET | |
| | | SHARES | | | VALUE | |
Silicon Genesis Corp., Common *(1)(2) | | | 891,892 | | | $ | 8,919 | |
| Internet — 4.0% ($5,148,995) | | | | | | | | |
| Akamai Technologies, Inc. * | | | 15,900 | | | | 748,095 | |
| Ctrip.com International Ltd. - ADR * | | | 50,000 | | | | 2,022,500 | |
| Shanda Interactive Entertainment Ltd. - ADR * | | | 60,000 | | | | 2,378,400 | |
| Internet Security — 4.1% ($5,251,554) | | | | | | | | |
| McAfee, Inc. * | | | 113,400 | | | | 5,251,554 | |
| Networking — 4.7% ($6,069,000) | | | | | | | | |
| Cisco Systems, Inc. * | | | 300,000 | | | | 6,069,000 | |
| Other Electronics — 6.4% ($8,288,703) | | | | | | | | |
| Intevac, Inc. * | | | 571,700 | | | | 8,009,517 | |
| Microvision, Inc. * | | | 150,100 | | | | 279,186 | |
| Photonics — 2.9% ($3,769,290) | | | | | | | | |
| Newport Corp. * | | | 217,000 | | | | 3,769,290 | |
| Renewable Energy — 3.4% ($4,354,000) | | | | | | | | |
| GT Solar International, Inc. * | | | 150,000 | | | | 1,368,000 | |
| JA Solar Holdings Co., Ltd. - ADR * | | | 200,000 | | | | 1,384,000 | |
| Suntech Power Holdings Co., Ltd. - ADR * | | | 200,000 | | | | 1,602,000 | |
| Semiconductors — 17.8% ($22,815,594) | | | | | | | | |
| AXT, Inc. * | | | 61,543 | | | | 642,509 | |
| Broadcom Corp., Class A | | | 151,600 | | | | 6,602,180 | |
| Entropic Communications, Inc. * | | | 187,200 | | | | 2,261,376 | |
| Intel Corp. | | | 290,800 | | | | 6,115,524 | |
| Marvell Technology Group Ltd. * | | | 115,900 | | | | 2,149,945 | |
| SanDisk Corp. * | | | 50,000 | | | | 2,493,000 | |
| Semiconductor Manufacturing International Corp. - ADR * | | | 400,000 | | | | 1,464,000 | |
see accompanying notes to financial statements
| www.firsthandfunds.com | 17 |
FIRSTHAND TECHNOLOGY VALUE FUND - continued
Portfolio of Investments (as of 12/31/10)
| | | | | | MARKET | |
| | | SHARES | | | VALUE | |
| Synaptics, Inc. * | | | 37,000 | | | $ | 1,087,060 | |
| Services — 0.0% ($—) | | | | | | | | |
Innovion Corp. *(1) | | | 2 | | | | 0 | |
| Software — 3.5% ($4,507,880) | | | | | | | | |
| Microsoft Corp. | | | 101,500 | | | | 2,833,880 | |
| Symantec Corp. * | | | 100,000 | | | | 1,674,000 | |
| PREFERRED STOCK — 5.4% ($6,932,458) | | | | | | | | |
| Intellectual Property — 1.7% ($2,215,642) | | | | | | | | |
Silicon Genesis Corp., Series 1-C *(1)(2) | | | 82,914 | | | | 829 | |
Silicon Genesis Corp., Series 1-D *(1)(2) | | | 850,830 | | | | 8,508 | |
Silicon Genesis Corp., Series 1-E *(1)(2) | | | 5,704,480 | | | | 1,806,495 | |
Silicon Genesis Corp., Series 1-F *(1)(2) | | | 912,453 | | | | 399,810 | |
| Networking — 0.0% ($3,862) | | | | | | | | |
IP Unity, Inc., Series C *(1) | | | 1,932,222 | | | | 1,932 | |
IP Unity, Inc., Series E *(1) | | | 193,042 | | | | 1,930 | |
| Renewable Energy — 3.6% ($4,637,131) | | | | | | | | |
SoloPower, Series A *(1)(2) | | | 3,999,999 | | | | 2,635,079 | |
SoloPower, Series B *(1)(2) | | | 1,002,052 | | | | 1,002,052 | |
SoloPower, Series D *(1)(2) | | | 1,000,000 | | | | 1,000,000 | |
| Services — 0.1% ($75,823) | | | | | | | | |
Innovion Corp., Series A-1 *(1) | | | 324,948 | | | | 71,326 | |
Innovion Corp., Series A-2 *(1) | | | 168,804 | | | | 169 | |
Innovion Corp., Trust *(1) | | | 1 | | | | 4,328 | |
| CONVERTIBLE BOND — 1.0% ($1,250,000) | | | | | | | | |
| | | PAR VALUE/ | | | MARKET | |
| | | SHARES | | | VALUE | |
| Intellectual Property — 1.0% ($1,250,000) | | | | | | |
Silicon Genesis Corp., 12% (1)(2) | | $ | 1,250,000 | | | $ | 1,250,000 | |
| WARRANTS — 0.0% ($1,222) | | | | | | | | |
| Advanced Materials — 0.0% ($753) | | | | | | | | |
UCT Coatings, Inc., Common Warrant (1) | | | 136,986 | | | | 600 | |
UCT Coatings, Inc., Common Warrant (1) | | | 1,839 | | | | 8 | |
UCT Coatings, Inc., Common Warrant (1) | | | 33,001 | | | | 145 | |
| Intellectual Property — 0.0% ($—) | | | | | | | | |
Silicon Genesis Corp., 1-E Warrant *(1)(2) | | | 1,257,859 | | | | 0 | |
Silicon Genesis Corp., 1-E Warrant *(1)(2) | | | 94,339 | | | | 0 | |
Silicon Genesis Corp., Common Warrant *(1)(2) | | | 37,982 | | | | 0 | |
| Networking — 0.0% ($69) | | | | | | | | |
IP Unity, Inc., E-1 Warrant *(1) | | | 69,496 | | | | 69 | |
| Renewable Energy — 0.0% ($400) | | | | | | | | |
SoloPower Common Stock Warrant *(1)(2) | | | 3,999,999 | | | | 400 | |
| Total Investments (Cost $139,009,049) — 87.2% | | | | | | | 112,023,774 | |
| Other assets in excess of liabilities — 12.8% | | | | | | | 16,387,771 | |
| | | | | | | | | |
| NET ASSETS — 100.0% | | | | | | $ | 128,411,545 | |
| * | Non-income producing security. |
| ADR | American Depositary Receipt |
| GDR | Global Depositary Receipt |
see accompanying notes to financial statements
FIRSTHAND TECHNOLOGY LEADERS FUND
Portfolio of Investments (as of 12/31/10)
| | | SHARES/ | | | MARKET | |
| | | CONTRACTS | | | VALUE | |
| COMMON STOCKS — 89.0% ($30,785,119) | | | | | | |
| Advanced Materials — 6.0% ($2,073,036) | | | | | | |
| Corning, Inc. | | | 107,300 | | | $ | 2,073,036 | |
| Communications Equipment — 13.9% ($4,824,066) | | | | | | | | |
| Nokia Corp. - ADR | | | 104,100 | | | | 1,074,312 | |
| QUALCOMM, Inc. | | | 48,300 | | | | 2,390,367 | |
Telefonaktiebolaget Ericsson LM - ADR (1) | | | 117,900 | | | | 1,359,387 | |
| Computer — 11.6% ($4,001,416) | | | | | | | | |
| Apple, Inc. * | | | 11,100 | | | | 3,580,416 | |
| Hewlett-Packard Co. | | | 10,000 | | | | 421,000 | |
| Internet — 6.2% ($2,138,292) | | | | | | | | |
| Google, Inc., Class A * | | | 3,600 | | | | 2,138,292 | |
| Internet Security — 4.0% ($1,389,300) | | | | | | | | |
| McAfee, Inc. * | | | 30,000 | | | | 1,389,300 | |
| Networking — 3.0% ($1,043,868) | | | | | | | | |
| Cisco Systems, Inc. * | | | 51,600 | | | | 1,043,868 | |
| Other Electronics — 12.6% ($4,354,002) | | | | | | | | |
Koninklijke (Royal) Philips Electronics N.V. (1) | | | 40,000 | | | | 1,228,000 | |
| LG Display Co., Ltd. - ADR | | | 63,800 | | | | 1,132,450 | |
VeriFone Holdings, Inc. * (1) | | | 51,700 | | | | 1,993,552 | |
| Renewable Energy — 1.1% ($370,062) | | | | | | | | |
Suntech Power Holdings Co., Ltd. - ADR * (1) | | | 46,200 | | | | 370,062 | |
| Semiconductor Equipment — 1.2% ($421,500) | | | | | | | | |
| Applied Materials, Inc. | | | 30,000 | | | | 421,500 | |
| Semiconductors — 16.1% ($5,559,017) | | | | | | | | |
| Intel Corp. | | | 103,100 | | | | 2,168,193 | |
| | | | | | MARKET | |
| | | SHARES | | | VALUE | |
| Micron Technology, Inc. * | | | 116,300 | | | $ | 932,726 | |
| SanDisk Corp. * | | | 49,300 | | | | 2,458,098 | |
| Software — 13.3% ($4,610,560) | | | | | | | | |
Activision Blizzard, Inc. (1) | | | 100,000 | | | | 1,244,000 | |
| Microsoft Corp. | | | 48,000 | | | | 1,340,160 | |
| Oracle Corp. | | | 38,000 | | | | 1,189,400 | |
| Symantec Corp. * | | | 50,000 | | | | 837,000 | |
| | | | | | | | | |
| PURCHASED OPTIONS — 1.3% ($464,111) | | | | | | | | |
| Communications Equipment — 0.0% ($2,947) | | | | | | | | |
| Telefonaktiebolaget Ericsson LM - ADR Put Option, Expiring January 2011, Strike Price $10.00 | | | 1,179 | | | | 2,947 | |
| Other Electronics — 0.1% ($27,000) | | | | | | | | |
| Koninklijke (Royal) Philips Electronics N.V. Put Option, Expiring January 2011, Strike Price $30.00 | | | 400 | | | | 24,000 | |
| VeriFone Holdings, Inc. Put Option, Expiring January 2011, Strike Price $20.00 | | | 600 | | | | 3,000 | |
| Renewable Energy — 0.0% ($10,164) | | | | | | | | |
| Suntech Power Holdings Co., Ltd. - ADR Put Option, Expiring January 2011, Strike Price $7.50 | | | 462 | | | | 10,164 | |
| Semiconductor Equipment — 0.5% ($168,000) | | | | | | | | |
| ASML Holding N.V. Call Option, Expiring January 2011, Strike Price $30.00 | | | 200 | | | | 168,000 | |
| Semiconductors — 0.7% ($253,500) | | | | | | | | |
see accompanying notes to financial statements
| www.firsthandfunds.com | 19 |
FIRSTHAND TECHNOLOGY LEADERS FUND - continued
Portfolio of Investments (as of 12/31/10)
| | | | | | MARKET | |
| | | CONTRACTS | | | VALUE | |
| SanDisk Corp. Call Option, Expiring January 2011, Strike Price $45.00 | | | 507 | | | $ | 253,500 | |
| Software — 0.0% ($2,500) | | | | | | | | |
| Activision Blizzard, Inc. Put Option, Expiring January 2011, Strike Price $10.00 | | | 1,000 | | | | 2,500 | |
| Total Investments (Cost $26,600,370) — 90.3% | | | | | | | 31,249,230 | |
| Other assets in excess of liabilities — 9.7% | | | | | | | 3,359,387 | |
| | | | | | | | | |
| NET ASSETS — 100.0% | | | | | | $ | 34,608,617 | |
| | | | | | | | | |
WRITTEN OPTIONS — (3.5)% ($1,217,190) (2) | | | | | | | | |
| Communications Equipment — (0.0)% ($7,074) | | | | | | | | |
| Telefonaktiebolaget Ericsson LM - ADR Call Option, Expiring January 2011, Strike Price $12.50 | | | 1,179 | | | | (7,074 | ) |
| | | | | | MARKET | |
| | | CONTRACTS | | | VALUE | |
| Other Electronics — (3.0)% ($1,032,700) | | | | | | |
| Koninklijke (Royal) Philips Electronics N.V. Call Option, Expiring January 2011, Strike Price $30.00 | | | 400 | | | $ | (50,400 | ) |
| VeriFone Holdings, Inc. Call Option, Expiring January 2011, Strike Price $20.00 | | | 517 | | | | (982,300 | ) |
| Renewable Energy — (0.1)% ($31,416) | | | | | | | | |
| Suntech Power Holdings Co., Ltd. - ADR Call Option, Expiring June 2011, Strike Price $9.00 | | | 462 | | | | (31,416 | ) |
| Semiconductor Equipment — (0.0)% ($1,000) | | | | | | | | |
| ASML Holding N.V. Put Option, Expiring January 2011, Strike Price $27.50 | | | 200 | | | | (1,000 | ) |
| Software — (0.4)% ($145,000) | | | | | | | | |
| Activision Blizzard, Inc. Call Option, Expiring January 2011, Strike Price $11.00 | | | 1,000 | | | | (145,000 | ) |
| | | | | | | | | |
| Total Written Options (Proceeds $543,940) | | | | | | $ | (1,217,190 | ) |
| * | Non-income producing security. |
| (1) | Securities held in connection with open written call and put options. |
| (2) | Cash in the amount of $2,440,725 was segregated with the brokers to serve as collateral for written options and is included in “Other assets in excess of liabilities”. |
| ADR | American Depositary Receipt |
see accompanying notes to financial statements
FIRSTHAND TECHNOLOGY OPPORTUNITIES FUND(1)
Portfolio of Investments (as of 12/31/10)
| | | | | | MARKET | |
| | | SHARES | | | VALUE | |
| COMMON STOCKS — 81.8% ($69,802,763) | | | | | | |
| Battery — 1.2% ($1,049,400) | | | | | | |
| A123 Systems, Inc.* | | | 110,000 | | | $ | 1,049,400 | |
| Business Services — 4.4% ($3,763,180) | | | | | | | | |
| DG FastChannel, Inc.* | | | 90,000 | | | | 2,599,200 | |
| Digital River, Inc.* | | | 20,000 | | | | 688,400 | |
| Taleo Corp., Class A* | | | 17,200 | | | | 475,580 | |
| Communications — 1.9% ($1,625,200) | | | | | | | | |
| Equinix, Inc.* | | | 20,000 | | | | 1,625,200 | |
| Communications Equipment — 4.0% ($3,413,500) | | | | | | | | |
| Ciena Corp.* | | | 80,000 | | | | 1,684,000 | |
| Telefonaktiebolaget Ericsson LM - ADR | | | 150,000 | | | | 1,729,500 | |
| Computer — 3.0% ($2,580,480) | | | | | | | | |
| Apple, Inc.* | | | 8,000 | | | | 2,580,480 | |
| Consumer Electronics — 2.0% ($1,691,949) | | | | | | | | |
| Shutterfly, Inc.* | | | 48,300 | | | | 1,691,949 | |
| Data Processing/Management — 0.7% ($572,400) | | | | | | | | |
| CommVault Systems, Inc.* | | | 20,000 | | | | 572,400 | |
| Internet — 25.3% ($21,629,469) | | | | | | | | |
| 51job, Inc. - ADR* | | | 60,000 | | | | 2,955,000 | |
| Akamai Technologies, Inc.* | | | 46,200 | | | | 2,173,710 | |
| Baidu, Inc. - SP ADR* | | | 33,000 | | | | 3,185,490 | |
| comScore, Inc.* | | | 40,000 | | | | 892,400 | |
| Ctrip.com International Ltd. - ADR* | | | 50,000 | | | | 2,022,500 | |
| E-Commerce China Dangdang, Inc. - SP ADR* | | | 20,000 | | | | 541,400 | |
| Giant Interactive Group, Inc. - ADR | | | 100,000 | | | | 712,000 | |
| | | | | | MARKET | |
| | | SHARES | | | VALUE | |
| Google, Inc., Class A* | | | 4,000 | | | $ | 2,375,880 | |
| LivePerson, Inc.* | | | 140,000 | | | | 1,582,000 | |
| Mail.ru Group Ltd. - GDR* | | | 40,000 | | | | 1,440,000 | |
| SINA Corp.* | | | 20,000 | | | | 1,376,400 | |
| Tencent Holdings Ltd. | | | 30,000 | | | | 651,889 | |
| ValueClick, Inc.* | | | 60,000 | | | | 961,800 | |
| VistaPrint NV* | | | 16,500 | | | | 759,000 | |
| Internet Security — 3.8% ($3,241,700) | | | | | | | | |
| McAfee, Inc.* | | | 70,000 | | | | 3,241,700 | |
| Networking — 2.1% ($1,758,500) | | | | | | | | |
| Riverbed Technology, Inc.* | | | 50,000 | | | | 1,758,500 | |
| Other Electronics — 6.9% ($5,922,600) | | | | | | | | |
| Cree, Inc.* | | | 20,000 | | | | 1,317,800 | |
| L-1 Identity Solutions, Inc.* | | | 160,000 | | | | 1,905,600 | |
| VeriFone Systems, Inc. * | | | 70,000 | | | | 2,699,200 | |
| Peripherals — 1.0% ($815,500) | | | | | | | | |
| Xyratex Ltd.* | | | 50,000 | | | | 815,500 | |
| Renewable Energy — 2.9% ($2,460,248) | | | | | | | | |
| JA Solar Holdings Co., Ltd. - ADR* | | | 181,900 | | | | 1,258,748 | |
| Suntech Power Holdings Co., Ltd. - ADR * | | | 150,000 | | | | 1,201,500 | |
| Semiconductor Equipment — 0.4% ($310,800) | | | | | | | | |
| FormFactor, Inc.* | | | 35,000 | | | | 310,800 | |
| Semiconductors — 10.0% ($8,510,220) | | | | | | | | |
| ARM Holdings, PLC - SP ADR | | | 80,000 | | | | 1,660,000 | |
| Atheros Communications, Inc.* | | | 20,000 | | | | 718,400 | |
| Cavium Networks, Inc.* | | | 60,000 | | | | 2,260,800 | |
| NVIDIA Corp.* | | | 50,000 | | | | 770,000 | |
| SanDisk Corp.* | | | 22,000 | | | | 1,096,920 | |
| Skyworks Solutions, Inc.* | | | 70,000 | | | | 2,004,100 | |
see accompanying notes to financial statements
| www.firsthandfunds.com | 21 |
FIRSTHAND TECHNOLOGY OPPORTUNITIES FUND(1) - continued
Portfolio of Investments (as of 12/31/10)
| | | SHARES/ | | | MARKET | |
| | | CONTRACTS | | | VALUE | |
| Services — 1.0% ($886,800) | | | | | | |
| LogMeIn, Inc.* | | | 20,000 | | | $ | 886,800 | |
| Software — 11.2% ($9,570,817) | | | | | | | | |
| Activision Blizzard, Inc. | | | 100,000 | | | | 1,244,000 | |
Citrix Systems, Inc. (2)* | | | 18,800 | | | | 1,286,108 | |
| Electronic Arts, Inc.* | | | 70,000 | | | | 1,146,600 | |
| Fortinet, Inc.* | | | 50,000 | | | | 1,617,500 | |
| NICE-Systems Ltd. - ADR* | | | 15,900 | | | | 554,910 | |
| Novell, Inc.* | | | 300,000 | | | | 1,776,000 | |
| Shanda Games Ltd. - SP ADR* | | | 50,000 | | | | 322,000 | |
| VeriSign, Inc. | | | 49,700 | | | | 1,623,699 | |
| | | | | | | | | |
| EXCHANGE-TRADED FUND — 2.6% ($2,178,800) | | | | | | | | |
| Other — 2.6% ($2,178,800) | | | | | | | | |
| Powershares QQQ | | | 40,000 | | | | 2,178,800 | |
| | | | | | | | | |
| PURCHASED OPTIONS — 0.1% ($92,524) | | | | | | | | |
| Internet — 0.1% ($83,964) | | | | | | | | |
| Akamai Technologies, Inc. Put Option, Expiring Janauary 2011, Strike Price $46.00 | | | 462 | | | | 56,364 | |
| Baidu, Inc. - SP ADR Put Option, Expiring January 2011, Strike Price $91.00 | | | 200 | | | | 27,600 | |
| Semiconductors — 0.0% ($1,980) | | | | | | | | |
| | | | | | MARKET | |
| | | CONTRACTS | | | VALUE | |
| SanDisk Corp. Put Option, Expiring January 2011, Strike Price $40.00 | | | 220 | | | $ | 1,980 | |
| Software — 0.0% ($6,580) | | | | | | | | |
| Citrix Systems, Inc. Put Option, Expiring January 2011, Strike Price $60.00 | | | 188 | | | | 6,580 | |
| Total Investments (Cost $54,092,994) — 84.5% | | | | | | | 72,074,087 | |
| Other assets in excess of liabilities — 15.5% | | | | | | | 13,245,204 | |
| | | | | | | | | |
| NET ASSETS — 100.0% | | | | | | $ | 85,319,291 | |
| | | | | | | | | |
| | | | | | | | | |
| WRITTEN OPTIONS — (0.1)% ($52,820) | | | | | | | | |
| Services — (0.0)% ($1,000) | | | | | | | | |
| OpenTable Inc. Put Option, Expiring January 2011, Strike Price $40.00 | | | 200 | | | | (1,000 | ) |
| Software — (0.1)% ($51,820) | | | | | | | | |
| Citrix Systems, Inc. Call Option, Expiring January 2011, Strike Price $67.50 | | | 188 | | | | (49,820 | ) |
| VMware, Inc. Put Option, Expiring January 2011, Strike Price $60.00 | | | 200 | | | | (2,000 | ) |
| | | | | | | | | |
| Total Written Options (Proceeds $93,118) | | | | | | $ | (52,820 | ) |
| * | Non-income producing security. |
| (1) | Prior to 5/1/10, Firsthand Technology Opportunities Fund was named Firsthand e-Commerce Fund. |
| (2) | Securities held in connection with open written call options. |
| ADR | American Depositary Receipt |
| GDR | Global Depositary Receipt |
| PLC | Public Limited Company |
| SP ADR | Sponsored American Depositary Receipt |
see accompanying notes to financial statements
FIRSTHAND ALTERNATIVE ENERGY FUND
Portfolio of Investments (as of 12/31/10)
| | | | | | MARKET | |
| | | SHARES | | | VALUE | |
| COMMON STOCKS — 97.6% ($5,774,129) | | | | | | |
| Advanced Materials — 7.7% ($457,334) | | | | | | |
| Corning, Inc. | | | 9,460 | | | $ | 182,767 | |
| MEMC Electronic Materials, Inc.* | | | 9,130 | | | | 102,804 | |
| Metabolix, Inc.* | | | 4,700 | | | | 57,199 | |
| Praxair, Inc. | | | 1,200 | | | | 114,564 | |
| Basic Materials — 1.2% ($67,620) | | | | | | | | |
| Metalico, Inc.* | | | 11,500 | | | | 67,620 | |
| Battery — 4.9% ($287,154) | | | | | | | | |
| A123 Systems, Inc.* | | | 30,100 | | | | 287,154 | |
| Building Automation — 1.4% ($84,040) | | | | | | | | |
| Johnson Controls, Inc. | | | 2,200 | | | | 84,040 | |
| Energy Efficiency — 9.0% ($531,247) | | | | | | | | |
| Echelon Corp.* | | | 19,500 | | | | 198,705 | |
| Honeywell International, Inc. | | | 3,580 | | | | 190,313 | |
| Itron, Inc.* | | | 2,565 | | | | 142,229 | |
| Environmental Services — 1.8% ($104,904) | | | | | | | | |
| ADA-ES, Inc.* | | | 9,400 | | | | 104,904 | |
| Industrials — 1.8% ($108,400) | | | | | | | | |
| 3M Co. | | | 800 | | | | 69,040 | |
| United Technologies Corp. | | | 500 | | | | 39,360 | |
| Intellectual Property — 0.0% ($1,814) | | | | | | | | |
Silicon Genesis Corp., Common *(1) | | | 181,407 | | | | 1,814 | |
| Other Electronics — 6.7% ($398,396) | | | | | | | | |
| Intevac, Inc.* | | | 17,800 | | | | 249,378 | |
| Koninklijke (Royal) Philips Electronics N.V. | | | 4,854 | | | | 149,018 | |
| Power Conversion/Supply Equipment — 2.7% ($160,140) | | | | | | | | |
| Power-One, Inc.* | | | 15,700 | | | | 160,140 | |
| | | | | | MARKET | |
| | | SHARES | | | VALUE | |
| Renewable Energy — 52.9% ($3,129,508) | | | | | | |
| Amtech Systems, Inc.* | | | 6,600 | | | $ | 165,990 | |
| Daystar Technologies, Inc.* | | | 112 | | | | 178 | |
| FuelCell Energy, Inc.* | | | 5,000 | | | | 11,550 | |
| Gamesa Corp. Tecnologica S.A.* | | | 7,000 | | | | 53,431 | |
| GT Solar International, Inc.* | | | 41,900 | | | | 382,128 | |
| Iberdrola S.A. | | | 16,000 | | | | 123,325 | |
| JA Solar Holdings Co., Ltd. - ADR* | | | 65,000 | | | | 449,800 | |
| KYOCERA Corp. - ADR | | | 1,450 | | | | 148,350 | |
| Meyer Burger Technology AG* | | | 10,000 | | | | 311,765 | |
| Motech Industries, Inc. | | | 50,495 | | | | 186,175 | |
| Orion Energy Systems, Inc.* | | | 14,000 | | | | 46,620 | |
| Sharp Corp. | | | 11,000 | | | | 113,401 | |
| Solarfun Power Holdings Co., Ltd. - ADR* | | | 20,400 | | | | 166,668 | |
| SunPower Corp., Class B* | | | 17,000 | | | | 210,970 | |
Suntech Power Holdings Co., Ltd. - ADR (3)* | | | 22,420 | | | | 179,584 | |
| Trina Solar Ltd. - ADR* | | | 4,600 | | | | 107,732 | |
| ULVAC, Inc. | | | 2,700 | | | | 70,534 | |
| Vestas Wind Systems A.S.* | | | 6,000 | | | | 188,760 | |
| WaterFurnace Renewable Energy, Inc. | | | 600 | | | | 14,947 | |
| Yingli Green Energy Holding Co. - ADR* | | | 20,000 | | | | 197,600 | |
| Semiconductors — 7.5% ($443,572) | | | | | | | | |
| Power Integrations, Inc. | | | 5,799 | | | | 232,772 | |
| Rubicon Technology, Inc.* | | | 10,000 | | | | 210,800 | |
| | | | | | | | | |
| PREFERRED STOCK — 0.4% ($26,876) | | | | | | | | |
| Intellectual Property — 0.0% ($952) | | | | | | | | |
Silicon Genesis Corp., Series 1-C *(1) | | | 152 | | | | 2 | |
Silicon Genesis Corp., Series 1-E *(1) | | | 3,000 | | | | 950 | |
| Renewable Energy — 0.4% ($25,924) | | | | | | | | |
see accompanying notes to financial statements
| www.firsthandfunds.com | 23 |
FIRSTHAND ALTERNATIVE ENERGY FUND - continued
Portfolio of Investments (as of 12/31/10)
| | | | | | MARKET | |
| | | SHARES | | | VALUE | |
SoloPower, Series C-1 (1) | | | 21,425 | | | $ | 25,924 | |
| Total Investments (Cost $5,955,041) — 98.0% | | | | | | | 5,801,005 | |
| Other assets in excess of liabilities — 2.0% | | | | | | | 116,533 | |
| | | | | | | | | |
| NET ASSETS — 100.0% | | | | | | $ | 5,917,538 | |
| * | Non-income producing security. |
| ADR | American Depositary Receipt |
see accompanying notes to financial statements
STATEMENTS OF ASSETS AND LIABILITIES
For the year ended December 31, 2010
| | | | | | | | | FIRSTHAND | | | | |
| | | FIRSTHAND | | | FIRSTHAND | | | TECHNOLOGY | | | FIRSTHAND | |
| | | TECHNOLOGY | | | TECHNOLOGY | | | OPPORTUNITIES | | | ALTERNATIVE | |
| | | VALUE FUND | | | LEADERS FUND | | | FUND (1) | | | ENERGY FUND | |
| ASSETS | | | | | | | | | | | | |
| Investment securities: | | | | | | | | | | | | |
| Unaffiliated issuers at acquisition cost | | $ | 112,454,835 | | | $ | 26,600,370 | | | $ | 54,092,994 | | | $ | 5,955,041 | |
| Affiliated issuers at acquisition cost | | | 26,554,214 | | | | — | | | | — | | | | — | |
| Total acquisition cost | | $ | 139,009,049 | | | $ | 26,600,370 | | | $ | 54,092,994 | | | $ | 5,955,041 | |
| Unaffiliated issuers at market value | | $ | 103,911,682 | | | $ | 31,249,230 | | | $ | 72,074,087 | | | $ | 5,801,005 | |
| Affiliated issuers at market value | | | 8,112,092 | | | | — | | | | — | | | | — | |
Total market value(2) (Note 2) | | | 112,023,774 | | | | 31,249,230 | | | | 72,074,087 | | | | 5,801,005 | |
| Cash | | | 17,523,856 | | | | 2,341,366 | | | | 16,797,230 | | | | 59,607 | |
| Segregated cash | | | — | | | | 2,440,725 | | | | 2,100,000 | | | | 8,906 | |
| Foreign currency at value (cost $0, $0, $0 and $73,300) | | | — | | | | — | | | | — | | | | 84,402 | |
| Receivable from dividends, interest, and reclaims | | | 28,264 | | | | 219 | | | | 1,986 | | | | 644 | |
| Receivable for capital shares sold | | | — | | | | 868 | | | | 728,901 | | | | 271 | |
| Other assets (Note 6) | | | 40,231 | | | | — | | | | — | | | | — | |
| TOTAL ASSETS | | | 129,616,125 | | | | 36,032,408 | | | | 91,702,204 | | | | 5,954,835 | |
| | | | | | | | | | | | | | | | | |
| LIABILITIES | | | | | | | | | | | | | | | | |
Written options, at value (proceeds $0, $543,940, $93,118
and $0)(3) | | | — | | | | 1,217,190 | | | | 52,820 | | | | — | |
| Payable for securities purchased | | | 418,609 | | | | — | | | | 6,069,478 | | | | — | |
| Payable to affiliates (Note 4) | | | 211,939 | | | | 55,029 | | | | 125,476 | | | | 10,044 | |
| Payable for capital shares redeemed | | | 574,032 | | | | 151,572 | | | | 135,139 | | | | 27,253 | |
| TOTAL LIABILITIES | | | 1,204,580 | | | | 1,423,791 | | | | 6,382,913 | | | | 37,297 | |
| NET ASSETS | | $ | 128,411,545 | | | $ | 34,608,617 | | | $ | 85,319,291 | | | $ | 5,917,538 | |
| | | | | | | | | | | | | | | | | |
| Net Assets consist of: | | | | | | | | | | | | | | | | |
| Paid-in-capital | | $ | 1,195,148,454 | | | $ | 123,301,443 | | | $ | 76,402,826 | | | $ | 6,809,120 | |
| Accumulated net investment loss | | | — | | | | — | | | | — | | | | (27 | ) |
| Accumulated net realized losses from security transactions, rights, purchased options, foreign currency transactions, short sales and written options | | | (1,039,751,634 | ) | | | (92,668,436 | ) | | | (9,104,429 | ) | | | (748,636 | ) |
| Net unrealized appreciation (depreciation) on investments, warrants, purchased options, foreign currency and written options | | | (26,985,275 | ) | | | 3,975,610 | | | | 18,020,894 | | | | (142,919 | ) |
| NET ASSETS | | $ | 128,411,545 | | | $ | 34,608,617 | | | $ | 85,319,291 | | | $ | 5,917,538 | |
| | | | | | | | | | | | | | | | | |
| Shares outstanding | | | 4,493,234 | | | | 1,670,071 | | | | 14,112,983 | | | | 813,927 | |
| Net asset value, redemption price and offering price per share (Note 2) | | $ | 28.58 | | | $ | 20.72 | | | $ | 6.05 | | | $ | 7.27 | |
| (1) | Prior to May 1, 2010, Firsthand Technology Opportunities Fund was named Firsthand e-Commerce Fund. |
| (2) | Includes warrants and purchased options whose primary risk exposure is equity. |
| (3) | Primary risk exposure is equity contracts. |
see accompanying notes to financial statements
| www.firsthandfunds.com | 25 |
STATEMENTS OF OPERATIONS
For the year ended December 31, 2010
| | | | | | | | | FIRSTHAND | | | | |
| | | FIRSTHAND | | | FIRSTHAND | | | TECHNOLOGY | | | FIRSTHAND | |
| | | TECHNOLOGY | | | TECHNOLOGY | | | OPPORTUNITIES | | | ALTERNATIVE | |
| | | VALUE FUND | | | LEADERS FUND | | | FUND(1) | | | ENERGY FUND | |
| INVESTMENT INCOME | | | | | | | | | | | | |
| Unaffiliated dividends | | $ | 623,765 | | | $ | 351,753 | | | $ | 206,935 | | | $ | 34,749 | |
| Unaffiliated interest | | | 9,900 | | | | 949 | | | | 5,401 | | | | 141 | |
| Affiliated interest | | | 24,904 | | | | — | | | | — | | | | — | |
| Foreign tax withholding | | | (8,481 | ) | | | (24,330 | ) | | | (2,490 | ) | | | (2,707 | ) |
| TOTAL INVESTMENT INCOME | | | 650,088 | | | | 328,372 | | | | 209,846 | | | | 32,183 | |
| | | | | | | | | | | | | | | | | |
| EXPENSES | | | | | | | | | | | | | | | | |
| Investment advisory fees (Note 4) | | | 2,167,134 | | | | 502,574 | | | | 681,038 | | | | 98,234 | |
| Administration fees (Note 4) | | | 696,579 | | | | 161,541 | | | | 218,905 | | | | 28,893 | |
| Trustees fees | | | 11,017 | | | | 5,250 | | | | 5,250 | | | | 7,883 | |
| Miscellaneous fees | | | 79,093 | | | | — | | | | — | | | | — | |
| GROSS EXPENSES | | | 2,953,823 | | | | 669,365 | | | | 905,193 | | | | 135,010 | |
| Investment advisory fees waived (Note 4) | | | (11,017 | ) | | | (5,250 | ) | | | (5,250 | ) | | | (7,883 | ) |
| TOTAL NET EXPENSES | | | 2,942,806 | | | | 664,115 | | | | 899,943 | | | | 127,127 | |
| | | | | | | | | | | | | | | | | |
| NET INVESTMENT LOSS | | | (2,292,718 | ) | | | (335,743 | ) | | | (690,097 | ) | | | (94,944 | ) |
| | | | | | | | | | | | | | | | | |
| Net Realized and Unrealized Gain (Loss) on Investments: | | | | | | | | | | | | | | | | |
| Net realized gains from security transactions Non-affiliated | | | 25,611,006 | | | | 816,156 | | | | 5,471,690 | | | | (275,779 | ) |
Net realized gains (losses) from rights and purchased option transactions(2) | | | 45,790 | | | | (653,145 | ) | | | (1,352,937 | ) | | | (10,055 | ) |
| Net realized gains on foreign currency | | | 16 | | | | — | | | | — | | | | 2,491 | |
Net realized gains (losses) from written option transactions(2) | | | — | | | | 968,864 | | | | (658,841 | ) | | | 3,525 | |
| Net realized gains from securities sold short | | | — | | | | — | | | | — | | | | 28,428 | |
| Net change in unrealized appreciation (depreciation) on investments and foreign currency | | | (31,300,505 | ) | | | 2,641,976 | | | | 10,749,425 | | | | (518,511 | ) |
Net change in unrealized appreciation (depreciation) on purchased options and warrants(2) | | | (2,280,414 | ) | | | (9,676 | ) | | | (367,145 | ) | | | — | |
Net change in unrealized appreciation (depreciation) on written options(2) | | | — | | | | (673,250 | ) | | | 40,298 | | | | — | |
| Net change in unrealized appreciation on securities sold short | | | — | | | | — | | | | — | | | | 13,985 | |
| Net Realized and Unrealized Gain (Loss) on Investments | | | (7,924,107 | ) | | | 3,090,925 | | | | 13,882,490 | | | | (755,916 | ) |
| | | | | | | | | | | | | | | | | |
| Net Increase (Decrease) In Net Assets Resulting From Operations | | $ | (10,216,825 | ) | | $ | 2,755,182 | | | $ | 13,192,393 | | | $ | (850,860 | ) |
| (1) | Prior to May 1, 2010, Firsthand Technology Opportunities Fund was named Firsthand e-Commerce Fund. |
| (2) | Primary risk exposure is equity contracts. |
see accompanying notes to financial statements
STATEMENTS OF CHANGES IN NET ASSETS
For the Years Ended December 31, 2010, and December 31, 2009
| | | FIRSTHAND TECHNOLOGY VALUE FUND | | | FIRSTHAND TECHNOLOGY LEADERS FUND | |
| | | YEAR ENDED | | | YEAR ENDED | | | YEAR ENDED | | | YEAR ENDED | |
| | | 12/31/10 | | | 12/31/09 | | | 12/31/10 | | | 12/31/09 | |
| FROM OPERATIONS: | | | | | | | | | | | | |
| Net investment loss | | $ | (2,292,718 | ) | | $ | (2,548,979 | ) | | $ | (335,743 | ) | | $ | (333,675 | ) |
| Net realized gains (losses) from security transactions, rights, purchased options, foreign currency, and written options | | | 25,656,812 | | | | (81,527,061 | ) | | | 1,131,875 | | | | (2,805,853 | ) |
| Net change in unrealized appreciation (depreciation) on investments, warrants, purchased options, foreign currency and written options | | | (33,580,919 | ) | | | 128,457,808 | | | | 1,959,050 | | | | 18,138,195 | |
| Net increase (decrease) in net assets from operations | | | (10,216,825 | ) | | | 44,381,768 | | | | 2,755,182 | | | | 14,998,667 | |
| | | | | | | | | | | | | | | | | |
| FROM CAPITAL SHARE TRANSACTIONS: | | | | | | | | | | | | | | | | |
| Proceeds from shares sold | | | 9,308,577 | | | | 18,711,657 | | | | 1,686,438 | | | | 9,568,729 | |
| Payment for shares redeemed | | | (48,510,926 | ) | | | (51,258,771 | ) | | | (7,804,976 | ) | | | (14,237,211 | ) |
| Net decrease in net assets from capital share transactions | | | (39,202,349 | ) | | | (32,547,114 | ) | | | (6,118,538 | ) | | | (4,668,482 | ) |
| TOTAL INCREASE (DECREASE) IN NET ASSETS | | | (49,419,174 | ) | | | 11,834,654 | | | | (3,363,356 | ) | | | 10,330,185 | |
| | | | | | | | | | | | | | | | | |
| NET ASSETS: | | | | | | | | | | | | | | | | |
| Beginning of year | | | 177,830,719 | | | | 165,996,065 | | | | 37,971,973 | | | | 27,641,788 | |
| End of year | | $ | 128,411,545 | | | $ | 177,830,719 | | | $ | 34,608,617 | | | $ | 37,971,973 | |
| | | | | | | | | | | | | | | | | |
| CAPITAL SHARE ACTIVITY: | | | | | | | | | | | | | | | | |
| Shares sold | | | 303,356 | | | | 682,033 | | | | 85,888 | | | | 629,525 | |
| Shares redeemed | | | (1,674,738 | ) | | | (1,908,417 | ) | | | (403,259 | ) | | | (892,772 | ) |
| Net decrease in shares outstanding | | | (1,371,382 | ) | | | (1,226,384 | ) | | | (317,371 | ) | | | (263,247 | ) |
| Shares outstanding, beginning of year | | | 5,864,616 | | | | 7,091,000 | | | | 1,987,442 | | | | 2,250,689 | |
| Shares of beneficial interest outstanding (unlimited number of shares authorized, no par value), end of year | | | 4,493,234 | | | | 5,864,616 | | | | 1,670,071 | | | | 1,987,442 | |
see accompanying notes to financial statements
| www.firsthandfunds.com | 27 |
STATEMENTS OF CHANGES IN NET ASSETS - continued
For the Years Ended December 31, 2010, and December 31, 2009
| | | FIRSTHAND TECHNOLOGY OPPORTUNITIES FUND (1) | | | FIRSTHAND ALTERNATIVE ENERGY FUND | |
| | | YEAR ENDED | | | YEAR ENDED | | | YEAR ENDED | | | YEAR ENDED | |
| | | 12/31/10 | | | 12/31/09 | | | 12/31/10 | | | 12/31/09 | |
| FROM OPERATIONS: | | | | | | | | | | | | |
| Net investment loss | | $ | (690,097 | ) | | $ | (431,156 | ) | | $ | (94,944 | ) | | $ | (89,284 | ) |
| Net realized gains (losses) from security transactions, purchased options, foreign currency, short sales and written options | | | 3,459,912 | | | | (851,713 | ) | | | (251,390 | ) | | | (305,993 | ) |
| Net change in unrealized appreciation (depreciation) on investments, purchased options, foreign currency, short sales and written options | | | 10,422,578 | | | | 15,259,495 | | | | (504,526 | ) | | | 2,346,643 | |
| Net increase (decrease) in net assets from operations | | | 13,192,393 | | | | 13,976,626 | | | | (850,860 | ) | | | 1,951,366 | |
| | | | | | | | | | | | | | | | | |
| FROM CAPITAL SHARE TRANSACTIONS: | | | | | | | | | | | | | | | | |
| Proceeds from shares sold | | | 49,771,733 | | | | 7,050,328 | | | | 3,348,444 | | | | 4,954,588 | |
| Payment for shares redeemed | | | (12,499,897 | ) | | | (5,540,915 | ) | | | (4,006,738 | ) | | | (3,132,085 | ) |
| Net increase (decrease) in net assets from capital share transactions | | | 37,271,836 | | | | 1,509,413 | | | | (658,294 | ) | | | 1,822,503 | |
| TOTAL INCREASE (DECREASE) IN NET ASSETS | | | 50,464,229 | | | | 15,486,039 | | | | (1,509,154 | ) | | | 3,773,869 | |
| | | | | | | | | | | | | | | | | |
| NET ASSETS: | | | | | | | | | | | | | | | | |
| Beginning of year | | | 34,855,062 | | | | 19,369,023 | | | | 7,426,692 | | | | 3,652,823 | |
| End of year | | $ | 85,319,291 | | | $ | 34,855,062 | | | $ | 5,917,538 | | | $ | 7,426,692 | |
| Accumulated Net Investment Income (Loss) | | $ | — | | | $ | — | | | $ | (27 | ) | | $ | (2,374 | ) |
| | | | | | | | | | | | | | | | | |
| CAPITAL SHARE ACTIVITY: | | | | | | | | | | | | | | | | |
| Shares sold | | | 9,024,385 | | | | 1,694,954 | | | | 442,347 | | | | 778,385 | |
| Shares redeemed | | | (2,366,280 | ) | | | (1,444,951 | ) | | | (555,224 | ) | | | (494,615 | ) |
| Net increase (decrease) in shares outstanding | | | 6,658,105 | | | | 250,003 | | | | (112,877 | ) | | | 283,770 | |
| Shares outstanding, beginning of year | | | 7,454,878 | | | | 7,204,875 | | | | 926,804 | | | | 643,034 | |
| Shares outstanding, end of year | | | 14,112,983 | | | | 7,454,878 | | | | 813,927 | | | | 926,804 | |
| (1) | Prior to May 1, 2010, Firsthand Technology Opportunities Fund was named Firsthand e-Commerce Fund. |
see accompanying notes to financial statements
STATEMENT OF CASH FLOWS
December 31, 2010
| | | FIRSTHAND | |
| | | TECHNOLOGY | |
| | | VALUE FUND | |
| CASH FLOWS FROM OPERATING ACTIVITIES | | | |
| Net decrease in Net Assets resulting from operations | | $ | (10,216,825 | ) |
| | | | | |
| Adjustments to reconcile net decrease in Net Assets derived from operations to net cash provided by operating activities: | | | | |
| Purchases of investments | | | (63,047,313 | ) |
| Proceeds from disposition of investments | | | 115,914,161 | |
| Increase in dividends, interest, and reclaims receivable | | | (27,648 | ) |
| Cash received from litigation claim | | | 338,693 | |
| Decrease in payable to affiliates | | | (66,871 | ) |
| Net realized gain from investments | | | (25,656,796 | ) |
| Increase in other assets | | | (40,231 | ) |
| Net unrealized appreciation (depreciation) from investments | | | 33,580,919 | |
| Net cash provided by operating activities | | | 50,778,089 | |
| | | | | |
| CASH FLOWS FROM FINANCING ACTIVITIES | | | | |
| Proceeds from shares sold | | | 9,324,248 | |
| Proceeds for shares redeemed | | | (48,327,302 | ) |
| Net cash used in financing activities | | | (39,003,054 | ) |
| | | | | |
| Net change in cash | | | 11,775,035 | |
| Cash - beginning of year | | | 5,748,821 | |
| Cash - end of year | | $ | 17,523,856 | |
see accompanying notes to financial statements
| www.firsthandfunds.com | 29 |
FINANCIAL HIGHLIGHTS
Selected per share data and ratios for a share outstanding throughout each year
FIRSTHAND TECHNOLOGY VALUE FUND
| | | YEAR ENDED | | | YEAR ENDED | | | YEAR ENDED | | | YEAR ENDED | | | YEAR ENDED | |
| | | 12/31/10 | | | 12/31/09 | | | 12/31/08 | | | 12/31/07 | | | 12/31/06 | |
| Net asset value at beginning of year | | $ | 30.32 | | | $ | 23.41 | | | $ | 44.53 | | | $ | 36.09 | | | $ | 33.12 | |
| Income from investment operations: | | | | | | | | | | | | | | | | | | | | |
| Net investment loss | | | (0.51 | ) | | | (0.43 | ) | | | (0.62 | ) | | | (0.70 | ) | | | (0.72 | ) |
| Net realized and unrealized gains(losses) on investments | | | (1.23 | ) | | | 7.34 | | | | (20.50 | ) | | | 9.14 | | | | 3.69 | |
| Total from investment operations | | | (1.74 | ) | | | 6.91 | | | | (21.12 | ) | | | 8.44 | | | | 2.97 | |
| Net asset value at end of year | | $ | 28.58 | | | $ | 30.32 | | | $ | 23.41 | | | $ | 44.53 | | | $ | 36.09 | |
| Total return | | | (5.74 | %) | | | 29.52 | % | | | (47.43 | %) | | | 23.39 | % | | | 8.97 | % |
| Net assets at end of year (millions) | | $ | 128.4 | | | $ | 177.8 | | | $ | 166.0 | | | $ | 382.8 | | | $ | 370.9 | |
| Ratio of gross expenses to average net assets before waiver | | | 1.91 | % | | | 1.95 | % | | | 2.00 | % | | | 1.93 | % | | | 1.93 | % |
| Ratio of net expenses to average net assets after waiver | | | 1.90 | % | | | 1.94 | % | | | 1.94 | % | | | 1.93 | % | | | 1.92 | % |
| Ratio of net investment loss average net assets | | | (1.48 | %) | | | (1.49 | %) | | | (1.62 | %) | | | (1.57 | %) | | | (1.70 | %) |
| Portfolio turnover rate | | | 45 | % | | | 21 | % | | | 54 | % | | | 50 | % | | | 47 | % |
FINANCIAL HIGHLIGHTS
Selected per share data and ratios for a share outstanding throughout each year
FIRSTHAND TECHNOLOGY LEADERS FUND
| | | YEAR ENDED | | | YEAR ENDED | | | YEAR ENDED | | | YEAR ENDED | | | YEAR ENDED | |
| | | 12/31/10 | | | 12/31/09 | | | 12/31/08 | | | 12/31/07 | | | 12/31/06 | |
| Net asset value at beginning of year | | $ | 19.11 | | | $ | 12.28 | | | $ | 23.06 | | | $ | 20.23 | | | $ | 18.95 | |
| Income from investment operations: | | | | | | | | | | | | | | | | | | | | |
| Net investment loss | | | (0.20 | ) | | | (0.17 | ) | | | (0.21 | ) | | | (0.29 | ) | | | (0.29 | ) |
| Net realized and unrealized gains (losses) on investments | | | 1.81 | | | | 7.00 | | | | (10.57 | ) | | | 3.12 | | | | 1.57 | |
| Total from investment operations | | | 1.61 | | | | 6.83 | | | | (10.78 | ) | | | 2.83 | | | | 1.28 | |
| Net asset value at end of year | | $ | 20.72 | | | $ | 19.11 | | | $ | 12.28 | | | $ | 23.06 | | | $ | 20.23 | |
| Total return | | | 8.42 | % | | | 55.62 | % | | | (46.75 | %) | | | 13.99 | % | | | 6.75 | % |
| Net assets at end of year (millions) | | $ | 34.6 | | | $ | 38.0 | | | $ | 27.6 | | | $ | 63.5 | | | $ | 74.0 | |
| Ratio of gross expenses to average net assets before waiver | | | 1.86 | % | | | 1.92 | % | | | 2.07 | % | | | 1.96 | % | | | 1.96 | % |
| Ratio of net expenses to average net assets after waiver | | | 1.85 | % | | | 1.90 | % | | | 1.95 | % | | | 1.95 | % | | | 1.95 | % |
| Ratio of net investment loss average net assets | | | (0.94 | %) | | | (0.98 | %) | | | (1.03 | %) | | | (1.16 | %) | | | (1.13 | %) |
| Portfolio turnover rate | | | 37 | % | | | 25 | % | | | 78 | % | | | 35 | % | | | 53 | % |
see accompanying notes to financial statements
FINANCIAL HIGHLIGHTS
Selected per share data and ratios for a share outstanding throughout each year
FIRSTHAND TECHNOLOGY OPPORTUNITIES FUND*
| | | YEAR ENDED | | | YEAR ENDED | | | YEAR ENDED | | | YEAR ENDED | | | YEAR ENDED | |
| | | 12/31/10 | | | 12/31/09 | | | 12/31/08 | | | 12/31/07 | | | 12/31/06 | |
| Net asset value at beginning of year | | $ | 4.68 | | | $ | 2.69 | | | $ | 4.67 | | | $ | 4.05 | | | $ | 3.40 | |
| Income from investment operations: | | | | | | | | | | | | | | | | | | | | |
| Net investment loss | | | (0.05 | ) | | | (0.06 | ) | | | (0.06 | ) | | | (0.06 | ) | | | (0.06 | ) |
| Net realized and unrealized gains (losses) on investments | | | 1.42 | | | | 2.05 | | | | (1.92 | ) | | | 0.68 | | | | 0.71 | |
| Total from investment operations | | | 1.37 | | | | 1.99 | | | | (1.98 | ) | | | 0.62 | | | | 0.65 | |
| Net asset value at end of year | | $ | 6.05 | | | $ | 4.68 | | | $ | 2.69 | | | $ | 4.67 | | | $ | 4.05 | |
| Total return | | | 29.27 | % | | | 73.98 | % | | | (42.40 | %) | | | 15.31 | % | | | 19.12 | % |
| Net assets at end of year (millions) | | $ | 85.3 | | | $ | 34.9 | | | $ | 19.4 | | | $ | 40.7 | | | $ | 40.3 | |
| Ratio of gross expenses to average net assets before waiver | | | 1.86 | % | | | 1.92 | % | | | 2.14 | % | | | 1.96 | % | | | 1.98 | % |
| Ratio of net expenses to average net assets after waiver | | | 1.85 | % | | | 1.90 | % | | | 1.95 | % | | | 1.95 | % | | | 1.95 | % |
| Ratio of net investment loss average net assets | | | (1.42 | %) | | | (1.66 | %) | | | (1.58 | %) | | | (1.28 | %) | | | (1.51 | %) |
| Portfolio turnover rate | | | 164 | % | | | 41 | % | | | 41 | % | | | 44 | % | | | 59 | % |
| * | Prior to 5/1/10 Firsthand Technology Opportunities Fund was named Firsthand e-Commerce Fund. |
FINANCIAL HIGHLIGHTS
Selected per share data and ratios for a share outstanding throughout each year/period
FIRSTHAND ALTERNATIVE ENERGY FUND
| | | YEAR ENDED | | | YEAR ENDED | | | YEAR ENDED | | | PERIOD ENDED | |
| | | 12/31/10 | | | 12/31/09 | | | 12/31/08 | | | 12/31/07* | |
| Net asset value at beginning of year/period | | $ | 8.01 | | | $ | 5.68 | | | $ | 10.89 | | | $ | 10.00 | |
| Income from investment operations: | | | | | | | | | | | | | | | | |
| Net investment loss | | | (0.12 | ) | | | (0.10 | ) | | | (0.07 | ) | | | — | (a) |
| Net realized and unrealized gains (losses) on investments | | | (0.62 | ) | | | 2.43 | | | | (5.14 | ) | | | 0.89 | |
| Total from investment operations | | | (0.74 | ) | | | 2.33 | | | | (5.21 | ) | | | 0.89 | |
| Net asset value at end of year/period | | $ | 7.27 | | | $ | 8.01 | | | $ | 5.68 | | | $ | 10.89 | |
| Total return | | | (9.24 | %) | | | 41.02 | % | | | (47.84 | %) | | | 8.90 | (b) |
| Net assets at end of year/period (millions) | | $ | 5.9 | | | $ | 7.4 | | | $ | 3.7 | | | $ | 1.9 | |
| Ratio of gross expenses to average net assets before waiver | | | 2.10 | % | | | 2.27 | %** | | | 2.37 | %** | | | 2.10 | %(c) |
| | | | | | | | | | | | | | | | | |
| Ratio of net expenses to averagenet assets after waiver | | | 1.98 | % | | | 2.15 | %** | | | 2.11 | %** | | | 2.10 | %(c) |
| Ratio of net investment loss average net assets | | | (1.48 | %) | | | (1.68 | %) | | | (1.26 | %) | | | (0.07 | %)(c) |
| Portfolio turnover rate | | | 58 | % | | | 41 | % | | | 44 | % | | | — | (b) |
| * | For the period October 29, 2007 (inception) through December 31, 2007. |
| ** | Ratio for years ended 2009 and 2008 includes dividend expenses on securities sold short of 0.11% and 0.01%, respectively. |
see accompanying notes to financial statements
| www.firsthandfunds.com | 31 |
NOTES TO FINANCIAL STATEMENTS
December 31, 2010
Each of Firsthand Technology Value Fund, Firsthand Technology Leaders Fund, Firsthand Technology Opportunities Fund (named Firsthand e-Commerce Fund prior to May 1, 2010), and Firsthand Alternative Energy Fund (individually the “Fund”, and collectively the “Funds”) is a non-diversified series of Firsthand Funds (the “Trust”), an open-end management investment company registered under the Investment Company Act of 1940, as amended (the “1940 Act”). The Trust, a Delaware statutory trust, was organized on November 8, 1993. Each Fund currently offers one class of shares—Investor Class shares. The inception dates for the Funds (the date on which a net asset value was first determined for that Fund) follow:
| FUND | INCEPTION DATE |
| Firsthand Technology Value Fund | May 20, 1994* |
| Firsthand Technology Leaders Fund | December 10, 1997 |
| Firsthand Technology Opportunities Fund | September 30, 1999 |
| Firsthand Alternative Energy Fund | October 29, 2007 |
| * | Firsthand Technology Value Fund Investor Class commenced operations on May 20, 1994; the SEC effective date for the Investor Class is December 15, 1994. |
Each Fund’s investment objective is long-term growth of capital.
Firsthand Technology Value Fund seeks to achieve its investment objective by investing, under normal circumstances, at least 80% of its assets in high-technology companies that SiVest Group, Inc. (the “Investment Adviser”) believes are undervalued and have potential for capital appreciation.
Firsthand Technology Leaders Fund seeks to achieve its investment objective by investing, under normal circumstances, at least 80% of its assets in high-technology companies that the Investment Adviser believes hold dominant competitive positions in high-growth industries.
Firsthand Technology Opportunities Fund seeks to achieve its investment objective by investing, under normal circumstances, at least 80% of its assets in equity securities of high-technology companies in the industries and markets that the Investment Adviser believes hold the most growth potential within the technology sector.
Firsthand Alternative Energy Fund seeks to achieve its investment objective by investing, under normal circumstances, at least 80% of its assets in alternative energy and energy technology companies, both U.S. and international.
2. Significant Accounting Policies
The following is a summary of the Funds’ significant accounting policies:
NOTES TO FINANCIAL STATEMENTS - continued
December 31, 2010
Securities Valuation — A Fund’s portfolio of securities is valued as follows:
| | 1. | Securities traded on stock exchanges, or quoted by NASDAQ, are valued according to the NASDAQ official closing price, if applicable, or at their last reported sale price as of the close of trading on the New York Stock Exchange (“NYSE”) (normally 4:00 P.M. Eastern Time). If a security is not traded that day, the security will be valued at its most recent bid price. |
| | 2. | Securities traded in the over-the-counter market, but not quoted by NASDAQ, are valued at the last sale price (or, if the last sale price is not readily available, at the most recent closing bid price as quoted by brokers that make markets in the securities) at the close of trading on the NYSE. |
| | 3. | Securities traded both in the over-the-counter market and on a stock exchange are valued according to the broadest and most representative market. |
| | 4. | Securities and other assets that do not have market quotations readily available are valued at their fair value as determined in good faith using procedures established by the Board of Trustees. |
In pricing illiquid, privately placed securities, the advisor follows well-accepted valuation techniques. Initial valuations are generally determined by the initial purchase price for each security. Subsequent to initial purchase, securities are repriced from time to time to reflect changes to the companies’ valuations caused by various events. Such events include, among others, a new round of financing establishing a new valuation for the company; material changes to a company’s business or business prospects, either due to company-specific internal issues (gaining or losing a major customer, missing a significant milestone, etc.) or macroeconomic events affecting the industry or the world. In analyzing a company’s valuation, factors that are also considered include a company’s cash flow, revenues, profitability, financial forecasts, and probability of success in those measures. Other potential factors include the value of comparable public and private companies and general market conditions.
Fair Value Measurement — In accordance with the authoritative guidance on fair value measurements and disclosures under GAAP, the Fund discloses the fair value of its investments in a hierarchy that prioritizes the inputs to valuation techniques used to measure the fair value. The hierarchy gives the highest priority to valuations based upon unadjusted quoted prices in active markets for identical assets or liabilities (level 1 measurement) and the lowest priority to valuations based upon unobservable inputs that are significant to the valuation (level 3 measurements).
The guidance establishes three levels of the fair value hierarchy as follows:
| | Level 1 – | Unadjusted quoted prices in active markets for identical assets or liabilities that the Funds have the ability to access |
| | Level 2 – | Observable inputs other than quoted prices included in level 1 that are observable for the asset or liability, either directly or indirectly. These inputs may include quoted prices for the identical instrument on an inactive mar- |
| www.firsthandfunds.com | 33 |
NOTES TO FINANCIAL STATEMENTS - continued
December 31, 2010
| | | ket, prices for similar instruments, interest rates, prepayment speeds, credit risks, yield curves, default rates, and similar data. |
| | Level 3 – | Unobservable inputs for the asset or liability, to the extent relevant observable inputs are not available, representing the Funds’ own assumptions about the assumptions a market participant would use in valuing the asset or liability, and would be based on the best information available. |
The availability of observable inputs can vary from security to security and is affected by a wide variety of factors, including, for example, the type of security, whether the security is new and not yet established in the marketplace, the liquidity of markets, and other characteristics particular to the security. To the extent that valuation is based on models or inputs that are less observable or unobservable in the market, the determination of fair value requires more judgment. Accordingly, the degree of judgment exercised in determining fair value is greatest for instruments categorized in level 3.
The inputs used to measure fair value may fall into different levels of the fair value hierarchy. In such cases, for disclosure purposes, the level in the fair value hierarchy within which the fair value measurement falls in its entirety, is determined based on the lowest level input that is significant to the fair value measurement in its entirety.
The inputs or methodology used for valuing securities are not necessarily an indication of the risk associated with investing in those securities. The following is a summary of the inputs used to value the following Funds’ net assets as of December 31, 2010:
| FUND* | | | | | | | | | |
| TVFQX | | | | | | | | | |
| Common Stocks | | | | | | | | | |
| Advanced Materials | | $ | 8,374,152 | | | $ | — | | | $ | 1,875,000 | |
| Battery | | | 4,789,080 | | | | — | | | | — | |
| Communications | | | 3,975,590 | | | | — | | | | — | |
| Communications Equipment | | | 12,511,859 | | | | — | | | | — | |
| Computer-Integrated | | | 394,000 | | | | — | | | | — | |
| Consumer Electronics | | | 3,412,302 | | | | — | | | | — | |
| Defense & Aerospace | | | 3,480,750 | | | | — | | | | — | |
| Electronics Manufacturing Services | | | — | | | | 333,902 | | | | — | |
| Energy Efficiency | | | 4,479,524 | | | | — | | | | — | |
| Intellectual Property | | | — | | | | — | | | | 8,919 | |
| Internet | | | 5,148,995 | | | | — | | | | — | |
| Internet Security | | | 5,251,554 | | | | — | | | | — | |
| Networking | | | 6,069,000 | | | | — | | | | — | |
| Other Electronics | | | 8,288,703 | | | | — | | | | — | |
| Photonics | | | 3,769,290 | | | | — | | | | — | |
| Renewable Energy | | | 4,354,000 | | | | — | | | | — | |
| Semiconductors | | | 22,815,594 | | | | — | | | | — | |
NOTES TO FINANCIAL STATEMENTS - continued
December 31, 2010
| FUND* | | | | | | | | | |
| TVFQX - continued | | | | | | | | | |
| Services | | | — | | | | — | | | | — | |
| Software | | | 4,507,880 | | | | — | | | | — | |
| Total Common Stocks | | | 101,622,273 | | | | 333,902 | | | | 1,883,919 | |
| Preferred Stocks | | | | | | | | | | | | |
| Intellectual Property | | | — | | | | — | | | | 2,215,642 | |
| Networking | | | — | | | | — | | | | 3,862 | |
| Renewable Energy | | | — | | | | — | | | | 4,637,131 | |
| Services | | | — | | | | — | | | | 75,823 | |
| Total Preferred Stocks | | | — | | | | — | | | | 6,932,458 | |
| Asset Derivatives | | | | | | | | | | | | |
| Equity Contracts | | | — | | | | — | | | | 1,222 | |
| Convertible Bonds | | | | | | | | | | | | |
| Intellectual Property | | | — | | | | — | | | | 1,250,000 | |
| Total | | $ | 101,622,273 | | | $ | 333,902 | | | $ | 10,067,599 | |
| | | | | | | | | | | | | |
| FUND* | | | | | | | | | |
| TLFQX | | | | | | | | | | | | |
| Common Stocks | | | | | | | | | | | | |
| Advanced Materials | | $ | 2,073,036 | | | $ | — | | | $ | — | |
| Communications | | | | | | | | | | | | |
| Equipment | | | 4,824,066 | | | | — | | | | — | |
| Computer | | | 4,001,416 | | | | — | | | | — | |
| Internet | | | 2,138,292 | | | | — | | | | — | |
| Internet Security | | | 1,389,300 | | | | — | | | | — | |
| Networking | | | 1,043,868 | | | | — | | | | — | |
| Other Electronics | | | 4,354,002 | | | | — | | | | — | |
| Renewable Energy | | | 370,062 | | | | — | | | | — | |
| Semiconductor Equipment | | | 421,500 | | | | — | | | | — | |
| Semiconductors | | | 5,559,017 | | | | — | | | | — | |
| Software | | | 4,610,560 | | | | — | | | | — | |
| Total Common Stock | | | 30,785,119 | | | | | | | | | |
| Asset Derivatives | | | | | | | | | | | | |
| Equity Contracts | | | — | | | | 464,111 | | | | — | |
| Total | | $ | 30,785,119 | | | $ | 464,111 | | | $ | — | |
| | | | | | | | | | | | | |
| Liability Derivatives | | | | | | | | | | | | |
| Equity Contracts | | $ | — | | | $ | (1,217,190 | ) | | $ | — | |
| www.firsthandfunds.com | 35 |
NOTES TO FINANCIAL STATEMENTS - continued
December 31, 2010
| FUND* | | | | | | | | | |
| TEFQX | | | | | | | | | |
| Common Stocks | | | | | | | | | |
| Battery | | $ | 1,049,400 | | | $ | — | | | $ | — | |
| Business Services | | | 3,763,180 | | | | — | | | | — | |
| Communications | | | 1,625,200 | | | | — | | | | — | |
| Communications | | | | | | | | | | | | |
| Equipment | | | 3,413,500 | | | | — | | | | — | |
| Computer | | | 2,580,480 | | | | — | | | | — | |
| Consumer Electronics | | | 1,691,949 | | | | — | | | | — | |
| Data Processing/Management | | | 572,400 | | | | — | | | | — | |
| Internet | | | 21,629,469 | | | | — | | | | — | |
| Internet Security | | | 3,241,700 | | | | — | | | | — | |
| Networking | | | 1,758,500 | | | | — | | | | — | |
| Other Electronics | | | 5,922,600 | | | | — | | | | — | |
| Peripherals | | | 815,500 | | | | | | | | | |
| Renewable Energy | | | 2,460,248 | | | | — | | | | — | |
| Semiconductor Equipment | | | 310,800 | | | | — | | | | — | |
| Semiconductors | | | 8,510,220 | | | | — | | | | — | |
| Services | | | 886,800 | | | | — | | | | — | |
| Software | | | 9,570,817 | | | | — | | | | — | |
| Total Common Stock | | | 69,802,763 | | | | — | | | | — | |
| Exchanged-Traded Fund | | | 2,178,800 | | | | — | | | | — | |
| Asset Derivatives | | | | | | | | | | | | |
| Equity Contracts | | | — | | | | 92,524 | | | | — | |
| Total | | $ | 71,981,563 | | | $ | 92,524 | | | $ | — | |
| | | | | | | | | | | | | |
| Liability Derivatives | | | | | | | | | | | | |
| Equity Contracts | | $ | — | | | $ | (52,820 | ) | | $ | — | |
| | | | | | | | | | | | | |
| FUND* | | | | | | | | | |
| ALTEX | | | | | | | | | | | | |
| Common Stocks | | | | | | | | | | | | |
| Advanced Materials | | $ | 457,334 | | | $ | — | | | $ | — | |
| Basic Materials | | | 67,620 | | | | — | | | | — | |
| Battery | | | 287,154 | | | | — | | | | — | |
| Building Automation | | | 84,040 | | | | — | | | | — | |
| Energy Efficiency | | | 531,247 | | | | — | | | | — | |
| Environmental Services | | | 104,904 | | | | — | | | | — | |
NOTES TO FINANCIAL STATEMENTS - continued
December 31, 2010
| FUND* | | | | | | | | | |
| ALTEX - continued | | | | | | | | | |
| Industrials | | | 108,400 | | | | — | | | | — | |
| Intellectual Property | | | — | | | | — | | | | 1,814 | |
| Other Electronics | | | 398,396 | | | | — | | | | — | |
| Power Conversion/Supply Equipment | | | 160,140 | | | | — | | | | — | |
| Renewable Energy | | | 2,457,052 | | | | 672,456 | | | | — | |
| Semiconductors | | | 443,572 | | | | — | | | | — | |
| Total Common Stocks | | | 5,099,859 | | | | 672,456 | | | | 1,814 | |
| Preferred Stocks | | | | | | | | | | | | |
| Intellectual Property | | | — | | | | — | | | | 952 | |
| Renewable Energy | | | — | | | | — | | | | 25,924 | |
| Total Preferred Stocks | | | — | | | | — | | | | 26,876 | |
| Total | | $ | 5,099,859 | | | $ | 672,456 | | | $ | 28,690 | |
| * | TVFQX: Firsthand Technology Value Fund; TLFQX: Firsthand Technology Leaders Fund; TEFQX: Firsthand Technology Opportunities Fund; ALTEX: Firsthand Alternative Energy Fund. |
At the end of each calendar quarter, management evaluates the Level 2 and 3 assets and liabilities for changes in liquidity, including but not limited to: whether a broker is willing to execute at the quoted price, the depth and consistency of prices from third party services, and the existence of contemporaneous, observable trades in the market. Additionally, management evaluates the Level 1 and 2 assets and liabilities on a quarterly basis for changes in listings or delistings on national exchanges. Transfers in and out of the levels are recognized at the value at the end of the period. There were no significant transfers between Levels 1 and 2 during the period ended December 31, 2010.
Following is a reconciliation of Level 3 assets (at either the beginning or the ending of the period) for which significant unobservable inputs were used to determine fair value.
New Accounting Pronouncement — In January 2010, the Financial Accounting Standards Board (“FASB”) issued Accounting Standards Update (“ASU”) No. 2010-06 “Improving Disclosures about Fair Value Measurements”. ASU 2010-06 amends FASB Accounting Standards Codification Topic 820, Fair Value Measurements and Disclosures, to require additional disclosures regarding fair value measurements. Certain disclosures required by ASU No. 2010-06 are currently effective for interim and annual reporting periods beginning after December 15, 2009, and other required disclosures are effective for fiscal years beginning after December 15, 2010, and for interim periods within those fiscal years. Management has evaluated the impact and has incorporated the appropriate disclosures required by ASU No. 2010-06 in its financial statement disclosures.
| www.firsthandfunds.com | 37 |
NOTES TO FINANCIAL STATEMENTS - continued
December 31, 2010
FIRSTHAND TECHNOLOGY VALUE FUND
INVESTMENTS AT FAIR VALUE USING SIGNIFICANT | | BALANCE | | | NET | | | | | | NET UNREALIZED | | | TRANSFERS | | | BALANCE | |
| UNOBSERVABLE | | AS OF | | | PURCHASES | | | NET REALIZED | | | APPRECIATION | | | IN (OUT) | | | AS OF | |
| INPUTS (LEVEL 3) | | 12/31/09 | | | (SALES) | | | GAINS (LOSSES) | | | (DEPRECIATION) | | | OF LEVEL 3 | | | 12/31/10 | |
| Common Stocks | | | | | | | | | | | | | | | | | | |
| Advanced Materials | | $ | — | | | $ | 5,000,000 | | | $ | — | | | $ | (3,125,000 | ) | | $ | — | | | $ | 1,875,000 | |
| Intellectual Property | | | 1,503,079 | | | | — | | | | — | | | | (1,494,160 | ) | | | — | | | | 8,919 | |
| Renewable Energy | | | 47,044 | | | | 13,822 | | | | (7,961,411 | ) | | | 7,900,545 | | | | — | | | | — | |
| Services | | | — | | | | 3,000,075 | | | | — | | | | (3,000,075 | ) | | | — | | | | — | |
| Preferred Stocks | | | �� | | | | | | | | | | | | | | | | | | | | | |
| Advanced Materials | | | 5,000,000 | | | | (5,000,000 | ) | | | — | | | | — | | | | — | | | | — | |
| Intellectual Property | | | 20,027,910 | | | | — | | | | — | | | | (17,812,268 | ) | | | — | | | | 2,215,642 | |
| Networking | | | 230,806 | | | | — | | | | — | | | | (226,944 | ) | | | — | | | | 3,862 | |
| Renewable Energy | | | 18,598,037 | | | | 1,000,000 | | | | — | | | | (14,960,906 | ) | | | — | | | | 4,637,131 | |
| Services | | | 15,753 | | | | (2,808,601 | ) | | | — | | | | 2,868,671 | | | | — | | | | 75,823 | |
| Warrants | | | | | | | | | | | | | | | | | | | | | | | | |
| Equity Contracts | | | 2,162,196 | | | | — | | | | — | | | | (2,160,974 | ) | | | — | | | | 1,222 | |
| Convertible Bonds | | | | | | | | | | | | | | | | | | | | | | | | |
| Intellectual Property | | | — | | | | 1,250,000 | | | | — | | | | — | | | | — | | | | 1,250,000 | |
| Services | | | 71,753 | | | | (223,966 | ) | | | — | | | | 152,213 | | | | — | | | | — | |
| Total | | $ | 47,656,578 | | | $ | 2,231,330 | | | $ | (7,961,411 | ) | | $ | (31,858,898 | ) | | $ | — | | | $ | 10,067,599 | |
FIRSTHAND ALTERNATIVE ENERGY FUND
INVESTMENTS AT FAIR VALUE USING SIGNIFICANT | | BALANCE | | | NET | | | | | | NET UNREALIZED | | | TRANSFERS | | | BALANCE | |
| UNOBSERVABLE | | AS OF | | | PURCHASES | | | NET REALIZED | | | APPRECIATION | | | IN (OUT) | | | AS OF | |
| INPUTS (LEVEL 3) | | 12/31/09 | | | (SALES) | | | GAINS (LOSSES) | | | (DEPRECIATION) | | | OF LEVEL 3 | | | 12/31/10 | |
| Common Stocks | | | | | | | | | | | | | | | | | | |
| Intellectual Property | | $ | 309,186 | | | $ | — | | | $ | — | | | $ | (307,372 | ) | | $ | — | | | $ | 1,814 | |
| Preferred Stocks | | | | | | | | | | | | | | | | | | | | | | | | |
| Intellectual Property | | | 8,630 | | | | — | | | | — | | | | (7,678 | ) | | | — | | | | 952 | |
| Renewable Energy | | | 10,865 | | | | — | | | | — | | | | 15,059 | | | | — | | | | 25,924 | |
| Total | | $ | 328,681 | | | $ | — | | | $ | — | | | $ | (299,991 | ) | | $ | — | | | $ | 28,690 | |
The net change in unrealized appreciation (depreciation) from Level 3 investments held as of December 31, 2010, for Firsthand Technology Value Fund and Firsthand Alternative Energy Fund was $(42,895,978) and $(299,991) respectively, and is included in “Net change in unrealized appreciation on investments and foreign currency” on the Statement of Operations.
Share Valuation — The net asset value (“NAV”) per share of each Fund is calculated by dividing the sum of the value of the securities held by the Fund, plus cash or other assets, minus all liabilities (including estimated accrued expenses) by the total number of shares
NOTES TO FINANCIAL STATEMENTS - continued
December 31, 2010
outstanding of the Fund, rounded to the nearest cent. A Fund’s shares will not be priced on the days on which the NYSE is closed for trading. The offering and redemption price per share of each Fund is equal to a Fund’s net asset value per share.
Investment Income — Dividend income is recorded on the ex-dividend date. Interest income is accrued as earned. Discounts and premiums on securities purchased are amortized over the lives of the respective securities. Other non-cash dividends are recognized as investment income at the fair value of the property received. Withholding taxes on foreign dividends have been provided for in accordance with the Funds’ understanding of the applicable country’s tax rules and rates.
Cash and Cash Equivalents — The Fund considers liquid assets deposited with a bank, money market funds, and certain short-term debt instruments with maturities of 3 months or less to be cash equivalents. These investments represent amounts held with financial institutions that are readily accessible to pay Fund expenses or purchase investments.
Foreign Securities — Each Fund may invest in companies that trade on U.S. exchanges as American Depositary Receipts (“ADRs”), on foreign exchanges, or on foreign over-the-counter markets. Investing in the securities of foreign companies exposes your investment in a Fund to risk. Foreign stock markets tend to be more volatile than the U.S. market due to economic and/or political instability and the regulatory conditions in some countries. In addition, some of the securities in which the Fund may invest may be denominated in foreign currencies, the value of which may decline against the U.S. dollar. An investment in foreign securities may be subject to high levels of foreign taxation, including foreign taxes withheld at the source. The Fund does not isolate the portion of the results of operations resulting from changes in foreign exchange rates on investments from the fluctuations arising from changes in market prices of securities held. Reported net realized foreign exchange gains or losses arise from sales of portfolio securities, currency gains or losses realized between the trade and settlement dates on securities transactions, and the difference between the amounts of dividends, interest, and foreign withholding taxes recorded on the Funds’ books and the U.S. dollar equivalent of the amounts actually received or paid.
Options — The Funds are subject to equity price risk in the normal course of pursuing their investment objectives and may enter into options written to hedge against changes in the value of equities. The Funds (other than Firsthand Technology Value Fund) may purchase put and call options to attempt to provide protection against adverse price effects from anticipated changes in prevailing prices of securities or stock indices. The Funds (other than Firsthand Technology Value Fund) may also write put and call options. When the Fund writes an option, an amount equal to the premium received by the Fund is recorded as a liability and is subsequently adjusted to the current fair value of the option written. Premiums received from writing options that expire unexercised are treated by the Fund on the expiration date as realized gains from investments. The difference between the premium and the amount paid on effecting a closing purchase transaction, including brokerage commissions, is also treated as a realized gain, or, if the premium is less than the amount paid for the closing purchase transaction, as a realized loss. If a call
| www.firsthandfunds.com | 39 |
NOTES TO FINANCIAL STATEMENTS - continued
December 31, 2010
option is exercised, the premium is added to the proceeds from the sale of the underlying security or currency in determining whether the Fund has realized a gain or loss. The Fund as writer of an option bears the market risk of an unfavorable change in the price of the security underlying the written option.
The number of option contracts written and the premiums received during the year ended December 31, 2010, were as follows:
| | | FIRSTHAND TECHNOLOGY LEADERS FUND | |
| | | Number of | | | Premiums | |
| | | Contracts | | | Received | |
| Options outstanding, beginning of year | | | — | | | $ | — | |
| Options written during period | | | 13,786 | | | | 1,793,090 | |
| Options expired during period | | | (7,931 | ) | | | (788,224 | ) |
| Options closed during period | | | (542 | ) | | | (183,811 | ) |
| Options exercised during period | | | (1,555 | ) | | | (277,115 | ) |
| Options outstanding, end of year | | | 3,758 | | | $ | 543,940 | |
| | | FIRSTHAND TECHNOLOGY OPPORTUNITIES FUND | |
| | | Number of | | | Premiums | |
| | | Contracts | | | Received | |
| Options outstanding, beginning of year | | | — | | | $ | — | |
| Options written during period | | | 8,784 | | | | 1,755,866 | |
| Options expired during period | | | (792 | ) | | | (161,160 | ) |
| Options closed during period | | | (7,401 | ) | | | (1,501,366 | ) |
| Options exercised during period | | | (3 | ) | | | (222 | ) |
| Options outstanding, end of year | | | 588 | | | $ | 93,118 | |
The average volume of each Fund’s derivatives during the year ended December 31, 2010 is as follows:
| | | | | | PURCHASED | | | WRITTEN | |
| | | WARRANTS | | | OPTIONS | | | OPTIONS | |
| | | (SHARES) | | | (CONTRACTS) | | | (CONTRACTS) | |
| Firsthand Technology Value Fund | | | 3,037,687 | | | | — | | | | — | |
| Firsthand Technology Leaders Fund | | | — | | | | 3,462 | | | | 3,324 | |
| Firsthand Technology Opportunities Fund | | | — | | | | 2,067 | | | | 1,290 | |
Distributions to Shareholders — Each Fund expects to distribute its net investment income and net realized gains, if any, annually. Distributions from net investment income and capital gains are recorded on the ex-dividend date and are determined in accordance with income tax regulations, which may differ from accounting principles generally accepted in the United States.
NOTES TO FINANCIAL STATEMENTS - continued
December 31, 2010
Short Positions — Firsthand Alternative Energy Fund may sell securities short for economic hedging purposes. Short sales are transactions in which the Fund sells a security it does not own, in anticipation of a decline in the market value of that security. To initiate such a transaction, the Fund must borrow the security to deliver to the buyer upon the short sale; the Fund is then obligated to replace the security borrowed by purchasing it in the open market at some later date, completing the transaction. The Fund is liable for any dividends payable on securities while those securities are in a short position.
The Fund will incur a loss if the market price of the security increases between the date of the short sale and the date on which the Fund replaces the borrowed security. The Fund will realize a gain if the security declines in value between those dates.
All short sales must be fully collateralized. The Fund maintains the collateral in a segregated account consisting of cash, cash equivalents and/or liquid securities sufficient to collateralize the market value of its short positions. Typically, the segregated cash with brokers and other financial institutions exceeds the minimum required. Deposits with brokers for securities sold short are invested in money market instruments.
Reclassification of Capital Accounts—Permanent book and tax differences resulted in reclassifications for the year ended December 31, 2010 as follows:
| | | INCREASE (DECREASE) | |
| | | Paid-in-Capital | | | Accumulated Net Investment Loss | | | Accumulated Net Realized Gain (Loss) | |
| Firsthand Technology Value Fund | | $ | (636,308,922 | ) | | $ | 2,292,718 | | | $ | 634,016,204 | |
| Firsthand Technology Leaders Fund | | | (109,412,404 | ) | | | 335,743 | | | | 109,076,661 | |
| Firsthand Opportunities Fund | | | (137,431,811 | ) | | | 690,097 | | | | 136,741,714 | |
| Firsthand Alternative Energy Fund | | | (94,800 | ) | | | 97,291 | | | | (2,491 | ) |
These reclassifications, related to different treatment of short-term capital gains, interest on short sales and expiration of capital loss carryforwards have no effect on net asset value per share.
Security Transactions — Security transactions are accounted for no later than one business day following the trade date, however, for financial reporting purposes, security transactions are accounted for on trade date. Realized gains and losses are calculated on a specific identification basis.
Estimates — The preparation of financial statements in conformity with accounting principles generally accepted in the United States of America requires management to make estimates and assumptions that affect the reported amounts of assets and liabilities at the date of the financial statements and the reported amounts of income and expenses during the reporting period. Actual results could differ from those estimates.
| www.firsthandfunds.com | 41 |
NOTES TO FINANCIAL STATEMENTS - continued
December 31, 2010
Federal Income Tax — Each Fund has elected, and intends to qualify annually, for the special tax treatment afforded regulated investment companies under the Internal Revenue Code of 1986, as amended (the “Code”). As provided in the Code, in any fiscal year in which a Fund so qualifies and distributes at least 90% of its taxable net income, the Fund (but not the shareholders) will be relieved of federal income tax on the income distributed. Accordingly, no provision for income taxes has been made. To avoid imposition of the excise tax applicable to regulated investment companies, each Fund intends to declare as dividends in each calendar year at least 98% of its net investment income (earned during the calendar year) and 98% of its net realized capital gains (earned during the 12 months ended October 31) plus undistributed amounts, if any, from prior years. The following information is based upon the federal income tax cost of portfolio investments as of December 31, 2010.
| | | | | | FIRSTHAND | | | FIRSTHAND | | | FIRSTHAND | |
| | | FIRSTHAND | | | TECHNOLOGY | | | TECHNOLOGY | | | ALTERNATIVE | |
| | | TECHNOLOGY | | | LEADERS | | | OPPORTUNITIES | | | ENERGY | |
| | | VALUE FUND | | | FUND | | | FUND | | | FUND | |
| Gross unrealized appreciation | | $ | 15,442,652 | | | $ | 7,683,982 | | | $ | 17,019,971 | | | $ | 1,028,222 | |
| Gross unrealized depreciation | | | (42,430,935 | ) | | | (4,134,667 | ) | | | (1,277,099 | ) | | | (1,637,638 | ) |
| Net unrealized appreciation (depreciation) | | $ | (26,988,283 | ) | | $ | 3,549,315 | | | $ | 15,742,872 | | | $ | (609,416 | ) |
| Federal income tax cost, investments | | $ | 139,012,057 | | | $ | 27,699,915 | | | $ | 56,331,215 | | | $ | 6,410,421 | |
The difference between the acquisition cost and the federal income tax cost of portfolio investments is due to certain timing differences in the recognition of capital losses under accounting principles generally accepted in the United States and income tax regulations.
As of December 31, 2010, the Funds had capital loss carryforwards for federal income tax purposes as follows:
| | | EXPIRING | | | EXPIRING | | | EXPIRING | | | EXPIRING | | | EXPIRING | | | EXPIRING | |
| | | 2011 | | | 2012 | | | 2013 | | | 2014 | | | 2015 | | | 2016 | |
| TVFQX | | $ | 330,969,371 | | | $ | 333,067,019 | | | $ | 167,523,435 | | | $ | 64,782,991 | | | $ | 57,959,032 | | | $ | 7,972,313 | |
| TLFQX | | | 53,324,264 | | | | 33,348,418 | | | | 2,501,372 | | | | — | | | | — | | | | — | |
| TEFQX | | | 6,014,495 | | | | — | | | | — | | | | — | | | | — | | | | — | |
| ALTEX | | | — | | | | — | | | | — | | | | — | | | | — | | | | — | |
| | �� | EXPIRING | | | EXPIRING | | | | |
| | | 2017 | | | 2018 | | | TOTAL | |
| TVFQX | | $ | 72,762,429 | | | $ | 4,712,036 | | | $ | 1,039,748,626 | |
| TLFQX | | | 2,394,837 | | | | — | | | | 91,568,891 | |
| TEFQX | | | 851,713 | | | | — | | | | 6,866,208 | |
| ALTEX | | | 181,999 | | | | 108,018 | | | | 290,017 | |
For Firsthand Technology Value Fund, $2,310,150 of the $167,523,435 capital loss carryforward expiring in 2013 was acquired in the reorganization with Firsthand Global
NOTES TO FINANCIAL STATEMENTS - continued
December 31, 2010
Technology Fund, $3,455,691 of the $64,782,991 capital loss carryforward expiring in 2014 was acquired in the reorganization with Firsthand Technology Innovators Fund and $261,564 of the $57,959,032 capital loss carryforward expiring in 2015 was acquired in the reorganization with Firsthand Technology Innovators Fund.
Components of Distributable Earnings
| | | | | | FIRSTHAND | | | FIRSTHAND | | | FIRSTHAND | |
| | | FIRSTHAND | | | TECHNOLOGY | | | TECHNOLOGY | | | ALTERNATIVE | |
| | | TECHNOLOGY | | | LEADERS | | | OPPORTUNITIES | | | ENERGY | |
| | | VALUE FUND | | | FUND | | | FUND | | | FUND | |
| Undistributed Ordinary Income | | $ | — | | | $ | — | | | $ | — | | | $ | — | |
| Accumulated Earnings | | | — | | | | — | | | | — | | | | — | |
| Net Unrealized Appreciation (Depreciation)* | | | (26,988,283 | ) | | | 2,876,065 | | | | 15,782,673 | | | | (598,299 | ) |
| Post October Capital/Currency Loss** | | | — | | | | — | | | | — | | | | (3,266 | ) |
| Accumulated Capital Loss Carryforward | | | (1,039,748,626 | ) | | | (91,568,891 | ) | | | (6,866,208 | ) | | | (290,017 | ) |
| Total Distributable Earnings | | $ | (1,066,736,909 | ) | | $ | (88,692,826 | ) | | $ | 8,916,465 | | | $ | (891,582 | ) |
| * | The differences between book-basis and tax-basis unrealized appreciation (depreciation) is attributable primarily to tax deferral of losses on wash sales and foreign currency exchange gain (loss). |
| ** | Under current tax law, capital and currency losses realized after October 31 and prior to the Fund’s fiscal year end may be deferred as occurring on the first day of the following fiscal year. |
The Funds are subject to tax provisions that establish a minimum threshold for recognizing, and a system for measuring, the benefits of a tax position taken or expected to be taken in a tax return. Taxable years ending 2010, 2009, 2008 and 2007 remain open to federal and state audit. As of December 31, 2010, management has evaluated the application of these provisions to the Funds, and has determined that no provision for income tax is required in the Funds’ financial statements for uncertain tax provisions.
3. Investment transactions (excluding short-term investments) were as follows for the year ended December 31, 2010.
| | | | | | FIRSTHAND | | | FIRSTHAND | | | FIRSTHAND | |
| | | FIRSTHAND | | | TECHNOLOGY | | | TECHNOLOGY | | | ALTERNATIVE | |
| | | TECHNOLOGY | | | LEADERS | | | OPPORTUNITIES | | | ENERGY | |
| | | VALUE FUND | | | FUND | | | FUND | | | FUND | |
| Purchase of investment securities | | $ | 63,465,922 | | | $ | 11,990,707 | | | $ | 93,989,194 | | | $ | 3,431,069 | |
| Proceeds from sales and maturities of investment securities | | $ | 114,422,817 | | | $ | 16,874,856 | | | $ | 67,021,122 | | | $ | 3,503,487 | |
| www.firsthandfunds.com | 43 |
NOTES TO FINANCIAL STATEMENTS - continued
December 31, 2010
4. Investment Advisory and Administration Agreements; Certain trustees and officers of the Trust are also officers of the Investment Adviser and BNY Mellon.
INVESTMENT ADVISORY AGREEMENT
Each Fund’s investments are managed by the Investment Adviser pursuant to the terms of a master investment advisory agreement (the “Advisory Agreement”). Under the Advisory Agreement, the Investment Adviser provides each Fund with investment research, advice, management, and supervision and manages the investment and reinvestment of assets of each Fund consistent with each Fund’s investment objectives, policies, and limitations. Subject to certain exceptions set forth in the Advisory Agreement, the Investment Adviser is responsible for (i) compensation of any of the Fund’s trustees, officers, and employees who are interested persons of the Investment Adviser; and (ii) compensation of the Investment Adviser’s personnel and other expenses incurred in connection with the provision of portfolio management services under the Advisory Agreement.
Effective August 3, 2009, SiVest Group, Inc. became the Investment Adviser to the Funds. For the services it provides under the Advisory Agreement, the Investment Adviser receives from each Fund, on a monthly basis, an advisory fee at the annual rate of 1.40% of its average daily net assets (1.53% for ALTEX). The Advisory Agreement requires the Investment Adviser to waive fees and, if necessary, to reimburse expenses of each such Fund to the extent necessary to limit a Fund’s total operating expenses (excluding independent trustees’ compensation, brokerage commission expenses, litigation costs, and any extraordinary and non-recurring expenses) to 1.85% (1.98% for ALTEX) of its average net assets up to $200 million, 1.80% (1.93% for ALTEX) of such assets from $200 million to $500 million, 1.75% (1.88% for ALTEX) of such assets from $500 million to $1 billion, and 1.70% (1.83% for ALTEX) of such assets in excess of $1 billion.
Prior to August 3, 2009, Firsthand Capital Management, Inc. (“FCM”) served as the Investment Adviser to the Funds. For the services it provides under the Advisory Agreement, FCM received from each Fund, on a monthly basis, an advisory fee at the annual rate of 1.50% of its average daily net assets (1.65% for ALTEX). The Advisory Agreement requires the Investment Adviser to waive fees and, if necessary, to reimburse expenses of each such Fund to the extent necessary to limit a Fund’s total operating expenses (excluding independent trustees’ compensation, brokerage commission expenses, litigation costs, and any extraordinary and non-recurring expenses) to 1.95% (2.10% for ALTEX) of its average net assets up to $200 million, 1.90% (2.05% for ALTEX) of such assets from $200 million to $500 million, 1.85% (2.00% for ALTEX) of such assets from $500 million to $1 billion, and 1.80% (1.95% for ALTEX) of such assets in excess of $1 billion.
ADMINISTRATION AGREEMENT
The Trust has entered into a separate Administration Agreement with the Investment Adviser. The agreement obligates the Investment Adviser to provide administrative and general supervisory services to each Fund (the “Administration Agreement”). Under the Administration Agreement, the Investment Adviser renders supervisory and corporate administrative services to the Trust, as well as oversees the maintenance of all books and re
NOTES TO FINANCIAL STATEMENTS - continued
December 31, 2010
cords with respect to each Fund’s securities transactions and each Fund’s book of accounts in accordance with all applicable federal and state laws and regulations. The Investment Adviser also arranges for the preservation of journals, ledgers, corporate documents, brokerage account records, and other records as required by the 1940 Act.
The Investment Adviser is responsible for the equipment, staff, office space, and facilities necessary to perform its obligations under the Administration Agreement. Under the Administration Agreement, the Investment Adviser has assumed responsibility for payment of all of each Fund’s operating expenses excluding brokerage and commission expenses; short sale expenses; fees payable under “Rule 12b-1 plans”, if any, and shareholder servicing plans, if any; litigation costs; and any extraordinary and non-recurring expenses. For the services it provides under the Administration Agreement, the Investment Adviser receives a fee from each Fund at the annual rate of 0.45% of its average daily net assets up to $200 million, 0.40% of such assets from $200 million to $500 million, 0.35% of such assets from $500 million to $1 billion, and 0.30% of such assets in excess of $1 billion.
Effective November 23, 2009, PNC Global Investment Servicing (U.S.) Inc. (“PNC”) has entered into a Sub-Administration Agreement with the Investment Adviser. Under this agreement, the Investment Adviser (not the Funds) pays to PNC the fees for the administrative services provided by PNC. In the case of Firsthand Alternative Energy Fund, the Investment Adviser has also agreed to donate a portion of its management fees allocated, amounting to 0.20% of Firsthand Alternative Energy Fund’s average daily net assets, to various non-profit organizations as elected by Fund shareholders.
Additionally, effective November 23, 2009, PNC serves as the sub-administrator, investment accounting agent and shareholder servicing and transfer agent. Prior to November 23, 2009, Citi Fund Services Ohio, Inc. served as the sub-administrator, investment accounting agent and shareholder servicing and transfer agent. PFPC Trust Company serves as the custodian for the Trust.
On July 1, 2010, The PNC Financial Services Group, Inc. sold the outstanding stock of PNC Global Investment Servicing Inc. to The Bank of New York Mellon Corporation. At the closing of the sale, PNC Global Investment Servicing (U.S.) Inc. and PFPC Distributors, Inc. changed their names to BNY Mellon Investment Servicing (US) Inc. and BNY Mellon Distributors Inc., respectively. PFPC Trust Company will not change its name until a later date to be announced.
| www.firsthandfunds.com | 45 |
NOTES TO FINANCIAL STATEMENTS - continued
December 31, 2010
5. Investments in Affiliates and Restricted Securities
Affiliated issuers, as defined by the 1940 Act, are those in which a Fund’s holdings represent 5% or more of the outstanding voting securities of the issuer. A summary of each Fund’s investments in affiliates, if any, for the year ended December 31, 2010, is noted below:
| | | SHARES/PAR ACTIVITY | | | | | | | | | | |
| | | | | | Purchases/ | | | Sales/ | | | Balance | | | | | | | | | | | | | |
| | | Balance at | | | Merger/ | | | Maturity/ | | | at | | | Realized | | | Dividends/ | | | Value | | | Acquisition | |
| Affiliate | | 12/31/09 | | | Splits | | | Expiration | | | 12/31/10 | | | Gain (Loss) | | | Interest | | | 12/31/10 | | | Cost | |
| TVFQX | | | | | | | | | | | | | | | | | | | | | | | | |
| Silicon Genesis Corp., Common | | | 881,892 | | | | 10,000 | | | | — | | | | 891,892 | | | $ | — | | | $ | — | | | $ | 8,919 | | | $ | 5,201,267 | |
| Silicon Genesis Corp., Convertible Note | | | — | | | | 1,250,000 | | | | — | | | | 1,250,000 | | | | — | | | | 24,904 | | | | 1,250,000 | | | | 1,250,000 | |
| Silicon Genesis Corp., Common Warrant | | | 37,982 | | | | — | | | | — | | | | 37,982 | | | | — | | | | — | | | | — | | | | — | |
| Silicon Genesis Corp., Series 1-C | | | 82,914 | | | | — | | | | — | | | | 82,914 | | | | — | | | | — | | | | 829 | | | | 1,731,250 | |
| Silicon Genesis Corp., Series 1-D | | | 850,830 | | | | — | | | | — | | | | 850,830 | | | | — | | | | — | | | | 8,508 | | | | 4,315,500 | |
| Silicon Genesis Corp., Series 1-E | | | 5,704,480 | | | | — | | | | — | | | | 5,704,480 | | | | — | | | | — | | | | 1,806,495 | | | | 6,046,749 | |
| Silicon Genesis Corp., Series 1-E Warrant | | | 1,257,859 | | | | — | | | | — | | | | 1,257,859 | | | | — | | | | — | | | | — | | | | — | |
| Silicon Genesis Corp., Series 1-E Warrant | | | 94,339 | | | | — | | | | — | | | | 94,339 | | | | — | | | | — | | | | — | | | | — | |
| Silicon Genesis Corp., Series 1-F | | | 912,453 | | | | — | | | | — | | | | 912,453 | | | | — | | | | — | | | | 399,810 | | | | 2,007,397 | |
| SoloPower, Series A | | | 2,721,088 | | | | 1,278,911 | | | | — | | | | 3,999,999 | | | | — | | | | — | | | | 2,635,079 | | | | 3,999,999 | |
| SoloPower, Series B | | | 228,779 | | | | 773,273 | | | | — | | | | 1,002,052 | | | | — | | | | — | | | | 1,002,052 | | | | 1,002,052 | |
NOTES TO FINANCIAL STATEMENTS - continued
December 31, 2010
| | | SHARES/PAR ACTIVITY | | | | | | | | | | |
| | | | | | Purchases/ | | | Sales/ | | | Balance | | | | | | | | | | | | | |
| | | Balance at | | | Merger/ | | | Maturity/ | | | at | | | Realized | | | Dividends/ | | | Value | | | Acquisition | |
| Affiliate | | 12/31/09 | | | Splits | | | Expiration | | | 12/31/10 | | | Gain (Loss) | | | Interest | | | 12/31/10 | | | Cost | |
| TVFQX (cont’d) | | | | | | | | | | | | | | | | | | | | | | | | |
| SoloPower, Series D | | | — | | | | 1,000,000 | | | | — | | | | 1,000,000 | | | | — | | | | — | | | | 1,000,000 | | | | 1,000,000 | |
| SoloPower Warrant | | | — | | | | 3,999,999 | | | | — | | | | 3,999,999 | | | | — | | | | — | | | | 400 | | | | — | |
As of December 31, 2010, Kevin Landis represents the Funds and sits on the following private companies’ boards: Silicon Genesis Corporation and UCT Coatings, Inc. Serving on the boards of directors of the portfolio companies may cause conflicts of interest. The Adviser has adopted various procedures to ensure that the Fund will not be unfavorably affected by these potential conflicts.
Restricted securities include securities that have not been registered under the Securities Act of 1933, as amended, and securities that are subject to restrictions on resale. A Fund may invest in restricted securities that are consistent with a Fund’s investment objective and investment strategies. A Fund will not invest in a restricted security if, immediately after and as a result of the investment in such security, more than 15% of the Fund’s net assets would be invested in illiquid securities. In some cases, the issuer of restricted securities has agreed to register such securities for resale, at the issuer’s expense either upon demand by the Fund or in connection with another registered offering of the securities. Investments in restricted securities are valued at fair value as determined in good faith in accordance with procedures adopted by the Board of Trustees. It is possible that the estimated value may differ significantly from the amount that might ultimately be realized in the near term, and the difference could be material.
As of December 31, 2010, the Funds were invested in the following restricted securities:
| SECURITY | ACQUISITION DATE | | SHARES | | | COST | | | VALUE | | | | |
| TVFQX | | | | | | | | | | | | | |
| Innovion Corp., Common Stock | February 23, 2001 | | | 2 | | | $ | 3,000,075 | | | $ | — | | | | 0.00 | % |
| Innovion Corp., Trust | December 2, 2010 | | | 1 | | | | — | | | | 4,328 | | | | 0.00 | % |
| Innovion Corp., Series A-1 | December 30, 2003 | | | 324,948 | | | | 95,737 | | | | 71,326 | | | | 0.06 | % |
| Innovion Corp., Series A-2 | December 30, 2003 | | | 168,804 | | | | 95,737 | | | | 169 | | | | 0.00 | % |
| IP Unity, Inc., Series C P/S | July 27, 2001 | | | 1,932,222 | | | | 3,478,000 | | | | 1,932 | | | | 0.00 | % |
| IP Unity, Inc., Series E P/S | August 4, 2004 | | | 193,042 | | | | 313,307 | | | | 1,930 | | | | 0.00 | % |
| IP Unity, Inc., E-1 Warrant | August 4, 2004 | | | 69,496 | | | | 69 | | | | 69 | | | | 0.00 | % |
| Silicon Genesis Corp., Common Stock | March 8, 2001 | | | 102,135 | | | | 1,516,773 | | | | 1,021 | | | | 0.00 | % |
| www.firsthandfunds.com | 47 |
NOTES TO FINANCIAL STATEMENTS - continued
December 31, 2010
| SECURITY | ACQUISITION DATE | | SHARES | | | COST | | | VALUE | | | | |
TVFQX (cont’d) | | | | | | | | | | | | | |
| Silicon Genesis Corp., Common Stock | April 30, 2002 | | | 726,424 | | | | 3,684,494 | | | | 7,264 | | | | 0.01 | % |
| Silicon Genesis Corp., Common Stock (1) | November 21, 2005 | | | 23,333 | | | | — | | | | 234 | | | | 0.00 | % |
| Silicon Genesis Corp., Common Stock (1) | June 10, 2008 | | | 20,000 | | | | — | | | | 200 | | | | 0.00 | % |
| Silicon Genesis Corp., Common Stock (1) | May 19, 2009 | | | 10,000 | | | | — | | | | 100 | | | | 0.00 | % |
| Silicon Genesis Corp., Common Stock (1) | December 27, 2010 | | | 10,000 | | | | — | | | | 100 | | | | 0.00 | % |
| Silicon Genesis Corp., C/N | November 3, 2010 | | | 1,250,000 | | | | 1,250,000 | | | | 1,250,000 | | | | 0.97 | % |
| Silicon Genesis Corp., Common Warrants | November 4, 2003 | | | 37,982 | | | | — | | | | — | | | | 0.00 | % |
| Silicon Genesis Corp., Series 1-C P/S | March 8, 2001 | | | 82,914 | | | | 1,731,250 | | | | 829 | | | | 0.00 | % |
| Silicon Genesis Corp., Series 1-D P/S | April 30, 2002 | | | 850,830 | | | | 4,315,500 | | | | 8,508 | | | | 0.01 | % |
| Silicon Genesis Corp., Series 1-E P/S | November 4, 2003 | | | 5,704,480 | | | | 6,046,749 | | | | 1,806,495 | | | | 1.41 | % |
| Silicon Genesis Corp., Series 1-E Warrants | February 26, 2003 | | | 94,339 | | | | — | | | | — | | | | 0.00 | % |
| Silicon Genesis Corp., Series 1-E Warrants | October 31, 2003 | | | 1,257,859 | | | | — | | | | — | | | | 0.00 | % |
| Silicon Genesis Corp., Series 1-F P/S | June 27, 2007 | | | 912,453 | | | | 2,007,397 | | | | 399,810 | | | | 0.31 | % |
| SoloPower, Series A P/S | June 29, 2006 | | | 3,999,999 | | | | 3,999,999 | | | | 2,635,079 | | | | 2.05 | % |
| SoloPower, Series B P/S | July 9, 2007 | | | 1,002,052 | | | | 1,002,052 | | | | 1,002,052 | | | | 0.78 | % |
| SoloPower, Series D P/S | December 17, 2010 | | | 1,000,000 | | | | 1,000,000 | | | | 1,000,000 | | | | 0.78 | % |
| SoloPower Warrants | December 17, 2010 | | | 3,999,999 | | | | — | | | | 400 | | | | 0.00 | % |
UCT Coatings, Inc., Common
Warrants (2) | October 5, 2004 | | | 136,986 | | | | — | | | | 600 | | | | 0.00 | % |
| UCT Coatings, Inc., Common Warrants | 2008-2010 | | | 1,839 | | | | — | | | | 8 | | | | 0.00 | % |
| UCT Coatings, Inc., Common Warrants | May 13, 2009 | | | 33,001 | | | | — | | | | 145 | | | | 0.00 | % |
| UCT Coatings, Inc., Common Stock (2) | October 5, 2004 | | | 1,500,000 | | | | 5,000,000 | | | | 1,875,000 | | | | 1.46 | % |
| | | | | | | | $ | 38,537,139 | | | $ | 10,067,599 | | | | 7.84 | % |
NOTES TO FINANCIAL STATEMENTS - continued
December 31, 2010
| SECURITY | ACQUISITION DATE | | SHARES | | | COST | | | VALUE | | | | |
| ALTEX | | | | | | | | | | | | | |
| Silicon Genesis Corp., Common Stock | September 2, 2008 | | | 109,855 | | | $ | 32,957 | | | $ | 1,099 | | | | 0.02 | % |
| Silicon Genesis Corp., Common Stock | September 26, 2008 | | | 71,552 | | | | 21,466 | | | | 715 | | | | 0.01 | % |
| Silicon Genesis Corp., Series 1-C P/S | September 2, 2008 | | | 152 | | | | 46 | | | | 2 | | | | 0.00 | % |
| Silicon Genesis Corp., Series 1-E P/S | September 2, 2008 | | | 3,000 | | | | 3,180 | | | | 950 | | | | 0.02 | % |
| SoloPower, Series C-1 P/S | September 23, 2008 | | | 21,425 | | | | 21,425 | | | | 25,924 | | | | 0.44 | % |
| | | | | | | | $ | 79,074 | | | $ | 28,690 | | | | 0.49 | % |
| (1) | Shares granted at no cost by issuer. |
Each Fund, consistent with SEC guidelines, has an investment restriction providing that it cannot purchase additional restricted securities once such securities comprise 15% of a Fund’s net assets. The SEC considers a security to be illiquid if it cannot be disposed of within seven days in the ordinary course of business at approximately the amount at which a Fund has valued the security. The restriction stems from the concern that, for an open-end mutual fund with daily redemption obligations, a high level of illiquid securities would increase the risk that a Fund may not be able to meet its daily redemption needs, because illiquid securities often take a longer period of time to sell, and may not necessarily be sold at that Fund’s then carrying value. As of December 31, 2010, Firsthand Technology Value Fund has approximately 7.84% of its assets invested in illiquid securities and Firsthand Alternative Energy Fund has approximately 0.49% of its assets invested in illiquid securities.
Other assets consist of a contingent receivable from the sale of Solaicx to MEMC for an initial cash payment plus possible future cash payments if certain criteria is met.
Management has evaluated the impact of all subsequent events on the Fund through the date the financial statements were issued, and has determined that there was the following subsequent event:
In the second week of February, 2011, proxy statements were mailed to shareholders of Firsthand Technology Value Fund (“TVF”) to seek their vote on a potential reorganization of TVF into a business development company at a TVF shareholders meeting on April 14, 2011. If shareholders of TVF approve the reorganization at the meeting, closing is scheduled to be on April 15, 2011.
| www.firsthandfunds.com | 49 |
NOTES TO FINANCIAL STATEMENTS - continued
December 31, 2010
Because the return on and value of an investment in each Fund will fluctuate in response to stock market movements, the most significant risk of investing in a Fund is that you may lose money. Stocks and other equity securities are subject to market risks and fluctuations in value due to earnings, as well as economic, political, or regulatory events, and other factors beyond the Investment Adviser’s control. The Funds are designed for long-term investors who can accept the risks of investing in a fund with significant common stock holdings in high-technology industries.
Each Fund is non-diversified. A risk of being non-diversified is that a significant change in the value of one company will have a greater impact on the Fund than it would if the Fund diversified its investments. Another risk for the Fund is its concentration of investments in companies within high-technology industries. The value of high-technology companies can, and often does, fluctuate dramatically and may expose you to greater-than-average financial and market risk.
9. Investment Advisory and Administration Agreements (Unaudited)
As required by the Investment Company Act of 1940, as amended (the “1940 Act”), the Board of Trustees (the “Board”) of Firsthand Funds (the “Trust”), including all of the Trustees who are not “interested persons” of the Trust, as that term is defined in the 1940 Act (the “Independent Trustees”), recently considered the renewal of the investment advisory agreement between SiVest Group, Incorporated (the “Adviser”) and the Trust on behalf of each of its series (each a “Fund” and collectively, the “Funds”) (the “Advisory Agreement”). The Advisory Agreement was approved for an additional one-year term at a meeting of the Board held on August 13, 2010. The Board’s decision to approve the Advisory Agreement reflects the exercise of its business judgment to continue the existing arrangement. In approving the Advisory Agreement, the Board considered information provided by the Adviser, with the assistance and advice of counsel to the Independent Trustees and counsel to the Trust.
Nature, Extent and Quality of Services
The Board received and considered various data and information regarding the nature, extent and quality of services provided to the Funds by the Adviser. The most recent investment adviser registration form for the Adviser was provided to the Board, as were written and oral responses of the Adviser to an information request submitted by independent counsel on behalf of the Independent Trustees. The Board reviewed these responses, which included, among other things, information about the background and experience of the investment personnel of the Adviser primarily responsible for the day-to-day portfolio management services for the Funds. The Board also considered the Adviser’s separate administration agreement with the Funds and the Adviser’s overall ability to manage and administer the Funds, as well as to oversee the service providers to the Funds.
The Board evaluated the ability of the Adviser, considering its financial condition, resources, reputation and other attributes, to attract and retain highly qualified investment professionals, including research, advisory, supervisory and administrative personnel. In
NOTES TO FINANCIAL STATEMENTS - continued
December 31, 2010
this regard, the Board considered information regarding the Adviser’s compensation program for its personnel involved in the management of the Funds, including incentive and retirement plans.
The Board considered the effectiveness of policies of the Funds in achieving the best execution of portfolio transactions, whether and to what extent “soft dollar” benefits are sought, the extent to which efforts are made to recapture transaction costs, and the controls applicable to brokerage allocation procedures. The Board reviewed the policies of the Adviser regarding the allocation of portfolio investment opportunities among the Funds and other clients. The Board noted that the Adviser does not use “traditional soft-dollar” arrangements where soft-dollar credits are generated based on the level of trades and then used for products or services from third-parties. The Board also noted that the Adviser, from time to time, entered into arrangements where it received research (including invitations to conferences) from broker-dealers that the Adviser used to execute client trades. The Board also considered that the Adviser had recently outsourced the trading function to achieve certain operating efficiencies.
The Board also considered the markets for the Funds, including the principal channels through which the Funds’ shares are offered and sold, and the activities of the Adviser in connection with the marketing of the Funds.
The Board also received and reviewed information on Securities and Exchange Commission (“SEC”) and other inquiries, examinations and proceedings relating to the Funds, the Adviser and the former Adviser. The Board considered the investment and legal compliance programs of the Adviser, including its implementation of enhanced compliance policies and procedures in response to SEC rule changes and other regulatory initiatives, and the level of compliance attained by the Adviser.
Based on the above factors, together with those referenced below, the Board, including a majority of the Independent Trustees, concluded that it was generally satisfied with the nature, extent and quality of the investment advisory services provided to each of the Funds by the Adviser.
Fund Performance
The Board considered each Fund’s performance results for the one-year, three-year, five-year and ten-year periods, or shorter periods, as relevant. The Board examined these results in comparison to the performance results of various benchmark indices and of the Funds in relevant Morningstar sectors. The Board noted that the performance for the Firsthand Technology Opportunities Fund has been exceptionally good over the one-, three-, and five-year periods, despite its unremarkable performance over the past ten years; the Firsthand Technology Leaders Fund outperformed its primary benchmark over the one- and five-year periods and underperformed its primary benchmark over the three- and ten-year periods; the Firsthand Alternative Energy Fund has outperformed its primary benchmark in each calendar year since its inception in 2007; and the Firsthand Technology Value Fund has generally underperformed its primary benchmark over the one-, three-, five- and ten-year periods.
| www.firsthandfunds.com | 51 |
NOTES TO FINANCIAL STATEMENTS - continued
December 31, 2010
Investment Advisory Fee Rates and Other Expenses
The Board reviewed and considered the proposed contractual investment advisory fee rates (the “Advisory Agreement Rates”) payable by the Funds to the Adviser for investment advisory services. Additionally, the Board received and considered information comparing the Advisory Agreement Rates (both on a stand-alone basis and on a combined basis with the Funds’ administration fee rates) and the total expense ratios of the Funds with those of other funds in appropriate peer universes provided by Lipper. The Board concluded that the respective Advisory Agreement Rates were significantly higher than the median rates of each Fund’s peer universe, but that the total expense ratio of each Fund was not appreciably above the median total expense ratio of the respective peer universe. The Board deemed the comparison of total expense ratios to be more relevant than the comparison of Advisory Agreement Rates because of the unitary fee structure of the Funds.
Profitability
The Board received and considered a profitability analysis of the Adviser with respect to the Funds. The Board concluded that, in light of the costs of providing investment management and other services to the Funds, the profits and other ancillary benefits that the Adviser received with regard to providing these services to the Funds were not excessive.
Economies of Scale
The Board received and considered information regarding whether there have been economies of scale with respect to the management of the Funds, whether the Funds have appropriately benefited from any economies of scale, and whether there is potential for realization of any further economies of scale with respect to the existing Funds. The Board observed that the Advisory Agreement limits each Fund’s total annual operating expenses to a percentage of the Fund’s assets and that this percentage is reduced as the Fund’s assets grow (known as “breakpoints”). The Board also observed that the total assets of the Funds had declined during the year. The Board concluded that no change was necessary to the current breakpoints to reflect any economies of scale.
Information about Services to Other Clients
The Board also received and considered information about the services and fee rates offered by the Adviser to its other clients, including other registered and unregistered investment companies, private accounts and institutional investors. The Board concluded that the Advisory Agreement Rates charged by the Adviser to the Funds were within a reasonable range of the fee rates offered to other clients of the Adviser. Where rates offered to other clients were lower, the Board concluded that the costs associated with managing and operating a registered open-end fund, compared with an unregistered investment company, private account or institutional investor account provided a justification for higher fee rates to the Funds.
Other Benefits to the Adviser
The Board received and considered information regarding potential “fall-out” or ancillary benefits to the Adviser as a result of its relationship with the Funds. Such benefits could include, among others, benefits directly attributable to the relationship of the Adviser
NOTES TO FINANCIAL STATEMENTS - continued
December 31, 2010
with the Funds (such as “soft dollar” benefits) and benefits potentially derived from an increase in the business of the Adviser as a result of its relationship with the Funds (such as the ability to market to shareholders other financial products offered by the Adviser).
Other Factors and Broader Review
Throughout the year, the Board regularly reviews and assesses the quality of the services that the Funds receive from the Adviser. In this regard, the Board reviews reports of the Adviser at least in each of its quarterly meetings, which include, among other things, a detailed portfolio review and detailed fund performance reports. In addition, the Board interviews the portfolio managers of the Funds at various times throughout the year.
Based on all of the information presented to the Board and its consideration of relevant factors, the Board concluded that the fee paid to the Adviser by each Fund was reasonable, and in the exercise of its business judgment, determined to approve the continuation of the Advisory Agreement for each Fund.
10. Proxy Voting Policies and Procedures (Unaudited)
The Funds have adopted proxy voting procedures pursuant to which the Funds delegate the responsibility for voting proxies relating to portfolio securities held by the Funds to the Investment Adviser as part of the Investment Adviser’s general management of the Funds, subject to the Board of Trustees’ continuing oversight. A copy of the Funds’ proxy voting policy and procedures is available without charge, upon request, by calling 1.888.884.2675. Information regarding how the Investment Adviser voted these proxies during the most recent one-year period ended June 30 is available by calling the same number and on the website of the U.S. Securities and Exchange Commission at http://www.sec.gov on Form N-PX. The Funds’ voting record is also available on the Funds’ website at www.firsthandfunds.com/proxy.
11. Portfolio Holdings (Unaudited)
The Funds file their complete schedule of portfolio holdings with the SEC for the first and third quarters of each fiscal year on Form N-Q. The Funds’ Forms N-Q will be available on the SEC’s website at http://www.sec.gov and may be reviewed and copied at the SEC’s Public Reference Room in Washington, D.C. Information on the operation of the Public Reference Room may be obtained by calling 1.800.SEC.0330.
| www.firsthandfunds.com | 53 |
ADDITIONAL INFORMATION
December 31, 2010
Information about the trustees and officers* of the Funds is set forth in the following table. The Statement of Additional Information (SAI) includes additional information about the Funds’ trustees and officers and is available free of charge, upon request, by calling 1.888.884.2675.
NAME, YEAR OF BIRTH, POSITION(S) HELD WITH FUNDS AND ADDRESS | TERM OF OFFICE AND LENGTH OF TIME SERVED1 | PRINCIPAL OCCUPATION(S) DURING PAST FIVE YEARS | NUMBER OF FUNDS IN FUND COMPLEX OVERSEEN BY TRUSTEE | OTHER TRUSTEESHIPS HELD BY TRUSTEES |
| DISINTERESTED TRUSTEES |
Greg Burglin (1960) TRUSTEE 150 Almaden Blvd. Suite 1250 San Jose, CA 95113 | SINCE 2008 | Mr. Burglin is a Tax Consultant and has been for more than 5 years. | FOUR | ONE3 |
Rodney Yee (1960) TRUSTEE 150 Almaden Blvd. Suite 1250 San Jose, CA 95113 | SINCE 2010 | Mr. Yee is Chief Operating Officer, Chief Financial Officer, and Treasurer of ASA Limited (a closed-end investment company) from August 2010 to present. From November 2005 to August 2010, Mr Yee was Chief Operating Officer and Chief Compliance Officer of CCM Partners (an SEC registered investment adviser). From 2004 to 2005, Mr. Yee served as Chief Financial Officer of Matthews International Capital Management (an SEC registered investment adviser) and Treasurer of Mathews Asian Funds. | FOUR | ONE3 |
| INTERESTED TRUSTEE |
Kevin M. Landis2 (1961) TRUSTEE/PRESIDENT/ SECRETARY/TREASURER 150 Almaden Blvd. Suite 1250 San Jose, CA 95113 | SINCE 1994 | Mr. Landis is President and Chief Executive Officer of SiVest Group, Inc. and has been a portfolio manager with SiVest Group, Inc. since August 2009. He was President and Chief Investment Officer and a Director of Firsthand Capital Management, Inc. and was a portfolio manager with Firsthand Capital Management, Inc. from May 1994 to August 2009. | FOUR | ONE3,4 |
ADDITIONAL INFORMATION - continued
December 31, 2010
| NAME, YEAR OF BIRTH, POSITION(S) HELD WITH FUNDS AND ADDRESS | TERM OF OFFICE AND LENGTH OF TIME SERVED1 | PRINCIPAL OCCUPATION(S) DURING PAST FIVE YEARS | NUMBER OF FUNDS IN FUND COMPLEX OVERSEEN BY TRUSTEE | OTHER TRUSTEESHIPS HELD BY TRUSTEES |
| OFFICERS WHO ARE NOT TRUSTEES |
Ellen Blanchard(1973) ASSISTANT SECRETARY One Boston Place 201 Washington Street 34th Floor Boston, MA 02108 | SINCE 2010 | Ms. Blanchard is Counsel and Vice President of BNY Mellon Investment Servicing (US) Inc. formerly, PNC Global Investment Servicing (U.S.) Inc. since 2010. She was Vice President and Counsel, Compliance Advisory Services, State Street Bank & Trust, from 2004 to 2010. | N/A | N/A |
Nicholas P. Petredis (1951) CHIEF COMPLIANCE OFFICER 150 Almaden Blvd. Suite 1250 San Jose, CA 95113 | SINCE 2008 | Mr. Petredis has been a principal of Petredis Law Offices from 1993 to present. He was Managing Director and Senior Counsel of Firsthand Capital Management, Inc. from 2000 to 2001. | N/A | N/A |
| * | The term “officer” means the president, vice president, secretary, treasurer, chief compliance officer, controller, or any other officer who performs policy-making functions. |
| (1) | Each trustee shall serve for the lifetime of Firsthand Funds or until he dies, resigns, or is removed. Each officer shall serve a one-year term subject to annual reappointment by the trustees. |
| (2) | Mr. Landis is an interested person of the Funds by reason of his position with the Investment Adviser. |
| (3) | The Trustee also serves as a Director of Firsthand Technology Value Fund, Inc., a Maryland corporation that has elected to be treated as a “business development company” under the Investment Company Act (the “BDC”). The Trust has mailed proxy statements to shareholders of Firsthand Technology Value Fund (“TVF”) to seek their approval to reorganize TVF into the BDC. If shareholderes of TVF approve the reorganization, closing is expected to occur on April 15, 2011. |
| (4) | Mr. Landis also currently sits on the board of directors for two private companies: Silicon Genesis Corp and UCT Coatings, Inc. |
| www.firsthandfunds.com | 55 |
NOTES
NOTES
| www.firsthandfunds.com | 57 |
FIRSTHAND FUNDS
P.O. Box 9836
Providence, RI 02940-8036
www.firsthandfunds.com
INVESTMENT ADVISER
SiVest Group, Inc.
150 Almaden Blvd., Suite 1250
San Jose, CA 95113
www.sivestgroup.com
DISTRIBUTOR
ALPS Distributors, Inc.
1290 Broadway
Suite 1100
Denver, CO 80203
TRANSFER AGENT
BNY Mellon Investment Servicing (US) Inc.
P.O. Box 9836
Providence, RI 02940-8036
1.888.884.2675
This report is provided for the general information of the shareholders of Firsthand Funds. This report is not intended for distribution to prospective investors in the Funds, unless preceded or accompanied by an effective prospectus. For more complete information about Firsthand Funds, please call toll free 1.888.884.2675 or visit www.firsthandfunds.com for a prospectus, which contains more information, including risks, fees, and expenses. Read the prospectus carefully before investing or sending money.
Firsthand Funds are distributed by ALPS Distributors, Inc.
FHF000539, exp. 3/31/2012
Firsthand, Technology Value Fund, and the interlocking “F” design are registered trademarks of SiVest Group, Inc.
Registrant’s Board of Trustees has determined that it has one board member who is an “audit committee financial expert”, namely Rodney Yee. Mr. Yee is an “independent” trustee of the Board.
The registrant's Audit Committee Charter states the following with respect to pre-approval procedures:
Not applicable.
Not applicable.
Not applicable.
Not applicable.