CONTENTS
| Performance Summary | 2 |
| President’s Letter | 4 |
| Shareholder Fee Example | 6 |
| Performance and Portfolio Discussion | 8 |
| Audit Letter | 14 |
| Portfolio of Investments | 15 |
| Statements of Assets and Liabilities | 20 |
| Statements of Operations | 21 |
| Statements of Changes in Net Assets | 22 |
| Financial Highlights | 24 |
| Notes to Financial Statements | 26 |
| Additional Information | 44 |
PERFORMANCE SUMMARY
Period Returns (Average Annual Total Returns as of 12/31/11)
| | | | | | EXPENSE |
| FUND | 1-YEAR | 3-YEAR | 5-YEAR | 10-YEAR | RATIO |
| Firsthand Technology Leaders Fund | -5.12% | 16.98% | -0.57% | 0.42% | 1.85% |
| Firsthand Technology Opportunities Fund | -10.74% | 26.15% | 5.92% | 4.95% | 1.85% |
| Firsthand Alternative Energy Fund | -39.89% | -8.37% | • | • | 1.98% |
| | | | | | |
| NASDAQ Composite Index | -0.79% | 19.46% | 2.50% | 3.74% | • |
| S&P 500 Index | 2.09% | 14.13% | -0.25% | 2.92% | • |
| WilderHill Clean Energy Index | -50.48% | -15.11% | • | • | • |
Returns assume reinvestment of all dividends and distributions but do not reflect the impact of taxes. The performance data quoted represent past performance. Past performance cannot guarantee future results, and current performance may be lower or higher than the performance quoted. Both the return from and the principal value of an investment in the Funds will fluctuate so that an investor’s shares, when redeemed, may be worth more or less than their original cost. To obtain performance as of the most recent month-end, please contact Firsthand Funds by calling 1.888.884.2675 or go to www.firsthandfunds.com.
The Nasdaq Composite Index (NASDAQ) is a capitalization-weighted index of all common stocks listed with NASDAQ. The Standard & Poor’s 500 Index (S&P 500) is a market-weighted index of 500 stocks of well-established companies. Each index represents an unmanaged, broad-based basket of stocks. These indices are typically used as benchmarks for overall market performance. The WilderHill Clean Energy Index is a market-weighted index of 58 companies in the cleaner fuel, energy conversion, energy storage, greener utilities, power delivery and conservation, and renewable energy harvesting sectors. You cannot invest directly in an index.
Returns Since Inception (Average Annual Total Returns as of 12/31/11)
| | AVERAGE | | | WILDERHILL |
| | ANNUAL | NASDAQ | | CLEAN |
| | TOTAL | COMPOSITE | S&P 500 | ENERGY |
| FUND (INCEPTION DATE) | RETURNS | INDEX | INDEX | INDEX |
| Firsthand Technology Leaders Fund (12/10/97) | 5.03% | 4.09% | 3.65% | • |
| Firsthand Technology Opportunities Fund (9/30/99) | -4.85% | 0.24% | 1.68% | • |
| Firsthand Alternative Energy Fund (10/29/07) | -17.98% | -0.87% | -2.61% | -31.94% |
Each Fund may invest in small-capitalization companies and Initial Public Offerings (“IPOs”). These investments will be more volatile than investments in large-capitalization companies and loss of principal could be greater. The Funds may invest in foreign securities, which will be subject to greater risks than investing in domestic securities. Because the Funds are not diversified, they can take larger positions in fewer companies, increasing their risk profile. The Funds invest in several industries within the technology sector and the relative weightings of these industries in a Fund’s portfolio may change at any time.
Holdings by Industry - % of Net Assets (as of 12/31/11)
| | FIRSTHAND | FIRSTHAND | FIRSTHAND |
| | TECHNOLOGY | TECHNOLOGY | ALTERNATIVE |
| INDUSTRY | LEADERS FUND | OPPORTUNITIES FUND | ENERGY FUND |
| Advanced Materials | 1.8% | • | 8.8% |
| Basic Materials | • | • | 1.1% |
| Battery | • | • | 1.4% |
| Building Automation | • | • | 2.0% |
| Communications | • | 4.8% | • |
| Communications Equipment | 4.9% | 15.6% | • |
| Computer | 7.5% | 5.1% | • |
| Energy Efficiency | • | • | 10.8% |
| Environmental Services | • | • | 6.0% |
| Industrials | • | • | 2.9% |
| Internet | 4.3% | 25.0% | • |
| Networking | 2.4% | 11.2% | • |
| Other | • | 5.8% | • |
| Other Electronics | 1.4% | 0.9% | 6.6% |
| Peripherals | • | 0.9% | • |
| Power Conversion/Supply Equipment | • | • | 1.7% |
| Renewable Energy | • | • | 39.3% |
| Semiconductor Equipment | 2.5% | • | • |
| Semiconductors | 8.4% | 13.9% | 5.5% |
| Software | 7.8% | 8.1% | • |
| Net Other Assets and Liabilities | 59.0% | 8.7% | 13.9% |
Portfolio holdings are subject to change.
PRESIDENT’S LETTER
Fellow Shareholders,
A very volatile market finished the year notably (and surprisingly) flat in 2011. It was a year of political turmoil, economic crises, and natural disasters. From the Japanese earthquake and tsunami to the Spring uprisings throughout the Middle East to the European debt crisis, the Solyndra debacle, and the Occupy protests here at home, it was one bad news story after another. And the negative trend seemed to build momentum all year. Between January and June, the NASDAQ fell between 2% and 3% on three trading days. In the second half of the year, the NASDAQ saw 12 down days in that range, and drops between 3% and 7% on seven additional days. That’s volatility by anyone’s definition. In August, the stock market experienced two of its worst-ever single-day point drops. The sixth-largest point drop in history came on August 8, after Standard & Poor’s announced it was going to downgrade the credit of the United States; the Dow Jones Industrial Average1 fell 634.76 points that day (5.55%) while the NASDAQ and S&P 500 were down 6.90% and 7.14%, respectively.
In our view the European debt crisis stands apart from all the other big picture issues in both its scope and its intractability. Much has been written elsewhere about it, so I’ll simply summarize our concerns: the Eurozone has one common currency and seventeen sovereign governments—each issuing their own bonds. This fundamental mismatch offers no clear mechanism for reconciling the disparate fiscal policies being pursued, nor does it allow for coordination with a central monetary policy. At this point, European governments and bankers have managed to avoid an outright default of any sovereign bonds, but they have not addressed the central flaws in their system. Europe continues to live under the sword of Damocles.
An Unpredictable Year
In the face of this uncertainty, our investment priorities shifted toward capital preservation. The effect was to buffer the volatility through much of the year, but it also caused us to miss out on much of the fourth quarter rally. Relative to the tech-heavy NASDAQ Composite Index, we had a bad year. For more information on our technology funds’ performance, please see pages 2 and 3.
Despite the uncertainty still lingering on Wall Street, we remain firm believers in the long-term opportunities available in technology. A number of big-name companies remain reasonably priced with healthy prospects for significant growth. Apple (AAPL) continues to dazzle, and there is still plenty of room for growth in all of their key businesses (phones, tablets, and PCs). Google (GOOG) remains a solid company, with outstanding growth prospects and great execution.
We’re also excited about the opportunities surrounding cloud computing. The Internet has become a supercomputer of connected data centers—a supercomputer easily accessed by increasingly powerful mobile computers. Five years ago, most people in the U.S. just talked on their cellphones. Today, talk represents a small fraction of usage for many customers, with a significant portion now using their phones for things like e-mail, shopping, video conferencing, and even paying for their coffee at Starbucks. Tablets and smartphones are taking away many of the tasks formerly assigned to personal computers, which is why we continue to avoid companies with significant exposure to the PC business.
The Promise of Renewable Energy
We still believe in alternative energy. Demand for solar and wind installations is still growing strongly. The U.S. wind industry saw more than 6,810 megawatts (MW) installed
in 2011, up 33% over 2010, with another 8,300 MW under construction.2 In Europe, offshore wind development is gathering momentum and despite new offshore capacity being down slightly in 2011, several new installations are under construction and will increase European offshore capacity by about 60%. New solar installations in the U.S. topped 1 gigawatt this year, beating the 887 MW installed in 2010.3 Yet, despite continued demand, the economics of the business have gotten hammered recently. Government subsidies for renewable energy were cut drastically in Italy, Germany, and Great Britain. On top of that, the European debt crisis meant banks were less willing to loan European solar developers the money they needed for capital equipment.
Adding to renewable’s woes, Chinese overproduction led to a glut of solar panel inventory and declining module prices. And polysilicon, a key ingredient in photovoltaic cells, experienced a price decline of epic proportions in 2011—from roughly $80 per kilogram in March to under $30/kg at year end. We witnessed several high-profile solar company bankruptcies in the U.S., including Solyndra, whose closure in late summer had a devastating ripple effect industry-wide. Additionally, Chinese solar companies were hit hard by the news of possible trade enforcement action against China by the United States, which has accused China of flooding the market with cheap panels.
The WilderHill Clean Energy Index finished 2011 with a -50.48% return. Although Firsthand Alternative Energy Fund beat that benchmark, it, too, was a disappointment, returning -39.89% for the year.
Still, we believe alternative energy offers great promise to long-term investors. In addition to solar and wind, we continue to monitor developments in low-energy lighting and energy efficiency technologies. We were disappointed to see the phase-in of new U.S. regulations restricting the sale of incandescent light bulbs delayed as part of a December 2011 federal budget deal. Nonetheless, we continue to believe the future is bright for manufacturers of compact fluorescent (CFL) and light-emitting diode (LED) bulbs. We are also encouraged by the positive momentum in hybrid and plug-in electric cars. Although the industry suffered some minor image bruises stemming from battery-related safety recalls in Q4, we are pleased to see sales of hybrid/electric vehicles growing strongly, with new models continuing to come to market.
Cautiously Optimistic
As I write this, the DJIA has reached a level not seen since 2008, and the NASDAQ is hitting an 11-year high, and the jobs market appears to be recovering, albeit slowly. We find ourselves cautiously optimistic for stability to return to the markets in 2012. Although 2011 was a challenging year for investors, we are excited about the prospects for new and existing technologies and remain committed to seeking out the companies best-positioned to capitalize on them.
Sincerely,
Kevin Landis
President, Firsthand Funds
| 1 | The Dow Jones Industrial Average is a price-weighted average of 30 significant stocks traded on the New York Stock Exchange and the NASDAQ. |
| 2 | American Wind Energy Association, Industry Statistics, www.awea.org/learnabout/industry_stats/index.cfm, accessed February 2012. |
| 3 | Greentech Media, Record U.S. Solar Quarter at 449 MW Installed, December 13, 2011. |
SHAREHOLDER FEE EXAMPLE
Example — In general, mutual fund shareholders may incur two types of costs: (1) transaction costs, including sales charges (loads), redemption fees, and exchange fees; and (2) ongoing costs, including management fees, 12b-1 distribution and service fees, non-12b-1 service fees, and other Fund expenses. This example is intended to help you understand your ongoing costs (in dollars) of investing in a Fund and to compare these costs with the ongoing costs of investing in other mutual funds. Note that Firsthand Funds (“Trust”) does not charge transaction fees for 12b-1 distribution and service fees, though you may incur transaction fees if you purchase shares through a broker.
The example on the following page is based on an investment of $1,000 invested at the beginning of the period and held for the entire period from July 1, 2011 through December 31, 2011.
Actual Expenses — The section of the table at right entitled “Actual” provides information about actual account values and actual expenses. You may use this information, together with the amount you invested, to estimate the expenses that you paid over the period. Simply divide your account value by $1,000 (for example, an $8,600 account value divided by $1,000 = 8.6), then multiply the result by the number in the section entitled “Actual” under the heading “Expenses Paid During Period” to estimate the expenses you paid on your account during this period. If your account is an IRA or other tax-qualified savings plan, your expenses may also have included a $10 annual fee. In either case, the amount of any fee paid through your account would increase the estimate of expenses you paid during the period and decrease your ending account value.
Hypothetical Example for Comparison Purposes — The section of the table at right entitled “Hypothetical” provides information about hypothetical account values and hypothetical expenses based on a Fund’s actual expense ratio and an assumed rate of return of 5% per year before expenses, which is not the Fund’s actual return. The hypothetical account values and expenses may not be used to estimate your actual ending account balance or the expenses you paid for the period. However, you may use this information to compare the ongoing costs of investing in the Trust to other funds. To do so, compare this 5% hypothetical example with the 5% hypothetical examples that appear in the shareholder reports of the other funds. As in the case of the actual expense example, if your account is subject to an IRA fee, the amount of the fee paid through your account would increase the hypothetical expenses you would have paid during the period and decrease the hypothetical ending account value.
Please note that the expenses shown in the table at right are meant to highlight your ongoing costs only and do not reflect any transactional costs, such as sales charges (loads), redemption fees, or exchange fees. Therefore, the table is useful in comparing ongoing costs only, and will not help you determine the relative total costs of owning different funds. In addition, if these transactional costs were included, your costs would have been higher. The examples also assume all dividends and distributions have been reinvested.
| | BEGINNING | ENDING | EXPENSES PAID | |
| | ACCOUNT VALUE | ACCOUNT VALUE | DURING PERIOD* | ANNUALIZED |
| | 7/1/11 | 12/31/11 | 7/1/11 - 12/31/11 | EXPENSE RATIO |
| Firsthand Technology Leaders Fund | | | | |
| Actual | $1,000 | $977.60 | $9.22 | 1.85% |
Hypothetical** | $1,000 | $1,015.88 | $9.40 | 1.85% |
| | | | | |
| Firsthand Technology Opportunities Fund | | | | |
| Actual | $1,000 | $855.80 | $8.65 | 1.85% |
Hypothetical** | $1,000 | $1,015.88 | $9.40 | 1.85% |
| | | | | |
| Firsthand Alternative Energy Fund | | | | |
| Actual | $1,000 | $593.70 | $7.95 | 1.98% |
Hypothetical** | $1,000 | $1,015.822 | $10.06 | 1.98% |
| * | Expenses are calculated by multiplying the Fund’s annualized expense ratio listed above by the average account value over the period and multiplying that number by 184/365 (to reflect the one-half year period). |
| ** | 5% return per year before expenses. |
| | The expenses shown in the table do not reflect any fees that may be charged to you by brokers, financial intermediaries, or other financial institutions. |
FIRSTHAND TECHNOLOGY LEADERS FUND
Performance and Portfolio Discussion
How did the Fund perform in 2011?
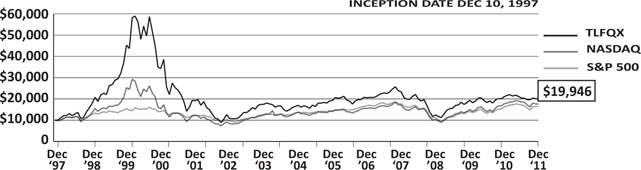
Firsthand Technology Leaders Fund (TLFQX) posted a loss of 5.12%, versus a 0.79% loss for the NASDAQ Composite Index and a 2.09% gain for the S&P 500 Index. For the six months ended December 31, 2011, Firsthand Technology Leaders Fund fell 2.24% as compared to 5.53% and 3.69% losses for the NASDAQ and the S&P 500 indices, respectively.
Which industries had the greatest impact on the Fund’s performance?
As of December 31, 2011, semiconductors and software represented the portfolio’s largest weightings, followed by holdings in the computer and communications equipment industries. The portfolio’s exposure to the Internet security, renewable energy, and other electronics contributed most to the Fund’s underperformance versus its benchmarks in 2011.
Which individual holdings were the largest contributors to the Fund’s performance?
The Fund’s top contributor for the year was Apple (AAPL). In addition to another version of its iPhone, Apple unveiled a new iPad in 2011. Sales of both have been spectacular, with Apple selling 37 million iPhones in its fiscal first quarter (which ended December 31). There is broad speculation that Apple will launch a new version of Apple TV, the iPad 3, and another new iPhone in 2012. The stock finished the period up 25.56%.
Communications chip maker Qualcomm (QCOM) had a string of good news in 2011. In early February, Nokia (NOK) announced that its smartphone would adopt Microsoft’s (MSFT) Windows Phone 7 for its operating system. As QUALCOMM processors are the leading processors used with the Windows Phone 7 OS, the company received a nice uptick in share price on that news. It also benefitted from Apple’s expansion to CDMA handsets, specifically Verizon (VZ) phones, which utilize QUALCOMM chips. Shares of QUALCOMM were up 12.25% for the year.
Another outperformer for the Fund in 2011 was Intel (INTC). Despite fears of a weakening PC market, the world’s largest chip company reported strong earnings in Q3 thanks to double-digit percentage growth in unit shipments of notebook PCs. The company issued a public notes offering in September primarily to repurchase shares of common stock. In September Intel announced that it was partnering with Google (GOOG) to optimize future versions of Google’s Android mobile operating system to run on Intel chips. The company did cut its Q4 outlook in late December, partly as a result of the October flooding in Thailand, which led to a hard disk drive supply shortage. Nonetheless, the company finished the year up 19.40%.
Which holdings were the greatest detractors from the Fund’s performance?
The largest detractor from Fund performance for the year was cellphone giant Nokia (NOK), down 50.41%. The company has struggled in the smartphone market, as it has instead focused on low-end phones in emerging markets. Nokia announced in February that it was partnering with Microsoft to create a smartphone running on the Windows 7 platform. While this could eventually help Nokia compete in the premium end cellphone market, investors are wary of a partnership with Microsoft, which is seen as a laggard in the smartphone space.
Another detractor was LG Display Co. (LPL). In July, the flat-panel display maker announced a quarterly loss and in August, it announced a 25% cut to 2012 capital spending, in part because the success of smartphones and tablet PCs are hurting demand for TVs. Currency devaluation is also driving up prices for the South Korean company’s products. LG Display finished down 40.68% for the year.
Fund Performance and Holdings Information (as of 12/31/11)
Firsthand Technology Leaders Fund vs. Market Indices
| | FIRSTHAND TECHNOLOGY | NASDAQ | S&P 500 |
| | LEADERS FUND | COMPOSITE INDEX | INDEX |
| Since Inception (12/10/97) | 5.03% | 4.09% | 3.65% |
| 10-Year | 0.42% | 3.74% | 2.92% |
| 5-Year | -0.57% | 2.50% | -0.25% |
| 3-Year | 16.98% | 19.46% | 14.13% |
| 1-Year | -5.12% | -0.79% | 2.09% |
Growth of a Hypothetical $10,000 Investment
Returns assume reinvestment of all dividends and distributions but do not reflect the impact of taxes. The performance data quoted represent past performance. Past performance cannot guarantee future results, and current performance may be lower or higher than the performance quoted. Both the return from and the principal value of an investment in the Fund will fluctuate so that an investor’s shares, when redeemed, may be worth more or less than their original cost. To obtain performance as of the most recent month-end, please contact Firsthand Funds by calling 1.888.884.2675 or go to www.firsthandfunds.com.
| Holdings by Industry* | Top 10 Holdings** |
| | % Net Assets | | % Net Assets |
| Semiconductors | 8.4% | Apple, Inc. | 7.5% |
| Software | 7.8% | Microsoft Corp. | 3.5% |
| Computer | 7.5% | SanDisk Corp. | 3.3% |
| Communications Equipment | 4.9% | Intel Corp. | 3.3% |
| Internet | 4.3% | Google, Inc., Class A | 3.3% |
| Semiconductor Equipment | 2.5% | Qualcomm, Inc. | 2.8% |
| Networking | 2.4% | Symantec Corp. | 2.6% |
| Advanced Materials | 1.8% | Cisco Systems, Inc. | 2.4% |
| Other Electronics | 1.4% | NVIDA Corp. | 1.9% |
| Net Other Assets and Liabilities | 59.0% | Corning, Inc.. | 1.8% |
| * | Based on percentage of net assets as of 12/31/11. |
| ** | Top 10 stock holdings total 32.4% of net assets. These holdings are current as of 12/31/11, and may not be representative of current or future investments. |
| FIRSTHAND TECHNOLOGY OPPORTUNITIES FUND |
Performance and Portfolio Discussion
How did the Fund perform in 2011?
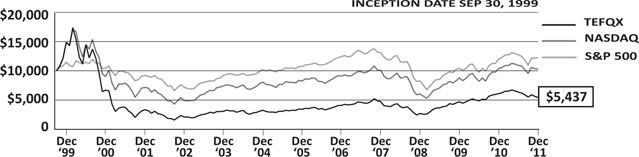
Firsthand Technology Opportunities Fund (TEFQX) posted a loss of 10.74%, versus a 0.79% loss for the NASDAQ Composite Index and a 2.09% gain for the S&P 500 Index. For the six months ended December 31, 2011, Firsthand Technology Opportunities Fund fell 14.42% as compared to 5.53% and 3.69% losses for the NASDAQ and the S&P 500 indices, respectively.
Which industries had the greatest impact on the Fund’s performance?
As of December 31, 2011, the Internet and communications equipment industries represented the portfolio’s largest weightings, followed by holdings in the semiconductors and networking industries. The portfolio’s exposure to the Internet, electronics manufacturing services, and communications equipment industries contributed most to the Fund’s underperformance versus its benchmarks in 2011.
Which individual holdings were the largest contributors to the Fund’s performance?
The Fund’s top contributor for the year was Apple (AAPL). In addition to another new version of its iPhone, Apple unveiled a new iPad in 2011. Sales of both have been spectacular, with Apple selling 37 million iPhones in its fiscal first quarter (which ended December 31). There is broad speculation that Apple will launch a new version of Apple TV, the iPad 3, and another new iPhone in 2012. The stock finished the period up 25.56%.
The Fund’s holdings in iPath S&P 500 VIX Short-Term Futures ETN (VXX) was another big contributor to Fund performance for the period. The VXX is an ETF that offers exposure to daily rolling long positions in volatility-index futures. Although the VXX was down 5.53% for the year, it was up 34.75% for the roughly six months we held it between April and October.
Which holdings were the greatest detractors from the Fund’s performance?
Skyworks Solutions (SWKS) was the biggest detractor from Fund performance in 2011, down 43.35%. The semiconductor company beat Street expectations for all four fiscal quarters in 2011. However, although chip companies are benefitting from the growth in the smartphone and tablet PC markets, they are also struggling in the face of weakened consumer confidence. Additionally, the semiconductor industry suffered from a sharp inventory correction in Q2. Skyworks is also a notable component of the S&P 600 Small Cap Index and the S&P 600 Semiconductors and Semiconductor Equpment Industry Group Index, and its valuation tends to move with its peers.
Fabrinet (FN) was another underperformer during the period. The company provides optical communications components and industrial lasers and sensors to the photonics industry. The Thailand-based company was hit hard by that country’s October flooding, which severely affected its production. The company’s woes were compounded by a drastic slowdown in carrier spending due to the Eurozone credit crunch. In response, we liquidated the position in October, at which point our return for 2011 was -54.16%.
Shares of LED chip maker Cree (CREE) were down 66.55% in 2011, making it a significant detractor from Fund performance. Overinvestment in Taiwan and Korea relating to the LED market depressed prices, and Cree announced its fiscal year Q1 results in October, which included a steep decline in profits.
Fund Performance and Holdings Information (as of 12/31/11)
Firsthand Technology Opportunities Fund vs. Market Indices
| | FIRSTHAND TECHNOLOGY | NASDAQ | S&P 500 |
| | OPPORTUNITIES FUND | COMPOSITE INDEX | INDEX |
| Since Inception (9/30/99) | -4.85% | 0.24% | 1.68% |
| 10-Year | 4.95% | 3.74% | 2.92% |
| 5-Year | 5.92% | 2.50% | -0.25% |
| 3-Year | 26.15% | 19.46% | 14.13% |
| 1-Year | -10.74% | -0.79% | 2.09% |
Growth of a Hypothetical $10,000 Investment
Returns assume reinvestment of all dividends and distributions but do not reflect the impact of taxes. The performance data quoted represent past performance. Past performance cannot guarantee future results, and current performance may be lower or higher than the performance quoted. Both the return from and the principal value of an investment in the Fund will fluctuate so that an investor’s shares, when redeemed, may be worth more or less than their original cost. To obtain performance as of the most recent month-end, please contact Firsthand Funds by calling 1.888.884.2675 or go to www.firsthandfunds.com.
| Holdings by Industry* | Top 10 Holdings** |
| | % Net Assets | | % Net Assets |
| Internet | 25.0% | Motorola Mobility Holdings, Inc. | 12.2% |
| Communications Equipment | 15.6% | Netlogic Microsystems, Inc. | 6.2% |
| Semiconductors | 13.9% | Powershares QQQ Trust Series 1 | 5.6% |
| Networking | 11.2% | Apple, Inc. | 5.1% |
| Software | 8.1% | Microsoft Corp. | 4.9% |
| Other | 5.8% | Baidu, Inc. - SP ADR | 4.4% |
| Computer | 5.1% | SINA Corp. | 3.9% |
| Communications | 4.8% | Tencent Holdings Ltd. | 3.8% |
| Peripherals | 0.9% | F5 Networks, Inc. | 3.3% |
| Other Electronics | 0.9% | Amazon.com, Inc. | 3.3% |
| Net Other Assets and Liabilities | 8.7% | | |
| * | Based on percentage of net assets as of 12/31/11. |
| ** | Top 10 stock holdings total 52.7% of net assets. These holdings are current as of 12/31/11, and may not be representative of current or future investments. |
FIRSTHAND ALTERNATIVE ENERGY FUND
Performance and Portfolio Discussion
How did the Fund perform in 2011?
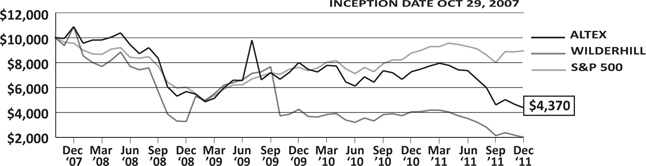
Firsthand Alternative Energy Fund (ALTEX) posted a loss of 39.89%, versus a 50.48% loss for the WilderHill Clean Energy Index and a 2.09% gain for the S&P 500 Index. For the six months ended December 31, 2011, Firsthand Alternative Energy Fund fell 40.63% as compared to 42.96% loss for the WilderHill Clean Energy and a 3.69% loss for the S&P 500 Index.
Which industries had the greatest impact on the Fund’s performance?
For the period ended December 31, 2011, renewable energy and energy efficiency represented the portfolio’s largest weightings, followed by holdings in the advanced materials and other electronics industries. The portfolio’s exposure to the environmental services industry contributed most to the Fund’s outperformance versus its primary benchmark in 2011.
Which individual holdings were the largest contributors to the Fund’s performance?
Environmental technology firm ADA-ES (ADES) was the biggest positive contributor to Fund performance in 2011. Early in the year, ADA-ES benefited from new proposals by the EPA for clean air standards. The company’s share price jumped in late September following a successful demonstration of its refined coal technology, M45. The patent-pending technology reduces emissions of mono-nitrogen oxides and mercury. ADES-ES finished the year up 102.87%.
Another positive contributor was Rubicon Technology (RBNC), which manufactures sapphire substrates for use in the semiconductor industry. While the company’s stock was down 55.46% during the year, we sold our position in April for a modest gain. Rubicon has been a beneficiary of the increased use of LEDs in mobile phones and other consumer electronics. The company began seeing increased demand in the spring, following the earthquake and tsunami in Japan, which disrupted many LED industry supply chains. However, subsidies in China have led to an overcapacity of LED manufacturing equipment, which in turn has led to an oversupply of LEDs and driven down prices.
Which holdings were the greatest detractors from the Fund’s performance?
2011 was a tough year for the renewable energy industry. Thanks to the European debt crisis, banks were even less willing to loan money to European solar developers. At the same time, weakened demand and Chinese overproduction led to price cuts, with the price of solar panels falling roughly 40% in 2011. Add to that the declining subsidies in Europe and several high-profile solar bankruptcies in the U.S., including Solyndra, and it became tough to find many positive performers in the sectors.
Additionally, Chinese solar companies were hit hard by the news of possible trade enforcement action against China by the United States. JA Solar Holdings (JASO) was the biggest detractor from Fund performance for the year, hit hard by tarriff worries and lower-than-expected demand. The maker of high-performance solar cells reported a Q3 loss and finished the year down 80.64%.
Hanwha SolarOne (HSOL), maker of silicon ingots and photovoltaic cells and modules, was another Chinese company with troubles in the second half of the year, posting worse-than-expected losses in Q3 and finishing the year down 88.00%.
Fund Performance and Holdings Information (as of 12/31/11)
Firsthand Alternative Energy Fund vs. Market Indices
| | FIRSTHAND ALTERNATIVE | WILDERHILL | S&P 500 |
| | ENERGY FUND | CLEAN ENERGY INDEX | INDEX |
| Since Inception (10/29/07) | -17.98% | -31.94% | -2.61% |
| 3-Year | -8.37% | -15.11% | 14.13% |
| 1-Year | -39.89% | -50.48% | 2.09% |
Growth of a Hypothetical $10,000 Investment
Returns assume reinvestment of all dividends and distributions but do not reflect the impact of taxes. The performance data quoted represent past performance. Past performance cannot guarantee future results, and current performance may be lower or higher than the performance quoted. Both the return from and the principal value of an investment in the Fund will fluctuate so that an investor’s shares, when redeemed, may be worth more or less than their original cost. To obtain performance as of the most recent month-end, please contact Firsthand Funds by calling 1.888.884.2675 or go to www.firsthandfunds.com.
| Holdings by Industry* | Top 10 Holdings** |
| | % Net Assets | | % Net Assets |
| Renewable Energy | 39.3% | GT Solar International, Inc. | 6.6% |
| Energy Efficiency | 10.8% | ADA-ES, Inc. | 6.0% |
| Advanced Materials | 8.8% | Honeywell International, Inc. | 5.5% |
| Other Electronics | 6.6% | Power Integrations, Inc. | 5.5% |
| Environmental Services | 6.0% | Meyer Burger Technology AG | 4.4% |
| Semiconductors | 5.5% | Intevac, Inc. | 3.7% |
| Industrials | 2.9% | Praxair, Inc. | 3.6% |
| Building Automation | 2.0% | Corning, Inc. | 3.5% |
| Power Conversion/Supply Equipment | 1.7% | Iberdrola S.A. | 2.9% |
| Battery | 1.4% | Motech Industries, Inc. | 2.9% |
| Basic Materials | 1.1% | | |
| Net Other Assets and Liabilities | 13.9% | | |
| * | Based on percentage of net assets as of 12/31/11. |
| ** | Top 10 stock holdings total 44.6% of net assets. These holdings are current as of 12/31/11, and may not be representative of current or future investments. |
REPORT OF INDEPENDENT REGISTERED PUBLIC ACCOUNTING FIRM
To the Shareholders and Board of Trustees
Firsthand Funds, San Jose, California
We have audited the accompanying statements of assets and liabilities of Firsthand Funds (the “Funds”), comprising respectively, Firsthand Technology Leaders Fund, Firsthand Technology Opportunities Fund, and Firsthand Alternative Energy Fund, including the portfolios of investments as of December 31, 2011, and the related statements of operations for the year then ended, the statements of changes in net assets for each of the two years in the period then ended, and the financial highlights for the periods indicated thereon. These financial statements and financial highlights are the responsibility of the Funds’ management. Our responsibility is to express an opinion on those financial statements and financial highlights based on our audits.
We conducted our audits in accordance with the standards of the Public Company Accounting Oversight Board (United States). Those standards require that we plan and perform the audit to obtain reasonable assurance about whether the financial statements and financial highlights are free of material misstatement. The Funds are not required to have, nor were we engaged to perform, an audit of their internal control over financial reporting. Our audits included consideration of internal control over financial reporting as a basis for designing audit procedures that are appropriate in the circumstances, but not for the purpose of expressing an opinion on the effectiveness of the Funds internal control over financial reporting. Accordingly, we express no such opinion. An audit includes examining, on a test basis, evidence supporting the amounts and disclosures in the financial statements. Our procedures included confirmation of securities owned as of December 31, 2011 by correspondence with the custodian. An audit also includes assessing the accounting principles used and significant estimates made by management, as well as evaluating the overall financial statement presentation. We believe that our audits provide a reasonable basis for our opinion.
In our opinion, the financial statements and financial highlights referred to above present fairly, in all material respects, the financial position of Firsthand Funds as of December 31, 2011, the results of their operations for the year then ended, the changes in their net assets for each of the two years in the period then ended, and the financial highlights for the periods indicated thereon, in conformity with accounting principles generally accepted in the United States of America.
TAIT, WELLER & BAKER, LLP
Philadelphia, Pennsylvania
February 17, 2012
FIRSTHAND TECHNOLOGY LEADERS FUND
Portfolio of Investments (as of 12/31/11)
| | | SHARES | | | MARKET VALUE | |
| | | | | | | |
| COMMON STOCKS — 41.0% ($12,203,850) | | | | | | |
| | | | | | | |
| Advanced Materials — 1.8% ($519,200) | | | | | | |
| Corning, Inc. | | | 40,000 | | | $ | 519,200 | |
| | | | | | | | | |
| Communications Equipment — 4.9% ($1,466,700) | | | | | | | | |
| Nokia OYJ - SP ADR | | | 50,000 | | | | 241,000 | |
| Qualcomm, Inc. | | | 15,000 | | | | 820,500 | |
| Telefonaktiebolaget Ericsson LM - SP ADR | | | 40,000 | | | | 405,200 | |
| | | | | | | | | |
| Computer — 7.5% ($2,227,500) | | | | | | | | |
| Apple, Inc. * | | | 5,500 | | | | 2,227,500 | |
| | | | | | | | | |
| Internet — 4.3% ($1,264,350) | | | | | | | | |
| Google, Inc., Class A * | | | 1,500 | | | | 968,850 | |
| Yandex NV, Class A * | | | 15,000 | | | | 295,500 | |
| | | | | | | | | |
| Networking — 2.4% ($723,200) | | | | | | | | |
| Cisco Systems, Inc. | | | 40,000 | | | | 723,200 | |
| | | | | | | | | |
| Other Electronics — 1.4% ($421,200) | | | | | | | | |
| LG Display Co., Ltd. - ADR * | | | 40,000 | | | | 421,200 | |
| Semiconductor Equipment — 2.5% ($739,200) | | | | | | | | |
| Applied Materials, Inc. | | | 30,000 | | | $ | 321,300 | |
| ASML Holding N.V. | | | 10,000 | | | | 417,900 | |
| | | | | | | | | |
| Semiconductors — 8.4% ($2,508,600) | | | | | | | | |
| Intel Corp. | | | 40,000 | | | | 970,000 | |
| NVIDIA Corp. * | | | 40,000 | | | | 554,400 | |
| SanDisk Corp. * | | | 20,000 | | | | 984,200 | |
| | | | | | | | | |
| Software — 7.8% ($2,333,900) | | | | | | | | |
| Microsoft Corp. | | | 40,000 | | | | 1,038,400 | |
| Oracle Corp. | | | 20,000 | | | | 513,000 | |
| Symantec Corp. * | | | 50,000 | | | | 782,500 | |
| | | | | | | | | |
| INVESTMENT COMPANY — 59.2% ($17,651,391) | | | | | | | | |
| Fidelity Institutional Money Market Fund | | | 17,651,391 | | | | 17,651,391 | |
| | | | | | | | | |
| Total Investments (Cost $28,369,556) — 100.2% | | | | | | | 29,855,241 | |
| | | | | | | | | |
| Liabilities in excess of other assets — (0.2)% | | | | | | | (62,415 | ) |
| | | | | | | | | |
| NET ASSETS — 100.0% | | | | | | $ | 29,792,826 | |
* - Non-income producing security.
ADR - American Depositary Receipt
SP ADR- Sponsored American Depositary Receipt
see accompanying notes to financial statements
FIRSTHAND TECHNOLOGY OPPORTUNITIES FUND
Portfolio of Investments (as of 12/31/11)
| | | SHARES | | | MARKET VALUE | |
| COMMON STOCKS — 84.2% ($66,849,516) | | | | | | |
| | | | | | | |
| Communications — 4.7% ($3,748,400) | | | | | | |
| Equinix, Inc.* | | | 20,000 | | | $ | 2,028,000 | |
| Rackspace Hosting, Inc.* | | | 40,000 | | | | 1,720,400 | |
| | | | | | | | | |
| Communications Equipment — 15.6% ($12,357,000) | | | | | | | | |
| Ciena Corp.* | | | 120,000 | | | | 1,452,000 | |
| Motorola Mobility Holdings, Inc.* | | | 250,000 | | | | 9,700,000 | |
| Nokia OYJ - SP ADR | | | 250,000 | | | | 1,205,000 | |
| | | | | | | | | |
| Computer — 5.1% ($4,050,000) | | | | | | | | |
| Apple, Inc.* | | | 10,000 | | | | 4,050,000 | |
| | | | | | | | | |
| Internet — 25.0% ($19,870,342) | | | | | | | | |
| Akamai Technologies, Inc.* | | | 80,000 | | | | 2,582,400 | |
| Amazon.com, Inc.* | | | 15,000 | | | | 2,596,500 | |
| Baidu, Inc. - SP ADR* | | | 30,000 | | | | 3,494,100 | |
| Mail.ru Group Ltd. - GDR* | | | 60,000 | | | | 1,560,000 | |
| Shanda Interactive Entertainment Ltd. - SP ADR* | | | 62,922 | | | | 2,517,509 | |
| SINA Corp.* | | | 60,000 | | | | 3,120,000 | |
| Tencent Holdings Ltd. | | | 150,000 | | | | 3,014,833 | |
| Yandex NV, Class A* | | | 50,000 | | | | 985,000 | |
| | | | | | | | | |
| Networking — 10.9% ($8,663,774) | | | | | | | | |
| Blue Coat Systems, Inc. | | | 85,000 | | | | 2,163,250 | |
| F5 Networks, Inc.* | | | 25,000 | | | | 2,653,000 | |
| Juniper Networks, Inc.* | | | 96,400 | | | | 1,967,524 | |
| Riverbed Technology, Inc.* | | | 80,000 | | | | 1,880,000 | |
| | | | | | | | | |
| Other Electronics — 0.9% ($710,400) | | | | | | | | |
| VeriFone Systems, Inc.* | | | 20,000 | | | | 710,400 | |
| | | | | | | | | |
| | | SHARES/ CONTRACTS | | | MARKET VALUE | |
| Semiconductors — 13.9% ($11,059,900) | | | | | | | | |
| Marvell Technology Group Ltd.* | | | 150,000 | | | $ | 2,077,500 | |
| Netlogic Microsystems, Inc.* | | | 100,000 | | | | 4,957,000 | |
| NVIDIA Corp.* | | | 150,000 | | | | 2,079,000 | |
| Skyworks Solutions, Inc.* | | | 120,000 | | | | 1,946,400 | |
| | | | | | | | | |
| Software — 8.1% ($6,389,700) | | | | | | | | |
| Microsoft Corp. | | | 150,000 | | | | 3,894,000 | |
| VMware, Inc., Class A* | | | 30,000 | | | | 2,495,700 | |
| | | | | | | | | |
| EXCHANGE-TRADED FUND — 5.6% ($4,466,400) | | | | | | | | |
| Other — 5.6% ($4,466,400) | | | | | | | | |
| Powershares QQQ Trust Series 1 | | | 80,000 | | | | 4,466,400 | |
| | | | | | | | | |
| PURCHASED OPTIONS — 1.5% ($1,164,300) | | | | | | | | |
| | | | | | | | | |
| Communications — 0.1% ($60,000) | | | | | | | | |
| ACME Packet, Inc. Call Option, Expiring February 2012, Strike Price $37.50 | | | 500 | | | | 60,000 | |
| | | | | | | | | |
| Networking — 0.3% ($210,000) | | | | | | | | |
| F5 Networks, Inc. Put Option, Expiring January 2012, Strike Price $110.00 | | | 250 | | | | 210,000 | |
see accompanying notes to financial statements
FIRSTHAND TECHNOLOGY OPPORTUNITIES FUND - continued
Portfolio of Investments (as of 12/31/11)
| | | SHARES/ CONTRACTS | | | MARKET VALUE | |
| Other — 0.2% ($159,300) | | | | | | | | |
| SPDR S&P 500 ETF Trust Put Option, Expiring March 2012, Strike Price $120.00 | | | 450 | | | $ | 159,300 | |
| | | | | | | | | |
| Peripherals — 0.9% ($715,000) | | | | | | | | |
| Western Digital Corp. Call Option, Expiring April 2012, Strike Price $25.00 | | | 1,000 | | | | 715,000 | |
| | | | | | | | | |
| Semiconductors — 0.0% ($20,000) | | | | | | | | |
| LSI Corp. Call Option, Expiring April 2012, Strike $7.00 | | | 1,000 | | | | 20,000 | |
| | | | | | | | | |
| INVESTMENT COMPANY — 9.1% ($7,216,864) | | | | | | | | |
| Fidelity Institutional Money Market Fund | | | 7,216,864 | | | | 7,216,864 | |
| | | | | | | | | |
| Total Investments (Cost $79,220,139) —100.4% | | | | | | | 79,697,080 | |
| | | | | | | | | |
| Liabilities in excess of other assets — (0.4)% | | | | | | | (309,602 | ) |
| | | | | | | | | |
| NET ASSETS — 100.0% | | | | | | $ | 79,387,478 | |
* - Non-income producing security.
ETF - Exchange Traded Fund
GDR - Global Depositary Receipt
SP ADR - Sponsored American Depositary Receipt
see accompanying notes to financial statements
FIRSTHAND ALTERNATIVE ENERGY FUND
Portfolio of Investments (as of 12/31/11)
| | | SHARES | | | MARKET VALUE | |
| COMMON STOCKS — 85.9% ($3,021,577) | | | | | | |
| | | | | | | |
| Advanced Materials — 8.8% ($308,428) | | | | | | |
| Corning, Inc. | | | 9,460 | | | $ | 122,791 | |
| MEMC Electronic Materials, Inc.* | | | 9,130 | | | | 35,972 | |
| Metabolix, Inc.* | | | 4,700 | | | | 21,385 | |
| Praxair, Inc. | | | 1,200 | | | | 128,280 | |
| | | | | | | | | |
| Basic Materials — 1.1% ($37,835) | | | | | | | | |
| Metalico, Inc.* | | | 11,500 | | | | 37,835 | |
| | | | | | | | | |
| Battery — 1.4% ($48,461) | | | | | | | | |
| A123 Systems, Inc.* | | | 30,100 | | | | 48,461 | |
| | | | | | | | | |
| Building Automation — 2.0% ($68,772) | | | | | | | | |
| Johnson Controls, Inc. | | | 2,200 | | | | 68,772 | |
| | | | | | | | | |
| Energy Efficiency — 10.8% ($381,288) | | | | | | | | |
| Echelon Corp.* | | | 19,500 | | | | 94,965 | |
| Honeywell International, Inc. | | | 3,580 | | | | 194,573 | |
| Itron, Inc.* | | | 2,565 | | | | 91,750 | |
| | | | | | | | | |
| Environmental Services — 6.0% ($212,816) | | | | | | | | |
| ADA-ES, Inc.* | | | 9,400 | | | | 212,816 | |
| | | | | | | | | |
| Industrials — 2.9% ($101,929) | | | | | | | | |
| 3M Co. | | | 800 | | | | 65,384 | |
| United Technologies Corp. | | | 500 | | | | 36,545 | |
| | | | | | | | | |
| Intellectual Property — 0.0% ($18) | | | | | | | | |
| Silicon Genesis Corp., Common (1)* | | | 181,407 | | | | 18 | |
| | | | | | | | | |
| Other Electronics — 6.6% ($233,411) | | | | | | | | |
| Intevac, Inc.* | | | 17,800 | | | | 131,720 | |
| Koninklijke (Royal) Philips Electronics N.V. | | | 4,854 | | | $ | 101,691 | |
| | | | | | | | | |
| Power Conversion/Supply Equipment — 1.7% ($61,387) | | | | | | | | |
| Power-One, Inc.* | | | 15,700 | | | | 61,387 | |
| | | | | | | | | |
| Renewable Energy — 39.1% ($1,374,937) | | | | | | | | |
| Amtech Systems, Inc.* | | | 6,600 | | | | 56,166 | |
| DayStar Technologies, Inc.* | | | 112 | | | | 25 | |
| FuelCell Energy, Inc.* | | | 5,000 | | | | 4,360 | |
| Gamesa Corp. Tecnologica S.A. | | | 7,059 | | | | 29,326 | |
| GT Advanced Technologies, Inc.* | | | 31,900 | | | | 230,956 | |
| Hanwha SolarOne Co., Ltd. - SP ADR* | | | 50,400 | | | | 49,528 | |
| Iberdrola S.A. | | | 16,421 | | | | 102,842 | |
| JA Solar Holdings Co., Ltd. - ADR* | | | 65,000 | | | | 87,100 | |
| JinkoSolar Holding Co., Ltd. - ADR* | | | 8,000 | | | | 40,000 | |
| Meyer Burger Technology AG* | | | 10,000 | | | | 156,500 | |
| Motech Industries, Inc. | | | 58,069 | | | | 101,835 | |
| Orion Energy Systems, Inc.* | | | 14,000 | | | | 41,300 | |
| Sharp Corp. | | | 11,000 | | | | 96,180 | |
| SunPower Corp., Class B* | | | 15,931 | | | | 99,250 | |
| Trina Solar Ltd. - SP ADR* | | | 14,600 | | | | 97,528 | |
| ULVAC, Inc.* | | | 2,700 | | | | 33,114 | |
| Vestas Wind Systems A.S.* | | | 6,000 | | | | 63,720 | |
| WaterFurnace Renewable Energy, Inc. | | | 600 | | | | 9,207 | |
| Yingli Green Energy Holding Co. - ADR* | | | 20,000 | | | | 76,000 | |
| | | | | | | | | |
| Semiconductors — 5.5% ($192,295) | | | | | | | | |
| Power Integrations, Inc. | | | 5,799 | | | | 192,295 | |
see accompanying notes to financial statements
FIRSTHAND ALTERNATIVE ENERGY FUND - continued
Portfolio of Investments (as of 12/31/11)
| PREFERRED STOCK — 0.2% ($7,374) | | | | | | | | |
| | | | | | | | | |
| Intellectual Property — 0.0% ($625) | | | | | | | | |
| Silicon Genesis Corp., | | | | | | | | |
| Series 1-C (1)* | | | 152 | | | $ | 2 | |
| Silicon Genesis Corp., | | | | | | | | |
| Series 1-E (1)* | | | 3,000 | | | | 623 | |
| | | | | | | | | |
| Renewable Energy — 0.2% ($6,749) | | | | | | | | |
| SoloPower, Series C-1 (1)* | | | 2,142 | | | | 6,749 | |
| | | | | | | | | |
| INVESTMENT COMPANY — 11.8% ($414,888) | | | | | | | | |
| Fidelity Institutional Money Market Fund | | | 414,888 | | | | 414,888 | |
| | | | | | | | | |
| Total Investments (Cost $6,121,245) — 97.9% | | | | | | | 3,443,839 | |
| | | | | | | | | |
| Other assets in excess of liabilities — 2.1% | | | | | | | 74,363 | |
| | | | | | | | | |
| NET ASSETS — 100.0% | | | | | | $ | 3,518,202 | |
* - Non-income producing security.
(1) - Restricted security.
ADR - American Depositary Receipt
SP ADR - Sponsored American Depositary Receipt
see accompanying notes to financial statements
STATEMENTS OF ASSETS AND LIABILITIES
For the year ended December 31, 2011
| | | | | | FIRSTHAND | | | | |
| | | FIRSTHAND | | | TECHNOLOGY | | | FIRSTHAND | |
| | | TECHNOLOGY | | | OPPORTUNITIES | | | ALTERNATIVE | |
| | | LEADERS FUND | | | FUND | | | ENERGY FUND | |
| | | | | | | | | | |
| | | | | | | | | | |
| ASSETS | | | | | | | | | |
| Investment securities: | | | | | | | | | |
| Acquisition cost | | $ | 28,369,556 | | | $ | 79,220,139 | | | $ | 6,121,245 | |
| Market value (Note 2) | | | 29,855,241 | | | | 79,697,080 | (1) | | | 3,443,839 | |
| Cash | | | — | | | | — | | | | 549 | |
| Foreign currency at value (cost $0, $8,480 and $82,646) | | | — | | | | 8,498 | | | | 90,267 | |
| Receivable from dividends, interest, and reclaims | | | — | | | | — | | | | 582 | |
| Receivable for capital shares sold | | | — | | | | 167,238 | | | | 321 | |
| TOTAL ASSETS | | | 29,855,241 | | | | 79,872,816 | | | | 3,535,558 | |
| | | | �� | | | | | | | | | |
| LIABILITIES | | | | | | | | | | | | |
| Payable to affiliates (Note 4) | | | 47,380 | | | | 129,391 | | | | 6,188 | |
| Payable for capital shares redeemed | | | 15,035 | | | | 355,947 | | | | 11,168 | |
| TOTAL LIABILITIES | | | 62,415 | | | | 485,338 | | | | 17,356 | |
| NET ASSETS | | $ | 29,792,826 | | | $ | 79,387,478 | | | $ | 3,518,202 | |
| | | | | | | | | | | | | |
| Net Assets consist of: | | | | | | | | | | | | |
| Paid-in-capital | | $ | 67,229,464 | | | $ | 82,533,769 | | | $ | 6,970,595 | |
| Accumulated net investment loss | | | — | | | | — | | | | (11 | ) |
| Accumulated net realized losses from security transactions, foreign currency transactions, purchased options and written options | | | (38,922,323 | ) | | | (3,623,250 | ) | | | (782,603 | ) |
| Net unrealized appreciation (depreciation) on investments, purchased options and foreign currency | | | 1,485,685 | | | | 476,959 | | | | (2,669,779 | ) |
| NET ASSETS | | $ | 29,792,826 | | | $ | 79,387,478 | | | $ | 3,518,202 | |
| | | | | | | | | | | | | |
| Shares outstanding | | | 1,515,531 | | | | 14,698,443 | | | | 804,285 | |
| Net asset value, redemption price and offering price per share (Note 2) | | $ | 19.66 | | | $ | 5.40 | | | $ | 4.37 | |
| (1) | Includes purchased options whose primary risk exposure is equity contracts. |
see accompanying notes to financial statements
STATEMENTS OF OPERATIONS
For the year ended December 31, 2011
| | | | | | FIRSTHAND | | | | |
| | | FIRSTHAND | | | TECHNOLOGY | | | FIRSTHAND | |
| | | TECHNOLOGY | | | OPPORTUNITIES | | | ALTERNATIVE | |
| | | LEADERS FUND | | | FUND | | | ENERGY FUND | |
| INVESTMENT INCOME | | | | | | | | | |
| Dividends | | $ | 246,083 | | | $ | 693,648 | | | $ | 34,633 | |
| Interest | | | 5,991 | | | | 8,651 | | | | 297 | |
| Foreign tax withholding | | | (17,749 | ) | | | (9,401 | ) | | | (4,097 | ) |
| TOTAL INVESTMENT INCOME | | | 234,325 | | | | 692,898 | | | | 30,833 | |
| | | | | | | | | | | | | |
| EXPENSES | | | | | | | | | | | | |
| Investment advisory fees (Note 4) | | | 448,997 | | | | 1,506,790 | | | | 85,918 | |
| Administration fees (Note 4) | | | 144,320 | | | | 484,326 | | | | 25,270 | |
| Trustees fees | | | 6,166 | | | | 6,166 | | | | 7,366 | |
| GROSS EXPENSES | | | 599,483 | | | | 1,997,282 | | | | 118,554 | |
| Trustees fees reimbursement | | | (6,166 | ) | | | (6,166 | ) | | | (7,366 | ) |
| TOTAL NET EXPENSES | | | 593,317 | | | | 1,991,116 | | | | 111,188 | |
| | | | | | | | | | | | | |
| NET INVESTMENT LOSS | | | (358,992 | ) | | | (1,298,218 | ) | | | (80,355 | ) |
| | | | | | | | | | | | | |
| Net Realized and Unrealized Loss on Investments: | | | | | | | | | | | | |
| Net realized gains (losses) from security transactions | | | 1,346,613 | | | | 6,989,532 | | | | (33,967 | ) |
Net realized losses from purchased option transactions(1) | | | (357,384 | ) | | | (1,604,968 | ) | | | — | |
| Net realized gains (losses) on foreign currency | | | — | | | | (18 | ) | | | 13 | |
Net realized gains from written option transactions(1) | | | 139,985 | | | | 96,615 | | | | — | |
| Net change in unrealized depreciation on investments and foreign currency | | | (3,172,851 | ) | | | (17,556,494 | ) | | | (2,526,860 | ) |
Net change in unrealized appreciation on purchased options(1) | | | 9,676 | | | | 52,857 | | | | — | |
Net change in unrealized appreciation (depreciation) on written options(1) | | | 673,250 | | | | (40,298 | ) | | | — | |
| Net Realized and Unrealized Loss on Investments | | | (1,360,711 | ) | | | (12,062,774 | ) | | | (2,560,814 | ) |
| | | | | | | | | | | | | |
| Net Decrease In Net Assets Resulting From Operations | | $ | (1,719,703 | ) | | $ | (13,360,992 | ) | | $ | (2,641,169 | ) |
| (1) | Primary risk exposure is equity contracts. |
see accompanying notes to financial statements
STATEMENTS OF CHANGES IN NET ASSETS
For the Years Ended December 31, 2011, and December 31, 2010
| | | FIRSTHAND TECHNOLOGYLEADERS FUND | | | FIRSTHAND TECHNOLOGYOPPORTUNITIES FUND (1) | |
| | | YEAR ENDED | | | YEAR ENDED | | | YEAR ENDED | | | YEAR ENDED | |
| | | 12/31/11 | | | 12/31/10 | | | 12/31/11 | | | 12/31/10 | |
| | | | | | | | | | | | | |
| FROM OPERATIONS: | | | | | | | | | | | | |
| Net investment loss | | $ | (358,992 | ) | | $ | (335,743 | ) | | $ | (1,298,218 | ) | | $ | (690,097 | ) |
| Net realized gains from security transactions, purchased options, foreign currency and written options | | | 1,129,214 | | | | 1,131,875 | | | | 5,481,161 | | | | 3,459,912 | |
| Net change in unrealized appreciation (depreciation) on investments, purchased options, foreign currency | | | (2,489,925 | ) | | | 1,959,050 | | | | (17,543,935 | ) | | | 10,422,578 | |
| Net increase (decrease) in net assets from operations | | | (1,719,703 | ) | | | 2,755,182 | | | | (13,360,992 | ) | | | 13,192,393 | |
| | | | | | | | | | | | | | | | | |
| FROM CAPITAL SHARE TRANSACTIONS: | | | | | | | | | | | | | | | | |
| Proceeds from shares sold | | | 8,145,916 | | | | 1,686,438 | | | | 79,636,017 | | | | 49,771,733 | |
| Payment for shares redeemed | | | (11,242,004 | ) | | | (7,804,976 | ) | | | (72,206,838 | ) | | | (12,499,897 | ) |
| Net increase (decrease) in net assets from capital share transactions | | | (3,096,088 | ) | | | (6,118,538 | ) | | | 7,429,179 | | | | 37,271,836 | |
| TOTAL INCREASE (DECREASE) IN NET ASSETS | | | (4,815,791 | ) | | | (3,363,356 | ) | | | (5,931,813 | ) | | | 50,464,229 | |
| NET ASSETS: | | | | | | | | | | | | | | | | |
| Beginning of year | | | 34,608,617 | | | | 37,971,973 | | | | 85,319,291 | | | | 34,855,062 | |
| End of year | | $ | 29,792,826 | | | $ | 34,608,617 | | | $ | 79,387,478 | | | $ | 85,319,291 | |
| | | | | | | | | | | | | | | | | |
| CAPITAL SHARE ACTIVITY: | | | | | | | | | | | | | | | | |
| Shares sold | | | 394,100 | | | | 85,888 | | | | 12,622,465 | | | | 9,024,385 | |
| Shares redeemed | | | (548,640 | ) | | | (403,259 | ) | | | (12,037,005 | ) | | | (2,366,280 | ) |
| Net increase (decrease) in shares outstanding | | | (154,540 | ) | | | (317,371 | ) | | | 585,460 | | | | 6,658,105 | |
| Shares outstanding, beginning of year | | | 1,670,071 | | | | 1,987,442 | | | | 14,112,983 | | | | 7,454,878 | |
| Shares outstanding, end of year | | | 1,515,531 | | | | 1,670,071 | | | | 14,698,443 | | | | 14,112,983 | |
| (1) | Prior to May 1, 2010, the Firsthand Technology Opportunities Fund was named Firsthand e-Commerce Fund. |
see accompanying notes to financial statements
STATEMENTS OF CHANGES IN NET ASSETS
For the Years Ended December 31, 2011, and December 31, 2010
| | | FIRSTHAND ALTERNATIVE ENERGY FUND | |
| | | YEAR ENDED | | | YEAR ENDED | |
| | | 12/31/11 | | | 12/31/10 | |
| FROM OPERATIONS: | | | | | | |
| Net investment loss | | $ | (80,355 | ) | | $ | (94,944 | ) |
| Net realized losses from security transactions, purchased options, written options and foreign currency | | | (33,954 | ) | | | (251,390 | ) |
| Net change in unrealized depreciation on investments, purchased options, written options and foreign currency | | | (2,526,860 | ) | | | (504,526 | ) |
| Net decrease in net assets from operations | | | (2,641,169 | ) | | | (850,860 | ) |
| | | | | | | | | |
| FROM CAPITAL SHARE TRANSACTIONS: | | | | | | | | |
| Proceeds from shares sold | | | 2,233,806 | | | | 3,348,444 | |
| Payment for shares redeemed | | | (1,991,973 | ) | | | (4,006,738 | ) |
| Net increase (decrease) in net assets from capital share transactions | | | 241,833 | | | | (658,294 | ) |
| TOTAL INCREASE (DECREASE) IN NET ASSETS | | | (2,399,336 | ) | | | (1,509,154 | ) |
| | | | | | | | | |
| NET ASSETS: | | | | | | | | |
| Beginning of year | | | 5,917,538 | | | | 7,426,692 | |
| End of year | | $ | 3,518,202 | | | $ | 5,917,538 | |
| Accumulated Net Investment Loss | | $ | (11 | ) | | $ | (27 | ) |
| | | | | | | | | |
| CAPITAL SHARE ACTIVITY: | | | | | | | | |
| Shares sold | | | 311,301 | | | | 442,347 | |
| Shares redeemed | | | (320,943 | ) | | | (555,224 | ) |
| Net increase (decrease) in shares outstanding | | | (9,642 | ) | | | (112,877 | ) |
| Shares outstanding, beginning of year | | | 813,927 | | | | 926,804 | |
| Shares outstanding, end of year | | | 804,285 | | | | 813,927 | |
see accompanying notes to financial statements
FINANCIAL HIGHLIGHTS
Selected per share data and ratios for a share outstanding throughout each year
FIRSTHAND TECHNOLOGY LEADERS FUND
| | | YEAR ENDED | | | YEAR ENDED | | | YEAR ENDED | | | YEAR ENDED | | | YEAR ENDED | |
| | | 12/31/11 | | | 12/31/10 | | | 12/31/09 | | | 12/31/08 | | | 12/31/07 | |
| Net asset value at beginning of year | | $ | 20.72 | | | $ | 19.11 | | | $ | 12.28 | | | $ | 23.06 | | | $ | 20.23 | |
| Income from investment operations: | | | | | | | | | | | | | | | | | | | | |
| Net investment loss | | | (0.24 | ) | | | (0.20 | ) | | | (0.17 | ) | | | (0.21 | ) | | | (0.29 | ) |
| Net realized and unrealized gains (losses) on investments | | | (0.82 | ) | | | 1.81 | | | | 7.00 | | | | (10.57 | ) | | | 3.12 | |
| Total from investment operations | | | (1.06 | ) | | | 1.61 | | | | 6.83 | | | | (10.78 | ) | | | 2.83 | |
| Net asset value at end of year | | $ | 19.66 | | | $ | 20.72 | | | $ | 19.11 | | | $ | 12.28 | | | $ | 23.06 | |
| Total return | | | (5.12 | %) | | | 8.42 | % | | | 55.62 | % | | | (46.75 | %) | | | 13.99 | % |
| Net assets at end of year (millions) | | $ | 29.8 | | | $ | 34.6 | | | $ | 38.0 | | | $ | 27.6 | | | $ | 63.5 | |
| Ratio of gross expenses to average net assets before waiver | | | 1.87 | % | | | 1.86 | % | | | 1.92 | % | | | 2.07 | % | | | 1.96 | % |
| Ratio of net expenses to average net assets after waiver | | | 1.85 | % | | | 1.85 | % | | | 1.90 | % | | | 1.95 | % | | | 1.95 | % |
| Ratio of net investment loss average net assets | | | (1.12 | %) | | | (0.94 | %) | | | (0.98 | %) | | | (1.03 | %) | | | (1.16 | %) |
| Portfolio turnover rate | | | 22 | % | | | 37 | % | | | 25 | % | | | 78 | % | | | 35 | % |
FINANCIAL HIGHLIGHTS
Selected per share data and ratios for a share outstanding throughout each year
FIRSTHAND TECHNOLOGY OPPORTUNITIES FUND
| | | YEAR ENDED | | | YEAR ENDED | | | YEAR ENDED | | | YEAR ENDED | | | YEAR ENDED | |
| | | 12/31/11 | | | 12/31/10 | | | 12/31/09 | | | 12/31/08 | | | 12/31/07 | |
| Net asset value at beginning of year | | $ | 6.05 | �� | | $ | 4.68 | | | $ | 2.69 | | | $ | 4.67 | | | $ | 4.05 | |
| Income from investment operations: | | | | | | | | | | | | | | | | | | | | |
| Net investment loss | | | (0.09 | ) | | | (0.05 | ) | | | (0.06 | ) | | | (0.06 | ) | | | (0.06 | ) |
| Net realized and unrealized gains (losses) on investments | | | (0.56 | ) | | | 1.42 | | | | 2.05 | | | | (1.92 | ) | | | 0.68 | |
| Total from investment operations | | | (0.65 | ) | | | 1.37 | | | | 1.99 | | | | (1.98 | ) | | | 0.62 | |
| Net asset value at end of year | | $ | 5.40 | | | $ | 6.05 | | | $ | 4.68 | | | $ | 2.69 | | | $ | 4.67 | |
| Total return | | | (10.74 | %) | | | 29.27 | % | | | 73.98 | % | | | (42.40 | %) | | | 15.31 | % |
| Net assets at end of year (millions) | | $ | 79.4 | | | $ | 85.3 | | | $ | 34.9 | | | $ | 19.4 | | | $ | 40.7 | |
| Ratio of gross expenses to average net assets before waiver | | | 1.86 | % | | | 1.86 | % | | | 1.92 | % | | | 2.14 | % | | | 1.96 | % |
| Ratio of net expenses to average net assets after waiver | | | 1.85 | % | | | 1.85 | % | | | 1.90 | % | | | 1.95 | % | | | 1.95 | % |
| Ratio of net investment loss average net assets | | | (1.21 | %) | | | (1.42 | %) | | | (1.66 | %) | | | (1.58 | %) | | | (1.28 | %) |
| Portfolio turnover rate | | | 128 | % | | | 164 | % | | | 41 | % | | | 41 | % | | | 44 | % |
see accompanying notes to financial statements
FINANCIAL HIGHLIGHTS
Selected per share data and ratios for a share outstanding throughout each year/period
FIRSTHAND ALTERNATIVE ENERGY FUND
| | | YEAR ENDED | | | YEAR ENDED | | | YEAR ENDED | | | YEAR ENDED | | | PERIOD ENDED | |
| | | 12/31/11 | | | 12/31/10 | | | 12/31/09 | | | 12/31/08 | | | 12/31/07* | |
| Net asset value at beginning of year/period | | $ | 7.27 | | | $ | 8.01 | | | $ | 5.68 | | | $ | 10.89 | | | $ | 10.00 | |
| Income from investment operations: | | | | | | | | | | | | | | | | | | | | |
| Net investment loss | | | (0.10 | ) | | | (0.12 | ) | | | (0.10 | ) | | | (0.07 | ) | | | — | (A) |
| Net realized and unrealized gains (losses) on investments | | | (2.80 | ) | | | (0.62 | ) | | | 2.43 | | | | (5.14 | ) | | | 0.89 | |
| Total from investment operations | | | (2.90 | ) | | | (0.74 | ) | | | 2.33 | | | | (5.21 | ) | | | 0.89 | |
| Net asset value at end of year/period | | $ | 4.37 | | | $ | 7.27 | | | $ | 8.01 | | | $ | 5.68 | | | $ | 10.89 | |
| Total return | | | (39.89 | %) | | | (9.24 | %) | | | 41.02 | % | | | (47.84 | %) | | | 8.90 | (B) |
| Net assets at end of year/period (millions) | | $ | 3.5 | | | $ | 5.9 | | | $ | 7.4 | | | $ | 3.7 | | | $ | 1.9 | |
Ratio of gross expenses to average net assets before waiver** | | | 2.11 | % | | | 2.10 | % | | | 2.27 | %** | | | 2.37 | % | | | 2.10 | %(C) |
| Ratio of net expenses to average net assets after waiver | | | 1.98 | % | | | 1.98 | % | | | 2.15 | %** | | | 2.11 | %** | | | 2.10 | %(C) |
| Ratio of net investment loss average net assets | | | (1.43 | %) | | | (1.48 | %) | | | (1.68 | %) | | | (1.26 | %) | | | (0.07 | %)(C) |
| Portfolio turnover rate | | | 16 | % | | | 58 | % | | | 41 | % | | | 44 | % | | | — | (B) |
| * | For the period October 29, 2007 (inception) through December 31, 2007. |
| ** | Ratio for years ended 2009 and 2008 includes dividend expenses on securities sold short of 0.11% and 0.01%, respectively. |
see accompanying notes to financial statements
NOTES TO FINANCIAL STATEMENTS
December 31, 2011
Each of Firsthand Technology Leaders Fund, Firsthand Technology Opportunities Fund and Firsthand Alternative Energy Fund (individually the “Fund”, and collectively the “Funds”) is a non-diversified series of Firsthand Funds (the “Trust”), an open-end management investment company registered under the Investment Company Act of 1940, as amended (the “1940 Act”). The Trust, a Delaware statutory trust, was organized on November 8, 1993. Each Fund currently offers one class of shares—Investor Class shares. The inception dates for the Funds (the date on which a net asset value was first determined for that Fund) follow:
| FUND | INCEPTION DATE |
| Firsthand Technology Leaders Fund | December 10, 1997 |
| Firsthand Technology Opportunities Fund | September 30, 1999 |
| Firsthand Alternative Energy Fund | October 29, 2007 |
Each Fund’s investment objective is long-term growth of capital.
Firsthand Technology Leaders Fund seeks to achieve its investment objective by investing, under normal circumstances, at least 80% of its assets in high-technology companies that the Investment Adviser believes hold dominant competitive positions in high-growth industries.
Firsthand Technology Opportunities Fund seeks to achieve its investment objective by investing, under normal circumstances, at least 80% of its assets in equity securities of high-technology companies in the industries and markets that the Investment Adviser believes hold the most growth potential within the technology sector.
Firsthand Alternative Energy Fund seeks to achieve its investment objective by investing, under normal circumstances, at least 80% of its assets in alternative energy and energy technology companies, both U.S. and international.
On December 12, 2011, the Board of Trustees approved the reorganization of Firsthand Technology Leaders Fund into Firsthand Technology Opportunities Fund. Proxy materials are being prepared to seek shareholders’ approval for the reorganization. As of December 14, 2011, Firsthand Technology Leaders Fund was closed to all new purchases and exchanges.
2. Significant Accounting Policies
The following is a summary of the Funds’ significant accounting policies:
Securities Valuation — A Fund’s portfolio of securities is valued as follows:
| | 1. | Securities traded on stock exchanges, or quoted by NASDAQ, are valued according to the NASDAQ official closing price, if applicable, or at their last reported sale price as of the close of trading on the New York Stock Exchange (“NYSE”) (normally 4:00 P.M. Eastern Time). If a security is not traded that day, the security will be valued at its most recent bid price. |
NOTES TO FINANCIAL STATEMENTS - continued
December 31, 2011
| | 2. | Securities traded in the over-the-counter market, but not quoted by NASDAQ, are valued at the last sale price (or, if the last sale price is not readily available, at the most recent closing bid price as quoted by brokers that make markets in the securities) at the close of trading on the NYSE. |
| | 3. | Securities traded both in the over-the-counter market and on a stock exchange are valued according to the broadest and most representative market. |
| | 4. | Securities and other assets that do not have market quotations readily available are valued at their fair value as determined in good faith using procedures established by the Board of Trustees. |
In pricing illiquid, privately placed securities, the advisor follows well-accepted valuation techniques. Initial valuations are generally determined by the initial purchase price for each security. Subsequent to initial purchase, securities are repriced from time to time to reflect changes to the companies’ valuations caused by various events. Such events include, among others, a new round of financing establishing a new valuation for the company; material changes to a company’s business or business prospects, either due to company-specific internal issues (gaining or losing a major customer, missing a significant milestone, etc.) or macroeconomic events affecting the industry or the world. In analyzing a company’s valuation, factors that are also considered include a company’s cash flow, revenues, profitability, financial forecasts, and probability of success in those measures. Other potential factors include the value of comparable public and private companies and general market conditions.
Fair Value Measurement — In accordance with the authoritative guidance on fair value measurements and disclosures under GAAP, each Fund discloses the fair value of its investments in a hierarchy that prioritizes the inputs to valuation techniques used to measure the fair value. The hierarchy gives the highest priority to valuations based upon unadjusted quoted prices in active markets for identical assets or liabilities (level 1 measurement) and the lowest priority to valuations based upon unobservable inputs that are significant to the valuation (level 3 measurements).
The guidance establishes three levels of the fair value hierarchy as follows:
| | Level 1 – | Unadjusted quoted prices in active markets for identical assets or liabilities that the Funds have the ability to access |
| | Level 2 – | Observable inputs other than quoted prices included in level 1 that are observable for the asset or liability, either directly or indirectly. These inputs may include quoted prices for the identical instrument on an inactive market, prices for similar instruments, interest rates, prepayment speeds, credit risks, yield curves, default rates, and similar data. |
| | Level 3 – | Unobservable inputs for the asset or liability, to the extent relevant observable inputs are not available, representing the Funds’ own assumptions about the assumptions a market participant would use in valuing the asset or liability, and would be based on the best information available. |
NOTES TO FINANCIAL STATEMENTS - continued
December 31, 2011
The availability of observable inputs can vary from security to security and is affected by a wide variety of factors, including, for example, the type of security, whether the security is new and not yet established in the marketplace, the liquidity of markets, and other characteristics particular to the security. To the extent that valuation is based on models or inputs that are less observable or unobservable in the market, the determination of fair value requires more judgment. Accordingly, the degree of judgment exercised in determining fair value is greatest for instruments categorized in level 3.
The inputs used to measure fair value may fall into different levels of the fair value hierarchy. In such cases, for disclosure purposes, the level in the fair value hierarchy within which the fair value measurement falls in its entirety, is determined based on the lowest level input that is significant to the fair value measurement in its entirety.
The inputs or methodology used for valuing securities are not necessarily an indication of the risk associated with investing in those securities. The following is a summary of the inputs used to value the following Funds’ net assets as of December 31, 2011:
| FUND* | | | | | | | | | |
| TLFQX | | | | | | | | | |
| Common Stocks | | | | | | | | | |
| Advanced Materials | | $ | 519,200 | | | $ | — | | | $ | — | |
| Communications Equipment | | | 1,466,700 | | | | — | | | | — | |
| Computer | | | 2,227,500 | | | | — | | | | — | |
| Internet | | | 1,264,350 | | | | — | | | | — | |
| Networking | | | 723,200 | | | | — | | | | — | |
| Other Electronics | | | 421,200 | | | | — | | | | — | |
| Semiconductor Equipment | | | 739,200 | | | | — | | | | — | |
| Semiconductors | | | 2,508,600 | | | | — | | | | — | |
| Software | | | 2,333,900 | | | | — | | | | — | |
| Total Common Stock | | | 12,203,850 | | | | — | | | | — | |
| Investment Company | | | 17,651,391 | | | | — | | | | — | |
| Total | | $ | 29,855,241 | | | $ | — | | | $ | — | |
NOTES TO FINANCIAL STATEMENTS - continued
December 31, 2011
| FUND* | | | | | | | | | |
| TEFQX | | | | | | | | | | | | |
| Common Stocks | | | | | | | | | | | | |
| Communications | | $ | 3,748,400 | | | $ | — | | | $ | — | |
| Communications Equipment | | | 12,357,000 | | | | — | | | | — | |
| Computer | | | 4,050,000 | | | | — | | | | — | |
| Internet | | | 19,870,342 | | | | — | | | | — | |
| Networking | | | 8,663,774 | | | | — | | | | — | |
| Other Electronics | | | 710,400 | | | | — | | | | — | |
| Semiconductors | | | 11,059,900 | | | | — | | | | — | |
| Software | | | 6,389,700 | | | | — | | | | — | |
| Total Common Stock | | | 66,849,516 | | | | — | | | | — | |
| Exchanged-Traded Note | | | 4,466,400 | | | | — | | | | — | |
| Investment Company | | | 7,216,864 | | | | | | | | | |
| Asset Derivatives** | | | | | | | | | | | | |
| Equity Contracts | | | — | | | | 1,164,300 | | | | — | |
| Total | | $ | 78,532,780 | | | $ | 1,164,300 | | | $ | — | |
| | | | | | | | | | |
| FUND* | | | | | | | | | |
| ALTEX | | | | | | | | | | | | |
| Common Stocks | | | | | | | | | | | | |
| Advanced Materials | | $ | 308,428 | | | $ | — | | | $ | — | |
| Basic Materials | | | 37,835 | | | | — | | | | — | |
| Battery | | | 48,461 | | | | — | | | | — | |
| Building Automation | | | 68,772 | | | | — | | | | — | |
| Energy Efficiency | | | 381,288 | | | | — | | | | — | |
| Environmental Services | | | 212,816 | | | | — | | | | — | |
| Industrials | | | 101,929 | | | | — | | | | — | |
| Intellectual Property | | | — | | | | — | | | | 18 | |
| Other Electronics | | | 233,411 | | | | — | | | | — | |
| Power Conversion/ Supply Equipment | | | 61,387 | | | | — | | | | — | |
| Renewable Energy | | | 1,374,937 | | | | — | | | | — | |
| Semiconductors | | | 192,295 | | | | — | | | | — | |
| Total Common Stocks | | | 3,021,559 | | | | — | | | | 18 | |
NOTES TO FINANCIAL STATEMENTS - continued
December 31, 2011
| FUND* | | | | | | | | | |
| ALTEX (cont’d) | | | | | | | | | | | | |
| Preferred Stocks | | | | | | | | | | | | |
| Intellectual Property | | $ | — | | | $ | — | | | $ | 625 | |
| Renewable Energy | | | — | | | | — | | | | 6,749 | |
| Total Preferred Stocks | | | — | | | | — | | | | 7,374 | |
| Investment Company | | | 414,888 | | | | — | | | | — | |
| Total | | $ | 3,436,447 | | | $ | — | | | $ | 7,392 | |
| * | TLFQX: Firsthand Technology Leaders Fund; TEFQX: Firsthand Technology Opportunities Fund; ALTEX: Firsthand Alternative Energy Fund. |
| ** | Asset derivatives include purchased options. |
At the end of each calendar quarter, management evaluates the Level 2 and 3 assets and liabilities for changes in liquidity, including but not limited to: whether a broker is willing to execute at the quoted price, the depth and consistency of prices from third party services, and the existence of contemporaneous, observable trades in the market. Additionally, management evaluates the Level 1 and 2 assets and liabilities on a quarterly basis for changes in listings or delistings on national exchanges. Transfers in and out of the levels are recognized at the value at the end of the period. There were no transfers between Levels 1 and 2 during the period ended December 31, 2011.
Following is a reconciliation of Level 3 assets (at either the beginning or the ending of the period) for which significant unobservable inputs were used to determine fair value.
FIRSTHAND ALTERNATIVE ENERGY FUND
| INVESTMENTS AT FAIR VALUE USING SIGNIFICANT UNOBSERVABLE INPUTS (LEVEL 3) | | BALANCE AS OF 12/31/10 | | | GROSS PURCHASES | | | GROSS SALES | | | NET REALIZED GAINS (LOSSES) | | | NET UNREALIZED APPRECIATION (DEPRECIATION) | | | TRANSFERS IN (OUT) OF LEVEL 3 | | | BALANCE AS OF 12/31/11 | |
Common Stocks Intellectual Property | | $ | 1,814 | | | $ | — | | | $ | — | | | $ | — | | | $ | (1,796 | ) | | $ | — | | | $ | 18 | |
Preferred Stocks Intellectual Property | | | 952 | | | | — | | | | — | | | | — | | | | (327 | ) | | | — | | | | 625 | |
| Renewable Energy | | | 25,924 | | | | — | | | | — | | | | — | | | | (19,175 | ) | | | — | | | | 6,749 | |
| Total | | $ | 28,690 | | | $ | — | | | $ | — | | | $ | — | | | $ | (21,298 | ) | | $ | — | | | $ | 7,392 | |
The net change in unrealized appreciation (depreciation) from Level 3 investments held as of December 31, 2011, Firsthand Alternative Energy Fund was $(21,298) and is included in “Net change in unrealized appreciation on investments and foreign currency” on the Statement of Operations.
NOTES TO FINANCIAL STATEMENTS - continued
December 31, 2011
Share Valuation — The net asset value (“NAV”) per share of each Fund is calculated by dividing the sum of the value of the securities held by the Fund, plus cash or other assets, minus all liabilities (including estimated accrued expenses) by the total number of shares outstanding of the Fund, rounded to the nearest cent. A Fund’s shares will not be priced on the days on which the NYSE is closed for trading. The offering and redemption price per share of each Fund is equal to a Fund’s net asset value per share.
Investment Income — Dividend income is recorded on the ex-dividend date. Interest income is accrued as earned. Discounts and premiums on securities purchased are amortized over the lives of the respective securities. Other non-cash dividends are recognized as investment income at the fair value of the property received. Withholding taxes on foreign dividends have been provided for in accordance with the Funds’ understanding of the applicable country’s tax rules and rates.
Cash and Cash Equivalents — The Funds consider liquid assets deposited with a bank, money market funds, and certain short-term debt instruments with maturities of 3 months or less to be cash equivalents. These investments represent amounts held with financial institutions that are readily accessible to pay Fund expenses or purchase investments. Cash and cash equivalents are valued at cost plus accrued interest, which approximates market value.
Foreign Securities — Each Fund may invest in companies that trade on U.S. exchanges as American Depositary Receipts (“ADRs”), on foreign exchanges, or on foreign over-the-counter markets. Investing in the securities of foreign companies exposes your investment in a Fund to risk. Foreign stock markets tend to be more volatile than the U.S. market due to economic and/or political instability and the regulatory conditions in some countries. In addition, some of the securities in which the Fund may invest may be denominated in foreign currencies, the value of which may decline against the U.S. dollar. An investment in foreign securities may be subject to high levels of foreign taxation, including foreign taxes withheld at the source. The Fund does not isolate the portion of the results of operations resulting from changes in foreign exchange rates on investments from the fluctuations arising from changes in market prices of securities held. Reported net realized foreign exchange gains or losses arise from sales of portfolio securities, currency gains or losses realized between the trade and settlement dates on securities transactions, and the difference between the amounts of dividends, interest, and foreign withholding taxes recorded on the Funds’ books and the U.S. dollar equivalent of the amounts actually received or paid.
Options — The Funds are subject to equity price risk in the normal course of pursuing their investment objectives and may enter into options written to hedge against changes in the value of equities. The Funds may purchase put and call options to attempt to provide protection against adverse price effects from anticipated changes in prevailing prices of securities or stock indices. The Funds may also write put and call options. When the Fund writes an option, an amount equal to the premium received by the Fund is recorded as a liability and is subsequently adjusted to the current fair value of the option written.
NOTES TO FINANCIAL STATEMENTS - continued
December 31, 2011
Premiums received from writing options that expire unexercised are treated by the Fund on the expiration date as realized gains from investments. The difference between the premium and the amount paid on effecting a closing purchase transaction, including brokerage commissions, is also treated as a realized gain, or, if the premium is less than the amount paid for the closing purchase transaction, as a realized loss. If a call option is exercised, the premium is added to the proceeds from the sale of the underlying security or currency in determining whether the Fund has realized a gain or loss. The Fund as writer of an option bears the market risk of an unfavorable change in the price of the security underlying the written option.
The market value of the Fund’s purchased options as of December 31, 2011 can be found on the Portfolio of Investments. The net realized gains/(loss) from purchased and written options and the net change in unrealized appreciation (depreciation) on purchased and written options for the year ended December 31, 2011 can be found on the Statements of Operations.
The number of option contracts written and the premiums received during the year ended December 31, 2011, were as follows:
| | | FIRSTHAND TECHNOLOGY LEADERS FUND | |
| | | Number of | | | Premiums | |
| | | Contracts | | | Received | |
| Options outstanding, beginning of year | | | 3,758 | | | $ | 543,940 | |
| Options written during period | | | 100 | | | | 10,430 | |
| Options expired during period | | | (1,479 | ) | | | (158,013 | ) |
| Options closed during period | | | (462 | ) | | | (35,102 | ) |
| Options exercised during period | | | (1,917 | ) | | | (361,255 | ) |
| Options outstanding, end of year | | | — | | | $ | — | |
| | | | | | | | | |
| | | FIRSTHAND TECHNOLOGY | |
| | | OPPORTUNITIES FUND | |
| | | Number of | | | Premiums | |
| | | Contracts | | | Received | |
| Options outstanding, beginning of year | | | 588 | | | $ | 93,118 | |
| Options written during period | | | 3,090 | | | | 677,192 | |
| Options expired during period | | | (588 | ) | | | (93,118 | ) |
| Options closed during period | | | (3,090 | ) | | | (677,192 | ) |
| Options exercised during period | | | — | | | | — | |
| Options outstanding, end of year | | | — | | | $ | — | |
The average volume of each Fund’s derivatives during the year ended December 31, 2011 is as follows:
| | PURCHASED OPTIONS | WRITTEN OPTIONS |
| | (CONTRACTS) | (CONTRACTS) |
| Firsthand Technology Leaders Fund | 2,070 | 772 |
| Firsthand Technology Opportunities Fund | 2,236 | 356 |
NOTES TO FINANCIAL STATEMENTS - continued
December 31, 2011
Distributions to Shareholders — Each Fund expects to distribute its net investment income and net realized gains, if any, annually. Distributions from net investment income and capital gains are recorded on the ex-dividend date and are determined in accordance with income tax regulations, which may differ from accounting principles generally accepted in the United States.
Short Positions — Firsthand Alternative Energy Fund may sell securities short for economic hedging purposes. Short sales are transactions in which the Fund sells a security it does not own, in anticipation of a decline in the market value of that security. To initiate such a transaction, the Fund must borrow the security to deliver to the buyer upon the short sale; the Fund is then obligated to replace the security borrowed by purchasing it in the open market at some later date, completing the transaction. The Fund is liable for any dividends payable on securities while those securities are in a short position.
The Fund will incur a loss if the market price of the security increases between the date of the short sale and the date on which the Fund replaces the borrowed security. The Fund will realize a gain if the security declines in value between those dates.
All short sales must be fully collateralized. The Fund maintains the collateral in a segregated account consisting of cash, cash equivalents and/or liquid securities sufficient to collateralize the market value of its short positions. Typically, the segregated cash with brokers and other financial institutions exceeds the minimum required. Deposits with brokers for securities sold short are invested in money market instruments.
Reclassification of Capital Accounts—Permanent book and tax differences resulted in reclassifications for the year ended December 31, 2011 as follows:
| | | INCREASE (DECREASE) | |
| | | Paid-in-Capital | | | Accumulated Net Investment Income (Loss) | | | Accumulated Net Realized Gain (Loss) | |
| Firsthand Technology Leaders Fund | | $ | (52,975,891 | ) | | $ | 358,992 | | | $ | 52,616,899 | |
| Firsthand Opportunities Fund | | | (1,298,236 | ) | | | 1,298,218 | | | | 18 | |
| Firsthand Alternative Energy Fund | | | (80,358 | ) | | | 80,371 | | | | (13 | ) |
These reclassifications, related to expiration of capital loss carryforwards, current year write off of net operating loss and 988 reclass, have no effect on net asset value per share.
Security Transactions — Security transactions are accounted for no later than one business day following the trade date, however, for financial reporting purposes, security transactions are accounted for on trade date. Realized gains and losses are calculated on a specific identification basis.
NOTES TO FINANCIAL STATEMENTS - continued
December 31, 2011
Estimates — The preparation of financial statements in conformity with accounting principles generally accepted in the United States of America requires management to make estimates and assumptions that affect the reported amounts of assets and liabilities at the date of the financial statements and the reported amounts of income and expenses during the reporting period. Actual results could differ from those estimates.
Federal Income Tax — Each Fund has elected, and intends to qualify annually, for the special tax treatment afforded regulated investment companies under the Internal Revenue Code of 1986, as amended (the “Code”). As provided in the Code, in any fiscal year in which a Fund so qualifies and distributes at least 90% of its taxable net income, the Fund (but not the shareholders) will be relieved of federal income tax on the income distributed. Accordingly, no provision for income taxes has been made. To avoid imposition of the excise tax applicable to regulated investment companies, each Fund intends to declare as dividends in each calendar year at least 98% of its net investment income (earned during the calendar year) and 98% of its net realized capital gains (earned during the 12 months ended October 31) plus undistributed amounts, if any, from prior years. The following information is based upon the federal income tax cost of portfolio investments as of December 31, 2011.
| | | | | | | | | | |
| Gross unrealized appreciation | | $ | 3,152,333 | | | $ | 7,229,241 | | | $ | 448,826 | |
| Gross unrealized depreciation | | | (1,740,872 | ) | | | (9,010,237 | ) | | | (3,252,360 | ) |
| Net unrealized appreciation (depreciation) | | $ | 1,411,461 | | | $ | (1,780,996 | ) | | $ | (2,803,534 | ) |
| Federal income tax cost | | $ | 28,443,780 | | | $ | 81,478,076 | | | $ | $6,247,373 | |
The difference between the acquisition cost and the federal income tax cost of portfolio investments is due to certain timing differences in the recognition of capital losses under accounting principles generally accepted in the United States and income tax regulations.
As of December 31, 2011, the Funds had capital loss carryforwards for federal income tax purposes as follows:
| | | EXPIRING | | | EXPIRING | | | EXPIRING | | | EXPIRING | |
| | | 2012 | | | 2013 | | | 2014 | | | 2015 | |
| TLFQX | | $ | 33,348,418 | | | $ | 2,501,372 | | | $ | — | | | $ | — | |
| TEFQX | | | — | | | | — | | | | — | | | | — | |
| ALTEX | | | — | | | | — | | | | — | | | | — | |
NOTES TO FINANCIAL STATEMENTS - continued
December 31, 2011
| | | EXPIRING | | | EXPIRING | | | EXPIRING | | | | | | | |
| | | 2016 | | | 2017 | | | 2018 | | | | N/A* | | | TOTAL | |
| TLFQX | | $ | — | | | $ | 2,394,837 | | | $ | — | | | $ | — | | | $ | 38,244,627 | |
| TEFQX | | | — | | | | 247,259 | | | | — | | | | — | | | | 247,259 | |
| ALTEX | | | — | | | | 181,999 | | | | 108,018 | | | | 366,458 | | | | 656,475 | |
| * | On December 22, 2010, President Obama signed into law the Regulated Investment Company Modernization Act of 2010 (the “Act”). The Act updates certain tax rules applicable to regulated investment companies (“RICs”). The various provisions of the Act will generally be effective for RICs with taxable years beginning after December 22, 2010. Under the Modernization Act, new capital losses may now be carried forward indefinitely, and retain the character of the original loss as compared with pre-enactment law where capital losses could be carried forward for eight years, and carried forward as short-term capital losses, irrespective of the character of the original loss. |
For the year ended December 31, 2011, the Technology Leaders Fund and the Technology Opportunities Fund utilized $707,365 and $6,618,949 of capital loss carryforwards, respectively. The Technology Leaders Fund had $52,616,899 of capital loss carryforwards expire.
Components of Distributable Earnings
| | | | | | | | | | |
| Undistributed Ordinary Income | | $ | — | | | $ | — | | | $ | — | |
| Accumulated Earnings | | | — | | | | — | | | | — | |
| Net Unrealized Appreciation (Depreciation) on securities and currencies* | | | 1,411,461 | | | | (1,780,978 | ) | | | (2,795,907 | ) |
| Late Year Capital Losses Deferred** | | | (603,472 | ) | | | (1,118,054 | ) | | | — | |
| Late Year Ordinary Losses Deferred** | | | — | | | | — | | | | (11 | ) |
| Accumulated Capital Loss Carryforward | | | (38,244,627 | ) | | | (247,259 | ) | | | (656,475 | ) |
| Total Distributable Earnings | | $ | (37,436,638 | ) | | $ | (3,146,291 | ) | | $ | (3,452,393 | ) |
| * | The differences between book-basis and tax-basis unrealized appreciation (depreciation) is attributable primarily to tax deferral of losses on wash sales and straddle losses. |
| ** | Under current tax law, capital and currency losses realized after October 31 and prior to the Fund’s fiscal year end may be deferred as occurring on the first day of the following fiscal year. |
The Funds are subject to tax provisions that establish a minimum threshold for recognizing, and a system for measuring, the benefits of a tax position taken or expected to be taken in a tax return. Taxable years ending 2011, 2010, 2009 and 2008 remain open to federal and state audit. As of December 31, 2011, management has evaluated the application of these provisions to the Funds, and has determined that no provision for income tax is required in the Funds’ financial statements for uncertain tax provisions.
NOTES TO FINANCIAL STATEMENTS - continued
December 31, 2011
3. Investment transactions (excluding short-term investments) were as follows for the year ended December 31, 2011.
| | | | | | | | | | |
| Purchase of investment securities | | $ | 4,256,890 | | | $ | 119,927,457 | | | $ | 796,054 | |
| Proceeds from sales and maturities of investment securities | | $ | 20,643,854 | | | $ | 110,023,108 | | | $ | 1,010,766 | |
4. Investment Advisory and Administration Agreements; Certain trustees and officers of the Trust are also officers of the Investment Adviser and BNY Mellon.
Certain trustees and officers of the Trust are also officers of the Investment Adviser or BNY Mellon. BNY Mellon serves as the sub-administrator, investment accounting agent, and shareholder servicing and transfer agent.
INVESTMENT ADVISORY AGREEMENT
Each Fund’s investments are managed by the Investment Adviser pursuant to the terms of a master investment advisory agreement (the “Advisory Agreement”). Under the Advisory Agreement, the Investment Adviser provides each Fund with investment research, advice, management, and supervision and manages the investment and reinvestment of assets of each Fund consistent with each Fund’s investment objectives, policies, and limitations. Subject to certain exceptions set forth in the Advisory Agreement, the Investment Adviser is responsible for (i) compensation of any of the Fund’s trustees, officers, and employees who are interested persons of the Investment Adviser; and (ii) compensation of the Investment Adviser’s personnel and other expenses incurred in connection with the provision of portfolio management services under the Advisory Agreement.
Effective August 3, 2009, SiVest Group, Inc. (SiVest changed its name to Firsthand Capital Management, Inc. on January 1, 2012. Throughout this report, we will refer to the Adviser as FCM) became the Investment Adviser to the Funds. For the services it provides under the Advisory Agreement, the Investment Adviser receives from each Fund, on a monthly basis, an advisory fee at the annual rate of 1.40% of its average daily net assets (1.53% for ALTEX). The Advisory Agreement requires the Investment Adviser to waive fees and, if necessary, to reimburse expenses of each such Fund to the extent necessary to limit a Fund’s total operating expenses to 1.85%, excluding any extraordinary fees, (1.98% for ALTEX) of its average net assets up to $200 million, 1.80% (1.93% for ALTEX) of such assets from $200 million to $500 million, 1.75% (1.88% for ALTEX) of such assets from $500 million to $1 billion, and 1.70% (1.83% for ALTEX) of such assets in excess of $1 billion.
ADMINISTRATION AGREEMENT
The Trust has entered into a separate Administration Agreement with the Investment
NOTES TO FINANCIAL STATEMENTS - continued
December 31, 2011
Adviser. The agreement obligates the Investment Adviser to provide administrative and general supervisory services to each Fund (the “Administration Agreement”). Under the Administration Agreement, the Investment Adviser renders supervisory and corporate administrative services to the Trust, as well as oversees the maintenance of all books and records with respect to each Fund’s securities transactions and each Fund’s book of accounts in accordance with all applicable federal and state laws and regulations. The Investment Adviser also arranges for the preservation of journals, ledgers, corporate documents, brokerage account records, and other records as required by the 1940 Act.
The Investment Adviser is responsible for the equipment, staff, office space, and facilities necessary to perform its obligations under the Administration Agreement. Under the Administration Agreement, the Investment Adviser has assumed responsibility for payment of all of each Fund’s operating expenses excluding brokerage and commission expenses; short sale expenses; fees payable under “Rule 12b-1 plans”, if any, and shareholder servicing plans, if any; litigation costs; and any extraordinary and non-recurring expenses. For the services it provides under the Administration Agreement, the Investment Adviser receives a fee from each Fund at the annual rate of 0.45% of its average daily net assets up to $200 million, 0.40% of such assets from $200 million to $500 million, 0.35% of such assets from $500 million to $1 billion, and 0.30% of such assets in excess of $1 billion.
Effective November 23, 2009, BNY Mellon Investment Servicing (US) Inc. (“BNY Mellon”), formerly known as PNC Global Investment Servicing (U.S.) Inc. (“PNC”) has entered into a Sub-Administration Agreement with the Investment Adviser. Under this agreement, the Investment Adviser (not the Funds) pays to BNY Mellon the fees for the administrative services provided by BNY Mellon. In the case of Firsthand Alternative Energy Fund, the Investment Adviser has also agreed to donate a portion of its management fees allocated, amounting to 0.20% of Firsthand Alternative Energy Fund’s average daily net assets, to various non-profit organizations as elected by Fund shareholders.
Additionally, effective November 23, 2009, BNY Mellon serves as the sub-administrator, investment accounting agent and shareholder servicing and transfer agent. Prior to November 23, 2009, Citi Fund Services Ohio, Inc. served as the sub-administrator, investment accounting agent and shareholder servicing and transfer agent. The Bank of New York Mellon, formerly PFPC trust Company serves as the custodian for the Trust.
5. Investments in Restricted Securities
Restricted securities include securities that have not been registered under the Securities Act of 1933, as amended, and securities that are subject to restrictions on resale. A Fund may invest in restricted securities that are consistent with a Fund’s investment objective and investment strategies. A Fund will not invest in a restricted security if, immediately after and as a result of the investment in such security, more than 15% of the Fund’s net assets would be invested in illiquid securities. In some cases, the issuer of restricted securities has agreed to register such securities for resale, at the issuer’s expense either upon demand by the Fund or in connection with another registered offering of the securities. Investments in restricted securities are valued at fair value as determined in good faith in accordance with procedures adopted by the Board of Trustees. It is possible that the esti-
NOTES TO FINANCIAL STATEMENTS - continued
December 31, 2011
mated value may differ significantly from the amount that might ultimately be realized in the near term, and the difference could be material.
As of December 31, 2011, the Alternative Energy Fund was invested in the following restricted securities:
| SECURITY | ACQUISITION DATE | | SHARES | | | COST | | | VALUE | | | % OF NET ASSETS | |
| ALTEX | | | | | | | | | | | | | |
| Silicon Genesis Corp., Common Stock | September 2, 2008 | | | 109,855 | | | $ | 32,957 | | | $ | 11 | | | | — | %* |
| Silicon Genesis Corp., Common Stock | September 26, 2008 | | | 71,552 | | | | 21,466 | | | | 7 | | | | — | %* |
| Silicon Genesis Corp., Series 1-C P/S | September 2, 2008 | | | 152 | | | | 46 | | | | 2 | | | | — | %* |
| Silicon Genesis Corp., Series 1-E P/S | September 2, 2008 | | | 3,000 | | | | 3,180 | | | | 623 | | | | — | %* |
| SoloPower, Series C-1 P/S | September 23, 2008 | | | 2,142 | | | | 21,425 | | | | 6,749 | | | | 0.2 | % |
| | | | | | | | $ | 79,074 | | | $ | 7,392 | | | | 0.2 | % |
* - Percentages are less than 0.05%.
Each Fund, consistent with SEC guidelines, has an investment restriction providing that it cannot purchase additional restricted securities once such securities comprise 15% of a Fund’s net assets. The SEC considers a security to be illiquid if it cannot be disposed of within seven days in the ordinary course of business at approximately the amount at which a Fund has valued the security. The restriction stems from the concern that, for an open-end mutual fund with daily redemption obligations, a high level of illiquid securities would increase the risk that a Fund may not be able to meet its daily redemption needs, because illiquid securities often take a longer period of time to sell, and may not necessarily be sold at that Fund’s then carrying value.
As of December 31, 2011, Kevin Landis represents the Funds and sits on the following private company’s board: Silicon Genesis Corporation. Serving on the boards of directors of the portfolio companies may cause conflicts of interest. The Adviser has adopted various procedures to ensure that the Fund will not be unfavorably affected by these potential conflicts.
Management has evaluated the impact of all subsequent events on the Fund through the date the financial statements were issued, and has determined that there was the following subsequent event:
Effective January 1, 2012, SiVest Group, Inc., the Investment Adviser to the Funds, changed its name to Firsthand Capital Management, Inc.
NOTES TO FINANCIAL STATEMENTS - continued
December 31, 2011
7. New Accounting Pronouncements
In May 2011, the Financial Accounting Standards Board (“FASB”) issued Accounting Standards Update (“ASU”) No. 2011-04 “Amendments to Achieve Common Fair Value Measurement and Disclosure Requirements in U.S. GAAP and International Financial Reporting Standards (“IFRS”)”. ASU 2011-04 includes common requirements for measurement of and disclosure about fair value between U.S. GAAP and IFRS. ASU 2011-04 will require reporting entities to disclose the following information for fair value measurements categorized within Level 3 of the fair value hierarchy: quantitative information about the unobservable inputs used in the fair value measurement, the valuation processes used by the reporting entity and a narrative description of the sensitivity of the fair value measurement to changes in unobservable inputs and the interrelationships between those unobservable inputs. In addition, ASU 2011-04 will require reporting entities to make disclosures about amounts and reasons for all transfers in and out of Level 1 and Level 2 fair value measurements. The new and revised disclosures are effective for interim and annual reporting periods beginning after December 15, 2011. Management is currently evaluating the implications of ASU No. 2011-04 and its impact on the financial statements.
In December 2011, the FASB issued Accounting Standards Update No. 2011-11, “Disclosures about Offsetting Assets and Liabilities” (“ASU 2011-11”). ASU 2011-11 requires disclosures to make financial statements that are prepared under U.S. GAAP more comparable to those prepared under International Financial Reporting Standards. The new disclosure requirements mandate that entities disclose both gross and net information about instruments and transactions eligible for offset in the statement of assets and liabilities as well as instruments and transactions subject to an agreement similar to a master netting arrangement. In addition, ASU 2011-11 requires disclosure of collateral received and posted in connection with master netting agreements or similar arrangements. New disclosures are required for annual reporting periods beginning on or after January 1, 2013, and interim periods within those annual periods. Management is evaluating the impact of ASU 2011-11 on the financial statements and disclosures.
Because the return on and value of an investment in each Fund will fluctuate in response to stock market movements, the most significant risk of investing in a Fund is that you may lose money. Stocks and other equity securities are subject to market risks and fluctuations in value due to earnings, as well as economic, political, or regulatory events, and other factors beyond the Investment Adviser’s control. The Funds are designed for long-term investors who can accept the risks of investing in a fund with significant common stock holdings in high-technology industries.
Each Fund is non-diversified. A risk of being non-diversified is that a significant change in the value of one company will have a greater impact on the Fund than it would if the Fund diversified its investments. Another risk for the Fund is its concentration of investments in companies within high-technology industries. The value of high-technology companies can, and often does, fluctuate dramatically and may expose you to greater-than-average financial and market risk.
NOTES TO FINANCIAL STATEMENTS - continued
December 31, 2011
9. Investment Advisory and Administration Agreements (Unaudited)
As required by the Investment Company Act of 1940, as amended (the “1940 Act”), the Board of Trustees (the “Board”) of Firsthand Funds (the “Trust”), including all of the Trustees who are not “interested persons” of the Trust, as that term is defined in the 1940 Act (the “Independent Trustees”), recently considered the renewal of the investment advisory agreement between SiVest Group, Incorporated (the “Adviser”) and the Trust on behalf of each of its series (each a “Fund” and collectively, the “Funds”) (the “Advisory Agreement”). The Advisory Agreement was approved for an additional one-year term at a meeting of the Board held on August 19, 2011. The Board’s decision to approve the Advisory Agreement reflects the exercise of its business judgment to continue the existing arrangement. In approving the Advisory Agreement, the Board considered information provided by the Adviser, with the assistance and advice of counsel to the Independent Trustees and counsel to the Trust.
Nature, Extent and Quality of Services
The Board received and considered various data and information regarding the nature, extent and quality of services provided to the Funds by the Adviser. The most recent investment adviser registration form for the Adviser was provided to the Board, as were written and oral responses of the Adviser to an information request submitted by independent counsel on behalf of the Independent Trustees. The Board reviewed these responses, which included, among other things, information about the background and experience of the investment personnel of the Adviser primarily responsible for the day-to-day portfolio management services for the Funds. The Board also considered the Adviser’s separate Administration Agreement with the Funds and the Adviser’s overall ability to manage and administer the Funds, as well as to oversee the service providers to the Funds.
The Board evaluated the ability of the Adviser, considering its financial condition, resources, reputation and other attributes, to attract and retain highly qualified investment professionals, including research, advisory, supervisory and administrative personnel. In this regard, the Board considered information regarding the Adviser’s compensation program for its personnel involved in the management of the Funds, including incentive and retirement plans.
The Board considered the effectiveness of policies of the Funds in achieving the best execution of portfolio transactions, whether and to what extent “soft dollar” benefits are sought, the extent to which efforts are made to recapture transaction costs, and the controls applicable to brokerage allocation procedures. The Board reviewed the policies of the Adviser regarding the allocation of portfolio investment opportunities among the Funds and other clients. The Board noted that the Adviser does not use “traditional soft-dollar” arrangements where soft-dollar credits are generated based on the level of trades and then used for products or services from third-parties. The Board also noted that the Adviser, from time to time, entered into arrangements where it received research (including invitations to conferences) from broker-dealers that the Adviser used to execute client trades. The Board also considered that the Adviser had recently outsourced the trading function to achieve certain operating efficiencies.