Washington, D.C. 20549
Firsthand Capital Management, Inc.
Form N-CSR is to be used by management investment companies to file reports with the Commission not later than 10 days after the transmission to stockholders of any report that is required to be transmitted to stockholders under Rule 30e-1 under the Investment Company Act of 1940 (17 CFR 270.30e-1). The Commission may use the information provided on Form N-CSR in its regulatory, disclosure review, inspection, and policymaking roles.
A registrant is required to disclose the information specified by Form N-CSR, and the Commission will make this information public. A registrant is not required to respond to the collection of information contained in Form N-CSR unless the Form displays a currently valid Office of Management and Budget ("OMB") control number. Please direct comments concerning the accuracy of the information collection burden estimate and any suggestions for reducing the burden to Secretary, Securities and Exchange Commission, 100 F Street, NE, Washington, DC 20549. The OMB has reviewed this collection of information under the clearance requirements of 44 U.S.C. § 3507.
Item 1. Reports to Stockholders.
The Report to Shareholders is attached herewith.
CONTENTS
| Performance Summary | 2 |
| President’s Letter | 4 |
| Shareholder Fee Example | 6 |
| Performance and Portfolio Discussion | 8 |
| Audit Letter | 14 |
| Portfolio of Investments | 15 |
| Statements of Assets and Liabilities | 19 |
| Statements of Operations | 20 |
| Statements of Changes in Net Assets | 21 |
| Financial Highlights | 22 |
| Notes to Financial Statements | 24 |
| Additional Information | 40 |
PERFORMANCE SUMMARY
Period Returns (Average Annual Total Returns as of 12/31/12)
| FUND | 1-YEAR | 3-YEAR | 5-YEAR | 10-YEAR | EXPENSE RATIO |
| Firsthand Technology Opportunities Fund | 16.67% | 10.42% | 6.17% | 11.72% | 1.85% |
| Firsthand Alternative Energy Fund | -23.57% | -25.29% | -21.05% | • | 1.98% |
| NASDAQ Composite Index | 17.75% | 11.32% | 3.78% | 9.46% | • |
| S&P 500 Index | 16.00% | 10.86% | 1.66% | 7.09% | • |
| WilderHill Clean Energy Index | -17.59% | -26.99% | -31.37% | • | • |
Returns assume reinvestment of all dividends and distributions but do not reflect the impact of taxes. The performance data quoted represent past performance. Past performance cannot guarantee future results, and current performance may be lower or higher than the performance quoted. Both the return from and the principal value of an investment in the Funds will fluctuate so that an investor’s shares, when redeemed, may be worth more or less than their original cost. To obtain performance as of the most recent month-end, please contact Firsthand Funds by calling 1.888.884.2675 or go to www.firsthandfunds.com.
The Nasdaq Composite Index (NASDAQ) is a capitalization-weighted index of all common stocks listed with NASDAQ. The Standard & Poor’s 500 Index (S&P 500) is a market-weighted index of 500 stocks of well-established companies. Each index represents an unmanaged, broad-based basket of stocks. These indices are typically used as benchmarks for overall market performance. The WilderHill Clean Energy Index is a market-weighted index of 58 companies in the cleaner fuel, energy conversion, energy storage, greener utilities, power delivery and conservation, and renewable energy harvesting sectors. You cannot invest directly in an index.
Returns Since Inception (Average Annual Total Returns as of 12/31/12)
FUND (INCEPTION DATE) | AVERAGE ANNUAL TOTAL RETURNS | NASDAQ COMPOSITE INDEX | S&P 500 INDEX | WILDERHILL CLEAN ENERGY INDEX |
| Firsthand Technology Opportunities Fund (9/30/99) | -3.38% | 1.47% | 2.70% | • |
| Firsthand Alternative Energy Fund (10/29/07) | -19.09% | 2.48% | 0.74% | -29.36% |
Each Fund may invest in small-capitalization companies and Initial Public Offerings (“IPOs”). These investments will be more volatile than investments in large-capitalization companies and loss of principal could be greater. The Funds may invest in foreign securities, which will be subject to greater risks than investing in domestic securities. Because the Funds are not diversified, they can take larger positions in fewer companies, increasing their risk profile. The Funds invest in several industries within the technology sector and the relative weightings of these industries in a Fund’s portfolio may change at any time.
Holdings by Industry - % of Net Assets (as of 12/31/12)
| INDUSTRY | FIRSTHAND TECHNOLOGY OPPORTUNITIES FUND | FIRSTHAND ALTERNATIVE ENERGY FUND |
| Advanced Materials | 0.5% | 14.3% |
| Basic Materials | • | 6.1% |
| Building Automation | • | 1.8% |
| Communications | 8.6% | • |
| Communications Equipment | 6.0% | • |
| Computer | 13.7% | • |
| Energy Efficiency | • | 10.7% |
| Environmental Services | • | 4.6% |
| Exchange-Traded Fund | 0.2% | • |
| Industrials | • | 5.8% |
| Intellectual Property | • | 0.0% |
| Internet | 38.2% | • |
| Medical Device | 0.1% | • |
| Networking | 2.2% | • |
| Other Electronics | 2.7% | 3.6% |
| Power Conversion/Supply Equipment | • | 3.2% |
| Renewable Energy | • | 40.6% |
| Semiconductor Equipment | 0.4% | • |
| Semiconductors | 7.7% | 6.9% |
| Social Networking | 1.1% | • |
| Software | 7.2% | • |
| Net Other Assets and Liabilities | 11.4% | 2.4% |
Portfolio holdings are subject to change.
PRESIDENT’S LETTER
Fellow Shareholders,
It was another year of macroeconomic instability in 2012, with the European debt crisis continuing its slow burn. Credit ratings were lowered for France, Spain, Italy, and six other European Union countries. While infusions of cash from the European Central Bank prevented meltdowns in Greece and Spain, bailouts don’t create rallies—they simply kick the fiscal can farther down the road. We remain skeptical that the debt crisis will be resolved in the near term, and we believe it will continue to have a depressing effect on financial markets worldwide. Here at home, Facebook (FB) and the “fiscal cliff” were the two stories with big impacts on the market this year. First, Facebook rattled the stock market with a poorly handled initial public offering (IPO). The so-called fiscal cliff was a series of tax increases and automatic spending cuts designed to reduce the budget deficit—a scenario that would have gone into effect on January 1, 2013 had lawmakers not struck a last-minute deal in December. Nonetheless, worries over massive spending cuts and higher unemployment took their toll on the markets.
Nonetheless, the NASDAQ Composite Index and S&P 500 Index finished the year up 17.75% and 16.00%, respectively. Performance for our funds was mixed, with Firsthand Technology Opportunities Fund roughly on par with its benchmarks, returning 16.67% for the year. But the environment was worse in the renewable energy sector, with Firsthand Alternative Energy Fund underperforming relative to its benchmark, the WilderHill Clean Energy Index. Detailed performance information is available on pages 2 and 3.
Continued Demand for Cloud Computing
Despite the continued dismal macro picture, we remain excited about the long-term prospects for technology companies. Six months ago, I talked about the sea change in technology with respect to cloud computing, highlighting Equinix (EQIX) and Rackspace (RAX) as examples of innovative businesses at the forefront of the shift to the cloud. Both of these companies continued their drive toward dominance in the second half of the year, finishing 2012 up 103.35% and 72.68%, respectively.
2013 promises to be the year that cloud infrastructure sees material penetration into businesses of all kinds. With this expansion comes a continued investment opportunity in companies with the capability to integrate the new technologies into existing IT investments, as well as to manage the new set of dynamics that these kinds of architecture introduce. Companies like software giant Oracle (ORCL), IT infrastructure firm Akamai (AKAM), and virtualization specialist VMWare (VMW) are poised to capitalize on this integration.
We Still Like Facebook
Facebook was one of the biggest stock stories of the year, with intense hype surrounding the company’s May market debut. But the Facebook IPO was plagued by problems, with questions surrounding last-minute pre-IPO disclosures by the company as well as technical errors at NASDAQ that left trades unexecuted or executed at the wrong price
on opening day. Nonetheless, despite the shaky start, the company rallied from its first-full-quarter loss of 30.35% in Q3 to finish Q4 up 22.90%. The stock rebounded nicely from its 2012 low of $17.55 in early September to finish the year at $26.63. With more than 1 billion users, we believe Facebook’s dominance in the social networking space puts it at a significant advantage in the all-important online advertising market. Ask yourself what is more appealing to advertisers: a company like Google (GOOG), which knows what you’re searching for, or Facebook, which knows a great deal more about the products you like and the products your friends like.
Mobility vs. PCs
It was also another solid year for Apple (AAPL). Although many feared the tech giant would stumble after the death of its founder, Steve Jobs, but the transition has been smooth. CEO Tim Cook has led successful launches of the iPhone5 and the third-generation iPad and Apple finished the year up 32.57%. Though its shares have declined recently, Apple remains well positioned to continue its growth in the smartphone space, accounting for nearly 20% of a global market that is continuing to flourish (total smartphone shipments grew 43% in 2012). Among the many companies in the Apple ecosphere benefiting from its continued success are ARM Holdings (ARMH) and Skyworks (SWKS). Both companies provide chip technologies for Apple products and finished the year up 37.66% and 25.15%, respectively.
We continue to believe that the console videogame and PC markets are in decline. However, while our put options on both GameStop (GME) and Dell (DELL) helped TEFQX in the first half of the year, results were mixed in the second half. Our GameStop options had a negative impact overall when the company rallied 39.78% in Q3 and Q4, in part because of Sony’s (SNE) announcement that the PlayStation 4 would not be an online-only console. Nonetheless, we remain bearish on GameStop, believing that mobile (iOS and Android) gaming is going to have a significant negative impact on its business in the long term. This same online/mobile trend is hurting PC maker Dell, and our put options (which give investors the right to sell an underlying stock at a specific price) on the PC giant were one of the biggest contributors to performance in 2012, up 292.48%.
Alternative Energy
Renewable energy stocks had another difficult year in large part because of continued oversupply of solar modules and falling prices for a key component—polysilicon. We believe the industry is facing continued consolidation, with the survivors emerging as solid players in a renewable energy market that continues to expand.
Thank you for your continued investment in Firsthand Funds.
Sincerely,
Kevin Landis
President, Firsthand Funds
SHAREHOLDER FEE EXAMPLE
Example— In general, mutual fund shareholders may incur two types of costs: (1) transaction costs, including sales charges (loads), redemption fees, and exchange fees; and (2) ongoing costs, including management fees, 12b-1 distribution and service fees, non-12b-1 service fees, and other Fund expenses. This example is intended to help you understand your ongoing costs (in dollars) of investing in a Fund and to compare these costs with the ongoing costs of investing in other mutual funds. Note that Firsthand Funds (“Trust”) does not charge transaction fees for 12b-1 distribution and service fees, though you may incur transaction fees if you purchase shares through a broker.
The example on the following page is based on an investment of $1,000 invested at the beginning of the period and held for the entire period from July 1, 2012 through December 31, 2012.
Actual Expenses— The section of the table at right entitled “Actual” provides information about actual account values and actual expenses. You may use this information, together with the amount you invested, to estimate the expenses that you paid over the period. Simply divide your account value by $1,000 (for example, an $8,600 account value divided by $1,000 = 8.6), then multiply the result by the number in the section entitled “Actual” under the heading “Expenses Paid During Period” to estimate the expenses you paid on your account during this period. If your account is an IRA or other tax-qualified savings plan, your expenses may also have included a $10 annual fee. In either case, the amount of any fee paid through your account would increase the estimate of expenses you paid during the period and decrease your ending account value.
Hypothetical Example for Comparison Purposes— The section of the table at right entitled “Hypothetical” provides information about hypothetical account values and hypothetical expenses based on a Fund’s actual expense ratio and an assumed rate of return of 5% per year before expenses, which is not the Fund’s actual return. The hypothetical account values and expenses may not be used to estimate your actual ending account balance or the expenses you paid for the period. However, you may use this information to compare the ongoing costs of investing in the Trust to other funds. To do so, compare this 5% hypothetical example with the 5% hypothetical examples that appear in the shareholder reports of the other funds. As in the case of the actual expense example, if your account is subject to an IRA fee, the amount of the fee paid through your account would increase the hypothetical expenses you would have paid during the period and decrease the hypothetical ending account value.
Please note that the expenses shown in the table at right are meant to highlight your ongoing costs only and do not reflect any transactional costs, such as sales charges (loads), redemption fees, or exchange fees. Therefore, the table is useful in comparing
ongoing costs only, and will not help you determine the relative total costs of owning different funds. In addition, if these transactional costs were included, your costs would have been higher. The examples also assume all dividends and distributions have been reinvested.
Firsthand Technology Opportunities Fund
| | BEGINNING ACCOUNT VALUE 7/1/12 | ENDING ACCOUNT VALUE 12/31/12 | EXPENSES PAID DURING PERIOD* 7/1/12 - 12/31/12 | ANNUALIZED EXPENSE RATIO |
| Actual | $1,000 | $869.80 | $8.70 | 1.85% |
Hypothetical** | $1,000 | $1,015.84 | $9.37 | 1.85% |
Firsthand Alternative Energy Fund
| | BEGINNING ACCOUNT VALUE 7/1/12 | ENDING ACCOUNT VALUE 12/31/12 | EXPENSES PAID DURING PERIOD* 7/1/12 - 12/31/12 | ANNUALIZED EXPENSE RATIO |
| Actual | $1,000 | $1,076.90 | $10.34 | 1.98% |
Hypothetical** | $1,000 | $1,015.18 | $10.03 | 1.98% |
| * | Expenses are calculated by multiplying the Fund’s annualized expense ratio listed above by the average account value over the period and multiplying that number by 184/366 (to reflect the one-half year period). |
| ** | 5% return per year before expenses. |
The expenses shown in the table do not reflect any fees that may be charged to you by brokers, financial intermediaries, or other financial institutions.
FIRSTHAND TECHNOLOGY OPPORTUNITIES FUND
Performance and Portfolio Discussion
How did the Fund perform in 2012?
Firsthand Technology Opportunities Fund (TEFQX) posted a gain of 16.67%, versus a 17.75% gain for the NASDAQ Composite Index and a 16.00% gain for the S&P 500 Index. For the six months ended December 31, 2012, Firsthand Technology Opportunities Fund rose 7.69% as compared to 3.91% and 5.95% gains for the NASDAQ and the S&P 500 indices, respectively.
Which industries had the greatest impact on the Fund’s performance?
As of December 31, 2012, the Internet and computer industries represented the portfolio’s largest weightings, followed by holdings in the communications and semiconductor industries. The portfolio’s exposure to the communications equipment and Internet industries contributed most to the Fund’s underperformance versus its primary benchmark in 2012.
Which individual holdings were the largest contributors to the Fund’s performance?
The Fund’s top contributor for the year was global data center services company Equinix (EQIX), one of the world’s largest co-location companies. Shares of Equinix finished the period up 103.35%, making it the best-performing data center stock for the year. Equinix is one of our biggest investments in cloud computing infrastructure, as it provides the critical component in that infrastructure—data hosting. The company continued to expand its capacity in 2012 and also announced plans to convert into a real estate investment trust (REIT) in 2014, which will help lower its tax obligations.
Online retail giant Amazon (AMZN) was another solid contributor to fund performance in 2012, up 44.93%. The company’s stock hit a record closing high of $261.68 on September 19. Amazon continues to adapt its offerings to capitalize on the global march toward mobility. The company’s hand-held reader, Kindle, controls more than a fifth of the tablet market. Amazon’s cloud offerings—leasing server space to businesses—has driven significant growth in third-party merchant offerings on the company’s amazon.com site; as much as 40% of the company’s unit sales are now made via these third-party sellers. We remain bullish on Amazon and its proven ability to anticipate market demand.
Tencent Holdings (no U.S. symbol) China’s largest web service portal, closed the year up 59.84%. China’s Internet penetration rate stands at roughly 40%, and the country has more than 1 billion mobile phone users. That translates to a lot of growth potential for a social networking and online gaming company like Tencent. The company entered into partnership with Disney (DIS) to develop animation content for China and for international consumers.
Struggling PC maker Dell Computer (DELL) fell 29.58% in 2012, with demand for more-mobile computing devices like smartphones and tables crushing demand for personal computers. Given our bearish sentiment on the PC industry, we purchased put options on Dell, which gave the Fund a 292.48% return in 2012.
FIRSTHAND TECHNOLOGY OPPORTUNITIES FUND - continued
Performance and Portfolio Discussion
Online search leader Google (GOOG) hit an all-time high in 2012 closing at $768.05 in early October, beating its previous record high of $732.94 in November 2007. Google has seen phenomenal success with its Android mobile platform. IDC reports Android captured 68.3% of the 2012 smartphone market, compared with Apple’s iOS phones’ 18.8%. Google finished the year up 9.52%.
Which holdings were the greatest detractors from the Fund’s performance?
Nokia (NOK) was the biggest detractor from Fund performance in 2012. While the once high-flying cellphone maker is still a top seller in China and maintains a strong presence in other developing countries such as India, Nokia continues to struggle against iOS and Android-based phones. We liquidated the Fund’s Nokia position in May.
The Fund’s holdings in iPath S&P 500 VIX Short-Term Futures ETN (VXX) was another big detractor from Fund performance for the period. The VXX is an exchange-traded fund (ETF) that offers exposure to daily rolling long positions in volatility-index futures. The VXX was down 77.62% for the year, an indicator of falling market volatility throughout the year.
Chinese Internet giant Baidu (BIDU) was another negative performer, down 13.89% in 2012. The company is facing increasing local competition in China, along with fears that China may eventually ease restrictions enough to entice foreign search engines like Google to return. Additionally, speculation about fraudulent accounting practices in China has taken a toll on many China-based stocks. Nonetheless, we believe Baidu’s growth is still impressive: The company’s 2012 revenues topped 2011 by 53.8%.
As we mentioned 6 months ago, we are bearish on video game retailers like GameStop (GME). Unfortunately, our put options on GameStop were another of the Fund’s detractors, thanks to a rally for the stock in the second half of the year. Mobile games are eroding the traditional disc/cartridge-based business of GameStop. In November, GameStop announced the anticipated closure of 200 stores in 2013. Nonetheless GameStop, while falling 22.80% in the first half of the year, rallied 39.78% in the second half in part because of Sony’s announcement that the Playstation 4 would not be an online-only console. The company finished 2012 up 7.91%, which meant a loss on our put options.
Declining prices for solar modules combined with anti-dumping tariffs in the U.S. have combined to create an extremely difficult environment for solar companies in China. We believe there will be significant consolidation among Chinese solar players and sold off our position in LDK Solar Co., Ltd. (LDK) in March at a relatively small loss, but avoided a much bigger loss when LDK finished the year down 65.63%.
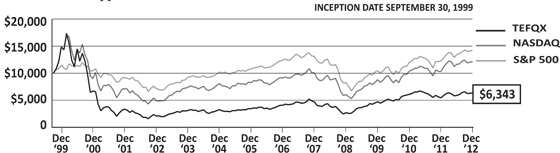
Fund Performance and Holdings Information (as of 12/31/12)
Firsthand Technology Opportunities Fund vs. Market Indices
| | FIRSTHAND TECHNOLOGY OPPORTUNITIES FUND | NASDAQ COMPOSITE INDEX | S&P 500 INDEX |
| Since Inception (9/30/99) | -3.38% | 1.47% | 2.70% |
| 10-Year | 11.72% | 9.46% | 7.09% |
| 5-Year | 6.17% | 3.78% | 1.66% |
| 3-Year | 10.42% | 11.32% | 10.86% |
| 1-Year | 16.67% | 17.75% | 16.00% |
Growth of a Hypothetical $10,000 Investment
Returns assume reinvestment of all dividends and distributions but do not reflect the impact of taxes. The performance data quoted represent past performance. Past performance cannot guarantee future results, and current performance may be lower or higher than the performance quoted. Both the return from and the principal value of an investment in the Fund will fluctuate so that an investor’s shares, when redeemed, may be worth more or less than their original cost. To obtain performance as of the most recent month-end, please contact Firsthand Funds by calling 1.888.884.2675 or go to www.firsthandfunds.com.
| Holdings by Industry* | |
| | % NET ASSETS |
| Internet | 38.2% |
| Computer | 13.7% |
| Communications | 8.6% |
| Semiconductors | 7.7% |
| Software | 7.2% |
| Communications Equipment | 6.0% |
| Other Electronics | 2.7% |
| Networking | 2.2% |
| Social Networking | 1.1% |
| Advanced Materials | 0.5% |
| Semiconductor Equipment | 0.4% |
| Medical Device | 0.1% |
| Exchange Traded Fund | 0.2% |
| Net Other Assets and Liabilities | 11.4% |
| * | Based on percentage of net assets as of 12/31/12. |
| Top 10 Holdings** | |
| | % NET ASSETS |
| Apple, Inc. | 13.7% |
| Amazon.com, Inc. | 10.6% |
| Google, Inc., Class A | 9.7% |
| QUALCOMM, Inc. | 5.5% |
| Tencent Holdings Ltd. | 5.1% |
| Equinix, Inc. | 4.3% |
| ARM Holdings, PLC – SP ADR | 4.2% |
| VMware, Inc., Class A | 4.0% |
| Baidu, Inc. – SP ADR | 3.7% |
| Akamai Technologies, Inc. | 3.4% |
| ** | Top 10 stock holdings total 64.2% of net assets. These holdings are current as of 12/31/12, and may not be representative of current or future investments. |
| FIRSTHAND ALTERNATIVE ENERGY FUND |
Performance and Portfolio Discussion
How did the Fund perform in 2012?
Firsthand Alternative Energy Fund (ALTEX) posted a loss of 23.57%, versus a 17.59% loss for the WilderHill Clean Energy Index and a 16.00% gain for the S&P 500 Index. For the six months ended December 31, 2012, Firsthand Alternative Energy Fund fell 13.02% as compared to an 8.01% loss for the WilderHill Clean Energy and a 5.95% gain for the S&P 500 Index.
Which industries had the greatest impact on the Fund’s performance?
For the period ended December 31, 2012, renewable energy and advanced materials represented the portfolio’s largest weightings, followed by holdings in the energy efficiency and semiconductor industries. The portfolio’s exposure to the renewable energy industry contributed most to the Fund’s underperformance versus its primary benchmark in 2011.
Which individual holdings were the largest contributors to the Fund’s performance?
Power-meter company Itron, Inc. (ITRI) was the largest contributor to Fund performance for the period. Growing international sales of the company’s smart meters helped send the stock up 24.55%. With penetration rates in the U.S. of one in three households, growth in the smart meter market is shifting to Europe and Asia, with many countries mandating them as part of a renewable energy plan and others looking for ways to curb energy use. Asia is expected to make up a significant portion of this market, and we are pleased with Itron’s positioning in China; the company opened a manufacturing facility in China in May.
Another positive contributor was technology conglomerate Honeywell (HON), up 19.87% for the period. In addition to growth in the company’s aerospace business, Honeywell has benefited from increased energy needs worldwide, which are helping create demand for the company’s automation and control solutions business.
Semiconductor firm Power Integrations (POWI) specializes in power supply and AC-DC conversion products. Its EcoSmart product line is designed to reduce energy use while products are in standby modes. While the stock finished the year up just 1.91%, we sold several thousand shares during the year for a much larger gain, making it one of the Fund’s top contributors for the period.
China-based solar module maker JinkoSolar (JKS) closed out the year up 24.20%. Continued oversupply is fueling intense competition among solar players in China. We expect that government-owned companies will have an advantage as consolidation inevitably occurs. With Jinko’s recent $1 billion loan from China Develoment Bank Corp, it seems the Chinese government may count Jinko as one of the eventual winners.
| FIRSTHAND ALTERNATIVE ENERGY FUND - continued |
Performance and Portfolio Discussion
Which holdings were the greatest detractors from the Fund’s performance?
GT Advanced Technologies (GTAT) was the biggest detractor from Fund performance for the year. Solar module oversupply continues to be a drag on the industry, with manufacturing equipment makers like GT Advanced among the hardest hit. We were pleased with the announcement in October of a 25% workforce reduction as part of a restructuring effort. Further, the company is diversified, with a substantial portion of its business devoted to the LED lighting industry, which we believe is a strong growth area.
Manufacturing equipment supplier Meyer Burger (no U.S. symbol) was another negative performer for the Fund during the period. The photovoltaic (PV) market slump continued in 2012, with equipment and module manufacturers struggling with oversupply and falling demand. PV equipment spending fell 72% in 2012 and is expected to fall another 39% in 2013.
Japanese electronics giant Sharp (no U.S. symbol) announced over $5 billion in losses for the year and fell 60.00% in 2012. Sharp’s displays are used in iPads and iPhones but the company needed a bailout in September thanks in part to a strong Yen raising its manufacturing costs.
Intevac (IVAC), which supplies manufacturing equipment to the photovoltaic (PV) and hard disk drive (HDD) industries, saw its stock price plunge 38.24% during the year as its two largest customer segments, PV and HDD, continued to struggle. One of the downsides to the trend toward cloud computing is increasing utilization rates for HDDs, which has limited demand growth for HDD manufacturing in the near term.
Motech Industries (no U.S. symbol), a solar-cell manufacturer based in Taiwan, announced in May that it was closing its polysilicon manufacturing facility in the United States because of falling prices for one of the solar industry’s key materials. Although Motech has gained a slight advantage thanks to U.S. tariffs on Chinese PV products, the collapse of PV prices has taken a heavy toll on Motech and the company finished the year down 46.49%.
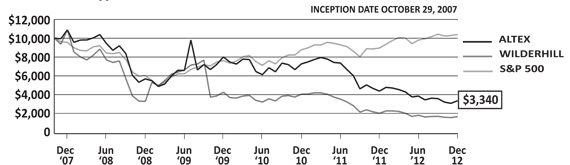
Fund Performance and Holdings Information (as of 12/31/12)
Firsthand Alternative Energy Fund vs. Market Indices
| | FIRSTHAND ALTERNATIVE ENERGY FUND | WILDERHILL CLEAN ENERGY INDEX | S&P 500 INDEX |
| Since Inception (10/29/07) | -19.09% | -29.36% | 0.74% |
| 5-Year | -21.05% | -31.37% | 1.66% |
| 3-Year | -25.29% | -26.99% | 10.86% |
| 1-Year | -23.57% | -17.59% | 16.00% |
Growth of a Hypothetical $10,000 Investment
Returns assume reinvestment of all dividends and distributions but do not reflect the impact of taxes. The performance data quoted represent past performance. Past performance cannot guarantee future results, and current performance may be lower or higher than the performance quoted. Both the return from and the principal value of an investment in the Fund will fluctuate so that an investor’s shares, when redeemed, may be worth more or less than their original cost. To obtain performance as of the most recent month-end, please contact Firsthand Funds by calling 1.888.884.2675 or go to www.firsthandfunds.com.
| Holdings by Industry* | |
| | % NET ASSETS |
| Renewable Energy | 40.6% |
| Advanced Materials | 14.3% |
| Energy Efficiency | 10.7% |
| Semiconductors | 6.9% |
| Basic Materials | 6.1% |
| Industrials | 5.8% |
| Environmental Services | 4.6% |
| Other Electronics | 3.6% |
| Power Conversion/Supply Equipment | 3.2% |
| Building Automation | 1.8% |
| Intellectual Property | 0.0% |
| Net Other Assets and Liabilities | 2.4% |
| * | Based on percentage of net assets as of 12/31/12. |
| Top 10 Holdings** | |
| | % NET ASSETS |
| Corning, Inc. | 6.0% |
| Itron, Inc. | 5.7% |
| Honeywell International, Inc. | 5.0% |
| Rockwood Holdings, Inc. | 4.9% |
| Praxair, Inc. | 4.9% |
| Iberdrola S.A. | 4.9% |
| GT Advanced Technologies, Inc. | 4.8% |
| Power Integrations, Inc. | 4.7% |
| ADA-ES, Inc. | 4.6% |
| SunPower Corp., Class B | 4.5% |
| ** | Top 10 stock holdings total 50.0% of net assets. These holdings are current as of 12/31/12, and may not be representative of current or future investments. |
REPORT OF INDEPENDENT REGISTERED PUBLIC ACCOUNTING FIRM
To the Shareholders and Board of Trustees
Firsthand Funds, San Jose, California
We have audited the accompanying statements of assets and liabilities of Firsthand Funds (the “Funds”), comprising respectively, Firsthand Technology Opportunities Fund and Firsthand Alternative Energy Fund, including the portfolios of investments as of December 31, 2012, and the related statements of operations for the year then ended, the statements of changes in net assets for each of the two years in the period then ended, and the financial highlights for each of the five years in the period then ended. These financial statements and financial highlights are the responsibility of the Funds’ management. Our responsibility is to express an opinion on those financial statements and financial highlights based on our audits.
We conducted our audits in accordance with the standards of the Public Company Accounting Oversight Board (United States). Those standards require that we plan and perform the audit to obtain reasonable assurance about whether the financial statements and financial highlights are free of material misstatement. The Funds are not required to have, nor were we engaged to perform, an audit of their internal control over financial reporting. Our audits included consideration of internal control over financial reporting as a basis for designing audit procedures that are appropriate in the circumstances, but not for the purpose of expressing an opinion on the effectiveness of the Fund’s internal control over financial reporting. Accordingly, we express no such opinion. An audit includes examining, on a test basis, evidence supporting the amounts and disclosures in the financial statements. Our procedures included confirmation of securities owned as of December 31, 2012 by correspondence with the custodian and brokers. An audit also includes assessing the accounting principles used and significant estimates made by management, as well as evaluating the overall financial statement presentation. We believe that our audits provide a reasonable basis for our opinion.
In our opinion, the financial statements and financial highlights referred to above present fairly, in all material respects, the financial position of Firsthand Funds as of December 31, 2012, the results of their operations for the year then ended, the changes in their net assets for each of the two years in the period then ended, and their financial highlights for each of the five years in the period then ended, in conformity with accounting principles generally accepted in the United States of America.
TAIT, WELLER & BAKER, LLP
Philadelphia, Pennsylvania
February 21, 2013
FIRSTHAND TECHNOLOGY OPPORTUNITIES FUND
Portfolio of Investments (as of 12/31/12)
| INDUSTRY/COMPANY (% OF NET ASSETS) | | SHARES | | | MARKET VALUE | |
COMMON STOCKS — 88.4% ($84,064,001) | | | | | | |
| Advanced Materials (0.5%) | | | | | | |
| Corning, Inc. | | | 40,000 | | | $ | 504,800 | |
| | | | | | | | | |
| Communications (8.6%) | | | | | | | | |
| Equinix, Inc.* | | | 20,000 | | | | 4,124,000 | |
| Rackspace Hosting, Inc.* | | | 40,000 | | | | 2,970,800 | |
| | | 100,000 | | | | 1,049,000 | |
| | | | | | | | 8,143,800 | |
| Communications Equipment (6.0%) | | | | | | | | |
| QUALCOMM, Inc. | | | 85,000 | | | | 5,271,700 | |
| Telefonaktiebolaget Ericsson LM - SP ADR | | | 40,000 | | | | 404,000 | |
| | | | | | | | 5,675,700 | |
| Computer (13.7%) | | | | | | | | |
| Apple, Inc. | | | 24,500 | | | | 13,059,235 | |
| | | | | | | | | |
| Internet (38.2%) | | | | | | | | |
| Akamai Technologies, Inc.* | | | 80,000 | | | | 3,272,800 | |
| Amazon.com, Inc.* | | | 40,000 | | | | 10,045,600 | |
| Baidu, Inc. - SP ADR* | | | 35,000 | | | | 3,510,150 | |
| Google, Inc., Class A* | | | 13,000 | | | | 9,221,810 | |
| SINA Corp.* | | | 60,000 | | | | 3,013,200 | |
| Tencent Holdings, Ltd. | | | 150,000 | | | | 4,818,826 | |
| Yandex NV, Class A* | | | 115,000 | | | | 2,480,550 | |
| | | | | | | | 36,362,936 | |
| Medical Device (0.1%) | | | | | | | | |
| MAKO Surgical Corp.* | | | 4,000 | | | | 51,480 | |
| | | | | | | | | |
| Networking (2.2%) | | | | | | | | |
| Palo Alto Networks, Inc.* | | | 10,000 | | | | 535,200 | |
| Riverbed Technology, Inc.* | | | 80,000 | | | | 1,577,600 | |
| | | | | | | | 2,112,800 | |
| Other Electronics (2.7%) | | | | | | | | |
| 3D Systems Corp.* | | | 20,000 | | | | 1,067,000 | |
| VeriFone Systems, Inc.* | | | 50,000 | | | | 1,484,000 | |
| | | | | | | | 2,551,000 | |
see accompanying notes to financial statements
FIRSTHAND TECHNOLOGY OPPORTUNITIES FUND - continued
Portfolio of Investments (as of 12/31/12)
| INDUSTRY/COMPANY (% OF NET ASSETS) | | SHARES/ CONTRACTS | | MARKET VALUE | |
| Semiconductor Equipment (0.4%) | | | | | | | | |
| Applied Materials, Inc. | | | 30,000 | | | $ | 343,200 | |
| | | | | | | | | |
| Semiconductors (7.7%) | | | | | | | | |
| ARM Holdings, PLC - SP ADR | | | 105,000 | | | | 3,972,150 | |
| Exar Corp.* | | | 100,000 | | | | 890,000 | |
Skyworks Solutions, Inc.* | | | 120,000 | | | | 2,436,000 | |
| | | | | | | | 7,298,150 | |
| Social Networking (1.1%) | | | | | | | | |
| Facebook, Inc.* | | | 40,000 | | | | 1,065,200 | |
| | | | | | | | | |
| Software (7.2%) | | | | | | | | |
| Intuit, Inc. | | | 20,000 | | | | 1,190,000 | |
| Oracle Corp. | | | 30,000 | | | | 999,600 | |
| Symantec Corp.* | | | 50,000 | | | | 940,500 | |
| | | 40,000 | | | | 3,765,600 | |
| | | | | | | | 6,895,700 | |
EXCHANGE-TRADED FUND — 0.2% ($238,425) | | | | | | | | |
| Other (0.2%) | | | | | | | | |
| iPath S&P 500 VIX Short-Term Futures ETF* | | | 7,500 | | | | 238,425 | |
| | | | | | | | | |
PURCHASED OPTIONS — 0.0% ($20,000) | | | | | | | | |
| Internet — 0.0% | | | | | | | | |
| GameStop Corp., Class A , Put Option, Expiring January | | | | | | | | |
| 2013, Strike Price $20.00 | | | 2,000 | | | | 20,000 | |
| | | | | | | | | |
Total Investments — 88.6% (Cost $69,643,670) | | | | | | | 84,322,426 | |
| | | | | | | | | |
Other assets in excess of liabilities — 11.4% | | | | | | | 10,818,036 | |
| | | | | | | | | |
| | | | | | $ | 95,140,462 | |
| * - Non-income producing security. |
| ETF - Exchange Traded Fund |
| SP ADR - Sponsored American Depositary Receipt |
see accompanying notes to financial statements
FIRSTHAND ALTERNATIVE ENERGY FUND
Portfolio of Investments (as of 12/31/12)
| INDUSTRY/COMPANY (% OF NET ASSETS) | | SHARES | | | MARKET VALUE | |
COMMON STOCKS —97.5% ($1,952,480) | | | | | | |
| Advanced Materials (14.3%) | | | | | | |
| Corning, Inc. | | | 9,460 | | | $ | 119,385 | |
| MEMC Electronic Materials Inc.* | | | 19,130 | | | | 61,407 | |
| Metabolix, Inc.* | | | 4,700 | | | | 6,956 | |
| | | 900 | | | | 98,505 | |
| | | | | | | | 286,253 | |
| Basic Materials (6.1%) | | | | | | | | |
| Metalico, Inc.* | | | 11,500 | | | | 22,540 | |
| | | 2,000 | | | | 98,920 | |
| | | | | | | | 121,460 | |
| Building Automation (1.8%) | | | | | | | | |
| Johnson Controls, Inc. | | | 1,200 | | | | 36,840 | |
| | | | | | | | | |
| Energy Efficiency (10.7%) | | | | | | | | |
| Honeywell International, Inc. | | | 1,580 | | | | 100,283 | |
| | | 2,565 | | | | 114,271 | |
| | | | | | | | 214,554 | |
| Environmental Services (4.6%) | | | | | | | | |
| ADA-ES, Inc.* | | | 5,400 | | | | 91,152 | |
| | | | | | | | | |
| Industrials (5.8%) | | | | | | | | |
| 3M Co. | | | 800 | | | | 74,280 | |
United Technologies Corp. | | | 500 | | | | 41,005 | |
| | | | | | | | 115,285 | |
| Intellectual Property (0.0%) | | | | | | | | |
Silicon Genesis Corp., Common (1)* | | | 181,407 | | | | 0 | |
| | | | | | | | | |
| Other Electronics (3.6%) | | | | | | | | |
| Intevac, Inc.* | | | 15,800 | | | | 72,206 | |
| | | | | | | | | |
| Power Conversion/Supply Equipment (3.2%) | | | | | | | | |
| Power-One, Inc.* | | | 15,700 | | | | 64,527 | |
| | | | | | | | | |
| Renewable Energy (40.5%) | | | | | | | | |
| Amtech Systems, Inc.* | | | 6,600 | | | | 21,252 | |
| Enphase Energy, Inc.* | | | 5,000 | | | | 18,250 | |
| Gamesa Corp. Tecnologica S.A. | | | 7,271 | | | | 15,932 | |
see accompanying notes to financial statements
FIRSTHAND ALTERNATIVE ENERGY FUND - continued
Portfolio of Investments (as of 12/31/12)
| INDUSTRY/COMPANY (% OF NET ASSETS) | | SHARES | | | MARKET VALUE | |
| GT Advanced Technologies, Inc.* | | | 31,900 | | | $ | 96,338 | |
| Hanwha SolarOne Co., Ltd. - SP ADR* | | | 50,400 | | | | 50,400 | |
| Iberdrola S.A. | | | 17,740 | | | | 98,230 | |
| JA Solar Holdings Co., Ltd. – ADR* | | | 13,000 | | | | 55,510 | |
| JinkoSolar Holding Co., Ltd. - ADR* | | | 8,000 | | | | 49,680 | |
| Meyer Burger Technology AG* | | | 10,000 | | | | 73,908 | |
| Motech Industries, Inc.* | | | 58,069 | | | | 54,491 | |
| Orion Energy Systems, Inc.* | | | 14,000 | | | | 23,240 | |
| Sharp Corp. | | | 11,000 | | | | 38,472 | |
| SunPower Corp., Class B* | | | 15,931 | | | | 89,532 | |
| Trina Solar Ltd. - SP ADR* | | | 4,600 | | | | 19,964 | |
| ULVAC, Inc.* | | | 2,700 | | | | 24,870 | |
| Vestas Wind Systems A.S.* | | | 6,000 | | | | 34,560 | |
Yingli Green Energy Holding Co. - ADR* | | | 20,000 | | | | 47,000 | |
| | | | | | | | 811,629 | |
| Semiconductors (6.9%) | | | | | | | | |
| Exar Corp.* | | | 5,000 | | | | 44,500 | |
| | | 2,799 | | | | 94,074 | |
| | | | | | | | 138,574 | |
PREFERRED STOCK — 0.1% ($2,801) | | | | | | | | |
| Intellectual Property (0.0%) | | | | | | | | |
Silicon Genesis Corp., Series 1-C (1)* | | | 152 | | | | 0 | |
Silicon Genesis Corp., Series 1-E (1)* | | | 3,000 | | | | 94 | |
| | | | | | | | 94 | |
| Renewable Energy (0.1%) | | | | | | | | |
SoloPower, Series C-1 (1)* | | | 2,142 | | | | 2,707 | |
| | | | | | | | | |
| Total Investments —97.6% (Cost $4,620,888) | | | | | | | 1,955,281 | |
| | | | | | | | | |
Other assets in excess of liabilities — 2.4% | | | | | | | 47,378 | |
| | | | | | | | | |
| | | | | | $ | 2,002,659 | |
| * Non-income producing security. |
| ADR - American Depositary Receipt |
| SP ADR - Sponsored American Depositary Receipt |
see accompanying notes to financial statements
STATEMENTS OF ASSETS AND LIABILITIES
For the year ended December 31, 2012
| | | FIRSTHAND TECHNOLOGY OPPORTUNITIES FUND | | | FIRSTHAND ALTERNATIVE ENERGY FUND | |
| ASSETS | | | | | | |
| Investment securities: | | | | | | |
| | $ | 69,643,670 | | | $ | 4,620,888 | |
| | | 84,322,426 | * | | | 1,955,281 | |
| Cash | | | 11,564,453 | | | | 80,166 | |
| Foreign currency at value ($22,964 and $1,281) | | | 23,029 | | | | 1,263 | |
| Receivable for securities sold | | | — | | | | 8,259 | |
| Receivable from dividends, interest, and reclaims | | | 68,000 | | | | 206 | |
Receivable for capital shares sold | | | 257,118 | | | | 70 | |
| | | 96,235,026 | | | | 2,045,245 | |
| | | | | | | | | |
| LIABILITIES | | | | | | | | |
| Payable for securities purchased | | | 676,236 | | | | 7,620 | |
| Payable to affiliates (Note 4) | | | 151,707 | | | | 3,329 | |
Payable for capital shares redeemed | | | 266,621 | | | | 31,637 | |
| | | 1,094,564 | | | | 42,586 | |
| | $ | 95,140,462 | | | $ | 2,002,659 | |
| | | | | | | | | |
| Net Assets consist of: | | | | | | | | |
| Paid-in-capital | | $ | 84,917,121 | | | $ | 6,118,409 | |
| Accumulated net realized losses from security transactions, purchased options, written options and foreign currency | | | (4,455,480 | ) | | | (1,450,138 | ) |
| Net unrealized appreciation (depreciation) on investments, purchased options and foreign currency | | | 14,678,821 | | | | (2,665,612 | ) |
| | $ | 95,140,462 | | | $ | 2,002,659 | |
| | | | | | | | | |
| | | 15,099,821 | | | | 599,148 | |
Net asset value, redemption price and offering price per share (Note 2) | | $ | 6.30 | | | $ | 3.34 | |
| * | Includes purchased options whose primary risk exposure is equity contracts. |
see accompanying notes to financial statements
STATEMENTS OF OPERATIONS
For the year ended December 31, 2012
| | | FIRSTHAND TECHNOLOGY OPPORTUNITIES FUND | | | FIRSTHAND ALTERNATIVE ENERGY FUND | |
| INVESTMENT INCOME | | | | | | |
| Dividends | | $ | 584,949 | | | $ | 27,912 | |
| Interest | | | 1,511 | | | | 12 | |
| | | (30,254 | ) | | | (958 | ) |
| | | 556,206 | | | | 26,966 | |
| EXPENSES | | | | | | | | |
| Investment advisory fees (Note 4) | | | 1,358,800 | | | | 41,255 | |
| Administration fees (Note 4) | | | 436,757 | | | | 12,134 | |
| | | 11,667 | | | | 10,733 | |
| GROSS EXPENSES | | | 1,807,224 | | | | 64,122 | |
Trustees fees reimbursement | | | (11,667 | ) | | | (10,733 | ) |
| | | 1,795,557 | | | | 53,389 | |
| | | | | | | | | |
| | | (1,239,351 | ) | | | (26,423 | ) |
| | | | | | | | | |
| Net Realized and Unrealized Gain (Loss) on Investments: | | | | | | | | |
| Net realized gains (losses) from security transactions | | | 210,637 | | | | (673,570 | ) |
Net realized gains from purchased option transactions(1) | | | 1,460,732 | | | | 6,035 | |
| Net realized gains (losses) on foreign currency | | | (1 | ) | | | 10,769 | |
Net realized gains from written option transactions(1) | | | 1,751,847 | | | | — | |
Net change in unrealized appreciation on investments and foreign currency(2) | | | 12,585,024 | | | | 4,167 | |
Net change in unrealized appreciation (depreciation) on purchased options(1) | | | (57,579 | ) | | | — | |
Net Realized and Unrealized Gain (Loss) on Investments | | | 15,950,660 | | | | (652,599 | ) |
Net Increase (Decrease) In Net Assets Resulting From Operations | | $ | 14,711,309 | | | $ | (679,022 | ) |
| (1) | Primary risk exposure is equity contracts. |
| (2) | Change in unrealized appreciation (depreciation) does not include appreciation of $1,674,417 in connection with the reorganization of the Firsthand Technology Opportunities Fund (See Note 6). |
see accompanying notes to financial statements
STATEMENTS OF CHANGES IN NET ASSETS
For the Years Ended December 31, 2012, and December 31, 2011
| | | FIRSTHAND TECHNOLOGY OPPORTUNITIES FUND | | | FIRSTHAND ALTERNATIVE ENERGY FUND | |
| | | Year Ended 12/31/12 | | | Year Ended 12/31/11 | | | Year Ended 12/31/12 | | | Year Ended 12/31/11 | |
| FROM OPERATIONS: | | | | | | | | | | | | |
| Net investment loss | | $ | (1,239,351 | ) | | $ | (1,298,218 | ) | | $ | (26,423 | ) | | $ | (80,355 | ) |
| Net realized gains (losses) from security transactions, purchased options, foreign currency and written options | | | 3,423,215 | | | | 5,481,161 | | | | (656,766 | ) | | | (33,954 | ) |
| Net change in unrealized appreciation (depreciation) on investments, purchased options, foreign currency | | | 12,527,445 | | | | (17,543,935 | ) | | | 4,167 | | | | (2,526,860 | ) |
| Net increase (decrease) in net assets from operations | | | 14,711,309 | | | | (13,360,992 | ) | | | (679,022 | ) | | | (2,641,169 | ) |
| FROM CAPITAL SHARE TRANSACTIONS: | | | | | | | | | | | | | | | | |
| Proceeds from shares sold | | | 16,225,658 | | | | 79,636,017 | | | | 275,864 | | | | 2,233,806 | |
| Proceeds received in merger (Note 6) | | | 25,002,665 | | | | — | | | | — | | | | — | |
Payment for shares redeemed | | | (40,186,648 | ) | | | (72,206,838 | ) | | | (1,112,385 | ) | | | (1,991,973 | ) |
| Net increase (decrease) in net assets from capital share transactions | | | 1,041,675 | | | | 7,429,179 | | | | (836,521 | ) | | | 241,833 | |
TOTAL INCREASE (DECREASE) IN NET ASSETS | | | 15,752,984 | | | | (5,931,813 | ) | | | (1,515,543 | ) | | | (2,399,336 | ) |
| NET ASSETS: | | | | | | | | | | | | | | | | |
| | | 79,387,478 | | | | 85,319,291 | | | | 3,518,202 | | | | 5,917,538 | |
| | $ | 95,140,462 | | | $ | 79,387,478 | | | $ | 2,002,659 | | | $ | 3,518,202 | |
Accumulated Net Investment Loss | | | — | | | | — | | | | — | | | | (11 | ) |
| | | | | | | | | | | | | | | | | |
| CAPITAL SHARE ACTIVITY: | | | | | | | | | | | | | | | | |
| Shares sold | | | 2,713,289 | | | | 12,622,465 | | | | 72,509 | | | | 311,301 | |
| Shares received in merger (Note 6) | | | 4,346,937 | | | | — | | | | — | | | | — | |
| | | (6,658,848 | ) | | | (12,037,005 | ) | | | (277,646 | ) | | | (320,943 | ) |
| Net increase (decrease) in shares outstanding | | | 401,378 | | | | 585,460 | | | | (205,137 | ) | | | (9,642 | ) |
Shares outstanding, beginning of year | | | 14,698,443 | | | | 14,112,983 | | | | 804,285 | | | | 813,927 | |
Shares outstanding, end of year | | | 15,099,821 | | | | 14,698,443 | | | | 599,148 | | | | 804,285 | |
see accompanying notes to financial statements
FINANCIAL HIGHLIGHTS
Selected per share data and ratios for a share outstanding throughout each year
FIRSTHAND TECHNOLOGY OPPORTUNITIES FUND*
| | | YEAR ENDED 12/31/12 | | | YEAR ENDED 12/31/11 | | | YEAR ENDED 12/31/10 | | | YEAR ENDED 12/31/09 | | | YEAR ENDED 12/31/08 | |
Net asset value at beginning of year | | $ | 5.40 | | | $ | 6.05 | | | | 4.68 | | | $ | 2.69 | | | $ | 4.67 | |
Income from investment operation: | | | | | | | | | | | | | | | | | | | | |
| Net investment loss | | | (0.08 | ) | | | (0.09 | ) | | | (0.05 | ) | | | (0.06 | ) | | | (0.06 | ) |
| Net realized and unrealized gains (losses) on investments | | | 0.98 | | | | (0.56 | ) | | | 1.42 | | | | 2.05 | | | | (1.92 | ) |
| Total from investment operations | | | 0.90 | | | | (0.65 | ) | | | 1.37 | | | | 1.99 | | | | (1.98 | ) |
Net asset value at end of year | | $ | 6.30 | | | $ | 5.40 | | | $ | 6.05 | | | $ | 4.68 | | | $ | 2.69 | |
| | | 16.67 | % | | | (10.74 | %) | | | 29.27 | % | | | 73.98 | % | | | (42.40 | %) |
Net assets at end of year (millions) | | $ | 95.1 | | | $ | 79.4 | | | $ | 85.3 | | | $ | 34.9 | | | $ | 19.4 | |
| Ratio of gross expenses to average net assets before waiver | | | 1.86 | % | | | 1.86 | % | | | 1.86 | % | | | 1.92 | % | | | 2.14 | % |
| Ratio of net expenses to average net assets after waiver | | | 1.85 | % | | | 1.85 | % | | | 1.85 | % | | | 1.90 | % | | | 1.95 | % |
| Ratio of net investment loss to average net assets | | | (1.28 | %) | | | (1.21 | %) | | | (1.42 | %) | | | (1.66 | %) | | | (1.58 | %) |
| Portfolio turnover rate | | | 81 | % | | | 128 | % | | | 164 | % | | | 41 | % | | | 41 | % |
* Prior to 5/1/10 Firsthand Technology Opportunities Fund was named Firsthand e-Commerce Fund. |
see accompanying notes to financial statements
FINANCIAL HIGHLIGHTS
Selected per share data and ratios for a share outstanding throughout each year
FIRSTHAND ALTERNATIVE ENERGY FUND
| | | YEAR ENDED 12/31/12 | | | YEAR ENDED 12/31/11 | | | YEAR ENDED 12/31/10 | | | YEAR ENDED 12/31/09 | | | YEAR ENDED 12/31/08 | |
Net asset value at beginning of year | | $ | 4.37 | | | $ | 7.27 | | | | 8.01 | | | $ | 5.68 | | | $ | 10.89 | |
Income from investment operation: | | | | | | | | | | | | | | | | | | | | |
| Net investment loss | | | (0.04 | ) | | | (0.10 | ) | | | (0.12 | ) | | | (0.10 | ) | | | (0.07 | ) |
| Net realized and unrealized gains (losses) on investments | | | (0.99 | ) | | | (2.80 | ) | | | (0.62 | ) | | | 2.43 | | | | (5.14 | ) |
| Total from investment operations | | | (1.03 | ) | | | (2.90 | ) | | | (0.74 | ) | | | 2.33 | | | | (5.21 | ) |
Net asset value at end of year | | $ | 3.34 | | | $ | 4.37 | | | $ | 7.27 | | | $ | 8.01 | | | $ | 5.68 | |
| | | (23.57 | %) | | | (39.89 | %) | | | (9.24 | %) | | | 41.02 | % | | | (47.84 | %) |
Net assets at end of year (millions) | | $ | 2.0 | | | $ | 3.5 | | | $ | 5.9 | | | $ | 7.4 | | | $ | 3.7 | |
| Ratio of gross expenses to average net assets before waiver | | | 2.38 | % | | | 2.11 | % | | | 2.10 | % | | | 2.27 | % * | | | 2.37 | % * |
| Ratio of net expenses to average net assets after waiver | | | 1.98 | % | | | 1.98 | % | | | 1.98 | % | | | 2.15 | % * | | | 2.11 | % * |
| Ratio of net investment loss to average net assets | | | (0.98 | %) | | | (1.43 | %) | | | (1.48 | %) | | | (1.68 | %) | | | (1.26 | %) |
| Portfolio turnover rate | | | 10 | % | | | 16 | % | | | 58 | % | | | 41 | % | | | 44 | % |
| * | Ratio for years ended 2009 and 2008 includes dividend expenses on securities sold short of 0.11% and 0.01%, respectively. |
see accompanying notes to financial statements
NOTES TO FINANCIAL STATEMENTS
December 31, 2012
1. ORGANIZATION
Each of Firsthand Technology Opportunities Fund and Firsthand Alternative Energy Fund (individually the “Fund”, and collectively the “Funds”) is a non-diversified series of Firsthand Funds (the “Trust”), an open-end management investment company registered under the Investment Company Act of 1940, as amended (the “1940 Act”). The Trust, a Delaware statutory trust, was organized on November 8, 1993. Each Fund currently offers one class of shares—Investor Class shares. The inception dates for the Funds (the date on which a net asset value was first determined for that Fund) follow:
| |
| Firsthand Technology Opportunities Fund | September 30, 1999 |
| Firsthand Alternative Energy Fund | October 29, 2007 |
Each Fund’s investment objective is long-term growth of capital.
Firsthand Technology Opportunities Fund seeks to achieve its investment objective by investing, under normal circumstances, at least 80% of its assets in equity securities of high-technology companies in the industries and markets that the Investment Adviser believes hold the most growth potential within the technology sector.
Firsthand Alternative Energy Fund seeks to achieve its investment objective by investing, under normal circumstances, at least 80% of its assets in alternative energy and energy technology companies, both U.S. and international.
2. SIGNIFICANT ACCOUNTING POLICIES
The following is a summary of the Funds’ significant accounting policies:
Securities Valuation — A Fund’s portfolio of securities is valued as follows:
| | 1. | Securities traded on stock exchanges, or quoted by NASDAQ, are valued according to the NASDAQ official closing price, if applicable, or at their last reported sale price as of the close of trading on the New York Stock Exchange (“NYSE”) (normally 4:00 P.M. Eastern Time). If a security is not traded that day, the security will be valued at its most recent bid price. |
| | 2. | Securities traded in the over-the-counter market, but not quoted by NASDAQ, are valued at the last sale price (or, if the last sale price is not readily available, at the most recent closing bid price as quoted by brokers that make markets in the securities) at the close of trading on the NYSE. |
| | 3. | Securities traded both in the over-the-counter market and on a stock exchange are valued according to the broadest and most representative market. |
NOTES TO FINANCIAL STATEMENTS - continued
December 31, 2012
| | 4. | Securities and other assets that do not have market quotations readily available are valued at their fair value as determined in good faith using procedures established by the Board of Trustees. |
In pricing illiquid, privately placed securities, the advisor follows well-accepted valuation techniques. Initial valuations are generally determined by the initial purchase price for each security. Subsequent to initial purchase, securities are repriced from time to time to reflect changes to the companies’ valuations caused by various events. Such events include, among others, a new round of financing establishing a new valuation for the company; material changes to a company’s business or business prospects, either due to company-specific internal issues (gaining or losing a major customer, missing a significant milestone, etc.) or macroeconomic events affecting the industry or the world. In analyzing a company’s valuation, factors that are also considered include a company’s cash flow, revenues, profitability, financial forecasts, and probability of success in those measures. Other potential factors include the value of comparable public and private companies and general market conditions.
Fair Value Measurement — In accordance with the authoritative guidance on fair value measurements and disclosures under GAAP, each Fund discloses the fair value of its investments in a hierarchy that prioritizes the inputs to valuation techniques used to measure the fair value. The hierarchy gives the highest priority to valuations based upon unadjusted quoted prices in active markets for identical assets or liabilities (level 1 measurement) and the lowest priority to valuations based upon unobservable inputs that are significant to the valuation (level 3 measurements).
The guidance establishes three levels of the fair value hierarchy as follows:
| | Level 1 – | Unadjusted quoted prices in active markets for identical assets or liabilities that the Funds have the ability to access |
| | Level 2 – | Observable inputs other than quoted prices included in level 1 that are observable for the asset or liability, either directly or indirectly. These inputs may include quoted prices for the identical instrument on an inactive market, prices for similar instruments, interest rates, prepayment speeds, credit risks, yield curves, default rates, and similar data. |
| | Level 3 – | Unobservable inputs for the asset or liability, to the extent relevant observable inputs are not available, representing the Funds’ own assumptions about the assumptions a market participant would use in valuing the asset or liability, and would be based on the best information available. |
NOTES TO FINANCIAL STATEMENTS - continued
December 31, 2012
The availability of observable inputs can vary from security to security and is affected by a wide variety of factors, including, for example, the type of security, whether the security is new and not yet established in the marketplace, the liquidity of markets, and other characteristics particular to the security. To the extent that valuation is based on models or inputs that are less observable or unobservable in the market, the determination of fair value requires more judgment. Accordingly, the degree of judgment exercised in determining fair value is greatest for instruments categorized in level 3.
The inputs used to measure fair value may fall into different levels of the fair value hierarchy. In such cases, for disclosure purposes, the level in the fair value hierarchy within which the fair value measurement falls in its entirety, is determined based on the lowest level input that is significant to the fair value measurement in its entirety.
The inputs or methodology used for valuing securities are not necessarily an indication of the risk associated with investing in those securities. The following is a summary of the inputs used to value the following Funds’ net assets as of December 31, 2012:
| FUND* | | LEVEL 1 QUOTED PRICES | | | LEVEL 2 OTHER SIGNIFICANT OBSERVABLE INPUTS | | | LEVEL 3 SIGNIFICANT UNOBSERVABLE INPUTS | |
| TEFQX | | | | | | | | | |
| Common Stocks | | | | | | | | | |
| Advanced Materials | | $ | 504,800 | | | $ | — | | | $ | — | |
| Communications | | | 8,143,800 | | | | — | | | | — | |
| Communications Equipment | | | 5,675,700 | | | | — | | | | — | |
| Computer | | | 13,059,235 | | | | — | | | | — | |
| Internet | | | 36,362,936 | | | | — | | | | — | |
| Medidcal Device | | | 51,480 | | | | | | | | | |
| Networking | | | 2,112,800 | | | | — | | | | — | |
| Other Electronics | | | 2,551,000 | | | | — | | | | — | |
| Semiconductor Equip. | | | 343,200 | | | | | | | | | |
| Semiconductors | | | 7,298,150 | | | | — | | | | — | |
| Social Networking | | | 1,065,200 | | | | | | | | | |
| Software | | | 6,895,700 | | | | — | | | | — | |
| Total Common Stock | | | 84,064,001 | | | | — | | | | — | |
| Exchanged-Traded Fund | | | 238,425 | | | | — | | | | — | |
| Asset Derivatives** | | | | | | | | | | | | |
| Equity Contracts | | | — | | | | 20,000 | | | | — | |
| Total | | $ | 84,302,426 | | | $ | 20,000 | | | $ | — | |
NOTES TO FINANCIAL STATEMENTS - continued
December 31, 2012
| FUND* | | LEVEL 1 QUOTED PRICES | | | LEVEL 2 OTHER SIGNIFICANT OBSERVABLE INPUTS | | | LEVEL 3 SIGNIFICANT UNOBSERVABLE INPUTS | |
| ALTEX | | | | | | | | | |
| Common Stocks | | | | | | | | | |
| Advanced Materials | | $ | 286,253 | | | $ | — | | | $ | — | |
| Basic Materials | | | 121,460 | | | | — | | | | — | |
| Building Automation | | | 36,840 | | | | — | | | | — | |
| Energy Efficiency | | | 214,554 | | | | — | | | | — | |
| Environmental Services | | | 91,152 | | | | — | | | | — | |
| Industrials | | | 115,285 | | | | | | | | | |
| Other Electronics | | | 72,206 | | | | — | | | | — | |
| Power Conversion/ Supply Equipment | | | 64,527 | | | | — | | | | — | |
| Renewable Energy | | | 811,629 | | | | — | | | | — | |
| Semiconductors | | | 138,574 | | | | — | | | | — | |
| Total Common Stocks | | | 1,952,480 | | | | — | | | | — | |
| Preferred Stocks | | | | | | | | | | | | |
| Intellectual Property | | | — | | | | — | | | | 94 | |
| Renewable Energy | | | — | | | | — | | | | 2,707 | |
| Total Preferred Stocks | | | — | | | | — | | | | 2,801 | |
| Total | | $ | 1,952,480 | | | $ | — | | | $ | 2,801 | |
| * | TEFQX: Firsthand Technology Opportunities Fund; ALTEX: Firsthand Alternative Energy Fund. |
| ** | Asset derivatives include purchased options. |
At the end of each calendar quarter, management evaluates the Level 2 and 3 assets and liabilities for changes in liquidity, including but not limited to: whether a broker is willing to execute at the quoted price, the depth and consistency of prices from third party services, and the existence of contemporaneous, observable trades in the market. Additionally, management evaluates the Level 1 and 2 assets and liabilities on a quarterly basis for changes in listings or delistings on national exchanges. Transfers in and out of the levels are recognized at the value at the end of the period. There were no transfers between Levels during the period ended December 31, 2012.
Following is a reconciliation of Level 3 assets (at either the beginning or the ending of the period) for which significant unobservable inputs were used to determine fair value.
NOTES TO FINANCIAL STATEMENTS - continued
December 31, 2012
FIRSTHAND ALTERNATIVE ENERGY FUND
| INVESTMENTS AT FAIRVALUE USING SIGNIFICANT UNOBSERVABLE INPUTS (LEVEL 3) | | BALANCE AS OF 12/31/11 | | | GROSS PURCHASES | | | GROSS SALES | | | NET REALIZED GAINS (LOSSES) | | | NET UNREALIZED APPRECIATION (DEPRECIATION) | | | TRANSFERS IN (OUT) OF LEVEL 3 | | | BALANCE AS OF 12/31/12 | |
| Common Stocks | | | | | | | | | | | | | | | | | | | | | |
| Intellectual Property | | $ | 18 | | | $ | — | | | $ | — | | | $ | — | | | $ | (18 | ) | | $ | — | | | $ | — | |
| Preferred Stocks | | | | | | | | | | | | | | | | | | | | | | | | | | | | |
| Intellectual Property | | | 625 | | | | — | | | | — | | | | — | | | | (531 | ) | | | — | | | | 94 | |
| | | 6,749 | | | | — | | | | — | | | | — | | | | (4,042 | ) | | | — | | | | 2,707 | |
| | $ | 7,392 | | | $ | — | | | $ | — | | | $ | — | | | $ | (4,591 | ) | | $ | — | | | $ | 2,801 | |
The net change in unrealized appreciation (depreciation) from Level 3 investments held as of December 31, 2012, Firsthand Alternative Energy Fund was $(4,591) and is included in “Net change in unrealized appreciation on investments and foreign currency” on the Statement of Operations.
The below chart represents quantitative disclosure about significant unobservable inputs for level 3 fair value measurements:
| | FAIR VALUE AT 12/31/12 | VALUATION TECHNIQUES | UNOBSERVABLE INPUTS | RANGE |
| Direct venture capital investments: Intellectual Property | $94 | Market Comparable Companies | Revenue Multiple EBITDA Multiple Discount for Lack of Marketability | 1.5x - 1.8x 6.0x - 8.2x 0.0% - 47.9% |
| Direct venture capital investments: Renewable Energy | $2,707 | Prior Transaction Analysis | Volatility Risk-Free Rate Discount for Lack of Marketability | 94.00% 0.36% 0.0% - 57.6% |
| | | Market Comparable Companies | Revenue Multiple EBITDA Multiple | 0.7x - 0.8x 4.0x - 7.1x |
Share Valuation — The net asset value (“NAV”) per share of each Fund is calculated by dividing the sum of the value of the securities held by the Fund, plus cash or other assets, minus all liabilities (including estimated accrued expenses) by the total number of shares outstanding of the Fund, rounded to the nearest cent. A Fund’s shares will not be priced on the days on which the NYSE is closed for trading. The offering and redemption price per share of each Fund is equal to a Fund’s net asset value per share.
NOTES TO FINANCIAL STATEMENTS - continued
December 31, 2012
Investment Income — Dividend income is recorded on the ex-dividend date. Interest income is accrued as earned. Discounts and premiums on securities purchased are amortized over the lives of the respective securities. Other non-cash dividends are recognized as investment income at the fair value of the property received. Withholding taxes on foreign dividends have been provided for in accordance with the Funds’ understanding of the applicable country’s tax rules and rates.
Cash and Cash Equivalents — The Funds consider liquid assets deposited with a bank, money market funds, and certain short-term debt instruments with maturities of 3 months or less to be cash equivalents. These investments represent amounts held with financial institutions that are readily accessible to pay Fund expenses or purchase investments. Cash and cash equivalents are valued at cost plus accrued interest, which approximates market value.
Foreign Securities — Each Fund may invest in companies that trade on U.S. exchanges as American Depositary Receipts (“ADRs”), on foreign exchanges, or on foreign over-the-counter markets. Investing in the securities of foreign companies exposes your investment in a Fund to risk. Foreign stock markets tend to be more volatile than the U.S. market due to economic and/or political instability and the regulatory conditions in some countries. In addition, some of the securities in which the Fund may invest may be denominated in foreign currencies, the value of which may decline against the U.S. dollar. An investment in foreign securities may be subject to high levels of foreign taxation, including foreign taxes withheld at the source. The Fund does not isolate the portion of the results of operations resulting from changes in foreign exchange rates on investments from the fluctuations arising from changes in market prices of securities held. Reported net realized foreign exchange gains or losses arise from sales of portfolio securities, currency gains or losses realized between the trade and settlement dates on securities transactions, and the difference between the amounts of dividends, interest, and foreign withholding taxes recorded on the Funds’ books and the U.S. dollar equivalent of the amounts actually received or paid.
Options — The Funds are subject to equity price risk in the normal course of pursuing their investment objectives and may enter into options written to hedge against changes in the value of equities. The Funds may purchase put and call options to attempt to provide protection against adverse price effects from anticipated changes in prevailing prices of securities or stock indices. The Funds may also write put and call options. When the Fund writes an option, an amount equal to the premium received by the Fund is recorded as a liability and is subsequently adjusted to the current fair value of the option written. Premiums received from writing options that expire unexercised are treated by the Fund on the expiration date as realized gains from investments. The difference between the premium and the amount paid on effecting a closing purchase transaction, including brokerage commissions, is also treated as a realized gain, or, if the
NOTES TO FINANCIAL STATEMENTS - continued
December 31, 2012
premium is less than the amount paid for the closing purchase transaction, as a realized loss. If a call option is exercised, the premium is added to the proceeds from the sale of the underlying security or currency in determining whether the Fund has realized a gain or loss. The Fund as writer of an option bears the market risk of an unfavorable change in the price of the security underlying the written option.
The market value of the Fund’s purchased and written options as of December 31, 2012 can be found on the Portfolio of Investments. The net realized gains/(loss) from purchased and written options and the net change in unrealized appreciation (depreciation) on purchased and written options for the year ended December 31, 2012 can be found on the Statements of Operations.
The number of option contracts written and the premiums received during the year ended December 31, 2012, were as follows:
| | | FIRSTHAND TECHNOLOGY | |
| | | Number of Contracts | | | Premiums Received | |
| Options outstanding, beginning of year | | | — | | | $ | — | |
| Options written during period | | | 25,460 | | | | 2,432,423 | |
| Options expired during period | | | (18,135 | ) | | | (1,209,592 | ) |
| Options closed during period | | | (3,500 | ) | | | (934,099 | ) |
Options exercised during period | | | (3,825 | ) | | | (288,732 | ) |
Options outstanding, end of year | | | — | | | $ | — | |
The average volume of derivatives during the year ended December 31, 2012 is as follows:
| | | PURCHASED OPTIONS (CONTRACTS) | | | WRITTEN OPTIONS (CONTRACTS) | |
| Firsthand Technology Opportunities Fund | | | 5,420 | | | | 2,052 | |
Distributions to Shareholders — Each Fund expects to distribute its net investment income and net realized gains, if any, annually. Distributions from net investment income and capital gains are recorded on the ex-dividend date and are determined in accordance with income tax regulations, which may differ from accounting principles generally accepted in the United States.
Short Positions — Firsthand Alternative Energy Fund may sell securities short for economic hedging purposes. Short sales are transactions in which the Fund sells a security it does not own, in anticipation of a decline in the market value of that security. To initiate such a transaction, the Fund must borrow the security to deliver to the buyer
NOTES TO FINANCIAL STATEMENTS - continued
December 31, 2012
upon the short sale; the Fund is then obligated to replace the security borrowed by purchasing it in the open market at some later date, completing the transaction. The Fund is liable for any dividends payable on securities while those securities are in a short position.
The Fund will incur a loss if the market price of the security increases between the date of the short sale and the date on which the Fund replaces the borrowed security. The Fund will realize a gain if the security declines in value between those dates.
All short sales must be fully collateralized. The Fund maintains the collateral in a segregated account consisting of cash, cash equivalents and/or liquid securities sufficient to collateralize the market value of its short positions. Typically, the segregated cash with brokers and other financial institutions exceeds the minimum required. Deposits with brokers for securities sold short are invested in money market instruments. The fund did not invest in short sales for the year ended December 31, 2012.
Reclassification of Capital Accounts—Permanent book and tax differences resulted in reclassifications for the year ended December 31, 2012 as follows:
| | | INCREASE (DECREASE) | |
| | | Paid-in-Capital | | | Accumulated Net Investment Income (Loss) | | | Accumulated Net Realized Gain (Loss) | |
| Firsthand Opportunities Fund | | $ | 3,016,094 | | | | 1,239,351 | | | $ | (4,255,445 | ) |
| Firsthand Alternative Energy Fund | | | (15,665 | ) | | | 26,434 | | | | (10,769 | ) |
These reclassifications, related to different treatment of expiration of capital loss carryforwards, current year write off of net operating loss, and foreign currency, have no effect on net asset value per share.
Security Transactions — Security transactions are accounted for no later than one business day following the trade date, however, for financial reporting purposes, security transactions are accounted for on trade date. Realized gains and losses are calculated on a specific identification basis.
Estimates — The preparation of financial statements in conformity with accounting principles generally accepted in the United States of America requires management to make estimates and assumptions that affect the reported amounts of assets and liabilities at the date of the financial statements and the reported amounts of income and expenses during the reporting period. Actual results could differ from those estimates.
NOTES TO FINANCIAL STATEMENTS - continued
December 31, 2012
Federal Income Tax — Each Fund has elected, and intends to qualify annually, for the special tax treatment afforded regulated investment companies under the Internal Revenue Code of 1986, as amended (the “Code”). As provided in the Code, in any fiscal year in which a Fund so qualifies and distributes at least 90% of its taxable net income, the Fund (but not the shareholders) will be relieved of federal income tax on the income distributed. Accordingly, no provision for income taxes has been made. To avoid imposition of the excise tax applicable to regulated investment companies, each Fund intends to declare as dividends in each calendar year at least 98% of its net investment income (earned during the calendar year) and 98% of its net realized capital gains (earned during the 12 months ended October 31) plus undistributed amounts, if any, from prior years. The following information is based upon the federal income tax cost of portfolio investments as of December 31, 2012.
| | | FIRSTHAND TECHNOLOGY OPPORTUNITIES FUND | | | FIRSTHAND ALTERNATIVE ENERGY FUND | |
| Gross unrealized appreciation | | $ | 19,121,355 | | | $ | 210,275 | |
Gross unrealized depreciation | | | (6,371,497 | ) | | | (2,974,118 | ) |
Net unrealized appreciation (depreciation) | | $ | 12,749,858 | | | $ | (2,763,843 | ) |
| | $ | 71,572,568 | | | $ | 4,719,124 | |
The difference between the acquisition cost and the federal income tax cost of portfolio investments is due to certain timing differences in the recognition of capital losses under accounting principles generally accepted in the United States and income tax regulations.
As of December 31, 2012, the Funds had capital loss carryforwards for federal income tax purposes as follows:
| | | SHORT-TERM EXPIRING 2016 | | | SHORT-TERM EXPIRING 2017 | | | SHORT-TERM EXPIRING 2018 | |
TEFQX* | | $ | (2,394,837 | )** | | | — | | | | — | |
ALTEX* | | | — | | | | (181,999 | ) | | | (108,018 | ) |
| | | SHORT-TERM NO EXPIRATION*** | | | LONG-TERM NO EXPIRATION*** | | | TOTAL | |
TEFQX* | | $ | (68,590 | )** | | $ | (63,155 | )** | | $ | (2,526,582 | ) |
ALTEX* | | | — | | | | (767,884 | ) | | | (1,057,901 | ) |
NOTES TO FINANCIAL STATEMENTS - continued
December 31, 2012
| * | TEFQX: Firsthand Technology Opportunities Fund; ALTEX: Firsthand Alternative Energy Fund. |
| ** | Subject to annual limitations from the Reorganization (See Note 6) |
| *** | On December 22, 2010, President Obama signed into law the Regulated Investment Company Modernization Act of 2010 (the “Act”). The Act updates certain tax rules applicable to regulated investment companies (“RICs”). The various provisions of the Act are in effect for the Funds’ fiscal year ending December 31, 2012. Under the Modernization Act, new capital losses may now be carried forward indefinitely, and retain the character of the original loss as compared with pre-enactment law where capital losses could be carried forward for eight years, and carried forward as short-term capital losses, irrespective of the character of the original loss. |
For the year ended December 31, 2012, the Technology Opportunities Fund utilized $736,311 ($247,259 of prior year capital loss carryforward and $489,052 of capital loss transferred to the fund in its merger with Firsthand Technology Leaders Fund). The Technology Opportunities Fund had $2,501,372 of capital loss carryforward expire.
Components of Distributable Earnings
| | | FIRSTHAND TECHNOLOGY OPPORTUNITIES FUND | | | FIRSTHAND ALTERNATIVE ENERGY FUND | |
| Net Unrealized Appreciation (Depreciation)* | | $ | 12,749,923 | | | | (2,763,848 | ) |
| Qualified Late Year Capital Losses Deferred** | | | — | | | | (294,001 | ) |
Accumulated Capital Loss Carryforward | | | (2,526,582 | ) | | | (1,057,901 | ) |
Total Distributable Earnings | | $ | 10,223,341 | | | $ | (4,115,750 | ) |
| * | The differences between book-basis and tax-basis unrealized appreciation (depreciation) is attributable primarily to tax deferral of losses on wash sales and straddle losses. |
| ** | Under current tax law, capital and currency losses realized after October 31 and prior to the Fund’s fiscal year end may be deferred as occurring on the first day of the following fiscal year. |
The Funds are subject to tax provisions that establish a minimum threshold for recognizing, and a system for measuring, the benefits of a tax position taken or expected to be taken in a tax return. Taxable years ending 2012, 2011, 2010 and 2009 remain open to federal and state audit. As of December 31, 2012, management has evaluated the application of these provisions to the Funds, and has determined that no provision for income tax is required in the Funds’ financial statements for uncertain tax provisions.
NOTES TO FINANCIAL STATEMENTS - continued
December 31, 2012
3. INVESTMENT TRANSACTIONS (EXCLUDING SHORT-TERM INVESTMENTS) WERE AS FOLLOWS FOR THE YEAR ENDED DECEMBER 31, 2012.
| | | FIRSTHAND TECHNOLOGY OPPORTUNITIES FUND | | | FIRSTHAND ALTERNATIVE ENERGY FUND | |
Purchase of investment securities | | $ | 65,792,758 | * | | $ | 247,711 | |
Proceeds from sales and maturities of investment securities | | $ | 88,170,845 | | | $ | 659,524 | |
| * | The cost of purchases excludes $21,566,018 from securities received from the merged funds (see Note 6). |
4. INVESTMENT ADVISORY AND ADMINISTRATION AGREEMENTS; CERTAIN TRUSTEES AND OFFICERS OF THE TRUST ARE ALSO OFFICERS OF THE INVESTMENT ADVISER AND BNY MELLON.
Certain trustees and officers of the Trust are also officers of the Investment Adviser or BNY Mellon. BNY Mellon serves as the sub-administrator, investment accounting agent, and shareholder servicing and transfer agent.
INVESTMENT ADVISORY AGREEMENT
Each Fund’s investments are managed by the Investment Adviser pursuant to the terms of a master investment advisory agreement (the “Advisory Agreement”). Under the Advisory Agreement, the Investment Adviser provides each Fund with investment research, advice, management, and supervision and manages the investment and reinvestment of assets of each Fund consistent with each Fund’s investment objectives, policies, and limitations. Subject to certain exceptions set forth in the Advisory Agreement, the Investment Adviser is responsible for (i) compensation of any of the Fund’s trustees, officers, and employees who are interested persons of the Investment Adviser; and (ii) compensation of the Investment Adviser’s personnel and other expenses incurred in connection with the provision of portfolio management services under the Advisory Agreement.
Firsthand Capital Management, Inc. is the Investment Adviser to the Funds. For the services it provides under the Advisory Agreement, the Investment Adviser receives from each Fund, on a monthly basis, an advisory fee at the annual rate of 1.40% for TEFQX and 1.53% for ALTEX of its average daily net assets, respectively. The Advisory Agreement requires the Investment Adviser to waive fees and, if necessary, to reimburse expenses of each Fund to the extent necessary to limit a Fund’s total operating expenses to 1.85%, for TEFQX and 1.98% for ALTEX, excluding any extraordinary fees, of its average net assets up to $200 million, 1.80% for TEFQX and 1.93% for ALTEX of such assets from $200 million to $500 million, 1.75% for TEFQX and 1.88%
NOTES TO FINANCIAL STATEMENTS - continued
December 31, 2012
for ALTEX of such assets from $500 million to $1 billion, and 1.70% for TEFQX and 1.83% for ALTEX of such assets in excess of $1 billion.
ADMINISTRATION AGREEMENT
The Trust has entered into a separate Administration Agreement with the Investment Adviser. The agreement obligates the Investment Adviser to provide administrative and general supervisory services to each Fund (the “Administration Agreement”). Under the Administration Agreement, the Investment Adviser renders supervisory and corporate administrative services to the Trust, as well as oversees the maintenance of all books and records with respect to each Fund’s securities transactions and each Fund’s book of accounts in accordance with all applicable federal and state laws and regulations. The Investment Adviser also arranges for the preservation of journals, ledgers, corporate documents, brokerage account records, and other records as required by the 1940 Act.
The Investment Adviser is responsible for the equipment, staff, office space, and facilities necessary to perform its obligations under the Administration Agreement. Under the Administration Agreement, the Investment Adviser has assumed responsibility for payment of all of each Fund’s operating expenses excluding brokerage and commission expenses; short sale expenses; fees payable under “Rule 12b-1 plans”, if any, and shareholder servicing plans, if any; litigation costs; and any extraordinary and non-recurring expenses. For the services it provides under the Administration Agreement, the Investment Adviser receives a fee from each Fund at the annual rate of 0.45% of its average daily net assets up to $200 million, 0.40% of such assets from $200 million to $500 million, 0.35% of such assets from $500 million to $1 billion, and 0.30% of such assets in excess of $1 billion.
BNY Mellon Investment Servicing (US) Inc. (“BNY Mellon”), has a Sub-Administration Agreement with the Investment Adviser. Under this agreement, the Investment Adviser (not the Funds) pays to BNY Mellon the fees for the administrative services provided by BNY Mellon. In the case of Firsthand Alternative Energy Fund, the Investment Adviser has also agreed to donate a portion of its management fees allocated, amounting to 0.20% of Firsthand Alternative Energy Fund’s average daily net assets, to various non-profit organizations as elected by Fund shareholders.
Additionally, BNY Mellon serves as the sub-administrator, investment accounting agent and shareholder servicing and transfer agent. The Bank of New York Mellon, serves as the custodian for the Trust.
NOTES TO FINANCIAL STATEMENTS - continued
December 31, 2012
5. INVESTMENTS IN RESTRICTED SECURITIES
Restricted securities include securities that have not been registered under the Securities Act of 1933, as amended, and securities that are subject to restrictions on resale. A Fund may invest in restricted securities that are consistent with a Fund’s investment objective and investment strategies. A Fund will not invest in a restricted security if, immediately after and as a result of the investment in such security, more than 15% of the Fund’s net assets would be invested in illiquid securities. In some cases, the issuer of restricted securities has agreed to register such securities for resale, at the issuer’s expense either upon demand by the Fund or in connection with another registered offering of the securities. Investments in restricted securities are valued at fair value as determined in good faith in accordance with procedures adopted by the Board of Trustees. It is possible that the estimated value may differ significantly from the amount that might ultimately be realized in the near term, and the difference could be material.
As of December 31, 2012, the Alternative Energy Fund was invested in the following restricted securities:
| SECURITY | ACQUISITION DATE | | SHARES | | | COST | | | VALUE | | | % OF NET ASSETS |
| Silicon Genesis Corp., Common Stock | September 2, 2008 | | | 109,855 | | | $ | 32,957 | | | $ | — | | | | — | %* |
| Silicon Genesis Corp., Common Stock | September 26, 2008 | | | 71,552 | | | | 21,466 | | | | — | | | | — | %* |
| Silicon Genesis Corp., Series 1-C P/S | September 2, 2008 | | | 152 | | | | 46 | | | | — | | | | — | %* |
| Silicon Genesis Corp., Series 1-E P/S | September 2, 2008 | | | 3,000 | | | | 3,180 | | | | 94 | | | | — | %* |
SoloPower, Series C-1 P/S | | | | 21,425 | | | | 21,425 | | | | 2,707 | | | | 0.1 | % |
| | | | | | | | $ | 79,074 | | | $ | 2,801 | | | | 0.1 | % |
| * - Percentages are less than 0.05%. |
Each Fund, consistent with SEC guidelines, has an investment restriction providing that it cannot purchase additional restricted securities once such securities comprise 15% of a Fund’s net assets. The SEC considers a security to be illiquid if it cannot be disposed of within seven days in the ordinary course of business at approximately the amount at which a Fund has valued the security. The restriction stems from the concern that, for an open-end mutual fund with daily redemption obligations, a high level of illiquid securities would increase the risk that a Fund may not be able to meet its daily
NOTES TO FINANCIAL STATEMENTS - continued
December 31, 2012
redemption needs, because illiquid securities often take a longer period of time to sell, and may not necessarily be sold at that Fund’s then carrying value.
As of December 31, 2012, Kevin Landis represents the Funds and sits on the following private company’s board: Silicon Genesis Corporation. Serving on the boards of directors of the portfolio companies may cause conflicts of interest. The Adviser has adopted various procedures to ensure that the Fund will not be unfavorably affected by these potential conflicts.
6. REORGANIZATION
On May 22, 2012, shareholders of Firsthand Technology Leaders Fund approved the merger of Firsthand Technology Leaders Fund (“TLFQX”) into Firsthand Technology Opportunities Fund (the “Fund”). The merger was completed on May 25, 2012. The merger was a non-taxable event. The reasons for the reorganization were the changing market environment for technology stocks, performance and achieving economies of scale. TLFQX was credited with 4,346,937 shares of beneficial interest of the Fund at $5.75 net asset value per share. As a result of the reorganization, each shareholder of TLFQX received shares of the Fund with an aggregate net asset value that is equal to the aggregate net asset value of the shares of TLFQX held by that shareholder as of close of business on May 25, 2012.
The shares outstanding of TLFQX immediately before the merger and shares of the Fund issued to TLFQX shareholders were:
| MERGED FUND | SHARES EXCHANGED | ACQUIRING FUND | SHARES ISSUED | NET ASSET VALUE | CONVERSION RATIO |
| Firsthand Technology Leaders Fund | 1,278,111 | Firsthand Technology Opportunities Fund | 4,346,937 | $5.75 | 3.40106 |
The net assets and net unrealized appreciation (depreciation) of TLFQX and the net assets of the Fund immediately before the merger were as follows:
| MERGED FUND | NET ASSETS | UNREALIZED APPRECIATION/ DEPRECIATION | ACQUIRING FUND | NET ASSETS |
| Firsthand Technology Leaders Fund | 25,002,665 | 1,674,417 | Firsthand Technology Opportunities Fund | $77,430,627 |
The net assets and shares outstanding of the Fund upon completion of the reorganization were $102,433,292 and 17,808,943 respectively.
NOTES TO FINANCIAL STATEMENTS - continued
December 31, 2012
Assuming the reorganization had been completed on January 1, 2012, the Fund’s results of operation for the year ended December 31, 2012 would have been as follows:
| Net investment income/(loss) | | $ | (1,375,110 | ) |
| Net realized and unrealized gain/(loss) on investments | | $ | 16,139,392 | |
| Net increase in assets from operations | | $ | 14,764,282 | |
Because the combined investment portfolio have been managed as a single portfolio since the acquisition was completed, it is not practicable to separate the amounts of revenue and earnings of TLFQX that have been included in the Fund’s Statement of Operations since May 25, 2012.
7. NEW ACCOUNTING PRONOUNCEMENTS
In December 2011, the FASB issued Accounting Standards Update No. 2011-11, “Disclosures about Offsetting Assets and Liabilities” (“ASU 2011-11”). ASU 2011-11 requires disclosures to make financial statements that are prepared under U.S. GAAP more comparable to those prepared under International Financial Reporting Standards. The new disclosure requirements mandate that entities disclose both gross and net information about instruments and transactions eligible for offset in the statement of assets and liabilities as well as instruments and transactions subject to an agreement similar to a master netting arrangement. In addition, ASU 2011-11 requires disclosure of collateral received and posted in connection with master netting agreements or similar arrangements. New disclosures are required for annual reporting periods beginning on or after January 1, 2013, and interim periods within those annual periods. Management is evaluating the impact of ASU 2011-11 on the financial statements and disclosures.
8. RISKS
Because the return on and value of an investment in each Fund will fluctuate in response to stock market movements, the most significant risk of investing in a Fund is that you may lose money. Stocks and other equity securities are subject to market risks and fluctuations in value due to earnings, as well as economic, political, or regulatory events, and other factors beyond the Investment Adviser’s control. The Funds are designed for long-term investors who can accept the risks of investing in a fund with significant common stock holdings in high-technology industries.
NOTES TO FINANCIAL STATEMENTS - continued
Each Fund is non-diversified. A risk of being non-diversified is that a significant change in the value of one company will have a greater impact on the Fund than it would if the Fund diversified its investments. Another risk for the Fund is its concentration of investments in companies within high-technology industries. The value of high-technology companies can, and often does, fluctuate dramatically and may expose you to greater-than-average financial and market risk.
9. SUBSEQUENT EVENT
Management has evaluated the impact of all subsequent events on the Fund through the date the financial statements were issued, and has determined that there were no subsequent events requiring recognition or disclosure in the financial statements.
ADDITIONAL INFORMATION (UNAUDITED)
December 31, 2012
INVESTMENT ADVISORY AND ADMINISTRATION AGREEMENTS (UNAUDITED)
As required by the Investment Company Act of 1940, as amended (the “1940 Act”), the Board of Trustees (the “Board”) of Firsthand Funds (the “Trust”), including all of the Trustees who are not “interested persons” of the Trust, as that term is defined in the 1940 Act (the “Independent Trustees”), considered the renewal of the master investment advisory agreement between Firsthand Capital Management, Inc. (the “Adviser”) and the Trust on behalf of each of its series (each a “Fund” and collectively, the “Funds”) (the “Advisory Agreement”). The Advisory Agreement was approved for an additional one-year term at a meeting of the Board held on August 17, 2012. The Board’s decision to approve the Advisory Agreement reflects the exercise of its business judgment to continue the existing arrangement. In approving the Advisory Agreement, the Board considered information provided by the Adviser, with the assistance and advice of counsel to the Independent Trustees and counsel to the Trust.
Nature, Extent and Quality of Services
The Board received and considered various data and information regarding the nature, extent and quality of services provided to the Funds by the Adviser. The most recent investment adviser registration form for the Adviser was provided to the Board, as were written and oral responses of the Adviser to an information request submitted by independent counsel on behalf of the Independent Trustees. The Board reviewed these responses, which included, among other things, information about the background and experience of the investment personnel of the Adviser primarily responsible for the day-to-day portfolio management services for the Funds. The Board also considered the Adviser’s separate Administration Agreement with the Funds and the Adviser’s overall ability to manage and administer the Funds, as well as to oversee the service providers to the Funds.
The Board evaluated the ability of the Adviser, considering its financial condition, resources, reputation and other attributes, to attract and retain highly qualified investment professionals, including research, advisory, supervisory and administrative personnel. In this regard, the Board considered information regarding the Adviser’s compensation program for its personnel involved in the management of the Funds, including incentive and retirement plans.
The Board considered the effectiveness of policies of the Funds in achieving the best execution of portfolio transactions, whether and to what extent “soft dollar” benefits are sought, the extent to which efforts are made to recapture transaction costs, and the controls applicable to brokerage allocation procedures. The Board reviewed the policies of the Adviser regarding the allocation of portfolio investment opportunities among the Funds and other clients. The Board noted that the Adviser does not use “traditional soft-dollar” arrangements where soft-dollar credits are generated based on the level of trades and then used for products or services from third-parties. The Board also noted that the Adviser, from time to time, entered into arrangements where it received research
ADDITIONAL INFORMATION (UNAUDITED) - continued
December 31, 2012
(including invitations to conferences) from broker-dealers that the Adviser used to execute client trades. The Board also considered that the Adviser has outsourced the trading function to achieve certain operating efficiencies.
The Board also considered the markets for the Funds, including the principal channels through which the Funds’ shares are offered and sold, and the activities of the Adviser in connection with the marketing of the Funds.
The Board also received and reviewed information on Securities and Exchange Commission (“SEC”) and other inquiries, examinations and proceedings relating to the Funds and the Adviser and the former Adviser. The Board considered the investment and legal compliance programs of the Adviser, including its implementation of enhanced compliance policies and procedures in response to SEC rule changes and other regulatory initiatives, and the level of compliance attained by the Adviser.
Based on the above factors, together with those referenced below, the Board, including a majority of the Independent Trustees, concluded that it was generally satisfied with the nature, extent and quality of the investment advisory services provided to each Fund by the Adviser.
Fund Performance
The Board considered each Fund’s performance results for the one-year, three-year, five-year and ten-year periods, or shorter periods, as relevant. The Board examined these results in comparison to the performance results of various benchmark indices and of the Funds in relevant Morningstar sectors. More specifically, the Board noted that the Firsthand Technology Opportunities Fund underperformed its primary benchmark for the one- and three-year periods ended June 30, 2012 and outperformed the benchmark for the five- and ten-year periods ended June 30, 2012. The Board also noted that the Firsthand Alternative Energy Fund outperformed one of its comparable funds over the one-year period ended June 30, 2012 and both of its comparable funds over the three-year period ended June 30, 2012.
Investment Advisory Fee Rates and Other Expenses
The Board reviewed and considered the proposed contractual investment advisory fee rates (the “Advisory Agreement Rates”) payable by the Funds to the Adviser for investment advisory services. Additionally, the Board received and considered information comparing the Advisory Agreement Rates (both on a stand-alone basis and on a combined basis with the Funds’ administration fee rates) and the total expense ratios of the Funds with those of other funds in appropriate peer universes provided by Lipper. The Board concluded that the respective Advisory Agreement Rates for each Fund were significantly higher than the median rates of each Fund’s peer universe, but that the total expense
ADDITIONAL INFORMATION (UNAUDITED) - continued
December 31, 2012
ratio of each Fund was not appreciably above the median total expense ratio of the respective peer universe. The Board deemed the comparison of total expense ratios to be more relevant than the comparison of Advisory Agreement Rates because of the unitary fee structure of the Funds.
Profitability
The Board received and considered a profitability analysis of the Adviser with respect to the Funds. The Board concluded that, in light of the costs of providing investment management and other services to the Funds, the profits and other ancillary benefits that the Adviser received with regard to providing these services to the Funds were not excessive.
Economies of Scale
The Board received and considered information regarding whether there have been economies of scale with respect to the management of the Funds, whether the Funds have appropriately benefited from any economies of scale, and whether there is potential for realization of any further economies of scale with respect to the existing Funds. The Board observed that the Advisory Agreement limits each Fund’s total annual operating expenses to a percentage of the Fund’s assets and that this percentage is reduced as the Fund’s assets grow (known as “breakpoints”). The Board also observed that the total assets of the Firsthand Alternative Energy Fund had declined during the year, and that the limited size of the Funds provided little opportunity for economies of scale without substantial further growth. The Board concluded that no change was necessary to the current breakpoints to reflect any economies of scale.
Information about Services to Other Clients
The Board also received and considered information about the services and fee rates offered by the Adviser to its other clients, including other registered and unregistered investment companies, private accounts and institutional investors. The Board concluded that the investment advisory rates charged by the Adviser to the Funds were within a reasonable range of the fee rates offered to other clients of the Adviser. Where rates offered to other clients were lower, the Board concluded that the costs associated with managing and operating a registered open-end fund, compared with an unregistered investment company, private account or institutional investor account provided a justification for higher fee rates to the Funds.
Other Benefits to the Adviser
The Board received and considered information regarding potential “fall-out” or ancillary benefits to the Adviser as a result of its relationship with the Funds. Such benefits could include, among others, benefits directly attributable to the relationship of the Adviser with the Funds (such as “soft dollar” benefits) and
ADDITIONAL INFORMATION (UNAUDITED) - continued
December 31, 2012
benefits potentially derived from an increase in the business of the Adviser as a result of its relationship with the Funds (such as the ability to market to shareholders other financial products offered by the Adviser).
Other Factors and Broader Review
Throughout the year, the Board regularly reviews and assesses the quality of the services that the Funds receive from the Adviser. In this regard, the Board reviews reports of the Adviser in each of its quarterly meetings, which include, among other things, a detailed portfolio review and detailed fund performance reports. In addition, the Board interviews the portfolio managers of the Funds at various times throughout the year.
After considering the aforementioned factors and based on its deliberations and evaluation of the information provided to it, the Board concluded that re-approval of the Advisory Agreement for each of the Funds was in the best interest of the Funds and their shareholders.
PROXY VOTING POLICIES AND PROCEDURES
The Funds have adopted proxy voting procedures pursuant to which the Funds delegate the responsibility for voting proxies relating to portfolio securities held by the Funds to the Investment Adviser as part of the Investment Adviser’s general management of the Funds, subject to the Board of Trustees’ continuing oversight. A copy of the Funds’ proxy voting policy and procedures is available without charge, upon request, by calling 1.888.884.2675. Information regarding how the Investment Adviser voted these proxies during the most recent one-year period ended June 30 is available by calling the same number and on the website of the U.S. Securities and Exchange Commission at http://www.sec.gov on Form N-PX. The Funds’ voting record is also available on the Funds’ website at www.firsthandfunds.com/proxy.
PORTFOLIO HOLDINGS
The Funds file their complete schedule of portfolio holdings with the SEC for the first and third quarters of each fiscal year on Form N-Q. The Funds’ Forms N-Q will be available on the SEC’s website at http://www.sec.gov and may be reviewed and copied at the SEC’s Public Reference Room in Washington, D.C. Information on the operation of the Public Reference Room may be obtained by calling 1.800.SEC.0330.
ADDITIONAL INFORMATION (UNAUDITED) - continued
December 31, 2012
Information about the trustees and officers* of the Funds is set forth in the following table. The Statement of Additional Information (the “SAI”) includes additional information about the Funds’ trustees and officers and is available free of charge, upon request, by calling 1.888.884.2675.
| NAME, YEAR OF BIRTH, POSITION(S) HELD WITH FUNDS AND ADDRESS | TERM OF OFFICE AND LENGTH OF TIME SERVED | PRINCIPAL OCCUPATION(S) DURING PAST FIVE YEARS | NUMBER OF FUNDS IN FUND COMPLEX OVERSEEN BY TRUSTEE | OTHER TRUSTEESHIPS HELD BY TRUSTEES |
| DISINTERESTED TRUSTEES |
Greg Burglin (1960) TRUSTEE 150 Almaden Blvd. Suite 1250 San Jose, CA 95113 | SINCE 2008 | Mr. Burglin is a Tax Consultant and has been for more than 5 years. | THREE | ONE3 |
Rodney Yee (1960) TRUSTEE 150 Almaden Blvd. Suite 1250 San Jose, CA 95113 | SINCE 2010 | Mr. Yee is COO, CFO, and Treasurer of ASA Gold and Precious Metals Limited (formerly called ASA Limited, a Bermuda based SEC registered closed-end fund traded on the NYSE) from August 2010 to Present, Mr. Yee was COO and CCO of CCM Partners (an SEC registered investment adviser) from November 2005 to August 2010. | THREE | ONE3 |
| INTERESTED TRUSTEE |
Kevin M. Landis2 (1961) TRUSTEE/PRESIDENT/ SECRETARY 150 Almaden Blvd. Suite 1250 San Jose, CA 95113 | SINCE 1994 | Mr. Landis is President and Chief Executive Officer of Firsthand Capital Management (prior to January 1, 2012, called SiVest Group, Inc.) and has been a portfolio manager with FCM since August 2009. He was President and Chief Investment Officer and a Director of Firsthand Capital Management, Inc.(a similarly named investment adviser) and was a portfolio manager with Firsthand Capital Management, Inc. from may 1994 to August 2009. | THREE | ONE3,4 |
ADDITIONAL INFORMATION (UNAUDITED) - continued
December 31, 2012
| NAME, YEAR OF BIRTH, POSITION(S) HELD WITH FUNDS AND ADDRESS | TERM OF OFFICE AND LENGTH OF TIME SERVED | PRINCIPAL OCCUPATION(S) DURING PAST FIVE YEARS | NUMBER OF FUNDS IN FUND COMPLEX OVERSEEN BY TRUSTEE | OTHER TRUSTEESHIPS HELD BY TRUSTEES |
| OFFICERS WHO ARE NOT TRUSTEES |
Ellen Blanchard(1973) ASSISTANT SECRETARY One Boston Place 201 Washington Street 34th Floor Boston, MA 02108 | SINCE 2010 | Ms. Blanchard is Counsel and Vice President of BNY Mellon Investment Servicing (US) Inc. formerly, PNC Global Investment Servicing (U.S.) Inc. since 2010. She was Vice President and Counsel, Compliance Advisory Services, State Street Bank & Trust, from 2004 to 2010. | N/A | N/A |
Nicholas P. Petredis (1951) CHIEF COMPLIANCE OFFICER 150 Almaden Blvd. Suite 1250 San Jose, CA 95113 | SINCE 2008 | Mr. Petredis has been a principal of Petredis Law Offices from 1993 to present. He was Managing Director and Senior Counsel of Firsthand Capital Management, Inc. from 2000 to 2001. | N/A | N/A |
Omar Billawala (1961) TREASURER 150 Almaden Blvd. Suite 1250 San Jose, CA 95113 | SINCE 2011 | Mr. Billawala has been the Chief Operating Officer of Firsthand Capital Management, Inc. since 2011. From 2009 to 2011, he was the President of a similarly named company (Firsthand Capital Management, Inc.) (“old FCM”). From 1999 to 2009 he was the Chief Operating Officer of the old FCM. | N/A | N/A |
| * | The term “officer” means the president, vice president, secretary, treasurer, chief compliance officer, controller, or any other officer who performs policy-making functions. |
| (1) | Each trustee shall serve for the lifetime of Firsthand Funds or until he dies, resigns, or is removed. Each officer shall serve a one-year term subject to annual reappointment by the trustees. |
| (2) | Mr. Landis is an interested person of the Funds by reason of his position with the Investment Adviser. |
| (3) | Each Trustee is also a director of Firsthand Technology Value Fund, Inc., a Maryland corporation that is a closed-end fund also advised by the Investment Adviser. |
| (4) | Mr. Landis also currently sits on the board of directors for three private companies: Silicon Genesis Corp., Pivotal Systems Corp., and QMAT, Inc. |
NOTES
NOTES
FIRSTHAND FUNDS
P.O. Box 9836
Providence, RI 02940-8036
www.firsthandfunds.com
INVESTMENT ADVISER
Firsthand Capital Management, Inc.
150 Almaden Blvd., Suite 1250
San Jose, CA 95113
www.firsthandcapital.com
DISTRIBUTOR
ALPS Distributors, Inc.
1290 Broadway
Suite 1100
Denver, CO 80203
TRANSFER AGENT
BNY Mellon Investment Servicing (US) Inc.
4400 Computer Drive
Westborough, MA 01581
1.888.884.2675
This report is provided for the general information of the shareholders of Firsthand Funds. This report is not intended for distribution to prospective investors in the Funds, unless preceded or accompanied by an effective prospectus. For more complete information about Firsthand Funds, please call toll free 1.888.884.2675 or visit www.firsthandfunds.com for a prospectus, which contains more information, including risks, fees, and expenses. Read the prospectus carefully before investing or sending money.
Firsthand Funds are distributed by ALPS Distributors, Inc.
FHF000623, exp. 3/31/2014
The interlocking “F” design is a registered trademark of Firsthand Capital Management, Inc.
Item 2. Code of Ethics.
Item 3. Audit Committee Financial Expert.
Registrant’s Board of Trustees has determined that it has one board member who is an “audit committee financial expert”, namely Rodney Yee. Mr. Yee is an “independent” trustee of the Board.
Item 4. Principal Accountant Fees and Services.
The registrant's Audit Committee Charter states the following with respect to pre-approval procedures:
The Committee hereby delegates to the Chairman of the Committee the authority to grant pre-approvals of audit and "permissible" non-audit services to be provided by the Auditors to the Funds, subject to the ratification of the full Committee at its next regularly scheduled meeting. Both the Auditors and Fund counsel will be responsible for informing the Committee whether they believe that a particular non-audit service is permissible or prohibited pursuant to applicable regulations and standards.
The specific types of non-audit services that the Chairman may pre-approve include, but are not limited to: reviewing the Funds' internal controls over financial reporting; providing tax-related services; reviewing and/or developing an anti-money laundering program; and issuing comfort letters, based on agreed-upon procedures, in connection with any Fund reorganization.
Pre-approval for a non-audit service provided to a Fund is not required if: (i) the aggregate amount of all such non-audit services provided to the Fund constitutes not more than 5% of the total amount of revenues paid by the Fund to the Auditors during the fiscal year in which the non-audit services are provided; (ii) such services were not recognized by the Fund at the time of the engagement to be non-audit services; and (iii) such services are promptly brought to the attention of the Committee and are approved by the Committee or by one or more members of the Committee to whom authority to grant such approvals has been delegated by the Committee prior to the completion of the audit (the "De Minimus Exceptions").
The Committee shall also pre-approve any non-audit services proposed to be provided by the Auditors to (i) a Fund's investment adviser and (ii) any entity controlling, controlled by, or under common control with the investment adviser that provides ongoing services to the Fund, if the Auditors' engagement with the investment adviser or any such control persons relates directly to the operations and financial reporting of the Fund. The De Minimus Exceptions applies to pre-approvals under this paragraph as well, except that the "total amount of revenues" calculation is based on the total amount of revenues paid to the Auditors by the Fund and any other entity that has its services approved under this paragraph (i.e., the investment adviser or any control person).
Item 5. Audit Committee of Listed registrants.
Not applicable.
Item 6. Investments.
Not applicable.
Item 8. Portfolio Managers of Closed-End Management Investment Companies.
Not applicable.
Not applicable.
Item 10. Submission of Matters to a Vote of Security Holders.
Not applicable.
Item 11. Controls and Procedures.
Item 12. Exhibits.
Pursuant to the requirements of the Securities Exchange Act of 1934 and the Investment Company Act of 1940, the registrant has duly caused this report to be signed on its behalf by the undersigned, thereunto duly authorized.
Pursuant to the requirements of the Securities Exchange Act of 1934 and the Investment Company Act of 1940, this report has been signed below by the following persons on behalf of the registrant and in the capacities and on the dates indicated.