UNITED STATES
SECURITIES AND EXCHANGE COMMISSION
Washington, D.C. 20549
FORM N-CSR
CERTIFIED SHAREHOLDER REPORT OF REGISTERED MANAGEMENT INVESTMENT COMPANIES
| Investment Company Act file number | 811-08268 | |
Firsthand Funds
(Exact name of registrant as specified in charter)
150 Almaden Blvd., Suite 1250
San Jose, CA 95113
(Address of principal executive offices) (Zip code)
Firsthand Capital Management, Incorporated
150 Almaden Blvd., Suite 1250
San Jose, CA 95113
(Name and address of agent for service)
Registrant's telephone number, including area code: (408) 866-7096
Date of fiscal year end: December 31
Date of reporting period: December 31, 2015
Form N-CSR is to be used by management investment companies to file reports with the Commission not later than 10 days after the transmission to stockholders of any report that is required to be transmitted to stockholders under Rule 30e-1 under the Investment Company Act of 1940 (17 CFR 270.30e-1). The Commission may use the information provided on Form N-CSR in its regulatory, disclosure review, inspection, and policymaking roles.
A registrant is required to disclose the information specified by Form N-CSR, and the Commission will make this information public. A registrant is not required to respond to the collection of information contained in Form N-CSR unless the Form displays a currently valid Office of Management and Budget ("OMB") control number. Please direct comments concerning the accuracy of the information collection burden estimate and any suggestions for reducing the burden to Secretary, Securities and Exchange Commission, 100 F Street, NE, Washington, DC 20549. The OMB has reviewed this collection of information under the clearance requirements of 44 U.S.C. § 3507.
Item 1. Reports to Stockholders.
The Report to Shareholders is attached herewith.
| CONTENTS | |
| | |
| Performance Summary | 2 |
| President’s Letter | 4 |
| Shareholder Fee Example | 6 |
| Performance and Portfolio Discussion | 8 |
| Audit Letter | 14 |
| Portfolio of Investments | 15 |
| Statements of Assets and Liabilities | 19 |
| Statements of Operations | 20 |
| Statements of Changes in Net Assets | 21 |
| Financial Highlights | 23 |
| Notes to Financial Statements | 25 |
| Additional Information | 38 |
| PERFORMANCE SUMMARY | | | | | |
| Period Returns (Average Annual Total Returns as of 12/31/15) | | | | | |
| FUND | 1-YEAR | 3-YEAR | 5-YEAR | 10-YEAR | GROSS
EXPENSE
RATIO* |
| Firsthand Technology Opportunities Fund | 4.28% | 14.53% | 9.36% | 10.78% | 1.86% |
| Firsthand Alternative Energy Fund | -9.75% | 20.40% | -4.32% | ● | 2.11% |
| NASDAQ Composite Index | 7.11% | 19.89% | 15.01% | 9.78% | ● |
| S&P 500 Index | 1.37% | 15.11% | 12.54% | 7.29% | ● |
| WilderHill Clean Energy Index | -10.36% | 5.69% | -13.54% | ● | ● |
| * | After fee waivers, Firsthand Technology Opportunities fund’s total net operating expenses are 1.85% and Firsthand Alternative energy Fund’s total net operating expenses are 1.98%. Please see the Fund’s prospectus for more information about fund expenses. |
Returns assume reinvestment of all dividends and distributions but do not reflect the impact of taxes. The performance data quoted represent past performance. Past performance cannot guarantee future results, and current performance may be lower or higher than the performance quoted. Both the return from and the principal value of an investment in the Funds will fluctuate so that an investor’s shares, when redeemed, may be worth more or less than their original cost. To obtain performance as of the most recent month-end, please contact Firsthand Funds by calling 1.888.884.2675 or go to www.firsthandfunds.com.
The Nasdaq Composite Index (NASDAQ) is a capitalization-weighted index of all common stocks listed with NASDAQ. The Standard & Poor’s 500 Index (S&P 500) is a market-weighted index of 500 stocks of well-established companies. Each index represents an unmanaged, broad-based basket of stocks. These indices are typically used as benchmarks for overall market performance. The WilderHill Clean Energy Index is a market-weighted index of 58 companies in the cleaner fuel, energy conversion, energy storage, greener utilities, power delivery and conservation, and renewable energy harvesting sectors. The Dow Jones Industrial Average is a price-weighted average of 30 significant stocks traded on the New York Stock Exchange and the NASDAQ. You cannot invest directly in an index.
Returns Since Inception (Average Annual Total Returns as of 12/31/15)
| FUND (INCEPTION DATE) | AVERAGE ANNUAL TOTAL RETURNS | NASDAQ COMPOSITE INDEX | S&P 500 INDEX | WILDERHILL CLEAN ENERGY INDEX |
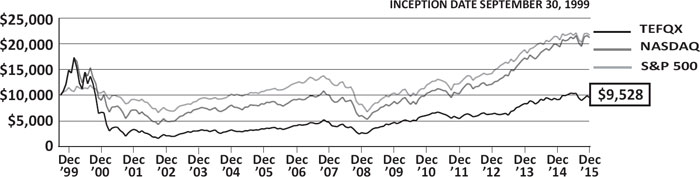
| Firsthand Technology Opportunities Fund (9/30/99) | -0.30% | 4.73% | 4.88% | ● |
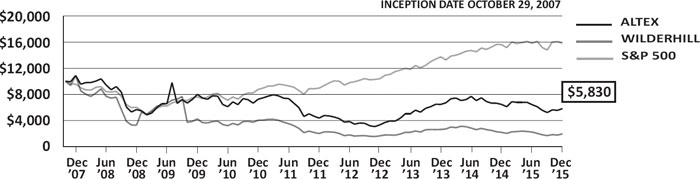
| Firsthand Alternative Energy Fund (10/29/07) | -6.39% | 8.56% | 5.79% | -18.08% |
Each Fund may invest in small-capitalization companies and Initial Public Offerings (“IPOs”). These investments will be more volatile than investments in large-capitalization companies and loss of principal could be greater. The Funds may invest in foreign securities, which will be subject to greater risks than investing in domestic securities. Because the Funds are not diversified, they can take larger positions in fewer companies, increasing their risk profile. The Funds invest in several industries within the technology sector and the relative weightings of these industries in a Fund’s portfolio may change at any time.
Holdings by Industry - % of Net Assets (as of 12/31/15)
| INDUSTRY | FIRSTHAND TECHNOLOGY OPPORTUNITIES FUND | FIRSTHAND ALTERNATIVE ENERGY FUND |
| Advanced Materials | ● | 6.4% |
| Advertising Technology | 2.2% | ● |
| Building Automation | ● | 3.9% |
| Communications | 6.1% | ● |
| Communications Equipment | 5.1% | ● |
| Computer | 5.8% | ● |
| Electrical Equipment | ● | 4.3% |
| Energy Efficiency | ● | 8.1% |
| Engineering Service | ● | 2.8% |
| Environmental Services | ● | 0.7% |
| Industrials | ● | 5.7% |
| Intellectual Property | ● | 0.1% |
| Internet | 30.2% | ● |
| Materials | ● | 2.5% |
| Networking | 8.9% | ● |
| Other Electronics | 0.8% | 10.4% |
| Renewable Energy | ● | 38.4% |
| Semiconductor Equipment | 6.6% | ● |
| Semiconductors | 14.1% | 8.2% |
| Social Networking | 9.0% | ● |
| Software | 10.5% | ● |
| Waste & Environment Service | ● | 2.1% |
| Net Other Assets and Liabilities | 0.7% | 6.4% |
Portfolio holdings are subject to change.
PRESIDENT’S LETTER
Fellow Shareholders,
The NASDAQ Composite Index reached an all-time high on July 20, 2015, more than 15 years after last peaking above 5,000 in March 2000. This was, however, one of the few highlights for the stock market in an otherwise lackluster year. The S&P 500 Index gained just 1.37% in 2015 and the NASDAQ Composite Index rose 7.11%, compared to the double-digit gains for both in 2014. For much of the year, macroeconomic events took center stage, as investors concerned themselves with falling oil prices, slowing growth in China, and the Federal Reserve’s interest rate decisions in the United States.
Six months ago, in the Funds’ Semi-Annual Report to Shareholders, we noted that 2015 had thus far been a “stock-pickers’ market,” marked by a dispersion of performance among individual stocks. This trend held throughout the year and had an impact on the performance of our funds. While both funds had their share of outperforming stocks, each fund was also hurt by holdings in a handful of large underperformers. Although Firsthand Alternative Energy Fund slightly outperformed its benchmark, it still declined -9.75% in 2015, versus a loss of -10.36% for the Wilder-Hill Clean Energy Index. Firsthand Technology Opportunities Fund finished up 4.28% for the year, beating the S&P 500 but falling short of its primary benchmark, the NASDAQ Composite.
Large, mature players dominated the tech investing landscape in 2015. In fact, a new acronym was coined to highlight the market leaders—FANG (Facebook, Amazon, Netflix, Google). A year ago, Apple was the big contributor to Firsthand Technology Opportunities Fund performance. But 2015 was comparatively lackluster for the tech giant, with shares down -3.02% (the first year of negative performance for Apple since 2008). But the top performers for Firsthand Technology Opportunities Fund were two heavyweights: Netflix (NFLX) and Amazon (AMZN), which were also the #1 and #2 gainers for the S&P 500 in 2015, with shares up 134.39% and 117.78%, respectively. Amazon continues its rapid expansion, adding to its product lineup with Fire TV, Echo, and Prime Now, as well as original content for its streaming service. Amazon’s cloud division, Amazon Web Services, saw a 69.68% year-over-year growth in net sales and contributed to Amazon’s success in 2015. Cord cutting remains a big trend and Netflix remains a primary beneficiary of consumers’ moves away from cable and toward streaming content. The company continues to expand its streaming business domestically and its growth is explosive internationally—up 182.23% in the past two years. While we were rewarded for holding these leading companies, several of our investments beyond this handful of big winners struggled in 2015.
The semiconductor industry is bearing the brunt of slowing growth in the personal computer, tablet, and smartphone markets. Consolidation in the chip market was a big story in 2015, with $78 billion worth of mergers and acquisitions during the year. Nonetheless, chip makers were a drag on Firsthand Technology Opportunities Fund performance in the second half of the year, with Qualcomm (QCOM) in particular taking a heavy toll in 2015. A couple of our other semiconductor investments, including InvenSense (INVN) and Exar (EXAR), struggled during the year as well, falling 37.08% and 39.90%, respectively. Despite the slide, we maintain a bullish long-term outlook for the semiconductor industry and hope to benefit from the continuing consolidation.
Our play on the popularity of cameras like those from GoPro (GPRO) was to invest in some of the underlying technologies, namely Ambarella (AMBA), which makes the high-definition chips used in the cameras. Ambarella had a strong first half (up 102.46%) but struggled in Q3 and Q4 as GoPro sales dragged and investor sentiment declined. Although Ambarella still outperformed GoPro for the full year (Ambarella finished 2015 up 9.90%, while GoPro was down 71.51%), it declined 45.72% in the second half.
The advertising technology (“adtech”) space was also a significant detractor from performance for Firsthand Technology Opportunities Fund in 2015, as we saw a major correction in the industry this year. Adtech companies—like portfolio holding RocketFuel (FUEL)—derive revenues by acting as a middleman between online advertisers and the websites that host the ads. Their software automates the buying and selling of online ad space and they get a fee for the service. There has been tremendous change in this young segment of the advertising market. One particular trend that has been playing out quickly over the past 18 months is the shift in digital ad buying away from agency trading desks and toward brands managing this component of the marketing mix directly. Many adtech firms have been caught in that transition and have had to make significant changes as their customer mix is in the midst of an upheaval.
Social networking was something of a mixed bag for the Fund, with Tencent Holdings (no U.S. symbol) and Facebook (FB) both contributing positively to performance, while Twitter (TWTR) was a detractor. Twitter has struggled to grow its monthly active user (MAU) base over the past several quarters. The company’s MAU grew 30.27% in 2013, 19.50% in 2014, and just 5.90% in 2015.
For Firsthand Alternative Energy Fund, the second half of the year was more frustrating than the first. Solar stocks remain extremely volatile, and falling energy prices are creating unique challenges in the alternative energy space. The price for a barrel of crude oil declined 30.5% in 2015, ending the year at $37.13 per barrel. Falling oil and gas prices take the luster off solar for many investors. In addition, pending changes in state regulations, particularly in Nevada and California, exacerbated the price volatility among solar stocks. Finally, companies such as SolarCity (SCTY) and SunEdison (SUNE) are relying heavily on debt financing to meet new demand, which makes rising interest rates troublesome. SunEdison ended the year down 73.91% and was the leading detractor from performance for Firsthand Alternative Energy Fund.
Looking forward, it’s not difficult to envision continued economic growth and continued increasing demand for energy, and we believe the long-term trend of rising prices for electricity is still intact. Renewable energy companies will continue to take advantage of tax credits as well. In December, Congress voted to extend the solar tax credit, which gave a late-year boost to Fund holdings First Solar (FSLR) and SunPower (SPWR), which finished the year up 47.96% and 16.18%, respectively. The move by Congress included tax credit extensions for wind power as well, which helped Vestas (VSWYF), another top Fund contributor, finish the year up 95.20%.
Against a backdrop of uncertainty in global macroeconomic conditions (China, oil, interest rates, etc.), we believe 2016 could be another challenging time for the stock market. As a relatively risky asset class, tech stocks tend to be more volatile than the broad market and that fact informs our portfolio construction, as we remain heavily focused on large-cap tech stocks. From where we sit, the U.S. economy appears to be on solid footing, and we are cautiously optimistic as we head into Spring.
Thank you for your continued investment in Firsthand Funds.
 | |
| Kevin Landis | |
| President, Firsthand Funds | |
SHAREHOLDER FEE EXAMPLE (UNAUDITED)
Example — In general, mutual fund shareholders may incur two types of costs: (1) transaction costs, including sales charges (loads), redemption fees, and exchange fees; and (2) ongoing costs, including management fees, 12b-1 distribution and service fees, non-12b-1 service fees, and other Fund expenses. This example is intended to help you understand your ongoing costs (in dollars) of investing in a Fund and to compare these costs with the ongoing costs of investing in other mutual funds. Note that Firsthand Funds (“Trust”) does not charge transaction fees for 12b-1 distribution and service fees, though you may incur transaction fees if you purchase shares through a broker.
The example on the following page is based on an investment of $1,000 invested at the beginning of the period and held for the entire period from July 1, 2015 through December 31, 2015.
Actual Expenses — The section of the table at right entitled “Actual” provides information about actual account values and actual expenses. You may use this information, together with the amount you invested, to estimate the expenses that you paid over the period. Simply divide your account value by $1,000 (for example, an $8,600 account value divided by $1,000 = 8.6), then multiply the result by the number in the section entitled “Actual” under the heading “Expenses Paid During Period” to estimate the expenses you paid on your account during this period. If your account is an IRA or other tax-qualified savings plan, your expenses may also have included a $10 annual fee. In either case, the amount of any fee paid through your account would increase the estimate of expenses you paid during the period and decrease your ending account value.
Hypothetical Example for Comparison Purposes — The section of the table at right entitled “Hypothetical” provides information about hypothetical account values and hypothetical expenses based on a Fund’s actual expense ratio and an assumed rate of return of 5% per year before expenses, which is not the Fund’s actual return. The hypothetical account values and expenses may not be used to estimate your actual ending account balance or the expenses you paid for the period. However, you may use this information to compare the ongoing costs of investing in the Trust to other funds. To do so, compare this 5% hypothetical example with the 5% hypothetical examples that appear in the shareholder reports of the other funds. As in the case of the actual expense example, if your account is subject to an IRA fee, the amount of the fee paid through your account would increase the hypothetical expenses you would have paid during the period and decrease the hypothetical ending account value.
Please note that the expenses shown in the table at right are meant to highlight your ongoing costs only and do not reflect any transactional costs, such as sales charges (loads), redemption fees, or exchange fees. Therefore, the table is useful in comparing ongoing costs only, and will not help you determine the relative total costs of owning different funds. In addition, if these transactional costs were included, your costs would have been higher. The examples also assume all dividends and distributions have been reinvested.
SHAREHOLDER FEE EXAMPLE (UNAUDITED) - continued
Firsthand Technology Opportunities Fund
| | BEGINNING ACCOUNT VALUE 7/1/15 | ENDING ACCOUNT VALUE 12/31/15 | EXPENSES PAID DURING PERIOD* 7/1/15 - 12/31/15 | ANNUALIZED EXPENSE RATIO |
| Actual | $1,000 | $922.70 | $8.97 | 1.85% |
Hypothetical** | $1,000 | $1,015.88 | $9.40 | 1.85% |
Firsthand Alternative Energy Fund
| | BEGINNING ACCOUNT VALUE 7/1/15 | ENDING ACCOUNT VALUE 12/31/15 | EXPENSES PAID DURING PERIOD* 7/1/15 - 12/31/15 | ANNUALIZED EXPENSE RATIO |
| Actual | $1,000 | $906.70 | $9.52 | 1.98% |
Hypothetical** | $1,000 | $1,015.22 | $10.06 | 1.98% |
| * | Expenses are calculated by multiplying the Fund’s annualized expense ratio listed above by the average account value over the period and multiplying that number by 184/365 (to reflect the one-half year period). |
| ** | 5% return per year before expenses. |
| The expenses shown in the table do not reflect any fees that may be charged to you by brokers, financial intermediaries, or other financial institutions. |
FIRSTHAND TECHNOLOGY OPPORTUNITIES FUND
Performance and Portfolio Discussion
How did the Fund perform in 2015?
Firsthand Technology Opportunities Fund (TEFQX) posted a gain of 4.28% versus a 7.11% gain for the NASDAQ Composite Index and a 1.37% gain for the S&P 500 Index. For the six months ended December 31, 2015, Firsthand Technology Opportunities Fund declined -7.73% compared to gains of 1.05% and 0.14% for the NASDAQ Composite Index and the S&P 500 Index, respectively.
Which industries had the greatest impact on the Fund’s performance?
For the period ended December 31, 2015, the Internet industry represented the portfolio’s largest weighting, followed by holdings in the semiconductors and software industries. The portfolio’s exposure to the advertising technology and and communications equipment industries contributed most to the Fund’s underperformance versus its primary benchmark in 2015.
Which individual holdings were the largest contributors to the Fund’s performance?
Online retail giant Amazon (AMZN) was the Fund’s top contributor to performance in 2015, up 117.78% for the annual period. Amazon saw significant sales growth throughout the year, especially in its electronics category. Additionally, the company has been expanding its Prime service by offering same-day delivery and is also continuing to add original content for television. The success of its cloud service, Amazon Web Services (AWS), also helped performance during the period, with net sales from the AWS segment up 69.68% year-over-year in 2015.
Streaming entertainment and DVD rental service Netflix (NFLX) was another top contributor to Fund performance in 2015, finishing the year up 134.39%. Total streaming subscribers increased 30.04% year-over-year as of December 31, 2015, thanks in part to the expansion of its original content offerings, which include popular shows such as House of Cards and Orange Is the New Black. Netflix expanded to more than 130 countries in 2015.
Data center service provider Equinix (EQIX) was a solid performer during the year, as demand for data center services continues to rise. The company began operating as a real estate investment trust (REIT) in 2015, a structure that offers substantial tax savings and also means Equinix will offer regular distributors to its investors. Equinix shares ended the year higher by 42.31%.
Tencent Holdings (no U.S. symbol) was also a top contributor, up 35.64% for the year. China’s largest Internet company bought out the remaining equity of U.S. video game publisher Riot Games that it did not already own. Its ownership of Riot Games is complemented by its 40% ownership of Epic Games, a U.S.-based developer of the Unreal series of games and the Gears of War series for the Xbox 360 and Xbox One. More than 10% of Tencent’s earnings come from online gaming revenue. Tencent also operates online messaging apps WeChat and QQ, which together boast roughly 1.5 billion monthly active users.
FIRSTHAND TECHNOLOGY OPPORTUNITIES FUND - continued
Performance and Portfolio Discussion
Firewall heavyweight Palo Alto Networks (PANW) rounds out the top five positive contributors, up 43.71% for the period. The company continues to expand its customer base with its best-in-class firewall products and has outpaced market growth in the security appliance space since 2013. In the second half of 2015, Palo Alto Networks edged out competitors CheckPoint (CHKP) and Cisco (CSCO) for some large deals, continuing its ongoing market share gains.
Which holdings were the greatest detractors from the Fund’s performance?
Programmatic advertising technology firm Rocket Fuel (FUEL) was the largest detractor from Fund performance for the period, down 78.35%. The company reported losses for all four quarters of 2015 as it continues to invest heavily in marketing, sales, and research and development. In April, Rocket Fuel announced an 11% layoff in an effort to cut costs. Adtech was hit hard in 2015 by investor concerns over the industry’s ability to sustain growth, ad-blocking technology, and data privacy issues.
Qualcomm (QCOM) suffered from declining sales and increased competition in 2015, which led to a 30.64% decline in the price of the company’s shares during the year. In February the company announced a $975 million settlement with Chinese regulators who alleged the company engages in monopolistic practices. Throughout the year, Qualcomm also faced delays in signing royalty agreements with Chinese manufacturers.
InvenSense (INVN), which makes motion-control chips for consumer electronic devices, was also a detractor from Fund performance during 2015, down 37.08%. The company is a leader in micro electro-mechanical systems (MEMS) sensors, which are found in devices like gyroscopes and compasses as well as smartphones, like the iPhone 6s. The company stumbled in 2015 in part because of pricing pressure from Apple and Samsung.
Social networking giant Twitter (TWTR) was hit hard in 2015 by lackluster earnings reports and weak user growth and ended the year down 35.49%. In an effort to aid ad performance measurement, the company announced a partnership with DoubleClick—Google’s digital ad bid manager—in April. Twitter co-founder Jack Dorsey returned as CEO in mid October (he had been acting as interim CEO since July) and announced the first large layoff in Twitter’s history as well as a variety of cost-cutting measures in an attempt to spark user growth.
Also detracting from Fund performance was Exar Corp. (EXAR), which was down 39.90% for the period. The company designs analog and mixed-signal chips for industrial and infrastructure markets and reported quarterly losses throughout the year. Shares took their biggest hit in the second half of the year, on the heels of another earnings miss and the resignation of its CEO, which tempered hopes for a buyout.
Fund Performance and Holdings Information (as of 12/31/15)
Firsthand Technology Opportunities Fund vs. Market Indices
| | FIRSTHAND TECHNOLOGY OPPORTUNITIES FUND | NASDAQ COMPOSITE INDEX | S&P 500 INDEX |
| Since Inception (9/30/99) | -0.30% | 4.73% | 4.88% |
| 10-Year | 10.78% | 9.78% | 7.29% |
| 5-Year | 9.36% | 15.01% | 12.54% |
| 3-Year | 14.53% | 19.89% | 15.11% |
| 1-Year | 4.28% | 7.11% | 1.37% |
Growth of a Hypothetical $10,000 Investment
Returns assume reinvestment of all dividends and distributions but do not reflect the impact of taxes. The performance data quoted represent past performance. Past performance cannot guarantee future results, and current performance may be lower or higher than the performance quoted. Both the return from and the principal value of an investment in the Fund will fluctuate so that an investor’s shares, when redeemed, may be worth more or less than their original cost. To obtain performance as of the most recent month-end, please contact Firsthand Funds by calling 1.888.884.2675 or go to www.firsthandfunds.com.
| Holdings by Industry* | % Net Assets |
| Internet | 30.2% |
| Semiconductors | 14.1% |
| Software | 10.5% |
| Social Networking | 9.0% |
| Networking | 8.9% |
| Semiconductor Equipment | 6.6% |
| Communications | 6.1% |
| Computer | 5.8% |
| Communications Equipment | 5.1% |
| Advertising Technology | 2.2% |
| Other Electronics | 0.8% |
| Net Other Assets and Liabilities | 0.7% |
| Top 10 Holdings** | % Net Assets |
| Facebook, Inc. | 6.0% |
| Apple, Inc. | 5.8% |
| Arista Networks, Inc. | 5.6% |
| Tencent Holdings, Ltd. | 5.0% |
| LAM Research Corp. | 4.9% |
| Alphabet, Inc. | 4.3% |
| Equinix, Inc. | 4.3% |
| Adobe Systems, Inc. | 4.0% |
| Netflix, Inc. | 3.8% |
| Skyworks Solutions, Inc. | 3.7% |
| * | Based on percentage of net assets as of 12/31/15. **Top 10 stock holdings total 47.4% of net assets. These holdings are current as of 12/31/15, and may not be representative of current or future investments. |
FIRSTHAND ALTERNATIVE ENERGY FUND
Performance and Portfolio Discussion
How did the Fund perform in 2015?
Firsthand Alternative Energy Fund (ALTEX) posted a 9.75% loss versus a loss of 10.36% for the WilderHill Clean Energy Index and a 1.37% gain for the S&P 500 Index. For the six months ended December 31, 2015, Firsthand Alternative Energy Fund was down 9.33% compared to a 12.49% loss for the WilderHill Clean Energy Index and a gain of 0.14% for the S&P 500 Index.
Which industries had the greatest impact on the Fund’s performance?
For the period ended December 31, 2015, the Renewable Energy industry represented the portfolio’s largest weighting, followed by holdings in the Other Electronics and Semiconductors industries. The portfolio’s exposure to the Renewable Energy industry contributed most to the Fund’s modest outperformance versus its primary benchmark in 2015.
Which individual holdings were the largest contributors to the Fund’s performance?
First Solar (FSLR) was the top contributor to Fund performance for the year, up 47.96%. Shares of the solar module and power system provider rose early in the year on news of a deal with Apple (AAPL). Under the agreement, the technology giant will invest $848 million in a solar farm being constructed by First Solar that will supply clean power to Apple under a 25-year power purchase agreement (PPA). During the year, First Solar and SunPower (SPWR) also launched a joint Yieldco, which is an investment vehicle that owns operating assets (in this case solar energy generation projects) that yield predictable cash flows. The joint venture, called 8point3 Energy Partners (CAFD), raised $420 million in its June initial public offering.
SunPower (SPWR) was the next largest contributor for the annual period. While the solar system provider was down nearly 30% in the third quarter following lower component sales and installations, shares got a lift in December when Congress voted to extend solar tax credits at the current 30% rate through 2019 and at decreasing percentages through 2022. SunPower finished Q4 up 49.75% and closed out the year with a 16.18% gain.
The spending and tax package unveiled by Congress in December also included extensions on tax credits for wind power, which helped portfolio holding Vestas (VSWYF) finish the year up 95.20%. Vestas was a top contributor to the Fund throughout the year, with record orders thanks to surging demand—wind power installations world-wide were up 30% from 2014. Additionally, in December, The Paris Agreement, a global climate initiative, was signed by nearly 200 nations pledging to limit greenhouse gas emissions, which could benefit renewable energy companies heading into 2016.
FIRSTHAND ALTERNATIVE ENERGY FUND - continued
Performance and Portfolio Discussion
Photovoltaics company Jinko Solar (JKS) and wind energy giant Gamesa (no U.S. symbol) round out the top five contributors for 2015. Jinko finished the year up 40.39%, while Gamesa was up 87.96%. Like First Solar and SunPower, both companies stand to benefit from the U.S. Congressional solar tax credit extension. Jinko also signed a supply deal with Vivint Solar (VSLR) in June and is well-positioned to benefit from the Chinese government’s new target of 150 gigawatts (GW) of solar installation by 2020. Gamesa turned in a solid performance in 2015, with profits doubling in the first half of the year on a 30% jump in revenue thanks to expanding sales.
Which holdings were the greatest detractors from the Fund’s performance?
The largest detractor from Fund performance for 2015 was the global renewable energy company SunEdison (SUNE), which deploys solar energy systems. The company had a solid first quarter, reporting record-breaking installations in Q1 and acquiring utility company First Wind. But SunEdison reported disappointing results in Q2 and Q3, while at the same time increasing its debt, which left investors concerned about its ability to continue expansion. Additionally, the performance of TerraForm Global (GLBL), a Yieldco that was spun out of SunEdison, has been poor since its inception in August. The Fund sold part of its SunEdison holdings in the first half of the year, avoiding some of the downturn as SunEdison finished 2015 lower by 73.91%.
Refined coal technologies company Advanced Emissions Solutions (ADES) was another negative performer, finishing the year down 68.67%. Shares tumbled in late January when the company’s accounting firm resigned, and Advanced Emissions’ stock was delisted on February 3 by the Nasdaq, pending required financial filings. The company was also negatively affected by a June Supreme Court ruling that told the Environmental Protection Agency to reconsider the Mercury Air Toxics Rule (MATS), which could delay the implementation of Advanced Emissions’ MATS compliance products in some states.
Quanta Services (PWR) also had a negative impact on Fund performance, finishing the year down 28.67%. Quanta provides infrastructure contracting services including construction, maintenance, and technology services for electric power, cable, telecommunications, and gas pipeline industries. The company was plagued by a series of earnings misses and lowered guidance, which it blames on delays in large transmission projects, which forced a shift to lower-margin smaller transmission work.
Also detracting from Fund performance was Exar Corp. (EXAR), down 39.90% for the period. The company designs analog and mixed-signal chips for industrial and infrastructure markets and reported quarterly losses throughout the year. Shares took their biggest hit in the second half of the year, on the heels of another earnings miss and the resignation of its CEO, which tempered hopes for a buyout.
Fund Performance and Holdings Information (as of 12/31/15)
Firsthand Alternative Energy Fund vs. Market Indices
| | FIRSTHAND ALTERNATIVE ENERGY FUND | WILDERHILL CLEAN ENERGY INDEX | S&P 500 INDEX |
| Since Inception (10/29/07) | -6.39% | -18.08% | 5.79% |
| 5-Year | -4.32% | -13.54% | 12.54% |
| 3-Year | 20.40% | 5.69% | 15.11% |
| 1-Year | -9.75% | -10.36% | 1.37% |
Growth of a Hypothetical $10,000 Investment
Returns assume reinvestment of all dividends and distributions but do not reflect the impact of taxes. The performance data quoted represent past performance. Past performance cannot guarantee future results, and current performance may be lower or higher than the performance quoted. Both the return from and the principal value of an investment in the Fund will fluctuate so that an investor’s shares, when redeemed, may be worth more or less than their original cost. To obtain performance as of the most recent month-end, please contact Firsthand Funds by calling 1.888.884.2675 or go to www.firsthandfunds.com.
| Holdings by Industry* | % Net Assets |
| Renewable Energy | 38.4% |
| Other Electronics | 10.4% |
| Semiconductors | 8.2% |
| Energy Efficiency | 8.1% |
| Advanced Materials | 6.4% |
| Industrials | 5.7% |
| Electrical Equipment | 4.3% |
| Building Automation | 3.9% |
| Engineering Service | 2.8% |
| Materials | 2.5% |
| Waste & Environment Service | 2.1% |
| Environmental Services | 0.7% |
| Intellectual Property | 0.1% |
| Net Other Assets and Liabilities | 6.4% |
| Top 10 Holdings** | % Net Assets |
| First Solar, Inc. | 9.0% |
| SunPower Corp., Class B | 8.2% |
| SolarCity Corp. | 7.3% |
| Power Integrations, Inc. | 6.5% |
| Cree, Inc. | 5.5% |
| ABB, Ltd. - SP ADR | 4.4% |
| Koninklijke (Royal) Philips Electronics N.V. | 4.0% |
| Johnson Controls, Inc. | 3.9% |
| 3M Co. | 3.7% |
| Praxair, Inc. | 3.4% |
| * | Based on percentage of net assets as of 12/31/15. **Top 10 stock holdings total 55.9% of net assets. These holdings are current as of 12/31/15, and may not be representative of current or future investments. |
REPORT OF INDEPENDENT REGISTERED PUBLIC ACCOUNTING FIRM
To the Shareholders of Firsthand Technology Opportunities Fund and Firsthand Alternative Energy Fund and The Board of Trustees of Firsthand Funds
We have audited the accompanying statements of assets and liabilities, including the portfolios of investments, of Firsthand Technology Opportunities Fund and Firsthand Alternative Energy Fund (the “Funds”), each a series of Firsthand Funds, as of December 31, 2015 and the related statements of operations for the year then ended, the statements of changes in net assets for each of the two years in the period then ended, and the financial highlights for each of the five years in the period then ended. These financial statements and financial highlights are the responsibility of the Funds’ management. Our responsibility is to express an opinion on these financial statements and financial highlights based on our audits.
We conducted our audits in accordance with the standards of the Public Company Accounting Oversight Board (United States). Those standards require that we plan and perform the audit to obtain reasonable assurance about whether the financial statements and financial highlights are free of material misstatement. The Fund is not required to have, nor were we engaged to perform, an audit of its internal control over financial reporting. Our audit included consideration of internal control over financial reporting as a basis for designing audit procedures that are appropriate in the circumstances, but not for the purpose of expressing an opinion on the effectiveness of the Funds’ internal control over financial reporting. Accordingly, we express no such opinion. An audit includes examining, on a test basis, evidence supporting the amounts and disclosures in the financial statements. Our procedures included confirmation of securities owned as of December 31, 2015, by correspondence with the custodian. An audit also includes assessing the accounting principles used and significant estimates made by management, as well as evaluating the overall financial statement presentation. We believe that our audit provides a reasonable basis for our opinion.
In our opinion, the financial statements and financial highlights referred to above present fairly, in all material respects, the financial position of Firsthand Funds as of December 31, 2015, the results of their operations for the year then ended, the statements of changes in net assets for each of the two years for the period then ended, and the financial highlights for each of the five years in the period then ended, in conformity with accounting principles generally accepted in the United States of America.
TAIT, WELLER & BAKER, LLP
Philadelphia, Pennsylvania
February 22, 2016
FIRSTHAND TECHNOLOGY OPPORTUNITIES FUND
Portfolio of Investments (as of 12/31/15)
| INDUSTRY/COMPANY (% OF NET ASSETS) | | SHARES | | | MARKET VALUE | |
COMMON STOCKS — 99.3% ($104,459,144) | | | | | | |
| Advertising Technology (2.2%) | | | | | | |
| Rocket Fuel, Inc.* | | | 660,000 | | | $ | 2,303,400 | |
| | | | | | | | | |
| Communications (6.1%) | | | | | | | | |
| Equinix, Inc. | | | 15,027 | | | | 4,544,165 | |
| Gogo, Inc.* | | | 50,000 | | | | 890,000 | |
| Rackspace Hosting, Inc.* | | | 40,000 | | | | 1,012,800 | |
| | | | | | | | 6,446,965 | |
| Communications Equipment (5.1%) | | | | | | | | |
| QUALCOMM, Inc. | | | 75,000 | | | | 3,748,875 | |
| Ruckus Wireless, Inc.* | | | 150,000 | | | | 1,606,500 | |
| | | | | | | | 5,355,375 | |
| Computer (5.8%) | | | | | | | | |
| Apple, Inc. | | | 57,500 | | | | 6,052,450 | |
| | | | | | | | | |
| Internet (30.2%) | | | | | | | | |
| Akamai Technologies, Inc.* | | | 40,000 | | | | 2,105,200 | |
| Alphabet, Inc., Class C* | | | 6,016 | | | | 4,565,422 | |
| Amazon.com, Inc.* | | | 5,000 | | | | 3,379,450 | |
| Baidu, Inc. - SP ADR* | | | 20,000 | | | | 3,780,800 | |
| Linkedin Corp., Class A* | | | 15,000 | | | | 3,376,200 | |
| Netflix, Inc.* | | | 35,000 | | | | 4,003,300 | |
| Pandora Media, Inc.* | | | 200,000 | | | | 2,682,000 | |
| SINA Corp.* | | | 55,000 | | | | 2,717,000 | |
| Tencent Holdings, Ltd. | | | 265,000 | | | | 5,214,482 | |
| | | | | | | | 31,823,854 | |
| Networking (8.9%) | | | | | | | | |
| Arista Networks, Inc.* | | | 75,000 | | | | 5,838,000 | |
| Palo Alto Networks, Inc.* | | | 20,000 | | | | 3,522,800 | |
| | | | | | | | 9,360,800 | |
| Other Electronics (0.8%) | | | | | | | | |
| VeriFone Systems, Inc.* | | | 30,000 | | | | 840,600 | |
see accompanying notes to financial statements
FIRSTHAND TECHNOLOGY OPPORTUNITIES FUND - continued
Portfolio of Investments (as of 12/31/15)
| INDUSTRY/COMPANY (% OF NET ASSETS) | | SHARES | | | MARKET VALUE | |
| Semiconductor Equipment (6.6%) | | | | | | |
| LAM Research Corp. | | | 65,000 | | | $ | 5,162,300 | |
| Mattson Technology, Inc.* | | | 500,000 | | | | 1,765,000 | |
| | | | | | | | 6,927,300 | |
| Semiconductors (14.1%) | | | | | | | | |
| Ambarella, Inc.* | | | 50,000 | | | | 2,787,000 | |
| ARM Holdings, PLC - SP ADR | | | 80,000 | | | | 3,619,200 | |
| Exar Corp.* | | | 250,000 | | | | 1,532,500 | |
| InvenSense, Inc.* | | | 300,000 | | | | 3,069,000 | |
| Skyworks Solutions, Inc. | | | 50,000 | | | | 3,841,500 | |
| | | | | | | | 14,849,200 | |
| Social Networking (9.0%) | | | | | | | | |
| Facebook, Inc., Class A* | | | 60,000 | | | | 6,279,600 | |
| Twitter, Inc.* | | | 100,000 | | | | 2,314,000 | |
| Yelp, Inc.* | | | 30,000 | | | | 864,000 | |
| | | | | | | | 9,457,600 | |
| Software (10.5%) | | | | | | | | |
| Adobe Systems, Inc.* | | | 45,000 | | | | 4,227,300 | |
| Intuit, Inc. | | | 20,000 | | | | 1,930,000 | |
| VMware, Inc., Class A* | | | 30,000 | | | | 1,697,100 | |
| Workday, Inc., Class A* | | | 40,000 | | | | 3,187,200 | |
| | | | | | | | 11,041,600 | |
| | | | | | | | | |
Total Investments — 99.3% (Cost $78,250,263) | | | | | | | 104,459,144 | |
| | | | | | | | | |
Other assets in excess of liabilities — 0.7% | | | | | | | 741,180 | |
| | | | | | | | | |
| NET ASSETS — 100.0% | | | | | | $ | 105,200,324 | |
| * | Non-income producing security |
PLC Public Limited Company
SP ADR Sponsored American Depositary Receipt
see accompanying notes to financial statements
FIRSTHAND ALTERNATIVE ENERGY FUND
Portfolio of Investments (as of 12/31/15)
| INDUSTRY/COMPANY (% OF NET ASSETS) | | SHARES | | | MARKET VALUE | |
COMMON STOCKS — 93.6% ($6,852,935) | | | | | | |
| Advanced Materials (6.4%) | | | | | | |
| Corning, Inc. | | | 6,460 | | | $ | 118,089 | |
| Praxair, Inc. | | | 2,400 | | | | 245,760 | |
| SunEdison, Inc.* | | | 21,130 | | | | 107,552 | |
| | | | | | | | 471,401 | |
| Building Automation (3.9%) | | | | | | | | |
| Johnson Controls, Inc. | | | 7,200 | | | | 284,328 | |
| | | | | | | | | |
| Electrical Equipment (4.3%) | | | | | | | | |
| ABB, Ltd. - SP ADR | | | 18,000 | | | | 319,140 | |
| | | | | | | | | |
| Energy Efficiency (8.1%) | | | | | | | | |
| ESCO Technologies, Inc. | | | 5,000 | | | | 180,700 | |
| Honeywell International, Inc. | | | 2,080 | | | | 215,426 | |
| Itron, Inc.* | | | 5,565 | | | | 201,342 | |
| | | | | | | | 597,468 | |
| Engineering Service (2.8%) | | | | | | | | |
| Quanta Services, Inc.* | | | 10,000 | | | | 202,500 | |
| | | | | | | | | |
| Environmental Services (0.7%) | | | | | | | | |
| Advanced Emissions Solutions, Inc.* | | | 6,800 | | | | 48,552 | |
| | | | | | | | | |
| Industrials (5.7%) | | | | | | | | |
| 3M Co. | | | 1,800 | | | | 271,152 | |
| United Technologies Corp. | | | 1,500 | | | | 144,105 | |
| | | | | | | | 415,257 | |
| Intellectual Property (0.1%) | | | | | | | | |
Silicon Genesis Corp., Common (1)* | | | 181,407 | | | | 4,535 | |
| | | | | | | | | |
| Materials (2.5%) | | | | | | | | |
| Aspen Aerogels, Inc.* | | | 30,000 | | | | 182,100 | |
| | | | | | | | | |
| Other Electronics (10.4%) | | | | | | | | |
| Cree, Inc.* | | | 15,000 | | | | 400,050 | |
| Intevac, Inc.* | | | 15,800 | | | | 74,418 | |
| Koninklijke Philips Electronics N.V. | | | 11,378 | | | | 289,570 | |
| | | | | | | | 764,038 | |
| Renewable Energy (38.4%) | | | | | | | | |
| Amtech Systems, Inc.* | | | 6,600 | | | | 41,316 | |
| First Solar, Inc.* | | | 10,000 | | | | 659,900 | |
see accompanying notes to financial statements
FIRSTHAND ALTERNATIVE ENERGY FUND - continued
Portfolio of Investments (as of 12/31/15)
| INDUSTRY/COMPANY (% OF NET ASSETS) | | SHARES | | | MARKET VALUE | |
| Gamesa Corp. Tecnologica S.A. | | | 7,271 | | | $ | 125,006 | |
| Iberdrola S.A. | | | 18,854 | | | | 134,206 | |
| JA Solar Holdings Co., Ltd. - ADR* | | | 13,000 | | | | 126,100 | |
| JinkoSolar Holding Co., Ltd. - ADR* | | | 2,000 | | | | 55,340 | |
| Motech Industries, Inc.* | | | 58,069 | | | | 79,907 | |
| Orion Energy Systems, Inc.* | | | 14,000 | | | | 30,380 | |
| Sharp Corp.* | | | 11,000 | | | | 11,440 | |
| SolarCity Corp.* | | | 10,500 | | | | 535,710 | |
| SunPower Corp., Class B* | | | 19,931 | | | | 598,129 | |
| ULVAC, Inc.* | | | 2,700 | | | | 77,387 | |
| Vestas Wind Systems A.S. | | | 3,000 | | | | 210,990 | |
| Vivint Solar, Inc.* | | | 12,000 | | | | 114,720 | |
| Yingli Green Energy Holding Co., Ltd. - ADR* | | | 2,000 | | | | 9,060 | |
| | | | | | | | 2,809,591 | |
| Semiconductors (8.2%) | | | | | | | | |
| Exar Corp.* | | | 20,000 | | | | 122,600 | |
| Power Integrations, Inc. | | | 9,799 | | | | 476,525 | |
| | | | | | | | 599,125 | |
| Waste & Environment Service (2.1%) | | | | | | | | |
| Covanta Holding Corp. | | | 10,000 | | | | 154,900 | |
| | | | | | | | | |
PREFERRED STOCK — 0.0% ($1,557) | | | | | | | | |
| Intellectual Property (0.0%) | | | | | | | | |
Silicon Genesis Corp., Series 1-C (1)* | | | 152 | | | | 186 | |
Silicon Genesis Corp., Series 1-E (1)* | | | 3,000 | | | | 1,371 | |
| | | | | | | | 1,557 | |
Investment Company — 5.8% | | | | | | | | |
Fidelity Institutional Money Market Fund (2) | | | 426,199 | | | | 426,199 | |
| | | | | | | | | |
| Total Investments —99.4% (Cost $8,366,499) | | | | | | | 7,280,691 | |
| | | | | | | | | |
| Other assets in excess of liabilities — 0.6% | | | | | | | 41,310 | |
| | | | | | | | | |
| NET ASSETS — 100.0% | | | | | | $ | 7,322,001 | |
| * | Non-income producing security. |
| (2) | The Fidelity Institutional Money Market Fund invests primarily in U.S. Treasury Securities. |
ADR American Depositary Receipt
SP ADR Sponsored American Depositary Receipt
see accompanying notes to financial statements
STATEMENTS OF ASSETS AND LIABILITIES
December 31, 2015
| | | FIRSTHAND TECHNOLOGY OPPORTUNITIES FUND | | | FIRSTHAND ALTERNATIVE ENERGY FUND | |
| ASSETS | | | | | | |
| Investment securities: | | | | | | |
| Acquisition cost | | $ | 78,250,263 | | | $ | 8,366,499 | |
| Market value (Note 2) | | | 104,459,144 | | | | 7,280,691 | |
| Receivable for securities sold | | | 1,768,954 | | | | — | |
| Receivable from dividends, interest, and reclaims | | | 21,000 | | | | 5,800 | |
| Receivable for capital shares sold | | | 143,753 | | | | 66,141 | |
| TOTAL ASSETS | | | 106,392,851 | | | | 7,352,632 | |
| | | | | | | | | |
| LIABILITIES | | | | | | | | |
| Cash overdraft | | | 24,349 | | | | — | |
| Payable to affiliates (Note 4) | | | 340,984 | | | | 22,691 | |
| Payable for capital shares redeemed | | | 827,194 | | | | 7,940 | |
| TOTAL LIABILITIES | | | 1,192,527 | | | | 30,631 | |
| NET ASSETS | | $ | 105,200,324 | | | $ | 7,322,001 | |
| | | | | | | | | |
| Net Assets consist of: | | | | | | | | |
| Paid-in-capital | | $ | 75,737,873 | | | $ | 9,221,393 | |
Accumulated net realized gain (loss) from security transactions and foreign currency transactions | | | 3,253,570 | | | | (813,479 | ) |
Net unrealized appreciation (depreciation) on investments and foreign currency | | | 26,208,881 | | | | (1,085,913 | ) |
| NET ASSETS | | $ | 105,200,324 | | | $ | 7,322,001 | |
| | | | | | | | | |
| Shares outstanding | | | 13,596,728 | | | | 1,255,978 | |
Net asset value, redemption price and offering price per share (Note 2) | | $ | 7.74 | | | $ | 5.83 | |
see accompanying notes to financial statements
STATEMENTS OF OPERATIONS
For the Year Ended December 31, 2015
| | | FIRSTHAND TECHNOLOGY OPPORTUNITIES FUND | | | FIRSTHAND ALTERNATIVE ENERGY FUND | |
| INVESTMENT INCOME | | | | | | |
| Dividends | | $ | 797,935 | | | $ | 67,673 | |
| Foreign tax withholding | | | — | | | | (1,991 | ) |
| TOTAL INVESTMENT INCOME | | | 797,935 | | | | 65,682 | |
| EXPENSES | | | | | | | | |
| Investment advisory fees (Note 4) | | | 1,624,631 | | | | 119,414 | |
| Administration fees (Note 4) | | | 522,203 | | | | 35,122 | |
| Trustees fees | | | 10,000 | | | | 10,000 | |
| GROSS EXPENSES | | | 2,156,834 | | | | 164,536 | |
| Trustees fees reimbursement | | | (10,000 | ) | | | (10,000 | ) |
| TOTAL NET EXPENSES | | | 2,146,834 | | | | 154,536 | |
| | | | | | | | | |
| NET INVESTMENT LOSS | | | (1,348,899 | ) | | | (88,854 | ) |
| | | | | | | | | |
| Net Realized and Unrealized Gain (Loss) on Investments: | | | | | | | | |
| Net realized gains from security transactions | | | 16,092,337 | | | | 96,118 | |
| Net realized gains (losses) on foreign currency | | | 84 | | | | (331 | ) |
Net change in unrealized depreciation on investments and foreign currency | | | (11,261,890 | ) | | | (771,529 | ) |
| Net Realized and Unrealized Gain (Loss) on Investments | | | 4,830,531 | | | | (675,742 | ) |
| | | | | | | | | |
Net Increase (Decrease) In Net Assets Resulting From Operations | | $ | 3,481,632 | | | $ | (764,596 | ) |
see accompanying notes to financial statements
STATEMENTS OF CHANGES IN NET ASSETS
For the Years Ended December 31, 2015, and December 31, 2014
| | | FIRSTHAND TECHNOLOGY OPPORTUNITIES FUND | |
| | | Year Ended 12/31/15 | | | Year Ended 12/31/14 | |
| FROM OPERATIONS: | | | | | | |
| Net investment loss | | $ | (1,348,899 | ) | | $ | (1,404,183 | ) |
| Net realized gains from security transactions and foreign currency | | | 16,092,421 | | | | 8,429,298 | |
| Net change in unrealized appreciation (depreciation) on investments and foreign currency | | | (11,261,890 | ) | | | 1,779,795 | |
| Net increase in net assets from operations | | | 3,481,632 | | | | 8,804,910 | |
| | | | | | | | | |
| DISTRIBUTIONS TO SHAREHOLDERS: | | | | | | | | |
| From realized gains on investments | | | (9,439,955 | ) | | | (5,852,018 | ) |
| Total Distributions | | | (9,439,955 | ) | | | (5,852,018 | ) |
| FROM CAPITAL SHARE TRANSACTIONS: | | | | | | | | |
| Proceeds from shares sold | | | 36,378,739 | | | | 30,428,480 | |
| Dividends reinvested | | | 9,252,754 | | | | 5,690,672 | |
| Payment for shares redeemed | | | (43,468,245 | ) | | | (29,057,956 | ) |
| Net increase in net assets from capital share transactions | | | 2,163,248 | | | | 7,061,196 | |
| TOTAL INCREASE (DECREASE) IN NET ASSETS | | | (3,795,075 | ) | | | 10,014,088 | |
| NET ASSETS: | | | | | | | | |
| Beginning of year | | | 108,995,399 | | | | 98,981,311 | |
| End of year | | $ | 105,200,324 | | | $ | 108,995,399 | |
| | | | | | | | | |
| COMMON SHARE ACTIVITY: | | | | | | | | |
| Shares sold | | | 3,985,647 | | | | 3,640,973 | |
| Shares reinvested | | | 1,207,932 | | | | 695,681 | |
| Shares redeemed | | | (4,993,451 | ) | | | (3,526,977 | ) |
| Net increase in shares outstanding | | | 200,128 | | | | 809,677 | |
| Shares outstanding, beginning of year | | | 13,396,600 | | | | 12,586,923 | |
| Shares outstanding, end of year | | | 13,596,728 | | | | 13,396,600 | |
see accompanying notes to financial statements
STATEMENTS OF CHANGES IN NET ASSETS
For the Years Ended December 31, 2015, and December 31, 2014
| | | FIRSTHAND ALTERNATIVE ENERGY FUND | |
| | | Year Ended 12/31/15 | | | Year Ended 12/31/14 | |
| FROM OPERATIONS: | | | | | | |
| Net investment loss | | $ | (88,854 | ) | | $ | (166,205 | ) |
| Net realized gains from security transactions and foreign currency | | | 95,787 | | | | 446,111 | |
| Net change in unrealized depreciation on investments and foreign currency | | | (771,529 | ) | | | (902,041 | ) |
| Net decrease in net assets from operations | | | (764,596 | ) | | | (622,135 | ) |
| | | | | | | | | |
| FROM CAPITAL SHARE TRANSACTIONS: | | | | | | | | |
| Proceeds from shares sold | | | 2,927,529 | | | | 22,682,752 | |
| Payment for shares redeemed | | | (3,950,109 | ) | | | (26,521,867 | ) |
| Net decrease in net assets from capital share transactions | | | (1,022,580 | ) | | | (3,839,115 | ) |
| TOTAL DECREASE IN NET ASSETS | | | (1,787,176 | ) | | | (4,461,250 | ) |
| NET ASSETS: | | | | | | | | |
| Beginning of year | | | 9,109,177 | | | | 13,570,427 | |
| End of year | | $ | 7,322,001 | | | $ | 9,109,177 | |
| | | | | | | | | |
| COMMON SHARE ACTIVITY: | | | | | | | | |
| Shares sold | | | 462,277 | | | | 3,152,062 | |
| Shares redeemed | | | (616,994 | ) | | | (3,838,182 | ) |
| Net decrease in shares outstanding | | | (154,717 | ) | | | (686,120 | ) |
| Shares outstanding, beginning of year | | | 1,410,695 | | | | 2,096,815 | |
| Shares outstanding, end of year | | | 1,255,978 | | | | 1,410,695 | |
see accompanying notes to financial statements
FINANCIAL HIGHLIGHTS
Selected per share data and ratios for a share outstanding throughout each year
FIRSTHAND TECHNOLOGY OPPORTUNITIES FUND
| | | Year Ended
12/31/15 | | | Year Ended
12/31/14 | | | Year Ended
12/31/13 | | | Year Ended
12/31/12 | | | Year Ended
12/31/11 | |
| Net asset value at beginning of year | | $ | 8.14 | | | $ | 7.86 | | | $ | 6.30 | | | $ | 5.40 | | | $ | 6.05 | |
| Income from investment operations: | | | | | | | | | | | | | | | | | | | | |
| Net investment loss | | | (0.10 | ) | | | (0.10 | ) | | | (0.09 | ) | | | (0.08 | ) | | | (0.09 | ) |
| Net realized and unrealized gains (losses) on investments | | | 0.44 | | | | 0.83 | | | | 2.09 | | | | 0.98 | | | | (0.56 | ) |
| Total from investment operations | | | 0.34 | | | | 0.73 | | | | 2.00 | | | | 0.90 | | | | (0.65 | ) |
| Distributions from: | | | | | | | | | | | | | | | | | | | | |
| Realized capital gains | | | (0.74 | ) | | | (0.45 | ) | | | (0.44 | ) | | | — | | | | — | |
| Net asset value at end of year | | $ | 7.74 | | | $ | 8.14 | | | $ | 7.86 | | | $ | 6.30 | | | $ | 5.40 | |
| Total return | | | 4.28 | % | | | 9.29 | % | | | 31.80 | % | | | 16.67 | % | | | (10.74 | %) |
| Net assets at end of year (millions) | | $ | 105.2 | | | $ | 109.0 | | | $ | 99.0 | | | $ | 95.1 | | | $ | 79.4 | |
| Ratio of gross expenses to average net assets before waiver | | | 1.86 | % | | | 1.86 | % | | | 1.86 | % | | | 1.86 | % | | | 1.86 | % |
| Ratio of net expenses to average net assets after waiver | | | 1.85 | % | | | 1.85 | % | | | 1.85 | % | | | 1.85 | % | | | 1.85 | % |
| Ratio of net investment loss to average net assets | | | (1.17 | %) | | | (1.28 | %) | | | (1.31 | %) | | | (1.28 | %) | | | (1.21 | %) |
| Portfolio turnover rate | | | 19 | % | | | 23 | % | | | 21 | % | | | 81 | %* | | | 128 | % |
| * | Portfolio turnover excludes the purchases and sales in connection with the merger of Firsthand Technology Leaders Fund into the Fund. |
see accompanying notes to financial statements
FINANCIAL HIGHLIGHTS
Selected per share data and ratios for a share outstanding throughout each year
FIRSTHAND ALTERNATIVE ENERGY FUND
| | | Year Ended 12/31/15 | | | Year Ended 12/31/14 | | | Year Ended 12/31/13 | | | Year Ended 12/31/12 | | | Year Ended 12/31/11 | |
| Net asset value at beginning of year | | $ | 6.46 | | | $ | 6.47 | | | $ | 3.34 | | | $ | 4.37 | | | $ | 7.27 | |
| Income from investment operations: | | | | | | | | | | | | | | | | | | | | |
| Net investment loss | | | (0.07 | ) | | | (0.12 | ) | | | (0.05 | ) | | | (0.04 | ) | | | (0.10 | ) |
| Net realized and unrealized gains (losses) on investments | | | (0.56 | ) | | | 0.11 | | | | 3.18 | | | | (0.99 | ) | | | (2.80 | ) |
| Total from investment operations | | | (0.63 | ) | | | (0.01 | ) | | | 3.13 | | | | (1.03 | ) | | | (2.90 | ) |
| Net asset value at end of year | | $ | 5.83 | | | $ | 6.46 | | | $ | 6.47 | | | $ | 3.34 | | | $ | 4.37 | |
| Total return | | | (9.75 | %) | | | (0.15 | %) | | | 93.71 | % | | | (23.57 | %) | | | (39.89 | %) |
| Net assets at end of year (millions) | | $ | 7.3 | | | $ | 9.1 | | | $ | 13.6 | | | $ | 2.0 | | | $ | 3.5 | |
| Ratio of gross expenses to average net assets before waiver | | | 2.11 | % | | | 2.04 | % | | | 2.14 | % | | | 2.38 | % | | | 2.11 | % |
| Ratio of net expenses to average net assets after waiver | | | 1.98 | % | | | 1.98 | % | | | 1.98 | % | | | 1.98 | % | | | 1.98 | % |
| Ratio of net investment loss to average net assets | | | (1.14 | %) | | | (0.98 | %) | | | (1.52 | %) | | | (0.98 | %) | | | (1.43 | %) |
| Portfolio turnover rate | | | 5 | % | | | 57 | % | | | 26 | % | | | 10 | % | | | 16 | % |
see accompanying notes to financial statements
NOTES TO FINANCIAL STATEMENTS
December 31, 2015
1. ORGANIZATION
Each of Firsthand Technology Opportunities Fund and Firsthand Alternative Energy Fund (individually the “Fund”, and collectively the “Funds”) is a non-diversified series of Firsthand Funds (the “Trust”), an open-end management investment company registered under the Investment Company Act of 1940, as amended (the “1940 Act”). The Trust, a Delaware statutory trust, was organized on November 8, 1993. Each Fund currently offers one class of shares—Investor Class shares. The inception dates for the Funds (the date on which a net asset value was first determined for that Fund) follow:
| FUND | INCEPTION DATE |
| Firsthand Technology Opportunities Fund | September 30, 1999 |
| Firsthand Alternative Energy Fund | October 29, 2007 |
Each Fund’s investment objective is long-term growth of capital.
Firsthand Technology Opportunities Fund seeks to achieve its investment objective by investing, under normal circumstances, at least 80% of its assets in equity securities of high-technology companies in the industries and markets that the Investment Adviser believes hold the most growth potential within the technology sector.
Firsthand Alternative Energy Fund seeks to achieve its investment objective by investing, under normal circumstances, at least 80% of its assets in alternative energy and energy technology companies, both U.S. and international.
2. SIGNIFICANT ACCOUNTING POLICIES
The following is a summary of the Funds’ significant accounting policies:
Securities Valuation — A Fund’s portfolio of securities is valued as follows:
| 1. | Securities traded on stock exchanges, or quoted by NASDAQ, are valued according to the NASDAQ official closing price, if applicable, or at their last reported sale price as of the close of trading on the New York Stock Exchange (“NYSE”) (normally 4:00 P.M. Eastern Time). If a security is not traded that day, the security will be valued at its most recent bid price. |
| 2. | Securities traded in the over-the-counter market, but not quoted by NASDAQ, are valued at the last sale price (or, if the last sale price is not readily available, at the most recent closing bid price as quoted by brokers that make markets in the securities) at the close of trading on the NYSE. |
| 3. | Securities traded both in the over-the-counter market and on a stock exchange are valued according to the broadest and most representative market. |
NOTES TO FINANCIAL STATEMENTS - continued
December 31, 2015
| 4. | Securities and other assets that do not have market quotations readily available are valued at their fair value as determined in good faith using procedures established by the Board of Trustees. |
In pricing illiquid, privately placed securities, the advisor follows well-accepted valuation techniques. Initial valuations are generally determined by the initial purchase price for each security. Subsequent to initial purchase, securities are repriced from time to time to reflect changes to the companies’ valuations caused by various events. Such events include, among others, a new round of financing establishing a new valuation for the company; material changes to a company’s business or business prospects, either due to company-specific internal issues (gaining or losing a major customer, missing a significant milestone, etc.) or macroeconomic events affecting the industry or the world. In analyzing a company’s valuation, factors that are also considered include a company’s cash flow, revenues, profitability, financial forecasts, and probability of success in those measures. Other potential factors include the value of comparable public and private companies and general market conditions.
Fair Value Measurement — In accordance with the authoritative guidance on fair value measurements and disclosures under GAAP, each Fund discloses the fair value of its investments in a hierarchy that prioritizes the inputs to valuation techniques used to measure the fair value. The hierarchy gives the highest priority to valuations based upon unadjusted quoted prices in active markets for identical assets or liabilities (level 1 measurement) and the lowest priority to valuations based upon unobservable inputs that are significant to the valuation (level 3 measurements).
The guidance establishes three levels of the fair value hierarchy as follows:
| Level 1 – | Unadjusted quoted prices in active markets for identical assets or liabilities that the Funds have the ability to access. |
| Level 2 – | Observable inputs other than quoted prices included in level 1 that are observable for the asset or liability, either directly or indirectly. These inputs may include quoted prices for the identical instrument on an inactive market, prices for similar instruments, interest rates, prepayment speeds, credit risks, yield curves, default rates, and similar data. |
| Level 3 – | Unobservable inputs for the asset or liability, to the extent relevant observable inputs are not available, representing the Funds’ own assumptions about the assumptions a market participant would use in valuing the asset or liability, and would be based on the best information available. |
NOTES TO FINANCIAL STATEMENTS - continued
December 31, 2015
The availability of observable inputs can vary from security to security and is affected by a wide variety of factors, including, for example, the type of security, whether the security is new and not yet established in the marketplace, the liquidity of markets, and other characteristics particular to the security. To the extent that valuation is based on models or inputs that are less observable or unobservable in the market, the determination of fair value requires more judgment. Accordingly, the degree of judgment exercised in determining fair value is greatest for instruments categorized in level 3.
The inputs used to measure fair value may fall into different levels of the fair value hierarchy. In such cases, for disclosure purposes, the level in the fair value hierarchy within which the fair value measurement falls in its entirety, is determined based on the lowest level input that is significant to the fair value measurement in its entirety.
The inputs or methodology used for valuing securities are not necessarily an indication of the risk associated with investing in those securities. The following is a summary of the inputs used to value the following Funds’ net assets as of December 31, 2015:
| FUND* | | LEVEL 1 QUOTED PRICES | | | LEVEL 2 OTHER SIGNIFICANT OBSERVABLE INPUTS | | | LEVEL 3 SIGNIFICANT UNOBSERVABLE INPUTS | |
| TEFQX | | | | | | | | | |
| Common Stocks | | | | | | | | | |
| Advertising Technology | | $ | 2,303,400 | | | $ | — | | | $ | — | |
| Communications | | | 6,446,965 | | | | — | | | | — | |
| Communications Equipment | | | 5,355,375 | | | | — | | | | — | |
| Computer | | | 6,052,450 | | | | — | | | | — | |
| Internet | | | 31,823,854 | | | | — | | | | — | |
| Networking | | | 9,360,800 | | | | — | | | | — | |
| Other Electronics | | | 840,600 | | | | — | | | | — | |
| Semiconductor Equipment | | | 6,927,300 | | | | — | | | | — | |
| Semiconductors | | | 14,849,200 | | | | — | | | | — | |
| Social Networking | | | 9,457,600 | | | | — | | | | — | |
| Software | | | 11,041,600 | | | | — | | | | — | |
| Total Common Stock | | | 104,459,144 | | | | — | | | | — | |
| Total | | $ | 104,459,144 | | | $ | — | | | $ | — | |
NOTES TO FINANCIAL STATEMENTS - continued
December 31, 2015
| FUND* | | LEVEL 1 QUOTED PRICES | | | LEVEL 2 OTHER SIGNIFICANT OBSERVABLE INPUTS | | | LEVEL 3 SIGNIFICANT UNOBSERVABLE INPUTS | |
| ALTEX | | | | | | | | | |
| Common Stocks | | | | | | | | | |
| Advanced Materials | | $ | 471,401 | | | $ | — | | | $ | — | |
| Building Automation | | | 284,328 | | | | — | | | | — | |
| Electrical Equipment | | | 319,140 | | | | — | | | | — | |
| Energy Efficiency | | | 597,468 | | | | — | | | | — | |
| Engineering Service | | | 202,500 | | | | — | | | | — | |
| Environmental Services | | | 48,552 | | | | — | | | | — | |
| Industrials | | | 415,257 | | | | — | | | | — | |
| Intellectual Property | | | — | | | | — | | | | 4,535 | |
| Materials | | | 182,100 | | | | — | | | | — | |
| Other Electronics | | | 764,038 | | | | — | | | | — | |
| Renewable Energy | | | 2,809,591 | | | | — | | | | — | |
| Semiconductors | | | 599,125 | | | | — | | | | — | |
| Waste & Environ. Service | | | 154,900 | | | | — | | | | — | |
| Total Common Stocks | | | 6,848,400 | | | | — | | | | 4,535 | |
| Preferred Stocks | | | — | | | | — | | | | 1,557 | |
| Investment Company | | | 426,199 | | | | — | | | | — | |
| Total | | $ | 7,274,599 | | | $ | — | | | $ | 6,092 | |
| * | TEFQX: Firsthand Technology Opportunities Fund; ALTEX: Firsthand Alternative Energy Fund. |
At the end of each calendar quarter, management evaluates the Level 2 and 3 assets and liabilities for changes in liquidity, including but not limited to: whether a broker is willing to execute at the quoted price, the depth and consistency of prices from third party services, and the existence of contemporaneous, observable trades in the market. Additionally, management evaluates the Level 1 and 2 assets and liabilities on a quarterly basis for changes in listings or delistings on national exchanges. Transfers in and out of the levels are recognized at the value at the end of the period.
Following is a reconciliation of Level 3 assets (at either the beginning or the ending of the period) for which significant unobservable inputs were used to determine fair value.
NOTES TO FINANCIAL STATEMENTS - continued
December 31, 2015
FIRSTHAND ALTERNATIVE ENERGY FUND
| INVESTMENTS AT FAIR VALUE USING SIGNIFICANT UNOBSERVABLE INPUTS (LEVEL 3) | | BALANCE AS OF 12/31/14 | | | NET PURCHASES | | | NET SALES | | | NET REALIZED GAINS (LOSSES) | | | NET UNREALIZED APPRECIATION (DEPRECIATION) | | | TRANSFERS IN (OUT) OF LEVEL 3 | | | BALANCE AS OF 12/31/15 | |
| Common Stocks | | | | | | | | | | | | | | | | | | | | | |
| Intellectual Property | | $ | — | * | | $ | — | | | $ | — | | | $ | — | | | $ | 4,535 | | | $ | — | | | $ | 4,535 | |
| Preferred Stocks | | | — | * | | | — | | | | — | | | | — | | | | 1,557 | | | | — | | | | 1,557 | |
| Total | | $ | — | * | | $ | — | | | $ | — | | | $ | — | | | $ | 6,092 | | | $ | — | | | $ | 6,092 | |
The below chart represents quantitative disclosure about significant unobservable inputs for level 3 fair value measurements:
| | FAIR VALUE AT 12/31/15 | VALUATION TECHNIQUES | UNOBSERVABLE INPUTS | RANGE |
| Direct venture capital | $ 6,092 | Prior Transaction | Volatility | 54.81% |
| investments: Intellectual | | Analysis | Risk-free Rate | 1.76% |
| Property | | | Discount for Lack of Marketability | 32.1% |
Share Valuation — The net asset value (“NAV”) per share of each Fund is calculated by dividing the net assets of the Fund (i.e, the sum of the value of the securities held by the Fund, plus cash or other assets, minus all liabilities (including estimated accrued expenses)) by the total number of shares outstanding of the Fund, rounded to the nearest cent. A Fund’s shares will not be priced on the days on which the NYSE is closed for trading. The offering and redemption price per share of each Fund is equal to a Fund’s NAV per share.
Investment Income — Dividend income is recorded on the ex-dividend date. Interest income is accrued as earned. Discounts and premiums on securities purchased are amortized over the lives of the respective securities. Other non-cash dividends are recognized as investment income at the fair value of the property received. Withholding taxes on foreign dividends have been provided for in accordance with the Funds’ understanding of the applicable country’s tax rules and rates.
Cash and Cash Equivalents — The Funds consider liquid assets deposited with a bank, money market funds, and certain short-term debt instruments with maturities of 3 months or less to be cash equivalents. These investments represent amounts held with financial institutions that are readily accessible to pay Fund expenses or purchase investments. Cash and cash equivalents are valued at cost plus accrued interest, which approximates market value.
NOTES TO FINANCIAL STATEMENTS - continued
December 31, 2015
Foreign Securities — Each Fund may invest in companies that trade on U.S. exchanges as American Depositary Receipts (“ADRs”), on foreign exchanges, or on foreign over-the-counter markets. Investing in the securities of foreign companies exposes your investment in a Fund to risk. Foreign stock markets tend to be more volatile than the U.S. market due to economic and/or political instability and the regulatory conditions in some countries. In addition, some of the securities in which the Fund may invest may be denominated in foreign currencies, the value of which may decline against the U.S. dollar. An investment in foreign securities may be subject to high levels of foreign taxation, including foreign taxes withheld at the source. Neither Fund isolates the portion of the results of operations resulting from changes in foreign exchange rates on investments from the fluctuations arising from changes in market prices of securities held. Reported net realized foreign exchange gains or losses arise from sales of portfolio securities, currency gains or losses realized between the trade and settlement dates on securities transactions, and the difference between the amounts of dividends, interest, and foreign withholding taxes recorded on the Funds’ books and the U.S. dollar equivalent of the amounts actually received or paid.
Options — The Funds are subject to equity price risk in the normal course of pursuing their investment objectives and may enter into options written to hedge against changes in the value of equities. The Funds may purchase put and call options to attempt to provide protection against adverse price effects from anticipated changes in prevailing prices of securities or stock indices. The Funds may also write put and call options. When a Fund writes an option, an amount equal to the premium received by the Fund is recorded as a liability and is subsequently adjusted to the current fair value of the option written. Premiums received from writing options that expire unexercised are treated by the Fund on the expiration date as realized gains from investments. The difference between the premium and the amount paid on effecting a closing purchase transaction, including brokerage commissions, is also treated as a realized gain, or, if the premium is less than the amount paid for the closing purchase transaction, as a realized loss. If a call option is exercised, the premium is added to the proceeds from the sale of the underlying security or currency in determining whether the Fund has realized a gain or loss. The Fund as writer of an option bears the market risk of an unfavorable change in the price of the security underlying the written option. For the year ended December 31, 2015, the Funds did not hold any written options.
Distributions to Shareholders — Each Fund expects to distribute its net investment income and net realized gains, if any, annually. Distributions from net investment income and capital gains are recorded on the ex-dividend date and are determined in accordance with income tax regulations, which may differ from accounting principles generally accepted in the United States.
NOTES TO FINANCIAL STATEMENTS - continued
Short Positions — Firsthand Alternative Energy Fund may sell securities short for economic hedging purposes. Short sales are transactions in which the Fund sells a security it does not own, in anticipation of a decline in the market value of that security. To initiate such a transaction, the Fund must borrow the security to deliver to the buyer upon the short sale; the Fund is then obligated to replace the security borrowed by purchasing it in the open market at some later date, completing the transaction. The Fund is liable for any dividends payable on securities while those securities are in a short position.
The Fund will incur a loss if the market price of the security increases between the date of the short sale and the date on which the Fund replaces the borrowed security. The Fund will realize a gain if the security declines in value between those dates.
All short sales must be fully collateralized. The Fund maintains the collateral in a segregated account consisting of cash, cash equivalents and/or liquid securities sufficient to collateralize the market value of its short positions. Typically, the segregated cash with brokers and other financial institutions exceeds the minimum required. Deposits with brokers for securities sold short are invested in money market instruments. The Fund did not invest in short sales for the year ended December 31, 2015.
Reclassification of Capital Accounts — Permanent book and tax differences resulted in reclassifications for the year ended December 31, 2015 as follows:
| | | INCREASE (DECREASE) | |
| | | Paid-in-Capital | | | Accumulated Net Investment Income (Loss) | | | Accumulated Net Realized Gain (Loss) | |
| Firsthand Technology Opportunities Fund | | $ | 3,725 | | | $ | 1,348,899 | | | $ | (1,352,624 | ) |
| Firsthand Alternative Energy Fund | | | (89,185 | ) | | | 88,854 | | | | 331 | |
These reclassifications, related to different treatment of current year write off of net operating loss and foreign currency transactions, have no effect on net asset value per share.
Security Transactions — Security transactions are accounted for no later than one business day following the trade date, however, for financial reporting purposes, security transactions are accounted for on trade date. Realized gains and losses are calculated on a specific identification basis.
NOTES TO FINANCIAL STATEMENTS - continued
December 31, 2015
Estimates — The preparation of financial statements in conformity with accounting principles generally accepted in the United States of America requires management to make estimates and assumptions that affect the reported amounts of assets and liabilities at the date of the financial statements and the reported amounts of income and expenses during the reporting period. Actual results could differ from those estimates.
Federal Income Tax — Each Fund has elected, and intends to qualify annually, for the special tax treatment afforded regulated investment companies under the Internal Revenue Code of 1986, as amended (the “Code”). As provided in the Code, in any fiscal year in which a Fund so qualifies and distributes at least 90% of its taxable net income, the Fund (but not the shareholders) will be relieved of federal income tax on the income distributed. Accordingly, no provision for income taxes has been made. To avoid imposition of the excise tax applicable to regulated investment companies, each Fund intends to declare as dividends in each calendar year at least 98% of its net investment income (earned during the calendar year) and 98% of its net realized capital gains (earned during the 12 months ended October 31) plus undistributed amounts, if any, from prior years.
The tax character of distributions paid for the year ended December 31, 2015 and 2014 was as follows:
| | | FIRSTHAND TECHNOLOGY
OPPORTUNITIES FUND | |
| | | 2015 | | | 2014 | |
| From ordinary income | | $ | 1,002,529 | | | $ | — | |
| From long-term capital gains | | $ | 8,437,426 | | | $ | 5,852,018 | |
The following information is based upon the federal income tax cost of portfolio investments as of December 31, 2015.
| | | FIRSTHAND
TECHNOLOGY
OPPORTUNITIES FUND | | | FIRSTHAND
ALTERNATIVE
ENERGY FUND | |
| Gross unrealized appreciation | | $ | 41,739,439 | | | $ | 1,061,542 | |
| Gross unrealized depreciation | | | (15,797,408 | ) | | | (2,249,702 | ) |
| Net unrealized appreciation (depreciation) | | $ | 25,942,031 | | | $ | (1,188,160 | ) |
| Federal income tax cost | | $ | 78,517,113 | | | $ | 8,468,851 | |
The difference between the acquisition cost and the federal income tax cost of portfolio investments is due to certain timing differences in the recognition of capital losses under accounting principles generally accepted in the United States and income tax regulations.
NOTES TO FINANCIAL STATEMENTS - continued
December 31, 2015
As of December 31, 2015, the Funds had capital loss carryforwards for federal income tax purposes as follows:
| | | EXPIRING 2016 | | | EXPIRING 2017 | | | EXPIRING 2018 | |
TEFQX* | | $ | (81,321 | )** | | $ | — | | | $ | — | |
ALTEX* | | | — | | | | (172,410 | ) | | | (108,018 | ) |
| | | SHORT-TERM
NO EXPIRATION | | | LONG-TERM
NO EXPIRATION | | | TOTAL | |
TEFQX* | | $ | — | | | $ | — | | | $ | (81,321 | ) |
ALTEX* | | | (430,699 | ) | | | — | | | | (711,127 | ) |
| * | TEFQX: Firsthand Technology Opportunities Fund; ALTEX: Firsthand Alternative Energy Fund. |
| ** | Subject to annual limitations from the reorganization of Firsthand Technology Leaders Fund into Firsthand Technology Opportunities Fund, which occurred in 2012. |
For the year ended December 31, 2015, the Technology Opportunities Fund utilized $815,087 of capital loss carryforwards.
Components of Distributable Earnings
| | | FIRSTHAND
TECHNOLOGY
OPPORTUNITIES FUND | | | FIRSTHAND
ALTERNATIVE
ENERGY FUND | |
| Net Unrealized Appreciation (Depreciation)* | | $ | 25,942,031 | | | $ | (1,188,265 | ) |
| Undistributed Ordinary Income | | | 67,305 | | | | — | |
| Undistributed Long Term Capital Gains | | | 4,326,627 | | | | — | |
| Other Temporary Differences | | | (792,191 | ) | | | — | |
| Accumulated Capital Loss Carryforward | | | (81,321 | ) | | | (711,127 | ) |
| Total Distributable Earnings | | $ | 29,462,451 | | | $ | (1,899,392 | ) |
| * | The differences between book-basis and tax-basis unrealized appreciation (depreciation) is attributable primarily to tax deferral of losses on wash sales. |
The Funds are subject to tax provisions that establish a minimum threshold for recognizing, and a system for measuring, the benefits of a tax position taken or expected to be taken in a tax return. Taxable years ending 2015, 2014, 2013 and 2012 remain open to federal and state audit. As of December 31, 2015, management has evaluated the application of these provisions to the Funds, and has determined that no provision for income tax is required in the Funds’ financial statements for uncertain tax provisions.
NOTES TO FINANCIAL STATEMENTS - continued
December 31, 2015
3. INVESTMENT TRANSACTIONS (EXCLUDING SHORT-TERM INVESTMENTS) WERE AS FOLLOWS FOR THE YEAR ENDED DECEMBER 31, 2015
| | | FIRSTHAND
TECHNOLOGY
OPPORTUNITIES FUND | | | FIRSTHAND
ALTERNATIVE
ENERGY FUND | |
| Purchase of investment securities | | $ | 21,554,814 | | | $ | 385,925 | |
| Proceeds from sales and maturities of investment securities | | $ | 30,837,549 | | | $ | 1,765,557 | |
4. INVESTMENT ADVISORY AND ADMINISTRATION AGREEMENTS; CERTAIN TRUSTEES AND OFFICERS OF THE TRUST ARE ALSO OFFICERS OF THE INVESTMENT ADVISER AND BNY MELLON.
Certain trustees and officers of the Trust are also officers of the Investment Adviser or BNY Mellon. BNY Mellon serves as the sub-administrator, investment accounting agent, and shareholder servicing and transfer agent.
INVESTMENT ADVISORY AGREEMENT
Each Fund’s investments are managed by the Investment Adviser pursuant to the terms of a master investment advisory agreement (the “Advisory Agreement”). Under the Advisory Agreement, the Investment Adviser provides each Fund with investment research, advice, management, and supervision and manages the investment and reinvestment of assets of each Fund consistent with each Fund’s investment objectives, policies, and limitations. Subject to certain exceptions set forth in the Advisory Agreement, the Investment Adviser is responsible for (i) compensation of any of the Fund’s trustees, officers, and employees who are interested persons of the Investment Adviser; and (ii) compensation of the Investment Adviser’s personnel and other expenses incurred in connection with the provision of portfolio management services under the Advisory Agreement.
Firsthand Capital Management, Inc. is the Investment Adviser to the Funds. For the services it provides under the Advisory Agreement, the Investment Adviser receives from each Fund, on a monthly basis, an advisory fee at the annual rate of 1.40% for TEFQX and 1.53% for ALTEX of its average daily net assets, respectively. The Advisory Agreement requires the Investment Adviser to waive fees and, if necessary, to reimburse expenses of each Fund to the extent necessary to limit a Fund’s total operating expenses to 1.85%, for TEFQX and 1.98% for ALTEX, excluding any extraordinary fees, of its average net assets up to $200 million, 1.80% for TEFQX and 1.93% for ALTEX of such assets from $200 million to $500 million, 1.75% for TEFQX and 1.88% for ALTEX of such assets from $500 million to $1 billion, and 1.70% for TEFQX and 1.83% for ALTEX of such assets in excess of $1 billion.
NOTES TO FINANCIAL STATEMENTS - continued
December 31, 2015
ADMINISTRATION AGREEMENT
The Trust has entered into a separate Administration Agreement with the Investment Adviser. The agreement obligates the Investment Adviser to provide administrative and general supervisory services to each Fund (the “Administration Agreement”). Under the Administration Agreement, the Investment Adviser renders supervisory and corporate administrative services to the Trust, as well as oversees the maintenance of all books and records with respect to each Fund’s securities transactions and each Fund’s book of accounts in accordance with all applicable federal and state laws and regulations. The Investment Adviser also arranges for the preservation of journals, ledgers, corporate documents, brokerage account records, and other records as required by the 1940 Act.
The Investment Adviser is responsible for the equipment, staff, office space, and facilities necessary to perform its obligations under the Administration Agreement. Under the Administration Agreement, the Investment Adviser has assumed responsibility for payment of all of each Fund’s operating expenses excluding brokerage and commission expenses; short sale expenses; fees payable under “Rule 12b-1 plans”, if any, and shareholder servicing plans, if any; litigation costs; and any extraordinary and non-recurring expenses. For the services it provides under the Administration Agreement, the Investment Adviser receives a fee from each Fund at the annual rate of 0.45% of its average daily net assets up to $200 million, 0.40% of such assets from $200 million to $500 million, 0.35% of such assets from $500 million to $1 billion, and 0.30% of such assets in excess of $1 billion.
BNY Mellon Investment Servicing (US) Inc. (“BNY Mellon”), has a Sub-Administration Agreement with the Investment Adviser. Under this agreement, the Investment Adviser (not the Funds) pays to BNY Mellon the fees for the administrative services provided by BNY Mellon. In the case of Firsthand Alternative Energy Fund, the Investment Adviser has also agreed to donate a portion of its management fees allocated, amounting to 0.20% of Firsthand Alternative Energy Fund’s average daily net assets, to various non-profit organizations as elected by Fund shareholders.
Additionally, BNY Mellon serves as the sub-administrator, investment accounting agent and shareholder servicing and transfer agent. The Bank of New York Mellon, serves as the custodian for the Trust.
5. INVESTMENTS IN RESTRICTED SECURITIES
Restricted securities include securities that have not been registered under the Securities Act of 1933, as amended, and securities that are subject to restrictions on resale. A Fund may invest in restricted securities that are consistent with a Fund’s investment objective and investment strategies. A Fund will not invest in a restricted security if, immediately after and as a result of the investment in such security, more than 15% of the Fund’s net assets would be invested in illiquid securities. In some cases, the issuer of restricted securities has agreed to register such securities for resale, at the issuer’s expense either upon demand by the Fund or in connection with another registered offering of the securities. Investments in restricted securities are valued at fair value as determined in good faith in accordance with procedures adopted by the Board of Trustees. It is possible that the estimated value may differ significantly from the amount that might ultimately be realized in the near term, and the difference could be material.
NOTES TO FINANCIAL STATEMENTS - continued
December 31, 2015
As of December 31, 2015, Firsthand Technology Opportunities Fund did not invest in any restricted securities and the Firsthand Alternative Energy Fund was invested in the following restricted securities:
| SECURITY | ACQUISITION
DATE | | SHARES | | | COST | | | VALUE | | | % OF NET
ASSETS | |
| Silicon Genesis Corp., Common Stock | September 2, 2008 | | | 109,855 | | | $ | 32,957 | | | $ | 2,746 | | | | 0.0 | %* |
| Silicon Genesis Corp., Common Stock | September 26, 2008 | | | 71,552 | | | | 21,466 | | | | 1,789 | | | | 0.0 | %* |
| Silicon Genesis Corp., Series 1-C P/S | September 2, 2008 | | | 152 | | | | 46 | | | | 186 | | | | 0.0 | %* |
| Silicon Genesis Corp., Series 1-E P/S | September 2, 2008 | | | 3,000 | | | | 3,180 | | | | 1,371 | | | | 0.0 | %* |
| | | | | | | | $ | 57,649 | | | $ | 6,092 | | | | 0.0 | %* |
P/S - Preferred Stock
Each Fund, consistent with SEC guidelines, has an investment restriction providing that it cannot purchase additional restricted securities once such securities comprise 15% of a Fund’s net assets. The SEC considers a security to be illiquid if it cannot be disposed of within seven days in the ordinary course of business at approximately the amount at which a Fund has valued the security. The restriction stems from the concern that, for an open-end mutual fund with daily redemption obligations, a high level of illiquid securities would increase the risk that a Fund may not be able to meet its daily redemption needs, because illiquid securities often take a longer period of time to sell, and may not necessarily be sold at that Fund’s then carrying value.
NOTES TO FINANCIAL STATEMENTS - continued
December 31, 2015
As of December 31, 2015, Kevin Landis represents the Funds and sits on the following private company’s board: Silicon Genesis Corporation. Serving on the boards of directors of the portfolio companies may cause conflicts of interest. The Adviser has adopted various procedures to ensure that the Funds will not be unfavorably affected by these potential conflicts.
6. RISKS
Because the return on and value of an investment in each Fund will fluctuate in response to stock market movements, the most significant risk of investing in a Fund is that you may lose money. Stocks and other equity securities are subject to market risks and fluctuations in value due to earnings, as well as economic, political, or regulatory events, and other factors beyond the Investment Adviser’s control. The Funds are designed for long-term investors who can accept the risks of investing in a fund with significant common stock holdings in high-technology industries.
Each Fund is non-diversified. A risk of being non-diversified is that a significant change in the value of one company will have a greater impact on a Fund than it would if the Fund diversified its investments. Another risk for each Fund is its concentration of investments in companies within high-technology industries. The value of high-technology companies can, and often does, fluctuate dramatically and may expose you to greater-than-average financial and market risk.
7. SUBSEQUENT EVENT
Management has evaluated the impact of all subsequent events on the Funds through the date the financial statements were issued, and has determined that there were no subsequent events requiring recognition or disclosure in the financial statements.
ADDITIONAL INFORMATION (UNAUDITED)
December 31, 2015
BOARD REVIEW OF ADVISORY AGREEMENT (UNAUDITED)
Trustees (the “Board”) of Firsthand Funds (the “Trust”), including all of the Trustees who are not “interested persons” of the Trust, as that term is defined in the 1940 Act (the “Independent Trustees”), considered the renewal of the master investment advisory agreement between Firsthand Capital Management, Inc. (the “Adviser”) and the Trust on behalf of each of its series (each a “Fund” and collectively, the “Funds”) (the “Investment Advisory Agreement”). The Advisory Agreement was approved for an additional one-year term at a meeting of the Board held on August 7, 2015. The Board’s decision to approve the Advisory Agreement reflects the exercise of its business judgment to continue the existing arrangement. In approving the Advisory Agreement, the Board considered information provided by the Adviser, with the assistance and advice of counsel to the Independent Trustees and counsel to the Trust.
Nature, Extent and Quality of Services
The Board received and considered various data and information regarding the nature, extent and quality of services provided to the Funds by the Adviser. The most recent AdviserForm ADV for the Adviser was provided to the Board, as were written and oral responses of the Adviser to an information request submitted by independent legal counsel on behalf of the Independent Trustees. The Board reviewed these responses, which included, among other things, information about the background and experience of the investment personnel of the Adviser primarily responsible for day-to-day portfolio management of the Funds. The Board also considered the Adviser’s separate Administration Agreement with the Funds and the Adviser’s overall ability to manage and administer the Funds as well as to oversee the service providers to the Funds.
The Board evaluated the ability of the Adviser, considering its financial condition, resources, reputation and other attributes, to attract and retain highly qualified investment professionals, including research, advisory, supervisory and administrative personnel. In this regard, the Board considered information regarding the Adviser’s compensation program for its personnel involved in the management of the Funds, including incentive and retirement plans.
The Board considered the effectiveness of policies of the Funds in achieving the best execution of portfolio transactions, whether and to what extent “soft dollar” benefits are sought, the extent to which efforts are made to recapture transaction costs and the controls applicable to brokerage allocation procedures. The Board reviewed the policies of the Adviser regarding the allocation of portfolio investment opportunities among the Funds and other clients. The Board noted that the Adviser does not use “traditional soft-dollar” arrangements, where soft-dollar credits are generated based on the level of trades and then used for products or services from third-parties. The Board also noted that the Adviser, from time to time, entered into arrangements where it received research (including invitations to conferences) from broker-dealers that the Adviser used to execute client trades. The Board also considered that the Adviser had outsourced the trading function to achieve certain operating efficiencies.
ADDITIONAL INFORMATION (UNAUDITED) - continued
December 31, 2015
The Board also considered the markets for the Funds, including the principal channels through which the Funds’ shares are offered and sold, and the activities of the Adviser in connection with the marketing of the Funds.
In addition, the Board received and reviewed information on SEC and other inquiries, examinations and proceedings relating to the Funds and the Adviser, including the former Adviser. The Board considered the investment and legal compliance programs of the Adviser, including its implementation of enhanced compliance policies and procedures in response to SEC rule changes and other regulatory initiatives, and the level of compliance attained by the Adviser.
Based on the above factors, together with those referenced below, the Board, including a majority of the Independent Trustees, concluded that it was generally satisfied with the nature, extent and quality of the investment advisory services provided to each fund by the Adviser.
Fund Performance
The Board considered each Fund’s performance results over one-year, three-year, five-year and ten-year periods, or shorter periods, as relevant. It also considered these results in comparison to the performance results of various benchmark indices and of the Funds in relevant Morningstar sectors. The Board referenced the presentation regarding performance earlier in the meeting and noted that TOF had outperformed its respective primary benchmark for the ten-year period ended June 30, 2015, which is consistent with the Board’s emphasis on longer-term performance. The Board also noted that AEF had outperformed peer funds and its sector benchmark for the three-and five-year periods ended June 30, 2015. The Board recognized that each Fund had experienced various periods of underperformance against the peer group funds and the applicable benchmark index, but the Board noted that the Adviser has remained committed to its investment strategy and style, and the Board was pleased with that consistency.
Investment Advisory Fee Rates and Other Expenses
The Board reviewed and considered the proposed contractual investment advisory fee rates (the “Advisory Agreement Rates”) payable by the Funds to the Adviser for investment advisory services. Additionally, the Board received and considered information comparing the Advisory Agreement Rates (both on a stand-alone basis and on a combined basis with the Funds’ administration fee rates) and the total expense ratios of the Funds with those of other funds in appropriate peer universes provided by Lipper. The Board noted that the respective Advisory Agreement Rates for each Fund were significantly higher than the median rates of each fund’s peer universe, but that the total expense ratio of each Fund was not appreciably above the median total expense ratio of the respective peer universe. The Board deemed the comparison of total expense ratios to be more relevant than the comparison of Advisory Agreement Rates because of the unitary fee structure of the Funds.
ADDITIONAL INFORMATION (UNAUDITED) - continued
December 31, 2015
Profitability
The Board received and considered a profitability analysis of the Adviser with respect to the Funds. The Board concluded that, in light of the costs of providing investment management and other services to the Funds, the profits and other ancillary benefits that the Adviser received with regard to providing these services to the Funds were not excessive.
Economies of Scale
The Board received and considered information regarding whether there have been economies of scale with respect to the management of the Funds, whether the Funds have appropriately benefited from any economies of scale, and whether there is potential for realization of any further economies of scale with respect to the existing Funds. The Board observed that the Investment Advisory Agreement limits each Fund’s total annual operating expenses to a percentage of the Fund’s assets and that this percentage is reduced as the Fund’s assets grow (known as “breakpoints”). The Board concluded that no change was necessary to the current breakpoints to reflect any economies of scale.
Information about Services to Other Clients
The Board also received and considered information about the services and fee rates offered by the Adviser to its other clients, including other registered and unregistered investment companies, private accounts and institutional investors. The Board concluded that the investment advisory rates charged by the Adviser to the Funds were within a reasonable range of the fee rates offered to other clients of the Adviser. Where rates offered to other clients or potential clients were lower, the Board concluded that the costs associated with managing and operating a registered open-end fund, compared with an unregistered investment company, private account or institutional investor account provided a justification for higher fee rates to the Funds.
Other Benefits to the Adviser
The Board received and considered information regarding potential “fall-out” or ancillary benefits to the Adviser as a result of its relationship with the Funds. Such benefits could include, among others, benefits directly attributable to the relationship of the Adviser with the Funds (such as “soft dollar” benefits) and benefits potentially derived from an increase in the business of the Adviser as a result of its relationship with the Funds (such as the ability to market to shareholders other financial products offered by the Adviser).
ADDITIONAL INFORMATION (UNAUDITED) - continued
December 31, 2015
Other Factors and Broader Review
Throughout the year, the Board regularly reviews and assesses the quality of the services that the Funds receive from the Adviser. In this regard, the Board reviews reports of the Adviser in each of its quarterly meetings, which include, among other things, a detailed portfolio review and detailed fund performance reports. In addition, the Board interviews the portfolio managers of the Funds at various times throughout the year.
After considering the aforementioned factors and based on its deliberations and evaluation of the information provided to it, the Board concluded that re-approval of the Investment Advisory Agreement for each of the Funds was in the best interest of the Funds and their shareholders.
FEDERAL TAX INFORMATION (UNAUDITED)
For the fiscal year ended December 31, 2015, the Funds make the following disclosures for federal income tax purposes. Below is listed the percentages, or the maximum amount allowable, of its ordinary income dividends (“QDI”) to qualify for the lower tax applicable to individual shareholders, and the percentage of ordinary income dividends earned by the Funds which qualifies for the dividends received deduction (“DRD”) for corporate shareholders. The actual percentage of QDI and DRD for the calendar year will be designated in year-end tax statements.
| | QDI | DRD |
| Firsthand Technology Opportunities Fund | 57.77% | 54.96% |
| Firsthand Alternative Energy Fund | 0.00% | 0.00% |
PROXY VOTING POLICIES AND PROCEDURES
The Funds have adopted proxy voting procedures pursuant to which the Funds delegate the responsibility for voting proxies relating to portfolio securities held by the Funds to the Investment Adviser as part of the Investment Adviser’s general management of the Funds, subject to the Board of Trustees’ continuing oversight. A copy of the Funds’ proxy voting policy and procedures is available without charge, upon request, by calling 1.888.884.2675. Information regarding how the Investment Adviser voted these proxies during the most recent one-year period ended June 30 is available by calling the same number and on the website of the U.S. Securities and Exchange Commission at http://www.sec.gov on Form N-PX. The Funds’ voting record is also available on the Funds’ website at www.firsthandfunds.com/proxy.
ADDITIONAL INFORMATION (UNAUDITED) - continued
December 31, 2015
PORTFOLIO HOLDINGS
The Funds file their complete schedule of portfolio holdings with the SEC for the first and third quarters of each fiscal year on Form N-Q. The Funds’ Forms N-Q will be available on the SEC’s website at http://www.sec.gov and may be reviewed and copied at the SEC’s Public Reference Room in Washington, D.C. Information on the operation of the Public Reference Room may be obtained by calling 1.800.SEC.0330.
ADDITIONAL INFORMATION (UNAUDITED) - continued
December 31, 2015
Information about the trustees and officers* of the Funds is set forth in the following table. The Statement of Additional Information (the “SAI”) includes additional information about the Funds’ trustees and officers and is available free of charge, upon request, by calling 1.888.884.2675.
| NAME, YEAR OF BIRTH, POSITION(S) HELD WITH FUNDS AND ADDRESS | TERM OF OFFICE AND LENGTH OF TIME SERVED(1) | PRINCIPAL OCCUPATION(S) DURING PAST FIVE YEARS | NUMBER OF FUNDS IN FUND COMPLEX OVERSEEN BY TRUSTEE | OTHER TRUSTEESHIPS HELD BY TRUSTEES |
| DISINTERESTED TRUSTEES |
Greg Burglin (1960) TRUSTEE 150 Almaden Blvd. Suite 1250 San Jose, CA 95113 | SINCE 2008 | Mr. Burglin is a Tax Consultant and has been for more than 5 years. | THREE | None |
Kimun Lee (1946) TRUSTEE 150 Almaden Blvd. Suite 1250 San Jose, CA 95113 | SINCE 2013 | Mr. Lee is a California registered investment advisor. In addition, he has also conducted a consulting business under the name Resources Consolidated since January 1980. | THREE | Since September 2009, Mr. Lee has served as a prin-ciple and director of iShares Delaware Trust Sponsor LLC, a commodity pool operator that operates iShares S&P GSCI Commodity Optimized Trust, iShares Commodity Indexed Trust, iShares Gold Trust, and iShares Silver Trust. Since April 2014, Mr. Lee has served as a trustee of FundX Investment Trust that operates FundX Upgrader Fund, FundX Aggressive Upgrader Fund, FundX Conservatative Up-grader Fund, FundX Flexible Income Fund, FundXTactical Upgrader Fund, and FundX Flexible Total Return Fund. |
ADDITIONAL INFORMATION (UNAUDITED) - continued
December 31, 2015
| NAME, YEAR OF BIRTH, POSITION(S) HELD WITH FUNDS AND ADDRESS | TERM OF OFFICE AND LENGTH OF TIME SERVED(1) | PRINCIPAL OCCUPATION(S) DURING PAST FIVE YEARS | NUMBER OF FUNDS IN FUND COMPLEX OVERSEEN BY TRUSTEE | OTHER TRUSTEESHIPS HELD BY TRUSTEES |
| INTERESTED TRUSTEE |
Kevin M. Landis2 (1961) TRUSTEE/PRESIDENT/ SECRETARY 150 Almaden Blvd. Suite 1250 San Jose, CA 95113 | SINCE 1994 | Mr. Landis is President and Chief Executive Officer of Firsthand Capital Management and has been portfolio manager with FCM since August 2009. | THREE | NONE3 |
| OFFICERS WHO ARE NOT TRUSTEES |
Dimitris Spiliakos (1977) ASSISTANT SECRETARY One Boston Place 201 Washington Street 34th Floor Boston, MA 02108 | SINCE 2015 | Mr. Spiliakos is Vice President and Manager of BNY Mellon Investment Servicing (US) Inc. Since 2015. He was Senior Specialist of BNY Mellon Investment Servicing (US) Inc. from 2012 to 2015. He was Public Finance Paralegal at Bowditch & Dewey, LLP from 2007 to 2012. | N/A | N/A |
ADDITIONAL INFORMATION (UNAUDITED) - continued
December 31, 2015
| NAME, YEAR OF BIRTH, POSITION(S) HELD WITH FUNDS AND ADDRESS | TERM OF OFFICE AND LENGTH OF TIME SERVED(1) | PRINCIPAL OCCUPATION(S) DURING PAST FIVE YEARS | NUMBER OF FUNDS IN FUND COMPLEX OVERSEEN BY TRUSTEE | OTHER TRUSTEESHIPS HELD BY TRUSTEES |
| OFFICERS WHO ARE NOT TRUSTEES (continued) |
NICHOLE MILESKI (1971) CHIEF COMPLIANCE OFFICER 150 Almaden Blvd. Suite 1250 San Jose, CA 95113 | SINCE 2013 | Ms. Mileski is corporate counsel of FCM since 2013; corporate paralegal of FCM since 2011. Bankruptcy paralegal at Law Office of Julian Roberts from 2009 to 2011. | N/A | N/A |
OMAR BILLALWALA (1961) TREASURER 150 Almaden Blvd. Suite 1250 San Jose, CA 95113 | SINCE 2011 | Chief Operating Officer and Chief Financial Officer of Firsthand Capital Management, Inc. from 1999 to present. Treasurer of Firsthand Funds from 2011 to present. | N/A | N/A |
| * | The term “officer” means the president, vice president, secretary, treasurer, chief compliance officer, controller, or any other officer who performs policy-making functions. |
| (1) | Each trustee shall serve for the lifetime of Firsthand Funds or until he dies, resigns, or is removed. Each officer shall serve a one-year term subject to annual reappointment by the trustees. |
| (2) | Mr. Landis is an interested person of the Funds by reason of his position with the Investment Adviser. |
| (3) | Mr. Landis also currently sits on the board of directors for 10 private companies: Silicon Genesis Corp.; Hera Systems, Inc.; Hiku Labs, Inc.; IntraOp Medical Corp.; Pivotal Systems Corp.; Phunware, Inc.; QMAT, Inc.; Telepathy Investors, Inc.; Vufine, Inc.; and Wrightspeed, Inc. |
THIS PAGE INTENTIONALLY LEFT BLANK
THIS PAGE INTENTIONALLY LEFT BLANK
FIRSTHAND FUNDS
P.O. Box 9836
Providence, RI 02940-8036
www.firsthandfunds.com
INVESTMENT ADVISER
Firsthand Capital Management, Inc.
150 Almaden Blvd., Suite 1250
San Jose, CA 95113
www.firsthandcapital.com
DISTRIBUTOR
ALPS Distributors, Inc.
1290 Broadway
Suite 1100
Denver, CO 80203
TRANSFER AGENT
BNY Mellon Investment Servicing (US) Inc.
4400 Computer Drive
Westborough, MA 01581
1.888.884.2675
This report is provided for the general information of the shareholders of Firsthand Funds. This report is not intended for distribution to prospective investors in the Funds, unless preceded or accompanied by an effective prospectus. For more complete information about Firsthand Funds, please call toll free 1.888.884.2675 or visit www.firsthandfunds.com for a prospectus, which contains more information, including risks, fees, and expenses. Read the prospectus carefully before investing or sending money.
Firsthand Funds are distributed by ALPS Distributors, Inc.
The interlocking “F” design is a registered trademark of Firsthand Capital Management, Inc.
Item 2. Code of Ethics.
| | (a) | The registrant, as of the end of the period covered by this report, has adopted a code of ethics that applies to the registrant’s principal executive officer, principal financial officer, principal accounting officer or controller, or persons performing similar functions, regardless of whether these individuals are employed by the registrant or a third party |
| (c) | There have been no amendments, during the period covered by this report, to a provision of the code of ethics that applies to the registrant’s principal executive officer, principal financial officer, principal accounting officer or controller, or persons performing similar functions, regardless of whether these individuals are employed by the registrant or a third party, and that relates to any element of the code of ethics description except that effective May 13, 2011, Omar Billawala replaced Kevin Landis as Treasurer (in the capacity of Chief Financial Officer) of the registrant. |
| (d) | The registrant has not granted any waivers, including an implicit waiver, from a provision of the code of ethics that applies to the registrant’s principal executive officer, principal financial officer, principal accounting officer or controller, or persons performing similar functions, regardless of whether these individuals are employed by the registrant or a third party, that relates to one or more of the items set forth in paragraph (b) of this item’s instructions. |
Item 3. Audit Committee Financial Expert.
Registrant’s Board of Trustees has determined that no board member is an “audit committee financial expert”.
Item 4. Principal Accountant Fees and Services.
Audit Fees
| | (a) | The aggregate fees billed for each of the last two fiscal years for professional services rendered by the principal accountant for the audit of the registrant's annual financial statements or services that are normally provided by the accountant in connection with statutory and regulatory filings or engagements for those fiscal years are $30,800 for 2014 and $30,800 for 2015. |
Audit-Related Fees
| | (b) | The aggregate fees billed in each of the last two fiscal years for assurance and related services by the principal accountant that are reasonably related to the performance of the audit of the registrant's financial statements and are not reported under paragraph (a) of this Item are $0 for 2014 and $0 for 2015. |
Tax Fees
| | (c) | The aggregate fees billed in each of the last two fiscal years for professional services rendered by the principal accountant for tax compliance, tax advice, and tax planning are $4,200 for 2014 and $4,200 for 2015. |
All Other Fees
| (d) | The aggregate fees billed in each of the last two fiscal years for products and services provided by the principal accountant, other than the services reported in paragraphs (a) through (c) of this Item are $1,500 for 2014 and $1,500 for 2015. |
| | (e)(1) | Disclose the audit committee's pre-approval policies and procedures described in paragraph (c)(7) of Rule 2-01 of Regulation S-X. |
The registrant's Audit Committee Charter states the following with respect to pre-approval procedures:
The Committee hereby delegates to the Chairman of the Committee the authority to grant pre-approvals of audit and "permissible" non-audit services to be provided by the Auditors to the Funds, subject to the ratification of the full Committee at its next regularly scheduled meeting. Both the Auditors and Fund counsel will be responsible for informing the Committee whether they believe that a particular non-audit service is permissible or prohibited pursuant to applicable regulations and standards.
The specific types of non-audit services that the Chairman may pre-approve include, but are not limited to: reviewing the Funds' internal controls over financial reporting; providing tax-related services; reviewing and/or developing an anti-money laundering program; and issuing comfort letters, based on agreed-upon procedures, in connection with any Fund reorganization.
Pre-approval for a non-audit service provided to a Fund is not required if: (i) the aggregate amount of all such non-audit services provided to the Fund constitutes not more than 5% of the total amount of revenues paid by the Fund to the Auditors during the fiscal year in which the non-audit services are provided; (ii) such services were not recognized by the Fund at the time of the engagement to be non-audit services; and (iii) such services are promptly brought to the attention of the Committee and are approved by the Committee or by one or more members of the Committee to whom authority to grant such approvals has been delegated by the Committee prior to the completion of the audit (the "De Minimus Exceptions").
The Committee shall also pre-approve any non-audit services proposed to be provided by the Auditors to (i) a Fund's investment adviser and (ii) any entity controlling, controlled by, or under common control with the investment adviser that provides ongoing services to the Fund, if the Auditors' engagement with the investment adviser or any such control persons relates directly to the operations and financial reporting of the Fund. The De Minimus Exceptions applies to pre-approvals under this paragraph as well, except that the "total amount of revenues" calculation is based on the total amount of revenues paid to the Auditors by the Fund and any other entity that has its services approved under this paragraph (i.e., the investment adviser or any control person).
| | (e)(2) | The percentage of services described in each of paragraphs (b) through (d) of this Item that were approved by the audit committee pursuant to paragraph (c)(7)(i)(C) of Rule 2-01 of Regulation S-X are as follows: |
(b) 100%
(c) 100%
(d) 100%
| | (f) | The percentage of hours expended on the principal accountant's engagement to audit the registrant's financial statements for the most recent fiscal year that were attributed to work performed by persons other than the principal accountant's full-time, permanent employees was less than fifty percent. |
| (g) | The aggregate non-audit fees billed by the registrant's accountant for services rendered to the registrant, and rendered to the registrant's investment adviser (not including any sub-adviser whose role is primarily portfolio management and is subcontracted with or overseen by another investment adviser), and any entity controlling, controlled by, or under common control with the adviser that provides ongoing services to the registrant for each of the last two fiscal years of the registrant was $0 for 2014 and $0 for 2015 . |
Item 5. Audit Committee of Listed Registrants.
Not applicable.
Item 6. Investments.
| (a) | Schedule of Investments in securities of unaffiliated issuers as of the close of the reporting period is included as part of the report to shareholders filed under Item 1 of this form. |
Item 7. Disclosure of Proxy Voting Policies and Procedures for Closed-End Management Investment Companies.
Not applicable.
Item 8. Portfolio Managers of Closed-End Management Investment Companies.
Not applicable.
Item 9. Purchases of Equity Securities by Closed-End Management Investment Company and Affiliated Purchasers.
Not applicable.
Item 10. Submission of Matters to a Vote of Security Holders.
Not applicable.
Item 11. Controls and Procedures.
| | (a) | The registrant’s principal executive officer and principal financial officer have concluded, based on their evaluation of the registrant's disclosure controls and procedures as conducted within 90 days of the filing date of this report, that these disclosure controls and procedures are adequately designed and are operating effectively to ensure that information required to be disclosed by the registrant on Form N-CSR is recorded, processed, summarized and reported within the time periods specified in the Securities and Exchange Commission's rules and forms. |
| | (b) | There were no changes in the registrant’s internal control over financial reporting (as defined in Rule 30a-3(d) under the Act (17 CFR 270.30a-3(d)) that occurred during the second fiscal quarter of the period covered by this report that have materially affected or are reasonably likely to materially affect, the registrant’s internal control over financial reporting. |
Item 12. Exhibits.
| (a)(1) | Code of ethics, or any amendment thereto, that is the subject of disclosure required by Item 2 is attached hereto. |
| (a)(2) | Certifications pursuant to Rule 30a-2(a) under the 1940 Act and Section 302 of the Sarbanes-Oxley Act of 2002 are attached hereto. |
| (b) | Certifications pursuant to Rule 30a-2(b) under the 1940 Act and Section 906 of the Sarbanes-Oxley Act of 2002 are attached hereto. |
SIGNATURES
Pursuant to the requirements of the Securities Exchange Act of 1934 and the Investment Company Act of 1940, the registrant has duly caused this report to be signed on its behalf by the undersigned, thereunto duly authorized.
(Registrant) | Firsthand Funds | |
| | |
By (Signature and Title)* | /s/ Kevin Landis | |
| | Kevin M. Landis, President and Secretary | |
| | (principal executive officer) | |
| | | |
| Date | February 29, 2016 | |
Pursuant to the requirements of the Securities Exchange Act of 1934 and the Investment Company Act of 1940, this report has been signed below by the following persons on behalf of the registrant and in the capacities and on the dates indicated.
By (Signature and Title)* | /s/ Kevin Landis | |
| | Kevin M. Landis, President and Secretary | |
| | (principal executive officer) | |
| | | |
| Date | February 29, 2016 | |
By (Signature and Title)* | /s/ Omar Billawala | |
| | Omar Billawala, Treasurer | |
| | (principal financial officer) | |
| | | |
| Date | February 29, 2016 | |
* | Print the name and title of each signing officer under his or her signature. |