UNITED STATES
SECURITIES AND EXCHANGE COMMISSION
Washington, D.C. 20549
FORM N-CSR
CERTIFIED SHAREHOLDER REPORT OF REGISTERED
MANAGEMENT INVESTMENT COMPANIES
Investment Company Act file number | 811-08268 |
|
Firsthand Funds |
(Exact name of registrant as specified in charter) |
|
150 Almaden Blvd., Suite 1250
San Jose, CA | | 95113 |
(Address of principal executive offices) | | (Zip code) |
|
SiVest Group, Incorporated
150 Almaden Blvd., Suite 1250
San Jose, CA 95113 |
(Name and address of agent for service) |
|
Registrant’s telephone number, including area code: | (408) 624-9527 | |
|
Date of fiscal year end: | December 31 | |
|
Date of reporting period: | December 31, 2018 | |
| | | | | | | | |
Form N-CSR is to be used by management investment companies to file reports with the Commission not later than 10 days after the transmission to stockholders of any report that is required to be transmitted to stockholders under Rule 30e-1 under the Investment Company Act of 1940 (17 CFR 270.30e-1). The Commission may use the information provided on Form N-CSR in its regulatory, disclosure review, inspection, and policymaking roles.
A registrant is required to disclose the information specified by Form N-CSR, and the Commission will make this information public. A registrant is not required to respond to the collection of information contained in Form N-CSR unless the Form displays a currently valid Office of Management and Budget (“OMB”) control number. Please direct comments concerning the accuracy of the information collection burden estimate and any suggestions for reducing the burden to Secretary, Securities and Exchange Commission, 450 Fifth Street, NW, Washington, DC 20549-0609. The OMB has reviewed this collection of information under the clearance requirements of 44 U.S.C. § 3507.
Item 1. Reports to Stockholders.
The Report to Shareholders is attached herewith.

Annual Report to Shareholders
Firsthand Technology Opportunities Fund
Firsthand Alternative Energy Fund

CONTENTS
Performance Summary | | | 2 | | |
President's Letter | | | 4 | | |
Shareholder Fee Example | | | 6 | | |
Performance and Portfolio Discussion | | | 8 | | |
Audit Letter | | | 14 | | |
Portfolio of Investments | | | 15 | | |
Statement of Assets and Liabilities | | | 19 | | |
Statement of Operations | | | 20 | | |
Statements of Changes in Net Assets | | | 21 | | |
Financial Highlights | | | 23 | | |
Notes to Financial Statements | | | 25 | | |
Additional Information | | | 39 | | |
PERFORMANCE SUMMARY
Period Returns (Average Annual Total Returns as of 12/31/18)
FUND | | 1-YEAR | | 3-YEAR | | 5-YEAR | | 10-YEAR | | GROSS
EXPENSE
RATIO* | |
Firsthand Technology Opportunities Fund | | | 4.31 | % | | | 19.78 | % | | | 14.39 | % | | | 19.72 | % | | | 1.86 | % | |
Firsthand Alternative Energy Fund | | | -18.57 | % | | | -2.01 | % | | | -3.25 | % | | | -0.35 | % | | | 2.15 | % | |
NASDAQ Composite Index | | | -2.81 | % | | | 11.16 | % | | | 11.05 | % | | | 16.85 | % | | | • | | |
S&P 500 Index | | | -4.39 | % | | | 9.24 | % | | | 8.48 | % | | | 13.10 | % | | | • | | |
WilderHill Clean Energy Index | | | -14.60 | % | | | -2.41 | % | | | -7.10 | % | | | -5.73 | % | | | • | | |
* After fee waivers, Firsthand Technology Opportunities Fund's total net operating expenses are 1.85% and Firsthand Alternative Energy Fund's total net operating expenses are 1.98% . Please see the Funds' prospectus for more information about fund expenses.
Returns assume reinvestment of all dividends and distributions but do not reflect the impact of taxes. The performance data quoted represent past performance. Past performance cannot guarantee future results, and current performance may be lower or higher than the performance quoted. Both the return from and the principal value of an investment in the Funds will fluctuate so that an investor's shares, when redeemed, may be worth more or less than their original cost. To obtain performance as of the most recent month-end, please contact Firsthand Funds by calling 1.888.884.2675 or go to www.firsthandfunds.com.
The Nasdaq Composite Index (NASDAQ) is a capitalization-weighted index of all common stocks listed with NASDAQ. The Standard & Poor's 500 Index (S&P 500) is a market-weighted index of 500 stocks of well-established companies. Each index represents an unmanaged, broad-based basket of stocks. These indices are typically used as benchmarks for overall market performance. The WilderHill Clean Energy Index is a market-weighted index of 58 companies in the cleaner fuel, energy conversion, energy storage, greener utilities, power delivery and conservation, and renewable energy harvesting sectors. The Dow Jones Industrial Average is a price-weighted average of 30 significant stocks traded on the New York Stock Exchange and the NASDAQ. You cannot invest directly in an index.
2018 Annual Report
2
Returns Since Inception (Average Annual Total Returns as of 12/31/18)
FUND (INCEPTION DATE) | | AVERAGE
ANNUAL
TOTAL
RETURNS | | NASDAQ
COMPOSITE
INDEX | | S&P 500
INDEX | | WILDERHILL
CLEAN
ENERGY
INDEX | |
Firsthand Technology Opportunities Fund (09/30/99) | | | 2.59 | % | | | 5.71 | % | | | 5.55 | % | | | • | | |
Firsthand Alternative Energy Fund (10/29/07) | | | -5.23 | % | | | 9.25 | % | | | 6.70 | % | | | -14.13 | % | |
Each Fund may invest in small-capitalization companies and Initial Public Offerings ("IPOs"). These investments will be more volatile than investments in large-capitalization companies and loss of principal could be greater. The Funds may invest in foreign securities, which will be subject to greater risks than investing in domestic securities. Because the Funds are not diversified, they can take larger positions in fewer companies, increasing their risk profile. The Funds invest in several industries within the technology sector and the relative weightings of these industries in a Fund's portfolio may change at any time.
Holdings by Industry - % of Net Assets (as of 12/31/18)
INDUSTRY | | FIRSTHAND TECHNOLOGY
OPPORTUNITIES FUND | | FIRSTHAND ALTERNATIVE
ENERGY FUND | |
Advanced Materials | | | • | | | | 4.4 | % | |
Agriculture | | | • | | | | 0.0 | % | |
Automotive | | | • | | | | 0.0 | % | |
Biotech | | | • | | | | 2.2 | % | |
Cloud Computing | | | 2.7 | % | | | • | | |
Communications | | | 1.1 | % | | | • | | |
Computer | | | 1.0 | % | | | • | | |
Computer Storage Devices | | | 1.0 | % | | | • | | |
Consumer Electronics | | | 5.0 | % | | | • | | |
Education | | | 5.2 | % | | | • | | |
Electrical Equipment | | | • | | | | 3.0 | % | |
Energy Efficiency | | | • | | | | 10.8 | % | |
Engineering Service | | | • | | | | 3.4 | % | |
Environmental Services | | | • | | | | 1.6 | % | |
Industrials | | | • | | | | 7.9 | % | |
Intellectual Property | | | • | | | | 0.0 | % | |
Internet | | | 26.7 | % | | | • | | |
Materials | | | • | | | | 4.8 | % | |
Networking | | | 15.9 | % | | | • | | |
Other Electronics | | | 3.5 | % | | | 13.0 | % | |
Renewable Energy | | | • | | | | 29.0 | % | |
Semiconductors | | | 4.4 | % | | | 8.0 | % | |
Services | | | 0.1 | % | | | • | | |
Social Networking | | | 3.7 | % | | | • | | |
Software | | | 28.7 | % | | | • | | |
Waste & Environment Service | | | • | | | | 3.0 | % | |
Investment Company | | | 0.9 | % | | | 9.5 | % | |
Net Other Liabilities | | | 0.1 | % | | | (0.6 | )% | |
Portfolio holdings are subject to change.
www.firsthandfunds.com
3

Fellow Shareholders,
The powerful rally that pushed stock prices higher in 2017 continued through the first half of 2018. However, a combination of factors, including escalating trade tensions with China and ongoing scrutiny of the technology sector's role in policing online content, caused a sharp increase in market volatility, spooking investors and leading to a pronounced fourth quarter reversal. After marking all-time record highs during the year, both the NASDAQ Composite Index and the S&P 500 Index finished the year in the red with declines of 2.81% and 4.39%, respectively, in 2018. I am pleased to report that, despite the challenging market conditions, Firsthand Technology Opportunities Fund produced a gain of 4.31% for the year, outperforming both of its benchmark indices. With continued weakness in the renewable energy sector, Firsthand Alternative Energy Fund declined 18.57% for the year, underperforming both the WilderHill Clean Energy Index and the S&P 500 Index, which reported losses of 14.60% and 4.39%, respectively, in 2018.
You can read more about the biggest individual contributors to fund performance on pages 8-12.
Firsthand Technology Opportunities Fund
In our Semi-Annual Report to Shareholders, I discussed the performance of what have become collectively known as the "FAANG" stocks: Facebook (FB), Amazon (AMZN), Apple (AAPL), Netflix (NFLX), and Google, now known as Alphabet (GOOG). These stocks were all the rage during the first half of 2018 and had become what some observers called a "crowded trade." In other words, it seemed everyone had to own these five stocks. It's a great feeling when "the crowd" decides it wants to own the stocks in one's portfolio. Later in the year we all witnessed what happens when the crowd stampedes out of certain investments.
Our concerns about the market's infatuation with the FAANG stocks led us to implement a strategy designed to differentiate our portfolio from those that have concentrated in such mega-cap stocks. Specifically, we did not buy additional shares of any of the FAANG stocks in 2018. Instead, we set our sights on companies that we believe have the ability to outperform these popular names. We believe this strategy enabled us to post gains for the year and outperform our benchmarks.
For example, we increased our holdings during the year in fast-growing companies such as Cree, Chegg, and Twilio. Twilio and Chegg finished 2018 as the two largest contributors to the Fund's positive performance for the year (see page 8 for more information).
We believe the cord-cutting trend still has plenty of room to run, and we initiated a position in Roku (ROKU) during the year to complement our investment in Netflix. We believe these two companies are in the right place at the right time, as consumers continue to seek alternatives to costly cable bundles.
We established new positions in a handful of software companies in 2018 that are perhaps best known for their splashy IPOs in recent years. In the first quarter, we added big data
2018 Annual Report
4
analytics company Splunk (SPLK) to the portfolio. After a successful IPO in 2012, Splunk stock languished for several years while the company quietly put up steadily-increasing sales figures. In Q4, we took advantage of market softness to initiate positions in MongoDB (MDB) and Okta (OKTA), suppliers of database and enterprise identity management software, respectively. Both companies debuted on the NASDAQ in 2017 and, similar to Splunk, watched their stock prices remain relatively stable while they consistently delivered solid sales growth. These three stocks, along with Twilio, are not as expensive as they once appeared, thanks to their increasing revenues, and the market rewarded their growth with higher valuations in 2018.
Firsthand Alternative Energy Fund
The solar energy industry came under significant pressure in 2018 from multiple directions. Most significantly, China's decision to aggressively cut solar energy subsidies and feed-in tariffs put a chill into solar stocks in the second half of the year. Ongoing trade disputes between the U.S. and China added to the uncertainty surrounding the industry. One bright spot for the solar industry during the year was residential solar installer Sunrun (RUN), which enjoyed a big run-up in its stock after a relatively flat year in 2017. Although profitability declined during 2018, the market appeared to appreciate the strong sequential growth in solar installations through the first three quarters of the year.
The wind energy industry continues to grow, in terms of megawatts installed. However, our investment in Vestas (VWSYF) struggled to maintain profitability in 2018 as intense competition led to declining prices for the company's wind turbines.
The Year Ahead
We expect to see trade tensions between the U.S. and China continuing to take center stage in 2019. China plays a key role for U.S. technology companies as both a major element of the supply chain and one of the largest consumer markets in the world. While equity markets appear to be generally healthy, additional headwinds may lie ahead in the form of slowing growth in China or Brexit confusion. We have assembled a strong portfolio of tech companies, but even the best companies will be affected by any general slowdown.
Thank you for your investment in Firsthand Funds.
Sincerely,

Kevin Landis
President, Firsthand Funds
Data and statistics presented have been calculated using data from Yahoo!Finance. All expressions of opinion are subject to change without notice.
www.firsthandfunds.com
5
SHAREHOLDER FEE EXAMPLE (UNAUDITED)
Example — In general, mutual fund shareholders may incur two types of costs: (1) transaction costs, including sales charges (loads), redemption fees, and exchange fees; and (2) ongoing costs, including management fees, 12b-1 distribution and service fees, non-12b-1 service fees, and other Fund expenses. This example is intended to help you understand your ongoing costs (in dollars) of investing in a Fund and to compare these costs with the ongoing costs of investing in other mutual funds. Note that Firsthand Funds ("Trust") does not charge transaction fees for 12b-1 distribution and service fees, though you may incur transaction fees if you purchase shares through a broker.
The example on the following page is based on an investment of $1,000 invested at the beginning of the period and held for the entire period from July 1, 2018 through December 31, 2018.
Actual Expenses — The section of the table at right entitled "Actual" provides information about actual account values and actual expenses. You may use this information, together with the amount you invested, to estimate the expenses that you paid over the period. Simply divide your account value by $1,000 (for example, an $8,600 account value divided by $1,000 = 8.6), then multiply the result by the number in the section entitled "Actual" under the heading "Expenses Paid During Period" to estimate the expenses you paid on your account during this period. If your account is an IRA or other tax-qualified savings plan, your expenses may also have included a $10 annual fee. In either case, the amount of any fee paid through your account would increase the estimate of expenses you paid during the period and decrease your ending account value.
Hypothetical Example for Comparison Purposes — The section of the table at right entitled "Hypothetical" provides information about hypothetical account values and hypothetical expenses based on a Fund's actual expense ratio and an assumed rate of return of 5% per year before expenses, which is not the Fund's actual return. The hypothetical account values and expenses may not be used to estimate your actual ending account balance or the expenses you paid for the period. However, you may use this information to compare the ongoing costs of investing in the Trust to other funds. To do so, compare this 5% hypothetical example with the 5% hypothetical examples that appear in the shareholder reports of the other funds. As in the case of the actual expense example, if your account is subject to an IRA fee, the amount of the fee paid through your account would increase the hypothetical expenses you would have paid during the period and decrease the hypothetical ending account value.
Please note that the expenses shown in the table below are meant to highlight your ongoing costs only and do not reflect any transactional costs, such as sales charges (loads), redemption fees, or exchange fees. Therefore, the table is useful in comparing ongoing costs only, and will not help you determine the relative total costs of owning different funds. In addition, if these transactional costs were included, your costs would have been higher. The examples also assume all dividends and distributions have been reinvested.
2018 Annual Report
6
SHAREHOLDER FEE EXAMPLE (UNAUDITED) - continued
Firsthand Technology Opportunities Fund
| | | BEGINNING
ACCOUNT VALUE
7/1/18 | | ENDING
ACCOUNT
VALUE
12/31/18 | | EXPENSES PAID
DURING
PERIOD*
7/1/18 - 12/31/18 | | ANNUALIZED EXPENSE
RATIO | |
Actual | | $ | 1,000 | | | $ | 877.00 | | | $ | 8.75 | | | | 1.85 | % | |
Hypothetical** | | $ | 1,000 | | | $ | 1,015.88 | | | $ | 9.39 | | | | 1.85 | % | |
Firsthand Alternative Energy Fund
| | | BEGINNING
ACCOUNT VALUE
7/1/18 | | ENDING
ACCOUNT
VALUE
12/31/18 | | EXPENSES PAID
DURING
PERIOD*
7/1/18 - 12/31/18 | | ANNUALIZED EXPENSE
RATIO | |
Actual | | $ | 1,000 | | | $ | 853.70 | | | $ | 9.25 | | | | 1.98 | % | |
Hypothetical** | | $ | 1,000 | | | $ | 1,015.22 | | | $ | 10.06 | | | | 1.98 | % | |
* Expenses are calculated by multiplying the Fund's annualized expense ratio listed above by the average account value over the period and multiplying that number by 184/365 (to reflect the one-half year period).
** 5% return per year before expenses.
The expenses shown in the table do not reflect any fees that may be charged to you by brokers, financial Intermediaries, or other financial institutions.
www.firsthandfunds.com
7
FIRSTHAND TECHNOLOGY OPPORTUNITIES FUND
Performance and Portfolio Discussion
How did the Fund perform in 2018?
Firsthand Technology Opportunities Fund (TEFQX) posted a gain of 4.31% in 2018 versus a loss of 2.81% for the NASDAQ Composite Index and a 4.39% loss for the S&P 500 Index. For the six months ended Decemeber 31, 2018, Firsthand Technology Opportunities Fund was down 12.30% compared to losses of 11.14% and 6.86% for the NASDAQ Composite Index and the S&P 500 Index, respectively.
Which industries had the greatest impact on the Fund's performance?
For the period ended December 31, 2018, software companies represented the portfolio's largest industry weighting, followed by holdings in the internet and networking industries. The portfolio's exposure to the internet and software industries contributed most to the Fund's outperformance versus its primary benchmark in 2018.
Which individual holdings were the largest contributors to the Fund's performance?
Twilio (TWLO) was the top contributor to Fund performance for the year. The cloud communications software company registered several consecutive quarters in which earnings exceeded analysts' expectations, and the company's shares finished 2018 up 278.39%. The company's sales strategies of focusing on ever-larger corporate customers and increasing sales from existing customers appear to be paying off.
Online education tool provider Chegg (CHGG) was another strong performer for the Fund during the period, with shares climbing 74.14%. Although its legacy textbook rental business has stagnated, Chegg is benefitting from strong brand awareness and a fast-growing services business to fuel improved revenues and gross margins.
Netflix (NFLX) was also a top contributor to the Fund during 2018, as the company continues to benefit from being on the right side of the powerful "cord-cutting" trend. The company enjoyed increasing paid membership additions during 2018 which, in turn, led to higher revenues and profits. Netflix shares finished 2018 up 39.44%.
Workday (WDAY) was another strong contributor to performance during the year, with its share price increasing 56.95% for the period. The provider of enterprise software for finance, human resources, and business planning is benefitting from businesses shifting their critical software and applications to cloud-based solutions.
Buoyed by expanding profitability, Amazon (AMZN) stock finished the year up 28.43% and contributed strongly to the Fund's outperformance in 2018.
Which holdings were the greatest detractors from the Fund's performance?
The largest detractor from Fund performance for the period was Chinese Internet giant Tencent Holdings (TCEHY), with shares falling 22.83% in 2018. Tencent stock was
2018 Annual Report
8
FIRSTHAND TECHNOLOGY OPPORTUNITIES FUND - continued
Performance and Portfolio Discussion
stung by a series of negative developments during the year, including declining profit margins, a lack of new games, and waning interest from investors in mainland China.
Against a headwind of privacy concerns and declining sales growth, Facebook (FB) shares dropped 25.71% for the period. The company was near the center of the controversy over 2016 election campaign manipulation by Russian interests. Facebook warned investors during the year that it would be increasing spending to combat security breaches, fake news, and inappropriate content.
Online collaboration software provider Box (BOX) was another significant detractor from Fund performance, with shares declining 20.08% in 2018. After strong second quarter results, Box disappointed investors by guiding analysts toward lower revenue and earnings figures for Q3, noting weakness in the Middle East and Africa region. Although the company eventually beat the lowered guidance, its stock did not recover earlier levels.
Arista Networks (ANET) was also a negative performer for the Fund, despite being added to the S&P 500 Index in late August. Shares stumbled in Q4 as investors digested the positive Q3 earnings announcement, which was accompanied by caution from management that uptake of the company's newly-announced 400 gigabit Ethernet products will take some time. Shares of Arista were down 10.56% for the year.
www.firsthandfunds.com
9
Fund Performance and Holdings Information (as of 12/31/18)
Firsthand Technology Opportunities Fund vs. Market Indices
| | | FIRSTHAND
TECHNOLOGY
OPPORTUNITIES FUND | | NASDAQ
COMPOSITE INDEX | | S&P 500
INDEX | |
Since Inception (9/30/99) | | | 2.59 | % | | | 5.71 | % | | | 5.55 | % | |
| 10-Year | | | 19.72 | % | | | 16.85 | % | | | 13.10 | % | |
| 5-year | | | 14.39 | % | | | 11.05 | % | | | 8.48 | % | |
| 3-year | | | 19.78 | % | | | 11.16 | % | | | 9.24 | % | |
| 1-Year | | | 4.31 | % | | | -2.81 | % | | | -4.39 | % | |
GROWTH OF A HYPOTHETICAL $10,000 INVESTMENT
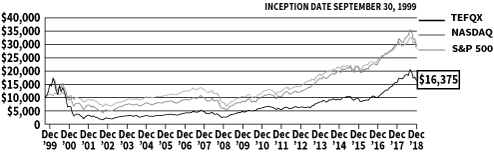
Returns assume reinvestment of all dividends and distributions but do not reflect the impact of taxes. The performance data quoted represent past performance. Past performance cannot guarantee future results, and current performance may be lower or higher than the performance quoted. Both the return from and the principal value of an investment in the Fund will fluctuate so that an investor's shares, when redeemed, may be worth more or less than their original cost. To obtain performance as of the most recent month-end, please contact Firsthand Funds by calling 1.888.884.2675 or go to www.firsthandfunds.com.
HOLDINGS BY INDUSTRY* | | % NET ASSETS | |
Software | | | 28.7 | % | |
Internet | | | 26.7 | % | |
Networking | | | 15.9 | % | |
Education | | | 5.2 | % | |
Consumer Electronics | | | 5.0 | % | |
Semiconductors | | | 4.4 | % | |
Social Networking | | | 3.7 | % | |
Other Electronics | | | 3.5 | % | |
Cloud Computing | | | 2.7 | % | |
Communications | | | 1.1 | % | |
Net Other Assets and Liabilities | | | 3.1 | % | |
TOP 10 HOLDINGS** | | % NET ASSETS | |
Arista Networks, Inc. | | | 9.3 | % | |
Twilio, Inc. | | | 7.9 | % | |
Nutanix, Inc. | | | 6.6 | % | |
Tencent Holdings, Ltd. | | | 6.2 | % | |
Netflix, Inc. | | | 5.9 | % | |
Chegg, Inc. | | | 5.2 | % | |
Roku, Inc. | | | 4.7 | % | |
Facebook, Inc. | | | 3.7 | % | |
Cree, Inc. | | | 3.5 | % | |
Workday, Inc. | | | 3.0 | % | |
* Based on percentage of net assets as of 12/31/18. **Top 10 stock holdings total 56.1% of net assets. These holdings are current as of 12/31/18, and may not be representative of current or future investments.
2018 Annual Report
10
FIRSTHAND ALTERNATIVE ENERGY FUND
Performance and Portfolio Discussion
How did the Fund perform in 2018?
Firsthand Alternative Energy Fund (ALTEX) posted an 18.57% loss in 2018 versus a loss of 14.60% for the WilderHill Clean Energy Index and a 4.39% loss for the S&P 500 Index. For the six months ended December 31, 2018, Firsthand Technology Opportunities Fund was down 14.63% compared to losses of 13.45% and 6.86% for the WilderHill Clean Energy Index and the S&P 500 Index, respectively.
Which industries had the greatest impact on the Fund's performance?
For the period ended December 31, 2018, renewable energy companies represented the portfolio's largest industry weighting, followed by other electronics and energy efficiency companies. The portfolio's exposure to the renewable energy and energy efficiency industries contributed most to the Fund's underperformance versus its primary benchmark in 2018.
Which individual holdings were the largest contributors to the Fund's performance?
The top contributor to Fund performance for the year was Cree (CREE), a manufacturer of power and radio frequency semiconductors, LEDs, and lighting products. During 2018, Cree made significant strides in developing new product lines to offset its declining lighting business. In August, the company announced its E-Series family of silicon carbide (SiC) semiconductor devices for the automotive industry. Revenues and profits were up for the first nine months of the year, as compared to the year ago period, and the stock finished the year with a 15.19% gain.
Sunrun (RUN), the leading residential solar installer in the U.S., was another top contributor to Fund performance in 2018. In May, California regulators approved a plan to mandate rooftop solar panels on most new single-family homes built in the state, starting in 2020. The announcement of this mandate immediately lifted Sunrun stock, and strong financial performance throughout 2018 helped the stock finish up 84.58% for the year.
Despite declining revenues for the first nine months of 2018, Vestas Wind Systems (VWSYF) displayed strong growth in orders during 2018, including an order in December for the largest wind farm in Russia. Vestas exited Q3 2018 with an all-time high order backlog and its stock closed the year with a 9.22% gain.
Iberdrola (no U.S. symbol) is a Spanish developer of power plants, renewable energy generation capacity, and electricity networks. Through the first three quarters of 2018, Iberdrola posted revenue growth of 19.7%, versus the same period in 2017. The company also announced an increase in its 2018 dividend and enjoyed a 9.02% gain in its stock price during the year.
www.firsthandfunds.com
11
FIRSTHAND ALTERNATIVE ENERGY FUND - continued
Performance and Portfolio Discussion
Which holdings were the greatest detractors from the Fund performance?
Unfortunately, the Fund had more decliners than gainers in its portfolio in 2018. The largest detractor from Fund performance was First Solar (FSLR), a leading provider of solar energy systems. The company's stock declined 25.81% in the second quarter after China announced in early June that it was immediately slashing its solar energy subsidies for the remainder of 2018. The predicted drop in demand and anticipation of declining solar module prices weighed heavily on First Solar stock for the remainder of the year. The stock finished 2018 down 37.12%.
Itron (ITRI) was also a drag on the performance of the Fund in 2018. While Itron experienced revenue growth for the first nine months of the year, supply chain problems led not only to increased expenses but also to a warning from the company that full-year 2018 revenues would fall short of expectations. The company's stock finished the year down 30.66%.
Aspen Aerogels (ASPN) was another negative contributor to fund performance during the year. The manufacturer of aerogel insulation products for the energy industry suffered declining revenue and increasing raw materials cost in 2018 its stock declined 56.35% for the year.
ULVAC (no U.S. symbol) was another significant detractor from fund performance in 2018. The Japanese maker of manufacturing equipment for the semiconductor and flat panel display industries experienced a steady decline in its stock throughout 2018 as flat sales and declining profit margins eroded investor demand. ULVAC stock finished the year down 53.81%.
2018 Annual Report
12
Fund Performance and Holdings Information (as of 12/31/18)
Firsthand Alternative Energy Fund vs. Market Indices
| | | FIRSTHAND
ALTERNATIVE
ENERGY FUND | | WILDERHILL CLEAN ENERGY
INDEX | | S&P 500
INDEX | |
Since Inception (10/29/07) | | | -5.23 | % | | | -14.13 | % | | | 6.70 | % | |
| 10-Year | | | -0.35 | % | | | -5.73 | % | | | 13.10 | % | |
| 5-year | | | -3.25 | % | | | -7.10 | % | | | 8.48 | % | |
| 3-year | | | -2.01 | % | | | -2.41 | % | | | 9.24 | % | |
| 1-Year | | | -18.57 | % | | | -14.60 | % | | | -4.39 | % | |
GROWTH OF A HYPOTHETICAL $10,000 INVESTMENT
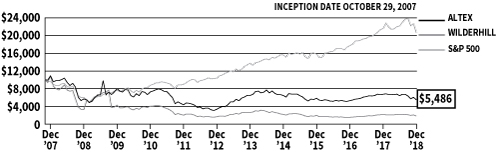
Returns assume reinvestment of all dividends and distributions but do not reflect the impact of taxes. The performance data quoted represent past performance. Past performance cannot guarantee future results, and current performance may be lower or higher than the performance quoted. Both the return from and the principal value of an investment in the Fund will fluctuate so that an investor's shares, when redeemed, may be worth more or less than their original cost. To obtain performance as of the most recent month-end, please contact Firsthand Funds by calling 1.888.884.2675 or go to www.firsthandfunds.com.
HOLDINGS BY INDUSTRY* | | % NET ASSETS | |
Renewable Energy | | | 29.0 | % | |
Other Electronics | | | 13.0 | % | |
Energy Efficiency | | | 10.8 | % | |
Semiconductors | | | 8.0 | % | |
Industrials | | | 7.9 | % | |
Materials | | | 4.8 | % | |
Advanced Materials | | | 4.4 | % | |
Engineering Service | | | 3.4 | % | |
Waste & Environment Service | | | 3.0 | % | |
Electrical Equipment | | | 3.0 | % | |
Biotech | | | 2.2 | % | |
Environmental Services | | | 1.6 | % | |
Net Other Assets and Liabilities | | | 8.9 | % | |
TOP 10 HOLDINGS** | | % NET ASSETS | |
Power Integrations, Inc. | | | 8.0 | % | |
Cree, Inc. | | | 7.7 | % | |
Itron, Inc. | | | 5.9 | % | |
SolarEdge Technologies, Inc. | | | 5.5 | % | |
Vestas Wind Systems A.S. | | | 5.1 | % | |
First Solar, Inc. | | | 4.8 | % | |
Honeywell International, Inc. | | | 4.7 | % | |
Koninklijke Philips Electronics N.V. | | | 4.6 | % | |
Corning, Inc. | | | 4.4 | % | |
3M Co. | | | 4.3 | % | |
* Based on percentage of net assets as of 12/31/18. **Top 10 stock holdings total 55.0% of net assets. These holdings are current as of 12/31/18, and may not be representative of current or future investments.
www.firsthandfunds.com
13
REPORT OF INDEPENDENT REGISTERED PUBLIC ACCOUNTING FIRM
To the Shareholders and Board of Trustees of Firsthand Funds
Opinion on the Financial Statements
We have audited the accompanying statements of assets and liabilities of Firsthand Technology Opportunities Fund and Firsthand Alternative Energy Fund, each a series of Firsthand Funds (the "Funds"), including the schedules of investments, as of December 31, 2018, the related statements of operations for the year then ended, the statements of changes in net assets for each of the two years in the period then ended, and financial highlights for each of the five years in the period then ended, and the related notes (collectively referred to as the "financial statements"). In our opinion, the financial statements present fairly, in all material respects, the financial position of Firsthand Funds as of December 31, 2018, the results of their operations for the year then ended, the changes in their net assets for each of the two years in the period then ended, and the financial highlights for each of the five years in the period then ended, in conformity with accounting principles generally accepted in the United States of America.
Basis for Opinion
These financial statements are the responsibility of the Funds' management. Our responsibility is to express an opinion on the Funds' financial statements based on our audits. We are a public accounting firm registered with the Public Company Accounting Oversight Board (United States) ("PCAOB") and are required to be independent with respect to the Funds in accordance with the U.S. federal securities laws and the applicable rules and regulations of the Securities and Exchange Commission and the PCAOB. We have served as the Funds' auditor since 1997.
We conducted our audits in accordance with the standards of the PCAOB. Those standards require that we plan and perform the audit to obtain reasonable assurance about whether the financial statements are free of material misstatement, whether due to error or fraud. The Funds are not required to have, nor were we engaged to perform, an audit of their internal control over financial reporting. As part of our audits we are required to obtain an understanding of internal control over financial reporting, but not for the purpose of expressing an opinion on the effectiveness of the Funds' internal control over financial reporting. Accordingly, we express no such opinion.
Our audits included performing procedures to assess the risks of material misstatement of the financial statements, whether due to error or fraud, and performing procedures that respond to those risks. Such procedures included examining, on a test basis, evidence regarding the amounts and disclosures in the financial statements. Our audits also included evaluating the accounting principles used and significant estimates made by management, as well as evaluating the overall presentation of the financial statements. Our procedures included confirmation of securities owned as of December 31, 2018 by correspondence with the custodian and Company. We believe that our audits provide a reasonable basis for our opinion.
TAIT, WELLER & BAKER LLP
Philadelphia, Pennsylvania
February 22, 2018
2018 Annual Report
14
FIRSTHAND TECHNOLOGY OPPORTUNITIES FUND
Portfolio of Investments, December 31, 2018
INDUSTRY/COMPANY — % OF NET ASSETS (MARKET VALUE) | | SHARES | | MARKET VALUE | |
COMMON STOCKS — 99.0% ($156,404,254) | |
Cloud Computing — 2.7% ($4,220,000) | |
Box, Inc., Class A * | | | 250,000 | | | $ | 4,220,000 | | |
Communications — 1.1% ($1,768,500) | |
ViaSat, Inc. * | | | 30,000 | | | | 1,768,500 | | |
Computer — 1.0% ($1,498,530) | |
Apple, Inc. | | | 9,500 | | | | 1,498,530 | | |
Computer Storage Devices — 1.0% ($1,608,000) | |
Pure Storage, Inc., Class A * | | | 100,000 | | | | 1,608,000 | | |
Consumer Electronics — 5.0% ($7,850,600) | |
Fitbit, Inc., Class A * | | | 100,000 | | | | 497,000 | | |
Roku, Inc. * | | | 240,000 | | | | 7,353,600 | | |
Education — 5.2% ($8,241,800) | |
Chegg, Inc. * | | | 290,000 | | | | 8,241,800 | | |
Internet — 26.7% ($42,128,774) | |
Alibaba Group Holding, Ltd. - SP ADR * | | | 25,000 | | | | 3,426,750 | | |
Alphabet, Inc., Class C * | | | 4,016 | | | | 4,159,010 | | |
Amazon.com, Inc. * | | | 3,000 | | | | 4,505,910 | | |
Baidu, Inc. - SP ADR * | | | 10,000 | | | | 1,586,000 | | |
Match Group, Inc. | | | 100,000 | | | | 4,277,000 | | |
Netflix, Inc. * | | | 35,000 | | | | 9,368,100 | | |
Pandora Media, Inc. * | | | 200,000 | | | | 1,618,000 | | |
PayPal Holdings, Inc. * | | | 40,000 | | | | 3,363,600 | | |
Tencent Holdings, Ltd. | | | 245,000 | | | | 9,824,404 | | |
Networking — 15.9% ($25,146,500) | |
Arista Networks, Inc. * | | | 70,000 | | | | 14,749,000 | | |
Nutanix, Inc., Class A * | | | 250,000 | | | | 10,397,500 | | |
Other Electronics — 3.5% ($5,560,750) | |
Cree, Inc. * | | | 130,000 | | | | 5,560,750 | | |
see accompanying notes to financial statements
www.firsthandfunds.com
15
FIRSTHAND TECHNOLOGY OPPORTUNITIES FUND - continued
Portfolio of Investments, December 31, 2018
INDUSTRY/COMPANY — % OF NET ASSETS (MARKET VALUE) | | SHARES | | MARKET VALUE | |
Semiconductors — 4.4% ($6,954,500) | |
II-VI, Inc. * | | | 100,000 | | | $ | 3,246,000 | | |
MaxLinear, Inc. * | | | 30,000 | | | | 528,000 | | |
NVIDIA Corp. | | | 10,000 | | | | 1,335,000 | | |
Taiwan Semiconductor Manufacturing Co. Ltd. - ADR | | | 50,000 | | | | 1,845,500 | | |
Services — 0.1% ($140,700) | |
Net 1 UEPS Technologies, Inc. * | | | 30,000 | | | | 140,700 | | |
Social Networking — 3.7% ($5,899,050) | |
Facebook, Inc., Class A * | | | 45,000 | | | | 5,899,050 | | |
Software — 28.7% ($45,386,550) | |
Adobe Systems, Inc. * | | | 20,000 | | | | 4,524,800 | | |
Coupa Software, Inc. * | | | 20,000 | | | | 1,257,200 | | |
Guidewire Software, Inc. * | | | 55,000 | | | | 4,412,650 | | |
MongoDB, Inc. * | | | 40,000 | | | | 3,349,600 | | |
Okta, Inc. * | | | 20,000 | | | | 1,276,000 | | |
Palo Alto Networks, Inc. * | | | 20,000 | | | | 3,767,000 | | |
Proofpoint, Inc. * | | | 40,000 | | | | 3,352,400 | | |
Splunk, Inc. * | | | 40,000 | | | | 4,194,000 | | |
Twilio Inc., Class A * | | | 140,000 | | | | 12,502,000 | | |
Workday, Inc., Class A * | | | 30,000 | | | | 4,790,400 | | |
Zscaler, Inc. * | | | 50,000 | | | | 1,960,500 | | |
INVESTMENT COMPANY — 0.9% ($1,455,355) | |
Fidelity Investments Money Market Fund -
Treasury Portfolio (1) | | | 1,455,355 | | | | 1,455,355 | | |
Total Investments — 99.9% (Cost $99,102,156) | | | | | 157,859,609 | | |
Other assets in excess of liabilities — 0.1% | | | | | 201,627 | | |
NET ASSETS — 100.0% | | | | $ | 158,061,236 | | |
* Non-income producing security.
(1) The Fidelity Investments Money Market Fund invests primarily in U.S. Treasury Securities.
ADR American Depositary Receipt
SP ADR Sponsored American Depositary Receipt
see accompanying notes to financial statements
2018 Annual Report
16
FIRSTHAND ALTERNATIVE ENERGY FUND
Portfolio of Investments, December 31, 2018
INDUSTRY/COMPANY — % OF NET ASSETS (MARKET VALUE) | | SHARES | | MARKET VALUE | |
COMMON STOCKS — 91.1% ($4,046,381) | |
Advanced Materials — 4.4% ($195,156) | |
Corning, Inc. | | | 6,460 | | | $ | 195,156 | | |
SunEdison, Inc. * | | | 21,130 | | | | 0 | | |
Agriculture — 0.0% ($7) | |
GrowLife, Inc. * | | | 1,000 | | | | 7 | | |
Automotive — 0.0% ($1,950) | |
Garrett Motion, Inc. * | | | 158 | | | | 1,950 | | |
Biotech — 2.2% ($97,390) | |
GW Pharmaceuticals PLC ADR * | | | 1,000 | | | | 97,390 | | |
Electrical Equipment — 3.0% ($133,070) | |
ABB, Ltd. - SP ADR | | | 7,000 | | | | 133,070 | | |
Energy Efficiency — 10.8% ($477,324) | |
Honeywell International, Inc. | | | 1,580 | | | | 208,750 | | |
Itron, Inc. * | | | 5,565 | | | | 263,169 | | |
Resideo Technologies, Inc. * | | | 263 | | | | 5,405 | | |
Engineering Service — 3.4% ($150,500) | |
Quanta Services, Inc. | | | 5,000 | | | | 150,500 | | |
Environmental Services — 1.6% ($71,740) | |
Advanced Emissions Solutions, Inc. | | | 6,800 | | | | 71,740 | | |
Industrials — 7.9% ($350,260) | |
3M Co. | | | 1,000 | | | | 190,540 | | |
United Technologies Corp. | | | 1,500 | | | | 159,720 | | |
Intellectual Property — 0.0% ($1,451) | |
Silicon Genesis Corp., Common *(1) | | | 181,407 | | | | 1,451 | | |
Materials — 4.8% ($214,986) | |
Aspen Aerogels, Inc. * | | | 35,000 | | | | 74,550 | | |
Linde PLC | | | 900 | | | | 140,436 | | |
Other Electronics — 13.0% ($575,119) | |
Cree, Inc. * | | | 8,000 | | | | 342,200 | | |
Intevac, Inc. * | | | 5,800 | | | | 30,334 | | |
Koninklijke Philips Electronics N.V. | | | 5,770 | | | | 202,585 | | |
see accompanying notes to financial statements
www.firsthandfunds.com
17
FIRSTHAND ALTERNATIVE ENERGY FUND - continued
Portfolio of Investments, December 31, 2018
INDUSTRY/COMPANY — % OF NET ASSETS (MARKET VALUE) | | SHARES | | MARKET VALUE | |
Renewable Energy — 29.0% ($1,289,605) | |
Amtech Systems, Inc. * | | | 6,600 | | | $ | 29,898 | | |
First Solar, Inc. * | | | 5,000 | | | | 212,275 | | |
Iberdrola S.A. | | | 21,565 | | | | 173,402 | | |
Motech Industries, Inc. * | | | 58,069 | | | | 16,058 | | |
Orion Energy Systems, Inc. * | | | 14,000 | | | | 7,994 | | |
Sharp Corp. | | | 1,100 | | | | 11,060 | | |
Siemens Gamesa Renewable Energy S.A. * | | | 7,271 | | | | 88,639 | | |
SolarEdge Technologies, Inc. * | | | 7,000 | | | | 245,700 | | |
SunPower Corp., Class B * | | | 19,931 | | | | 99,057 | | |
Sunrun, Inc. * | | | 5,000 | | | | 54,450 | | |
ULVAC, Inc. | | | 2,700 | | | | 78,582 | | |
Vestas Wind Systems A.S. | | | 3,000 | | | | 226,770 | | |
Vivint Solar, Inc. * | | | 12,000 | | | | 45,720 | | |
Semiconductors — 8.0% ($353,623) | |
Power Integrations, Inc. | | | 5,799 | | | | 353,623 | | |
Waste & Environment Service — 3.0% ($134,200) | |
Covanta Holding Corp. | | | 10,000 | | | | 134,200 | | |
PREFERRED STOCK — 0.0% ($842) | |
Intellectual Property — 0.0% ($842) | |
Silicon Genesis Corp., Series 1-C *(1) | | | 152 | | | | 70 | | |
Silicon Genesis Corp., Series 1-E *(1) | | | 3,000 | | | | 772 | | |
INVESTMENT COMPANY — 9.5% ($419,678) | |
Fidelity Investments Money Market Fund -
Treasury Portfolio (2) | | | 419,678 | | | | 419,678 | | |
Total Investments — 100.6% (Cost $5,260,706) | | | | | 4,466,901 | | |
Liabilities in excess of other assets — (0.6)% | | | | | (26,241 | ) | |
NET ASSETS — 100.0% | | | | $ | 4,440,660 | | |
* Non-income producing security.
(1) Restricted/illiquid security (0.05% of net assets).
(2) The Fidelity Investments Money Market Fund invests primarily in U.S. Treasury Securities.
ADR American Depositary Receipt
PLC Public Limited Company
SP ADR Sponsored American Depositary Receipt
see accompanying notes to financial statements
2018 Annual Report
18
STATEMENTS OF ASSETS AND LIABILITIES
December 31, 2018
| | | FIRSTHAND
TECHNOLOGY
OPPORTUNITIES FUND | | FIRSTHAND
ALTERNATIVE
ENERGY FUND | |
ASSETS | |
Investment securities: | |
Acquisition cost | | $ | 99,102,156 | | | $ | 5,260,706 | | |
Market value (Note 2) | | | 157,859,609 | | | | 4,466,901 | | |
Foreign currency at value ($0 and $95) | | | — | | | | 93 | | |
Receivable for securities sold | | | 1,319,983 | | | | — | | |
Receivable from dividends, interest, and reclaims | | | 4,371 | | | | 6,714 | | |
Receivable for capital shares sold | | | 160,250 | | | | 124 | | |
TOTAL ASSETS | | | 159,344,213 | | | | 4,473,832 | | |
LIABILITIES | |
Payable to affiliates (Note 4) | | | 256,604 | | | | 7,645 | | |
Payable for capital shares redeemed | | | 1,026,373 | | | | 25,527 | | |
TOTAL LIABILITIES | | | 1,282,977 | | | | 33,172 | | |
NET ASSETS | | $ | 158,061,236 | | | $ | 4,440,660 | | |
Net Assets consist of: | |
Paid-in-capital | | $ | 96,898,785 | | | $ | 6,313,477 | | |
Total distributable earnings (loss) | | | 61,162,451 | | | | (1,872,817 | ) | |
NET ASSETS | | $ | 158,061,236 | | | $ | 4,440,660 | | |
Shares outstanding | | | 15,179,327 | | | | 811,496 | | |
Net asset value, redemption price and offering price per share
(Note 2) | | $ | 10.41 | | | $ | 5.47 | | |
see accompanying notes to financial statements
www.firsthandfunds.com
19
STATEMENTS OF OPERATIONS
For the Year Ended December 31, 2018
| | | FIRSTHAND
TECHNOLOGY
OPPORTUNITIES FUND | | FIRSTHAND
ALTERNATIVE
ENERGY FUND | |
INVESTMENT INCOME | |
Dividends | | $ | 549,643 | | | $ | 73,661 | | |
Foreign tax withholding | | | (400 | ) | | | (2,586 | ) | |
TOTAL INVESTMENT INCOME | | | 549,243 | | | | 71,075 | | |
EXPENSES | |
Investment advisory fees (Note 4) | | | 2,525,327 | | | | 83,665 | | |
Administration fees (Note 4) | | | 809,888 | | | | 24,607 | | |
Trustees fees | | | 9,500 | | | | 9,500 | | |
GROSS EXPENSES | | | 3,344,715 | | | | 117,772 | | |
Trustees fees reimbursement | | | (9,500 | ) | | | (9,500 | ) | |
TOTAL NET EXPENSES | | | 3,335,215 | | | | 108,272 | | |
NET INVESTMENT LOSS | | | (2,785,972 | ) | | | (37,197 | ) | |
Net Realized and Unrealized Gain (Loss) on Investments: | |
Net realized gains (losses) from security transactions | | | 4,532,595 | | | | (161,639 | ) | |
Net realized gain on written option transactions | | | 21,596 | | | | — | | |
Net realized gains (losses) on foreign currency | | | 7 | | | | (69 | ) | |
Net change in unrealized depreciation on
investments and foreign currency | | | (738,716 | ) | | | (808,147 | ) | |
Net Realized and Unrealized Gain (Loss) on Investments | | | 3,815,482 | | | | (969,855 | ) | |
Net Increase (Decrease) In Net Assets Resulting
From Operations | | $ | 1,029,510 | | | $ | (1,007,052 | ) | |
see accompanying notes to financial statements
2018 Annual Report
20
STATEMENTS OF CHANGES IN NET ASSETS
For the Years Ended December 31, 2018, and December 31, 2017
| | | FIRSTHAND TECHNOLOGY
OPPORTUNITIES FUND | |
| | | Year Ended
12/31/18 | | Year Ended
12/31/17 | |
FROM OPERATIONS: | |
Net investment loss | | $ | (2,785,972 | ) | | $ | (1,527,849 | ) | |
Net realized gains (loss) from security transactions,
foreign currency and written options | | | 4,554,198 | | | | (1,006,627 | ) | |
Net change in unrealized appreciation (depreciation) on
investments and foreign currency | | | (738,716 | ) | | | 43,477,935 | | |
Net increase in net assets from operations | | | 1,029,510 | | | | 40,943,459 | | |
FROM CAPITAL SHARE TRANSACTIONS: | |
Proceeds from shares sold | | | 135,111,437 | | | | 31,193,130 | | |
Payment for shares redeemed | | | (102,541,326 | ) | | | (24,619,677 | ) | |
Net increase in net assets from capital share transactions | | | 32,570,111 | | | | 6,573,453 | | |
TOTAL INCREASE IN NET ASSETS | | | 33,599,621 | | | | 47,516,912 | | |
NET ASSETS: | |
Beginning of year | | | 124,461,615 | | | | 76,944,703 | | |
End of year | | $ | 158,061,236 | | | $ | 124,461,615 | | |
COMMON STOCK ACTIVITY: | |
Shares sold | | | 11,545,256 | | | | 3,398,012 | | |
Shares redeemed | | | (8,842,252 | ) | | | (2,908,220 | ) | |
Net increase in shares outstanding | | | 2,703,004 | | | | 489,792 | | |
Shares outstanding, beginning of year | | | 12,476,323 | | | | 11,986,531 | | |
Shares outstanding, end of year | | | 15,179,327 | | | | 12,476,323 | | |
see accompanying notes to financial statements
www.firsthandfunds.com
21
STATEMENTS OF CHANGES IN NET ASSETS
For the Years Ended December 31, 2018, and December 31, 2017
| | | FIRSTHAND ALTERNATIVE
ENERGY FUND | |
| | | Year Ended
12/31/18 | | Year Ended
12/31/17 | |
FROM OPERATIONS: | |
Net investment income (loss) | | $ | (37,197 | ) | | $ | 16,661 | | |
Net realized loss from security transactions and
foreign currency | | | (161,708 | ) | | | (52,602 | ) | |
Net change in unrealized appreciation (depreciation) on
investments and foreign currency | | | (808,147 | ) | | | 1,366,004 | | |
Net increase (decrease) in net assets from operations | | | (1,007,052 | ) | | | 1,330,063 | | |
DISTRIBUTIONS TO SHAREHOLDERS: | |
Distributions (1) | | | (2,031 | ) | | | (14,653 | ) | |
Total Distributions | | | (2,031 | ) | | | (14,653 | ) | |
FROM CAPITAL SHARE TRANSACTIONS: | |
Proceeds from shares sold | | | 972,675 | | | | 917,570 | | |
Dividends reinvested | | | 1,905 | | | | 13,920 | | |
Payment for shares redeemed | | | (1,422,599 | ) | | | (1,431,164 | ) | |
Net decrease in net assets from capital share transactions | | | (448,019 | ) | | | (499,674 | ) | |
TOTAL INCREASE (DECREASE) IN NET ASSETS | | | (1,457,102 | ) | | | 815,736 | | |
NET ASSETS: | |
Beginning of year | | | 5,897,762 | | | | 5,082,026 | | |
End of year | | $ | 4,440,660 | | | $ | 5,897,762 | | |
COMMON STOCK ACTIVITY: | |
Shares sold | | | 154,229 | | | | 150,339 | | |
Shares reinvested | | | 331 | | | | 2,047 | | |
Shares redeemed | | | (220,344 | ) | | | (236,441 | ) | |
Net decrease in shares outstanding | | | (65,784 | ) | | | (84,055 | ) | |
Shares outstanding, beginning of year | | | 877,280 | | | | 961,335 | | |
Shares outstanding, end of year | | | 811,496 | | | | 877,280 | | |
(1) The SEC eliminated the requirement to disclose components of distributions paid to shareholders in September 2018. Distributions in 2017 were from net investment income.
see accompanying notes to financial statements
2018 Annual Report
22
FINANCIAL HIGHLIGHTS
Selected per share data and ratios for a share outstanding throughout each year
FIRSTHAND TECHNOLOGY OPPORTUNITIES FUND
| | | Year Ended
12/31/18 | | Year Ended
12/31/17 | | Year Ended
12/31/16 | | Year Ended
12/31/15 | | Year Ended
12/31/14 | |
Net asset value at beginning
of year | | $ | 9.98 | | | $ | 6.42 | | | $ | 7.74 | | | $ | 8.14 | | | $ | 7.86 | | |
Income from investment operations: | |
Net investment loss | | | (0.18 | ) | | | (0.12 | ) | | | (0.10 | ) | | | (0.10 | ) | | | (0.10 | ) | |
Net realized and unrealized gains on
investments and written options | | | 0.61 | | | | 3.68 | | | | 0.56 | | | | 0.44 | | | | 0.83 | | |
Total from investment operations | | | 0.43 | | | | 3.56 | | | | 0.46 | | | | 0.34 | | | | 0.73 | | |
Distributions from: | |
Realized capital gains | | | — | | | | — | | | | (1.78 | ) | | | (0.74 | ) | | | (0.45 | ) | |
Net asset value at end of year | | $ | 10.41 | | | $ | 9.98 | | | $ | 6.42 | | | $ | 7.74 | | | $ | 8.14 | | |
Total return | | | 4.31 | % | | | 55.45 | % | | | 5.99 | % | | | 4.28 | % | | | 9.29 | % | |
Net assets at end of year
(millions) | | $ | 158.1 | | | $ | 124.5 | | | $ | 76.9 | | | $ | 105.2 | | | $ | 109.0 | | |
Ratio of gross expenses to average
net assets before waiver | | | 1.86 | % | | | 1.86 | % | | | 1.86 | % | | | 1.86 | % | | | 1.86 | % | |
Ratio of net expenses to average
net assets after waiver | | | 1.85 | % | | | 1.85 | % | | | 1.85 | % | | | 1.85 | % | | | 1.85 | % | |
Ratio of net investment loss
to average net assets | | | (1.54 | %) | | | (1.57 | %) | | | (1.45 | %) | | | (1.17 | %) | | | (1.28 | %) | |
Portfolio turnover rate | | | 25 | % | | | 19 | % | | | 18 | % | | | 19 | % | | | 23 | % | |
see accompanying notes to financial statements
www.firsthandfunds.com
23
FINANCIAL HIGHLIGHTS
Selected per share data and ratios for a share outstanding throughout each year
FIRSTHAND ALTERNATIVE ENERGY FUND
| | | Year Ended
12/31/18 | | Year Ended
12/31/17 | | Year Ended
12/31/16 | | Year Ended
12/31/15 | | Year Ended
12/31/14 | |
Net asset value at beginning
of year | | $ | 6.72 | | | $ | 5.29 | | | $ | 5.83 | | | $ | 6.46 | | | $ | 6.47 | | |
Income from investment operations: | |
Net investment income (loss) | | | (0.04 | ) | | | 0.02 | | | | (0.05 | ) | | | (0.07 | ) | | | (0.12 | ) | |
Net realized and unrealized
gains (losses) on investments | | | (1.21 | ) | | | 1.43 | | | | (0.49 | ) | | | (0.56 | ) | | | 0.11 | | |
Total from investment operations | | | (1.25 | ) | | | 1.45 | | | | (0.54 | ) | | | (0.63 | ) | | | (0.01 | ) | |
Distributions from: | |
Net investment income | | | — | (a) | | | (0.02 | ) | | | — | | | | — | | | | — | | |
Net asset value at end of year | | $ | 5.47 | | | $ | 6.72 | | | $ | 5.29 | | | $ | 5.83 | | | $ | 6.46 | | |
Total return | | | (18.57 | %) | | | 27.35 | % | | | (9.26 | %) | | | (9.75 | %) | | | (0.15 | %) | |
Net assets at end of year
(millions) | | $ | 4.4 | | | $ | 5.9 | | | $ | 5.1 | | | $ | 7.3 | | | $ | 9.1 | | |
Ratio of gross expenses to average
net assets before waiver | | | 2.15 | % | | | 2.15 | % | | | 2.14 | % | | | 2.11 | % | | | 2.04 | % | |
Ratio of net expenses to average
net assets after waiver | | | 1.98 | % | | | 1.98 | % | | | 1.98 | % | | | 1.98 | % | | | 1.98 | % | |
Ratio of net investment income (loss)
to average net assets | | | (0.68 | %) | | | 0.30 | % | | | (0.75 | %) | | | (1.14 | %) | | | (0.98 | %) | |
Portfolio turnover rate | | | 7 | % | | | 0 | % | | | 10 | % | | | 5 | % | | | 57 | % | |
(a) Amount represents less than $0.01 per share
see accompanying notes to financial statements
2018 Annual Report
24
NOTES TO FINANCIAL STATEMENTS
December 31, 2018
1. ORGANIZATION
Each of Firsthand Technology Opportunities Fund and Firsthand Alternative Energy Fund (individually the "Fund", and collectively the "Funds") is a non-diversified series of Firsthand Funds (the "Trust"), an open-end management investment company registered under the Investment Company Act of 1940, as amended (the "1940 Act"). The Trust, a Delaware statutory trust, was organized on November 8, 1993. Each Fund currently offers one class of shares—Investor Class shares. The inception dates for the Funds (the date on which a net asset value was first determined for that Fund) follow:
FUND | | INCEPTION DATE | |
Firsthand Technology Opportunities Fund | | September 30, 1999 | |
Firsthand Alternative Energy Fund | | October 29, 2007 | |
Each Fund's investment objective is long-term growth of capital.
Firsthand Technology Opportunities Fund seeks to achieve its investment objective by investing, under normal circumstances, at least 80% of its assets in equity securities of high-technology companies in the industries and markets that the Investment Adviser believes hold the most growth potential within the technology sector.
Firsthand Alternative Energy Fund seeks to achieve its investment objective by investing, under normal circumstances, at least 80% of its assets in alternative energy and energy technology companies, both U.S. and international.
The Funds are an investment company and follow accounting and reporting guidance in the Financial Accounting Standards Board ("FASB") Accounting Standards Codification Topic 946.
2. SIGNIFICANT ACCOUNTING POLICIES
The following is a summary of the Funds' significant accounting policies:
Securities Valuation — A Fund's portfolio of securities is valued as follows:
1. Securities traded on stock exchanges, or quoted by NASDAQ, are valued according to the NASDAQ official closing price, if applicable, or at their last reported sale price as of the close of trading on the New York Stock Exchange ("NYSE") (normally 4:00 P.M. Eastern Time). If a security is not traded that day, the security will be valued at its most recent bid price.
2. Securities traded in the over-the-counter market, but not quoted by NASDAQ, are valued at the last sale price (or, if the last sale price is not readily available, at
www.firsthandfunds.com
25
NOTES TO FINANCIAL STATEMENTS - continued
December 31, 2018
the most recent closing bid price as quoted by brokers that make markets in the securities) at the close of trading on the NYSE.
3. Securities traded both in the over-the-counter market and on a stock exchange are valued according to the broadest and most representative market.
4. Securities and other assets that do not have market quotations readily available are valued at their fair value as determined in good faith using procedures established by the Board of Trustees.
In pricing illiquid, privately placed securities, the advisor follows well-accepted valuation techniques. Initial valuations are generally determined by the initial purchase price for each security. Subsequent to initial purchase, securities are repriced from time to time to reflect changes to the companies' valuations caused by various events. Such events include, among others, a new round of financing establishing a new valuation for the company; material changes to a company's business or business prospects, either due to company-specific internal issues (gaining or losing a major customer, missing a significant milestone, etc.) or macroeconomic events affecting the industry or the world. In analyzing a company's valuation, factors that are also considered include a company's cash flow, revenues, profitability, financial forecasts, and probability of success in those measures. Other potential factors include the value of comparable public and private companies and general market conditions.
Fair Value Measurement — In accordance with the authoritative guidance on fair value measurements and disclosures under GAAP, each Fund discloses the fair value of its investments in a hierarchy that prioritizes the inputs to valuation techniques used to measure the fair value. The hierarchy gives the highest priority to valuations based upon unadjusted quoted prices in active markets for identical assets or liabilities (level 1 measurement) and the lowest priority to valuations based upon unobservable inputs that are significant to the valuation (level 3 measurements).
The guidance establishes three levels of the fair value hierarchy as follows:
Level 1 – Unadjusted quoted prices in active markets for identical assets or liabilities that the Funds have the ability to access.
Level 2 – Observable inputs other than quoted prices included in level 1 that are observable for the asset or liability, either directly or indirectly. These inputs may include quoted prices for the identical instrument on an inactive market, prices for similar instruments, interest rates, prepayment speeds, credit risks, yield curves, default rates, and similar data.
2018 Annual Report
26
NOTES TO FINANCIAL STATEMENTS - continued
December 31, 2018
Level 3 – Unobservable inputs for the asset or liability, to the extent relevant observable inputs are not available, representing the Funds' own assumptions about the assumptions a market participant would use in valuing the asset or liability, and would be based on the best information available.
The availability of observable inputs can vary from security to security and is affected by a wide variety of factors, including, for example, the type of security, whether the security is new and not yet established in the marketplace, the liquidity of markets, and other characteristics particular to the security. To the extent that valuation is based on models or inputs that are less observable or unobservable in the market, the determination of fair value requires more judgment. Accordingly, the degree of judgment exercised in determining fair value is greatest for instruments categorized in level 3.
The inputs used to measure fair value may fall into different levels of the fair value hierarchy. In such cases, for disclosure purposes, the level in the fair value hierarchy within which the fair value measurement falls in its entirety, is determined based on the lowest level input that is significant to the fair value measurement in its entirety.
The inputs or methodology used for valuing securities are not necessarily an indication of the risk associated with investing in those securities. The following is a summary of the inputs used to value the following Funds' net assets as of December 31, 2018:
FUND* | | LEVEL 1
QUOTED PRICES | | LEVEL 2
OTHER SIGNIFICANT
OBSERVABLE INPUTS | | LEVEL 3
SIGNIFICANT
UNOBSERVABLE INPUTS | |
TEFQX | |
Common Stocks | | | | | | | |
Cloud Computing | | $ | 4,220,000 | | | $ | — | | | $ | — | | |
Communications | | | 1,768,500 | | | | — | | | | — | | |
Computer | | | 1,498,530 | | | | — | | | | — | | |
Computer Storage Devices | | | 1,608,000 | | | | — | | | | — | | |
Consumer Electronics | | | 7,850,600 | | | | — | | | | — | | |
Education | | | 8,241,800 | | | | — | | | | — | | |
Internet | | | 42,128,774 | | | | — | | | | — | | |
Networking | | | 25,146,500 | | | | — | | | | — | | |
Other Electronics | | | 5,560,750 | | | | — | | | | — | | |
Semiconductors | | | 6,954,500 | | | | — | | | | — | | |
Services | | | 140,700 | | | | — | | | | — | | |
Social Networking | | | 5,899,050 | | | | — | | | | — | | |
Software | | | 45,386,550 | | | | — | | | | — | | |
Total Common Stocks | | | 156,404,254 | | | | — | | | | — | | |
Investment Company | | | 1,455,355 | | | | — | | | | — | | |
Total | | $ | 157,859,609 | | | $ | — | | | $ | — | | |
www.firsthandfunds.com
27
NOTES TO FINANCIAL STATEMENTS - continued
December 31, 2018
FUND* | | LEVEL 1
QUOTED PRICES | | LEVEL 2
OTHER SIGNIFICANT
OBSERVABLE INPUTS | | LEVEL 3
SIGNIFICANT
UNOBSERVABLE INPUTS | |
ALTEX | |
Common Stocks | | | | | | | |
Advanced Materials | | $ | 195,156 | | | $ | — | | | $ | — | | |
Agriculture | | | 7 | | | | — | | | | — | | |
Automotive | | | 1,950 | | | | — | | | | — | | |
Biotech | | | 97,390 | | | | — | | | | — | | |
Electrical Equipment | | | 133,070 | | | | — | | | | — | | |
Energy Efficiency | | | 477,324 | | | | — | | | | — | | |
Engineering Service | | | 150,500 | | | | — | | | | — | | |
Environmental Services | | | 71,740 | | | | — | | | | — | | |
Industrials | | | 350,260 | | | | — | | | | — | | |
Intellectual Property | | | — | | | | — | | | | 1,451 | | |
Materials | | | 214,986 | | | | — | | | | — | | |
Other Electronics | | | 575,119 | | | | — | | | | — | | |
Renewable Energy | | | 1,289,605 | | | | — | | | | — | | |
Semiconductors | | | 353,623 | | | | — | | | | — | | |
Waste & Environment Service | | | 134,200 | | | | — | | | | — | | |
Total Common Stocks | | | 4,044,930 | | | | — | | | | 1,451 | | |
Preferred Stocks | | | — | | | | — | | | | 842 | | |
Investment Company | | | 419,678 | | | | — | | | | — | | |
Total | | $ | 4,464,608 | | | $ | — | | | $ | 2,293 | | |
* TEFQX: Firsthand Technology Opportunities Fund; ALTEX: Firsthand Alternative Energy Fund
At the end of each calendar quarter, management evaluates the Level 2 and 3 assets and liabilities for changes in liquidity, including but not limited to: whether a broker is willing to execute at the quoted price, the depth and consistency of prices from third party services, and the existence of contemporaneous, observable trades in the market.
Following is a reconciliation of Level 3 assets (at either the beginning or the ending of the period) for which significant unobservable inputs were used to determine fair value.
2018 Annual Report
28
NOTES TO FINANCIAL STATEMENTS - continued
December 31, 2018
FIRSTHAND ALTERNATIVE ENERGY FUND
INVESTMENTS AT FAIR
VALUE USING SIGNIFICANT
UNOBSERVABLE INPUTS
(LEVEL 3) | | BALANCE AS
OF 12/31/17 | | NET
PURCHASES | | NET SALES | | NET REALIZED
GAINS /
(LOSSES) | | NET
UNREALIZED
APPRECIATION
(DEPRECIATION) | | TRANSFERS
IN (OUT) OF
LEVEL 3 | | BALANCE AS
OF 12/31/18 | |
Common Stocks
Intellectual
Property | | $ | 2,612 | | | $ | — | | | $ | — | | | $ | — | | | $ | (1,161 | ) | | $ | — | | | $ | 1,451 | | |
Preferred Stocks | | | 1,098 | | | | — | | | | — | | | | — | | | | (256 | ) | | | — | | | | 842 | | |
Total | | $ | 3,710 | | | $ | — | | | $ | — | | | $ | — | | | $ | (1,417 | ) | | $ | — | | | $ | 2,293 | | |
As of the year ended December 31, 2018, these investments were valued in accordance with procedures approved by the Board of Trustees. These investments did not have a material impact on the Fund's net assets and, therefore, disclosure of unobservable inputs used in formulating valuations is not presented.
Share Valuation — The net asset value ("NAV") per share of each Fund is calculated by dividing the net assets of the Fund (i.e, the sum of the value of the securities held by the Fund, plus cash or other assets, minus all liabilities (including estimated accrued expenses)) by the total number of shares outstanding of the Fund, rounded to the nearest cent. A Fund's shares will not be priced on the days on which the NYSE is closed for trading. The offering and redemption price per share of each Fund is equal to a Fund's NAV per share.
Investment Income — Dividend income is recorded on the ex-dividend date. Interest income is accrued as earned. Discounts and premiums on securities purchased are amortized over the lives of the respective securities. Other non-cash dividends are recognized as investment income at the fair value of the property received. Withholding taxes on foreign dividends have been provided for in accordance with the Funds' understanding of the applicable country's tax rules and rates. All distributions as indicated on the Statement of Changes in Net Assets for the year ended December 31, 2017 for Firsthand Alternative Energy Fund were from net investment income. Firsthand Technology Opportunities Fund did not have any distributions for the year ended December 31, 2017. Undistributed net investment income at December 31, 2017 was $2,028 for Firsthand Alternative Energy Fund.
Cash and Cash Equivalents — The Funds consider liquid assets deposited with a bank, money market funds, and certain short-term debt instruments with maturities of 3 months or less to be cash equivalents. These investments represent amounts held with financial institutions that are readily accessible to pay Fund expenses or purchase investments. Cash and cash equivalents are valued at cost plus accrued interest, which approximates market value.
www.firsthandfunds.com
29
NOTES TO FINANCIAL STATEMENTS - continued
December 31, 2018
Foreign Securities — Each Fund may invest in companies that trade on U.S. exchanges as American Depositary Receipts ("ADRs"), on foreign exchanges, or on foreign over-the-counter markets. Investing in the securities of foreign companies exposes your investment in a Fund to risk. Foreign stock markets tend to be more volatile than the U.S. market due to economic and/or political instability and the regulatory conditions in some countries. In addition, some of the securities in which the Fund may invest may be denominated in foreign currencies, the value of which may decline against the U.S. dollar. An investment in foreign securities may be subject to high levels of foreign taxation, including foreign taxes withheld at the source. Neither Fund isolates the portion of the results of operations resulting from changes in foreign exchange rates on investments from the fluctuations arising from changes in market prices of securities held. Reported net realized foreign exchange gains or losses arise from sales of portfolio securities, currency gains or losses realized between the trade and settlement dates on securities transactions, and the difference between the amounts of dividends, interest, and foreign withholding taxes recorded on the Funds' books and the U.S. dollar equivalent of the amounts actually received or paid.
Options — The Funds are subject to equity price risk in the normal course of pursuing their investment objectives and may enter into options written to hedge against changes in the value of equities. The Funds may purchase put and call options to attempt to provide protection against adverse price effects from anticipated changes in prevailing prices of securities or stock indices. The Funds may also write put and call options. When a Fund writes an option, an amount equal to the premium received by the Fund is recorded as a liability and is subsequently adjusted to the current fair value of the option written. Premiums received from writing options that expire unexercised are treated by the Fund on the expiration date as realized gains from investments. The difference between the premium and the amount paid on effecting a closing purchase transaction, including brokerage commissions, is also treated as a realized gain, or, if the premium is less than the amount paid for the closing purchase transaction, as a realized loss. If a call option is exercised, the premium is added to the proceeds from the sale of the underlying security or currency in determining whether the Fund has realized a gain or loss. The Fund as writer of an option bears the market risk of an unfavorable change in the price of the security underlying the written option. The net realized gains/(loss) from written options for the year ended December 31, 2018 can be found on the Statements of Operations.
The average volume of derivatives during the year ended December 31, 2018 is as follows:
| | | FIRSTHAND TECHNOLOGY OPPORTUNITIES FUND
WRITTEN OPTIONS
(contracts) | |
| | | | | | (4,319 | ) | |
2018 Annual Report
30
NOTES TO FINANCIAL STATEMENTS - continued
December 31, 2018
Distributions to Shareholders — Each Fund expects to distribute its net investment income and net realized gains, if any, annually. Distributions from net investment income and capital gains are recorded on the ex-dividend date and are determined in accordance with income tax regulations, which may differ from accounting principles generally accepted in the United States.
Short Positions — Firsthand Alternative Energy Fund may sell securities short for economic hedging purposes. Short sales are transactions in which the Fund sells a security it does not own, in anticipation of a decline in the market value of that security. To initiate such a transaction, the Fund must borrow the security to deliver to the buyer upon the short sale; the Fund is then obligated to replace the security borrowed by purchasing it in the open market at some later date, completing the transaction. The Fund is liable for any dividends payable on securities while those securities are in a short position.
The Fund will incur a loss if the market price of the security increases between the date of the short sale and the date on which the Fund replaces the borrowed security. The Fund will realize a gain if the security declines in value between those dates.
All short sales must be fully collateralized. The Fund maintains the collateral in a segregated account consisting of cash, cash equivalents and/or liquid securities sufficient to collateralize the market value of its short positions. Typically, the segregated cash with brokers and other financial institutions exceeds the minimum required. Deposits with brokers for securities sold short are invested in money market instruments. The Fund did not invest in short sales for the year ended December 31, 2018.
Reclassification of Capital Accounts — Permanent book and tax differences resulted in reclassifications for the year ended December 31, 2018 as follows:
| | | INCREASE (DECREASE) | |
| | | Paid-in-Capital | | Distributable
Earnings | |
Firsthand Technology Opportunities Fund | | $ | (2,785,965 | ) | | $ | 2,785,965 | | |
Firsthand Alternative Energy Fund | | | (191,175 | ) | | | 191,175 | | |
These reclassifications, related to different treatment of current year write off of net operating loss, and different book and tax treatment for gain/loss on foreign currency, have no effect on net asset value per share.
Security Transactions — Security transactions are accounted for no later than one business day following the trade date, however, for financial reporting purposes, security transactions are accounted for on trade date. Realized gains and losses are calculated on a specific identification basis.
www.firsthandfunds.com
31
NOTES TO FINANCIAL STATEMENTS - continued
December 31, 2018
Estimates — The preparation of financial statements in conformity with accounting principles generally accepted in the United States of America requires management to make estimates and assumptions that affect the reported amounts of assets and liabilities at the date of the financial statements and the reported amounts of income and expenses during the reporting period. Actual results could differ from those estimates.
Federal Income Tax — Each Fund has elected, and intends to qualify annually, for the special tax treatment afforded regulated investment companies under the Internal Revenue Code of 1986, as amended (the "Code"). As provided in the Code, in any fiscal year in which a Fund so qualifies and distributes at least 90% of its taxable net income, the Fund (but not the shareholders) will be relieved of federal income tax on the income distributed. Accordingly, no provision for income taxes has been made. To avoid imposition of the excise tax applicable to regulated investment companies, each Fund intends to declare as dividends in each calendar year at least 98% of its net investment income (earned during the calendar year) and 98.2% of its net realized capital gains (earned during the 12 months ended October 31) plus undistributed amounts, if any, from prior years.
The tax character of distributions paid for the year ended December 31, 2018 and 2017 was as follows:
| | | FIRSTHAND TECHNOLOGY
OPORTUNITIES FUND | |
| | | 2018 | | 2017 | |
From ordinary income | | $ | — | | | $ | — | | |
From long-term capital gains | | $ | — | | | $ | — | | |
| | | FIRSTHAND ALTERNATIVE
ENERGY FUND | |
| | | 2018 | | 2017 | |
From ordinary income | | $ | 2,031 | | | $ | 14,653 | | |
From long-term capital gains | | $ | — | | | $ | — | | |
The following information is based upon the federal income tax cost of portfolio investments as of December 31, 2018.
| | | FIRSTHAND
TECHNOLOGY
OPPORTUNITIES FUND | | FIRSTHAND
ALTERNATIVE
ENERGY FUND | |
Gross unrealized appreciation | | $ | 68,305,767 | | | $ | 893,950 | | |
Gross unrealized depreciation | | | (10,389,713 | ) | | | (1,686,282 | ) | |
Net unrealized appreciation (depreciation) | | $ | 57,916,054 | | | $ | (792,332 | ) | |
Federal income tax cost | | $ | 99,943,555 | | | $ | 5,259,233 | | |
2018 Annual Report
32
NOTES TO FINANCIAL STATEMENTS - continued
December 31, 2018
The difference between the acquisition cost and the federal income tax cost of portfolio investments is due to certain timing differences in the recognition of capital losses under accounting principles generally accepted in the United States and income tax regulations.
As of December 31, 2018, the Funds had capital loss carryforwards for federal income tax purposes as follows:
| | | SHORT-TERM
NO EXPIRATION | | LONG-TERM
NO EXPIRATION | | TOTAL | |
TEFQX* | | $ | — | | | $ | — | | | $ | — | | |
ALTEX* | | | (431,088 | ) | | | (649,326 | ) | | | (1,080,414 | ) | |
* TEFQX: Firsthand Technology Opportunities Fund; ALTEX: Firsthand Alternative Energy Fund.
Components of Distributable Earnings
| | | FIRSTHAND
TECHNOLOGY
OPPORTUNITIES FUND | | FIRSTHAND
ALTERNATIVE
ENERGY FUND | |
Net Unrealized Appreciation (Depreciation)* | | $ | 57,916,054 | | | $ | (792,403 | ) | |
Undistributed Ordinary Income | | | — | | | | — | | |
Undistributed Long Term Capital Gains | | | 3,355,286 | | | | — | | |
Qualified Late Year Losses Deferred** | | | — | | | | — | | |
Other Temporary Differences | | | (108,889 | ) | | | — | | |
Accumulated Capital Loss Carryforward | | | — | | | | (1,080,414 | ) | |
Total Distributable Earnings/Accumulated Loss | | $ | 61,162,451 | | | $ | (1,872,817 | ) | |
* The differences between book-basis and tax-basis unrealized appreciation (depreciation) is attributable primarily to tax deferral of losses on wash sales.
** Under current tax law, capital and currency losses realized after October 31 and prior to the Fund's fiscal year end may be deferred as occurring on the first day of the following fiscal year.
The Funds are subject to tax provisions that establish a minimum threshold for recognizing, and a system for measuring, the benefits of a tax position taken or expected to be taken in a tax return. Taxable years ending 2018, 2017, 2016 and 2015 remain open to federal and state audit. As of December 31, 2018, management has evaluated the application of these provisions to the Funds, and has determined that no provision for income tax is required in the Funds' financial statements for uncertain tax provisions.
www.firsthandfunds.com
33
NOTES TO FINANCIAL STATEMENTS - continued
December 31, 2018
3. INVESTMENT TRANSACTIONS (EXCLUDING SHORT-TERM INVESTMENTS) WERE AS FOLLOWS FOR THE YEAR ENDED DECEMBER 31, 2018
| | | FIRSTHAND
TECHNOLOGY
OPPORTUNITIES FUND | | FIRSTHAND
ALTERNATIVE
ENERGY FUND | |
Purchase of investment securities | | $ | 80,939,091 | | | $ | 370,752 | | |
Proceeds from sales and maturities of
investment securities | | $ | 41,559,019 | | | $ | 973,398 | | |
4. INVESTMENT ADVISORY AND ADMINISTRATION AGREEMENTS; CERTAIN TRUSTEES AND OFFICERS OF THE TRUST ARE ALSO OFFICERS OF THE INVESTMENT ADVISER AND BNY MELLON
Certain trustees and officers of the Trust are also officers of the Investment Adviser or BNY Mellon. BNY Mellon serves as the sub-administrator, investment accounting agent, and shareholder servicing and transfer agent.
INVESTMENT ADVISORY AGREEMENT
Each Fund's investments are managed by the Investment Adviser pursuant to the terms of a master investment advisory agreement (the "Advisory Agreement"). Under the Advisory Agreement, the Investment Adviser provides each Fund with investment research, advice, management, and supervision and manages the investment and reinvestment of assets of each Fund consistent with each Fund's investment objectives, policies, and limitations. Subject to certain exceptions set forth in the Advisory Agreement, the Investment Adviser is responsible for (i) compensation of any of the Fund's trustees, officers, and employees who are interested persons of the Investment Adviser; and (ii) compensation of the Investment Adviser's personnel and other expenses incurred in connection with the provision of portfolio management services under the Advisory Agreement.
Firsthand Capital Management, Inc. is the Investment Adviser to the Funds. For the services it provides under the Advisory Agreement, the Investment Adviser receives from each Fund, on a monthly basis, an advisory fee at the annual rate of 1.40% for TEFQX and 1.53% for ALTEX of its average daily net assets, respectively. The Advisory Agreement requires the Investment Adviser to waive fees and, if necessary, to reimburse expenses of each Fund to the extent necessary to limit a Fund's total operating expenses to 1.85%, for TEFQX and 1.98% for ALTEX, excluding any extraordinary fees, of its average net assets up to $200 million, 1.80% for TEFQX and 1.93% for ALTEX of such assets from $200 million to $500 million, 1.75% for TEFQX and 1.88% for ALTEX of such assets from $500 million to $1 billion, and 1.70% for TEFQX and 1.83% for ALTEX of such assets in excess of $1 billion.
2018 Annual Report
34
NOTES TO FINANCIAL STATEMENTS - continued
December 31, 2018
ADMINISTRATION AGREEMENT
The Trust has entered into a separate Administration Agreement with the Investment Adviser. The agreement obligates the Investment Adviser to provide administrative and general supervisory services to each Fund (the "Administration Agreement"). Under the Administration Agreement, the Investment Adviser renders supervisory and corporate administrative services to the Trust, as well as oversees the maintenance of all books and records with respect to each Fund's securities transactions and each Fund's book of accounts in accordance with all applicable federal and state laws and regulations. The Investment Adviser also arranges for the preservation of journals, ledgers, corporate documents, brokerage account records, and other records as required by the 1940 Act.
The Investment Adviser is responsible for the equipment, staff, office space, and facilities necessary to perform its obligations under the Administration Agreement. Under the Administration Agreement, the Investment Adviser has assumed responsibility for payment of all of each Fund's operating expenses excluding brokerage and commission expenses; short sale expenses; fees payable under "Rule 12b-1 plans", if any, and shareholder servicing plans, if any; litigation costs; and any extraordinary and non-recurring expenses. For the services it provides under the Administration Agreement, the Investment Adviser receives a fee from each Fund at the annual rate of 0.45% of its average daily net assets up to $200 million, 0.40% of such assets from $200 million to $500 million, 0.35% of such assets from $500 million to $1 billion, and 0.30% of such assets in excess of $1 billion.
The Bank of New York Mellon ("BNY Mellon"), has a Sub-Administration Agreement with the Investment Adviser. Under this agreement, the Investment Adviser (not the Funds) pays to BNY Mellon the fees for the administrative services provided by BNY Mellon. In the case of Firsthand Alternative Energy Fund, for the year 2018, the Investment Adviser has also agreed to donate a portion of its management fees allocated, amounting to 0.20% of Firsthand Alternative Energy Fund's average daily net assets, to various non-profit organizations as elected by Fund shareholders.
Additionally, BNY Mellon serves as the sub-administrator, investment accounting agent, shareholder servicing and transfer agent and custodian for the Trust.
5. INVESTMENTS IN RESTRICTED SECURITIES
Restricted securities include securities that have not been registered under the Securities Act of 1933, as amended, and securities that are subject to restrictions on resale. A Fund may invest in restricted securities that are consistent with a Fund's investment objective and investment strategies. A Fund will not invest in a restricted security if, immediately
www.firsthandfunds.com
35
NOTES TO FINANCIAL STATEMENTS - continued
December 31, 2018
after and as a result of the investment in such security, more than 15% of the Fund's net assets would be invested in illiquid securities. In some cases, the issuer of restricted securities has agreed to register such securities for resale, at the issuer's expense either upon demand by the Fund or in connection with another registered offering of the securities. Investments in restricted securities are valued at fair value as determined in good faith in accordance with procedures adopted by the Board of Trustees. It is possible that the estimated value may differ significantly from the amount that might ultimately be realized in the near term, and the difference could be material.
As of December 31, 2018, Firsthand Technology Opportunities Fund did not invest in any restricted securities and the Firsthand Alternative Energy Fund was invested in the following restricted securities:
SECURITY | | ACQUISITION DATE | | SHARES | | COST | | VALUE | | % OF NET
ASSETS | |
Silicon Genesis Corp., Common
Stock | | September 2, 2008 | | | 109,855 | | | $ | 32,956 | | | $ | 879 | | | | 0.0 | %* | |
Silicon Genesis Corp., Common
Stock | | September 26, 2008 | | | 71,552 | | | | 21,466 | | | | 572 | | | | 0.0 | %* | |
Silicon Genesis Corp., Series 1-C
Preferred Stock | | September 2, 2008 | | | 152 | | | | 46 | | | | 70 | | | | 0.0 | %* | |
Silicon Genesis Corp., Series 1-E
Preferred Stock | | September 2, 2008 | | | 3,000 | | | | 2,878 | | | | 772 | | | | 0.0 | %* | |
| | | | | | | $ | 57,346 | | | $ | 2,293 | | | | 0.1 | % | |
* Less than 0.05%.
Each Fund, consistent with SEC guidelines, has an investment restriction providing that it cannot purchase additional restricted securities once such securities comprise 15% of a Fund's net assets. The SEC considers a security to be illiquid if it cannot be disposed of within seven days in the ordinary course of business at approximately the amount at which a Fund has valued the security. The restriction stems from the concern that, for an open-end mutual fund with daily redemption obligations, a high level of illiquid securities would increase the risk that a Fund may not be able to meet its daily redemption needs, because illiquid securities often take a longer period of time to sell, and may not necessarily be sold at that Fund's then carrying value.
As of December 31, 2018, Kevin Landis represents the Funds and sits on the following private company's board: Silicon Genesis Corporation. Serving on the boards of directors of the portfolio companies may cause conflicts of interest. The Adviser has adopted various procedures to ensure that the Funds will not be unfavorably affected by these potential conflicts.
2018 Annual Report
36
NOTES TO FINANCIAL STATEMENTS - continued
December 31, 2018
6. RISKS
Because the return on and value of an investment in each Fund will fluctuate in response to stock market movements, the most significant risk of investing in a Fund is that you may lose money. Stocks and other equity securities are subject to market risks and fluctuations in value due to earnings, as well as economic, political, or regulatory events, and other factors beyond the Investment Adviser's control. The Funds are designed for long-term investors who can accept the risks of investing in a fund with significant common stock holdings in high-technology industries.
Each Fund is non-diversified. A risk of being non-diversified is that a significant change in the value of one company will have a greater impact on a Fund than it would if the Fund diversified its investments. Another risk for each Fund is its concentration of investments in companies within high-technology industries. The value of high-technology companies can, and often does, fluctuate dramatically and may expose you to greater-than-average financial and market risk.
7. RECENT ACCOUNTING PRONOUNCEMENTS
New Rule Issuances — In August 2018, the Securities and Exchange Commission issued Final Rule Release No. 33 10532, Disclosure Update and Simplification, which in part amends certain financial statement disclosure requirements of Regulation S-X that have become redundant, duplicative, overlapping, outdated, or superseded, in light of other Commission disclosure requirements, GAAP, or changes in the information environment. The amendments are intended to facilitate the disclosure of information to investors and simplify compliance without significantly altering the total mix of information provided to investors. The amendments to Rule 6-04.17 of Regulation S-X (balance sheet) were amended to require presentation of the total, rather than the components of net assets, of distributable earnings on the balance sheet. Consistent with GAAP, funds will be required to disclose to distributable earnings. The amendments to Rule 6-09 of Regulation S-X (statement of changes in net assets) omit the requirement to separately state the sources of distributions paid as well as omit the requirement to parenthetically state the book basis amount of undistributed net investment income. Instead, consistent with GAAP, funds will be required to disclose the total amount of distributions paid, except that any tax return of capital must be separately disclosed. The requirements of the Final Rule Release are effective November 5, 2018 and the Fund's statement of Assets and Liabilities and the Statement of Changes in Net Assets for the current and prior reporting period have been modified accordingly.
New Accounting Pronouncements — In August 2018, the FASB issued Accounting Standards Update No. 2018-13 "Disclosure Framework — Changes to the Disclosure Requirements for Fair Value Measurement" ("ASU 2018-13"). ASU 2018-13 eliminates
www.firsthandfunds.com
37
NOTES TO FINANCIAL STATEMENTS - continued
December 31, 2018
the requirement to disclose the amount of and reasons for transfers between Level 1 and Level 2 of the fair value hierarchy, the timing of transfers between levels of the fair value hierarchy, and the valuation process for Level 3 fair value measurements. ASU 2018-13 does not eliminate the requirement to disclose the range and weighted average used to develop significant unobservable inputs for Level 3 fair value measurements, and the changes in unrealized gains and losses for recurring Level 3 fair value measurements. ASU 2018-13 requires that information is provided about the measurement uncertainty of Level 3 fair value measurements as of the reporting date. The guidance is effective for fiscal years beginning after December 15, 2019, and interim periods within those fiscal years. Management has evaluated the impact of this change in guidance, and due to the permissibility of early adoption, modified the Funds' fair value disclosures for the current reporting period.
8. SUBSEQUENT EVENT
Management has evaluated the impact of all subsequent events on the Funds through the date the financial statements were issued, and has determined that there were no subsequent events requiring recognition or disclosure in the financial statements.
2018 Annual Report
38
ADDITIONAL INFORMATION (UNAUDITED)
December 31, 2018
BOARD REVIEW OF ADVISORY AGREEMENT (UNAUDITED)
Trustees (the "Board") of Firsthand Funds (the "Trust"), including all of the Trustees who are not "interested persons" of the Trust, as that term is defined in the 1940 Act (the "Independent Trustees"), considered the renewal of the master investment advisory agreement between Firsthand Capital Management, Inc. (the "Adviser") and the Trust on behalf of each of its series (each a "Fund" and collectively, the "Funds") (the "Advisory Agreement"). The Advisory Agreement was approved for an additional one-year term at a meeting of the Board held on August 3, 2018. The Board's decision to approve the Advisory Agreement reflects the exercise of its business judgment to continue the existing arrangement. In approving the Advisory Agreement, the Board considered information provided by the Adviser, with the assistance and advice of counsel to the Independent Trustees and counsel to the Trust.
Nature, Extent and Quality of Services
The Board received and considered various data and information regarding the nature, extent and quality of services provided to the Funds by the Adviser. The most recent Form ADV for the Adviser was provided to the Board, as were written and oral responses of the Adviser to an information request submitted by independent legal counsel on behalf of the Independent Trustees. The Board reviewed these responses, which included, among other things, information about the background and experience of the investment personnel of the Adviser primarily responsible for day-to-day portfolio management of the Funds. The Board also considered the Adviser's separate Administration Agreement with the Funds and the Adviser's overall ability to manage and administer the Funds as well as to oversee the service providers to the Funds.
The Board evaluated the ability of the Adviser, considering its financial condition, resources, reputation and other attributes, to attract and retain highly qualified investment professionals, including research, advisory, supervisory and administrative personnel. In this regard, the Board considered information regarding the Adviser's compensation program for its personnel involved in the management of the Funds, including incentive and retirement plans.
The Board considered the effectiveness of policies of the Funds in achieving the best execution of portfolio transactions, whether and to what extent "soft dollar" benefits are sought, the extent to which efforts are made to recapture transaction costs and the controls applicable to brokerage allocation procedures. The Board reviewed the policies of the Adviser regarding the allocation of portfolio investment opportunities among the Funds and other clients. The Board noted that the Adviser does not use "traditional soft-dollar" arrangements, where soft-dollar credits are generated based on the level of trades and then used for products or services from third-parties. The Board also noted that the Adviser, from time to time, entered into arrangements where it received research
www.firsthandfunds.com
39
ADDITIONAL INFORMATION (UNAUDITED) - continued
December 31, 2018
(including invitations to conferences) from broker-dealers that the Adviser used to execute client trades. The Board also considered that the Adviser had outsourced the trading function to achieve certain operating efficiencies.
The Board also considered the markets for the Funds, including the principal channels through which the Funds' shares are offered and sold, and the activities of the Adviser in connection with the marketing of the Funds.
In addition, the Board received and reviewed information on SEC and other inquiries, examinations and proceedings relating to the Funds and the Adviser. The Board considered the investment and legal compliance programs of the Adviser, including its implementation of enhanced compliance policies and procedures in response to SEC rule changes and other regulatory initiatives, and the level of compliance attained by the Adviser.
Based on the above factors, together with those referenced below, the Board, including a majority of the Independent Trustees, concluded that it was generally satisfied with the nature, extent and quality of the investment advisory services provided to each Fund by the Adviser.
Fund Performance
The Board considered each Fund's performance results over one-year, three-year, five-year and ten-year periods, or shorter periods, as relevant. It also considered these results in comparison to the performance results of various benchmark indices and of the Funds in relevant Morningstar sectors. The Board referenced the presentation regarding performance earlier in the meeting and noted that TOF had exhibited strong performance over the ten-year period ended June 30, 2018, which is consistent with the Board's emphasis on longer-term performance. The Board also noted the periods for which each Fund had experienced weaker performance. The Board recognized that each Fund had experienced various periods of underperformance against the peer group funds and the applicable benchmark index, but the Board noted that the Adviser has remained committed to its investment strategy and style and the Board was pleased with that consistency.
Investment Advisory Fee Rates and Other Expenses
The Board reviewed and considered the proposed contractual investment advisory fee rates (the "Advisory Agreement Rates") payable by the Funds to the Adviser for investment advisory services. Additionally, the Board received and considered information comparing the Advisory Agreement Rates (both on a stand-alone basis and on a combined basis with the Funds' administration fee rates) and the total expense ratios
2018 Annual Report
40
ADDITIONAL INFORMATION (UNAUDITED) - continued
December 31, 2018
of the Funds with those of other funds in appropriate peer universes provided by Broadridge (formerly Lipper). The Board noted that the respective Advisory Agreement Rates for each Fund were higher than the median rates of each fund's peer universe, but that the total expense ratio of each Fund was not appreciably above the median total expense ratio of the respective peer universe. The Board deemed the comparison of total expense ratios to be more relevant than the comparison of Advisory Agreement Rates because of the unitary fee structure of the Funds.
Profitability
The Board received and considered a profitability analysis of the Adviser with respect to the Funds. The Board concluded that, in light of the costs of providing investment management and other services to the Funds, the profits and other ancillary benefits that the Adviser received with regard to providing these services to the Funds were not excessive.
Economies of Scale
The Board received and considered information regarding whether there have been economies of scale with respect to the management of the Funds, whether the Funds have appropriately benefited from any economies of scale, and whether there is potential for realization of any further economies of scale with respect to the existing Funds. The Board observed that the Investment Advisory Agreement limits each Fund's total annual operating expenses to a percentage of the Fund's assets and that this percentage is reduced as the Fund's assets grow (known as "breakpoints"). The Board concluded that no change was necessary to the current breakpoints to reflect any economies of scale given the limited size and scale of the Funds.
Information about Services to Other Clients
The Board also received and considered information about the services and fee rates offered by the Adviser to its other client, Firsthand Technology Value Fund, Inc.. The Board concluded that the investment advisory rates charged by the Adviser to the Funds were within a reasonable range of the fee rates offered to other client of the Adviser. Where rates offered to other client or potential clients were lower, the Board concluded that the costs associated with managing and operating a registered open-end fund, compared with an unregistered investment company, private account or institutional investor account provided a justification for higher fee rates to the Funds.
Other Benefits to the Adviser
The Board received and considered information regarding potential "fall-out" or ancillary benefits to the Adviser as a result of its relationship with the Funds. Such benefits could include, among others, benefits directly attributable to the relationship of the
www.firsthandfunds.com
41
ADDITIONAL INFORMATION (UNAUDITED) - continued
December 31, 2018
Adviser with the Funds (such as "soft dollar" benefits) and benefits potentially derived from an increase in the business of the Adviser as a result of its relationship with the Funds (such as the ability to market to shareholders other financial products offered by the Adviser).
Other Factors and Broader Review
Throughout the year, the Board regularly reviews and assesses the quality of the services that the Funds receive from the Adviser. In this regard, the Board reviews reports of the Adviser in each of its quarterly meetings, which include, among other things, a detailed portfolio review and detailed fund performance reports. In addition, the Board interviews the portfolio managers of the Funds at various times throughout the year.
Board Consideration
After considering the aforementioned factors and based on its deliberations and evaluation of the information provided to it, the Board concluded that re-approval of the Investment Advisory Agreement for each of the Funds was in the best interest of the Funds and their shareholders.
FEDERAL TAX INFORMATION (UNAUDITED)
For the fiscal year ended December 31, 2018, the Funds make the following disclosures for federal income tax purposes. Below is listed the percentages, or the maximum amount allowable, of its ordinary income dividends ("QDI") to qualify for the lower tax applicable to individual shareholders, and the percentage of ordinary income dividends earned by the Funds which qualifies for the dividends received deduction ("DRD") for corporate shareholders. The actual percentage of QDI and DRD for the calendar year will be designated in year-end tax statements.
| | | QDI | | DRD | |
Firsthand Technology Opportunities Fund | | | 0 | % | | | 0 | % | |
Firsthand Alternative Energy Fund | | | 100 | % | | | 100 | % | |
PROXY VOTING POLICIES AND PROCEDURES
The Funds have adopted proxy voting procedures pursuant to which the Funds delegate the responsibility for voting proxies relating to portfolio securities held by the Funds to the Investment Adviser as part of the Investment Adviser's general management of the Funds, subject to the Board of Trustees' continuing oversight. A copy of the Funds' proxy voting policy and procedures is available without charge, upon request, by calling 1.888.884.2675. Information regarding how the Investment Adviser voted these proxies during the most recent one-year period ended June 30 is available by calling the same
2018 Annual Report
42
ADDITIONAL INFORMATION (UNAUDITED) - continued
December 31, 2018
number and on the website of the U.S. Securities and Exchange Commission at http://www.sec.gov on Form N-PX. The Funds' voting record is also available on the Funds' website at www.firsthandfunds.com/proxy.
PORTFOLIO HOLDINGS
The Funds file their complete schedule of portfolio holdings with the SEC for the first and third quarters of each fiscal year on Form N-Q. The Funds' Forms N-Q will be available on the SEC's website at http://www.sec.gov and may be reviewed and copied at the SEC's Public Reference Room in Washington, D.C. Information on the operation of the Public Reference Room may be obtained by calling 1.800.SEC.0330.
www.firsthandfunds.com
43
ADDITIONAL INFORMATION (UNAUDITED) - continued
December 31, 2018
Information about the trustees and officers* of the Funds is set forth in the following table. The Statement of Additional Information (the "SAI") includes additional information about the Funds' trustees and officers and is available free of charge, upon request, by calling 1.888.884.2675.
NAME, YEAR OF BIRTH,
POSITION(S) HELD
WITH FUNDS AND
ADDRESS | | TERM OF
OFFICE
AND LENGTH
OF TIME
SERVED(1) | | PRINCIPAL OCCUPATION(S)
DURING PAST FIVE YEARS | | NUMBER
OF FUNDS
IN FUND
COMPLEX
OVERSEEN BY
TRUSTEE | | OTHER
TRUSTEESHIPS
HELD BY
TRUSTEES | |
DISINTERESTED TRUSTEES | | | | | | | | | |
Greg Burglin (1960) TRUSTEE
150 Almaden Blvd. Suite 1250
San Jose, CA 95113 | | SINCE 2008 | | Mr. Burglin is a Tax Consultant and has been for more than 5 years. | | THREE | | None | |
Kimun Lee (1946) TRUSTEE
150 Almaden Blvd. Suite 1250
San Jose, CA 95113 | | SINCE 2013 | | Mr. Lee is a California registered investment advisor. In addition, he has also conducted a consulting business under the name Resources Consolidated since January 1980. | | THREE | | Since September 2009, Mr. Lee has served as a principle and director of iShares Delaware Trust Sponsor LLC, a commodity pool operator that operates iShares S&P GSCI Commodity Optimized Trust, iShares Commodity Indexed Trust, iShares Gold Trust, iShares Silver Trust and iShares Commodity Optimized Trust. Since April 2014, Mr. Lee has served as a trustee of FundX Investment Trust that operates FundX Upgrader Fund, FundX Aggressive Upgrader Fund, FundX Conservative Upgrader Fund, FundX Flexible Income Fund, FundXTactical Upgrader Fund, and FundX Sustainable Impact Fund. | |
2018 Annual Report
44
ADDITIONAL INFORMATION (UNAUDITED) - continued
December 31, 2018
NAME, YEAR OF BIRTH,
POSITION(S) HELD
WITH FUNDS AND
ADDRESS | | TERM OF
OFFICE
AND LENGTH
OF TIME
SERVED(1) | | PRINCIPAL OCCUPATION(S)
DURING PAST FIVE YEARS | | NUMBER
OF FUNDS
IN FUND
COMPLEX
OVERSEEN BY
TRUSTEE | | OTHER
TRUSTEESHIPS
HELD BY
TRUSTEES | |
INTERESTED TRUSTEE | | | | | | | | | |
Kevin M. Landis2
(1961)
TRUSTEE/PRESIDENT/SECRETARY 150 Almaden Blvd.
Suite 1250
San Jose, CA 95113 | | SINCE 1994 | | Mr. Landis is President and Chief Executive Officer of Firsthand Capital Management and has been portfolio manager with FCM since August 2009. | | THREE | | NONE3 | |
OFFICERS WHO ARE NOT TRUSTEES | | | | | | | | | |
Dimitris Spiliakos (1977)
ASSISTANT SECRETARY
135 Santilli Highway
Everett, MA 02149 | | SINCE 2015 | | Mr. Spiliakos is Vice President and Manager, Fund Accounting and Administration Department, The Bank of New York Mellon since 2015. He was Senior Specialist, Fund Accounting and Administration Department, The Bank of New York Mellon from 2012 to 2015. | | N/A | | N/A | |
NICHOLE MILESKI (1971)
CHIEF COMPLIANCE OFFICER
150 Almaden Blvd.
Suite 1250
San Jose, CA 95113 | | SINCE 2013 | | Ms. Mileski is corporate counsel of FCM since 2013; corporate paralegal of FCM since 2011. | | N/A | | N/A | |
www.firsthandfunds.com
45
ADDITIONAL INFORMATION (UNAUDITED) - continued
December 31, 2018
NAME, YEAR OF BIRTH,
POSITION(S) HELD
WITH FUNDS AND
ADDRESS | | TERM OF
OFFICE
AND LENGTH
OF TIME
SERVED(1) | | PRINCIPAL OCCUPATION(S)
DURING PAST FIVE YEARS | | NUMBER
OF FUNDS
IN FUND
COMPLEX
OVERSEEN BY
TRUSTEE | | OTHER
TRUSTEESHIPS
HELD BY
TRUSTEES | |
OFFICERS WHO ARE NOT TRUSTEES (continued) | | | | | | | |
OMAR BILLALWALA (1961)
TREASURER
150 Almaden Blvd.
Suite 1250
San Jose, CA 95113 | | SINCE 2011 | | Chief Operating Officer and Chief Financial Officer of Firsthand Capital Management, Inc. from 1999 to present. Treasurer of Firsthand Funds from 2011 to present. | | N/A | | N/A | |
* The term "officer" means the president, vice president, secretary, treasurer, chief compliance officer, controller, or any other officer who performs policy-making functions.
(1) Each trustee shall serve for the lifetime of Firsthand Funds or until he dies, resigns, or is removed. Each officer shall serve a one-year term subject to annual reappointment by the trustees.
(2) Mr. Landis is an interested person of the Funds by reason of his position with the Investment Adviser.
(3) Mr. Landis also currently sits on the boards of directors for 9 companies: Silicon Genesis Corp.; Hera Systems, Inc.; Revasum, Inc.; IntraOp Medical Corp.; Pivotal Systems Corp.; QMAT, Inc.; Telepathy Investors, Inc.; Vufine, Inc.; and Wrightspeed, Inc. All the companies are private companies, except for Revasum, Inc., and Pivotal Systems Corp. both of which are listed on the Australian Securities Exchange.
2018 Annual Report
46
Item 2. Code of Ethics.
(a) The registrant, as of the end of the period covered by this report, has adopted a code of ethics that applies to the registrant’s principal executive officer, principal financial officer, principal accounting officer or controller, or persons performing similar functions, regardless of whether these individuals are employed by the registrant or a third party
(c) There have been no amendments, during the period covered by this report, to a provision of the code of ethics that applies to the registrant’s principal executive officer, principal financial officer, principal accounting officer or controller, or persons performing similar functions, regardless of whether these individuals are employed by the registrant or a third party, and that relates to any element of the code of ethics description except that effective May 13, 2011, Omar Billawala replaced Kevin Landis as Treasurer (in the capacity of Chief Financial Officer) of the registrant.
(d) The registrant has not granted any waivers, including an implicit waiver, from a provision of the code of ethics that applies to the registrant’s principal executive officer, principal financial officer, principal accounting officer or controller, or persons performing similar functions, regardless of whether these individuals are employed by the registrant or a third party, that relates to one or more of the items set forth in paragraph (b) of this item’s instructions.
Item 3. Audit Committee Financial Expert.
As of the end of the period covered by the report, the registrant’s Board of Trustees has not determined that any of its members is qualified as an audit committee financial expert. Although each member of the Audit Committee is “independent,” as defined by Item 3 of Form N-CSR, and is financially sophisticated, the registrant has in place a small Board of Trustees with a limited number of members. Even without an audit committee financial expert, the registrant is comfortable that its Audit Committee can function effectively given the investment and financial experience and expertise of its members.
Item 4. Principal Accountant Fees and Services.
· Registrant may incorporate the following information by reference, if this information has been disclosed in the registrant’s definitive proxy statement or definitive information statement. The proxy statement or information statement must be filed no later than 120 days after the end of the fiscal year covered by the Annual Report.
Audit Fees
(a) The aggregate fees billed for each of the last two fiscal years for professional services rendered by the principal accountant for the audit of the registrant’s annual financial statements or services that are normally provided by the accountant in connection with statutory and regulatory filings or engagements for those fiscal years are $32,600 for 2018 and $31,700 for 2017.
Audit-Related Fees
(b) The aggregate fees billed in each of the last two fiscal years for assurance and related services by the principal accountant that are reasonably related to the performance of the audit of the registrant’s financial statements and are not reported under paragraph (a) of this Item are $ 0 for 2018 and $0 for 2017.
Tax Fees
(c) The aggregate fees billed in each of the last two fiscal years for professional services rendered by the principal accountant for tax compliance, tax advice, and tax planning are $4,200 for 2018 and $4,200 for 2017.
All Other Fees
(d) The aggregate fees billed in each of the last two fiscal years for products and services provided by the principal accountant, other than the services reported in paragraphs (a) through (c) of this Item are $1,500 for 2018 and $1,500 for 2017. The fees are incurred in connection with the principal accountants performing an annual anti-money laundering audit program for the Registrant.
(e)(1) Disclose the audit committee’s pre-approval policies and procedures described in paragraph (c)(7) of Rule 2-01 of Regulation S-X.
The registrant’s Audit Committee Charter states the following with respect to pre-approval procedures:
The Committee hereby delegates to the Chairman of the Committee the authority to grant pre-approvals of audit and “permissible” non-audit services to be provided by the Auditors to the Funds, subject to the ratification of the full Committee at its next regularly scheduled meeting. Both the Auditors and Fund counsel will be responsible for informing the Committee whether they believe that a particular non-audit service is permissible or prohibited pursuant to applicable regulations and standards.
The specific types of non-audit services that the Chairman may pre-approve include, but are not limited to: reviewing the Funds’ internal controls over financial reporting; providing tax-related services; reviewing and/or developing an anti-money laundering program; and issuing comfort letters, based on agreed-upon procedures, in connection with any Fund reorganization.
Pre-approval for a non-audit service provided to a Fund is not required if: (i) the aggregate amount of all such non-audit services provided to the Fund constitutes not more than 5% of the total amount of revenues paid by the Fund to the Auditors during the fiscal year in which the non-audit services are provided; (ii) such services were not recognized by the Fund at the time of the engagement to be non-audit services; and (iii) such services are promptly brought to the attention of the Committee and are approved by the Committee or by one or more members of the Committee to whom authority to grant such approvals has been delegated by the Committee prior to the completion of the audit (the “De Minimus Exceptions”).
The Committee shall also pre-approve any non-audit services proposed to be provided by the Auditors to (i) a Fund’s investment adviser and (ii) any entity controlling, controlled by, or under common control with the investment adviser that provides ongoing services to the Fund, if the Auditors’ engagement with the investment adviser or any such control persons relates directly to the operations and financial reporting of the Fund. The De Minimus Exceptions applies to pre-approvals under this paragraph as well, except that the “total amount of revenues” calculation is based on the total amount of revenues paid to the Auditors by the Fund and any other entity that has its services approved under this paragraph (i.e., the investment adviser or any control person).
(e)(2) The percentage of services described in each of paragraphs (b) through (d) of this Item that were approved by the audit committee pursuant to paragraph (c)(7)(i)(C) of Rule 2-01 of Regulation S-X are as follows:
(b) 100%
(c) 100%
(d) 100%
(f) Not applicable.
(g) The aggregate non-audit fees billed by the registrant’s accountant for services rendered to the registrant, and rendered to the registrant’s investment adviser (not including any sub-adviser whose role is primarily portfolio management and is subcontracted with or overseen by another investment adviser), and any entity controlling, controlled by, or under common control with the adviser that provides ongoing services to the registrant for each of the last two fiscal years of the registrant was $0 for 2018 and $0 for 2017.
(h) Not applicable.
Item 5. Audit Committee of Listed Registrants.
Not applicable.
Item 6. Investments.
(a) Schedule of Investments in securities of unaffiliated issuers as of the close of the reporting period is included as part of the report to shareholders filed under Item 1 of this form.
(b) Not applicable.
Item 7. Disclosure of Proxy Voting Policies and Procedures for Closed-End Management Investment Companies.
Not applicable.
Item 8. Portfolio Managers of Closed-End Management Investment Companies.
Not applicable.
Item 9. Purchases of Equity Securities by Closed-End Management Investment Company and Affiliated Purchasers.
Not applicable.
Item 10. Submission of Matters to a Vote of Security Holders.
Not applicable.
Item 11. Controls and Procedures.
(a) The registrant’s principal executive officer and principal financial officer have concluded, based on their evaluation of the registrant’s disclosure controls and procedures as conducted within 90 days of the filing date of this report, that these disclosure controls and procedures are adequately designed and are operating effectively to ensure that information required to be disclosed by the registrant on Form N-CSR is recorded, processed, summarized and reported within the time periods specified in the Securities and Exchange Commission’s rules and forms.
(b) There were no changes in the registrant’s internal control over financial reporting (as defined in Rule 30a-3(d) under the Act (17 CFR 270.30a-3(d))) that occurred during the registrant’s last fiscal quarter that have materially affected or are reasonably likely to materially affect, the registrant’s internal control over financial reporting.
Item 12. Disclosure of Securities Lending Activities for Closed-End Management Investment Companies.
Not applicable.
Item 13. Exhibits.
(a)(1) Code of ethics, or any amendment thereto, that is the subject of disclosure required by Item 2 is attached hereto.
(a)(2) Certifications pursuant to Rule 30a-2(a) under the 1940 Act and Section 302 of the Sarbanes-Oxley Act of 2002 are attached hereto.
(a)(3) Not applicable.
(a)(4) Not applicable.
(b) Certifications pursuant to Rule 30a-2(b) under the 1940 Act and Section 906 of the Sarbanes-Oxley Act of 2002 are attached hereto.
SIGNATURES
Pursuant to the requirements of the Securities Exchange Act of 1934 and the Investment Company Act of 1940, the registrant has duly caused this report to be signed on its behalf by the undersigned, thereunto duly authorized.
(Registrant) | | Firsthand Funds |
| |
| |
By (Signature and Title)* | /s/ Kevin Landis |
| Kevin M. Landis, President and Secretary |
| |
| |
Date | March 6, 2019 |
|
|
Pursuant to the requirements of the Securities Exchange Act of 1934 and the Investment Company Act of 1940, this report has been signed below by the following persons on behalf of the registrant and in the capacities and on the dates indicated. |
|
|
By (Signature and Title)* | /s/ Kevin Landis |
| Kevin M. Landis, President and Secretary |
| |
| |
Date | March 6, 2019 |
| |
| |
By (Signature and Title)* | /s/ Omar Billawala |
| Omar Billawala, Treasurer |
| |
| |
Date | March 6, 2019 |
| | | |
* Print the name and title of each signing officer under his or her signature.