UNITED STATES
SECURITIES AND EXCHANGE COMMISSION
Washington, D.C. 20549
FORM N-CSR
CERTIFIED SHAREHOLDER REPORT OF REGISTERED MANAGEMENT INVESTMENT COMPANIES
Investment Company Act file number811-08268
Firsthand Funds
(Exact name of registrant as specified in charter)
150 Almaden Blvd., Suite 1250
San Jose, CA 95113
(Address of principal executive offices) (Zip code)
Firsthand Capital Management, Inc.
150 Almaden Blvd., Suite 1250
San Jose, CA 95113
(Name and address of agent for service)
Registrant's telephone number, including area code: (408) 624-9527
Date of fiscal year end:December 31
Date of reporting period:December 31, 2019
Form N-CSR is to be used by management investment companies to file reports with the Commission not later than 10 days after the transmission to stockholders of any report that is required to be transmitted to stockholders under Rule 30e-1 under the Investment Company Act of 1940 (17 CFR 270.30e-1). The Commission may use the information provided on Form N-CSR in its regulatory, disclosure review, inspection, and policymaking roles.
A registrant is required to disclose the information specified by Form N-CSR, and the Commission will make this information public. A registrant is not required to respond to the collection of information contained in Form N-CSR unless the Form displays a currently valid Office of Management and Budget ("OMB") control number. Please direct comments concerning the accuracy of the information collection burden estimate and any suggestions for reducing the burden to Secretary, Securities and Exchange Commission, 450 Fifth Street, NW, Washington, DC 20549-0609. The OMB has reviewed this collection of information under the clearance requirements of 44 U.S.C. § 3507.
Item 1. Reports to Stockholders.
The Report to Shareholders is attached herewith.

Beginning on January 1, 2021, as permitted by regulations adopted by the U.S. Securities and Exchange Commission, paper copies of the shareholder reports of the Firsthand Funds (each, a “Fund” and, collectively, the “Funds”) will no longer be sent by mail, unless you specifically request paper copies of the reports from the Funds, or from your financial intermediary, such as a broker-dealer or bank. Instead, the reports will be made available on the Funds’ website, www.firsthandfunds.com, and you will be notified by mail each time a report is posted and provided with a website link to access the report.
If you already elected to receive shareholder reports electronically, you will not be affected by this change and you need not take any action. You may elect to receive shareholder reports and other communications from a Fund, or from your financial intermediary, electronically anytime by contacting your financial intermediary or, if you are a direct investor, by calling 1-888-884-2675.
You may elect to receive all future reports in paper free of charge. If you invest through a financial intermediary, you can contact your financial intermediary to request that you continue to receive paper copies of your shareholder reports. If you invest directly with a Fund, you can call 1-888-884-2675 to let the Fund know you wish to continue receiving paper copies of your shareholder reports. Your election to receive reports in paper will apply to all Funds held in your account if you invest through your financial intermediary or all Funds held with the fund complex if you invest directly with a Fund.
CONTENTS
| | |
Performance Summary | 2 |
President’s Letter | 5 |
Shareholder Fee Example | 7 |
Performance and Portfolio Discussion | 9 |
Audit Letter | 15 |
Portfolio of Investments | 16 |
Statements of Assets and Liabilities | 22 |
Statements of Operations | 23 |
Statements of Changes in Net Assets | 24 |
Financial Highlights | 26 |
Notes to Financial Statements | 28 |
Additional Information | 41 |
Performance Summary
Period Returns (Average Annual Total Returns as of 12/31/19)
FUND | 1-year | 3-year | 5-year | 10-year | Gross
expense
ratio* |
Firsthand Technology Opportunities Fund | 28.51% | 27.73% | 18.16% | 16.14% | 1.84% |
Firsthand Alternative Energy Fund | 40.59% | 13.39% | 3.61% | -0.38% | 2.15% |
NASDAQ Composite Index | 36.74% | 19.89% | 15.00% | 16.14% | ● |
S&P 500 Index | 31.48% | 15.25% | 11.68% | 13.54% | ● |
WilderHill Clean Energy Index | 59.22% | 23.85% | 5.81% | -3.78% | ● |
* | After fee waivers, Firsthand Technology Opportunities fund’s total net operating expenses are 1.83% and Firsthand Alternative Energy Fund’s total net operating expenses are 1.98%. Please see the Funds’ prospectus for more information about fund expenses. |
Returns assume reinvestment of all dividends and distributions but do not reflect the impact of taxes. The performance data quoted represent past performance. Past performance cannot guarantee future results, and current performance may be lower or higher than the performance quoted. Both the return from and the principal value of an investment in the Funds will fluctuate so that an investor’s shares, when redeemed, may be worth more or less than their original cost. To obtain performance as of the most recent month-end, please contact Firsthand Funds by calling 1.888.884.2675 or go to www.firsthandfunds.com.
The Nasdaq Composite Index (NASDAQ) is a capitalization-weighted index of all common stocks listed with NASDAQ. The Standard & Poor’s 500 Index (S&P 500) is a market-weighted index of 500 stocks of well-established companies. Each index represents an unmanaged, broad-based basket of stocks. These indices are typically used as benchmarks for overall market performance. The WilderHill Clean Energy Index is a market-weighted index of 58 companies in the cleaner fuel, energy conversion, energy storage, greener utilities, power delivery and conservation, and renewable energy harvesting sectors. The Dow Jones Industrial Average is a price-weighted average of 30 significant stocks traded on the New York Stock Exchange and the NASDAQ. You cannot invest directly in an index.
Returns Since Inception (Average Annual Total Returns as of 12/31/19)
FUND (inception Date) | Average
Annual
Total
Returns | NASDAQ
composite
index | s&p 500
index | wilderhill
clean
energy
index |
Firsthand Technology Opportunities Fund (09/30/99) | 3.74% | 7.06% | 6.70% | ● |
Firsthand Alternative Energy Fund (10/29/07) | -2.11% | 11.28% | 8.55% | -9.67% |
Each Fund may invest in small-capitalization companies and Initial Public Offerings (“IPOs”). These investments will be more volatile than investments in large-capitalization companies and loss of principal could be greater. The Funds may invest in foreign securities, which will be subject to greater risks than investing in domestic securities. Because the Funds are not diversified, they can take larger positions in fewer companies, increasing their risk profile. The Funds invest in several industries within the technology sector and the relative weightings of these industries in a Fund’s portfolio may change at any time.
Holdings by Industry - % of Net Assets (as of 12/31/19)
INDUSTRY | FIRSTHAND technology
opportunities fund | FIRSTHAND alternative
energy fund |
Advanced Materials | ● | 3.1% |
Agriculture | ● | 0.0% |
Automotive | ● | 0.0% |
Biotech | 0.4% | 2.7% |
Communications | 1.1% | ● |
Computer Storage Devices | 0.7% | ● |
Consumer Electronics | 12.6% | ● |
Defense & Aerospace | 1.7% | ● |
Education | 6.0% | ● |
Electrical Equipment | ● | 2.8% |
Energy Efficiency | ● | 12.2% |
Engineering Service | ● | 3.3% |
Environmental Services | ● | 1.2% |
Industrials | ● | 6.5% |
Intellectual Property | ● | 0.0% |
Internet | 16.0% | ● |
Materials | ● | 7.5% |
Networking | 11.1% | ● |
Other Electronics | 3.8% | 11.2% |
Renewable Energy | 3.4% | 37.1% |
Semiconductor Equipment | 1.3% | ● |
Semiconductors | 9.3% | 9.3% |
Services | 1.0% | ● |
Social Networking | 4.0% | ● |
Software | 27.4% | ● |
Waste & Environment Service | ● | 2.4% |
Investment Company | 1.0% | 0.1% |
Net Other Liabilities | (0.8)% | 0.6% |
Portfolio holdings are subject to change.
President’s Letter

Fellow Shareholders,
The bull market in U.S. equities continued its impressive run in 2019. For the year ended December 31, 2019, the Nasdaq Composite Index was up 36.74% and the S&P 500 Index finished up 31.48%. I am disappointed to report that Firsthand Technology Opportunities Fund underperformed its benchmarks, with a gain of 28.51% for the year. The performance of Firsthand Alternative Energy Fund was better, with the Fund posting a gain of 40.59% for the period. However, the Fund underperformed its primary benchmark, the WilderHill Clean Energy Index, for the year. That index gained 59.22% during the period.
FIRSTHAND TECHNOLOGY OPPORTUNITIES FUND
Six months ago, in the pages of our Semi-Annual Report to Shareholders, I spoke of the fact that we had deemphasized FAANG (Facebook, Amazon, Apple, Netflix, Google) stocks and increased our cash position in an effort to reduce our exposure to a market that we believed was overheated. While the Fund’s first-half performance was encouraging, it turned out that we called the top in the FAANG names too early. Furthermore, 2019 was a bad year to be out of Apple (AAPL). Apple stock was up nearly 90% during the year, and the fact that it has the largest weighting in both the Nasdaq Composite Index and the S&P 500 compounded our underperformance.
Roku (ROKU) was far and away the biggest bright spot in the portfolio, up over 300% for the year. The company has become one of the leading providers of video streaming technologies to the consumer market. Roku is representative of a group of companies with market capitalizations between $5 billion and $50 billion that form the core of our holdings. This group of stocks also includes Arista Networks (ANET), Nutanix (NTNX), Twilio (TWLO), Chegg (CHGG), Match Group (MTCH), and Cree (CREE).
After being among the biggest contributors to the Fund’s outperformance in the first half of the year, the stocks of Arista Networks, Twilio, Chegg, and Cree slumped in the second half. Most regained their footing prior to year’s end, but the result was underperformance at the fund level for the second half of the year.
Nutanix stock spent much of the year in the penalty box as the company struggled through its transition from a hardware-centric revenue model toward a subscription-based revenue model. The stock finished the year on an upswing, as its financial results began to reflect a return to growth in its business.
PRESIDENT’S LETTER -continued
FIRSTHAND ALTERNATIVE ENERGY FUND
2019 was a great year for solar stocks, and for solar inverter stocks in particular. Both SolarEdge (SEDG) and Enphase (ENPH) enjoyed sparkling gains of well over 100% for the year. While we were able to capture that performance with our SolarEdge investment, our purchase of Enphase came near its all-time high, which it is only now re-approaching.
The Fund has made a couple of investments in legal cannabis-related businesses, including Curaleaf Holdings (CURLF) and GW Pharmaceuticals (GWPH). GW Pharmaceuticals is a biotech company with a cannabis-derived epilepsy treatment called Epidiolex, which is approved for use in both the U.S. and the European Commission. Curaleaf markets cannabis-derived products for medical and recreational use in U.S. states in which it is legal. Both companies posted strong revenue growth in 2019, but when investors took the wind out of the sails of the broader group of listed cannabis stocks in the second half of the year, our two holdings suffered along with others in the sector.
LOOKING AHEAD
The U.S. economy appears to be on stable footing, showing few, if any, signs of fundamental weakness. It appears today that the most significant threats to continued growth include trade tensions with China, geopolitical squabbles, and the occasional virus scare. We have positioned our portfolios to take advantage of the growth we anticipate across several technology and alternative energy trends and enter 2020 fully invested.
Thank you for your investment in Firsthand Funds.
Sincerely,

Kevin Landis
President, Firsthand Funds
Data and statistics presented have been calculated using data from Yahoo!Finance. All expressions of opinion are subject to change without notice.
Shareholder Fee Example(UNAUDITED)
Example — In general, mutual fund shareholders may incur two types of costs: (1) transaction costs, including sales charges (loads), redemption fees, and exchange fees; and (2) ongoing costs, including management fees, 12b-1 distribution and service fees, non-12b-1 service fees, and other Fund expenses. This example is intended to help you understand your ongoing costs (in dollars) of investing in a Fund and to compare these costs with the ongoing costs of investing in other mutual funds. Note that Firsthand Funds (“Trust”) does not charge transaction fees for 12b-1 distribution and service fees, though you may incur transaction fees if you purchase shares through a broker.
The example on the following page is based on an investment of $1,000 invested at the beginning of the period and held for the entire period from July 1, 2019 through December 31, 2019.
Actual Expenses — The section of the table at right entitled “Actual” provides information about actual account values and actual expenses. You may use this information, together with the amount you invested, to estimate the expenses that you paid over the period. Simply divide your account value by $1,000 (for example, an $8,600 account value divided by $1,000 = 8.6), then multiply the result by the number in the section entitled “Actual” under the heading “Expenses Paid During Period” to estimate the expenses you paid on your account during this period. If your account is an IRA or other tax-qualified savings plan, your expenses may also have included a $10 annual fee. In either case, the amount of any fee paid through your account would increase the estimate of expenses you paid during the period and decrease your ending account value.
Hypothetical Example for Comparison Purposes — The section of the table at right entitled “Hypothetical” provides information about hypothetical account values and hypothetical expenses based on a Fund’s actual expense ratio and an assumed rate of return of 5% per year before expenses, which is not the Fund’s actual return. The hypothetical account values and expenses may not be used to estimate your actual ending account balance or the expenses you paid for the period. However, you may use this information to compare the ongoing costs of investing in the Trust to other funds. To do so, compare this 5% hypothetical example with the 5% hypothetical examples that appear in the shareholder reports of the other funds. As in the case of the actual expense example, if your account is subject to an IRA fee, the amount of the fee paid through your account would increase the hypothetical expenses you would have paid during the period and decrease the hypothetical ending account value.
Please note that the expenses shown in the table below are meant to highlight your ongoing costs only and do not reflect any transactional costs, such as sales charges (loads), redemption fees, or exchange fees. Therefore, the table is useful in comparing ongoing costs only, and will not help you determine the relative total costs of owning different funds. In addition, if these transactional costs were included, your costs would have been higher. The examples also assume all dividends and distributions have been reinvested.
SHAREHOLDER FEE EXAMPLE(UNAUDITED) - continued
Firsthand Technology Opportunities Fund
| BEGINNING
ACCOUNT VALUE
7/1/19 | ENDING
ACCOUNT
VALUE
12/31/19 | EXPENSES PAID
DURING
PERIOD*
7/1/19 - 12/31/19 | ANNUALIZED
EXPENSE RATIO |
Actual | $1,000 | $1,002.90 | $9.25 | 1.83% |
Hypothetical** | $1,000 | $1,015.96 | $9.31 | 1.83% |
Firsthand Alternative Energy Fund
| BEGINNING
ACCOUNT VALUE
7/1/19 | ENDING
ACCOUNT
VALUE
12/31/19 | EXPENSES PAID
DURING
PERIOD*
7/1/19 - 12/31/19 | ANNUALIZED
EXPENSE RATIO |
Actual | $1,000 | $1,050.60 | $10.23 | 1.98% |
Hypothetical** | $1,000 | $1,015.22 | $10.06 | 1.98% |
* | Expenses are calculated by multiplying the Fund’s annualized expense ratio listed above by the average account value over the period and multiplying that number by 184/365 (to reflect the one-half year period). |
** | 5% return per year before expenses. |
| The expenses shown in the table do not reflect any fees that may be charged to you by brokers, financial Intermediaries, or other financial institutions. |
FIRSTHAND TECHNOLOGY OPPORTUNITIES FUND
Performance and Portfolio Discussion
How did the Fund perform in 2019?
Firsthand Technology Opportunities Fund (TEFQX) posted a gain of 28.51% in 2019 versus a gain of 36.74% for the NASDAQ Composite Index and a 31.48% gain for the S&P 500 Index. For the six months ended December 31, 2019, Firsthand Technology Opportunities Fund was up 0.28% compared to gains of 12.70% and 10.92% for the NASDAQ Composite Index and the S&P 500 Index, respectively.
Which industries had the greatest impact on the Fund’s performance?
For the period ended December 31, 2019, software companies represented the portfolio’s largest industry weighting, followed by holdings in the internet and consumer electronics industries. The portfolio’s exposure to the software and networking industries contributed most to the Fund’s underperformance versus its primary benchmark in 2019.
Which individual holdings were the largest contributors to the Fund’s performance?
Roku (ROKU) was the top contributor to fund performance for the year. The video streaming hardware and software company registered strong revenue growth throughout the year, and the company’s shares finished 2019 up 329.5%. The company’s highly-profitable platform business is now more than double the player business and is growing more quickly. Roku expects its recent acquisition of advertising technology provider dataxu to enhance the company’s self-serve ad buying capabilities.
Another leading contributor to the Fund’s performance during the year was dating website leader Match Group (MTCH). The company has grown revenue and net income sequentially for the past several quarters, though weaker than expected guidance for Q4 hurt the company’s stock in November. Match Group’s stock finished 2019 near all-time highs after announcing an agreement in December to spin off from majority owner IAC/InterActiveCorp (IAC).
Facebook (FB) stock quietly had an outstanding year in 2019, and was the third largest contributor to the Fund’s performance. In July, Facebook and the Federal Trade Commission (FTC) reached a settlement to resolve the FTC’s investigation into the company’s privacy practices. The settlement included a $5 billion fine, which impacted Facebook’s financials in Q2 and Q3. The company continued to grow monthly average users throughout 2019 and its stock finished the year near its all-time high.
Which holdings were the greatest detractors from the Fund’s performance?
The largest detractor from Fund performance for the period was educational technology company 2U (TWOU). The company’s stock fell sharply in May after reducing its revenue outlook for 2019, noting enrollment declines of 20% at its five largest programs over the past two years. Later, the stock plunged more than 60% in late July following the company’s announcement of a slowing cadence of new program launches resulting in reduced near-term revenue growth.
FIRSTHAND TECHNOLOGY OPPORTUNITIES FUND - continued
Performance and Portfolio Discussion
Nutanix (NTNX) was another significant negative contributor to Fund performance in 2019, as it dealt with a challenging transition away from hardware and toward a subscription-based revenue model. After a strong start to the year, the company’s stock took a major hit in early March when the company issued disappointing financial guidance for its third fiscal quarter ended April 30. Nutanix stock suffered further declines after its Q3 earnings came in below the revised guidance. The company’s stock was up for the second half of the year as two consecutive strong quarters buoyed investors’ hopes that the recurring revenue model was beginning to deliver top-line growth again.
The Fund’s third largest detractor from fund performance during the quarter was Revasum (ASX: RVS). The California-based company, whose shares are listed on the Australian Securities Exchange, warned of lower than expected revenues for the second half of 2019 shortly after the Fund established its position in Revasum in late Q3. The company’s stock fell nearly 50% during the fourth quarter in the wake of the disappointing news.
Fund Performance and Holdings Information (as of 12/31/19)
Firsthand Technology Opportunities Fund vs. Market Indices
| FIRSTHAND
TECHNOLOGY
OPPORTUNITIES FUND | NASDAQ
COMPOSITE INDEX | S&P 500 INDEX |
Since Inception (9/30/99) | 3.74% | 7.06% | 6.70% |
10-Year | 16.14% | 16.14% | 13.54% |
5-year | 18.16% | 15.00% | 11.68% |
3-year | 27.73% | 19.89% | 15.25% |
1-Year | 28.51% | 36.74% | 31.48% |
GROWTH OF A HYPOTHETICAL $10,000 INVESTMENT
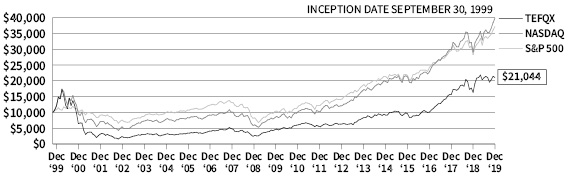
Returns assume reinvestment of all dividends and distributions but do not reflect the impact of taxes. The performance data quoted represent past performance. Past performance cannot guarantee future results, and current performance may be lower or higher than the performance quoted. Both the return from and the principal value of an investment in the Fund will fluctuate so that an investor’s shares, when redeemed, may be worth more or less than their original cost. To obtain performance as of the most recent month-end, please contact Firsthand Funds by calling 1.888.884.2675 or go to www.firsthandfunds.com.
HOLDINGS BY INDUSTRY* | % NET ASSETS | | TOP 10 HOLDINGS** | % NET ASSETS |
Software | 27.4% | | Roku, Inc. | 12.6% |
Internet | 16.0% | | Arista Networks, Inc. | 5.6% |
Consumer Electronics | 12.6% | | Nutanix, Inc. | 5.5% |
Networking | 11.1% | | Twilio, Inc. | 5.4% |
Semiconductors | 9.3% | | Chegg, Inc. | 5.1% |
Education | 6.0% | | Match Group, Inc. | 4.8% |
Social Networking | 4.0% | | Netflix, Inc. | 4.4% |
Other Electronics | 3.8% | | Facebook, Inc. | 4.0% |
Renewable Energy | 3.4% | | Cree, Inc. | 3.8% |
Defense & Aerospace | 1.7% | | NVIDIA Corp. | 3.7% |
Semiconductor Equipment | 1.3% | | | |
Communications | 1.1% | | | |
Net Other Assets and Liabilities | 2.3% | | | |
* | Based on percentage of net assets as of 12/31/19.**Top 10 stock holdings total 54.9% of net assets. These holdings are current as of 12/31/19, and may not be representative of current or future investments. |
FIRSTHAND ALTERNATIVE ENERGY FUND
Performance and Portfolio Discussion
How did the Fund perform in 2019?
Firsthand Alternative Energy Fund (ALTEX) posted 40.59% gain in 2019 versus a gain of 59.22% for the WilderHill Clean Energy Index and a 31.48% gain for the S&P 500 Index. For the six months ended December 31, 2019, Firsthand Alternative Energy Fund was up 5.05% compared to gains of 14.92% and 10.92% for the WilderHill Clean Energy Index and the S&P 500 Index, respectively.
Which industries had the greatest impact on the Fund’s performance?
For the period ended December 31, 2019, renewable energy companies represented the portfolio’s largest industry weighting, followed by energy efficiency and other electronics companies. The portfolio’s exposure to the renewable energy and biotech industries contributed most to the Fund’s underperformance versus its primary benchmark in 2019.
Which individual holdings were the largest contributors to the Fund’s performance?
The top contributor to Fund performance for the year was SolarEdge (SEDG), a manufacturer of power management components for solar installations. Company revenues for the first nine months of 2019 topped $1 billion, compared to $674 million during the same period in 2018, and SolarEdge stock finished the year up 168%.
Power Integrations (POWI) was another significant contributor to the Fund’s performance in 2019. The company’s stock swooned in May after the company reported declines in revenues and earnings for its first quarter ended March 31. The stock surged higher in the second half of 2019, buoyed by increasing revenues and the company’s announcement that it had settled its patent disputes with ON Semiconductor (ON), which resulted in a payment of $175 million from ON Semiconductor to Power Integrations in Q4.
Smart metering supplier Itron (ITRI) delivered successive earnings beats during 2019, resulting in a steady increase in the company’s stock price through the last three quarters of the year. The company swung to a profit for the first nine months of 2019, after posting a loss for the same period in 2018. Itron stock finished the year up over 77%.
Which holdings were the greatest detractors from the Fund performance?
The Fund had few decliners in its portfolio in 2019, and those holdings tended to be relatively small, which limited the Fund’s losses. The largest detractor from Fund performance was Enphase, which was purchased by the Fund in August. In September, noted short-seller Citron Research published a report outlining a bearish outlook for the stock, which led to a sharp sell-off. After additional declines following the company’s release of its Q3 financial results, Enphase stock rallied into year end.
We established a small position in cannabis operator Curaleaf Holdings (CURLF) in the second quarter but poor timing resulted in our buying the stock near its all-time highs. The subsequent decline in Curaleaf’s share price resulted in the stock being the second largest
FIRSTHAND ALTERNATIVE ENERGY FUND - continued
Performance and Portfolio Discussion
detractor from the Fund’s performance in 2019. The company made several acquisitions of other cannabis businesses in 2019, and revenue more than tripled during the first nine months of the year.
3M (MMM) stock was the third largest detractor from fund performance, finishing the year down about 5%. The company endured sales declines in its largest business segments; its health care segment was the only one of its five major segments to post meaningful sales growth in the first nine months of the year.
Fund Performance and Holdings Information (as of 12/31/19)
Firsthand Alternative Energy Fund vs. Market Indices
| FIRSTHAND
ALTERNATIVE
ENERGY FUND | WILDERHILL CLEAN
ENERGY INDEX | S&P 500 INDEX |
Since Inception (10/29/07) | -2.11% | -9.67% | 8.55% |
10-Year | -0.38% | -3.78% | 13.54% |
5-year | 3.61% | 5.81% | 11.68% |
3-year | 13.39% | 23.85% | 15.25% |
1-Year | 40.59% | 59.22% | 31.48% |
GROWTH OF A HYPOTHETICAL $10,000 INVESTMENT
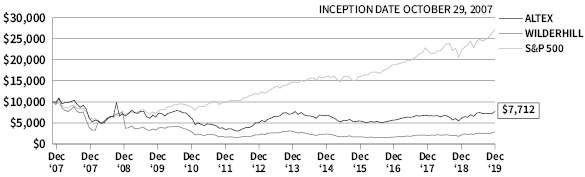
Returns assume reinvestment of all dividends and distributions but do not reflect the impact of taxes. The performance data quoted represent past performance. Past performance cannot guarantee future results, and current performance may be lower or higher than the performance quoted. Both the return from and the principal value of an investment in the Fund will fluctuate so that an investor’s shares, when redeemed, may be worth more or less than their original cost. To obtain performance as of the most recent month-end, please contact Firsthand Funds by calling 1.888.884.2675 or go to www.firsthandfunds.com.
HOLDINGS BY INDUSTRY* | % NET ASSETS | | TOP 10 HOLDINGS** | % NET ASSETS |
Renewable Energy | 37.1% | | SolarEdge Technologies, Inc. | 10.8% |
Energy Efficiency | 12.2% | | Power Integrations, Inc. | 9.3% |
Other Electronics | 11.2% | | Itron, Inc. | 7.6% |
Semiconductors | 9.3% | | Cree, Inc. | 6.0% |
Materials | 7.5% | | Vestas Wind Systems A.S. | 4.9% |
Industrials | 6.5% | | Koninklijke Philips Electronics N.V. | 4.6% |
Engineering Service | 3.3% | | First Solar, Inc. | 4.5% |
Advanced Materials | 3.1% | | Honeywell International, Inc. | 4.5% |
Electrical Equipment | 2.8% | | Aspen Aerogels, Inc. | 4.4% |
Biotech | 2.7% | | Iberdrola S.A. | 3.8% |
Waste & Environmental Services | 2.4% | | | |
Environmental Services | 1.2% | | | |
Net Other Assets and Liabilities | 0.7% | | | |
* | Based on percentage of net assets as of 12/31/19.**Top 10 stock holdings total 60.4% of net assets. These holdings are current as of 12/31/19, and may not be representative of current or future investments. |
REPORT OF INDEPENDENT REGISTERED PUBLIC ACCOUNTING FIRM
To the Shareholders and Board of Trustees of Firsthand Funds
Opinion on the Financial Statements
We have audited the accompanying statements of assets and liabilities of Firsthand Technology Opportunities Fund and Firsthand Alternative Energy Fund, each a series of Firsthand Funds (the “Funds”), including the schedules of investments, as of December 31, 2019, the related statements of operations for the year then ended, the statements of changes in net assets for each of the two years in the period then ended, and financial highlights for each of the five years in the period then ended, and the related notes (collectively referred to as the “financial statements”). In our opinion, the financial statements present fairly, in all material respects, the financial position of Firsthand Funds as of December 31, 2019, the results of their operations for the year then ended, the changes in their net assets for each of the two years in the period then ended, and the financial highlights for each of the five years in the period then ended, in conformity with accounting principles generally accepted in the United States of America.
Basis for Opinion
These financial statements are the responsibility of the Funds’ management. Our responsibility is to express an opinion on the Funds’ financial statements based on our audits. We are a public accounting firm registered with the Public Company Accounting Oversight Board (United States) (“PCAOB”) and are required to be independent with respect to the Funds in accordance with the U.S. federal securities laws and the applicable rules and regulations of the Securities and Exchange Commission and the PCAOB. We have served as the Funds’ auditor since 1997.
We conducted our audits in accordance with the standards of the PCAOB. Those standards require that we plan and perform the audit to obtain reasonable assurance about whether the financial statements are free of material misstatement, whether due to error or fraud. The Funds are not required to have, nor were we engaged to perform, an audit of their internal control over financial reporting. As part of our audits we are required to obtain an understanding of internal control over financial reporting, but not for the purpose of expressing an opinion on the effectiveness of the Funds’ internal control over financial reporting. Accordingly, we express no such opinion.
Our audits included performing procedures to assess the risks of material misstatement of the financial statements, whether due to error or fraud, and performing procedures that respond to those risks. Such procedures included examining, on a test basis, evidence regarding the amounts and disclosures in the financial statements. Our audits also included evaluating the accounting principles used and significant estimates made by management, as well as evaluating the overall presentation of the financial statements. Our procedures included confirmation of securities owned as of December 31, 2019 by correspondence with the custodian and company. We believe that our audits provide a reasonable basis for our opinion.
TAIT, WELLER & BAKER LLP
Philadelphia, Pennsylvania
February 20, 2019
FIRSTHAND TECHNOLOGY OPPORTUNITIES FUND
Portfolio of Investments, December 31, 2019
| | SHARES | | | MARKET VALUE | |
COMMON STOCKS — 99.8% ($254,478,099) | | | | | | | | |
Biotech — 0.4% ($1,045,600) | | | | | | | | |
GW Pharmaceuticals PLC ADR* | | | 10,000 | | | $ | 1,045,600 | |
Communications — 1.1% ($2,927,800) | | | | | | | | |
ViaSat, Inc.* | | | 40,000 | | | | 2,927,800 | |
Computer Storage Devices — 0.7% ($1,711,000) | | | | | | | | |
Pure Storage, Inc., Class A* | | | 100,000 | | | | 1,711,000 | |
Consumer Electronics — 12.6% ($32,136,000) | | | | | | | | |
Roku, Inc.* | | | 240,000 | | | | 32,136,000 | |
Defense & Aerospace — 1.7% ($4,322,400) | | | | | | | | |
Kratos Defense & Security Solutions, Inc.* | | | 240,000 | | | | 4,322,400 | |
Education — 6.0% ($15,288,400) | | | | | | | | |
2U, Inc.* | | | 100,000 | | | | 2,399,000 | |
Chegg, Inc.* | | | 340,000 | | | | 12,889,400 | |
Internet — 16.0% ($40,729,082) | | | | | | | | |
Alphabet, Inc., Class C* | | | 4,016 | | | | 5,369,472 | |
Amazon.com, Inc.* | | | 4,000 | | | | 7,391,360 | |
Match Group, Inc.* | | | 150,000 | | | | 12,316,500 | |
Netflix, Inc.* | | | 35,000 | | | | 11,324,950 | |
PayPal Holdings, Inc.* | | | 40,000 | | | | 4,326,800 | |
Networking — 11.1% ($28,305,000) | | | | | | | | |
Arista Networks, Inc.* | | | 70,000 | | | | 14,238,000 | |
Nutanix, Inc., Class A* | | | 450,000 | | | | 14,067,000 | |
Other Electronics — 3.8% ($9,691,500) | | | | | | | | |
Cree, Inc.* | | | 210,000 | | | | 9,691,500 | |
Renewable Energy — 3.4% ($8,674,000) | | | | | | | | |
Enphase Energy, Inc.* | | | 150,000 | | | | 3,919,500 | |
SolarEdge Technologies, Inc.* | | | 50,000 | | | | 4,754,500 | |
Semiconductor Equipment — 1.3% ($3,244,867) | | | | | | | | |
Revasum, Inc.* | | | 7,113,796 | | | | 3,244,867 | |
see accompanying notes to financial statements
FIRSTHAND TECHNOLOGY OPPORTUNITIES FUND - continued
Portfolio of Investments, December 31, 2019
| | SHARES | | | MARKET VALUE | |
Semiconductors — 9.3% ($23,758,000) | | | | | | | | |
II-VI, Inc.* | | | 160,000 | | | $ | 5,387,200 | |
NVIDIA Corp. | | | 40,000 | | | | 9,412,000 | |
ON Semiconductor Corp.* | | | 10,000 | | | | 243,800 | |
Taiwan Semiconductor Manufacturing Co. Ltd. - SP ADR | | | 150,000 | | | | 8,715,000 | |
Services — 1.0% ($2,614,000) | | | | | | | | |
Net 1 UEPS Technologies, Inc.* | | | 30,000 | | | | 111,600 | |
Square, Inc., Class A* | | | 40,000 | | | | 2,502,400 | |
Social Networking — 4.0% ($10,262,500) | | | | | | | | |
Facebook, Inc., Class A* | | | 50,000 | | | | 10,262,500 | |
Software — 27.4% ($69,767,950) | | | | | | | | |
Adobe Systems, Inc.* | | | 20,000 | | | | 6,596,200 | |
Coupa Software, Inc.* | | | 20,000 | | | | 2,925,000 | |
Domo, Inc., Class B* | | | 50,000 | | | | 1,086,000 | |
Guidewire Software, Inc.* | | | 55,000 | | | | 6,037,350 | |
Microsoft Corp. | | | 50,000 | | | | 7,885,000 | |
MongoDB, Inc.* | | | 10,000 | | | | 1,316,100 | |
Okta, Inc.* | | | 20,000 | | | | 2,307,400 | |
Palo Alto Networks, Inc.* | | | 20,000 | | | | 4,625,000 | |
Proofpoint, Inc.* | | | 40,000 | | | | 4,591,200 | |
Splunk, Inc.* | | | 40,000 | | | | 5,990,800 | |
Twilio, Inc., Class A* | | | 140,000 | | | | 13,759,200 | |
Workday, Inc., Class A* | | | 30,000 | | | | 4,933,500 | |
Zendesk, Inc.* | | | 40,000 | | | | 3,065,200 | |
Zscaler, Inc.* | | | 100,000 | | | | 4,650,000 | |
see accompanying notes to financial statements
FIRSTHAND TECHNOLOGY OPPORTUNITIES FUND - continued
Portfolio of Investments, December 31, 2019
| | SHARES | | | MARKET VALUE | |
INVESTMENT COMPANY — 1.0% ($2,482,168) | | | | | | | | |
Fidelity Investments Money Market Fund - Treasury Portfolio(1) | | | 2,482,168 | | | $ | 2,482,168 | |
Total Investments | | | | | | | | |
(Cost $160,893,717) — 100.8% | | | | | | | 256,960,267 | |
Liabilities in excess of other assets — (0.8)% | | | | | | | (1,913,302 | ) |
| | | | | | | | | |
NET ASSETS — 100.0% | | | | | | $ | 255,046,965 | |
* | Non-income producing security. |
(1) | The Fidelity Investments Money Market Fund invests primarily in U.S. Treasury Securities. |
ADR | American Depositary Receipt |
PLC | Public Limited Company |
SP ADR | Sponsored American Depositary Receipt |
see accompanying notes to financial statements
FIRSTHAND ALTERNATIVE ENERGY FUND
Portfolio of Investments, December 31, 2019
| | SHARES | | | MARKET VALUE | |
COMMON STOCKS — 99.3% ($6,113,597) | | | | | | | | |
Advanced Materials — 3.1% ($188,050) | | | | | | | | |
Corning, Inc. | | | 6,460 | | | $ | 188,050 | |
Agriculture — 0.0% ($3) | | | | | | | | |
Growlife Inc.* | | | 7 | | | | 3 | |
Automotive — 0.0% ($1,578) | | | | | | | | |
Garrett Motion, Inc.* | | | 158 | | | | 1,578 | |
Biotech — 2.7% ($167,660) | | | | | | | | |
Curaleaf Holdings, Inc.* | | | 10,000 | | | | 63,100 | |
GW Pharmaceuticals PLC ADR* | | | 1,000 | | | | 104,560 | |
Electrical Equipment — 2.8% ($168,630) | | | | | | | | |
ABB, Ltd. - SP ADR | | | 7,000 | | | | 168,630 | |
Energy Efficiency — 12.2% ($749,980) | | | | | | | | |
Honeywell International, Inc. | | | 1,580 | | | | 279,660 | |
Itron, Inc.* | | | 5,565 | | | | 467,182 | |
Resideo Technologies, Inc.* | | | 263 | | | | 3,138 | |
Engineering Service — 3.3% ($203,550) | | | | | | | | |
Quanta Services, Inc. | | | 5,000 | | | | 203,550 | |
Environmental Services — 1.2% ($71,400) | | | | | | | | |
Advanced Emissions Solutions, Inc. | | | 6,800 | | | | 71,400 | |
Industrials — 6.5% ($401,060) | | | | | | | | |
3M Co. | | | 1,000 | | | | 176,420 | |
United Technologies Corp. | | | 1,500 | | | | 224,640 | |
Intellectual Property — 0.0% ($145) | | | | | | | | |
Silicon Genesis Corp., Common*(1) | | | 181,407 | | | | 145 | |
Materials — 7.5% ($463,210) | | | | | | | | |
Aspen Aerogels, Inc.* | | | 35,000 | | | | 271,600 | |
Linde PLC | | | 900 | | | | 191,610 | |
see accompanying notes to financial statements
FIRSTHAND ALTERNATIVE ENERGY FUND - continued
Portfolio of Investments, December 31, 2019
| | SHARES | | | MARKET VALUE | |
Other Electronics — 11.2% ($691,724) | | | | | | | | |
Cree, Inc.* | | | 8,000 | | | $ | 369,200 | |
Intevac, Inc.* | | | 5,800 | | | | 40,948 | |
Koninklijke Philips Electronics N.V. | | | 5,770 | | | | 281,576 | |
Renewable Energy — 37.1% ($2,284,628) | | | | | | | | |
Amtech Systems, Inc.* | | | 6,600 | | | | 47,256 | |
Enphase Energy, Inc.* | | | 5,000 | | | | 130,650 | |
First Solar, Inc.* | | | 5,000 | | | | 279,800 | |
Iberdrola S.A. | | | 22,556 | | | | 232,265 | |
Motech Industries, Inc.* | | | 58,069 | | | | 15,788 | |
Orion Energy Systems, Inc.* | | | 14,000 | | | | 46,900 | |
Sharp Corp. | | | 1,100 | | | | 17,059 | |
Siemens Gamesa Renewable Energy S.A. | | | 7,271 | | | | 127,518 | |
SolarEdge Technologies, Inc.* | | | 7,000 | | | | 665,630 | |
SunPower Corp., Class B* | | | 19,931 | | | | 155,462 | |
Sunrun, Inc.* | | | 5,000 | | | | 69,050 | |
ULVAC, Inc. | | | 2,700 | | | | 107,970 | |
Vestas Wind Systems A.S. | | | 3,000 | | | | 302,160 | |
Vivint Solar, Inc.* | | | 12,000 | | | | 87,120 | |
Semiconductors — 9.3% ($573,579) | | | | | | | | |
Power Integrations, Inc. | | | 5,799 | | | | 573,579 | |
Waste & Environment Service — 2.4% ($148,400) | | | | | | | | |
Covanta Holding Corp. | | | 10,000 | | | | 148,400 | |
PREFERRED STOCK — 0.0% ($356) | | | | | | | | |
Intellectual Property — 0.0% ($356) | | | | | | | | |
Silicon Genesis Corp., Series 1-C*(1) | | | 152 | | | | 10 | |
Silicon Genesis Corp., Series 1-E*(1) | | | 3,000 | | | | 346 | |
see accompanying notes to financial statements
FIRSTHAND ALTERNATIVE ENERGY FUND - continued
Portfolio of Investments, December 31, 2019
| | SHARES | | | MARKET VALUE | |
INVESTMENT COMPANY — 0.1% ($5,129) | | | | | | | | |
Fidelity Investments Money Market Fund - Treasury Portfolio(2) | | | 5,129 | | | $ | 5,129 | |
Total Investments | | | | | | | | |
(Cost $4,987,700) — 99.4% | | | | | | | 6,119,082 | |
Other assets in excess of liabilities — 0.6% | | | | | | | 38,655 | |
| | | | | | | | | |
NET ASSETS — 100.0% | | | | | | $ | 6,157,737 | |
* | Non-income producing security. |
(1) | Restricted/illiquid security (0.01% of net assets). Fair valued in accordance with procedures approved by the Board of Trustees. |
(2) | The Fidelity Investments Money Market Fund invests primarily in U.S. Treasury Securities. |
ADR | American Depositary Receipt |
PLC | Public Limited Company |
SP ADR | Sponsored American Depositary Receipt |
see accompanying notes to financial statements
Statements of Assets and Liabilities
December 31, 2019
| | | Firsthand
Technology
Opportunities
Fund | | | Firsthand
Alternative
Energy Fund | |
ASSETS | | | | | | | | |
Investment securities: | | | | | | | | |
Acquisition cost | | $ | 160,893,717 | | | $ | 4,987,700 | |
Market value (Note 2) | | | 256,960,267 | | | | 6,119,082 | |
Foreign currency at value (cost $0 and $198) | | | — | | | | 198 | |
Receivable from dividends, interest, and reclaims | | | 63,265 | | | | 3,080 | |
Receivable for capital shares sold | | | 221,722 | | | | 50,074 | |
TOTAL ASSETS | | | 257,245,254 | | | | 6,172,434 | |
| | | | | | | | | |
LIABILITIES | | | | | | | | |
Payable to affiliates (Note 4) | | | 410,952 | | | | 10,106 | |
Payable for capital shares redeemed | | | 1,787,337 | | | | 4,591 | |
TOTAL LIABILITIES | | | 2,198,289 | | | | 14,697 | |
NET ASSETS | | $ | 255,046,965 | | | $ | 6,157,737 | |
| | | | | | | | | |
Net Assets consist of: | | | | | | | | |
Paid-in-capital | | $ | 159,862,889 | | | $ | 6,222,033 | |
Total distributable earnings (loss) | | | 95,184,076 | | | | (64,296 | ) |
NET ASSETS | | $ | 255,046,965 | | | $ | 6,157,737 | |
| | | | | | | | | |
Shares outstanding | | | 20,153,237 | | | | 801,145 | |
Net asset value, redemption price and offering price per share (Note 2) | | $ | 12.66 | | | $ | 7.69 | |
see accompanying notes to financial statements
Statements of Operations
For the Year Ended December 31, 2019
| | | Firsthand
Technology
Opportunities
Fund | | | Firsthand
Alternative
Energy Fund | |
INVESTMENT INCOME | | | | | | | | |
Dividends | | $ | 1,736,517 | | | $ | 76,958 | |
Foreign tax withholding | | | (68,222 | ) | | | (6,086 | ) |
TOTAL INVESTMENT INCOME | | | 1,668,295 | | | | 70,872 | |
| | | | | | | | | |
EXPENSES | | | | | | | | |
Investment advisory fees (Note 4) | | | 4,199,258 | | | | 85,973 | |
Administration fees (Note 4) | | | 1,298,910 | | | | 25,286 | |
Trustees fees | | | 9,500 | | | | 9,500 | |
GROSS EXPENSES | | | 5,507,668 | | | | 120,759 | |
Trustees fees reimbursement | | | (9,500 | ) | | | (9,500 | ) |
TOTAL NET EXPENSES | | | 5,498,168 | | | | 111,259 | |
| | | | | | | | | |
NET INVESTMENT LOSS | | | (3,829,873 | ) | | | (40,387 | ) |
| | | | | | | | | |
Net Realized and Unrealized Gain (Loss) on Investments: | | | | | | | | |
Net realized gains (losses) from security transactions | | | 14,476,169 | | | | (136,582 | ) |
Net realized gains (losses) on foreign currency | | | 2 | | | | (133 | ) |
Net realized gains from written option transactions(1) | | | 77,075 | | | | — | |
Net change in unrealized appreciation on investments and foreign currency | | | 37,309,097 | | | | 1,925,243 | |
Net Realized and Unrealized Gain on Investments | | | 51,862,343 | | | | 1,788,528 | |
| | | | | | | | | |
Net Increase In Net Assets Resulting From Operations | | $ | 48,032,470 | | | $ | 1,748,141 | |
(1) | Primary risk exposure is equity contracts. |
see accompanying notes to financial statements
Statements of Changes in Net Assets
For the Years Ended December 31, 2019, and December 31, 2018
| | | Firsthand Technology
Opportunities Fund | |
| | | YEAR ended
12/31/19 | | | YEAR ended
12/31/18 | |
FROM OPERATIONS: | | | | | | | | |
Net investment loss | | $ | (3,829,873 | ) | | $ | (2,785,972 | ) |
Net realized gains from security transactions, foreign currency and written options | | | 14,553,246 | | | | 4,554,198 | |
Net change in unrealized appreciation (depreciation) on investments and foreign currency | | | 37,309,097 | | | | (738,716 | ) |
Net increase in net assets from operations | | | 48,032,470 | | | | 1,029,510 | |
| | | | | | | | | |
DISTRIBUTIONS TO SHAREHOLDERS: | | | | | | | | |
Distributions(1) | | | (14,016,728 | ) | | | — | |
Total Distributions | | | (14,016,728 | ) | | | — | |
| | | | | | | | | |
FROM CAPITAL SHARE TRANSACTIONS: | | | | | | | | |
Proceeds from shares sold | | | 240,911,290 | | | | 135,111,437 | |
Dividends reinvested | | | 13,446,038 | | | | — | |
Payment for shares redeemed | | | (191,387,341 | ) | | | (102,541,326 | ) |
Net increase in net assets from capital share transactions | | | 62,969,987 | | | | 32,570,111 | |
TOTAL INCREASE IN NET ASSETS | | | 96,985,729 | | | | 33,599,621 | |
| | | | | | | | | |
NET ASSETS: | | | | | | | | |
Beginning of year | | | 158,061,236 | | | | 124,461,615 | |
End of year | | $ | 255,046,965 | | | $ | 158,061,236 | |
| | | | | | | | | |
COMMON STOCK ACTIVITY: | | | | | | | | |
Shares sold | | | 18,438,378 | | | | 11,545,256 | |
Shares reinvested | | | 1,086,988 | | | | — | |
Shares redeemed | | | (14,551,456 | ) | | | (8,842,252 | ) |
Net increase in shares outstanding | | | 4,973,910 | | | | 2,703,004 | |
Shares outstanding, beginning of year | | | 15,179,327 | | | | 12,476,323 | |
Shares outstanding, end of year | | | 20,153,237 | | | | 15,179,327 | |
(1) | The SEC eliminated the requirement to disclose components of distributions paid to shareholders. |
see accompanying notes to financial statements
STATEMENTS OF CHANGES IN NET ASSETS
For the Years Ended December 31, 2019, and December 31, 2018
| | | Firsthand Alternative
energy Fund | |
| | | YEAR ended
12/31/19 | | | YEAR ended
12/31/18 | |
FROM OPERATIONS: | | | | | | | | |
Net investment loss | | $ | (40,387 | ) | | $ | (37,197 | ) |
Net realized loss from security transactions and foreign currency | | | (136,715 | ) | | | (161,708 | ) |
Net change in unrealized appreciation (depreciation) on investments and foreign currency | | | 1,925,243 | | | | (808,147 | ) |
Net increase (decrease) in net assets from operations | | | 1,748,141 | | | | (1,007,052 | ) |
| | | | | | | | | |
DISTRIBUTIONS TO SHAREHOLDERS: | | | | | | | | |
Distributions(1) | | | — | | | | (2,031 | ) |
Total Distributions | | | — | | | | (2,031 | ) |
| | | | | | | | | |
FROM CAPITAL SHARE TRANSACTIONS: | | | | | | | | |
Proceeds from shares sold | | | 1,412,166 | | | | 972,675 | |
Dividends reinvested | | | — | | | | 1,905 | |
Payment for shares redeemed | | | (1,443,230 | ) | | | (1,422,599 | ) |
Net decrease in net assets from capital share transactions | | | (31,064 | ) | | | (448,019 | ) |
TOTAL INCREASE (DECREASE) IN NET ASSETS | | | 1,717,077 | | | | (1,457,102 | ) |
| | | | | | | | | |
NET ASSETS: | | | | | | | | |
Beginning of year | | | 4,440,660 | | | | 5,897,762 | |
End of year | | $ | 6,157,737 | | | $ | 4,440,660 | |
| | | | | | | | | |
COMMON STOCK ACTIVITY: | | | | | | | | |
Shares sold | | | 196,092 | | | | 154,229 | |
Shares reinvested | | | — | | | | 331 | |
Shares redeemed | | | (206,443 | ) | | | (220,344 | ) |
Net decrease in shares outstanding | | | (10,351 | ) | | | (65,784 | ) |
Shares outstanding, beginning of year | | | 811,496 | | | | 877,280 | |
Shares outstanding, end of year | | | 801,145 | | | | 811,496 | |
(1) | The SEC eliminated the requirement to disclose components of distributions paid to shareholders. |
see accompanying notes to financial statements
Financial Highlights
Selected per share data and ratios for a share outstanding throughout each year
FIRSTHAND TECHNOLOGY OPPORTUNITIES FUND
| | | YEAR
ENDED
12/31/19 | | | YEAR
ENDED
12/31/18 | | | YEAR
ENDED
12/31/17 | | | YEAR
ENDED
12/31/16 | | | YEAR
ENDED
12/31/15 | |
Net asset value at beginning of year | | $ | 10.41 | | | $ | 9.98 | | | $ | 6.42 | | | $ | 7.74 | | | $ | 8.14 | |
| | | | | | | | | | | | | | | | | | | | | |
Income from investment operations: | | | | | | | | | | | | | | | | | | | | |
Net investment loss | | | (0.19 | ) | | | (0.18 | ) | | | (0.12 | ) | | | (0.10 | ) | | | (0.10 | ) |
Net realized and unrealized gains on investments | | | 3.14 | | | | 0.61 | | | | 3.68 | | | | 0.56 | | | | 0.44 | |
| | | | | | | | | | | | | | | | | | | | | |
Total from investment operations | | | 2.95 | | | | 0.43 | | | | 3.56 | | | | 0.46 | | | | 0.34 | |
| | | | | | | | | | | | | | | | | | | | | |
Distributions from: | | | | | | | | | | | | | | | | | | | | |
Realized capital gains | | | (0.70 | ) | | | — | | | | — | | | | (1.78 | ) | | | (0.74 | ) |
| | | | | | | | | | | | | | | | | | | | | |
Net asset value at end of year | | $ | 12.66 | | | $ | 10.41 | | | $ | 9.98 | | | $ | 6.42 | | | $ | 7.74 | |
| | | | | | | | | | | | | | | | | | | | | |
Total return | | | 28.51 | % | | | 4.31 | % | | | 55.45 | % | | | 5.99 | % | | | 4.28 | % |
Net assets at end of year (millions) | | $ | 255.0 | | | $ | 158.1 | | | $ | 124.5 | | | $ | 76.9 | | | $ | 105.2 | |
Ratio of gross expenses to averagenet assets before waiver | | | 1.84 | % | | | 1.86 | % | | | 1.86 | % | | | 1.86 | % | | | 1.86 | % |
Ratio of net expenses to average net assets after waiver | | | 1.83 | % | | | 1.85 | % | | | 1.85 | % | | | 1.85 | % | | | 1.85 | % |
Ratio of net investment loss to average net assets | | | (1.28 | %) | | | (1.54 | %) | | | (1.57 | %) | | | (1.45 | %) | | | (1.17 | %) |
| | | | | | | | | | | | | | | | | | | | | |
Portfolio turnover rate | | | 43 | % | | | 25 | % | | | 19 | % | | | 18 | % | | | 19 | % |
see accompanying notes to financial statements
FINANCIAL HIGHLIGHTS
Selected per share data and ratios for a share outstanding throughout each year
FIRSTHAND ALTERNATIVE ENERGY FUND
| | | YEAR
ENDED
12/31/19 | | | YEAR
ENDED
12/31/18 | | | YEAR
ENDED
12/31/17 | | | YEAR
ENDED
12/31/16 | | | YEAR
ENDED
12/31/15 | |
Net asset value at beginning of year | | $ | 5.47 | | | $ | 6.72 | | | $ | 5.29 | | | $ | 5.83 | | | $ | 6.46 | |
| | | | | | | | | | | | | | | | | | | | | |
Income from investment operations: | | | | | | | | | | | | | | | | | | | | |
Net investment income (loss) | | | (0.05 | ) | | | (0.04 | ) | | | 0.02 | | | | (0.05 | ) | | | (0.07 | ) |
Net realized and unrealized gains(losses) on investments | | | 2.27 | | | | (1.21 | ) | | | 1.43 | | | | (0.49 | ) | | | (0.56 | ) |
| | | | | | | | | | | | | | | | | | | | | |
Total from investment operations | | | 2.22 | | | | (1.25 | ) | | | 1.45 | | | | (0.54 | ) | | | (0.63 | ) |
| | | | | | | | | | | | | | | | | | | | | |
Distributions from: | | | | | | | | | | | | | | | | | | | | |
Net investment income | | | — | | | | — | (a) | | | (0.02 | ) | | | — | | | | — | |
| | | | | | | | | | | | | | | | | | | | | |
Net asset value at end of year | | $ | 7.69 | | | $ | 5.47 | | | $ | 6.72 | | | $ | 5.29 | | | $ | 5.83 | |
| | | | | | | | | | | | | | | | | | | | | |
Total return | | | 40.59 | % | | | (18.57 | %) | | | 27.35 | % | | | (9.26 | %) | | | (9.75 | %) |
Net assets at end of year (millions) | | $ | 6.2 | | | $ | 4.4 | | | $ | 5.9 | | | $ | 5.1 | | | $ | 7.3 | |
Ratio of gross expenses to averagenet assets before waiver | | | 2.15 | % | | | 2.15 | % | | | 2.15 | % | | | 2.14 | % | | | 2.11 | % |
Ratio of net expenses to average net assets after waiver | | | 1.98 | % | | | 1.98 | % | | | 1.98 | % | | | 1.98 | % | | | 1.98 | % |
Ratio of net investment income (loss) toaverage net assets | | | (0.72 | %) | | | (0.68 | %) | | | 0.30 | % | | | (0.75 | %) | | | (1.14 | %) |
| | | | | | | | | | | | | | | | | | | | | |
Portfolio turnover rate | | | 0 | % | | | 7 | % | | | 0 | % | | | 10 | % | | | 5 | % |
(a) | Amount represents less than $0.01 per share |
see accompanying notes to financial statements
Notes to Financial Statements
December 31, 2019
1. ORGANIZATION
Each of Firsthand Technology Opportunities Fund and Firsthand Alternative Energy Fund (individually the “Fund”, and collectively the “Funds”) is a non-diversified series of Firsthand Funds (the “Trust”), an open-end management investment company registered under the Investment Company Act of 1940, as amended (the “1940 Act”). The Trust, a Delaware statutory trust, was organized on November 8, 1993. Each Fund currently offers one class of shares—Investor Class shares. The inception dates for the Funds (the date on which a net asset value was first determined for that Fund) follow:
FUND | INCEPTION DATE |
Firsthand Technology Opportunities Fund | September 30, 1999 |
Firsthand Alternative Energy Fund | October 29, 2007 |
Each Fund’s investment objective is long-term growth of capital.
Firsthand Technology Opportunities Fund seeks to achieve its investment objective by investing, under normal circumstances, at least 80% of its assets in equity securities of high-technology companies in the industries and markets that the Investment Adviser believes hold the most growth potential within the technology sector.
Firsthand Alternative Energy Fund seeks to achieve its investment objective by investing, under normal circumstances, at least 80% of its assets in alternative energy and energy technology companies, both U.S. and international.
The Funds are an investment company and follow accounting and reporting guidance in the Financial Accounting Standards Board (“FASB”) Accounting Standards Codification Topic 946.
2. SIGNIFICANT ACCOUNTING POLICIES
The following is a summary of the Funds’ significant accounting policies:
Securities Valuation — A Fund’s portfolio of securities is valued as follows:
| | 1. | Securities traded on stock exchanges, or quoted by NASDAQ, are valued according to the NASDAQ official closing price, if applicable, or at their last reported sale price as of the close of trading on the New York Stock Exchange (“NYSE”) (normally 4:00 P.M. Eastern Time). If a security is not traded that day, the security will be valued at its most recent bid price. |
| | 2. | Securities traded in the over-the-counter market, but not quoted by NASDAQ, are valued at the last sale price (or, if the last sale price is not readily available, at the most recent closing bid price as quoted by brokers that make markets in the securities) at the close of trading on the NYSE. |
NOTES TO FINANCIAL STATEMENTS - continued
December 31, 2019
| | 3. | Securities traded both in the over-the-counter market and on a stock exchange are valued according to the broadest and most representative market. |
| | 4. | Securities and other assets that do not have market quotations readily available are valued at their fair value as determined in good faith using procedures established by the Board of Trustees. |
In pricing illiquid, privately placed securities, the advisor follows well-accepted valuation techniques. Initial valuations are generally determined by the initial purchase price for each security. Subsequent to initial purchase, securities are repriced from time to time to reflect changes to the companies’ valuations caused by various events. Such events include, among others, a new round of financing establishing a new valuation for the company; material changes to a company’s business or business prospects, either due to company-specific internal issues (gaining or losing a major customer, missing a significant milestone, etc.) or macroeconomic events affecting the industry or the world. In analyzing a company’s valuation, factors that are also considered include a company’s cash flow, revenues, profitability, financial forecasts, and probability of success in those measures. Other potential factors include the value of comparable public and private companies and general market conditions.
Fair Value Measurement — In accordance with the authoritative guidance on fair value measurements and disclosures under GAAP, each Fund discloses the fair value of its investments in a hierarchy that prioritizes the inputs to valuation techniques used to measure the fair value. The hierarchy gives the highest priority to valuations based upon unadjusted quoted prices in active markets for identical assets or liabilities (level 1 measurement) and the lowest priority to valuations based upon unobservable inputs that are significant to the valuation (level 3 measurements).
The guidance establishes three levels of the fair value hierarchy as follows:
| | Level 1 | – Unadjusted quoted prices in active markets for identical assets or liabilities that the Funds have the ability to access. |
| | Level 2 | – Observable inputs other than quoted prices included in level 1 that are observable for the asset or liability, either directly or indirectly. These inputs may include quoted prices for the identical instrument on an inactive market, prices for similar instruments, interest rates, prepayment speeds, credit risks, yield curves, default rates, and similar data. |
| | Level 3 | – Unobservable inputs for the asset or liability, to the extent relevant observable inputs are not available, representing the Funds’ own assumptions about the assumptions a market participant would use in valuing the asset or liability, and would be based on the best information available. |
NOTES TO FINANCIAL STATEMENTS - continued
December 31, 2019
The availability of observable inputs can vary from security to security and is affected by a wide variety of factors, including, for example, the type of security, whether the security is new and not yet established in the marketplace, the liquidity of markets, and other characteristics particular to the security. To the extent that valuation is based on models or inputs that are less observable or unobservable in the market, the determination of fair value requires more judgment. Accordingly, the degree of judgment exercised in determining fair value is greatest for instruments categorized in level 3.
The inputs used to measure fair value may fall into different levels of the fair value hierarchy. In such cases, for disclosure purposes, the level in the fair value hierarchy within which the fair value measurement falls in its entirety, is determined based on the lowest level input that is significant to the fair value measurement in its entirety.
The inputs or methodology used for valuing securities are not necessarily an indication of the risk associated with investing in those securities. The following is a summary of the inputs used to value the following Funds’ net assets as of December 31, 2019:
FUND* | | LEVEL 1
QUOTED PRICES | | | LEVEL 2
OTHER SIGNIFICANT
OBSERVABLE INPUTS | | | LEVEL 3
SIGNIFICANT
UNOBSERVABLE INPUTS | |
TEFQX | | | | | | | | | | | | |
Common Stocks | | | | | | | | | | | | |
Biotech | | $ | 1,045,600 | | | $ | — | | | $ | — | |
Communications | | | 2,927,800 | | | | — | | | | — | |
Computer Storage Devices | | | 1,711,000 | | | | — | | | | — | |
Consumer Electronics | | | 32,136,000 | | | | — | | | | — | |
Defense & Aerospace | | | 4,322,400 | | | | — | | | | — | |
Education | | | 15,288,400 | | | | — | | | | — | |
Internet | | | 40,729,082 | | | | — | | | | — | |
Networking | | | 28,305,000 | | | | — | | | | — | |
Other Electronics | | | 9,691,500 | | | | — | | | | — | |
Renewable Energy | | | 8,674,000 | | | | — | | | | — | |
Semiconductor Equipment | | | 3,244,867 | | | | — | | | | — | |
Semiconductors | | | 23,758,000 | | | | — | | | | — | |
Services | | | 2,614,000 | | | | — | | | | — | |
Social Networking | | | 10,262,500 | | | | — | | | | — | |
Software | | | 69,767,950 | | | | — | | | | — | |
Total Common Stock | | | 254,478,099 | | | | — | | | | — | |
Investment Company | | | 2,482,168 | | | | — | | | | — | |
Total | | $ | 256,960,267 | | | $ | — | | | $ | — | |
NOTES TO FINANCIAL STATEMENTS - continued
December 31, 2019
FUND* | | LEVEL 1
QUOTED PRICES | | | LEVEL 2
OTHER SIGNIFICANT
OBSERVABLE INPUTS | | | LEVEL 3
SIGNIFICANT
UNOBSERVABLE INPUTS | |
ALTEX | | | | | | | | | | | | |
Common Stocks | | | | | | | | | | | | |
Advanced Materials | | $ | 188,050 | | | $ | — | | | $ | — | |
Agriculture | | | 3 | | | | — | | | | — | |
Automotive | | | 1,578 | | | | — | | | | — | |
Biotech | | | 167,660 | | | | — | | | | — | |
Electrical Equipment | | | 168,630 | | | | — | | | | — | |
Energy Efficiency | | | 749,980 | | | | — | | | | — | |
Engineering Service | | | 203,550 | | | | — | | | | — | |
Environmental Services | | | 71,400 | | | | — | | | | — | |
Industrials | | | 401,060 | | | | — | | | | — | |
Intellectual Property | | | — | | | | — | | | | 145 | |
Materials | | | 463,210 | | | | — | | | | — | |
Other Electronics | | | 691,724 | | | | — | | | | — | |
Renewable Energy | | | 2,284,628 | | | | — | | | | — | |
Semiconductors | | | 573,579 | | | | — | | | | — | |
Waste & Environment Service | | | 148,400 | | | | — | | | | — | |
Total Common Stocks | | | 6,113,452 | | | | — | | | | 145 | |
Preferred Stocks | | | — | | | | — | | | | 356 | |
Investment Company | | | 5,129 | | | | — | | | | — | |
Total | | $ | 6,118,581 | | | $ | — | | | $ | 501 | |
* | TEFQX: Firsthand Technology Opportunities Fund; ALTEX: Firsthand Alternative Energy Fund |
At the end of each calendar quarter, management evaluates the Level 2 and 3 assets and liabilities for changes in liquidity, including but not limited to: whether a broker is willing to execute at the quoted price, the depth and consistency of prices from third party services, and the existence of contemporaneous, observable trades in the market. Additionally, management evaluates the Level 1 and 2 assets and liabilities on a quarterly basis for changes in listings or delistings on national exchanges.
NOTES TO FINANCIAL STATEMENTS - continued
December 31, 2019
Following is a reconciliation of Level 3 assets (at either the beginning or the ending of the period) for which significant unobservable inputs were used to determine fair value.
INVESTMENTS AT
FAIR VALUE USING
SIGNIFICANT
UNOBSERVABLE
INPUTS (LEVEL 3) | | BALANCE
AS OF
12/31/18 | | | NET
PURCHASES | | | NET
SALES | | | NET
REALIZED
GAINS/
(LOSSES) | | | NET
UNREALIZED
APPRECIATION
(DEPRECIATION) | | | TRANSFERS
IN (OUT)
OF
LEVEL 3 | | | BALANCE
AS OF
12/31/19 | |
Common Stocks | | | | | | | | | | | | | | | | | | | | | | | | | | | | |
Intellectual Property | | $ | 1,451 | | | $ | — | | | $ | — | | | $ | — | | | $ | (1,306 | ) | | $ | — | | | $ | 145 | |
Preferred Stocks | | | 842 | | | | — | | | | — | | | | — | | | | (486 | ) | | | — | | | | 356 | |
Total | | $ | 2,293 | | | $ | — | | | $ | — | | | $ | — | | | $ | (1,792 | ) | | $ | — | | | $ | 501 | |
As of the year ended December 31, 2019, these investments were valued in accordance with procedures approved by the Board of Trustees. These investments did not have a material impact on the Fund’s net assets and, therefore, disclosure of unobservable inputs used in formulating valuations is not presented.
Share Valuation — The net asset value (“NAV”) per share of each Fund is calculated by dividing the net assets of the Fund (i.e, the sum of the value of the securities held by the Fund, plus cash or other assets, minus all liabilities (including estimated accrued expenses)) by the total number of shares outstanding of the Fund, rounded to the nearest cent. A Fund’s shares will not be priced on the days on which the NYSE is closed for trading. The offering and redemption price per share of each Fund is equal to a Fund’s NAV per share.
Investment Income — Dividend income is recorded on the ex-dividend date. Interest income is accrued as earned. Discounts and premiums on securities purchased are amortized over the lives of the respective securities. Other non-cash dividends are recognized as investment income at the fair value of the property received. Withholding taxes on foreign dividends have been provided for in accordance with the Funds’ understanding of the applicable country’s tax rules and rates.
Cash and Cash Equivalents — The Funds consider liquid assets deposited with a bank, money market funds, and certain short-term debt instruments with maturities of 3 months or less to be cash equivalents. These investments represent amounts held with financial institutions that are readily accessible to pay Fund expenses or purchase investments. Cash and cash equivalents are valued at cost plus accrued interest, which approximates market value.
Foreign Securities — Each Fund may invest in companies that trade on U.S. exchanges as American Depositary Receipts (“ADRs”), on foreign exchanges, or on foreign over-the-counter markets. Investing in the securities of foreign companies exposes your investment in a Fund to risk. Foreign stock markets tend to be more volatile than the U.S. market due
NOTES TO FINANCIAL STATEMENTS - continued
December 31, 2019
to economic and/or political instability and the regulatory conditions in some countries. In addition, some of the securities in which the Fund may invest may be denominated in foreign currencies, the value of which may decline against the U.S. dollar. An investment in foreign securities may be subject to high levels of foreign taxation, including foreign taxes withheld at the source. Neither Fund isolates the portion of the results of operations resulting from changes in foreign exchange rates on investments from the fluctuations arising from changes in market prices of securities held. Reported net realized foreign exchange gains or losses arise from sales of portfolio securities, currency gains or losses realized between the trade and settlement dates on securities transactions, and the difference between the amounts of dividends, interest, and foreign withholding taxes recorded on the Funds’ books and the U.S. dollar equivalent of the amounts actually received or paid.
Options — The Funds are subject to equity price risk in the normal course of pursuing their investment objectives and may enter into options written to hedge against changes in the value of equities. The Funds may purchase put and call options to attempt to provide protection against adverse price effects from anticipated changes in prevailing prices of securities or stock indices. The Funds may also write put and call options. When a Fund writes an option, an amount equal to the premium received by the Fund is recorded as a liability and is subsequently adjusted to the current fair value of the option written. Premiums received from writing options that expire unexercised are treated by the Fund on the expiration date as realized gains from investments. The difference between the premium and the amount paid on effecting a closing purchase transaction, including brokerage commissions, is also treated as a realized gain, or, if the premium is less than the amount paid for the closing purchase transaction, as a realized loss. If a call option is exercised, the premium is added to the proceeds from the sale of the underlying security or currency in determining whether the Fund has realized a gain or loss. The Fund as writer of an option bears the market risk of an unfavorable change in the price of the security underlying the written option. The net realized gains/(loss) from written options for the year ended December 31, 2019 can be found on the Statements of Operations.
The average volume of derivatives during the year ended December 31, 2019 is as follows:
FIRSTHAND TECHNOLOGY OPPORTUNITIES FUND
WRITTEN OPTIONS
(value) |
(101,297) |
NOTES TO FINANCIAL STATEMENTS - continued
December 31, 2019
Distributions to Shareholders — Each Fund expects to distribute its net investment income and net realized gains, if any, annually. Distributions from net investment income and capital gains are recorded on the ex-dividend date and are determined in accordance with income tax regulations, which may differ from accounting principles generally accepted in the United States.
Short Positions — Firsthand Alternative Energy Fund may sell securities short for economic hedging purposes. Short sales are transactions in which the Fund sells a security it does not own, in anticipation of a decline in the market value of that security. To initiate such a transaction, the Fund must borrow the security to deliver to the buyer upon the short sale; the Fund is then obligated to replace the security borrowed by purchasing it in the open market at some later date, completing the transaction. The Fund is liable for any dividends payable on securities while those securities are in a short position.
The Fund will incur a loss if the market price of the security increases between the date of the short sale and the date on which the Fund replaces the borrowed security. The Fund will realize a gain if the security declines in value between those dates.
All short sales must be fully collateralized. The Fund maintains the collateral in a segregated account consisting of cash, cash equivalents and/or liquid securities sufficient to collateralize the market value of its short positions. Typically, the segregated cash with brokers and other financial institutions exceeds the minimum required. Deposits with brokers for securities sold short are invested in money market instruments. The Fund did not invest in short sales for the year ended December 31, 2019.
Reclassification of Capital Accounts — Permanent book and tax differences resulted in reclassifications for the year ended December 31, 2019 as follows:
| | | INCREASE (DECREASE) | |
| | | Paid-in-Capital | | | Distributable Earnings | |
Firsthand Technology Opportunities Fund | | $ | (5,883 | ) | | $ | 5,883 | |
Firsthand Alternative Energy Fund | | | (60,380 | ) | | | 60,380 | |
These reclassifications, related to different treatment of current year write off of net operating loss, and different book and tax treatment for gain/loss on foreign currency, have no effect on net asset value per share.
Security Transactions — Security transactions are accounted for no later than one business day following the trade date, however, for financial reporting purposes, security transactions are accounted for on trade date. Realized gains and losses are calculated on a specific identification basis.
NOTES TO FINANCIAL STATEMENTS - continued
December 31, 2019
Estimates— The preparation of financial statements in conformity with accounting principles generally accepted in the United States of America requires management to make estimates and assumptions that affect the reported amounts of assets and liabilities at the date of the financial statements and the reported amounts of income and expenses during the reporting period. Actual results could differ from those estimates.
Federal Income Tax — Each Fund has elected, and intends to qualify annually, for the special tax treatment afforded regulated investment companies under the Internal Revenue Code of 1986, as amended (the “Code”). As provided in the Code, in any fiscal year in which a Fund so qualifies and distributes at least 90% of its taxable net income, the Fund (but not the shareholders) will be relieved of federal income tax on the income distributed. Accordingly, no provision for income taxes has been made. To avoid imposition of the excise tax applicable to regulated investment companies, each Fund intends to declare as dividends in each calendar year at least 98% of its net investment income (earned during the calendar year) and 98% of its net realized capital gains (earned during the 12 months ended October 31) plus undistributed amounts, if any, from prior years.
The tax character of distributions paid for the year ended December 31, 2019 and 2018 was as follows:
| | | FIRSTHAND TECHNOLOGY
OPPORTUNITIES FUND | |
| | | 2019 | | | 2018 | |
From ordinary income | | $ | 2,159,563 | | | $ | — | |
From long-term capital gains | | $ | 11,857,165 | | | $ | — | |
| | | FIRSTHAND ALTERNATIVE
ENERGY FUND | |
| | | 2019 | | | 2018 | |
From ordinary income | | $ | — | | | $ | 2,031 | |
From long-term capital gains | | $ | — | | | $ | — | |
NOTES TO FINANCIAL STATEMENTS - continued
December 31, 2019
The following information is based upon the federal income tax cost of portfolio investments as of December 31, 2019.
| | | FIRSTHAND
TECHNOLOGY
OPPORTUNITIES FUND | | | FIRSTHAND
ALTERNATIVE
ENERGY FUND | |
Gross unrealized appreciation | | $ | 108,523,447 | | | $ | 2,290,942 | |
Gross unrealized depreciation | | | (13,325,841 | ) | | | (1,138,230 | ) |
Net unrealized appreciation (depreciation) | | $ | 95,197,606 | | | $ | 1,152,712 | |
Federal income tax cost | | $ | 161,762,661 | | | $ | 4,966,370 | |
The difference between the acquisition cost and the federal income tax cost of portfolio investments is due to certain timing differences in the recognition of capital losses under accounting principles generally accepted in the United States and income tax regulations.
As of December 31, 2019, the Funds had capital loss carryforwards for federal income tax purposes as follows:
| | | SHORT-TERM
NO EXPIRATION | | | LONG-TERM
NO EXPIRATION | | | TOTAL | |
TEFQX* | | $ | — | | | $ | — | | | $ | — | |
ALTEX* | | | (431,096 | ) | | | (785,897 | ) | | | (1,216,993 | ) |
* | TEFQX: Firsthand Technology Opportunities Fund; ALTEX: Firsthand Alternative Energy Fund. |
Components of Distributable Earnings
| | | FIRSTHAND
TECHNOLOGY
OPPORTUNITIES FUND | | | FIRSTHAND
ALTERNATIVE
ENERGY FUND | |
Net Unrealized Appreciation (Depreciation)* | | $ | 95,197,606 | | | $ | 1,152,697 | |
Undistributed Ordinary Income | | | — | | | | — | |
Undistributed Long Term Capital Gains | | | — | | | | — | |
Qualified Late Year Losses Deferred** | | | — | | | | — | |
Other Temporary Differences | | | (13,530 | ) | | | — | |
Accumulated Capital Loss Carryforward | | | — | | | | (1,216,993 | ) |
Total Distributable Earnings/Accumulated Loss | | $ | 95,184,076 | | | $ | (64,296 | ) |
* | The differences between book-basis and tax-basis unrealized appreciation (depreciation) is attributable primarily to tax deferral of losses on wash sales. |
** | Under current tax law, capital and currency losses realized after October 31 and prior to the Fund’s fiscal year end may be deferred as occurring on the first day of the following fiscal year. |
NOTES TO FINANCIAL STATEMENTS - continued
December 31, 2019
The Funds are subject to tax provisions that establish a minimum threshold for recognizing, and a system for measuring, the benefits of a tax position taken or expected to be taken in a tax return. Taxable years ending 2019, 2018, 2017 and 2016 remain open to federal and state audit. As of December 31, 2019, management has evaluated the application of these provisions to the Funds, and has determined that no provision for income tax is required in the Funds’ financial statements for uncertain tax provisions.
3. INVESTMENT TRANSACTIONS (EXCLUDING SHORT-TERM INVESTMENTS) WERE AS FOLLOWS FOR THE YEAR ENDED DECEMBER 31, 2019
| | | FIRSTHAND
TECHNOLOGY
OPPORTUNITIES FUND | | | FIRSTHAND
ALTERNATIVE
ENERGY FUND | |
Purchase of investment securities | | $ | 150,208,351 | | | $ | 269,426 | |
Proceeds from sales and maturities of investment securities | | $ | 103,919,772 | | | $ | — | |
4. INVESTMENT ADVISORY AND ADMINISTRATION AGREEMENTS; CERTAIN TRUSTEES AND OFFICERS OF THE TRUST ARE ALSO OFFICERS OF THE INVESTMENT ADVISER AND BNY MELLON
Certain trustees and officers of the Trust are also officers of the Investment Adviser or BNY Mellon. BNY Mellon serves as the sub-administrator, investment accounting agent, and shareholder servicing and transfer agent.
INVESTMENT ADVISORY AGREEMENT
Each Fund’s investments are managed by the Investment Adviser pursuant to the terms of a master investment advisory agreement (the “Advisory Agreement”). Under the Advisory Agreement, the Investment Adviser provides each Fund with investment research, advice, management, and supervision and manages the investment and reinvestment of assets of each Fund consistent with each Fund’s investment objectives, policies, and limitations. Subject to certain exceptions set forth in the Advisory Agreement, the Investment Adviser is responsible for (i) compensation of any of the Fund’s trustees, officers, and employees who are interested persons of the Investment Adviser; and (ii) compensation of the Investment Adviser’s personnel and other expenses incurred in connection with the provision of portfolio management services under the Advisory Agreement.
Firsthand Capital Management, Inc. is the Investment Adviser to the Funds. For the services it provides under the Advisory Agreement, the Investment Adviser receives from each Fund, on a monthly basis, an advisory fee at the annual rate of 1.40% for TEFQX and 1.53% for ALTEX of its average daily net assets, respectively. The Advisory Agreement requires the Investment Adviser to waive fees and, if necessary, to reimburse expenses of
NOTES TO FINANCIAL STATEMENTS - continued
December 31, 2019
each Fund to the extent necessary to limit a Fund’s total operating expenses to 1.85%, for TEFQX and 1.98% for ALTEX, excluding any extraordinary fees, of its average net assets up to $200 million, 1.80% for TEFQX and 1.93% for ALTEX of such assets from $200 million to $500 million, 1.75% for TEFQX and 1.88% for ALTEX of such assets from $500 million to $1 billion, and 1.70% for TEFQX and 1.83% for ALTEX of such assets in excess of $1 billion.
ADMINISTRATION AGREEMENT
The Trust has entered into a separate Administration Agreement with the Investment Adviser. The agreement obligates the Investment Adviser to provide administrative and general supervisory services to each Fund (the “Administration Agreement”). Under the Administration Agreement, the Investment Adviser renders supervisory and corporate administrative services to the Trust, as well as oversees the maintenance of all books and records with respect to each Fund’s securities transactions and each Fund’s book of accounts in accordance with all applicable federal and state laws and regulations. The Investment Adviser also arranges for the preservation of journals, ledgers, corporate documents, brokerage account records, and other records as required by the 1940 Act.
The Investment Adviser is responsible for the equipment, staff, office space, and facilities necessary to perform its obligations under the Administration Agreement. Under the Administration Agreement, the Investment Adviser has assumed responsibility for payment of all of each Fund’s operating expenses excluding brokerage and commission expenses; short sale expenses; fees payable under “Rule 12b-1 plans”, if any, and shareholder servicing plans, if any; litigation costs; and any extraordinary and non-recurring expenses. For the services it provides under the Administration Agreement, the Investment Adviser receives a fee from each Fund at the annual rate of 0.45% of its average daily net assets up to $200 million, 0.40% of such assets from $200 million to $500 million, 0.35% of such assets from $500 million to $1 billion, and 0.30% of such assets in excess of $1 billion.
The Bank of New York Mellon (“BNY Mellon”), has a Sub-Administration Agreement with the Investment Adviser. Under this agreement, the Investment Adviser (not the Funds) pays to BNY Mellon the fees for the administrative services provided by BNY Mellon.
Additionally, BNY Mellon serves as the investment accounting agent, shareholder servicing agent and custodian. BNY Mellon Investment Servicing (US), Inc., serves as the transfer agent for the Trust.
5. INVESTMENTS IN RESTRICTED SECURITIES
Restricted securities include securities that have not been registered under the Securities Act of 1933, as amended, and securities that are subject to restrictions on resale. A Fund may invest in restricted securities that are consistent with a Fund’s investment objective and investment strategies. A Fund will not invest in a restricted security if, immediately after
NOTES TO FINANCIAL STATEMENTS - continued
December 31, 2019
and as a result of the investment in such security, more than 15% of the Fund’s net assets would be invested in illiquid securities. In some cases, the issuer of restricted securities has agreed to register such securities for resale, at the issuer’s expense either upon demand by the Fund or in connection with another registered offering of the securities. Investments in restricted securities are valued at fair value as determined in good faith in accordance with procedures adopted by the Board of Trustees. It is possible that the estimated value may differ significantly from the amount that might ultimately be realized in the near term, and the difference could be material.
As of December 31, 2019, Firsthand Technology Opportunities Fund did not invest in any restricted securities and the Firsthand Alternative Energy Fund was invested in the following restricted securities:
SECURITY | | ACQUISITION DATE | | | SHARES | | | COST | | | VALUE | | | % OF NET
ASSETS | |
Silicon Genesis Corp., Common Stock | | | September 2, 2008 | | | | 109,855 | | | $ | 32,956 | | | $ | 88 | | | | 0.0 | %* |
Silicon Genesis Corp., Common Stock | | | September 26, 2008 | | | | 71,552 | | | | 21,466 | | | | 57 | | | | 0.0 | %* |
Silicon Genesis Corp., Series 1-C Preferred Stock | | | September 2, 2008 | | | | 152 | | | | 46 | | | | 10 | | | | 0.0 | %* |
Silicon Genesis Corp., Series 1-E Preferred Stock | | | September 2, 2008 | | | | 3,000 | | | | 2,878 | | | | 346 | | | | 0.0 | %* |
| | | | | | | | | | | $ | 57,346 | | | $ | 501 | | | | 0.0 | % |
Each Fund, consistent with SEC guidelines, has an investment restriction providing that it cannot purchase additional restricted securities once such securities comprise 15% of a Fund’s net assets. The SEC considers a security to be illiquid if it cannot be disposed of within seven days in the ordinary course of business at approximately the amount at which a Fund has valued the security. The restriction stems from the concern that, for an open-end mutual fund with daily redemption obligations, a high level of illiquid securities would increase the risk that a Fund may not be able to meet its daily redemption needs, because illiquid securities often take a longer period of time to sell, and may not necessarily be sold at that Fund’s then carrying value.
As of December 31, 2019, Kevin Landis represents the Funds and sits on the following private company’s board: Silicon Genesis Corporation. Serving on the boards of directors of the portfolio companies may cause conflicts of interest. The Adviser has adopted various procedures to ensure that the Funds will not be unfavorably affected by these potential conflicts.
NOTES TO FINANCIAL STATEMENTS - continued
December 31, 2019
6. RISKS
Because the return on and value of an investment in each Fund will fluctuate in response to stock market movements, the most significant risk of investing in a Fund is that you may lose money. Stocks and other equity securities are subject to market risks and fluctuations in value due to earnings, as well as economic, political, or regulatory events, and other factors beyond the Investment Adviser’s control. The Funds are designed for long-term investors who can accept the risks of investing in a fund with significant common stock holdings in high-technology industries.
Each Fund is non-diversified. A risk of being non-diversified is that a significant change in the value of one company will have a greater impact on a Fund than it would if the Fund diversified its investments. Another risk for each Fund is its concentration of investments in companies within high-technology industries. The value of high-technology companies can, and often does, fluctuate dramatically and may expose you to greater-than-average financial and market risk.
7. RECENT ACCOUNTING PRONOUNCEMENTS
New Accounting Pronouncements — In August 2018, the FASB issued Accounting Standards Update No. 2018-13 “Disclosure Framework — Changes to the Disclosure Requirements for Fair Value Measurement” (“ASU 2018-13”). ASU 2018-13 eliminates the requirement to disclose the amount of and reasons for transfers between Level 1 and Level 2 of the fair value hierarchy, the timing of transfers between levels of the fair value hierarchy, and the valuation process for Level 3 fair value measurements. ASU 2018-13 does not eliminate the requirement to disclose the range and weighted average used to develop significant unobservable inputs for Level 3 fair value measurements, and the changes in unrealized gains and losses for recurring Level 3 fair value measurements. ASU 2018-13 requires that information is provided about the measurement uncertainty of Level 3 fair value measurements as of the reporting date. The guidance is effective for fiscal years beginning after December 15, 2019, and interim periods within those fiscal years. Management has evaluated the impact of this change in guidance, and due to the permissibility of early adoption, modified the Funds’ fair value disclosures for the current reporting period.
8. SUBSEQUENT EVENT
Management has evaluated the impact of all subsequent events on the Funds through the date the financial statements were issued, and has determined that there were no subsequent events requiring recognition or disclosure in the financial statements.
Additional Information (Unaudited)
December 31, 2019
BOARD REVIEW OF ADVISORY AGREEMENT (UNAUDITED)
Trustees (the “Board”) of Firsthand Funds (the “Trust”), including all of the Trustees who are not “interested persons” of the Trust, as that term is defined in the 1940 Act (the “Independent Trustees”), considered the renewal of the master investment advisory agreement between Firsthand Capital Management, Inc. (the “Adviser”) and the Trust on behalf of each of its series (each a “Fund” and collectively, the “Funds”) (the “Advisory Agreement”). The Advisory Agreement was approved for an additional one-year term at a meeting of the Board held on August 9, 2019. The Board’s decision to approve the Advisory Agreement reflects the exercise of its business judgment to continue the existing arrangement. In approving the Advisory Agreement, the Board considered information provided by the Adviser, with the assistance and advice of counsel to the Independent Trustees and counsel to the Trust.
Nature, Extent and Quality of Services
The Board received and considered various data and information regarding the nature, extent and quality of services provided to the Funds by the Adviser. The most recent Form ADV for the Adviser was provided to the Board, as were written and oral responses of the Adviser to an information request submitted by independent legal counsel on behalf of the Independent Trustees. The Board reviewed these responses, which included, among other things, information about the background and experience of the investment personnel of the Adviser primarily responsible for day-to-day portfolio management of the Funds. The Board also considered the Adviser’s separate Administration Agreement with the Funds and the Adviser’s overall ability to manage and administer the Funds as well as to oversee the service providers to the Funds.
The Board evaluated the ability of the Adviser, considering its financial condition, resources, reputation and other attributes, to attract and retain highly qualified investment professionals, including research, advisory, supervisory and administrative personnel. In this regard, the Board considered information regarding the structure of the Adviser’s compensation program for its personnel involved in the management of the Funds, including incentive and retirement plans.
The Board considered the effectiveness of policies of the Funds in achieving the best execution of portfolio transactions, whether and to what extent “soft dollar” benefits are used, the extent to which efforts are made to recapture transaction costs and the controls applicable to brokerage allocation procedures. The Board reviewed the policies of the Adviser regarding the allocation of portfolio investment opportunities among the Funds and other clients. The Board noted that the Adviser does not use “traditional soft-dollar” arrangements, where soft-dollar credits are generated based on the level of trades and then used for products or services from third-parties. The Board also noted that the Adviser, from time to time, entered into arrangements where it received research (including invitations to
ADDITIONAL INFORMATION (UNAUDITED) - continued
December 31, 2019
conferences) from broker-dealers that the Adviser used to execute client trades. The Board also considered that the Adviser had outsourced the trading function to achieve certain operating efficiencies.
The Board also considered the markets for the Funds, including the principal channels through which the Funds’ shares are offered and sold, and the activities of the Adviser in connection with the marketing of the Funds.
In addition, the Board received and reviewed information on SEC and other inquiries, examinations and proceedings relating to the Funds and the Adviser. The Board considered the investment and legal compliance programs of the Adviser, including its implementation of enhanced compliance policies and procedures in response to SEC rule changes and other regulatory initiatives, and the level of compliance attained by the Adviser.
Based on the above factors, together with those referenced below, the Board, including a majority of the Independent Trustees, concluded that it was generally satisfied with the nature, extent and quality of the investment advisory services provided to each Fund by the Adviser.
Fund Performance
The Board considered each Fund’s performance results over one-year, three-year, five-year and ten-year periods, or shorter periods, as relevant. It also considered these results in comparison to the performance results of various benchmark indices and of the Funds in relevant Morningstar sectors. The Board referenced the presentation regarding performance earlier in the meeting and noted that TOF had exhibited strong performance over the ten-year period ended June 30, 2019, which is consistent with the Board’s emphasis on longer-term performance. The Board also noted the periods for which each Fund had experienced weaker performance. The Board recognized that each Fund had experienced various periods of underperformance against the peer group funds and the applicable benchmark index, but the Board noted that the Adviser has remained committed to its investment strategy and style and the Board was pleased with that consistency.
Investment Advisory Fee Rates and Other Expenses
The Board reviewed and considered the proposed contractual investment advisory fee rates (the “Advisory Agreement Rates”) payable by the Funds to the Adviser for investment advisory services. Additionally, the Board received and considered information comparing the Advisory Agreement Rates (both on a stand-alone basis and on a combined basis with the Funds’ administration fee rates) and the total expense ratios of the Funds with those of other funds in appropriate peer universes provided by Broadridge (formerly Lipper). The Board noted that the respective Advisory Agreement Rates for each Fund were higher than the median rates of each fund’s peer universe, but that the total expense ratio of each Fund
ADDITIONAL INFORMATION (UNAUDITED) - continued
December 31, 2019
was not appreciably above the median total expense ratio of the respective peer universe. The Board deemed the comparison of total expense ratios to be more relevant than the comparison of Advisory Agreement Rates because of the unitary fee structure of the Funds.
Profitability
The Board received and considered a profitability analysis of the Adviser with respect to the Funds. The Board concluded that, in light of the costs of providing investment management and other services to the Funds, the profits and other ancillary benefits that the Adviser received with regard to providing these services to the Funds were not excessive.
Economies of Scale
The Board received and considered information regarding whether there have been economies of scale with respect to the management of the Funds, whether the Funds have appropriately benefited from any economies of scale, and whether there is potential for realization of any further economies of scale with respect to the existing Funds. The Board observed that the Advisory Agreement limits each Fund’s total annual operating expenses to a percentage of the Fund’s assets and that this percentage is reduced as the Fund’s assets grow (known as “breakpoints”). The Board concluded that no change was necessary to the current breakpoints to reflect any economies of scale given the limited size and scale of the Funds.
Information about Services to Other Clients
The Board also received and considered information about the services and fee rates offered by the Adviser to its other client, Firsthand Technology Value Fund, Inc. The Board concluded that the investment advisory rates charged by the Adviser to the Funds were within a reasonable range of the fee rates offered to the other client of the Adviser. Where rates offered to the other client or potential clients were lower, the Board concluded that the costs associated with managing and operating a registered open-end fund, compared with an unregistered investment company, private account or institutional investor account provided a justification for higher fee rates to the Funds.
Other Benefits to the Adviser
The Board received and considered information regarding potential “fall-out” or ancillary benefits to the Adviser as a result of its relationship with the Funds. Such benefits could include, among others, benefits directly attributable to the relationship of the Adviser with the Funds (such as “soft dollar” benefits) and benefits potentially derived from an increase in the business of the Adviser as a result of its relationship with the Funds (such as the ability to market to shareholders other financial products offered by the Adviser).
ADDITIONAL INFORMATION (UNAUDITED) - continued
December 31, 2019
Other Factors and Broader Review
Throughout the year, the Board regularly reviews and assesses the quality of the services that the Funds receive from the Adviser. In this regard, the Board reviews reports of the Adviser in each of its quarterly meetings, which include, among other things, a detailed portfolio review and detailed fund performance reports. In addition, the Board interviews the portfolio managers of the Funds at various times throughout the year.
Board Consideration
After considering the aforementioned factors and based on its deliberations and evaluation of the information provided to it, the Board concluded that re-approval of the Advisory Agreement for each of the Funds was in the best interest of the Funds and their shareholders.
FEDERAL TAX INFORMATION (UNAUDITED)
For the fiscal year ended December 31, 2019, the Funds make the following disclosures for federal income tax purposes. Below is listed the percentages, or the maximum amount allowable, of its ordinary income dividends (“QDI”) to qualify for the lower tax applicable to individual shareholders, and the percentage of ordinary income dividends earned by the Funds which qualifies for the dividends received deduction (“DRD”) for corporate shareholders. The actual percentage of QDI and DRD for the calendar year will be designated in year-end tax statements.
| | | QDI | | | DRD | |
Firsthand Technology Opportunities Fund | | | 21.07 | % | | | 7.01 | % |
Firsthand Alternative Energy Fund | | | 0.00 | % | | | 0.00 | % |
PROXY VOTING POLICIES AND PROCEDURES
The Funds have adopted proxy voting procedures pursuant to which the Funds delegate the responsibility for voting proxies relating to portfolio securities held by the Funds to the Investment Adviser as part of the Investment Adviser’s general management of the Funds, subject to the Board of Trustees’ continuing oversight. A copy of the Funds’ proxy voting policy and procedures is available without charge, upon request, by calling 1.888.884.2675. Information regarding how the Investment Adviser voted these proxies during the most recent one-year period ended June 30 is available by calling the same number and on the website of the U.S. Securities and Exchange Commission at http://www.sec.gov on Form N-PX. The Funds’ voting record is also available on the Funds’ website at www.firsthandfunds.com/proxy.
ADDITIONAL INFORMATION (UNAUDITED) - continued
December 31, 2019
PORTFOLIO HOLDINGS
The Funds file their complete schedule of portfolio holdings with the SEC for the first and third quarters of each fiscal year on Form N-Q. The Funds’ Forms N-Q will be available on the SEC’s website at http://www.sec.gov and may be reviewed and copied at the SEC’s Public Reference Room in Washington, D.C. Information on the operation of the Public Reference Room may be obtained by calling 1.800.SEC.0330.
NOTES
NOTES

FIRSTHAND FUNDS P.O. Box 9836 Providence, RI 02940-8036 www.firsthandfunds.com INVESTMENT ADVISER Firsthand Capital Management, Inc. 150 Almaden Blvd., Suite 1250 San Jose, CA 95113 www.firsthandcapital.com DISTRIBUTOR ALPS Distributors, Inc. 1290 Broadway Suite 1000 Denver, CO 80203 | AUDITOR Tait, Weller & Baker LLP 50 South 16th St., Suite 2900 Philadelphia, PA 19102 TRANSFER AGENT BNY Mellon Investment Servicing (US) Inc. 4400 Computer Drive Westborough, MA 01581 1.888.884.2675 |
This report is provided for the general information of the shareholders of Firsthand Funds. This report is not intended for distribution to prospective investors in the Funds, unless preceded or accompanied by an effective prospectus. For more complete information about Firsthand Funds, please call toll free 1.888.884.2675 or visit www.firsthandfunds.com for an additional prospectus, which contains more information, including risks, fees, and expenses. Read the prospectus carefully before investing or sending money.
Firsthand Funds are distributed by ALPS Distributors, Inc.
FHF000847, exp. 3/1/2021
The interlocking “F” design is a registered trademark of Firsthand Capital Management, Inc.
Item 2. Code of Ethics.
| (a) | The registrant, as of the end of the period covered by this report, has adopted a code of ethics that applies to the registrant’s principal executive officer, principal financial officer, principal accounting officer or controller, or persons performing similar functions, regardless of whether these individuals are employed by the registrant or a third party |
| (b) | There have been no amendments, during the period covered by this report, to a provision of the code of ethics that applies to the registrant’s principal executive officer, principal financial officer, principal accounting officer or controller, or persons performing similar functions, regardless of whether these individuals are employed by the registrant or a third party, and that relates to any element of the code of ethics description except that effective May 13, 2011, Omar Billawala replaced Kevin Landis as Treasurer (in the capacity of Chief Financial Officer) of the registrant. |
| (c) | The registrant has not granted any waivers, including an implicit waiver, from a provision of the code of ethics that applies to the registrant’s principal executive officer, principal financial officer, principal accounting officer or controller, or persons performing similar functions, regardless of whether these individuals are employed by the registrant or a third party, that relates to one or more of the items set forth in paragraph (b) of this item’s instructions. |
Item 3. Audit Committee Financial Expert.
As of the end of the period covered by the report, the registrant’s Board of Trustees has not determined that any of its members is qualified as an audit committee financial expert. Although each member of the Audit Committee is “independent,” as defined by Item 3 of Form N-CSR, and is financially sophisticated, the registrant has in place a small Board of Trustees with a limited number of members. Even without an audit committee financial expert, the registrant is comfortable that its Audit Committee can function effectively given the investment and financial experience and expertise of its members.
Item 4. Principal Accountant Fees and Services.
| • | Registrant may incorporate the following information by reference, if this information has been disclosed in the registrant’s definitive proxy statement or definitive information statement. The proxy statement or information statementmust be filed no later than 120 days after the end of the fiscal year covered by the Annual Report. |
Audit Fees
| (a) | The aggregate fees billed for each of the last two fiscal years for professional services rendered by the principal accountant for the audit of the registrant's annual financial statements or services that are normally provided by the accountant in connection with statutory and regulatory filings or engagements for those fiscal years are $33,500 for 2019 and $32,600 for 2018. |
Audit-Related Fees
| (b) | The aggregate fees billed in each of the last two fiscal years for assurance and related services by the principal accountant that are reasonably related to the performance of the audit of the registrant's financial statements and are not reported under paragraph (a) of this Item are $0 for 2019 and $0 for 2018. |
Tax Fees
| (c) | The aggregate fees billed in each of the last two fiscal years for professional services rendered by the principal accountant for tax compliance, tax advice, and tax planning are $4,200 for 2019 and $4,200 for 2018. |
All Other Fees
| (d) | The aggregate fees billed in each of the last two fiscal years for products and services provided by the principal accountant, other than the services reported in paragraphs (a) through (c) of this Item are $1,500 for 2019 and $1,500 for 2018. The fees are incurred in connection with the principal accountants performing an annual anti-money laundering audit program for the Registrant. |
| (e)(1) | Disclose the audit committee's pre-approval policies and procedures described in paragraph (c)(7) of Rule 2-01 of Regulation S-X. |
The registrant's Audit Committee Charter states the following with respect to pre-approval procedures:
The Committee hereby delegates to the Chairman of the Committee the authority to grant pre-approvals of audit and "permissible" non-audit services to be provided by the Auditors to the Funds, subject to the ratification of the full Committee at its next regularly scheduled meeting. Both the Auditors and Fund counsel will be responsible for informing the Committee whether they believe that a particular non-audit service is permissible or prohibited pursuant to applicable regulations and standards.
The specific types of non-audit services that the Chairman may pre-approve include, but are not limited to: reviewing the Funds' internal controls over financial reporting; providing tax-related services; reviewing and/or developing an anti-money laundering program; and issuing comfort letters, based on agreed-upon procedures, in connection with any Fund reorganization.
Pre-approval for a non-audit service provided to a Fund is not required if: (i) the aggregate amount of all such non-audit services provided to the Fund constitutes not more than 5% of the total amount of revenues paid by the Fund to the Auditors during the fiscal year in which the non-audit services are provided; (ii) such services were not recognized by the Fund at the time of the engagement to be non-audit services; and (iii) such services are promptly brought to the attention of the Committee and are approved by the Committee or by one or more members of the Committee to whom authority to grant such approvals has been delegated by the Committee prior to the completion of the audit (the “De Minimus Exceptions”).
The Committee shall also pre-approve any non-audit services proposed to be provided by the Auditors to (i) a Fund's investment adviser and (ii) any entity controlling, controlled by, or under common control with the investment adviser that provides ongoing services to the Fund, if the Auditors' engagement with the investment adviser or any such control persons relates directly to the operations and financial reporting of the Fund. The De Minimus Exceptions applies to pre-approvals under this paragraph as well, except that the "total amount of revenues" calculation is based on the total amount of revenues paid to the Auditors by the Fund and any other entity that has its services approved under this paragraph (i.e., the investment adviser or any control person).
| (e)(2) | The percentage of services described in each of paragraphs (b) through (d) of this Item that were approved by the audit committee pursuant to paragraph (c)(7)(i)(C) of Rule 2-01 of Regulation S-X are as follows: |
| (f) | The percentage of hours expended on the principal accountant's engagement to audit the registrant's financial statements for the most recent fiscal year that were attributed to work performed by persons other than the principal accountant’s full-time, permanent employees was less than fifty percent. |
| (g) | The aggregate non-audit fees billed by the registrant's accountant for services rendered to the registrant, and rendered to the registrant's investment adviser (not including any sub-adviser whose role is primarily portfolio management and is subcontracted with or overseen by another investment adviser), and any entity controlling, controlled by, or under common control with the adviser that provides ongoing services to the registrant for each of the last two fiscal years of the registrant was $0 for 2019 and $0 for 2018. |
| (h) | The registrant's audit committee of the board of directors has considered whether the provision of non-audit services that were rendered to the registrant's investment adviser (not including any sub-adviser whose role is primarily portfolio management and is subcontracted with or overseen by another investment adviser), and any entity controlling, controlled by, or under common control with the investment adviser that provides ongoing services to the registrant that were not pre-approved pursuant to paragraph (c)(7)(ii) of Rule 2-01 of Regulation S-X is compatible with maintaining the principal accountant's independence. |
Item 5. Audit Committee of Listed Registrants.
Not applicable.
Item 6. Investments.
| (a) | Schedule of Investments in securities of unaffiliated issuers as of the close of the reporting period is included as part of the report to shareholders filed under Item 1 of this form. |
Item 7. Disclosure of Proxy Voting Policies and Procedures for Closed-End Management Investment Companies.
Not applicable.
Item 8. Portfolio Managers of Closed-End Management Investment Companies.
Not applicable.
Item 9. Purchases of Equity Securities by Closed-End Management Investment Company and Affiliated Purchasers.
Not applicable.
Item 10. Submission of Matters to a Vote of Security Holders.
There have been no material changes to the procedures by which the shareholders may recommend nominees to the registrant’s board of directors, where those changes were implemented after the registrant last provided disclosure in response to the requirements of Item 407(c)(2)(iv) of Regulation S-K (17 CFR 229.407) (as required by Item 22(b)(15) of Schedule 14A (17 CFR 240.14a-101)), or this Item.
Item 11. Controls and Procedures.
| (a) | The registrant’s principal executive officer and principal financial officer have concluded, based on their evaluation of the registrant's disclosure controls and procedures as of a date within 90 days of the filing date of this report, that these disclosure controls and procedures are adequately designed and are operating effectively to ensure that information required to be disclosed by the registrant on Form N-CSR is recorded, processed, summarized and reported within the time periods specified in the Securities and Exchange Commission's rules and forms. |
| (b) | There were no changes in the registrant’s internal control over financial reporting (as defined in Rule 30a-3(d) under the Act (17 CFR 270.30a-3(d))) that occurred during the registrant’s last fiscal quarter that have materially affected or are reasonably likely to materially affect, the registrant’s internal control over financial reporting. |
Item 12. Disclosure of Securities Lending Activities for Closed-End Management Investment Companies.
Not applicable.
Item 13. Exhibits.
| (a)(1) | Code of ethics, or any amendment thereto, that is the subject of disclosure required by Item 2 is attached hereto. |
| (a)(2) | Certifications pursuant to Rule 30a-2(a) under the 1940 Act and Section 302 of the Sarbanes-Oxley Act of 2002 are attached hereto. |
| (b) | Certifications pursuant to Rule 30a-2(b) under the 1940 Act and Section 906 of the Sarbanes-Oxley Act of 2002 are attached hereto. |
SIGNATURES
Pursuant to the requirements of the Securities Exchange Act of 1934 and the Investment Company Act of 1940, the registrant has duly caused this report to be signed on its behalf by the undersigned, thereunto duly authorized.
| (Registrant) | Firsthand Funds | |
| | | |
| By (Signature and Title)* | /s/ Kevin Landis | |
| | Kevin M. Landis, President and Secretary | |
| | | |
| | | |
| Date | February 28, 2020 | |
Pursuant to the requirements of the Securities Exchange Act of 1934 and the Investment Company Act of 1940, this report has been signed below by the following persons on behalf of the registrant and in the capacities and on the dates indicated.
| By (Signature and Title)* | /s/ Kevin Landis | |
| | Kevin M. Landis, President and Secretary | |
| | | |
| Date | February 28, 2020 | |
| | | |
| By (Signature and Title)* | /s/ Omar Billawala | |
| | Omar Billawala, Treasurer | |
| | | |
| Date | February 28, 2020 | |
| * | Print the name and title of each signing officer under his or her signature. |