Washington, D.C. 20549
(Address of principal executive offices) (Zip code)
Firsthand Capital Management, Inc., 125 South Market, Suite 1300, San Jose, CA 95113
Form N-CSR is to be used by management investment companies to file reports with the Commission not later than 10 days after the transmission to stockholders of any report that is required to be transmitted to stockholders under Rule 30e-1 under the Investment Company Act of 1940 (17 CFR 270.30e-1). The Commission may use the information provided on Form N-CSR in its regulatory, disclosure review, inspection, and policymaking roles.
A registrant is required to disclose the information specified by Form N-CSR, and the Commission will make this information public. A registrant is not required to respond to the collection of information contained in Form N-CSR unless the Form displays a currently valid Office of Management and Budget (“OMB”) control number. Please direct comments concerning the accuracy of the information collection burden estimate and any suggestions for reducing the burden to Secretary, Securities and Exchange Commission, 450 Fifth Street, NW, Washington, DC 20549-0609. The OMB has reviewed this collection of information under the clearance requirements of 44 U.S.C. § 3507.
Item 1. Reports to Stockholders.
Include a copy of the report transmitted to stockholders pursuant to Rule 30e-1 under the Act (17 CFR 270.30e-1).
CONTENTS
| Performance Summary | 2 |
| President’s Letter | 4 |
| Shareholder Fee Example | 6 |
| Performance and Portfolio Discussion | 8 |
| Audit Letter | 16 |
| Portfolio of Investments | 17 |
| Statements of Assets and Liabilities | 22 |
| Statements of Operations | 23 |
| Statements of Changes in Net Assets | 24 |
| Statement of Cash Flows | 26 |
| Financial Highlights | 27 |
| Notes to Financial Statements | 29 |
| Additional Information | 44 |
PERFORMANCE SUMMARY
PERIOD RETURNS (average annual total returns as of 12/31/08)
| Fund | 1-Year | 3-Year | 5-Year | 10-Year | Exp. Ratio |
| Firsthand Technology Value Fund® | -47.43% | -10.92% | -5.81% | -1.83% | 1.94% |
| Firsthand Technology Leaders Fund | -46.75% | -13.46% | -6.55% | -3.58% | 1.95% |
| Firsthand e-Commerce Fund | -42.40% | -7.51% | -2.54% | • | 1.95% |
| Firsthand Alternative Energy Fund | -47.84% | • | • | • | 2.11% |
| | | | | | |
| NASDAQ Composite Index | -39.98% | -9.81% | -3.95% | -2.71% | • |
S&P 500 Index | -37.00% | -8.35% | -2.19% | -1.38% | • |
| WilderHill Clean Energy Index | -69.89% | • | • | • | • |
Returns assume reinvestment of all dividends and distributions but do not reflect the impact of taxes. The performance data quoted represent past performance. Past performance cannot guarantee future results, and current performance may be lower or higher than the performance quoted. Both the return from and the principal value of an investment in the Funds will fluctuate so that an investor’s shares, when redeemed, may be worth more or less than their original cost. To obtain performance as of the most recent month-end, please contact Firsthand Funds by calling 1.888.884.2675 or go to www.firsthandfunds.com.
The Nasdaq Composite Index (NASDAQ) is a capitalization-weighted index of all common stocks listed with Nasdaq. The Standard & Poor’s 500 Index (S&P 500) is a market-weighted index of 500 stocks of well-established companies. Each index represents an unmanaged, broad-based basket of stocks. These indices are typically used as benchmarks for overall market performance. The Wilder Hill Clean Energy Index is a market-weighted index of 40 companies in the cleaner fuel, energy conversion, energy storage, greener utilities, power delivery and conservation, and renewable energy harvesting sectors. You cannot invest directly in an index.
RETURNS SINCE INCEPTION (average annual total returns as of 12/31/08)
| Fund (Inception Date) | Avg Annual Total Return | NASDAQ | S&P 500 | WilderHill Clean Energy |
| Firsthand Technology Value Fund® (5/20/94) | 9.05% | 5.95% | 6.71% | • |
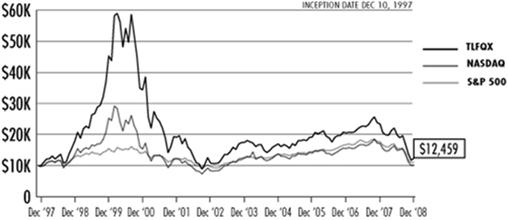
| Firsthand Technology Leaders Fund (12/10/97) | 2.01% | 0.27% | 0.98% | • |
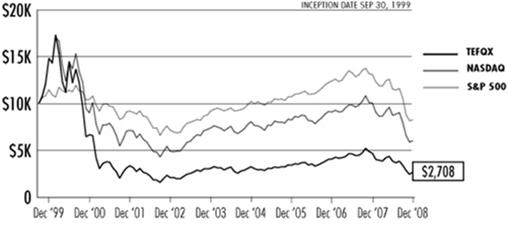
| Firsthand e-Commerce Fund (9/30/99) | -13.16% | -5.29% | -2.05% | • |
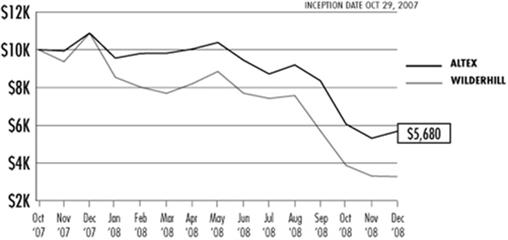
| Firsthand Alternative Energy Fund (10/29/07) | -38.20% | -38.39% | -34.99% | -61.29% |
Each Fund may invest in small-capitalization companies and Initial Public Offerings (“IPOs”). These investments will be more volatile than investments in large-capitalization companies and loss of principal could be greater. The Funds may invest in foreign securities, which will be subject to greater risks than investing in domestic securities. Because the Funds are not diversified, they can take larger positions in fewer companies, increasing their risk profile. The Funds invest in several industries within the technology sector and the relative weightings of these industries in a Fund’s portfolio may change at any time.
HOLDINGS BY INDUSTRY - % of net assets (as of 12/31/08)
| Industry | TVFQX | TLFQX | TEFQX | ALTEX |
| Advanced Materials | 10.2% | 4.3% | • | 4.1% |
| Basic Materials | • | • | • | 0.5% |
| Building Automation | • | • | • | 1.9% |
| Communications | 2.7% | 7.0% | 13.3% | • |
| Communications Equipment | 2.9% | 5.9% | • | • |
| Computer | • | 5.0% | 6.5% | • |
| Electronic Manufacturing Services | 0.2% | 0.8% | • | • |
| Energy Efficiency | 2.4% | • | • | 7.6% |
| Environmental Services | • | • | • | 0.8% |
| Industrials | • | • | • | 3.0% |
Intellectual Property | 15.3% | • | • | 9.3% |
| Internet | 9.1% | 6.1% | 43.5% | • |
| Media | • | • | 2.8% | • |
| Networking | 0.1% | 6.8% | 4.4% | • |
| Other Electronics | 4.5% | 8.8% | 9.3% | 3.7% |
| Peripherals | 1.0% | 2.4% | • | • |
| Photonics | 1.3% | • | • | • |
| Renewable Energy | 20.3% | 7.6% | • | 32.0% |
| Semiconductors | 24.2% | 16.1% | 0.8% | • |
| Semiconductor Equipment | • | 1.0% | • | • |
| Services | 0.1% | • | • | • |
| Software | 4.2% | 20.1% | 10.9% | • |
| Water Treatment | • | • | • | 2.5% |
| Net Cash | 1.5% | 8.1% | 8.5% | 34.6% |
TVFQX: Firsthand Technology Value Fund, TLFQX: Firsthand Technology Leaders Fund, TEFQX: Firsthand e-Commerce Fund, ALTEX: Firsthand Alternative Energy Fund.
PRESIDENT’S LETTER
Dear Fellow Shareholders,
By now you have probably heard and read more about the great financial collapse of 2008 than you’d care to. For those of us focused on investing outside of the mortgage industry, it’s been a bitter lesson in the interconnectedness of things. What did we miss? For starters, many of us had a vague and distant unease about the real estate market, but the vast majority of us failed to follow that troubling thought to its next, fateful step: the vast, institutionalized securitization of mortgages—an experiment in financial engineering that transformed a significant problem into a disaster.
We also failed to notice the fragile, crumbling reality behind many of Wall Street’s great name-brand facades. It’s one thing to leave yourself vulnerable by taking on too much debt, and it’s always trouble when you make bad investments, but by combining twenty- and even thirty-to-one leverage with “exotic” mortgage-backed securities that almost no one understands, the big-name financial firms piled blunder upon blunder to seal their own fate. Even the most recklessly overextended home buyers took less risk than Lehman et al.
It was the combination of cheap credit and leverage that caused this crisis to explode so forcefully upon the rest of us. As various banks, hedge funds, and insurance companies marked down their bad assets, they were forced to sell others in order to pay down their debts (or to meet redemptions). These waves of “forced selling” affected virtually every other asset class—when you can’t find a buyer for your mistakes, you may have to sell something perfectly good instead.
Under normal circumstances, the market “reasons” with buyers and sellers: Lower prices draw in buyers and cause some sellers to reconsider. That’s how markets work to find a balance. But the forced seller cannot be reasoned with, and panic-stricken buyers often step back from a falling market to see where it will finally come to rest.
For a time, we took some comfort in the fact that our portfolio companies were safely removed from the world of sub-prime lending, mortgage-backed securities, and credit-default swaps. Tech companies carry little or no debt, and their markets are not driven by real estate values, so why should Microsoft, Cisco, Amazon, or Intel care about the state of the mortgage market? Well, because a heart attack is not just bad for your heart, and a collapsing financial sector wreaks havoc systemically. As many large portfolios were either liquidated or deleveraged, fund managers sold what they could—simply because they had to.
In hindsight, we would have been better off selling our stocks at a loss and temporarily becoming a money market fund. But such things are always obvious after the fact, and the fact is that’s not who we are. Our mission is to find the best long-term technology investments, and market timing is not part of that mandate. Still, it has been frustrating to witness the dysfunctions of our financial system—frustrating and very, very costly.
So here we are, in the midst of the aftermath. A deep recession, no matter where or how it starts, is painful for nearly everyone, and the technology industry has begun to make adjustments. There have been layoffs and other cost-cutting measures, and more are sure to come. But the smart companies are cutting costs with an eye towards positioning themselves for the rebound. As ever, our task is to identify the companies that will not only survive the tough times, but emerge as the leaders in this story’s next chapter.
If you are looking for a silver lining, consider this: There will be many successful companies in the years to come. With investor confidence near an all-time low, 2009 may be remembered as a year of incredible opportunity—a time when great companies were available at astonishing prices. I believe that Silicon Valley’s future remains bright. From alternative energy to innovative new consumer gadgets, great value is being created all around us.
We appreciate your continued investment in Firsthand Funds. We believe that our commitment to a disciplined philosophy of fundamental research and a long-term approach will serve us well in navigating the current difficult environment and position us to take advantage of the eventual recovery.
Sincerely,
Kevin Landis
President and Chief Executive Officer
SHAREHOLDER FEE EXAMPLE (unaudited)
Example—In general, mutual fund shareholders may incur two types of costs: (1) transaction costs, including sales charges (loads), redemption fees, and exchange fees; and (2) ongoing costs, including management fees, 12b-1 distribution and service fees, non-12b-1 service fees, and other Fund expenses. This example is intended to help you understand your ongoing costs (in dollars) of investing in a Fund and to compare these costs with the ongoing costs of investing in other mutual funds. Note that Firsthand Funds (“Trust”) does not charge transaction fees for 12b-1 distribution and service fees, though you may incur transaction fees if you purchase shares through a broker.
The example on the following page is based on an investment of $1,000 invested at the beginning of the period and held for the entire period from July 1, 2008 through December 31, 2008.
Actual Expenses—The section of the table at right entitled “Actual” provides information about actual account values and actual expenses. You may use this information, together with the amount you invested, to estimate the expenses that you paid over the period. Simply divide your account value by $1,000 (for example, an $8,600 account value divided by $1,000 = 8.6), then multiply the result by the number in the section entitled “Actual” under the heading “Expenses Paid During Period” to estimate the expenses you paid on your account during this period. If your account is an IRA or other tax-qualified savings plan, your expenses may also have included a $10 annual fee. In either case, the amount of any fee paid through your account would increase the estimate of expenses you paid during the period and decrease your ending account value.
Hypothetical Example for Comparison Purposes—The section of the table at right entitled “Hypothetical” provides information about hypothetical account values and hypothetical expenses based on a Fund’s actual expense ratio and an assumed rate of return of 5% per year before expenses, which is not the Fund’s actual return. The hypothetical account values and expenses may not be used to estimate your actual ending account balance or the expenses you paid for the period. However, you may use this information to compare the ongoing costs of investing in the Trust to other funds. To do so, compare this 5% hypothetical example with the 5% hypothetical examples that appear in the shareholder reports of the other funds. As in the case of the actual expense example, if your account is subject to an IRA fee, the amount of the fee paid through your account would increase the hypothetical expenses you would have paid during the period and decrease the hypothetical ending account value.
Please note that the expenses shown in the table at right are meant to highlight your ongoing costs only and do not reflect any transactional costs, such as sales charges (loads), redemption fees, or exchange fees. Therefore, the table is useful in comparing ongoing costs only, and will not help you determine the relative total costs of owning different funds. In addition, if these transactional costs were included, your costs would have been higher. The examples also assume all dividends and distributions have been reinvested.
Firsthand Technology Value Fund
| | Beginning Account Value 7/1/08 | Ending Account Value 12/31/08 | Expenses Paid During Period* 7/1/08-12/31/08 | Annualized Expense Ratio |
| Actual | $1,000 | $648.66 | $8.20 | 1.94% |
| Hypothetical** | $1,000 | $1,014.94 | $9.83 | 1.94% |
Firsthand Technology Leaders Fund
| | Beginning Account Value 7/1/08 | Ending Account Value 12/31/08 | Expenses Paid During Period* 7/1/08-12/31/08 | Annualized Expense Ratio |
| Actual | $1,000 | $624.94 | $7.85 | 1.95% |
| Hypothetical** | $1,000 | $1,014.89 | $9.88 | 1.95% |
Firsthand e-Commerce Fund
| | Beginning Account Value 7/1/08 | Ending Account Value 12/31/08 | Expenses Paid During Period* 7/1/08-12/31/08 | Annualized Expense Ratio |
| Actual | $1,000 | $704.19 | $8.15 | 1.95% |
| Hypothetical** | $1,000 | $1,014.89 | $9.88 | 1.95% |
Firsthand Alternative Energy Fund
| | Beginning Account Value 7/1/08 | Ending Account Value 12/31/08 | Expenses Paid During Period* 7/1/08-12/31/08 | Annualized Expense Ratio |
| Actual | $1,000 | $601.06 | $8.27 | 2.11% |
| Hypothetical** | $1,000 | $1,014.08 | $10.68 | 2.11% |
| * | Expenses are calculated by multiplying the Fund’s annualized expense ratio listed above by the average account value over the period and multiplying that number by 184/366 (to reflect the one-half year period). |
| ** | 5% return per year before expenses. |
The expenses shown in the table do not reflect any fees that may be charged to you by brokers, financial intermediaries, or other financial institutions.
FIRSTHAND TECHNOLOGY VALUE FUND
Performance and Portfolio Discussion
How did the Fund perform in 2008?
In 2008, Firsthand Technology Value Fund (TVFQX) posted a 47.43% loss, versus a 39.98% decrease for the NASDAQ Composite Index and a 37.00% drop for the S&P 500 Index. For the six months ending December 31, 2008, Firsthand Technology Value Fund fell 35.13% as compared to 30.87% and 28.48% declines for the NASDAQ and the S&P 500 indices, respectively.
Which industries had the greatest impact on the Fund's performance?
For the period ending December 31, 2008, renewable energy and semiconductor stocks represented the portfolio’s largest weightings, followed by intellectual property and advanced materials holdings. Results over the last 12 months reflect poor performance of our holdings in the semiconductor, advanced materials, and peripherals industries.
Which individual holdings were the largest contributors to the Fund's performance?
The Fund’s top contributors in 2008 were both privately-held companies in the alternative energy industry. The biggest winner was SoloPower, a thin-film solar company in which the Fund initially invested in 2006. SoloPower is helping to drive down the cost of manufacturing solar panels by utilizing copper-indium-gallium-selenide (CIGS) as its material of choice, rather than silicon, which is more costly. During 2008, the value of our SoloPower investment increased, reflecting a new round of funding that was closed during the year at a substantially higher valuation. The other positive contributor was Silicon Genesis (SiGen). SiGen is developing technologies to reduce the amount of wasted silicon during the manufacturing process, which can potentially result in dramatic cost savings for solar panel manufacturers.
Shares of Yahoo! (YHOO) jumped after Microsoft (MSFT) made a $44.6 billion unsolicited bid to acquire the company in February 2008. The acquisition talks temporarily helped revive shares of the struggling Internet portal. Yahoo!, however, eventually rebuffed Microsoft’s advances, and we liquidated our position in the company shortly thereafter.
Chinese online-game publisher Shanda Interactive Entertainment (SNDA) also was a profitable investment for the Fund in 2008. Online gaming in China continued to flourish despite a slowing economy because it provides its users with an inexpensive source of entertainment. Shares continued to appreciate late in the year after the company raised its guidance for the fourth quarter.
Which holdings were the greatest detractors from the Fund's performance?
The Fund’s largest detractor in 2008 was SiRF Technology (SIRF). The maker of chipsets for global-positioning systems never recovered after the company reported a huge drop in Q4 profits and slashed its Q1 ’08 estimates significantly. Increasing competition, aggressive pricing and weaker sales of personal navigation devices were reasons cited for the significant shortfall.
Shares of Corning (GLW) began to slide in the second half of 2008 as it became apparent that worsening economic conditions in the U.S. would likely curtail consumer demand for LCD TVs. Corning withdrew its guidance for the fourth quarter of 2008 and for 2009 after revealing that demand had dropped more severely than expected. The company indicated that it would reduce its production of glass in order to avoid an inventory glut.
Our position in AuthenTec (AUTH) also weighed on Fund performance after the maker of fingerprint sensors lowered its revenue and profit estimates significantly. The loss of one large customer – one that represented about a third of AuthenTec’s revenue - was the primary reason for the shortfall.
A deepening economic recession weighed heavily on disk-drive manufacturer Seagate Technology (STX). Slowing demand and a more competitive pricing environment for hard drives hurt the company’s profit margins and earnings, forcing Seagate to slash its 2009 forecast. This dour outlook sent shares spiraling down to their lowest level in more than five years.
Fund Performance and Holdings (as of 12/31/08)
Firsthand Technology Value Fund vs. Market Indices
| | TVFQX | NASDAQ | S&P 500 |
| Since Inception (5/20/94) | 9.05% | 5.95% | 6.71% |
| 10-Year | -1.83% | -2.71% | -1.38% |
| 5 -Year | -5.81% | -3.95% | -2.19% |
| 3 -Year | -10.92% | -9.81% | -8.35% |
| 1 -Year | -47.43% | -39.98% | -37.00% |
Growth of a Hypothetical $10,000 Investment
Returns assume reinvestment of all dividends and distributions but do not reflect the impact of taxes. The performance data quoted represent past performance. Past performance cannot guarantee future results, and current performance may be lower or higher than the performance quoted. Both the return from and the principal value of an investment in the Funds will fluctuate so that an investor’s shares, when redeemed, may be worth more or less than their original cost. To obtain performance as of the most recent month-end, please contact Firsthand Funds by calling 1.888.884.2675 or go to www.firsthandfunds.com.
Holdings by Industry*
| | % Net Assets |
| Semiconductors | 24.2% |
| Renewable Energy | 20.3% |
| Intellectual Property | 15.3% |
| Advanced Materials | 10.2% |
| Internet | 9.1% |
| Other Electronics | 4.5% |
| Software | 4.2% |
| Communications Equipment | 2.9% |
| Communications | 2.7% |
| Other | 2.7% |
| Energy Efficiency | 2.4% |
| Net Cash | 1.5% |
| * | Based on percentage of net assets as of 12/31/08. |
Top 10 Holdings**
| | % Net Assets |
| SoloPower - Series A | 13.7% |
| Silicon Genesis Corp. - Series 1-E | 8.7% |
| Rambus, Inc. | 7.9% |
| Corning, Inc. | 5.7% |
| Broadcom Corp. - A | 4.8% |
UCT Coatings, Inc. - Series B | 4.5% |
| Netflix, Inc. | 4.5% |
| Intel Corp. | 4.0% |
| Shanda Interactive Entertainment, Ltd. | 3.9% |
| Intevac, Inc. | 2.4% |
| ** | Top 10 stock holdings total 60.1% of net assets. These holdings are current as of 12/31/08, and may not be representative of current or future investments. |
FIRSTHAND TECHNOLOGY LEADERS FUND
Performance and Portfolio Discussion
How did the Fund perform in 2008?
In 2008, Firsthand Technology Leaders Fund (TLFQX) posted a 46.75% loss, versus a 39.98% decrease for the NASDAQ Composite Index and a 37.00% drop for the S&P 500 Index. For the six months ending December 31, 2008, Firsthand Technology Leaders Fund fell 37.51% as compared to 30.87% and 28.48% declines for the NASDAQ and the S&P 500 indices, respectively.
Which industries had the greatest impact on the Fund's performance?
For the period ending December 31, 2008, semiconductor and software stocks represented the portfolio’s largest weightings, followed by renewable energy and other electronics holdings. The portfolio’s exposure to the peripheral, communications, and renewable energy industries contributed most to the Fund’s underperformance versus its benchmarks in 2008.
Which individual holdings were the largest contributors to the Fund's performance?
Due to extremely unfavorable market conditions, there were only a small number of portfolio holdings that contributed positively to performance on an absolute basis during the period. The portfolio’s top contributor in 2008 was Qualcomm (QCOM). Shares of the wireless chipmaker rose after the company reported fiscal first quarter results that were in line with Wall Street expectations. We closed our position shortly thereafter as we felt ongoing litigation among Qualcomm, Nokia, and Broadcom would likely continue to weigh on the company’s financial results.
The Fund also realized a gain from its investment in Japanese electronics giant Sharp Corp. (no U.S. symbol) after Sony announced in Q1 that it would join forces with Sharp to produce LCD television panels. Sharp manufacturers a wide array of consumer electronics products ranging from TVs and DVD players to laptop computers and home theater components.
Which holdings were the greatest detractors from the Fund's performance?
The Fund’s largest detractor in 2008 was disk-drive manufacturer Seagate Technology (STX). A deepening economic recession weighed heavily on the stock price as slowing demand and a more competitive pricing environment for hard drives hurt the company’s profit margins and earnings, forcing Seagate to slash its 2009 forecast. This dour outlook sent shares spiraling down to their lowest level in more than five years.
Nokia (NOK) saw its lead in the global handset market continue to narrow as competitors such as Apple, Research In Motion, and others kept up the pressure on the world’s largest cell phone manufacturer. Nokia lost more than half of its market cap in 2008 as aggressive price cuts and a slowing economy impacted sales of high-end smartphone devices. Furthermore, the average selling price of Nokia cell phones continued to fall, as its product mix shifted toward cheaper phones sold in emerging markets.
Despite plummeting raw materials costs and the passing of an eight-year extension of solar incentives by Congress, 2008 was otherwise a challenging year for the solar industry. While growth remained robust through much of the year, tightening credit markets threatened future growth as project financing became difficult to acquire. These developments hurt several of the Fund’s renewable energy holdings, including Suntech Power Holdings (STP), First Solar (FSLR), and SunPower Corp. (SPWRB).
After several years of strong performance, Google (GOOG) stumbled badly in 2008. The Internet search and advertising leader’s stock finished the year lower by more than 50% as investors feared that a slowdown in online advertising would hurt the company’s revenue growth.
Fund Performance and Holdings (as of 12/31/08)
Firsthand Technology Leaders Fund vs. Market Indices
| | TLFQX | NASDAQ | S&P 500 |
| Since Inception (12/10/97) | 2.01% | 0.27% | 0.98% |
| 10-Year | -3.58% | -2.71% | -1.38% |
| 5 -Year | -6.55% | -3.95% | -2.19% |
| 3 -Year | -13.46% | -9.81% | -8.35% |
| 1 -Year | -46.75% | -39.98% | -37.00% |
Growth of a Hypothetical $10,000 Investment
Returns assume reinvestment of all dividends and distributions but do not reflect the impact of taxes. The performance data quoted represent past performance. Past performance cannot guarantee future results, and current performance may be lower or higher than the performance quoted. Both the return from and the principal value of an investment in the Funds will fluctuate so that an investor’s shares, when redeemed, may be worth more or less than their original cost. To obtain performance as of the most recent month-end, please contact Firsthand Funds by calling 1.888.884.2675 or go to www.firsthandfunds.com.
Holdings by Industry*
| | % Net Assets |
| Software | 20.1% |
| Semiconductors | 16.1% |
| Other Electronics | 8.8% |
| Renewable Energy | 7.6% |
| Communications | 7.0% |
| Networking | 6.8% |
| Internet | 6.1% |
| Communications Equipment | 5.9% |
| Computer | 5.0% |
| Advanced Materials | 4.3% |
| Peripherals | 2.4% |
| Other | 1.8% |
| Net Cash | 8.1% |
| * | Based on percentage of net assets as of 12/31/08. |
Top 10 Holdings**
| | % Net Assets |
| China Mobile Hong Kong Ltd. - ADR | 7.0% |
| Cisco Systems, Inc. | 6.8% |
| Google, Inc., Class A | 6.1% |
| Intel Corp. | 6.0% |
| Nokia Corp. - ADR | 5.9% |
| Microsoft Corp. | 5.7% |
| Apple, Inc. | 4.9% |
| Samsung Electronics Co., Ltd. - GDR | 4.5% |
| NICE-Systems, Ltd. | 4.4% |
| VMware, Inc. | 4.3% |
| ** | Top 10 stock holdings total 55.6% of net assets. These holdings are current as of 12/31/08, and may not be representative of current or future investments. |
FIRSTHAND E-COMMERCE FUND
Performance and Portfolio Discussion
How did the Fund perform in 2008?
In 2008, Firsthand e-Commerce Fund (TEFQX) posted a 42.40% loss, versus a 39.98% decrease for the NASDAQ Composite Index and a 37.00% drop for the S&P 500 Index. For the six months ending December 31, 2008, Firsthand e-Commerce Fund fell 29.58% as compared to 30.87% and 28.48% declines for the NASDAQ and the S&P 500 indices, respectively.
Which industries had the greatest impact on the Fund's performance?
For the period ending December 31, 2008, Internet and communications stocks represented the portfolio’s largest weightings, followed by software and electronics holdings. The Fund fared slightly worse than its respective benchmarks in 2008 due to the portfolio’s exposure to the Internet, software, communications, and semiconductor industries.
Which individual holdings were the largest contributors to the Fund's performance?
Due to extremely unfavorable market conditions, there were only a small number of portfolio holdings that contributed positively to performance on an absolute basis during the period. The portfolio’s top contributor in 2008 was Chinese online-game publisher Shanda Interactive Entertainment (SNDA). Online gaming in China has continued to flourish despite a slowing economy because it provides its users with an inexpensive source of entertainment. Shares continued to appreciate late in the year after the company raised its guidance for the fourth quarter.
The Fund got a nice boost in performance from its holdings in Yahoo! (YHOO) after Microsoft (MSFT) made a $44.6 billion unsolicited bid to acquire the Internet portal in February 2008. The synergies derived from combining the assets of the two companies were expected to limit Google’s (GOOG) ability to further tighten its grip on the online search category. The acquisition talks temporarily helped revive shares of Yahoo!, but the company eventually rebuffed Microsoft’s advances, and we liquidated our position in Yahoo! shortly thereafter. The Fund also realized a small gain from its investment in PC maker Dell (DELL).
Which holdings were the greatest detractors from the Fund's performance?
The Fund’s biggest money-loser during the period was Google (GOOG). After several years of strong performance, Google shares stumbled badly in 2008. The Internet search and advertising leader’s stock finished the year lower by more than 50% as investors feared that a slowdown in online advertising would hurt the company’s revenue growth.
Microsoft (MSFT) also had a forgettable year as the software giant most notably failed to acquire Yahoo!; continued to lose market share in the Internet browser space to Mozilla, Apple, and Google; and saw software sales hurt by a global slowdown in PC demand. All of these events helped drive Microsoft’s share price down more than 40% in 2008.
Our position in AuthenTec (AUTH) also weighed on Fund performance after the maker of fingerprint sensors revised its revenue and profit estimates significantly lower. The loss of a single large customer - one that represented about a third of AuthenTec’s revenue - was the primary reason for the shortfall.
Strong revenue growth helped Equinix (EQIX) deliver earnings that beat Wall Street’s expectations. The company could not, however, avoid the economic malaise and saw its shares lose nearly half of their value in 2008. Equinix operates data centers for outsourced IT infrastructure, a business that has benefited from continued growth of Internet traffic.
Fund Performance and Holdings (as of 12/31/08)
Firsthand e-Commerce Fund vs. Market Indices
| | TEFQX | NASDAQ | S&P 500 |
| Since Inception (9/30/99) | -13.16% | -5.29% | -2.05% |
| 5 -Year | -2.54% | -3.95% | -2.19% |
| 3 -Year | -7.51% | -9.81% | -8.35% |
| 1 -Year | -42.40% | -39.98% | -37.00% |
Growth of a Hypothetical $10,000 Investment
Returns assume reinvestment of all dividends and distributions but do not reflect the impact of taxes. The performance data quoted represent past performance. Past performance cannot guarantee future results, and current performance may be lower or higher than the performance quoted. Both the return from and the principal value of an investment in the Funds will fluctuate so that an investor’s shares, when redeemed, may be worth more or less than their original cost. To obtain performance as of the most recent month-end, please contact Firsthand Funds by calling 1.888.884.2675 or go to www.firsthandfunds.com.
Holdings by Industry*
| | % Net Assets |
| Internet | 43.5% |
| Communications | 13.3% |
| Software | 10.9% |
| Other Electronics | 9.3% |
| Computer | 6.5% |
| Networking | 4.4% |
| Media | 2.8% |
| Other | 0.8% |
| Net Cash | 8.5% |
| * | Based on percentage of net assets as of 12/31/08. |
Top 10 Holdings**
| | % Net Assets |
| Google, Inc., Class A | 9.2% |
| Microsoft Corp. | 7.0% |
| Shanda Interactive Entertainment, Ltd. - ADR | 7.0% |
| Equinix, Inc. | 6.9% |
| VeriFone Holdings, Inc. | 6.3% |
| Akamai Technologies, Inc. | 6.3% |
| Baidu.com, Inc. - ADR | 4.7% |
| Cisco Systems, Inc. | 4.4% |
| NeuStar, Inc. | 4.3% |
International Business Machines Corp. | 4.0% |
| ** | Top 10 stock holdings total 60.1% of net assets. These holdings are current as of 12/31/08, and may not be representative of current or future investments. Firsthand includes only public companies in top 10 holdings. |
FIRSTHAND ALTERNATIVE ENERGY FUND
Performance and Portfolio Discussion
How did the Fund perform in 2008?
In 2008, Firsthand Alternative Energy Fund (ALTEX) posted a 47.84% loss, versus a 69.89% drop for the WilderHill Clean Energy Index and a 37.00% decline for the S&P 500 Index. For the six months ending December 31, 2008, Firsthand Alternative Energy Fund fell 39.89% as compared to 57.43% and 28.48% declines for the WilderHill Clean Energy and S&P 500 indices, respectively.
Which industries had the greatest impact on the Fund's performance?
For the period ending December 31, 2008, the Fund’s holdings in the renewable energy industry had the greatest impact on performance, followed by positions in the intellectual property and energy efficiency markets. Certain defensive measures, such as shorting stocks and holding a significant portion of the Fund’s assets in cash, helped the Fund outperform its primary benchmark - the WilderHill Clean Energy Index - by a wide margin in 2008.
Which individual holdings were the largest contributors to the Fund's performance?
Valence Technology (VLNC) was the Fund’s top performing long position during the period. Shares of Valence soared in the first quarter of 2008 after the company received a $70 million contract to supply its rechargeable battery system technology for a variety of electric vehicles, including hybrids and plug-in hybrids. The contract served as a vote of confidence for Valence’s lithium-ion technology and provided a much-needed revenue boost for the small-cap company. The share price more than doubled on the news, and we closed our position in Valence after realizing a nice return for the Fund. The portfolio also benefited from a modest gain in its position in Applied Materials (AMAT). Shares rose after the chip equipment maker received a sizeable order to equip new solar panel factories.
The Fund’s ability to take short positions in stocks also helped the Fund avoid greater losses when the market began to deteriorate rapidly in the second half of the year. This included profitable short positions in air-pollution control systems maker Fuel Tech (FTEK) and Evergreen Solar (ESLR).
Which holdings were the greatest detractors from the Fund's performance?
Despite plummeting raw materials costs and the passing of an eight-year extension of solar incentives by Congress, 2008 was otherwise a challenging year for the solar industry. While growth remained robust through much of the year, tightening credit markets threatened future growth as project financing became difficult to acquire. These developments hurt several of the Fund’s renewable energy holdings, including Suntech Power Holdings (STP), GT Solar International (SOLR), JA Solar Holdings (JASO), and Solarfun Power Holdings (SOLF).
A sharp correction in the commodities sector during 2008 resulted in significantly cheaper prices for scrap metal, which weighed heavily on the Fund’s position in Metalico (MEA). Metalico is a scrap metal recycler and fabricator and also holds a significant stake in Beacon Energy Holdings, an emerging biofuel producer.
Fund Performance and Holdings (as of 12/31/08)
Firsthand Alternative Energy Fund vs. Market Indices
| | ALTEX | WilderHill Clean Energy | S&P 500 |
| Since Inception (10/29/07) | -38.20% | -61.38% | -35.06% |
| 1-Year | -47.84% | -69.89% | -37.00% |
Growth of a Hypothetical $10,000 Investment
Returns assume reinvestment of all dividends and distributions but do not reflect the impact of taxes. The performance data quoted represent past performance. Past performance cannot guarantee future results, and current performance may be lower or higher than the performance quoted. Both the return from and the principal value of an investment in the Funds will fluctuate so that an investor’s shares, when redeemed, may be worth more or less than their original cost. To obtain performance as of the most recent month-end, please contact Firsthand Funds by calling 1.888.884.2675 or go to www.firsthandfunds.com.
Holdings by Industry*
| | % Net Assets |
| Renewable Energy | 32.0% |
| Intellectual Property | 9.3% |
| Energy Efficiency | 7.6% |
| Advanced Materials | 4.1% |
| Other Electronics | 3.7% |
| Industrials | 3.0% |
| Water Treatment | 2.5% |
| Building Automation | 1.9% |
| Other | 1.3% |
| Net Cash | 34.6% |
| * | Based on percentage of net assets as of 12/31/08. |
Top 10 Holdings**
| | % Net Assets |
| Silicon Genesis Corp. - Common Stock | 9.1% |
| SunPower Corp. - Class B | 6.9% |
| Honeywell International, Inc. | 3.5% |
| Echelon Corp. | 3.1% |
| Suntech Power Holdings Co., Ltd - ADR | 3.0% |
| 3M Co. | 3.0% |
| Energy Recovery, Inc. | 2.5% |
| Aixtron AG - ADR | 2.2% |
| Orion Energy Systems, Inc. | 2.1% |
| Power Integrations, Inc. | 2.1% |
| ** | Top 10 stock holdings total 37.5% of net assets. These holdings are current as of 12/31/08, and may not be representative of current or future investments. |
REPORT OF INDEPENDENT REGISTERED PUBLIC ACCOUNTING FIRM
To the Shareholders and Board of Trustees
Firsthand Funds
San Jose, California
We have audited the accompanying statements of assets and liabilities of Firsthand Funds (the “Funds”), comprising respectively, the Firsthand Technology Value Fund, Firsthand Technology Leaders Fund, Firsthand e- Commerce Fund and Firsthand Alternative Energy Fund, including the portfolios of investments as of December 31, 2008, the related statements of operations for the year then ended, the statements of changes in net assets, and the financial highlights for the periods indicated thereon, and for Firsthand Technology Value Fund the statement of cash flows for the year then ended. These financial statements and financial highlights are the responsibility of the Funds’ management. Our responsibility is to express an opinion on those financial statements and financial highlights based on our audits.
We conducted our audits in accordance with the standards of the Public Company Accounting Oversight Board (United States). Those standards require that we plan and perform the audit to obtain reasonable assurance about whether the financial statements and financial highlights are free of material misstatement. The Fund is not required to have, nor were we engaged to perform, an audit of its internal control over financial reporting. Our audits included consideration of internal control over financial reporting as a basis for designing audit procedures that are appropriate in the circumstances, but not for the purpose of expressing an opinion on the effectiveness of the Fund’s internal control over financial reporting. Accordingly, we express no such opinion. An audit includes examining, on a test basis, evidence supporting the amounts and disclosures in the financial statements. Our procedures included confirmation of securities owned as of December 31, 2008 by correspondence with the custodian and brokers or by other appropriate auditing procedures as deemed necessary. An audit also includes assessing the accounting principles used and significant estimates made by management, as well as evaluating the overall financial statement presentation. We believe that our audits provide a reasonable basis for our opinion.
In our opinion, the financial statements and financial highlights referred to above present fairly, in all material respects, the financial position of Firsthand Funds as of December 31, 2008, the results of their operations, the changes in their net assets, the financial highlights, and for Firsthand Technology Value Fund the statement of cash flows for the periods referred to above, in conformity with accounting principles generally accepted in the United States of America.
TAIT, WELLER & BAKER, LLP
Philadelphia, Pennsylvania
February 26, 2009
PORTFOLIO OF INVESTMENTS, DECEMBER 31, 2008
Firsthand Technology Value Fund
| | | SHARES/UNITS | | | MARKET VALUE | |
COMMON STOCKS — 96.5% ($160,224,281) | | | | | | |
| Advanced Materials — 10.2% ($16,906,110) | | | | | | |
| Corning, Inc. | | | 987,000 | | | $ | 9,406,110 | |
| UCT Coatings, Inc., Series B* (1) | | | 500,000 | | | | 7,500,000 | |
| Communications — 2.7% ($4,549,114) | | | | | | | | |
| Clearwire Corp. Class A* | | | 499,000 | | | | 2,460,070 | |
| Mobile TeleSystems - ADR* | | | 78,300 | | | | 2,089,044 | |
| Communications Equipment — 2.9% ($4,897,624) | | | | | | | | |
| Alvarion Ltd.* | | | 597,335 | | | | 2,168,326 | |
| QUALCOMM, Inc. | | | 25,000 | | | | 895,750 | |
| ZTE Corp. | | | 700,000 | | | | 1,833,548 | |
| Electronics Manufacturing Services — 0.2% ($257,407) | | | | | | | | |
| Hon Hai Precision Industry Co., Ltd. - GDR | | | 26,869 | | | | 91,355 | |
| Quanta Computer, Inc. - GDR | | | 31,500 | | | | 166,052 | |
| Energy Efficiency— 2.4% ($3,908,740) | | | | | | | | |
| Echelon Corp.* | | | 479,600 | | | | 3,908,740 | |
| Intellectual Property — 13.9% ($23,009,614) | | | | | | | | |
| Silicon Genesis Corp., Common* (1)(2) | | | 871,892 | | | | 1,589,346 | |
| Silicon Genesis Corp., Series 1-C* (1)(2) | | | 82,914 | | | | 880,654 | |
| Silicon Genesis Corp., Series 1-D* (1)(2) | | | 850,830 | | | | 3,492,921 | |
| Silicon Genesis Corp., Series 1-E* (1)(2) | | | 5,704,480 | | | | 14,480,081 | |
| Silicon Genesis Corp., Series 1-F* (1)(2) | | | 912,453 | | | | 2,566,612 | |
| Internet — 9.1% ($15,159,245) | | | | | | | | |
| Akamai Technologies, Inc.* | | | 80,500 | | | | 1,214,745 | |
| Netflix, Inc.* | | | 250,000 | | | | 7,472,500 | |
| Shanda Interactive Entertainment Ltd. - ADR* | | | 200,000 | | | | 6,472,000 | |
| Networking — 0.1% ($230,806) | | | | | |
| IP Unity, Inc., Series C* (1) | | | 1,932,222 | | | | 19,322 | |
| IP Unity, Inc., Series E* (1) | | | 193,042 | | | | 211,484 | |
| Polaris Networks, Inc., Series A* (1) | | | 297,848 | | | | 0 | |
| Other Electronics — 4.5% ($7,433,937) | | | | | | | | |
| Intevac, Inc.* | | | 791,700 | | | | 4,013,919 | |
| Microvision, Inc.* | | | 255,100 | | | | 428,568 | |
| VeriFone Holdings, Inc.* | | | 610,500 | | | | 2,991,450 | |
| Peripherals— 1.0% ($1,709,980) | | | | | | | | |
| Seagate Technology, Inc. | | | 386,000 | | | | 1,709,980 | |
| Photonics — 1.3% ($2,081,460) | | | | | | | | |
| Celox Networks, Inc., Common* (1) | | | 138,121 | | | | 0 | |
| Celox Networks, Inc., Series A-1* (1) | | | 1,000,000 | | | | 0 | |
| Newport Corp.* | | | 307,000 | | | | 2,081,460 | |
| Renewable Energy — 19.8% ($32,809,340) | | | | | | | | |
| Sharp Corp. | | | 45,288 | | | | 317,811 | |
| Solaicx, Series B* (1)(2) | | | 7,396,238 | | | | 3,653,298 | |
| Solaicx, Series C* (1)(2) | | | 2,916,581 | | | | 2,415,833 | |
| SoloPower, Series A* (1)(2) | | | 2,721,088 | | | | 22,706,200 | |
| SoloPower, Series B* (1)(2) | | | 228,779 | | | | 2,028,368 | |
| Suntech Power Holdings Co., Ltd. - ADR* | | | 9,800 | | | | 114,660 | |
| Trina Solar Ltd. - ADR* | | | 157,100 | | | | 1,459,459 | |
| ULVAC, Inc. | | | 7,600 | | | | 113,711 | |
| Semiconductors — 24.2% ($40,231,556) | | | | | | | | |
| AuthenTec, Inc.* | | | 745,305 | | | | 1,244,659 | |
| Broadcom Corp. - A* | | | 471,600 | | | | 8,003,052 | |
| Chartered Semiconductor Manufacturing Ltd. - ADR* | | | 884,900 | | | | 1,070,729 | |
| Clarisay, Inc., Series B* (1)(2) | | | 2,605,306 | | | | 0 | |
| Clarisay, Inc., Series C* (1)(2) | | | 7,194,244 | | | | 0 | |
| Intel Corp. | | | 450,800 | | | | 6,608,728 | |
| Marvell Technology Group, Ltd.* | | | 395,900 | | | | 2,640,653 | |
| NVIDIA Corp.* | | | 264,700 | | | | 2,136,129 | |
| Rambus, Inc.* | | | 826,500 | | | | 13,157,880 | |
| Samsung Electronics Co., Ltd. - GDR (3) | | | 1,699 | | | | 304,176 | |
| Semiconductor Manufacturing International Corp.* | | | 1,000,000 | | | | 2,110,000 | |
| Silicon Optix, Inc., Series B* (1) | | | 1,111,111 | | | | 0 | |
| Techwell, Inc.* | | | 454,700 | | | | 2,955,550 | |
| Services — 0.0% ($15,753) | | | | | | | | |
| Innovion Corp., Series C* (1) | | | 1,575,322 | | | | 15,753 | |
| Software — 4.2% ($7,023,595) | | | | | | | | |
| Activision Blizzard, Inc.* | | | 379,100 | | | | 3,275,424 | |
| NICE-Systems Ltd. - ADR* | | | 98,100 | | | | 2,204,307 | |
| Omniture, Inc.* | | | 145,100 | | | | 1,543,864 | |
| WARRANTS — 1.7% ($2,937,250) | | | | | | | | |
| Advanced Materials — 0.0% ($6,000) | | | | | | | | |
see accompanying notes to financial statements
PORTFOLIO OF INVESTMENTS, DECEMBER 31, 2008
Firsthand Technology Value Fund (continued)
| UCT Coatings, Inc., Common Warrant (1) | | | 600,000 | | | $ | 6,000 | |
| Intellectual Property — 1.4% ($2,382,247) | | | | | | | | |
| Silicon Genesis Corp., 1-E Warrant* (1)(2) | | | 94,339 | | | | 139,468 | |
| Silicon Genesis Corp., 1-E Warrant* (1)(2) | | | 1,257,859 | | | | 2,192,914 | |
| Silicon Genesis Corp., Common Warrant* (1)(2) | | | 37,982 | | | | 49,865 | |
| Networking— 0.0% ($69) | | | | | | | | |
| IP Unity, Inc., E Warrant* (1) | | | 69,496 | | | | 69 | |
| Polaris Networks, Inc., Convertible Warrant* (1) | | | 75,712 | | | | 0 | |
| Photonics— 0.0% ($0) | | | | | | | | |
| Celox Networks, Inc., A-1 Warrant* (1) | | | 500,000 | | | | 0 | |
| Renewable Energy— 0.3% ($548,934) | | | | | | | | |
| Solaicx, Series C Warrant* (1)(2) | | | 670,814 | | | | 548,934 | |
| Semiconductors— 0.0% ($0) | | | | | | | | |
| Clarisay, Inc., D Warrant* (1)(2) | | | 2,350,000 | | | | 0 | |
| CONVERTIBLE BONDS — 0.1% ($105,806) | | | | | | | | |
| Networking— 0.0% ($0) | | | | | | | | |
| Polaris Networks, Inc., 10.00%* (1) | | | 100,949 | | | | 0 | |
| Semiconductors — 0.0% ($0) | | | | | | | | |
| Clarisay, Inc., 8.00%* (1)(2) | | | 2,350,000 | | | | 0 | |
| Services — 0.1% ($105,806) | | | | | | | | |
| Innovion Corp., 9.50%* (1) | | | 529,031 | | | | 105,806 | |
| PARTICIPATION NOTE — 0.2% ($328,960) | | | | | | | | |
| Renewable Energy — 0.2% ($328,960) | | | | | | | | |
| Suzlon Energy Ltd., 0.00%, 09/16/10 | | | 257,000 | | | | 328,960 | |
| CASH EQUIVALENTS — 2.3% ($3,777,980) | | | | | | | | |
| PNC Bank Money Market Portfolio | | | 3,777,980 | | | | 3,777,980 | |
| Total Investments (Cost $289,236,441) — 100.8% | | | | | | | 167,374,277 | |
| Liabilities in excess of other assets — (0.8)% | | | | | | | (1,378,212 | ) |
| | | | | | | | | |
| NET ASSETS — 100.0% | | | | | | $ | 165,996,065 | |
| (3) | Rule 144A, Section 4(2), or other security that is restricted as to resale to institutional investors. The Investment Adviser, using Board-approved procedures has deemed these securities to be liquid. At December 31, 2008, the value of these securities amounted to $304,176 or 0.2%. |
| * | Non-income producing security. |
| ADR | American Depositary Receipt |
| GDR | Global Depositary Receipt |
see accompanying notes to financial statements
PORTFOLIO OF INVESTMENTS, DECEMBER 31, 2008
Firsthand Technology Leaders Fund
| | | SHARES | | | MARKET VALUE | |
| | | | | | | |
| | | | | | | |
| COMMON STOCKS — 91.9% ($25,391,364) | | | | | | |
| Advanced Materials — 4.3% ($1,186,742) | | | | | | |
| Corning, Inc. | | | 124,527 | | | $ | 1,186,742 | |
| Communications — 7.0% ($1,937,385) | | | | | | | | |
| China Mobile Hong Kong Ltd. - ADR | | | 38,100 | | | | 1,937,385 | |
| Communications Equipment — 5.9% ($1,623,960) | | | | | | | | |
| Nokia Corp. – ADR | | | 104,100 | | | | 1,623,960 | |
| Computer — 5.0% ($1,365,600) | | | | | | | | |
| Apple, Inc.* | | | 16,000 | | | | 1,365,600 | |
| Electronics Manufacturing Services — 0.8% ($226,848) | | | | | | | | |
| Hon Hai Precision Industry Co., Ltd. - GDR | | | 66,720 | | | | 226,848 | |
| Internet — 6.1% ($1,678,231) | | | | | | | | |
| Google, Inc., Class A* | | | 5,455 | | | | 1,678,231 | |
| Networking — 6.8% ($1,877,271) | | | | | | | | |
| Cisco Systems, Inc.* | | | 115,170 | | | | 1,877,271 | |
| Other Electronics — 8.8% ($2,426,155) | | | | | | | | |
| Koninklijke (Royal) Philips Electronics N.V. | | | 39,100 | | | | 776,917 | |
| L-1 Identity Solutions, Inc.* | | | 155,200 | | | | 1,046,048 | |
| VeriFone Holdings, Inc.* | | | 123,100 | | | | 603,190 | |
| Peripherals — 2.4% ($672,727) | | | | | | | | |
| Seagate Technology, Inc. | | | 151,857 | | | | 672,727 | |
| Renewable Energy — 7.6% ($2,103,348) | | | | | | | | |
| SunPower Corp., Class B* | | | 31,200 | | | | 949,728 | |
| Suntech Power Holdings Co., Ltd. - ADR* | | | 98,600 | | | | 1,153,620 | |
| Semiconductor Equipment — 1.0% ($278,575) | | | | | | | | |
| Applied Materials, Inc. | | | 27,500 | | | | 278,575 | |
| Semiconductors — 16.1%($4,451,487) | | | | | | | | |
| Broadcom Corp.* | | | 55,925 | | | | 949,047 | |
| Intel Corp. | | | 112,300 | | | | 1,646,318 | |
| Samsung Electronics Co., Ltd. - GDR (1) | | | 6,900 | | | | 1,235,322 | |
| Texas Instruments, Inc. | | | 40,000 | | | | 620,800 | |
| Software — 20.1% ($5,563,035) | | | | | | | | |
| Activision Blizzard, Inc.* | | | 104,700 | | | | 904,608 | |
| Adobe Systems, Inc.* | | | 30,400 | | | | 647,216 | |
| Microsoft Corp. | | | 81,450 | | | | 1,583,388 | |
| NICE-Systems Ltd. - ADR* | | | 54,700 | | | | 1,229,109 | |
| VMware, Inc., Class A* | | | 50,600 | | | | 1,198,714 | |
| CASH EQUIVALENTS — 8.5% ($2,359,024) | | | | | | | | |
| PNC Bank Money Market Portfolio | | | 2,359,024 | | | | 2,359,024 | |
| Total Investments (Cost $43,872,023) — 100.4% | | | | | | | 27,750,388 | |
| Liabilities in excess of other assets — (0.4)% | | | | | | | (108,600 | ) |
| | | | | | | | | |
| NET ASSETS — 100.0% | | | | | | $ | 27,641,788 | |
| (1) | Rule 144A, Section 4(2), or other security that is restricted as to resale to institutional investors. The Investment Adviser, using Board-approved procedures has deemed these securities to be liquid. At December 31, 2008, the value of these securities amounted to $1,235,322 or 4.5%. |
| * | Non-income producing security. |
| ADR | American Depositary Receipt |
| GDR | Global Depositary Receipt |
see accompanying notes to financial statements
PORTFOLIO OF INVESTMENTS, DECEMBER 31, 2008
Firsthand e-Commerce Fund
| | | SHARES | | | MARKET VALUE | |
| | | | | | | |
| COMMON STOCKS — 91.5% ($17,722,539) | | | | | | |
| Communications — 13.3% ($2,582,655) | | | | | | |
| Comcast Corp., Special Class A | | | 22,500 | | | $ | 363,375 | |
| Equinix, Inc.* | | | 25,000 | | | | 1,329,750 | |
| Internap Network Services Corp.* | | | 23,715 | | | | 59,288 | |
| NeuStar, Inc.* | | | 43,400 | | | | 830,242 | |
| Computer — 6.5% ($1,260,767) | | | | | | | | |
| Apple, Inc.* | | | 5,700 | | | | 486,495 | |
| International Business Machines Corp. | | | 9,200 | | | | 774,272 | |
| Internet — 43.5% ($8,429,617) | | | | | | | | |
| 51job, Inc. - ADR* | | | 33,000 | | | | 203,280 | |
| Akamai Technologies, Inc.* | | | 80,800 | | | | 1,219,272 | |
| Baidu.com, Inc. - ADR* | | | 6,900 | | | | 900,933 | |
| Ctrip.com International Ltd. - ADR | | | 19,800 | | | | 471,240 | |
| CyberSource Corp.* | | | 41,814 | | | | 501,350 | |
| eBay, Inc.* | | | 33,700 | | | | 470,452 | |
| Gmarket, Inc. - ADR* | | | 27,100 | | | | 467,475 | |
| Google, Inc., Class A* | | | 5,800 | | | | 1,784,370 | |
| LivePerson, Inc.* | | | 140,000 | | | | 254,800 | |
| Monster Worldwide, Inc.* | | | 34,900 | | | | 421,941 | |
| Shanda Interactive Entertainment Ltd. - ADR* | | | 41,700 | | | | 1,349,412 | |
| ValueClick, Inc.* | | | 56,300 | | | | 385,092 | |
| Media — 2.8% ($531,307) | | | | | | | | |
| News Corp., Class B | | | 55,460 | | | | 531,307 | |
| Networking — 4.4% ($859,010) | | | | | | | | |
| Cisco Systems, Inc.* | | | 52,700 | | | | 859,010 | |
| Other Electronics — 9.3% ($1,794,530) | | | | | | | | |
| L-1 Identity Solutions, Inc.* | | | 84,500 | | | | 569,530 | |
| VeriFone Holdings, Inc.* | | | 250,000 | | | | 1,225,000 | |
| Semiconductors — 0.8% ($154,308) | | | | | | | | |
| AuthenTec, Inc.* | | | 92,400 | | | | 154,308 | |
| Software — 10.9% ($2,110,345) | | | | | | | | |
| Microsoft Corp. | | | 70,000 | | | | 1,360,800 | |
| Omniture, Inc.* | | | 70,446 | | | | 749,545 | |
| CASH EQUIVALENTS — 2.9% ($566,085) | | | | | | | | |
| PNC Bank Money Market Portfolio | | | 566,085 | | | | 566,085 | |
| Total Investments (Cost $25,949,803) — 94.4% | | | | | | $ | 18,288,624 | |
| Other assets in excess of liabilities — 5.6% | | | | | | | 1,080,399 | |
| | | | | | | | | |
| NET ASSETS — 100.0% | | | | | | $ | 19,369,023 | |
| * | Non-income producing security. |
| ADR | American Depositary Receipt |
see accompanying notes to financial statements
PORTFOLIO OF INVESTMENTS, DECEMBER 31, 2008
Firsthand Alternative Energy Fund
| | | SHARES | | | MARKET VALUE | |
| | | | | | | |
| COMMON STOCKS — 67.5% ($2,466,027) | | | | | | |
| Advanced Materials — 4.1% ($151,433) | | | | | | |
| Corning, Inc. (1) | | | 7,760 | | | $ | 73,953 | |
| MEMC Electronic Materials, Inc.* | | | 2,130 | | | | 30,416 | |
| Metabolix, Inc.* | | | 3,700 | | | | 47,064 | |
| Basic Materials — 0.5% ($17,825) | | | | | | | | |
| Metalico, Inc.* | | | 11,500 | | | | 17,825 | |
| Building Automation — 1.9% ($69,008) | | | | | | | | |
| Johnson Controls, Inc. | | | 3,800 | | | | 69,008 | |
| Energy Efficiency — 7.6% ($277,493) | | | | | | | | |
| Echelon Corp.* | | | 14,000 | | | | 114,100 | |
| Honeywell International, Inc. | | | 3,880 | | | | 127,380 | |
| Itron, Inc.* | | | 565 | | | | 36,013 | |
| Environmental Services — 0.8% ($28,670) | | | | | | | | |
| ADA-ES, Inc.* | | | 9,400 | | | | 28,670 | |
| Industrials — 3.0% ($109,326) | | | | | | | | |
| 3M Co. (1) | | | 1,900 | | | | 109,326 | |
| Intellectual Property — 9.3% ($339,911) | | | | | | | | |
| Silicon Genesis Corp., Common* (2) | | | 181,407 | | | | 330,681 | |
| Silicon Genesis Corp., Series 1-C* (2) | | | 152 | | | | 1,615 | |
| Silicon Genesis Corp., Series 1-E* (2) | | | 3,000 | | | | 7,615 | |
| Other Electronics — 3.7% ($134,211) | | | | | | | | |
| Aixtron AG – ADR | | | 11,900 | | | | 81,158 | |
| Koninklijke (Royal) Philips Electronics N.V. | | | 2,670 | | | | 53,053 | |
| Renewable Energy — 32.0% ($1,170,130) | | | | | | | | |
| Amtech Systems, Inc.* | | | 9,500 | | | | 35,055 | |
| Ascent Solar Technologies, Inc.* | | | 2,000 | | | | 7,520 | |
| Clipper Windpower PLC* | | | 3,000 | | | | 3,062 | |
| Energy Conversion Devices, Inc.* | | | 1,500 | | | | 37,815 | |
| FuelCell Energy, Inc.* | | | 5,000 | | | | 19,400 | |
| Gamesa Corp. Tecnologica S.A. | | | 2,000 | | | | 35,414 | |
| GT Solar International, Inc.* | | | 18,900 | | | | 54,621 | |
| JA Solar Holdings Co., Ltd. - ADR* | | | 7,000 | | | | 30,590 | |
| KYOCERA Corp. – ADR | | | 950 | | | | 68,752 | |
| LDK Solar Co., Ltd. - ADR* | | | 930 | | | | 12,202 | |
| Motech Industries, Inc. | | | 31,670 | | | | 74,797 | |
| Orion Energy Systems, Inc.* | | | 14,000 | | | | 75,740 | |
| Renewable Energy Corp. A.S.* | | | 5,400 | | | | 49,774 | |
| Sharp Corp. | | | 6,000 | | | | 42,105 | |
| Solarfun Power Holdings Co., Ltd. - ADR* | | | 8,400 | | | | 42,084 | |
| SoloPower, Series C-1* (2) | | | 1,331 | | | | 13,883 | |
| Spire Corp.* | | | 5,500 | | | | 28,270 | |
| SunPower Corp. Class B* | | | 8,300 | | | | 252,652 | |
| Suntech Power Holdings Co., Ltd. - ADR* | | | 9,420 | | | | 110,214 | |
| Trina Solar Ltd. - ADR* | | | 2,300 | | | | 21,367 | |
| U.S. Geothermal, Inc.* | | | 10,500 | | | | 8,715 | |
| ULVAC, Inc. | | | 2,700 | | | | 40,397 | |
| Vestas Wind Systems A.S.* | | | 980 | | | | 57,820 | |
| WaterFurnace Renewable Energy, Inc. | | | 600 | | | | 11,281 | |
| Yingli Green Energy Holding Co. - ADR* | | | 6,000 | | | | 36,600 | |
| Semiconductors — 2.1% ($75,544) | | | | | | | | |
| Power Integrations, Inc. | | | 3,800 | | | | 75,544 | |
| Water Treatment — 2.5% ($92,476) | | | | | | | | |
| Energy Recovery, Inc.* | | | 12,200 | | | | 92,476 | |
| CASH EQUIVALENTS — 33.9% ($1,239,381) | | | | | | | | |
| PNC Bank Money Market Portfolio | | | 1,239,381 | | | | 1,239,381 | |
| Total Investments (Cost $5,773,695) — 101.4% | | | | | | | 3,705,408 | |
| Liabilities in excess of other assets — (1.4)% | | | | | | | (52,585 | ) |
| | | | | | | | | |
| NET ASSETS — 100.0% | | | | | | $ | 3,652,823 | |
| | | SHARES | | | MARKET VALUE | |
| | | | | | | |
SCHEDULE OF SECURITIES SOLD SHORT— (2.1)% ($78,403) | | | | | | |
Semiconductors — (2.1)% ($78,403) | | | | | | |
| SunPower Corp. Class A* | | | 2,119 | | | $ | 78,403 | |
| | | | | | | | | |
Total Securities Sold Short (Proceeds $161,930) | | | | | | $ | 78,403 | |
| (1) | All or a portion of the shares have been committed for open short positions, which equates to $183,279 or 5.0% of the Fund’s net assets. |
| * | Non-income producing security; ADR: American Depositary Receipt; PLC: Public Liability Co. |
see accompanying notes to financial statements
STATEMENTS OF ASSETS AND LIABILITIES
December 31, 2008
| | | Firsthand Technology Value Fund | | | Firsthand Technology Leaders Fund | | | Firsthand e-Commerce Fund | | | Firsthand Alternative Energy Fund | |
| | | | | | | | | | | | | |
| ASSETS | | | | | | | | | | | | |
| Investment securities: | | | | | | | | | | | | |
Unaffiliated issuers at acquisition cost | | $ | 250,223,139 | | | $ | 43,872,023 | | | $ | 25,949,803 | | | $ | 5,773,695 | |
Affiliated issuers at acquisition cost | | | 39,013,302 | | | | — | | | | — | | | | — | |
Total acquisition cost | | $ | 289,236,441 | | | $ | 43,872,023 | | | $ | 25,949,803 | | | $ | 5,773,695 | |
Unaffiliated issuers at market value | | $ | 110,629,783 | | | $ | 27,750,388 | | | $ | 18,288,624 | | | $ | 3,705,408 | |
Affiliated issuers at market value | | | 56,744,494 | | | | — | | | | — | | | | — | |
Total market value (Note 2) | | | 167,374,277 | | | | 27,750,388 | | | | 18,288,624 | | | | 3,705,408 | |
| Cash | | | 1 | | | | 1 | | | | — | | | | — | |
| Foreign currency, at value (Cost $0, $0, $0 and $17,922) | | | — | | | | — | | | | — | | | | 17,646 | |
| Receivable for securities sold | | | — | | | | — | | | | 1,148,524 | | | | — | |
| Receivable from dividends, interest, and reclaims | | | — | | | | — | | | | — | | | | 494 | |
| Receivable for capital shares sold | | | 8,454 | | | | 5,303 | | | | — | | | | 16,641 | |
| Other Assets (Note 6) | | | — | | | | — | | | | — | | | | — | |
TOTAL ASSETS | | | 167,382,732 | | | | 27,755,692 | | | | 19,437,148 | | | | 3,740,189 | |
| | | | | | | | | | | | | | | | | |
| LIABILITIES | | | | | | | | | | | | | | | | |
| Payable for securities purchased | | | 679,000 | | | | — | | | | — | | | | — | |
| Payable to affiliates (Note 4) | | | 265,736 | | | | 44,815 | | | | 30,502 | | | | 5,694 | |
| Payable for capital shares redeemed | | | 441,931 | | | | 69,089 | | | | 37,623 | | | | 3,269 | |
| Securities sold short, at value (Cost $0, $0, $0 and $161,930) | | | — | | | | — | | | | — | | | | 78,403 | |
TOTAL LIABILITIES | | | 1,386,667 | | | | 113,904 | | | | 68,125 | | | | 87,366 | |
| | | | | | | | | | | | | | | | | |
| NET ASSETS | | $ | 165,996,065 | | | $ | 27,641,788 | | | $ | 19,369,023 | | | $ | 3,652,823 | |
| Net Assets consist of: | | | | | | | | | | | | | | | | |
Paid-in-capital | | $ | 2,997,945,174 | | | $ | 365,249,897 | | | $ | 421,951,993 | | | $ | 5,827,047 | |
Accumulated net realized losses from security transactions, options and foreign currency | | | (2,710,086,945 | ) | | | (321,486,474 | ) | | | (394,921,791 | ) | | | (189,188 | ) |
Net unrealized depreciation on investments, options and foreign currency | | | (121,862,164 | ) | | | (16,121,635 | ) | | | (7,661,179 | ) | | | (1,985,036 | ) |
| NET ASSETS | | $ | 165,996,065 | | | $ | 27,641,788 | | | $ | 19,369,023 | | | $ | 3,652,823 | |
| Shares of beneficial interest outstanding (unlimited number of shares authorized, no par value) | | | 7,091,000 | | | | 2,250,689 | | | | 7,204,875 | | | | 643,034 | |
| Net asset value, redemption price and offering price per share (Note 2) | | $ | 23.41 | | | $ | 12.28 | | | $ | 2.69 | | | $ | 5.68 | |
see accompanying notes to financial statements
STATEMENTS OF OPERATIONS
For the Year Ended December 31, 2008
| | | Firsthand Technology Value Fund | | | Firsthand Technology Leaders Fund | | | Firsthand e-Commerce Fund | | | Firsthand Fund | |
| | | | | | | | | | | | | |
| | | | | | | | | | | | | |
| INVESTMENT INCOME | | | | | | | | | | | | |
Dividends | | $ | 872,849 | | | $ | 435,133 | | | $ | 109,001 | | | $ | 30,968 | |
Foreign tax withholding | | | (10,615 | ) | | | (14,189 | ) | | | (1,002 | ) | | | (2,129 | ) |
TOTAL INVESTMENT INCOME | | | 862,234 | | | | 420,944 | | | | 107,999 | | | | 28,839 | |
| | | | | | | | | | | | | | | | | |
| EXPENSES | | | | | | | | | | | | | | | | |
| Investment advisory fees (Note 4) | | | 4,110,728 | | | | 687,460 | | | | 437,521 | | | | 56,141 | |
| Administration fees (Note 4) | | | 1,170,465 | | | | 206,238 | | | | 131,256 | | | | 15,311 | |
| Trustees fees | | | 175,086 | | | | 55,218 | | | | 55,218 | | | | 8,950 | |
| Dividend expense | | | — | | | | — | | | | — | | | | 252 | |
GROSS EXPENSES | | | 5,456,279 | | | | 948,916 | | | | 623,995 | | | | 80,654 | |
| Investment advisory fees waived | | | (175,086 | ) | | | (55,218 | ) | | | (55,218 | ) | | | (8,950 | ) |
TOTAL NET EXPENSES | | | 5,281,193 | | | | 893,698 | | | | 568,777 | | | | 71,704 | |
| | | | | | | | | | | | | | | | | |
| NET INVESTMENT LOSS | | | (4,418,959 | ) | | | (472,754 | ) | | | (460,778 | ) | | | (42,865 | ) |
| | | | | | | | | | | | | | | | | |
| REALIZED AND UNREALIZED GAINS (LOSSES) ON INVESTMENTS | | | | | | | | | | | | | | | | |
Net realized gains (losses) from security transactions | | | | | | | | | | | | | | | | |
Non-affiliated | | | (28,560,853 | ) | | | 1,122,581 | | | | 289,629 | | | | (251,341 | ) |
Net realized gains (losses) from foreign currency | | | (553 | ) | | | (9,097 | ) | | | — | | | | 904 | |
Net realized gains from written options transactions | | | — | | | | 1,010,107 | | | | — | | | | 21,078 | |
Net realized gains from securities sold short | | | — | | | | — | | | | — | | | | 53,822 | |
Net change in unrealized depreciation on other assets | | | (2,363,510 | ) | | | — | | | | — | | | | — | |
Net change in unrealized depreciation on investments, options and foreign currency | | | (136,264,410 | ) | | | (28,972,979 | ) | | | (15,860,320 | ) | | | (2,100,521 | ) |
| | | | | | | | | | | | | | | | | |
| NET REALIZED AND UNREALIZED LOSSES ON INVESTMENTS | | | (167,189,326 | ) | | | (26,849,388 | ) | | | (15,570,691 | ) | | | (2,276,058 | ) |
| | | | | | | | | | | | | | | | | |
| CHANGE IN NET ASSETS FROM OPERATIONS | | $ | (171,608,285 | ) | | $ | (27,322,142 | ) | | $ | (16,031,469 | ) | | $ | (2,318,923 | ) |
see accompanying notes to financial statements
STATEMENTS OF CHANGES IN NET ASSETS
For the Years Ended December 31, 2008, and December 31, 2007
| | | Firsthand Technology
Value Fund | | | Firsthand Technology
Leaders Fund | |
| | | Year Ended 12/31/08 | | | Year Ended 12/31/07 | | | Year Ended 12/31/08 | | | Year Ended 12/31/07 | |
| FROM OPERATIONS: | | | | | | | | | | | | |
Net investment loss | | $ | (4,418,959 | ) | | $ | (6,015,754 | ) | | $ | (472,754 | ) | | $ | (794,008 | ) |
Net realized gains (losses) from security transactions, options and foreign currency | | | (28,561,406 | ) | | | (31,524,505 | ) | | | 2,123,591 | | | | 11,345,786 | |
Net change in unrealized appreciation (depreciation) on investments, options, foreign currency and other assets | | | (138,627,920 | ) | | | 116,080,418 | | | | (28,972,979 | ) | | | (1,458,660 | ) |
Net increase (decrease) in net assets from operations | | | (171,608,285 | ) | | | 78,540,159 | | | | (27,322,142 | ) | | | 9,093,118 | |
| | | | | | | | | | | | | | | | | |
| FROM CAPITAL SHARE TRANSACTIONS: | | | | | | | | | | | | | | | | |
| Proceeds from shares sold | | | 22,286,071 | | | | 94,372,812 | | | | 2,917,653 | | | | 3,632,363 | |
| Proceeds received in merger (Note 12) | | | 25,594,071 | | | | — | | | | — | | | | — | |
| Payment for shares redeemed | | | (93,054,223 | ) | | | (161,074,182 | ) | | | (11,495,234 | ) | | | (23,177,192 | ) |
| Net decrease in net assets from capital share transactions | | | (45,174,081 | ) | | | (66,701,370 | ) | | | (8,577,581 | ) | | | (19,544,829 | ) |
| | | | | | | | | | | | | | | | | |
| TOTAL INCREASE (DECREASE) IN NET ASSETS | | | (216,782,366 | ) | | | 11,838,789 | | | | (35,899,723 | ) | | | (10,451,711 | ) |
| NET ASSETS: | | | | | | | | | | | | | | | | |
Beginning of year | | | 382,778,431 | | | | 370,939,642 | | | | 63,541,511 | | | | 73,993,222 | |
End of year | | $ | 165,996,065 | | | $ | 382,778,431 | | | $ | 27,641,788 | | | $ | 63,541,511 | |
| | | | | | | | | | | | | | | | | |
| CAPITAL SHARE ACTIVITY: | | | | | | | | | | | | | | | | |
Shares sold | | | 609,743 | | | | 2,289,099 | | | | 152,514 | | | | 160,504 | |
Shares issued in exchange for proceeds received in merger (Note 12) | | | 648,799 | | | | — | | | | — | | | | — | |
Shares redeemed | | | (2,764,047 | ) | | | (3,971,586 | ) | | | (656,841 | ) | | | (1,063,363 | ) |
Net decrease in shares outstanding | | | (1,505,505 | ) | | | (1,682,487 | ) | | | (504,327 | ) | | | (902,859 | ) |
Shares outstanding, beginning of year | | | 8,596,505 | | | | 10,278,992 | | | | 2,755,016 | | | | 3,657,875 | |
Shares outstanding, end of year | | | 7,091,000 | | | | 8,596,505 | | | | 2,250,689 | | | | 2,755,016 | |
see accompanying notes to financial statements
STATEMENTS OF CHANGES IN NET ASSETS (continued)
For the Years/Period Ended December 31, 2008, and December 31, 2007
| | | Firsthand e-Commerce Fund | | | Firsthand Alternative
Energy Fund | |
| | | Year Ended 12/31/08 | | | Year Ended 12/31/07 | | | Year Ended 12/31/08 | | | Period Ended 12/31/07* | |
| | | | | | | | | | | | | |
| FROM OPERATIONS: | | | | | | | | | | | | |
Net investment loss | | $ | (460,778 | ) | | $ | (554,505 | ) | | $ | (42,865 | ) | | $ | (128 | ) |
Net realized gains (losses) from security transactions, options and foreign currency | | | 289,629 | | | | 6,041,371 | | | | (175,537 | ) | | | (211 | ) |
Net change in unrealized appreciation (depreciation) on investments, options and foreign currency | | | (15,860,320 | ) | | | 159,678 | | | | (2,100,521 | ) | | | 115,485 | |
Net increase (decrease) in net assets from operations | | | (16,031,469 | ) | | | 5,646,544 | | | | (2,318,923 | ) | | | 115,146 | |
| | | | | | | | | | | | | | | | | |
| FROM CAPITAL SHARE TRANSACTIONS: | | | | | | | | | | | | | | | | |
| Proceeds from shares sold | | | 776,794 | | | | 12,235,244 | | | | 6,067,082 | | | | 1,847,450 | |
| Payment for shares redeemed | | | (6,044,231 | ) | | | (17,518,670 | ) | | | (1,977,420 | ) | | | (80,512 | ) |
| Net increase (decrease) in net assets from capital share transactions | | | (5,267,437 | ) | | | (5,283,426 | ) | | | 4,089,662 | | | | 1,766,938 | |
| | | | | | | | | | | | | | | | | |
| TOTAL INCREASE (DECREASE) IN NET ASSETS | | | (21,298,906 | ) | | | 363,118 | | | | 1,770,739 | | | | 1,882,084 | |
| NET ASSETS: | | | | | | | | | | | | | | | | |
Beginning of period | | | 40,667,929 | | | | 40,304,811 | | | | 1,882,084 | | | | — | |
End of period | | $ | 19,369,023 | | | $ | 40,667,929 | | | $ | 3,652,823 | | | $ | 1,882,084 | |
Accumulated Net Investment (Loss) | | $ | — | | | $ | — | | | $ | — | | | $ | (211 | ) |
| | | | | | | | | | | | | | | | | |
| CAPITAL SHARE ACTIVITY: | | | | | | | | | | | | | | | | |
Shares sold | | | 189,222 | | | | 2,764,369 | | | | 702,194 | | | | 180,409 | |
Shares redeemed | | | (1,692,106 | ) | | | (4,016,588 | ) | | | (231,920 | ) | | | (7,649 | ) |
Net increase (decrease) in shares outstanding | | | (1,502,884 | ) | | | (1,252,219 | ) | | | 470,274 | | | | 172,760 | |
Shares outstanding, beginning of period | | | 8,707,759 | | | | 9,959,978 | | | | 172,760 | | | | — | |
Shares outstanding, end of period | | | 7,204,875 | | | | 8,707,759 | | | | 643,034 | | | | 172,760 | |
| * | For the period October 29, 2007 (inception) through December 31, 2007. |
see accompanying notes to financial statements
STATEMENT OF CASH FLOWS
December 31, 2008
Firsthand Technology Value Fund
| CASH FLOWS FROM OPERATING ACTIVITIES | | | |
| Net decrease in Net Assets derived from operations | | $ | (171,608,285 | ) |
Adjustments to reconcile net decrease in Net Assets derived from operations to net cash used in operating activities: | | | | |
| Purchase of investments | | | (141,743,152 | ) |
| Proceeds from disposition of investments | | | 184,881,381 | |
| Net sales of short-term investments | | | 2,116,900 | |
| Net realized gain from investments | | | 28,560,853 | |
| Change in unrealized appreciation/depreciation from investments | | | 141,504,159 | |
| | | | | |
| Change in assets and liabilities: | | | | |
| | | | | |
| (Increase) Decrease in assets: | | | | |
| Receivable from dividends, interest, and reclaims | | | 13,997 | |
| Deferred for Trustee Compensation | | | 113,191 | |
| Other assets | | | 2,363,510 | |
| | | | | |
| Increase (Decrease) in payables: | | | | |
| Payable for securities purchased | | | 679,000 | |
| Payable to affiliates | | | (368,480 | ) |
| Payable for Trustee Compensation | | | (113,191 | ) |
| Net cash used in operating activities | | | 46,399,883 | |
| | | | | |
| CASH FLOWS FROM FINANCING ACTIVITIES | | | | |
| Proceeds from shares sold | | | 22,457,235 | |
| Proceeds received in merger | | | 25,594,071 | |
| Payment for shares redeemed | | | (94,451,189 | ) |
| | | | | |
| Net cash provided by financing activities | | | (46,399,883 | ) |
| Net change in cash and cash equivalents | | | — | |
| Cash and cash equivalents - beginning of period | | | 1 | |
| Cash and cash equivalents - end of period | | $ | 1 | |
see accompanying notes to financial statements
FINANCIAL HIGHLIGHTS
Selected per share data and ratios for a share outstanding throughout each year
Firsthand Technology Value Fund
| | | Year Ended 12/31/08 | | | Year Ended 12/31/07 | | | Year Ended 12/31/06 | | | Year Ended 12/31/05 | | | Year Ended 12/31/04 | |
| | | | | | | | | | | | | | | | |
| Net asset value at beginning of year | | $ | 44.53 | | | $ | 36.09 | | | $ | 33.12 | | | $ | 29.48 | | | $ | 31.57 | |
| Income from investment operations: | | | | | | | | | | | | | | | | | | | | |
Net investment loss | | | (0.62 | ) | | | (0.70 | ) | | | (0.72 | ) | | | (0.62 | ) | | | (0.49 | ) |
Net realized and unrealized gains (losses) on investments | | | (20.50 | ) | | | 9.14 | | | | 3.69 | | | | 4.26 | | | | (1.60 | ) |
| Total from investment operations | | | (21.12 | ) | | | 8.44 | | | | 2.97 | | | | 3.64 | | | | (2.09 | ) |
| Net asset value at end of year | | $ | 23.41 | | | $ | 44.53 | | | $ | 36.09 | | | $ | 33.12 | | | $ | 29.48 | |
| Total return | | | (47.43 | %) | | | 23.39 | % | | | 8.97 | % | | | 12.35 | % | | | (6.62 | %) |
| Net assets at end of year (millions) | | $ | 166.0 | | | $ | 382.8 | | | $ | 370.9 | | | $ | 446.6 | | | $ | 586.9 | |
| Ratio of gross expenses to average net assets before waiver | | | 2.00 | % | | | 1.93 | % | | | 1.93 | % | | | 1.92 | % | | | 1.90 | % |
| Ratio of net expenses to average net assets after waiver | | | 1.94 | % | | | 1.93 | % | | | 1.92 | % | | | 1.92 | % | | | 1.90 | % |
| Ratio of net investment loss to average net assets | | | (1.62 | %) | | | (1.57 | %) | | | (1.70 | %) | | | (1.81 | %) | | | (1.41 | %) |
| Portfolio turnover rate | | | 54 | % | | | 50 | % | | | 47 | % | | | 42 | % | | | 17 | % |
Firsthand Technology Leaders Fund
| | | Year Ended 12/31/08 | | | Year Ended 12/31/07 | | | Year Ended 12/31/06 | | | Year Ended 12/31/05 | | | Year Ended 12/31/04 | |
| | | | | | | | | | | | | | | | |
| Net asset value at beginning of year | | $ | 23.06 | | | $ | 20.23 | | | $ | 18.95 | | | $ | 16.75 | | | $ | 17.23 | |
| Income from investment operations: | | | | | | | | | | | | | | | | | | | | |
Net investment loss | | | (0.21 | ) | | | (0.29 | ) | | | (0.29 | ) | | | (0.23 | ) | | | (0.30 | ) |
Net realized and unrealized gains (losses) on investments | | | (10.57 | ) | | | 3.12 | | | | 1.57 | | | | 2.43 | | | | (0.18 | ) |
| Total from investment operations | | | (10.78 | ) | | | 2.83 | | | | 1.28 | | | | 2.20 | | | | (0.48 | ) |
| Net asset value at end of year | | $ | 12.28 | | | $ | 23.06 | | | $ | 20.23 | | | $ | 18.95 | | | $ | 16.75 | |
| Total return | | | (46.75 | %) | | | 13.99 | % | | | 6.75 | % | | | 13.13 | % | | | (2.79 | %) |
| Net assets at end of year (millions) | | $ | 27.6 | | | $ | 63.5 | | | $ | 74.0 | | | $ | 121.0 | | | $ | 113.9 | |
| Ratio of gross expenses to average net assets before waiver | | | 2.07 | % | | | 1.96 | % | | | 1.96 | % | | | 1.95 | % | | | 1.95 | % |
| Ratio of net expenses to average net assets after waiver | | | 1.95 | % | | | 1.95 | % | | | 1.95 | % | | | 1.95 | % | | | 1.95 | % |
| Ratio of net investment loss to average net assets | | | (1.03 | %) | | | (1.16 | %) | | | (1.13 | %) | | | (1.43 | %) | | | (1.58 | %) |
| Portfolio turnover rate | | | 78 | % | | | 35 | % | | | 53 | % | | | 43 | % | | | 22 | % |
see accompanying notes to financial statements
FINANCIAL HIGHLIGHTS (continued)
Selected per share data and ratios for a share outstanding throughout each period
Firsthand e-Commerce Fund
| | | Year Ended 12/31/08 | | | Year Ended 12/31/07 | | | Year Ended 12/31/06 | | | Year Ended 12/31/05 | | | Year Ended 12/31/04 | |
| | | | | | | | | | | | | | | | |
| Net asset value at beginning of year | | $ | 4.67 | | | $ | 4.05 | | | $ | 3.40 | | | $ | 3.23 | | | $ | 3.06 | |
| Income from investment operations: | | | | | | | | | | | | | | | | | | | | |
Net investment loss | | | (0.06 | ) | | | (0.06 | ) | | | (0.06 | ) | | | (0.06 | ) | | | (0.06 | ) |
Net realized and unrealized gains (losses) on investments | | | (1.92 | ) | | | 0.68 | | | | 0.71 | | | | 0.23 | | | | 0.23 | |
| Total from investment operations | | | (1.98 | ) | | | 0.62 | | | | 0.65 | | | | 0.17 | | | | 0.17 | |
| Net asset value at end of year | | $ | 2.69 | | | $ | 4.67 | | | $ | 4.05 | | | $ | 3.40 | | | $ | 3.23 | |
| Total return | | | (42.40 | %) | | | 15.31 | % | | | 19.12 | % | | | 5.26 | % | | | 5.56 | % |
| Net assets at end of year (millions) | | $ | 19.4 | | | $ | 40.7 | | | $ | 40.3 | | | $ | 42.9 | | | $ | 55.6 | |
| Ratio of gross expenses to average net assets before waiver | | | 2.14 | % | | | 1.96 | % | | | 1.98 | % | | | 1.95 | % | | | 1.95 | % |
| Ratio of net expenses to average net assets after waiver | | | 1.95 | % | | | 1.95 | % | | | 1.95 | % | | | 1.95 | % | | | 1.95 | % |
| Ratio of net investment loss to average net assets | | | (1.58 | %) | | | (1.28 | %) | | | (1.51 | %) | | | (1.66 | %) | | | (1.90 | %) |
| Portfolio turnover rate | | | 41 | % | | | 44 | % | | | 59 | % | | | 55 | % | | | 22 | % |
Firsthand Alternative Energy Fund
| | | Year Ended 12/31/08 | | | Period Ended 12/31/07* | |
| | | | | | | |
| Net asset value at beginning of period | | $ | 10.89 | | | $ | 10.00 | |
| Income from investment operations: | | | | | | | | |
Net investment income (loss) | | | (0.07 | ) | | | — | (A) |
Net realized and unrealized gains (losses) on investments | | | (5.14 | ) | | | 0.89 | |
Total from investment operations | | | (5.21 | ) | | | 0.89 | |
| Net asset value at end of period | | $ | 5.68 | | | $ | 10.89 | |
| Total return | | | (47.84 | %) | | | 8.90 | % (B) |
| Net assets at end of period (millions) | | $ | 3.7 | | | $ | 1.9 | |
| Ratio of gross expenses to average net assets before waiver | | | 2.37 | % | | | 2.10 | % (C) |
| Ratio of net expenses to average net assets after waiver | | | 2.11 | % ** | | | 2.10 | % (C) |
| Ratio of net investment loss to average net assets | | | (1.26 | %) | | | (0.07 | %) (C) |
| Portfolio turnover rate | | | 44 | % | | | — | (B) |
| * | For the period October 29, 2007 (inception) through December 31, 2007. |
| ** | Ratio includes dividend expense (0.01%) on securities sold short. |
see accompanying notes to financial statements
NOTES TO FINANCIAL STATEMENTS, December 31, 2008
1. Organization
Each of Firsthand Technology Value Fund, Firsthand Technology Leaders Fund, Firsthand e-Commerce Fund, and Firsthand Alternative Energy Fund (individually the “Fund”, and collectively the “Funds”) is a non-diversified series of Firsthand Funds (the “Trust”), an open-end management investment company registered under the Investment Company Act of 1940, as amended (the “1940 Act”). The Trust, a Delaware statutory trust, was organized on November 8, 1993. The inception dates for the Funds (the date on which a net asset value was first determined for that Fund) follow:
| Fund | Inception Date |
| Firsthand Technology Value Fund | May 20, 1994* |
| Firsthand Technology Leaders Fund | December 10, 1997 |
| Firsthand e-Commerce Fund | September 30, 1999 |
| Firsthand Alternative Energy Fund | October 29, 2007 |
| * | Firsthand Technology Value Fund Investor Class commenced operations on May 20, 1994; the SEC effective date for the Investor Class is December 15, 1994. Each Fund currently offers one class of shares—Investor Class shares. |
Each Fund’s investment objective is long-term growth of capital.
Firsthand Technology Value Fund seeks to achieve its investment objective by investing, under normal circumstances, at least 80% of its assets in high-technology companies that Firsthand Capital Management, Inc. (the “Investment Adviser”) believes are undervalued and have potential for capital appreciation.
Firsthand Technology Leaders Fund seeks to achieve its investment objective by investing, under normal circumstances, at least 80% of its assets in high-technology companies that the Investment Adviser believes hold dominant competitive positions in high-growth industries.
Firsthand e-Commerce Fund seeks to achieve its investment objective by investing, under normal circumstances, at least 80% of its assets in equity securities of companies that provide the products, services, and technologies to facilitate the growth of electronic commerce.
Firsthand Alternative Energy Fund seeks to achieve its investment objective by investing, under normal circumstances, at least 80% of its assets in alternative energy and energy technology companies, both U.S. and international.
The shareholders of Firsthand Global Technology Fund and Firsthand Technology Innovators Fund approved a reorganization of those funds into Firsthand Technology Value Fund at a special meeting of the shareholders of those funds held on May 21, 2008. Pursuant to that reorganization, the shareholders of those funds received shares of Firsthand Technology Value Fund of equivalent value. Please see note 12 for more information.
2. Significant Accounting Policies
The following is a summary of the Funds’ significant accounting policies:
Securities Valuation—A Fund’s portfolio of securities is valued as follows:
| 1. | Securities traded on stock exchanges, or quoted by NASDAQ, are valued according to the NASDAQ official closing price, if applicable, or at their last reported sale price as of the close of trading on the New York Stock Exchange (“NYSE”) (normally 4:00 P.M. Eastern Time). If a security is not traded that day, the security will be valued at its most recent bid price. |
| 2. | Securities traded in the over-the-counter market, but not quoted by NASDAQ, are valued at the last sale price (or, if the last sale price is not readily available, at the most recent closing bid price as quoted by brokers that make markets in the securities) at the close of trading on the NYSE. |
| 3. | Securities traded both in the over-the-counter market and on a stock exchange are valued according to the broadest and most representative market. |
| 4. | Securities and other assets that do not have market quotations readily available are valued at their fair value as determined in good faith using procedures established by the Board of Trustees. |
NOTES TO FINANCIAL STATEMENTS, December 31, 2008 - cont'd
Statement of Financial Accounting Standard No. 157—Effective January 1, 2008, the Funds adopted Statement of Financial Accounting Standards (“SFAS”) No. 157, “Fair Value Measurements”. This standard establishes a single authoritative definition of fair value, sets out a framework for measuring fair value, and requires additional disclosures about fair value measurements. SFAS No. 157 applies to fair value measurements already required or permitted by existing standards.
One key component of the implementation of SFAS 157 included the development of a three-tier fair value hierarchy. The basis of the tiers is dependant upon the various “inputs” used to determine the value of the Funds’ investments. These inputs are summarized in the three broad levels listed below:
Level 1 - quoted prices in active markets for identical assets.
Level 2 - other significant observable inputs (including quoted prices of similar securities, interest rates, prepayments speeds, credit risk, etc.)
Level 3 - significant unobservable inputs (including the Fund’s own assumptions in determining the fair value of investments.)
The inputs or methodology used for valuing securities are not necessarily an indication of the risk associated with investing in those securities.
The following is a summary of the inputs used to value the following Funds’ net assets as of December 31, 2008:
| | | LEVEL 1 - Quoted Prices | | | LEVEL 2 - Other Significant Observable Inputs | | | LEVEL 3 - Significant Unobservable Inputs | |
| Fund Name* | | Investments
in Securities | | | Other Financial Investments** | | | Investments
in Securities | | | Other Financial Investments** | | | Investments
in Securities | | | Other Financial Investments** | |
| TVFQX | | $ | 101,880,807 | | | $ | — | | | $ | 890,542 | | | $ | — | | | $ | 64,602,928 | | | $ | — | |
| TLFQX | | | 26,288,218 | | | | — | | | | 1,462,170 | | | | — | | | | — | | | | — | |
| TEFQX | | | 18,288,624 | | | | — | | | | — | | | | — | | | | — | | | | — | |
| ALTEX | | | 3,204,110 | | | | — | | | | 69,101 | | | | — | | | | 353,794 | | | | — | |
| Total | | $ | 149,661,759 | | | $ | — | | | $ | 2,421,813 | | | $ | — | | | $ | 64,956,722 | | | $ | — | |
| * | TVFQX: Firsthand Technology Value Fund; TLFQX: Firsthand Technology Leaders Fund; TEFQX: Firsthand e-Commerce Fund; ALTEX: Firsthand Alternative Energy Fund. |
Following is a reconciliation of Level 3 assets (at either the beginning or the ending of the period) for which significant unobservable inputs were used to determine fair value.
| | | Firsthand Technology Value Fund | | | Firsthand Alternative Energy Fund | |
| | | Investments in Securities | | | Other Financial Investments** | | | Investments in Securities | | | Other Financial Investments** | |
| | | | | | | | | | | | | |
| Balance as of 1/01/08 | | $ | 27,650,788 | | | $ | — | | | $ | 33,402 | | | $ | — | |
| Accrued Accretion/(Amortization) | | | — | | | | — | | | | — | | | | — | |
| Change in Unrealized Appreciation/(Depreciation) | | | (17,988,965 | ) | | | — | | | | 226,217 | | | | — | |
| Realized Market Gain/(Loss) | | | 15,011,650 | | | | — | | | | — | | | | — | |
| Net Purchase/(Sales) | | | (24,673,473 | ) | | | — | | | | 149,393 | | | | — | |
| Transfers In/(Out) of Level 3 | | | 64,602,928 | | | | — | | | | (55,218 | ) | | | — | |
| Balance as of 12/31/2008 | | $ | 64,602,928 | | | $ | — | | | $ | 353,794 | | | $ | — | |
| ** | Other financial instruments are derivative instruments not reflected in the Portfolio of Investments, such as futures, forwards, and swap contracts, which are valued at the unrealized appreciation / (depreciation) on the investment. |
NOTES TO FINANCIAL STATEMENTS, December 31, 2008 - cont'd
In March 2008, the Financial Accounting Standards Board issued the Statement of Financial Accounting Standards No.161, “Disclosures about Derivative Instruments and Hedging Activities” (“SFAS 161”). SFAS 161 is effective for fiscal years and interim periods beginning after November 15, 2008. SFAS 161 requires enhanced disclosures about the Funds’ derivative and hedging activities, including how such activities are accounted for and their effect on the Funds’ financial position, performance and cash flows. Management is currently evaluating the impact the adoption of SFAS 161 will have on the Funds’ financial statements and related disclosures.
Share Valuation—The net asset value (“NAV”) per share of each Fund is calculated by dividing the sum of the value of the securities held by the Fund, plus cash or other assets, minus all liabilities (including estimated accrued expenses) by the total number of shares outstanding of the Fund, rounded to the nearest cent. A Fund’s shares will not be priced on the days on which the NYSE is closed for trading. The offering and redemption price per share of each Fund is equal to a Fund’s net asset value per share.
Investment Income—Dividend income is recorded on the ex-dividend date. Interest income is accrued as earned. Discounts and premiums on securities purchased are amortized over the lives of the respective securities. Other non-cash dividends are recognized as investment income at the fair value of the property received. Withholding taxes on foreign dividends have been provided for in accordance with the company’s understanding of the applicable country’s tax rules and rates.
Foreign Securities—Each Fund may invest in companies that trade on U.S. exchanges as American Depositary Receipts (“ADRs”), on foreign exchanges, or on foreign over-the-counter markets. Investing in the securities of foreign companies exposes your investment in a Fund to risk. Foreign stock markets tend to be more volatile than the U.S. market due to economic and/or political instability and the regulatory conditions in some countries. In addition, some of the securities in which the Fund may invest may be denominated in foreign currencies, the value of which may decline against the U.S. dollar. An investment in foreign securities may be subject to high levels of foreign taxation, including foreign taxes withheld at the source. The Fund isolates that portion of the results of operations resulting of operations resulting from changes in foreign exchange rates on investments from the fluctuations arising from changes in market prices of securities held. Reported net realized foreign exchange gains or losses arise from sales of portfolio securities, currency gains or losses realized between the trade and settlement dates on securities transactions, and the difference between the amounts of dividends, interest, and foreign withholding taxes recorded on the company’s books and the U.S. dollar equivalent of the amounts actually received or paid.
Options—The Funds (other than Firsthand Technology Value Fund) may purchase put and call options to attempt to provide protection against adverse price effects from anticipated changes in prevailing prices of securities or stock indices. The Funds (other than Firsthand Technology Value Fund) may also write put and call options. When the Fund writes an option, an amount equal to the premium received by the Fund is recorded as a liability and is subsequently adjusted to the current fair value of the option written. Premiums received from writing options that expire unexercised are treated by the Fund on the expiration date as realized gains from investments. The difference between the premium and the amount paid on effecting a closing purchase transaction, including brokerage commissions, is also treated as a realized gain, or, if the premium is less than the amount paid for the closing purchase transaction, as a realized loss. If a call option is exercised, the premium is added to the proceeds from the sale of the underlying security or currency in determining whether the Fund has realized a gain or loss. The Fund as writer of an option bears the market risk of an unfavorable change in the price of the security underlying the written option.
The number of option contracts written and the premiums received during the period ended December 31, 2008, were as follows:
| | | Firsthand Technology Leaders Fund | | | Firsthand Alternative Energy Fund | |
| | | Number of Contracts | | | Premiums Received | | | Number of Contracts | | | Premiums Received | |
| | | | | | | | | | | | | |
| Options outstanding, beginning of period | | | — | | | $ | — | | | | — | | | $ | — | |
| Options written during period | | | 12,489 | | | | 1,489,591 | | | | 142 | | | | 40,213 | |
| Options expired during period | | | (6,392 | ) | | | (763,766 | ) | | | (25 | ) | | | (13,177 | ) |
| Options closed during period | | | (3,374 | ) | | | (326,990 | ) | | | (32 | ) | | | (1,978 | ) |
| Options exercised during period | | | (2,723 | ) | | | (398,835 | ) | | | (85 | ) | | | (25,058 | ) |
| Options outstanding, end of period | | | — | | | $ | — | | | | — | | | $ | — | |
NOTES TO FINANCIAL STATEMENTS, December 31, 2008 - cont'd
Distributions to Shareholders—Each Fund expects to distribute its net investment income and net realized gains, if any, annually. Distributions from net investment income and capital gains are recorded on the ex-dividend date and are determined in accordance with income tax regulations, which may differ from accounting principles generally accepted in the United States.
Short Positions—Firsthand Alternative Energy Fund may sell securities short for economic hedging purposes. Short sales are transactions in which the Fund sells a security it does not own, in anticipation of a decline in the market value of that security. To initiate such a transaction, the Fund must borrow the security to deliver to the buyer upon the short sale; the Fund is then obligated to replace the security borrowed by purchasing it in the open market at some later date, completing the transaction. The Fund is liable for any dividends payable on securities while those securities are in a short position.
The Fund will incur a loss if the market price of the security increases between the date of the short sale and the date on which the Fund replaces the borrowed security. The Fund will realize a gain if the security declines in value between those dates.
All short sales must be fully collateralized. The Fund maintains the collateral in a segregated account consisting of cash, cash equivalents and/or liquid securities sufficient to collateralize the market value of its short positions. Typically, the segregated cash with brokers and other financial institutions exceeds the minimum required. Deposits with brokers for securities sold short are invested in money market instruments.
Reclassification of Capital Accounts—The Funds account and report for distributions to shareholders in accordance with the American Institute of Certified Public Accountant’s Statement of Position 93-2: Determination, Disclosure, and Financial Statement Presentation of Income, Capital and Return of Capital Distributions by Investment Companies. For the year ended December 31, 2008, each Fund recorded the following reclassifications to the accounts listed below:
| | | Increase (Decrease) | |
| | | Paid-in-Capital | | | Accumulated Net Investment Loss | | | Accumulated Net Realized Loss | |
| Firsthand Technology Value Fund | | $ | 1,607,893 | | | $ | 4,418,959 | | | $ | (6,026,852 | ) |
| Firsthand Technology Leaders Fund | | | (481,852 | ) | | | 472,754 | | | | 9,098 | |
| Firsthand e-Commerce Fund | | | (460,778 | ) | | | 460,778 | | | | 0 | |
| Firsthand Alternative Energy Fund | | | (29,425 | ) | | | 43,076 | | | | (13,651 | ) |
Security Transactions—Security transactions are accounted for no later than one business day following the trade date, however, for financial reporting purposes, security transactions are accounted for on trade date. Securities sold are valued on a specific identification basis.
Estimates—The preparation of financial statements in conformity with accounting principles generally accepted in the United States of America requires management to make estimates and assumptions that affect the reported amounts of assets and liabilities at the date of the financial statements and the reported amounts of income and expenses during the reporting period. Actual results could differ from those estimates.
Federal Income Tax—Each Fund has elected, and intends to qualify annually, for the special tax treatment afforded regulated investment companies under the Internal Revenue Code of 1986, as amended (the “Code”). As provided in the Code, in any fiscal year in which a Fund so qualifies and distributes at least 90% of its taxable net income, the Fund (but not the shareholders) will be relieved of federal income tax on the income distributed. Accordingly, no provision for income taxes has been made. To avoid imposition of the excise tax applicable to regulated investment companies, each Fund intends to declare as dividends in each calendar year at least 98% of its net investment income (earned during the calendar year) and 98% of its net realized capital gains (earned during the 12 months ended October 31) plus undistributed amounts, if any, from prior years. The following information is based upon the federal income tax cost of portfolio investments as of December 31, 2008.
NOTES TO FINANCIAL STATEMENTS, December 31, 2008 - cont'd
| | | Firsthand Technology Value Fund | | | Firsthand Technology Leaders Fund | | | Firsthand e-Commerce Fund | | | Firsthand Alternative Energy Fund | |
| | | | | | | | | | | | | |
| Gross unrealized appreciation | | $ | 37,149,082 | | | $ | — | | | $ | 942,675 | | | $ | 366,669 | |
| Gross unrealized depreciation | | | (159,677,067 | ) | | | (17,320,761 | ) | | | (9,731,385 | ) | | | (2,383,457 | ) |
Net unrealized appreciation (depreciation) | | $ | (122,527,985 | ) | | $ | (17,320,761 | ) | | $ | (8,788,710 | ) | | $ | (2,016,788 | ) |
Federal income tax cost, long positions | | $ | 289,902,262 | | | $ | 45,071,149 | | | $ | 27,077,334 | | | $ | 5,805,723 | |
Federal income tax cost, short positions | | | — | | | | — | | | | — | | | | (161,930 | ) |
| Total federal income tax cost | | $ | 289,902,262 | | | $ | 45,071,149 | | | $ | 27,077,334 | | | $ | 5,643,793 | |
The difference between the acquisition cost and the federal income tax cost of portfolio investments is due to certain timing differences in the recognition of capital losses under accounting principles generally accepted in the United States and income tax regulations. As of December 31, 2008, the Funds had capital loss carryforwards for federal income tax purposes as follows:
| | | Expiring 2009 | | | Expiring 2010 | | | Expiring 2011 | | | Expiring 2012 | | | Expiring 2013 | | | Expiring 2014 | |
| TVFQX | | $ | 1,092,189,416 | | | $ | 634,016,220 | | | $ | 330,969,371 | | | $ | 333,067,019 | | | $ | 167,523,435 | | | $ | 64,782,991 | |
| TLFQX | | | 121,415,356 | | | | 109,312,900 | | | | 53,324,264 | | | | 33,348,418 | | | | 2,501,372 | | | | — | |
| TEFQX | | | 246,467,450 | | | | 141,312,315 | | | | 6,014,495 | | | | — | | | | — | | | | — | |
| ALTEX | | | — | | | | — | | | | — | | | | — | | | | — | | | | — | |
| | | Expiring 2015 | | | Expiring 2016 | | | Total | | |
| | | | | | | | | | | |
| TVFQX | | $ | 57,959,032 | | | $ | 7,972,313 | | | $ | 2,688,479,797 | | |
| TLFQX | | | — | | | | — | | | | 319,902,310 | | |
| TEFQX | | | — | | | | — | | | | 393,794,260 | | |
| ALTEX | | | — | | | | — | | | | — | | |
For Firsthand Technology Value Fund, $7,924,308 of the $1,092,189,416 capital loss carryforward expiring in 2009 was acquired in the reorganization with Firsthand Communications Fund, $2,310,150 of the $167,523,435 capital loss carryforward expiring in 2013 was acquired in the reorganization with Firsthand Global Technology Fund, $3,455,691 of the $64,782,991 capital loss carryforward expiring in 2014 was acquired in the reorganization with Firsthand Technology Innovators Fund and $261,564 of the $57,959,032 capital loss carryforward expiring in 2015 was acquired in the reorganization with Firsthand Technology Innovators Fund.
NOTES TO FINANCIAL STATEMENTS, December 31, 2008 - cont'd
Components of Distributable Earnings
| | | Firsthand Technology Value Fund | | | Firsthand Technology Leaders Fund | | | Firsthand e-Commerce Fund | | | Firsthand Alternative Energy Fund | |
| | | | | | | | | | | | | |
Undistributed Ordinary Income | | $ | — | | | $ | — | | | $ | — | | | $ | — | |
| Accumulated Earnings | | | — | | | | — | | | | — | | | | — | |
Net Unrealized Appreciation (Depreciation)* | | | (122,527,985 | ) | | | (17,320,761 | ) | | | (8,788,710 | ) | | | (2,017,064 | ) |
Post October Capital/Currency Loss** | | | (20,941,327 | ) | | | (385,039 | ) | | | — | | | | (157,160 | ) |
Accumulated Capital Loss Carryforward | | | (2,688,479,797 | ) | | | (319,902,310 | ) | | | (393,794,260 | ) | | | — | |
| Total Distributable Earnings | | $ | (2,831,949,109 | ) | | $ | (337,608,110 | ) | | $ | (402,582,970 | ) | | $ | (2,174,224 | ) |
| * | The differences between book-basis and tax-basis unrealized appreciation (depreciation) is attributable primarily to tax deferral of losses on wash sales and foreign currency exchange gain (loss). |
| ** | Under current tax law, capital and currency losses realized after October 31 and prior to the Fund’s fiscal year end may be deferred as occurring on the first day of the following fiscal year. |
In July 2006, the Financial Accounting Standards Board (“FASB”) released FASB Interpretation No. 48 “Accounting for Uncertainty in Income Taxes” (“FIN 48”). FIN 48 provides guidance for how uncertain tax positions should be recognized, measured, presented and disclosed in the financial statements. FIN 48 requires the evaluation of tax positions taken or expected to be taken in the course of preparing the Fund’s tax return to determine whether the tax positions are “more-likely-than-not” of being sustained by the applicable tax authority. Tax positions not deemed to meet the more-likely-than-not threshold would be recorded as a tax benefit or expense in the year of determination. Adoption of FIN 48 is required no later than the last business day of the first financial statement reporting period for fiscal years beginning after December 15, 2006 and is to be applied to all open tax years as of the effective date. Management has completed their analysis and the adoption of FIN 48 did not impact the Funds’ net assets or results of operations.
3. Investment Transactions
Investment transactions (excluding short-term investments) were as follows for the year ended December 31, 2008.
| | | Firsthand Technology Value Fund | | | Firsthand Technology Leaders Fund | | | Firsthand e-Commerce Fund | | | Firsthand Alternative Energy Fund | |
| | | | | | | | | | | | | |
Purchase of investment securities | | $ | 141,743,152 | | | $ | 33,110,941 | | | $ | 10,548,263 | | | $ | 4,409,401 | |
Proceeds from sales and maturities of investment securities | | $ | 184,323,194 | | | $ | 42,285,000 | | | $ | 14,950,130 | | | $ | 1,083,437 | |
NOTES TO FINANCIAL STATEMENTS, December 31, 2008 - cont'd
4. Investment Advisory and Administration Agreements
Certain trustees and officers of the Trust are also officers of the Investment Adviser or Citi Fund Services Ohio, Inc. (“Citi”). Citi serves as the sub-administrator, investment accounting agent and shareholder servicing and transfer agent. PFPC Trust Company serves as the custodian for the Trust.
INVESTMENT ADVISORY AGREEMENT
Each Fund’s investments are managed by the Investment Adviser pursuant to the terms of a master investment advisory agreement (the “Advisory Agreement”). Under the Advisory Agreement, the Investment Adviser provides each Fund with investment research, advice, management, and supervision and manages the investment and reinvestment of assets of each Fund consistent with each Fund’s investment objectives, policies, and limitations. Subject to certain exceptions set forth in the Advisory Agreement, the Investment Adviser is responsible for (i) compensation of any of the Fund’s trustees, officers, and employees who are interested persons of the Investment Adviser; and (ii) compensation of the Investment Adviser’s personnel and other expenses incurred in connection with the provision of portfolio management services under the Advisory Agreement.
For the services it provides under the Advisory Agreement, the Investment Adviser receives from each Fund, on a monthly basis, an advisory fee at the annual rate of 1.50% of its average daily net assets (1.65% for ALTEX). The Advisory Agreement requires the Investment Adviser to waive fees and, if necessary, to reimburse expenses of each such Fund to the extent necessary to limit a Fund’s total operating expenses to 1.95% (2.10% for ALTEX) of its average net assets up to $200 million, 1.90% (2.05% for ALTEX) of such assets from $200 million to $500 million, 1.85% (2.00% for ALTEX) of such assets from $500 million to $1 billion, and 1.80% (1.95% for ALTEX) of such assets in excess of $1 billion.
ADMINISTRATION AGREEMENT
The Trust has entered into a separate Administration Agreement with the Investment Adviser. The agreement obligates the Investment Adviser to provide administrative and general supervisory services to each Fund (the “Administration Agreement”). Under the Administration Agreement, the Investment Adviser renders supervisory and corporate administrative services to the Trust, as well as oversees the maintenance of all books and records with respect to each Fund’s securities transactions and each Fund’s book of accounts in accordance with all applicable federal and state laws and regulations. The Investment Adviser also arranges for the preservation of journals, ledgers, corporate documents, brokerage account records, and other records as required by the 1940 Act.
The Investment Adviser is responsible for the equipment, staff, office space, and facilities necessary to perform its obligations under the Administration Agreement. Under the Administration Agreement, the Investment Adviser has assumed responsibility for payment of all of each Fund’s operating expenses excluding brokerage and commission expenses; short sale expenses; fees payable under “Rule 12b-1 plans”, if any, and shareholder servicing plans, if any; litigation costs; and any extraordinary and non-recurring expenses. For the services it provides under the Administration Agreement, the Investment Adviser receives a fee from each Fund at the annual rate of 0.45% of its average daily net assets up to $200 million, 0.40% of such assets from $200 million to $500 million, 0.35% of such assets from $500 million to $1 billion, and 0.30% of such assets in excess of $1 billion. The Investment Adviser has entered into a Sub-Administration Agreement with Citi. Under this agreement, the Investment Adviser (not the Funds) pays to Citi the fees for the administrative services provided by Citi. In the case of Firsthand Alternative Energy Fund, the Investment Adviser has also agreed to donate a portion of its management fees allocated, amounting to 0.20% of Firsthand Alternative Energy Fund’s average daily net assets, to various non-profit organizations as elected by Fund shareholders.
NOTES TO FINANCIAL STATEMENTS, December 31, 2008 - cont'd
5. Investments in Affiliates and Restricted Securities
Affiliated issuers, as defined by the 1940 Act, are those in which a Fund’s holdings represent 5% or more of the outstanding voting securities of the issuer. A summary of each Fund’s investments in affiliates, if any, for the year ended December 31, 2008, is noted below:
| | | SHARE ACTIVITY | | | | | | | | | | |
| Affiliate | | Balance 12/31/07 | | | Purchases/ Merger | | | Sales/Maturity/ Expiration | | | Balance 12/31/08 | | | Realized Gain(Loss) | | | Value 12/31/08 | | | Acquition Cost | |
| Firsthand Technology Value Fund | | | | | | | | | | | | | | | | | | | | | |
| | | | | | | | | | | | | | | | | | | | | | |
| Clarisay, Inc., 8.00% | | | 500,000 | | | | — | | | | — | | | | 500,000 | | | $ | — | | | $ | — | | | $ | 500,000 | |
| Clarisay, Inc., 8.00% | | | 500,000 | | | | — | | | | — | | | | 500,000 | | | | — | | | | — | | | | 500,000 | |
| Clarisay, Inc., 8.00% | | | 250,000 | | | | — | | | | — | | | | 250,000 | | | | — | | | | — | | | | 250,000 | |
| Clarisay, Inc., 8.00% | | | 100,000 | | | | — | | | | — | | | | 100,000 | | | | — | | | | — | | | | 100,000 | |
| Clarisay, Inc., 8.00% | | | 500,000 | | | | — | | | | — | | | | 500,000 | | | | — | | | | — | | | | 500,000 | |
| Clarisay, Inc., 8.00% | | | 500,000 | | | | — | | | | — | | | | 500,000 | | | | — | | | | — | | | | 500,000 | |
| Clarisay, Inc., Series B | | | 2,605,306 | | | | — | | | | — | | | | 2,605,306 | | | | — | | | | — | | | | 2,383,855 | |
| Clarisay, Inc., Series C | | | 7,194,244 | | | | — | | | | — | | | | 7,194,244 | | | | — | | | | — | | | | 2,000,000 | |
| Clarisay, Inc., Warrant | | | 500,000 | | | | — | | | | — | | | | 500,000 | | | | — | | | | — | | | | — | |
| Clarisay, Inc., Warrant | | | 500,000 | | | | — | | | | — | | | | 500,000 | | | | — | | | | — | | | | — | |
| Clarisay, Inc., Warrant | | | 250,000 | | | | — | | | | — | | | | 250,000 | | | | — | | | | — | | | | — | |
| Clarisay, Inc., Warrant | | | 100,000 | | | | — | | | | — | | | | 100,000 | | | | — | | | | — | | | | — | |
| Clarisay, Inc., Warrant | | | 500,000 | | | | — | | | | — | | | | 500,000 | | | | — | | | | — | | | | — | |
| Clarisay, Inc., Warrant | | | 500,000 | | | | — | | | | — | | | | 500,000 | | | | — | | | | — | | | | — | |
| Silicon Genesis Corp., Common (1) | | | 743,077 | | | | 128,815 | | | | — | | | | 871,892 | | | | — | | | | 1,589,346 | | | | 5,201,267 | |
Silicon Genesis Corp., Common Warrant | | | 37,982 | | | | — | | | | — | | | | 37,982 | | | | — | | | | 49,865 | | | | — | |
Silicon Genesis Corp., Series 1-C (1) | | | — | | | | 82,914 | | | | — | | | | 82,914 | | | | — | | | | 880,654 | | | | 1,731,250 | |
| Silicon Genesis Corp., Series 1-D | | | 850,830 | | | | — | | | | — | | | | 850,830 | | | | — | | | | 3,492,921 | | | | 4,315,500 | |
Silicon Genesis Corp., Series 1-E (1) | | | 4,071,226 | | | | 1,633,254 | | | | — | | | | 5,704,480 | | | | — | | | | 14,480,081 | | | | 6,046,749 | |
Silicon Genesis Corp., Series 1-E Warrant | | | 1,257,859 | | | | — | | | | — | | | | 1,257,859 | | | | — | | | | 2,192,914 | | | | — | |
Silicon Genesis Corp., Series 1-E Warrant (1) | | | — | | | | 94,339 | | | | — | | | | 94,339 | | | | — | | | | 139,468 | | | | — | |
| Silicon Genesis Corp., Series 1-F | | | 912,453 | | | | — | | | | — | | | | 912,453 | | | | — | | | | 2,566,612 | | | | 2,007,397 | |
| Solaicx, Series B | | | 7,396,238 | | | | — | | | | — | | | | 7,396,238 | | | | — | | | | 3,653,298 | | | | 4,396,238 | |
| Solaicx, Series C | | | 2,916,581 | | | | — | | | | — | | | | 2,916,581 | | | | — | | | | 2,415,833 | | | | 3,578,995 | |
| Solaicx, Series C Warrant | | | 670,814 | | | | — | | | | — | | | | 670,814 | | | | — | | | | 548,934 | | | | — | |
| SoloPower, Series A | | | 2,721,088 | | | | — | | | | — | | | | 2,721,088 | | | | — | | | | 22,706,200 | | | | 3,999,999 | |
| SoloPower, Series B | | | 228,779 | | | | — | | | | — | | | | 228,779 | | | | — | | | | 2,028,368 | | | | 1,002,052 | |
| (1) | Amounts include shares from the merger of Firsthand Technology Innovators Fund into Firsthand Technology Value Fund. |
Restricted securities include securities that have not been registered under the Securities Act of 1933, as amended, and securities that are subject to restrictions on resale. A Fund may invest in restricted securities that are consistent with a Fund’s investment objective and investment strategies. A Fund will not invest in a restricted security if, immediately after and as a result of the investment in such security, more than 15% of the Fund’s net assets would be invested in illiquid securities. In some cases, the issuer of restricted securities has agreed to register such securities for resale, at the issuer’s expense either upon demand by the Fund or in connection with
NOTES TO FINANCIAL STATEMENTS, December 31, 2008 - cont'd
another registered offering of the securities. Investments in restricted securities are valued at fair value as determined in good faith in accordance with procedures adopted by the Board of Trustees. It is possible that the estimated value may differ significantly from the amount that might ultimately be realized in the near term, and the difference could be material. As of December 31, 2008, the Funds were invested in the following restricted securities:
| Security | Acquisition Date | | Shares | | | Cost | | | Value | | | % of Net Assets | |
| Firsthand Technology Value Fund | | | | | | | | | | | | | |
| | | | | | | | | | | | | | |
| Celox Networks, Inc., Common | April 17, 2001 | | | 138,121 | | | $ | 14,999,941 | | | $ | — | | | | 0.00 | % |
| Celox Networks, Inc., Series A-1 P/S | August 23, 2002 | | | 1,000,000 | | | | 1,200,000 | | | | — | | | | 0.00 | % |
| Celox Networks, Inc., Series A-1 Warrants | August 23, 2002 | | | 500,000 | | | | - | | | | — | | | | 0.00 | % |
| Clarisay, Inc., 8.00% C/N | June 3, 2003 | | | 500,000 | | | | 500,000 | | | | — | | | | 0.00 | % |
| Clarisay, Inc., 8.00% C/N | July 7, 2003 | | | 500,000 | | | | 500,000 | | | | — | | | | 0.00 | % |
| Clarisay, Inc., 8.00% C/N | August 7, 2003 | | | 500,000 | | | | 500,000 | | | | — | | | | 0.00 | % |
| Clarisay, Inc., 8.00% C/N | September 12, 2003 | | | 250,000 | | | | 250,000 | | | | — | | | | 0.00 | % |
| Clarisay, Inc., 8.00% C/N | September 19, 2003 | | | 100,000 | | | | 100,000 | | | | — | | | | 0.00 | % |
| Clarisay, Inc., 8.00% C/N | November 10, 2003 | | | 500,000 | | | | 500,000 | | | | — | | | | 0.00 | % |
| Clarisay, Inc., D Warrants | June 3, 2003 | | | 500,000 | | | | — | | | | — | | | | 0.00 | % |
| Clarisay, Inc., D Warrants | July 7, 2003 | | | 500,000 | | | | — | | | | — | | | | 0.00 | % |
| Clarisay, Inc., D Warrants | August 7, 2003 | | | 500,000 | | | | — | | | | — | | | | 0.00 | % |
| Clarisay, Inc., D Warrants | September 12, 2003 | | | 250,000 | | | | — | | | | — | | | | 0.00 | % |
| Clarisay, Inc., D Warrants | September 19, 2003 | | | 100,000 | | | | — | | | | — | | | | 0.00 | % |
| Clarisay, Inc., D Warrants | November 10, 2003 | | | 500,000 | | | | — | | | | — | | | | 0.00 | % |
| Clarisay, Inc., Series B P/S | January 24, 2001 | | | 2,605,306 | | | | 2,383,855 | | | | — | | | | 0.00 | % |
| Clarisay, Inc., Series C P/S | August 28, 2002 | | | 7,194,244 | | | | 2,000,000 | | | | — | | | | 0.00 | % |
| Innovion Corp., 9.50%, C/N | December 30, 2003 | | | 529,031 | | | | 529,031 | | | | 105,806 | | | | 0.06 | % |
| Innovion Corp., Series C P/S | February 23, 2001 | | | 1,500,000 | | | | 3,000,000 | | | | 15,000 | | | | 0.01 | % |
| Innovion Corp., Series C P/S | November 20, 2007 | | | 75,322 | | | | 75 | | | | 753 | | | | 0.00 | % |
| IP Unity, Inc., Series C P/S | July 27, 2001 | | | 1,932,222 | | | | 3,478,000 | | | | 19,322 | | | | 0.01 | % |
| IP Unity, Inc., Series E P/S | August 4, 2004 | | | 193,042 | | | | 313,307 | | | | 211,484 | | | | 0.13 | % |
| IP Unity, Inc., Series E Warrants | August 4, 2004 | | | 69,496 | | | | 69 | | | | 69 | | | | 0.00 | % |
| Polaris Networks, Inc., 10.00% C/N | April 12, 2004 | | | 50,475 | | | | 50,475 | | | | — | | | | 0.00 | % |
| Polaris Networks, Inc., 10.00% C/N | July 14, 2004 | | | 50,474 | | | | 50,474 | | | | — | | | | 0.00 | % |
Polaris Networks, Inc., Convertible Warrants | March 29, 2004 | | | 75,712 | | | | — | | | | — | | | | 0.00 | % |
| Polaris Networks, Inc., Series A P/S | November 16, 2001 | | | 297,848 | | | | 297,848 | | | | — | | | | 0.00 | % |
| Silicon Genesis Corp., Common Stock | March 8, 2001 | | | 102,135 | | | | 1,516,773 | | | | 186,179 | | | | 0.11 | % |
| Silicon Genesis Corp., Common Stock | April 30, 2002 | | | 726,424 | | | | 3,684,494 | | | | 1,324,177 | | | | 0.80 | % |
| Silicon Genesis Corp., Common Stock (1) | November 21, 2005 | | | 23,333 | | | | — | | | | 42,533 | | | | 0.03 | % |
| Silicon Genesis Corp., Common Stock | June 10, 2008 | | | 20,000 | | | | — | | | | 36,457 | | | | 0.02 | % |
| Silicon Genesis Corp., Common Warrants | November 4, 2003 | | | 37,982 | | | | — | | | | 49,865 | | | | 0.03 | % |
| Silicon Genesis Corp., Series 1-C P/S | March 8, 2001 | | | 82,914 | | | | 1,731,250 | | | | 880,654 | | | | 0.53 | % |
| Silicon Genesis Corp., Series 1-D P/S | April 30, 2002 | | | 850,830 | | | | 4,315,500 | | | | 3,492,921 | | | | 2.10 | % |
| Silicon Genesis Corp., Series 1-E P/S | November 4, 2003 | | | 5,704,480 | | | | 6,046,749 | | | | 14,480,081 | | | | 8.72 | % |
| Silicon Genesis Corp., Series 1-E Warrant | February 26, 2003 | | | 94,339 | | | | — | | | | 139,468 | | | | 0.08 | % |
| Silicon Genesis Corp., Series 1-E Warrants | October 31, 2003 | | | 1,257,859 | | | | — | | | | 2,192,914 | | | | 1.32 | % |
| Silicon Genesis Corp., Series 1-F P/S | June 29, 2007 | | | 912,453 | | | | 2,007,397 | | | | 2,566,612 | | | | 1.55 | % |
| Silicon Optix, Inc., Series B P/S | November 7, 2003 | | | 1,111,111 | | | | 1,000,000 | | | | — | | | | 0.00 | % |
| Solaicx, Series B P/S | December 16, 2005 | | | 6,000,000 | | | | 3,000,000 | | | | 2,963,640 | | | | 1.79 | % |
| Solaicx, Series B P/S | January 19, 2007 | | | 1,396,238 | | | | 1,396,238 | | | | 689,658 | | | | 0.42 | % |
| Solaicx, Series C P/S | April 23, 2007 | | | 2,916,581 | | | | 3,578,995 | | | | 2,415,833 | | | | 1.46 | % |
NOTES TO FINANCIAL STATEMENTS, December 31, 2008 - cont'd
| Security | Acquisition Date | | Shares | | | Cost | | | Value | | | % of Net Assets | |
| Firsthand Technology Value Fund (continued) | | | | | | | | | | | | | |
| | | | | | | | | | | | | | | | | | |
| Solaicx, Series C Warrants | April 23, 2007 | | | 670,814 | | | $ | — | | | $ | 548,934 | | | | 0.33 | % |
| SoloPower, Series A P/S | June 29, 2006 | | | 2,721,088 | | | | 3,999,999 | | | | 22,706,200 | | | | 13.68 | % |
| SoloPower, Series B P/S | July 9, 2007 | | | 228,779 | | | | 1,002,052 | | | | 2,028,368 | | | | 1.22 | % |
UCT Coatings, Inc., Common Warrants (2) | October 5, 2004 | | | 600,000 | | | | — | | | | 6,000 | | | | 0.00 | % |
| UCT Coatings, Inc., Series B P/S | October 5, 2004 | | | 500,000 | | | | 5,000,000 | | | | 7,500,000 | | | | 4.52 | % |
| | | | | | | | $ | 68,932,522 | | | $ | 64,602,928 | | | | 38.92 | % |
| Firsthand Alternative Energy Fund | | | | | | | | | | | | | |
| | | | | | | | | | | | | | |
| Silicon Genesis Corp., Common Stock | September 2, 2008 | | | 109,855 | | | $ | 32,957 | | | $ | 200,251 | | | | 5.48 | % |
| Silicon Genesis Corp., Common Stock | September 26, 2008 | | | 71,552 | | | | 21,466 | | | | 130,430 | | | | 3.57 | % |
| Silicon Genesis Corp., Series 1-C P/S | September 2, 2008 | | | 152 | | | | 46 | | | | 1,615 | | | | 0.04 | % |
| Silicon Genesis Corp., Series 1-E P/S | September 2, 2008 | | | 3,000 | | | | 3,180 | | | | 7,615 | | | | 0.21 | % |
| SoloPower, Series C-1 P/S | September 23, 2008 | | | 1,331 | | | | 21,425 | | | | 13,883 | | | | 0.38 | % |
| | | | | | | | $ | 79,074 | | | $ | 353,794 | | | | 9.68 | % |
| (1) | Shares granted at no cost by issuer. |
Each Fund, consistent with SEC guidelines, has an investment restriction providing that it cannot purchase additional restricted securities once such securities comprise 15% of a Fund’s net assets. The SEC considers a security to be illiquid if it cannot be disposed of within seven days in the ordinary course of business at approximately the amount at which a Fund has valued the security. The restriction stems from the concern that, for an open-end mutual fund with daily redemption obligations, a high level of illiquid securities would increase the risk that a Fund may not be able to meet its daily redemption needs, because illiquid securities often take a longer period of time to sell, and may not necessarily be sold at that Fund’s then carrying value.
As of December 31, 2008, two privately held solar technology companies, SoloPower and Silicon Genesis, comprised 30% of the net asset value of Firsthand Technology Value Fund (TVFQX). One of the factors increasing Firsthand Technology Value Fund’s percentage of illiquid holdings has been the better relative performance of its venture capital investments compared with its investments in public companies over the past several quarters. An additional factor has been shareholder redemptions, which a Fund meets through the sale of its liquid holdings. A third contributing factor is the fact that Firsthand Technology Value Fund has not disposed of those restricted securities. Going forward, the percentage of restricted securities could increase or decrease depending on the relative performance of its illiquid and liquid investments; shareholder purchase or redemption levels; and whether Firsthand Technology Value Fund disposes of any restricted securities.
6. Other Assets
Other assets consist of a contingent receivable from the sale of Global Locate, Inc. to Broadcom. Part of the sale has shareholders receiving additional earn outs based on future contingencies. The Board of Trustees is fair valuing this asset.
NOTES TO FINANCIAL STATEMENTS, December 31, 2008 - cont'd
7. Investment Advisory and Administration Agreements (Unaudited)
Below is a description of the specific materials provided, factors considered, and conclusions reached by the Board, including a majority of non-interested Trustees, relating to the selection of the Investment Adviser and the re-approval of the Advisory Agreement.
Nature, Extent and Quality of Services
The Board received and considered various data and information regarding the nature, extent and quality of services provided to the Funds by the Adviser. The most recent investment adviser registration form (“Form ADV”) for the Adviser was provided to the Board, as were written and oral responses of the Adviser to an information request submitted by independent counsel on behalf of the Independent Trustees. The Board reviewed these responses, which included, among other things, information about the background and experience of the investment personnel of the Adviser primarily responsible for day-to-day portfolio management services for the Funds. The Board also considered the Adviser’s separate administration agreement with the Funds and the Adviser’s overall ability to manage and administer the Funds, as well as to oversee the service providers to the Funds.
The Board evaluated the ability of the Adviser, considering its financial condition, resources, reputation and other attributes, to attract and retain highly qualified investment professionals, including research, advisory, supervisory and administrative personnel. In this regard, the Board considered information regarding the Adviser’s compensation program for its personnel involved in the management of the Funds, including incentive and retirement plans.
The Board considered the effectiveness of policies of the Funds in achieving the best execution of portfolio transactions, whether and to what extent “soft dollar” benefits are sought, the extent to which efforts are made to recapture transaction costs, and the controls applicable to brokerage allocation procedures. The Board reviewed the policies of the Adviser regarding the allocation of portfolio investment opportunities among the Funds and other clients. The Board noted that the Adviser does not use “traditional soft-dollar” arrangements where soft-dollar credits are generated based on the level of trades and then used for products or services from third-parties. The Board also noted that the Adviser, from time to time, enters into arrangements where it receives research (including invitations to conferences) from broker-dealers that the Adviser uses to execute client trades.
The Board also considered the markets for the Funds, including the principal channels through which the Funds’ shares are offered and sold, and the activities of the Adviser in connection with the marketing of the Funds.
In addition, the Board received and reviewed information on SEC and other inquiries, examinations and proceedings relating to the Funds and the Adviser, and noted that there is currently no SEC examination in process. The Board considered the investment and legal compliance programs of the Adviser, including its implementation of enhanced compliance policies and procedures in response to SEC rule changes and other regulatory initiatives, and the level of compliance attained by the Adviser.
Based on the above factors, together with those referenced below, the Board, including a majority of Independent Trustees, concluded that it was generally satisfied with the nature, extent and quality of the investment advisory services provided to each of the Funds by the Adviser.
Fund Performance
The Board considered each Fund’s performance results over one-year, three-year, five-year and ten-year periods, or shorter periods, as relevant. It also considered these results in comparison to the performance results of various benchmark indices and of the funds in relevant Morningstar sectors. The Board referenced the presentation regarding performance earlier in the meeting and noted that while recent short-term performance was less favorable compared to peer funds, the Funds’ performance for the 3-year and 5-year periods tended to be average or above average against relevant peer funds.
NOTES TO FINANCIAL STATEMENTS, December 31, 2008 - cont'd
Investment Advisory Fee Rates and Other Expenses
The Board reviewed and considered the proposed contractual investment advisory fee rates (the “Advisory Agreement Rates”) payable by the Funds to the Adviser for investment advisory services. Additionally, the Board received and considered information comparing the Advisory Agreement Rates (both on a stand-alone basis and on a combined basis with the Funds’ administration fee rates) and the total expense ratios of the Funds with those of other funds in appropriate peer universes provided by Lipper. The Board concluded that the respective Advisory Agreement Rates were significantly higher than the median rates of each Fund’s peer universe, but that the total expense ratio of each Fund was not appreciably above the median total expense ratio of the respective peer universe. The Board deemed the comparison of total expense ratios to be more relevant than the comparison of Advisory Agreement Rates because of the unitary fee structure of the Funds.
Profitability
The Board received and considered a profitability analysis of the Adviser with respect to the Funds. The Board concluded that, in light of the costs of providing investment management and other services to the Funds, the profits and other ancillary benefits that the Adviser received with regard to providing these services to the Funds were not excessive.
Economies of Scale
The Board received and considered information regarding whether there have been economies of scale with respect to the management of the Funds, whether the Funds have appropriately benefited from any economies of scale, and whether there is potential for realization of any further economies of scale with respect to the existing Funds. The Board observed that the investment advisory agreement limits each Fund’s total annual operating expenses to a percentage of the Fund’s assets and that this percentage is reduced as the Fund’s assets grow (known as “breakpoints”). The Board also observed that the total assets of the Funds had declined during the year. The Board concluded that no change was necessary to the current breakpoints to reflect any economies of scale.
Information about Services to Other Clients
The Board also received and considered information about the services and fee rates offered by the Adviser to its other clients, including other registered and unregistered investment companies, private accounts and institutional investors. The Board concluded that the investment advisory rates charged by the Adviser to the Funds were within a reasonable range of the fee rates offered to other clients of the Adviser. Where rates offered to other clients were lower, the Board concluded that the costs associated with managing and operating a registered open-end fund, compared with an unregistered investment company, private account or institutional investor account provided a justification for higher fee rates to the Funds.
Other Benefits to the Adviser
The Board received and considered information regarding potential “fall-out” or ancillary benefits to the Adviser as a result of its relationship with the Funds. Such benefits could include, among others, benefits directly attributable to the relationship of the Adviser with the Funds (such as “soft dollar” benefits) and benefits potentially derived from an increase in the business of the Adviser as a result of its relationship with the Funds (such as the ability to market to shareholders other financial products offered by the Adviser).
Other Factors and Broader Review
Throughout the year, the Board regularly reviews and assesses the quality of the services that the Funds receive from the Adviser. In this regard, the Board reviews reports of the Adviser at least in each of its quarterly meetings, which include, among other things, a detailed portfolio review and detailed fund performance reports. In addition, the Board interviews the portfolio managers of the Funds at various times throughout the year.
NOTES TO FINANCIAL STATEMENTS, December 31, 2008 - cont'd
8. Shareholder Proxy Vote (unaudited)
At a special meeting of shareholders, held on May 21, 2008, shares were voted as follows on the proposals presented to shareholders:
1. To approve the Investment Advisory Agreement and Plan of Reorganization between the Trust and Investment Advisor with respect to the Firsthand Global Technology Fund and Firsthand Technology Value Fund. The shareholders approved the reorganization of the Firsthand Global Technology Fund into Firsthand Technology Value Fund by the following votes:
| For | Against | Abstain |
| 1,010,096 | 68,748 | 28,536 |
2. To approve the Investment Advisory Agreement and Plan of Reorganization between the Trust and Investment Advisor with respect to the Firsthand Technology Innovators Fund and Firsthand Technology Value Fund. The shareholders approved the reorganization of the Firsthand Technology Innovators Fund into Firsthand Technology Value Fund by the following votes:
| For | Against | Abstain |
| 738,547 | 39,426 | 25,169 |
9. Risks (unaudited)
Because the return on and value of an investment in each Fund will fluctuate in response to stock market movements, the most significant risk of investing in a Fund is that you may lose money. Stocks and other equity securities are subject to market risks and fluctuations in value due to earnings, as well as economic, political, or regulatory events, and other factors beyond the Investment Adviser’s control. The Funds are designed for long-term investors who can accept the risks of investing in a fund with significant common stock holdings in high-technology industries.
Each Fund is non-diversified. A risk of being non-diversified is that a significant change in the value of one company will have a greater impact on the Fund than it would if the Fund diversified its investments. Another risk for the Fund is its concentration of investments in companies within high-technology industries. The value of high-technology companies can, and often does, fluctuate dramatically and may expose you to greater-than-average financial and market risk.
10. Proxy Voting Policy and Procedures (unaudited)
The Funds have adopted proxy voting procedures pursuant to which the Funds delegate the responsibility for voting proxies relating to portfolio securities held by the Funds to the Investment Adviser as part of the Investment Adviser’s general management of the Funds, subject to the Board of Trustees’ continuing oversight. A copy of the Funds’ proxy voting policy and procedures is available without charge, upon request, by calling 1.888.884.2675. Information regarding how the Investment Adviser voted these proxies for the one-year period ended June 30, 2008, is available by calling the same number and on the website of the U.S. Securities and Exchange Commission at http://www.sec.gov on Form N-PX. The Funds’ voting record is also available on the Funds’ website at www.firsthandfunds.com/proxy.
NOTES TO FINANCIAL STATEMENTS, December 31, 2008 - cont'd
11. Portfolio Holdings (unaudited)
The Funds file their complete schedule of portfolio holdings with the SEC for the first and third quarters of each fiscal year on Form N-Q. The Funds’ Forms N-Q will be available on the SEC’s website at http://www.sec.gov and may be reviewed and copied at the SEC’s Public Reference Room in Washington, D.C. Information on the operation of the Public Reference Room may be obtained by calling 1.800.SEC.0330.
12. Fund Reorganization
On May 21, 2008, Firsthand Technology Value Fund (the “Acquiring Fund”), acquired the assets and assumed the liabilities of Firsthand Technology Innovators Fund and Firsthand Global Technology Fund (the “Acquired Funds”), in a tax-free reorganization in exchange for shares of the Acquiring Fund, pursuant to a plan of reorganization approved by the Acquired Funds’ shareholders. When funds merge, capital loss carryforwards may be limited under section 382 of the Internal Revenue Code. The number and value of shares issued by the Acquiring Fund are presented in the Schedules of Changes in Net Assets. Net assets and unrealized depreciation as of the reorganization date were as follows:
Total Net Assets of Acquired Fund | Total Net Assets of Acquiring Fund | Total Net Assets of Acquiring Fund After Acquisition | Acquiring Fund Unrealized Appreciation/(Depreciation) |
| TIFQX | GTFQX | TIFQX | GTFQX | TIFQX | GTFQX | TIFQX | GTFQX |
| $ 15,784,526 | $ 9,809,545 | $ 306,066,492 | $ 306,066,492 | $ 331,660,563 | $ 331,660,563 | ($ 6,087,254) | $ 847,505 |
This page intentionally left blank
ADDITIONAL INFORMATION, December 31, 2008
Information about the trustees and officers* of the Funds is set forth in the following table. The Statement of Additional Information (the “SAI”) includes additional information about the Funds’ trustees and officers and is available free of charge, upon request, by calling 1.888.884.2675, option 2.
Name, Year of Birth,
Position(s) Held
With Funds | Term of Office and Length of Time Served (1) | Principal Occupation(s) During Past Five Years | Number of Funds in Fund Complex Overseen by Trustee | Other Trusteeships Held by Trustees |
| DISINTERESTED TRUSTEES |
GREG BURGLIN (1960) TRUSTEE 125 South Market Ste. 1300 San Jose, CA 95113 | SINCE 2008 | Mr. Burglin is a Tax Consultant and has been for more than 5 years. | FOUR | NONE (2) |
KEVIN P. TANNER (1962) TRUSTEE 125 South Market Ste. 1300 San Jose, CA 95113 | SINCE 2008 | Mr. Tanner is President, Chief Financial Officer and Chief Compliance Officer of Saratoga Research and Investment Management (formerly Tanner & Associates Asset Management) (an SEC registered investment adviser) and has been for more than 5 years. | FOUR | NONE (2) |
| INTERESTED TRUSTEES |
KEVIN M. LANDIS (3) (1961) TRUSTEE/ PRESIDENT 125 South Market Ste. 1300 San Jose, CA 95113 | SINCE 1994 | Mr. Landis is President and Chief Investment Officer and a Director of Firsthand Capital Management, Inc. and has been a portfolio manager with Firsthand Capital Management, Inc. since May 1994. | FOUR | NONE (2,4) |
ADDITIONAL INFORMATION, December 31, 2008
Name, Year of Birth, Position(s) Held With Funds | Term of Office and Length of Time Served (1) | Principal Occupation(s) During Past Five Years | Number of Funds in Fund Complex Overseen by Trustee | Other Trusteeships Held by Trustees |
| OFFICERS WHO ARE NOT TRUSTEES |
YAKOUB BELLAWALA (1965) SECRETARY 125 South Market Ste. 1300 San Jose, CA 95113 | SINCE 2003 | Mr. Bellawala is a Vice President of Firsthand Capital Management, Inc. (FCM) from 1999 to present. | N/A | N/A |
JONATHAN ROSEN (1971) TREASURER 125 South Market Ste. 1300 San Jose, CA 95113 | SINCE 2008 | Mr. Rosen is Senior Vice President, Global Transaction Services of Citi Fund Services for the last five years. | N/A | N/A |
NICHOLAS P. PETREDIS (1951) CHIEF COMPLIANCE OFFICER 125 South Market Ste. 1300 San Jose, CA 95113 | SINCE 2008 | Mr. Petredis has been a principal of Petredis Law Offices from 1993 to present. He was Managing Director and Senior Counsel of Firsthand Capital Management, Inc. from 2000 to 2001. | N/A | N/A |
| * | The term “officer” means the president, vice president, secretary, treasurer, chief compliance officer, controller, or any other officer who performs policy-making functions. |
| (1) | Each trustee shall serve for the lifetime of Firsthand Funds or until he dies, resigns, or is removed. Each officer shall serve a one-year term subject to annual reappointment by the trustees. |
| (2) | Messrs. Burglin, Tanner and Landis each served as a Trustee of Black Pearl Funds, a registered investment company, from its inception in September, 2005 through its liquidation in August, 2008. |
| (3) | Mr. Landis is an interested person of the Funds by reason of his position with the Investment Adviser. |
| (4) | Mr. Landis also currently sits on the board of directors for four private companies: Silicon Genesis Corp., Solaicx, SoloPower, Inc., and UCT Coatings, Inc. |
NOTES
NOTES
Firsthand Funds
P.O. Box 183120
Columbus, OH 43218-3120
1.888.884.2675
www.firsthandfunds.com
Investment Adviser
Firsthand Capital Management, Inc.
125 South Market
Suite 1300
San Jose, CA 95113
www.firsthandcapital.com
Distributor
ALPS Distributors, Inc.
1290 Broadway
Suite 1100
Denver, CO 80203
Transfer Agent
Citi Fund Services Ohio, Inc.
P.O. Box 183120
Columbus, OH 43218-3120
1.888.884.2675
This report is provided for the general information of the shareholders of Firsthand Funds. This report is not intended for distribution to prospective investors in the Funds, unless preceded or accompanied by an effective prospectus. For more complete information about Firsthand Funds, please call toll free 1.888.884.2675 or visit www.firsthandfunds.com for a prospectus, which contains more information, including risks, fees, and expenses. Read the prospectus carefully before investing or sending money.
Firsthand Funds are distributed by ALPS Distributors, Inc.
Firsthand, Technology Value Fund, and the interlocking “F” design are registered trademarks of Firsthand Capital Management, Inc.
Printed on chlorine-free paper.
FHF000444, exp. 3/15/2010
Item 2. Code of Ethics.
Disclose whether, as of the end of the period covered by the report, the registrant has adopted a code of ethics that applies to the registrant’s principal executive officer, principal financial officer, principal accounting officer or controller, or persons performing similar functions, regardless of whether these individuals are employed by the registrant or a third party. If the registrant has not adopted such a code of ethics, explain why it has not done so.
The registrant has adopted a code of ethics that applies to the registrant’s principal executive officer, principal financial officer, principal accounting officer or controller, or persons performing similar functions. This code of ethics is included as an Exhibit.
The registrant must briefly describe the nature of any amendment, during the period covered by the report, to a provision of its code of ethics that applies to the registrant’s principal executive officer, principal financial officer, principal accounting officer or controller, or persons performing similar functions, regardless of whether these individuals are employed by the registrant or a third party, and that relates to any element of the code of ethics definition enumerated in paragraph (b) of this Item. The registrant must file a copy of any such amendment as an exhibit pursuant to Item 12(a)(1), unless the registrant has elected to satisfy paragraph (f) of this Item by posting its code of ethics on its website pursuant to paragraph (f)(2) of this Item, or by undertaking to provide its code of ethics to any person without charge, upon request, pursuant to paragraph (f)(3) of this Item.
If the registrant has, during the period covered by the report, granted a waiver, including an implicit waiver, from a provision of the code of ethics that applies to the registrant’s principal executive officer, principal financial officer, principal accounting officer or controller, or persons performing similar functions, regardless of whether these individuals are employed by the registrant or a third party, that relates to one or more items set forth in paragraph (b) of this Item, the registrant must briefly describe the nature of the waiver, the name of the person to whom the waiver was granted, and the date of the waiver.
During the period covered by the report, with respect to the registrant's code of ethics that applies to its principal executive officer, principal financial officer, principal accounting officer or controller, or persons performing similar functions; there have been no amendments to, nor any waivers granted from, a provision that relates to any element of the code of ethics definition enumerated in paragraph (b) of this Item 2.
Item 3. Audit Committee Financial Expert.
(a) (1) Disclose that the registrant’s board of directors has determined that the registrant either:
(ii) Does not have an audit committee financial expert serving on its audit committee.
(2) If the registrant provides the disclosure required by paragraph (a)(1)(i) of this Item, it must disclose the name of the audit committee financial expert and whether that person is “independent.” In order to be considered “independent” for purposes of this Item, a member of an audit committee may not, other than in his or her capacity as a member of the audit committee, the board of directors, or any other board committee:
(i) Accept directly or indirectly any consulting, advisory, or other compensatory fee from the issuer; or
(ii) Be an “interested person” of the investment company as defined in Section 2(a)(19) of the Act (15 U.S.C. 80a-
2(a)(19)).
(3) If the registrant provides the disclosure required by paragraph (a)(1)(ii) of this Item, it must explain why it does not
have an audit committee financial expert.
Registrant’s Board of Trustees has determined that it does not have an “audit committee financial expert” serving on its audit committee. While Registrant believes that each of the members of its audit committee has sufficient knowledge of accounting principles and financial statements to serve on the audit committee, none has the requisite experience to qualify as an “audit committee financial expert”; as such term is defined by the Securities and Exchange Commission.
Item 4. Principal Accountant Fees and Services.
(e) (1) Disclose the audit committee’s pre-approval policies and procedures described in paragraph (c)(7) of Rule 2-01 of Regulation S-X.
The registrant's Audit Committee Charter states the following with respect to pre-approval procedures:
The Committee hereby delegates to the Chairman of the Committee the authority to grant pre-approvals of audit and "permissible" non-audit services to be provided by the Auditors to the Funds, subject to the ratification of the full Committee at its next regularly scheduled meeting. Both the Auditors and Fund counsel will be responsible for informing the Committee whether they believe that a particular non-audit service is permissible or prohibited pursuant to applicable regulations and standards.
The specific types of non-audit services that the Chairman may pre-approve include, but are not limited to: reviewing the Funds' internal controls over financial reporting; providing tax-related services; reviewing and/or developing an anti-money laundering program; and issuing comfort letters, based on agreed-upon procedures, in connection with any Fund reorganization.
Pre-approval for a non-audit service provided to a Fund is not required if: (i) the aggregate amount of all such non-audit services provided to the Fund constitutes not more than 5% of the total amount of revenues paid by the Fund to the Auditors during the fiscal year in which the non-audit services are provided; (ii) such services were not recognized by the Fund at the time of the engagement to be non-audit services; and (iii) such services are promptly brought to the attention of the Committee and are approved by the Committee or by one or more members of the Committee to whom authority to grant such approvals has been delegated by the Committee prior to the completion of the audit (the "De Minimus Exceptions").
The Committee shall also pre-approve any non-audit services proposed to be provided by the Auditors to (i) a Fund's investment adviser and (ii) any entity controlling, controlled by, or under common control with the investment adviser that provides ongoing services to the Fund, if the Auditors' engagement with the investment adviser or any such control persons relates directly to the operations and financial reporting of the Fund. The De Minimus Exceptions applies to pre-approvals under this paragraph as well, except that the "total amount of revenues" calculation is based on the total amount of revenues paid to the Auditors by the Fund and any other entity that has its services approved under this paragraph (i.e., the investment adviser or any control person).
(f) If greater than 50 percent, disclose the percentage of hours expended on the principal accountant’s engagement to audit the registrant’s financial statements for the most recent fiscal year that were attributed to work performed by persons other than the principal accountant’s full-time, permanent employees.
Not applicable.
(g) Disclose the aggregate non-audit fees billed by the registrant’s accountant for services rendered to the registrant, and rendered to the registrant’s investment adviser (not including any sub-adviser whose role is primarily portfolio management and is subcontracted with or overseen by another investment adviser), and any entity controlling, controlled by, or under common control with the adviser that provides ongoing services to the registrant for each of the last two fiscal years of the registrant.
(h) Disclose whether the registrant’s audit committee of the board of directors has considered whether the provision of non-audit services that were rendered to the registrant’s investment adviser (not including any sub-adviser whose role is primarily portfolio management and is subcontracted with or overseen by another investment adviser), and any entity controlling, controlled by, or under common control with the investment adviser that provides ongoing services to the registrant that were not pre-approved pursuant to paragraph (c)(7)(ii) of Rule 2-01 of Regulation S-X is compatible with maintaining the principal accountant’s independence.
Item 5. Audit Committee of Listed Registrants.
Not applicable.
Item 6. Investments.
(a) Not applicable.
(b) The Registrant made no divestments of securities in accordance with Section 13(a) of the Investment Company Act of 1940.
Item 7. Disclosure of Proxy Voting Policies and Procedures for Closed-End Management Investment Companies.
A closed-end management investment company that is filing an annual report on this Form N-CSR must, unless it invests exclusively in non-voting securities, describe the policies and procedures that it uses to determine how to vote proxies relating to portfolio securities, including the procedures that the company uses when a vote presents a conflict between the interests of its shareholders, on the one hand, and those of the company’s investment adviser; principal underwriter; or any affiliated person (as defined in Section 2(a)(3) of the Investment Company Act of 1940 (15 U.S.C. 80a-2(a)(3)) and the rules there under) of the company, its investment adviser, or its principal underwriter, on the other. Include any policies and procedures of the company’s investment adviser, or any other third party, that the company uses, or that are used on the company’s behalf, to determine how to vote proxies relating to portfolio securities.
Item 8. Portfolio Managers of Closed-End Management Investment Companies.
If the registrant is a closed-end management investment company that is filing an annual report on this Form N-CSR, provide the information specified in paragraphs (a) and (b) of this Item with respect to portfolio managers.
Not applicable.
Item 9. Purchases of Equity Securities by Closed-End Management Investment Company and Affiliated Purchasers.
Not applicable.
Item 10. Submission of Matters to a Vote of Security Holders.
Describe any material changes to the procedures by which shareholders may recommend nominees to the registrant's board of directors, where those changes were implemented after the registrant last provided disclosure in response to the requirements of Item 7(d)(2)(ii)(G) of Schedule 14A (17 CFR 240.14a-101), or this Item.
Not applicable.
Item 11. Controls and Procedures.
(a) Disclose the conclusions of the registrant’s principal executive and principal financial officers, or persons performing similar functions, regarding the effectiveness of the registrant’s disclosure controls and procedures (as defined in Rule 30a-3(c) under the Act (17 CFR 270.30a-3(c))) as of a date within 90 days of the filing date of the report that includes the disclosure required by this paragraph, based on the evaluation of these controls and procedures required by Rule 30a-3(b) under the Act (17 CFR 270.30a-3(b)) and Rules 13a-15(b) or 15d-15(b) under the Exchange Act (17 CFR 240.13a-15(b) or 240.15d-15(b)).
The registrant’s principal executive officer and principal financial officer have concluded, based on their evaluation of the registrant's disclosure controls and procedures as conducted within 90 days of the filing date of this report, that these disclosure controls and procedures are adequately designed and are operating effectively to ensure that information required to be disclosed by the registrant on Form N-CSR is recorded, processed, summarized and reported within the time periods specified in the Securities and Exchange Commission's rules and forms.
(b) Disclose any change in the registrant’s internal control over financial reporting (as defined in Rule 30a-3(d) under the Act (17 CFR 270.30a-3(d)) that occurred during the second fiscal quarter of the period covered by this report that has materially affected, or is reasonably likely to materially affect, the registrant's internal control over financial reporting.
There were no changes in the registrant’s internal control over financial reporting (as defined in Rule 30a-3(d) under the Act (17 CFR 270.30a-3(d)) that occurred during the second fiscal quarter of the period covered by this report that have materially affected or are reasonably likely to materially affect, the registrant’s internal control over financial reporting.
Item 12. Exhibits.
(a) File the exhibits listed below as part of this Form. Letter or number the exhibits in the sequence indicated.
(a)(1) Any code of ethics, or amendment thereto, that is the subject of the disclosure required by Item 2, to the extent that the registrant intends to satisfy the Item 2 requirements through filing of an exhibit.
The code of ethics that is the subject of the disclosure required by Item 2 is attached hereto.
(a)(2) A separate certification for each principal executive officer and principal financial officer of the registrant as required by Rule 30a-2(a) under the Act (17 CFR 270.30a-2).
Certifications pursuant to Rule 30a-2(a) are attached hereto.
(a)(3) Any written solicitation to purchase securities under Rule 23c-1 under the Act (17 CFR 270.23c-1) sent or given during the period covered by the report by or on behalf of the registrant to 10 or more persons.
Not applicable.
(b) If the report is filed under Section 13(a) or 15(d) of the Exchange Act, provide the certifications required by rule 30a-2(b) under the Act as an exhibit. A certification furnished pursuant to this paragraph will not be deemed “filed” for purposes of Section 18 of the Exchange Act, or otherwise subject to the liability of that section. Such certification will not be deemed to be incorporated by reference into any filing under the Securities Act of 1933 or the Exchange Act, except to the extent that the registrant incorporates it by reference.
Certifications pursuant to Rule 30a-2(b) are furnished herewith.
Pursuant to the requirements of the Securities Exchange Act of 1934 and the Investment Company Act of 1940, the registrant has duly caused this report to be signed on its behalf by the undersigned, thereunto duly authorized.