UNITED STATES
SECURITIES AND EXCHANGE COMMISSION
Washington, D.C. 20549
FORM N-CSR
CERTIFIED SHAREHOLDER REPORT OF REGISTERED
MANAGEMENT INVESTMENT COMPANIES
Investment Company Act file number | 811-8268 |
|
Firsthand Funds |
(Exact name of registrant as specified in charter) |
|
125 South Market, Suite 1200
San Jose, CA | | 95113 |
(Address of principal executive offices) | | (Zip code) |
|
Firsthand Capital Management, Inc.
125 South Market, Suite 1200
San Jose, CA 95113 |
(Name and address of agent for service) |
|
Registrant’s telephone number, including area code: | (408) 294-2200 | |
|
Date of fiscal year end: | December 31, 2005 | |
|
Date of reporting period: | December 31, 2005 | |
| | | | | | | | |
Form N-CSR is to be used by management investment companies to file reports with the Commission not later than 10 days after the transmission to stockholders of any report that is required to be transmitted to stockholders under Rule 30e-1 under the Investment Company Act of 1940 (17 CFR 270.30e-1). The Commission may use the information provided on Form N-CSR in its regulatory, disclosure review, inspection, and policymaking roles.
A registrant is required to disclose the information specified by Form N-CSR, and the Commission will make this information public. A registrant is not required to respond to the collection of information contained in Form N-CSR unless the Form displays a currently valid Office of Management and Budget (“OMB”) control number. Please direct comments concerning the accuracy of the information collection burden estimate and any suggestions for reducing the burden to Secretary, Securities and Exchange Commission, 450 Fifth Street, NW, Washington, DC 20549-0609. The OMB has reviewed this collection of information under the clearance requirements of 44 U.S.C. § 3507.
Item 1. Reports to Stockholders.
Include a copy of the report transmitted to stockholders pursuant to Rule 30e-1 under the Act (17 CFR 270.30e-1).

| | Firsthand
Funds |
| |
| |
| December 31, 2005 |
Annual Report to Shareholders
Firsthand Technology Value FundÒ
Firsthand Technology Leaders Fund
Firsthand Technology Innovators Fund
Firsthand e-Commerce Fund
Firsthand Global Technology Fund

This report is provided for the general information of the shareholders of Firsthand Funds.
This report is not intended for distribution to prospective investors in the Funds,
unless preceded or accompanied by an effective prospectus. For more complete
information about Firsthand Funds, please call toll free 1.888.884.2675, option 2, or
visit www.firsthandfunds.com for a prospectus, which contains more information,
including risks, fees, and expenses. Read the prospectus carefully before
investing or sending money.
Firsthand Funds are distributed by ALPS Distributors, Inc.
INTRODUCING FIRSTHAND HEALTH SCIENCES FUND
On January 3, 2006, Firsthand Health Sciences Fund, a health care sector fund, opened to investors. The Fund intends to invest in a broad array of health care-related companies, including biotechnology, pharmaceutical, medical device, managed care and health care service companies.
Portfolio manager | | Chen/Payer | |
Portfolio manager tenure | | Since inception | |
Inception | | 12/30/05 | |
Ticker symbol | | HSFQX | |
CUSIP | | 337941835 | |
Sales load | | None | |
Redemption fee | | None | |
For more information about the Fund, please visit www.firsthandfunds.com
or call 1.888.884.2675, option 2.
Firsthand Health Sciences Fund is subject to greater risk than more diversified funds because of its investments in fewer securities and because of its concentration of investments in certain industries in the health care sector. Specific risks associated with investments in foreign companies (as described in the Fund’s Prospectus) could cause the Fund’s share price to fluctuate dramatically. The Fund’s investments in small-cap companies present greater risk than investments in larger companies. The Fund invests in several industries within the health care sector and the relative weightings of these industries in the Fund’s portfolio may change at any time. Equity investing involves risks, including the potential loss of the principal amount invested. Firsthand Funds are subject to greater risk than more diversified funds.
This page intentionally left blank
CONTENTS
Performance Summary | | 4 |
| | |
President’s Letter | | 6 |
| | |
Shareholder Fee Example | | 8 |
| | |
Performance and Portfolio Discussion | | 10 |
| | |
Report of Independent Registered Public Accounting Firm | 20 |
| | |
Financial Statements | |
| | |
Portfolio of Investments | |
| | |
| Firsthand Technology Value Fund | 21 |
| | |
| Firsthand Technology Leaders Fund | 25 |
| | |
| Firsthand Technology Innovators Fund | 27 |
| | |
| Firsthand e-Commerce Fund | 30 |
| | |
| Firsthand Global Technology Fund | 32 |
| | |
Statements of Assets and Liabilities | 34 |
| | |
Statements of Operations | 36 |
| | |
Statements of Changes in Net Assets | 38 |
| | |
Financial Highlights | |
| | |
| Firsthand Technology Value Fund | 43 |
| | |
| Firsthand Technology Leaders Fund | 44 |
| | |
| Firsthand Technology Innovators Fund | 45 |
| | |
| Firsthand e-Commerce Fund | 46 |
| | |
| Firsthand Global Technology Fund | 47 |
| |
Notes to Financial Statements | | 48 |
| | |
Additional Information | | 64 |
| | | |
3
PERFORMANCE SUMMARY
PERIOD RETURNS
(average annual total returns as of 12/31/05)
| | JUL-DEC | | | | | | | | | |
| | 2005 | | | | | | | | | |
FUND | | TOTAL | | 1-YEAR | | 3-YEAR | | 5-YEAR | | 10-YEAR | |
Firsthand Technology Value Fund® | | 18.75 | % | 12.35 | % | 22.33 | % | -14.77 | % | 9.53 | % |
| | | | | | | | | | | |
Firsthand Technology Leaders Fund | | 16.90 | % | 13.13 | % | 21.18 | % | -10.95 | % | * | |
| | | | | | | | | | | |
Firsthand Technology Innovators Fund | | 5.59 | % | -11.90 | % | 6.17 | % | -17.43 | % | * | |
| | | | | | | | | | | |
Firsthand e-Commerce Fund | | 11.48 | % | 5.26 | % | 17.80 | % | -12.50 | % | * | |
| | | | | | | | | | | |
Firsthand Global Technology Fund | | 4.55 | % | -8.64 | % | 17.34 | % | -14.88 | % | * | |
| | | | | | | | | | | |
Nasdaq | | 7.64 | % | 2.13 | % | 18.89 | % | -1.75 | % | 8.11 | % |
| | | | | | | | | | | |
DJIA | | 5.57 | % | 1.72 | % | 11.17 | % | 2.00 | % | 9.79 | % |
| | | | | | | | | | | |
S&P 500 | | 5.77 | % | 4.91 | % | 14.38 | % | 0.54 | % | 9.06 | % |
*Not annualized.
Returns assume reinvestment of all dividends and distributions but do not reflect the impact of taxes. The performance data quoted represent past performance. Past performance cannot guarantee future results, and current performance may be lower or higher than the performance quoted. Both the return from and the principal value of an investment in the Funds will fluctuate so that an investor’s shares, when redeemed, may be worth more or less than their original cost. To obtain performance as of the most recent month-end, please contact Firsthand Funds by calling 1.888.884.2675 or go to www.firsthandfunds.com.
The Dow Jones Industrial Average (DJIA) is a group of 30 stocks tracked by the Dow Jones Company. The Nasdaq Composite Index (Nasdaq) is a capitalization-weighted index of all common stocks listed with Nasdaq. The Standard & Poor’s 500 Index (S&P 500) is a market-weighted index of 500 stocks of well-established companies. Each index represents an unmanaged, broad-based basket of stocks. These indices are typically used as benchmarks for overall market performance. The Lipper Science and Technology Fund Index includes the largest 30 mutual funds in the group, which, by prospectus or portfolio practice, invest at least 80% of their equity portfolios in science and technology stocks. Investments cannot be made directly in an index.
4
RETURNS SINCE INCEPTION
(average annual total returns as of 12/31/05)
| | AVERAGE | | | | | | | |
| | ANNUAL | | | | | | | |
| | TOTAL | | | | | | S&P | |
FUND (INCEPTION DATE) | | RETURN | | NASDAQ | | DJIA | | 500 | |
Firsthand Technology Value Fund® (5/20/94) | | 14.90 | % | 10.46 | % | 11.69 | % | 10.99 | % |
| | | | | | | | | |
Firsthand Technology Leaders Fund (12/10/97) | | 8.45 | % | 4.31 | % | 5.63 | % | 4.69 | % |
| | | | | | | | | |
Firsthand Technology Innovators Fund (5/20/98) | | 2.32 | % | 2.78 | % | 4.24 | % | 3.12 | % |
| | | | | | | | | |
Firsthand e-Commerce Fund (9/30/99) | | -15.75 | % | -3.03 | % | 2.60 | % | 1.13 | % |
| | | | | | | | | |
Firsthand Global Technology Fund (9/29/00) | | -16.30 | % | -8.82 | % | 2.23 | % | -1.03 | % |
Each Fund may invest in small-capitalization companies and Initial Public Offerings (“IPOs”). These investments may be more volatile than investments in large-capitalization companies and loss of principal could be greater. The Funds may invest in foreign securities, which may be subject to greater risks than investing in domestic securities. Because the Funds are not diversified, they can take larger positions in fewer companies, increasing their risk profile. The Funds invest in several industries within the technology sector and the relative weightings of these industries in a Fund’s portfolio may change at any time.
5
PRESIDENT’S LETTER

| FELLOW SHAREHOLDERS,
The major market indices made little progress in 2005, with the Dow Jones Industrial Average, the S&P 500 Index, and the NASDAQ Composite Index posting gains of 1.72%, 4.91%, and 2.13%, respectively. With no general market upswing, it was a stock-picker’s market. The best gains were achieved by picking the right stocks, not necessarily the right sectors or segments.
Given that environment, I am pleased to report that our three largest funds handily beat the indices, with Firsthand Technology Value Fund, Firsthand Technology Leaders Fund, and Firsthand e-Commerce Fund posting gains of |
12.35%, 13.13%, and 5.26%, respectively. Unfortunately, a few of the companies owned by Firsthand Technology Innovators Fund and Firsthand Global Technology Fund stumbled badly in 2005, causing both funds to underperform the market.
Investing while looking in the rearview mirror is almost never a good idea. As I’ve said before, technology investors should avoid falling back on the familiar names from the last bull market. In the six years since the NASDAQ peaked, the technology landscape has changed radically, and the tech “bellwethers” are not the same growth machines they once were. Our focus is growth, so these well-known technology companies of the past do not dominate our portfolios. Though it may feel unsettling to see so many new and unfamiliar names in our funds, these newcomers are often the companies leading us into the most exciting opportunities. I would like to discuss some of the most promising areas within the tech sector, highlighting those in which we have already made significant investments.
Consumer Electronics—Ten years ago, PCs and corporate networks were the major growth drivers in the technology sector. Today, that distinction belongs almost exclusively to consumer electronics, a global market that has been fueled by the emergence of middle-class consumers in developing economies such as China and India. From iPods and game consoles to flat-panel TVs and digital cameras, consumer electronics are hot. In fact, they have surpassed corporate IT gear in terms of end markets for semiconductors. Companies such as SanDisk (SNDK) and Corning (GLW) performed extremely well as consumer demand for flash memory and LCD displays surged in 2005.
The magnitude of the emerging economies of China and India and their impact on business opportunities is profound. Considering that the Chinese middle class will soon outnumber the U.S. middle class, it should soon surpass the total U.S. market for consumer electronics—at least in terms of units sold. This has already happened with cell phones and will soon happen with Internet connections. Televisions and PCs could take a while longer, but the trend is clear. For the right companies, this is very, very good news.
The Internet—The Internet is also capitalizing on a growing user base and has become a dominant force shaping both consumer behavior and business strategies. In 2005, the number of people online hit one billion. Although penetration rates in the U.S. are already nearing 70%, in Asia it is still only about 10%—a 200% increase in just five years. Our funds capitalized on this growth with solid 2005 performances from companies such as Google (GOOG), Akamai (AKAM), and Netflix (NFLX).
Note: All portfolio compositions are subject to change
6
Location, Location, Location—“Markets within markets” remain an important component of our investment strategy. We believe that great growth potential exists for companies selling a new feature or service to an already huge, established market. A good example of this is the cell phone market. Although somewhat mature in terms of total penetration rates (approximately 2 billion people worldwide already own cell phones), the cell phone market offers numerous and lucrative opportunities to businesses that offer new features and services to even a fraction of that existing user base. We believe location-based technology is poised to become one of the hottest of these new features. GPS companies like Global Locate and SiRF (SIRF) are well positioned to benefit if and when GPS-enabled phones become as popular as camera phones are today. Another company already benefiting from cell phone users’ demand for new features is QUALCOMM (QCOM), a maker of chipsets that enable multimedia capabilities on wireless phones and PDAs.
Semiconductors and Moore’s Law—Though the market for lithography equipment is relatively mature, we believe ASM Lithography (ASML) is in an excellent position to gain market share as manufacturers begin to re-tool for producing the next generation of semiconductor devices. Immersion lithography is a semiconductor manufacturing technology that enables chip makers to enhance resolution, allowing them to produce circuit features as small as 45 nanometers. As one of the leading developers of this lithography technology, we believe ASM is in a good position to capture a sizeable share of this market.
Solar Power—Cypress Semiconductor (CY) was an outstanding performer for the Funds last year, based largely on its majority ownership of solar cell manufacturer SunPower (SPWR). It may not be intuitive that solar and semiconductor technologies are interrelated, but most solar cells are made from silicon wafers—the same basic building block used to manufacture all kinds of silicon chips. While the science of collecting solar energy is fairly well understood today, we expect to see further advances in materials technology that will improve the efficiency of solar cells. Meanwhile, the market for solar equipment is expected to double by 2010.
These are just a few of what we believe to be the most promising areas of investment within the technology sector in the coming years. There are many others, such as security, RFID, web services, solid state lighting, clean technologies—and, yes, even nanotech—that we are watching closely. While I expect the U.S economy to continue to perform well in 2006, external factors, such as oil prices and international politics, will always have a considerable influence on the stock market. Nevertheless, I am encouraged by the fact that technology sector earnings are growing and innovation is alive and well.
Thank you for your investment in Firsthand Funds.
Sincerely,

Kevin Landis
President and Chief Executive Officer
7
SHAREHOLDER FEE EXAMPLE (UNAUDITED)
Example—In general, mutual fund shareholders may incur two types of costs: (1) transaction costs, including sales charges (loads), redemption fees, and exchange fees; and (2) ongoing costs, including management fees, 12b-1 distribution and service fees, non-12b-1 service fees, and other Fund expenses. This example is intended to help you understand your ongoing costs (in dollars) of investing in a Fund and to compare these costs with the ongoing costs of investing in other mutual funds. Note that Firsthand Funds (“Trust”) does not charge transaction fees or 12b-1 distribution and service fees, though you may incur transaction fees if you purchase shares through a broker.
The example below is based on an investment of $1,000 made at the beginning of the period and held for the entire period from July 1, 2005, to December 31, 2005.
Actual Expenses—The section of the table at right entitled “Actual” provides information about actual account values and actual expenses. You may use this information, together with the amount you invested, to estimate the expenses that you paid over the period. Simply divide your account value by $1,000 (for example, an $8,600 account value divided by $1,000 = 8.6), and multiply the result by the number in the section entitled “Actual” under the heading “Expenses Paid During Period” to estimate the expenses you paid on your account during this period. If your account is an IRA or other tax-qualified savings plan, your expenses may also have included a $10 annual fee. In either case, the amount of any fee paid through your account would increase the estimate of expenses you paid during the period and decrease your ending account value.
Hypothetical Example for Comparison Purposes—The section of the table at right entitled “Hypothetical” provides information about hypothetical account values and hypothetical expenses based on a Fund’s actual expense ratio and an assumed rate of return of 5% per year before expenses, which is not the Fund’s actual return. The hypothetical account values and expenses may not be used to estimate your actual ending account balance or the expenses you paid for the period. However, you may use this information to compare the ongoing costs of investing in the Fund and other funds. To do so, compare this 5% hypothetical example with the 5% hypothetical examples that appear in the shareholder reports of the other funds. As in the case of the actual expense example, if your account is subject to an IRA fee, the amount of the fee paid through your account would increase the hypothetical expenses you would have paid during the period and decrease the hypothetical ending account value.
Please note that the expenses shown in the table at right are meant to highlight your ongoing costs only and do not reflect any transactional costs, such as sales charges (loads), redemption fees, or exchange fees. Therefore, the table is useful in comparing ongoing costs only, and will not help you determine the relative total costs of owning different funds. If these transactional costs were included, your costs would have been higher. The examples also assume all dividends and distributions have been reinvested.
8
Firsthand Technology Value Fund
| | Beginning | | Ending | | Expenses Paid | | | |
| | Account Value | | Account Value | | During Period* | | Annualized | |
| | 7/1/05 | | 12/31/05 | | 7/1/05-12/31/05 | | Expense Ratio | |
Actual | | $ | 1,000 | | $ | 1,187.50 | | $ | 10.87 | | 1.92 | % |
Hypothetical** | | $ | 1,000 | | $ | 1,015.08 | | $ | 9.75 | | 1.92 | % |
Firsthand Technology Leaders Fund
| | Beginning | | Ending | | Expenses Paid | | | |
| | Account Value | | Account Value | | During Period* | | Annualized | |
| | 7/1/05 | | 12/31/05 | | 7/1/05-12/31/05 | | Expense Ratio | |
Actual | | $ | 1,000 | | $ | 1,169.00 | | $ | 10.91 | | 1.95 | % |
Hypothetical** | | $ | 1,000 | | $ | 1,014.93 | | $ | 9.90 | | 1.95 | % |
Firsthand Technology Innovators Fund
| | Beginning | | Ending | | Expenses Paid | | | |
| | Account Value | | Account Value | | During Period* | | Annualized | |
| | 7/1/05 | | 12/31/05 | | 7/1/05-12/31/05 | | Expense Ratio | |
Actual | | $ | 1,000 | | $ | 1,055.90 | | $ | 10.15 | | 1.95 | % |
Hypothetical** | | $ | 1,000 | | $ | 1,014.93 | | $ | 9.90 | | 1.95 | % |
Firsthand e-Commerce Fund
| | Beginning | | Ending | | Expenses Paid | | | |
| | Account Value | | Account Value | | During Period* | | Annualized | |
| | 7/1/05 | | 12/31/05 | | 7/1/05-12/31/05 | | Expense Ratio | |
Actual | | $ | 1,000 | | $ | 1,114.80 | | $ | 10.45 | | 1.95 | % |
Hypothetical** | | $ | 1,000 | | $ | 1,014.93 | | $ | 9.90 | | 1.95 | % |
Firsthand Global Technology Fund
| | Beginning | | Ending | | Expenses Paid | | | |
| | Account Value | | Account Value | | During Period* | | Annualized | |
| | 7/1/05 | | 12/31/05 | | 7/1/05-12/31/05 | | Expense Ratio | |
Actual | | $ | 1,000 | | $ | 1,045.50 | | $ | 9.96 | | 1.95 | % |
Hypothetical** | | $ | 1,000 | | $ | 1,014.93 | | $ | 9.90 | | 1.95 | % |
* Expenses are calculated by multiplying the Fund’s annualized expense ratio listed above by the average account value over the period and multiplying that number by 184/365 (to reflect the one-half year period).
** 5% return per year before expenses.
The expenses shown in the table do not reflect any fees that may be charged to you by brokers, financial intermediaries, or other financial institutions.
9
Firsthand Technology Value Fund
Performance and Portfolio Discussion
How did the Fund perform in 2005?
In 2005, Firsthand Technology Value Fund (TVFQX) posted a 12.35% gain, versus a 2.13% increase for the Nasdaq Composite Index and a 5.38% gain for the Lipper Science and Technology Fund Index. For the six months ending December 31, 2005, Firsthand Technology Value Fund rose 18.75% as compared to 7.64% and 11.19% gains for the Nasdaq and the Lipper peer group benchmarks, respectively.
Which industries had the greatest impact on the Fund’s performance?
During 2005, Firsthand Technology Value Fund’s holdings in the semiconductor, Internet, and photonics industries helped it significantly outperform its benchmarks. Our decision to tilt the portfolio toward the consumer market paid off as robust spending on consumer electronics in 2005 benefitted the Fund’s portfolio holdings in these industries.
Which individual holdings were the largest contributors to the Fund’s performance?*
The Fund’s largest contributor in 2005 was flash memory supplier SanDisk (SNDK). SanDisk manufactures NAND flash, which is smaller, lighter, and consumes less power than a hard disk, making it the storage technology of choice for portable electronic devices such as digital cameras, MP3 players, and cell phones. Demand for flash increased when Apple Computer (AAPL) chose this type of memory over mini hard drives for use in some of its popular iPod products. After enjoying a nice run we gradually pared back our holdings as the stock price advanced, and we completely liquidated the Fund’s position by year end. Another positive contribution came from online DVD provider Netflix (NFLX), whose shares dipped briefly into the single digits early in 2005 as concerns of increased competition raised questions about the viability of the company’s business model. However, as its competitors stumbled, Netflix’s large customer base of more than four million subscribers helped it bounce back, with the stock up 119% for the year.
Once a high flier based on its leadership position in the photonics industry, Corning (GLW) successfully turned its business around by focusing on the manufacture of glass for liquid crystal display (LCD) panels found in desktop monitors, laptop computers, and LCD TVs. Increasing consumer demand for next-generation flat-panel TVs helped shares of Corning jump 67% this past year. Other holdings that helped boost performance in 2005 included Internet service provider Akamai Technologies (AKAM), employee Internet management software vendor Websense (WBSN), and semiconductor manufacturers Texas Instruments (TXN) and Zoran (ZRAN).
Which holdings were the greatest detractors from the Fund’s performance?
The Fund’s biggest money-loser during the period was telecommunications equipment provider UTStarcom (UTSI). UTStarcom struggled with declining demand for its telecom infrastructure equipment for wireline and wireless networks in its key market—China. UTStarcom’s dependence on China for the bulk of its revenues forced the company to pursue other opportunities to revitalize growth when that market started to slow. UTStarcom’s uncertain future growth prospects led many investors to abandon the stock, sending it down more than 60% in 2005.
Competition in the online music market got a bit more fierce in 2005 when Yahoo! (YHOO) announced that it would offer an online music service at significantly lower rates than Napster (NAPS)—news that sent shares of Napster down more than 25%. Other notable laggards among our portfolio holdings included communications equipment supplier Tekelec (TKLC), thermal imaging provider FLIR Systems (FLIR), and chipmakers PMC-Sierra (PMCS), Applied Micro Circuits (AMCC), and Skyworks Solutions (SWKS).
*Portfolio composition is subject to change.
10
Fund Performance and Holding Information (as of December 31, 2005)
Firsthand Technology Value Fund vs. Market Indices
| | TVFQX | | NASDAQ | | DJIA | | S&P 500 | |
Since Inception (5/20/94) | | 14.90 | % | 10.46 | % | 11.69 | % | 10.99 | % |
| | | | | | | | | |
10-Year | | 9.53 | % | 8.11 | % | 9.79 | % | 9.06 | % |
| | | | | | | | | |
5-Year | | -14.77 | % | -1.75 | % | 2.00 | % | 0.54 | % |
| | | | | | | | | |
3-Year | | 22.33 | % | 18.89 | % | 11.17 | % | 14.38 | % |
| | | | | | | | | |
1-Year | | 12.35 | % | 2.13 | % | 1.72 | % | 4.91 | % |
Growth of a Hypothetical $10,000 Investment
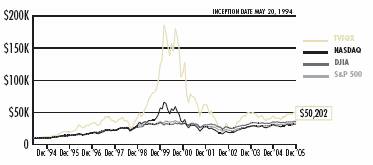
Returns assume reinvestment of all dividends and distributions but do not reflect the impact of taxes. The performance data quoted represent past performance. Past performance cannot guarantee future results, and current performance may be lower or higher than the performance quoted. Both the return from and the principal value of an investment in the Funds will fluctuate so that an investor’s shares, when redeemed, may be worth more or less than their original cost. To obtain performance as of the most recent month-end, please contact Firsthand Funds by calling 1.888.884.2675 or go to www.firsthandfunds.com.
Holdings by Industry*
| | % of Net Assets | |
Semiconductors | | 22.7 | % |
Software | | 18.5 | % |
Internet | | 13.6 | % |
Photonics | | 8.5 | % |
Communications Equipment | | 7.7 | % |
Semiconductor Equipment | | 6.3 | % |
Other Electronics | | 6.0 | % |
Peripherals | | 4.5 | % |
Networking | | 3.5 | % |
Intellectual Property | | 2.2 | % |
Defense & Aerospace | | 1.7 | % |
Other | | 3.0 | % |
Net Cash | | 1.8 | % |
* Based on percentage of net assets as of December 31, 2005.
Top 10 Holdings**
| | % of Net Assets | |
Netflix, Inc. | | 7.5 | % |
Corning, Inc. | | 6.8 | % |
Cypress Semiconductor Corp. | | 5.7 | % |
Comverse Technology, Inc. | | 5.5 | % |
Western Digital Corp. | | 4.5 | % |
Symbol Technologies, Inc. | | 4.4 | % |
VeriSign, Inc. | | 4.1 | % |
Applied Materials, Inc. | | 4.0 | % |
Akamai Technologies, Inc. | | 3.8 | % |
Aeroflex, Inc. | | 3.0 | % |
** Top 10 stock holdings total 49.3% of net assets. These holdings are current as of December 31, 2005, and may not be representative of current or future investments. Firsthand includes only public companies in top 10 holdings.
11
Firsthand Technology Leaders Fund
Performance and Portfolio Discussion
How did the Fund perform in 2005?
In 2005, Firsthand Technology Leaders Fund (TLFQX) posted a 13.13% gain, versus a 2.13% increase for the Nasdaq Composite Index and a 5.38% gain for the Lipper Science and Technology Fund Index. For the six months ending December 31, 2005, Firsthand Technology Leaders Fund rose 16.90% as compared to 7.64% and 11.19% gains for the Nasdaq and the Lipper peer group benchmarks, respectively.
Which industries had the greatest impact on the Fund’s performance?
Firsthand Technology Leaders Fund was able to outperform its benchmarks in 2005 due to its exposure to the semiconductor and photonics industries. Detracting from Fund performance were the portfolio’s Internet, software, and networking holdings.
Which individual holdings were the largest contributors to the Fund’s performance?*
For the period, the Fund’s top contributor was flash memory supplier SanDisk (SNDK). SanDisk manufactures NAND flash, which is smaller, lighter, and consumes less power than a hard disk, making it the storage technology of choice for portable electronic devices such as digital cameras, MP3 players, and cell phones. Demand for flash increased when Apple Computer (AAPL) chose this type of memory over mini hard drives for use in some of its popular iPod products. This news also boosted shares of Samsung Electronics (no U.S. symbol), a diversified consumer electronics giant and the world’s largest manufacturer of flash memory. Other semiconductor firms that helped Fund performance included Texas Instruments (TXN), chip foundry Taiwan Semiconductor Manufacturing Company (TSM), and semiconductor equipment provider ASML Holding N.V. (ASML).
In the photonics industry, shares of Corning (GLW) rose 67% in 2005 due in part to the success the company has experienced in its display technology division. Corning is the primary supplier of glass substrates to many of the world’s biggest television and display manufacturers and the company saw robust demand throughout 2005 as lower prices helped spark consumer interest for liquid crystal display (LCD) TVs and flat-panel monitors.
Which holdings were the greatest detractors from the Fund’s performance?
eBay (EBAY) was the Fund’s largest detractor in 2005. During the year, the online auction giant saw decelerating growth in several of its key markets and acknowledged that it would not meet Wall Street expectations. Despite moving aggressively into the Asian markets, expectations for robust growth there have not yet been realized. Investors also questioned eBay’s pricey acquisition of Skype and how easily it could be integrated into eBay’s core business. Skype allows users to make phone calls over the Internet using voice-over Internet protocol technology, or VoIP.
Cisco Systems (CSCO) finished the year down 11.4% as investors remained concerned about the company’s lackluster growth prospects. Cisco is the dominant supplier of routers, switches, and software that enable computer networks to communicate over the Internet. However, growth in Cisco’s core router and switch business has declined, forcing the company to look for other high-growth areas such as VoIP to bolster revenue.
Shares of VERITAS Software (VRTS) also lagged after Symantec (SYMC) announced that it would acquire the storage software vendor in December 2004. We elected to exit our position in VERITAS Software prior to the acquisition’s July 2005 closing. Other positions that were closed at a loss included software vendors Mercury Interactive (MERQ) and BEA Systems (BEAS).
*Portfolio composition is subject to change.
12
Fund Performance and Holding Information (as of December 31, 2005)
Firsthand Technology Leaders Fund vs. Market Indices
| | TLFQX | | NASDAQ | | DJIA | | S&P 500 | |
Since Inception (12/10/97) | | 8.45 | % | 4.31 | % | 5.63 | % | 4.69 | % |
5-Year | | -10.95 | % | -1.75 | % | 2.00 | % | 0.54 | % |
3-Year | | 21.18 | % | 18.89 | % | 11.17 | % | 14.38 | % |
1-Year | | 13.13 | % | 2.13 | % | 1.72 | % | 4.91 | % |
Growth of a Hypothetical $10,000 Investment
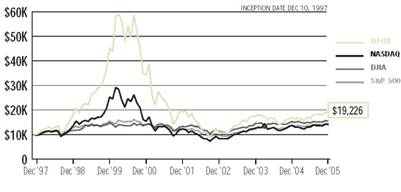
Returns assume reinvestment of all dividends and distributions but do not reflect the impact of taxes. The performance data quoted represent past performance. Past performance cannot guarantee future results, and current performance may be lower or higher than the performance quoted. Both the return from and the principal value of an investment in the Funds will fluctuate so that an investor’s shares, when redeemed, may be worth more or less than their original cost. To obtain performance as of the most recent month-end, please contact Firsthand Funds by calling 1.888.884.2675 or go to www.firsthandfunds.com.
Holdings by Industry*
| | % of Net Assets | |
Semiconductors | | 29.5 | % |
Software | | 25.0 | % |
Semiconductor Equipment | | 9.5 | % |
Communications Equipment | | 7.4 | % |
Internet | | 5.8 | % |
Photonics | | 4.9 | % |
Media | | 3.8 | % |
Electronics Manufacturing Services | | 3.7 | % |
Other Electronics | | 3.7 | % |
Networking | | 3.6 | % |
Net Cash | | 3.1 | % |
* Based on percentage of net assets as of December 31, 2005.
Top 10 Holdings**
| | % of Net Assets | |
Taiwan Semi. Mfg. Co. - ADR | | 5.9 | % |
QUALCOMM, Inc. | | 5.5 | % |
SanDisk Corp. | | 5.4 | % |
Texas Instruments, Inc. | | 5.0 | % |
Corning, Inc. | | 4.9 | % |
VeriSign, Inc. | | 4.8 | % |
ASML Holding N.V. | | 4.7 | % |
Samsung Electronics Co., Ltd. - GDR | | 4.4 | % |
SAP AG - ADR | | 4.3 | % |
Adobe Systems, Inc. | | 4.2 | % |
** Top 10 stock holdings total 49.1% of net assets. These holdings are current as of December 31, 2005, and may not be representative of current or future investments. Firsthand includes only public companies in top 10 holdings.
13
Firsthand Technology Innovators Fund
Performance and Portfolio Discussion
How did the Fund perform in 2005?
In 2005, Firsthand Technology Innovators Fund (TIFQX) posted an 11.90% loss, versus a 2.13% increase for the Nasdaq Composite Index and a 5.38% gain for the Lipper Science and Technology Fund Index. For the six months ending December 31, 2005, Firsthand Technology Innovators Fund rose 5.59% as compared to 7.64% and 11.19% gains for the Nasdaq and the Lipper peer group benchmarks, respectively.
Which industries had the greatest impact on the Fund’s performance?
The Fund underperformed its benchmarks due to its holdings in the photonics, software, and communications equipment industries. While we are disappointed with the poor performance of the Fund, we remain committed to our style of investing in small, emerging technology companies despite the inherent volatility of this asset class.
Which individual holdings were the largest contributors to the Fund’s performance?*
During the period, the largest contributor to Fund performance was disk drive component supplier Intevac (IVAC). An increase in consumer devices that utilize portable storage, such as digital video recorders and handheld music players, drove demand for the company’s equipment as hard drive manufacturers continue to increase storage capacity. Earlier in the year, we realized a nice gain in SiRF Technology (SIRF) after the maker of global positioning navigation products posted second-quarter results that surpassed analysts’ expectations. GPS technology provides instant location information using satellite signals and is being embedded in many consumer and commercial applications, such as car navigation systems, cell phones, and PDAs.
Other portfolio holdings that positively contributed to Fund performance included Power Integrations (POWI), a supplier of high-voltage analog integrated circuits used in power conversion; Trident Microsystems (TRID), a provider of integrated circuits to the fast-growing LCD and plasma television market; and Synaptics (SYNA), a leading supplier of user interface solutions for laptop computers and portable digital music players.
Which holdings were the greatest detractors from the Fund’s performance?
The Fund’s greatest detractor during the period was Avici Systems (AVCI), a provider of optical networking equipment used by telecommunications companies and Internet service providers. The company struggled with increasing competition in the router market, which resulted in a 56% drop in Avici’s share price during 2005.
Shares of Napster (NAPS) stumbled in 2005 as well, after nearly doubling the year before. Napster offers a subscription service that allows users to either listen to or download music over the Internet. However, competition in the online music market intensified in 2005 as Yahoo! (YHOO) launched its own online music service at a significant discount to Napster’s prices. Other holdings that weighed heavily on Fund performance included wireless broadband infrastructure provider Vyyo (VYYO), software vendor Altiris (ATRS), and Microvision (MVIS), a provider of display technologies.
*Portfolio composition is subject to change.
14
Fund Performance and Holding Information (as of December 31, 2005)
Firsthand Technology Innovators Fund vs. Market Indices
| | TIFQX | | NASDAQ | | DJIA | | S&P 500 | |
Since Inception (5/20/98) | | 2.32 | % | 2.78 | % | 4.24 | % | 3.12 | % |
5-Year | | -17.43 | % | -1.75 | % | 2.00 | % | 0.54 | % |
3-Year | | 6.17 | % | 18.89 | % | 11.17 | % | 14.38 | % |
1-Year | | -11.90 | % | 2.13 | % | 1.72 | % | 4.91 | % |
Growth of a Hypothetical $10,000 Investment
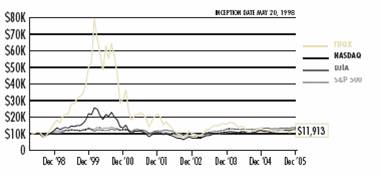
Returns assume reinvestment of all dividends and distributions but do not reflect the impact of taxes. The performance data quoted represent past performance. Past performance cannot guarantee future results, and current performance may be lower or higher than the performance quoted. Both the return from and the principal value of an investment in the Funds will fluctuate so that an investor’s shares, when redeemed, may be worth more or less than their original cost. To obtain performance as of the most recent month-end, please contact Firsthand Funds by calling 1.888.884.2675 or go to www.firsthandfunds.com.
Holdings by Industry*
| | % of Net Assets | |
Semiconductors | | 21.5 | % |
Other Electronics | | 16.6 | % |
Intellectual Property | | 12.1 | % |
Communications Equipment | | 9.6 | % |
Networking | | 7.7 | % |
Services | | 6.4 | % |
Software | | 6.3 | % |
Internet | | 5.3 | % |
Electronic Design Automation | | 4.1 | % |
Photonics | | 2.6 | % |
Other | | 2.1 | % |
Net Cash | | 5.7 | % |
* Based on percentage of net assets as of December 31, 2005.
Top 10 Holdings**
| | % of Net Assets | |
Intevac, Inc. | | 9.5 | % |
Applied Films Corp. | | 4.1 | % |
Airspan Networks, Inc. | | 4.1 | % |
PDF Solutions, Inc. | | 4.1 | % |
Finisar Corp. | | 3.3 | % |
Synaptics, Inc. | | 3.1 | % |
Altiris, Inc. | | 2.9 | % |
Packeteer, Inc. | | 2.8 | % |
Power Integrations, Inc. | | 2.2 | % |
Microvision, Inc. | | 2.2 | % |
** Top 10 stock holdings total 38.3% of net assets. These holdings are current as of December 31, 2005, and may not be representative of current or future investments. Firsthand includes only public companies in top 10 holdings.
15
Firsthand e-Commerce Fund
Performance and Portfolio Discussion
How did the Fund perform in 2005?
In 2005, Firsthand e-Commerce Fund (TEFQX) posted a 5.26% gain, versus a 2.13% increase for the Nasdaq Composite Index and a 5.38% gain for the Lipper Science and Technology Fund Index. For the six months ending December 31, 2005, Firsthand
e-Commerce Fund rose 11.48% as compared to 7.64% and 11.19% gains for the Nasdaq and the Lipper peer group benchmarks, respectively.
Which industries had the greatest impact on the Fund’s performance?
The portfolio’s exposure to Internet stocks and the software industry helped the Fund perform well during the period. Internet stocks in general had a good year, with shoppers spending an estimated $30.1 billion online during the 2005 holiday season, up 30% from 2004.
Which individual holdings were the largest contributors to the Fund’s performance?*
For the period, the Fund’s top contributor within the Internet segment was online DVD provider Netflix (NFLX). Netflix’s stock price dipped briefly into the single digits early in 2005 as concerns about increased competition had some investors questioning the viability of the company’s business model. However, as its competitors stumbled, shares of Netflix bounced back strongly as the company added to an already large customer base of more than four million subscribers. Web content delivery firm Akamai Technologies (AKAM) also saw a nice turnaround in its business in 2005 due to increased demand for fast, reliable, and more robust multimedia content. Akamai has thousands of servers strategically placed around the world that enable companies like Yahoo! (YHOO), FedEx (FDX), and Apple (AAPL) to host their Web content physically closer to end-users, thus significantly improving download speeds.
In the software industry, the steady adoption of the Linux operating system (“OS”) helped boost shares of Novell (NOVL) and Red Hat (RHAT), two of the system’s primary suppliers. The Linux open-source OS is a powerful, low-cost alternative to proprietary operating systems such as UNIX and Microsoft Windows. Also in software, we exited our position in Macromedia for a nice gain shortly after Adobe Systems (ADBE) announced that it would acquire the company. Other holdings that positively contributed to Fund performance included Monster Worldwide (MNST), an online provider of job listings, and CNET Networks (CNET), a leading interactive media company.
Which holdings were the greatest detractors from the Fund’s performance?
During the period, Napster (NAPS) was the largest detractor from Fund performance. Increasing competition in the online music market hurt Napster as Yahoo! announced that it would offer its own online music service at a significant discount to Napster, whose shares fell more than 25% on the announcement. In the Internet industry, eBay (EBAY) struggled as the online auction giant saw decelerating growth in several of its key markets and acknowledged that the company would not meet Wall Street expectations. Despite moving aggressively into the Asian markets, eBay’s expectations for robust growth there have yet to be realized.
Other portfolio holdings that disappointed during 2005 included InfoSpace (INSP), a provider of online search and directory services, and VeriSign (VRSN), a provider of Internet infrastructure services. Earlier in the year we closed our position in Veritas Software (VRTS) at a loss after Symantec (SYMC) announced in December 2004 that it would acquire the storage software vendor.
*Portfolio composition is subject to change.
16
Fund Performance and Holding Information (as of December 31, 2005)
Firsthand e-Commerce Fund vs. Market Indices
| | TEFQX | | NASDAQ | | DJIA | | S&P 500 | |
Since Inception (9/30/99) | | -15.75 | % | -3.03 | % | 2.60 | % | 1.13 | % |
5-Year | | -12.50 | % | -1.75 | % | 2.00 | % | 0.54 | % |
3-Year | | 17.80 | % | 18.89 | % | 11.17 | % | 14.38 | % |
1-Year | | 5.26 | % | 2.13 | % | 1.72 | % | 4.91 | % |
Growth of a Hypothetical $10,000 Investment
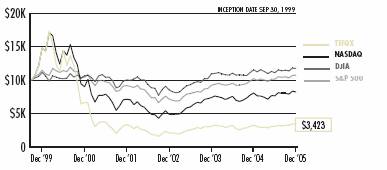
Returns assume reinvestment of all dividends and distributions but do not reflect the impact of taxes. The performance data quoted represent past performance. Past performance cannot guarantee future results, and current performance may be lower or higher than the performance quoted. Both the return from and the principal value of an investment in the Funds will fluctuate so that an investor’s shares, when redeemed, may be worth more or less than their original cost. To obtain performance as of the most recent month-end, please contact Firsthand Funds by calling 1.888.884.2675 or go to www.firsthandfunds.com.
Holdings by Industry*
| | % of Net Assets | |
Internet | | 47.6 | % |
Software | | 19.6 | % |
Services | | 15.0 | % |
Other Electronics | | 5.1 | % |
Computer | | 3.1 | % |
Communications | | 2.3 | % |
Other | | 2.0 | % |
Net Cash | | 5.3 | % |
* Based on percentage of net assets as of December 31, 2005.
Top 10 Holdings**
| | % of Net Assets | |
Akamai Technologies, Inc. | | 8.4 | % |
Netflix, Inc. | | 5.6 | % |
Microsoft Corp. | | 4.9 | % |
VeriSign, Inc. | | 4.6 | % |
Monster Worldwide, Inc. | | 4.2 | % |
Time Warner, Inc. | | 4.2 | % |
Fair Isaac Corp. | | 4.1 | % |
Novell, Inc. | | 3.8 | % |
CheckFree Corp. | | 3.7 | % |
First Data Corp. | | 3.5 | % |
** Top 10 stock holdings total 47.0% of net assets. These holdings are current as of December 31, 2005, and may not be representative of current or future investments. Firsthand includes only public companies in top 10 holdings.
17
Firsthand Global Technology Fund
Performance and Portfolio Discussion
How did the Fund perform in 2005?
In 2005, Firsthand Global Technology Fund (GTFQX) posted an 8.64% loss, versus a 2.13% increase for the Nasdaq Composite Index and a 5.38% gain for the Lipper Science and Technology Fund Index. For the six months ending December 31, 2005, Firsthand Global Technology Fund rose 4.55% as compared to 7.64% and 11.19% gains for the Nasdaq and the Lipper peer group benchmarks, respectively.
Which industries had the greatest impact on the Fund’s performance?
The Fund underperformed its benchmarks during 2005 primarily as a result of its exposure to the communications industry. While international markets in general posted strong returns in 2005, our communications equipment holdings struggled with end-demand problems that negatively affected Fund performance. On a positive note, our holdings in the semiconductor and software industries helped offset some of those losses.
Which individual holdings were the largest contributors to the Fund’s performance?*
During the period the largest contributor to Fund performance was disk drive component supplier Intevac (IVAC). An increase in consumer devices that utilize portable storage, such as digital video recorders and handheld music players, drove demand for the company’s equipment. This trend also benefitted disk-drive manufacturer Western Digital (WDC), which the Fund sold for a gain in December 2005.
Samsung Electronics (no U.S. symbol) also enjoyed a good year in 2005 due to the company’s strong line-up of consumer electronics products. Samsung’s results were driven by continued strength in its semiconductor and liquid crystal display (LCD) business. Manufacturing memory chips remains Samsung’s largest business, and soaring demand for NAND flash memory helped boost the company’s revenues and profit margins in 2005. Other holdings that aided Fund performance during the period included semiconductor players Taiwan Semiconductor Manufacturing (TSM) and ASML Holding N.V. (ASML), and Business Objects (BOBJ), a provider of business intelligence software, which the Fund sold for a gain in September 2005.
Which holdings were the greatest detractors from the Fund’s performance?
UTStarcom (UTSI) was the largest detractor from Fund performance in 2005. UTStarcom provides telecommunications equipment for wireline and wireless networks in China and other emerging markets. As the company’s business in China has slowed, UTStarcom’s dependence on that country for the bulk of its revenues has hurt the company’s bottom line, forcing it to pursue other opportunities to revitalize growth. UTStarcom’s uncertain future growth prospects led investors to abandon the stock, sending it down more than 60% in 2005.
Another telecom holding that weighed on Fund performance was Israel-based Alvarion (ALVR). Alvarion is a provider of wireless broadband equipment, such as the base stations that are used to make wireless voice and data transmission possible. Alvarion’s stock has lagged during the company’s rollout of the next generation of broadband wireless access—WiMAX. WiMAX is a technology that offers wireless access data rates of up to 75 megabits per second—compared with 11 megabits per second for a typical Wi-Fi network—over distances as long as 30 miles. Alvarion has placed a big bet on WiMAX, which has not yet paid off for the company.
Other portfolio holdings that hurt Fund performance included broadband wireless-network equipment maker Ceragon Networks (CRNT), and Cognos (COGN), a provider of business intelligence software. The Fund also realized a loss in semiconductor outsourcer Amkor Technology (AMKR).
*Portfolio composition is subject to change.
18
Fund Performance and Holding Information (as of December 31, 2005)
Firsthand Global Technology Fund vs. Market Indices
| | GTFQX | | NASDAQ | | DJIA | | S&P 500 | |
Since Inception (9/29/00) | | -16.30 | % | -8.82 | % | 2.23 | % | -1.03 | % |
5-Year | | -14.88 | % | -1.75 | % | 2.00 | % | 0.54 | % |
3-Year | | 17.34 | % | 18.89 | % | 11.17 | % | 14.38 | % |
1-Year | | -8.64 | % | 2.13 | % | 1.72 | % | 4.91 | % |
Growth of a Hypothetical $10,000 Investment
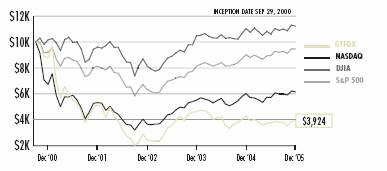
Returns assume reinvestment of all dividends and distributions but do not reflect the impact of taxes. The performance data quoted represent past performance. Past performance cannot guarantee future results, and current performance may be lower or higher than the performance quoted. Both the return from and the principal value of an investment in the Funds will fluctuate so that an investor’s shares, when redeemed, may be worth more or less than their original cost. To obtain performance as of the most recent month-end, please contact Firsthand Funds by calling 1.888.884.2675 or go to www.firsthandfunds.com.
Holdings by Industry*
| | % of Net Assets | |
Other Electronics | | 17.4 | % |
Communications Equipment | | 15.2 | % |
Software | | 14.5 | % |
Semiconductors | | 11.9 | % |
Electronics Manufacturing Services | | 9.7 | % |
Services | | 9.6 | % |
Semiconductor Equipment | | 9.4 | % |
Internet | | 2.2 | % |
Other | | 1.1 | % |
Net Cash | | 9.0 | % |
* Based on percentage of net assets as of December 31, 2005.
Top 10 Holdings**
| | % of Net Assets | |
UTStarcom, Inc. | | 5.7 | % |
Intevac, Inc. | | 5.5 | % |
Alvarion Ltd. | | 5.4 | % |
Taiwan Semi. Mfg. Co. - ADR | | 5.4 | % |
Tokyo Electron Ltd. | | 5.0 | % |
Sharp Corp. | | 4.5 | % |
ASML Holding N.V. | | 4.5 | % |
Samsung Electronics Co., Ltd. - GDR | | 4.0 | % |
Lionbridge Technologies, Inc. | | 4.0 | % |
Amdocs Ltd. | | 3.6 | % |
** Top 10 stock holdings total 47.6% of net assets. These holdings are current as of December 31, 2005, and may not be representative of current or future investments. Firsthand includes only public companies in top 10 holdings.
19
REPORT OF INDEPENDENT REGISTERED PUBLIC ACCOUNTING FIRM
To the Shareholders and Board of Trustees
Firsthand Funds
San Jose, California
We have audited the accompanying statements of assets and liabilities of Firsthand Funds (the “Funds”) comprising, respectively, Firsthand Technology Value Fund, Firsthand Technology Leaders Fund, Firsthand Technology Innovators Fund, Firsthand
e-Commerce Fund, and Firsthand Global Technology Fund, including the portfolios of investments as of December 31, 2005, and the related statements of operations for the year then ended, statements of changes in net assets for each of the two years in the period then ended, and the financial highlights for the periods indicated thereon. These financial statements and financial highlights are the responsibility of the Funds’ management. Our responsibility is to express an opinion on these financial statements and financial highlights based on our audits.
We conducted our audits in accordance with standards of the Public Company Accounting Oversight Board (United States). Those standards require that we plan and perform the audits to obtain reasonable assurance about whether the financial statements and financial highlights are free of material misstatement. We were not engaged to perform an audit of the Fund’s internal control over financial reporting. Our audits included consideration of internal control over financial reporting as a basis for designing audit procedures that are appropriate in the circumstances, but not for the purpose of expressing an opinion on the effectiveness of the Funds’ internal control over financial reporting. Accordingly, we express no such opinion. An audit also includes examining, on a test basis, evidence supporting the amounts and disclosures in the financial statements. Our procedures included confirmation of securities owned as of December 31, 2005, by correspondence with the custodian and brokers. An audit also includes assessing the accounting principles used and significant estimates made by management, as well as evaluating the overall financial statement presentation. We believe that our audits provide a reasonable basis for our opinion.
In our opinion, the financial statements and financial highlights referred to above present fairly, in all material respects, the financial position of Firsthand Funds as of December 31, 2005, the results of their operations, the changes in their net assets, and the financial highlights for the periods referred to above, in conformity with accounting principles generally accepted in the United States of America.
TAIT, WELLER & BAKER, LLP
Philadelphia, Pennsylvania
January 20, 2006
20
Firsthand Technology Value Fund
PORTFOLIO OF INVESTMENTS
December 31, 2005
| | | | MARKET | |
| | SHARES | | VALUE | |
COMMON STOCK - 98.0% | | | | | |
| | | | | |
ADVANCED MATERIALS - 1.1% | | | | | |
UCT Coatings, Inc., Series B (2) * | | 500,000 | | $ | 5,000,000 | |
| | | | | |
ALTERNATIVE ENERGY - 0.7% | | | | | |
Solaicx, Series B (1)(2) * | | 6,000,000 | | 3,000,000 | |
| | | | | |
COMMUNICATIONS - 0.9% | | | | | |
ViaSat, Inc. * | | 154,300 | | 4,124,439 | |
| | | | | |
COMMUNICATIONS EQUIPMENT - 7.7% | | | | | |
Harris Corp. | | 100,000 | | 4,301,000 | |
Stratex Networks, Inc. * | | 2,137,036 | | 7,650,589 | |
Tekelec, Inc. * | | 875,800 | | 12,173,620 | |
UTStarcom, Inc. * | | 1,273,300 | | 10,262,798 | |
| | | | 34,388,007 | |
DEFENSE & AEROSPACE - 1.7% | | | | | |
Flir Systems, Inc. * | | 65,000 | | 1,451,450 | |
L-3 Communications Holdings, Inc. | | 80,000 | | 5,948,000 | |
| | | | 7,399,450 | |
INTELLECTUAL PROPERTY - 2.0% | | | | | |
Silicon Genesis Corp., Common (1) (2) * | | 743,077 | | 7,431 | |
Silicon Genesis Corp., Series 1-D (1) (2) * | | 850,830 | | 2,274,745 | |
Silicon Genesis Corp., Series 1-E (1) (2) * | | 4,071,226 | | 6,473,249 | |
| | | | 8,755,425 | |
INTERNET - 13.6% | | | | | |
Akamai Technologies, Inc. * | | 858,000 | | 17,099,940 | |
InfoSpace, Inc. * | | 201,000 | | 5,189,820 | |
Napster, Inc. (3) * | | 1,450,000 | | 5,104,000 | |
Netflix, Inc. * | | 1,232,800 | | 33,359,568 | |
| | | | 60,753,328 | |
NETWORKING - 3.5% | | | | | |
Caspian Networks, Inc., Common * | | 337 | | 0 | |
Cisco Systems, Inc. * | | 780,000 | | 13,353,600 | |
IP Unity, Inc., Series C (2) * | | 1,104,265 | | 1,936,660 | |
IP Unity, Inc., Series E (2) * | | 193,042 | | 342,765 | |
Polaris Networks, Inc., Series A (2) * | | 297,848 | | 0 | |
| | | | 15,633,025 | |
OTHER ELECTRONICS - 6.0% | | | | | |
Intevac, Inc. * | | 157,500 | | 2,079,000 | |
NanoMuscle, Inc., Common (2) * | | 1,250,000 | | 0 | |
NanoMuscle, Inc., Series A-1 (2) * | | 1,250,000 | | 0 | |
| | | | | | |
see accompanying notes to financial statements
21
| | | | MARKET | |
| | SHARES | | VALUE | |
Symbol Technologies, Inc. | | 1,520,000 | | $ | 19,486,400 | |
Zebra Technologies Corp., Class A * | | 124,500 | | 5,334,825 | |
| | | | 26,900,225 | |
PERIPHERALS - 4.5% | | | | | |
Western Digital Corp. * | | 1,080,000 | | 20,098,800 | |
| | | | | |
PHOTONICS - 8.5% | | | | | |
Celox Networks, Inc., Common (2) * | | 138,121 | | 0 | |
Celox Networks, Inc., Series A-1 (2) * | | 1,000,000 | | 0 | |
Corning, Inc. * | | 1,550,000 | | 30,472,999 | |
JDS Uniphase Corp. * | | 3,000,000 | | 7,080,000 | |
Luminous Networks, Inc., Common (2) * | | 28,513 | | 29 | |
Luminous Networks, Inc., Series A1 (2) * | | 129,664 | | 1,297 | |
Luminous Networks, Inc., Series B1 (2) * | | 259,236 | | 210,448 | |
Maple Optical Systems, Inc., Series A-1 (1) (2) * | | 10,352,054 | | 0 | |
| | | | 37,764,773 | |
SEMICONDUCTOR EQUIPMENT - 6.3% | | | | | |
Applied Materials, Inc. | | 1,000,000 | | 17,940,000 | |
ASML Holding N.V. * | | 500,000 | | 10,040,000 | |
| | | | 27,980,000 | |
SEMICONDUCTORS - 22.7% | | | | | |
Aeroflex, Inc. * | | 1,250,600 | | 13,443,950 | |
Applied Micro Circuits Corp. * | | 599,900 | | 1,541,743 | |
AuthenTec, Inc., Series C (2) * | | 1,472,495 | | 1,002,902 | |
AuthenTec, Inc., Series D (2) * | | 290,958 | | 197,851 | |
Clarisay, Inc., Series B (1) (2) * | | 2,605,306 | | 0 | |
Clarisay, Inc., Series C (1) (2) * | | 7,194,244 | | 0 | |
Cypress Semiconductor Corp. * | | 1,785,100 | | 25,437,675 | |
Freescale Semiconductor, Inc., Series B * | | 76,208 | | 1,918,155 | |
Global Locate, Inc., Series A (1) (2) * | | 6,030,896 | | 4,547,296 | |
Global Locate, Inc., Series C (1) (2) * | | 1,111,111 | | 837,778 | |
Global Locate, Inc., Series D (1) (2) * | | 932,835 | | 749,999 | |
Kopin Corp. * | | 299,100 | | 1,600,185 | |
PMC-Sierra, Inc. * | | 755,700 | | 5,826,447 | |
Semiconductor Manufacturing International Corp. * | | 1,000,000 | | 6,760,000 | |
Skyworks Solutions, Inc. * | | 498,300 | | 2,536,347 | |
Texas Instruments, Inc. | | 340,000 | | 10,903,800 | |
TranSwitch Corp. * | | 2,883,000 | | 5,275,890 | |
Triquint Semiconductor, Inc. * | | 1,532,400 | | 6,819,180 | |
Zoran Corp. * | | 760,500 | | 12,327,705 | |
| | | | 101,726,903 | |
SERVICES - 0.3% | | | | | |
TeleCommunication Systems, Inc., Class A * | | 557,600 | | 1,226,720 | |
| | | | | | |
see accompanying notes to financial statements
22
| | | | MARKET | |
| | SHARES | | VALUE | |
SOFTWARE - 18.5% | | | | | |
Citrix Systems, Inc. * | | 277,000 | | $ | 7,972,060 | |
Comverse Technology, Inc. * | | 920,900 | | 24,486,731 | |
Manhattan Associates, Inc. * | | 417,500 | | 8,550,400 | |
Sybase, Inc. * | | 200,000 | | 4,372,000 | |
VeriSign, Inc. * | | 840,100 | | 18,414,992 | |
Websense, Inc. * | | 96,900 | | 6,360,516 | |
Wind River Systems, Inc. * | | 852,600 | | 12,592,903 | |
| | | | 82,749,602 | |
Total COMMON STOCK | | | | 437,500,697 | |
| | | | | |
WARRANTS - 0.2% | | | | | |
| | | | | |
ADVANCED MATERIALS - 0.0% | | | | | |
UCT Coatings, Inc., B Warrant (2) * | | 200,000 | | 200 | |
| | | | | |
INTELLECTUAL PROPERTY - 0.2% | | | | | |
Silicon Genesis Corp., 1-E Warrant (1) (2) * | | 1,257,859 | | 999,998 | |
Silicon Genesis Corp., Common Warrant (1) (2) * | | 59,147 | | 59 | |
Silicon Genesis Corp., Common Warrant (1) (2) * | | 37,982 | | 38 | |
| | | | 1,000,095 | |
NETWORKING - 0.0% | | | | | |
IP Unity, Inc., E Warrant (2) * | | 69,496 | | 69 | |
Polaris Networks, Inc., Convertible Warrant (2) * | | 75,712 | | 0 | |
| | | | 69 | |
OTHER ELECTRONICS - 0.0% | | | | | |
NanoMuscle, Inc., B-1 Warrant (2) * | | 306,757 | | 0 | |
| | | | | |
PHOTONICS - 0.0% | | | | | |
Celox Networks, Inc., A-1 Warrant (2) * | | 500,000 | | 0 | |
Luminous Networks, Inc., Common Warrant (2) * | | 3,822 | | 0 | |
| | | | 0 | |
SEMICONDUCTORS - 0.0% | | | | | |
AuthenTec, Inc., C Warrant (2) * | | 392,665 | | 70,640 | |
Clarisay, Inc., Warrants (1) (2) * | | 2,350,000 | | 0 | |
Global Locate, Inc., Board Warrants (1) (2) * | | 75,000 | | 375 | |
Global Locate, Inc., Board Warrants (1) (2) * | | 75,000 | | 375 | |
Global Locate, Inc., Board Warrants (1) (2) * | | 18,750 | | 94 | |
Global Locate, Inc., Board Warrants (1) (2) * | | 75,000 | | 375 | |
Global Locate, Inc., C Warrant (1) (2) * | | 370,370 | | 3,704 | |
Global Locate, Inc., D Warrant (1) (2) * | | 233,208 | | 2,332 | |
| | | | 77,895 | |
Total WARRANTS | | | | 1,078,259 | |
| | | | | | |
see accompanying notes to financial statements
23
| | SHARES/ | | MARKET | |
| | PRINCIPAL | | VALUE | |
CONVERTIBLE BONDS - 0.0% | | | | | |
| | | | | |
NETWORKING - 0.0% | | | | | |
Polaris Networks, Inc., 10.00% (2) * | | 100,949 | | $ | 0 | |
| | | | | |
OTHER ELECTRONICS - 0.0% | | | | | |
NanoMuscle, Inc., 8.00% (2) * | | 398,639 | | 0 | |
| | | | | |
SEMICONDUCTORS - 0.0% | | | | | |
Clarisay, Inc., 8.00%, (1) (2) * | | 2,350,000 | | 0 | |
| | | | | |
Total CONVERTIBLE BONDS | | | | 0 | |
| | | | | |
CASH EQUIVALENTS - 2.7% | | | | | |
PNC Bank Money Market Portfolio | | 12,015,831 | | 12,015,831 | |
Total CASH EQUIVALENTS | | | | 12,015,831 | |
| | | | | |
Total Investments (Cost $629,024,519) - 100.9% | | | | 450,594,787 | |
Liabilities in excess of other assets - (0.9)% | | | | (3,987,702 | ) |
NET ASSETS - 100.0% | | | | $ | 446,607,085 | |
* Non-income producing security
(1) Affiliated issuer
(2) Restricted security
(3) Napster, Inc. has the right to put a restriction of public sale on 600,000 shares of the Fund’s Napster, Inc. holding. As of December 31, 2005, there are no restrictions on the Fund’s shares of Napster, Inc.
see accompanying notes to financial statements
24
Firsthand Technology Leaders Fund
PORTFOLIO OF INVESTMENTS
December 31, 2005
| | | | MARKET | |
| | SHARES | | VALUE | |
COMMON STOCK - 96.9% | | | | | |
| | | | | |
COMMUNICATIONS EQUIPMENT - 7.4% | | | | | |
Nokia Corp. - ADR | | 127,900 | | $ | 2,340,570 | |
QUALCOMM, Inc. | | 154,600 | | 6,660,168 | |
| | | | 9,000,738 | |
ELECTRONICS MANUFACTURING SERVICES - 3.7% | | | | | |
Flextronics International Ltd. * | | 428,900 | | 4,477,716 | |
| | | | | |
INTERNET - 5.8% | | | | | |
eBay, Inc. * | | 50,200 | | 2,171,150 | |
Google, Inc., Class A * | | 7,800 | | 3,235,908 | |
IAC/InterActiveCorp * | | 57,850 | | 1,637,734 | |
| | | | 7,044,792 | |
MEDIA - 3.8% | | | | | |
Pixar Animation Studios * | | 87,400 | | 4,607,728 | |
| | | | | |
NETWORKING - 3.6% | | | | | |
Cisco Systems, Inc. * | | 257,800 | | 4,413,536 | |
| | | | | |
OTHER ELECTRONICS - 3.7% | | | | | |
Agilent Technologies, Inc. * | | 134,956 | | 4,492,685 | |
| | | | | |
PHOTONICS - 4.9% | | | | | |
Corning, Inc. * | | 301,200 | | 5,921,592 | |
| | | | | |
SEMICONDUCTOR EQUIPMENT - 9.5% | | | | | |
Applied Materials, Inc. | | 241,400 | | 4,330,716 | |
ASML Holding N.V. * | | 281,600 | | 5,654,528 | |
Teradyne, Inc. * | | 106,500 | | 1,551,705 | |
| | | | 11,536,949 | |
SEMICONDUCTORS - 29.5% | | | | | |
Altera Corp. * | | 207,500 | | 3,844,975 | |
Intel Corp. | | 120,200 | | 3,000,192 | |
Samsung Electronics Co., Ltd. - GDR (1) | | 16,200 | | 5,280,605 | |
SanDisk Corp. * | | 104,300 | | 6,552,126 | |
Taiwan Semiconductor Manufacturing Co. - ADR | | 726,649 | | 7,201,091 | |
Texas Instruments, Inc. | | 187,950 | | 6,027,557 | |
Xilinx, Inc. | | 145,600 | | 3,670,576 | |
| | | | 35,577,122 | |
SOFTWARE - 25.0% | | | | | |
Adobe Systems, Inc. | | 136,700 | | 5,052,432 | |
Amdocs Ltd. * | | 170,700 | | 4,694,250 | |
Autodesk, Inc. | | 27,800 | | 1,194,010 | |
| | | | | | |
see accompanying notes to financial statements
25
| | | | MARKET | |
| | SHARES | | VALUE | |
Microsoft Corp. | | 154,800 | | $ | 4,048,020 | |
Oracle Corp. * | | 342,000 | | 4,175,820 | |
SAP AG - ADR | | 115,400 | | 5,201,078 | |
VeriSign, Inc. * | | 267,800 | | 5,870,176 | |
| | | | 30,235,786 | |
Total COMMON STOCK | | | | 117,308,644 | |
| | | | | |
CASH EQUIVALENTS - 4.6% | | | | | |
PNC Bank Money Market Portfolio | | 5,546,894 | | 5,546,894 | |
Total CASH EQUIVALENTS | | | | 5,546,894 | |
| | | | | |
Total Investments (Cost $109,842,471) - 101.5% | | | | 122,855,538 | |
Liabilities in excess of other assets - (1.5)% | | | | (1,846,645 | ) |
NET ASSETS - 100.0% | | | | $ | 121,008,893 | |
* Non-income producing security
(1) Rule 144A, Section 4(2), or other security that is restricted as to resale to institutional investors. The Investment Advisor, using Board-approved procedures has deemed these securities to be liquid.
ADR American Depositary Receipts
GDR Global Depositary Receipts
see accompanying notes to financial statements
26
Firsthand Technology Innovators Fund
PORTFOLIO OF INVESTMENTS
December 31, 2005
| | | | MARKET | |
| | SHARES | | VALUE | |
COMMON STOCK - 92.0% | | | | | |
| | | | | |
COMMUNICATIONS - 0.6% | | | | | |
Symmetricom, Inc. * | | 20,000 | | $ | 169,400 | |
| | | | | |
COMMUNICATIONS EQUIPMENT - 9.6% | | | | | |
Airspan Networks, Inc. * | | 214,000 | | 1,217,660 | |
Finisar Corp. * | | 476,500 | | 991,120 | |
Vyyo, Inc. * | | 127,900 | | 617,757 | |
| | | | 2,826,537 | |
ELECTRONIC DESIGN AUTOMATION - 4.1% | | | | | |
PDF Solutions, Inc. * | | 74,100 | | 1,204,125 | |
| | | | | |
INTELLECTUAL PROPERTY - 11.9% | | | | | |
Silicon Genesis Corp., Common (1) (2) * | | 108,815 | | 1,088 | |
Silicon Genesis Corp., Series 1-C (1) (2) * | | 82,914 | | 912,560 | |
Silicon Genesis Corp., Series 1-E (1) (2) * | | 1,633,254 | | 2,596,874 | |
| | | | 3,510,522 | |
INTERNET - 5.3% | | | | | |
JAMDAT Mobile, Inc. * | | 15,000 | | 398,700 | |
LivePerson, Inc. * | | 102,400 | | 574,464 | |
Napster, Inc. * | | 166,700 | | 586,784 | |
| | | | 1,559,948 | |
NETWORKING - 7.7% | | | | | |
IP Unity, Inc., Series C (2) * | | 827,957 | | 1,452,071 | |
Packeteer, Inc. * | | 105,300 | | 818,181 | |
| | | | 2,270,252 | |
OTHER ELECTRONICS - 16.6% | | | | | |
3D Systems Corp. * | | 11,900 | | 214,200 | |
Applied Films Corp. * | | 58,800 | | 1,221,276 | |
Intevac, Inc. * | | 213,700 | | 2,820,840 | |
Microvision, Inc. * | | 180,300 | | 649,080 | |
| | | | 4,905,396 | |
PERIPHERALS - 1.1% | | | | | |
Universal Display Corp. * | | 30,000 | | 315,300 | |
| | | | | |
PHOTONICS - 2.6% | | | | | |
Avanex Corp. * | | 200,000 | | 274,000 | |
Avici Systems, Inc. * | | 125,000 | | 488,750 | |
Luminous Networks, Inc., Common (2) * | | 49,979 | | 50 | |
Luminous Networks, Inc., Series A1 (2) * | | 227,282 | | 2,273 | |
| | | | 765,073 | |
| | | | | | |
see accompanying notes to financial statements
27
| | | | MARKET | |
| | SHARES | | VALUE | |
SEMICONDUCTOR EQUIPMENT - 0.4% | | | | | |
Therma-Wave, Inc. * | | 91,300 | | $ | 130,559 | |
| | | | | |
SEMICONDUCTORS - 21.4% | | | | | |
Aeroflex, Inc. * | | 32,000 | | 344,000 | |
AuthenTec, Inc., Series C (2) * | | 736,248 | | 501,451 | |
Hi/Fn, Inc. * | | 100,000 | | 560,300 | |
Kopin Corp. * | | 68,700 | | 367,545 | |
Microtunes, Inc. * | | 106,100 | | 442,437 | |
Power Integrations, Inc. * | | 27,300 | | 650,013 | |
PowerDsine Ltd. * | | 30,000 | | 206,100 | |
Ramtron International Corp. * | | 100,000 | | 200,000 | |
Silicon Optix, Inc., Series B (2) * | | 1,111,111 | | 700,000 | |
Synaptics, Inc. * | | 37,300 | | 922,056 | |
Trident Microsystems, Inc. * | | 30,000 | | 540,000 | |
Volterra Semiconductor Corp. * | | 40,000 | | 600,000 | |
Zygo Corp. * | | 20,000 | | 293,800 | |
| | | | 6,327,702 | |
SERVICES - 4.4% | | | | | |
Innovion Corp., Series C (1) (2) * | | 1,500,000 | | 744,675 | |
WebEx Communications, Inc. * | | 25,000 | | 540,750 | |
| | | | 1,285,425 | |
| | | | | |
SOFTWARE - 6.3% | | | | | |
Altiris, Inc. * | | 50,000 | | 844,500 | |
Verint Systems, Inc. * | | 18,200 | | 627,354 | |
Witness Systems, Inc. * | | 19,400 | | 381,598 | |
| | | | 1,853,452 | |
Total COMMON STOCK | | | | 27,123,691 | |
| | | | | |
WARRANTS - 0.3% | | | | | |
| | | | | |
INTELLECTUAL PROPERTY - 0.2% | | | | | |
Silicon Genesis Corp., 1-E Warrant (1) (2) * | | 94,339 | | 49,999 | |
| | | | | |
PHOTONICS - 0.0% | | | | | |
Luminous Networks, Inc., Common Warrant (2) * | | 6,699 | | 1 | |
| | | | | |
SEMICONDUCTORS - 0.1% | | | | | |
AuthenTec, Inc., C Warrant (2) * | | 196,333 | | 35,320 | |
| | | | | | |
see accompanying notes to financial statements
28
| | SHARES/
PRINCIPAL | | MARKET
VALUE | |
SERVICES - 0.0% | | | | | |
Innovion Corp., Warrant (1) (2) * | | 30,129 | | $ | 30 | |
Innovion Corp., Warrant (1) (2) * | | 602,577 | | 603 | |
| | | | 633 | |
Total WARRANTS | | | | 85,953 | |
| | | | | |
CONVERTIBLE BONDS - 2.0% | | | | | |
| | | | | |
SERVICES - 2.0% | | | | | |
Innovion Corp., 9.50%, 3/7/06 (1) (2) | | 602,577 | | 602,577 | |
| | | | | |
Total CONVERTIBLE BONDS | | | | 602,577 | |
| | | | | |
CASH EQUIVALENTS - 2.2% | | | | | |
PNC Bank Money Market Portfolio | | 639,265 | | 639,265 | |
Total CASH EQUIVALENTS | | | | 639,265 | |
| | | | | |
Total Investments (Cost $39,850,048) - 96.5% | | | | 28,451,486 | |
Other assets in excess of liabilities - 3.5% | | | | 1,024,038 | |
NET ASSETS - 100.0% | | | | $ | 29,475,524 | |
* Non-income producing security
(1) Affiliated issuer
(2) Restricted security
see accompanying notes to financial statements
29
Firsthand e-Commerce Fund
PORTFOLIO OF INVESTMENTS
December 31, 2005
| | SHARES | | MARKET
VALUE | |
| | | | | |
COMMON STOCK - 94.7% | | | | | |
| | | | | |
BROADCASTING & CABLE TV - 0.8% | | | | | |
Liberty Global, Inc., Class A * | | 7,500 | | $ | 168,750 | |
Liberty Global, Inc., Class C * | | 7,500 | | 159,000 | |
| | | | 327,750 | |
COMMUNICATIONS - 2.3% | | | | | |
Comcast Corp., Special Class A * | | 15,000 | | 385,350 | |
OpenTV Corp. * | | 268,300 | | 600,992 | |
| | | | 986,342 | |
COMPUTER - 3.1% | | | | | |
Dell, Inc. * | | 30,000 | | 899,700 | |
International Business Machines Corp. | | 5,000 | | 411,000 | |
| | | | 1,310,700 | |
INTERNET - 47.6% | | | | | |
Akamai Technologies, Inc. * | | 180,900 | | 3,605,337 | |
Amazon.com, Inc. * | | 10,000 | | 471,500 | |
eBay, Inc. * | | 19,200 | | 830,400 | |
Expedia, Inc. * | | 49,684 | | 1,190,429 | |
IAC/InterActiveCorp * | | 49,684 | | 1,406,554 | |
InfoSpace, Inc. * | | 36,300 | | 937,266 | |
iVillage, Inc. * | | 50,000 | | 401,000 | |
LivePerson, Inc. * | | 100,000 | | 561,000 | |
Monster Worldwide, Inc. * | | 44,600 | | 1,820,572 | |
Napster, Inc. * | | 254,500 | | 895,840 | |
Netflix, Inc. * | | 89,500 | | 2,421,870 | |
Overstock.com, Inc. * | | 28,800 | | 810,720 | |
PlanetOut, Inc. * | | 40,000 | | 347,600 | |
Priceline.com, Inc. * | | 20,000 | | 446,400 | |
Time Warner, Inc. | | 102,600 | | 1,789,344 | |
ValueClick, Inc. * | | 46,300 | | 838,493 | |
WebSideStory, Inc. * | | 20,000 | | 362,600 | |
Yahoo! Inc. * | | 34,300 | | 1,343,874 | |
| | | | 20,480,799 | |
NETWORKING - 1.2% | | | | | |
Cisco Systems, Inc. * | | 30,000 | | 513,600 | |
| | | | | |
OTHER ELECTRONICS - 5.1% | | | | | |
ActivCard Corp. * | | 255,000 | | 889,950 | |
Symbol Technologies, Inc. | | 100,000 | | 1,282,000 | |
| | | | 2,171,950 | |
| | | | | | |
see accompanying notes to financial statements
30
| | | | MARKET | |
| | SHARES | | VALUE | |
| | | | | |
SERVICES - 15.0% | | | | | |
Anteon International Corp. * | | 11,700 | | $ | 635,895 | |
CNET Networks, Inc. * | | 99,200 | | 1,457,248 | |
Emdeon Corp. * | | 130,000 | | 1,099,800 | |
Fair Isaac Corp. | | 40,000 | | 1,766,800 | |
First Data Corp. | | 35,000 | | 1,505,350 | |
| | | | 6,465,093 | |
SOFTWARE - 19.6% | | | | | |
CheckFree Corp. * | | 35,000 | | 1,606,500 | |
Microsoft Corp. | | 80,000 | | 2,092,000 | |
Novell, Inc. * | | 186,200 | | 1,644,146 | |
RSA Security, Inc. * | | 100,000 | | 1,123,000 | |
VeriSign, Inc. * | | 90,000 | | 1,972,800 | |
| | | | 8,438,446 | |
Total COMMON STOCK | | | | 40,694,680 | |
| | | | | |
CASH EQUIVALENTS - 5.8% | | | | | |
PNC Bank Money Market Portfolio | | 2,483,145 | | 2,483,145 | |
Total CASH EQUIVALENTS | | | | 2,483,145 | |
| | | | | |
Total Investments (Cost $36,591,912) - 100.5% | | | | 43,177,825 | |
Liabilities in excess of other assets - (0.5)% | | | | (234,380 | ) |
NET ASSETS - 100.0% | | | | $ | 42,943,445 | |
* Non-income producing security
see accompanying notes to financial statements
31
Firsthand Global Technology Fund
PORTFOLIO OF INVESTMENTS
December 31, 2005
| | | | MARKET | |
| | SHARES | | VALUE | |
COMMON STOCK - 91.0% | | | | | |
| | | | | |
COMMUNICATIONS - 1.1% | | | | | |
Mobile TeleSystems - ADR | | 5,000 | | $ | 175,000 | |
| | | | | |
COMMUNICATIONS EQUIPMENT - 15.2% | | | | | |
Alvarion Ltd. * | | 102,100 | | 890,312 | |
Ceragon Networks Ltd. * | | 62,100 | | 241,569 | |
QUALCOMM, Inc. | | 10,000 | | 430,800 | |
UTStarcom, Inc. * | | 116,900 | | 942,214 | |
| | | | 2,504,895 | |
ELECTRONICS MANUFACTURING SERVICES - 9.7% | | | | | |
Compal Electronics - GDR | | 56,146 | | 253,011 | |
Elcoteq Network Corp. - Class A | | 15,000 | | 356,473 | |
Flextronics International Ltd. * | | 29,800 | | 311,112 | |
Hon Hai Precision - GDR | | 42,449 | | 465,292 | |
Quanta Computer, Inc. - GDR | | 29,400 | | 206,335 | |
| | | | 1,592,223 | |
INTERNET - 2.2% | | | | | |
RADWARE Ltd. * | | 20,000 | | 363,200 | |
| | | | | |
OTHER ELECTRONICS - 17.4% | | | | | |
Alps Electric Co., Ltd. | | 28,000 | | 389,831 | |
Hoya Corp. | | 7,600 | | 273,062 | |
Intevac, Inc. * | | 69,000 | | 910,801 | |
LG. Philips LCD Co., Ltd. - ADR * | | 7,800 | | 167,388 | |
NIDEC Corp. | | 17,200 | | 372,208 | |
Sharp Corp. | | 49,000 | | 744,903 | |
| | | | 2,858,193 | |
SEMICONDUCTOR EQUIPMENT - 9.4% | | | | | |
ASML Holding N.V. * | | 36,758 | | 738,101 | |
Tokyo Electron Ltd. | | 13,200 | | 828,844 | |
| | | | 1,566,945 | |
SEMICONDUCTORS - 11.9% | | | | | |
Samsung Electronics Co., Ltd. - GDR (1) | | 2,000 | | 651,927 | |
Semiconductor Manufacturing International Corp. * | | 60,000 | | 405,600 | |
Taiwan Semiconductor Manufacturing Co. - ADR | | 89,736 | | 889,283 | |
| | | | 1,946,810 | |
SERVICES - 9.6% | | | | | |
Accenture Ltd. | | 10,000 | | 288,700 | |
Affiliated Computer Services, Inc., Class A * | | 5,000 | | 295,900 | |
| | | | | | |
see accompanying notes to financial statements
32
| | | | MARKET | |
| | SHARES | | VALUE | |
Kanbay International, Inc. * | | 7,900 | | $ | 125,531 | |
Lionbridge Technologies, Inc. * | | 92,800 | | 651,456 | |
Syntel, Inc. | | 10,000 | | 208,300 | |
| | | | 1,569,887 | |
SOFTWARE - 14.5% | | | | | |
Amdocs Ltd. * | | 21,500 | | 591,250 | |
Cognos, Inc. * | | 10,000 | | 347,100 | |
Comverse Technology, Inc. * | | 20,200 | | 537,118 | |
Dassault Systemes SA - ADR | | 5,000 | | 282,550 | |
SAP AG - ADR | | 10,000 | | 450,700 | |
Verint Systems, Inc. * | | 5,000 | | 172,350 | |
| | | | 2,381,068 | |
Total COMMON STOCK | | | | 14,958,221 | |
| | | | | |
CASH EQUIVALENTS - 9.5% | | | | | |
PNC Bank Money Market Portfolio | | 1,554,283 | | 1,554,283 | |
Total CASH EQUIVALENTS | | | | 1,554,283 | |
| | | | | |
Total Investments (Cost $15,916,774) - 100.5% | | | | 16,512,504 | |
Liabilities in excess of other assets - (0.5)% | | | | (83,797 | ) |
NET ASSETS - 100.0% | | | | $ | 16,428,707 | |
* Non-income producing security
(1) Rule 144A, Section 4(2), or other security that is restricted as to resale to institutional investors. The Investment Advisor, using Board-approved procedures has deemed these securities to be liquid.
ADR American Depositary Receipts
GDR Global Depositary Receipts
see accompanying notes to financial statements
33
STATEMENTS OF ASSETS AND LIABILITIES
December 31, 2005
| | FIRSTHAND
TECHNOLOGY
VALUE
FUND | | FIRSTHAND
TECHNOLOGY
LEADERS
FUND | | FIRSTHAND
TECHNOLOGY
INNOVATORS
FUND | |
| | | | | | | |
ASSETS | | | | | | | |
Investment securities: | | | | | | | |
Unaffiliated issuers at acquisition cost | | $ | 596,457,598 | | $ | 109,842,471 | | $ | 31,268,199 | |
Affiliated issuers at acquisition cost | | 32,566,921 | | — | | 8,581,849 | |
Total acquisition cost | | $ | 629,024,519 | | $ | 109,842,471 | | $ | 39,850,048 | |
Unaffiliated issuers at market value | | $ | 431,696,939 | | $ | 122,855,538 | | $ | 23,543,080 | |
Affiliated issuers at market value | | 18,897,848 | | — | | 4,908,406 | |
Total market value (Note 2) | | 450,594,787 | | 122,855,538 | | 28,451,486 | |
Cash | | 1 | | 1 | | — | |
Receivable for securities sold | | — | | — | | 1,215,852 | |
Receivable from dividends and interest | | 61,721 | | 32,780 | | 107,540 | |
Receivable for capital shares sold | | 238,326 | | 94,796 | | 5,700 | |
Deferred trustee compensation (Note 5) | | 76,223 | | 44,513 | | 44,513 | |
TOTAL ASSETS | | 450,971,058 | | 123,027,628 | | 29,825,091 | |
| | | | | | | |
LIABILITIES | | | | | | | |
Payable for securities purchased | | 2,223,630 | | 1,441,590 | | 105,718 | |
Payable to affiliates (Note 4) | | 772,800 | | 205,427 | | 50,905 | |
Payable for capital shares redeemed | | 1,291,320 | | 327,205 | | 148,431 | |
Payable for trustee compensation (Note 5) | | 76,223 | | 44,513 | | 44,513 | |
TOTAL LIABILITIES | | 4,363,973 | | 2,018,735 | | 349,567 | |
| | | | | | | |
NET ASSETS | | $ | 446,607,085 | | $ | 121,008,893 | | $ | 29,475,524 | |
| | | | | | | |
Net assets consist of: | | | | | | | |
Paid-in-capital | | $ | 3,227,708,408 | | $ | 449,375,557 | | $ | 413,544,234 | |
Accumulated net realized losses from security transactions, written options and foreign currency | | (2,602,671,591 | ) | (341,379,731 | ) | (372,670,148 | ) |
Net unrealized appreciation (depreciation) on investments and foreign currency | | (178,429,732 | ) | 13,013,067 | | (11,398,562 | ) |
NET ASSETS | | $ | 446,607,085 | | $ | 121,008,893 | | $ | 29,475,524 | |
| | | | | | | |
Shares of beneficial interest outstanding (unlimited number of shares authorized, no par value) | | 13,483,152 | | 6,385,113 | | 3,320,897 | |
| | | | | | | |
Net asset value, redemption price and offering price per share (Note 2) | | $ | 33.12 | | $ | 18.95 | | $ | 8.88 | |
see accompanying notes to financial statements
34
| | FIRSTHAND
E-COMMERCE
FUND | | FIRSTHAND
GLOBAL
TECHNOLOGY
FUND | |
ASSETS | | | | | |
Investment securities: | | | | | |
Unaffiliated issuers at acquisition cost | | $ | 36,591,912 | | $ | 15,916,774 | |
Affiliated issuers at acquisition cost | | — | | — | |
Total acquisition cost | | $ | 36,591,912 | | $ | 15,916,774 | |
Unaffiliated issuers at market value | | $ | 43,177,825 | | $ | 16,512,504 | |
Affiliated issuers at market value | | — | | — | |
Total market value (Note 2) | | 43,177,825 | | 16,512,504 | |
Cash | | — | | — | |
Receivable for securities sold | | — | | — | |
Receivable from dividends and interest | | 9,629 | | 8,482 | |
Receivable for capital shares sold | | 1,589 | | — | |
Deferred trustee compensation (Note 5) | | 44,513 | | 33,390 | |
TOTAL ASSETS | | 43,233,556 | | 16,554,376 | |
| | | | | |
LIABILITIES | | | | | |
Payable for securities purchased | | — | | — | |
Payable to affiliates (Note 4) | | 75,098 | | 28,124 | |
Payable for capital shares redeemed | | 170,500 | | 64,155 | |
Payable for trustee compensation (Note 5) | | 44,513 | | 33,390 | |
TOTAL LIABILITIES | | 290,111 | | 125,669 | |
| | | | | |
NET ASSETS | | $ | 42,943,445 | | $ | 16,428,707 | |
| | | | | |
Net assets consist of: | | | | | |
Paid-in-capital | | $ | 443,682,100 | | $ | 95,892,862 | |
Accumulated net realized losses from security transactions, written options and foreign currency | | (407,324,568 | ) | (80,059,931 | ) |
Net unrealized appreciation (depreciation) on investments and foreign currency | | 6,585,913 | | 595,776 | |
NET ASSETS | | $ | 42,943,445 | | $ | 16,428,707 | |
| | | | | |
Shares of beneficial interest outstanding (unlimited number of shares authorized, no par value) | | 12,621,447 | | 4,198,063 | |
| | | | | |
Net asset value, redemption price and offering price per share (Note 2) | | $ | 3.40 | | $ | 3.91 | |
see accompanying notes to financial statements
35
STATEMENTS OF OPERATIONS
For the year ended December 31, 2005
| | FIRSTHAND | | FIRSTHAND | | FIRSTHAND | |
| | TECHNOLOGY | | TECHNOLOGY | | TECHNOLOGY | |
| | VALUE | | LEADERS | | INNOVATORS | |
| | FUND | | FUND | | FUND | |
INVESTMENT INCOME | | | | | | | |
Interest* | | $ | 51,173 | | $ | 13,069 | | $ | 66,113 | |
Dividends** | | 488,026 | | 516,103 | | 35,893 | |
TOTAL INVESTMENT INCOME | | 539,199 | | 529,172 | | 102,006 | |
EXPENSES | | | | | | | |
Investment advisory fees (Note 4) | | 6,944,316 | | 1,530,568 | | 569,953 | |
Administrative fees (Note 4) | | 1,950,321 | | 459,171 | | 170,986 | |
TOTAL EXPENSES | | 8,894,637 | | 1,989,739 | | 740,939 | |
| | | | | | | |
NET INVESTMENT LOSS | | (8,355,438 | ) | (1,460,567 | ) | (638,933 | ) |
| | | | | | | |
REALIZED AND UNREALIZED GAINS (LOSSES) ON INVESTMENTS | | | | | | | |
Net realized losses from security transactions and foreign currency | | | | | | | |
Non-affiliated | | (114,862,089 | ) | (881,013 | ) | (12,827,442 | ) |
Affiliated | | (28,293,176 | ) | — | | (7,145,068 | ) |
Written Options | | — | | — | | — | |
Net change in unrealized appreciation on investments and foreign currency | | 193,732,975 | | 14,301,064 | | 13,583,828 | |
Written Options | | — | | — | | — | |
| | | | | | | |
NET REALIZED AND UNREALIZED GAINS (LOSSES) ON INVESTMENTS | | 50,577,710 | | 13,420,051 | | (6,388,682 | ) |
| | | | | | | |
NET INCREASE (DECREASE) IN NET ASSETS FROM OPERATIONS | | $ | 42,222,272 | | $ | 11,959,484 | | $ | (7,027,615 | ) |
*Including interest from affiliated security | | $ | — | | $ | — | | $ | 57,270 | |
**Net of foreign tax withholding | | $ | 2,113 | | $ | 56,042 | | $ | — | |
see accompanying notes to financial statements
36
| | | | FIRSTHAND | |
| | FIRSTHAND | | GLOBAL | |
| | E-COMMERCE | | TECHNOLOGY | |
| | FUND | | FUND | |
INVESTMENT INCOME | | | | | |
Interest | | $ | 46,664 | | $ | 5,695 | |
Dividends * | | 85,364 | | 142,193 | |
TOTAL INVESTMENT INCOME | | 132,028 | | 147,888 | |
| | | | | |
EXPENSES | | | | | |
Investment advisory fees (Note 4) | | 688,528 | | 294,880 | |
Administrative fees (Note 4) | | 206,559 | | 88,464 | |
TOTAL EXPENSES | | 895,087 | | 383,344 | |
| | | | | |
NET INVESTMENT LOSS | | (763,059 | ) | (235,456 | ) |
| | | | | |
REALIZED AND UNREALIZED GAINS (LOSSES) ON INVESTMENTS | | | | | |
Net realized gains (losses) from security transactions and foreign currency | | | | | |
Non-affiliated | | 2,007,484 | | (2,629,847 | ) |
Affiliated | | — | | — | |
Written Options | | 157,629 | | — | |
Net change in unrealized appreciation (depreciation) on investments and foreign currency | | (127,250 | ) | (36,882 | ) |
Written Options | | 388,714 | | — | |
| | | | | |
NET REALIZED AND UNREALIZED GAINS (LOSSES) ON INVESTMENTS | | 2,426,577 | | (2,666,729 | ) |
| | | | | |
NET INCREASE (DECREASE) IN NET ASSETS FROM OPERATIONS | | $ | 1,663,518 | | $ | (2,902,185 | ) |
*Net of foreign tax withholding | | $ | — | | $ | 15,867 | |
see accompanying notes to financial statements
37
STATEMENTS OF CHANGES IN NET ASSETS
For the years December 31, 2005, and December 31, 2004
| | FIRSTHAND TECHNOLOGY | |
| | VALUE FUND | |
| | Year | | Year | |
| | Ended | | Ended | |
| | 12/31/05 | | 12/31/04 | |
FROM OPERATIONS: | | | | | |
Net investment loss | | $ | (8,355,438 | ) | $ | (9,766,774 | ) |
Net realized losses from security transactions and foreign currency | | (143,155,265 | ) | (258,926,742 | ) |
Net change in unrealized appreciation on investments and foreign currency | | 193,732,975 | | 204,966,127 | |
Net increase (decrease) in net assets from operations | | 42,222,272 | | (63,727,389 | ) |
| | | | | |
FROM CAPITAL SHARE TRANSACTIONS: | | | | | |
Proceeds from shares sold | | 29,662,063 | | 91,603,669 | |
Payment for shares redeemed | | (212,207,191 | ) | (318,385,285 | ) |
Net decrease in net assets from capital share transactions | | (182,545,128 | ) | (226,781,616 | ) |
| | | | | |
TOTAL DECREASE IN NET ASSETS | | (140,322,856 | ) | (290,509,005 | ) |
| | | | | |
NET ASSETS: | | | | | |
Beginning of year | | 586,929,941 | | 877,438,946 | |
End of year | | $ | 446,607,085 | | $ | 586,929,941 | |
| | | | | |
CAPITAL SHARE ACTIVITY: | | | | | |
Shares sold | | 993,682 | | 2,988,191 | |
Shares redeemed | | (7,420,470 | ) | (10,869,703 | ) |
Net decrease in shares outstanding | | (6,426,788 | ) | (7,881,512 | ) |
Shares outstanding, beginning of year | | 19,909,940 | | 27,791,452 | |
Shares outstanding, end of year | | 13,483,152 | | 19,909,940 | |
see accompanying notes to financial statements
38
| | FIRSTHAND TECHNOLOGY | |
| | LEADERS FUND | |
| | Year | | Year | |
| | Ended | | Ended | |
| | 12/31/05 | | 12/31/04 | |
FROM OPERATIONS: | | | | | |
Net investment loss | | $ | (1,460,567 | ) | $ | (2,042,527 | ) |
Net realized losses from security transactions and foreign currency | | (881,013 | ) | (11,851,283 | ) |
Net change in unrealized appreciation on investments and foreign currency | | 14,301,064 | | 8,177,778 | |
Net increase (decrease) in net assets from operations | | 11,959,484 | | (5,716,032 | ) |
| | | | | |
FROM CAPITAL SHARE TRANSACTIONS: | | | | | |
Proceeds from shares sold | | 35,038,398 | | 9,383,379 | |
Payment for shares redeemed | | (39,903,838 | ) | (45,894,167 | ) |
Net decrease in net assets from capital share transactions | | (4,865,440 | ) | (36,510,788 | ) |
| | | | | |
TOTAL INCREASE (DECREASE) IN NET ASSETS | | 7,094,044 | | (42,226,820 | ) |
| | | | | |
NET ASSETS: | | | | | |
Beginning of year | | 113,914,849 | | 156,141,669 | |
End of year | | $ | 121,008,893 | | $ | 113,914,849 | |
| | | | | |
CAPITAL SHARE ACTIVITY: | | | | | |
Shares sold | | 1,955,489 | | 564,475 | |
Shares redeemed | | (2,372,791 | ) | (2,823,820 | ) |
Net decrease in shares outstanding | | (417,302 | ) | (2,259,345 | ) |
Shares outstanding, beginning of year | | 6,802,415 | | 9,061,760 | |
Shares outstanding, end of year | | 6,385,113 | | 6,802,415 | |
see accompanying notes to financial statements
39
| | FIRSTHAND TECHNOLOGY | |
| | INNOVATORS FUND | |
| | Year | | Year | |
| | Ended | | Ended | |
| | 12/31/05 | | 12/31/04 | |
FROM OPERATIONS: | | | | | |
Net investment loss | | $ | (638,933 | ) | $ | (1,252,860 | ) |
Net realized losses from security transactions and foreign currency | | (19,972,510 | ) | (8,641,233 | ) |
Net change in unrealized appreciation (depreciation) on investments and foreign currency | | 13,583,828 | | (707,775 | ) |
Net decrease in net assets from operations | | (7,027,615 | ) | (10,601,868 | ) |
| | | | | |
FROM CAPITAL SHARE TRANSACTIONS: | | | | | |
Proceeds from shares sold | | 3,579,870 | | 21,438,690 | |
Payment for shares redeemed | | (25,232,780 | ) | (40,785,516 | ) |
Net decrease in net assets from capital share transactions | | (21,652,910 | ) | (19,346,826 | ) |
| | | | | |
TOTAL DECREASE IN NET ASSETS | | (28,680,525 | ) | (29,948,694 | ) |
| | | | | |
NET ASSETS: | | | | | |
Beginning of year | | 58,156,049 | | 88,104,743 | |
End of year | | $ | 29,475,524 | | $ | 58,156,049 | |
| | | | | |
CAPITAL SHARE ACTIVITY: | | | | | |
Shares sold | | 395,792 | | 1,943,599 | |
Shares redeemed | | (2,845,292 | ) | (3,793,112 | ) |
Net decrease in shares outstanding | | (2,449,500 | ) | (1,849,513 | ) |
Shares outstanding, beginning of year | | 5,770,397 | | 7,619,910 | |
Shares outstanding, end of year | | 3,320,897 | | 5,770,397 | |
see accompanying notes to financial statements
40
| | FIRSTHAND | |
| | E-COMMERCE FUND | |
| | Year | | Year | |
| | Ended | | Ended | |
| | 12/31/05 | | 12/31/04 | |
FROM OPERATIONS: | | | | | |
Net investment loss | | $ | (763,059 | ) | $ | (1,105,421 | ) |
Net realized gains from security transactions, written options and foreign currency | | 2,165,113 | | 5,762,830 | |
Net change in unrealized appreciation (depreciation) on investments, written options and foreign currency | | 261,464 | | (2,076,748 | ) |
Net increase in net assets from operations | | 1,663,518 | | 2,580,661 | |
| | | | | |
FROM CAPITAL SHARE TRANSACTIONS: | | | | | |
Proceeds from shares sold | | 1,368,881 | | 9,715,349 | |
Payment for shares redeemed | | (15,641,580 | ) | (23,141,295 | ) |
Net decrease in net assets from capital share transactions | | (14,272,699 | ) | (13,425,946 | ) |
| | | | | |
TOTAL DECREASE IN NET ASSETS | | (12,609,181 | ) | (10,845,285 | ) |
| | | | | |
NET ASSETS: | | | | | |
Beginning of year | | 55,552,626 | | 66,397,911 | |
End of year | | $ | 42,943,445 | | $ | 55,552,626 | |
| | | | | |
CAPITAL SHARE ACTIVITY: | | | | | |
Shares sold | | 445,763 | | 3,137,874 | |
Shares redeemed | | (5,044,549 | ) | (7,586,633 | ) |
Net decrease in shares outstanding | | (4,598,786 | ) | (4,448,759 | ) |
Shares outstanding, beginning of year | | 17,220,233 | | 21,668,992 | |
Shares outstanding, end of year | | 12,621,447 | | 17,220,233 | |
see accompanying notes to financial statements
41
| | FIRSTHAND GLOBAL | |
| | TECHNOLOGY FUND | |
| | Year | | Year | |
| | Ended | | Ended | |
| | 12/31/05 | | 12/31/04 | |
FROM OPERATIONS: | | | | | |
Net investment loss | | $ | (235,456 | ) | $ | (751,395 | ) |
Net realized gains (losses) from security transactions and foreign currency | | (2,629,847 | ) | 2,012,583 | |
Net change in unrealized depreciation on investments and foreign currency | | (36,882 | ) | (6,944,463 | ) |
Net decrease in net assets from operations | | (2,902,185 | ) | (5,683,275 | ) |
| | | | | |
FROM CAPITAL SHARE TRANSACTIONS: | | | | | |
Proceeds from shares sold | | 2,179,106 | | 27,899,673 | |
Payment for shares redeemed | | (15,372,316 | ) | (47,030,264 | ) |
Net decrease in net assets from capital share transactions | | (13,193,210 | ) | (19,130,591 | ) |
| | | | | |
TOTAL DECREASE IN NET ASSETS | | (16,095,395 | ) | (24,813,866 | ) |
| | | | | |
NET ASSETS: | | | | | |
Beginning of year | | 32,524,102 | | 57,337,968 | |
End of year | | $ | 16,428,707 | | $ | 32,524,102 | |
| | | | | |
CAPITAL SHARE ACTIVITY: | | | | | |
Shares sold | | 571,676 | | 6,368,151 | |
Shares redeemed | | (3,973,837 | ) | (11,197,824 | ) |
Net decrease in shares outstanding | | (3,402,161 | ) | (4,829,673 | ) |
Shares outstanding, beginning of year | | 7,600,224 | | 12,429,897 | |
Shares outstanding, end of year | | 4,198,063 | | 7,600,224 | |
see accompanying notes to financial statements
42
FINANCIAL HIGHLIGHTS
Selected per share data and ratios for a share outstanding throughout each year
| | FIRSTHAND TECHNOLOGY VALUE FUND | |
| | Year | | Year | | Year | | Year | | Year | |
| | Ended | | Ended | | Ended | | Ended | | Ended | |
| | 12/31/05 | | 12/31/04 | | 12/31/03 | | 12/31/02 | | 12/31/01 | |
| | | | | | | | | | | |
Net asset value at beginning of year | | $ | 29.48 | | $ | 31.57 | | $ | 18.09 | | $ | 41.25 | | $ | 74.33 | |
| | | | | | | | | | | |
Income from investment operations: | | | | | | | | | | | |
Net investment loss | | (0.62 | ) | (0.49 | ) | (0.40 | ) | (0.46 | ) | (0.65 | ) |
Net realized and unrealized gains (losses) on investments | | 4.26 | | (1.60 | ) | 13.88 | | (22.72 | ) | (32.16 | ) |
Total from investment operations | | 3.64 | | (2.09 | ) | 13.48 | | (23.18 | ) | (32.81 | ) |
| | | | | | | | | | | |
Less distributions: | | | | | | | | | | | |
Distributions from net realized capital gains | | — | | — | | — | | — | | (0.38 | ) |
Total distributions | | — | | — | | — | | — | | (0.38 | ) |
| | | | | | | | | | | |
Paid-in-capital from redemption fees
(Note 2) | | — | | — | | 0.00 | (A) | 0.02 | | 0.11 | |
| | | | | | | | | | | |
Net asset value at end of year | | $ | 33.12 | | $ | 29.48 | | $ | 31.57 | | $ | 18.09 | | $ | 41.25 | |
| | | | | | | | | | | |
Total return | | 12.35 | % | (6.62 | )% | 74.52 | % | (56.15 | )% | (44.00 | )% |
| | | | | | | | | | | |
Net assets at end of year (millions) | | $ | 446.6 | | $ | 586.9 | | $ | 877.4 | | $ | 492.7 | | $ | 1,449.9 | |
| | | | | | | | | | | |
Ratio of expenses to average net assets | | 1.92 | % | 1.90 | % | 1.90 | % | 1.89 | % | 1.84 | % |
| | | | | | | | | | | |
Ratio of net investment loss to average net assets | | (1.81 | )% | (1.41 | )% | (1.64 | )% | (1.56 | )% | (1.20 | )% |
| | | | | | | | | | | |
Portfolio turnover rate | | 42 | % | 17 | % | 38 | % | 44 | % | 57 | % |
(A) Amount is less than $0.01.
see accompanying notes to financial statements
43
| | FIRSTHAND TECHNOLOGY LEADERS FUND | |
| | Year | | Year | | Year | | Year | | Year | |
| | Ended | | Ended | | Ended | | Ended | | Ended | |
| | 12/31/05 | | 12/31/04 | | 12/31/03 | | 12/31/02 | | 12/31/01 | |
| | | | | | | | | | | |
Net asset value at beginning of year | | $ | 16.75 | | $ | 17.23 | | $ | 10.65 | | $ | 18.86 | | $ | 33.84 | |
| | | | | | | | | | | |
Income from investment operations: | | | | | | | | | | | |
Net investment loss | | (0.23 | ) | (0.30 | ) | (0.24 | ) | (0.26 | ) | (0.41 | ) |
Net realized and unrealized gains (losses) on investments | | 2.43 | | (0.18 | ) | 6.82 | | (7.96 | ) | (14.62 | ) |
Total from investment operations | | 2.20 | | (0.48 | ) | 6.58 | | (8.22 | ) | (15.03 | ) |
| | | | | | | | | | | |
Paid-in-capital from redemption fees
(Note 2) | | — | | — | | 0.00 | (A) | 0.01 | | 0.05 | |
| | | | | | | | | | | |
Net asset value at end of year | | $ | 18.95 | | $ | 16.75 | | $ | 17.23 | | $ | 10.65 | | $ | 18.86 | |
| | | | | | | | | | | |
Total return | | 13.13 | % | (2.79 | )% | 61.78 | % | (43.53 | )% | (44.27 | )% |
| | | | | | | | | | | |
Net assets at end of year (millions) | | $ | 121.0 | | $ | 113.9 | | $ | 156.1 | | $ | 105.0 | | $ | 241.3 | |
| | | | | | | | | | | |
Ratio of expenses to average net assets | | 1.95 | % | 1.95 | % | 1.95 | % | 1.95 | % | 1.93 | % |
| | | | | | | | | | | |
Ratio of net investment loss to average
net assets | | (1.43 | )% | (1.58 | )% | (1.65 | )% | (1.63 | )% | (1.54 | )% |
| | | | | | | | | | | |
Portfolio turnover rate | | 43 | % | 22 | % | 28 | % | 46 | % | 44 | % |
(A) Amount is less than $0.01.
see accompanying notes to financial statements
44
| | FIRSTHAND TECHNOLOGY INNOVATORS FUND |
| | Year | | Year | | Year | | Year | | Year | |
| | Ended | | Ended | | Ended | | Ended | | Ended | |
| | 12/31/05 | | 12/31/04 | | 12/31/03 | | 12/31/02 | | 12/31/01 | |
| | | | | | | | | | | |
Net asset value at beginning of year | | $ | 10.08 | | $ | 11.56 | | $ | 7.42 | | $ | 16.40 | | $ | 23.13 | |
| | | | | | | | | | | |
Income from investment operations: | | | | | | | | | | | |
Net investment loss | | (0.19 | ) | (0.22 | ) | (0.17 | ) | (0.20 | ) | (0.24 | ) |
Net realized and unrealized gains (losses) on investments | | (1.01 | ) | (1.26 | ) | 4.31 | | (8.80 | ) | (6.51 | ) |
Total from investment operations | | (1.20 | ) | (1.48 | ) | 4.14 | | (9.00 | ) | (6.75 | ) |
| | | | | | | | | | | |
Paid-in-capital from redemption fees
(Note 2) | | — | | — | | 0.00 | (A) | 0.02 | | 0.02 | |
| | | | | | | | | | | |
Net asset value at end of year | | $ | 8.88 | | $ | 10.08 | | $ | 11.56 | | $ | 7.42 | | $ | 16.40 | |
| | | | | | | | | | | |
Total return | | (11.90 | )% | (12.80 | )% | 55.80 | % | (54.76 | )% | (29.10 | )% |
| | | | | | | | | | | |
Net assets at end of year (millions) | | $ | 29.5 | | $ | 58.2 | | $ | 88.1 | | $ | 62.6 | | $ | 204.9 | |
| | | | | | | | | | | |
Ratio of expenses to average net assets | | 1.95 | % | 1.95 | % | 1.95 | % | 1.95 | % | 1.94 | % |
| | | | | | | | | | | |
Ratio of net investment loss to average
net assets | | (1.68 | )% | (1.83 | )% | (1.67 | )% | (1.66 | )% | (1.43 | )% |
| | | | | | | | | | | |
Portfolio turnover rate | | 41 | % | 41 | % | 64 | % | 53 | % | 63 | % |
(A) Amount is less than $0.01.
see accompanying notes to financial statements
45
| | FIRSTHAND E-COMMERCE FUND |
| | Year | | Year | | Year | | Year | | Year | |
| | Ended | | Ended | | Ended | | Ended | | Ended | |
| | 12/31/05 | | 12/31/04 | | 12/31/03 | | 12/31/02 | | 12/31/01 | |
| | | | | | | | | | | |
Net asset value at beginning of year | | $ | 3.23 | | $ | 3.06 | | $ | 2.08 | | $ | 3.33 | | $ | 6.63 | |
| | | | | | | | | | | |
Income from investment operations: | | | | | | | | | | | |
Net investment loss | | (0.06 | ) | (0.06 | ) | (0.05 | ) | (0.04 | ) | (0.04 | ) |
Net realized and unrealized gains
(losses) on investments | | 0.23 | | 0.23 | | 1.03 | | (1.21 | ) | (3.26 | ) |
Total from investment operations | | 0.17 | | 0.17 | | 0.98 | | (1.25 | ) | (3.30 | ) |
| | | | | | | | | | | |
Paid-in-capital from redemption fees
(Note 2) | | — | | — | | 0.00 | (A) | 0.00 | (A) | 0.00 | (A) |
| | | | | | | | | | | |
Net asset value at end of year | | $ | 3.40 | | $ | 3.23 | | $ | 3.06 | | $ | 2.08 | | $ | 3.33 | |
| | | | | | | | | | | |
Total return | | 5.26 | % | 5.56 | % | 47.12 | % | (37.54 | )% | (49.77 | )% |
| | | | | | | | | | | |
Net assets at end of year (millions) | | $ | 42.9 | | $ | 55.6 | | $ | 66.4 | | $ | 51.8 | | $ | 99.5 | |
| | | | | | | | | | | |
Ratio of expenses to average net assets | | 1.95 | % | 1.95 | % | 1.95 | % | 1.95 | % | 1.95 | % |
| | | | | | | | | | | |
Ratio of net investment loss to average
net assets | | (1.66 | )% | (1.90 | )% | (1.72 | )% | (1.69 | )% | (1.13 | )% |
| | | | | | | | | | | |
Portfolio turnover rate | | 55 | % | 22 | % | 46 | % | 61 | % | 67 | % |
(A) Amount is less than $0.01.
see accompanying notes to financial statements
46
| | FIRSTHAND GLOBAL TECHNOLOGY FUND |
| | Year | | Year | | Year | | Year | | Year | |
| | Ended | | Ended | | Ended | | Ended | | Ended | |
| | 12/31/05 | | 12/31/04 | | 12/31/03 | | 12/31/02 | | 12/31/01 | |
| | | | | | | | | | | |
Net asset value at beginning of year | | $ | 4.28 | | $ | 4.61 | | $ | 2.42 | | $ | 5.14 | | $ | 8.75 | |
| | | | | | | | | | | |
Income from investment operations: | | | | | | | | | | | |
Net investment loss | | (0.06 | ) | (0.10 | ) | (0.05 | ) | (0.07 | ) | (0.07 | ) |
Net realized and unrealized gains
(losses) on investments | | (0.31 | ) | (0.23 | ) | 2.24 | | (2.65 | ) | (3.57 | ) |
Total from investment operations | | (0.37 | ) | (0.33 | ) | 2.19 | | (2.72 | ) | (3.64 | ) |
| | | | | | | | | | | |
Paid-in-capital from redemption fees
(Note 2) | | — | | — | | 0.00 | (A) | 0.00 | (A) | 0.03 | |
| | | | | | | | | | | |
Net asset value at end of year | | $ | 3.91 | | $ | 4.28 | | $ | 4.61 | | $ | 2.42 | | $ | 5.14 | |
| | | | | | | | | | | |
Total return | | (8.64 | )% | (7.16 | )% | 90.50 | % | (52.92 | )% | (41.26 | )% |
| | | | | | | | | | | |
Net assets at end of year (millions) | | $ | 16.4 | | $ | 32.5 | | $ | 57.3 | | $ | 20.2 | | $ | 53.0 | |
| | | | | | | | | | | |
Ratio of expenses to average net assets | | 1.95 | % | 1.95 | % | 1.95 | % | 1.95 | % | 1.95 | % |
| | | | | | | | | | | |
Ratio of net investment loss to average
net assets | | (1.20 | )% | (1.69 | )% | (1.77 | )% | (1.73 | )% | (0.95 | )% |
| | | | | | | | | | | |
Portfolio turnover rate | | 23 | % | 15 | % | 50 | % | 26 | % | 67 | % |
(A) Amount is less than $0.01.
see accompanying notes to financial statements
47
NOTES TO FINANCIAL STATEMENTS
December 31, 2005
1. Organization
Each of Firsthand Technology Value Fund, Firsthand Technology Leaders Fund, Firsthand Technology Innovators Fund, Firsthand
e-Commerce Fund, Firsthand Global Technology Fund, and Firsthand Health Sciences Fund (individually the “Fund”, and collectively the “Funds”) is a non-diversified series of Firsthand Funds (the “Trust”), an open-end management investment company registered under the Investment Company Act of 1940, as amended (the “1940 Act”). The Trust, a Delaware statutory trust, was organized on November 8, 1993. The inception dates for the Funds (the date on which a net asset value was first determined for that Fund) follow.
The accompanying financial statements and notes relate only to the following Funds:
Fund | | Inception Date |
Firsthand Technology Value Fund | | May 20, 1994* |
Firsthand Technology Leaders Fund | | December 10, 1997 |
Firsthand Technology Innovators Fund | | May 20, 1998 |
Firsthand e-Commerce Fund | | September 30, 1999 |
Firsthand Global Technology Fund | | September 29, 2000 |
* Firsthand Technology Value Fund Investor Class commenced operations on May 20, 1994; the SEC effective date for the Investor Class is December 15, 1994. Each Fund currently offers one class of shares — Investor Class shares.
Each Fund’s investment objective is long-term growth of capital.
Firsthand Technology Value Fund seeks to achieve its investment objective by investing, under normal circumstances, at least 80% of its assets in high-technology companies that Firsthand Capital Management, Inc. (the “Investment Adviser”) believes are undervalued and have potential for capital appreciation.
Firsthand Technology Leaders Fund seeks to achieve its investment objective by investing, under normal circumstances, at least 80% of its assets in high-technology companies that the Investment Adviser believes hold dominant competitive positions in high-growth industries.
Firsthand Technology Innovators Fund seeks to achieve its investment objective by investing, under normal circumstances, at least 80% of its assets in high-technology companies that the Investment Adviser considers to be best positioned to introduce “breakthrough” products in the fastest-growing markets in the technology sector.
Firsthand e-Commerce Fund seeks to achieve its investment objective by investing, under normal circumstances, at least 80% of its assets in equity securities of companies that provide the products, services, and technologies to facilitate the growth of electronic commerce.
Firsthand Global Technology Fund seeks to achieve its investment objective by investing, under normal circumstances, at least 80% of its assets in high-technology companies, both domestic and foreign, that the Investment Adviser considers best positioned to benefit significantly from the adoption of new technologies worldwide.
48
2. Significant Accounting Policies
The following is a summary of the Funds’ significant accounting policies:
Securities Valuation — A Fund’s portfolio of securities is valued as follows:
1. Securities traded on stock exchanges, or quoted by NASDAQ, are valued according to the NASDAQ official closing price, if applicable, or at their last reported sale price as of the close of trading on the New York Stock Exchange (“NYSE”) (normally 4:00 P.M. Eastern Time). If a security is not traded that day, the security will be valued at its most recent bid price.
2. Securities traded in the over-the-counter market, but not quoted by NASDAQ, are valued at the last sale price (or, if the last sale price is not readily available, at the most recent closing bid price as quoted by brokers that make markets in the securities) at the close of trading on the NYSE.
3. Securities traded both in the over-the-counter market and on a stock exchange are valued according to the broadest and most representative market.
4. Securities and other assets that do not have market quotations readily available are valued at their fair value as determined in good faith using procedures established by the Board of Trustees.
Share Valuation — The net asset value (“NAV”) per share of each Fund is calculated by dividing the sum of the value of the securities held by the Fund, plus cash or other assets, minus all liabilities (including estimated accrued expenses) by the total number of shares outstanding of the Fund, rounded to the nearest cent. A Fund’s shares will not be priced on the days on which the NYSE is closed for trading. The offering and redemption price per share of each Fund is equal to a Fund’s net asset value per share. Prior to April 30, 2003, shares of each Fund were charged a 2% redemption fee on shares redeemed or exchanged within 180 days of purchase. These fees were deducted from the redemption proceeds otherwise payable to the shareholder. Each Fund retained the fee charged as paid-in capital and such fees became part of that Fund’s daily NAV calculation.
Repurchase Agreements — Repurchase agreements, which must be secured with collateral of a credit quality at least equal to a Fund’s investment criteria for its portfolio securities, are valued at cost, which, together with accrued interest, approximates market value. At the time a Fund enters into a repurchase agreement, the value of the underlying securities, including accrued interest, will equal or exceed the value of the repurchase agreement, and in the case of a repurchase agreement exceeding one day, the seller will agree that the value of the underlying securities, including accrued interest, will at all times equal or exceed the value of the repurchase agreement. In the event of a bankruptcy or other default by the seller of a repurchase agreement, a Fund could experience delays in liquidating the underlying securities and losses.
Investment Income — Dividend income is recorded on the ex-dividend date. Interest income is accrued as earned. Discounts and premiums on securities purchased are amortized over the lives of the respective securities. Other non-cash dividends are recognized as investment income at the fair value of the property received.
Foreign Securities — Each Fund may invest in companies that trade on U.S. exchanges as American Depositary Receipts (“ADRs”), on foreign exchanges, or on foreign over-the-counter markets. Investing in the securities of foreign companies exposes your investment in a Fund to risk. Foreign stock markets tend to be more volatile than the U.S. market due to economic and/or political instability and the regulatory conditions in some countries. In addition, some of the
49
securities in which the Fund may invest may be denominated in foreign currencies, the value of which may decline against the U.S. dollar. An investment in foreign securities may be subject to high levels of foreign taxation, including foreign taxes withheld at the source.
Options — The Funds (other than Firsthand Technology Value Fund) may purchase put and call options to attempt to provide protection against adverse price effects from anticipated changes in prevailing prices of securities or stock indices. When the Fund writes an option, an amount equal to the premium received by the Fund is recorded as a liability and is subsequently adjusted to the current fair value of the option written. Premiums received from writing options that expire unexercised are treated by the Fund on the expiration date as realized gains from investments. The difference between the premium and the amount paid on effecting a closing purchase transaction, including brokerage commissions, is also treated as a realized gain, or, if the premium is less than the amount paid for the closing purchase transaction, as a realized loss. If a call option is exercised, the premium is added to the proceeds from the sale of the underlying security or currency in determining whether the Fund has realized a gain or loss. The Fund as writer of an option bears the market risk of an unfavorable change in the price of the security underlying the written option.
Distributions to Shareholders — Each Fund expects to distribute its net investment income and net realized gains, if any, annually. Distributions from net investment income and capital gains are determined in accordance with income tax regulations, which may differ from accounting principles generally accepted in the United States.
Reclassification of Capital Accounts — The Funds account and report for distributions to shareholders in accordance with the American Institute of Certified Public Accountant’s Statement of Position 93-2: Determination, Disclosure, and Financial Statement Presentation of Income, Capital and Return of Capital Distributions by Investment Companies. For the year ended December 31, 2005, each Fund recorded the following reclassifications to the accounts listed below:
| | Increase (Decrease) | |
| | Paid-in-Capital | | Accumulated Net
Investment Loss | | Accumulated Net
Realized Loss | |
Firsthand Technology Value Fund | | $ | (8,355,438 | ) | $ | 8,355,438 | | $ | — | |
Firsthand Technology Leaders Fund | | (1,460,567 | ) | 1,460,567 | | — | |
Firsthand Technology Innovators Fund | | (638,933 | ) | 638,933 | | — | |
Firsthand e-Commerce Fund | | (763,059 | ) | 763,059 | | — | |
Firsthand Global Technology Fund | | (232,843 | ) | 235,456 | | (2,613 | ) |
| | | | | | | | | | |
Security Transactions — Security transactions are accounted for on the trade date. Securities sold are valued on a specific identification basis.
Estimates — The preparation of financial statements in conformity with accounting principles generally accepted in the United States of America requires management to make estimates and assumptions that affect the reported amounts of assets and liabilities at the date of the financial
50
statements and the reported amounts of income and expenses during the reporting period. Actual results could differ from those estimates.
Federal Income Tax — Each Fund has elected, and intends to qualify annually for, the special tax treatment afforded regulated investment companies under the Internal Revenue Code of 1986, as amended (the “Code”). As provided in the Code, in any fiscal year in which a Fund so qualifies and distributes at least 90% of its taxable net income, the Fund (but not the shareholders) will be relieved of federal income tax on the income distributed. Accordingly, no provision for income taxes has been made. To avoid imposition of the excise tax applicable to regulated investment companies, each Fund intends to declare as dividends in each calendar year at least 98% of its net investment income (earned during the calendar year) and 98% of its net realized capital gains (earned during the 12 months ended October 31) plus undistributed amounts, if any, from prior years. The following information is based upon the federal income tax cost of portfolio investments as of December 31, 2005.
| | | | | | Firsthand | | | | Firsthand | |
| | Firsthand | | Firsthand | | Technology | | Firsthand | | Global | |
| | Technology | | Technology | | Innovators | | e-Commerce | | Technology | |
| | Value Fund | | Leaders Fund | | Fund | | Fund | | Fund | |
| | | | | | | | | | | |
Gross unrealized appreciation | | $ | 30,379,668 | | $ | 25,819,077 | | $ | 2,928,204 | | $ | 10,163,260 | | $ | 2,897,371 | |
Gross unrealized depreciation | | (256,025,680 | ) | (13,136,603 | ) | (14,326,766 | ) | (3,681,540 | ) | (2,301,641 | ) |
Net unrealized appreciation (depreciation) | | $ | (225,646,012 | ) | $ | 12,682,474 | | $ | (11,398,562 | ) | $ | 6,481,720 | | $ | 595,730 | |
Federal income tax cost | | $ | 676,240,799 | | $ | 110,173,064 | | $ | 39,850,048 | | $ | 36,696,105 | | $ | 15,916,774 | |
The difference between the acquisition cost and the federal income tax cost of portfolio investments is due to certain timing differences in the recognition of capital losses under accounting principles generally accepted in the United States and income tax regulations. As of December 31, 2005, the Funds had capital loss carryforwards for federal income tax purposes as follows:
| | Expiring | | Expiring | | Expiring | | Expiring | | Expiring | | Expiring | |
| | 2008 | | 2009 | | 2010 | | 2011 | | 2012 | | 2013 | |
| | | | | | | | | | | | | |
Firsthand Technology Value Fund | | $ | — | | $ | 1,092,189,416 | | $ | 634,016,220 | | $ | 330,969,371 | | $ | 333,067,019 | | $ | 165,213,285 | |
Firsthand Technology Leaders Fund | | 7,699,026 | | 134,863,157 | | 109,312,900 | | 53,324,264 | | 33,348,418 | | 2,501,373 | |
Firsthand Technology Innovators Fund | | — | | 195,444,987 | | 87,067,727 | | 61,543,691 | | 7,252,266 | | 11,273,401 | |
Firsthand e-Commerce Fund | | — | | 259,893,565 | | 141,312,315 | | 6,014,495 | | — | | — | |
Firsthand Global Technology Fund | | — | | 47,790,468 | | 13,149,532 | | 16,183,628 | | — | | 2,936,303 | |
| | | | | | | | | | | | | | | | | | | |
For Firsthand Technology Value Fund, $7,924,308 of the $1,092,189,416 capital loss carryforward expiring in 2009 was acquired in the reorganization with Firsthand Communications Fund.
51
Components of distributable earnings:
| | | | | | Firsthand | | | | Firsthand | |
| | Firsthand | | Firsthand | | Technology | | Firsthand | | Global | |
| | Technology | | Technology | | Innovators | | e-Commerce | | Technology | |
| | Value Fund | | Leaders Fund | | Fund | | Fund | | Fund | |
| | | | | | | | | | | |
Net Unrealized Appreciation(Depreciation) | | $ | (225,646,012 | ) | $ | 12,682,474 | | $ | (11,398,562 | ) | $ | 6,481,720 | | $ | 595,776 | |
Post October Capital/Currency Loss | | — | | — | | (10,088,076 | ) | — | | — | |
| | | | | | | | | | | |
Accumulated Capital Loss Carryforward | | (2,555,455,311 | ) | (341,049,138 | ) | (362,582,072 | ) | (407,220,375 | ) | (80,059,931 | ) |
Total Distributable Earnings | | $ | (2,781,101,323 | ) | $ | (328,366,664 | ) | $ | (384,068,710 | ) | $ | (400,738,655 | ) | $ | (79,464,155 | ) |
The differences between book-basis and tax-basis unrealized appreciation (depreciation) is attributable primarily to tax deferral of losses on wash sales and foreign currency exchange gain (loss).
3. Investment Transactions
Investment transactions (excluding short-term investments) were as follows for the year ended December 31, 2005.
| | | | | | Firsthand | | | | Firsthand | |
| | Firsthand | | Firsthand | | Technology | | Firsthand | | Global | |
| | Technology | | Technology | | Innovators | | e-Commerce | | Technology | |
| | Value Fund | | Leaders Fund | | Fund | | Fund | | Fund | |
| | | | | | | | | | | |
Purchase of investment securities | | $ | 193,167,905 | | $ | 42,996,459 | | $ | 15,161,259 | | $ | 23,396,642 | | $ | 4,522,914 | |
Proceeds from sales and maturities of investment securities | | $ | 388,253,765 | | $ | 52,410,506 | | $ | 36,284,216 | | $ | 36,910,255 | | $ | 19,039,868 | |
Transactions in options written during the year ended December 31, 2005, were as follows:
Firsthand e-Commerce Fund
| | Number of Contracts | | Premiums Received | |
| | | | | |
Options outstanding at December 31, 2004 | | 1,200 | | $ | 187,286 | |
Options written | | 600 | | 157,221 | |
Options terminated in closing purchase transactions | | (600 | ) | (91,798 | ) |
Options exercised | | (1,200 | ) | (252,709 | ) |
Options outstanding at December 31, 2005 | | — | | $ | — | |
4. Investment Advisory and Administration Agreements
Certain trustees and officers of the Trust are also officers of the Investment Adviser or BISYS Fund Services Ohio, Inc. (“BISYS”). BISYS serves as the sub-administrator and investment accounting agent. State Street Bank and Trust Company (“State Street”) serves as the shareholder servicing and transfer agent. PFPC Trust Company serves as the custodian for the Trust. Prior to June 20, 2005, State Street served as the sub-administrator and investment accounting agent. Prior to July 8, 2005, State Street served as the custodian.
52
INVESTMENT ADVISORY AGREEMENT
Each Fund’s investments are managed by the Investment Adviser pursuant to the terms of an Investment Advisory Agreement (the “Advisory Agreement”). Under the Advisory Agreement, the Investment Adviser provides each Fund with investment research, advice, management, and supervision and manages the investment and reinvestment of assets of each Fund consistent with each Fund’s investment objectives, policies, and limitations. The Investment Adviser is responsible for (i) compensation of any of the Fund’s trustees, officers, and employees who are interested persons of the Investment Adviser; and (ii) compensation of the Investment Adviser’s personnel and other expenses incurred in connection with the provision of portfolio management services under the Advisory Agreement.
For the services it provides under the Advisory Agreement, the Investment Adviser receives from each Fund, on a monthly basis, an advisory fee at the annual rate of 1.50% of its average daily net assets. The Advisory Agreement requires the Investment Adviser to waive fees and, if necessary, to reimburse expenses of each such Fund to the extent necessary to limit a Fund’s total operating expenses to 1.95% of its average net assets up to $200 million, 1.90% of such assets from $200 million to $500 million, 1.85% of such assets from $500 million to $1 billion, and 1.80% of such assets in excess of $1 billion.
ADMINISTRATION AGREEMENT
The Trust has entered into a separate Administration Agreement with the Investment Adviser. The agreement obligates the Investment Adviser to provide administrative and general supervisory services to each Fund (the “Administration Agreement”). Under the Administration Agreement, the Investment Adviser renders supervisory and corporate administrative services to the Trust, as well as oversees the maintenance of all books and records with respect to each Fund’s securities transactions and each Fund’s book of accounts in accordance with all applicable federal and state laws and regulations. The Investment Adviser also arranges for the preservation of journals, ledgers, corporate documents, brokerage account records, and other records as required by the 1940 Act.
The Investment Adviser is responsible for the equipment, staff, office space, and facilities necessary to perform its obligations under the Administration Agreement. Under the Administration Agreement, the Investment Adviser has assumed responsibility for payment of all of each Fund’s operating expenses excluding independent trustees’ compensation; brokerage and commission expenses; fees payable under “Rule 12b-1 plans”, if any, and shareholder servicing plans, if any; litigation costs; and any extraordinary and non-recurring expenses. For the services it provides under the Administration Agreement, the Investment Adviser receives a fee from each Fund at the annual rate of 0.45% of its average daily net assets up to $200 million, 0.40% of such assets from $200 million to $500 million, 0.35% of such assets from $500 million to $1 billion, and 0.30% of such assets in excess of $1 billion. The Investment Adviser has entered into a Sub-Administration Agreement with BISYS. Under this agreement, the Investment Adviser (not the Funds) pays to BISYS the fees for the administrative services provided by BISYS.
5. Investment Advisory and Administration Agreements (unaudited)
Below is a description of the specific materials provided, factors considered, and conclusions reached by the Board relating to the selection of the Investment Adviser and the re-approval of the Advisory Agreement.
Nature, Extent and Quality of Services
The Board received and considered various data and information regarding the nature, extent
53
and quality of services provided to the Funds by the Investment Adviser. The most recent investment adviser registration form (“Form ADV”) for the Investment Adviser was provided to the Board, as were responses of the Investment Adviser to a detailed series of requests submitted by the Independent Trustees’ independent legal counsel on behalf of such Trustees. The Board reviewed and analyzed these materials, which included, among other things, information about the background and experience of the senior management and the expertise of, and amount of attention devoted to the Funds by, investment personnel of the Investment Adviser. In this regard, the Board specifically reviewed the qualifications, backgrounds and responsibilities of the portfolio managers primarily responsible for day-to-day portfolio management services for the Funds.
In addition, the Board received and reviewed information on SEC and other regulatory inquiries and examinations relating to the Funds and the Investment Adviser. The Board considered the investment and legal compliance programs of the Fund and the Investment Adviser, including their implementation of enhanced compliance policies and procedures in response to SEC rule changes and other regulatory initiatives. The Board also considered the Funds’ Chief Compliance Officer’s report and recommendations.
The Board evaluated the ability of the Investment Adviser, including its resources, reputations and other attributes, to attract and retain highly qualified investment professionals, including research, advisory, and supervisory personnel. In this regard, the Board considered information regarding the Investment Adviser’s compensation program for its personnel involved in the management of the Funds, including incentive and retirement plans.
Based on the above factors, together with those referenced below, the Board concluded that it was generally satisfied with the nature, extent and quality of the investment advisory services provided to each of the Funds by the Investment Adviser.
Fund Performance and Expenses
The Board considered the one-year, three-year and five-year performance results for each of the Funds, as relevant. It also considered these results in comparison to the median performance results of the group of funds that was determined to be the most similar to a given Fund (the “Peer Group”) and to the median performance of a broader universe of relevant funds (the “Universe”), as well as to each Fund’s benchmark index. Lipper Inc., an independent provider of investment company data, determined the Peer Group and Universe for each Fund. The Board was provided with a description of the methodology used by Lipper to select the mutual funds in each Fund’s Peer Group and Universe. The Board noted that Firsthand Technology Leaders Fund, Firsthand e-Commerce Fund, and Firsthand Technology Value Fund had been strong performers, but that Firsthand Global Technology Fund and Firsthand Technology Innovators Fund had struggled and hoped to see improvement.
The Board received and considered statistical information regarding each Fund’s total expense ratio and its various components, including contractual advisory fees, actual advisory fees, actual non-management fees, fee waivers/caps and/or expense reimbursements. It also considered comparisons of these fees to the comparative expense information for each Fund’s Peer Group and Universe as provided by Lipper Inc. The Board noted that the overall expense ratios of each of the Funds were lower than, or not appreciably above, each Fund’s Peer Group’s median overall expense ratio.
Investment Advisory Fee Rates
The Board reviewed and considered the proposed contractual investment advisory fee rates (the “Advisory Agreement Rates”) payable by the Funds to the Investment Adviser for investment advisory services. Additionally, the Board received and considered information comparing the
54
Advisory Agreement Rates (both on a stand-alone basis and on a combined basis with the Funds’ administration fee rates) with those of the other funds in the Peer Group. The Board concluded that the respective Advisory Agreement Rates and the advisory/administration fee rates for the Funds were higher than the median rates of each Fund’s Peer Group, but noted that the Investment Adviser had agreed to waive fees to ensure that the total fee ratio was very close to the median rates of each Fund’s Peer Group.
Profitability
The Board received and considered a detailed profitability analysis of the Investment Adviser based on the Advisory Agreement Rates as well as on other relationships between the Funds and the Investment Adviser. The Board concluded that, in light of the costs of providing investment management and other services to the Funds, the profits and other ancillary benefits that the Investment Adviser received with regard to providing these services to the Funds were not unreasonable.
Economies of Scale
The Board received and considered information regarding whether there have been economies of scale with respect to the management of the Funds, whether the Funds have appropriately benefited from any economies of scale, and whether there is potential for realization of any further economies of scale. The Board observed that the Advisory Agreements offer breakpoints. However, the Board considered the Advisory Agreement Rate and concluded that the fees were fair and equitable based on relevant factors, including the Funds’ performance results and all-in fee structure.
Information About Services to Other Clients
The Board also received and considered information about the nature, extent and quality of services and fee rates offered by the Investment Adviser to its other clients, including other registered and unregistered investment companies, private accounts and institutional investors. The Board concluded that the Advisory Agreement Rates were within a reasonable range of the fee rates offered to other Investment Adviser clients. Where rates offered to other clients were lower, the Board concluded that, based on information provided by the Investment Adviser, the costs associated with managing and operating a registered open-end fund, compared with a private investment company, private account or institutional investor account, provided a justification for higher fee rates to the Funds.
Other Benefits to the Investment Adviser
The Board received and considered information regarding potential “fall-out” or ancillary benefits received by the Investment Adviser as a result of its relationship with the Funds. Such benefits could include, among others, benefits directly attributable to the relationship of the Investment Adviser with the Funds (such as soft-dollar credits) and benefits potentially derived from an increase in the business of the Investment Adviser as a result of its relationship with the Funds (such as the ability to market to shareholders other financial products offered by the Investment Adviser).
The Board also considered the effectiveness of policies of the Funds in achieving the best execution of portfolio transactions, whether and to what extent soft dollar credits are sought and how any such credits are utilized, the extent to which efforts are made to recapture transaction costs, and the controls applicable to brokerage allocation procedures. The Board also reviewed the policies of the Investment Adviser regarding the allocation of portfolio investment opportunities among the Funds and other clients.
Other Factors and Broader Review
The Board also considered the markets for the Funds, including the principal channels through
55
which the Funds’ shares are offered and sold. As discussed above, the Board reviewed detailed materials received from the Investment Adviser annually as part of the Advisory Agreement re-approval process under Section 15(c) of the 1940 Act. The Board also regularly reviews and assesses the quality of the services that the Funds receive from the Investment Adviser throughout the year. In this regard, the Board reviews reports of the Investment Adviser at least in each of its quarterly meetings, which include, among other things, a detailed portfolio review and detailed fund performance reports. In addition, the Board interviews the portfolio managers of the Funds at various times throughout the year.
6. Deferred Compensation Agreement With Trustees
During the fiscal year ended December 31, 2000, the Trust entered into a deferred compensation agreement with the independent trustees of the Trust.
Under the deferred compensation agreement, each independent trustee may elect to defer some or all of his trustee fees. Each independent trustee is paid an annual retainer of $24,000, $6,000 for each regular meeting attended in person, and $1,000 for each special meeting attended. Deferred fees may be deemed invested in the Firsthand Funds selected by each independent trustee on a tax-deferred basis and deferred fees (and the income, gains, and losses credited during the deferral period) are payable on a deferral date elected by the trustees. Upon payment of any deferred fees (and the income, gains, and losses credited during the deferral period), each Fund will expense its pro rata share of those fees.
7. Investments in Affiliates and Restricted Securities
Affiliated issuers, as defined by the 1940 Act, are those in which a Fund’s holdings represent 5% or more of the outstanding voting securities of the issuer. A summary of each Fund’s investments in affiliates, if any, for the year ended December 31, 2005, is noted below:
| | SHARE ACTIVITY | | | | | | | |
| | Balance | | | | | | Balance | | Realized | | Value | | Acquisition | |
Affiliate | | 12/31/04 | | Purchases | | Sales | | 12/31/05 | | Gain (Loss) | | 12/31/05 | | Cost | |
| | | | | | | | | | | | | | | |
Firsthand Technology Value Fund | | | | | | | | | | | | | | | |
Anaren, Inc. * | | 1,111,900 | | — | | 1,111,900 | | — | | $ | (4,384,155 | ) | $ | — | | $ | — | |
Clarisay, Inc., Series B * | | 2,605,306 | | — | | — | | 2,605,306 | | — | | — | | 2,383,855 | |
Clarisay, Inc., Series C | | 7,194,244 | | — | | — | | 7,194,244 | | — | | — | | 2,000,000 | |
Clarisay, Inc., Warrant | | 500,000 | | — | | — | | 500,000 | | — | | — | | — | |
Clarisay, Inc., Warrant | | 500,000 | | — | | — | | 500,000 | | — | | — | | — | |
Clarisay, Inc., Warrant | | 250,000 | | — | | — | | 250,000 | | — | | — | | — | |
Clarisay, Inc., Warrant | | 100,000 | | — | | — | | 100,000 | | — | | — | | — | |
Clarisay, Inc., Warrant | | 500,000 | | — | | — | | 500,000 | | — | | — | | — | |
Clarisay, Inc., Warrant | | 500,000 | | — | | — | | 500,000 | | — | | — | | — | |
| | | | | | | | | | | | | | | | | | |
56
| | SHARE ACTIVITY | | | | | | | |
| | Balance | | | | | | Balance | | Realized | | Value | | Acquisition | |
Affiliate | | 12/31/04 | | Purchases | | Sales | | 12/31/05 | | Gain (Loss) | | 12/31/05 | | Cost | |
| | | | | | | | | | | | | | | |
Firsthand Technology Value Fund (cont’d) | | | | | | | | | | | | | | | |
Clarisay, Inc., 8.00% | | 500,000 | | — | | — | | 500,000 | | — | | — | | 500,000 | |
Clarisay, Inc., 8.00% | | 500,000 | | — | | — | | 500,000 | | $ | — | | $ | — | | $ | 500,000 | |
Clarisay, Inc., 8.00% | | 250,000 | | — | | — | | 250,000 | | — | | — | | 250,000 | |
Clarisay, Inc., 8.00% | | 100,000 | | — | | — | | 100,000 | | — | | — | | 100,000 | |
Clarisay, Inc., 8.00% | | 500,000 | | — | | — | | 500,000 | | — | | — | | 500,000 | |
Clarisay, Inc., 8.00% | | 500,000 | | — | | — | | 500,000 | | — | | — | | 500,000 | |
Concord Communications, Inc. | | 1,089,300 | | — | | 1,089,300 | | — | | (24,703,061 | ) | — | | — | |
Global Locate, Inc., Series A * | | 6,030,896 | | — | | — | | 6,030,896 | | — | | 4,547,296 | | 5,144,354 | |
Global Locate, Inc., Series C | | 1,111,111 | | — | | — | | 1,111,111 | | — | | 837,778 | | 1,000,000 | |
Global Locate, Inc., Series D | | 621,890 | ** | 310,945 | | — | | 932,835 | | — | | 749,999 | | 749,999 | |
Global Locate, Inc., Board Warrant | | — | | 75,000 | | — | | 75,000 | | — | | 375 | | — | |
Global Locate, Inc., Board Warrant | | 18,750 | | — | | — | | 18,750 | | — | | 94 | | — | |
Global Locate, Inc., Board Warrant | | 75,000 | | — | | — | | 75,000 | | — | | 375 | | — | |
Global Locate, Inc., Board Warrant | | 75,000 | | — | | — | | 75,000 | | — | | 375 | | — | |
Global Locate, Inc., Series C Warrant | | 370,370 | | — | | — | | 370,370 | | — | | 3,704 | | — | |
Global Locate, Inc., Series D Warrant | | — | | 233,208 | | — | | 233,208 | | — | | 2,332 | | — | |
Maple Optical Systems, Inc., Series A-1 | | 10,352,054 | | — | | — | | 10,352,054 | | — | | — | | 3,623,219 | |
Napster, Inc. *** | | 1,750,000 | | — | | 300,000 | | 1,450,000 | | 794,040 | | 5,104,000 | | 7,399,254 | |
Silicon Genesis Corp., Series 1-D | | 850,830 | | — | | — | | 850,830 | | — | | 2,274,745 | | 4,315,500 | |
Silicon Genesis Corp., Series 1-E | | 4,071,226 | | — | | — | | 4,071,226 | | — | | 6,473,249 | | 4,315,500 | |
Silicon Genesis Corp., Common | | 726,424 | | 16,653 | | — | | 743,077 | | — | | 7,431 | | 3,684,494 | |
Silicon Genesis Corp., Series 1-E Warrant | | 1,257,859 | | — | | — | | 1,257,859 | | — | | 999,998 | | — | |
Silicon Genesis Corp., Common Warrant | | 37,982 | | — | | — | | 37,982 | | — | | 38 | | — | |
Silicon Genesis Corp., Common Warrant | | 59,147 | | — | | — | | 59,147 | | — | | 59 | | — | |
Solaicx, Series B | | — | | 6,000,000 | | — | | 6,000,000 | | — | | 3,000,000 | | 3,000,000 | |
| | | | | | | | | | | | | | | | | | |
57
| | SHARE ACTIVITY | | | | | | | |
| | Balance | | | | | | Balance | | Realized | | Value | | Acquisition | |
Affiliate | | 12/31/04 | | Purchases | | Sales | | 12/31/05 | | Gain (Loss) | | 12/31/05 | | Cost | |
| | | | | | | | | | | | | | | |
Firsthand Technology
Innovators Fund | | | | | | | | | | | | | | | |
Clarisay, Inc., Series B | | 2,861,519 | | — | | 2,861,519 | | — | | $ | (2,618,289) | | $ | — | | $ | — | |
Clarisay, Inc., Warrant | | 150,000 | | — | | 150,000 | | — | | — | | — | | — | |
Clarisay, Inc., Warrant | | 500,000 | | — | | 500,000 | | — | | — | | — | | — | |
Clarisay, Inc., Warrant | | 500,000 | | — | | 500,000 | | — | | — | | — | | — | |
Clarisay, Inc., Warrant 12/31/10 | | 109,290 | | — | | 109,290 | | — | | 1 | | — | | — | |
Clarisay, Inc., 8.00% | | 150,000 | | — | | 150,000 | | — | | (150,000 | ) | — | | — | |
Clarisay, Inc., 8.00% | | 500,000 | | — | | 500,000 | | — | | (500,000 | ) | — | | — | |
Clarisay, Inc., 8.00% | | 500,000 | | — | | 500,000 | | — | | (500,000 | ) | — | | — | |
Innovion Corp., Series C | | 1,500,000 | | — | | — | | 1,500,000 | | — | | 744,675 | | 3,000,000 | |
Innovion Corp., Warrant | | 602,577 | | — | | — | | 602,577 | | — | | 603 | | — | |
Innovion Corp., 9.50%, 3/7/06 | | 602,577 | | — | | — | | 602,577 | | — | | 602,577 | | 602,577 | |
Innovion Corp., Warrant | | — | | 30,129 | | — | | 30,129 | | — | | 30 | | — | |
Maple Optical Systems, Inc., Series A-1 | | 9,647,945 | | — | | 9,647,945 | | — | | (3,376,780 | ) | — | | — | |
Silicon Genesis Corp., Series 1-C | | 82,914 | | — | | — | | 82,914 | | — | | 912,560 | | 1,731,250 | |
Silicon Genesis Corp., Series 1-E | | 1,633,254 | | — | | — | | 1,633,254 | | — | | 2,596,874 | | 1,731,249 | |
Silicon Genesis Corp., Common | | 102,135 | | 6,680 | | — | | 108,815 | | — | | 1,088 | | 1,516,773 | |
Silicon Genesis Corp., Series 1-E Warrant | | 94,339 | | — | | — | | 94,339 | | — | | 49,999 | | — | |
| | | | | | | | | | | | | | | | | | |
* | Amounts include shares from the merger of Firsthand Communications Fund into Firsthand Technology Value Fund. |
** | The beginning share balance is a result of a Silicon Genesis Corp. share restructure. |
*** | Balance is a result of Roxio, Inc., being acquired by Napster, Inc. |
Restricted securities include securities that have not been registered under the Securities Act of 1933, as amended, and securities that are subject to restrictions on resale. A Fund may invest in restricted securities that are consistent with a Fund’s investment objective and investment strategies. A Fund will not invest in a restricted security if, immediately after and as a result of the investment in such security, more than 15% of the Fund’s net assets would be invested in illiquid securities. In some cases, the issuer of restricted securities has agreed to register such securities for resale, at the issuer’s expense either upon demand by the Fund or in connection with another registered offering of the securities. Investments in restricted securities are valued at fair value as determined in good faith in accordance with procedures adopted by the Board of Trustees. It is possible that the estimated value may differ significantly from the amount that might ultimately be realized in the near term, and the difference could be material. As of December 31, 2005, the Funds were invested in the following restricted securities:
58
Security | | Acquisition Date | | Shares | | Cost | | Value | | % Net Assets | |
| | | | | | | | | | | |
Firsthand Technology Value Fund | | | | | | | | | | | |
AuthenTec, Inc., Series C P/S | | April 4, 2003 | | 1,472,495 | | $ | 738,000 | | $ | 1,002,902 | | 0.22 | % |
AuthenTec, Inc., Series C Warrants | | April 4, 2003 | | 392,665 | | — | | 70,640 | | 0.02 | % |
AuthenTec, Inc., Series D P/S | | June 14, 2004 | | 290,958 | | 290,958 | | 197,851 | | 0.04 | % |
Caspian Networks, Inc., Common | | February 21, 2002 | | 337 | * | 3,378,104 | | — | | 0.00 | % |
Celox Networks, Inc., Common | | April 17, 2001 | | 138,121 | | 14,999,941 | | — | | 0.00 | % |
Celox Networks, Inc., Series A-1 P/S | | August 23, 2002 | | 1,000,000 | | 1,200,000 | | — | | 0.00 | % |
Celox Networks, Inc., Series A-1 Warrants | | August 23, 2002 | | 500,000 | | — | | — | | 0.00 | % |
Clarisay, Inc., 8.00% C/N | | July 7, 2003 | | 500,000 | | 500,000 | | — | | 0.00 | % |
Clarisay, Inc., 8.00% C/N | | August 7, 2003 | | 500,000 | | 500,000 | | — | | 0.00 | % |
Clarisay, Inc., 8.00% C/N | | November 10, 2003 | | 500,000 | | 500,000 | | — | | 0.00 | % |
Clarisay, Inc., 8.00% C/N | | June 3, 2003 | | 500,000 | | 500,000 | | — | | 0.00 | % |
Clarisay, Inc., 8.00% C/N | | September 12, 2003 | | 250,000 | | 250,000 | | — | | 0.00 | % |
Clarisay, Inc., 8.00% C/N | | September 19, 2003 | | 100,000 | | 100,000 | | — | | 0.00 | % |
Clarisay, Inc., Series B P/S | | January 24, 2001 | | 2,605,306 | | 2,383,855 | | — | | 0.00 | % |
Clarisay, Inc., Series C P/S | | August 28, 2002 | | 7,194,244 | | 2,000,000 | | — | | 0.00 | % |
Clarisay, Inc., Warrants | | September 19, 2003 | | 100,000 | | — | | — | | 0.00 | % |
Clarisay, Inc., Warrants | | August 7, 2003 | | 500,000 | | — | | — | | 0.00 | % |
Clarisay, Inc., Warrants | | June 3, 2003 | | 500,000 | | — | | — | | 0.00 | % |
Clarisay, Inc., Warrants | | November 10, 2003 | | 500,000 | | — | | — | | 0.00 | % |
Clarisay, Inc., Warrants | | September 12, 2003 | | 250,000 | | — | | — | | 0.00 | % |
Clarisay, Inc., Warrants | | July 7, 2003 | | 500,000 | | — | | — | | 0.00 | % |
Global Locate, Inc., Board Warrants | | September 8, 2003 | | 75,000 | | — | | 375 | | 0.00 | % |
Global Locate, Inc., Board Warrants | | May 4, 2004 | | 18,750 | | — | | 94 | | 0.00 | % |
Global Locate, Inc., Board Warrants | | July 7, 2004 | | 75,000 | | — | | 375 | | 0.00 | % |
Global Locate, Inc., Board Warrants | | July 1, 2005 | | 75,000 | | — | | 375 | | 0.00 | % |
Global Locate, Inc., Series A P/S | | October 5, 2001 | | 5,861,664 | | 5,000,000 | | 4,419,695 | | 0.99 | % |
Global Locate, Inc., Series A P/S | | March 28, 2002 | | 169,232 | | 144,355 | | 127,601 | | 0.03 | % |
| | | | | | | | | | | | | |
59
Security | | Acquisition Date | | Shares | | Cost | | Value | | % Net Assets | |
| | | | | | | | | | | |
Firsthand Technology Value Fund (cont’d) | | | | | | | | | | | |
Global Locate, Inc., Series C P/S | | May 15, 2003 | | 1,111,111 | | 1,000,000 | | 837,778 | | 0.19 | % |
Global Locate, Inc., Series C Warrants | | May 15, 2003 | | 370,370 | | — | | 3,704 | | 0.00 | % |
Global Locate, Inc., Series D P/S | | April 2, 2004 | | 621,890 | ** | $ | 500,000 | | $ | 500,000 | | 0.11 | % |
Global Locate, Inc., Series D P/S | | April 26, 2005 | | 310,945 | | 249,999 | | 249,999 | | 0.06 | % |
Global Locate, Inc., Series D Warrants | | April 26, 2005 | | 233,208 | | — | | 2,332 | | 0.00 | % |
IP Unity, Inc., Series E Warrants | | August 4, 2004 | | 69,496 | | 69 | | 69 | | 0.00 | % |
IP Unity, Inc., Series C P/S | | July 27, 2001 | | 1,104,265 | | 1,987,677 | | 1,936,660 | | 0.43 | % |
IP Unity, Inc., Series E P/S | | August 4, 2004 | | 193,042 | | 313,307 | | 342,765 | | 0.08 | % |
Luminous Networks, Inc., Common*** | | Various | | 28,513 | | 1,800,638 | | 29 | | 0.00 | % |
Luminous Networks, Inc., Common Warrants | | December 31, 2003 | | 3,822 | | — | | — | | 0.00 | % |
Luminous Networks, Inc., Series A1 P/S*** | | Various | | 129,664 | | 200,071 | | 1,297 | | 0.00 | % |
Luminous Networks, Inc., Series B1 P/S | | June 9, 2005 | | 259,236 | | 400,000 | | 210,448 | | 0.05 | % |
Maple Optical Systems, Inc., Series A-1 P/S | | July 31, 2002 | | 5,714,285 | | 2,000,000 | | — | | 0.00 | % |
Maple Optical Systems, Inc., Series A-1 P/S | | August 9, 2001 | | 4,637,769 | | 1,623,219 | | — | | 0.00 | % |
NanoMuscle, Inc., 8.00% C/N | | August 17, 2004 | | 122,549 | | 122,549 | | — | | 0.00 | % |
NanoMuscle, Inc., 8.00% C/N | | September 7, 2004 | | 245,422 | | 245,422 | | — | | 0.00 | % |
NanoMuscle, Inc., 8.00% C/N | | November 12, 2004 | | 30,668 | | 30,668 | | — | | 0.00 | % |
NanoMuscle, Inc., Series B-1 Warrants | | August 17, 2004 | | 306,757 | | 123 | | — | | 0.00 | % |
NanoMuscle, Inc., Common | | August 29, 2003 | | 1,250,000 | | 1,250,000 | | — | | 0.00 | % |
NanoMuscle, Inc., Series A-1 P/S | | August 17, 2004 | | 1,250,000 | | — | | — | | 0.00 | % |
Polaris Networks, Inc., 10.00% C/N | | April 12, 2004 | | 50,475 | | 50,475 | | — | | 0.00 | % |
Polaris Networks, Inc., 10.00% C/N | | July 14, 2004 | | 50,474 | | 50,474 | | — | | 0.00 | % |
Polaris Networks, Inc., Convertible Warrants | | March 29, 2004 | | 75,712 | | — | | — | | 0.00 | % |
Polaris Networks, Inc., Series A P/S | | November 16, 2001 | | 297,848 | | 297,848 | | — | | 0.00 | % |
Silicon Genesis Corp., Series 1-E Warrants | | October 31, 2003 | | 1,257,859 | | — | | 999,998 | | 0.22 | % |
Silicon Genesis Corp., Common | | April 30, 2002 | | 726,424 | | 3,684,494 | | 7,264 | | 0.00 | % |
Silicon Genesis Corp., Common**** | | November 21, 2005 | | 16,653 | | — | | 167 | | 0.00 | % |
Silicon Genesis Corp., Common Warrants | | April 30, 2002 | | 59,147 | | — | | 59 | | 0.00 | % |
Silicon Genesis Corp., Common Warrants | | November 4, 2003 | | 37,982 | | — | | 38 | | 0.00 | % |
| | | | | | | | | | | | | |
60
Security | | Acquisition Date | | Shares | | Cost | | Value | | % Net Assets | |
| | | | | | | | | | | |
Firsthand Technology Value Fund (cont’d) | | | | | | | | | | | |
Silicon Genesis Corp., Series 1-D P/S | | April 30, 2002 | | 850,830 | | 4,315,500 | | 2,274,745 | | 0.51 | % |
Silicon Genesis Corp., Series 1-E P/S | | November 4, 2003 | | 4,071,226 | | 4,315,500 | | 6,473,249 | | 1.45 | % |
Solaicx, Series B P/S | | December 16, 2005 | | 6,000,000 | | $ | 3,000,000 | | $ | 3,000,000 | | 0.67 | % |
UCT Coatings, Inc., Series B P/S | | October 5, 2004 | | 500,000 | | 5,000,000 | | 5,000,000 | | 1.12 | % |
UCT Coatings, Inc., Series B Warrants | | October 5, 2004 | | 200,000 | | — | | 200 | | 0.00 | % |
| | | | | | $ | 64,923,246 | | $ | 27,660,709 | | 6.19 | % |
| | | | | | | | | | | |
Firsthand Technology Innovators Fund | | | | | | | | | | | |
AuthenTec, Inc., Series C P/S | | April 4, 2003 | | 736,248 | | $ | 369,000 | | $ | 501,451 | | 1.70 | % |
AuthenTec, Inc., Series C Warrants | | April 4, 2003 | | 196,333 | | — | | 35,320 | | 0.12 | % |
Innovion Corp., 9.50%, 3/7/06 C/N | | December 30, 2003 | | 602,577 | | 602,577 | | 602,577 | | 2.04 | % |
Innovion Corp., Series C P/S | | February 23, 2001 | | 1,500,000 | | 3,000,000 | | 744,675 | | 2.53 | % |
Innovion Corp., Warrant | | December 30, 2003 | | 602,577 | | — | | 603 | | 0.00 | % |
Innovion Corp., Warrant | | March 7, 2005 | | 30,129 | | — | | 30 | | 0.00 | % |
IP Unity, Inc., Series C P/S | | July 27, 2001 | | 827,957 | | 1,490,323 | | 1,452,071 | | 4.93 | % |
Luminous Networks, Inc., Common *** | | Various | | 49,979 | | 3,156,250 | | 50 | | 0.00 | % |
Luminous Networks, Inc., Common Warrants | | December 31, 2003 | | 6,699 | | — | | 1 | | 0.00 | % |
Luminous Networks, Inc., Series A1 P/S *** | | Various | | 227,282 | | 350,694 | | 2,273 | | 0.01 | % |
Silicon Genesis Corp., Series 1-E Warrant | | February 26, 2003 | | 94,339 | | — | | 49,999 | | 0.17 | % |
Silicon Genesis Corp., Common | | March 8, 2001 | | 102,135 | | 1,516,773 | | 1,021 | | 0.00 | % |
Silicon Genesis Corp., Common**** | | November 21, 2005 | | 6,680 | | — | | 67 | | 0.00 | % |
Silicon Genesis Corp., Series 1-C P/S | | March 8, 2001 | | 82,914 | | 1,731,250 | | 912,560 | | 3.10 | % |
Silicon Genesis Corp., Series 1-E P/S | | November 4, 2003 | | 1,633,254 | | 1,731,249 | | 2,596,874 | | 8.81 | % |
Silicon Optix, Inc., Series B P/S | | November 7, 2003 | | 1,111,111 | | 1,000,000 | | 700,000 | | 2.37 | % |
| | | | | | $ | 14,948,116 | | $ | 7,599,572 | | 25.78 | % |
* | The share balance changed as a result of a 1:100 reverse stock split of Caspian Networks, Inc. |
** | As a result of a restructuring of the Series D transaction, the Fund received additional Series D shares, which is reflected in the balance. |
*** | As a result of a new round of financing on June 9, 2005, certain shares of Luminous Series D P/S and Series E P/S were converted |
61
| into certain Common and Series A1 P/S shares. The original acquisition date for the Series D P/S shares was May 31, 2001, and the original acquisition date for the Series E P/S shares was October 16, 2003. The new Common and Series A1 P/S will carry the original acquisition date of the Series D and Series E P/S. |
**** | Shares granted at no cost by issuer. |
C/S | Common Stock |
P/S | Preferred Stock |
C/N | Convertible Note |
8. Risks (Unaudited)
Because the return on and value of an investment in each Fund will fluctuate in response to stock market movements, the most significant risk of investing in a Fund is that you may lose money. Stocks and other equity securities are subject to market risks and fluctuations in value due to earnings, as well as economic, political, or regulatory events, and other factors beyond the Investment Adviser’s control. The Funds are designed for long-term investors who can accept the risks of investing in a fund with significant common stock holdings in high-technology industries.
Each Fund is non-diversified. A risk of being non-diversified is that a significant change in the value of one company will have a greater impact on the Fund than it would if the Fund diversified its investments. Another risk for the Fund is its concentration of investments in companies within high-technology industries. The value of high-technology companies can, and often does, fluctuate dramatically and may expose you to greater-than-average financial and market risk.
9. Proxy Voting Policy and Procedures (Unaudited)
The Funds have adopted proxy voting procedures pursuant to which the Funds delegate the responsibility for voting proxies relating to portfolio securities held by the Funds to the Investment Adviser as part of the Investment Adviser’s general management of the Funds, subject to the Board of Trustees’ continuing oversight. A copy of the Funds’ proxy voting policy and procedures is available without charge, upon request, by calling 1.888.884.2675. Information regarding how the Investment Adviser voted these proxies for the one-year period ended June 30, 2005, is available by calling the same number and on the website of the U.S. Securities and Exchange Commission at http://www.sec.gov on Form N-PX, which was filed on August 29, 2005. The Funds’ voting record is also available on the Funds’ website at www.firsthandfunds.com/proxy.
10. Portfolio Holdings (Unaudited)
The Funds file their complete schedule of portfolio holdings with the SEC for the first and third quarters of each fiscal year on Form N-Q. The Funds’ Forms N-Q will be available on the SEC’s website at http://www.sec.gov and may be reviewed and copied at the SEC’s Public Reference Room in Washington, D.C. Information on the operation of the Public Reference Room may be obtained by calling 1.800.SEC.0330.
62
This page intentionally left blank
63
ADDITIONAL INFORMATION
December 31, 2005 (unaudited)
Information about the trustees and officers* of the Funds is set forth in the following table. The Statement of Additional Information (the “SAI”) includes additional information about the Funds’ trustees and officers and is available free of charge, upon request, by calling 1.888.884.2675, option 2. The address for each of the persons named below is 125 South Market, Suite 1200, San Jose, CA 95113.
Name, Year
of Birth,
Position(s)
Held With
Funds | | Term of
Office
and Length
of Time
Served (1) | | Principal
Occupation(s)
During Past Five
Years | | Number of
Funds in Fund
Complex
Overseen by
Trustee | | Other
Trusteeships
Held by
Trustees | |
| | | | | | | | | |
DISINTERESTED TRUSTEES | | | | | | | |
| | | | | | | | | |
MICHAEL T. LYNCH
(1961)
TRUSTEE | | SINCE 1994 | | Mr. Lynch is a principal of Rainier Wine (wine distribution) from March 2004 to the present. Mr. Lynch served as VP of Sales and Business Development of AlphaOmega Soft, Inc. (a manufacturer of software) from 2002 through 2003. Mr. Lynch served as VP of Sales and Business Development at Picture IQ Corporation (a manufacturer of digital imaging software) from 1999 through 2002. | | SIX | | NONE | |
| | | | | | | | | |
JERRY WONG
(1951)
TRUSTEE | | SINCE 1999 | | Mr. Wong serves as a consultant from October 2002 to present. From June 2003 to December 2005, Mr. Wong served as Chief Financial Officer for Companion Worlds, Inc. (a manufacturer of hardware/software to facilitate fitness and health maintenance). Mr. Wong served as VP of Finance and EVP of U.S. Operations of Poet Holdings, Inc. (a manufacturer of software) from 1995 to 2002. | | SIX | | NONE | |
| | | | | | | | | |
INTERESTED TRUSTEES | | | | | | | | | |
| | | | | | | | | |
KEVIN M. LANDIS (2)
(1961)
TRUSTEE/PRESIDENT | | SINCE 1994 | | Mr. Landis is President and Chief Investment Officer and a Director of Firsthand Capital Management, Inc. and has been a portfolio manager with Firsthand Capital Management, Inc. since May 1994. From 1998 through 2001, he was also the President and CEO of Silicon Capital Management LLC. | | SIX | | Mr. Landis is a trustee of Black Pearl Funds, a registered investment company. | |
64
Name, Year
of Birth,
Position(s)
Held With
Funds | | Term of
Office
and Length
of Time
Served (1) | | Principal
Occupation(s)
During Past Five
Years | | Number of
Funds in Fund
Complex
Overseen by
Trustee | | Other
Trusteeships
Held by
Trustees | |
| | | | | | | | | |
OFFICERS WHO ARE NOT TRUSTEES | | | | | | | |
| | | | | | | | | |
YAKOUB BELLAWALA
(1965)
SECRETARY | | SINCE 2003 | | Mr. Bellawala is VP of Business Process Development for Firsthand Capital Management, Inc. (FCM) from August 2002 to present. He was VP of Business Development for FCM from 1999 to 2002. He was Treasurer of FCM’s Board of Trustees from 1996 to 2003. | | N/A | | N/A | |
| | | | | | | | | |
AARON MASEK
(1974)
TREASURER | | SINCE 2005 | | Mr. Masek has been a Director of BISYS Fund Services, Inc. since 2005 and has been employed by BISYS in various other roles since 1997. | | N/A | | N/A | |
| | | | | | | | | |
NICK PETREDIS
(1961)
CHIEF COMPLIANCE OFFICER | | SINCE 2004 | | Mr. Petredis is a principal of Petredis Law Offices from 1993 to present. He was Managing Director and Senior Counsel of Firsthand Capital Management, Inc. from 2000 to 2001. | | N/A | | N/A | |
* | The term “officer” means the president, vice president, secretary, treasurer, chief compliance officer, controller, or any other officer who performs policy-making functions. |
(1) | Each trustee shall serve for the lifetime of Firsthand Funds or until he dies, resigns, or is removed. Each officer shall serve a one-year term subject to annual reappointment by the trustees. |
(2) | Mr. Landis is an interested person of the Funds by reason of his position with the Adviser. |
65

Firsthand Funds
P.O. Box 8356
Boston, MA 02266-8356
1.888.884.2675
www.firsthandfunds.com
Investment Adviser
Firsthand Capital Management, Inc.
125 South Market
Suite 1200
San Jose, CA 95113
www.firsthandcapital.com
Distributor
ALPS Distributors, Inc.
1625 Broadway
Suite 2200
Denver, CO 80202
Transfer Agent
State Street Bank and Trust Company
P.O. Box 8356
Boston, MA 02266-8356
1.888.884.2675
REPORT OF INDEPENDENT REGISTERED PUBLIC ACCOUNTING FIRM
To the Shareholders and Board of Trustees of
Firsthand Funds
San Jose, California
We have audited the accompanying statement of assets and liabilities of the Firsthand Health Sciences Fund, a series of the Firsthand Funds as of December 31, 2005. These financial statements are the responsibility of the Funds’ management. Our responsibility is to express an opinion on these financial statements based on our audit.
We conducted our audit in accordance with the standards of the Public Company Accounting Oversight Board (United States). Those standards require that we plan and perform the audit to obtain reasonable assurance about whether the financial statements are free of material misstatement. We were not engaged to perform an audit of the Fund’s internal control over financial reporting. Our audits included consideration of internal control over financial reporting as a basis for designing audit procedures that are appropriate in the circumstances, but not for the purpose of expressing an opinion on the effectiveness of the Fund’s internal control over financial reporting. Accordingly, we express no such opinion. An audit includes examining, on a test basis, evidence supporting the amounts and disclosures in the financial statements. An audit also includes assessing the accounting principles used and significant estimates made by management, as well as evaluating the overall financial statement presentation. We believe that our audit provides a reasonable basis for our opinion.
In our opinion, the statement of assets and liabilities referred to above present fairly, in all material respects, the financial position of the Firsthand Health Sciences Fund as of December 31, 2005, in conformity with accounting principles generally accepted in the United States of America.
| /S/ TAIT, WELLER & BAKER LLP | |
|
Philadelphia, Pennsylvania |
January 20, 2006 |
Firsthand Health Sciences Fund
Statements of Assets and Liabilities
As of December 31, 2005
| | Health Sciences Fund | |
ASSETS | | | |
Cash | | $ | 500,000 | |
TOTAL ASSETS | | 500,000 | |
| | | |
LIABILITIES | | — | |
| | | |
Net assets for shares of beneficial interest outstanding | | $ | 500,000 | |
| | | |
Shares outstanding | | 50,000 | |
| | | |
Net asset value, offering and redemption price per share | | $ | 10.00 | |
| | | |
Net assets consist of: | | | |
Paid-in capital | | $ | 500,000 | |
The accompanying notes are an integral part of this statement.
FIRSTHAND HEALTH SCIENCES FUND
NOTES TO THE FINANCIAL STATEMENTS
AS OF DECEMBER 31, 2005
(1) Each of Firsthand Technology Value Fund, Firsthand Technology Leaders Fund, Firsthand Technology Innovators Fund, Firsthand e-Commerce Fund, Firsthand Global Technology Fund, and Firsthand Health Sciences Fund (individually the “Fund”, and collectively the “Funds”) is a non-diversified series of Firsthand Funds (the “Trust”), an open-end management investment company registered under the Investment Company Act of 1940, as amended (the “1940 Act”). The Trust, a Delaware statutory trust, was organized on November 8, 1993. The accompanying financial statements and notes relate only to Firsthand Health Sciences Fund. The investment objective of Firsthand Health Sciences Fund is long-term growth of capital. Firsthand Health Sciences Fund seeks to achieve its investment objective by investing, under normal circumstances, at least 80% of the Fund’s assets in companies principally engaged in the research, development, production or distribution of products and services in the biotechnology, pharmaceutical, health care and medical industries (collectively “health sciences”). On December 30, 2005, 50,000 shares of Firsthand Health Sciences Fund were issued for cash, at $10.00 per share, to Firsthand Capital Management, Inc., the investment advisor to the Funds. The Fund has had no operations except for the initial issuance of shares.
(2) Firsthand Capital Management, Inc. (the “Investment Advisor”) serves as the investment advisor to the Funds. Firsthand Capital Management, Inc. has appointed Sectoral Asset Management, Inc. and Evergreen Investment Management Company, LLC as the two sub-advisors for the Fund. For its services, Firsthand Health Sciences Fund will pay the Investment Advisor, on a monthly basis, an investment advisory fee at the annual rate of 1.50% of its average daily net assets. Firsthand Capital Management, Inc. is responsible for paying the sub-advisor fees.
(3) The Investment Advisor is responsible for the provision of administrative and supervisory services to the Fund. For its services, the Fund will pay to the Investment Advisor, on a monthly basis, a fee equal to 0.45% per annum of its average daily net assets up to $200 million, 0.40% of such assets from $200 million to $500 million, 0.35% of such assets from $500 million to $1 billion, and 0.30% of such assets in excess of $1 billion.
(4) The Fund intends to qualify as a “registered investment company” and to comply with the applicable provisions of the Internal Revenue Code of 1986, as amended, such that it will not be subject to Federal income tax.
(5) Reference is made to the Prospectus and the Statement of Additional Information for a description of the Advisory Agreement, tax aspects of the Funds and the calculation of the net asset value of shares of the Funds.
Item 2. Code of Ethics.
Disclose whether, as of the end of the period covered by the report, the registrant has adopted a code of ethics that applies to the registrant’s principal executive officer, principal financial officer, principal accounting officer or controller, or persons performing similar functions, regardless of whether these individuals are employed by the registrant or a third party. If the registrant has not adopted such a code of ethics, explain why it has not done so.
The registrant has adopted a code of ethics that applies to the registrant’s principal executive officer, principal financial officer, principal accounting officer or controller, or persons performing similar functions. This code of ethics is included as an Exhibit.
The registrant must briefly describe the nature of any amendment, during the period covered by the report, to a provision of its code of ethics that applies to the registrant’s principal executive officer, principal financial officer, principal accounting officer or controller, or persons performing similar functions, regardless of whether these individuals are employed by the registrant or a third party, and that relates to any element of the code of ethics definition enumerated in paragraph (b) of this Item. The registrant must file a copy of any such amendment as an exhibit pursuant to Item 12(a)(1), unless the registrant has elected to satisfy paragraph (f) of this Item by posting its code of ethics on its website pursuant to paragraph (f)(2) of this Item, or by undertaking to provide its code of ethics to any person without charge, upon request, pursuant to paragraph (f)(3) of this Item.
If the registrant has, during the period covered by the report, granted a waiver, including an implicit waiver, from a provision of the code of ethics that applies to the registrant’s principal executive officer, principal financial officer, principal accounting officer or controller, or persons performing similar functions, regardless of whether these individuals are employed by the registrant or a third party, that relates to one or more items set forth in paragraph (b) of this Item, the registrant must briefly describe the nature of the waiver, the name of the person to whom the waiver was granted, and the date of the waiver.
During the period covered by the report, with respect to the registrant’s code of ethics that applies to its principal executive officer, principal financial officer, principal accounting officer or controller, or persons performing similar functions; there have been no amendments to, nor any waivers granted from, a provision that relates to any element of the code of ethics definition enumerated in paragraph (b) of this Item 2, except for, effective May 14, 2005, Aaron Masek replaced Omar Billawala as Treasurer of the registrant.
Item 3. Audit Committee Financial Expert.
(a) (1) Disclose that the registrant’s board of directors has determined that the registrant either:
(i) Has at least one audit committee financial expert serving on its audit committee; or
(ii) Does not have an audit committee financial expert serving on its audit committee.
(2) If the registrant provides the disclosure required by paragraph (a)(1)(i) of this Item, it must disclose the name of the audit committee financial expert and whether that person is “independent.” In order to be considered “independent” for purposes of this Item, a member of an audit committee may not, other than in his or her capacity as a member of the audit committee, the board of directors, or any other board committee:
(i) Accept directly or indirectly any consulting, advisory, or other compensatory fee from the issuer; or
(ii) Be an “interested person” of the investment company as defined in Section 2(a)(19) of the Act (15 U.S.C. 80a-2(a)(19)).
(3) If the registrant provides the disclosure required by paragraph (a)(1)(ii) of this Item, it must explain why it does not have an audit committee financial expert.
3(a)(1) The registrant’s board of trustees has determined that the registrant has at least one audit committee financial expert serving on its audit committee.
3(a)(2) The audit committee financial expert is Mr. Jerry Wong, who is “independent” for purposes of this Item 3 of Form N-CSR.
Item 4. Principal Accountant Fees and Services.
(a) Disclose, under the caption Audit Fees, the aggregate fees billed for each of the last two fiscal years for professional services rendered by the principal accountant for the audit of the registrant’s annual financial statements or services that are normally provided by the accountant in connection with statutory and regulatory filings or engagements for those fiscal years.
2004 - $96,000
2005 - $96,000
(b) Disclose, under the caption Audit-Related Fees, the aggregate fees billed in each of the last two fiscal years for assurance and related services by the principal accountant that are reasonably related to the performance of the audit of the registrant’s financial statements and are not reported under paragraph (a) of this Item. Registrants shall describe the nature of the services comprising the fees disclosed under this category.
Not applicable.
(c) Disclose, under the caption Tax Fees, the aggregate fees billed in each of the last two fiscal years for professional services rendered by the principal accountant for tax compliance, tax advice, and tax planning. Registrants shall describe the nature of the services comprising the fees disclosed under this category.
2004 - $10,000
2005 - $10,000
(d) Disclose, under the caption All Other Fees, the aggregate fees billed in each of the last two fiscal years for products and services provided by the principal accountant, other than the services reported in paragraphs (a) through (c) of this Item. Registrants shall describe the nature of the services comprising the fees disclosed under this category.
2004 - $1,500 (audit of the registrant’s anti-money laundering program)
2005 - $2,500 (audit of the registrant’s anti-money laundering program)
(e) (1) Disclose the audit committee’s pre-approval policies and procedures described in paragraph (c)(7) of Rule 2-01 of Regulation S-X.
The registrant’s Audit Committee Charter states the following with respect to pre-approval procedures:
The Committee hereby delegates to the Chairman of the Committee the authority to grant pre-approvals of audit and “permissible” non-audit services to be provided by the Auditors to the Funds, subject to the ratification of the full Committee at its next regularly scheduled meeting. Both the Auditors and Fund counsel will be responsible for informing the Committee whether they believe that a particular non-audit service is permissible or prohibited pursuant to applicable regulations and standards.
The specific types of non-audit services that the Chairman may pre-approve include, but are not limited to: reviewing the Funds’ internal controls over financial reporting; providing tax-related services; reviewing and/or developing an anti-money laundering program; and issuing comfort letters, based on agreed-upon procedures, in connection with any Fund reorganization.
Pre-approval for a non-audit service provided to a Fund is not required if: (i) the aggregate amount of all such non-audit services provided to the Fund constitutes not more than 5% of the total amount of revenues paid by the Fund to the Auditors during the fiscal year in which the non-audit services are provided; (ii) such services were not recognized by the Fund at the time of the engagement to be non-audit services; and (iii) such services are promptly brought to the attention of the Committee and are approved by the Committee or by one or more members of the Committee to whom authority to grant such approvals has been delegated by the Committee prior to the completion of the audit (the “De Minimus Exceptions”).
The Committee shall also pre-approve any non-audit services proposed to be provided by the Auditors to (i) a Fund’s investment adviser and (ii) any entity controlling, controlled by, or under common control with the investment adviser that provides ongoing services to the Fund, if the Auditors’ engagement with the investment adviser or any such control persons relates directly to the operations and financial reporting of the Fund. The De Minimus Exceptions applies to pre-approvals under this paragraph as well, except that the “total amount of revenues” calculation is based on the total amount of revenues paid to the Auditors by the Fund and any other entity that has its services approved under this paragraph (i.e., the investment adviser or any control person).
(2) Disclose the percentage of services described in each of paragraphs (b) through (d) of this Item that were approved by the audit committee pursuant to paragraph (c)(7)(i)(C) of Rule 2-01 of Regulation S-X.
100%
(f) If greater than 50 percent, disclose the percentage of hours expended on the principal accountant’s engagement to audit the registrant’s financial statements for the most recent fiscal year that were attributed to work performed by persons other than the principal accountant’s full-time, permanent employees.
Not applicable.
(g) Disclose the aggregate non-audit fees billed by the registrant’s accountant for services rendered to the registrant, and rendered to the registrant’s investment adviser (not including any sub-adviser whose role is primarily portfolio management and is
subcontracted with or overseen by another investment adviser), and any entity controlling, controlled by, or under common control with the adviser that provides ongoing services to the registrant for each of the last two fiscal years of the registrant.
2004 - $36,500
2005 - $60,500
(h) Disclose whether the registrant’s audit committee of the board of directors has considered whether the provision of nonaudit services that were rendered to the registrant’s investment adviser (not including any subadviser whose role is primarily portfolio management and is subcontracted with or overseen by another investment adviser), and any entity controlling, controlled by, or under common control with the investment adviser that provides ongoing services to the registrant that were not pre-approved
pursuant to paragraph (c)(7)(ii) of Rule 2-01 of Regulation S-X is compatible with maintaining the principal accountant’s independence.
Not applicable.
Item 5. Audit Committee of Listed Registrants.
(a) If the registrant is a listed issuer as defined in Rule 10A-3 under the Exchange Act (17CFR 240.10A-3), state whether or not the registrant has a separately-designated standing audit committee established in accordance with Section 3(a)(58)(A) of the Exchange Act (15 U.S.C. 78c(a)(58)(A)). If the registrant has such a committee, however designated, identify each committee member. If the entire board of directors is acting as the registrant’s audit committee as specified in Section 3(a)(58)(B) of the Exchange Act (15 U.S.C. 78c(a)(58)(B)), so state.
(b) If applicable, provide the disclosure required by Rule 10A-3(d) under the Exchange Act (17CFR 240.10A-3(d)) regarding an exemption from the listing standards for all audit committees.
Not applicable.
Item 6. Schedule of Investments.
File Schedule I – Investments in securities of unaffiliated issuers as of the close of the reporting period as set forth in § 210.12-12 of Regulation S-X, unless the schedule is included as part of the report to shareholders filed under Item 1 of this Form.
Not applicable.
Item 7. Disclosure of Proxy Voting Policies and Procedures for Closed-End Management Investment Companies.
A closed-end management investment company that is filing an annual report on this Form N-CSR must, unless it invests exclusively in non-voting securities, describe the policies and procedures that it uses to determine how to vote proxies relating to portfolio securities, including the procedures that the company uses when a vote presents a conflict between the interests of its shareholders, on the one hand, and those of the company’s investment adviser; principal underwriter; or any affiliated person (as defined in Section 2(a)(3) of the Investment Company Act of 1940 (15 U.S.C. 80a-2(a)(3)) and the rules thereunder) of the company, its investment adviser, or its principal underwriter, on the other. Include any policies and procedures of the company’s investment adviser, or any other third party, that the company uses, or that are used on the company’s behalf, to determine how to vote proxies relating to portfolio securities.
Not applicable.
Item 8. Portfolio Managers of Closed-End Management Investment Companies.
If the registrant is a closed-end management investment company that is filing an annual report on this Form N-CSR, provide the information specified in paragraphs (a) and (b) of this Item with respect to portfolio managers.
Not applicable.
Item 9. Purchases of Equity Securities by Closed-End Management Investment Company and Affiliated Purchasers.
If the registrant is a closed-end management investment company, provide the information specified in paragraph (b) of this Item with respect to any purchase made by or on behalf of the registrant or any “affiliated purchaser,” as defined in Rule 10b-18(a)(3) under the Exchange Act (17 CFR 240.10b-18(a)(3)), of shares or other units of any class of the registrant’s equity securities that is registered by the registrant pursuant to Section 12 of the Exchange Act (15 U.S.C. 781).
Not applicable.
Item 10. Submission of Matters to a Vote of Security Holders.
Describe any material changes to the procedures by which shareholders may recommend nominees to the registrant’s board of directors, where those changes were implemented after the registrant last provided disclosure in response to the requirements of Item 7(d)(2)(ii)(G) of Schedule 14A (17 CFR 240.14a-101), or this Item.
Not applicable.
Item 11. Controls and Procedures.
(a) Disclose the conclusions of the registrant’s principal executive and principal financial officers, or persons performing similar functions, regarding the effectiveness of the registrant’s disclosure controls and procedures (as defined in Rule 30a-3(c) under the Act (17 CFR 270.30a-3(c))) as of a date within 90 days of the filing date of the report that includes the disclosure required by this paragraph, based on the evaluation of these controls and procedures required by Rule 30a-3(b) under the Act (17 CFR 270.30a-3(b)) and Rules 13a-15(b) or 15d-15(b) under the Exchange Act (17 CFR 240.13a-15(b) or 240.15d-15(b)).
The registrant’s principal executive officer and principal financial officer have concluded, based on their evaluation of the registrant’s disclosure controls and procedures as conducted within 90 days of the filing date of this report, that these disclosure controls and procedures are adequately designed and are operating effectively to ensure that information required to be disclosed by the registrant on Form N-CSR is recorded, processed, summarized and reported within the time periods specified in the Securities and Exchange Commission’s rules and forms.
(b) Disclose any change in the registrant’s internal control over financial reporting (as defined in Rule 30a-3(d) under the Act (17 CFR 270.30a-3(d)) that occurred during the second fiscal quarter of the period covered by this report that has materially affected, or is reasonably likely to materially affect, the registrant’s internal control over financial reporting.
There were no changes in the registrant’s internal control over financial reporting that occurred during the second fiscal quarter of the period covered by this report that have materially affected or are reasonably likely to materially affect, the registrant’s internal control over financial reporting.
Item 12. Exhibits.
(a) File the exhibits listed below as part of this Form. Letter or number the exhibits in the sequence indicated.
(a)(1) Any code of ethics, or amendment thereto, that is the subject of the disclosure required by Item 2, to the extent that the
registrant intends to satisfy the Item 2 requirements through filing of an exhibit.
The code of ethics that is the subject of the disclosure required by Item 2 is attached hereto.
(a)(2) A separate certification for each principal executive officer and principal financial officer of the registrant as required by Rule 30a-2(a) under the Act (17 CFR 270.30a-2).
Certifications pursuant to Rule 30a-2(a) are attached hereto.
(a)(3) Any written solicitation to purchase securities under Rule 23c-1 under the Act (17 CFR 270.23c-1) sent or given during the period covered by the report by or on behalf of the registrant to 10 or more persons.
Not applicable.
(b) If the report is filed under Section 13(a) or 15(d) of the Exchange Act, provide the certifications required by rule 30a-2(b) under the Act as an exhibit. A certification furnished pursuant to this paragraph will not be deemed “filed” for purposes of Section 18 of the Exchange Act, or otherwise subject to the liability of that section. Such certification will not be deemed to be incorporated by reference into any filing under the Securities Act of 1933 or the Exchange Act, except to the extent that the registrant incorporates it by reference.
Certifications pursuant to Rule 30a-2(b) are furnished herewith.
SIGNATURES
Pursuant to the requirements of the Securities Exchange Act of 1934 and the Investment Company Act of 1940, the registrant has duly caused this report to be signed on its behalf by the undersigned, thereunto duly authorized.
(Registrant) | Firsthand Funds | |
| |
By (Signature and Title)* | /s/ Kevin M. Landis | |
| Kevin M. Landis |
| President |
| |
Date | 2 / 28 / 2006 | |
| | | | | |
Pursuant to the requirements of the Securities Exchange Act of 1934 and the Investment Company Act of 1940, this report has been signed below by the following persons on behalf of the registrant and in the capacities and on the dates indicated.
By (Signature and Title)* | /s/ Kevin M. Landis | |
| Kevin M. Landis |
| President |
| |
Date | 2 / 28 / 2006 | |
| | | | |
By (Signature and Title)* | /s/ Aaron Masek | |
| Aaron Masek |
| Treasurer |
| |
Date | 2 / 28 / 2006 | |
| | | | |
* Print the name and title of each signing officer under his or her signature.
82