UNITED STATES
SECURITIES AND EXCHANGE COMMISSION
Washington, D.C. 20549
FORM N-CSR
CERTIFIED SHAREHOLDER REPORT OF REGISTERED MANAGEMENT INVESTMENT COMPANIES
Investment Company Act file number 811-08268
(Exact name of registrant as specified in charter)
150 Almaden Blvd., Suite 1250
(Address of principal executive offices) (Zip code)
Firsthand Capital Management, Inc.
150 Almaden Blvd., Suite 1250
(Name and address of agent for service)
Registrant's telephone number, including area code: (408) 624-9527
Date of fiscal year end: December 31
Date of reporting period: December 31, 2023
Form N-CSR is to be used by management investment companies to file reports with the Commission not later than 10 days after the transmission to stockholders of any report that is required to be transmitted to stockholders under Rule 30e-1 under the Investment Company Act of 1940 (17 CFR 270.30e-1). The Commission may use the information provided on Form N-CSR in its regulatory, disclosure review, inspection, and policymaking roles.
A registrant is required to disclose the information specified by Form N-CSR, and the Commission will make this information public. A registrant is not required to respond to the collection of information contained in Form N-CSR unless the Form displays a currently valid Office of Management and Budget ("OMB") control number. Please direct comments concerning the accuracy of the information collection burden estimate and any suggestions for reducing the burden to Secretary, Securities and Exchange Commission, 450 Fifth Street, NW, Washington, DC 20549-0609. The OMB has reviewed this collection of information under the clearance requirements of 44 U.S.C. § 3507.
Item 1. Reports to Stockholders.
| | (a) | The Report to Shareholders is attached herewith. |
PERFORMANCE SUMMARY
Period Returns (Average Annual Total Returns as of 12/31/23)
FUND | 1-YEAR | 3-YEAR | 5-YEAR | 10-YEAR | GROSS EXPENSE RATIO* |
| | | | | | |
Firsthand Technology Opportunities Fund | 10.81% | -28.20% | -1.34% | 6.24% | 1.86% |
Firsthand Alternative Energy Fund | -2.31% | -8.83% | 14.40% | 5.21% | 2.07% |
NASDAQ Composite Index | 44.64% | 6.04% | 18.75% | 14.80% | ● |
S&P 500 Index | 26.29% | 10.00% | 15.69% | 12.03% | ● |
WilderHill Clean Energy Index | -22.44% | -33.68% | 7.14% | -0.23% | ● |
* | After fee waivers, Firsthand Technology Opportunities Fund’s total net operating expenses are 1.85% and Firsthand Alternative Energy Fund’s total net operating expenses are 2.00%. Please see the Funds’ prospectus for more information about fund expenses. |
Returns assume reinvestment of all dividends and distributions but do not reflect the impact of taxes. The performance data quoted represent past performance. Past performance cannot guarantee future results, and current performance may be lower or higher than the performance quoted. Both the return from and the principal value of an investment in the Funds will fluctuate so that an investor’s shares, when redeemed, may be worth more or less than their original cost. To obtain performance as of the most recent month-end, please contact Firsthand Funds by calling 1.888.884.2675 or go to www.firsthandfunds.com.
The Nasdaq Composite Index (NASDAQ) is a capitalization-weighted index of all common stocks listed with NASDAQ. The Standard & Poor’s 500 Index (S&P 500) is a market-weighted index of 500 stocks of well-established companies. Each index represents an unmanaged, broad-based basket of stocks. These indices are typically used as benchmarks for overall market performance. The WilderHill Clean Energy Index is a market-weighted index of 58 companies in the cleaner fuel, energy conversion, energy storage, greener utilities, power delivery and conservation, and renewable energy harvesting sectors. The Dow Jones Industrial Average is a price-weighted average of 30 significant stocks traded on the New York Stock Exchange and the NASDAQ. You cannot invest directly in an index.
Returns Since Inception (Average Annual Total Returns as of 12/31/23)
FUND (INCEPTION DATE) | AVERAGE ANNUAL TOTAL RETURNS | NASDAQ COMPOSITE INDEX | S&P 500 INDEX | WILDERHILL CLEAN ENERGY INDEX |
Firsthand Technology Opportunities Fund (09/30/99) | 1.77% | 8.29% | 7.57% | ● |
Firsthand Alternative Energy Fund (10/29/07) | 0.45% | 12.04% | 9.41% | -8.06 |
Each Fund may invest in small-capitalization companies and Initial Public Offerings (“IPOs”). These investments will be more volatile than investments in large-capitalization companies and loss of principal could be greater. The Funds may invest in foreign securities, which will be subject to greater risks than investing in domestic securities. Because the Funds are not diversified, they can take larger positions in fewer companies, increasing their risk profile. The Funds invest in several industries within the technology sector and the relative weightings of these industries in a Fund’s portfolio may change at any time.
Holdings by Industry - % of Net Assets (as of 12/31/23)
INDUSTRY | Firsthand Technology Opportunities Fund | Firsthand Alternative Energy Fund |
Advanced Materials | ● | 4.1% |
Automotive | ● | 8.1% |
Biotech | ● | 0.4% |
Consumer Electronics | 10.1% | ● |
Defense & Aerospace | 7.3% | 4.9% |
Education | 4.3% | ● |
Electrical Equipment | ● | 2.5% |
Electronics Manufacturing Services | 0.0%* | ● |
Energy Efficiency | ● | 4.4% |
Engineering Service | ● | 8.8% |
Industrials | ● | 0.6% |
Internet | 4.2% | ● |
Materials | ● | 4.5% |
Other Electronics | ● | 5.4% |
Renewable Energy | 4.9% | 23.8% |
Semiconductor Equipment | 8.0% | 5.3% |
Semiconductors | 10.2% | 13.4% |
Services | ● | 2.9% |
Software | 46.6% | ● |
Solar | ● | 1.9% |
Transportation | ● | 0.0%* |
Waste & Environment Service | ● | 0.2% |
Investment Company | 3.3% | 8.8% |
Net Other Assets/(Liabilities) | 1.1% | 0.0%* |
Portfolio holdings are subject to change.
PRESIDENT’S LETTER
FELLOW SHAREHOLDERS,
 | In my mid-year letter to shareholders, I spoke of cautious optimism in equity markets in the first half of 2023, driven by easing inflation in the U.S. That cautious optimism blossomed into a full-blown market rally in Q4 as the Fed signaled the end of this rate hike cycle by holding interest rates steady, having last hiked rates in July. Further, it became clear that the elusive “soft landing” for the economy could be a real possibility. While the equity market gains in the first half of the year were fairly narrow, the Q4 rally was broad-based, as evidenced by the fact that the Russell 2000 (small-cap) Index outperformed the S&P 500 (large-cap) Index during the quarter. For the year ended December 31, 2023, the Nasdaq Composite Index was up 44.64% while the S&P 500 Index advanced 26.29%. I am disappointed to report that, despite a furious rally in Q4, Firsthand Technology Opportunities Fund underperformed its benchmarks, with a gain of 10.81% for the year. Firsthand Alternative Energy Fund suffered a loss of 2.31% in 2023, though it outperformed its primary benchmark, the WilderHill Clean Energy Index, which declined 22.44% during the period. |
Firsthand Technology Opportunities Fund (TEFQX)
The “Magnificent Seven” tech stocks, including Alphabet (GOOG), Apple (AAPL), Amazon (AMZN), Meta (FB), Microsoft (MSFT), Nvidia (NVDA), and Tesla (TSLA), led the stock market rally in 2023. By some measures, they were the rally: the average gain for these seven stocks in 2023 was 111%. If one were to remove the Magnificent Seven from the S&P 500 Index, the index return would have been only 8%, instead of the 26% it actually achieved.
Owing to the large weighting of these stocks in the major indices, we believe many mutual fund and ETF investors may have substantial exposure to these mega-cap companies. By contrast, our strategy has been to give investors exposure to tech companies that are not yet household names. We hold exactly one Magnificent Seven stock, Tesla, in our Firsthand Alternative Energy Fund. Suffice it to say that our performance suffered relative to our benchmarks because we did not hold these mega-cap tech stocks in 2023.
As the breadth of the market rally expanded throughout the year, a number of our core positions rebounded from their 2022 lows. Of particular significance, Roku (ROKU) and Palo Alto Networks (PANW) each posted triple-digit returns for the year.
On the downside, our solar energy investments took a hit in 2023, with both Enphase Energy (ENPH) and SolarEdge Technologies (SEDG) posting losses for the year. More on that in the Firsthand Alternative Energy Fund review below. Artificial Intelligence (“AI”) was a hot investment theme in 2023, and tech companies scrambled to hitch their wagons to this emerging technology area. Unfortunately, the Fund was negatively impacted by the rise of AI, as education technology provider Chegg (CHGG) warned that ChatGPT could pose a threat to subscriber growth and suffered a stock price collapse as a result.
Firsthand Alternative Energy Fund (ALTEX)
The solar industry struggled in 2023 as its economic foundation shifted beneath it. Interest rates, which continued increasing in the first half of the year and remained at elevated levels through the year, raised renewable energy project financing costs and pressured profit margins. In addition, California, which is the largest single-state solar market by a wide margin, implemented changes to its net metering rules in April, significantly cutting reimbursement rates for new solar customers. This negatively impacted the economics of rooftop solar and it appears new sales were softer than expected in 2023 as a result.
It should come as no surprise, then, that after leading the way in performance in 2022, the Fund’s solar stocks were among the biggest drags on fund performance in 2023. Enphase Energy (ENPH) and SolarEdge Technologies (SEDG) were two of the largest detractors, but our positions in SunPower (SPWR), SunRun (RUN), Maxeon Solar (MAXN), and Orion Energy Systems (OESX) also were negative contributors to performance. The Fund’s investments in electric vehicle charging providers ChargePoint Holdings (CHPT) and EVgo (EVGO) represented another performance lowlight during the year.
Thankfully, there were a handful of solid winners in the portfolio this year which helped moderate the losses for the Fund. Quanta Services (PWR), Kratos Defense & Security Solutions (KTOS), and Tesla (TSLA) were the biggest positive contributors to performance (read more details about these holdings beginning on page [8]). Other positive contributors included power semiconductor company ON Semiconductor (ON), industrial insulation specialist Aspen Aerogels (ASPN), Itron (ITRI), a leading supplier of smart meters to the electric utility industry.
Looking Ahead
From a macroeconomic perspective, interest rates remain a significant input to the market’s pricing mechanism. While some prognosticators are predicting Fed rate cuts later this year, we believe it’s still too early to anticipate such a move. Nevertheless, we are encouraged that a “soft landing” may be in the cards, though geopolitical instability remains a threat. Importantly, emerging technologies continue to capture consumers’ attention and we believe there are strong reasons to be optimistic about the future of technology companies.
Thank you for your continued investment in Firsthand Funds.
Sincerely,
Kevin Landis
President, Firsthand Funds
SHAREHOLDER FEE EXAMPLE (UNAUDITED)
Example — In general, mutual fund shareholders may incur two types of costs: (1) transaction costs, including sales charges (loads), redemption fees, and exchange fees; and (2) ongoing costs, including management fees, 12b-1 distribution and service fees, non-12b-1 service fees, and other Fund expenses. This example is intended to help you understand your ongoing costs (in dollars) of investing in a Fund and to compare these costs with the ongoing costs of investing in other mutual funds. Note that Firsthand Funds (“Trust”) does not charge transaction fees for 12b-1 distribution and service fees, though you may incur transaction fees if you purchase shares through a broker.
The example on the following page is based on an investment of $1,000 invested at the beginning of the period and held for the entire period from July 1, 2023 through December 31, 2023.
Actual Expenses — The section of the table at right entitled “Actual” provides information about actual account values and actual expenses. You may use this information, together with the amount you invested, to estimate the expenses that you paid over the period. Simply divide your account value by $1,000 (for example, an $8,600 account value divided by $1,000 = 8.6), then multiply the result by the number in the section entitled “Actual” under the heading “Expenses Paid During Period” to estimate the expenses you paid on your account during this period. If your account is an IRA or other tax-qualified savings plan, your expenses may also have included a $10 annual fee. In either case, the amount of any fee paid through your account would increase the estimate of expenses you paid during the period and decrease your ending account value.
Hypothetical Example for Comparison Purposes — The section of the table at right entitled “Hypothetical” provides information about hypothetical account values and hypothetical expenses based on a Fund’s actual expense ratio and an assumed rate of return of 5% per year before expenses, which is not the Fund’s actual return. The hypothetical account values and expenses may not be used to estimate your actual ending account balance or the expenses you paid for the period. However, you may use this information to compare the ongoing costs of investing in the Trust to other funds. To do so, compare this 5% hypothetical example with the 5% hypothetical examples that appear in the shareholder reports of the other funds. As in the case of the actual expense example, if your account is subject to an IRA fee, the amount of the fee paid through your account would increase the hypothetical expenses you would have paid during the period and decrease the hypothetical ending account value.
Please note that the expenses shown in the table below are meant to highlight your ongoing costs only and do not reflect any transactional costs, such as sales charges (loads), redemption fees, or exchange fees. Therefore, the table is useful in comparing ongoing costs only, and will not help you determine the relative total costs of owning different funds. In addition, if these transactional costs were included, your costs would have been higher. The examples also assume all dividends and distributions have been reinvested.
SHAREHOLDER FEE EXAMPLE (UNAUDITED) - continued
Firsthand Technology Opportunities Fund
| | BEGINNING
ACCOUNT VALUE
7/1/23 | ENDING
ACCOUNT VALUE
12/31/23 | EXPENSES PAID
DURING
PERIOD*
7/1/23 - 12/31/23 | ANNUALIZED
EXPENSE RATIO |
Actual | $1,000 | $1,058.40 | $9.60 | 1.85% |
Hypothetical** | $1,000 | $1,015.88 | $9.40 | 1.85% |
Firsthand Alternative Energy Fund
| | BEGINNING
ACCOUNT VALUE
7/1/23 | ENDING
ACCOUNT VALUE
12/31/23 | EXPENSES PAID
DURING
PERIOD*
7/1/23 - 12/31/23 | ANNUALIZED
EXPENSE RATIO |
Actual | $1,000 | $904.30 | $9.50 | 1.98% |
Hypothetical** | $1,000 | $1,015.22 | $10.06 | 1.98% |
* | Expenses are calculated by multiplying the Fund’s annualized expense ratio listed above by the average account value over the period and multiplying that number by 184/365 (to reflect the one-half year period). |
** | 5% return per year before expenses. |
The expenses shown in the table do not reflect any fees that may be charged to you by brokers, financial Intermediaries, or other financial institutions.
FIRSTHAND TECHNOLOGY OPPORTUNITIES FUND
Performance and Portfolio Discussion
How did the Fund perform in 2023?
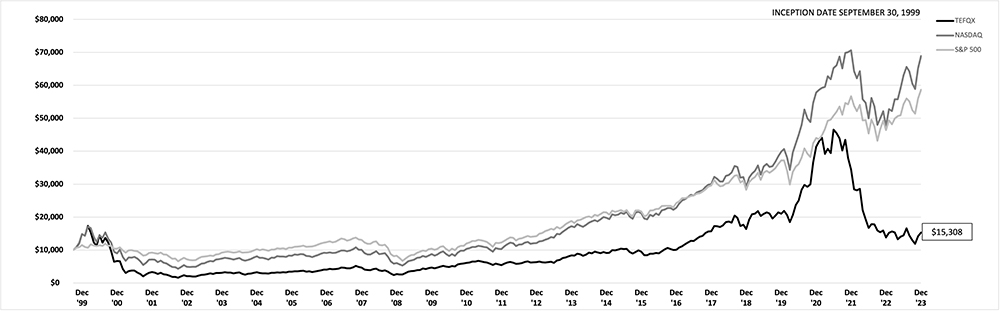
Firsthand Technology Opportunities Fund (TEFQX) posted a gain of 10.81% in 2023 versus a gain of 44.64% for the NASDAQ Composite Index and an 26.29% gain for the S&P 500 Index. For the six months ended December 31, 2023, Firsthand Technology Opportunities Fund was up 5.84% compared to gains of 9.31% and 8.03% for the NASDAQ Composite Index and the S&P 500 Index, respectively.
Which industries had the greatest impact on the Fund’s performance?
For the year ended December 31, 2023, software companies represented the portfolio’s largest industry weighting, followed by holdings in the semiconductor and consumer electronics industries. The portfolio’s exposure to the semiconductor and renewable energy industries contributed most to the Fund’s underperformance versus its primary benchmark in 2023.
Which individual holdings were the largest contributors to the Fund’s performance?
Streaming media leader Roku (ROKU), the Fund’s second-largest holding at year end, was the leading contributor to the Fund’s performance for the year. The company’s stock was up nearly 30% in the fourth quarter alone, on the heels its late-October earnings announcement that exceeded expectations. Roku stock finished up 125% for the year.
The Fund’s second-largest contributor to its performance in 2023 was Palo Alto Networks (PANW). The cybersecurity company’s stock more than doubled in 2023, including a 25% increase in Q4 after posting 20% revenue growth in its fiscal first quarter ended October 31, 2023. In December, the company completed the acquisitions of two cybersecurity start-ups: Talon Cyber Security and Dig Security.
Kratos Defense & Security Solutions (KTOS), a defense contractor specializing in unmanned aerial vehicles and space systems, was the third largest contributor to performance during the year. The company posted increasing sequential quarterly revenues throughout 2023 and its stock rose 97% during the year.
Which holdings were the greatest detractors from the Fund’s performance?
It was a tough year for the solar industry, and these troubles hit Enphase Energy (ENPH) and SolarEdge Technologies (SEDG) hard. Collectively, these two holdings represented the largest drag on fund performance in 2023. The two microinverter companies suffered stock declines of 50% and 67%, respectively, during the year as higher interest rates combined with changes to California’s net metering rules to soften demand and erode margins in the industry.
Silicon carbide semiconductor specialist Wolfspeed (WOLF) ended the year as the largest individual detractor from Fund performance for 2023. Despite 25% revenue growth for its fiscal 2023, Wolfspeed’s stock dipped in the second half of the year after the company warned of higher costs and lower revenues noting, “we are incurring significant factory start-up costs relating to factories that we are constructing or expanding that have not started revenue-generating production.”
Chegg (CHGG) was another significant detractor from fund performance in 2023. The education technology company’s stock dropped sharply in April after the company lowered second-quarter revenue guidance, suspended full-year revenue guidance, and noted that it believed that ChatGPT was having an impact on its new customer growth rate.
| Fund Performance and Holdings Information (as of 12/31/23) | | | | | |
| Firsthand Technology Opportunities Fund vs. Market Indices | | | | | |
| | | | | | |
| | FIRSTHAND | | | | |
| | TECHNOLOGY | | NASDAQ | | |
| | OPPORTUNITIES | | COMPOSITE | | S&P 500 |
| | FUND | | INDEX | | INDEX |
| Since Inception (9/30/99) | 1.77% | | 8.29% | | 7.57% |
| 10-year | 6.24% | | 14.80% | | 12.03% |
| 5-year | -1.34% | | 18.75% | | 15.69% |
| 3-year | -28.20% | | 6.04% | | 10.00% |
| 1-year | 10.81% | | 44.64% | | 26.29% |
GROWTH OF A HYPOTHETICAL $10,000 INVESTMENT
HOLDINGS BY INDUSTRY* | % NET ASSETS |
Software | 46.6% |
Semiconductors | 10.2% |
Consumer Electronics | 10.1% |
Semiconductor Equipment | 8.0% |
Defense & Aerospace | 7.3% |
Renewable Energy | 4.9% |
Education | 4.3% |
Internet | 4.2% |
Net Other Assets and Liabilities | 4.4% |
* | Based on percentage of net assets as of 12/31/23. |
FIRSTHAND TECHNOLOGY OPPORTUNITIES FUND - continued
Performance and Portfolio Discussion
TOP 10 HOLDINGS** | % NET ASSETS |
Wolfspeed, Inc. | 10.2% |
Roku, Inc. | 10.1% |
Kratos Defense & Security Solutions, Inc. | 7.3% |
Zscaler, Inc. | 6.1% |
DocuSign, Inc. | 4.9% |
Cloudflare, Inc., | 4.6% |
Revasum, Inc. | 4.2% |
Chegg, Inc. | 4.1% |
Monday.com, Ltd. | 3.9% |
PagerDuty, Inc. | 3.8% |
** | Top 10 stock holdings total 59.2% of net assets. These holdings are current as of 12/31/23, and may not be representative of current or future investments. |
FIRSTHAND ALTERNATIVE ENERGY FUND
Performance and Portfolio Discussion
How did the Fund perform in 2023?
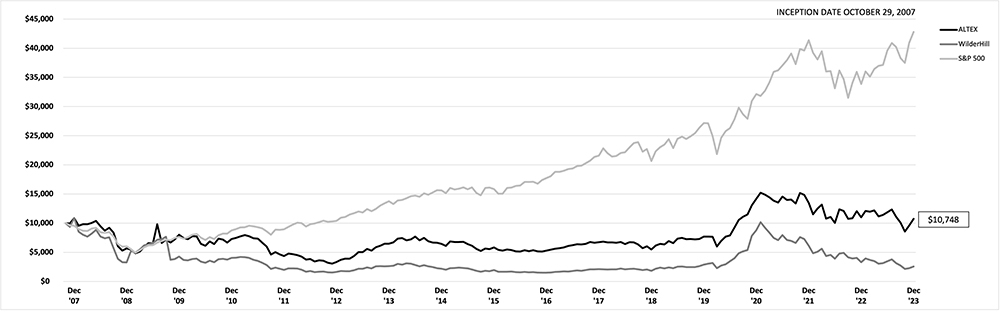
Firsthand Alternative Energy Fund (ALTEX) posted a 2.31% loss in 2023 versus a loss of 22.44% for the WilderHill Clean Energy Index and a 26.29% gain for the S&P 500 Index. For the six months ended December 31, 2023, Firsthand Alternative Energy Fund was down 9.57% compared to a loss of 26.15% for the WilderHill Clean Energy Index and an 8.03% gain for the S&P 500 Index.
Which industries had the greatest impact on the Fund’s performance?
For the year ended December 31, 2023, renewable energy companies represented the portfolio’s largest industry weighting, followed by semiconductor and engineering services companies. The portfolio’s exposure to engineering services and defense & aerospace stocks contributed most to the Fund’s outperformance versus its primary benchmark in 2023.
Which individual holdings were the largest contributors to the Fund’s performance?
The largest contributor to the Fund’s performance in 2023 was Quanta Services (PWR), an energy infrastructure construction company. Through the first nine months of the year, Quanta posted 19% revenue growth, as compared to the year-ago period. In December, the company announced an increase in its quarterly dividend to stockholders, the fifth such increase in the five years since declaring its first dividend.
Kratos Defense & Security Solutions (KTOS) was the second largest contributor to performance during the year. The defense contractor specializing in unmanned aerial vehicles and space systems posted increasing sequential quarterly revenues throughout 2023 and its stock rose 97% during the year.
The third largest contributor to fund performance in 2023 was electric vehicle manufacturer Tesla (TSLA). Despite some potholes along the way, Tesla stock generally marched higher in 2023, closing the year up more than 100%. The stock’s performance in 2023, however, seems to belie the challenges the company is facing in declining margins and slackening consumer demand growth for EVs.
Which holdings were the greatest detractors from the Fund’s performance?
It was a tough year for the solar industry, and these troubles hit Enphase Energy (ENPH) and SolarEdge Technologies (SEDG) hard. Collectively, these two holdings represented the largest drag on fund performance in 2023. The two microinverter companies suffered stock declines of 50% and 67%, respectively, during the year as higher interest rates combined with changes to California’s net metering rules to soften demand and erode margins in the industry. A third solar company, SunPower (SPWR) was also among the Fund’s biggest detractors from performance in 2023.
FIRSTHAND ALTERNATIVE ENERGY FUND
Performance and Portfolio Discussion
A December rebound of more than 25% did not save EV charging infrastructure company ChargePoint Holdings (CHPT) from a dismal year in the market. The company’s stock declined more than 75% in 2023 as slowing EV growth and adoption of Tesla’s fast charging station by several prominent EV makers (including Ford, GM, and Rivian) weighed on demand for ChargePoint’s services.
Silicon carbide semiconductor specialist Wolfspeed (WOLF) was another significant detractor from Fund performance for 2023. Despite 25% revenue growth for its fiscal 2023, Wolfspeed’s stock dipped in the second half of the year after the company warned of higher costs and lower revenues noting, “we are incurring significant factory start-up costs relating to factories that we are constructing or expanding that have not started revenue-generating production.”
| Fund Performance and Holdings Information (as of 12/31/23) | | | | | |
| Firsthand Alternative Energy Fund vs. Market Indices | | | | | |
| | | | | | |
| | FIRSTHAND | | | | |
| | ALTERNATIVE | | WILDERHILL CLEAN | | |
| | ENERGY | | ENERGY | | S&P |
| | FUND | | INDEX | | 500 |
| Since inception (10/29/07) | 0.45% | | -8.06% | | 9.41% |
| 10-year | 5.21% | | -0.23% | | 12.03% |
| 5-year | 14.40% | | 7.14% | | 15.69% |
| 3-year | -8.83% | | -33.68 | | 10.00% |
| 1-year | -2.31% | | 22.44% | | 26.29% |
| | | | | | |
GROWTH OF A HYPOTHETICAL $10,000 INVESTMENT
FIRSTHAND ALTERNATIVE ENERGY FUND - continued
Performance and Portfolio Discussion
HOLDINGS BY INDUSTRY* | % NET ASSETS |
Renewable Energy | 23.8% |
Semiconductors | 13.4% |
Engineering Service | 8.8% |
Automotive | 8.1% |
Other Electronics | 5.4% |
Semiconductor Equipment | 5.3% |
Defense & Aerospace | 4.9% |
Materials | 4.5% |
Energy Efficiency | 4.4% |
Advanced Materials | 4.1% |
Services | 2.9% |
Electrical Equipment | 2.5% |
Solar | 1.9% |
Net Other Assets and Liabilities | 10.0% |
* | Based on percentage of net assets as of 12/31/23. |
TOP 10 HOLDINGS** | % NET ASSETS |
Quanta Services, Inc. | 8.8% |
Tesla, Inc. | 8.1% |
First Solar, Inc. | 7.0% |
ON Semiconductor Corp. | 6.8% |
Axcelis Technologies, Inc. | 5.3% |
Kratos Defense & Security Solutions, Inc. | 4.9% |
Aspen Aerogels, Inc. | 4.5% |
Corning, Inc. | 4.1% |
Vestas Wind Systems A.S. | 3.9% |
Wolfspeed, Inc. | 3.5% |
** | Top 10 stock holdings total 56.9% of net assets. These holdings are current as of 12/31/23, and may not be representative of current or future investments. |
REPORT OF INDEPENDENT REGISTERED PUBLIC ACCOUNTING FIRM
To the Shareholders and Board of Trustees of Firsthand Funds
Opinion on the Financial Statements
We have audited the accompanying statements of assets and liabilities of Firsthand Technology Opportunities Fund and Firsthand Alternative Energy Fund, each a series of Firsthand Funds (the “Funds”), including the schedules of investments, as of December 31, 2023, the related statements of operations for the year then ended, the statements of changes in net assets for each of the two years in the period then ended, and financial highlights for each of the five years in the period then ended, and the related notes (collectively referred to as the “financial statements”). In our opinion, the financial statements present fairly, in all material respects, the financial position of Firsthand Funds as of December 31, 2023, the results of their operations for the year then ended, the changes in their net assets for each of the two years in the period then ended, and the financial highlights for each of the five years in the period then ended, in conformity with accounting principles generally accepted in the United States of America.
Basis for Opinion
These financial statements are the responsibility of the Funds’ management. Our responsibility is to express an opinion on the Funds’ financial statements based on our audits. We are a public accounting firm registered with the Public Company Accounting Oversight Board (United States) (“PCAOB”) and are required to be independent with respect to the Funds in accordance with the U.S. federal securities laws and the applicable rules and regulations of the Securities and Exchange Commission and the PCAOB. We have served as the Funds’ auditor since 1997.
We conducted our audits in accordance with the standards of the PCAOB. Those standards require that we plan and perform the audits to obtain reasonable assurance about whether the financial statements are free of material misstatement, whether due to error or fraud. The Funds are not required to have, nor were we engaged to perform, an audit of their internal control over financial reporting. As part of our audits we are required to obtain an understanding of internal control over financial reporting, but not for the purpose of expressing an opinion on the effectiveness of the Funds’ internal control over financial reporting. Accordingly, we express no such opinion.
Our audits included performing procedures to assess the risks of material misstatement of the financial statements, whether due to error or fraud, and performing procedures that respond to those risks. Such procedures included examining, on a test basis, evidence regarding the amounts and disclosures in the financial statements. Our procedures also included confirmation of securities owned as of December 31, 2023 by correspondence with the custodian and company. Our audits also included evaluating the accounting principles used and significant estimates made by management, as well as evaluating the overall presentation of the financial statements. We believe that our audits provide a reasonable basis for our opinion.
| | |
| | 
|
| | TAIT, WELLER & BAKER LLP |
Philadelphia, Pennsylvania
February 26, 2024
Firsthand Technology Opportunities Fund
Portfolio of Investments, December 31, 2023
| | | SHARES/PAR VALUE ($) | | | MARKET VALUE | |
COMMON STOCKS — 91.4% ($68,895,427) | | | | | | | | |
Consumer Electronics — 10.1% ($2,729,736) | | | | | | | | |
Roku, Inc.* | | | 80,000 | | | $ | 7,332,800 | |
Defense & Aerospace — 7.3% ($5,258,486) | | | | | | | | |
Astra Space, Inc.* | | | 1 | | | | 2 | |
Kratos Defense & Security Solutions, Inc.* | | | 260,000 | | | | 5,275,400 | |
Education — 4.3% ($5,141,889) | | | | | | | | |
Chegg, Inc.* | | | 260,000 | | | | 2,953,600 | |
Coursera, Inc.* | | | 10,000 | | | | 193,700 | |
Electronics Manufacturing Services — 0.0%** ($91,168) | | | | | | | | |
Tempo Automation Holdings, Inc.*(1) | | | 320,000 | | | | 168 | |
Internet — 4.2% ($680,851) | | | | | | | | |
Netflix, Inc.* | | | 5,000 | | | | 2,434,400 | |
PayPal Holdings, Inc.* | | | 10,000 | | | | 614,100 | |
Renewable Energy — 4.9% ($891,883) | | | | | | | | |
Enphase Energy, Inc.* | | | 20,000 | | | | 2,642,800 | |
SolarEdge Technologies, Inc.* | | | 10,000 | | | | 936,000 | |
Semiconductor Equipment — 3.8% ($13,005,099) | | | | | | | | |
Revasum, Inc.*(2) | | | 28,367,549 | | | | 2,754,677 | |
Semiconductors — 10.2% ($7,220,640) | | | | | | | | |
Wolfspeed, Inc.* | | | 170,000 | | | | 7,396,700 | |
Software — 46.6% ($34,875,675) | | | | | | | | |
BILL Holdings, Inc.* | | | 30,000 | | | | 2,447,700 | |
Cloudflare, Inc., Class A* | | | 40,000 | | | | 3,330,400 | |
DocuSign, Inc.* | | | 60,000 | | | | 3,567,000 | |
Domo, Inc., Class B* | | | 230,000 | | | | 2,366,700 | |
Fastly, Inc., Class A* | | | 50,000 | | | | 890,000 | |
Monday.com, Ltd.* | | | 15,000 | | | | 2,817,150 | |
MongoDB, Inc.* | | | 5,000 | | | | 2,044,250 | |
Okta, Inc.* | | | 10,000 | | | | 905,300 | |
PagerDuty, Inc.* | | | 120,000 | | | | 2,778,000 | |
Palantir Technologies, Inc., Class A* | | | 100,000 | | | | 1,717,000 | |
Palo Alto Networks, Inc.* | | | 5,000 | | | | 1,474,400 | |
Twilio, Inc., Class A* | | | 30,000 | | | | 2,276,100 | |
Workday, Inc., Class A* | | | 10,000 | | | | 2,760,600 | |
Zscaler, Inc.* | | | 20,000 | | | | 4,431,200 | |
| | | | | | | | | |
CORPORATE NOTE — 4.2% ($3,082,144) | | | | | | | | |
Semiconductor Equipment — 4.2% ($3,082,144) | | | | | | | | |
Revasum, Inc. August 19, 2025 Interest Rate 14.75%(1)(2)(3)(5) | | | 1,782,144 | | | | 1,782,144 | |
Revasum, Inc. August 19, 2025 Interest Rate 14.75%(1)(2)(3)(5) | | | 750,000 | | | | 750,000 | |
Revasum, Inc. August 19, 2025 Interest Rate 14.75%(1)(2)(3)(5) | | | 300,000 | | | | 300,000 | |
| see accompanying notes to financial statements |
| www.firsthandfunds.com | 17 |
Firsthand Technology Opportunities Fund
Portfolio of Investments, December 31, 2023
| | | SHARES/PAR VALUE ($) | | | MARKET VALUE | |
CORPORATE NOTE (continued) | | | | | | | | |
Semiconductor Equipment (continued) | | | | | | | | |
Revasum, Inc. August 19, 2025 Interest Rate 14.75%(1)(2)(3)(5) | | | 250,000 | | | | 250,000 | |
| | | | | | | | | |
INVESTMENT COMPANY — 3.3% ($2,358,752) | | | | | | | | |
Fidelity Investments Money Market Fund - Treasury Portfolio(4) | | | 2,358,752 | | | | 2,358,752 | |
| Total Investments | | | | | | | | |
(Cost $75,336,323) — 98.9% | | | | | | | 71,781,043 | |
Other assets in excess of liabilities — 1.1% | | | | | | | 769,773 | |
NET ASSETS - 100.0% | | | | | | $ | 72,550,816 | |
* | Non-income producing security. |
** | Less than 0.05%. |
(1) | Restricted/illiquid security (4.2% of net assets). |
(2) | Affiliated issuer. |
(3) | Fair Value Level 3 security (4.2% of net assets). |
(4) | The Fidelity Investments Money Market Fund invests primarily in U.S. Treasury Securities. |
| (5) | Subordinated debt whose interest accrues over the life of the note. Unpaid principal and interest is due on August 19, 2025. |
| see accompanying notes to financial statements |
| 18 | 2023 Annual Report |
Firsthand Alternative Energy Fund
Portfolio of Investments, December 31, 2023
| | | SHARES | | | MARKET VALUE | |
COMMON STOCKS — 91.2% ($9,865,378) | | | | | | | | |
Advanced Materials — 4.1% ($460,431) | | | | | | | | |
Corning, Inc. | | | 16,460 | | | $ | 501,207 | |
Automotive — 8.1% ($1,039,643) | | | | | | | | |
Tesla, Inc.* | | | 4,000 | | | | 993,920 | |
Biotech — 0.4% ($118,324) | | | | | | | | |
Curaleaf Holdings, Inc.* | | | 10,000 | | | | 40,600 | |
Jazz Pharmaceuticals PLC* | | | 120 | | | | 14,760 | |
Defense & Aerospace — 4.9% ($809,472) | | | | | | | | |
Kratos Defense & Security Solutions, Inc.* | | | 30,000 | | | | 608,700 | |
Electrical Equipment — 2.5% ($143,152) | | | | | | | | |
ABB, Ltd. - SP ADR | | | 7,000 | | | | 310,100 | |
Energy Efficiency — 4.4% ($291,255) | | | | | | | | |
Honeywell International, Inc. | | | 580 | | | | 121,632 | |
Itron, Inc.* | | | 5,565 | | | | 420,213 | |
Engineering Service — 8.8% ($129,504) | | | | | | | | |
Quanta Services, Inc. | | | 5,000 | | | | 1,079,000 | |
Industrials — 0.6% ($18,462) | | | | | | | | |
Accelleron Industries AG - ADR | | | 350 | | | | 10,911 | |
Carrier Global Corp. | | | 1,000 | | | | 57,450 | |
Materials — 4.5% ($251,930) | | | | | | | | |
Aspen Aerogels, Inc.* | | | 35,000 | | | | 552,300 | |
Other Electronics — 5.4% ($828,538) | | | | | | | | |
Enovix Corp.* | | | 30,000 | | | | 375,600 | |
Intevac, Inc.* | | | 5,800 | | | | 25,056 | |
Koninklijke Philips N.V.* | | | 11,373 | | | | 265,332 | |
Renewable Energy — 23.8% ($1,961,803) | | | | | | | | |
Amtech Systems, Inc.* | | | 6,600 | | | | 27,720 | |
Enphase Energy, Inc.* | | | 3,000 | | | | 396,420 | |
First Solar, Inc.* | | | 5,000 | | | | 861,400 | |
Iberdrola S.A. | | | 26,647 | | | | 349,179 | |
Maxeon Solar Technologies, Ltd.* | | | 2,491 | | | | 17,860 | |
Orion Energy Systems, Inc.* | | | 14,000 | | | | 12,132 | |
Sharp Corp.* | | | 1,100 | | | | 7,844 | |
SolarEdge Technologies, Inc.* | | | 3,000 | | | | 280,800 | |
SunPower Corp., Class B* | | | 29,931 | | | | 144,567 | |
Sunrun, Inc.* | | | 11,600 | | | | 227,708 | |
ULVAC, Inc. | | | 2,700 | | | | 129,026 | |
Vestas Wind Systems A.S.* | | | 15,000 | | | | 475,875 | |
Semiconductor Equipment — 5.3% ($884,211) | | | | | | | | |
Axcelis Technologies, Inc.* | | | 5,000 | | | | 648,450 | |
| see accompanying notes to financial statements |
| www.firsthandfunds.com | 19 |
Firsthand Alternative Energy Fund
Portfolio of Investments, December 31, 2023
| | | SHARES | | | MARKET VALUE | |
COMMON STOCKS (continued) | | | | | | | | |
Semiconductors — 13.4% ($1,422,227) | | | | | | | | |
ON Semiconductor Corp.* | | | 10,000 | | | $ | 835,300 | |
Power Integrations, Inc. | | | 1,598 | | | | 131,212 | |
STMicroelectronics N.V. | | | 5,000 | | | | 250,650 | |
Wolfspeed, Inc.* | | | 10,000 | | | | 435,100 | |
Services — 2.9% ($1,237,343) | | | | | | | | |
ChargePoint Holdings, Inc.* | | | 60,000 | | | | 140,400 | |
EVgo, Inc.* | | | 60,000 | | | | 214,800 | |
Solar — 1.9% ($234,948) | | | | | | | | |
Sunnova Energy International, Inc.* | | | 15,000 | | | | 228,750 | |
Waste & Environment Service — 0.2% ($34,135) | | | | | | | | |
Advanced Emissions Solutions, Inc.* | | | 6,800 | | | | 20,264 | |
| | | | | | | | | |
WARRANTS — 0.0%** ($13,950) | | | | | | | | |
Transportation — 0.0%** ($13,950) | | | | | | | | |
Swvl Holdings Corp. * | | | 13,333 | | | | 88 | |
| | | | | | | | | |
INVESTMENT COMPANY — 8.8% ($1,087,114) | | | | | | | | |
Fidelity Investments Money Market Fund - Treasury Portfolio(1) | | | 1,087,114 | | | | 1,087,114 | |
| Total Investments | | | | | | | | |
(Cost $10,966,442) — 100.0% | | | | | | | 12,299,440 | |
Liabilities in excess of other assets — (0.0)%** | | | | | | | (6,022 | ) |
NET ASSETS - 100.0% | | | | | | $ | 12,293,418 | |
* | Non-income producing security. |
(1) | The Fidelity Investments Money Market Fund invests primarily in U.S. Treasury Securities. |
ADR | American Depositary Receipt |
PLC | Public Limited Company |
SP ADR | Sponsored American Depositary Receipt |
| see accompanying notes to financial statements |
| 20 | 2023 Annual Report |
STATEMENTS OF ASSETS AND LIABILITIES
December 31, 2023
| | | FIRSTHAND TECHNOLOGY OPPORTUNITIES FUND | | | FIRSTHAND ALTERNATIVE ENERGY FUND | |
ASSETS | | | | | | | | |
Investment securities: | | | | | | | | |
Unaffiliated investments at acquisition cost | | $ | 59,249,080 | | | $ | 10,966,442 | |
Affiliated investments at acquisition cost | | | 16,087,243 | | | | — | |
Total acquisition cost | | $ | 75,336,323 | | | $ | 10,966,442 | |
Unaffiliated investments at market value | | | 65,944,222 | | | | 12,299,440 | |
Affiliated investments at market value | | | 5,836,821 | | | | — | |
Total market value (Note 2) | | | 71,781,043 | | | | 12,299,440 | |
Receivable for securities sold | | | 950,258 | | | | — | |
Receivable from dividends, interest, and reclaims | | | 235,319 | | | | 7,217 | |
Receivable for capital shares sold | | | 4,811 | | | | 10,533 | |
TOTAL ASSETS | | | 72,971,431 | | | | 12,317,190 | |
| | | | | | | | | |
LIABILITIES | | | | | | | | |
Payable to affiliates (Note 4) | | | 113,781 | | | | 19,814 | |
Payable for capital shares redeemed | | | 306,768 | | | | 3,958 | |
Distributions payable | | | 66 | | | | — | |
TOTAL LIABILITIES | | | 420,615 | | | | 23,772 | |
NET ASSETS | | $ | 72,550,816 | | | $ | 12,293,418 | |
| | | | | | | | | |
Net Assets consist of: | | | | | | | | |
Paid-in Capital | | $ | 97,377,001 | | | $ | 11,051,870 | |
Total distributable earnings (loss) | | | (24,826,185 | ) | | | 1,241,548 | |
NET ASSETS | | $ | 72,550,816 | | | $ | 12,293,418 | |
| | | | | | | | | |
Shares Outstanding | | | 14,921,062 | | | | 1,186,949 | |
Net asset value, redemption price and offering price per share (Note 2) | | $ | 4.86 | | | $ | 10.36 | |
| see accompanying notes to financial statements |
| www.firsthandfunds.com | 21 |
STATEMENTS OF OPERATIONS
For the Year Ended December 31, 2023
| | | FIRSTHAND TECHNOLOGY OPPORTUNITIES FUND | | | FIRSTHAND ALTERNATIVE ENERGY FUND | |
INVESTMENT INCOME | | | | | | | | |
Unaffiliated dividends | | $ | 59,426 | | | $ | 138,838 | |
Affiliated/controlled interest | | | 262,437 | | | | — | |
Foreign tax withholding | | | — | | | | (1,421 | ) |
TOTAL INVESTMENT INCOME | | | 321,863 | | | | 137,417 | |
| | | | | | | | | |
EXPENSES | | | | | | | | |
Investment advisory fees (Note 4) | | | 1,100,980 | | | | 202,191 | |
Administration fees (Note 4) | | | 353,886 | | | | 59,468 | |
Trustee fees | | | 9,000 | | | | 9,000 | |
Miscellaneous | | | 183 | | | | — | |
GROSS EXPENSES | | | 1,464,049 | | | | 270,659 | |
Trustee fees reimbursement | | | (9,000 | ) | | | (9,000 | ) |
TOTAL NET EXPENSES | | | 1,455,049 | | | | 261,659 | |
| | | | | | | | | |
NET INVESTMENT LOSS | | | (1,133,186 | ) | | | (124,242 | ) |
| | | | | | | | | |
Net Realized and Unrealized Gain (Loss) on Investments: | | | | | | | | |
Net realized gains (losses) from security transactions on: | | | | | | | | |
Unaffiliated investments and foreign currency | | | 9,997,557 | | | | 101,763 | |
Affiliated investments | | | (25,975,359 | ) | | | — | |
Net realized gains from written options transactions (1) | | | — | | | | 131,032 | |
Net realized (Loss) Gain | | | (15,977,802 | ) | | | 232,795 | |
Net change in unrealized appreciation (depreciation) on: | | | | | | | | |
Unaffiliated investments and foreign currency | | | (14,022 | ) | | | (599,017 | ) |
Affiliated investments | | | 24,714,770 | | | | — | |
Net change in unrealized appreciation (depreciation) | | | 24,700,748 | | | | (599,017 | ) |
| | | | | | | | | |
Net Realized and Unrealized Gain (Loss) on Investments | | | 8,722,946 | | | | (366,222 | ) |
| | | | | | | | | |
Net Increase (Decrease) In Net Assets Resulting From Operations | | $ | 7,589,760 | | | $ | (490,464 | ) |
(1) | Primary risk exposure is equity contracts. |
| see accompanying notes to financial statements |
| 22 | 2023 Annual Report |
STATEMENTS OF CHANGES IN NET ASSETS
For the Years Ended December 31, 2023, and December 31, 2022
| | | FIRSTHAND TECHNOLOGY OPPORTUNITIES FUND | |
| | | YEAR ENDED 12/31/2023 | | | YEAR ENDED 12/31/2022 | |
| | | | | | | | | |
FROM OPERATIONS: | | | | | | | | |
Net investment loss | | $ | (1,133,186 | ) | | $ | (2,687,579 | ) |
Net realized (loss) gains from security transactions and foreign currency | | | (15,977,802 | ) | | | 14,338,311 | |
Net change in unrealized appreciation (depreciation) on investments and foreign currency | | | 24,700,748 | | | | (162,910,692 | ) |
Net increase (decrease) in net assets from operations | | | 7,589,760 | | | | (151,259,960 | ) |
| | | | | | | | | |
DISTRIBUTIONS TO SHAREHOLDERS: | | | | | | | | |
Distributions | | | (1,384,085 | ) | | | (32,280,491 | ) |
Total Distributions | | | (1,384,085 | ) | | | (32,280,491 | ) |
| | | | | | | | | |
FROM CAPITAL SHARE TRANSACTIONS: | | | | | | | | |
Proceeds from shares sold | | | 6,517,307 | | | | 10,073,489 | |
Dividends reinvested | | | 1,331,089 | | | | 30,900,980 | |
Payment for shares redeemed | | | (26,076,899 | ) | | | (51,893,764 | ) |
Net decrease in net assets from capital share transactions | | | (18,228,503 | ) | | | (10,919,295 | ) |
TOTAL DECREASE IN NET ASSETS | | | (12,022,828 | ) | | | (194,459,746 | ) |
| | | | | | | | | |
NET ASSETS: | | | | | | | | |
Beginning of year | | | 84,573,644 | | | | 279,033,390 | |
End of year | | $ | 72,550,816 | | | $ | 84,573,644 | |
| | | | | | | | | |
COMMON STOCK ACTIVITY: | | | | | | | | |
Shares sold | | | 1,377,542 | | | | 1,011,859 | |
Shares reinvested | | | 275,588 | | | | 6,437,704 | |
Shares redeemed | | | (5,653,604 | ) | | | (5,105,874 | ) |
Net increase (decrease) in shares outstanding | | | (4,000,474 | ) | | | 2,343,689 | |
Shares outstanding, beginning of year | | | 18,921,536 | | | | 16,577,847 | |
Shares outstanding, end of year | | | 14,921,062 | | | | 18,921,536 | |
| see accompanying notes to financial statements |
| www.firsthandfunds.com | 23 |
STATEMENTS OF CHANGES IN NET ASSETS
For the Years Ended December 31, 2023, and December 31, 2022
| | | FIRSTHAND ALTERNATIVE ENERGY FUND | |
| | | YEAR ENDED 12/31/2023 | | | YEAR ENDED 12/31/2022 | |
| | | | | | | | | |
FROM OPERATIONS: | | | | | | | | |
Net investment loss | | $ | (124,242 | ) | | $ | (203,791 | ) |
Net realized gain from security transactions, foreign currency and written options | | | 232,795 | | | | 854,501 | |
Net change in unrealized (depreciation) on investments and foreign currency | | | (599,017 | ) | | | (3,577,211 | ) |
Net decrease in net assets from operations | | | (490,464 | ) | | | (2,926,501 | ) |
| | | | | | | | | |
DISTRIBUTIONS TO SHAREHOLDERS: | | | | | | | | |
Distributions | | | (406,773 | ) | | | — | |
Total Distributions | | | (406,773 | ) | | | — | |
| | | | | | | | | |
FROM CAPITAL SHARE TRANSACTIONS: | | | | | | | | |
Proceeds from shares sold | | | 7,497,818 | | | | 12,096,637 | |
Dividends reinvested | | | 397,828 | | | | — | |
Payment for shares redeemed | | | (7,387,723 | ) | | | (12,655,462 | ) |
Net increase (decrease) in net assets from capital share transactions | | | 507,923 | | | | (558,825 | ) |
TOTAL DECREASE IN NET ASSETS | | | (389,314 | ) | | | (3,485,326 | ) |
| | | | | | | | | |
NET ASSETS: | | | | | | | | |
Beginning of year | | | 12,682,732 | | | | 16,168,058 | |
End of year | | $ | 12,293,418 | | | $ | 12,682,732 | |
| | | | | | | | | |
COMMON STOCK ACTIVITY: | | | | | | | | |
Shares sold | | | 631,124 | | | | 1,055,798 | |
Shares reinvested | | | 38,549 | | | | — | |
Shares redeemed | | | (639,119 | ) | | | (1,104,040 | ) |
Net increase (decrease) in shares outstanding | | | 30,554 | | | | (48,242 | ) |
Shares outstanding, beginning of year | | | 1,156,395 | | | | 1,204,637 | |
Shares outstanding, end of year | | | 1,186,949 | | | | 1,156,395 | |
| see accompanying notes to financial statements |
| 24 | 2023 Annual Report |
FINANCIAL HIGHLIGHTS
Selected per share data and ratios for a share outstanding throughout each year
FIRSTHAND TECHNOLOGY OPPORTUNITIES FUND
| | | YEAR ENDED 12/31/23 | | | YEAR ENDED 12/31/22 | | | YEAR ENDED 12/31/21 | | | YEAR ENDED 12/31/20 | | | YEAR ENDED 12/31/19 | |
Net asset value at beginning of year | | $ | 4.47 | | | $ | 16.83 | | | $ | 21.60 | | | $ | 12.66 | | | $ | 10.41 | |
Income from investment operations: | | | | | | | | | | | | | | | | | | | | |
Net investment loss | | | (0.08 | ) | | | (0.14 | ) | | | (0.41 | ) | | | (0.27 | ) | | | (0.19 | ) |
Net realized and unrealized gains (losses) on investments | | | 0.56 | | | | (9.77 | ) | | | (3.20 | ) | | | 12.51 | | | | 3.14 | |
Total from investment operations | | | 0.48 | | | | (9.91 | ) | | | (3.61 | ) | | | 12.24 | | | | 2.95 | |
| Distributions from: | | | | | | | | | | | | | | | | | | | | |
Realized capital gains | | | (0.09 | ) | | | (2.45 | ) | | | (1.16 | ) | | | (3.30 | ) | | | (0.70 | ) |
Net asset value at end of year | | $ | 4.86 | | | $ | 4.47 | | | $ | 16.83 | | | $ | 21.60 | | | $ | 12.66 | |
| | | | | | | | | | | | | | | | | | | | | |
Total return | | | 10.81% | | | | (59.91% | ) | | | (16.69% | ) | | | 96.52% | | | | 28.51% | |
Net assets at end of year (millions) | | $ | 72.6 | | | $ | 84.6 | | | $ | 279.0 | | | $ | 368.7 | | | $ | 255.0 | |
Ratio of gross expenses to average net assets before waiver | | | 1.86% | | | | 1.86% | | | | 1.83% | | | | 1.84% | | | | 1.84% | |
Ratio of net expenses to average net assets after waiver | | | 1.85% | | | | 1.85% | | | | 1.83% | | | | 1.84% | | | | 1.83% | |
Ratio of net investment loss to average net assets | | | (1.44% | ) | | | (1.83% | ) | | | (1.83% | ) | | | (1.81% | ) | | | (1.28% | ) |
| | | | | | | | | | | | | | | | | | | | | |
Portfolio turnover rate | | | 8% | | | | 10% | | | | 16% | | | | 65% | | | | 43% | |
| see accompanying notes to financial statements |
| www.firsthandfunds.com | 25 |
FINANCIAL HIGHLIGHTS
Selected per share data and ratios for a share outstanding throughout each year
FIRSTHAND ALTERNATIVE ENERGY FUND
| | | YEAR ENDED 12/31/23 | | | YEAR ENDED 12/31/22 | | | YEAR ENDED 12/31/21 | | | YEAR ENDED 12/31/20 | | | YEAR ENDED 12/31/19 | |
Net asset value at beginning of year | | $ | 10.97 | | | $ | 13.42 | | | $ | 14.14 | | | $ | 7.69 | | | $ | 5.47 | |
Income from investment operations: | | | | | | | | | | | | | | | | | | | | |
Net investment loss | | | (0.10 | ) | | | (0.18 | ) | | | (0.29 | ) | | | (0.08 | ) | | | (0.05 | ) |
Net realized and unrealized gains (losses) on investments | | | (0.15 | ) | | | (2.27 | ) | | | (0.43 | ) | | | 6.53 | | | | 2.27 | |
Total from investment operations | | | (0.25 | ) | | | (2.45 | ) | | | (0.72 | ) | | | 6.45 | | | | 2.22 | |
| Distributions from: | | | | | | | | | | | | | | | | | | | | |
Realized capital gains | | | (0.36 | ) | | | — | | | | — | | | | — | | | | — | |
Net asset value at end of year | | $ | 10.36 | | | $ | 10.97 | | | $ | 13.42 | | | $ | 14.14 | | | $ | 7.69 | |
| | | | | | | | | | | | | | | | | | | | | |
Total return | | | (2.31% | ) | | | (18.26% | ) | | | (5.09% | ) | | | 83.88% | | | | 40.59% | |
Net assets at end of year (millions) | | $ | 12.3 | | | $ | 12.7 | | | $ | 16.2 | | | $ | 18.7 | | | $ | 6.2 | |
Ratio of gross expenses to average net assets before waiver | | | 2.05% | | | | 2.05% | | | | 2.03% | | | | 2.09% | | | | 2.15% | |
Ratio of net expenses to average net assets after waiver | | | 1.98% | | | | 1.98% | | | | 1.98% | | | | 1.98% | | | | 1.98% | |
Ratio of net investment loss to average net assets | | | (0.94% | ) | | | (1.45% | ) | | | (1.75% | ) | | | (1.41% | ) | | | (0.72% | ) |
| | | | | | | | | | | | | | | | | | | | | |
Portfolio turnover rate | | | 22% | | | | 26% | | | | 23% | | | | 14% | | | | 0% | |
| see accompanying notes to financial statements |
| 26 | 2023 Annual Report |
NOTES TO FINANCIAL STATEMENTS
December 31, 2023
1. ORGANIZATION
Each of Firsthand Technology Opportunities Fund and Firsthand Alternative Energy Fund (individually the “Fund”, and collectively the “Funds”) is a non-diversified series of Firsthand Funds (the “Trust”), an open-end management investment company registered under the Investment Company Act of 1940, as amended (the “1940 Act”). The Trust, a Delaware statutory trust, was organized on November 8, 1993. Each Fund currently offers one class of shares—Investor Class shares. The inception dates for the Funds (the date on which a net asset value was first determined for that Fund) follow:
FUND | INCEPTION DATE |
Firsthand Technology Opportunities Fund | September 30, 1999 |
Firsthand Alternative Energy Fund | October 29, 2007 |
Each Fund’s investment objective is long-term growth of capital.
Firsthand Technology Opportunities Fund seeks to achieve its investment objective by investing, under normal circumstances, at least 80% of its assets in equity securities of high-technology companies in the industries and markets that Firsthand Capital Management, Inc. (the “Investment Adviser”) believes hold the most growth potential within the technology sector.
Firsthand Alternative Energy Fund seeks to achieve its investment objective by investing, under normal circumstances, at least 80% of its assets in alternative energy and energy technology companies, both U.S. and international.
The Funds are an investment company and follow accounting and reporting guidance in the Financial Accounting Standards Board (“FASB”) Accounting Standards Codification Topic 946.
2. SIGNIFICANT ACCOUNTING POLICIES
The following is a summary of the Funds’ significant accounting policies:
SECURITIES VALUATION — A Fund’s portfolio of securities is valued as follows:
| | 1. | Securities traded on stock exchanges, or quoted by NASDAQ, are valued according to the NASDAQ official closing price, if applicable, or at their last reported sale price as of the close of trading on the New York Stock Exchange (“NYSE”) (normally 4:00 P.M. Eastern Time). If a security is not traded that day, the security will be valued at its most recent bid price. |
| | 2. | Securities traded in the over-the-counter market, but not quoted by NASDAQ, are valued at the last sale price (or, if the last sale price is not readily available, at the most recent closing bid price as quoted by brokers that make markets in the securities) at the close of trading on the NYSE. |
NOTES TO FINANCIAL STATEMENTS – continued
December 31, 2023
| | 3. | Securities traded both in the over-the-counter market and on a stock exchange are valued according to the broadest and most representative market. |
| | 4. | If a price is not readily available for a portfolio security, the security will be valued at fair value (the amount which the Fund might reasonably expect to receive for the security upon its current sale). The Board of Trustees has designated the Advisor as the Funds' valuation designee (the "Valuation Designee") to make all fair value determinations with respect to the Funds' portfolio investments, subject to the Board's oversight. As the Valuation Designee, the Advisor has adopted policies and procedures to be followed when the Fund must utilize fair value pricing. |
In pricing illiquid, privately placed securities, the advisor follows well-accepted valuation techniques. Initial valuations are generally determined by the initial purchase price for each security. Subsequent to initial purchase, securities are repriced from time to time to reflect changes to the companies’ valuations caused by various events. Such events include, among others, a new round of financing establishing a new valuation for the company; material changes to a company’s business or business prospects, either due to company-specific internal issues (gaining or losing a major customer, missing a significant milestone, etc.) or macroeconomic events affecting the industry or the world. In analyzing a company’s valuation, factors that are also considered include a company’s cash flow, revenues, profitability, financial forecasts, and probability of success in those measures. Other potential factors include the value of comparable public and private companies and general market conditions.
FAIR VALUE MEASUREMENT — In accordance with the authoritative guidance on fair value measurements and disclosures under GAAP, each Fund discloses the fair value of its investments in a hierarchy that prioritizes the inputs to valuation techniques used to measure the fair value. The hierarchy gives the highest priority to valuations based upon unadjusted quoted prices in active markets for identical assets or liabilities (level 1 measurement) and the lowest priority to valuations based upon unobservable inputs that are significant to the valuation (level 3 measurements).
The guidance establishes three levels of the fair value hierarchy as follows:
LEVEL 1 – Unadjusted quoted prices in active markets for identical assets or liabilities that the Funds have the ability to access.
LEVEL 2 – Observable inputs other than quoted prices included in level 1 that are observable for the asset or liability, either directly or indirectly. These inputs may include quoted prices for the identical instrument on an inactive market, prices for similar instruments, interest rates, prepayment speeds, credit risks, yield curves, default rates, and similar data.
NOTES TO FINANCIAL STATEMENTS – continued
December 31, 2023
LEVEL 3 – Unobservable inputs for the asset or liability, to the extent relevant observable inputs are not available, representing the Funds’ own assumptions about the assumptions a market participant would use in valuing the asset or liability, and would be based on the best information available.
The availability of observable inputs can vary from security to security and is affected by a wide variety of factors, including, for example, the type of security, whether the security is new and not yet established in the marketplace, the liquidity of markets, and other characteristics particular to the security. To the extent that valuation is based on models or inputs that are less observable or unobservable in the market, the determination of fair value requires more judgment. Accordingly, the degree of judgment exercised in determining fair value is greatest for instruments categorized in level 3.
The inputs used to measure fair value may fall into different levels of the fair value hierarchy. In such cases, for disclosure purposes, the level in the fair value hierarchy within which the fair value measurement falls in its entirety, is determined based on the lowest level input that is significant to the fair value measurement in its entirety.
The inputs or methodology used for valuing securities are not necessarily an indication of the risk associated with investing in those securities. The following is a summary of the inputs used to value the following Funds’ net assets as of December 31, 2023:
FUND | | LEVEL 1
QUOTED
PRICES | | | LEVEL 2
OTHER
SIGNIFICANT
OBSERVABLE
INPUTS | | | LEVEL 3
SIGNIFICANT
OBSERVABLE
INPUTS | |
TEFQX* | | | | | | | | | | | | |
Common Stocks | | | | | | | | | | | | |
Consumer Electronics | | $ | 7,332,800 | | | $ | — | | | $ | — | |
Defense & Aerospace | | | 5,275,402 | | | | — | | | | — | |
Education | | | 3,147,300 | | | | — | | | | — | |
Electronics Manufacturing Services | | | — | | | | 168 | | | | — | |
Internet | | | 3,048,500 | | | | — | | | | — | |
Renewable Energy | | | 3,578,800 | | | | — | | | | — | |
Semiconductor Equipment | | | 2,754,677 | | | | — | | | | — | |
Semiconductors | | | 7,396,700 | | | | — | | | | — | |
Software | | | 33,805,800 | | | | — | | | | — | |
Total Common Stocks | | | 66,339,979 | | | | 168 | | | | — | |
Corporate Note | | | | | | | | | | | | |
Semiconductor Equipment | | | — | | | | — | | | | 3,082,144 | |
Investment Company | | | 2,358,752 | | | | — | | | | — | |
Total | | $ | 68,698,731 | | | $ | 168 | | | $ | 3,082,144 | |
NOTES TO FINANCIAL STATEMENTS – continued
December 31, 2023
FUND | | LEVEL 1
QUOTED
PRICES | | | LEVEL 2
OTHER
SIGNIFICANT
OBSERVABLE
INPUTS | | | LEVEL 3
SIGNIFICANT
OBSERVABLE
INPUTS | |
ALTEX* | | | | | | | | | | | | |
Common Stocks | | | | | | | | | | | | |
Advanced Materials | | $ | 501,207 | | | $ | — | | | $ | — | |
Automotive | | | 993,920 | | | | — | | | | — | |
Biotech | | | 55,360 | | | | — | | | | — | |
Defense & Aerospace | | | 608,700 | | | | — | | | | — | |
Electrical Equipment | | | 310,100 | | | | — | | | | — | |
Energy Efficiency | | | 541,845 | | | | — | | | | — | |
Engineering Service | | | 1,079,000 | | | | — | | | | — | |
Industrials | | | 68,361 | | | | — | | | | — | |
Materials | | | 552,300 | | | | — | | | | — | |
Other Electronics | | | 665,988 | | | | — | | | | — | |
Renewable Energy | | | 2,930,531 | | | | — | | | | — | |
Semiconductor Equipment | | | 648,450 | | | | — | | | | — | |
Semiconductors | | | 1,652,262 | | | | — | | | | — | |
Services | | | 355,200 | | | | — | | | | — | |
Solar | | | 228,750 | | | | — | | | | — | |
Waste & Environment Service | | | 20,264 | | | | — | | | | — | |
Total Common Stocks | | | 11,212,238 | | | | — | | | | — | |
Warrants | | | | | | | | | | | | |
Transportation | | | 88 | | | | — | | | | — | |
Investment Company | | | 1,087,114 | | | | — | | | | — | |
Total | | $ | 12,299,440 | | | $ | — | | | $ | — | |
* | TEFQX: Firsthand Technology Opportunities Fund; ALTEX: Firsthand Alternative Energy Fund. |
At the end of each calendar quarter, management evaluates the Level 2 and 3 assets and liabilities for changes in liquidity, including but not limited to: whether a broker is willing to execute at the quoted price, the depth and consistency of prices from third party services, and the existence of contemporaneous, observable trades in the market. Additionally, management evaluates the Level 1 and 2 assets and liabilities on a quarterly basis for changes in listings or delistings on national exchanges.
NOTES TO FINANCIAL STATEMENTS – continued
December 31, 2023
TEFQX* INVESTMENTS AT FAIR VALUE USING SIGNIFICANT UNOBSERVABLE INPUTS (LEVEL 3) | | BALANCE AS OF 12/31/22 | | | NET PURCHASES | | | NET SALES | | | NET
REALIZED GAINS/
(LOSSES) | | | NET UNREALIZED APPRECIATION (DEPRECIATION) | | | TRANSFERS IN (OUT) OF LEVEL 3 | | | BALANCE AS OF 12/31/23 | |
Corporate Note | | | | | | | | | | | | | | | | | | | | | | | | | | | | |
Semiconductor Equipment | | $ | 750,000 | | | $ | 2,332,144 | | | $ | — | | | $ | — | | | $ | — | | | $ | — | | | $ | 3,082,144 | |
Total | | $ | 750,000 | | | $ | 2,332,144 | | | $ | — | | | $ | — | | | $ | — | | | $ | — | | | $ | 3,082,144 | |
ALTEX* INVESTMENTS AT FAIR VALUE USING SIGNIFICANT UNOBSERVABLE INPUTS (LEVEL 3) | | BALANCE AS OF 12/31/22 | | | NET PURCHASES | | | NET SALES | | | NET
REALIZED GAINS/
(LOSSES) | | | NET UNREALIZED APPRECIATION (DEPRECIATION) | | | TRANSFERS IN (OUT) OF LEVEL 3 | | | BALANCE AS OF 12/31/23 | |
Common Stocks | | | | | | | | | | | | | | | | | | | | | | | | | | | | |
Intellectual Property | | $ | 22 | | | $ | — | | | $ | (1,568 | ) | | $ | (52,855 | ) | | $ | 54,401 | | | $ | — | | | $ | — | |
Preferred Stocks | | | | | | | | | | | | | | | | | | | | | | | | | | | | |
Intellectual Property | | | 174 | | | | — | | | | (27 | ) | | | (2,897 | ) | | | 2,750 | | | | — | | | | — | |
Total | | $ | 196 | | | $ | — | | | $ | (1,595 | ) | | $ | (55,752 | ) | | $ | 57,151 | | | $ | — | | | $ | — | |
TEFQX* Unobservable Inputs
| | Fair Value at 12/31/23 | Valuation Techniques | Unobservable Inputs | Range (Weighted Average) |
Corporate Note Semiconductor Equipment | $3,082,144 | Cost Approach | N/A | N/A |
* | TEFQX: Firsthand Technology Opportunities Fund; ALTEX: Firsthand Alternative Energy Fund. |
SHARE VALUATION — The net asset value (“NAV”) per share of each Fund is calculated by dividing the net assets of the Fund (i.e., the sum of the value of the securities held by the Fund, plus cash or other assets, minus all liabilities (including estimated accrued expenses)) by the total number of shares outstanding of the Fund, rounded to the nearest cent. A Fund’s shares will not be priced on the days on which the NYSE is closed for trading. The offering and redemption price per share of each Fund is equal to a Fund’s NAV per share.
INVESTMENT INCOME — Dividend income is recorded in the ex-dividend date. Interest income is accrued as earned. Discounts and premiums on securities purchased are amortized over the lives of the respective securities. Other non-cash dividends are recognized as investment income at the fair value of the property received. Withholding taxes on foreign dividends have been provided for in accordance with the Funds’ understanding of the applicable country’s tax rules and rates.
NOTES TO FINANCIAL STATEMENTS – continued
December 31, 2023
CASH AND CASH EQUIVALENTS — The Funds consider liquid assets deposited with a bank, money market funds, and certain short-term debt instruments with maturities of 3 months or less to be cash equivalents. These investments represent amounts held with financial institutions that are readily accessible to pay Fund expenses or purchase investments. Cash and cash equivalents are valued at cost plus accrued interest, which approximates market value.
FOREIGN SECURITIES — Each Fund may invest in companies that trade on U.S. exchanges as American Depositary Receipts (“ADRs”), on foreign exchanges, or on foreign over-the- counter markets. Investing in the securities of foreign companies exposes your investment in a Fund to risk. Foreign stock markets tend to be more volatile than the U.S. market due to economic and/or political instability and the regulatory conditions in some countries. In addition, some of the securities in which the Fund may invest may be denominated in foreign currencies, the value of which may decline against the U.S. dollar. An investment in foreign securities may be subject to high levels of foreign taxation, including foreign taxes withheld at the source. Neither Fund isolates the portion of the results of operations resulting from changes in foreign exchange rates on investments from the fluctuations arising from changes in market prices of securities held. Reported net realized foreign exchange gains or losses arise from sales of portfolio securities, currency gains or losses realized between the trade and settlement dates on securities transactions, and the difference between the amounts of dividends, interest, and foreign withholding taxes recorded on the Funds’ books and the U.S. dollar equivalent of the amounts actually received or paid.
OPTIONS — The Funds are subject to equity price risk in the normal course of pursuing their investment objectives and may enter into options written to hedge against changes in the value of equities. The Funds may purchase put and call options to attempt to provide protection against adverse price effects from anticipated changes in prevailing prices of securities or stock indices. The Funds may also write put and call options. When a Fund writes an option, an amount equal to the premium received by the Fund is recorded as a liability and is subsequently adjusted to the current fair value of the option written. Premiums received from writing options that expire unexercised are treated by the Fund on the expiration date as realized gains from investments. The difference between the premium and the amount paid on effecting a closing purchase transaction, including brokerage commissions, is also treated as a realized gain, or, if the premium is less than the amount paid for the closing purchase transaction, as a realized loss. If a call option is exercised, the premium is added to the proceeds from the sale of the underlying security or currency in determining whether the Fund has realized a gain or loss. The Fund as writer of an option bears the market risk of an unfavorable change in the price of the security underlying the written option.
NOTES TO FINANCIAL STATEMENTS – continued
December 31, 2023
FASB Accounting Standard Codification, “Derivative and Hedging”, Topic 815 (ASC 815) requires enhanced disclosures about each Fund’s derivative and hedging activities, including how such activities are accounted for and their effects on each Fund’s financial position, performance, and cash flows. ALTEX invested in options contracts during the year ended December 31, 2023. TEFQX did not invest in derivatives during the year ended December 31, 2023.
The effects of these derivative instruments on ALTEX’s financial performance as reflected in the Statement of Operations is presented in the table below. There were no outstanding derivative contracts in ALTEX as of December 31, 2023.
| | Amount of Realized Gain or (Loss) on |
| | Derivatives Recognized in Income |
| | Derivatives not designated as hedging instruments |
| | Written Options | | Total |
Firsthand Alternative Energy Fund | $131,032 | | $131,032 |
The average monthly volume of derivatives during the year ended December 31, 2023 is as follows:
| | | WRITTEN OPTIONS
(Value) | |
Firsthand Alternative Energy Fund | | $(20,758) | |
DISTRIBUTIONS TO SHAREHOLDERS — Each Fund expects to distribute its net investment income and net realized gains, if any, annually. Distributions from net investment income and capital gains are recorded on the ex-dividend date and are determined in accordance with income tax regulations, which may differ from accounting principles generally accepted in the United States.
SHORT POSITIONS — Firsthand Alternative Energy Fund may sell securities short for economic hedging purposes. Short sales are transactions in which the Fund sells a security it does not own, in anticipation of a decline in the market value of that security. To initiate such a transaction, the Fund must borrow the security to deliver to the buyer upon the short sale; the Fund is then obligated to replace the security borrowed by purchasing it in the open market at some later date, completing the transaction. The Fund is liable for any dividends payable on securities while those securities are in a short position.
NOTES TO FINANCIAL STATEMENTS – continued
December 31, 2023
The Fund will incur a loss if the market price of the security increases between the date of the short sale and the date on which the Fund replaces the borrowed security. The Fund will realize a gain if the security declines in value between those dates.
All short sales must be fully collateralized. The Fund maintains the collateral in a segregated account consisting of cash, cash equivalents and/or liquid securities sufficient to collateralize the market value of its short positions. Typically, the segregated cash with brokers and other financial institutions exceeds the minimum required. Deposits with brokers for securities sold short are invested in money market instruments. The Fund did not invest in short sales for the year ended December 31, 2023.
RECLASSIFICATION OF CAPITAL ACCOUNTS — Permanent book and tax differences resulted in reclassifications for the year ended December 31, 2023 as follows:
| | | INCREASE (DECREASE) | |
| | | Paid-in Capital | | | Distributable Earnings | |
Firsthand Technology Opportunities Fund | | $ | (1,133,168) | | | $ | 1,133,168 | |
Firsthand Alternative Energy Fund | | | (121,118) | | | | 121,118 | |
These reclassifications, related to different treatment of current year write off of net operating loss, and has no effect on net asset value per share.
SECURITY TRANSACTIONS — Security transactions are accounted for no later than one business day following the trade date, however, for financial reporting purposes, security transactions are accounted for on trade date. Realized gains and losses are calculated on a specific identification basis.
ESTIMATES — The preparation of financial statements in conformity with accounting principles generally accepted in the United States of America requires management to make estimates and assumptions that affect the reported amounts of assets and liabilities at the date of the financial statements and the reported amounts of income and expenses during the reporting period. Actual results could differ from those estimates.
FEDERAL INCOME TAX — Each Fund has elected, and intends to qualify annually, for the special tax treatment afforded regulated investment companies under the Internal Revenue Code of 1986, as amended (the “Code”). As provided in the Code, in any fiscal year in which a Fund so qualifies and distributes at least 90% of its taxable net income, the Fund (but not the shareholders) will be relieved of federal income tax on the income distributed. Accordingly, no provision for income taxes has been made. To avoid imposition of the excise tax applicable to regulated investment companies, each Fund intends to declare as dividends in each calendar year at least 98% of its net investment income (earned during the calendar year) and 98% of its net realized capital gains (earned during the 12 months ended October 31) plus undistributed amounts, if any, from prior years.
NOTES TO FINANCIAL STATEMENTS – continued
December 31, 2023
The tax character of distributions paid for the year ended December 31, 2023 and 2022 was as follows:
| | | FIRSTHAND TECHNOLOGY OPPORTUNITIES FUND | |
| | | 2023 | | | 2022 | |
From long-term capital gains | | $ | 1,384,085 | | | $ | 32,280,491 | |
| | | FIRSTHAND ALTERNATIVE ENERGY FUND | |
| | | 2023 | | | 2022 | |
| From ordinary income | | $ | 18,080 | | | $ | — | |
From long-term capital gains | | $ | 388,693 | | | $ | — | |
The following information is based upon the federal income tax cost of portfolio investments as of December 31, 2023.
| | | FIRSTHAND TECHNOLOGY OPPORTUNITIES FUND | | | FIRSTHAND ALTERNATIVE ENERGY FUND | |
Gross unrealized appreciation | | $ | 20,120,163 | | | $ | 3,896,962 | |
Gross unrealized depreciation | | | (24,259,230 | ) | | | (2,655,414 | ) |
Net unrealized appreciation (depreciation) | | $ | (4,139,067 | ) | | $ | 1,241,548 | |
Federal income tax cost | | $ | 75,920,110 | | | $ | 11,057,898 | |
As of December 31, 2023, the Funds did not have capital loss carryforwards for federal income tax purposes.
NOTES TO FINANCIAL STATEMENTS – continued
December 31, 2023
Components of Distributable Earnings (as of December 31, 2023)
| | | FIRSTHAND TECHNOLOGY OPPORTUNITIES FUND | | | FIRSTHAND ALTERNATIVE ENERGY FUND | |
Net unrealized appreciation (depreciation)* | | $ | (4,139,067) | | | $ | 1,241,548 | |
Undistributed ordinary income | | | — | | | | — | |
Undistributed long term capital gains | | | — | | | | — | |
Qualified late year losses deferred** | | | (20,687,118) | | | | — | |
Other temporary differences | | | — | | | | — | |
Accumulated capital loss carryforward | | | — | | | | — | |
Total distributable earnings/accumulated loss | | $ | (24,826,185) | | | $ | 1,241,548 | |
* | The difference between book-basis and tax-basis unrealized appreciation (depreciation) is attributable primarily to tax deferral of losses on wash sales. |
** | Under current tax law, capital and currency losses realized after October 31 and prior to the Fund’s fiscal year end may defer as occurring on the first day of the following fiscal year. |
The Funds are subject to tax provisions that establish a minimum threshold for recognizing, and a system for measuring, the benefits of a tax position taken or expected to be taken in a tax return. Taxable years ending 2022, 2021, and 2020 remain open to federal and state audit. As of December 31, 2023, management has evaluated the application of these provisions to the Funds, and has determined that no provision for income tax is required in the Funds’ financial statements for uncertain tax provisions.
NOTES TO FINANCIAL STATEMENTS – continued
December 31, 2023
3. INVESTMENT TRANSACTIONS (EXCLUDING SHORT-TERM INVESTMENTS) WERE AS FOLLOWS FOR THE YEAR ENDED DECEMBER 31, 2023
| | | FIRSTHAND TECHNOLOGY OPPORTUNITIES FUND | | | FIRSTHAND ALTERNATIVE ENERGY FUND | |
Purchase of investment securities | | $ | 6,158,166 | | | $ | 3,348,380 | |
Proceeds from sales and maturities of investment securities | | $ | 26,686,287 | | | $ | 2,495,453 | |
4. INVESTMENT ADVISORY AND ADMINISTRATION AGREEMENTS; CERTAIN TRUSTEES AND OFFICERS OF THE TRUST ARE ALSO OFFICERS OF THE INVESTMENT ADVISER AND BNY MELLON
Certain trustees and officers of the Trust are also officers of the Investment Adviser or BNY Mellon. BNY Mellon serves as the sub-administrator, investment accounting agent, and shareholder servicing and transfer agent.
NOTES TO FINANCIAL STATEMENTS – continued
December 31, 2023
INVESTMENT ADVISORY AGREEMENT
Each Fund’s investments are managed by the Investment Adviser pursuant to the terms of a master investment advisory agreement (the “Advisory Agreement”). Under the Advisory Agreement, the Investment Adviser provides each Fund with investment research, advice, management, and supervision and manages the investment and reinvestment of assets of each Fund consistent with each Fund’s investment objectives, policies, and limitations. Subject to certain exceptions set forth in the Advisory Agreement, the Investment Adviser is responsible for (i) compensation of any of the Fund’s trustees, officers, and employees who are interested persons of the Investment Adviser; and (ii) compensation of the Investment Adviser’s personnel and other expenses incurred in connection with the provision of portfolio management services under the Advisory Agreement.
Firsthand Capital Management, Inc., is the Investment Adviser to the Funds. For the services it provides under the Advisory Agreement, the Investment Adviser receives from each Fund, on a monthly basis, an advisory fee at the annual rate of 1.40% for TEFQX and 1.53% for ALTEX of its average daily net assets, respectively. The Advisory Agreement requires the Investment Adviser to waive fees and, if necessary, to reimburse expenses of each Fund to the extent necessary to limit a Fund’s total operating expenses to 1.85%, for TEFQX and 1.98% for ALTEX, excluding any extraordinary fees, of its average net assets up to $200 million, 1.80% for TEFQX and 1.93% for ALTEX of such assets from $200 million to $500 million, 1.75% for TEFQX and 1.88% for ALTEX of such assets from $500 million to $1 billion, and 1.70% for TEFQX and 1.83% for ALTEX of such assets in excess of $1 billion.
ADMINISTRATION AGREEMENT
The Trust has entered into a separate Administration Agreement with the Investment Adviser. The agreement obligates the Investment Adviser to provide administrative and general supervisory services to each Fund (the “Administration Agreement”). Under the Administration Agreement, the Investment Adviser renders supervisory and corporate administrative services to the Trust, as well as oversees the maintenance of all books and records with respect to each Fund’s securities transactions and each Fund’s book of accounts in accordance with all applicable federal and state laws and regulations. The Investment Adviser also arranges for the preservation of journals, ledgers, corporate documents, brokerage account records, and other records as required by the 1940 Act.
NOTES TO FINANCIAL STATEMENTS – continued
December 31, 2023
The Investment Adviser is responsible for the equipment, staff, office space, and facilities necessary to perform its obligations under the Administration Agreement. Under the Administration Agreement, the Investment Adviser has assumed responsibility for payment of all of each Fund’s operating expenses excluding brokerage and commission expenses; short sale expenses; fees payable under “Rule 12b-1 plans”, if any, and shareholder servicing plans, if any; litigation costs; and any extraordinary and non-recurring expenses. For the services it provides under the Administration Agreement, the Investment Adviser receives a fee from each Fund at the annual rate of 0.45% of its average daily net assets up to $200 million, 0.40% of such assets from $200 million to $500 million, 0.35% of such assets from $500 million to $1 billion, and 0.30% of such assets in excess of $1 billion.
The Bank of New York Mellon (“BNY Mellon”) has a Sub-Administration Agreement with the Investment Adviser. Under this agreement, the Investment Adviser (not the Funds) pays to BNY Mellon the fees for the administrative services provided by BNY Mellon.
Additionally, BNY Mellon serves as the investment accounting agent, shareholder servicing agent and custodian and BNY Mellon Investment Servicing (US), Inc., serves as the transfer agent for the Trust.
5. INVESTMENTS IN RESTRICTED SECURITIES
Restricted securities include securities that have not been registered under the Securities Act of 1933, as amended, and securities that are subject to restrictions on resale. A Fund may invest in restricted securities that are consistent with a Fund’s investment objective and investment strategies. A Fund will not invest in a restricted security if, immediately after and as a result of the investment in such security, more than 15% of the Fund’s net assets would be invested in illiquid securities. In some cases, the issuer of restricted securities has agreed to register such securities for resale, at the issuer’s expense either upon demand by the Fund or in connection with another registered offering of the securities. Investments in restricted securities are valued at fair value as determined in good faith in accordance with procedures adopted by the Board of Trustees. It is possible that the estimated value may differ significantly from the amount that might ultimately be realized in the near term, and the difference could be material.
NOTES TO FINANCIAL STATEMENTS – continued
December 31, 2023
As of December 31, 2023, Firsthand Technology Opportunities Fund invested in the following restricted securities:
SECURITY | ACQUISTITION DATE | | SHARES/PAR VALUE ($) | | | COST | | | VALUE | | | % OF NET ASSETS | |
Revasum, Inc. | April 12, 2023 | | | 1,782,144 | | | $ | 1,782,144 | | | $ | 1,782,144 | | | | 2.5% | |
Revasum, Inc. | May 31, 2023 | | | 750,000 | | | | 750,000 | | | | 750,000 | | | | 1.0% | |
Revasum, Inc. | September 8, 2023 | | | 300,000 | | | | 300,000 | | | | 300,000 | | | | 0.4% | |
Revasum, Inc. | May 17, 2023 | | | 250,000 | | | | 250,000 | | | | 250,000 | | | | 0.3% | |
Tempo Automation Holdings, Inc. | August 16, 2023 | | | 320,000 | | | | 91,168 | | | | 168 | | | | 0.0%* | |
Total | | | | | | | $ | 3,173,312 | | | $ | 3,082,312 | | | | 4.2% | |
As of December 31, 2023, the Firsthand Alternative Energy Fund did not invest in any restricted securities.
Each Fund, consistent with SEC guidelines, has an investment restriction providing that it cannot purchase additional restricted securities once such securities comprise 15% of a Fund’s net assets. The SEC considers a security to be illiquid if it cannot be disposed of within seven days in the ordinary course of business at approximately the amount at which a Fund has valued the security. The restriction stems from the concern that, for an open- end mutual fund with daily redemption obligations, a high level of illiquid securities would increase the risk that a Fund may not be able to meet its daily redemption needs, because illiquid securities often take a longer period of time to sell, and may not necessarily be sold at that Fund’s then carrying value.
6. INVESTMENTS IN AFFILIATES AND CONTROLLED INVESTMENTS
Under the 1940 Act, each Fund is required to identify investments where it owns greater than 5% (but less than 25%) of the portfolio company’s outstanding voting shares as an affiliate of the Fund. Also, under the 1940 Act, the Fund is required to identify investments where it owns greater than 25% of the portfolio company’s outstanding voting shares as a controlled investment of the Fund. The Firsthand Alternative Energy Fund did not have investments in affiliates or controlled investments for the year from January 1, 2023, through December 31, 2023. A summary of the Firsthand Technology Opportunities Fund’s investments in affiliates and controlled investments for the year from January 1, 2023, through December 31, 2023, is noted below:
NOTES TO FINANCIAL STATEMENTS – continued
December 31, 2023
AFFILIATE/CONTROLLED INVESTMENTS | | VALUE AT
12/31/22 | | | PURCHASE/
MERGER/ REFINANCE | | | INTEREST | | | SALES/
MATURITY/
EXPIRATION | | | REALIZED
GAIN (LOSS) | | | CHANGE IN APPRECIATION/
DEPRECIATION | | | VALUE
12/31/23 | | | SHARES
HELD AT
12/31/23 | |
Pivotal Systems Corp. Common Stocks | | $ | 1,505,786 | | | $ | — | | | $ | — | | | $ | (2,712 | ) | | $ | (25,975,359 | ) | | $ | 24,472,285 | | | $ | — | | | | — | |
Revasum, Inc. Common Stocks | | | 2,507,286 | | | | 4,906 | | | | — | | | | — | | | | — | | | | 242,485 | | | | 2,754,677 | | | | 28,367,549 | |
| Revasum, Inc. Corporate Note(1) | | | 750,000 | | | | 1,032,144 | | | | 180,088 | | | | — | | | | — | | | | — | | | | 1,782,144 | | | | 1,782,144 | |
Revasum, Inc. Corporate Note | | | — | | | | 750,000 | | | | 51,786 | | | | — | | | | — | | | | — | | | | 750,000 | | | | 750,000 | |
Revasum, Inc. Corporate Note | | | — | | | | 300,000 | | | | 12,223 | | | | — | | | | — | | | | — | | | | 300,000 | | | | 300,000 | |
Revasum, Inc. Corporate Note | | | — | | | | 250,000 | | | | 18,340 | | | | — | | | | — | | | | — | | | | 250,000 | | | | 250,000 | |
Total Affiliates | | $ | 4,763,072 | | | $ | 2,337,050 | | | $ | 262,437 | | | $ | (2,712 | ) | | $ | (25,975,359 | ) | | $ | 24,714,770 | | | $ | 5,836,821 | | | | | |
(1) On April 12, 2023, the note which was outstanding at December 31, 2022 was reinvested with additional notes purchased in 2023 for a total of $1,782,144.
As of December 31, 2023, Kevin Landis, President and Trustee of the Trust, represents the Funds and sits on the following affiliated company's board: Revasum, Inc. Serving on the boards of directors of portfolio companies may cause a conflict of interest. The Investment Adviser has adopted various procedures to ensure that the Funds will not be unfavorably affected by these potential conflicts.
7. RISKS
Because the return on and value of an investment in each Fund will fluctuate in response to stock market movements, the most significant risk of investing in a Fund is that you may lose money. Stocks and other equity securities are subject to market risks and fluctuations in value due to earnings, as well as economic, political, or regulatory events, and other factors beyond the Investment Adviser’s control. The Funds are designed for long-term investors who can accept the risks of investing in a fund with significant common stock holdings in high-technology industries.
Each Fund is non-diversified. A risk of being non-diversified is that a significant change in the value of one company will have a greater impact on a Fund than it would if the Fund diversified its investments. Another risk for each Fund is its concentration of investments in companies within high-technology industries. The value of high-technology companies can, and often does, fluctuate dramatically and may expose you to greater-than-average financial and market risk.
In addition, certain local, regional or global events such as war, acts of terrorism, the spread of infectious illness or other public health issues, or other events could have a significant impact on a security or instrument. Since 2020, the novel strain of coronavirus (COVID-19) has negatively affected the worldwide economy, as well as the economies of individual countries, the financial health of individual companies and the market in general in significant and unforeseen ways. Following Russia’s large-scale invasion of Ukraine, the President of the United States signed an Executive Order in February 2023 prohibiting U.S. persons from entering transactions with the Central Bank of Russia and Executive Orders in March 2023 prohibiting U.S. persons from importing oil and gas
NOTES TO FINANCIAL STATEMENTS – continued
December 31, 2023
from Russia as well as other popular Russian exports. The duration of the coronavirus outbreak and the Russian-Ukraine conflict could adversely affect the Funds’ performance. The ultimate impact of COVID-19 and Russia-Ukraine conflict on the financial performance of the Funds’ investments is not reasonably estimable at this time.
8. NEW ACCOUNTING PRONOUNCEMENTS AND REGULATORY UPDATES
Effective January 24, 2023, the SEC adopted rule and form amendments to require mutual funds and exchange traded funds (ETFs) to transmit concise and visually engaging streamlined annual and semiannual reports to shareholders that highlight key information deemed important for retail investors to assess and monitor their fund investments. Other information, including financial statements, will no longer appear in the funds’ streamlined shareholder reports but must be available online, delivered free of charge upon request, and filed on a semiannual basis on Form N-CSR. The rule and form amendments have a compliance date of July 24, 2024. At this time, management is evaluating the impact of these rule and form amendment changes on the content of the current shareholder report and the newly created annual and semiannual streamlined shareholder reports.
In December 2020, the SEC adopted a new rule providing a framework for fund valuation practices (“Rule 2a-5”). Rule 2a-5 establishes requirements for determining fair value in good faith for purposes of the 1940 Act. Rule 2a-5 will permit fund boards to designate certain parties to perform fair value determinations, subject to board oversight and certain other conditions. Rule 2a-5 also defines when market quotations are “readily available” for purposes of the 1940 Act and the threshold for determining whether a fund must fair value a security. In connection with Rule 2a-5, the SEC also adopted related recordkeeping requirements and is rescinding previously issued guidance, including with respect to the role of a board in determining fair value and the accounting and auditing of fund investments. The Funds have adopted procedures in accordance with Rule 2a-5.
9. SUBSEQUENT EVENT
Management has evaluated the impact of all subsequent events on the Funds through the date the financial statements were issued, and, except as noted below, has determined that there were no subsequent events requiring recognition or disclosure in the financial statements.
Subsequent to year-end, on February 2, 2024, the Advisor Valuation Committee met to evaluate TEFQX’s holdings in Revasum corporate notes (the “Notes”). As a result of financial information received on February 1, 2024, which reflected adverse changes to the financial condition of Revasum, the Advisor Valuation Committee determined that the valuation of each note should be reduced to 50 cents on the dollar. Additionally, the Advisor Valuation Committee reduced its equity holdings in Revasum to AU$0.04 a share.
ADDITIONAL INFORMATION
FEDERAL TAX INFORMATION (UNAUDITED)
For the fiscal year ended December 31, 2023, the Funds make the following disclosures for federal income tax purposes. Below is listed the percentages, or the maximum amount allowable, of its ordinary income dividends (`QDI') to qualify for the lower tax applicable to individual shareholders, and the percentage of ordinary income dividends earned by the Funds which qualifies for the dividends received deduction ("DRD") for corporate shareholders. The actual percentage of QDI and DRD for the calendar year will be designated in year-end tax statements.
| | | QDI | | | DRD | |
Firsthand Technology Opportunities Fund | | | 0.00 | % | | | 0.00 | % |
Firsthand Alternative Energy Fund | | | 0.00 | % | | | 0.00 | % |
PROXY VOTING POLICIES AND PROCEDURES
The Funds have adopted proxy voting procedures pursuant to which the Funds delegate the responsibility for voting proxies relating to portfolio securities held by the Funds to the Investment Adviser as part of the Investment Adviser’s general management of the Funds, subject to the Board of Trustees’ continuing oversight. A copy of the Funds’ proxy voting policy and procedures is available without charge, upon request, by calling 1.888.884.2675. Information regarding how the Investment Adviser voted these proxies during the most recent one-year period ended June 30 is available by calling the same number and on the website of the U.S. Securities and Exchange Commission at http://www.sec.gov on Form N-PX. The Funds’ voting record is also available on the Funds’ website at www.firsthandfunds.com/proxy.
PORTFOLIO HOLDINGS
The Funds file their complete schedule of portfolio holdings with the SEC for the first and third quarters of each fiscal year on Form N-PORT. The Funds’ Forms N-PORT will be available on the SEC’s website at http://www.sec.gov and may be reviewed and copied at the SEC’s Public Reference Room in Washington, D.C. Information on the operation of the Public Reference Room may be obtained by calling 1.800.SEC.0330.
NOTES
| FIRSTHAND FUNDS | AUDITOR |
| P.O. Box 534444 | Tait Weller & Baker LLP |
| Pittsburgh, PA 15253-4444 | 50 South 16th St., Suite 2900 |
| www.firsthandfunds.com | Philadelphia, PA 19102 |
| INVESTMENT ADVISER | TRANSFER AGENT |
| Firsthand Capital Management, Inc. | BNY Mellon Investment Servicing (US) Inc. |
| 150 Almaden Blvd., Suite 1250 | Attention 534444 |
| San Jose, CA 95113 | 500 Ross Street, 154-0520 |
| www.firsthandcapital.com | Pittsburgh, PA 15262 1.888.884.2675 |
| DISTRIBUTOR | |
| ALPS Distributors, Inc. 1290 | |
| 1290 Broadway | |
| Suite 1000 | |
| Denver, CO 80203 | |
This report is provided for the general information of the shareholders of Firsthand Funds. This report is not intended for distribution to prospective investors in the Funds, unless preceded or accompanied by an effective prospectus. For more complete information about Firsthand Funds, please call toll free 1.888.884.2675 or visit www.firsthandfunds.com for an additional prospectus, which contains more information, including risks, fees, and expenses. Read the prospectus carefully before investing or sending money.
Firsthand Funds are distributed by ALPS Distributors, Inc.
FHF000971, exp. 3/1/2025
The interlocking “F” design is a registered trademark of Firsthand Capital Management, Inc.
| | (a) | The registrant, as of the end of the period covered by this report, has adopted a code of ethics that applies to the registrant’s principal executive officer, principal financial officer, principal accounting officer or controller, or persons performing similar functions, regardless of whether these individuals are employed by the registrant or a third party. |
| | (c) | There have been no amendments, during the period covered by this report, to a provision of the code of ethics that applies to the registrant’s principal executive officer, principal financial officer, principal accounting officer or controller, or persons performing similar functions, regardless of whether these individuals are employed by the registrant or a third party, and that relates to any element of the code of ethics description except that effective August 30, 2023, Kevin Landis replaced Omar Billawala as Treasurer (in the capacity of Chief Financial Officer) of the registrant. |
| | (d) | The registrant has not granted any waivers, including an implicit waiver, from a provision of the code of ethics that applies to the registrant’s principal executive officer, principal financial officer, principal accounting officer or controller, or persons performing similar functions, regardless of whether these individuals are employed by the registrant or a third party, that relates to one or more of the items set forth in paragraph (b) of this item’s instructions. |
Item 3. | Audit Committee Financial Expert. |
As of the end of the period covered by the report, the registrant’s Board of Trustees has not determined that any of its members is qualified as an audit committee financial expert. Although each member of the Audit Committee is “independent,” as defined by Item 3 of Form N-CSR, and is financially sophisticated, the registrant has in place a small Board of Trustees with a limited number of members. Even without an audit committee financial expert, the registrant is comfortable that its Audit Committee can function effectively given the investment and financial experience and expertise of its members.
Item 4. | Principal Accountant Fees and Services. |
Audit Fees
| | (a) | The aggregate fees billed for each of the last two fiscal years for professional services rendered by the principal accountant for the audit of the registrant's annual financial statements or services that are normally provided by the accountant in connection with statutory and regulatory filings or engagements for those fiscal years are $27,600 for 2023 and $27,600 for 2022. |
Audit-Related Fees
| | (b) | The aggregate fees billed in each of the last two fiscal years for assurance and related services by the principal accountant that are reasonably related to the performance of the audit of the registrant's financial statements and are not reported under paragraph (a) of this Item are $0 for 2023 and $0 for 2022. |
Tax Fees
| | (c) | The aggregate fees billed in each of the last two fiscal years for professional services rendered by the principal accountant for tax compliance, tax advice, and tax planning are $3,400 for 2023 and $3,400 for 2022. |
All Other Fees
| | (d) | The aggregate fees billed in each of the last two fiscal years for products and services provided by the principal accountant, other than the services reported in paragraphs (a) through (c) of this Item are $1,650 for 2023 and $1,575 for 2022. The fees are incurred in connection with the principal accountants performing an annual anti-money laundering audit program for the Registrant. |
| | (e)(1) | Disclose the audit committee's pre-approval policies and procedures described in paragraph (c)(7) of Rule 2-01 of Regulation S-X. |
The registrant's Audit Committee Charter states the following with respect to pre-approval procedures:
The Committee hereby delegates to the Chairman of the Committee the authority to grant pre-approvals of audit and "permissible" non-audit services to be provided by the Auditors to the Funds, subject to the ratification of the full Committee at its next regularly scheduled meeting. Both the Auditors and Fund counsel will be responsible for informing the Committee whether they believe that a particular non-audit service is permissible or prohibited pursuant to applicable regulations and standards.
The specific types of non-audit services that the Chairman may pre-approve include, but are not limited to: reviewing the Funds' internal controls over financial reporting; providing tax-related services; reviewing and/or developing an anti-money laundering program; and issuing comfort letters, based on agreed-upon procedures, in connection with any Fund reorganization.
Pre-approval for a non-audit service provided to a Fund is not required if: (i) the aggregate amount of all such non-audit services provided to the Fund constitutes not more than 5% of the total amount of revenues paid by the Fund to the Auditors during the fiscal year in which the non-audit services are provided; (ii) such services were not recognized by the Fund at the time of the engagement to be non-audit services; and (iii) such services are promptly brought to the attention of the Committee and are approved by the Committee or by one or more members of the Committee to whom authority to grant such approvals has been delegated by the Committee prior to the completion of the audit (the “De Minimus Exceptions”).
The Committee shall also pre-approve any non-audit services proposed to be provided by the Auditors to (i) a Fund's investment adviser and (ii) any entity controlling, controlled by, or under common control with the investment adviser that provides ongoing services to the Fund, if the Auditors' engagement with the investment adviser or any such control persons relates directly to the operations and financial reporting of the Fund. The De Minimus Exceptions applies to pre-approvals under this paragraph as well, except that the "total amount of revenues" calculation is based on the total amount of revenues paid to the Auditors by the Fund and any other entity that has its services approved under this paragraph (i.e., the investment adviser or any control person).
| | (e)(2) | The percentage of services described in each of paragraphs (b) through (d) of this Item that were approved by the audit committee pursuant to paragraph (c)(7)(i)(C) of Rule 2-01 of Regulation S-X are as follows: |
(b) 100%
(c) 100%
(d) 100%
| | (g) | The aggregate non-audit fees billed by the registrant's accountant for services rendered to the registrant, and rendered to the registrant's investment adviser (not including any sub-adviser whose role is primarily portfolio management and is subcontracted with or overseen by another investment adviser), and any entity controlling, controlled by, or under common control with the adviser that provides ongoing services to the registrant for each of the last two fiscal years of the registrant was $0 for 2023 and $0 for 2022. |
Item 5. | Audit Committee of Listed Registrants. |
Not applicable.
(a) | Schedule of Investments in securities of unaffiliated issuers as of the close of the reporting period is included as part of the report to shareholders filed under Item 1(a) of this form. |
Item 7. | Disclosure of Proxy Voting Policies and Procedures for Closed-End Management Investment Companies. |
Not applicable.
Item 8. | Portfolio Managers of Closed-End Management Investment Companies. |
Not applicable.
Item 9. | Purchases of Equity Securities by Closed-End Management Investment Company and Affiliated Purchasers. |
Not applicable.
Item 10. | Submission of Matters to a Vote of Security Holders. |
There have been no material changes to the procedures by which the shareholders may recommend nominees to the registrant’s board of directors, where those changes were implemented after the registrant last provided disclosure in response to the requirements of Item 407(c)(2)(iv) of Regulation S-K (17 CFR 229.407) (as required by Item 22(b)(15) of Schedule 14A (17 CFR 240.14a-101)), or this Item.
Item 11. | Controls and Procedures. |
| | (a) | The registrant’s principal executive officer and principal financial officer have concluded, based on their evaluation of the registrant's disclosure controls and procedures as of a date within 90 days of the filing date of this report, that these disclosure controls and procedures are adequately designed and are operating effectively to ensure that information required to be disclosed by the registrant on Form N-CSR is recorded, processed, summarized and reported within the time periods specified in the Securities and Exchange Commission's rules and forms. |
| | (b) | There were no changes in the registrant’s internal control over financial reporting (as defined in Rule 30a-3(d) under the Act (17 CFR 270.30a-3(d))) that occurred during the period covered by this report that have materially affected or are reasonably likely to materially affect, the registrant’s internal control over financial reporting. |
Item 12. | Disclosure of Securities Lending Activities for Closed-End Management Investment Companies. |
Not applicable.
| | (a)(2)(1) | There were no written solicitations to purchase securities under Rule 23c-1 under the Act sent or given during the period covered by the report by or on behalf of the Registrant to 10 or more persons. |
| | (a)(2)(2) | There was no change in the Registrant’s independent public accountant during the period covered by the report. |
SIGNATURES
Pursuant to the requirements of the Securities Exchange Act of 1934 and the Investment Company Act of 1940, the registrant has duly caused this report to be signed on its behalf by the undersigned, thereunto duly authorized.
| (Registrant) | Firsthand Funds | |
| By (Signature and Title)* | /s/ Kevin Landis | |
| | Kevin M. Landis, President, Treasurer and Secretary | |
Pursuant to the requirements of the Securities Exchange Act of 1934 and the Investment Company Act of 1940, this report has been signed below by the following persons on behalf of the registrant and in the capacities and on the dates indicated.
| By (Signature and Title)* | /s/ Kevin Landis | |
| | Kevin M. Landis, President, Treasurer and Secretary | |
* Print the name and title of each signing officer under his or her signature.