UNITED STATES
SECURITIES AND EXCHANGE COMMISSION
Washington, D.C. 20549
FORM N-CSR
CERTIFIED SHAREHOLDER REPORT OF REGISTERED
MANAGEMENT INVESTMENT COMPANIES
Investment Company Act file number: 811-08282
Loomis Sayles Funds I
(Exact name of Registrant as specified in charter)
| | |
| 399 Boylston Street, Boston, Massachusetts 02116 |
| (Address of principal executive offices) (Zip code) |
Coleen Downs Dinneen, Esq.
Natixis Distributors, L.P.
399 Boylston Street
Boston, Massachusetts 02116
(Name and address of agent for service)
Registrant’s telephone number, including area code: (617) 449-2810
Date of fiscal year end: September 30
Date of reporting period: March 31, 2008
| Item 1. | Reports to Stockholders. |
The Registrant’s semi-annual report transmitted to shareholders pursuant to Rule 30e-1 under the Investment Company Act of 1940 is as follows:

Loomis Sayles Mid Cap Growth Fund
Loomis Sayles Small Cap Growth Fund
Loomis Sayles Small Cap Value Fund
Loomis Sayles Tax-Managed Equity Fund
SEMIANNUAL REPORT
MARCH 31, 2008 (Unaudited)
FUND AND MANAGER REVIEW
Loomis Sayles Mid Cap Growth Fund

Phil Fine, CFA
Manager since February 1999
FUND FACTS
Symbol | Institutional: LSAIX;
Retail: LAGRX
Objective | Long-term capital growth from investments in common stocks or similar securities
Strategy | Invests at least 80% of its net assets (plus any borrowings made for investment purposes) in common stocks or other equity securities (which may include securities offered in the secondary markets or in initial public offerings) of companies with market capitalizations that fall within the capitalization range of the Russell Midcap Growth Index, although the Fund may invest in companies of any size
Fund Inception Date | 12/31/96
Commencement of Operations of Class | Institutional: 1/2/97;
Retail: 1/2/97
Total Net Assets | $123.5 million
PORTFOLIO REVIEW
In a difficult period for the securities markets, the Fund held up better than its Benchmark, the Russell Midcap Growth Index, for the six months ended March 31, 2008. The Fund’s outperformance was primarily due to good stock selection in the materials and processing, healthcare, consumer discretionary and technology sectors. Stock selection in the financial services and utilities sectors detracted from relative performance.
The materials and processing and energy sectors were the only sectors posting positive absolute returns for the Fund. Good stock selection in the overweight materials sector had the greatest positive impact on performance, both in absolute and relative terms. Our strongest performers included steel and fertilizer stocks, which benefited from rising commodity prices, supported by structural imbalances between supply and demand. Mosaic, a phosphate and potash producer, was the Fund’s top performer. Prices and cash margins for both nutrients have risen sharply, due to strong demand, low inventories and supply constraints. We were modestly underweight in energy, but our holdings outperformed the Benchmark’s energy stocks. Our top contributors included two exploration and production companies, Range Resources and Southwestern Energy.
The Fund’s weakest sector on an absolute basis was financial services. The technology and consumer discretionary sectors were also weak on an absolute basis, but when viewed on a relative basis, these sectors added value because of good stock selection. In the first quarter of 2008, virtually every company related to the capital markets came under pressure, due to the turmoil in the credit markets. For example, FCStone, a commodities broker and consultant, plunged in value due to its perceived exposure to counterparty credit risk and concerns that trading volumes could suffer if hedge fund clients were forced to deleverage. We sold the stock. In technology, the Fund experienced losses in telecommunication equipment and computer stocks, and our solar stocks were hit by profit-taking. Nevertheless, our position in First Solar, a producer of solar modules, was a top contributor. We believe the company’s proprietary technology gives it a cost advantage relative to competitors, and management has done an exceptional job ramping up new capacity.
NII Holdings, a provider of wireless communication services in Latin America, detracted from the Fund’s performance. The company reported disappointing net subscriber additions in its two largest markets, Mexico and Brazil, and announced price cuts to match competitor promotions. We sold the position.
OUTLOOK
Uncertainty and fear often create attractive buying opportunities, as emotion overcomes fundamentals. We anticipate improving conditions in the equity markets during 2008. We believe pessimism is high, risk appetites are low, and concerns about corporate profit growth may be overstated. In our view, this suggests that valuations are attractive, and the market is well-positioned for a recovery if the fog of uncertainty begins to clear and investors return to looking at normalized earnings and cash-flow growth rates.
1
AVERAGE ANNUAL TOTAL RETURNS
Periods Ended March 31, 2008
| | | | | | | | | | | | | |
| 6 Months | | | 1 Year | | | 5 Years | | | 10 Years | | | Since
Inception | |
| Loomis Sayles Mid Cap Growth: Institutional | |
| -7.74 | % | | 9.82 | % | | 19.85 | % | | 8.76 | % | | 10.28 | % |
| Loomis Sayles Mid Cap Growth: Retail | |
| -7.86 | | | 9.57 | | | 19.54 | | | 8.46 | | | 9.98 | |
| Russell Midcap Growth Index(c) | |
| -12.46 | | | -4.55 | | | 15.20 | | | 5.15 | | | 7.55 | |
| Lipper Mid-Cap Growth Funds Index(c) | |
| -12.81 | | | 1.09 | | | 15.12 | | | 5.12 | | | 6.61 | |
| | | | | | | | |
| Gross expense ratio (before reductions and reimbursements)* |
| Institutional: 1.10% | | Retail: 1.43% | | |
| Net expense ratio (after reductions and reimbursements)* |
| Institutional: 1.00% | | Retail: 1.25% | | |
* As stated in the most recent prospectus
CUMULATIVE PERFORMANCE
Inception to March 31, 2008(a)(b)
Data quoted reflects past performance and cannot guarantee future results. Average annual total returns assume reinvestment of dividends and capital gain distributions. Investment return and principal value will fluctuate so that shares, when redeemed, may be worth more or less than their original cost. For performance current to the most recent month end, please visit the Loomis Sayles website. Current performance may be higher or lower than quoted.
Returns do not reflect the taxes that a shareholder would pay on fund distributions or the redemption of shares. Periods of less than one year are not annualized. Performance data reflects certain fee reductions and reimbursements, if any, without which performance would be lower.
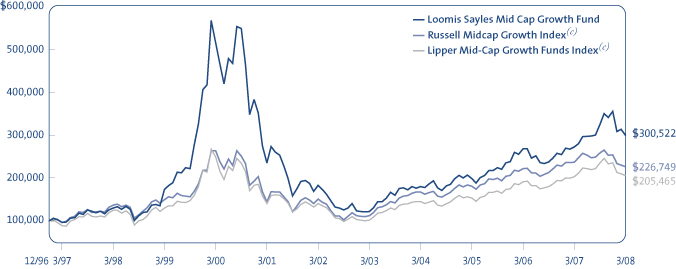
(a) Cumulative performance is shown for the Institutional Class of Shares. Performance of the Retail Class would be lower due to higher fees. (b) The mountain chart is based on the initial investment minimum of $100,000 for the Institutional Class. (c) See page 9 for a description of the Indices.
WHAT YOU SHOULD KNOW
Small- and mid-cap stocks may be more volatile than larger, more established companies. The secondary market for these stocks may be less liquid, which could adversely impact the Fund’s value. Growth funds involve increased risks, in part, because the value of the underlying securities is based on future expectations that may or may not be met.
The Fund can invest a significant percentage of assets in foreign securities and the value of the fund shares can be adversely affected by changes in currency exchange rates, political, and economic developments. In emerging markets these risks can be significant. The Fund is subject to currency risk, which is the risk that fluctuations in exchange rates between the US dollar and foreign currencies may cause the value of a Fund’s investments to decline. Fund shares should be viewed as a long-term investment.
2
FUND AND MANAGER REVIEW
Loomis Sayles Small Cap Growth Fund

Mark F. Burns, CFA
Manager since January 2005

John Slavik, CFA
Manager since April 2005
FUND FACTS
Symbol | Institutional: LSSIX;
Retail: LCGRX
Objective | Long-term capital growth from investments in common stocks or other equity securities
Strategy | Invests at least 80% of its net assets (plus any borrowings made for investment purposes) in equity securities of companies with market capitalizations that fall within the capitalization range of the Russell 2000 Index. Unlike the Index, the Fund may invest in companies of any size
Fund Inception Date | 12/31/96
Commencement of Operations of Class | Institutional: 1/2/97;
Retail: 1/2/97
Total Net Assets | $103.1 million
PORTFOLIO REVIEW
The Fund underperformed its Benchmarks, the Russell 2000 Growth and the Russell 2000 Indices, for the six months ended March 31, 2008. Poor stock selection in the financial services and healthcare sectors accounted for the majority of the performance shortfall versus the Benchmarks.
On an absolute basis, energy was the only sector in the Fund’s portfolio that offered a positive return for the period. The technology, healthcare and consumer discretionary sectors made the largest negative contributions to the Fund’s absolute performance. Within these sectors, Inverness Medical Innovations, a diagnostic testing company; Life Time Fitness, a nationwide owner of health clubs; and Tessera Technologies, a semiconductor company, were among the Fund’s worst performers. Each of these positions was sold.
In light of the recent stock market volatility, we sought to limit the Fund’s risk by reducing exposure to the technology and financial services sectors. In financial services, we cut exposure to companies that were influenced by the ongoing credit crisis. In the technology sector, we reduced exposure to the semiconductor industry, which was experiencing a cyclical slowdown.
We also reduced the Fund’s consumer discretionary exposure aggressively in the fourth quarter of 2007, as it became evident the US consumer was becoming more cautious about the economy, but we started adding back exposure in the first quarter of 2008. To offset these reductions, we increased the Fund’s exposure to the healthcare, producer durables and energy sectors.
OUTLOOK
Although we expected some challenges as the market adjusted to the economic slowdown, the depth of the markets’ sell-off across nearly every sector was larger than we had anticipated. Turmoil in the credit markets led to fears about the financial system’s vulnerability, and this, combined with growing inflationary pressures, fueled the rise in volatility. Economic uncertainty is never pleasant, but the market has a long history of coping with it. The Federal Reserve has been working to support the economy and instill order and confidence in the financial markets.
Uncertainty and fear often create attractive buying opportunities, as emotion overcomes fundamentals. We anticipate improvements in the equity markets during 2008. We believe pessimism is high, risk appetites are low, and concerns about corporate profit growth may be overstated. In our view, this suggests valuations are attractive, and the market is well-positioned for a recovery if the fog of uncertainty begins to clear and investors return to looking at normalized earnings and cash-flow growth rates.
3
We expect the stocks of companies that benefit from corporate spending, non-US earnings streams and strong emerging-market economies to perform better than those tied to the US economy in general and to US consumer spending in particular.
AVERAGE ANNUAL TOTAL RETURNS
Periods Ended March 31, 2008
| | | | | | | | | | | | | |
| 6 Months | | | 1 Year | | | 5 Years | | | 10 Years | | | Since
Inception | |
| Loomis Sayles Small Cap Growth: Institutional | |
| -15.75 | % | | -1.11 | % | | 17.03 | % | | 1.15 | % | | 3.68 | % |
| Loomis Sayles Small Cap Growth: Retail | |
| -15.86 | | | -1.29 | | | 16.76 | | | 0.89 | | | 3.42 | |
| Russell 2000 Growth Index(c) | |
| -14.66 | | | -8.94 | | | 14.24 | | | 1.75 | | | 3.69 | |
| Russell 2000 Index(c) | |
| -14.02 | | | -13.00 | | | 14.90 | | | 4.96 | | | 7.20 | |
| Lipper Small-Cap Growth Funds Index(c) | |
| -16.90 | | | -9.53 | | | 12.68 | | | 3.98 | | | 5.51 | |
| Gross expense ratio (before reductions and reimbursements)* | |
| Institutional: 1.23% | | | Retail: 1.50% | | | | |
| Net expense ratio (after reductions and reimbursements)* | |
| Institutional: 1.00% | | | Retail: 1.25% | | | | |
* As stated in the most recent prospectus
CUMULATIVE PERFORMANCE
Inception to March 31, 2008(a)(b)
Data quoted reflects past performance and cannot guarantee future results. Average annual total returns assume reinvestment of dividends and capital gains distributions. Investment return and principal value will fluctuate so that shares, when redeemed, may be worth more or less than their original cost. For performance current to the most recent month end, please visit the Loomis Sayles website. Current performance may be higher or lower than quoted.
Returns do not reflect the taxes that a shareholder would pay on fund distributions or the redemption of shares. Periods of less than one year are not annualized. Performance data reflects certain fee reductions and reimbursements, if any, without which performance would be lower.
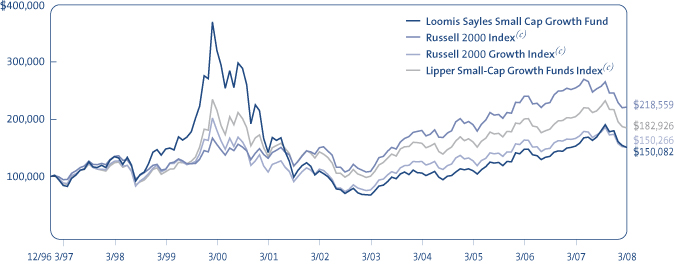
(a) Cumulative performance is shown for the Institutional Class of Shares. Performance of the Retail Class would be lower due to higher fees. (b) The mountain chart is based on the initial investment minimum of $100,000 for the Institutional Class. (c) See page 9 for a description of the Indices.
WHAT YOU SHOULD KNOW
Small- and mid-cap stocks may be more volatile than larger, more established companies. The secondary market for these stocks may be less liquid, which could adversely impact the Fund’s value. Growth funds involve increased risks, in part, because the value of the underlying securities is based on future expectations that may or may not be met.
The Fund can invest a significant percentage of assets in foreign securities and the value of the fund shares can be adversely affected by changes in currency exchange rates, political, and economic developments. In emerging markets these risks can be significant. The Fund is subject to currency risk, which is the risk that fluctuations in exchange rates between the US dollar and foreign currencies may cause the value of a Fund’s investments to decline. Fund shares should be viewed as a long-term investment.
4
FUND AND MANAGER REVIEW
Loomis Sayles Small Cap Value Fund

Manager since January 2000

Manager since April 2000
FUND FACTS
Symbol | Institutional: LSSCX;
Retail: LSCRX; Admin: LSVAX
Objective | Long-term capital growth from investments in common stocks or other equity securities
Strategy | Invests at least 80% of its net assets (plus any borrowings made for investment purposes) in equity securities of companies with market capitalizations that fall within the capitalization range of the Russell 2000 Index. Unlike the Index, the Fund may invest in companies of any size
Fund Inception Date | 5/13/91
Commencement of Operations of Class | Institutional: 5/13/91;
Retail: 1/2/97; Admin: 1/2/98
Total Net Assets | $1,008.8 million
PORTFOLIO REVIEW
The Fund underperformed one of its Benchmarks, the Russell 2000 Value Index, and outperformed its other Benchmark, the Russell 2000 Index, during the six months ended March 31, 2008. The Fund’s underperformance was primarily due to poor stock selection in the financial services and energy sectors. However, stock selection in the autos and transportation and technology sectors aided the Fund’s relative performance.
The Fund’s worst performing sector was financial services. Our cautious stance and underweight positions were positive factors late in 2007, but we were not positioned for the surprising resilience demonstrated by small banks and real estate investment trusts in early 2008. They held up remarkably well, despite significantly negative revisions to earnings estimates, a broadening of the liquidity crisis, and the near collapse of several high-profile financial institutions. In addition, a handful of financial services names suffered, from a fundamental perspective, including National Financial Partners, a distributor of financial services products to businesses and individuals, and Advanta Corp., a provider of credit cards and related products to business. We sold both positions.
The automotive and transportation sector was one of the Fund’s strongest positions. Transportation stocks generally perform well in anticipation of an economic recovery after a recession. Short-line railroad operator Genesee & Wyoming, which has been in the portfolio for a long time, paced the sector with a strongly positive return.
“Broken-deal” stocks are a new theme pursued in the portfolio as opportunities appeared. These are situations where leveraged buyouts collapsed as buyers and banks felt the pressure of the weakening debt and credit markets, causing the deals to fall through. These situations included new positions in Alliance Data Systems, a financial data-services provider, Myers Industries, a rubber and plastics manufacturer, and PHH Corp., a provider of mortgage management services.
OUTLOOK
Although we expected some challenges as the market adjusted to the economic slowdown, the depth of the markets’ sell-off across nearly every sector was larger than we had anticipated. Turmoil in the credit markets led to fears about the financial system’s vulnerability. This, along with growing inflation pressures, fueled the rise in volatility. Economic uncertainty is never pleasant, but the market has a long history of coping with it. The Federal Reserve has been working to support the economy and instill order and confidence in the financial markets.
Uncertainty and fear often create attractive buying opportunities, as emotion overcomes fundamentals. We anticipate improvements in the equity markets during 2008. We believe pessimism is high, risk appetites are low, and concerns over corporate profit growth may be overstated. In our view, this suggests valuations are attractive, and the market is well-positioned for a recovery if the fog of uncertainty begins to clear and investors return to looking at normalized earnings and cash-flow growth rates.
5
AVERAGE ANNUAL TOTAL RETURNS
Periods Ended March 31, 2008
| | | | | | | | | | | | |
| 6 Months | | | 1 Year | | | 5 Years | | | 10 Years | | | Since
Inception(a)(b) |
| Loomis Sayles Small Cap Value: Institutional |
| -13.74 | % | | -10.22 | % | | 15.13 | % | | 7.88 | % | | 13.56% |
| Loomis Sayles Small Cap Value: Retail(a) |
| -13.85 | | | -10.43 | | | 14.83 | | | 7.61 | | | 13.36 |
| Loomis Sayles Small Cap Value: Admin(a) |
| -13.98 | | | -10.68 | | | 14.53 | | | 7.32 | | | 13.01 |
| Russell 2000 Value Index(c) |
| -13.33 | | | -16.88 | | | 15.45 | | | 7.46 | | | 12.81 |
| Russell 2000 Index(c) |
| -14.02 | | | -13.00 | | | 14.90 | | | 4.96 | | | 10.11 |
| Lipper Small-Cap Core Funds Index(b)(c) |
| -13.03 | | | -10.26 | | | 14.76 | | | 6.20 | | | N/A |
| Gross expense ratio (before reductions and reimbursements)* |
| Institutional: 0.89% | | | Retail: 1.24% | | | Admin: 1.57% |
| Net expense ratio (after reductions and reimbursements)* |
| Institutional: 0.89% | | | Retail: 1.16% | | | Admin: 1.41% |
* As stated in the most recent prospectus
CUMULATIVE PERFORMANCE
Inception to March 31, 2008(d)(e)
Data quoted reflects past performance and cannot guarantee future results. Average annual total returns assume reinvestment of dividends and capital gains distributions. Investment return and principal value will fluctuate so that shares, when redeemed, may be worth more or less than their original cost. For performance current to the most recent month end, please visit the Loomis Sayles website. Current performance may be higher or lower than quoted.
Returns do not reflect the taxes that a shareholder would pay on fund distributions or the redemption of shares. Periods of less than one year are not annualized. Performance data reflects certain fee reductions and reimbursements, if any, without which performance would be lower.
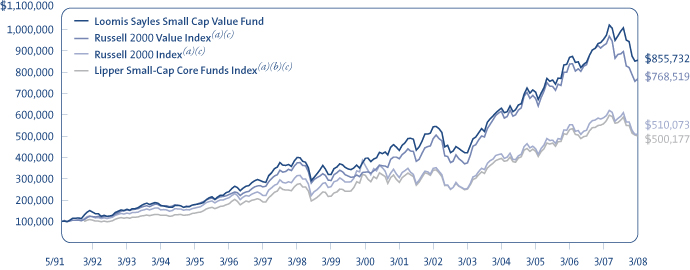
(a) Performance shown for periods prior to the inception date of the Retail Class (12/31/96) and Admin Class (1/02/98) represents the performance of the Institutional Class of shares during the periods shown, adjusted to reflect current levels of 12b-1 fees payable by the respective Classes. Since index performance data is not available coincident with the Fund’s inception date, the beginning value of the index is the value as of the month end closest to the Fund’s inception date. (b) The Lipper Small-Cap Core Funds Index performance data is not available prior to January 1, 1992. (c) See page 9 for a description of the Indices. (d) Cumulative performance is shown for the Institutional Class of Shares. Performance of the Retail and Admin Classes would be lower due to higher fees and expenses. (e) The mountain chart is based on the initial investment minimum of $100,000 for the Institutional Class.
WHAT YOU SHOULD KNOW
Value stocks may fall out of favor with investors and underperform the overall equity market during any given period. Small- and mid-cap stocks may be more volatile than larger, more established companies. The secondary market for these stocks may be less liquid, which could adversely impact the Fund’s value. Foreign investments involve special risks, including greater economic, political and currency fluctuation risks, which may be even greater in emerging markets. Foreign countries may have different accounting standards than US standards.
The Fund can invest a significant percentage of assets in foreign securities and the value of the fund shares can be adversely affected by changes in currency exchange rates, political, and economic developments. In emerging markets these risks can be significant. The Fund is subject to currency risk, which is the risk that fluctuations in exchange rates between the US dollar and foreign currencies may cause the value of a Fund’s investments to decline. Fund shares should be viewed as a long-term investment.
6
FUND AND MANAGER REVIEW
Loomis Sayles Tax-Managed Equity Fund

Mark Shank, CFA, CIC
Manager since June 2003

David Sowerby, CFA
Manager since August 2005
FUND FACTS
Symbol | LSCGX
Objective | Long-term capital growth
Strategy | Invests at least 80% of net assets (plus any borrowings made for investment purposes) in equity securities and may invest in companies of any size; the Fund uses a tax-managed approach in an effort to minimize the effect of US federal income tax
Fund Inception Date | 10/1/95
Fund Registration Date | 3/7/97
Total Net Assets | $6.5 million
PORTFOLIO REVIEW
The Fund outperformed its Benchmark, the S&P 500 Index, for the six months ended March 31, 2008, primarily due to stock selection and an underweight in the financials sector, which was the worst-performing sector for the period. For example, our positions in Aflac and State Street were both up significantly, while the Benchmark financials fell sharply. In addition, our stock selection in the energy and consumer discretionary sectors helped performance, while our underweights in consumer staples and utilities, which outperformed during the period, modestly detracted from relative results.
On an absolute basis, consumer staples and energy were the only sectors that generated a positive total return for the Fund. In the consumer staples sector, Alberto-Culver and Colgate-Palmolive both appreciated significantly, while the S&P 500 Index’s consumer staples sector only managed a small gain. Alberto-Culver specializes in personal care products and manufactures such brand names as Tresemme and Nexxus. The company’s operating profit margins have improved due to double-digit revenue growth and cost savings from more efficient manufacturing operations. Colgate-Palmolive, which has been a steady wealth creator, was added to the Fund in the fourth quarter at what appeared to be an attractive valuation relative to other consumer staples companies. In the energy sector, Devon Energy and Transocean were among our best performers. Devon Energy explores and produces oil and gas and has recently witnessed a favorable acceleration in earnings. Devon has been a Fund holding for over seven years. The world’s largest offshore drilling contractor, Transocean last year merged with another drilling company, Global Santa Fe.
The information technology, industrials and financials sectors—the Fund’s largest sector weights—had the greatest negative impact on absolute return. Within information technology, Cisco Systems was among the Fund’s worst performers, declining on concerns about worldwide economic growth. The company supplies such data networking products as routers for the internet. While Cisco detracted from performance for the period, the stock has been a positive contributor to investment returns following our increased allocation in early 2006. We believe the stock remains attractive, so we took advantage of low prices to modestly add to our position during the period. Overall, though, we reduced the Fund’s information technology weighting.
In the industrials sector, Boeing experienced delays in delivering its new aircraft, which resulted in a strong stock-price decline. Financial stocks faced a series of ongoing challenges primarily related to asset write-downs resulting from the subprime lending crisis, which led to disappointing performance. We reduced the Fund’s financial holdings by selling positions in Allstate, Citigroup and Zions, and by reducing positions in Goldman Sachs and State Street.
OUTLOOK
Although we expected some challenges as the market adjusted to the economic slowdown, the depth of the sell-off across nearly every sector was larger than we had anticipated. Turmoil in the credit markets led to fears about the financial system’s vulnerability, and this, coupled with growing inflationary pressures, fueled the
7
rise in volatility. Economic and market uncertainty is never pleasant, but the market has a long history of coping with it. The Federal Reserve has been working to support the economy and instill order and confidence in the financial markets.
Uncertainty and fear often create attractive buying opportunities, as emotion overcomes investors’ ability to evaluate fundamentals. We anticipate improvements in the equity markets during 2008. We believe pessimism is high, risk appetites are low, and concerns about corporate profit growth may be overstated. In our view, this suggests that valuations are attractive and the market is well-positioned for a recovery, if the fog of uncertainty begins to clear and investors return to looking at normalized earnings and cash-flow growth rates.
AVERAGE ANNUAL TOTAL RETURNS
Periods Ended March 31, 2008
| | | | | | | | | | | | | | | |
| 6 Months | | 1 Year | | | 5 Years | | | 10 Years | | | Since Registration(a)(b) | | | Since Inception(a)(b) | |
| Loomis Sayles Tax Managed Equity: Institutional | |
| -9.67% | | -1.61 | % | | 10.22 | % | | 7.01 | % | | 8.29 | % | | 9.27 | % |
| Return After Taxes on Distributions(c) | |
| -10.08 | | -2.05 | | | 9.93 | | | 4.28 | | | 5.59 | | | 6.82 | |
| Return After Taxes on Distributions and Sale of Fund Shares(c) | |
| -6.12 | | -0.86 | | | 8.80 | | | 4.51 | | | 5.70 | | | 6.78 | |
| S&P 500 Index(c) | |
| -12.46 | | -5.08 | | | 11.32 | | | 3.50 | | | 6.47 | | | 8.57 | |
| Lipper Large-Cap Core Funds Index(c) | |
| -11.72 | | -4.32 | | | 10.04 | | | 2.87 | | | 5.70 | | | 7.43 | |
| Gross expense ratio (before reductions and reimbursements)* | |
| Institutional: 1.92% | | | | | | | |
| Net expense ratio (after reductions and reimbursements)* | |
| Institutional: 0.65% | | | | | | | |
* As stated in the most recent prospectus
CUMULATIVE PERFORMANCE
Registration to March 31, 2008(d)
Inception to March 31, 2008(d)

Data quoted reflects past performance and cannot guarantee future results. Average annual total returns assume reinvestment of dividends and capital gains distributions. Investment return and principal value will fluctuate so that shares, when redeemed, may be worth more or less than their original cost. For performance current to the most recent month end, please visit the Loomis Sayles website. Current performance may be higher or lower than quoted.
Performance data reflects certain fee reductions and reimbursements, if any, without which performance would be lower. Except as indicated in the table above, returns do not reflect the taxes that a shareholder would pay on fund distributions or the redemption of shares.
After-tax returns are calculated using the historical highest individual federal marginal income tax rates and do not reflect the impact of state and local taxes. Actual after-tax returns depend on an investor’s tax situation and may differ from those shown. After-tax returns shown are not relevant to investors who hold their shares through tax-deferred arrangements, such as 401(k) plans, qualified plans, education savings accounts or individual retirement accounts. Under certain circumstances, the addition of the tax benefits from capital losses resulting from redemptions may cause the Return After Taxes on Distributions and Sale of Fund Shares to be greater than the Return After Taxes on Distributions or even the Return Before Taxes.
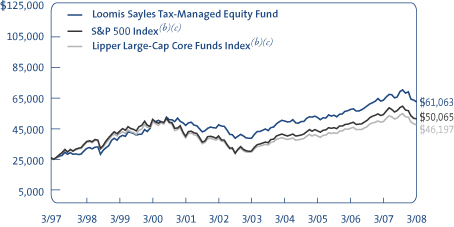
(a) Shares of the Fund were registered for offer under the Securities Act of 1933 on March 7, 1997. In accordance with regulations, performance information is provided for the period beginning on March 7, 1997 (“Registration”). Performance from inception is also provided for the convenience of our shareholders. (b) Index performance is not available coincident with the Fund’s inception and registration dates; comparative performance is presented from the month end closest to the Fund’s inception and registration dates. (c) See page 9 for a description of the Indices and disclosure related to after-tax returns. (d) The mountain chart is based on the Fund’s initial minimum investment of $25,000.
WHAT YOU SHOULD KNOW
Growth funds involve increased risks, in part, because the value of the underlying securities is based on future expectations that may or may not be met. The Fund can invest a significant percentage of assets in foreign securities and the value of the Fund shares can be adversely affected by changes in currency exchange rates, political, and economic developments. In emerging markets these risks can be significant. The Fund is subject to currency risk, which is the risk that fluctuations in exchange rates between the US dollar and foreign currencies may cause the value of a Fund’s investments to decline. Fund shares should be viewed as a long-term investment.
8
ADDITIONAL INFORMATION
Index Definitions
Indexes are unmanaged and do not have expenses that affect results, unlike mutual funds. Index returns are adjusted for the reinvestment of capital gain distributions and income dividends. It is not possible to invest directly in an index.
Lipper Mid-Cap Growth Funds Index is an equally weighted index of typically the 30 largest mutual funds within the mid-cap growth funds investment objective.
Lipper Large-Cap Core Funds Index is an equally weighted index of typically the 30 largest mutual funds within the large-cap core funds investment objective.
Lipper Small-Cap Core Funds Index is an equally weighted index of typically the 30 largest mutual funds within the small-cap core funds investment objective.
Lipper Small-Cap Growth Funds Index is an equally weighted index of typically the 30 largest mutual funds within the small-cap growth funds investment objective.
Source: Lipper, Inc.
Russell Midcap Growth Index is a market capitalization weighted index of medium capitalization stocks determined by Russell to be growth stocks as measured by their price-to-book ratios and forecasted growth values. The stocks are also members of the Russell 1000 Growth Index.
Russell 2000 Growth Index is an index comprised of those Russell 2000 companies with higher price-to-book ratios and higher forecasted growth values.
Russell 2000 Index is an index comprised of the 2,000 smallest companies in the Russell 3000 Index (a broad market index), representing approximately 8% of the Russell 3000 total market capitalization.
Russell 2000 Value Index is an index comprised of those Russell 2000 companies with lower price-to-book ratios and lower forecasted growth values.
S&P 500 Index consists of 500 stocks chosen for market size, liquidity, and industry group representation. A commonly used benchmark of US equity securities, it is a market-value weighted index (stock price times number of shares outstanding), with each stock’s weight in the index proportionate to its market value.
After-Tax Returns
After-tax returns are calculated using the historical highest individual federal marginal income tax rates and do not reflect the impact of state and local taxes. Actual after-tax returns depend on an investor’s tax situation and may differ from those shown. After-tax returns shown are not relevant to investors who hold their shares through tax-deferred arrangements, such as 401(k) plans, qualified plans, education savings accounts or individual retirement accounts. Under certain circumstances, the addition of the tax benefits from capital losses resulting from redemptions may cause the return after taxes on distributions and sale of fund shares to be greater than the return after taxes on distribution or even the return before taxes.
Proxy Voting Information
A description of the Funds’ proxy voting policies and procedures is available without charge, upon request, (i) by calling Loomis Sayles at 800-633-3330; (ii) on the Funds’ website, www.loomissayles.com, and (iii) on the SEC’s website, www.sec.gov. Information about how the Funds voted proxies relating to portfolio securities during the 12 months ended June 30, 2007 is available on (i) the Funds’ website and (ii) the SEC’s website.
Quarterly Portfolio Schedules
The Funds file a complete schedule of portfolio holdings with the SEC for the first and third quarters of each fiscal year on Form N-Q. The Funds’ Forms N-Q are available on the SEC’s website at www.sec.gov and may be reviewed and copied at the SEC’s Public Reference Room in Washington, DC. Information on the operation of the Public Reference Room may be obtained by calling 800-SEC-0330.
UNDERSTANDING YOUR FUND’S EXPENSES
As a mutual fund shareholder you incur two types of costs: (1) transaction costs, including redemption fees and certain exchange fees; and (2) ongoing costs, including management fees, distribution and/or service fees (12b-1 fees), and other Fund expenses. These costs are described in more detail in the Funds’ prospectus. The examples below are intended to help you understand the ongoing costs of investing in the Funds and help you compare these with the ongoing costs of investing in other mutual funds.
The first line in the table of each Fund shows the actual amount of Fund expenses you would have paid on a $1,000 investment in the Fund from October 1, 2007 through March 31, 2008. It also shows how much a $1,000 investment would be worth at the close of the period, assuming actual fund returns and expenses. To estimate the expenses you paid over the period, simply divide your account value by $1,000 (for example $8,600 account value divided by $1,000 = 8.6) and multiply the result by the number in the Expenses Paid During the Period column as shown below for your class.
The second line in the table of each Fund provides information about hypothetical account values and hypothetical expenses based on the Fund’s actual expense ratios and an assumed rate of return of 5% per year before expenses, which is not the Fund’s actual return. The hypothetical account values and expenses may not be used to estimate the actual ending account balance or expenses you paid on your investment for the period. You may use this information to compare the ongoing costs of investing in the Funds and other funds. To do so, compare this 5% hypothetical example with the 5% hypothetical examples that appear in the shareholder reports of other funds.
9
Please note that the expenses shown reflect ongoing costs only, and do not include any transaction costs. Therefore, the second line in the table is useful in comparing ongoing costs only, and will not help you determine the relative costs of owning different funds. If transaction costs were included, total costs would be higher.
Loomis Sayles Mid Cap Growth Fund
| | | | | | |
Institutional Class | | Beginning
Account Value
10/1/07 | | Ending
Account Value
3/31/08 | | Expenses Paid
During Period*
10/1/07 – 3/31/08 |
Actual | | $1,000.00 | | $ 922.60 | | $4.81 |
Hypothetical (5% return before expenses) | | $1,000.00 | | $1,020.00 | | $5.05 |
| | | |
Retail Class | | | | | | |
Actual | | $1,000.00 | | $ 921.40 | | $6.00 |
Hypothetical (5% return before expenses) | | $1,000.00 | | $1,018.75 | | $6.31 |
* Expenses are equal to the Fund’s annualized expense ratio (after fee reduction/reimbursement): 1.00% and 1.25% for the Institutional and Retail Class, respectively, multiplied by the average account value over the period, multiplied by 183/366 (to reflect the half-year period). |
Loomis Sayles Small Cap Growth Fund
| | | | | | |
Institutional Class | | Beginning
Account Value
10/1/07 | | Ending
Account Value
3/31/08 | | Expenses Paid
During Period*
10/1/07 – 3/31/08 |
Actual | | $1,000.00 | | $ 842.50 | | $4.61 |
Hypothetical (5% return before expenses) | | $1,000.00 | | $1,020.00 | | $5.05 |
| | | |
Retail Class | | | | | | |
Actual | | $1,000.00 | | $ 841.40 | | $5.75 |
Hypothetical (5% return before expenses) | | $1,000.00 | | $1,018.75 | | $6.31 |
* Expenses are equal to the Fund’s annualized expense ratio (after fee reduction/reimbursement): 1.00% and 1.25% for Institutional and Retail Class, respectively, multiplied by the average account value over the period, multiplied by 183/366 (to reflect the half-year period). |
Loomis Sayles Small Cap Value Fund
| | | | | | |
Institutional Class | | Beginning
Account Value
10/1/07 | | Ending
Account Value
3/31/08 | | Expenses Paid
During Period*
10/1/07 – 3/31/08 |
Actual | | $1,000.00 | | $ 862.60 | | $4.10 |
Hypothetical (5% return before expenses) | | $1,000.00 | | $1,020.60 | | $4.45 |
| | | |
Retail Class | | | | | | |
Actual | | $1,000.00 | | $ 861.50 | | $5.35 |
Hypothetical (5% return before expenses) | | $1,000.00 | | $1,019.25 | | $5.81 |
| | | |
Administrative Class | | | | | | |
Actual | | $1,000.00 | | $860.20 | | $6.51 |
Hypothetical (5% return before expenses) | | $1,000.00 | | $1,018.00 | | $7.06 |
* Expenses are equal to the Fund’s annualized expense ratio (after fee reduction/reimbursement) of 0.88%, 1.15% and 1.40% for the Institutional Class, Retail and Admin Class, respectively, multiplied by the average account value over the period, multiplied by 183/366 (to reflect the half-year period). |
Loomis Sayles Taxed-Managed Equity Fund
| | | | | | |
Institutional Class | | Beginning
Account Value
10/1/07 | | Ending
Account Value
3/31/08 | | Expenses Paid
During Period*
10/1/07 – 3/31/08 |
Actual | | $1,000.00 | | $ 903.30 | | $3.09 |
Hypothetical (5% return before expenses) | | $1,000.00 | | $1,021.75 | | $3.29 |
* Expenses are equal to the Fund’s annualized expense ratio (after fee reduction/reimbursement) of 0.65%, multiplied by the average account value over the period, multiplied by 183/366 (to reflect the half-year period). |
10
PORTFOLIO OF INVESTMENTS – as of March 31, 2008 (Unaudited)
Loomis Sayles Mid Cap Growth Fund
| | | | | | | |
| | | | | Shares | | Value (†) |
| | | | | | | |
| | | |
| COMMON STOCKS – 93.6% of Net Assets | | | | | | | |
| | | |
| Beverages – 1.6% | | | | | | | |
Central European Distribution Corp.(b)(c) | | | | 34,080 | | $ | 1,983,115 |
| | | | | | | |
| Biotechnology – 2.5% | | | | | | | |
BioMarin Pharmaceutical, Inc.(b)(c) | | | | 36,708 | | | 1,298,362 |
Genzyme Corp.(b)(c) | | | | 24,136 | | | 1,799,097 |
| | | | | | | |
| | | | | | | 3,097,459 |
| | | | | | | |
| Capital Markets – 4.3% | | | | | | | |
BlackRock, Inc.(b) | | | | 14,547 | | | 2,970,207 |
Waddell & Reed Financial, Inc.(b) | | | | 70,878 | | | 2,277,310 |
| | | | | | | |
| | | | | | | 5,247,517 |
| | | | | | | |
| Chemicals – 4.1% | | | | | | | |
CF Industries Holdings, Inc.(b) | | | | 19,448 | | | 2,015,202 |
Mosaic Co. (The)(c) | | | | 29,871 | | | 3,064,764 |
| | | | | | | |
| | | | | | | 5,079,966 |
| | | | | | | |
| Commercial Services & Supplies – 5.9% | | | | | | | |
Corrections Corp. of America(b)(c) | | | | 87,478 | | | 2,407,395 |
FTI Consulting, Inc.(b)(c) | | | | 26,533 | | | 1,884,904 |
Stericycle, Inc.(b)(c) | | | | 59,036 | | | 3,040,354 |
| | | | | | | |
| | | | | | | 7,332,653 |
| | | | | | | |
| Containers & Packaging – 1.6% | | | | | | | |
Crown Holdings, Inc.(c) | | | | 77,669 | | | 1,954,152 |
| | | | | | | |
| Distributors – 2.0% | | | | | | | |
LKQ Corp.(b)(c) | | | | 112,158 | | | 2,520,190 |
| | | | | | | |
| Diversified Financial Services – 3.8% | | | | | | | |
IntercontinentalExchange, Inc.(b)(c) | | | | 19,769 | | | 2,579,855 |
Nasdaq Stock Market, Inc.(b)(c) | | | | 54,309 | | | 2,099,586 |
| | | | | | | |
| | | | | | | 4,679,441 |
| | | | | | | |
| Electrical Equipment – 2.1% | | | | | | | |
First Solar, Inc.(b)(c) | | | | 11,246 | | | 2,599,401 |
| | | | | | | |
| Electronic Equipment & Instruments – 2.0% | | | | | | | |
Mettler-Toledo International, Inc.(c) | | | | 24,851 | | | 2,413,529 |
| | | | | | | |
| Energy Equipment & Services – 3.6% | | | | | | | |
Cameron International Corp.(b)(c) | | | | 46,104 | | | 1,919,770 |
Nabors Industries Ltd.(b)(c) | | | | 75,205 | | | 2,539,673 |
| | | | | | | |
| | | | | | | 4,459,443 |
| | | | | | | |
| Health Care Equipment & Supplies – 4.9% | | | | | | | |
Idexx Laboratories, Inc.(b)(c) | | | | 43,437 | | | 2,139,707 |
Intuitive Surgical, Inc.(b)(c) | | | | 12,066 | | | 3,913,607 |
| | | | | | | |
| | | | | | | 6,053,314 |
| | | | | | | |
| Hotels, Restaurants & Leisure – 3.9% | | | | | | | |
Ctrip.com International Ltd., ADR(b) | | | | 42,567 | | | 2,256,902 |
Yum! Brands, Inc.(b) | | | | 70,286 | | | 2,615,342 |
| | | | | | | |
| | | | | | | 4,872,244 |
| | | | | | | |
| Insurance – 1.4% | | | | | | | |
Fairfax Financial Holdings Ltd.(b) | | | | 5,923 | | | 1,700,493 |
| | | | | | | |
11
| | | | | | | |
| | | | | Shares | | Value (†) |
| | | | | | | |
| | | |
| COMMON STOCKS – continued | | | | | | | |
| | | |
| Internet & Catalog Retail – 3.1% | | | | | | | |
Priceline.com, Inc.(b)(c) | | | | 31,476 | | $ | 3,804,189 |
| | | | | | | |
| IT Services – 2.7% | | | | | | | |
MasterCard, Inc., Class A(b) | | | | 15,122 | | | 3,372,055 |
| | | | | | | |
| Life Sciences Tools & Services – 6.6% | | | | | | | |
Covance, Inc.(c) | | | | 27,667 | | | 2,295,531 |
Illumina, Inc.(b)(c) | | | | 46,561 | | | 3,533,980 |
Pharmaceutical Product Development, Inc. | | | | 56,683 | | | 2,375,018 |
| | | | | | | |
| | | | | | | 8,204,529 |
| | | | | | | |
| Machinery – 4.4% | | | | | | | |
AGCO Corp.(b)(c) | | | | 42,257 | | | 2,530,349 |
Flowserve Corp.(b) | | | | 27,306 | | | 2,850,201 |
| | | | | | | |
| | | | | | | 5,380,550 |
| | | | | | | |
| Marine – 1.6% | | | | | | | |
Genco Shipping & Trading Ltd.(b) | | | | 34,554 | | | 1,949,882 |
| | | | | | | |
| Metals & Mining – 5.6% | | | | | | | |
Agnico-Eagle Mines Ltd. | | | | 15,698 | | | 1,062,912 |
Kinross Gold Corp. | | | | 114,921 | | | 2,540,903 |
Steel Dynamics, Inc.(b) | | | | 101,274 | | | 3,346,093 |
| | | | | | | |
| | | | | | | 6,949,908 |
| | | | | | | |
| Oil, Gas & Consumable Fuels – 10.4% | | | | | | | |
Arena Resources, Inc.(b)(c) | | | | 50,568 | | | 1,957,487 |
Denbury Resources, Inc.(c) | | | | 94,020 | | | 2,684,271 |
Petrohawk Energy Corp.(c) | | | | 62,432 | | | 1,259,253 |
Range Resources Corp.(b) | | | | 55,995 | | | 3,552,883 |
Southwestern Energy Co.(b)(c) | | | | 98,830 | | | 3,329,583 |
| | | | | | | |
| | | | | | | 12,783,477 |
| | | | | | | |
| Semiconductors & Semiconductor Equipment – 3.0% | | | | | | | |
Intersil Corp., Class A(b) | | | | 73,972 | | | 1,898,861 |
MEMC Electronic Materials, Inc.(c) | | | | 25,199 | | | 1,786,609 |
| | | | | | | |
| | | | | | | 3,685,470 |
| | | | | | | |
| Software – 4.4% | | | | | | | |
Concur Technologies, Inc.(c) | | | | 36,683 | | | 1,139,007 |
Micros Systems, Inc.(b)(c) | | | | 68,330 | | | 2,299,988 |
Salesforce.com, Inc.(b)(c) | | | | 34,522 | | | 1,997,788 |
| | | | | | | |
| | | | | | | 5,436,783 |
| | | | | | | |
| Specialty Retail – 4.2% | | | | | | | |
TJX Cos., Inc.(b) | | | | 70,689 | | | 2,337,685 |
Urban Outfitters, Inc.(b)(c) | | | | 91,514 | | | 2,868,964 |
| | | | | | | |
| | | | | | | 5,206,649 |
| | | | | | | |
| Wireless Telecommunication Services – 3.9% | | | | | | | |
Millicom International Cellular SA(b)(c) | | | | 18,601 | | | 1,758,725 |
Turkcell Iletisim Hizmet AS, ADR | | | | 58,282 | | | 1,217,511 |
Vimpel-Communications, ADR | | | | 61,272 | | | 1,831,420 |
| | | | | | | |
| | | | | | | 4,807,656 |
| | | | | | | |
| | | |
| TOTAL COMMON STOCKS | | | | | | | |
(Identified Cost $109,720,584) | | | | | | | 115,574,065 |
| | | | | | | |
12
PORTFOLIO OF INVESTMENTS – as of March 31, 2008 (Unaudited)
Loomis Sayles Mid Cap Growth Fund – continued
| | | | | | | | |
| | | | | Shares/
Principal Amount | | Value (†) |
| | | | | | | | |
| | | |
| SHORT-TERM INVESTMENTS – 46.3% | | | | | | | | |
| State Street Navigator Securities Lending Prime Portfolio(d) | | | | | 49,772,699 | | $ | 49,772,699 |
| Tri-Party Repurchase Agreement with Fixed Income Clearing Corporation, dated 3/31/2008 at 1.250% to be repurchased at $7,369,256 on 4/01/2008 collateralized by $7,265,000 Federal National Mortgage Association, 5.020% due 11/21/2012 valued at $7,519,275, including accrued interest (Note 2g of Notes to Financial Statements) | | | | $ | 7,369,000 | | | 7,369,000 |
| | | | | | | | |
| | | |
| TOTAL SHORT-TERM INVESTMENTS | | | | | | | | |
(Identified Cost $57,141,699) | | | | | | | | 57,141,699 |
| | | | | | | | |
| | | |
| TOTAL INVESTMENTS – 139.9% | | | | | | | | |
(Identified Cost $166,862,283)(a) | | | | | | | $ | 172,715,764 |
Other assets less liabilities—(39.9)% | | | | | | | | (49,213,624) |
| | | | | | | | |
| | | |
| NET ASSETS – 100.0% | | | | | | | $ | 123,502,140 |
| | | | | | | | |
| |
(†) See Note 2a of Notes to Financial Statements. | | | |
(a) Federal Tax Information (Amounts exclude certain adjustments made at the end of the Fund’s fiscal year for tax purposes. Such adjustments are primarily due to wash sales.): | | | |
At March 31, 2008, the net unrealized appreciation on investments based on a cost of $166,862,283 for federal income tax purposes was as follows: | | | |
Aggregate gross unrealized appreciation for all investments in which there is an excess of value over tax cost | | $ | 8,919,935 |
Aggregate gross unrealized depreciation for all investments in which there is an excess of tax cost over value | | | (3,066,454) |
| | | | | | | | |
Net unrealized appreciation | | $ | 5,853,481 |
| | | | | | | | |
| (b) | All or a portion of this security was on loan to brokers at March 31, 2008. |
| (c) | Non-income producing security. |
| (d) | Represents investment of securities lending collateral. |
| ADR | An American Depositary Receipt is a certificate issued by a custodian bank representing the right to receive securities of the foreign issuer described. The values of ADRs are significantly influenced by trading on exchanges not located in the United States. |
HOLDINGS AT MARCH 31, 2008 AS A PERCENTAGE OF NET ASSETS (Unaudited)
| | | |
Oil, Gas & Consumable Fuels | | 10.4 | % |
Life Sciences Tools & Services | | 6.6 | |
Commercial Services & Supplies | | 5.9 | |
Metals & Mining | | 5.6 | |
Health Care Equipment & Supplies | | 4.9 | |
Software | | 4.4 | |
Machinery | | 4.4 | |
Capital Markets | | 4.3 | |
Specialty Retail | | 4.2 | |
Chemicals | | 4.1 | |
Hotels, Restaurants & Leisure | | 3.9 | |
Wireless Telecommunication Services | | 3.9 | |
Diversified Financial Services | | 3.8 | |
Energy Equipment & Services | | 3.6 | |
Internet & Catalog Retail | | 3.1 | |
Semiconductors & Semiconductor Equipment | | 3.0 | |
IT Services | | 2.7 | |
Biotechnology | | 2.5 | |
Electrical Equipment | | 2.1 | |
Distributors | | 2.0 | |
Electronic Equipment & Instruments | | 2.0 | |
Other, less than 2% each | | 6.2 | |
See accompanying notes to financial statements.
13
PORTFOLIO OF INVESTMENTS – as of March 31, 2008 (Unaudited)
Loomis Sayles Small Cap Growth Fund
| | | | | | | |
| | | | | Shares | | Value (†) |
| | | | | | | |
| | | |
| COMMON STOCKS – 97.4% of Net Assets | | | | | | | |
| | | |
| Aerospace & Defense – 3.1% | | | | | | | |
American Science & Engineering, Inc.(b) | | | | 18,201 | | $ | 993,229 |
Moog, Inc., Class A(b)(c) | | | | 35,487 | | | 1,497,906 |
Taser International, Inc.(b)(c) | | | | 78,806 | | | 740,776 |
| | | | | | | |
| | | | | | | 3,231,911 |
| | | | | | | |
| Biotechnology – 2.8% | | | | | | | |
BioMarin Pharmaceutical, Inc.(b)(c) | | | | 21,655 | | | 765,937 |
Indevus Pharmaceuticals, Inc.(b)(c) | | | | 130,240 | | | 621,245 |
Myriad Genetics, Inc.(b)(c) | | | | 16,305 | | | 656,928 |
United Therapeutics Corp.(c) | | | | 10,034 | | | 869,948 |
| | | | | | | |
| | | | | | | 2,914,058 |
| | | | | | | |
| Chemicals – 0.9% | | | | | | | |
Penford Corp.(b) | | | | 40,706 | | | 884,541 |
| | | | | | | |
| Commercial Banks – 1.3% | | | | | | | |
PrivateBankcorp, Inc.(b) | | | | 26,454 | | | 832,507 |
Westamerica Bancorporation | | | | 10,025 | | | 527,315 |
| | | | | | | |
| | | | | | | 1,359,822 |
| | | | | | | |
| Commercial Services & Supplies – 11.3% | | | | | | | |
Advisory Board Co.(b)(c) | | | | 25,870 | | | 1,421,298 |
FTI Consulting, Inc.(b)(c) | | | | 26,396 | | | 1,875,172 |
Geo Group, Inc. (The)(b)(c) | | | | 47,833 | | | 1,360,371 |
ICF International, Inc.(b)(c) | | | | 45,226 | | | 906,781 |
IHS, Inc., Class A(b)(c) | | | | 20,640 | | | 1,327,358 |
Innerworkings, Inc.(b)(c) | | | | 87,091 | | | 1,221,887 |
Interface, Inc., Class A(b) | | | | 55,208 | | | 775,672 |
Team, Inc.(b)(c) | | | | 40,037 | | | 1,093,010 |
Waste Connections, Inc.(b)(c) | | | | 52,923 | | | 1,626,853 |
| | | | | | | |
| | | | | | | 11,608,402 |
| | | | | | | |
| Communications Equipment – 1.3% | | | | | | | |
Foundry Networks, Inc.(b)(c) | | | | 75,449 | | | 873,699 |
Sonus Networks, Inc.(b)(c) | | | | 147,770 | | | 508,329 |
| | | | | | | |
| | | | | | | 1,382,028 |
| | | | | | | |
| Computers & Peripherals – 1.0% | | | | | | | |
Brocade Communications Systems, Inc.(b)(c) | | | | 137,585 | | | 1,004,371 |
| | | | | | | |
| Construction & Engineering – 1.7% | | | | | | | |
Northwest Pipe Co.(b)(c) | | | | 40,542 | | | 1,722,630 |
| | | | | | | |
| Distributors – 1.6% | | | | | | | |
LKQ Corp.(c) | | | | 73,535 | | | 1,652,331 |
| | | | | | | |
| Diversified Consumer Services – 4.8% | | | | | | | |
American Public Education, Inc.(c) | | | | 26,755 | | | 812,549 |
Bright Horizons Family Solutions, Inc.(b)(c) | | | | 22,076 | | | 950,151 |
Capella Education Co.(b)(c) | | | | 19,739 | | | 1,077,750 |
DeVry, Inc.(b) | | | | 23,457 | | | 981,441 |
INVESTools, Inc.(b)(c) | | | | 105,221 | | | 1,156,379 |
| | | | | | | |
| | | | | | | 4,978,270 |
| | | | | | | |
| Diversified Telecommunication Services – 2.0% | | | | | | | |
Cogent Communications Group, Inc.(b)(c) | | | | 50,663 | | | 927,640 |
NTELOS Holdings Corp. | | | | 48,632 | | | 1,176,894 |
| | | | | | | |
| | | | | | | 2,104,534 |
| | | | | | | |
14
PORTFOLIO OF INVESTMENTS – as of March 31, 2008 (Unaudited)
Loomis Sayles Small Cap Growth Fund – continued
| | | | | | | |
| | | | | Shares | | Value (†) |
| | | | | | | |
| | | |
| COMMON STOCKS – continued | | | | | | | |
| | | |
| Electric Utilities – 1.1% | | | | | | | |
ITC Holdings Corp.(b) | | | | 22,511 | | $ | 1,171,923 |
| | | | | | | |
| Electronic Equipment & Instruments – 0.9% | | | | | | | |
IPG Photonics Corp.(b)(c) | | | | 58,877 | | | 923,780 |
| | | | | | | |
| Energy Equipment & Services – 4.5% | | | | | | | |
Exterran Holdings, Inc.(b)(c) | | | | 16,744 | | | 1,080,658 |
Mitcham Industries, Inc.(b)(c) | | | | 53,292 | | | 949,664 |
T-3 Energy Services, Inc.(b)(c) | | | | 25,290 | | | 1,076,342 |
Tesco Corp.(b)(c) | | | | 29,858 | | | 715,099 |
Trico Marine Services, Inc.(b)(c) | | | | 20,775 | | | 809,602 |
| | | | | | | |
| | | | | | | 4,631,365 |
| | | | | | | |
| Health Care Equipment & Supplies – 7.2% | | | | | | | |
Conceptus, Inc.(b)(c) | | | | 52,110 | | | 967,162 |
Masimo Corp.(b)(c) | | | | 38,963 | | | 1,013,038 |
Meridian Bioscience, Inc.(b) | | | | 27,034 | | | 903,747 |
Natus Medical, Inc.(b)(c) | | | | 62,843 | | | 1,140,600 |
NuVasive, Inc.(b)(c) | | | | 31,566 | | | 1,089,343 |
Orthofix International NV(b)(c) | | | | 19,242 | | | 765,254 |
Quidel Corp.(b)(c) | | | | 47,639 | | | 765,082 |
SonoSite, Inc.(b)(c) | | | | 28,865 | | | 820,632 |
| | | | | | | |
| | | | | | | 7,464,858 |
| | | | | | | |
| Health Care Providers & Services – 7.4% | | | | | | | |
athenahealth, Inc.(c) | | | | 28,425 | | | 672,820 |
CardioNet, Inc.(c) | | | | 41,636 | | | 749,032 |
HealthExtras, Inc.(b)(c) | | | | 50,128 | | | 1,245,179 |
MWI Veterinary Supply, Inc.(b)(c) | | | | 26,305 | | | 927,514 |
Psychiatric Solutions, Inc.(b)(c) | | | | 43,699 | | | 1,482,270 |
RadNet, Inc.(b)(c) | | | | 143,266 | | | 1,008,593 |
Sun Healthcare Group, Inc.(b)(c) | | | | 117,603 | | | 1,545,303 |
| | | | | | | |
| | | | | | | 7,630,711 |
| | | | | | | |
| Health Care Technology – 1.7% | | | | | | | |
Phase Forward, Inc.(b)(c) | | | | 59,931 | | | 1,023,621 |
Trizetto Group(b)(c) | | | | 46,840 | | | 781,760 |
| | | | | | | |
| | | | | | | 1,805,381 |
| | | | | | | |
| Household Durables – 0.7% | | | | | | | |
Jarden Corp.(b)(c) | | | | 32,425 | | | 704,920 |
| | | | | | | |
| Insurance – 3.5% | | | | | | | |
AmTrust Financial Services, Inc. | | | | 25,367 | | | 411,199 |
Arch Capital Group Ltd.(c) | | | | 18,238 | | | 1,252,403 |
eHealth, Inc.(b)(c) | | | | 43,183 | | | 953,049 |
Navigators Group, Inc.(c) | | | | 9,597 | | | 522,077 |
ProAssurance Corp.(b)(c) | | | | 9,206 | | | 495,559 |
| | | | | | | |
| | | | | | | 3,634,287 |
| | | | | | | |
| Internet Software & Services – 3.7% | | | | | | | |
Ariba, Inc.(b)(c) | | | | 128,049 | | | 1,236,953 |
VistaPrint Ltd.(b)(c) | | | | 40,941 | | | 1,430,888 |
Vocus, Inc.(b)(c) | | | | 43,022 | | | 1,135,781 |
| | | | | | | |
| | | | | | | 3,803,622 |
| | | | | | | |
15
| | | | | | | |
| | | | | Shares | | Value (†) |
| | | | | | | |
| | | |
| COMMON STOCKS – continued | | | | | | | |
| | | |
| IT Services – 1.4% | | | | | | | |
Information Services Group, Inc.(b)(c) | | | | 95,105 | | $ | 490,742 |
Syntel, Inc.(b) | | | | 35,021 | | | 933,309 |
| | | | | | | |
| | | | | | | 1,424,051 |
| | | | | | | |
| Life Sciences Tools & Services – 3.6% | | | | | | | |
Exelixis, Inc.(b)(c) | | | | 85,166 | | | 591,904 |
Icon PLC, Sponsored ADR(b)(c) | | | | 17,285 | | | 1,121,624 |
Parexel International Corp.(b)(c) | | | | 44,799 | | | 1,169,254 |
Third Wave Technologies(b)(c) | | | | 90,038 | | | 830,150 |
| | | | | | | |
| | | | | | | 3,712,932 |
| | | | | | | |
| Machinery – 3.2% | | | | | | | |
Kadant, Inc.(c) | | | | 49,238 | | | 1,446,612 |
Middleby Corp.(b)(c) | | | | 12,076 | | | 753,422 |
RBC Bearings, Inc.(b)(c) | | | | 29,870 | | | 1,109,073 |
| | | | | | | |
| | | | | | | 3,309,107 |
| | | | | | | |
| Media – 3.1% | | | | | | | |
DG FastChannel, Inc.(b)(c) | | | | 53,746 | | | 1,030,849 |
Knology, Inc.(b)(c) | | | | 80,677 | | | 1,044,767 |
Morningstar, Inc.(b)(c) | | | | 17,875 | | | 1,096,631 |
| | | | | | | |
| | | | | | | 3,172,247 |
| | | | | | | |
| Oil, Gas & Consumable Fuels – 4.3% | | | | | | | |
Arena Resources, Inc.(c) | | | | 22,682 | | | 878,020 |
Carrizo Oil & Gas, Inc.(b)(c) | | | | 15,666 | | | 928,524 |
Petrohawk Energy Corp.(b)(c) | | | | 44,526 | | | 898,089 |
Petroleum Development Corp.(b)(c) | | | | 13,965 | | | 967,356 |
TXCO Resources, Inc.(b)(c) | | | | 60,383 | | | 747,542 |
| | | | | | | |
| | | | | | | 4,419,531 |
| | | | | | | |
| Personal Products – 0.9% | | | | | | | |
Bare Escentuals, Inc.(b)(c) | | | | 38,096 | | | 892,208 |
| | | | | | | |
| Pharmaceuticals – 0.8% | | | | | | | |
K-V Pharmaceutical Co.(b)(c) | | | | 31,351 | | | 782,521 |
| | | | | | | |
| Semiconductors & Semiconductor Equipment – 3.4% | | | | | | | |
ATMI, Inc.(b)(c) | | | | 39,189 | | | 1,090,630 |
Cavium Network, Inc.(b)(c) | | | | 53,397 | | | 875,711 |
Netlogic Microsystems, Inc.(b)(c) | | | | 40,258 | | | 971,828 |
Varian Semiconductor Equipment Associates, Inc.(c) | | | | 18,666 | | | 525,448 |
| | | | | | | |
| | | | | | | 3,463,617 |
| | | | | | | |
| Software – 8.8% | | | | | | | |
Blackbaud, Inc.(b) | | | | 50,104 | | | 1,216,525 |
Blackboard, Inc.(c) | | | | 37,830 | | | 1,260,874 |
BladeLogic, Inc.(b)(c) | | | | 34,677 | | | 972,690 |
Informatica Corp.(b)(c) | | | | 83,128 | | | 1,418,164 |
Solera Holdings, Inc.(c) | | | | 33,588 | | | 818,204 |
Taleo Corp., Class A(b)(c) | | | | 35,163 | | | 682,162 |
Tyler Technologies, Inc.(b)(c) | | | | 103,180 | | | 1,442,456 |
Ultimate Software Group, Inc.(b)(c) | | | | 40,538 | | | 1,218,572 |
| | | | | | | |
| | | | | | | 9,029,647 |
| | | | | | | |
16
PORTFOLIO OF INVESTMENTS – as of March 31, 2008 (Unaudited)
Loomis Sayles Small Cap Growth Fund – continued
| | | | | | | | |
| | | | | Shares | | Value (†) |
| | | | | | | | |
| | | |
| COMMON STOCKS – continued | | | | | | | | |
| | | |
| Specialty Retail – 2.6% | | | | | | | | |
Aeropostale, Inc.(b)(c) | | | | | 29,940 | | $ | 811,673 |
Dick’s Sporting Goods, Inc.(b)(c) | | | | | 39,722 | | | 1,063,755 |
Gymboree Corp.(b)(c) | | | | | 20,593 | | | 821,249 |
| | | | | | | | |
| | | | | | | | 2,696,677 |
| | | | | | | | |
| Textiles, Apparel & Luxury Goods – 0.4% | | | | | | | | |
Movado Group, Inc.(b) | | | | | 22,245 | | | 433,555 |
| | | | | | | | |
| Trading Companies & Distributors – 1.0% | | | | | | | | |
Kaman Corp.(b) | | | | | 35,355 | | | 1,000,193 |
| | | | | | | | |
| Wireless Telecommunication Services – 1.4% | | | | | | | | |
SBA Communications Corp., Class A(b)(c) | | | | | 47,798 | | | 1,425,814 |
| | | | | | | | |
| | | |
| TOTAL COMMON STOCKS | | | | | | | | |
(Identified Cost $102,936,522) | | | | | | | | 100,375,845 |
| | | | | | | | |
| | | |
| | | | | Shares/
Principal Amount | | |
| | | |
| SHORT-TERM INVESTMENTS – 50.7% | | | | | | | | |
| State Street Navigator Securities Lending Prime Portfolio(d) | | | | | 50,220,457 | | | 50,220,457 |
| Tri-Party Repurchase Agreement with Fixed Income Clearing Corporation, dated 3/31/08 at 1.250% to be repurchased at $2,096,073 on 4/01/08 collateralized by $2,130,000 Federal Home Loan Mortgage Corp., 5.510% due 1/23/23 valued at $2,141,161 including accrued interest (Note 2g of Notes to Financial Statements) | | | | $ | 2,096,000 | | | 2,096,000 |
| | | | | | | | |
| | | |
| TOTAL SHORT-TERM INVESTMENTS | | | | | | | | |
(Identified Cost $52,316,457) | | | | | | | | 52,316,457 |
| | | | | | | | |
| | | |
| TOTAL INVESTMENTS – 148.1% | | | | | | | | |
(Identified Cost $155,252,979)(a) | | | | | | | | 152,692,302 |
Other assets less liabilities—(48.1)% | | | | | | | | (49,581,723) |
| | | | | | | | |
| | | |
| NET ASSETS – 100.0% | | | | | | | $ | 103,110,579 |
| | | | | | | | |
| |
(†) See Note 2a of Notes to Financial Statements. | | | |
(a) Federal Tax Information (Amounts exclude certain adjustments made at the end of the Fund’s fiscal year for tax purposes. Such adjustments are primarily due to wash sales.): | | | |
At March 31, 2008, the net unrealized depreciation on investments based on a cost of $155,252,979 for federal income tax purposes was as follows: | | | |
Aggregate gross unrealized appreciation for all investments in which there is an excess of value over tax cost | | $ | 3,002,601 |
Aggregate gross unrealized depreciation for all investments in which there is an excess of tax cost over value | | | (5,563,278) |
| | | | | | | | |
Net unrealized depreciation | | | | | $ | (2,560,677) |
| | | | | | | | |
| (b) | All or a portion of this security was on loan to brokers at March 31, 2008. |
| (c) | Non-income producing security. |
| (d) | Represents investment of securities lending collateral. |
ADR An American Depositary Receipt is a certificate issued by a custodian bank representing the right to receive securities of the foreign issuer described. The values of ADRs are significantly influenced by trading on exchanges not located in the United States.
17
HOLDINGS AT MARCH 31, 2008 AS A PERCENTAGE OF NET ASSETS (Unaudited)
| | | |
Commercial Services & Supplies | | 11.3 | % |
Software | | 8.8 | |
Health Care Providers & Services | | 7.4 | |
Health Care Equipment & Supplies | | 7.2 | |
Diversified Consumer Services | | 4.8 | |
Energy Equipment & Services | | 4.5 | |
Oil, Gas & Consumable Fuels | | 4.3 | |
Internet Software & Services | | 3.7 | |
Life Sciences Tools & Services | | 3.6 | |
Insurance | | 3.5 | |
Semiconductors & Semiconductor Equipment | | 3.4 | |
Machinery | | 3.2 | |
Aerospace & Defense | | 3.1 | |
Media | | 3.1 | |
Biotechnology | | 2.8 | |
Specialty Retail | | 2.6 | |
Diversified Telecommunication Services | | 2.0 | |
Other, less than 2% each | | 18.1 | |
See accompanying notes to financial statements.
18
PORTFOLIO OF INVESTMENTS – as of March 31, 2008 (Unaudited)
Loomis Sayles Small Cap Value Fund
| | | | | | | |
| | | | | Shares | | Value (†) |
| | | | | | | |
| | | |
| COMMON STOCKS – 93.2% of Net Assets | | | | | | | |
| | | |
| Aerospace & Defense – 3.6% | | | | | | | |
AAR Corp.(b)(c) | | | | 132,450 | | $ | 3,611,912 |
BE Aerospace, Inc.(c) | | | | 163,519 | | | 5,714,989 |
Ducommun, Inc.(c) | | | | 181,638 | | | 5,025,923 |
Moog, Inc., Class A(c) | | | | 255,144 | | | 10,769,628 |
Teledyne Technologies, Inc.(c) | | | | 243,109 | | | 11,426,123 |
| | | | | | | |
| | | | | | | 36,548,575 |
| | | | | | | |
| Air Freight & Logistics – 0.8% | | | | | | | |
Hub Group, Inc., Class A(c) | | | | 229,667 | | | 7,553,748 |
| | | | | | | |
| Auto Components – 0.6% | | | | | | | |
Drew Industries, Inc.(b)(c) | | | | 46,020 | | | 1,125,649 |
Gentex Corp.(b) | | | | 298,422 | | | 5,117,938 |
| | | | | | | |
| | | | | | | 6,243,587 |
| | | | | | | |
| Automobiles – 0.2% | | | | | | | |
Winnebago Industries, Inc.(b) | | | | 119,847 | | | 2,025,414 |
| | | | | | | |
| Building Products – 0.7% | | | | | | | |
Armstrong World Industries, Inc. | | | | 205,788 | | | 7,338,400 |
| | | | | | | |
| Capital Markets – 1.8% | | | | | | | |
Investment Technology Group, Inc.(c) | | | | 166,685 | | | 7,697,513 |
JMP Group, Inc.(b) | | | | 356,233 | | | 2,493,631 |
Stifel Financial Corp.(b)(c) | | | | 166,015 | | | 7,454,074 |
| | | | | | | |
| | | | | | | 17,645,218 |
| | | | | | | |
| Chemicals – 2.7% | | | | | | | |
Cytec Industries, Inc. | | | | 99,270 | | | 5,345,689 |
FMC Corp. | | | | 143,416 | | | 7,958,154 |
Minerals Technologies, Inc.(b) | | | | 96,191 | | | 6,040,795 |
Scotts Miracle-Gro Co., Class A | | | | 142,935 | | | 4,633,953 |
Zep, Inc.(b) | | | | 167,579 | | | 2,718,131 |
| | | | | | | |
| | | | | | | 26,696,722 |
| | | | | | | |
| Commercial Banks – 6.0% | | | | | | | |
Bank of the Ozarks, Inc.(b) | | | | 195,451 | | | 4,671,279 |
CVB Financial Corp.(b) | | | | 452,459 | | | 4,710,098 |
East West Bancorp, Inc.(b) | | | | 355,616 | | | 6,312,184 |
First State Bancorporation(b) | | | | 310,157 | | | 4,153,002 |
Hancock Holding Co.(b) | | | | 199,734 | | | 8,392,823 |
IBERIABANK Corp.(b) | | | | 110,759 | | | 4,901,086 |
Old National Bancorp.(b) | | | | 196,430 | | | 3,535,740 |
Pennsylvania Commerce Bancorp, Inc.(b)(c) | | | | 105,394 | | | 2,766,592 |
Prosperity Bancshares, Inc.(b) | | | | 245,189 | | | 7,027,117 |
Signature Bank(b)(c) | | | | 145,458 | | | 3,709,179 |
Sterling Bancshares, Inc.(b) | | | | 722,735 | | | 7,183,986 |
United Community Banks, Inc.(b) | | | | 205,643 | | | 3,491,818 |
| | | | | | | |
| | | | | | | 60,854,904 |
| | | | | | | |
| Commercial Services & Supplies – 6.4% | | | | | | | |
ABM Industries, Inc. | | | | 345,259 | | | 7,747,612 |
American Ecology Corp. | | | | 215,698 | | | 5,463,630 |
Geo Group, Inc. (The)(b)(c) | | | | 259,868 | | | 7,390,646 |
McGrath Rentcorp(b) | | | | 302,894 | | | 7,302,774 |
PHH Corp.(c) | | | | 170,632 | | | 2,974,116 |
Rollins, Inc. | | | | 823,475 | | | 14,567,273 |
19
| | | | | | | |
| | | | | Shares | | Value (†) |
| | | | | | | |
| | | |
| COMMON STOCKS – continued | | | | | | | |
| | | |
| Commercial Services & Supplies – continued | | | | | | | |
Standard Parking Corp.(b)(c) | | | | 481,547 | | $ | 10,093,225 |
Waste Connections, Inc.(c) | | | | 302,690 | | | 9,304,691 |
| | | | | | | |
| | | | | | | 64,843,967 |
| | | | | | | |
| Communications Equipment – 2.5% | | | | | | | |
ADTRAN, Inc. | | | | 350,473 | | | 6,483,750 |
Anaren, Inc.(b)(c) | | | | 316,301 | | | 4,004,371 |
Black Box Corp. | | | | 112,911 | | | 3,483,304 |
CommScope, Inc.(b)(c) | | | | 74,336 | | | 2,589,123 |
Harris Stratex Networks, Inc., Class A(b)(c) | | | | 223,458 | | | 2,241,284 |
Tekelec(b)(c) | | | | 527,089 | | | 6,562,258 |
| | | | | | | |
| | | | | | | 25,364,090 |
| | | | | | | |
| Computers & Peripherals – 0.5% | | | | | | | |
Emulex Corp.(c) | | | | 315,984 | | | 5,131,580 |
| | | | | | | |
| Construction & Engineering – 0.4% | | | | | | | |
Granite Construction, Inc.(b) | | | | 83,247 | | | 2,723,009 |
Michael Baker Corp.(c) | | | | 69,561 | | | 1,562,340 |
| | | | | | | |
| | | | | | | 4,285,349 |
| | | | | | | |
| Construction Materials – 0.6% | | | | | | | |
Texas Industries, Inc.(b) | | | | 101,723 | | | 6,114,570 |
| | | | | | | |
| Consumer Finance – 1.0% | | | | | | | |
Dollar Financial Corp.(b)(c) | | | | 307,638 | | | 7,075,674 |
First Cash Financial Services, Inc.(b)(c) | | | | 285,707 | | | 2,951,353 |
| | | | | | | |
| | | | | | | 10,027,027 |
| | | | | | | |
| Containers & Packaging – 1.4% | | | | | | | |
Greif, Inc. | | | | 66,346 | | | 4,506,884 |
Myers Industries, Inc.(b) | | | | 261,593 | | | 3,434,716 |
Rock-Tenn Co., Class A | | | | 205,117 | | | 6,147,356 |
| | | | | | | |
| | | | | | | 14,088,956 |
| | | | | | | |
| Distributors – 0.2% | | | | | | | |
Core-Mark Holding Co., Inc.(b)(c) | | | | 57,420 | | | 1,650,251 |
| | | | | | | |
| Diversified Consumer Services – 0.6% | | | | | | | |
INVESTools, Inc.(b)(c) | | | | 408,757 | | | 4,492,240 |
Jackson Hewitt Tax Service, Inc.(b) | | | | 122,022 | | | 1,399,592 |
| | | | | | | |
| | | | | | | 5,891,832 |
| | | | | | | |
| Electric Utilities – 1.8% | | | | | | | |
ALLETE, Inc.(b) | | | | 169,935 | | | 6,562,889 |
ITC Holdings Corp.(b) | | | | 122,562 | | | 6,380,578 |
Portland General Electric Co. | | | | 230,716 | | | 5,202,646 |
| | | | | | | |
| | | | | | | 18,146,113 |
| | | | | | | |
| Electrical Equipment – 3.0% | | | | | | | |
Acuity Brands, Inc.(b) | | | | 137,851 | | | 5,920,700 |
Belden, Inc.(b) | | | | 69,862 | | | 2,467,526 |
General Cable Corp.(b)(c) | | | | 133,851 | | | 7,906,579 |
II-VI, Inc.(b)(c) | | | | 228,348 | | | 8,672,657 |
Polypore International, Inc.(b)(c) | | | | 242,680 | | | 5,021,049 |
| | | | | | | |
| | | | | | | 29,988,511 |
| | | | | | | |
20
PORTFOLIO OF INVESTMENTS – as of March 31, 2008 (Unaudited)
Loomis Sayles Small Cap Value Fund – continued
| | | | | | | |
| | | | | Shares | | Value (†) |
| | | | | | | |
| | | |
| COMMON STOCKS – continued | | | | | | | |
| | | |
| Electronic Equipment & Instruments – 3.9% | | | | | | | |
Agilysys, Inc.(b) | | | | 246,591 | | $ | 2,860,456 |
Anixter International, Inc.(b)(c) | | | | 72,597 | | | 4,649,112 |
Excel Technology, Inc.(c) | | | | 161,670 | | | 4,358,623 |
Littelfuse, Inc.(c) | | | | 330,808 | | | 11,568,356 |
Plexus Corp.(c) | | | | 154,220 | | | 4,325,871 |
Rofin-Sinar Technologies, Inc.(c) | | | | 118,661 | | | 5,327,879 |
Vishay Intertechnology, Inc.(c) | | | | 514,017 | | | 4,656,994 |
X-Rite, Inc.(b)(c) | | | | 244,088 | | | 1,457,205 |
| | | | | | | |
| | | | | | | 39,204,496 |
| | | | | | | |
| Energy Equipment & Services – 2.6% | | | | | | | |
Dresser-Rand Group, Inc.(c) | | | | 207,410 | | | 6,377,858 |
Exterran Holdings, Inc.(b)(c) | | | | 77,026 | | | 4,971,258 |
Helix Energy Solutions Group, Inc.(c) | | | | 130,358 | | | 4,106,277 |
Oceaneering International, Inc.(c) | | | | 117,421 | | | 7,397,523 |
TETRA Technologies, Inc.(b)(c) | | | | 185,237 | | | 2,934,154 |
| | | | | | | |
| | | | | | | 25,787,070 |
| | | | | | | |
| Food & Staples Retailing – 1.3% | | | | | | | |
Casey’s General Stores, Inc.(b) | | | | 231,251 | | | 5,226,273 |
Spartan Stores, Inc.(b) | | | | 388,250 | | | 8,095,012 |
| | | | | | | |
| | | | | | | 13,321,285 |
| | | | | | | |
| Food Products – 1.2% | | | | | | | |
J & J Snack Foods Corp. | | | | 142,510 | | | 3,914,750 |
Ralcorp Holdings, Inc.(b)(c) | | | | 141,367 | | | 8,220,491 |
| | | | | | | |
| | | | | | | 12,135,241 |
| | | | | | | |
| Gas Utilities – 1.4% | | | | | | | |
UGI Corp. | | | | 552,790 | | | 13,775,527 |
| | | | | | | |
| Health Care Equipment & Supplies – 1.3% | | | | | | | |
Orthofix International NV(c) | | | | 121,813 | | | 4,844,503 |
West Pharmaceutical Services, Inc.(b) | | | | 194,888 | | | 8,619,896 |
| | | | | | | |
| | | | | | | 13,464,399 |
| | | | | | | |
| Health Care Providers & Services – 3.2% | | | | | | | |
Amedisys, Inc.(b)(c) | | | | 153,931 | | | 6,055,645 |
CorVel Corp.(c) | | | | 208,162 | | | 6,367,676 |
Healthspring, Inc.(c) | | | | 182,675 | | | 2,572,064 |
inVentiv Health, Inc.(c) | | | | 263,574 | | | 7,593,567 |
MWI Veterinary Supply, Inc.(b)(c) | | | | 120,394 | | | 4,245,092 |
Skilled Healthcare Group, Inc., Class A(b)(c) | | | | 476,366 | | | 5,230,499 |
| | | | | | | |
| | | | | | | 32,064,543 |
| | | | | | | |
| Hotels, Restaurants & Leisure – 1.7% | | | | | | | |
Bob Evans Farms, Inc.(b) | | | | 213,375 | | | 5,887,016 |
CEC Entertainment, Inc.(c) | | | | 259,820 | | | 7,503,602 |
Cosi, Inc.(b)(c) | | | | 1,391,575 | | | 3,993,820 |
| | | | | | | |
| | | | | | | 17,384,438 |
| | | | | | | |
| Industrial Conglomerates – 0.9% | | | | | | | |
Teleflex, Inc. | | | | 128,379 | | | 6,124,962 |
Walter Industries, Inc. | | | | 43,550 | | | 2,727,537 |
| | | | | | | |
| | | | | | | 8,852,499 |
| | | | | | | |
21
| | | | | | | |
| | | | | Shares | | Value (†) |
| | | | | | | |
| | | |
| COMMON STOCKS – continued | | | | | | | |
| | | |
| Insurance – 4.8% | | | | | | | |
American Equity Investment Life Holding Co.(b) | | | | 555,085 | | $ | 5,151,189 |
American Physicians Capital, Inc. | | | | 96,826 | | | 4,488,853 |
Delphi Financial Group, Inc. | | | | 210,969 | | | 6,166,624 |
Employers Holdings, Inc. | | | | 336,817 | | | 6,244,587 |
First Mercury Financial Corp.(c) | | | | 94,334 | | | 1,642,355 |
Midland Co. (The)(b) | | | | 124,506 | | | 8,084,175 |
Navigators Group, Inc.(c) | | | | 103,178 | | | 5,612,883 |
ProAssurance Corp.(b)(c) | | | | 96,672 | | | 5,203,854 |
RLI Corp.(b) | | | | 120,788 | | | 5,987,461 |
| | | | | | | |
| | | | | | | 48,581,981 |
| | | | | | | |
| Internet Software & Services – 0.4% | | | | | | | |
United Online, Inc.(b) | | | | 418,576 | | | 4,420,163 |
| | | | | | | |
| IT Services – 3.7% | | | | | | | |
Alliance Data Systems Corp.(c) | | | | 209,706 | | | 9,963,132 |
Broadridge Financial Solutions, Inc. | | | | 512,615 | | | 9,022,024 |
Perot Systems Corp., Class A(c) | | | | 410,651 | | | 6,176,191 |
Wright Express Corp.(c) | | | | 408,653 | | | 12,557,907 |
| | | | | | | |
| | | | | | | 37,719,254 |
| | | | | | | |
| Leisure Equipment & Products – 0.5% | | | | | | | |
Steinway Musical Instruments, Inc.(b)(c) | | | | 158,470 | | | 4,519,564 |
| | | | | | | |
| Life Sciences Tools & Services – 0.7% | | | | | | | |
PerkinElmer, Inc. | | | | 280,637 | | | 6,805,447 |
| | | | | | | |
| Machinery – 4.7% | | | | | | | |
Actuant Corp., Class A(b) | | | | 332,237 | | | 10,036,880 |
CLARCOR, Inc.(b) | | | | 145,721 | | | 5,180,382 |
Commercial Vehicle Group, Inc.(b)(c) | | | | 210,155 | | | 2,082,636 |
ESCO Technologies, Inc.(b)(c) | | | | 121,429 | | | 4,823,160 |
Harsco Corp. | | | | 135,666 | | | 7,513,183 |
Nordson Corp.(b) | | | | 59,559 | | | 3,207,252 |
RBC Bearings, Inc.(c) | | | | 195,392 | | | 7,254,905 |
Wabtec Corp. | | | | 179,423 | | | 6,757,070 |
| | | | | | | |
| | | | | | | 46,855,468 |
| | | | | | | |
| Media – 3.0% | | | | | | | |
A H Belo Corp., Class A(b) | | | | 323,897 | | | 3,702,143 |
Alloy, Inc.(c) | | | | 231,904 | | | 1,704,494 |
Belo Corp., Class A | | | | 298,257 | | | 3,152,576 |
Interactive Data Corp. | | | | 342,107 | | | 9,739,786 |
John Wiley & Sons, Inc., Class A | | | | 296,265 | | | 11,761,721 |
| | | | | | | |
| | | | | | | 30,060,720 |
| | | | | | | |
| Metals & Mining – 1.2% | | | | | | | |
Haynes International, Inc.(b)(c) | | | | 54,118 | | | 2,969,996 |
Reliance Steel & Aluminum Co.(b) | | | | 159,568 | | | 9,551,740 |
| | | | | | | |
| | | | | | | 12,521,736 |
| | | | | | | |
| Multi-Utilities & Unregulated Power – 0.4% | | | | | | | |
NorthWestern Corp. | | | | 170,590 | | | 4,157,278 |
| | | | | | | |
| Multiline Retail – 0.4% | | | | | | | |
Dollar Tree Stores, Inc.(c) | | | | 157,223 | | | 4,337,783 |
| | | | | | | |
22
PORTFOLIO OF INVESTMENTS – as of March 31, 2008 (Unaudited)
Loomis Sayles Small Cap Value Fund – continued
| | | | | | | |
| | | | | Shares | | Value (†) |
| | | | | | | |
| | | |
| COMMON STOCKS – continued | | | | | | | |
| | | |
| Oil, Gas & Consumable Fuels – 2.9% | | | | | | | |
Mariner Energy, Inc.(b)(c) | | | | 285,875 | | $ | 7,721,484 |
Parallel Petroleum Corp.(b)(c) | | | | 366,057 | | | 7,163,736 |
Penn Virginia Corp. | | | | 223,748 | | | 9,865,049 |
St. Mary Land & Exploration Co. | | | | 114,504 | | | 4,408,404 |
| | | | | | | |
| | | | | | | 29,158,673 |
| | | | | | | |
| Personal Products – 1.2% | | | | | | | |
Alberto-Culver Co. | | | | 444,192 | | | 12,175,303 |
| | | | | | | |
| Pharmaceuticals – 1.6% | | | | | | | |
Perrigo Co. | | | | 230,454 | | | 8,695,029 |
Sciele Pharma, Inc.(b)(c) | | | | 374,419 | | | 7,301,171 |
| | | | | | | |
| | | | | | | 15,996,200 |
| | | | | | | |
| Real Estate Investment Trusts (REITs) – 2.5% | | | | | | | |
Capstead Mortgage Corp.(b) | | | | 247,432 | | | 2,820,725 |
Health Care REIT, Inc.(b) | | | | 149,267 | | | 6,736,420 |
Kite Realty Group Trust | | | | 389,506 | | | 5,453,084 |
MFA Mortgage Investments, Inc.(b) | | | | 488,148 | | | 3,075,332 |
Potlatch Corp. | | | | 177,994 | | | 7,345,812 |
| | | | | | | |
| | | | | | | 25,431,373 |
| | | | | | | |
| Real Estate Management & Development – 0.7% | | | | | | | |
Forestar Real Estate Group, Inc.(b)(c) | | | | 268,443 | | | 6,686,915 |
| | | | | | | |
| Road & Rail – 1.4% | | | | | | | |
Genesee & Wyoming, Inc., Class A(b)(c) | | | | 202,540 | | | 6,967,376 |
Ryder System, Inc.(b) | | | | 122,931 | | | 7,487,727 |
| | | | | | | |
| | | | | | | 14,455,103 |
| | | | | | | |
| Semiconductors & Semiconductor Equipment – 2.0% | | | | | | | |
Cohu, Inc.(b) | | | | 275,771 | | | 4,481,279 |
Exar Corp.(b)(c) | | | | 411,801 | | | 3,389,122 |
Fairchild Semiconductor International, Inc., Class A(c) | | | | 380,475 | | | 4,535,262 |
Verigy Ltd.(c) | | | | 407,870 | | | 7,684,271 |
| | | | | | | |
| | | | | | | 20,089,934 |
| | | | | | | |
| Software – 3.0% | | | | | | | |
Epicor Software Corp.(b)(c) | | | | 349,079 | | | 3,909,685 |
Intervoice, Inc.(c) | | | | 598,351 | | | 4,762,874 |
Progress Software Corp.(c) | | | | 269,392 | | | 8,060,208 |
Quest Software, Inc.(b)(c) | | | | 172,926 | | | 2,260,143 |
Radiant Systems, Inc.(c) | | | | 368,295 | | | 5,145,081 |
Sybase, Inc.(c) | | | | 243,400 | | | 6,401,420 |
| | | | | | | |
| | | | | | | 30,539,411 |
| | | | | | | |
| Specialty Retail – 2.1% | | | | | | | |
Genesco, Inc.(b)(c) | | | | 181,941 | | | 4,204,656 |
Jo-Ann Stores, Inc.(b)(c) | | | | 151,104 | | | 2,225,762 |
Sally Beauty Holdings, Inc.(b)(c) | | | | 968,029 | | | 6,679,400 |
Sonic Automotive, Inc., Class A(b) | | | | 404,089 | | | 8,304,029 |
| | | | | | | |
| | | | | | | 21,413,847 |
| | | | | | | |
| Textiles, Apparel & Luxury Goods – 2.5% | | | | | | | |
Carter’s, Inc.(c) | | | | 250,422 | | | 4,044,315 |
FGX International Holdings Ltd.(c) | | | | 226,561 | | | 2,709,670 |
23
| | | | | | | | |
| | | | | Shares | | Value (†) |
| | | | | | | | |
| | | |
| COMMON STOCKS – continued | | | | | | | | |
| | | |
| Textiles, Apparel & Luxury Goods – continued | | | | | | | | |
Fossil, Inc.(b)(c) | | | | | 283,252 | | $ | 8,650,516 |
Hanesbrands, Inc.(b)(c) | | | | | 343,492 | | | 10,029,966 |
| | | | | | | | |
| | | | | | | | 25,434,467 |
| | | | | | | | |
| Thrifts & Mortgage Finance – 0.2% | | | | | | | | |
Westfield Financial, Inc. | | | | | 197,422 | | | 1,928,813 |
| | | | | | | | |
| Trading Companies & Distributors – 0.3% | | | | | | | | |
Genesis Lease Ltd., ADR | | | | | 226,882 | | | 3,301,133 |
| | | | | | | | |
| Water Utilities – 0.7% | | | | | | | | |
American States Water Co.(b) | | | | | 107,990 | | | 3,887,640 |
Middlesex Water Co. | | | | | 182,987 | | | 3,323,044 |
| | | | | | | | |
| | | | | | | | 7,210,684 |
| | | | | | | | |
| | | |
| TOTAL COMMON STOCKS | | | | | | | | |
(Identified Cost $910,883,519) | | | | | | | | 940,229,562 |
| | | | | | | | |
| | | |
| EXCHANGE TRADED FUND – 1.0% | | | | | | | | |
| | | |
| Diversified Financial Services – 1.0% | | | | | | | | |
iShares Russell 2000 Value Index Fund(b) | | | | | | | | |
(Identified Cost $10,705,095) | | | | | 148,664 | | | 9,747,899 |
| | | | | | | | |
| | | |
| | | | | Shares/
Principal Amount | | |
| | | |
| SHORT-TERM INVESTMENTS – 32.1% | | | | | | | | |
State Street Navigator Securities Lending Prime Portfolio(e) | | | | | 255,144,557 | | | 255,144,557 |
| San Paolo U.S. Financial, Commercial Paper, 1.000%, 4/1/2008(d) | | | | $ | 68,946,000 | | | 68,946,000 |
| | | | | | | | |
| | | |
| TOTAL SHORT-TERM INVESTMENTS | | | | | | | | |
(Identified Cost $324,090,557) | | | | | | | | 324,090,557 |
| | | | | | | | |
| | | |
| TOTAL INVESTMENTS – 126.3% | | | | | | | | |
(Identified Cost $1,245,679,171)(a) | | | | | | | | 1,274,068,018 |
Other assets less liabilities—(26.3)% | | | | | | | | (265,290,539) |
| | | | | | | | |
| | | |
| NET ASSETS – 100.0% | | | | | | | $ | 1,008,777,479 |
| | | | | | | | |
| |
(†) See Note 2a of Notes to Financial Statements. | | | |
(a) Federal Tax Information (Amounts exclude certain adjustments made at the end of the Fund’s fiscal year for tax purposes. Such adjustments are primarily due to wash sales.): | | | |
At March 31, 2008, the net unrealized appreciation on investments based on a cost of $1,246,145,209 for federal income tax purposes was as follows: | | | |
Aggregate gross unrealized appreciation for all investments in which there is an excess of value over tax cost | | $ | 106,698,557 |
Aggregate gross unrealized depreciation for all investments in which there is an excess of tax cost over value | | | (78,775,748) |
| | | | | | | | |
Net unrealized appreciation | | $ | 27,922,809 |
| | | | | | | | |
| (b) | All or a portion of this security was on loan to brokers at March 31, 2008. |
| (c) | Non-income producing security. |
| (d) | Interest rate represents annualized yield at time of purchase; not a coupon rate. |
| (e) | Represents investment of securities lending collateral. |
| ADR | An American Depositary Receipt is a certificate issued by a custodian bank representing the right to receive securities of the foreign issuer described. The values of ADRs are significantly influenced by trading on exchanges not located in the United States. |
24
PORTFOLIO OF INVESTMENTS – as of March 31, 2008 (Unaudited)
Loomis Sayles Small Cap Value Fund – continued
HOLDINGS AT MARCH 31, 2008 AS A PERCENTAGE OF NET ASSETS (Unaudited)
| | | |
Commercial Services & Supplies | | 6.4 | % |
Commercial Banks | | 6.0 | |
Insurance | | 4.8 | |
Machinery | | 4.7 | |
Electronic Equipment & Instruments | | 3.9 | |
IT Services | | 3.7 | |
Aerospace & Defense | | 3.6 | |
Health Care Providers & Services | | 3.2 | |
Software | | 3.0 | |
Media | | 3.0 | |
Electrical Equipment | | 3.0 | |
Oil, Gas & Consumable Fuels | | 2.9 | |
Chemicals | | 2.7 | |
Energy Equipment & Services | | 2.6 | |
Textiles, Apparel & Luxury Goods | | 2.5 | |
Real Estate Investment Trusts (REITs) | | 2.5 | |
Communications Equipment | | 2.5 | |
Specialty Retail | | 2.1 | |
Semiconductors & Semiconductor Equipment | | 2.0 | |
Other, less than 2% each | | 29.1 | |
See accompanying notes to financial statements.
25
PORTFOLIO OF INVESTMENTS – as of March 31, 2008 (Unaudited)
Loomis Sayles Tax-Managed Equity Fund
| | | | | | | |
| | | | | Shares | | Value (†) |
| | | | | | | |
| | | |
| COMMON STOCKS – 94.0% of Net Assets | | | | | | | |
| | | |
| Aerospace & Defense – 5.3% | | | | | | | |
Boeing Co.(b) | | | | 1,925 | | $ | 143,162 |
United Technologies Corp. | | | | 2,963 | | | 203,914 |
| | | | | | | |
| | | | | | | 347,076 |
| | | | | | | |
| Beverages – 2.1% | | | | | | | |
PepsiCo, Inc.(b) | | | | 1,890 | | | 136,458 |
| | | | | | | |
| Capital Markets – 6.0% | | | | | | | |
Franklin Resources, Inc.(b) | | | | 1,934 | | | 187,579 |
Goldman Sachs Group, Inc. | | | | 700 | | | 115,773 |
State Street Corp.(b) | | | | 1,100 | | | 86,900 |
| | | | | | | |
| | | | | | | 390,252 |
| | | | | | | |
| Chemicals – 4.5% | | | | | | | |
Ecolab, Inc.(b) | | | | 3,376 | | | 146,620 |
Praxair, Inc.(b) | | | | 1,730 | | | 145,718 |
| | | | | | | |
| | | | | | | 292,338 |
| | | | | | | |
| Communications Equipment – 8.8% | | | | | | | |
Cisco Systems, Inc.(c) | | | | 9,698 | | | 233,625 |
Corning, Inc.(b) | | | | 8,925 | | | 214,557 |
Harris Corp.(b) | | | | 2,565 | | | 124,479 |
| | | | | | | |
| | | | | | | 572,661 |
| | | | | | | |
| Computers & Peripherals – 8.1% | | | | | | | |
Apple, Inc.(c) | | | | 1,250 | | | 179,375 |
EMC Corp.(b)(c) | | | | 9,251 | | | 132,659 |
Hewlett-Packard Co.(b) | | | | 4,732 | | | 216,063 |
| | | | | | | |
| | | | | | | 528,097 |
| | | | | | | |
| Diversified Telecommunication Services – 2.7% | | | | | | | |
AT&T, Inc. | | | | 4,551 | | | 174,303 |
| | | | | | | |
| Energy Equipment & Services – 1.9% | | | | | | | |
Transocean, Inc.(b)(c) | | | | 916 | | | 123,843 |
| | | | | | | |
| Food & Staples Retailing – 3.8% | | | | | | | |
Costco Wholesale Corp.(b) | | | | 2,150 | | | 139,685 |
Spartan Stores, Inc.(b) | | | | 5,050 | | | 105,293 |
| | | | | | | |
| | | | | | | 244,978 |
| | | | | | | |
| Health Care Equipment & Supplies – 5.6% | | | | | | | |
Covidien Ltd.(b) | | | | 3,300 | | | 146,025 |
Hologic, Inc.(b)(c) | | | | 1,725 | | | 95,910 |
Zimmer Holdings, Inc.(c) | | | | 1,581 | | | 123,097 |
| | | | | | | |
| | | | | | | 365,032 |
| | | | | | | |
| Hotels, Restaurants & Leisure – 1.7% | | | | | | | |
Marriott International, Inc., Class A(b) | | | | 3,300 | | | 113,388 |
| | | | | | | |
| Household Products – 2.4% | | | | | | | |
Colgate-Palmolive Co. | | | | 2,000 | | | 155,820 |
| | | | | | | |
| Insurance – 6.0% | | | | | | | |
Aflac, Inc.(b) | | | | 3,331 | | | 216,348 |
Everest Re Group Ltd. | | | | 1,943 | | | 173,957 |
| | | | | | | |
| | | | | | | 390,305 |
| | | | | | | |
26
PORTFOLIO OF INVESTMENTS – as of as of March 31, 2008 (Unaudited)
Loomis Sayles Tax-Managed Equity Fund – continued
| | | | | | | | |
| | | | | Shares | | Value (†) |
| | | | | | | | |
| | | |
| COMMON STOCKS – continued | | | | | | | | |
| IT Services – 1.8% | | | | | | | | |
Broadridge Financial Solutions, Inc.(b) | | | | | 6,800 | | $ | 119,680 |
| | | | | | | | |
| Machinery – 9.2% | | | | | | | | |
Danaher Corp.(b) | | | | | 2,653 | | | 201,708 |
Eaton Corp. | | | | | 2,350 | | | 187,224 |
Joy Global, Inc. | | | | | 1,900 | | | 123,804 |
Terex Corp.(b)(c) | | | | | 1,350 | | | 84,375 |
| | | | | | | | |
| | | | | | | | 597,111 |
| | | | | | | | |
| Media – 2.5% | | | | | | | | |
DIRECTV Group, Inc. (The)(b)(c) | | | | | 6,515 | | | 161,507 |
| | | | | | | | |
| Oil, Gas & Consumable Fuels – 10.1% | | | | | | | | |
ConocoPhillips | | | | | 2,310 | | | 176,045 |
Devon Energy Corp. | | | | | 2,488 | | | 259,573 |
ExxonMobil Corp.(b) | | | | | 2,593 | | | 219,316 |
| | | | | | | | |
| | | | | | | | 654,934 |
| | | | | | | | |
| Personal Products – 1.9% | | | | | | | | |
Alberto-Culver Co.(b) | | | | | 4,540 | | | 124,441 |
| | | | | | | | |
| Pharmaceuticals – 4.7% | | | | | | | | |
Abbott Laboratories(b) | | | | | 3,175 | | | 175,101 |
Novartis AG, ADR | | | | | 2,480 | | | 127,051 |
| | | | | | | | |
| | | | | | | | 302,152 |
| | | | | | | | |
| Semiconductors & Semiconductor Equipment – 1.8% | | | | | | | | |
Texas Instruments, Inc.(b) | | | | | 4,155 | | | 117,462 |
| | | | | | | | |
| Specialty Retail – 1.6% | | | | | | | | |
Gap, Inc. (The)(b) | | | | | 5,370 | | | 105,681 |
| | | | | | | | |
| Wireless Telecommunication Services – 1.5% | | | | | | | | |
NII Holdings, Inc.(b)(c) | | | | | 3,000 | | | 95,340 |
| | | | | | | | |
| | | |
| TOTAL COMMON STOCKS | | | | | | | | |
(Identified Cost $5,127,443) | | | | | | | | 6,112,859 |
| | | | | | | | |
| | | |
| | | | | Shares/
Principal Amount | | |
| | | |
| SHORT-TERM INVESTMENTS – 41.3% | | | | | | | | |
State Street Navigator Securities Lending Prime Portfolio(d) | | | | | 2,250,228 | | | 2,250,228 |
| Tri-Party Repurchase Agreement with Fixed Income Clearing Corporation, dated 3/31/08 at 1.25% to be repurchased at $437,015 on 4/01//08 collateralized by $445,000 Federal Home Loan Mortgage Corp., 3.375% due 3/5/10 with value of $446,669, including accrued interest (Note 2g of Notes to Financial Statements) | | | | $ | 437,000 | | | 437,000 |
| | | | | | | | |
| | | |
| TOTAL SHORT-TERM INVESTMENTS | | | | | | | | |
(Identified Cost $2,687,228) | | | | | | | | 2,687,228 |
| | | | | | | | |
| | | |
| TOTAL INVESTMENTS – 135.3% | | | | | | | | |
(Identified Cost $7,814,671)(a) | | | | | | | | 8,800,087 |
Other assets less liabilities—(35.3)% | | | | | | | | (2,296,479) |
| | | | | | | | |
| | | |
| NET ASSETS – 100.0% | | | | | | | $ | 6,503,608 |
| | | | | | | | |
27
| | | | | | | |
| |
(†) See Note 2a of Notes to Financial Statements. | | | |
(a) Federal Tax Information (Amounts exclude certain adjustments made at the end of the Fund’s fiscal year for tax purposes. Such adjustments are primarily due to wash sales.): | | | |
At March 31, 2008, the net unrealized appreciation on investments based on cost of $7,814,671 for federal income tax purposes was as follows: | | | |
Aggregate gross unrealized appreciation for all investments in which there is an excess of value over tax cost | | $ | 1,207,806 |
Aggregate gross unrealized depreciation for all investments in which there is an excess of tax cost over value | | | (222,390) |
| | | | | | | |
Net unrealized appreciation | | $ | 985,416 |
| | | | | | | |
| (b) | All or a portion of this security was on loan to brokers at March 31, 2008. |
| (c) | Non-income producing security. |
| (d) | Represents investment of securities lending collateral. |
| ADR | An American Depositary Receipt is a certificate issued by a custodian bank representing the right to receive securities of the foreign issuer described. The values of ADRs are significantly influenced by trading on exchanges not located in the United States. |
HOLDINGS AT MARCH 31, 2008 AS A PERCENTAGE OF NET ASSETS (Unaudited)
| | | |
Oil, Gas & Consumable Fuels | | 10.1 | % |
Machinery | | 9.2 | |
Communications Equipment | | 8.8 | |
Computers & Peripherals | | 8.1 | |
Insurance | | 6.0 | |
Capital Markets | | 6.0 | |
Health Care Equipment & Supplies | | 5.6 | |
Aerospace & Defense | | 5.3 | |
Pharmaceuticals | | 4.7 | |
Chemicals | | 4.5 | |
Food & Staples Retailing | | 3.8 | |
Diversified Telecommunication Services | | 2.7 | |
Media | | 2.5 | |
Household Products | | 2.4 | |
Beverages | | 2.1 | |
Other, less than 2% each | | 12.2 | |
See accompanying notes to financial statements.
28
STATEMENTS OF ASSETS AND LIABILITIES
March 31, 2008 (Unaudited)
| | | | | | | | |
| | | Mid Cap
Growth Fund | | | Small Cap
Growth Fund | |
| | | | | | | | |
Assets | | | | | | | | |
Investments at cost | | $ | 166,862,283 | | | $ | 155,252,979 | |
Net unrealized appreciation (depreciation) | | | 5,853,481 | | | | (2,560,677 | ) |
| | | | | | | | |
Investments at value | | | 172,715,764 | | | | 152,692,302 | |
Cash | | | 95,457 | | | | 467,345 | |
Receivable for Fund shares sold | | | 984,966 | | | | 288,488 | |
Receivable for securities sold | | | 1,058,955 | | | | 3,192,965 | |
Dividends and interest receivable | | | 21,888 | | | | 17,336 | |
Receivable from investment adviser (Note 4) | | | — | | | | — | |
Securities lending income receivable | | | 15,545 | | | | 16,408 | |
Other assets | | | 27,426 | | | | — | |
| | | | | | | | |
Total Assets | | | 174,920,001 | | | | 156,674,844 | |
| | | | | | | | |
| | |
| Liabilities | | | | | | | | |
Collateral on securities loaned, at value (Note 2) | | | 49,772,699 | | | | 50,220,457 | |
Payable for securities purchased | | | 1,349,044 | | | | 2,955,227 | |
Payable for Fund shares redeemed | | | 143,739 | | | | 273,348 | |
Management fees payable (Note 4) | | | 81,919 | | | | 64,706 | |
Administrative fees payable (Note 4) | | | 9,312 | | | | 7,165 | |
Deferred Trustees’ fees (Note 4) | | | 42,769 | | | | 40,124 | |
Service and distribution fees payable (Note 4) | | | 2,128 | | | | 1,260 | |
Other accounts payable and accrued expenses | | | 16,251 | | | | 1,978 | |
| | | | | | | | |
Total Liabilities | | | 51,417,861 | | | | 53,564,265 | |
| | | | | | | | |
Net Assets | | $ | 123,502,140 | | | $ | 103,110,579 | |
| | | | | | | | |
Net Assets consist of: | | | | | | | | |
Paid-in capital | | $ | 207,277,021 | | | $ | 306,815,825 | |
Undistributed (accumulated) net investment income (loss) | | | (241,655 | ) | | | (225,297 | ) |
Accumulated net realized loss on investments and foreign currency transactions | | | (89,386,707 | ) | | | (200,919,272 | ) |
Net unrealized appreciation (depreciation) on investments and foreign currency translations | | | 5,853,481 | | | | (2,560,677 | ) |
| | | | | | | | |
Net Assets | | $ | 123,502,140 | | | $ | 103,110,579 | |
| | | | | | | | |
| | |
| Net Asset Value and Offering Price | | | | | | | | |
Institutional Class | | | | | | | | |
Net assets | | $ | 28,013,518 | | | $ | 41,839,649 | |
| | | | | | | | |
Shares of beneficial interest | | | 1,103,750 | | | | 3,129,080 | |
| | | | | | | | |
Net asset value, offering and redemption price per share | | $ | 25.38 | | | $ | 13.37 | |
| | | | | | | | |
Retail Class | | | | | | | | |
Net assets | | $ | 95,488,622 | | | $ | 61,270,930 | |
| | | | | | | | |
Shares of beneficial interest | | | 3,860,333 | | | | 4,713,803 | |
| | | | | | | | |
Net asset value, offering and redemption price per share | | $ | 24.74 | | | $ | 13.00 | |
| | | | | | | | |
Admin Class | | | | | | | | |
Net assets | | $ | — | | | $ | — | |
| | | | | | | | |
Shares of beneficial interest | | | — | | | | — | |
| | | | | | | | |
Net asset value, offering and redemption price per share | | $ | — | | | $ | — | |
| | | | | | | | |
Value of securities on loan (Note 2) | | $ | 47,347,527 | | | $ | 49,117,532 | |
| | | | | | | | |
See accompanying notes to financial statements.
29
| | | | | | |
Small Cap
Value Fund | | | Tax-Managed
Equity Fund | |
| | | | | | |
| | | | | | |
| $ | 1,245,679,171 | | | $ | 7,814,671 | |
| | 28,388,847 | | | | 985,416 | |
| | 1,274,068,018 | | | | 8,800,087 | |
| | 2,620 | | | | 826 | |
| | 2,560,411 | | | | — | |
| | 1,160,184 | | | | — | |
| | 718,272 | | | | 5,346 | |
| | 74,544 | | | | 6,526 | |
| | 117,833 | | | | 630 | |
| | — | | | | — | |
| | 1,278,701,882 | | | | 8,813,415 | |
| |
| | | | | | |
| | 255,144,557 | | | | 2,250,228 | |
| | 12,942,977 | | | | — | |
| | 961,519 | | | | — | |
| | 622,209 | | | | 2,714 | |
| | 82,048 | | | | 533 | |
| | 123,112 | | | | 37,234 | |
| | 12,115 | | | | — | |
| | 35,866 | | | | 19,098 | |
| | 269,924,403 | | | | 2,309,807 | |
| $ | 1,008,777,479 | | | $ | 6,503,608 | |
| | | | | | |
| $ | 1,008,538,190 | | | $ | 9,146,200 | |
| | 1,345,731 | | | | (5,394 | ) |
| | (29,495,289 | ) | | | (3,622,614 | ) |
| |
| | 28,388,847 | | | | 985,416 | |
| $ | 1,008,777,479 | | | $ | 6,503,608 | |
| |
| | | | | | |
| | | | | | |
| $ | 486,432,863 | | | $ | 6,503,608 | |
| | 21,778,798 | | | | 625,118 | |
| $ | 22.34 | | | $ | 10.40 | |
| | | | | | |
| $ | 446,379,759 | | | $ | — | |
| | 20,167,086 | | | | ��� | |
| $ | 22.13 | | | $ | — | |
| | | | | | |
| $ | 75,964,857 | | | $ | — | |
| | 3,490,006 | | | | — | |
| $ | 21.77 | | | $ | — | |
| $ | 250,993,030 | | | $ | 2,216,019 | |
See accompanying notes to financial statements.
30
STATEMENTS OF OPERATIONS
For the Six Months Ended March 31, 2008 (Unaudited)
| | | | | | | | |
| | | Mid Cap
Growth Fund | | | Small Cap
Growth Fund | |
| | | | | | | | |
Investment Income | | | | | | | | |
Dividends | | $ | 97,075 | | | $ | 77,284 | |
Interest | | | 90,993 | | | | 64,387 | |
Securities lending income (Note 2) | | | 71,741 | | | | 52,075 | |
Less net foreign taxes withheld | | | (679 | ) | | | — | |
| | | | | | | | |
| | | 259,130 | | | | 193,746 | |
| | | | | | | | |
| | |
| Expenses | | | | | | | | |
Management fees (Note 4) | | | 298,263 | | | | 256,422 | |
Distribution fees—Retail Class (Note 4) | | | 64,933 | | | | 41,549 | |
Service and distribution fees—Admin Class (Note 4) | | | — | | | | — | |
Trustees’ fees and expenses (Note 4) | | | 5,429 | | | | 5,334 | |
Administrative fees (Note 4) | | | 20,740 | | | | 17,848 | |
Custodian fees and expenses | | | 8,618 | | | | 14,140 | |
Transfer agent fees and expenses—Institutional Class (Note 4) | | | 5,093 | | | | 5,548 | |
Transfer agent fees and expenses—Retail Class (Note 4) | | | 16,439 | | | | 14,531 | |
Transfer agent fees and expenses—Admin Class (Note 4) | | | — | | | | — | |
Audit and tax services fees | | | 16,979 | | | | 16,765 | |
Registration fees | | | 19,070 | | | | 16,710 | |
Shareholder reporting expenses | | | 4,064 | | | | 3,079 | |
Legal fees | | | 705 | | | | 424 | |
Expense recapture—Institutional Class (Note 4) | | | 1,930 | | | | — | |
Miscellaneous expenses | | | 2,822 | | | | 2,696 | |
| | | | | | | | |
Total expenses | | | 465,085 | | | | 395,046 | |
Less fee reduction and/or expense reimbursement (Note 4) | | | (2,469 | ) | | | (11,574 | ) |
| | | | | | | | |
Net expenses | | | 462,616 | | | | 383,472 | |
| | | | | | | | |
Net investment income (loss) | | | (203,486 | ) | | | (189,726 | ) |
| | | | | | | | |
| | |
| Net Realized And Unrealized Gain (Loss) On Investments and Foreign Currency Transactions | | | | | | | | |
Net Realized Gain (Loss) on: | | | | | | | | |
Investments | | | (1,265,859 | ) | | | (2,092,546 | ) |
Foreign currency transactions | | | 166 | | | | — | |
| | |
| Net Change in Unrealized Appreciation (Depreciation) on: | | | | | | | | |
Investments | | | (7,172,815 | ) | | | (10,342,691 | ) |
Foreign currency translations | | | (109 | ) | | | — | |
| | | | | | | | |
Net realized and unrealized loss on investments and foreign currency transactions | | | (8,438,617 | ) | | | (12,435,237 | ) |
| | | | | | | | |
| | |
| Net Decrease in Net Assets Resulting from Operations | | $ | (8,642,103 | ) | | $ | (12,624,963 | ) |
| | | | | | | | |
| * | Amount includes a special dividend of $926,046 in which the source of the dividend has not been determined by the issuer. |
See accompanying notes to financial statements.
31
| | | | | | |
Small Cap
Value Fund | | | Tax-Managed
Equity Fund | |
| | | | | | |
| | | | | | |
| $ | 6,025,435 | * | | $ | 40,087 | |
| | 665,580 | | | | 5,219 | |
| | 755,942 | | | | 4,061 | |
| | — | | | | (508 | ) |
| | 7,446,957 | | | | 48,859 | |
| | | | | | | |
| |
| | | | | | |
| | 3,843,560 | | | | 16,375 | |
| | 558,399 | | | | — | |
| | 188,924 | | | | — | |
| | 16,255 | | | | 4,876 | |
| | 268,358 | | | | 1,715 | |
| | 24,325 | | | | 6,666 | |
| | 94,735 | | | | 1,308 | |
| | 362,284 | | | | — | |
| | 113,952 | | | | — | |
| | 19,088 | | | | 15,029 | |
| | 48,074 | | | | 12,676 | |
| | 66,586 | | | | 814 | |
| | 14,513 | | | | 94 | |
| | — | | | | — | |
| | 15,661 | | | | 1,993 | |
| | | | | | | |
| | 5,634,714 | | | | 61,546 | |
| | (332,131 | ) | | | (40,256 | ) |
| | | | | | | |
| | 5,302,583 | | | | 21,290 | |
| | | | | | | |
| | 2,144,374 | | | | 27,569 | |
| | | | | | | |
| |
| | | | | | |
| | | | | | |
| | (16,356,684 | ) | | | (136,888 | ) |
| | — | | | | — | |
| |
| | | | | | |
| | (138,660,144 | ) | | | (554,050 | ) |
| | — | | | | — | |
| | | | | | | |
| | (155,016,828 | ) | | | (690,938 | ) |
| | | | | | | |
| |
| $ | (152,872,454 | ) | | $ | (663,369 | ) |
| | | | | | | |
See accompanying notes to financial statements.
32
STATEMENTS OF CHANGES IN NET ASSETS
Mid Cap Growth Fund
| | | | | | | | |
| | | Six Months Ended
March 31, 2008
(Unaudited) | | | Year Ended
September 30, 2007 | |
From Operations: | | | | | | | | |
Net investment loss | | $ | (203,486 | ) | | $ | (288,083 | ) |
Net realized gain (loss) on investments and foreign currency transactions | | | (1,265,693 | ) | | | 7,015,246 | |
Net change in net unrealized appreciation (depreciation) on investments and foreign currency translations | | | (7,172,924 | ) | | | 8,067,259 | |
| | | | | | | | |
Increase (decrease) in net assets from operations | | | (8,642,103 | ) | | | 14,794,422 | |
| | | | | | | | |
From Distributions to Shareholders: | | | | | | | | |
Net Investment Income: | | | | | | | | |
Institutional Class | | | — | | | | — | |
Retail Class | | | — | | | | — | |
Capital Gains: | | | | | | | | |
Institutional Class | | | — | | | | — | |
Retail Class | | | — | | | | — | |
| | | | | | | | |
Total distributions | | | — | | | | — | |
| | | | | | | | |
Increase (Decrease) in Net Assets Derived from Capital Shares Transactions (Note 8) | | | 77,347,619 | | | | (4,132,735 | ) |
| | | | | | | | |
Total increase in net assets | | | 68,705,516 | | | | 10,661,687 | |
Net Assets | | | | | | | | |
Beginning of period | | | 54,796,624 | | | | 44,134,937 | |
| | | | | | | | |
End of period | | $ | 123,502,140 | | | $ | 54,796,624 | |
| | | | | | | | |
Undistributed Net Investment Income/Accumulated Net Investment Loss | | $ | (241,655 | ) | | $ | (38,169 | ) |
| | | | | | | | |
Small Cap Growth Fund
| | | | | | | | |
| | | Six Months Ended
March 31, 2008
(Unaudited) | | | Year Ended
September 30, 2007 | |
From Operations: | | | | | | | | |
Net investment loss | | $ | (189,726 | ) | | $ | (143,375 | ) |
Net realized gain (loss) on investments | | | (2,092,546 | ) | | | 3,362,779 | |
Net change in net unrealized appreciation (depreciation) on investments | | | (10,342,691 | ) | | | 5,500,407 | |
| | | | | | | | |
Increase (decrease) in net assets from operations | | | (12,624,963 | ) | | | 8,719,811 | |
| | | | | | | | |
From Distributions to Shareholders: | | | | | | | | |
Net Investment Income: | | | | | | | | |
Institutional Class | | | — | | | | — | |
Retail Class | | | — | | | | — | |
Capital Gains: | | | | | | | | |
Institutional Class | | | — | | | | — | |
Retail Class | | | — | | | | — | |
| | | | | | | | |
Total distributions | | | — | | | | — | |
| | | | | | | | |
Increase in Net Assets Derived from Capital Shares Transactions (Note 8) | | | 66,713,844 | | | | 16,896,224 | |
| | | | | | | | |
Redemption Fees | | | | | | | | |
Institutional Class | | | 4,430 | | | | 346 | |
Retail Class | | | 5,074 | | | | 186 | |
| | | | | | | | |
Total increase in net assets | | | 54,098,385 | | | | 25,616,567 | |
Net Assets | | | | | | | | |
Beginning of period | | | 49,012,194 | | | | 23,395,627 | |
| | | | | | | | |
End of period | | $ | 103,110,579 | | | $ | 49,012,194 | |
| | | | | | | | |
Undistributed Net Investment Income/Accumulated Net Investment Loss | | $ | (225,297 | ) | | $ | (35,571 | ) |
| | | | | | | | |
See accompanying notes to financial statements.
33
STATEMENTS OF CHANGES IN NET ASSETS – continued
Small Cap Value Fund
| | | | | | | | |
| | | Six Months Ended
March 31, 2008
(Unaudited) | | | Year Ended
September 30, 2007 | |
From Operations: | | | | | | | | |
Net investment income | | $ | 2,144,374 | | | $ | 2,636,586 | |
Net realized gain (loss) on investments | | | (16,356,684 | ) | | | 100,922,002 | |
Net change in net unrealized appreciation (depreciation) on investments | | | (138,660,144 | ) | | | 34,456,656 | |
| | | | | | | | |
Increase (decrease) in net assets from operations | | | (152,872,454 | ) | | | 138,015,244 | |
| | | | | | | | |
From Distributions to Shareholders: | | | | | | | | |
Net Investment Income: | | | | | | | | |
Institutional Class | | | (1,132,960 | ) | | | (2,801,001 | ) |
Retail Class | | | — | | | | (1,058,622 | ) |
Admin Class | | | — | | | | (101,702 | ) |
Capital Gains: | | | | | | | | |
Institutional Class | | | (51,944,174 | ) | | | (50,563,842 | ) |
Retail Class | | | (47,065,282 | ) | | | (32,749,822 | ) |
Admin Class | | | (8,031,853 | ) | | | (7,983,100 | ) |
| | | | | | | | |
Total distributions | | | (108,174,269 | ) | | | (95,258,089 | ) |
| | | | | | | | |
Increase in Net Assets Derived from Capital Shares Transactions (Note 8) | | | 193,183,889 | | | | 235,053,214 | |
| | | | | | | | |
Redemption Fees | | | | | | | | |
Institutional Class | | | 12,943 | | | | 16,563 | |
Retail Class | | | 11,514 | | | | 13,201 | |
Admin Class | | | 1,942 | | | | 2,493 | |
| | | | | | | | |
Total increase (decrease) in net assets | | | (67,836,435 | ) | | | 277,842,626 | |
Net Assets | | | | | | | | |
Beginning of period | | | 1,076,613,914 | | | | 798,771,288 | |
| | | | | | | | |
End of period | | $ | 1,008,777,479 | | | $ | 1,076,613,914 | |
| | | | | | | | |
Undistributed Net Investment Income | | $ | 1,345,731 | | | $ | 334,317 | |
| | | | | | | | |
Tax-Managed Equity Fund
| | | | | | | | |
| | | Six Months Ended
March 31, 2008
(Unaudited) | | | Year Ended
September 30, 2007 | |
From Operations: | | | | | | | | |
Net investment income | | $ | 27,569 | | | $ | 102,751 | |
Net realized gain (loss) on investments | | | (136,888 | ) | | | 1,153,272 | |
Net change in net unrealized appreciation (depreciation) on investments | | | (554,050 | ) | | | (241,314 | ) |
| | | | | | | | |
Increase (decrease) in net assets from operations | | | (663,369 | ) | | | 1,014,709 | |
| | | | | | | | |
From Distributions to Shareholders: | | | | | | | | |
Net Investment Income: | | | | | | | | |
Institutional Class | | | (114,263 | ) | | | (75,417 | ) |
Capital Gains: | | | | | | | | |
Institutional Class | | | — | | | | — | |
| | | | | | | | |
Total distributions | | | (114,263 | ) | | | (75,417 | ) |
| | | | | | | | |
Increase (Decrease) in Net Assets Derived from Capital Shares Transactions (Note 8) | | | 611,128 | | | | (3,344,828 | ) |
| | | | | | | | |
Total decrease in net assets | | | (166,504 | ) | | | (2,405,536 | ) |
Net Assets | | | | | | | | |
Beginning of period | | | 6,670,112 | | | | 9,075,648 | |
| | | | | | | | |
End of period | | $ | 6,503,608 | | | $ | 6,670,112 | |
| | | | | | | | |
Undistributed (Overdistributed) Net Investment Income (Loss) | | $ | (5,394 | ) | | $ | 81,300 | |
| | | | | | | | |
See accompanying notes to financial statements.
34
FINANCIAL HIGHLIGHTS
For a share outstanding throughout each period.
| | | | | | | | | | | | | | | | | | | | | | | | |
| | | | | Income (Loss) from Investment Operations: | | | | | Less Distributions: |
| | | Net asset
value,
beginning
of the period | | Net
investment
loss(c) | | | Net realized
and unrealized
gain (loss) | | | Total from
investment
operations | | | | | Dividends
from
net investment
income | | | Distributions
from net
realized
capital gains |
| Mid Cap Growth Fund | | | | | | | | | | | | | | | | | | | | | |
| | | | | | | |
| Institutional Class | | | | | | | | | | | | | | | | | | | | | | | | |
3/31/2008(e) | | $ | 27.51 | | $ | (0.06 | ) | | $ | (2.07 | ) | | $ | (2.13 | ) | | | | $ | — | | | $ | — |
9/30/2007 | | | 20.13 | | | (0.11 | )(d) | | | 7.49 | | | | 7.38 | | | | | | — | | | | — |
9/30/2006 | | | 19.00 | | | (0.10 | ) | | | 1.23 | | | | 1.13 | | | | | | — | | | | — |
9/30/2005 | | | 15.50 | | | (0.10 | ) | | | 3.78 | | | | 3.68 | | | | | | (0.18 | ) | | | — |
9/30/2004 | | | 13.69 | | | (0.13 | ) | | | 1.94 | | | | 1.81 | | | | | | — | | | | — |
9/30/2003 | | | 10.70 | | | (0.10 | ) | | | 3.09 | | | | 2.99 | | | | | | — | | | | — |
| | | | | | | |
| Retail Class | | | | | | | | | | | | | | | | | | | | | | | | |
3/31/2008(e) | | $ | 26.84 | | $ | (0.07 | ) | | $ | (2.03 | ) | | $ | (2.10 | ) | | | | $ | — | | | $ | — |
9/30/2007 | | | 19.69 | | | (0.16 | )(d) | | | 7.31 | | | | 7.15 | | | | | | — | | | | — |
9/30/2006 | | | 18.63 | | | (0.15 | ) | | | 1.21 | | | | 1.06 | | | | | | — | | | | — |
9/30/2005 | | | 15.20 | | | (0.14 | ) | | | 3.70 | | | | 3.56 | | | | | | (0.13 | ) | | | — |
9/30/2004 | | | 13.46 | | | (0.16 | ) | | | 1.90 | | | | 1.74 | | | | | | — | | | | — |
9/30/2003 | | | 10.55 | | | (0.13 | ) | | | 3.04 | | | | 2.91 | | | | | | — | | | | — |
(a) Had certain expenses not been reduced during the period, if applicable, total returns would have been lower. Periods less than one year, if applicable, are not annualized.
(b) The investment adviser and/or administrator has agreed to reimburse a portion of the Fund’s expenses and/or reduce its fees during the period. Without this reimbursement/fee reduction, if applicable, expenses would have been higher.
(c) Per share net investment loss has been calculated using the average shares outstanding during the period.
(d) Includes a non-recurring payment of $0.02 per share.
(e) For the six months ended March 31, 2008 (Unaudited).
(f) Computed on an annualized basis for periods less than one year, if applicable.
(g) Includes expense recapture of 0.01%.
See accompanying notes to financial statements.
35
| | | | | | | | | | | | | | | | | | | | | | |
| | | | | | | | | | | Ratios to Average Net Assets: | | | |
Total
distributions | | | Net asset
value,
end of the
period | | Total
return (%)(a) | | | Net assets,
end of the
period
(000’s) | | Net
expenses (%)(b)(f) | | | Gross
expenses (%)(f) | | | Net
investment
loss (%)(f) | | | Portfolio
turnover
rate (%) |
| | | | | | | | | | | | | | | | | | | | | | |
| | | | | | | |
| | | | | | | | | | | | | | | | | | | | | | |
| $ | — | | | $ | 25.38 | | (7.7 | ) | | $ | 28,014 | | 1.00 | (g) | | 1.00 | (g) | | (0.40 | ) | | 102 |
| | — | | | | 27.51 | | 36.7 | | | | 24,143 | | 1.00 | | | 1.10 | | | (0.47 | ) | | 194 |
| | — | | | | 20.13 | | 6.0 | | | | 17,467 | | 1.00 | | | 1.12 | | | (0.49 | ) | | 211 |
| | (0.18 | ) | | | 19.00 | | 23.9 | | | | 26,159 | | 1.00 | | | 1.21 | | | (0.60 | ) | | 280 |
| | — | | | | 15.50 | | 13.2 | | | | 25,191 | | 1.00 | | | 1.17 | | | (0.84 | ) | | 284 |
| | — | | | | 13.69 | | 27.9 | | | | 23,866 | | 1.00 | | | 1.23 | | | (0.88 | ) | | 248 |
| | | | | | | |
| | | | | | | | | | | | | | | | | | | | | | |
| $ | — | | | $ | 24.74 | | (7.9 | ) | | $ | 95,489 | | 1.25 | | | 1.26 | | | (0.57 | ) | | 102 |
| | — | | | | 26.84 | | 36.3 | | | | 30,654 | | 1.25 | | | 1.43 | | | (0.71 | ) | | 194 |
| | — | | | | 19.69 | | 5.7 | | | | 26,668 | | 1.25 | | | 1.52 | | | (0.72 | ) | | 211 |
| | (0.13 | ) | | | 18.63 | | 23.6 | | | | 25,802 | | 1.25 | | | 1.50 | | | (0.85 | ) | | 280 |
| | — | | | | 15.20 | | 12.9 | | | | 25,382 | | 1.25 | | | 1.42 | | | (1.10 | ) | | 284 |
| | — | | | | 13.46 | | 27.6 | | | | 32,813 | | 1.25 | | | 1.47 | | | (1.13 | ) | | 248 |
See accompanying notes to financial statements.
36
FINANCIAL HIGHLIGHTS – continued
For a share outstanding throughout each period.
| | | | | | | | | | | | | | | | | | | | | | | | | |
| | | | | Income (Loss) from Investment Operations: | | | | | Less Distributions: | |
| | | Net asset
value,
beginning
of the period | | Net
investment
income
(loss)(c)(d) | | | Net realized
and unrealized
gain (loss) | | | Total from
investment
operations | | | | | Dividends
from
net investment
income | | | Distributions
from net
realized
capital gains | |
| Small Cap Growth Fund | | | | | | | | | | | | | | | | | | | | | | |
| | | | | | | |
| Institutional Class | | | | | | | | | | | | | | | | | | | | | | | | | |
3/31/2008(i) | | $ | 15.87 | | $ | (0.03 | ) | | $ | (2.47 | ) | | $ | (2.50 | ) | | | | $ | — | | | $ | — | |
9/30/2007 | | | 12.00 | | | (0.06 | )(f) | | | 3.93 | | | | 3.87 | | | | | | — | | | | — | |
9/30/2006 | | | 11.08 | | | (0.08 | ) | | | 0.99 | | | | 0.91 | | | | | | — | | | | — | |
9/30/2005 | | | 8.96 | | | (0.08 | ) | | | 2.20 | | | | 2.12 | | | | | | — | | | | — | |
9/30/2004 | | | 8.59 | | | (0.09 | ) | | | 0.46 | | | | 0.37 | | | | | | — | | | | — | |
9/30/2003 | | | 6.35 | | | (0.06 | ) | | | 2.30 | | | | 2.24 | | | | | | — | | | | — | |
| | | | | | | |
| Retail Class | | | | | | | | | | | | | | | | | | | | | | | | | |
3/31/2008(i) | | $ | 15.45 | | $ | (0.05 | ) | | $ | (2.40 | ) | | $ | (2.45 | ) | | | | $ | — | | | $ | — | |
9/30/2007 | | | 11.71 | | | (0.09 | )(f) | | | 3.83 | | | $ | 3.74 | | | | | | — | | | | — | |
9/30/2006 | | | 10.84 | | | (0.11 | ) | | | 0.97 | | | $ | 0.86 | | | | | | — | | | | — | |
9/30/2005 | | | 8.78 | | | (0.11 | ) | | | 2.17 | | | $ | 2.06 | | | | | | — | | | | — | |
9/30/2004 | | | 8.45 | | | (0.11 | ) | | | 0.44 | | | $ | 0.33 | | | | | | — | | | | — | |
9/30/2003 | | | 6.26 | | | (0.08 | ) | | | 2.27 | | | $ | 2.19 | | | | | | — | | | | — | |
| | | | | | |
| Small Cap Value Fund | | | | | | | | | | | | | | | | | | | | | | |
| | | | | | | |
| Institutional Class | | | | | | | | | | | | | | | | | | | | | | | | | |
3/31/2008(i) | | $ | 28.77 | | $ | 0.07 | (j) | | $ | (3.66 | ) | | $ | (3.59 | ) | | | | $ | (0.06 | ) | | $ | (2.78 | ) |
9/30/2007 | | | 27.69 | | | 0.12 | (f)(g) | | | 4.29 | | | | 4.41 | | | | | | (0.17 | ) | | | (3.16 | ) |
9/30/2006 | | | 27.43 | | | 0.13 | | | | 2.70 | | | | 2.83 | | | | | | (0.15 | ) | | | (2.42 | ) |
9/30/2005 | | | 25.75 | | | 0.13 | | | | 4.22 | | | | 4.35 | | | | | | (0.02 | ) | | | (2.65 | ) |
9/30/2004 | | | 21.34 | | | 0.04 | | | | 4.97 | | | | 5.01 | | | | | | (0.05 | ) | | | (0.55 | ) |
9/30/2003 | | | 17.28 | | | 0.05 | | | | 4.01 | | | | 4.06 | | | | | | — | | | | — | |
| | | | | | | |
| Retail Class | | | | | | | | | | | | | | | | | | | | | | | | | |
3/31/2008(i) | | $ | 28.52 | | $ | 0.04 | (j) | | $ | (3.65 | ) | | $ | (3.61 | ) | | | | $ | — | | | $ | (2.78 | ) |
9/30/2007 | | | 27.46 | | | 0.04 | (f)(g) | | | 4.28 | | | | 4.32 | | | | | | (0.10 | ) | | | (3.16 | ) |
9/30/2006 | | | 27.23 | | | 0.06 | | | | 2.67 | | | | 2.73 | | | | | | (0.08 | ) | | | (2.42 | ) |
9/30/2005 | | | 25.62 | | | 0.06 | | | | 4.20 | | | | 4.26 | | | | | | — | | | | (2.65 | ) |
9/30/2004 | | | 21.25 | | | (0.02 | ) | | | 4.95 | | | | 4.93 | | | | | | (0.01 | ) | | | (0.55 | ) |
9/30/2003 | | | 17.25 | | | (0.00 | ) | | | 4.00 | | | | 4.00 | | | | | | — | | | | — | |
| | | | | | | |
| Admin Class | | | | | | | | | | | | | | | | | | | | | | | | | |
3/31/2008(i) | | $ | 28.13 | | $ | 0.01 | (j) | | $ | (3.59 | ) | | $ | (3.58 | ) | | | | $ | — | | | $ | (2.78 | ) |
9/30/2007 | | | 27.14 | | | (0.03 | )(f)(g) | | | 4.22 | | | | 4.19 | | | | | | (0.04 | ) | | | (3.16 | ) |
9/30/2006 | | | 26.94 | | | (0.01 | ) | | | 2.65 | | | | 2.64 | | | | | | (0.02 | ) | | | (2.42 | ) |
9/30/2005 | | | 25.43 | | | (0.00 | ) | | | 4.16 | | | �� | 4.16 | | | | | | — | | | | (2.65 | ) |
9/30/2004 | | | 21.13 | | | (0.08 | ) | | | 4.93 | | | | 4.85 | | | | | | — | | | | (0.55 | ) |
9/30/2003 | | | 17.20 | | | (0.05 | ) | | | 3.98 | | | | 3.93 | | | | | | — | | | | — | |
(a) Had certain expenses not been reduced during the period, if applicable, total returns would have been lower. Periods less than one year, if applicable, are not annualized.
(b) The investment adviser and/or administrator has agreed to reimburse a portion of the Fund’s expenses and/or reduce its fees during the period. Without this reimbursement/fee reduction, if applicable, expenses would have been higher.
(c) Per share net investment income (loss) has been calculated using the average shares outstanding during the period.
(d) Amount rounds to less than $0.01 per share, if applicable.
(e) Includes expense recapture of 0.02%.
(f) Includes a non-recurring payment of $0.01 per share and $0.00 per share for Small Cap Growth Fund and Small Cap Value Fund, respectively.
(g) Includes a non-recurring special dividend of $0.05 per share in which the source of the dividend has not been determined by the issuer.
(h) Computed on an annualized basis for periods less than one year, if applicable.
(i) For the six months ended March 31, 2008 (Unaudited).
(j) Includes a special dividend of $.02 per share in which the source of the dividend has not been determined by the issuer.
See accompanying notes to financial statements.
37
| | | | | | | | | | | | | | | | | | | | | | | | | |
| | | | | | | | | | | | | Ratios to Average Net Assets: | | | |
Total
distributions | | | Redemption
fees(d) | | Net asset
value,
end of
the period | | Total
return (%)(a) | | | Net assets,
end of
the period
(000’s) | | Net
expenses (%)(b)(h) | | | Gross
expenses (%)(h) | | | Net
investment
income (loss) (%)(h) | | | Portfolio
turnover
rate (%) |
| | | | | | | | | | | | | | | | | | | | | | | | | |
| | | | | | | | |
| | | | | | | | | | | | | | | | | | | | | | | | | |
| $ | — | | | $ | 0.00 | | $ | 13.37 | | (15.8 | ) | | $ | 41,840 | | 1.00 | | | 1.01 | | | (0.46 | ) | | 44 |
| | — | | | | 0.00 | | | 15.87 | | 32.3 | | | | 28,088 | | 1.00 | | | 1.23 | | | (0.47 | ) | | 83 |
| | — | | | | 0.01 | | | 12.00 | | 8.3 | | | | 20,414 | | 1.00 | | | 1.38 | | | (0.69 | ) | | 100 |
| | — | | | | 0.00 | | | 11.08 | | 23.7 | | | | 15,785 | | 1.00 | | | 1.70 | | | (0.85 | ) | | 227 |
| | — | | | | 0.00 | | | 8.96 | | 4.3 | | | | 15,867 | | 1.00 | | | 1.31 | | | (0.95 | ) | | 217 |
| | — | | | | — | | | 8.59 | | 35.3 | | | | 22,519 | | 1.00 | | | 1.19 | | | (0.91 | ) | | 190 |
| | | | | | | | |
| | | | | | | | | | | | | | | | | | | | | | | | | |
| $ | — | | | $ | 0.00 | | $ | 13.00 | | (15.9 | ) | | $ | 61,271 | | 1.25 | | | 1.31 | | | (0.66 | ) | | 44 |
| | — | | | | 0.00 | | | 15.45 | | 31.9 | | | | 20,924 | | 1.25 | | | 1.50 | | | (0.66 | ) | | 83 |
| | — | | | | 0.01 | | | 11.71 | | 8.0 | | | | 2,981 | | 1.25 | | | 1.92 | | | (0.94 | ) | | 100 |
| | — | | | | 0.00 | | | 10.84 | | 23.5 | | | | 3,592 | | 1.25 | | | 1.87 | | | (1.14 | ) | | 227 |
| | — | | | | 0.00 | | | 8.78 | | 3.9 | | | | 14,589 | | 1.25 | | | 1.52 | | | (1.19 | ) | | 217 |
| | — | | | | — | | | 8.45 | | 35.0 | | | | 30,345 | | 1.25 | | | 1.43 | | | (1.17 | ) | | 190 |
| | | | | | | | |
| | | | | | | | | | | | | | | | | | | | | | | | | |
| | | | | | | | |
| | | | | | | | | | | | | | | | | | | | | | | | | |
| $ | (2.84 | ) | | $ | 0.00 | | $ | 22.34 | | (13.7 | ) | | $ | 486,433 | | 0.88 | | | 0.88 | | | 0.57 | | | 29 |
| | (3.33 | ) | | | 0.00 | | | 28.77 | | 17.0 | | | | 534,776 | | 0.89 | | | 0.89 | | | 0.43 | | | 57 |
| | (2.57 | ) | | | 0.00 | | | 27.69 | | 11.2 | | | | 442,714 | | 0.89 | (e) | | 0.89 | (e) | | 0.47 | | | 62 |
| | (2.67 | ) | | | 0.00 | | | 27.43 | | 18.0 | | | | 403,110 | | 0.90 | | | 0.93 | | | 0.48 | | | 59 |
| | (0.60 | ) | | | 0.00 | | | 25.75 | | 23.8 | | | | 346,356 | | 0.90 | | | 0.93 | | | 0.16 | | | 70 |
| | — | | | | — | | | 21.34 | | 23.5 | | | | 289,945 | | 0.90 | | | 0.94 | | | 0.26 | | | 74 |
| | | | | | | | |
| | | | | | | | | | | | | | | | | | | | | | | | | |
| $ | (2.78 | ) | | $ | 0.00 | | $ | 22.13 | | (13.9 | ) | | $ | 446,380 | | 1.15 | | | 1.25 | | | 0.30 | | | 29 |
| | (3.26 | ) | | | 0.00 | | | 28.52 | | 16.7 | | | | 465,055 | | 1.15 | | | 1.24 | | | 0.15 | | | 57 |
| | (2.50 | ) | | | 0.00 | | | 27.46 | | 10.9 | | | | 291,690 | | 1.15 | | | 1.20 | | | 0.21 | | | 62 |
| | (2.65 | ) | | | 0.00 | | | 27.23 | | 17.7 | | | | 235,948 | | 1.15 | | | 1.20 | | | 0.24 | | | 59 |
| | (0.56 | ) | | | 0.00 | | | 25.62 | | 23.5 | | | | 173,411 | | 1.15 | | | 1.18 | | | (0.08 | ) | | 70 |
| | — | | | | — | | | 21.25 | | 23.2 | | | | 140,152 | | 1.15 | | | 1.20 | | | (0.01 | ) | | 74 |
| | | | | | | | |
| | | | | | | | | | | | | | | | | | | | | | | | | |
| $ | (2.78 | ) | | $ | 0.00 | | $ | 21.77 | | (14.0 | ) | | $ | 75,965 | | 1.40 | | | 1.64 | | | 0.06 | | | 29 |
| | (3.20 | ) | | | 0.00 | | | 28.13 | | 16.4 | | | | 76,783 | | 1.40 | | | 1.56 | | | (0.10 | ) | | 57 |
| | (2.44 | ) | | | 0.00 | | | 27.14 | | 10.6 | | | | 64,367 | | 1.40 | | | 1.46 | | | (0.04 | ) | | 62 |
| | (2.65 | ) | | | 0.00 | | | 26.94 | | 17.4 | | | | 67,505 | | 1.40 | | | 1.43 | | | (0.01 | ) | | 59 |
| | (0.55 | ) | | | 0.00 | | | 25.43 | | 23.3 | | | | 62,680 | | 1.40 | | | 1.43 | | | (0.33 | ) | | 70 |
| | — | | | | — | | | 21.13 | | 22.9 | | | | 37,411 | | 1.40 | | | 1.47 | | | (0.27 | ) | | 74 |
See accompanying notes to financial statements.
38
FINANCIAL HIGHLIGHTS – continued
For a share outstanding throughout each period.
| | | | | | | | | | | | | | | | | | | | | | | | |
| | | | | Income (Loss) from Investment Operations: | | | | | Less Distributions: |
| | | Net asset
value,
beginning
of the period | | Net
investment
income(c) | | | Net realized
and unrealized
gain (loss) | | | Total from
investment
operations | | | | | Dividends
from
net investment
income | | | Distributions
from net
realized
capital gains |
| Tax-Managed Equity Fund | | | | | | | | | | | | | | | | | | | | | |
| | | | | | | |
| Institutional Class | | | | | | | | | | | | | | | | | | | | | | | | |
3/31/2008(f) | | $ | 11.71 | | $ | 0.05 | | | $ | (1.16 | ) | | $ | (1.11 | ) | | | | $ | (0.20 | ) | | $ | — |
9/30/2007 | | | 10.18 | | | 0.16 | (d) | | | 1.45 | | | | 1.61 | | | | | | (0.08 | ) | | | — |
9/30/2006 | | | 9.20 | | | 0.07 | | | | 0.97 | | | | 1.04 | | | | | | (0.06 | ) | | | — |
9/30/2005 | | | 8.49 | | | 0.05 | | | | 0.69 | | | | 0.74 | | | | | | (0.03 | ) | | | — |
9/30/2004 | | | 7.66 | | | 0.05 | | | | 0.97 | | | | 1.02 | | | | | | (0.19 | ) | | | — |
9/30/2003 | | | 6.78 | | | 0.06 | | | | 0.85 | | | | 0.91 | | | | | | (0.03 | ) | | | — |
(a) Had certain expenses not been reduced during the period, if applicable, total returns would have been lower. Periods less than one year, if applicable, are not annualized.
(b) The investment adviser and/or administrator has agreed to reimburse a portion of the Fund’s expenses and/or reduce its fees during the period. Without this reimbursement/fee reduction, if applicable, expenses would have been higher.
(c) Per share net investment income has been calculated using the average shares outstanding during the period.
(d) Includes a non-recurring special dividend of $0.08 per share in which the source of the dividend has not been determined by the issuer.
(e) Computed on an annualized basis for periods less than one year, if applicable.
(f) For the six months ended March 31, 2008 (Unaudited).
See accompanying notes to financial statements.
39
| | | | | | | | | | | | | | | | | | | |
| | | | | | | | | | | Ratios to Average Net Assets: | | |
Total
distributions | | | Net asset
value,
end of
the period | | Total
return (%)(a) | | | Net assets,
end of
the period
(000’s) | | Net
expenses (%)(b)(e) | | Gross
expenses (%)(e) | | Net
investment
income (%)(e) | | Portfolio
turnover
rate (%) |
| | | | | | | | | | | | | | | | | | | |
| | | | | | | |
| | | | | | | | | | | | | | | | | | | |
| $ | (0.20 | ) | | $ | 10.40 | | (9.7 | ) | | $ | 6,504 | | 0.65 | | 1.88 | | 0.84 | | 20 |
| | (0.08 | ) | | | 11.71 | | 15.9 | | | | 6,670 | | 0.65 | | 1.92 | | 1.51 | | 45 |
| | (0.06 | ) | | | 10.18 | | 11.3 | | | | 9,076 | | 0.65 | | 1.64 | | 0.71 | | 40 |
| | (0.03 | ) | | | 9.20 | | 8.7 | | | | 9,230 | | 0.65 | | 2.02 | | 0.59 | | 38 |
| | (0.19 | ) | | | 8.49 | | 13.4 | | | | 5,202 | | 0.65 | | 3.39 | | 0.59 | | 27 |
| | (0.03 | ) | | | 7.66 | | 13.5 | | | | 2,490 | | 0.65 | | 1.82 | | 0.81 | | 200 |
See accompanying notes to financial statements.
40
NOTES TO FINANCIAL STATEMENTS
March 31, 2008 (Unaudited)
1. Organization. Loomis Sayles Funds I and Loomis Sayles Funds II (the “Trusts” and each a “Trust”) are each organized as a Massachusetts business trust. Each Trust is registered under the Investment Company Act of 1940, as amended (the “1940 Act”), as an open-end management investment company. Each Declaration of Trust permits the Board of Trustees to authorize the issuance of an unlimited number of shares of the Trusts in multiple series. Shares of Loomis Sayles Tax-Managed Equity Fund were first registered under the Securities Act of 1933 (the “1933 Act”) effective March 7, 1997 (subsequent to its commencement of investment operations). Information presented in these financial statements pertains to certain equity funds of the Trusts; the financial statements for the remaining equity funds and the fixed income funds of the Trusts are presented in separate reports. The following funds (individually, a “Fund” and collectively, the “Funds”) are included in this report:
Loomis Sayles Funds I:
Loomis Sayles Small Cap Value Fund (the “Small Cap Value Fund”)
Loomis Sayles Funds II:
Loomis Sayles Mid Cap Growth Fund (the “Mid Cap Growth Fund”)
Loomis Sayles Small Cap Growth Fund (the “Small Cap Growth Fund”)
Loomis Sayles Tax-Managed Equity Fund (the “Tax-Managed Equity Fund”)
Each Fund offers Institutional Class Shares. Mid Cap Growth Fund, Small Cap Growth Fund and Small Cap Value Fund also offer Retail Class Shares. In addition, Small Cap Value Fund offers Admin Class Shares.
Most expenses of the Trusts can be directly attributed to a fund. Expenses which cannot be directly attributed to a fund are generally apportioned based on the relative net assets of each of the funds in the Trusts. Expenses of a fund are borne pro rata by the holders of each class of shares, except that each class bears expenses unique to that class (including the Rule 12b-1 service and distribution fees and transfer agent fees applicable to such class). In addition, each class votes as a class only with respect to its own Rule 12b-1 Plan. Shares of each class would receive their pro rata share of the net assets of a fund if the fund were liquidated. The Trustees approve separate dividends from net investment income on each class of shares.
2. Significant Accounting Policies. The following is a summary of significant accounting policies consistently followed by each Fund in the preparation of its financial statements. The Funds’ financial statements are prepared in accordance with accounting principles generally accepted in the United States of America which require the use of management estimates that affect the reported amounts and disclosures in the financial statements. Actual results could differ from those estimates.
a. Security Valuation. Equity securities, including closed-end investment companies and exchange-traded funds, for which market quotations are readily available are valued at market value, as reported by pricing services recommended by the investment adviser and approved by the Board of Trustees. Such pricing services generally use the security’s last sale price on the exchange or market where the security is primarily traded or, if there is no reported sale during the day, the closing bid price. Securities traded on the NASDAQ Global Select Market, NASDAQ Global Market and NASDAQ Capital Market are valued at the NASDAQ Official Closing Price (“NOCP”), or if lacking a NOCP, at the most recent bid quotation on the applicable NASDAQ Market. Debt securities (other than short-term obligations purchased with an original or remaining maturity of sixty days or less) are generally valued on the basis of evaluated bids furnished to the Fund by a pricing service recommended by the investment adviser and approved by the Board of Trustees, which service determines valuations for normal, institutional-size trading units of such securities using market information, transactions for comparable securities and various relationships between securities which are generally recognized by institutional traders. Broker-dealer bid quotations may also be used to value debt and equity securities where a pricing service does not price a security or where a pricing service does not provide a reliable price for the security. In instances where broker-dealer bid quotations are not available, certain securities held by the Fund may be valued on the basis of a price provided by a principal market maker. Short-term obligations purchased with an original or remaining maturity of sixty days or less are valued at amortized cost, which approximates market value. Securities for which market quotations are not readily available are valued at fair value as determined in good faith by the Fund’s adviser using consistently applied procedures under the general supervision of the Board of Trustees. Investments in other open-end investment companies are valued at their net asset value each day.
The Funds may hold securities traded in foreign markets. Foreign securities are valued at the market price in the foreign market. However, if events occurring after the close of the foreign market (but before the close of regular trading on the New York Stock Exchange) are believed to materially affect the value of those securities, such securities are fair valued pursuant to procedures approved by the Board of Trustees. When fair valuing securities, the Funds may, among other things, use modeling tools or other processes that may take into account factors such as securities market activity and/or significant events that occur after the close of the foreign market and before the Funds calculate their net asset values.
41
b. Security Transactions and Related Investment Income. Security transactions are accounted for on trade date. Dividend income is recorded on ex-dividend date, or in the case of certain foreign securities, as soon as the Fund is notified, and interest income is recorded on an accrual basis. Interest income is increased by the accretion of discount and decreased by the amortization of premium. Investment income is recorded net of foreign taxes withheld when applicable. The Small Cap Value Fund estimates the recharacterization of distributions received from Real Estate Investment Trusts (REITs) into the following categories: ordinary income, long-term and short-term capital gains, and return of capital. In determining net gain or loss on securities sold, the cost of securities has been determined on an identified cost basis. Investment income, non-class specific expenses and realized and unrealized gains and losses are allocated on a pro rata basis to each class based on the relative net assets of each class to the total net assets of the Fund.
c. Foreign Currency Translation. The books and records of the Funds are maintained in U.S. dollars. The value of securities, currencies and other assets and liabilities denominated in currencies other than U.S. dollars are translated into U.S. dollars based upon foreign exchange rates prevailing at the end of the period. Purchases and sales of investment securities, income and expenses are translated on the respective dates of such transactions.
Since the values of investment securities are presented at the foreign exchange rates prevailing at the end of the period, it is not practical to isolate that portion of the results of operations arising from changes in exchange rates caused by fluctuations which arise due to changes in market prices of the investment securities. Such changes are included with the net realized and unrealized gain or loss on investments.
Net realized foreign exchange gains or losses arise from sales of foreign currency, currency gains or losses realized between the trade and settlement dates on securities transactions and the difference between the amounts of dividends, interest and foreign withholding taxes recorded on the Funds’ books and the U.S. dollar equivalent of the amounts actually received or paid. Net unrealized foreign exchange gains and losses arise from changes in the value of assets and liabilities, other than investment securities, at the end of the fiscal period, resulting from changes in exchange rates.
Each Fund may use foreign currency exchange contracts to facilitate transactions in foreign-denominated investments. Losses may arise from changes in the value of the foreign currency or if the counterparties do not perform under the contracts’ terms.
Each Fund may purchase investments of foreign issuers. Investing in securities of foreign issuers involves special risks and considerations not typically associated with investing in U.S. companies and securities of the U.S. government. These risks include revaluation of currencies and the risk of appropriation. Moreover, the markets for securities of many foreign issuers may be less liquid and the price of such securities may be more volatile than those of comparable U.S. companies and the U.S. Government.
d. Forward Foreign Currency Contracts. Each Fund may enter into forward foreign currency contracts. Contracts to buy generally are used to acquire exposure to foreign currencies, while contracts to sell generally are used to hedge a Fund’s investments against currency fluctuation. Also, a contract to buy or sell can offset a previous contract. These contracts involve market risk in excess of the unrealized gain or loss reflected in the Fund’s Statement of Assets and Liabilities. The U.S. dollar value of the currencies a Fund has committed to buy or sell represents the aggregate exposure to each currency the Fund has acquired or hedged through currency contracts outstanding at period end.
All contracts are “marked-to-market” daily at the applicable exchange rates and any gains or losses are recorded for financial statement purposes as unrealized until settlement date. Risks may arise upon entering into these contracts from the potential inability of counterparties to meet the terms of their contracts and from unanticipated movements in the value of a foreign currency relative to the U.S. dollar. At March 31, 2008, there were no open forward currency contracts.
e. Federal and Foreign Income Taxes. Each Trust treats each Fund as a separate entity for federal income tax purposes. Each Fund intends to meet the requirements of the Internal Revenue Code applicable to regulated investment companies, and to distribute to its shareholders substantially all of its net investment income and any net realized capital gains, at least annually. Financial Accounting Standards Board (“FASB”) Interpretation No. 48, Accounting for Uncertainty in Income Taxes—an Interpretation of FASB Statement 109 (“FIN 48”) was issued and became effective for fiscal years beginning after December 15, 2006. FIN 48 sets forth a threshold for financial statement recognition, measurement and disclosure of a tax position taken or expected to be taken on a tax return. Management has performed an analysis of the Fund’s tax positions taken on federal and state tax returns that remain subject to examinations (tax years ended September 30, 2004-2007) and has concluded that no provisions for income tax are required. Fund Management is not aware of any events that are reasonably possible to occur in the next six months that would result in the amounts of any unrecognized tax benefits significantly increasing or decreasing for the Fund. However, management’s conclusions regarding FIN 48 may be subject to review and adjustment at a later date based on factors including, but not limited to, further implementation guidance from the FASB, new tax laws, regulations and interpretations thereof.
A Fund may be subject to foreign taxes on income and gains on investments that are accrued based upon the Fund’s understanding of the tax rules and regulations that exist in the countries in which the Fund invests. Foreign governments may also impose taxes or other payments on investments with respect to foreign securities. Such taxes are accrued as applicable.
42
NOTES TO FINANCIAL STATEMENTS – continued
March 31, 2008 (Unaudited)
f. Dividends and Distributions to Shareholders. Dividends and distributions are recorded on ex-dividend date. The timing and characterization of certain income and capital gain distributions are determined annually in accordance with federal tax regulations, which may differ from accounting principles generally accepted in the United States of America. Permanent differences are primarily due to differing treatments for book and tax purposes of items such as distributions from REITs, net operating losses and redemption in kind transactions. Permanent book and tax basis differences relating to shareholder distributions will result in reclassifications to capital accounts. Temporary differences between book and tax distributable earnings are primarily due to deferred Trustees’ fees and wash sales. Distributions from net investment income and short-term capital gains are considered to be distributed from ordinary income for tax purposes.
The tax characterization of distributions is determined on an annual basis. The tax character of distributions paid to shareholders during the year ended September 30, 2007 was as follows:
| | | | | | | | | |
| | | 2007 Distributions Paid From: |
Fund | | Ordinary
Income | | Long-Term
Capital Gains | | Total |
Mid Cap Growth Fund | | $ | — | | $ | — | | $ | — |
Small Cap Growth Fund | | | — | | | — | | | — |
Small Cap Value Fund | | | 19,298,487 | | | 75,959,602 | | | 95,258,089 |
Tax-Managed Equity Fund | | | 75,417 | | | — | | | 75,417 |
As of September 30, 2007, the capital loss carryforwards were as follows:
| | | | | | | | | | | | |
Capital Loss Carryforward | | Mid Cap
Growth Fund | | Small Cap
Growth Fund | | Small Cap
Value Fund | | Tax-Managed
Equity Fund |
Expires September 30, 2010 | | $ | 66,978,246 | | $ | 139,524,244 | | $ | — | | $ | 1,693,070 |
Expires September 30, 2011 | | | 21,142,388 | | | 59,283,040 | | | — | | | 1,662,157 |
Expires September 30, 2012 | | | — | | | — | | | — | | | 110,150 |
Expires September 30, 2013 | | | — | | | — | | | — | | | 17,395 |
| | | | | | | | | | | | |
Total capital loss carryforward | | $ | 88,120,634 | | $ | 198,807,284 | | $ | — | | $ | 3,482,772 |
| | | | | | | | | | | | |
g. Repurchase Agreements. Each Fund, through its custodian, receives delivery of the underlying securities collateralizing repurchase agreements. It is each Fund’s policy that the market value of the collateral be at least equal to 102% of the repurchase price, including interest. The repurchase agreements are tri-party arrangements whereby the collateral is held at the custodian bank in a segregated account for the benefit of the Fund and on behalf of the counterparty. Repurchase agreements could involve certain risks in the event of default or insolvency of the counterparty including possible delays or restrictions upon a Fund’s ability to dispose of the underlying securities.
h. Securities Lending. The Funds have entered into an agreement with State Street Bank and Trust Company (“State Street Bank”), as agent of the Funds, to lend securities to certain designated borrowers. The loans are collateralized with cash or securities in an amount equal to at least 105% or 102% of the market value of the loaned international or domestic securities, respectively, when the loan is initiated. Thereafter, the value of the collateral must remain at least 102% of the market value of loaned securities for U.S. equities and U.S. corporate debt; at least 105% of the market value of loaned securities for non-U.S. equities; and at least 100% of the market value of loaned securities for U.S. government securities, sovereign debt issued by non-U.S. governments and non-U.S. corporate debt. In the event that the market value of the collateral falls below the required percentages described above, the borrower will deliver additional collateral on the next business day. As with other extensions of credit, the Funds may bear the risk of loss with respect to the investment of the collateral. The Funds invest cash collateral in short-term investments, a portion of the income from which is remitted to the borrowers and the remainder allocated between the Funds and State Street Bank as lending agent. The value of securities on loan to borrowers and the value of collateral held by the Funds with respect to such loans at March 31, 2008 were as follows:
| | | | | | |
| | | Value
of Securities
on Loan | | Value of
Collateral |
Mid Cap Growth Fund | | $ | 47,347,527 | | $ | 49,772,699 |
Small Cap Growth Fund | | | 49,117,532 | | | 50,220,457 |
Small Cap Value Fund | | | 250,993,030 | | | 255,144,557 |
Tax-Managed Equity Fund | | | 2,216,019 | | | 2,250,228 |
43
i. Indemnifications. Under the Trusts’ organizational documents, their officers and Trustees are indemnified against certain liability arising out of the performance of their duties to the Funds. Additionally, in the normal course of business, the Funds enter into contracts with service providers that contain general indemnification clauses. The Funds’ maximum exposure under these arrangements is unknown as this would involve future claims that may be made against Funds that have not yet occurred. However, based on experience, the Funds expect the risk of loss to be remote.
j. New Accounting Pronouncements. In September 2006, Statement of Financial Accounting Standards No. 157, Fair Value Measurements (“FAS 157”), was issued and is effective for fiscal years beginning after November 15, 2007. FAS 157 defines fair value, establishes a framework for measuring fair value and expands disclosures about fair value measurements. Management has evaluated the impact the adoption of FAS 157 will have on the Funds’ financial statements and believes that such impact will be limited to expanded disclosure in the Funds’ financial statements regarding inputs used in determining the value of the Funds’ investments and will not have a material impact on the Funds’ net assets or results of operations.
In March 2008, Statement of Financial Accounting Standards No. 161, Disclosures about Derivative Instruments and Hedging Activities (“FAS 161”), was issued and will be effective for fiscal years and interim periods beginning after November 15, 2008. FAS 161 requires enhanced disclosures about funds’ derivative and hedging activities. Management is currently evaluating the impact the adoption of FAS 161 will have on the Funds’ financial statement disclosures.
3. Purchases and Sales of Securities. For the six months ended March 31, 2008, purchases and sales of securities (excluding short-term investments) were as follows:
| | | | | | |
Fund | | Purchases | | Sales |
Mid Cap Growth Fund | | $ | 149,071,907 | | $ | 78,074,079 |
Small Cap Growth Fund | | | 94,755,704 | | | 29,459,975 |
Small Cap Value Fund | | | 379,573,777 | | | 289,781,724 |
Tax-Managed Equity Fund | | | 1,622,344 | | | 1,264,822 |
4. Management Fees and Other Transactions with Affiliates.
a. Management Fees. Loomis, Sayles & Company, L.P. (“Loomis Sayles”) serves as investment adviser to each Fund. Under the terms of the management agreements, each Fund pays a management fee at the following annual rates, calculated daily and payable monthly, based on each Fund’s average daily net assets:
| | |
Fund | | Percentage of
Average Daily
Net Assets |
Mid Cap Growth Fund | | 0.75% |
Small Cap Growth Fund | | 0.75% |
Small Cap Value Fund | | 0.75% |
Tax-Managed Equity Fund | | 0.50% |
Loomis Sayles has given binding undertakings to the Funds to reduce management fees and/or reimburse certain expenses associated with the Funds to limit their operating expenses. These undertakings are in effect until January 31, 2009 and will be reevaluated on an annual basis. For the six months ended March 31, 2008, the expense limits as a percentage of average daily net assets under the expense limitation agreements were as follows:
| | | | | | |
| | | Expense Limit as a Percentage
of Average Daily Net Assets |
Fund | | Institutional Class | | Retail Class | | Admin Class |
Mid Cap Growth Fund | | 1.00% | | 1.25% | | — |
Small Cap Growth Fund | | 1.00% | | 1.25% | | — |
Small Cap Value Fund | | 0.90% | | 1.15% | | 1.40% |
Tax-Managed Equity Fund | | 0.65% | | — | | — |
44
NOTES TO FINANCIAL STATEMENTS – continued
March 31, 2008 (Unaudited)
For the six months ended March 31, 2008, the management fees for each Fund were as follows:
| | | | | |
Fund | | Management
Fee | | Percentage of
Average Daily
Net Assets |
Mid Cap Growth Fund | | $ | 298,263 | | 0.75% |
Small Cap Growth Fund | | | 256,422 | | 0.75% |
Small Cap Value Fund | | | 3,843,560 | | 0.75% |
Tax-Managed Equity Fund | | | 16,375 | | 0.50% |
For the six months ended March 31, 2008, expenses have been reimbursed as follows:
| | | |
Fund | | Reimbursement |
Mid Cap Growth Fund | | $ | 1,459 |
Small Cap Growth Fund | | | 10,707 |
Small Cap Value Fund | | | 319,176 |
Tax-Managed Equity Fund | | | 40,173 |
Loomis Sayles shall be permitted to recover expenses they have borne under the expense limitation agreement (whether through a reduction of its management fee or otherwise) on a class by class basis in later periods to the extent the expenses of a class fall below a class’ expense limits, provided, however, that a class is not obligated to pay such deferred fees/expenses more than one year after the end of the fiscal year in which the fee/expense was deferred. The amounts subject to possible reimbursement under the expense limitation agreements at March 31, 2008 were as follows:
| | | | | | | | | | | | |
| | | Expenses Subject to Possible Reimbursement Until
September 30, 2008 |
Fund | | Institutional Class | | Retail Class | | Admin Class | | Total |
Mid Cap Growth Fund | | $ | 20,701 | | $ | 49,919 | | $ | — | | $ | 70,620 |
Small Cap Growth Fund | | | 53,263 | | | 12,411 | | | — | | | 65,674 |
Small Cap Value Fund | | | — | | | 325,613 | | | 125,266 | | | 450,879 |
Tax-Managed Equity Fund | | | 86,601 | | | — | | | — | | | 86,601 |
| | | | | | | | | | | | |
| | | Expenses Subject to Possible Reimbursement Until
September 30, 2009 |
Fund | | Institutional Class | | Retail Class | | Admin Class | | Total |
Mid Cap Growth Fund | | $ | — | | $ | 1,459 | | $ | — | | $ | 1,459 |
Small Cap Growth Fund | | | 976 | | | 9,731 | | | — | | | 10,707 |
Small Cap Value Fund | | | — | | | 227,718 | | | 91,458 | | | 319,176 |
Tax-Managed Equity Fund | | | 40,173 | | | — | | | — | | | 40,173 |
Certain officers and employees of Loomis Sayles are also officers or Trustees of the Trust. Loomis Sayles’ general partner is indirectly owned by Natixis Global Asset Management, L.P. (“Natixis US”), which is part of Natixis Global Asset Management, an international asset management group based in Paris, France.
b. Administrative Fees. Natixis Asset Management Advisors, L.P. (“Natixis Advisors”) provides certain administrative services for the Funds and subcontracts with State Street Bank to serve as sub-administrator. Natixis Advisors is a wholly-owned subsidiary of Natixis US. Pursuant to an agreement among Natixis Funds Trust I, Natixis Funds Trust II, Natixis Funds Trust III, Natixis Funds Trust IV, Natixis Cash Management Trust, Gateway Trust (“Natixis Funds Trusts”), Loomis Sayles Funds I, Loomis Sayles Funds II (“Loomis Sayles Funds Trusts”), the Hansberger International Series and Natixis Advisors, each Fund pays Natixis Advisors monthly its pro rata portion of fees equal to an annual rate of 0.0675% of the first $5 billion of the average daily net assets of the Natixis Funds Trusts, Loomis Sayles Funds Trusts and the Hansberger International Series, 0.0625% of the next $5 billion, 0.0500% of the next $20 billion and 0.045% of such assets in excess of $30 billion, subject to an annual aggregate minimum fee for the Natixis Funds Trusts , Loomis Sayles Funds Trusts and the Hansberger International Series of $5 million, which is reevaluated on an annual basis. New funds are subject to an annual fee of $50,000 plus $12,500 per class and an additional $50,000 if managed by multiple subadvisors in their first calendar year of operations.
Effective October 1, 2007, State Street Bank reduced the fees it receives from Natixis Advisors for serving as sub-administrator to the Funds. Also, effective October 1, 2007, Natixis Advisors has given a binding contractual undertaking to the Funds to waive
45
the administrative fees paid by the Funds in an amount equal to the reduction in sub-administrative fees discussed above. The waiver is in effect through June 30, 2008.
For the six months ended March 31, 2008, amounts paid to Natixis Advisors for administrative fees were as follows:
| | | | | | | | | |
Fund | | Gross
Administrative
Fees | | Waiver of
Administrative
Fees | | Net
Administrative
Fees |
Mid Cap Growth Fund | | $ | 20,740 | | $ | 1,010 | | $ | 19,730 |
Small Cap Growth Fund | | | 17,848 | | | 867 | | | 16,981 |
Small Cap Value Fund | | | 268,358 | | | 12,955 | | | 255,403 |
Tax-Managed Equity Fund | | | 1,715 | | | 83 | | | 1,632 |
c. Service and Distribution Fees. Natixis Distributors, L.P. (“Natixis Distributors”), a wholly owned subsidiary of Natixis US, has entered into a distribution agreement with the Trust. Pursuant to this agreement, Natixis Distributors serves as principal underwriter of each Fund.
Pursuant to Rule 12b-1 under the 1940 Act, the Mid Cap Growth Fund, the Small Cap Growth Fund and the Small Cap Value Fund have adopted Distribution Plans relating to their Retail Class shares (the “Retail Class Plan”) and the Small Cap Value Fund has adopted a separate Distribution Plan relating to its Admin Class shares (the “Admin Class Plan”).
Under the respective Retail Class and Admin Class Plans, each Fund pays Natixis Distributors a monthly distribution fee at an annual rate not to exceed 0.25% of the average daily net assets attributable to the Fund’s Retail Class and Admin Class Shares, as reimbursement for expenses incurred by Natixis Distributors in providing personal services to investors in Retail Class and Admin Class Shares and/or maintenance of shareholder accounts. In addition, the Admin Class shares of the Small Cap Value Fund may pay an administrative service fee, at an annual rate not to exceed 0.25% of the average daily net assets attributable to Admin Class shares, to securities dealers or financial intermediaries for providing personal service and account maintenance for their customers who hold such shares.
For the six months ended March 31, 2008, the Funds paid the following service and distribution fees:
| | | | | | | | | |
| | | Service Fees | | Distribution Fees |
Fund | | Admin
Class | | Retail
Class | | Admin
Class |
Mid Cap Growth Fund | | $ | — | | $ | 64,933 | | $ | — |
Small Cap Growth Fund | | | — | | | 41,549 | | | — |
Small Cap Value Fund | | | 94,462 | | | 558,399 | | | 94,462 |
Tax-Managed Equity Fund | | | — | | | — | | | — |
d. Sub-Transfer Agent Fees. Natixis Distributors has entered into agreements with financial intermediaries to provide certain recordkeeping, processing, shareholder communications and other services to customers of the intermediaries and has agreed to compensate the intermediaries for providing those services. Certain services would be provided by the Funds if the shares of those customers were registered directly with the Funds’ transfer agent. Accordingly, the Funds agreed to pay a portion of the intermediary fees attributable to shares of the Fund held by the intermediary (which generally is a percentage of the value of shares held) not exceeding what the Funds would have paid its transfer agent had each customer’s shares been registered directly with the transfer agent instead of held through the intermediary. Natixis Distributors pays the remainder of the fees. Listed below are the fees incurred by the Funds which are included in the transfer agent fees and expenses in the Statements of Operations.
| | | | | | | | | |
| | | Sub-Transfer Agent Fees |
Fund | | Institutional
Class | | Retail
Class | | Admin
Class |
Mid Cap Growth Fund | | $ | 3,728 | | $ | 14,071 | | $ | — |
Small Cap Growth Fund | | | 4,005 | | | 12,866 | | | — |
Small Cap Value Fund | | | 81,523 | | | 346,925 | | | 111,203 |
Tax-Managed Equity Fund | | | 72 | | | — | | | — |
e. Trustees Fees and Expenses. The Fund does not pay any compensation directly to its officers or Trustees who are directors, officers or employees of Natixis Advisors, Natixis Distributors, Natixis US, or their affiliates. The Chairperson of the Board
46
NOTES TO FINANCIAL STATEMENTS – continued
March 31, 2008 (Unaudited)
receives a retainer fee at the annual rate of $200,000. The Chairperson does not receive any meeting attendance fees for Board of Trustees meetings or committee meetings that she attends. Each independent Trustee (other than the Chairperson) receives, in the aggregate, a retainer fee at the annual rate of $65,000. Each independent Trustee also receives a meeting attendance fee of $7,500 for each meeting of the Board of Trustees that he or she attends in person and $3,750 for each meeting of the Board of Trustees that he or she attends telephonically. In addition, each committee chairman receives an additional retainer fee at the annual rate of $10,000. Each Contract Review and Governance Committee member is compensated $5,000 for each Committee meeting that he or she attends in person and $2,500 for each meeting that he or she attends telephonically. Each Audit Committee member is compensated $6,250 for each Committee meeting that he or she attends in person and $3,125 for each meeting that he or she attends telephonically. These fees are allocated among the Funds in the Natixis Funds Trusts, Loomis Sayles Funds Trusts and the Hansberger International Series based on a formula that takes into account, among other factors, the relative net assets of each Fund. Trustees are reimbursed for travel expenses in connection with attendance at meetings.
Prior to January 1, 2008, each Independent Trustee (other than the Chairperson) received, in the aggregate, a retainer fee at the annual rate of $55,000. Each Independent Trustee also received a meeting attendance fee of $6,000 for each meeting of the Board of Trustees that he or she attended in person and $3,000 for each meeting that he or she attended telephonically. In addition, each Contract Review and Governance Committee member received $4,000 for each committee meeting that he or she attended in person and $2,000 for each committee meeting that he or she attended telephonically. Each Audit Committee member received $5,000 for each committee meeting that he or she attended in person and $2,500 for each committee meeting that he or she attended telephonically. The Chairperson of the Board and committee chair retainers were $200,000 and $10,000, respectively.
A deferred compensation plan (the “Plan”) is available to the Trustees on a voluntary basis. Each participating Trustee will receive an amount equal to the value that such deferred compensation would have been had it been invested in a designated Fund or certain other Funds of the Natixis Funds Trusts, Loomis Sayles Funds Trusts and the Hansberger International Series on the normal payment date. Deferred amounts remain in the Funds until distributed in accordance with the Plan.
f. Redemption Fees. Shareholders of Small Cap Growth Fund and Small Cap Value Fund are charged a 2% redemption fee if they redeem, including redeeming by exchange, any class of shares of such Funds within 60 days of their acquisition (including acquisition by exchange). The redemption fee is intended to offset the costs to the Funds of short-term trading, such as portfolio transaction and market impact costs associated with redemption activity and administrative costs associated with processing redemptions. The redemption fee is deducted from the shareholder’s redemption or exchange proceeds and is paid to the Fund.
The “first-in, first-out” method is used to determine the holding period of redeemed or exchanged shares, which means that if a shareholder acquired shares on different days, the shares acquired first will be redeemed or exchanged first for purposes of determining whether the redemption fee applies. A new holding period begins with each purchase or exchange. These fees are accounted for as an addition to paid-in capital and are presented on the Statements of Changes in Net Assets.
5. Line of Credit. Each Fund, together with certain other funds of Natixis Funds Trusts, Loomis Sayles Funds Trusts and the Hansberger International Series, participates in a $200,000,000 committed line of credit provided by State Street Bank, with an individual limit of $125,000,000 for each Fund that participates in the line of credit. Interest is charged to each participating fund based on its borrowings at a rate per annum equal to the Federal Funds rate plus 0.50%. In addition, a commitment fee of 0.09% per annum, payable at the end of each calendar quarter, is accrued and apportioned among the participating funds based on their average daily unused portion of the line of credit. For the six months ended March 31, 2008, the Funds had no borrowings under this agreement.
Prior to March 12, 2008, each fund together with certain other funds of Natixis Funds Trusts, Loomis Sayles Funds Trusts and Hansberger International Series, participated in a $75,000,000 committed line of credit provided by State Street Bank.
6. Brokerage Commission Recapture. Each Fund has entered into agreements with certain brokers whereby the brokers will rebate a portion of brokerage commissions. All amounts rebated by the brokers are returned to the Funds under such agreements and are included in realized gains in the Statements of Operations. For the six months ended March 31, 2008, amounts rebated under these agreements were as follows:
| | | |
Fund | | Rebates |
Mid Cap Growth Fund | | $ | 14,520 |
Small Cap Growth Fund | | | 6,996 |
Small Cap Value Fund | | | 62,006 |
Tax-Managed Equity Fund | | | 616 |
47
7. Shareholders. At March 31, 2008, the Loomis Sayles Funded Pension Plan (“Pension Plan”) and the Loomis Sayles Employees’ Profit Sharing Retirement Plan held shares of beneficial interest in the Funds as follows:
| | | | |
Fund | | Pension Plan | | Profit Sharing
Retirement Plan |
Mid Cap Growth Fund | | 325,144 | | 343,288 |
Small Cap Growth Fund | | 381,184 | | 382,009 |
Small Cap Value Fund | | 371,979 | | 733,841 |
Tax-Managed Equity Fund | | — | | — |
At March 31, 2008, three shareholders individually owned more than 5% of the Tax-Managed Equity Fund’s total outstanding shares, representing, in aggregate, 19.03% of the Fund.
8. Capital Shares. Each Fund may issue an unlimited number of shares of beneficial interest, without par value. Transactions in capital shares were as follows:
| | | | | | | | | | | | | | |
| | | Mid Cap Growth Fund | |
| | |
| | | Six Months Ended March 31, 2008 | | | Year Ended September 30, 2007 | |
| | | | |
| Institutional Class | | Shares | | | Amount | | | Shares | | | Amount | |
Issued from the sale of shares | | 434,821 | | | $ | 12,366,299 | | | 122,987 | | | $ | 2,932,877 | |
Issued in connection with the
reinvestment of distributions | | — | | | | — | | | — | | | | — | |
Redeemed | | (208,611 | ) | | | (5,464,972 | ) | | (113,087 | ) | | | (2,616,811 | ) |
| | | | | | | | | | | | | | |
Net change | | 226,210 | | | $ | 6,901,327 | | | 9,900 | | | $ | 316,066 | |
| | | | | | | | | | | | | | |
| | | | |
| Retail Class | | Shares | | | Amount | | | Shares | | | Amount | |
Issued from the sale of shares | | 3,157,549 | | | $ | 81,916,486 | | | 404,396 | | | $ | 9,618,611 | |
Issued in connection with the
reinvestment of distributions | | — | | | | — | | | — | | | | — | |
Redeemed | | (439,102 | ) | | | (11,470,194 | ) | | (616,665 | ) | | | (14,067,412 | ) |
| | | | | | | | | | | | | | |
Net change | | 2,718,447 | | | $ | 70,446,292 | | | (212,269 | ) | | $ | (4,448,801 | ) |
| | | | | | | | | | | | | | |
Increase (decrease) from capital
share transactions | | 2,944,657 | | | $ | 77,347,619 | | | (202,369 | ) | | $ | (4,132,735 | ) |
| | | | | | | | | | | | | | |
| |
| | | Small Cap Growth Fund | |
| | |
| | | Six Months Ended March 31, 2008 | | | Year Ended September 30, 2007 | |
| | | | |
| Institutional Class | | Shares | | | Amount | | | Shares | | | Amount | |
Issued from the sale of shares | | 1,611,457 | | | $ | 23,847,625 | | | 227,764 | | | $ | 3,236,460 | |
Issued in connection with the
reinvestment of distributions | | — | | | | — | | | — | | | | — | |
Redeemed | | (252,417 | ) | | | (3,596,454 | ) | | (158,397 | ) | | | (2,160,742 | ) |
| | | | | | | | | | | | | | |
Net change | | 1,359,040 | | | $ | 20,251,171 | | | 69,367 | | | $ | 1,075,718 | |
| | | | | | | | | | | | | | |
| | | | |
| Retail Class | | Shares | | | Amount | | | Shares | | | Amount | |
Issued from the sale of shares | | 4,312,171 | | | $ | 59,434,837 | | | 1,247,066 | | | $ | 17,800,763 | |
Issued in connection with the
reinvestment of distributions | | — | | | | — | | | — | | | | — | |
Redeemed | | (952,937 | ) | | | (12,972,164 | ) | | (147,091 | ) | | | (1,980,257 | ) |
| | | | | | | | | | | | | | |
Net change | | 3,359,234 | | | $ | 46,462,673 | | | 1,099,975 | | | $ | 15,820,506 | |
| | | | | | | | | | | | | | |
Increase (decrease) from capital
share transactions | | 4,718,274 | | | $ | 66,713,844 | | | 1,169,342 | | | $ | 16,896,224 | |
| | | | | | | | | | | | | | |
48
NOTES TO FINANCIAL STATEMENTS – continued
March 31, 2008 (Unaudited)
| | | | | | | | | | | | | | |
| | | Small Cap Value Fund | |
| | |
| | | Six Months Ended March 31, 2008 | | | Year Ended September 30, 2007 | |
| | | | |
| Institutional Class | | Shares | | | Amount | | | Shares | | | Amount | |
Issued from the sale of shares | | 3,787,839 | | | $ | 93,018,647 | | | 3,665,690 | | | $ | 103,476,796 | |
Issued in connection with the
reinvestment of distributions | | 1,942,238 | | | | 49,352,283 | | | 1,908,336 | | | | 50,494,585 | |
Redeemed | | (2,536,374 | ) | | | (63,077,483 | ) | | (2,978,936 | ) | | | (83,598,708 | ) |
| | | | | | | | | | | | | | |
Net change | | 3,193,703 | | | $ | 79,293,447 | | | 2,595,090 | | | $ | 70,372,673 | |
| | | | | | | | | | | | | | |
| | | | |
| Retail Class | | Shares | | | Amount | | | Shares | | | Amount | |
Issued from the sale of shares | | 5,640,655 | | | $ | 136,600,853 | | | 9,567,844 | | | $ | 267,672,472 | |
Issued in connection with the
reinvestment of distributions | | 1,850,508 | | | | 46,632,804 | | | 1,279,692 | | | | 33,617,503 | |
Redeemed | | (3,632,498 | ) | | | (88,303,370 | ) | | (5,159,588 | ) | | | (145,568,951 | ) |
| | | | | | | | | | | | | | |
Net change | | 3,858,665 | | | $ | 94,930,287 | | | 5,687,948 | | | $ | 155,721,024 | |
| | | | | | | | | | | | | | |
| | | | |
| Admin Class | | Shares | | | Amount | | | Shares | | | Amount | |
Issued from the sale of shares | | 1,164,673 | | | $ | 28,348,156 | | | 1,317,587 | | | $ | 35,992,658 | |
Issued in connection with the
reinvestment of distributions | | 271,956 | | | | 6,747,215 | | | 292,721 | | | | 7,599,049 | |
Redeemed | | (676,254 | ) | | | (16,135,216 | ) | | (1,252,476 | ) | | | (34,632,190 | ) |
| | | | | | | | | | | | | | |
Net change | | 760,375 | | | $ | 18,960,155 | | | 357,832 | | | $ | 8,959,517 | |
| | | | | | | | | | | | | | |
Increase (decrease) from capital
share transactions | | 7,812,743 | | | $ | 193,183,889 | | | 8,640,870 | | | $ | 235,053,214 | |
| | | | | | | | | | | | | | |
| |
| | | Tax-Managed Equity Fund | |
| | |
| | | Six Months Ended March 31, 2008 | | | Year Ended September 30, 2007 | |
| | | | |
| Institutional Class | | Shares | | | Amount | | | Shares | | | Amount | |
Issued from the sale of shares | | 58,225 | | | $ | 632,094 | | | 136,117 | | | $ | 1,473,501 | |
Issued in connection with the
reinvestment of distributions | | 9,661 | | | | 111,971 | | | 6,824 | | | | 70,495 | |
Redemptions-in-kind* | | | | | | | | | (261,354 | ) | | | (2,702,405 | ) |
Redeemed | | (12,413 | ) | | | (132,937 | ) | | (203,597 | ) | | | (2,186,419 | ) |
| | | | | | | | | | | | | | |
Increase (decrease) from capital
share transactions | | 55,473 | | | $ | 611,128 | | | (322,010 | ) | | $ | (3,344,828 | ) |
| | | | | | | | | | | | | | |
* On October 20, 2006, Natixis US liquidated its position of 261,354 shares. This was accomplished through a redemption-in-kind which included $2,453,150 of securities and $249,255 in cash. | |
49

Loomis Sayles Bond Fund
Loomis Sayles Fixed Income Fund
Loomis Sayles Global Bond Fund
Loomis Sayles Inflation Protected Securities Fund
Loomis Sayles Institutional High Income Fund
Loomis Sayles Intermediate Duration Fixed Income Fund
Loomis Sayles Investment Grade Fixed Income Fund
SEMIANNUAL REPORT
MARCH 31, 2008 (Unaudited)
FUND AND MANAGER REVIEW
Loomis Sayles Bond Fund
| | |
 Daniel Fuss, CFA, CIC Manager since May 1991 | | 
Matthew Eagan, CFA Associate Manager since February 2007 |

Kathleen Gaffney, CFA Manager since October 1997 | | 
Elaine Stokes Associate Manager since February 2007 |
PORTFOLIO REVIEW
The Fund underperformed its Benchmark, the Lehman US Government/Credit Index, for the six months ended March 31, 2008, primarily due to poor performance from our high yield bond holdings and an underweight in securities with AAA and A ratings.
Most high yield bonds declined in value during the period, notably in the industrial sector, and we had a large allocation to this sector. In the investment grade arena, finance companies were bogged down by their exposure to the subprime market and further stymied by the lack of market liquidity. Communication issues also struggled, as investors grew increasingly concerned about access to capital markets. In addition, consumer cyclicals weighed on returns, in large part because of their exposure to higher energy costs and sagging demand from an increasingly cash-strapped public.
Inflation fears dragged down our positions in the Canadian dollar, British pound and Icelandic krona, while illiquidity and risk-aversion hampered the Fund’s convertible bonds.
On the upside, our defensive duration strategy had a positive influence on performance. From a quality perspective, bonds rated AA contributed the majority of positive returns. Our exposure to the brokerage sector helped performance, including our position in Bear Stearns, which rallied after the Federal Reserve facilitated JP Morgan’s purchase of the ailing firm. Other top industry performers included energy providers, which benefited from record-high commodity prices, and banking firms. Capital infusions from sovereign funds to major banking corporations hit by the subprime crisis also bolstered returns in the first half of the period.
Our currency positions in the Malaysian ringgit and the Singapore and Australian dollar contributed positively to performance. In addition, the Mexican peso recovered to become the overall currency leader for the period.
OUTLOOK
Although the US economy has weakened, we see pockets of strength. For example, the industrial sector appears to be vital relative to other economic areas; the weak US dollar is improving the outlook for exports; corporate spending remains disciplined; and non-residential construction is booming. We believe the Federal Reserve will ease once more before holding the fed funds target steady at 2.00%, while continuing to use other methods to maintain liquidity, as necessary. By year-end, we believe the economy may show signs of recovery.
FUND FACTS
Symbol | Institutional: LSBDX;
Retail: LSBRX; Admin: LBFAX
Objective | High total investment return through a combination of current income and capital appreciation
Strategy | Invests primarily in investment-grade fixed-income securities, although it may invest up to 35% of assets in lower rated fixed-income securities and up to 20% of its assets in preferred stocks. The Fund may invest any portion of its assets in Canadian securities and up to 20% of assets in other foreign securities, including emerging markets securities.
Fund Inception Date | 5/16/91
Commencement of Operations of Class | Institutional: 5/16/91; Retail: 1/2/97; Admin: 1/2/98
Total Net Assets | $16,980.3 million
1
In our view, valuations outside the Treasury sector are attractive. The shaky economy poses risks, but the market appears to have priced in a more dismal scenario than we expect. Longer-term, we believe risk spreads should become less widespread, enabling markets to price risk more appropriately. Specific US high yield securities may offer compelling relative value, but the potential for further fallout calls for caution. Near-term, we believe the US dollar may have further downside potential, as non-Japanese Asian currencies strengthen.
AVERAGE ANNUAL TOTAL RETURNS
Periods Ended March 31, 2008
| | | | | | | | | | | | | |
| 6 Months | | | 1 Year | | | 5 Years | | | 10 Years | | | Since
Inception(a) | |
| Loomis Sayles Bond: Institutional | |
| -0.59 | % | | 4.53 | % | | 10.74 | % | | 8.57 | % | | 10.81 | % |
| Loomis Sayles Bond: Retail(c) | |
| -0.74 | | | 4.24 | | | 10.46 | | | 8.29 | | | 10.53 | |
| Loomis Sayles Bond: Admin(c) | |
| -0.87 | | | 3.98 | | | 10.18 | | | 8.02 | | | 10.04 | |
| Lehman US Government/Credit Index(d) | |
| 5.71 | | | 8.35 | | | 4.62 | | | 6.12 | | | 7.11 | |
| Lipper BBB-Rated Funds Index(d) | |
| 1.69 | | | 3.52 | | | 5.02 | | | 5.30 | | | 6.86 | |
| | | | | | | |
| Gross Expense Ratio (before reductions and reimbursements)* | |
| Institutional: 0.67 | % | | Retail: 0.97 | % | | Admin: 1.24 | % |
| Net Expense Ratio (after reductions and reimbursements)* | |
| Institutional: 0.67 | % | | Retail: 0.95 | % | | Admin: 1.20 | % |
* As stated in the most recent prospectus
CUMULATIVE PERFORMANCE(e)
Inception to March 31, 2008(b)
Data quoted reflects past performance and cannot guarantee future results. Average annual total returns assume reinvestment of dividends and capital gains distributions. Investment return and principal value will fluctuate so that shares, when redeemed, may be worth more or less than their original cost. For performance current to the most recent month-end, please visit the Loomis Sayles website. Current performance may be higher or lower than quoted.
Returns do not reflect the taxes that a shareholder would pay on Fund distributions or the redemption of shares. Periods of less than one year are not annualized. Performance data reflects certain fee reductions and reimbursements, if any, without which performance would be lower.
(a) Inception dates of the Institutional, Retail and Admin Classes of shares are May 16, 1991, December 31, 1996 and January 2, 1998, respectively. (b) The mountain chart is based on the initial minimum investment of $100,000 for the Institutional Class. (c) Performance shown for periods prior to the inception date of the Retail Class and the Admin Class represents the performance of the Institutional Class during the periods shown, adjusted to reflect the current levels of 12b-1 fees payable by the respective classes of shares. (d) See page 15 for a description of the indices. Index performance data is not available coincident with the Fund’s inception date; the beginning value of the index is the value as of the month end closest to the Fund’s inception date. (e) Cumulative performance is shown for the Institutional Class of shares. Performance of the Retail and Admin Classes would be lower, due to higher fees.
WHAT YOU SHOULD KNOW
The Fund can invest a significant percentage of assets in debt securities that are rated below investment grade and the value of fund shares can be adversely affected by changes in economic conditions or other circumstances. Lower rated debt securities have speculative characteristics and may be subject to greater price volatility than higher rated investments. In addition, the secondary market for these securities may lack liquidity. Fund shares should be viewed as a long-term investment. Securities issued by US government agencies are not insured by and may not be guaranteed by the US government. The Fund can invest a significant percentage of assets in foreign securities and the value of the fund shares can be adversely affected by changes in currency exchange rates, political, and economic developments. In emerging markets these risks can be significant. The Fund is subject to currency risk, which is the risk that fluctuations in exchange rates between the US dollar and foreign currencies may cause the value of a Fund’s investments to decline. Accordingly, the purchase of fund shares should be viewed as a long-term investment.
2
FUND AND MANAGER REVIEW
Loomis Sayles Fixed Income Fund
| | |
Daniel Fuss, CFA, CIC Manager since January 1995 | |
Matthew Eagan, CFA Associate Manager since
February 2007 |
Kathleen Gaffney, CFA Associate Manager since February 2007 | |
Elaine Stokes Associate Manager since February 2007 |
PORTFOLIO REVIEW
The Fund underperformed its Benchmark, the Lehman US Government/Credit Index, for the six months ended March 31, 2008, primarily due to poor performance from our high yield bond holdings and an underweight in US Treasurys and other securities with AAA ratings.
Most of the high yield market suffered during the period, especially in the industrial sector, where our large allocation detracted from results. In the investment grade arena, communication issues struggled as investors grew increasingly concerned about access to capital markets. Consumer cyclicals also weighed on returns, partly because of their exposure to higher energy costs and sagging demand from an increasingly cash-strapped public. In addition, finance companies were bogged down by their exposure to the subprime market and the lack of market liquidity.
Our positions in the Canadian dollar, British pound and Icelandic krona were hurt by inflation fears, while the Fund’s convertible bonds suffered from illiquidity and risk aversion.
Our defensive duration strategy was a positive influence on performance. From a quality perspective, bonds rated A and AA were the strongest performers during the period. Our exposure to the insurance and banking industries and sovereign funds helped performance. Capital infusions from sovereign funds to major banking corporations hit by the subprime crisis bolstered returns in the first half of the period.
Our currency positions in the Singapore and New Zealand dollar and the Brazilian real contributed positively to performance. In addition, the Mexican peso recovered to become the overall currency leader for the period.
OUTLOOK
Although the US economy has weakened, we see pockets of strength. For example, the industrial sector is showing relative strength; the weak US dollar may stimulate business for export companies; corporate spending remains disciplined; and nonresidential construction is booming. We believe the Federal Reserve will ease once more before holding the fed funds target rate steady at 2.00%, while continuing to use other methods to maintain liquidity, as necessary. By year-end, we believe the economy may show signs of recovery.
In our view, valuations outside the Treasury sector remain attractive. The shaky economy poses risks, but bond valuations appear to reflect a more dismal scenario than we expect. Longer-term, we believe risk spreads should become less widespread, enabling markets to price risk
FUND FACTS
Symbol | LSFIX
Objective | High total investment return through a combination of current income and capital appreciation
Strategy | Invests primarily in fixed-income securities, may invest up to 35% of its assets in lower-rated fixed-income securities and up to 20% of its assets in preferred stocks. The Fund may invest any portion of its assets in Canadian securities and up to 20% of assets in other foreign securities, including emerging markets securities.
Fund Inception Date | 1/17/95
Fund Registration Date | 3/7/97
Total Net Assets | $624.7 million
3
more appropriately. Specific US high yield securities may offer compelling relative value, but the potential for further fallout calls for caution. Near term, we believe the US dollar may have further downside potential, while non-Japanese Asian currencies continue to strengthen.
AVERAGE ANNUAL TOTAL RETURNS
Periods Ended March 31, 2008
| | | | | | | | | | | | | | | | |
| 6 Months | | | 1 Year | | | 5 Years | | | 10 Years | | | Since
Registration(a) | | | Since
Inception(a) | |
| Loomis Sayles Fixed Income: Institutional | |
| 0.13 | % | | 5.36 | % | | 11.30 | % | | 8.64 | % | | 9.17 | % | | 10.56 | % |
| Lehman US Government/Credit Index(b) | |
| 5.71 | | | 8.35 | | | 4.62 | | | 6.12 | | | 6.51 | | | 6.98 | |
| Lipper BBB-Rated Funds Index(b) | |
| 1.69 | | | 3.52 | | | 5.02 | | | 5.30 | | | 5.78 | | | 6.59 | |
| | | | | |
| Gross Expense Ratio (before reductions and reimbursements)* |
| Institutional: 0.60 | % | | | | |
| Net Expense Ratio (after reductions and reimbursements)* |
| Institutional: 0.60 | % | | | | |
* As stated in the most recent prospectus
CUMULATIVE PERFORMANCE
Registration to March 31, 2008(c)
Inception to March 31, 2008(c)
Data quoted reflects past performance and cannot guarantee future results. Average annual total returns assume reinvestment of dividends and capital gains distributions. Investment return and principal value will fluctuate so that shares, when redeemed, may be worth more or less than their original cost. For performance current to the most recent month end, please visit the Loomis Sayles website. Current performance may be higher or lower than quoted.
Returns do not reflect the taxes that a shareholder would pay on Fund distributions or the redemption of shares. Periods of less than one year are not annualized. Performance data reflects certain fee reductions and reimbursements, if any, without which performance would be lower.
(a) Shares of the Fund were registered for offer and sale under the Securities Act of 1933 on March 7, 1997. In accordance with regulations, performance information is provided for the period beginning on March 7, 1997 (“Registration”). Performance from inception is also provided for the convenience of our long-term shareholders. Since index performance data is not available coincident with the Fund’s inception and registration dates, comparative performance is presented from the month end closest to the Fund’s inception and registration dates. (b) See page 15 for a description of the indices. (c) The mountain chart is based on the Fund’s minimum initial investment of $3,000,000.
WHAT YOU SHOULD KNOW
The Fund can invest a significant percentage of assets in debt securities that are rated below investment grade and the value of fund shares can be adversely affected by changes in economic conditions or other circumstances. Lower rated debt securities have speculative characteristics and may be subject to greater price volatility than higher rated investments. In addition, the secondary market for these securities may lack liquidity. Fund shares should be viewed as a long-term investment. Securities issued by US government agencies are not insured by and may not be guaranteed by the US government. The Fund can invest a significant percentage of assets in foreign securities and the value of the fund shares can be adversely affected by changes in currency exchange rates, political, and economic developments. In emerging markets these risks can be significant. The Fund is subject to currency risk, which is the risk that fluctuations in exchange rates between the US dollar and foreign currencies may cause the value of a Fund’s investments to decline. Accordingly, the purchase of fund shares should be viewed as a long-term investment.
4
FUND AND MANAGER REVIEW
Loomis Sayles Global Bond Fund

Ken Buntrock, CFA, CIC
Manager since September 2000

David Rolley, CFA
Manager since September 2000

Lynda Schweitzer, CFA
Manager since February 2007
PORTFOLIO REVIEW
The Fund underperformed its Benchmark, the Lehman Global Aggregate Bond Index, for the six months ended March 31, 2008, primarily due to its overweight in corporate bonds. With the exception of commodities, most asset classes underperformed government bonds during the period.
We added to the Fund’s corporate bond holdings during the period by lowering the Fund’s exposure to high-quality government, quasi-government and securitized issuers. This strategy hurt relative performance, as the investment grade and high yield bond markets underperformed government bonds in the United States, United Kingdom and Europe. However, we began to see the benefits of the Fund’s sector positioning in the second half of March, as spreads stabilized or tightened.
Our country allocation was marginally positive. An underweight position in Canada and overweight positions in Malaysia, Poland and Sweden detracted, while our overweight in the US bond market and underweight in euro-denominated issues enhanced performance. The Fund’s overall currency strategy detracted from relative performance, as gains in select Southeast Asian and euro-peripheral currencies could not offset the negative impact of our underweight positions in the yen and euro.
Our duration/yield curve positioning had a slightly positive impact on relative performance. A longer-than-Benchmark duration in the United States and Europe enhanced returns, as deteriorating market conditions led to lower bond yields. We extended duration in the yen-pay market to a Benchmark-neutral position, but our short-duration position detracted from performance earlier in the period.
OUTLOOK
Credit spreads continued to widen in March and turmoil may have peaked with the collapse of Bear Stearns, a significant Federal Reserve rate cut, and the opening of the discount window to US broker-dealers. We believe US authorities responded to a heart attack in the financial system with the equivalent of a bypass operation. With the Federal Reserve apparently determined not to let broker/dealers fail and allowing them to borrow at a discount, we believe the upward spiral in risk aversion will be capped, and risk spreads will become more issue-specific.
Because we anticipate a relatively mild US recession, we favor corporate bonds, including select high yield names with stable cash flow. We are adding longer maturity bonds, increasing spread duration as a result, but we have reduced Treasury exposure. We believe near term trends suggest wider economic growth and interest rate gaps with Europe, meaning downside risks persist for the US dollar. We are duration-neutral in the yen and euro.
FUND FACTS
Symbol | Institutional: LSGBX;
Retail: LSGLX
Objective | High total investment return through a combination of high current income and capital appreciation
Strategy | Invests primarily in investment-grade fixed-income securities worldwide, although it may invest up to 20% of assets in lower-rated fixed-income securities.
Fund Inception Date | 5/10/91
Commencement of Operations of Class | Institutional: 5/10/91; Retail: 1/2/97
Total Net Assets | $2,512.4 million
5
The prospect of a near term correction in the commodities markets is keeping us underweight in the volatile commodity currencies.
Based on our outlook, we want the Fund to have greater exposure to the US dollar and to credit spreads long term, while maintaining its overweight in non-Japanese Asian currencies.
AVERAGE ANNUAL TOTAL RETURNS
Periods Ended March 31, 2008
| | | | | | | | | | | | | |
| 6 Months | | | 1 Year | | | 5 Years | | | 10 Years | | | Since
Inception(a) | |
| Loomis Sayles Global Bond: Institutional | |
| 6.86 | % | | 11.51 | % | | 8.23 | % | | 8.17 | % | | 8.65 | % |
| Loomis Sayles Global Bond: Retail(b) | |
| 6.66 | | | 11.10 | | | 7.94 | | | 7.89 | | | 8.46 | |
| Lehman Global Aggregate Bond Index(c) | |
| 10.11 | | | 15.25 | | | 7.32 | | | 6.64 | | | 7.45 | |
| Lipper Global Income Funds Index(c) | |
| 5.04 | | | 8.60 | | | 6.63 | | | 5.56 | | | 6.44 | |
| | | | | | |
| Gross Expense Ratio (before reductions and reimbursements)* |
| Institutional: 0.68 | % | | Retail: 1.04 | % | | |
| Net Expense Ratio (after reductions and reimbursements)* |
| Institutional: 0.68 | % | | Retail: 1.00 | % | | |
* As stated in the most recent prospectus
CUMULATIVE PERFORMANCE(d)
Inception to March 31, 2008(e)
Data quoted reflects past performance and cannot guarantee future results. Average annual total returns assume reinvestment of dividends and capital gains distributions. Investment return and principal value will fluctuate so that shares, when redeemed, may be worth more or less than their original cost. For performance current to the most recent month-end, please visit the Loomis Sayles website. Current performance may be higher or lower than quoted.
Returns do not reflect the taxes that a shareholder would pay on Fund distributions or the redemption of shares. Periods of less than one year are not annualized. Performance data reflects certain fee reductions and reimbursements, if any, without which performance would be lower.
(a) Since index performance data is not available coincident with the Fund’s inception date, the beginning value of the index is the value as of the month end closest to the Fund’s inception date. (b) Performance shown for periods prior to the inception date of the Retail Class (12/31/96) represents the performance of the Institutional Class during the periods shown, adjusted to reflect the current levels of 12b-1 fees payable by the respective Classes of shares. (c) See page 15 for a description of the indices. (d) Cumulative performance is shown for the Institutional Class. Performance of the Retail Class would be lower due to higher fees. (e) The mountain chart is based on the Institutional Class minimum initial investment of $100,000.
WHAT YOU SHOULD KNOW
The Fund can invest a significant percentage of assets in debt securities that are rated below investment grade and the value of fund shares can be adversely affected by changes in economic conditions or other circumstances. Lower rated debt securities have speculative characteristics and may be subject to greater price volatility than higher rated investments. In addition, the secondary market for these securities may lack liquidity. Fund shares should be viewed as a long-term investment. Securities issued by US government agencies are not insured by and may not be guaranteed by the US government. The Fund can invest a significant percentage of assets in foreign securities and the value of the fund shares can be adversely affected by changes in currency exchange rates, political, and economic developments. In emerging markets these risks can be significant. The Fund is subject to currency risk, which is the risk that fluctuations in exchange rates between the US dollar and foreign currencies may cause the value of a Fund’s investments to decline. Accordingly, the purchase of fund shares should be viewed as a long-term investment.
6
FUND AND MANAGER REVIEW
Loomis Sayles Inflation Protected Securities Fund

John Hyll
Manager since January 2003

Cliff Rowe, CFA
Manager since January 2003
PORTFOLIO REVIEW
The Fund underperformed its Benchmark, the Lehman US Treasury Inflation Protected Securities Index, for the six months ended March 31, 2008, primarily due to the Fund’s overweight exposure to high yield bonds, which experienced significant spread widening during the period.
The real yield on 10-year Treasury Inflation Protected Securities (TIPS) declined by 117 basis points during the period to 1.1%. Five year TIPS declined even further, falling 206 basis points to 0.11%. Declining yields and the steepening of the yield curve reflected investors’ gloomy outlook for employment and overall economic growth. The Federal Reserve maintained an aggressive easing policy, lowering the fed funds target rate by 250 basis points to 2.25% to help temper the downside risks to the economy.
The main driver of the Fund’s performance was its exposure to US TIPS, which represented approximately 80% of the Fund’s total net assets at the end of March 2008. Declining interest rates, slightly widening breakevens and headlines about inflation led to positive results for TIPS. The Fund’s longer average duration contributed to its performance. On the negative side, the Fund’s laddered maturity structure did not work well as the yield curve steepened.
The Fund’s exposure to the energy sector yielded positive results, as the price of oil soared. However, this was not sufficient to offset negative results from other credit sectors, including telecommunications and financials.
Foreign-currency exposure also contributed positively to performance. Specifically, the Fund’s non-dollar holdings in Mexico benefited from the weakness in the US dollar.
OUTLOOK
Although the US economy has weakened, we see pockets of strength. For example, the industrial sector is showing relative strength; the weak US dollar may stimulate exports; corporate spending remains disciplined; and non-residential construction is booming. We believe the Federal Reserve will ease once more before holding the fed funds target rate steady at 2.00%, while they continue to use other methods to maintain liquidity, as needed. By year-end, we believe the economy may show signs of recovery.
In our view, valuations outside the Treasury sector remain attractive. The shaky economy poses risks, but bond prices appear to reflect a more dismal scenario than we expect. Longer term, risk spreads should become less widespread, enabling markets to price risk more appropriately.
FUND FACTS
Symbol | LSGSX
Objective | High total investment return through a combination of current income and capital appreciation
Strategy | Invests primarily in inflation-protected securities with emphasis on debt securities issued by the US Treasury
Fund Inception Date | 5/21/91
Total Net Assets | $16.5 million
7
AVERAGE ANNUAL TOTAL RETURNS
Periods Ended March 31, 2008
| | | | | | | | | | | | | |
| 6 Months | | | 1 Year | | | 5 Years | | | 10 Years | | | Since
Inception(a) | |
| Loomis Sayles Inflation Protected Securities: Institutional | |
| 8.64 | % | | 12.46 | % | | 4.54 | % | | 6.29 | % | | 7.83 | % |
| Lehman US Treasury Inflation Protected Securities Index(b) | |
| 10.40 | | | 14.54 | | | 6.75 | | | 7.97 | | | N/A | |
| Lipper Treasury Inflation Protected Securities Index(b) | |
| 9.96 | | | 13.56 | | | N/A | | | N/A | | | N/A | |
| | | | | |
| Gross Expense Ratio (before reductions and reimbursements)* |
| Institutional: 1.28 | % | | | | |
| Net Expense Ratio (after reductions and reimbursements)* |
| Institutional: 0.40 | % | | | | |
* As stated in the most recent prospectus
CUMULATIVE PERFORMANCE
Inception to March 31, 2008(c)
Data quoted reflects past performance and cannot guarantee future results. Average annual total returns assume reinvestment of dividends and capital gains distributions. Investment return and principal value will fluctuate so that shares, when redeemed, may be worth more or less than their original cost. For performance current to the most recent month end, please visit the Loomis Sayles website. Current performance may be higher or lower than quoted.
For illustrative purposes, the chart above reflects the growth of a hypothetical investment of $100,000 in the Fund, since its inception. The chart above also reflects the growth of a hypothetical investment in the former primary benchmark of the Fund, the Lehman US Government Bond Index (the “Former Benchmark”), compared to the performance of the Fund from the Fund’s inception date through December 31, 2004. On December 15, 2004, in connection with a change of the Fund’s investment objective, the Fund changed its primary benchmark to the Lehman US Treasury Inflation Protected Securities Index (the “New Benchmark”). Since index performance data is not available coincident with the date of the Fund’s strategy change, comparative data for the Fund’s New Benchmark begins on December 31, 2004. The chart above reflects the growth of a hypothetical investment in the New Benchmark, compared to the performance of the Fund, from December 31, 2004, through March 31, 2008. The chart above also compares the performance of the Fund to the Lipper Treasury Inflation Protected Securities Funds Index from December 31, 2004 and through March 31, 2008. The performance of the New Benchmark and of the Lipper Treasury Inflation Protected Securities Funds Index was linked to the performance of the Former Benchmark as of December 31, 2004.
Returns do not reflect the taxes that a shareholder would pay on fund distributions or the redemption of shares. Periods of less than one year are not annualized. Performance data reflects certain fee reductions and reimbursements, if any, without which performance would be lower.
(a) Since index performance data is not available coincident with the Fund’s inception date, comparative performance is presented from the month end closest to the Fund’s inception date. (b) See page 15 for a description of the indices. Return data is not available for the Lehman US Treasury Inflation Protected Securities Index prior to March 1, 1997. Similarly, return data is not available for the Lipper Treasury Inflation Protected Securities Funds Index prior to July 1, 2003. (c) The mountain chart is based on the Fund’s minimum initial investment of $100,000.
WHAT YOU SHOULD KNOW
Securities issued by US government agencies are not insured by and may not be guaranteed by the US government. The Fund can invest a significant percentage of assets in foreign securities and the value of the fund shares can be adversely affected by changes in currency exchange rates, political, and economic developments. In emerging markets these risks can be significant. The Fund is subject to currency risk, which is the risk that fluctuations in exchange rates between the US dollar and foreign currencies may cause the value of a Fund’s investments to decline. Accordingly, the purchase of fund shares should be viewed as a long-term investment.
Effective December 15, 2004, the Fund’s name and investment strategy changed. The Fund’s strategy emphasizes inflation-protected debt securities issued by the US Treasury (TIPS). The principal value of the types of securities are periodically adjusted according to the rate of inflation and repayment of the original bonds is guaranteed by the US government.
8
FUND AND MANAGER REVIEW
Loomis Sayles Institutional High Income Fund
| | |
Daniel Fuss, CFA, CIC Manager since June 1996 | |
Matthew Eagan, CFA Associate Manager since
February 2007 |
Kathleen Gaffney, CFA Associate Manager since February 2007 | |
Elaine Stokes Associate Manager since February 2007 |
PORTFOLIO REVIEW
The Fund outperformed its Benchmark, the Lehman High Yield Index, for the six months ended March 31, 2008, primarily due to allocations and security selection in longer maturity US Treasurys and non-US-dollar corporate bonds.
US Treasurys outperformed other asset classes as yields on government securities rallied. Our allocation to long-duration Treasurys benefited from investors’ risk aversion and provided the bulk of the Fund’s excess return for the period. In addition, non-US-dollar-denominated investments remained a major source of positive performance. In particular, securities denominated in the Brazilian real benefited from the country’s robust local economy and strong currency. Growth in Mexico boosted our peso-based investments, while strong fundamentals supported attractive returns from securities issued in the New Zealand dollar and Thai baht.
Good security selection among investment grade credits added to excess return, with select high-quality financials turning in double-digits gains. While debt issues in below-investment grade financials suffered, an underweight allocation helped us recoup the losses and added to relative performance.
Yield spreads widened to levels not seen in many years, impacting returns on corporate bonds in general and high yield bonds in particular. From an industry perspective, certain financials (including real estate investment trusts and financial companies) and media issues were among the worst performers in absolute terms, but our underweight position relative to the Benchmark helped absolute performance. Conversely, electric, energy and consumer non-cyclical issues all generated positive absolute performance, although they detracted from performance on a relative basis because of our underweight.
OUTLOOK
Although the US economy has weakened, we see pockets of strength. For example, the industrial sector is showing relative strength; the weak US dollar may stimulate US exports; corporate spending remains disciplined; and non-residential construction is booming. We expect the Federal Reserve to ease once more before holding the fed funds target rate steady at 2.00%, while they continue to use other methods to maintain liquidity, as needed. By year-end, we believe the economy may show signs of recovery.
FUND FACTS
Symbol | LSHIX
Objective | High total investment return through a combination of current income and capital appreciation
Strategy | Invests in primarily lower-rated fixed-income securities and other securities that are expected to produce a relatively high level of income, (including income-producing preferred and common stocks).
The Fund may invest any portion of its assets in Canadian securities and up to 50% of assets in other foreign securities, including emerging markets securities.
Fund Inception Date | 6/5/96
Fund Registration Date | 3/7/97
Total Net Assets | $189.1 million
9
In our opinion, valuations outside the Treasury sector remain extraordinarily attractive. The shaky economy poses risks, but bond prices appear to reflect a more dismal scenario than we anticipate. Longer term, we believe risk spreads will become less widespread, enabling markets to price risk more appropriately. US high yield securities may offer compelling relative value on a security-specific basis, but the potential for further fallout calls for caution. Near term, we believe the US dollar may have further downside potential, as non-Japanese Asian currencies continue to gain strength.
AVERAGE ANNUAL TOTAL RETURNS
Periods Ended March 31, 2008
| | | | | | | | | | | | | | | | |
| 6 Months | | | 1 Year | | | 5 Years | | | 10 Years | | | Since
Registration(a) | | | Since
Inception(a) | |
| Loomis Sayles Institutional High Income: Institutional | |
| -2.44 | % | | -0.08 | % | | 14.18 | % | | 7.19 | % | | 7.94 | % | | 8.07 | % |
| Lehman High Yield Index(b) | |
| -4.27 | | | -3.74 | | | 8.62 | | | 4.84 | | | 5.56 | | | 6.16 | |
| Lipper High Current Yield Funds Index(b) | |
| -4.65 | | | -4.05 | | | 7.99 | | | 3.15 | | | 4.15 | | | 4.83 | |
| | | | | |
| Gross Expense Ratio (before reductions and reimbursements)* |
| Institutional: 0.76 | % | | | | |
| Net Expense Ratio (after reductions and reimbursements)* |
| Institutional: 0.76 | % | | | | |
* As stated in the most recent prospectus
CUMULATIVE PERFORMANCE
Registration to March 31, 2008(c)
Inception to March 31, 2008(c)
Data quoted reflects past performance and cannot guarantee future results. Average annual total returns assume reinvestment of dividends and capital gains distributions. Investment return and principal value will fluctuate so that shares, when redeemed, may be worth more or less than their original cost. For performance current to the most recent month end, please visit the Loomis Sayles website. Current performance may be higher or lower than quoted.
Returns do not reflect the taxes that a shareholder would pay on Fund distributions or the redemption of shares. Periods of less than one year are not annualized. Performance data reflects certain fee reductions and reimbursements, if any, without which performance would be lower.
(a) Shares of the Fund were registered for offer and sale under the Securities Act of 1933 on March 7, 1997. In accordance with regulations, performance information is provided for the period beginning on March 7, 1997 (“Registration”). Performance from inception is also provided for the convenience of our long-term shareholders. Since index performance data is not available coincident with the Fund’s inception and registration dates, comparative performance is presented from the month end closest to the Fund’s inception and registration dates. (b) See page 15 for a description of the indices. (c) The mountain chart is based on the Fund’s minimum initial investment of $3,000,000.
WHAT YOU SHOULD KNOW
The Fund can invest a significant percentage of assets in debt securities that are rated below investment grade and the value of fund shares can be adversely affected by changes in economic conditions or other circumstances. Lower rated debt securities have speculative characteristics and may be subject to greater price volatility than higher rated investments. In addition, the secondary market for these securities may lack liquidity. Fund shares should be viewed as a long-term investment. Securities issued by US government agencies are not insured by and may not be guaranteed by the US government. The Fund can invest a significant percentage of assets in foreign securities and the value of the fund shares can be adversely affected by changes in currency exchange rates, political, and economic developments. In emerging markets these risks can be significant. The Fund is subject to currency risk, which is the risk that fluctuations in exchange rates between the US dollar and foreign currencies may cause the value of a Fund’s investments to decline. Accordingly, the purchase of fund shares should be viewed as a long-term investment.
10
FUND AND MANAGER REVIEW
Loomis Sayles Intermediate Duration Fixed Income Fund

Neil Burke
Manager since December 2005
Cliff Rowe, CFA
Manager since December 2005

Richard Raczkowski
Manager since December 2005
PORTFOLIO REVIEW
The Fund underperformed its Benchmark, the Lehman US Government/Credit Intermediate Index, for the six months ended March 31, 2008, primarily due to continued volatility in mortgage-backed securities (MBS) and the Fund’s underweight to Treasurys.
As economic conditions deteriorated and the credit crisis gained momentum investors flocked to safe havens.
The Fund’s underweight position in securities with AAA ratings hurt performance as uncertainty, volatility and negative information concerning the overall health of the market drove risk-averse investors into Treasurys, and higher quality securities. Investors’ flight to safety sharply decreased demand for lower quality bonds throughout the period.
Residential and commercial MBS performed poorly during the period, due to concerns about the subprime market and other troubled mortgage-backed bonds. In the credit sector, economic and liquidity problems hampered most securities, with financial securities among the hardest hit. Securities in the consumer cyclicals sector weighed on returns, reflecting higher energy costs and sagging demand from an increasingly cash-strapped public. Communication issues also struggled, as investors became more concerned about waning access to capital markets.
The Fund’s non-US-dollar holdings contributed to performance, led by the Singapore dollar. In addition, investment grade utilities held up reasonably well, serving as a relative “island of calm” within a turbulent corporate sector. Intermediate and short term MBS and asset-backed securities (ABS) also performed well, but they lagged Treasurys. On an absolute basis, AAA-rated securities (including Treasurys, GE Singapore dollar securities and Freddie Mac pass-through securities) contributed most to performance.
OUTLOOK
Although the US economy has weakened, we see pockets of strength. For example, the industrial sector is relatively robust; the weak US dollar may stimulate US exports; corporate spending remains disciplined; and nonresidential construction is booming. We expect the Federal Reserve to ease once more before holding the fed funds target rate steady at 2.00%, while they continue to use other methods to maintain liquidity, as needed. By year-end, we believe the economy may show signs of recovery.
In our view, valuations outside of the Treasury sector remain attractive. The shaky economy poses risks, but bond prices appear to reflect a more dismal scenario than we anticipate. Longer-term, risk spreads should become less widespread, enabling markets to price risk more appropriately. Specific US high yield securities may offer compelling relative value, but the potential for further fallout calls for caution. Near term, we believe the US dollar may have further downside potential, as non-Japanese Asian currencies continue to strengthen.
FUND FACTS
Symbol | LSDIX
Objective | Above-average total return through a combination of current income and capital appreciation
Strategy | Invests only in investment-grade fixed-income securities. The Fund’s weighted average duration generally is two to five years
Fund Inception Date | 1/28/98
Total Net Assets | $34.8 million
11
AVERAGE ANNUAL TOTAL RETURNS
Periods Ended March 31, 2008
| | | | | | | | | | | | | |
| 6 Months | | | 1 Year | | | 5 Years | | | 10 Years | | | Since
Inception(a) | |
| Loomis Sayles Intermediate Duration Fund:Institutional | |
| 3.27 | % | | 5.19 | % | | 4.33 | % | | 5.27 | % | | 5.26 | % |
| Lehman US Gov’t/Credit Intermediate Index(b) | |
| 5.99 | | | 8.88 | | | 4.37 | | | 5.91 | | | 5.83 | |
| Lipper Intermediate Investment Grade Debt FundsIndex(b) | |
| 2.20 | | | 4.01 | | | 4.03 | | | 5.39 | | | 5.32 | |
| | | | | | |
| Gross Expense Ratio (before reductions and reimbursements)* |
| Institutional: 0.61% | | | | | | |
| Net Expense Ratio (after reductions and reimbursements)* |
| Institutional 0.40% | | | | | | |
* As stated in the most recent prospectus
CUMULATIVE PERFORMANCE
Inception to March 31, 2008(c)
Data quoted reflects past performance and cannot guarantee future results. Average annual total returns assume reinvestment of dividends and capital gains distributions. Investment return and principal value will fluctuate so that shares, when redeemed, may be worth more or less than their original cost. For performance current to the most recent month-end, please visit the Loomis Sayles website. Current performance may be higher or lower than quoted.
Returns do not reflect the taxes that a shareholder would pay on fund distributions or the redemption of shares. Periods of less than one year are not annualized. Performance data reflects certain fee reductions and reimbursements, if any, without which performance would be lower.
(a) Since index performance data is not available coincident with the Fund’s inception date, comparative performance is presented from the month end closest to the Fund’s inception date. (b) See page 15 for a description of the indices. (c) The mountain chart is based on the Fund’s minimum initial investment of $2,000,000.
WHAT YOU SHOULD KNOW
If the credit rating of a security held by the Fund falls below investment grade, the Fund may continue to hold it if Loomis Sayles believes the investment is appropriate. The secondary market for securities that fall below investment grade may lack liquidity and such securities may incur greater risk of default, which may adversely affect the value of the Fund. Foreign countries may have different accounting standards than those of the US. Securities issued by US government agencies are not insured by and may not be guaranteed by the US government. The Fund can invest a significant percentage of assets in foreign securities and the value of the fund shares can be adversely affected by changes in currency exchange rates, political, and economic developments. In emerging markets these risks can be significant. The Fund is subject to currency risk, which is the risk that fluctuations in exchange rates between the US dollar and foreign currencies may cause the value of a Fund’s investments to decline. The Fund can invest a significant percentage of assets in debt securities that are rated below investment grade and the value of fund shares can be adversely affected by changes in economic conditions or other circumstances. Lower rated debt securities have speculative characteristics and may be subject to greater price volatility than higher rated investments. In addition, the secondary market for these securities may lack liquidity. Accordingly, the purchase of fund shares should be viewed as a long-term investment.
12
FUND AND MANAGER REVIEW
Loomis Sayles Investment Grade Fixed Income Fund
Daniel Fuss, CFA, CIC
Manager since July 1994

Steven Kaseta, CFA
Manager since February 2002
Kathleen Gaffney, CFA
Associate Manager since September 2006
Matthew Eagan, CFA
Associate Manager since September 2006
Elaine Stokes
Associate Manager since September 2006
PORTFOLIO REVIEW
The Fund underperformed its Benchmark, the Lehman US Government/Credit Index, for the six months ended March 31, 2008, primarily due to an underweight position in Treasury securities and ongoing spread widening among investment grade and high yield credits. Throughout the period, investors flocked to safe havens, as economic conditions deteriorated, and the credit crisis gained momentum. The turmoil culminated with the Federal Reserve taking historic steps to restore normalcy to the markets, including brokerage access to its lending window and rate cuts totaling 250 basis points, which pushed the fed funds target rate to 2.25%.
A growing fear of recession and increased liquidity concerns weighed on the Fund’s credit positions, causing wider spreads and negative returns. Poor market liquidity, anemic risk appetites and the market’s general crisis of confidence pressured credit valuations. Our high yield exposure, primarily in the telecommunication and cable industries, was hard hit, as investors grew increasingly concerned about access to capital markets.
Despite continued solid performance of the underlying collateral, our AAA-rated home-equity exposure significantly underperformed the broader asset-backed securities (ABS) market, due to ongoing mortgage-related concerns. The Fund’s non-US dollar sector, a former source of strength, also detracted considerably, with our positions in the Canadian dollar and Icelandic krona showing notable weakness.
As investors avoided risk, the Treasury market offered the best performance for the period, and our long-duration strategy in Treasurys contributed positively to performance. In addition, our underweight position in the poor-performing financial sector of the US corporate bond market benefited the Fund.
OUTLOOK
Although the US economy has weakened, we see pockets of strength. For example, we believe the industrial sector is showing relative strength; the weak US dollar is improving the outlook for exports; corporate spending remains disciplined; and non-residential construction is booming. We think the Fed will ease once more before holding the fed funds target steady at 2.00%, while they continue to use other methods to maintain liquidity, as needed. By year-end, we believe the economy may show signs of recovery.
FUND FACTS
Symbol | LSIGX
Objective | Above-average total investment return through a combination of current income and capital appreciation
Strategy | Invests in primarily investment-grade fixed-income securities, although it may invest up to 10% of its assets in lower rated fixed-income securities and up to 10% of its assets in preferred stocks. The Fund may invest any portion of its assets in securities of Canadian issuers and up to 20% of assets in securities of other foreign issuers, including emerging markets.
Fund Inception Date | 7/1/94
Fund Registration Date | 3/7/97
Total Net Assets | $273.9 million
13
In our view, valuations outside the Treasury sector are attractive. The shaky economy poses risks, but bond prices appear to reflect a more dismal scenario than we expect. Longer term, we believe risk spreads should become less widespread, enabling markets to price risk more appropriately. Specific US high yield securities may offer compelling relative value, but the potential for further fallout calls for caution. Near-term, we think the US dollar may have further downside potential, as non-Japanese Asian currencies continue to strengthen.
AVERAGE ANNUAL TOTAL RETURNS
Periods Ended March 31, 2008
| | | | | | | | | | | | | | | | |
| 6 Months | | | 1 Year | | | 5 Years | | | 10 Years | | | Since
Registration(a) | | | Since
Inception(a) | |
| Loomis Sayles Investment Grade Fixed Income:Institutional | |
| 2.62 | % | | 8.92 | % | | 10.01 | % | | 8.85 | % | | 9.13 | % | | 10.25 | % |
| Lehman US Government/Credit Index(b) | |
| 5.71 | | | 8.35 | | | 4.62 | | | 6.12 | | | 6.51 | | | 6.88 | |
| Lipper BBB-Rated Funds Index(b) | |
| 1.69 | | | 3.52 | | | 5.02 | | | 5.30 | | | 5.78 | | | 6.48 | |
| | | | | | |
| Gross Expense Ratio (before reductions and reimbursements)* |
| Institutional: 0.53% | | | | | | |
| Net Expense Ratio (after reductions and reimbursements)* |
| Institutional 0.53% | | | | | | |
* As stated in the most recent prospectus
CUMULATIVE PERFORMANCE
Registration to March 31, 2008(c)
Inception to March 31, 2008(c)
Data quoted reflects past performance and cannot guarantee future results. Average annual total returns assume reinvestment of dividends and capital gains distributions. Investment return and principal value will fluctuate so that shares, when redeemed, may be worth more or less than their original cost. For performance current to the most recent month end, please visit the Loomis Sayles website. Current performance may be higher or lower than quoted.
Returns do not reflect the taxes that a shareholder would pay on Fund distributions or the redemption of shares. Periods of less than one year are not annualized. Performance data reflects certain fee reductions and reimbursements, if any, without which performance would be lower.
(a) Shares of the Fund were registered for offer and sale under the Securities Act of 1933 on March 7, 1997. In accordance with regulations, performance information is provided for the period beginning on March 7, 1997 (“Registration”). Performance from inception is also provided for the convenience of our long-term shareholders. Since index performance data is not available coincident with the Fund’s inception and registration dates, comparative performance is presented from the month end closest to the Fund’s inception and registration dates. (b) See page 15 for a description of the indices. (c) The mountain chart is based on the Fund’s minimum initial investment of $3,000,000.
WHAT YOU SHOULD KNOW
The Fund can invest a significant percentage of assets in debt securities that are rated below investment grade and the value of fund shares can be adversely affected by changes in economic conditions or other circumstances. Lower rated debt securities have speculative characteristics and may be subject to greater price volatility than higher rated investments. In addition, the secondary market for these securities may lack liquidity. Fund shares should be viewed as a long-term investment. Securities issued by US government agencies are not insured by and may not be guaranteed by the US government. The Fund can invest a significant percentage of assets in foreign securities and the value of the fund shares can be adversely affected by changes in currency exchange rates, political, and economic developments. In emerging markets these risks can be significant. The Fund is subject to currency risk, which is the risk that fluctuations in exchange rates between the US dollar and foreign currencies may cause the value of a Fund’s investments to decline. The Fund can invest a significant percentage of assets in debt securities that are rated below investment grade and the value of fund shares can be adversely affected by changes in economic conditions or other circumstances. Lower rated debt securities have speculative characteristics and may be subject to greater price volatility than higher rated investments. In addition, the secondary market for these securities may lack liquidity. Accordingly, the purchase of fund shares should be viewed as a long-term investment.
14
ADDITIONAL INFORMATION
Index Definitions
Indexes are unmanaged and do not have expenses that affect results, unlike mutual funds. Index returns are adjusted for the reinvestment of capital gain distributions and income dividends. It is not possible to invest directly in an index.
Lipper BBB-Rated Funds Index is an equally weighted index of typically the 30 largest mutual funds within the corporate debt funds BBB-rated investment objective.
Lipper Global Income Funds Index is an equally weighted index of typically the 30 largest mutual funds within the global income funds investment objective.
Lipper High Current Yield Funds Index is an equally weighted unmanaged index of typically the 30 largest mutual funds within the high current yield funds investment objective.
Lipper Intermediate Investment Grade Debt Funds Index is an equally weighted unmanaged index of the 30 largest mutual funds within the intermediate investment grade debt funds investment objectives.
Lipper Treasury Inflation Protected Securities Funds Index is an equally weighted index of typically the 30 largest mutual funds within the treasury inflation protected securities funds investment objective.
Source: Lipper, Inc.
Lehman US Government/Credit Index includes treasuries (public obligations of the U.S. Treasury that have remaining maturities of more than one year) and agencies (publicly issued debt of U.S. Government agencies, quasi-federal corporations, and corporate or foreign debt guaranteed by the U.S. Government) as well as other publicly issued investment grade corporate and foreign debentures that meet specified maturity, liquidity, and quality requirements.
Lehman US Government/Credit Intermediate Index includes securities which have a remaining maturity of 1-10 years and includes Treasuries (public obligations of the U.S. Treasury that have remaining maturities of more than one year) and agencies (publicly issued debt of U.S. Government agencies, quasi-federal corporations, and corporate or foreign debt guaranteed by the U.S. Government), as well as other publicly issued investment grade corporate and non-corporate debentures that meet specified maturity, liquidity, and quality requirements.
Lehman Global Aggregate Bond Index covers the most liquid portion of the global investment grade fixed-rate bond market, including government, credit and collateralized securities.
Lehman High Yield Index covers the universe of fixed rate, non-investment grade debt. Pay-in-kind bonds, Eurobonds, and debt issues from countries designated as emerging markets (e.g., Argentina, Brazil, Venezuela, etc.) are excluded, but Canadian and global bonds (SEC registered) of issuers in non-emerging market countries are included. Original issue zeroes, step-up coupon structures, and 144As are also included.
Lehman US Treasury Inflation Protected Securities Index measures the performance of the inflation protected securities issued by the U.S. Treasury.
Proxy Voting Information
A description of the Funds’ proxy voting policies and procedures is available without charge, upon request, (i) by calling Loomis Sayles at 800-633-3330; (ii) on the Funds’ website, www.loomissayles.com, and (iii) on the SEC’s website, www.sec.gov. Information about how the Funds voted proxies relating to portfolio securities during the 12 months ended June 30, 2007 is available on (i) the Funds’ website and (ii) the SEC’s website.
Quarterly Portfolio Schedules
The Funds file a complete schedule of portfolio holdings with the SEC for the first and third quarters of each fiscal year on Form N-Q. The Funds’ Forms N-Q are available on the SEC’s website at www.sec.gov and may be reviewed and copied at the SEC’s Public Reference Room in Washington, DC. Information on the operation of the Public Reference Room may be obtained by calling 1-800-SEC-0330.
UNDERSTANDING YOUR FUND’S EXPENSES
As a mutual fund shareholder you incur two types of costs: (1) transaction costs, including redemption fees and certain exchange fees; and (2) ongoing costs, including management fees, distribution and/or service fees (12b-1 fees), and other Fund expenses. These costs are described in more detail in each Fund’s prospectus. The examples below are intended to help you understand the ongoing costs of investing in the Funds and help you compare these with the ongoing costs of investing in other mutual funds.
The first line in the table for each Class of shares shows the actual amount of Fund expenses you would have paid on a $1,000 investment in the Fund from October 1, 2007 through March 31, 2008. It also shows how much a $1,000 investment would be worth at the close of the period, assuming actual Fund returns and expenses. To estimate the expenses you paid over the period, simply divide your account value by $1,000 (for example $8,600 account value divided by $1,000 = 8.6) and multiply the result by the number in the Expenses Paid During Period column as shown below for your Class.
The second line in the table for each Class of Fund shares provides information about hypothetical account values and hypothetical expenses based on the Fund’s actual expense ratios and an assumed rate of return of 5% per year before expenses, which is not the Fund’s actual return. The hypothetical account values and expenses may not be used to estimate the actual ending account balance or expenses you paid on your investment for the period. You may use this information to compare the ongoing costs of investing in the Fund and other funds. To do so, compare this 5% hypothetical example with the 5% hypothetical examples that appear in the shareholder reports of the other funds.
15
Loomis Sayles Bond Fund
| | | | | | | | | |
Institutional Class | | Beginning
Account��Value
10/1/2007 | | Ending
Account Value
3/31/2008 | | Expenses Paid
During Period*
10/1/2007 – 3/31/2008 |
Actual | | $ | 1,000.00 | | $ | 994.10 | | $ | 3.19 |
Hypothetical (5% return before expenses) | | $ | 1,000.00 | | $ | 1,021.80 | | $ | 3.23 |
| | | |
Retail Class | | | | | | |
Actual | | $ | 1,000.00 | | $ | 992.60 | | $ | 4.73 |
Hypothetical (5% return before expenses) | | $ | 1,000.00 | | $ | 1,020.25 | | $ | 4.80 |
| | | |
Admin Class | | | | | | |
Actual | | $ | 1,000.00 | | $ | 991.30 | | $ | 5.97 |
Hypothetical (5% return before expenses) | | $ | 1,000.00 | | $ | 1,019.00 | | $ | 6.06 |
* Expenses are equal to the Fund’s annualized expense ratio (after fee reduction/reimbursement): 0.64%, 0.95% and 1.20% for Institutional, Retail and Admin Class, respectively, multiplied by the average account value over the period, multiplied by 183/366 (to reflect the half-year period). |
Loomis Sayles Fixed Income Fund
| | | | | | | | | |
Institutional Class | | Beginning
Account Value
10/1/2007 | | Ending
Account Value
3/31/2008 | | Expenses Paid
During Period*
10/1/2007 – 3/31/2008 |
Actual | | $ | 1,000.00 | | $ | 1,001.30 | | $ | 2.90 |
Hypothetical (5% return before expenses) | | $ | 1,000.00 | | $ | 1,022.10 | | $ | 2.93 |
* Expenses are equal to the Fund’s annualized expense ratio (after fee reduction/reimbursement) of 0.58%, multiplied by the average account value over the period, multiplied by 183/366 (to reflect the half-year period). |
Loomis Sayles Global Bond Fund
| | | | | | | | | |
Institutional Class | | Beginning
Account Value
10/1/2007 | | Ending
Account Value
3/31/2008 | | Expenses Paid
During Period*
10/1/2007 – 3/31/2008 |
Actual | | $ | 1,000.00 | | $ | 1,068.60 | | $ | 3.31 |
Hypothetical (5% return before expenses) | | $ | 1,000.00 | | $ | 1,021.80 | | $ | 3.23 |
| | | |
Retail Class | | | | | | |
Actual | | $ | 1,000.00 | | $ | 1,066.60 | | $ | 5.17 |
Hypothetical (5% return before expenses) | | $ | 1,000.00 | | $ | 1,020.00 | | $ | 5.05 |
* Expenses are equal to the Fund’s annualized expense ratio (after fee reduction/reimbursement) of 0.64% and 1.00% for the Institutional and Retail Class, respectively, multiplied by the average account value over the period multiplied by 183/366 (to reflect the half-year period). |
Loomis Sayles Inflation Protected Securities Fund
| | | | | | | | | |
Institutional Class | | Beginning
Account Value
10/1/2007 | | Ending
Account Value
3/31/2008 | | Expenses Paid
During Period*
10/1/2007 – 3/31/2008 |
Actual | | $ | 1,000.00 | | $ | 1,086.40 | | $ | 2.09 |
Hypothetical (5% return before expenses) | | $ | 1,000.00 | | $ | 1,023.00 | | $ | 2.02 |
* Expenses are equal to the Fund’s annualized expense ratio (after fee reduction/reimbursement) of 0.40%, multiplied by the average account value over the period, multiplied by 183/366 (to reflect the half-year period). |
16
Loomis Sayles Institutional High Income Fund
| | | | | | |
Institutional Class | | Beginning
Account Value
10/1/2007 | | Ending
Account Value
3/31/2008 | | Expenses Paid
During Period*
10/1/2007 – 3/31/2008 |
Actual | | $1,000.00 | | $975.60 | | $3.56 |
Hypothetical (5% return before expenses) | | $1,000.00 | | $1,021.40 | | $3.64 |
* Expenses are equal to the Fund’s annualized expense ratio (after fee reduction/reimbursement) of 0.72%, multiplied by the average account value over the period, multiplied by 183/366 (to reflect the half-year period). |
Loomis Sayles Intermediate Duration Fixed Income Fund
| | | | | | |
Institutional Class | | Beginning
Account Value
10/1/2007 | | Ending
Account Value
3/31/2008 | | Expenses Paid
During Period*
10/1/2007 – 3/31/2008 |
Actual | | $1,000.00 | | $1,032.70 | | $2.03 |
Hypothetical (5% return before expenses) | | $1,000.00 | | $1,023.00 | | $2.02 |
* Expenses are equal to the Fund’s annualized expense ratio (after fee reduction/reimbursement) of 0.40%, multiplied by the average account value over the period, multiplied by 183/366 (to reflect the half-year period). |
Loomis Sayles Investment Grade Fixed Income Fund
| | | | | | |
Institutional Class | | Beginning
Account Value
10/1/2007 | | Ending
Account Value
3/31/2008 | | Expenses Paid
During Period*
10/1/2007 – 3/31/2008 |
Actual | | $1,000.00 | | $1,026.20 | | $2.53 |
Hypothetical (5% return before expenses) | | $1,000.00 | | $1,022.50 | | $2.53 |
* Expenses are equal to the Fund’s annualized expense ratio (after fee reduction/reimbursement) of 0.50%, multiplied by the average account value over the period, multiplied by 183/366 (to reflect the half-year period). |
17
BOARD APPROVAL OF THE EXISTING ADVISORY AGREEMENT FOR LOOMIS SAYLES BOND FUND
The Board of Trustees, including the Independent Trustees, considers matters bearing on each Fund’s advisory agreements (collectively, the “Agreements”) at most of its meetings throughout the year. The Contract Review and Governance Committee of the Board meets to review the Agreements to determine whether to recommend that the full Board approve the continuation of the Agreements. After the Committee has made its recommendation, the full Board, including the Independent Trustees, determines whether to approve the continuation of the Agreements.
In connection with these meetings, the Trustees receive materials that the Funds’ investment advisers believe to be reasonably necessary for the Trustees to evaluate the Agreements. These materials generally include, among other items, (i) information on the investment performance of the Funds and the performance of peer groups of funds and the Funds’ performance benchmarks, (ii) information on the Funds’ advisory fees and other expenses, including information comparing the Funds’ expenses to those of peer groups of funds and information about any applicable expense caps and fee “breakpoints,” (iii) sales and redemption data in respect of the Funds, (iv) information about the profitability of the Agreements to Loomis, Sayles & Company, L.P., adviser to each of the Funds (the “Adviser”), and (v) information obtained through the completion of a questionnaire by the Adviser (the Trustees are consulted as to the information requested through that questionnaire). The Board of Trustees, including the Independent Trustees, also consider other matters such as (i) the Adviser’s financial results and financial condition, (ii) each Fund’s investment objective and strategies and the size, education and experience of the Adviser’s investment staff and its use of technology, external research and trading cost measurement tools, (iii) arrangements in respect of the distribution of the Funds’ shares, (iv) the procedures employed to determine the value of the Funds’ assets, (v) the allocation of the Funds’ brokerage, if any, including allocations to brokers affiliated with the Adviser and the use of “soft” commission dollars to pay Fund expenses and to pay for research and other similar services, (vi) the resources devoted to, and the record of compliance with, the Funds’ investment policies and restrictions, policies on personal securities transactions and other compliance policies, and (vii) the general economic outlook with particular emphasis on the mutual fund industry. Throughout the process, the Trustees are afforded the opportunity to ask questions of and request additional materials from the Adviser.
In addition to the materials requested by the Trustees in connection with their consideration of the continuation of the Agreements, the Trustees receive materials in advance of each regular quarterly meeting of the Board of Trustees that provide detailed information about each Fund’s investment performance and the fees charged to the Funds for advisory and other services. This information generally includes, among other things, an internal performance rating for each Fund based on agreed-upon criteria, graphs showing performance and fee differentials against each Fund’s peer group, performance ratings provided by a third-party, total return information for various periods, and third-party performance rankings for various periods comparing a Fund against its peer group. The portfolio management team for each Fund makes periodic presentations to the Contract Review and Governance Committee and/or the full Board of Trustees, and Funds identified as presenting possible performance concerns may be subject to more frequent board presentations and reviews. In addition, each quarter the Trustees are provided with detailed statistical information about each Fund’s portfolio.
At the June 2007 Board meeting, the Board of Trustees, including the Independent Trustees, authorized the extension of the Advisory Agreement for the Loomis Sayles Bond Fund (the “Loomis Sayles Bond Fund Agreement”) through November 30, 2007. At the meeting held in November 2007, the Board of Trustees approved the continuation of the Loomis Sayles Bond Fund Agreement through June 30, 2008, and approved an amendment to the advisory fee schedule to add a breakpoint in the advisory fee schedule of 1 basis point at $15 billion. In considering whether to approve the continuation of the Loomis Sayles Bond Fund Agreement, the Board of Trustees, including the Independent Trustees, did not identify any single factor as determinative. In considering the continuation of the Loomis Sayles Bond Fund Agreement in November 2007, the Trustees considered the information that had been provided to them in the spring in connection with their regularly scheduled consideration of the Agreements, updates to that information, and their discussions at such meetings. Matters considered by the Trustees, including the Independent Trustees, in connection with their approval of the Loomis Sayles Bond Fund Agreement included the following:
The nature, extent and quality of the services provided to the Fund under the Agreement. The Trustees considered the nature, extent and quality of the services provided by the Adviser and its affiliates to the Fund and the resources dedicated to the Fund by the Adviser and its affiliates, including recent or planned investments by the Adviser in additional personnel or other resources. They also took note of the competitive market for talented personnel, in particular, for personnel who have contributed to the generation of strong investment performance. They considered the need for the Adviser to offer competitive compensation in order to attract and retain capable personnel. The Trustees recalled that at the June 2007 meeting, they considered the following factors: (1) the additional efforts required to manage the Fund’s portfolio in periods of rapid growth (including the need to identify additional portfolio securities for investment as the Fund’s assets grow), (2) the additional personnel and other resources needed in such efforts, (3) the possible effects of such cash inflows on the Fund’s ability to achieve attractive investment returns and (4) the benefits to the Fund of such net cash inflows and asset growth (including lower expense ratios). They also considered the administrative services provided by the Adviser’s affiliates to the Fund.
18
The Trustees also considered the benefits to Fund shareholders of investing in a mutual fund that is part of a family of funds offering a variety of investment disciplines and providing for a variety of fund and shareholder services.
After reviewing these and related factors, the Trustees concluded, within the context of their overall conclusions regarding the Agreement, that the nature, extent and quality of services provided supported the renewal of the Agreement.
Investment performance of the Fund and the Adviser. As noted above, the Trustees received information about the performance of the Fund over various time periods, including information which compared the performance of the Fund to the performance of peer groups of funds and the Fund’s respective performance benchmarks. In addition, the Trustees also reviewed data prepared by an independent third party which analyzed the performance of the Fund using a variety of performance metrics, including metrics which also measured the performance of the Fund on a risk adjusted basis. With respect to the Fund, the Board concluded that the Fund’s performance or other relevant factors supported the renewal of the Agreement.
The Trustees also considered the Adviser’s performance and reputation generally, the Fund’s performance as a fund family generally, and the historical responsiveness of the Adviser to Trustee concerns about performance and the willingness of the Adviser to take steps intended to improve performance.
After reviewing these and related factors, the Trustees concluded, within the context of their overall conclusions regarding the Agreement, that the performance of the Fund and the Adviser supported the renewal of the Agreement.
The costs of the services to be provided and profits to be realized by the Adviser and its affiliates from their respective relationships with the Fund. The Trustees considered the fees charged to the Fund for advisory services as well as the total expense levels of the Fund. This information included comparisons (provided both by management and also by an independent third party) of the Fund’s advisory fees and total expense levels to those of its peer group and information about the advisory fees charged by the Adviser to comparable accounts. In considering the fees charged to comparable accounts, the Trustees considered, among other things, management’s representations about the differences between managing mutual funds as compared to other types of accounts, including the additional resources required to effectively manage mutual fund assets. In evaluating the Fund’s advisory fees, the Trustees also took into account the demands, complexity and quality of the investment management of the Fund. The Trustees noted that the Fund has an expense cap in place, and they considered the amounts waived or reimbursed by the Adviser under the cap. The Trustees also noted that, effective July 1, 2007, management had reduced the expense cap for the Fund.
The Trustees also considered the compensation directly or indirectly received by the Adviser and its affiliates from their relationships with the Fund. The Trustees reviewed information provided by management as to the profitability of the Adviser’s and its affiliates’ relationships with the Fund, and information about the allocation of expenses used to calculate profitability. They also reviewed information provided by management about the effect of distribution costs and Fund growth on Adviser profitability, including information regarding resources spent on distribution activities and the increase in net sales for the family of funds. When reviewing profitability, the Trustees also considered information about court cases in which adviser profitability was an issue, the performance of the Fund, the expense levels of the Fund, and that the Adviser had implemented an expense cap for the Fund. After reviewing these and related factors, the Trustees concluded, within the context of their overall conclusions regarding the Agreement, that the advisory fees charged to the Fund were fair and reasonable, and that the costs of these services generally and the related profitability of the Adviser and its affiliates in respect of their relationships with the Fund supported the renewal of the Agreement.
Economies of Scale. The Trustees considered the existence of any economies of scale in the provision of services by the Adviser and whether those economies are shared with the Fund through breakpoints in their investment advisory fees or other means, such as expense waivers. The Trustees noted that the Fund was subject to an expense cap. The Trustees also considered that in connection with the June 2007 Board meeting, the Trustees received a report and presentation from management on the effect of recent growth in net assets of the Fund and the benefits of economies of scale realized and expected to be realized by the Fund (including decreases in the Fund’s expense ratio resulting from increase in assets). The Trustees also noted that at the June 2007 meeting, they had determined to approve the continuation of the Loomis Sayles Bond Fund Agreement for five months rather than a full year to allow further review of the growth of the Fund’s net assets and the effects of such growth on the Fund and the Adviser, and considered updated information on such growth. In considering these issues, the Trustees also took note of the costs of the services provided (both on an absolute and a relative basis) and the profitability to the Adviser and its affiliates of their relationships with the Fund.
After reviewing these and related factors, the Trustees considered, within the context of their overall conclusions regarding the Agreement, that the extent to which economies of scale were shared with the Fund supported the renewal of the Agreement.
The Trustees also considered other factors, which included but were not limited to the following:
| • | | whether the Fund has operated in accordance with its investment objective and the Fund’s record of compliance with its investment restrictions, and the compliance programs of the Fund and the Adviser. They also considered the compliance-related resources the Adviser and its affiliates were providing to the Fund. |
19
| • | | the nature, quality, cost and extent of administrative and shareholder services performed by the Adviser and its affiliates, both under the Loomis Sayles Bond Fund Agreement and under a separate agreement covering administrative services |
| • | | so-called “fallout benefits” to the Adviser, such as the engagement of affiliates of the Adviser to provide distribution, administrative and brokerage services to the Fund, and the benefits of research made available to the Adviser by reason of brokerage commissions generated by the Fund’s securities transactions. The Trustees considered the possible conflicts of interest associated with these fallout and other benefits, and the reporting, disclosure and other processes in place to disclose and monitor such possible conflicts of interest. |
Based on their evaluation of all factors that they deemed to be material, including those factors described above, and assisted by the advice of independent counsel, the Trustees, including the Independent Trustees, concluded that the Loomis Sayles Bond Fund Agreement should be continued through June 30, 2008.
20
PORTFOLIO OF INVESTMENTS – as of March 31, 2008 (Unaudited)
Loomis Sayles Bond Fund
| | | | | | | |
| | | | | Principal Amount (‡) | | Value (†) |
| | | | | | | |
| | | |
| BONDS AND NOTES – 88.3% of Net Assets | | | | | | | |
| | | |
| NON-CONVERTIBLE BONDS – 83.9% | | | | | | | |
| | | |
| ABS Credit Card – 0.0% | | | | | | | |
MBNA Credit Card Master Note Trust, 4.150%, 4/19/2010, Series 03A5 | | EUR | | 300,000 | | $ | 461,741 |
| | | | | | | |
| Aerospace & Defense – 0.1% | | | | | | | |
Bombardier, Inc., 6.300%, 5/01/2014 144A | | | | 2,250,000 | | | 2,137,500 |
Bombardier, Inc., 7.350%, 12/22/2026 | | CAD | | 6,785,000 | | | 6,158,158 |
Bombardier, Inc., 7.450%, 5/01/2034, 144A | | | | 17,130,000 | | | 16,016,550 |
| | | | | | | |
| | | | | | | 24,312,208 |
| | | | | | | |
| Airlines – 1.4% | | | | | | | |
American Airlines, Inc., Series 1999-1, 7.324%, 4/15/2011 | | | | 1,255,000 | | | 1,204,047 |
American Airlines, Inc., Series 93A6, 8.040%, 9/16/2011 | | | | 2,251,517 | | | 2,175,528 |
Continental Airlines, Inc., Series 1997-4B, 6.900%, 1/02/2017 | | | | 4,609,946 | | | 4,148,951 |
Continental Airlines, Inc., Series 1998-1, Class B, 6.748%, 3/15/2017 | | | | 7,775,612 | | | 6,998,051 |
Continental Airlines, Inc., Series 1999-1B, 6.795%, 8/02/2018 | | | | 4,300,766 | | | 3,870,689 |
Continental Airlines, Inc., Series 1999-1C, 6.954%, 8/02/2009 | | | | 3,810,053 | | | 3,581,449 |
Continental Airlines, Inc., Series 1999-2, Class B, 7.566%, 3/15/2020 | | | | 4,602,425 | | | 4,234,231 |
Continental Airlines, Inc., Series 2000-2, Class B, 8.307%, 10/2/2019 | | | | 7,201,340 | | | 6,733,253 |
Continental Airlines, Inc., Series 2001-1, Class B, 7.373%, 6/15/2017 | | | | 3,754,805 | | | 3,398,099 |
Continental Airlines, Inc., Series 96-A, Class B, 6.940%, 10/15/2013 | | | | 335,683 | | | 325,613 |
Continental Airlines, Inc., Series 971A, 7.461%, 4/01/2015 | | | | 7,968,815 | | | 7,410,998 |
Continental Airlines, Inc., Series A, 5.983%, 4/19/2022 | | | | 20,785,000 | | | 18,517,564 |
Continental Airlines, Inc., Series B, 6.903%, 4/19/2022 | | | | 20,255,000 | | | 16,912,925 |
Delta Air Lines, Inc., 6.821%, 8/10/2022, 144A | | | | 2,432,098 | | | 2,286,172 |
Delta Air Lines, Inc., 8.954%, 8/10/2014, 144A | | | | 45,181,831 | | | 42,019,103 |
Northwest Airlines, Inc., Series 07-1, 8.028%, 11/01/2017 | | | | 37,035,000 | | | 34,812,900 |
Qantas Airways Ltd., 5.125%, 6/20/2013, 144A | | | | 2,000,000 | | | 2,110,824 |
Qantas Airways Ltd., 6.050%, 4/15/2016, 144A | | | | 44,235,000 | | | 47,245,944 |
United Air Lines, Inc., 6.636%, 7/02/2022 | | | | 22,024,559 | | | 20,482,840 |
| | | | | | | |
| | | | | | | 228,469,181 |
| | | | | | | |
| Automotive – 2.1% | | | | | | | |
Cummins, Inc., 6.750%, 2/15/2027 | | | | 2,547,000 | | | 2,533,295 |
Cummins, Inc., 7.125%, 3/01/2028 | | | | 3,000,000 | | | 2,960,526 |
FCE Bank PLC, Series EMTN, 7.125%, 1/16/2012 | | EUR | | 9,800,000 | | | 12,377,390 |
FCE Bank PLC, Series EMTN, 7.125%, 1/15/2013 | | EUR | | 6,550,000 | | | 8,169,236 |
Ford Motor Co., 6.375%, 2/01/2029 | | | | 1,195,000 | | | 717,000 |
Ford Motor Co., 6.500%, 8/01/2018(b) | | | | 2,240,000 | | | 1,500,800 |
Ford Motor Co., 6.625%, 2/15/2028 | | | | 500,000 | | | 305,000 |
Ford Motor Co., 6.625%, 10/01/2028 | | | | 62,410,000 | | | 38,070,100 |
21
| | | | | | | | |
| | | | | Principal Amount (‡) | | Value (†) |
| | | | | | | | |
| | | |
| BONDS AND NOTES – continued | | | | | | | | |
| | | |
| Automotive – continued | | | | | | | | |
Ford Motor Co., 7.125%, 11/15/2025 | | | | $ | 1,940,000 | | $ | 1,280,400 |
Ford Motor Co., 7.450%, 7/16/2031(b) | | | | | 114,220,000 | | | 75,385,200 |
Ford Motor Co., 7.500%, 8/01/2026(b) | | | | | 795,000 | | | 508,800 |
Ford Motor Credit Co. LLC, 5.700%, 1/15/2010 | | | | | 64,398,000 | | | 55,945,634 |
Ford Motor Credit Co. LLC, 7.000%, 10/01/2013(b) | | | | | 13,075,000 | | | 10,198,748 |
Ford Motor Credit Co. LLC, 7.250%, 10/25/2011 | | | | | 18,760,000 | | | 15,409,914 |
Ford Motor Credit Co. LLC, 7.375%, 10/28/2009 | | | | | 500,000 | | | 455,566 |
Ford Motor Credit Co. LLC, 7.875%, 6/15/2010 | | | | | 1,320,000 | | | 1,150,957 |
Ford Motor Credit Co. LLC, 8.000%, 12/15/2016(b) | | | | | 18,970,000 | | | 14,849,811 |
Ford Motor Credit Co. LLC, 8.625%, 11/01/2010 | | | | | 29,945,000 | | | 26,090,959 |
Ford Motor Credit Co. LLC, 9.750%, 9/15/2010 | | | | | 2,150,000 | | | 1,915,162 |
Ford Motor Credit Co. LLC, Series EMTN, 4.875%, 1/15/2010 | | EUR | | | 12,200,000 | | | 16,206,137 |
General Motors Corp., 7.250%, 7/03/2013(b) | | EUR | | | 2,805,000 | | | 3,498,428 |
General Motors Corp., 7.400%, 9/01/2025 | | | | | 9,790,000 | | | 6,559,300 |
General Motors Corp., 8.250%, 7/15/2023 | | | | | 73,625,000 | | | 51,537,500 |
General Motors Corp., 8.375%, 7/15/2033(b) | | | | | 3,445,000 | | | 2,428,725 |
Goodyear Tire & Rubber Co., 7.000%, 3/15/2028 | | | | | 5,641,000 | | | 4,597,415 |
| | | | | | | | |
| | | | | | | | 354,652,003 |
| | | | | | | | |
| Banking – 5.0% | | | | | | | | |
BAC Capital Trust VI, 5.625%, 3/08/2035 | | | | | 35,170,000 | | | 29,527,923 |
Barclays Financial LLC, 4.060%, 9/16/2010, 144A | | KRW | | | 38,370,000,000 | | | 40,347,875 |
Barclays Financial LLC, 4.160%, 2/22/2010, 144A | | THB | | | 2,816,000,000 | | | 91,471,850 |
Barclays Financial LLC, 4.460%, 9/23/2010, 144A | | KRW | | | 48,070,000,000 | | | 51,023,562 |
Barclays Financial LLC, Series EMTN, 4.100%, 3/22/2010, 144A | | THB | | | 247,000,000 | | | 8,017,776 |
BNP Paribas SA, Series EMTN, Zero Coupon Bond, 6/13/2011, 144A | | IDR | | | 273,109,870,000 | | | 21,302,867 |
HSBC Bank USA, Zero Coupon Bond, 4/18/2012, 144A | | MYR | | | 108,110,000 | | | 33,360,816 |
HSBC Bank USA, 3.310%, 8/25/2010, 144A | | | | | 41,250,000 | | | 49,797,000 |
ICICI Bank Ltd., 6.375%, 4/30/2022, 144A(c) | | | | | 12,345,000 | | | 10,616,638 |
JPMorgan Chase & Co., Zero Coupon Bond, 5/10/2010, 144A | | BRL | | | 241,667,000 | | | 109,791,080 |
JPMorgan Chase & Co., Zero Coupon Bond, 3/28/2011, 144A | | IDR | | | 699,525,000,000 | | | 55,999,997 |
JPMorgan Chase & Co., Zero Coupon Bond, 3/28/2011, 144A | | IDR | | | 248,433,920,000 | | | 19,869,316 |
JPMorgan Chase & Co., Zero Coupon Bond, 4/12/2012, 144A | | IDR | | | 599,419,948,660 | | | 42,092,890 |
JPMorgan Chase & Co., Series EMTN, Zero Coupon Bond, 6/08/2012, 144A | | MYR | | | 200,911,735 | | | 55,986,440 |
JPMorgan Chase London, Zero Coupon Bond, 10/21/2010, 144A | | IDR | | | 152,206,784,000 | | | 12,851,180 |
Kreditanstalt fuer Wiederaufbau, Series EMTN, 10.000%, 10/27/2008 | | ISK | | | 743,300,000 | | | 9,759,707 |
Kreditanstalt Fuer Wiederaufbau, Series EMTN, 10.750%, 2/01/2010 | | ISK | | | 95,000,000 | | | 1,242,670 |
Rabobank Nederland, Series EMTN, 12.500%, 2/17/2009 | | ISK | | | 1,330,000,000 | | | 17,470,242 |
22
PORTFOLIO OF INVESTMENTS – as of March 31, 2008 (Unaudited)
Loomis Sayles Bond Fund – continued
| | | | | | | |
| | | | | Principal Amount (‡) | | Value (†) |
| | | | | | | |
| | | |
| BONDS AND NOTES – continued | | | | | | | |
| | | |
| Banking – continued | | | | | | | |
Rabobank Nederland, Series EMTN, 14.000%, 1/28/2009, 144A | | ISK | | 13,545,000,000 | | $ | 179,717,803 |
| | | | | | | |
| | | | | | | 840,247,632 |
| | | | | | | |
| Brokerage – 0.8% | | | | | | | |
Bear Stearns Cos., Inc. (The), 4.650%, 7/02/2018 | | | | 545,000 | | | 465,237 |
Bear Stearns Cos., Inc. (The), 5.300%, 10/30/2015 | | | | 1,445,000 | | | 1,356,481 |
Bear Stearns Cos., Inc. (The), 6.400%, 10/02/2017 | | | | 3,160,000 | | | 3,120,187 |
Bear Stearns Cos., Inc. (The), 7.250%, 2/01/2018 | | | | 24,770,000 | | | 25,597,095 |
Bear Stearns Cos., Inc. (The), Series MTN, 3.190%, 5/18/2010(c) | | | | 11,020,000 | | | 10,248,831 |
Merrill Lynch & Co., Inc., 10.710%, 3/08/2017(b) | | BRL | | 100,000,000 | | | 50,720,921 |
Morgan Stanley, Series F, MTN, 6.625%, 4/01/2018 | | | | 46,840,000 | | | 46,856,488 |
| | | | | | | |
| | | | | | | 138,365,240 |
| | | | | | | |
| Building Materials – 0.6% | | | | | | | |
Owens Corning, Inc., 6.500%, 12/01/2016 | | | | 19,905,000 | | | 16,501,365 |
Owens Corning, Inc., 7.000%, 12/01/2036 | | | | 48,860,000 | | | 35,330,519 |
Ply Gem Industries, Inc., 9.000%, 2/15/2012(b) | | | | 4,805,000 | | | 3,507,650 |
USG Corp., 6.300%, 11/15/2016 | | | | 34,370,000 | | | 27,152,300 |
USG Corp., 8.000%, 1/15/2018 | | | | 17,605,000 | | | 15,668,450 |
| | | | | | | |
| | | | | | | 98,160,284 |
| | | | | | | |
| Chemicals – 0.4% | | | | | | | |
Borden, Inc., 7.875%, 2/15/2023 | | | | 29,454,000 | | | 18,261,480 |
Borden, Inc., 8.375%, 4/15/2016 | | | | 2,785,000 | | | 1,893,800 |
Borden, Inc., 9.200%, 3/15/2021 | | | | 11,255,000 | | | 7,540,850 |
Georgia Gulf Corp., 10.750%, 10/15/2016(b) | | | | 1,000,000 | | | 655,000 |
Hercules, Inc., 6.500%, 6/30/2029 | | | | 19,619,000 | | | 15,695,200 |
Methanex Corp., 6.000%, 8/15/2015 | | | | 10,555,000 | | | 10,238,350 |
Mosaic Global Holdings, Inc., 7.300%, 1/15/2028 | | | | 9,000,000 | | | 8,910,000 |
Mosaic Global Holdings, Inc., 7.375%, 8/01/2018 | | | | 9,095,000 | | | 9,276,900 |
| | | | | | | |
| | | | | | | 72,471,580 |
| | | | | | | |
| Construction Machinery – 0.3% | | | | | | | |
Great Lakes Dredge & Dock Corp., 7.750%, 12/15/2013(b) | | | | 3,590,000 | | | 3,284,850 |
Joy Global, Inc., 6.625%, 11/15/2036 | | | | 1,975,000 | | | 1,831,177 |
Toro Co., 6.625%, 5/01/2037 | | | | 27,030,000 | | | 28,567,169 |
United Rentals North America, Inc., 7.000%, 2/15/2014 | | | | 17,850,000 | | | 14,012,250 |
| | | | | | | |
| | | | | | | 47,695,446 |
| | | | | | | |
| Consumer Cyclical Services – 0.8% | | | | | | | |
Western Union Co., 6.200%, 11/17/2036(b) | | | | 154,180,000 | | | 141,124,809 |
| | | | | | | |
| Containers & Packaging – 0.0% | | | | | | | |
Owens Brockway Glass Container, Inc., 6.750%, 12/01/2014 | | EUR | | 750,000 | | | 1,124,859 |
| | | | | | | |
| Distributors – 0.0% | | | | | | | |
ONEOK, Inc., 6.000%, 6/15/2035 | | | | 3,805,000 | | | 3,372,687 |
| | | | | | | |
| Electric – 3.6% | | | | | | | |
AES Corp., 7.750%, 3/01/2014(b) | | | | 4,875,000 | | | 4,905,469 |
AES Corp., 8.375%, 3/01/2011 | | GBP | | 1,990,000 | | | 3,894,163 |
23
| | | | | | | | |
| | | | | Principal Amount (‡) | | Value (†) |
| | | | | | | | |
| | | |
| BONDS AND NOTES – continued | | | | | | | | |
| | | |
| Electric – continued | | | | | | | | |
Bruce Mansfield Unit, 6.850%, 6/01/2034 | | | | $ | 95,735,000 | | $ | 102,850,025 |
Cleveland Electric Illuminating Co. (The), 5.950%, 12/15/2036 | | | | | 54,070,000 | | | 46,587,469 |
Commonwealth Edison Co., 4.750%, 12/01/2011(e) | | | | | 335,000 | | | 303,014 |
Dominion Resources, Inc., 5.950%, 6/15/2035 | | | | | 13,040,000 | | | 12,314,089 |
Dynegy Holdings, Inc., 7.125%, 5/15/2018 | | | | | 5,295,000 | | | 4,765,500 |
Dynegy Holdings, Inc., 7.625%, 10/15/2026 | | | | | 11,835,000 | | | 10,030,163 |
Dynegy Holdings, Inc., 7.750%, 6/01/2019 | | | | | 600,000 | | | 561,000 |
Dynegy Holdings, Inc., 8.375%, 5/01/2016(b) | | | | | 2,000,000 | | | 1,980,000 |
Edison Mission Energy, 7.625%, 5/15/2027 | | | | | 23,200,000 | | | 21,808,000 |
Empresa Nacional de Electricidad SA (Endesa-Chile), 7.875%, 2/01/2027(b) | | | | | 11,581,000 | | | 12,755,545 |
Energy Future Holdings Corp., Series P, 5.550%, 11/15/2014 | | | | | 35,216,000 | | | 27,498,097 |
Enersis SA, 7.400%, 12/01/2016 | | | | | 4,250,000 | | | 4,593,230 |
ITC Holdings Corp., 5.875%, 9/30/2016, 144A | | | | | 25,460,000 | | | 25,200,537 |
ITC Holdings Corp., 6.375%, 9/30/2036, 144A | | | | | 37,955,000 | | | 34,682,937 |
MidAmerican Energy Holdings Co., 6.125%, 4/01/2036 | | | | | 6,540,000 | | | 6,321,145 |
MidAmerican Energy Holdings Co., 6.500%, 9/15/2037 | | | | | 54,485,000 | | | 54,603,505 |
NGC Corporation Capital Trust I, Series B, 8.316%, 6/01/2027(b) | | | | | 23,775,000 | | | 20,387,062 |
Nisource Finance Corp., 6.400%, 3/15/2018 | | | | | 63,435,000 | | | 63,526,664 |
Power Receivables Finance LLC, 6.290%, 1/01/2012, 144A | | | | | 2,125,459 | | | 2,224,101 |
Quezon Power Philippines Co., 8.860%, 6/15/2017 | | | | | 6,181,875 | | | 6,243,694 |
Salton Sea Funding Corp., Series E, 8.300%, 5/30/2011 | | | | | 1,554,314 | | | 1,762,763 |
Salton Sea Funding Corp., Series F, 7.475%, 11/30/2018 | | | | | 218,038 | | | 252,606 |
Southern California Edison Co., 7.625%, 1/15/2010 | | | | | 2,000,000 | | | 2,126,400 |
SP Powerassets Ltd., 3.730%, 10/22/2010 | | SGD | | | 1,000,000 | | | 753,284 |
Texas-New Mexico Power Co., 6.250%, 1/15/2009 | | | | | 1,000,000 | | | 1,019,289 |
Toledo Edison Co., 6.150%, 5/15/2037 | | | | | 13,195,000 | | | 11,684,674 |
TXU Corp., Series Q, 6.500%, 11/15/2024 | | | | | 139,336,000 | | | 98,939,428 |
TXU Corp., Series R, 6.550%, 11/15/2034 | | | | | 6,429,000 | | | 4,538,733 |
White Pine Hydro LLC, 6.310%, 7/10/2017(e) | | | | | 9,175,000 | | | 8,997,730 |
White Pine Hydro LLC, 6.960%, 7/10/2037(e) | | | | | 14,695,000 | | | 12,634,496 |
White Pine Hydro LLC, 7.260%, 7/20/2015(e) | | | | | 5,000,000 | | | 5,126,985 |
| | | | | | | | |
| | | | | | | | 615,871,797 |
| | | | | | | | |
| Entertainment – 0.7% | | | | | | | | |
Six Flags, Inc., 9.625%, 6/01/2014(b) | | | | | 11,190,000 | | | 6,322,350 |
Six Flags, Inc., 9.750%, 4/15/2013(b) | | | | | 3,875,000 | | | 2,228,125 |
Time Warner, Inc., 6.500%, 11/15/2036 | | | | | 9,510,000 | | | 8,724,778 |
Time Warner, Inc., 6.625%, 5/15/2029 | | | | | 21,780,000 | | | 20,422,191 |
Time Warner, Inc., 6.950%, 1/15/2028 | | | | | 8,805,000 | | | 8,552,631 |
Time Warner, Inc., 7.625%, 4/15/2031 | | | | | 5,885,000 | | | 6,155,175 |
Time Warner, Inc., 7.700%, 5/01/2032 | | | | | 3,785,000 | | | 3,984,875 |
Viacom, Inc., Class B, 6.875%, 4/30/2036 | | | | | 55,225,000 | | | 53,179,245 |
| | | | | | | | |
| | | | | | | | 109,569,370 |
| | | | | | | | |
24
PORTFOLIO OF INVESTMENTS – as of March 31, 2008 (Unaudited)
Loomis Sayles Bond Fund – continued
| | | | | | | | |
| | | | | Principal Amount (‡) | | Value (†) |
| | | | | | | | |
| | | |
| BONDS AND NOTES – continued | | | | | | | | |
| | | |
| Food & Beverage – 0.9% | | | | | | | | |
Aramark Services, Inc., 5.000%, 6/01/2012 | | | | $ | 2,115,000 | | $ | 1,840,050 |
Corn Products International , Inc., 6.625%, 4/15/2037 | | | | | 31,590,000 | | | 33,166,941 |
Dole Food Co., Inc., 8.625%, 5/01/2009 | | | | | 6,900,000 | | | 6,003,000 |
Kraft Foods, Inc., 6.500%, 8/11/2017 | | | | | 45,310,000 | | | 46,485,749 |
Kraft Foods, Inc., 6.500%, 11/01/2031 | | | | | 14,990,000 | | | 14,080,407 |
Kraft Foods, Inc., 7.000%, 8/11/2037 | | | | | 36,870,000 | | | 36,865,465 |
Sara Lee Corp., 6.125%, 11/01/2032(b) | | | | | 18,615,000 | | | 17,545,643 |
| | | | | | | | |
| | | | | | | | 155,987,255 |
| | | | | | | | |
| Foreign Local Governments – 0.1% | | | | | | | | |
Ontario Hydro, Zero Coupon Bond, 11/27/2020 | | CAD | | | 1,507,000 | | | 841,480 |
Province of Alberta, 5.930%, 9/16/2016 | | CAD | | | 18,999,126 | | | 20,492,847 |
| | | | | | | | |
| | | | | | | | 21,334,327 |
| | | | | | | | |
| Government Guaranteed – 0.8% | | | | | | | | |
Canada Housing Trust, 4.100%, 12/15/2008 | | CAD | | | 130,265,000 | | | 128,239,544 |
| | | | | | | | |
| Government Sponsored – 1.1% | | | | | | | | |
Federal Home Loan Mortgage Corp., 4.625%, 10/25/2012(b) | | | | | 32,925,000 | | | 34,930,165 |
Federal National Mortgage Association, 2.290%, 2/19/2009 | | SGD | | | 145,900,000 | | | 106,626,406 |
Queensland Treasury Corp.,
7.125%, 9/18/2017, 144A | | NZD | | | 60,170,000 | | | 46,568,016 |
| | | | | | | | |
| | | | | | | | 188,124,587 |
| | | | | | | | |
| Healthcare – 4.7% | | | | | | | | |
Boston Scientific Corp., 5.450%, 6/15/2014 | | | | | 3,710,000 | | | 3,403,925 |
Boston Scientific Corp., 6.400%, 6/15/2016 | | | | | 14,305,000 | | | 13,339,412 |
Boston Scientific Corp., 7.000%, 11/15/2035 | | | | | 22,132,000 | | | 19,254,840 |
Covidien International Finance, 6.000%, 10/15/2017, 144A | | | | | 24,890,000 | | | 25,654,198 |
Covidien International Finance, 6.550%, 10/15/2037, 144A | | | | | 25,070,000 | | | 25,622,543 |
HCA, Inc., 5.750%, 3/15/2014(b) | | | | | 12,820,000 | | | 10,576,500 |
HCA, Inc., 6.250%, 2/15/2013 | | | | | 4,280,000 | | | 3,723,600 |
HCA, Inc., 6.300%, 10/01/2012(b) | | | | | 2,500,000 | | | 2,225,000 |
HCA, Inc., 6.375%, 1/15/2015(b) | | | | | 15,850,000 | | | 13,413,062 |
HCA, Inc., 6.500%, 2/15/2016(b) | | | | | 63,515,000 | | | 53,511,387 |
HCA, Inc., 6.750%, 7/15/2013 | | | | | 3,040,000 | | | 2,690,400 |
HCA, Inc., 7.050%, 12/01/2027 | | | | | 24,130,000 | | | 17,595,210 |
HCA, Inc., 7.190%, 11/15/2015 | | | | | 10,645,000 | | | 9,056,063 |
HCA, Inc., 7.500%, 12/15/2023 | | | | | 21,830,000 | | | 17,140,851 |
HCA, Inc., 7.500%, 11/06/2033 | | | | | 19,830,000 | | | 15,318,675 |
HCA, Inc., 7.580%, 9/15/2025 | | | | | 17,200,000 | | | 13,463,180 |
HCA, Inc., 7.690%, 6/15/2025 | | | | | 60,098,000 | | | 47,630,430 |
HCA, Inc., 7.750%, 7/15/2036 | | | | | 9,766,000 | | | 7,499,126 |
HCA, Inc., 8.360%, 4/15/2024 | | | | | 31,104,000 | | | 25,818,839 |
Hospira, Inc., 6.050%, 3/30/2017 | | | | | 15,175,000 | | | 15,040,352 |
Medco Health Solutions, Inc., 7.125%, 3/15/2018 | | | | | 250,270,000 | | | 256,436,403 |
Owens & Minor, Inc., 6.350%, 4/15/2016 | | | | | 4,710,000 | | | 4,759,964 |
Tenet Healthcare Corp., 6.875%, 11/15/2031 | | | | | 23,328,000 | | | 16,329,600 |
Tenet Healthcare Corp., 9.250%, 2/01/2015(b) | | | | | 560,000 | | | 523,600 |
WellPoint, Inc., 6.375%, 6/15/2037 | | | | | 191,190,000 | | | 171,396,290 |
| | | | | | | | |
| | | | | | | | 791,423,450 |
| | | | | | | | |
25
| | | | | | | | |
| | | | | Principal Amount (‡) | | Value (†) |
| | | | | | | | |
| | | |
| BONDS AND NOTES – continued | | | | | | | | |
| | | |
| Healthcare Insurance – 0.1% | | | | | | | | |
CIGNA Corp., 6.150%, 11/15/2036 | | | | $ | 20,530,000 | | $ | 17,871,283 |
| | | | | | | | |
| Home Construction – 1.5% | | | | | | | | |
Centex Corp., 5.250%, 6/15/2015 | | | | | 5,110,000 | | | 3,960,250 |
D.R. Horton, Inc., 5.250%, 2/15/2015 | | | | | 70,845,000 | | | 58,801,350 |
D.R. Horton, Inc., 5.625%, 9/15/2014 | | | | | 7,235,000 | | | 6,149,750 |
D.R. Horton, Inc., 5.625%, 1/15/2016 | | | | | 26,345,000 | | | 21,998,075 |
D.R. Horton, Inc., 6.500%, 4/15/2016 | | | | | 1,975,000 | | | 1,757,750 |
K. Hovnanian Enterprises, Inc., 6.250%, 1/15/2015(b) | | | | | 6,430,000 | | | 4,308,100 |
K. Hovnanian Enterprises, Inc., 6.250%, 1/15/2016(b) | | | | | 19,270,000 | | | 13,007,250 |
K. Hovnanian Enterprises, Inc., 6.375%, 12/15/2014(b) | | | | | 6,249,000 | | | 4,218,075 |
K. Hovnanian Enterprises, Inc., 6.500%, 1/15/2014(b) | | | | | 4,050,000 | | | 2,733,750 |
K. Hovnanian Enterprises, Inc., 7.500%, 5/15/2016(b) | | | | | 1,650,000 | | | 1,146,750 |
K. Hovnanian Enterprises, Inc., 7.750%, 5/15/2013(b) | | | | | 2,865,000 | | | 1,518,450 |
K. Hovnanian Enterprises, Inc., 8.875%, 4/01/2012(b) | | | | | 1,690,000 | | | 937,950 |
KB Home, 5.875%, 1/15/2015 | | | | | 895,000 | | | 774,175 |
Lennar Corp., 5.125%, 10/01/2010 | | | | | 3,495,000 | | | 3,040,650 |
Lennar Corp., 7.625%, 3/01/2009 | | | | | 5,245,000 | | | 5,035,200 |
Lennar Corp., Series B, 5.500%, 9/01/2014 | | | | | 18,630,000 | | | 14,158,800 |
Lennar Corp., Series B, 5.600%, 5/31/2015 | | | | | 8,112,000 | | | 6,002,880 |
Lennar Corp., Series B, 6.500%, 4/15/2016(b) | | | | | 40,810,000 | | | 31,015,600 |
Pulte Homes, Inc., 5.200%, 2/15/2015 | | | | | 6,790,000 | | | 5,771,500 |
Pulte Homes, Inc., 6.000%, 2/15/2035(b) | | | | | 63,520,000 | | | 48,910,400 |
Pulte Homes, Inc., 6.375%, 5/15/2033 | | | | | 17,205,000 | | | 13,419,900 |
Stanley-Martin Communities LLC, 9.750%, 8/15/2015 | | | | | 5,185,000 | | | 2,488,800 |
Toll Brothers Finance Corp., 5.150%, 5/15/2015(b) | | | | | 7,935,000 | | | 7,177,200 |
| | | | | | | | |
| | | | | | | | 258,332,605 |
| | | | | | | | |
| Independent Energy – 1.6% | | | | | | | | |
Anadarko Petroleum Corp., 5.950%, 9/15/2016 | | | | | 53,650,000 | | | 55,482,040 |
Anadarko Petroleum Corp., 6.450%, 9/15/2036 | | | | | 76,885,000 | | | 78,296,071 |
Chesapeake Energy Corp., 6.250%, 1/15/2017 | | EUR | | | 5,925,000 | | | 8,465,448 |
Chesapeake Energy Corp., 6.500%, 8/15/2017 | | | | | 3,820,000 | | | 3,686,300 |
Chesapeake Energy Corp., 6.875%, 11/15/2020 | | | | | 13,805,000 | | | 13,390,850 |
Connacher Oil and Gas Ltd., 10.250%, 12/15/2015, 144A | | | | | 40,310,000 | | | 40,612,325 |
Pioneer Natural Resources Co., 5.875%, 7/15/2016 | | | | | 10,275,000 | | | 9,357,576 |
Pioneer Natural Resources Co., 6.875%, 5/01/2018 | | | | | 2,125,000 | | | 2,013,414 |
Pioneer Natural Resources Co., 7.200%, 1/15/2028 | | | | | 6,665,000 | | | 5,793,491 |
Talisman Energy, Inc., 5.850%, 2/01/2037 | | | | | 12,155,000 | | | 10,657,091 |
Talisman Energy, Inc., 6.250%, 2/01/2038 | | | | | 32,435,000 | | | 29,882,820 |
XTO Energy, Inc., 6.100%, 4/01/2036 | | | | | 2,165,000 | | | 2,142,064 |
XTO Energy, Inc., 6.750%, 8/01/2037 | | | | | 11,225,000 | | | 12,005,620 |
| | | | | | | | |
| | | | | | | | 271,785,110 |
| | | | | | | | |
| Industrial Other – 0.1% | | | | | | | | |
Ranhill Labuan Ltd., 12.500%, 10/26/2011, 144A | | | | | 26,410,000 | | | 21,128,000 |
| | | | | | | | |
26
PORTFOLIO OF INVESTMENTS – as of March 31, 2008 (Unaudited)
Loomis Sayles Bond Fund – continued
| | | | | | | | |
| | | | | Principal Amount (‡) | | Value (†) |
| | | | | | | | |
| | | |
| BONDS AND NOTES – continued | | | | | | | | |
| | | |
| Integrated Energy – 0.0% | | | | | | | | |
PF Export Receivables Master Trust, 6.436%, 6/01/2015, 144A | | | | $ | 1,755,082 | | $ | 1,842,836 |
| | | | | | | | |
| Life Insurance – 0.5% | | | | | | | | |
ASIF Global Financing XXVII, 2.380%, 2/26/2009, 144A | | SGD | | | 38,400,000 | | | 27,894,282 |
Mutual of Omaha Insurance Co., 6.800%, 6/15/2036, 144A | | | | | 57,985,000 | | | 57,048,485 |
| | | | | | | | |
| | | | | | | | 84,942,767 |
| | | | | | | | |
| Local Authorities – 1.6% | | | | | | | | |
Queensland Treasury Corp., Series 11G, 6.000%, 6/14/2011(b) | | AUD | | | 109,725,000 | | | 98,063,011 |
Virginia Tobacco Settlement Financing Corp., Series A-1, 6.706%, 6/01/2046 | | | | | 183,475,000 | | | 166,446,685 |
| | | | | | | | |
| | | | | | | | 264,509,696 |
| | | | | | | | |
| Media Cable – 2.2% | | | | | | | | |
Comcast Corp., 5.500%, 3/15/2011 | | | | | 3,000,000 | | | 3,022,761 |
Comcast Corp., 5.650%, 6/15/2035 | | | | | 70,675,000 | | | 60,015,726 |
Comcast Corp., 6.450%, 3/15/2037 | | | | | 59,810,000 | | | 56,361,296 |
Comcast Corp., 6.500%, 11/15/2035 | | | | | 37,670,000 | | | 35,627,683 |
Comcast Corp., 6.950%, 8/15/2037 | | | | | 195,555,000 | | | 195,947,088 |
CSC Holdings, Inc., 7.875%, 2/15/2018 | | | | | 1,550,000 | | | 1,433,750 |
Shaw Communications, Inc., 5.700%, 3/02/2017 | | CAD | | | 12,775,000 | | | 11,482,378 |
Virgin Media Finance PLC, 9.125%, 8/15/2016 | | | | | 500,000 | | | 447,500 |
Virgin Media Finance PLC, 9.750%, 4/15/2014 | | GBP | | | 6,005,000 | | | 10,115,256 |
| | | | | | | | |
| | | | | | | | 374,453,438 |
| | | | | | | | |
| Media Non-Cable – 0.9% | | | | | | | | |
Clear Channel Communications, Inc., 4.900%, 5/15/2015 | | | | | 15,420,000 | | | 10,331,400 |
Clear Channel Communications, Inc., 5.500%, 9/15/2014 | | | | | 5,195,000 | | | 3,740,400 |
Clear Channel Communications, Inc., 5.500%, 12/15/2016(b) | | | | | 16,180,000 | | | 10,678,800 |
Clear Channel Communications, Inc., 5.750%, 1/15/2013 | | | | | 2,080,000 | | | 1,653,600 |
Clear Channel Communications, Inc., 6.875%, 6/15/2018 | | | | | 1,095,000 | | | 793,875 |
News America, Inc., 6.150%, 3/01/2037 | | | | | 64,380,000 | | | 60,815,408 |
News America, Inc., 6.200%, 12/15/2034 | | | | | 17,665,000 | | | 16,823,828 |
News America, Inc., 6.400%, 12/15/2035 | | | | | 29,275,000 | | | 28,411,944 |
R.H. Donnelley Corp., 8.875%, 10/15/2017, 144A | | | | | 3,564,000 | | | 2,227,500 |
R.H. Donnelley Corp., Series A-1, 6.875%, 1/15/2013 | | | | | 4,713,000 | | | 2,874,930 |
R.H. Donnelley Corp., Series A-2, 6.875%, 1/15/2013 | | | | | 1,645,000 | | | 1,003,450 |
R.H. Donnelley Corp., Series A-3, 8.875%, 1/15/2016 | | | | | 927,000 | | | 586,327 |
Tribune Co., 5.250%, 8/15/2015(b) | | | | | 41,550,000 | | | 15,996,750 |
| | | | | | | | |
| | | | | | | | 155,938,212 |
| | | | | | | | |
27
| | | | | | | | |
| | | | | Principal Amount (‡) | | Value (†) |
| | | | | | | | |
| | | |
| BONDS AND NOTES – continued | | | | | | | | |
| | | |
| Metals & Mining – 0.3% | | | | | | | | |
Algoma Acquisition Corp., 9.875%, 6/15/2015, 144A | | | | $ | 13,180,000 | | $ | 11,400,700 |
Newmont Mining Corp., 5.875%, 4/01/2035 | | | | | 5,621,000 | | | 4,614,296 |
OI European Group BV, 6.875%, 3/31/2017 144A | | EUR | | | 2,050,000 | | | 3,042,249 |
United States Steel Corp., 6.050%, 6/01/2017 | | | | | 9,420,000 | | | 8,713,236 |
United States Steel Corp., 6.650%, 6/01/2037 | | | | | 7,095,000 | | | 5,997,425 |
United States Steel Corp., 7.000%, 2/01/2018(b) | | | | | 22,600,000 | | | 22,075,589 |
| | | | | | | | |
| | | | | | | | 55,843,495 |
| | | | | | | | |
| Mortgage Related – 0.0% | | | | | | | | |
Federal Home Loan Mortgage Corp., 5.000%, 12/01/2031 | | | | | 374,632 | | | 374,746 |
| | | | | | | | |
| Non-Captive Consumer – 4.1% | | | | | | | | |
American General Finance Corp., Series J, MTN, 6.900%, 12/15/2017 | | | | | 305,415,000 | | | 298,474,139 |
Countrywide Financial Corp., Series A, MTN, 2.849%, 12/19/2008(c) | | | | | 5,670,000 | | | 5,188,050 |
Countrywide Home Loans, Inc., Series L, MTN, 4.000%, 3/22/2011 | | | | | 16,188,000 | | | 14,437,235 |
Residential Capital LLC, 8.125%, 11/21/2008(b)(c) | | | | | 1,280,000 | | | 883,200 |
Residential Capital LLC, 8.375%, 6/30/2010(b)(c) | | | | | 5,670,000 | | | 2,849,175 |
Residential Capital LLC, 8.375%, 5/17/2013(c) | | GBP | | | 57,435,000 | | | 49,015,018 |
Residential Capital LLC, 8.500%, 6/01/2012(c) | | | | | 3,905,000 | | | 1,913,450 |
Residential Capital LLC, 8.500%, 4/17/2013(c) | | | | | 165,035,000 | | | 80,041,975 |
Residential Capital LLC, 8.875%, 6/30/2015(b)(c) | | | | | 16,635,000 | | | 8,067,975 |
Residential Capital LLC, Series EMTN, 9.875%, 7/01/2014(c) | | GBP | | | 25,920,000 | | | 22,120,123 |
SLM Corp., 4.000%, 1/15/2010 | | | | | 10,300,000 | | | 8,656,635 |
SLM Corp., 6.500%, 6/15/2010 | | NZD | | | 1,010,000 | | | 693,207 |
SLM Corp., Series A, 5.000%, 6/15/2018 | | | | | 22,293,000 | | | 15,939,495 |
SLM Corp., Series A, 5.375%, 5/15/2014 | | | | | 28,800,000 | | | 21,613,536 |
SLM Corp., Series A, MTN, 5.000%, 10/01/2013 | | | | | 68,150,000 | | | 51,296,573 |
SLM Corp., Series A, MTN, 5.000%, 4/15/2015 | | | | | 53,696,000 | | | 38,259,528 |
SLM Corp., Series A, MTN, 5.375%, 1/15/2013 | | | | | 26,940,000 | | | 21,013,200 |
SLM Corp., Series EMTN, 4.750%, 3/17/2014 | | EUR | | | 3,300,000 | | | 3,377,716 |
SLM Corp., Series MTN, 5.050%, 11/14/2014 | | | | | 27,310,000 | | | 19,861,908 |
SLM Corp., Series MTN, 5.625%, 8/01/2033 | | | | | 38,535,000 | | | 26,685,487 |
| | | | | | | | |
| | | | | | | | 690,387,625 |
| | | | | | | | |
| Non-Captive Diversified – 7.2% | | | | | | | | |
CIT Group Funding Co. of Canada, 5.200%, 6/01/2015 | | | | | 8,278,000 | | | 6,191,812 |
CIT Group, Inc., 4.250%, 3/17/2015 | | EUR | | | 28,320,000 | | | 26,319,623 |
CIT Group, Inc., 5.000%, 2/13/2014 | | | | | 5,895,000 | | | 4,639,094 |
CIT Group, Inc., 5.000%, 2/01/2015(b) | | | | | 270,000 | | | 211,501 |
CIT Group, Inc., 5.125%, 9/30/2014(b) | | | | | 13,385,000 | | | 10,306,450 |
CIT Group, Inc., 5.400%, 1/30/2016 | | | | | 280,000 | | | 221,569 |
CIT Group, Inc., 5.500%, 12/01/2014 | | GBP | | | 28,635,000 | | | 35,058,889 |
CIT Group, Inc., 5.600%, 4/27/2011(b) | | | | | 10,435,000 | | | 8,416,850 |
CIT Group, Inc., 5.650%, 2/13/2017 | | | | | 1,120,000 | | | 868,501 |
CIT Group, Inc., 5.800%, 10/01/2036(b) | | | | | 1,130,000 | | | 879,339 |
CIT Group, Inc., 6.000%, 4/01/2036 | | | | | 500,000 | | | 380,000 |
CIT Group, Inc., 7.625%, 11/30/2012(b) | | | | | 342,170,000 | | | 284,389,463 |
28
PORTFOLIO OF INVESTMENTS – as of March 31, 2008 (Unaudited)
Loomis Sayles Bond Fund – continued
| | | | | | | |
| | | | | Principal Amount (‡) | | Value (†) |
| | | | | | | |
| | | |
| BONDS AND NOTES – continued | | | | | | | |
| | | |
| Non-Captive Diversified – continued | | | | | | | |
CIT Group, Inc., Series EMTN, 3.800%, 11/14/2012 | | EUR | | 21,000,000 | | $ | 20,124,675 |
CIT Group, Inc., Series EMTN, 4.650%, 9/19/2016 | | EUR | | 18,350,000 | | | 17,348,795 |
CIT Group, Inc., Series EMTN, 5.500%, 12/20/2016 | | GBP | | 13,450,000 | | | 16,653,894 |
CIT Group, Inc., Series GMTN, 4.250%, 9/22/2011 | | EUR | | 25,450,000 | | | 25,765,728 |
CIT Group, Inc., Series GMTN, 5.000%, 5/13/2014 | | EUR | | 3,500,000 | | | 3,536,790 |
General Electric Capital Corp., 6.500%, 9/28/2015 | | NZD | | 266,148,000 | | | 193,422,615 |
General Electric Capital Corp., Series A, GMTN, 3.485%, 3/08/2012 | | SGD | | 150,000,000 | | | 110,827,491 |
General Electric Capital Corp., Series EMTN, 1.725%, 6/27/2008 | | SGD | | 4,250,000 | | | 3,088,082 |
General Electric Capital Corp., Series EMTN, 6.750%, 9/26/2016 | | NZD | | 89,945,000 | | | 66,773,471 |
General Electric Capital Corp., Series GMTN, 2.960%, 5/18/2012 | | SGD | | 5,400,000 | | | 3,933,151 |
GMAC Canada Ltd., Series EMTN, 6.625%, 12/17/2010 | | GBP | | 500,000 | | | 793,860 |
GMAC LLC, 5.625%, 5/15/2009(b) | | | | 2,040,000 | | | 1,859,060 |
GMAC LLC, 6.000%, 12/15/2011 | | | | 80,850,000 | | | 60,434,809 |
GMAC LLC, 6.625%, 5/15/2012 | | | | 32,245,000 | | | 24,392,762 |
GMAC LLC, 6.750%, 12/01/2014 | | | | 48,351,000 | | | 34,218,051 |
GMAC LLC, 6.875%, 9/15/2011 | | | | 8,945,000 | | | 6,846,181 |
GMAC LLC, 6.875%, 8/28/2012 | | | | 6,680,000 | | | 5,076,332 |
GMAC LLC, 7.000%, 2/01/2012 | | | | 16,765,000 | | | 12,749,430 |
GMAC LLC, 8.000%, 11/01/2031 | | | | 57,598,000 | | | 41,280,026 |
GMAC LLC, Series EMTN, 5.375%, 6/06/2011 | | EUR | | 52,640,000 | | | 57,504,488 |
International Lease Finance Corp., 6.375%, 3/25/2013 | | | | 29,315,000 | | | 29,292,398 |
iStar Financial, Inc., 5.150%, 3/01/2012 | | | | 36,565,000 | | | 27,058,100 |
iStar Financial, Inc., 5.375%, 4/15/2010(b) | | | | 6,905,000 | | | 5,454,950 |
iStar Financial, Inc., 5.500%, 6/15/2012 | | | | 2,180,000 | | | 1,613,200 |
iStar Financial, Inc., 5.650%, 9/15/2011 | | | | 27,725,000 | | | 21,071,000 |
iStar Financial, Inc., Series REGS, 5.700%, 3/01/2014 | | | | 5,855,000 | | | 4,215,600 |
iStar Financial, Inc., 5.800%, 3/15/2011 | | | | 5,305,000 | | | 4,137,900 |
iStar Financial, Inc., 5.850%, 3/15/2017 | | | | 2,060,000 | | | 1,421,400 |
iStar Financial, Inc., 5.875%, 3/15/2016 | | | | 10,480,000 | | | 7,336,000 |
iStar Financial, Inc., 6.050%, 4/15/2015 | | | | 5,110,000 | | | 3,628,100 |
iStar Financial, Inc., Series B, 5.125%, 4/01/2011 | | | | 2,330,000 | | | 1,794,100 |
iStar Financial, Inc., Series B, 5.950%, 10/15/2013 | | | | 36,460,000 | | | 26,615,800 |
Prologis, 5.625%, 11/15/2015 | | | | 2,660,000 | | | 2,427,960 |
Prologis, 5.750%, 4/01/2016 | | | | 2,170,000 | | | 1,992,314 |
Simon Property Group LP, 5.750%, 12/01/2015 | | | | 3,450,000 | | | 3,281,871 |
| | | | | | | |
| | | | | | | 1,225,853,475 |
| | | | | | | |
| Non-Captive Finance – 0.0% | | | | | | | |
Toll Corp., 8.250%, 12/01/2011 | | | | 5,550,000 | | | 5,050,500 |
| | | | | | | |
| Oil Field Services – 0.2% | | | | | | | |
North American Energy Partners, Inc., 8.750%, 12/01/2011 | | | | 12,530,000 | | | 12,404,700 |
29
| | | | | | | | |
| | | | | Principal Amount (‡) | | Value (†) |
| | | | | | | | |
| | | |
| BONDS AND NOTES – continued | | | | | | | | |
| | | |
| Oil Field Services – continued | | | | | | | | |
Weatherford International Ltd., 6.500%, 8/01/2036 | | | | $ | 20,375,000 | | $ | 19,412,730 |
| | | | | | | | |
| | | | | | | | 31,817,430 |
| | | | | | | | |
| Packaging – 0.1% | | | | | | | | |
Owens-Illinois, Inc., 7.800%, 5/15/2018 | | | | | 23,567,000 | | | 23,331,330 |
| | | | | | | | |
| Paper – 1.2% | | | | | | | | |
Abitibi-Consolidated, Inc., 7.400%, 4/01/2018 | | | | | 11,675,000 | | | 5,137,000 |
Abitibi-Consolidated, Inc., 7.500%, 4/01/2028 | | | | | 14,820,000 | | | 6,076,200 |
Abitibi-Consolidated, Inc., 8.500%, 8/01/2029(b) | | | | | 4,215,000 | | | 1,917,825 |
Abitibi-Consolidated, Inc., 8.850%, 8/01/2030(b) | | | | | 47,185,000 | | | 20,997,325 |
Avenor, Inc., 10.850%, 11/30/2014 | | CAD | | | 450,000 | | | 219,588 |
Bowater, Inc., 6.500%, 6/15/2013 | | | | | 3,880,000 | | | 2,560,800 |
Georgia-Pacific Corp., 7.250%, 6/01/2028 | | | | | 25,782,000 | | | 21,012,330 |
Georgia-Pacific Corp., 7.375%, 12/01/2025(b) | | | | | 31,207,000 | | | 25,901,810 |
Georgia-Pacific Corp., 7.700%, 6/15/2015 | | | | | 95,000 | | | 89,300 |
Georgia-Pacific Corp., 7.750%, 11/15/2029 | | | | | 80,700,000 | | | 67,788,000 |
Georgia-Pacific Corp., 8.000%, 1/15/2024(b) | | | | | 21,284,000 | | | 18,729,920 |
Georgia-Pacific LLC, 8.875%, 5/15/2031(b) | | | | | 27,237,000 | | | 24,240,930 |
International Paper Co., 4.250%, 1/15/2009 | | | | | 2,000,000 | | | 1,999,288 |
Jefferson Smurfit Corp., 7.500%, 6/01/2013(b) | | | | | 4,990,000 | | | 4,291,400 |
| | | | | | | | |
| | | | | | | | 200,961,716 |
| | | | | | | | |
| Pharmaceuticals – 2.0% | | | | | | | | |
Astrazeneca PLC, 6.450%, 9/15/2037 | | | | | 228,855,000 | | | 245,557,753 |
Elan Financial PLC, 7.750%, 11/15/2011 | | | | | 65,746,000 | | | 61,143,780 |
Elan Financial PLC, 8.875%, 12/01/2013 | | | | | 41,925,000 | | | 39,409,500 |
| | | | | | | | |
| | | | | | | | 346,111,033 |
| | | | | | | | |
| Pipelines – 2.2% | | | | | | | | |
Colorado Interstate Gas Co., 5.950%, 3/15/2015 | | | | | 1,099,000 | | | 1,087,896 |
Colorado Interstate Gas Co., 6.800%, 11/15/2015 | | | | | 3,670,000 | | | 3,783,796 |
DCP Midstream LP, 6.450%, 11/03/2036, 144A | | | | | 27,200,000 | | | 25,573,086 |
El Paso Corp., 6.950%, 6/01/2028 | | | | | 11,959,000 | | | 11,181,641 |
El Paso Corp., 7.420%, 2/15/2037 | | | | | 2,045,000 | | | 1,994,223 |
El Paso Corp., 7.750%, 1/15/2032 | | | | | 1,500,000 | | | 1,540,553 |
El Paso Corp., 7.800%, 8/01/2031 | | | | | 1,000,000 | | | 1,026,739 |
Energy Transfer Partners LP, 6.125%, 2/15/2017 | | | | | 7,325,000 | | | 7,126,976 |
Energy Transfer Partners LP, 6.625%, 10/15/2036 | | | | | 14,235,000 | | | 13,200,286 |
Enterprise Products Operating LP, 6.300%, 9/15/2017 | | | | | 25,030,000 | | | 25,152,647 |
Kinder Morgan Energy Partners LP, 5.800%, 3/15/2035 | | | | | 778,000 | | | 658,060 |
Kinder Morgan Finance, 5.700%, 1/05/2016 | | | | | 14,160,000 | | | 13,416,600 |
Kinder Morgan, Inc., Senior Note, 5.150%, 3/01/2015 | | | | | 16,530,000 | | | 15,207,600 |
NGPL Pipeco LLC, 7.119%, 12/15/2017, 144A | | | | | 117,630,000 | | | 121,681,177 |
ONEOK Partners LP, 6.650%, 10/01/2036 | | | | | 12,495,000 | | | 12,058,025 |
Plains All American Pipeline LP, 6.125%, 1/15/2017 | | | | | 28,845,000 | | | 29,321,289 |
Plains All American Pipeline LP, 6.650%, 1/15/2037 | | | | | 62,130,000 | | | 58,857,116 |
Southern Natural Gas Co., 7.350%, 2/15/2031 | | | | | 4,695,000 | | | 4,808,483 |
30
PORTFOLIO OF INVESTMENTS – as of March 31, 2008 (Unaudited)
Loomis Sayles Bond Fund – continued
| | | | | | | | |
| | | | | Principal Amount (‡) | | Value (†) |
| | | | | | | | |
| | | |
| BONDS AND NOTES – continued | | | | | | | | |
| | | |
| Pipelines – continued | | | | | | | | |
Tennessee Gas Pipeline Co., 7.000%, 10/15/2028(b) | | | | $ | 7,900,000 | | $ | 7,871,599 |
Williams Cos., Inc., 7.500%, 1/15/2031 | | | | | 13,985,000 | | | 14,579,362 |
| | | | | | | | |
| | | | | | | | 370,127,154 |
| | | | | | | | |
| Property & Casualty Insurance – 1.1% | | | | | | | | |
Allstate Corp., 5.950%, 4/01/2036 | | | | | 7,745,000 | | | 6,925,703 |
Marsh & McLennan Cos., Inc., 5.375%, 7/15/2014 | | | | | 46,320,000 | | | 44,749,613 |
Marsh & McLennan Cos., Inc., 5.750%, 9/15/2015 | | | | | 34,729,000 | | | 34,002,365 |
Marsh & McLennan Cos., Inc., 5.875%, 8/01/2033 | | | | | 49,522,000 | | | 41,521,077 |
MBIA Insurance Corp., 14.000%, 1/15/2033, 144A(b)(c) | | | | | 3,570,000 | | | 3,498,600 |
St. Paul Travelers Co., Inc., 6.750%, 6/20/2036 | | | | | 6,850,000 | | | 6,787,466 |
Travelers Cos., Inc., 6.250%, 6/15/2037 | | | | | 42,880,000 | | | 39,745,601 |
Travelers Property Casualty Corp., 6.375%, 3/15/2033(b) | | | | | 1,000,000 | | | 969,048 |
Willis North America, Inc., 6.200%, 3/28/2017 | | | | | 12,000,000 | | | 11,975,352 |
| | | | | | | | |
| | | | | | | | 190,174,825 |
| | | | | | | | |
| Railroads – 0.4% | | | | | | | | |
Canadian Pacific Railway Ltd., 5.950%, 5/15/2037 | | | | | 13,985,000 | | | 11,598,012 |
CSX Corp., 6.000%, 10/01/2036(b) | | | | | 46,468,000 | | | 40,003,558 |
CSX Corp., 6.250%, 3/15/2018 | | | | | 5,000,000 | | | 4,934,375 |
Missouri Pacific Railroad Co., 5.000%, 1/01/2045 | | | | | 7,804,000 | | | 5,072,600 |
| | | | | | | | |
| | | | | | | | 61,608,545 |
| | | | | | | | |
| Real Estate Investment Trusts – 0.5% | | | | | | | | |
Camden Property Trust, 5.700%, 5/15/2017 | | | | | 18,425,000 | | | 15,953,618 |
Colonial Realty LP, 6.050%, 9/01/2016 | | | | | 3,980,000 | | | 3,262,028 |
Duke Realty LP, 5.950%, 2/15/2017 | | | | | 5,705,000 | | | 4,947,387 |
ERP Operating LP, 5.125%, 3/15/2016 | | | | | 4,675,000 | | | 4,050,041 |
First Industrial LP, 5.950%, 5/15/2017 | | | | | 7,750,000 | | | 6,705,471 |
Highwoods Properties, Inc., 5.850%, 3/15/2017 | | | | | 56,685,000 | | | 48,420,157 |
Highwoods Properties, Inc., 7.500%, 4/15/2018 | | | | | 5,640,000 | | | 5,249,114 |
| | | | | | | | |
| | | | | | | | 88,587,816 |
| | | | | | | | |
| Restaurants – 0.0% | | | | | | | | |
McDonald’s Corp., 3.628%, 10/10/2010 | | SGD | | | 3,750,000 | | | 2,826,341 |
| | | | | | | | |
| Retailers – 3.4% | | | | | | | | |
Dillard’s, Inc., 6.625%, 1/15/2018 | | | | | 1,920,000 | | | 1,440,000 |
Dillard’s, Inc., 7.000%, 12/01/2028 | | | | | 4,255,000 | | | 2,882,762 |
Dillard’s, Inc., 7.130%, 8/01/2018 | | | | | 1,740,000 | | | 1,348,500 |
Dillard’s, Inc., 7.750%, 7/15/2026 | | | | | 7,182,000 | | | 5,314,680 |
Dillard’s, Inc., 7.750%, 5/15/2027 | | | | | 1,000,000 | | | 740,000 |
Foot Locker, Inc., 8.500%, 1/15/2022 | | | | | 14,269,000 | | | 12,556,720 |
Home Depot, Inc., 5.875%, 12/16/2036 | | | | | 147,327,000 | | | 120,273,048 |
J.C. Penney Co., Inc., Senior Note, 6.375%, 10/15/2036 | | | | | 95,983,000 | | | 81,568,945 |
J.C. Penney Corp., Inc., 5.750%, 2/15/2018 | | | | | 5,145,000 | | | 4,750,337 |
J.C. Penney Corp., Inc., 7.125%, 11/15/2023 | | | | | 1,933,000 | | | 2,007,096 |
Lowes Cos., Inc., 6.650%, 9/15/2037 | | | | | 55,705,000 | | | 55,845,711 |
Macy’s Retail Holdings, Inc., 6.375%, 3/15/2037 | | | | | 28,840,000 | | | 22,836,637 |
Macy’s Retail Holdings, Inc., 6.790%, 7/15/2027 | | | | | 11,098,000 | | | 9,104,522 |
31
| | | | | | | | | |
| | | | | Principal Amount (‡) | | | Value (†) |
| | | | | | | | | |
| | | |
| BONDS AND NOTES – continued | | | | | | | | | |
| | | |
| Retailers – continued | | | | | | | | | |
Macy’s Retail Holdings, Inc., 6.900%, 4/01/2029 | | | | $ | 5,133,000 | | | $ | 4,343,832 |
Marks & Spencer PLC, 7.125%, 12/01/2037, 144A | | | | | 9,245,000 | | | | 8,343,612 |
Target Corp., 7.000%, 1/15/2038 | | | | | 210,010,000 | | | | 215,860,459 |
Toys R Us, Inc., 7.375%, 10/15/2018(b) | | | | | 36,290,000 | | | | 25,130,825 |
Toys R Us, Inc., 7.875%, 4/15/2013(b) | | | | | 11,255,000 | | | | 8,441,250 |
| | | | | | | | | |
| | | | | | | | | 582,788,936 |
| | | | | | | | | |
| Sovereigns – 11.4% | | | | | | | | | |
Canadian Government, 4.000%, 6/01/2016 | | CAD | | | 35,000,000 | | | | 35,765,843 |
Canadian Government, 4.250%, 9/01/2008 | | CAD | | | 225,630,000 | | | | 221,402,941 |
Canadian Government, 4.250%, 12/01/2008 | | CAD | | | 474,235,000 | | | | 467,226,237 |
Canadian Government, 4.250%, 9/01/2009 | | CAD | | | 73,725,000 | | | | 73,434,108 |
Canadian Government, 5.750%, 6/01/2033(b) | | CAD | | | 48,845,000 | | | | 61,193,180 |
Canadian Government, Series WH31, 6.000%, 6/01/2008(b) | | CAD | | | 58,550,000 | | | | 57,406,323 |
Indonesia Treasury Bond, 9.500%, 7/15/2023 | | IDR | | | 10,000,000,000 | | | | 895,874 |
Indonesia Treasury Bond, 10.250%, 7/15/2027 | | IDR | | | 25,000,000,000 | | | | 2,330,535 |
Indonesia Treasury Bond, Series FR43, 10.250%, 7/15/2022 | | IDR | | | 145,156,000,000 | | | | 13,883,962 |
Indonesia Treasury Bond, Series ZC3, Zero Coupon Bond, 11/20/2012 | | IDR | | | 378,003,000,000 | | | | 25,730,034 |
Mexican Fixed Rate Bonds, Series M-10, 8.000%, 12/17/2015 | | MXN | | | 4,585,000 | (††) | | | 44,537,107 |
Mexican Fixed Rate Bonds, Series M-20, 8.000%, 12/07/2023 | | MXN | | | 42,372,800 | (††) | | | 414,501,159 |
Mexican Fixed Rate Bonds, Series MI-10, 9.000%, 12/20/2012 | | MXN | | | 10,500,000 | (††) | | | 104,982,735 |
New South Wales Treasury Corp., Series 10RG, 7.000%, 12/01/2010 | | AUD | | | 165,565,000 | | | | 151,882,962 |
New South Wales Treasury Corp., Series 12RG, 6.000%, 5/01/2012 | | AUD | | | 87,640,000 | | | | 77,647,291 |
Republic of Brazil, 8.875%, 4/15/2024 | | | | | 32,625,000 | | | | 40,455,000 |
Republic of Brazil, 10.250%, 1/10/2028(b) | | BRL | | | 96,195,000 | | | | 51,038,665 |
Republic of Brazil, 12.500%, 1/05/2016(b) | | BRL | | | 17,305,000 | | | | 10,590,893 |
Republic of Brazil, 12.500%, 1/05/2022 | | BRL | | | 114,735,000 | | | | 70,945,162 |
| | | | | | | | | |
| | | | | | | | | 1,925,850,011 |
| | | | | | | | | |
| Supermarkets – 0.8% | | | | | | | | | |
Albertson’s, Inc., 6.625%, 6/01/2028 | | | | | 17,485,000 | | | | 14,875,031 |
Albertson’s, Inc., 7.450%, 8/01/2029 | | | | | 100,465,000 | | | | 92,508,775 |
Albertson’s, Inc., 7.750%, 6/15/2026 | | | | | 20,515,000 | | | | 19,345,891 |
Albertson’s, Inc., 8.000%, 5/01/2031 | | | | | 9,680,000 | | | | 9,227,557 |
Albertson’s, Inc., 8.700%, 5/01/2030 | | | | | 2,995,000 | | | | 3,005,462 |
| | | | | | | | | |
| | | | | | | | | 138,962,716 |
| | | | | | | | | |
| Supranational – 3.6% | | | | | | | | | |
Eurofima, Series EMTN, 10.000%, 11/03/2008 | | ISK | | | 557,100,000 | | | | 7,296,469 |
Eurofima, Series EMTN, 11.000%, 2/05/2010 | | ISK | | | 290,000,000 | | | | 3,862,519 |
European Investment Bank, Zero Coupon Bond, 9/12/2008, 144A | | BRL | | | 10,732,465 | | | | 5,796,522 |
European Investment Bank, Zero Coupon Bond, 3/10/2021 | | AUD | | | 148,280,000 | | | | 57,814,472 |
European Investment Bank, 4.600%, 1/30/2037, 144A | | CAD | | | 200,000,000 | | | | 188,572,264 |
32
PORTFOLIO OF INVESTMENTS – as of March 31, 2008 (Unaudited)
Loomis Sayles Bond Fund – continued
| | | | | | | |
| | | | | Principal Amount (‡) | | Value (†) |
| | | | | | | |
| | | |
| BONDS AND NOTES – continued | | | | | | | |
| | | |
| Supranational – continued | | | | | | | |
Inter-American Development Bank, Series EMTN, Zero Coupon Bond, 5/11/2009 | | BRL | | 297,000,000 | | $ | 142,855,189 |
Inter-American Development Bank, Series EMTN, 6.000%, 12/15/2017(b) | | NZD | | 184,525,000 | | | 130,534,281 |
Nordic Investment Bank, 13.000%, 9/12/2008 | | ISK | | 5,343,100,000 | | | 70,117,386 |
Nordic Investment Bank, Series EMTN, 11.250%, 4/16/2009 | | ISK | | 89,400,000 | | | 1,175,378 |
| | | | | | | |
| | | | | | | 608,024,480 |
| | | | | | | |
| Technology – 2.5% | | | | | | | |
Affiliated Computer Services, Inc., 5.200%, 6/01/2015 | | | | 115,000 | | | 95,737 |
Agilent Technologies, Inc., 6.500%, 11/01/2017 | | | | 57,300,000 | | | 57,498,373 |
Amkor Technology, Inc., 7.125%, 3/15/2011(b) | | | | 8,785,000 | | | 8,257,900 |
Amkor Technology, Inc., 7.750%, 5/15/2013(b) | | | | 11,745,000 | | | 10,717,312 |
Arrow Electronics, Inc., 6.875%, 7/01/2013 | | | | 14,165,000 | | | 15,086,660 |
Arrow Electronics, Inc., 6.875%, 6/01/2018 | | | | 5,000,000 | | | 5,156,015 |
Avnet, Inc., 5.875%, 3/15/2014 | | | | 36,145,000 | | | 37,385,460 |
Avnet, Inc., 6.000%, 9/01/2015 | | | | 50,685,000 | | | 50,806,239 |
Avnet, Inc., 6.625%, 9/15/2016 | | | | 15,225,000 | | | 15,715,626 |
Corning, Inc., 5.900%, 3/15/2014(b) | | | | 9,330,000 | | | 9,783,485 |
Corning, Inc., 6.200%, 3/15/2016 | | | | 5,155,000 | | | 5,350,426 |
Corning, Inc., 6.850%, 3/01/2029 | | | | 10,321,000 | | | 10,516,325 |
Corning, Inc., 7.250%, 8/15/2036 | | | | 5,645,000 | | | 6,089,250 |
Equifax, Inc., 7.000%, 7/01/2037 | | | | 19,270,000 | | | 17,209,440 |
Freescale Semiconductor, Inc., 10.125%, 12/15/2016(b) | | | | 30,004,000 | | | 20,252,700 |
Lucent Technologies, Inc., 6.450%, 3/15/2029(b) | | | | 66,137,000 | | | 47,287,955 |
Lucent Technologies, Inc., 6.500%, 1/15/2028 | | | | 2,216,000 | | | 1,584,440 |
Motorola, Inc., 5.220%, 10/01/2097 | | | | 13,750,000 | | | 7,413,725 |
Motorola, Inc., 6.500%, 9/01/2025 | | | | 10,200,000 | | | 8,375,883 |
Motorola, Inc., 6.500%, 11/15/2028(b) | | | | 16,280,000 | | | 12,701,705 |
Motorola, Inc., 6.625%, 11/15/2037 | | | | 16,075,000 | | | 12,433,000 |
Nortel Networks Corp., 1.750%, 4/15/2012, 144A | | | | 1,045,000 | | | 705,375 |
Nortel Networks Corp., 6.875%, 9/01/2023 | | | | 18,222,000 | | | 11,206,530 |
Nortel Networks Ltd., 10.125%, 7/15/2013 | | | | 22,825,000 | | | 20,884,875 |
Northern Telecom Capital Corp., 7.875%, 6/15/2026 | | | | 12,035,000 | | | 7,521,875 |
Samsung Electronics Co. Ltd., 7.700%, 10/01/2027, 144A | | | | 5,060,000 | | | 5,505,735 |
Xerox Capital Trust I, 8.000%, 2/01/2027 | | | | 25,440,000 | | | 25,112,155 |
Xerox Corp., 7.200%, 4/01/2016 | | | | 615,000 | | | 657,699 |
| | | | | | | |
| | | | | | | 431,311,900 |
| | | | | | | |
| Textile – 0.0% | | | | | | | |
Kellwood Co., 7.625%, 10/15/2017(e) | | | | 11,070,000 | | | 7,195,500 |
| | | | | | | |
| Tobacco – 0.5% | | | | | | | |
Reynolds American, Inc., 6.750%, 6/15/2017 | | | | 71,085,000 | | | 71,899,847 |
Reynolds American, Inc., 7.250%, 6/15/2037 | | | | 17,990,000 | | | 17,808,409 |
| | | | | | | |
| | | | | | | 89,708,256 |
| | | | | | | |
33
| | | | | | | | |
| | | | | Principal Amount (‡) | | Value (†) |
| | | | | | | | |
| | | |
| BONDS AND NOTES – continued | | | | | | | | |
| | | |
| Transportation Services – 0.7% | | | | | | | | |
APL Ltd., 8.000%, 1/15/2024(e) | | | | $ | 19,894,000 | | $ | 16,163,875 |
Atlas Air, Inc., Series 1999-1A, 6.880%, 7/02/2009 | | | | | 1,153,157 | | | 1,130,094 |
Atlas Air, Inc., Series 1999-1B, 7.630%, 1/02/2015(g) | | | | | 18,164,300 | | | 19,980,729 |
Atlas Air, Inc., Series 1999-1C, 8.770%, 1/02/2011(g) | | | | | 15,689,997 | | | 15,533,097 |
Atlas Air, Inc., Series 2000-1, 9.702%, 7/02/2011(g) | | | | | 201,720 | | | 197,685 |
Atlas Air, Inc., Series 2000-1, Class B, 9.057%, 1/02/2014(g) | | | | | 9,260,147 | | | 11,019,575 |
Atlas Air, Inc., Series B, 7.680%, 1/02/2014(g) | | | | | 39,925,752 | | | 46,313,872 |
Atlas Air, Inc., Series C, 8.010%, 1/02/2010(g) | | | | | 6,552,024 | | | 5,634,741 |
| | | | | | | | |
| | | | | | | | 115,973,668 |
| | | | | | | | |
| Treasuries – 3.0% | | | | | | | | |
U.S. Treasury Bonds, 4.500%, 2/15/2036(b) | | | | | 218,105,000 | | | 225,312,716 |
U.S. Treasury Bonds, 5.375%, 2/15/2031(b) | | | | | 245,380,000 | | | 283,797,183 |
| | | | | | | | |
| | | | | | | | 509,109,899 |
| | | | | | | | |
| Wireless – 1.5% | | | | | | | | |
ALLTEL Corp., 6.500%, 11/01/2013 | | | | | 2,880,000 | | | 2,116,800 |
ALLTEL Corp., 6.800%, 5/01/2029 | | | | | 10,985,000 | | | 7,030,400 |
ALLTEL Corp., 7.000%, 7/01/2012 | | | | | 32,740,000 | | | 26,192,000 |
ALLTEL Corp., 7.000%, 3/15/2016(b) | | | | | 3,125,000 | | | 2,250,000 |
ALLTEL Corp., 7.875%, 7/01/2032(b) | | | | | 92,074,000 | | | 60,768,840 |
Nextel Communications, Inc., Series D, 7.375%, 8/01/2015 | | | | | 11,305,000 | | | 8,704,850 |
Nextel Communications, Inc., Series E, 6.875%, 10/31/2013 | | | | | 5,780,000 | | | 4,566,200 |
Nextel Communications, Inc., Series F, 5.950%, 3/15/2014 | | | | | 37,140,000 | | | 27,483,600 |
Philippine Long Distance Telephone Co., 11.375%, 5/15/2012 | | | | | 925,000 | | | 1,112,312 |
Rogers Wireless, Inc., 6.375%, 3/01/2014 | | | | | 1,895,000 | | | 1,878,819 |
Rogers Wireless, Inc., 7.625%, 12/15/2011(b) | | CAD | | | 6,990,000 | | | 7,523,554 |
Sprint Capital Corp., 6.875%, 11/15/2028 | | | | | 42,331,000 | | | 31,536,595 |
Sprint Capital Corp., 6.900%, 5/01/2019 | | | | | 23,405,000 | | | 18,431,437 |
Sprint Nextel Corp., 6.000%, 12/01/2016 | | | | | 15,184,000 | | | 11,805,560 |
True Move Co. Ltd., 10.750%, 12/16/2013, 144A | | | | | 36,610,000 | | | 34,413,400 |
Vodafone Group PLC, 6.150%, 2/27/2037(b) | | | | | 2,655,000 | | | 2,474,715 |
| | | | | | | | |
| | | | | | | | 248,289,082 |
| | | | | | | | |
| Wirelines – 5.3% | | | | | | | | |
AT&T Corp., 6.500%, 3/15/2029 | | | | | 27,859,000 | | | 26,982,667 |
AT&T, Inc., 6.150%, 9/15/2034 | | | | | 14,755,000 | | | 14,172,635 |
AT&T, Inc., 6.500%, 9/01/2037 | | | | | 152,250,000 | | | 150,604,482 |
Bell Canada, 5.000%, 2/15/2017 | | CAD | | | 7,738,000 | | | 5,897,224 |
Bell Canada, 6.550%, 5/01/2029, 144A | | CAD | | | 5,790,000 | | | 4,262,415 |
Bell Canada, 7.300%, 2/23/2032 | | CAD | | | 11,405,000 | | | 9,088,778 |
Bell Canada, Series M-17, 6.100%, 3/16/2035 | | CAD | | | 45,500,000 | | | 32,436,675 |
BellSouth Corp., 6.000%, 11/15/2034(b) | | | | | 26,970,000 | | | 25,326,098 |
Embarq Corp., 7.995%, 6/01/2036 | | | | | 8,735,000 | | | 7,977,300 |
GTE Corp., 6.940%, 4/15/2028 | | | | | 11,700,000 | | | 11,809,594 |
Koninklijke (Royal) KPN NV, 8.375%, 10/01/2030 | | | | | 10,505,000 | | | 12,020,756 |
34
PORTFOLIO OF INVESTMENTS – as of March 31, 2008 (Unaudited)
Loomis Sayles Bond Fund – continued
| | | | | | | |
| | | | | Principal Amount (‡) | | Value (†) |
| | | | | | | |
| | | |
| BONDS AND NOTES – continued | | | | | | | |
| | | |
| Wirelines – continued | | | | | | | |
Koninklijke (Royal) KPN NV, Series EMTN, 5.750%, 3/18/2016 | | GBP | | 1,600,000 | | $ | 2,948,397 |
Koninklijke (Royal) KPN NV, Series GMTN, 4.000%, 6/22/2015 | | EUR | | 2,750,000 | | | 3,782,800 |
Level 3 Financing, Inc., 8.750%, 2/15/2017 | | | | 43,605,000 | | | 33,139,800 |
Level 3 Financing, Inc., 9.250%, 11/01/2014(b) | | | | 17,580,000 | | | 14,371,650 |
New England Telephone & Telegraph, 7.875%, 11/15/2029 | | | | 2,740,000 | | | 3,003,793 |
Qwest Capital Funding, Inc., 6.375%, 7/15/2008 | | | | 919,000 | | | 916,703 |
Qwest Capital Funding, Inc., 6.500%, 11/15/2018 | | | | 29,990,000 | | | 24,291,900 |
Qwest Capital Funding, Inc., 6.875%, 7/15/2028(b) | | | | 66,907,000 | | | 52,521,995 |
Qwest Capital Funding, Inc., 7.625%, 8/03/2021(b) | | | | 15,025,000 | | | 12,696,125 |
Qwest Capital Funding, Inc., 7.750%, 2/15/2031(b) | | | | 40,120,000 | | | 33,700,800 |
Qwest Corp., 6.875%, 9/15/2033 | | | | 23,425,000 | | | 18,740,000 |
Qwest Corp., 7.200%, 11/10/2026 | | | | 1,505,000 | | | 1,267,963 |
Qwest Corp., 7.250%, 9/15/2025 | | | | 9,920,000 | | | 8,630,400 |
Qwest Corp., 7.500%, 6/15/2023 | | | | 4,455,000 | | | 3,886,987 |
Telecom Italia Capital, 6.000%, 9/30/2034 | | | | 30,915,000 | | | 26,128,925 |
Telecom Italia Capital, 6.375%, 11/15/2033 | | | | 26,400,000 | | | 23,083,553 |
Telefonica Emisiones SAU, 7.045%, 6/20/2036 | | | | 174,550,000 | | | 182,500,403 |
Telus Corp., 4.950%, 3/15/2017 | | CAD | | 45,415,000 | | | 40,978,581 |
Verizon Communications, 5.850%, 9/15/2035 | | | | 87,716,000 | | | 79,905,153 |
Verizon Maryland, Inc., 5.125%, 6/15/2033 | | | | 10,290,000 | | | 8,242,033 |
Verizon New York, Inc., Series B, 7.375%, 4/01/2032(b) | | | | 17,475,000 | | | 18,266,880 |
| | | | | | | |
| | | | | | | 893,583,465 |
| | | | | | | |
| | | |
| TOTAL NON-CONVERTIBLE BONDS | | | | | | | |
(Identified Cost $14,430,587,302) | | | | | | | 14,255,665,891 |
| | | | | | | |
| | | |
| CONVERTIBLE BONDS – 3.5% | | | | | | | |
| | | |
| Healthcare – 0.1% | | | | | | | |
Invitrogen Corp., 1.500%, 2/15/2024 | | | | 14,480,000 | | | 14,697,200 |
| | | | | | | |
| Independent Energy – 0.0% | | | | | | | |
Devon Energy Corp., 4.900%, 8/15/2008(b) | | | | 1,400,000 | | | 2,233,000 |
Devon Energy Corp., 4.950%, 8/15/2008(b) | | | | 2,600,000 | | | 4,147,000 |
| | | | | | | |
| | | | | | | 6,380,000 |
| | | | | | | |
| Industrial Other – 0.2% | | | | | | | |
Incyte Corp., 3.500%, 2/15/2011(b) | | | | 24,551,000 | | | 26,116,126 |
| | | | | | | |
| Media Non-Cable – 0.1% | | | | | | | |
Liberty Media LLC, 3.500%, 1/15/2031 | | | | 10,195,931 | | | 7,124,407 |
Sinclair Broadcast Group, Inc., (Step to 2.000% on 1/15/2011), 4.875%, 7/15/2018(d) | | | | 4,048,000 | | | 3,683,680 |
| | | | | | | |
| | | | | | | 10,808,087 |
| | | | | | | |
| Non-Captive Consumer – 0.2% | | | | | | | |
Countrywide Financial Corp., Series A, 0.758%, 4/15/2037(b)(c) | | | | 11,242,000 | | | 9,949,170 |
35
| | | | | | | | |
| | | | | Principal Amount (‡) | | Value (†) |
| | | | | | | | |
| | | |
| BONDS AND NOTES – continued | | | | | | | | |
| | | |
| Non-Captive Consumer – continued | | | | | | | | |
Countrywide Financial Corp., Series B, 0.815%, 5/15/2037(c) | | | | $ | 33,004,000 | | $ | 28,218,420 |
| | | | | | | | |
| | | | | | | | 38,167,590 |
| | | | | | | | |
| Non-Captive Diversified – 0.3% | | | | | | | | |
iStar Financial, Inc., 5.229%, 10/01/2012(b)(c) | | | | | 60,445,000 | | | 42,523,057 |
| | | | | | | | |
| Pharmaceuticals – 0.9% | | | | | | | | |
Epix Pharmaceuticals, Inc., 3.000%, 6/15/2024 | | | | | 7,122,000 | | | 3,561,000 |
Human Genome Sciences, Inc., 2.250%, 8/15/2012 | | | | | 36,215,000 | | | 26,255,875 |
Nektar Therapeutics, 3.250%, 9/28/2012 | | | | | 26,120,000 | | | 20,177,700 |
Regeneron Pharmaceuticals, Inc., 5.500%, 10/17/2008 | | | | | 38,828,000 | | | 38,682,395 |
Valeant Pharmaceuticals International, 3.000%, 8/16/2010 | | | | | 34,125,000 | | | 31,053,750 |
Valeant Pharmaceuticals International, 4.000%, 11/15/2013(b) | | | | | 33,914,000 | | | 28,191,012 |
Vertex Pharmaceuticals, Inc., 4.750%, 2/15/2013(b) | | | | | 11,035,000 | | | 13,159,238 |
| | | | | | | | |
| | | | | | | | 161,080,970 |
| | | | | | | | |
| Real Estate Investment Trusts – 0.1% | | | | | | | | |
Host Hotels & Resorts, Inc., 2.625%, 4/15/2027, 144A | | | | | 26,530,000 | | | 22,218,875 |
| | | | | | | | |
| Technology – 0.5% | | | | | | | | |
Avnet, Inc., 2.000%, 3/15/2034(b) | | | | | 18,780,000 | | | 21,127,500 |
Kulicke & Soffa Industries, Inc., 0.500%, 11/30/2008 | | | | | 10,920,000 | | | 10,210,200 |
Kulicke & Soffa Industries, Inc., 0.875%, 6/01/2012 | | | | | 8,485,000 | | | 5,854,650 |
Kulicke & Soffa Industries, Inc., 1.000%, 6/30/2010 | | | | | 5,805,000 | | | 4,585,950 |
Maxtor Corp., 5.750%, 3/01/2012(e) | | | | | 9,352,000 | | | 8,790,880 |
Nortel Networks Corp., 2.125%, 4/15/2014, 144A | | | | | 44,934,000 | | | 27,915,247 |
Nortel Networks Corp., 4.250%, 9/01/2008 | | | | | 4,109,000 | | | 4,057,638 |
Richardson Electronics Ltd., 7.750%, 12/15/2011 | | | | | 395,000 | | | 363,400 |
| | | | | | | | |
| | | | | | | | 82,905,465 |
| | | | | | | | |
| Textile – 0.1% | | | | | | | | |
Dixie Yarns, Inc., 7.000%, 5/15/2012 | | | | | 165,000 | | | 154,275 |
Kellwood Co., (Step to 0.000% on 6/15/2011), 3.500%, 6/15/2034(d) | | | | | 18,615,000 | | | 18,708,075 |
| | | | | | | | |
| | | | | | | | 18,862,350 |
| | | | | | | | |
| Transportation Services – 0.0% | | | | | | | | |
Builders Transportation, Inc., 8.000%, 8/15/2005(f) | | | | | 1,000,000 | | | — |
Preston Corp., 7.000%, 5/01/2011 | | | | | 750,000 | | | 710,783 |
| | | | | | | | |
| | | | | | | | 710,783 |
| | | | | | | | |
| Wireless – 0.1% | | | | | | | | |
Nextel Communications, Inc., 5.250%, 1/15/2010 | | | | | 3,505,000 | | | 3,215,837 |
NII Holdings, Inc., 3.125%, 6/15/2012(b) | | | | | 17,260,000 | | | 13,700,125 |
| | | | | | | | |
| | | | | | | | 16,915,962 |
| | | | | | | | |
| Wirelines – 0.9% | | | | | | | | |
Level 3 Communications, Inc., 2.875%, 7/15/2010 | | | | | 41,240,000 | | | 28,816,450 |
Level 3 Communications, Inc., 3.500%, 6/15/2012(b) | | | | | 46,770,000 | | | 32,037,450 |
Level 3 Communications, Inc., 5.250%, 12/15/2011 | | | | | 19,145,000 | | | 15,028,825 |
Level 3 Communications, Inc., 6.000%, 9/15/2009(b) | | | | | 39,230,000 | | | 34,816,625 |
Level 3 Communications, Inc., 6.000%, 3/15/2010(b) | | | | | 43,124,000 | | | 34,822,630 |
| | | | | | | | |
| | | | | | | | 145,521,980 |
| | | | | | | | |
36
PORTFOLIO OF INVESTMENTS – as of March 31, 2008 (Unaudited)
Loomis Sayles Bond Fund – continued
| | | | | | | | |
| | | | | Principal Amount (‡) | | Value (†) |
| | | | | | | | |
| | | |
| BONDS AND NOTES – continued | | | | | | | | |
| | | |
| TOTAL CONVERTIBLE BONDS | | | | | | | | |
(Identified Cost $637,988,591) | | | | | | | $ | 586,908,445 |
| | | | | | | | |
| | | |
| MUNICIPALS – 0.9% | | | | | | | | |
| | | |
| Alabama – 0.0% | | | | | | | | |
Alabama Public School & College Authority (Capital Improvement), 4.500%, 12/01/2026 | | | | $ | 4,640,000 | | | 4,382,666 |
| | | | | | | | |
| California – 0.4% | | | | | | | | |
San Diego Unified School District (Election 1998), 4.500%, 7/01/2029, Series F-1 (FSA insured) | | | | | 4,870,000 | | | 4,530,269 |
San Jose California Redevelopment Agency Tax
Allocation (Merged Area Redevelopment), 3.750%, 8/01/2028, Series C | | | | | 2,165,000 | | | 1,802,211 |
San Jose Redevelopment Agency Tax Allocation (Merged Area), 3.750%, 8/01/2028, Series C (MBIA insured) | | | | | 5,425,000 | | | 4,290,687 |
State of California, 4.500%, 8/01/2027 (AMBAC insured) | | | | | 7,340,000 | | | 6,847,559 |
State of California, 4.500%, 8/01/2030 (AMBAC insured) | | | | | 5,945,000 | | | 5,380,106 |
State of California, 4.500%, 8/01/2030 | | | | | 5,140,000 | | | 4,623,430 |
State of California, 4.500%, 10/01/2029 | | | | | 20,455,000 | | | 18,458,592 |
State of California (Various Purpose),
3.250%, 12/01/2027 (MBIA insured) | | | | | 3,805,000 | | | 2,854,016 |
State of California (Various Purpose),
4.500%, 12/01/2033 (AMBAC insured) | | | | | 17,945,000 | | | 16,031,166 |
University of California Regents Medical Center, 4.750%, 5/15/2031, Series A (MBIA Insured) | | | | | 1,260,000 | | | 1,203,754 |
| | | | | | | | |
| | | | | | | | 66,021,790 |
| | | | | | | | |
| District Of Columbia – 0.0% | | | | | | | | |
District of Columbia, 4.750%, 6/01/2036, Series A (FGIC insured) | | | | | 4,640,000 | | | 4,264,067 |
| | | | | | | | |
| Florida – 0.0% | | | | | | | | |
Florida State Turnpike Authority (Department of Transportation), 3.500%, 7/01/2027, Series A (MBIA insured) | | | | | 4,640,000 | | | 3,638,549 |
| | | | | | | | |
| Illinois – 0.1% | | | | | | | | |
Chicago Board of Education, 4.750%, 12/01/2031,
Series B (FSA insured) | | | | | 8,020,000 | | | 7,678,749 |
Chicago O’Hare International Airport, 4.500%, 1/01/2038, Series A (FSA insured) | | | | | 2,440,000 | | | 2,220,424 |
| | | | | | | | |
| | | | | | | | 9,899,173 |
| | | | | | | | |
| Louisiana – 0.0% | | | | | | | | |
State of Louisiana, 3.250%, 5/01/2026, Series C (FSA insured) | | | | | 4,640,000 | | | 3,457,125 |
| | | | | | | | |
| Massachusetts – 0.0% | | | | | | | | |
Massachusetts School Building Authority, 4.750%, 8/15/2032, Series A (AMBAC insured) | | | | | 4,645,000 | | | 4,450,653 |
| | | | | | | | |
| Michigan – 0.1% | | | | | | | | |
Grosse Pointe Public School System, 3.000%, 5/01/2027 (FGIC insured) | | | | | 2,800,000 | | | 1,978,200 |
Michigan Tobacco Settlement Finance Authority,
7.309%, 6/01/2034 | | | | | 21,965,000 | | | 21,333,946 |
| | | | | | | | |
| | | | | | | | 23,312,146 |
| | | | | | | | |
37
| | | | | | | | |
| | | | | Principal Amount (‡) | | Value (†) |
| | | | | | | | |
| | | |
| MUNICIPALS – continued | | | | | | | | |
| Nebraska – 0.1% | | | | | | | | |
Omaha Public Power District, 4.500%, 2/01/2034,
Series AA (FGIC insured) | | | | $ | 11,595,000 | | $ | 10,414,629 |
| | | | | | | | |
| Ohio – 0.1% | | | | | | | | |
Buckeye Ohio Tobacco Settlement, Series A-2, 5.875%, 6/01/2047 | | | | | 10,390,000 | | | 9,141,953 |
| | | | | | | | |
| Texas – 0.1% | | | | | | | | |
County of Harris TX, 4.500%, 10/01/2031, Series B | | | | | 13,125,000 | | | 11,780,212 |
| | | | | | | | |
| Wisconsin – 0.0% | | | | | | | | |
Green Bay Wisconsin Water System Revenue, 3.500%, 11/01/2029 (FSA insured) | | | | | 3,415,000 | | | 2,642,015 |
Green Bay Wisconsin Water System Revenue, 3.500%, 11/01/2026 (FSA insured) | | | | | 3,170,000 | | | 2,560,314 |
Wisconsin Housing & Economic Development Authority, 4.900%, 11/01/2035, Series E | | | | | 1,185,000 | | | 1,105,285 |
| | | | | | | | |
| | | | | | | | 6,307,614 |
| | | | | | | | |
| | | |
| TOTAL MUNICIPALS | | | | | | | | |
(Identified Cost $158,658,512) | | | | | | | | 157,070,577 |
| | | | | | | | |
| | | |
| TOTAL BONDS AND NOTES | | | | | | | | |
(Identified Cost $15,227,234,405) | | | | | | | | 14,999,644,913 |
| | | | | | | | |
| | | |
| BANK LOANS – 0.8% | | | | | | | | |
| | | |
| Electric – 0.3% | | | | | | | | |
Calpine Corp., Dip Term Loan, 5.575%, 3/29/2009(h) | | | | | 29,685,600 | | | 26,480,446 |
TXU Tech Co., Term Loan B2, 6.579%, 10/10/2014(h) | | | | | 27,510,614 | | | 25,040,436 |
| | | | | | | | |
| | | | | | | | 51,520,882 |
| | | | | | | | |
| | | |
| Food & Beverage – 0.0% | | | | | | | | |
Dole Food Co., Inc., LOC, 4/12/2013(i) | | | | | 358,477 | | | 307,394 |
Dole Food Co., Inc., Term Loan, 4/12/2013(i) | | | | | 794,319 | | | 681,128 |
Dole Food Co., Inc., Tranche C Term Loan, 4/12/2013(i) | | | | | 2,653,633 | | | 2,275,490 |
| | | | | | | | |
| | | | | | | | 3,264,012 |
| | | | | | | | |
| Healthcare – 0.1% | | | | | | | | |
Community Health Systems, Inc. Term Loan B, 5.335%, 7/25/2014(h) | | | | | 4,170,000 | | | 3,840,487 |
HCA, Inc., Term Loan B, 4.946%, 11/17/2013(h) | | | | | 11,695,391 | | | 10,755,316 |
| | | | | | | | |
| | | | | | | | 14,595,803 |
| | | | | | | | |
| Manufacturing – 0.1% | | | | | | | | |
Georgia Pacific Corp., First Lien Term Loan, 4.727%, 12/20/2012(h) | | | | | 21,067,130 | | | 19,539,763 |
Georgia Pacific Corp., Term Loan B2, 4.684%, 12/29/2012(h) | | | | | 2,927,588 | | | 2,720,842 |
| | | | | | | | |
| | | | | | | | 22,260,605 |
| | | | | | | | |
| Media Non-Cable – 0.0% | | | | | | | | |
Idearc, Inc., Term Loan B, 11/17/2014(i) | | | | | 2,345,000 | | | 1,872,483 |
| | | | | | | | |
| Oil Field Services – 0.0% | | | | | | | | |
Dresser, Inc., Second Lien Term Loan, 8.820%, 5/04/2015(h) | | | | | 3,515,000 | | | 3,122,480 |
38
PORTFOLIO OF INVESTMENTS – as of March 31, 2008 (Unaudited)
Loomis Sayles Bond Fund – continued
| | | | | | | | |
| | | | | Principal Amount (‡) | | Value (†) |
| | | | | | | | |
| | | |
| BANK LOANS – continued | | | | | | | | |
| | | |
| Oil Field Services – continued | | | | | | | | |
Dresser, Inc., Term Loan B, 5.557%, 5/04/2014(h) | | | | $ | 1,755,000 | | $ | 1,637,994 |
| | | | | | | | |
| | | | | | | | 4,760,474 |
| | | | | | | | |
| Technology – 0.1% | | | | | | | | |
Freescale Semiconductor, Term Loan B, 4.869%, 12/01/2013(h) | | | | | 2,344,066 | | | 1,976,188 |
Nuance Communication, Inc., Term Loan B2, 5.210%, 3/31/2013(h) | | | | | 16,458,543 | | | 14,113,200 |
| | | | | | | | |
| | | | | | | | 16,089,388 |
| | | | | | | | |
| Wireless – 0.1% | | | | | | | | |
ALLTEL Corp., Term Loan B2, 5.550%, 5/16/2015(h) | | | | | 15,797,970 | | | 14,195,108 |
| | | | | | | | |
| Wirelines – 0.1% | | | | | | | | |
Hawaiian Telecom Communications, Inc., Term Loan C, 4.946%, 6/01/2014(h) | | | | | 12,073,217 | | | 9,115,279 |
| | | | | | | | |
| | | |
| TOTAL BANK LOANS | | | | | | | | |
(Identified Cost $137,420,545) | | | | | | | | 137,674,034 |
| | | | | | | | |
| | | | | | | | |
| | | |
| | | | | Shares | | |
| | | |
| COMMON STOCKS – 0.4% | | | | | | | | |
| | | |
| Biotechnology – 0.1% | | | | | | | | |
Vertex Pharmaceuticals, Inc.(b)(g) | | | | | 879,080 | | | 21,001,221 |
| | | | | | | | |
| Communications Equipment – 0.1% | | | | | | | | |
Corning, Inc.(b) | | | | | 630,490 | | | 15,156,979 |
| | | | | | | | |
| Containers & Packaging – 0.2% | | | | | | | | |
Owens-Illinois, Inc.(g) | | | | | 639,339 | | | 36,077,900 |
| | | | | | | | |
| | | |
| TOTAL COMMON STOCKS | | | | | | | | |
(Identified Cost $42,506,343) | | | | | | | | 72,236,100 |
| | | | | | | | |
| | | |
| PREFERRED STOCKS – 2.9% | | | | | | | | |
| | | |
| CONVERTIBLE PREFERRED STOCKS – 1.2% | | | | | | | | |
| | | |
| Automotive – 0.3% | | | | | | | | |
Ford Motor Co., Capital Trust II(b) | | | | | 1,957,035 | | | 57,380,266 |
| | | | | | | | |
| Capital Markets – 0.1% | | | | | | | | |
Newell Financial Trust I | | | | | 207,122 | | | 9,372,271 |
| | | | | | | | |
| Construction Materials – 0.0% | | | | | | | | |
Williams Cos., Inc. | | | | | 25,000 | | | 3,859,375 |
| | | | | | | | |
| Diversified Consumer Services – 0.0% | | | | | | | | |
Six Flags, Inc.(b) | | | | | 517,100 | | | 6,282,765 |
| | | | | | | | |
| Diversified Financial Services – 0.0% | | | | | | | | |
Sovereign Capital Trust | | | | | 81,074 | | | 2,472,757 |
| | | | | | | | |
| Electric Utilities – 0.2% | | | | | | | | |
AES Trust III(b) | | | | | 346,577 | | | 16,115,830 |
CMS Energy Trust I(b) | | | | | 207,375 | | | 9,331,875 |
| | | | | | | | |
| | | | | | | | 25,447,705 |
| | | | | | | | |
| Machinery – 0.0% | | | | | | | | |
United Rentals Trust | | | | | 61,871 | | | 1,859,997 |
| | | | | | | | |
39
| | | | | | | |
| | | | | Shares | | Value (†) |
| | | | | | | |
| | | |
| PREFERRED STOCKS – continued | | | | | | | |
| | | |
| Oil, Gas & Consumable Fuels – 0.4% | | | | | | | |
Chesapeake Energy Corp.(b) | | | | 87,351 | | $ | 10,181,632 |
Chesapeake Energy Corp. | | | | 360,780 | | | 47,176,531 |
El Paso Energy Capital Trust I | | | | 187,179 | | | 6,813,316 |
| | | | | | | |
| | | | | | | 64,171,479 |
| | | | | | | |
| Real Estate Investment Trusts (REITs) – 0.0% | | | | | | | |
FelCor Lodging Trust, Inc., Series A | | | | 53,600 | | | 1,058,064 |
| | | | | | | |
| Semiconductors & Semiconductor Equipment – 0.2% | | | | | | | |
Lucent Technologies Capital Trust | | | | 37,754 | | | 26,427,800 |
| | | | | | | |
| | | |
| TOTAL CONVERTIBLE PREFERRED STOCKS | | | | | | | |
(Identified Cost $211,717,493) | | | | | | | 198,332,479 |
| | | | | | | |
| | | |
| NON-CONVERTIBLE PREFERRED STOCKS – 1.7% | | | | | | | |
| | | |
| Electric Utilities – 0.0% | | | | | | | |
Connecticut Light & Power Co. | | | | 2,925 | | | 112,430 |
Entergy Arkansas, Inc. | | | | 100 | | | 8,091 |
Entergy Mississippi, Inc. | | | | 5,000 | | | 419,844 |
Entergy New Orleans, Inc. | | | | 665 | | | 49,231 |
Entergy New Orleans, Inc. | | | | 200 | | | 15,231 |
MDU Resources Group, Inc. | | | | 1,318 | | | 131,924 |
Public Service Co. | | | | 360 | | | 28,901 |
Southern California Edison Co.(b) | | | | 50,100 | | | 1,064,625 |
Xcel Energy, Inc. | | | | 1,100 | | | 78,375 |
| | | | | | | |
| | | | | | | 1,908,652 |
| | | | | | | |
| Thrifts & Mortgage Finance – 1.7% | | | | | | | |
Federal Home Loan Mortgage Corp.(b) | | | | 1,998,739 | | | 50,608,071 |
Federal Home Loan Mortgage Corp. | | | | 531,400 | | | 10,149,740 |
Federal Home Loan Mortgage Corp.(b) | | | | 3,049,402 | | | 74,405,409 |
Federal National Mortgage Association(b) | | | | 131,150 | | | 4,655,825 |
Federal National Mortgage Association(b) | | | | 6,085,000 | | | 146,344,250 |
| | | | | | | |
| | | | | | | 286,163,295 |
| | | | | | | |
| | | |
| TOTAL NON-CONVERTIBLE PREFERRED STOCKS | | | | | | | |
(Identified Cost $298,388,592) | | | | | | | 288,071,947 |
| | | | | | | |
| | | |
| TOTAL PREFERRED STOCKS | | | | | | | |
(Identified Cost $510,106,085) | | | | | | | 486,404,426 |
| | | | | | | |
| | | |
| CLOSED END INVESTMENT COMPANIES – 0.2% | | | | | | | |
| BlackRock Senior High Income Fund, Inc. | | | | 199,071 | | | 969,476 |
Dreyfus High Yield Strategies Fund | | | | 1,033,274 | | | 3,585,461 |
DWS High Income Trust | | | | 177,909 | | | 813,044 |
Highland Credit Strategies Fund(b) | | | | 860,000 | | | 11,197,200 |
Morgan Stanley Emerging Markets Debt Fund, Inc. | | | | 356,954 | | | 3,426,758 |
Van Kampen High Income Trust II(b) | | | | 141,611 | | | 504,135 |
Western Asset High Income Opportunity Fund, Inc. | | | | 2,217,450 | | | 12,550,767 |
Western Asset Managed High Income Fund, Inc.(b) | | | | 1,369,100 | | | 7,502,668 |
| | | | | | | |
| | | |
| TOTAL CLOSED END INVESTMENT COMPANIES | | | | | | | |
(Identified Cost $45,128,723) | | | | | | | 40,549,509 |
| | | | | | | |
40
PORTFOLIO OF INVESTMENTS – as of March 31, 2008 (Unaudited)
Loomis Sayles Bond Fund – continued
| | | | | | | | |
| | | | | Principal Amount (‡) | | Value (†) |
| | | |
| SHORT-TERM INVESTMENTS – 12.6% | | | | | | | | |
| Tri-Party Repurchase Agreement with Fixed Income Clearing Corporation, dated 3/31/2008 at 1.250%, to be repurchased at $1,055,638,653 on 4/1/2008 collateralized by $50,000,000 Federal Home Loan Mortgage Corp., 5.450% due 9/02/2011 valued at $50,812,500; $90,265,000 Federal Home Loan Mortgage Corp., 3.675% due 3/05/2010 valued at $90,603,494; $50,000,000 Federal Farm Credit Bank, 3.750% due 12/06/2010 valued at $52,187,500; $50,000,000 Federal Home Loan Bank, 4.875% due 11/18/2011 valued at $54,250,000; $100,000,000 Federal National Mortgage Association, 6.000% due 5/15/2011 valued at $111,750,000; $50,000,000 Federal National Mortgage Association, 5.000% due 10/15/2011 valued at $54,625,000; $68,975,000 Federal National Mortgage Association, 5.020% due 11/21/2012 value at $71,389,125; $24,205,000 Federal National Mortgage Association, 3.675% due 3/05/2010 valued at $24,386,538; $217,800,000 Federal Home Loan Mortgage Corp., 3.675% due 3/05/2010 valued at $218,616,750; $290,640,000 Federal National Mortgage Association, 5.210% due 3/03/2023 valued at $291,384,038; $56,860,000 Federal Home Loan Mortgage Corp. Discount Note, Zero Coupon due 6/30/2008 valued at $56,717,850 including accrued interest (Note 2h of Notes to Financial Statements) | | | | $ | 1,055,602,000 | | $ | 1,055,602,000 |
| | | | | | | | |
| | | |
| | | | | Shares | | |
State Street Navigator Securities Lending Prime Portfolio(j) | | | | | 1,075,922,564 | | | 1,075,922,564 |
| | | | | | | | |
| | | |
| TOTAL SHORT-TERM INVESTMENTS | | | | | | | | |
(Identified Cost $2,131,524,564) | | | | | | | | 2,131,524,564 |
| | | | | | | | |
| | | |
| TOTAL INVESTMENTS – 105.2% | | | | | | | | |
(Identified Cost $18,093,920,665)(a) | | | | | | | | 17,868,033,546 |
Other assets less liabilities—(5.2)% | | | | | | | | (887,691,733) |
| | | | | | | | |
| | | |
| NET ASSETS – 100.0% | | | | | | | $ | 16,980,341,813 |
| | | | | | | | |
| | | |
(‡) Principal amount stated in U.S. dollars unless otherwise noted. | | | | | | | | |
(†) See Note 2a of Notes to Financial
Statements. | | | | | | | | |
(††) Amount shown represents units. One unit represents a principal amount of 100. | | | |
(a) Federal Tax Information (Amounts exclude certain adjustments made at the end of the Fund’s fiscal year for tax purposes. Such adjustments are primarily due to wash sales. Amortization of premium on debt securities is excluded for tax purposes.): At March 31, 2008, the net unrealized depreciation on investments based on a cost of $18,101,534,012 for federal income tax purposes was as follows: | | | |
Aggregate gross unrealized appreciation for all investments in which there is an excess of value over tax cost | | $ | 724,778,513 |
Aggregate gross unrealized depreciation for all investments in which there is an excess of tax cost over value | | | (958,278,979) |
| | | | | | | | |
Net unrealized depreciation | | | | | | | $ | (233,500,466) |
| | | | | | | | |
| (b) | All or a portion of this security was on loan to brokers at March 31, 2008. |
| (c) | Variable rate security. Rate as of March 31, 2008 is disclosed. |
| (d) | Step Bond: Coupon is a fixed rate for an initial period then resets at a specified date and rate. |
| (e) | Illiquid security. At March 31, 2008, the value of these securities amounted to $59,212,480 or 0.3% of net assets. |
| (f) | Bankrupt issuer. Security remains in the Portfolio of Investments pending final resolution of bankruptcy proceedings. |
| (g) | Non-income producing security. |
| (h) | Variable rate security. Rate shown represents the weighted average rate at March 31, 2008. |
| (i) | The security has not settled. Contract rates do not take effect until settlement date. |
41
| (j) | Represents investment of securities lending collateral. |
| 144A | Securities exempt from registration under Rule 144A of the Securities Act of 1933. These securities may be resold in transactions exempt from registration, normally to qualified institutional buyers. At March 31, 2008, the total value of these securities amounted to $1,667,698,200 or 9.8% of net assets. |
| EMTN | Euro Medium Term Note |
| GMTN | Global Medium Term Note |
Key to Abbreviations AUD: Australian Dollar; BRL: Brazilian Real; CAD: Canadian Dollar; EUR: Euro; GBP: Great British Pound; IDR: Indonesian Rupiah; ISK: Iceland Krona; KRW: South Korean Won; MXN: Mexican Peso; MYR: Malaysian Ringgit; NZD: New Zealand Dollar; SGD: Singapore Dollar; THB: Thailand Baht
HOLDINGS AT MARCH 31, 2008 AS A PERCENTAGE OF NET ASSETS (Unaudited)
| | | |
Sovereigns | | 11.4 | % |
Non-Captive Diversified | | 7.5 | |
Wirelines | | 6.3 | |
Banking | | 5.0 | |
Healthcare | | 4.9 | |
Non-Captive Consumer | | 4.3 | |
Electric | | 3.9 | |
Supranational | | 3.6 | |
Retailers | | 3.4 | |
Technology | | 3.1 | |
Treasuries | | 3.0 | |
Pharmaceuticals | | 2.9 | |
Automotive | | 2.4 | |
Media Cable | | 2.2 | |
Pipelines | | 2.2 | |
Other, less than 2% each | | 26.5 | |
CURRENCY EXPOSURE AT MARCH 31, 2008 AS A PERCENTAGE OF NET ASSETS (Unaudited)
| | | |
United States Dollar | | 65.7 | % |
Canadian Dollar | | 8.1 | |
Mexican Peso | | 3.3 | |
Brazilian Real | | 2.6 | |
New Zealand Dollar | | 2.6 | |
Australian Dollar | | 2.3 | |
Other, less than 2% each | | 8.0 | |
See accompanying notes to financial statements.
42
PORTFOLIO OF INVESTMENTS – as of March 31, 2008 (Unaudited)
Loomis Sayles Fixed Income Fund
| | | | | | | | |
| | | | | Principal Amount (‡) | | Value (†) |
| | | | | | | | |
| | | |
| BONDS AND NOTES – 83.5% of Net Assets | | | | | | | | |
| | | |
| NON-CONVERTIBLE BONDS – 79.3% | | | | | | | | |
| | | |
| Aerospace & Defense – 0.0% | | | | | | | | |
Bombardier, Inc., 7.450%, 5/01/2034, 144A | | | | $ | 175,000 | | $ | 163,625 |
| | | | | | | | |
| Airlines – 0.6% | | | | | | | | |
American Airlines, Inc., Series 1999-1, 7.324%, 4/15/2011 | | | | | 250,000 | | | 239,850 |
American Airlines, Inc., Series 93A6, 8.040%, 9/16/2011 | | | | | 34,639 | | | 33,470 |
Continental Airlines, Inc., Series 2000-2, Class B, 8.307%, 10/2/2019 | | | | | 124,483 | | | 116,391 |
Continental Airlines, Inc., Series 2001-1, Class B, 7.373%, 12/15/2015 | | | | | 203,816 | | | 184,453 |
Continental Airlines, Inc., Series 971A, 7.461%, 10/1/2016 | | | | | 478,218 | | | 444,743 |
Delta Air Lines, Inc., 8.954%, 8/10/2014, 144A | | | | | 1,904,253 | | | 1,770,955 |
United Air Lines, Inc., 6.636%, 7/02/2022 | | | | | 1,026,321 | | | 954,479 |
| | | | | | | | |
| | | | | | | | 3,744,341 |
| | | | | | | | |
| Asset-Backed Securities – 0.1% | | | | | | | | |
Community Program Loan Trust, Series 1987-A, Class A5, 4.500%, 4/01/2029 | | | | | 725,000 | | | 644,032 |
Ford Credit Auto Owner Trust, 4.380%, 1/15/2010 | | | | | 72,211 | | | 72,280 |
| | | | | | | | |
| | | | | | | | 716,312 |
| | | | | | | | |
| Automotive – 2.1% | | | | | | | | |
Cummins, Inc., 7.125%, 3/01/2028 | | | | | 2,400,000 | | | 2,368,421 |
FCE Bank PLC, 7.125%, 1/16/2012 | | EUR | | | 300,000 | | | 378,900 |
FCE Bank PLC, 7.125%, 1/15/2013 | | EUR | | | 200,000 | | | 249,442 |
Ford Motor Co., 6.375%, 2/01/2029 | | | | | 730,000 | | | 438,000 |
Ford Motor Co., 6.500%, 8/01/2018(b) | | | | | 50,000 | | | 33,500 |
Ford Motor Co., 6.625%, 10/01/2028 | | | | | 2,435,000 | | | 1,485,350 |
Ford Motor Co., 7.125%, 11/15/2025 | | | | | 595,000 | | | 392,700 |
Ford Motor Co., 7.450%, 7/16/2031 | | | | | 4,565,000 | | | 3,012,900 |
Ford Motor Credit Co. LLC, 5.700%, 1/15/2010 | | | | | 55,000 | | | 47,781 |
Ford Motor Credit Co. LLC, 7.000%, 10/01/2013 | | | | | 110,000 | | | 85,802 |
Ford Motor Credit Co. LLC, 7.875%, 6/15/2010 | | | | | 500,000 | | | 435,968 |
Ford Motor Credit Co. LLC, 8.000%, 12/15/2016 | | | | | 565,000 | | | 442,285 |
General Motors Corp., 7.400%, 9/01/2025 | | | | | 250,000 | | | 167,500 |
General Motors Corp., 8.250%, 7/15/2023 | | | | | 4,435,000 | | | 3,104,500 |
General Motors Corp., 8.375%, 7/15/2033(b) | | | | | 55,000 | | | 38,775 |
Goodyear Tire & Rubber Co., 7.000%, 3/15/2028 | | | | | 375,000 | | | 305,625 |
| | | | | | | | |
| | | | | | | | 12,987,449 |
| | | | | | | | |
| Banking – 6.2% | | | | | | | | |
BAC Capital Trust VI, 5.625%, 3/08/2035 | | | | | 2,385,000 | | | 2,002,391 |
Bank of America Corp., 4.850%, 11/15/2014 | | | | | 500,000 | | | 495,846 |
Barclays Bank PLC, Series A, 6.080%, 5/12/2008(c) | | | | | 1,000,000 | | | 998,520 |
Barclays Financial LLC, 4.060%, 9/16/2010, 144A | | KRW | | | 2,340,000,000 | | | 2,460,621 |
Barclays Financial LLC, 4.160%, 2/22/2010, 144A | | THB | | | 175,000,000 | | | 5,684,508 |
Barclays Financial LLC, Series EMTN, 4.100%, 3/22/2010, 144A | | THB | | | 45,000,000 | | | 1,460,728 |
BNP Paribas SA, Series EMTN, Zero Coupon Bond, 6/13/2011, 144A | | IDR | | | 18,710,000,000 | | | 1,459,400 |
43
| | | | | | | |
| | | | | Principal Amount (‡) | | Value (†) |
| | | | | | | |
| | | |
| BONDS AND NOTES – continued | | | | | | | |
| | | |
| Banking – continued | | | | | | | |
GMAC LLC, 5.375%, 6/06/2011 | | EUR | | 1,795,000 | | $ | 1,960,877 |
HSBC Bank USA, 3.310%, 8/25/2010, 144A | | | | 5,000,000 | | | 6,036,000 |
JPMorgan Chase & Co., Zero Coupon Bond, 5/17/2010, 144A | | BRL | | 16,585,000 | | | 7,534,686 |
JPMorgan Chase & Co., Zero Coupon Bond, 3/28/2011, 144A | | IDR | | 13,692,036,000 | | | 1,096,107 |
JPMorgan Chase & Co., Zero Coupon Bond, 3/28/2011, 144A | | IDR | | 17,920,000,000 | | | 1,433,211 |
JPMorgan Chase & Co., Zero Coupon Bond, 4/12/2012, 144A | | IDR | | 21,194,634,240 | | | 1,488,345 |
JPMorgan Chase & Co., Zero Coupon Bond, 6/08/2012, Series EMTN, 144A | | MYR | | 4,651,835 | | | 1,296,289 |
JPMorgan Chase London, Zero Coupon Bond, 10/21/2010, 144A | | IDR | | 18,824,303,000 | | | 1,589,381 |
Rabobank Nederland, 12.500%, 2/17/2009 | | ISK | | 70,000,000 | | | 919,486 |
Rabobank Nederland, 14.000%, 1/28/2009, 144A | | ISK | | 48,000,000 | | | 636,874 |
| | | | | | | |
| | | | | | | 38,553,270 |
| | | | | | | |
| Brokerage – 0.3% | | | | | | | |
Morgan Stanley, Inc., Series F, 6.625%, 4/01/2018 | | | | 1,745,000 | | | 1,745,614 |
| | | | | | | |
| Building Materials – 0.5% | | | | | | | |
Owens Corning, Inc., 6.500%, 12/01/2016 | | | | 805,000 | | | 667,350 |
Owens Corning, Inc., 7.000%, 12/01/2036 | | | | 1,205,000 | | | 871,332 |
Ply Gem Industries, Inc., 9.000%, 2/15/2012(b) | | | | 250,000 | | | 182,500 |
USG Corp., 6.300%, 11/15/2016 | | | | 1,680,000 | | | 1,327,200 |
| | | | | | | |
| | | | | | | 3,048,382 |
| | | | | | | |
| Chemicals – 1.1% | | | | | | | |
Borden, Inc., 7.875%, 2/15/2023 | | | | 5,240,000 | | | 3,248,800 |
Borden, Inc., 8.375%, 4/15/2016 | | | | 55,000 | | | 37,400 |
Borden, Inc., 9.200%, 3/15/2021 | | | | 905,000 | | | 606,350 |
ICI Wilmington, Inc., 5.625%, 12/01/2013 | | | | 115,000 | | | 120,905 |
Lubrizol Corp., 5.500%, 10/01/2014 | | | | 365,000 | | | 356,820 |
Lubrizol Corp., 6.500%, 10/01/2034 | | | | 1,170,000 | | | 1,172,938 |
Methanex Corp., 6.000%, 8/15/2015 | | | | 1,565,000 | | | 1,518,050 |
| | | | | | | |
| | | | | | | 7,061,263 |
| | | | | | | |
| Construction Machinery – 0.2% | | | | | | | |
Toro Co., 6.625%, 5/01/2037 | | | | 965,000 | | | 1,019,879 |
| | | | | | | |
| Diversified Manufacturing – 0.1% | | | | | | | |
General Electric Co., 5.000%, 2/01/2013 | | | | 500,000 | | | 517,911 |
| | | | | | | |
| Electric – 3.7% | | | | | | | |
AES Corp., 7.750%, 3/01/2014 | | | | 730,000 | | | 734,563 |
Duke Energy Corp., 4.200%, 10/01/2008 | | | | 85,000 | | | 85,299 |
Dynegy Holdings, Inc., 7.125%, 5/15/2018 | | | | 380,000 | | | 342,000 |
Dynegy Holdings, Inc., 7.625%, 10/15/2026 | | | | 810,000 | | | 686,475 |
Empresa Nacional de Electricidad SA (Endesa-Chile), 7.875%, 2/01/2027(b) | | | | 1,589,000 | | | 1,750,156 |
Energy Future Holdings Corp., Series P,
5.550%, 11/15/2014 | | | | 765,000 | | | 597,343 |
Energy Future Holdings Corp., Series Q,
6.500%, 11/15/2024 | | | | 1,515,000 | | | 1,075,768 |
Enersis SA, 7.375%, 1/15/2014(b) | | | | 275,000 | | | 303,361 |
44
PORTFOLIO OF INVESTMENTS – as of March 31, 2008 (Unaudited)
Loomis Sayles Fixed Income Fund – continued
| | | | | | | | |
| | | | | Principal Amount (‡) | | Value (†) |
| | | | | | | | |
| | | |
| BONDS AND NOTES – continued | | | | | | | | |
| | | |
| Electric – continued | | | | | | | | |
Enersis SA, 7.400%, 12/01/2016 | | | | $ | 4,000,000 | | $ | 4,323,040 |
Mackinaw Power LLC, 6.296%, 10/31/2023, 144A | | | | | 4,100,745 | | | 4,413,796 |
NGC Corporation Capital Trust I, Series B, 8.316%, 6/01/2027 | | | | | 695,000 | | | 595,963 |
Nisource Finance Corp., 6.400%, 3/15/2018 | | | | | 2,855,000 | | | 2,859,125 |
Power Receivables Finance LLC, 6.290%, 1/01/2012, 144A | | | | | 891,801 | | | 933,189 |
Quezon Power Philippines Co., 8.860%, 6/15/2017 | | | | | 1,428,700 | | | 1,442,987 |
TXU Corp., Series R, 6.550%, 11/15/2034 | | | | | 1,275,000 | | | 900,122 |
White Pine Hydro LLC, 6.310%, 7/10/2017(d) | | | | | 450,000 | | | 441,306 |
White Pine Hydro LLC, 6.960%, 7/10/2037(d) | | | | | 670,000 | | | 576,054 |
White Pine Hydro LLC, 7.260%, 7/20/2015(d) | | | | | 1,280,000 | | | 1,312,508 |
| | | | | | | | |
| | | | | | | | 23,373,055 |
| | | | | | | | |
| Entertainment – 1.7% | | | | | | | | |
Six Flags, Inc., 9.625%, 6/01/2014(b) | | | | | 100,000 | | | 56,500 |
Time Warner, Inc., 6.500%, 11/15/2036 | | | | | 910,000 | | | 834,863 |
Time Warner, Inc., 6.625%, 5/15/2029 | | | | | 2,065,000 | | | 1,936,264 |
Time Warner, Inc., 6.950%, 1/15/2028 | | | | | 875,000 | | | 849,921 |
Time Warner, Inc., 7.625%, 4/15/2031 | | | | | 730,000 | | | 763,514 |
Time Warner, Inc., 7.700%, 5/01/2032 | | | | | 1,155,000 | | | 1,215,992 |
Viacom, Inc., Class B, 6.875%, 4/30/2036 | | | | | 4,880,000 | | | 4,699,225 |
| | | | | | | | |
| | | | | | | | 10,356,279 |
| | | | | | | | |
| Food & Beverage – 0.3% | | | | | | | | |
Corn Products International, Inc., 6.625%, 4/15/2037 | | | | | 1,540,000 | | | 1,616,875 |
Dole Food Co., Inc., 8.625%, 5/01/2009 | | | | | 165,000 | | | 143,550 |
Sara Lee Corp., 6.125%, 11/01/2032 | | | | | 295,000 | | | 278,054 |
| | | | | | | | |
| | | | | | | | 2,038,479 |
| | | | | | | | |
| Foreign Local Governments – 4.6% | | | | | | | | |
Province of Alberta, 5.930%, 9/16/2016 | | CAD | | | 957,797 | | | 1,033,099 |
Province of British Columbia, Zero Coupon Bond, 8/23/2013 | | CAD | | | 11,700,000 | | | 9,433,293 |
Province of Ontario, 5.700%, 12/01/2008 | | CAD | | | 18,145,000 | | | 18,021,788 |
| | | | | | | | |
| | | | | | | | 28,488,180 |
| | | | | | | | |
| Healthcare – 2.3% | | | | | | | | |
Boston Scientific Corp., 5.450%, 6/15/2014 | | | | | 290,000 | | | 266,075 |
Boston Scientific Corp., 6.400%, 6/15/2016 | | | | | 860,000 | | | 801,950 |
Boston Scientific Corp., 7.000%, 11/15/2035 | | | | | 860,000 | | | 748,200 |
HCA, Inc., 5.750%, 3/15/2014 | | | | | 70,000 | | | 57,750 |
HCA, Inc., 6.250%, 2/15/2013 | | | | | 1,050,000 | | | 913,500 |
HCA, Inc., 6.375%, 1/15/2015 | | | | | 220,000 | | | 186,175 |
HCA, Inc., 6.500%, 2/15/2016(b) | | | | | 610,000 | | | 513,925 |
HCA, Inc., 6.750%, 7/15/2013 | | | | | 115,000 | | | 101,775 |
HCA, Inc., 7.050%, 12/01/2027 | | | | | 3,545,000 | | | 2,584,957 |
HCA, Inc., 7.190%, 11/15/2015 | | | | | 220,000 | | | 187,162 |
HCA, Inc., 7.500%, 12/15/2023 | | | | | 620,000 | | | 486,822 |
HCA, Inc., 7.500%, 11/06/2033 | | | | | 1,440,000 | | | 1,112,400 |
HCA, Inc., 7.580%, 9/15/2025 | | | | | 2,900,000 | | | 2,269,955 |
HCA, Inc., 7.690%, 6/15/2025 | | | | | 2,495,000 | | | 1,977,402 |
HCA, Inc., 7.750%, 7/15/2036 | | | | | 360,000 | | | 276,437 |
HCA, Inc., 8.360%, 4/15/2024 | | | | | 1,250,000 | | | 1,037,601 |
45
| | | | | | | | |
| | | | | Principal Amount (‡) | | Value (†) |
| | | | | | | | |
| | | |
| BONDS AND NOTES – continued | | | | | | | | |
| | | |
| Healthcare – continued | | | | | | | | |
Owens & Minor, Inc., 6.350%, 4/15/2016 | | | | $ | 320,000 | | $ | 323,395 |
Tenet Healthcare Corp., 6.875%, 11/15/2031 | | | | | 720,000 | | | 504,000 |
| | | | | | | | |
| | | | | | | | 14,349,481 |
| | | | | | | | |
| Home Construction – 1.2% | | | | | | | | |
K. Hovnanian Enterprises, Inc.,
6.250%, 1/15/2016 | | | | | 115,000 | | | 77,625 |
K. Hovnanian Enterprises, Inc.,
6.375%, 12/15/2014(b) | | | | | 155,000 | | | 104,625 |
K. Hovnanian Enterprises, Inc.,
6.500%, 1/15/2014(b) | | | | | 115,000 | | | 77,625 |
Lennar Corp., 7.625%, 3/01/2009 | | | | | 470,000 | | | 451,200 |
Lennar Corp., Series B, 5.600%, 5/31/2015 | | | | | 500,000 | | | 370,000 |
Pulte Homes, Inc., 5.200%, 2/15/2015 | | | | | 1,305,000 | | | 1,109,250 |
Pulte Homes, Inc., 6.000%, 2/15/2035 | | | | | 3,920,000 | | | 3,018,400 |
Pulte Homes, Inc., 6.375%, 5/15/2033 | | | | | 1,960,000 | | | 1,528,800 |
Stanley-Martin Communities LLC,
9.750%, 8/15/2015 | | | | | 370,000 | | | 177,600 |
Toll Brothers Finance Corp., 5.150%, 5/15/2015 | | | | | 565,000 | | | 511,042 |
| | | | | | | | |
| | | | | | | | 7,426,167 |
| | | | | | | | |
| Independent Energy – 2.8% | | | | | | | | |
Anadarko Petroleum Corp., 5.950%, 9/15/2016 | | | | | 3,495,000 | | | 3,614,347 |
Anadarko Petroleum Corp., 6.450%, 9/15/2036 | | | | | 2,580,000 | | | 2,627,351 |
Bruce Mansfield Unit, 6.850%, 6/01/2034 | | | | | 4,255,000 | | | 4,571,232 |
Chesapeake Energy Corp., 6.500%, 8/15/2017 | | | | | 380,000 | | | 366,700 |
Chesapeake Energy Corp., 6.875%, 1/15/2016 | | | | | 200,000 | | | 198,000 |
Chesapeake Energy Corp., 6.875%, 11/15/2020 | | | | | 900,000 | | | 873,000 |
Connacher Oil and Gas Ltd.,
10.250%, 12/15/2015, 144A | | | | | 1,580,000 | | | 1,591,850 |
Pioneer Natural Resources Co., 5.875%, 7/15/2016 | | | | | 435,000 | | | 396,160 |
Pioneer Natural Resources Co., 7.200%, 1/15/2028 | | | | | 1,465,000 | | | 1,273,438 |
Talisman Energy, Inc., 5.850%, 2/01/2037 | | | | | 550,000 | | | 482,221 |
Talisman Energy, Inc., 6.250%, 2/01/2038 | | | | | 1,485,000 | | | 1,368,151 |
XTO Energy, Inc., 6.100%, 4/01/2036 | | | | | 155,000 | | | 153,358 |
| | | | | | | | |
| | | | | | | | 17,515,808 |
| | | | | | | | |
| Industrial Other – 0.2% | | | | | | | | |
Ranhill Labuan Ltd., 12.500%, 10/26/2011, 144A | | | | | 1,575,000 | | | 1,260,000 |
| | | | | | | | |
| Integrated Energy – 0.3% | | | | | | | | |
PF Export Receivables Master Trust, 6.436%, 6/01/2015, 144A | | | | | 1,462,568 | | | 1,535,697 |
| | | | | | | | |
| Life Insurance – 2.4% | | | | | | | | |
ASIF Global Financing XXVII, 2.380%, 2/26/2009, 144A | | SGD | | | 17,000,000 | | | 12,349,031 |
Hartford Life Insurance Co., 6.480%, 9/15/2011(c) | | | | | 500,000 | | | 517,430 |
John Hancock Insurance Co., 6.130%, 4/15/2009(c) | | | | | 500,000 | | | 507,880 |
Principal Life Income Funding Trust, 5.000%, 10/15/2014 | | | | | 500,000 | | | 504,753 |
Protective Life Secured Trust, 6.010%, 9/10/2014(c) | | | | | 1,000,000 | | | 981,300 |
| | | | | | | | |
| | | | | | | | 14,860,394 |
| | | | | | | | |
46
PORTFOLIO OF INVESTMENTS – as of March 31, 2008 (Unaudited)
Loomis Sayles Fixed Income Fund – continued
| | | | | | | |
| | | | | Principal Amount (‡) | | Value (†) |
| | | | | | | |
| | | |
| BONDS AND NOTES – continued | | | | | | | |
| | | |
| Local Authorities – 1.5% | | | | | | | |
Queensland Treasury Corp., Series 11G,
6.000%, 6/14/2011 | | AUD | | 2,150,000 | | $ | 1,921,490 |
Virginia Tobacco Settlement Financing Corp., Series A-1, 6.706%, 6/01/2046 | | | | 7,970,000 | | | 7,230,304 |
| | | | | | | |
| | | | | | | 9,151,794 |
| | | | | | | |
| Lodging – 0.0% | | | | | | | |
Host Marriott LP, Series O, 6.375%, 3/15/2015 | | | | 150,000 | | | 139,500 |
| | | | | | | |
| Media Cable – 3.0% | | | | | | | |
Comcast Corp., 5.650%, 6/15/2035 | | | | 2,660,000 | | | 2,258,816 |
Comcast Corp., 6.450%, 3/15/2037 | | | | 2,645,000 | | | 2,492,487 |
Comcast Corp., 6.500%, 11/15/2035 | | | | 3,240,000 | | | 3,064,340 |
Comcast Corp., 6.950%, 8/15/2037 | | | | 7,695,000 | | | 7,710,428 |
CSC Holdings, Inc., 6.750%, 4/15/2012 | | | | 200,000 | | | 193,000 |
CSC Holdings, Inc., 7.625%, 4/01/2011 | | | | 50,000 | | | 49,438 |
CSC Holdings, Inc., 7.875%, 2/15/2018 | | | | 170,000 | | | 157,250 |
Rogers Cable, Inc., 5.500%, 3/15/2014 | | | | 150,000 | | | 141,560 |
TCI Communications, Inc., 7.875%, 2/15/2026(b) | | | | 550,000 | | | 579,518 |
Time Warner Cable, Inc., 6.550%, 5/01/2037 | | | | 1,500,000 | | | 1,415,971 |
Virgin Media Finance PLC, 9.125%, 8/15/2016 | | | | 400,000 | | | 358,000 |
Virgin Media Finance PLC, 9.750%, 4/15/2014 | | GBP | | 250,000 | | | 421,118 |
| | | | | | | |
| | | | | | | 18,841,926 |
| | | | | | | |
| Media Non-Cable – 0.5% | | | | | | | |
Clear Channel Communications, Inc.,
4.250%, 5/15/2009 | | | | 85,000 | | | 82,450 |
Clear Channel Communications, Inc.,
5.500%, 12/15/2016 | | | | 50,000 | | | 33,000 |
News America, Inc., 6.150%, 3/01/2037 | | | | 2,630,000 | | | 2,484,382 |
News America, Inc., 6.200%, 12/15/2034 | | | | 795,000 | | | 757,144 |
| | | | | | | |
| | | | | | | 3,356,976 |
| | | | | | | |
| Mortgage Related – 0.0% | | | | | | | |
GS Mortgage Securities Corp. II, Series 2005-GG4, Class A4A, 4.751%, 7/10/2039 | | | | 95,000 | | | 92,191 |
| | | | | | | |
| Non-Captive Consumer – 0.9% | | | | | | | |
Countrywide Home Loans, Inc., Series L, MTN, 4.000%, 3/22/2011 | | | | 84,000 | | | 74,915 |
HSBC Finance Corp., 6.500%, 11/15/2008 | | | | 60,000 | | | 60,716 |
Residential Capital LLC, 8.375%, 5/17/2013(c) | | GBP | | 580,000 | | | 494,972 |
Residential Capital LLC, 8.500%, 6/01/2012(c) | | | | 180,000 | | | 88,200 |
Residential Capital LLC, 8.500%, 4/17/2013(c) | | | | 6,335,000 | | | 3,072,475 |
Residential Capital LLC, 8.875%, 6/30/2015(c) | | | | 730,000 | | | 354,050 |
Residential Capital LLC, Series EMTN,
9.875%, 7/01/2014(c) | | GBP | | 560,000 | | | 477,904 |
SLM Corp., Series A, 5.375%, 1/15/2013 | | | | 660,000 | | | 514,800 |
SLM Corp., Series B, 6.430%, 9/15/2009(c) | | | | 500,000 | | | 455,000 |
| | | | | | | |
| | | | | | | 5,593,032 |
| | | | | | | |
| Non-Captive Diversified – 3.5% | | | | | | | |
CIT Group Funding Co. of Canada,
5.200%, 6/01/2015 | | | | 770,000 | | | 575,948 |
47
| | | | | | | | |
| | | | | Principal Amount (‡) | | Value (†) |
| | | | | | | | |
| | | |
| BONDS AND NOTES – continued | | | | | | | | |
| | | |
| Non-Captive Diversified – continued | | | | | | | | |
CIT Group Holdings, Inc., 5.400%, 1/30/2016 | | | | $ | 180,000 | | $ | 142,437 |
CIT Group, Inc., 3.800%, 11/14/2012 | | EUR | | | 750,000 | | | 718,738 |
CIT Group, Inc., 4.250%, 9/22/2011 | | EUR | | | 400,000 | | | 404,962 |
CIT Group, Inc., 4.250%, 3/17/2015 | | EUR | | | 1,000,000 | | | 929,365 |
CIT Group, Inc., 4.650%, 9/19/2016 | | EUR | | | 700,000 | | | 661,807 |
CIT Group, Inc., 5.000%, 2/13/2014 | | | | | 1,145,000 | | | 901,062 |
CIT Group, Inc., 5.000%, 5/13/2014 | | EUR | | | 50,000 | | | 50,526 |
CIT Group, Inc., 5.000%, 2/01/2015(b) | | | | | 170,000 | | | 133,167 |
CIT Group, Inc., 5.050%, 9/15/2014 | | | | | 500,000 | | | 315,962 |
CIT Group, Inc., 5.125%, 9/30/2014 | | | | | 2,400,000 | | | 1,848,000 |
CIT Group, Inc., 5.500%, 12/01/2014 | | GBP | | | 700,000 | | | 857,036 |
CIT Group, Inc., 5.600%, 4/27/2011 | | | | | 625,000 | | | 504,124 |
CIT Group, Inc., 5.650%, 2/13/2017 | | | | | 760,000 | | | 589,340 |
CIT Group, Inc., 5.800%, 10/01/2036(b) | | | | | 720,000 | | | 560,287 |
CIT Group, Inc., 6.000%, 4/01/2036 | | | | | 830,000 | | | 630,800 |
CIT Group, Inc., Series EMTN,
5.500%, 12/20/2016 | | GBP | | | 600,000 | | | 742,925 |
General Electric Capital Corp., 3.500%, 5/01/2008 | | | | | 150,000 | | | 150,027 |
General Electric Capital Corp., 6.500%, 9/28/2015 | | NZD | | | 9,210,000 | | | 6,693,352 |
General Electric Capital Corp., Series EMTN,
1.725%, 6/27/2008 | | SGD | | | 250,000 | | | 181,652 |
General Electric Capital Corp., Series EMTN,
6.750%, 9/26/2016 | | NZD | | | 1,345,000 | | | 998,503 |
GMAC LLC, 5.625%, 5/15/2009(b) | | | | | 1,500,000 | | | 1,366,956 |
GMAC LLC, 6.000%, 12/15/2011 | | | | | 220,000 | | | 164,448 |
GMAC LLC, 6.875%, 8/28/2012 | | | | | 355,000 | | | 269,775 |
GMAC LLC, 7.000%, 2/01/2012 | | | | | 400,000 | | | 304,192 |
GMAC LLC, 8.000%, 11/01/2031 | | | | | 295,000 | | | 211,424 |
ProLogis, 5.625%, 11/15/2015 | | | | | 100,000 | | | 91,277 |
ProLogis, 5.750%, 4/01/2016 | | | | | 80,000 | | | 73,449 |
SLM Corp., 4.000%, 1/15/2010 | | | | | 930,000 | | | 781,618 |
| | | | | | | | |
| | | | | | | | 21,853,159 |
| | | | | | | | |
| Oil Field Services – 0.2% | | | | | | | | |
North American Energy Partners, Inc.,
8.750%, 12/01/2011 | | | | | 1,000,000 | | | 990,000 |
| | | | | | | | |
| Packaging – 0.3% | | | | | | | | |
Owens-Illinois, Inc., 7.800%, 5/15/2018 | | | | | 2,000,000 | | | 1,980,000 |
| | | | | | | | |
| Paper – 1.7% | | | | | | | | |
Abitibi-Consolidated, Inc., 7.500%, 4/01/2028 | | | | | 650,000 | | | 266,500 |
Georgia-Pacific Corp., 7.250%, 6/01/2028 | | | | | 2,000,000 | | | 1,630,000 |
Georgia-Pacific Corp., 7.375%, 12/01/2025(b) | | | | | 2,868,000 | | | 2,380,440 |
Georgia-Pacific Corp., 7.750%, 11/15/2029 | | | | | 6,005,000 | | | 5,044,200 |
Georgia-Pacific Corp., 8.000%, 1/15/2024 | | | | | 132,000 | | | 116,160 |
International Paper Co., 4.250%, 1/15/2009 | | | | | 700,000 | | | 699,751 |
Jefferson Smurfit Corp., 7.500%, 6/01/2013 | | | | | 335,000 | | | 288,100 |
| | | | | | | | |
| | | | | | | | 10,425,151 |
| | | | | | | | |
| Pharmaceuticals – 0.9% | | | | | | | | |
Elan Financial PLC, 7.750%, 11/15/2011 | | | | | 2,725,000 | | | 2,534,250 |
Vertex Pharmaceuticals, Inc., 4.750%, 2/15/2013 | | | | | 2,770,000 | | | 3,303,225 |
| | | | | | | | |
| | | | | | | | 5,837,475 |
| | | | | | | | |
48
PORTFOLIO OF INVESTMENTS – as of March 31, 2008 (Unaudited)
Loomis Sayles Fixed Income Fund – continued
| | | | | | | | |
| | | | | Principal Amount (‡) | | Value (†) |
| | | | | | | | |
| | | |
| BONDS AND NOTES – continued | | | | | | | | |
| | | | | | | | |
| | | |
| Pipelines – 1.8% | | | | | | | | |
DCP Midstream LP, 6.450%, 11/03/2036, 144A | | | | $ | 1,740,000 | | $ | 1,635,925 |
El Paso Corp., 6.950%, 6/01/2028 | | | | | 925,000 | | | 864,873 |
El Paso Corp., 7.800%, 8/01/2031 | | | | | 250,000 | | | 256,685 |
Enterprise Products Operating LP,
6.300%, 9/15/2017 | | | | | 1,550,000 | | | 1,557,595 |
Kinder Morgan, Inc., 6.500%, 9/01/2012 | | | | | 90,000 | | | 91,258 |
Kinder Morgan, Inc., Senior Note,
5.150%, 3/01/2015 | | | | | 305,000 | | | 280,600 |
Plains All American Pipeline LP,
6.125%, 1/15/2017 | | | | | 1,785,000 | | | 1,814,474 |
Plains All American Pipeline LP,
6.650%, 1/15/2037 | | | | | 3,850,000 | | | 3,647,190 |
Williams Cos., Inc., 7.500%, 1/15/2031 | | | | | 1,000,000 | | | 1,042,500 |
| | | | | | | | |
| | | | | | | | 11,191,100 |
| | | | | | | | |
| Property & Casualty Insurance – 1.1% | | | | | | | | |
Allstate Corp., 5.950%, 4/01/2036 | | | | | 540,000 | | | 482,877 |
Axis Capital Holdings Ltd., 5.750%, 12/01/2014 | | | | | 80,000 | | | 76,085 |
Marsh & McLennan Cos., Inc.,
5.375%, 7/15/2014 | | | | | 1,190,000 | | | 1,149,655 |
Marsh & McLennan Cos., Inc.,
5.750%, 9/15/2015 | | | | | 775,000 | | | 758,785 |
Marsh & McLennan Cos., Inc.,
5.875%, 8/01/2033 | | | | | 180,000 | | | 150,919 |
MBIA Insurance Corp., 14.000%,
1/15/2033, 144A(c) | | | | | 430,000 | | | 421,400 |
Travelers Cos., Inc. (The), 6.250%, 6/15/2037 | | | | | 1,925,000 | | | 1,784,288 |
Travelers Property Casualty Corp.,
6.375%, 3/15/2033 | | | | | 1,400,000 | | | 1,356,667 |
White Mountains RE Group, 6.375%, 3/20/2017, 144A | | | | | 750,000 | | | 698,853 |
| | | | | | | | |
| | | | | | | | 6,879,529 |
| | | | | | | | |
| Railroads – 0.3% | | | | | | | | |
CSX Corp., 6.000%, 10/01/2036(b) | | | | | 1,575,000 | | | 1,355,892 |
Missouri Pacific Railroad Co., 5.000%, 1/01/2045 | | | | | 500,000 | | | 325,000 |
| | | | | | | | |
| | | | | | | | 1,680,892 |
| | | | | | | | |
| Real Estate Investment Trusts – 0.7% | | | | | | | | |
Camden Property Trust, 5.700%, 5/15/2017 | | | | | 680,000 | | | 588,790 |
Colonial Realty LP, 4.750%, 2/01/2010 | | | | | 15,000 | | | 14,771 |
Duke Realty LP, 5.950%, 2/15/2017 | | | | | 210,000 | | | 182,113 |
ERP Operating LP, 5.125%, 3/15/2016 | | | | | 70,000 | | | 60,642 |
Highwoods Properties, Inc., 5.850%, 3/15/2017 | | | | | 2,560,000 | | | 2,186,744 |
Highwoods Properties, Inc., 7.500%, 4/15/2018 | | | | | 475,000 | | | 442,080 |
Realty Income Corp., 6.750%, 8/15/2019 | | | | | 1,000,000 | | | 948,297 |
| | | | | | | | |
| | | | | | | | 4,423,437 |
| | | | | | | | |
| Restaurants – 0.1% | | | | | | | | |
McDonald’s Corp., 3.628%, 10/10/2010 | | SGD | | | 1,000,000 | | | 753,691 |
| | | | | | | | |
| Retailers – 1.3% | | | | | | | | |
Dillard’s, Inc., 7.750%, 7/15/2026 | | | | | 1,025,000 | | | 758,500 |
Foot Locker, Inc., 8.500%, 1/15/2022 | | | | | 1,100,000 | | | 968,000 |
Home Depot, Inc., 5.875%, 12/16/2036 | | | | | 2,825,000 | | | 2,306,239 |
49
| | | | | | | | | |
| | | | | Principal Amount (‡) | | | Value (†) |
| | | | | | | | | |
| | | |
| BONDS AND NOTES – continued | | | | | | | | | |
| | | |
| Retailers – continued | | | | | | | | | |
J.C. Penney Corp., Inc., 6.375%, 10/15/2036 | | | | $ | 1,110,000 | | | $ | 943,308 |
J.C. Penney Corp., Inc., 7.125%, 11/15/2023 | | | | | 575,000 | | | | 597,041 |
Toys R Us, Inc., 7.375%, 10/15/2018 | | | | | 3,240,000 | | | | 2,243,700 |
Toys R Us, Inc., 7.875%, 4/15/2013(b) | | | | | 750,000 | | | | 562,500 |
| | | | | | | | | |
| | | | | | | | | 8,379,288 |
| | | | | | | | | |
| Sovereigns – 9.2% | | | | | | | | | |
Canadian Government, 4.250%, 9/01/2008 | | CAD | | | 12,760,000 | | | | 12,520,948 |
Canadian Government, 4.250%, 9/01/2009 | | CAD | | | 16,520,000 | | | | 16,454,818 |
Canadian Government, Series WH31, 6.000%, 6/01/2008 | | CAD | | | 800,000 | | | | 784,373 |
Indonesia Treasury Bond, Series FR43, 10.250%, 7/15/2022 | | IDR | | | 2,915,000,000 | | | | 278,816 |
Indonesia Treasury Bond, Series ZC3, Zero Coupon Bond, 11/20/2012 | | IDR | | | 7,590,000,000 | | | | 516,639 |
Mexican Fixed Rate Bonds, Series M-10, 8.000%, 12/17/2015 | | MXN | | | 125,000 | (††) | | | 1,214,207 |
Mexican Fixed Rate Bonds, Series M-20, 8.000%, 12/07/2023 | | MXN | | | 305,000 | (††) | | | 2,983,585 |
Mexican Fixed Rate Bonds, Series MI-10, 9.000%, 12/20/2012 | | MXN | | | 1,015,000 | (††) | | | 10,148,331 |
New South Wales Treasury Corp., Series 10RG, 7.000%, 12/01/2010 | | AUD | | | 3,240,000 | | | | 2,972,251 |
New South Wales Treasury Corp., Series 12RG, 6.000%, 5/01/2012 | | AUD | | | 1,675,000 | | | | 1,484,017 |
Republic of Brazil, 10.250%, 1/10/2028(b) | | BRL | | | 14,885,000 | | | | 7,897,609 |
Republic of Brazil, 12.500%, 1/05/2022 | | BRL | | | 625,000 | | | | 386,462 |
| | | | | | | | | |
| | | | | | | | | 57,642,056 |
| | | | | | | | | |
| Supermarkets – 1.5% | | | | | | | | | |
Albertson’s, Inc., 6.625%, 6/01/2028 | | | | | 1,745,000 | | | | 1,484,525 |
Albertson’s, Inc., 7.450%, 8/01/2029 | | | | | 6,515,000 | | | | 5,999,051 |
Albertson’s, Inc., 7.750%, 6/15/2026 | | | | | 1,470,000 | | | | 1,386,228 |
Albertson’s, Inc., 8.000%, 5/01/2031 | | | | | 565,000 | | | | 538,592 |
Albertson’s, Inc., 8.700%, 5/01/2030 | | | | | 5,000 | | | | 5,017 |
American Stores Co., 8.000%, 6/01/2026 | | | | | 25,000 | | | | 25,300 |
| | | | | | | | | |
| | | | | | | | | 9,438,713 |
| | | | | | | | | |
| Supranational – 6.7% | | | | | | | | | |
Eurofima, Series EMTN, 10.000%, 11/03/2008 | | ISK | | | 4,400,000 | | | | 57,628 |
Eurofima, Series EMTN, 11.000%, 2/05/2010 | | ISK | | | 20,000,000 | | | | 266,381 |
European Investment Bank, 4.600%, 1/30/2037, 144A | | CAD | | | 6,000,000 | | | | 5,657,168 |
Inter-American Development Bank, Series EMTN, Zero Coupon Bond, 5/11/2009 | | BRL | | | 30,000,000 | | | | 14,429,817 |
Inter-American Development Bank, Series EMTN, 6.000%, 12/15/2017 | | NZD | | | 19,735,000 | | | | 13,960,678 |
Nordic Investment Bank, 11.250%, 4/16/2009 | | ISK | | | 4,800,000 | | | | 63,107 |
Nordic Investment Bank, 13.000%, 9/12/2008 | | ISK | | | 564,900,000 | | | | 7,413,170 |
| | | | | | | | | |
| | | | | | | | | 41,847,949 |
| | | | | | | | | |
| Technology – 2.4% | | | | | | | | | |
Agilent Technologies, Inc., 6.500%, 11/01/2017 | | | | | 2,365,000 | | | | 2,373,188 |
Amkor Technology, Inc., 7.125%, 3/15/2011 | | | | | 725,000 | | | | 681,500 |
Amkor Technology, Inc., 7.750%, 5/15/2013 | | | | | 470,000 | | | | 428,875 |
50
PORTFOLIO OF INVESTMENTS – as of March 31, 2008 (Unaudited)
Loomis Sayles Fixed Income Fund – continued
| | | | | | | | |
| | | | | Principal Amount (‡) | | Value (†) |
| | | | | | | | |
| | | |
| BONDS AND NOTES – continued | | | | | | | | |
| | | |
| Technology – continued | | | | | | | | |
Arrow Electronics, Inc., 6.875%, 7/01/2013 | | | | $ | 2,850,000 | | $ | 3,035,438 |
Avnet, Inc., 6.000%, 9/01/2015 | | | | | 1,645,000 | | | 1,648,935 |
Avnet, Inc., 6.625%, 9/15/2016 | | | | | 130,000 | | | 134,189 |
Corning, Inc., 6.200%, 3/15/2016 | | | | | 250,000 | | | 259,477 |
Corning, Inc., 6.850%, 3/01/2029 | | | | | 450,000 | | | 458,516 |
Corning, Inc., 7.250%, 8/15/2036 | | | | | 1,175,000 | | | 1,267,470 |
Lucent Technologies, Inc., 6.450%, 3/15/2029 | | | | | 250,000 | | | 178,750 |
Motorola, Inc., 5.220%, 10/01/2097 | | | | | 515,000 | | | 277,678 |
Motorola, Inc., 5.800%, 10/15/2008(b) | | | | | 500,000 | | | 506,234 |
Motorola, Inc., 6.500%, 11/15/2028 | | | | | 510,000 | | | 397,904 |
Motorola, Inc., 6.625%, 11/15/2037 | | | | | 600,000 | | | 464,062 |
Nortel Networks Corp., 6.875%, 9/01/2023 | | | | | 1,325,000 | | | 814,875 |
Nortel Networks Corp. New, 2.125%, 4/15/2014 | | | | | 83,000 | | | 51,564 |
Nortel Networks Ltd., 10.125%, 7/15/2013 | | | | | 1,000,000 | | | 915,000 |
Northern Telecom Capital Corp., 7.875%, 6/15/2026 | | | | | 150,000 | | | 93,750 |
Samsung Electronics Co., Ltd., 7.700%, 10/01/2027, 144A | | | | | 1,158,000 | | | 1,260,008 |
| | | | | | | | |
| | | | | | | | 15,247,413 |
| | | | | | | | |
| Textile – 0.3% | | | | | | | | |
Kellwood Co., 7.625%, 10/15/2017(d) | | | | | 3,250,000 | | | 2,112,500 |
| | | | | | | | |
| Tobacco – 0.7% | | | | | | | | |
Reynolds American, Inc., 6.750%, 6/15/2017 | | | | | 3,320,000 | | | 3,358,057 |
Reynolds American, Inc., 7.250%, 6/15/2037 | | | | | 810,000 | | | 801,824 |
| | | | | | | | |
| | | | | | | | 4,159,881 |
| | | | | | | | |
| Transportation Services – 0.9% | | | | | | | | |
APL Ltd., 8.000%, 1/15/2024(d) | | | | | 2,500,000 | | | 2,031,250 |
Atlas Air, Inc., Series 1999-1B, 7.630%, 1/02/2015(f) | | | | | 1,326,184 | | | 1,458,802 |
Atlas Air, Inc., Series 2000-1, Class B, 9.057%, 7/2/2017(f) | | | | | 394,351 | | | 469,278 |
Atlas Air, Inc., Series B, 7.680%, 1/02/2014(f) | | | | | 1,500,291 | | | 1,740,338 |
| | | | | | | | |
| | | | | | | | 5,699,668 |
| | | | | | | | |
| Treasuries – 1.8% | | | | | | | | |
U.S. Treasury Bonds, 4.500%, 2/15/2036(b) | | | | | 5,180,000 | | | 5,351,183 |
U.S. Treasury Bonds, 5.250%, 11/15/2028(b) | | | | | 260,000 | | | 292,602 |
U.S. Treasury Bonds, 5.375%, 2/15/2031(b) | | | | | 4,855,000 | | | 5,615,109 |
| | | | | | | | |
| | | | | | | | 11,258,894 |
| | | | | | | | |
| Wireless – 1.6% | | | | | | | | |
ALLTEL Corp., 6.800%, 5/01/2029 | | | | | 115,000 | | | 73,600 |
ALLTEL Corp., 7.000%, 7/01/2012 | | | | | 90,000 | | | 72,000 |
ALLTEL Corp., 7.875%, 7/01/2032 | | | | | 1,615,000 | | | 1,065,900 |
Nextel Communications, Inc., 7.375%, 8/01/2015 | | | | | 385,000 | | | 296,450 |
Nextel Communications, Inc., Series E, 6.875%, 10/31/2013 | | | | | 340,000 | | | 268,600 |
Nextel Communications, Inc., Series F, 5.950%, 3/15/2014 | | | | | 1,215,000 | | | 899,100 |
Philippine Long Distance Telephone Co., Series EMTN, 8.350%, 3/06/2017 | | | | | 3,914,000 | | | 4,354,325 |
Sprint Capital Corp., 6.125%, 11/15/2008 | | | | | 65,000 | | | 64,513 |
Sprint Capital Corp., 6.875%, 11/15/2028 | | | | | 1,827,000 | | | 1,361,115 |
Sprint Capital Corp., 6.900%, 5/01/2019 | | | | | 795,000 | | | 626,062 |
Sprint Nextel Corp., 6.000%, 12/01/2016 | | | | | 898,000 | | | 698,195 |
| | | | | | | | |
| | | | | | | | 9,779,860 |
| | | | | | | | |
51
| | | | | | | | |
| | | | | Principal Amount (‡) | | Value (†) |
| | | | | | | | |
| | | |
| BONDS AND NOTES – continued | | | | | | | | |
| | | |
| Wirelines – 5.7% | | | | | | | | |
AT&T Corp., 6.500%, 3/15/2029 | | | | $ | 355,000 | | $ | 343,833 |
AT&T, Inc., 6.500%, 9/01/2037 | | | | | 6,600,000 | | | 6,528,667 |
Bell Canada, 5.000%, 2/15/2017 | | CAD | | | 155,000 | | | 118,127 |
Bell Canada, 6.550%, 5/01/2029, 144A | | CAD | | | 195,000 | | | 143,553 |
Bell Canada, 7.300%, 2/23/2032 | | CAD | | | 190,000 | | | 151,413 |
Bell Canada, Series M-17, 6.100%, 3/16/2035 | | CAD | | | 600,000 | | | 427,736 |
Embarq Corp., 7.082%, 6/01/2016 | | | | | 235,000 | | | 222,483 |
Embarq Corp., 7.995%, 6/01/2036 | | | | | 200,000 | | | 182,652 |
Level 3 Financing, Inc., 9.250%, 11/01/2014 | | | | | 500,000 | | | 408,750 |
Qwest Capital Funding, Inc., 6.500%, 11/15/2018 | | | | | 3,305,000 | | | 2,677,050 |
Qwest Capital Funding, Inc., 6.875%, 7/15/2028 | | | | | 7,575,000 | | | 5,946,375 |
Qwest Capital Funding, Inc., 7.625%, 8/03/2021 | | | | | 350,000 | | | 295,750 |
Qwest Capital Funding, Inc., 7.750%, 2/15/2031 | | | | | 775,000 | | | 651,000 |
Telecom Italia Capital, 6.000%, 9/30/2034 | | | | | 1,330,000 | | | 1,124,098 |
Telecom Italia Capital, 6.375%, 11/15/2033 | | | | | 1,320,000 | | | 1,154,178 |
Telefonica Emisiones SAU, 7.045%, 6/20/2036 | | | | | 11,330,000 | | | 11,846,059 |
Verizon Communications, 5.850%, 9/15/2035 | | | | | 3,975,000 | | | 3,621,038 |
| | | | | | | | |
| | | | | | | | 35,842,762 |
| | | | | | | | |
| | | |
| TOTAL NON-CONVERTIBLE BONDS | | | | | | | | |
(Identified Cost $486,282,092) | | | | | | | | 495,360,423 |
| | | | | | | | |
| | | |
| CONVERTIBLE BONDS – 3.8% | | | | | | | | |
| | | |
| Independent Energy – 0.8% | | | | | | | | |
Devon Energy Corp., 4.900%, 8/15/2008 | | | | | 1,300,000 | | | 2,073,500 |
Devon Energy Corp., 4.950%, 8/15/2008 | | | | | 1,900,000 | | | 3,030,500 |
| | | | | | | | |
| | | | | | | | 5,104,000 |
| | | | | | | | |
| Industrial Other – 0.2% | | | | | | | | |
Incyte Corp., 3.500%, 2/15/2011 | | | | | 1,290,000 | | | 1,372,238 |
| | | | | | | | |
| Media Non-Cable – 0.1% | | | | | | | | |
Liberty Media LLC, 3.500%, 1/15/2031 | | | | | 457,403 | | | 319,610 |
Sinclair Broadcast Group, Inc., (Step to 2.000% on 1/15/2011), 4.875%, 7/15/2018(e) | | | | | 500,000 | | | 455,000 |
| | | | | | | | |
| | | | | | | | 774,610 |
| | | | | | | | |
| Non-Captive Consumer – 0.0% | | | | | | | | |
Countrywide Financial Corp., 0.758%, 4/15/2037(c) | | | | | 78,000 | | | 69,030 |
Countrywide Financial Corp., 0.815%, 5/15/2037(c) | | | | | 213,000 | | | 182,115 |
| | | | | | | | |
| | | | | | | | 251,145 |
| | | | | | | | |
| Non-Captive Diversified – 0.1% | | | | | | | | |
iStar Financial, Inc., 5.229%, 10/01/2012(b)(c) | | | | | 380,000 | | | 267,330 |
| | | | | | | | |
| Pharmaceuticals – 0.6% | | | | | | | | |
Epix Pharmaceuticals, Inc., 3.000%, 6/15/2024 | | | | | 250,000 | | | 125,000 |
Nektar Therapeutics, 3.250%, 9/28/2012 | | | | | 1,065,000 | | | 822,712 |
Regeneron Pharmaceuticals, Inc., 5.500%, 10/17/2008 | | | | | 1,200,000 | | | 1,195,500 |
Valeant Pharmaceuticals International, 3.000%, 8/16/2010 | | | | | 1,035,000 | | | 941,850 |
52
PORTFOLIO OF INVESTMENTS – as of March 31, 2008 (Unaudited)
Loomis Sayles Fixed Income Fund – continued
| | | | | | | | |
| | | | | Principal Amount (‡) | | Value (†) |
| | | | | | | | |
| | | |
| BONDS AND NOTES – continued | | | | | | | | |
| | | |
| Pharmaceuticals – continued | | | | | | | | |
Valeant Pharmaceuticals International, 4.000%, 11/15/2013 | | | | $ | 1,095,000 | | $ | 910,219 |
| | | | | | | | |
| | | | | | | | 3,995,281 |
| | | | | | | | |
| Pipelines – 0.3% | | | | | | | | |
CenterPoint Energy Resources Corp., 6.000%, 3/15/2012 | | | | | 1,676,000 | | | 1,650,860 |
| | | | | | | | |
| Real Estate Investment Trusts – 0.2% | | | | | | | | |
Host Hotels & Resorts, Inc., 2.625%, 4/15/2027, 144A | | | | | 1,430,000 | | | 1,197,625 |
| | | | | | | | |
| Technology – 0.6% | | | | | | | | |
Avnet, Inc., 2.000%, 3/15/2034 | | | | | 1,270,000 | | | 1,428,750 |
Kulicke & Soffa Industries, Inc., 0.500%, 11/30/2008 | | | | | 425,000 | | | 397,375 |
Kulicke & Soffa Industries, Inc., 0.875%, 6/01/2012 | | | | | 690,000 | | | 476,100 |
Kulicke & Soffa Industries, Inc., 1.000%, 6/30/2010 | | | | | 380,000 | | | 300,200 |
Maxtor Corp., 5.750%, 3/01/2012(d) | | | | | 408,000 | | | 383,520 |
Nortel Networks Corp., 4.250%, 9/01/2008 | | | | | 180,000 | | | 177,750 |
Richardson Electronics Ltd., 7.750%, 12/15/2011 | | | | | 263,000 | | | 241,960 |
| | | | | | | | |
| | | | | | | | 3,405,655 |
| | | | | | | | |
| Textile – 0.1% | | | | | | | | |
Dixie Yarns, Inc., 7.000%, 5/15/2012 | | | | | 85,000 | | | 79,475 |
Kellwood Co., (Step to 0.000% on 6/15/2011), 3.500%, 6/15/2034(e) | | | | | 570,000 | | | 572,850 |
| | | | | | | | |
| | | | | | | | 652,325 |
| | | | | | | | |
| Wirelines – 0.8% | | | | | | | | |
Level 3 Communications, Inc., 2.875%, 7/15/2010 | | | | | 3,870,000 | | | 2,704,162 |
Level 3 Communications, Inc., 6.000%, 9/15/2009 | | | | | 2,685,000 | | | 2,382,938 |
Level 3 Communications, Inc., 6.000%, 3/15/2010 | | | | | 125,000 | | | 100,938 |
| | | | | | | | |
| | | | | | | | 5,188,038 |
| | | | | | | | |
| | | |
| TOTAL CONVERTIBLE BONDS | | | | | | | | |
(Identified Cost $22,677,825) | | | | | | | | 23,859,107 |
| | | | | | | | |
| | | |
| MUNICIPALS – 0.4% | | | | | | | | |
| Michigan – 0.4% | | | | | | | | |
Michigan Tobacco Settlement Finance Authority, 7.309%, 6/01/2034 | | | | | 2,540,000 | | | 2,467,026 |
| | | | | | | | |
| | | |
| TOTAL MUNICIPALS | | | | | | | | |
(Identified Cost $2,539,851) | | | | | | | | 2,467,026 |
| | | | | | | | |
| | | |
| TOTAL BONDS AND NOTES | | | | | | | | |
(Identified Cost $511,499,768) | | | | | | | | 521,686,556 |
| | | | | | | | |
| | | |
| | | | | Shares | | |
| | | |
| COMMON STOCKS – 1.1% | | | | | | | | |
| | | |
| Communications Equipment – 0.8% | | | | | | | | |
Corning, Inc.(b) | | | | | 205,167 | | | 4,932,215 |
| | | | | | | | |
| Containers & Packaging – 0.3% | | | | | | | | |
Owens-Illinois, Inc.(f) | | | | | 35,353 | | | 1,994,970 |
| | | | | | | | |
| | | |
| TOTAL COMMON STOCKS | | | | | | | | |
(Identified Cost $3,058,544) | | | | | | | | 6,927,185 |
| | | | | | | | |
53
| | | | | | | | |
| | | | | Shares | | Value (†) |
| | | | | | | | |
| | | |
| PREFERRED STOCKS – 1.7% | | | | | | | | |
| | | |
| CONVERTIBLE PREFERRED STOCKS – 1.6% | | | | | | | | |
| | | |
| Automotive – 0.4% | | | | | | | | |
Ford Motor Co., Capital Trust II, 6.500% | | | | | 79,845 | | $ | 2,341,055 |
| | | | | | | | |
| | | |
| Capital Markets – 0.2% | | | | | | | | |
Newell Financial Trust I, 5.250% | | | | | 25,075 | | | 1,134,644 |
| | | | | | | | |
| Diversified Financial Services – 0.1% | | | | | | | | |
Sovereign Capital Trust, 4.375% | | | | | 15,159 | | | 462,350 |
| | | | | | | | |
| Electric Utilities – 0.1% | | | | | | | | |
AES Trust III, 6.750%(b) | | | | | 10,000 | | | 465,000 |
| | | | | | | | |
| Machinery – 0.0% | | | | | | | | |
United Rentals Trust, 6.500% | | | | | 1,975 | | | 59,373 |
| | | | | | | | |
| Oil, Gas & Consumable Fuels – 0.5% | | | | | | | | |
Chesapeake Energy Corp., 4.500%(b) | | | | | 775 | | | 90,334 |
Chesapeake Energy Corp., 5.000% | | | | | 19,065 | | | 2,492,989 |
El Paso Energy Capital Trust I, 4.750% | | | | | 20,200 | | | 735,280 |
| | | | | | | | |
| | | | | | | | 3,318,603 |
| | | | | | | | |
| Real Estate Investment Trusts (REITs) – 0.0% | | | | | | | | |
FelCor Lodging Trust, Inc., Series A, 1.950% | | | | | 2,500 | | | 49,350 |
| | | | | | | | |
| Semiconductors & Semiconductor Equipment – 0.3% | | | | | | | | |
Lucent Technologies Capital Trust, 7.750% | | | | | 2,661 | | | 1,862,700 |
| | | | | | | | |
| | | |
| TOTAL CONVERTIBLE PREFERRED STOCKS | | | | | | | | |
(Identified Cost $9,909,430) | | | | | | | | 9,693,075 |
| | | | | | | | |
| | | |
| NON-CONVERTIBLE PREFERRED STOCKS – 0.1% | | | | | | | | |
| | | |
| Electric Utilities – 0.1% | | | | | | | | |
Entergy New Orleans, Inc., 4.360% | | | | | 90 | | | 6,663 |
Entergy New Orleans, Inc., 4.750% | | | | | 2,876 | | | 219,025 |
MDU Resources Group, Inc., 5.100% | | | | | 307 | | | 30,729 |
Public Service Electric & Gas Co., 4.180%(b) | | | | | 1,950 | | | 144,768 |
Union Electric Co., 4.500% | | | | | 4,670 | | | 340,910 |
Xcel Energy, Inc., 4.110%(b) | | | | | 100 | | | 8,175 |
| | | | | | | | |
| | | |
| TOTAL NON-CONVERTIBLE PREFERRED STOCKS | | | | | | | | |
(Identified Cost $575,376) | | | | | | | | 750,270 |
| | | | | | | | |
| | | |
| TOTAL PREFERRED STOCKS | | | | | | | | |
(Identified Cost $10,484,806) | | | | | | | | 10,443,345 |
| | | | | | | | |
| | | |
| | | | | Principal Amount (‡) | | |
| | | |
| SHORT-TERM INVESTMENTS – 17.2% | | | | | | | | |
| Tri-Party Repurchase Agreement with Fixed Income Clearing Corporation, dated 3/31/08 at 1.250% to be repurchased at $84,810,945 on 4/01/08 collateralized by $84,640,000 Federal Home Loan Mortgage Corp., 5.500% due 3/19/17 valued at $86,505,466, including accrued interest (Note 2h of Notes to Financial Statements) | | | | $ | 84,808,000 | | | 84,808,000 |
| | | | | | | | |
| | | |
| | | | | Shares | | |
State Street Navigator Securities Lending Prime Portfolio(g) | | | | | 22,359,618 | | | 22,359,618 |
| | | | | | | | |
54
PORTFOLIO OF INVESTMENTS – as of March 31, 2008 (Unaudited)
Loomis Sayles Fixed Income Fund – continued
| | | | | | | |
| | | | | | | Value (†) |
| | | |
| TOTAL SHORT-TERM INVESTMENTS | | | | | | | |
(Identified Cost $107,167,618) | | | | | | $ | 107,167,618 |
| | | | | | | |
| | | |
| TOTAL INVESTMENTS – 103.5% | | | | | | | |
(Identified Cost $632,210,736)(a) | | | | | | | 646,224,704 |
Other assets less liabilities—(3.5)% | | | | | | | (21,553,346) |
| | | | | | | |
| | | |
| NET ASSETS – 100.0% | | | | | | $ | 624,671,358 |
| | | | | | | |
| |
(‡) Principal amount stated in U.S. dollars unless otherwise noted. | | | |
(†) See Note 2a of Notes to Financial Statements. | | | |
(††) Amount shown represents units. One unit represents a principal amount of 100. | | | |
(a) Federal Tax Information (Amounts exclude certain adjustments made at the end of the Fund’s fiscal year for tax purposes. Such adjustments are primarily due to wash sales. Amortization of premium debt securities is excluded for tax purposes.): At March 31, 2008, the net unrealized appreciation on investments based on a cost of $632,844,279 for federal income tax purposes was as follows: | | | |
Aggregate gross unrealized appreciation for all investments in which there is an excess of value over tax cost | | $ | 40,870,728 |
Aggregate gross unrealized depreciation for all investments in which there is an excess of tax cost over value | | | (27,490,303) |
| | | | | | | |
Net unrealized appreciation | | $ | 13,380,425 |
| | | | | | | |
| (b) | All or a portion of this security was on loan to brokers at March 31, 2008. |
| (c) | Variable rate security. Rate as of March 31, 2008 is disclosed. |
| (d) | Illiquid security. At March 31, 2008, the value of these securities amounted to $6,857,138 or 1.1% of net assets. |
| (e) | Step Bond: Coupon is a fixed rate for an initial period then resets at a specified date and rate. |
| (f) | Non-income producing security. |
| (g) | Represents investment of securities lending collateral. |
| 144A | Securities exempt from registration under Rule 144A of the Securities Act of 1933. These securities may be resold in transactions exempt from registration, normally to qualified institutional buyers. At March 31, 2008, the total value of these securities amounted to $67,208,825 or 10.8% of net assets. |
| EMTN | Euro Medium Term Note |
Key to Abbreviations: AUD: Australian Dollar; BRL: Brazilian Real; CAD: Canadian Dollar; EUR: Euro; GBP: Great British Pound; IDR: Indonesian Rupiah; ISK: Iceland Krona; KRW: South Korean Won; MXN: Mexican Peso; MYR: Malaysian Ringgit; NZD: New Zealand Dollar; SGD: Singapore Dollar; THB: Thailand Baht
HOLDINGS AT MARCH 31, 2008 AS A PERCENTAGE OF NET ASSETS (Unaudited)
| | | | | | | | |
Sovereigns | | 9.2 | % | | Media Cable | | 3.0 | % |
Supranational | | 6.7 | | | Technology | | 3.0 | |
Wirelines | | 6.5 | | | Automotive | | 2.5 | |
Banking | | 6.2 | | | Life Insurance | | 2.4 | |
Foreign Local Governments | | 4.6 | | | Healthcare | | 2.3 | |
Electric | | 3.7 | | | Pipelines | | 2.1 | |
Independent Energy | | 3.6 | | | Other, less than 2% each | | 26.9 | |
Non-Captive Diversified | | 3.6 | | | | | | |
CURRENCY EXPOSURE AT MARCH 31, 2008 AS A PERCENTAGE OF NET ASSETS (Unaudited)
| | | |
United States Dollar | | 56.3 | % |
Canadian Dollar | | 10.4 | |
Brazilian Real | | 4.8 | |
New Zealand Dollar | | 3.5 | |
Mexican Peso | | 2.3 | |
Singapore Dollar | | 2.1 | |
Other, less than 2% each | | 6.9 | |
See accompanying notes to financial statements.
55
PORTFOLIO OF INVESTMENTS – as of March 31, 2008 (Unaudited)
Loomis Sayles Global Bond Fund
| | | | | | | | |
| | | | | Principal Amount (‡) | | Value (†) |
| | | | | | | | |
| | | |
| BONDS AND NOTES – 92.5% of Net Assets | | | | | | | | |
| | | |
| NON-CONVERTIBLE BONDS – 92.5% | | | | | | | | |
| | | |
| Argentina – 0.3% | | | | | | | | |
Transportadora de Gas del Sur SA, 7.875%, 5/14/2017, 144A | | | | $ | 8,050,000 | | $ | 6,440,000 |
| | | | | | | | |
| Austria – 1.5% | | | | | | | | |
Oesterreichische Kontrollbank AG, 1.800%, 3/22/2010 | | JPY | | | 2,530,000,000 | | | 25,885,342 |
Oesterreichische Kontrollbank AG, 2.750%, 6/14/2011 | | CHF | | | 7,360,000 | | | 7,408,876 |
Sappi Papier Holding AG, 7.500%, 6/15/2032, 144A | | | | | 7,350,000 | | | 5,026,070 |
| | | | | | | | |
| | | | | | | | 38,320,288 |
| | | | | | | | |
| Belgium – 1.8% | | | | | | | | |
Kingdom of Belgium, 5.500%, 9/28/2017 | | EUR | | | 25,555,000 | | | 44,334,635 |
| | | | | | | | |
| Bermuda – 0.2% | | | | | | | | |
White Mountains RE Group, 6.375%, 3/20/2017, 144A | | | | | 5,000,000 | | | 4,659,020 |
| | | | | | | | |
| Brazil – 0.3% | | | | | | | | |
Cosan Finance Ltd., 7.000%, 2/01/2017, 144A | | | | | 1,250,000 | | | 1,150,000 |
ISA Capital Do Brasil SA, 7.875%, 1/30/2012, 144A | | | | | 1,100,000 | | | 1,135,750 |
Marfrig Overseas Ltd., 9.625%, 11/16/2016, 144A(b) | | | | | 1,170,000 | | | 1,117,350 |
Republic of Brazil, 10.250%, 1/10/2028(b) | | BRL | | | 9,750,000 | | | 5,173,107 |
| | | | | | | | |
| | | | | | | | 8,576,207 |
| | | | | | | | |
| Canada – 1.3% | | | | | | | | |
Bell Aliant Regional Communications, 5.410%, 9/26/2016 | | CAD | | | 4,280,000 | | | 3,894,719 |
Bell Canada, 5.000%, 2/15/2017 | | CAD | | | 4,035,000 | | | 3,075,122 |
Bell Canada, 6.550%, 5/01/2029, 144A | | CAD | | | 160,000 | | | 117,787 |
Bell Canada, 7.300%, 2/23/2032 | | CAD | | | 385,000 | | | 306,811 |
Bell Canada, Series M-17, 6.100%, 3/16/2035 | | CAD | | | 3,090,000 | | | 2,202,842 |
Bombardier, Inc., 6.750%, 5/01/2012, 144A | | | | | 2,000,000 | | | 1,980,000 |
Bombardier, Inc., 7.250%, 11/15/2016, 144A | | EUR | | | 350,000 | | | 524,934 |
Canadian Government, 4.250%, 9/01/2009 | | CAD | | | 600,000 | | | 597,633 |
Canadian Government, 4.500%, 6/01/2015 | | CAD | | | 3,813,000 | | | 4,021,100 |
Kinder Morgan Finance, 5.700%, 1/05/2016 | | | | | 5,705,000 | | | 5,405,487 |
Province of Quebec, 1.600%, 5/09/2013 | | JPY | | | 687,000,000 | | | 7,097,934 |
Shaw Communications, Inc., 5.700%, 3/02/2017 | | CAD | | | 4,215,000 | | | 3,788,511 |
| | | | | | | | |
| | | | | | | | 33,012,880 |
| | | | | | | | |
| Cayman Island – 0.8% | | | | | | | | |
Embraer Overseas Ltd., 6.375%, 1/24/2017 | | | | | 5,580,000 | | | 5,566,050 |
LPG International, Inc., 7.250%, 12/20/2015 | | | | | 3,010,000 | | | 2,998,712 |
Odebrecht Finance Ltd., 7.500%, 10/18/2017, 144A | | | | | 1,850,000 | | | 1,914,750 |
Vale Overseas Ltd., 6.875%, 11/21/2036 | | | | | 8,765,000 | | | 8,552,142 |
| | | | | | | | |
| | | | | | | | 19,031,654 |
| | | | | | | | |
| Colombia – 0.4% | | | | | | | | |
Republic of Colombia, 7.375%, 1/27/2017(b) | | | | | 1,430,000 | | | 1,581,580 |
Republic of Colombia, 9.850%, 6/28/2027 | | COP | | | 3,195,000,000 | | | 1,562,985 |
56
PORTFOLIO OF INVESTMENTS – as of March 31, 2008 (Unaudited)
Loomis Sayles Global Bond Fund – continued
| | | | | | | |
| | | | | Principal Amount (‡) | | Value (†) |
| | | | | | | |
| | | |
| BONDS AND NOTES – continued | | | | | | | |
| | | |
| Colombia – continued | | | | | | | |
Republic of Colombia, 11.750%, 3/01/2010 | | COP | | 3,090,000,000 | | $ | 1,715,363 |
Republic of Colombia, 12.000%, 10/22/2015(b) | | COP | | 9,545,000,000 | | | 5,448,401 |
| | | | | | | |
| | | | | | | 10,308,329 |
| | | | | | | |
| Egypt – 0.4% | | | | | | | |
Arab Republic of Egypt, 8.750%, 7/18/2012, 144A | | EGP | | 59,400,000 | | | 11,147,892 |
| | | | | | | |
| France – 5.9% | | | | | | | |
Alcatel-Lucent, Series EMTN, 6.375%, 4/07/2014 | | EUR | | 300,000 | | | 376,532 |
BNP Paribas, 4.730%, 4/29/2049(c) | | EUR | | 3,100,000 | | | 4,035,594 |
France Telecom SA, Series EMTN, 3.625%, 10/14/2015(b) | | EUR | | 6,255,000 | | | 8,896,790 |
France Telecom SA, Series EMTN, 4.750%, 2/21/2017 | | EUR | | 9,705,000 | | | 14,637,487 |
Government of France, 5.000%, 10/25/2016 | | EUR | | 47,395,000 | | | 80,016,891 |
Lafarge SA, Series EMTN, 4.750%, 3/23/2020(b) | | EUR | | 3,335,000 | | | 4,352,154 |
Lafarge SA, Series EMTN, 5.375%, 6/26/2017 | | EUR | | 2,950,000 | | | 4,240,489 |
Pinault Printemps Redoute SA, Series EMTN, 4.000%, 1/29/2013 | | EUR | | 3,235,000 | | | 4,615,358 |
Veolia Environnement, Series EMTN, 4.000%, 2/12/2016 | | EUR | | 4,310,000 | | | 6,120,047 |
Veolia Environnement, Series EMTN, 5.125%, 5/24/2022 | | EUR | | 3,970,000 | | | 5,549,939 |
Wendel, 4.375%, 8/09/2017 | | EUR | | 3,050,000 | | | 3,373,046 |
Wendel, 4.875%, 5/26/2016 | | EUR | | 10,150,000 | | | 12,588,786 |
| | | | | | | |
| | | | | | | 148,803,113 |
| | | | | | | |
| Germany – 12.2% | | | | | | | |
Bertelsmann AG, Series EMTN, 3.625%, 10/06/2015 | | EUR | | 4,170,000 | | | 5,690,610 |
Bundesrepublik Deutschland, Series 06, 3.750%, 1/04/2017 | | EUR | | 38,060,000 | | | 59,348,106 |
Bundesrepublik Deutschland, Series 97, 6.500%, 7/04/2027 | | EUR | | 5,040,000 | | | 9,971,341 |
Kreditanstalt fuer Wiederaufbau, 2.500%, 10/11/2010 | | EUR | | 15,925,000 | | | 24,339,885 |
Kreditanstalt fuer Wiederaufbau, 2.600%, 6/20/2037 | | JPY | | 1,140,000,000 | | | 11,788,250 |
Kreditanstalt fuer Wiederaufbau, Series INTL, 1.850%, 9/20/2010 | | JPY | | 2,214,000,000 | | | 22,779,790 |
Munchener Hypothekenbank eG, 5.000%, 1/16/2012 | | EUR | | 31,180,000 | | | 50,832,596 |
Republic of Germany, 3.250%, 4/17/2009 | | EUR | | 23,200,000 | | | 36,421,494 |
Republic of Germany, 4.000%, 4/13/2012 | | EUR | | 46,195,000 | | | 74,027,901 |
Republic of Germany, 4.000%, 1/04/2037 | | EUR | | 7,639,000 | | | 11,012,645 |
| | | | | | | |
| | | | | | | 306,212,618 |
| | | | | | | |
| India – 0.9% | | | | | | | |
Canara Bank Ltd., 6.365%, 11/28/2021(b)(c) | | | | 17,350,000 | | | 15,446,896 |
ICICI Bank Ltd., 6.375%, 4/30/2022, 144A(c) | | | | 7,800,000 | | | 6,707,961 |
| | | | | | | |
| | | | | | | 22,154,857 |
| | | | | | | |
| Indonesia – 0.5% | | | | | | | |
Indonesia Treasury Bond, 11.000%, 12/15/2012 | | IDR | | 122,434,000,000 | | | 13,591,610 |
| | | | | | | |
57
| | | | | | | |
| | | | | Principal Amount (‡) | | Value (†) |
| | | | | | | |
| | | |
| BONDS AND NOTES – continued | | | | | | | |
| | | |
| Ireland – 1.1% | | | | | | | |
Depfa ACS Bank, Series EMTN, 1.875%, 5/07/2009 | | CHF | | 2,160,000 | | $ | 2,153,318 |
Republic of Ireland, 4.600%, 4/18/2016 | | EUR | | 15,675,000 | | | 25,508,844 |
| | | | | | | |
| | | | | | | 27,662,162 |
| | | | | | | |
| Japan – 5.8% | | | | | | | |
Development Bank of Japan, 1.750%, 3/17/2017(b) | | JPY | | 7,520,000,000 | | | 77,379,880 |
Japan Government, 0.900%, 9/15/2009 | | JPY | | 6,650,000,000 | | | 67,036,176 |
| | | | | | | |
| | | | | | | 144,416,056 |
| | | | | | | |
| Korea – 0.5% | | | | | | | |
Hanarotelecom, Inc., 7.000%, 2/01/2012, 144A | | | | 1,610,000 | | | 1,636,163 |
SK Telecom Co., Ltd., 6.625%, 7/20/2027, 144A | | | | 11,225,000 | | | 10,486,613 |
| | | | | | | |
| | | | | | | 12,122,776 |
| | | | | | | |
| Luxembourg – 0.3% | | | | | | | |
Telecom Italia Capital, 5.250%, 10/01/2015 | | | | 1,660,000 | | | 1,508,122 |
Telecom Italia Capital, 6.375%, 11/15/2033 | | | | 1,910,000 | | | 1,670,060 |
Telecom Italia Capital SA, 4.950%, 9/30/2014 | | | | 3,990,000 | | | 3,631,139 |
| | | | | | | |
| | | | | | | 6,809,321 |
| | | | | | | |
| Mexico – 0.5% | | | | | | | |
Axtel SAB de CV, 7.625%, 2/01/2017, 144A | | | | 3,920,000 | | | 3,939,600 |
Desarrolladora Homex SAB de CV, 7.500%, 9/28/2015(b) | | | | 8,210,000 | | | 8,148,425 |
| | | | | | | |
| | | | | | | 12,088,025 |
| | | | | | | |
| Netherlands – 1.8% | | | | | | | |
Bite Finance International, 8.106%, 3/15/2014, 144A(c) | | EUR | | 2,820,000 | | | 3,561,657 |
Excelcomindo Finance Co., 7.125%, 1/18/2013, 144A | | | | 1,460,000 | | | 1,430,800 |
Kingdom of Netherlands, 5.500%, 1/15/2028 | | EUR | | 12,995,000 | | | 22,849,107 |
Koninklijke KPN NV, Series GMTN, 4.750%, 1/17/2017 | | EUR | | 6,400,000 | | | 8,882,824 |
Linde Finance BV, Series EMTN, 4.750%, 4/24/2017 | | EUR | | 3,865,000 | | | 5,706,774 |
Majapahit Holding BV, 7.250%, 6/28/2017, 144A | | | | 3,340,000 | | | 3,173,000 |
| | | | | | | |
| | | | | | | 45,604,162 |
| | | | | | | |
| Poland – 0.5% | | | | | | | |
Republic of Poland, Series 2BR, 1.020%, 6/09/2009 | | JPY | | 1,200,000,000 | | | 12,040,088 |
| | | | | | | |
| Singapore – 1.8% | | | | | | | |
Government of Singapore, 3.625%, 7/01/2011 | | SGD | | 9,640,000 | | | 7,539,412 |
Government of Singapore, 4.625%, 7/01/2010 | | SGD | | 45,450,000 | | | 35,697,261 |
SP Powerassets Ltd., 3.730%, 10/22/2010 | | SGD | | 2,340,000 | | | 1,762,685 |
| | | | | | | |
| | | | | | | 44,999,358 |
| | | | | | | |
| South Africa – 0.8% | | | | | | | |
Edcon Proprietary Ltd., 7.856%, 6/15/2014, 144A(c) | | EUR | | 8,335,000 | | | 8,684,855 |
Republic of South Africa, 4.500%, 4/05/2016 | | EUR | | 9,090,000 | | | 12,528,271 |
| | | | | | | |
| | | | | | | 21,213,126 |
| | | | | | | |
58
PORTFOLIO OF INVESTMENTS – as of March 31, 2008 (Unaudited)
Loomis Sayles Global Bond Fund – continued
| | | | | | | |
| | | | | Principal Amount (‡) | | Value (†) |
| | | | | | | |
| | | |
| BONDS AND NOTES – continued | | | | | | | |
| | | |
| Spain – 0.8% | | | | | | | |
Instituto de Credito Oficial, Series EMTN, 0.800%, 9/28/2009 | | JPY | | 1,565,000,000 | | $ | 15,700,210 |
Telefonica Emisiones SAU, 6.221%, 7/03/2017 | | | | 4,610,000 | | | 4,638,743 |
| | | | | | | |
| | | | | | | 20,338,953 |
| | | | | | | |
| Supranational – 4.1% | | | | | | | |
Asia Development Bank, 2.350%, 6/21/2027 | | JPY | | 1,700,000,000 | | | 18,146,988 |
European Investment Bank, 1.250%, 9/20/2012(b) | | JPY | | 2,400,000,000 | | | 24,514,406 |
European Investment Bank, 1.400%, 6/20/2017 | | JPY | | 3,930,000,000 | | | 40,003,047 |
European Investment Bank, Series EMTN, 6.500%, 8/12/2014 | | PLN | | 43,400,000 | | | 20,323,668 |
| | | | | | | |
| | | | | | | 102,988,109 |
| | | | | | | |
| United Kingdom – 3.1% | | | | | | | |
British Sky Broadcasting Group PLC, 6.100%, 2/15/2018, 144A | | | | 9,150,000 | | | 9,129,083 |
BSKYB Finance UK PLC, 5.750%, 10/20/2017 | | GBP | | 3,270,000 | | | 5,977,243 |
FCE Bank PLC, Series EMTN, 7.125%, 1/15/2013 | | EUR | | 1,250,000 | | | 1,559,014 |
JPMorgan Chase London, Zero Coupon Bond, 10/21/2010, 144A | | IDR | | 75,579,375,000 | | | 6,381,345 |
Lloyds TSB Bank PLC, 4.385%, 5/29/2049(c) | | EUR | | 5,225,000 | | | 6,519,122 |
Lloyds TSB Group PLC, 5.875%, 7/08/2014 | | EUR | | 1,235,000 | | | 2,025,189 |
Network Rail MTN Finance PLC, Series EMTN, 4.875%, 3/06/2009 | | GBP | | 6,200,000 | | | 12,323,255 |
Standard Chartered Bank, 6.750%, 4/27/2009 | | GBP | | 800,000 | | | 1,592,082 |
United Kingdom Treasury, 5.000%, 3/07/2025 | | GBP | | 13,585,000 | | | 28,312,250 |
United Kingdom Treasury, 5.250%, 6/07/2012 | | GBP | | 2,520,000 | | | 5,251,236 |
| | | | | | | |
| | | | | | | 79,069,819 |
| | | | | | | |
| United States – 44.1% | | | | | | | |
Ahold Finance USA, Inc., Series EMTN, 6.500%, 3/14/2017 | | GBP | | 5,960,000 | | | 11,272,578 |
Albertson’s, Inc., 6.625%, 6/01/2028 | | | | 830,000 | | | 706,107 |
Albertson’s, Inc., 7.450%, 8/01/2029 | | | | 5,544,000 | | | 5,104,948 |
Albertson’s, Inc., 7.750%, 6/15/2026 | | | | 50,000 | | | 47,151 |
Albertson’s, Inc., 8.000%, 5/01/2031 | | | | 1,000,000 | | | 953,260 |
ALLTEL Corp., 6.500%, 11/01/2013 | | | | 1,335,000 | | | 981,225 |
ALLTEL Corp., 6.800%, 5/01/2029 | | | | 1,595,000 | | | 1,020,800 |
ALLTEL Corp., 7.000%, 7/01/2012 | | | | 2,865,000 | | | 2,292,000 |
ALLTEL Corp., 7.000%, 3/15/2016(b) | | | | 160,000 | | | 115,200 |
ALLTEL Corp., 7.875%, 7/01/2032 | | | | 3,220,000 | | | 2,125,200 |
American Express Co., 6.150%, 8/28/2017 | | | | 2,955,000 | | | 2,941,375 |
American Express Co., 7.000%, 3/19/2018 | | | | 8,722,000 | | | 9,156,521 |
ASIF Global Financing XXVII, 2.380%, 2/26/2009, 144A | | SGD | | 16,300,000 | | | 11,840,542 |
Bank of America, 5.300%, 3/15/2017 | | | | 15,925,000 | | | 15,817,602 |
Barclays Financial LLC, 4.060%, 9/16/2010, 144A | | KRW | | 6,820,000,000 | | | 7,171,553 |
Barclays Financial LLC, 4.460%, 9/23/2010, 144A | | KRW | | 3,250,000,000 | | | 3,449,690 |
Barclays Financial LLC, 5.780%, 3/23/2009, 144A(c) | | KRW | | 4,844,220,000 | | | 5,021,534 |
Biogen Idec, Inc., 6.000%, 3/01/2013 | | | | 10,850,000 | | | 10,977,943 |
Bristol-Myers Squibb Co., 4.625%, 11/15/2021 | | EUR | | 3,700,000 | | | 5,153,012 |
Cardinal Health, Inc., 6.000%, 6/15/2017 | | | | 4,570,000 | | | 4,656,821 |
Cargill, Inc., 5.600%, 9/15/2012, 144A | | | | 5,595,000 | | | 5,734,008 |
59
| | | | | | | |
| | | | | Principal Amount (‡) | | Value (†) |
| | | | | | | |
| | | |
| BONDS AND NOTES – continued | | | | | | | |
| | | |
| United States – continued | | | | | | | |
Chesapeake Energy Corp., 6.250%, 1/15/2017 | | EUR | | 250,000 | | $ | 357,192 |
Chesapeake Energy Corp., 6.500%, 8/15/2017 | | | | 1,990,000 | | | 1,920,350 |
Chesapeake Energy Corp., 6.875%, 11/15/2020 | | | | 5,615,000 | | | 5,446,550 |
CIT Group, Inc., 5.500%, 12/01/2014 | | GBP | | 11,655,000 | | | 14,269,647 |
CIT Group, Inc., Series EMTN, 3.800%, 11/14/2012 | | EUR | | 1,100,000 | | | 1,054,150 |
CIT Group, Inc., Series EMTN, 5.500%, 12/20/2016 | | GBP | | 4,150,000 | | | 5,138,562 |
CIT Group, Inc., Series GMTN, 4.250%, 9/22/2011 | | EUR | | 1,400,000 | | | 1,417,368 |
CIT Group, Inc., Series GMTN, 5.000%, 5/13/2014 | | EUR | | 350,000 | | | 353,679 |
Citi Credit Card Issuance Trust, 5.375%, 4/10/2013 | | EUR | | 5,130,000 | | | 8,005,632 |
Citigroup, Inc., 5.000%, 9/15/2014 | | | | 19,620,000 | | | 18,490,398 |
Citizens Communications Co., 6.250%, 1/15/2013 | | | | 11,175,000 | | | 10,113,375 |
Citizens Communications Co., 7.125%, 3/15/2019 | | | | 1,205,000 | | | 1,054,375 |
Citizens Communications Co., 9.000%, 8/15/2031 | | | | 1,795,000 | | | 1,570,625 |
Comcast Corp., 4.950%, 6/15/2016 | | | | 6,300,000 | | | 5,864,317 |
Comcast Corp., 5.900%, 3/15/2016 | | | | 3,360,000 | | | 3,332,599 |
Comcast Corp., 6.950%, 8/15/2037 | | | | 3,444,000 | | | 3,450,905 |
Community Health Systems, Inc., 8.875%, 7/15/2015 | | | | 3,490,000 | | | 3,503,087 |
Corning, Inc., 5.900%, 3/15/2014 | | | | 1,675,000 | | | 1,756,413 |
Corning, Inc., 6.200%, 3/15/2016 | | | | 3,670,000 | | | 3,809,130 |
Couche-Tard US/Finance, 7.500%, 12/15/2013(b) | | | | 3,775,000 | | | 3,765,562 |
CSX Corp., 5.600%, 5/01/2017 | | | | 859,000 | | | 816,151 |
CSX Corp., 6.000%, 10/01/2036(b) | | | | 5,358,000 | | | 4,612,616 |
CVS Caremark Corp., 5.750%, 6/01/2017 | | | | 21,345,000 | | | 21,677,150 |
DaimlerChrysler NA Holding, 4.875%, 6/15/2010 | | | | 3,285,000 | | | 3,304,845 |
Delta Air Lines, Inc., 6.821%, 8/10/2022, 144A | | | | 7,578,417 | | | 7,123,712 |
Delta Air Lines, Inc., 8.021%, 8/10/2022, 144A | | | | 2,045,504 | | | 1,861,408 |
Energy Future Holdings Corp., Series P, 5.550%, 11/15/2014 | | | | 1,390,000 | | | 1,085,369 |
Energy Future Holdings Corp., Series Q, 6.500%, 11/15/2024 | | | | 12,560,000 | | | 8,918,580 |
Erac USA Finance Co., 6.375%, 10/15/2017, 144A | | | | 4,730,000 | | | 4,226,184 |
Erac USA Finance Co., 7.000%, 10/15/2037, 144A | | | | 2,496,000 | | | 2,051,887 |
Federal Home Loan Mortgage Corp., 4.000%, 12/01/2019 | | | | 142,427 | | | 139,442 |
Federal Home Loan Mortgage Corp., 4.000%, 9/01/2020 | | | | 954,271 | | | 930,950 |
Federal Home Loan Mortgage Corp., 4.500%, 9/01/2020 | | | | 4,359,479 | | | 4,341,854 |
Federal Home Loan Mortgage Corp., 5.000%, 4/01/2020 | | | | 3,229,135 | | | 3,268,744 |
Federal Home Loan Mortgage Corp., 5.000%, 7/01/2035 | | | | 20,520,343 | | | 20,350,773 |
Federal Home Loan Mortgage Corp., 5.500%, 5/01/2020 | | | | 1,778,098 | | | 1,818,259 |
Federal Home Loan Mortgage Corp., 5.500%, 1/01/2021 | | | | 1,157,654 | | | 1,183,801 |
Federal Home Loan Mortgage Corp., 5.500%, 4/01/2037 | | | | 54,536,295 | | | 55,136,717 |
60
PORTFOLIO OF INVESTMENTS – as of March 31, 2008 (Unaudited)
Loomis Sayles Global Bond Fund – continued
| | | | | | | | |
| | | | | Principal Amount (‡) | | Value (†) |
| | | | | | | | |
| | | |
| BONDS AND NOTES – continued | | | | | | | | |
| | | |
| United States – continued | | | | | | | | |
Federal Home Loan Mortgage Corp., 6.000%, 5/01/2018 | | | | $ | 603,224 | | $ | 622,215 |
Federal Home Loan Mortgage Corp., 6.000%, 10/01/2020 | | | | | 1,076,980 | | | 1,109,125 |
Federal Home Loan Mortgage Corp., 6.500%, 8/01/2035 | | | | | 765,773 | | | 795,740 |
Federal Home Loan Mortgage Corp., 6.500%, 10/01/2035 | | | | | 903,263 | | | 938,611 |
Federal National Mortgage Association, 2.290%, 2/19/2009 | | SGD | | | 16,200,000 | | | 11,839,258 |
Federal National Mortgage Association, 4.500%, 6/01/2019(d) | | | | | 4,395,496 | | | 4,388,026 |
Federal National Mortgage Association, 5.000%, 10/01/2019 | | | | | 1,459,076 | | | 1,477,997 |
Federal National Mortgage Association, 5.000%, 10/01/2019 | | | | | 389,712 | | | 394,765 |
Federal National Mortgage Association, 5.000%, 4/01/2020 | | | | | 372,478 | | | 376,821 |
Federal National Mortgage Association, 5.000%, 6/01/2020 | | | | | 690,083 | | | 698,127 |
Federal National Mortgage Association, 5.000%, 9/01/2035(d) | | | | | 9,814,939 | | | 9,728,666 |
Federal National Mortgage Association, 5.000%, 5/01/2036 | | | | | 854,283 | | | 846,774 |
Federal National Mortgage Association, 5.500%, 11/01/2016 | | | | | 449,972 | | | 461,869 |
Federal National Mortgage Association, 5.500%, 5/01/2020 | | | | | 1,997,958 | | | 2,045,108 |
Federal National Mortgage Association, 5.500%, 9/01/2020 | | | | | 753,460 | | | 771,982 |
Federal National Mortgage Association, 5.500%, 11/01/2034 | | | | | 1,416,364 | | | 1,433,386 |
Federal National Mortgage Association, 5.500%, 6/01/2035 | | | | | 6,432,179 | | | 6,506,159 |
Federal National Mortgage Association, 5.500%, 9/01/2035 | | | | | 3,835,893 | | | 3,880,012 |
Federal National Mortgage Association, 5.500%, 12/01/2035 | | | | | 18,779,027 | | | 18,995,015 |
Federal National Mortgage Association, 5.500%, 4/01/2036 | | | | | 13,685,075 | | | 13,842,475 |
Federal National Mortgage Association, 5.500%, 6/01/2037(d) | | | | | 8,779,650 | | | 8,871,031 |
Federal National Mortgage Association, 6.000%, 6/01/2017 | | | | | 1,007,924 | | | 1,038,950 |
Federal National Mortgage Association, 6.000%, 11/01/2017 | | | | | 778,566 | | | 803,585 |
Federal National Mortgage Association, 6.000%, 9/01/2021 | | | | | 2,371,779 | | | 2,443,530 |
Federal National Mortgage Association, 6.000%, 11/01/2034 | | | | | 2,435,147 | | | 2,503,189 |
Federal National Mortgage Association, 6.000%, 4/01/2035 | | | | | 2,914,032 | | | 2,995,455 |
Federal National Mortgage Association, 6.000%, 5/01/2035 | | | | | 3,014,841 | | | 3,093,859 |
61
| | | | | | | | |
| | | | | Principal Amount (‡) | | Value (†) |
| | | | | | | | |
| | | |
| BONDS AND NOTES – continued | | | | | | | | |
| | | |
| United States – continued | | | | | | | | |
Federal National Mortgage Association, 6.000%, 8/01/2037 | | | | $ | 14,238,227 | | $ | 14,598,596 |
Federal National Mortgage Association, 6.500%, 3/01/2033 | | | | | 1,647,626 | | | 1,720,696 |
Federal National Mortgage Association, 6.500%, 6/01/2035 | | | | | 451,290 | | | 468,287 |
Federal National Mortgage Association, 6.500%, 7/01/2035 | | | | | 186,395 | | | 193,415 |
Federal National Mortgage Association, 6.500%, 10/01/2035 | | | | | 1,408,371 | | | 1,463,353 |
Ford Motor Credit Co. LLC, 5.700%, 1/15/2010 | | | | | 10,030,000 | | | 8,713,542 |
Ford Motor Credit Co. LLC, Series EMTN, 4.875%, 1/15/2010 | | EUR | | | 1,750,000 | | | 2,324,651 |
General Electric Capital Corp., 0.750%, 2/05/2009(b) | | JPY | | | 1,365,000,000 | | | 13,658,860 |
General Electric Capital Corp., 2.250%, 2/09/2009 | | CHF | | | 10,980,000 | | | 10,976,197 |
General Electric Capital Corp., Series EMTN, 1.000%, 3/21/2012 | | JPY | | | 2,035,000,000 | | | 19,979,972 |
General Electric Capital Corp., Series EMTN, 1.725%, 6/27/2008 | | SGD | | | 2,250,000 | | | 1,634,867 |
Georgia-Pacific Corp., 7.125%, 1/15/2017, 144A | | | | | 1,860,000 | | | 1,720,500 |
Georgia-Pacific Corp., 7.250%, 6/01/2028 | | | | | 4,540,000 | | | 3,700,100 |
Georgia-Pacific LLC, 8.000%, 1/15/2024 | | | | | 180,000 | | | 158,400 |
Georgia-Pacific LLC, 8.875%, 5/15/2031 | | | | | 1,805,000 | | | 1,606,450 |
Goldman Sachs Group, Inc. (The), 4.723%, 5/23/2016(c) | | EUR | | | 8,500,000 | | | 11,596,196 |
Goldman Sachs Group, Inc. (The), 6.875%, 1/18/2038 | | GBP | | | 3,500,000 | | | 6,509,773 |
Government National Mortgage Association, 5.500%, 11/20/2034 | | | | | 508,898 | | | 518,901 |
Government National Mortgage Association, 5.500%, 2/20/2036 | | | | | 1,508,091 | | | 1,537,069 |
Government National Mortgage Association, 6.000%, 10/20/2035 | | | | | 930,737 | | | 961,179 |
Government National Mortgage Association, 6.000%, 5/15/2037 | | | | | 2,618,145 | | | 2,705,932 |
Government National Mortgage Association, 6.500%, 7/20/2037 | | | | | 4,020,625 | | | 4,186,485 |
Greenwich Capital Commercial Funding Corp., Series 2005-GG5, Class A2, 5.117%, 4/10/2037 | | | | | 11,075,000 | | | 11,006,612 |
HCA, Inc., 5.750%, 3/15/2014 | | | | | 265,000 | | | 218,625 |
HCA, Inc., 6.375%, 1/15/2015 | | | | | 1,170,000 | | | 990,113 |
HCA, Inc., 6.500%, 2/15/2016(b) | | | | | 2,360,000 | | | 1,988,300 |
HCA, Inc., 7.580%, 9/15/2025 | | | | | 614,000 | | | 480,604 |
HCA, Inc., 7.690%, 6/15/2025 | | | | | 625,000 | | | 495,341 |
Hilcorp Energy I LP, 7.750%, 11/01/2015, 144A | | | | | 5,680,000 | | | 5,325,000 |
Home Depot, Inc., 5.875%, 12/16/2036 | | | | | 5,400,000 | | | 4,408,387 |
Hospira, Inc., 5.550%, 3/30/2012 | | | | | 3,120,000 | | | 3,224,947 |
Hospira, Inc., 6.050%, 3/30/2017 | | | | | 890,000 | | | 882,103 |
Host Hotels & Resorts LP, 6.875%, 11/01/2014 | | | | | 4,255,000 | | | 4,052,887 |
Host Marriott LP, Series O, 6.375%, 3/15/2015 | | | | | 6,040,000 | | | 5,617,200 |
Host Marriott LP, Series Q, 6.750%, 6/01/2016 | | | | | 3,745,000 | | | 3,501,575 |
HSBC Bank USA, Zero Coupon Bond, 4/18/2012, 144A | | MYR | | | 7,370,000 | | | 2,274,250 |
62
PORTFOLIO OF INVESTMENTS – as of March 31, 2008 (Unaudited)
Loomis Sayles Global Bond Fund – continued
| | | | | | | |
| | | | | Principal Amount (‡) | | Value (†) |
| | | | | | | |
| | | |
| BONDS AND NOTES – continued | | | | | | | |
| | | |
| United States – continued | | | | | | | |
HSBC Bank USA, Zero Coupon Bond, 5/17/2012, 144A | | MYR | | 36,855,000 | | $ | 11,290,985 |
HSBC Bank USA, 3.310%, 8/25/2010, 144A | | | | 11,760,000 | | | 14,196,672 |
JPMorgan Chase & Co., Zero Coupon Bond, 10/22/2012, 144A | | KRW | | 11,947,200,000 | | | 9,513,366 |
JPMorgan Chase & Co., Zero Coupon Bond, 11/01/2012, 144A | | MYR | | 16,825,000 | | | 4,624,837 |
JPMorgan Chase & Co., 5.125%, 9/15/2014 | | | | 15,965,000 | | | 15,774,218 |
JPMorgan Chase & Co., 5.150%, 10/01/2015 | | | | 6,000,000 | | | 5,893,698 |
JPMorgan Chase & Co., Series EMTN, Zero Coupon Bond, 6/08/2012, 144A | | MYR | | 67,400,675 | | | 18,781,998 |
JPMorgan Chase & Co., Series EMTN, Zero Coupon Bond, 9/10/2012, 144A | | MYR | | 12,911,029 | | | 3,570,363 |
JPMorgan Chase And Co., Zero Coupon Bond, 11/01/2012, 144A | | KRW | | 2,381,600,000 | | | 1,902,442 |
Kinder Morgan Energy Partners LP, 5.950%, 2/15/2018 | | | | 10,800,000 | | | 10,695,910 |
Kraft Foods, Inc., 6.000%, 2/11/2013(b) | | | | 7,055,000 | | | 7,293,903 |
Kraft Foods, Inc., 6.875%, 2/01/2038(b) | | | | 8,065,000 | | | 7,936,726 |
L-3 Communications Corp., 5.875%, 1/15/2015 | | | | 1,935,000 | | | 1,852,763 |
L-3 Communications Corp., 6.125%, 7/15/2013 | | | | 830,000 | | | 811,325 |
L-3 Communications Corp., 6.125%, 1/15/2014 | | | | 280,000 | | | 273,000 |
Lehman Brothers Holdings, Inc., 5.750%, 1/03/2017 | | | | 4,355,000 | | | 3,934,250 |
Lucent Technologies, Inc., 6.450%, 3/15/2029 | | | | 7,950,000 | | | 5,684,250 |
Medco Health Solutions, Inc., 7.125%, 3/15/2018 | | | | 9,465,000 | | | 9,698,208 |
Merrill Lynch/Countrywide Commercial Mortgage Trust, Series 2006-1, Class A2, 5.439%, 2/12/2039 | | | | 5,755,000 | | | 5,705,303 |
Morgan Stanley, 5.375%, 11/14/2013 | | GBP | | 2,010,000 | | | 3,661,228 |
Motorola, Inc., 6.625%, 11/15/2037 | | | | 6,000,000 | | | 4,640,622 |
Nabors Industries, Inc., 6.150%, 2/15/2018, 144A | | | | 6,235,000 | | | 6,382,682 |
National Semiconductor Corp., 6.150%, 6/15/2012 | | | | 9,275,000 | | | 9,473,068 |
News America, Inc., 6.150%, 3/01/2037 | | | | 5,730,000 | | | 5,412,741 |
Nextel Communications, Inc., Series D, 7.375%, 8/01/2015 | | | | 5,475,000 | | | 4,215,750 |
NGPL PipeCo LLC, 6.514%, 12/15/2012, 144A | | | | 8,320,000 | | | 8,640,686 |
NGPL PipeCo LLC, 7.119%, 12/15/2017, 144A | | | | 1,740,000 | | | 1,799,926 |
NGPL PipeCo LLC, 7.768%, 12/15/2037, 144A | | | | 1,740,000 | | | 1,787,944 |
Nisource Finance Corp., 6.400%, 3/15/2018 | | | | 5,925,000 | | | 5,933,562 |
NRG Energy, Inc., 7.375%, 1/15/2017 | | | | 1,285,000 | | | 1,249,663 |
Owens & Minor, Inc., 6.350%, 4/15/2016 | | | | 5,630,000 | | | 5,689,723 |
Petrobras International Finance Co., 5.875%, 3/01/2018 | | | | 15,600,000 | | | 15,015,718 |
Qwest Capital Funding, Inc., 6.500%, 11/15/2018 | | | | 855,000 | | | 692,550 |
Qwest Capital Funding, Inc., 6.875%, 7/15/2028(b) | | | | 250,000 | | | 196,250 |
Qwest Capital Funding, Inc., 7.250%, 2/15/2011 | | | | 1,435,000 | | | 1,363,250 |
Qwest Capital Funding, Inc., 7.750%, 2/15/2031(b) | | | | 1,845,000 | | | 1,549,800 |
Qwest Corp., 6.500%, 6/01/2017(b) | | | | 734,000 | | | 662,435 |
Qwest Corp., 6.875%, 9/15/2033 | | | | 1,815,000 | | | 1,452,000 |
Qwest Corp., 7.200%, 11/10/2026 | | | | 100,000 | | | 84,250 |
63
| | | | | | | | |
| | | | | Principal Amount (‡) | | Value (†) |
| | | | | | | | |
| | | |
| BONDS AND NOTES – continued | | | | | | | | |
| | | |
| United States – continued | | | | | | | | |
Qwest Corp., 7.250%, 9/15/2025 | | | | $ | 1,656,000 | | $ | 1,440,720 |
Qwest Corp., 7.250%, 10/15/2035 | | | | | 2,630,000 | | | 2,169,750 |
R.H. Donnelley Corp., 6.875%, 1/15/2013 | | | | | 1,950,000 | | | 1,189,500 |
R.H. Donnelley Corp., 8.875%, 10/15/2017, 144A | | | | | 925,000 | | | 578,125 |
R.H. Donnelley Corp., Series A-1, 6.875%, 1/15/2013 | | | | | 4,535,000 | | | 2,766,350 |
R.H. Donnelley Corp., Series A-2, 6.875%, 1/15/2013 | | | | | 4,300,000 | | | 2,623,000 |
RBS Capital Trust, 4.243%, 1/12/2016(c) | | EUR | | | 4,485,000 | | | 5,476,417 |
Reynolds American, Inc., 6.750%, 6/15/2017 | | | | | 9,755,000 | | | 9,866,822 |
SLM Corp., 4.000%, 1/15/2010 | | | | | 2,815,000 | | | 2,365,867 |
SLM Corp., Series A, MTN, 5.000%, 10/01/2013 | | | | | 4,740,000 | | | 3,567,803 |
Sprint Nextel Corp., 6.000%, 12/01/2016 | | | | | 6,775,000 | | | 5,267,562 |
SUPERVALU, Inc., 7.500%, 11/15/2014 | | | | | 1,735,000 | | | 1,752,351 |
Texas Competitive Electric Holdings Co. LLC, 10.250%, 11/01/2015, 144A | | | | | 2,225,000 | | | 2,216,656 |
Textron, Inc., 3.875%, 3/11/2013 | | EUR | | | 4,000,000 | | | 6,037,653 |
Time Warner, Inc., 6.625%, 5/15/2029(b) | | | | | 7,255,000 | | | 6,802,709 |
Time Warner, Inc., 6.950%, 1/15/2028 | | | | | 2,055,000 | | | 1,996,100 |
TXU Corp., Series R, 6.550%, 11/15/2034(b) | | | | | 2,700,000 | | | 1,906,141 |
U.S. Treasury Notes, 2.875%, 1/31/2013(b) | | | | | 81,280,000 | | | 82,848,460 |
U.S. Treasury Notes, 3.375%, 11/30/2012(b) | | | | | 65,440,000 | | | 68,175,196 |
U.S. Treasury Notes, 4.500%, 3/31/2012(b) | | | | | 9,720,000 | | | 10,556,076 |
U.S. Treasury Notes, 5.000%, 7/31/2008(b)(d) | | | | | 16,885,000 | | | 17,084,192 |
Union Pacific Corp., 5.375%, 6/01/2033(b) | | | | | 1,198,000 | | | 1,050,307 |
Union Pacific Corp., 5.450%, 1/31/2013 | | | | | 2,535,000 | | | 2,608,900 |
Union Pacific Corp., 5.650%, 5/01/2017 | | | | | 4,190,000 | | | 4,180,962 |
Unitedhealth Group, Inc., 6.000%, 2/15/2018(b) | | | | | 23,035,000 | | | 22,563,174 |
Wells Fargo & Co., 4.625%, 11/02/2035 | | GBP | | | 12,030,000 | | | 18,486,205 |
| | | | | | | | |
| | | | | | | | 1,107,277,586 |
| | | | | | | | |
| Uruguay – 0.8% | | | | | | | | |
Republic of Uruguay, 4.250%, 4/05/2027 | | UYU | | | 431,936,901 | | | 21,281,377 |
| | | | | | | | |
| | | |
| TOTAL NON-CONVERTIBLE BONDS | | | | | | | | |
(Identified Cost $2,201,566,226) | | | | | | | | 2,324,504,021 |
| | | | | | | | |
| | | |
| TOTAL BONDS AND NOTES | | | | | | | | |
(Identified Cost $2,201,566,226) | | | | | | | | 2,324,504,021 |
| | | | | | | | |
| | | |
| | | | | Shares | | |
| | | |
| PREFERRED STOCKS – 1.3% | | | | | | | | |
| | | |
| NON-CONVERTIBLE PREFERRED STOCKS – 1.3% | | | | | | | | |
| | | |
| United States – 1.3% | | | | | | | | |
Federal Home Loan Mortgage Corp., 8.375%(b) | | | | | 505,450 | | | 12,332,980 |
Federal National Mortgage Association, 8.250%(b) | | | | | 853,775 | | | 20,533,289 |
| | | | | | | | |
| | | |
| TOTAL NON-CONVERTIBLE PREFERRED STOCKS | | | | | | | | |
(Identified Cost $34,621,942) | | | | | | | | 32,866,269 |
| | | | | | | | |
| | | |
| TOTAL PREFERRED STOCKS | | | | | | | | |
(Identified Cost $34,621,942) | | | | | | | | 32,866,269 |
| | | | | | | | |
64
PORTFOLIO OF INVESTMENTS – as of March 31, 2008 (Unaudited)
Loomis Sayles Global Bond Fund – continued
| | | | | | | | |
| | | | | Principal Amount (‡) | | Value (†) |
| | | | | | | | |
| | | |
| SHORT-TERM INVESTMENTS – 14.3% | | | | | | | | |
| Tri-Party Repurchase Agreement with Fixed Income Clearing Corporation dated 3/31/08 at 1.250% to be repurchased at $75,025,605 on 4/01/08 collateralized by $68,055,000 Federal National Mortgage Association, 5.020% due 11/21/2012 valued at $70,436,925; and $5,940,000 Federal National Mortgage Association, 4.750% due 1/2/2013 valued at $6,090,401 including accrued interest (Note 2h of Notes to Financial Statements) | | | | $ | 75,023,000 | | $ | 75,023,000 |
| | | | | | | | |
| | | |
| | | | | Shares | | |
State Street Navigator Securities Lending Prime Portfolio(e) | | | | | 283,468,823 | | | 283,468,823 |
| | | | | | | | |
| | | |
| TOTAL SHORT-TERM INVESTMENTS | | | | | | | | |
(Identified Cost $358,491,823) | | | | | | | | 358,491,823 |
| | | | | | | | |
| | | |
| TOTAL INVESTMENTS – 108.1% | | | | | | | | |
(Identified Cost $2,594,679,991)(a) | | | | | | | | 2,715,862,113 |
Other assets less liabilities—(8.1)% | | | | | | | | (203,444,361) |
| | | | | | | | |
| | | |
| NET ASSETS – 100.0% | | | | | | | $ | 2,512,417,752 |
| | | | | | | | |
| | | |
(†) See Note 2a of Notes to Financial Statements. | | | | | | | | |
(‡) Principal amount stated in U.S. dollars unless otherwise noted. | | | | | | | | |
(a) Federal Tax Information (Amounts exclude certain adjustments made at the end of the Fund’s fiscal year for tax purposes. Such adjustments are primarily due to wash sales. Amortization of premium on debt securities is excluded for tax purposes.): At March 31, 2008, the net unrealized appreciation on investments based on a cost of $2,599,183,285 for federal income tax purposes was as follows: | | | |
Aggregate gross unrealized appreciation for all investments in which there is an excess of value over tax cost | | $ | 161,803,701 |
Aggregate gross unrealized depreciation for all investments in which there is an excess of tax cost over value | | | (45,124,873) |
| | | | | | | | |
Net unrealized appreciation | | | | | | | $ | 116,678,828 |
| | | | | | | | |
| (b) | All or a portion of this security was on loan to brokers at March 31, 2008. |
| (c) | Variable rate security. Rate as of March 31, 2008 is disclosed. |
| (d) | All or a portion of this security is held as collateral for open futures contracts. |
| (e) | Represents investment of securities lending collateral. |
| 144A | Securities exempt from registration under Rule 144A of the Securities Act of 1933. These securities may be resold in transactions exempt from registration, normally to qualified institutional buyers. At March 31, 2008, the total value of these securities amounted to $233,431,580 or 9.3% of net assets. |
| EMTN | Euro Medium Term Note |
| GMTN | Global Medium Term Note |
| | Key to Abbreviations: BRL: Brazilian Real; CAD: Canadian Dollar; CHF: Swiss Franc; COP: Colombian Peso; EGP: Egyptian Pound; EUR: Euro; GBP: British Pound; IDR: Indonesian Rupiah; JPY: Japanese Yen; KRW: South Korean Won; MYR: Malaysian Ringgit; PLN: Polish Zloty; SGD: Singapore Dollar; UYU: Uruguayan Peso |
At March 31, 2008, open futures contracts sold were as follows:
| | | | | | | | | | | |
Futures | | Expiration
Date | | Contracts | | Notional Value | | Unrealized
Depreciation | |
U.S. Treasury Bond | | 06/19/2008 | | 150 | | $ | 17,819,531 | | ($ | 553,400 | ) |
65
HOLDINGS AT MARCH 31, 2008 AS A PERCENTAGE OF NET ASSETS (Unaudited)
| | | |
Treasuries | | 18.2 | % |
Sovereigns | | 13.0 | |
Banking | | 11.4 | |
Mortgage Related | | 10.9 | |
Supranational | | 4.1 | |
Wirelines | | 3.2 | |
Non-Captive Diversified | | 2.8 | |
Government Guaranteed | | 2.5 | |
Other, less than 2% each | | 27.7 | |
See accompanying notes to financial statements.
66
PORTFOLIO OF INVESTMENTS – as of March 31, 2008 (Unaudited)
Loomis Sayles Inflation Protected Securities Fund
| | | | | | | | |
| | | | | Principal Amount (‡) | | Value (†) |
| | | | | | | | |
| | | |
| BONDS AND NOTES – 94.3% of Net Assets | | | | | | | | |
| | | |
| Automotive – 1.4% | | | | | | | | |
Ford Motor Co., 6.625%, 2/15/2028 | | | | $ | 20,000 | | $ | 12,200 |
Ford Motor Co., 6.625%, 10/01/2028 | | | | | 185,000 | | | 112,850 |
Ford Motor Co., 7.450%, 7/16/2031 | | | | | 140,000 | | | 92,400 |
Ford Motor Co., 7.500%, 8/01/2026 | | | | | 15,000 | | | 9,600 |
| | | | | | | | |
| | | | | | | | 227,050 |
| | | | | | | | |
| Brokerage – 0.6% | | | | | | | | |
Goldman Sachs Group, Inc., 6.750%, 10/01/2037 | | | | | 100,000 | | | 93,033 |
| | | | | | | | |
| Construction Machinery – 0.9% | | | | | | | | |
Joy Global, Inc., 6.625%, 11/15/2036 | | | | | 165,000 | | | 152,984 |
| | | | | | | | |
| Electric – 0.5% | | | | | | | | |
Energy Future Holdings Corp., Series Q, 6.500%, 11/15/2024 | | | | | 10,000 | | | 7,101 |
Texas Competitive Electric Holdings Co., 10.250%, 11/01/2015, 144A | | | | | 80,000 | | | 79,700 |
| | | | | | | | |
| | | | | | | | 86,801 |
| | | | | | | | |
| Food & Beverage – 0.4% | | | | | | | | |
Dean Foods Co., 6.900%, 10/15/2017 | | | | | 75,000 | | | 64,125 |
| | | | | | | | |
| Independent Energy – 0.2% | | | | | | | | |
Chesapeake Energy Corp., 6.500%, 8/15/2017 | | | | | 35,000 | | | 33,775 |
| | | | | | | | |
| Lodging – 0.2% | | | | | | | | |
Royal Caribbean Cruises Ltd., 7.500%, 10/15/2027 | | | | | 50,000 | | | 42,420 |
| | | | | | | | |
| Metals & Mining – 0.3% | | | | | | | | |
United States Steel Corp., 6.650%, 6/01/2037 | | | | | 55,000 | | | 46,492 |
| | | | | | | | |
| Non-Captive Consumer – 0.8% | | | | | | | | |
Residential Capital LLC, 8.500%, 4/17/2013(c) | | | | | 50,000 | | | 24,250 |
SLM Corp., 5.050%, 11/14/2014 | | | | | 25,000 | | | 18,182 |
SLM Corp., Series A, MTN, 5.000%, 10/01/2013 | | | | | 30,000 | | | 22,581 |
SLM Corp., Series A, MTN, 5.000%, 4/15/2015 | | | | | 45,000 | | | 32,063 |
SLM Corp., Series A, MTN, 5.375%, 5/15/2014 | | | | | 5,000 | | | 3,752 |
SLM Corp., Series A, MTN, 5.625%, 8/01/2033 | | | | | 45,000 | | | 31,163 |
| | | | | | | | |
| | | | | | | | 131,991 |
| | | | | | | | |
| Non-Captive Diversified – 2.9% | | | | | | | | |
General Electric Capital Corp., Series GMTN, 2.960%, 5/18/2012 | | SGD | | | 200,000 | | | 145,672 |
General Electric Capital Corp., Series A, GMTN, 3.485%, 3/08/2012 | | SGD | | | 300,000 | | | 221,655 |
iStar Financial, Inc., 5.150%, 3/01/2012 | | | | | 35,000 | | | 25,900 |
iStar Financial, Inc., 5.375%, 4/15/2010 | | | | | 5,000 | | | 3,950 |
iStar Financial, Inc., 5.500%, 6/15/2012 | | | | | 5,000 | | | 3,700 |
iStar Financial, Inc., 5.650%, 9/15/2011 | | | | | 15,000 | | | 11,400 |
iStar Financial, Inc., 5.850%, 3/15/2017 | | | | | 5,000 | | | 3,450 |
iStar Financial, Inc., 5.875%, 3/15/2016 | | | | | 20,000 | | | 14,000 |
iStar Financial, Inc., 6.050%, 4/15/2015 | | | | | 5,000 | | | 3,550 |
iStar Financial, Inc., Series B, 5.125%, 4/01/2011 | | | | | 5,000 | | | 3,850 |
iStar Financial, Inc., Series B, 5.950%, 10/15/2013 | | | | | 55,000 | | | 40,150 |
| | | | | | | | |
| | | | | | | | 477,277 |
| | | | | | | | |
| Paper – 0.4% | | | | | | | | |
Georgia-Pacific Corp., 7.700%, 6/15/2015 | | | | | 70,000 | | | 65,800 |
| | | | | | | | |
67
| | | | | | | | | |
| | | | | Principal Amount (‡) | | | Value (†) |
| | | | | | | | | |
| | | |
| BONDS AND NOTES – continued | | | | | | | | | |
| | | |
| Pipelines – 0.2% | | | | | | | | | |
Colorado Interstate Gas Co., 5.950%, 3/15/2015 | | | | $ | 3,000 | | | $ | 2,970 |
Southern Natural Gas Co., 7.350%, 2/15/2031 | | | | | 30,000 | | | | 30,725 |
| | | | | | | | | |
| | | | | | | | | 33,695 |
| | | | | | | | | |
| Sovereigns – 0.9% | | | | | | | | | |
Mexican Fixed Rate Bonds, Series M-10, 8.000%, 12/17/2015 | | MXN | | | 15,000 | (††) | | | 145,705 |
| | | | | | | | | |
| Technology – 1.1% | | | | | | | | | |
Agilent Technologies, Inc., 6.500%, 11/01/2017 | | | | | 105,000 | | | | 105,364 |
Lucent Technologies, Inc., 6.450%, 3/15/2029 | | | | | 90,000 | | | | 64,350 |
Lucent Technologies, Inc., 6.500%, 1/15/2028 | | | | | 15,000 | | | | 10,725 |
| | | | | | | | | |
| | | | | | | | | 180,439 |
| | | | | | | | | |
| Textile – 0.0% | | | | | | | | | |
Jones Apparel Group, Inc., 6.125%, 11/15/2034 | | | | | 10,000 | | | | 6,800 |
| | | | | | | | | |
| Treasuries – 81.0% | | | | | | | | | |
U.S. Treasury Inflation Index Bonds, 1.625%, 1/15/2018(b) | | | | | 302,220 | | | | 317,355 |
U.S. Treasury Inflation Index Bonds, 2.000%, 1/15/2026(b) | | | | | 170,133 | | | | 175,396 |
U.S. Treasury Inflation Index Bonds, 2.375%, 1/15/2017(b) | | | | | 758,727 | | | | 846,811 |
U.S. Treasury Inflation Index Bonds, 2.375%, 1/15/2025(b) | | | | | 772,545 | | | | 840,565 |
U.S. Treasury Inflation Index Bonds, 2.500%, 7/15/2016 | | | | | 297,834 | | | | 335,505 |
U.S. Treasury Inflation Index Bonds, 3.375%, 4/15/2032 | | | | | 1,498,127 | | | | 1,967,228 |
U.S. Treasury Inflation Index Notes, 0.875%, 4/15/2010(b) | | | | | 880,076 | | | | 900,633 |
U.S. Treasury Inflation Index Notes, 1.625%, 1/15/2015(b) | | | | | 613,425 | | | | 650,662 |
U.S. Treasury Inflation Index Notes, 1.875%, 7/15/2013(b) | | | | | 930,763 | | | | 1,003,915 |
U.S. Treasury Inflation Index Notes, 1.875%, 7/15/2015(b) | | | | | 602,186 | | | | 650,032 |
U.S. Treasury Inflation Index Notes, 2.000%, 4/15/2012(b) | | | | | 109,204 | | | | 117,574 |
U.S. Treasury Inflation Index Notes, 2.000%, 1/15/2014(b) | | | | | 713,869 | | | | 773,209 |
U.S. Treasury Inflation Index Notes, 2.000%, 7/15/2014 | | | | | 660,582 | | | | 717,402 |
U.S. Treasury Inflation Index Notes, 2.000%, 1/15/2016(b) | | | | | 441,282 | | | | 478,481 |
U.S. Treasury Inflation Index Notes, 2.375%, 4/15/2011(b) | | | | | 404,046 | | | | 434,097 |
U.S. Treasury Inflation Index Notes, 2.375%, 1/15/2027(b) | | | | | 413,375 | | | | 451,225 |
U.S. Treasury Inflation Index Notes, 2.625%, 7/15/2017(b) | | | | | 997,924 | | | | 1,137,166 |
U.S. Treasury Inflation Index Notes, 3.000%, 7/15/2012(b) | | | | | 721,875 | | | | 809,063 |
U.S. Treasury Inflation Index Notes, 3.375%, 1/15/2012(b) | | | | | 196,112 | | | | 220,764 |
68
PORTFOLIO OF INVESTMENTS – as of March 31, 2008 (Unaudited)
Loomis Sayles Inflation Protected Securities Fund – continued
| | | | | | | | |
| | | | | Principal Amount (‡) | | Value (†) |
| | | | | | | | |
| | | |
| BONDS AND NOTES – continued | | | | | | | | |
| | | |
| Treasuries – continued | | | | | | | | |
U.S. Treasury Inflation Index Notes, 3.500%, 1/15/2011 | | | | $ | 339,528 | | $ | 375,470 |
U.S. Treasury Inflation Index Notes, 4.250%, 1/15/2010 | | | | | 150,528 | | | 163,323 |
| | | | | | | | |
| | | | | | | | 13,365,876 |
| | | | | | | | |
| Wireless – 0.6% | | | | | | | | |
ALLTEL Corp., 7.875%, 7/01/2032 | | | | | 20,000 | | | 13,200 |
Sprint Capital Corp., 6.875%, 11/15/2028 | | | | | 120,000 | | | 89,400 |
| | | | | | | | |
| | | | | | | | 102,600 |
| | | | | | | | |
| Wirelines – 1.9% | | | | | | | | |
AT&T Corp., 8.000%, 11/15/2031 | | | | | 80,000 | | | 93,481 |
Bell Canada, 5.000%, 2/15/2017 | | CAD | | | 30,000 | | | 22,863 |
Bell Canada, 6.550%, 5/01/2029, 144A | | CAD | | | 5,000 | | | 3,681 |
Bell Canada, 7.300%, 2/23/2032 | | CAD | | | 15,000 | | | 11,954 |
Bell Canada, Series M-17, 6.100%, 3/16/2035 | | CAD | | | 35,000 | | | 24,951 |
Embarq Corp., 7.995%, 6/01/2036 | | | | | 165,000 | | | 150,687 |
| | | | | | | | |
| | | | | | | | 307,617 |
| | | | | | | | |
| | | |
| TOTAL BONDS AND NOTES | | | | | | | | |
(Identified Cost $14,941,220) | | | | | | | | 15,564,480 |
| | | | | | | | |
| | | |
| | | | | Shares | | |
| | | |
| PREFERRED STOCKS – 0.7% | | | | | | | | |
| | | |
| NON-CONVERTIBLE PREFERRED STOCKS – 0.7% | | | | | | | | |
| | | |
| Thrifts & Mortgage Finance – 0.7% | | | | | | | | |
Federal Home Loan Mortgage Corp., 8.375% | | | | | 1,160 | | | 28,304 |
Federal National Mortgage Association, 8.250% | | | | | 3,500 | | | 84,175 |
| | | | | | | | |
| | | |
| TOTAL NON-CONVERTIBLE PREFERRED STOCKS | | | | | | | | |
(Identified Cost $116,500) | | | | | | | | 112,479 |
| | | | | | | | |
| | | |
| TOTAL PREFERRED STOCKS | | | | | | | | |
(Identified Cost $116,500) | | | | | | | | 112,479 |
| | | | | | | | |
| | | |
| | | | | Principal Amount (‡) | | |
| | | |
| SHORT-TERM INVESTMENTS – 29.7% | | | | | | | | |
| Tri-Party Repurchase Agreement with Fixed Income Clearing Corporation, dated 3/31/08 at 1.25% to be repurchased at $743,026 on 4/01/08 collateralized by $755,000 Federal Home Loan Mortgage Corp., 5.510% due 1/23/23 valued at $758,956, including accrued interest (Note 2h of Notes to Financial Statements) | | | | $ | 743,000 | | | 743,000 |
| | | | | | | | |
| | | |
| | | | | Shares | | |
State Street Navigator Securities Lending Prime Portfolio(c) | | | | | 4,165,445 | | | 4,165,445 |
| | | | | | | | |
69
| | | | | | | |
| | | | | | | Value (†) |
| | | |
| TOTAL SHORT-TERM INVESTMENTS | | | | | | | |
(Identified Cost $4,908,445) | | | | | | $ | 4,908,445 |
| | | | | | | |
| | | |
| TOTAL INVESTMENTS – 124.7% | | | | | | | |
(Identified Cost $19,966,165)(a) | | | | | | | 20,585,404 |
Other assets less liabilities—(24.7)% | | | | | | | (4,076,398) |
| | | | | | | |
| | | |
| NET ASSETS – 100.0% | | | | | | $ | 16,509,006 |
| | | | | | | |
| |
(‡) Principal amount stated in U.S. dollars unless otherwise noted. | | | |
(†) See Note 2a of Notes to Financial Statements. | | | |
(††) Amount shown represents units. One unit represents a principal amount of 100. | | | |
(a) Federal Tax Information (Amounts exclude certain adjustments made at the end of the Fund’s fiscal year for tax purposes. Such adjustments are primarily due to wash sales. Amortization of premium on debt securities is excluded for tax purposes.): At March 31, 2008, the net unrealized appreciation on investments based on a cost of $20,057,553 for federal income tax purposes was as follows: | | | |
Aggregate gross unrealized appreciation for all investments in which there is an excess of value over tax cost | | $ | 788,262 |
Aggregate gross unrealized depreciation for all investments in which there is an excess of tax cost over value | | | (260,411) |
| | | | | | | |
Net unrealized appreciation | | $ | 527,851 |
| | | | | | | |
| (b) | All or a portion of this security was on loan to brokers at March 31, 2008. |
| (c) | Represents investment of securities lending collateral. |
| 144A | Securities exempt from registration under Rule 144A of the Securities Act of 1933. These securities may be resold in transactions exempt from registration, normally to qualified institutional buyers. At March 31, 2008, the total value of these securities amounted to $83,381 or 0.5% of net assets. |
| GMTN | Global Medium Term Note |
Key to Abbreviations: CAD Canadian Dollar; MXN: Mexican Peso; SGD: Singapore Dollar
HOLDINGS AT MARCH 31, 2008 AS A PERCENTAGE OF NET ASSETS (Unaudited)
| | | |
Treasuries | | 81.0 | % |
Non-Captive Diversified | | 2.9 | |
Other, less than 2% each | | 11.1 | |
See accompanying notes to financial statements.
70
PORTFOLIO OF INVESTMENTS – as of March 31, 2008 (Unaudited)
Loomis Sayles Institutional High Income Fund
| | | | | | | |
| | | | | Principal Amount (‡) | | Value (†) |
| | | | | | | |
| | | |
| BONDS AND NOTES – 85.4% of Net Assets | | | | | | | |
| | | |
| NON-CONVERTIBLE BONDS – 75.9% | | | | | | | |
| | | |
| Aerospace & Defense – 1.0% | | | | | | | |
Bombardier, Inc., 7.350%, 12/22/2026 | | CAD | | 600,000 | | $ | 544,568 |
Bombardier, Inc., 7.450%, 5/01/2034, 144A | | | | 1,500,000 | | | 1,402,500 |
| | | | | | | |
| | | | | | | 1,947,068 |
| | | | | | | |
| Airlines – 0.6% | | | | | | | |
American Airlines, Inc., Series 93A6, 8.040%, 9/16/2011 | | | | 34,639 | | | 33,470 |
Continental Airlines, Inc., Series 2000-2, Class B, 8.307%, 10/02/2019 | | | | 336,104 | | | 314,257 |
Continental Airlines, Inc., Series 2001-1B, 7.373%, 12/15/2015 | | | | 180,851 | | | 163,670 |
Delta Air Lines, Inc., 8.954%, 8/10/2014, 144A | | | | 588,944 | | | 547,718 |
| | | | | | | |
| | | | | | | 1,059,115 |
| | | | | | | |
| Automotive – 6.2% | | | | | | | |
Cummins, Inc., 7.125%, 3/01/2028 | | | | 350,000 | | | 345,395 |
FCE Bank PLC, Series EMTN, 7.125%, 1/16/2012 | | EUR | | 150,000 | | | 189,450 |
Ford Motor Co., 6.500%, 8/01/2018(b) | | | | 20,000 | | | 13,400 |
Ford Motor Co., 6.625%, 2/15/2028 | | | | 30,000 | | | 18,300 |
Ford Motor Co., 6.625%, 10/01/2028 | | | | 1,510,000 | | | 921,100 |
Ford Motor Co., 7.125%, 11/15/2025 | | | | 190,000 | | | 125,400 |
Ford Motor Co., 7.450%, 7/16/2031 | | | | 1,685,000 | | | 1,112,100 |
Ford Motor Co., 7.500%, 8/01/2026 | | | | 30,000 | | | 19,200 |
Ford Motor Credit Co., 5.700%, 1/15/2010 | | | | 2,980,000 | | | 2,588,869 |
Ford Motor Credit Co. LLC, 8.000%, 12/15/2016 | | | | 940,000 | | | 735,836 |
Ford Motor Credit Co. LLC, 8.625%, 11/01/2010 | | | | 70,000 | | | 60,991 |
Ford Motor Credit Co. LLC, 9.750%, 9/15/2010 | | | | 155,000 | | | 138,070 |
Ford Motor Credit Co. LLC, Series EMTN, 4.875%, 1/15/2010 | | EUR | | 130,000 | | | 172,688 |
General Motors Corp., 7.400%, 9/01/2025(b) | | | | 5,110,000 | | | 3,423,700 |
General Motors Corp., 8.250%, 7/15/2023 | | | | 645,000 | | | 451,500 |
Goodyear Tire & Rubber Co., 7.000%, 3/15/2028 | | | | 1,750,000 | | | 1,426,250 |
| | | | | | | |
| | | | | | | 11,742,249 |
| | | | | | | |
| Banking – 3.6% | | | | | | | |
Barclays Financial LLC, 4.160%, 2/22/2010, 144A | | THB | | 50,000,000 | | | 1,624,145 |
Barclays Financial LLC, Series EMTN, 4.100%, 3/22/2010, 144A | | THB | | 11,000,000 | | | 357,067 |
BNP Paribas SA, Series EMTN, Zero Coupon Bond, 6/13/2011, 144A | | IDR | | 10,477,600,000 | | | 817,264 |
HSBC Bank USA, 3.310%, 8/25/2010, 144A | | | | 500,000 | | | 603,600 |
JPMorgan Chase & Co., Zero Coupon Bond, 3/28/2011, 144A | | IDR | | 6,846,018,000 | | | 548,053 |
JPMorgan Chase & Co., Zero Coupon Bond, 3/28/2011, 144A | | IDR | | 5,376,000,000 | | | 429,963 |
JPMorgan Chase & Co., Zero Coupon Bond, 5/07/2012, 144A | | BRL | | 2,200,000 | | | 999,476 |
JPMorgan Chase London, Zero Coupon Bond, 10/21/2010, 144A | | IDR | | 9,533,078,500 | | | 804,901 |
Rabobank Nederland, 14.000%, 1/28/2009, 144A | | ISK | | 40,000,000 | | | 530,728 |
| | | | | | | |
| | | | | | | 6,715,197 |
| | | | | | | |
71
| | | | | | | | |
| | | | | Principal Amount (‡) | | Value (†) |
| | | | | | | | |
| | | |
| BONDS AND NOTES – continued | | | | | | | | |
| | | |
| Brokerage – 0.0% | | | | | | | | |
Bear Stearns Cos., Inc. (The), 4.650%, 7/02/2018 | | | | $ | 10,000 | | $ | 8,536 |
Bear Stearns Cos., Inc. (The), 6.400%, 10/02/2017 | | | | | 5,000 | | | 4,937 |
Bear Stearns Cos., Inc. (The), 7.250%, 2/01/2018 | | | | | 10,000 | | | 10,334 |
| | | | | | | | |
| | | | | | | | 23,807 |
| | | | | | | | |
| Building Materials – 0.1% | | | | | | | | |
Ply Gem Industries, Inc., 9.000%, 2/15/2012(b) | | | | | 125,000 | | | 91,250 |
USG Corp., 6.300%, 11/15/2016 | | | | | 175,000 | | | 138,250 |
| | | | | | | | |
| | | | | | | | 229,500 |
| | | | | | | | |
| Chemicals – 3.2% | | | | | | | | |
Borden, Inc., 7.875%, 2/15/2023 | | | | | 1,474,000 | | | 913,880 |
Borden, Inc., 9.200%, 3/15/2021 | | | | | 2,541,000 | | | 1,702,470 |
Georgia Gulf Corp., 10.750%, 10/15/2016(b) | | | | | 500,000 | | | 327,500 |
Hercules, Inc., 6.500%, 6/30/2029 | | | | | 1,743,000 | | | 1,394,400 |
Mosaic Global Holdings, Inc., 7.300%, 1/15/2028 | | | | | 1,405,000 | | | 1,390,950 |
Mosaic Global Holdings, Inc., 7.375%, 8/01/2018 | | | | | 400,000 | | | 408,000 |
| | | | | | | | |
| | | | | | | | 6,137,200 |
| | | | | | | | |
| Construction Machinery – 0.9% | | | | | | | | |
Great Lakes Dredge & Dock Corp., 7.750%, 12/15/2013(b) | | | | | 300,000 | | | 274,500 |
United Rentals North America, Inc., 7.000%, 2/15/2014 | | | | | 1,315,000 | | | 1,032,275 |
United Rentals North America, Inc., 7.750%, 11/15/2013(b) | | | | | 430,000 | | | 350,450 |
| | | | | | | | |
| | | | | | | | 1,657,225 |
| | | | | | | | |
| Electric – 5.5% | | | | | | | | |
AES Corp. (The), 7.750%, 3/01/2014 | | | | | 1,185,000 | | | 1,192,406 |
AES Corp. (The), 7.750%, 10/15/2015 | | | | | 645,000 | | | 649,838 |
Dynegy Holdings, Inc., 7.125%, 5/15/2018 | | | | | 100,000 | | | 90,000 |
Dynegy Holdings, Inc., 7.625%, 10/15/2026 | | | | | 490,000 | | | 415,275 |
Dynegy Holdings, Inc., 7.750%, 6/01/2019 | | | | | 1,250,000 | | | 1,168,750 |
Dynegy Holdings, Inc., 8.375%, 5/01/2016 | | | | | 250,000 | | | 247,500 |
Energy Future Holdings Corp., Series P, 5.550%, 11/15/2014 | | | | | 920,000 | | | 718,374 |
Energy Future Holdings Corp., Series Q, 6.500%, 11/15/2024 | | | | | 1,515,000 | | | 1,075,768 |
NGC Corporation Capital Trust I, Series B, 8.316%, 6/01/2027 | | | | | 1,685,000 | | | 1,444,887 |
NRG Energy, Inc., 7.375%, 2/01/2016 | | | | | 575,000 | | | 563,500 |
Quezon Power Philippines Co., 8.860%, 6/15/2017 | | | | | 392,500 | | | 396,425 |
Reliant Energy, Inc., 7.875%, 6/15/2017(b) | | | | | 1,025,000 | | | 1,019,875 |
TXU Corp., Series R, 6.550%, 11/15/2034 | | | | | 420,000 | | | 296,511 |
White Pine Hydro Portfolio LLC, 7.260%, 7/20/2015(c) | | | | | 1,000,000 | | | 1,025,397 |
| | | | | | | | |
| | | | | | | | 10,304,506 |
| | | | | | | | |
| Entertainment – 0.0% | | | | | | | | |
Six Flags, Inc., 9.625%, 6/01/2014(b) | | | | | 140,000 | | | 79,100 |
| | | | | | | | |
| Food & Beverage – 0.5% | | | | | | | | |
Dean Foods Co., 7.000%, 6/01/2016 | | | | | 225,000 | | | 196,875 |
Dole Food Co., Inc., 8.625%, 5/01/2009 | | | | | 50,000 | | | 43,500 |
Sara Lee Corp., 6.125%, 11/01/2032 | | | | | 690,000 | | | 650,362 |
| | | | | | | | |
| | | | | | | | 890,737 |
| | | | | | | | |
72
PORTFOLIO OF INVESTMENTS – as of March 31, 2008 (Unaudited)
Loomis Sayles Institutional High Income Fund – continued
| | | | | | | | |
| | | | | Principal Amount (‡) | | Value (†) |
| | | | | | | | |
| | | |
| BONDS AND NOTES – continued | | | | | | | | |
| | | |
| Healthcare – 3.7% | | | | | | | | |
HCA, Inc., 5.750%, 3/15/2014 | | | | $ | 10,000 | | $ | 8,250 |
HCA, Inc., 6.250%, 2/15/2013 | | | | | 10,000 | | | 8,700 |
HCA, Inc., 6.375%, 1/15/2015 | | | | | 545,000 | | | 461,206 |
HCA, Inc., 6.500%, 2/15/2016 | | | | | 550,000 | | | 463,375 |
HCA, Inc., 6.750%, 7/15/2013 | | | | | 20,000 | | | 17,700 |
HCA, Inc., 7.050%, 12/01/2027 | | | | | 1,000,000 | | | 729,184 |
HCA, Inc., 7.190%, 11/15/2015 | | | | | 35,000 | | | 29,776 |
HCA, Inc., 7.500%, 12/15/2023 | | | | | 395,000 | | | 310,153 |
HCA, Inc., 7.500%, 11/06/2033 | | | | | 2,120,000 | | | 1,637,700 |
HCA, Inc., 7.580%, 9/15/2025 | | | | | 560,000 | | | 438,336 |
HCA, Inc., 7.690%, 6/15/2025 | | | | | 700,000 | | | 554,782 |
HCA, Inc., 7.750%, 7/15/2036 | | | | | 180,000 | | | 138,218 |
HCA, Inc., 8.360%, 4/15/2024 | | | | | 170,000 | | | 141,114 |
Tenet Healthcare Corp., 6.875%, 11/15/2031 | | | | | 2,855,000 | | | 1,998,500 |
| | | | | | | | |
| | | | | | | | 6,936,994 |
| | | | | | | | |
| Home Construction – 2.1% | | | | | | | | |
K. Hovnanian Enterprises, Inc., 6.250%, 1/15/2015(b) | | | | | 185,000 | | | 123,950 |
K. Hovnanian Enterprises, Inc., 6.250%, 1/15/2016 | | | | | 1,068,000 | | | 720,900 |
K. Hovnanian Enterprises, Inc., 6.375%, 12/15/2014(b) | | | | | 425,000 | | | 286,875 |
K. Hovnanian Enterprises, Inc., 6.500%, 1/15/2014(b) | | | | | 272,000 | | | 183,600 |
K. Hovnanian Enterprises, Inc., 7.500%, 5/15/2016(b) | | | | | 755,000 | | | 524,725 |
K. Hovnanian Enterprises, Inc., 7.750%, 5/15/2013(b) | | | | | 10,000 | | | 5,300 |
KB Home, 7.250%, 6/15/2018 | | | | | 1,260,000 | | | 1,127,700 |
Lennar Corp., 7.625%, 3/01/2009 | | | | | 766,000 | | | 735,360 |
Lennar Corp., Series B, 5.500%, 9/01/2014 | | | | | 40,000 | | | 30,400 |
Pulte Homes, Inc., 6.000%, 2/15/2035 | | | | | 400,000 | | | 308,000 |
| | | | | | | | |
| | | | | | | | 4,046,810 |
| | | | | | | | |
| Independent Energy – 1.9% | | | | | | | | |
Chesapeake Energy Corp., 6.500%, 8/15/2017 | | | | | 155,000 | | | 149,575 |
Chesapeake Energy Corp., 6.875%, 11/15/2020 | | | | | 515,000 | | | 499,550 |
Connacher Oil and Gas Ltd., 10.250%, 12/15/2015, 144A | | | | | 495,000 | | | 498,713 |
Hilcorp Energy I LP, 7.750%, 11/01/2015, 144A | | | | | 985,000 | | | 923,437 |
Pioneer Natural Resources Co., 6.875%, 5/01/2018 | | | | | 820,000 | | | 776,941 |
Pioneer Natural Resources Co., 7.200%, 1/15/2028 | | | | | 920,000 | | | 799,702 |
| | | | | | | | |
| | | | | | | | 3,647,918 |
| | | | | | | | |
| Media Cable – 0.3% | | | | | | | | |
Virgin Media Finance Plc, 9.125%, 8/15/2016 | | | | | 685,000 | | | 613,075 |
| | | | | | | | |
| Media Non-Cable – 1.5% | | | | | | | | |
Clear Channel Communications, Inc., 4.900%, 5/15/2015 | | | | | 705,000 | | | 472,350 |
Clear Channel Communications, Inc., 5.500%, 9/15/2014 | | | | | 455,000 | | | 327,600 |
Clear Channel Communications, Inc., 5.500%, 12/15/2016 | | | | | 1,285,000 | | | 848,100 |
Clear Channel Communications, Inc., 5.750%, 1/15/2013 | | | | | 225,000 | | | 178,875 |
R.H. Donnelley Corp., 8.875%, 10/15/2017, 144A | | | | | 1,460,000 | | | 912,500 |
Tribune Co., 5.250%, 8/15/2015 | | | | | 160,000 | | | 61,600 |
| | | | | | | | |
| | | | | | | | 2,801,025 |
| | | | | | | | |
73
| | | | | | | | |
| | | | | Principal Amount (‡) | | Value (†) |
| | | | | | | | |
| | | |
| BONDS AND NOTES – continued | | | | | | | | |
| | | |
| Metals & Mining – 1.0% | | | | | | | | |
Algoma Acquisition Corp., 9.875%, 6/15/2015, 144A | | | | $ | 1,245,000 | | $ | 1,076,925 |
Ryerson, Inc., 12.000%, 11/01/2015, 144A | | | | | 775,000 | | | 732,375 |
| | | | | | | | |
| | | | | | | | 1,809,300 |
| | | | | | | | |
| Non-Captive Consumer – 3.0% | | | | | | | | |
Countrywide Home Loans, Inc., Series L, MTN, 4.000%, 3/22/2011 | | | | | 120,000 | | | 107,022 |
Residential Capital LLC, 8.375%, 5/17/2013(d) | | GBP | | | 1,020,000 | | | 870,468 |
Residential Capital LLC, 8.500%, 6/01/2012(d) | | | | | 90,000 | | | 44,100 |
Residential Capital LLC, 8.500%, 4/17/2013(d) | | | | | 1,990,000 | | | 965,150 |
Residential Capital LLC, 8.875%, 6/30/2015(b)(d) | | | | | 255,000 | | | 123,675 |
Residential Capital LLC, Series EMTN, 9.875%, 7/01/2014(d) | | GBP | | | 305,000 | | | 260,287 |
SLM Corp., 6.500%, 6/15/2010 | | NZD | | | 4,720,000 | | | 3,239,543 |
| | | | | | | | |
| | | | | | | | 5,610,245 |
| | | | | | | | |
| Non-Captive Diversified – 3.7% | | | | | | | | |
CIT Group, Inc., 5.400%, 1/30/2016 | | | | | 20,000 | | | 15,826 |
CIT Group, Inc., 5.650%, 2/13/2017 | | | | | 190,000 | | | 147,335 |
CIT Group, Inc. Series MTN, 4.250%, 3/17/2015 | | EUR | | | 450,000 | | | 418,214 |
CIT Group, Inc., Series EMTN, 3.800%, 11/14/2012 | | EUR | | | 300,000 | | | 287,496 |
CIT Group, Inc., Series EMTN, 4.650%, 9/19/2016 | | EUR | | | 250,000 | | | 236,360 |
CIT Group, Inc., Series GMTN, 4.250%, 9/22/2011 | | EUR | | | 1,750,000 | | | 1,771,710 |
General Electric Capital Corp., 6.500%, 9/28/2015 | | NZD | | | 3,035,000 | | | 2,205,681 |
General Electric Capital Corp., Series EMTN, 6.750%, 9/26/2016 | | NZD | | | 250,000 | | | 185,595 |
GMAC Canada Ltd., Series EMTN, 6.625%, 12/17/2010 | | GBP | | | 25,000 | | | 39,693 |
GMAC LLC, 6.000%, 12/15/2011 | | | | | 680,000 | | | 508,295 |
GMAC LLC, 6.625%, 5/15/2012 | | | | | 75,000 | | | 56,736 |
GMAC LLC, 6.750%, 12/01/2014 | | | | | 244,000 | | | 172,679 |
GMAC LLC, 6.875%, 9/15/2011 | | | | | 85,000 | | | 65,056 |
GMAC LLC, 6.875%, 8/28/2012 | | | | | 150,000 | | | 113,990 |
GMAC LLC, 7.000%, 2/01/2012 | | | | | 175,000 | | | 133,084 |
GMAC LLC, 8.000%, 11/01/2031 | | | | | 340,000 | | | 243,675 |
GMAC LLC, Series EMTN, 5.375%, 6/06/2011 | | EUR | | | 400,000 | | | 436,964 |
| | | | | | | | |
| | | | | | | | 7,038,389 |
| | | | | | | | |
| Packaging – 0.8% | | | | | | | | |
Owens-Illinois, Inc., 7.800%, 5/15/2018 | | | | | 1,555,000 | | | 1,539,450 |
| | | | | | | | |
| Paper – 1.8% | | | | | | | | |
Abitibi-Consolidated, Inc., 5.250%, 6/20/2008(b) | | | | | 200,000 | | | 200,000 |
Abitibi-Consolidated, Inc., 6.000%, 6/20/2013 | | | | | 250,000 | | | 122,500 |
Abitibi-Consolidated, Inc., 7.400%, 4/01/2018 | | | | | 15,000 | | | 6,600 |
Abitibi-Consolidated, Inc., 7.500%, 4/01/2028 | | | | | 140,000 | | | 57,400 |
Abitibi-Consolidated, Inc., 8.500%, 8/01/2029 | | | | | 15,000 | | | 6,825 |
Abitibi-Consolidated, Inc., 8.850%, 8/01/2030(b) | | | | | 90,000 | | | 40,050 |
Georgia-Pacific Corp., 7.250%, 6/01/2028 | | | | | 1,240,000 | | | 1,010,600 |
Georgia-Pacific Corp., 7.750%, 11/15/2029 | | | | | 1,165,000 | | | 978,600 |
74
PORTFOLIO OF INVESTMENTS – as of March 31, 2008 (Unaudited)
Loomis Sayles Institutional High Income Fund – continued
| | | | | | | | | |
| | | | | Principal Amount (‡) | | | Value (†) |
| | | | | | | | | |
| | | |
| BONDS AND NOTES – continued | | | | | | | | | |
| | | |
| Paper – continued | | | | | | | | | |
Georgia-Pacific Corp., 8.000%, 1/15/2024 | | | | $ | 250,000 | | | $ | 220,000 |
Georgia-Pacific LLC, 8.875%, 5/15/2031 | | | | | 765,000 | | | | 680,850 |
| | | | | | | | | |
| | | | | | | | | 3,323,425 |
| | | | | | | | | |
| Pharmaceuticals – 2.2% | | | | | | | | | |
Elan Financial PLC, 7.750%, 11/15/2011 | | | | | 3,590,000 | | | | 3,338,700 |
Elan Financial PLC, 8.875%, 12/01/2013 | | | | | 830,000 | | | | 780,200 |
| | | | | | | | | |
| | | | | | | | | 4,118,900 |
| | | | | | | | | |
| Pipelines – 3.2% | | | | | | | | | |
Colorado Interstate Gas Co., 5.950%, 3/15/2015 | | | | | 22,000 | | | | 21,778 |
El Paso Corp., 6.950%, 6/01/2028 | | | | | 15,000 | | | | 14,025 |
El Paso Corp., 7.420%, 2/15/2037 | | | | | 1,055,000 | | | | 1,028,804 |
El Paso Corp., 7.800%, 8/01/2031 | | | | | 500,000 | | | | 513,370 |
Kinder Morgan, Inc., Senior Note, 5.150%, 3/01/2015 | | | | | 50,000 | | | | 46,000 |
Southern Natural Gas Co., 7.350%, 2/15/2031 | | | | | 95,000 | | | | 97,296 |
Tennessee Gas Pipeline Co., 7.000%, 10/15/2028(b) | | | �� | | 890,000 | | | | 886,800 |
Williams Cos., Inc., 7.500%, 1/15/2031 | | | | | 3,375,000 | | | | 3,518,438 |
| | | | | | | | | |
| | | | | | | | | 6,126,511 |
| | | | | | | | | |
| Property & Casualty Insurance – 0.1% | | | | | | | | | |
MBIA Insurance Corp., 14.000%, 1/15/2033, 144A(b)(d) | | | | | 240,000 | | | | 235,200 |
| | | | | | | | | |
| Railroads – 0.1% | | | | | | | | | |
Missouri Pacific Railroad Co., 4.750%, 1/01/2020 | | | | | 30,000 | | | | 25,500 |
Missouri Pacific Railroad Co., 5.000%, 1/01/2045 | | | | | 314,000 | | | | 204,100 |
| | | | | | | | | |
| | | | | | | | | 229,600 |
| | | | | | | | | |
| Retailers – 4.0% | | | | | | | | | |
Dillard’s, Inc., 6.625%, 1/15/2018 | | | | | 500,000 | | | | 375,000 |
Dillard’s, Inc., 7.000%, 12/01/2028 | | | | | 450,000 | | | | 304,875 |
Dillard’s, Inc., 7.130%, 8/01/2018 | | | | | 750,000 | | | | 581,250 |
Dillard’s, Inc., 7.750%, 7/15/2026 | | | | | 1,500,000 | | | | 1,110,000 |
Foot Locker, Inc., 8.500%, 1/15/2022 | | | | | 1,679,000 | | | | 1,477,520 |
Toys R Us, Inc., 7.375%, 10/15/2018 | | | | | 5,185,000 | | | | 3,590,613 |
Toys R Us, Inc., 7.875%, 4/15/2013(b) | | | | | 197,000 | | | | 147,750 |
| | | | | | | | | |
| | | | | | | | | 7,587,008 |
| | | | | | | | | |
| Sovereigns – 3.9% | | | | | | | | | |
Indonesia Treasury Bond, Series FR43, 10.250%, 7/15/2022 | | IDR | | | 1,881,000,000 | | | | 179,915 |
Indonesia Treasury Bond, Series ZC3, Zero Coupon Bond, 11/20/2012 | | IDR | | | 4,897,000,000 | | | | 333,331 |
Mexican Fixed Rate Bonds, Series M-20, 8.000%, 12/07/2023 | | MXN | | | 95,000 | (††) | | | 929,313 |
Mexican Fixed Rate Bonds, Series MI-10, 9.000%, 12/20/2012 | | MXN | | | 365,000 | (††) | | | 3,649,400 |
Republic of Brazil, 10.250%, 1/10/2028 | | BRL | | | 4,170,000 | | | | 2,212,498 |
| | | | | | | | | |
| | | | | | | | | 7,304,457 |
| | | | | | | | | |
| Supermarkets – 1.2% | | | | | | | | | |
Albertson’s, Inc., 6.625%, 6/01/2028 | | | | | 240,000 | | | | 204,175 |
Albertson’s, Inc., 7.450%, 8/01/2029 | | | | | 1,525,000 | | | | 1,404,229 |
75
| | | | | | | | |
| | | | | Principal Amount (‡) | | Value (†) |
| | | | | | | | |
| | | |
| BONDS AND NOTES – continued | | | | | | | | |
| | | |
| Supermarkets – continued | | | | | | | | |
Albertson’s, Inc., 8.000%, 5/01/2031 | | | | $ | 480,000 | | $ | 457,565 |
Albertson’s, Inc., 8.700%, 5/01/2030 | | | | | 180,000 | | | 180,629 |
American Stores Co., 8.000%, 6/01/2026 | | | | | 110,000 | | | 111,319 |
| | | | | | | | |
| | | | | | | | 2,357,917 |
| | | | | | | | |
| Supranational – 3.6% | | | | | | | | |
Inter-American Development Bank, Series EMTN, Zero Coupon Bond, 5/11/2009 | | BRL | | | 11,000,000 | | | 5,290,933 |
Nordic Investment Bank, 13.000%, 9/12/2008 | | ISK | | | 113,000,000 | | | 1,482,897 |
| | | | | | | | |
| | | | | | | | 6,773,830 |
| | | | | | | | |
| Technology – 4.5% | | | | | | | | |
Affiliated Computer Services, Inc., 5.200%, 6/01/2015 | | | �� | | 100,000 | | | 83,250 |
Amkor Technology, Inc., 7.125%, 3/15/2011 | | | | | 400,000 | | | 376,000 |
Amkor Technology, Inc., 7.750%, 5/15/2013 | | | | | 1,600,000 | | | 1,460,000 |
Corning, Inc., 6.850%, 3/01/2029 | | | | | 701,000 | | | 714,267 |
Freescale Semiconductor, Inc., 10.125%, 12/15/2016(b) | | | | | 1,047,000 | | | 706,725 |
Lucent Technologies, Inc., 6.450%, 3/15/2029 | | | | | 4,115,000 | | | 2,942,225 |
Motorola, Inc., 5.220%, 10/01/2097 | | | | | 80,000 | | | 43,134 |
Motorola, Inc., 6.500%, 11/15/2028 | | | | | 70,000 | | | 54,614 |
Motorola, Inc., 6.625%, 11/15/2037 | | | | | 70,000 | | | 54,141 |
Nortel Networks Corp., 6.875%, 9/01/2023 | | | | | 1,000,000 | | | 615,000 |
Northern Telecom Capital Corp., 7.875%, 6/15/2026 | | | | | 2,225,000 | | | 1,390,625 |
| | | | | | | | |
| | | | | | | | 8,439,981 |
| | | | | | | | |
| Textile – 0.2% | | | | | | | | |
Kellwood Co., 7.625%, 10/15/2017(c) | | | | | 500,000 | | | 325,000 |
| | | | | | | | |
| Transportation Services – 3.1% | | | | | | | | |
APL Ltd., 8.000%, 1/15/2024(c) | | | | | 2,685,000 | | | 2,181,563 |
Atlas Air, Inc., Series 1999-1B, 7.630%, 1/02/2015(g) | | | | | 397,855 | | | 437,641 |
Atlas Air, Inc., Series 1999-1C, 8.770%, 1/02/2011(g) | | | | | 399,542 | | | 395,546 |
Atlas Air, Inc., Series 2000-1C, 9.702%, 7/02/2011(g) | | | | | 40,344 | | | 39,537 |
Atlas Air, Inc., Series B, 7.680%, 1/02/2014(g) | | | | | 2,207,572 | | | 2,560,783 |
Atlas Air, Inc., Series C, 8.010%, 1/02/2010(g) | | | | | 289,324 | | | 248,818 |
| | | | | | | | |
| | | | | | | | 5,863,888 |
| | | | | | | | |
| Treasuries – 4.5% | | | | | | | | |
U.S. Treasury Bonds, 4.500%, 2/15/2036(b) | | | | | 8,220,000 | | | 8,491,646 |
| | | | | | | | |
| Wireless – 1.4% | | | | | | | | |
ALLTEL Corp., 7.875%, 7/01/2032 | | | | | 625,000 | | | 412,500 |
Nextel Communications, Inc., Series D, 7.375%, 8/01/2015 | | | | | 355,000 | | | 273,350 |
Nextel Communications, Inc., Series F, 5.950%, 3/15/2014 | | | | | 60,000 | | | 44,400 |
Sprint Capital Corp., 6.875%, 11/15/2028 | | | | | 1,045,000 | | | 778,525 |
Sprint Capital Corp., 6.900%, 5/01/2019 | | | | | 725,000 | | | 570,938 |
True Move Co. Ltd., 10.750%, 12/16/2013, 144A | | | | | 600,000 | | | 564,000 |
| | | | | | | | |
| | | | | | | | 2,643,713 |
| | | | | | | | |
76
PORTFOLIO OF INVESTMENTS – as of March 31, 2008 (Unaudited)
Loomis Sayles Institutional High Income Fund – continued
| | | | | | | |
| | | | | Principal Amount (‡) | | Value (†) |
| | | | | | | |
| | | |
| BONDS AND NOTES – continued | | | | | | | |
| | | |
| Wirelines – 2.5% | | | | | | | |
Bell Canada, 5.000%, 2/15/2017 | | CAD | | 105,000 | | $ | 80,022 |
Bell Canada, 7.300%, 2/23/2032 | | CAD | | 275,000 | | | 219,151 |
Bell Canada, Series M-17, 6.100%, 3/16/2035 | | CAD | | 220,000 | | | 156,836 |
Citizens Communications Co., 7.875%, 1/15/2027 | | | | 860,000 | | | 737,450 |
Level 3 Financing, Inc., 8.750%, 2/15/2017 | | | | 95,000 | | | 72,200 |
Level 3 Financing, Inc., 9.250%, 11/01/2014 | | | | 290,000 | | | 237,075 |
Qwest Capital Funding, Inc., 6.500%, 11/15/2018 | | | | 964,000 | | | 780,840 |
Qwest Capital Funding, Inc., 6.875%, 7/15/2028 | | | | 800,000 | | | 628,000 |
Qwest Capital Funding, Inc., 7.625%, 8/03/2021 | | | | 290,000 | | | 245,050 |
Qwest Capital Funding, Inc., 7.750%, 2/15/2031 | | | | 1,550,000 | | | 1,302,000 |
Qwest Corp., 6.875%, 9/15/2033 | | | | 190,000 | | | 152,000 |
Qwest Corp., 7.250%, 9/15/2025 | | | | 15,000 | | | 13,050 |
Qwest Corp., 7.250%, 10/15/2035 | | | | 225,000 | | | 185,625 |
| | | | | | | |
| | | | | | | 4,809,299 |
| | | | | | | |
| | | |
| TOTAL NON-CONVERTIBLE BONDS | | | | | | | |
(Identified Cost $146,655,154) | | | | | | | 143,459,285 |
| | | | | | | |
| | | |
| CONVERTIBLE BONDS – 9.5% | | | | | | | |
| | | |
| Industrial Other – 0.6% | | | | | | | |
Incyte Corp., 3.500%, 2/15/2011 | | | | 1,100,000 | | | 1,170,125 |
| | | | | | | |
| Media Non-Cable – 0.1% | | | | | | | |
Liberty Media LLC, 3.500%, 1/15/2031 | | | | 62,373 | | | 43,583 |
Sinclair Broadcast Group, Inc., (Step to 2.000% on 1/15/2011), 4.875%, 7/15/2018(f) | | | | 155,000 | | | 141,050 |
| | | | | | | |
| | | | | | | 184,633 |
| | | | | | | |
| Non-Captive Consumer – 0.2% | | | | | | | |
Countrywide Financial Corp., Series A,
0.758%, 4/15/2037(b)(d) | | | | 108,000 | | | 95,580 |
Countrywide Financial Corp., Series B,
0.815%, 5/15/2037(d) | | | | 292,000 | | | 249,660 |
| | | | | | | |
| | | | | | | 345,240 |
| | | | | | | |
| Pharmaceuticals – 3.9% | | | | | | | |
Epix Pharmaceuticals, Inc., 3.000%, 6/15/2024 | | | | 230,000 | | | 115,000 |
Human Genome Sciences, Inc., 2.250%, 8/15/2012 | | | | 880,000 | | | 638,000 |
Nektar Therapeutics, 3.250%, 9/28/2012 | | | | 1,180,000 | | | 911,550 |
Regeneron Pharmaceuticals, Inc., 5.500%, 10/17/2008 | | | | 1,600,000 | | | 1,594,000 |
Valeant Pharmaceuticals International, 3.000%, 8/16/2010 | | | | 1,230,000 | | | 1,119,300 |
Valeant Pharmaceuticals International, 4.000%, 11/15/2013 | | | | 980,000 | | | 814,625 |
Vertex Pharmaceuticals, Inc., 4.750%, 2/15/2013 | | | | 1,805,000 | | | 2,152,462 |
| | | | | | | |
| | | | | | | 7,344,937 |
| | | | | | | |
| Real Estate Investment Trusts – 0.4% | | | | | | | |
Host Hotels & Resorts, Inc., 2.625%, 4/15/2027, 144A | | | | 920,000 | | | 770,500 |
| | | | | | | |
| Technology – 1.5% | | | | | | | |
Kulicke & Soffa Industries, Inc., 0.500%, 11/30/2008 | | | | 595,000 | | | 556,325 |
77
| | | | | | | | |
| | | | | Principal Amount (‡) | | Value (†) |
| | | | | | | | |
| | | |
| BONDS AND NOTES – continued | | | | | | | | |
| | | |
| Technology – continued | | | | | | | | |
Kulicke & Soffa Industries, Inc., 0.875%, 6/01/2012 | | | | $ | 130,000 | | $ | 89,700 |
Kulicke & Soffa Industries, Inc., 1.000%, 6/30/2010 | | | | | 350,000 | | | 276,500 |
Maxtor Corp., 5.750%, 3/01/2012(c) | | | | | 1,489,000 | | | 1,399,660 |
Nortel Networks Corp., 2.125%, 4/15/2014, 144A | | | | | 795,000 | | | 493,894 |
Richardson Electronics, Ltd., 7.750%, 12/15/2011 | | | | | 132,000 | | | 121,440 |
| | | | | | | | |
| | | | | | | | 2,937,519 |
| | | | | | | | |
| Textile – 0.9% | | | | | | | | |
Dixie Yarns, Inc., 7.000%, 5/15/2012 | | | | | 22,000 | | | 20,570 |
Kellwood Co., (Step to 0.000% on 6/15/2011), 3.500%, 6/15/2034(f) | | | | | 1,600,000 | | | 1,608,000 |
| | | | | | | | |
| | | | | | | | 1,628,570 |
| | | | | | | | |
| Transportation Services – 0.0% | | | | | | | | |
Builders Transportation, Inc., 8.000%, 8/15/2005(e) | | | | | 75,000 | | | — |
| | | | | | | | |
| Wirelines – 1.9% | | | | | | | | |
Level 3 Communications, Inc., 2.875%, 7/15/2010 | | | | | 2,005,000 | | | 1,400,994 |
Level 3 Communications, Inc., 3.500%, 6/15/2012 | | | | | 155,000 | | | 106,175 |
Level 3 Communications, Inc., 6.000%, 9/15/2009 | | | | | 1,820,000 | | | 1,615,251 |
Level 3 Communications, Inc., 6.000%, 3/15/2010 | | | | | 575,000 | | | 464,312 |
| | | | | | | | |
| | | | | | | | 3,586,732 |
| | | | | | | | |
| | | |
| TOTAL CONVERTIBLE BONDS | | | | | | | | |
(Identified Cost $18,370,717) | | | | | | | | 17,968,256 |
| | | | | | | | |
| | | |
| TOTAL BONDS AND NOTES | | | | | | | | |
(Identified Cost $165,025,871) | | | | | | | | 161,427,541 |
| | | | | | | | |
| | | |
| | | | | Shares | | |
| | | |
| COMMON STOCKS – 3.8% | | | | | | | | |
| | | |
| Biotechnology – 1.1% | | | | | | | | |
Vertex Pharmaceuticals, Inc.(b)(g) | | | | | 82,587 | | | 1,973,003 |
| | | | | | | | |
| Communications Equipment – 0.9% | | | | | | | | |
Corning, Inc.(b) | | | | | 69,766 | | | 1,677,175 |
| | | | | | | | |
| Containers & Packaging – 1.2% | | | | | | | | |
Owens-Illinois, Inc.(b)(g) | | | | | 40,621 | | | 2,292,243 |
| | | | | | | | |
| Food Products – 0.0% | | | | | | | | |
ConAgra Foods, Inc. | | | | | 3,100 | | | 74,245 |
| | | | | | | | |
| Household Durables – 0.1% | | | | | | | | |
KB Home(b) | | | | | 6,775 | | | 167,546 |
| | | | | | | | |
| Pharmaceuticals – 0.1% | | | | | | | | |
Bristol-Myers Squibb Co. | | | | | 5,243 | | | 111,676 |
| | | | | | | | |
| Real Estate Investment Trusts (REITs) – 0.4% | | | | | | | | |
Apartment Investment & Management Co.(b) | | | | | 4,462 | | | 159,784 |
Associated Estates Realty Corp.(b) | | | | | 32,565 | | | 372,544 |
Developers Diversified Realty Corp.(b) | | | | | 7,125 | | | 298,395 |
| | | | | | | | |
| | | | | | | | 830,723 |
| | | | | | | | |
| | | |
| TOTAL COMMON STOCKS | | | | | | | | |
(Identified Cost $4,304,905) | | | | | | | | 7,126,611 |
| | | | | | | | |
78
PORTFOLIO OF INVESTMENTS – as of March 31, 2008 (Unaudited)
Loomis Sayles Institutional High Income Fund – continued
| | | | | | | | |
| | | | | Shares | | Value (†) |
| | | | | | | | |
| | | |
| PREFERRED STOCKS – 1.8% | | | | | | | | |
| | | |
| CONVERTIBLE PREFERRED STOCKS – 1.8% | | | | | | | | |
| | | |
| Automobiles – 0.4% | | | | | | | | |
Ford Motor Co., Capital Trust II, 6.500%(b) | | | | | 27,177 | | $ | 796,830 |
| | | | | | | | |
| Diversified Consumer Services – 0.2% | | | | | | | | |
Six Flags, Inc., 7.250%(b) | | | | | 39,950 | | | 485,392 |
| | | | | | | | |
| Electric Utilities – 0.5% | | | | | | | | |
AES Trust III, 6.750% | | | | | 17,119 | | | 796,033 |
CMS Energy Trust I, 7.750% | | | | | 4,150 | | | 186,750 |
| | | | | | | | |
| | | | | | | | 982,783 |
| | | | | | | | |
| Machinery – 0.1% | | | | | | | | |
United Rentals Trust, 6.500% | | | | | 4,937 | | | 148,419 |
| | | | | | | | |
| Oil, Gas & Consumable Fuels – 0.2% | | | | | | | | |
Chesapeake Energy Corp., 5.000% | | | | | 1,000 | | | 130,763 |
El Paso Energy Capital Trust I, 4.750% | | | | | 5,700 | | | 207,480 |
| | | | | | | | |
| | | | | | | | 338,243 |
| | | | | | | | |
| Real Estate Investment Trusts (REITs) – 0.0% | | | | | | | | |
FelCor Lodging Trust, Inc., Series A, 1.950% | | | | | 1,100 | | | 21,714 |
| | | | | | | | |
| Semiconductors & Semiconductor Equipment – 0.4% | | | | | | | | |
Lucent Technologies Capital Trust, 7.750% | | | | | 1,050 | | | 735,000 |
| | | | | | | | |
| | | |
| TOTAL CONVERTIBLE PREFERRED STOCKS | | | | | | | | |
(Identified Cost $4,271,593) | | | | | | | | 3,508,381 |
| | | | | | | | |
| | | |
| TOTAL PREFERRED STOCKS | | | | | | | | |
(Identified Cost $4,271,593) | | | | | | | | 3,508,381 |
| | | | | | | | |
| | | |
| CLOSED END INVESTMENT COMPANIES – 1.7% | | | | | | | | |
| Western Asset High Income Opportunity Fund, Inc. | | | | | 176,050 | | | 996,443 |
Western Asset Managed High Income Fund, Inc.(b) | | | | | 222,550 | | | 1,219,573 |
BlackRock Senior High Income Fund, Inc. | | | | | 15,920 | | | 77,530 |
DWS High Income Trust | | | | | 22,522 | | | 102,926 |
Dreyfus High Yield Strategies Fund | | | | | 78,008 | | | 270,688 |
Highland Credit Strategies Fund | | | | | 31,505 | | | 410,195 |
Van Kampen High Income Trust II(b) | | | | | 42,002 | | | 149,527 |
| | | | | | | | |
| | | |
| TOTAL CLOSED END INVESTMENT COMPANIES | | | | | | | | |
(Identified Cost $3,511,223) | | | | | | | | 3,226,882 |
| | | | | | | | |
| | | |
| | | | | Principal Amount (‡) | | |
| | | |
| SHORT-TERM INVESTMENTS – 16.1% | | | | | | | | |
| Tri-Party Repurchase Agreement with Fixed Income Clearing Corporation, dated 3/31/08 at 1.250% to be repurchased at $10,541,366 on 4/01/08 collateralized by $9,905,000 Federal Farm Credit Bank, 5.150% due 11/15/19 valued at $10,753,066, including accrued interest (Note 2h of Notes to Financial Statements) | | | | $ | 10,541,000 | | | 10,541,000 |
| | | | | | | | |
| | | |
| | | | | Shares | | |
State Street Navigator Securities Lending Prime Portfolio(h) | | | | | 19,821,388 | | | 19,821,388 |
| | | | | | | | |
79
| | | | | | | |
| | | | | | | Value (†) |
| | | |
| TOTAL SHORT-TERM INVESTMENTS | | | | | | | |
(Identified Cost $30,362,388) | | | | | | $ | 30,362,388 |
| | | | | | | |
| | | |
| TOTAL INVESTMENTS – 108.8% | | | | | | | |
(Identified Cost $207,475,980)(a) | | | | | | | 205,651,803 |
Other assets less liabilities—(8.8)% | | | | | | | (16,571,102) |
| | | | | | | |
| | | |
| NET ASSETS – 100.0% | | | | | | $ | 189,080,701 |
| | | | | | | |
| |
(‡) Principal amount stated in U.S. dollars unless otherwise noted. | | | |
(†) See Note 2a of Notes to Financial Statements. | | | |
(††) Amount shown represents units. One unit represents a principal amount of 100. | | | |
(a) Federal Tax Information (Amounts exclude certain adjustments made at the end of the Fund’s fiscal year for tax purposes. Amortization of premium on debt securities is excluded for tax purposes.): At March 31, 2008, the net unrealized depreciation on investments based on a cost of $207,521,458 for federal income tax purposes was as follows: | | | |
Aggregate gross unrealized appreciation for all investments in which there is an excess of value over tax cost | | $ | 12,544,502 |
Aggregate gross unrealized depreciation for all investments in which there is an excess of tax cost over value | | | (14,414,157) |
| | | | | | | |
Net unrealized depreciation | | $ | (1,869,655) |
| | | | | | | |
| (b) | All or a portion of this security was on loan to brokers at March 31, 2008. |
| (c) | Illiquid security. At March 31, 2008, the value of these securities amounted to $4,931,620 or 2.6% of net assets. |
| (d) | Variable rate security. Rate as of March 31, 2008 is disclosed. |
| (e) | Bankrupt issuer. Security remains in the Portfolio of Investments pending final resolution of bankruptcy proceedings. |
| (f) | Step Bond: Coupon is a fixed rate for an initial period then resets at a specified date and rate. |
| (g) | Non-income producing security. |
| (h) | Represents investments of security lending collateral. |
| 144A | Securities exempt from registration under Rule 144A of the Securities Act of 1933. These securities may be resold in transactions exempt from registration, normally to qualified institutional buyers. At March 31, 2008, the total value of these securities amounted to $14,872,959 or 7.9% of net assets. |
| EMTN | Euro Medium Term Note |
| GMTN | Global Medium Term Note |
| | Key to Abbreviations: BRL: Brazilian Real; CAD: Canadian Dollar; EUR: Euro; GBP: British Pound; IDR: Indonesian Rupiah; ISK: Iceland Krona; MXN: Mexican Peso; NZD: New Zealand Dollar; THB: Thailand Baht |
HOLDINGS AT MARCH 31, 2008 AS A PERCENTAGE OF NET ASSETS (Unaudited)
| | | |
Automotive | | 6.2 | % |
Pharmaceuticals | | 6.2 | |
Technology | | 6.0 | |
Electric | | 5.5 | |
Treasuries | | 4.5 | |
Wirelines | | 4.4 | |
Retailers | | 4.0 | |
Sovereigns | | 3.9 | |
Non-Captive Diversified | | 3.7 | |
Healthcare | | 3.7 | |
Supranational | | 3.6 | |
Banking | | 3.6 | |
Chemicals | | 3.2 | |
Pipelines | | 3.2 | |
Non-Captive Consumer | | 3.2 | |
Transportation Services | | 3.1 | |
Home Construction | | 2.1 | |
Other, less than 2% each | | 22.6 | |
See accompanying notes to financial statements.
80
PORTFOLIO OF INVESTMENTS – as of March 31, 2008 (Unaudited)
Loomis Sayles Intermediate Duration Fixed Income Fund
| | | | | | | | |
| | | | | Principal Amount (‡) | | Value (†) |
| | | | | | | | |
| | | |
| BONDS AND NOTES – 97.5% of Net Assets | | | | | | | | |
| | | |
| NON-CONVERTIBLE BONDS – 97.5% | | | | | | | | |
| | | |
| Aerospace & Defense – 0.0% | | | | | | | | |
Boeing Capital Corp., 6.100%, 3/01/2011(b) | | | | $ | 5,000 | | $ | 5,320 |
| | | | | | | | |
| Asset-Backed Securities – 5.6% | | | | | | | | |
Americredit Automobile Receivables Trust, Series 2004-DF, Class A4, 3.430%, 7/06/2011 | | | | | 97,949 | | | 97,284 |
Capital Auto Receivables Asset Trust, Series 2004-2, Class A4, 3.750%, 7/15/2009 | | | | | 25,000 | | | 25,048 |
Countrywide Asset Backed Certificates, Series 2004-S1, Class A2, 3.872%, 3/25/2020 | | | | | 68,454 | | | 65,612 |
Countrywide Asset Backed Certificates, Series 2004-S1, Class A3, 4.615%, 2/25/2035 | | | | | 135,000 | | | 107,323 |
Countrywide Asset-Backed Certificates, Series 2006-S1, Class A2, 5.549%, 8/25/2021 | | | | | 346,150 | | | 337,644 |
DaimlerChrysler Auto Trust, Series 2004-C, Class A4, 3.280%, 12/08/2009 | | | | | 96,243 | | | 96,289 |
Ford Credit Auto Owner Trust, 4.380%, 1/15/2010 | | | | | 244,142 | | | 244,373 |
Honda Auto Receivables Owner Trust, Series 2004-3, Class A4, 3.280%, 2/18/2010 | | | | | 196,593 | | | 196,729 |
John Deere Owner Trust, Series 2005-A, Class A3, 3.980%, 6/15/2009 | | | | | 40 | | | 40 |
Navistar Financial Corp. Owner Trust, Series 2004-B, Class A4, 3.530%, 10/15/2012 | | | | | 233,916 | | | 233,897 |
USAA Auto Owner Trust, Series 2004-3, Class A4, 3.530%, 6/15/2011 | | | | | 246,100 | | | 246,474 |
USAA Auto Owner Trust, Series 2006-1, Class A3, 5.010%, 9/15/2010 | | | | | 98,965 | | | 99,708 |
WFS Financial Owner Trust, Series 2004-2, Class A4, 3.540%, 11/21/2011 | | | | | 188,752 | | | 188,789 |
| | | | | | | | |
| | | | | | | | 1,939,210 |
| | | | | | | | |
| Automotive – 0.5% | | | | | | | | |
Ford Motor Credit Co. LLC, 7.000%, 10/01/2013(b) | | | | | 235,000 | | | 183,305 |
| | | | | | | | |
| Banking – 9.0% | | | | | | | | |
Bank of America Corp., 6.250%, 4/01/2008 | | | | | 450,000 | | | 450,000 |
Bank One Corp., 5.900%, 11/15/2011(b) | | | | | 5,000 | | | 5,305 |
Citigroup, Inc., 5.300%, 10/17/2012 | | | | | 670,000 | | | 671,672 |
Credit Suisse NY, 6.000%, 2/15/2018 | | | | | 110,000 | | | 109,737 |
HSBC Finance Corp., 4.750%, 4/15/2010(b) | | | | | 350,000 | | | 348,103 |
JPMorgan Chase & Co., 5.600%, 6/01/2011 | | | | | 475,000 | | | 497,227 |
Suntrust Banks, Inc., 5.250%, 11/05/2012 | | | | | 190,000 | | | 187,196 |
Wachovia Corp., 5.300%, 10/15/2011(b) | | | | | 530,000 | | | 535,108 |
Wells Fargo & Co., 5.250%, 10/23/2012 | | | | | 305,000 | | | 316,307 |
| | | | | | | | |
| | | | | | | | 3,120,655 |
| | | | | | | | |
| Brokerage – 5.7% | | | | | | | | |
Bear Stearns Cos., Inc., 5.350%, 2/01/2012(b) | | | | | 130,000 | | | 125,023 |
Goldman Sachs Group, Inc., 4.500%, 6/15/2010 | | | | | 300,000 | | | 302,273 |
Goldman Sachs Group, Inc., 5.300%, 2/14/2012 | | | | | 10,000 | | | 10,130 |
Goldman Sachs Group, Inc., 5.450%, 11/01/2012 | | | | | 270,000 | | | 273,458 |
Lehman Brothers Holdings, Inc., 6.200%, 9/26/2014 | | | | | 100,000 | | | 98,632 |
Lehman Brothers Holdings, Inc., Series I, 5.250%, 2/06/2012 | | | | | 265,000 | | | 255,708 |
81
| | | | | | | | |
| | | | | Principal Amount (‡) | | Value (†) |
| | | | | | | | |
| | | |
| BONDS AND NOTES – continued | | | | | | | | |
| | | |
| Brokerage – continued | | | | | | | | |
Lehman Brothers Holdings, Inc., Series MTN, 5.625%, 1/24/2013 | | | | $ | 175,000 | | $ | 170,164 |
Merrill Lynch & Co., Inc., 5.450%, 2/05/2013 | | | | | 350,000 | | | 344,351 |
Morgan Stanley, 5.300%, 3/01/2013 | | | | | 400,000 | | | 398,656 |
| | | | | | | | |
| | | | | | | | 1,978,395 |
| | | | | | | | |
| Chemicals – 0.5% | | | | | | | | |
Lubrizol Corp., 4.625%, 10/01/2009 | | | | | 5,000 | | | 5,018 |
PPG Industries, Inc., 5.750%, 3/15/2013 | | | | | 170,000 | | | 175,376 |
| | | | | | | | |
| | | | | | | | 180,394 |
| | | | | | | | |
| Construction Machinery – 0.5% | | | | | | | | |
Caterpillar Financial Services, Series MTN, 4.850%, 12/07/2012 | | | | | 160,000 | | | 163,637 |
| | | | | | | | |
| Consumer Products – 1.0% | | | | | | | | |
Koninklijke (Royal) Philips Electronics NV, 4.625%, 3/11/2013 | | | | | 175,000 | | | 175,893 |
Newell Rubberamid, Inc., 5.500%, 4/15/2013 | | | | | 170,000 | | | 170,931 |
| | | | | | | | |
| | | | | | | | 346,824 |
| | | | | | | | |
| Diversified Manufacturing – 0.5% | | | | | | | | |
Honeywell International, Inc., 4.250%, 3/01/2013 | | | | | 175,000 | | | 176,772 |
| | | | | | | | |
| Electric – 2.2% | | | | | | | | |
Carolina Power & Light Co., 6.500%, 7/15/2012 | | | | | 5,000 | | | 5,386 |
Duke Energy Corp., 5.625%, 11/30/2012(b) | | | | | 300,000 | | | 318,968 |
Nisource Finance Corp., 7.875%, 11/15/2010 | | | | | 145,000 | | | 157,622 |
Pacific Gas & Electric Co., 3.600%, 3/01/2009 | | | | | 5,000 | | | 4,988 |
Virginia Electric and Power Co., 5.100%, 11/30/2012 | | | | | 260,000 | | | 270,149 |
| | | | | | | | |
| | | | | | | | 757,113 |
| | | | | | | | |
| Entertainment – 1.7% | | | | | | | | |
Time Warner, Inc., 5.875%, 11/15/2016 | | | | | 225,000 | | | 213,965 |
Time Warner, Inc., 6.500%, 11/15/2036(b) | | | | | 45,000 | | | 41,284 |
Walt Disney Co., 5.700%, 7/15/2011 | | | | | 315,000 | | | 334,104 |
| | | | | | | | |
| | | | | | | | 589,353 |
| | | | | | | | |
| Financial Other – 0.3% | | | | | | | | |
Deere John Capital Corp., Series MTN, 4.500%, 4/03/2013 | | | | | 90,000 | | | 89,852 |
| | | | | | | | |
| Food & Beverage – 1.5% | | | | | | | | |
General Mills, Inc., 5.650%, 9/10/2012 | | | | | 225,000 | | | 234,009 |
HJ Heinz Finance Co., 6.000%, 3/15/2012 | | | | | 100,000 | | | 104,782 |
Kellogg Co., 5.125%, 12/03/2012 | | | | | 175,000 | | | 180,961 |
Kraft Foods, Inc., 5.625%, 11/01/2011(b) | | | | | 5,000 | | | 5,094 |
| | | | | | | | |
| | | | | | | | 524,846 |
| | | | | | | | |
| Government Sponsored – 1.0% | | | | | | | | |
Federal National Mortgage Association, 2.290%, 2/19/2009 | | SGD | | | 500,000 | | | 365,409 |
| | | | | | | | |
| Healthcare – 2.0% | | | | | | | | |
Hospira, Inc., 5.550%, 3/30/2012 | | | | | 250,000 | | | 258,409 |
Medco Health Solutions, Inc., 6.125%, 3/15/2013 | | | | | 170,000 | | | 172,198 |
82
PORTFOLIO OF INVESTMENTS – as of March 31, 2008 (Unaudited)
Loomis Sayles Intermediate Duration Fixed Income Fund – continued
| | | | | | | | |
| | | | | Principal Amount (‡) | | Value (†) |
| | | | | | | | |
| | | |
| BONDS AND NOTES – continued | | | | | | | | |
| | | |
| Healthcare – continued | | | | | | | | |
UnitedHealth Group, Inc., 4.875%, 2/15/2013 | | | | $ | 180,000 | | $ | 177,802 |
WellPoint, Inc., 5.250%, 1/15/2016 | | | | | 100,000 | | | 94,037 |
| | | | | | | | |
| | | | | | | | 702,446 |
| | | | | | | | |
| Healthcare Insurance – 0.5% | | | | | | | | |
Aetna, Inc., 7.875%, 3/01/2011 | | | | | 170,000 | | | 187,886 |
| | | | | | | | |
| Home Construction – 0.0% | | | | | | | | |
Pulte Homes, Inc., 4.875%, 7/15/2009 | | | | | 5,000 | | | 4,724 |
| | | | | | | | |
| Hybrid ARMS – 1.3% | | | | | | | | |
Indymac Index Mortgage Loan Trust, Series 2006-AR25, Class 3A1, 6.366%, 9/25/2036(c) | | | | | 580,546 | | | 440,305 |
| | | | | | | | |
| Independent Energy – 0.0% | | | | | | | | |
XTO Energy, Inc., 4.900%, 2/01/2014(b) | | | | | 5,000 | | | 4,995 |
| | | | | | | | |
| Media Cable – 1.6% | | | | | | | | |
Comcast Cable Communications, 7.125%, 6/15/2013 | | | | | 195,000 | | | 207,169 |
Comcast Corp., 4.950%, 6/15/2016 | | | | | 160,000 | | | 148,935 |
Cox Communications, Inc., 4.625%, 1/15/2010 | | | | | 5,000 | | | 5,003 |
Cox Communications, Inc., 5.450%, 12/15/2014 | | | | | 215,000 | | | 211,671 |
| | | | | | | | |
| | | | | | | | 572,778 |
| | | | | | | | |
| Metals & Mining – 0.9% | | | | | | | | |
United States Steel Corp., 6.050%, 6/01/2017(b) | | | | | 175,000 | | | 161,870 |
Vale Overseas Ltd., 6.250%, 1/23/2017 | | | | | 165,000 | | | 164,320 |
| | | | | | | | |
| | | | | | | | 326,190 |
| | | | | | | | |
| Mortgage Related – 22.9% | | | | | | | | |
Banc of America Commercial Mortgage, Inc., Series 2006-2, Class A4, 5.740%, 5/10/2045(c) | | | | | 205,000 | | | 207,115 |
Banc of America Commercial Mortgage, Inc., Series 2007-2, Class A2, 5.634%, 4/10/2049 | | | | | 490,000 | | | 481,912 |
Citigroup/Deutsche Bank Commercial Mortgage Trust, Series 2006-CD2, Class A2, 5.408%, 1/15/2046 | | | | | 140,000 | | | 138,665 |
Countrywide Alternative Loan Trust, Series 2006-J5, Class 4A1, 6.027%, 7/25/2021(c) | | | | | 310,274 | | | 266,812 |
Federal Home Loan Mortgage Corp., 4.500%, 12/01/2019 | | | | | 16,654 | | | 16,611 |
Federal Home Loan Mortgage Corp., 5.000%, 5/01/2019 | | | | | 6,116 | | | 6,207 |
Federal Home Loan Mortgage Corp., 5.000%, 1/01/2020 | | | | | 7,603 | | | 7,705 |
Federal Home Loan Mortgage Corp., 5.000%, 8/15/2024 | | | | | 603,020 | | | 613,935 |
Federal Home Loan Mortgage Corp., 5.500%, 3/01/2013 | | | | | 11,854 | | | 12,155 |
Federal Home Loan Mortgage Corp., 5.500%, 8/01/2022 | | | | | 213,633 | | | 218,100 |
Federal Home Loan Mortgage Corp., 6.000%, 11/01/2012 | | | | | 20,389 | | | 21,097 |
Federal Home Loan Mortgage Corp., 6.500%, 1/01/2024 | | | | | 4,789 | | | 5,036 |
Federal Home Loan Mortgage Corp., 6.597%, 1/01/2035(c) | | | | | 321,515 | | | 324,008 |
83
| | | | | | | | |
| | | | | Principal Amount (‡) | | Value (†) |
| | | | | | | | |
| | | |
| BONDS AND NOTES – continued | | | | | | | | |
| | | |
| Mortgage Related – continued | | | | | | | | |
Federal Home Loan Mortgage Corp., 7.000%, 2/01/2009 | | | | $ | 413 | | $ | 418 |
Federal Home Loan Mortgage Corp., 8.000%, 7/01/2025 | | | | | 502 | | | 546 |
Federal National Mortgage Association, 4.500%, 12/01/2019 | | | | | 20,935 | | | 20,899 |
Federal National Mortgage Association, 5.000%, 1/01/2019(d) | | | | | 343,957 | | | 348,831 |
Federal National Mortgage Association, 5.000%, 2/01/2019 | | | | | 491,172 | | | 497,541 |
Federal National Mortgage Association, 5.500%, 1/01/2017 | | | | | 55,841 | | | 57,318 |
Federal National Mortgage Association, 5.500%, 1/01/2017 | | | | | 64,354 | | | 66,054 |
Federal National Mortgage Association, 5.500%, 2/01/2017 | | | | | 33,679 | | | 34,570 |
Federal National Mortgage Association, 5.500%, 8/01/2017 | | | | | 768,311 | | | 788,609 |
Federal National Mortgage Association, 5.500%, 9/01/2017 | | | | | 171,035 | | | 175,554 |
Federal National Mortgage Association, 5.500%, 11/01/2017 | | | | | 1,326 | | | 1,361 |
Federal National Mortgage Association, 5.500%, 1/01/2020 | | | | | 712,214 | | | 729,721 |
Federal National Mortgage Association, 5.500%, 3/01/2020 | | | | | 590,321 | | | 604,252 |
Federal National Mortgage Association, 6.000%, 9/01/2021 | | | | | 11,004 | | | 11,336 |
Federal National Mortgage Association, 7.500%, 6/01/2016 | | | | | 2,975 | | | 3,109 |
Federal National Mortgage Association, 8.000%, 6/01/2015 | | | | | 4,311 | | | 4,558 |
Government National Mortgage Association, 6.500%, 12/15/2023 | | | | | 11,742 | | | 12,254 |
Government National Mortgage Association, 8.500%, 9/15/2022 | | | | | 3,306 | | | 3,649 |
Government National Mortgage Association, 9.500%, 1/15/2019 | | | | | 8,039 | | | 8,976 |
GS Mortgage Securities Corp. II, Series 2005-GG4, Class A4A, 4.751%, 7/10/2039 | | | | | 205,000 | | | 198,940 |
GS Mortgage Securities Corporation. II, Series 2006-GG8, Class A2, 5.479%, 11/10/2039 | | | | | 410,000 | | | 405,129 |
JPMorgan Chase Commercial Mortgage Securities Corp., Series 2006-LDP7, Class A2, 5.861%, 4/15/2045(c) | | | | | 375,000 | | | 375,864 |
LB-UBS Commercial Mortgage Trust, Series 2005-C3, Class A3, 4.647%, 7/15/2030 | | | | | 230,000 | | | 223,162 |
Merrill Lynch/Countrywide Commercial Mortgage Trust, Series 2006-1, Class A4, 5.426%, 2/12/2039(c) | | | | | 320,000 | | | 317,688 |
Merrill Lynch/Countrywide Commercial Mortgage Trust, Series 2006-2, Class A4, 5.910%, 6/12/2046(c) | | | | | 210,000 | | | 214,071 |
Morgan Stanley Capital I, Series 2005-T19, Class A4A, 4.890%, 6/12/2047 | | | | | 330,000 | | | 322,101 |
Morgan Stanley Capital I, Series 2006-T23, Series A2, 5.742%, 8/12/2041(c) | | | | | 205,000 | | | 205,014 |
| | | | | | | | |
| | | | | | | | 7,950,883 |
| | | | | | | | |
84
PORTFOLIO OF INVESTMENTS – as of March 31, 2008 (Unaudited)
Loomis Sayles Intermediate Duration Fixed Income Fund – continued
| | | | | | | | |
| | | | | Principal Amount (‡) | | Value (†) |
| | | | | | | | |
| | | |
| BONDS AND NOTES – continued | | | | | | | | |
| | | |
| Non-Captive Consumer – 0.9% | | | | | | | | |
American Express Co., 5.500%, 9/12/2016 | | | | $ | 85,000 | | $ | 82,090 |
American Express Co., 6.150%, 8/28/2017 | | | | | 45,000 | | | 44,793 |
American General Finance Corp., Series H, 5.375%, 10/01/2012 | | | | | 5,000 | | | 4,908 |
Residential Capital LLC, 8.500%, 4/17/2013(b)(c) | | | | | 345,000 | | | 167,325 |
| | | | | | | | |
| | | | | | | | 299,116 |
| | | | | | | | |
| Non-Captive Diversified – 3.7% | | | | | | | | |
CIT Group, Inc., 5.650%, 2/13/2017 | | | | | 255,000 | | | 197,739 |
CIT Group, Inc., 5.850%, 9/15/2016(b) | | | | | 20,000 | | | 15,374 |
General Electric Capital Corp., Series GMTN, 3.485%, 3/08/2012 | | SGD | | | 500,000 | | | 369,425 |
General Electric Capital Corp., Series MTN, 5.250%, 10/19/2012 | | | | | 345,000 | | | 358,497 |
International Lease Finance Corp., 5.750%, 6/15/2011 | | | | | 205,000 | | | 206,269 |
iStar Financial, Inc., 5.150%, 3/01/2012 | | | | | 170,000 | | | 125,800 |
| | | | | | | | |
| | | | | | | | 1,273,104 |
| | | | | | | | |
| Oil Field Services – 0.5% | | | | | | | | |
Weatherford International Ltd., 5.150%, 3/15/2013 | | | | | 175,000 | | | 175,152 |
| | | | | | | | |
| Paper – 0.0% | | | | | | | | |
MeadWestvaco Corp., 6.850%, 4/01/2012 | | | | | 5,000 | | | 5,190 |
| | | | | | | | |
| Pharmaceuticals – 0.7% | | | | | | | | |
Abbott Laboratories, 5.150%, 11/30/2012 | | | | | 240,000 | | | 255,596 |
Schering-Plough Corp., 5.550%, 12/01/2013 | | | | | 5,000 | | | 5,164 |
| | | | | | | | |
| | | | | | | | 260,760 |
| | | | | | | | |
| Pipelines – 1.5% | | | | | | | | |
Energy Transfer Partners LP, 6.000%, 7/01/2013 | | | | | 170,000 | | | 171,001 |
Kinder Morgan Energy Partners LP, 5.000%, 12/15/2013(b) | | | | | 185,000 | | | 182,405 |
Spectra Energy Capital LLC, 5.668%, 8/15/2014(b) | | | | | 175,000 | | | 175,957 |
| | | | | | | | |
| | | | | | | | 529,363 |
| | | | | | | | |
| Railroads – 1.7% | | | | | | | | |
Burlington Northern Santa Fe Corp., 6.125%, 3/15/2009 | | | | | 205,000 | | | 208,957 |
CSX Corp., 6.750%, 3/15/2011(b) | | | | | 200,000 | | | 211,150 |
Union Pacific Corp., 5.750%, 11/15/2017 | | | | | 160,000 | | | 161,992 |
| | | | | | | | |
| | | | | | | | 582,099 |
| | | | | | | | |
| Real Estate Investment Trusts – 3.2% | | | | | | | | |
Camden Property Trust, 4.375%, 1/15/2010(b) | | | | | 5,000 | | | 4,881 |
Colonial Realty LP, 4.750%, 2/01/2010 | | | | | 55,000 | | | 54,159 |
Developers Diversified Realty Corp., 3.875%, 1/30/2009 | | | | | 10,000 | | | 9,851 |
ERP Operating LP, 6.625%, 3/15/2012 | | | | | 10,000 | | | 10,161 |
Federal Realty Investment Trust, 5.400%, 12/01/2013 | | | | | 215,000 | | | 210,878 |
First Industrial LP, 5.250%, 6/15/2009 | | | | | 10,000 | | | 10,025 |
ProLogis Trust, 5.500%, 4/01/2012 | | | | | 410,000 | | | 411,010 |
Simon Property Group LP, 3.750%, 1/30/2009 | | | | | 400,000 | | | 397,005 |
85
| | | | | | | | |
| | | | | Principal Amount (‡) | | Value (†) |
| | | | | | | | |
| | | |
| BONDS AND NOTES – continued | | | | | | | | |
| | | |
| Real Estate Investment Trusts – continued | | | | | | | | |
Simon Property Group LP, 4.600%, 6/15/2010 | | | | $ | 5,000 | | $ | 4,962 |
Simon Property Group LP, 4.875%, 3/18/2010 | | | | | 5,000 | | | 4,990 |
| | | | | | | | |
| | | | | | | | 1,117,922 |
| | | | | | | | |
| Retailers – 1.2% | | | | | | | | |
CVS Caremark Corp., 5.750%, 6/01/2017 | | | | | 160,000 | | | 162,490 |
J.C. Penney Co., Inc., 5.750%, 2/15/2018(b) | | | | | 50,000 | | | 46,165 |
Macy’s Retail Holdings, Inc., 5.350%, 3/15/2012 | | | | | 205,000 | | | 195,322 |
| | | | | | | | |
| | | | | | | | 403,977 |
| | | | | | | | |
| Supermarkets – 0.6% | | | | | | | | |
Kroger Co., 6.200%, 6/15/2012 | | | | | 50,000 | | | 52,378 |
Kroger Co., 6.400%, 8/15/2017(b) | | | | | 35,000 | | | 36,938 |
Kroger Co., 6.750%, 4/15/2012 | | | | | 115,000 | | | 123,132 |
| | | | | | | | |
| | | | | | | | 212,448 |
| | | | | | | | |
| Technology – 4.0% | | | | | | | | |
Agilent Technologies, Inc., 6.500%, 11/01/2017 | | | | | 120,000 | | | 120,415 |
Corning, Inc., 6.200%, 3/15/2016 | | | | | 45,000 | | | 46,706 |
Equifax, Inc., 7.000%, 7/01/2037 | | | | | 85,000 | | | 75,911 |
IBM International Group Capital, 5.050%, 10/22/2012 | | | | | 230,000 | | | 240,248 |
Jabil Circuit, Inc., 5.875%, 7/15/2010 | | | | | 350,000 | | | 345,677 |
National Semiconductor Corp., 6.600%, 6/15/2017 | | | | | 175,000 | | | 173,435 |
Pitney Bowes, Inc., 5.250%, 1/15/2037 | | | | | 225,000 | | | 222,686 |
Xerox Corp., 6.400%, 3/15/2016 | | | | | 170,000 | | | 175,870 |
| | | | | | | | |
| | | | | | | | 1,400,948 |
| | | | | | | | |
| Treasuries – 17.5% | | | | | | | | |
U.S. STRIPS, Zero Coupon Bond, 2/15/2015 | | | | | 535,000 | | | 432,761 |
U.S. Treasury Inflation Index Notes, 2.625%, 7/15/2017(b) | | | | | 646,614 | | | 736,837 |
U.S. Treasury Notes, 2.750%, 2/28/2013(b) | | | | | 1,560,000 | | | 1,581,450 |
U.S. Treasury Notes, 4.000%, 11/15/2012(b) | | | | | 575,000 | | | 617,451 |
U.S. Treasury Notes, 4.000%, 2/15/2015(b)(d) | | | | | 320,000 | | | 344,100 |
U.S. Treasury Notes, 4.250%, 8/15/2014(b) | | | | | 230,000 | | | 251,383 |
U.S. Treasury Notes, 4.750%, 5/15/2014(b) | | | | | 175,000 | | | 196,451 |
U.S. Treasury Notes, 4.750%, 8/15/2017(b) | | | | | 1,745,000 | | | 1,930,679 |
| | | | | | | | |
| | | | | | | | 6,091,112 |
| | | | | | | | |
| Wireless – 0.9% | | | | | | | | |
Nextel Communications, Inc., Series F, 5.950%, 3/15/2014 | | | | | 5,000 | | | 3,700 |
Sprint Nextel Corp., 6.000%, 12/01/2016 | | | | | 170,000 | | | 132,175 |
Vodafone Group Plc, 5.350%, 2/27/2012(b) | | | | | 175,000 | | | 177,211 |
| | | | | | | | |
| | | | | | | | 313,086 |
| | | | | | | | |
| Wirelines – 1.9% | | | | | | | | |
AT&T, Inc., 5.100%, 9/15/2014 | | | | | 180,000 | | | 178,824 |
Embarq Corp., 7.995%, 6/01/2036 | | | | | 155,000 | | | 141,555 |
Qwest Corp., 5.625%, 11/15/2008 | | | | | 110,000 | | | 109,450 |
Verizon New England, Inc., 6.500%, 9/15/2011 | | | | | 5,000 | | | 5,224 |
Verizon Virginia, Inc., Series A, 4.625%, 3/15/2013 | | | | | 230,000 | | | 223,623 |
| | | | | | | | |
| | | | | | | | 658,676 |
| | | | | | | | |
| | | |
| TOTAL NON-CONVERTIBLE BONDS | | | | | | | | |
(Identified Cost $34,175,389) | | | | | | | | 33,934,245 |
| | | | | | | | |
| | | |
| TOTAL BONDS AND NOTES | | | | | | | | |
(Identified Cost $34,175,389) | | | | | | | | 33,934,245 |
| | | | | | | | |
86
PORTFOLIO OF INVESTMENTS – as of March 31, 2008 (Unaudited)
Loomis Sayles Intermediate Duration Fixed Income Fund – continued
| | | | | | | | |
| | | | | Principal Amount (‡) | | Value (†) |
| | | | | | | | |
| | | |
| SHORT-TERM INVESTMENTS – 23.4% | | | | | | | | |
| Tri-Party Repurchase Agreement with Fixed Income Clearing Corporation, dated 3/31/08 at 1.250% to be repurchased at $542,019 on 4/01/08 collateralized by $535,000 Federal National Mortgage Association 5.020% due 11/21/12 valued at $553,725 including accrued interest (Note 2h of Notes to Financial Statements) | | | | $ | 542,000 | | $ | 542,000 |
| | | | | | | | |
| | | |
| | | | | Shares | | |
State Street Navigator Securities Lending Prime Portfolio(e) | | | | | 7,600,779 | | | 7,600,779 |
| | | | | | | | |
| | | |
| TOTAL SHORT-TERM INVESTMENTS | | | | | | | | |
(Identified Cost $8,142,779) | | | | | | | | 8,142,779 |
| | | | | | | | |
| | | |
| TOTAL INVESTMENTS – 120.9% | | | | | | | | |
(Identified Cost $42,318,168)(a) | | | | | | | | 42,077,024 |
Other Assets Less Liabilities—(20.9)% | | | | | | | | (7,282,785) |
| | | | | | | | |
| | | |
| NET ASSETS – 100.0% | | | | | | | $ | 34,794,239 |
| | | | | | | | |
|
(‡) Principal amount stated in U.S. dollars unless otherwise noted. |
(†) See Note 2a of Notes to Financial Statements. |
(a) Federal Tax Information (Amounts exclude certain adjustments made at the end of the Fund’s fiscal year for tax purpose. Such adjustments are primarily due to wash sales. Amortization of premium on debt securities is excluded for tax purposes.) : At March 31, 2008, the net unrealized depreciation on investments based on a cost of $42,379,603 for federal income tax purposes was as follows: | | | |
Aggregate gross unrealized appreciation for all investments in which there is an excess of value over tax cost | | $ | 509,700 |
Aggregate gross unrealized depreciation for all investments in which there is an excess of tax cost over value | | | (812,279) |
| | | | | | | | |
Net unrealized depreciation | | $ | (302,579) |
| | | | | | | | |
| (b) | All or a portion of this security was on loan to brokers at March 31, 2008. |
| (c) | Variable rate security. Rate as of March 31, 2008 is disclosed. |
| (d) | All or a portion of this security is held as collateral for open futures contracts. |
| (e) | Represents investment of securities lending collateral. |
| GMTN | Global Medium Term Note |
| STRIPS | Separate Trading of Registered Interest and Principal of Securities |
| | Key to Abbreviation: SGD: Singapore Dollar |
| | At March 31, 2008, open futures contracts purchased were as follows: |
| | | | | | | | | | |
Futures | | Expiration
Date | | Contracts | | Notional
Value | | Unrealized
Appreciation |
10 Year U.S. Treasury Note | | 6/19/2008 | | 9 | | $ | 1,070,578 | | $ | 38,796 |
HOLDINGS AT MARCH 31, 2008 AS A PERCENTAGE ON NET ASSETS (Unaudited)
| | | | | | | | |
Mortgage Related | | 22.9 | % | | Non-Captive Diversified | | 3.7 | % |
Treasuries | | 17.5 | | | Real Estate Investment Trusts | | 3.2 | |
Banking | | 9.0 | | | Electric | | 2.2 | |
Brokerage | | 5.7 | | | Healthcare | | 2.0 | |
Asset-Backed Securities | | 5.6 | | | Other, less than 2% each | | 21.7 | |
Technology | | 4.0 | | | | | | |
See accompanying notes to financial statements.
87
PORTFOLIO OF INVESTMENTS – as of March 31, 2008 (Unaudited)
Loomis Sayles Investment Grade Fixed Income Fund
| | | | | | | | |
| | | | | Principal Amount (‡) | | Value (†) |
| | | | | | | | |
| | | |
| BONDS AND NOTES – 85.4% of Net Assets | | | | | | | | |
| | | |
| NON-CONVERTIBLE BONDS – 83.9% | | | | | | | | |
| | | |
| Aerospace & Defense – 0.1% | | | | | | | | |
Boeing Capital Corp., 6.500%, 2/15/2012 | | | | $ | 165,000 | | $ | 179,067 |
| | | | | | | | |
| Airlines – 2.1% | | | | | | | | |
Delta Air Lines, Inc., 8.021%, 8/10/2022, 144A | | | | | 2,370,264 | | | 2,156,940 |
Qantas Airways Ltd., 6.050%, 4/15/2016, 144A | | | | | 3,455,000 | | | 3,690,172 |
| | | | | | | | |
| | | | | | | | 5,847,112 |
| | | | | | | | |
| Asset-Backed Securities – 1.3% | | | | | | | | |
CNH Equipment Trust, Series 2004-A, Series A4B, 3.480%, 9/15/2011 | | | | | 245,900 | | | 246,354 |
Community Program Loan Trust, Series 1987-A, Class A5, 4.500%, 4/01/2029 | | | | | 2,500,000 | | | 2,220,802 |
Countrywide Asset-Backed Certificates, Series 2006-S1, Class A2, 5.549%, 8/25/2021 | | | | | 401,027 | | | 391,173 |
Countrywide Asset-Backed Certificates, Series 2006-S3, Class A3, 6.287%, 6/25/2021(c) | | | | | 455,000 | | | 213,621 |
Countrywide Asset-Backed Certificates, Series 2006-S4, Class A3, 5.804%, 7/25/2034 | | | | | 500,000 | | | 384,002 |
Navistar Financial Corp. Owner Trust, Series 2005-A, Class A3, 4.220%, 2/15/2010 | | | | | 115,939 | | | 116,223 |
| | | | | | | | |
| | | | | | | | 3,572,175 |
| | | | | | | | |
| Automotive – 0.7% | | | | | | | | |
Ford Motor Co., 6.375%, 2/01/2029 | | | | | 2,665,000 | | | 1,599,000 |
Ford Motor Credit Co. LLC, 7.375%, 10/28/2009 | | | | | 150,000 | | | 136,670 |
General Motors Corp., 8.250%, 7/15/2023 | | | | | 50,000 | | | 35,000 |
| | | | | | | | |
| | | | | | | | 1,770,670 |
| | | | | | | | |
| Banking – 8.1% | | | | | | | | |
BAC Capital Trust VI, 5.625%, 3/08/2035 | | | | | 1,045,000 | | | 877,358 |
Barclays Financial LLC, 4.060%, 9/16/2010, 144A | | KRW | | | 940,000,000 | | | 988,455 |
Barclays Financial LLC, 4.160%, 2/22/2010, 144A | | THB | | | 70,000,000 | | | 2,273,803 |
Barclays Financial LLC, 4.460%, 9/23/2010, 144A | | KRW | | | 1,950,000,000 | | | 2,069,814 |
Barclays Financial LLC, Series EMTN, 4.100%, 3/22/2010, 144A | | THB | | | 17,000,000 | | | 551,831 |
BNP Paribas SA, Series EMTN, Zero Coupon Bond, 6/13/2011, 144A | | IDR | | | 7,484,000,000 | | | 583,760 |
Citibank NA, 15.000%, 7/02/2010, 144A | | BRL | | | 4,000,000 | | | 2,467,852 |
Countrywide Financial Corp., 6.250%, 5/15/2016 | | | | | 230,000 | | | 186,617 |
HSBC Bank USA, Zero Coupon Bond, 4/18/2012, 144A | | MYR | | | 2,015,000 | | | 621,793 |
HSBC Bank USA, 3.310%, 8/25/2010, 144A | | | | | 2,000,000 | | | 2,414,400 |
JPMorgan Chase & Co., Zero Coupon Bond, 5/17/2010, 144A | | BRL | | | 8,035,000 | | | 3,650,359 |
JPMorgan Chase & Co., Zero Coupon Bond, 3/28/2011, 144A | | IDR | | | 8,972,574,000 | | | 718,293 |
JPMorgan Chase & Co., Zero Coupon Bond, 3/28/2011, 144A | | IDR | | | 5,376,000,000 | | | 429,963 |
JPMorgan Chase & Co., 6.750%, 2/01/2011 | | | | | 60,000 | | | 63,708 |
JPMorgan Chase & Co., Series EMTN, Zero Coupon Bond, 6/08/2012, 144A | | MYR | | | 1,663,795 | | | 463,636 |
JPMorgan Chase London, Zero Coupon Bond, 10/21/2010, 144A | | IDR | | | 9,533,078,500 | | | 804,900 |
88
PORTFOLIO OF INVESTMENTS – as of March 31, 2008 (Unaudited)
Loomis Sayles Investment Grade Fixed Income Fund – continued
| | | | | | | |
| | | | | Principal Amount (‡) | | Value (†) |
| | | | | | | |
| | | |
| BONDS AND NOTES – continued | | | | | | | |
| | | |
| Banking – continued | | | | | | | |
Rabobank Nederland, Series EMTN, 14.000%, 1/28/2009, 144A | | ISK | | 220,000,000 | | $ | 2,919,005 |
Washington Mutual Finance Corp., 6.875%, 5/15/2011 | | | | 135,000 | | | 142,179 |
| | | | | | | |
| | | | | | | 22,227,726 |
| | | | | | | |
| Brokerage – 1.4% | | | | | | | |
Bear Stearns Co., Inc. (The), 5.550%, 1/22/2017(b) | | | | 230,000 | | | 205,352 |
Lehman Brothers Holdings, Inc., Series G, MTN, 3.950%, 11/10/2009 | | | | 230,000 | | | 219,066 |
Merrill Lynch & Co., Inc., Series C, MTN, 5.000%, 1/15/2015 | | | | 235,000 | | | 218,385 |
Morgan Stanley, 4.750%, 4/01/2014 | | | | 245,000 | | | 227,429 |
Morgan Stanley, Series F, MTN, 6.625%, 4/01/2018 | | | | 3,045,000 | | | 3,046,072 |
| | | | | | | |
| | | | | | | 3,916,304 |
| | | | | | | |
| Building Materials – 0.2% | | | | | | | |
Masco Corp., 5.850%, 3/15/2017 | | | | 500,000 | | | 455,334 |
| | | | | | | |
| Chemicals – 1.9% | | | | | | | |
Lubrizol Corp., 6.500%, 10/01/2034 | | | | 1,680,000 | | | 1,684,219 |
Methanex Corp., 6.000%, 8/15/2015 | | | | 980,000 | | | 950,600 |
PPG Industries, Inc., 6.650%, 3/15/2018 | | | | 2,410,000 | | | 2,553,814 |
| | | | | | | |
| | | | | | | 5,188,633 |
| | | | | | | |
| Distributors – 0.8% | | | | | | | |
Equitable Resources, Inc., 6.500%, 4/01/2018 | | | | 2,150,000 | | | 2,160,959 |
| | | | | | | |
| Diversified Manufacturing – 0.1% | | | | | | | |
General Electric Co., 5.000%, 2/01/2013 | | | | 310,000 | | | 321,105 |
| | | | | | | |
| Electric – 3.3% | | | | | | | |
Bruce Mansfield Unit, 6.850%, 6/01/2034 | | | | 1,550,000 | | | 1,665,196 |
Cleveland Electric Illuminating Co., 5.950%, 12/15/2036 | | | | 960,000 | | | 827,149 |
Commonwealth Edison Co., 4.700%, 4/15/2015(b) | | | | 555,000 | | | 528,446 |
Commonwealth Edison Co., 4.750%, 12/01/2011(e) | | | | 51,000 | | | 46,131 |
Commonwealth Edison Co., 5.875%, 2/01/2033 | | | | 1,180,000 | | | 1,065,099 |
Dominion Resources, Inc., 5.950%, 6/15/2035 | | | | 385,000 | | | 363,568 |
Duke Energy Carolinas, 4.200%, 10/01/2008 | | | | 460,000 | | | 461,617 |
Empresa Nacional de Electricidad SA (Endesa-Chile), 7.875%, 2/01/2027(b) | | | | 1,000,000 | | | 1,101,420 |
MidAmerican Energy Holdings Co., 6.125%, 4/01/2036 | | | | 445,000 | | | 430,109 |
MidAmerican Energy Holdings Co., 6.500%, 9/15/2037 | | | | 1,035,000 | | | 1,037,251 |
Nisource Finance Corp., 6.150%, 3/01/2013 | | | | 195,000 | | | 201,556 |
Nisource Finance Corp., 6.400%, 3/15/2018(b) | | | | 1,255,000 | | | 1,256,813 |
| | | | | | | |
| | | | | | | 8,984,355 |
| | | | | | | |
| Entertainment – 1.2% | | | | | | | |
Time Warner, Inc., 6.500%, 11/15/2036 | | | | 410,000 | | | 376,147 |
Time Warner, Inc., 6.625%, 5/15/2029 | | | | 870,000 | | | 815,762 |
Time Warner, Inc., 6.950%, 1/15/2028 | | | | 375,000 | | | 364,252 |
Time Warner, Inc., 7.625%, 4/15/2031 | | | | 245,000 | | | 256,248 |
89
| | | | | | | | |
| | | | | Principal Amount (‡) | | Value (†) |
| | | | | | | | |
| | | |
| BONDS AND NOTES – continued | | | | | | | | |
| | | |
| Entertainment – continued | | | | | | | | |
Time Warner, Inc., 7.700%, 5/01/2032 | | | | $ | 160,000 | | $ | 168,449 |
Viacom, Inc., Class B, 6.875%, 4/30/2036 | | | | | 1,325,000 | | | 1,275,917 |
| | | | | | | | |
| | | | | | | | 3,256,775 |
| | | | | | | | |
| Food & Beverage – 1.4% | | | | | | | | |
Anheuser-Busch Cos, Inc., 5.950%, 1/15/2033(b) | | | | | 995,000 | | | 997,461 |
Anheuser-Busch Cos, Inc., 6.450%, 9/01/2037 | | | | | 1,270,000 | | | 1,370,635 |
Cia Brasileira de Bebidas, 8.750%, 9/15/2013 | | | | | 1,025,000 | | | 1,199,250 |
Kraft Foods, Inc., 6.250%, 6/01/2012 | | | | | 210,000 | | | 218,695 |
| | | | | | | | |
| | | | | | | | 3,786,041 |
| | | | | | | | |
| Foreign Local Governments – 0.9% | | | | | | | | |
Province of Alberta, 5.000%, 12/16/2008 | | CAD | | | 2,000,000 | | | 1,982,191 |
Province of Alberta, 5.930%, 9/16/2016 | | CAD | | | 431,408 | | | 465,325 |
| | | | | | | | |
| | | | | | | | 2,447,516 |
| | | | | | | | |
| Government Owned – No Guarantee – 0.0% | | | | | | | | |
Pemex Project Funding Master Trust, 6.125%, 8/15/2008 | | | | | 11,000 | | | 11,072 |
| | | | | | | | |
| Healthcare – 1.3% | | | | | | | | |
Covidien International Finance, 6.000%, 10/15/2017, 144A | | | | | 900,000 | | | 927,633 |
Covidien International Finance, 6.550%, 10/15/2037, 144A | | | | | 900,000 | | | 919,836 |
HCA, Inc., 5.750%, 3/15/2014 | | | | | 1,020,000 | | | 841,500 |
HCA, Inc., 6.250%, 2/15/2013 | | | | | 165,000 | | | 143,550 |
HCA, Inc., 6.375%, 1/15/2015 | | | | | 55,000 | | | 46,544 |
HCA, Inc., 6.500%, 2/15/2016 | | | | | 15,000 | | | 12,637 |
HCA, Inc., 6.750%, 7/15/2013 | | | | | 30,000 | | | 26,550 |
HCA, Inc., 7.050%, 12/01/2027 | | | | | 100,000 | | | 72,918 |
HCA, Inc., 7.190%, 11/15/2015 | | | | | 60,000 | | | 51,044 |
HCA, Inc., 7.500%, 12/15/2023 | | | | | 60,000 | | | 47,112 |
HCA, Inc., 7.690%, 6/15/2025 | | | | | 120,000 | | | 95,106 |
HCA, Inc., 7.750%, 7/15/2036 | | | | | 285,000 | | | 218,846 |
HCA, Inc., 8.360%, 4/15/2024 | | | | | 235,000 | | | 195,069 |
| | | | | | | | |
| | | | | | | | 3,598,345 |
| | | | | | | | |
| Home Construction – 3.0% | | | | | | | | |
Centex Corp., 5.250%, 6/15/2015 | | | | | 380,000 | | | 294,500 |
Lennar Corp., Series B, 5.600%, 5/31/2015 | | | | | 1,250,000 | | | 925,000 |
Lennar Corp., Series B, 6.500%, 4/15/2016 | | | | | 770,000 | | | 585,200 |
Pulte Homes, Inc., 5.200%, 2/15/2015 | | | | | 1,265,000 | | | 1,075,250 |
Pulte Homes, Inc., 6.000%, 2/15/2035 | | | | | 3,340,000 | | | 2,571,800 |
Pulte Homes, Inc., 6.375%, 5/15/2033 | | | | | 1,455,000 | | | 1,134,900 |
Toll Brothers Finance Corp., 5.150%, 5/15/2015 | | | | | 1,725,000 | | | 1,560,261 |
| | | | | | | | |
| | | | | | | | 8,146,911 |
| | | | | | | | |
| Hybrid ARMS – 0.6% | | | | | | | | |
Federal National Mortgage Association, 6.051%, 2/01/2037(d) | | | | | 447,235 | | | 456,400 |
Indymac Index Mortgage Loan Trust, Series 2006-AR25, Class 3A1, 6.367%, 9/25/2036(d) | | | | | 592,475 | | | 449,352 |
Morgan Stanley Mortgage Loan Trust, Series 2005-3AR, Class 5A, 5.588%, 7/25/2035(d) | | | | | 433,485 | | | 436,600 |
90
PORTFOLIO OF INVESTMENTS – as of March 31, 2008 (Unaudited)
Loomis Sayles Investment Grade Fixed Income Fund – continued
| | | | | | | | |
| | | | | Principal Amount (‡) | | Value (†) |
| | | | | | | | |
| | | |
| BONDS AND NOTES – continued | | | | | | | | |
| | | |
| Hybrid ARMS – continued | | | | | | | | |
Wells Fargo Mortgage Backed Securities Trust, Series 2005-AR16, Class 3A2, 4.996%, 10/25/2035(d) | | | | $ | 353,515 | | $ | 317,922 |
| | | | | | | | |
| | | | | | | | 1,660,274 |
| | | | | | | | |
| Independent Energy – 1.9% | | | | | | | | |
Anadarko Petroleum Corp., 5.950%, 9/15/2016 | | | | | 1,365,000 | | | 1,411,612 |
Anadarko Petroleum Corp., 6.450%, 9/15/2036 | | | | | 1,215,000 | | | 1,237,299 |
Apache Corp., 6.000%, 1/15/2037 | | | | | 1,940,000 | | | 1,958,432 |
Talisman Energy, Inc., 5.850%, 2/01/2037 | | | | | 15,000 | | | 13,152 |
XTO Energy, Inc., 6.100%, 4/01/2036 | | | | | 65,000 | | | 64,311 |
XTO Energy, Inc., 6.750%, 8/01/2037 | | | | | 435,000 | | | 465,251 |
| | | | | | | | |
| | | | | | | | 5,150,057 |
| | | | | | | | |
| Local Authorities – 1.5% | | | | | | | | |
Queensland Treasury Corp., Series 11G, 6.000%, 6/14/2011 | | AUD | | | 1,735,000 | | | 1,550,597 |
Virginia Tobacco Settlement Financing Corp., Series A-1, 6.706%, 6/01/2046 | | | | | 2,900,000 | | | 2,630,851 |
| | | | | | | | |
| | | | | | | | 4,181,448 |
| | | | | | | | |
| Media Cable – 2.3% | | | | | | | | |
Comcast Corp., 5.650%, 6/15/2035 | | | | | 2,090,000 | | | 1,774,784 |
Comcast Corp., 6.450%, 3/15/2037 | | | | | 1,230,000 | | | 1,159,077 |
Comcast Corp., 6.500%, 11/15/2035 | | | | | 1,570,000 | | | 1,484,881 |
Comcast Corp., 6.950%, 8/15/2037 | | | | | 1,925,000 | | | 1,928,860 |
| | | | | | | | |
| | | | | | | | 6,347,602 |
| | | | | | | | |
| Media Non-Cable – 1.1% | | | | | | | | |
Clear Channel Communications, Inc., 5.750%, 1/15/2013 | | | | | 250,000 | | | 198,750 |
News America, Inc., 6.200%, 12/15/2034 | | | | | 950,000 | | | 904,763 |
News America, Inc., 6.400%, 12/15/2035 | | | | | 1,980,000 | | | 1,921,628 |
| | | | | | | | |
| | | | | | | | 3,025,141 |
| | | | | | | | |
| Metals & Mining – 0.0% | | | | | | | | |
Teck Cominco Ltd., 7.000%, 9/15/2012 | | | | | 100,000 | | | 112,211 |
| | | | | | | | |
| Mortgage Related – 7.4% | | | | | | | | |
Banc of America Commercial Mortgage, Inc., Series 2005-6, Class A4, 5.353%, 9/10/2047(d) | | | | | 160,000 | | | 159,182 |
Banc of America Commercial Mortgage, Inc., Series 2006-1, Class A2, 5.334%, 9/10/2045, Class A | | | | | 220,000 | | | 217,592 |
Bear Stearns Commercial Mortgage Securities, Series 2005-PW10, Class A2, 5.270%, 12/11/2040 | | | | | 280,000 | | | 278,666 |
Bear Stearns Commercial Mortgage Securities, Series 2006-T24, Class A4, 5.537%, 10/12/2041 | | | | | 360,000 | | | 356,353 |
Citigroup/Deutsche Bank Commercial Mortgage Trust, Series 2006-CD2, Class A2, 5.408%, 1/15/2046 | | | | | 155,000 | | | 153,522 |
Commercial Mortgage Pass Through Certificates, Series 2006-C7, Class A4, 5.961%, 6/10/2046(d) | | | | | 480,000 | | | 485,730 |
91
| | | | | | | | |
| | | | | Principal Amount (‡) | | Value (†) |
| | | | | | | | |
| | | |
| BONDS AND NOTES – continued | | | | | | | | |
| | | |
| Mortgage Related – continued | | | | | | | | |
CS First Boston Mortgage Securities Corp., Series 2005-7, Class 3A1, 5.000%, 8/25/2020 | | | | $ | 359,837 | | $ | 338,863 |
Federal Home Loan Mortgage Corp., 4.000%, 7/01/2019 | | | | | 344,785 | | | 337,557 |
Federal Home Loan Mortgage Corp., 4.500%, 4/01/2019 | | | | | 703,009 | | | 701,197 |
Federal Home Loan Mortgage Corp., 5.000%, 5/01/2034 | | | | | 218,530 | | | 216,967 |
Federal Home Loan Mortgage Corp., 5.500%, 8/01/2033 | | | | | 541,881 | | | 548,988 |
Federal Home Loan Mortgage Corp., 5.500%, 2/01/2037 | | | | | 647,412 | | | 654,540 |
Federal Home Loan Mortgage Corp., 6.000%, 2/01/2020 | | | | | 244,688 | | | 251,974 |
Federal Home Loan Mortgage Corp., 6.000%, 6/01/2035 | | | | | 453,916 | | | 468,014 |
Federal Home Loan Mortgage Corp., 6.500%, 10/15/2008 | | | | | 43,312 | | | 43,262 |
Federal Home Loan Mortgage Corp., 10.000%, 8/01/2018 | | | | | 3,802 | | | 4,517 |
Federal Home Loan Mortgage Corp., 10.000%, 10/01/2018 | | | | | 2,596 | | | 3,073 |
Federal Home Loan Mortgage Corp., 10.250%, 12/01/2009 | | | | | 4,266 | | | 4,361 |
Federal Home Loan Mortgage Corp., Series 2912, Class EH, 5.500%, 1/15/2035 | | | | | 675,000 | | | 681,429 |
Federal National Mortgage Association, 4.000%, 1/01/2020 | | | | | 183,553 | | | 179,717 |
Federal National Mortgage Association, 4.500%, 3/01/2035 | | | | | 283,211 | | | 273,798 |
Federal National Mortgage Association, 4.500%, 9/01/2035 | | | | | 392,445 | | | 378,736 |
Federal National Mortgage Association, 5.000%, 2/01/2018 | | | | | 118,089 | | | 119,850 |
Federal National Mortgage Association, 5.000%, 6/01/2020 | | | | | 343,740 | | | 347,747 |
Federal National Mortgage Association, 5.000%, 4/01/2034 | | | | | 207,068 | | | 205,399 |
Federal National Mortgage Association, 5.000%, 5/01/2034 | | | | | 220,299 | | | 218,524 |
Federal National Mortgage Association, 5.000%, 5/01/2035 | | | | | 382,525 | | | 379,163 |
Federal National Mortgage Association, 5.000%, 6/01/2035 | | | | | 266,365 | | | 264,023 |
Federal National Mortgage Association, 5.000%, 6/01/2035 | | | | | 155,784 | | | 154,414 |
Federal National Mortgage Association, 5.000%, 8/01/2035 | | | | | 381,777 | | | 378,421 |
Federal National Mortgage Association, 5.500%, 9/01/2016 | | | | | 82,644 | | | 84,829 |
Federal National Mortgage Association, 5.500%, 8/01/2019 | | | | | 52,758 | | | 54,055 |
Federal National Mortgage Association, 5.500%, 12/01/2032 | | | | | 122,068 | | | 123,698 |
92
PORTFOLIO OF INVESTMENTS – as of March 31, 2008 (Unaudited)
Loomis Sayles Investment Grade Fixed Income Fund – continued
| | | | | | | | |
| | | | | Principal Amount (‡) | | Value (†) |
| | | | | | | | |
| | | |
| BONDS AND NOTES – continued | | | | | | | | |
| | | |
| Mortgage Related – continued | | | | | | | | |
Federal National Mortgage Association, 5.500%, 1/01/2033 | | | | $ | 279,274 | | $ | 283,003 |
Federal National Mortgage Association, 5.500%, 6/01/2033 | | | | | 410,345 | | | 416,021 |
Federal National Mortgage Association, 5.500%, 7/01/2033 | | | | | 604,999 | | | 612,715 |
Federal National Mortgage Association, 5.500%, 9/01/2034 | | | | | 239,056 | | | 241,929 |
Federal National Mortgage Association, 5.500%, 3/01/2035 | | | | | 80,803 | | | 81,774 |
Federal National Mortgage Association, 5.500%, 3/01/2035 | | | | | 69,568 | | | 70,368 |
Federal National Mortgage Association, 5.500%, 5/01/2035 | | | | | 80,589 | | | 81,516 |
Federal National Mortgage Association, 5.500%, 8/01/2035 | | | | | 151,933 | | | 153,680 |
Federal National Mortgage Association, 5.500%, 12/01/2035 | | | | | 341,254 | | | 345,179 |
Federal National Mortgage Association, 5.500%, 1/01/2036 | | | | | 18,492 | | | 18,705 |
Federal National Mortgage Association, 5.500%, 2/01/2036 | | | | | 7,776 | | | 7,865 |
Federal National Mortgage Association, 5.500%, 4/01/2036 | | | | | 431,475 | | | 436,437 |
Federal National Mortgage Association, 5.500%, 6/01/2036 | | | | | 101,955 | | | 103,046 |
Federal National Mortgage Association, 5.742%, 9/01/2036(d) | | | | | 493,553 | | | 502,875 |
Federal National Mortgage Association, 6.000%, 12/01/2018 | | | | | 31,429 | | | 32,552 |
Federal National Mortgage Association, 6.000%, 12/01/2020 | | | | | 38,032 | | | 39,183 |
Federal National Mortgage Association, 6.000%, 3/01/2021 | | | | | 379,469 | | | 391,663 |
Federal National Mortgage Association, 6.000%, 10/01/2028 | | | | | 29,827 | | | 30,822 |
Federal National Mortgage Association, 6.000%, 10/01/2033 | | | | | 652,854 | | | 672,179 |
Federal National Mortgage Association, 6.500%, 2/01/2011 | | | | | 5,176 | | | 5,345 |
Federal National Mortgage Association, 6.500%, 10/01/2031 | | | | | 92,989 | | | 97,035 |
Federal National Mortgage Association, 6.500%, 10/01/2033 | | | | | 52,599 | | | 54,754 |
Federal National Mortgage Association, 6.500%, 10/01/2033 | | | | | 102,729 | | | 106,937 |
Federal National Mortgage Association, 6.500%, 10/01/2033 | | | | | 69,096 | | | 71,927 |
Federal National Mortgage Association, 6.500%, 11/01/2033 | | | | | 95,072 | | | 98,967 |
Federal National Mortgage Association, 7.000%, 4/25/2020 | | | | | 50,696 | | | 53,733 |
Government National Mortgage Association, 6.500%, 2/20/2028 | | | | | 162,410 | | | 169,984 |
93
| | | | | | | | |
| | | | | Principal Amount (‡) | | Value (†) |
| | | | | | | | |
| | | |
| BONDS AND NOTES – continued | | | | | | | | |
| | | |
| Mortgage Related – continued | | | | | | | | |
Government National Mortgage Association, 7.000%, 11/20/2025 | | | | $ | 6,094 | | $ | 6,522 |
Government National Mortgage Association, 10.000%, 5/15/2018 | | | | | 15,884 | | | 18,984 |
Government National Mortgage Association, 10.000%, 8/15/2018 | | | | | 10,047 | | | 12,008 |
Government National Mortgage Association, 10.000%, 12/15/2018 | | | | | 49,858 | | | 59,589 |
Greenwich Capital Commercial Funding Corp., Series 2005-GG5, Class A2, 5.117%, 4/10/2037 | | | | | 485,000 | | | 482,005 |
GS Mortgage Securities Corp. II, Series 2005-GG4, Class A4A, 4.751%, 7/10/2039 | | | | | 805,000 | | | 781,202 |
GS Mortgage Securities Corp. II, Series 2006-GG8, Class A4, 5.560%, 11/10/2039 | | | | | 350,000 | | | 346,636 |
JP Morgan Chase Commercial Mortgage Securities Corp., Series 2006-LDP7, Class A4, 6.065%, 4/15/2045(d) | | | | | 600,000 | | | 609,775 |
LB-UBS Commercial Mortgage Trust, Series 2005-C3, Class A5, 4.739%, 7/15/2030 | | | | | 480,000 | | | 465,462 |
LB-UBS Commercial Mortgage Trust, Series 2006-C4, Class A4, 5.883%, 6/15/2038(d) | | | | | 180,000 | | | 183,402 |
LB-UBS Commercial Mortgage Trust, Series 2006-C6, Class A4, 5.372%, 9/15/2039 | | | | | 390,000 | | | 381,682 |
LB-UBS Commercial Mortgage Trust, Series 2007-C2, Class A2, 5.303%, 2/15/2040 | | | | | 915,000 | | | 893,243 |
Merrill Lynch/Countrywide Commercial Mortgage Trust, Series 2006-1, Class A2, 5.439%, 2/12/2039(d) | | | | | 335,000 | | | 332,107 |
Merrill Lynch/Countrywide Commercial Mortgage Trust, Series 2006-2, Class A4, 6.104%, 6/12/2046(d) | | | | | 235,000 | | | 239,556 |
Morgan Stanley Capital I, Series 2005-HQ6, Class A4A, 4.989%, 8/13/2042 | | | | | 350,000 | | | 343,916 |
Morgan Stanley Capital I, Series 2005-T19, Class A4A, 4.890%, 6/12/2047 | | | | | 425,000 | | | 414,827 |
Residential Accredit Loans, Inc., Series 2006-QS18, Class 3A3, 5.750%, 12/25/2021 | | | | | 363,905 | | | 355,567 |
| | | | | | | | |
| | | | | | | | 20,174,838 |
| | | | | | | | |
| Non-Captive Consumer – 1.3% | | | | | | | | |
American General Finance Corp., Series H, 5.375%, 10/01/2012 | | | | | 45,000 | | | 44,176 |
American General Finance Corp., Series J, MTN, 6.900%, 12/15/2017 | | | | | 2,355,000 | | | 2,301,480 |
Countrywide Financial Corp., Series A, MTN, 2.849%, 12/19/2008(d) | | | | | 50,000 | | | 45,750 |
Countrywide Home Loans, Inc., Series L, MTN, 4.000%, 3/22/2011 | | | | | 144,000 | | | 128,426 |
HSBC Finance Corp., 8.000%, 7/15/2010 | | | | | 205,000 | | | 216,334 |
Residential Capital LLC, 8.500%, 6/01/2012(d) | | | | | 380,000 | | | 186,200 |
Residential Capital LLC, 8.875%, 6/30/2015(d) | | | | | 155,000 | | | 75,175 |
SLM Corp., 6.500%, 6/15/2010 | | NZD | | | 970,000 | | | 665,754 |
| | | | | | | | |
| | | | | | | | 3,663,295 |
| | | | | | | | |
94
PORTFOLIO OF INVESTMENTS – as of March 31, 2008 (Unaudited)
Loomis Sayles Investment Grade Fixed Income Fund – continued
| | | | | | | | |
| | | | | Principal Amount (‡) | | Value (†) |
| | | | | | | | |
| | | |
| BONDS AND NOTES – continued | | | | | | | | |
| | | |
| Non-Captive Diversified – 3.9% | | | | | | | | |
CIT Group Funding Co. of Canada, 5.200%, 6/01/2015 | | | | $ | 180,000 | | $ | 134,637 |
CIT Group, Inc., 5.000%, 2/13/2014 | | | | | 195,000 | | | 153,456 |
CIT Group, Inc., 5.000%, 2/01/2015(b) | | | | | 40,000 | | | 31,333 |
CIT Group, Inc., 5.125%, 9/30/2014 | | | | | 450,000 | | | 346,500 |
CIT Group, Inc., 5.400%, 1/30/2016 | | | | | 40,000 | | | 31,653 |
CIT Group, Inc., 5.650%, 2/13/2017 | | | | | 185,000 | | | 143,458 |
CIT Group, Inc., 5.800%, 7/28/2011(b) | | | | | 240,000 | | | 191,528 |
CIT Group, Inc., 5.800%, 10/01/2036(b) | | | | | 170,000 | | | 132,290 |
CIT Group, Inc., 5.850%, 9/15/2016(b) | | | | | 15,000 | | | 11,530 |
CIT Group, Inc., 6.000%, 4/01/2036 | | | | | 925,000 | | | 703,000 |
General Electric Capital Corp., 6.500%, 9/28/2015 | | NZD | | | 5,535,000 | | | 4,022,552 |
General Electric Capital Corp., Series A, MTN, 6.000%, 6/15/2012 | | | | | 735,000 | | | 783,657 |
General Electric Capital Corp., Series EMTN, 6.750%, 9/26/2016 | | NZD | | | 400,000 | | | 296,952 |
GMAC LLC, 5.625%, 5/15/2009(b) | | | | | 2,500,000 | | | 2,278,260 |
International Lease Finance Corp., 4.350%, 9/15/2008 | | | | | 50,000 | | | 49,913 |
International Lease Finance Corp., 6.375%, 3/15/2009 | | | | | 725,000 | | | 733,571 |
International Lease Finance Corp., 6.375%, 3/25/2013 | | | | | 470,000 | | | 469,638 |
Prologis, 5.625%, 11/15/2015 | | | | | 40,000 | | | 36,511 |
Prologis, 5.750%, 4/01/2016 | | | | | 35,000 | | | 32,134 |
Simon Property Group LP, 5.750%, 12/01/2015 | | | | | 55,000 | | | 52,320 |
| | | | | | | | |
| | | | | | | | 10,634,893 |
| | | | | | | | |
| Oil Field Services – 0.1% | | | | | | | | |
Weatherford International Ltd., 6.500%, 8/01/2036 | | | | | 195,000 | | | 185,791 |
| | | | | | | | |
| Paper – 1.0% | | | | | | | | |
Georgia-Pacific Corp., 7.250%, 6/01/2028 | | | | | 1,500,000 | | | 1,222,500 |
International Paper Co., 4.000%, 4/01/2010 | | | | | 500,000 | | | 491,453 |
International Paper Co., 4.250%, 1/15/2009 | | | | | 1,000,000 | | | 999,644 |
| | | | | | | | |
| | | | | | | | 2,713,597 |
| | | | | | | | |
| Pipelines – 1.4% | | | | | | | | |
DCP Midstream LP, 6.450%, 11/03/2036, 144A | | | | | 635,000 | | | 597,019 |
El Paso Corp., 6.950%, 6/01/2028 | | | | | 350,000 | | | 327,249 |
Enterprise Products Operating LP, 6.300%, 9/15/2017 | | | | | 680,000 | | | 683,332 |
Kinder Morgan Energy Partners LP, 5.125%, 11/15/2014 | | | | | 145,000 | | | 142,480 |
NGPL Pipeco LLC, 7.119%, 12/15/2017, 144A | | | | | 965,000 | | | 998,235 |
Southern Natural Gas Co., 5.900%, 4/01/2017, 144A | | | | | 810,000 | | | 791,800 |
Spectra Energy Capital LLC, 5.500%, 3/01/2014(b) | | | | | 230,000 | | | 233,150 |
| | | | | | | | |
| | | | | | | | 3,773,265 |
| | | | | | | | |
| Property & Casualty Insurance – 1.7% | | | | | | | | |
Allstate Corp., 5.950%, 4/01/2036 | | | | | 470,000 | | | 420,282 |
Marsh & McLennan Cos., Inc., 5.375%, 7/15/2014 | | | | | 65,000 | | | 62,796 |
95
| | | | | | | | | |
| | | | | Principal Amount (‡) | | | Value (†) |
| | | | | | | | | |
| | | |
| BONDS AND NOTES – continued | | | | | | | | | |
| | | |
| Property & Casualty Insurance – continued | | | | | | | | | |
Marsh & McLennan Cos., Inc., 5.750%, 9/15/2015 | | | | $ | 1,842,000 | | | $ | 1,803,460 |
Marsh & McLennan Cos., Inc., 5.875%, 8/01/2033(b) | | | | | 2,360,000 | | | | 1,978,711 |
Progressive Corp., 7.000%, 10/01/2013 | | | | | 150,000 | | | | 165,042 |
Willis North America, Inc., 6.200%, 3/28/2017 | | | | | 225,000 | | | | 224,538 |
| | | | | | | | | |
| | | | | | | | | 4,654,829 |
| | | | | | | | | |
| Railroads – 1.0% | | | | | | | | | |
Canadian Pacific Railway Ltd., 4.900%, 6/15/2010, 144A | | CAD | | | 1,000,000 | | | | 983,906 |
Canadian Pacific Railway Ltd., 5.950%, 5/15/2037 | | | | | 115,000 | | | | 95,372 |
CSX Corp., 6.000%, 10/01/2036 | | | | | 210,000 | | | | 180,786 |
CSX Corp., 6.250%, 3/15/2018 | | | | | 670,000 | | | | 661,206 |
Missouri Pacific Railroad Co., 5.000%, 1/01/2045 | | | | | 190,000 | | | | 123,500 |
Union Pacific Corp., 3.875%, 2/15/2009 | | | | | 325,000 | | | | 326,382 |
Union Pacific Corp., 5.375%, 6/01/2033 | | | | | 415,000 | | | | 363,837 |
| | | | | | | | | |
| | | | | | | | | 2,734,989 |
| | | | | | | | | |
| Real Estate Investment Trusts – 1.8% | | | | | | | | | |
Camden Property Trust, 5.700%, 5/15/2017 | | | | | 295,000 | | | | 255,431 |
Colonial Realty LP, 4.800%, 4/01/2011 | | | | | 1,840,000 | | | | 1,741,775 |
Colonial Realty LP, 5.500%, 10/01/2015 | | | | | 290,000 | | | | 236,692 |
Duke Realty LP, 5.950%, 2/15/2017 | | | | | 90,000 | | | | 78,048 |
Equity One, Inc., 6.000%, 9/15/2017 | | | | | 1,000,000 | | | | 883,191 |
ERP Operating LP, 5.125%, 3/15/2016 | | | | | 30,000 | | | | 25,990 |
ERP Operating LP, 5.750%, 6/15/2017 | | | | | 180,000 | | | | 163,916 |
Highwoods Properties, Inc., 5.850%, 3/15/2017 | | | | | 80,000 | | | | 68,336 |
Highwoods Properties, Inc., 7.500%, 4/15/2018 | | | | | 1,075,000 | | | | 1,000,496 |
Realty Income Corp., 6.750%, 8/15/2019 | | | | | 500,000 | | | | 474,148 |
| | | | | | | | | |
| | | | | | | | | 4,928,023 |
| | | | | | | | | |
| Retailers – 1.2% | | | | | | | | | |
J.C. Penney Corp., Inc., 6.375%, 10/15/2036 | | | | | 230,000 | | | | 195,460 |
Lowes Cos., Inc., 6.650%, 9/15/2037 | | | | | 975,000 | | | | 977,463 |
Macy’s Retail Holdings, Inc., 5.350%, 3/15/2012 | | | | | 355,000 | | | | 338,241 |
Macy’s Retail Holdings, Inc., 6.375%, 3/15/2037 | | | | | 2,275,000 | | | | 1,801,434 |
| | | | | | | | | |
| | | | | | | | | 3,312,598 |
| | | | | | | | | |
| Sovereigns – 8.0% | | | | | | | | | |
Canadian Government, 4.000%, 6/01/2016 | | CAD | | | 1,000,000 | | | | 1,021,881 |
Canadian Government, 4.250%, 9/01/2008 | | CAD | | | 5,410,000 | | | | 5,308,647 |
Canadian Government, 4.250%, 9/01/2009 | | CAD | | | 4,070,000 | | | | 4,053,941 |
Canadian Government, Series WH31, 6.000%, 6/01/2008 | | CAD | | | 2,050,000 | | | | 2,009,957 |
Mexican Fixed Rate Bonds, Series M-20, 8.000%, 12/07/2023 | | MXN | | | 140,000 | (††) | | | 1,369,514 |
Mexican Fixed Rate Bonds, Series MI-10, 9.000%, 12/20/2012 | | MXN | | | 460,000 | (††) | | | 4,599,244 |
New South Wales Treasury Corp., Series 10RG, 7.000%, 12/01/2010 | | AUD | | | 26,250 | | | | 2,408,074 |
New South Wales Treasury Corp., Series 12RG, 6.000%, 5/01/2012 | | AUD | | | 1,355,000 | | | | 1,200,503 |
| | | | | | | | | |
| | | | | | | | | 21,971,761 |
| | | | | | | | | |
96
PORTFOLIO OF INVESTMENTS – as of March 31, 2008 (Unaudited)
Loomis Sayles Investment Grade Fixed Income Fund – continued
| | | | | | | |
| | | | | Principal Amount (‡) | | Value (†) |
| | | | | | | |
| | | |
| BONDS AND NOTES – continued | | | | | | | |
| | | |
| Supranational – 3.4% | | | | | | | |
European Investment Bank, 4.600%, 1/30/2037, 144A | | CAD | | 1,900,000 | | $ | 1,791,436 |
Inter-American Development Bank, Series EMTN, Zero Coupon Bond, 5/11/2009 | | BRL | | 9,000,000 | | | 4,328,945 |
Inter-American Development Bank, Series EMTN, 6.000%, 12/15/2017 | | NZD | | 4,375,000 | | | 3,094,906 |
| | | | | | | |
| | | | | | | 9,215,287 |
| | | | | | | |
| Technology – 4.2% | | | | | | | |
Avnet, Inc., 6.000%, 9/01/2015 | | | | 1,970,000 | | | 1,974,712 |
Avnet, Inc., 6.625%, 9/15/2016 | | | | 270,000 | | | 278,701 |
Corning, Inc., 6.850%, 3/01/2029 | | | | 10,000 | | | 10,189 |
Corning, Inc., 7.250%, 8/15/2036 | | | | 1,565,000 | | | 1,688,162 |
Dun & Bradstreet Corp., 6.000%, 4/01/2013 | | | | 1,970,000 | | | 1,975,863 |
International Business Machines Corp., 4.750%, 11/29/2012 | | | | 795,000 | | | 822,793 |
Intuit, Inc., 5.750%, 3/15/2017 | | | | 635,000 | | | 615,148 |
Koninklijke (Royal) Philips Electronics N.V., 6.875%, 3/11/2038 | | | | 2,745,000 | | | 2,928,012 |
Motorola, Inc., 5.220%, 10/01/2097 | | | | 1,000,000 | | | 539,180 |
Motorola, Inc., 6.500%, 9/01/2025 | | | | 190,000 | | | 156,021 |
Samsung Electronics Co. Ltd., 7.700%, 10/01/2027, 144A | | | | 500,000 | | | 544,045 |
| | | | | | | |
| | | | | | | 11,532,826 |
| | | | | | | |
| Textile – 0.2% | | | | | | | |
Kellwood Co., 7.625%, 10/15/2017(e) | | | | 1,000,000 | | | 650,000 |
| | | | | | | |
| Tobacco – 0.3% | | | | | | | |
Reynolds American, Inc., 6.750%, 6/15/2017 | | | | 735,000 | | | 743,425 |
Reynolds American, Inc., 7.250%, 6/15/2037 | | | | 195,000 | | | 193,032 |
| | | | | | | |
| | | | | | | 936,457 |
| | | | | | | |
| Transportation Services – 1.5% | | | | | | | |
APL Ltd., 8.000%, 1/15/2024(e) | | | | 100,000 | | | 81,250 |
Atlas Air, Inc., Series B, 7.680%, 1/02/2014(f) | | | | 3,429,237 | | | 3,977,915 |
| | | | | | | |
| | | | | | | 4,059,165 |
| | | | | | | |
| Treasuries – 3.6% | | | | | | | |
U.S. Treasury Bonds, 4.750%, 2/15/2037(b) | | | | 1,390,000 | | | 1,495,010 |
U.S. Treasury Bonds, 5.375%, 2/15/2031(b) | | | | 5,985,000 | | | 6,922,024 |
United States Treasury Bond, 6.000%, 2/15/2026(b) | | | | 330,000 | | | 399,712 |
United States Treasury Note, 4.250%, 11/15/2013(b) | | | | 330,000 | | | 360,113 |
United States Treasury STRIP, Zero Coupon Bond, 2/15/2036(b) | | | | 1,885,000 | | | 557,325 |
| | | | | | | |
| | | | | | | 9,734,184 |
| | | | | | | |
| Wireless – 1.2% | | | | | | | |
America Movil SAB de CV, 4.125%, 3/01/2009 | | | | 500,000 | | | 501,000 |
Nextel Communications, Inc., Series E, 6.875%, 10/31/2013 | | | | 140,000 | | | 110,600 |
97
| | | | | | | | |
| | | | | Principal Amount (‡) | | Value (†) |
| | | | | | | | |
| | | |
| BONDS AND NOTES – continued | | | | | | | | |
| | | |
| Wireless – continued | | | | | | | | |
Nextel Communications, Inc., Series F, 5.950%, 3/15/2014 | | | | $ | 470,000 | | $ | 347,800 |
Sprint Capital Corp., 6.875%, 11/15/2028 | | | | | 359,000 | | | 267,455 |
Sprint Nextel Corp., 6.000%, 12/01/2016 | | | | | 366,000 | | | 284,565 |
Telefonica Emisones SAU, 6.421%, 6/20/2016 | | | | | 185,000 | | | 189,610 |
Vodafone Group Plc, 6.150%, 2/27/2037 | | | | | 1,725,000 | | | 1,607,866 |
| | | | | | | | |
| | | | | | | | 3,308,896 |
| | | | | | | | |
| Wirelines – 5.5% | | | | | | | | |
AT&T Corp., 6.500%, 3/15/2029 | | | | | 1,310,000 | | | 1,268,793 |
AT&T, Inc., 6.150%, 9/15/2034 | | | | | 545,000 | | | 523,489 |
AT&T, Inc., 6.500%, 9/01/2037 | | | | | 965,000 | | | 954,570 |
BellSouth Corp., 6.000%, 11/15/2034(b) | | | | | 1,875,000 | | | 1,760,713 |
GTE Corp., 6.940%, 4/15/2028 | | | | | 50,000 | | | 50,468 |
New England Telephone & Telegraph, 7.875%, 11/15/2029 | | | | | 570,000 | | | 624,877 |
Qwest Capital Funding, Inc., 6.500%, 11/15/2018 | | | | | 500,000 | | | 405,000 |
Telefonica Emisiones SAU, 7.045%, 6/20/2036 | | | | | 4,075,000 | | | 4,260,608 |
Verizon Communications, 5.850%, 9/15/2035 | | | | | 3,715,000 | | | 3,384,191 |
Verizon Maryland, Inc., 5.125%, 6/15/2033 | | | | | 290,000 | | | 232,283 |
Verizon New York, Inc., Series B, 7.375%, 4/01/2032 | | | | | 1,110,000 | | | 1,160,300 |
Verizon Virginia, Inc., Series A, 4.625%, 3/15/2013 | | | | | 505,000 | | | 490,998 |
| | | | | | | | |
| | | | | | | | 15,116,290 |
| | | | | | | | |
| | | |
| TOTAL NON-CONVERTIBLE BONDS | | | | | | | | |
(Identified Cost $224,389,322) | | | | | | | | 229,647,817 |
| | | | | | | | |
| | | |
| CONVERTIBLE BONDS – 0.9% | | | | | | | | |
| | | |
| Independent Energy – 0.4% | | | | | | | | |
Devon Energy Corp., 4.900%, 8/15/2008 | | | | | 200,000 | | | 319,000 |
Devon Energy Corp., 4.950%, 8/15/2008 | | | | | 500,000 | | | 797,500 |
| | | | | | | | |
| | | | | | | | 1,116,500 |
| | | | | | | | |
| Non-Captive Consumer – 0.1% | | | | | | | | |
Countrywide Financial Corp., Series A, 0.758%, 4/15/2037(d)(b) | | | | | 99,000 | | | 87,615 |
Countrywide Financial Corp., Series B, 0.815%, 5/15/2037(d) | | | | | 265,000 | | | 226,575 |
| | | | | | | | |
| | | | | | | | 314,190 |
| | | | | | | | |
| Pharmaceuticals – 0.2% | | | | | | | | |
Vertex Pharmaceuticals, Inc., 4.750%, 2/15/2013(b) | | | | | 298,000 | | | 355,365 |
Watson Pharmaceuticals, Inc., 1.750%, 3/15/2023(b) | | | | | 125,000 | | | 120,312 |
| | | | | | | | |
| | | | | | | | 475,677 |
| | | | | | | | |
| Technology – 0.2% | | | | | | | | |
Avnet, Inc., 2.000%, 3/15/2034(b) | | | | | 430,000 | | | 483,750 |
Maxtor Corp., 5.750%, 3/01/2012(e) | | | | | 54,000 | | | 50,760 |
Richardson Electronics, Ltd., 7.750%, 12/15/2011 | | | | | 44,000 | | | 40,480 |
| | | | | | | | |
| | | | | | | | 574,990 |
| | | | | | | | |
| Transportation Services – 0.0% | | | | | | | | |
Builders Transportation, Inc., 6.500%, 5/01/2011(g) | | | | | 129,000 | | | — |
| | | | | | | | |
98
PORTFOLIO OF INVESTMENTS – as of March 31, 2008 (Unaudited)
Loomis Sayles Investment Grade Fixed Income Fund – continued
| | | | | | | | |
| | | | | Shares | | Value (†) |
| | | | | | | | |
| | | |
| BONDS AND NOTES – continued | | | | | | | | |
| | | |
| TOTAL CONVERTIBLE BONDS | | | | | | | | |
(Identified Cost $2,024,182) | | | | | | | $ | 2,481,357 |
| | | | | | | | |
| | | |
| MUNICIPALS – 0.6% | | | | | | | | |
| | | |
| Michigan – 0.4% | | | | | | | | |
Michigan Tobacco Settlement Finance Authority, 7.309%, 6/01/2034 | | | | | 1,110,000 | | | 1,078,110 |
| | | | | | | | |
| Ohio – 0.2% | | | | | | | | |
Buckeye Ohio Tobacco Settlement, Series A-2,
5.875%, 6/01/2047 | | | | | 750,000 | | | 659,910 |
| | | | | | | | |
| | | |
| TOTAL MUNICIPALS | | | | | | | | |
(Identified Cost $1,838,109) | | | | | | | | 1,738,020 |
| | | | | | | | |
| | | |
| TOTAL BONDS AND NOTES | | | | | | | | |
(Identified Cost $228,251,613) | | | | | | | | 233,867,194 |
| | | | | | | | |
| | | |
| PREFERRED STOCKS – 0.6% | | | | | | | | |
| | | |
| NON-CONVERTIBLE PREFERRED STOCKS – 0.1% | | | | | | | | |
| | | |
| Electric Utilities – 0.1% | | | | | | | | |
Connecticut Light & Power Co., 2.200% | | | | | 263 | | | 9,927 |
MDU Resources Group, Inc., 5.100% | | | | | 307 | | | 30,729 |
Public Service Electric & Gas Co., 4.080%(b) | | | | | 400 | | | 30,460 |
San Diego Gas & Electric Co., 4.500% | | | | | 100 | | | 1,815 |
Union Electric Co., 4.500% | | | | | 3,160 | | | 230,680 |
| | | |
| TOTAL NON-CONVERTIBLE PREFERRED STOCKS | | | | | | | | |
(Identified Cost $222,664) | | | | | | | | 303,611 |
| | | | | | | | |
| | | |
| CONVERTIBLE PREFERRED STOCKS – 0.5% | | | | | | | | |
| | | |
| Capital Markets – 0.5% | | | | | | | | |
Newell Financial Trust I, 5.250%, 12/01/2027 | | | | | | | | |
(Identified Cost $1,294,828) | | | | | 33,050 | | | 1,495,513 |
| | | | | | | | |
| | | |
| TOTAL PREFERRED STOCKS | | | | | | | | |
(Identified Cost $1,517,492) | | | | | | | | 1,799,124 |
| | | | | | | | |
| | | |
| | | | | Principal Amount (‡) | | |
| | | |
| SHORT-TERM INVESTMENTS – 21.9% | | | | | | | | |
| Tri-Party Repurchase Agreement with Fixed Income Clearing Corporation, dated 3/31/08 at 1.250% to be repurchased at $40,978,423 on 4/01/08 collateralized by $41,645,000 Federal Home Loan Mortgage Corp., 3.375% due 3/5/2010 valued at $41,801,169 including accrued interest (Note 2h Notes to Financial Statements) | | | | $ | 40,977,000 | | | 40,977,000 |
| | | | | | | | |
| | | |
| | | | | Shares | | |
State Street Navigator Securities Lending Prime Portfolio(h) | | | | | 18,933,811 | | | 18,933,811 |
| | | | | | | | |
| | | |
| TOTAL SHORT-TERM INVESTMENT | | | | | | | | |
(Identified Cost $59,910,811) | | | | | | | | 59,910,811 |
| | | | | | | | |
99
| | | | | | | |
| | | | | | | Value (†) |
| | | |
| TOTAL INVESTMENTS – 107.9% | | | | | | | |
(Identified Cost $289,679,916)(a) | | | | | | $ | 295,577,129 |
Other assets less liabilities—(7.9)% | | | | | | | (21,662,730) |
| | | | | | | |
| | | |
| NET ASSETS – 100.0% | | | | | | | 273,914,399 |
| | | | | | | |
| |
(‡) Principal amount stated in U.S. dollars unless otherwise noted. | | | |
(†) See Note 2a of Notes to Financial Statements. | | | |
(††) Amount shown represents units. One unit represents a principal amount of 100. | | | |
(a) Federal Tax Information (Amounts exclude certain adjustments made at the end of the Fund’s fiscal year for tax purposes. Such adjustments are primarily due to wash sales. Amortization of premium on debt securities is excluded for tax purposes.): At March 31, 2008, the net unrealized appreciation on investments based on a cost of $289,906,399 for federal income tax purposes was as follows: | | | |
Aggregate gross unrealized appreciation for all investments in which there is an excess of value over tax cost | | $ | 13,769,863 |
Aggregate gross unrealized depreciation for all investments in which there is an excess of tax cost over value | | | (8,099,133) |
| | | | | | | |
Net unrealized appreciation | | | | | | $ | 5,670,730 |
| | | | | | | |
| (b) | All or a portion of this security was on loan to brokers at March 31, 2008. |
| (c) | Step Bond: Coupon is a fixed rate for an initial period then resets at a specified date and rate. |
| (d) | Variable rate security. Rate as of March 31, 2008 is disclosed. |
| (e) | Illiquid security. At March 31, 2008, the value of these securities amounted to $828,141 or 0.3% of net assets. |
| (f) | Non-income producing security. |
| (g) | Bankrupt issuer. Security remains in the Portfolio of Investments pending final resolution of bankruptcy proceedings. |
| (h) | Represents investment of securities lending collateral. |
| 144A | Securities exempt from registration under Rule 144A of the Securities Act of 1933. These securities may be resold in transactions exempt from registration, normally to qualified institutional buyers. At March 31, 2008, the total value of these securities amounted to $34,358,886 or 12.5% of total net assets. |
| EMTN | Euro Medium Term Note |
Key to Abbreviations: AUD: Australian Dollar; BRL: Brazilian Real; CAD: Canadian Dollar; IDR: Indonesian Rupiah; ISK: Iceland Krona; KRW: South Korean Won; MXN: Mexican Peso; MYR: Malaysian Ringgit; NZD: New Zealand Dollar; THB: Thailand Baht
HOLDINGS AT MARCH 31, 2008 AS A PERCENTAGE OF NET ASSETS (Unaudited)
| | | |
Banking | | 8.1 | % |
Sovereigns | | 8.0 | |
Mortgage Related | | 7.4 | |
Wirelines | | 5.5 | |
Technology | | 4.4 | |
Non-Captive Diversified | | 3.9 | |
Treasuries | | 3.6 | |
Supranational | | 3.4 | |
Electric | | 3.3 | |
Home Construction | | 3.0 | |
Media Cable | | 2.3 | |
Independent Energy | | 2.3 | |
Airline | | 2.1 | |
Other, less than 2% each | | 28.7 | |
CURRENCY EXPOSURE AT MARCH 31, 2008 AS A PERCENTAGE OF NET ASSETS (Unaudited)
| | | |
United States Dollar | | 64.2 | % |
Canadian Dollar | | 6.4 | |
Brazilian Real | | 3.8 | |
New Zealand Dollar | | 3.0 | |
Mexican Peso | | 2.2 | |
Other, less than 2% each | | 6.4 | |
See accompanying notes to financial statements.
100
STATEMENTS OF ASSETS AND LIABILITIES
March 31, 2008 (Unaudited)
| | | | | | | |
| | | Bond Fund | | | Fixed Income Fund |
| | | | | | | |
Assets | | | | | | | |
Investments at cost | | $ | 18,093,920,665 | | | $ | 632,210,736 |
Net unrealized appreciation (depreciation) | | | (225,887,119 | ) | | | 14,013,968 |
| | | | | | | |
Investments at value | | | 17,868,033,546 | | | | 646,224,704 |
Cash | | | 1,164,342 | | | | 600 |
Foreign currency at value (identified cost $7,727,453, $238,427, $42,863,198, $0, $77,549, $0 and $162,732) | | | 7,628,994 | | | | 235,329 |
Receivable for Fund shares sold | | | 51,919,599 | | | | — |
Receivable for securities sold | | | 841,357 | | | | — |
Receivable for forward foreign currency exchange contracts | | | — | | | | — |
Dividends and interest receivable | | | 263,370,461 | | | | 8,569,013 |
Tax reclaims receivable | | | — | | | | 1,557 |
Receivable from investment adviser (Note 4) | | | — | | | | — |
Securities lending income receivable | | | 752,694 | | | | 14,768 |
Receivable from broker—variation margin on open futures contracts | | | — | | | | — |
Other assets | | | 2,248 | | | | — |
| | | | | | | |
Total Assets | | | 18,193,713,241 | | | | 655,045,971 |
| | | | | | | |
| | |
| Liabilities | | | | | | | |
Collateral on securities loaned, at value (Note 2) | | | 1,075,922,564 | | | | 22,359,618 |
Payable for securities purchased | | | 111,112,601 | | | | 2,520,133 |
Payable for Fund shares redeemed | | | 14,618,026 | | | | 5,045,394 |
Foreign taxes payable | | | 307,081 | | | | 21,965 |
Management fees payable (Note 4) | | | 7,644,485 | | | | 267,312 |
Administrative fees payable (Note 4) | | | 1,396,604 | | | | 51,938 |
Deferred Trustees’ fees (Note 4) | | | 643,835 | | | | 88,688 |
Service and distribution fees payable (Note 4) | | | 174,383 | | | | — |
Payable to broker—variation margin on open futures contracts | | | — | | | | — |
Payable for forward foreign currency exchange contracts | | | — | | | | — |
Other accounts payable and accrued expenses | | | 1,551,849 | | | | 19,565 |
| | | | | | | |
Total Liabilities | | | 1,213,371,428 | | | | 30,374,613 |
| | | | | | | |
Net Assets | | $ | 16,980,341,813 | | | $ | 624,671,358 |
| | | | | | | |
Net Assets consist of: | | | | | | | |
Paid-in capital | | $ | 16,959,882,969 | | | $ | 594,455,281 |
Undistributed (Overdistributed) net investment income (loss) | | | (2,011,930 | ) | | | 8,867,345 |
Accumulated net realized gain (loss) on investments, futures contracts and foreign currency transactions | | | 250,171,564 | | | | 7,462,274 |
Net unrealized appreciation (depreciation) on investments, futures contracts and foreign currency translations | | | (227,700,790 | ) | | | 13,886,458 |
| | | | | | | |
Net Assets | | $ | 16,980,341,813 | | | $ | 624,671,358 |
| | | | | | | |
| | |
| Net Asset Value and Offering Price | | | | | | | |
Institutional Class | | | | | | | |
Net assets | | $ | 8,696,777,237 | | | $ | 624,671,358 |
| | | | | | | |
Shares of beneficial interest | | | 616,718,920 | | | | 46,542,039 |
| | | | | | | |
Net asset value, offering and redemption price per share | | $ | 14.10 | | | $ | 13.42 |
| | | | | | | |
Retail Class | | | | | | | |
Net assets | | $ | 8,053,192,720 | | | $ | — |
| | | | | | | |
Shares of beneficial interest | | | 572,825,967 | | | | — |
| | | | | | | |
Net asset value, offering and redemption price per share | | $ | 14.06 | | | $ | — |
| | | | | | | |
Admin Class | | | | | | | |
Net assets | | $ | 230,371,856 | | | $ | — |
| | | | | | | |
Shares of beneficial interest | | | 16,419,004 | | | | — |
| | | | | | | |
Net asset value, offering and redemption price per share | | $ | 14.03 | | | $ | — |
| | | | | | | |
Value of securities on loan (Note 2) | | $ | 1,057,109,090 | | | $ | 21,983,955 |
| | | | | | | |
See accompanying notes to financial statements.
101
| | | | | | | | | | | | | | | | | |
| Global Bond Fund | | | Inflation Protected
Securities Fund | | | Institutional High
Income Fund | | | Intermediate Duration
Fixed Income Fund | | | Investment Grade
Fixed Income Fund |
| | | | | | | | | | | | | | | | | |
| | | | | | | | | | | | | | | | | |
| $ | 2,594,679,991 | | | $ | 19,966,165 | | | $ | 207,475,980 | | | $ | 42,318,168 | | | $ | 289,679,916 |
| | 121,182,122 | | | | 619,239 | | | | (1,824,177 | ) | | | (241,144 | ) | | | 5,897,213 |
| | 2,715,862,113 | | | | 20,585,404 | | | | 205,651,803 | | | | 42,077,024 | | | | 295,577,129 |
| | 87,348 | | | | 983 | | | | 290 | | | | 7,665 | | | | 358 |
| 43,856,226 | | | | — | | | | 77,549 | | | | — | | | | 160,240 |
| | 7,659,209 | | | | 9,306 | | | | 212,528 | | | | 36,476 | | | | — |
| | 19,691,090 | | | | — | | | | 45,882 | | | | 87,206 | | | | — |
| | 1,123,091 | | | | — | | | | — | | | | — | | | | — |
| | 31,248,652 | | | | 130,353 | | | | 3,332,970 | | | | 333,663 | | | | 2,821,317 |
| | 69,848 | | | | — | | | | — | | | | — | | | | — |
| | — | | | | 7,169 | | | | — | | | | 5,098 | | | | — |
| | 277,348 | | | | 3,042 | | | | 15,028 | | | | 6,543 | | | | 10,620 |
| | — | | | | — | | | | — | | | | 2,250 | | | | — |
| | — | | | | — | | | | — | | | | — | | | | — |
| | 2,819,874,925 | | | | 20,736,257 | | | | 209,336,050 | | | | 42,555,925 | | | | 298,569,664 |
| | | | |
| | | | | | | | | | | | | | | | | |
| | 283,468,823 | | | | 4,165,445 | | | | 19,821,388 | | | | 7,600,779 | | | | 18,933,811 |
| | 20,041,362 | | | | — | | | | 218,900 | | | | 89,852 | | | | 5,021,657 |
| | 2,145,898 | | | | 133 | | | | 24,852 | | | | — | | | | 500,664 |
| | — | | | | — | | | | 6,095 | | | | — | | | | 8,689 |
| | 1,300,552 | | | | 3,362 | | | | 98,889 | | | | 7,352 | | | | 91,726 |
| | 198,382 | | | | 1,289 | | | | 16,510 | | | | 2,877 | | | | 22,322 |
| | 158,448 | | | | 37,556 | | | | 50,678 | | | | 40,957 | | | | 58,876 |
| | 24,036 | | | | — | | | | — | | | | — | | | | — |
| | 39,844 | | | | — | | | | — | | | | — | | | | — |
| | 35,777 | | | | — | | | | — | | | | — | | | | — |
| | 44,051 | | | | 19,466 | | | | 18,037 | | | | 19,869 | | | | 17,520 |
| | 307,457,173 | | | | 4,227,251 | | | | 20,255,349 | | | | 7,761,686 | | | | 24,655,265 |
| $ | 2,512,417,752 | | | $ | 16,509,006 | | | $ | 189,080,701 | | | $ | 34,794,239 | | | $ | 273,914,399 |
| | | | |
| | | | | | | | | | | | | | | | | |
| $ | 2,373,698,706 | | | $ | 16,154,834 | | | $ | 185,852,254 | | | $ | 35,616,102 | | | $ | 262,874,640 |
| | (1,059,916 | ) | | | (19,549 | ) | | | 3,031,128 | | | | (15,616 | ) | | | 5,524 |
| 15,826,313 | | | | (245,604 | ) | | | 2,047,988 | | | | (603,913 | ) | | | 5,155,214 |
| 123,952,649 | | | | 619,325 | | | | (1,850,669 | ) | | | (202,334 | ) | | | 5,879,021 |
| $ | 2,512,417,752 | | | $ | 16,509,006 | | | $ | 189,080,701 | | | $ | 34,794,239 | | | $ | 273,914,399 |
| | | | |
| | | | | | | | | | | | | | | | | |
| | | | |
| | | | | | | | | | | | | | | | | |
| $ | 1,335,171,998 | | | $ | 16,509,006 | | | $ | 189,080,701 | | | $ | 34,794,239 | | | $ | 273,914,399 |
| | 81,092,647 | | | | 1,509,055 | | | | 24,898,681 | | | | 3,649,153 | | | | 21,409,486 |
| $ | 16.46 | | | $ | 10.94 | | | $ | 7.59 | | | $ | 9.53 | | | $ | 12.79 |
| | | | |
| | | | | | | | | | | | | | | | | |
| $ | 1,177,245,754 | | | $ | — | | | $ | — | | | $ | — | | | $ | — |
| | 72,068,698 | | | | — | | | | — | | | | — | | | | — |
| $ | 16.34 | | | $ | — | | | $ | — | | | $ | — | | | $ | — |
| | | | |
| | | | | | | | | | | | | | | | | |
| $ | — | | | $ | — | | | $ | — | | | $ | — | | | $ | — |
| | — | | | | — | | | | — | | | | — | | | | — |
| $ | — | | | $ | — | | | $ | — | | | $ | — | | | $ | — |
| $ | 278,294,925 | | | $ | 4,109,991 | | | $ | 19,743,246 | | | $ | 7,457,396 | | | $ | 18,618,521 |
See accompanying notes to financial statements.
102
STATEMENTS OF OPERATIONS
For the Six Months Ended March 31, 2008 (Unaudited)
| | | | | | | | |
| | | Bond Fund | | | Fixed Income Fund | |
| | | | | | | | |
Investment Income | | | | | | | | |
Dividends | | $ | 16,766,291 | | | $ | 433,713 | |
Interest | | | 543,591,242 | | | | 20,819,575 | |
Securities lending income (Note 2) | | | 5,799,439 | | | | 118,160 | |
Less net foreign taxes withheld | | | (53,651 | ) | | | (1,905 | ) |
| | | | | | | | |
| | | 566,103,321 | | | | 21,369,543 | |
| | | | | | | | |
| | |
| Expenses | | | | | | | | |
Management fees (Note 4) | | | 41,533,341 | | | | 1,544,516 | |
Distribution fees—Retail Class (Note 4) | | | 9,304,102 | | | | — | |
Service and distribution fees—Admin Class (Note 4) | | | 543,762 | | | | — | |
Trustees’ fees and expenses (Note 4) | | | 150,718 | | | | 11,476 | |
Administrative fees (Note 4) | | | 4,193,824 | | | | 161,668 | |
Custodian fees and expenses | | | 450,299 | | | | 26,654 | |
Transfer agent fees and expenses—Institutional Class (Note 4) | | | 1,975,436 | | | | 1,167 | |
Transfer agent fees and expenses—Retail Class (Note 4) | | | 3,534,010 | | | | — | |
Transfer agent fees and expenses—Admin Class (Note 4) | | | 137,580 | | | | — | |
Audit and tax services fees | | | 24,673 | | | | 20,861 | |
Registration fees | | | 415,948 | | | | 18,100 | |
Shareholder reporting expenses | | | 819,603 | | | | 1,653 | |
Legal fees | | | 168,146 | | | | 7,894 | |
Expense recapture—Retail Class (Note 4) | | | 215,069 | | | | — | |
Miscellaneous expenses | | | 168,131 | | | | 8,766 | |
| | | | | | | | |
Total expenses | | | 63,634,642 | | | | 1,802,755 | |
Less fee reduction and/or expense reimbursement (Note 4) | | | (225,974 | ) | | | (7,812 | ) |
| | | | | | | | |
Net expenses | | | 63,408,668 | | | | 1,794,943 | |
| | | | | | | | |
Net investment income | | | 502,694,653 | | | | 19,574,600 | |
| | | | | | | | |
| | |
| Net Realized And Unrealized Gain (Loss) On Investments, Futures Contracts and Foreign Currency Transactions | | | | | | | | |
Net Realized Gain (Loss) on: | | | | | | | | |
Investments | | | 266,025,373 | | | | 8,909,294 | |
Futures contracts | | | — | | | | — | |
Foreign currency transactions | | | 2,638,742 | | | | 37,475 | |
| | |
| Net Change in Unrealized Appreciation (Depreciation) on: | | | | | | | | |
Investments* | | | (920,932,991 | ) | | | (28,163,799 | ) |
Futures contracts | | | — | | | | — | |
Foreign currency translations | | | (3,785,785 | ) | | | (161,202 | ) |
| | | | | | | | |
Net realized and unrealized gain (loss) on investments, futures contracts and foreign currency transactions | | | (656,054,661 | ) | | | (19,378,232 | ) |
| | | | | | | | |
| | |
| Net Increase (Decrease) in Net Assets Resulting from Operations | | $ | (153,360,008 | ) | | $ | 196,368 | |
| | | | | | | | |
| * | Including change in foreign capital gains tax accrual of $(307,081), $(21,965), $(6,095), and $(8,689) on Bond Fund, Fixed Income Fund, Institutional High Income Fund and Investment Grade Fixed Income Fund, respectively. |
See accompanying notes to financial statements.
103
| | | | | | | | | | | | | | | | | | |
| Global Bond Fund | | | Inflation Protected
Securities Fund | | | Institutional High
Income Fund | | | Intermediate Duration
Fixed Income Fund | | | Investment Grade
Fixed Income Fund | |
| | | | | | | | | | | | | | | | | | |
| | | | | | | | | | | | | | | | | | |
| $ | 819,765 | | | $ | 3,013 | | | $ | 407,731 | | | $ | — | | | $ | 52,761 | |
| | 51,513,426 | | | | 348,719 | | | | 7,599,078 | | | | 898,406 | | | | 8,165,633 | |
| | 637,783 | | | | 12,618 | | | | 130,698 | | | | 26,607 | | | | 73,966 | |
| | (47,282 | ) | | | — | | | | (182 | ) | | | — | | | | — | |
| | 52,923,692 | | | | 364,350 | | | | 8,137,325 | | | | 925,013 | | | | 8,292,360 | |
| | | | |
| | | | | | | | | | | | | | | | | | |
| | 5,944,132 | | | | 18,445 | | | | 606,886 | | | | 42,602 | | | | 531,268 | |
| | 1,276,167 | | | | — | | | | — | | | | — | | | | — | |
| | — | | | | — | | | | — | | | | — | | | | — | |
| | 25,072 | | | | 4,952 | | | | 6,885 | | | | 5,203 | | | | 7,704 | |
| | 571,420 | | | | 3,860 | | | | 52,953 | | | | 8,917 | | | | 69,513 | |
| | 102,728 | | | | 8,627 | | | | 13,991 | | | | 9,587 | | | | 16,541 | |
| | 94,486 | | | | 3,119 | | | | 3,308 | | | | 811 | | | | 703 | |
| | 467,084 | | | | — | | | | — | | | | — | | | | — | |
| | — | | | | — | | | | — | | | | — | | | | — | |
| | 22,294 | | | | 18,880 | | | | 19,957 | | | | 17,554 | | | | 18,268 | |
| | 67,154 | | | | 14,212 | | | | 17,941 | | | | 13,825 | | | | 14,999 | |
| | 65,013 | | | | 417 | | | | 2,220 | | | | 1,035 | | | | 1,029 | |
| | 23,097 | | | | 181 | | | | 2,453 | | | | 520 | | | | 3,031 | |
| | 176,808 | | | | — | | | | — | | | | — | | | | — | |
| | 24,647 | | | | 2,068 | | | | 4,007 | | | | 2,288 | | | | 4,796 | |
| | 8,860,102 | | | | 74,761 | | | | 730,601 | | | | 102,342 | | | | 667,852 | |
| | (27,658 | ) | | | (45,252 | ) | | | (2,558 | ) | | | (34,178 | ) | | | (3,359 | ) |
| | 8,832,444 | | | | 29,509 | | | | 728,043 | | | | 68,164 | | | | 664,493 | |
| | 44,091,248 | | | | 334,841 | | | | 7,409,282 | | | | 856,849 | | | | 7,627,867 | |
| | | | |
| | | | | | | | | | | | | | | | | | |
| | | | | | | | | | | | | | | | | | |
| | 28,738,526 | | | | 82,687 | | | | 2,351,463 | | | | 122,544 | | | | 2,002,708 | |
| | (714,604 | ) | | | — | | | | — | | | | 57,191 | | | | — | |
| | 2,016,356 | | | | 466 | | | | 10,119 | | | | (649 | ) | | | 3,898,855 | |
| | | | |
| | | | | | | | | | | | | | | | | | |
| | 69,435,294 | | | | 789,858 | | | | (14,679,771 | ) | | | 20,959 | | | | (6,717,386 | ) |
| | (563,988 | ) | | | — | | | | — | | | | 38,796 | | | | — | |
| | 1,735,851 | | | | (750 | ) | | | (30,357 | ) | | | 14 | | | | (41,534 | ) |
| 100,647,435 | | | | 872,261 | | | | (12,348,546 | ) | | | 238,855 | | | | (857,357 | ) |
| | | | |
| $ | 144,738,683 | | | $ | 1,207,102 | | | $ | (4,939,264 | ) | | $ | 1,095,704 | | | $ | 6,770,510 | |
See accompanying notes to financial statements.
104
STATEMENTS OF CHANGES IN NET ASSETS
Bond Fund
| | | | | | | | |
| | | Six Months Ended
March 31, 2008
(Unaudited) | | | Year Ended
September 30, 2007 | |
From Operations: | | | | | | | | |
Net investment income | | $ | 502,694,653 | | | $ | 602,981,854 | |
Net realized gain on investments and foreign currency transactions | | | 268,664,115 | | | | 141,128,552 | |
Net change in net unrealized appreciation (depreciation) on investments and foreign currency translations | | | (924,718,776 | ) | | | 288,741,579 | |
| | | | | | | | |
Increase (decrease) in net assets from operations | | | (153,360,008 | ) | | | 1,032,851,985 | |
| | | | | | | | |
From Distributions to Shareholders: | | | | | | | | |
Net Investment Income: | | | | | | | | |
Institutional Class | | | (298,335,850 | ) | | | (367,518,277 | ) |
Retail Class | | | (256,363,877 | ) | | | (254,215,109 | ) |
Admin Class | | | (7,179,816 | ) | | | (8,202,969 | ) |
Capital Gains: | | | | | | | | |
Institutional Class | | | — | | | | — | |
Retail Class | | | — | | | | — | |
Admin Class | | | — | | | | — | |
| | | | | | | | |
Total distributions | | | (561,879,543 | ) | | | (629,936,355 | ) |
| | | | | | | | |
Increase in Net Assets Derived from Capital Shares Transactions (Note 7) | | | 3,352,685,591 | | | | 6,856,379,181 | |
| | | | | | | | |
Redemption Fees | | | | | | | | |
Institutional Class | | | 339,157 | | | | 440,675 | |
Retail Class | | | 303,345 | | | | 303,180 | |
Admin Class | | | 8,867 | | | | 10,693 | |
| | | | | | | | |
Total increase in net assets | | | 2,638,097,409 | | | | 7,260,049,359 | |
Net Assets | | | | | | | | |
Beginning of period | | | 14,342,244,404 | | | | 7,082,195,045 | |
| | | | | | | | |
End of period | | $ | 16,980,341,813 | | | $ | 14,342,244,404 | |
| | | | | | | | |
Undistributed (Overdistributed) Net Investment Income (Loss) | | $ | (2,011,930 | ) | | $ | 57,172,960 | |
| | | | | | | | |
Fixed Income Fund
| | | | | | | | |
| | | Six Months Ended
March 31, 2008
(Unaudited) | | | Year Ended
September 30, 2007 | |
From Operations: | | | | | | | | |
Net investment income | | $ | 19,574,600 | | | $ | 30,944,356 | |
Net realized gain on investments and foreign currency transactions | | | 8,946,769 | | | | 18,051,055 | |
Net change in net unrealized appreciation (depreciation) on investments and foreign currency translations | | | (28,325,001 | ) | | | 6,460,609 | |
| | | | | | | | |
Increase in net assets resulting from operations | | | 196,368 | | | | 55,456,020 | |
| | | | | | | | |
From Distributions to Shareholders: | | | | | | | | |
Net Investment Income: | | | | | | | | |
Institutional Class | | | (43,626,372 | ) | | | (30,011,559 | ) |
Capital Gains: | | | | | | | | |
Institutional Class | | | (643,688 | ) | | | — | |
| | | | | | | | |
Total distributions | | | (44,270,060 | ) | | | (30,011,559 | ) |
| | | | | | | | |
Increase in Net Assets Derived from Capital Shares Transactions (Note 7) | | | 63,644,613 | | | | 123,644,710 | |
| | | | | | | | |
Total increase in net assets | | | 19,570,921 | | | | 149,089,171 | |
Net Assets | | | | | | | | |
Beginning of period | | | 605,100,437 | | | | 456,011,266 | |
| | | | | | | | |
End of period | | $ | 624,671,358 | | | $ | 605,100,437 | |
| | | | | | | | |
Undistributed Net Investment Income | | $ | 8,867,345 | | | $ | 32,919,117 | |
| | | | | | | | |
See accompanying notes to financial statements.
105
Global Bond Fund
| | | | | | | | |
| | | Six Months Ended
March 31, 2008
(Unaudited) | | | Year Ended
September 30, 2007 | |
From Operations: | | | | | | | | |
Net investment income | | $ | 44,091,248 | | | $ | 55,241,500 | |
Net realized gain on investments, futures contracts and foreign currency transactions | | | 30,040,278 | | | | 14,783,271 | |
Net change in unrealized appreciation (depreciation) on investments, futures contracts and foreign currency translations | | | 70,607,157 | | | | 56,531,746 | |
| | | | | | | | |
Increase in net assets resulting from operations | | | 144,738,683 | | | | 126,556,517 | |
| | | | | | | | |
From Distributions to Shareholders: | | | | | | | | |
Net Investment Income: | | | | | | | | |
Institutional Class | | | (31,641,710 | ) | | | (46,911,889 | ) |
Retail Class | | | (26,260,410 | ) | | | (37,021,466 | ) |
Capital Gains: | | | | | | | | |
Institutional Class | | | — | | | | — | |
Retail Class | | | — | | | | — | |
| | | | | | | | |
Total distributions | | | (57,902,120 | ) | | | (83,933,355 | ) |
| | | | | | | | |
Increase in Net Assets Derived from Capital Shares Transactions (Note 7) | | | 554,858,405 | | | | 643,198,818 | |
| | | | | | | | |
Redemption Fees | | | | | | | | |
Institutional Class | | | 54,032 | | | | 59,521 | |
Retail Class | | | 47,604 | | | | 51,588 | |
| | | | | | | | |
Total increase in net assets | | | 641,796,604 | | | | 685,933,089 | |
Net Assets | | | | | | | | |
Beginning of period | | | 1,870,621,148 | | | | 1,184,688,059 | |
| | | | | | | | |
End of period | | $ | 2,512,417,752 | | | $ | 1,870,621,148 | |
| | | | | | | | |
Undistributed (Overdistributed) Net Investment Income (Loss) | | $ | (1,059,916 | ) | | $ | 12,750,956 | |
| | | | | | | | |
Inflation Protected Securities Fund
| | | | | | | | |
| | | Six Months Ended
March 31, 2008
(Unaudited) | | | Year Ended
September 30, 2007 | |
From Operations: | | | | | | | | |
Net investment income | | $ | 334,841 | | | $ | 535,955 | |
Net realized gain (loss) on investments and foreign currency transactions | | | 83,153 | | | | (18,387 | ) |
Net change in unrealized appreciation (depreciation) on investments and foreign currency translations | | | 789,108 | | | | 114,691 | |
| | | | | | | | |
Increase in net assets resulting from operations | | | 1,207,102 | | | | 632,259 | |
| | | | | | | | |
From Distributions to Shareholders: | | | | | | | | |
Net Investment Income: | | | | | | | | |
Institutional Class | | | (356,116 | ) | | | (595,612 | ) |
Capital Gains: | | | | | | | | |
Institutional Class | | | — | | | | — | |
| | | | | | | | |
Total distributions | | | (356,116 | ) | | | (595,612 | ) |
| | | | | | | | |
Increase in Net Assets Derived from Capital Shares Transactions (Note 7) | | | 2,190,412 | | | | 4,378,400 | |
| | | | | | | | |
Total increase in net assets | | | 3,041,398 | | | | 4,415,047 | |
Net Assets | | | | | | | | |
Beginning of period | | | 13,467,608 | | | | 9,052,561 | |
| | | | | | | | |
End of period | | $ | 16,509,006 | | | $ | 13,467,608 | |
| | | | | | | | |
Undistributed (Overdistributed) Net Investment Income (Loss) | | $ | (19,549 | ) | | $ | 1,726 | |
| | | | | | | | |
See accompanying notes to financial statements.
106
STATEMENTS OF CHANGES IN NET ASSETS – continued
Institutional High Income Fund
| | | | | | | | |
| | | Six Months Ended
March 31, 2008
(Unaudited) | | | Year Ended
September 30, 2007 | |
From Operations: | | | | | | | | |
Net investment income | | $ | 7,409,282 | | | $ | 10,809,328 | |
Net realized gain on investments and foreign currency transactions | | | 2,361,582 | | | | 8,148,235 | |
Net change in net unrealized appreciation (depreciation) on investments and foreign currency translations | | | (14,710,128 | ) | | | (3,394,602 | ) |
| | | | | | | | |
Increase (decrease) in net assets from operations | | | (4,939,264 | ) | | | 15,562,961 | |
| | | | | | | | |
From Distributions to Shareholders: | | | | | | | | |
Net Investment Income: | | | | | | | | |
Institutional Class | | | (12,543,920 | ) | | | (9,165,373 | ) |
Capital Gains: | | | | | | | | |
Institutional Class | | | (3,556,542 | ) | | | — | |
| | | | | | | | |
Total distributions | | | (16,100,462 | ) | | | (9,165,373 | ) |
| | | | | | | | |
Increase in Net Assets Derived from Capital Shares Transactions (Note 7) | | | 22,551,992 | | | | 39,853,081 | |
| | | | | | | | |
Total increase in net assets | | | 1,512,266 | | | | 46,250,669 | |
Net Assets | | | | | | | | |
Beginning of period | | | 187,568,435 | | | | 141,317,766 | |
| | | | | | | | |
End of period | | $ | 189,080,701 | | | $ | 187,568,435 | |
| | | | | | | | |
Undistributed Net Investment Income | | $ | 3,031,128 | | | $ | 8,165,766 | |
| | | | | | | | |
Intermediate Duration Fixed Income Fund
| | | | | | | | |
| | | Six Months Ended
March 31, 2008
(Unaudited) | | | Year Ended
September 30, 2007 | |
From Operations: | | | | | | | | |
Net investment income | | $ | 856,849 | | | $ | 1,737,447 | |
Net realized gain (loss) on investments, futures contracts and foreign currency transactions | | | 179,086 | | | | (82,683 | ) |
Net change in unrealized appreciation (depreciation) on investments, futures contracts and foreign currency translations | | | 59,769 | | | | 42,252 | |
| | | | | | | | |
Increase in net assets resulting from operations | | | 1,095,704 | | | | 1,697,016 | |
| | | | | | | | |
From Distributions to Shareholders: | | | | | | | | |
Net Investment Income: | | | | | | | | |
Institutional Class | | | (877,378 | ) | | | (1,835,942 | ) |
Capital Gains: | | | | | | | | |
Institutional Class | | | — | | | | — | |
| | | | | | | | |
Total distributions | | | (877,378 | ) | | | (1,835,942 | ) |
| | | | | | | | |
Increase (Decrease) in Net Assets Derived from Capital Shares Transactions (Note 7) | | | 3,130,761 | | | | (10,267,100 | ) |
| | | | | | | | |
Total increase (decrease) in Net Assets | | | 3,349,087 | | | | (10,406,026 | ) |
Net Assets | | | | | | | | |
Beginning of period | | | 31,445,152 | | | | 41,851,178 | |
| | | | | | | | |
End of period | | $ | 34,794,239 | | | $ | 31,445,152 | |
| | | | | | | | |
Undistributed (Overdistributed) Net Investment Income (Loss) | | $ | (15,616 | ) | | $ | 4,913 | |
| | | | | | | | |
See accompanying notes to financial statements.
107
Investment Grade Fixed Income Fund
| | | | | | | | |
| | | Six Months Ended
March 31, 2008
(Unaudited) | | | Year Ended
September 30, 2007 | |
From Operations: | | | | | | | | |
Net investment income | | $ | 7,627,867 | | | $ | 11,275,232 | |
Net realized gain on investments and foreign currency transactions | | | 5,901,563 | | | | 3,867,775 | |
Net change in net unrealized appreciation (depreciation) on investments and foreign currency translations | | | (6,758,920 | ) | | | 5,644,073 | |
| | | | | | | | |
Increase in net assets resulting from operations | | | 6,770,510 | | | | 20,787,080 | |
| | | | | | | | |
From Distributions to Shareholders: | | | | | | | | |
Net Investment Income: | | | | | | | | |
Institutional Class | | | (10,038,789 | ) | | | (14,190,258 | ) |
Capital Gains: | | | | | | | | |
Institutional Class | | | — | | | | — | |
| | | | | | | | |
Total distributions | | | (10,038,789 | ) | | | (14,190,258 | ) |
| | | | | | | | |
Increase in Net Assets Derived from Capital Shares Transactions (Note 7) | | | 15,441,966 | | | | 81,594,581 | |
| | | | | | | | |
Total increase in net assets | | | 12,173,687 | | | | 88,191,403 | |
Net Assets | | | | | | | | |
Beginning of period | | | 261,740,712 | | | | 173,549,309 | |
| | | | | | | | |
End of period | | $ | 273,914,399 | | | $ | 261,740,712 | |
| | | | | | | | |
Undistributed Net Investment Income | | $ | 5,524 | | | $ | 2,416,446 | |
| | | | | | | | |
See accompanying notes to financial statements.
108
FINANCIAL HIGHLIGHTS
For a share outstanding throughout each period.
| | | | | | | | | | | | | | | | | | | | | | | | | | | |
| | | | | Income (Loss) from Investment Operations: | | | | | Less Distributions: | |
| | | Net asset
value,
beginning
of the period | | Net
investment
income(c) | | Net realized
and unrealized
gain (loss) | | | Total from
investment
operations | | | | | Dividends
from
net investment
income | | | Distributions
from net
realized
capital gains | | Total
distributions | |
| Bond Fund | | | | | | | | | | | | | | | | | | | | | | | | | | | |
| | | | | | | | |
| Institutional Class | | | | | | | | | | | | | | | | | | | | | | | | | | | |
3/31/2008(h) | | $ | 14.71 | | $ | 0.47 | | $ | (0.56 | ) | | $ | (0.09 | ) | | | | $ | (0.52 | ) | | $ | — | | $ | (0.52 | ) |
9/30/2007 | | | 14.13 | | | 0.83 | | | 0.58 | | | | 1.41 | | | | | | (0.83 | ) | | | — | | | (0.83 | ) |
9/30/2006 | | | 13.81 | | | 0.72 | | | 0.47 | | | | 1.19 | | | | | | (0.87 | ) | | | — | | | (0.87 | ) |
9/30/2005 | | | 13.46 | | | 0.67 | | | 0.57 | | | | 1.24 | | | | | | (0.89 | ) | | | — | | | (0.89 | ) |
9/30/2004 | | | 12.66 | | | 0.72 | | | 0.82 | | | | 1.54 | | | | | | (0.74 | ) | | | — | | | (0.74 | ) |
9/30/2003 | | | 10.33 | | | 0.78 | | | 2.34 | | | | 3.12 | | | | | | (0.79 | ) | | | — | | | (0.79 | ) |
| | | | | | | | |
| Retail Class | | | | | | | | | | | | | | | | | | | | | | | | | | | |
3/31/2008(h) | | $ | 14.67 | | $ | 0.44 | | $ | (0.55 | ) | | $ | (0.11 | ) | | | | $ | (0.50 | ) | | $ | — | | $ | (0.50 | ) |
9/30/2007 | | | 14.10 | | | 0.79 | | | 0.57 | | | | 1.36 | | | | | | (0.79 | ) | | | — | | | (0.79 | ) |
9/30/2006 | | | 13.78 | | | 0.69 | | | 0.47 | | | | 1.16 | | | | | | (0.84 | ) | | | — | | | (0.84 | ) |
9/30/2005 | | | 13.44 | | | 0.64 | | | 0.57 | | | | 1.21 | | | | | | (0.87 | ) | | | — | | | (0.87 | ) |
9/30/2004 | | | 12.65 | | | 0.69 | | | 0.82 | | | | 1.51 | | | | | | (0.72 | ) | | | — | | | (0.72 | ) |
9/30/2003 | | | 10.33 | | | 0.75 | | | 2.34 | | | | 3.09 | | | | | | (0.77 | ) | | | — | | | (0.77 | ) |
| | | | | | | | |
| Admin Class | | | | | | | | | | | | | | | | | | | | | | | | | | | |
3/31/2008(h) | | $ | 14.64 | | $ | 0.42 | | $ | (0.55 | ) | | $ | (0.13 | ) | | | | $ | (0.48 | ) | | $ | — | | $ | (0.48 | ) |
9/30/2007 | | | 14.07 | | | 0.75 | | | 0.58 | | | | 1.33 | | | | | | (0.76 | ) | | | — | | | (0.76 | ) |
9/30/2006 | | | 13.75 | | | 0.65 | | | 0.48 | | | | 1.13 | | | | | | (0.81 | ) | | | — | | | (0.81 | ) |
9/30/2005 | | | 13.42 | | | 0.60 | | | 0.56 | | | | 1.16 | | | | | | (0.83 | ) | | | — | | | (0.83 | ) |
9/30/2004 | | | 12.64 | | | 0.65 | | | 0.82 | | | | 1.47 | | | | | | (0.69 | ) | | | — | | | (0.69 | ) |
9/30/2003 | | | 10.32 | | | 0.72 | | | 2.34 | | | | 3.06 | | | | | | (0.74 | ) | | | — | | | (0.74 | ) |
(a) Had certain expenses not been reduced during the period, if applicable, total returns would have been lower. Periods less than one year, if applicable, are not annualized.
(b) The investment adviser and/or administrator has agreed to reimburse a portion of the Fund’s expenses and/or reduce its fees during the period. Without this reimbursement/fee reduction, if applicable, expenses would have been higher.
(c) Per share net investment income has been calculated using the average shares outstanding during the period.
(d) Amount rounds to less than $0.01 per share, if applicable.
(e) Includes expense recapture of 0.02%.
(f) Effective July 1, 2007, the Fund decreased its net expense limitations to 0.70%, 0.95% and 1.20% from 0.75%, 1.00% and 1.25% for the Institutional Class, Retail Class and Admin Class, respectively.
(g) Computed on an annualized basis for periods less than one year, if applicable.
(h) For the six months ended March 31, 2008 (Unaudited).
(i) Includes expense recapture of 0.00%.
(j) Includes expense recapture of 0.01%.
See accompanying notes to financial statements.
109
| | | | | | | | | | | | | | | | | | | | |
| | | | | | | | | | Ratios to Average Net Assets: | | |
Redemption
fees(d) | | Net asset
value,
end of
the period | | Total
return (%)(a) | | | Net assets,
end of
the period
(000’s) | | Net
expenses (%)(b)(g) | | | Gross
expenses (%)(g) | | | Net
investment
income (%)(g) | | Portfolio
turnover
rate (%) |
| | | | | | | | | | | | | | | | | | | | |
| | | | | | | |
| | | | | | | | | | | | | | | | | | | | |
| $ | 0.00 | | $ | 14.10 | | (0.6 | ) | | $ | 8,696,777 | | 0.64 | | | 0.64 | | | 6.41 | | 16 |
| | 0.00 | | | 14.71 | | 10.3 | | | | 7,716,061 | | 0.67 | (f) | | 0.67 | | | 5.75 | | 20 |
| | 0.00 | | | 14.13 | | 9.0 | | | | 4,742,622 | | 0.75 | (e) | | 0.75 | (e) | | 5.20 | | 26 |
| | 0.00 | | | 13.81 | | 9.5 | | | | 3,303,997 | | 0.75 | | | 0.79 | | | 4.91 | | 22 |
| | 0.00 | | | 13.46 | | 12.5 | | | | 2,365,199 | | 0.75 | | | 0.79 | | | 5.48 | | 42 |
| | — | | | 12.66 | | 30.9 | | | | 1,730,165 | | 0.75 | | | 0.78 | | | 6.64 | | 35 |
| | | | | | | |
| | | | | | | | | | | | | | | | | | | | |
| $ | 0.00 | | $ | 14.06 | | (0.7 | ) | | $ | 8,053,193 | | 0.95 | (j) | | 0.95 | (j) | | 6.12 | | 16 |
| | 0.00 | | | 14.67 | | 9.9 | | | | 6,432,333 | | 0.97 | (f) | | 0.97 | | | 5.49 | | 20 |
| | 0.00 | | | 14.10 | | 8.8 | | | | 2,232,632 | | 1.00 | | | 1.01 | | | 4.99 | | 26 |
| | 0.00 | | | 13.78 | | 9.2 | | | | 707,394 | | 1.00 | | | 1.05 | | | 4.64 | | 22 |
| | 0.00 | | | 13.44 | | 12.2 | | | | 275,349 | | 1.00 | | | 1.04 | | | 5.24 | | 42 |
| | — | | | 12.65 | | 30.6 | | | | 143,932 | | 1.00 | | | 1.07 | | | 6.35 | | 35 |
| | | | | | | |
| | | | | | | | | | | | | | | | | | | | |
| $ | 0.00 | | $ | 14.03 | | (0.9 | ) | | $ | 230,372 | | 1.20 | | | 1.22 | | | 5.86 | | 16 |
| | 0.00 | | | 14.64 | | 9.7 | | | | 193,850 | | 1.23 | (f)(i) | | 1.23 | (i) | | 5.20 | | 20 |
| | 0.00 | | | 14.07 | | 8.5 | | | | 106,941 | | 1.25 | | | 1.29 | | | 4.71 | | 26 |
| | 0.00 | | | 13.75 | | 8.9 | | | | 64,263 | | 1.25 | | | 1.31 | | | 4.39 | | 22 |
| | 0.00 | | | 13.42 | | 11.9 | | | | 27,299 | | 1.25 | | | 1.29 | | | 4.99 | | 42 |
| | — | | | 12.64 | | 30.4 | | | | 12,061 | | 1.25 | | | 1.40 | | | 6.13 | | 35 |
See accompanying notes to financial statements.
110
FINANCIAL HIGHLIGHTS – continued
For a share outstanding throughout each period.
| | | | | | | | | | | | | | | | | | | | | | | | | | | |
| | | | | Income (Loss) from Investment Operations: | | | | Less Distributions: | |
| | | Net asset
value,
beginning
of the period | | Net
investment
income(c) | | Net realized
and unrealized
gain (loss) | | | Total from
investment
operations | | | | Dividends
from
net investment
income | | | Distributions
from net
realized
capital gains | | | Total
distributions | |
| Fixed Income Fund | | | | | | | | | | | | | | | | | | | | | | | | | | | |
| | | | | | | | |
| Institutional Class | | | | | | | | | | | | | | | | | | | | | | | | | | | |
3/31/2008(g) | | $ | 14.49 | | $ | 0.44 | | $ | (0.43 | ) | | $ | 0.01 | | | | $ | (1.06 | ) | | $ | (0.02 | ) | | $ | (1.08 | ) |
9/30/2007 | | | 13.89 | | | 0.83 | | | 0.67 | | | | 1.50 | | | | | (0.90 | ) | | | — | | | | (0.90 | ) |
9/30/2006 | | | 13.88 | | | 0.74 | | | 0.30 | | | | 1.04 | | | | | (1.03 | ) | | | — | | | | (1.03 | ) |
9/30/2005 | | | 13.93 | | | 0.75 | | | 0.58 | | | | 1.33 | | | | | (1.38 | ) | | | — | | | | (1.38 | ) |
9/30/2004 | | | 13.24 | | | 0.82 | | | 0.79 | | | | 1.61 | | | | | (0.92 | ) | | | — | | | | (0.92 | ) |
9/30/2003 | | | 10.95 | | | 0.84 | | | 2.40 | | | | 3.24 | | | | | (0.95 | ) | | | — | | | | (0.95 | ) |
| | | | | | | |
| Global Bond Fund | | | | | | | | | | | | | | | | | | | | | | | | |
| | | | | | | | |
| Institutional Class | | | | | | | | | | | | | | | | | | | | | | | | | | | |
3/31/2008(g) | | $ | 15.83 | | $ | 0.34 | | $ | 0.73 | | | $ | 1.07 | | | | $ | (0.44 | ) | | $ | — | | | $ | (0.44 | ) |
9/30/2007 | | | 15.43 | | | 0.60 | | | 0.70 | | | | 1.30 | | | | | (0.90 | ) | | | — | | | | (0.90 | ) |
9/30/2006 | | | 15.57 | | | 0.48 | | | 0.16 | | | | 0.64 | | | | | (0.70 | ) | | | (0.08 | ) | | | (0.78 | ) |
9/30/2005 | | | 15.59 | | | 0.44 | | | 0.05 | | | | 0.49 | | | | | (0.46 | ) | | | (0.05 | ) | | | (0.51 | ) |
9/30/2004 | | | 14.93 | | | 0.48 | | | 0.78 | | | | 1.26 | | | | | (0.60 | ) | | | — | | | | (0.60 | ) |
9/30/2003 | | | 12.68 | | | 0.62 | | | 2.25 | | | | 2.87 | | | | | (0.62 | ) | | | — | | | | (0.62 | ) |
| | | | | | | | |
| Retail Class | | | | | | | | | | | | | | | | | | | | | | | | | | | |
3/31/2008(g) | | $ | 15.71 | | $ | 0.31 | | $ | 0.73 | | | $ | 1.04 | | | | $ | (0.41 | ) | | $ | — | | | $ | (0.41 | ) |
9/30/2007 | | | 15.29 | | | 0.54 | | | 0.70 | | | | 1.24 | | | | | (0.82 | ) | | | — | | | | (0.82 | ) |
9/30/2006 | | | 15.43 | | | 0.44 | | | 0.15 | | | | 0.59 | | | | | (0.65 | ) | | | (0.08 | ) | | | (0.73 | ) |
9/30/2005 | | | 15.46 | | | 0.40 | | | 0.05 | | | | 0.45 | | | | | (0.43 | ) | | | (0.05 | ) | | | (0.48 | ) |
9/30/2004 | | | 14.83 | | | 0.43 | | | 0.79 | | | | 1.22 | | | | | (0.59 | ) | | | — | | | | (0.59 | ) |
9/30/2003 | | | 12.62 | | | 0.58 | | | 2.24 | | | | 2.82 | | | | | (0.61 | ) | | | — | | | | (0.61 | ) |
(a) Had certain expenses not been reduced during the period, if applicable, total return would have been lower. Periods less than one year, if applicable, are not annualized.
(b) The investment adviser and/or administrator has agreed to reimburse a portion of the Fund’s expenses and/or reduce its fees during the period. Without this reimbursement/fee reduction, if applicable, expenses would have been higher.
(c) Per share net investment income has been calculated using the average shares outstanding during the period.
(d) Amount rounds to less than $0.01 per share, if applicable.
(e) Includes expense recapture of 0.00% and 0.03% for Fixed Income Fund and Global Bond Fund, respectively.
(f) Includes expense recapture of 0.03%.
(g) For the six months ended March 31, 2008 (Unaudited).
(h) Computed on an annualized basis for periods less than one year, if applicable.
See accompanying notes to financial statements.
111
| | | | | | | | | | | | | | | | | | | |
| | | | | | | | | Ratios to Average Net Assets: | | |
Redemption
fees(d) | | Net asset
value,
end of
the period | | Total
return (%)(a) | | Net assets,
end of
the period
(000’s) | | Net
expenses (%)(b)(h) | | | Gross
expenses (%)(h) | | | Net
investment
income (%)(h) | | Portfolio
turnover
rate (%) |
| | | | | | | | | | | | | | | | | | | |
| | | | | | | |
| | | | | | | | | | | | | | | | | | | |
| $ | — | | $ | 13.42 | | 0.1 | | $ | 624,671 | | 0.58 | | | 0.58 | | | 6.34 | | 10 |
| | — | | | 14.49 | | 11.3 | | | 605,100 | | 0.60 | | | 0.60 | | | 5.96 | | 22 |
| | — | | | 13.89 | | 8.1 | | | 456,011 | | 0.60 | (e) | | 0.60 | (e) | | 5.48 | | 40 |
| | — | | | 13.88 | | 9.9 | | | 444,552 | | 0.65 | | | 0.65 | | | 5.47 | | 34 |
| | — | | | 13.93 | | 12.6 | | | 358,652 | | 0.65 | | | 0.66 | | | 6.17 | | 35 |
| | — | | | 13.24 | | 31.5 | | | 412,521 | | 0.65 | | | 0.67 | | | 7.03 | | 33 |
| | | | | | | |
| | | | | | | | | | | | | | | | | | | |
| | | | | | | |
| | | | | | | | | | | | | | | | | | | |
| $ | 0.00 | | $ | 16.46 | | 6.9 | | $ | 1,335,172 | | 0.64 | (f) | | 0.64 | (f) | | 4.20 | | 28 |
| | 0.00 | | | 15.83 | | 8.7 | | | 996,046 | | 0.68 | | | 0.68 | | | 3.84 | | 95 |
| | 0.00 | | | 15.43 | | 4.3 | | | 643,991 | | 0.74 | (e) | | 0.74 | (e) | | 3.21 | | 77 |
| | 0.00 | | | 15.57 | | 3.1 | | | 553,704 | | 0.75 | | | 0.80 | | | 2.75 | | 63 |
| | 0.00 | | | 15.59 | | 8.6 | | | 287,830 | | 0.80 | | | 0.85 | | | 3.15 | | 61 |
| | — | | | 14.93 | | 23.4 | | | 83,325 | | 0.90 | | | 0.94 | | | 4.50 | | 107 |
| | | | | | | |
| | | | | | | | | | | | | | | | | | | |
| $ | 0.00 | | $ | 16.34 | | 6.7 | | $ | 1,177,246 | | 1.00 | | | 1.00 | | | 3.84 | | 28 |
| | 0.00 | | | 15.71 | | 8.4 | | | 874,575 | | 1.00 | | | 1.04 | | | 3.53 | | 95 |
| | 0.00 | | | 15.29 | | 4.0 | | | 540,697 | | 1.00 | | | 1.09 | | | 2.93 | | 77 |
| | 0.00 | | | 15.43 | | 2.8 | | | 699,498 | | 1.00 | | | 1.09 | | | 2.57 | | 63 |
| | 0.00 | | | 15.46 | | 8.4 | | | 413,652 | | 1.04 | | | 1.10 | | | 2.88 | | 61 |
| | — | | | 14.83 | | 23.1 | | | 55,487 | | 1.15 | | | 1.21 | | | 4.13 | | 107 |
See accompanying notes to financial statements.
112
FINANCIAL HIGHLIGHTS – continued
For a share outstanding throughout each period.
| | | | | | | | | | | | | | | | | | | | | | | | | | | | |
| | | | | Income (Loss) from Investment Operations: | | | | | Less Distributions: | |
| | | Net asset
value,
beginning
of the period | | Net
investment
income(c) | | Net realized
and unrealized
gain (loss) | | | Total from
investment
operations | | | | | Dividends
from
net investment
income | | | Distributions
from net
realized
capital gains | | | Total
distributions | |
| Inflation Protected Securities Fund | | | | | | | | | | | | | | | | | | | | | | |
| | | | | | | |
| Institutional Class | | | | | | | | | | | | | | | | | | | | | | | | | |
3/31/2008(i) | | $ | 10.31 | | $ | 0.24 | | $ | 0.52 | | | $ | 0.76 | | | | | $ | (0.13 | ) | | $ | — | | | $ | (0.13 | ) |
9/30/2007 | | | 10.30 | | | 0.47 | | | 0.03 | | | | 0.50 | | | | | | (0.49 | ) | | | — | | | | (0.49 | ) |
9/30/2006 | | | 10.84 | | | 0.52 | | | (0.38 | ) | | | 0.14 | | | | | | (0.63 | ) | | | (0.05 | ) | | | (0.68 | ) |
9/30/2005 | | | 11.02 | | | 0.42 | | | (0.08 | ) | | | 0.34 | | | | | | (0.52 | ) | | | — | | | | (0.52 | ) |
9/30/2004 | | | 11.60 | | | 0.37 | | | (0.12 | ) | | | 0.25 | | | | | | (0.54 | ) | | | (0.29 | ) | | | (0.83 | ) |
9/30/2003 | | | 11.94 | | | 0.43 | | | 0.05 | | | | 0.48 | | | | | | (0.53 | ) | | | (0.29 | ) | | | (0.82 | ) |
| | | | | | |
| Institutional High Income Fund | | | | | | | | | | | | | | | | | | | | | | |
| | | | | | | |
| Institutional Class | | | | | | | | | | | | | | | | | | | | | | | | | |
3/31/2008(i) | | $ | 8.45 | | $ | 0.29 | | $ | (0.48 | ) | | $ | (0.19 | ) | | | | $ | (0.52 | ) | | $ | (0.15 | ) | | $ | (0.67 | ) |
9/30/2007 | | | 8.11 | | | 0.55 | | | 0.30 | | | | 0.85 | | | | | | (0.51 | ) | | | — | | | | (0.51 | ) |
9/30/2006 | | | 7.80 | | | 0.50 | | | 0.34 | | | | 0.84 | | | | | | (0.53 | ) | | | — | | | | (0.53 | ) |
9/30/2005 | | | 7.50 | | | 0.55 | | | 0.39 | | | | 0.94 | | | | | | (0.64 | ) | | | — | | | | (0.64 | ) |
9/30/2004 | | | 6.91 | | | 0.55 | | | 0.66 | | | | 1.21 | | | | | | (0.62 | ) | | | — | | | | (0.62 | ) |
9/30/2003 | | | 4.81 | | | 0.59 | | | 1.69 | | | | 2.28 | | | | | | (0.18 | ) | | | — | | | | (0.18 | ) |
| | | | | |
| Intermediate Duration Fixed Income Fund | | | | | | | | | | | | | | | | | | | |
| | | | | | | |
| Institutional Class | | | | | | | | | | | | | | | | | | | | | | | | | |
3/31/2008(i) | | $ | 9.47 | | $ | 0.24 | | $ | 0.07 | | | $ | 0.31 | | | | | $ | (0.25 | ) | | $ | — | | | $ | (0.25 | ) |
9/30/2007 | | | 9.50 | | | 0.45 | | | (0.01 | ) | | | 0.44 | | | | | | (0.47 | ) | | | — | | | | (0.47 | ) |
9/30/2006 | | | 9.60 | | | 0.42 | | | (0.07 | ) | | | 0.35 | | | | | | (0.45 | ) | | | — | | | | (0.45 | ) |
9/30/2005 | | | 9.92 | | | 0.40 | | | (0.25 | ) | | | 0.15 | | | | | | (0.45 | ) | | | (0.02 | ) | | | (0.47 | ) |
9/30/2004 | | | 10.10 | | | 0.45 | | | (0.10 | ) | | | 0.35 | | | | | | (0.53 | ) | | | — | | | | (0.53 | ) |
9/30/2003 | | | 9.62 | | | 0.51 | | | 0.49 | | | | 1.00 | | | | | | (0.52 | ) | | | — | | | | (0.52 | ) |
| | | | | |
| Investment Grade Fixed Income Fund | | | | | | | | | | | | | | | | | | | |
| | | | | | | |
| Institutional Class | | | | | | | | | | | | | | | | | | | | | | | | | |
3/31/2008(i) | | $ | 12.96 | | $ | 0.37 | | $ | (0.05 | ) | | $ | 0.32 | | | | | $ | (0.49 | ) | | $ | — | | | $ | (0.49 | ) |
9/30/2007 | | | 12.63 | | | 0.70 | | | 0.53 | | | | 1.23 | | | | | | (0.90 | ) | | | — | | | | (0.90 | ) |
9/30/2006 | | | 13.28 | | | 0.60 | | | 0.22 | | | | 0.82 | | | | | | (0.92 | ) | | | (0.55 | ) | | | (1.47 | ) |
9/30/2005 | | | 13.54 | | | 0.57 | | | 0.27 | | | | 0.84 | | | | | | (0.83 | ) | | | (0.27 | ) | | | (1.10 | ) |
9/30/2004 | | | 13.38 | | | 0.67 | | | 0.75 | | | | 1.42 | | | | | | (0.88 | ) | | | (0.38 | ) | | | (1.26 | ) |
9/30/2003 | | | 11.56 | | | 0.77 | | | 1.87 | | | | 2.64 | | | | | | (0.78 | ) | | | (0.04 | ) | | | (0.82 | ) |
(a) Had certain expenses not been reduced during the period, if applicable, total return would have been lower. Periods less than one year, if applicable, are not annualized.
(b) The investment adviser and/or administrator has agreed to reimburse a portion of the Fund’s expenses and/or reduce its fees during the period. Without this reimbursement/fee reduction, if applicable, expenses would have been higher.
(c) Per share net investment income has been calculated using the average shares outstanding during the period.
(d) Amount rounds to less than $0.01 per share, if applicable.
(e) Includes expense recapture of 0.00%.
(f) Effective July 1, 2005, the Intermediate Duration Fixed Income Fund and the Inflation Protected Securities Fund decreased their net expense limitations to 0.40% and 0.45%, respectively, from 0.45% and 0.50%, respectively.
(g) Includes expense recapture of 0.01%.
(h) Computed on an annualized basis for periods less than one year, if applicable.
(i) For the six months ended March 31, 2008 (Unaudited).
See accompanying notes to financial statements.
113
| | | | | | | | | | | | | | | | | | | | |
| | | | | | | | | | Ratios to Average Net Assets: | | |
Redemption
fees(d) | | Net asset
value,
end of
the period | | Total
return (%)(a) | | | Net assets,
end of
the period
(000’s) | | Net
expenses (%)(b)(h) | | | Gross
expenses (%)(h) | | | Net
investment
income (%)(h) | | Portfolio
turnover
rate (%) |
| | | | | | | | | | | | | | | | | | | | |
| | | | | | | |
| | | | | | | | | | | | | | | | | | | | |
| $ | — | | $ | 10.94 | | 8.6 | | | $ | 16,509 | | 0.40 | | | 1.01 | | | 4.54 | | 11 |
| | — | | | 10.31 | | 5.1 | | | | 13,468 | | 0.40 | | | 1.28 | | | 4.60 | | 26 |
| | — | | | 10.30 | | 1.5 | | | | 9,053 | | 0.40 | | | 1.69 | | | 4.96 | | 41 |
| | — | | | 10.84 | | 3.1 | | | | 9,298 | | 0.49 | (f) | | 1.54 | | | 3.81 | | 141 |
| | — | | | 11.02 | | 2.3 | | | | 7,390 | | 0.50 | | | 1.73 | | | 3.33 | | 99 |
| | — | | | 11.60 | | 4.3 | | | | 9,549 | | 0.50 | | | 1.28 | | | 3.68 | | 60 |
| | | | | | | |
| | | | | | | | | | | | | | | | | | | | |
| | | | | | | |
| | | | | | | | | | | | | | | | | | | | |
| $ | — | | $ | 7.59 | | (2.4 | ) | | $ | 189,081 | | 0.72 | | | 0.72 | | | 7.33 | | 18 |
| | — | | | 8.45 | | 10.8 | | | | 187,568 | | 0.75 | (g) | | 0.75 | (g) | | 6.60 | | 31 |
| | — | | | 8.11 | | 11.6 | | | | 141,318 | | 0.75 | | | 0.79 | | | 6.40 | | 23 |
| | — | | | 7.80 | | 13.0 | | | | 110,533 | | 0.75 | | | 0.82 | | | 7.24 | | 22 |
| | — | | | 7.50 | | 18.1 | | | | 97,109 | | 0.75 | | | 0.88 | | | 7.66 | | 59 |
| | 0.00 | | | 6.91 | | 48.7 | | | | 86,141 | | 0.75 | | | 0.91 | | | 10.01 | | 53 |
| | | | | | | |
| | | | | | | | | | | | | | | | | | | | |
| | | | | | | |
| | | | | | | | | | | | | | | | | | | | |
| $ | — | | $ | 9.53 | | 3.3 | | | $ | 34,794 | | 0.40 | | | 0.60 | | | 5.03 | | 38 |
| | — | | | 9.47 | | 4.8 | | | | 31,445 | | 0.40 | | | 0.61 | | | 4.71 | | 87 |
| | — | | | 9.50 | | 3.8 | | | | 41,851 | | 0.40 | | | 0.62 | | | 4.48 | | 62 |
| | — | | | 9.60 | | 1.5 | | | | 40,628 | | 0.44 | (f) | | 0.68 | | | 4.10 | | 50 |
| | — | | | 9.92 | | 3.6 | | | | 31,051 | | 0.45 | | | 0.76 | | | 4.48 | | 48 |
| | — | | | 10.10 | | 10.7 | | | | 37,103 | | 0.45 | | | 0.74 | | | 5.15 | | 63 |
| | | | | | | |
| | | | | | | | | | | | | | | | | | | | |
| | | | | | | |
| | | | | | | | | | | | | | | | | | | | |
| $ | — | | $ | 12.79 | | 2.6 | | | $ | 273,914 | | 0.50 | | | 0.50 | | | 5.74 | | 14 |
| | — | | | 12.96 | | 10.2 | | | | 261,741 | | 0.53 | | | 0.53 | | | 5.52 | | 23 |
| | — | | | 12.63 | | 6.8 | | | | 173,549 | | 0.55 | (e) | | 0.55 | (e) | | 4.79 | | 50 |
| | — | | | 13.28 | | 6.4 | | | | 186,749 | | 0.55 | | | 0.58 | | | 4.28 | | 42 |
| | — | | | 13.54 | | 11.1 | | | | 177,094 | | 0.55 | | | 0.60 | | | 5.03 | | 34 |
| | — | | | 13.38 | | 23.8 | | | | 142,271 | | 0.55 | | | 0.62 | | | 6.22 | | 32 |
See accompanying notes to financial statements.
114
NOTES TO FINANCIAL STATEMENTS
March 31, 2008 (Unaudited)
1. Organization. Loomis Sayles Funds I (the “Trust”) is organized as a Massachusetts business trust. The Trust is registered under the Investment Company Act of 1940, as amended, (the “1940 Act”) as an open-end management investment company. The Declaration of Trust permits the Board of Trustees to authorize the issuance of an unlimited number of shares of the Trust in multiple series. Shares of certain funds in the Trust were first registered under the Securities Act of 1933 (the “1933 Act”) effective March 7, 1997 (subsequent to their commencement of investment operations). Information presented in these financial statements pertains to the fixed income funds of the Trust; the financial statements for the equity funds of the Trust are presented in a separate report. The following funds (individually, a “Fund” and collectively, the “Funds”) are included in this report:
Loomis Sayles Bond Fund (the “Bond Fund”)
Loomis Sayles Fixed Income Fund (the “Fixed Income Fund”)
Loomis Sayles Global Bond Fund (the “Global Bond Fund”)
Loomis Sayles Inflation Protected Securities Fund (the “Inflation Protected Securities Fund”)
Loomis Sayles Institutional High Income Fund (the “Institutional High Income Fund”)
Loomis Sayles Intermediate Duration Fixed Income Fund (the “Intermediate Duration Fixed Income Fund”)
Loomis Sayles Investment Grade Fixed Income Fund (the “Investment Grade Fixed Income Fund”)
Each Fund offers Institutional Class Shares. Bond Fund and Global Bond Fund also offer Retail Class Shares. In addition, Bond Fund offers Admin Class Shares.
Most expenses of the Trust can be directly attributed to a fund. Expenses which cannot be directly attributed to a fund are generally apportioned based on the relative net assets of each of the funds in the Trust. Expenses of a fund are borne pro rata by the holders of each class of shares, except that each class bears expenses unique to that class (including the Rule 12b-1 service and distribution fees and transfer agent fees applicable to such class). In addition, each class votes as a class only with respect to its own Rule 12b-1 Plan. Shares of each class would receive their pro rata share of the net assets of a fund if the fund were liquidated. The Trustees approve separate dividends from net investment income on each class of shares.
2. Significant Accounting Policies. The following is a summary of significant accounting policies consistently followed by each Fund in the preparation of its financial statements. The Funds’ financial statements are prepared in accordance with accounting principles generally accepted in the United States of America which require the use of management estimates that affect the reported amounts and disclosures in the financial statements. Actual results could differ from those estimates.
a. Security Valuation. Debt securities (other than short-term obligations purchased with an original or remaining maturity of sixty days or less) are generally valued on the basis of evaluated bids furnished to the Funds by a pricing service recommended by the investment adviser and approved by the Board of Trustees, which service determines valuations for normal, institutional size-trading units of such securities using market information, transactions for comparable securities and various relationships between securities which are generally recognized by institutional traders. Equity securities, including closed-end investment companies and exchange traded funds, for which market quotations are readily available are valued at market value, as reported by pricing services recommended by the investment adviser and approved by the Board of Trustees. Such pricing services generally use the security’s last sale price on the exchange or market where the security is primarily traded or, if there is no reported sale during the day, the closing bid price. Securities traded on the NASDAQ Global Select Market, NASDAQ Global Market and NASDAQ Capital Market are valued at the NASDAQ Official Closing Price (“NOCP”), or if lacking a NOCP, at the most recent bid quotation on the applicable NASDAQ Market. Broker-dealer bid quotations may also be used to value debt and equity securities where a pricing service does not price a security or where a pricing service does not provide a reliable price for the security. In instances where broker-dealer bid quotations are not available, certain securities held by the Funds may be valued on the basis of a price provided by a principal market maker. Futures contracts are priced at their most recent settlement price. Short-term obligations purchased with an original or remaining maturity of sixty days or less are valued at amortized cost, which approximates market value. Securities for which market quotations are not readily available are valued at fair value as determined in good faith by the Funds’ adviser using consistently applied procedures under the general supervision of the Board of Trustees. Investments in other open-end investment companies are valued at their net asset value each day.
The Funds may hold securities traded in foreign markets. Foreign securities are valued at the market price in the foreign market. However, if events occurring after the close of the foreign market (but before the close of regular trading on the New York Stock Exchange) are believed to materially affect the value of those securities, such securities are fair valued pursuant to procedures approved by the Board of Trustees. When fair valuing securities, the Funds may, among other things, use modeling tools or other processes that may take into account factors such as securities market activity and/or significant events that occur after the close of the foreign market and before the Funds calculate their net asset values.
115
b. Security Transactions and Related Investment Income. Security transactions are accounted for on trade date. Dividend income is recorded on ex-dividend date, or in the case of certain foreign securities, as soon as the Fund is notified, and interest income is recorded on an accrual basis. Interest income is increased by the accretion of discount and decreased by the amortization of premium. Investment income is recorded net of foreign taxes withheld when applicable. In determining net gain or loss on securities sold, the cost of securities has been determined on an identified cost basis. Investment income, non-class specific expenses and realized and unrealized gains and losses are allocated on a pro rata basis to each class based on the relative net assets of each class to the net assets of the Fund.
c. Foreign Currency Translation. The books and records of the Funds are maintained in U.S. dollars. The value of securities, currencies and other assets and liabilities denominated in currencies other than U.S. dollars are translated into U.S. dollars based upon foreign exchange rates prevailing at the end of the period. Purchases and sales of investment securities, income and expenses are translated on the respective dates of such transactions.
Since the values of investment securities are presented at the foreign exchange rates prevailing at the end of the period, it is not practical to isolate that portion of the results of operations arising from changes in exchange rates caused by fluctuations which arise due to changes in market prices of the investment securities. Such changes are included with the net realized and unrealized gain or loss on investments.
Net realized foreign exchange gains or losses arise from sales of foreign currency, currency gains or losses realized between the trade and settlement dates on securities transactions and the difference between the amounts of dividends, interest and foreign withholding taxes recorded on the Funds’ books and the U.S. dollar equivalent of the amounts actually received or paid. Net unrealized foreign exchange gains and losses arise from changes in the value of assets and liabilities, other than investment securities, at the end of the fiscal period, resulting from changes in exchange rates.
Certain Funds may use foreign currency exchange contracts to facilitate transactions in foreign-denominated investments. Losses may arise from changes in the value of the foreign currency or if the counterparties do not perform under the contracts’ terms.
Each Fund may purchase investments of foreign issuers. Investing in securities of foreign issuers involves special risks and considerations not typically associated with investing in U.S. companies and securities of the U.S. government. These risks include revaluation of currencies and the risk of appropriation. Moreover, the markets for securities of many foreign issuers may be less liquid and the prices of such securities may be more volatile than those of comparable U.S. companies and the U.S. Government.
d. Forward Foreign Currency Contracts. Each Fund that may invest in foreign investments may enter into forward foreign currency contracts. Contracts to buy generally are used to acquire exposure to foreign currencies, while contracts to sell generally are used to hedge a Fund’s investments against currency fluctuation. Also, a contract to buy or sell may offset a previous contract. These contracts involve market risk in excess of the unrealized gain or loss reflected in the Fund’s Statement of Assets and Liabilities. The U.S. dollar value of the currencies a Fund has committed to buy or sell represents the aggregate exposure to each currency the Fund has acquired or hedged through currency contracts outstanding at period end.
All contracts are “marked-to-market” daily at the applicable exchange rates and any gains or losses are recorded for financial statement purposes as unrealized until settlement date. Risks may arise upon entering into these contracts from the potential inability of counterparties to meet the terms of their contracts and from unanticipated movements in the value of a foreign currency relative to the U.S. dollar. At March 31, 2008, the Global Bond Fund had the following open forward foreign currency exchange contracts:
| | | | | | | | | | |
Contract to
Buy/Sell | | Delivery
Date | | Currency | | Units | | Value | | Unrealized Appreciation (Depreciation) |
Sell | | 6/18/2008 | | Canadian Dollar | | 19,500,000 | | $18,967,765 | | $624,515 |
Sell | | 6/18/2008 | | Colombian Peso | | 17,480,000,000 | | 9,383,371 | | (35,777) |
Buy | | 6/18/2008 | | Iceland Krona | | 1,164,000,000 | | 15,237,417 | | 498,576 |
e. Futures Contracts. The Funds may enter into futures contracts. A futures contract is an agreement between two parties to buy and sell a particular commodity, instrument or index (e.g., an interest-bearing security) for a specified price on a specified future date.
116
NOTES TO FINANCIAL STATEMENTS – continued
March 31, 2008 (Unaudited)
When a Fund enters into a futures contract, it is required to deposit with (or for the benefit of) its broker as “initial margin” an amount of cash or short-term high-quality securities. As the value of the contract changes, the value of the futures contract position increases or declines. At the end of each trading day, the amount of such increase or decline is received or paid, respectively, by and to the holders of these positions. The amount received or paid is known as “variation margin.” Realized gain or loss on a futures position is equal to the net variation margin received or paid over the time the position is held, plus or minus the amount received or paid when the position is closed, minus brokerage commissions. When a Fund enters into a futures contract certain risks may arise such as illiquidity in the futures market, which may limit the Fund’s ability to close out a futures contract prior to settlement date, and unanticipated movements in the value of securities or interest rates.
f. Federal and Foreign Income Taxes. The Trust treats each Fund as a separate entity for federal income tax purposes. Each Fund intends to meet the requirements of the Internal Revenue Code applicable to regulated investment companies, and to distribute to its shareholders substantially all of its net investment income and any net realized capital gains, at least annually. Financial Accounting Standards Board (“FASB”) Interpretation No. 48, Accounting for Uncertainty in Income Taxes - an Interpretation of FASB Statement 109 (“FIN 48”) was issued and became effective for fiscal years beginning after December 15, 2006. FIN 48 sets forth a threshold for financial statement recognition, measurement and disclosure of a tax position taken or expected to be taken on a tax return. Management has performed an analysis of the Funds’ tax positions taken on federal and state tax returns that remain subject to examinations (tax years ended September 30, 2004 – 2007) and has concluded that no provisions for income tax are required. Fund Management is not aware of any events that are reasonably possible to occur in the next six months that would result in the amounts of any unrecognized tax benefits significantly increasing or decreasing for the Funds. However, management’s conclusions regarding FIN 48 may be subject to review and adjustment at a later date based on factors including, but not limited to, further implementation guidance from the FASB, new tax laws, regulations and interpretations thereof.
A Fund may be subject to foreign taxes on income and gains on investments that are accrued based upon the Fund’s understanding of the tax rules and regulations that exist in the countries in which the Fund invests. Foreign governments may also impose taxes or other payments on investments with respect to foreign securities. Such taxes are accrued as applicable.
g. Dividends and Distributions to Shareholders. Dividends and distributions are recorded on ex-dividend date. The timing and characterization of certain income and capital gain distributions are determined annually in accordance with federal tax regulations, which may differ from accounting principles generally accepted in the United States of America. These differences are primarily due to differing treatments for book and tax purposes of items such as net operating losses, foreign currency transactions, gains realized from passive foreign investment companies (“PFICs”), paydown gains and losses, equalization and premium amortization accruals. Permanent book and tax basis differences relating to shareholder distributions will result in reclassifications to capital accounts. Temporary differences between book and tax distributable earnings are primarily due to deferred Trustees’ fees, wash sales, unrealized gains on PFICs, premium amortization accruals, dividends payable, futures contracts mark to market, and defaulted bond interest. Distributions from net investment income and short-term capital gains are considered to be distributed from ordinary income for tax purposes.
The tax characterization of distributions is determined on an annual basis. The tax character of distributions paid to shareholders during the year ended September 30, 2007 was as follows:
| | | | | | | | | |
| | | 2007 Distributions Paid From: |
Fund | | Ordinary
Income | | Long-Term
Capital Gains | | Total |
Bond Fund | | $ | 629,936,355 | | $ | — | | $ | 629,936,355 |
Fixed Income Fund | | | 30,011,559 | | | — | | | 30,011,559 |
Global Bond Fund | | | 83,933,355 | | | — | | | 83,933,355 |
Inflation Protected Securities Fund | | | 595,612 | | | — | | | 595,612 |
Institutional High Income Fund | | | 9,165,373 | | | — | | | 9,165,373 |
Intermediate Duration Fixed Income Fund | | | 1,835,942 | | | — | | | 1,835,942 |
Investment Grade Fixed Income Fund | | | 14,190,258 | | | — | | | 14,190,258 |
117
As of September 30, 2007, the capital loss carryforwards and post-October losses were as follows:
| | | | | | | | | | | | |
| | | Bond
Fund | | Fixed Income
Fund | | Global
Bond
Fund | | Inflation Protected
Securities Fund |
Capital Loss Carryforward: | | | | | | | | | | | | |
Expires September 30, 2011 | | $ | 4,480,283 | | $ | — | | $ | — | | $ | — |
Expires September 30, 2012 | | | — | | | — | | | — | | | — |
Expires September 30, 2013 | | | — | | | — | | | — | | | — |
Expires September 30, 2014 | | | 273,495 | | | — | | | 1,046,616 | | | 22,173 |
Expires September 30, 2015 | | | — | | | — | | | 5,497,643 | | | 155,005 |
| | | | | | | | | | | | |
Total Capital Loss Carryforward | | | 4,753,778 | | | — | | | 6,544,259 | | | 177,178 |
| | | | | | | | | | | | |
Deferred net capital losses (post-October 2006) | | | — | | | — | | | 3,593,453 | | | 49,001 |
| | | | | | | | | | | | |
| | | | | | | | | |
| | | Institutional High
Income Fund | | Intermediate Duration
Fixed Income Fund | | Investment Grade
Fixed Income Fund |
Capital Loss Carryforward: | | | | | | | | | |
Expires September 30, 2011 | | $ | — | | $ | — | | $ | — |
Expires September 30, 2012 | | | — | | | — | | | — |
Expires September 30, 2013 | | | — | | | 3,797 | | | — |
Expires September 30, 2014 | | | — | | | 186,919 | | | 309,092 |
Expires September 30, 2015 | | | — | | | 326,220 | | | 23,637 |
| | | | | | | | | |
Total Capital Loss Carryforward | | | — | | | 516,936 | | | 332,729 |
| | | | | | | | | |
Deferred net capital losses (post-October 2006) | | | — | | | 203,769 | | | — |
| | | | | | | | | |
h. Repurchase Agreements. Each Fund, through its custodian, receives delivery of the underlying securities collateralizing repurchase agreements. It is each Fund’s policy that the market value of the collateral be at least equal to 102% of the repurchase price, including interest. The repurchase agreements are tri-party arrangements whereby the collateral is held at the custodian bank in a segregated account for the benefit of the Fund and on behalf of the counterparty. Repurchase agreements could involve certain risks in the event of default or insolvency of the counterparty including possible delays or restrictions upon a Fund’s ability to dispose of the underlying securities.
i. Delayed Delivery Commitments. Each Fund may purchase or sell securities on a when issued or forward commitment basis. Payment and delivery may take place a month or more after the date of the transaction. The price of the underlying securities and the date when the securities will be delivered and paid for are fixed at the time the transaction is negotiated. Losses may arise due to changes in the market value of the underlying securities or if the counterparty does not perform under the contract. Collateral consisting of liquid securities or cash and cash equivalents is maintained in an amount at least equal to these commitments with the custodian. At March 31, 2008, there were no delayed delivery commitments.
j. Securities Lending. The Funds have entered into an agreement with State Street Bank and Trust Company (“State Street Bank”), as agent of the Funds, to lend securities to certain designated borrowers. The loans are collateralized with cash or securities in an amount equal to at least 105% or 102% of the market value of the loaned international or domestic securities, respectively, when the loan is initiated. Thereafter, the value of the collateral must remain at least 102% of the market value of loaned securities for U.S. equities and U.S. corporate debt; at least 105% of the market value of loaned securities for non-U.S. equities; and at least 100% of the market value of loaned securities for U.S. government securities, sovereign debt issued by non-U.S. governments and non-U.S. corporate debt. In the event that the market value of the collateral falls below the required percentages described above, the borrower will deliver additional collateral on the next business day. As with other extensions of credit, the Funds may bear the risk of loss with respect to the investment of the collateral. The Funds invest cash collateral in short-term investments, a portion of the income from which is remitted to the borrowers and the remainder allocated between the Funds and State Street Bank as lending agent. The value of securities on loan to borrowers and the value of collateral held by the Funds with respect to such loans at March 31, 2008 were as follows:
| | | | | | |
| | | Value
of Securities
on Loan | | Value of
Collateral |
Bond Fund | | $ | 1,057,109,090 | | $ | 1,075,922,564 |
Fixed Income Fund | | | 21,983,955 | | | 22,359,618 |
Global Bond Fund | | | 278,294,925 | | | 283,468,823 |
Inflation Protected Securities Fund | | | 4,109,991 | | | 4,165,445 |
Institutional High Income Fund | | | 19,743,246 | | | 19,821,388 |
Intermediate Duration Fixed Income Fund | | | 7,457,396 | | | 7,600,779 |
Investment Grade Fixed Income Fund | | | 18,618,521 | | | 18,933,811 |
118
NOTES TO FINANCIAL STATEMENTS – continued
March 31, 2008 (Unaudited)
k. Indemnifications. Under the Trust’s organizational documents, its officers and Trustees are indemnified against certain liability arising out of the performance of their duties to the Funds. Additionally, in the normal course of business, the Funds enter into contracts with service providers that contain general indemnification clauses. The Funds’ maximum exposure under these arrangements is unknown as this would involve future claims that may be made against Funds that have not yet occurred. However, based on experience, the Funds expect the risk of loss to be remote.
l. New Accounting Pronouncements. In September 2006, Statement of Financial Accounting Standards No. 157, Fair Value Measurements (“FAS 157”), was issued and is effective for fiscal years beginning after November 15, 2007. FAS 157 defines fair value, establishes a framework for measuring fair value and expands disclosures about fair value measurements. Management has evaluated the impact the adoption of FAS 157 will have on the Funds’ financial statements and believes that such impact will be limited to expanded disclosure in the Funds’ financial statements regarding inputs used in determining the value of the Funds’ investments and will not have a material impact on the Funds’ net assets or results of operations.
In March 2008, Statement of Financial Accounting Standards No. 161, Disclosures about Derivative Instruments and Hedging Activities (“FAS 161”), was issued and will be effective for fiscal years and interim periods beginning after November 15, 2008. FAS 161 requires enhanced disclosures about funds’ derivative and hedging activities. Management is currently evaluating the impact the adoption of FAS 161 will have on the Funds’ financial statement disclosures.
3. Purchases and Sales of Securities. For the six months ended March 31, 2008, purchases and sales of securities (excluding short-term investments and including paydowns) were as follows:
| | | | | | | | | | | | |
| | | U.S. Government/Agency
Securities | | Other Securities |
Fund | | Purchases | | Sales | | Purchases | | Sales |
Bond Fund | | $ | 187,563,405 | | $ | 1,031,593,306 | | $ | 4,806,862,313 | | $ | 1,350,735,160 |
Fixed Income Fund | | | — | | | 22,906,508 | | | 55,295,650 | | | 66,013,945 |
Global Bond Fund | | | 234,490,108 | | | 180,251,176 | | | 832,553,087 | | | 393,264,975 |
Inflation Protected Securities Fund | | | 2,623,642 | | | 1,027,408 | | | 450,463 | | | 544,120 |
Institutional High Income Fund | | | — | | | 27,992,842 | | | 37,255,728 | | | 5,231,941 |
Intermediate Duration Fixed Income Fund | | | 9,559,129 | | | 8,539,414 | | | 6,302,585 | | | 4,196,403 |
Investment Grade Fixed Income Fund | | | — | | | 14,692,551 | | | 34,009,314 | | | 38,604,690 |
4. Management Fees and Other Transactions with Affiliates.
a. Management Fees. Loomis, Sayles & Company, L.P. (“Loomis Sayles”) serves as investment adviser to each Fund. Separate management agreements for each Fund in effect for the six months ended March 31, 2008, provided for fees at the following annual percentage rates of each Fund’s average daily net assets:
| | | | | | | | | | |
| | | Percentage of Average Daily Net Assets |
Fund | | First
$1 Billion | | Next
$1 Billion | | Next
$1 Billion | | Next
$12 Billion | | Over
$15 Billion |
Bond Fund | | 0.60% | | 0.60% | | 0.60% | | 0.50% | | 0.49% |
Fixed Income Fund | | 0.50% | | 0.50% | | 0.50% | | 0.50% | | 0.50% |
Global Bond Fund | | 0.60% | | 0.50% | | 0.48% | | 0.48% | | 0.48% |
Inflation Protected Securities Fund | | 0.25% | | 0.25% | | 0.25% | | 0.25% | | 0.25% |
Institutional High Income Fund | | 0.60% | | 0.60% | | 0.60% | | 0.60% | | 0.60% |
Intermediate Duration Fixed Income Fund | | 0.25% | | 0.25% | | 0.25% | | 0.25% | | 0.25% |
Investment Grade Fixed Income Fund | | 0.40% | | 0.40% | | 0.40% | | 0.40% | | 0.40% |
Prior to December 1, 2007, the management fees for the Bond Fund were 0.60% for the first $3 billion of average daily net assets of the Fund and 0.50% of such assets thereafter.
Loomis Sayles has given binding undertakings to the Funds to reduce management fees and/or reimburse certain expenses associated with the Funds to limit their operating expenses. These undertakings are in effect until January 31, 2009 and will be
119
reevaluated on an annual basis. For the six months ended March 31, 2008, the expense limits as a percentage of average daily net assets under the expense limitation agreements were as follows:
| | | | | | |
| | | Expense Limit as a Percentage of
Average Daily Net Assets |
Fund | | Institutional Class | | Retail Class | | Admin Class |
Bond Fund | | 0.70% | | 0.95% | | 1.20% |
Fixed Income Fund | | 0.65% | | — | | — |
Global Bond Fund | | 0.75% | | 1.00% | | — |
Inflation Protected Securities Fund | | 0.40% | | — | | — |
Institutional High Income Fund | | 0.75% | | — | | — |
Intermediate Duration Fixed Income Fund | | 0.40% | | — | | — |
Investment Grade Fixed Income Fund | | 0.55% | | — | | — |
For the six months ended March 31, 2008, the management fees for each Fund were as follows:
| | | | | |
Fund | | Management
Fee | | Percentage of
Average Daily
Net Assets |
Bond Fund | | $ | 41,533,341 | | 0.52% |
Fixed Income Fund | | | 1,544,516 | | 0.50% |
Global Bond Fund | | | 5,944,132 | | 0.54% |
Inflation Protected Securities Fund | | | 18,445 | | 0.25% |
Institutional High Income Fund | | | 606,886 | | 0.60% |
Intermediate Duration Fixed Income Fund | | | 42,602 | | 0.25% |
Investment Grade Fixed Income Fund | | | 531,268 | | 0.40% |
For the six months ended March 31, 2008, expenses were reimbursed as follows:
| | | |
Fund | | Reimbursement |
Bond Fund | | $ | 23,154 |
Fixed Income Fund | | | — |
Global Bond Fund | | | — |
Inflation Protected Securities Fund | | | 45,067 |
Institutional High Income Fund | | | — |
Intermediate Duration Fixed Income Fund | | | 33,747 |
Investment Grade Fixed Income Fund | | | — |
Loomis Sayles shall be permitted to recover expenses they have borne under the expense limitation agreement (whether through a reduction of its management fee or otherwise) on a class by class basis in later periods to the extent the expenses of a Class fall below a Class’ expense limits, provided, however, that a class is not obligated to pay such reduced fees/expenses more than one year after the end of the fiscal year in which the fee/expense was reduced. The amounts subject to possible reimbursement under the expense limitation agreements at March 31, 2008 were as follows:
| | | | | | | | | | | | |
| | | Expenses Subject to Possible Reimbursement Until
September 30, 2008 |
Fund | | Institutional Class | | Retail Class | | Admin Class | | Total |
Bond Fund | | $ | — | | $ | 215,069 | | $ | — | | $ | 215,069 |
Fixed Income Fund | | | — | | | — | | | — | | | — |
Global Bond Fund | | | — | | | 268,311 | | | — | | | 268,311 |
Inflation Protected Securities Fund | | | 102,653 | | | — | | | — | | | 102,653 |
Institutional High Income Fund | | | — | | | — | | | — | | | — |
Intermediate Duration Fixed Income Fund | | | 76,556 | | | — | | | — | | | 76,556 |
Investment Grade Fixed Income Fund | | | — | | | — | | | — | | | — |
120
NOTES TO FINANCIAL STATEMENTS – continued
March 31, 2008 (Unaudited)
| | | | | | | | | | | | |
| |
| | | Expenses Subject to Possible Reimbursement Until
September 30, 2009 |
Fund | | Institutional
Class | | Retail
Class | | Admin
Class | | Total |
Bond Fund | | $ | — | | $ | — | | $ | 23,154 | | $ | 23,154 |
Fixed Income Fund | | | — | | | — | | | — | | | — |
Global Bond Fund | | | — | | | — | | | — | | | — |
Inflation Protected Securities Fund | | | 45,067 | | | — | | | — | | | 45,067 |
Institutional High Income Fund | | | — | | | — | | | — | | | — |
Intermediate Duration Fixed Income Fund | | | 33,747 | | | — | | | — | | | 33,747 |
Investment Grade Fixed Income Fund | | | — | | | — | | | — | | | — |
Certain officers and employees of Loomis Sayles are also officers or Trustees of the Trust. Loomis Sayles’ general partner is indirectly owned by Natixis Global Asset Management, L.P. (“Natixis US”), which is part of Natixis Global Asset Management Group, an international asset management group based in Paris, France.
b. Administrative Fees. Natixis Advisors provides certain administrative services for the Funds and subcontracts with State Street Bank to serve as sub-administrator. Natixis Advisors is a wholly-owned subsidiary of Natixis US. Pursuant to an agreement among Natixis Funds Trust I, Natixis Funds Trust II, Natixis Funds Trust III, Natixis Funds Trust IV, Natixis Cash Management Trust, Gateway Trust (“Natixis Funds Trusts”), Loomis Sayles Funds I, Loomis Sayles Funds II (“Loomis Sayles Funds Trusts”), the Hansberger International Series and Natixis Advisors, each Fund pays Natixis Advisors monthly its pro rata portion of fees equal to an annual rate of 0.0675% of the first $5 billion of the average daily net assets of the Natixis Funds Trusts, Loomis Sayles Funds Trusts and Hansberger International Series, 0.0625% of the next $5 billion, 0.0500% of the next $20 billion and 0.045% of such assets in excess of $30 billion, subject to an annual aggregate minimum fee for the Natixis Funds Trusts, Loomis Sayles Funds Trusts and Hansberger International Series of $5 million, which is reevaluated on an annual basis. New funds are subject to an annual fee of $50,000 plus $12,500 per class and an additional $50,000 if managed by multiple subadvisors in their first calendar year of operations.
Effective October 1, 2007, State Street Bank reduced the fees it receives from Natixis Advisors for serving as sub-administrator to the Funds. Also, effective October 1, 2007, Natixis Advisors has given a binding contractual undertaking to the Funds to waive the administrative fees paid by the Funds in an amount equal to the reduction in sub-administrative fees discussed above. The waiver is in effect through June 30, 2008.
For the six months ended March 31, 2008, amounts paid to Natixis Advisors for administrative fees were as follows:
| | | | | | | | | |
Fund | | Gross
Administrative
Fees | | Waiver of
Administrative
Fees | | Net
Administrative
Fees |
Bond Fund | | $ | 4,193,824 | | $ | 202,820 | | $ | 3,991,004 |
Fixed Income Fund | | | 161,668 | | | 7,812 | | | 153,856 |
Global Bond Fund | | | 571,420 | | | 27,658 | | | 543,762 |
Inflation Protected Securities Fund | | | 3,860 | | | 185 | | | 3,675 |
Institutional High Income Fund | | | 52,953 | | | 2,558 | | | 50,395 |
Intermediate Duration Fixed Income Fund | | | 8,917 | | | 431 | | | 8,486 |
Investment Grade Fixed Income Fund | | | 69,513 | | | 3,359 | | | 66,154 |
c. Service and Distribution Fees. Natixis Distributors, L.P. (“Natixis Distributors”), a wholly owned subsidiary of Natixis US, has entered into a distribution agreement with the Trust. Pursuant to this agreement, Natixis Distributors serves as principal underwriter of each Fund.
Pursuant to Rule 12b-1 under the 1940 Act, the Bond Fund and the Global Bond Fund have adopted Distribution Plans relating to each Fund’s Retail Class shares (the “Retail Class Plan”) and the Bond Fund has adopted a separate Distribution Plan relating to its Admin Class shares (the “Admin Class Plan”).
Under the respective Retail Class and Admin Class Plans, each Fund pays Natixis Distributors a monthly distribution fee at an annual rate not to exceed 0.25% of the average daily net assets attributable to the Fund’s Retail Class and Admin Class Shares, as reimbursement for expenses incurred by Natixis Distributors in providing personal services to investors in Retail Class and Admin
121
Class Shares and/or maintenance of shareholder accounts. In addition, the Admin Class shares of the Bond Fund may pay an administrative service fee at an annual rate not to exceed 0.25% of the average daily net assets attributable to Admin Class shares to securities dealers or financial intermediaries for providing personal service and account maintenance for their customers who hold such shares.
For the six months ended March 31, 2008, the Funds paid the following service and distribution fees:
| | | | | | | | | | | | |
| | | Service Fees | | Distribution Fees |
Fund | | Admin
Class | | Retail
Class | | Admin
Class | | Retail
Class |
Bond Fund | | $ | 271,881 | | $ | — | | $ | 271,881 | | $ | 9,304,102 |
Fixed Income Fund | | | — | | | — | | | — | | | — |
Global Bond Fund | | | — | | | — | | | — | | | 1,276,167 |
Inflation Protected Securities Fund | | | — | | | — | | | — | | | — |
Institutional High Income Fund | | | — | | | — | | | — | | | — |
Intermediate Duration Fixed Income Fund | | | — | | | — | | | — | | | — |
Investment Grade Fixed Income Fund | | | — | | | — | | | — | | | — |
d. Sub-Transfer Agent Fees. Natixis Distributors has entered into agreements with financial intermediaries to provide certain recordkeeping, processing, shareholder communications and other services to customers of the intermediaries and has agreed to compensate the intermediaries for providing those services. Certain services would be provided by the Funds if the shares of those customers were registered directly with the Funds’ transfer agent. Accordingly, the Funds agreed to pay a portion of the intermediary fees attributable to shares of the Fund held by the intermediary (which generally is a percentage of the value of shares held) not exceeding what the Funds would have paid its transfer agent had each customer’s shares been registered directly with the transfer agent instead of held through the intermediary. Natixis Distributors pays the remainder of the fees. Listed below are the fees incurred by the Funds which are included in the transfer agent fees and expenses in the Statements of Operations.
| | | | | | | | | |
| | | Sub-Transfer Agent Fees |
Fund | | Institutional
Class | | Retail
Class | | Admin
Class |
Bond Fund | | $ | 1,692,241 | | $ | 2,635,381 | | $ | 111,203 |
Fixed Income Fund | | | — | | | — | | | — |
Global Bond Fund | | | 89,823 | | | 442,875 | | | — |
Inflation Protected Securities Fund | | | 2,456 | | | — | | | — |
Institutional High Income Fund | | | 2,392 | | | — | | | — |
Intermediate Duration Fixed Income Fund | | | 281 | | | — | | | — |
Investment Grade Fixed Income Fund | | | — | | | — | | | — |
e. Trustees Fees and Expenses. The Fund does not pay any compensation directly to its officers or Trustees who are directors, officers or employees of Natixis Advisors, Natixis Distributors, Natixis US, or their affiliates. The Chairperson of the Board receives a retainer fee at the annual rate of $200,000. The Chairperson does not receive any meeting attendance fees for Board of Trustees meetings or committee meetings that she attends. Each independent Trustee (other than the Chairperson) receives, in the aggregate, a retainer fee at the annual rate of $65,000. Each independent Trustee also receives a meeting attendance fee of $7,500 for each meeting of the Board of Trustees that he or she attends in person and $3,750 for each meeting of the Board of Trustees that he or she attends telephonically. In addition, each committee chair receives an additional retainer fee at the annual rate of $10,000. Each Contract Review and Governance Committee member is compensated $5,000 for each Committee meeting that he or she attends in person and $2,500 for each meeting that he or she attends telephonically. Each Audit Committee member is compensated $6,250 for each Committee meeting that he or she attends in person and $3,125 for each meeting that he or she attends telephonically. These fees are allocated among the Funds in the Natixis Funds Trusts, Loomis Sayles Funds Trusts and the Hansberger International Series based on a formula that takes into account, among other factors, the relative net assets of each Fund. Trustees are reimbursed for travel expenses in connection with attendance at meetings.
Prior to January 1, 2008, each Independent Trustee (other than the Chairperson) received, in the aggregate, a retainer fee at the annual rate of $55,000. Each Independent Trustee also received a meeting attendance fee of $6,000 for each meeting of the Board of Trustees that he or she attended in person and $3,000 for each meeting that he or she attended telephonically. In addition, each Contract Review and Governance Committee member received $4,000 for each committee meeting that he or she attended in
122
NOTES TO FINANCIAL STATEMENTS – continued
March 31, 2008 (Unaudited)
person and $2,000 for each committee meeting that he or she attended telephonically. Each Audit Committee member received $5,000 for each committee meeting that he or she attended in person and $2,500 for each committee meeting that he or she attended telephonically. The Chairperson of the Board and committee chair retainers were $200,000 and $10,000, respectively.
A deferred compensation plan (the “Plan”) is available to the Trustees on a voluntary basis. Each participating Trustee will receive an amount equal to the value that such deferred compensation would have been had it been invested in a designated Fund or certain other Funds of the Natixis Funds Trusts, Loomis Sayles Funds Trusts and Hansberger International Series on the normal payment date. Deferred amounts remain in the Funds until distributed in accordance with the Plan.
f. Redemption Fees. Shareholders of the Bond Fund and the Global Bond Fund are charged a 2% redemption fee if they redeem, including redeeming by exchange, any class of shares of the Bond Fund or the Global Bond Fund within 60 days of their acquisition (including acquisition by exchange). The redemption fee is intended to offset the costs to the Funds of short-term trading, such as portfolio transaction and market impact costs associated with redemption activity and administrative costs associated with processing redemptions. The redemption fee is deducted from the shareholder’s redemption or exchange proceeds and is paid to the Fund.
The “first-in, first-out” method is used to determine the holding period of redeemed or exchanged shares, which means that if a shareholder acquired shares on different days, the shares acquired first will be redeemed or exchanged first for purposes of determining whether the redemption fee applies. A new holding period begins with each purchase or exchange. These fees are accounted for as an addition to paid-in capital and are presented on the Statements of Changes in Net Assets.
5. Line of Credit. Each Fund, together with certain other funds of Natixis Funds Trusts, Loomis Sayles Funds Trusts and the Hansberger International Series, participates in a $200,000,000 committed line of credit provided by State Street Bank, with an individual limit of $125,000,000 for each Fund that participates in the line of credit. Interest is charged to each participating fund based on its borrowings at a rate per annum equal to the Federal Funds rate plus 0.50%. In addition, a commitment fee of 0.09% per annum, payable at the end of each calendar quarter, is accrued and apportioned among the participating funds based on their average daily unused portion of the line of credit. For the six months ended March 31, 2008, the Funds had no borrowings under this agreement.
Prior to March 12, 2008, each fund together with certain other funds of Natixis Funds Trusts, Loomis Sayles Funds Trusts and Hansberger International Series, participated in a $75,000,000 committed line of credit provided by State Street Bank.
6. Shareholders. At March 31, 2008, Loomis Sayles Distributors LP and Loomis Sayles Trust Co. LLC owned 235,652 shares, equal to 15.6% of Inflation Protected Securities Fund’s shares outstanding. At March 31, 2008, the Loomis Sayles Funded Pension Plan and Trust (“Pension Plan”) and the Loomis Sayles Employees’ Profit Sharing Retirement Plan held shares of beneficial interest in the Funds as follows:
| | | | |
Fund | | Pension Plan | | Profit Sharing
Retirement Plan |
Bond Fund | | 1,141,264 | | 1,419,387 |
Fixed Income Fund | | — | | — |
Global Bond Fund | | 654,169 | | 453,942 |
Inflation Protected Securities Fund | | 186,644 | | 151,342 |
Institutional High Income Fund | | — | | 963,708 |
Intermediate Duration Fixed Income Fund | | — | | 59,991 |
Investment Grade Fixed Income Fund | | — | | — |
In addition, two individuals affiliated with Institutional High Income Fund held approximately 12.1% of the Fund’s total outstanding shares.
At March 31, 2008, 5 shareholders individually owned more than 5% of the Fixed Income Fund’s total outstanding shares, representing, in aggregate, 31.7% of the Fund; 3 shareholders individually owned more than 5% of the Inflation Protected Securities Fund’s total outstanding shares, representing, in aggregate, 20.7% of the Fund; 9 shareholders individually owned more than 5% of the Institutional High Income Fund’s total outstanding shares, representing, in aggregate, 60.8% of the Fund; 3 shareholders individually owned more than 5% of the Intermediate Duration Fixed Income Fund’s total outstanding shares, representing, in aggregate, 82.9% of the Fund; and 7 shareholders individually owned more than 5% of the Investment Grade Fixed Income Fund’s total outstanding shares representing in aggregate, 67.8% of the Fund.
123
7. Capital Shares. Each Fund may issue an unlimited number of shares of beneficial interest, without par value. Transactions in capital shares were as follows:
| | | | | | | | | | | | | | |
| | | Bond Fund | |
| | |
| | | Six Months Ended March 31, 2008 | | | Year Ended September 30, 2007 | |
| | | | |
| Institutional Class | | Shares | | | Amount | | | Shares | | | Amount | |
Issued from the sale of shares | | 137,014,872 | | | $ | 2,001,115,040 | | | 225,302,977 | | | $ | 3,259,332,205 | |
Issued in connection with the reinvestment of distributions | | 17,760,915 | | | | 256,756,858 | | | 21,376,443 | | | | 307,439,341 | |
Redeemed | | (62,607,833 | ) | | | (909,705,337 | ) | | (57,759,551 | ) | | | (835,264,911 | ) |
| | | | | | | | | | | | | | |
Net change | | 92,167,954 | | | $ | 1,348,166,561 | | | 188,919,869 | | | $ | 2,731,506,635 | |
| | | | | | | | | | | | | | |
| | | | |
| Retail Class | | Shares | | | Amount | | | Shares | | | Amount | |
Issued from the sale of shares | | 179,231,284 | | | $ | 2,609,206,073 | | | 316,905,718 | | | $ | 4,574,277,582 | |
Issued in connection with the reinvestment of distributions | | 16,694,991 | | | | 240,505,343 | | | 16,459,304 | | | | 236,127,467 | |
Redeemed | | (61,662,719 | ) | | | (891,494,711 | ) | | (53,198,802 | ) | | | (766,662,779 | ) |
| | | | | | | | | | | | | | |
Net change | | 134,263,556 | | | $ | 1,958,216,705 | | | 280,166,220 | | | $ | 4,043,742,270 | |
| | | | | | | | | | | | | | |
| | | | |
| Admin Class | | Shares | | | Amount | | | Shares | | | Amount | |
Issued from the sale of shares | | 5,823,830 | | | $ | 84,452,030 | | | 7,435,777 | | | $ | 106,930,369 | |
Issued in connection with the reinvestment of distributions | | 425,957 | | | | 6,124,542 | | | 484,814 | | | | 6,942,995 | |
Redeemed | | (3,073,108 | ) | | | (44,274,247 | ) | | (2,279,523 | ) | | | (32,743,088 | ) |
| | | | | | | | | | | | | | |
Net change | | 3,176,679 | | | $ | 46,302,325 | | | 5,641,068 | | | $ | 81,130,276 | |
| | | | | | | | | | | | | | |
Increase (decrease) from capital share transactions | | 229,608,189 | | | $ | 3,352,685,591 | | | 474,727,157 | | | $ | 6,856,379,181 | |
| | | | | | | | | | | | | | |
| |
| | | Fixed Income Fund | |
| | |
| | | Six Months Ended March 31, 2008 | | | Year Ended September 30, 2007 | |
| | | | |
| Institutional Class | | Shares | | | Amount | | | Shares | | | Amount | |
Issued from the sale of shares | | 8,714,048 | | | $ | 122,892,199 | | | 8,214,414 | | | $ | 114,350,567 | |
Issued in connection with the reinvestment of distributions | | 3,076,075 | | | | 41,096,367 | | | 2,112,444 | | | | 28,412,372 | |
Issued from subscriptions-in-kind* | | — | | | | — | | | 1,358,851 | | | | 18,602,665 | |
Redeemed | | (7,020,553 | ) | | | (100,343,953 | ) | | (2,736,152 | ) | | | (37,720,894 | ) |
| | | | | | | | | | | | | | |
Increase (decrease) from capital share transactions | | 4,769,570 | | | $ | 63,644,613 | | | 8,949,557 | | | $ | 123,644,710 | |
| | | | | | | | | | | | | | |
* Issued in exchange for portfolio securities contributed to the Fund in-kind by such shareholders on March, 1, 2007. Contribution includes $18,407,166 of cash and securities and $195,499 in receivables. The securities contributed were part of a portfolio that was previously managed by Loomis Sayles. | |
124
NOTES TO FINANCIAL STATEMENTS – continued
March 31, 2008 (Unaudited)
| | | | | | | | | | | | | | |
| | | Global Bond Fund | |
| | |
| | | Six Months Ended March 31, 2008 | | | Year Ended September 30, 2007 | |
| | | | |
| Institutional Class | | Shares | | | Amount | | | Shares | | | Amount | |
Issued from the sale of shares | | 22,125,983 | | | $ | 356,287,362 | | | 27,734,425 | | | $ | 431,703,225 | |
Issued in connection with the reinvestment of distributions | | 1,718,654 | | | | 27,531,967 | | | 2,446,517 | | | | 37,807,115 | |
Redeemed | | (5,661,478 | ) | | | (91,385,093 | ) | | (9,017,324 | ) | | | (139,876,702 | ) |
| | | | | | | | | | | | | | |
Net change | | 18,183,159 | | | $ | 292,434,236 | | | 21,163,618 | | | $ | 329,633,638 | |
| | | | | | | | | | | | | | |
| | | | |
| Retail Class | | Shares | | | Amount | | | Shares | | | Amount | |
Issued from the sale of shares | | 24,231,524 | | | $ | 388,170,973 | | | 30,549,761 | | | $ | 471,407,761 | |
Issued in connection with the reinvestment of distributions | | 1,544,877 | | | | 24,542,929 | | | 2,275,012 | | | | 34,895,516 | |
Redeemed | | (9,370,502 | ) | | | (150,289,733 | ) | | (12,534,751 | ) | | | (192,738,097 | ) |
| | | | | | | | | | | | | | |
Net change | | 16,405,899 | | | $ | 262,424,169 | | | 20,290,022 | | | $ | 313,565,180 | |
| | | | | | | | | | | | | | |
Increase (decrease) from capital share transactions | | 34,589,058 | | | $ | 554,858,405 | | | 41,453,640 | | | $ | 643,198,818 | |
| | | | | | | | | | | | | | |
| |
| | | Inflation Protected Securities Fund | |
| | |
| | | Six Months Ended March 31, 2008 | | | Year Ended September 30, 2007 | |
| | | | |
| Institutional Class | | Shares | | | Amount | | | Shares | | | Amount | |
Issued from the sale of shares | | 351,110 | | | $ | 3,811,737 | | | 513,841 | | | $ | 5,272,640 | |
Issued in connection with the reinvestment of distributions | | 27,361 | | | | 292,925 | | | 52,702 | | | | 533,425 | |
Redeemed | | (175,769 | ) | | | (1,914,250 | ) | | (139,248 | ) | | | (1,427,665 | ) |
| | | | | | | | | | | | | | |
Increase (decrease) from capital share transactions | | 202,702 | | | $ | 2,190,412 | | | 427,295 | | | $ | 4,378,400 | |
| | | | | | | | | | | | | | |
| |
| | | Institutional High Income Fund | |
| | |
| | | Six Months Ended March 31, 2008 | | | Year Ended September 30, 2007 | |
| | | | |
| Institutional Class | | Shares | | | Amount | | | Shares | | | Amount | |
Issued from the sale of shares | | 5,231,922 | | | $ | 43,445,869 | | | 5,899,925 | | | $ | 49,270,705 | |
Issued in connection with the reinvestment of distributions | | 1,889,032 | | | | 14,526,657 | | | 912,481 | | | | 7,327,229 | |
Redeemed | | (4,432,679 | ) | | | (35,420,534 | ) | | (2,029,721 | ) | | | (16,744,853 | ) |
| | | | | | | | | | | | | | |
Increase (decrease) from capital share transactions | | 2,688,275 | | | $ | 22,551,992 | | | 4,782,685 | | | $ | 39,853,081 | |
| | | | | | | | | | | | | | |
125
| | | | | | | | | | | | | | |
| | | Intermediate Duration Fixed Income Fund | |
| | |
| | | Six Months Ended March 31, 2008 | | | Year Ended September 30, 2007 | |
| | | | |
| Institutional Class | | Shares | | | Amount | | | Shares | | | Amount | |
Issued from the sale of shares | | 441,547 | | | $ | 4,213,903 | | | 288,140 | | | $ | 2,734,830 | |
Issued in connection with the reinvestment of distributions | | 62,243 | | | | 592,291 | | | 132,904 | | | | 1,257,767 | |
Issued from subscriptions-in-kind* | | — | | | | — | | | 112,853 | | | | 1,070,978 | |
Redeemed | | (176,088 | ) | | | (1,675,433 | ) | | (1,619,583 | ) | | | (15,330,675 | ) |
| | | | | | | | | | | | | | |
Increase (decrease) from capital share transactions | | 327,702 | | | $ | 3,130,761 | | | (1,085,686 | ) | | $ | (10,267,100 | ) |
| | | | | | | | | | | | | | |
* Issued in exchange for portfolio securities contributed to the Fund in-kind by such shareholders on October, 30, 2006. Contribution includes $1,057,779 of securities and $13,199 in receivables. The securities contributed were part of a portfolio that was previously managed by Loomis Sayles. | |
| |
| | | Investment Grade Fixed Income Fund | |
| | |
| | | Six Months Ended March 31, 2008 | | | Year Ended September 30, 2007 | |
| | | | |
| Institutional Class | | Shares | | | Amount | | | Shares | | | Amount | |
Issued from the sale of shares | | 2,754,698 | | | $ | 35,646,047 | | | 3,430,409 | | | $ | 43,194,911 | |
Issued in connection with the reinvestment of distributions | | 523,190 | | | | 6,707,438 | | | 902,151 | | | | 11,398,175 | |
Issued from subscriptions-in-kind* | | — | | | | — | | | 3,389,172 | | | | 43,211,946 | |
Redeemed | | (2,058,712 | ) | | | (26,911,519 | ) | | (1,275,094 | ) | | | (16,210,451 | ) |
| | | | | | | | | | | | | | |
Increase (decrease) from capital share transactions | | 1,219,176 | | | $ | 15,441,966 | | | 6,446,638 | | | $ | 81,594,581 | |
| | | | | | | | | | | | | | |
* Issued in exchange for portfolio securities contributed to the Fund in-kind by such shareholders on July, 12, 2007. Contributions include $42,946,879 of cash and securities and $265,067 in receivables. The securities contributed were part of portfolios that were previously managed by Loomis Sayles. | |
8. Unfunded Loan Commitments. As of March 31, 2008, the Bond Fund had one unfunded loan commitment which could be extended at the option of the following Borrower, pursuant to the loan agreement:
| | | |
Borrower | | Unfunded Loan Commitment |
Community Health Systems, Inc. | | $ | 210,000 |
126

Loomis Sayles High Income Opportunities Fund
Loomis Sayles Securitized Asset Fund
SEMIANNUAL REPORT
MARCH 31, 2008 (Unaudited)
FUND AND MANAGER REVIEW
Loomis Sayles High Income Opportunities Fund

Matthew Eagan, CFA
Manager Since April 2004

Kathleen Gaffney, CFA
Manager Since April 2004

Dan Fuss, CFA, CIC
Manager Since April 2004

Elaine Stokes
Manager Since April 2004
KEY FUND FACTS
Symbol | LSIOX
Objective | High current income. Capital appreciation is the Fund’s secondary objective.
Strategy | Invests substantially all of its assets, and may invest up to 100% of its assets, in high income securities. High income securities are fixed-income securities that Loomis Sayles believes have the potential to generate relatively high levels of current income.
Fund Inception Date | 4/01/04
Commencement of Operations of Class | Institutional: 4/12/04
Total Net Assets | $77.3 million
PORTFOLIO REVIEW
The Fund outperformed its Benchmark, the Lehman High Yield Index, during the six months ended March 31, 2008, primarily due to sector allocation and individual security selection.
Throughout the period, investors moved to safe havens as economic conditions deteriorated and the credit crisis gained momentum. The Fund’s underweight position in financials enabled it to avoid some of the price declines in this sector, which was among the worst performing group for the period. US Treasurys continued to outperform all other fixed-income sectors, and the Fund’s allocation to Treasurys remained a source of excess return.
Our security selection in the investment grade sector contributed positively to performance. On an industry level, the more stable areas, such as energy, natural gas and healthcare, were the best performers during the period. Energy companies benefited from high oil prices, while the natural gas industry, which is mostly insulated from the subprime fallout and consumer worries, benefited from strong commodity prices. Healthcare, a relatively defensive area, held up better than most industries.
The utilities sector (investment grade and high yield) was one of the best performing sectors. Strong security selection among investment grade issues benefited the Fund. However, our relative underweight allocation in lower quality, higher yielding securities, combined with poor security selection, detracted from performance.
The TMT (technology, media, telecommunication) industry was a drag on performance, primarily due to lower-quality issues and those with exposure to leveraged buyout risks were out of favor with investors during the period. An over-supply of high yield bonds and loans, combined with weak consumer spending, further diminished returns.
OUTLOOK
Although the US economy has weakened, we see pockets of strength. For example, the industrials sector is relatively strong; the weak US dollar is improving the outlook for exports; corporate spending remains disciplined; and nonresidential construction is booming. We believe the Federal Reserve will ease once more before holding the fed funds target rate steady at 2.00%, while it continues to use other methods to maintain liquidity, as needed. By year-end, we believe the economy may show signs of recovery.
In our view, valuations outside of the Treasury sector are attractive. The shaky economy poses risks, but bond prices appear to reflect a more dismal scenario than we anticipate. Longer term, risk spreads should become less widespread, enabling markets to price risk more
1
appropriately. US high yield securities may offer more compelling value on a security-specific basis, although the potential for further fallout calls for caution. Near-term, we believe the US dollar may have further downside potential, as non-Japanese Asian currencies strengthen.
AVERAGE ANNUAL TOTAL RETURNS
Periods Ended March 31, 2008
| | | | | | | | | | |
| 6 Months | | | 1 year | | | 3 years | | | Since Inception(a) | |
|
| Loomis Sayles High Income Opportunities Fund | |
| -4.12 | % | | -3.28 | % | | 4.74 | % | | 6.34 | % |
|
Lehman High Yield Index(b)
|
|
| -4.27 | | | -3.74 | | | 4.89 | | | 5.37 | |
|
Lipper High Current Yield Funds Index(b)
|
|
| -4.65 | | | -4.05 | | | 4.29 | | | 4.93 | |
|
Gross Expense Ratio (before reductions and reimbursements)(c)
|
|
| Institutional: 0.68% | |
|
| Net Expense Ratio (after reductions and reimbursements)(c) | |
| Institutional: 0.00% | |
CUMULATIVE PERFORMANCE
Inception to March 31, 2008
Data quoted reflects past performance and cannot guarantee future results. Total returns assume reinvestment of dividends and capital gains distributions. Investment return and principal value will fluctuate so that shares, when redeemed, may be worth more or less than their original cost. Current performance may be higher or lower than quoted.
Returns do not reflect the taxes that a shareholder would pay on fund distributions or the redemption of shares. Periods of less than one year are not annualized. Index performance data is not available coincident with the Fund’s inception date.
(a) Since Index performance data is not available coincident with the Fund’s inception date, the beginning value of the index is the value of the month-end closest to the Fund’s inception date. (b) See page 5 for a description of the Indices. (c) The amount shown under Gross Expense Ratio reflects the approximate amount that would be required to compensate Loomis Sayles for providing investment advisory services to the fund (not advisory fees charged for the entire “wrap fee” program or for an investor’s separate account with Loomis Sayles), and the amount of operating expenses of the Fund, which is paid for by Loomis Sayles. The amount shown under Net Expense Ratio is 0.00% to reflect the fact that the Fund does not pay any advisory, administration or distribution and service fees, and that Loomis Sayles has agreed to pay certain expenses of the Fund.
WHAT YOU SHOULD KNOW
High yield securities are subject to a high degree of market and credit risk. The secondary market for these securities may lack liquidity, which may adversely affect the value of the Fund. Securities issued by US government agencies are not insured by and may not be guaranteed by the US government.
2
FUND AND MANAGER REVIEW
Loomis Sayles Securitized Asset Fund

Clifton Rowe, CFA
Manager since March 2006

Fan Hu, CFA
Manager since April 2006
KEY FUND FACTS
Symbol | LSSAX
Objective | High current income consistent with capital preservation.
Strategy | Invest at least 80% of its net assets (plus any borrowings made for investment purposes) in a diversified portfolio of securitized assets, such as mortgage-backed and other asset-backed securities.
Fund Inception Date | 3/2/06
Commencement of Operations of Class | Institutional: 3/2/06
Total Net Assets | $362.9 million
PORTFOLIO REVIEW
The Fund underperformed its Benchmark, the Lehman Securitized Index, for the six months ended March 31, 2008, primarily due to its overweight position in mortgage-backed securities (MBS) and commercial mortgage-backed securities (CMBS), both of which lagged during the period.
The reporting period was characterized by a continuation of the liquidity and credit concerns that spread from subprime mortgages into prime MBS
and the corporate credit markets, causing most spreads to widen. Investors preferred the safety and liquidity of higher-quality securities, despite their relatively modest income. MBS issued by GSEs (Government-Sponsored Entities) fared better than privately-issued securities. Similarly, GNMA issues performed relatively well, due to their explicit guarantee from the US government.
Non-GSE mortgages, which are perceived as having greater credit risk, were the worst performers. Many were rated AAA through some form of credit enhancement, but as the real estate market continued to deteriorate, investors grew cautious of all privately issued MBS, even prime issues. This weakness also spread to the corporate bond market and non-residential mortgages, including CMBS, which subsequently partially recovered.
As interest rates declined during the period, bonds with relatively longer maturities were among the best performers, because their prices are more sensitive to interest rate moves.
We increased the Fund’s position in short-duration, high-quality, asset-backed securities (ABS), including securities backed by automobile loans and credit-card receivables. We also added high-quality CMBS at attractive prices. These securities currently offer both high yields and strong credit quality, due to their secured status and additional credit enhancements. Credit enhancements include subordinated bonds, which are first to absorb any losses from underlying loans.
OUTLOOK
The Fund remains overweight in residential and commercial MBS, which are largely shielded from subprime issues. We expect these sectors to benefit significantly from their attractive yield advantages and from price appreciation. The GSE MBS derive their strong credit quality from conservative underwriting and guarantees from the issuing government agency. The commercial real estate market did not experience the proliferation of bad loans and speculative lending seen in the residential market. We believe our CMBS position remains of strong credit quality due to its significant credit enhancement. We believe these distinctions will draw investors back into these sectors in time.
3
The aggressive Federal Reserve rate cuts have resulted in a steep yield curve. In our view, longer maturity securities now offer significant yield advantages versus shorter alternatives. We are pursuing opportunities to take advantage of this situation.
AVERAGE ANNUAL TOTAL RETURNS
Periods Ended March 31, 2008
| | | | |
| 6 Months | | 1 year | | Since
Inception(a) |
|
| Loomis Sayles Securitized Asset Fund |
| 1.70% | | 3.12% | | 4.62% |
|
| Lehman Securitized Index(b) |
| 4.65 | | 6.82 | | 6.16 |
|
| Lipper US Mortgage Funds Index(b) |
| 2.91 | | 4.39 | | 4.84 |
|
| Gross Expense Ratio (before reductions and reimbursements)(c) |
| Institutional: 0.35% |
|
| Net Expense Ratio (after reductions and reimbursements)(c) |
| Institutional: 0.00% |
CUMULATIVE PERFORMANCE
Inception to March 31, 2008
Data quoted reflects past performance and cannot guarantee future results. Total returns assume reinvestment of dividends and capital gains distributions. Investment return and principal value will fluctuate so that shares, when redeemed, may be worth more or less than their original cost. Current performance may be higher or lower than quoted.
Returns do not reflect the taxes that a shareholder would pay on fund distributions or the redemption of shares. Periods of less than one year are not annualized.
(a) Since Index performance data is not available coincident with the Fund’s inception date, the beginning value of the index is the value of the month-end closest to the Fund’s inception date. (b) See page 5 for a description of the Indices. (c) The amount shown under Gross Expense Ratio reflects the approximate amount that would be required to compensate Loomis Sayles for providing investment advisory services to the fund (not advisory fees charged for the entire “wrap fee” program or for an investor’s separate account with Loomis Sayles), and the amount of operating expenses of the Fund, which is paid for by Loomis Sayles. The amount shown under Net Expense Ratio is 0.00% to reflect the fact that the Fund does not pay any advisory, administration or distribution and service fees, and that Loomis Sayles has agreed to pay certain expenses of the Fund.
WHAT YOU SHOULD KNOW
High yield securities are subject to a high degree of market and credit risk. The secondary market for these securities may lack liquidity, which may adversely affect the value of the Fund. Securities issued by US government agencies are not insured by and may not be guaranteed by the US government.
4
ADDITIONAL INFORMATION
Index Definitions
Lipper High Current Yield Funds Index is an equally weighted, unmanaged index of typically the 30 largest mutual funds within the high current yield funds investment objective.
Lipper US Mortgage Funds Index is an equally weighted, unmanaged index of typically the 30 largest mutual funds within the US mortgage funds investment objective.
Source: Lipper, Inc.
Lehman High Yield Index covers the universe of fixed rate, non-investment grade debt. Pay-in-kind (PIK) bonds, Eurobonds, and debt issues from countries designated as emerging markets (e.g., Argentina, Brazil, Venezuela, etc.) are excluded, but Canadian and global bonds (SEC registered) of issuers in non-emerging market countries are included. Original issue zeroes, step-up coupon structures, and 144As are also included.
Lehman Securitized Index is an unmanaged index of asset-backed securities, collateralized mortgage-backed securities (ERISA eligible) and fixed rate mortgage-backed securities.
Returns are adjusted for the reinvestment of capital gains distributions and income dividends. Indices are unmanaged and do not have expenses that affect results, unlike most mutual funds. It is not possible to invest directly in an index.
Proxy Voting Information
A description of the Funds’ proxy voting policies and procedures is available without charge, upon request, (i) by calling Loomis Sayles at 800-633-3330; (ii) on the Funds’ website, www.loomissayles.com, and (iii) on the SEC’s website at www.sec.gov. Information about how the Funds voted proxies relating to portfolio securities during the 12-month period ended June 30, 2007 is available on (i) the Funds’ website and (ii) the SEC’s website.
Quarterly Portfolio Schedules
The Funds file a complete schedule of portfolio holdings with the SEC for the first and third quarters of each fiscal year on Form N-Q. The Funds’ Forms N-Q is available on the SEC’s website at www.sec.gov and may be reviewed and copied at the SEC’s Public Reference Room in Washington, DC. Information on the operation of the Public Reference Room may be obtained by calling 800-SEC-0330.
UNDERSTANDING FUND EXPENSES
Typically, mutual fund shareholders incur two types of costs: (1) transaction costs, including sales charges (loads) on purchases, redemption fees and certain exchange fees; and (2) ongoing costs, including management fees, distribution fees (12b-1 fees), and other fund expenses. However, the Funds are unlike other mutual funds; they do not charge any fees or expenses.
You should be aware that shares in the Funds are available only to institutional investment advisory clients of Loomis, Sayles & Company, L.P. (“Loomis Sayles”) and Natixis Asset Management Advisors, L.P. (“Natixis Advisors”) and to participants in “wrap-fee” programs sponsored by broker dealers and investment advisers that may be affiliated or unaffiliated with the Funds, Loomis Sayles or Natixis Advisors. The institutional investment advisory clients of Loomis Sayles and Natixis Advisors pay Loomis Sayles or Natixis Advisors a fee for their investment advisory services, while participants in “wrap fee” programs pay a “wrap” fee to the program’s sponsor. The “wrap fee” program sponsors, in turn, pay a fee to Natixis Advisors. “Wrap fee” program participants should read carefully the wrap fee brochure provided to them by their program’s sponsor and the fees paid by such sponsor to Natixis Advisors. Shareholders pay no additional fees or expenses to purchase shares of the Funds. However, shareholders will indirectly pay a proportionate share of those costs, such as brokerage commissions, taxes and extraordinary expenses, that are borne by the Funds through a reduction in each Fund’s net asset value.
The first line in each Fund’s table below shows the actual amount of Fund expenses ($0) you would have paid on a $1,000 investment in the Fund from October 1, 2007 through March 31, 2008. It also shows how much a $1,000 investment would be worth at the close of the period, assuming actual Fund returns and expenses.
The second line in each Fund’s table provides information about hypothetical account values and hypothetical expenses based on the Fund’s actual expense ratio (0%) and an assumed rate of return of 5% per year before expenses, which is not the Fund’s actual return. The hypothetical account values and expenses may not be used to estimate the actual ending account balance or expenses you paid on your investment for the period. You may use this information to compare the ongoing costs of investing in the Funds and other funds. To do so, compare this 5% hypothetical example with the 5% hypothetical examples that appear in the shareholder reports of the other funds.
Loomis Sayles High Income Opportunities Fund
| | | | | | |
Institutional Class | | Beginning
Account Value
10/1/2007 | | Ending
Account Value
3/31/2008 | | Expenses Paid
During Period*
10/1/2007 – 3/31/2008 |
Actual | | $1,000.00 | | $958.80 | | $0.00 |
Hypothetical (5% return before expenses) | | $1,000.00 | | $1,025.00 | | $0.00 |
* Expenses are equal to the Fund’s annualized expense ratio of 0.00%, multiplied by the average account value over the period, multiplied by 183/366 (to reflect the half-year period). |
Loomis Sayles Securitized Asset Fund
| | | | | | |
Institutional Class | | Beginning
Account Value
10/1/2007 | | Ending
Account Value
3/31/2008 | | Expenses Paid
During Period*
10/1/2007 – 3/31/2008 |
Actual | | $1,000.00 | | $1,017.00 | | $0.00 |
Hypothetical (5% return before expenses) | | $1,000.00 | | $1,025.00 | | $0.00 |
* Expenses are equal to the Fund’s annualized expense ratio of 0.00%, multiplied by the average account value over the period, multiplied by 183/366 (to reflect the half-year period). |
5
PORTFOLIO OF INVESTMENTS – as of March 31, 2008 (Unaudited)
Loomis Sayles High Income Opportunities Fund
| | | | | | | | |
| | | | | Principal Amount | | Value (†) |
| | | | | | | | |
| | | |
| BONDS AND NOTES – 94.8% of Net Assets | | | | | | | | |
| | | |
| NON-CONVERTIBLE BONDS – 89.7% | | | | | | | | |
| | | |
| Aerospace & Defense – 2.0% | | | | | | | | |
Bombardier, Inc., 7.450%, 5/01/2034, 144A | | | | $ | 1,670,000 | | $ | 1,561,450 |
| | | | | | | | |
| Airlines – 2.7% | | | | | | | | |
American Airlines, Inc., Series 93A6, 8.040%, 9/16/2011 | | | | | 112,576 | | | 108,776 |
Continental Airlines, Inc., Series 1997-4B, 6.900%, 1/02/2017 | | | | | 84,214 | | | 75,793 |
Continental Airlines, Inc., Series 1998-1, Class B, 6.748%, 3/15/2017 | | | | | 231,900 | | | 208,710 |
Continental Airlines, Inc., Series 2000-2, Class B, 8.307%, 4/02/2018 | | | | | 15,560 | | | 14,549 |
Continental Airlines, Inc., Series 2001-1, Class B, 7.373%, 12/15/2015 | | | | | 74,637 | | | 67,546 |
Continental Airlines, Inc., Series 971A, 7.461%, 4/01/2015 | | | | | 185,356 | | | 172,381 |
Delta Air Lines, Inc., 6.821%, 8/10/2022, 144A | | | | | 243,210 | | | 228,617 |
Delta Air Lines, Inc., 8.021%, 8/10/2022, 144A | | | | | 746,463 | | | 679,282 |
Northwest Airlines, Inc., Series 07-1, 8.028%, 11/01/2017(b) | | | | | 540,000 | | | 507,600 |
| | | | | | | | |
| | | | | | | | 2,063,254 |
| | | | | | | | |
| Automotive – 4.9% | | | | | | | | |
Cummins, Inc., 6.750%, 2/15/2027 | | | | | 139,000 | | | 138,252 |
Ford Motor Co., 6.625%, 2/15/2028 | | | | | 165,000 | | | 100,650 |
Ford Motor Co., 6.625%, 10/01/2028 | | | | | 1,470,000 | | | 896,700 |
Ford Motor Co., 7.125%, 11/15/2025 | | | | | 35,000 | | | 23,100 |
Ford Motor Co., 7.450%, 7/16/2031(b) | | | | | 695,000 | | | 458,700 |
Ford Motor Co., 7.500%, 8/01/2026 | | | | | 110,000 | | | 70,400 |
Ford Motor Credit Co. LLC, 7.000%, 10/01/2013 | | | | | 825,000 | | | 643,516 |
Ford Motor Credit Co. LLC, 7.250%, 10/25/2011 | | | | | 370,000 | | | 303,927 |
Ford Motor Credit Co. LLC, 8.000%, 12/15/2016 | | | | | 100,000 | | | 78,280 |
General Motors Corp., 7.400%, 9/01/2025 | | | | | 45,000 | | | 30,150 |
General Motors Corp., 8.250%, 7/15/2023(b) | | | | | 1,060,000 | | | 742,000 |
General Motors Corp., 8.375%, 7/15/2033(b) | | | | | 25,000 | | | 17,625 |
Goodyear Tire & Rubber Co., 7.000%, 3/15/2028 | | | | | 320,000 | | | 260,800 |
| | | | | | | | |
| | | | | | | | 3,764,100 |
| | | | | | | | |
| Brokerage – 0.8% | | | | | | | | |
Bear Stearns Cos., Inc. (The), 3.190%, 5/18/2010(c) | | | | | 50,000 | | | 46,501 |
Bear Stearns Cos., Inc. (The), 4.650%, 7/02/2018 | | | | | 5,000 | | | 4,268 |
Bear Stearns Cos., Inc. (The), 5.300%, 10/30/2015 | | | | | 5,000 | | | 4,694 |
Bear Stearns Cos., Inc. (The), 6.400%, 10/02/2017 | | | | | 10,000 | | | 9,874 |
Bear Stearns Cos., Inc. (The), 7.250%, 2/01/2018 | | | | | 105,000 | | | 108,506 |
Nuveen Investments, Inc., 10.500%, 11/15/2015, 144A | | | | | 550,000 | | | 471,625 |
| | | | | | | | |
| | | | | | | | 645,468 |
| | | | | | | | |
| Building Materials – 0.7% | | | | | | | | |
Owens Corning, Inc., 6.500%, 12/01/2016 | | | | | 85,000 | | | 70,465 |
Owens Corning, Inc., 7.000%, 12/01/2036 | | | | | 130,000 | | | 94,003 |
Texas Industries, Inc., 7.250%, 7/15/2013 | | | | | 70,000 | | | 68,075 |
USG Corp., 6.300%, 11/15/2016 | | | | | 365,000 | | | 288,350 |
| | | | | | | | |
| | | | | | | | 520,893 |
| | | | | | | | |
6
PORTFOLIO OF INVESTMENTS – as of March 31, 2008 (Unaudited)
Loomis Sayles High Income Opportunities Fund – continued
| | | | | | | | |
| | | | | Principal Amount | | Value (†) |
| | | | | | | | |
| | | |
| BONDS AND NOTES – continued | | | | | | | | |
| | | |
| Chemicals – 3.8% | | | | | | | | |
Basell AF SCA, 8.375%, 8/15/2015, 144A | | | | $ | 200,000 | | $ | 146,000 |
Borden, Inc., 7.875%, 2/15/2023 | | | | | 610,000 | | | 378,200 |
Borden, Inc., 8.375%, 4/15/2016 | | | | | 175,000 | | | 119,000 |
Borden, Inc., 9.200%, 3/15/2021 | | | | | 220,000 | | | 147,400 |
Chemtura Corp., 6.875%, 6/01/2016 | | | | | 365,000 | | | 324,850 |
Georgia Gulf Corp., 10.750%, 10/15/2016(b) | | | | | 335,000 | | | 219,425 |
Hercules, Inc., 6.500%, 6/30/2029 | | | | | 675,000 | | | 540,000 |
LPG International, Inc., 7.250%, 12/20/2015(b) | | | | | 100,000 | | | 99,625 |
Methanex Corp., 6.000%, 8/15/2015 | | | | | 150,000 | | | 145,500 |
Montell Finance Co., 8.100%, 3/15/2027, 144A | | | | | 290,000 | | | 179,800 |
Mosaic Global Holdings, Inc., 7.300%, 1/15/2028 | | | | | 235,000 | | | 232,650 |
Mosaic Global Holdings, Inc., 7.375%, 8/01/2018 | | | | | 275,000 | | | 280,500 |
Nalco Finance Holdings, Inc.,
(step to 9.000% on 2/1/2009),
Zero Coupon Bond, 2/01/2014(b)(d) | | | | | 43,000 | | | 38,700 |
Polyone Corp., 8.875%, 5/01/2012(b) | | | | | 80,000 | | | 80,800 |
| | | | | | | | |
| | | | | | | | 2,932,450 |
| | | | | | | | |
| Construction Machinery – 0.3% | | | | | | | | |
United Rentals North America, Inc., 7.000%, 2/15/2014 | | | | | 275,000 | | | 215,875 |
| | | | | | | | |
| Consumer Cyclical Services – 0.2% | | | | | | | | |
Kar Holdings, Inc., 10.000%, 5/01/2015(b) | | | | | 165,000 | | | 142,725 |
| | | | | | | | |
| Consumer Products – 0.3% | | | | | | | | |
Church & Dwight Co., Inc., 6.000%, 12/15/2012 | | | | | 195,000 | | | 190,125 |
Jostens IH Corp., 7.625%, 10/01/2012 | | | | | 25,000 | | | 24,313 |
| | | | | | | | |
| | | | | | | | 214,438 |
| | | | | | | | |
| Electric – 7.4% | | | | | | | | |
AES Corp., 7.750%, 3/01/2014 | | | | | 160,000 | | | 161,000 |
Allegheny Energy Supply Co., LLC, 7.800%, 3/15/2011 | | | | | 40,000 | | | 42,400 |
Allegheny Generating Co., 6.875%, 9/01/2023 | | | | | 100,000 | | | 101,020 |
Dynegy Holdings, Inc., 7.125%, 5/15/2018 | | | | | 195,000 | | | 175,500 |
Dynegy Holdings, Inc., 7.500%, 6/01/2015 | | | | | 100,000 | | | 93,750 |
Dynegy Holdings, Inc., 7.625%, 10/15/2026 | | | | | 325,000 | | | 275,437 |
Dynegy Holdings, Inc., 7.750%, 6/01/2019 | | | | | 350,000 | | | 327,250 |
Dynegy Holdings, Inc., 8.375%, 5/01/2016(b) | | | | | 280,000 | | | 277,200 |
Edison Mission Energy, 7.625%, 5/15/2027 | | | | | 525,000 | | | 493,500 |
Edison Mission Energy, 7.750%, 6/15/2016 | | | | | 515,000 | | | 530,450 |
Energy Future Holdings Corp., Series P, 5.550%, 11/15/2014 | | | | | 160,000 | | | 124,935 |
Energy Future Holdings Corp., Series Q, 6.500%, 11/15/2024 | | | | | 1,415,000 | | | 1,004,760 |
Enersis SA, 7.375%, 1/15/2014(b) | | | | | 50,000 | | | 55,157 |
Enersis SA, 7.400%, 12/01/2016 | | | | | 175,000 | | | 189,133 |
NGC Corporation Capital Trust I, Series B, 8.316%, 6/01/2027 | | | | | 460,000 | | | 394,450 |
NSG Holdings LLC, 7.750%, 12/15/2025, 144A | | | | | 355,000 | | | 344,350 |
Reliant Energy, Inc., 7.875%, 6/15/2017(b) | | | | | 410,000 | | | 407,950 |
TXU Corp., Series R, 6.550%, 11/15/2034 | | | | | 515,000 | | | 363,579 |
White Pine Hydro Portfolio LLC, 7.260%, 7/20/2015(e) | | | | | 365,000 | | | 374,270 |
| | | | | | | | |
| | | | | | | | 5,736,091 |
| | | | | | | | |
7
| | | | | | | | |
| | | | | Principal Amount | | Value (†) |
| | | | | | | | |
| | | |
| BONDS AND NOTES – continued | | | | | | | | |
| | | |
| Food & Beverage – 1.8% | | | | | | | | |
Aramark Services, Inc., 5.000%, 6/01/2012 | | | | $ | 950,000 | | $ | 826,500 |
Cosan Finance Ltd., 7.000%, 2/01/2017, 144A | | | | | 105,000 | | | 96,600 |
Marfrig Overseas Ltd., 9.625%, 11/16/2016, 144A(b) | | | | | 110,000 | | | 105,050 |
Sara Lee Corp., 6.125%, 11/01/2032(b) | | | | | 425,000 | | | 400,585 |
| | | | | | | | |
| | | | | | | | 1,428,735 |
| | | | | | | | |
| Gaming – 0.5% | | | | | | | | |
Harrah’s Operating Co., Inc., 5.750%, 10/01/2017 | | | | | 350,000 | | | 196,000 |
Harrah’s Operating Co., Inc., 10.750%, 2/01/2016, 144A | | | | | 220,000 | | | 185,350 |
| | | | | | | | |
| | | | | | | | 381,350 |
| | | | | | | | |
| Healthcare – 5.3% | | | | | | | | |
Boston Scientific Corp., 5.450%, 6/15/2014 | | | | | 20,000 | | | 18,350 |
Boston Scientific Corp., 6.400%, 6/15/2016 | | | | | 135,000 | | | 125,888 |
Boston Scientific Corp., 7.000%, 11/15/2035 | | | | | 250,000 | | | 217,500 |
Community Health Systems, Inc., 8.875%, 7/15/2015 | | | | | 870,000 | | | 873,262 |
DaVita, Inc., 7.250%, 3/15/2015 | | | | | 155,000 | | | 151,125 |
HCA, Inc., 5.750%, 3/15/2014 | | | | | 15,000 | | | 12,375 |
HCA, Inc., 6.375%, 1/15/2015 | | | | | 510,000 | | | 431,587 |
HCA, Inc., 6.500%, 2/15/2016(b) | | | | | 720,000 | | | 606,600 |
HCA, Inc., 7.050%, 12/01/2027 | | | | | 430,000 | | | 313,549 |
HCA, Inc., 7.500%, 12/15/2023 | | | | | 30,000 | | | 23,556 |
HCA, Inc., 7.500%, 11/06/2033 | | | | | 840,000 | | | 648,900 |
HCA, Inc., 7.690%, 6/15/2025 | | | | | 160,000 | | | 126,807 |
HCA, Inc., 8.360%, 4/15/2024 | | | | | 40,000 | | | 33,203 |
HCA, Inc., Series MTN, 7.580%, 9/15/2025 | | | | | 200,000 | | | 156,549 |
HCA, Inc., Series MTN, 7.750%, 7/15/2036 | | | | | 20,000 | | | 15,358 |
Tenet Healthcare Corp., 6.875%, 11/15/2031 | | | | | 450,000 | | | 315,000 |
| | | | | | | | |
| | | | | | | | 4,069,609 |
| | | | | | | | |
| Home Construction – 4.4% | | | | | | | | |
Centex Corp., 5.250%, 6/15/2015 | | | | | 125,000 | | | 96,875 |
D.R. Horton, Inc., 5.625%, 9/15/2014 | | | | | 65,000 | | | 55,250 |
Desarrolladora Homex SAB de CV, 7.500%, 9/28/2015 | | | | | 1,030,000 | | | 1,022,275 |
K. Hovnanian Enterprises, Inc., 6.250%, 1/15/2015(b) | | | | | 15,000 | | | 10,050 |
K. Hovnanian Enterprises, Inc., 6.250%, 1/15/2016 | | | | | 690,000 | | | 465,750 |
K. Hovnanian Enterprises, Inc., 6.375%, 12/15/2014(b) | | | | | 145,000 | | | 97,875 |
K. Hovnanian Enterprises, Inc., 6.500%, 1/15/2014(b) | | | | | 130,000 | | | 87,750 |
K. Hovnanian Enterprises, Inc., 8.875%, 4/01/2012(b) | | | | | 10,000 | | | 5,550 |
KB Home, 5.750%, 2/01/2014 | | | | | 90,000 | | | 77,400 |
KB Home, 5.875%, 1/15/2015 | | | | | 390,000 | | | 337,350 |
KB Home, 6.250%, 6/15/2015(b) | | | | | 265,000 | | | 234,856 |
KB Home, 7.250%, 6/15/2018 | | | | | 290,000 | | | 259,550 |
Lennar Corp., Series B, 5.600%, 5/31/2015(b) | | | | | 250,000 | | | 185,000 |
Pulte Homes, Inc., 6.000%, 2/15/2035 | | | | | 475,000 | | | 365,750 |
Pulte Homes, Inc., 6.375%, 5/15/2033 | | | | | 100,000 | | | 78,000 |
Toll Brothers Finance Corp., 5.150%, 5/15/2015 | | | | | 40,000 | | | 36,180 |
| | | | | | | | |
| | | | | | | | 3,415,461 |
| | | | | | | | |
| Independent Energy – 6.1% | | | | | | | | |
Chesapeake Energy Corp., 6.500%, 8/15/2017 | | | | | 570,000 | | | 550,050 |
Chesapeake Energy Corp., 6.875%, 1/15/2016 | | | | | 100,000 | | | 99,000 |
Chesapeake Energy Corp., 6.875%, 11/15/2020 | | | | | 405,000 | | | 392,850 |
8
PORTFOLIO OF INVESTMENTS – as of March 31, 2008 (Unaudited)
Loomis Sayles High Income Opportunities Fund – continued
| | | | | | | | |
| | | | | Principal Amount | | Value (†) |
| | | | | | | | |
| | | |
| BONDS AND NOTES – continued | | | | | | | | |
| | | |
| Independent Energy – continued | | | | | | | | |
Encore Acquisition Co., 6.000%, 7/15/2015 | | | | $ | 275,000 | | $ | 247,500 |
Encore Acquisition Co., 7.250%, 12/01/2017 | | | | | 115,000 | | | 109,825 |
Forest Oil Corp., 7.250%, 6/15/2019, 144A | | | | | 715,000 | | | 727,513 |
Hilcorp Energy I LP, 7.750%, 11/01/2015, 144A | | | | | 430,000 | | | 403,125 |
Hilcorp Energy I LP, 9.000%, 6/01/2016, 144A | | | | | 185,000 | | | 186,388 |
Pioneer Natural Resources Co., 5.875%, 7/15/2016 | | | | | 20,000 | | | 18,214 |
Pioneer Natural Resources Co., 7.200%, 1/15/2028 | | | | | 1,640,000 | | | 1,425,555 |
Swift Energy Co., 7.125%, 6/01/2017 | | | | | 600,000 | | | 550,500 |
Swift Energy Co., 7.625%, 7/15/2011 | | | | | 20,000 | | | 19,800 |
| | | | | | | | |
| | | | | | | | 4,730,320 |
| | | | | | | | |
| Industrial Other – 1.0% | | | | | | | | |
Baldor Electric Co., 8.625%, 2/15/2017 | | | | | 325,000 | | | 321,750 |
Chart Industries, Inc., 9.125%, 10/15/2015 | | | | | 305,000 | | | 298,900 |
Ranhill Labuan Ltd., 12.500%, 10/26/2011, 144A | | | | | 155,000 | | | 124,000 |
| | | | | | | | |
| | | | | | | | 744,650 |
| | | | | | | | |
| Lodging – 0.6% | | | | | | | | |
Host Marriott LP, Series M, 7.000%, 8/15/2012 | | | | | 175,000 | | | 171,063 |
Host Marriott LP, Series O, 6.375%, 3/15/2015 | | | | | 50,000 | | | 46,500 |
Royal Caribbean Cruises Ltd., 7.250%, 6/15/2016 | | | | | 315,000 | | | 287,525 |
| | | | | | | | |
| | | | | | | | 505,088 |
| | | | | | | | |
| Media Cable – 2.7% | | | | | | | | |
Charter Communications Operating LLC/CAP,
8.000%, 4/30/2012, 144A | | | | | 170,000 | | | 155,975 |
Comcast Corp., 5.650%, 6/15/2035 | | | | | 80,000 | | | 67,934 |
CSC Holdings, Inc., 6.750%, 4/15/2012 | | | | | 215,000 | | | 207,475 |
CSC Holdings, Inc., 7.625%, 7/15/2018 | | | | | 1,260,000 | | | 1,149,750 |
CSC Holdings, Inc., 7.875%, 2/15/2018 | | | | | 310,000 | | | 286,750 |
Virgin Media Finance PLC, 8.750%, 4/15/2014 | | | | | 30,000 | | | 26,925 |
Virgin Media Finance PLC, 9.125%, 8/15/2016 | | | | | 175,000 | | | 156,625 |
| | | | | | | | |
| | | | | | | | 2,051,434 |
| | | | | | | | |
| Media Non-Cable – 2.1% | | | | | | | | |
Clear Channel Communications, Inc., 4.900%, 5/15/2015 | | | | | 5,000 | | | 3,350 |
Clear Channel Communications, Inc., 5.500%, 12/15/2016 | | | | | 390,000 | | | 257,400 |
Clear Channel Communications, Inc., 5.750%, 1/15/2013 | | | | | 75,000 | | | 59,625 |
EchoStar DBS Corp., 7.125%, 2/01/2016 | | | | | 275,000 | | | 256,438 |
Idearc, Inc., 8.000%, 11/15/2016 | | | | | 455,000 | | | 294,612 |
Intelsat Corp., 6.875%, 1/15/2028 | | | | | 235,000 | | | 185,650 |
R.H. Donnelley Corp., 8.875%, 10/15/2017, 144A | | | | | 160,000 | | | 100,000 |
R.H. Donnelley Corp., Series A-1, 6.875%, 1/15/2013 | | | | | 405,000 | | | 247,050 |
R.H. Donnelley Corp., Series A-2, 6.875%, 1/15/2013 | | | | | 340,000 | | | 207,400 |
| | | | | | | | |
| | | | | | | | 1,611,525 |
| | | | | | | | |
| Metals & Mining – 2.5% | | | | | | | | |
Algoma Acquisition Corp., 9.875%, 6/15/2015, 144A | | | | | 765,000 | | | 661,725 |
International Steel Group, Inc., 6.500%, 4/15/2014 | | | | | 75,000 | | | 77,218 |
Novelis, Inc., 7.250%, 2/15/2015 | | | | | 70,000 | | | 61,950 |
Peabody Energy Corp., 7.375%, 11/01/2016 | | | | | 110,000 | | | 113,850 |
United States Steel Corp., 6.050%, 6/01/2017 | | | | | 80,000 | | | 73,998 |
9
| | | | | | | | |
| | | | | Principal Amount | | Value (†) |
| | | | | | | | |
| | | |
| BONDS AND NOTES – continued | | | | | | | | |
| | | |
| Metals & Mining – continued | | | | | | | | |
United States Steel Corp., 6.650%, 6/01/2037 | | | | $ | 275,000 | | $ | 232,458 |
Vale Overseas Ltd., 6.875%, 11/21/2036 | | | | | 740,000 | | | 722,029 |
| | | | | | | | |
| | | | | | | | 1,943,228 |
| | | | | | | | |
| Non-Captive Consumer – 1.6% | | | | | | | | |
Countrywide Financial Corp., Series A, MTN,
2.849%, 12/19/2008(c) | | | | | 30,000 | | | 27,450 |
Countrywide Home Loans, Inc., Series L, MTN,
4.000%, 3/22/2011 | | | | | 88,000 | | | 78,483 |
Residential Capital LLC, 8.125%, 11/21/2008(b)(c) | | | | | 5,000 | | | 3,450 |
Residential Capital LLC, 8.375%, 6/30/2010(b)(c) | | | | | 15,000 | | | 7,537 |
Residential Capital LLC, 8.500%, 6/01/2012(c) | | | | | 80,000 | | | 39,200 |
Residential Capital LLC, 8.500%, 4/17/2013(c) | | | | | 570,000 | | | 276,450 |
Residential Capital LLC, 8.875%, 6/30/2015(b)(c) | | | | | 120,000 | | | 58,200 |
SLM Corp., MTN, 5.050%, 11/14/2014 | | | | | 60,000 | | | 43,636 |
SLM Corp., Series A, MTN, 5.000%, 10/01/2013 | | | | | 55,000 | | | 41,399 |
SLM Corp., Series A, MTN, 5.000%, 6/15/2018 | | | | | 65,000 | | | 46,475 |
SLM Corp., Series A, MTN, 5.375%, 5/15/2014 | | | | | 70,000 | | | 52,533 |
SLM Corp., Series A, MTN, 5.625%, 8/01/2033 | | | | | 850,000 | | | 588,625 |
| | | | | | | | |
| | | | | | | | 1,263,438 |
| | | | | | | | |
| Non-Captive Diversified – 3.4% | | | | | | | | |
CIT Group Funding Co. of Canada, 5.200%, 6/01/2015 | | | | | 288,000 | | | 215,419 |
CIT Group Holdings, Inc., 5.400%, 1/30/2016 | | | | | 10,000 | | | 7,913 |
CIT Group, Inc., 5.650%, 2/13/2017 | | | | | 78,000 | | | 60,485 |
GMAC LLC, 6.000%, 12/15/2011 | | | | | 490,000 | | | 366,272 |
GMAC LLC, 6.625%, 5/15/2012 | | | | | 782,000 | | | 591,569 |
GMAC LLC, 6.750%, 12/01/2014 | | | | | 1,010,000 | | | 714,778 |
GMAC LLC, 6.875%, 9/15/2011 | | | | | 175,000 | | | 133,939 |
GMAC LLC, 6.875%, 8/28/2012 | | | | | 65,000 | | | 49,395 |
GMAC LLC, 7.000%, 2/01/2012 | | | | | 100,000 | | | 76,048 |
GMAC LLC, 8.000%, 11/01/2031(b) | | | | | 230,000 | | | 164,839 |
iStar Financial, Inc., 5.150%, 3/01/2012 | | | | | 130,000 | | | 96,200 |
iStar Financial, Inc., 5.650%, 9/15/2011 | | | | | 45,000 | | | 34,200 |
iStar Financial, Inc., 5.800%, 3/15/2011 | | | | | 20,000 | | | 15,600 |
iStar Financial, Inc., Series B, 5.950%, 10/15/2013 | | | | | 190,000 | | | 138,700 |
| | | | | | | | |
| | | | | | | | 2,665,357 |
| | | | | | | | |
| Oil Field Services – 1.6% | | | | | | | | |
Basic Energy Services, Inc., 7.125%, 4/15/2016 | | | | | 330,000 | | | 314,325 |
Grant Prideco, Inc., 6.125%, 8/15/2015 | | | | | 205,000 | | | 209,613 |
North American Energy Partners, Inc., 8.750%, 12/01/2011 | | | | | 620,000 | | | 613,800 |
Pride International, Inc., 7.375%, 7/15/2014 | | | | | 85,000 | | | 88,400 |
| | | | | | | | |
| | | | | | | | 1,226,138 |
| | | | | | | | |
| Packaging – 1.7% | | | | | | | | |
Owens-Illinois, Inc., 7.500%, 5/15/2010(b) | | | | | 500,000 | | | 511,250 |
Owens-Illinois, Inc., 7.800%, 5/15/2018(b) | | | | | 825,000 | | | 816,750 |
| | | | | | | | |
| | | | | | | | 1,328,000 |
| | | | | | | | |
| Paper – 3.4% | | | | | | | | |
Abitibi-Consolidated, Inc., 6.000%, 6/20/2013 | | | | | 75,000 | | | 36,750 |
Abitibi-Consolidated, Inc., 7.400%, 4/01/2018 | | | | | 40,000 | | | 17,600 |
10
PORTFOLIO OF INVESTMENTS – as of March 31, 2008 (Unaudited)
Loomis Sayles High Income Opportunities Fund – continued
| | | | | | | | |
| | | | | Principal Amount | | Value (†) |
| | | | | | | | |
| | | |
| BONDS AND NOTES – continued | | | | | | | | |
| | | |
| Paper – continued | | | | | | | | |
Abitibi-Consolidated, Inc., 7.500%, 4/01/2028 | | | | $ | 250,000 | | $ | 102,500 |
Abitibi-Consolidated, Inc., 8.500%, 8/01/2029 | | | | | 25,000 | | | 11,375 |
Abitibi-Consolidated, Inc., 8.850%, 8/01/2030(b) | | | | | 190,000 | | | 84,550 |
Bowater, Inc., 6.500%, 6/15/2013 | | | | | 435,000 | | | 287,100 |
Domtar Corp., 5.375%, 12/01/2013 | | | | | 250,000 | | | 218,750 |
Georgia-Pacific Corp., 7.250%, 6/01/2028 | | | | | 215,000 | | | 175,225 |
Georgia-Pacific Corp., 7.375%, 12/01/2025(b) | | | | | 495,000 | | | 410,850 |
Georgia-Pacific Corp., 7.700%, 6/15/2015(b) | | | | | 125,000 | | | 117,500 |
Georgia-Pacific Corp., 7.750%, 11/15/2029 | | | | | 525,000 | | | 441,000 |
Georgia-Pacific Corp., 8.000%, 1/15/2024 | | | | | 260,000 | | | 228,800 |
Georgia-Pacific LLC, 8.875%, 5/15/2031 | | | | | 225,000 | | | 200,250 |
Mercer International, Inc., 9.250%, 2/15/2013(b) | | | | | 140,000 | | | 116,200 |
Sappi Papier Holding AG, 7.500%, 6/15/2032, 144A | | | | | 290,000 | | | 198,308 |
| | | | | | | | |
| | | | | | | | 2,646,758 |
| | | | | | | | |
| Pharmaceuticals – 1.9% | | | | | | | | |
Elan Financial PLC, 7.750%, 11/15/2011 | | | | | 800,000 | | | 744,000 |
Elan Financial PLC, 8.875%, 12/01/2013 | | | | | 770,000 | | | 723,800 |
| | | | | | | | |
| | | | | | | | 1,467,800 |
| | | | | | | | |
| Pipelines – 2.1% | | | | | | | | |
El Paso Corp., 6.950%, 6/01/2028 | | | | | 250,000 | | | 233,749 |
Kinder Morgan Energy Partners, LP, 5.800%, 3/15/2035 | | | | | 60,000 | | | 50,750 |
Kinder Morgan Finance, 5.700%, 1/05/2016 | | | | | 130,000 | | | 123,175 |
Kinder Morgan, Inc., Senior Note, 5.150%, 3/01/2015 | | | | | 225,000 | | | 207,000 |
Tennessee Gas Pipeline Co., 7.000%, 10/15/2028(b) | | | | | 150,000 | | | 149,461 |
Williams Cos., Inc., 7.500%, 1/15/2031 | | | | | 235,000 | | | 244,987 |
Williams Cos., Inc., 7.750%, 6/15/2031 | | | | | 85,000 | | | 90,313 |
Williams Partners LP, 7.250%, 2/01/2017 | | | | | 530,000 | | | 532,650 |
| | | | | | | | |
| | | | | | | | 1,632,085 |
| | | | | | | | |
| Refining – 0.7% | | | | | | | | |
Petroplus Finance Ltd., 6.750%, 5/01/2014, 144A | | | | | 500,000 | | | 456,250 |
Petroplus Finance Ltd., 7.000%, 5/01/2017, 144A | | | | | 75,000 | | | 66,938 |
| | | | | | | | |
| | | | | | | | 523,188 |
| | | | | | | | |
| Restaurants – 0.1% | | | | | | | | |
Denny’s Corp. Holdings, Inc., 10.000%, 10/01/2012(b) | | | | | 120,000 | | | 110,400 |
| | | | | | | | |
| Retailers – 3.4% | | | | | | | | |
Dillard’s, Inc., 6.625%, 1/15/2018 | | | | | 155,000 | | | 116,250 |
Dillard’s, Inc., 7.000%, 12/01/2028 | | | | | 480,000 | | | 325,200 |
Dillard’s, Inc., 7.130%, 8/01/2018 | | | | | 175,000 | | | 135,625 |
Dillard’s, Inc., 7.875%, 1/01/2023 | | | | | 75,000 | | | 57,750 |
Foot Locker, Inc., 8.500%, 1/15/2022 | | | | | 280,000 | | | 246,400 |
Home Depot, Inc., 5.875%, 12/16/2036 | | | | | 785,000 | | | 640,849 |
Macy’s Retail Holdings, Inc., 6.790%, 7/15/2027 | | | | | 180,000 | | | 147,668 |
Macys Retail Holdings, Inc., 6.900%, 4/01/2029 | | | | | 300,000 | | | 253,877 |
Toys R Us, Inc., 7.375%, 10/15/2018 | | | | | 985,000 | | | 682,112 |
| | | | | | | | |
| | | | | | | | 2,605,731 |
| | | | | | | | |
| Sovereigns – 0.4% | | | | | | | | |
Republic of Brazil, 8.250%, 1/20/2034 | | | | | 235,000 | | | 280,825 |
| | | | | | | | |
11
| | | | | | | | |
| | | | | Principal Amount | | Value (†) |
| | | | | | | | |
| | | |
| BONDS AND NOTES – continued | | | | | | | | |
| | | |
| Supermarkets – 2.4% | | | | | | | | |
Albertson’s, Inc., 6.625%, 6/01/2028 | | | | $ | 605,000 | | $ | 514,692 |
Albertson’s, Inc., 7.450%, 8/01/2029 | | | | | 1,075,000 | | | 989,866 |
Albertson’s, Inc., 7.750%, 6/15/2026 | | | | | 220,000 | | | 207,463 |
Albertson’s, Inc., 8.000%, 5/01/2031 | | | | | 30,000 | | | 28,598 |
American Stores Co., 8.000%, 6/01/2026 | | | | | 70,000 | | | 70,840 |
Couche-Tard US/Finance, 7.500%, 12/15/2013 | | | | | 40,000 | | | 39,900 |
| | | | | | | | |
| | | | | | | | 1,851,359 |
| | | | | | | | |
| Technology – 6.2% | | | | | | | | |
Activant Solutions, Inc., 9.500%, 5/01/2016 | | | | | 90,000 | | | 75,600 |
Flextronics International Ltd., 6.250%, 11/15/2014 | | | | | 380,000 | | | 349,600 |
Freescale Semiconductor, Inc., 10.125%, 12/15/2016(b) | | | | | 480,000 | | | 324,000 |
Lucent Technologies, Inc., 6.450%, 3/15/2029 | | | | | 3,020,000 | | | 2,159,300 |
Lucent Technologies, Inc., 6.500%, 1/15/2028 | | | | | 290,000 | | | 207,350 |
Nortel Networks Corp., 6.875%, 9/01/2023 | | | | | 125,000 | | | 76,875 |
Nortel Networks Ltd., 10.125%, 7/15/2013 | | | | | 370,000 | | | 338,550 |
Northern Telecom Capital Corp., 7.875%, 6/15/2026 | | | | | 860,000 | | | 537,500 |
Seagate Technology HDD Holdings, 6.800%, 10/01/2016 | | | | | 750,000 | | | 714,375 |
Unisys Corp, 8.000%, 10/15/2012 | | | | | 15,000 | | | 12,900 |
| | | | | | | | |
| | | | | | | | 4,796,050 |
| | | | | | | | |
| Transportation Services – 0.8% | | | | | | | | |
APL Ltd., 8.000%, 1/15/2024(e) | | | | | 185,000 | | | 150,312 |
Atlas Air, Inc., Series B, 7.680%, 1/02/2014(f) | | | | | 34,292 | | | 39,779 |
Atlas Air, Inc., Series C, 8.010%, 1/02/2010(f) | | | | | 347,188 | | | 298,582 |
Overseas Shipholding Group, 7.500%, 2/15/2024 | | | | | 155,000 | | | 135,238 |
| | | | | | | | |
| | | | | | | | 623,911 |
| | | | | | | | |
| Wireless – 1.5% | | | | | | | | |
ALLTEL Corp., 6.500%, 11/01/2013 | | | | | 5,000 | | | 3,675 |
ALLTEL Corp., 6.800%, 5/01/2029 | | | | | 15,000 | | | 9,600 |
ALLTEL Corp., 7.000%, 7/01/2012 | | | | | 20,000 | | | 16,000 |
ALLTEL Corp., 7.875%, 7/01/2032 | | | | | 170,000 | | | 112,200 |
Nextel Communications, Inc., Series D, 7.375%, 8/01/2015 | | | | | 85,000 | | | 65,450 |
Philippine Long Distance Telephone Co., 8.350%, 3/06/2017 | | | | | 150,000 | | | 166,875 |
Sprint Capital Corp., 6.875%, 11/15/2028 | | | | | 501,000 | | | 373,245 |
Sprint Nextel Corp., 6.000%, 12/01/2016 | | | | | 502,000 | | | 390,305 |
| | | | | | | | |
| | | | | | | | 1,137,350 |
| | | | | | | | |
| Wirelines – 8.4% | | | | | | | | |
Axtel SAB de CV, 7.625%, 2/01/2017, 144A | | | | | 765,000 | | | 768,825 |
Cincinnati Bell Telephone Co., 6.300%, 12/01/2028(b) | | | | | 185,000 | | | 148,000 |
Cincinnati Bell, Inc., 8.375%, 1/15/2014 | | | | | 800,000 | | | 750,000 |
Citizens Communications Co., 7.000%, 11/01/2025 | | | | | 15,000 | | | 10,875 |
Citizens Communications Co., 7.125%, 3/15/2019 | | | | | 325,000 | | | 284,375 |
Citizens Communications Co., 7.450%, 7/01/2035 | | | | | 325,000 | | | 235,625 |
Citizens Communications Co., 7.875%, 1/15/2027 | | | | | 540,000 | | | 463,050 |
Hanarotelecom, Inc., 7.000%, 2/01/2012, 144A | | | | | 785,000 | | | 797,756 |
L-3 Communications Corp., Series B, 6.375%, 10/15/2015 | | | | | 25,000 | | | 24,438 |
12
PORTFOLIO OF INVESTMENTS – as of March 31, 2008 (Unaudited)
Loomis Sayles High Income Opportunities Fund – continued
| | | | | | | | |
| | | | | Principal Amount | | Value (†) |
| | | | | | | | |
| | | |
| BONDS AND NOTES – continued | | | | | | | | |
| | | |
| Wirelines – continued | | | | | | | | |
Level 3 Financing, Inc., 8.750%, 2/15/2017 | | | | $ | 790,000 | | $ | 600,400 |
Level 3 Financing, Inc., 9.250%, 11/01/2014 | | | | | 835,000 | | | 682,612 |
Qwest Capital Funding, Inc., 6.500%, 11/15/2018 | | | | | 860,000 | | | 696,600 |
Qwest Capital Funding, Inc., 6.875%, 7/15/2028 | | | | | 495,000 | | | 388,575 |
Qwest Capital Funding, Inc., 7.625%, 8/03/2021 | | | | | 315,000 | | | 266,175 |
Qwest Capital Funding, Inc., 7.750%, 2/15/2031 | | | | | 280,000 | | | 235,200 |
Qwest Corp., 6.875%, 9/15/2033 | | | | | 150,000 | | | 120,000 |
Qwest Corp., 7.250%, 9/15/2025 | | | | | 10,000 | | | 8,700 |
| | | | | | | | |
| | | | | | | | 6,481,206 |
| | | | | | | | |
| | | |
| TOTAL NON-CONVERTIBLE BONDS | | | | | | | | |
(Identified Cost $76,991,573) | | | | | | | | 69,317,740 |
| | | | | | | | |
| | | |
| CONVERTIBLE BONDS – 5.1% | | | | | | | | |
| | | |
| Healthcare – 0.1% | | | | | | | | |
Invitrogen Corp., 1.500%, 2/15/2024 | | | | | 50,000 | | | 50,750 |
| | | | | | | | |
| | | |
| Industrial Other – 0.2% | | | | | | | | |
Incyte Corp., 3.500%, 2/15/2011(b) | | | | | 185,000 | | | 196,794 |
| | | | | | | | |
| | | |
| Media Non-Cable – 0.4% | | | | | | | | |
Liberty Media LLC, 3.500%, 1/15/2031 | | | | | 153,854 | | | 107,505 |
Sinclair Broadcast Group, Inc.,
(step to 2.000% on 1/15/2011), 4.875%, 7/15/2018(d) | | | | | 190,000 | | | 172,900 |
| | | | | | | | |
| | | | | | | | 280,405 |
| | | | | | | | |
| | | |
| Non-Captive Consumer – 0.2% | | | | | | | | |
Countrywide Financial Corp., 0.758%, 4/15/2037(c)(b) | | | | | 54,000 | | | 47,790 |
Countrywide Financial Corp., 0.815%, 5/15/2037(c) | | | | | 176,000 | | | 150,480 |
| | | | | | | | |
| | | | | | | | 198,270 |
| | | | | | | | |
| | | |
| Non-Captive Diversified – 0.0% | | | | | | | | |
iStar Financial, Inc., 3.198%, 10/01/2012(c) | | | | | 5,000 | | | 3,518 |
| | | | | | | | |
| | | |
| Pharmaceuticals – 1.4% | | | | | | | | |
Epix Pharmaceuticals, Inc., 3.000%, 6/15/2024 | | | | | 45,000 | | | 22,500 |
Human Genome Sciences, Inc., 2.250%, 8/15/2012 | | | | | 275,000 | | | 199,375 |
Nektar Therapeutics, 3.250%, 9/28/2012 | | | | | 205,000 | | | 158,363 |
Regeneron Pharmaceuticals, Inc., 5.500%, 10/17/2008 | | | | | 160,000 | | | 159,400 |
Valeant Pharmaceuticals International, 3.000%, 8/16/2010 | | | | | 180,000 | | | 163,800 |
Valeant Pharmaceuticals International, 4.000%, 11/15/2013 | | | | | 510,000 | | | 423,937 |
| | | | | | | | |
| | | | | | | | 1,127,375 |
| | | | | | | | |
| | | |
| Real Estate Investment Trusts – 0.4% | | | | | | | | |
Host Hotels & Resorts, Inc., 2.625%, 4/15/2027, 144A | | | | | 405,000 | | | 339,187 |
| | | | | | | | |
| | | |
| Technology – 0.5% | | | | | | | | |
JDS Uniphase Corp., 1.000%, 5/15/2026 | | | | | 200,000 | | | 158,250 |
Kulicke & Soffa Industries, Inc., 0.500%, 11/30/2008 | | | | | 50,000 | | | 46,750 |
Kulicke & Soffa Industries, Inc., 1.000%, 6/30/2010 | | | | | 45,000 | | | 35,550 |
Maxtor Corp., 5.750%, 3/01/2012(e) | | | | | 123,000 | | | 115,620 |
| | | | | | | | |
| | | | | | | | 356,170 |
| | | | | | | | |
13
| | | | | | | | |
| | | | | Principal Amount | | Value (†) |
| | | | | | | | |
| | | |
| BONDS AND NOTES – continued | | | | | | | | |
| | | |
| Textile – 0.4% | | | | | | | | |
Jones Apparel Group, Inc., 6.125%, 11/15/2034 | | | | $ | 425,000 | | $ | 289,000 |
| | | | | | | | |
| | | |
| Wirelines – 1.5% | | | | | | | | |
Level 3 Communications, Inc., 2.875%, 7/15/2010 | | | | | 270,000 | | | 188,662 |
Level 3 Communications, Inc., 6.000%, 9/15/2009 | | | | | 105,000 | | | 93,188 |
Level 3 Communications, Inc., 6.000%, 3/15/2010(b) | | | | | 1,062,000 | | | 857,565 |
| | | | | | | | |
| | | | | | | | 1,139,415 |
| | | | | | | | |
| | | |
| TOTAL CONVERTIBLE BONDS | | | | | | | | |
(Identified Cost $4,402,218) | | | | | | | | 3,980,884 |
| | | | | | | | |
| | | |
| TOTAL BONDS AND NOTES | | | | | | | | |
(Identified Cost $81,393,791) | | | | | | | | 73,298,624 |
| | | | | | | | |
| | | |
| | | | | | Shares | | | |
| | | |
| COMMON STOCKS – 0.7% | | | | | | | | |
| | | |
| Chemicals – 0.5% | | | | | | | | |
Hercules, Inc.(b) | | | | | 20,651 | | | 377,707 |
| | | | | | | | |
| Containers & Packaging – 0.2% | | | | | | | | |
Owens-Illinois, Inc.(b)(f) | | | | | 3,321 | | | 187,404 |
| | | | | | | | |
| | | |
| TOTAL COMMON STOCKS | | | | | | | | |
(Identified Cost $513,304) | | | | | | | | 565,111 |
| | | | | | | | |
| | | |
| PREFERRED STOCKS – 1.8% | | | | | | | | |
| | | |
| Automotive – 0.3% | | | | | | | | |
Ford Motor Co., Capital Trust II(b) | | | | | 6,225 | | | 182,517 |
| | | | | | | | |
| Capital Markets – 0.1% | | | | | | | | |
Newell Financial Trust I | | | | | 1,675 | | | 75,794 |
| | | | | | | | |
| Diversified Consumer Services – 0.0% | | | | | | | | |
Six Flags, Inc. | | | | | 2,100 | | | 25,515 |
| | | | | | | | |
| Electric Utilities – 0.5% | | | | | | | | |
AES Trust III(b) | | | | | 7,975 | | | 370,837 |
| | | | | | | | |
| Oil, Gas & Consumable Fuels – 0.9% | | | | | | | | |
Chesapeake Energy Corp. | | | | | 3,260 | | | 426,286 |
El Paso Energy Capital Trust I | | | | | 8,050 | | | 293,020 |
| | | | | | | | |
| | | | | | | | 719,306 |
| | | | | | | | |
| | | |
| TOTAL PREFERRED STOCKS | | | | | | | | |
(Identified Cost $1,355,825) | | | | | | | | 1,373,969 |
| | | | | | | | |
| | | |
| | | | | | Principal Amount | | | |
| | | |
| SHORT-TERM INVESTMENTS – 11.1% | | | | | | | | |
| Tri-Party Repurchase Agreement with Fixed Income Clearing Corporation, dated 3/31/08 at 1.250% to be repurchased at $278,010 on 4/01/08 collateralized by $285,000 Federal Home Loan Mortgage Corp., 3.3750% due 3/05/10 valued at $286,069 including accrued interest (Note 2h of Notes to Financial Statements) | | | | $ | 278,000 | | | 278,000 |
| | | | | | | | |
14
PORTFOLIO OF INVESTMENTS – as of March 31, 2008 (Unaudited)
Loomis Sayles High Income Opportunities Fund – continued
| | | | | | | |
| | | | | Shares | | Value (†) |
| | | | | | | |
| | | |
| SHORT-TERM INVESTMENTS – continued | | | | | | | |
| State Street Navigator Securities Lending Prime Portfolio(g) | | | | 8,273,185 | | $ | 8,273,185 |
| | | | | | | |
| | | |
| TOTAL SHORT-TERM INVESTMENTS | | | | | | | |
(Identified Cost $8,551,185) | | | | | | | 8,551,185 |
| | | | | | | |
| | | |
| TOTAL INVESTMENTS – 108.4% | | | | | | | |
(Identified Cost $91,814,105)(a) | | | | | | | 83,788,889 |
Other assets less liabilities—(8.4)% | | | | | | | (6,499,354) |
| | | | | | | |
| | | |
| NET ASSETS – 100.0% | | | | | | $ | 77,289,535 |
| | | | | | | |
| |
(†) See Note 2a of Notes to Financial Statements. | | | |
(a) Federal Tax Information (Amounts exclude certain adjustments made at the end of the Fund’s fiscal year for tax purposes. Amortization of premium on debt securities is excluded for tax purposes): | | | |
At March 31, 2008, the net unrealized depreciation on investments based on a cost of $91,830,766 for federal income tax purposes was as follows: | | | |
Aggregate gross unrealized appreciation for all investments in which there is an excess of value over tax cost | | $ | 825,600 |
Aggregate gross unrealized depreciation for all investments in which there is an excess of tax cost over value | | | (8,867,477) |
| | | | | | | |
Net unrealized depreciation | | $ | (8,041,877) |
| | | | | | | |
| (b) | All or a portion of this security was on loan to brokers at March 31, 2008. |
| (c) | Variable rate security. Rate as of March 31, 2008 is disclosed. |
| (d) | Step Bond: Coupon is a fixed rate for an initial period then resets at a specified date and rate. |
| (e) | Illiquid security. At March 31, 2008, the value of these securities amounted to $640,202 or 0.8% of net assets. |
| (f) | Non-income producing security. |
| (g) | Represents investment of securities lending collateral. |
| 144A | Securities exempt from registration under Rule 144A of the Securities Act of 1933. These securities may be resold in transactions exempt from registration, normally to qualified institutional buyers. At March 31, 2008, the total value of these securities amounted to $8,984,114 or 11.6% of net assets. |
HOLDINGS AT MARCH 31, 2008 AS A PERCENTAGE OF NET ASSETS (Unaudited)
| | | |
Wirelines | | 9.9 | % |
Electric | | 7.4 | |
Technology | | 6.7 | |
Independent Energy | | 6.1 | |
Healthcare | | 5.4 | |
Automotive | | 5.2 | |
Home Construction | | 4.4 | |
Chemicals | | 4.3 | |
Non-Captive Diversified | | 3.4 | |
Paper | | 3.4 | |
Retailers | | 3.4 | |
Pharmaceuticals | | 3.3 | |
Airlines | | 2.7 | |
Media Cable | | 2.7 | |
Media Non-Cable | | 2.5 | |
Metals & Mining | | 2.5 | |
Supermarkets | | 2.4 | |
Pipelines | | 2.1 | |
Aerospace & Defense | | 2.0 | |
Other, less than 2% each | | 17.5 | |
See accompanying notes to financial statements.
15
PORTFOLIO OF INVESTMENTS – as of March 31, 2008 (Unaudited)
Loomis Sayles Securitized Asset Fund
| | | | | | | | |
| | | | | Principal Amount | | Value (†) |
| | | | | | | | |
| | | |
| BONDS AND NOTES – 140.0% of Net Assets | | | | | | | | |
| | | |
| NON-CONVERTIBLE BONDS – 140.0% | | | | | | | | |
| | | |
| ABS Car Loan – 1.3% | | | | | | | | |
Americredit Prime Automobile Receivables,
Series 2007-2M, Class A2B,
3.438%, 11/08/2010(b)(c) | | | | $ | 1,705,000 | | $ | 1,695,786 |
Capital Auto Receivables Asset Trust, Series 2008-1, Class A2B, 3.518%, 9/15/2010(b)(c) | | | | | 3,000,000 | | | 2,991,234 |
| | | | | | | | |
| | | | | | | | 4,687,020 |
| | | | | | | | |
| ABS Credit Card – 1.1% | | | | | | | | |
Citibank Credit Card Issuance Trust, Series 2007-A8, Class A8, 5.650%, 9/20/2019(c) | | | | | 4,215,000 | | | 4,217,677 |
| | | | | | | | |
| ABS Home Equity – 1.0% | | | | | | | | |
Countrywide Asset-Backed Certificates, Series 2006-S3, Class A1, 2.709%, 6/25/2021(b)(c) | | | | | 4,326,268 | | | 3,768,430 |
| | | | | | | | |
| Asset-Backed Securities – 3.3% | | | | | | | | |
Chase Issuance Trust, Series 2005-A9, Class A9, 2.838%, 11/15/2011(b)(c) | | | | | 500,000 | | | 493,585 |
CNH Equipment Trust, Series 2004-A, Series A4B, 3.480%, 9/15/2011(c) | | | | | 3,791,619 | | | 3,798,626 |
CNH Equipment Trust, Series 2007-B, Class A2A, 5.460%, 6/15/2010(c) | | | | | 850,000 | | | 856,304 |
Countrywide Asset-Backed Certificates, Series 2004-S1, Class A3, 4.615%, 2/25/2035(c) | | | | | 995,000 | | | 791,010 |
Countrywide Asset-Backed Certificates, Series 2006-S1, Class A2, 5.549%, 8/25/2021(c) | | | | | 768,284 | | | 749,405 |
Countrywide Asset-Backed Certificates, Series 2006-S3, Class A3, 6.287%, 6/25/2021(c) | | | | | 895,000 | | | 420,199 |
Countrywide Asset-Backed Certificates, Series 2006-S7, Class A3, 5.712%, 11/25/2035(c) | | | | | 2,355,000 | | | 1,263,601 |
Discover Card Master Trust, Series 2007-A1, Class A1, 5.650%, 3/16/2020(c) | | | | | 3,305,000 | | | 3,299,679 |
Residential Asset Mortgage Products, Inc., Series 2004-RZ1, Class AI5, 4.070%, 7/25/2032(c) | | | | | 250,290 | | | 242,613 |
| | | | | | | | |
| | | | | | | | 11,915,022 |
| | | | | | | | |
| Auto Loan – 0.1% | | | | | | | | |
Nissan Auto Receivables Owner Trust, Series 2005-A, Class A4, 3.820%, 7/15/2010(c) | | | | | 219,669 | | | 219,755 |
| | | | | | | | |
| Automotive – 1.4% | | | | | | | | |
Daimler Chrysler Auto Trust, Series 2008-A,
Class A2B, 3.908%, 10/08/2010(b)(c) | | | | | 5,000,000 | | | 4,985,937 |
| | | | | | | | |
| Hybrid ARMs – 14.3% | | | | | | | | |
Countrywide Home Loans, Series 2004-HYB4,
Class 6A2, 5.454%, 4/20/2035(b)(c) | | | | | 780,850 | | | 605,999 |
Federal Home Loan Mortgage Corp.,
5.947%, 11/01/2036(b)(c) | | | | | 7,946,230 | | | 8,096,706 |
Federal National Mortgage Association,
6.047%, 2/01/2037(b)(c) | | | | | 8,594,020 | | | 8,770,131 |
First Horizon Alternative Mortgage Securities,
Series 2006-AA3, Class A1,
6.321%, 6/25/2036(b)(c) | | | | | 6,492,475 | | | 5,175,622 |
16
PORTFOLIO OF INVESTMENTS – as of March 31, 2008 (Unaudited)
Loomis Sayles Securitized Asset Fund – continued
| | | | | | | | |
| | | | | Principal Amount | | Value (†) |
| | | | | | | | |
| | | |
| BONDS AND NOTES – continued | | | | | | | | |
| | | |
| Hybrid ARMs – continued | | | | | | | | |
Indymac Index Mortgage Loan Trust,
Series 2006-AR25, Class 3A1,
6.367%, 9/25/2036(b)(c) | | | | $ | 7,149,459 | | $ | 5,422,384 |
JPMorgan Mortgage Trust, Series 2006-A7, Class 1A3, 5.929%, 1/25/2037(b)(c) | | | | | 1,499,945 | | | 1,516,041 |
Morgan Stanley Mortgage Loan Trust, Series 2005-3AR, Class 5A, 5.588%, 7/25/2035(b)(c) | | | | | 1,071,208 | | | 1,078,904 |
Washington Mutual Mortgage Pass Through Certificates, Series 2007-HY6, Class 2A1,
5.699%, 6/25/2037(b)(c) | | | | | 7,775,191 | | | 7,058,419 |
Washington Mutual Mortgage Pass-Through Certificates, Series 2007-HY2, Class 2A2,
6.409%, 11/25/2036(b)(c) | | | | | 13,734,154 | | | 13,249,033 |
Wells Fargo Mortgage Backed Securities Trust,
Series 2005-AR16, Class 3A2,
4.996%, 10/25/2035(b)(c) | | | | | 976,988 | | | 878,621 |
| | | | | | | | |
| | | | | | | | 51,851,860 |
| | | | | | | | |
| Mortgage Related – 117.5% | | | | | | | | |
Banc of America Commercial Mortgage, Inc.,
Series 2005-6, Class A2, 5.165%, 9/10/2047 | | | | | 120,000 | | | 119,144 |
Banc of America Commercial Mortgage, Inc.,
Series 2005-6, Class A4, 5.353%, 9/10/2047(b)(c) | | | | | 189,000 | | | 188,034 |
Banc of America Commercial Mortgage, Inc.,
Series 2006-2, Class A4, 5.930%, 5/10/2045(b)(c) | | | | | 350,000 | | | 353,611 |
Banc of America Commercial Mortgage, Inc.,
Series 2006-4, Class A2, 5.522%, 7/10/2046(c) | | | | | 460,000 | | | 455,438 |
Banc of America Commercial Mortgage, Inc.,
Series 2007-2, Class A2, 5.634%, 4/10/2049(c) | | | | | 5,375,000 | | | 5,286,275 |
Bank of America-First Union NB Commercial Mortgage, Series 2001-3, Class A2,
5.464%, 4/11/2037(c) | | | | | 430,000 | | | 428,927 |
Bear Stearns Commercial Mortgage Securities,
Series 2001-TOP2, Class A2, 6.480%, 2/15/2035(c) | | | | | 175,000 | | | 179,228 |
Bear Stearns Commercial Mortgage Securities,
Series 2005-PW10, Class A2,
5.270%, 12/11/2040(c) | | | | | 1,601,000 | | | 1,593,369 |
Bear Stearns Commercial Mortgage Securities,
Series 2005-T18, Class A2, 4.556%, 2/13/2042(c) | | | | | 171,000 | | | 169,218 |
Bear Stearns Commercial Mortgage Securities,
Series 2006-PW12, Class A2, 5.688%, 9/11/2038(c) | | | | | 1,000,000 | | | 996,218 |
Bear Stearns Commercial Mortgage Securities, Series 2007-PW15, Class A4, 5.331%, 2/11/2044(c) | | | | | 225,000 | | | 217,305 |
Bear Stearns Commercial Mortgage Securities,
Series 2007-PW16, Class A4,
5.902%, 6/11/2040(b)(c) | | | | | 150,000 | | | 148,995 |
Citigroup/Deutsche Bank Commercial Mortgage Trust, Series 2006-CD2, Class A2, 5.408%, 1/15/2046(c) | | | | | 1,057,000 | | | 1,046,923 |
Citigroup/Deutsche Bank Commercial Mortgage Trust, Series 2006-CD3, Class A5, 5.617%, 10/15/2048(c) | | | | | 5,000,000 | | | 4,970,956 |
Commercial Mortgage Pass Through Certificates,
Series 2006-C7, Class A4, 5.961%, 6/10/2046(b)(c) | | | | | 250,000 | | | 252,984 |
Countrywide Alternative Loan Trust,
Series 2006-15CB, Class A1, 6.500%, 6/25/2036(c) | | | | | 1,364,797 | | | 1,044,923 |
Countrywide Alternative Loan Trust, Series 2006-J5, Class 4A1, 6.027%, 7/25/2021(b)(c) | | | | | 1,562,322 | | | 1,343,477 |
17
| | | | | | | | |
| | | | | Principal Amount | | Value (†) |
| | | | | | | | |
| | | |
| BONDS AND NOTES – continued | | | | | | | | |
| | | |
| Mortgage Related – continued | | | | | | | | |
CS First Boston Mortgage Securities Corp., Series 2005-7, Class 3A1, 5.000%, 8/25/2020(c) | | | | $ | 349,042 | | $ | 328,697 |
Federal Home Loan Mortgage Corp., 4.500%, 6/01/2021(c) | | | | | 4,016,781 | | | 4,000,540 |
Federal Home Loan Mortgage Corp., 5.000%, 7/01/2020(c) | | | | | 63,614 | | | 64,474 |
Federal Home Loan Mortgage Corp., 5.000%, 10/01/2020(c) | | | | | 390,578 | | | 395,369 |
Federal Home Loan Mortgage Corp., 5.000%, 7/01/2035(c) | | | | | 666,300 | | | 660,794 |
Federal Home Loan Mortgage Corp., 5.000%, 9/01/2035(c) | | | | | 843,973 | | | 836,999 |
Federal Home Loan Mortgage Corp., 5.000%, 12/01/2035(c) | | | | | 166,977 | | | 165,598 |
Federal Home Loan Mortgage Corp., 5.000%, 2/01/2036(c) | | | | | 314,968 | | | 312,365 |
Federal Home Loan Mortgage Corp., 5.000%, 2/01/2036(c) | | | | | 694,690 | | | 688,950 |
Federal Home Loan Mortgage Corp., 5.500%, 9/01/2021(c) | | | | | 9,040,504 | | | 9,236,500 |
Federal Home Loan Mortgage Corp.,
5.500%, 12/01/2021(c) | | | | | 4,363,845 | | | 4,458,451 |
Federal Home Loan Mortgage Corp., 5.500%, 5/01/2035(c) | | | | | 466,545 | | | 472,002 |
Federal Home Loan Mortgage Corp., 5.500%, 7/01/2037(c) | | | | | 4,161,142 | | | 4,205,886 |
Federal Home Loan Mortgage Corp., 5.500%, 7/01/2037(c) | | | | | 1,907,997 | | | 1,928,514 |
Federal Home Loan Mortgage Corp., 5.500%, 8/01/2037(c) | | | | | 4,818,570 | | | 4,870,383 |
Federal Home Loan Mortgage Corp.,
5.990%, 2/01/2037(b)(c) | | | | | 9,635,704 | | | 9,838,370 |
Federal Home Loan Mortgage Corp., 6.000%, 6/01/2037(c) | | | | | 4,773,761 | | | 4,899,692 |
Federal Home Loan Mortgage Corp., 6.000%, 6/01/2037(c) | | | | | 11,571,790 | | | 11,877,052 |
Federal Home Loan Mortgage Corp., 6.000%, 8/01/2037(c) | | | | | 4,878,936 | | | 5,007,641 |
Federal Home Loan Mortgage Corp.,
6.000%, 10/01/2037(c) | | | | | 4,686,285 | | | 4,809,908 |
Federal Home Loan Mortgage Corp.,
6.000%, 11/01/2037(c) | | | | | 7,459,246 | | | 7,656,019 |
Federal Home Loan Mortgage Corp.,
6.000%, 12/01/2037(c) | | | | | 1,995,519 | | | 2,048,160 |
Federal Home Loan Mortgage Corp., 6.500%, 1/01/2038(c) | | | | | 236,916 | | | 245,977 |
Federal Home Loan Mortgage Corp.,
6.595%, 1/01/2035(b)(c) | | | | | 473,550 | | | 477,221 |
Federal Home Loan Mortgage Corp. (TBA),
5.500%, 1/01/2035(d) | | | | | 14,000,000 | | | 14,135,632 |
Federal Home Loan Mortgage Corp. (TBA),
6.000%, 9/01/2035(d) | | | | | 17,000,000 | | | 17,430,304 |
Federal Home Loan Mortgage Corp., Series 2613, Class HI, 5.500%, 2/15/2033(c) | | | | | 1,025,293 | | | 125,478 |
18
PORTFOLIO OF INVESTMENTS – as of March 31, 2008 (Unaudited)
Loomis Sayles Securitized Asset Fund – continued
| | | | | | | | |
| | | | | Principal Amount | | Value (†) |
| | | | | | | | |
| | | |
| BONDS AND NOTES – continued | | | | | | | | |
| | | |
| Mortgage Related – continued | | | | | | | | |
Federal Home Loan Mortgage Corp., Series 2912, Class EH, 5.500%, 1/15/2035(c) | | | | $ | 2,797,000 | | $ | 2,823,641 |
Federal National Mortgage Association,
4.500%, 7/01/2020(c) | | | | | 1,021,856 | | | 1,020,119 |
Federal National Mortgage Association,
4.500%, 3/01/2021(c) | | | | | 666,522 | | | 663,377 |
Federal National Mortgage Association,
4.500%, 10/01/2035(c) | | | | | 876,480 | | | 845,865 |
Federal National Mortgage Association,
5.500%, 5/01/2035(c) | | | | | 160,336 | | | 162,181 |
Federal National Mortgage Association,
5.500%, 12/01/2035(c) | | | | | 240,121 | | | 242,883 |
Federal National Mortgage Association,
5.500%, 4/01/2036(c) | | | | | 165,281 | | | 167,050 |
Federal National Mortgage Association,
5.500%, 4/01/2036(c) | | | | | 397,925 | | | 402,182 |
Federal National Mortgage Association,
5.500%, 4/01/2036(c) | | | | | 85,262 | | | 86,174 |
Federal National Mortgage Association,
5.500%, 4/01/2036(c) | | | | | 2,527,790 | | | 2,556,864 |
Federal National Mortgage Association,
5.500%, 5/01/2036(c) | | | | | 418,722 | | | 423,202 |
Federal National Mortgage Association,
5.500%, 5/01/2036(c) | | | | | 671,552 | | | 678,738 |
Federal National Mortgage Association,
5.500%, 6/01/2036(c) | | | | | 851,063 | | | 860,169 |
Federal National Mortgage Association,
5.500%, 6/01/2036(c) | | | | | 1,496,765 | | | 1,512,779 |
Federal National Mortgage Association,
5.500%, 6/01/2036(c) | | | | | 615,604 | | | 622,191 |
Federal National Mortgage Association,
5.500%, 6/01/2036(c) | | | | | 4,216,981 | | | 4,262,101 |
Federal National Mortgage Association,
5.500%, 8/01/2036(c) | | | | | 693,591 | | | 701,012 |
Federal National Mortgage Association,
5.500%, 9/01/2036(c) | | | | | 1,510,241 | | | 1,526,400 |
Federal National Mortgage Association,
5.500%, 12/01/2036(c) | | | | | 8,965,719 | | | 9,061,648 |
Federal National Mortgage Association,
5.500%, 6/01/2037(c) | | | | | 3,296,756 | | | 3,331,070 |
Federal National Mortgage Association,
5.742%, 9/01/2036(b)(c) | | | | | 4,799,439 | | | 4,890,085 |
Federal National Mortgage Association,
6.000%, 5/01/2021(c) | | | | | 219,969 | | | 226,623 |
Federal National Mortgage Association,
6.000%, 10/01/2034(c) | | | | | 79,551 | | | 81,774 |
Federal National Mortgage Association,
6.000%, 4/01/2036(c) | | | | | 329,490 | | | 337,911 |
Federal National Mortgage Association,
6.000%, 6/01/2036(c) | | | | | 5,561,082 | | | 5,703,216 |
Federal National Mortgage Association,
6.000%, 6/01/2036(c) | | | | | 1,916,333 | | | 1,965,312 |
Federal National Mortgage Association,
6.000%, 9/01/2036(c) | | | | | 1,330,718 | | | 1,364,730 |
19
| | | | | | | | |
| | | | | Principal Amount | | Value (†) |
| | | | | | | | |
| | | |
| BONDS AND NOTES – continued | | | | | | | | |
| | | |
| Mortgage Related – continued | | | | | | | | |
Federal National Mortgage Association,
6.000%, 10/01/2036(c) | | | | $ | 1,683,388 | | $ | 1,726,414 |
Federal National Mortgage Association,
6.000%, 11/01/2036(c) | | | | | 4,400,912 | | | 4,513,394 |
Federal National Mortgage Association,
6.000%, 1/01/2037(c) | | | | | 1,018,748 | | | 1,044,786 |
Federal National Mortgage Association,
6.000%, 10/01/2037(c) | | | | | 6,365,927 | | | 6,527,048 |
Federal National Mortgage Association,
7.000%, 12/01/2037(c) | | | | | 233,133 | | | 244,885 |
Federal National Mortgage Association (TBA),
5.500%, 12/01/2034(d) | | | | | 12,000,000 | | | 12,112,500 |
Federal National Mortgage Association (TBA),
6.000%, 10/01/2035(d) | | | | | 49,000,000 | | | 50,194,375 |
Federal National Mortgage Association (TBA),
6.500%, 11/01/2034(d) | | | | | 53,450,000 | | | 55,354,156 |
Federal National Mortgage Association, Series 2003-26, Class 0I, 5.500%, 11/25/2032(c) | | | | | 24,838,541 | | | 3,725,781 |
Federal National Mortgage Association, Series 2004-2,
Class QK, 4.000%, 9/25/2017(c) | | | | | 10,000,000 | | | 10,010,502 |
Government National Mortgage Association,
5.500%, 8/15/2033(c) | | | | | 85,476 | | | 87,379 |
Government National Mortgage Association,
5.500%, 12/15/2035(c) | | | | | 369,449 | | | 377,496 |
Government National Mortgage Association,
5.500%, 9/15/2036(c) | | | | | 2,514,498 | | | 2,568,297 |
Government National Mortgage Association, 6.000%, 6/15/2036(c) | | | | | 231,477 | | | 239,248 |
Government National Mortgage Association, 6.000%, 5/15/2037(c) | | | | | 378,280 | | | 390,964 |
Government National Mortgage Association, 6.500%, 9/15/2036(c) | | | | | 1,087,468 | | | 1,131,650 |
Government National Mortgage Association, 6.500%, 2/15/2037(c) | | | | | 1,078,905 | | | 1,122,744 |
Government National Mortgage Association, 6.500%, 7/20/2037(c) | | | | | 3,377,677 | | | 3,517,014 |
Government National Mortgage Association (TBA), 5.500%, 8/01/2034(d) | | | | | 10,130,000 | | | 10,326,269 |
Government National Mortgage Association (TBA), 6.000%, 1/01/2035(d) | | | | | 6,000,000 | | | 6,191,250 |
Greenwich Capital Commercial Funding Corp., Series 2005-GG5, Class A2, 5.117%, 4/10/2037(c) | | | | | 305,000 | | | 303,117 |
Greenwich Capital Commercial Funding Corp., Series 2007-GG9, Class A2, 5.381%, 3/10/2039(c) | | | | | 2,005,000 | | | 1,963,280 |
Greenwich Capital Commercial Funding Corp., Series 2007-GG9, Class A4, 5.444%, 3/10/2039(c) | | | | | 5,000,000 | | | 4,864,737 |
GS Mortgage Securities Corp. II, Series 2004-GG2, Class A6, 5.396%, 8/10/2038(c) | | | | | 125,000 | | | 126,773 |
GS Mortgage Securities Corp. II, Series 2005-GG4, Class A2, 4.475%, 7/10/2039(c) | | | | | 1,130,000 | | | 1,113,165 |
GS Mortgage Securities Corp. II, Series 2005-GG4, Class A4A, 4.751%, 7/10/2039(c) | | | | | 7,495,000 | | | 7,273,428 |
GS Mortgage Securities Corp. II, Series 2006-GG6, Class A2, 5.506%, 4/10/2038(c) | | | | | 500,000 | | | 497,340 |
20
PORTFOLIO OF INVESTMENTS – as of March 31, 2008 (Unaudited)
Loomis Sayles Securitized Asset Fund – continued
| | | | | | | | |
| | | | | Principal Amount | | Value (†) |
| | | | | | | | |
| | | |
| BONDS AND NOTES – continued | | | | | | | | |
| | | |
| Mortgage Related – continued | | | | | | | | |
GS Mortgage Securities Corporation. II,
Series 2006-GG8, Class A2, 5.479%, 11/10/2039(c) | | | | $ | 4,449,000 | | $ | 4,396,144 |
JPMorgan Chase Commercial Mortgage Securities Corp., Series 2001-CIBC, Class A3, 6.260%, 3/15/2033(c) | | | | | 182,759 | | | 186,140 |
JPMorgan Chase Commercial Mortgage Securities Corp., Series 2005-LDP5, Class A4, 5.345%, 12/15/2044(b)(c) | | | | | 7,000,000 | | | 6,978,698 |
JPMorgan Chase Commercial Mortgage Securities Corp., Series 2006-LDP7, Class A2, 6.051%, 4/15/2045(b)(c) | | | | | 1,065,000 | | | 1,067,453 |
JPMorgan Chase Commercial Mortgage Securities Corp., Series 2007-LDPX, Class A3, 5.420%, 1/15/2049(c) | | | | | 4,085,000 | | | 3,952,713 |
LB-UBS Commercial Mortgage Trust, Series 2005-C3, Class A3, 4.647%, 7/15/2030(c) | | | | | 275,000 | | | 266,824 |
LB-UBS Commercial Mortgage Trust, Series 2006-C3, Class A4, 5.661%, 3/15/2039(c) | | | | | 2,440,000 | | | 2,447,088 |
LB-UBS Commercial Mortgage Trust, Series 2006-C7, Class A2, 5.300%, 11/15/2038(c) | | | | | 2,460,000 | | | 2,415,129 |
LB-UBS Commercial Mortgage Trust, Series 2007-C2, Class A2, 5.303%, 2/15/2040(c) | | | | | 11,060,000 | | | 10,797,011 |
Merrill Lynch Mortgage Trust, Series 2006-C1, Class A2, 5.439%, 5/12/2039(b)(c) | | | | | 1,000,000 | | | 996,212 |
Merrill Lynch/Countrywide Commercial Mortgage Trust, Series 2006-1, Class A2,
5.439%, 2/12/2039 | | | | | 4,895,000 | | | 4,852,729 |
Merrill Lynch/Countrywide Commercial Mortgage Trust, Series 2006-1, Class A4,
5.600%, 2/12/2039(b)(c) | | | | | 1,000,000 | | | 992,774 |
Merrill Lynch/Countrywide Commercial Mortgage Trust, Series 2006-2, Class A4, 6.105%, 6/12/2046(b)(c) | | | | | 250,000 | | | 254,846 |
Merrill Lynch/Countrywide Commercial Mortgage Trust, Series 2006-3, Class A4, 5.414%, 7/12/2046(c) | | | | | 1,000,000 | | | 981,164 |
Morgan Stanley Capital I, Class A, 5.328%, 11/12/2041(c) | | | | | 5,000,000 | | | 4,874,359 |
Morgan Stanley Capital I, Series 2005-HQ6, Class A4A, 4.989%, 8/13/2042(c) | | | | | 5,280,000 | | | 5,188,220 |
Morgan Stanley Capital I, Series 2005-HQ7, Class A4, 5.379%, 11/14/2042(b)(c) | | | | | 5,965,000 | | | 6,019,624 |
Morgan Stanley Capital I, Series 2005-T19, Class A4A, 4.890%, 6/12/2047(c) | | | | | 1,267,000 | | | 1,236,672 |
Morgan Stanley Capital I, Series 2006-T23, Series A2, 5.915%, 8/12/2041(b)(c) | | | | | 555,000 | | | 555,039 |
Residential Accredit Loans, Inc., Series 2006-QS13, Class 2A1, 5.750%, 9/25/2021(c) | | | | | 762,800 | | | 705,814 |
Residential Accredit Loans, Inc., Series 2006-QS18, Class 3A3, 5.750%, 12/25/2021(c) | | | | | 3,226,626 | | | 3,152,697 |
Residential Accredit Loans, Inc., Series 2006-QS6, Class 2A1, 6.000%, 6/25/2021(c) | | | | | 170,653 | | | 167,313 |
21
| | | | | | | | |
| | | | | Principal Amount | | Value (†) |
| | | | | | | | |
| | | |
| BONDS AND NOTES – continued | | | | | | | | |
| | | |
| Mortgage Related – continued | | | | | | | | |
Wachovia Bank Commercial Mortgage Trust, Series 2005-C16, Class A2, 4.380%, 10/15/2041(c) | | | | $ | 79,832 | | $ | 78,814 |
| | | | | | | | |
| | | | | | | | 426,602,767 |
| | | | | | | | |
| | | |
| TOTAL NON-CONVERTIBLE BONDS | | | | | | | | |
(Identified Cost $510,785,413) | | | | | | | | 508,248,468 |
| | | | | | | | |
| | | |
| TOTAL BONDS AND NOTES | | | | | | | | |
(Identified Cost $510,785,413) | | | | | | | | 508,248,468 |
| | | | | | | | |
| | | |
| SHORT-TERM INVESTMENTS – 3.4% | | | | | | | | |
| Federal Home Loan Bank, Discount Notes, 4/14/2008 | | | | | 9,300,000 | | | 9,293,168 |
| | | | | | | | |
| Tri-Party Repurchase Agreement with Fixed Income Clearing Corporation dated 3/31/08 at 1.250% to be repurchased at $2,934,102 on 4/01/08 collateralized by $2,895,000 Federal National Mortgage Association, 5.020% due 11/21/12 valued at $2,996,325 including accrued interest (Note 2h of Notes to Financial Statements) | | | | | 2,934,000 | | | 2,934,000 |
| | | | | | | | |
| | | |
| TOTAL SHORT-TERM INVESTMENTS | | | | | | | | |
(Identified Cost $12,227,168) | | | | | | | | 12,227,168 |
| | | | | | | | |
| | | |
| TOTAL INVESTMENTS – 143.4% | | | | | | | | |
(Identified Cost $523,012,581)(a) | | | | | | | | 520,475,636 |
Other assets less liabilities—(43.4)% | | | | | | | | (157,599,071) |
| | | | | | | | |
| | | |
| NET ASSETS – 100.0% | | | | | | | $ | 362,876,565 |
| | | | | | | | |
| |
(†) See Note 2a of Notes to Financial Statements. | | | |
(a) Federal Tax Information (Amounts exclude certain adjustments made at the end of the Fund’s fiscal year for tax purposes: | | | |
At March 31, 2008, the net unrealized depreciation on investments based on a cost of $523,012,581 for federal income tax purposes was as follows: | | | |
Aggregate gross unrealized appreciation for all investments in which there is an excess of value over tax cost | | $ | 7,481,477 |
Aggregate gross unrealized depreciation for all investments in which there is an excess of tax cost over value | | | (10,018,422) |
| | | | | | | | |
Net unrealized depreciation | | $ | (2,536,945) |
| | | | | | | | |
| (b) | Variable rate security. Rate as of March 31, 2008 is disclosed. |
| (c) | All or a portion of this security has been segregated to cover requirements on TBA obligations and future contracts. |
| (d) | Delayed Delivery. (See Note 2i of Notes to Financial Statements). |
| ARM | Adjustable Rate Mortgages. |
At March 31, 2008, open futures contracts sold were as follows:
| | | | | | | | | | | |
| Futures | | Expiration
Date | | Contracts | | Notional
Value | | Unrealized
Depreciation | |
10 Year U.S. Treasury Note | | 06/19/2008 | | 88 | | $ | 10,467,875 | | $ | (380,348 | ) |
5 Year U.S. Treasury Note | | 06/30/2008 | | 82 | | | 9,367,219 | | | (139,166 | ) |
| | | | | | | | | | | |
| Total unrealized depreciation | | | | | | | | | $ | (519,514 | ) |
| | | | | | | | | | | |
HOLDINGS AT MARCH 31, 2008 AS A PERCENTAGE OF NET ASSETS (Unaudited)
| | | |
Mortgage Related | | 117.5 | % |
Hybrid ARMS | | 14.3 | |
Asset-Backed Securities | | 3.3 | |
Other, less than 2% each | | 4.9 | |
See accompanying notes to financial statements.
22
STATEMENTS OF ASSETS AND LIABILITIES
March 31, 2008 (Unaudited)
| | | | | | | | |
| | | High Income
Opportunities
Fund | | | Securitized
Asset Fund | |
| | | | | | | | |
Assets | | | | | | | | |
Investments at cost | | $ | 91,814,105 | | | $ | 523,012,581 | |
Net unrealized depreciation | | | (8,025,216 | ) | | | (2,536,945 | ) |
| | | | | | | | |
Investments at value | | | 83,788,889 | | | | 520,475,636 | |
Cash | | | 447 | | | | 485,387 | |
Receivable for Fund shares sold | | | 76,110 | | | | 3,083,907 | |
Receivable for securities sold | | | 28,235 | | | | 37,222,427 | |
Dividends and interest receivable | | | 1,727,097 | | | | 2,371,579 | |
Tax reclaims receivable | | | 570 | | | | — | |
Securities lending income receivable | | | 4,309 | | | | — | |
| | | | | | | | |
Total Assets | | | 85,625,657 | | | | 563,638,936 | |
| | | | | | | | |
| | |
| Liabilities | | | | | | | | |
Collateral on securities loaned, at value (Note 2) | | | 8,273,185 | | | | — | |
Payable for securities purchased | | | 36,224 | | | | — | |
Payable for delayed delivery securities purchased | | | — | | | | 200,565,017 | |
Payable for Fund shares redeemed | | | 26,713 | | | | 156,135 | |
Payable to broker—variation margin on open futures contracts | | | — | | | | 41,219 | |
| | | | | | | | |
Total Liabilities | | | 8,336,122 | | | | 200,762,371 | |
| | | | | | | | |
Net Assets | | $ | 77,289,535 | | | $ | 362,876,565 | |
| | | | | | | | |
Net Assets consist of: | | | | | | | | |
Paid-in capital | | $ | 84,557,301 | | | $ | 368,439,659 | |
Undistributed net investment income | | | 591,514 | | | | 1,737,717 | |
Accumulated net realized gain (loss) on investments and futures contracts | | | 165,936 | | | | (4,244,352 | ) |
Net unrealized depreciation on investments and futures contracts | | | (8,025,216 | ) | | | (3,056,459 | ) |
| | | | | | | | |
Net Assets | | $ | 77,289,535 | | | $ | 362,876,565 | |
| | | | | | | | |
| | |
| Net Asset Value and Offering Price | | | | | | | | |
Institutional Class | | | | | | | | |
Net assets | | $ | 77,289,535 | | | $ | 362,876,565 | |
| | | | | | | | |
Shares of beneficial interest | | | 8,113,023 | | | | 36,486,924 | |
| | | | | | | | |
Net asset value, offering and redemption price per share | | $ | 9.53 | | | $ | 9.95 | |
| | | | | | | | |
Value of securities on loan (Note 2) | | $ | 8,081,482 | | | $ | — | |
| | | | | | | | |
See accompanying notes to financial statements.
23
STATEMENTS OF OPERATIONS
For the Six Months Ended March 31, 2008 (Unaudited)
| | | | | | | | |
| | | High Income
Opportunities
Fund | | | Securitized
Asset Fund | |
| | | | | | | | |
Investment Income | | | | | | | | |
Dividends | | $ | 51,606 | | | $ | — | |
Interest | | | 3,323,806 | | | | 10,311,047 | |
Securities lending income (Note 2) | | | 30,491 | | | | — | |
| | | | | | | | |
Net investment income | | | 3,405,903 | | | | 10,311,047 | |
| | | | | | | | |
| | |
| Net Realized and Unrealized Gain (Loss) on Investments and Futures Contracts | | | | | | | | |
Net Realized Gain (Loss) on: | | | | | | | | |
Investments | | | 187,874 | | | | 2,827,372 | |
Futures contracts | | | — | | | | (5,043,254 | ) |
| | |
| Net Change in Unrealized Appreciation (Depreciation) on: | | | | | | | | |
Investments | | | (7,020,261 | ) | | | (1,951,007 | ) |
Futures contracts | | | — | | | | (448,889 | ) |
| | | | | | | | |
Net realized and unrealized gain (loss) on investments and futures contracts | | | (6,832,387 | ) | | | (4,615,778 | ) |
| | | | | | | | |
| | |
| Net Increase (Decrease) in Net Assets Resulting from Operations | | $ | (3,426,484 | ) | | $ | 5,695,269 | |
| | | | | | | | |
See accompanying notes to financial statements.
24
STATEMENTS OF CHANGES IN NET ASSETS
High Income Opportunities Fund
| | | | | | | | |
| | | Six Months Ended
March 31, 2008
(Unaudited) | | | Year Ended
September 30, 2007 | |
From Operations: | | | | | | | | |
Net investment income | | $ | 3,405,903 | | | $ | 4,937,988 | |
Net realized gain on investments | | | 187,874 | | | | 548,692 | |
Net change in net unrealized appreciation (depreciation) on investments | | | (7,020,261 | ) | | | (1,332,208 | ) |
| | | | | | | | |
Increase (decrease) in net assets from operations | | | (3,426,484 | ) | | | 4,154,472 | |
| | | | | | | | |
From Distributions to Shareholders: | | | | | | | | |
Net Investment Income: | | | | | | | | |
Institutional Class | | | (3,363,018 | ) | | | (4,658,683 | ) |
Capital Gains: | | | | | | | | |
Institutional Class | | | (543,232 | ) | | | (10,790 | ) |
| | | | | | | | |
Total distributions | | | (3,906,250 | ) | | | (4,669,473 | ) |
| | | | | | | | |
Increase in Net Assets Derived from Capital Shares Transactions (Note 7) | | | 549,002 | | | | 41,741,681 | |
| | | | | | | | |
Total increase (decrease) in net assets | | | (6,783,732 | ) | | | 41,226,680 | |
Net Assets | | | | | | | | |
Beginning of period | | | 84,073,267 | | | | 42,846,587 | |
| | | | | | | | |
End of period | | $ | 77,289,535 | | | $ | 84,073,267 | |
| | | | | | | | |
Undistributed Net Investment Income | | $ | 591,514 | | | $ | 548,629 | |
| | | | | | | | |
Securitized Asset Fund
| | | | | | | | |
| | | Six Months Ended
March 31, 2008
(Unaudited) | | | Year Ended
September 30, 2007 | |
From Operations: | | | | | | | | |
Net investment income | | $ | 10,311,047 | | | $ | 13,048,141 | |
Net realized loss on investments and futures contracts | | | (2,215,882 | ) | | | (1,735,124 | ) |
Net change in net unrealized appreciation (depreciation) on investments and
futures contracts | | | (2,399,896 | ) | | | (1,369,392 | ) |
| | | | | | | | |
Increase (decrease) in net assets from operations | | | 5,695,269 | | | | 9,943,625 | |
| | | | | | | | |
From Distributions to Shareholders: | | | | | | | | |
Net Investment Income: | | | | | | | | |
Institutional Class | | | (10,349,631 | ) | | | (11,831,185 | ) |
Capital Gains: | | | | | | | | |
Institutional Class | | | — | | | | (53,435 | ) |
| | | | | | | | |
Total distributions | | | (10,349,631 | ) | | | (11,884,620 | ) |
| | | | | | | | |
Increase in Net Assets Derived from Capital Shares Transactions (Note 7) | | | 20,377,536 | | | | 278,101,365 | |
| | | | | | | | |
Total increase (decrease) in net assets | | | 15,723,174 | | | | 276,160,370 | |
Net Assets | | | | | | | | |
Beginning of period | | | 347,153,391 | | | | 70,993,021 | |
| | | | | | | | |
End of period | | $ | 362,876,565 | | | $ | 347,153,391 | |
| | | | | | | | |
Undistributed Net Investment Income | | $ | 1,737,717 | | | $ | 1,776,301 | |
| | | | | | | | |
See accompanying notes to financial statements.
25
THIS PAGE INTENTIONALLY LEFT BLANK
26
FINANCIAL HIGHLIGHTS
For a share outstanding throughout each period.
| | | | | | | | | | | | | | | | | | | | | | | | |
| | | | | Income (Loss) from Investment Operations: | | | | | Less Distributions: | |
| | | Net asset
value,
beginning
of the period | | Net
investment
income(e) | | Net realized
and unrealized
gain (loss) | | | Total from
investment
operations | | | | | Dividends
from
net investment
income | | | Distributions
from net
realized
capital gains(g) | |
| High Income Opportunities Fund | | | | | | | | | | | | | | | |
| | | | | | |
| Institutional Class | | | | | | | | | | | | | | | | | | | | | |
3/31/2008(i) | | $ | 10.42 | | $ | 0.42 | | $ | (0.83 | ) | | $ | (0.41 | ) | | | | $ | (0.41 | ) | | $ | (0.07 | ) |
9/30/2007 | | | 10.39 | | | 0.77 | | | 0.01 | (h) | | | 0.78 | | | | | | (0.75 | ) | | | (0.00 | ) |
9/30/2006 | | | 10.50 | | | 0.76 | | | (0.10 | ) | | | 0.66 | | | | | | (0.73 | ) | | | (0.04 | ) |
9/30/2005 | | | 10.32 | | | 0.78 | | | 0.17 | | | | 0.95 | | | | | | (0.77 | ) | | | — | |
9/30/2004(a) | | | 10.00 | | | 0.33 | | | 0.25 | | | | 0.58 | | | | | | (0.26 | ) | | | — | |
| | | | |
| Securitized Asset Fund | | | | | | | | | | | | | | | |
| | | | | | |
| Institutional Class | | | | | | | | | | | | | | | | | | | | | |
3/31/2008(i) | | $ | 10.07 | | $ | 0.29 | | $ | (0.12 | ) | | $ | 0.17 | | | | | $ | (0.29 | ) | | $ | (0.00 | ) |
9/30/2007 | | | 10.13 | | | 0.55 | | | (0.10 | ) | | | 0.45 | | | | | | (0.51 | ) | | | (0.00 | ) |
9/30/2006(f) | | | 10.00 | | | 0.30 | | | 0.02 | | | | 0.32 | | | | | | (0.19 | ) | | | — | |
(a) For the period April 12, 2004 (commencement of operations) through September 30, 2004.
(b) Periods less than one year, if applicable, are not annualized.
(c) Loomis Sayles has agreed to pay, without reimbursement from the Fund, all expenses associated with the operations of the Fund.
(d) Computed on an annualized basis for periods less than one year, if applicable
(e) Per share net investment income has been calculated using the average shares outstanding during the period.
(f) For the period March 2, 2006 (commencement of operations) through September 30, 2006.
(g) Amount rounds to less than $0.01 per share, if applicable.
(h) The amount shown for a share outstanding does not correspond with the aggregate realized and unrealized gain (loss) on investments for the period due to the timing of sales and redemptions of fund shares in relation to fluctuating market values of investments of the fund.
(i) For the six months ended March 31, 2008 (Unaudited).
See accompanying notes to financial statements.
27
| | | | | | | | | | | | | | | | | | | |
| | | | | | | | | | | Ratios to Average Net Assets: | | |
Total
distributions | | | Net asset
value,
end of
the period | | Total
return (%)(b) | | | Net assets,
end of the period
(000’s) | | Net
expenses (%)(c) | | Gross
expenses (%)(c) | | Net
investment
income (%)(d) | | Portfolio
turnover
rate (%) |
| | | | | | | | | | | | | | | | | | | |
| | | | | | | |
| | | | | | | | | | | | | | | | | | | |
| $ | (0.48 | ) | | $ | 9.53 | | (4.1 | ) | | $ | 77,290 | | — | | — | | 8.34 | | 11 |
| | (0.75 | ) | | | 10.42 | | 7.7 | | | | 84,073 | | — | | — | | 7.35 | | 29 |
| | (0.77 | ) | | | 10.39 | | 6.6 | | | | 42,847 | | — | | — | | 7.36 | | 26 |
| | (0.77 | ) | | | 10.50 | | 9.5 | | | | 13,115 | | — | | — | | 7.40 | | 22 |
| | (0.26 | ) | | | 10.32 | | 5.9 | | | | 9,079 | | — | | — | | 7.03 | | 45 |
| | | | | | | |
| | | | | | | | | | | | | | | | | | | |
| | | | | | | |
| | | | | | | | | | | | | | | | | | | |
| $ | (0.29 | ) | | $ | 9.95 | | 1.7 | | | $ | 362,877 | | — | | — | | 5.76 | | 202 |
| | (0.51 | ) | | | 10.07 | | 4.6 | | | | 347,153 | | — | | — | | 5.43 | | 73 |
| | (0.19 | ) | | | 10.13 | | 3.3 | | | | 70,993 | | — | | — | | 3.02 | | 55 |
See accompanying notes to financial statements.
28
NOTES TO FINANCIAL STATEMENTS
March 31, 2008 (Unaudited)
1. Organization. Loomis Sayles Funds I (the “Trust”) is organized as a Massachusetts business trust. The Trust is registered under the Investment Company Act of 1940, as amended (the “1940 Act”), as an open-end management investment company. The Declaration of Trust permits the Board of Trustees to authorize the issuance of an unlimited number of shares of the Trust in multiple series. The following funds (individually, a “Fund” and collectively, the “Funds”) are included in this report:
Loomis Sayles High Income Opportunities Fund (the “High Income Opportunities Fund”)
Loomis Sayles Securitized Asset Fund (the “Securitized Asset Fund”)
Each Fund offers Institutional Class Shares. The Funds’ shares are offered exclusively to investors in “wrap fee” programs approved by Natixis Asset Management Advisors, L.P. (“Natixis Advisors”) and/or Loomis Sayles & Company, L.P. (“Loomis Sayles”) and to institutional advisory clients of Natixis Advisors or Loomis Sayles that, in each case, meet the Funds’ policies as established by Loomis Sayles.
2. Significant Accounting Policies. The following is a summary of significant accounting policies consistently followed by each Fund in the preparation of its financial statements. Each Fund’s financial statements are prepared in accordance with accounting principles generally accepted in the United States of America which require the use of management estimates that affect the reported amounts and disclosures in the financial statements. Actual results could differ from those estimates.
a. Security Valuation. Debt securities (other than short-term obligations purchased with an original or remaining maturity of sixty days or less) are generally valued on the basis of evaluated bids furnished to the Funds by a pricing service recommended by the investment adviser and approved by the Board of Trustees, which service determines valuations for normal, institutional size-trading units of such securities using market information, transactions for comparable securities and various relationships between securities which are generally recognized by institutional traders. Equity securities, including closed-end investment companies and exchange traded funds, for which market quotations are readily available are valued at market value, as reported by pricing services recommended by the investment adviser and approved by the Board of Trustees. Such pricing services generally use the security’s last sale price on the exchange or market where the security is primarily traded or, if there is no reported sale during the day, the closing bid price. Securities traded on the NASDAQ Global Select Market, NASDAQ Global Market and NASDAQ Capital Markets are valued at the NASDAQ Official Closing Price (“NOCP”), or if lacking a NOCP, at the most recent bid quotation on the applicable NASDAQ Market. Broker-dealer bid quotations may also be used to value debt and equity securities where a pricing service does not price a security or where a pricing service does not provide a reliable price for the security. In instances where broker-dealer bid quotations are not available, certain securities held by the Funds may be valued on the basis of a price provided by a principal market maker. Futures contracts are priced at their most recent settlement price. Short-term obligations purchased with an original or remaining maturity of sixty days or less are valued at amortized cost, which approximates market value. Securities for which market quotations are not readily available are valued at fair value as determined in good faith by the Funds’ investment adviser using consistently applied procedures under the general supervision of the Board of Trustees. Investments in other open-end investment companies are valued at their net asset value each day.
The High Income Opportunities Fund may hold securities traded in foreign markets. Foreign securities are valued at the market price in the foreign market. However, if events occurring after the close of the foreign market (but before the close of regular trading on the New York Stock Exchange) are believed to materially affect the value of those securities, such securities are fair valued pursuant to procedures approved by the Board of Trustees. When fair valuing securities, the Fund may, among other things, use modeling tools or other processes that may take into account factors such as securities market activity and/or significant events that occur after the close of the foreign market and before the Fund calculates its net asset value.
b. Security Transactions and Related Investment Income. Security transactions are accounted for on trade date. Dividend income is recorded on ex-dividend date, or in the case of certain foreign securities, as soon as the Fund is notified, and interest income is recorded on an accrual basis. Interest income is increased by the accretion of discount and decreased by the amortization of premium. Investment income is recorded net of foreign taxes withheld when applicable. In determining net gain or loss on securities sold, the cost of securities has been determined on an identified cost basis.
c. Foreign Currency Translation. The books and records of the Funds are maintained in U.S. dollars. The value of securities, currencies and other assets and liabilities denominated in currencies other than U.S. dollars are translated into U.S. dollars based upon foreign exchange rates prevailing at the end of the period. Purchases and sales of investment securities, income and expenses are translated on the respective dates of such transactions.
29
Since the values of investment securities are presented at the foreign exchange rates prevailing at the end of the period, it is not practical to isolate that portion of the results of operations arising from changes in exchange rates caused by fluctuations which arise due to changes in market prices of the investment securities. Such changes are included with the net realized and unrealized gain or loss on investments.
Net realized foreign exchange gains or losses arise from sales of foreign currency, currency gains or losses realized between the trade and settlement dates on securities transactions and the difference between the amounts of dividends, interest and foreign withholding taxes recorded on the High Income Opportunities Fund’s books and the U.S. dollar equivalent of the amounts actually received or paid. Net unrealized foreign exchange gains and losses arise from changes in the value of assets and liabilities, other than investment securities, at the end of the fiscal period, resulting from changes in exchange rates.
The High Income Opportunities Fund may use foreign currency exchange contracts to facilitate transactions in foreign denominated investments. Losses may arise from changes in the value of the foreign currency or if the counterparties do not perform under the contracts’ terms.
The High Income Opportunities Fund may purchase investments of foreign issuers. Investing in securities of foreign issuers involves special risks and considerations not typically associated with investing in U.S. companies and securities of the U.S. government. These risks include revaluation of currencies and the risk of appropriation. Moreover, the markets for securities of many foreign issuers may be less liquid and the prices of such securities may be more volatile than those of comparable U.S. companies and the U.S. government.
d. Forward Foreign Currency Contracts. The High Income Opportunities Fund may enter into forward foreign currency exchange contracts. Contracts to buy generally are used to acquire exposure to foreign currencies, while contracts to sell generally are used to hedge the Fund’s investments against currency fluctuation. Also, a contract to buy or sell can offset a previous contract. These contracts involve market risk in excess of the unrealized gain or loss reflected in the Fund’s Statement of Assets and Liabilities. The U.S. dollar value of the currencies a Fund has committed to buy or sell represents the aggregate exposure to each currency the Fund has acquired or hedged through currency contracts outstanding at period end.
All contracts are “marked-to-market” daily at the applicable exchange rates and any gains or losses are recorded for financial statement purposes as unrealized until settlement date. Risks may arise upon entering into these contracts from the potential inability of counterparties to meet the terms of their contracts and from unanticipated movements in the value of a foreign currency relative to the U.S. dollar. At March 31, 2008, there were no open foreign forward currency contracts.
e. Futures Contracts. The Funds may enter into futures contracts. A futures contract is an agreement between two parties to buy and sell a particular commodity, instrument or index (e.g., an interest-bearing security) for a specified price on a specified future date.
When a Fund enters into a futures contract, it is required to deposit with (or for the benefit of) its broker as “initial margin” an amount of cash or short-term high-quality securities. As the value of the contract changes, the value of the futures contract position increases or declines. At the end of each trading day, the amount of such increase or decline is received or paid, respectively, by and to the holders of these positions. The amount received or paid is known as “variation margin.” Realized gain or loss on a futures position is equal to the net variation margin received or paid over the time the position is held, plus or minus the amount received or paid when the position is closed, minus brokerage commissions. When a Fund enters into a futures contract certain risks may arise such as illiquidity in the futures market, which may limit the Fund’s ability to close out a futures contract prior to settlement date, and unanticipated movements in the value of securities or interest rates.
f. Federal and Foreign Income Taxes. The Trust treats each Fund as a separate entity for federal income tax purposes. Each Fund intends to meet the requirements of the Internal Revenue Code applicable to regulated investment companies, and to distribute to its shareholders substantially all of its net investment income and any net realized capital gains, at least annually. Financial Accounting Standards Board (“FASB”) Interpretation No. 48, Accounting for Uncertainty in Income Taxes – an Interpretation of FASB Statement 109 (“FIN 48”) was issued and became effective for fiscal years beginning after December 15, 2006. FIN 48 sets forth a threshold for financial statement recognition, measurement and disclosure of a tax position taken or expected to be taken on a tax return. Management has performed an analysis of the Funds’ tax positions taken on federal and state tax returns that remain subject to examinations (tax years ended September 30, 2004 – 2007) and has concluded that no provisions for income tax are required. Fund Management is not aware of any events that are reasonably possible to occur in the next six months that would result in the amounts of any unrecognized tax benefits significantly increasing or decreasing for the Funds. However, management’s conclusions regarding FIN 48 may be subject to review and adjustment at a later date based on factors including, but not limited to, further implementation guidance from the FASB, new tax laws, regulations and interpretations thereof.
30
NOTES TO FINANCIAL STATEMENTS – continued
March 31, 2008 (Unaudited)
The High Income Opportunities Fund may be subject to foreign taxes on income and gains on investments that are accrued based upon the Fund’s understanding of the tax rules and regulations that exist in the countries in which the Fund invests. Foreign governments may also impose taxes or other payments on investments with respect to foreign securities. Such taxes are accrued as applicable.
g. Dividends and Distributions to Shareholders. Dividends and distributions are recorded on ex-dividend date. The timing and characterization of certain income and capital gains distributions are determined annually in accordance with federal tax regulations, which may differ from accounting principles generally accepted in the United States of America. Permanent differences are primarily due to differing treatments for book and tax purposes of items such as premium amortization, distribution redesignations and paydown gains and losses. Permanent book and tax basis differences relating to shareholder distributions will result in reclassifications to capital accounts. Temporary differences between book and tax distributable earnings are primarily due to defaulted bond income accruals, premium amortization accruals and futures contracts marked to market. Distributions from net investment income and short-term capital gains are considered to be ordinary income for tax purposes.
The tax characterization of distributions is determined on an annual basis. The tax character of distributions paid to shareholders during the year ended September 30, 2007 was as follows:
| | | | | | | | | |
| | | 2007 Distributions Paid From: |
Fund | | Ordinary
Income | | Long-Term
Capital Gains | | Total |
High Income Opportunities Fund | | $ | 4,658,683 | | $ | 10,790 | | $ | 4,669,473 |
Securitized Asset Fund | | | 11,884,620 | | | — | | | 11,884,620 |
As of September 30, 2007, post-October losses were as follows: |
| | | High Income
Opportunities Fund | | Securitized
Asset Fund | | |
Deferred net capital losses (post-October 2006) | | $ | — | | $ | 2,099,095 | | | |
| | | | | | | | | |
h. Repurchase Agreements. Each Fund, through its custodian, receives delivery of the underlying securities collateralizing repurchase agreements. It is each Fund’s policy that the market value of the collateral be at least equal to 102% of the repurchase price, including interest. The repurchase agreements are tri-party arrangements whereby the collateral is held at the custodian bank in a segregated account for the benefit of the Fund and on behalf of the counterparty. Repurchase agreements could involve certain risks in the event of default or insolvency of the counterparty including possible delays or restrictions upon a Fund’s ability to dispose of the underlying securities.
i. Delayed Delivery Commitments. Each Fund may purchase or sell securities on a when issued or forward commitment basis. Payment and delivery may take place a month or more after the date of the transaction. The price of the underlying securities and the date when the securities will be delivered and paid for are fixed at the time the transaction is negotiated. Losses may arise due to changes in the market value of the underlying securities or if the counterparty does not perform under the contract. Collateral consisting of liquid securities or cash and cash equivalents is maintained in an amount at least equal to these commitments with the custodian.
j. Securities Lending. The Funds have entered into an agreement with State Street Bank and Trust Company (“State Street Bank”), as agent of the Funds, to lend securities to certain designated borrowers. The loans are collateralized with cash or securities in an amount equal to at least 105% or 102% of the market value of the loaned international or domestic securities, respectively, when the loan is initiated. Thereafter, the value of the collateral must remain at least 102% of the market value of loaned securities for U.S. equities and U.S. corporate debt; at least 105% of the market value of loaned securities for non-U.S. equities; and at least 100% of the market value of loaned securities for U.S. government securities, sovereign debt issued by non-U.S. governments and non-U.S. corporate debt. In the event that the market value of the collateral falls below the required percentages described above, the borrower will deliver additional collateral on the next business day. As with other extensions of credit, the Funds may bear the risk of loss with respect to the investment of the collateral. The Funds invest cash collateral in short-term investments, a portion of the income from which is remitted to the borrowers and the remainder allocated between the Funds and State Street Bank as lending agent. The value of securities on loan to borrowers and the value of collateral held by the Funds with respect to such loans at March 31, 2008 were as follows:
| | | | | | | | |
| | | Value of Securities
on Loan | | Value of Collateral | | |
High Income Opportunities Fund | | $ | 8,081,482 | | $ | 8,273,185 | | |
Securitized Asset Fund | | | — | | | — | | |
31
k. Indemnifications. Under the Trust’s organizational documents, its officers and Trustees are indemnified against certain liability arising out of the performance of their duties to the Funds. Additionally, in the normal course of business, the Funds’ enter into contracts with service providers that contain general indemnification clauses. The Funds’ maximum exposure under these arrangements is unknown as this would involve future claims that may be made against the Funds that have not yet occurred. However, based on experience the Funds expect the risk of loss to be remote.
l. New Accounting Pronouncements. In September 2006, Statement of Financial Accounting Standards No. 157, Fair Value Measurements (“FAS 157”), was issued and is effective for fiscal years beginning after November 15, 2007. FAS 157 defines fair value, establishes a framework for measuring fair value and expands disclosures about fair value measurements. Management has evaluated the impact the adoption of FAS 157 will have on the Funds’ financial statements and believes that such impact will be limited to expanded disclosure in the Funds’ financial statements regarding inputs used in determining the value of the Funds’ investments and will not have a material impact on the Funds’ net assets or results of operations.
In March 2008, Statement of Financial Accounting Standards No. 161, Disclosures about Derivative Instruments and Hedging Activities (“FAS 161”), was issued and will be effective for fiscal years and interim periods beginning after November 15, 2008. FAS 161 requires enhanced disclosures about funds’ derivative and hedging activities. Management is currently evaluating the impact the adoption of FAS 161 will have on the Funds’ financial statement disclosures.
3. Purchases and Sales of Securities. For the six months ended March 31, 2008, purchases and sales of securities (excluding short-term investments and including paydowns) were as follows:
| | | | | | | | | | | | | | |
| | | U.S. Government and Agency
Securities | | Other Securities |
Fund | | Purchases | | Sales | | | | Purchases | | Sales |
High Income Opportunities Fund | | $ | — | | $ | 1,384,083 | | | | $ | 11,245,872 | | $ | 7,118,711 |
Securitized Asset Fund | | | 1,057,465,336 | | | 1,041,855,963 | | | | | 42,170,737 | | | 8,902,344 |
4. Management Fees and Other Transactions with Affiliates.
a. Management Fees. Loomis Sayles has agreed to pay, without reimbursement from the Funds or the Trust, the following expenses of the Funds: compensation to Trustees of the Trust who are not “interested persons” (as defined in the 1940 Act) of the Trust; registration, filing and other fees in connection with requirements of regulatory authorities; the charges and expenses of any entity appointed by the Funds for custodial, paying agent, shareholder servicing and plan agent services; charges and expenses of the independent registered public accounting firm retained by the Funds; charges and expenses of any transfer agents and registrars appointed by the Funds; any cost of certificates representing shares of the Funds; legal fees and expenses in connection with the day-to-day affairs of the Funds, including registering and qualifying its shares with Federal and State regulatory authorities; expenses of meetings of shareholders and Trustees of the Trust; the costs of services, including services of counsel, required in connection with the preparation of the Funds’ registration statements and prospectuses, including amendments and revisions thereto, annual, semi-annual and other periodic reports of the Funds, and notices and proxy solicitation material furnished to shareholders of the Funds or regulatory authorities, and any costs of printing or mailing these items; and the Funds’ expenses of bookkeeping, accounting, auditing and financial reporting, including related clerical expenses.
Loomis Sayles serves as investment adviser to each Fund. Under the terms of each management agreement, Loomis Sayles does not charge the Funds an investment advisory fee, also known as a management fee, or any other fee for those services or for bearing those expenses. Although the Funds do not compensate Loomis Sayles directly for services under the advisory agreement, Loomis Sayles will typically receive an advisory fee from the sponsors of “wrap programs,” who in turn charge the programs’ participants.
Certain officers and employees of Loomis Sayles are also officers or Trustees of the Trust. Loomis Sayles’ general partner is indirectly owned by Natixis Global Asset Management, L.P. (“Natixis US”), which is part of Natixis Global Asset Management, an international asset management group based in Paris, France.
b. Administrative Fees. Natixis Advisors provides certain administrative services for the Funds and subcontracts with State Street Bank to serve as sub-administrator. Natixis Advisors is a wholly-owned subsidiary of Natixis US. Loomis Sayles has agreed to pay, without reimbursement from the Trust or Funds, fees to Natixis Advisors for services to the Funds under each agreement.
c. Service and Distribution Fees. The Trust has entered into a distribution agreement with Natixis Distributors, L.P. (“Natixis Distributors”), a wholly-owned subsidiary of Natixis US. Pursuant to this agreement, Natixis Distributors serves as principal
32
NOTES TO FINANCIAL STATEMENTS – continued
March 31, 2008 (Unaudited)
underwriter of the Funds. Natixis Distributors currently is not paid a fee for serving as distributor for the Funds. Loomis Sayles has agreed to reimburse Natixis Distributors to the extent that Natixis Distributors incurs expenses in connection with any redemption of Fund shares.
d. Trustees Fees and Expenses. The Fund does not pay any compensation directly to its officers or Trustees who are directors, officers or employees of Natixis Advisors, Natixis Distributors, Natixis US, or their affiliates. The Chairperson of the Board receives a retainer fee at the annual rate of $200,000. The Chairperson does not receive any meeting attendance fees for Board of Trustees meetings or committee meetings that she attends. Each independent Trustee (other than the Chairperson) receives, in the aggregate, a retainer fee at the annual rate of $65,000. Each independent Trustee also receives a meeting attendance fee of $7,500 for each meeting of the Board of Trustees that he or she attends in person and $3,750 for each meeting of the Board of Trustees that he or she attends telephonically. In addition, each committee chair receives an additional retainer fee at the annual rate of $10,000. Each Contract Review and Governance Committee member is compensated $5,000 for each Committee meeting that he or she attends in person and $2,500 for each meeting that he or she attends telephonically. Each Audit Committee member is compensated $6,250 for each Committee meeting that he or she attends in person and $3,125 for each meeting that he or she attends telephonically. These fees are allocated among the Funds in the Natixis Funds Trust I, Natixis Funds Trust II, Natixis Funds Trust III, Natixis Funds Trust IV, Natixis Cash Management Trust, Gateway Trust (“Natixis Funds Trusts”), Loomis Sayles Funds I, Loomis Sayles Funds II (“Loomis Sayles Funds Trusts”) and the Hansberger International Series based on a formula that takes into account, among other factors, the relative net assets of each Fund. Trustees are reimbursed for travel expenses in connection with attendance at meetings.
Prior to January 1, 2008, each Independent Trustee (other than the Chairperson) received, in the aggregate, a retainer fee at the annual rate of $55,000. Each Independent Trustee also received a meeting attendance fee of $6,000 for each meeting of the Board of Trustees that he or she attended in person and $3,000 for each meeting that he or she attended telephonically. In addition, each Contract Review and Governance Committee member received $4,000 for each committee meeting that he or she attended in person and $2,000 for each committee meeting that he or she attended telephonically. Each Audit Committee member received $5,000 for each committee meeting that he or she attended in person and $2,500 for each committee meeting that he or she attended telephonically. The Chairperson of the Board and committee chair retainers were $200,000 and $10,000, respectively.
5. Line of Credit. Each Fund, together with certain other funds of Natixis Funds Trusts, Loomis Sayles Funds Trusts and the Hansberger International Series, participates in a $200,000,000 committed line of credit provided by State Street Bank, with an individual limit of $125,000,000 for each Fund that participates in the line of credit. Interest is charged to each participating fund based on its borrowings at a rate per annum equal to the Federal Funds rate plus 0.50%. In addition, a commitment fee of 0.09% per annum, payable at the end of each calendar quarter, is accrued and apportioned among the participating funds based on their average daily unused portion of the line of credit. For the six months ended March 31, 2008, the Funds had no borrowings under this agreement.
Prior to March 12, 2008, each fund together with certain other funds of Natixis Funds Trusts, Loomis Sayles Funds Trusts and Hansberger International Series, participated in a $75,000,000 committed line of credit provided by State Street Bank.
6. Concentration of Risk. The Securitized Asset Fund is a non-diversified fund. Compared with diversified mutual funds, the Securitized Asset Fund may invest a greater percentage of its assets in a particular company. Therefore, the Securitized Asset Fund’s returns could be significantly affected by the performance of any one of the small number of bonds in its portfolio.
7. Capital Shares. Each Fund may issue an unlimited number of shares of beneficial interest, without par value. Transactions in capital shares were as follows:
| | | | | | | | | | | | | | |
| | | High Income Opportunities Fund | |
| | |
| | | Six Months Ended March 31, 2008 | | | Year Ended September 30, 2007 | |
| | | | |
| | | Shares | | | Amount | | | Shares | | | Amount | |
Issued from the sale of shares | | 721,246 | | | $ | 7,296,471 | | | 5,003,754 | | | $ | 52,835,635 | |
Issued in connection with the
reinvestment of distributions | | 188,351 | | | | 1,887,816 | | | 190,501 | | | | 1,995,422 | |
Redeemed | | (868,482 | ) | | | (8,635,285 | ) | | (1,244,842 | ) | | | (13,089,376 | ) |
| | | | | | | | | | | | | | |
Increase (decrease) from capital share transactions | | 41,115 | | | $ | 549,002 | | | 3,949,413 | | | $ | 41,741,681 | |
| | | | | | | | | | | | | | |
33
| | | | | | | | | | | | | | |
| | | Securitized Asset Fund | |
| | |
| | | Six Months Ended March 31, 2008 | | | Year Ended September 30, 2007 | |
| | | | |
| | | Shares | | | Amount | | | Shares | | | Amount | |
Issued from the sale of shares | | 6,846,285 | | | $ | 68,843,063 | | | 34,557,748 | | | $ | 349,398,198 | |
Issued in connection with the reinvestment of distributions | | 8,466 | | | | 85,118 | | | 12,259 | | | | 123,960 | |
Redeemed | | (4,834,036 | ) | | | (48,550,645 | ) | | (7,110,836 | ) | | | (71,420,793 | ) |
| | | | | | | | | | | | | | |
Increase (decrease) from capital share transactions | | 2,020,715 | | | $ | 20,377,536 | | | 27,459,171 | | | $ | 278,101,365 | |
| | | | | | | | | | | | | | |
34
Not applicable.
| Item 3. | Audit Committee Financial Expert. |
Not applicable.
| Item 4. | Principal Accountant Fees and Services. |
Not applicable.
| Item 5. | Audit Committee of Listed Registrants. |
Not applicable.
| Item 6. | Schedule of Investments. |
Included as part of the Report to Shareholders filed as Item 1 herewith.
| Item 7. | Disclosure of Proxy Voting Policies and Procedures for Closed-End Management Investment Companies. |
Not applicable.
| Item 8. | Portfolio Managers of Closed-End Management Investment Companies. |
Not applicable.
| Item 9. | Purchases of Equity Securities by Closed-End Management Investment Companies and Affiliated Purchasers. |
Not applicable.
| Item 10. | Submission of Matters to a Vote of Securities Holders. |
There were no material changes to the procedures by which shareholders may recommend nominees to the Trust’s Board of Trustees.
| Item 11. | Controls and Procedures. |
The Registrant’s principal executive officer and principal financial officer have concluded that the Registrant’s disclosure controls and procedures are sufficient to ensure that information required to be disclosed by the Registrant in this Form N-CSR was recorded, processed, summarized and reported within the time periods specified in the Securities and Exchange Commission’s rules and forms, based upon such officers’ evaluation of these controls and procedures as of a date within 90 days of the filing date of the report.
There was no change in the Registrant’s internal control over financial reporting that occurred during the Registrant’s last fiscal quarter of the period covered by the report that has materially affected, or is reasonably likely to materially affect, the Registrant’s internal control over financial reporting.
| | |
| (a) (1) | | Not applicable. |
| |
| (a) (2) | | Certifications of Principal Executive Officer and Principal Financial Officer pursuant to Rule 30a-2(a) under the Investment Company Act of 1940 (17 CFR 270.30a-2(a)), filed herewith as Exhibits (a)(2)(1) and (a)(2)(2), respectively. |
| |
| (a) (3) | | Not applicable. |
| |
| (b) | | Certifications of Principal Executive Officer and Principal Financial Officer pursuant to Section 906 of Sarbanes-Oxley Act of 2002 are filed herewith as Exhibit (b). |
SIGNATURES
Pursuant to the requirements of the Securities Exchange Act of 1934 and the Investment Company Act of 1940, the Registrant has duly caused this report to be signed on its behalf by the undersigned, thereunto duly authorized.
| | |
| Loomis Sayles Funds I |
| |
| By: | | /s/ Robert J. Blanding |
| Name: | | Robert J. Blanding |
| Title: | | President and Chief Executive Officer |
| Date: | | May 22, 2008 |
Pursuant to the requirements of the Securities Exchange Act of 1934 and the Investment Company Act of 1940, this report has been signed by the following persons on behalf of the Registrant and in the capacities and on the dates indicated.
| | |
| |
| By: | | /s/ Robert J. Blanding |
| Name: | | Robert J. Blanding |
| Title: | | President and Chief Executive Officer |
| Date: | | May 22, 2008 |
| |
| By: | | /s/ Michael C. Kardok |
| Name: | | Michael C. Kardok |
| Title: | | Treasurer |
| Date: | | May 22, 2008 |