UNITED STATES
SECURITIES AND EXCHANGE COMMISSION
Washington, D.C. 20549
FORM N-CSR
CERTIFIED SHAREHOLDER REPORT OF REGISTERED
MANAGEMENT INVESTMENT COMPANIES
Investment Company Act file number: 811-08282
Loomis Sayles Funds I
(Exact name of Registrant as specified in charter)
399 Boylston Street, Boston, Massachusetts 02116
(Address of principal executive offices) (Zip code)
Coleen Downs Dinneen, Esq.
Natixis Distributors, L.P.
399 Boylston Street
Boston, Massachusetts 02116
(Name and address of agent for service)
Registrant’s telephone number, including area code: (617) 449-2810
Date of fiscal year end: September 30
Date of reporting period: March 31, 2011
Item 1. Reports to Stockholders.
The Registrant’s semi-annual report transmitted to shareholders pursuant to Rule 30e-1 under the Investment Company Act of 1940 is as follows:

Loomis Sayles Small Cap Growth Fund
Loomis Sayles Small Cap Value Fund
SEMI-ANNUAL REPORT
MARCH 31, 2011
LOOMIS SAYLES SMALL CAP GROWTH FUND
Fund and manager review
FUND FACTS
Managers:
Mark F. Burns, CFA
John Slavik, CFA
Symbols:
| | |
| Institutional Class | | LSSIX |
| Retail Class | | LCGRX |
Objective:
Long-term capital growth from investments in common stocks or other equity securities
Strategy:
Invests at least 80% of its net assets (plus any borrowings made for investment purposes) in equity securities of companies with market capitalizations that fall within the capitalization range of the Russell 2000 Index or is $3 billion or less at the time of investment. Unlike the Index, the Fund may invest in companies of any size.
The fund may invest any portion of its assets in Canadian securities and up to 20% of assets in other foreign securities, including emerging markets securities.
Fund Inception Date:
December 31, 1996
Net Assets:
$249.5 million
Market Conditions
Stocks rallied sharply during the six-month period, fueled by a modest improvement in U.S. business conditions and renewed investor optimism stemming from continued accommodation from the Federal Reserve Board (the Fed). These factors, combined with better-than-expected corporate profits, drove share prices higher despite political turmoil in North Africa and the Middle East and the earthquake, tsunami and nuclear crisis in Japan. Risk appetites stayed fairly high, and equities remained the vehicle of choice for investors. Overall, small-cap stocks led the market higher, and growth stocks outperformed value stocks.
Performance Results
For the six months ended March 31, 2011, Institutional Class shares of Loomis Sayles Small Cap Growth Fund returned 32.43%. The fund outperformed its benchmark, the Russell 2000 Growth Index, which returned 27.93% for the period.
Explanation of Fund Performance
Strong stock selection primarily drove the fund’s relative outperformance. Our choices were particularly strong in the consumer discretionary sector, where IMAX and Tempur-Pedic International drove results. Shares of IMAX, the operator of large screen movie theaters, rose sharply after beating earnings and raising estimates for new theater installations. Tempur-Pedic shares rose sharply after reporting better-than-expected earnings due to market share gains for the company’s Cloud Collection mattresses, which appeal to the higher end of the market. Stock selection and an overweight position led to favorable relative results in the energy sector with Rosetta Resources Inc. and T-3 Energy Services as the top performers. Rosetta Resources, an oil and gas exploration and production company, rose sharply in the fourth quarter after reporting strong earnings. T-3 Energy Services, an oilfield products and service company, saw shares spike after the company announced it was being acquired by Robbins and Myers in the fourth quarter. Stock selection also contributed favorably in the producer durables sector. Shares of Ladish, a metal processing and fabrication company,
1 |
spiked after Allegheny Technologies agreed to acquire the company at a nearly 60% premium. MasTec, a building and construction company focusing on utilities and communications infrastructure, advanced on solid earnings and revenue growth.
Stock selection was weakest in the financial services sector, the only sector to materially detract from relative performance. Shares of NetSpend Holding Inc., a provider of pre-paid debit cards, declined due to poor business fundamentals, while investment-banking firm Greenhill tumbled on a weak fourth quarter and uneven mergers and acquisitions activity.
The largest change in sector weights during the period was a reduction in the healthcare sector. We sold specific companies within the medical device, healthcare services and pharmaceutical/biotechnology industries. We also reduced the fund’s weight in the consumer discretionary sector, albeit to a lesser extent, primarily by selling holdings in the retail industry. The biggest beneficiaries of the sales proceeds were the producer durables, technology and materials and processing sectors.
Outlook
Core inflation statistics have remained well within the Fed’s informal target range, but many commentators believe that the Fed may need to snug things up somewhat in the next few months. The Fed’s second round of large-scale Treasury purchases, which is referred to as “QE2”, is scheduled to end on June 30, 2011. At this point we do not expect an extension of asset purchases in the form of a “QE3” unless the economy takes an unexpected turn to the downside. Employment conditions have improved substantially over the past several months, and the employment reports for the months of February and March, 2011, made for some of the best reading we have seen in several years. Our working assumption is that investors and corporate executives need to plan for somewhat higher energy and other commodity input costs in the months ahead. This may be a factor in an eventual plateauing of corporate margins. However, this is built into our outlook in that we are anticipating about 15% earnings growth for the S&P 500 this year, decelerating to 10% or so next year.
What You Should Know:
Investments in the fund are subject to a number of risks. Please see the “Principal Risks” section of the fund’s prospectus. The purchase of fund shares should be seen as a long-term investment.
| 2
LOOMIS SAYLES SMALL CAP GROWTH FUND
Average Annual Returns
March 31, 2011
| | | | | | | | | | | | | | | | | | | | |
| | | | | | |
| | | | | | 6 months | | | 1 year | | | 5 years | | | 10 years | |
| | | | | | |
| Institutional Class (Inception 12/31/96) | | | | | | | 32.43 | % | | | 39.07 | % | | | 7.29 | % | | | 4.00 | % |
| Retail Class (Inception 12/31/96) | | | | | | | 32.32 | | | | 38.67 | | | | 7.04 | | | | 3.75 | |
| | | | | | |
| Comparative Performance | | | | | | | | | | | | | | | | | | | | |
| Russell 2000 Growth Index(c)(d) | | | | | | | 27.93 | | | | 31.04 | | | | 4.34 | | | | 6.44 | |
| Russell 2000 Index(c) | | | | | | | 25.48 | | | | 25.79 | | | | 3.35 | | | | 7.87 | |
| Lipper Small-Cap Growth Funds Index(c) | | | | | | | 25.75 | | | | 28.19 | | | | 3.28 | | | | 5.63 | |
| | |
| Gross expense ratio (before fee waivers and/or expense reimbursements)* | | | | | |
| Institutional: 1.09% Retail: 1.42% | | | | | | | | | | | | | | | | | | | | |
| | |
| Net expense ratio (after fee waivers and/or expense reimbursements)* | | | | | |
| Institutional: 1.03% Retail: 1.28% | | | | | | | | | | | | | | | | | | | | |
| * | | As stated in the most recent prospectus. Waivers/reimbursements are contractual and are set to expire on 1/31/12. Contracts are reevaluated on an annual basis. |
Cumulative Performance
March 31, 2001 to March 31, 2011(a)(b)
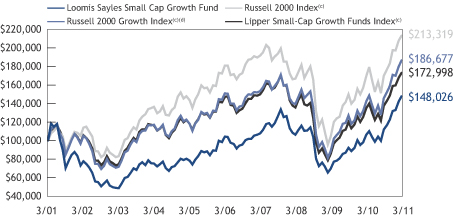
Data quoted reflects past performance and cannot guarantee future results. Average annual total returns assume reinvestment of dividends and capital gains distributions. Investment return and principal value will fluctuate so that shares, when redeemed, may be worth more or less than their original cost. For performance current to the most recent month end, please visit www.loomissayles.com. Current performance may be higher or lower than quoted.
Returns do not reflect the taxes that a shareholder would pay on fund distributions or the redemption of shares. Periods of less than one year are not annualized. Performance data reflects certain fee waivers and/or expense reimbursements, if any, without which performance would be lower.
| (a) | | Cumulative performance is shown for the Institutional Class. Performance of the Retail Class would be lower due to higher fees and expenses. |
| (b) | | The mountain chart is based on the initial investment minimum of $100,000 for the Institutional Class. |
| (c) | | See page 7 for a description of the indices. |
| (d) | | Effective August 20, 2010, the Russell 2000 Growth Index replaced the Russell 2000 Index as the fund’s primary benchmark. |
3 |
LOOMIS SAYLES SMALL CAP VALUE FUND
Fund and manager review
FUND FACTS
Managers:
Joseph Gatz, CFA
Daniel Thelen, CFA*
Symbols:
| | |
| Institutional Class | | LSSCX |
| Retail Class | | LSCRX |
| Admin Class | | LSVAX |
Objective:
Long-term capital growth from investments in common stocks or other equity securities
Strategy:
Invests at least 80% of its net assets (plus any borrowings made for investment purposes) in equity securities of companies with market capitalizations that fall within the capitalization range of the Russell 2000 Index or is $3 billion or less at the time of investment. Unlike the Index, the Fund may invest in companies of any size.
The fund may invest up to 20% of its assets in securities of foreign issuers including emerging market securities.
Fund Inception Date:
May 13, 1991
Class Inception Date:
Institutional Class: May 13, 1991
Retail Class: December 31, 1996
Admin Class: January 2, 1998
Net Assets:
$1,146.4 million
| * | | Effective June 1, 2011, Daniel Thelen will no longer serve as a portfolio manager of the fund. |
Market Conditions
Stocks rallied sharply during the six-month period, fueled by a modest improvement in U.S. business conditions and renewed investor optimism stemming from continued accommodation from the Federal Reserve Board. These factors, combined with better-than-expected corporate profits, drove share prices higher despite a host of challenges: political turmoil in North Africa and the Middle East and an earthquake, tsunami and nuclear crisis in Japan. Risk appetites stayed fairly high, and equities remained the vehicle of choice for investors. Overall, small-cap stocks led the market higher, and growth stocks outperformed value stocks.
Performance Results
For the six months ended March 31, 2011, Institutional Class shares of Loomis Sayles Small Cap Value Fund returned 26.11%. The fund outperformed its benchmark, the Russell 2000 Value Index, which returned 22.97% for the period.
Explanation of Fund Performance
All sectors of the portfolio delivered double-digit returns for the period. Stock selection, particularly in the producer durables and financial services sectors, drove the fund’s outperformance relative to the benchmark. Within producer durables, the fund’s position in Baldor Electric, a manufacturer of industrial electric motors, was its top contributor. The company agreed to be acquired by Switzerland-based power and automation engineering company ABB Ltd. for a 41% premium to prior trading levels. In the financial services sector, our stock selections in the brokerage, transaction processing and consumer lending industries contributed positively to performance. In addition, an underweight in the financial services sector helped, as the group trailed the small cap value index. Overall, the fund’s sector weights contributed positively to relative performance, with overweight positions in outperforming sectors, including producer durables and materials and processing, offsetting a slight underweight in energy stocks.
| 4
What You Should Know:
Investments in the fund are subject to a number of risks. Please see the “Principal Risks” section of the fund’s prospectus. The purchase of fund shares should be seen as a long-term investment.
On a relative basis, an underweight in the energy sector, which was the market’s top-performing sector, and weak stock selection in the real estate investment trust (REIT) segment of the financials sector detracted from results. REIT stocks lagged during the six-month period. While the fund benefited from having a relatively small weight in the sector, stock selection lagged due to weaker performance in certain data center and health-care facility REITs.
Changes to the portfolio during the six months were largely driven by company-specific factors, with the net result showing an increase in technology holdings and a reduction in consumer durables. The technology weight increased with the addition of several communications-related stocks positioned to benefit from increasing demands on enterprise and carrier-based networks.
Outlook
Core inflation statistics have remained well within the Fed’s informal target range, but many commentators believe that the Fed may need to snug things up somewhat in the next few months. The Fed’s second round of large-scale Treasury purchases, which is referred to as “QE2”, is scheduled to end on June 30, 2011. At this point we do not expect an extension of asset purchases in the form of a “QE3” unless the economy takes an unexpected turn to the downside. Employment conditions have improved substantially over the past several months, and the employment reports for the months of February and March, 2011, made for some of the best reading we have seen in several years. Our working assumption is that investors and corporate executives need to plan for somewhat higher energy and other commodity input costs in the months ahead. This may be a factor in an eventual plateauing of corporate margins. However, this is built into our outlook in that we are anticipating about 15% earnings growth for the S&P 500 this year, decelerating to 10% or so next year.
5 |
LOOMIS SAYLES SMALL CAP VALUE FUND
Average Annual Returns
March 31, 2011
| | | | | | | | | | | | | | | | | | | | |
| | | | | | |
| | | | | | 6 months | | | 1 year | | | 5 years | | | 10 years | |
| | | | | | |
| Institutional Class (Inception 5/13/91) | | | | | | | 26.11 | % | | | 28.01 | % | | | 5.18 | % | | | 9.98 | % |
| Retail Class (Inception 12/31/96) | | | | | | | 25.96 | | | | 27.76 | | | | 4.92 | | | | 9.71 | |
| Admin Class (Inception 1/2/98) | | | | | | | 25.78 | | | | 27.43 | | | | 4.65 | | | | 9.43 | |
| | | | | | |
| Comparative Performance | | | | | | | | | | | | | | | | | | | | |
| Russell 2000 Value Index(c) | | | | | | | 22.97 | | | | 20.63 | | | | 2.23 | | | | 9.01 | |
| Russell 2000 Index(c) | | | | | | | 25.48 | | | | 25.79 | | | | 3.35 | | | | 7.87 | |
| Lipper Small-Cap Core Funds Index(c) | | | | | | | 24.22 | | | | 25.72 | | | | 4.01 | | | | 8.60 | |
| |
| Gross expense ratio (before fee waivers and/or expense reimbursements)* | |
| Institutional: 1.00% Retail: 1.30% Admin: 1.62% | | | | | |
| | |
| Net expense ratio (after fee waivers and/or expense reimbursements)* | | | | | |
| Institutional: 0.96% Retail: 1.21% Admin: 1.46% | | | | | |
| * | | As stated in the most recent prospectus. Waivers/reimbursements are contractual and are set to expire on 1/31/12. Contracts are reevaluated on an annual basis. |
Cumulative Performance
March 31, 2001 to March 31, 2011(a)(b)
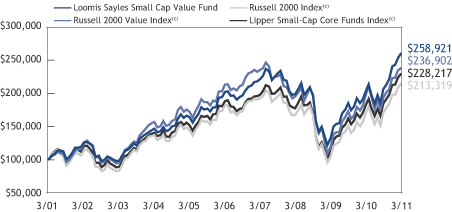
Data quoted reflects past performance and cannot guarantee future results. Average annual total returns assume reinvestment of dividends and capital gains distributions. Investment return and principal value will fluctuate so that shares, when redeemed, may be worth more or less than their original cost. For performance current to the most recent month end, please visit www.loomissayles.com. Current performance may be higher or lower than quoted.
Returns do not reflect the taxes that a shareholder would pay on fund distributions or the redemption of shares. Periods of less than one year are not annualized. Performance data reflects certain fee waivers and/or expense reimbursements, if any, without which performance would be lower.
| (a) | | Cumulative performance is shown for the Institutional Class. Performance of the Retail and Admin Classes would be lower due to higher fees and expenses. |
| (b) | | The mountain chart is based on the initial investment minimum of $100,000 for the Institutional Class. |
| (c) | | See page 7 for a description of the indices. |
| 6
ADDITIONAL INFORMATION
The views expressed in this report reflect those of the portfolio managers as of the dates indicated. The managers’ views are subject to change at any time without notice based on changes in market or other conditions. References to specific securities or industries should not be regarded as investment advice. Because the funds are actively managed, there is no assurance that they will continue to invest in the securities or industries mentioned.
Index Definitions
Indices are unmanaged and do not have expenses that affect results, unlike mutual funds. Index returns are adjusted for the reinvestment of capital gain distributions and income dividends. It is not possible to invest directly in an index.
Lipper Small-Cap Core Funds Index is an unmanaged index that tracks the average performance of the 30 largest small-cap core funds according to Lipper Inc.
Lipper Small-Cap Growth Funds Index is an unmanaged index that tracks the average performance of the 30 largest small-cap growth funds according to Lipper Inc.
Source: Lipper, Inc.
Russell 2000 Index is an unmanaged index that measures the performance of the small-cap segment of the U.S. equity universe.
Russell 2000 Growth Index is an unmanaged index that measures the performance of the small-cap growth segment of the U.S. equity universe. It includes those Russell 2000 companies with higher price-to-book ratios and higher forecasted growth values.
Russell 2000 Value Index is an unmanaged index that measures the performance of the small-cap value segment of the U.S. equity universe. It includes those Russell 2000 companies with lower price-to-book ratios and lower forecasted growth values.
Proxy Voting Information
A description of the funds’ proxy voting policies and procedures is available without charge, upon request, (i) by calling Loomis Sayles at 800-633-3330; (ii) on the funds’ website, www.loomissayles.com, and (iii) on the SEC’s website, www.sec.gov. Information about how the funds voted proxies relating to portfolio securities during the 12 months ended June 30, 2010 is available on (i) the funds’ website and (ii) the SEC’s website.
Quarterly Portfolio Schedules
The funds file a complete schedule of portfolio holdings with the SEC for the first and third quarters of each fiscal year on Form N-Q. The funds’ Forms N-Q are available on the SEC’s website at www.sec.gov and may be reviewed and copied at the SEC’s Public Reference Room in Washington, DC. Information on the operation of the Public Reference Room may be obtained by calling 800-SEC-0330.
UNDERSTANDING YOUR FUND’S EXPENSES
As a mutual fund shareholder you incur two types of costs: (1) transaction costs and (2) ongoing costs, including management fees, distribution and/or service fees (12b-1 fees), and other fund expenses. These costs are described in more detail in the funds’ prospectus. The examples below are intended to help you understand the ongoing costs of investing in the funds and help you compare these with the ongoing costs of investing in other mutual funds.
7 |
The first line in the table of each fund shows the actual amount of fund expenses you would have paid on a $1,000 investment in the fund from October 1, 2010 through March 31, 2011. It also shows how much a $1,000 investment would be worth at the close of the period, assuming actual fund returns and expenses. To estimate the expenses you paid over the period, simply divide your account value by $1,000 (for example $8,600 account value divided by $1,000 = 8.6) and multiply the result by the number in the Expenses Paid During the Period column as shown below for your class.
The second line in the table of each fund provides information about hypothetical account values and hypothetical expenses based on the fund’s actual expense ratios and an assumed rate of return of 5% per year before expenses, which is not the fund’s actual return. The hypothetical account values and expenses may not be used to estimate the actual ending account balance or expenses you paid on your investment for the period. You may use this information to compare the ongoing costs of investing in the funds and other funds. To do so, compare this 5% hypothetical example with the 5% hypothetical examples that appear in the shareholder reports of other funds.
Please note that the expenses shown reflect ongoing costs only, and do not include any transaction costs. Therefore, the second line in the table is useful in comparing ongoing costs only, and will not help you determine the relative costs of owning different funds. If transaction costs were included, total costs would be higher.
Loomis Sayles Small Cap Growth Fund
| | | | | | | | | | | | |
Institutional Class | | Beginning
Account Value
10/1/2010 | | | Ending
Account Value
3/31/2011 | | | Expenses Paid
During Period*
10/1/2010 – 3/31/2011 | |
Actual | | | $1,000.00 | | | | $1,324.30 | | | | $5.79 | |
Hypothetical
(5% return before expenses) | | | $1,000.00 | | | | $1,019.95 | | | | $5.04 | |
| | | |
Retail Class | | | | | | | | | |
Actual | | | $1,000.00 | | | | $1,323.20 | | | | $7.24 | |
Hypothetical
(5% return before expenses) | | | $1,000.00 | | | | $1,018.70 | | | | $6.29 | |
|
* Expenses are equal to the Fund’s annualized expense ratio (after waiver/reimbursement): 1.00% and 1.25% for Institutional and Retail Class, respectively, multiplied by the average account value over the period multiplied by the number of days in the most recent fiscal half-year, divided by 365 (to reflect the half-year period). | |
| 8
Loomis Sayles Small Cap Value Fund
| | | | | | | | | | | | |
Institutional Class | | Beginning
Account Value
10/1/2010 | | | Ending
Account Value
3/31/2011 | | | Expenses Paid
During Period*
10/1/2010 – 3/31/2011 | |
Actual | | | $1,000.00 | | | | $1,261.10 | | | | $5.07 | |
Hypothetical
(5% return before expenses) | | | $1,000.00 | | | | $1,020.44 | | | | $4.53 | |
| | | |
Retail Class | | | | | | | | | |
Actual | | | $1,000.00 | | | | $1,259.60 | | | | $6.48 | |
Hypothetical
(5% return before expenses) | | | $1,000.00 | | | | $1,019.20 | | | | $5.79 | |
| | | |
Admin Class | | | | | | | | | |
Actual | | | $1,000.00 | | | | $1,257.80 | | | | $7.88 | |
Hypothetical
(5% return before expenses) | | | $1,000.00 | | | | $1,017.95 | | | | $7.04 | |
|
* Expenses are equal to the Fund’s annualized expense ratio (after waiver/reimbursement): 0.90%, 1.15% and 1.40% for Institutional, Retail and Admin Class, respectively, multiplied by the average account value over the period, multiplied by the number of days in the most recent fiscal half-year, divided by 365 (to reflect the half-year period). | |
9 |
Portfolio of Investments – as of March 31, 2011 (Unaudited)
Loomis Sayles Small Cap Growth Fund
| | | | | | | | |
| Shares | | | Description | | Value (†) | |
| | | | | | | | |
| |
| | Common Stocks – 95.5% of Net Assets | | | | |
| | |
| | | | Aerospace & Defense – 2.1% | | | | |
| | 39,011 | | | HEICO Corp. | | $ | 2,438,968 | |
| | 142,718 | | | Hexcel Corp.(b) | | | 2,810,117 | |
| | | | | | | | |
| | | | | | | 5,249,085 | |
| | | | | | | | |
| | | | Air Freight & Logistics – 2.3% | | | | |
| | 43,812 | | | Atlas Air Worldwide Holdings, Inc.(b) | | | 3,054,573 | |
| | 71,258 | | | HUB Group, Inc., Class A(b) | | | 2,578,827 | |
| | | | | | | | |
| | | | | | | 5,633,400 | |
| | | | | | | | |
| | | | Auto Components – 2.1% | | | | |
| | 197,069 | | | Amerigon, Inc.(b) | | | 3,009,244 | |
| | 55,214 | | | Tenneco, Inc.(b) | | | 2,343,834 | |
| | | | | | | | |
| | | | | | | 5,353,078 | |
| | | | | | | | |
| | | | Biotechnology – 3.3% | | | | |
| | 103,488 | | | Cepheid, Inc.(b) | | | 2,899,734 | |
| | 65,349 | | | Genomic Health, Inc.(b) | | | 1,607,585 | |
| | 89,404 | | | Incyte Corp. Ltd.(b) | | | 1,417,053 | |
| | 28,201 | | | Pharmasset, Inc.(b) | | | 2,219,701 | |
| | | | | | | | |
| | | | | | | 8,144,073 | |
| | | | | | | | |
| | | | Building Products – 1.7% | | | | |
| | 122,454 | | | NCI Building Systems, Inc.(b) | | | 1,551,492 | |
| | 83,370 | | | Trex Company, Inc.(b) | | | 2,719,530 | |
| | | | | | | | |
| | | | | | | 4,271,022 | |
| | | | | | | | |
| | | | Capital Markets – 2.7% | | | | |
| | 70,922 | | | Evercore Partners, Inc., Class A | | | 2,431,915 | |
| | 24,794 | | | Greenhill & Co., Inc. | | | 1,631,197 | |
| | 37,402 | | | Stifel Financial Corp.(b) | | | 2,685,090 | |
| | | | | | | | |
| | | | | | | 6,748,202 | |
| | | | | | | | |
| | | | Commercial Banks – 2.1% | | | | |
| | 45,759 | | | Signature Bank(b) | | | 2,580,807 | |
| | 45,105 | | | SVB Financial Group(b) | | | 2,567,828 | |
| | | | | | | | |
| | | | | | | 5,148,635 | |
| | | | | | | | |
| | | | Commercial Services & Supplies – 1.1% | | | | |
| | 93,651 | | | Waste Connections, Inc. | | | 2,696,212 | |
| | | | | | | | |
| | | | Communications Equipment – 1.8% | | | | |
| | 66,552 | | | Aruba Networks, Inc.(b) | | | 2,252,119 | |
| | 89,655 | | | Ciena Corp.(b) | | | 2,327,444 | |
| | | | | | | | |
| | | | | | | 4,579,563 | |
| | | | | | | | |
| | | | Construction & Engineering – 0.9% | | | | |
| | 101,658 | | | MasTec, Inc.(b) | | | 2,114,486 | |
| | | | | | | | |
See accompanying notes to financial statements.
| 10
Portfolio of Investments – as of March 31, 2011 (Unaudited)
Loomis Sayles Small Cap Growth Fund – continued
| | | | | | | | |
| Shares | | | Description | | Value (†) | |
| | | | | | | | |
| |
| | Common Stocks – continued | | | | |
| | |
| | | | Diversified Consumer Services – 1.1% | | | | |
| | 77,636 | | | K12, Inc.(b) | | $ | 2,616,333 | |
| | | | | | | | |
| | | | Diversified Financial Services – 0.9% | | | | |
| | 64,040 | | | MSCI, Inc., Class A(b) | | | 2,357,953 | |
| | | | | | | | |
| | | | Electrical Equipment – 1.7% | | | | |
| | 115,709 | | | GrafTech International Ltd.(b) | | | 2,387,077 | |
| | 32,649 | | | Polypore International, Inc.(b) | | | 1,879,929 | |
| | | | | | | | |
| | | | | | | 4,267,006 | |
| | | | | | | | |
| | | | Electronic Equipment, Instruments & Components – 1.8% | | | | |
| | 44,820 | | | IPG Photonics Corp.(b) | | | 2,585,218 | |
| | 113,207 | | | Maxwell Technologies, Inc.(b) | | | 1,955,085 | |
| | | | | | | | |
| | | | | | | 4,540,303 | |
| | | | | | | | |
| | | | Energy Equipment & Services – 1.9% | | | | |
| | 23,120 | | | Lufkin Industries, Inc. | | | 2,161,026 | |
| | 29,528 | | | Oceaneering International, Inc.(b) | | | 2,641,280 | |
| | | | | | | | |
| | | | | | | 4,802,306 | |
| | | | | | | | |
| | | | Food & Staples Retailing – 0.6% | | | | |
| | 38,072 | | | Fresh Market, Inc. (The)(b) | | | 1,436,837 | |
| | | | | | | | |
| | | | Food Products – 1.1% | | | | |
| | 50,006 | | | Diamond Foods, Inc. | | | 2,790,335 | |
| | | | | | | | |
| | | | Health Care Equipment & Supplies – 5.8% | | | | |
| | 173,477 | | | Accuray, Inc.(b) | | | 1,566,497 | |
| | 13,022 | | | HeartWare International, Inc.(b) | | | 1,113,772 | |
| | 144,144 | | | Insulet Corp.(b) | | | 2,972,249 | |
| | 139,502 | | | Natus Medical, Inc.(b) | | | 2,343,633 | |
| | 77,016 | | | NxStage Medical, Inc.(b) | | | 1,692,812 | |
| | 85,725 | | | Volcano Corp.(b) | | | 2,194,560 | |
| | 57,023 | | | Zoll Medical Corp.(b) | | | 2,555,201 | |
| | | | | | | | |
| | | | | | | 14,438,724 | |
| | | | | | | | |
| | | | Health Care Providers & Services – 5.6% | | | | |
| | 103,354 | | | ExamWorks Group, Inc.(b) | | | 2,297,559 | |
| | 85,609 | | | Hanger Orthopedic Group, Inc.(b) | | | 2,228,402 | |
| | 29,949 | | | HMS Holdings Corp.(b) | | | 2,451,326 | |
| | 29,175 | | | MWI Veterinary Supply, Inc.(b) | | | 2,353,839 | |
| | 96,724 | | | PSS World Medical, Inc.(b) | | | 2,626,057 | |
| | 118,477 | | | Team Health Holdings, Inc.(b) | | | 2,070,978 | |
| | | | | | | | |
| | | | | | | 14,028,161 | |
| | | | | | | | |
| | | | Health Care Technology – 1.3% | | | | |
| | 56,972 | | | SXC Health Solutions Corp.(b) | | | 3,122,066 | |
| | | | | | | | |
See accompanying notes to financial statements.
11 |
Portfolio of Investments – as of March 31, 2011 (Unaudited)
Loomis Sayles Small Cap Growth Fund – continued
| | | | | | | | |
| Shares | | | Description | | Value (†) | |
| | | | | | | | |
| |
| | Common Stocks – continued | | | | |
| | |
| | | | Hotels, Restaurants & Leisure – 3.6% | | | | |
| | 60,195 | | | Life Time Fitness, Inc.(b) | | $ | 2,245,875 | |
| | 18,969 | | | Panera Bread Co., Class A(b) | | | 2,409,063 | |
| | 169,970 | | | Shuffle Master, Inc.(b) | | | 1,815,280 | |
| | 141,553 | | | Texas Roadhouse, Inc. | | | 2,404,986 | |
| | | | | | | | |
| | | | | | | 8,875,204 | |
| | | | | | | | |
| | | | Household Durables – 1.4% | | | | |
| | 67,666 | | | Tempur-Pedic International, Inc.(b) | | | 3,427,960 | |
| | | | | | | | |
| | | | Internet Software & Services – 7.2% | | | | |
| | 49,906 | | | Ancestry.com, Inc.(b) | | | 1,769,168 | |
| | 53,580 | | | comScore, Inc.(b) | | | 1,581,146 | |
| | 69,646 | | | Constant Contact, Inc.(b) | | | 2,430,645 | |
| | 84,430 | | | DealerTrack Holdings, Inc.(b) | | | 1,938,513 | |
| | 126,118 | | | Dice Holdings, Inc.(b) | | | 1,905,643 | |
| | 55,307 | | | IntraLinks Holdings, Inc.(b) | | | 1,478,909 | |
| | 47,605 | | | SAVVIS, Inc.(b) | | | 1,765,670 | |
| | 91,654 | | | Vocus, Inc.(b) | | | 2,370,172 | |
| | 52,508 | | | WebMD Health Corp.(b) | | | 2,804,977 | |
| | | | | | | | |
| | | | | | | 18,044,843 | |
| | | | | | | | |
| | | | IT Services – 0.7% | | | | |
| | 125,241 | | | InterXion Holding NV(b) | | | 1,628,133 | |
| | | | | | | | |
| | | | Machinery – 2.5% | | | | |
| | 33,338 | | | Chart Industries, Inc.(b) | | | 1,834,923 | |
| | 45,306 | | | Robbins & Myers, Inc. | | | 2,083,623 | |
| | 108,171 | | | Westport Innovations, Inc.(b) | | | 2,377,599 | |
| | | | | | | | |
| | | | | | | 6,296,145 | |
| | | | | | | | |
| | | | Media – 1.1% | | | | |
| | 84,301 | | | Imax Corp.(b) | | | 2,695,946 | |
| | | | | | | | |
| | | | Metals & Mining – 0.7% | | | | |
| | 28,436 | | | Schnitzer Steel Industries, Inc., Class A | | | 1,848,624 | |
| | | | | | | | |
| | | | Oil, Gas & Consumable Fuels – 5.6% | | | | |
| | 50,695 | | | Approach Resources, Inc.(b) | | | 1,703,352 | |
| | 63,418 | | | Brigham Exploration Co.(b) | | | 2,357,881 | |
| | 83,134 | | | Comstock Resources, Inc.(b) | | | 2,572,166 | |
| | 56,990 | | | Oasis Petroleum, Inc.(b) | | | 1,802,024 | |
| | 56,520 | | | Rosetta Resources, Inc.(b) | | | 2,686,961 | |
| | 67,313 | | | World Fuel Services Corp. | | | 2,733,581 | |
| | | | | | | | |
| | | | | | | 13,855,965 | |
| | | | | | | | |
| | | | Pharmaceuticals – 2.0% | | | | |
| | 70,821 | | | Auxilium Pharmaceuticals, Inc.(b) | | | 1,520,527 | |
| | 160,727 | | | Nektar Therapeutics(b) | | | 1,522,084 | |
See accompanying notes to financial statements.
| 12
Portfolio of Investments – as of March 31, 2011 (Unaudited)
Loomis Sayles Small Cap Growth Fund – continued
| | | | | | | | |
| Shares | | | Description | | Value (†) | |
| | | | | | | | |
| |
| | Common Stocks – continued | | | | |
| | |
| | | | Pharmaceuticals – continued | | | | |
| | 137,624 | | | Questcor Pharmaceuticals, Inc.(b) | | $ | 1,983,162 | |
| | | | | | | | |
| | | | | | | 5,025,773 | |
| | | | | | | | |
| | |
| | | | Professional Services – 3.2% | | | | |
| | 59,612 | | | Advisory Board Co. (The)(b) | | | 3,070,018 | |
| | 55,070 | | | Corporate Executive Board Co. (The) | | | 2,223,176 | |
| | 31,661 | | | IHS, Inc., Class A(b) | | | 2,809,914 | |
| | | | | | | | |
| | | | | | | 8,103,108 | |
| | | | | | | | |
| | | | Road & Rail – 1.0% | | | | |
| | 43,493 | | | Genesee & Wyoming, Inc., Class A(b) | | | 2,531,293 | |
| | | | | | | | |
| | | | Semiconductors & Semiconductor Equipment – 8.9% | | | | |
| | 130,665 | | | Advanced Energy Industries, Inc.(b) | | | 2,136,373 | |
| | 53,632 | | | Cavium Network, Inc.(b) | | | 2,409,686 | |
| | 52,742 | | | Cymer, Inc.(b) | | | 2,984,142 | |
| | 171,155 | | | GT Solar International, Inc.(b) | | | 1,824,512 | |
| | 37,467 | | | Hittite Microwave Corp.(b) | | | 2,389,271 | |
| | 97,199 | | | Inphi Corp.(b) | | | 2,042,151 | |
| | 57,929 | | | Netlogic Microsystems, Inc.(b) | | | 2,434,176 | |
| | 41,378 | | | Power Integrations, Inc. | | | 1,586,019 | |
| | 36,880 | | | Silicon Laboratories, Inc.(b) | | | 1,593,585 | |
| | 57,627 | | | Varian Semiconductor Equipment Associates, Inc.(b) | | | 2,804,706 | |
| | | | | | | | |
| | | | | | | 22,204,621 | |
| | | | | | | | |
| | | | Software – 7.9% | | | | |
| | 112,619 | | | Ariba, Inc.(b) | | | 3,844,813 | |
| | 45,021 | | | Concur Technologies, Inc.(b) | | | 2,496,414 | |
| | 76,024 | | | Informatica Corp.(b) | | | 3,970,734 | |
| | 70,201 | | | QLIK Technologies, Inc.(b) | | | 1,825,226 | |
| | 72,365 | | | SuccessFactors, Inc.(b) | | | 2,828,748 | |
| | 48,462 | | | Ultimate Software Group, Inc.(The)(b) | | | 2,847,142 | |
| | 62,864 | | | VanceInfo Technologies, Inc., ADR(b) | | | 1,974,558 | |
| | | | | | | | |
| | | | | | | 19,787,635 | |
| | | | | | | | |
| | | | Specialty Retail – 4.6% | | | | |
| | 93,711 | | | Asbury Automotive Group, Inc.(b) | | | 1,732,716 | |
| | 62,075 | | | DSW, Inc., Class A(b) | | | 2,480,517 | |
| | 68,824 | | | Hibbett Sports, Inc.(b) | | | 2,464,587 | |
| | 49,959 | | | Ulta Salon, Cosmetics & Fragrance, Inc.(b) | | | 2,404,527 | |
| | 72,365 | | | Vitamin Shoppe, Inc.(b) | | | 2,448,108 | |
| | | | | | | | |
| | | | | | | 11,530,455 | |
| | | | | | | | |
| | | | Textiles, Apparel & Luxury Goods – 2.7% | | | | |
| | 24,343 | | | Deckers Outdoor Corp.(b) | | | 2,097,149 | |
| | 62,241 | | | G-III Apparel Group Ltd.(b) | | | 2,339,017 | |
See accompanying notes to financial statements.
13 |
Portfolio of Investments – as of March 31, 2011 (Unaudited)
Loomis Sayles Small Cap Growth Fund – continued
| | | | | | | | |
| Shares | | | Description | | Value (†) | |
| | | | | | | | |
| |
| | Common Stocks – continued | | | | |
| | |
| | | | Textiles, Apparel & Luxury Goods – continued | | | | |
| | 35,520 | | | Phillips-Van Heusen Corp. | | $ | 2,309,866 | |
| | | | | | | | |
| | | | | | | 6,746,032 | |
| | | | | | | | |
| | | | Trading Companies & Distributors – 0.5% | | | | |
| | 53,717 | | | Titan Machinery, Inc.(b) | | | 1,356,354 | |
| | | | | | | | |
| | |
| | | | Total Common Stocks (Identified Cost $174,761,736) | | | 238,295,871 | |
| | | | | | | | |
| | |
| Principal
Amount |
| | | | | | |
| |
| | Short-Term Investments – 6.4% | | | | |
| $ | 16,104,356 | | | Tri-Party Repurchase Agreement with Fixed Income Clearing Corporation, dated 3/31/2011 at 0.000% to be repurchased at $16,104,356 on 4/01/2011 collateralized by $17,270,000 Federal Home Loan Mortgage Corp., 3.310% due 11/10/2020 valued at $16,428,088 including accrued interest (Note 2 of Notes to Financial Statements) (Identified Cost $16,104,356) | | | 16,104,356 | |
| | | | | | | | |
| | |
| | | | Total Investments – 101.9% (Identified Cost $190,866,092)(a) | | | 254,400,227 | |
| | | | Other assets less liabilities—(1.9)% | | | (4,863,744 | ) |
| | | | | | | | |
| | | | Net Assets – 100.0% | | $ | 249,536,483 | |
| | | | | | | | |
| | |
| | (†) | | | See Note 2 of Notes to Financial Statements. | | | | |
| | (a) | | | Federal Tax Information (Amounts exclude certain adjustments made at the end of the Fund’s fiscal year for tax purposes. Such adjustments are primarily due to wash sales.): | | | | |
| | | | At March 31, 2011, the net unrealized appreciation on investments based on a cost of $190,865,183 for federal income tax purposes was as follows: | | | | |
| | | | Aggregate gross unrealized appreciation for all investments in which there is an excess of value over tax cost | | $ | 64,102,669 | |
| | | | Aggregate gross unrealized depreciation for all investments in which there is an excess of tax cost over value | | | (567,625 | ) |
| | | | | | | | |
| | | | Net unrealized appreciation | | $ | 63,535,044 | |
| | | | | | | | |
| | (b) | | | Non-income producing security. | | | | |
| | |
| | ADR | | | An American Depositary Receipt is a certificate issued by a custodian bank representing the right to receive securities of the foreign issuer described. The values of ADRs may be significantly influenced by trading on exchanges not located in the United States. | | | | |
See accompanying notes to financial statements.
| 14
Portfolio of Investments – as of March 31, 2011 (Unaudited)
Loomis Sayles Small Cap Growth Fund – continued
Industry Summary at March 31, 2011 (Unaudited)
| | | | |
Semiconductors & Semiconductor Equipment | | | 8.9 | % |
Software | | | 7.9 | |
Internet Software & Services | | | 7.2 | |
Health Care Equipment & Supplies | | | 5.8 | |
Health Care Providers & Services | | | 5.6 | |
Oil, Gas & Consumable Fuels | | | 5.6 | |
Specialty Retail | | | 4.6 | |
Hotels, Restaurants & Leisure | | | 3.6 | |
Biotechnology | | | 3.3 | |
Professional Services | | | 3.2 | |
Capital Markets | | | 2.7 | |
Textiles, Apparel & Luxury Goods | | | 2.7 | |
Machinery | | | 2.5 | |
Air Freight & Logistics | | | 2.3 | |
Auto Components | | | 2.1 | |
Aerospace & Defense | | | 2.1 | |
Commercial Banks | | | 2.1 | |
Pharmaceuticals | | | 2.0 | |
Other Investments, less than 2% each | | | 21.3 | |
Short-Term Investments | | | 6.4 | |
| | | | |
Total Investments | | | 101.9 | |
Other assets less liabilities | | | (1.9 | ) |
| | | | |
Net Assets | | | 100.0 | % |
| | | | |
See accompanying notes to financial statements.
15 |
Portfolio of Investments – as of March 31, 2011 (Unaudited)
Loomis Sayles Small Cap Value Fund
| | | | | | | | |
| Shares | | | Description | | Value (†) | |
| | | | | | | | |
| |
| | Common Stocks – 96.8% of Net Assets | | | | |
| | |
| | | | Air Freight & Logistics – 1.1% | | | | |
| | 187,245 | | | Atlas Air Worldwide Holdings, Inc.(b) | | $ | 13,054,721 | |
| | | | | | | | |
| | | | Auto Components – 1.4% | | | | |
| | 483,703 | | | Dana Holding Corp.(b) | | | 8,411,595 | |
| | 172,744 | | | Tenneco, Inc.(b) | | | 7,332,983 | |
| | | | | | | | |
| | | | | | | 15,744,578 | |
| | | | | | | | |
| | | | Building Products – 0.8% | | | | |
| | 102,030 | | | Armstrong World Industries, Inc. | | | 4,720,928 | |
| | 376,559 | | | Griffon Corp.(b) | | | 4,944,220 | |
| | | | | | | | |
| | | | | | | 9,665,148 | |
| | | | | | | | |
| | | | Capital Markets – 2.6% | | | | |
| | 555,653 | | | Ares Capital Corp. | | | 9,390,536 | |
| | 698,225 | | | Fifth Street Finance Corp. | | | 9,321,304 | |
| | 162,890 | | | Stifel Financial Corp.(b) | | | 11,693,873 | |
| | | | | | | | |
| | | | | | | 30,405,713 | |
| | | | | | | | |
| | | | Chemicals – 4.9% | | | | |
| | 473,609 | | | Chemtura Corp.(b) | | | 8,146,075 | |
| | 541,390 | | | Ferro Corp.(b) | | | 8,981,660 | |
| | 230,016 | | | Koppers Holdings, Inc. | | | 9,821,683 | |
| | 80,553 | | | Minerals Technologies, Inc. | | | 5,519,492 | |
| | 244,931 | | | Olin Corp. | | | 5,613,818 | |
| | 421,127 | | | Omnova Solutions, Inc.(b) | | | 3,314,269 | |
| | 263,186 | | | WR Grace & Co.(b) | | | 10,077,392 | |
| | 285,865 | | | Zep, Inc. | | | 4,976,910 | |
| | | | | | | | |
| | | | | | | 56,451,299 | |
| | | | | | | | |
| | | | Commercial Banks – 7.3% | | | | |
| | 618,248 | | | Cathay General Bancorp | | | 10,541,128 | |
| | 158,997 | | | City National Corp. | | | 9,070,779 | |
| | 495,700 | | | CVB Financial Corp. | | | 4,614,967 | |
| | 424,006 | | | First Financial Bancorp | | | 7,076,660 | |
| | 500,904 | | | First Horizon National Corp. | | | 5,615,134 | |
| | 147,328 | | | IBERIABANK Corp. | | | 8,858,833 | |
| | 266,529 | | | Pinnacle Financial Partners, Inc.(b) | | | 4,408,390 | |
| | 2,273,275 | | | Popular, Inc.(b) | | | 6,615,230 | |
| | 183,036 | | | Prosperity Bancshares, Inc. | | | 7,828,450 | |
| | 180,927 | | | Signature Bank(b) | | | 10,204,283 | |
| | 244,462 | | | Wintrust Financial Corp. | | | 8,983,978 | |
| | | | | | | | |
| | | | | | | 83,817,832 | |
| | | | | | | | |
| | | | Commercial Services & Supplies – 3.2% | | | | |
| | 195,496 | | | KAR Auction Services, Inc.(b) | | | 2,998,909 | |
| | 221,440 | | | McGrath Rentcorp | | | 6,038,669 | |
See accompanying notes to financial statements.
| 16
Portfolio of Investments – as of March 31, 2011 (Unaudited)
Loomis Sayles Small Cap Value Fund – continued
| | | | | | | | |
| Shares | | | Description | | Value (†) | |
| | | | | | | | |
| |
| | Common Stocks – continued | | | | |
| | |
| | | | Commercial Services & Supplies – continued | | | | |
| | 567,866 | | | Rollins, Inc. | | $ | 11,527,680 | |
| | 444,373 | | | Standard Parking Corp.(b) | | | 7,892,064 | |
| | 113,083 | | | Team, Inc.(b) | | | 2,969,560 | |
| | 187,550 | | | Waste Connections, Inc. | | | 5,399,564 | |
| | | | | | | | |
| | | | | | | 36,826,446 | |
| | | | | | | | |
| | | | Communications Equipment – 2.2% | | | | |
| | 135,839 | | | ADTRAN, Inc. | | | 5,767,724 | |
| | 1,387,561 | | | Brocade Communications Systems, Inc.(b) | | | 8,533,500 | |
| | 395,609 | | | Harmonic, Inc.(b) | | | 3,710,812 | |
| | 227,170 | | | NETGEAR, Inc.(b) | | | 7,369,395 | |
| | | | | | | | |
| | | | | | | 25,381,431 | |
| | | | | | | | |
| | | | Construction & Engineering – 0.7% | | | | |
| | 223,305 | | | MYR Group, Inc.(b) | | | 5,341,455 | |
| | 60,077 | | | URS Corp.(b) | | | 2,766,546 | |
| | | | | | | | |
| | | | | | | 8,108,001 | |
| | | | | | | | |
| | | | Consumer Finance – 1.8% | | | | |
| | 200,778 | | | Cash America International, Inc. | | | 9,245,827 | |
| | 545,544 | | | Dollar Financial Corp.(b) | | | 11,320,038 | |
| | | | | | | | |
| | | | | | | 20,565,865 | |
| | | | | | | | |
| | | | Containers & Packaging – 0.8% | | | | |
| | 400,477 | | | Temple-Inland, Inc. | | | 9,371,162 | |
| | | | | | | | |
| | | | Distributors – 0.3% | | | | |
| | 109,064 | | | Core-Mark Holding Co., Inc.(b) | | | 3,604,565 | |
| | | | | | | | |
| | | | Diversified Financial Services – 1.3% | | | | |
| | 322,962 | | | MarketAxess Holdings, Inc. | | | 7,815,680 | |
| | 311,941 | | | PHH Corp.(b) | | | 6,790,956 | |
| | | | | | | | |
| | | | | | | 14,606,636 | |
| | | | | | | | |
| | | | Diversified Telecommunication Services – 0.1% | | | | |
| | 55,583 | | | Neutral Tandem, Inc.(b) | | | 819,849 | |
| | | | | | | | |
| | | | Electric Utilities – 2.0% | | | | |
| | 178,898 | | | ALLETE, Inc. | | | 6,971,655 | |
| | 131,699 | | | ITC Holdings Corp. | | | 9,205,760 | |
| | 224,693 | | | UIL Holdings Corp. | | | 6,857,631 | |
| | | | | | | | |
| | | | | | | 23,035,046 | |
| | | | | | | | |
| | | | Electrical Equipment – 2.5% | | | | |
| | 189,632 | | | AZZ, Inc. | | | 8,647,219 | |
| | 178,305 | | | II-VI, Inc.(b) | | | 8,870,674 | |
| | 92,247 | | | LaBarge, Inc.(b) | | | 1,632,772 | |
See accompanying notes to financial statements.
17 |
Portfolio of Investments – as of March 31, 2011 (Unaudited)
Loomis Sayles Small Cap Value Fund – continued
| | | | | | | | |
| Shares | | | Description | | Value (†) | |
| | | | | | | | |
| |
| | Common Stocks – continued | | | | |
| | |
| | | | Electrical Equipment – continued | | | | |
| | 152,523 | | | Thomas & Betts Corp.(b) | | $ | 9,070,543 | |
| | | | | | | | |
| | | | | | | 28,221,208 | |
| | | | | | | | |
| | | | Electronic Equipment, Instruments & Components – 5.1% | | | | |
| | 440,208 | | | Brightpoint, Inc.(b) | | | 4,771,855 | |
| | 231,931 | | | Cognex Corp. | | | 6,552,051 | |
| | 359,931 | | | GSI Group, Inc.(b) | | | 3,707,289 | |
| | 131,288 | | | Littelfuse, Inc. | | | 7,496,545 | |
| | 537,821 | | | Methode Electronics, Inc. | | | 6,496,877 | |
| | 152,792 | | | Rofin-Sinar Technologies, Inc.(b) | | | 6,035,284 | |
| | 122,746 | | | Rogers Corp.(b) | | | 5,530,935 | |
| | 278,194 | | | ScanSource, Inc.(b) | | | 10,568,590 | |
| | 407,515 | | | TTM Technologies, Inc.(b) | | | 7,400,472 | |
| | | | | | | | |
| | | | | | | 58,559,898 | |
| | | | | | | | |
| | | | Energy Equipment & Services – 3.0% | | | | |
| | 191,015 | | | Dresser-Rand Group, Inc.(b) | | | 10,242,224 | |
| | 289,873 | | | Helix Energy Solutions Group, Inc.(b) | | | 4,985,816 | |
| | 78,328 | | | Lufkin Industries, Inc. | | | 7,321,318 | |
| | 133,752 | | | Oceaneering International, Inc.(b) | | | 11,964,116 | |
| | | | | | | | |
| | | | | | | 34,513,474 | |
| | | | | | | | |
| | | | Food & Staples Retailing – 0.5% | | | | |
| | 410,633 | | | Spartan Stores, Inc. | | | 6,073,262 | |
| | | | | | | | |
| | | | Food Products – 3.5% | | | | |
| | 167,748 | | | Corn Products International, Inc. | | | 8,692,701 | |
| | 634,943 | | | Darling International, Inc.(b) | | | 9,759,074 | |
| | 186,239 | | | Fresh Del Monte Produce, Inc. | | | 4,862,700 | |
| | 168,066 | | | J & J Snack Foods Corp. | | | 7,910,867 | |
| | 1,098,796 | | | Pilgrim’s Pride Corp.(b) | | | 8,471,717 | |
| | | | | | | | |
| | | | | | | 39,697,059 | |
| | | | | | | | |
| | | | Gas Utilities – 1.1% | | | | |
| | 401,155 | | | UGI Corp. | | | 13,198,000 | |
| | | | | | | | |
| | | | Health Care Equipment & Supplies – 1.6% | | | | |
| | 150,493 | | | Alere, Inc.(b) | | | 5,890,296 | |
| | 112,062 | | | Teleflex, Inc. | | | 6,497,355 | |
| | 124,562 | | | West Pharmaceutical Services, Inc. | | | 5,576,641 | |
| | | | | | | | |
| | | | | | | 17,964,292 | |
| | | | | | | | |
| | | | Health Care Providers & Services – 1.6% | | | | |
| | 103,792 | | | MEDNAX, Inc.(b) | | | 6,913,585 | |
| | 274,348 | | | WellCare Health Plans, Inc.(b) | | | 11,508,899 | |
| | | | | | | | |
| | | | | | | 18,422,484 | |
| | | | | | | | |
See accompanying notes to financial statements.
| 18
Portfolio of Investments – as of March 31, 2011 (Unaudited)
Loomis Sayles Small Cap Value Fund – continued
| | | | | | | | |
| Shares | | | Description | | Value (†) | |
| | | | | | | | |
| |
| | Common Stocks – continued | | | | |
| | |
| | | | Hotels, Restaurants & Leisure – 2.0% | | | | |
| | 149,999 | | | Bob Evans Farms, Inc. | | $ | 4,889,968 | |
| | 205,689 | | | California Pizza Kitchen, Inc.(b) | | | 3,472,030 | |
| | 473,802 | | | Isle of Capri Casinos, Inc.(b) | | | 4,501,119 | |
| | 47,861 | | | Six Flags Entertainment Corp. | | | 3,445,992 | |
| | 222,622 | | | Wyndham Worldwide Corp. | | | 7,081,606 | |
| | | | | | | | |
| | | | | | | 23,390,715 | |
| | | | | | | | |
| | | | Household Durables – 0.9% | | | | |
| | 197,326 | | | Jarden Corp. | | | 7,018,886 | |
| | 117,495 | | | Leggett & Platt, Inc. | | | 2,878,627 | |
| | | | | | | | |
| | | | | | | 9,897,513 | |
| | | | | | | | |
| | | | Industrial Conglomerates – 0.9% | | | | |
| | 162,146 | | | Raven Industries, Inc. | | | 9,959,007 | |
| | | | | | | | |
| | | | Insurance – 3.9% | | | | |
| | 446,540 | | | Employers Holdings, Inc. | | | 9,225,516 | |
| | 58,490 | | | Hanover Insurance Group, Inc. (The) | | | 2,646,673 | |
| | 299,373 | | | HCC Insurance Holdings, Inc. | | | 9,373,369 | |
| | 496,165 | | | Old Republic International Corp. | | | 6,296,334 | |
| | 123,616 | | | ProAssurance Corp.(b) | | | 7,833,546 | |
| | 156,558 | | | Reinsurance Group of America, Inc., Class A | | | 9,828,711 | |
| | | | | | | | |
| | | | | | | 45,204,149 | |
| | | | | | | | |
| | | | Internet & Catalog Retail – 0.4% | | | | |
| | 127,655 | | | HSN, Inc.(b) | | | 4,088,790 | |
| | | | | | | | |
| | | | Internet Software & Services – 0.6% | | | | |
| | 193,225 | | | IAC/InterActiveCorp(b) | | | 5,968,720 | |
| | 124,392 | | | Perficient, Inc.(b) | | | 1,493,948 | |
| | | | | | | | |
| | | | | | | 7,462,668 | |
| | | | | | | | |
| | | | IT Services – 1.3% | | | | |
| | 39,664 | | | Alliance Data Systems Corp.(b) | | | 3,406,741 | |
| | 234,247 | | | Wright Express Corp.(b) | | | 12,143,364 | |
| | | | | | | | |
| | | | | | | 15,550,105 | |
| | | | | | | | |
| | | | Life Sciences Tools & Services – 0.4% | | | | |
| | 155,622 | | | Pharmaceutical Product Development, Inc. | | | 4,312,286 | |
| | | | | | | | |
| | | | Machinery – 5.5% | | | | |
| | 334,348 | | | Actuant Corp., Class A | | | 9,696,092 | |
| | 439,916 | | | Albany International Corp., Class A | | | 10,953,908 | |
| | 402,453 | | | Altra Holdings, Inc.(b) | | | 9,505,940 | |
| | 308,158 | | | Commercial Vehicle Group, Inc.(b) | | | 5,497,539 | |
| | 283,740 | | | John Bean Technologies Corp. | | | 5,456,320 | |
| | 200,062 | | | Meritor, Inc.(b) | | | 3,395,052 | |
| | 42,038 | | | Middleby Corp. (The)(b) | | | 3,918,782 | |
See accompanying notes to financial statements.
19 |
Portfolio of Investments – as of March 31, 2011 (Unaudited)
Loomis Sayles Small Cap Value Fund – continued
| | | | | | | | |
| Shares | | | Description | | Value (†) | |
| | | | | | | | |
| |
| | Common Stocks – continued | | | | |
| | |
| | | | Machinery – continued | | | | |
| | 114,839 | | | RBC Bearings, Inc.(b) | | $ | 4,390,295 | |
| | 564,738 | | | Wabash National Corp.(b) | | | 6,539,666 | |
| | 49,107 | | | Wabtec Corp. | | | 3,330,928 | |
| | | | | | | | |
| | | | | | | 62,684,522 | |
| | | | | | | | |
| | | | Marine – 0.6% | | | | |
| | 113,347 | | | Kirby Corp.(b) | | | 6,493,650 | |
| | | | | | | | |
| | | | Media – 3.4% | | | | |
| | 163,892 | | | Arbitron, Inc. | | | 6,560,597 | |
| | 168,118 | | | Harte-Hanks, Inc. | | | 2,000,604 | |
| | 211,322 | | | John Wiley & Sons, Inc., Class A | | | 10,743,611 | |
| | 176,394 | | | Liberty Media-Starz, Series A(b) | | | 13,688,174 | |
| | 168,066 | | | Live Nation Entertainment, Inc.(b) | | | 1,680,660 | |
| | 145,558 | | | Madison Square Garden, Inc., Class A(b) | | | 3,928,610 | |
| | | | | | | | |
| | | | | | | 38,602,256 | |
| | | | | | | | |
| | | | Metals & Mining – 2.2% | | | | |
| | 102,828 | | | Haynes International, Inc. | | | 5,701,813 | |
| | 560,885 | | | Horsehead Holding Corp.(b) | | | 9,563,089 | |
| | 166,083 | | | Reliance Steel & Aluminum Co. | | | 9,596,276 | |
| | | | | | | | |
| | | | | | | 24,861,178 | |
| | | | | | | | |
| | | | Multiline Retail – 0.6% | | | | |
| | 486,031 | | | Fred’s, Inc. Class A | | | 6,473,933 | |
| | | | | | | | |
| | | | Oil, Gas & Consumable Fuels – 3.7% | | | | |
| | 172,522 | | | Berry Petroleum Co., Class A | | | 8,703,735 | |
| | 271,798 | | | Cloud Peak Energy, Inc.(b) | | | 5,868,119 | |
| | 140,906 | | | Comstock Resources, Inc.(b) | | | 4,359,632 | |
| | 506,035 | | | Energy Partners Ltd.(b) | | | 9,108,630 | |
| | 105,638 | | | Petroleum Development Corp.(b) | | | 5,071,680 | |
| | 140,096 | | | Rosetta Resources, Inc.(b) | | | 6,660,164 | |
| | 87,847 | | | SemGroup Corp., Class A(b) | | | 2,473,771 | |
| | | | | | | | |
| | | | | | | 42,245,731 | |
| | | | | | | | |
| | | | Paper & Forest Products – 0.5% | | | | |
| | 89,855 | | | Deltic Timber Corp. | | | 6,005,908 | |
| | | | | | | | |
| | | | Pharmaceuticals – 0.3% | | | | |
| | 296,279 | | | Obagi Medical Products, Inc.(b) | | | 3,744,967 | |
| | | | | | | | |
| | | | REITs – Apartments – 2.4% | | | | |
| | 332,085 | | | American Campus Communities, Inc. | | | 10,958,805 | |
| | 133,984 | | | Mid-America Apartment Communities, Inc. | | | 8,601,773 | |
| | 309,208 | | | UDR, Inc. | | | 7,535,399 | |
| | | | | | | | |
| | | | | | | 27,095,977 | |
| | | | | | | | |
See accompanying notes to financial statements.
| 20
Portfolio of Investments – as of March 31, 2011 (Unaudited)
Loomis Sayles Small Cap Value Fund – continued
| | | | | | | | |
| Shares | | | Description | | Value (†) | |
| | | | | | | | |
| |
| | Common Stocks – continued | | | | |
| | |
| | | | REITs – Diversified – 1.5% | | | | |
| | 364,429 | | | DuPont Fabros Technology, Inc. | | $ | 8,837,403 | |
| | 205,021 | | | Potlatch Corp. | | | 8,241,844 | |
| | | | | | | | |
| | | | | | | 17,079,247 | |
| | | | | | | | |
| | | | REITs – Healthcare – 0.7% | | | | |
| | 382,192 | | | Omega Healthcare Investors, Inc. | | | 8,538,169 | |
| | | | | | | | |
| | | | REITs – Hotels – 0.6% | | | | |
| | 1,093,626 | | | Hersha Hospitality Trust | | | 6,496,138 | |
| | | | | | | | |
| | | | REITs – Office Property – 0.8% | | | | |
| | 463,665 | | | BioMed Realty Trust, Inc. | | | 8,818,908 | |
| | | | | | | | |
| | | | REITs – Single Tenant – 0.6% | | | | |
| | 268,632 | | | National Retail Properties, Inc. | | | 7,019,354 | |
| | | | | | | | |
| | | | REITs – Storage – 1.1% | | | | |
| | 132,469 | | | Sovran Self Storage, Inc. | | | 5,239,149 | |
| | 707,732 | | | U-Store-It Trust | | | 7,445,341 | |
| | | | | | | | |
| | | | | | | 12,684,490 | |
| | | | | | | | |
| | | | Road & Rail – 1.7% | | | | |
| | 123,490 | | | Genesee & Wyoming, Inc., Class A(b) | | | 7,187,118 | |
| | 218,510 | | | Old Dominion Freight Line, Inc.(b) | | | 7,667,516 | |
| | 306,604 | | | Vitran Corp., Inc.(b) | | | 4,320,050 | |
| | | | | | | | |
| | | | | | | 19,174,684 | |
| | | | | | | | |
| | | | Semiconductors & Semiconductor Equipment – 2.4% | | | | |
| | 151,607 | | | Cohu, Inc. | | | 2,328,684 | |
| | 167,103 | | | Diodes, Inc.(b) | | | 5,691,528 | |
| | 575,368 | | | PMC-Sierra, Inc.(b) | | | 4,315,260 | |
| | 558,088 | | | Teradyne, Inc.(b) | | | 9,939,547 | |
| | 380,746 | | | TriQuint Semiconductor, Inc.(b) | | | 4,915,431 | |
| | | | | | | | |
| | | | | | | 27,190,450 | |
| | | | | | | | |
| | | | Software – 1.9% | | | | |
| | 197,611 | | | Monotype Imaging Holdings, Inc.(b) | | | 2,865,360 | |
| | 280,515 | | | Progress Software Corp.(b) | | | 8,160,181 | |
| | 342,563 | | | Radiant Systems, Inc.(b) | | | 6,063,365 | |
| | 240,438 | | | SS&C Technologies Holdings, Inc.(b) | | | 4,909,744 | |
| | | | | | | | |
| | | | | | | 21,998,650 | |
| | | | | | | | |
| | | | Specialty Retail – 2.7% | | | | |
| | 169,583 | | | Genesco, Inc.(b) | | | 6,817,237 | |
| | 1,077,563 | | | Hot Topic, Inc. | | | 6,142,109 | |
| | 202,455 | | | OfficeMax, Inc.(b) | | | 2,619,768 | |
| | 680,131 | | | PEP Boys-Manny Moe & Jack | | | 8,644,465 | |
| | 515,951 | | | Sally Beauty Holdings, Inc.(b) | | | 7,228,473 | |
| | | | | | | | |
| | | | | | | 31,452,052 | |
| | | | | | | | |
See accompanying notes to financial statements.
21 |
Portfolio of Investments – as of March 31, 2011 (Unaudited)
Loomis Sayles Small Cap Value Fund – continued
| | | | | | | | |
| Shares | | | Description | | Value (†) | |
| | | | | | | | |
| |
| | Common Stocks – continued | | | | |
| | |
| | | | Textiles, Apparel & Luxury Goods – 0.9% | | | | |
| | 160,273 | | | Kenneth Cole Productions, Inc., Class A(b) | | $ | 2,078,741 | |
| | 418,305 | | | Movado Group, Inc.(b) | | | 6,140,717 | |
| | 41,046 | | | Vera Bradley, Inc.(b) | | | 1,732,552 | |
| | | | | | | | |
| | | | | | | 9,952,010 | |
| | | | | | | | |
| | | | Thrifts & Mortgage Finance – 1.5% | | | | |
| | 216,184 | | | BankUnited, Inc. | | | 6,206,642 | |
| | 503,218 | | | Capitol Federal Financial, Inc. | | | 5,671,267 | |
| | 358,162 | | | First Niagara Financial Group, Inc. | | | 4,863,840 | |
| | | | | | | | |
| | | | | | | 16,741,749 | |
| | | | | | | | |
| | | | Trading Companies & Distributors – 1.0% | | | | |
| | 288,240 | | | H&E Equipment Services, Inc.(b) | | | 5,623,562 | |
| | 299,808 | | | Rush Enterprises, Inc., Class A(b) | | | 5,936,199 | |
| | | | | | | | |
| | | | | | | 11,559,761 | |
| | | | | | | | |
| | | | Water Utilities – 0.4% | | | | |
| | 272,189 | | | Middlesex Water Co. | | | 4,951,118 | |
| | | | | | | | |
| | |
| | | | Total Common Stocks (Identified Cost $811,005,423) | | | 1,109,838,104 | |
| | | | | | | | |
| | |
| Principal
Amount |
| | | | | | |
| |
| | Short-Term Investments – 3.1% | | | | |
| $ | 35,067,817 | | | Tri-Party Repurchase Agreement with Fixed Income Clearing Corporation, dated 3/31/2011 at 0.000% to be repurchased at $35,067,817 on 4/01/2011 collateralized by $36,085,000 Federal Home Loan Mortgage Corp., 4.125% due 5/12/2025 valued at $35,769,256 including accrued interest (Note 2 of Notes to Financial Statements) (Identified Cost $35,067,817) | | | 35,067,817 | |
| | | | | | | | |
| | |
| | | | Total Investments – 99.9% (Identified Cost $846,073,240)(a) | | | 1,144,905,921 | |
| | | | Other assets less liabilities—0.1% | | | 1,447,067 | |
| | | | | | | | |
| | | | Net Assets – 100.0% | | $ | 1,146,352,988 | |
| | | | | | | | |
| | |
| | (†) | | | See Note 2 of Notes to Financial Statements. | | | | |
| | (a) | | | Federal Tax Information (Amounts exclude certain adjustments made at the end of the Fund’s fiscal year for tax purposes. Such adjustments are primarily due to wash sales.): | | | | |
| | | | At March 31, 2011, the net unrealized appreciation on investments based on a cost of $846,075,914 for federal income tax purposes was as follows: | | | | |
| | | | Aggregate gross unrealized appreciation for all investments in which there is an excess of value over tax cost | | $ | 306,575,976 | |
| | | | Aggregate gross unrealized depreciation for all investments in which there is an excess of tax cost over value | | | (7,745,969 | ) |
| | | | | | | | |
| | | | Net unrealized appreciation | | $ | 298,830,007 | |
| | | | | | | | |
| | (b) | | | Non-income producing security. | | | | |
| | |
| | REITs | | | Real Estate Investment Trusts | | | | |
See accompanying notes to financial statements.
| 22
Portfolio of Investments – as of March 31, 2011 (Unaudited)
Loomis Sayles Small Cap Value Fund – continued
Industry Summary at March 31, 2011 (Unaudited)
| | | | |
Commercial Banks | | | 7.3 | % |
Machinery | | | 5.5 | |
Electronic Equipment, Instruments & Components | | | 5.1 | |
Chemicals | | | 4.9 | |
Insurance | | | 3.9 | |
Oil, Gas & Consumable Fuels | | | 3.7 | |
Food Products | | | 3.5 | |
Media | | | 3.4 | |
Commercial Services & Supplies | | | 3.2 | |
Energy Equipment & Services | | | 3.0 | |
Specialty Retail | | | 2.7 | |
Capital Markets | | | 2.6 | |
Electrical Equipment | | | 2.5 | |
Semiconductors & Semiconductor Equipment | | | 2.4 | |
REITs – Apartments | | | 2.4 | |
Communications Equipment | | | 2.2 | |
Metals & Mining | | | 2.2 | |
Hotels, Restaurants & Leisure | | | 2.0 | |
Electric Utilities | | | 2.0 | |
Other Investments, less than 2% each | | | 32.3 | |
Short-Term Investments | | | 3.1 | |
| | | | |
Total Investments | | | 99.9 | |
Other assets less liabilities | | | 0.1 | |
| | | | |
Net Assets | | | 100.0 | % |
| | | | |
See accompanying notes to financial statements.
23 |
Statements of Assets And Liabilities
March 31, 2011 (Unaudited)
| | | | | | | | |
| | | Small Cap
Growth Fund | | | Small Cap
Value Fund | |
ASSETS | | | | | | | | |
Investments at cost | | $ | 190,866,092 | | | $ | 846,073,240 | |
Net unrealized appreciation | | | 63,534,135 | | | | 298,832,681 | |
| | | | | | | | |
Investments at value | | | 254,400,227 | | | | 1,144,905,921 | |
Receivable for Fund shares sold | | | 2,759,371 | | | | 1,189,404 | |
Receivable for securities sold | | | 2,493,718 | | | | 3,596,864 | |
Dividends receivable | | | 11,807 | | | | 1,023,887 | |
| | | | | | | | |
TOTAL ASSETS | | | 259,665,123 | | | | 1,150,716,076 | |
| | | | | | | | |
LIABILITIES | | | | | | | | |
Payable for securities purchased | | | 9,412,848 | | | | 2,599,458 | |
Payable for Fund shares redeemed | | | 419,498 | | | | 822,884 | |
Management fees payable (Note 5) | | | 165,921 | | | | 625,040 | |
Deferred Trustees’ fees (Note 5) | | | 61,666 | | | | 128,955 | |
Administrative fees payable (Note 5) | | | 9,006 | | | | 44,333 | |
Other accounts payable and accrued expenses | | | 59,701 | | | | 142,418 | |
| | | | | | | | |
TOTAL LIABILITIES | | | 10,128,640 | | | | 4,363,088 | |
| | | | | | | | |
NET ASSETS | | $ | 249,536,483 | | | $ | 1,146,352,988 | |
| | | | | | | | |
NET ASSETS CONSIST OF: | | | | | | | | |
Paid-in capital | | $ | 256,543,687 | | | $ | 925,364,035 | |
Distributions in excess of net investment income/Accumulated net investment (loss) | | | (979,364 | ) | | | (570,274 | ) |
Accumulated net realized loss on investments | | | (69,561,975 | ) | | | (77,273,454 | ) |
Net unrealized appreciation on investments | | | 63,534,135 | | | | 298,832,681 | |
| | | | | | | | |
NET ASSETS | | $ | 249,536,483 | | | $ | 1,146,352,988 | |
| | | | | | | | |
| | |
COMPUTATION OF NET ASSET VALUE AND OFFERING PRICE: | | | | | | | | |
Institutional Class: | | | | | | | | |
Net assets | | $ | 120,790,368 | | | $ | 582,154,282 | |
| | | | | | | | |
Shares of beneficial interest | | | 6,500,074 | | | | 20,253,147 | |
| | | | | | | | |
Net asset value, offering and redemption price per share | | $ | 18.58 | | | $ | 28.74 | |
| | | | | | | | |
Retail Class: | | | | | | | | |
Net assets | | $ | 128,746,115 | | | $ | 473,307,134 | |
| | | | | | | | |
Shares of beneficial interest | | | 7,179,209 | | | | 16,613,259 | |
| | | | | | | | |
Net asset value, offering and redemption price per share | | $ | 17.93 | | | $ | 28.49 | |
| | | | | | | | |
Admin Class: | | | | | | | | |
Net assets | | $ | — | | | $ | 90,891,572 | |
| | | | | | | | |
Shares of beneficial interest | | | — | | | | 3,247,518 | |
| | | | | | | | |
Net asset value, offering and redemption price per share | | $ | — | | | $ | 27.99 | |
| | | | | | | | |
See accompanying notes to financial statements.
| 24
Statements of Operations
For the Six Months Ended March 31, 2011 (Unaudited)
| | | | | | | | |
| | | Small Cap
Growth Fund | | | Small Cap
Value Fund | |
INVESTMENT INCOME | | | | | | | | |
Dividends | | $ | 103,003 | | | $ | 7,729,887 | |
| | | | | | | | |
Expenses | | | | | | | | |
Management fees (Note 5) | | | 678,739 | | | | 3,876,424 | |
Service and distribution fees (Note 5) | | | 123,948 | | | | 744,175 | |
Administrative fees (Note 5) | | | 42,270 | | | | 241,468 | |
Trustees’ fees and expenses (Note 5) | | | 13,834 | | | | 24,363 | |
Transfer agent fees and expenses (Notes 5 and 6) | | | 95,109 | | | | 631,451 | |
Audit and tax services fees | | | 18,507 | | | | 21,221 | |
Custodian fees and expenses | | | 12,298 | | | | 19,242 | |
Legal fees | | | 1,772 | | | | 11,302 | |
Registration fees | | | 22,072 | | | | 32,931 | |
Shareholder reporting expenses | | | 14,740 | | | | 70,671 | |
Miscellaneous expenses | | | 5,390 | | | | 17,116 | |
| | | | | | | | |
Total expenses | | | 1,028,679 | | | | 5,690,364 | |
Fee/expense recovery (Note 5) | | | 20,355 | | | | — | |
Less waiver and/or expense reimbursement (Note 5) | | | (20,098 | ) | | | (294,480 | ) |
| | | | | | | | |
Net expenses | | | 1,028,936 | | | | 5,395,884 | |
| | | | | | | | |
Net investment income (loss) | | | (925,933 | ) | | | 2,334,003 | |
| | | | | | | | |
| | |
NET REALIZED AND UNREALIZED GAIN ON INVESTMENTS | | | | | | | | |
Net realized gain on: | | | | | | | | |
Investments | | | 17,120,406 | | | | 71,963,853 | |
Net change in unrealized appreciation (depreciation) on: | | | | | | | | |
Investments | | | 34,048,054 | | | | 161,720,968 | |
| | | | | | | | |
Net realized and unrealized gain on investments | | | 51,168,460 | | | | 233,684,821 | |
| | | | | | | | |
| | |
NET INCREASE IN NET ASSETS RESULTING FROM OPERATIONS | | $ | 50,242,527 | | | $ | 236,018,824 | |
| | | | | | | | |
See accompanying notes to financial statements.
25 |
Statements of Changes in Net Assets
| | | | | | | | |
| Small Cap Growth Fund | | Six Months Ended
March 31, 2011
(Unaudited) | | | Year Ended
September 30, 2010 | |
FROM OPERATIONS: | | | | | | | | |
Net investment income (loss) | | $ | (925,933 | ) | | $ | (1,245,082 | ) |
Net realized gain on investments | | | 17,120,406 | | | | 14,954,786 | |
Net change in unrealized appreciation (depreciation) on investments | | | 34,048,054 | | | | 10,136,058 | |
| | | | | | | | |
Net increase in net assets resulting from operations | | | 50,242,527 | | | | 23,845,762 | |
| | | | | | | | |
FROM DISTRIBUTIONS TO SHAREHOLDERS: | | | | | | | | |
Net investment income | | | | | | | | |
Institutional Class | | | — | | | | — | |
Retail Class | | | — | | | | — | |
Admin Class | | | — | | | | — | |
| | | | | | | | |
Total distributions | | | — | | | | — | |
| | | | | | | | |
NET INCREASE (DECREASE) IN NET ASSETS FROM CAPITAL SHARE TRANSACTIONS (NOTE 10) | | | 71,448,603 | | | | (17,035,340 | ) |
| | | | | | | | |
Net increase (decrease) in net assets | | | 121,691,130 | | | | 6,810,422 | |
NET ASSETS | | | | | | | | |
Beginning of the period | | | 127,845,353 | | | | 121,034,931 | |
| | | | | | | | |
End of the period | | $ | 249,536,483 | | | $ | 127,845,353 | |
| | | | | | | | |
UNDISTRIBUTED (DISTRIBUTIONS IN EXCESS OF) NET INVESTMENT INCOME/ACCUMULATED NET INVESTMENT (LOSS) | | $ | (979,364 | ) | | $ | (53,431 | ) |
| | | | | | | | |
| | | | | | | | |
| Small Cap Value Fund | | Six Months Ended
March 31, 2011
(Unaudited) | | | Year Ended
September 30, 2010 | |
FROM OPERATIONS: | | | | | | | | |
Net investment income (loss) | | $ | 2,334,003 | | | $ | 3,463,326 | |
Net realized gain on investments | | | 71,963,853 | | | | 58,619,537 | |
Net change in unrealized appreciation (depreciation) on investments | | | 161,720,968 | | | | 34,774,717 | |
| | | | | | | | |
Net increase in net assets resulting from operations | | | 236,018,824 | | | | 96,857,580 | |
| | | | | | | | |
FROM DISTRIBUTIONS TO SHAREHOLDERS: | | | | | | | | |
Net investment income | | | | | | | | |
Institutional Class | | | (3,276,432 | ) | | | (1,798,397 | ) |
Retail Class | | | (1,768,636 | ) | | | (522,660 | ) |
Admin Class | | | (178,569 | ) | | | — | |
| | | | | | | | |
Total distributions | | | (5,223,637 | ) | | | (2,321,057 | ) |
| | | | | | | | |
NET INCREASE (DECREASE) IN NET ASSETS FROM CAPITAL SHARE TRANSACTIONS (NOTE 10) | | | 3,327,416 | | | | (150,208,179 | ) |
| | | | | | | | |
Net increase (decrease) in net assets | | | 234,122,603 | | | | (55,671,656 | ) |
NET ASSETS | | | | | | | | |
Beginning of the period | | | 912,230,385 | | | | 967,902,041 | |
| | | | | | | | |
End of the period | | $ | 1,146,352,988 | | | $ | 912,230,385 | |
| | | | | | | | |
UNDISTRIBUTED (DISTRIBUTIONS IN EXCESS OF) NET INVESTMENT INCOME/ACCUMULATED NET INVESTMENT (LOSS) | | $ | (570,274 | ) | | $ | 2,319,360 | |
| | | | | | | | |
See accompanying notes to financial statements.
| 26
Financial Highlights
For a share outstanding throughout each period.
| | | | | | | | | | | | | | | | | | | | | | | | | | | | | | | | |
| | | | | | Income (Loss) from
Investment Operations: | | | | | | Less Distributions: | |
| | | Net asset
value,
beginning
of the
period | | | Net
investment
income
(loss) (a)(b) | | | Net
realized
and
unrealized
gain (loss) | | | Total
from
investment
operations | | | | | | Dividends
from net
investment
income (b) | | | Distributions
from net
realized
capital
gains | | | Total
distributions | |
SMALL CAP GROWTH FUND | | | | | | | | | | | | | | | | | | | | | | | | | |
| | | | | | | |
| Institutional Class | | | | | | | | | | | | | | | | | | | | | | | | | | | | | |
3/31/2011(g) | | $ | 14.03 | | | $ | (0.07 | ) | | $ | 4.62 | | | $ | 4.55 | | | | | | | $ | — | | | $ | — | | | $ | — | |
9/30/2010 | | | 11.58 | | | | (0.11 | )(i) | | | 2.56 | | | | 2.45 | | | | | | | | — | | | | — | | | | — | |
9/30/2009 | | | 13.07 | | | | (0.07 | ) | | | (1.42 | ) | | | (1.49 | ) | | | | | | | — | | | | — | | | | — | |
9/30/2008 | | | 15.87 | | | | (0.07 | ) | | | (2.73 | ) | | | (2.80 | ) | | | | | | | — | | | | — | | | | — | |
9/30/2007 | | | 12.00 | | | | (0.06 | )(j) | | | 3.93 | | | | 3.87 | | | | | | | | — | | | | — | | | | — | |
9/30/2006 | | | 11.08 | | | | (0.08 | ) | | | 0.99 | | | | 0.91 | | | | | | | | — | | | | — | | | | — | |
| | | | | | | |
| Retail Class | | | | | | | | | | | | | | | | | | | | | | | | | | | | | |
3/31/2011(g) | | | 13.55 | | | | (0.09 | ) | | | 4.47 | | | | 4.38 | | | | | | | | — | | | | — | | | | — | |
9/30/2010 | | | 11.21 | | | | (0.13 | )(i) | | | 2.47 | | | | 2.34 | | | | | | | | — | | | | — | | | | — | |
9/30/2009 | | | 12.69 | | | | (0.09 | ) | | | (1.39 | ) | | | (1.48 | ) | | | | | | | — | | | | — | | | | — | |
9/30/2008 | | | 15.45 | | | | (0.10 | ) | | | (2.66 | ) | | | (2.76 | ) | | | | | | | — | | | | — | | | | — | |
9/30/2007 | | | 11.71 | | | | (0.09 | )(j) | | | 3.83 | | | | 3.74 | | | | | | | | — | | | | — | | | | — | |
9/30/2006 | | | 10.84 | | | | (0.11 | ) | | | 0.97 | | | | 0.86 | | | | | | | | — | | | | — | | | | — | |
| SMALL CAP VALUE FUND | | | | | | | | | | | | | | | | | | | | | | | | | |
| | | | | | | |
| Institutional Class | | | | | | | | | | | | | | | | | | | | | | | | | | | | | |
3/31/2011(g) | | $ | 22.93 | | | $ | 0.08 | | | $ | 5.89 | | | $ | 5.97 | | | | | | | $ | (0.16 | ) | | $ | — | | | $ | (0.16 | ) |
9/30/2010 | | | 20.66 | | | | 0.11 | | | | 2.23 | | | | 2.34 | | | | | | | | (0.07 | ) | | | — | | | | (0.07 | ) |
9/30/2009 | | | 22.01 | | | | 0.09 | | | | (1.32 | ) | | | (1.23 | ) | | | | | | | (0.11 | ) | | | (0.01 | ) | | | (0.12 | ) |
9/30/2008 | | | 28.77 | | | | 0.11 | (k) | | | (4.03 | ) | | | (3.92 | ) | | | | | | | (0.06 | ) | | | (2.78 | ) | | | (2.84 | ) |
9/30/2007 | | | 27.69 | | | | 0.12 | (j)(l) | | | 4.29 | | | | 4.41 | | | | | | | | (0.17 | ) | | | (3.16 | ) | | | (3.33 | ) |
9/30/2006 | | | 27.43 | | | | 0.13 | | | | 2.70 | | | | 2.83 | | | | | | | | (0.15 | ) | | | (2.42 | ) | | | (2.57 | ) |
| | | | | | | |
| Retail Class | | | | | | | | | | | | | | | | | | | | | | | | | | | | | |
3/31/2011(g) | | | 22.71 | | | | 0.04 | | | | 5.85 | | | | 5.89 | | | | | | | | (0.11 | ) | | | — | | | | (0.11 | ) |
9/30/2010 | | | 20.47 | | | | 0.06 | | | | 2.21 | | | | 2.27 | | | | | | | | (0.03 | ) | | | — | | | | (0.03 | ) |
9/30/2009 | | | 21.79 | | | | 0.04 | | | | (1.30 | ) | | | (1.26 | ) | | | | | | | (0.05 | ) | | | (0.01 | ) | | | (0.06 | ) |
9/30/2008 | | | 28.52 | | | | 0.05 | (k) | | | (4.00 | ) | | | (3.95 | ) | | | | | | | — | | | | (2.78 | ) | | | (2.78 | ) |
9/30/2007 | | | 27.46 | | | | 0.04 | (j)(l) | | | 4.28 | | | | 4.32 | | | | | | | | (0.10 | ) | | | (3.16 | ) | | | (3.26 | ) |
9/30/2006 | | | 27.23 | | | | 0.06 | | | | 2.67 | | | | 2.73 | | | | | | | | (0.08 | ) | | | (2.42 | ) | | | (2.50 | ) |
| | | | | | | |
| Admin Class | | | | | | | | | | | | | | | | | | | | | | | | | | | | | |
3/31/2011(g) | | | 22.30 | | | | 0.01 | | | | 5.73 | | | | 5.74 | | | | | | | | (0.05 | ) | | | — | | | | (0.05 | ) |
9/30/2010 | | | 20.11 | | | | 0.00 | | | | 2.19 | | | | 2.19 | | | | | | | | — | | | | — | | | | — | |
9/30/2009 | | | 21.40 | | | | 0.00 | | | | (1.28 | ) | | | (1.28 | ) | | | | | | | (0.00 | ) | | | (0.01 | ) | | | (0.01 | ) |
9/30/2008 | | | 28.13 | | | | (0.01 | )(k) | | | (3.94 | ) | | | (3.95 | ) | | | | | | | — | | | | (2.78 | ) | | | (2.78 | ) |
9/30/2007 | | | 27.14 | | | | (0.03 | )(j)(l) | | | 4.22 | | | | 4.19 | | | | | | | | (0.04 | ) | | | (3.16 | ) | | | (3.20 | ) |
9/30/2006 | | | 26.94 | | | | (0.01 | ) | | | 2.65 | | | | 2.64 | | | | | | | | (0.02 | ) | | | (2.42 | ) | | | (2.44 | ) |
| (a) | Per share net investment income (loss) has been calculated using the average shares outstanding during the period. | |
| (b) | Amount rounds to less than $0.01 per share, if applicable. | |
| (c) | Effective June 1, 2009, redemption fees were eliminated. | |
| (d) | Had certain expenses not been waived/reimbursed during the period, if applicable, total returns would have been lower. Periods less than one year, if applicable, are not annualized. | |
| (e) | Computed on an annualized basis for periods less than one year, if applicable. | |
| (f) | The investment adviser and/or administrator agreed to waive its fees and/or reimburse a portion of the Fund’s expenses during the period. Without this waiver/reimbursement, if applicable, expenses would have been higher. | |
| (g) | For the six months ended March 31, 2011 (Unaudited). | |
| (h) | Includes fee/expense recovery of 0.05%. | |
See accompanying notes to financial statements.
27 |
| | | | | | | | | | | | | | | | | | | | | | | | | | | | | | |
| | | | | | | | | | | | |
Ratios to Average Net Assets: | | | | |
Redemption
fees (b)(c) | | | Net asset
value,
end of
the
period | | | Total
return
(%) (d) | | | Net assets,
end of
the period
(000’s) | | | Net
expenses
(%) (e)(f) | | | Gross
expenses
(%) (e) | | | Net
investment
income (loss)
(%) (e) | | | Portfolio
turnover
rate (%) | |
| | | | | | | | | | | | | | | | | | | | | | | | | | | | | | |
| | | | | | | |
| | | | | | | | | | | | | | | | | | | | | | | | | | | | | | |
| $ | — | | | $ | 18.58 | | | | 32.43 | | | $ | 120,790 | | | | 1.00 | (h) | | | 1.00 | (h) | | | (0.89 | ) | | | 39 | |
| | — | | | | 14.03 | | | | 21.16 | | | | 52,501 | | | | 1.00 | | | | 1.06 | | | | (0.85 | )(i) | | | 69 | |
| | — | | | | 11.58 | | | | (11.40 | ) | | | 45,557 | | | | 1.00 | | | | 1.01 | | | | (0.68 | ) | | | 107 | |
| | 0.00 | | | | 13.07 | | | | (17.64 | ) | | | 44,540 | | | | 1.00 | | | | 1.01 | | | | (0.47 | ) | | | 92 | |
| | 0.00 | | | | 15.87 | | | | 32.25 | | | | 28,088 | | | | 1.00 | | | | 1.23 | | | | (0.47 | ) | | | 83 | |
| | 0.01 | | | | 12.00 | | | | 8.30 | | | | 20,414 | | | | 1.00 | | | | 1.38 | | | | (0.69 | ) | | | 100 | |
| | | | | | | |
| | | | | | | | | | | | | | | | | | | | | | | | | | | | | | |
| | — | | | | 17.93 | | | | 32.32 | | | | 128,746 | | | | 1.25 | | | | 1.29 | | | | (1.14 | ) | | | 39 | |
| | — | | | | 13.55 | | | | 20.87 | | | | 75,344 | | | | 1.25 | | | | 1.39 | | | | (1.10 | )(i) | | | 69 | |
| | — | | | | 11.21 | | | | (11.66 | ) | | | 75,478 | | | | 1.25 | | | | 1.43 | | | | (0.93 | ) | | | 107 | |
| | 0.00 | | | | 12.69 | | | | (17.86 | ) | | | 79,897 | | | | 1.25 | | | | 1.42 | | | | (0.70 | ) | | | 92 | |
| �� | 0.00 | | | | 15.45 | | | | 31.94 | | | | 20,924 | | | | 1.25 | | | | 1.50 | | | | (0.66 | ) | | | 83 | |
| | 0.01 | | | | 11.71 | | | | 8.03 | | | | 2,981 | | | | 1.25 | | | | 1.92 | | | | (0.94 | ) | | | 100 | |
| | | | | | | | | | | | | | | | | | | | | | | | | | | | | | |
| | | | | | | |
| | | | | | | | | | | | | | | | | | | | | | | | | | | | | | |
| $ | — | | | $ | 28.74 | | | | 26.11 | | | $ | 582,154 | | | | 0.90 | | | | 0.93 | | | | 0.60 | | | | 25 | |
| | — | | | | 22.93 | | | | 11.39 | | | | 454,853 | | | | 0.90 | | | | 0.94 | | | | 0.50 | | | | 52 | |
| | 0.00 | | | | 20.66 | | | | (5.42 | ) | | | 506,324 | | | | 0.90 | | | | 0.94 | | | | 0.52 | | | | 55 | |
| | 0.00 | | | | 22.01 | | | | (15.02 | ) | | | 553,268 | | | | 0.89 | | | | 0.89 | | | | 0.47 | | | | 61 | |
| | 0.00 | | | | 28.77 | | | | 17.02 | | | | 534,776 | | | | 0.89 | | | | 0.89 | | | | 0.43 | | | | 57 | |
| | 0.00 | | | | 27.69 | | | | 11.17 | | | | 442,714 | | | | 0.89 | (m) | | | 0.89 | (m) | | | 0.47 | | | | 62 | |
| | | | | | | |
| | | | | | | | | | | | | | | | | | | | | | | | | | | | | | |
| | — | | | | 28.49 | | | | 25.96 | | | | 473,307 | | | | 1.15 | | | | 1.22 | | | | 0.34 | | | | 25 | |
| | — | | | | 22.71 | | | | 11.10 | | | | 383,934 | | | | 1.15 | | | | 1.24 | | | | 0.26 | | | | 52 | |
| | 0.00 | | | | 20.47 | | | | (5.66 | ) | | | 387,383 | | | | 1.15 | | | | 1.31 | | | | 0.26 | | | | 55 | |
| | 0.00 | | | | 21.79 | | | | (15.21 | ) | | | 464,525 | | | | 1.15 | | | | 1.27 | | | | 0.21 | | | | 61 | |
| | 0.00 | | | | 28.52 | | | | 16.74 | | | | 465,055 | | | | 1.15 | | | | 1.24 | | | | 0.15 | | | | 57 | |
| | 0.00 | | | | 27.46 | | | | 10.87 | | | | 291,690 | | | | 1.15 | | | | 1.20 | | | | 0.21 | | | | 62 | |
| | | | | | | |
| | | | | | | | | | | | | | | | | | | | | | | | | | | | | | |
| | — | | | | 27.99 | | | | 25.78 | | | | 90,892 | | | | 1.40 | | | | 1.52 | | | | 0.10 | | | | 25 | |
| | — | | | | 22.30 | | | | 10.89 | | | | 73,443 | | | | 1.40 | | | | 1.56 | | | | 0.02 | | | | 52 | |
| | 0.00 | | | | 20.11 | | | | (5.93 | ) | | | 74,195 | | | | 1.40 | | | | 1.77 | | | | 0.02 | | | | 55 | |
| | 0.00 | | | | 21.40 | | | | (15.44 | ) | | | 77,855 | | | | 1.40 | | | | 1.68 | | | | (0.04 | ) | | | 61 | |
| | 0.00 | | | | 28.13 | | | | 16.41 | | | | 76,783 | | | | 1.40 | | | | 1.56 | | | | (0.10 | ) | | | 57 | |
| | 0.00 | | | | 27.14 | | | | 10.59 | | | | 64,367 | | | | 1.40 | | | | 1.46 | | | | (0.04 | ) | | | 62 | |
| | (i) | Includes a non-recurring dividend. Without this dividend, net investment loss per share would have been $(0.12) and $(0.14) for Institutional Class and Retail Class, respectively, and the ratio of net investment loss to average net assets would have been (0.92)% and (1.17)% for Institutional Class and Retail Class, respectively. | |
| | (j) | Includes a non-recurring payment of $0.01 per share and $0.00 per share for Small Cap Growth Fund and Small Cap Value Fund, respectively. | |
| | (k) | Includes a non-recurring dividend of $0.02 per share. | |
| | (l) | Includes a non-recurring dividend of $0.05 per share. | |
| | (m) | Includes fee/expense recovery of 0.02%. | |
See accompanying notes to financial statements.
| 28
Notes to Financial Statements
March 31, 2011 (Unaudited)
1. Organization. Loomis Sayles Funds I and Loomis Sayles Funds II (the “Trusts” and each a “Trust”) are each organized as a Massachusetts business trust. Each Trust is registered under the Investment Company Act of 1940, as amended (the “1940 Act”), as an open-end management investment company. Each Declaration of Trust permits the Board of Trustees to authorize the issuance of an unlimited number of shares of the Trust in multiple series. The financial statements for certain funds of the Trusts are presented in separate reports. The following funds (individually, a “Fund” and collectively, the “Funds”) are included in this report:
Loomis Sayles Funds I:
Loomis Sayles Small Cap Value Fund (the “Small Cap Value Fund”)
Loomis Sayles Funds II:
Loomis Sayles Small Cap Growth Fund (the “Small Cap Growth Fund”)
Each Fund offers Institutional Class Shares and Retail Class Shares. In addition, Small Cap Value Fund offers Admin Class Shares.
Most expenses of the Trusts can be directly attributed to a Fund. Expenses which cannot be directly attributed to a Fund are generally apportioned based on the relative net assets of each of the Funds in the Trusts. Expenses of a Fund are borne pro rata by the holders of each class of shares, except that each class bears expenses unique to that class (including the Rule 12b-1 service and distribution fees and transfer agent fees). In addition, each class votes as a class only with respect to its own Rule 12b-1 Plan. Shares of each class would receive their pro rata share of the net assets of a Fund if the Fund were liquidated. The Trustees approve separate distributions from net investment income on each class of shares.
2. Significant Accounting Policies. The following is a summary of significant accounting policies consistently followed by each Fund in the preparation of its financial statements. The Funds’ financial statements are prepared in accordance with accounting principles generally accepted in the United States of America which require the use of management estimates that affect the reported amounts and disclosures in the financial statements. Actual results could differ from those estimates. Management has evaluated the events and transactions subsequent to period-end through the date the financial statements were issued and has determined that there were no material events that would require disclosure in the Funds’ financial statements.
a. Valuation. Equity securities, including shares of closed-end investment companies and exchange-traded funds, for which market quotations are readily available are valued at market value, as reported by pricing services recommended by the investment adviser and approved by the Board of Trustees. Such pricing services generally use the security’s last sale price on the exchange or market where the security is primarily traded or, if there is no reported sale during the day, the closing bid price. Securities traded on the NASDAQ Global Select Market, NASDAQ Global Market and NASDAQ Capital Market are valued at the NASDAQ Official Closing Price (“NOCP”), or if lacking a NOCP, at the most
29 |
Notes to Financial Statements – continued
March 31, 2011 (Unaudited)
recent bid quotation on the applicable NASDAQ Market. Debt securities (other than short-term obligations purchased with an original or remaining maturity of sixty days or less) are generally valued on the basis of evaluated bids furnished to the Funds by a pricing service recommended by the investment adviser and approved by the Board of Trustees, which service determines valuations for normal, institutional-size trading units of such securities using market information, transactions for comparable securities and various relationships between securities which are generally recognized by institutional traders. Broker-dealer bid quotations may also be used to value debt and equity securities where a pricing service does not price a security or where a pricing service does not provide a reliable price for the security. In instances where broker-dealer bid quotations are not available, certain securities held by the Funds may be valued on the basis of a price provided by a principal market maker. Forward foreign currency contracts are valued utilizing interpolated prices determined from information provided by an independent pricing service. Short-term obligations purchased with an original or remaining maturity of sixty days or less are valued at amortized cost, which approximates market value. Investments in other open-end investment companies are valued at their net asset value each day. Securities for which market quotations are not readily available are valued at fair value as determined in good faith by the Funds’ investment adviser using consistently applied procedures under the general supervision of the Board of Trustees.
The Funds may hold securities traded in foreign markets. Foreign securities are valued at the market price in the foreign market. However, if events occurring after the close of the foreign market (but before the close of regular trading on the New York Stock Exchange) are believed to materially affect the value of those securities, such securities are fair valued pursuant to procedures approved by the Board of Trustees. When fair valuing securities, the Funds may, among other things, use modeling tools or other processes that may take into account factors such as securities market activity and/or significant events that occur after the close of the foreign market and before the Funds calculate their net asset values.
b. Investment Transactions and Related Investment Income. Investment transactions are accounted for on a trade date plus one basis for daily net asset value calculation. However, for financial reporting purposes, investment transactions are reported on trade date. Dividend income is recorded on ex-dividend date, or in the case of certain foreign securities, as soon as a Fund is notified, and interest income is recorded on an accrual basis. Interest income is increased by the accretion of discount and decreased by the amortization of premium. Distributions received from investments in securities that represent a return of capital or capital gain are recorded as a reduction of cost of investments or as a realized gain, respectively. The calendar year-end amounts of ordinary income, capital gains, and return of capital included in distributions received from the Funds’ investments in real estate investment trusts (“REITs”) are reported to the Funds after the end of the fiscal year; accordingly, the Funds estimate these amounts for accounting purposes until the characterization of REIT distributions is reported to the Funds after the end of the fiscal year. Estimates are based on the most recent REIT
| 30
Notes to Financial Statements – continued
March 31, 2011 (Unaudited)
distribution information available. Investment income is recorded net of foreign taxes withheld when applicable. In determining net gain or loss on securities sold, the cost of securities has been determined on an identified cost basis. Investment income, non-class specific expenses and realized and unrealized gains and losses are allocated on a pro rata basis to each class based on the relative net assets of each class to the total net assets of the Fund.
c. Foreign Currency Translation. The books and records of the Funds are maintained in U.S. dollars. The values of securities, currencies and other assets and liabilities denominated in currencies other than U.S. dollars are translated into U.S. dollars based upon foreign exchange rates prevailing at the end of the period. Purchases and sales of investment securities, income and expenses are translated on the respective dates of such transactions.
Since the values of investment securities are presented at the foreign exchange rates prevailing at the end of the period, it is not practical to isolate that portion of the results of operations arising from changes in exchange rates from fluctuations which arise due to changes in market prices of investment securities. Such changes are included with the net realized and unrealized gain or loss on investments.
Net realized foreign exchange gains or losses arise from sales of foreign currency, currency gains or losses realized between the trade and settlement dates on securities transactions and the difference between the amounts of dividends, interest and foreign withholding taxes recorded on the Funds’ books and the U.S. dollar equivalent of the amounts actually received or paid. Net unrealized foreign exchange gains and losses arise from changes in the value of assets and liabilities, other than investment securities, at the end of the fiscal period, resulting from changes in exchange rates.
Each Fund may use foreign currency exchange contracts to facilitate transactions in foreign-denominated investments. Losses may arise from changes in the value of the foreign currency or if the counterparties do not perform under the contracts’ terms.
d. Federal and Foreign Income Taxes. Each Trust treats each Fund as a separate entity for federal income tax purposes. Each Fund intends to meet the requirements of the Internal Revenue Code of 1986, as amended, applicable to regulated investment companies, and to distribute to its shareholders substantially all of its net investment income and any net realized capital gains at least annually. Management has performed an analysis of each Fund’s tax positions for the open tax years as of March 31, 2011 and has concluded that no provisions for income tax are required. The Funds’ federal tax returns for the prior three fiscal years remain subject to examination by the Internal Revenue Service. Management is not aware of any events that are reasonably possible to occur in the next six months that would result in the amounts of any unrecognized tax benefits significantly increasing or decreasing for the Funds. However, management’s conclusions regarding tax positions taken may be subject to review and adjustment at a later date based on factors including, but not limited to, new tax laws and accounting regulations and interpretations thereof.
31 |
Notes to Financial Statements – continued
March 31, 2011 (Unaudited)
A Fund may be subject to foreign taxes on income and gains on investments that are accrued based upon the Fund’s understanding of the tax rules and regulations that exist in the countries in which the Fund invests. Foreign governments may also impose taxes or other payments on investments with respect to foreign securities. Such taxes are accrued as applicable.
e. Dividends and Distributions to Shareholders. Dividends and distributions are recorded on ex-dividend date. The timing and characterization of certain income and capital gain distributions are determined annually in accordance with federal tax regulations, which may differ from accounting principles generally accepted in the United States of America. Permanent differences are primarily due to differing treatments for book and tax purposes of items such as expired capital loss carryforwards, distribution redesignations and net operating losses. Permanent book and tax basis differences relating to shareholder distributions will result in reclassifications to capital accounts. Temporary differences between book and tax distributable earnings are primarily due to securities lending collateral gain/loss adjustment, deferred Trustees’ fees and wash sales. Distributions from net investment income and short-term capital gains are considered to be distributed from ordinary income for tax purposes.
The tax characterization of distributions is determined on an annual basis. The tax character of distributions paid to shareholders during the year ended September 30, 2010 was as follows:
| | | | | | | | | | | | |
| | | 2010 Distributions Paid From: | |
Fund | | Ordinary
Income | | | Long-Term
Capital Gains | | | Total | |
Small Cap Growth Fund | | $ | — | | | $ | — | | | $ | — | |
Small Cap Value Fund | | | 2,321,057 | | | | — | | | | 2,321,057 | |
As of September 30, 2010, the capital loss carryforwards were as follows:
| | | | | | | | |
| Capital loss carryforward: | | Small Cap
Growth Fund | | | Small Cap
Value Fund | |
Expires September 30, 2011 | | $ | (59,283,040 | ) | | $ | — | |
Expires September 30, 2017 | | | (14,995,800 | ) | | | (88,137,321 | ) |
Expires September 30, 2018 | | | (11,885,718 | ) | | | (58,500,125 | ) |
| | | | | | | | |
Total capital loss carryforward | | $ | (86,164,558 | ) | | $ | (146,637,446 | ) |
| | | | | | | | |
On December 22, 2010, the Regulated Investment Company Modernization Act of 2010 (the “Act”) was enacted. The Act modernizes several of the federal income and excise tax provisions related to RICs, and, with certain exceptions, is effective for taxable years beginning after December 22, 2010. Among the changes made are changes to the capital loss carryforward rules allowing for capital losses to be carried forward indefinitely. Rules in effect as of the report date limit the carryforward period to eight years. Capital loss carryforwards generated in taxable years beginning after effective date of the Act must be
| 32
Notes to Financial Statements – continued
March 31, 2011 (Unaudited)
fully used before capital loss carryforwards generated in taxable years prior to effective date of the Act; therefore, under certain circumstances, capital loss carryforwards available as of the report date, if any, may expire unused.
f. Repurchase Agreements. It is each Fund’s policy that the market value of the collateral for repurchase agreements be at least equal to 102% of the repurchase price, including interest. Certain repurchase agreements are tri-party arrangements whereby the collateral is held in a segregated account for the benefit of the Fund and on behalf of the counterparty. Repurchase agreements could involve certain risks in the event of default or insolvency of the counterparty, including possible delays or restrictions upon a Fund’s ability to dispose of the underlying securities.
g. Securities Lending. The Funds have entered into an agreement with State Street Bank and Trust Company (“State Street Bank”), as agent of the Funds, to lend securities to certain designated borrowers. The loans are collateralized with cash or securities in an amount equal to at least 105% or 102% of the market value (including accrued interest) of the loaned international or domestic securities, respectively, when the loan is initiated. Thereafter, the value of the collateral must remain at least 102% of the market value (including accrued interest) of loaned securities for U.S. equities and U.S. corporate debt; at least 105% of the market value (including accrued interest) of loaned securities for non-U.S. equities; and at least 100% of the market value (including accrued interest) of loaned securities for U.S. Government securities, sovereign debt issued by non-U.S. Governments and non-U.S. corporate debt. In the event that the market value of the collateral falls below the required percentages described above, the borrower will deliver additional collateral on the next business day. As with other extensions of credit, the Funds may bear the risk of loss with respect to the investment of the collateral. The Funds invest cash collateral in short-term investments, a portion of the income from which is remitted to the borrowers and the remainder allocated between the Funds and State Street Bank as lending agent.
For the six months ended March 31, 2011, none of the Funds had loaned securities under this agreement.
h. Indemnifications. Under the Trusts’ organizational documents, their officers and Trustees are indemnified against certain liabilities arising out of the performance of their duties to the Funds. Additionally, in the normal course of business, the Funds enter into contracts with service providers that contain general indemnification clauses. The Funds’ maximum exposure under these arrangements is unknown as this would involve future claims that may be made against the Funds that have not yet occurred. However, based on experience, the Funds expect the risk of loss to be remote.
3. Fair Value Measurements. In accordance with accounting standards related to fair value measurements and disclosures, the Funds have categorized the inputs utilized in
33 |
Notes to Financial Statements – continued
March 31, 2011 (Unaudited)
determining the value of each Fund’s assets or liabilities. These inputs are summarized in the three broad levels listed below:
| | • | | Level 1—quoted prices in active markets for identical assets or liabilities; |
| | • | | Level 2—prices determined using other significant inputs that are observable either directly, or indirectly through corroboration with observable market data (which could include quoted prices for similar assets or liabilities, interest rates, credit risk, etc.); |
| | • | | Level 3—prices determined using significant unobservable inputs when quoted prices or observable inputs are unavailable such as when there is little or no market activity for an asset or liability (unobservable inputs reflect each Fund’s own assumptions in determining the fair value of assets or liabilities and would be based on the best information available). |
The inputs or methodology used for valuing securities are not necessarily an indication of the risk associated with investing in those securities.
The following is a summary of the inputs used to value the Funds’ investments as of March 31, 2011, at value:
Small Cap Growth Fund
Asset Valuation Inputs
| | | | | | | | | | | | | | | | |
Description(a) | | Level 1 | | | Level 2 | | | Level 3 | | | Total | |
Common Stocks | | $ | 238,295,871 | | | $ | — | | | $ | — | | | $ | 238,295,871 | |
Short-Term Investments | | | — | | | | 16,104,356 | | | | — | | | | 16,104,356 | |
| | | | | | | | | | | | | | | | |
Total | | $ | 238,295,871 | | | $ | 16,104,356 | | | $ | — | | | $ | 254,400,227 | |
| | | | | | | | | | | | | | | | |
(a) Major categories of the Fund’s investments are included in the Portfolio of Investments.
Small Cap Value Fund
Asset Valuation Inputs
| | | | | | | | | | | | | | | | |
Description(a) | | Level 1 | | | Level 2 | | | Level 3 | | | Total | |
Common Stocks | | $ | 1,109,838,104 | | | $ | — | | | $ | — | | | $ | 1,109,838,104 | |
Short-Term Investments | | | — | | | | 35,067,817 | | | | — | | | | 35,067,817 | |
| | | | | | | | | | | | | | | | |
Total | | $ | 1,109,838,104 | | | $ | 35,067,817 | | | $ | — | | | $ | 1,144,905,921 | |
| | | | | | | | | | | | | | | | |
| (a) | Major categories of the Fund’s investments are included in the Portfolio of Investments. | |
4. Purchases and Sales of Securities. For the six months ended March 31, 2011, purchases and sales of securities (excluding short-term investments) were as follows:
| | | | | | | | |
Fund | | Purchases | | | Sales | |
Small Cap Growth Fund | | $ | 132,000,138 | | | $ | 68,953,957 | |
Small Cap Value Fund | | | 247,614,342 | | | | 273,055,808 | |
| 34
Notes to Financial Statements – continued
March 31, 2011 (Unaudited)
5. Management Fees and Other Transactions with Affiliates.
a. Management Fees. Loomis, Sayles & Company, L.P. (“Loomis Sayles”) serves as investment adviser to each Fund. Under the terms of the management agreements, each Fund pays a management fee at the following annual rates, calculated daily and payable monthly, based on each Fund’s average daily net assets:
| | |
Fund | | Percentage of
Average Daily Net Assets |
Small Cap Growth Fund | | 0.75% |
Small Cap Value Fund | | 0.75% |
Loomis Sayles has given binding undertakings to the Funds to waive management fees and/or reimburse certain expenses to limit the Funds’ operating expenses, exclusive of acquired fund fees and expenses, brokerage expenses, interest expense, taxes and extraordinary expenses. These undertakings are in effect until January 31, 2012 and are reevaluated on an annual basis. Management fees payable, as reflected on the Statements of Assets and Liabilities, is net of waivers and/or expense reimbursements, if any, pursuant to these undertakings.
For the six months ended March 31, 2011, the expense limits as a percentage of average daily net assets under the expense limitation agreements were as follows:
| | | | | | |
| | | Expense Limit as a Percentage of
Average Daily Net Assets |
Fund | | Institutional Class | | Retail Class | | Admin Class |
Small Cap Growth Fund | | 1.00% | | 1.25% | | — |
Small Cap Value Fund | | 0.90% | | 1.15% | | 1.40% |
Loomis Sayles shall be permitted to recover expenses it has borne under the expense limitation agreements (whether through waiver of its management fees or otherwise) on a class by class basis in later periods to the extent the expenses of a class fall below a class’ expense limits, provided, however, that a class is not obligated to pay such waived/reimbursed fees or expenses more than one year after the end of the fiscal year in which the fees or expenses were waived/reimbursed.
For the six months ended March 31, 2011, the management fees for each Fund were as follows:
| | | | | | |
Fund | | Management
Fees | | | Percentage of
Average Daily Net Assets |
Small Cap Growth Fund | | $ | 678,739 | | | 0.75% |
Small Cap Value Fund | | | 3,876,424 | | | 0.75% |
For the six months ended March 31, 2011, class-specific expenses have been reimbursed as follows:
| | | | | | | | | | | | | | | | |
| | | Reimbursement1 | |
Fund | | Institutional
Class | | | Retail
Class | | | Admin
Class | | | Total | |
Small Cap Growth Fund | | $ | — | | | $ | 20,098 | | | $ | — | | | $ | 20,098 | |
Small Cap Value Fund | | | 83,694 | | | | 160,951 | | | | 49,835 | | | | 294,480 | |
1Expense reimbursements are subject to possible recovery until September 30, 2012.
35 |
Notes to Financial Statements – continued
March 31, 2011 (Unaudited)
For the six months ended March 31, 2011, expense reimbursements related to the prior fiscal year were recovered as follows:
| | | | | | | | | | | | |
| | | Recovered Expenses | |
Fund | | Institutional
Class | | | Retail Class | | | Total | |
Small Cap Growth Fund | | $ | 20,355 | | | $ | — | | | $ | 20,355 | |
Certain officers and employees of Loomis Sayles are also officers or Trustees of the Trust. Loomis Sayles’ general partner is indirectly owned by Natixis Global Asset Management, L.P. (“Natixis US”), which is part of Natixis Global Asset Management, an international asset management group based in Paris, France.
b. Service and Distribution Fees. Natixis Distributors, L.P. (“Natixis Distributors”), a wholly-owned subsidiary of Natixis US, has entered into a distribution agreement with the Trusts. Pursuant to this agreement, Natixis Distributors serves as principal underwriter of the Funds of the Trusts.
Pursuant to Rule 12b-1 under the 1940 Act, Small Cap Growth Fund and Small Cap Value Fund have adopted a Distribution Plan relating to each Fund’s Retail Class shares (the “Retail Class Plans”) and Small Cap Value Fund has adopted a Distribution Plan relating to its Admin Class shares (the “Admin Class Plan”).
Under the Retail Class Plans, each Fund pays Natixis Distributors a monthly distribution fee at an annual rate not to exceed 0.25% of the average daily net assets attributable to the Funds’ Retail Class shares, as compensation for services provided by Natixis Distributors in connection with the marketing or sale of Retail Class shares or for payments made by Natixis Distributors to securities dealers or other financial intermediaries as commissions, asset-based sales charges or other compensation with respect to the sale of Retail Class shares, or for providing personal services to investors and/or maintenance of shareholder accounts.
Under the Admin Class Plan, Small Cap Value Fund pays Natixis Distributors a monthly distribution fee at an annual rate not to exceed 0.25% of the average daily net assets attributable to the Fund’s Admin Class shares, as compensation for services provided by Natixis Distributors in connection with the marketing or sale of Admin Class shares or for payments made by Natixis Distributors to securities dealers or other financial intermediaries as commissions, asset-based sales charges or other compensation with respect to the sale of Admin Class shares, or for providing personal services to investors and/or the maintenance of shareholder accounts.
In addition, the Admin Class shares of Small Cap Value Fund may pay Natixis Distributors an administrative service fee, at an annual rate not to exceed 0.25% of the average daily net assets attributable to Admin Class shares. These fees are subsequently paid to securities dealers or financial intermediaries for providing personal services and/or account maintenance for their customers who hold such shares.
| 36
Notes to Financial Statements – continued
March 31, 2011 (Unaudited)
For the six months ended March 31, 2011, the Funds paid the following service and distribution fees:
| | | | | | | | | | | | |
| | | Service Fees | | | Distribution Fees | |
Fund | | Admin Class | | | Retail Class | | | Admin Class | |
Small Cap Growth Fund | | $ | — | | | $ | 123,948 | | | $ | — | |
Small Cap Value Fund | | | 103,146 | | | | 537,883 | | | | 103,146 | |
c. Administrative Fees. Natixis Asset Management Advisors, L.P. (“Natixis Advisors”) provides certain administrative services for the Funds and contracts with State Street Bank to serve as sub-administrator. Natixis Advisors is a wholly-owned subsidiary of Natixis US. Pursuant to an agreement among Natixis Funds Trust I, Natixis Funds Trust II, Natixis Funds Trust IV, Natixis Cash Management Trust, Gateway Trust (“Natixis Funds Trusts”), Loomis Sayles Funds I, Loomis Sayles Funds II (“Loomis Sayles Funds Trusts”), Hansberger International Series and Natixis Advisors, each Fund pays Natixis Advisors monthly its pro rata portion of fees equal to an annual rate of 0.0575% of the first $15 billion of the average daily net assets of the Natixis Funds Trusts, Loomis Sayles Funds Trusts and Hansberger International Series, 0.0500% of the next $15 billion, 0.0400% of the next $30 billion and 0.0350% of such assets in excess of $60 billion, subject to an annual aggregate minimum fee for the Natixis Funds Trusts, Loomis Sayles Funds Trusts and Hansberger International Series of $10 million, which is reevaluated on an annual basis. New funds are subject to a fee for the first twelve months of operations of $75,000 plus $12,500 per additional class and an additional $75,000 if managed by multiple subadvisers.
For the six months ended March 31, 2011, each Fund paid the following administrative fees to Natixis Advisors:
| | | | |
Fund | | Administrative
Fees | |
Small Cap Growth Fund | | $ | 42,270 | |
Small Cap Value Fund | | | 241,468 | |
d. Sub-Transfer Agent Fees. Natixis Distributors has entered into agreements with financial intermediaries to provide certain recordkeeping, processing, shareholder communications and other services to customers of the intermediaries and has agreed to compensate the intermediaries for providing those services. Certain services would be provided by the Funds if the shares of those customers were registered directly with the Funds’ transfer agent. Accordingly, the Funds agreed to pay a portion of the intermediary fees attributable to shares of the Fund held by the intermediaries (which generally is a percentage of the value of shares held) not to exceed what the Funds would have paid its transfer agent had each customer’s shares been registered directly with the transfer agent instead of held through the intermediaries. Natixis Distributors pays the remainder of the fees.
37 |
Notes to Financial Statements – continued
March 31, 2011 (Unaudited)
For the six months ended March 31, 2011, the Funds paid the following sub-transfer agent fees, which are reflected in transfer agent fees and expenses in the Statements of Operations:
| | | | | | | | | | | | |
| | | Sub-Transfer Agent Fees | |
Fund | | Institutional
Class | | | Retail Class | | | Admin
Class | |
Small Cap Growth Fund | | $ | 21,215 | | | $ | 29,301 | | | $ | — | |
Small Cap Value Fund | | | 209,839 | | | | 274,357 | | | | 74,719 | |
e. Trustees Fees and Expenses. The Trusts do not pay any compensation directly to their officers or Trustees who are directors, officers or employees of Natixis Advisors, Natixis Distributors, Natixis US or their affiliates. The Chairperson of the Board receives a retainer fee at the annual rate of $250,000. The Chairperson does not receive any meeting attendance fees for Board of Trustees meetings or committee meetings that she attends. Each Independent Trustee (other than the Chairperson) receives, in the aggregate, a retainer fee at the annual rate of $80,000. Each Independent Trustee also receives a meeting attendance fee of $10,000 for each meeting of the Board of Trustees that he or she attends in person and $5,000 for each meeting of the Board of Trustees that he or she attends telephonically. In addition, each committee chairman receives an additional retainer fee at an annual rate of $15,000. Each Contract Review and Governance Committee member is compensated $6,000 for each Committee meeting that he or she attends in person and $3,000 for each meeting that he or she attends telephonically. Each Audit Committee member is compensated $7,500 for each Committee meeting that he or she attends in person and $3,750 for each meeting that he or she attends telephonically. These fees are allocated among the funds in the Natixis Funds Trusts, Loomis Sayles Funds Trusts and Hansberger International Series based on a formula that takes into account, among other factors, the relative net assets of each fund. Trustees are reimbursed for travel expenses in connection with attendance at meetings.
A deferred compensation plan (the “Plan”) is available to the Trustees on a voluntary basis. Deferred amounts remain in the Funds until distributed in accordance with the provisions of the Plan. The value of a participating Trustee’s deferral account is based on theoretical investments of deferred amounts, on the normal payment dates, in certain funds of the Natixis Funds Trusts, Loomis Sayles Funds Trusts and Hansberger International Series as designated by the participating Trustees. Changes in the value of participants’ deferral accounts are allocated pro rata among the funds in the Natixis Funds Trusts, Loomis Sayles Funds Trusts, and Hansberger International Series, and are normally reflected as Trustees’ fees and expenses in the Statements of Operations. The portions of the accrued obligations allocated to the Funds under the Plan are reflected as Deferred Trustees’ fees in the Statements of Assets and Liabilities.
f. Payments by Affiliates. For the six months ended March 31, 2011, Loomis Sayles reimbursed Small Cap Growth Fund $36 for losses incurred in connection with a trading error.
| 38
Notes to Financial Statements – continued
March 31, 2011 (Unaudited)
6. Class Specific Expenses. For the six months ended March 31, 2011, the Funds paid the following class-specific transfer agent fees and expenses (including sub-transfer agent fees):
| | | | | | | | | | | | |
| | | Transfer Agent Fees and Expenses | |
Fund | | Institutional
Class | | | Retail Class | | | Admin
Class | |
Small Cap Growth Fund | | $ | 22,608 | | | $ | 72,501 | | | $ | — | |
Small Cap Value Fund | | | 253,033 | | | | 301,579 | | | | 76,839 | |
7. Line of Credit. Each Fund, together with certain other funds of Natixis Funds Trusts, Loomis Sayles Funds Trusts and Hansberger International Series, participates in a $200,000,000 committed unsecured line of credit provided by State Street Bank, with an individual limit of $125,000,000 for each fund that participates in the line of credit. Interest is charged to each participating fund based on its borrowings at a rate per annum equal to the greater of the Federal Funds rate or overnight LIBOR, plus 1.25%. In addition, a commitment fee of 0.15% per annum, payable at the end of each calendar quarter, is accrued and apportioned among the participating funds based on their average daily unused portion of the line of credit.
Effective April 21, 2011, each Fund, together with certain other funds of Natixis Funds Trusts, Loomis Sayles Funds Trusts and Hansberger International Series, will participate in a $200,000,000 committed unsecured line of credit provided by State Street Bank, with an individual limit of $125,000,000 for each fund that will participate in the line of credit. Interest will be charged to each participating fund based on its borrowings at a rate per annum equal to the greater of the Federal Funds rate or overnight LIBOR, plus 1.25%. In addition, a commitment fee of 0.125% per annum, payable at the end of each calendar quarter, will be accrued and apportioned among the participating funds based on their average daily unused portion of the line of credit.
For the six months ended March 31, 2011, none of the Funds had borrowings under these agreements.
8. Brokerage Commission Recapture. Each Fund has entered into agreements with certain brokers whereby the brokers will rebate a portion of brokerage commissions. All amounts rebated by the brokers are returned to the Funds under such agreements and are included in realized gains on investments in the Statements of Operations. For the six months ended March 31, 2011, amounts rebated under these agreements were as follows:
| | | | |
Fund | | Rebates | |
Small Cap Growth Fund | | $ | 10,256 | |
Small Cap Value Fund | | | 67,389 | |
9. Concentration of Ownership. At March 31, 2011, Loomis Sayles Funded Pension Plan and Trust (“Pension Plan”) and the Loomis Sayles Employees’ Profit Sharing Retirement Plan (“Retirement Plan”) held shares of beneficial interest in the Funds as follows:
| | | | | | | | |
Fund | | Pension Plan | | | Retirement Plan | |
Small Cap Growth Fund | | | 356,240 | | | | 420,374 | |
Small Cap Value Fund | | | 394,254 | | | | 730,654 | |
39 |
Notes to Financial Statements – continued
March 31, 2011 (Unaudited)
From time to time, the Funds may have a concentration of several shareholders having a significant percentage of shares outstanding. Investment activities of these shareholders could have material impacts on the Funds. As of March 31, 2011, one shareholder account owned more than 5% of Small Cap Growth Fund’s total outstanding shares, representing 5.30% of the Fund’s net assets. Such ownership may be beneficially held by individuals or entities other than the owner of record.
10. Capital Shares. Each Fund may issue an unlimited number of shares of beneficial interest, without par value. Transactions in capital shares were as follows:
| | | | | | | | | | | | | | | | |
| | | Small Cap Growth Fund | |
| | | Six Months Ended
March 31, 2011 | | | Year Ended
September 30, 2010 | |
| Institutional Class | | Shares | | | Amount | | | Shares | | | Amount | |
Issued from the sale of shares | | | 3,332,975 | | | $ | 55,477,806 | | | | 942,038 | | | $ | 12,157,438 | |
Issued in connection with the reinvestment of distributions | | | — | | | | — | | | | — | | | | — | |
Redeemed | | | (575,534 | ) | | | (9,643,306 | ) | | | (1,134,399 | ) | | | (14,055,822 | ) |
| | | | | | | | | | | | | | | | |
Net change | | | 2,757,441 | | | $ | 45,834,500 | | | | (192,361 | ) | | $ | (1,898,384 | ) |
| | | | | | | | | | | | | | | | |
| Retail Class | | | | | | | | | | | | |
Issued from the sale of shares | | | 2,572,111 | | | $ | 40,906,269 | | | | 1,649,726 | | | $ | 20,206,682 | |
Issued in connection with the reinvestment of distributions | | | — | | | | — | | | | — | | | | — | |
Redeemed | | | (951,624 | ) | | | (15,292,166 | ) | | | (2,822,162 | ) | | | (35,343,638 | ) |
| | | | | | | | | | | | | | | | |
Net change | | | 1,620,487 | | | $ | 25,614,103 | | | | (1,172,436 | ) | | $ | (15,136,956 | ) |
| | | | | | | | | | | | | | | | |
Increase (decrease) from capital share transactions | | | 4,377,928 | | | $ | 71,448,603 | | | | (1,364,797 | ) | | $ | (17,035,340 | ) |
| | | | | | | | | | | | | | | | |
| 40
Notes to Financial Statements – continued
March 31, 2011 (Unaudited)
10. Capital Shares (continued)
| | | | | | | | | | | | | | | | |
| | | Small Cap Value Fund | |
| | | Six Months Ended
March 31, 2011 | | | Year Ended
September 30, 2010 | |
| Institutional Class | | Shares | | | Amount | | | Shares | | | Amount | |
Issued from the sale of shares | | | 1,940,008 | | | $ | 51,491,304 | | | | 2,602,888 | | | $ | 56,206,503 | |
Issued in connection with the reinvestment of distributions | | | 114,244 | | | | 3,053,734 | | | | 80,409 | | | | 1,643,559 | |
Redeemed | | | (1,635,183 | ) | | | (43,226,771 | ) | | | (7,355,313 | ) | | | (156,910,081 | ) |
| | | | | | | | | | | | | | | | |
Net change | | | 419,069 | | | $ | 11,318,267 | | | | (4,672,016 | ) | | $ | (99,060,019 | ) |
| | | | | | | | | | | | | | | | |
| Retail Class | | | | | | | | | | | | |
Issued from the sale of shares | | | 1,288,707 | | | $ | 33,912,104 | | | | 1,882,548 | | | $ | 40,646,183 | |
Issued in connection with the reinvestment of distributions | | | 66,486 | | | | 1,762,558 | | | | 25,691 | | | | 521,021 | |
Redeemed | | | (1,647,759 | ) | | | (42,551,105 | ) | | | (3,929,781 | ) | | | (84,156,249 | ) |
| | | | | | | | | | | | | | | | |
Net change | | | (292,566 | ) | | $ | (6,876,443 | ) | | | (2,021,542 | ) | | $ | (42,989,045 | ) |
| | | | | | | | | | | | | | | | |
| Admin Class | | | | | | | | | | | | |
Issued from the sale of shares | | | 630,020 | | | $ | 16,316,416 | | | | 995,292 | | | $ | 21,022,763 | |
Issued in connection with the reinvestment of distributions | | | 5,109 | | | | 133,140 | | | | — | | | | — | |
Redeemed | | | (681,741 | ) | | | (17,563,964 | ) | | | (1,389,922 | ) | | | (29,181,878 | ) |
| | | | | | | | | | | | | | | | |
Net change | | | (46,612 | ) | | $ | (1,114,408 | ) | | | (394,630 | ) | | $ | (8,159,115 | ) |
| | | | | | | | | | | | | | | | |
Increase (decrease) from capital share transactions | | | 79,891 | | | $ | 3,327,416 | | | | (7,088,188 | ) | | $ | (150,208,179 | ) |
| | | | | | | | | | | | | | | | |
41 |

Loomis Sayles High Income Opportunities Fund
Loomis Sayles Securitized Asset Fund
SEMIANNUAL REPORT
MARCH 31, 2011
LOOMIS SAYLES HIGH INCOME OPPORTUNITIES FUND
Fund and manager review
FUND FACTS
Managers:
Matthew Eagan, CFA
Dan Fuss, CFA, CIC
Kathleen Gaffney, CFA
Elaine Stokes
Symbol:
| | |
| Institutional Class | | LSIOX |
Objective:
High current income.
Capital appreciation is the Fund’s secondary objective.
Strategy:
Invests substantially all of its assets, and may invest up to 100% of its assets, in high income securities. High income securities are fixed-income securities that Loomis Sayles believes have the potential to generate relatively high levels of current income.
Fund Inception Date:
April 12, 2004
Net Assets:
$70.7 million
Market Conditions
Strong technical and fundamental factors helped keep the high-yield and equity markets resilient throughout the six-month period, despite several negative events, including headline risk in Japan, the Middle East and North Africa, concerns about European sovereign debt and ratings downgrades for corporate credits in peripheral euro zone countries. The yield curve steadily steepened during the period, driven mostly by shifting growth expectations as economic data continued to improve. With the curve so steep, investors are being compensated for investing further along on the yield curve.
Performance Results
For the six months ended March 31, 2011, Loomis Sayles High Income Opportunities Fund returned 9.06%. The fund outperformed its benchmark, the Barclays Capital U.S. Corporate High-Yield Bond Index, which returned 7.23% for the period.
Explanation of Fund Performance
Our out-of-benchmark allocation to convertible securities made the largest contribution to the fund’s relative return for the period. In particular, strong underlying equity performance from the communications, automotive, technology and healthcare industries drove the favorable performance. In addition, issue selection remained critical within the high-yield space, where we focused on credits with positive fundamentals, low default probability and solid balance sheets. Within the high-yield sector, industrials contributed significantly to absolute and relative performance, particularly among holdings in the technology, communications and energy industries. High-yield utilities also contributed positively, with electric names buoying the sector.
With the yield curve steepening significantly during the period, the fund’s longer duration weighed on performance. The fund had considerable exposure to the middle and the longer portions of the curve. In addition, while exposure to the consumer non-cyclical sector helped on an absolute basis, it weighed on relative performance. Lackluster returns from issues in the pharmaceutical, supermarket, and food and beverage industries put downward pressure on the sector.
Outlook
Strong liquidity, markets in transition, geopolitical turmoil, continued economic recovery and tragic natural disasters garnered significant attention from market participants during the first quarter of 2011. Many of these themes will continue to dominate investor consciousness going forward.
We believe markets remain in transition regarding interest rates, with pressures building both globally and domestically. Globally, growth in many areas of the world remains robust; however, inflation concerns have begun to attract attention. Central banks will likely continue to shift toward less accommodative policy as 2011 progresses. We anticipate the Federal Reserve Board’s program of Treasury purchases in the United States, which is referred to as “QE2” (short for quantitative easing), will end during the second quarter and believe the U.S. economic recovery has sufficient momentum to continue expanding without outsized government stimulus.
Our assessment of the fundamental underpinnings of the corporate sector remains positive. In general, corporations are proceeding conservatively with regard to hiring and capital expenditures. Merger and acquisition activity has increased recently, and we believe there is room for more growth in that space. Valuations in the corporate bond space are generally fair, with investor demand for yield providing support and liquidity to the high-yield, investment-grade and convertible sectors.
We continue to position the fund for global economic recovery, as well as a gradual upward bias in interest rates. We continue to emphasize yield advantage, global diversification and specific bond picking within the fund.
1 |
LOOMIS SAYLES HIGH INCOME OPPORTUNITIES FUND
Average Annual Returns
March 31, 2011
| | | | | | | | | | | | | | | | | | | | |
| | | | | | |
| | | | | | 6 months | | | 1 year | | | 5 years | | | Since
Inception(a) | |
Institutional Class (Inception 4/12/04) | | | | | | | 9.06 | % | | | 15.86 | % | | | 8.95 | % | | | 9.17 | % |
| | | | | | |
COMPARATIVE PERFORMANCE | | | | | | | | | | | | | | | | | | | | |
Barclays Capital U.S. Corporate High-Yield Bond Index(b) | | | | | | | 7.23 | | | | 14.31 | | | | 9.12 | | | | 8.55 | |
Lipper High Current Yield Funds Index(b) | | | | | | | 7.91 | | | | 14.15 | | | | 6.87 | | | | 6.91 | |
| | | | | | |
| Expense Ratio(c) | | | | | | | | | | | | | | | | | | | | |
| Institutional Class: 0.00% | | | | | | | | | | | | | | | | | | | | |
Cumulative Performance
Inception to March 31, 2011
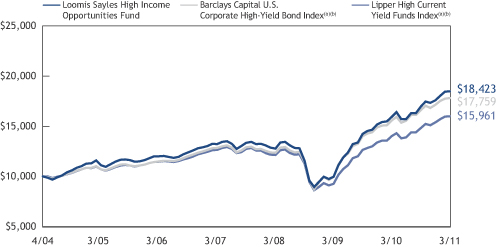
Data quoted reflects past performance and cannot guarantee future results. Total returns assume reinvestment of dividends and capital gains distributions. Investment return and principal value will fluctuate so that shares, when redeemed, may be worth more or less than their original cost. Current performance may be higher or lower than quoted.
Returns do not reflect the taxes that a shareholder would pay on fund distributions or the redemption of shares. Periods of less than one year are not annualized.
| (a) | | Since Index performance data is not available coincident with the fund’s inception date, the beginning value of the Index is the value of the month-end closest to the fund’s inception date. |
| (b) | | See page 5 for a description of the indices. |
| (c) | | The amount shown under Expense Ratio is 0.00% to reflect the fact that the fund does not pay any advisory, administration or distribution and service fees, and that Loomis Sayles has agreed to pay certain expenses of the fund. |
What You Should Know
Investments in the fund are subject to a number of risks. Please see the “Principal Risks” section of the fund’s prospectus. The purchase of fund shares should be seen as a long-term investment.
| 2
LOOMIS SAYLES SECURITIZED ASSET FUND
Fund and manager review
FUND FACTS
Managers:
Clifton Rowe, CFA
Alessandro Pagani, CFA
Symbol:
| | |
| Institutional Class | | LSSAX |
Objective:
High level of current income consistent with capital preservation.
Strategy:
Invests at least 80% of its net assets (plus any borrowings made for investment purposes) in a diversified portfolio of securitized assets, such as mortgage-backed and other asset-backed securities.
Fund Inception Date:
March 2, 2006
Net Assets:
$690.2 million
Market Conditions
Sentiment generally remained healthy in the domestic financial markets, despite disruptions abroad, including sovereign debt concerns in Europe, civil unrest in the Middle East and North Africa and the earthquake in Japan. While the Federal Reserve Board (the Fed) maintained its low-interest-rate policy, stronger macroeconomic data and improved economic growth prospects caused market interest rates to increase slightly. Against a backdrop of low interest rates, investor demand for yield in the U.S. fixed-income markets persisted. Sectors offering a yield advantage benefited.
Performance Results
For the six months ended March 31, 2011, Loomis Sayles Securitized Asset Fund returned 2.29%. The fund outperformed its benchmark, the Barclays Capital U.S. Securitized Bond Index, which returned 0.97% for the period.
Explanation of Fund Performance
A combination of favorable security selection and yield curve positioning helped the fund outperform its benchmark for the six-month period. In addition, our overweight allocation to commercial mortgage-backed securities (CMBS) contributed favorably to performance. The fund’s holdings were primarily senior securities well protected from credit risk and offering compelling value. We acquired the majority of the fund’s CMBS in late 2008 and early 2009, when prices were severely depressed. Since then, they have experienced significant price appreciation, driven by investor demand for yield. In the asset-backed securities (ABS) segment, we favored high quality issues, including auto equipment-backed securities, which performed well. The fund’s shorter average duration also contributed positively, as improving economic growth prospects caused rates to rise across the curve. Duration is a measure of interest-rate sensitivity.
Overall, the fund’s higher quality securities detracted from relative performance due to investor preference for lower quality securities during the period, but returns were still positive. Also, a substantial underweight to the 30-year mortgage-backed sector, which outperformed the benchmark, had a slightly negative influence on relative performance. The fund’s overweight allocation to the ABS space detracted from relative results, but this was offset by strong security selection and shorter relative duration within the sector.
Outlook
We expect the Fed will continue its current interest rate policy well into 2011. In the intermediate term, we anticipate interest rates will gradually increase as modest economic growth persists. We are maintaining overweights in CMBS and ABS, and while we expect fundamental weakness to persist in the mortgage and consumer loan market, we believe the securities we currently hold are protected from significant credit risk and can continue to offer favorable risk-adjusted returns. Furthermore, we expect our government-sponsored enterprise (GSE) mortgage positions to benefit from a relatively stable interest rate environment. This sector continues to offer a modest yield advantage with strong credit quality. We will continue to look for opportunities to take advantage of the steep yield curve and will focus on income, rather than price appreciation.
3 |
LOOMIS SAYLES SECURITIZED ASSET FUND
Average Annual Returns
March 31, 2011
| | | | | | | | | | | | | | | | |
| | | | | |
| | | 6 months | | | 1 year | | | 5 years | | | Since
inception(a) | |
| Institutional Class (Inception 3/2/06) | | | 2.29 | % | | | 8.47 | % | | | 7.80 | % | | | 7.61 | % |
| | | | | |
| Comparative Performance | | | | | | | | | | | | | | | | |
| Barclays Capital U.S. Securitized Bond Index(b) | | | 0.97 | | | | 5.01 | | | | 6.31 | | | | 6.03 | |
| Lipper U.S. Mortgage Funds Index(b) | | | 0.61 | | | | 5.20 | | | | 5.63 | | | | 5.40 | |
| | | | | |
| Expense Ratio(c) | | | | | | | | | | | | | | | | |
| Institutional Class: 0.00% | | | | | | | | | | | | | | | | |
Cumulative Performance
Inception to March 31, 2011
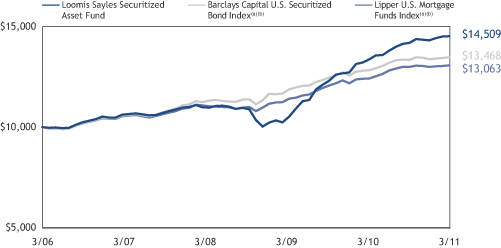
Data quoted reflects past performance and cannot guarantee future results. Total returns assume reinvestment of dividends and capital gains distributions. Investment return and principal value will fluctuate so that shares, when redeemed, may be worth more or less than their original cost. Current performance may be higher or lower than quoted.
Returns do not reflect the taxes that a shareholder would pay on fund distributions or the redemption of shares. Periods of less than one year are not annualized.
| (a) | | Since Index performance data is not available coincident with the fund’s inception date, the beginning value of the Index is the value of the month-end closest to the fund’s inception date. |
| (b) | | See page 5 for a description of the indices. |
| (c) | | The amount shown under Expense Ratio is 0.00% to reflect the fact that the fund does not pay any advisory, administration or distribution and service fees, and that Loomis Sayles has agreed to pay certain expenses of the fund. |
What you should know
Investments in the fund are subject to a number of risks. Please see the “Principal Risks” section of the fund’s prospectus. The purchase of fund shares should be seen as a long-term investment.
| 4
ADDITIONAL INFORMATION
The views expressed in this report reflect those of the portfolio managers as of the dates indicated. The managers’ views are subject to change at any time without notice based on changes in market or other conditions. References to specific securities or industries should not be regarded as investment advice. Because the funds are actively managed, there is no assurance that they will continue to invest in the securities or industries mentioned.
Index Definitions
Barclays Capital U.S. Corporate High-Yield Bond Index is an unmanaged index that covers the U.S.-dollar-denominated, non-investment grade, fixed-rate, taxable corporate bond market.
Barclays Capital U.S. Securitized Bond Index is an unmanaged index of asset-backed securities, collateralized mortgage-backed securities (ERISA-eligible), and fixed-rate mortgage-backed securities.
Lipper High Current Yield Funds Index is an unmanaged index that tracks the average performance of the 30 largest high current yield funds according to Lipper Inc.
Lipper U.S. Mortgage Funds Index is an unmanaged index that tracks the average performance of the 30 largest U.S. mortgage funds according to Lipper Inc.
Source: Lipper, Inc.
Proxy Voting Information
A description of the Funds’ proxy voting policies and procedures is available without charge, upon request, (i) by calling Loomis Sayles at 800-633-3330; (ii) on the Funds’ website, www.loomissayles.com, and (iii) on the Securities and Exchange Commission’s (“SEC’s”) website at www.sec.gov. Information about how the Funds voted proxies relating to portfolio securities during the 12-month period ended June 30, 2010 is available on (i) the Funds’ website and (ii) the SEC’s website.
Quarterly Portfolio Schedules
The Funds file a complete schedule of portfolio holdings with the SEC for the first and third quarters of each fiscal year on Form N-Q. The Funds’ Forms N-Q are available on the SEC’s website at www.sec.gov and may be reviewed and copied at the SEC’s Public Reference Room in Washington, DC. Information on the operation of the Public Reference Room may be obtained by calling 800-SEC-0330.
UNDERSTANDING FUND EXPENSES
Typically, mutual fund shareholders incur two types of costs: (1) transaction costs; and (2) ongoing costs, including management fees, distribution fees (12b-1 fees), and other fund expenses. However, the Funds are unlike other mutual funds; they do not charge any fees or expenses.
You should be aware that shares in the Funds are available only to institutional investment advisory clients of Loomis, Sayles & Company, L.P. (“Loomis Sayles”) and Natixis Asset Management Advisors, L.P. (“Natixis Advisors”) and to participants in “wrap fee” programs sponsored by broker dealers and investment advisers that may be affiliated or unaffiliated with the Funds, Loomis Sayles or Natixis Advisors. The institutional investment advisory clients of Loomis Sayles and Natixis Advisors pay Loomis Sayles or Natixis Advisors a fee for their investment advisory services, while participants in “wrap fee” programs pay a “wrap fee” to the program’s sponsor. The “wrap fee” program sponsors, in turn, pay a fee to Natixis Advisors. “Wrap fee” program participants should read carefully the wrap fee brochure provided to them by their program’s sponsor and the fees paid by such sponsor to Natixis Advisors. Shareholders pay no additional fees or expenses to purchase shares of the Funds. However, shareholders will indirectly pay a proportionate share of those costs, such as brokerage commissions, taxes and extraordinary expenses, that are borne by the Funds through a reduction in each Fund’s net asset value.
The first line in each Fund’s table shows the actual amount of Fund expenses ($0) you would have paid on a $1,000 investment in the Fund from October 1, 2010 through March 31, 2011. It also shows how much a $1,000 investment would be worth at the close of the period, assuming actual Fund returns and expenses.
The second line in each Fund’s table provides information about hypothetical account values and hypothetical expenses based on the Fund’s actual expense ratio (0%) and an assumed rate of return of 5% per year before expenses, which is not the Fund’s actual return. The hypothetical account values and expenses may not be used to estimate the actual ending account balance or expenses you paid on your investment for the period. You may use this information to compare the ongoing costs of investing in the Funds and other funds. To do so, compare this 5% hypothetical example with the 5% hypothetical examples that appear in the shareholder reports of the other funds.
5 |
Please note that the expenses shown reflect ongoing costs only, and do not include any transaction costs. Therefore, the second line in the table is useful in comparing ongoing costs only, and will not help you determine the relative costs of owning different funds. If transaction costs were included, total costs would be higher.
Loomis Sayles High Income Opportunities Fund
| | | | | | | | | | | | |
Institutional Class | | Beginning
Account Value
10/1/2010 | | | Ending
Account Value
3/31/2011 | | | Expenses Paid
During Period*
10/1/2010 – 3/31/2011 | |
Actual | | | $1,000.00 | | | | $1,090.60 | | | | $0.00 | |
Hypothetical (5% return before expenses) | | | $1,000.00 | | | | $1,024.93 | | | | $0.00 | |
* Expenses are equal to the Fund’s annualized expense ratio: 0.00%, multiplied by the average account value over the period, multiplied by the number of days in the most recent fiscal half-year, divided by 365 (to reflect the half-year period). | |
Loomis Sayles Securitized Asset Fund
| | | | | | | | | | | | |
Institutional Class | | Beginning
Account Value
10/1/2010 | | | Ending
Account Value
3/31/2011 | | | Expenses Paid
During Period*
10/1/2010 – 3/31/2011 | |
Actual | | | $1,000.00 | | | | $1,022.90 | | | | $0.00 | |
Hypothetical (5% return before expenses) | | | $1,000.00 | | | | $1,024.93 | | | | $0.00 | |
* Expenses are equal to the Fund’s annualized expense ratio: 0.00%, multiplied by the average account value over the period, multiplied by the number of days in the most recent fiscal half-year, divided by 365 (to reflect the half-year period). | |
| 6
Portfolio of Investments – as of March 31, 2011 (Unaudited)
Loomis Sayles High Income Opportunities Fund
| | | | | | | | |
Principal
Amount | | | Description | | Value (†) | |
| | | | | | | | |
| |
| | Bonds and Notes – 85.6% of Net Assets | | | | |
| |
| | Non-Convertible Bonds – 73.8% | | | | |
| | |
| | | | ABS Home Equity – 1.0% | | | | |
| $ | 80,000 | | | Countrywide Asset-Backed Certificates,
Series 2004-13, Class AF5B,
5.103%, 5/25/2035 | | $ | 67,927 | |
| | 75,000 | | | New Century Home Equity Loan Trust,
Series 2005-1, Class M3,
0.770%, 3/25/2035(b) | | | 47,907 | |
| | 125,000 | | | New Century Home Equity Loan Trust,
Series 2005-2, Class M2,
0.700%, 6/25/2035(b) | | | 96,204 | |
| | 75,000 | | | Park Place Securities, Inc.,
Series 2004-WCW2, Class M2,
0.900%, 10/25/2034(b) | | | 58,468 | |
| | 225,000 | | | Park Place Securities, Inc.,
Series 2005-WCW2, Class M1,
0.750%, 7/25/2035(b) | | | 165,592 | |
| | 109,858 | | | Saxon Asset Securities Trust,
Series 2004-3, Class M2,
0.900%, 12/26/2034(b) | | | 91,981 | |
| | 116,391 | | | Structured Asset Investment Loan Trust,
Series 2004-9, Class M1,
0.900%, 10/25/2034(b) | | | 73,743 | |
| | 143,306 | | | Structured Asset Securities Corp.,
Series 2007-EQ1, Class A2,
0.340%, 3/25/2037(b) | | | 103,874 | |
| | | | | | | | |
| | | | | | | 705,696 | |
| | | | | | | | |
| | | | ABS Other – 0.1% | | | | |
| | 60,873 | | | Diamond Resorts Owner Trust,
Series 2009-1, Class B,
12.000%, 3/20/2026, 144A | | | 57,520 | |
| | | | | | | | |
| | | | Aerospace & Defense – 1.2% | | | | |
| | 885,000 | | | Bombardier, Inc.,
7.450%, 5/01/2034, 144A | | | 849,600 | |
| | | | | | | | |
| | | | Airlines – 2.6% | | | | |
| | 20,294 | | | American Airlines Pass Through Trust,
Series 1993-A6,
8.040%, 9/16/2011 | | | 20,294 | |
| | 116,114 | | | Continental Airlines Pass Through Trust,
Series 1997-1, Class A,
7.461%, 10/01/2016 | | | 117,420 | |
| | 38,192 | | | Continental Airlines Pass Through Trust,
Series 1997-4, Class B,
6.900%, 7/02/2018 | | | 38,097 | |
| | 84,427 | | | Continental Airlines Pass Through Trust,
Series 1998-1, Class B,
6.748%, 9/15/2018 | | | 85,061 | |
| | 99,555 | | | Continental Airlines Pass Through Trust,
Series 1999-1, Class B,
6.795%, 2/02/2020 | | | 97,564 | |
| | 6,370 | | | Continental Airlines Pass Through Trust,
Series 2000-2, Class B,
8.307%, 10/02/2019 | | | 6,433 | |
| | 63,297 | | | Continental Airlines Pass Through Trust,
Series 2001-1, Class B,
7.373%, 6/15/2017 | | | 63,455 | |
| | | | | | | | |
Principal
Amount | | | Description | | Value (†) | |
| | | | | | | | |
| | |
| | | | Airlines – continued | | | | |
| $ | 198,000 | | | Delta Air Lines, Inc.,
9.500%, 9/15/2014, 144A | | $ | 210,375 | |
| | 196,224 | | | Delta Air Lines Pass Through Trust,
Series 2007-1, Class A,
6.821%, 2/10/2024 | | | 202,602 | |
| | 589,535 | | | Delta Air Lines Pass Through Trust,
Series 2007-1, Class B,
8.021%, 2/10/2024 | | | 608,695 | |
| | 381,997 | | | Northwest Airlines, Inc.,
Series 2007-1, Class B,
8.028%, 11/01/2017 | | | 389,637 | |
| | | | | | | | |
| | | | | | | 1,839,633 | |
| | | | | | | | |
| | | | Automotive – 2.9% | | | | |
| | 139,000 | | | Cummins, Inc.,
6.750%, 2/15/2027 | | | 145,878 | |
| | 165,000 | | | Ford Motor Co.,
6.625%, 2/15/2028 | | | 160,213 | |
| | 35,000 | | | Ford Motor Co.,
7.125%, 11/15/2025 | | | 33,981 | |
| | 775,000 | | | Ford Motor Co.,
7.450%, 7/16/2031 | | | 839,023 | |
| | 110,000 | | | Ford Motor Co.,
7.500%, 8/01/2026 | | | 110,440 | |
| | 225,000 | | | Ford Motor Credit Co. LLC,
8.000%, 12/15/2016 | | | 255,416 | |
| | 320,000 | | | Goodyear Tire & Rubber Co. (The),
7.000%, 3/15/2028 | | | 300,800 | |
| | 200,000 | | | TRW Automotive, Inc.,
7.250%, 3/15/2017, 144A | | | 220,000 | |
| | | | | | | | |
| | | | | | | 2,065,751 | |
| | | | | | | | |
| | | | Building Materials – 1.4% | | | | |
| | 155,000 | | | Masco Corp.,
6.500%, 8/15/2032 | | | 139,855 | |
| | 130,000 | | | Owens Corning, Inc.,
7.000%, 12/01/2036 | | | 130,446 | |
| | 720,000 | | | USG Corp.,
6.300%, 11/15/2016 | | | 676,800 | |
| | 30,000 | | | USG Corp.,
9.750%, 1/15/2018 | | | 31,425 | |
| | | | | | | | |
| | | | | | | 978,526 | |
| | | | | | | | |
| | | | Chemicals – 2.0% | | | | |
| | 60,000 | | | Georgia Gulf Corp.,
9.000%, 1/15/2017, 144A | | | 65,700 | |
| | 675,000 | | | Hercules, Inc.,
6.500%, 6/30/2029 | | | 567,844 | |
| | 160,000 | | | Hexion US Finance Corp./Hexion Nova Scotia Finance ULC,
9.000%, 11/15/2020, 144A | | | 165,900 | |
| | 110,000 | | | Koppers, Inc.,
7.875%, 12/01/2019 | | | 119,350 | |
| | 148,000 | | | LBI Escrow Corp.,
8.000%, 11/01/2017, 144A | | | 163,170 | |
| | 150,000 | | | Methanex Corp., Senior Note,
6.000%, 8/15/2015 | | | 150,322 | |
| | 160,000 | | | Momentive Performance Materials, Inc.,
9.000%, 1/15/2021, 144A | | | 165,400 | |
| | | | | | | | |
| | | | | | | 1,397,686 | |
| | | | | | | | |
7 |
Portfolio of Investments – as of March 31, 2011 (Unaudited)
Loomis Sayles High Income Opportunities Fund – continued
| | | | | | | | |
Principal
Amount | | | Description | | Value (†) | |
| | | | | | | | |
| |
| | Bonds and Notes – continued | | | | |
| |
| | | | Collateralized Mortgage Obligations – 3.3% | |
| $ | 148,471 | | | Adjustable Rate Mortgage Trust,
Series 2005-10, Class 5A1,
0.510%, 1/25/2036(b) | | $ | 85,064 | |
| | 40,101 | | | American Home Mortgage Investment Trust, Series 2004-3, Class 3A,
2.292%, 10/25/2034(b) | | | 32,821 | |
| | 122,853 | | | Countrywide Alternative Loan Trust,
Series 2005-14, Class 2A1,
0.460%, 5/25/2035(b) | | | 81,821 | |
| | 190,339 | | | Countrywide Home Loan Mortgage Pass Through Trust, Series 2005-2, Class 2A3,
0.590%, 3/25/2035(b) | | | 120,055 | |
| | 161,334 | | | GSR Mortgage Loan Trust,
Series 2005-AR7, Class 2A1,
2.788%, 11/25/2035(b) | | | 144,628 | |
| | 187,807 | | | Impac CMB Trust,
Series 2005-3, Class A1,
0.730%, 8/25/2035(b) | | | 137,972 | |
| | 244,692 | | | Lehman Mortgage Trust,
Series 2005-3, Class 1A6,
0.750%, 1/25/2036(b) | | | 169,838 | |
| | 257,142 | | | Lehman Mortgage Trust,
Series 2007-8, Class 2A1,
6.500%, 9/25/2037 | | | 215,614 | |
| | 220,990 | | | Luminent Mortgage Pass Through Trust,
Series 2006-6, Class A1,
0.450%, 10/25/2046(b) | | | 151,361 | |
| | 108,813 | | | Master Adjustable Rate Mortgages Trust,
Series 2005-2, Class 5A1,
2.637%, 3/25/2035(b) | | | 97,371 | |
| | 315,041 | | | Master Adjustable Rate Mortgages Trust,
Series 2007-1, Class I2A1,
0.410%, 1/25/2047(b) | | | 185,632 | |
| | 44,977 | | | MLCC Mortgage Investors, Inc.,
Series 2004-1, Class 2A1,
2.220%, 12/25/2034(b) | | | 43,198 | |
| | 201,783 | | | Morgan Stanley Mortgage Loan Trust,
Series 2007-15AR, Class 2A1,
4.995%, 11/25/2037(b) | | | 140,489 | |
| | 378,884 | | | Residential Accredit Loans, Inc.,
Series 2006-QA9, Class A1,
0.430%, 11/25/2036(b) | | | 218,282 | |
| | 186,511 | | | WaMu Mortgage Pass Through Certificates, Series 2006-AR11, Class 2A,
2.984%, 9/25/2046(b) | | | 151,657 | |
| | 325,278 | | | Washington Mutual Alternative Mortgage Pass-Through Certificates,
Series 2007-OC1, Class A1,
0.490%, 1/25/2047(b) | | | 144,222 | |
| | 25,527 | | | Wells Fargo Mortgage Backed Securities Trust, Series 2005-AR2, Class 2A2,
2.744%, 3/25/2035(b) | | | 23,029 | |
| | 196,016 | | | Wells Fargo Mortgage Backed Securities Trust, Series 2005-AR4, Class 2A2,
2.753%, 4/25/2035(b) | | | 188,946 | |
| | | | | | | | |
| | | | | | | 2,332,000 | |
| | | | | | | | |
| | | | | | | | |
Principal
Amount | | | Description | | Value (†) | |
| | | | | | | | |
| | |
| | | | Construction Machinery – 0.5% | | | | |
| $ | 200,000 | | | RSC Equipment Rental, Inc./
RSC Holdings III LLC,
8.250%, 2/01/2021, 144A | | $ | 208,000 | |
| | 140,000 | | | Terex Corp.,
8.000%, 11/15/2017 | | | 147,525 | |
| | | | | | | | |
| | | | | | | 355,525 | |
| | | | | | | | |
| | | | Consumer Cyclical Services – 0.0% | | | | |
| | 1,000 | | | KAR Auction Services, Inc.,
10.000%, 5/01/2015 | | | 1,054 | |
| | | | | | | | |
| | | | Consumer Products – 0.2% | | | | |
| | 120,000 | | | Visant Corp.,
10.000%, 10/01/2017 | | | 129,600 | |
| | | | | | | | |
| | | | Diversified Manufacturing – 0.4% | | | | |
| | 249,000 | | | Fibria Overseas Finance Ltd.,
7.500%, 5/04/2020, 144A | | | 270,165 | |
| | | | | | | | |
| | | | Electric – 4.7% | | | | |
| | 20,000 | | | AES Corp. (The),
8.000%, 10/15/2017 | | | 21,500 | |
| | 325,000 | | | AES Corp. (The),
8.000%, 6/01/2020 | | | 351,000 | |
| | 51,200 | | | CE Generation LLC,
7.416%, 12/15/2018 | | | 52,543 | |
| | 300,000 | | | Dubai Electricity & Water Authority,
7.375%, 10/21/2020, 144A | | | 291,000 | |
| | 525,000 | | | Edison Mission Energy,
7.625%, 5/15/2027 | | | 391,125 | |
| | 460,000 | | | NGC Corp. Capital Trust I, Series B,
8.316%, 6/01/2027(c) | | | 234,600 | |
| | 264,000 | | | NSG Holdings LLC,
7.750%, 12/15/2025, 144A | | | 258,720 | |
| | 345,000 | | | RRI Energy, Inc.,
7.875%, 6/15/2017 | | | 342,413 | |
| | 160,000 | | | TXU Corp., Series P,
5.550%, 11/15/2014 | | | 104,800 | |
| | 1,415,000 | | | TXU Corp., Series Q, 6.500%, 11/15/2024 | | | 661,512 | |
| | 515,000 | | | TXU Corp., Series R, 6.550%, 11/15/2034 | | | 236,900 | |
| | 365,000 | | | White Pine Hydro Portfolio LLC, 7.260%, 7/20/2015(c) | | | 346,075 | |
| | | | | | | | |
| | | | | | | 3,292,188 | |
| | | | | | | | |
| | | | Food & Beverage – 0.9% | | | | |
| | 185,000 | | | Blue Merger Sub, Inc., 7.625%, 2/15/2019, 144A | | | 187,544 | |
| | 40,000 | | | Dean Foods Co., 6.900%, 10/15/2017 | | | 37,100 | |
| | 300,000 | | | Dean Foods Co., 7.000%, 6/01/2016 | | | 286,125 | |
| | 110,000 | | | Marfrig Overseas Ltd., 9.625%, 11/16/2016, 144A | | | 116,600 | |
| | | | | | | | |
| | | | | | | 627,369 | |
| | | | | | | | |
| | | | Gaming – 1.1% | | | | |
| | 220,000 | | | Caesars Entertainment Operating Co., Inc., 10.000%, 12/15/2018 | | | 200,750 | |
| | 290,000 | | | MGM Resorts International, 7.500%, 6/01/2016 | | | 274,050 | |
| 8
Portfolio of Investments – as of March 31, 2011 (Unaudited)
Loomis Sayles High Income Opportunities Fund – continued
| | | | | | | | |
Principal
Amount | | | Description | | Value (†) | |
| | | | | | | | |
| |
| | Bonds and Notes – continued | | | | |
| | |
| | | | Gaming – continued | | | | |
| $ | 145,000 | | | MGM Resorts International, 7.625%, 1/15/2017 | | $ | 136,843 | |
| | 115,000 | | | MGM Resorts International, 9.000%, 3/15/2020 | | | 126,069 | |
| | | | | | | | |
| | | | | | | 737,712 | |
| | | | | | | | |
| | | | Government Owned – No Guarantee – 0.8% | |
| | 600,000 | | | DP World Ltd., 6.850%, 7/02/2037, 144A | | | 552,000 | |
| | | | | | | | |
| | | | Healthcare – 5.6% | | | | |
| | 5,000 | | | HCA Holdings, Inc., 7.750%, 5/15/2021, 144A | | | 5,213 | |
| | 120,000 | | | HCA, Inc., 6.375%, 1/15/2015 | | | 122,400 | |
| | 720,000 | | | HCA, Inc., 6.500%, 2/15/2016 | | | 732,600 | |
| | 430,000 | | | HCA, Inc., 7.050%, 12/01/2027 | | | 382,700 | |
| | 30,000 | | | HCA, Inc., 7.500%, 12/15/2023 | | | 28,350 | |
| | 1,240,000 | | | HCA, Inc., 7.500%, 11/06/2033 | | | 1,137,700 | |
| | 160,000 | | | HCA, Inc., 7.690%, 6/15/2025 | | | 152,400 | |
| | 40,000 | | | HCA, Inc., 8.360%, 4/15/2024 | | | 40,000 | |
| | 200,000 | | | HCA, Inc., MTN, 7.580%, 9/15/2025 | | | 188,500 | |
| | 20,000 | | | HCA, Inc., MTN, 7.750%, 7/15/2036 | | | 18,700 | |
| | 330,000 | | | Quintiles Transnational Corp., 9.500%, 12/30/2014, 144A(d) | | | 337,425 | |
| | 1,015,000 | | | Tenet Healthcare Corp., 6.875%, 11/15/2031 | | | 841,181 | |
| | | | | | | | |
| | | | | | | 3,987,169 | |
| | | | | | | | |
| | | | Home Construction – 1.6% | | | | |
| | 290,000 | | | KB Home,
7.250%, 6/15/2018 | | | 284,200 | |
| | 215,000 | | | Lennar Corp.,
6.950%, 6/01/2018 | | | 212,850 | |
| | 495,000 | | | Pulte Group, Inc.,
6.000%, 2/15/2035 | | | 387,337 | |
| | 255,000 | | | Pulte Group, Inc.,
6.375%, 5/15/2033 | | | 207,188 | |
| | | | | | | | |
| | | | | | | 1,091,575 | |
| | | | | | | | |
| | | | Hybrid ARMs – 0.1% | | | | |
| | 174,654 | | | Countrywide Home Loan Mortgage Pass Through Trust, Series 2005-11, Class 3A3, 3.262%, 4/25/2035(b) | | | 89,215 | |
| | | | | | | | |
| | | | Independent Energy – 3.7% | | | | |
| | 260,000 | | | Pioneer Natural Resources Co.,
6.875%, 5/01/2018 | | | 282,219 | |
| | 1,320,000 | | | Pioneer Natural Resources Co.,
7.200%, 1/15/2028 | | | 1,376,479 | |
| | 335,000 | | | QEP Resources, Inc.,
6.875%, 3/01/2021 | | | 351,750 | |
| | | | | | | | |
Principal
Amount | | | Description | | Value (†) | |
| | | | | | | | |
| | |
| | | | Independent Energy – continued | | | | |
| $ | 620,000 | | | Swift Energy Co.,
7.125%, 6/01/2017 | | $ | 633,950 | |
| | | | | | | | |
| | | | | | | 2,644,398 | |
| | | | | | | | |
| | | | Industrial Other – 0.6% | | | | |
| | 305,000 | | | Chart Industries, Inc.,
9.125%, 10/15/2015 | | | 317,962 | |
| | 155,000 | | | Ranhill Labuan Ltd.,
12.500%, 10/26/2011, 144A | | | 136,400 | |
| | | | | | | | |
| | | | | | | 454,362 | |
| | | | | | | | |
| | | | Life Insurance – 0.6% | | | | |
| | 370,000 | | | American International Group, Inc., (fixed rate to 5/15/2038, variable rate thereafter),
8.175%, 5/15/2068 | | | 398,213 | |
| | | | | | | | |
| | | | Lodging – 0.6% | | | | |
| | 55,000 | | | Felcor Lodging LP,
10.000%, 10/01/2014 | | | 62,837 | |
| | 50,000 | | | Host Marriott LP, Series O,
6.375%, 3/15/2015 | | | 51,063 | |
| | 315,000 | | | Royal Caribbean Cruises Ltd.,
7.250%, 6/15/2016 | | | 337,444 | |
| | | | | | | | |
| | | | | | | 451,344 | |
| | | | | | | | |
| | | | Media Cable – 1.0% | | | | |
| | 640,000 | | | CSC Holdings LLC,
7.625%, 7/15/2018 | | | 700,800 | |
| | | | | | | | |
| | | | Media Non-Cable – 0.6% | | | | |
| | 395,000 | | | Intelsat SA,
11.250%, 2/04/2017 | | | 431,538 | |
| | | | | | | | |
| | | | Metals & Mining – 0.9% | | | | |
| | 330,000 | | | ArcelorMittal,
7.000%, 10/15/2039 | | | 330,883 | |
| | 80,000 | | | United States Steel Corp.,
6.050%, 6/01/2017 | | | 82,500 | |
| | 275,000 | | | United States Steel Corp.,
6.650%, 6/01/2037 | | | 253,000 | |
| | | | | | | | |
| | | | | | | 666,383 | |
| | | | | | | | |
| | | | Non-Captive Consumer – 3.8% | | | | |
| | 235,000 | | | Residential Capital LLC,
9.625%, 5/15/2015 | | | 237,056 | |
| | 65,000 | | | SLM Corp., Series A, MTN,
5.000%, 6/15/2018 | | | 61,082 | |
| | 850,000 | | | SLM Corp., Series A, MTN,
5.625%, 8/01/2033 | | | 726,706 | |
| | 306,000 | | | SLM Corp., Series A, MTN,
8.450%, 6/15/2018 | | | 342,720 | |
| | 200,000 | | | Springleaf Finance Corp.,
Series H, MTN,
5.375%, 10/01/2012 | | | 196,750 | |
| | 100,000 | | | Springleaf Finance Corp., Series I, MTN,
4.875%, 7/15/2012 | | | 98,250 | |
| | 220,000 | | | Springleaf Finance Corp., Series I, MTN,
5.850%, 6/01/2013 | | | 215,050 | |
| | 100,000 | | | Springleaf Finance Corp., Series J, MTN,
5.200%, 12/15/2011 | | | 99,750 | |
| | 500,000 | | | Springleaf Finance Corp., Series J, MTN,
6.500%, 9/15/2017 | | | 445,000 | |
9 |
Portfolio of Investments – as of March 31, 2011 (Unaudited)
Loomis Sayles High Income Opportunities Fund – continued
| | | | | | | | |
Principal
Amount | | | Description | | Value (†) | |
| | | | | | | | |
| |
| | Bonds and Notes – continued | | | | |
| | |
| | | | Non-Captive Consumer – continued | | | | |
| $ | 300,000 | | | Springleaf Finance Corp., Series J, MTN,
6.900%, 12/15/2017 | | $ | 274,125 | |
| | | | | | | | |
| | | | | | | 2,696,489 | |
| | | | | | | | |
| | | | Non-Captive Diversified – 2.4% | | | | |
| | 60,000 | | | Ally Financial, Inc.,
7.500%, 9/15/2020, 144A | | | 63,975 | |
| | 331,000 | | | Ally Financial, Inc.,
8.000%, 11/01/2031 | | | 360,790 | |
| | 95,000 | | | Ally Financial, Inc.,
8.300%, 2/12/2015 | | | 104,144 | |
| | 675,000 | | | CIT Group, Inc.,
7.000%, 5/01/2017 | | | 675,844 | |
| | 120,000 | | | International Lease Finance Corp.,
8.250%, 12/15/2020 | | | 131,550 | |
| | 130,000 | | | iStar Financial, Inc.,
5.150%, 3/01/2012 | | | 129,025 | |
| | 75,000 | | | iStar Financial, Inc.,
5.850%, 3/15/2017 | | | 65,437 | |
| | 190,000 | | | iStar Financial, Inc., Series B,
5.950%, 10/15/2013 | | | 180,025 | |
| | | | | | | | |
| | | | | | | 1,710,790 | |
| | | | | | | | |
| | | | Oil Field Services – 1.5% | | | | |
| | 680,000 | | | Basic Energy Services, Inc.,
7.125%, 4/15/2016 | | | 690,200 | |
| | 130,000 | | | Parker Drilling Co.,
9.125%, 4/01/2018 | | | 139,750 | |
| | 235,000 | | | Pioneer Drilling Co.,
9.875%, 3/15/2018 | | | 252,625 | |
| | | | | | | | |
| | | | | | | 1,082,575 | |
| | | | | | | | |
| | | | Packaging – 0.1% | | | | |
| | 100,000 | | | Reynolds Group Holdings Ltd.,
8.250%, 2/15/2021, 144A | | | 99,000 | |
| | | | | | | | |
| | | | Paper – 1.0% | | | | |
| | 190,000 | | | Westvaco Corp.,
7.950%, 2/15/2031 | | | 198,779 | |
| | 455,000 | | | Westvaco Corp.,
8.200%, 1/15/2030 | | | 485,588 | |
| | | | | | | | |
| | | | | | | 684,367 | |
| | | | | | | | |
| | | | Pharmaceuticals – 0.3% | | | | |
| | 80,000 | | | Valeant Pharmaceuticals International,
6.750%, 8/15/2021, 144A | | | 75,900 | |
| | 125,000 | | | Valeant Pharmaceuticals International,
7.250%, 7/15/2022, 144A | | | 120,938 | |
| | | | | | | | |
| | | | | | | 196,838 | |
| | | | | | | | |
| | | | Refining – 0.9% | | | | |
| | 500,000 | | | Petroplus Finance Ltd.,
6.750%, 5/01/2014, 144A | | | 490,000 | |
| | 150,000 | | | Petroplus Finance Ltd.,
7.000%, 5/01/2017, 144A | | | 142,500 | |
| | | | | | | | |
| | | | | | | 632,500 | |
| | | | | | | | |
| | | | REITs – Shopping Centers – 0.3% | | | | |
| | 190,000 | | | Developers Diversified Realty Corp.,
7.875%, 9/01/2020 | | | 217,862 | |
| | | | | | | | |
| | | | | | | | |
Principal
Amount | | | Description | | Value (†) | |
| | | | | | | | |
| | |
| | | | Retailers – 3.2% | | | | |
| $ | 155,000 | | | Dillard’s, Inc.,
6.625%, 1/15/2018 | | $ | 152,675 | |
| | 480,000 | | | Dillard’s, Inc.,
7.000%, 12/01/2028 | | | 427,200 | |
| | 175,000 | | | Dillard’s, Inc.,
7.130%, 8/01/2018 | | | 176,313 | |
| | 75,000 | | | Dillard’s, Inc.,
7.875%, 1/01/2023 | | | 73,125 | |
| | 280,000 | | | Foot Locker, Inc.,
8.500%, 1/15/2022 | | | 282,800 | |
| | 180,000 | | | Macy’s Retail Holdings, Inc.,
6.790%, 7/15/2027 | | | 174,150 | |
| | 985,000 | | | Toys R Us, Inc.,
7.375%, 10/15/2018 | | | 987,462 | |
| | | | | | | | |
| | | | | | | 2,273,725 | |
| | | | | | | | |
| | | | Supermarkets – 2.2% | | | | |
| | 70,000 | | | American Stores Co.,
8.000%, 6/01/2026 | | | 63,350 | |
| | 1,075,000 | | | New Albertson’s, Inc.,
7.450%, 8/01/2029 | | | 849,250 | |
| | 220,000 | | | New Albertson’s, Inc.,
7.750%, 6/15/2026 | | | 183,150 | |
| | 30,000 | | | New Albertson’s, Inc.,
8.000%, 5/01/2031 | | | 24,600 | |
| | 605,000 | | | New Albertson’s, Inc., Series C, MTN,
6.625%, 6/01/2028 | | | 438,625 | |
| | | | | | | | |
| | | | | | | 1,558,975 | |
| | | | | | | | |
| | | | Technology – 6.3% | | | | |
| | 90,000 | | | Activant Solutions, Inc.,
9.500%, 5/01/2016 | | | 92,475 | |
| | 125,000 | | | Advanced Micro Devices, Inc.,
7.750%, 8/01/2020 | | | 128,437 | |
| | 190,000 | | | Advanced Micro Devices, Inc.,
8.125%, 12/15/2017 | | | 197,600 | |
| | 3,020,000 | | | Alcatel-Lucent USA, Inc.,
6.450%, 3/15/2029 | | | 2,597,200 | |
| | 290,000 | | | Alcatel-Lucent USA, Inc.,
6.500%, 1/15/2028 | | | 249,400 | |
| | 145,000 | | | CommScope, Inc., 8.250%, 1/15/2019, 144A | | | 151,525 | |
| | 350,000 | | | First Data Corp., 8.250%, 1/15/2021, 144A | | | 349,125 | |
| | 860,000 | | | Nortel Networks Capital Corp.,
7.875%, 6/15/2026(e) | | | 632,100 | |
| | 125,000 | | | Nortel Networks Ltd., 6.875%, 9/01/2023(e) | | | 32,500 | |
| | | | | | | | |
| | | | | | | 4,430,362 | |
| | | | | | | | |
| | | | Textile – 0.5% | | | | |
| | 425,000 | | | Jones Apparel Group, Inc., 6.125%, 11/15/2034 | | | 338,938 | |
| | | | | | | | |
| | | | Transportation Services – 1.0% | | | | |
| | 185,000 | | | APL Ltd., 8.000%, 1/15/2024(c) | | | 126,725 | |
| | 25,038 | | | Atlas Air Pass Through Trust, Series 1998-1, Class B, 7.680%, 7/02/2015 | | | 24,788 | |
| | 347,188 | | | Atlas Air Pass Through Trust, Series 1998-1, Class C, 8.010%, 7/02/2011(f) | | | 291,638 | |
| 10
Portfolio of Investments – as of March 31, 2011 (Unaudited)
Loomis Sayles High Income Opportunities Fund – continued
| | | | | | | | |
Principal
Amount | | | Description | | Value (†) | |
| | | | | | | | |
| |
| | Bonds and Notes – continued | | | | |
| | |
| | | | Transportation Services – continued | | | | |
| $ | 155,000 | | | Overseas Shipholding Group, 7.500%, 2/15/2024 | | $ | 132,913 | |
| | 130,000 | | | Teekay Corp., 8.500%, 1/15/2020 | | | 140,887 | |
| | | | | | | | |
| | | | | | | 716,951 | |
| | | | | | | | |
| | | | Wireless – 2.1% | | | | |
| | 200,000 | | | eAccess Ltd., 8.250%, 4/01/2018, 144A | | | 203,260 | |
| | 520,000 | | | Nextel Communications, Inc., Series C,
5.950%, 3/15/2014 | | | 521,300 | |
| | 170,000 | | | Nextel Communications, Inc., Series D,
7.375%, 8/01/2015 | | | 170,637 | |
| | 65,000 | | | NII Capital Corp., 7.625%, 4/01/2021 | | | 66,463 | |
| | 125,000 | | | NII Capital Corp., 8.875%, 12/15/2019 | | | 137,500 | |
| | 446,000 | | | Sprint Capital Corp., 6.875%, 11/15/2028 | | | 411,435 | |
| | | | | | | | |
| | | | | | | 1,510,595 | |
| | | | | | | | |
| | | | Wirelines – 9.8% | | | | |
| | 765,000 | | | Axtel SAB de CV, 7.625%, 2/01/2017, 144A | | | 719,100 | |
| | 300,000 | | | Bakrie Telecom Pte Ltd., 11.500%, 5/07/2015, 144A | | | 320,250 | |
| | 220,000 | | | Cincinnati Bell Telephone Co. LLC,
6.300%, 12/01/2028 | | | 176,000 | |
| | 205,000 | | | Cincinnati Bell, Inc., 8.750%, 3/15/2018 | | | 193,469 | |
| | 15,000 | | | Frontier Communications Corp.,
7.000%, 11/01/2025 | | | 13,518 | |
| | 80,000 | | | Frontier Communications Corp.,
7.125%, 3/15/2019 | | | 81,200 | |
| | 325,000 | | | Frontier Communications Corp.,
7.450%, 7/01/2035 | | | 296,400 | |
| | 805,000 | | | Frontier Communications Corp.,
7.875%, 1/15/2027 | | | 768,775 | |
| | 790,000 | | | Level 3 Financing, Inc., 8.750%, 2/15/2017 | | | 784,075 | |
| | 835,000 | | | Level 3 Financing, Inc., 9.250%, 11/01/2014 | | | 853,787 | |
| | 1,030,000 | | | Qwest Capital Funding, Inc.,
6.500%, 11/15/2018 | | | 1,050,600 | |
| | 480,000 | | | Qwest Capital Funding, Inc.,
6.875%, 7/15/2028 | | | 476,400 | |
| | 315,000 | | | Qwest Capital Funding, Inc.,
7.625%, 8/03/2021 | | | 327,600 | |
| | 190,000 | | | Qwest Corp.,
6.875%, 9/15/2033 | | | 190,237 | |
| | 10,000 | | | Qwest Corp.,
7.250%, 9/15/2025 | | | 10,650 | |
| | 375,000 | | | Telecom Italia Capital SA,
7.200%, 7/18/2036 | | | 376,334 | |
| | | | | | | | |
Principal
Amount | | | Description | | Value (†) | |
| | | | | | | | |
| | |
| | | | Wirelines – continued | | | | |
| $ | 290,000 | | | Telecom Italia Capital SA,
7.721%, 6/04/2038 | | $ | 307,221 | |
| | | | | | | | |
| | | | | | | 6,945,616 | |
| | | | | | | | |
| | |
| | | | Total Non-Convertible Bonds | | | | |
| | | | (Identified Cost $50,983,179) | | | 52,202,605 | |
| | | | | | | | |
| |
| | Convertible Bonds – 11.8% | | | | |
| | |
| | | | Automotive – 2.0% | | | | |
| | 75,000 | | | ArvinMeritor, Inc., (Step to Zero Coupon on 2/15/2019),
4.000%, 2/15/2027(g) | | | 73,969 | |
| | 640,000 | | | Ford Motor Co.,
4.250%, 11/15/2016 | | | 1,160,000 | |
| | 115,000 | | | Navistar International Corp.,
3.000%, 10/15/2014 | | | 173,650 | |
| | | | | | | | |
| | | | | | | 1,407,619 | |
| | | | | | | | |
| | | | Diversified Manufacturing – 1.0% | | | | |
| | 335,000 | | | Owens-Brockway Glass Container, Inc.,
3.000%, 6/01/2015, 144A | | | 339,606 | |
| | 330,000 | | | Trinity Industries, Inc.,
3.875%, 6/01/2036 | | | 359,700 | |
| | | | | | | | |
| | | | | | | 699,306 | |
| | | | | | | | |
| | | | Electric – 0.7% | | | | |
| | 330,000 | | | CMS Energy Corp.,
5.500%, 6/15/2029 | | | 479,737 | |
| | | | | | | | |
| | | | Healthcare – 1.1% | | | | |
| | 450,000 | | | Hologic, Inc., (Step to Zero Coupon on 12/15/2013),
2.000%, 12/15/2037(g) | | | 434,250 | |
| | 50,000 | | | Hologic, Inc., (Step to Zero Coupon on 12/15/2016),
2.000%, 12/15/2037(g) | | | 60,813 | |
| | 165,000 | | | LifePoint Hospitals, Inc.,
3.500%, 5/15/2014 | | | 175,725 | |
| | 55,000 | | | Omnicare, Inc.,
3.750%, 12/15/2025 | | | 70,881 | |
| | | | | | | | |
| | | | | | | 741,669 | |
| | | | | | | | |
| | | | Home Construction – 0.0% | | | | |
| | 30,000 | | | Lennar Corp.,
2.000%, 12/01/2020, 144A | | | 30,188 | |
| | | | | | | | |
| | | | Independent Energy – 0.2% | | | | |
| | 25,000 | | | Chesapeake Energy Corp.,
2.250%, 12/15/2038 | | | 22,969 | |
| | 30,000 | | | Chesapeake Energy Corp.,
2.500%, 5/15/2037 | | | 32,587 | |
| | 90,000 | | | Penn Virginia Corp.,
4.500%, 11/15/2012 | | | 92,925 | |
| | | | | | | | |
| | | | | | | 148,481 | |
| | | | | | | | |
| | | | Lodging – 0.5% | | | | |
| | 355,000 | | | Host Hotels & Resorts, Inc.,
2.625%, 4/15/2027, 144A | | | 355,444 | |
| | | | | | | | |
| | | | Media Non-Cable – 0.1% | | | | |
| | 150,437 | | | Liberty Media LLC,
3.500%, 1/15/2031 | | | 84,245 | |
| | | | | | | | |
11 |
Portfolio of Investments – as of March 31, 2011 (Unaudited)
Loomis Sayles High Income Opportunities Fund – continued
| | | | | | | | |
Principal
Amount | | | Description | | Value (†) | |
| | | | | | | | |
| |
| | Bonds and Notes – continued | | | | |
| | |
| | | | Metals & Mining – 0.4% | | | | |
| $ | 230,000 | | | Peabody Energy Corp.,
4.750%, 12/15/2066 | | $ | 304,750 | |
| | | | | | | | |
| | | | Non-Captive Diversified – 0.0% | | | | |
| | 5,000 | | | iStar Financial, Inc.,
0.803%, 10/01/2012(b) | | | 4,563 | |
| | | | | | | | |
| | | | Pharmaceuticals – 1.3% | | | | |
| | 380,000 | | | Amylin Pharmaceuticals, Inc.,
3.000%, 6/15/2014 | | | 326,800 | |
| | 325,000 | | | Human Genome Sciences, Inc.,
2.250%, 8/15/2012 | | | 526,500 | |
| | 50,000 | | | Kendle International, Inc.,
3.375%, 7/15/2012 | | | 47,375 | |
| | | | | | | | |
| | | | | | | 900,675 | |
| | | | | | | | |
| | | | Technology – 2.8% | | | | |
| | 5,000 | | | Ciena Corp.,
0.250%, 5/01/2013 | | | 5,100 | |
| | 565,000 | | | Ciena Corp.,
0.875%, 6/15/2017 | | | 551,581 | |
| | 290,000 | | | Ciena Corp.,
3.750%, 10/15/2018, 144A | | | 434,275 | |
| | 30,000 | | | Ciena Corp.,
4.000%, 3/15/2015, 144A | | | 43,950 | |
| | 435,000 | | | Intel Corp.,
2.950%, 12/15/2035 | | | 447,506 | |
| | 440,000 | | | Intel Corp.,
3.250%, 8/01/2039 | | | 517,550 | |
| | | | | | | | |
| | | | | | | 1,999,962 | |
| | | | | | | | |
| | | | Wirelines – 1.7% | | | | |
| | 1,014,000 | | | Level 3 Communications, Inc.,
7.000%, 3/15/2015, 144A(c) | | | 1,180,042 | |
| | | | | | | | |
| | |
| | | | Total Convertible Bonds | | | | |
| | | | (Identified Cost $6,432,909) | | | 8,336,681 | |
| | | | | | | | |
| | |
| | | | Total Bonds and Notes | | | | |
| | | | (Identified Cost $57,416,088) | | | 60,539,286 | |
| | | | | | | | |
| |
| | Bank Loans – 0.2% | | | | |
| | |
| | | | Media Non-Cable – 0.2% | | | | |
| | 181,970 | | | Tribune Company, Term Loan X,
5.000%, 6/04/2009(e)(h)(i) | | | 124,478 | |
| | | | | | | | |
| | | | Wireless – 0.0% | | | | |
| | 30,539 | | | Hawaiian Telcom Communications, Inc.,
Exit Term Loan,
9.000%, 11/01/2015(d)(h) | | | 31,104 | |
| | | | | | | | |
| | |
| | | | Total Bank Loans | | | | |
| | | | (Identified Cost $234,962) | | | 155,582 | |
| | | | | | | | |
| | | | | | | | |
Shares | | | Description | | Value (†) | |
| | | | | | | | |
| |
| | Preferred Stocks – 5.1% | | | | |
| |
| | Convertible Preferred Stocks – 3.6% | | | | |
| | |
| | | | Automotive – 2.2% | | | | |
| | 25,150 | | | General Motors Co., Series B,
4.750% | | $ | 1,212,230 | |
| | 6,380 | | | Goodyear Tire & Rubber Co. (The),
5.875% | | | 325,890 | |
| | | | | | | | |
| | | | | | | 1,538,120 | |
| | | | | | | | |
| | | | Capital Markets – 0.4% | | | | |
| | 5,724 | | | Newell Financial Trust I,
5.250% | | | 274,037 | |
| | | | | | | | |
| | | | Electric Utilities – 0.5% | | | | |
| | 7,975 | | | AES Trust III,
6.750% | | | 389,180 | |
| | | | | | | | |
| | | | Oil, Gas & Consumable Fuels – 0.5% | | | | |
| | 8,050 | | | El Paso Energy Capital Trust I,
4.750% | | | 356,213 | |
| | | | | | | | |
| | |
| | | | Total Convertible Preferred Stocks | | | | |
| | | | (Identified Cost $2,476,937) | | | 2,557,550 | |
| | | | | | | | |
| |
| | Non-Convertible Preferred Stocks – 1.5% | | | | |
| | |
| | | | Banking – 1.5% | | | | |
| | 11,350 | | | Ally Financial, Inc., Series A, (fixed rate to 5/15/2016, variable rate thereafter),
8.500% | | | 282,604 | |
| | 803 | | | Ally Financial, Inc., Series G,
7.000%, 144A | | | 747,191 | |
| | | | | | | | |
| | |
| | | | Total Non-Convertible Preferred Stocks | | | | |
| | | | (Identified Cost $722,540) | | | 1,029,795 | |
| | | | | | | | |
| | |
| | | | Total Preferred Stocks | | | | |
| | | | (Identified Cost $3,199,477) | | | 3,587,345 | |
| | | | | | | | |
| |
| | Common Stocks – 0.5% | | | | |
| |
| | | | Diversified Telecommunication Services – 0.1% | |
| | 940 | | | FairPoint Communications, Inc.(f) | | | 15,858 | |
| | 1,017 | | | Hawaiian Telcom Holdco, Inc.(f) | | | 26,696 | |
| | | | | | | | |
| | | | | | | 42,554 | |
| | | | | | | | |
| | | | Media – 0.0% | | | | |
| | 321 | | | Dex One Corp.(f) | | | 1,554 | |
| | | | | | | | |
| | | | Oil, Gas & Consumable Fuels – 0.4% | | | | |
| | 9,278 | | | Chesapeake Energy Corp. | | | 310,998 | |
| | | | | | | | |
| | |
| | | | Total Common Stocks | | | | |
| | | | (Identified Cost $510,909) | | | 355,106 | |
| | | | | | | | |
| |
| | Warrants – 0.0% | | | | |
| | 1,603 | | | FairPoint Communications, Inc., Expiration on 1/24/2018(c)(f)(j) | | | | |
| | | | (Identified Cost $0) | | | — | |
| | | | | | | | |
| 12
Portfolio of Investments – as of March 31, 2011 (Unaudited)
Loomis Sayles High Income Opportunities Fund – continued
| | | | | | | | |
Principal
Amount | | | Description | | Value (†) | |
| | | | | | | | |
| |
| | Short-Term Investments – 7.9% | | | | |
| $ | 5,624,137 | | | Tri-Party Repurchase Agreement with Fixed Income Clearing Corporation, dated 3/31/2011 at 0.000% to be repurchased at $5,624,137 on 4/01/2011 collateralized by $5,790,000 Federal Home Loan Mortgage Corp., 2.950% due 12/08/2017 valued at $5,739,338 including accrued interest (Note 2 of Notes to Financial Statements)
(Identified Cost $5,624,137) | | $ | 5,624,137 | |
| | | | | | | | |
| | |
| | | | Total Investments – 99.3% | | | | |
| | | | (Identified Cost $66,985,573)(a) | | | 70,261,456 | |
| | | | Other Assets Less Liabilities – 0.7% | | | 471,676 | |
| | | | | | | | |
| | |
| | | | Net Assets – 100.0% | | $ | 70,733,132 | |
| | | | | | | | |
| | |
| | (†) | | | See Note 2 of Notes to Financial Statements. | | | | |
| | (a) | | | Federal Tax Information (Amounts exclude certain adjustments made at the end of the Fund’s fiscal year for tax purposes. Such adjustments are primarily due to wash sales. Amortization of premium on debt securities is excluded for tax purposes.): | | | | |
| | | | At March 31, 2011, the net unrealized appreciation on investments based on a cost of $67,013,109 for federal income tax purposes was as follows: | |
| | | | Aggregate gross unrealized appreciation for all investments in which there is an excess of value over tax cost | | $ | 5,751,938 | |
| | | | Aggregate gross unrealized depreciation for all investments in which there is an excess of tax cost over value | | | (2,503,591 | ) |
| | | | | | | | |
| | | | Net unrealized appreciation | | $ | 3,248,347 | |
| | | | | | | | |
| | (b) | | | Variable rate security. Rate as of March 31, 2011 is disclosed. | |
| | (c) | | | Illiquid security. At March 31, 2011, the value of these securities amounted to $1,887,442 or 2.7% of net assets. | |
| | (d) | | | All or a portion of interest payment is paid-in-kind. | |
| | (e) | | | The issuer is in default with respect to interest and/or principal payments. Income is not being accrued. | |
| | (f) | | | Non-income producing security. | | | | |
| | (g) | | | Coupon rate is a fixed rate for an initial period then resets at a specified date and rate. | |
| | (h) | | | Variable rate security. Rate shown represents the weighted average rate at March 31, 2011. | |
| | (i) | | | Issuer has filed for bankruptcy. | | | | |
| | (j) | | | Fair valued security by the Fund’s investment adviser. At March 31, 2011, the value of this security amounted to $0. | |
| |
| | 144A | | | All or a portion of these securities are exempt from registration under Rule 144A of the Securities Act of 1933. These securities may be resold in transactions exempt from registration, normally to qualified institutional buyers. At March 31, 2011, the value of Rule 144A holdings amounted to $10,127,001 or 14.3% of net assets. | |
| | ABS | | | Asset-Backed Securities | | | | |
| | ARMs | | | Adjustable Rate Mortgages | | | | |
| | MTN | | | Medium Term Note | | | | |
| | REITs | | | Real Estate Investment Trusts | | | | |
Industry Summary at March 31, 2011 (Unaudited)
| | | | |
Wirelines | | | 11.5 | % |
Technology | | | 9.1 | |
Automotive | | | 7.1 | |
Healthcare | | | 6.7 | |
Electric | | | 5.4 | |
Independent Energy | | | 3.9 | |
Non-Captive Consumer | | | 3.8 | |
Collateralized Mortgage Obligations | | | 3.3 | |
Retailers | | | 3.2 | |
Airlines | | | 2.6 | |
Non-Captive Diversified | | | 2.4 | |
Supermarkets | | | 2.2 | |
Wireless | | | 2.1 | |
Chemicals | | | 2.0 | |
Other Investments, less than 2% each | | | 26.1 | |
Short-Term Investments | | | 7.9 | |
| | | | |
Total Investments | | | 99.3 | |
Other assets less liabilities | | | 0.7 | |
| | | | |
Net Assets | | | 100.0 | % |
| | | | |
See accompanying notes to financial statements.
13 |
Portfolio of Investments – as of March 31, 2011 (Unaudited)
Loomis Sayles Securitized Asset Fund
| | | | | | | | |
Principal
Amount | | | Description | | Value (†) | |
| | | | | | | | |
| |
| | Bonds and Notes – 113.2% of Net Assets | | | | |
| | |
| | | | ABS Car Loan – 15.8% | | | | |
| $ | 5,290,000 | | | Ally Auto Receivables Trust, Series 2010-4, Class A3, 0.910%, 11/17/2014 | | $ | 5,268,683 | |
| | 7,250,000 | | | Ally Master Owner Trust, Series 2011-1, Class A2, 2.150%, 1/15/2016 | | | 7,250,639 | |
| | 2,900,000 | | | AmeriCredit Automobile Receivables Trust, Series 2010-4, Class A3, 1.270%, 4/08/2015 | | | 2,895,544 | |
| | 2,455,000 | | | AmeriCredit Automobile Receivables Trust, Series 2011-1, Class A3, 1.390%, 9/08/2015 | | | 2,453,863 | |
| | 2,166,402 | | | ARI Fleet Lease Trust, Series 2010-A, Class A, 1.705%, 8/15/2018, 144A(b) | | | 2,182,418 | |
| | 2,800,000 | | | Avis Budget Rental Car Funding AESOP LLC, Series 2009-1A, Class A, 9.310%, 10/20/2013, 144A | | | 3,063,943 | |
| | 4,235,000 | | | Avis Budget Rental Car Funding AESOP LLC, Series 2010-3A, Class A, 4.640%, 5/20/2016, 144A | | | 4,518,427 | |
| | 326,174 | | | Capital One Auto Finance Trust, Series 2006-C, Class A4, 0.285%, 5/15/2013(b) | | | 325,056 | |
| | 706,874 | | | Capital One Auto Finance Trust, Series 2007-C, Class A4, 5.230%, 7/15/2014 | | | 725,833 | |
| | 1,500,000 | | | CarMax Auto Owner Trust, Series 2009-2, Class A3, 1.740%, 4/15/2014 | | | 1,513,765 | |
| | 766,258 | | | Centre Point Funding LLC, Series 2010-1A, Class 1, 5.430%, 7/20/2016, 144A | | | 809,934 | |
| | 1,107,533 | | | Chrysler Financial Lease Trust, Series 2010-A, Class B, 3.460%, 9/16/2013, 144A | | | 1,108,626 | |
| | 2,195,000 | | | Chrysler Financial Lease Trust, Series 2010-A, Class C, 4.490%, 9/16/2013, 144A | | | 2,202,179 | |
| | 1,135,000 | | | Daimler Chrysler Auto Trust, Series 2008-B, Class A4A, 5.320%, 11/10/2014 | | | 1,167,696 | |
| | 7,740,000 | | | DSC Floorplan Master Owner Trust, Series 2011-1, Class A, 3.910%, 3/15/2016, 144A | | | 7,740,000 | |
| | 4,790,000 | | | Harley-Davidson Motorcycle Trust, Series 2010-1, Class A3, 1.160%, 2/15/2015 | | | 4,783,910 | |
| | 2,740,000 | | | Hertz Vehicle Financing LLC, Series 2009-2A, Class A1, 4.260%, 3/25/2014, 144A | | | 2,870,737 | |
| | 3,190,000 | | | Hertz Vehicle Financing LLC, Series 2009-2A, Class A2, 5.290%, 3/25/2016, 144A | | | 3,483,124 | |
| | 2,440,000 | | | Hertz Vehicle Financing LLC, Series 2009-2A, Class B2, 5.930%, 3/25/2016, 144A | | | 2,655,887 | |
| | 1,305,000 | | | Merrill Auto Trust Securitization Asset, Series 2008-1, Class B, 6.750%, 4/15/2015 | | | 1,373,900 | |
| | | | | | | | |
Principal
Amount | | | Description | | Value (†) | |
| | | | | | | | |
| | |
| | | | ABS Car Loan – continued | | | | |
| $ | 6,565,000 | | | Navistar Financial Corp. Owner Trust, Series 2010-B, Class A2, 0.810%, 1/18/2013, 144A | | $ | 6,564,688 | |
| | 5,755,000 | | | Navistar Financial Dealer Note Master Trust, Series 2010-1, Class A, 1.900%, 1/26/2015, 144A(b) | | | 5,793,213 | |
| | 9,590,000 | | | Nissan Auto Lease Trust, Series 2010-B, Class A3, 1.120%, 12/15/2013 | | | 9,595,672 | |
| | 137,913 | | | Nissan Auto Receivables Owner Trust, Series 2008-B, Class A3, 4.460%, 4/16/2012 | | | 138,404 | |
| | 8,490,000 | | | Nissan Master Owner Trust Receivables, Series 2010-AA, Class A, 1.405%, 1/15/2015, 144A(b) | | | 8,582,217 | |
| | 9,793,841 | | | Santander Drive Auto Receivables Trust, Series 2011-S1A, Class D, 3.100%, 5/15/2017, 144A | | | 9,799,717 | |
| | 9,940,000 | | | Volkswagen Auto Lease Trust, Series 2010-A, Class A3, 0.990%, 11/20/2013 | | | 9,929,562 | |
| | | | | | | | |
| | | | | | | 108,797,637 | |
| | | | | | | | |
| | | | ABS Credit Card – 8.1% | | | | |
| | 1,895,000 | | | Capital One Multi-Asset Execution Trust, Series 2004-A4, Class A4, 0.475%, 3/15/2017(b) | | | 1,889,672 | |
| | 2,670,000 | | | Capital One Multi-Asset Execution Trust, Series 2007-A5, Class A5, 0.295%, 7/15/2020(b) | | | 2,593,791 | |
| | 2,300,000 | | | Chase Issuance Trust, Series 2007-B1, Class B1, 0.505%, 4/15/2019(b) | | | 2,213,869 | |
| | 1,750,000 | | | Chase Issuance Trust, Series 2007-C1, Class C1, 0.715%, 4/15/2019(b) | | | 1,685,437 | |
| | 1,150,000 | | | Citibank Credit Card Issuance Trust, Series 2005-C2, Class C2, 0.722%, 3/24/2017(b) | | | 1,108,333 | |
| | 4,215,000 | | | Citibank Credit Card Issuance Trust, Series 2007-A8, Class A8, 5.650%, 9/20/2019 | | | 4,742,027 | |
| | 11,410,000 | | | Citibank Omni Master Trust, Series 2009-A14A, Class A14, 3.005%, 8/15/2018, 144A(b) | | | 12,083,195 | |
| | 3,305,000 | | | Discover Card Master Trust, Series 2007-A1, Class A1, 5.650%, 3/16/2020 | | | 3,707,173 | |
| | 1,335,000 | | | GE Capital Credit Card Master Note Trust, Series 2007-2, Class B, 0.435%, 3/15/2015(b) | | | 1,326,365 | |
| | 2,815,000 | | | GE Capital Credit Card Master Note Trust, Series 2009-4, Class B, 5.390%, 11/15/2017, 144A | | | 3,000,515 | |
| | 4,975,000 | | | GE Capital Credit Card Master Note Trust, Series 2010-2, Class A, 4.470%, 3/15/2020 | | | 5,273,161 | |
| | 2,070,000 | | | MBNA Credit Card Master Note Trust, Series 2004-A3, Class A3, 0.515%, 8/16/2021(b) | | | 2,031,802 | |
| 14
Portfolio of Investments – as of March 31, 2011 (Unaudited)
Loomis Sayles Securitized Asset Fund – continued
| | | | | | | | |
Principal
Amount | | | Description | | Value (†) | |
| | | | | | | | |
| |
| | Bonds and Notes – continued | | | | |
| | |
| | | | ABS Credit Card – continued | | | | |
| $ | 3,130,000 | | | MBNA Credit Card Master Note Trust, Series 2004-C2, Class C2, 1.155%, 11/15/2016(b) | | $ | 3,103,043 | |
| | 1,520,000 | | | World Financial Network Credit Card Master Trust, Series 2006-A, Class A, 0.385%, 2/15/2017, 144A(b) | | | 1,494,519 | |
| | 9,695,000 | | | World Financial Network Credit Card Master Trust, Series 2010-A, Class A, 3.960%, 4/15/2019 | | | 10,032,928 | |
| | | | | | | | |
| | | | | | | 56,285,830 | |
| | | �� | | | | | |
| | | | ABS Home Equity – 0.5% | | | | |
| | 616,697 | | | Countrywide Asset-Backed Certificates, Series 2004-S1, Class A3, 4.615%, 2/25/2035 | | | 580,215 | |
| | 245,988 | | | Countrywide Asset-Backed Certificates, Series 2006-S3, Class A1, 0.360%, 6/25/2021(b) | | | 239,449 | |
| | 1,559,180 | | | Countrywide Asset-Backed Certificates, Series 2006-S7, Class A3, 5.712%, 11/25/2035 | | | 900,426 | |
| | 2,175,996 | | | Soundview Home Equity Loan Trust, Series 2006-OPT5, Class 2A3, 0.400%, 7/25/2036(b) | | | 1,569,546 | |
| | | | | | | | |
| | | | | | | 3,289,636 | |
| | | | | | | | |
| | | | ABS Other – 2.0% | | | | |
| | 1,142,266 | | | CIT Equipment Collateral, Series 2008-VT1, Class A3, 6.590%, 12/22/2014 | | | 1,161,800 | |
| | 1,193,450 | | | Marriott Vacation Club Owner Trust, Series 2009-2A, Class A, 4.809%, 7/20/2031, 144A | | | 1,224,005 | |
| | 3,808,840 | | | Premium Yield Facility, Series 2010-A, 6.080%, 2/20/2026, 144A(c) | | | 3,818,362 | |
| | 1,555,195 | | | Sierra Receivables Funding Co., Series 2007-1A, Class A2, 0.404%, 3/20/2019, 144A(b) | | | 1,465,089 | |
| | 485,654 | | | Sierra Receivables Funding Co., Series 2009-3A, Class A1, 7.620%, 7/20/2026, 144A | | | 496,771 | |
| | 1,248,936 | | | Sierra Receivables Funding Co., Series 2010-1A, Class A1, 4.480%, 7/20/2026, 144A | | | 1,253,833 | |
| | 2,183,602 | | | Sierra Receivables Funding Co., Series 2010-2A, Class A, 3.840%, 11/20/2025, 144A | | | 2,175,463 | |
| | 2,320,930 | | | Sierra Receivables Funding Co., Series 2010-3A, Class A,
3.510%, 11/20/2025, 144A | | | 2,328,710 | |
| | | | | | | | |
| | | | | | | 13,924,033 | |
| | | | | | | | |
| | | | ABS Student Loan – 2.2% | | | | |
| | 15,565,000 | | | South Carolina Student Loan Corp., Series 2010-1, Class A2,
1.303%, 7/25/2025(b) | | | 15,538,384 | |
| | | | | | | | |
| | | | | | | | |
Principal
Amount | | | Description | | Value (†) | |
| | | | | | | | |
| |
| | | | Collateralized Mortgage Obligations – 10.0% | |
| $ | 1,045,388 | | | Countrywide Alternative Loan Trust, Series 2006-15CB, Class A1,
6.500%, 6/25/2036 | | $ | 636,279 | |
| | 668,987 | | | Countrywide Alternative Loan Trust, Series 2006-J5, Class 4A1,
5.652%, 7/25/2021(b) | | | 497,844 | |
| | 499,962 | | | Countrywide Home Loans, Series 2004-HYB5, Class 6A2,
3.065%, 4/20/2035(b) | | | 175,764 | |
| | 2,797,000 | | | Federal Home Loan Mortgage Corp., Series 2912, Class EH,
5.500%, 1/15/2035(d) | | | 3,044,606 | |
| | 7,536,316 | | | Federal National Mortgage Association, Series 2003-26, Class OI,
5.500%, 11/25/2032(d)(e) | | | 904,817 | |
| | 8,594,062 | | | Federal National Mortgage Association, Series 2004-2, Class QK,
4.000%, 9/25/2017(d) | | | 8,846,246 | |
| | 4,124,274 | | | First Horizon Alternative Mortgage Securities, Series 2006-AA3, Class A1,
5.860%, 6/25/2036(b) | | | 2,388,899 | |
| | 701,131 | | | Morgan Stanley Mortgage Loan Trust, Series 2005-3AR, Class 5A,
5.515%, 7/25/2035(b) | | | 648,465 | |
| | 3,670,000 | | | NCUA Guaranteed Notes, Series 2010-C1, Class A2,
2.900%, 10/29/2020 | | | 3,572,966 | |
| | 6,189,540 | | | NCUA Guaranteed Notes, Series 2010-R1, Class 1A,
0.690%, 10/07/2020(b) | | | 6,197,277 | |
| | 32,495,859 | | | NCUA Guaranteed Notes, Series 2010-R3, Class 1A, 0.800%,
12/08/2020(b) | | | 32,648,264 | |
| | 425,564 | | | Residential Accredit Loans, Inc., Series 2006-QS13, Class 2A1,
5.750%, 9/25/2021 | | | 347,035 | |
| | 1,738,063 | | | Residential Accredit Loans, Inc., Series 2006-QS18, Class 3A3,
5.750%, 12/25/2021 | | | 1,594,943 | |
| | 94,351 | | | Residential Accredit Loans, Inc., Series 2006-QS6, Class 2A1,
6.000%, 6/25/2021 | | | 86,488 | |
| | 8,395,001 | | | Washington Mutual Mortgage Pass Through Certificates, Series 2007-HY2, Class 2A2,
6.194%, 11/25/2036(b) | | | 6,643,502 | |
| | 540,004 | | | Wells Fargo Mortgage Backed Securities Trust, Series 2005-AR16, Class 3A2,
2.787%, 10/25/2035(b) | | | 513,678 | |
| | | | | | | | |
| | | | | | | 68,747,073 | |
| | | | | | | | |
| | | | Commercial Mortgage-Backed Securities – 28.5% | |
| | 11,306 | | | Banc of America Commercial Mortgage, Inc., Series 2005-6, Class A2,
5.165%, 9/10/2047 | | | 11,300 | |
| | 189,000 | | | Banc of America Commercial Mortgage, Inc., Series 2005-6, Class A4,
5.368%, 9/10/2047(b) | | | 203,843 | |
| | 350,000 | | | Banc of America Commercial Mortgage, Inc., Series 2006-2, Class A4,
5.929%, 5/10/2045(b) | | | 380,130 | |
15 |
Portfolio of Investments – as of March 31, 2011 (Unaudited)
Loomis Sayles Securitized Asset Fund �� continued
| | | | | | | | |
Principal
Amount | | | Description | | Value (†) | |
| | | | | | | | |
| |
| | Bonds and Notes – continued | | | | |
| |
| | | | Commercial Mortgage-Backed Securities – continued | |
| $ | 421,033 | | | Banc of America Commercial Mortgage, Inc., Series 2006-4, Class A2,
5.522%, 7/10/2046 | | $ | 423,073 | |
| | 6,017,000 | | | Banc of America Commercial Mortgage, Inc., Series 2007-5, Class A4,
5.492%, 2/10/2051 | | | 6,318,153 | |
| | 260,679 | | | Bank of America-First Union NB Commercial Mortgage, Series 2001-3, Class A2,
5.464%, 4/11/2037 | | | 262,389 | |
| | 33,653 | | | Bear Stearns Commercial Mortgage Securities, Series 2001-TOP2, Class A2,
6.480%, 2/15/2035 | | | 33,635 | |
| | 97,902 | | | Bear Stearns Commercial Mortgage Securities, Series 2005-T18, Class A2,
4.556%, 2/13/2042 | | | 98,773 | |
| | 2,725,000 | | | Bear Stearns Commercial Mortgage Securities, Series 2007-PW15, Class A4,
5.331%, 2/11/2044 | | | 2,854,676 | |
| | 1,200,000 | | | Bear Stearns Commercial Mortgage Securities, Series 2007-PW16, Class A4,
5.906%, 6/11/2040(b) | | | 1,293,957 | |
| | 7,500,000 | | | Citigroup Commercial Mortgage Trust,
Series 2006-C5, Class A4,
5.431%, 10/15/2049 | | | 8,011,360 | |
| | 8,870,000 | | | Citigroup/Deutsche Bank Commercial Mortgage Trust, Series 2007-CD4, Class A4,
5.322%, 12/11/2049 | | | 9,323,085 | |
| | 250,000 | | | Commercial Mortgage Pass Through Certificates, Series 2006-C7, Class A4,
5.951%, 6/10/2046(b) | | | 272,941 | |
| | 4,860,000 | | | Credit Suisse Mortgage Capital Certificates, Series 2006-C3, Class A3,
6.018%, 6/15/2038(b) | | | 5,259,244 | |
| | 5,250,000 | | | Credit Suisse Mortgage Capital Certificates, Series 2007-C2, Class A3,
5.542%, 1/15/2049 | | | 5,445,750 | |
| | 5,688,000 | | | Credit Suisse Mortgage Capital Certificates, Series 2007-C3, Class A4,
5.905%, 6/15/2039(b) | | | 6,023,298 | |
| | 5,000,000 | | | Credit Suisse Mortgage Capital Certificates, Series 2007-C4, Class A4,
5.995%, 9/15/2039(b) | | | 5,310,582 | |
| | 11,163,000 | | | Credit Suisse Mortgage Capital Certificates, Series 2007-C5, Class A4,
5.695%, 9/15/2040 | | | 11,600,075 | |
| | 1,508,000 | | | Credit Suisse Mortgage Capital Certificates, Series 2008-C1, Class A3,
6.417%, 2/15/2041(b) | | | 1,630,535 | |
| | 6,600,000 | | | Extended Stay America Trust,
Series 2010-ESHA, Class B,
4.221%, 11/05/2027, 144A | | | 6,651,007 | |
| | 10,510,000 | | | Greenwich Capital Commercial Funding Corp., Series 2007-GG11, Class A4,
5.736%, 12/10/2049 | | | 11,116,467 | |
| | 8,745,000 | | | Greenwich Capital Commercial Funding Corp., Series 2007-GG9, Class A4,
5.444%, 3/10/2039 | | | 9,256,262 | |
| | | | | | | | |
Principal
Amount | | | Description | | Value (†) | |
| | | | | | | | |
| |
| | | | Commercial Mortgage-Backed Securities – continued | |
| $ | 125,000 | | | GS Mortgage Securities Corp. II,
Series 2004-GG2, Class A6,
5.396%, 8/10/2038 | | $ | 133,895 | |
| | 742,634 | | | GS Mortgage Securities Corp. II,
Series 2005-GG4, Class A2,
4.475%, 7/10/2039 | | | 742,056 | |
| | 1,815,000 | | | GS Mortgage Securities Corp. II,
Series 2005-GG4, Class A4A,
4.751%, 7/10/2039 | | | 1,909,701 | |
| | 308,576 | | | GS Mortgage Securities Corp. II,
Series 2006-GG6, Class A2,
5.506%, 4/10/2038 | | | 310,607 | |
| | 6,730,000 | | | GS Mortgage Securities Corp. II,
Series 2006-GG6, Class A4,
5.553%, 4/10/2038 | | | 7,217,524 | |
| | 7,500,000 | | | GS Mortgage Securities Corp. II,
Series 2006-GG8, Class A4,
5.560%, 11/10/2039 | | | 8,066,563 | |
| | 12,500,000 | | | GS Mortgage Securities Trust,
Series 2007-GG10, Class A4,
6.002%, 8/10/2045(b) | | | 13,271,692 | |
| | 7,500,000 | | | JPMorgan Chase Commercial Mortgage Securities Corp., Series 2006-CB15, Class A4,
5.814%, 6/12/2043 | | | 8,138,791 | |
| | 3,200,000 | | | JPMorgan Chase Commercial Mortgage Securities Corp., Series 2007-CB18, Class A4,
5.440%, 6/12/2047 | | | 3,374,350 | |
| | 7,585,000 | | | JPMorgan Chase Commercial Mortgage Securities Corp., Series 2007-LDPX, Class A3,
5.420%, 1/15/2049 | | | 7,999,431 | |
| | 275,000 | | | LB-UBS Commercial Mortgage Trust,
Series 2005-C3, Class A3,
4.647%, 7/15/2030 | | | 278,887 | |
| | 2,440,000 | | | LB-UBS Commercial Mortgage Trust,
Series 2006-C3, Class A4,
5.661%, 3/15/2039 | | | 2,630,971 | |
| | 7,500,000 | | | LB-UBS Commercial Mortgage Trust,
Series 2006-C7, Class A3,
5.347%, 11/15/2038 | | | 7,934,398 | |
| | 1,000,000 | | | Merrill Lynch/Countrywide Commercial Mortgage Trust, Series 2006-1, Class A4,
5.610%, 2/12/2039(b) | | | 1,076,309 | |
| | 250,000 | | | Merrill Lynch/Countrywide Commercial Mortgage Trust, Series 2006-2, Class A4,
6.097%, 6/12/2046(b) | | | 273,708 | |
| | 1,000,000 | | | Merrill Lynch/Countrywide Commercial Mortgage Trust, Series 2006-3, Class A4,
5.414%, 7/12/2046 | | | 1,059,107 | |
| | 4,700,000 | | | Merrill Lynch/Countrywide Commercial Mortgage Trust, Series 2007-5, Class A4,
5.378%, 8/12/2048 | | | 4,869,633 | |
| | 7,525,000 | | | Merrill Lynch/Countrywide Commercial Mortgage Trust, Series 2007-6, Class A4, 5.485%, 3/12/2051 | | | 7,881,328 | |
| | 1,330,000 | | | Morgan Stanley Capital I, Series 2005-HQ6, Class A4A, 4.989%, 8/13/2042 | | | 1,418,108 | |
| 16
Portfolio of Investments – as of March 31, 2011 (Unaudited)
Loomis Sayles Securitized Asset Fund – continued
| | | | | | | | |
Principal
Amount | | | Description | | Value (†) | |
| | | | | | | | |
| |
| | Bonds and Notes – continued | | | | |
| |
| | | | Commercial Mortgage-Backed Securities – continued | |
| $ | 555,000 | | | Morgan Stanley Capital I, Series 2006-T23, Class A2, 5.910%, 8/12/2041(b) | | $ | 586,378 | |
| | 9,130,000 | | | Morgan Stanley Capital I, Series 2007-IQ14, Class A4, 5.692%, 4/15/2049 | | | 9,619,261 | |
| | 7,381,000 | | | Morgan Stanley Capital I, Series 2007-IQ15, Class A4, 6.071%, 6/11/2049(b) | | | 7,862,764 | |
| | 23,878 | | | Wachovia Bank Commercial Mortgage Trust, Series 2005-C16, Class A2, 4.380%, 10/15/2041 | | | 24,052 | |
| | 7,600,000 | | | Wachovia Bank Commercial Mortgage Trust, Series 2006-C23, Class A4, 5.418%, 1/15/2045 | | | 8,160,622 | |
| | | | | | | | |
| | | | | | | 196,620,671 | |
| | | | | | | | |
| | | | Hybrid ARMs – 1.4% | | | | |
| | 218,455 | | | FHLMC, 2.576%, 1/01/2035(b)(d) | | | 229,705 | |
| | 3,195,790 | | | FHLMC, 5.928%, 2/01/2037(b)(d) | | | 3,383,145 | |
| | 2,460,063 | | | FHLMC, 6.004%, 11/01/2036(b)(d) | | | 2,630,312 | |
| | 1,533,506 | | | FNMA, 5.710%, 9/01/2036(b)(d) | | | 1,621,678 | |
| | 1,695,380 | | | FNMA, 5.983%, 2/01/2037(b)(d) | | | 1,803,103 | |
| | | | | | | | |
| | | | | | | 9,667,943 | |
| | | | | | | | |
| | | | Mortgage Related – 44.7% | | | | |
| | 20,656,835 | | | FHLMC, 5.000%, with various maturities from 2022 to 2040(d)(f) | | | 21,793,918 | |
| | 28,817,663 | | | FHLMC, 5.500%, with various maturities from 2035 to 2040(d)(f) | | | 30,788,623 | |
| | 13,446,472 | | | FHLMC, 6.000%, with various maturities from 2036 to 2037(d)(f) | | | 14,659,590 | |
| | 75,840 | | | FHLMC, 6.500%, 1/01/2038(d) | | | 84,999 | |
| | 12,450,000 | | | FHLMC (TBA), 4.500%, 6/01/2020(g) | | | 13,037,491 | |
| | 33,000,000 | | | FHLMC (TBA), 5.000%, 9/01/2036(g) | | | 34,438,602 | |
| | 20,000,000 | | | FHLMC (TBA), 6.000%, 9/01/2035(g) | | | 21,725,000 | |
| | 406,502 | | | FNMA, 4.500%, 10/01/2035(d) | | | 417,057 | |
| | 1,820,931 | | | FNMA, 5.000%, 4/01/2040(d) | | | 1,908,396 | |
| | 10,643,878 | | | FNMA, 5.500%, with various maturities from 2034 to 2036(d)(f) | | | 11,453,646 | |
| | 7,138,014 | | | FNMA, 6.000%, with various maturities from 2034 to 2037(d)(f) | | | 7,819,160 | |
| | | | | | | | |
Principal
Amount | | | Description | | Value (†) | |
| | | | | | | | |
| | |
| | | | Mortgage Related – continued | | | | |
| $ | 8,126,495 | | | FNMA, 6.500%, with various maturities from 2036 to 2038(d)(f) | | $ | 9,122,873 | |
| | 20,040 | | | FNMA, 7.000%, 12/01/2037(d) | | | 22,936 | |
| | 26,700,000 | | | FNMA (TBA), 5.000%, 5/01/2036(g) | | | 27,930,710 | |
| | 1,295,000 | | | FNMA (TBA), 6.000%, 8/01/2035(g) | | | 1,408,312 | |
| | 70,929,363 | | | GNMA, 4.500%, with various maturities from 2039 to 2040(d)(f) | | | 73,304,753 | |
| | 1,115,230 | | | GNMA, 5.500%, with various maturities from 2033 to 2036(d)(f) | | | 1,211,130 | |
| | 63,811 | | | GNMA,
6.000%, 6/15/2036(d) | | | 70,365 | |
| | 284,449 | | | GNMA,
6.500%, 9/15/2036(d) | | | 321,605 | |
| | 34,000,000 | | | GNMA (TBA),
5.500%, 3/01/2036(g) | | | 36,815,608 | |
| | | | | | | | |
| | | | | | | 308,334,774 | |
| | | | | | | | |
| | |
| | | | Total Bonds and Notes | | | | |
| | | | (Identified Cost $754,705,488) | | | 781,205,981 | |
| | | | | | | | |
| |
| | Short-Term Investments – 6.0% | | | | |
| | 41,681,826 | | | Tri-Party Repurchase Agreement with Fixed Income Clearing Corporation, dated 3/31/2011 at 0.000% to be repurchased at $41,681,826 on 4/01/2011 collateralized by $42,895,000 Federal Home Loan Mortgage Corp., 2.950% due 12/08/2017 valued at $42,519,669 including accrued interest (Note 2 of Notes of Financial Statements)
(Identified Cost $41,681,826) | | | 41,681,826 | |
| | | | | | | | |
| | |
| | | | Total Investments – 119.2% | | | | |
| | | | (Identified Cost $796,387,314)(a) | | | 822,887,807 | |
| | | | Other Assets Less Liabilities – (19.2)% | | | (132,733,070 | ) |
| | | | | | | | |
| | |
| | | | Net Assets – 100.0% | | $ | 690,154,737 | |
| | | | | | | | |
| | |
| | (†) | | | See Note 2 of Notes to Financial Statements. | | | | |
| | (a) | | | Federal Tax Information (Amounts exclude certain adjustments made at the end of the Fund’s fiscal year for tax purposes. Such adjustments are primarily due to wash sales.): | |
| | | | At March 31, 2011, the net unrealized appreciation on investments based on a cost of $796,387,314 for federal income tax purposes was as follows: | |
| | | | Aggregate gross unrealized appreciation for all investments in which there is an excess of value over tax cost | | $ | 32,148,248 | |
| | | | Aggregate gross unrealized depreciation for all investments in which there is an excess of tax cost over value | | | (5,647,755 | ) |
| | | | | | | | |
| | | | Net unrealized appreciation | | $ | 26,500,493 | |
| | | | | | | | |
See accompanying notes to financial statements.
17 |
Portfolio of Investments – as of March 31, 2011 (Unaudited)
Loomis Sayles Securitized Asset Fund – continued
| | | | | | | | |
| | (b) | | | Variable rate security. Rate as of March 31, 2011 is disclosed. | |
| | (c) | | | Illiquid security. At March 31, 2011, the value of this security amounted to $3,818,362 or 0.6% of net assets. | |
| | (d) | | | All or a portion of this security has been designated to cover the Fund’s obligations under open TBA transactions. | |
| | (e) | | | Security represents right to receive monthly interest payments on an underlying pool of mortgages. Principal shown is the outstanding par amount of the pool held as of the end of the period. | |
| | (f) | | | The Fund’s investment in mortgage related securities of Federal Home Loan Mortgage Corporation, Federal National Mortgage Association and Government National Mortgage Association are interests in separate pools of mortgages. All separate investments in securities of each issuer which have the same coupon rate have been aggregated for the purpose of presentation in the Portfolio of Investments. | |
| | (g) | | | Delayed delivery. See Note 2 of Notes to Financial Statements. | |
| |
| | 144A | | | All or a portion of these securities are exempt from registration under Rule 144A of the Securities Act of 1933. These securities may be resold in transactions exempt from registration, normally to qualified institutional buyers. At March 31, 2011, the value of Rule 144A holdings amounted to $97,366,579 or 14.1% of net assets. | |
| | ABS | | | Asset-Backed Securities | | | | |
| | ARMs | | | Adjustable Rate Mortgages | | | | |
| | FHLMC | | | Federal Home Loan Mortgage Corp. | | | | |
| | FNMA | | | Federal National Mortgage Association | | | | |
| | GNMA | | | Government National Mortgage Association | | | | |
| | TBA | | | To Be Announced | | | | |
Industry Summary at March 31, 2011 (Unaudited)
| | | | |
Mortgage Related | | | 44.7 | % |
Commercial Mortgage-Backed Securities | | | 28.5 | |
ABS Car Loan | | | 15.8 | |
Collateralized Mortgage Obligations | | | 10.0 | |
ABS Credit Card | | | 8.1 | |
ABS Student Loan | | | 2.2 | |
ABS Other | | | 2.0 | |
Other Investments, less than 2% each | | | 1.9 | |
Short-Term Investments | | | 6.0 | |
| | | | |
Total Investments | | | 119.2 | |
Other assets less liabilities | | | (19.2 | ) |
| | | | |
Net Assets | | | 100.0 | % |
| | | | |
See accompanying notes to financial statements.
| 18
Statements of Assets and Liabilities
March 31, 2011 (Unaudited)
| | | | | | | | |
| | | High Income
Opportunities
Fund | | | Securitized
Asset Fund | |
ASSETS | | | | | | | | |
Investments at cost | | $ | 66,985,573 | | | $ | 796,387,314 | |
Net unrealized appreciation | | | 3,275,883 | | | | 26,500,493 | |
| | | | | | | | |
Investments at value | | | 70,261,456 | | | | 822,887,807 | |
Receivable for Fund shares sold | | | — | | | | 777,216 | |
Dividends and interest receivable | | | 1,039,274 | | | | 2,424,969 | |
| | | | | | | | |
TOTAL ASSETS | | | 71,300,730 | | | | 826,089,992 | |
| | | | | | | | |
| | |
| LIABILITIES | | | | | | | | |
Payable for securities purchased | | | 562,755 | | | | — | |
Payable for delayed delivery securities purchased (Note 2) | | | — | | | | 135,743,506 | |
Payable for Fund shares redeemed | | | 4,843 | | | | 191,749 | |
| | | | | | | | |
TOTAL LIABILITIES | | | 567,598 | | | | 135,935,255 | |
| | | | | | | | |
NET ASSETS | | $ | 70,733,132 | | | $ | 690,154,737 | |
| | | | | | | | |
NET ASSETS CONSIST OF: | | | | | | | | |
Paid-in capital | | $ | 72,628,423 | | | $ | 660,906,922 | |
Undistributed net investment income | | | 210,528 | | | | 500,191 | |
Accumulated net realized gain (loss) on investments, futures contracts and foreign currency transactions | | | (5,381,702 | ) | | | 2,247,131 | |
Net unrealized appreciation on investments | | | 3,275,883 | | | | 26,500,493 | |
| | | | | | | | |
NET ASSETS | | $ | 70,733,132 | | | $ | 690,154,737 | |
| | | | | | | | |
| | |
| NET ASSET VALUE AND OFFERING PRICE: | | | | | | | | |
Institutional Class: | | | | | | | | |
Net assets | | $ | 70,733,132 | | | $ | 690,154,737 | |
| | | | | | | | |
Shares of beneficial interest | | | 6,819,286 | | | | 62,715,574 | |
| | | | | | | | |
Net asset value, offering and redemption price per share | | $ | 10.37 | | | $ | 11.00 | |
| | | | | | | | |
See accompanying notes to financial statements.
19 |
Statements of Operations
For the Six Months Ended March 31, 2011 (Unaudited)
| | | | | | | | |
| | | High Income
Opportunities
Fund | | | Securitized
Asset Fund | |
INVESTMENT INCOME | | | | | | | | |
Interest | | $ | 2,451,513 | | | $ | 12,048,055 | |
Dividends | | | 76,186 | | | | — | |
| | | | | | | | |
Net investment income | | | 2,527,699 | | | | 12,048,055 | |
| | | | | | | | |
| | |
| NET REALIZED AND UNREALIZED GAIN (LOSS) ON INVESTMENTS | | | | | | | | |
Net realized gain on: | | | | | | | | |
Investments | | | 997,962 | | | | 3,862,856 | |
Net change in unrealized appreciation (depreciation) on: | | | | | | | | |
Investments | | | 2,331,689 | | | | (492,956 | ) |
| | | | | | | | |
Net realized and unrealized gain on investments | | | 3,329,651 | | | | 3,369,900 | |
| | | | | | | | |
| | |
| NET INCREASE IN NET ASSETS RESULTING FROM OPERATIONS | | $ | 5,857,350 | | | $ | 15,417,955 | |
| | | | | | | | |
See accompanying notes to financial statements.
| 20
Statements of Changes in Net Assets
| | | | | | | | | | | | | | | | |
| | | High Income Opportunities Fund | | | Securitized Asset Fund | |
| | | Six Months Ended
March 31, 2011
(Unaudited) | | | Year Ended
September 30, 2010 | | | Six Months Ended
March 31, 2011
(Unaudited) | | | Year Ended
September 30, 2010 | |
| FROM OPERATIONS: | | | | | | | | | | | | | | | | |
Net investment income | | $ | 2,527,699 | | | $ | 5,589,114 | | | $ | 12,048,055 | | | $ | 18,710,575 | |
Net realized gain on investments and futures contracts | | | 997,962 | | | | 1,485,070 | | | | 3,862,856 | | | | 3,355,685 | |
Net change in unrealized appreciation (depreciation) on investments and futures contracts | | | 2,331,689 | | | | 5,014,237 | | | | (492,956 | ) | | | 39,981,038 | |
| | | | | | | | | | | | | | | | |
Net increase in net assets resulting from operations | | | 5,857,350 | | | | 12,088,421 | | | | 15,417,955 | | | | 62,047,298 | |
| | | | | | | | | | | | | | | | |
| FROM DISTRIBUTIONS TO SHAREHOLDERS: | | | | | | | | | | | | | | | | |
Net investment income | | | | | | | | | | | | | | | | |
Institutional Class | | | (2,818,433) | | | | (5,690,124 | ) | | | (14,269,664 | ) | | | (20,474,786 | ) |
Net realized capital gains | | | | | | | | | | | | | | | | |
Institutional Class | | | — | | | | — | | | | — | | | | (4,702,129 | ) |
| | | | | | | | | | | | | | | | |
Total distributions | | | (2,818,433 | ) | | | (5,690,124 | ) | | | (14,269,664 | ) | | | (25,176,915 | ) |
| | | | | | | | | | | | | | | | |
| NET INCREASE (DECREASE) IN NET ASSETS FROM CAPITAL SHARE TRANSACTIONS (NOTE 8) | | | 2,134,459 | | | | (12,548,060 | ) | | | 35,707,510 | | | | 325,960,515 | |
| | | | | | | | | | | | | | | | |
Net increase (decrease) in net assets | | | 5,173,376 | | | | (6,149,763 | ) | | | 36,855,801 | | | | 362,830,898 | |
| NET ASSETS | | | | | | | | | | | | | | | | |
Beginning of the period | | | 65,559,756 | | | | 71,709,519 | | | | 653,298,936 | | | | 290,468,038 | |
| | | | | | | | | | | | | | | | |
End of the period | | $ | 70,733,132 | | | $ | 65,559,756 | | | $ | 690,154,737 | | | $ | 653,298,936 | |
| | | | | | | | | | | | | | | | |
| UNDISTRIBUTED NET INVESTMENT INCOME | | $ | 210,528 | | | $ | 501,262 | | | $ | 500,191 | | | $ | 2,721,800 | |
| | | | | | | | | | | | | | | | |
See accompanying notes to financial statements.
21 |
THIS PAGE INTENTIONALLY LEFT BLANK
| 22
Financial Highlights
For a share outstanding throughout each period.
| | | | | | | | | | | | | | | | | | | | | | | | | | | | | | | | |
| | | | | | Income (Loss) from Investment Operations: | | | | | | Less Distributions: | |
| | | Net asset
value,
beginning
of the period | | | Net
investment
income(a) | | | Net realized
and unrealized
gain (loss) | | | Total from
investment
operations | | | | | | Dividends
from net investment
income | | | Distributions
from net
realized
capital gains(b) | | | Total
distributions | |
| HIGH INCOME OPPORTUNITIES FUND | | | | | | | | | | | | | | | | | | | | | | | | | |
| | | | | | | | |
| Institutional Class | | | | | | | | | | | | | | | | | | | | | | | | | | | | | | | | |
3/31/2011(f) | | $ | 9.92 | | | $ | 0.38 | | | $ | 0.50 | | | $ | 0.88 | | | | | | | $ | (0.43 | ) | | $ | — | | | $ | (0.43 | ) |
9/30/2010 | | | 9.07 | | | | 0.78 | | | | 0.86 | | | | 1.64 | | | | | | | | (0.79 | ) | | | — | | | | (0.79 | ) |
9/30/2009 | | | 8.26 | | | | 0.79 | | | | 0.84 | | | | 1.63 | | | | | | | | (0.81 | ) | | | (0.01 | ) | | | (0.82 | ) |
9/30/2008 | | | 10.42 | | | | 0.82 | | | | (2.09 | ) | | | (1.27 | ) | | | | | | | (0.82 | ) | | | (0.07 | ) | | | (0.89 | ) |
9/30/2007 | | | 10.39 | | | | 0.77 | | | | 0.01 | (g) | | | 0.78 | | | | | | | | (0.75 | ) | | | (0.00 | ) | | | (0.75 | ) |
9/30/2006 | | | 10.50 | | | | 0.76 | | | | (0.10 | ) | | | 0.66 | | | | | | | | (0.73 | ) | | | (0.04 | ) | | | (0.77 | ) |
| | | | | | | |
| SECURITIZED ASSET FUND | | | | | | | | | | | | | | | | | | | | | | | | | | | | | |
| | | | | | | |
| Institutional Class | | | | | | | | | | | | | | | | | | | | | | | | | | | | | |
3/31/2011(f) | | $ | 10.99 | | | $ | 0.20 | | | $ | 0.05 | | | $ | 0.25 | | | | | | | $ | (0.24 | ) | | $ | — | | | $ | (0.24 | ) |
9/30/2010 | | | 10.16 | | | | 0.41 | | | | 1.08 | | | | 1.49 | | | | | | | | (0.49 | ) | | | (0.17 | ) | | | (0.66 | ) |
9/30/2009 | | | 9.60 | | | | 0.50 | | | | 0.66 | | | | 1.16 | | | | | | | | (0.57 | ) | | | (0.03 | ) | | | (0.60 | ) |
9/30/2008 | | | 10.07 | | | | 0.55 | | | | (0.45 | ) | | | 0.10 | | | | | | | | (0.57 | ) | | | — | | | | (0.57 | ) |
9/30/2007 | | | 10.13 | | | | 0.55 | | | | (0.10 | ) | | | 0.45 | | | | | | | | (0.51 | ) | | | (0.00 | ) | | | (0.51 | ) |
9/30/2006(h) | | | 10.00 | | | | 0.30 | | | | 0.02 | | | | 0.32 | | | | | | | | (0.19 | ) | | | — | | | | (0.19 | ) |
| (a) | | Per share net investment income has been calculated using the average shares outstanding during the period. | |
| (b) | | Amount rounds to less than $0.01 per share, if applicable. | |
| (c) | | Periods less than one year, if applicable, are not annualized. | |
| (d) | | Loomis Sayles has agreed to pay, without reimbursement from the Fund, all expenses associated with the operations of the Fund. | |
| (e) | | Computed on an annualized basis for periods less than one year, if applicable. | |
| (f) | | For the six months ended March 31, 2011 (Unaudited). | |
| (g) | | The amount shown for a share outstanding does not correspond with the aggregate realized and unrealized gain (loss) on investments for the period due to the timing of sales and redemptions of fund shares in relation to fluctuating market values of investments of the Fund. | |
| (h) | | For the period March 2, 2006 (commencement of operations) through September 30, 2006. | |
See accompanying notes to financial statements.
23 |
| | | | | | | | | | | | | | | | | | | | | | | | | | |
| | | | | | | | | | Ratios to Average Net Assets | | | | |
Net asset
value, end
of the period | | | Total
return (%)(c) | | | Net assets,
end of
the period
(000’s) | | | Net
expenses
(%)(d) | | | Gross
expenses
(%)(d) | | | Net
investment
income (%)(e) | | | Portfolio
turnover
rate(%) | |
| | | | | | | | | | | | | | | | | | | | | | | | | | |
| | | | | | |
| | | | | | | | | | | | | | | | | | | | | | | | | | |
| | $10.37 | | | | 9.06 | | | $ | 70,733 | | | | — | | | | — | | | | 7.51 | | | | 17 | |
| | 9.92 | | | | 18.88 | | | | 65,560 | | | | — | | | | — | | | | 8.21 | | | | 26 | |
| | 9.07 | | | | 23.06 | | | | 71,710 | | | | — | | | | — | | | | 10.86 | | | | 34 | |
| | 8.26 | | | | (13.24 | ) | | | 64,950 | | | | — | | | | — | | | | 8.47 | | | | 24 | |
| | 10.42 | | | | 7.68 | | | | 84,073 | | | | — | | | | — | | | | 7.35 | | | | 29 | |
| | 10.39 | | | | 6.64 | | | | 42,847 | | | | — | | | | — | | | | 7.36 | | | | 26 | |
| | | | | | |
| | | | | | | | | | | | | | | | | | | | | | | | | | |
| | | | | | |
| | | | | | | | | | | | | | | | | | | | | | | | | | |
| | $11.00 | | | | 2.29 | | | $ | 690,155 | | | | — | | | | — | | | | 3.65 | | | | 111 | |
| | 10.99 | | | | 15.24 | | | | 653,299 | | | | — | | | | — | | | | 3.89 | | | | 251 | |
| | 10.16 | | | | 12.97 | | | | 290,468 | | | | — | | | | — | | | | 5.42 | | | | 390 | |
| | 9.60 | | | | 0.92 | | | | 382,054 | | | | — | | | | — | | | | 5.55 | | | | 430 | |
| | 10.07 | | | | 4.58 | | | | 347,153 | | | | — | | | | — | | | | 5.43 | | | | 73 | |
| | 10.13 | | | | 3.28 | | | | 70,993 | | | | — | | | | — | | | | 3.02 | | | | 55 | |
See accompanying notes to financial statements.
| 24
Notes To Financial Statements
March 31, 2011 (Unaudited)
1. Organization. Loomis Sayles Funds I (the “Trust”) is organized as a Massachusetts business trust. The Trust is registered under the Investment Company Act of 1940, as amended (the “1940 Act”), as an open-end management investment company. The Declaration of Trust permits the Board of Trustees to authorize the issuance of an unlimited number of shares of the Trust in multiple series. The financial statements for certain funds of the Trust are presented in separate reports. The following funds (individually, a “Fund” and collectively, the “Funds”) are included in this report:
Loomis Sayles High Income Opportunities Fund (the “High Income Opportunities Fund”)
Loomis Sayles Securitized Asset Fund (the “Securitized Asset Fund”)
Each Fund offers Institutional Class shares. The Funds’ shares are offered exclusively to investors in “wrap fee” programs approved by Natixis Asset Management Advisors, L.P. (“Natixis Advisors”) and/or Loomis, Sayles & Company, L.P. (“Loomis Sayles”) and to institutional advisory clients of Natixis Advisors or Loomis Sayles that, in each case, meet the Funds’ policies as established by Loomis Sayles.
2. Significant Accounting Policies. The following is a summary of significant accounting policies consistently followed by each Fund in the preparation of its financial statements. The Funds’ financial statements are prepared in accordance with accounting principles generally accepted in the United States of America which require the use of management estimates that affect the reported amounts and disclosures in the financial statements. Actual results could differ from those estimates. Management has evaluated the events and transactions subsequent to period-end through the date the financial statements were issued and has determined that there were no material events that would require disclosure in the Funds’ financial statements.
a. Valuation. Debt securities (other than short-term obligations purchased with an original or remaining maturity of sixty days or less) are generally valued on the basis of evaluated bids furnished to the Funds by a pricing service recommended by the investment adviser and approved by the Board of Trustees, which service determines valuations for normal, institutional-size trading units of such securities using market information, transactions for comparable securities and various relationships between securities which are generally recognized by institutional traders. Equity securities, including shares of closed-end investment companies and exchange-traded funds, for which market quotations are readily available are valued at market value, as reported by pricing services recommended by the investment adviser and approved by the Board of Trustees. Such pricing services generally use the security’s last sale price on the exchange or market where the security is primarily traded or, if there is no reported sale during the day, the closing bid price. Securities traded on the NASDAQ Global Select Market, NASDAQ Global Market and NASDAQ Capital Market are valued at the NASDAQ Official Closing Price (“NOCP”), or if lacking a NOCP, at the most recent bid quotation on the applicable NASDAQ Market. Broker-dealer bid quotations may also be used to value debt and equity securities where a pricing service does not price a security or where a pricing service does not provide a reliable price for the security. In instances where broker-dealer bid quotations are not available, certain securities held by the Funds may be valued on the basis of a price provided by a principal market maker. Forward foreign currency contracts are valued utilizing interpolated prices determined from information provided by an independent pricing service. Futures contracts are valued at their most recent settlement price. Short-term obligations purchased with an original or remaining maturity of sixty days or less are valued at amortized cost, which approximates market value. Investments in other open-end investment companies are valued at their net asset value each day. Securities for which market quotations are not readily available are valued at fair value as determined in good faith by the Funds’ investment adviser using consistently applied procedures under the general supervision of the Board of Trustees.
The High Income Opportunities Fund may hold securities traded in foreign markets. Foreign securities are valued at the market price in the foreign market. However, if events occurring after the close of the foreign market (but before the close of regular trading on the New York Stock Exchange) are believed to materially affect the value of those securities, such securities are fair valued pursuant to procedures approved by the Board of Trustees. When fair valuing securities, the Fund may, among other things, use modeling tools or other processes that may take into account factors such as securities market activity and/or significant events that occur after the close of the foreign market and before the Fund calculates its net asset value.
b. Investment Transactions and Related Investment Income. Investment transactions are accounted for on a trade date plus one basis for daily net asset value calculation. However, for financial reporting purposes, investment transactions are reported on trade date. Dividend income is recorded on ex-dividend date, or in the case of certain foreign securities, as soon as a Fund is notified, and interest income is recorded on an accrual basis. Interest income is increased by the accretion of discount and decreased by the amortization of premium. Investment income is recorded net of foreign taxes withheld when applicable. In determining net gain or loss on securities sold, the cost of securities has been determined on an identified cost basis.
c. Foreign Currency Translation. The books and records of the Funds are maintained in U.S. dollars. The values of securities, currencies and other assets and liabilities denominated in currencies other than U.S. dollars are translated into U.S. dollars based upon foreign exchange rates prevailing at the end of the period. Purchases and sales of investment securities, income and expenses are translated on the respective dates of such transactions.
25 |
Since the values of investment securities are presented at the foreign exchange rates prevailing at the end of the period, it is not practical to isolate that portion of the results of operations arising from changes in exchange rates from fluctuations which arise due to changes in market prices of investment securities. Such changes are included with the net realized and unrealized gain or loss on investments.
Net realized foreign exchange gains or losses arise from sales of foreign currency, currency gains or losses realized between the trade and settlement dates on securities transactions and the difference between the amounts of dividends, interest and foreign withholding taxes recorded on High Income Opportunities Fund’s books and the U.S. dollar equivalent of the amounts actually received or paid. Net unrealized foreign exchange gains and losses arise from changes in the value of assets and liabilities, other than investment securities, at the end of the fiscal period, resulting from changes in exchange rates.
The High Income Opportunities Fund may use foreign currency exchange contracts to facilitate transactions in foreign denominated investments. Losses may arise from changes in the value of the foreign currency or if the counterparties do not perform under the contracts’ terms.
d. Forward Foreign Currency Contracts. The High Income Opportunities Fund may enter into forward foreign currency contracts, including forward foreign cross currency contracts. Contracts to buy generally are used to acquire exposure to foreign currencies, while contracts to sell generally are used to hedge the Fund’s investments against currency fluctuation. Also, a contract to buy or sell can offset a previous contract. These contracts involve market risk in excess of the unrealized gain or loss reflected in the Fund’s Statements of Assets and Liabilities. The U.S. dollar value of the currencies the Fund has committed to buy or sell represents the aggregate exposure to each currency the Fund has acquired or hedged through currency contracts outstanding at period end. Gains or losses are recorded for financial statement purposes as unrealized until settlement date. Risks may arise upon entering into these contracts from the potential inability of counterparties to meet the terms of their contracts and from unanticipated movements in the value of a foreign currency relative to the U.S. dollar. Certain contracts may require the movement of cash or securities as collateral for the Funds’ or counterparty’s net obligations under the contracts.
There were no forward currency contracts held by the Fund during the six months ended March 31, 2011.
e. Futures Contracts. The Funds may enter into futures contracts. Futures contracts are agreements between two parties to buy and sell a particular commodity, instrument or index for a specified price on a specified future date.
When a Fund enters into a futures contract, it is required to deposit with (or for the benefit of) its broker an amount of cash or short-term high quality securities as “initial margin”. As the value of the contract changes, the value of the futures contract position increases or declines. Subsequent payments, known as “variation margin”, are made or received by a Fund, depending on the price fluctuations in the fair value of the contract and the value of cash or securities on deposit with the broker. The aggregate principal amounts of the contracts are not recorded in the financial statements. Fluctuations in the value of the contracts are recorded in the Statements of Assets and Liabilities as an asset (liability) and in the Statements of Operations as unrealized appreciation (depreciation) until the contracts are closed, when they are recorded as realized gains (losses). Realized gain or loss on a futures position is equal to the difference between the value of the contract at the time it was opened and the value at the time it was closed, minus brokerage commissions. When a Fund enters into a futures contract, certain risks may arise, such as illiquidity in the futures market, which may limit a Fund’s ability to close out a futures contract prior to settlement date, and unanticipated movements in the value of securities, commodities or interest rates.
Futures contracts are exchange-traded. Exchange-traded futures have standardized contracts and are settled through a clearing house with fulfillment guaranteed by the credit of the exchange. Therefore, counterparty credit risks to the Funds are limited.
There were no futures contracts held by the Funds during the six months ended March 31, 2011.
f. Federal and Foreign Income Taxes. The Trust treats each Fund as a separate entity for federal income tax purposes. Each Fund intends to meet the requirements of the Internal Revenue Code of 1986, as amended, applicable to regulated investment companies, and to distribute to its shareholders substantially all of its net investment income and any net realized capital gains at least annually. Management has performed an analysis of each Fund’s tax positions for the open tax years as of March 31, 2011 and has concluded that no provisions for income tax are required. The Funds’ federal tax returns for the prior three fiscal years remain subject to examination by the Internal Revenue Service. Management is not aware of any events that are reasonably possible to occur in the next six months that would result in the amounts of any unrecognized tax benefits significantly increasing or decreasing for the Funds. However, management’s conclusions regarding tax positions taken may be subject to review and adjustment at a later date based on factors including, but not limited to, new tax laws and accounting regulations and interpretations thereof.
The High Income Opportunities Fund may be subject to foreign taxes on income and gains on investments that are accrued based upon the Fund’s understanding of the tax rules and regulations that exist in the countries in which the Fund invests. Foreign governments may also impose taxes or other payments on investments with respect to foreign securities. Such taxes are accrued as applicable.
g. Dividends and Distributions to Shareholders. Dividends and distributions are recorded on ex-dividend date. The timing and characterization of certain income and capital gain distributions are determined annually in accordance with federal tax regulations, which
| 26
Notes To Financial Statements – continued
March 31, 2011 (Unaudited)
may differ from accounting principles generally accepted in the United States of America. Permanent differences are primarily due to differing treatments for book and tax purposes of items such as premium amortization, defaulted bonds, distribution redesignations and paydown gains and losses. Permanent book and tax basis differences relating to shareholder distributions will result in reclassifications to capital accounts. Temporary differences between book and tax distributable earnings are primarily due to defaulted bond income accruals, premium amortization, securities lending collateral gain/loss adjustments, contingent payment debt instruments and wash sales. Distributions from net investment income and short-term capital gains are considered to be distributed from ordinary income for tax purposes.
The tax characterization of distributions is determined on an annual basis. The tax character of distributions paid to shareholders during the year ended September 30, 2010 was as follows:
| | | | | | | | | | | | |
| | | 2010 Distributions Paid From: | |
Fund | | Ordinary
Income | | | Long-Term
Capital Gains | | | Total | |
High Income Opportunities Fund | | $ | 5,690,124 | | | $ | — | | | $ | 5,690,124 | |
Securitized Asset Fund | | | 25,176,915 | | | | — | | | | 25,176,915 | |
Differences between these amounts and those reported in the Statements of Changes in Net Assets are primarily attributable to different book and tax treatment for short-term capital gains.
As of September 30, 2010, the capital loss carryforwards and post-October losses were as follows:
| | | | | | | | |
| Capital loss carryforward: | | High Income
Opportunities Fund | | | Securitized
Asset Fund | |
Expires September 30, 2017 | | $ | (811,815 | ) | | $ | — | |
Expires September 30, 2018 | | | (5,225,445 | ) | | | (1,367,506 | ) |
| | | | | | | | |
Total capital loss carryforward | | $ | (6,037,260 | ) | | $ | (1,367,506 | ) |
| | | | | | | | |
Deferred net capital losses (post-October 2009) | | $ | — | | | $ | (239,014 | ) |
| | | | | | | | |
On December 22, 2010, the Regulated Investment Company Modernization Act of 2010 (the “Act”) was enacted. The Act modernizes several of the federal income and excise tax provisions related to RICs, and, with certain exceptions, is effective for taxable years beginning after December 22, 2010. Among the changes made are changes to the capital loss carryforward rules allowing for capital losses to be carried forward indefinitely. Rules in effect as of the report date limit the carryforward period to eight years. Capital loss carryforwards generated in taxable years beginning after effective date of the Act must be fully used before capital loss carryforwards generated in taxable years prior to effective date of the Act; therefore, under certain circumstances, capital loss carryforwards available as of the report date, if any, may expire unused.
h. Repurchase Agreements. It is each Fund’s policy that the market value of the collateral for repurchase agreements be at least equal to 102% of the repurchase price, including interest. Certain repurchase agreements are tri-party arrangements whereby the collateral is held in a segregated account for the benefit of the Fund and on behalf of the counterparty. Repurchase agreements could involve certain risks in the event of default or insolvency of the counterparty, including possible delays or restrictions upon a Fund’s ability to dispose of the underlying securities.
i. Delayed Delivery Commitments. The Funds may purchase securities, including those designated as TBAs in the Portfolio of Investments, for which delivery or payment will occur at a later date, beyond the normal settlement period. The price of the security and the date when the security will be delivered and paid for are fixed at the time the transaction is negotiated. The security and the obligation to pay for it are recorded by the Funds at the time the commitment is entered into. The actual security that will be delivered to fulfill a TBA trade is not designated at the time of the trade. The security is “to be announced” 48 hours prior to the established trade settlement date. The value of the security may vary with market fluctuations during the time before the Funds take delivery of the security. No interest accrues to the Funds until the transaction settles. When the Funds enter into such a transaction, collateral consisting of liquid securities or cash and cash equivalents is required to be segregated or earmarked at the custodian in an amount at least equal to the amount of the Funds’ commitment.
Purchases of delayed delivery securities may have a similar effect on the Funds’ net asset value as if the Funds had created a degree of leverage in its portfolio. Risks may arise upon entering into such transactions from the potential inability of counterparties to meet their obligations under the transactions. Additionally, losses may arise due to changes in the value of the underlying securities.
j. Securities Lending. The Funds have entered into an agreement with State Street Bank and Trust Company (“State Street Bank”), as agent of the Funds, to lend securities to certain designated borrowers. The loans are collateralized with cash or securities in an amount equal to at least 105% or 102% of the market value (including accrued interest) of the loaned international or domestic securities, respectively, when the loan is initiated. Thereafter, the value of the collateral must remain at least 102% of the market value (including accrued interest) of loaned securities for U.S. equities and U.S. corporate debt; at least 105% of the market value (including accrued interest) of loaned securities for
27 |
non-U.S. equities; and at least 100% of the market value (including accrued interest) of loaned securities for U.S. Government securities, sovereign debt issued by non-U.S. Governments and non-U.S. corporate debt. In the event that the market value of the collateral falls below the required percentages described above, the borrower will deliver additional collateral on the next business day. As with other extensions of credit, the Funds may bear the risk of loss with respect to the investment of the collateral. The Funds invest cash collateral in short-term investments, a portion of the income from which is remitted to the borrowers and the remainder allocated between the Funds and State Street Bank as lending agent.
For the six months ended March 31, 2011, none of the Funds had loaned securities under this agreement.
k. Indemnifications. Under the Trust’s organizational documents, its officers and Trustees are indemnified against certain liabilities arising out of the performance of their duties to the Funds. Additionally, in the normal course of business, the Funds enter into contracts with service providers that contain general indemnification clauses. The Funds’ maximum exposure under these arrangements is unknown as this would involve future claims that may be made against the Funds that have not yet occurred. However, based on experience, the Funds expect the risk of loss to be remote.
3. Fair Value Measurements. In accordance with accounting standards related to fair value measurements and disclosures, the Funds have categorized the inputs utilized in determining the value of each Fund’s assets or liabilities. These inputs are summarized in the three broad levels listed below:
| | • | | Level 1—quoted prices in active markets for identical assets or liabilities; |
| | • | | Level 2—prices determined using other significant inputs that are observable either directly, or indirectly through corroboration with observable market data (which could include quoted prices for similar assets or liabilities, interest rates, credit risk, etc.); |
| | • | | Level 3—prices determined using significant unobservable inputs when quoted prices or observable inputs are unavailable such as when there is little or no market activity for an asset or liability (unobservable inputs reflect each Fund’s own assumptions in determining the fair value of assets or liabilities and would be based on the best information available). |
The inputs or methodology used for valuing securities are not necessarily an indication of the risk associated with investing in those securities.
The following is a summary of the inputs used to value the Funds’ investments as of March 31, 2011, at value:
High Income Opportunities Fund
Asset Valuation Inputs
| | | | | | | | | | | | | | | | |
Description | | Level 1 | | | Level 2 | | | Level 3 | | | Total | |
Bonds and Notes | | | | | | | | | | | | | | | | |
Non-Convertible Bonds | | | | | | | | | | | | | | | | |
Wireless | | $ | — | | | $ | 1,307,335 | | | $ | 203,260 | | | $ | 1,510,595 | |
All Other Non-Convertible Bonds(a) | | | — | | | | 50,692,010 | | | | — | | | | 50,692,010 | |
| | | | | | | | | | | | | | | | |
Total Non-Convertible Bonds | | | — | | | | 51,999,345 | | | | 203,260 | | | | 52,202,605 | |
| | | | | | | | | | | | | | | | |
Convertible Bonds(a) | | | — | | | | 8,336,681 | | | | — | | | | 8,336,681 | |
| | | | | | | | | | | | | | | | |
Total Bonds and Notes | | | — | | | | 60,336,026 | | | | 203,260 | | | | 60,539,286 | |
| | | | | | | | | | | | | | | | |
Bank Loans(a) | | | — | | | | 155,582 | | | | — | | | | 155,582 | |
| | | | | | | | | | | | | | | | |
Preferred Stocks | | | | | | | | | | | | | | | | |
Convertible Preferred Stocks | | | | | | | | | | | | | | | | |
Automotive | | | 1,212,230 | | | | 325,890 | | | | — | | | | 1,538,120 | |
Capital Markets | | | — | | | | 274,037 | | | | — | | | | 274,037 | |
Electric Utilities | | | 389,180 | | | | — | | | | — | | | | 389,180 | |
Oil, Gas & Consumable Fuels | | | 356,213 | | | | — | | | | — | | | | 356,213 | |
| | | | | | | | | | | | | | | | |
Total Convertible Preferred Stocks | | | 1,957,623 | | | | 599,927 | | | | — | | | | 2,557,550 | |
| | | | | | | | | | | | | | | | |
Non-Convertible Preferred Stocks(a) | | | — | | | | 1,029,795 | | | | — | | | | 1,029,795 | |
| | | | | | | | | | | | | | | | |
Total Preferred Stocks | | | 1,957,623 | | | | 1,629,722 | | | | — | | | | 3,587,345 | |
| | | | | | | | | | | | | | | | |
Common Stocks(a) | | | 355,106 | | | | — | | | | — | | | | 355,106 | |
Warrants | | | — | | | | — | | | | — | | | | — | |
Short-Term Investments | | | — | | | | 5,624,137 | | | | — | | | | 5,624,137 | |
| | | | | | | | | | | | | | | | |
Total | | $ | 2,312,729 | | | $ | 67,745,467 | | | $ | 203,260 | | | $ | 70,261,456 | |
| | | | | | | | | | | | | | | | |
(a) Major categories of the Fund’s investments are included in the Portfolio of Investments.
| 28
Notes To Financial Statements – continued
March 31, 2011 (Unaudited)
Securitized Asset Fund
Asset Valuation Inputs
| | | | | | | | | | | | | | | | |
Description | | Level 1 | | | Level 2 | | | Level 3 | | | Total | |
Bonds and Notes | | | | | | | | | | | | | | | | |
ABS Car Loan | | $ | — | | | $ | 101,057,637 | | | $ | 7,740,000 | | | $ | 108,797,637 | |
ABS Home Equity | | | — | | | | 2,389,210 | | | | 900,426 | | | | 3,289,636 | |
ABS Other | | | — | | | | 10,105,671 | | | | 3,818,362 | | | | 13,924,033 | |
All Other Bonds and Notes(a) | | | — | | | | 655,194,675 | | | | — | | | | 655,194,675 | |
| | | | | | | | | | | | | | | | |
Total Bonds and Notes | | | — | | | | 768,747,193 | | | | 12,458,788 | | | | 781,205,981 | |
| | | | | | | | | | | | | | | | |
Short-Term Investments | | | — | | | | 41,681,826 | | | | — | | | | 41,681,826 | |
| | | | | | | | | | | | | | | | |
Total | | $ | — | | | $ | 810,429,019 | | | $ | 12,458,788 | | | $ | 822,887,807 | |
| | | | | | | | | | | | | | | | |
(a) Major categories of the Fund’s investments are included in the Portfolio of Investments.
The following is a reconciliation of Level 3 investments for which significant unobservable inputs were used to determine fair value as of March 31, 2011:
High Income Opportunities Fund
Asset Valuation Inputs
| | | | | | | | | | | | | | | | | | | | | | | | | | | | | | | | | | | | | | | | |
Investments in Securities | | Balance as of
September 30,
2010 | | | Accrued
Discounts
(Premiums) | | | Realized
Gain
(Loss) | | | Change in
Unrealized
Appreciation
(Depreciation) | | | Purchases | | | Sales | | | Transfers
into
Level 3 | | | Transfers
out of
Level 3 | | | Balance
as of
March 31,
2011 | | | Change in
Unrealized
Appreciation
(Depreciation)
from
Investments
Still Held at
March 31,
2011 | |
Bonds and Notes | | | | | | | | | | | | | | | | | | | | | | | | | | | | | | | | | | | | | | | | |
Non-Convertible Bonds | | | | | | | | | | | | | | | | | | | | | | | | | | | | | | | | | | | | | | | | |
Wireless | | $ | — | | | $ | — | | | $ | — | �� | | $ | 3,260 | | | $ | 200,000 | | | $ | — | | | $ | — | | | $ | — | | | $ | 203,260 | | | $ | 3,260 | |
| | | | | | | | | | | | | | | | | | | | | | | | | | | | | | | | | | | | | | | | |
Total | | $ | — | | | $ | — | | | $ | — | | | $ | 3,260 | | | $ | 200,000 | | | $ | — | | | $ | — | | | $ | — | | | $ | 203,260 | | | $ | 3,260 | |
| | | | | | | | | | | | | | | | | | | | | | | | | | | | | | | | | | | | | | | | |
Securitized Asset Fund
Asset Valuation Inputs
| | | | | | | | | | | | | | | | | | | | | | | | | | | | | | | | | | | | | | | | |
Investments in Securities | | Balance as of
September 30,
2010 | | | Accrued
Discounts
(Premiums) | | | Realized
Gain
(Loss) | | | Change in
Unrealized
Appreciation
(Depreciation) | | | Purchases | | | Sales | | | Transfers
into
Level 3 | | | Transfers
out of
Level 3 | | | Balance
as of
March 31,
2011 | | | Change in
Unrealized
Appreciation
(Depreciation)
from
Investments
Still Held at
March 31,
2011 | |
Bonds and Notes | | | | | | | | | | | | | | | | | | | | | | | | | | | | | | | | | | | | | | | | |
ABS Car Loan | | $ | — | | | $ | — | | | $ | — | | | $ | 214 | | | $ | 7,739,786 | | | $ | — | | | $ | — | | | $ | — | | | $ | 7,740,000 | | | $ | 214 | |
ABS Home Equity | | | 345,569 | | | | — | | | | 3 | | | | 852,042 | | | | — | | | | (297,188 | ) | | | — | | | | — | | | | 900,426 | | | | 581,574 | |
ABS Other | | | 4,588,503 | | | | — | | | | — | | | | 9,522 | | | | — | | | | (779,663 | ) | | | — | | | | — | | | | 3,818,362 | | | | 9,522 | |
| | | | | | | | | | | | | | | | | | | | | | | | | | | | | | | | | | | | | | | | |
Total | | $ | 4,934,072 | | | $ | — | | | $ | 3 | | | $ | 861,778 | | | $ | 7,739,786 | | | $ | (1,076,851 | ) | | $ | — | | | $ | — | | | $ | 12,458,788 | | | $ | 591,310 | |
| | | | | | | | | | | | | | | | | | | | | | | | | | | | | | | | | | | | | | | | |
29 |
4. Purchases and Sales of Securities. For the six months ended March 31, 2011, purchases and sales of securities (excluding short-term investments and including paydowns) were as follows:
| | | | | | | | | | | | | | | | |
| | | U.S. Government/Agency
Securities | | | Other Securities | |
Fund | | Purchases | | | Sales | | | Purchases | | | Sales | |
High Income Opportunities Fund | | $ | — | | | $ | — | | | $ | 11,190,013 | | | $ | 12,212,298 | |
Securitized Asset Fund | | | 787,326,283 | | | | 792,184,527 | | | | 172,995,127 | | | | 42,950,638 | |
5. Management Fees and Other Transactions with Affiliates.
a. Management Fees. Loomis Sayles has agreed to pay, without reimbursement from the Funds or the Trust, the following expenses of the Funds: compensation to Trustees of the Trust who are not “interested persons” (as defined in the 1940 Act) of the Trust; registration, filing and other fees in connection with requirements of regulatory authorities; the charges and expenses of any entity appointed by the Funds for custodial, paying agent, shareholder servicing and plan agent services; charges and expenses of the independent registered public accounting firm retained by the Funds; charges and expenses of any transfer agents and registrars appointed by the Funds; any cost of certificates representing shares of the Funds; legal fees and expenses in connection with the day-to-day affairs of the Funds, including registering and qualifying its shares with Federal and State regulatory authorities; expenses of meetings of shareholders and Trustees of the Trust; the costs of services, including services of counsel, required in connection with the preparation of the Funds’ registration statements and prospectuses, including amendments and revisions thereto, annual, semi-annual and other periodic reports of the Funds, and notices and proxy solicitation material furnished to shareholders of the Funds or regulatory authorities, and any costs of printing or mailing these items; and the Funds’ expenses of bookkeeping, accounting and financial reporting, including related clerical expenses.
Loomis Sayles serves as investment adviser to each Fund. Under the terms of each management agreement, Loomis Sayles does not charge the Funds an investment advisory fee, also known as a management fee, or any other fee for those services or for bearing those expenses. Although the Funds do not compensate Loomis Sayles directly for services under the advisory agreement, Loomis Sayles will typically receive an advisory fee from the sponsors of “wrap programs,” who in turn charge the programs’ participants.
Certain officers and employees of Loomis Sayles are also officers or Trustees of the Trust. Loomis Sayles’ general partner is indirectly owned by Natixis Global Asset Management, L.P. (“Natixis US”), which is part of Natixis Global Asset Management, an international asset management group based in Paris, France.
b. Service and Distribution Fees. Natixis Distributors, L.P. (“Natixis Distributors”), a wholly-owned subsidiary of Natixis US has entered into a distribution agreement with the Trust. Pursuant to this agreement, Natixis Distributors serves as principal underwriter of the Funds of the Trust. Natixis Distributors currently is not paid a fee for serving as distributor for the Funds. Loomis Sayles has agreed to reimburse Natixis Distributors to the extent that Natixis Distributors incurs expenses in connection with any redemption of Fund shares.
c. Administrative Fees. Natixis Advisors provides certain administrative services for the Funds and contracts with State Street Bank to serve as sub-administrator. Natixis Advisors is a wholly-owned subsidiary of Natixis US. Loomis Sayles has agreed to pay, without reimbursement from the Trust or Funds, fees to Natixis Advisors for services to the Funds.
d. Trustees Fees and Expenses. The Trust does not pay any compensation directly to its officers or Trustees who are directors, officers or employees of Natixis Advisors, Natixis Distributors, Natixis US or their affiliates. The Chairperson of the Board receives a retainer fee at the annual rate of $250,000. The Chairperson does not receive any meeting attendance fees for Board of Trustees meetings or committee meetings that she attends. Each Independent Trustee (other than the Chairperson) receives, in the aggregate, a retainer fee at the annual rate of $80,000. Each Independent Trustee also receives a meeting attendance fee of $10,000 for each meeting of the Board of Trustees that he or she attends in person and $5,000 for each meeting of the Board of Trustees that he or she attends telephonically. In addition, each committee chairman receives an additional retainer fee at an annual rate of $15,000. Each Contract Review and Governance Committee member is compensated $6,000 for each Committee meeting that he or she attends in person and $3,000 for each meeting that he or she attends telephonically. Each Audit Committee member is compensated $7,500 for each Committee meeting that he or she attends in person and $3,750 for each meeting that he or she attends telephonically. These fees are allocated among the funds in Natixis Funds Trust I, Natixis Funds Trust II, Natixis Funds Trust IV, Gateway Trust (“Natixis Funds Trusts”), Loomis Sayles Funds I, Loomis Sayles Funds II (“Loomis Sayles Funds Trusts”) and Hansberger International Series based on a formula that takes into account, among other factors, the relative net assets of each fund. Trustees are reimbursed for travel expenses in connection with attendance at meetings.
6. Line of Credit. Each Fund, together with certain other funds of Natixis Funds Trusts, Loomis Sayles Funds Trusts and Hansberger International Series, participates in a $200,000,000 committed unsecured line of credit provided by State Street Bank, with an individual limit of $125,000,000 for each fund that participates in the line of credit. Interest is charged to each participating fund based on its borrowings at a rate per annum equal to the greater of the Federal Funds rate or overnight LIBOR, plus 1.25%. In addition, a commitment
| 30
Notes To Financial Statements – continued
March 31, 2011 (Unaudited)
fee of 0.15% per annum, payable at the end of each calendar quarter, is accrued and apportioned among the participating funds based on their average daily unused portion of the line of credit.
Effective April 21, 2011, each Fund, together with certain other funds of Natixis Funds Trusts, Loomis Sayles Funds Trusts and Hansberger International Series, will participate in a $200,000,000 committed unsecured line of credit provided by State Street Bank, with an individual limit of $125,000,000 for each fund that will participate in the line of credit. Interest will be charged to each participating fund based on its borrowings at a rate per annum equal to the greater of the Federal Funds rate or overnight LIBOR, plus 1.25%. In addition, a commitment fee of 0.125% per annum, payable at the end of each calendar quarter, will be accrued and apportioned among the participating funds based on their average daily unused portion of the line of credit.
For the six months ended March 31, 2011, none of the Funds had borrowings under these agreements.
7. Concentration of Ownership. From time to time, the Funds may have a concentration of several shareholders having a significant percentage of shares outstanding. Investment activities of these shareholders could have material impacts on the Funds. As of March 31, 2011, four shareholder accounts owned more than 5% of High Income Opportunities Fund’s outstanding shares, representing 38.83% of the Fund’s net assets. Such ownership may be beneficially held by multiple individuals or entities other than the owner of record.
8. Capital Shares. Each Fund may issue an unlimited number of shares of beneficial interest, without par value. Transactions in capital shares were as follows:
| | | | | | | | | | | | | | | | |
| | | High Income Opportunities Fund | |
| | |
| | | Six Months Ended March 31, 2011 | | | Year Ended September 30, 2010 | |
| | | | |
| Institutional Class | | Shares | | | Amount | | | Shares | | | Amount | |
Issued from the sale of shares | | | 636,813 | | | $ | 6,537,926 | | | | 696,898 | | | $ | 6,634,833 | |
Issued in connection with the reinvestment of distributions | | | 222,270 | | | | 2,233,310 | | | | 492,408 | | | | 4,619,407 | |
Redeemed | | | (650,841 | ) | | | (6,636,777 | ) | | | (2,487,653 | ) | | | (23,802,300 | ) |
| | | | | | | | | | | | | | | | |
Increase (decrease) from capital share transactions | | | 208,242 | | | $ | 2,134,459 | | | | (1,298,347 | ) | | $ | (12,548,060 | ) |
| | | | | | | | | | | | | | | | |
| |
| | | Securitized Asset Fund | |
| | |
| | | Six Months Ended March 31, 2011 | | | Year Ended September 30, 2010 | |
| | | | |
| Institutional Class | | Shares | | | Amount | | | Shares | | | Amount | |
Issued from the sale of shares | | | 10,096,040 | | | $ | 110,811,501 | | | | 43,829,638 | | | $ | 463,734,471 | |
Issued in connection with the reinvestment of distributions | | | 23,082 | | | | 253,034 | | | | 50,062 | | | | 521,565 | |
Redeemed | | | (6,861,855 | ) | | | (75,357,025 | ) | | | (13,015,425 | ) | | | (138,295,521 | ) |
| | | | | | | | | | | | | | | | |
Increase (decrease) from capital share transactions | | | 3,257,267 | | | $ | 35,707,510 | | | | 30,864,275 | | | $ | 325,960,515 | |
| | | | | | | | | | | | | | | | |
31 |

Loomis Sayles Bond Fund
Loomis Sayles Fixed Income Fund
Loomis Sayles Global Bond Fund
Loomis Sayles Inflation Protected Securities Fund
Loomis Sayles Institutional High Income Fund
Loomis Sayles Intermediate Duration Bond Fund
Loomis Sayles Investment Grade Fixed Income Fund
SEMI-ANNUAL REPORT
MARCH 31, 2011
LOOMIS SAYLES BOND FUND
Fund and manager review
FUND FACTS
Managers:
Daniel Fuss, CFA, CIC
Matthew Eagan, CFA
Kathleen Gaffney, CFA
Elaine Stokes
Symbols:
| | |
| Institutional Class | | LSBDX |
| Retail Class | | LSBRX |
| Admin Class | | LBFAX |
Objective:
High total investment return through a combination of current income and capital appreciation
Strategy:
Invests primarily in investment-grade fixed-income securities, although it may invest up to 35% of assets in lower-quality fixed-income securities and up to 20% of its assets in preferred stocks. The fund may invest any portion of its assets in Canadian securities and up to 20% of assets in other foreign securities, including emerging markets securities.
Fund Inception Date:
May 16, 1991
Class Inception Date:
Institutional Class:
May 16, 1991
Retail Class:
December 31, 1996
Admin Class:
January 2, 1998
Net Assets:
$20,025.1 million
Market Conditions
As attention shifted from economic recovery to economic growth, investors began to displace lingering economic pessimism with optimism. The transition was far from smooth though, as new concerns materialized and old ones resurfaced. Specifically, increased anxiety regarding sovereign debt solvency in Europe, unrest in North Africa and the Middle East, precarious macroeconomic data, earthquakes in Japan and New Zealand and China’s lending restrictions percolated through global credit markets in waves during the period, alternately fostering and stymieing investors’ appetite for risk. The Federal Reserve’s second round of quantitative easing, popularly referred to as “QE2,” tempered modest price decreases that occurred during the period. Overall, liquidity returned to the credit markets during the period, largely in the form of new issuance as firms sought to refinance debt. This trend supported high-yield and investment-grade names.
Performance Results
For the six months ended March 31, 2011, Institutional Class shares of Loomis Sayles Bond Fund returned 5.64%. The fund outperformed its benchmark, the Barclays Capital U.S. Government/Credit Bond Index, which returned -1.90% for the period.
Explanation of Fund Performance
Positive security selection primarily accounted for the fund’s outperformance. Tentative signs of stability in Europe, namely the acceptance of euro zone bank stress tests, allayed investor fears, and major currencies rallied against the U.S. dollar. This translated into sizable contributions from our investments denominated in the Canadian dollar, Australian dollar, New Zealand dollar and Norwegian krone. Similarly, bonds issued in the Indonesian rupiah, Singapore dollar and South Korean won contributed modestly to performance. In addition, our holdings in equity-sensitive convertible bonds and preferred securities advanced due to healthy stock market performance during the period. Among high-yield bonds, the industrials sector was the top performer, with the strongest returns coming from issues in the technology, consumer cyclical and communications segments. Our allocation to high-yield financials also contributed positively. Our underweight in U.S. Treasuries helped performance, as investors favored riskier assets in their search for yield, causing Treasuries to underperform.
A small position in government-owned securities had a negative effect on relative performance, primarily due to a long duration stance within the allocation. (Duration is a measure of interest rate sensitivity.) Additionally, the fund’s overall longer-than-benchmark duration detracted from returns because yields increased during the period. Furthermore, while most non-U.S.-dollar positions contributed positively, holdings denominated in the euro lagged on fears of sovereign risk.
Outlook
Strong liquidity, markets in transition, geopolitical turmoil, continued economic recovery and tragic natural disasters garnered significant attention from market participants during the first quarter of 2011. Many of these themes will continue to dominate investor consciousness going forward.
We believe markets remain in transition regarding interest rates, with pressures building both globally and domestically. Globally, growth in many areas of the world remains robust; however, inflation concerns have begun to attract attention. Central banks will likely continue to shift toward less accommodative policy as 2011 progresses. We anticipate the Federal Reserve’s program of Treasury purchases in the United States will end during the second quarter and believe the U.S. economic recovery has sufficient momentum to continue expanding without outsized government stimulus.
Our assessment of the fundamental underpinnings of the corporate sector remains positive. In general, corporations are proceeding conservatively with regard to hiring and capital expenditures. Merger and acquisition activity has increased recently, and we believe there is room for more growth in that space. Valuations in the corporate bond space are generally fair, with investor demand for yield providing support and liquidity to the high-yield, investment-grade and convertible sectors.
We continue to position the fund for global economic recovery, as well as a gradual upward bias in interest rates. We continue to emphasize yield advantage, global diversification and specific bond picking within the fund.
1 |
LOOMIS SAYLES BOND FUND
Average Annual Returns
March 31, 2011
| | | | | | | | | | | | | | | | |
| | | | | |
| | | 6 months | | | 1 year | | | 5 years | | | 10 years | |
| | | | | |
| Institutional Class (Inception 5/16/91) | | | 5.64 | % | | | 11.94 | % | | | 8.22 | % | | | 10.21 | % |
| Retail Class (Inception 12/31/96) | | | 5.51 | | | | 11.66 | | | | 7.91 | | | | 9.92 | |
| Admin Class (Inception 1/2/98) | | | 5.38 | | | | 11.31 | | | | 7.63 | | | | 9.63 | |
| | | | | |
| Comparative Performance | | | | | | | | | | | | | | | | |
| Barclays Capital U.S. Government/Credit Bond Index(c) | | | -1.90 | | | | 5.26 | | | | 5.83 | | | | 5.53 | |
| Lipper BBB-Rated Funds Index(c) | | | 0.37 | | | | 8.77 | | | | 5.97 | | | | 5.79 | |
| |
| Gross expense ratio (before fee waivers and/or expense reimbursements)* | |
| Institutional: 0.64% Retail: 0.94% Admin: 1.21% | | | | | | | | | | | | | | | | |
| |
| Net expense ratio (after fee waivers and/or expense reimbursements)* | |
| Institutional: 0.64% Retail: 0.94% Admin: 1.20% | | | | | | | | | | | | | | | | |
| * | | As stated in the most recent prospectus. Waivers/reimbursements are contractual and are set to expire on 1/31/12. Contracts are reevaluated on an annual basis. |
Cumulative Performance(a)
March 31, 2001 through March 31, 2011(a)(b)
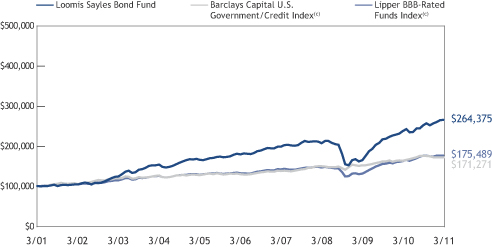
Data quoted reflects past performance and cannot guarantee future results. Average annual total returns assume reinvestment of dividends and capital gains distributions. Investment return and principal value will fluctuate so that shares, when redeemed, may be worth more or less than their original cost. For performance current to the most recent month-end, please visit www.loomissayles.com. Current performance may be higher or lower than quoted.
Returns do not reflect the taxes that a shareholder would pay on fund distributions or the redemption of shares. Periods of less than one year are not annualized. Performance data reflects certain fee waivers and/or expense reimbursements, if any, without which performance would be lower.
| (a) | | Cumulative performance is shown for the Institutional Class. Performance of the Retail and Admin Classes would be lower, due to higher fees. |
| (b) | | The mountain chart is based on the initial minimum investment of $100,000 for the Institutional Class. |
| (c) | | See page 15 for a description of the indices. |
What you should know:
Investments in the fund are subject to a number of risks. Please see the “Principal Risks” section of the fund’s prospectus. The purchase of fund shares should be seen as a long-term investment.
| 2
LOOMIS SAYLES FIXED INCOME FUND
Fund and manager review
FUND FACTS
Managers:
Daniel Fuss, CFA, CIC
Matthew Eagan, CFA
Kathleen Gaffney, CFA
Elaine Stokes
Symbol:
| | |
| Institutional Class | | LSFIX |
Objective:
High total investment return through a combination of current income and capital appreciation
Strategy:
Invests primarily in fixed-income securities, may invest up to 35% of its assets in lower-quality fixed-income securities and up to 20% of its assets in preferred stocks. The fund may invest any portion of its assets in Canadian securities and up to 20% of assets in other foreign securities, including emerging markets securities.
Fund Inception Date:
January 17, 1995
Fund Registration Date:
March 7, 1997
Net Assets:
$860.1 million
Market Conditions
As attention shifted from economic recovery to economic growth, investors began to displace lingering economic pessimism with optimism. The transition was far from smooth though, as new concerns materialized and old ones resurfaced. Specifically, increased anxiety regarding sovereign debt solvency in Europe, unrest in North Africa and the Middle East, precarious macroeconomic data, earthquakes in Japan and New Zealand and China’s lending restrictions percolated through global credit markets in waves during the period, alternately fostering and stymieing investors’ appetite for risk. The Federal Reserve Board’s second round of Treasury purchases, which is popularly referred to as quantitative easing (QE2), tempered modest price decreases that occurred during the period. Overall, liquidity returned to the credit markets during the period, largely in the form of new issuance as firms sought to refinance debt. This trend supported high-yield and investment-grade names.
Performance Results
For the six months ended March 31, 2011, Loomis Sayles Fixed Income Fund returned 5.64%. The fund outperformed its benchmark, the Barclays Capital U.S. Government/Credit Bond Index, which returned -1.90% for the period.
Explanation of Fund Performance
Favorable security selection primarily accounted for the fund’s outperformance. Tentative signs of stability in Europe, namely the acceptance of eurozone bank stress tests, allayed investor fears, and major currencies rallied against the U.S. dollar. This translated into sizable contributions from our investments denominated in the Canadian dollar, Australian dollar, New Zealand dollar and Norwegian krone. Similarly, bonds issued in the Indonesian rupiah, Singapore dollar and South Korean won contributed modestly to performance. In addition, our holdings in equity-sensitive convertible bonds and preferred securities advanced due to healthy stock market performance during the period. Among high-yield bonds, the industrials sector was the top performer, with the strongest returns coming from issues in the technology, consumer non-cyclical and communication segments. Our allocation to high-yield financials also contributed positively.
A small position in government-owned securities had a negative effect on relative performance, primarily due to a long duration stance within the allocation. Additionally, our overall longer-than-Benchmark duration detracted from returns due to yields increasing during the period. Furthermore, while most non-U.S.-dollar positions contributed positively, our holdings denominated in the euro lagged on fears of sovereign risk. Issues denominated in the Brazilian real also struggled during the period.
Outlook
Strong liquidity, markets in transition, geopolitical turmoil, continued economic recovery and tragic natural disasters garnered significant attention from market participants during the first quarter of 2011. Many of these themes will continue to dominate investor consciousness going forward.
We believe markets remain in transition regarding interest rates, with pressures building both globally and domestically. Globally, growth in many areas of the world remains robust; however, inflation concerns have begun to attract attention. Central banks will likely continue to shift toward less accommodative policy as 2011 progresses. We anticipate the Federal Reserve’s program of Treasury purchases in the United States will end during the second quarter and believe the U.S. economic recovery has sufficient momentum to continue expanding without outsized government stimulus.
Our assessment of the fundamental underpinnings of the corporate sector remains positive. In general, corporations are proceeding conservatively with regard to hiring and capital expenditures. Merger and acquisition activity has increased recently, and we believe there is room for more growth in that space. Valuations in the corporate bond space are generally fair, with investor demand for yield providing support and liquidity to the high-yield, investment-grade and convertible sectors.
We continue to position the fund for global economic recovery, as well as a gradual upward bias in interest rates. We continue to emphasize yield advantage, global diversification and specific bond picking within the fund.
3 |
LOOMIS SAYLES FIXED INCOME FUND
Average Annual Returns
March 31, 2011
| | | | | | | | | | | | | | | | |
| | | | | |
| | | 6 months | | | 1 year | | | 5 years | | | 10 years | |
| | | | | |
| Institutional Class (Inception 1/17/95) | | | 5.64 | % | | | 12.16 | % | | | 8.99 | % | | | 10.69 | % |
| | | | | |
| Comparative Performance | | | | | | | | | | | | | | | | |
| Barclays Capital U.S. Government/Credit Bond Index(b) | | | -1.90 | | | | 5.26 | | | | 5.83 | | | | 5.53 | |
| Lipper BBB-Rated Funds Index(b) | | | 0.37 | | | | 8.77 | | | | 5.97 | | | | 5.79 | |
| | | |
| Gross expense ratio (before fee waivers and/or expense reimbursements)* | | | | | | | | | |
| Institutional: 0.58% | | | | | | | | | | | | | | | | |
| | | |
| Net expense ratio (after fee waivers and/or expense reimbursements)* | | | | | | | | | |
| Institutional: 0.58% | | | | | | | | | | | | | | | | |
| * | | As stated in the most recent prospectus. Waivers/reimbursements are contractual and are set to expire on 1/31/12. Contracts are reevaluated on an annual basis. |
Cumulative Performance
March 31, 2001 through March 31, 2011(a)
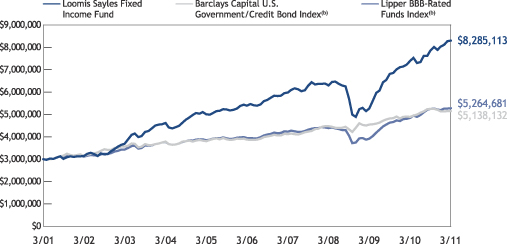
Data quoted reflects past performance and cannot guarantee future results. Average annual total returns assume reinvestment of dividends and capital gains distributions. Investment return and principal value will fluctuate so that shares, when redeemed, may be worth more or less than their original cost. For performance current to the most recent month end, please visit www.loomissayles.com. Current performance may be higher or lower than quoted.
Returns do not reflect the taxes that a shareholder would pay on fund distributions or the redemption of shares. Periods of less than one year are not annualized. Performance data reflects certain fee waivers and/or expense reimbursements, if any, without which performance would be lower.
| (a) | | The mountain chart is based on the fund’s minimum initial investment of $3,000,000. |
| (b) | | See page 15 for a description of the indices. |
What you should know
Investments in the fund are subject to a number of risks. Please see the “Principal Risks” section of the fund’s prospectus. The purchase of fund shares should be seen as a long-term investment.
| 4
LOOMIS SAYLES GLOBAL BOND FUND
Fund and manager review
FUND FACTS
Managers:
Ken Buntrock, CFA, CIC
David Rolley, CFA
Lynda Schweitzer, CFA
Symbols:
| | |
| Institutional Class | | LSGBX |
| Retail Class | | LSGLX |
Objective:
High total investment return through a combination of high current income and capital appreciation
Strategy:
Invests primarily in investment grade fixed-income securities worldwide, although it may invest up to 20% of assets in lower-quality fixed-income securities.
Fund Inception Date:
May 10, 1991
Class Inception Date:
Institutional Class:
May 10, 1991
Retail Class:
December 31, 1996
Net Assets:
$2,294.6 million
Market Conditions
Government bond yields rose at the end of 2010, as investors favored risk in the form of equity and other higher-yielding investments in the wake of improving economic data. But, mid-way through the first quarter of 2011, deteriorating sentiment and increased uncertainty began to test risk preference. Higher oil prices, turmoil in the Middle East and North Africa, and the Japanese disaster caused the market to revise global economic growth forecasts down. Meanwhile, the ambiguity of European sovereign debt concerns remained. Nevertheless, riskier assets performed well during the period, despite mounting uncertainty and rising interest rates around the globe. Global credit strongly outperformed government-issued bonds on a duration-matched basis, while lower-quality bonds generally outperformed high-quality bonds. Among currencies, the U.S. dollar finished the period weaker versus all major currencies.
Performance Results
For the six months ended March 31, 2011, Institutional Class shares of Loomis Sayles Global Bond Fund returned 1.37%. The fund outperformed its benchmark, the Barclays Capital Global Aggregate Bond Index, which returned -0.10% for the period.
Explanation of Fund Performance
Favorable security selection and an overweight in corporate bonds, along with an underweight in government bonds, drove the fund’s outperformance relative to the benchmark. Specifically, our preference for cyclical corporate bonds within the technology and communications industries aided performance. From a quality perspective, the fund’s overweights in BBB-rated credits and high-yield bonds boosted relative returns. From a currency perspective, we capitalized on a weak U.S. dollar with overweights in developing and non-yen, -euro and –U.S.-dollar currencies, including the Indonesian rupiah, Malaysian ringgit, Mexican peso, Singapore dollar, Danish krone, Norwegian krone and Swedish krona. To better align the currency exposure of specific holdings, we traded foreign currency contracts throughout the period. These derivatives were an integral part of the fund’s overall currency strategy, which boosted returns for the period. Country selection also enhanced returns, primarily due to substantial underweights in the European local markets. In addition, the fund’s shorter-than-benchmark duration across the U.S.-dollar-based corporate, securitized and Treasury sectors enhanced returns, as yields rose across the curve. Duration is a measure of interest rate sensitivity.
The fund’s underweight in the euro detracted from returns, as the currency strengthened against the U.S. dollar during the period. Euro positioning also dampened relative performance from a yield curve perspective. As rates rose across the curve, the fund’s average long-duration exposure hurt relative performance.
Outlook
We are maintaining overweight positions in non-yen Asian currencies, because we expect the currency-positive effects of tighter central bank policies to outweigh the currency-negative effects of weaker local equity markets. The impact of higher oil prices on inflation has resulted in a more hawkish tone coming from the European Central Bank (ECB). This is why the euro has firmed. Oil price hikes increase the likelihood of ECB hikes, widening the euro-to-dollar spread in short-term rates. We used the latest bond rally to tweak duration lower in developed countries. We believe there are clear risks to growth in 2012, but for now we remain global expansion optimists and are therefore also retaining our corporate credit positions. Finally, positions in emerging markets, commodity currencies and non-Japan Asian countries still appear warranted, given the global growth and rates outlook. Nevertheless, some equity volatility is likely following the conclusion of the Federal Reserve Board’s quantitative easing, which involves large-scale purchases of Treasury securities. As long as growth prospects remain firm, we anticipate spillover into credit spreads will be relatively minor.
5 |
LOOMIS SAYLES GLOBAL BOND FUND
Average Annual Returns
March 31, 2011
| | | | | | | | | | | | | | | | |
| | | | | |
| | | 6 months | | | 1 year | | | 5 years | | | 10 years | |
| | | | | |
| Institutional Class (Inception 5/10/91) | | | 1.37 | % | | | 9.12 | % | | | 7.56 | % | | | 8.98 | % |
| Retail Class (Inception 12/31/96) | | | 1.22 | | | | 8.79 | | | | 7.22 | | | | 8.67 | |
| | | | | |
| Comparative Performance | | | | | | | | | | | | | | | | |
| Barclays Capital Global Aggregate Bond Index(c) | | | -0.10 | | | | 7.15 | | | | 6.95 | | | | 7.02 | |
| Lipper Global Income Funds Index(c) | | | 1.80 | | | | 7.81 | | | | 6.46 | | | | 6.63 | |
| |
| Gross expense ratio (before fee waivers and/or expense reimbursements)* | |
| Institutional: 0.66% Retail 1.00% | | | | | | | | | | | | | | | | |
| |
| Gross expense ratio (after fee waivers and/or expense reimbursements)* | |
| Institutional: 0.66% Retail: 1.00% | | | | | | | | | | | | | | | | |
| * | | As stated in the most recent prospectus. Waivers/reimbursements are contractual and are set to expire on 1/31/12. Contracts are reevaluated on an annual basis. |
Cumulative Performance(a)
March 31, 2001 through March 31, 2011(a)(b)
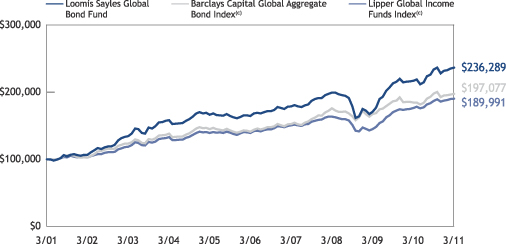
Data quoted reflects past performance and cannot guarantee future results. Average annual total returns assume reinvestment of dividends and capital gains distributions. Investment return and principal value will fluctuate so that shares, when redeemed, may be worth more or less than their original cost. For performance current to the most recent month-end, please visit www.loomissayles.com. Current performance may be higher or lower than quoted.
Returns do not reflect the taxes that a shareholder would pay on fund distributions or the redemption of shares. Periods of less than one year are not annualized. Performance data reflects certain fee waiver and/or expense reimbursements, if any, without which performance would be lower.
| (a) | | Cumulative performance is shown for the Institutional Class. Performance of the Retail Class would be lower due to higher fees. |
| (b) | | The mountain chart is based on the Institutional Class minimum initial investment of $100,000. |
| (c) | | See page 15 for a description of the indices. |
What you should know:
Investments in the fund are subject to a number of risks. Please see the “Principal Risks” section of the fund’s prospectus. The purchase of fund shares should be seen as a long-term investment.
.
| 6
LOOMIS SAYLES INFLATION PROTECTED SECURITIES FUND
Fund and manager review
FUND FACTS
Managers:
John Hyll
Cliff Rowe, CFA
Symbols:
| | |
| Institutional Class | | LSGSX |
| Retail Class | | LIPRX |
Objective:
High total investment return through a combination of current income and capital appreciation
Strategy:
Invests primarily in inflation-protected securities with emphasis on debt securities issued by the U.S. Treasury.
Fund Inception Date:
May 20, 1991
Class Inception Date:
Institutional Class:
May 20, 1991
Retail Class:
May 28, 2010
Net Assets:
$17.3 million
Market Conditions
While still close to historical lows, interest rates began to move higher at the end of 2010, a trend that continued through the first quarter of 2011. A preference for riskier assets prevailed for most of the first quarter, but headline news, including a severe earthquake in Japan, political instability in the Middle East and North Africa, and the re-emergence of European sovereign-debt woes contributed to volatility that negatively influenced investor sentiment. Despite these headwinds, the markets remained relatively resilient, as positive corporate earning news and macroeconomic indicators supported the continuation of the economic recovery.
Performance Results
For the six months ended March 31, 2011, Institutional Class shares of Loomis Sayles Inflation Protected Securities Fund returned 1.40%. The fund performed in line with its benchmark, the Barclays Capital U.S. Treasury Inflation Protected Securities Index, which returned 1.42% for the period.
Explanation of Fund Performance
Against a backdrop of higher interest rates, shorter-duration Treasury Inflation Protected Securities (TIPS) led fund performance during the period. The fund’s slightly-shorter-than-benchmark yield curve positioning contributed positively to performance and helped the fund’s TIPS outperform those of the benchmark.
In addition, an overweight to corporate credit – particularly our small allocation to high-yield industrials – helped relative results, as riskier assets performed better during the period. Among corporates, the largest contribution to return came from holdings in the basic industry, capital goods and insurance areas. Nevertheless, our corporate exposure favored longer-duration issues, and rising interest rates dampened the sector’s positive contribution. Furthermore, corporate returns in the consumer non-cyclical and technology sectors were weak and slightly detracted from relative performance.
The fund’s exposure to the Mexican peso and Canadian dollar also helped relative performance. Both currencies appreciated versus the U.S. dollar, due to sustained demand for local market commodities and continued low rates in the United States.
Outlook
Higher food and commodity prices have stoked expected inflation levels, which helped TIPS outperform nominal Treasuries. Despite recent bouts of volatility, the market has shown to be fairly resilient, offering further conviction that the economic recovery may continue as anticipated. The continuation of the Federal Reserve Board’s (the Fed’s) loose monetary policy may cause inflation speculation to mount over time, which could increase breakeven rates (the difference between the nominal yields offered by Treasuries and the real, or inflation-adjusted, yields offered by TIPS). Further out, when the Fed shifts toward a more hawkish stance on inflation and raises interest rates, inflation expectations at the longer end of the yield curve may dampen. In this scenario, real and nominal yields for long-dated issues would converge, effectively lowering breakeven rates at the long end of the yield curve. If this occurs, we may find opportunities at the shorter and intermediate parts of the yield curve to maximize returns. Additionally, corporate earnings generally have been positive, and we will continue to hold a small overweight to the sector, seeking to opportunistically add value when what we view as attractive risk/reward issues become available.
7 |
LOOMIS SAYLES INFLATION PROTECTED SECURITIES FUND
Average Annual Returns
March 31, 2011
| | | | | | | | | | | | | | | | |
| | | | | |
| | | 6 Months | | | 1 Year | | | 5 Years | | | 10 Years | |
| | | | | |
| Institutional Class (Inception 5/20/91)(e) | | | 1.40 | % | | | 8.29 | % | | | 5.90 | % | | | 5.37 | % |
| Retail Class (Inception 5/28/10)(a)(e) | | | 1.31 | | | | 8.05 | | | | 5.59 | | | | 5.02 | |
| | | | | |
| Comparative Performance | | | | | | | | | | | | | | | | |
| Barclays Capital U.S. Treasury Inflation Protected Securities Index(c) | | | 1.42 | | | | 7.91 | | | | 6.25 | | | | 6.74 | |
| Lipper Treasury Inflation Protected Securities Funds Index(c) | | | 1.24 | | | | 7.99 | | | | 5.68 | | | | N/A | |
| | | |
| Gross expense ratio (before fee waivers and/or expense reimbursements)* | | | | | | | | | |
| Institutional: 1.22% Retail: 2.36% | | | | | | | | | | | | | | | | |
| | | |
| Net expense ratio (after fee waivers and/or expense reimbursements)* | | | | | | | | | |
| Institutional: 0.40% Retail: 0.65% | | | | | | | | | | | | | | | | |
| * | | As stated in the most recent prospectus. Waivers/reimbursements are contractual and are set to expire on 1/31/12. Contracts are reevaluated on an annual basis. |
Cumulative Performance(d)(e)
March 31, 2001 through March 31, 2011(b)(d)(e)
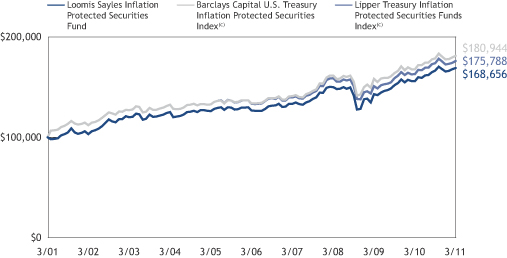
Data quoted reflects past performance and cannot guarantee future results. Average annual total returns assume reinvestment of dividends and capital gains distributions. Investment return and principal value will fluctuate so that shares, when redeemed, may be worth more or less than their original cost. For performance current to the most recent month end, please visit www.loomissayles.com. Current performance may be higher or lower than quoted.
For illustrative purposes, the chart above reflects the growth of a hypothetical investment of $100,000 in the fund, for the last ten years. The chart above also reflects the growth of a hypothetical investment in the former primary benchmark of the fund, the Barclays Capital U.S. Government Bond Index (the “Former Benchmark”), compared to the performance of the fund from March 31, 2001 through December 31, 2004. On December 15, 2004, in connection with a change of the fund’s investment objective, the fund changed its primary benchmark to the Barclays Capital U.S. Treasury Inflation Protected Securities Index (the “New Benchmark”). Since index performance data is not available coincident with the date of the fund’s strategy change, comparative data for the fund’s New Benchmark begins on December 31, 2004. The chart above reflects the growth of a hypothetical investment in the New Benchmark, compared to the performance of the fund, from December 31, 2004, through March 31, 2011. The chart above also compares the performance of the fund to the Lipper Treasury Inflation Protected Securities Funds Index from December 31, 2004 through March 31, 2011. The performance of the New Benchmark and of the Lipper Treasury Inflation Protected Securities Funds Index was linked to the performance of the Former Benchmark as of December 31, 2004.
Returns do not reflect the taxes that a shareholder would pay on fund distributions or the redemption of shares. Periods of less than one year are not annualized. Performance data reflects certain fee waivers and/or expense reimbursements, if any, without which performance would be lower.
| (a) | | Prior to inception of Retail Class (5/28/10), performance is that of Institutional Class, restated to reflect the higher net expenses of Retail Class. |
| (b) | | The mountain chart is based on the fund’s initial minimum investment of $100,000 for the Institutional Class. |
| (c) | | See page 15 for a description of the indices. Return data is not available for the Lipper Treasury Inflation Protected Securities Index prior to July 1, 2003. |
| (d) | | Cumulative performance is shown for the Institutional Class. Performance of the Retail Class would be lower due to higher fees. |
| (e) | | The fund revised its investment strategies on 12/15/04; performance may have been different had the current investment strategy been in place for all periods shown. |
What you should know:
Investments in the fund are subject to a number of risks. Please see the “Principal Risks” section of the fund’s prospectus. The purchase of fund shares should be seen as a long-term investment.
| 8
LOOMIS SAYLES INSTITUTIONAL HIGH INCOME FUND
Fund and manager review
FUND FACTS
Managers:
Daniel Fuss, CFA, CIC
Matthew Eagan, CFA
Kathleen Gaffney, CFA
Elaine Stokes
Symbol:
| | |
| Institutional Class | | LSHIX |
Objective:
High total investment return through a combination of current income and capital appreciation
Strategy:
Invests in primarily lower-quality fixed-income securities and other securities that are expected to produce a relatively high level of income, (including income-producing preferred and common stocks).
The fund may invest any portion of its assets in Canadian securities and up to 50% of assets in other foreign securities, including emerging markets securities.
Fund Inception Date:
June 5, 1996
Fund Registration Date:
March 7, 1997
Net Assets:
$429.4 million
Market Conditions
A gradually improving global economic environment drove risk appetite, while stronger corporate balance sheets and employment gains generated additional investor confidence. In this environment, high-yield credits generally outperformed their investment-grade counterparts, and investors were rewarded for taking on higher degrees of risk. Record market liquidity allowed debt issuers to refinance old lines of credit at more beneficial terms, as investors reached for yield in the continued artificially-low interest rate environment. Challenges emerged, as European sovereign-debt worries continued to pop up on news of elections, resignations and banking sector troubles. In addition, political upheaval in the Middle East and North Africa led to volatility in the global markets and created uncertainty regarding oil shipments. The natural and nuclear disasters in Japan also rattled the markets, as many of the country’s manufacturers had to shut down operations. Investors also feared that Japan, one of the largest holders of U.S. Treasuries, would liquidate its positions to rebuild.
Performance Results
For the six months ended March 31, 2011, Loomis Sayles Institutional High Income Fund returned 9.60%. The fund outperformed its benchmark, the Barclays Capital U.S. Corporate High-Yield Bond Index, which returned 7.23% for the period.
Explanation of Fund Performance
Favorable security selection and exposure to out-of-benchmark sectors were the main drivers of the fund’s outperformance relative to the benchmark. In particular, positions in convertible bonds and a small allocation to equities boosted relative returns due to strong underlying equity-market performance. In the high-yield sector, holdings in the industrials, utilities and financial segments posted strong returns, while consumer non-cyclical and cyclical, technology, finance, communication, capital goods and energy credits represented some of the strongest industry-based returns.
Although investment-grade securities and securities denominated in foreign currencies provided positive returns, the returns they generated were not as strong as the return of the benchmark. A small allocation to U.S. Treasuries posted negative results. While investors flocked to relatively safer assets during periods of increased volatility, a preference for risk dominated during the six-month period.
Outlook
Strong liquidity, markets in transition, geopolitical turmoil, continued economic recovery and tragic natural disasters garnered significant attention from market participants during the first quarter of 2011. Many of these themes will continue to dominate investor consciousness going forward.
We believe markets remain in transition regarding interest rates, with pressures building both globally and domestically. Globally, growth in many areas of the world remains robust; however, inflation concerns have begun to attract attention. Central banks will likely continue to shift toward less accommodative policy as 2011 progresses. We anticipate the Federal Reserve’s program of Treasury purchases in the United States, which is referred to as “QE2” (short for quantitative easing), will end during the second quarter and believe the U.S. economic recovery has sufficient momentum to continue expanding without outsized government stimulus.
Our assessment of the fundamental underpinnings of the corporate sector remains positive. In general, corporations are proceeding conservatively with regard to hiring and capital expenditures. Merger and acquisition activity has increased recently, and we believe there is room for more growth in that space. Valuations in the corporate bond space are generally fair, with investor demand for yield providing support and liquidity to the high-yield, investment-grade and convertible sectors.
We continue to position the fund for global economic recovery, as well as a gradual upward bias in interest rates. We continue to emphasize yield advantage, global diversification and specific bond picking within the fund.
9 |
LOOMIS SAYLES INSTITUTIONAL HIGH INCOME FUND
Average Annual Returns
March 31, 2011
| | | | | | | | | | | | | | | | |
| | | | | |
| | | 6 months | | | 1 year | | | 5 years | | | 10 years | |
| Institutional Class (Inception 6/5/96) | | | 9.60 | % | | | 14.12 | % | | | 9.51 | % | | | 11.21 | % |
| Comparative Performance | | | | | | | | | | | | | | | | |
| Barclays Capital U.S. Corporate High-Yield Bond Index(b) | | | 7.23 | | | | 14.31 | | | | 9.12 | | | | 8.63 | |
| Lipper High Current Yield Funds Index(b) | | | 7.91 | | | | 14.15 | | | | 6.87 | | | | 6.72 | |
| |
| Gross expense ratio (before fee waivers and/or expense reimbursements)* | |
| Institutional: 0.72% | | | | | | | | | | | | | | | | |
| |
| Net expense ratio (after fee waivers and/or expense reimbursements)* | |
| Institutional: 0.72% | | | | | | | | | | | | | | | | |
| * | | As stated in the most recent prospectus. Waivers/reimbursements are contractual and are set to expire on 1/31/12. Contracts are reevaluated on an annual basis. |
Cumulative Performance
March 31, 2001 through March 31, 2011(a)
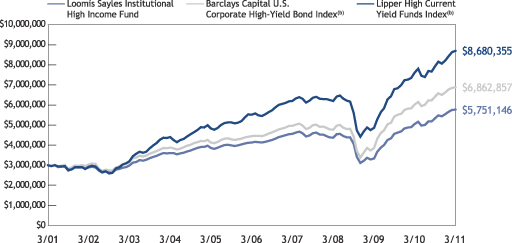
Data quoted reflects past performance and cannot guarantee future results. Average annual total returns assume reinvestment of dividends and capital gains distributions. Investment return and principal value will fluctuate so that shares, when redeemed, may be worth more or less than their original cost. For performance current to the most recent month end, please visit www.loomissayles.com. Current performance may be higher or lower than quoted.
Returns do not reflect the taxes that a shareholder would pay on fund distributions or the redemption of shares. Periods of less than one year are not annualized. Performance data reflects certain fee waivers and/or expense reimbursements, if any, without which performance would be lower.
| (a) | | The mountain chart is based on the fund’s minimum initial investment of $3,000,000. |
| (b) | | See page 15 for a description of the indices. |
What you should know
Investments in the fund are subject to a number of risks. Please see the “Principal Risks” section of the fund’s prospectus. The purchase of fund shares should be seen as a long-term investment.
| 10
LOOMIS SAYLES INTERMEDIATE DURATION BOND FUND
Fund and manager review
FUND FACTS
Managers:
Neil Burke
Cliff Rowe, CFA
Richard Raczkowski
Symbols:
| | |
| Institutional Class | | LSDIX |
| Retail Class | | LSDRX |
Objective:
Above-average total return through a combination of current income and capital appreciation
Strategy:
Invests only in investment-grade fixed-income securities. The fund’s weighted average duration generally is two to five years. The fund may invest any portion of its assets in U.S.-dollar-denominated Canadian securities and up to 20% of its assets in other U.S.-dollar-denominated foreign securities, including emerging market securities.
Fund Inception Date:
January 28, 1998
Class Inception Date:
Institutional Class:
January 28, 1998
Retail Class:
May 28, 2010
Net Assets:
$56.8 million
Market Conditions
By the end of calendar year 2010, interest rates began to move steadily steeper, creating a challenging environment for most rate-sensitive sectors. A preference for riskier assets prevailed throughout much of the first quarter of 2011, but headline news, including a severe earthquake in Japan, political instability in the Middle East and North Africa, and the re-emergence of European sovereign-debt woes contributed to volatility that negatively influenced investor sentiment. Despite these headwinds, the markets remained relatively resilient, as positive corporate earning news and macroeconomic indicators supported a continuation of the economic recovery.
Performance Results
For the six months ended March 31, 2011, Institutional Class shares of Loomis Sayles Intermediate Duration Bond Fund returned -0.34%. The fund outperformed its benchmark, the Barclays Capital U.S. Intermediate Government/Credit Bond Index, which returned -1.11% for the period.
Explanation of Fund Performance
Favorable issue selection and sector allocations contributed to the fund’s outperformance. In particular, commercial mortgage-backed securities (CMBS) continued to offer attractive value for the fund, and an overweight position in CMBS was the largest individual contributor to performance during the period. Our allocations remained concentrated in higher-quality, super-senior CMBS. Issue selection among U.S. corporate bonds also made a positive contribution to performance, helping to buoy returns in a challenging market environment. In particular, the fund’s holdings in the communications, energy and basic industry sectors boosted relative return. A small allocation to high-yield corporate securities, focused in the industrials segment, provided a small boost to excess return and generated the largest gains for the fund. Additionally, an underweight in U.S. Treasuries helped performance, because returns among Treasuries were largely negative in the rising-rate environment, and riskier assets performed better.
The fund’s longer-duration positions tended to underperform during the period, as interest rates ratcheted higher. Despite remaining in line with the benchmark in terms of duration, a negative yield curve effect was the largest detractor from the fund’s performance. Returns from Treasury securities declined during the period. Longer-duration positions weighed on performance, while issues at the shorter end of the yield curve eked out small positive gains. Within the corporate sector, returns were weakest in the capital goods, technology and transportation industries.
Outlook
We anticipate maintaining an overweight in corporate securities and structured assets while remaining underweight in Treasuries for the foreseeable future. There is a more cautious view of interest rates and yield curve effects going forward, due to the Federal Reserve Board’s scheduled conclusion to its second round of quantitative easing, popularly referred to as “QE2,” by the end of the second quarter. We expect to maintain the fund’s relatively neutral duration versus the benchmark. Anticipating future volatility as QE2 winds down, we will continue to diversify the fund’s holdings. In addition, we will continue to use Treasuries for liquidity and duration management.
11 |
LOOMIS SAYLES INTERMEDIATE DURATION BOND FUND
Average Annual Returns
March 31, 2011
| | | | | | | | | | | | | | | | |
| | | | | |
| | | 6 months | | | 1 year | | | 5 years | | | 10 years | |
| | | | | |
| Institutional Class (Inception 1/28/98) | | | -0.34 | % | | | 5.63 | % | | | 6.83 | % | | | 5.66 | % |
| Retail Class (Inception 5/28/10)(a) | | | -0.37 | | | | 5.61 | | | | 6.58 | | | | 5.35 | |
| | | | | |
| Comparative Performance | | | | | | | | | | | | | | | | |
| Barclays Capital U.S. Intermediate Government/Credit Bond Index(c) | | | -1.11 | | | | 4.63 | | | | 5.68 | | | | 5.20 | |
| Lipper Intermediate Investment Grade Debt Funds Index(c) | | | -0.01 | | | | 6.68 | | | | 5.77 | | | | 5.34 | |
| |
| Gross expense ratio (before fee waivers and/or expense reimbursements)* | |
| Institutional: 0.73% Retail: 1.61% | | | | | | | | | | | | | | | | |
| |
| Net expense ratio (after fee waivers and/or expense reimbursements)* | |
| Institutional: 0.40% Retail: 0.65% | | | | | | | | | | | | | | | | |
| * | | As stated in the most recent prospectus. Waivers/reimbursements are contractual and are set to expire on 1/31/12. Contracts are reevaluated on an annual basis. |
Cumulative Performance(d)
March 31, 2001 through March 31, 2011(b)(d)
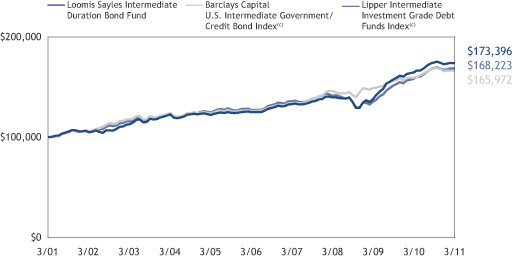
Data quoted reflects past performance and cannot guarantee future results. Average annual total returns assume reinvestment of dividends and capital gains distributions. Investment return and principal value will fluctuate so that shares, when redeemed, may be worth more or less than their original cost. For performance current to the most recent month-end, please visit www.loomissayles.com. Current performance may be higher or lower than quoted.
Returns do not reflect the taxes that a shareholder would pay on fund distributions or the redemption of shares. Periods of less than one year are not annualized. Performance data reflects certain fee waivers and/or expense reimbursements, if any, without which performance would be lower.
| (a) | | Prior to inception of Retail Class (5/28/10), performance is that of Institutional Class, restated to reflect the higher net expenses of Retail Class. |
| (b) | | The mountain chart is based on the fund’s initial minimum investment of $100,000 for the Institutional Class. |
| (c) | | See page 15 for a description of the indices. |
| (d) | | Cumulative performance is shown for the Institutional Class. Performance of the Retail Class would be lower due to higher fees. |
What you should know:
Investments in the fund are subject to a number of risks. Please see the “Principal Risks” section of the fund’s prospectus. The purchase of fund shares should be seen as a long-term investment.
| 12
LOOMIS SAYLES INVESTMENT GRADE FIXED INCOME FUND
Fund and manager review
FUND FACTS
Managers:
Daniel Fuss, CFA, CIC
Matthew Eagan, CFA
Kathleen Gaffney, CFA
Elaine Stokes
Symbols:
| | |
| Institutional Class | | LSIGX |
Objective:
Above-average total investment return through a combination of current income and capital appreciation
Strategy:
Invests in primarily investment-grade fixed-income securities, although it may invest up to 10% of its assets in lower-quality fixed-income securities and up to 10% of its assets in preferred stocks. The fund may invest any portion of its assets in securities of Canadian issuers and up to 20% of assets in securities of other foreign issuers, including emerging markets.
Fund Inception Date:
July 1, 1994
Fund Registration Date:
March 7, 1997
Net Assets:
$455.4 million
Market Conditions
Riskier assets rallied during the period amid positive macroeconomic indicators and continued support from the Federal Reserve Board’s quantitative easing program, which involves significant purchases of Treasury securities. Many fourth-quarter 2010 earnings reports surpassed expectations, and consumer confidence trended higher. Late in the period, unrest in the Middle East and a devastating earthquake in Japan brought volatility back to the market. Commodity prices increased sharply, and inflationary pressures prompted China to raise reserve rates. Oil prices hit 12-month highs, as unrest in North Africa created supply concerns. On a bright note, the U.S. unemployment rate dropped to 8.8% in March from a high of 9.8% in November. Demand for risk and a technical rally continued to drive returns in corporate and securitized debt. Overall, corporate bonds outpaced U.S. Treasuries, as yield spreads continued to tighten.
Performance Results
For the six months ended March 31, 2011, Loomis Sayles Investment Grade Fixed Income Fund returned 3.39%. The fund outperformed its benchmark, the Barclays Capital U.S. Government/Credit Bond Index, which returned -1.90% for the period.
Explanation of Fund Performance
Strong security selection and sector positioning within corporate credit, high-yield, non-U.S. dollar and convertibles were the primary drivers of the fund’s outperformance. In particular, a substantial allocation to the non-U.S.-dollar space boosted relative performance, as the commodity-rich nations of Canada, Australia, Norway and New Zealand provided the strongest returns. Additionally, strong security selection in the investment-grade corporate bond sector bolstered relative performance, with names in the finance, insurance, communication and transportation industries offering the best returns. A modest allocation to high-yield corporate bonds also contributed favorably, particularly in the consumer cyclical, transportation and finance industries. The fund’s commercial mortgage-backed securities and asset-backed securities offered strong returns relative to Treasuries and continued to support relative performance, while exposure to convertible bonds and preferred stock benefited from strong returns in the equity market. Selected names in the automotive, banking, technology and consumer non-cyclical industries performed the best. In addition, an underweight position in U.S. Treasuries helped relative performance, as demand for risk drove investors away from normally safer sectors, which lagged for the period.
The only notable detractor to relative performance was the fund’s yield-curve positioning. Specifically, the fund’s slightly-longer-than-benchmark duration weighed on returns, as the yield curve shifted up during the period. Duration is a measure of interest-rate sensitivity.
Outlook
Strong liquidity, markets in transition, geopolitical turmoil, continued economic recovery and tragic natural disasters garnered significant attention from market participants during the first quarter of 2011. Many of these themes will continue to dominate investor consciousness going forward.
We believe markets remain in transition regarding interest rates, with pressures building both globally and domestically. Globally, growth in many areas of the world remains robust; however, inflation concerns have begun to attract attention. Central banks will likely continue to shift toward less accommodative policy as 2011 progresses. We anticipate the Federal Reserve’s program of Treasury purchases in the United States, which is referred to as “QE2” (short for quantitative easing), will end during the second quarter and believe the U.S. economic recovery has sufficient momentum to continue expanding without outsized government stimulus.
Our assessment of the fundamental underpinnings of the corporate sector remains positive. In general, corporations are proceeding conservatively with regard to hiring and capital expenditures. Merger and acquisition activity has increased recently, and we believe there is room for more growth in that space. Valuations in the corporate bond space are generally fair, with investor demand for yield providing support and liquidity to the high-yield, investment-grade and convertible sectors.
We continue to position the fund for global economic recovery, as well as a gradual upward bias in interest rates. We continue to emphasize yield advantage, global diversification and specific bond picking within the fund.
13 |
LOOMIS SAYLES INVESTMENT GRADE FIXED INCOME FUND
Average Annual Returns
March 31, 2011
| | | | | | | | | | | | | | | | |
| | | | | |
| | | 6 months | | | 1 year | | | 5 years | | | 10 years | |
| Institutional Class (Inception 7/1/94) | | | 3.39 | % | | | 11.40 | % | | | 9.18 | % | | | 10.16 | % |
| Comparative Performance | | | | | | | | | | | | | | | | |
| Barclays Capital U.S. Government/Credit Bond Index(b) | | | -1.90 | | | | 5.26 | | | | 5.83 | | | | 5.53 | |
| Lipper BBB-Rated Funds Index(b) | | | 0.37 | | | | 8.77 | | | | 5.97 | | | | 5.79 | |
| | | |
| Gross expense ratio (before fee waivers and/or expense reimbursements)* | | | | | | | | | |
| Institutional: 0.48% | | | | | | | | | | | | | | | | |
| | | |
| Net expense ratio (after fee waivers and/or expense reimbursements)* | | | | | | | | | |
| Institutional: 0.48% | | | | | | | | | | | | | | | | |
| * | | As stated in the most recent prospectus. Waivers/reimbursements are contractual and are set to expire on 1/31/12. Contracts are reevaluated on an annual basis. |
Cumulative Performance
March 31, 2001 through March 31, 2011(a)
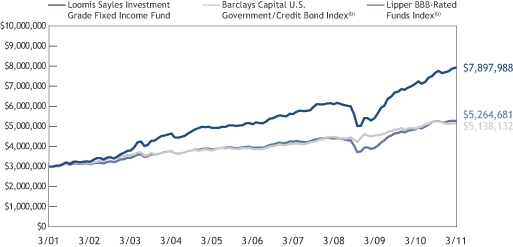
Data quoted reflects past performance and cannot guarantee future results. Average annual total returns assume reinvestment of dividends and capital gains distributions. Investment return and principal value will fluctuate so that shares, when redeemed, may be worth more or less than their original cost. For performance current to the most recent month end, please visit www.loomissayles.com. Current performance may be higher or lower than quoted.
Returns do not reflect the taxes that a shareholder would pay on fund distributions or the redemption of shares. Periods of less than one year are not annualized. Performance data reflects certain fee waivers and/or expense reimbursements, if any, without which performance would be lower.
| (a) | | The mountain chart is based on the fund’s minimum initial investment of $3,000,000. |
| (b) | | See page 15 for a description of the indices. |
What you should know
Investments in the fund are subject to a number of risks. Please see the “Principal Risks” section of the fund’s prospectus. The purchase of fund shares should be seen as a long-term investment.
| 14
ADDITIONAL INFORMATION
The views expressed in this report reflect those of the portfolio managers as of the dates indicated. The managers’ views are subject to change at any time without notice based on changes in market or other conditions. References to specific securities or industries should not be regarded as investment advice. Because the funds are actively managed, there is no assurance that they will continue to invest in the securities or industries mentioned.
Index Definitions
Indexes are unmanaged and do not have expenses that affect results, unlike mutual funds. Index returns are adjusted for the reinvestment of capital gain distributions and income dividends. It is not possible to invest directly in an index.
Barclays Capital U.S. Government/Credit Bond Index is an unmanaged index that includes U.S. Treasuries, government-related issues, and investment grade U.S. corporate securities.
Barclays Capital U.S. Intermediate Government/Credit Bond Index is an unmanaged index that includes U.S. Treasuries, government-related issues, and investment grade U.S. corporate securities with remaining maturities of one to ten years.
Barclays Capital Global Aggregate Bond Index is an unmanaged index that provides a broad-based measure of the global investment-grade fixed-rate debt markets.
Barclays Capital U.S. Corporate High-Yield Bond Index is an unmanaged index that covers the U.S.-dollar denominated, non-investment grade, fixed-rate, taxable corporate bond market.
Barclays Capital U.S. Treasury Inflation Protected Securities Index is an unmanaged index that tracks inflation protected securities issued by the U.S. Treasury.
Lipper BBB-Rated Funds Index is an unmanaged index that tracks the average performance of the 30 largest BBB-rated funds according to Lipper Inc.
Lipper Global Income Funds Index is an unmanaged index that tracks the average performance of the 30 largest global income funds according to Lipper Inc.
Lipper High Current Yield Funds Index is an unmanaged index that tracks the average performance of the 30 largest high current yield funds according to Lipper Inc.
Lipper Intermediate Investment Grade Debt Funds Index is an unmanaged index that tracks the average performance of the 30 largest intermediate investment grade debt funds according to Lipper Inc.
Lipper Treasury Inflation Protected Securities Funds Index is an unmanaged index that tracks the average performance of the 30 largest treasury inflation protected securities funds according to Lipper Inc.
Source: Lipper, Inc.
Proxy Voting Information
A description of the funds’ proxy voting policies and procedures is available without charge, upon request, (i) by calling Loomis Sayles at 800-633-3330; (ii) on the funds’ website, www.loomissayles.com, and (iii) on the SEC’s website, www.sec.gov. Information about how the funds voted proxies relating to portfolio securities during the 12 months ended June 30, 2010 is available on (i) the funds’ website and (ii) the SEC’s website.
Quarterly Portfolio Schedules
The funds file a complete schedule of portfolio holdings with the SEC for the first and third quarters of each fiscal year on Form N-Q. The funds’ Forms N-Q are available on the SEC’s website at www.sec.gov and may be reviewed and copied at the SEC’s Public Reference Room in Washington, DC. Information on the operation of the Public Reference Room may be obtained by calling 1-800-SEC-0330.
UNDERSTANDING YOUR FUND’S EXPENSES
As a mutual fund shareholder you incur two types of costs: (1) transaction costs, and (2) ongoing costs, including management fees, distribution and/or service fees (12b-1 fees), and other fund expenses. These costs are described in more detail in each fund’s prospectus. The examples below are intended to help you understand the ongoing costs of investing in the funds and help you compare these with the ongoing costs of investing in other mutual funds.
The first line in the table for each class of fund shares shows the actual amount of Fund expenses you would have paid on a $1,000 investment in the fund from October 1, 2010 through March 31, 2011. It also shows how much a $1,000 investment would be worth at the close of the period, assuming actual fund returns and expenses. To estimate the expenses you paid over the period, simply divide your account value by $1,000 (for example $8,600 account value divided by $1,000 = 8.6) and multiply the result by the number in the Expenses Paid During Period column as shown below for your Class.
The second line in the table for each class of fund shares provides information about hypothetical account values and hypothetical expenses based on the fund’s actual expense ratios and an assumed rate of return of 5% per year before expenses, which is not the fund’s actual return. The hypothetical account values and expenses may not be used to estimate the actual ending account balance or expenses you paid on your investment for the period. You may use this information to compare the ongoing costs of investing in the fund and other funds. To do so, compare this 5% hypothetical example with the 5% hypothetical examples that appear in the shareholder reports of the other funds.
Please note that the expenses shown reflect ongoing costs only, and do not include any transaction costs. Therefore, the second line in the table is useful in comparing ongoing costs only, and will not help you determine the relative costs of owning different funds. If transaction costs were included, total costs would be higher.
15 |
Loomis Sayles Bond Fund
| | | | | | | | | | | | |
Institutional Class | | Beginning
Account Value
10/1/2010 | | | Ending
Account Value
3/31/2011 | | | Expenses Paid
During Period*
10/1/2010 – 3/31/2011 | |
Actual | | | $1,000.00 | | | | $1,056.40 | | | | $3.23 | |
Hypothetical (5% return before expenses) | | | $1,000.00 | | | | $1,021.79 | | | | $3.18 | |
| | | |
Retail Class | | | | | | | | | |
Actual | | | $1,000.00 | | | | $1,055.10 | | | | $4.71 | |
Hypothetical (5% return before expenses) | | | $1,000.00 | | | | $1,020.34 | | | | $4.63 | |
| | | |
Admin Class | | | | | | | | | |
Actual | | | $1,000.00 | | | | $1,053.80 | | | | $6.14 | |
Hypothetical (5% return before expenses) | | | $1,000.00 | | | | $1,018.95 | | | | $6.04 | |
* Expenses are equal to the Fund’s annualized expense ratio: 0.63%, 0.92% and 1.20% for Institutional, Retail and Admin Class, respectively, multiplied by the average account value over the period, multiplied by the number of days in the most recent fiscal half-year, divided by 365 (to reflect the half-year period). | |
Loomis Sayles Fixed Income Fund
| | | | | | | | | | | | |
Institutional Class | | Beginning
Account Value
10/1/2010 | | | Ending
Account Value
3/31/2011 | | | Expenses Paid
During Period*
10/1/2010 – 3/31/2011 | |
Actual | | | $1,000.00 | | | | $1,056.40 | | | | $2.97 | |
Hypothetical (5% return before expenses) | | | $1,000.00 | | | | $1,022.04 | | | | $2.92 | |
* Expenses are equal to the Fund’s annualized expense ratio: 0.58%, multiplied by the average account value over the period, multiplied by the number of days in the most recent fiscal half-year, divided by 365 (to reflect the half-year period). | |
Loomis Sayles Global Bond Fund
| | | | | | | | | | | | |
Institutional Class | | Beginning
Account Value
10/1/2010 | | | Ending
Account Value
3/31/2011 | | | Expenses Paid
During Period*
10/1/2010 – 3/31/2011 | |
Actual | | | $1,000.00 | | | | $1,013.70 | | | | $3.31 | |
Hypothetical (5% return before expenses) | | | $1,000.00 | | | | $1,021.64 | | | | $3.33 | |
| | | |
Retail Class | | | | | | | | | |
Actual | | | $1,000.00 | | | | $1,012.20 | | | | $4.92 | |
Hypothetical (5% return before expenses) | | | $1,000.00 | | | | $1,020.04 | | | | $4.94 | |
* Expenses are equal to the Fund’s annualized expense ratio: 0.66% and 0.98% for Institutional and Retail Class, respectively, multiplied by the average account value over the period, multiplied by the number of days in the most recent fiscal half-year, divided by 365 (to reflect the half-year period). | |
Loomis Sayles Inflation Protected Securities Fund
| | | | | | | | | | | | |
Institutional Class | | Beginning
Account Value
10/1/2010 | | | Ending
Account Value
3/31/2011 | | | Expenses Paid
During Period*
10/1/2010 – 3/31/2011 | |
Actual | | | $1,000.00 | | | | $1,014.00 | | | | $2.01 | |
Hypothetical (5% return before expenses) | | | $1,000.00 | | | | $1,022.94 | | | | $2.02 | |
| | | |
Retail Class | | | | | | | | | |
Actual | | | $1,000.00 | | | | $1,013.10 | | | | $3.26 | |
Hypothetical (5% return before expenses) | | | $1,000.00 | | | | $1,021.69 | | | | $3.28 | |
* Expenses are equal to the Fund’s annualized expense ratio (after waiver/reimbursement): 0.40% and 0.65% for Institutional and Retail Class, respectively, multiplied by the average account value over the period, multiplied by the number of days in the most recent fiscal half-year, divided by 365 (to reflect the half-year period). | |
| 16
Loomis Sayles Institutional High Income Fund
| | | | | | | | | | | | |
Institutional Class | | Beginning
Account Value
10/1/2010 | | | Ending
Account Value
3/31/2011 | | | Expenses Paid
During Period*
10/1/2010 – 3/31/2011 | |
Actual | | | $1,000.00 | | | | $1,096.00 | | | | $3.66 | |
Hypothetical (5% return before expenses) | | | $1,000.00 | | | | $1,021.44 | | | | $3.53 | |
* Expenses are equal to the Fund’s annualized expense ratio: 0.70%, multiplied by the average account value over the period, multiplied by the number of days in the most recent fiscal half-year, divided by 365 (to reflect the half-year period). | |
Loomis Sayles Intermediate Duration Bond Fund
| | | | | | | | | | | | |
Institutional Class | | Beginning
Account Value
10/1/2010 | | | Ending
Account Value
3/31/2011 | | | Expenses Paid
During Period*
10/1/2010 – 3/31/2011 | |
Actual | | | $1,000.00 | | | | $996.60 | | | | $1.99 | |
Hypothetical (5% return before expenses) | | | $1,000.00 | | | | $1,022.94 | | | | $2.02 | |
| | | |
Retail Class | | | | | | | | | |
Actual | | | $1,000.00 | | | | $996.30 | | | | $3.24 | |
Hypothetical (5% return before expenses) | | | $1,000.00 | | | | $1,021.69 | | | | $3.28 | |
* Expenses are equal to the Fund’s annualized expense ratio (after waiver/reimbursement): 0.40% and 0.65% for Institutional and Retail Class, respectively, multiplied by the average account value over the period multiplied by the number of days in the most recent fiscal half-year, divided by 365 (to reflect the half-year period). | |
Loomis Sayles Investment Grade Fixed Income Fund
| | | | | | | | | | | | |
Institutional Class | | Beginning
Account Value
10/1/2010 | | | Ending
Account Value
3/31/2011 | | | Expenses Paid
During Period*
10/1/2010 – 3/31/2011 | |
Actual | | | $1,000.00 | | | | $1,033.90 | | | | $2.48 | |
Hypothetical (5% return before expenses) | | | $1,000.00 | | | | $1,022.49 | | | | $2.47 | |
* Expenses are equal to the Fund’s annualized expense ratio: 0.49%, multiplied by the average account value over the period, multiplied by the number of days in the most recent fiscal half-year, divided by 365 (to reflect the half-year period). | |
17 |
Portfolio of Investments – as of March 31, 2011 (Unaudited)
Loomis Sayles Bond Fund
| | | | | | | | |
Principal
Amount (‡) | | | Description | | Value (†) | |
| | | | | | | | |
|
| | Bonds and Notes – 86.8% of Net Assets | |
|
| | Non-Convertible Bonds – 76.9% | |
| | |
| | | | ABS Car Loan – 0.1% | | | | |
| $ | 10,423,000 | | | Avis Budget Rental Car Funding AESOP LLC,
Series 2007-2A, Class A,
0.394%, 8/20/2013, 144A(b) | | $ | 10,200,077 | |
| | 5,917,000 | | | Avis Budget Rental Car Funding AESOP LLC,
Series 2010-5A, Class B,
5.110%, 3/20/2017, 144A | | | 6,202,528 | |
| | | | | | | | |
| | | | | | | 16,402,605 | |
| | | | | | | | |
| | | | Aerospace & Defense – 0.1% | |
| | 1,510,000 | | | Bombardier, Inc.,
7.350%, 12/22/2026, (CAD) | | | 1,593,778 | |
| | 13,664,000 | | | Bombardier, Inc.,
7.450%, 5/01/2034, 144A | | | 13,117,440 | |
| | | | | | | | |
| | | | | | | 14,711,218 | |
| | | | | | | | |
| | | | Airlines – 2.1% | | | | |
| | 51,400,000 | | | Air Canada,
10.125%, 8/01/2015,
144A, (CAD) | | | 56,463,125 | |
| | 405,876 | | | American Airlines Pass Through Trust,
Series 1993-A6,
8.040%, 9/16/2011 | | | 405,876 | |
| | 1,655,398 | | | American Airlines Pass Through Trust,
Series 2009-1A,
10.375%, 1/02/2021 | | | 1,945,092 | |
| | 146,307 | | | Continental Airlines Pass Through Trust,
Series 1996-1,
Class A, 6.940%, 4/15/2015 | | | 148,867 | |
| | 7,195,819 | | | Continental Airlines Pass Through Trust,
Series 1997-1, Class A,
7.461%, 10/01/2016 | | | 7,276,772 | |
| | 2,090,679 | | | Continental Airlines Pass Through Trust,
Series 1997-4, Class B,
6.900%, 7/02/2018 | | | 2,085,452 | |
| | 2,898,362 | | | Continental Airlines Pass Through Trust,
Series 1998-1, Class B,
6.748%, 9/15/2018 | | | 2,920,100 | |
| | 8,657,826 | | | Continental Airlines Pass Through Trust,
Series 1999-1, Class B,
6.795%, 2/02/2020 | | | 8,484,669 | |
| | 4,276,392 | | | Continental Airlines Pass Through Trust,
Series 1999-2, Class B,
7.566%, 9/15/2021 | | | 4,233,628 | |
| | 2,527,025 | | | Continental Airlines Pass Through Trust,
Series 2000-1, Class A-1,
8.048%, 5/01/2022 | | | 2,754,458 | |
| | | | | | | | |
Principal
Amount (‡) | | | Description | | Value (†) | |
| | | | | | | | |
| | |
| | | | Airlines – continued | | | | |
| $ | 2,365,219 | | | Continental Airlines Pass Through Trust,
Series 2000-2, Class A-1,
7.707%, 10/02/2022 | | $ | 2,560,350 | |
| | 3,452,515 | | | Continental Airlines Pass Through Trust,
Series 2000-2, Class B,
8.307%, 10/02/2019 | | | 3,487,040 | |
| | 2,741,509 | | | Continental Airlines Pass Through Trust,
Series 2001-1, Class A-1,
6.703%, 12/15/2022 | | | 2,864,877 | |
| | 3,618,639 | | | Continental Airlines Pass Through Trust,
Series 2001-1, Class B,
7.373%, 6/15/2017 | | | 3,627,686 | |
| | 17,074,761 | | | Continental Airlines Pass Through Trust,
Series 2007-1, Class A,
5.983%, 10/19/2023 | | | 17,501,630 | |
| | 26,253,528 | | | Continental Airlines Pass Through Trust,
Series 2007-1, Class B,
6.903%, 4/19/2022 | | | 26,450,429 | |
| | 23,894,768 | | | Continental Airlines Pass Through Trust,
Series 2009-1,
9.000%, 7/08/2016 | | | 27,120,562 | |
| | 28,806,593 | | | Continental Airlines Pass Through Trust,
Series 2009-2, Class A,
7.250%, 5/10/2021 | | | 31,111,120 | |
| | 2,000,000 | | | Delta Air Lines Pass Through Trust, Series 2001-1, Class A-2,
7.111%, 3/18/2013 | | | 2,060,000 | |
| | 2,894,701 | | | Delta Air Lines Pass Through Trust, Series 2007-1, Class A,
6.821%, 2/10/2024 | | | 2,988,778 | |
| | 4,593,778 | | | Delta Air Lines Pass Through Trust, Series 2007-1, Class B,
8.021%, 2/10/2024 | | | 4,743,076 | |
| | 33,863,762 | | | Delta Air Lines Pass Through Trust, Series 2007-1, Class C,
8.954%, 8/10/2014 | | | 35,133,653 | |
| | 9,017,945 | | | Delta Air Lines Pass Through Trust, Series 2009-1, Series B,
9.750%, 12/17/2016 | | | 9,559,022 | |
| | 2,825,000 | | | Delta Air Lines, Inc.,
9.500%, 9/15/2014, 144A | | | 3,001,563 | |
| | 3,515,463 | | | Northwest Airlines, Inc.,
Series 2002-1, Class G2,
(MBIA insured),
6.264%, 5/20/2023 | | | 3,620,927 | |
| | 26,198,659 | | | Northwest Airlines, Inc.,
Series 2007-1, Class B,
8.028%, 11/01/2017 | | | 26,722,632 | |
| | 2,000,000 | | | Qantas Airways Ltd.,
5.125%, 6/20/2013, 144A | | | 2,104,568 | |
| | 44,235,000 | | | Qantas Airways Ltd.,
6.050%, 4/15/2016, 144A | | | 47,111,160 | |
See accompanying notes to financial statements.
| 18
Portfolio of Investments – as of March 31, 2011 (Unaudited)
Loomis Sayles Bond Fund – continued
| | | | | | | | |
Principal
Amount (‡) | | | Description | | Value (†) | |
| | | | | | | | |
|
| | Bonds and Notes – continued | |
| | |
| | | | Airlines – continued | | | | |
| $ | 26,836,367 | | | UAL Pass Through Trust,
Series 2007-1, Class A,
6.636%, 1/02/2024 | | $ | 27,104,730 | |
| | 15,845,464 | | | UAL Pass Through Trust,
Series 2009-1,
10.400%, 5/01/2018 | | | 18,143,056 | |
| | 27,843,000 | | | US Airways Pass Through Trust, Series 2010-1, Class B,
8.500%, 10/22/2018 | | | 27,982,215 | |
| | | | | | | | |
| | | | | | | 411,717,113 | |
| | | | | | | | |
| | | | Automotive – 1.7% | | | | |
| | 385,000 | | | ArvinMeritor, Inc.,
8.125%, 9/15/2015 | | | 400,400 | |
| | 3,172,000 | | | Cummins, Inc.,
6.750%, 2/15/2027 | | | 3,328,950 | |
| | 9,800,000 | | | FCE Bank PLC, EMTN,
7.125%, 1/16/2012, (EUR) | | | 14,305,211 | |
| | 6,550,000 | | | FCE Bank PLC, EMTN,
7.125%, 1/15/2013, (EUR) | | | 9,746,789 | |
| | 2,590,000 | | | Ford Motor Co.,
6.375%, 2/01/2029 | | | 2,446,882 | |
| | 2,611,000 | | | Ford Motor Co.,
6.500%, 8/01/2018 | | | 2,733,720 | |
| | 1,560,000 | | | Ford Motor Co.,
6.625%, 2/15/2028 | | | 1,514,743 | |
| | 64,950,000 | | | Ford Motor Co.,
6.625%, 10/01/2028 | | | 63,035,729 | |
| | 2,720,000 | | | Ford Motor Co.,
7.125%, 11/15/2025 | | | 2,640,848 | |
| | 122,204,000 | | | Ford Motor Co.,
7.450%, 7/16/2031 | | | 132,299,272 | |
| | 1,580,000 | | | Ford Motor Co.,
7.500%, 8/01/2026 | | | 1,586,325 | |
| | 55,235,000 | | | Ford Motor Credit Co. LLC,
7.000%, 4/15/2015 | | | 59,787,800 | |
| | 7,040,000 | | | Ford Motor Credit Co. LLC,
8.700%, 10/01/2014 | | | 7,991,526 | |
| | 6,041,000 | | | Goodyear Tire & Rubber Co. (The),
7.000%, 3/15/2028 | | | 5,678,540 | |
| | 14,150,000 | | | Goodyear Tire & Rubber Co. (The),
10.500%, 5/15/2016 | | | 15,848,000 | |
| | 3,700,000 | | | TRW Automotive, Inc.,
7.250%, 3/15/2017, 144A | | | 4,070,000 | |
| | 6,400,000 | | | TRW Automotive, Inc.,
8.875%, 12/01/2017, 144A | | | 7,168,000 | |
| | | | | | | | |
| | | | | | | 334,582,735 | |
| | | | | | | | |
| | | | Banking – 6.2% | |
| | 100,540,000 | | | AgriBank FCB,
9.125%, 7/15/2019, 144A | | | 120,032,796 | |
| | 33,073,000 | | | Associates Corp. of North America,
6.950%, 11/01/2018 | | | 36,961,723 | |
| | 35,170,000 | | | BAC Capital Trust VI,
5.625%, 3/08/2035 | | | 30,691,136 | |
| | 2,682,000 | | | Bank of America Corp.,
5.420%, 3/15/2017 | | | 2,738,011 | |
| | | | | | | | |
Principal
Amount (‡) | | | Description | | Value (†) | |
| | | | | | | | |
| | |
| | | | Banking – continued | | | | |
| $ | 7,290,000 | | | Bank of America Corp.,
6.000%, 9/01/2017 | | $ | 7,813,407 | |
| | 12,823,000 | | | Bank of America NA,
5.300%, 3/15/2017 | | | 13,164,938 | |
| | 87,880,000,000 | | | Barclays Bank PLC, EMTN,
3.680%, 8/20/2015, (KRW) | | | 78,217,726 | |
| | 3,260,000 | | | Bear Stearns Cos., Inc. (The),
4.650%, 7/02/2018 | | | 3,292,206 | |
| | 274,980,870,000 | | | BNP Paribas SA,
EMTN, Zero Coupon,
6/13/2011, 144A, (IDR) | | | 31,172,394 | |
| | 66,710,000 | | | Citigroup, Inc.,
5.000%, 9/15/2014 | | | 69,658,782 | |
| | 1,445,000 | | | Citigroup, Inc.,
5.850%, 12/11/2034 | | | 1,416,925 | |
| | 33,485,000 | | | Citigroup, Inc.,
5.875%, 2/22/2033 | | | 31,479,918 | |
| | 15,880,000 | | | Citigroup, Inc.,
6.000%, 10/31/2033 | | | 15,163,637 | |
| | 43,650,000 | | | Citigroup, Inc.,
6.125%, 5/15/2018 | | | 47,609,535 | |
| | 8,805,000 | | | Citigroup, Inc.,
6.125%, 8/25/2036 | | | 8,396,404 | |
| | 72,120,000 | | | Citigroup, Inc.,
6.375%, 8/12/2014 | | | 79,724,189 | |
| | 4,900,000 | | | Citigroup, Inc., EMTN, (fixed rate to 11/30/2012, variable rate thereafter),
3.625%, 11/30/2017, (EUR) | | | 6,526,530 | |
| | 87,000,000 | | | Citigroup, Inc., MTN,
5.500%, 10/15/2014 | | | 93,838,200 | |
| | 14,370,000 | | | First Niagara Finance Group, Inc.,
6.750%, 3/19/2020 | | | 15,675,198 | |
| | 900,000 | | | Goldman Sachs Group, Inc. (The),
6.450%, 5/01/2036 | | | 880,176 | |
| | 54,175,000 | | | Goldman Sachs Group, Inc. (The),
6.750%, 10/01/2037 | | | 54,642,476 | |
| | 4,065,000 | | | Goldman Sachs Group, Inc. (The), GMTN,
5.375%, 3/15/2020 | | | 4,127,337 | |
| | 4,680,000 | | | HBOS PLC,
6.000%, 11/01/2033, 144A | | | 3,521,677 | |
| | 12,345,000 | | | ICICI Bank Ltd., (fixed rate to 4/30/2017, variable rate thereafter),
6.375%, 4/30/2022, 144A | | | 12,283,275 | |
| | 599,419,948,660 | | | JPMorgan Chase & Co.,
Zero Coupon,
4/12/2012, 144A, (IDR) | | | 64,681,594 | |
| | 327,370,000,000 | | | JPMorgan Chase & Co., EMTN,
7.070%, 3/22/2014, (IDR) | | | 37,325,631 | |
| | 80,020,000 | | | Lloyds TSB Bank PLC, MTN,
6.500%, 9/14/2020, 144A | | | 78,668,142 | |
| | 4,825,000 | | | Merrill Lynch & Co., Inc.,
5.700%, 5/02/2017 | | | 4,968,206 | |
| | 6,110,000 | | | Merrill Lynch & Co., Inc.,
6.110%, 1/29/2037 | | | 5,794,828 | |
See accompanying notes to financial statements.
19 |
Portfolio of Investments – as of March 31, 2011 (Unaudited)
Loomis Sayles Bond Fund – continued
| | | | | | | | |
Principal
Amount (‡) | | | Description | | Value (†) | |
| | | | | | | | |
|
| | Bonds and Notes – continued | |
| | |
| | | | Banking – continued | | | | |
| | 100,400,000 | | | Merrill Lynch & Co., Inc.,
10.710%, 3/08/2017, (BRL) | | $ | 62,110,066 | |
| | 4,887,000 | | | Merrill Lynch & Co., Inc., EMTN,
4.625%, 9/14/2018, (EUR) | | | 6,376,100 | |
| | 8,660,000 | | | Merrill Lynch & Co., Inc., MTN,
6.875%, 4/25/2018 | | | 9,618,593 | |
| | 3,600,000 | �� | | Merrill Lynch & Co., Inc.,
Series C, MTN,
6.050%, 6/01/2034 | | | 3,309,804 | |
| | 1,970,000 | | | Merrill Lynch & Co., Inc.,
Series C, MTN,
6.400%, 8/28/2017 | | | 2,147,454 | |
| | 12,895,000 | | | Morgan Stanley,
4.750%, 4/01/2014 | | | 13,436,796 | |
| | 19,500,000 | | | Morgan Stanley,
5.500%, 7/24/2020 | | | 19,486,292 | |
| | 4,100,000 | | | Morgan Stanley,
5.750%, 1/25/2021 | | | 4,138,114 | |
| | 117,500,000 | | | Morgan Stanley, GMTN,
7.625%, 3/03/2016, (AUD) | | | 122,433,150 | |
| | 9,600,000 | | | Morgan Stanley,
Series F, GMTN,
5.625%, 9/23/2019 | | | 9,804,816 | |
| | 11,700,000 | | | Morgan Stanley,
Series F, GMTN,
6.625%, 4/01/2018 | | | 12,859,657 | |
| | 7,795,000 | | | Morgan Stanley,
Series F, MTN,
5.950%, 12/28/2017 | | | 8,372,906 | |
| | 7,500,000 | | | Morgan Stanley,
Series G & H, GMTN,
5.125%, 11/30/2015, (GBP) | | | 12,378,205 | |
| | | | | | | | |
| | | | | | | 1,246,938,950 | |
| | | | | | | | |
| | | | Brokerage – 0.0% | |
| | 1,295,000 | | | Jefferies Group, Inc.,
6.250%, 1/15/2036 | | | 1,196,995 | |
| | 4,860,000 | | | Jefferies Group, Inc.,
8.500%, 7/15/2019 | | | 5,733,337 | |
| | | | | | | | |
| | | | | | | 6,930,332 | |
| | | | | | | | |
| | | | Building Materials – 0.8% | |
| | 4,805,000 | | | Masco Corp.,
4.800%, 6/15/2015 | | | 4,774,753 | |
| | 3,285,000 | | | Masco Corp.,
5.850%, 3/15/2017 | | | 3,220,903 | |
| | 19,873,000 | | | Masco Corp.,
6.125%, 10/03/2016 | | | 20,383,100 | |
| | 2,900,000 | | | Masco Corp.,
6.500%, 8/15/2032 | | | 2,616,629 | |
| | 26,195,000 | | | Owens Corning, Inc.,
6.500%, 12/01/2016 | | | 28,521,142 | |
| | 51,180,000 | | | Owens Corning, Inc.,
7.000%, 12/01/2036 | | | 51,355,701 | |
| | 35,870,000 | | | USG Corp.,
6.300%, 11/15/2016 | | | 33,717,800 | |
| | 17,605,000 | | | USG Corp.,
9.750%, 1/15/2018 | | | 18,441,238 | |
| | | | | | | | |
| | | | | | | 163,031,266 | |
| | | | | | | | |
| | | | | | | | |
Principal
Amount (‡) | | | Description | | Value (†) | |
| | | | | | | | |
| | |
| | | | Chemicals – 0.7% | | | | |
| $ | 51,205,000 | | | Chevron Phillips Chemical Co. LLC,
8.250%, 6/15/2019, 144A | | $ | 61,134,213 | |
| | 19,619,000 | | | Hercules, Inc.,
6.500%, 6/30/2029 | | | 16,504,483 | |
| | 2,550,000 | | | Hexion US Finance Corp./Hexion Nova Scotia Finance ULC,
8.875%, 2/01/2018 | | | 2,696,625 | |
| | 10,565,000 | | | Methanex Corp., Senior Note,
6.000%, 8/15/2015 | | | 10,587,715 | |
| | 31,054,000 | | | Momentive Specialty Chemicals, Inc.,
7.875%, 2/15/2023 | | | 25,464,280 | |
| | 2,886,000 | | | Momentive Specialty Chemicals, Inc.,
8.375%, 4/15/2016 | | | 2,683,980 | |
| | 11,305,000 | | | Momentive Specialty Chemicals, Inc.,
9.200%, 3/15/2021 | | | 10,513,650 | |
| | 1,025,000 | | | Mosaic Global Holdings, Inc.,
7.375%, 8/01/2018 | | | 1,165,634 | |
| | | | | | | | |
| | | | | | | 130,750,580 | |
| | | | | | | | |
| | | | Collateralized Mortgage Obligations – 0.2% | |
| | 2,193,623 | | | Banc of America Alternative Loan Trust,
Series 2007-1, Class 2A1,
5.763%, 4/25/2037(b) | | | 1,736,979 | |
| | 10,029,033 | | | WaMu Mortgage Pass Through Certificates,
Series 2007-OA6, Class 2A,
2.734%, 7/25/2047(b) | | | 6,303,257 | |
| | 30,121,098 | | | Wells Fargo Mortgage Backed Securities Trust,
Series 2005-AR4, Class 2A2,
2.753%, 4/25/2035(b) | | | 29,034,720 | |
| | | | | | | | |
| | | | | | | 37,074,956 | |
| | | | | | | | |
| | | | Commercial Mortgage-Backed Securities – 0.0% | |
| | 4,964,749 | | | GSR Mortgage Loan Trust,
Series 2005-AR2, Class 2A1,
2.745%, 4/25/2035(b) | | | 4,477,349 | |
| | | | | | | | |
| | | | Construction Machinery – 0.5% | |
| | 60,172,000 | | | Case New Holland, Inc.,
7.750%, 9/01/2013 | | | 65,512,265 | |
| | 1,975,000 | | | Joy Global, Inc.,
6.625%, 11/15/2036 | | | 2,000,474 | |
| | 1,902,000 | | | RSC Equipment Rental, Inc./RSC Holdings III LLC,
9.500%, 12/01/2014 | | | 1,992,345 | |
| | 27,030,000 | | | Toro Co.,
6.625%, 5/01/2037(c) | | | 24,280,373 | |
| | | | | | | | |
| | | | | | | 93,785,457 | |
| | | | | | | | |
| | | | Consumer Cyclical Services – 0.6% | |
| | 1,000,000 | | | ServiceMaster Co. (The),
7.100%, 3/01/2018 | | | 940,000 | |
| | 6,175,000 | | | ServiceMaster Co. (The),
7.450%, 8/15/2027 | | | 4,986,313 | |
| | 106,395,000 | | | Western Union Co. (The),
6.200%, 11/17/2036 | | | 104,115,913 | |
See accompanying notes to financial statements.
| 20
Portfolio of Investments – as of March 31, 2011 (Unaudited)
Loomis Sayles Bond Fund – continued
| | | | | | | | |
Principal
Amount (‡) | | | Description | | Value (†) | |
| | | | | | | | |
|
| | Bonds and Notes – continued | |
| |
| | | | Consumer Cyclical Services – continued | |
| $ | 1,575,000 | | | Western Union Co. (The),
6.200%, 6/21/2040 | | $ | 1,545,651 | |
| | | | | | | | |
| | | | | | | 111,587,877 | |
| | | | | | | | |
| | | | Consumer Products – 0.1% | |
| | 695,000 | | | Acco Brands Corp.,
7.625%, 8/15/2015 | | | 708,900 | |
| | 7,210,000 | | | Snap-on, Inc.,
6.700%, 3/01/2019 | | | 8,149,326 | |
| | | | | | | | |
| | | | | | | 8,858,226 | |
| | | | | | | | |
| | | | Distributors – 0.0% | |
| | 1,775,000 | | | EQT Corp.,
8.125%, 6/01/2019 | | | 2,115,825 | |
| | 3,805,000 | | | ONEOK, Inc.,
6.000%, 6/15/2035 | | | 3,701,504 | |
| | | | | | | | |
| | | | | | | 5,817,329 | |
| | | | | | | | |
| | | | Diversified Manufacturing – 0.4% | |
| | 8,473,000 | | | Fibria Overseas Finance Ltd.,
7.500%, 5/04/2020, 144A | | | 9,193,205 | |
| | 1,435,000 | | | Textron Financial Corp.,
5.400%, 4/28/2013 | | | 1,508,961 | |
| | 550,000 | | | Textron Financial Corp.,
Series E, MTN,
5.125%, 8/15/2014 | | | 564,623 | |
| | 19,900,000 | | | Textron, Inc.,
3.875%, 3/11/2013, (EUR) | | | 28,046,677 | |
| | 7,145,000 | | | Textron, Inc.,
5.600%, 12/01/2017 | | | 7,465,782 | |
| | 23,658,000 | | | Textron, Inc., EMTN,
6.625%, 4/07/2020, (GBP) | | | 37,525,106 | |
| | | | | | | | |
| | | | | | | 84,304,354 | |
| | | | | | | | |
| | | | Electric – 2.8% | |
| | 4,875,000 | | | AES Corp. (The),
7.750%, 3/01/2014 | | | 5,265,000 | |
| | 12,356,963 | | | AES Ironwood LLC,
8.857%, 11/30/2025 | | | 12,264,286 | |
| | 1,432,373 | | | AES Red Oak LLC, Series A,
8.540%, 11/30/2019 | | | 1,453,859 | |
| | 75,513,000 | | | Alta Wind Holdings LLC,
7.000%, 6/30/2035, 144A | | | 79,531,047 | |
| | 3,105,000 | | | Ameren Illinois Co.,
6.250%, 4/01/2018 | | | 3,397,758 | |
| | 94,196,017 | | | Bruce Mansfield Unit,
6.850%, 6/01/2034(c) | | | 98,844,638 | |
| | 4,541,440 | | | CE Generation LLC,
7.416%, 12/15/2018 | | | 4,660,571 | |
| | 62,180,000 | | | Cleveland Electric Illuminating Co. (The),
5.950%, 12/15/2036 | | | 58,163,421 | |
| | 134,000 | | | Commonwealth Edison Co.,
4.750%, 12/01/2011(c) | | | 133,855 | |
| | 5,295,000 | | | Dynegy Holdings, Inc.,
7.125%, 5/15/2018 | | | 3,891,825 | |
| | 11,835,000 | | | Dynegy Holdings, Inc.,
7.625%, 10/15/2026 | | | 8,225,325 | |
| | 3,504,000 | | | Dynegy Holdings, Inc.,
7.750%, 6/01/2019 | | | 2,719,980 | |
| | | | | | | | |
Principal
Amount (‡) | | | Description | | Value (†) | |
| | | | | | | | |
| |
| | | | Electric – continued | |
| $ | 23,200,000 | | | Edison Mission Energy,
7.625%, 5/15/2027 | | $ | 17,284,000 | |
| | 19,000,000 | | | EDP Finance BV,
4.900%, 10/01/2019, 144A | | | 16,584,454 | |
| | 11,581,000 | | | Endesa SA/Cayman Islands,
7.875%, 2/01/2027 | | | 12,933,035 | |
| | 7,425,000 | | | Energy Future Holdings Corp.,
10.000%, 1/15/2020 | | | 7,868,087 | |
| | 4,250,000 | | | Enersis SA, Cayman Islands,
7.400%, 12/01/2016 | | | 4,904,645 | |
| | 25,460,000 | | | ITC Holdings Corp.,
5.875%, 9/30/2016, 144A | | | 28,079,019 | |
| | 37,955,000 | | | ITC Holdings Corp.,
6.375%, 9/30/2036, 144A | | | 39,709,242 | |
| | 23,775,000 | | | NGC Corp. Capital Trust I,
Series B,
8.316%, 6/01/2027(c) | | | 12,125,250 | |
| | 581,702 | | | Power Receivables Finance LLC,
6.290%, 1/01/2012, 144A | | | 582,051 | |
| | 4,764,375 | | | Quezon Power Philippines LC,
8.860%, 6/15/2017 | | | 5,193,169 | |
| | 557,391 | | | Salton Sea Funding Corp.,
Series E,
8.300%, 5/30/2011 | | | 559,698 | |
| | 206,251 | | | Salton Sea Funding Corp.,
Series F,
7.475%, 11/30/2018 | | | 218,077 | |
| | 70,980,000 | | | TXU Corp., Series P,
5.550%, 11/15/2014 | | | 46,491,900 | |
| | 140,586,000 | | | TXU Corp., Series Q,
6.500%, 11/15/2024 | | | 65,723,955 | |
| | 9,406,000 | | | TXU Corp., Series R,
6.550%, 11/15/2034 | | | 4,326,760 | |
| | 9,175,000 | | | White Pine Hydro LLC,
6.310%, 7/10/2017(c) | | | 9,523,925 | |
| | 14,695,000 | | | White Pine Hydro LLC,
6.960%, 7/10/2037(c) | | | 13,916,165 | |
| | 5,000,000 | | | White Pine Hydro Portfolio LLC,
7.260%, 7/20/2015(c) | | | 4,740,750 | |
| | | | | | | | |
| | | | | | | 569,315,747 | |
| | | | | | | | |
| | | | Entertainment – 0.0% | |
| | 10,000 | | | Time Warner, Inc.,
7.625%, 4/15/2031 | | | 11,536 | |
| | | | | | | | |
| | | | Financial Other – 0.2% | |
| | 38,476,000 | | | National Life Insurance Co.,
10.500%, 9/15/2039, 144A | | | 48,330,281 | |
| | | | | | | | |
| | | | Food & Beverage – 0.2% | |
| | 31,590,000 | | | Corn Products International, Inc.,
6.625%, 4/15/2037 | | | 33,019,100 | |
| | 6,400,000 | | | Viterra, Inc.,
6.406%, 2/16/2021, 144A, (CAD) | | | 6,840,441 | |
| | | | | | | | |
| | | | | | | 39,859,541 | |
| | | | | | | | |
See accompanying notes to financial statements.
21 |
Portfolio of Investments – as of March 31, 2011 (Unaudited)
Loomis Sayles Bond Fund – continued
| | | | | | | | |
Principal
Amount (‡) | | | Description | | Value (†) | |
| | | | | | | | |
|
| | Bonds and Notes – continued | |
| |
| | | | Government Owned – No Guarantee – 0.6% | |
| $ | 34,515,000 | | | DP World Ltd.,
6.850%, 7/02/2037, 144A | | $ | 31,753,800 | |
| | 152,980,000,000 | | | Export-Import Bank of Korea,
6.600%, 11/04/2013, 144A, (IDR) | | | 16,974,938 | |
| | 691,350,000,000 | | | Export-Import Bank of Korea,
8.300%, 3/15/2014, 144A, (IDR) | | | 80,230,741 | |
| | | | | | | | |
| | | | | | | 128,959,479 | |
| | | | | | | | |
| | | | Health Insurance – 0.1% | |
| | 10,565,000 | | | CIGNA Corp.,
6.150%, 11/15/2036 | | | 10,775,349 | |
| | | | | | | | |
| | | | Healthcare – 2.2% | | | | |
| | 7,100,000 | | | Boston Scientific Corp.,
5.125%, 1/12/2017 | | | 7,262,214 | |
| | 3,725,000 | | | Boston Scientific Corp.,
5.450%, 6/15/2014 | | | 3,975,525 | |
| | 15,410,000 | | | Boston Scientific Corp.,
6.000%, 1/15/2020 | | | 16,146,860 | |
| | 7,230,000 | | | Boston Scientific Corp.,
6.400%, 6/15/2016 | | | 7,883,187 | |
| | 22,142,000 | | | Boston Scientific Corp.,
7.000%, 11/15/2035 | | | 22,611,964 | |
| | 13,400,000 | | | HCA, Inc.,
5.750%, 3/15/2014 | | | 13,651,250 | |
| | 7,800,000 | | | HCA, Inc.,
6.250%, 2/15/2013 | | | 8,092,500 | |
| | 17,380,000 | | | HCA, Inc.,
6.375%, 1/15/2015 | | | 17,727,600 | |
| | 63,735,000 | | | HCA, Inc.,
6.500%, 2/15/2016 | | | 64,850,362 | |
| | 3,045,000 | | | HCA, Inc.,
6.750%, 7/15/2013 | | | 3,201,056 | |
| | 27,204,000 | | | HCA, Inc.,
7.050%, 12/01/2027 | | | 24,211,560 | |
| | 20,287,000 | | | HCA, Inc.,
7.190%, 11/15/2015 | | | 20,388,435 | |
| | 27,148,000 | | | HCA, Inc.,
7.500%, 12/15/2023 | | | 25,654,860 | |
| | 26,465,000 | | | HCA, Inc.,
7.500%, 11/06/2033 | | | 24,281,638 | |
| | 70,501,000 | | | HCA, Inc.,
7.690%, 6/15/2025 | | | 67,152,202 | |
| | 44,984,000 | | | HCA, Inc.,
8.360%, 4/15/2024 | | | 44,984,000 | |
| | 21,924,000 | | | HCA, Inc., MTN,
7.580%, 9/15/2025 | | | 20,663,370 | |
| | 12,446,000 | | | HCA, Inc., MTN,
7.750%, 7/15/2036 | | | 11,637,010 | |
| | 4,710,000 | | | Owens & Minor, Inc.,
6.350%, 4/15/2016(c) | | | 4,832,432 | |
| | 34,198,000 | | | Tenet Healthcare Corp.,
6.875%, 11/15/2031 | | | 28,341,593 | |
| | 560,000 | | | Tenet Healthcare Corp.,
9.250%, 2/01/2015 | | | 616,700 | |
| | | | | | | | |
| | | | | | | 438,166,318 | |
| | | | | | | | |
| | | | | | | | |
Principal
Amount (‡) | | | Description | | Value (†) | |
| | | | | | | | |
| | |
| | | | Home Construction – 0.5% | | | | |
| $ | 6,430,000 | | | K. Hovnanian Enterprises, Inc.,
6.250%, 1/15/2015 | | $ | 5,336,900 | |
| | 19,270,000 | | | K. Hovnanian Enterprises, Inc.,
6.250%, 1/15/2016 | | | 14,356,150 | |
| | 6,249,000 | | | K. Hovnanian Enterprises, Inc.,
6.375%, 12/15/2014 | | | 5,670,968 | |
| | 4,050,000 | | | K. Hovnanian Enterprises, Inc.,
6.500%, 1/15/2014 | | | 3,675,375 | |
| | 1,650,000 | | | K. Hovnanian Enterprises, Inc.,
7.500%, 5/15/2016 | | | 1,254,000 | |
| | 895,000 | | | KB Home,
5.875%, 1/15/2015 | | | 883,813 | |
| | 6,007,000 | | | Pulte Group, Inc.,
5.200%, 2/15/2015 | | | 5,961,947 | |
| | 65,355,000 | | | Pulte Group, Inc.,
6.000%, 2/15/2035 | | | 51,140,287 | |
| | 17,240,000 | | | Pulte Group, Inc.,
6.375%, 5/15/2033 | | | 14,007,500 | |
| | 3,930,000 | | | Toll Brothers Finance Corp.,
5.150%, 5/15/2015 | | | 4,011,406 | |
| | | | | | | | |
| | | | | | | 106,298,346 | |
| | | | | | | | |
| | | | Independent Energy – 0.8% | |
| | 9,585,000 | | | Anadarko Petroleum Corp.,
6.375%, 9/15/2017 | | | 10,550,161 | |
| | 80,585,000 | | | Anadarko Petroleum Corp.,
6.450%, 9/15/2036 | | | 80,480,965 | |
| | 5,925,000 | | | Chesapeake Energy Corp.,
6.250%, 1/15/2017, (EUR) | | | 8,722,287 | |
| | 2,615,000 | | | Chesapeake Energy Corp.,
6.500%, 8/15/2017 | | | 2,827,469 | |
| | 13,805,000 | | | Chesapeake Energy Corp.,
6.875%, 11/15/2020 | | | 14,909,400 | |
| | 20,226,000 | | | Connacher Oil and Gas Ltd.,
10.250%, 12/15/2015, 144A | | | 21,439,560 | |
| | 3,640,000 | | | Connacher Oil and Gas Ltd.,
11.750%, 7/15/2014, 144A | | | 3,913,000 | |
| | 8,782,000 | | | Pioneer Natural Resources Co.,
7.200%, 1/15/2028 | | | 9,157,755 | |
| | 9,825,000 | | | QEP Resources, Inc.,
6.875%, 3/01/2021 | | | 10,316,250 | |
| | | | | | | | |
| | | | | | | 162,316,847 | |
| | | | | | | | |
| | | | Industrial Other – 0.2% | | | | |
| | 26,410,000 | | | Ranhill Labuan Ltd.,
12.500%, 10/26/2011, 144A | | | 23,240,800 | |
| | 10,540,000 | | | Worthington Industries, Inc.,
6.500%, 4/15/2020 | | | 11,274,164 | |
| | | | | | | | |
| | | | | | | 34,514,964 | |
| | | | | | | | |
| | | | Integrated Energy – 0.0% | | | | |
| | 1,028,864 | | | PF Export Receivables Master Trust, Series A,
6.436%, 6/01/2015, 144A | | | 1,095,740 | |
| | | | | | | | |
See accompanying notes to financial statements.
| 22
Portfolio of Investments – as of March 31, 2011 (Unaudited)
Loomis Sayles Bond Fund – continued
| | | | | | | | |
Principal
Amount (‡) | | | Description | | Value (†) | |
| | | | | | | | |
|
| | Bonds and Notes – continued | |
| | |
| | | | Life Insurance – 0.9% | | | | |
| | 2,800,000 | | | American International Group, Inc., EMTN,
5.000%, 4/26/2023, (GBP) | | $ | 3,859,678 | |
| | 3,245,000 | | | American International Group, Inc., Series G, MTN,
5.600%, 10/18/2016 | | | 3,366,480 | |
| | 29,065,000 | | | American International Group, Inc., Series G, MTN,
5.850%, 1/16/2018 | | | 30,275,150 | |
| | 7,075,000 | | | American International Group, Inc.,
Series MP, GMTN,
5.450%, 5/18/2017 | | | 7,262,763 | |
| | 4,145,000 | | | American International Group, Inc., Series MPLE,
4.900%, 6/02/2014, (CAD) | | | 4,318,154 | |
| | 6,655,000 | | | ASIF III Jersey Ltd.,
Series 2003-G, EMTN,
4.750%, 9/11/2013, (EUR) | | | 9,626,448 | |
| | 22,550,000 | | | MetLife, Inc.,
6.400%, 12/15/2066 | | | 21,717,905 | |
| | 12,020,000 | | | MetLife, Inc.,
10.750%, 8/01/2069 | | | 16,587,600 | |
| | 57,985,000 | | | Mutual of Omaha Insurance Co.,
6.800%, 6/15/2036, 144A | | | 58,678,211 | |
| | 12,950,000 | | | NLV Financial Corp.,
7.500%, 8/15/2033, 144A | | | 12,450,285 | |
| | 5,670,000 | | | Penn Mutual Life Insurance Co. (The),
6.650%, 6/15/2034, 144A | | | 5,494,525 | |
| | 9,965,000 | | | Unum Group,
7.125%, 9/30/2016 | | | 11,233,883 | |
| | | | | | | | |
| | | | | | | 184,871,082 | |
| | | | | | | | |
| | | | Local Authorities – 1.8% | | | | |
| | 110,620,000 | | | New South Wales Treasury Corp.,
6.000%, 5/01/2012, (AUD) | | | 115,674,951 | |
| | 15,305,000 | | | New South Wales Treasury Corp., Series 12RG,
6.000%, 5/01/2012, (AUD) | | | 16,002,043 | |
| | 95,840,000 | | | New South Wales Treasury Corp., Series 17RG,
5.500%, 3/01/2017, (AUD) | | | 98,632,154 | |
| | 1,507,000 | | | Ontario Hydro, Zero Coupon, 11/27/2020, (CAD) | | | 1,028,553 | |
| | 13,340,077 | | | Province of Alberta,
5.930%, 9/16/2016, (CAD) | | | 15,279,376 | |
| | 730,000 | | | Province of British Columbia,
5.750%, 1/09/2012, (CAD) | | | 778,423 | |
| | 760,000 | | | Province of Ontario,
4.400%, 12/02/2011, (CAD) | | | 799,956 | |
| | 92,365,000 | | | Queensland Treasury Corp.,
7.125%, 9/18/2017, 144A, (NZD) | | | 76,369,263 | |
| | 60,000 | | | Queensland Treasury Corp.,
Series 11G,
6.000%, 6/14/2011, (AUD) | | | 62,194 | |
| | | | | | | | |
Principal
Amount (‡) | | | Description | | Value (†) | |
| | | | | | | | |
| |
| | | | Local Authorities – continued | |
| | 38,965,000 | | | Queensland Treasury Corp.,
Series 14,
5.750%, 11/21/2014, (AUD) | | $ | 40,595,637 | |
| | | | | | | | |
| | | | | | | 365,222,550 | |
| | | | | | | | |
| | | | Lodging – 0.0% | | | | |
| | 8,450,000 | | | Wyndham Worldwide Corp.,
5.750%, 2/01/2018 | | | 8,755,484 | |
| | | | | | | | |
| | | | Media Cable – 1.3% | | | | |
| | 174,935,000 | | | Comcast Corp.,
6.950%, 8/15/2037 | | | 190,448,936 | |
| | 1,550,000 | | | CSC Holdings LLC,
7.875%, 2/15/2018 | | | 1,720,500 | |
| | 37,585,000 | | | Shaw Communications, Inc.,
5.650%, 10/01/2019, (CAD) | | | 39,693,171 | |
| | 26,541,000 | | | Time Warner Cable, Inc.,
6.750%, 7/01/2018 | | | 30,151,133 | |
| | | | | | | | |
| | | | | | | 262,013,740 | |
| | | | | | | | |
| | | | Media Non-Cable – 0.3% | | | | |
| | 5,765,000 | | | Clear Channel Communications, Inc.,
5.000%, 3/15/2012 | | | 5,721,763 | |
| | 44,385,000 | | | News America, Inc.,
6.150%, 3/01/2037 | | | 43,979,942 | |
| | | | | | | | |
| | | | | | | 49,701,705 | |
| | | | | | | | |
| | | | Metals & Mining – 0.4% | | | | |
| | 11,557,000 | | | Alcoa, Inc.,
5.720%, 2/23/2019 | | | 12,018,332 | |
| | 4,935,000 | | | Alcoa, Inc.,
5.870%, 2/23/2022 | | | 5,050,218 | |
| | 2,050,000 | | | Alcoa, Inc.,
5.950%, 2/01/2037 | | | 1,933,974 | |
| | 6,490,000 | | | Alcoa, Inc.,
6.750%, 1/15/2028 | | | 6,788,994 | |
| | 15,150,000 | | | Algoma Acquisition Corp.,
9.875%, 6/15/2015, 144A | | | 13,938,000 | |
| | 11,175,000 | | | United States Steel Corp.,
6.050%, 6/01/2017 | | | 11,524,219 | |
| | 9,625,000 | | | United States Steel Corp.,
6.650%, 6/01/2037 | | | 8,855,000 | |
| | 23,520,000 | | | United States Steel Corp.,
7.000%, 2/01/2018 | | | 24,431,400 | |
| | | | | | | | |
| | | | | | | 84,540,137 | |
| | | | | | | | |
| | | | Mortgage Related – 0.0% | | | | |
| | 223,613 | | | FHLMC,
5.000%, 12/01/2031 | | | 235,650 | |
| | | | | | | | |
| | | | Non-Captive Consumer – 4.9% | |
| | 86,353,000 | | | Residential Capital LLC,
9.625%, 5/15/2015 | | | 87,108,589 | |
| | 1,305,000 | | | SLM Corp.,
6.000%, 5/10/2012, (AUD) | | | 1,313,665 | |
| | 150,125(††) | | | SLM Corp.,
6.000%, 12/15/2043 | | | 3,155,252 | |
| | 27,880,000 | | | SLM Corp., MTN,
5.050%, 11/14/2014 | | | 28,142,853 | |
| | 4,875,000 | | | SLM Corp., MTN,
5.125%, 8/27/2012 | | | 5,031,175 | |
See accompanying notes to financial statements.
23 |
Portfolio of Investments – as of March 31, 2011 (Unaudited)
Loomis Sayles Bond Fund – continued
| | | | | | | | |
Principal
Amount (‡) | | | Description | | Value (†) | |
| | | | | | | | |
|
| | Bonds and Notes – continued | |
| |
| | | | Non-Captive Consumer – continued | |
| $ | 2,030,000 | | | SLM Corp., MTN,
8.000%, 3/25/2020 | | $ | 2,212,700 | |
| | 76,745,000 | | | SLM Corp., Series A, MTN,
5.000%, 10/01/2013 | | | 79,437,982 | |
| | 57,166,000 | | | SLM Corp., Series A, MTN,
5.000%, 4/15/2015 | | | 57,556,444 | |
| | 23,623,000 | | | SLM Corp., Series A, MTN,
5.000%, 6/15/2018 | | | 22,199,100 | |
| | 28,262,000 | | | SLM Corp., Series A, MTN,
5.375%, 1/15/2013 | | | 29,396,776 | |
| | 34,835,000 | | | SLM Corp., Series A, MTN,
5.375%, 5/15/2014 | | | 36,123,477 | |
| | 45,279,000 | | | SLM Corp., Series A, MTN,
5.625%, 8/01/2033 | | | 38,711,190 | |
| | 140,870,000 | | | SLM Corp., Series A, MTN,
8.450%, 6/15/2018 | | | 157,774,400 | |
| | 37,484,000 | | | Springleaf Finance Corp.,
3.250%, 1/16/2013, (EUR) | | | 49,536,176 | |
| | 4,690,000 | | | Springleaf Finance Corp., MTN,
5.750%, 9/15/2016 | | | 4,221,000 | |
| | 10,870,000 | | | Springleaf Finance Corp.,
Series H, MTN,
5.375%, 10/01/2012 | | | 10,693,362 | |
| | 17,024,000 | | | Springleaf Finance Corp.,
Series I, MTN,
4.875%, 7/15/2012 | | | 16,726,080 | |
| | 27,427,000 | | | Springleaf Finance Corp.,
Series I, MTN,
5.850%, 6/01/2013 | | | 26,809,892 | |
| | 800,000 | | | Springleaf Finance Corp.,
Series J, MTN,
5.200%, 12/15/2011 | | | 798,000 | |
| | 400,000 | | | Springleaf Finance Corp.,
Series J, MTN,
5.625%, 8/17/2011 | | | 400,500 | |
| | 4,800,000 | | | Springleaf Finance Corp.,
Series J, MTN,
5.900%, 9/15/2012 | | | 4,752,000 | |
| | 935,000 | | | Springleaf Finance Corp.,
Series J, MTN,
6.500%, 9/15/2017 | | | 832,150 | |
| | 340,340,000 | | | Springleaf Finance Corp.,
Series J, MTN,
6.900%, 12/15/2017 | | | 310,985,675 | |
| | | | | | | | |
| | | | | | | 973,918,438 | |
| | | | | | | | |
| | | | Non-Captive Diversified – 7.6% | |
| | 30,190,000 | | | Ally Financial, Inc.,
6.750%, 12/01/2014 | | | 31,812,713 | |
| | 23,588,000 | | | Ally Financial, Inc.,
7.500%, 12/31/2013 | | | 25,386,585 | |
| | 50,810,000 | | | Ally Financial, Inc.,
7.500%, 9/15/2020, 144A | | | 54,176,162 | |
| | 44,981,000 | | | Ally Financial, Inc.,
8.000%, 12/31/2018 | | | 48,298,349 | |
| | 35,442,000 | | | Ally Financial, Inc.,
8.000%, 11/01/2031 | | | 38,631,780 | |
| | 72,545,000 | | | Ally Financial, Inc.,
8.300%, 2/12/2015 | | | 79,527,456 | |
| | | | | | | | |
Principal
Amount (‡) | | | Description | | Value (†) | |
| | | | | | | | |
| |
| | | | Non-Captive Diversified – continued | |
| $ | 71,260,000 | | | Aviation Capital Group Corp.,
6.750%, 4/06/2021, 144A | | $ | 71,438,150 | |
| | 13,608,616 | | | CIT Group, Inc.,
7.000%, 5/01/2013 | | | 13,863,778 | |
| | 38,902,776 | | | CIT Group, Inc.,
7.000%, 5/01/2014 | | | 39,632,203 | |
| | 38,902,776 | | | CIT Group, Inc.,
7.000%, 5/01/2015 | | | 39,243,175 | |
| | 89,288,640 | | | CIT Group, Inc.,
7.000%, 5/01/2016 | | | 89,400,251 | |
| | 102,048,173 | | | CIT Group, Inc.,
7.000%, 5/01/2017 | | | 102,175,733 | |
| | 44,525,000 | | | General Electric Capital Australia Funding Pty Ltd., EMTN,
8.000%, 2/13/2012, (AUD) | | | 46,983,661 | |
| | 89,985,000 | | | General Electric Capital Corp., Series A, EMTN,
6.750%, 9/26/2016, (NZD) | | | 71,358,003 | |
| | 15,000,000 | | | General Electric Capital Corp., Series A, GMTN,
2.960%, 5/18/2012, (SGD) | | | 12,090,012 | |
| | 150,000,000 | | | General Electric Capital Corp., Series A, GMTN,
3.485%, 3/08/2012, (SGD) | | | 120,922,967 | |
| | 84,065,000 | | | General Electric Capital Corp., Series A, GMTN,
7.625%, 12/10/2014, (NZD) | | | 69,268,368 | |
| | 22,590,000 | | | General Electric Capital Corp., Series A, MTN,
0.603%, 5/13/2024(b) | | | 19,776,935 | |
| | 266,643,000 | | | General Electric Capital Corp., Series A, MTN,
6.500%, 9/28/2015, (NZD) | | | 211,762,128 | |
| | 7,270,000 | | | General Motors Acceptance Corp. of Canada Ltd., EMTN,
7.125%, 9/13/2011, (AUD) | | | 7,454,572 | |
| | 360,000 | | | International Lease Finance Corp.,
5.875%, 5/01/2013 | | | 369,000 | |
| | 15,925,000 | | | International Lease Finance Corp.,
6.375%, 3/25/2013 | | | 16,482,375 | |
| | 28,765,000 | | | International Lease Finance Corp.,
8.250%, 12/15/2020 | | | 31,533,631 | |
| | 35,950,000 | | | International Lease Finance Corp.,
8.875%, 9/15/2015, 144A | | | 39,545,000 | |
| | 415,000 | | | International Lease Finance Corp., Series Q, MTN,
5.250%, 1/10/2013 | | | 420,188 | |
| | 3,680,000 | | | International Lease Finance Corp., Series R, MTN,
5.625%, 9/20/2013 | | | 3,739,800 | |
| | 3,545,000 | | | International Lease Finance Corp., Series R, MTN,
5.650%, 6/01/2014 | | | 3,562,725 | |
| | 52,875,000 | | | iStar Financial, Inc.,
5.150%, 3/01/2012 | | | 52,478,437 | |
See accompanying notes to financial statements.
| 24
Portfolio of Investments – as of March 31, 2011 (Unaudited)
Loomis Sayles Bond Fund – continued
| | | | | | | | |
Principal
Amount (‡) | | | Description | | Value (†) | |
| | | | | | | | |
|
| | Bonds and Notes – continued | |
| |
| | | | Non-Captive Diversified – continued | |
| $ | 3,865,000 | | | iStar Financial, Inc.,
5.500%, 6/15/2012 | | $ | 3,826,350 | |
| | 25,633,000 | | | iStar Financial, Inc.,
5.650%, 9/15/2011 | | | 25,697,083 | |
| | 16,230,000 | | | iStar Financial, Inc.,
5.850%, 3/15/2017 | | | 14,160,675 | |
| | 29,057,000 | | | iStar Financial, Inc.,
5.875%, 3/15/2016 | | | 25,860,730 | |
| | 5,655,000 | | | iStar Financial, Inc.,
6.050%, 4/15/2015 | | | 5,174,325 | |
| | 46,795,000 | | | iStar Financial, Inc.,
8.625%, 6/01/2013 | | | 47,496,925 | |
| | 9,690,000 | | | iStar Financial, Inc., Series B,
5.700%, 3/01/2014 | | | 9,060,150 | |
| | 60,205,000 | | | iStar Financial, Inc., Series B,
5.950%, 10/15/2013 | | | 57,044,237 | |
| | | | | | | | |
| | | | | | | 1,529,654,612 | |
| | | | | | | | |
| | | | Oil Field Services – 1.4% | | | | |
| | 10,680,000 | | | Allis-Chalmers Energy, Inc.,
8.500%, 3/01/2017 | | | 11,454,300 | |
| | 15,693,000 | | | Nabors Industries, Inc.,
6.150%, 2/15/2018 | | | 17,181,450 | |
| | 134,360,000 | | | Nabors Industries, Inc.,
9.250%, 1/15/2019 | | | 169,367,632 | |
| | 4,497,000 | | | Parker Drilling Co.,
9.125%, 4/01/2018 | | | 4,834,275 | |
| | 23,050,000 | | | Rowan Cos., Inc.,
7.875%, 8/01/2019 | | | 27,341,357 | |
| | 25,600,000 | | | Weatherford International Ltd.,
6.500%, 8/01/2036 | | | 25,596,954 | |
| | 4,250,000 | | | Weatherford International Ltd.,
6.800%, 6/15/2037 | | | 4,419,838 | |
| | 13,670,000 | | | Weatherford International Ltd.,
7.000%, 3/15/2038 | | | 14,478,950 | |
| | | | | | | | |
| | | | | | | 274,674,756 | |
| | | | | | | | |
| | | | Packaging – 0.2% | |
| | 3,450,000 | | | OI European Group BV,
6.875%, 3/31/2017, 144A, (EUR) | | | 4,999,348 | |
| | 2,500,000 | | | Owens-Brockway Glass Container, Inc.,
6.750%, 12/01/2014, (EUR) | | | 3,596,144 | |
| | 18,644,000 | | | Owens-Illinois, Inc.,
7.800%, 5/15/2018 | | | 20,345,265 | |
| | | | | | | | |
| | | | | | | 28,940,757 | |
| | | | | | | | |
| | | | Paper – 1.5% | |
| | 26,262,000 | | | Georgia-Pacific LLC,
7.250%, 6/01/2028 | | | 27,443,790 | |
| | 31,317,000 | | | Georgia-Pacific LLC,
7.375%, 12/01/2025 | | | 33,039,435 | |
| | 470,000 | | | Georgia-Pacific LLC,
7.700%, 6/15/2015 | | | 532,275 | |
| | 80,840,000 | | | Georgia-Pacific LLC,
7.750%, 11/15/2029 | | | 88,822,950 | |
| | | | | | | | |
Principal
Amount (‡) | | | Description | | Value (†) | |
| | | | | | | | |
| |
| | | | Paper – continued | |
| $ | 21,749,000 | | | Georgia-Pacific LLC,
8.000%, 1/15/2024 | | $ | 24,848,232 | |
| | 16,307,000 | | | Georgia-Pacific LLC,
8.875%, 5/15/2031 | | | 19,690,703 | |
| | 4,447,000 | | | International Paper Co.,
6.875%, 11/01/2023 | | | 4,758,779 | |
| | 10,392,000 | | | International Paper Co.,
8.700%, 6/15/2038 | | | 13,322,014 | |
| | 24,586,000 | | | Westvaco Corp.,
7.950%, 2/15/2031 | | | 25,722,045 | |
| | 36,799,000 | | | Westvaco Corp.,
8.200%, 1/15/2030 | | | 39,272,850 | |
| | 4,127,000 | | | Weyerhaeuser Co.,
6.950%, 10/01/2027 | | | 4,107,038 | |
| | 12,470,000 | | | Weyerhaeuser Co.,
7.375%, 3/15/2032 | | | 13,149,453 | |
| | | | | | | | |
| | | | | | | 294,709,564 | |
| | | | | | | | |
| | | | Pharmaceuticals – 0.1% | |
| | 22,630,000 | | | Elan Finance PLC/Elan Finance Corp.,
8.875%, 12/01/2013 | | | 23,393,763 | |
| | | | | | | | |
| | | | Pipelines – 2.3% | |
| | 27,325,000 | | | DCP Midstream LP,
6.450%, 11/03/2036, 144A | | | 27,777,775 | |
| | 12,209,000 | | | El Paso Corp.,
6.950%, 6/01/2028 | | | 12,369,011 | |
| | 2,045,000 | | | El Paso Corp.,
7.420%, 2/15/2037 | | | 2,092,816 | |
| | 1,500,000 | | | El Paso Corp., GMTN,
7.750%, 1/15/2032 | | | 1,680,873 | |
| | 1,000,000 | | | El Paso Corp., GMTN,
7.800%, 8/01/2031 | | | 1,109,361 | |
| | 7,325,000 | | | Energy Transfer Partners LP,
6.125%, 2/15/2017 | | | 8,177,864 | |
| | 11,435,000 | | | Energy Transfer Partners LP,
6.625%, 10/15/2036 | | | 11,948,237 | |
| | 25,030,000 | | | Enterprise Products
Operating LLP,
6.300%, 9/15/2017 | | | 28,220,149 | |
| | 7,500,000 | | | Florida Gas Transmission Co.,
7.900%, 5/15/2019, 144A | | | 9,046,335 | |
| | 56,672,004 | | | Maritimes & Northeast Pipeline LLC,
7.500%, 5/31/2014, 144A(c) | | | 61,298,706 | |
| | 116,405,000 | | | NGPL PipeCo LLC,
7.119%, 12/15/2017, 144A | | | 130,063,148 | |
| | 57,010,000 | | | NiSource Finance Corp.,
6.400%, 3/15/2018 | | | 63,780,850 | |
| | 1,235,000 | | | NiSource Finance Corp.,
6.800%, 1/15/2019 | | | 1,412,871 | |
| | 28,845,000 | | | Plains All American Pipeline LP,
6.125%, 1/15/2017 | | | 31,945,088 | |
| | 62,130,000 | | | Plains All American Pipeline LP,
6.650%, 1/15/2037 | | | 65,697,194 | |
| | 5,572,000 | | | Transportadora de Gas del Sur SA,
7.875%, 5/14/2017, 144A | | | 5,502,350 | |
| | | | | | | | |
| | | | | | | 462,122,628 | |
| | | | | | | | |
See accompanying notes to financial statements.
25 |
Portfolio of Investments – as of March 31, 2011 (Unaudited)
Loomis Sayles Bond Fund – continued
| | | | | | | | |
Principal
Amount (‡) | | | Description | | Value (†) | |
| | | | | | | | |
|
| | Bonds and Notes – continued | |
| |
| | | | Property & Casualty Insurance – 0.5% | |
| $ | 4,090,000 | | | Hanover Insurance Group, Inc. (The),
7.500%, 3/01/2020 | | $ | 4,347,551 | |
| | 16,825,000 | | | Liberty Mutual Group, Inc.,
6.500%, 3/15/2035, 144A | | | 15,816,627 | |
| | 51,522,000 | | | Marsh & McLennan
Cos., Inc.,
5.875%, 8/01/2033 | | | 48,500,441 | |
| | 8,600,000 | | | MBIA Insurance Corp., (fixed rate to 1/15/2013, variable rate thereafter),
14.000%, 1/15/2033, 144A | | | 4,730,000 | |
| | 12,080,000 | | | White Mountains Re Group Ltd.,
6.375%, 3/20/2017, 144A | | | 12,361,911 | |
| | 6,575,000 | | | XL Group PLC,
6.250%, 5/15/2027 | | | 6,528,344 | |
| | 2,110,000 | | | XL Group PLC,
6.375%, 11/15/2024 | | | 2,194,691 | |
| | | | | | | | |
| | | | | | | 94,479,565 | |
| | | | | | | | |
| | | | Property Trust – 0.4% | |
| | 68,360,000 | | | WEA Finance LLC/WT Finance Australia Property Ltd.,
6.750%, 9/02/2019, 144A | | | 78,437,494 | |
| | | | | | | | |
| | | | Railroads – 0.0% | |
| | 7,944,000 | | | Missouri Pacific Railroad Co.,
5.000%, 1/01/2045(c) | | | 5,421,780 | |
| | 63,300 | | | Missouri Pacific Railroad Co., Series A,
4.750%, 1/01/2020(c) | | | 58,869 | |
| | | | | | | | |
| | | | | | | 5,480,649 | |
| | | | | | | | |
| | | | Real Estate Operations/Development – 0.0% | |
| | 7,750,000 | | | First Industrial LP,
5.950%, 5/15/2017 | | | 7,305,832 | |
| | | | | | | | |
| | | | Refining – 0.0% | |
| | 1,782,000 | | | Valero Energy Corp.,
6.625%, 6/15/2037 | | | 1,796,174 | |
| | | | | | | | |
| | | | REITs – Apartments – 0.3% | |
| | 2,565,000 | | | Camden Property Trust,
5.000%, 6/15/2015 | | | 2,743,078 | |
| | 40,075,000 | | | Camden Property Trust,
5.700%, 5/15/2017 | | | 43,868,219 | |
| | 4,680,000 | | | ERP Operating LP,
5.125%, 3/15/2016 | | | 5,025,655 | |
| | 3,000,000 | | | ERP Operating LP,
5.375%, 8/01/2016 | | | 3,262,401 | |
| | | | | | | | |
| | | | | | | 54,899,353 | |
| | | | | | | | |
| | | | REITs – Diversified – 0.0% | |
| | 5,720,000 | | | Duke Realty LP,
5.950%, 2/15/2017 | | | 6,170,261 | |
| | | | | | | | |
| | | | REITs – Office Property – 0.3% | |
| | 57,890,000 | | | Highwoods Properties, Inc.,
5.850%, 3/15/2017 | | | 61,610,417 | |
| | | | | | | | |
Principal
Amount (‡) | | | Description | | Value (†) | |
| | | | | | | | |
| |
| | | | REITs – Office Property – continued | |
| $ | 5,640,000 | | | Highwoods Properties, Inc.,
7.500%, 4/15/2018 | | $ | 6,446,751 | |
| | | | | | | | |
| | | | | | | 68,057,168 | |
| | | | | | | | |
| | | | REITs – Regional Malls – 0.1% | |
| | 9,032,000 | | | Simon Property Group LP,
5.750%, 12/01/2015 | | | 10,045,228 | |
| | 1,690,000 | | | Simon Property Group LP,
6.125%, 5/30/2018 | | | 1,894,006 | |
| | | | | | | | |
| | | | | | | 11,939,234 | |
| | | | | | | | |
| | | | REITs – Warehouse/Industrials – 0.1% | |
| | 6,022,000 | | | ProLogis,
5.625%, 11/15/2015 | | | 6,390,926 | |
| | 6,110,000 | | | ProLogis,
5.625%, 11/15/2016 | | | 6,400,231 | |
| | 6,375,000 | | | ProLogis,
5.750%, 4/01/2016 | | | 6,847,388 | |
| | 2,332,000 | | | ProLogis,
6.625%, 5/15/2018 | | | 2,525,952 | |
| | 1,595,000 | | | ProLogis,
6.875%, 3/15/2020 | | | 1,745,295 | |
| | 3,020,000 | | | ProLogis,
7.375%, 10/30/2019 | | | 3,420,292 | |
| | | | | | | | |
| | | | | | | 27,330,084 | |
| | | | | | | | |
| | | | Retailers – 1.0% | |
| | 1,920,000 | | | Dillard’s, Inc.,
6.625%, 1/15/2018 | | | 1,891,200 | |
| | 4,680,000 | | | Dillard’s, Inc.,
7.000%, 12/01/2028 | | | 4,165,200 | |
| | 1,740,000 | | | Dillard’s, Inc.,
7.130%, 8/01/2018 | | | 1,753,050 | |
| | 7,182,000 | | | Dillard’s, Inc.,
7.750%, 7/15/2026 | | | 6,894,720 | |
| | 1,000,000 | | | Dillard’s, Inc.,
7.750%, 5/15/2027 | | | 945,000 | |
| | 14,269,000 | | | Foot Locker, Inc.,
8.500%, 1/15/2022 | | | 14,411,690 | |
| | 5,160,000 | | | J.C. Penney Corp., Inc.,
5.750%, 2/15/2018 | | | 5,198,700 | |
| | 50,232,000 | | | J.C. Penney Corp., Inc.,
6.375%, 10/15/2036 | | | 45,271,590 | |
| | 2,798,000 | | | J.C. Penney Corp., Inc.,
7.125%, 11/15/2023 | | | 2,895,930 | |
| | 5,580,000 | | | J.C. Penney Corp., Inc.,
7.625%, 3/01/2097 | | | 4,994,100 | |
| | 28,445,000 | | | Macy’s Retail Holdings, Inc.,
6.375%, 3/15/2037 | | | 28,445,000 | |
| | 14,133,000 | | | Macy’s Retail Holdings, Inc.,
6.790%, 7/15/2027 | | | 13,673,678 | |
| | 2,098,000 | | | Macy’s Retail Holdings, Inc.,
6.900%, 4/01/2029 | | | 2,124,225 | |
| | 1,485,000 | | | Macy’s Retail Holdings, Inc.,
8.375%, 7/15/2015 | | | 1,726,313 | |
| | 9,245,000 | | | Marks & Spencer PLC,
7.125%, 12/01/2037, 144A | | | 8,828,004 | |
| | 39,965,000 | | | Toys R Us, Inc.,
7.375%, 10/15/2018 | | | 40,064,912 | |
| | 11,255,000 | | | Toys R Us, Inc.,
7.875%, 4/15/2013 | | | 12,099,125 | |
| | | | | | | | |
| | | | | | | 195,382,437 | |
| | | | | | | | |
See accompanying notes to financial statements.
| 26
Portfolio of Investments – as of March 31, 2011 (Unaudited)
Loomis Sayles Bond Fund – continued
| | | | | | | | |
Principal
Amount (‡) | | | Description | | Value (†) | |
| | | | | | | | |
|
| | Bonds and Notes – continued | |
| | |
| | | | Sovereigns – 3.8% | | | | |
| | 10,000,000,000 | | | Indonesia Government International Bond,
9.500%, 7/15/2023, (IDR) | | $ | 1,225,862 | |
| | 25,000,000,000 | | | Indonesia Treasury Bond,
10.250%, 7/15/2027, (IDR) | | | 3,128,961 | |
| | 145,156,000,000 | | | Indonesia Treasury Bond,
Series FR43,
10.250%, 7/15/2022, (IDR) | | | 18,924,425 | |
| | 498,832,000,000 | | | Indonesia Treasury Bond,
Series FR44,
10.000%, 9/15/2024, (IDR) | | | 62,849,108 | |
| | 317,658,000,000 | | | Indonesia Treasury Bond,
Series FR52,
10.500%, 8/15/2030, (IDR) | | | 40,316,719 | |
| | 378,003,000,000 | | | Indonesia Treasury Bond,
Series ZC3, Zero Coupon,
11/20/2012, (IDR) | | | 39,316,045 | |
| | 5,258,000(†††) | | | Mexican Fixed Rate Bonds,
Series M-10,
7.250%, 12/15/2016, (MXN) | | | 44,696,393 | |
| | 28,585,700(†††) | | | Mexican Fixed Rate Bonds,
Series M-20,
8.000%, 12/07/2023, (MXN) | | | 243,957,006 | |
| | 4,557,000(†††) | | | Mexican Fixed Rate Bonds,
Series MI-10,
9.000%, 12/20/2012, (MXN) | | | 40,507,263 | |
| | 98,690,000 | | | Republic of Brazil,
10.250%, 1/10/2028, (BRL) | | | 60,145,500 | |
| | 17,305,000 | | | Republic of Brazil,
12.500%, 1/05/2016, (BRL) | | | 12,030,242 | |
| | 114,735,000 | | | Republic of Brazil,
12.500%, 1/05/2022, (BRL) | | | 81,519,370 | |
| | 26,800,000 | | | Republic of Croatia,
6.750%, 11/05/2019, 144A | | | 28,073,000 | |
| | 1,910,000,000 | | | Republic of Iceland, Zero Coupon, 7/15/2011, (ISK) | | | 9,792,362 | |
| | 5,263,700,000 | | | Republic of Iceland,
4.250%, 8/24/2012, (ISK) | | | 27,610,697 | |
| | 4,616,100,000 | | | Republic of Iceland,
7.250%, 5/17/2013, (ISK) | | | 25,902,779 | |
| | 5,473,160,000 | | | Republic of Iceland,
8.000%, 7/22/2011, (ISK) | | | 28,698,358 | |
| | | | | | | | |
| | | | | | | 768,694,090 | |
| | | | | | | | |
| | | | Supermarkets – 0.7% | | | | |
| | 3,000,000 | | | American Stores Co.,
7.900%, 5/01/2017 | | | 2,887,500 | |
| | 13,145,000 | | | American Stores Co.,
Series B, MTN,
7.100%, 3/20/2028 | | | 9,924,475 | |
| | 100,590,000 | | | New Albertson’s, Inc.,
7.450%, 8/01/2029 | | | 79,466,100 | |
| | 20,550,000 | | | New Albertson’s, Inc.,
7.750%, 6/15/2026 | | | 17,107,875 | |
| | 9,715,000 | | | New Albertson’s, Inc.,
8.000%, 5/01/2031 | | | 7,966,300 | |
| | 2,995,000 | | | New Albertson’s, Inc.,
8.700%, 5/01/2030 | | | 2,568,213 | |
| | | | | | | | |
Principal
Amount (‡) | | | Description | | Value (†) | |
| | | | | | | | |
| |
| | | | Supermarkets – continued | |
| $ | 17,575,000 | | | New Albertson’s, Inc.,
Series C, MTN,
6.625%, 6/01/2028 | | $ | 12,741,875 | |
| | | | | | | | |
| | | | | | | 132,662,338 | |
| | | | | | | | |
| | | | Supranational – 2.0% | | | | |
| | 11,505,000 | | | European Investment Bank,
11.250%, 2/14/2013, (BRL) | | | 7,240,191 | |
| | 837,962,640,000 | | | European Investment Bank, EMTN, Zero Coupon,
4/24/2013, 144A, (IDR) | | | 84,003,168 | |
| | 16,500,000 | | | European Investment Bank, EMTN,
7.000%, 1/18/2012, (NZD) | | | 12,965,813 | |
| | 71,230,000 | | | European Investment Bank, MTN,
6.250%, 4/15/2015, (AUD) | | | 74,889,450 | |
| | 345,270,000,000 | | | Inter-American Development Bank, EMTN, Zero Coupon,
5/20/2013, (IDR) | | | 33,779,559 | |
| | 185,840,000 | | | Inter-American Development Bank, EMTN,
6.000%, 12/15/2017, (NZD) | | | 148,320,942 | |
| | 40,000,000 | | | International Bank for Reconstruction & Development,
1.430%, 3/05/2014, (SGD) | | | 31,863,514 | |
| | | | | | | | |
| | | | | | | 393,062,637 | |
| | | | | | | | |
| | | | Technology – 2.0% | | | | |
| | 1,940,000 | | | Advanced Micro Devices, Inc.,
7.750%, 8/01/2020 | | | 1,993,350 | |
| | 65,276,000 | | | Agilent Technologies, Inc.,
6.500%, 11/01/2017 | | | 72,822,036 | |
| | 1,000,000 | | | Alcatel-Lucent, EMTN,
6.375%, 4/07/2014, (EUR) | | | 1,466,801 | |
| | 71,937,000 | | | Alcatel-Lucent USA, Inc.,
6.450%, 3/15/2029 | | | 61,865,820 | |
| | 3,916,000 | | | Alcatel-Lucent USA, Inc.,
6.500%, 1/15/2028 | | | 3,367,760 | |
| | 2,630,000 | | | Arrow Electronics, Inc.,
6.875%, 6/01/2018 | | | 2,867,187 | |
| | 12,555,000 | | | Avnet, Inc.,
5.875%, 3/15/2014 | | | 13,497,115 | |
| | 50,915,000 | | | Avnet, Inc.,
6.000%, 9/01/2015 | | | 54,690,856 | |
| | 15,245,000 | | | Avnet, Inc.,
6.625%, 9/15/2016 | | | 16,685,576 | |
| | 10,821,000 | | | Corning, Inc.,
6.850%, 3/01/2029 | | | 12,179,176 | |
| | 5,645,000 | | | Corning, Inc.,
7.250%, 8/15/2036 | | | 6,444,744 | |
| | 3,640,000 | | | Eastman Kodak Co.,
7.250%, 11/15/2013 | | | 3,621,800 | |
| | 15,578,000 | | | Equifax, Inc.,
7.000%, 7/01/2037 | | | 16,606,693 | |
| | 430,000 | | | Freescale Semiconductor, Inc.,
8.875%, 12/15/2014 | | | 445,588 | |
| | 6,016,000 | | | Freescale Semiconductor, Inc.,
10.125%, 12/15/2016 | | | 6,392,000 | |
See accompanying notes to financial statements.
27 |
Portfolio of Investments – as of March 31, 2011 (Unaudited)
Loomis Sayles Bond Fund – continued
| | | | | | | | |
Principal
Amount (‡) | | | Description | | Value (†) | |
| | | | | | | | |
|
| | Bonds and Notes – continued | |
| | |
| | | | Technology – continued | | | | |
| $ | 929,000 | | | Motorola Solutions, Inc.,
6.000%, 11/15/2017 | | $ | 1,016,703 | |
| | 15,055,000 | | | Motorola Solutions, Inc.,
6.500%, 9/01/2025 | | | 15,841,564 | |
| | 32,320,000 | | | Motorola Solutions, Inc.,
6.500%, 11/15/2028 | | | 33,214,521 | |
| | 33,295,000 | | | Motorola Solutions, Inc.,
6.625%, 11/15/2037 | | | 35,725,602 | |
| | 12,015,000 | | | Nortel Networks
Capital Corp.,
7.875%, 6/15/2026(d) | | | 8,831,025 | |
| | 18,622,000 | | | Nortel Networks Ltd.,
6.875%, 9/01/2023(d) | | | 4,841,720 | |
| | 4,301,000 | | | Samsung Electronics Co. Ltd.,
7.700%, 10/01/2027, 144A | | | 5,050,836 | |
| | 28,030,000 | | | Xerox Capital Trust I,
8.000%, 2/01/2027 | | | 28,520,525 | |
| | 40,000 | | | Xerox Corp.,
6.350%, 5/15/2018 | | | 45,227 | |
| | 615,000 | | | Xerox Corp., MTN,
7.200%, 4/01/2016 | | | 706,471 | |
| | | | | | | | |
| | | | | | | 408,740,696 | |
| | | | | | | | |
| | | | Tobacco – 0.5% | | | | |
| | 71,085,000 | | | Reynolds American, Inc.,
6.750%, 6/15/2017 | | | 81,289,394 | |
| | 17,990,000 | | | Reynolds American, Inc.,
7.250%, 6/15/2037 | | | 19,039,950 | |
| | | | | | | | |
| | | | | | | 100,329,344 | |
| | | | | | | | |
| | | | Transportation Services – 0.5% | |
| | 20,469,000 | | | APL Ltd.,
8.000%, 1/15/2024(c) | | | 14,021,265 | |
| | 29,151,288 | | | Atlas Air Pass Through Trust,
Series 1998-1, Class B,
7.680%, 7/02/2015 | | | 28,859,775 | |
| | 6,552,024 | | | Atlas Air Pass Through Trust,
Series 1998-1, Class C,
8.010%, 7/02/2011(e) | | | 5,503,701 | |
| | 10,413,583 | | | Atlas Air Pass Through Trust,
Series 1999-1, Class A-1,
7.200%, 7/02/2020 | | | 10,205,311 | |
| | 520,914 | | | Atlas Air Pass Through Trust,
Series 1999-1, Class A-2,
6.880%, 7/02/2011 | | | 510,495 | |
| | 13,376,540 | | | Atlas Air Pass Through Trust,
Series 1999-1, Class B,
7.630%, 7/02/2016 | | | 11,905,121 | |
| | 15,689,997 | | | Atlas Air Pass Through Trust,
Series 1999-1, Class C,
8.770%, 7/02/2012(e) | | | 12,551,998 | |
| | 7,695,836 | | | Atlas Air Pass Through Trust,
Series 2000-1, Class B,
10.128%, 7/02/2017(e) | | | 7,772,794 | |
| | 201,720 | | | Atlas Air Pass Through Trust,
Series 2000-1, Class C,
9.702%, 7/02/2011(e) | | | 173,479 | |
| | 2,675,000 | | | Erac USA Finance Co.,
7.000%, 10/15/2037, 144A | | | 2,914,487 | |
| | | | | | | | |
| | | | | | | 94,418,426 | |
| | | | | | | | |
| | | | | | | | |
Principal
Amount (‡) | | | Description | | Value (†) | |
| | | | | | | | |
| | |
| | | | Treasuries – 16.6% | | | | |
| | 587,055,000 | | | Canadian Government,
2.000%, 9/01/2012, (CAD) | | $ | 608,920,452 | |
| | 228,647,000 | | | Canadian Government,
3.500%, 6/01/2013, (CAD) | | | 243,839,821 | |
| | 94,395,000 | | | Canadian Government,
3.750%, 6/01/2012, (CAD) | | | 99,915,574 | |
| | 246,645,000 | | | Canadian Government,
3.750%, 6/01/2019, (CAD) | | | 263,855,453 | |
| | 297,760,000 | | | Canadian Government,
4.250%, 6/01/2018, (CAD) | | | 330,072,872 | |
| | 5,954,553 | | | Hellenic Republic Government Bond,
2.300%, 7/25/2030, (EUR) | | | 4,226,818 | |
| | 1,950,000 | | | Hellenic Republic Government Bond,
4.600%, 7/20/2018, (EUR) | | | 1,702,616 | |
| | 38,475,000 | | | Hellenic Republic Government Bond,
4.700%, 3/20/2024, (EUR) | | | 32,339,814 | |
| | 19,500,000 | | | Hellenic Republic Government International Bond,
2.125%, 7/05/2013, (CHF) | | | 16,688,263 | |
| | 161,775,000 | | | Ireland Government Bond,
4.500%, 10/18/2018, (EUR) | | | 161,885,736 | |
| | 54,925,000 | | | Ireland Government Bond,
4.500%, 4/18/2020, (EUR) | | | 52,736,382 | |
| | 9,025,000 | | | Ireland Government Bond,
5.000%, 10/18/2020, (EUR) | | | 8,817,709 | |
| | 114,275,000 | | | Ireland Government Bond,
5.400%, 3/13/2025, (EUR) | | | 107,854,150 | |
| | 33,000,000 | | | New Zealand Government Bond,
6.000%, 12/15/2017, (NZD) | | | 26,342,018 | |
| | 224,730,000 | | | New Zealand Government Bond,
6.500%, 4/15/2013, (NZD) | | | 181,649,103 | |
| | 668,075,000 | | | Norwegian Government,
4.250%, 5/19/2017, (NOK) | | | 125,676,381 | |
| | 319,620,000 | | | Norwegian Government,
5.000%, 5/15/2015, (NOK) | | | 61,495,460 | |
| | 530,990,000 | | | Norwegian Government,
6.000%, 5/16/2011, (NOK) | | | 96,414,015 | |
| | 2,021,445,000 | | | Norwegian Government,
6.500%, 5/15/2013, (NOK) | | | 392,623,999 | |
| | 35,750,000 | | | Portugal Obrigacoes do Tesouro OT,
3.850%, 4/15/2021, (EUR) | | | 35,556,612 | |
| | 9,000,000 | | | Portugal Obrigacoes do Tesouro OT,
4.800%, 6/15/2020, (EUR) | | | 9,897,338 | |
| | 490,910,000 | | | U.S. Treasury Bond,
4.250%, 11/15/2040 | | | 469,509,269 | |
| | | | | | | | |
| | | | | | | 3,332,019,855 | |
| | | | | | | | |
| | | | Utility Other – 0.0% | | | | |
| | 4,800,000 | | | Listrindo Capital BV,
9.250%, 1/29/2015, 144A | | | 5,310,288 | |
| | | | | | | | |
| | | | Wireless – 1.1% | | | | |
| | 57,512,000 | | | Nextel Communications,
Inc., Series C,
5.950%, 3/15/2014 | | | 57,655,780 | |
See accompanying notes to financial statements.
| 28
Portfolio of Investments – as of March 31, 2011 (Unaudited)
Loomis Sayles Bond Fund – continued
| | | | | | | | |
Principal
Amount (‡) | | | Description | | Value (†) | |
| | | | | | | | |
|
| | Bonds and Notes – continued | |
| | |
| | | | Wireless – continued | | | | |
| $ | 40,092,000 | | | Nextel Communications, Inc.,
Series D,
7.375%, 8/01/2015 | | $ | 40,242,345 | |
| | 4,680,000 | | | Nextel Communications, Inc.,
Series E,
6.875%, 10/31/2013 | | | 4,715,100 | |
| | 34,124,000 | | | Sprint Capital Corp.,
6.875%, 11/15/2028 | | | 31,479,390 | |
| | 38,286,000 | | | Sprint Capital Corp.,
6.900%, 5/01/2019 | | | 39,530,295 | |
| | 8,390,000 | | | Sprint Capital Corp.,
8.750%, 3/15/2032 | | | 8,924,863 | |
| | 15,252,000 | | | Sprint Nextel Corp.,
6.000%, 12/01/2016 | | | 15,309,195 | |
| | 16,745,000 | | | True Move Co. Ltd.,
10.750%, 12/16/2013, 144A | | | 18,126,462 | |
| | | | | | | | |
| | | | | | | 215,983,430 | |
| | | | | | | | |
| | | | Wirelines – 3.2% | | | | |
| | 20,118,000 | | | AT&T Corp.,
6.500%, 3/15/2029 | | | 21,286,132 | |
| | 8,395,000 | | | Axtel SAB de CV,
9.000%, 9/22/2019, 144A | | | 8,059,200 | |
| | 5,790,000 | | | Bell Canada, MTN,
6.550%, 5/01/2029, 144A, (CAD) | | | 6,326,478 | |
| | 12,705,000 | | | Bell Canada, MTN,
7.300%, 2/23/2032, (CAD) | | | 14,814,069 | |
| | 37,096,000 | | | Bell Canada, Series M-17,
6.100%, 3/16/2035, (CAD) | | | 37,981,024 | |
| | 3,940,000 | | | BellSouth Telecommunications, Inc.,
7.000%, 12/01/2095 | | | 4,014,974 | |
| | 1,000,000 | | | Cincinnati Bell Telephone Co. LLC,
6.300%, 12/01/2028 | | | 800,000 | |
| | 8,735,000 | | | Embarq Corp.,
7.995%, 6/01/2036 | | | 9,847,848 | |
| | 3,075,000 | | | Frontier Communications Corp.,
7.875%, 1/15/2027 | | | 2,936,625 | |
| | 730,000 | | | Frontier Communications Corp.,
9.000%, 8/15/2031 | | | 746,425 | |
| | 17,975,000 | | | GTE Corp.,
6.940%, 4/15/2028 | | | 19,928,793 | |
| | 1,600,000 | | | Koninklijke (Royal) KPN NV, EMTN,
5.750%, 3/18/2016, (GBP) | | | 2,747,595 | |
| | 2,750,000 | | | Koninklijke (Royal) KPN NV, GMTN,
4.000%, 6/22/2015, (EUR) | | | 3,960,941 | |
| | 68,090,000 | | | Level 3 Financing, Inc.,
8.750%, 2/15/2017 | | | 67,579,325 | |
| | 17,580,000 | | | Level 3 Financing, Inc.,
9.250%, 11/01/2014 | | | 17,975,550 | |
| | 3,545,000 | | | Level 3 Financing, Inc.,
9.375%, 4/01/2019, 144A | | | 3,429,788 | |
| | 10,210,000 | | | Portugal Telecom International Finance BV, EMTN,
4.500%, 6/16/2025, (EUR) | | | 11,071,564 | |
| | | | | | | | |
Principal
Amount (‡) | | | Description | | Value (†) | |
| | | | | | | | |
| | |
| | | | Wirelines – continued | | | | |
| | 20,159,000 | | | Portugal Telecom International Finance BV, EMTN,
5.000%, 11/04/2019, (EUR) | | $ | 24,533,049 | |
| | 30,365,000 | | | Qwest Capital Funding, Inc.,
6.500%, 11/15/2018 | | | 30,972,300 | |
| | 64,147,000 | | | Qwest Capital Funding, Inc.,
6.875%, 7/15/2028 | | | 63,665,897 | |
| | 15,925,000 | | | Qwest Capital Funding, Inc.,
7.625%, 8/03/2021 | | | 16,562,000 | |
| | 40,420,000 | | | Qwest Capital Funding, Inc.,
7.750%, 2/15/2031 | | | 43,047,300 | |
| | 38,025,000 | | | Qwest Corp.,
6.875%, 9/15/2033 | | | 38,072,531 | |
| | 1,505,000 | | | Qwest Corp.,
7.200%, 11/10/2026 | | | 1,512,525 | |
| | 10,620,000 | | | Qwest Corp.,
7.250%, 9/15/2025 | | | 11,310,300 | |
| | 2,890,000 | | | Qwest Corp.,
7.500%, 6/15/2023 | | | 2,897,225 | |
| | 39,844,000 | | | Telecom Italia Capital SA,
6.000%, 9/30/2034 | | | 36,053,082 | |
| | 26,495,000 | | | Telecom Italia Capital SA,
6.375%, 11/15/2033 | | | 25,003,782 | |
| | 45,415,000 | | | Telus Corp.,
4.950%, 3/15/2017, (CAD) | | | 48,518,866 | |
| | 27,020,000 | | | Telus Corp., Series CG,
5.050%, 12/04/2019, (CAD) | | | 27,988,484 | |
| | 18,105,000 | | | Verizon Maryland, Inc.,
Series B,
5.125%, 6/15/2033 | | | 16,342,243 | |
| | 2,905,000 | | | Verizon New England, Inc.,
7.875%, 11/15/2029 | | | 3,360,652 | |
| | 10,310,000 | | | Verizon New York, Inc.,
Series B, 7.375%, 4/01/2032 | | | 11,567,263 | |
| | 7,860,000 | | | Verizon Pennsylvania, Inc.,
6.000%, 12/01/2028 | | | 7,319,075 | |
| | | | | | | | |
| | | | | | | 642,232,905 | |
| | | | | | | | |
| |
| | | | Total Non-Convertible Bonds | |
| | | | (Identified Cost $13,984,043,370) | | | 15,398,101,621 | |
| | | | | | | | |
| |
| | Convertible Bonds – 8.6% | | | | |
| | | | Airlines – 0.1% | | | | |
| | 15,985,000 | | | AMR Corp., 6.250%, 10/15/2014 | | | 16,824,212 | |
| | 1,730,000 | | | UAL Corp.,
4.500%, 6/30/2021 | | | 1,753,874 | |
| | | | | | | | |
| | | | | | | 18,578,086 | |
| | | | | | | | |
| | | | Automotive – 1.7% | | | | |
| | 2,615,000 | | | ArvinMeritor, Inc., (Step to Zero Coupon on 2/15/2019),
4.000%, 2/15/2027(f) | | | 2,579,044 | |
| | 176,290,000 | | | Ford Motor Co.,
4.250%, 11/15/2016 | | | 319,525,625 | |
| | 12,335,000 | | | Navistar International Corp.,
3.000%, 10/15/2014 | | | 18,625,850 | |
| | | | | | | | |
| | | | | | | 340,730,519 | |
| | | | | | | | |
See accompanying notes to financial statements.
29 |
Portfolio of Investments – as of March 31, 2011 (Unaudited)
Loomis Sayles Bond Fund – continued
| | | | | | | | |
Principal
Amount (‡) | | | Description | | Value (†) | |
| | | | | | | | |
|
| | Bonds and Notes – continued | |
| |
| | | | Diversified Manufacturing – 0.3% | |
| $ | 44,380,000 | | | Owens-Brockway Glass Container, Inc.,
3.000%, 6/01/2015, 144A | | $ | 44,990,225 | |
| | 24,037,000 | | | Trinity Industries, Inc.,
3.875%, 6/01/2036 | | | 26,200,330 | |
| | | | | | | | |
| | | | | | | 71,190,555 | |
| | | | | | | | |
| | | | Electric – 0.0% | |
| | 1,000,000 | | | CMS Energy Corp.,
5.500%, 6/15/2029 | | | 1,453,750 | |
| | | | | | | | |
| | | | Healthcare – 0.5% | |
| | 32,436,000 | | | Hologic, Inc., (Step to Zero Coupon on 12/15/2013),
2.000%, 12/15/2037(f) | | | 31,300,740 | |
| | 14,480,000 | | | Life Technologies Corp.,
1.500%, 2/15/2024 | | | 16,796,800 | |
| | 285,000 | | | LifePoint Hospitals, Inc.,
3.250%, 8/15/2025 | | | 294,619 | |
| | 2,510,000 | | | LifePoint Hospitals, Inc.,
3.500%, 5/15/2014 | | | 2,673,150 | |
| | 3,107,000 | | | Omnicare, Inc.,
3.250%, 12/15/2035 | | | 2,881,743 | |
| | 29,850,000 | | | Omnicare, Inc.,
3.750%, 12/15/2025 | | | 38,469,187 | |
| | | | | | | | |
| | | | | | | 92,416,239 | |
| | | | | | | | |
| | | | Independent Energy – 0.1% | |
| | 10,809,000 | | | Chesapeake Energy Corp.,
2.250%, 12/15/2038 | | | 9,930,769 | |
| | 9,405,000 | | | Chesapeake Energy Corp.,
2.500%, 5/15/2037 | | | 10,216,181 | |
| | | | | | | | |
| | | | | | | 20,146,950 | |
| | | | | | | | |
| | | | Life Insurance – 0.4% | |
| | 72,915,000 | | | Old Republic International Corp.,
3.750%, 3/15/2018 | | | 73,188,431 | |
| | | | | | | | |
| | | | Lodging – 0.1% | |
| | 27,935,000 | | | Host Hotels & Resorts, Inc.,
2.625%, 4/15/2027, 144A | | | 27,969,919 | |
| | | | | | | | |
| | | | Media Non-Cable – 0.0% | |
| | 10,067,087 | | | Liberty Media LLC,
3.500%, 1/15/2031 | | | 5,637,569 | |
| | | | | | | | |
| | | | Metals & Mining – 0.1% | |
| | 1,255,000 | | | Steel Dynamics, Inc.,
5.125%, 6/15/2014 | | | 1,606,400 | |
| | 16,535,000 | | | United States Steel Corp.,
4.000%, 5/15/2014 | | | 30,155,706 | |
| | | | | | | | |
| | | | | | | 31,762,106 | |
| | | | | | | | |
| | | | Non-Captive Diversified – 0.3% | |
| | 60,585,000 | | | iStar Financial, Inc.,
0.803%, 10/01/2012(b) | | | 55,283,812 | |
| | | | | | | | |
| | | | Pharmaceuticals – 1.2% | | | | |
| | 940,000 | | | Human Genome Sciences, Inc.,
2.250%, 10/15/2011 | | | 1,666,150 | |
| | | | | | | | |
Principal
Amount (‡) | | | Description | | Value (†) | |
| | | | | | | | |
| |
| | | | Pharmaceuticals – continued | |
| $ | 51,585,000 | | | Human Genome Sciences, Inc.,
2.250%, 8/15/2012 | | $ | 83,567,700 | |
| | 4,120,000 | | | Kendle International, Inc.,
3.375%, 7/15/2012 | | | 3,903,700 | |
| | 26,120,000 | | | Nektar Therapeutics,
3.250%, 9/28/2012 | | | 26,315,900 | |
| | 34,079,000 | | | Valeant Pharmaceuticals International,
4.000%, 11/15/2013 | | | 134,612,050 | |
| | | | | | | | |
| | | | | | | 250,065,500 | |
| | | | | | | | |
| | | | REITs – Warehouse/Industrials – 0.2% | |
| | 28,230,000 | | | ProLogis,
3.250%, 3/15/2015 | | | 33,134,962 | |
| | | | | | | | |
| | | | Technology – 2.8% | | | | |
| | 330,000 | | | Ciena Corp.,
0.250%, 5/01/2013 | | | 336,600 | |
| | 45,854,000 | | | Ciena Corp.,
0.875%, 6/15/2017 | | | 44,764,967 | |
| | 8,030,000 | | | Ciena Corp.,
3.750%, 10/15/2018, 144A | | | 12,024,925 | |
| | 8,680,000 | | | Ciena Corp.,
4.000%, 3/15/2015, 144A | | | 12,716,200 | |
| | 11,651,000 | | | Intel Corp.,
2.950%, 12/15/2035 | | | 11,985,966 | |
| | 343,275,000 | | | Intel Corp.,
3.250%, 8/01/2039 | | | 403,777,219 | |
| | 10,025,000 | | | Kulicke & Soffa Industries, Inc.,
0.875%, 6/01/2012 | | | 10,012,469 | |
| | 21,955,000 | | | Micron Technology, Inc.,
1.875%, 6/01/2014 | | | 23,876,063 | |
| | 1,045,000 | | | Nortel Networks Corp.,
1.750%, 4/15/2012(d) | | | 900,006 | |
| | 49,636,000 | | | Nortel Networks Corp.,
2.125%, 4/15/2014(d) | | | 42,749,005 | |
| | | | | | | | |
| | | | | | | 563,143,420 | |
| | | | | | | | |
| | | | Textile – 0.0% | | | | |
| | 102,000 | | | Dixie Yarns, Inc.,
7.000%, 5/15/2012 | | | 98,940 | |
| | | | | | | | |
| | | | Wirelines – 0.8% | | | | |
| | 20,455,000 | | | Level 3 Communications, Inc.,
3.500%, 6/15/2012 | | | 20,173,744 | |
| | 64,473,000 | | | Level 3 Communications, Inc.,
7.000%, 3/15/2015, 144A(c) | | | 75,030,454 | |
| | 48,975,000 | | | Level 3 Communications, Inc., Series B,
7.000%, 3/15/2015(c) | | | 56,994,656 | |
| | | | | | | | |
| | | | | | | 152,198,854 | |
| | | | | | | | |
| | |
| | | | Total Convertible Bonds | | | | |
| | | | (Identified Cost $1,294,259,442) | | | 1,736,999,612 | |
| | | | | | | | |
See accompanying notes to financial statements.
| 30
Portfolio of Investments – as of March 31, 2011 (Unaudited)
Loomis Sayles Bond Fund – continued
| | | | | | | | |
Principal
Amount (‡) | | | Description | | Value (†) | |
| | | | | | | | |
|
| | Bonds and Notes – continued | |
| |
| | Municipals – 1.3% | | | | |
| |
| | | | California – 0.3% | |
| $ | 5,425,000 | | | San Jose California Redevelopment Agency Tax Allocation (Merged Area Redevelopment),
Series C, (MBIA insured),
3.750%, 8/01/2028 | | $ | 3,751,116 | |
| | 2,165,000 | | | San Jose California Redevelopment Agency Tax Allocation (Merged Area Redevelopment),
Series C, (Registered), (MBIA insured),
3.750%, 8/01/2028 | | | 1,611,864 | |
| | 20,455,000 | | | State of California,
4.500%, 10/01/2029 | | | 17,780,100 | |
| | 5,805,000 | | | State of California,
4.500%, 8/01/2030 | | | 4,997,467 | |
| | 7,340,000 | | | State of California, (AMBAC insured),
4.500%, 8/01/2027 | | | 6,610,551 | |
| | 5,945,000 | | | State of California, (AMBAC insured),
4.500%, 8/01/2030 | | | 5,117,991 | |
| | 17,945,000 | | | State of California (Various Purpose), (AMBAC insured),
4.500%, 12/01/2033 | | | 15,122,610 | |
| | 3,805,000 | | | State of California (Various Purpose), (MBIA insured),
3.250%, 12/01/2027 | | | 2,834,687 | |
| | | | | | | | |
| | | | | | | 57,826,386 | |
| | | | | | | | |
| | | | District of Columbia – 0.0% | |
| | 5,610,000 | | | Metropolitan Washington DC Airports Authority, Series D,
8.000%, 10/01/2047 | | | 5,457,015 | |
| | | | | | | | |
| | | | Illinois – 0.3% | |
| | 69,245,000 | | | State of Illinois,
5.100%, 6/01/2033 | | | 56,148,693 | |
| | 2,440,000 | | | Chicago O’Hare International Airport,
Series A, (AGMC insured),
4.500%, 1/01/2038 | | | 1,899,247 | |
| | | | | | | | |
| | | | | | | 58,047,940 | |
| | | | | | | | |
| | | | Michigan – 0.1% | |
| | 21,020,000 | | | Michigan Tobacco Settlement Finance Authority Taxable Turbo, Series A,
7.309%, 6/01/2034(c) | | | 14,909,696 | |
| | | | | | | | |
| | | | Ohio – 0.0% | |
| | 10,390,000 | | | Buckeye Tobacco Settlement Financing Authority,
Series A-2,
5.875%, 6/01/2047(c) | | | 6,891,999 | |
| | | | | | | | |
| | | | | | | | |
Principal
Amount (‡) | | | Description | | Value (†) | |
| | | | | | | | |
| |
| | | | Virginia – 0.6% | |
| $ | 178,970,000 | | | Virginia Tobacco Settlement Financing Corp., Series A-1,
6.706%, 6/01/2046(c) | | $ | 112,563,182 | |
| | | | | | | | |
| | |
| | | | Total Municipals | | | | |
| | | | (Identified Cost $331,072,706) | | | 255,696,218 | |
| | | | | | | | |
| | |
| | | | Total Bonds and Notes | | | | |
| | | | (Identified Cost $15,609,375,518) | | | 17,390,797,451 | |
| | | | | | | | |
| |
| | Bank Loans – 0.3% | | | | |
| |
| | | | Electric – 0.0% | |
| | 7,195,436 | | | Texas Competitive Electric Holdings Company, LLC, Term Loan B2,
3.783%, 10/10/2014(g) | | | 6,056,614 | |
| | | | | | | | |
| | | | Media Non-Cable – 0.1% | |
| | 4,319,791 | | | Dex Media West, LLC,
New Term Loan,
7.000%, 10/24/2014(g) | | | 3,823,922 | |
| | 37,309,205 | | | SuperMedia, Inc., Exit Term Loan,
11.000%, 12/31/2015(g) | | | 24,649,446 | |
| | | | | | | | |
| | | | | | | 28,473,368 | |
| | | | | | | | |
| | | | Wireless – 0.1% | | | | |
| | 12,129,970 | | | Hawaiian Telcom Communications, Inc., Exit Term Loan,
9.000%, 11/01/2015(g)(h) | | | 12,354,375 | |
| | | | | | | | |
| | | | Wirelines – 0.1% | | | | |
| | 11,414,523 | | | FairPoint Communications, Inc., New Term Loan B,
6.500%, 1/24/2016(g) | | | 11,001,888 | |
| | 3,415,000 | | | Level 3 Financing, Inc., Tranche A Term Loan,
2.553%, 3/13/2014(g) | | | 3,310,603 | |
| | | | | | | | |
| | | | | | | 14,312,491 | |
| | | | | | | | |
| | |
| | | | Total Bank Loans | | | | |
| | | | (Identified Cost $85,672,471) | | | 61,196,848 | |
| | | | | | | | |
| | |
| | Shares | | | | | | | |
|
| | Preferred Stocks – 2.7% | |
|
| | Convertible Preferred Stocks – 1.9% | |
| | |
| | | | Automotive – 0.9% | | | | |
| | 2,624,400 | | | General Motors Co., Series B,
4.750% | | | 126,496,080 | |
| | 949,385 | | | Goodyear Tire & Rubber Co.
(The), 5.875% | | | 48,494,586 | |
| | | | | | | | |
| | | | | | | 174,990,666 | |
| | | | | | | | |
See accompanying notes to financial statements.
31 |
Portfolio of Investments – as of March 31, 2011 (Unaudited)
Loomis Sayles Bond Fund – continued
| | | | | | | | |
Shares | | | Description | | Value (†) | |
| | | | | | | | |
|
| | Preferred Stocks – continued | |
| | |
| | | | Capital Markets – 0.1% | | | | |
| | 270,416 | | | Newell Financial Trust I, 5.250% | | $ | 12,946,166 | |
| | | | | | | | |
| | | | Commercial Banks – 0.1% | | | | |
| | 12,483 | | | Wells Fargo & Co.,
Series L, Class A, 7.500% | | | 12,922,402 | |
| | | | | | | | |
| | | | Diversified Financial Services – 0.2% | |
| | 25,823 | | | Bank of America Corp.,
Series L, 7.250% | | | 26,106,795 | |
| | 304,895 | | | Sovereign Capital Trust IV, 4.375% | | | 13,567,827 | |
| | | | | | | | |
| | | | | | | 39,674,622 | |
| | | | | | | | |
| | | | Electric Utilities – 0.1% | | | | |
| | 346,577 | | | AES Trust III, 6.750% | | | 16,912,958 | |
| | 208,375 | | | CMS Energy Trust I, 7.750%(c)(i) | | | 9,376,875 | |
| | | | | | | | |
| | | | | | | 26,289,833 | |
| | | | | | | | |
| | | | Machinery – 0.1% | | | | |
| | 263,437 | | | United Rentals Trust I, 6.500% | | | 12,381,539 | |
| | | | | | | | |
| | | | Oil, Gas & Consumable Fuels – 0.2% | |
| | 87,351 | | | Chesapeake Energy Corp., 4.500% | | | 8,473,047 | |
| | 269,293 | | | El Paso Energy Capital Trust I, 4.750% | | | 11,916,215 | |
| | 144,600 | | | SandRidge Energy, Inc., 8.500% | | | 26,146,572 | |
| | 25,000 | | | Williams Cos., Inc., 5.500% | | | 3,581,250 | |
| | | | | | | | |
| | | | | | | 50,117,084 | |
| | | | | | | | |
| | | | REITs – Healthcare – 0.0% | | | | |
| | 172,150 | | | Health Care REIT, Inc.,
Series I, 6.500% | | | 8,969,015 | |
| | | | | | | | |
| | | | Semiconductors & Semiconductor Equipment – 0.2% | |
| | 52,704 | | | Lucent Technologies Capital Trust I, 7.750% | | | 51,649,920 | |
| | | | | | | | |
| |
| | | | Total Convertible Preferred Stocks | |
| | | | (Identified Cost $349,582,523) | | | 389,941,247 | |
| | | | | | | | |
|
| | Non-Convertible Preferred Stocks – 0.8% | |
| | |
| | | | Banking – 0.2% | | | | |
| | 52,843 | | | Ally Financial, Inc., Series G,
7.000%, 144A | | | 49,170,412 | |
| | | | | | | | |
| | | | Diversified Financial Services – 0.2% | |
| | 53,000 | | | Bank of America Corp., 6.375% | | | 1,186,670 | |
| | 1,226,700 | | | Citigroup Capital XIII, (fixed rate to 10/30/2015, variable rate thereafter), 7.875% | | | 33,611,580 | |
| | | | | | | | |
| | | | | | | 34,798,250 | |
| | | | | | | | |
| | | | Electric Utilities – 0.0% | | | | |
| | 2,925 | | | Connecticut Light & Power Co., 1.900% | | | 102,923 | |
| | | | | | | | |
Shares | | | Description | | Value (†) | |
| | | | | | | | |
| | |
| | | | Electric Utilities – continued | | | | |
| | 100 | | | Entergy Arkansas, Inc., 4.320% | | $ | 7,844 | |
| | 5,000 | | | Entergy Mississippi, Inc., 4.360% | | | 375,781 | |
| | 665 | | | Entergy New Orleans, Inc., 4.360% | | | 52,639 | |
| | 200 | | | Entergy New Orleans, Inc., 4.750% | | | 16,225 | |
| | 645 | | | MDU Resources Group, Inc., 5.100% | | | 64,863 | |
| | 360 | | | Public Service Company of Oklahoma, 4.000% | | | 27,090 | |
| | 50,100 | | | Southern California Edison Co., 4.780% | | | 1,060,617 | |
| | | | | | | | |
| | | | | | | 1,707,982 | |
| | | | | | | | |
| | | | Household Durables – 0.0% | | | | |
| | 36,783 | | | Hovnanian Enterprises, Inc., 7.625%(e) | | | 248,285 | |
| | | | | | | | |
| | | | Multi Utilities – 0.0% | | | | |
| | 1,100 | | | Xcel Energy, Inc., 3.600% | | | 75,911 | |
| | | | | | | | |
| | | | REITs – Office Property – 0.0% | |
| | 2,318 | | | Highwoods Properties, Inc., Series A, 8.625% | | | 2,470,119 | |
| | | | | | | | |
| | | | REITs – Warehouse/Industrials – 0.1% | |
| | 169,007 | | | ProLogis, Series C, 8.540% | | | 9,126,378 | |
| | | | | | | | |
| | | | Software – 0.2% | | | | |
| | 38,000 | | | Falcons Funding Trust I, (Step to 10.875% on 3/15/2015, variable rate after 3/15/2020),
8.875%, 144A(f) | | | 41,051,875 | |
| | | | | | | | |
| | | | Thrifts & Mortgage Finance – 0.1% | |
| | 534,725 | | | Countrywide Capital IV, 6.750% | | | 13,245,138 | |
| | | | | | | | |
| | | | Total Non-Convertible Preferred Stocks | |
| | | | (Identified Cost $102,702,022) | | | 151,894,350 | |
| | | | | | | | |
| | |
| | | | Total Preferred Stocks | | | | |
| | | | (Identified Cost $452,284,545) | | | 541,835,597 | |
| | | | | | | | |
|
| | Common Stocks – 2.6% | |
| | |
| | | | Biotechnology – 0.3% | | | | |
| | 1,409,794 | | | Vertex Pharmaceuticals, Inc.(e) | | | 67,571,426 | |
| | | | | | | | |
| | | | Containers & Packaging – 0.1% | |
| | 645,508 | | | Owens-Illinois, Inc.(e) | | | 19,487,887 | |
| | 8,919 | | | Smurfit-Stone Container Corp.(e) | | | 344,719 | |
| | | | | | | | |
| | | | | | | 19,832,606 | |
| | | | | | | | |
| | | | Diversified Telecommunication Services – 0.1% | |
| | 269,619 | | | FairPoint Communications, Inc.(e) | | | 4,548,472 | |
| | 403,884 | | | Hawaiian Telcom Holdco, Inc.(e) | | | 10,601,955 | |
| | | | | | | | |
| | | | | | | 15,150,427 | |
| | | | | | | | |
See accompanying notes to financial statements.
| 32
Portfolio of Investments – as of March 31, 2011 (Unaudited)
Loomis Sayles Bond Fund – continued
| | | | | | | | |
Shares | | | Description | | Value (†) | |
| | | | | | | | |
|
| | Common Stocks – continued | |
| |
| | | | Electronic Equipment, Instruments & Components – 0.1% | |
| | 630,490 | | | Corning, Inc. | | $ | 13,007,009 | |
| | | | | | | | |
| | | | Media – 0.0% | | | | |
| | 4,746 | | | Dex One Corp.(e) | | | 22,971 | |
| | 79,727 | | | SuperMedia, Inc.(e) | | | 497,496 | |
| | | | | | | | |
| | | | | | | 520,467 | |
| | | | | | | | |
| | | | Oil, Gas & Consumable Fuels – 0.2% | |
| | 1,026,979 | | | Chesapeake Energy Corp. | | | 34,424,336 | |
| | 313,333 | | | Repsol YPF SA, Sponsored ADR | | | 10,794,322 | |
| | | | | | | | |
| | | | | | | 45,218,658 | |
| | | | | | | | |
| | | | Pharmaceuticals – 0.4% | | | | |
| | 1,528,400 | | | Bristol-Myers Squibb Co. | | | 40,395,612 | |
| | 690,207 | | | Valeant Pharmaceuticals International, Inc. | | | 34,379,211 | |
| | | | | | | | |
| | | | | | | 74,774,823 | |
| | | | | | | | |
| | | | Semiconductors & Semiconductor Equipment – 1.4% | |
| | 14,199,033 | | | Intel Corp. | | | 286,394,496 | |
| | | | | | | | |
| | |
| | | | Total Common Stocks | | | | |
| | | | (Identified Cost $417,869,200) | | | 522,469,912 | |
| | | | | | | | |
|
| | Closed End Investment Companies – 0.2% | |
| | 147,148 | | | Dreyfus High Yield Strategies Fund | | | 687,181 | |
| | 60,769 | | | DWS High Income Trust | | | 616,198 | |
| | 860,000 | | | Highland Credit Strategies Fund | | | 6,458,600 | |
| | 337,212 | | | Morgan Stanley Emerging Markets Debt Fund, Inc. | | | 3,429,446 | |
| | 2,203,264 | | | Western Asset High Income Opportunity Fund, Inc. | | | 14,012,759 | |
| | 1,077,051 | | | Western Asset Managed High Income Fund, Inc. | | | 6,871,585 | |
| | | | | | | | |
| | |
| | | | Total Closed End Investment Companies | | | | |
| | | | (Identified Cost $37,855,232) | | | 32,075,769 | |
| | | | | | | | |
| | | | | | | | |
Principal
Amount (‡) | | | Description | | Value (†) | |
| | | | | | | | |
| |
| | Short-Term Investments – 6.2% | | | | |
| $ | 1,242,914,288 | | | Tri-Party Repurchase Agreement with Fixed Income Clearing Corporation, dated 3/31/2011 at 0.000% to be repurchased at $1,242,914,288 on 4/01/2011 collateralized by $14,665,000 Federal Home Loan Bank, 2.350% due 12/21/2015 valued at $14,555,013; $1,540,000 Federal Home Loan Mortgage Corp., 2.500% due 1/14/2016 valued at $1,545,775; $150,000,000 Federal Home Loan Mortgage Corp., 1.750% due 11/17/2015 valued at $148,125,000; $203,575,000 Federal National Mortgage Association, 4.375% due 10/15/2015 valued at $225,968,250; $150,000,000 Federal National Mortgage Association, 1.550% due 11/12/2015 valued at $146,250,000; $100,000,000 Federal National Mortgage Association, 1.650% due 10/29/2015 valued at $97,250,000; $33,000,000 Federal Home Loan Mortgage Corp., 2.125% due 8/25/2015 valued at $32,175,000; $116,425,000 Federal National Mortgage Association, 4.375% due 10/15/2015 valued at $129,231,750; $48,540,000 Federal National Mortgage Association, 2.000% due 8/05/2015 valued at $48,722,025; $59,000,000 Federal National Mortgage Association, 2.000% due 8/18/2015 valued at $58,778,750; $32,000,000 Federal National Mortgage Association, 2.050% due 10/08/2015 valued at $31,880,000; $335,000,000 Federal National Mortgage Association, 2.000% due 9/21/2015 valued at $332,906,250; $70,000 Federal National Mortgage Association Discount Note, due 5/02/2011 valued at $70,000; $310,000 U.S. Treasury Note, 3.625% due 2/15/2020 valued at $320,075 including accrued interest (Note 2 of Notes to Financial Statements) (Identified Cost $1,242,914,288) | | $ | 1,242,914,288 | |
| | | | | | | | |
| | |
| | | | Total Investments – 98.8% | | | | |
| | | | (Identified Cost $17,845,971,254)(a) | | | 19,791,289,865 | |
| | | | Other Assets Less Liabilities—1.2% | | | 233,779,611 | |
| | | | | | | | |
| | |
| | | | Net Assets – 100.0% | | $ | 20,025,069,476 | |
| | | | | | | | |
See accompanying notes to financial statements.
33 |
Portfolio of Investments – as of March 31, 2011 (Unaudited)
Loomis Sayles Bond Fund – continued
| | | | | | | | |
| | (‡) | | | Principal amount stated in U.S. dollars unless otherwise noted. | |
| | (†) | | | See Note 2 of Notes to Financial Statements. | |
| | (††) | | | Amount shown represents units. One unit represents a principal amount of 25. | |
| | (†††) | | | Amount shown represents units. One unit represents a principal amount of 100. | |
| | (a) | | | Federal Tax Information (Amounts exclude certain adjustments made at the end of the Fund’s fiscal year for tax purposes. Such adjustments are primarily due to wash sales. Amortization of premium on debt securities is excluded for tax purposes.): | |
| | | | At March 31, 2011, the net unrealized appreciation on investments based on a cost of $17,905,251,847 for federal income tax purposes was as follows: | |
| | | | Aggregate gross unrealized appreciation for all investments in which there is an excess of value over tax cost | | $ | 2,271,391,644 | |
| | | | Aggregate gross unrealized depreciation for all investments in which there is an excess of tax cost over value | | | (385,353,626 | ) |
| | | | | | | | |
| | | | Net unrealized appreciation | | $ | 1,886,038,018 | |
| | | | | | | | |
| | (b) | | | Variable rate security. Rate as of March 31, 2011 is disclosed. | |
| | (c) | | | Illiquid security. At March 31, 2011, the value of these securities amounted to $524,964,870 or 2.6% of net assets. | |
| | (d) | | | The issuer is in default with respect to interest and/or principal payments. Income is not being accrued. | |
| | (e) | | | Non-income producing security. | |
| | (f) | | | Coupon rate is a fixed rate for an initial period then resets at a specified date and rate. | |
| | (g) | | | Variable rate security. Rate shown represents the weighted average rate at March 31, 2011. | |
| | (h) | | | All or a portion of interest payment is paid-in-kind. | |
| | (i) | | | Fair valued security by the Fund’s investment adviser. At March 31, 2011 the value of this security amounted to $9,376,875 representing less than 0.01% of net assets. | |
| |
| | 144A | | | All or a portion of these securities are exempt from registration under Rule 144A of the Securities Act of 1933. These securities may be resold in transactions exempt from registration, normally to qualified institutional buyers. At March 31, 2011, the value of Rule 144A holdings amounted to $2,043,629,882 or 10.2% of net assets. | |
| | ADR | | | An American Depositary Receipt is a certificate issued by a custodian bank representing the right to receive securities of the foreign issuer described. The values of ADRs may be significantly influenced by trading on exchanges not located in the United States. | |
| | ABS | | | Asset-Backed Securities | |
| | AGMC | | | Assured Guaranty Municipal Corp. | |
| | AMBAC | | | American Municipal Bond Assurance Corp. | |
| | EMTN | | | Euro Medium Term Note | |
| | FHLMC | | | Federal Home Loan Mortgage Corp. | |
| | GMTN | | | Global Medium Term Note | |
| | MBIA | | | Municipal Bond Investors Assurance Corp. | |
| | MTN | | | Medium Term Note | |
| | REITs | | | Real Estate Investment Trusts | |
| |
| | AUD | | | Australian Dollar | |
| | BRL | | | Brazilian Real | |
| | CAD | | | Canadian Dollar | |
| | CHF | | | Swiss Franc | |
| | EUR | | | Euro | |
| | GBP | | | British Pound | |
| | IDR | | | Indonesian Rupiah | |
| | ISK | | | Icelandic Krona | |
| | KRW | | | South Korean Won | |
| | MXN | | | Mexican Peso | |
| | NOK | | | Norwegian Krone | |
| | NZD | | | New Zealand Dollar | |
| | SGD | | | Singapore Dollar | |
Industry Summary at March 31, 2011 (Unaudited)
| | | | |
Treasuries | | | 16.6 | % |
Non-Captive Diversified | | | 7.9 | |
Banking | | | 6.4 | |
Non-Captive Consumer | | | 4.9 | |
Technology | | | 4.8 | |
Automotive | | | 4.3 | |
Wirelines | | | 4.1 | |
Sovereigns | | | 3.8 | |
Electric | | | 2.8 | |
Healthcare | | | 2.7 | |
Pipelines | | | 2.3 | |
Airlines | | | 2.2 | |
Supranational | | | 2.0 | |
Other Investments, less than 2% each | | | 27.8 | |
Short-Term Investments | | | 6.2 | |
| | | | |
Total Investments | | | 98.8 | |
Other assets less liabilities | | | 1.2 | |
| | | | |
Net Assets | | | 100.0 | % |
| | | | |
Currency Exposure at March 31, 2011 (Unaudited)
| | | | |
United States Dollar | | | 69.5 | % |
Canadian Dollar | | | 9.0 | |
New Zealand Dollar | | | 4.0 | |
Norwegian Krone | | | 3.4 | |
Euro | | | 3.0 | |
Australian Dollar | | | 2.6 | |
Indonesian Rupiah | | | 2.6 | |
Other, less than 2% each | | | 4.7 | |
| | | | |
Total Investments | | | 98.8 | |
Other assets less liabilities | | | 1.2 | |
| | | | |
Net Assets | | | 100.0 | % |
| | | | |
See accompanying notes to financial statements.
| 34
Portfolio of Investments – as of March 31, 2011 (Unaudited)
Loomis Sayles Fixed Income Fund
| | | | | | | | |
Principal
Amount (‡) | | | Description | | Value (†) | |
| | | | | | | | |
| |
| | Bonds and Notes – 86.3% of Net Assets | | | | |
| |
| | Non-Convertible Bonds – 76.4% | | | | |
| | |
| | | | ABS Other – 0.1% | | | | |
| $ | 725,000 | | | Community Program Loan Trust,
Series 1987-A, Class A5,
4.500%, 4/01/2029 | | $ | 685,589 | |
| | | | | | | | |
| | | | Aerospace & Defense – 0.0% | | | | |
| | 175,000 | | | Bombardier, Inc.,
7.450%, 5/01/2034, 144A | | | 168,000 | |
| | | | | | | | |
| | | | Airlines – 0.6% | | | | |
| | 6,244 | | | American Airlines Pass Through Trust, Series 1993-A6,
8.040%, 9/16/2011 | | | 6,244 | |
| | 484,865 | | | American Airlines Pass Through Trust, Series 2009-1A,
10.375%, 1/02/2021 | | | 569,716 | |
| | 299,574 | | | Continental Airlines Pass Through Trust, Series 1997-1, Class A,
7.461%, 10/01/2016 | | | 302,944 | |
| | 50,956 | | | Continental Airlines Pass Through Trust, Series 2000-2, Class B,
8.307%, 10/02/2019 | | | 51,466 | |
| | 172,849 | | | Continental Airlines Pass Through Trust, Series 2001-1, Class B,
7.373%, 6/15/2017 | | | 173,282 | |
| | 548,000 | | | Delta Air Lines, Inc.,
9.500%, 9/15/2014, 144A | | | 582,250 | |
| | 1,427,237 | | | Delta Air Lines Pass Through Trust, Series 2007-1, Class C,
8.954%, 8/10/2014 | | | 1,480,758 | |
| | 450,897 | | | Delta Air Lines Pass Through Trust, Series 2009-1, Series B,
9.750%, 12/17/2016 | | | 477,951 | |
| | 1,098,391 | | | UAL Pass Through Trust,
Series 2007-1, Class A,
6.636%, 1/02/2024 | | | 1,109,375 | |
| | | | | | | | |
| | | | | | | 4,753,986 | |
| | | | | | | | |
| | | | Automotive – 2.7% | | | | |
| | 2,400,000 | | | Cummins, Inc.,
7.125%, 3/01/2028 | | | 2,659,747 | |
| | 300,000 | | | FCE Bank PLC, EMTN,
7.125%, 1/16/2012, (EUR) | | | 437,915 | |
| | 200,000 | | | FCE Bank PLC, EMTN,
7.125%, 1/15/2013, (EUR) | | | 297,612 | |
| | 765,000 | | | Ford Motor Co.,
6.375%, 2/01/2029 | | | 722,728 | |
| | 1,030,000 | | | Ford Motor Co.,
6.500%, 8/01/2018 | | | 1,078,411 | |
| | 165,000 | | | Ford Motor Co.,
6.625%, 2/15/2028 | | | 160,213 | |
| | 4,230,000 | | | Ford Motor Co.,
6.625%, 10/01/2028 | | | 4,105,329 | |
| | 690,000 | | | Ford Motor Co.,
7.125%, 11/15/2025 | | | 669,921 | |
| | 9,250,000 | | | Ford Motor Co.,
7.450%, 7/16/2031 | | | 10,014,142 | |
| | 1,645,000 | | | Ford Motor Co.,
7.500%, 8/01/2026 | | | 1,651,585 | |
| | | | | | | | |
Principal
Amount (‡) | | | Description | | Value (†) | |
| | | | | | | | |
| | |
| | | | Automotive – continued | | | | |
| $ | 645,000 | | | Ford Motor Credit Co. LLC,
7.000%, 4/15/2015 | | $ | 698,165 | |
| | 565,000 | | | Ford Motor Credit Co. LLC,
8.000%, 12/15/2016 | | | 641,378 | |
| | 375,000 | | | Goodyear Tire & Rubber Co. (The),
7.000%, 3/15/2028 | | | 352,500 | |
| | | | | | | | |
| | | | | | | 23,489,646 | |
| | | | | | | | |
| | | | Banking – 5.7% | | | | |
| | 1,710,000 | | | Associates Corp. of North America,
6.950%, 11/01/2018 | | | 1,911,062 | |
| | 2,385,000 | | | BAC Capital Trust VI,
5.625%, 3/08/2035 | | | 2,081,273 | |
| | 500,000 | | | Bank of America Corp.,
4.850%, 11/15/2014 | | | 501,176 | |
| | 2,420,000,000 | | | Barclays Bank PLC, EMTN,
3.680%, 8/20/2015, (KRW) | | | 2,153,925 | |
| | 18,710,000,000 | | | BNP Paribas SA, EMTN,
Zero Coupon,
6/13/2011, 144A, (IDR) | | | 2,121,004 | |
| | 6,020,000 | | | Citigroup, Inc.,
5.000%, 9/15/2014 | | | 6,286,102 | |
| | 135,000 | | | Citigroup, Inc.,
5.850%, 12/11/2034 | | | 132,377 | |
| | 3,075,000 | | | Citigroup, Inc.,
5.875%, 2/22/2033 | | | 2,890,869 | |
| | 1,460,000 | | | Citigroup, Inc.,
6.000%, 10/31/2033 | | | 1,394,138 | |
| | 795,000 | | | Citigroup, Inc.,
6.125%, 8/25/2036 | | | 758,108 | |
| | 200,000 | | | Citigroup, Inc., EMTN, (fixed rate to 11/30/2012, variable rate thereafter),
3.625%, 11/30/2017, (EUR) | | | 266,389 | |
| | 1,470,000 | | | Goldman Sachs Group, Inc. (The),
6.750%, 10/01/2037 | | | 1,482,685 | |
| | 1,955,000 | | | Goldman Sachs Group, Inc. (The),
GMTN,
5.375%, 3/15/2020 | | | 1,984,980 | |
| | 21,194,634,240 | | | JPMorgan Chase & Co.,
Zero Coupon,
4/12/2012, 144A, (IDR) | | | 2,287,049 | |
| | 1,000,000,000 | | | JPMorgan Chase & Co., EMTN,
7.070%, 3/22/2014, (IDR) | | | 114,017 | |
| | 600,000 | | | Merrill Lynch & Co., Inc.,
6.110%, 1/29/2037 | | | 569,050 | |
| | 1,000,000 | | | Merrill Lynch & Co., Inc., EMTN,
4.625%, 9/14/2018, (EUR) | | | 1,304,706 | |
| | 300,000 | | | Merrill Lynch & Co., Inc.,
Series C, MTN,
6.050%, 6/01/2034 | | | 275,817 | |
| | 595,000 | | | Morgan Stanley,
4.750%, 4/01/2014 | | | 619,999 | |
| | 7,000,000 | | | Morgan Stanley,
5.500%, 7/24/2020 | | | 6,995,079 | |
| | 6,700,000 | | | Morgan Stanley,
5.750%, 1/25/2021 | | | 6,762,283 | |
| | 370,000 | | | Morgan Stanley, EMTN,
5.450%, 1/09/2017 | | | 390,055 | |
| | 4,100,000 | | | Morgan Stanley, GMTN,
7.625%, 3/03/2016, (AUD) | | | 4,272,135 | |
See accompanying notes to financial statements.
35 |
Portfolio of Investments – as of March 31, 2011 (Unaudited)
Loomis Sayles Fixed Income Fund – continued
| | | | | | | | |
Principal
Amount (‡) | | | Description | | Value (†) | |
| | | | | | | | |
| |
| | Bonds and Notes – continued | | | | |
| | |
| | | | Banking – continued | | | | |
| $ | 625,000 | | | Morgan Stanley, Series F, MTN,
5.950%, 12/28/2017 | | $ | 671,336 | |
| | 350,000 | | | Morgan Stanley,
Series G & H, GMTN,
5.125%, 11/30/2015, (GBP) | | | 577,649 | |
| | | | | | | | |
| | | | | | | 48,803,263 | |
| | | | | | | | |
| | | | Building Materials – 1.0% | | | | |
| | 860,000 | | | Masco Corp.,
4.800%, 6/15/2015 | | | 854,586 | |
| | 240,000 | | | Masco Corp.,
5.850%, 3/15/2017 | | | 235,317 | |
| | 2,600,000 | | | Masco Corp.,
6.125%, 10/03/2016 | | | 2,666,737 | |
| | 305,000 | | | Masco Corp.,
6.500%, 8/15/2032 | | | 275,197 | |
| | 805,000 | | | Owens Corning, Inc.,
6.500%, 12/01/2016 | | | 876,485 | |
| | 2,050,000 | | | Owens Corning, Inc.,
7.000%, 12/01/2036 | | | 2,057,038 | |
| | 1,680,000 | | | USG Corp.,
6.300%, 11/15/2016 | | | 1,579,200 | |
| | | | | | | | |
| | | | | | | 8,544,560 | |
| | | | | | | | |
| | | | Chemicals – 1.3% | |
| | 3,440,000 | | | Chevron Phillips Chemical Co. LLC,
8.250%, 6/15/2019, 144A | | | 4,107,054 | |
| | 115,000 | | | ICI Wilmington, Inc.,
5.625%, 12/01/2013 | | | 124,278 | |
| | 1,565,000 | | | Methanex Corp., Senior Note,
6.000%, 8/15/2015 | | | 1,568,365 | |
| | 5,240,000 | | | Momentive Specialty Chemicals, Inc.,
7.875%, 2/15/2023 | | | 4,296,800 | |
| | 55,000 | | | Momentive Specialty Chemicals, Inc.,
8.375%, 4/15/2016 | | | 51,150 | |
| | 905,000 | | | Momentive Specialty Chemicals, Inc.,
9.200%, 3/15/2021 | | | 841,650 | |
| | | | | | | | |
| | | | | | | 10,989,297 | |
| | | | | | | | |
| | | | Collateralized Mortgage Obligations – 0.1% | |
| | 1,200,597 | | | Wells Fargo Mortgage Backed Securities Trust,
Series 2005-AR4, Class 2A2,
2.753%, 4/25/2035(b) | | | 1,157,295 | |
| | | | | | | | |
| | | | Commercial Mortgage-Backed Securities – 0.1% | |
| | 95,000 | | | GS Mortgage Securities Corp. II,
Series 2005-GG4, Class A4A,
4.751%, 7/10/2039 | | | 99,957 | |
| | 1,000,000 | | | Merrill Lynch/Countrywide Commercial Mortgage Trust,
Series 2007-6, Class A4,
5.485%, 3/12/2051 | | | 1,047,352 | |
| | | | | | | | |
| | | | | | | 1,147,309 | |
| | | | | | | | |
| | | | Construction Machinery – 0.1% | |
| | 965,000 | | | Toro Co.,
6.625%, 5/01/2037(c) | | | 866,835 | |
| | | | | | | | |
| | | | | | | | |
Principal
Amount (‡) | | | Description | | Value (†) | |
| | | | | | | | |
| |
| | | | Distributors – 0.1% | |
| $ | 1,000,000 | | | ONEOK, Inc.,
6.000%, 6/15/2035 | | $ | 972,800 | |
| | | | | | | | |
| | | | Diversified Manufacturing – 0.2% | |
| | 245,000 | | | Textron, Inc.,
5.600%, 12/01/2017 | | | 255,999 | |
| | 1,290,000 | | | Textron, Inc.,
7.250%, 10/01/2019 | | | 1,487,334 | |
| | | | | | | | |
| | | | | | | 1,743,333 | |
| | | | | | | | |
| | | | Electric – 3.5% | |
| | 730,000 | | | AES Corp. (The),
7.750%, 3/01/2014 | | | 788,400 | |
| | 3,100,000 | | | Alta Wind Holdings LLC,
7.000%, 6/30/2035, 144A | | | 3,264,951 | |
| | 4,174,607 | | | Bruce Mansfield Unit,
6.850%, 6/01/2034(c) | | | 4,380,626 | |
| | 380,000 | | | Dynegy Holdings, Inc.,
7.125%, 5/15/2018 | | | 279,300 | |
| | 810,000 | | | Dynegy Holdings, Inc.,
7.625%, 10/15/2026 | | | 562,950 | |
| | 1,700,000 | | | EDP Finance BV,
4.900%, 10/01/2019, 144A | | | 1,483,872 | |
| | 1,589,000 | | | Endesa SA/Cayman Islands,
7.875%, 2/01/2027 | | | 1,774,509 | |
| | 2,890,000 | | | Energy Future Holdings Corp.,
10.000%, 1/15/2020 | | | 3,062,461 | |
| | 275,000 | | | Enersis SA,
7.375%, 1/15/2014 | | | 306,110 | |
| | 4,000,000 | | | Enersis SA, Cayman Islands,
7.400%, 12/01/2016 | | | 4,616,136 | |
| | 3,517,985 | | | Mackinaw Power LLC,
6.296%, 10/31/2023, 144A | | | 3,712,741 | |
| | 695,000 | | | NGC Corp. Capital Trust I,
Series B,
8.316%, 6/01/2027(c) | | | 354,450 | |
| | 244,070 | | | Power Receivables Finance LLC,
6.290%, 1/01/2012, 144A | | | 244,216 | |
| | 1,101,100 | | | Quezon Power Philippines LC,
8.860%, 6/15/2017 | | | 1,200,199 | |
| | 765,000 | | | TXU Corp., Series P,
5.550%, 11/15/2014 | | | 501,075 | |
| | 1,515,000 | | | TXU Corp., Series Q,
6.500%, 11/15/2024 | | | 708,263 | |
| | 1,675,000 | | | TXU Corp., Series R,
6.550%, 11/15/2034 | | | 770,500 | |
| | 450,000 | | | White Pine Hydro LLC,
6.310%, 7/10/2017(c) | | | 467,114 | |
| | 670,000 | | | White Pine Hydro LLC, 6.960%, 7/10/2037(c) | | | 634,490 | |
| | 1,280,000 | | | White Pine Hydro Portfolio LLC,
7.260%, 7/20/2015(c) | | | 1,213,632 | |
| | | | | | | | |
| | | | | | | 30,325,995 | |
| | | | | | | | |
| | | | Entertainment – 0.5% | | | | |
| | 2,065,000 | | | Time Warner, Inc.,
6.625%, 5/15/2029 | | | 2,201,940 | |
| | 730,000 | | | Time Warner, Inc.,
7.625%, 4/15/2031 | | | 842,105 | |
| | 1,155,000 | | | Time Warner, Inc.,
7.700%, 5/01/2032 | | | 1,346,913 | |
| | | | | | | | |
| | | | | | | 4,390,958 | |
| | | | | | | | |
See accompanying notes to financial statements.
| 36
Portfolio of Investments – as of March 31, 2011 (Unaudited)
Loomis Sayles Fixed Income Fund – continued
| | | | | | | | |
Principal
Amount (‡) | | | Description | | Value (†) | |
| | | | | | | | |
| |
| | Bonds and Notes – continued | | | | |
| | |
| | | | Food & Beverage – 0.5% | | | | |
| $ | 1,540,000 | | | Corn Products International, Inc.,
6.625%, 4/15/2037 | | $ | 1,609,668 | |
| | 2,740,000 | | | Viterra, Inc.,
6.406%, 2/16/2021, 144A, (CAD) | | | 2,928,564 | |
| | | | | | | | |
| | | | | | | 4,538,232 | |
| | | | | | | | |
| | | | Government Owned - No Guarantee – 0.9% | |
| | 2,400,000 | | | DP World Ltd.,
6.850%, 7/02/2037, 144A | | | 2,208,000 | |
| | 18,000,000,000 | | | Export-Import Bank of Korea,
6.600%, 11/04/2013, 144A, (IDR) | | | 1,997,313 | |
| | 29,200,000,000 | | | Export-Import Bank of Korea,
8.300%, 3/15/2014, 144A, (IDR) | | | 3,388,642 | |
| | | | | | | | |
| | | | | | | 7,593,955 | |
| | | | | | | | |
| | | | Healthcare – 2.6% | | | | |
| | 425,000 | | | Boston Scientific Corp.,
5.125%, 1/12/2017 | | | 434,710 | |
| | 290,000 | | | Boston Scientific Corp.,
5.450%, 6/15/2014 | | | 309,504 | |
| | 435,000 | | | Boston Scientific Corp.,
6.400%, 6/15/2016 | | | 474,300 | |
| | 860,000 | | | Boston Scientific Corp.,
7.000%, 11/15/2035 | | | 878,254 | |
| | 455,000 | | | HCA, Inc.,
5.750%, 3/15/2014 | | | 463,531 | |
| | 2,345,000 | | | HCA, Inc.,
6.250%, 2/15/2013 | | | 2,432,937 | |
| | 410,000 | | | HCA, Inc.,
6.375%, 1/15/2015 | | | 418,200 | |
| | 610,000 | | | HCA, Inc.,
6.500%, 2/15/2016 | | | 620,675 | |
| | 115,000 | | | HCA, Inc.,
6.750%, 7/15/2013 | | | 120,894 | |
| | 3,545,000 | | | HCA, Inc.,
7.050%, 12/01/2027 | | | 3,155,050 | |
| | 820,000 | | | HCA, Inc.,
7.190%, 11/15/2015 | | | 824,100 | |
| | 1,475,000 | | | HCA, Inc.,
7.500%, 12/15/2023 | | | 1,393,875 | |
| | 1,440,000 | | | HCA, Inc.,
7.500%, 11/06/2033 | | | 1,321,200 | |
| | 2,660,000 | | | HCA, Inc.,
7.690%, 6/15/2025 | | | 2,533,650 | |
| | 2,220,000 | | | HCA, Inc.,
8.360%, 4/15/2024 | | | 2,220,000 | |
| | 2,930,000 | | | HCA, Inc., MTN,
7.580%, 9/15/2025 | | | 2,761,525 | |
| | 430,000 | | | HCA, Inc., MTN,
7.750%, 7/15/2036 | | | 402,050 | |
| | 320,000 | | | Owens & Minor, Inc.,
6.350%, 4/15/2016(c) | | | 328,318 | |
| | 1,075,000 | | | Tenet Healthcare Corp.,
6.875%, 11/15/2031 | | | 890,906 | |
| | | | | | | | |
| | | | | | | 21,983,679 | |
| | | | | | | | |
| | | | Home Construction – 0.9% | | | | |
| | 115,000 | | | K. Hovnanian Enterprises, Inc.,
6.250%, 1/15/2016 | | | 85,675 | |
| | | | | | | | |
Principal
Amount (‡) | | | Description | | Value (†) | |
| | | | | | | | |
| |
| | | | Home Construction – continued | |
| $ | 155,000 | | | K. Hovnanian Enterprises, Inc.,
6.375%, 12/15/2014 | | $ | 140,662 | |
| | 115,000 | | | K. Hovnanian Enterprises, Inc.,
6.500%, 1/15/2014 | | | 104,363 | |
| | 1,700,000 | | | Lennar Corp., Series B,
5.600%, 5/31/2015 | | | 1,674,500 | |
| | 1,152,000 | | | Pulte Group, Inc.,
5.200%, 2/15/2015 | | | 1,143,360 | |
| | 3,920,000 | | | Pulte Group, Inc.,
6.000%, 2/15/2035 | | | 3,067,400 | |
| | 1,960,000 | | | Pulte Group, Inc., 6.375%, 5/15/2033 | | | 1,592,500 | |
| | 275,000 | | | Toll Brothers Finance Corp.,
5.150%, 5/15/2015 | | | 280,696 | |
| | | | | | | | |
| | | | | | | 8,089,156 | |
| | | | | | | | |
| | | | Independent Energy – 1.5% | | | | |
| | 3,230,000 | | | Anadarko Petroleum Corp.,
5.950%, 9/15/2016 | | | 3,512,254 | |
| | 1,915,000 | | | Anadarko Petroleum Corp.,
6.375%, 9/15/2017 | | | 2,107,831 | |
| | 2,845,000 | | | Anadarko Petroleum Corp.,
6.450%, 9/15/2036 | | | 2,841,327 | |
| | 380,000 | | | Chesapeake Energy Corp.,
6.500%, 8/15/2017 | | | 410,875 | |
| | 900,000 | | | Chesapeake Energy Corp.,
6.875%, 11/15/2020 | | | 972,000 | |
| | 792,000 | | | Connacher Oil and Gas Ltd.,
10.250%, 12/15/2015, 144A | | | 839,520 | |
| | 525,000 | | | Connacher Oil and Gas Ltd.,
11.750%, 7/15/2014, 144A | | | 564,375 | |
| | 1,465,000 | | | Pioneer Natural Resources Co.,
7.200%, 1/15/2028 | | | 1,527,683 | |
| | | | | | | | |
| | | | | | | 12,775,865 | |
| | | | | | | | |
| | | | Industrial Other – 0.2% | | | | |
| | 1,575,000 | | | Ranhill Labuan Ltd.,
12.500%, 10/26/2011, 144A | | | 1,386,000 | |
| | | | | | | | |
| | | | Integrated Energy – 0.1% | | | | |
| | 857,385 | | | PF Export Receivables Master Trust, Series A,
6.436%, 6/01/2015, 144A | | | 913,115 | |
| | | | | | | | |
| | | | Life Insurance – 1.1% | | | | |
| | 615,000 | | | American International Group, Inc., Series G, MTN,
5.850%, 1/16/2018 | | | 640,606 | |
| | 175,000 | | | American International Group, Inc., Series MP, GMTN,
5.450%, 5/18/2017 | | | 179,644 | |
| | 500,000 | | | Hartford Life Insurance Co.,
3.830%, 9/15/2011(b) | | | 503,935 | |
| | 1,000,000 | | | MetLife, Inc.,
6.400%, 12/15/2066 | | | 963,100 | |
| | 3,385,000 | | | MetLife, Inc.,
10.750%, 8/01/2069 | | | 4,671,300 | |
| | 1,165,000 | | | Penn Mutual Life Insurance Co. (The),
6.650%, 6/15/2034, 144A | | | 1,128,946 | |
| | 1,000,000 | | | Protective Life Secured Trust,
3.360%, 9/10/2014(b) | | | 997,930 | |
| | | | | | | | |
| | | | | | | 9,085,461 | |
| | | | | | | | |
See accompanying notes to financial statements.
37 |
Portfolio of Investments – as of March 31, 2011 (Unaudited)
Loomis Sayles Fixed Income Fund – continued
| | | | | | | | |
Principal
Amount (‡) | | | Description | | Value (†) | |
| | | | | | | | |
| |
| | Bonds and Notes – continued | | | | |
| | |
| | | | Local Authorities – 5.2% | | | | |
| | 3,240,000 | | | New South Wales Treasury Corp.,
6.000%, 5/01/2012, (AUD) | | $ | 3,388,057 | |
| | 845,000 | | | New South Wales Treasury Corp.,
Series 12RG,
6.000%, 5/01/2012, (AUD) | | | 883,484 | |
| | 4,280,000 | | | New South Wales Treasury Corp.,
Series 17RG,
5.500%, 3/01/2017, (AUD) | | | 4,404,691 | |
| | 672,508 | | | Province of Alberta,
5.930%, 9/16/2016, (CAD) | | | 770,273 | |
| | 11,700,000 | | | Province of British Columbia,
Zero Coupon, 8/23/2013, (CAD) | | | 11,449,708 | |
| | 19,825,000 | | | Province of Ontario, Canada,
4.200%, 3/08/2018, (CAD) | | | 21,191,586 | |
| | 2,150,000 | | | Queensland Treasury Corp.,
Series 11G,
6.000%, 6/14/2011, (AUD) | | | 2,228,633 | |
| | | | | | | | |
| | | | | | | 44,316,432 | |
| | | | | | | | |
| | | | Lodging – 0.0% | |
| | 150,000 | | | Host Marriott LP, Series O,
6.375%, 3/15/2015 | | | 153,188 | |
| | | | | | | | |
| | | | Media Cable – 0.2% | |
| | 26,000 | | | CSC Holdings LLC,
6.750%, 4/15/2012 | | | 26,975 | |
| | 170,000 | | | CSC Holdings LLC,
7.875%, 2/15/2018 | | | 188,700 | |
| | 1,500,000 | | | Time Warner Cable, Inc.,
6.550%, 5/01/2037 | | | 1,526,724 | |
| | | | | | | | |
| | | | | | | 1,742,399 | |
| | | | | | | | |
| | | | Media Non-Cable – 0.6% | |
| | 2,190,000 | | | Clear Channel Communications, Inc.,
5.000%, 3/15/2012 | | | 2,173,575 | |
| | 2,630,000 | | | News America, Inc.,
6.150%, 3/01/2037 | | | 2,605,999 | |
| | | | | | | | |
| | | | | | | 4,779,574 | |
| | | | | | | | |
| | | | Metals & Mining – 0.7% | |
| | 1,500,000 | | | Alcoa, Inc.,
5.720%, 2/23/2019 | | | 1,559,877 | |
| | 300,000 | | | Alcoa, Inc.,
5.870%, 2/23/2022 | | | 307,004 | |
| | 4,660,000 | | | Algoma Acquisition Corp.,
9.875%, 6/15/2015, 144A | | | 4,287,200 | |
| | | | | | | | |
| | | | | | | 6,154,081 | |
| | | | | | | | |
| | | | Non-Captive Consumer – 3.7% | |
| | 3,905,000 | | | Residential Capital LLC,
9.625%, 5/15/2015 | | | 3,939,169 | |
| | 31,725(††) | | | SLM Corp.,
6.000%, 12/15/2043 | | | 666,780 | |
| | 760,000 | | | SLM Corp., MTN,
5.125%, 8/27/2012 | | | 784,347 | |
| | 1,665,000 | | | SLM Corp., Series A, MTN,
5.000%, 10/01/2013 | | | 1,723,425 | |
| | 200,000 | | | SLM Corp., Series A, MTN,
5.000%, 4/15/2015 | | | 201,366 | |
| | | | | | | | |
Principal
Amount (‡) | | | Description | | Value (†) | |
| | | | | | | | |
| |
| | | | Non-Captive Consumer – continued | |
| $ | 145,000 | | | SLM Corp., Series A, MTN,
5.000%, 6/15/2018 | | $ | 136,260 | |
| | 2,920,000 | | | SLM Corp., Series A, MTN,
5.375%, 1/15/2013 | | | 3,037,244 | |
| | 235,000 | | | SLM Corp., Series A, MTN,
5.375%, 5/15/2014 | | | 243,692 | |
| | 2,575,000 | | | SLM Corp., Series A, MTN,
5.625%, 8/01/2033 | | | 2,201,491 | |
| | 7,986,000 | | | SLM Corp., Series A, MTN,
8.450%, 6/15/2018 | | | 8,944,320 | |
| | 300,000 | | | Springleaf Finance Corp., MTN,
5.750%, 9/15/2016 | | | 270,000 | |
| | 800,000 | | | Springleaf Finance Corp.,
Series H, MTN,
5.375%, 10/01/2012 | | | 787,000 | |
| | 700,000 | | | Springleaf Finance Corp.,
Series I, MTN,
4.875%, 7/15/2012 | | | 687,750 | |
| | 200,000 | | | Springleaf Finance Corp.,
Series I, MTN,
5.400%, 12/01/2015 | | | 182,500 | |
| | 2,200,000 | | | Springleaf Finance Corp.,
Series I, MTN,
5.850%, 6/01/2013 | | | 2,150,500 | |
| | 1,000,000 | | | Springleaf Finance Corp.,
Series J, MTN,
5.900%, 9/15/2012 | | | 990,000 | |
| | 2,100,000 | | | Springleaf Finance Corp.,
Series J, MTN,
6.500%, 9/15/2017 | | | 1,869,000 | |
| | 2,800,000 | | | Springleaf Finance Corp.,
Series J, MTN,
6.900%, 12/15/2017 | | | 2,558,500 | |
| | | | | | | | |
| | | | | | | 31,373,344 | |
| | | | | | | | |
| | | | Non-Captive Diversified – 5.8% | |
| | 1,305,000 | | | Ally Financial, Inc.,
6.000%, 12/15/2011 | | | 1,334,362 | |
| | 224,000 | | | Ally Financial, Inc.,
6.875%, 8/28/2012 | | | 235,200 | |
| | 682,000 | | | Ally Financial, Inc.,
7.500%, 12/31/2013 | | | 734,003 | |
| | 2,275,000 | | | Ally Financial, Inc.,
7.500%, 9/15/2020, 144A | | | 2,425,719 | |
| | 1,460,000 | | | Ally Financial, Inc.,
8.000%, 12/31/2018 | | | 1,567,675 | |
| | 181,000 | | | Ally Financial, Inc.,
8.000%, 11/01/2031 | | | 197,290 | |
| | 6,055,000 | | | Ally Financial, Inc.,
8.300%, 2/12/2015 | | | 6,637,794 | |
| | 456,794 | | | CIT Group, Inc.,
7.000%, 5/01/2013 | | | 465,359 | |
| | 1,305,836 | | | CIT Group, Inc.,
7.000%, 5/01/2014 | | | 1,330,320 | |
| | 1,305,836 | | | CIT Group, Inc.,
7.000%, 5/01/2015 | | | 1,317,262 | |
| | 346,610 | | | CIT Group, Inc.,
7.000%, 5/01/2016 | | | 347,043 | |
| | 3,046,961 | | | CIT Group, Inc.,
7.000%, 5/01/2017 | | | 3,050,770 | |
| | 830,000 | | | General Electric Capital Australia Funding Pty Ltd., EMTN,
8.000%, 2/13/2012, (AUD) | | | 875,832 | |
See accompanying notes to financial statements.
| 38
Portfolio of Investments – as of March 31, 2011 (Unaudited)
Loomis Sayles Fixed Income Fund – continued
| | | | | | | | |
Principal
Amount (‡) | | | Description | | Value (†) | |
| | | | | | | | |
| |
| | Bonds and Notes – continued | | | | |
| |
| | | | Non-Captive Diversified – continued | |
| $ | 35,000 | | | General Electric Capital Corp.,
5.625%, 5/01/2018 | | $ | 37,839 | |
| | 170,000 | | | General Electric Capital Corp., MTN,
5.875%, 1/14/2038 | | | 167,837 | |
| | 1,345,000 | | | General Electric Capital Corp.,
Series A, EMTN,
6.750%, 9/26/2016, (NZD) | | | 1,066,583 | |
| | 5,360,000 | | | General Electric Capital Corp.,
Series A, GMTN,
7.625%, 12/10/2014, (NZD) | | | 4,416,564 | |
| | 1,145,000 | | | General Electric Capital Corp.,
Series A, MTN,
4.875%, 3/04/2015 | | | 1,234,552 | |
| | 9,210,000 | | | General Electric Capital Corp.,
Series A, MTN,
6.500%, 9/28/2015, (NZD) | | | 7,314,384 | |
| | 4,905,000 | | | International Lease Finance Corp.,
7.125%, 9/01/2018, 144A | | | 5,270,422 | |
| | 1,015,000 | | | International Lease Finance Corp.,
8.250%, 12/15/2020 | | | 1,112,694 | |
| | 3,045,000 | | | International Lease Finance Corp.,
8.875%, 9/15/2015, 144A | | | 3,349,500 | |
| | 85,000 | | | iStar Financial, Inc.,
5.500%, 6/15/2012 | | | 84,150 | |
| | 225,000 | | | iStar Financial, Inc.,
5.850%, 3/15/2017 | | | 196,313 | |
| | 905,000 | | | iStar Financial, Inc.,
5.875%, 3/15/2016 | | | 805,450 | |
| | 30,000 | | | iStar Financial, Inc.,
6.050%, 4/15/2015 | | | 27,450 | |
| | 2,495,000 | | | iStar Financial, Inc.,
8.625%, 6/01/2013 | | | 2,532,425 | |
| | 195,000 | | | iStar Financial, Inc., Series B,
5.700%, 3/01/2014 | | | 182,325 | |
| | 1,245,000 | | | iStar Financial, Inc., Series B,
5.950%, 10/15/2013 | | | 1,179,637 | |
| | | | | | | | |
| | | | | | | 49,496,754 | |
| | | | | | | | |
| | | | Oil Field Services – 0.1% | | | | |
| | 420,000 | | | Allis-Chalmers Energy, Inc.,
8.500%, 3/01/2017 | | | 450,450 | |
| | 490,000 | | | Allis-Chalmers Energy, Inc.,
9.000%, 1/15/2014 | | | 500,413 | |
| | 235,000 | | | Parker Drilling Co.,
9.125%, 4/01/2018 | | | 252,625 | |
| | | | | | | | |
| | | | | | | 1,203,488 | |
| | | | | | | | |
| | | | Packaging – 0.3% | | | | |
| | 2,000,000 | | | Owens-Illinois, Inc.,
7.800%, 5/15/2018 | | | 2,182,500 | |
| | | | | | | | |
| | | | Paper – 1.6% | | | | |
| | 2,000,000 | | | Georgia-Pacific LLC,
7.250%, 6/01/2028 | | | 2,090,000 | |
| | 2,868,000 | | | Georgia-Pacific LLC,
7.375%, 12/01/2025 | | | 3,025,740 | |
| | 6,005,000 | | | Georgia-Pacific LLC,
7.750%, 11/15/2029 | | | 6,597,994 | |
| | 132,000 | | | Georgia-Pacific LLC,
8.000%, 1/15/2024 | | | 150,810 | |
| | | | | | | | |
Principal
Amount (‡) | | | Description | | Value (†) | |
| | | | | | | | |
| | |
| | | | Paper – continued | | | | |
| $ | 1,045,000 | | | Westvaco Corp.,
7.950%, 2/15/2031 | | $ | 1,093,286 | |
| | 1,080,000 | | | Westvaco Corp.,
8.200%, 1/15/2030 | | | 1,152,604 | |
| | | | | | | | |
| | | | | | | 14,110,434 | |
| | | | | | | | |
| | | | Pharmaceuticals – 0.0% | | | | |
| | 335,000 | | | Elan Finance PLC/Elan Finance Corp.,
8.875%, 12/01/2013 | | | 346,306 | |
| | | | | | | | |
| | | | Pipelines – 1.3% | | | | |
| | 1,740,000 | | | DCP Midstream LP,
6.450%, 11/03/2036, 144A | | | 1,768,832 | |
| | 925,000 | | | El Paso Corp.,
6.950%, 6/01/2028 | | | 937,123 | |
| | 250,000 | | | El Paso Corp., GMTN,
7.800%, 8/01/2031 | | | 277,340 | |
| | 1,550,000 | | | Enterprise Products Operating LLP,
6.300%, 9/15/2017 | | | 1,747,552 | |
| | 300,000 | | | Florida Gas Transmission Co.,
7.900%, 5/15/2019, 144A | | | 361,853 | |
| | 250,000 | | | NiSource Finance Corp.,
5.250%, 9/15/2017 | | | 266,223 | |
| | 1,785,000 | | | Plains All American Pipeline LP,
6.125%, 1/15/2017 | | | 1,976,841 | |
| | 3,850,000 | | | Plains All American Pipeline LP,
6.650%, 1/15/2037 | | | 4,071,048 | |
| | | | | | | | |
| | | | | | | 11,406,812 | |
| | | | | | | | |
| | | | Property & Casualty Insurance – 1.0% | |
| | 80,000 | | | Axis Capital Holdings Ltd.,
5.750%, 12/01/2014 | | | 85,949 | |
| | 2,645,000 | | | Hanover Insurance Group, Inc. (The),
7.500%, 3/01/2020 | | | 2,811,558 | |
| | 180,000 | | | Marsh & McLennan Cos., Inc.,
5.875%, 8/01/2033 | | | 169,444 | |
| | 1,545,000 | | | MBIA Insurance Corp., (fixed rate to 1/15/2013, variable rate thereafter),
14.000%, 1/15/2033, 144A | | | 849,750 | |
| | 2,140,000 | | | White Mountains Re Group Ltd.,
6.375%, 3/20/2017, 144A | | | 2,189,941 | |
| | 1,430,000 | | | XL Group PLC,
6.250%, 5/15/2027 | | | 1,419,853 | |
| | 1,135,000 | | | XL Group PLC,
6.375%, 11/15/2024 | | | 1,180,556 | |
| | | | | | | | |
| | | | | | | 8,707,051 | |
| | | | | | | | |
| | | | Property Trust – 0.4% | | | | |
| | 2,960,000 | | | WEA Finance LLC/WT Finance Australia Property Ltd.,
6.750%, 9/02/2019, 144A | | | 3,396,357 | |
| | | | | | | | |
| | | | Railroads – 0.0% | | | | |
| | 500,000 | | | Missouri Pacific Railroad Co.,
5.000%, 1/01/2045(c) | | | 341,250 | |
| | | | | | | | |
| | | | REITs – Apartments – 0.2% | | | | |
| | 1,495,000 | | | Camden Property Trust,
5.700%, 5/15/2017 | | | 1,636,506 | |
See accompanying notes to financial statements.
39 |
Portfolio of Investments – as of March 31, 2011 (Unaudited)
Loomis Sayles Fixed Income Fund – continued
| | | | | | | | |
Principal
Amount (‡) | | | Description | | Value (†) | |
| | | | | | | | |
| |
| | Bonds and Notes – continued | | | | |
| |
| | | | REITs – Apartments – continued | |
| $ | 70,000 | | | ERP Operating LP,
5.125%, 3/15/2016 | | $ | 75,170 | |
| | | | | | | | |
| | | | | | | 1,711,676 | |
| | | | | | | | |
| | | | REITs – Diversified – 0.0% | | | | |
| | 210,000 | | | Duke Realty LP,
5.950%, 2/15/2017 | | | 226,531 | |
| | | | | | | | |
| | | | REITs – Office Property – 0.5% | | | | |
| | 3,485,000 | | | Highwoods Properties, Inc.,
5.850%, 3/15/2017 | | | 3,708,971 | |
| | 475,000 | | | Highwoods Properties, Inc.,
7.500%, 4/15/2018 | | | 542,944 | |
| | | | | | | | |
| | | | | | | 4,251,915 | |
| | | | | | | | |
| | | | REITs – Regional Malls – 0.1% | | | | |
| | 200,000 | | | Simon Property Group LP,
5.875%, 3/01/2017 | | | 221,889 | |
| | 290,000 | | | Simon Property Group LP,
6.100%, 5/01/2016 | | | 327,719 | |
| | | | | | | | |
| | | | | | | 549,608 | |
| | | | | | | | |
| | | | REITs – Single Tenant – 0.1% | | | | |
| | 185,000 | | | Realty Income Corp.,
5.750%, 1/15/2021 | | | 194,739 | |
| | 815,000 | | | Realty Income Corp.,
6.750%, 8/15/2019 | | | 929,961 | |
| | | | | | | | |
| | | | | | | 1,124,700 | |
| | | | | | | | |
| | | | REITs – Warehouse/Industrials – 0.0% | |
| | 100,000 | | | ProLogis,
5.625%, 11/15/2015 | | | 106,126 | |
| | 80,000 | | | ProLogis,
5.750%, 4/01/2016 | | | 85,928 | |
| | | | | | | | |
| | | | | | | 192,054 | |
| | | | | | | | |
| | | | Retailers – 0.9% | | | | |
| | 1,025,000 | | | Dillard’s, Inc.,
7.750%, 7/15/2026 | | | 984,000 | |
| | 1,100,000 | | | Foot Locker, Inc.,
8.500%, 1/15/2022 | | | 1,111,000 | |
| | 1,079,000 | | | J.C. Penney Corp., Inc.,
6.375%, 10/15/2036 | | | 972,449 | |
| | 575,000 | | | J.C. Penney Corp., Inc.,
7.125%, 11/15/2023 | | | 595,125 | |
| | 3,240,000 | | | Toys R Us, Inc.,
7.375%, 10/15/2018 | | | 3,248,100 | |
| | 750,000 | | | Toys R Us, Inc.,
7.875%, 4/15/2013 | | | 806,250 | |
| | | | | | | | |
| | | | | | | 7,716,924 | |
| | | | | | | | |
| | | | Sovereigns – 3.7% | | | | |
| | 2,915,000,000 | | | Indonesia Treasury Bond,
Series FR43,
10.250%, 7/15/2022, (IDR) | | | 380,037 | |
| | 33,387,000,000 | | | Indonesia Treasury Bond,
Series FR44,
10.000%, 9/15/2024, (IDR) | | | 4,206,513 | |
| | 7,590,000,000 | | | Indonesia Treasury Bond,
Series ZC3,
Zero Coupon, 11/20/2012, (IDR) | | | 789,435 | |
| | | | | | | | |
Principal
Amount (‡) | | | Description | | Value (†) | |
| | | | | | | | |
| | |
| | | | Sovereigns – continued | | | | |
| | 578,000(†††) | | | Mexican Fixed Rate Bonds,
Series M-10,
7.250%, 12/15/2016, (MXN) | | $ | 4,913,373 | |
| | 125,000(†††) | | | Mexican Fixed Rate Bonds,
Series M-10,
8.000%, 12/17/2015, (MXN) | | | 1,096,257 | |
| | 305,000(†††) | | | Mexican Fixed Rate Bonds,
Series M-20,
8.000%, 12/07/2023, (MXN) | | | 2,602,941 | |
| | 501,000(†††) | | | Mexican Fixed Rate Bonds,
Series MI-10,
9.000%, 12/20/2012, (MXN) | | | 4,453,399 | |
| | 14,885,000 | | | Republic of Brazil,
10.250%, 1/10/2028, (BRL) | | | 9,071,494 | |
| | 625,000 | | | Republic of Brazil,
12.500%, 1/05/2022, (BRL) | | | 444,063 | |
| | 157,270,000 | | | Republic of Iceland,
4.250%, 8/24/2012, (ISK) | | | 824,959 | |
| | 212,600,000 | | | Republic of Iceland,
7.250%, 5/17/2013, (ISK) | | | 1,192,984 | |
| | 294,565,000 | | | Republic of Iceland,
8.000%, 7/22/2011, (ISK) | | | 1,544,543 | |
| | | | | | | | |
| | | | | | | 31,519,998 | |
| | | | | | | | |
| | | | Supermarkets – 0.9% | | | | |
| | 25,000 | | | American Stores Co.,
8.000%, 6/01/2026 | | | 22,625 | |
| | 6,515,000 | | | New Albertson’s, Inc.,
7.450%, 8/01/2029 | | | 5,146,850 | |
| | 1,470,000 | | | New Albertson’s, Inc.,
7.750%, 6/15/2026 | | | 1,223,775 | |
| | 565,000 | | | New Albertson’s, Inc.,
8.000%, 5/01/2031 | | | 463,300 | |
| | 5,000 | | | New Albertson’s, Inc.,
8.700%, 5/01/2030 | | | 4,287 | |
| | 1,745,000 | | | New Albertson’s, Inc.,
Series C, MTN,
6.625%, 6/01/2028 | | | 1,265,125 | |
| | | | | | | | |
| | | | | | | 8,125,962 | |
| | | | | | | | |
| | | | Supranational – 3.4% | | | | |
| | 19,735,000 | | | Inter-American Development Bank, EMTN,
6.000%, 12/15/2017, (NZD) | | | 15,750,720 | |
| | 17,000,000 | | | International Bank for Reconstruction & Development,
1.430%, 3/05/2014, (SGD) | | | 13,541,994 | |
| | | | | | | | |
| | | | | | | 29,292,714 | |
| | | | | | | | |
| | | | Technology – 1.6% | | | | |
| | 5,215,000 | | | Agilent Technologies, Inc.,
6.500%, 11/01/2017 | | | 5,817,864 | |
| | 250,000 | | | Alcatel-Lucent USA, Inc.,
6.450%, 3/15/2029 | | | 215,000 | |
| | 1,645,000 | | | Avnet, Inc.,
6.000%, 9/01/2015 | | | 1,766,993 | |
| | 130,000 | | | Avnet, Inc.,
6.625%, 9/15/2016 | | | 142,284 | |
| | 450,000 | | | Corning, Inc.,
6.850%, 3/01/2029 | | | 506,481 | |
| | 1,175,000 | | | Corning, Inc.,
7.250%, 8/15/2036 | | | 1,341,466 | |
See accompanying notes to financial statements.
| 40
Portfolio of Investments – as of March 31, 2011 (Unaudited)
Loomis Sayles Fixed Income Fund – continued
| | | | | | | | |
Principal
Amount (‡) | | | Description | | Value (†) | |
| | | | | | | | |
| |
| | Bonds and Notes – continued | | | | |
| | |
| | | | Technology – continued | | | | |
| $ | 740,000 | | | Freescale Semiconductor, Inc.,
8.875%, 12/15/2014 | | $ | 766,825 | |
| | 815,000 | | | Motorola Solutions, Inc.,
6.500%, 11/15/2028 | | | 837,557 | |
| | 995,000 | | | Motorola Solutions, Inc.,
6.625%, 11/15/2037 | | | 1,067,637 | |
| | 150,000 | | | Nortel Networks Capital Corp.,
7.875%, 6/15/2026(d) | | | 110,250 | |
| | 1,325,000 | | | Nortel Networks Ltd.,
6.875%, 9/01/2023(d) | | | 344,500 | |
| | 984,300 | | | Samsung Electronics Co. Ltd.,
7.700%, 10/01/2027, 144A | | | 1,155,903 | |
| | | | | | | | |
| | | | | | | 14,072,760 | |
| | | | | | | | |
| | | | Tobacco – 0.5% | | | | |
| | 3,320,000 | | | Reynolds American, Inc.,
6.750%, 6/15/2017 | | | 3,796,593 | |
| | 810,000 | | | Reynolds American, Inc.,
7.250%, 6/15/2037 | | | 857,274 | |
| | | | | | | | |
| | | | | | | 4,653,867 | |
| | | | | | | | |
| | | | Transportation Services – 0.5% | | | | |
| | 2,500,000 | | | APL Ltd.,
8.000%, 1/15/2024(c) | | | 1,712,500 | |
| | 1,095,419 | | | Atlas Air Pass Through Trust,
Series 1998-1, Class B,
7.680%, 7/02/2015 | | | 1,084,465 | |
| | 976,627 | | | Atlas Air Pass Through Trust,
Series 1999-1, Class B,
7.630%, 7/02/2016 | | | 869,198 | |
| | 327,733 | | | Atlas Air Pass Through Trust,
Series 2000-1, Class B,
10.128%, 7/02/2017(e) | | | 331,011 | |
| | | | | | | | |
| | | | | | | 3,997,174 | |
| | | | | | | | |
| | | | Treasuries – 15.2% | | | | |
| | 175,000 | | | Canadian Government,
1.000%, 9/01/2011, (CAD) | | | 180,487 | |
| | 8,525,000 | | | Canadian Government,
1.250%, 12/01/2011, (CAD) | | | 8,797,941 | |
| | 19,910,000 | | | Canadian Government,
2.000%, 9/01/2012, (CAD) | | | 20,651,568 | |
| | 2,860,000 | | | Canadian Government,
3.500%, 6/01/2013, (CAD) | | | 3,050,037 | |
| | 18,145,000 | | | Canadian Government,
3.750%, 9/01/2011, (CAD) | | | 18,922,643 | |
| | 7,385,000 | | | Canadian Government,
3.750%, 6/01/2019, (CAD) | | | 7,900,312 | |
| | 9,615,000 | | | Canadian Government,
4.250%, 6/01/2018, (CAD) | | | 10,658,418 | |
| | 263,571 | | | Hellenic Republic Government Bond,
2.300%, 7/25/2030, (EUR) | | | 187,095 | |
| | 100,000 | | | Hellenic Republic Government Bond,
4.600%, 7/20/2018, (EUR) | | | 87,314 | |
| | 1,600,000 | | | Hellenic Republic Government Bond,
4.700%, 3/20/2024, (EUR) | | | 1,344,866 | |
| | | | | | | | |
Principal
Amount (‡) | | | Description | | Value (†) | |
| | | | | | | | |
| | |
| | | | Treasuries – continued | | | | |
| | 6,675,000 | | | Ireland Government Bond,
4.500%, 10/18/2018, (EUR) | | $ | 6,679,569 | |
| | 2,225,000 | | | Ireland Government Bond,
4.500%, 4/18/2020, (EUR) | | | 2,136,340 | |
| | 375,000 | | | Ireland Government Bond,
5.000%, 10/18/2020, (EUR) | | | 366,387 | |
| | 4,700,000 | | | Ireland Government Bond,
5.400%, 3/13/2025, (EUR) | | | 4,435,918 | |
| | 5,520,000 | | | New Zealand Government Bond,
6.500%, 4/15/2013, (NZD) | | | 4,461,812 | |
| | 56,415,000 | | | Norwegian Government,
4.250%, 5/19/2017, (NOK) | | | 10,612,630 | |
| | 9,425,000 | | | Norwegian Government,
5.000%, 5/15/2015, (NOK) | | | 1,813,387 | |
| | 11,705,000 | | | Norwegian Government,
6.000%, 5/16/2011, (NOK) | | | 2,125,325 | |
| | 8,410,000 | | | Norwegian Government,
6.500%, 5/15/2013, (NOK) | | | 1,633,469 | |
| | 1,500,000 | | | Portugal Obrigacoes do Tesouro OT,
3.850%, 4/15/2021, (EUR) | | | 1,491,886 | |
| | 375,000 | | | Portugal Obrigacoes do Tesouro OT,
4.800%, 6/15/2020, (EUR) | | | 412,389 | |
| | 23,565,000 | | | U.S. Treasury Bond,
4.250%, 11/15/2040 | | | 22,537,707 | |
| | | | | | | | |
| | | | | | | 130,487,500 | |
| | | | | | | | |
| | | | Utility Other – 0.0% | |
| | 200,000 | | | Listrindo Capital BV,
9.250%, 1/29/2015, 144A | | | 221,262 | |
| | | | | | | | |
| | | | Wireless – 1.2% | |
| | 1,745,000 | | | Nextel Communications, Inc.,
Series C,
5.950%, 3/15/2014 | | | 1,749,362 | |
| | 4,635,000 | | | Nextel Communications, Inc.,
Series D,
7.375%, 8/01/2015 | | | 4,652,381 | |
| | 165,000 | | | Nextel Communications, Inc.,
Series E,
6.875%, 10/31/2013 | | | 166,238 | |
| | 1,982,000 | | | Sprint Capital Corp.,
6.875%, 11/15/2028 | | | 1,828,395 | |
| | 1,020,000 | | | Sprint Capital Corp.,
6.900%, 5/01/2019 | | | 1,053,150 | |
| | 300,000 | | | Sprint Capital Corp.,
8.750%, 3/15/2032 | | | 319,125 | |
| | 898,000 | | | Sprint Nextel Corp.,
6.000%, 12/01/2016 | | | 901,368 | |
| | | | | | | | |
| | | | | | | 10,670,019 | |
| | | | | | | | |
| | | | Wirelines – 2.9% | |
| | 355,000 | | | AT&T Corp.,
6.500%, 3/15/2029 | | | 375,613 | |
| | 355,000 | | | Axtel SAB de CV,
9.000%, 9/22/2019, 144A | | | 340,800 | |
| | 195,000 | | | Bell Canada, MTN,
6.550%, 5/01/2029, 144A, (CAD) | | | 213,068 | |
| | 690,000 | | | Bell Canada, MTN,
7.300%, 2/23/2032, (CAD) | | | 804,542 | |
See accompanying notes to financial statements.
41 |
Portfolio of Investments – as of March 31, 2011 (Unaudited)
Loomis Sayles Fixed Income Fund – continued
| | | | | | | | |
Principal
Amount (‡) | | | Description | | Value (†) | |
| | | | | | | | |
| |
| | Bonds and Notes – continued | | | | |
| |
| | | | Wirelines – continued | |
| | 600,000 | | | Bell Canada, Series M-17,
6.100%, 3/16/2035, (CAD) | | $ | 614,315 | |
| | 235,000 | | | Embarq Corp.,
7.082%, 6/01/2016 | | | 267,240 | |
| | 200,000 | | | Embarq Corp.,
7.995%, 6/01/2036 | | | 225,480 | |
| | 350,000 | | | GTE Corp.,
6.940%, 4/15/2028 | | | 388,043 | |
| | 985,000 | | | Level 3 Financing, Inc.,
8.750%, 2/15/2017 | | | 977,613 | |
| | 500,000 | | | Level 3 Financing, Inc.,
9.250%, 11/01/2014 | | | 511,250 | |
| | 140,000 | | | Level 3 Financing, Inc.,
9.375%, 4/01/2019, 144A | | | 135,450 | |
| | 500,000 | | | Portugal Telecom International Finance BV, EMTN,
4.500%, 6/16/2025, (EUR) | | | 542,192 | |
| | 850,000 | | | Portugal Telecom International Finance BV, EMTN,
5.000%, 11/04/2019, (EUR) | | | 1,034,431 | |
| | 3,305,000 | | | Qwest Capital Funding, Inc.,
6.500%, 11/15/2018 | | | 3,371,100 | |
| | 7,205,000 | | | Qwest Capital Funding, Inc.,
6.875%, 7/15/2028 | | | 7,150,962 | |
| | 350,000 | | | Qwest Capital Funding, Inc.,
7.625%, 8/03/2021 | | | 364,000 | |
| | 775,000 | | | Qwest Capital Funding, Inc.,
7.750%, 2/15/2031 | | | 825,375 | |
| | 790,000 | | | Qwest Corp.,
6.875%, 9/15/2033 | | | 790,988 | |
| | 1,780,000 | | | Qwest Corp.,
7.200%, 11/10/2026 | | | 1,788,900 | |
| | 1,220,000 | | | Qwest Corp.,
7.250%, 9/15/2025 | | | 1,299,300 | |
| | 1,330,000 | | | Telecom Italia Capital SA,
6.000%, 9/30/2034 | | | 1,203,458 | |
| | 1,320,000 | | | Telecom Italia Capital SA,
6.375%, 11/15/2033 | | | 1,245,706 | |
| | | | | | | | |
| | | | | | | 24,469,826 | |
| | | | | | | | |
| | |
| | | | Total Non-Convertible Bonds | | | | |
| | | | (Identified Cost $585,697,164) | | | 657,398,789 | |
| | | | | | | | |
| |
| | Convertible Bonds – 9.1% | | | | |
| |
| | | | Airlines – 0.6% | |
| | 4,785,000 | | | AMR Corp.,
6.250%, 10/15/2014 | | | 5,036,213 | |
| | | | | | | | |
| | | | Automotive – 0.6% | |
| | 2,925,000 | | | Ford Motor Co.,
4.250%, 11/15/2016 | | | 5,301,563 | |
| | | | | | | | |
| | | | Diversified Manufacturing – 0.7% | |
| | 5,310,000 | | | Owens-Brockway Glass Container, Inc.,
3.000%, 6/01/2015, 144A | | | 5,383,012 | |
| | 510,000 | | | Trinity Industries, Inc.,
3.875%, 6/01/2036 | | | 555,900 | |
| | | | | | | | |
| | | | | | | 5,938,912 | |
| | | | | | | | |
| | | | | | | | |
Principal
Amount (‡) | | | Description | | Value (†) | |
| | | | | | | | |
| |
| | | | Electric – 0.1% | |
| $ | 500,000 | | | CMS Energy Corp.,
5.500%, 6/15/2029 | | $ | 726,875 | |
| | | | | | | | |
| | | | Healthcare – 0.2% | |
| | 1,270,000 | | | Omnicare, Inc.,
3.750%, 12/15/2025 | | | 1,636,713 | |
| | | | | | | | |
| | | | Independent Energy – 0.2% | |
| | 1,150,000 | | | Chesapeake Energy Corp.,
2.250%, 12/15/2038 | | | 1,056,562 | |
| | 675,000 | | | Chesapeake Energy Corp.,
2.500%, 5/15/2037 | | | 733,219 | |
| | | | | | | | |
| | | | | | | 1,789,781 | |
| | | | | | | | |
| | | | Life Insurance – 1.3% | | | | |
| | 11,000,000 | | | Old Republic International Corp.,
3.750%, 3/15/2018 | | | 11,041,250 | |
| | | | | | | | |
| | | | Lodging – 0.1% | | | | |
| | 1,245,000 | | | Host Hotels & Resorts, Inc.,
2.625%, 4/15/2027, 144A | | | 1,246,556 | |
| | | | | | | | |
| | | | Media Non-Cable – 0.0% | | | | |
| | 447,246 | | | Liberty Media LLC,
3.500%, 1/15/2031 | | | 250,458 | |
| | | | | | | | |
| | | | Metals & Mining – 0.4% | | | | |
| | 235,000 | | | Steel Dynamics, Inc.,
5.125%, 6/15/2014 | | | 300,800 | |
| | 1,540,000 | | | United States Steel Corp.,
4.000%, 5/15/2014 | | | 2,808,575 | |
| | | | | | | | |
| | | | | | | 3,109,375 | |
| | | | | | | | |
| | | | Non-Captive Diversified – 0.0% | | | | |
| | 380,000 | | | iStar Financial, Inc.,
0.803%, 10/01/2012(b) | | | 346,750 | |
| | | | | | | | |
| | | | Pharmaceuticals – 0.7% | | | | |
| | 175,000 | | | Human Genome Sciences, Inc.,
2.250%, 10/15/2011 | | | 310,188 | |
| | 205,000 | | | Human Genome Sciences, Inc.,
2.250%, 8/15/2012 | | | 332,100 | |
| | 1,065,000 | | | Nektar Therapeutics,
3.250%, 9/28/2012 | | | 1,072,987 | |
| | 1,095,000 | | | Valeant Pharmaceuticals International,
4.000%, 11/15/2013 | | | 4,325,250 | |
| | | | | | | | |
| | | | | | | 6,040,525 | |
| | | | | | | | |
| | | | Technology – 3.4% | | | | |
| | 4,065,000 | | | Ciena Corp.,
0.875%, 6/15/2017 | | | 3,968,456 | |
| | 2,810,000 | | | Ciena Corp.,
3.750%, 10/15/2018, 144A | | | 4,207,975 | |
| | 8,417,000 | | | Intel Corp.,
2.950%, 12/15/2035 | | | 8,658,989 | |
| | 7,000,000 | | | Intel Corp.,
3.250%, 8/01/2039 | | | 8,233,750 | |
| | 3,585,000 | | | Kulicke & Soffa Industries, Inc.,
0.875%, 6/01/2012 | | | 3,580,519 | |
| | 520,000 | | | Micron Technology, Inc.,
1.875%, 6/01/2014 | | | 565,500 | |
| | 248,000 | | | Nortel Networks Corp.,
2.125%, 4/15/2014(d) | | | 213,590 | |
| | | | | | | | |
| | | | | | | 29,428,779 | |
| | | | | | | | |
See accompanying notes to financial statements.
| 42
Portfolio of Investments – as of March 31, 2011 (Unaudited)
Loomis Sayles Fixed Income Fund – continued
| | | | | | | | |
Principal
Amount (‡) | | | Description | | Value (†) | |
| | | | | | | | |
| |
| | Bonds and Notes – continued | | | | |
| | |
| | | | Textile – 0.0% | | | | |
| $ | 52,000 | | | Dixie Yarns, Inc.,
7.000%, 5/15/2012 | | $ | 50,440 | |
| | | | | | | | |
| | | | Wirelines – 0.8% | | | | |
| | 820,000 | | | Level 3 Communications, Inc.,
3.500%, 6/15/2012 | | | 808,725 | |
| | 3,040,000 | | | Level 3 Communications, Inc.,
7.000%, 3/15/2015, 144A(c) | | | 3,537,800 | |
| | 1,990,000 | | | Level 3 Communications, Inc., Series B,
7.000%, 3/15/2015(c) | | | 2,315,862 | |
| | | | | | | | |
| | | | | | | 6,662,387 | |
| | | | | | | | |
| | |
| | | | Total Convertible Bonds | | | | |
| | | | (Identified Cost $65,011,374) | | | 78,606,577 | |
| | | | | | | | |
| |
| | Municipals – 0.8% | | | | |
| | |
| | | | Michigan – 0.2% | | | | |
| | 2,405,000 | | | Michigan Tobacco Settlement Finance Authority Taxable Turbo, Series A,
7.309%, 6/01/2034(c) | | | 1,705,890 | |
| | | | | | | | |
| | | | Virginia – 0.6% | | | | |
| | 7,725,000 | | | Virginia Tobacco Settlement Financing Corp., Series A-1,
6.706%, 6/01/2046(c) | | | 4,858,639 | |
| | | | | | | | |
| | |
| | | | Total Municipals | | | | |
| | | | (Identified Cost $10,110,743) | | | 6,564,529 | |
| | | | | | | | |
| | |
| | | | Total Bonds and Notes | | | | |
| | | | (Identified Cost $660,819,281) | | | 742,569,895 | |
| | | | | | | | |
| |
| | Bank Loans – 0.1% | | | | |
| | |
| | | | Media Non-Cable – 0.1% | | | | |
| | 576,317 | | | SuperMedia, Inc., Exit Term Loan,
11.000%, 12/31/2015(f) | | | 380,761 | |
| | | | | | | | |
| | | | Wireless – 0.0% | | | | |
| | 241,769 | | | Hawaiian Telcom Communications, Inc., Exit Term Loan,
9.000%, 11/01/2015(f)(g) | | | 246,242 | |
| | | | | | | | |
| | |
| | | | Total Bank Loans | | | | |
| | | | (Identified Cost $988,657) | | | 627,003 | |
| | | | | | | | |
| | |
| | Shares | | | | | | | |
|
| | Preferred Stocks – 3.3% | |
|
| | Convertible Preferred Stocks – 2.6% | |
| | |
| | | | Automotive – 0.8% | | | | |
| | 93,100 | | | General Motors Co., Series B,
4.750% | | | 4,487,420 | |
| | | | | | | | |
Shares | | | Description | | Value (†) | |
| | | | | | | | |
| | |
| | | | Automotive – continued | | | | |
| | 40,805 | | | Goodyear Tire & Rubber Co. (The), 5.875% | | $ | 2,084,319 | |
| | | | | | | | |
| | | | | | | 6,571,739 | |
| | | | | | | | |
| | | | Capital Markets – 0.1% | | | | |
| | 25,075 | | | Newell Financial Trust I, 5.250% | | | 1,200,466 | |
| | | | | | | | |
| | | | Diversified Financial Services – 0.6% | |
| | 2,844 | | | Bank of America Corp., Series L,
7.250% | | | 2,875,256 | |
| | 55,343 | | | Sovereign Capital Trust IV, 4.375% | | | 2,462,763 | |
| | | | | | | | |
| | | | | | | 5,338,019 | |
| | | | | | | | |
| | | | Electric Utilities – 0.1% | | | | |
| | 10,000 | | | AES Trust III, 6.750% | | | 488,000 | |
| | | | | | | | |
| | | | Machinery – 0.2% | |
| | 30,199 | | | United Rentals Trust I, 6.500% | | | 1,419,353 | |
| | | | | | | | |
| | | | Oil, Gas & Consumable Fuels – 0.4% | |
| | 775 | | | Chesapeake Energy Corp., 4.500% | | | 75,175 | |
| | 72,200 | | | El Paso Energy Capital Trust I, 4.750% | | | 3,194,850 | |
| | | | | | | | |
| | | | | | | 3,270,025 | |
| | | | | | | | |
| | | | REITs – Healthcare – 0.0% | |
| | 7,400 | | | Health Care REIT, Inc., Series I,
6.500% | | | 385,540 | |
| | | | | | | | |
| | | | Semiconductors & Semiconductor Equipment – 0.4% | |
| | 3,875 | | | Lucent Technologies Capital Trust I, 7.750% | | | 3,797,500 | |
| | | | | | | | |
| |
| | | | Total Convertible Preferred Stocks | |
| | | | (Identified Cost $18,927,754) | | | 22,470,642 | |
| | | | | | | | |
| |
| | Non-Convertible Preferred Stocks – 0.7% | | | | |
| |
| | | | Banking – 0.1% | |
| | 1,121 | | | Ally Financial, Inc., Series G,
7.000%, 144A | | | 1,043,091 | |
| | | | | | | | |
| | | | Diversified Financial Services – 0.0% | |
| | 5,000 | | | Bank of America Corp., 6.375% | | | 111,950 | |
| | | | | | | | |
| | | | Electric Utilities – 0.1% | |
| | 90 | | | Entergy New Orleans, Inc., 4.360% | | | 7,124 | |
| | 2,876 | | | Entergy New Orleans, Inc., 4.750% | | | 233,316 | |
| | 150 | | | MDU Resources Group, Inc., 5.100% | | | 15,084 | |
| | 4,670 | | | Union Electric Co., 4.500% | | | 354,920 | |
| | | | | | | | |
| | | | | | | 610,444 | |
| | | | | | | | |
| | | | Multi Utilities – 0.0% | |
| | 100 | | | Xcel Energy, Inc., Series D, 4.110% | | | 8,050 | |
| | | | | | | | |
| | | | Software – 0.4% | |
| | 3,000 | | | Falcons Funding Trust I, (Step to 10.875% on 3/15/2015, variable rate after 3/15/2020),
8.875%, 144A(h) | | | 3,240,937 | |
| | | | | | | | |
See accompanying notes to financial statements.
43 |
Portfolio of Investments – as of March 31, 2011 (Unaudited)
Loomis Sayles Fixed Income Fund – continued
| | | | | | | | |
Shares | | | Description | | Value (†) | |
| | | | | | | | |
| |
| | Non-Convertible Preferred Stocks – continued | | | | |
| |
| | | | Thrifts & Mortgage Finance – 0.1% | |
| | 20,975 | | | Countrywide Capital IV, 6.750% | | $ | 519,551 | |
| | | | | | | | |
| |
| | | | Total Non-Convertible Preferred Stocks | |
| | | | (Identified Cost $4,149,005) | | | 5,534,023 | |
| | | | | | | | |
| | |
| | | | Total Preferred Stocks | | | | |
| | | | (Identified Cost $23,076,759) | | | 28,004,665 | |
| | | | | | | | |
| |
| | Common Stocks – 2.6% | | | | |
| |
| | | | Biotechnology – 0.7% | |
| | 127,420 | | | Vertex Pharmaceuticals, Inc.(e) | | | 6,107,240 | |
| | | | | | | | |
| | | | Containers & Packaging – 0.2% | |
| | 35,353 | | | Owens-Illinois, Inc.(e) | | | 1,067,307 | |
| | 447 | | | Smurfit-Stone Container Corp.(e) | | | 17,277 | |
| | | | | | | | |
| | | | | | | 1,084,584 | |
| | | | | | | | |
| | | | Diversified Telecommunication Services – 0.0% | |
| | 8,050 | | | Hawaiian Telcom Holdco, Inc.(e) | | | 211,312 | |
| | | | | | | | |
| | | | Electronic Equipment, Instruments & Components – 0.5% | |
| | 205,167 | | | Corning, Inc. | | | 4,232,595 | |
| | | | | | | | |
| | | | Media – 0.0% | |
| | 3,027 | | | SuperMedia, Inc.(e) | | | 18,888 | |
| | | | | | | | |
| | | | Oil, Gas & Consumable Fuels – 0.2% | |
| | 54,259 | | | Chesapeake Energy Corp. | | | 1,818,762 | |
| | | | | | | | |
| | | | Pharmaceuticals – 0.1% | |
| | 20,881 | | | Valeant Pharmaceuticals International, Inc. | | | 1,040,083 | |
| | | | | | | | |
| | | | Semiconductors & Semiconductor Equipment – 0.9% | |
| | 388,905 | | | Intel Corp. | | | 7,844,214 | |
| | | | | | | | |
| | |
| | | | Total Common Stocks | | | | |
| | | | (Identified Cost $15,586,737) | | | 22,357,678 | |
| | | | | | | | |
| | |
| Principal
Amount (‡) |
| | | | | | |
| |
| | Short-Term Investments – 6.5% | | | | |
| $ | 56,191,130 | | | Tri-Party Repurchase Agreement with Fixed Income Clearing Corporation, dated 3/31/2011 at 0.000% to be repurchased at $56,191,130 on 4/01/2011 collateralized by $60,255,000 Federal Home Loan Mortgage Corp., 3.310% due 11/10/2020 valued at $57,317,569 including accrued interest (Note 2 of Notes to Financial Statements) (Identified Cost $56,191,130) | | | 56,191,130 | |
| | | | | | | | |
| | |
| | | | Total Investments – 98.8% | | | | |
| | | | (Identified Cost $756,662,564)(a) | | | 849,750,371 | |
| | | | Other assets less liabilities—1.2% | | | 10,367,347 | |
| | | | | | | | |
| | |
| | | | Net Assets – 100.0% | | $ | 860,117,718 | |
| | | | | | | | |
| | | | | | | | |
| | (‡) | | | Principal amount stated in U.S. dollars unless otherwise noted. | |
| | (†) | | | See Note 2 of Notes to Financial Statements. | |
| | (††) | | | Amount shown represents units. One unit represents a principal amount of 25. | |
| | (†††) | | | Amount shown represents units. One unit represents a principal amount of 100. | |
| | (a) | | | Federal Tax Information (Amounts exclude certain adjustments made at the end of the Fund’s fiscal year for tax purposes. Such adjustments are primarily due to wash sales. Amortization of premium on debt securities is excluded for tax purposes.): | |
| | | | At March 31, 2011, the net unrealized appreciation on investments based on a cost of $758,493,488 for federal income tax purposes was as follows: | |
| | | | Aggregate gross unrealized appreciation for all investments in which there is an excess of value over tax cost | | $ | 104,975,578 | |
| | | | Aggregate gross unrealized depreciation for all investments in which there is an excess of tax cost over value | | | (13,718,695 | ) |
| | | | | | | | |
| | | | Net unrealized appreciation | | $ | 91,256,883 | |
| | | | | | | | |
| | (b) | | | Variable rate security. Rate as of March 31, 2011 is disclosed. | |
| | (c) | | | Illiquid security. At March 31, 2011, the value of these securities amounted to $22,717,406 or 2.6% of net assets. | |
| | (d) | | | The issuer is in default with respect to interest and/or principal payments. Income is not being accrued. | |
| | (e) | | | Non-income producing security. | |
| | (f) | | | Variable rate security. Rate shown represents the weighted average rate at March 31, 2011. | |
| | (g) | | | All or a portion of interest payment is paid-in-kind. | |
| | (h) | | | Coupon rate is a fixed rate for an initial period then resets at a specified date and rate. | |
| |
| | 144A | | | All or a portion of these securities are exempt from registration under Rule 144A of the Securities Act of 1933. These securities may be resold in transactions exempt from registration, normally to qualified institutional buyers. At March 31, 2011, the value of Rule 144A holdings amounted to $77,951,040 or 9.1% of net assets. | |
| | ABS | | | Asset-Backed Securities | |
| | EMTN | | | Euro Medium Term Note | |
| | GMTN | | | Global Medium Term Note | |
| | MTN | | | Medium Term Note | |
| | REITs | | | Real Estate Investment Trusts | |
| |
| | AUD | | | Australian Dollar | |
| | BRL | | | Brazilian Real | |
| | CAD | | | Canadian Dollar | |
| | EUR | | | Euro | |
| | GBP | | | British Pound | |
| | IDR | | | Indonesian Rupiah | |
| | ISK | | | Icelandic Krona | |
| | KRW | | | South Korean Won | |
| | MXN | | | Mexican Peso | |
| | NOK | | | Norwegian Krone | |
| | NZD | | | New Zealand Dollar | |
| | SGD | | | Singapore Dollar | |
Industry Summary at March 31, 2011 (Unaudited)
| | | | |
Treasuries | | | 15.2 | % |
Banking | | | 5.8 | |
Non-Captive Diversified | | | 5.8 | |
Local Authorities | | | 5.2 | |
Technology | | | 5.0 | |
Automotive | | | 4.1 | |
Sovereigns | | | 3.7 | |
Non-Captive Consumer | | | 3.7 | |
Wirelines | | | 3.7 | |
Electric | | | 3.6 | |
Supranational | | | 3.4 | |
Healthcare | | | 2.8 | |
Life Insurance | | | 2.4 | |
Other Investments, less than 2% each | | | 27.9 | |
Short-Term Investments | | | 6.5 | |
| | | | |
Total Investments | | | 98.8 | |
Other assets less liabilities | | | 1.2 | |
| | | | |
Net Assets | | | 100.0 | % |
| | | | |
See accompanying notes to financial statements.
| 44
Portfolio of Investments – as of March 31, 2011 (Unaudited)
Loomis Sayles Fixed Income Fund – continued
Currency Exposure at March 31, 2011 (Unaudited)
| | | | |
United States Dollar | | | 69.5 | % |
Canadian Dollar | | | 12.6 | |
New Zealand Dollar | | | 3.8 | |
Euro | | | 2.4 | |
Other, less than 2% each | | | 10.5 | |
| | | | |
Total Investments | | | 98.8 | |
Other assets less liabilities | | | 1.2 | |
| | | | |
Net Assets | | | 100.0 | % |
| | | | |
See accompanying notes to financial statements.
45 |
Portfolio of Investments – as of March 31, 2011 (Unaudited)
Loomis Sayles Global Bond Fund
| | | | | | | | |
Principal
Amount (‡) | | | Description | | Value (†) | |
| | | | | | | | |
|
| | Bonds and Notes – 96.0% of Net Assets | |
|
| | Non-Convertible Bonds – 95.5% | |
| | |
| | | | Argentina – 1.2% | | | | |
| $ | 12,963,979 | | | Argentina Government International Bond,
8.280%, 12/31/2033 | | $ | 11,557,387 | |
| | 6,675,000 | | | Pan American Energy LLC,
7.875%, 5/07/2021, 144A | | | 7,184,303 | |
| | 8,320,000 | | | Transportadora de Gas del Sur SA,
7.875%, 5/14/2017, 144A | | | 8,216,000 | |
| | | | | | | | |
| | | | | | | 26,957,690 | |
| | | | | | | | |
| | | | Australia – 1.6% | | | | |
| | 5,180,000 | | | Asciano Finance Ltd.,
4.625%, 9/23/2020, 144A | | | 4,905,993 | |
| | 16,413,243 | | | Australia Government Bond,
3.000%, 9/20/2025, (AUD) | | | 17,635,748 | |
| | 6,804,311 | | | New South Wales Treasury Corp.,
2.750%, 11/20/2025, (AUD) | | | 6,654,001 | |
| | 2,700,000 | | | New South Wales Treasury Corp.,
6.000%, 5/01/2012, (AUD) | | | 2,823,381 | |
| | 6,000,000 | | | SMART Trust,
Series 2011-1USA, Class A3B,
1.104%, 10/14/2014, 144A(b) | | | 5,988,102 | |
| | | | | | | | |
| | | | | | | 38,007,225 | |
| | | | | | | | |
| | | | Bermuda – 0.5% | | | | |
| | 4,805,000 | | | Noble Group Ltd.,
8.500%, 5/30/2013, 144A | | | 5,369,587 | |
| | 6,905,000 | | | White Mountains Re Group Ltd.,
6.375%, 3/20/2017, 144A | | | 7,066,142 | |
| | | | | | | | |
| | | | | | | 12,435,729 | |
| | | | | | | | |
| | | | Brazil – 0.9% | | | | |
| | 7,000,000 | | | Banco Nacional de Desenvolvimento Economico e Social,
6.500%, 6/10/2019, 144A | | | 7,630,000 | |
| | 4,000,000 | | | Telemar Norte Leste SA,
5.125%, 12/15/2017, 144A, (EUR) | | | 5,524,243 | |
| | 7,444,000 | | | Telemar Norte Leste SA,
5.500%, 10/23/2020, 144A | | | 7,313,730 | |
| | | | | | | | |
| | | | | | | 20,467,973 | |
| | | | | | | | |
| | | | Canada – 7.7% | | | | |
| | 4,440,000 | | | Bell Aliant Regional Communications,
5.410%, 9/26/2016, (CAD) | | | 4,814,709 | |
| | 1,240,000 | | | Bell Canada, MTN,
5.000%, 2/15/2017, (CAD) | | | 1,334,672 | |
| | 160,000 | | | Bell Canada, MTN,
6.550%, 5/01/2029, 144A, (CAD) | | | 174,825 | |
| | 3,180,000 | | | Bell Canada, MTN,
7.300%, 2/23/2032, (CAD) | | | 3,707,890 | |
| | 3,090,000 | | | Bell Canada, Series M-17,
6.100%, 3/16/2035, (CAD) | | | 3,163,720 | |
| | | | | | | | |
Principal
Amount (‡) | | | Description | | Value (†) | |
| | | | | | | | |
| | |
| | | | Canada – continued | | | | |
| | 59,895,000 | | | Canadian Government,
3.000%, 12/01/2015, (CAD) | | $ | 62,697,308 | |
| | 10,595,000 | | | Corus Entertainment, Inc.,
7.250%, 2/10/2017, 144A, (CAD) | | | 11,665,975 | |
| | 5,212,000 | | | Ford Auto Securitization Trust,
Series 2010-R3A, Class D,
4.526%, 3/15/2017, 144A, (CAD) | | | 5,359,839 | |
| | 3,800,000 | | | Pacific Rubiales Energy Corp.,
8.750%, 11/10/2016, 144A | | | 4,341,500 | |
| | 14,540,000 | | | Province of British Columbia Canada,
2.850%, 6/15/2015 | | | 14,933,511 | |
| | 6,700,000 | | | Province of Ontario, EMTN,
4.000%, 12/03/2019, (EUR) | | | 9,580,000 | |
| | 766,000,000 | | | Province of Quebec Canada,
1.600%, 5/09/2013, (JPY) | | | 9,373,416 | |
| | 11,000,000 | | | Province of Quebec Canada, EMTN,
3.375%, 6/20/2016, (EUR) | | | 15,632,797 | |
| | 13,150,000 | | | Province of Quebec Canada,
Series 169, EMTN,
3.625%, 2/10/2015, (EUR) | | | 19,013,163 | |
| | 1,550,000 | | | Shaw Communications, Inc.,
6.500%, 6/02/2014, (CAD) | | | 1,739,341 | |
| | 9,500,000 | | | Shaw Communications, Inc.,
6.750%, 11/09/2039, (CAD) | | | 9,459,531 | |
| | | | | | | | |
| | | | | | | 176,992,197 | |
| | | | | | | | |
| | | | Cayman Islands – 2.3% | | | | |
| | 5,000,000 | | | CCL Finance Ltd.,
9.500%, 8/15/2014, 144A | | | 5,787,500 | |
| | 14,500,000 | | | Hyundai Capital Auto Funding Ltd.,
Series 2010-8A, Class A,
1.254%, 9/20/2016, 144A(b) | | | 14,401,038 | |
| | 5,500,000 | | | IPIC GMTN Ltd., MTN,
5.000%, 11/15/2020, 144A | | | 5,335,000 | |
| | 3,600,000 | | | Marfrig Overseas Ltd.,
9.500%, 5/04/2020, 144A | | | 3,753,000 | |
| | 1,170,000 | | | Marfrig Overseas Ltd.,
9.625%, 11/16/2016, 144A | | | 1,240,200 | |
| | 7,300,000 | | | Odebrecht Drilling Norbe VIII/IX Ltd.,
6.350%, 6/30/2021, 144A | | | 7,692,375 | |
| | 6,716,000 | | | Vale Overseas Ltd.,
6.875%, 11/21/2036 | | | 7,151,606 | |
| | 6,700,000 | | | Voto-Votorantim Ltd.,
6.750%, 4/05/2021, 144A | | | 7,102,000 | |
| | | | | | | | |
| | | | | | | 52,462,719 | |
| | | | | | | | |
| | | | Colombia – 0.6% | | | | |
| | 9,200,000,000 | | | Emgesa SA ESP,
8.750%, 1/25/2021, 144A, (COP) | | | 5,180,807 | |
| | 17,600,000,000 | | | Empresas Publicas de Medellin ESP,
8.375%, 2/01/2021, 144A, (COP) | | | 9,716,441 | |
| | | | | | | | |
| | | | | | | 14,897,248 | |
| | | | | | | | |
See accompanying notes to financial statements.
| 46
Portfolio of Investments – as of March 31, 2011 (Unaudited)
Loomis Sayles Global Bond Fund – continued
| | | | | | | | |
Principal
Amount (‡) | | | Description | | Value (†) | |
| | | | | | | | |
|
| | Bonds and Notes – continued | |
| | |
| | | | Denmark – 2.1% | | | | |
| | 210,000,000 | | | Denmark Government Bond,
4.000%, 11/15/2015, (DKK) | | $ | 42,019,399 | |
| | 3,970,000 | | | Kingdom of Denmark, EMTN,
1.750%, 10/05/2015, (EUR) | | | 5,396,763 | |
| | | | | | | | |
| | | | | | | 47,416,162 | |
| | | | | | | | |
| | | | Finland – 2.2% | | | | |
| | 24,215,000 | | | Finland Government Bond,
3.125%, 9/15/2014, (EUR) | | | 35,182,284 | |
| | 10,070,000 | | | Finland Government Bond,
3.875%, 9/15/2017, (EUR) | | | 14,823,494 | |
| | | | | | | | |
| | | | | | | 50,005,778 | |
| | | | | | | | |
| | | | France – 0.9% | | | | |
| | 7,362,000 | | | AXA SA,
7.125%, 12/15/2020, (GBP) | | | 12,628,791 | |
| | 5,000,000 | | | Lafarge SA, EMTN,
5.375%, 11/29/2018, (EUR) | | | 7,018,092 | |
| | 465,000 | | | Lafarge SA, EMTN,
4.750%, 3/23/2020, (EUR) | | | 605,863 | |
| | | | | | | | |
| | | | | | | 20,252,746 | |
| | | | | | | | |
| | | | Germany – 5.5% | | | | |
| | 29,855,000 | | | Bundesrepublik Deutschland,
3.250%, 1/04/2020, (EUR) | | | 42,221,637 | |
| | 11,365,000 | | | Bundesrepublik Deutschland,
3.750%, 7/04/2013, (EUR)(c) | | | 16,771,024 | |
| | 16,000,000 | | | Bundesrepublik Deutschland,
Series 6,
3.750%, 1/04/2017, (EUR) | | | 23,747,954 | |
| | 1,140,000,000 | | | Kreditanstalt fuer Wiederaufbau,
2.600%, 6/20/2037, (JPY) | | | 14,467,913 | |
| | 20,500,000 | | | Republic of Germany,
1.250%, 9/16/2011, (EUR) | | | 29,090,066 | |
| | | | | | | | |
| | | | | | | 126,298,594 | |
| | | | | | | | |
| | | | Hungary – 0.3% | | | | |
| | 6,250,000 | | | Hungary Government International Bond,
6.375%, 3/29/2021 | | | 6,256,250 | |
| | | | | | | | |
| | | | India – 0.8% | | | | |
| | 12,170,000 | | | Canara Bank Ltd., (fixed rate to 11/28/2016, variable rate thereafter),
6.365%, 11/28/2021 | | | 12,123,827 | |
| | 5,700,000 | | | ICICI Bank Ltd., (fixed rate to 4/30/2017, variable rate thereafter),
6.375%, 4/30/2022, 144A | | | 5,671,500 | |
| | | | | | | | |
| | | | | | | 17,795,327 | |
| | | | | | | | |
| | | | Indonesia – 0.2% | | | | |
| | 42,900,000,000 | | | Indonesia Government International Bond,
11.500%, 9/15/2019, (IDR) | | | 5,981,110 | |
| | | | | | | | |
| | | | Italy – 2.2% | | | | |
| | 4,850,000 | | | Finmeccanica SpA, EMTN,
4.875%, 3/24/2025, (EUR) | | | 6,494,218 | |
| | | | | | | | |
Principal
Amount (‡) | | | Description | | Value (†) | |
| | | | | | | | |
| | |
| | | | Italy – continued | | | | |
| | 33,530,000 | | | Italy Buoni Poliennali Del Tesoro,
4.000%, 9/01/2020, (EUR) | | $ | 45,048,199 | |
| | | | | | | | |
| | | | | | | 51,542,417 | |
| | | | | | | | |
| | | | Japan – 12.6% | | | | |
| | 400,000,000 | | | Development Bank of Japan,
1.750%, 3/17/2017, (JPY) | | | 5,071,195 | |
| | 5,630,000 | | | eAccess Ltd.,
8.250%, 4/01/2018, 144A | | | 5,721,769 | |
| | 3,100,000,000 | | | Japan Finance Organization for Municipal Enterprises,
1.350%, 11/26/2013, (JPY) | | | 38,222,613 | |
| | 1,200,000,000 | | | Japan Finance Organization for Municipal Enterprises,
1.550%, 2/21/2012, (JPY) | | | 14,593,359 | |
| | 7,100,000,000 | | | Japan Government Five Year Bond,
0.700%, 6/20/2014, (JPY) | | | 86,399,437 | |
| | 1,270,000,000 | | | Japan Government Ten Year Bond,
1.200%, 12/20/2020, (JPY) | | | 15,255,054 | |
| | 7,936,000,000 | | | Japan Government Ten Year Bond,
1.300%, 3/20/2019, (JPY) | | | 98,108,347 | |
| | 454,000,000 | | | Japan Government Ten Year Bond,
1.700%, 9/20/2017, (JPY) | | | 5,799,105 | |
| | 1,672,000,000 | | | Japan Government Two Year Bond,
0.200%, 2/15/2013, (JPY) | | | 20,101,227 | |
| | | | | | | | |
| | | | | | | 289,272,106 | |
| | | | | | | | |
| | | | Jersey – 0.3% | | | | |
| | 4,550,000 | | | WPP PLC,
6.000%, 4/04/2017, (GBP) | | | 7,778,146 | |
| | | | | | | | |
| | | | Korea – 1.0% | | | | |
| | 485,000,000 | | | Export-Import Bank of Korea,
4.000%, 11/26/2015, 144A, (PHP) | | | 10,716,935 | |
| | 11,600,000 | | | SK Telecom Co. Ltd.,
6.625%, 7/20/2027, 144A | | | 12,861,152 | |
| | | | | | | | |
| | | | | | | 23,578,087 | |
| | | | | | | | |
| | | | Lithuania – 0.2% | | | | |
| | 5,000,000 | | | Lithuania Government International Bond,
6.125%, 3/09/2021, 144A | | | 5,105,000 | |
| | | | | | | | |
| | | | Luxembourg – 1.3% | | | | |
| | 13,800,000 | | | ArcelorMittal,
7.000%, 10/15/2039 | | | 13,836,929 | |
| | 4,200,000 | | | Enel Finance International NV,
5.125%, 10/07/2019, 144A | | | 4,234,839 | |
| | 5,800,000 | | | Gazprom Via Gaz Capital SA,
5.092%, 11/29/2015, 144A | | | 6,053,460 | |
| | 4,127,000 | | | Telecom Italia Capital SA,
6.375%, 11/15/2033 | | | 3,894,720 | |
| | 1,007,000 | | | Telecom Italia Capital SA,
7.200%, 7/18/2036 | | | 1,010,582 | |
| | | | | | | | |
| | | | | | | 29,030,530 | |
| | | | | | | | |
See accompanying notes to financial statements.
47 |
Portfolio of Investments – as of March 31, 2011 (Unaudited)
Loomis Sayles Global Bond Fund – continued
| | | | | | | | |
Principal
Amount (‡) | | | Description | | Value (†) | |
| | | | | | | | |
|
| | Bonds and Notes – continued | |
| | |
| | | | Mexico – 3.2% | | | | |
| $ | 3,160,000 | | | Axtel SAB de CV,
7.625%, 2/01/2017, 144A | | $ | 2,970,400 | |
| | 4,715,000 | | | Axtel SAB de CV,
9.000%, 9/22/2019, 144A | | | 4,526,400 | |
| | 5,300,000 | | | BBVA Bancomer SA,
7.250%, 4/22/2020, 144A | | | 5,350,716 | |
| | 6,850,000 | | | Corporacion GEO SAB de CV,
9.250%, 6/30/2020, 144A | | | 7,620,625 | |
| | 8,400,000 | | | Desarrolladora Homex SAB de CV,
7.500%, 9/28/2015 | | | 8,652,000 | |
| | 2,027,500(††) | | | Mexican Fixed Rate Bonds, Series M-10,
8.000%, 12/17/2015, (MXN) | | | 17,781,290 | |
| | 1,735,500(††) | | | Mexican Fixed Rate Bonds, Series M-10,
8.500%, 12/13/2018, (MXN) | | | 15,625,329 | |
| | 1,373,000(††) | | | Mexican Fixed Rate Bonds, Series M-20,
8.000%, 12/07/2023, (MXN) | | | 11,717,501 | |
| | | | | | | | |
| | | | | | | 74,244,261 | |
| | | | | | | | |
| | | | Netherlands – 2.3% | | | | |
| | 10,000,000 | | | Allianz Finance II BV, EMTN,
4.750%, 7/22/2019, (EUR) | | | 14,681,038 | |
| | 950,000 | | | EDP Finance BV, EMTN,
8.625%, 1/04/2024, (GBP) | | | 1,573,149 | |
| | 12,995,000 | | | Kingdom of Netherlands,
5.500%, 1/15/2028, (EUR)(c) | | | 21,991,150 | |
| | 1,000,000 | | | OI European Group BV,
6.875%, 3/31/2017, 144A, (EUR) | | | 1,449,086 | |
| | 12,700,000 | | | Volkswagen International Finance NV,
2.875%, 4/01/2016, 144A | | | 12,516,231 | |
| | | | | | | | |
| | | | | | | 52,210,654 | |
| | | | | | | | |
| | | | New Zealand – 0.9% | | | | |
| | 26,500,000 | | | New Zealand Government Bond,
6.500%, 4/15/2013, (NZD) | | | 21,419,932 | |
| | | | | | | | |
| | | | Norway – 3.0% | | | | |
| | 139,050,000 | | | Norwegian Government,
4.250%, 5/19/2017, (NOK) | | | 26,157,693 | |
| | 223,125,000 | | | Norwegian Government,
4.500%, 5/22/2019, (NOK)(c) | | | 42,487,010 | |
| | | | | | | | |
| | | | | | | 68,644,703 | |
| | | | | | | | |
| | | | Peru – 0.4% | | | | |
| | 22,155,000 | | | Republic of Peru,
7.840%, 8/12/2020, 144A, (PEN) | | | 8,471,865 | |
| | | | | | | | |
| | | | Philippines – 0.4% | | | | |
| | 395,000,000 | | | Philippine Government International Bond,
6.250%, 1/14/2036, (PHP) | | | 8,596,711 | |
| | | | | | | | |
| | | | | | | | |
Principal
Amount (‡) | | | Description | | Value (†) | |
| | | | | | | | |
| | |
| | | | Poland – 1.3% | | | | |
| | 5,900,000 | | | Poland Government International Bond,
3.000%, 9/23/2014, (CHF) | | $ | 6,500,599 | |
| | 65,000,000 | | | Poland Government International Bond,
5.000%, 10/24/2013, (PLN) | | | 22,810,454 | |
| | | | | | | | |
| | | | | | | 29,311,053 | |
| | | | | | | | |
| | | | Singapore – 1.9% | | | | |
| | 27,845,000 | | | Singapore Government Bond,
1.625%, 4/01/2013, (SGD) | | | 22,613,343 | |
| | 24,355,000 | | | Singapore Government Bond,
2.250%, 7/01/2013, (SGD) | | | 20,122,814 | |
| | | | | | | | |
| | | | | | | 42,736,157 | |
| | | | | | | | |
| | | | South Africa – 1.0% | | | | |
| | 8,495,000 | | | Edcon Proprietary Ltd.,
4.423%, 6/15/2014, 144A, (EUR)(b) | | | 10,293,438 | |
| | 12,000,000 | | | Transnet Ltd.,
4.500%, 2/10/2016, 144A | | | 12,250,296 | |
| | | | | | | | |
| | | | | | | 22,543,734 | |
| | | | | | | | |
| | | | Supranationals – 3.7% | | | | |
| | 1,700,000,000 | | | Asian Development Bank, EMTN,
2.350%, 6/21/2027, (JPY) | | | 21,954,648 | |
| | 17,470,000 | | | European Investment Bank,
2.375%, 7/10/2020, (CHF) | | | 19,383,122 | |
| | 90,681,660,000 | | | European Investment Bank, EMTN,
Zero Coupon, 4/24/2013, 144A, (IDR) | | | 9,090,556 | |
| | 285,470,000,000 | | | Inter-American Development Bank, EMTN,
Zero Coupon, 8/20/2015, (IDR) | | | 22,667,121 | |
| | 503,700,000 | | | Inter-American Development Bank, EMTN,
4.750%, 1/10/2014, (INR) | | | 10,983,247 | |
| | | | | | | | |
| | | | | | | 84,078,694 | |
| | | | | | | | |
| | | | Sweden – 1.8% | | | | |
| | 250,275,000 | | | Sweden Government Bond,
5.500%, 10/08/2012, (SEK)(c) | | | 41,499,044 | |
| | | | | | | | |
| | | | Switzerland – 0.4% | | | | |
| | 8,500,000 | | | Credit Suisse of New York, MTN,
4.375%, 8/05/2020 | | | 8,302,469 | |
| | | | | | | | |
| | | | Turkey – 0.4% | | | | |
| | 8,500,000 | | | Akbank TAS,
5.125%, 7/22/2015, 144A | | | 8,532,300 | |
| | | | | | | | |
| | | | United Arab Emirates – 2.0% | |
| | 6,800,000 | | | Abu Dhabi National Energy Co.,
7.250%, 8/01/2018, 144A | | | 7,488,500 | |
| | 5,168,240 | | | Dolphin Energy Ltd.,
5.888%, 6/15/2019, 144A | | | 5,491,255 | |
| | 29,110,000 | | | DP World Ltd.,
6.850%, 7/02/2037, 144A | | | 26,781,200 | |
See accompanying notes to financial statements.
| 48
Portfolio of Investments – as of March 31, 2011 (Unaudited)
Loomis Sayles Global Bond Fund – continued
| | | | | | | | |
Principal
Amount (‡) | | | Description | | Value (†) | |
| | | | | | | | |
|
| | Bonds and Notes – continued | |
| |
| | | | United Arab Emirates – continued | |
| $ | 5,900,000 | | | Dubai Electricity & Water Authority,
6.375%, 10/21/2016, 144A | | $ | 5,944,250 | |
| | | | | | | | |
| | | | | | | 45,705,205 | |
| | | | | | | | |
| | | | United Kingdom – 6.1% | | | | |
| | 9,500,000 | | | Barclays Bank PLC,
6.050%, 12/04/2017, 144A | | | 9,897,794 | |
| | 950,000 | | | British Sky Broadcasting Group PLC, EMTN,
6.000%, 5/21/2027, (GBP) | | | 1,570,710 | |
| | 7,100,000 | | | British Telecommunications PLC,
5.750%, 12/07/2028, (GBP) | | | 10,937,638 | |
| | 4,300,000 | | | HSBC Bank PLC,
4.125%, 8/12/2020, 144A | | | 4,114,885 | |
| | 4,800,000 | | | Lloyds TSB Bank PLC, MTN,
6.500%, 9/14/2020, 144A | | | 4,718,909 | |
| | 13,775,000 | | | Rexam PLC,
6.750%, 6/01/2013, 144A | | | 14,945,544 | |
| | 6,500,000 | | | United Kingdom Treasury,
4.000%, 9/07/2016, (GBP) | | | 11,074,829 | |
| | 13,240,000 | | | United Kingdom Treasury,
4.000%, 3/07/2022, (GBP) | | | 21,493,835 | |
| | 15,075,000 | | | United Kingdom Treasury,
4.750%, 3/07/2020, (GBP) | | | 26,296,923 | |
| | 8,300,000 | | | United Kingdom Treasury,
5.000%, 3/07/2025, (GBP) | | | 14,614,649 | |
| | 11,620,000 | | | United Kingdom Treasury,
5.250%, 6/07/2012, (GBP) | | | 19,563,141 | |
| | | | | | | | |
| | | | | | | 139,228,857 | |
| | | | | | | | |
| | | | United States – 21.3% | | | | |
| | 3,895,000 | | | Ally Financial, Inc.,
6.875%, 8/28/2012 | | | 4,089,750 | |
| | 4,200,000 | | | Alta Wind Holdings LLC,
7.000%, 6/30/2035, 144A | | | 4,423,482 | |
| | 4,200,000 | | | Anadarko Petroleum Corp.,
6.375%, 9/15/2017 | | | 4,622,919 | |
| | 1,864,000 | | | Arch Western Finance LLC,
6.750%, 7/01/2013 | | | 1,882,640 | |
| | 5,655,000 | | | Avnet, Inc.,
5.875%, 6/15/2020 | | | 5,781,338 | |
| | 9,360,000 | | | Bank of America Corp.,
5.625%, 7/01/2020 | | | 9,609,687 | |
| | 300,000 | | | Bear Stearns Commercial Mortgage Securities,
Series 2006-PW13, Class A4,
5.540%, 9/11/2041 | | | 321,772 | |
| | 200,000 | | | Bear Stearns Commercial Mortgage Securities,
Series 2007-PW15, Class A4,
5.331%, 2/11/2044 | | | 209,518 | |
| | 100,000 | | | Bear Stearns Commercial Mortgage Securities,
Series 2007-PW16, Class A4,
5.906%, 6/11/2040(b) | | | 107,830 | |
| | 6,350,000 | | | Capital One Multi-Asset Execution Trust,
Series 2004-B7, Class B7,
1.502%, 8/17/2017, (EUR)(b) | | | 8,583,812 | |
| | | | | | | | |
Principal
Amount (‡) | | | Description | | Value (†) | |
| | | | | | | | |
| | |
| | | | United States – continued | | | | |
| $ | 5,000,000 | | | Caterpillar Financial Services Corp., Series F, MTN,
2.650%, 4/01/2016 | | $ | 4,962,365 | |
| | 2,498,666 | | | Centre Point Funding LLC,
Series 2010-1A, Class
1, 5.430%, 7/20/2016, 144A | | | 2,641,087 | |
| | 2,580,000 | | | CenturyLink, Inc., Series G,
6.875%, 1/15/2028 | | | 2,607,072 | |
| | 5,130,000 | | | Citibank Credit Card Issuance Trust,
Series 2001-A4, Class A4,
5.375%, 4/10/2013, (EUR) | | | 7,273,643 | |
| | 6,900,000 | | | Citigroup, Inc.,
5.500%, 2/15/2017 | | | 7,167,920 | |
| | 689,178 | | | Continental Airlines Pass Through Trust,
Series 2000-2, Class B,
8.307%, 10/02/2019 | | | 696,070 | |
| | 486,900 | | | Continental Airlines Pass Through Trust,
Series 2001-1, Class B,
7.373%, 6/15/2017 | | | 488,117 | |
| | 3,858,485 | | | Continental Airlines Pass Through Trust,
Series 2007-1, Class A,
5.983%, 10/19/2023 | | | 3,954,947 | |
| | 900,000 | | | Credit Suisse Mortgage Capital Certificates,
Series 2007-C4, Class A4,
5.995%, 9/15/2039(b) | | | 955,905 | |
| | 1,675,000 | | | Credit Suisse Mortgage Capital Certificates,
Series 2007-C5, Class A4,
5.695%, 9/15/2040 | | | 1,740,583 | |
| | 3,000,000 | | | Crown Castle Towers LLC,
3.214%, 8/15/2035, 144A | | | 2,991,840 | |
| | 6,300,000 | | | Crown Castle Towers LLC,
4.523%, 1/15/2035, 144A | | | 6,525,250 | |
| | 3,401,000 | | | Crown Castle Towers LLC,
6.113%, 1/15/2040, 144A | | | 3,686,184 | |
| | 8,590,000 | | | CSC Holdings LLC,
8.500%, 4/15/2014 | | | 9,631,537 | |
| | 4,000,000 | | | CSX Corp.,
6.150%, 5/01/2037 | | | 4,236,996 | |
| | 3,958,000 | | | CSX Corp., MTN,
6.000%, 10/01/2036 | | | 4,105,693 | |
| | 6,259,555 | | | Delta Air Lines Pass Through Trust,
Series 2007-1, Class A,
6.821%, 2/10/2024 | | | 6,462,990 | |
| | 1,615,479 | | | Delta Air Lines Pass Through Trust,
Series 2007-1, Class B,
8.021%, 2/10/2024 | | | 1,667,982 | |
| | 5,890,000 | | | DSC Floorplan Master Owner Trust,
Series 2011-1, Class A,
3.910%, 3/15/2016, 144A | | | 5,890,000 | |
| | 3,467,000 | | | Embarq Corp.,
7.995%, 6/01/2036 | | | 3,908,699 | |
| | 6,306,000 | | | Erac USA Finance Co.,
6.375%, 10/15/2017, 144A | | | 7,069,537 | |
See accompanying notes to financial statements.
49 |
Portfolio of Investments – as of March 31, 2011 (Unaudited)
Loomis Sayles Global Bond Fund – continued
| | | | | | | | |
Principal
Amount (‡) | | | Description | | Value (†) | |
| | | | | | | | |
|
| | Bonds and Notes – continued | |
| | |
| | | | United States – continued | | | | |
| $ | 120,000 | | | Erac USA Finance Co.,
6.700%, 6/01/2034, 144A | | $ | 123,958 | |
| | 7,530,000 | | | Erac USA Finance Co.,
7.000%, 10/15/2037, 144A | | | 8,204,146 | |
| | 12,790,000 | | | Extended Stay America Trust,
Series 2010-ESHA, Class D,
5.498%, 11/05/2027, 144A | | | 12,936,245 | |
| | 4,500,000 | | | Ford Motor Credit Co. LLC,
7.000%, 4/15/2015 | | | 4,870,917 | |
| | 480,000 | | | Frontier Communications Corp.,
6.625%, 3/15/2015 | | | 500,400 | |
| | 888,000,000 | | | General Electric Capital Corp., EMTN,
1.000%, 3/21/2012, (JPY) | | | 10,692,991 | |
| | 4,540,000 | | | Georgia-Pacific LLC,
7.250%, 6/01/2028 | | | 4,744,300 | |
| | 180,000 | | | Georgia-Pacific LLC,
8.000%, 1/15/2024 | | | 205,650 | |
| | 1,805,000 | | | Georgia-Pacific LLC,
8.875%, 5/15/2031 | | | 2,179,537 | |
| | 1,250,000 | | | Goldman Sachs Group, Inc. (The),
6.875%, 1/18/2038, (GBP) | | | 2,000,049 | |
| | 8,280,204 | | | Greenwich Capital Commercial Funding Corp.,
Series 2005-GG5, Class A2,
5.117%, 4/10/2037 | | | 8,363,885 | |
| | 1,000,000 | | | Greenwich Capital Commercial Funding Corp.,
Series 2007-GG11, Class A4,
5.736%, 12/10/2049 | | | 1,057,704 | |
| | 700,000 | | | Greenwich Capital Commercial Funding Corp.,
Series 2007-GG9, Class A4,
5.444%, 3/10/2039 | | | 740,924 | |
| | 3,535,000 | | | HCA, Inc.,
5.750%, 3/15/2014 | | | 3,601,281 | |
| | 1,270,000 | | | HCA, Inc.,
6.250%, 2/15/2013 | | | 1,317,625 | |
| | 1,205,000 | | | HCA, Inc.,
6.375%, 1/15/2015 | | | 1,229,100 | |
| | 2,440,000 | | | HCA, Inc.,
6.500%, 2/15/2016 | | | 2,482,700 | |
| | 770,000 | | | HCA, Inc.,
6.750%, 7/15/2013 | | | 809,463 | |
| | 525,000 | | | HCA, Inc.,
7.500%, 11/06/2033 | | | 481,688 | |
| | 635,000 | | | HCA, Inc.,
7.690%, 6/15/2025 | | | 604,838 | |
| | 624,000 | | | HCA, Inc., MTN,
7.580%, 9/15/2025 | | | 588,120 | |
| | 165,000 | | | HCA, Inc., MTN,
7.750%, 7/15/2036 | | | 154,275 | |
| | 5,000,000 | | | Hertz Vehicle Financing LLC,
Series 2009-2A, Class B1,
4.940%, 3/25/2016, 144A | | | 5,107,114 | |
| | 5,700,000 | | | HSBC USA, Inc.,
5.000%, 9/27/2020 | | | 5,596,773 | |
| | | | | | | | |
Principal
Amount (‡) | | | Description | | Value (†) | |
| | | | | | | | |
| | |
| | | | United States – continued | | | | |
| $ | 4,435,000 | | | Incitec Pivot Finance LLC,
6.000%, 12/10/2019, 144A | | $ | 4,647,122 | |
| | 1,875,000 | | | IPALCO Enterprises, Inc.,
7.250%, 4/01/2016, 144A | | | 2,029,688 | |
| | 1,105,000 | | | JPMorgan Chase & Co.,
4.400%, 7/22/2020 | | | 1,067,820 | |
| | 26,740,000,000 | | | JPMorgan Chase Bank NA, EMTN, Zero Coupon, 10/17/2011, 144A, (IDR) | | | 2,979,403 | |
| | 1,900,000 | | | JPMorgan Chase Commercial Mortgage Securities Corp.,
Series 2007-LD11, Class A4,
6.005%, 6/15/2049(b) | | | 2,034,930 | |
| | 300,000 | | | LB-UBS Commercial Mortgage Trust,
Series 2006-C4, Class A4,
6.078%, 6/15/2038(b) | | | 329,927 | |
| | 4,879,296 | | | Marriott Vacation Club Owner Trust,
Series 2009-2A, Class A,
4.809%, 7/20/2031, 144A | | | 5,004,218 | |
| | 5,200,000 | | | MBNA Credit Card Master Note Trust,
Series 2005-B3, Class B3,
1.314%, 3/19/2018, (EUR)(b) | | | 6,829,604 | |
| | 8,058,065 | | | Merrill Auto Trust Securitization,
Series 2008-1, Class A4A,
6.150%, 4/15/2015 | | | 8,256,163 | |
| | 1,000,000 | | | Merrill Lynch/Countrywide Commercial Mortgage Trust,
Series 2007-6, Class A4,
5.485%, 3/12/2051 | | | 1,047,353 | |
| | 2,070,000 | | | Morgan Stanley,
5.375%, 11/14/2013, (GBP) | | | 3,472,103 | |
| | 3,200,000 | | | Morgan Stanley,
5.500%, 7/24/2020 | | | 3,197,750 | |
| | 200,000 | | | Morgan Stanley Capital I,
Series 2008-T29, Class A4,
6.458%, 1/11/2043(b) | | | 224,041 | |
| �� | 125,000 | | | Motorola Solutions, Inc.,
6.500%, 9/01/2025 | | | 131,531 | |
| | 115,000 | | | Motorola Solutions, Inc.,
6.500%, 11/15/2028 | | | 118,183 | |
| | 6,120,000 | | | Motorola Solutions, Inc.,
6.625%, 11/15/2037 | | | 6,566,772 | |
| | 4,855,000 | | | Nabors Industries, Inc.,
6.150%, 2/15/2018 | | | 5,315,487 | |
| | 3,730,000 | | | News America, Inc.,
6.150%, 3/01/2037 | | | 3,695,960 | |
| | 540,000 | | | Nextel Communications, Inc., Series C,
5.950%, 3/15/2014 | | | 541,350 | |
| | 3,599,000 | | | Nextel Communications, Inc., Series E,
6.875%, 10/31/2013 | | | 3,625,992 | |
| | 5,080,000 | | | NII Capital Corp.,
7.625%, 4/01/2021 | | | 5,194,300 | |
| | 5,995,000 | | | Nissan Master Owner Trust Receivables,
Series 2010-AA, Class A,
1.405%, 1/15/2015, 144A(b) | | | 6,060,116 | |
See accompanying notes to financial statements.
| 50
Portfolio of Investments – as of March 31, 2011 (Unaudited)
Loomis Sayles Global Bond Fund – continued
| | | | | | | | |
Principal
Amount (‡) | | | Description | | Value (†) | |
| | | | | | | | |
|
| | Bonds and Notes – continued | |
| | |
| | | | United States – continued | | | | |
| $ | 3,745,000 | | | NRG Energy, Inc.,
8.250%, 9/01/2020, 144A | | $ | 3,894,800 | |
| | 7,740,000 | | | Owens & Minor, Inc.,
6.350%, 4/15/2016(d) | | | 7,941,194 | |
| | 2,170,000 | | | Owens-Brockway Glass Container, Inc.,
6.750%, 12/01/2014, (EUR) | | | 3,121,453 | |
| | 6,890,000 | | | ProLogis,
6.625%, 5/15/2018 | | | 7,463,041 | |
| | 5,770,000 | | | Prudential Financial, Inc.,
5.375%, 6/21/2020 | | | 6,008,289 | |
| | 3,410,000 | | | Qwest Capital Funding, Inc.,
7.750%, 2/15/2031 | | | 3,631,650 | |
| | 2,635,000 | | | Qwest Corp.,
6.875%, 9/15/2033 | | | 2,638,294 | |
| | 5,165,000 | | | Qwest Corp.,
7.250%, 10/15/2035 | | | 5,242,475 | |
| | 5,285,000 | | | Qwest Corp.,
7.500%, 6/15/2023 | | | 5,298,212 | |
| | 10,745,000 | | | Rowan Cos., Inc.,
7.875%, 8/01/2019 | | | 12,745,461 | |
| | 4,021,338 | | | Sierra Receivables Funding Co.,
Series 2009-3A, Class A1,
7.620%, 7/20/2026, 144A | | | 4,113,389 | |
| | 6,610,000 | | | SLM Corp., Series A, MTN,
5.000%, 10/01/2013 | | | 6,841,945 | |
| | 11,350,000 | | | Textron, Inc.,
3.875%, 3/11/2013, (EUR) | | | 15,996,471 | |
| | 12,420,718 | | | Trinity Rail Leasing LP,
Series 2010-1A, Class A,
5.194%, 10/16/2040, 144A | | | 12,419,420 | |
| | 59,020,000 | | | U.S. Treasury Note,
0.625%, 2/28/2013 | | | 58,874,752 | |
| | 10,710,000 | | | U.S. Treasury Note,
1.000%, 7/31/2011(e) | | | 10,740,545 | |
| | 5,395,000 | | | Valeant Pharmaceuticals International,
6.750%, 8/15/2021, 144A | | | 5,118,506 | |
| | 2,000,000 | | | Valeant Pharmaceuticals International,
7.250%, 7/15/2022, 144A | | | 1,935,000 | |
| | 300,000 | | | Wachovia Bank Commercial Mortgage Trust,
Series 2006-C29, Class A4,
5.308%, 11/15/2048 | | | 321,383 | |
| | 2,427,000 | | | Wells Fargo & Co.,
4.625%, 11/02/2035, (GBP) | | | 3,390,801 | |
| | 1,950,000 | | | Wells Fargo & Co.,
Series F, EMTN,
4.875%, 11/29/2035, (GBP) | | | 2,586,536 | |
| | 9,465,000 | | | World Financial Network Credit Card Master Trust, Series 2010-A, Class A,
3.960%, 4/15/2019 | | | 9,794,911 | |
| | 8,655,000 | | | Wyndham Worldwide Corp.,
5.750%, 2/01/2018 | | | 8,967,896 | |
| | 4,800,000 | | | Zurich Finance USA, Inc., EMTN, (fixed rate to 10/02/2013, variable rate thereafter),
5.750%, 10/02/2023, (EUR) | | | 7,047,946 | |
| | | | | | | | |
Principal
Amount (‡) | | | Description | | Value (†) | |
| | | | | | | | |
| | |
| | | | United States – continued | | | | |
| | 3,200,000 | | | Zurich Finance USA, Inc., EMTN, (fixed rate to 6/15/2015, variable rate thereafter),
4.500%, 6/15/2025, (EUR) | | $ | 4,518,435 | |
| | | | | | | | |
| | | | | | | 489,913,466 | |
| | | | | | | | |
| | | | Uruguay – 1.0% | | | | |
| | 193,274,130 | | | Uruguay Government International Bond,
3.700%, 6/26/2037, (UYU) | | | 10,226,006 | |
| | 221,244,863 | | | Uruguay Government International Bond,
5.000%, 9/14/2018, (UYU) | | | 13,634,814 | |
| | | | | | | | |
| | | | | | | 23,860,820 | |
| | | | | | | | |
| |
| | | | Total Non-Convertible Bonds | |
| | | | (Identified Cost $2,076,784,829) | | | 2,191,832,959 | |
| | | | | | | | |
| |
| | Convertible Bonds – 0.5% | | | | |
| | |
| | | | United States – 0.5% | | | | |
| | 5,375,000 | | | Ciena Corp.,
0.875%, 6/15/2017 | | | 5,247,344 | |
| | 1,500,000 | | | ERP Operating LP,
3.850%, 8/15/2026 | | | 1,535,700 | |
| | 3,820,000 | | | Hologic, Inc., (Step to Zero Coupon on 12/15/2013), 2.000%, 12/15/2037(f) | | | 3,686,300 | |
| | | | | | | | |
| | |
| | | | Total Convertible Bonds | | | | |
| | | | (Identified Cost $8,227,363) | | | 10,469,344 | |
| | | | | | | | |
| | |
| | | | Total Bonds and Notes | | | | |
| | | | (Identified Cost $2,085,012,192) | | | 2,202,302,303 | |
| | | | | | | | |
| |
| | Short-Term Investments – 3.6% | | | | |
| | 82,626,362 | | | Tri-Party Repurchase Agreement with Fixed Income Clearing Corporation, dated 3/31/2011 at 0.000% to be repurchased at $82,626,362 on 4/01/2011 collateralized by $39,085,000 Federal Home Loan Mortgage Corp., 3.310% due 11/10/2020 valued at $37,179,606; $49,515,000 Federal National Mortgage Association, 3.420% due 11/24/2020 valued at $47,101,144 including accrued interest (Note 2 of Notes to Financial Statements) | | | | |
| | | | (Identified Cost $82,626,362) | | | 82,626,362 | |
| | | | | | | | |
| | | | Total Investments – 99.6% | | | | |
| | | | (Identified Cost $2,167,638,554)(a) | | | 2,284,928,665 | |
| | | | Other Assets Less liabilities— 0.4% | | | 9,714,766 | |
| | | | | | | | |
| | | | Net Assets – 100.0% | | $ | 2,294,643,431 | |
| | | | | | | | |
See accompanying notes to financial statements.
51 |
Portfolio of Investments – as of March 31, 2011 (Unaudited)
Loomis Sayles Global Bond Fund – continued
| | | | | | | | |
| | |
| | (‡) | | | Principal amount stated in U.S. dollars unless otherwise noted. | | | | |
| | (†) | | | See Note 2 of Notes to Financial Statements. | | | | |
| | (††) | | | Amount shown represents units. One unit represents a principal amount of 100. | | | | |
| | (a) | | | Federal Tax Information (Amounts exclude certain adjustments made at the end of the Fund’s fiscal year for tax purposes. Such adjustments are primarily due to wash sales. Amortization of premium on debt securities is excluded for tax purposes.): | | | | |
| | | | At March 31, 2011, the net unrealized appreciation on investments based on a cost of $2,175,191,055 for federal income tax purposes was as follows: | | | | |
| | | | Aggregate gross unrealized appreciation for all investments in which there is an excess of value over tax cost | | | $ 120,399,851 | |
| | | | Aggregate gross unrealized depreciation for all investments in which there is an excess of tax cost over value | | | (10,662,241 | ) |
| | | | | | | | |
| | | | Net unrealized appreciation | | $ | 109,737,610 | |
| | | | | | | | |
| | (b) | | | Variable rate security. Rate as of March 31, 2011 is disclosed. | |
| | (c) | | | All or a portion of this security has been designated to cover the Fund’s obligations under open forward foreign currency contracts or futures contracts. | |
| | (d) | | | Illiquid security. At March 31, 2011, the value of this security amounted to $7,941,194 or 0.3% of net assets. | |
| | (e) | | | All or a portion of this security has been pledged for open forward foreign currency contracts and as initial margin for open futures contracts. | |
| | (f) | | | Coupon rate is a fixed rate for an initial period then resets at a specified date and rate. | |
| | | | | | |
| |
| | 144A | | | All or a portion of these securities are exempt from registration under Rule 144A of the Securities Act of 1933. These securities may be resold in transactions exempt from registration, normally to qualified institutional buyers. At March 31, 2011, the value of Rule 144A holdings amounted to $461,568,010 or 20.1% of net assets. |
| | EMTN | | | Euro Medium Term Note |
| | MTN | | | Medium Term Note |
| |
| | AUD | | | Australian Dollar |
| | CAD | | | Canadian Dollar |
| | CHF | | | Swiss Franc |
| | COP | | | Colombian Peso |
| | DKK | | | Danish Krone |
| | EUR | | | Euro |
| | GBP | | | British Pound |
| | IDR | | | Indonesian Rupiah |
| | INR | | | Indian Rupee |
| | JPY | | | Japanese Yen |
| | MXN | | | Mexican Peso |
| | NOK | | | Norwegian Krone |
| | NZD | | | New Zealand Dollar |
| | PEN | | | Peruvian Nuevo Sol |
| | PHP | | | Philippine Peso |
| | PLN | | | Polish Zloty |
| | SEK | | | Swedish Krona |
| | SGD | | | Singapore Dollar |
| | UYU | | | Uruguayan Peso |
At March 31, 2011, the Fund had the following open forward foreign currency contracts:
| | | | | | | | | | |
| Contract to Buy/Sell | | Delivery
Date | | Currency | | Units | | Notional
Value | | Unrealized
Appreciation
(Depreciation) |
Buy(1) | | 04/25/2011 | | Brazilian Real | | 18,150,000 | | $11,072,508 | | $ 201,478 |
Sell(1) | | 04/25/2011 | | Brazilian Real | | 18,150,000 | | 11,072,508 | | (275,364) |
Sell(1) | | 06/07/2011 | | Canadian Dollar | | 22,580,000 | | 23,256,237 | | (123,835) |
Sell(2) | | 06/15/2011 | | Danish Krone | | 230,000,000 | | 43,659,381 | | (1,109,732) |
Buy(3) | | 06/20/2011 | | Malaysian Ringgit | | 69,000,000 | | 22,662,331 | | 183,832 |
Buy(1) | | 05/27/2011 | | New Zealand Dollar | | 28,030,000 | | 21,314,377 | | 663,667 |
Sell(1) | | 05/27/2011 | | New Zealand Dollar | | 28,030,000 | | 21,314,377 | | (429,505) |
Buy(4) | | 06/02/2011 | | Polish Zloty | | 70,200,000 | | 24,598,914 | | 500,047 |
Sell(4) | | 06/02/2011 | | Polish Zloty | | 70,200,000 | | 24,598,914 | | (468,983) |
Buy(2) | | 04/13/2011 | | Singapore Dollar | | 29,000,000 | | 23,007,017 | | 602,814 |
Buy(2) | | 06/13/2011 | | South Korean Won | | 43,930,000,000 | | 39,871,508 | | 683,283 |
Buy(1) | | 06/13/2011 | | South Korean Won | | 23,100,000,000 | | 20,965,896 | | 344,579 |
Buy(5) | | 06/13/2011 | | South Korean Won | | 21,500,000,000 | | 19,513,713 | | 334,409 |
| | | | | | | | | | |
Total | | | | | | | | | | $ 1,106,690 |
| | | | | | | | | | |
At March 31, 2011, the Fund had the following open forward cross currency contracts:
| | | | | | |
| Settlement Date | | Deliver(5)/Units of Currency | | Receive/In Exchange For | | Unrealized
Appreciation |
06/16/2011 | | British Pound 14,203,235 | | Euro 16,520,000 | | $ 616,337 |
| (1) | Counterparty is Credit Suisse. |
| (2) | Counterparty is Barclays. |
| (3) | Counterparty is JPMorgan Chase. |
| (4) | Counterparty is Morgan Stanley. |
See accompanying notes to financial statements.
| 52
Portfolio of Investments – as of March 31, 2011 (Unaudited)
Loomis Sayles Global Bond Fund – continued
At March 31, 2011, open futures contracts sold were as follows:
| | | | | | | | |
| Financial Futures | | Expiration
Date | | Contracts | | Notional
Value | | Unrealized
Appreciation |
30 Year U.S. Treasury Bond | | 06/21/2011 | | 560 | | $67,305,000 | | $34,522 |
Industry Summary at March 31, 2011 (Unaudited)
| | | | |
Treasuries | | | 42.1 | % |
Sovereigns | | | 4.8 | |
Banking | | | 4.3 | |
Supranational | | | 3.7 | |
Government Guaranteed | | | 3.2 | |
Local Authorities | | | 3.1 | |
Wirelines | | | 2.6 | |
ABS Car Loan | | | 2.3 | |
Government Owned—No Guarantee | | | 2.2 | |
Life Insurance | | | 2.0 | |
Other Investments, less than 2% each | | | 25.7 | |
Short-Term Investments | | | 3.6 | |
| | | | |
Total Investments | | | 99.6 | |
Other assets less liabilities (including open forward foreign currency contracts and futures contracts) | | | 0.4 | |
| | | | |
Net Assets | | | 100.0 | % |
| | | | |
Currency Exposure at March 31, 2011 (Unaudited)
| | | | |
United States Dollar | | | 37.7 | % |
Euro | | | 16.6 | |
Japanese Yen | | | 14.9 | |
British Pound | | | 6.1 | |
Canadian Dollar | | | 4.5 | |
Norwegian Krone | | | 3.0 | |
Mexican Peso | | | 2.0 | |
Other, less than 2% each | | | 14.8 | |
| | | | |
Total Investments | | | 99.6 | |
Other assets less liabilities(including open forward foreign currency contracts and futures contracts) | | | 0.4 | |
| | | | |
Net Assets | | | 100.0 | % |
| | | | |
See accompanying notes to financial statements.
53 |
Portfolio of Investments – as of March 31, 2011 (Unaudited)
Loomis Sayles Inflation Protected Securities Fund
| | | | | | | | |
Principal
Amount (‡) | | | Description | | Value (†) | |
| | | | | | | | |
|
| | Bonds and Notes – 90.8% of Net Assets | |
| | |
| | | | Automotive – 0.4% | | | | |
| $ | 60,000 | | | Ford Motor Co.,
7.450%, 7/16/2031 | | $ | 64,957 | |
| | | | | | | | |
| | | | Banking – 1.5% | | | | |
| | 115,000 | | | Goldman Sachs Group, Inc. (The),
6.750%, 10/01/2037 | | | 115,992 | |
| | 145,000 | | | Lloyds TSB Bank PLC,
6.375%, 1/21/2021 | | | 151,104 | |
| | | | | | | | |
| | | | | | | 267,096 | |
| | | | | | | | |
| | | | Building Materials – 0.1% | | | | |
| | 10,000 | | | Masco Corp.,
7.125%, 3/15/2020 | | | 10,349 | |
| | | | | | | | |
| | | | Chemicals – 0.2% | | | | |
| | 25,000 | | | CF Industries, Inc.,
6.875%, 5/01/2018 | | | 28,063 | |
| | | | | | | | |
| | | | Collateralized Mortgage Obligations – 0.2% | |
| | 30,000 | | | NCUA Guaranteed Notes,
Series 2010-C1, Class A2,
2.900%, 10/29/2020 | | | 29,207 | |
| | | | | | | | |
| | | | Food & Beverage – 0.6% | | | | |
| | 40,000 | | | Bottling Group LLC, 5.125%, 1/15/2019 | | | 43,816 | |
| | 75,000 | | | Dean Foods Co.,
6.900%, 10/15/2017 | | | 69,563 | |
| | | | | | | | |
| | | | | | | 113,379 | |
| | | | | | | | |
| | | | Healthcare – 0.1% | | | | |
| | 15,000 | | | McKesson Corp.,
6.000%, 3/01/2041 | | | 15,531 | |
| | | | | | | | |
| | | | Independent Energy – 0.3% | | | | |
| | 35,000 | | | Chesapeake Energy Corp.,
6.500%, 8/15/2017 | | | 37,843 | |
| | 15,000 | | | SM Energy Co.,
6.625%, 2/15/2019, 144A | | | 15,394 | |
| | | | | | | | |
| | | | | | | 53,237 | |
| | | | | | | | |
| | | | Life Insurance – 0.4% | | | | |
| | 60,000 | | | Penn Mutual Life Insurance Co. (The),
7.625%, 6/15/2040, 144A | | | 64,866 | |
| | | | | | | | |
| | | | Lodging – 0.3% | | | | |
| | 50,000 | | | Royal Caribbean Cruises Ltd.,
7.500%, 10/15/2027 | | | 49,562 | |
| | | | | | | | |
| | | | Media Non-Cable – 0.2% | | | | |
| | 30,000 | | | CBS Corp.,
5.500%, 5/15/2033 | | | 27,188 | |
| | | | | | | | |
| | | | Metals & Mining – 0.7% | | | | |
| | 85,000 | | | Alcoa, Inc.,
5.950%, 2/01/2037 | | | 80,189 | |
| | 55,000 | | | United States Steel Corp.,
6.650%, 6/01/2037 | | | 50,600 | |
| | | | | | | | |
| | | | | | | 130,789 | |
| | | | | | | | |
| | | | Paper – 0.5% | | | | |
| | 70,000 | | | Georgia-Pacific LLC,
7.700%, 6/15/2015 | | | 79,275 | |
| | | | | | | | |
| | | | | | | | |
Principal
Amount (‡) | | | Description | | Value (†) | |
| | | | | | | | |
| | | | Pharmaceuticals – 0.1% | | | | |
| $ | 10,000 | | | Valeant Pharmaceuticals International,
6.750%, 10/01/2017, 144A | | $ | 9,850 | |
| | | | | | | | |
| | | | Pipelines – 0.2% | | | | |
| | 3,000 | | | Colorado Interstate Gas Co.,
5.950%, 3/15/2015 | | | 3,306 | |
| | 30,000 | | | Southern Natural Gas Co.,
7.350%, 2/15/2031 | | | 34,025 | |
| | | | | | | | |
| | | | | | | 37,331 | |
| | | | | | | | |
| | | | Sovereigns – 0.8% | | | | |
| | 15,000(††) | | | Mexican Fixed Rate Bonds, Series M-10,
8.000%, 12/17/2015, (MXN) | | | 131,551 | |
| | | | | | | | |
| | | | Technology – 0.7% | | | | |
| | 105,000 | | | Agilent Technologies, Inc.,
6.500%, 11/01/2017 | | | 117,138 | |
| | | | | | | | |
| | | | Textile – 0.0% | | | | |
| | 10,000 | | | Jones Apparel Group, Inc.,
6.125%, 11/15/2034 | | | 7,975 | |
| | | | | | | | |
| | | | Tobacco – 1.0% | | | | |
| | 130,000 | | | Altria Group, Inc.,
9.950%, 11/10/2038 | | | 181,323 | |
| | | | | | | | |
| | | | Treasuries – 79.5% | | | | |
| | 347,267 | | | U.S. Treasury Inflation Indexed Bond,
1.125%, 1/15/2021 | | | 352,340 | |
| | 208,086 | | | U.S. Treasury Inflation Indexed Bond,
1.250%, 4/15/2014 | | | 222,368 | |
| | 704,197 | | | U.S. Treasury Inflation Indexed Bond,
1.750%, 1/15/2028 | | | 717,731 | |
| | 149,768 | | | U.S. Treasury Inflation Indexed Bond,
2.000%, 1/15/2026 | | | 159,854 | |
| | 509,370 | | | U.S. Treasury Inflation Indexed Bond,
2.125%, 2/15/2040 | | | 538,619 | |
| | 64,247 | | | U.S. Treasury Inflation Indexed Bond,
2.375%, 1/15/2025 | | | 72,122 | |
| | 278,424 | | | U.S. Treasury Inflation Indexed Bond,
2.375%, 1/15/2027 | | | 310,030 | |
| | 1,011,008 | | | U.S. Treasury Inflation Indexed Bond,
3.375%, 4/15/2032 | | | 1,301,830 | |
| | 453,112 | | | U.S. Treasury Inflation Indexed Note,
1.375%, 1/15/2020 | | | 475,096 | |
| | 1,037,835 | | | U.S. Treasury Inflation Indexed Note,
1.625%, 1/15/2015 | | | 1,124,996 | |
| | 1,093,082 | | | U.S. Treasury Inflation Indexed Note,
1.625%, 1/15/2018 | | | 1,181,894 | |
| | 1,144,921 | | | U.S. Treasury Inflation Indexed Note,
1.875%, 7/15/2013 | | | 1,238,393 | |
| | 752,793 | | | U.S. Treasury Inflation Indexed Note,
1.875%, 7/15/2015 | | | 828,190 | |
| | 440,918 | | | U.S. Treasury Inflation Indexed Note,
2.000%, 1/15/2014 | | | 480,463 | |
| | 858,576 | | | U.S. Treasury Inflation Indexed Note,
2.000%, 7/15/2014 | | | 942,153 | |
| | 926,341 | | | U.S. Treasury Inflation Indexed Note,
2.000%, 1/15/2016 | | | 1,022,737 | |
| | 731,546 | | | U.S. Treasury Inflation Indexed Note,
2.375%, 1/15/2017 | | | 824,418 | |
| | 299,835 | | | U.S. Treasury Inflation Indexed Note,
2.500%, 7/15/2016 | | | 340,313 | |
See accompanying notes to financial statements.
| 54
Portfolio of Investments – as of March 31, 2011, (Unaudited)
Loomis Sayles Inflation Protected Securities Fund – continued
| | | | | | | | |
Principal
Amount (‡) | | | Description | | Value (†) | |
| | | | | | | | |
|
| | Bonds and Notes – continued | |
| | |
| | | | Treasuries – continued | | | | |
| $ | 642,752 | | | U.S. Treasury Inflation Indexed Note,
2.625%, 7/15/2017 | | $ | 738,211 | |
| | 673,547 | | | U.S. Treasury Inflation Indexed Note,
3.000%, 7/15/2012 | | | 721,432 | |
| | 820,000 | | | U.S. Treasury STRIPS,
Zero Coupon, 5/15/2040 | | | 203,685 | |
| | | | | | | | |
| | | | | | | 13,796,875 | |
| | | | | | | | |
| | | | Wireless – 0.6% | | | | |
| | 10,000 | | | Nextel Communications, Inc., Series C,
5.950%, 3/15/2014 | | | 10,025 | |
| | 20,000 | | | Nextel Communications, Inc., Series D,
7.375%, 8/01/2015 | | | 20,075 | |
| | 5,000 | | | Nextel Communications, Inc., Series E,
6.875%, 10/31/2013 | | | 5,038 | |
| | 85,000 | | | Sprint Capital Corp.,
6.875%, 11/15/2028 | | | 78,412 | |
| | | | | | | | |
| | | | | | | 113,550 | |
| | | | | | | | |
| | | | Wirelines – 2.4% | | | | |
| | 91,000 | | | AT&T, Inc.,
5.350%, 9/01/2040, 144A | | | 81,513 | |
| | 30,000 | | | Bell Canada, MTN,
5.000%, 2/15/2017, (CAD) | | | 32,291 | |
| | 5,000 | | | Bell Canada, MTN,
6.550%, 5/01/2029, 144A, (CAD) | | | 5,463 | |
| | 15,000 | | | Bell Canada, MTN,
7.300%, 2/23/2032, (CAD) | | | 17,490 | |
| | 35,000 | | | Bell Canada, Series M-17,
6.100%, 3/16/2035, (CAD) | | | 35,835 | |
| | 70,000 | | | BellSouth Telecommunications, Inc.,
7.000%, 12/01/2095 | | | 71,332 | |
| | 155,000 | | | Embarq Corp.,
7.995%, 6/01/2036 | | | 174,747 | |
| | | | | | | | |
| | | | | | | 418,671 | |
| | | | | | | | |
| | |
| | | | Total Bonds and Notes | | | | |
| | | | (Identified Cost $14,968,594) | | | 15,747,763 | |
| | | | | | | | |
| |
| | Short-Term Investments – 1.4% | | | | |
| | 250,190 | | | Tri-Party Repurchase Agreement with Fixed Income Clearing Corporation, dated 3/31/2011 at 0.000% to be repurchased at $250,190 on 4/01/2011 collateralized by $270,000 Federal Home Loan Mortgage Corp., 3.310% due 11/10/2020 valued at $256,838 including accrued interest (Note 2 of Notes to Financial Statements) (Identified Cost $250,190) | | | 250,190 | |
| | | | | | | | |
| | |
| | | | Total Investments – 92.2% | | | | |
| | | | (Identified Cost $15,218,784)(a) | | | 15,997,953 | |
| | | | Other Assets Less Liabilities—7.8% | | | 1,350,364 | |
| | | | | | | | |
| | |
| | | | Net Assets – 100.0% | | $ | 17,348,317 | |
| | | | | | | | |
| |
| | (‡) | | | Principal amount stated in U.S. dollars unless otherwise noted. | |
| | (†) | | | See Note 2 of Notes to Financial Statements | | | | |
| | | | | | | | |
| | (††) | | | Amount shown represents units. One unit represents a principal amount of 100. | |
| | (a) | | | Federal Tax Information (Amounts exclude certain adjustments made at the end of the Fund’s fiscal year for tax purposes. Such adjustments are primarily due to wash sales. Amortization of premium on debt securities is excluded for tax purposes.): | |
| | | | At March 31, 2011, the net unrealized appreciation on investments based on a cost of $15,359,770 for federal income tax purposes was as follows: | |
| | | | Aggregate gross unrealized appreciation for all investments in which there is an excess of value over tax cost | | $ | 694,510 | |
| | | | Aggregate gross unrealized depreciation for all investments in which there is an excess of tax cost over value | | | (56,327 | ) |
| | | | | | | | |
| | | | Net unrealized appreciation | | $ | 638,183 | |
| | | | | | | | |
| |
| | 144A | | | All or a portion of these securities are exempt from registration under Rule 144A of the Securities Act of 1933. These securities may be resold in transactions exempt from registration, normally to qualified institutional buyers. At March 31, 2011, the value of Rule 144A holdings amounted to $177,086 or 1.0% of net assets. | |
| | MTN | | | Medium Term Note | | | | |
| | STRIPS | | | Separate Trading of Registered Interest and Principal of Securities | |
| | |
| | CAD | | | Canadian Dollar | | | | |
| | MXN | | | Mexican Peso | | | | |
Industry Summary at March 31, 2011 (Unaudited)
| | | | |
Treasuries | | | 79.5 | % |
Wirelines | | | 2.4 | |
Other Investments, less than 2% each | | | 8.9 | |
Short-Term Investments | | | 1.4 | |
| | | | |
Total Investments | | | 92.2 | |
Other assets less liabilities | | | 7.8 | |
| | | | |
Net Assets | | | 100.0 | % |
| | | | |
See accompanying notes to financial statements.
55 |
Portfolio of Investments – as of March 31, 2011 (Unaudited)
Loomis Sayles Institutional High Income Fund
| | | | | | | | |
Principal
Amount (‡) | | | Description | | Value (†) | |
| | | | | | | | |
| |
| | Bonds and Notes – 86.4% of Net Assets | | | | |
| |
| | Non-Convertible Bonds – 64.2% | | | | |
| | |
| | | | Aerospace & Defense – 0.5% | | | | |
| | 135,000 | | | Bombardier, Inc.,
7.350%, 12/22/2026, (CAD) | | $ | 142,490 | |
| | 2,175,000 | | | Bombardier, Inc.,
7.450%, 5/01/2034, 144A | | | 2,088,000 | |
| | | | | | | | |
| | | | | | | 2,230,490 | |
| | | | | | | | |
| | | | Airlines – 1.2% | | | | |
| | 985,000 | | | Air Canada,
10.125%, 8/01/2015, 144A, (CAD) | | | 1,082,027 | |
| | 6,244 | | | American Airlines Pass Through Trust,
Series 1993-A6,
8.040%, 9/16/2011 | | | 6,244 | |
| | 338,154 | | | Continental Airlines Pass Through Trust,
Series 2000-2, Class A-1,
7.707%, 10/02/2022 | | | 366,052 | |
| | 137,581 | | | Continental Airlines Pass Through Trust,
Series 2000-2, Class B,
8.307%, 10/02/2019 | | | 138,957 | |
| | 153,373 | | | Continental Airlines Pass Through Trust,
Series 2001-1, Class B,
7.373%, 6/15/2017 | | | 153,757 | |
| | 382,815 | | | Delta Air Lines Pass Through Trust,
Series 2007-1, Class B,
8.021%, 2/10/2024 | | | 395,256 | |
| | 441,413 | | | Delta Air Lines Pass Through Trust,
Series 2007-1, Class C,
8.954%, 8/10/2014 | | | 457,967 | |
| | 1,773,000 | | | United Air Lines, Inc.,
9.875%, 8/01/2013, 144A | | | 1,872,731 | |
| | 585,000 | | | US Airways Pass Through Trust,
Series 2010-1, Class B,
8.500%, 4/22/2017 | | | 587,925 | |
| | | | | | | | |
| | | | | | | 5,060,916 | |
| | | | | | | | |
| | | | Automotive – 1.6% | | | | |
| | 500,000 | | | Cummins, Inc.,
6.750%, 2/15/2027 | | | 524,740 | |
| | 15,000 | | | Ford Motor Co.,
6.375%, 2/01/2029 | | | 14,171 | |
| | 20,000 | | | Ford Motor Co.,
6.500%, 8/01/2018 | | | 20,940 | |
| | 95,000 | | | Ford Motor Co.,
6.625%, 2/15/2028 | | | 92,244 | |
| | 1,945,000 | | | Ford Motor Co.,
6.625%, 10/01/2028 | | | 1,887,675 | |
| | 230,000 | | | Ford Motor Co.,
7.125%, 11/15/2025 | | | 223,307 | |
| | 1,905,000 | | | Ford Motor Co.,
7.450%, 7/16/2031 | | | 2,062,372 | |
| | 40,000 | | | Ford Motor Co.,
7.500%, 8/01/2026 | | | 40,160 | |
| | | | | | | | |
Principal
Amount (‡) | | | Description | | Value (†) | |
| | | | | | | | |
| | | | Automotive – continued | | | | |
| $ | 2,090,000 | | | Goodyear Tire & Rubber Co. (The),
7.000%, 3/15/2028 | | $ | 1,964,600 | |
| | | | | | | | |
| | | | | | | 6,830,209 | |
| | | | | | | | |
| | | | Banking – 0.5% | | | | |
| | 10,477,600,000 | | | BNP Paribas SA, EMTN,
Zero Coupon, 6/13/2011, 144A, (IDR) | | | 1,187,762 | |
| | 7,000,000,000 | | | JPMorgan Chase & Co., EMTN,
7.070%, 3/22/2014, (IDR) | | | 798,117 | |
| | | | | | | | |
| | | | | | | 1,985,879 | |
| | | | | | | | |
| | | | Building Materials – 1.9% | | | | |
| | 440,000 | | | Masco Corp.,
5.850%, 3/15/2017 | | | 431,415 | |
| | 750,000 | | | Masco Corp.,
6.125%, 10/03/2016 | | | 769,251 | |
| | 670,000 | | | Masco Corp.,
6.500%, 8/15/2032 | | | 604,532 | |
| | 1,225,000 | | | Owens Corning, Inc.,
7.000%, 12/01/2036 | | | 1,229,205 | |
| | 4,595,000 | | | USG Corp.,
6.300%, 11/15/2016 | | | 4,319,300 | |
| | 620,000 | | | USG Corp.,
9.750%, 1/15/2018 | | | 649,450 | |
| | | | | | | | |
| | | | | | | 8,003,153 | |
| | | | | | | | |
| | | | Chemicals – 2.6% | | | | |
| | 2,558,000 | | | Hercules, Inc.,
6.500%, 6/30/2029 | | | 2,151,917 | |
| | 475,000 | | | Hexion US Finance Corp./Hexion Nova Scotia Finance ULC,
8.875%, 2/01/2018 | | | 502,313 | |
| | 1,824,000 | | | Momentive Specialty Chemicals, Inc.,
7.875%, 2/15/2023 | | | 1,495,680 | |
| | 430,000 | | | Momentive Specialty Chemicals, Inc.,
8.375%, 4/15/2016 | | | 399,900 | |
| | 2,641,000 | | | Momentive Specialty Chemicals, Inc.,
9.200%, 3/15/2021 | | | 2,456,130 | |
| | 4,707,000 | | | Reichhold Industries, Inc.,
9.000%, 8/15/2014, 144A(b) | | | 4,148,044 | |
| | | | | | | | |
| | | | | | | 11,153,984 | |
| | | | | | | | |
| | | | Collateralized Mortgage Obligations – 0.3% | |
| | 546,572 | | | Banc of America Alternative Loan Trust,
Series 2007-1, Class 2A1,
5.763%, 4/25/2037(c) | | | 432,792 | |
| | 745,455 | | | Banc of America Funding Corp.,
Series 2007-8, Class 4A1,
6.000%, 8/25/2037 | | | 666,696 | |
| | 196,722 | | | WaMu Mortgage Pass Through Certificates, Series 2007-OA6, Class 2A,
2.734%, 7/25/2047(c) | | | 123,640 | |
| | | | | | | | |
| | | | | | | 1,223,128 | |
| | | | | | | | |
See accompanying notes to financial statements.
| 56
Portfolio of Investments – as of March 31, 2011 (Unaudited)
Loomis Sayles Institutional High Income Fund – continued
| | | | | | | | |
Principal
Amount (‡) | | | Description | | Value (†) | |
| | | | | | | | |
| |
| | Bonds and Notes – continued | | | | |
| |
| | | | Commercial Mortgage-Backed Securities – 0.3% | |
| $ | 555,000 | | | Credit Suisse Mortgage Capital Certificates, Series 2007-C5,
Class A4,
5.695%, 9/15/2040 | | $ | 576,730 | |
| | 91,563 | | | GSR Mortgage Loan Trust,
Series 2005-AR2, Class 2A1,
2.745%, 4/25/2035(c) | | | 82,574 | |
| | 415,000 | | | JPMorgan Chase Commercial Mortgage Securities Corp.,
Series 2007-LD11, Class A4,
6.005%, 6/15/2049(c) | | | 444,472 | |
| | 205,000 | | | JPMorgan Chase Commercial Mortgage Securities Corp.,
Series 2007-LDPX, Class A3,
5.420%, 1/15/2049 | | | 216,201 | |
| | | | | | | | |
| | | | | | | 1,319,977 | |
| | | | | | | | |
| | | | Construction Machinery – 0.6% | | | | |
| | 239,000 | | | RSC Equipment Rental, Inc./RSC Holdings III LLC,
9.500%, 12/01/2014 | | | 250,352 | |
| | 1,200,000 | | | Terex Corp.,
8.000%, 11/15/2017 | | | 1,264,500 | |
| | 965,000 | | | United Rentals North America, Inc.,
10.875%, 6/15/2016 | | | 1,114,575 | |
| | | | | | | | |
| | | | | | | 2,629,427 | |
| | | | | | | | |
| | | | Consumer Cyclical Services – 0.0% | |
| | 135,000 | | | ServiceMaster Co. (The),
7.100%, 3/01/2018 | | | 126,900 | |
| | 90,000 | | | ServiceMaster Co. (The),
7.450%, 8/15/2027 | | | 72,675 | |
| | | | | | | | |
| | | | | | | 199,575 | |
| | | | | | | | |
| | | | Consumer Products – 0.3% | | | | |
| | 945,000 | | | Acco Brands Corp.,
7.625%, 8/15/2015 | | | 963,900 | |
| | 400,000 | | | Visant Corp.,
10.000%, 10/01/2017 | | | 432,000 | |
| | | | | | | | |
| | | | | | | 1,395,900 | |
| | | | | | | | |
| | | | Electric – 2.3% | | | | |
| | 645,000 | | | AES Corp. (The),
7.750%, 10/15/2015 | | | 696,600 | |
| | 312,298 | | | AES Ironwood LLC,
8.857%, 11/30/2025 | | | 309,955 | |
| | 100,000 | | | Dynegy Holdings, Inc.,
7.125%, 5/15/2018 | | | 73,500 | |
| | 490,000 | | | Dynegy Holdings, Inc.,
7.625%, 10/15/2026 | | | 340,550 | |
| | 1,500,000 | | | Dynegy Holdings, Inc.,
7.750%, 6/01/2019 | | | 1,164,375 | |
| | 720,000 | | | Edison Mission Energy,
7.625%, 5/15/2027 | | | 536,400 | |
| | 287,056 | | | Midwest Generation LLC, Series B,
8.560%, 1/02/2016 | | | 292,797 | |
| | 1,685,000 | | | NGC Corp. Capital Trust I, Series B,
8.316%, 6/01/2027(b) | | | 859,350 | |
| | 680,625 | | | Quezon Power Philippines LC,
8.860%, 6/15/2017 | | | 741,881 | |
| | | | | | | | |
Principal
Amount (‡) | | | Description | | Value (†) | |
| | | | | | | | |
| | | | Electric – continued | | | | |
| $ | 1,025,000 | | | RRI Energy, Inc.,
7.875%, 6/15/2017 | | $ | 1,017,312 | |
| | 2,390,000 | | | Texas Competitive Electric Holdings Co. LLC, Series A,
10.250%, 11/01/2015 | | | 1,398,150 | |
| | 920,000 | | | TXU Corp., Series P,
5.550%, 11/15/2014 | | | 602,600 | |
| | 1,515,000 | | | TXU Corp., Series Q,
6.500%, 11/15/2024 | | | 708,263 | |
| | 420,000 | | | TXU Corp., Series R,
6.550%, 11/15/2034 | | | 193,200 | |
| | 1,000,000 | | | White Pine Hydro Portfolio LLC,
7.260%, 7/20/2015(b) | | | 948,150 | |
| | | | | | | | |
| | | | | | | 9,883,083 | |
| | | | | | | | |
| | | | Food & Beverage – 0.1% | | | | |
| | 255,000 | | | Smithfield Foods, Inc.,
7.750%, 7/01/2017 | | | 274,125 | |
| | | | | | | | |
| | | | Government Owned – No Guarantee – 0.8% | |
| | 400,000 | | | DP World Ltd.,
6.850%, 7/02/2037, 144A | | | 368,000 | |
| | 9,000,000,000 | | | Export-Import Bank of Korea,
6.600%, 11/04/2013, 144A, (IDR) | | | 998,656 | |
| | 16,700,000,000 | | | Export-Import Bank of Korea,
8.300%, 3/15/2014, 144A, (IDR) | | | 1,938,025 | |
| | | | | | | | |
| | | | | | | 3,304,681 | |
| | | | | | | | |
| | | | Healthcare – 4.5% | | | | |
| | 1,135,000 | | | Gentiva Health Services, Inc.,
11.500%, 9/01/2018 | | | 1,283,969 | |
| | 410,000 | | | HCA, Inc.,
5.750%, 3/15/2014 | | | 417,688 | |
| | 30,000 | | | HCA, Inc.,
6.250%, 2/15/2013 | | | 31,125 | |
| | 560,000 | | | HCA, Inc.,
6.375%, 1/15/2015 | | | 571,200 | |
| | 550,000 | | | HCA, Inc.,
6.500%, 2/15/2016 | | | 559,625 | |
| | 20,000 | | | HCA, Inc., 6.750%, 7/15/2013 | | | 21,025 | |
| | 1,020,000 | | | HCA, Inc.,
7.050%, 12/01/2027 | | | 907,800 | |
| | 965,000 | | | HCA, Inc.,
7.190%, 11/15/2015 | | | 969,825 | |
| | 865,000 | | | HCA, Inc.,
7.500%, 12/15/2023 | | | 817,425 | |
| | 4,240,000 | | | HCA, Inc.,
7.500%, 11/06/2033 | | | 3,890,200 | |
| | 1,370,000 | | | HCA, Inc.,
7.690%, 6/15/2025 | | | 1,304,925 | |
| | 375,000 | | | HCA, Inc.,
8.360%, 4/15/2024 | | | 375,000 | |
| | 600,000 | | | HCA, Inc., MTN,
7.580%, 9/15/2025 | | | 565,500 | |
| | 1,550,000 | | | HCA, Inc., MTN,
7.750%, 7/15/2036 | | | 1,449,250 | |
| | 6,874,000 | | | Tenet Healthcare Corp.,
6.875%, 11/15/2031 | | | 5,696,827 | |
| | 300,000 | | | Tenet Healthcare Corp.,
9.250%, 2/01/2015 | | | 330,375 | |
| | | | | | | | |
| | | | | | | 19,191,759 | |
| | | | | | | | |
See accompanying notes to financial statements.
57 |
Portfolio of Investments – as of March 31, 2011 (Unaudited)
Loomis Sayles Institutional High Income Fund – continued
| | | | | | | | |
Principal
Amount (‡) | | | Description | | Value (†) | |
| | | | | | | | |
| |
| | Bonds and Notes – continued | | | | |
| | |
| | | | Home Construction – 0.9% | | | | |
| $ | 185,000 | | | K. Hovnanian Enterprises, Inc.,
6.250%, 1/15/2015 | | $ | 153,550 | |
| | 1,068,000 | | | K. Hovnanian Enterprises, Inc.,
6.250%, 1/15/2016 | | | 795,660 | |
| | 425,000 | | | K. Hovnanian Enterprises, Inc.,
6.375%, 12/15/2014 | | | 385,687 | |
| | 272,000 | | | K. Hovnanian Enterprises, Inc., 6.500%, 1/15/2014 | | | 246,840 | |
| | 755,000 | | | K. Hovnanian Enterprises, Inc.,
7.500%, 5/15/2016 | | | 573,800 | |
| | 1,260,000 | | | KB Home,
7.250%, 6/15/2018 | | | 1,234,800 | |
| | 400,000 | | | Pulte Group, Inc.,
6.000%, 2/15/2035 | | | 313,000 | |
| | | | | | | | |
| | | | | | | 3,703,337 | |
| | | | | | | | |
| | | | Independent Energy – 1.4% | | | | |
| | 250,000 | | | Chesapeake Energy Corp.,
6.250%, 1/15/2017, (EUR) | | | 368,029 | |
| | 1,110,000 | | | Chesapeake Energy Corp.,
6.500%, 8/15/2017 | | | 1,200,187 | |
| | 1,415,000 | | | Chesapeake Energy Corp.,
6.875%, 11/15/2020 | | | 1,528,200 | |
| | 704,000 | | | Connacher Oil and Gas Ltd.,
10.250%, 12/15/2015, 144A | | | 746,240 | |
| | 910,000 | | | Pioneer Natural Resources Co.,
6.875%, 5/01/2018 | | | 987,768 | |
| | 920,000 | | | Pioneer Natural Resources Co.,
7.200%, 1/15/2028 | | | 959,364 | |
| | 415,000 | | | Swift Energy Co.,
7.125%, 6/01/2017 | | | 424,338 | |
| | | | | | | | |
| | | | | | | 6,214,126 | |
| | | | | | | | |
| | | | Life Insurance – 0.6% | | | | |
| | 1,810,000 | | | MetLife, Inc.,
10.750%, 8/01/2039 | | | 2,497,800 | |
| | | | | | | | |
| | | | Local Authorities – 3.9% | | | | |
| | 12,200,000 | | | Province of Ontario, Canada,
4.200%, 3/08/2018, (CAD) | | | 13,040,976 | |
| | 4,720,000 | | | Queensland Treasury Corp.,
7.125%, 9/18/2017, 144A, (NZD) | | | 3,902,592 | |
| | | | | | | | |
| | | | | | | 16,943,568 | |
| | | | | | | | |
| | | | Media Non-Cable – 0.9% | | | | |
| | 440,000 | | | Clear Channel Communications, Inc.,
5.000%, 3/15/2012 | | | 436,700 | |
| | 3,265,000 | | | Clear Channel Communications, Inc.,
5.750%, 1/15/2013 | | | 3,232,350 | |
| | | | | | | | |
| | | | | | | 3,669,050 | |
| | | | | | | | |
| | | | Metals & Mining – 3.0% | | | | |
| | 4,530,000 | | | Algoma Acquisition Corp.,
9.875%, 6/15/2015, 144A | | | 4,167,600 | |
| | 4,740,000 | | | United States Steel Corp.,
6.050%, 6/01/2017 | | | 4,888,125 | |
| | 2,020,000 | | | United States Steel Corp.,
6.650%, 6/01/2037 | | | 1,858,400 | |
| | | | | | | | |
Principal
Amount (‡) | | | Description | | Value (†) | |
| | | | | | | | |
| | | | Metals & Mining – continued | | | | |
| $ | 2,035,000 | | | United States Steel Corp.,
7.000%, 2/01/2018 | | $ | 2,113,856 | |
| | | | | | | | |
| | | | | | | 13,027,981 | |
| | | | | | | | |
| | | | Non-Captive Consumer – 4.6% | | | | |
| | 4,350,000 | | | Residential Capital LLC,
9.625%, 5/15/2015 | | | 4,388,062 | |
| | 750,000 | | | SLM Corp., Series A, MTN,
5.000%, 4/15/2015 | | | 755,123 | |
| | 115,000 | | | SLM Corp., Series A, MTN,
5.000%, 6/15/2018 | | | 108,068 | |
| | 4,550,000 | | | SLM Corp., Series A, MTN,
5.625%, 8/01/2033 | | | 3,890,013 | |
| | 2,020,000 | | | SLM Corp., Series A, MTN,
8.450%, 6/15/2018 | | | 2,262,400 | |
| | 1,250,000 | | | Springleaf Finance Corp.,
3.250%, 1/16/2013, (EUR) | | | 1,651,911 | |
| | 900,000 | | | Springleaf Finance Corp., MTN,
5.750%, 9/15/2016 | | | 810,000 | |
| | 680,000 | | | Springleaf Finance Corp., Series H, MTN,
5.375%, 10/01/2012 | | | 668,950 | |
| | 900,000 | | | Springleaf Finance Corp., Series I, MTN,
4.875%, 7/15/2012 | | | 884,250 | |
| | 2,920,000 | | | Springleaf Finance Corp., Series I, MTN,
5.850%, 6/01/2013 | | | 2,854,300 | |
| | 400,000 | | | Springleaf Finance Corp., Series J, MTN,
5.200%, 12/15/2011 | | | 399,000 | |
| | 300,000 | | | Springleaf Finance Corp., Series J, MTN,
5.900%, 9/15/2012 | | | 297,000 | |
| | 800,000 | | | Springleaf Finance Corp., Series J, MTN,
6.900%, 12/15/2017 | | | 731,000 | |
| | | | | | | | |
| | | | | | | 19,700,077 | |
| | | | | | | | |
| | | | Non-Captive Diversified – 3.8% | | | | |
| | 149,000 | | | Ally Financial, Inc.,
6.750%, 12/01/2014 | | | 157,009 | |
| | 585,000 | | | Ally Financial, Inc.,
8.000%, 12/31/2018 | | | 628,144 | |
| | 208,000 | | | Ally Financial, Inc.,
8.000%, 11/01/2031 | | | 226,720 | |
| | 313,032 | | | CIT Group, Inc.,
7.000%, 5/01/2013 | | | 318,901 | |
| | 894,866 | | | CIT Group, Inc.,
7.000%, 5/01/2014 | | | 911,645 | |
| | 894,866 | | | CIT Group, Inc.,
7.000%, 5/01/2015 | | | 902,696 | |
| | 2,021,450 | | | CIT Group, Inc.,
7.000%, 5/01/2016 | | | 2,023,977 | |
| | 5,013,031 | | | CIT Group, Inc.,
7.000%, 5/01/2017 | | | 5,019,297 | |
| | 250,000 | | | General Electric Capital Corp., Series A, EMTN,
6.750%, 9/26/2016, (NZD) | | | 198,250 | |
| | 3,035,000 | | | General Electric Capital Corp., Series A, MTN,
6.500%, 9/28/2015, (NZD) | | | 2,410,332 | |
See accompanying notes to financial statements.
| 58
Portfolio of Investments – as of March 31, 2011 (Unaudited)
Loomis Sayles Institutional High Income Fund – continued
| | | | | | | | |
Principal
Amount (‡) | | | Description | | Value (†) | |
| | | | | | | | |
| |
| | Bonds and Notes – continued | | | | |
| |
| | | | Non-Captive Diversified – continued | |
| $ | 490,000 | | | International Lease Finance Corp.,
8.250%, 12/15/2020 | | $ | 537,162 | |
| | 65,000 | | | iStar Financial, Inc.,
5.500%, 6/15/2012 | | | 64,350 | |
| | 110,000 | | | iStar Financial, Inc.,
5.850%, 3/15/2017 | | | 95,975 | |
| | 470,000 | | | iStar Financial, Inc.,
5.875%, 3/15/2016 | | | 418,300 | |
| | 20,000 | | | iStar Financial, Inc.,
6.050%, 4/15/2015 | | | 18,300 | |
| | 1,770,000 | | | iStar Financial, Inc.,
8.625%, 6/01/2013 | | | 1,796,550 | |
| | 120,000 | | | iStar Financial, Inc., Series B,
5.700%, 3/01/2014 | | | 112,200 | |
| | 565,000 | | | iStar Financial, Inc., Series B,
5.950%, 10/15/2013 | | | 535,337 | |
| | | | | | | | |
| | | | | | | 16,375,145 | |
| | | | | | | | |
| | | | Oil Field Services – 0.1% | | | | |
| | 210,000 | | | Parker Drilling Co.,
9.125%, 4/01/2018 | | | 225,750 | |
| | | | | | | | |
| | | | Packaging – 0.4% | | | | |
| | 1,555,000 | | | Owens-Illinois, Inc.,
7.800%, 5/15/2018 | | | 1,696,894 | |
| | | | | | | | |
| | | | Paper – 2.4% | | | | |
| | 1,240,000 | | | Georgia-Pacific LLC,
7.250%, 6/01/2028 | | | 1,295,800 | |
| | 3,620,000 | | | Georgia-Pacific LLC,
7.750%, 11/15/2029 | | | 3,977,475 | |
| | 1,270,000 | | | Georgia-Pacific LLC,
8.000%, 1/15/2024 | | | 1,450,975 | |
| | 2,930,000 | | | Georgia-Pacific LLC,
8.875%, 5/15/2031 | | | 3,537,975 | |
| | | | | | | | |
| | | | | | | 10,262,225 | |
| | | | | | | | |
| | | | Pipelines – 1.8% | | | | |
| | 1,430,000 | | | El Paso Corp.,
6.950%, 6/01/2028 | | | 1,448,742 | |
| | 1,055,000 | | | El Paso Corp.,
7.420%, 2/15/2037 | | | 1,079,668 | |
| | 2,210,000 | | | El Paso Corp., GMTN,
7.750%, 1/15/2032 | | | 2,476,486 | |
| | 550,000 | | | El Paso Corp., GMTN,
7.800%, 8/01/2031 | | | 610,148 | |
| | 1,105,000 | | | El Paso Corp., GMTN,
8.050%, 10/15/2030 | | | 1,257,214 | |
| | 1,000,000 | | | Transportadora de Gas del Sur SA,
7.875%, 5/14/2017, 144A | | | 987,500 | |
| | | | | | | | |
| | | | | | | 7,859,758 | |
| | | | | | | | |
| | | | Property & Casualty Insurance – 0.8% | |
| | 940,000 | | | MBIA Insurance Corp.,
(fixed rate to 1/15/2013,
variable rate thereafter),
14.000%, 1/15/2033, 144A | | | 517,000 | |
| | 3,245,000 | | | White Mountains Re Group Ltd., (fixed rate to 6/30/2017, variable rate thereafter),
7.506%, 5/29/2049, 144A | | | 3,104,232 | |
| | | | | | | | |
| | | | | | | 3,621,232 | |
| | | | | | | | |
| | | | | | | | |
Principal
Amount (‡) | | | Description | | Value (†) | |
| | | | | | | | |
| | | | Railroads – 0.1% | | | | |
| $ | 314,000 | | | Missouri Pacific Railroad Co.,
5.000%, 1/01/2045(b) | | $ | 214,305 | |
| | 30,000 | | | Missouri Pacific Railroad Co.,
Series A,
4.750%, 1/01/2020(b) | | | 27,900 | |
| | | | | | | | |
| | | | | | | 242,205 | |
| | | | | | | | |
| | | | REITs – Office Property – 0.1% | | | | |
| | 470,000 | | | Highwoods Properties, Inc.,
5.850%, 3/15/2017 | | | 500,205 | |
| | | | | | | | |
| | | | Retailers – 3.3% | | | | |
| | 430,000 | | | Dillard’s, Inc.,
6.625%, 1/15/2018 | | | 423,550 | |
| | 450,000 | | | Dillard’s, Inc.,
7.000%, 12/01/2028 | | | 400,500 | |
| | 750,000 | | | Dillard’s, Inc.,
7.130%, 8/01/2018 | | | 755,625 | |
| | 1,895,000 | | | Dillard’s, Inc.,
7.750%, 7/15/2026 | | | 1,819,200 | |
| | 125,000 | | | Dillard’s, Inc.,
7.750%, 5/15/2027 | | | 118,125 | |
| | 170,000 | | | Dillard’s, Inc.,
7.875%, 1/01/2023 | | | 165,750 | |
| | 1,679,000 | | | Foot Locker, Inc.,
8.500%, 1/15/2022 | | | 1,695,790 | |
| | 3,494,000 | | | Macy’s Retail Holdings, Inc.,
6.375%, 3/15/2037 | | | 3,494,000 | |
| | 295,000 | | | Macy’s Retail Holdings, Inc.,
7.000%, 2/15/2028 | | | 297,950 | |
| | 5,185,000 | | | Toys R Us, Inc.,
7.375%, 10/15/2018 | | | 5,197,962 | |
| | | | | | | | |
| | | | | | | 14,368,452 | |
| | | | | | | | |
| | | | Sovereigns – 2.8% | | | | |
| | 1,881,000,000 | | | Indonesia Treasury Bond,
Series FR43,
10.250%, 7/15/2022, (IDR) | | | 245,232 | |
| | 24,214,000,000 | | | Indonesia Treasury Bond,
Series FR44,
10.000%, 9/15/2024, (IDR) | | | 3,050,783 | |
| | 6,561,000,000 | | | Indonesia Treasury Bond,
Series FR52,
10.500%, 8/15/2030, (IDR) | | | 832,713 | |
| | 4,897,000,000 | | | Indonesia Treasury Bond,
Series ZC3, Zero Coupon,
11/20/2012, (IDR) | | | 509,336 | |
| | 208,681(††) | | | Mexican Fixed Rate Bonds,
Series M-10,
7.250%, 12/15/2016, (MXN) | | | 1,773,923 | |
| | 95,000(††) | | | Mexican Fixed Rate Bonds,
Series M-20,
8.000%, 12/07/2023, (MXN) | | | 810,752 | |
| | 180,000(††) | | | Mexican Fixed Rate Bonds,
Series MI-10,
9.000%, 12/20/2012, (MXN) | | | 1,600,024 | |
| | 4,170,000 | | | Republic of Brazil,
10.250%, 1/10/2028, (BRL) | | | 2,541,359 | |
| | 19,725,000 | | | Republic of Iceland,
4.250%, 8/24/2012, (ISK) | | | 103,467 | |
| | 49,000,000 | | | Republic of Iceland,
7.250%, 5/17/2013, (ISK) | | | 274,959 | |
See accompanying notes to financial statements.
59 |
Portfolio of Investments – as of March 31, 2011 (Unaudited)
Loomis Sayles Institutional High Income Fund – continued
| | | | | | | | |
Principal
Amount (‡) | | | Description | | Value (†) | |
| | | | | | | | |
| |
| | Bonds and Notes – continued | | | | |
| | |
| | | | Sovereigns – continued | | | | |
| | 59,020,000 | | | Republic of Iceland,
8.000%, 7/22/2011, (ISK) | | $ | 309,470 | |
| | | | | | | | |
| | | | | | | 12,052,018 | |
| | | | | | | | |
| | |
| | | | Supermarkets – 1.5% | | | | |
| | 110,000 | | | American Stores Co.,
8.000%, 6/01/2026 | | | 99,550 | |
| | 1,865,000 | | | American Stores Co., Series B, MTN,
7.100%, 3/20/2028 | | | 1,408,075 | |
| | 2,250,000 | | | New Albertson’s, Inc.,
7.450%, 8/01/2029 | | | 1,777,500 | |
| | 440,000 | | | New Albertson’s, Inc.,
7.750%, 6/15/2026 | | | 366,300 | |
| | 2,935,000 | | | New Albertson’s, Inc.,
8.000%, 5/01/2031 | | | 2,406,700 | |
| | 180,000 | | | New Albertson’s, Inc.,
8.700%, 5/01/2030 | | | 154,350 | |
| | 240,000 | | | New Albertson’s, Inc., Series C, MTN,
6.625%, 6/01/2028 | | | 174,000 | |
| | | | | | | | |
| | | | | | | 6,386,475 | |
| | | | | | | | |
| | |
| | | | Supranational – 0.2% | | | | |
| | 1,639,380,000 | | | European Investment Bank, EMTN, Zero Coupon,
4/24/2013, 144A, (IDR) | | | 164,343 | |
| | 8,600,000,000 | | | Inter-American Development Bank, EMTN,
Zero Coupon, 5/20/2013, (IDR) | | | 841,383 | |
| | | | | | | | |
| | | | | | | 1,005,726 | |
| | | | | | | | |
| | |
| | | | Technology – 3.1% | | | | |
| | 90,000 | | | Advanced Micro Devices, Inc.,
7.750%, 8/01/2020 | | | 92,475 | |
| | 6,580,000 | | | Alcatel-Lucent USA, Inc., 6.450%, 3/15/2029 | | | 5,658,800 | |
| | 3,055,000 | | | Alcatel-Lucent USA, Inc.,
6.500%, 1/15/2028 | | | 2,627,300 | |
| | 801,000 | | | Corning, Inc.,
6.850%, 3/01/2029 | | | 901,536 | |
| | 960,000 | | | Eastman Kodak Co.,
7.250%, 11/15/2013 | | | 955,200 | |
| | 60,000 | | | Freescale Semiconductor, Inc.,
8.875%, 12/15/2014 | | | 62,175 | |
| | 210,000 | | | Freescale Semiconductor, Inc.,
10.125%, 12/15/2016 | | | 223,125 | |
| | 190,000 | | | Motorola Solutions, Inc.,
6.500%, 9/01/2025 | | | 199,927 | |
| | 700,000 | | | Motorola Solutions, Inc.,
6.500%, 11/15/2028 | | | 719,374 | |
| | 70,000 | | | Motorola Solutions, Inc.,
6.625%, 11/15/2037 | | | 75,110 | |
| | 2,275,000 | | | Nortel Networks Capital Corp.,
7.875%, 6/15/2026(d) | | | 1,672,125 | |
| | 1,000,000 | | | Nortel Networks Ltd.,
6.875%, 9/01/2023(d) | | | 260,000 | |
| | | | | | | | |
| | | | | | | 13,447,147 | |
| | | | | | | | |
| | | | | | | | |
Principal
Amount (‡) | | | Description | | Value (†) | |
| | | | | | | | |
| | |
| | | | Textile – 0.2% | | | | |
| $ | 890,000 | | | Jones Apparel Group, Inc., 6.125%, 11/15/2034 | | $ | 709,775 | |
| | | | | | | | |
| | | | Transportation Services – 1.2% | | | | |
| | 2,685,000 | | | APL Ltd., 8.000%, 1/15/2024(b) | | | 1,839,225 | |
| | 1,611,831 | | | Atlas Air Pass Through Trust, Series 1998-1, Class B,
7.680%, 7/02/2015 | | | 1,595,712 | |
| | 289,324 | | | Atlas Air Pass Through Trust, Series 1998-1, Class C,
8.010%, 7/02/2011(e) | | | 243,032 | |
| | 292,988 | | | Atlas Air Pass Through Trust, Series 1999-1, Class B,
7.630%, 7/02/2016 | | | 260,760 | |
| | 399,542 | | | Atlas Air Pass Through Trust, Series 1999-1, Class C,
8.770%, 7/02/2012(e) | | | 319,633 | |
| | 40,344 | | | Atlas Air Pass Through Trust, Series 2000-1, Class C,
9.702%, 7/02/2011(e) | | | 34,696 | |
| | 740,000 | | | Teekay Corp.,
8.500%, 1/15/2020 | | | 801,975 | |
| | | | | | | | |
| | | | | | | 5,095,033 | |
| | | | | | | | |
| | | | Treasuries – 1.7% | | | | |
| | 199,023 | | | Hellenic Republic Government Bond,
2.300%, 7/25/2030, (EUR) | | | 141,276 | |
| | 50,000 | | | Hellenic Republic Government Bond,
4.600%, 7/20/2018, (EUR) | | | 43,657 | |
| | 750,000 | | | Hellenic Republic Government Bond,
4.700%, 3/20/2024, (EUR) | | | 630,406 | |
| | 3,175,000 | | | Ireland Government Bond,
4.500%, 10/18/2018, (EUR) | | | 3,177,173 | |
| | 725,000 | | | Ireland Government Bond,
4.500%, 4/18/2020, (EUR) | | | 696,111 | |
| | 175,000 | | | Ireland Government Bond,
5.000%, 10/18/2020, (EUR) | | | 170,981 | |
| | 1,825,000 | | | Ireland Government Bond,
5.400%, 3/13/2025, (EUR) | | | 1,722,457 | |
| | 700,000 | | | Portugal Obrigacoes do Tesouro OT,
3.850%, 4/15/2021, (EUR) | | | 696,213 | |
| | 175,000 | | | Portugal Obrigacoes do Tesouro
OT,
4.800%, 6/15/2020, (EUR) | | | 192,448 | |
| | | | | | | | |
| | | | | | | 7,470,722 | |
| | | | | | | | |
| | | | Wireless – 1.8% | | | | |
| | 805,000 | | | Nextel Communications, Inc., Series C,
5.950%, 3/15/2014 | | | 807,013 | |
| | 2,050,000 | | | Nextel Communications, Inc., Series D,
7.375%, 8/01/2015 | | | 2,057,687 | |
| | 2,620,000 | | | Sprint Capital Corp.,
6.875%, 11/15/2028 | | | 2,416,950 | |
| | 840,000 | | | Sprint Capital Corp.,
6.900%, 5/01/2019 | | | 867,300 | |
| | 215,000 | | | Sprint Capital Corp.,
8.750%, 3/15/2032 | | | 228,706 | |
| | 1,170,000 | | | True Move Co. Ltd.,
10.750%, 12/16/2013, 144A | | | 1,266,525 | |
| | | | | | | | |
| | | | | | | 7,644,181 | |
| | | | | | | | |
See accompanying notes to financial statements.
| 60
Portfolio of Investments – as of March 31, 2011 (Unaudited)
Loomis Sayles Institutional High Income Fund – continued
| | | | | | | | |
Principal
Amount (‡) | | | Description | | Value (†) | |
| | | | | | | | |
| |
| | Bonds and Notes – continued | | | | |
| | |
| | | | Wirelines – 6.1% | | | | |
| $ | 410,000 | | | Axtel SAB de CV,
9.000%, 9/22/2019, 144A | | $ | 393,600 | |
| | 385,000 | | | Cincinnati Bell Telephone Co. LLC,
6.300%, 12/01/2028 | | | 308,000 | |
| | 760,000 | | | Cincinnati Bell, Inc.,
8.750%, 3/15/2018 | | | 717,250 | |
| | 3,180,000 | | | Frontier Communications Corp.,
7.875%, 1/15/2027 | | | 3,036,900 | |
| | 2,330,000 | | | Frontier Communications Corp.,
9.000%, 8/15/2031 | | | 2,382,425 | |
| | 1,590,000 | | | Level 3 Financing, Inc.,
8.750%, 2/15/2017 | | | 1,578,075 | |
| | 1,675,000 | | | Level 3 Financing, Inc.,
9.250%, 11/01/2014 | | | 1,712,687 | |
| | 145,000 | | | Level 3 Financing, Inc.,
9.375%, 4/01/2019, 144A | | | 140,288 | |
| | 1,439,000 | | | Qwest Capital Funding, Inc.,
6.500%, 11/15/2018 | | | 1,467,780 | |
| | 800,000 | | | Qwest Capital Funding, Inc.,
6.875%, 7/15/2028 | | | 794,000 | |
| | 1,385,000 | | | Qwest Capital Funding, Inc.,
7.625%, 8/03/2021 | | | 1,440,400 | |
| | 5,332,000 | | | Qwest Capital Funding, Inc.,
7.750%, 2/15/2031 | | | 5,678,580 | |
| | 1,936,000 | | | Qwest Corp.,
6.875%, 9/15/2033 | | | 1,938,420 | |
| | 1,500,000 | | | Qwest Corp.,
7.200%, 11/10/2026 | | | 1,507,500 | |
| | 645,000 | | | Qwest Corp.,
7.250%, 9/15/2025 | | | 686,925 | |
| | 1,407,000 | | | Qwest Corp.,
7.250%, 10/15/2035 | | | 1,428,105 | |
| | 985,000 | | | Qwest Corp.,
7.500%, 6/15/2023 | | | 987,462 | |
| | | | | | | | |
| | | | | | | 26,198,397 | |
| | | | | | | | |
| | |
| | | | Total Non-Convertible Bonds | | | | |
| | | | (Identified Cost $238,587,237) | | | 275,603,565 | |
| | | | | | | | |
| |
| | Convertible Bonds – 22.1% | | | | |
| | |
| | | | Airlines – 0.3% | | | | |
| | 890,000 | | | AMR Corp.,
6.250%, 10/15/2014 | | | 936,725 | |
| | 175,000 | | | UAL Corp.,
4.500%, 6/30/2021 | | | 177,415 | |
| | | | | | | | |
| | | | | | | 1,114,140 | |
| | | | | | | | |
| | | | Automotive – 1.5% | | | | |
| | 3,530,000 | | | Ford Motor Co.,
4.250%, 11/15/2016 | | | 6,398,125 | |
| | | | | | | | |
| | | | Diversified Manufacturing – 1.5% | |
| | 3,765,000 | | | Owens-Brockway Glass Container, Inc.,
3.000%, 6/01/2015, 144A | | | 3,816,769 | |
| | 2,315,000 | | | Trinity Industries, Inc.,
3.875%, 6/01/2036 | | | 2,523,350 | |
| | | | | | | | |
| | | | | | | 6,340,119 | |
| | | | | | | | |
| | | | | | | | |
Principal
Amount (‡) | | | Description | | Value (†) | |
| | | | | | | | |
| | | | Electric – 0.1% | | | | |
| $ | 250,000 | | | CMS Energy Corp.,
5.500%, 6/15/2029 | | $ | 363,438 | |
| | | | | | | | |
| | | | Healthcare – 2.9% | | | | |
| | 3,325,000 | | | Health Management Associates, Inc.,
3.750%, 5/01/2028, 144A | | | 4,247,687 | |
| | 2,470,000 | | | Hologic, Inc., (Step to Zero Coupon on 12/15/2013),
2.000%, 12/15/2037(f) | | | 2,383,550 | |
| | 345,000 | | | LifePoint Hospitals, Inc.,
3.250%, 8/15/2025 | | | 356,644 | |
| | 860,000 | | | LifePoint Hospitals, Inc.,
3.500%, 5/15/2014 | | | 915,900 | |
| | 3,833,000 | | | Omnicare, Inc.,
3.250%, 12/15/2035 | | | 3,555,107 | |
| | 610,000 | | | Omnicare, Inc.,
3.750%, 12/15/2025 | | | 786,138 | |
| | | | | | | | |
| | | | | | | 12,245,026 | |
| | | | | | | | |
| | | | Independent Energy – 1.4% | | | | |
| | 4,835,000 | | | Chesapeake Energy Corp., 2.250%, 12/15/2038 | | | 4,442,156 | |
| | 1,340,000 | | | Chesapeake Energy Corp., 2.500%, 5/15/2037 | | | 1,455,575 | |
| | | | | | | | |
| | | | | | | 5,897,731 | |
| | | | | | | | |
| | | | Life Insurance – 0.7% | | | | |
| | 2,990,000 | | | Old Republic International Corp.,
3.750%, 3/15/2018 | | | 3,001,213 | |
| | | | | | | | |
| | | | Lodging – 0.5% | | | | |
| | 2,189,000 | | | Host Hotels & Resorts, Inc.,
2.625%, 4/15/2027, 144A | | | 2,191,736 | |
| | | | | | | | |
| | | | Media Non-Cable – 0.0% | | | | |
| | 60,988 | | | Liberty Media LLC,
3.500%, 1/15/2031 | | | 34,153 | |
| | | | | | | | |
| | | | Metals & Mining – 1.3% | | | | |
| | 1,250,000 | | | Steel Dynamics, Inc.,
5.125%, 6/15/2014 | | | 1,600,000 | |
| | 2,280,000 | | | United States Steel Corp.,
4.000%, 5/15/2014 | | | 4,158,150 | |
| | | | | | | | |
| | | | | | | 5,758,150 | |
| | | | | | | | |
| | | | Pharmaceuticals – 4.3% | | | | |
| | 2,215,000 | | | Human Genome Sciences, Inc.,
2.250%, 10/15/2011 | | | 3,926,087 | |
| | 3,325,000 | | | Human Genome Sciences, Inc.,
2.250%, 8/15/2012 | | | 5,386,500 | |
| | 2,715,000 | | | Kendle International, Inc., 3.375%, 7/15/2012 | | | 2,572,462 | |
| | 2,091,000 | | | Nektar Therapeutics,
3.250%, 9/28/2012 | | | 2,106,683 | |
| | 1,165,000 | | | Valeant Pharmaceuticals International,
4.000%, 11/15/2013 | | | 4,601,750 | |
| | | | | | | | |
| | | | | | | 18,593,482 | |
| | | | | | | | |
| | | | Technology – 6.5% | | | | |
| | 540,000 | | | Ciena Corp.,
0.250%, 5/01/2013 | | | 550,800 | |
| | 5,260,000 | | | Ciena Corp.,
0.875%, 6/15/2017 | | | 5,135,075 | |
See accompanying notes to financial statements.
61 |
Portfolio of Investments – as of March 31, 2011 (Unaudited)
Loomis Sayles Institutional High Income Fund – continued
| | | | | | | | |
Principal
Amount (‡) | | | Description | | Value (†) | |
| | | | | | | | |
| |
| | Bonds and Notes – continued | | | | |
| | |
| | | | Technology – continued | | | | |
| $ | 3,420,000 | | | Ciena Corp.,
3.750%, 10/15/2018, 144A | | $ | 5,121,450 | |
| | 175,000 | | | Ciena Corp.,
4.000%, 3/15/2015, 144A | | | 256,375 | |
| | 3,125,000 | | | Eastman Kodak Co.,
7.000%, 4/01/2017 | | | 2,785,156 | |
| | 5,750,000 | | | Intel Corp.,
3.250%, 8/01/2039 | | | 6,763,437 | |
| | 3,020,000 | | | Kulicke & Soffa Industries, Inc.,
0.875%, 6/01/2012 | | | 3,016,225 | |
| | 240,000 | | | Micron Technology, Inc.,
1.875%, 6/01/2014 | | | 261,000 | |
| | 795,000 | | | Nortel Networks Corp.,
2.125%, 4/15/2014(d) | | | 684,694 | |
| | 1,050,000 | | | Teradyne, Inc.,
4.500%, 3/15/2014 | | | 3,500,438 | |
| | | | | | | | |
| | | | | | | 28,074,650 | |
| | | | | | | | |
| | | | Textile – 0.0% | | | | |
| | 13,000 | | | Dixie Yarns, Inc.,
7.000%, 5/15/2012 | | | 12,610 | |
| | | | | | | | |
| | | | Wirelines – 1.1% | | | | |
| | 830,000 | | | Level 3 Communications, Inc.,
3.500%, 6/15/2012 | | | 818,588 | |
| | 2,210,000 | | | Level 3 Communications, Inc.,
7.000%, 3/15/2015, 144A(b) | | | 2,571,887 | |
| | 1,190,000 | | | Level 3 Communications, Inc., Series B,
7.000%, 3/15/2015(b) | | | 1,384,863 | |
| | | | | | | | |
| | | | | | | 4,775,338 | |
| | | | | | | | |
| | |
| | | | Total Convertible Bonds | | | | |
| | | | (Identified Cost $67,048,704) | | | 94,799,911 | |
| | | | | | | | |
| |
| | Municipals – 0.1% | | | | |
| | |
| | | | District of Columbia – 0.1% | | | | |
| | 540,000 | | | Metropolitan Washington DC Airports Authority, Series D,
8.000%, 10/01/2047
(Identified Cost $540,000) | | | 525,274 | |
| | | | | | | | |
| | |
| | | | Total Bonds and Notes | | | | |
| | | | (Identified Cost $306,175,941) | | | 370,928,750 | |
| | | | | | | | |
| |
| | Bank Loans – 0.5% | | | | |
| | |
| | | | Media Non-Cable – 0.5% | | | | |
| | 2,069,612 | | | Dex Media West, LLC, New Term Loan,
7.000%, 10/24/2014(g) | | | 1,832,041 | |
| | 182,908 | | | SuperMedia, Inc., Exit Term Loan,
11.000%, 12/31/2015(g) | | | 120,844 | |
| | | | | | | | |
| | | | | | | 1,952,885 | |
| | | | | | | | |
| | | | Wireless – 0.0% | | | | |
| | 78,893 | | | Hawaiian Telcom Communications, Inc.,
Exit Term Loan,
9.000%, 11/01/2015(g)(h) | | | 80,353 | |
| | | | | | | | |
| | | | | | | | |
Principal
Amount (‡) | | | Description | | Value (†) | |
| | | | | | | | |
| | | | Wirelines – 0.0% | | | | |
| $ | 115,983 | | | FairPoint Communications, Inc.,
New Term Loan B,
6.500%, 1/24/2016(g) | | $ | 111,790 | |
| | | | | | | | |
| | |
| | | | Total Bank Loans | | | | |
| | | | (Identified Cost $2,391,771) | | | 2,145,028 | |
| | | | | | | | |
| | |
| | Shares | | | | | | | |
| |
| | Common Stocks – 6.1% | | | | |
| | |
| | | | Automobiles – 1.6% | | | | |
| | 465,000 | | | Ford Motor Co.(e) | | | 6,933,150 | |
| | | | | | | | |
| | | | Biotechnology – 1.9% | | | | |
| | 165,617 | | | Vertex Pharmaceuticals, Inc.(e) | | | 7,938,023 | |
| | | | | | | | |
| | | | Containers & Packaging – 0.3% | | | | |
| | 40,621 | | | Owens-Illinois, Inc.(e) | | | 1,226,348 | |
| | 4,495 | | | Smurfit-Stone Container Corp.(e) | | | 173,732 | |
| | | | | | | | |
| | | | | | | 1,400,080 | |
| | | | | | | | |
| | | | Diversified Telecommunication Services – 0.1% | |
| | 22,208 | | | FairPoint Communications, Inc.(e) | | | 374,649 | |
| | 2,627 | | | Hawaiian Telcom Holdco, Inc.(e) | | | 68,959 | |
| | | | | | | | |
| | | | | | | 443,608 | |
| | | | | | | | |
| | | | Electronic Equipment, Instruments & Components – 0.3% | |
| | 69,766 | | | Corning, Inc. | | | 1,439,272 | |
| | | | | | | | |
| | | | Food Products – 0.0% | | | | |
| | 3,100 | | | ConAgra Foods, Inc. | | | 73,625 | |
| | | | | | | | |
| | | | Household Durables – 0.0% | | | | |
| | 6,775 | | | KB Home | | | 84,281 | |
| | | | | | | | |
| | | | Media – 0.0% | | | | |
| | 849 | | | Dex One Corp.(e) | | | 4,109 | |
| | 961 | | | SuperMedia, Inc.(e) | | | 5,997 | |
| | | | | | | | |
| | | | | | | 10,106 | |
| | | | | | | | |
| | | | Oil, Gas & Consumable Fuels – 0.1% | |
| | 2,846 | | | Chesapeake Energy Corp. | | | 95,398 | |
| | 5,965 | | | Repsol YPF SA, Sponsored ADR | | | 205,494 | |
| | | | | | | | |
| | | | | | | 300,892 | |
| | | | | | | | |
| | | | Pharmaceuticals – 0.7% | | | | |
| | 64,900 | | | Bristol-Myers Squibb Co. | | | 1,715,307 | |
| | 24,929 | | | Valeant Pharmaceuticals International, Inc. | | | 1,241,713 | |
| | | | | | | | |
| | | | | | | 2,957,020 | |
| | | | | | | | |
| | | | REITs – Apartments – 0.2% | | | | |
| | 6,185 | | | Apartment Investment & Management Co., Class A | | | 157,532 | |
| | 32,565 | | | Associated Estates Realty Corp. | | | 517,132 | |
| | | | | | | | |
| | | | | | | 674,664 | |
| | | | | | | | |
| | | | REITs – Shopping Centers – 0.0% | |
| | 7,868 | | | Developers Diversified Realty Corp. | | | 110,152 | |
| | | | | | | | |
See accompanying notes to financial statements.
| 62
Portfolio of Investments – as of March 31, 2011 (Unaudited)
Loomis Sayles Institutional High Income Fund – continued
| | | | | | | | |
Shares | | | Description | | Value (†) | |
| | | | | | | | |
| |
| | Common Stocks – continued | | | | |
| |
| | | | Semiconductors & Semiconductor Equipment – 0.9% | |
| | 190,970 | | | Intel Corp. | | $ | 3,851,865 | |
| | | | | | | | |
| | |
| | | | Total Common Stocks | | | | |
| | | | (Identified Cost $19,814,162) | | | 26,216,738 | |
| | | | | | | | |
| |
| | Preferred Stocks – 3.2% | | | | |
| |
| | Convertible Preferred Stocks – 2.7% | | | | |
| |
| | | | Automotive – 1.0% | |
| | 68,450 | | | General Motors Co., Series B,
4.750% | | | 3,299,290 | |
| | 20,345 | | | Goodyear Tire & Rubber Co. (The),
5.875% | | | 1,039,223 | |
| | | | | | | | |
| | | | | | | 4,338,513 | |
| | | | | | | | |
| | | | Capital Markets – 0.0% | |
| | 4,000 | | | Newell Financial Trust I, 5.250% | | | 191,500 | |
| | | | | | | | |
| | | | Commercial Banks – 0.0% | |
| | 138 | | | Wells Fargo & Co., Series L,
Class A, 7.500% | | | 142,858 | |
| | | | | | | | |
| | | | Diversified Financial Services – 0.2% | |
| | 14,200 | | | Sovereign Capital Trust IV,
4.375% | | | 631,900 | |
| | | | | | | | |
| | | | Electric Utilities – 0.2% | |
| | 17,119 | | | AES Trust III,
6.750% | | | 835,407 | |
| | 4,150 | | | CMS Energy Trust I,
7.750%(b)(i) | | | 186,750 | |
| | | | | | | | |
| | | | | | | 1,022,157 | |
| | | | | | | | |
| | | | Household Durables – 0.1% | |
| | 11,000 | | | Hovnanian Enterprises, Inc.,
7.250% | | | 233,200 | |
| | | | | | | | |
| | | | Machinery – 0.2% | |
| | 14,328 | | | United Rentals Trust I,
6.500% | | | 673,416 | |
| | | | | | | | |
| | | | Oil, Gas & Consumable Fuels – 0.3% | |
| | 29,700 | | | El Paso Energy Capital Trust I,
4.750% | | | 1,314,225 | |
| | | | | | | | |
| | | | Semiconductors & Semiconductor Equipment – 0.7% | |
| | 3,260 | | | Lucent Technologies Capital Trust I,
7.750% | | | 3,194,800 | |
| | | | | | | | |
| | |
| | | | Total Convertible Preferred Stocks | | | | |
| | | | (Identified Cost $10,722,253) | | | 11,742,569 | |
| | | | | | | | |
| |
| | Non-Convertible Preferred Stocks – 0.5% | | | | |
| |
| | | | Banking – 0.1% | |
| | 448 | | | Ally Financial, Inc., Series G,
7.000%, 144A | | | 416,864 | |
| | | | | | | | |
| | | | Diversified Financial Services – 0.3% | |
| | 18,000 | | | Bank of America Corp.,
6.375% | | | 403,020 | |
| | | | | | | | |
Shares | | | Description | | Value (†) | |
| | | | | | | | |
| |
| | | | Diversified Financial Services – continued | |
| | 23,925 | | | Citigroup Capital XIII,
(fixed rate to 10/30/2015,
variable rate thereafter), 7.875% | | $ | 655,545 | |
| | | | | | | | |
| | | | | | | 1,058,565 | |
| | | | | | | | |
| | | | Household Durables – 0.1% | | | | |
| | 57,194 | | | Hovnanian Enterprises, Inc., 7.625%(e) | | | 386,059 | |
| | | | | | | | |
| | | | REITs - Warehouse/Industrials – 0.0% | |
| | 3,363 | | | ProLogis, Series C, 8.540% | | | 181,602 | |
| | | | | | | | |
| | | | Thrifts & Mortgage Finance – 0.0% | |
| | 7,075 | | | Countrywide Capital IV, 6.750% | | | 175,248 | |
| | | | | | | | |
| | |
| | | | Total Non-Convertible Preferred Stocks | | | | |
| | | | (Identified Cost $1,857,155) | | | 2,218,338 | |
| | | | | | | | |
| | |
| | | | Total Preferred Stocks | | | | |
| | | | (Identified Cost $12,579,408) | | | 13,960,907 | |
| | | | | | | | |
| |
| | Closed End Investment Companies – 0.1% | | | | |
| | 11,109 | | | Dreyfus High Yield Strategies Fund | | | 51,879 | |
| | 7,693 | | | DWS High Income Trust | | | 78,007 | |
| | 31,505 | | | Highland Credit Strategies Fund | | | 236,603 | |
| | | | | | | | |
| | |
| | | | Total Closed End Investment Companies | | | | |
| | | | (Identified Cost $585,304) | | | 366,489 | |
| | | | | | | | |
| |
| | Warrants – 0.0% | | | | |
| | 33,185 | | | FairPoint Communications, Inc., Expiration on 1/24/2018(b)(e)(i) | | | | |
| | | | (Identified Cost $0) | | | — | |
| | | | | | | | |
| | |
| Principal
Amount (‡) |
| | | | | | |
| |
| | Short-Term Investments – 2.2% | | | | |
| $ | 9,453,903 | | | Tri-Party Repurchase Agreement with Fixed Income Clearing Corporation, dated 3/31/2011 at 0.000% to be repurchased at $9,453,903 on 4/01/2011 collateralized by $10,020,000 Federal Home Loan Mortgage Corp, 3.310% due 11/10/2020 valued at $9,531,525; $115,000 Federal National Mortgage Association, 2.000% due 1/09/2012 valued at $117,013 including accrued interest (See Note 2 of Notes to Financial Statements) | | | | |
| | | | (Identified Cost $9,453,903) | | | 9,453,903 | |
| | | | | | | | |
| | |
| | | | Total Investments – 98.5% | | | 423,071,815 | |
| | | | (Identified Cost $351,000,489)(a) | | | | |
| | | | Other assets less liabilities—1.5% | | | 6,286,879 | |
| | | | | | | | |
| | |
| | | | Net Assets – 100.0% | | $ | 429,358,694 | |
| | | | | | | | |
See accompanying notes to financial statements.
63 |
Portfolio of Investments – as of March 31, 2011 (Unaudited)
Loomis Sayles Institutional High Income Fund – continued
| | | | | | | | |
| |
| | (‡) | | | Principal amount stated in U.S. dollars unless otherwise noted. | |
| | (†) | | | See Note 2 of Notes to Financial Statements | |
| | (††) | | | Amount shown represents units. One unit represents a principal amount of 100. | |
| | (a) | | | Federal Tax Information (Amounts exclude certain adjustments made at the end of the Fund’s fiscal year for tax purposes. Such adjustments are primarily due to wash sales. Amortization of premium on debt securities is excluded for tax purposes.): | |
| | | | At March 31, 2011, the net unrealized appreciation on investments based on a cost of $351,107,191 for federal income tax purposes was as follows: | |
| | | | Aggregate gross unrealized appreciation for all investments in which there is an excess of
value over tax cost | | $ | 81,335,236 | |
| | | | Aggregate gross unrealized depreciation for all investments in which there is an excess of tax
cost over value | | | (9,370,612 | ) |
| | | | | | | | |
| | | | Net unrealized appreciation | | | $ 71,964,624 | |
| | | | | | | | |
| | (b) | | | Illiquid security. At March 31, 2011, the value of these securities amounted to $12,180,474 or 2.8% of net assets. | |
| | (c) | | | Variable rate security. Rate as of March 31, 2011 is disclosed. | |
| | (d) | | | The issuer is in default with respect to interest and/or principal payments. Income is not being accrued. | |
| | (e) | | | Non-income producing security. | |
| | (f) | | | Coupon rate is a fixed rate for an initial period then resets at a specified date and rate. | |
| | (g) | | | Variable rate security. Rate shown represents the weighted average rate at March 31, 2011. | |
| | (h) | | | All or a portion of interest payment is paid-in-kind. | |
| | (i) | | | Fair valued security by the Fund’s investment adviser. At March 31, 2011 the value of these securities amounted to $186,750 representing less than 0.01% of net assets. | |
| |
| | 144A | | | All or a portion of these securities are exempt from registration under Rule 144A of the Securities Act of 1933. These securities may be resold in transactions exempt from registration, normally to qualified institutional buyers. At March 31, 2011, the value of Rule 144A holdings amounted to $47,695,933 or 11.1% of net assets. | |
| | ADR | | | An American Depositary Receipt is a certificate issued by a custodian bank representing the right to receive securities of the foreign issuer described. The values of ADRs may be significantly influenced by trading on exchanges not located in the United States. | |
| | EMTN | | | Euro Medium Term Note | |
| | GMTN | | | Global Medium Term Note | |
| | MTN | | | Medium Term Note | |
| | REITs | | | Real Estate Investment Trusts | |
| |
| | BRL | | | Brazilian Real | |
| | CAD | | | Canadian Dollar | |
| | EUR | | | Euro | |
| | IDR | | | Indonesian Rupiah | |
| | ISK | | | Icelandic Krona | |
| | MXN | | | Mexican Peso | |
| | NZD | | | New Zealand Dollar | |
Industry Summary at March 31, 2011 (Unaudited)
| | | | |
Technology | | | 9.6 | % |
Healthcare | | | 7.4 | |
Wirelines | | | 7.2 | |
Pharmaceuticals | | | 5.0 | |
Non-Captive Consumer | | | 4.6 | |
Metals & Mining | | | 4.3 | |
Automotive | | | 4.1 | |
Local Authorities | | | 3.9 | |
Non-Captive Diversified | | | 3.8 | |
Retailers | | | 3.3 | |
Independent Energy | | | 2.8 | |
Sovereigns | | | 2.8 | |
Chemicals | | | 2.6 | |
Paper | | | 2.4 | |
Electric | | | 2.4 | |
Other Investments, less than 2% each | | | 30.1 | |
Short-Term Investments | | | 2.2 | |
| | | | |
Total Investments | | | 98.5 | |
Other assets less liabilities | | | 1.5 | |
| | | | |
Net Assets | | | 100.0 | % |
| | | | |
See accompanying notes to financial statements.
| 64
Portfolio of Investments – as of March 31, 2011 (Unaudited)
Loomis Sayles Intermediate Duration Bond Fund
| | | | | | | | |
Principal
Amount | | | Description | | Value (†) | |
| | | | | | | | |
| |
| | Bonds and Notes – 98.9% of Net Assets | | | | |
| | |
| | | | ABS Car Loan – 2.3% | | | | |
| $ | 335,000 | | | Ally Master Owner Trust,
Series 2011-1, Class A2,
2.150%, 1/15/2016 | | $ | 335,029 | |
| | 150,000 | | | AmeriCredit Automobile Receivables Trust, Series 2011-1, Class A3,
1.390%, 9/08/2015 | | | 149,930 | |
| | 120,000 | | | Avis Budget Rental Car Funding AESOP LLC, Series 2010-3A, Class A,
4.640%, 5/20/2016, 144A | | | 128,031 | |
| | 280,000 | | | CarMax Auto Owner Trust,
Series 2011-1, Class A3,
1.290%, 9/15/2015 | | | 279,117 | |
| | 160,000 | | | Ford Credit Floorplan Master Owner Trust, Series 2010-5, Class A1,
1.500%, 9/15/2015 | | | 158,991 | |
| | 270,000 | | | World Omni Auto Receivables Trust,
Series 2011-A, Class A3,
1.110%, 5/15/2015 | | | 269,677 | |
| | | | | | | | |
| | | | | | | 1,320,775 | |
| | | | | | | | |
| | | | ABS Credit Card – 1.8% | | | | |
| | 260,000 | | | BA Credit Card Trust,
Series 2008-A5, Class A5,
1.455%, 12/16/2013(b) | | | 260,789 | |
| | 60,000 | | | Capital One Multi-Asset Execution Trust,
Series 2004-A4, Class A4,
0.475%, 3/15/2017(b) | | | 59,831 | |
| | 315,000 | | | Chase Issuance Trust,
Series 2007-A16, Class A16,
0.610%, 6/16/2014(b) | | | 315,507 | |
| | 150,000 | | | Discover Card Master Trust I,
Series 2007-3, Class A2,
0.305%, 10/16/2014(b) | | | 149,756 | |
| | 140,000 | | | MBNA Credit Card Master Note Trust,
Series 2004-A3, Class A3,
0.515%, 8/16/2021(b) | | | 137,417 | |
| | 110,000 | | | MBNA Credit Card Master Note Trust,
Series 2004-B1, Class B1,
4.450%, 8/15/2016 | | | 117,292 | |
| | | | | | | | |
| | | | | | | 1,040,592 | |
| | | | | | | | |
| | | | ABS Home Equity – 0.1% | | | | |
| | 83,672 | | | Countrywide Asset-Backed Certificates,
Series 2004-S1, Class A3,
4.615%, 2/25/2035 | | | 78,723 | |
| | | | | | | | |
| | | | ABS Other – 0.5% | | | | |
| | 264,764 | | | CIT Equipment Collateral,
Series 2008-VT1, Class A3,
6.590%, 12/22/2014 | | | 269,291 | |
| | | | | | | | |
| | | | ABS Student Loan – 0.9% | | | | |
| | 525,000 | | | South Carolina Student Loan Corp.,
Series 2010-1, Class A2,
1.303%, 7/25/2025(b) | | | 524,102 | |
| | | | | | | | |
| | | | Aerospace & Defense – 1.6% | | | | |
| | 265,000 | | | General Dynamics Corp.,
5.250%, 2/01/2014 | | | 292,967 | |
| | 285,000 | | | Goodrich Corp.,
4.875%, 3/01/2020 | | | 296,366 | |
| | | | | | | | |
Principal
Amount | | | Description | | Value (†) | |
| | | | | | | | |
| | | | Aerospace & Defense – continued | | | | |
| $ | 355,000 | | | Raytheon Co.,
3.125%, 10/15/2020 | | $ | 325,284 | |
| | | | | | | | |
| | | | | | | 914,617 | |
| | | | | | | | |
| | | | Airlines – 0.4% | | | | |
| | 190,360 | | | Delta Air Lines Pass Through Trust,
Series 2009-1, Class A,
7.750%, 6/17/2021 | | | 208,445 | |
| | | | | | | | |
| | | | Automotive – 1.0% | | | | |
| | 235,000 | | | Ford Motor Credit Co. LLC,
7.000%, 10/01/2013 | | | 253,675 | |
| | 305,000 | | | Toyota Motor Credit Corp., MTN,
2.800%, 1/11/2016 | | | 303,759 | |
| | | | | | | | |
| | | | | | | 557,434 | |
| | | | | | | | |
| | | | Banking – 10.4% | | | | |
| | 85,000 | | | American Express Co.,
5.500%, 9/12/2016 | | | 92,662 | |
| | 330,000 | | | American Express Co.,
6.150%, 8/28/2017 | | | 369,286 | |
| | 460,000 | | | Bank of America Corp.,
5.650%, 5/01/2018 | | | 480,738 | |
| | 250,000 | | | Barclays Bank PLC,
5.000%, 9/22/2016 | | | 265,045 | |
| | 615,000 | | | Bear Stearns Cos., Inc. (The),
7.250%, 2/01/2018 | | | 716,559 | |
| | 285,000 | | | BNP Paribas, MTN,
3.600%, 2/23/2016 | | | 285,483 | |
| | 550,000 | | | Citigroup, Inc.,
6.010%, 1/15/2015 | | | 601,048 | |
| | 200,000 | | | Credit Suisse NY,
6.000%, 2/15/2018 | | | 212,420 | |
| | 430,000 | | | Goldman Sachs Group, Inc. (The),
6.150%, 4/01/2018 | | | 466,196 | |
| | 305,000 | | | Lloyds TSB Bank PLC,
4.875%, 1/21/2016 | | | 314,493 | |
| | 205,000 | | | Merrill Lynch & Co., Inc.,
Series C, MTN,
6.400%, 8/28/2017 | | | 223,466 | |
| | 475,000 | | | Morgan Stanley,
Series F, GMTN,
6.625%, 4/01/2018 | | | 522,080 | |
| | 355,000 | | | Morgan Stanley,
Series F, MTN,
5.950%, 12/28/2017 | | | 381,319 | |
| | 250,000 | | | Royal Bank of Scotland PLC (The),
4.875%, 3/16/2015 | | | 259,843 | |
| | 265,000 | | | Wells Fargo & Co.,
3.625%, 4/15/2015 | | | 273,150 | |
| | 435,000 | | | Wells Fargo & Co.,
3.676%, 6/15/2016 | | | 437,571 | |
| | | | | | | | |
| | | | | | | 5,901,359 | |
| | | | | | | | |
| | | | Building Materials – 0.1% | | | | |
| | 30,000 | | | Masco Corp.,
7.125%, 3/15/2020 | | | 31,046 | |
| | | | | | | | |
| | | | Chemicals – 0.5% | | | | |
| | 130,000 | | | Eastman Chemical Co.,
4.500%, 1/15/2021 | | | 126,375 | |
| | 140,000 | | | RPM International, Inc.,
6.125%, 10/15/2019 | | | 146,861 | |
| | | | | | | | |
| | | | | | | 273,236 | |
| | | | | | | | |
See accompanying notes to financial statements.
65 |
Portfolio of Investments – as of March 31, 2011 (Unaudited)
Loomis Sayles Intermediate Duration Bond Fund – continued
| | | | | | | | |
Principal
Amount | | | Description | | Value (†) | |
| | | | | | | | |
| | Bonds and Notes – continued | | | | |
| |
| | | | Collateralized Mortgage Obligations – 3.3% | |
| $ | 132,860 | | | Countrywide Alternative Loan Trust,
Series 2006-J5, Class 4A1,
5.652%, 7/25/2021(b) | | $ | 98,871 | |
| | 17,831 | | | Federal Home Loan Mortgage Corp.,
Series 3145, Class KA,
5.000%, 8/15/2024 | | | 17,828 | |
| | 140,000 | | | NCUA Guaranteed Notes,
Series 2010-C1, Class A2,
2.900%, 10/29/2020 | | | 136,298 | |
| | 456,071 | | | NCUA Guaranteed Notes,
Series 2010-R1, Class 1A,
0.690%, 10/07/2020(b) | | | 456,641 | |
| | 1,184,846 | | | NCUA Guaranteed Notes,
Series 2010-R3, Class 1A,
0.800%, 12/08/2020(b) | | | 1,190,403 | |
| | | | | | | | |
| | | | | | | 1,900,041 | |
| | | | | | | | |
| | | | Commercial Mortgage-Backed Securities – 12.4% | |
| | 375,000 | | | Banc of America Commercial Mortgage, Inc., Series 2006-5, Class A4,
5.414%, 9/10/2047 | | | 398,088 | |
| | 346,706 | | | Banc of America Commercial Mortgage, Inc., Series 2007-2, Class A2,
5.634%, 4/10/2049 | | | 351,871 | |
| | 255,000 | | | Banc of America Commercial Mortgage, Inc., Series 2007-5, Class A4,
5.492%, 2/10/2051 | | | 267,763 | |
| | 250,000 | | | Bear Stearns Commercial Mortgage Securities, Series 2007-PW16, Class A4,
5.906%, 6/11/2040(b) | | | 269,574 | |
| | 45,000 | | | Citigroup Commercial Mortgage Trust,
Series 2006-C5, Class A4,
5.431%, 10/15/2049 | | | 48,068 | |
| | 265,000 | | | Citigroup/Deutsche Bank Commercial Mortgage Trust,
Series 2007-CD4, Class A4,
5.322%, 12/11/2049 | | | 278,536 | |
| | 140,000 | | | Commercial Mortgage Pass Through Certificates, Series 2007-C9, Class A4,
6.008%, 12/10/2049(b) | | | 151,907 | |
| | 250,000 | | | Credit Suisse Mortgage Capital Certificates, Series 2007-C2, Class A3,
5.542%, 1/15/2049 | | | 259,321 | |
| | 400,000 | | | Credit Suisse Mortgage Capital Certificates, Series 2007-C3, Class A4,
5.905%, 6/15/2039(b) | | | 423,579 | |
| | 360,000 | | | Credit Suisse Mortgage Capital Certificates, Series 2007-C5, Class A4,
5.695%, 9/15/2040 | | | 374,095 | |
| | 165,000 | | | Greenwich Capital Commercial Funding Corp., Series 2006-GG7, Class A4,
6.078%, 7/10/2038(b) | | | 180,509 | |
| | 175,000 | | | Greenwich Capital Commercial Funding Corp., Series 2007-GG11, Class A4,
5.736%, 12/10/2049 | | | 185,098 | |
| | 470,000 | | | GS Mortgage Securities Trust,
Series 2007-GG10, Class A4,
6.002%, 8/10/2045(b) | | | 499,016 | |
| | 200,000 | | | JPMorgan Chase Commercial Mortgage Securities Corp.,
Series 2007-CB18, Class A4,
5.440%, 6/12/2047 | | | 210,897 | |
| | | | | | | | |
Principal
Amount | | | Description | | Value (†) | |
| | | | | | | | |
| | | | Commercial Mortgage-Backed Securities – continued | |
| $ | 85,000 | | | JPMorgan Chase Commercial Mortgage Securities Corp.,
Series 2007-CB19, Class A4,
5.932%, 2/12/2049(b) | | $ | 91,028 | |
| | 410,000 | | | JPMorgan Chase Commercial Mortgage Securities Corp.,
Series 2007-LD11, Class A4,
6.005%, 6/15/2049(b) | | | 439,117 | |
| | 210,000 | | | JPMorgan Chase Commercial Mortgage Securities Corp.,
Series 2007-LDPX, Class A3,
5.420%, 1/15/2049 | | | 221,474 | |
| | 320,000 | | | Merrill Lynch/Countrywide Commercial Mortgage Trust, Series 2006-1, Class A4,
5.610%, 2/12/2039(b) | | | 344,419 | |
| | 210,000 | | | Merrill Lynch/Countrywide Commercial Mortgage Trust, Series 2006-2, Class A4,
6.097%, 6/12/2046(b) | | | 229,915 | |
| | 237,000 | | | Merrill Lynch/Countrywide Commercial Mortgage Trust, Series 2007-6, Class A4,
5.485%, 3/12/2051 | | | 248,223 | |
| | 205,000 | | | Morgan Stanley Capital I,
Series 2006-T23, Class A2,
5.910%, 8/12/2041(b) | | | 216,590 | |
| | 400,000 | | | Morgan Stanley Capital I,
Series 2007-IQ14, Class A4,
5.692%, 4/15/2049 | | | 421,435 | |
| | 475,000 | | | Morgan Stanley Capital I,
Series 2007-IQ15, Class A4,
6.071%, 6/11/2049(b) | | | 506,004 | |
| | 420,000 | | | Wachovia Bank Commercial Mortgage Trust, Series 2007-C30, Class A5,
5.342%, 12/15/2043 | | | 434,917 | |
| | | | | | | | |
| | | | | | | 7,051,444 | |
| | | | | | | | |
| | | | Construction Machinery – 0.7% | | | | |
| | 290,000 | | | Caterpillar Financial Services Corp., MTN,
6.125%, 2/17/2014 | | | 326,651 | |
| | 90,000 | | | John Deere Capital Corp., MTN,
4.500%, 4/03/2013 | | | 95,698 | |
| | | | | | | | |
| | | | | | | 422,349 | |
| | | | | | | | |
| | | | Consumer Cyclical Services – 0.3% | | | | |
| | 160,000 | | | Expedia, Inc.,
5.950%, 8/15/2020 | | | 161,400 | |
| | | | | | | | |
| | | | Consumer Products – 0.6% | | | | |
| | 325,000 | | | Koninklijke (Royal) Philips Electronics NV, 4.625%, 3/11/2013 | | | 343,799 | |
| | | | | | | | |
| | | | Distributors – 0.2% | | | | |
| | 90,000 | | | EQT Corp.,
8.125%, 6/01/2019 | | | 107,281 | |
| | | | | | | | |
| | | | Diversified Manufacturing – 1.1% | | | | |
| | 90,000 | | | Snap-On, Inc.,
4.250%, 1/15/2018 | | | 92,064 | |
| | 300,000 | | | Tyco International Finance SA,
3.750%, 1/15/2018 | | | 300,326 | |
| | 220,000 | | | Tyco International Finance SA,
4.125%, 10/15/2014 | | | 233,598 | |
| | | | | | | | |
| | | | | | | 625,988 | |
| | | | | | | | |
See accompanying notes to financial statements.
| 66
Portfolio of Investments – as of March 31, 2011 (Unaudited)
Loomis Sayles Intermediate Duration Bond Fund – continued
| | | | | | | | |
Principal
Amount | | | Description | | Value (†) | |
| | | | | | | | |
| | Bonds and Notes – continued | | | | |
| | |
| | | | Electric – 3.0% | | | | |
| $ | 260,000 | | | Carolina Power & Light Co.,
5.250%, 12/15/2015 | | $ | 288,662 | |
| | 5,000 | | | Carolina Power & Light Co.,
6.500%, 7/15/2012 | | | 5,338 | |
| | 245,000 | | | Consolidated Edison Co. of NY, Inc.,
7.125%, 12/01/2018 | | | 295,870 | |
| | 150,000 | | | Duke Energy Corp.,
5.625%, 11/30/2012 | | | 160,687 | |
| | 180,000 | | | Duke Energy Corp.,
5.650%, 6/15/2013 | | | 195,878 | |
| | 140,000 | | | NextEra Energy Capital Holdings, Inc.,
0.712%, 11/09/2012(b) | | | 140,463 | |
| | 265,000 | | | Southern California Edison Co.,
5.750%, 3/15/2014 | | | 294,392 | |
| | 115,000 | | | Southern Co.,
0.703%, 10/21/2011(b) | | | 115,280 | |
| | 205,000 | | | Virginia Electric and Power Co.,
5.100%, 11/30/2012 | | | 218,024 | |
| | | | | | | | |
| | | | | | | 1,714,594 | |
| | | | | | | | |
| | | | Entertainment – 0.8% | | | | |
| | 265,000 | | | Time Warner, Inc.,
5.875%, 11/15/2016 | | | 295,643 | |
| | 145,000 | | | Walt Disney Co.,
5.700%, 7/15/2011 | | | 147,267 | |
| | | | | | | | |
| | | | | | | 442,910 | |
| | | | | | | | |
| | | | Environmental – 0.2% | | | | |
| | 90,000 | | | Waste Management, Inc.,
6.375%, 3/11/2015 | | | 101,998 | |
| | | | | | | | |
| | | | Food & Beverage – 1.7% | | | | |
| | 200,000 | | | Anheuser-Busch Cos., Inc.,
6.450%, 9/01/2037 | | | 225,682 | |
| | 100,000 | | | HJ Heinz Finance Co.,
6.000%, 3/15/2012 | | | 104,975 | |
| | 300,000 | | | Kellogg Co.,
5.125%, 12/03/2012 | | | 320,042 | |
| | 270,000 | | | Kraft Foods, Inc.,
6.125%, 8/23/2018 | | | 301,947 | |
| | | | | | | | |
| | | | | | | 952,646 | |
| | | | | | | | |
| | | | Government Owned – No Guarantee – 0.9% | |
| | 150,000 | | | Federal National Mortgage Association,
5.375%, 6/12/2017 | | | 171,037 | |
| | 305,000 | | | Petrobras International Finance Co.,
5.750%, 1/20/2020 | | | 314,649 | |
| | | | | | | | |
| | | | | | | 485,686 | |
| | | | | | | | |
| | | | Health Insurance – 1.4% | | | | |
| | 275,000 | | | UnitedHealth Group, Inc.,
4.875%, 2/15/2013 | | | 292,042 | |
| | 260,000 | | | WellPoint, Inc.,
4.350%, 8/15/2020 | | | 259,394 | |
| | 165,000 | | | WellPoint, Inc.,
5.250%, 1/15/2016 | | | 181,325 | |
| | 35,000 | | | WellPoint, Inc.,
6.000%, 2/15/2014 | | | 38,791 | |
| | | | | | | | |
| | | | | | | 771,552 | |
| | | | | | | | |
| | | | | | | | |
Principal
Amount | | | Description | | Value (†) | |
| | | | | | | | |
| | | | Healthcare – 1.1% | | | | |
| $ | 20,000 | | | Express Scripts, Inc.,
6.250%, 6/15/2014 | | $ | 22,219 | |
| | 170,000 | | | Life Technologies Corp.,
4.400%, 3/01/2015 | | | 177,398 | |
| | 335,000 | | | McKesson Corp.,
3.250%, 3/01/2016 | | | 337,415 | |
| | 105,000 | | | McKesson Corp.,
6.500%, 2/15/2014 | | | 117,729 | |
| | | | | | | | |
| | | | | | | 654,761 | |
| | | | | | | | |
| | | | Hybrid ARMs – 0.3% | | | | |
| | 148,320 | | | FHLMC, 2.576%, 1/01/2035(b) | | | 155,958 | |
| | | | | | | | |
| | | | Independent Energy – 1.6% | | | | |
| | 215,000 | | | Anadarko Petroleum Corp.,
6.375%, 9/15/2017 | | | 236,649 | |
| | 260,000 | | | Devon Energy Corp.,
5.625%, 1/15/2014 | | | 287,509 | |
| | 150,000 | | | Encana Corp.,
6.500%, 5/15/2019 | | | 175,139 | |
| | 15,000 | | | Talisman Energy, Inc.,
5.850%, 2/01/2037 | | | 14,904 | |
| | 125,000 | | | Talisman Energy, Inc.,
6.250%, 2/01/2038 | | | 131,399 | |
| | 25,000 | | | Talisman Energy, Inc.,
7.750%, 6/01/2019 | | | 30,505 | |
| | 55,000 | | | XTO Energy, Inc.,
4.900%, 2/01/2014 | | | 60,034 | |
| | | | | | | | |
| | | | | | | 936,139 | |
| | | | | | | | |
| | | | Integrated Energy – 1.0% | | | | |
| | 285,000 | | | BP Capital Markets PLC,
3.125%, 10/01/2015 | | | 286,593 | |
| | 70,000 | | | Hess Corp.,
7.000%, 2/15/2014 | | | 79,307 | |
| | 170,000 | | | XTO Energy, Inc.,
5.750%, 12/15/2013 | | | 190,227 | |
| | | | | | | | |
| | | | | | | 556,127 | |
| | | | | | | | |
| | | | Life Insurance – 0.9% | | | | |
| | 130,000 | | | American International Group, Inc.,
3.650%, 1/15/2014 | | | 132,228 | |
| | 30,000 | | | Lincoln National Corp.,
4.300%, 6/15/2015 | | | 31,126 | |
| | 255,000 | | | MetLife, Inc.,
4.750%, 2/08/2021 | | | 255,581 | |
| | 70,000 | | | Unum Group,
5.625%, 9/15/2020 | | | 71,130 | |
| | | | | | | | |
| | | | | | | 490,065 | |
| | | | | | | | |
| | | | Lodging – 0.0% | | | | |
| | 15,000 | | | Wyndham Worldwide Corp.,
5.750%, 2/01/2018 | | | 15,542 | |
| | | | | | | | |
| | | | Media Cable – 2.3% | | | | |
| | 335,000 | | | Comcast Corp.,
4.950%, 6/15/2016 | | | 358,184 | |
| | 100,000 | | | Cox Communications, Inc.,
4.625%, 6/01/2013 | | | 106,144 | |
| | 215,000 | | | Cox Communications, Inc.,
5.450%, 12/15/2014 | | | 237,292 | |
| | 290,000 | | | DIRECTV Holdings LLC / DIRECTV Financing Co., Inc.,
5.000%, 3/01/2021 | | | 291,021 | |
See accompanying notes to financial statements.
67 |
Portfolio of Investments – as of March 31, 2011 (Unaudited)
Loomis Sayles Intermediate Duration Bond Fund – continued
| | | | | | | | |
Principal
Amount | | | Description | | Value (†) | |
| | | | | | | | |
| | Bonds and Notes – continued | | | | |
| | |
| | | | Media Cable – continued | | | | |
| $ | 250,000 | | | Time Warner Cable, Inc.,
8.250%, 2/14/2014 | | $ | 290,677 | |
| | | | | | | | |
| | | | | | | 1,283,318 | |
| | | | | | | | |
| | | | Media Non-Cable – 0.9% | | | | |
| | 30,000 | | | CBS Corp.,
5.750%, 4/15/2020 | | | 31,730 | |
| | 210,000 | | | CBS Corp.,
8.875%, 5/15/2019 | | | 263,698 | |
| | 175,000 | | | Thomson Reuters Corp.,
5.950%, 7/15/2013 | | | 192,764 | |
| | | | | | | | |
| | | | | | | 488,192 | |
| | | | | | | | |
| | | | Metals & Mining – 1.3% | | | | |
| | 260,000 | | | Alcoa, Inc.,
6.150%, 8/15/2020 | | | 274,748 | |
| | 235,000 | | | ArcelorMittal,
9.850%, 6/01/2019 | | | 298,156 | |
| | 175,000 | | | United States Steel Corp.,
6.050%, 6/01/2017 | | | 180,469 | |
| | | | | | | | |
| | | | | | | 753,373 | |
| | | | | | | | |
| | | | Mortgage Related – 5.8% | | | | |
| | 377,450 | | | FHLMC,
4.000%, 6/01/2025 | | | 388,596 | |
| | 929,458 | | | FHLMC,
4.500%, with various maturities from 2019 to 2025(c) | | | 975,089 | |
| | 2,575 | | | FHLMC,
5.500%, 3/01/2013 | | | 2,782 | |
| | 3,796 | | | FHLMC,
6.000%, 11/01/2012 | | | 3,952 | |
| | 2,701 | | | FHLMC,
6.500%, 1/01/2024 | | | 3,052 | |
| | 308 | | | FHLMC,
8.000%, 7/01/2025 | | | 363 | |
| | 756,165 | | | FNMA,
4.000%, 4/01/2024 | | | 778,377 | |
| | 379,872 | | | FNMA,
4.500%, 4/01/2024 | | | 398,914 | |
| | 664,363 | | | FNMA,
5.500%, with various maturities from 2017 to 2020(c) | | | 721,255 | |
| | 4,565 | | | FNMA,
6.000%, 9/01/2021 | | | 4,992 | |
| | 1,226 | | | FNMA,
7.500%, 6/01/2016 | | | 1,357 | |
| | 1,786 | | | FNMA,
8.000%, 6/01/2015 | | | 1,970 | |
| | 7,035 | | | GNMA,
6.500%, 12/15/2023 | | | 7,978 | |
| | 1,682 | | | GNMA,
8.500%, 9/15/2022 | | | 1,804 | |
| | 3,977 | | | GNMA,
9.500%, 1/15/2019 | | | 4,708 | |
| | | | | | | | |
| | | | | | | 3,295,189 | |
| | | | | | | | |
| | | | Non-Captive Consumer – 0.4% | | | | |
| | 225,000 | | | SLM Corp., MTN,
6.250%, 1/25/2016 | | | 234,563 | |
| | | | | | | | |
| | | | | | | | |
Principal
Amount | | | Description | | Value (†) | |
| | | | | | | | |
| | | | Non-Captive Diversified – 1.0% | | | | |
| $ | 550,000 | | | General Electric Capital Corp., MTN,
5.500%, 1/08/2020 | | $ | 581,910 | |
| | | | | | | | |
| | | | Oil Field Services – 0.7% | | | | |
| | 285,000 | | | Ensco PLC,
3.250%, 3/15/2016 | | | 283,952 | |
| | 115,000 | | | Rowan Cos., Inc.,
5.000%, 9/01/2017 | | | 118,988 | |
| | | | | | | | |
| | | | | | | 402,940 | |
| | | | | | | | |
| | | | Paper – 0.6% | | | | |
| | 330,000 | | | Georgia-Pacific LLC,
5.400%, 11/01/2020, 144A | | | 325,866 | |
| | | | | | | | |
| | | | Pharmaceuticals – 1.0% | | | | |
| | 275,000 | | | Eli Lilly & Co.,
4.200%, 3/06/2014 | | | 294,784 | |
| | 270,000 | | | Schering-Plough Corp.,
5.300%, 12/01/2013 | | | 297,462 | |
| | | | | | | | |
| | | | | | | 592,246 | |
| | | | | | | | |
| | | | Pipelines – 2.1% | | | | |
| | 290,000 | | | Energy Transfer Partners LP,
6.000%, 7/01/2013 | | | 315,055 | |
| | 245,000 | | | NiSource Finance Corp.,
6.125%, 3/01/2022 | | | 266,593 | |
| | 150,000 | | | Plains All American Pipeline LP / PAA Finance Corp.,
5.000%, 2/01/2021 | | | 150,446 | |
| | 175,000 | | | Questar Corp.,
2.750%, 2/01/2016 | | | 172,975 | |
| | 265,000 | | | Spectra Energy Capital LLC,
5.668%, 8/15/2014 | | | 290,363 | |
| | | | | | | | |
| | | | | | | 1,195,432 | |
| | | | | | | | |
| | | | Property & Casualty Insurance – 0.3% | | | | |
| | 155,000 | | | Willis Group Holdings PLC,
4.125%, 3/15/2016 | | | 154,202 | |
| | 15,000 | | | Willis North America, Inc.,
7.000%, 9/29/2019 | | | 16,245 | |
| | | | | | | | |
| | | | | | | 170,447 | |
| | | | | | | | |
| | | | Railroads – 1.7% | | | | |
| | 350,000 | | | Burlington Northern Santa Fe Corp.,
7.000%, 2/01/2014 | | | 398,283 | |
| | 245,000 | | | CSX Corp.,
3.700%, 10/30/2020 | | | 230,983 | |
| | 30,000 | | | CSX Corp.,
6.150%, 5/01/2037 | | | 31,777 | |
| | 260,000 | | | Union Pacific Corp.,
5.750%, 11/15/2017 | | | 291,685 | |
| | | | | | | | |
| | | | | | | 952,728 | |
| | | | | | | | |
| | | | Real Estate Operations/Development – 0.1% | |
| | 36,000 | | | Colonial Realty LP,
4.800%, 4/01/2011 | | | 36,000 | |
| | | | | | | | |
| | | | Refining – 0.5% | | | | |
| | 240,000 | | | Valero Energy Corp.,
9.375%, 3/15/2019 | | | 306,789 | |
| | | | | | | | |
See accompanying notes to financial statements.
| 68
Portfolio of Investments – as of March 31, 2011 (Unaudited)
Loomis Sayles Intermediate Duration Bond Fund – continued
| | | | | | | | |
Principal
Amount | | | Description | | Value (†) | |
| | | | | | | | |
| | Bonds and Notes – continued | | | | |
| | |
| | | | REITs – Apartments – 0.5% | | | | |
| $ | 250,000 | | | ERP Operating LP,
6.625%, 3/15/2012 | | $ | 262,768 | |
| | | | | | | | |
| | | | REITs – Shopping Centers – 0.5% | | | | |
| | 280,000 | | | Federal Realty Investment Trust, 5.400%, 12/01/2013 | | | 301,496 | |
| | | | | | | | |
| | | | Retailers – 0.2% | | | | |
| | 130,000 | | | Macy’s Retail Holdings, Inc.,
5.350%, 3/15/2012 | | | 133,900 | |
| | | | | | | | |
| | | | Supermarkets – 0.6% | | | | |
| | 135,000 | | | Kroger Co. (The),
6.150%, 1/15/2020 | | | 152,248 | |
| | 50,000 | | | Kroger Co. (The),
6.200%, 6/15/2012 | | | 52,857 | |
| | 35,000 | | | Kroger Co. (The),
6.400%, 8/15/2017 | | | 40,270 | |
| | 65,000 | | | Kroger Co. (The),
6.750%, 4/15/2012 | | | 68,878 | |
| | | | | | | | |
| | | | | | | 314,253 | |
| | | | | | | | |
| | | | Technology – 3.4% | | | | |
| | 265,000 | | | Agilent Technologies, Inc.,
6.500%, 11/01/2017 | | | 295,635 | |
| | 580,000 | | | Cisco Systems, Inc.,
2.900%, 11/17/2014 | | | 602,104 | |
| | 95,000 | | | Corning, Inc.,
4.250%, 8/15/2020 | | | 94,127 | |
| | 160,000 | | | Equifax, Inc.,
7.000%, 7/01/2037 | | | 170,566 | |
| | 230,000 | | | IBM International Group Capital,
5.050%, 10/22/2012 | | | 244,690 | |
| | 275,000 | | | Oracle Corp.,
4.950%, 4/15/2013 | | | 296,248 | |
| | 145,000 | | | Xerox Corp.,
4.250%, 2/15/2015 | | | 152,634 | |
| | 80,000 | | | Xerox Corp.,
6.400%, 3/15/2016 | | | 90,677 | |
| | | | | | | | |
| | | | | | | 1,946,681 | |
| | | | | | | | |
| | | | Tobacco – 1.1% | | | | |
| | 205,000 | | | Altria Group, Inc.,
9.700%, 11/10/2018 | | | 269,599 | |
| | 335,000 | | | Philip Morris International, Inc.,
6.875%, 3/17/2014 | | | 384,489 | |
| | | | | | | | |
| | | | | | | 654,088 | |
| | | | | | | | |
| | | | Transportation Services – 0.5% | | | | |
| | 300,000 | | | ERAC USA Finance LLC,
2.250%, 1/10/2014, 144A | | | 299,279 | |
| | | | | | | | |
| | | | Treasuries – 16.5% | | | | |
| | 595,000 | | | U.S. Treasury Bond,
4.250%, 11/15/2040 | | | 569,061 | |
| | 2,415,000 | | | U.S. Treasury Note,
1.125%, 12/15/2012 | | | 2,434,057 | |
| | 1,610,000 | | | U.S. Treasury Note,
1.250%, 8/31/2015 | | | 1,560,443 | |
| | 1,815,000 | | | U.S. Treasury Note,
1.750%, 4/15/2013 | | | 1,849,322 | |
| | 1,775,000 | | | U.S. Treasury Note,
4.250%, 8/15/2014 | | | 1,940,991 | |
| | | | | | | | |
Principal
Amount | | | Description | | Value (†) | |
| | | | | | | | |
| | | | Treasuries – continued | | | | |
| $ | 980,000 | | | U.S. Treasury Note,
4.875%, 7/31/2011 | | $ | 995,465 | |
| | | | | | | | |
| | | | | | | 9,349,339 | |
| | | | | | | | |
| | | | Wireless – 1.8% | | | | |
| | 250,000 | | | America Movil SAB de CV,
3.625%, 3/30/2015 | | | 257,241 | |
| | 280,000 | | | American Tower Corp.,
4.500%, 1/15/2018 | | | 274,984 | |
| | 5,000 | | | Nextel Communications, Inc., Series C,
5.950%, 3/15/2014 | | | 5,013 | |
| | 170,000 | | | Sprint Nextel Corp.,
6.000%, 12/01/2016 | | | 170,637 | |
| | 330,000 | | | Vodafone Group PLC,
5.350%, 2/27/2012 | | | 343,957 | |
| | | | | | | | |
| | | | | | | 1,051,832 | |
| | | | | | | | |
| | | | Wirelines – 4.0% | | | | |
| | 515,000 | | | AT&T, Inc.,
5.800%, 2/15/2019 | | | 572,057 | |
| | 255,000 | | | Embarq Corp.,
7.995%, 6/01/2036 | | | 287,487 | |
| | 260,000 | | | Qwest Corp.,
6.875%, 9/15/2033 | | | 260,325 | |
| | 400,000 | | | Telecom Italia Capital SA,
4.950%, 9/30/2014 | | | 416,729 | |
| | 275,000 | | | Telefonica Emisiones SAU,
4.949%, 1/15/2015 | | | 290,158 | |
| | 435,000 | | | Verizon Communications, Inc.,
1.950%, 3/28/2014 | | | 435,363 | |
| | | | | | | | |
| | | | | | | 2,262,119 | |
| | | | | | | | |
| | |
| | | | Total Bonds and Notes | | | | |
| | | | (Identified Cost $54,634,821) | | | 56,204,648 | |
| | | | | | | | |
| |
| | Short-Term Investments – 1.2% | | | | |
| | 667,232 | | | Tri-Party Repurchase Agreement with Fixed Income Clearing Corporation, dated 3/31/2011 at 0.000% to be repurchased at $667,232 on 4/1/2011 collateralized by $250,000 Federal Home Loan Mortgage Corp, 3.31% due 11/10/2020 valued 237,813; $440,000 Federal National Mortgage Association, 2.000% due 1/9/2012 valued at $447,700 including accrued interest (Note 2 of Notes to Financial Statements) (Identified
Cost $667,232) | | | 667,232 | |
| | | | | | | | |
| | |
| | | | Total Investments – 100.1%
| | | | |
| | | | (Identified Cost $55,302,053)(a) | | | 56,871,880 | |
| | | | Other Assets Less Liabilities—(0.1)% | | | (85,081 | ) |
| | | | | | | | |
| | |
| | | | Net Assets – 100.0% | | $ | 56,786,799 | |
| | | | | | | | |
| | |
| | (†) | | | See Note 2 of Notes to Financial Statements. | | | | |
| | (a) | | | Federal Tax Information (Amounts exclude certain adjustments made at the end of the Fund’s fiscal year for tax purposes. Such adjustments are primarily due to wash sales. Amortization of premium on debt securities is excluded for tax purposes.): | | | | |
See accompanying notes to financial statements.
69 |
Portfolio of Investments – as of March 31, 2011 (Unaudited)
Loomis Sayles Intermediate Duration Bond Fund – continued
| | | | | | | | |
| | | | At March 31, 2011, the net unrealized appreciation on investments based on a cost of $55,502,932 for federal income tax purposes was as follows: | | | | |
| | | | Aggregate gross unrealized appreciation for all investments in which there is an excess of value over tax cost | | $ | 1,658,637 | |
| | | | Aggregate gross unrealized depreciation for all investments in which there is an excess of tax cost over value | | | (289,689 | ) |
| | | | | | | | |
| | | | Net unrealized appreciation | | $ | 1,368,948 | |
| | | | | | | | |
| | (b) | | | Variable rate security. Rate as of March 31, 2011 is disclosed. | | | | |
| | (c) | | | The Fund’s investment in mortgage related securities of Federal Home Loan Mortgage Corporation, Federal National Mortgage Association and Government National Mortgage Association are interests in separate pools of mortgages. All separate investments in securities of each issuer which have the same coupon rate have been aggregated for the purpose of presentation in the Portfolio of Investments. | | | | |
| | |
| | 144A | | | All or a portion of these securities are exempt from registration under Rule 144A of the Securities Act of 1933. These securities may be resold in transactions exempt from registration, normally to qualified institutional buyers. At March 31, 2011, the value of Rule 144A holdings amounted to $753,176 or 1.3% of net assets. | | | | |
| | ABS | | | Asset-Backed Securities | | | | |
| | ARMs | | | Adjustable Rate Mortgages | | | | |
| | FHLMC | | | Federal Home Loan Mortgage Corp. | | | | |
| | FNMA | | | Federal National Mortgage Association | | | | |
| | GMTN | | | Global Medium Term Note | | | | |
| | GNMA | | | Government National Mortgage Association | | | | |
| | MTN | | | Medium Term Note | | | | |
| | REITs | | | Real Estate Investment Trusts | | | | |
Industry Summary at March 31, 2011 (Unaudited)
| | | | |
| | | | |
Treasuries | | | 16.5 | % |
Commercial Mortgage-Backed Securities | | | 12.4 | |
Banking | | | 10.4 | |
Mortgage Related | | | 5.8 | |
Wirelines | | | 4.0 | |
Technology | | | 3.4 | |
Collateralized Mortgage Obligations | | | 3.3 | |
Electric | | | 3.0 | |
ABS Car Loan | | | 2.3 | |
Media Cable | | | 2.3 | |
Pipelines | | | 2.1 | |
Other Investments, less than 2% each | | | 33.4 | |
Short-Term Investments | | | 1.2 | |
| | | | |
Total Investments | | | 100.1 | |
Other assets less liabilities | | | (0.1 | ) |
| | | | |
Net Assets | | | 100.0 | % |
| | | | |
See accompanying notes to financial statements.
| 70
Portfolio of Investments – as of March 31, 2011 (Unaudited)
Loomis Sayles Investment Grade Fixed Income Fund
| | | | | | | | |
Principal
Amount (‡) | | | Description | | Value (†) | |
| | | | | | | | |
| |
| | Bonds and Notes – 86.6% of Net Assets | | | | |
| |
| | Non-Convertible Bonds – 81.5% | | | | |
| | |
| | | | ABS Credit Card – 0.2% | | | | |
| $ | 1,000,000 | | | World Financial Network Credit Card Master Trust,
Series 2010-A, Class B,
6.750%, 4/15/2019 | | $ | 1,083,942 | |
| | | | | | | | |
| | | | ABS Other – 1.8% | | | | |
| | 2,500,000 | | | Community Program Loan Trust,
Series 1987-A, Class A5,
4.500%, 4/01/2029 | | | 2,364,100 | |
| | 1,158,455 | | | Sierra Receivables Funding Co.,
Series 2009-3A, Class A1,
7.620%, 7/20/2026, 144A | | | 1,184,973 | |
| | 3,605,875 | | | SVO VOI Mortgage Corp.,
Series 2009-BA, Class NT,
5.810%, 12/20/2028, 144A | | | 3,722,740 | |
| | 949,645 | | | Trinity Rail Leasing LP,
Series 2009-1A, Class A,
6.657%, 11/16/2039, 144A | | | 1,008,649 | |
| | | | | | | | |
| | | | | | | 8,280,462 | |
| | | | | | | | |
| | | | Airlines – 4.6% | | | | |
| | 323,243 | | | American Airlines Pass Through Trust, Series 2009-1A,
10.375%, 1/02/2021 | | | 379,811 | |
| | 338,154 | | | Continental Airlines Pass Through Trust, Series 2000-2, Class A-1,
7.707%, 10/02/2022 | | | 366,052 | |
| | 1,056,260 | | | Continental Airlines Pass Through Trust, Series 2007-1, Class A,
5.983%, 10/19/2023 | | | 1,082,667 | |
| | 4,696,853 | | | Continental Airlines Pass Through Trust, Series 2009-1,
9.000%, 7/08/2016 | | | 5,330,928 | |
| | 1,871,965 | | | Delta Air Lines Pass Through Trust, Series 2007-1, Class B,
8.021%, 2/10/2024 | | | 1,932,803 | |
| | 5,232,467 | | | Delta Air Lines Pass Through Trust, Series 2009-1, Class A,
7.750%, 6/17/2021 | | | 5,729,551 | |
| | 2,198,950 | | | Delta Air Lines Pass Through Trust, Series 2010-1, Class A,
6.200%, 7/02/2018 | | | 2,281,411 | |
| | 3,455,000 | | | Qantas Airways Ltd.,
6.050%, 4/15/2016, 144A | | | 3,679,644 | |
| | | | | | | | |
| | | | | | | 20,782,867 | |
| | | | | | | | |
| | | | Automotive – 0.9% | | | | |
| | 1,930,000 | | | Cummins, Inc.,
5.650%, 3/01/2098 | | | 1,560,816 | |
| | 2,665,000 | | | Ford Motor Co.,
6.375%, 2/01/2029 | | | 2,517,738 | |
| | | | | | | | |
| | | | | | | 4,078,554 | |
| | | | | | | | |
| | | | Banking – 8.1% | | | | |
| | 2,670,000 | | | Associates Corp. of North America, 6.950%, 11/01/2018 | | | 2,983,939 | |
| | 1,045,000 | | | BAC Capital Trust VI,
5.625%, 3/08/2035 | | | 911,920 | |
| | | | | | | | |
Principal
Amount (‡) | | | Description | | Value (†) | |
| | | | | | | | |
| | | | Banking – continued | | | | |
| $ | 230,000 | | | Bank of America Corp.,
5.420%, 3/15/2017 | | $ | 234,803 | |
| | 2,770,000,000 | | | Barclays Bank PLC, EMTN,
3.680%, 8/20/2015, (KRW) | | | 2,465,443 | |
| | 7,484,000,000 | | | BNP Paribas SA, EMTN, Zero Coupon, 6/13/2011, 144A, (IDR) | | | 848,402 | |
| | 85,000 | | | Citigroup, Inc.,
5.850%, 12/11/2034 | | | 83,349 | |
| | 185,000 | | | Citigroup, Inc.,
5.875%, 2/22/2033 | | | 173,922 | |
| | 2,515,000 | | | Citigroup, Inc.,
6.125%, 8/25/2036 | | | 2,398,291 | |
| | 2,420,000 | | | Goldman Sachs Group, Inc. (The),
6.750%, 10/01/2037 | | | 2,440,882 | |
| | 870,000 | | | Goldman Sachs Group, Inc. (The), GMTN, 5.375%, 3/15/2020 | | | 883,341 | |
| | 60,000 | | | JPMorgan Chase & Co.,
4.750%, 5/01/2013 | | | 63,738 | |
| | 5,000,000,000 | | | JPMorgan Chase & Co., EMTN,
7.070%, 3/22/2014, (IDR) | | | 570,083 | |
| | 2,870,000 | | | Merrill Lynch & Co., Inc.,
6.110%, 1/29/2037 | | | 2,721,957 | |
| | 235,000 | | | Merrill Lynch & Co., Inc.,
Series C, MTN,
5.000%, 1/15/2015 | | | 248,619 | |
| | 1,700,000 | | | Merrill Lynch & Co., Inc.,
Series C, MTN,
6.050%, 6/01/2034 | | | 1,562,963 | |
| | 4,800,000 | | | Morgan Stanley,
5.500%, 7/24/2020 | | | 4,796,626 | |
| | 3,400,000 | | | Morgan Stanley,
5.750%, 1/25/2021 | | | 3,431,606 | |
| | 260,000 | | | Morgan Stanley, EMTN,
5.450%, 1/09/2017 | | | 274,093 | |
| | 2,000,000 | | | Morgan Stanley, GMTN,
7.625%, 3/03/2016, (AUD) | | | 2,083,969 | |
| | 1,400,000 | | | Morgan Stanley, Series F, GMTN,
5.625%, 9/23/2019 | | | 1,429,869 | |
| | 695,000 | | | Morgan Stanley, Series F, MTN,
5.950%, 12/28/2017 | | | 746,526 | |
| | 420,000 | | | National City Bank of Indiana,
4.250%, 7/01/2018 | | | 414,162 | |
| | 300,000 | | | Standard Chartered Bank,
6.400%, 9/26/2017, 144A | | | 324,048 | |
| | 4,500,000 | | | Standard Chartered PLC,
5.500%, 11/18/2014, 144A | | | 4,856,634 | |
| | 135,000 | | | Washington Mutual Finance Corp., 6.875%, 5/15/2011 | | | 135,867 | |
| | | | | | | | |
| | | | | | | 37,085,052 | |
| | | | | | | | |
| | | | Brokerage – 2.1% | | | | |
| | 2,955,000 | | | Cantor Fitzgerald LP,
6.375%, 6/26/2015, 144A | | | 2,974,385 | |
| | 2,645,000 | | | Cantor Fitzgerald LP,
7.875%, 10/15/2019, 144A(b) | | | 2,748,327 | |
| | 755,000 | | | Jefferies Group, Inc.,
6.250%, 1/15/2036 | | | 697,861 | |
| | 2,835,000 | | | Jefferies Group, Inc.,
8.500%, 7/15/2019 | | | 3,344,447 | |
| | | | | | | | |
| | | | | | | 9,765,020 | |
| | | | | | | | |
See accompanying notes to financial statements.
71 |
Portfolio of Investments – as of March 31, 2011 (Unaudited)
Loomis Sayles Investment Grade Fixed Income Fund – continued
| | | | | | | | |
Principal
Amount (‡) | | | Description | | Value (†) | |
| | | | | | | | |
| |
| | Bonds and Notes – continued | | | | |
| | |
| | | | Building Materials – 1.7% | | | | |
| $ | 1,175,000 | | | Masco Corp.,
4.800%, 6/15/2015 | | $ | 1,167,603 | |
| | 730,000 | | | Masco Corp.,
5.850%, 3/15/2017 | | | 715,756 | |
| | 1,695,000 | | | Masco Corp.,
6.125%, 10/03/2016 | | | 1,738,507 | |
| | 200,000 | | | Masco Corp.,
6.500%, 8/15/2032 | | | 180,457 | |
| | 375,000 | | | Masco Corp.,
7.750%, 8/01/2029 | | | 381,444 | |
| | 1,235,000 | | | Owens Corning, Inc.,
6.500%, 12/01/2016 | | | 1,344,669 | |
| | 2,255,000 | | | Owens Corning, Inc.,
7.000%, 12/01/2036 | | | 2,262,742 | |
| | | | | | | | |
| | | | | | | 7,791,178 | |
| | | | | | | | |
| | | | Chemicals – 1.4% | | | | |
| | 4,450,000 | | | Chevron Phillips Chemical Co. LLC,
8.250%, 6/15/2019, 144A | | | 5,312,904 | |
| | 980,000 | | | Methanex Corp., Senior Note,
6.000%, 8/15/2015 | | | 982,107 | |
| | | | | | | | |
| | | | | | | 6,295,011 | |
| | | | | | | | |
| | | | Collateralized Mortgage Obligations – 0.3% | |
| | 675,000 | | | Federal Home Loan Mortgage Corp., Series 2912, Class EH,
5.500%, 1/15/2035 | | | 734,755 | |
| | 283,726 | | | Morgan Stanley Mortgage Loan Trust, Series 2005-3AR, Class 5A,
5.515%, 7/25/2035(c) | | | 262,414 | |
| | 195,396 | | | Wells Fargo Mortgage Backed Securities Trust,
Series 2005-AR16, Class 3A2,
2.787%, 10/25/2035(c) | | | 185,870 | |
| | | | | | | | |
| | | | | | | 1,183,039 | |
| | | | | | | | |
| | | | Commercial Mortgage-Backed Securities – 6.3% | |
| | 160,000 | | | Banc of America Commercial Mortgage, Inc.,
Series 2005-6, Class A4,
5.368%, 9/10/2047(c) | | | 172,566 | |
| | 600,000 | | | Bear Stearns Commercial Mortgage Securities,
Series 2006-PW13, Class A4,
5.540%, 9/11/2041 | | | 643,545 | |
| | 360,000 | | | Bear Stearns Commercial Mortgage Securities,
Series 2006-T24, Class A4,
5.537%, 10/12/2041 | | | 386,600 | |
| | 600,000 | | | Bear Stearns Commercial Mortgage Securities,
Series 2007-PW15, Class A4,
5.331%, 2/11/2044 | | | 628,553 | |
| | 407,000 | | | Bear Stearns Commercial Mortgage Securities,
Series 2007-PW16, Class A4,
5.906%, 6/11/2040(c) | | | 438,867 | |
| | 58,416 | | | Citigroup/Deutsche Bank Commercial Mortgage Trust,
Series 2006-CD2, Class A2,
5.408%, 1/15/2046 | | | 58,386 | |
| | | | | | | | |
Principal
Amount (‡) | | | Description | | Value (†) | |
| | | | | | | | |
| | | | Commercial Mortgage-Backed Securities –continued | |
| $ | 1,055,000 | | | Citigroup/Deutsche Bank Commercial Mortgage Trust,
Series 2007-CD4, Class A4,
5.322%, 12/11/2049 | | $ | 1,108,890 | |
| | 480,000 | | | Commercial Mortgage Pass Through Certificates,
Series 2006-C7, Class A4,
5.951%, 6/10/2046(c) | | | 524,046 | |
| | 3,525,000 | | | Credit Suisse Mortgage Capital Certificates,
Series 2007-C3, Class A4,
5.905%, 6/15/2039(c) | | | 3,732,793 | |
| | 2,030,000 | | | Credit Suisse Mortgage Capital Certificates,
Series 2007-C4, Class A4,
5.995%, 9/15/2039(c) | | | 2,156,096 | |
| | 685,000 | | | Credit Suisse Mortgage Capital Certificates,
Series 2007-C5, Class A4,
5.695%, 9/15/2040 | | | 711,820 | |
| | 3,125,000 | | | Crown Castle Towers LLC,
6.113%, 1/15/2040, 144A | | | 3,387,041 | |
| | 1,500,000 | | | Greenwich Capital Commercial Funding Corp.,
Series 2007-GG11, Class A4,
5.736%, 12/10/2049 | | | 1,586,556 | |
| | 805,000 | | | GS Mortgage Securities Corp. II,
Series 2005-GG4, Class A4A,
4.751%, 7/10/2039 | | | 847,002 | |
| | 350,000 | | | GS Mortgage Securities Corp. II,
Series 2006-GG8, Class A4,
5.560%, 11/10/2039 | | | 376,440 | |
| | 1,180,000 | | | JPMorgan Chase Commercial Mortgage Securities Corp.,
Series 2006-LDP6, Class A4,
5.475%, 4/15/2043 | | | 1,271,258 | |
| | 1,100,000 | | | JPMorgan Chase Commercial Mortgage Securities Corp.,
Series 2006-LDP7, Class A4,
6.061%, 4/15/2045(c) | | | 1,208,710 | |
| | 4,055,000 | | | JPMorgan Chase Commercial Mortgage Securities Corp.,
Series 2007-LD11, Class A4,
6.005%, 6/15/2049(c) | | | 4,342,969 | |
| | 1,405,000 | | | JPMorgan Chase Commercial Mortgage Securities Corp.,
Series 2007-LDPX, Class A3,
5.420%, 1/15/2049 | | | 1,481,767 | |
| | 480,000 | | | LB-UBS Commercial Mortgage Trust, Series 2005-C3, Class A5,
4.739%, 7/15/2030 | | | 508,647 | |
| | 380,000 | | | LB-UBS Commercial Mortgage Trust, Series 2006-C4, Class A4,
6.078%, 6/15/2038(c) | | | 417,907 | |
| | 390,000 | | | LB-UBS Commercial Mortgage Trust, Series 2006-C6, Class A4,
5.372%, 9/15/2039 | | | 416,262 | |
| | 235,000 | | | Merrill Lynch/Countrywide Commercial Mortgage Trust,
Series 2006-2, Class A4,
6.097%, 6/12/2046(c) | | | 257,286 | |
See accompanying notes to financial statements.
| 72
Portfolio of Investments – as of March 31, 2011 (Unaudited)
Loomis Sayles Investment Grade Fixed Income Fund – continued
| | | | | | | | |
Principal
Amount (‡) | | | Description | | Value (†) | |
| | | | | | | | |
| |
| | Bonds and Notes – continued | | | | |
| |
| | | | Commercial Mortgage-Backed Securities –
continued | |
| $ | 350,000 | | | Morgan Stanley Capital I,
Series 2005-HQ6, Class A4A,
4.989%, 8/13/2042 | | $ | 373,186 | |
| | 425,000 | | | Morgan Stanley Capital I,
Series 2005-T19, Class A4A,
4.890%, 6/12/2047 | | | 452,266 | |
| | 250,000 | | | Morgan Stanley Capital I,
Series 2007-IQ14, Class A4,
5.692%, 4/15/2049 | | | 263,397 | |
| | 800,000 | | | Morgan Stanley Capital I,
Series 2008-T29, Class A4,
6.458%, 1/11/2043(c) | | | 896,163 | |
| | 200,000 | | | Wachovia Bank Commercial Mortgage Trust, Series 2006-C29, Class A4, 5.308%, 11/15/2048 | | | 214,256 | |
| | | | | | | | |
| | | | | | | 28,863,275 | |
| | | | | | | | |
| | | | Consumer Products – 0.3% | | | | |
| | 605,000 | | | Hasbro, Inc.,
6.600%, 7/15/2028 | | | 631,020 | |
| | 780,000 | | | Snap-on, Inc.,
6.700%, 3/01/2019 | | | 881,619 | |
| | | | | | | | |
| | | | | | | 1,512,639 | |
| | | | | | | | |
| | | | Distributors – 1.3% | | | | |
| | 3,000,000 | | | EQT Corp.,
8.125%, 6/01/2019 | | | 3,576,042 | |
| | 2,150,000 | | | Equitable Resources, Inc.,
6.500%, 4/01/2018 | | | 2,337,719 | |
| | | | | | | | |
| | | | | | | 5,913,761 | |
| | | | | | | | |
| | | | Diversified Manufacturing – 0.4% | |
| | 700,000 | | | Textron, Inc.,
3.875%, 3/11/2013, (EUR) | | | 986,567 | |
| | 540,000 | | | Textron, Inc., EMTN,
6.625%, 4/07/2020, (GBP) | | | 856,520 | |
| | | | | | | | |
| | | | | | | 1,843,087 | |
| | | | | | | | |
| | | | Electric – 1.8% | | | | |
| | 2,800,000 | | | AmerenEnergy Generating Co.,
Series H,
7.000%, 4/15/2018 | | | 2,837,954 | |
| | 1,520,715 | | | Bruce Mansfield Unit,
6.850%, 6/01/2034(b) | | | 1,595,763 | |
| | 1,185,000 | | | Cleveland Electric Illuminating Co. (The), 5.700%, 4/01/2017 | | | 1,260,135 | |
| | 555,000 | | | Commonwealth Edison Co.,
4.700%, 4/15/2015 | | | 595,314 | |
| | 21,000 | | | Commonwealth Edison Co.,
4.750%, 12/01/2011(b) | | | 20,977 | |
| | 900,000 | | | EDP Finance BV,
4.900%, 10/01/2019, 144A | | | 785,579 | |
| | 1,000,000 | | | Endesa SA/Cayman Islands,
7.875%, 2/01/2027 | | | 1,116,746 | |
| | | | | | | | |
| | | | | | | 8,212,468 | |
| | | | | | | | |
| | | | | | | | |
Principal
Amount (‡) | | | Description | | Value (†) | |
| | | | | | | | |
| | | | Financial Other – 0.7% | | | | |
| $ | 2,500,000 | | | National Life Insurance Co.,
10.500%, 9/15/2039, 144A | | $ | 3,140,287 | |
| | | | | | | | |
| | | | Food & Beverage – 0.1% | | | | |
| | 500,000 | | �� | Corn Products International, Inc.,
6.625%, 4/15/2037 | | | 522,619 | |
| | | | | | | | |
| | | | Government Guaranteed – 0.5% | | | | |
| | 2,500,000 | | | Instituto de Credito Oficial, MTN, 6.125%, 2/27/2014, (AUD) | | | 2,460,620 | |
| | | | | | | | |
| | | | Government Owned – No Guarantee – 2.0% | |
| | 2,565,000 | | | Abu Dhabi National Energy Co.,
7.250%, 8/01/2018, 144A | | | 2,824,706 | |
| | 4,500,000 | | | DP World Ltd.,
6.850%, 7/02/2037, 144A | | | 4,140,000 | |
| | 9,000,000,000 | | | Export-Import Bank of Korea,
6.600%, 11/04/2013, 144A, (IDR) | | | 998,656 | |
| | 10,400,000,000 | | | Export-Import Bank of Korea,
8.300%, 3/15/2014, 144A, (IDR) | | | 1,206,914 | |
| | | | | | | | |
| | | | | | | 9,170,276 | |
| | | | | | | | |
| | | | Health Insurance – 0.0% | | | | |
| | 20,000 | | | CIGNA Corp.,
7.875%, 5/15/2027 | | | 23,401 | |
| | | | | | | | |
| | | | Healthcare – 0.5% | | | | |
| | 855,000 | | | Boston Scientific Corp.,
6.000%, 1/15/2020 | | | 895,884 | |
| | 95,000 | | | HCA, Inc.,
6.375%, 1/15/2015 | | | 96,900 | |
| | 55,000 | | | HCA, Inc.,
6.500%, 2/15/2016 | | | 55,963 | |
| | 100,000 | | | HCA, Inc.,
7.050%, 12/01/2027 | | | 89,000 | |
| | 190,000 | | | HCA, Inc.,
7.190%, 11/15/2015 | | | 190,950 | |
| | 75,000 | | | HCA, Inc.,
7.500%, 12/15/2023 | | | 70,875 | |
| | 175,000 | | | HCA, Inc.,
7.690%, 6/15/2025 | | | 166,687 | |
| | 305,000 | | | HCA, Inc.,
8.360%, 4/15/2024 | | | 305,000 | |
| | 10,000 | | | HCA, Inc., MTN,
7.580%, 9/15/2025 | | | 9,425 | |
| | 305,000 | | | HCA, Inc., MTN,
7.750%, 7/15/2036 | | | 285,175 | |
| | | | | | | | |
| | | | | | | 2,165,859 | |
| | | | | | | | |
| | | | Home Construction – 1.3% | | | | |
| | 1,116,000 | | | Pulte Group, Inc.,
5.200%, 2/15/2015 | | | 1,107,630 | |
| | 3,340,000 | | | Pulte Group, Inc.,
6.000%, 2/15/2035 | | | 2,613,550 | |
| | 1,455,000 | | | Pulte Group, Inc.,
6.375%, 5/15/2033 | | | 1,182,188 | |
| | 835,000 | | | Toll Brothers Finance Corp.,
5.150%, 5/15/2015 | | | 852,296 | |
| | | | | | | | |
| | | | | | | 5,755,664 | |
| | | | | | | | |
| | | | Hybrid ARMs – 0.1% | | | | |
| | 157,699 | | | FNMA,
5.710%, 9/01/2036(c) | | | 166,766 | |
See accompanying notes to financial statements.
73 |
Portfolio of Investments – as of March 31, 2011 (Unaudited)
Loomis Sayles Investment Grade Fixed Income Fund – continued
| | | | | | | | |
Principal
Amount (‡) | | | Description | | Value (†) | |
| | | | | | | | |
| |
| | Bonds and Notes – continued | | | | |
| | |
| | | | Hybrid ARMs – continued | | | | |
| $ | 88,228 | | | FNMA,
5.983%, 2/01/2037(c) | | $ | 93,834 | |
| | | | | | | | |
| | | | | | | 260,600 | |
| | | | | | | | |
| | | | Independent Energy – 0.6% | | | | |
| | 1,195,000 | | | Anadarko Petroleum Corp.,
6.375%, 9/15/2017 | | | 1,315,330 | |
| | 1,320,000 | | | Anadarko Petroleum Corp.,
6.450%, 9/15/2036 | | | 1,318,296 | |
| | | | | | | | |
| | | | | | | 2,633,626 | |
| | | | | | | | |
| | | | Industrial Other – 0.3% | | | | |
| | 1,150,000 | | | Worthington Industries, Inc.,
6.500%, 4/15/2020 | | | 1,230,103 | |
| | | | | | | | |
| | | | Life Insurance – 1.1% | | | | |
| | 390,000 | | | American International Group, Inc.,
Series G, MTN,
5.850%, 1/16/2018 | | | 406,238 | |
| | 110,000 | | | American International Group, Inc.,
Series MP, GMTN,
5.450%, 5/18/2017 | | | 112,919 | |
| | 355,000 | | | ASIF III Jersey Ltd.,
Series 2003-G, EMTN,
4.750%, 9/11/2013, (EUR) | | | 513,507 | |
| | 1,095,000 | | | MetLife, Inc.,
6.400%, 12/15/2066 | | | 1,054,595 | |
| | 2,885,000 | | | Penn Mutual Life Insurance Co. (The),
7.625%, 6/15/2040, 144A | | | 3,118,982 | |
| | | | | | | | |
| | | | | | | 5,206,241 | |
| | | | | | | | |
| | | | Local Authorities – 3.3% | | | | |
| | 4,635,000 | | | Manitoba (Province of), GMTN,
6.375%, 9/01/2015, (NZD) | | | 3,744,101 | |
| | 2,625,000 | | | New South Wales Treasury Corp.,
6.000%, 5/01/2012, (AUD) | | | 2,744,954 | |
| | 685,000 | | | New South Wales Treasury Corp.,
Series 12RG,
6.000%, 5/01/2012, (AUD) | | | 716,197 | |
| | 4,000,000 | | | New South Wales Treasury Corp.,
Series 17RG,
5.500%, 3/01/2017, (AUD) | | | 4,116,534 | |
| | 302,908 | | | Province of Alberta,
5.930%, 9/16/2016, (CAD) | | | 346,943 | |
| | 1,185,000 | | | Province of Quebec, Canada,
Series QC,
6.750%, 11/09/2015, (NZD) | | | 968,975 | |
| | 970,000 | | | Queensland Treasury Corp.,
7.125%, 9/18/2017, 144A, (NZD) | | | 802,016 | |
| | 1,735,000 | | | Queensland Treasury Corp.,
Series 11G,
6.000%, 6/14/2011, (AUD) | | | 1,798,455 | |
| | | | | | | | |
| | | | | | | 15,238,175 | |
| | | | | | | | |
| | | | Lodging – 0.8% | | | | |
| | 1,480,000 | | | Wyndham Worldwide Corp.,
6.000%, 12/01/2016 | | | 1,568,267 | |
| | 1,660,000 | | | Wyndham Worldwide Corp.,
7.375%, 3/01/2020 | | | 1,831,229 | |
| | | | | | | | |
| | | | | | | 3,399,496 | |
| | | | | | | | |
| | | | | | | | |
Principal
Amount (‡) | | | Description | | Value (†) | |
| | | | | | | | |
| | | | Media Non-Cable – 0.1% | | | | |
| $ | 240,000 | | | News America, Inc.,
8.150%, 10/17/2036 | | $ | 290,930 | |
| | | | | | | | |
| | | | Mortgage Related – 0.0% | | | | |
| | 26,174 | | | Federal National Mortgage Association,
7.000%, 4/25/2020 | | | 28,599 | |
| | 3,964 | | | FHLMC,
10.000%, with various maturities in 2018(d) | | | 4,484 | |
| | 14,647 | | | FNMA,
6.000%, 12/01/2018 | | | 16,011 | |
| | 48,400 | | | GNMA,
10.000%, with various maturities in 2018(d) | | | 55,028 | |
| | | | | | | | |
| | | | | | | 104,122 | |
| | | | | | | | |
| | | | Non-Captive Consumer – 2.2% | | | | |
| | 470,000 | | | SLM Corp., MTN,
5.050%, 11/14/2014 | | | 474,431 | |
| | 240,000 | | | SLM Corp.,
Series A, MTN,
5.000%, 4/15/2015 | | | 241,639 | |
| | 995,000 | | | SLM Corp.,
Series A, MTN,
5.375%, 1/15/2013 | | | 1,034,951 | |
| | 1,295,000 | | | SLM Corp., Series A, MTN,
5.625%, 8/01/2033 | | | 1,107,158 | |
| | 2,385,000 | | | SLM Corp.,
Series A, MTN,
8.450%, 6/15/2018 | | | 2,671,200 | |
| | 45,000 | | | Springleaf Finance Corp.,
Series H, MTN,
5.375%, 10/01/2012 | | | 44,269 | |
| | 1,300,000 | | | Springleaf Finance Corp.,
Series J, MTN,
6.500%, 9/15/2017 | | | 1,157,000 | |
| | 3,615,000 | | | Springleaf Finance Corp.,
Series J, MTN,
6.900%, 12/15/2017 | | | 3,303,206 | |
| | | | | | | | |
| | | | | | | 10,033,854 | |
| | | | | | | | |
| | | | Non-Captive Diversified – 4.1% | | | | |
| | 97,000 | | | Ally Financial, Inc.,
8.000%, 12/31/2018 | | | 104,154 | |
| | 4,165,000 | | | Aviation Capital Group Corp.,
6.750%, 4/06/2021, 144A | | | 4,175,413 | |
| | 59,287 | | | CIT Group, Inc.,
7.000%, 5/01/2013 | | | 60,398 | |
| | 169,485 | | | CIT Group, Inc.,
7.000%, 5/01/2014 | | | 172,663 | |
| | 169,485 | | | CIT Group, Inc.,
7.000%, 5/01/2015 | | | 170,968 | |
| | 282,478 | | | CIT Group, Inc.,
7.000%, 5/01/2016 | | | 282,831 | |
| | 395,473 | | | CIT Group, Inc.,
7.000%, 5/01/2017 | | | 395,967 | |
| | 670,000 | | | General Electric Capital Australia Funding Pty Ltd., EMTN,
8.000%, 2/13/2012, (AUD) | | | 706,997 | |
| | 65,000 | | | General Electric Capital Corp.,
5.625%, 5/01/2018 | | | 70,273 | |
See accompanying notes to financial statements.
| 74
Portfolio of Investments – as of March 31, 2011 (Unaudited)
Loomis Sayles Investment Grade Fixed Income Fund – continued
| | | | | | | | |
Principal
Amount (‡) | | | Description | | Value (†) | |
| | | | | | | | |
| |
| | Bonds and Notes – continued | | | | |
| |
| | | | Non-Captive Diversified – continued | |
| $ | 300,000 | | | General Electric Capital Corp., MTN,
5.875%, 1/14/2038 | | $ | 296,182 | |
| | 470,000 | | | General Electric Capital Corp.,
Series A, EMTN,
6.750%, 9/26/2016, (NZD) | | | 372,709 | |
| | 2,205,000 | | | General Electric Capital Corp.,
Series A, GMTN,
7.625%, 12/10/2014, (NZD) | | | 1,816,889 | |
| | 655,000 | | | General Electric Capital Corp.,
Series A, MTN,
0.603%, 5/13/2024(c) | | | 573,435 | |
| | 5,650,000 | | | General Electric Capital Corp.,
Series A, MTN,
6.500%, 9/28/2015, (NZD) | | | 4,487,108 | |
| | 4,355,000 | | | International Lease Finance Corp.,
6.375%, 3/25/2013 | | | 4,507,425 | |
| | 25,000 | | | International Lease Finance Corp.,
8.875%, 9/15/2015, 144A | | | 27,500 | |
| | 315,000 | | | International Lease Finance Corp.,
Series R, MTN,
5.650%, 6/01/2014 | | | 316,575 | |
| | | | | | | | |
| | | | | | | 18,537,487 | |
| | | | | | | | |
| | | | Oil Field Services – 0.4% | | | | |
| | 1,090,000 | | | Rowan Cos., Inc.,
7.875%, 8/01/2019 | | | 1,292,932 | |
| | 235,000 | | | Weatherford International Ltd.,
6.500%, 8/01/2036 | | | 234,972 | |
| | 105,000 | | | Weatherford International Ltd.,
6.800%, 6/15/2037 | | | 109,196 | |
| | | | | | | | |
| | | | | | | 1,637,100 | |
| | | | | | | | |
| | | | Paper – 0.4% | | | | |
| | 1,500,000 | | | Georgia-Pacific LLC,
7.250%, 6/01/2028 | | | 1,567,500 | |
| | 200,000 | | | Westvaco Corp.,
8.200%, 1/15/2030 | | | 213,445 | |
| | | | | | | | |
| | | | | | | 1,780,945 | |
| | | | | | | | |
| | | | Pharmaceuticals – 0.0% | | | | |
| | 170,000 | | | Elan Finance PLC/Elan Finance Corp.,
8.875%, 12/01/2013 | | | 175,738 | |
| | | | | | | | |
| | | | Pipelines – 1.2% | | | | |
| | 635,000 | | | DCP Midstream LP,
6.450%, 11/03/2036, 144A | | | 645,522 | |
| | 350,000 | | | El Paso Corp.,
6.950%, 6/01/2028 | | | 354,587 | |
| | 200,000 | | | Florida Gas Transmission Co.,
7.900%, 5/15/2019, 144A | | | 241,236 | |
| | 965,000 | | | NGPL PipeCo LLC,
7.119%, 12/15/2017, 144A | | | 1,078,226 | |
| | 2,000,000 | | | NiSource Finance Corp.,
6.125%, 3/01/2022 | | | 2,176,270 | |
| | 810,000 | | | Southern Natural Gas Co.,
5.900%, 4/01/2017, 144A | | | 901,215 | |
| | | | | | | | |
| | | | | | | 5,397,056 | |
| | | | | | | | |
| | | | | | | | |
Principal
Amount (‡) | | | Description | | Value (†) | |
| | | | | | | | |
| | | | Property & Casualty Insurance – 2.0% | |
| $ | 1,695,000 | | | Hanover Insurance Group, Inc. (The),
7.500%, 3/01/2020 | | $ | 1,801,736 | |
| | 2,465,000 | | | Marsh & McLennan Cos., Inc.,
5.875%, 8/01/2033 | | | 2,320,438 | |
| | 60,000 | | | MBIA Insurance Corp., (fixed rate to 1/15/2013, variable rate thereafter),
14.000%, 1/15/2033, 144A | | | 33,000 | |
| | 150,000 | | | Progressive Corp.,
7.000%, 10/01/2013 | | | 166,414 | |
| | 220,000 | | | White Mountains Re Group Ltd.,
6.375%, 3/20/2017, 144A | | | 225,134 | |
| | 805,000 | | | Willis North America, Inc.,
7.000%, 9/29/2019 | | | 871,790 | |
| | 2,015,000 | | | XL Group PLC,
6.250%, 5/15/2027 | | | 2,000,701 | |
| | 1,595,000 | | | XL Group PLC,
6.375%, 11/15/2024 | | | 1,659,020 | |
| | | | | | | | |
| | | | | | | 9,078,233 | |
| | | | | | | | |
| | | | Railroads – 0.0% | | | | |
| | 190,000 | | | Missouri Pacific Railroad Co.,
5.000%, 1/01/2045(b) | | | 129,675 | |
| | | | | | | | |
| | | | Real Estate Operations/Development – 0.1% | | | | |
| | 531,000 | | | Colonial Realty LP,
4.800%, 4/01/2011 | | | 531,000 | |
| | | | | | | | |
| | | | REITs – Apartments – 0.1% | | | | |
| | 30,000 | | | ERP Operating LP,
5.125%, 3/15/2016 | | | 32,216 | |
| | 180,000 | | | ERP Operating LP,
5.750%, 6/15/2017 | | | 198,178 | |
| | | | | | | | |
| | | | | | | 230,394 | |
| | | | | | | | |
| | | | REITs – Office Property – 0.3% | | | | |
| | 80,000 | | | Highwoods Properties, Inc.,
5.850%, 3/15/2017 | | | 85,141 | |
| | 1,075,000 | | | Highwoods Properties, Inc.,
7.500%, 4/15/2018 | | | 1,228,769 | |
| | | | | | | | |
| | | | | | | 1,313,910 | |
| | | | | | | | |
| | | | REITs – Shopping Centers – 0.6% | | | | |
| | 1,000,000 | | | Equity One, Inc.,
6.000%, 9/15/2017 | | | 1,028,636 | |
| | 1,350,000 | | | Federal Realty Investment Trust,
5.650%, 6/01/2016 | | | 1,469,560 | |
| | | | | | | | |
| | | | | | | 2,498,196 | |
| | | | | | | | |
| | | | REITs – Single Tenant – 0.1% | | | | |
| | 95,000 | | | Realty Income Corp.,
5.750%, 1/15/2021 | | | 100,001 | |
| | 405,000 | | | Realty Income Corp.,
6.750%, 8/15/2019 | | | 462,128 | |
| | | | | | | | |
| | | | | | | 562,129 | |
| | | | | | | | |
| | | | REITs – Warehouse/Industrials – 0.3% | |
| | 55,000 | | | ProLogis,
5.625%, 11/15/2015 | | | 58,370 | |
| | 240,000 | | | ProLogis,
5.625%, 11/15/2016 | | | 251,400 | |
See accompanying notes to financial statements.
75 |
Portfolio of Investments – as of March 31, 2011 (Unaudited)
Loomis Sayles Investment Grade Fixed Income Fund – continued
| | | | | | | | |
Principal
Amount (‡) | | | Description | | Value (†) | |
| | | | | | | | |
| |
| | Bonds and Notes – continued | | | | |
| |
| | | | REITs – Warehouse/Industrials – continued | |
| $ | 265,000 | | | ProLogis,
5.750%, 4/01/2016 | | $ | 284,637 | |
| | 785,000 | | | ProLogis,
7.375%, 10/30/2019 | | | 889,049 | |
| | | | | | | | |
| | | | | | | 1,483,456 | |
| | | | | | | | |
| | | | Restaurants – 0.1% | | | | |
| | 610,000 | | | Darden Restaurants, Inc.,
6.000%, 8/15/2035 | | | 590,252 | |
| | | | | | | | |
| | | | Retailers – 0.6% | | | | |
| | 118,000 | | | J.C. Penney Corp., Inc.,
6.375%, 10/15/2036 | | | 106,347 | |
| | 2,803,000 | | | Macy’s Retail Holdings, Inc.,
6.375%, 3/15/2037 | | | 2,803,000 | |
| | | | | | | | |
| | | | | | | 2,909,347 | |
| | | | | | | | |
| | | | Sovereigns – 2.2% | | | | |
| | 262,000(††) | | | Mexican Fixed Rate Bonds,
Series M-10,
7.250%, 12/15/2016, (MXN) | | | 2,227,169 | |
| | 140,000(††) | | | Mexican Fixed Rate Bonds,
Series M-20,
8.000%, 12/07/2023, (MXN) | | | 1,194,793 | |
| | 227,000(††) | | | Mexican Fixed Rate Bonds,
Series MI-10,
9.000%, 12/20/2012, (MXN) | | | 2,017,807 | |
| | 3,100,000 | | | Republic of Croatia,
6.750%, 11/05/2019, 144A | | | 3,247,250 | |
| | 38,315,000 | | | Republic of Iceland,
4.250%, 8/24/2012, (ISK) | | | 200,981 | |
| | 101,800,000 | | | Republic of Iceland,
7.250%, 5/17/2013, (ISK) | | | 571,240 | |
| | 69,235,000 | | | Republic of Iceland,
8.000%, 7/22/2011, (ISK) | | | 363,032 | |
| | | | | | | | |
| | | | | | | 9,822,272 | |
| | | | | | | | |
| | | | Supranational – 2.3% | | | | |
| | 4,000,000 | | | European Bank for Reconstruction & Development, GMTN,
9.250%, 9/10/2012, (BRL) | | | 2,448,976 | |
| | 45,300,000,000 | | | Inter-American Development Bank, EMTN, Zero Coupon, 9/23/2013, (IDR) | | | 4,296,672 | |
| | 4,375,000 | | | Inter-American Development Bank, EMTN, 6.000%, 12/15/2017, (NZD) | | | 3,491,735 | |
| | | | | | | | |
| | | | | | | 10,237,383 | |
| | | | | | | | |
| | | | Technology – 2.3% | | | | |
| | 210,000 | | | Corning, Inc.,
6.850%, 3/01/2029 | | | 236,358 | |
| | 810,000 | | | Corning, Inc.,
7.000%, 5/15/2024 | | | 927,294 | |
| | 3,565,000 | | | Corning, Inc.,
7.250%, 8/15/2036 | | | 4,070,064 | |
| | 3,550,000 | | | Ingram Micro, Inc.,
5.250%, 9/01/2017 | | | 3,609,111 | |
| | 470,000 | | | Motorola Solutions, Inc.,
6.500%, 9/01/2025 | | | 494,556 | |
| | | | | | | | |
Principal
Amount (‡) | | | Description | | Value (†) | |
| | | | | | | | |
| | | | Technology – continued | | | | |
| $ | 235,000 | | | Motorola Solutions, Inc.,
6.500%, 11/15/2028 | | $ | 241,504 | |
| | 290,000 | | | Motorola Solutions, Inc.,
6.625%, 11/15/2037 | | | 311,171 | |
| | 425,000 | | | Samsung Electronics Co. Ltd.,
7.700%, 10/01/2027, 144A | | | 499,094 | |
| | | | | | | | |
| | | | | | | 10,389,152 | |
| | | | | | | | |
| | | | Tobacco – 0.2% | | | | |
| | 735,000 | | | Reynolds American, Inc.,
6.750%, 6/15/2017 | | | 840,511 | |
| | 195,000 | | | Reynolds American, Inc.,
7.250%, 6/15/2037 | | | 206,381 | |
| | | | | | | | |
| | | | | | | 1,046,892 | |
| | | | | | | | |
| | | | Transportation Services – 0.8% | | | | |
| | 100,000 | | | APL Ltd.,
8.000%, 1/15/2024(b) | | | 68,500 | |
| | 2,503,815 | | | Atlas Air Pass Through Trust,
Series 1998-1, Class B,
7.680%, 7/02/2015 | | | 2,478,776 | |
| | 945,000 | | | Erac USA Finance Co.,
6.700%, 6/01/2034, 144A | | | 976,172 | |
| | | | | | | | |
| | | | | | | 3,523,448 | |
| | | | | | | | |
| | | | Treasuries – 15.0% | | | | |
| | 135,000 | | | Canadian Government,
1.250%, 12/01/2011, (CAD) | | | 139,322 | |
| | 31,580,000 | | | Canadian Government,
3.750%, 6/01/2019, (CAD) | | | 33,783,597 | |
| | 1,000,000 | | | Canadian Government,
4.000%, 6/01/2016, (CAD) | | | 1,093,770 | |
| | 7,935,000 | | | Canadian Government,
5.250%, 6/01/2012, (CAD) | | | 8,538,862 | |
| | 155,991 | | | Hellenic Republic Government Bond,
2.300%, 7/25/2030, (EUR) | | | 110,730 | |
| | 50,000 | | | Hellenic Republic Government Bond,
4.600%, 7/20/2018, (EUR) | | | 43,657 | |
| | 1,000,000 | | | Hellenic Republic Government Bond,
4.700%, 3/20/2024, (EUR) | | | 840,541 | |
| | 1,775,000 | | | Ireland Government Bond,
4.500%, 10/18/2018, (EUR) | | | 1,776,215 | |
| | 800,000 | | | Ireland Government Bond,
4.500%, 4/18/2020, (EUR) | | | 768,122 | |
| | 100,000 | | | Ireland Government Bond,
5.000%, 10/18/2020, (EUR) | | | 97,703 | |
| | 1,425,000 | | | Ireland Government Bond,
5.400%, 3/13/2025, (EUR) | | | 1,344,932 | |
| | 5,460,000 | | | New Zealand Government Bond,
6.500%, 4/15/2013, (NZD) | | | 4,413,314 | |
| | 23,620,000 | | | Norwegian Government,
4.250%, 5/19/2017, (NOK) | | | 4,443,328 | |
| | 54,560,000 | | | Norwegian Government,
6.500%, 5/15/2013, (NOK) | | | 10,597,155 | |
| | 400,000 | | | Portugal Obrigacoes do Tesouro OT,
3.850%, 4/15/2021, (EUR) | | | 397,836 | |
| | 100,000 | | | Portugal Obrigacoes do Tesouro OT,
4.800%, 6/15/2020, (EUR) | | | 109,970 | |
| | | | | | | | |
| | | | | | | 68,499,054 | |
| | | | | | | | |
See accompanying notes to financial statements.
| 76
Portfolio of Investments – as of March 31, 2011 (Unaudited)
Loomis Sayles Investment Grade Fixed Income Fund – continued
| | | | | | | | |
Principal
Amount (‡) | | | Description | | Value (†) | |
| | | | | | | | |
| |
| | Bonds and Notes – continued | | | | |
| |
| | | | Wireless – 0.3% | |
| $ | 510,000 | | | Nextel Communications, Inc.,
Series C,
5.950%, 3/15/2014 | | $ | 511,275 | |
| | 70,000 | | | Nextel Communications, Inc.,
Series D,
7.375%, 8/01/2015 | | | 70,262 | |
| | 35,000 | | | Nextel Communications, Inc.,
Series E,
6.875%, 10/31/2013 | | | 35,263 | |
| | 234,000 | | | Sprint Capital Corp.,
6.875%, 11/15/2028 | | | 215,865 | |
| | 120,000 | | | Sprint Capital Corp.,
6.900%, 5/01/2019 | | | 123,900 | |
| | 366,000 | | | Sprint Nextel Corp.,
6.000%, 12/01/2016 | | | 367,372 | |
| | | | | | | | |
| | | | | | | 1,323,937 | |
| | | | | | | | |
| | | | Wirelines – 3.3% | | | | |
| | 1,310,000 | | | AT&T Corp.,
6.500%, 3/15/2029 | | | 1,386,064 | |
| | 2,000,000 | | | BellSouth Telecommunications, Inc.,
5.850%, 11/15/2045 | | | 1,792,118 | |
| | 2,165,000 | | | CenturyLink, Inc., Series P,
7.600%, 9/15/2039 | | | 2,319,163 | |
| | 500,000 | | | Qwest Capital Funding, Inc.,
6.500%, 11/15/2018 | | | 510,000 | |
| | 2,875,000 | | | Qwest Corp.,
6.875%, 9/15/2033 | | | 2,878,594 | |
| | 195,000 | | | Qwest Corp.,
7.500%, 6/15/2023 | | | 195,487 | |
| | 1,880,000 | | | Telecom Italia Capital SA,
6.000%, 9/30/2034 | | | 1,701,129 | |
| | 290,000 | | | Verizon Maryland, Inc.,
Series B,
5.125%, 6/15/2033 | | | 261,765 | |
| | 2,170,000 | | | Verizon New England, Inc.,
7.875%, 11/15/2029 | | | 2,510,367 | |
| | 915,000 | | | Verizon New York, Inc.,
Series B,
7.375%, 4/01/2032 | | | 1,026,581 | |
| | 695,000 | | | Verizon Pennsylvania, Inc.,
6.000%, 12/01/2028 | | | 647,170 | |
| | | | | | | | |
| | | | | | | 15,228,438 | |
| | | | | | | | |
| | |
| | | | Total Non-Convertible Bonds | | | | |
| | | | (Identified Cost $322,378,527) | | | 371,251,722 | |
| | | | | | | | |
| |
| | Convertible Bonds – 4.2% | | | | |
| | |
| | | | Automotive – 0.4 % | | | | |
| | 1,035,000 | | | Ford Motor Co.,
4.250%, 11/15/2016 | | | 1,875,938 | |
| | | | | | | | |
| | | | Life Insurance – 1.8% | | | | |
| | 7,950,000 | | | Old Republic International Corp.,
3.750%, 3/15/2018 | | | 7,979,812 | |
| | | | | | | | |
| | | | REITs – Apartments – 0.0% | | | | |
| | 180,000 | | | ERP Operating LP,
3.850%, 8/15/2026 | | | 184,284 | |
| | | | | | | | |
| | | | | | | | |
Principal
Amount (‡) | | | Description | | Value (†) | |
| | | | | | | | |
| | | | Technology – 2.0% | | | | |
| $ | 3,505,000 | | | Intel Corp.,
2.950%, 12/15/2035 | | $ | 3,605,769 | |
| | 4,700,000 | | | Intel Corp.,
3.250%, 8/01/2039 | | | 5,528,375 | |
| | | | | | | | |
| | | | | | | 9,134,144 | |
| | | | | | | | |
| | |
| | | | Total Convertible Bonds | | | | |
| | | | (Identified Cost $17,282,177) | | | 19,174,178 | |
| | | | | | | | |
| |
| | Municipals – 0.9% | | | | |
| | |
| | | | Illinois – 0.2% | | | | |
| | 1,105,000 | | | State of Illinois,
5.100%, 6/01/2033 | | | 896,011 | |
| | | | | | | | |
| | | | Michigan – 0.2% | | | | |
| | 1,055,000 | | | Michigan Tobacco Settlement Finance Authority Taxable Turbo,
Series A, 7.309%, 6/01/2034(b) | | | 748,322 | |
| | | | | | | | |
| | | | Ohio – 0.1% | | | | |
| | 750,000 | | | Buckeye Tobacco Settlement Financing Authority, Series A-2,
5.875%, 6/01/2047(b) | | | 497,498 | |
| | | | | | | | |
| | | | Virginia – 0.4% | | | | |
| | 2,815,000 | | | Virginia Tobacco Settlement Financing Corp., Series A-1,
6.706%, 6/01/2046(b) | | | 1,770,494 | |
| | | | | | | | |
| | |
| | | | Total Municipals | | | | |
| | | | (Identified Cost $5,421,393) | | | 3,912,325 | |
| | | | | | | | |
| | |
| | | | Total Bonds and Notes | | | | |
| | | | (Identified Cost $345,082,097) | | | 394,338,225 | |
| | | | | | | | |
| | |
| | Shares | | | | | | | |
| |
| | Preferred Stocks – 1.6% | | | | |
| |
| | Non-Convertible Preferred Stocks – 0.8% | | | | |
| | |
| | | | Banking – 0.0% | | | | |
| | 161 | | | Ally Financial, Inc., Series G, 7.000%, 144A | | | 149,811 | |
| | | | | | | | |
| | | | Electric Utilities – 0.1% | | | | |
| | 263 | | | Connecticut Light & Power Co.,
2.200% | | | 9,912 | |
| | 150 | | | MDU Resources Group, Inc.,
5.100% | | | 15,084 | |
| | 3,160 | | | Union Electric Co.,
4.500% | | | 240,160 | |
| | | | | | | | |
| | | | | | | 265,156 | |
| | | | | | | | |
| | | | Multi Utilities – 0.0% | | | | |
| | 100 | | | San Diego Gas & Electric Co.,
4.500% | | | 1,675 | |
| | | | | | | | |
See accompanying notes to financial statements.
77 |
Portfolio of Investments – as of March 31, 2011 (Unaudited)
Loomis Sayles Investment Grade Fixed Income Fund – continued
| | | | | | | | |
| Shares | | | Description | | Value (†) | |
| | | | | | | | |
| |
| | Preferred Stocks – continued | | | | |
| | |
| | | | Software – 0.7% | | | | |
| | 3,000 | | | Falcons Funding Trust I, (Step to 10.875% on 3/15/2015, variable rate after 3/15/2020), 8.875%, 144A(f) | | $ | 3,240,937 | |
| | | | | | | | |
| |
| | | | Total Non-Convertible Preferred Stocks | |
| | | | (Identified Cost $3,228,421) | | | 3,657,579 | |
| | | | | | | | |
| |
| | Convertible Preferred Stocks – 0.8% | | | | |
| | |
| | | | Capital Markets – 0.3% | | | | |
| | 33,050 | | | Newell Financial Trust I,
5.250% | | | 1,582,269 | |
| | | | | | | | |
| | | | Diversified Financial Services – 0.5% | |
| | 940 | | | Bank of America Corp., Series L,
7.250% | | | 950,331 | |
| | 25,000 | | | Sovereign Capital Trust IV,
4.375% | | | 1,112,500 | |
| | | | | | | | |
| | | | | | | 2,062,831 | |
| | | | | | | | |
| |
| | | | Total Convertible Preferred Stocks | |
| | | | (Identified Cost $2,578,145) | | | 3,645,100 | |
| | | | | | | | |
| | |
| | | | Total Preferred Stocks | | | | |
| | | | (Identified Cost $5,806,566) | | | 7,302,679 | |
| | | | | | | | |
| |
| | Common Stocks – 0.2% | | | | |
| | |
| | | | Biotechnology – 0.2% | | | | |
| | 13,708 | | | Vertex Pharmaceuticals, Inc.(e)
(Identified Cost $302,522) | | | 657,024 | |
| | | | | | | | |
| | |
| Principal
Amount (‡) |
| | | | | | |
| |
| | Short-Term Investments – 11.2% | | | | |
| $ | 51,164,471 | | | Tri-Party Repurchase Agreement with Fixed Income Clearing Corporation, dated 3/31/2011 at 0.000% to be repurchased at $51,164,471 on 4/01/2011 collateralized by $54,865,000 Federal National Mortgage Association, 3.420% due 11/24/2020 valued at $52,190,331 including accrued interest (Note 2 of Notes to Financial Statements) (Identified Cost $51,164,471) | | | 51,164,471 | |
| | | | | | | | |
| | |
| | | | Total Investments – 99.6% | | | | |
| | | | (Identified Cost $402,355,656)(a) | | | 453,462,399 | |
| | | | Other Assets Less Liabilities—0.4% | | | 1,981,408 | |
| | | | | | | | |
| | |
| | | | Net Assets – 100.0% | | $ | 455,443,807 | |
| | | | | | | | |
| |
| | (‡) | | | Principal amount stated in U.S. dollars unless otherwise noted. | |
| | | | | | | | |
| | (†) | | | See Note 2 of Notes to Financial Statements. | |
| | (††) | | | Amount shown represents units. One unit represents a principal amount of 100. | |
| | (a) | | | Federal Tax Information (Amounts exclude certain adjustments made at the end of the Fund’s fiscal year for tax purposes. Such adjustments are primarily due to wash sales. Amortization of premium on debt securities is excluded for tax purposes.): | |
| | | | At March 31, 2011, the net unrealized appreciation on investments based on a cost of $404,120,897 for federal income tax purposes was as follows: | |
| | | | Aggregate gross unrealized appreciation for all investments in which there is an excess of value over tax cost | | $ | 52,750,731 | |
| | | | Aggregate gross unrealized depreciation for all investments in which there is an excess of tax cost over value | | | (3,409,229 | ) |
| | | | | | | | |
| | | | Net unrealized appreciation | | $ | 49,341,502 | |
| | | | | | | | |
| | (b) | | | Illiquid security. At March 31, 2011, the value of these securities amounted to $7,579,556 or 1.7% of net assets. | |
| | (c) | | | Variable rate security. Rate as of March 31, 2011 is disclosed. | |
| | (d) | | | The Fund’s investment in mortgage related securities of Federal Home Loan Mortgage Corporation, Federal National Mortgage Association and Government National Mortgage Association are interests in separate pools of mortgages. All separate investments in securities of each issuer which have the same coupon rate have been aggregated for the purpose of presentation in the Portfolio of Investments. | |
| | (e) | | | Non-income producing security. | |
| | (f) | | | Coupon rate is a fixed rate for an initial period then resets at a specified date and rate. | |
| |
| | 144A | | | All or a portion of these securities are exempt from registration under Rule 144A of the Securities Act of 1933. These securities may be resold in transactions exempt from registration, normally to qualified institutional buyers. At March 31, 2011, the value of Rule 144A holdings amounted to $62,505,397 or 13.7% of net assets. | |
| | ABS | | | Asset-Backed Securities | | | | |
| | ARMs | | | Adjustable Rate Mortgages | | | | |
| | EMTN | | | Euro Medium Term Note | | | | |
| | FHLMC | | | Federal Home Loan Mortgage Corp. | | | | |
| | FNMA | | | Federal National Mortgage Association | | | | |
| | GMTN | | | Global Medium Term Note | | | | |
| | GNMA | | | Government National Mortgage Association | | | | |
| | MTN | | | Medium Term Note | | | | |
| | REITs | | | Real Estate Investment Trusts | | | | |
| | |
| | AUD | | | Australian Dollar | | | | |
| | BRL | | | Brazilian Real | | | | |
| | CAD | | | Canadian Dollar | | | | |
| | EUR | | | Euro | | | | |
| | GBP | | | British Pound | | | | |
| | IDR | | | Indonesian Rupiah | | | | |
| | ISK | | | Icelandic Krona | | | | |
| | KRW | | | South Korean Won | | | | |
| | MXN | | | Mexican Peso | | | | |
| | NOK | | | Norwegian Krone | | | | |
| | NZD | | | New Zealand Dollar | | | | |
See accompanying notes to financial statements.
| 78
Portfolio of Investments – as of March 31, 2011 (Unaudited)
Loomis Sayles Investment Grade Fixed Income Fund – continued
Industry Summary at March 31, 2011 (Unaudited)
| | | | |
Treasuries | | | 15.0 | % |
Banking | | | 8.1 | |
Commercial Mortgage-Backed Securities | | | 6.3 | |
Airlines | | | 4.6 | |
Technology | | | 4.3 | |
Non-Captive Diversified | | | 4.1 | |
Local Authorities | | | 3.3 | |
Wirelines | | | 3.3 | |
Life Insurance | | | 2.9 | |
Supranational | | | 2.3 | |
Non-Captive Consumer | | | 2.2 | |
Sovereigns | | | 2.2 | |
Brokerage | | | 2.1 | |
Government Owned – No Guarantee | | | 2.0 | |
Property & Casualty Insurance | | | 2.0 | |
Other Investments, less than 2% each | | | 23.7 | |
Short-Term Investments | | | 11.2 | |
| | | | |
Total Investments | | | 99.6 | |
Other assets less liabilities | | | 0.4 | |
| | | | |
Net Assets | | | 100.0 | % |
| | | | |
Currency Exposure at March 31, 2011 (Unaudited)
| | | | |
U.S. Dollar | | | 73.0 | % |
Canadian Dollar | | | 9.6 | |
New Zealand Dollar | | | 4.5 | |
Norwegian Krone | | | 3.3 | |
Australian Dollar | | | 3.2 | |
Other, less than 2% each | | | 6.0 | |
| | | | |
Total Investments | | | 99.6 | |
Other assets less liabilities | | | 0.4 | |
| | | | |
Net Assets | | | 100.0 | % |
| | | | |
See accompanying notes to financial statements.
79 |
THIS PAGE INTENTIONALLY LEFT BLANK
| 80
Statements of Assets and Liabilities
March 31, 2011 (Unaudited)
| | | | | | | | | | | | |
| | | Bond Fund | | | Fixed Income
Fund | | | Global Bond
Fund | |
ASSETS | | | | | | | | | | | | |
Investments at cost | | $ | 16,603,056,966 | | | $ | 700,471,434 | | | $ | 2,085,012,192 | |
Repurchase agreement(s) at cost | | | 1,242,914,288 | | | | 56,191,130 | | | | 82,626,362 | |
Net unrealized appreciation | | | 1,945,318,611 | | | | 93,087,807 | | | | 117,290,111 | |
| | | | | | | | | | | | |
Investments at value | | | 19,791,289,865 | | | | 849,750,371 | | | | 2,284,928,665 | |
Cash | | | 7,638,633 | | | | 292,982 | | | | — | |
Foreign currency at value (identified cost $22,059,192, $795,753 and $40,630,041) | | | 21,647,173 | | | | 755,805 | | | | 41,544,482 | |
Receivable for Fund shares sold | | | 46,880,807 | | | | 600,000 | | | | 4,338,569 | |
Receivable for securities sold | | | 8,759,417 | | | | 337,807 | | | | — | |
Collateral received for open forward foreign currency contracts (Note 2) | | | — | | | | — | | | | 939,998 | |
Dividends and interest receivable | | | 282,475,218 | | | | 10,801,661 | | | | 25,866,369 | |
Unrealized appreciation on forward foreign currency contracts (Note 2) | | | — | | | | — | | | | 4,130,446 | |
Tax reclaims receivable | | | 1,525,689 | | | | 63,787 | | | | 202,626 | |
| | | | | | | | | | | | |
TOTAL ASSETS | | | 20,160,216,802 | | | | 862,602,413 | | | | 2,361,951,155 | |
| | | | | | | | | | | | |
| | | |
| LIABILITIES | | | | | | | | | | | | |
Payable for securities purchased | | | 105,407,189 | | | | 1,884,668 | | | | 60,554,235 | |
Payable for Fund shares redeemed | | | 17,647,886 | | | | 45,394 | | | | 1,942,481 | |
Unrealized depreciation on forward foreign currency contracts (Note 2) | | | — | | | | — | | | | 2,407,419 | |
Foreign taxes payable (Note 2) | | | 352,526 | | | | 15,970 | | | | — | |
Due to brokers (Note 2) | | | — | | | | — | | | | 939,998 | |
Management fees payable (Note 6) | | | 8,668,680 | | | | 362,678 | | | | 1,037,736 | |
Deferred Trustees’ fees (Note 6) | | | 802,472 | | | | 102,450 | | | | 175,847 | |
Administrative fees payable (Note 6) | | | 796,490 | | | | 34,175 | | | | 90,263 | |
Other accounts payable and accrued expenses | | | 1,472,083 | | | | 39,360 | | | | 159,745 | |
| | | | | | | | | | | | |
TOTAL LIABILITIES | | | 135,147,326 | | | | 2,484,695 | | | | 67,307,724 | |
| | | | | | | | | | | | |
NET ASSETS | | $ | 20,025,069,476 | | | $ | 860,117,718 | | | $ | 2,294,643,431 | |
| | | | | | | | | | | | |
NET ASSETS CONSIST OF: | | | | | | | | | | | | |
Paid-in capital | | $ | 18,872,463,351 | | | $ | 758,395,589 | | | $ | 2,239,714,315 | |
Undistributed net investment income (Distributions in excess of net investment income) | | | (61,343,180 | ) | | | 8,832,700 | | | | (18,715,351 | ) |
Accumulated net realized gain (loss) on investments, futures contracts, swap agreements and foreign currency transactions | | | (733,532,950 | ) | | | (228,175 | ) | | | (46,781,906 | ) |
Net unrealized appreciation on investments, futures contracts and foreign currency translations | | | 1,947,482,255 | | | | 93,117,604 | | | | 120,426,373 | |
| | | | | | | | | | | | |
NET ASSETS | | $ | 20,025,069,476 | | | $ | 860,117,718 | | | $ | 2,294,643,431 | |
| | | | | | | | | | | | |
| | | |
| COMPUTATION OF NET ASSET VALUE AND OFFERING PRICE: | | | | | | | | | | | | |
Institutional Class: | | | | | | | | | | | | |
Net assets | | $ | 11,438,988,894 | | | $ | 860,117,718 | | | $ | 1,326,479,414 | |
| | | | | | | | | | | | |
Shares of beneficial interest | | | 785,077,965 | | | | 61,281,832 | | | | 78,947,652 | |
| | | | | | | | | | | | |
Net asset value, offering and redemption price per share | | $ | 14.57 | | | $ | 14.04 | | | $ | 16.80 | |
| | | | | | | | | | | | |
Retail Class: | | | | | | | | | | | | |
Net assets | | $ | 8,318,500,269 | | | $ | — | | | $ | 968,164,017 | |
| | | | | | | | | | | | |
Shares of beneficial interest | | | 573,041,322 | | | | — | | | | 58,145,833 | |
| | | | | | | | | | | | |
Net asset value, offering and redemption price per share | | $ | 14.52 | | | $ | — | | | $ | 16.65 | |
| | | | | | | | | | | | |
Admin Class: | | | | | | | | | | | | |
Net assets | | $ | 267,580,313 | | | $ | — | | | $ | — | |
| | | | | | | | | | | | |
Shares of beneficial interest | | | 18,478,847 | | | | — | | | | — | |
| | | | | | | | | | | | |
Net asset value, offering and redemption price per share | | $ | 14.48 | | | $ | — | | | $ | — | |
| | | | | | | | | | | | |
See accompanying notes to financial statements.
81 |
| | | | | | | | | | | | | | | | |
| | | Inflation
Protected
Securities Fund | | | Institutional
High Income
Fund | | | Intermediate
Duration
Bond Fund | | | Investment
Grade Fixed
Income Fund | |
ASSETS | | | | | | | | | | | | | | | | |
Investments at cost | | $ | 14,968,594 | | | $ | 341,546,586 | | | $ | 54,634,821 | | | $ | 351,191,185 | |
Repurchase agreement(s) at cost | | | 250,190 | | | | 9,453,903 | | | | 667,232 | | | | 51,164,471 | |
Net unrealized appreciation | | | 779,169 | | | | 72,071,326 | | | | 1,569,827 | | | | 51,106,743 | |
| | | | | | | | | | | | | | | | |
Investments at value | | | 15,997,953 | | | | 423,071,815 | | | | 56,871,880 | | | | 453,462,399 | |
Cash | | | — | | | | 149,108 | | | | — | | | | 27,274 | |
Foreign currency at value (identified cost $0, $112,049, $0 and $551,245) | | | — | | | | 105,478 | | | | — | | | | 557,766 | |
Receivable for Fund shares sold | | | 1,320,171 | | | | 841,264 | | | | 194,916 | | | | — | |
Receivable from investment adviser (Note 6) | | | 10,200 | | | | — | | | | 1,113 | | | | — | |
Receivable for securities sold | | | — | | | | 134,166 | | | | 417,297 | | | | — | |
Dividends and interest receivable | | | 102,321 | | | | 5,708,924 | | | | 460,231 | | | | 5,988,134 | |
Tax reclaims receivable | | | — | | | | 19,913 | | | | 1,951 | | | | 122,348 | |
| | | | | | | | | | | | | | | | |
TOTAL ASSETS | | | 17,430,645 | | | | 430,030,668 | | | | 57,947,388 | | | | 460,157,921 | |
| | | | | | | | | | | | | | | | |
| | | | |
| LIABILITIES | | | | | | | | | | | | | | | | |
Payable for securities purchased | | | — | | | | 326,238 | | | | 437,873 | | | | 4,430,108 | |
Payable for Fund shares redeemed | | | 2,832 | | | | — | | | | 635,882 | | | | — | |
Foreign taxes payable (Note 2) | | | — | | | | 3,625 | | | | — | | | | 7,519 | |
Management fees payable (Note 6) | | | — | | | | 218,299 | | | | — | | | | 147,358 | |
Deferred Trustees’ fees (Note 6) | | | 59,656 | | | | 69,224 | | | | 62,652 | | | | 76,672 | |
Administrative fees payable (Note 6) | | | 591 | | | | 17,137 | | | | 2,337 | | | | 17,379 | |
Other accounts payable and accrued expenses | | | 19,249 | | | | 37,451 | | | | 21,845 | | | | 35,078 | |
| | | | | | | | | | | | | | | | |
TOTAL LIABILITIES | | | 82,328 | | | | 671,974 | | | | 1,160,589 | | | | 4,714,114 | |
| | | | | | | | | | | | | | | | |
NET ASSETS | | $ | 17,348,317 | | | $ | 429,358,694 | | | $ | 56,786,799 | | | $ | 455,443,807 | |
| | | | | | | | | | | | | | | | |
NET ASSETS CONSIST OF: | | | | | | | | | | | | | | | | |
Paid-in capital | | $ | 17,274,166 | | | $ | 347,239,978 | | | $ | 56,238,023 | | | $ | 398,953,019 | |
Undistributed net investment income (Distributions in excess of net investment income) | | | (103,175 | ) | | | 4,423,240 | | | | (201,429 | ) | | | (1,157,666 | ) |
Accumulated net realized gain (loss) on investments, futures contracts, swap agreements and foreign currency transactions | | | (601,897 | ) | | | 5,625,994 | | | | (819,622 | ) | | | 6,456,129 | |
Net unrealized appreciation on investments, futures contracts and foreign currency translations | | | 779,223 | | | | 72,069,482 | | | | 1,569,827 | | | | 51,192,325 | |
| | | | | | | | | | | | | | | | |
NET ASSETS | | $ | 17,348,317 | | | $ | 429,358,694 | | | $ | 56,786,799 | | | $ | 455,443,807 | |
| | | | | | | | | | | | | | | | |
| | | | |
| COMPUTATION OF NET ASSET VALUE AND OFFERING PRICE: | | | | | | | | | | | | | | | | |
Institutional Class: | | | | | | | | | | | | | | | | |
Net assets | | $ | 16,894,760 | | | $ | 429,358,694 | | | $ | 55,406,078 | | | $ | 455,443,807 | |
| | | | | | | | | | | | | | | | |
Shares of beneficial interest | | | 1,528,339 | | | | 54,564,722 | | | | 5,350,895 | | | | 35,619,108 | |
| | | | | | | | | | | | | | | | |
Net asset value, offering and redemption price per share | | $ | 11.05 | | | $ | 7.87 | | | $ | 10.35 | | | $ | 12.79 | |
| | | | | | | | | | | | | | | | |
Retail Class: | | | | | | | | | | | | | | | | |
Net assets | | $ | 453,557 | | | $ | — | | | $ | 1,380,721 | | | $ | — | |
| | | | | | | | | | | | | | | | |
Shares of beneficial interest | | | 41,082 | | | | — | | | | 133,193 | | | | — | |
| | | | | | | | | | | | | | | | |
Net asset value, offering and redemption price per share | | $ | 11.04 | | | $ | — | | | $ | 10.37 | | | $ | — | |
| | | | | | | | | | | | | | | | |
See accompanying notes to financial statements.
| 82
Statements of Operations
For the Six Months Ended March 31, 2011 (Unaudited)
| | | | | | | | | | | | |
| | | Bond Fund | | | Fixed Income
Fund | | | Global Bond
Fund | |
INVESTMENT INCOME | | | | | | | | | | | | |
Interest | | $ | 539,645,682 | | | $ | 23,073,332 | | | $ | 44,018,789 | |
Dividends | | | 28,793,675 | | | | 1,127,673 | | | | — | |
Less net foreign taxes withheld | | | (1,317,368 | ) | | | (49,710 | ) | | | (158,854 | ) |
| | | | | | | | | | | | |
| | | 567,121,989 | | | | 24,151,295 | | | | 43,859,935 | |
| | | | | | | | | | | | |
Expenses | | | | | | | | | | | | |
Management fees (Note 6) | | | 50,428,026 | | | | 2,065,773 | | | | 6,140,270 | |
Service and distribution fees (Note 6) | | | 10,879,239 | | | | — | | | | 1,223,515 | |
Administrative fees (Note 6) | | | 4,594,562 | | | | 193,034 | | | | 529,760 | |
Trustees’ fees and expenses (Note 6) | | | 219,043 | | | | 21,834 | | | | 38,535 | |
Transfer agent fees and expenses (Notes 6 and 7) | | | 6,549,068 | | | | 1,577 | | | | 771,073 | |
Audit and tax services fees | | | 32,777 | | | | 22,855 | | | | 27,205 | |
Custodian fees and expenses | | | 567,509 | | | | 35,814 | | | | 109,951 | |
Legal fees | | | 232,554 | | | | 9,773 | | | | 26,776 | |
Registration fees | | | 225,857 | | | | 17,946 | | | | 76,888 | |
Shareholder reporting expenses | | | 748,041 | | | | 1,267 | | | | 91,146 | |
Miscellaneous expenses | | | 285,902 | | | | 14,375 | | | | 35,577 | |
| | | | | | | | | | | | |
Total expenses | | | 74,762,578 | | | | 2,384,248 | | | | 9,070,696 | |
Fee/expense recovery (Note 6) | | | 6,942 | | | | — | | | | — | |
| | | | | | | | | | | | |
Net expenses | | | 74,769,520 | | | | 2,384,248 | | | | 9,070,696 | |
| | | | | | | | | | | | |
Net investment income | | | 492,352,469 | | | | 21,767,047 | | | | 34,789,239 | |
| | | | | | | | | | | | |
| | | |
NET REALIZED AND UNREALIZED GAIN (LOSS) ON INVESTMENTS, FUTURES CONTRACTS AND FOREIGN CURRENCY TRANSACTIONS | | | | | | | | | | | | |
Net realized gain on: | | | | | | | | | | | | |
Investments | | | 255,924,412 | | | | 11,554,766 | | | | 34,118,503 | |
Futures contracts | | | — | | | | — | | | | 4,296,316 | |
Foreign currency transactions | | | 5,232,177 | | | | 200,609 | | | | 4,946,543 | |
Net change in unrealized appreciation (depreciation) on: | | | | | | | | | | | | |
Investments | | | 313,067,057 | | | | 11,754,469 | | | | (49,057,035 | ) |
Futures contracts | | | — | | | | — | | | | 555,658 | |
Foreign currency translations | | | 122,187 | | | | 8,671 | | | | (293,629 | ) |
| | | | | | | | | | | | |
Net realized and unrealized gain (loss) on investments, futures contracts and foreign currency transactions | | | 574,345,833 | | | | 23,518,515 | | | | (5,433,644 | ) |
| | | | | | | | | | | | |
NET INCREASE IN NET ASSETS RESULTING FROM OPERATIONS | | $ | 1,066,698,302 | | | $ | 45,285,562 | | | $ | 29,355,595 | |
| | | | | | | | | | | | |
See accompanying notes to financial statements.
83 |
| | | | | | | | | | | | | | | | |
| | | Inflation
Protected
Securities Fund | | | Institutional
High Income
Fund | | | Intermediate
Duration Bond
Fund | | | Investment
Grade Fixed
Income Fund | |
INVESTMENT INCOME | | | | | | | | | | | | | | | | |
Interest | | $ | 230,733 | | | $ | 14,114,047 | | | $ | 865,679 | | | $ | 11,818,500 | |
Dividends | | | — | | | | 576,138 | | | | — | | | | 410,426 | |
Less net foreign taxes withheld | | | — | | | | (45,935 | ) | | | (157 | ) | | | (602 | ) |
| | | | | | | | | | | | | | | | |
| | | 230,733 | | | | 14,644,250 | | | | 865,522 | | | | 12,228,324 | |
| | | | | | | | | | | | | | | | |
Expenses | | | | | | | | | | | | | | | | |
Management fees (Note 6) | | | 17,343 | | | | 1,230,100 | | | | 64,962 | | | | 864,970 | |
Service and distribution fees (Note 6) | | | 244 | | | | — | | | | 1,483 | | | | — | |
Administrative fees (Note 6) | | | 3,241 | | | | 95,786 | | | | 12,139 | | | | 101,040 | |
Trustees’ fees and expenses (Note 6) | | | 18,032 | | | | 16,391 | | | | 18,789 | | | | 17,580 | |
Transfer agent fees and expenses (Notes 6 and 7) | | | 3,890 | | | | 4,479 | | | | 1,062 | | | | 965 | |
Audit and tax services fees | | | 20,446 | | | | 21,866 | | | | 20,349 | | | | 21,244 | |
Custodian fees and expenses | | | 8,320 | | | | 23,596 | | | | 10,523 | | | | 23,187 | |
Legal fees | | | 170 | | | | 4,673 | | | | 507 | | | | 5,420 | |
Registration fees | | | 19,502 | | | | 18,358 | | | | 17,657 | | | | 14,714 | |
Shareholder reporting expenses | | | 1,393 | | | | 1,900 | | | | 2,125 | | | | 1,077 | |
Miscellaneous expenses | | | 3,068 | | | | 8,309 | | | | 3,389 | | | | 9,606 | |
| | | | | | | | | | | | | | | | |
Total expenses | | | 95,649 | | | | 1,425,458 | | | | 152,985 | | | | 1,059,803 | |
Less waiver and/or expense reimbursement (Note 6) | | | (67,657 | ) | | | — | | | | (47,562 | ) | | | — | |
| | | | | | | | | | | | | | | | |
Net expenses | | | 27,992 | | | | 1,425,458 | | | | 105,423 | | | | 1,059,803 | |
| | | | | | | | | | | | | | | | |
Net investment income | | | 202,741 | | | | 13,218,792 | | | | 760,099 | | | | 11,168,521 | |
| | | | | | | | | | | | | | | | |
| | | | |
NET REALIZED AND UNREALIZED GAIN (LOSS) ON INVESTMENTS, FUTURES CONTRACTS AND FOREIGN CURRENCY TRANSACTIONS | | | | | | | | | | | | | | | | |
Net realized gain (loss) on: | | | | | | | | | | | | | | | | |
Investments | | | 38,095 | | | | 7,063,709 | | | | 57,819 | | | | 11,906,310 | |
Futures contracts | | | — | | | | — | | | | (11,130 | ) | | | — | |
Foreign currency transactions | | | 225 | | | | 47,382 | | | | — | | | | 118,202 | |
Net change in unrealized appreciation (depreciation) on: | | | | | | | | | | | | | | | | |
Investments | | | (59,884 | ) | | | 17,294,686 | | | | (957,143 | ) | | | (8,915,753 | ) |
Foreign currency translations | | | 9 | | | | (7,165 | ) | | | — | | | | 41,373 | |
| | | | | | | | | | | | | | | | |
Net realized and unrealized gain (loss) on investments, futures contracts and foreign currency transactions | | | (21,555 | ) | | | 24,398,612 | | | | (910,454 | ) | | | 3,150,132 | |
| | | | | | | | | | | | | | | | |
NET INCREASE (DECREASE) IN NET ASSETS RESULTING FROM OPERATIONS | | $ | 181,186 | | | $ | 37,617,404 | | | $ | (150,355 | ) | | $ | 14,318,653 | |
| | | | | | | | | | | | | | | | |
See accompanying notes to financial statements.
| 84
Statements of Changes in Net Assets
| | | | | | | | | | | | | | | | | | | | | | | | |
| | | Bond Fund | | | Fixed Income Fund | | | Global Bond Fund | |
| | | Six Months
Ended
March 31, 2011
(Unaudited) | | | Year Ended
September 30,
2010 | | | Six Months
Ended
March 31, 2011
(Unaudited) | | | Year Ended
September 30,
2010 | | | Six Months
Ended
March 31, 2011
(Unaudited) | | | Year Ended
September 30,
2010 | |
| FROM OPERATIONS: | | | | | | | | | | | | | | | | | | | | | |
Net investment income | | $ | 492,352,469 | | | $ | 1,070,035,077 | | | $ | 21,767,047 | | | $ | 45,727,241 | | | $ | 34,789,239 | | | $ | 68,638,745 | |
Net realized gain (loss) on investments, futures contracts, swap agreements and foreign currency transactions | | | 261,156,589 | | | | (80,917,562 | ) | | | 11,755,375 | | | | 11,807,903 | | | | 43,361,362 | | | | 17,629,634 | |
Net change in unrealized appreciation (depreciation) on investments, futures contracts and foreign currency translations | | | 313,189,244 | | | | 1,805,551,398 | | | | 11,763,140 | | | | 54,418,162 | | | | (48,795,006 | ) | | | 102,327,637 | |
| | | | | | | | | | | | | | | | | | | | | | | | |
Net increase (decrease) in net assets resulting from operations | | | 1,066,698,302 | | | | 2,794,668,913 | | | | 45,285,562 | | | | 111,953,306 | | | | 29,355,595 | | | | 188,596,016 | |
| | | | | | | | | | | | | | | | | | | | | | | | |
| FROM DISTRIBUTIONS TO SHAREHOLDERS: | | | | | | | | | | | | | | | | | |
Net investment income | | | | | | | | | | | | | | | | | | | | | | | | |
Institutional Class | | | (327,821,826) | | | | (642,070,620 | ) | | | (48,778,586 | ) | | | (42,551,309 | ) | | | (32,690,275 | ) | | | (39,529,201 | ) |
Retail Class | | | (227,371,155) | | | | (448,114,393 | ) | | | — | | | | — | | | | (23,460,114 | ) | | | (31,727,897 | ) |
Admin Class | | | (7,052,730) | | | | (13,185,534 | ) | | | — | | | | — | | | | — | | | | — | |
Net realized capital gains | | | | | | | | | | | | | | | | | | | | | | | | |
Institutional Class | | | — | | | | — | | | | — | | | | — | | | | — | | | | — | |
| | | | | | | | | | | | | | | | | | | | | | | | |
Total distributions | | | (562,245,711 | ) | | | (1,103,370,547 | ) | | | (48,778,586 | ) | | | (42,551,309 | ) | | | (56,150,389 | ) | | | (71,257,098 | ) |
| | | | | | | | | | | | | | | | | | | | | | | | |
| NET INCREASE (DECREASE) IN NET ASSETS FROM CAPITAL SHARE TRANSACTIONS (NOTE 11) | | | (181,187,912 | ) | | | (717,934,887 | ) | | | 57,472,289 | | | | (25,218,972 | ) | | | 9,534,894 | | | | 243,357,966 | |
| | | | | | | | | | | | | | | | | | | | | | | | |
Net increase (decrease) in net assets | | | 323,264,679 | | | | 973,363,479 | | | | 53,979,265 | | | | 44,183,025 | | | | (17,259,900 | ) | | | 360,696,884 | |
| NET ASSETS | | | | | | | | | | | | | | | | | | | | | | | | |
Beginning of the period | | | 19,701,804,797 | | | | 18,728,441,318 | | | | 806,138,453 | | | | 761,955,428 | | | | 2,311,903,331 | | | | 1,951,206,447 | |
| | | | | | | | | | | | | | | | | | | | | | | | |
End of the period | | $ | 20,025,069,476 | | | $ | 19,701,804,797 | | | $ | 860,117,718 | | | $ | 806,138,453 | | | $ | 2,294,643,431 | | | $ | 2,311,903,331 | |
| | | | | | | | | | | | | | | | | | | | | | | | |
| UNDISTRIBUTED NET INVESTMENT INCOME (DISTRIBUTIONS IN EXCESS OF NET INVESTMENT INCOME) | | $ | (61,343,180 | ) | | $ | 8,550,062 | | | $ | 8,832,700 | | | $ | 35,844,239 | | | $ | (18,715,351 | ) | | $ | 2,645,799 | |
| | | | | | | | | | | | | | | | | | | | | | | | |
See accompanying notes to financial statements.
85 |
| | | | | | | | | | | | | | | | | | | | | | | | | | | | |
Inflation Protected
Securities Fund | | | Institutional High
Income Fund | | | Intermediate Duration
Bond Fund | | | Investment Grade Fixed
Income Fund | |
Six Months
Ended
March 31, 2011
(Unaudited) | | Year Ended
September 30,
2010 | | | Six Months
Ended
March 31, 2011
(Unaudited) | | | Year Ended
September 30,
2010 | | | Six Months
Ended
March 31, 2011
(Unaudited) | | | Year Ended
September 30,
2010 | | | Six Months
Ended
March 31, 2011
(Unaudited) | | | Year Ended
September 30,
2010 | |
| | | | | | | | | | | | | | | | | | | | | | | | | | | | |
| $ 202,741 | | $ | 426,034 | | | $ | 13,218,792 | | | $ | 28,061,451 | | | $ | 760,099 | | | $ | 1,184,695 | | | $ | 11,168,521 | | | $ | 26,566,472 | |
| | | | | | | |
| 38,320 | | | 188,071 | | | | 7,111,091 | | | | 25,735,774 | | | | 46,689 | | | | 478,623 | | | | 12,024,512 | | | | 19,397,666 | |
| | | | | | | |
| (59,875) | | | 727,374 | | | | 17,287,521 | | | | 11,621,609 | | | | (957,143 | ) | | | 1,575,620 | | | | (8,874,380 | ) | | | 21,278,146 | |
| | | | | | | | | | | | | | | | | | | | | | | | | | | | | |
| | | | | | | |
| 181,186 | | | 1,341,479 | | | | 37,617,404 | | | | 65,418,834 | | | | (150,355 | ) | | | 3,238,938 | | | | 14,318,653 | | | | 67,242,284 | |
| | | | | | | | | | | | | | | | | | | | | | | | | | | | | |
| | | | | | | | | | | | | | | | | | | | | | | | | | | | |
| | | | | | | | | | | | | | | | | | | | | | | | | | | | |
| (260,879) | | | (490,125) | | | | (28,511,356 | ) | | | (30,543,921 | ) | | | (904,560 | ) | | | (1,295,593 | ) | | | (14,267,694 | ) | | | (27,602,054 | ) |
| (4,406) | | | (471) | | | | — | | | | — | | | | (18,601 | ) | | | (690 | ) | | | — | | | | — | |
| — | | | — | | | | — | | | | — | | | | — | | | | — | | | | — | | | | — | |
| | | | | | | | | | | | | | | | | | | | | | | | | | | | |
| — | | | — | | | | (15,983,712 | ) | | | (11,736 | ) | | | — | | | | — | | | | (19,655,485 | ) | | | — | |
| | | | | | | | | | | | | | | | | | | | | | | | | | | | | |
| (265,285) | | | (490,596 | ) | | | (44,495,068 | ) | | | (30,555,657 | ) | | | (923,161 | ) | | | (1,296,283 | ) | | | (33,923,179 | ) | | | (27,602,054 | ) |
| | | | | | | | | | | | | | | | | | | | | | | | | | | | | |
| | | | | | | |
| 4,116,607 | | | (1,511,063 | ) | | | 52,543,700 | | | | (109,686,518 | ) | | | 20,819,091 | | | | 7,071,240 | | | | 1,849,629 | | | | (91,945,491 | ) |
| | | | | | | | | | | | | | | | | | | | | | | | | | | | | |
| 4,032,508 | | | (660,180 | ) | | | 45,666,036 | | | | (74,823,341 | ) | | | 19,745,575 | | | | 9,013,895 | | | | (17,754,897 | ) | | | (52,305,261 | ) |
| | | | | | | | | | | | | | | | | | | | | | | | | | | | |
| 13,315,809 | | | 13,975,989 | | | | 383,692,658 | | | | 458,515,999 | | | | 37,041,224 | | | | 28,027,329 | | | | 473,198,704 | | | | 525,503,965 | |
| | | | | | | | | | | | | | | | | | | | | | | | | | | | | |
| $17,348,317 | | $ | 13,315,809 | | | $ | 429,358,694 | | | $ | 383,692,658 | | | $ | 56,786,799 | | | $ | 37,041,224 | | | $ | 455,443,807 | | | $ | 473,198,704 | |
| | | | | | | | | | | | | | | | | | | | | | | | | | | | | |
| | | | | | | |
| $ (103,175) | | $ | (40,631 | ) | | $ | 4,423,240 | | | $ | 19,715,804 | | | $ | (201,429 | ) | | $ | (38,367 | ) | | $ | (1,157,666 | ) | | $ | 1,941,507 | |
| | | | | | | | | | | | | | | | | | | | | | | | | | | | | |
See accompanying notes to financial statements.
| 86
Financial Highlights
For a share outstanding throughout each period.
| | | | | | | | | | | | | | | | | | | | | | | | | | | | | | | | |
| | | | | | Income (Loss) from Investment Operations: | | | | | | Less Distributions: | |
| | | Net asset
value,
beginning
of the period | | | Net
investment
income(a) | | | Net realized
and unrealized
gain (loss) | | | Total from
investment
operations | | | | | | Dividends
from
net investment
income | | | Distributions
from net
realized
capital gains | | | Total
distributions | |
| BOND FUND | | | | | | | | | | | | | | | | | | | | | | | | | | | | | | | | |
| | | | | | |
| Institutional Class | | | | | | | | | | | | | | | | | | | | | | | | | |
3/31/2011(g) | | $ | 14.20 | | | $ | 0.37 | | | $ | 0.42 | | | $ | 0.79 | | | | | | | $ | (0.42 | ) | | $ | — | | | $ | (0.42 | ) |
9/30/2010 | | | 12.99 | | | | 0.78 | | | | 1.24 | | | | 2.02 | | | | | | | | (0.81 | ) | | | — | | | | (0.81 | ) |
9/30/2009 | | | 11.89 | | | | 0.85 | | | | 1.23 | | | | 2.08 | | | | | | | | (0.87 | ) | | | (0.11 | ) | | | (0.98 | ) |
9/30/2008 | | | 14.71 | | | | 0.96 | | | | (2.77 | ) | | | (1.81 | ) | | | | | | | (1.01 | ) | | | — | | | | (1.01 | ) |
9/30/2007 | | | 14.13 | | | | 0.83 | | | | 0.58 | | | | 1.41 | | | | | | | | (0.83 | ) | | | — | | | | (0.83 | ) |
9/30/2006 | | | 13.81 | | | | 0.72 | | | | 0.47 | | | | 1.19 | | | | | | | | (0.87 | ) | | | — | | | | (0.87 | ) |
| | | | | | | | |
| Retail Class | | | | | | | | | | | | | | | | | | | | | | | | | | | | | | | | |
3/31/2011(g) | | | 14.15 | | | | 0.35 | | | | 0.42 | | | | 0.77 | | | | | | | | (0.40 | ) | | | — | | | | (0.40 | ) |
9/30/2010 | | | 12.94 | | | | 0.74 | | | | 1.24 | | | | 1.98 | | | | | | | | (0.77 | ) | | | — | | | | (0.77 | ) |
9/30/2009 | | | 11.85 | | | | 0.82 | | | | 1.22 | | | | 2.04 | | | | | | | | (0.84 | ) | | | (0.11 | ) | | | (0.95 | ) |
9/30/2008 | | | 14.67 | | | | 0.92 | | | | (2.77 | ) | | | (1.85 | ) | | | | | | | (0.97 | ) | | | — | | | | (0.97 | ) |
9/30/2007 | | | 14.10 | | | | 0.79 | | | | 0.57 | | | | 1.36 | | | | | | | | (0.79 | ) | | | — | | | | (0.79 | ) |
9/30/2006 | | | 13.78 | | | | 0.69 | | | | 0.47 | | | | 1.16 | | | | | | | | (0.84 | ) | | | — | | | | (0.84 | ) |
| | | | | | | | |
| Admin Class | | | | | | | | | | | | | | | | | | | | | | | | | | | | | | | | |
3/31/2011(g) | | | 14.11 | | | | 0.32 | | | | 0.43 | | | | 0.75 | | | | | | | | (0.38 | ) | | | — | | | | (0.38 | ) |
9/30/2010 | | | 12.91 | | | | 0.70 | | | | 1.23 | | | | 1.93 | | | | | | | | (0.73 | ) | | | — | | | | (0.73 | ) |
9/30/2009 | | | 11.82 | | | | 0.79 | | | | 1.22 | | | | 2.01 | | | | | | | | (0.81 | ) | | | (0.11 | ) | | | (0.92 | ) |
9/30/2008 | | | 14.64 | | | | 0.88 | | | | (2.76 | ) | | | (1.88 | ) | | | | | | | (0.94 | ) | | | — | | | | (0.94 | ) |
9/30/2007 | | | 14.07 | | | | 0.75 | | | | 0.58 | | | | 1.33 | | | | | | | | (0.76 | ) | | | — | | | | (0.76 | ) |
9/30/2006 | | | 13.75 | | | | 0.65 | | | | 0.48 | | | | 1.13 | | | | | | | | (0.81 | ) | | | — | | | | (0.81 | ) |
| (a) | | Per share net investment income has been calculated using the average shares outstanding during the period. | |
| (b) | | Amount rounds to less than $0.01 per share, if applicable. | |
| (c) | | Effective June 2, 2008, redemption fees were eliminated. | |
| (d) | | Had certain expenses not been waived/reimbursed during the period, if applicable, total returns would have been lower. Periods less than one year, if applicable, are not annualized. | |
| (e) | | The investment adviser and/or administrator agreed to waive its fees and/or reimburse a portion of the Fund’s expenses during the period. Without this waiver/reimbursement, if applicable, expenses would have been higher. | |
| (f) | | Computed on an annualized basis for periods less than one year, if applicable. | |
| (g) | | For the six months ended March 31, 2011 (Unaudited). | |
| (h) | | Effective July 1, 2007, the Fund decreased its net expense limitations to 0.70%, 0.95% and 1.20% from 0.75%, 1.00% and 1.25% for the Institutional Class, Retail Class and Admin Class, respectively. | |
| (i) | | Includes fee/expense recovery of 0.02%. | |
| (j) | | Includes fee/expense recovery of less than 0.01%. | |
| (k) | | Includes fee/expense recovery of 0.01%. | |
See accompanying notes to financial statements.
87 |
| | | | | | | | | | | | | | | | | | | | | | | | | | | | | | |
| | | | | | | | | | | | | Ratios to Average Net Assets: | | | | |
Redemption
fees(b)(c) | | | Net asset
value,
end of
the period | | | Total
return (%)(d) | | | Net assets,
end of
the period
(000’s) | | | Net
expenses
(%)(e)(f) | | | Gross
expenses
(%)(f) | | | Net
investment
income (%)(f) | | | Portfolio
turnover
rate (%) | |
| | | | | | | | | | | | | | | | | | | | | | | | | | | | | | |
| | | | | | | |
| | | | | | | | | | | | | | | | | | | | | | | | | | | | | | |
| $ | — | | | $ | 14.57 | | | | 5.64 | | | $ | 11,438,989 | | | | 0.63 | | | | 0.63 | | | | 5.14 | | | | 10 | |
| | — | | | | 14.20 | | | | 16.00 | | | | 11,194,527 | | | | 0.64 | | | | 0.64 | | | | 5.76 | | | | 27 | |
| | — | | | | 12.99 | | | | 19.84 | | | | 10,855,818 | | | | 0.65 | | | | 0.65 | | | | 7.69 | | | | 39 | |
| | 0.00 | | | | 11.89 | | | | (13.14 | ) | | | 7,616,621 | | | | 0.64 | | | | 0.64 | | | | 6.78 | | | | 26 | |
| | 0.00 | | | | 14.71 | | | | 10.28 | | | | 7,716,061 | | | | 0.67 | (h) | | | 0.67 | | | | 5.75 | | | | 20 | |
| | 0.00 | | | | 14.13 | | | | 9.00 | | | | 4,742,622 | | | | 0.75 | (i) | | | 0.75 | (i) | | | 5.20 | | | | 26 | |
| | | | | | | |
| | | | | | | | | | | | | | | | | | | | | | | | | | | | | | |
| | — | | | | 14.52 | | | | 5.51 | | | | 8,318,500 | | | | 0.92 | | | | 0.92 | | | | 4.84 | | | | 10 | |
| | — | | | | 14.15 | | | | 15.72 | | | | 8,241,062 | | | | 0.93 | (j) | | | 0.93 | (j) | | | 5.46 | | | | 27 | |
| | — | | | | 12.94 | | | | 19.46 | | | | 7,646,591 | | | | 0.95 | | | | 0.96 | | | | 7.44 | | | | 39 | |
| | 0.00 | | | | 11.85 | | | | (13.44 | ) | | | 6,863,594 | | | | 0.94 | (j) | | | 0.94 | (j) | | | 6.49 | | | | 26 | |
| | 0.00 | | | | 14.67 | | | | 9.93 | | | | 6,432,333 | | | | 0.97 | (h) | | | 0.97 | | | | 5.49 | | | | 20 | |
| | 0.00 | | | | 14.10 | | | | 8.79 | | | | 2,232,632 | | | | 1.00 | | | | 1.01 | | | | 4.99 | | | | 26 | |
| | | | | | | |
| | | | | | | | | | | | | | | | | | | | | | | | | | | | | | |
| | — | | | | 14.48 | | | | 5.38 | | | | 267,580 | | | | 1.20 | (k) | | | 1.20 | (k) | | | 4.56 | | | | 10 | |
| | — | | | | 14.11 | | | | 15.37 | | | | 266,215 | | | | 1.20 | | | | 1.21 | | | | 5.20 | | | | 27 | |
| | — | | | | 12.91 | | | | 19.21 | | | | 226,032 | | | | 1.20 | | | | 1.25 | | | | 7.22 | | | | 39 | |
| | 0.00 | | | | 11.82 | | | | (13.69 | ) | | | 210,494 | | | | 1.20 | | | | 1.24 | | | | 6.23 | | | | 26 | |
| | 0.00 | | | | 14.64 | | | | 9.66 | | | | 193,850 | | | | 1.23 | (h)(j) | | | 1.23 | (j) | | | 5.20 | | | | 20 | |
| | 0.00 | | | | 14.07 | | | | 8.51 | | | | 106,941 | | | | 1.25 | | | | 1.29 | | | | 4.71 | | | | 26 | |
See accompanying notes to financial statements.
| 88
Financial Highlights – continued
For a share outstanding throughout each period.
| | | | | | | | | | | | | | | | | | | | | | | | | | | | | | | | |
| | | | | | Income (Loss) from Investment Operations: | | | | | | Less Distributions: | |
| | | Net asset
value,
beginning
of the period | | | Net
investment
income(a) | | | Net realized
and unrealized
gain (loss) | | | Total from
investment
operations | | | | | | Dividends
from
net investment
income | | | Distributions
from net
realized
capital gains | | | Total
distributions | |
| FIXED INCOME FUND | | | | | | | | | | | | | | | | | | | | | | | | | | | | | |
| | | | | | | | |
| Institutional Class | | | | | | | | | | | | | | | | | | | | | | | | | | | | | | | | |
3/31/2011(f) | | $ | 14.12 | | | $ | 0.37 | | | $ | 0.39 | | | $ | 0.76 | | | | | | | $ | (0.84 | ) | | $ | — | | | $ | (0.84 | ) |
9/30/2010 | | | 12.94 | | | | 0.77 | | | | 1.14 | | | | 1.91 | | | | | | | | (0.73 | ) | | | — | | | | (0.73 | ) |
9/30/2009 | | | 12.15 | | | | 0.78 | | | | 1.15 | | | | 1.93 | | | | | | | | (0.89 | ) | | | (0.25 | ) | | | (1.14 | ) |
9/30/2008 | | | 14.49 | | | | 0.88 | | | | (2.14 | ) | | | (1.26 | ) | | | | | | | (1.06 | ) | | | (0.02 | ) | | | (1.08 | ) |
9/30/2007 | | | 13.89 | | | | 0.83 | | | | 0.67 | | | | 1.50 | | | | | | | | (0.90 | ) | | | — | | | | (0.90 | ) |
9/30/2006 | | | 13.88 | | | | 0.74 | | | | 0.30 | | | | 1.04 | | | | | | | | (1.03 | ) | | | — | | | | (1.03 | ) |
| | | | | | | |
| GLOBAL BOND FUND | | | | | | | | | | | | | | | | | | | | | | | | | | | | | |
| | | | | | | | |
| Institutional Class | | | | | | | | | | | | | | | | | | | | | | | | | | | | | | | | |
3/31/2011(f) | | $ | 16.99 | | | $ | 0.27 | | | $ | (0.04 | ) | | $ | 0.23 | | | | | | | $ | (0.42 | ) | | $ | — | | | $ | (0.42 | ) |
9/30/2010 | | | 16.09 | | | | 0.55 | | | | 0.92 | | | | 1.47 | | | | | | | | (0.57 | ) | | | — | | | | (0.57 | ) |
9/30/2009 | | | 14.42 | | | | 0.67 | | | | 1.89 | | | | 2.56 | | | | | | | | (0.89 | ) | | | — | | | | (0.89 | ) |
9/30/2008 | | | 15.83 | | | | 0.70 | | | | (1.30 | ) | | | (0.60 | ) | | | | | | | (0.81 | ) | | | — | | | | (0.81 | ) |
9/30/2007 | | | 15.43 | | | | 0.60 | | | | 0.70 | | | | 1.30 | | | | | | | | (0.90 | ) | | | — | | | | (0.90 | ) |
9/30/2006 | | | 15.57 | | | | 0.48 | | | | 0.16 | | | | 0.64 | | | | | | | | (0.70 | ) | | | (0.08 | ) | | | (0.78 | ) |
| | | | | | | | |
| Retail Class | | | | | | | | | | | | | | | | | | | | | | | | | | | | | | | | |
3/31/2011(f) | | | 16.84 | | | | 0.24 | | | | (0.03 | ) | | | 0.21 | | | | | | | | (0.40 | ) | | | — | | | | (0.40 | ) |
9/30/2010 | | | 15.96 | | | | 0.49 | | | | 0.91 | | | | 1.40 | | | | | | | | (0.52 | ) | | | — | | | | (0.52 | ) |
9/30/2009 | | | 14.31 | | | | 0.62 | | | | 1.88 | | | | 2.50 | | | | | | | | (0.85 | ) | | | — | | | | (0.85 | ) |
9/30/2008 | | | 15.71 | | | | 0.64 | | | | (1.29 | ) | | | (0.65 | ) | | | | | | | (0.75 | ) | | | — | | | | (0.75 | ) |
9/30/2007 | | | 15.29 | | | | 0.54 | | | | 0.70 | | | | 1.24 | | | | | | | | (0.82 | ) | | | — | | | | (0.82 | ) |
9/30/2006 | | | 15.43 | | | | 0.44 | | | | 0.15 | | | | 0.59 | | | | | | | | (0.65 | ) | | | (0.08 | ) | | | (0.73 | ) |
| (a) | | Per share net investment income has been calculated using the average shares outstanding during the period. | |
| (b) | | Amount rounds to less than $0.01 per share, if applicable. | |
| (c) | | Had certain expenses not been waived/reimbursed during the period, if applicable, total returns would have been lower. Periods less than one year, if applicable, are not annualized. | |
| (d) | | The investment adviser and/or administrator agreed to waive its fees and/or reimburse a portion of the Fund’s expenses during the period. Without this waiver/reimbursement, if applicable, expenses would have been higher. | |
| (e) | | Computed on an annualized basis for periods less than one year, if applicable. | |
| (f) | | For the six months ended March 31, 2011 (Unaudited). | |
| (g) | | Includes fee/expense recovery of less than 0.01% and 0.03% for Fixed Income Fund and Global Bond Fund, respectively. | |
| (h) | | Effective June 2, 2008, redemption fees were eliminated. | |
| (i) | | Includes fee/expense recovery of 0.01%. | |
| (j) | | Includes fee/expense recovery of 0.02%. | |
See accompanying notes to financial statements.
89 |
| | | | | | | | | | | | | | | | | | | | | | | | | | | | | | |
| | | | | | | | | | | | | Ratios to Average Net Assets: | | | | |
Redemption
fees(b) | | | Net asset
value,
end of
the period | | | Total
return (%)(c) | | | Net assets,
end of
the period
(000’s) | | | Net
expenses
(%)(d)(e) | | | Gross
expenses (%)(e) | | | Net
investment
income (%)(e) | | | Portfolio
turnover
rate(%) | |
| | | | | | | | | | | | | | | | | | | | | | | | | | | | | | |
| | | | | | | |
| | | | | | | | | | | | | | | | | | | | | | | | | | | | | | |
| | $— | | | $ | 14.04 | | | | 5.64 | | | $ | 860,118 | | | | 0.58 | | | | 0.58 | | | | 5.27 | | | | 13 | |
| | — | | | | 14.12 | | | | 15.38 | | | | 806,138 | | | | 0.58 | | | | 0.58 | | | | 5.83 | | | | 22 | |
| | — | | | | 12.94 | | | | 19.55 | | | | 761,955 | | | | 0.58 | | | | 0.58 | | | | 7.11 | | | | 29 | |
| | — | | | | 12.15 | | | | (9.42 | ) | | | 624,486 | | | | 0.58 | | | | 0.58 | | | | 6.43 | | | | 30 | |
| | — | | | | 14.49 | | | | 11.31 | | | | 605,100 | | | | 0.60 | | | | 0.60 | | | | 5.96 | | | | 22 | |
| | — | | | | 13.89 | | | | 8.06 | | | | 456,011 | | | | 0.60 | (g) | | | 0.60 | (g) | | | 5.48 | | | | 40 | |
| | | | | | | |
| | | | | | | | | | | | | | | | | | | | | | | | | | | | | | |
| | | | | | | |
| | | | | | | | | | | | | | | | | | | | | | | | | | | | | | |
| | $— | | | $ | 16.80 | | | | 1.37 | | | $ | 1,326,479 | | | | 0.66 | | | | 0.66 | | | | 3.21 | | | | 42 | |
| | — | | | | 16.99 | | | | 9.46 | | | | 1,285,095 | | | | 0.66 | | | | 0.66 | | | | 3.41 | | | | 100 | |
| | — | | | | 16.09 | | | | 19.19 | | | | 1,032,465 | | | | 0.68 | | | | 0.68 | | | | 4.76 | | | | 75 | |
| | 0.00 | (h) | | | 14.42 | | | | (4.14 | ) | | | 1,157,175 | | | | 0.64 | | | | 0.64 | | | | 4.36 | | | | 60 | |
| | 0.00 | | | | 15.83 | | | | 8.70 | | | | 996,046 | | | | 0.68 | | | | 0.68 | | | | 3.84 | | | | 95 | |
| | 0.00 | | | | 15.43 | | | | 4.32 | | | | 643,991 | | | | 0.74 | (g) | | | 0.74 | (g) | | | 3.21 | | | | 77 | |
| | | | | | | |
| | | | | | | | | | | | | | | | | | | | | | | | | | | | | | |
| | — | | | | 16.65 | | | | 1.22 | | | | 968,164 | | | | 0.98 | | | | 0.98 | | | | 2.88 | | | | 42 | |
| | — | | | | 16.84 | | | | 9.05 | | | | 1,026,809 | | | | 1.00 | (i) | | | 1.00 | (i) | | | 3.08 | | | | 100 | |
| | — | | | | 15.96 | | | | 18.81 | | | | 918,742 | | | | 1.00 | | | | 1.02 | | | | 4.46 | | | | 75 | |
| | 0.00 | (h) | | | 14.31 | | | | (4.45 | ) | | | 1,073,466 | | | | 1.00 | (j) | | | 1.00 | (j) | | | 4.02 | | | | 60 | |
| | 0.00 | | | | 15.71 | | | | 8.36 | | | | 874,575 | | | | 1.00 | | | | 1.04 | | | | 3.53 | | | | 95 | |
| | 0.00 | | | | 15.29 | | | | 4.03 | | | | 540,697 | | | | 1.00 | | | | 1.09 | | | | 2.93 | | | | 77 | |
See accompanying notes to financial statements.
| 90
Financial Highlights – continued
For a share outstanding throughout each period.
| | | | | | | | | | | | | | | | | | | | | | | | | | | | | | | | |
| | | | | | Income (Loss) from Investment Operations: | | | | | | Less Distributions: | |
| | | Net asset
value,
beginning
of the period | | | Net
investment
income(a) | | | Net realized
and unrealized
gain (loss) | | | Total from
investment
operations | | | | | | Dividends
from
net investment
income | | | Distributions
from net
realized
capital gains(b) | | | Total
distributions | |
| INFLATION PROTECTED SECURITIES FUND | | | | | | | | | | | | | | | | | | | | | | | | | |
| | | | | | | |
| Institutional Class | | | | | | | | | | | | | | | | | | | | | | | | | | | | | |
3/31/2011(f) | | $ | 11.10 | | | $ | 0.16 | | | $ | (0.01 | ) | | $ | 0.15 | | | | | | | $ | (0.20 | ) | | $ | — | | | $ | (0.20 | ) |
9/30/2010 | | | 10.46 | | | | 0.31 | | | | 0.67 | | | | 0.98 | | | | | | | | (0.34 | ) | | | — | | | | (0.34 | ) |
9/30/2009 | | | 9.86 | | | | 0.09 | (g) | | | 0.61 | | | | 0.70 | | | | | | | | (0.10 | ) | | | — | | | | (0.10 | ) |
9/30/2008 | | | 10.31 | | | | 0.73 | | | | (0.43 | ) | | | 0.30 | | | | | | | | (0.75 | ) | | | — | | | | (0.75 | ) |
9/30/2007 | | | 10.30 | | | | 0.47 | | | | 0.03 | | | | 0.50 | | | | | | | | (0.49 | ) | | | — | | | | (0.49 | ) |
9/30/2006 | | | 10.84 | | | | 0.52 | | | | (0.38 | ) | | | 0.14 | | | | | | | | (0.63 | ) | | | (0.05 | ) | | | (0.68 | ) |
| | | | | | | |
| Retail Class | | | | | | | | | | | | | | | | | | | | | | | | | | | | | |
3/31/2011(f) | | | 11.09 | | | | 0.17 | | | | (0.03 | ) | | | 0.14 | | | | | | | | (0.19 | ) | | | — | | | | (0.19 | ) |
9/30/2010* | | | 10.71 | | | | 0.04 | | | | 0.44 | | | | 0.48 | | | | | | | | (0.10 | ) | | | — | | | | (0.10 | ) |
| | | | | |
| INSTITUTIONAL HIGH INCOME FUND | | | | | | | | | | | | | | | | | | | | | |
| | | | | | | |
| Institutional Class | | | | | | | | | | | | | | | | | | | | | | | | | | | | | |
3/31/2011(f) | | $ | 8.08 | | | $ | 0.25 | | | $ | 0.46 | | | $ | 0.71 | | | | | | | $ | (0.59 | ) | | $ | (0.33 | ) | | $ | (0.92 | ) |
9/30/2010 | | | 7.40 | | | | 0.54 | | | | 0.66 | | | | 1.20 | | | | | | | | (0.52 | ) | | | (0.00 | ) | | | (0.52 | ) |
9/30/2009 | | | 6.87 | | | | 0.57 | | | | 0.54 | | | | 1.11 | | | | | | | | (0.49 | ) | | | (0.09 | ) | | | (0.58 | ) |
9/30/2008 | | | 8.45 | | | | 0.60 | | | | (1.52 | ) | | | (0.92 | ) | | | | | | | (0.51 | ) | | | (0.15 | ) | | | (0.66 | ) |
9/30/2007 | | | 8.11 | | | | 0.55 | | | | 0.30 | | | | 0.85 | | | | | | | | (0.51 | ) | | | — | | | | (0.51 | ) |
9/30/2006 | | | 7.80 | | | | 0.50 | | | | 0.34 | | | | 0.84 | | | | | | | | (0.53 | ) | | | — | | | | (0.53 | ) |
| * | | From commencement of Class operations on May 28, 2010 through September 30, 2010 | |
| (a) | | Per share net investment income has been calculated using the average shares outstanding during the period. | |
| (b) | | Amount rounds to less than $0.01 per share, if applicable. | |
| (c) | | Had certain expenses not been waived/reimbursed during the period, if applicable, total returns would have been lower. Periods less than one year, if applicable, are not annualized. | |
| (d) | | The investment adviser and/or administrator agreed to waive its fees and/or reimburse a portion of the Fund’s expenses during the period. Without this waiver/reimbursement, if applicable, expenses would have been higher. | |
| (e) | | Computed on an annualized basis for periods less than one year, if applicable. | |
| (f) | | For the six months ended March 31, 2011 (Unaudited). | |
| (g) | | Includes income reductions resulting from principal deflation adjustments during the period in the amount of $0.14 per share and 1.44% of average net assets. See Note 2 of Notes to Financial Statements. | |
| (h) | | Includes fee/expense recovery of 0.01%. | |
See accompanying notes to financial statements.
91 |
| | | | | | | | | | | | | | | | | | | | | | | | | | |
| | | | | | | | | | Ratios to Average Net Assets: | | | | |
Net asset
value,
end of
the period | | | Total
return (%)(c) | | | Net assets,
end of
the period
(000’s) | | | Net
expenses
(%)(d)(e) | | | Gross
expenses
(%)(e) | | | Net
investment
income (%)(e) | | | Portfolio
turnover
rate (%) | |
| | | | | | | | | | | | | | | | | | | | | | | | | | |
| | | | | | |
| | | | | | | | | | | | | | | | | | | | | | | | | | |
| $ | 11.05 | | | | 1.40 | | | $ | 16,895 | | | | 0.40 | | | | 1.37 | | | | 2.92 | | | | 7 | |
| | 11.10 | | | | 9.58 | | | | 13,240 | | | | 0.40 | | | | 1.22 | | | | 2.88 | | | | 39 | |
| | 10.46 | | | | 7.21 | | | | 13,976 | | | | 0.40 | | | | 1.11 | | | | 0.88 | (g) | | | 12 | |
| | 9.86 | | | | 2.64 | | | | 16,033 | | | | 0.40 | | | | 0.95 | | | | 6.85 | | | | 22 | |
| | 10.31 | | | | 5.05 | | | | 13,468 | | | | 0.40 | | | | 1.28 | | | | 4.60 | | | | 26 | |
| | 10.30 | | | | 1.48 | | | | 9,053 | | | | 0.40 | | | | 1.69 | | | | 4.96 | | | | 41 | |
| | | | | | |
| | | | | | | | | | | | | | | | | | | | | | | | | | |
| | 11.04 | | | | 1.31 | | | | 454 | | | | 0.65 | | | | 1.70 | | | | 3.12 | | | | 7 | |
| | 11.09 | | | | 4.47 | | | | 75 | | | | 0.65 | | | | 2.36 | | | | 1.12 | | | | 39 | |
| | | | | | |
| | | | | | | | | | | | | | | | | | | | | | | | | | |
| | | | | | |
| | | | | | | | | | | | | | | | | | | | | | | | | | |
| $ | 7.87 | | | | 9.60 | | | $ | 429,359 | | | | 0.70 | | | | 0.70 | | | | 6.45 | | | | 14 | |
| | 8.08 | | | | 17.06 | | | | 383,693 | | | | 0.71 | | | | 0.71 | | | | 7.08 | | | | 21 | |
| | 7.40 | | | | 20.82 | | | | 458,516 | | | | 0.72 | | | | 0.72 | | | | 9.54 | | | | 37 | |
| | 6.87 | | | | (11.70 | ) | | | 214,201 | | | | 0.72 | | | | 0.72 | | | | 7.70 | | | | 35 | |
| | 8.45 | | | | 10.81 | | | | 187,568 | | | | 0.75 | (h) | | | 0.75 | (h) | | | 6.60 | | | | 31 | |
| | 8.11 | | | | 11.56 | | | | 141,318 | | | | 0.75 | | | | 0.79 | | | | 6.40 | | | | 23 | |
See accompanying notes to financial statements.
| 92
Financial Highlights – continued
For a share outstanding throughout each period.
| | | | | | | | | | | | | | | | | | | | | | | | | | | | | | | | |
| | | | | | Income (Loss) from Investment Operations: | | | | | | Less Distributions: | |
| | | Net asset
value,
beginning
of the period | | | Net
investment
income (a) | | | Net realized
and unrealized
gain (loss) | | | Total from
investment
operations | | | | | | Dividends
from
net investment
income | | | Distributions
from net
realized
capital gains | | | Total
distributions | |
| INTERMEDIATE DURATION BOND FUND | | | | | | | | | | | | | | | | | | | | | | | | | |
| | | | | | | |
| Institutional Class | | | | | | | | | | | | | | | | | | | | | | | | | | | | | |
3/31/2011(e) | | $ | 10.57 | | | $ | 0.15 | | | $ | (0.19 | ) | | $ | (0.04 | ) | | | | | | $ | (0.18 | ) | | $ | — | | | $ | (0.18 | ) |
9/30/2010 | | | 9.95 | | | | 0.38 | | | | 0.66 | | | | 1.04 | | | | | | | | (0.42 | ) | | | — | | | | (0.42 | ) |
9/30/2009 | | | 8.95 | | | | 0.48 | | | | 0.98 | | | | 1.46 | | | | | | | | (0.46 | ) | | | — | | | | (0.46 | ) |
9/30/2008 | | | 9.47 | | | | 0.47 | | | | (0.50 | ) | | | (0.03 | ) | | | | | | | (0.49 | ) | | | — | | | | (0.49 | ) |
9/30/2007 | | | 9.50 | | | | 0.45 | | | | (0.01 | ) | | | 0.44 | | | | | | | | (0.47 | ) | | | — | | | | (0.47 | ) |
9/30/2006 | | | 9.60 | | | | 0.42 | | | | (0.07 | ) | | | 0.35 | | | | | | | | (0.45 | ) | | | — | | | | (0.45 | ) |
| | | | | | | |
| Retail Class | | | | | | | | | | | | | | | | | | | | | | | | | | | | | |
3/31/2011(e) | | | 10.58 | | | | 0.14 | | | | (0.18 | ) | | | (0.04 | ) | | | | | | | (0.17 | ) | | | — | | | | (0.17 | ) |
9/30/2010* | | | 10.21 | | | | 0.09 | �� | | | 0.41 | | | | 0.50 | | | | | | | | (0.13 | ) | | | — | | | | (0.13 | ) |
| | | | | |
| INVESTMENT GRADE FIXED INCOME FUND | | | | | | | | | | | | | | | | | | | | | |
| | | | | | | |
| Institutional Class | | | | | | | | | | | | | | | | | | | | | | | | | | | | | |
3/31/2011(e) | | $ | 13.44 | | | $ | 0.33 | | | $ | 0.09 | | | $ | 0.42 | | | | | | | $ | (0.44 | ) | | $ | (0.63 | ) | | $ | (1.07 | ) |
9/30/2010 | | | 12.39 | | | | 0.68 | | | | 1.07 | | | | 1.75 | | | | | | | | (0.70 | ) | | | – | | | | (0.70 | ) |
9/30/2009 | | | 11.36 | | | | 0.67 | | | | 1.31 | | | | 1.98 | | | | | | | | (0.81 | ) | | | (0.14 | ) | | | (0.95 | ) |
9/30/2008 | | | 12.96 | | | | 0.76 | | | | (1.47 | ) | | | (0.71 | ) | | | | | | | (0.89 | ) | | | – | | | | (0.89 | ) |
9/30/2007 | | | 12.63 | | | | 0.70 | | | | 0.53 | | | | 1.23 | | | | | | | | (0.90 | ) | | | – | | | | (0.90 | ) |
9/30/2006 | | | 13.28 | | | | 0.60 | | | | 0.22 | | | | 0.82 | | | | | | | | (0.92 | ) | | | (0.55 | ) | | | (1.47 | ) |
| * | | From commencement of Class operations on May 28, 2010 through September 30, 2010 | |
| (a) | | Per share net investment income has been calculated using the average shares outstanding during the period. | |
| (b) | | Had certain expenses not been waived/reimbursed during the period, if applicable, total returns would have been lower. Periods less than one year, if applicable, are not annualized. | |
| (c) | | The investment adviser and/or administrator agreed to waive its fees and/or reimburse a portion of the Fund’s expenses during the period. Without this waiver/reimbursement, if applicable, expenses would have been higher. | |
| (d) | | Computed on an annualized basis for periods less than one year, if applicable. | |
| (e) | | For the six months ended March 31, 2011 (Unaudited). | |
| (f) | | Includes fee/expense recovery of less than 0.01%. | |
See accompanying notes to financial statements.
93 |
| | | | | | | | | | | | | | | | | | | | | | | | | | |
| | | | | | | | | | Ratios to Average Net Assets: | | | | |
Net asset
value,
end of
the period | | | Total
return (%)(b) | | | Net assets,
end of
the period
(000’s) | | | Net
expenses (%)(c)(d) | | | Gross
expenses (%)(d) | | | Net
investment
income (%)(d) | | | Portfolio
turnover
rate(%) | |
| | | | | | | | | | | | | | | | | | | | | | | | | | |
| | | | | | |
| | | | | | | | | | | | | | | | | | | | | | | | | | |
| $ | 10.35 | | | | (0.34 | ) | | $ | 55,406 | | | | 0.40 | | | | 0.58 | | | | 2.93 | | | | 37 | |
| | 10.57 | | | | 10.67 | | | | 36,959 | | | | 0.40 | | | | 0.73 | | | | 3.75 | | | | 43 | |
| | 9.95 | | | | 16.99 | | | | 28,027 | | | | 0.40 | | | | 0.68 | | | | 5.24 | | | | 52 | |
| | 8.95 | | | | (0.46 | ) | | | 32,748 | | | | 0.40 | | | | 0.59 | | | | 5.00 | | | | 65 | |
| | 9.47 | | | | 4.76 | | | | 31,445 | | | | 0.40 | | | | 0.61 | | | | 4.71 | | | | 87 | |
| | 9.50 | | | | 3.82 | | | | 41,851 | | | | 0.40 | | | | 0.62 | | | | 4.48 | | | | 62 | |
| | | | | | |
| | | | | | | | | | | | | | | | | | | | | | | | | | |
| | 10.37 | | | | (0.37 | ) | | | 1,381 | | | | 0.65 | | | | 0.88 | | | | 2.74 | | | | 37 | |
| | 10.58 | | | | 4.89 | | | | 82 | | | | 0.65 | | | | 1.61 | | | | 2.66 | | | | 43 | |
| | | | | | |
| | | | | | | | | | | | | | | | | | | | | | | | | | |
| | | | | | |
| | | | | | | | | | | | | | | | | | | | | | | | | | |
| | $12.79 | | | | 3.39 | | | $ | 455,444 | | | | 0.49 | | | | 0.49 | | | | 5.16 | | | | 7 | |
| | 13.44 | | | | 14.59 | | | | 473,199 | | | | 0.48 | | | | 0.48 | | | | 5.29 | | | | 24 | |
| | 12.39 | | | | 19.35 | | | | 525,504 | | | | 0.49 | | | | 0.49 | | | | 6.10 | | | | 22 | |
| | 11.36 | | | | (6.00 | ) | | | 277,863 | | | | 0.50 | | | | 0.50 | | | | 5.98 | | | | 32 | |
| | 12.96 | | | | 10.19 | | | | 261,741 | | | | 0.53 | | | | 0.53 | | | | 5.52 | | | | 23 | |
| | 12.63 | | | | 6.81 | | | | 173,549 | | | | 0.55 | (f) | | | 0.55 | (f) | | | 4.79 | | | | 50 | |
See accompanying notes to financial statements.
| 94
Notes to Financial Statements
March 31, 2011 (Unaudited)
1. Organization. Loomis Sayles Funds I (the “Trust”) is organized as a Massachusetts business trust. The Trust is registered under the Investment Company Act of 1940, as amended (the “1940 Act”) as an open-end management investment company. The Declaration of Trust permits the Board of Trustees to authorize the issuance of an unlimited number of shares of the Trust in multiple series. Shares of certain funds in the Trust were first registered under the Securities Act of 1933 (the “1933 Act”) effective March 7, 1997 (subsequent to their commencement of investment operations). The financial statements for certain funds of the Trust are presented in separate reports. The following funds (individually, a “Fund” and collectively, the “Funds”) are included in this report:
Loomis Sayles Bond Fund (the “Bond Fund”)
Loomis Sayles Fixed Income Fund (the “Fixed Income Fund”)
Loomis Sayles Global Bond Fund (the “Global Bond Fund”)
Loomis Sayles Inflation Protected Securities Fund (the “Inflation Protected Securities Fund”)
Loomis Sayles Institutional High Income Fund (the “Institutional High Income Fund”)
Loomis Sayles Intermediate Duration Bond Fund (the “Intermediate Duration Bond Fund”)
Loomis Sayles Investment Grade Fixed Income Fund (the “Investment Grade Fixed Income Fund”)
Each Fund offers Institutional Class shares. Bond Fund, Global Bond Fund, Inflation Protected Securities Fund and Intermediate Duration Bond Fund also offer Retail Class shares. In addition, Bond Fund offers Admin Class shares.
Most expenses of the Trust can be directly attributed to a Fund. Expenses which cannot be directly attributed to a Fund are generally apportioned based on the relative net assets of each of the Funds in the Trust. Expenses of a Fund are borne pro rata by the holders of each class of shares, except that each class bears expenses unique to that class (including the Rule 12b-1 service and distribution fees and transfer agent fees). In addition, each class votes as a class only with respect to its own Rule 12b-1 Plan. Shares of each class would receive their pro rata share of the net assets of a Fund if the Fund were liquidated. The Trustees approve separate distributions from net investment income on each class of shares.
2. Significant Accounting Policies. The following is a summary of significant accounting policies consistently followed by each Fund in the preparation of its financial statements. The Funds’ financial statements are prepared in accordance with accounting principles generally accepted in the United States of America which require the use of management estimates that affect the reported amounts and disclosures in the financial statements. Actual results could differ from those estimates. Management has evaluated the events and transactions subsequent to period-end through the date the financial statements were issued and has determined that there were no material events that would require disclosure in the Funds’ financial statements.
a. Valuation. Debt securities (other than short-term obligations purchased with an original or remaining maturity of sixty days or less) are generally valued on the basis of evaluated bids furnished to the Funds by a pricing service recommended by the investment adviser and approved by the Board of Trustees, which service determines valuations for normal, institutional-size trading units of such securities using market information, transactions for comparable securities and various relationships between securities which are generally recognized by institutional traders. Equity securities, including shares of closed-end investment companies and exchange-traded funds, for which market quotations are readily available are valued at market value, as reported by pricing services recommended by the investment adviser and approved by the Board of Trustees. Such pricing services generally use the security’s last sale price on the exchange or market where the security is primarily traded or, if there is no reported sale during the day, the closing bid price. Securities traded on the NASDAQ Global Select Market, NASDAQ Global Market and NASDAQ Capital Market are valued at the NASDAQ Official Closing Price (“NOCP”), or if lacking a NOCP, at the most recent bid quotation on the applicable NASDAQ Market. Broker-dealer bid quotations may also be used to value debt and equity securities where a pricing service does not price a security or where a pricing service does not provide a reliable price for the security. In instances where broker-dealer bid quotations are not available, certain securities held by the Funds may be valued on the basis of a price provided by a principal market maker. Forward foreign currency contracts are valued utilizing interpolated prices determined from information provided by an independent pricing service. Futures contracts are valued at their most recent settlement price. Swap agreements are valued based on prices supplied by a pricing service, if available, or quotations obtained from broker-dealers. Short-term obligations purchased with an original or remaining maturity of sixty days or less are valued at amortized cost, which approximates market value. Investments in other open-end investment companies are valued at their net asset value each day. Securities for which market quotations are not readily available are valued at fair value as determined in good faith by the Funds’ investment adviser using consistently applied procedures under the general supervision of the Board of Trustees.
The Funds may hold securities traded in foreign markets. Foreign securities are valued at the market price in the foreign market. However, if events occurring after the close of the foreign market (but before the close of regular trading on the New York Stock Exchange) are believed to materially affect the value of those securities, such securities are fair valued pursuant to procedures approved by the Board of Trustees. When fair valuing securities, the Funds may, among other things, use modeling tools or other processes that may take into account factors such as securities market activity and/or significant events that occur after the close of the foreign market and before the Funds calculate their net asset values.
95 |
Notes to Financial Statements – continued
March 31, 2011 (Unaudited)
b. Investment Transactions and Related Investment Income. Investment transactions are accounted for on a trade date plus one basis for daily net asset value calculation. However, for financial reporting purposes, investment transactions are reported on trade date. Dividend income is recorded on ex-dividend date, or in the case of certain foreign securities, as soon as a Fund is notified, and interest income is recorded on an accrual basis. Interest income is increased by the accretion of discount and decreased by the amortization of premium. Periodic principal adjustments for inflation-protected securities are recorded to interest income. Negative principal adjustments (in the event of deflation) are recorded as reductions of interest income to the extent of interest income earned, not to exceed the amount of positive principal adjustments on a cumulative basis. Distributions received from investments in securities that represent a return of capital or capital gain are recorded as a reduction of cost of investments or as a realized gain, respectively. The calendar year-end amounts of ordinary income, capital gains, and return of capital included in distributions received from the Funds’ investments in real estate investment trusts (“REITs”) are reported to the Funds after the end of the fiscal year; accordingly, the Funds estimate these amounts for accounting purposes until the characterization of REIT distributions is reported to the Funds after the end of the fiscal year. Estimates are based on the most recent REIT distribution information available. Investment income is recorded net of foreign taxes withheld when applicable. In determining net gain or loss on securities sold, the cost of securities has been determined on an identified cost basis. Investment income, non-class-specific expenses and realized and unrealized gains and losses are allocated on a pro rata basis to each class based on the relative net assets of each class to the total net assets of the Fund.
c. Foreign Currency Translation. The books and records of the Funds are maintained in U.S. dollars. The values of securities, currencies and other assets and liabilities denominated in currencies other than U.S. dollars are translated into U.S. dollars based upon foreign exchange rates prevailing at the end of the period. Purchases and sales of investment securities, income and expenses are translated on the respective dates of such transactions.
Since the values of investment securities are presented at the foreign exchange rates prevailing at the end of the period, it is not practical to isolate that portion of the results of operations arising from changes in exchange rates from fluctuations which arise due to changes in market prices of investment securities. Such changes are included with the net realized and unrealized gain or loss on investments.
Net realized foreign exchange gains or losses arise from sales of foreign currency, currency gains or losses realized between the trade and settlement dates on securities transactions and the difference between the amounts of dividends, interest and foreign withholding taxes recorded on the Funds’ books and the U.S. dollar equivalent of the amounts actually received or paid. Net unrealized foreign exchange gains and losses arise from changes in the value of assets and liabilities, other than investment securities, at the end of the fiscal period, resulting from changes in exchange rates.
Certain Funds may use foreign currency exchange contracts to facilitate transactions in foreign-denominated investments. Losses may arise from changes in the value of the foreign currency or if the counterparties do not perform under the contracts’ terms.
d. Forward Foreign Currency Contracts. Certain Funds may enter into forward foreign currency contracts, including forward foreign cross currency contracts. Contracts to buy generally are used to acquire exposure to foreign currencies, while contracts to sell generally are used to hedge a Fund’s investments against currency fluctuation. Also, a contract to buy or sell may offset a previous contract. These contracts involve market risk in excess of the unrealized gain or loss reflected in the Funds’ Statements of Assets and Liabilities. The U.S. dollar value of the currencies a Fund has committed to buy or sell represents the aggregate exposure to each currency the Fund has acquired or hedged through currency contracts outstanding at period end. Gains or losses are recorded for financial statement purposes as unrealized until settlement date. Risks may arise upon entering into these contracts from the potential inability of counterparties to meet the terms of their contracts and from unanticipated movements in the value of a foreign currency relative to the U.S. dollar. Certain contracts may require the movement of cash or securities as collateral for the Funds’ or counterparty’s net obligations under the contracts.
e. Futures Contracts. The Funds may enter into futures contracts. Futures contracts are agreements between two parties to buy and sell a particular commodity, instrument or index for a specified price on a specified future date.
When a Fund enters into a futures contract, it is required to deposit with (or for the benefit of) its broker an amount of cash or short-term high quality securities as “initial margin”. As the value of the contract changes, the value of the futures contract position increases or declines. Subsequent payments, known as “variation margin”, are made or received by a Fund, depending on the price fluctuations in the fair value of the contract and the value of cash or securities on deposit with the broker. The aggregate principal amounts of the contracts are not recorded in the financial statements. Fluctuations in the value of the contracts are recorded in the Statements of Assets and Liabilities as an asset (liability) and in the Statements of Operations as unrealized appreciation (depreciation) until the contracts are closed, when they are recorded as realized gains (losses). Realized gain or loss on a futures position is equal to the difference between the value of the contract at the time it was opened and the value at the time it was closed, minus brokerage commissions. When a Fund enters into a futures contract, certain risks may arise, such as illiquidity in the futures market, which may limit a Fund’s ability to close out a futures contract prior to settlement date, and unanticipated movements in the value of securities or interest rates.
| 96
Notes to Financial Statements – continued
March 31, 2011 (Unaudited)
Futures contracts are exchange-traded. Exchange-traded futures have standardized contracts and are settled through a clearing house with fulfillment guaranteed by the credit of the exchange. Therefore, counterparty credit risks to the Funds are limited.
f. Swap Agreements. Each Fund may enter into credit default swaps. A credit default swap is an agreement between two parties (the “protection buyer” and “protection seller”) to exchange the credit risk of an issuer (“reference obligation”) for a specified time period. The reference obligation may be one or more debt securities or an index of such securities. The Funds may be either the protection buyer or the protection seller. The protection buyer is obligated to pay the protection seller a stream of payments (“fees”) over the term of the contract, provided that no credit event, such as a default or a downgrade in credit rating, occurs on the reference obligation. The Funds may also make or receive upfront payments. If a credit event occurs, the protection seller must pay the protection buyer the difference between the agreed upon notional value and market value of the reference obligation. Market value in this case is determined by a facilitated auction whereby a minimum number of allowable broker bids, together with a specified valuation method, are used to calculate the value. The maximum potential amount of undiscounted future payments that a Fund as the protection seller could be required to make under a credit default swap agreement would be an amount equal to the notional amount of the agreement.
The notional amounts of credit default swaps are not recorded in the financial statements. Credit default swaps are marked-to-market daily. Fluctuations in the value of credit default swaps are recorded in the Statements of Operations as change in unrealized appreciation (depreciation) on swap agreements. Fees are accrued in accordance with the terms of the agreement and are recorded in the Statements of Operations as realized gain or loss when received or paid. Upfront fees paid or received by the Funds are recorded on the Statements of Assets and Liabilities as an asset or liability, respectively, and are amortized or accreted over the term of the agreement and recorded as realized gain or loss. Payments made or received by the Funds as a result of a credit event or termination of the agreement are recorded as realized gain or loss.
Credit default swaps are privately negotiated and traded between counterparties and, as such, are subject to the risk that a party to the agreement will not be able to meet its obligations. The Funds cover their net obligations under outstanding credit default swaps by segregating or earmarking liquid assets or cash.
There were no credit default swaps held by the Funds during the six months ended March 31, 2011.
g. Due to/from Brokers. Transactions and positions in forward foreign currency contracts and swap agreements are maintained and cleared by registered U.S. broker/dealers pursuant to customer agreements between the Fund and the various broker/dealers. Due to brokers’ balances in the Statements of Assets and Liabilities represent cash and securities received as collateral for forward foreign currency contracts. In certain circumstances the Funds’ use of cash and/or securities pledged as collateral is restricted by regulation or broker mandated limits.
h. Federal and Foreign Income Taxes. The Trust treats each Fund as a separate entity for federal income tax purposes. Each Fund intends to meet the requirements of the Internal Revenue Code of 1986, as amended, applicable to regulated investment companies, and to distribute to its shareholders substantially all of its net investment income and any net realized capital gains at least annually. Management has performed an analysis of each Fund’s tax positions for the open tax years as of March 31, 2011 and has concluded that no provisions for income tax are required. The Funds’ federal tax returns for the prior three fiscal years remain subject to examination by the Internal Revenue Service. Management is not aware of any events that are reasonably possible to occur in the next six months that would result in the amounts of any unrecognized tax benefits significantly increasing or decreasing for the Funds. However, management’s conclusions regarding tax positions taken may be subject to review and adjustment at a later date based on factors including, but not limited to, new tax laws and accounting regulations and interpretations thereof.
A Fund may be subject to foreign taxes on income and gains on investments that are accrued based upon the Fund’s understanding of the tax rules and regulations that exist in the countries in which the Fund invests. Foreign governments may also impose taxes or other payments on investments with respect to foreign securities. Such taxes are accrued as applicable, and are reflected as foreign taxes payable on the Statements of Assets and Liabilities.
i. Dividends and Distributions to Shareholders. Dividends and distributions are recorded on ex-dividend date. The timing and characterization of certain income and capital gain distributions are determined annually in accordance with federal tax regulations, which may differ from accounting principles generally accepted in the United States of America. Permanent differences are primarily due to differing treatments for book and tax purposes of items such as foreign currency transactions, defaulted bond adjustments, discount adjustments on inflation-protected securities, paydown gains and losses, premium amortization, reclassification of realized capital gain to ordinary income and return of capital and capital gain distributions from REITs. Permanent book and tax basis differences relating to shareholder distributions will result in reclassifications to capital accounts. Temporary differences between book and tax distributable earnings are primarily due to deferred Trustees’ fees, wash sales, premium amortization, securities lending collateral gain/loss adjustments, forward and futures contracts mark to market, defaulted bond interest, REIT basis adjustments, adjustments to inflation-protected securities and contingent payment debt instruments. Distributions from net investment income and short-term capital gains are considered to be distributed from ordinary income for tax purposes.
97 |
Notes to Financial Statements – continued
March 31, 2011 (Unaudited)
The tax characterization of distributions is determined on an annual basis. The tax character of distributions paid to shareholders during the year ended September 30, 2010 was as follows:
| | | | | | | | | | | | |
| | | 2010 Distributions Paid From: | |
Fund | | Ordinary
Income | | | Long-Term
Capital Gains | | | Total | |
Bond Fund | | $ | 1,103,370,547 | | | $ | — | | | $ | 1,103,370,547 | |
Fixed Income Fund | | | 42,551,309 | | | | — | | | | 42,551,309 | |
Global Bond Fund | | | 71,257,098 | | | | — | | | | 71,257,098 | |
Inflation Protected Securities Fund | | | 490,596 | | | | — | | | | 490,596 | |
Institutional High Income Fund | | | 30,544,655 | | | | 11,002 | | | | 30,555,657 | |
Intermediate Duration Bond Fund | | | 1,296,283 | | | | — | | | | 1,296,283 | |
Investment Grade Fixed Income Fund | | | 27,602,054 | | | | — | | | | 27,602,054 | |
Differences between these amounts and those reported in the Statements of Changes in Net Assets are primarily attributable to different book and tax treatment for short-term capital gains.
As of September 30, 2010, the capital loss carryforwards and post-October losses were as follows:
| | | | | | | | | | | | | | | | |
| Capital loss carryforward: | | Bond Fund | | | Fixed Income
Fund | | | Global
Bond Fund | | | Inflation Protected
Securities Fund | |
Expires September 30, 2014 | | $ | — | | | $ | — | | | $ | (1,046,616 | ) | | $ | (19,853 | ) |
Expires September 30, 2015 | | | — | | | | — | | | | (5,497,643 | ) | | | (155,005 | ) |
Expires September 30, 2016 | | | — | | | | — | | | | (3,309,847 | ) | | | — | |
Expires September 30, 2017 | | | (73,277,381 | ) | | | (129,506 | ) | | | (21,329,772 | ) | | | (110,122 | ) |
Expires September 30, 2018 | | | (667,219,656 | ) | | | (9,202,603 | ) | | | (34,063,363 | ) | | | (238,354 | ) |
| | | | | | | | | | | | | | | | |
Total capital loss carryforward | | $ | (740,497,037 | ) | | $ | (9,332,109 | ) | | $ | (65,247,241 | ) | | $ | (523,334 | ) |
| | | | | | | | | | | | | | | | |
Deferred net capital losses (post-October 2009) | | $ | (182,708,157 | ) | | $ | — | | | $ | (18,054,311 | ) | | $ | — | |
| | | | | | | | | | | | | | | | |
| | | | | | | | | | | | |
| Capital loss carryforward: | | Institutional High
Income Fund | | | Intermediate Duration
Bond Fund | | | Investment Grade
Fixed Income Fund | |
Expires September 30, 2014 | | $ | — | | | $ | — | | | $ | — | |
Expires September 30, 2015 | | | — | | | | (83,490 | ) | | | — | |
Expires September 30, 2016 | | | — | | | | (222,423 | ) | | | — | |
Expires September 30, 2017 | | | — | | | | (460,684 | ) | | | — | |
Expires September 30, 2018 | | | — | | | | — | | | | — | |
| | | | | | | | | | | | |
Total capital loss carryforward | | $ | — | | | $ | (766,597 | ) | | $ | — | |
| | | | | | | | | | | | |
Deferred net capital losses (post-October 2009) | | $ | — | | | $ | — | | | $ | — | |
| | | | | | | | | | | | |
On December 22, 2010, the Regulated Investment Company Modernization Act of 2010 (the “Act”) was enacted. The Act modernizes several of the federal income and excise tax provisions related to RICs, and, with certain exceptions, is effective for taxable years beginning after December 22, 2010. Among the changes made are changes to the capital loss carryforward rules allowing for capital losses to be carried forward indefinitely. Rules in effect as of the report date limit the carryforward period to eight years. Capital loss carryforwards generated in taxable years beginning after effective date of the Act must be fully used before capital loss carryforwards generated in taxable years prior to effective date of the Act; therefore, under certain circumstances, capital loss carryforwards available as of the report date, if any, may expire unused.
j. Repurchase Agreements. It is each Fund’s policy that the market value of the collateral for repurchase agreements be at least equal to 102% of the repurchase price, including interest. Certain repurchase agreements are tri-party arrangements whereby the collateral is held in a segregated account for the benefit of the Fund and on behalf of the counterparty. Repurchase agreements could involve certain risks in the event of default or insolvency of the counterparty including possible delays or restrictions upon a Fund’s ability to dispose of the underlying securities.
k. Delayed Delivery Commitments. The Funds may purchase securities, including those designated as TBAs in the Portfolio of Investments, for which delivery or payment will occur at a later date, beyond the normal settlement period. The price of the security and the date when the security will be delivered and paid for are fixed at the time the transaction is negotiated. The security and the obligation to pay for it are recorded by the Funds at the time the commitment is entered into. The actual security that will be delivered to fulfill a TBA trade is not designated at the time of the trade. The security is “to be announced” 48 hours prior to the established trade settlement date. The value of
| 98
Notes to Financial Statements – continued
March 31, 2011 (Unaudited)
the security may vary with market fluctuations during the time before the Funds take delivery of the security. No interest accrues to the Funds until the transaction settles. When the Funds enter into such a transaction, collateral consisting of liquid securities or cash and cash equivalents is required to be segregated or earmarked at the custodian in an amount at least equal to the amount of the Funds’ commitment.
Purchases of delayed delivery securities may have a similar effect on the Funds’ net asset value as if the Funds had created a degree of leverage in its portfolio. Risks may arise upon entering into such transactions from the potential inability of counterparties to meet their obligations under the transactions. Additionally, losses may arise due to changes in the value of the underlying securities.
There were no delayed delivery securities held by the Funds as of March 31, 2011.
l. Securities Lending. The Funds have entered into an agreement with State Street Bank and Trust Company (“State Street Bank”), as agent of the Funds, to lend securities to certain designated borrowers. The loans are collateralized with cash or securities in an amount equal to at least 105% or 102% of the market value (including accrued interest) of the loaned international or domestic securities, respectively, when the loan is initiated. Thereafter, the value of the collateral must remain at least 102% of the market value (including accrued interest) of loaned securities for U.S. equities and U.S. corporate debt; at least 105% of the market value (including accrued interest) of loaned securities for non-U.S. equities; and at least 100% of the market value (including accrued interest) of loaned securities for U.S. Government securities, sovereign debt issued by non-U.S. Governments and non-U.S. corporate debt. In the event that the market value of the collateral falls below the required percentages described above, the borrower will deliver additional collateral on the next business day. As with other extensions of credit, the Funds may bear the risk of loss with respect to the investment of the collateral. The Funds invest cash collateral in short-term investments, a portion of the income from which is remitted to the borrowers and the remainder allocated between the Funds and State Street Bank as lending agent.
For the six months ended March 31, 2011, none of the Funds had loaned securities under this agreement.
m. Indemnifications. Under the Trust’s organizational documents, its officers and Trustees are indemnified against certain liabilities arising out of the performance of their duties to the Funds. Additionally, in the normal course of business, the Funds enter into contracts with service providers that contain general indemnification clauses. The Funds’ maximum exposure under these arrangements is unknown as this would involve future claims that may be made against the Funds that have not yet occurred. However, based on experience, the Funds expect the risk of loss to be remote.
3. Fair Value Measurements. In accordance with accounting standards related to fair value measurements and disclosures, the Funds have categorized the inputs utilized in determining the value of each Fund’s assets or liabilities. These inputs are summarized in the three broad levels listed below:
| | • | | Level 1—quoted prices in active markets for identical assets or liabilities; |
| | • | | Level 2—prices determined using other significant inputs that are observable either directly, or indirectly through corroboration with observable market data (which could include quoted prices for similar assets or liabilities, interest rates, credit risk, etc.); |
| | • | | Level 3—prices determined using significant unobservable inputs when quoted prices or observable inputs are unavailable such as when there is little or no market activity for an asset or liability (unobservable inputs reflect each Fund’s own assumptions in determining the fair value of assets or liabilities and would be based on the best information available). |
The inputs or methodology used for valuing securities are not necessarily an indication of the risk associated with investing in those securities.
The following is a summary of the inputs used to value the Funds’ investments as of March 31, 2011, at value:
Bond Fund
Asset Valuation Inputs
| | | | | | | | | | | | | | | | |
Description | | Level 1 | | | Level 2 | | | Level 3 | | | Total | |
Bonds and Notes | | | | | | | | | | | | | | | | |
Non-Convertible Bonds | | | | | | | | | | | | | | | | |
Non-Captive Consumer | | $ | 3,155,252 | | | $ | 970,763,186 | | | $ | — | | | $ | 973,918,438 | |
Non-Captive Diversified | | | — | | | | 1,458,216,462 | | | | 71,438,150 | | | | 1,529,654,612 | |
All Other Non-Convertible Bonds(a) | | | — | | | | 12,894,528,571 | | | | — | | | | 12,894,528,571 | |
| | | | | | | | | | | | | | | | |
Total Non-Convertible Bonds | | | 3,155,252 | | | | 15,323,508,219 | | | | 71,438,150 | | | | 15,398,101,621 | |
| | | | | | | | | | | | | | | | |
Convertible Bonds(a) | | | — | | | | 1,736,999,612 | | | | — | | | | 1,736,999,612 | |
Municipals(a) | | | — | | | | 255,696,218 | | | | — | | | | 255,696,218 | |
| | | | | | | | | | | | | | | | |
Total Bonds and Notes | | | 3,155,252 | | | | 17,316,204,049 | | | | 71,438,150 | | | | 17,390,797,451 | |
| | | | | | | | | | | | | | | | |
Bank Loans(a) | | | — | | | | 61,196,848 | | | | — | | | | 61,196,848 | |
| | | | | | | | | | | | | | | | |
99 |
Notes to Financial Statements – continued
March 31, 2011 (Unaudited)
Bond Fund
Asset Valuation Inputs – continued
| | | | | | | | | | | | | | | | |
Description | | Level 1 | | | Level 2 | | | Level 3 | | | Total | |
Preferred Stocks | | | | | | | | | | | | | | | | |
Convertible Preferred Stocks | | | | | | | | | | | | | | | | |
Automotive | | $ | 126,496,080 | | | $ | 48,494,586 | | | $ | — | | | $ | 174,990,666 | |
Capital Markets | | | — | | | | 12,946,166 | | | | — | | | | 12,946,166 | |
Commercial Banks | | | 12,922,402 | | | | — | | | | — | | | | 12,922,402 | |
Diversified Financial Services | | | 26,106,795 | | | | 13,567,827 | | | | — | | | | 39,674,622 | |
Electric Utilities | | | 16,912,958 | | | | — | | | | 9,376,875 | | | | 26,289,833 | |
Machinery | | | — | | | | — | | | | 12,381,539 | | | | 12,381,539 | |
Oil, Gas & Consumable Fuels | | | 46,535,834 | | | | 3,581,250 | | | | — | | | | 50,117,084 | |
REITs—Healthcare | | | 8,969,015 | | | | — | | | | — | | | | 8,969,015 | |
Semiconductors & Semiconductor Equipment | | | 51,649,920 | | | | — | | | | — | | | | 51,649,920 | |
| | | | | | | | | | | | | | | | |
Total Convertible Preferred Stocks | | | 289,593,004 | | | | 78,589,829 | | | | 21,758,414 | | | | 389,941,247 | |
| | | | | | | | | | | | | | | | |
Non-Convertible Preferred Stocks | | | | | | | | | | | | | | | | |
Banking | | | — | | | | 49,170,412 | | | | — | | | | 49,170,412 | |
Diversified Financial Services | | | 34,798,250 | | | | — | | | | — | | | | 34,798,250 | |
Electric Utilities | | | 1,060,617 | | | | 647,365 | | | | — | | | | 1,707,982 | |
Household Durables | | | 248,285 | | | | — | | | | — | | | | 248,285 | |
Multi Utilities | | | 75,911 | | | | — | | | | — | | | | 75,911 | |
REITs—Office Property | | | — | | | | 2,470,119 | | | | — | | | | 2,470,119 | |
REITs—Warehouse/Industrials | | | 9,126,378 | | | | — | | | | — | | | | 9,126,378 | |
Software | | | — | | | | 41,051,875 | | | | — | | | | 41,051,875 | |
Thrifts & Mortgage Finance | | | 13,245,138 | | | | — | | | | — | | | | 13,245,138 | |
| | | | | | | | | | | | | | | | |
Total Non-Convertible Preferred Stocks | | | 58,554,579 | | | | 93,339,771 | | | | — | | | | 151,894,350 | |
| | | | | | | | | | | | | | | | |
Total Preferred Stocks | | | 348,147,583 | | | | 171,929,600 | | | | 21,758,414 | | | | 541,835,597 | |
| | | | | | | | | | | | | | | | |
Common Stocks(a) | | | 522,469,912 | | | | — | | | | — | | | | 522,469,912 | |
Closed End Investment Companies | | | 32,075,769 | | | | — | | | | — | | | | 32,075,769 | |
Short-Term Investments | | | — | | | | 1,242,914,288 | | | | — | | | | 1,242,914,288 | |
| | | | | | | | | | | | | | | | |
Total | | $ | 905,848,516 | | | $ | 18,792,244,785 | | | $ | 93,196,564 | | | $ | 19,791,289,865 | |
| | | | | | | | | | | | | | | | |
(a) Major categories of the Fund’s investments are included in the Portfolio of Investments.
Preferred stocks valued at $30,667,500 were transferred from Level 2 to Level 1 during the six months ended March 31, 2011. At September 30, 2010, this security was valued at original purchase price; at March 31, 2011, this security was valued at a market price in accordance with the Fund’s valuation policies. All transfers are recognized as of the beginning of the reporting period.
Fixed Income Fund
Asset Valuation Inputs
| | | | | | | | | | | | | | | | |
Description | | Level 1 | | | Level 2 | | | Level 3 | | | Total | |
Bonds and Notes | | | | | | | | | | | | | | | | |
Non-Convertible Bonds | | | | | | | | | | | | | | | | |
Non-Captive Consumer | | $ | 666,780 | | | $ | 30,706,564 | | | $ | — | | | $ | 31,373,344 | |
All Other Non-Convertible Bonds(a) | | | — | | | | 626,025,445 | | | | — | | | | 626,025,445 | |
| | | | | | | | | | | | | | | | |
Total Non-Convertible Bonds | | | 666,780 | | | | 656,732,009 | | | | — | | | | 657,398,789 | |
| | | | | | | | | | | | | | | | |
Convertible Bonds(a) | | | — | | | | 78,606,577 | | | | — | | | | 78,606,577 | |
Municipals(a) | | | — | | | | 6,564,529 | | | | — | | | | 6,564,529 | |
| | | | | | | | | | | | | | | | |
Total Bonds and Notes | | | 666,780 | | | | 741,903,115 | | | | — | | | | 742,569,895 | |
| | | | | | | | | | | | | | | | |
Bank Loans(a) | | | — | | | | 627,003 | | | | — | | | | 627,003 | |
| | | | | | | | | | | | | | | | |
| 100
Notes to Financial Statements – continued
March 31, 2011 (Unaudited)
Fixed Income Fund
Asset Valuation Inputs – continued
| | | | | | | | | | | | | | | | |
Description | | Level 1 | | | Level 2 | | | Level 3 | | | Total | |
Preferred Stocks | | | | | | | | | | | | | | | | |
Convertible Preferred Stocks | | | | | | | | | | | | | | | | |
Automotive | | $ | 4,487,420 | | | $ | 2,084,319 | | | $ | — | | | $ | 6,571,739 | |
Capital Markets | | | — | | | | 1,200,466 | | | | — | | | | 1,200,466 | |
Diversified Financial Services | | | 2,875,256 | | | | 2,462,763 | | | | — | | | | 5,338,019 | |
Electric Utilities | | | 488,000 | | | | — | | | | — | | | | 488,000 | |
Machinery | | | — | | | | — | | | | 1,419,353 | | | | 1,419,353 | |
Oil, Gas & Consumable Fuels | | | 3,270,025 | | | | — | | | | — | | | | 3,270,025 | |
REITs—Healthcare | | | 385,540 | | | | — | | | | — | | | | 385,540 | |
Semiconductors & Semiconductor Equipment | | | 3,797,500 | | | | — | | | | — | | | | 3,797,500 | |
| | | | | | | | | | | | | | | | |
Total Convertible Preferred Stocks | | | 15,303,741 | | | | 5,747,548 | | | | 1,419,353 | | | | 22,470,642 | |
| | | | | | | | | | | | | | | | |
Non-Convertible Preferred Stocks | | | | | | | | | | | | | | | | |
Banking | | | — | | | | 1,043,091 | | | | — | | | | 1,043,091 | |
Diversified Financial Services | | | 111,950 | | | | — | | | | — | | | | 111,950 | |
Electric Utilities | | | 354,920 | | | | 255,524 | | | | — | | | | 610,444 | |
Multi Utilities | | | 8,050 | | | | — | | | | — | | | | 8,050 | |
Software | | | — | | | | 3,240,937 | | | | — | | | | 3,240,937 | |
Thrifts & Mortgage Finance | | | 519,551 | | | | — | | | | — | | | | 519,551 | |
| | | | | | | | | | | | | | | | |
Total Non-Convertible Preferred Stocks | | | 994,471 | | | | 4,539,552 | | | | — | | | | 5,534,023 | |
| | | | | | | | | | | | | | | | |
Total Preferred Stocks | | | 16,298,212 | | | | 10,287,100 | | | | 1,419,353 | | | | 28,004,665 | |
| | | | | | | | | | | | | | | | |
Common Stocks(a) | | | 22,357,678 | | | | — | | | | — | | | | 22,357,678 | |
Short-Term Investments | | | — | | | | 56,191,130 | | | | — | | | | 56,191,130 | |
| | | | | | | | | | | | | | | | |
Total | | $ | 39,322,670 | | | $ | 809,008,348 | | | $ | 1,419,353 | | | $ | 849,750,371 | |
| | | | | | | | | | | | | | | | |
(a) Major categories of the Fund’s investments are included in the Portfolio of Investments.
Global Bond Fund
Asset Valuation Inputs
| | | | | | | | | | | | | | | | |
Description | | Level 1 | | | Level 2 | | | Level 3 | | | Total | |
Bonds and Notes | | | | | | | | | | | | | | | | |
Non-Convertible Bonds | | | | | | | | | | | | | | | | |
Australia | | $ | — | | | $ | 7,729,374 | | | $ | 30,277,851 | | | $ | 38,007,225 | |
Canada | | | — | | | | 171,632,358 | | | | 5,359,839 | | | | 176,992,197 | |
Japan | | | — | | | | 283,550,337 | | | | 5,721,769 | | | | 289,272,106 | |
Supranationals | | | — | | | | 73,095,447 | | | | 10,983,247 | | | | 84,078,694 | |
United States | | | — | | | | 484,023,466 | | | | 5,890,000 | | | | 489,913,466 | |
All Other Non-Convertible Bonds(a) | | | — | | | | 1,113,569,271 | | | | — | | | | 1,113,569,271 | |
| | | | | | | | | | | | | | | | |
Total Non-Convertible Bonds | | | — | | | | 2,133,600,253 | | | | 58,232,706 | | | | 2,191,832,959 | |
| | | | | | | | | | | | | | | | |
Convertible Bonds(a) | | | — | | | | 10,469,344 | | | | — | | | | 10,469,344 | |
| | | | | | | | | | | | | | | | |
Total Bonds and Notes | | | — | | | | 2,144,069,597 | | | | 58,232,706 | | | | 2,202,302,303 | |
| | | | | | | | | | | | | | | | |
Short-Term Investments | | | — | | | | 82,626,362 | | | | — | | | | 82,626,362 | |
| | | | | | | | | | | | | | | | |
Total Investments | | | — | | | | 2,226,695,959 | | | | 58,232,706 | | | | 2,284,928,665 | |
| | | | | | | | | | | | | | | | |
Forward Foreign Currency Contracts (unrealized appreciation) | | | — | | | | 4,130,446 | | | | — | | | | 4,130,446 | |
Futures Contracts (unrealized appreciation) | | | 34,522 | | | | — | | | | — | | | | 34,522 | |
| | | | | | | | | | | | | | | | |
Total | | $ | 34,522 | | | $ | 2,230,826,405 | | | $ | 58,232,706 | | | $ | 2,289,093,633 | |
| | | | | | | | | | | | | | | | |
101 |
Notes to Financial Statements – continued
March 31, 2011 (Unaudited)
Global Bond Fund
Liability Valuation Inputs
| | | | | | | | | | | | | | | | |
Description(a) | | Level 1 | | | Level 2 | | | Level 3 | | | Total | |
Forward Foreign Currency Contracts (unrealized depreciation) | | $ | — | | | $ | (2,407,419 | ) | | $ | — | | | $ | (2,407,419 | ) |
| | | | | | | | | | | | | | | | |
(a) Major categories of the Fund’s investments are included in the Portfolio of Investments.
Inflation Protected Securities Fund
Asset Valuation Inputs
| | | | | | | | | | | | | | | | |
Description(a) | | Level 1 | | | Level 2 | | | Level 3 | | | Total | |
Bonds and Notes | | $ | — | | | $ | 15,747,763 | | | $ | — | | | $ | 15,747,763 | |
Short-Term Investments | | | — | | | | 250,190 | | | | — | | | | 250,190 | |
| | | | | | | | | | | | | | | | |
Total | | $ | — | | | $ | 15,997,953 | | | $ | — | | | $ | 15,997,953 | |
| | | | | | | | | | | | | | | | |
(a) Major categories of the Fund’s investments are included in the Portfolio of Investments.
Institutional High Income Fund
Asset Valuation Inputs
| | | | | | | | | | | | | | | | |
Description | | Level 1 | | | Level 2 | | | Level 3 | | | Total | |
Bonds and Notes(a) | | $ | — | | | $ | 370,928,750 | | | $ | — | | | $ | 370,928,750 | |
Bank Loans(a) | | | — | | | | 2,145,028 | | | | — | | | | 2,145,028 | |
Common Stocks(a) | | | 26,216,738 | | | | — | | | | — | | | | 26,216,738 | |
Preferred Stocks | | | | | | | | | | | | | | | | |
Convertible Preferred Stocks | | | | | | | | | | | | | | | | |
Automotive | | | 3,299,290 | | | | 1,039,223 | | | | — | | | | 4,338,513 | |
Capital Markets | | | — | | | | 191,500 | | | | — | | | | 191,500 | |
Commercial Banks | | | 142,858 | | | | — | | | | — | | | | 142,858 | |
Diversified Financial Services | | | — | | | | 631,900 | | | | — | | | | 631,900 | |
Electric Utilities | | | 835,407 | | | | — | | | | 186,750 | | | | 1,022,157 | |
Household Durables | | | 233,200 | | | | — | | | | — | | | | 233,200 | |
Machinery | | | — | | | | — | | | | 673,416 | | | | 673,416 | |
Oil, Gas & Consumable Fuels | | | 1,314,225 | | | | — | | | | — | | | | 1,314,225 | |
Semiconductors & Semiconductor Equipment | | | 3,194,800 | | | | — | | | | — | | | | 3,194,800 | |
| | | | | | | | | | | | | | | | |
Total Convertible Preferred Stocks | | | 9,019,780 | | | | 1,862,623 | | | | 860,166 | | | | 11,742,569 | |
| | | | | | | | | | | | | | | | |
Non-Convertible Preferred Stocks(a) | | | 1,801,474 | | | | 416,864 | | | | — | | | | 2,218,338 | |
| | | | | | | | | | | | | | | | |
Total Preferred Stocks | | | 10,821,254 | | | | 2,279,487 | | | | 860,166 | | | | 13,960,907 | |
| | | | | | | | | | | | | | | | |
Closed End Investment Companies | | | 366,489 | | | | — | | | | — | | | | 366,489 | |
Warrants | | | — | | | | — | | | | — | | | | — | |
Short-Term Investments | | | — | | | | 9,453,903 | | | | — | | | | 9,453,903 | |
| | | | | | | | | | | | | | | | |
Total | | $ | 37,404,481 | | | $ | 384,807,168 | | | $ | 860,166 | | | $ | 423,071,815 | |
| | | | | | | | | | | | | | | | |
(a) Major categories of the Fund’s investments are included in the Portfolio of Investments.
Preferred stocks valued at $598,125 were transferred from Level 2 to Level 1 during the six months ended March 31, 2011. At September 30, 2010, this security was valued at original purchase price; at March 31, 2011, this security was valued at a market price in accordance with the Fund’s valuation policies. All transfers are recognized as of the beginning of the reporting period.
Intermediate Duration Bond Fund
Asset Valuation Inputs
| | | | | | | | | | | | | | | | |
Description(a) | | Level 1 | | | Level 2 | | | Level 3 | | | Total | |
Bonds and Notes | | $ | — | | | $ | 56,204,648 | | | $ | — | | | $ | 56,204,648 | |
Short-Term Investments | | | — | | | | 667,232 | | | | — | | | | 667,232 | |
| | | | | | | | | | | | | | | | |
Total | | $ | — | | | $ | 56,871,880 | | | $ | — | | | $ | 56,871,880 | |
| | | | | | | | | | | | | | | | |
(a) Major categories of the Fund’s investments are included in the Portfolio of Investments.
| 102
Notes to Financial Statements – continued
March 31, 2011 (Unaudited)
Investment Grade Fixed Income Fund
Asset Valuation Inputs
| | | | | | | | | | | | | | | | |
Description | | Level 1 | | | Level 2 | | | Level 3 | | | Total | |
Bonds and Notes | | | | | | | | | | | | | | | | |
Non-Convertible Bonds | | | | | | | | | | | | | | | | |
Non-Captive Diversified | | $ | — | | | $ | 14,362,074 | | | $ | 4,175,413 | | | $ | 18,537,487 | |
All Other Non-Convertible Bonds(a) | | | — | | | | 352,714,235 | | | | — | | | | 352,714,235 | |
| | | | | | | | | | | | | | | | |
Total Non-Convertible Bonds | | | — | | | | 367,076,309 | | | | 4,175,413 | | | | 371,251,722 | |
| | | | | | | | | | | | | | | | |
Convertible Bonds(a) | | | — | | | | 19,174,178 | | | | — | | | | 19,174,178 | |
Municipals(a) | | | — | | | | 3,912,325 | | | | — | | | | 3,912,325 | |
| | | | | | | | | | | | | | | | |
Total Bonds and Notes | | | — | | | | 390,162,812 | | | | 4,175,413 | | | | 394,338,225 | |
| | | | | | | | | | | | | | | | |
Preferred Stocks | | | | | | | | | | | | | | | | |
Non-Convertible Preferred Stocks | | | | | | | | | | | | | | | | |
Banking | | | — | | | | 149,811 | | | | — | | | | 149,811 | |
Electric Utilities | | | 240,160 | | | | 24,996 | | | | — | | | | 265,156 | |
Multi Utilities | | | 1,675 | | | | — | | | | — | | | | 1,675 | |
Software | | | — | | | | 3,240,937 | | | | — | | | | 3,240,937 | |
| | | | | | | | | | | | | | | | |
Total Non-Convertible Preferred Stocks | | | 241,835 | | | | 3,415,744 | | | | — | | | | 3,657,579 | |
| | | | | | | | | | | | | | | | |
Convertible Preferred Stocks | | | | | | | | | | | | | | | | |
Capital Markets | | | — | | | | 1,582,269 | | | | — | | | | 1,582,269 | |
Diversified Financial Services | | | 950,331 | | | | 1,112,500 | | | | — | | | | 2,062,831 | |
| | | | | | | | | | | | | | | | |
Total Convertible Preferred Stocks | | | 950,331 | | | | 2,694,769 | | | | — | | | | 3,645,100 | |
| | | | | | | | | | | | | | | | |
Total Preferred Stocks | | | 1,192,166 | | | | 6,110,513 | | | | — | | | | 7,302,679 | |
| | | | | | | | | | | | | | | | |
Common Stocks(a) | | | 657,024 | | | | — | | | | — | | | | 657,024 | |
Short-Term Investments | | | — | | | | 51,164,471 | | | | — | | | | 51,164,471 | |
| | | | | | | | | | | | | | | | |
Total Investments | | $ | 1,849,190 | | | $ | 447,437,796 | | | $ | 4,175,413 | | | $ | 453,462,399 | |
| | | | | | | | | | | | | | | | |
(a) Major categories of the Fund’s investments are included in the Portfolio of Investments.
The following is a reconciliation of Level 3 investments for which significant unobservable inputs were used to determine fair value as of March 31, 2011:
Bond Fund
Asset Valuation Inputs
| | | | | | | | | | | | | | | | | | | | | | | | | | | | | | | | | | | | | | | | |
Investments in Securities | | Balance as of
September 30,
2010 | | | Accrued
Discounts
(Premiums) | | | Realized
Gain
(Loss) | | | Change in
Unrealized
Appreciation
(Depreciation) | | | Purchases | | | Sales | | | Transfers
into
Level 3 | | | Transfers
out of
Level 3 | | | Balance as of
March 31,
2011 | | | Change in
Unrealized
Appreciation
(Depreciation)
from
Investments
Still Held at
March 31,
2011 | |
Bonds and Notes | | | | | | | | | | | | | | | | | | | | | | | | | | | | | | | | | | | | | | | | |
Non-Convertible Bonds | | | | | | | | | | | | | | | | | | | | | | | | | | | | | | | | | | | | | | | | |
Airlines | | $ | 50,705,608 | | | $ | — | | | $ | — | | | $ | — | | | $ | — | | | $ | — | | | $ | — | | | $ | (50,705,608 | ) | | $ | — | | | $ | — | |
Non-Captive Diversified | | | — | | | | — | | | | — | | | | 178,150 | | | | 71,260,000 | | | | — | | | | — | | | | — | | | | 71,438,150 | | | | 178,150 | |
Preferred Stocks | | | | | | | | | | | | | | | | | | | | | | | | | | | | | | | | | | | | | | | | |
Convertible Preferred Stocks | | | | | | | | | | | | | | | | | | | | | | | | | | | | | | | | | | | | | | | | |
Electric Utilities | | | 7,293,125 | | | | — | | | | — | | | | 2,083,750 | | | | — | | | | — | | | | — | | | | — | | | | 9,376,875 | | | | 2,083,750 | |
Machinery | | | — | | | | — | | | | — | | | | 3,556,399 | | | | — | | | | — | | | | 8,825,140 | | | | — | | | | 12,381,539 | | | | 3,556,399 | |
| | | | | | | | | | | | | | | | | | | | | | | | | | | | | | | | | | | | | | | | |
Total | | $ | 57,998,733 | | | $ | — | | | $ | — | | | $ | 5,818,299 | | | $ | 71,260,000 | | | $ | — | | | $ | 8,825,140 | | | $ | (50,705,608 | ) | | $ | 93,196,564 | | | $ | 5,818,299 | |
| | | | | | | | | | | | | | | | | | | | | | | | | | | | | | | | | | | | | | | | |
103 |
Notes to Financial Statements – continued
March 31, 2011 (Unaudited)
Debt securities valued at $50,705,608 were transferred from Level 3 to Level 2 during the six months ended March 31, 2011. At September 30, 2010, these securities were valued using broker-dealer bid quotations based on inputs unobservable to the Fund; at March 31, 2011, these securities were valued on the basis of evaluated bids furnished to the Fund by a pricing service.
Preferred stocks valued at $8,825,140 were transferred from Level 2 to Level 3 during the six months ended March 31, 2011. At September 30, 2010, these securities were valued using evaluated bids furnished to the Fund by a pricing service; at March 31, 2011, these securities were valued using broker-dealer bid quotations based on inputs unobservable to the Fund.
All transfers are recognized as of the beginning of the reporting period.
Fixed Income Fund
Asset Valuation Inputs
| | | | | | | | | | | | | | | | | | | | | | | | | | | | | | | | | | | | | | | | |
Investments in Securities | | Balance as of
September 30,
2010 | | | Accrued
Discounts
(Premiums) | | | Realized
Gain
(Loss) | | | Change in
Unrealized
Appreciation
(Depreciation) | | | Purchases | | | Sales | | | Transfers
into
Level 3 | | | Transfers
out of
Level 3 | | | Balance as of
March 31,
2011 | | | Change in
Unrealized
Appreciation
(Depreciation)
from
Investments
Still Held at
March 31,
2011 | |
Preferred Stocks | | | | | | | | | | | | | | | | | | | | | | | | | | | | | | | | | | | | | | | | |
Convertible Preferred Stocks | | | | | | | | | | | | | | | | | | | | | | | | | | | | | | | | | | | | | | | | |
Machinery | | $ | — | | | $ | — | | | $ | — | | | $ | 407,686 | | | $ | — | | | $ | — | | | $ | 1,011,667 | | | $ | — | | | $ | 1,419,353 | | | $ | 407,686 | |
| | | | | | | | | | | | | | | | | | | | | | | | | | | | | | | | | | | | | | | | |
Preferred stocks valued at $1,011,667 were transferred from Level 2 to Level 3 during the six months ended March 31, 2011. At September 30, 2010, these securities were valued using evaluated bids furnished to the Fund by a pricing service; at March 31, 2011, these securities were valued using broker-dealer bid quotations based on inputs unobservable to the Fund.
All transfers are recognized as of the beginning of the reporting period.
Global Bond Fund
Asset Valuation Inputs
| | | | | | | | | | | | | | | | | | | | | | | | | | | | | | | | | | | | | | | | |
Investments in Securities | | Balance as of
September 30,
2010 | | | Accrued
Discounts
(Premiums) | | | Realized
Gain
(Loss) | | | Change in
Unrealized
Appreciation
(Depreciation) | | | Purchases | | | Sales | | | Transfers
into
Level 3 | | | Transfers
out of
Level 3 | | | Balance as of
March 31,
2011 | | | Change in
Unrealized
Appreciation
(Depreciation)
from
Investments
Still Held at
March 31,
2011 | |
Bonds and Notes | | | | | | | | | | | | | | | | | | | | | | | | | | | | | | | | | | | | | | | | |
Non-Convertible Bonds | | | | | | | | | | | | | | | | | | | | | | | | | | | | | | | | | | | | | | | | |
Australia | | $ | — | | | $ | 265,237 | | | $ | (358,735 | ) | | $ | 427,091 | | | $ | 36,494,000 | | | $ | (6,549,742 | ) | | $ | — | | | $ | — | | | $ | 30,277,851 | | | $ | 427,091 | |
Canada | | | 5,065,604 | | | | — | | | | — | | | | 294,235 | | | | — | | | | — | | | | — | | | | — | | | | 5,359,839 | | | | 294,235 | |
Japan | | | — | | | | — | | | | — | | | | 91,769 | | | | 5,630,000 | | | | — | | | | — | | | | — | | | | 5,721,769 | | | | 91,769 | |
Supranationals | | | — | | | | 2,961 | | | | — | | | | (138,000 | ) | | | 11,118,286 | | | | — | | | | — | | | | — | | | | 10,983,247 | | | | (138,000 | ) |
United States | | | — | | | | — | | | | — | | | | 163 | | | | 5,889,837 | | | | — | | | | — | | | | — | | | | 5,890,000 | | | | 163 | |
| | | | | | | | | | | | | | | | | | | | | | | | | | | | | | | | | | | | | | | | |
Total | | $ | 5,065,604 | | | $ | 268,198 | | | $ | (358,735 | ) | | $ | 675,258 | | | $ | 59,132,123 | | | $ | (6,549,742 | ) | | $ | — | | | $ | — | | | $ | 58,232,706 | | | $ | 675,258 | |
| | | | | | | | | | | | | | | | | | | | | | | | | | | | | | | | | | | | | | | | |
| 104
Notes to Financial Statements – continued
March 31, 2011 (Unaudited)
Institutional High Income Fund
Asset Valuation Inputs
| | | | | | | | | | | | | | | | | | | | | | | | | | | | | | | | | | | | | | | | |
Investments in Securities | | Balance as of
September 30,
2010 | | | Accrued
Discounts
(Premiums) | | | Realized
Gain
(Loss) | | | Change in
Unrealized
Appreciation
(Depreciation) | | | Purchases | | | Sales | | | Transfers
into
Level 3 | | | Transfers
out of
Level 3 | | | Balance as of
March 31,
2011 | | | Change in
Unrealized
Appreciation
(Depreciation)
from
Investments
Still Held at
March 31,
2011 | |
Bonds and Notes | | | | | | | | | | | | | | | | | | | | | | | | | | | | | | | | | | | | | | | | |
Non-Convertible Bonds | | | | | | | | | | | | | | | | | | | | | | | | | | | | | | | | | | | | | | | | |
Airlines | | $ | 971,693 | | | $ | — | | | $ | — | | | $ | — | | | $ | — | | | $ | — | | | $ | — | | | $ | (971,693 | ) | | $ | — | | | $ | — | |
Preferred Stocks | | | | | | | | | | | | | | | | | | | | | | | | | | | | | | | | | | | | | | | | |
Convertible Preferred Stocks | | | | | | | | | | | | | | | | | | | | | | | | | | | | | | | | | | | | | | | | |
Electric Utilities | | | 145,250 | | | | — | | | | — | | | | 41,500 | | | | — | | | | — | | | | — | | | | — | | | | 186,750 | | | | 41,500 | |
Machinery | | | — | | | | — | | | | — | | | | 193,428 | | | | — | | | | — | | | | 479,988 | | | | — | | | | 673,416 | | | | 193,428 | |
| | | | | | | | | | | | | | | | | | | | | | | | | | | | | | | | | | | | | | | | |
Total | | $ | 1,116,943 | | | $ | — | | | $ | — | | | $ | 234,928 | | | $ | — | | | $ | — | | | $ | 479,988 | | | $ | (971,693 | ) | | $ | 860,166 | | | $ | 234,928 | |
| | | | | | | | | | | | | | | | | | | | | | | | | | | | | | | | | | | | | | | | |
Debt securities valued at $971,693 were transferred from Level 3 to Level 2 during the six months ended March 31, 2011. At September 30, 2010, these securities were valued using broker-dealer bid quotations based on inputs unobservable to the Fund; at March 31, 2011, these securities were valued on the basis of evaluated bids furnished to the Fund by a pricing service.
Preferred stocks valued at $479,988 were transferred from Level 2 to Level 3 during the six months ended March 31, 2011. At September 30, 2010, these securities were valued using evaluated bids furnished to the Fund by a pricing service; at March 31, 2011, these securities were valued using broker-dealer bid quotations based on inputs unobservable to the Fund.
All transfers are recognized as of the beginning of the reporting period.
Intermediate Duration Bond Fund
Asset Valuation Inputs
| | | | | | | | | | | | | | | | | | | | | | | | | | | | | | | | | | | | | | | | |
Investments in Securities | | Balance as of
September 30,
2010 | | | Accrued
Discounts
(Premiums) | | | Realized
Gain
(Loss) | | | Change in
Unrealized
Appreciation
(Depreciation) | | | Purchases | | | Sales | | | Transfers
into
Level 3 | | | Transfers
out of
Level 3 | | | Balance as of
March 31,
2011 | | | Change in
Unrealized
Appreciation
(Depreciation)
from
Investments
Still Held at
March 31,
2011 | |
Bonds and Notes | | | | | | | | | | | | | | | | | | | | | | | | | | | | | | | | | | | | | | | | |
Non-Convertible Bonds | | | | | | | | | | | | | | | | | | | | | | | | | | | | | | | | | | | | | | | | |
ABS Car Loan | | $ | 160,000 | | | $ | — | | | $ | — | | | $ | — | | | $ | — | | | $ | — | | | $ | — | | | $ | (160,000 | ) | | $ | — | | | $ | — | |
| | | | | | | | | | | | | | | | | | | | | | | | | | | | | | | | | | | | | | | | |
Debt securities valued at $160,000 were transferred from Level 3 to Level 2 during the six months ended March 31, 2011. At September 30, 2010, these securities were valued using broker-dealer bid quotations based on inputs unobservable to the Fund; at March 31, 2011, these securities were valued on the basis of evaluated bids furnished to the Fund by a pricing service.
All transfers are recognized as of the beginning of the reporting period.
Investment Grade Fixed Income Fund
Asset Valuation Inputs
| | | | | | | | | | | | | | | | | | | | | | | | | | | | | | | | | | | | | | | | |
Investments in Securities | | Balance as of
September 30,
2010 | | | Accrued
Discounts
(Premiums) | | | Realized
Gain
(Loss) | | | Change in
Unrealized
Appreciation
(Depreciation) | | | Purchases | | | Sales | | | Transfers
into
Level 3 | | | Transfers
out of
Level 3 | | | Balance as of
March 31,
2011 | | | Change in
Unrealized
Appreciation
(Depreciation)
from
Investments
Still Held at
March 31,
2011 | |
Bonds and Notes | | | | | | | | | | | | | | | | | | | | | | | | | | | | | | | | | | | | | | | | |
Non-Convertible Bonds | | | | | | | | | | | | | | | | | | | | | | | | | | | | | | | | | | | | | | | | |
Non-Captive Diversified | | $ | — | | | $ | — | | | $ | — | | | $ | 10,413 | | | $ | 4,165,000 | | | $ | — | | | $ | — | | | $ | — | | | $ | 4,175,413 | | | $ | 10,413 | |
| | | | | | | | | | | | | | | | | | | | | | | | | | | | | | | | | | | | | | | | |
105 |
Notes to Financial Statements – continued
March 31, 2011 (Unaudited)
4. Derivatives. Derivative instruments are defined as financial instruments whose value and performance are based on the value and performance of another security or financial instrument. Derivative instruments that the Funds used during the period include forward foreign currency contracts and futures contracts.
The Funds are subject to the risk that changes in foreign currency exchange rates will have an unfavorable effect on the value of Fund assets denominated in foreign currencies. Certain Funds may enter into forward foreign currency exchange contracts for hedging purposes to protect the value of the Funds’ holdings of foreign securities. Certain Funds may also use forward foreign currency contracts to gain exposure to foreign currencies, regardless of whether securities denominated in such currencies are held in the Funds. During the six months ended March 31, 2011, Global Bond Fund engaged in forward foreign currency transactions for hedging purposes and to gain exposure to foreign currencies.
The Funds are subject to the risk that changes in interest rates will affect the value of the Funds’ investments in fixed income securities. A Fund will be subject to increased interest rate risk to the extent that it invests in fixed-income securities with longer maturities or durations, as compared to investing in fixed-income securities with shorter maturities or durations. The Funds may use futures contracts to manage their duration in order to control interest rate risk without having to buy or sell portfolio securities. During the six months ended March 31, 2011, Global Bond Fund and Intermediate Duration Bond Fund used futures contracts in accordance with this objective.
Each Fund is party to agreements with counterparties that govern transactions in forward foreign currency contracts. The agreements contain credit-risk-related contingent features that allow the counterparties to terminate open contracts early if the net asset value of a Fund declines beyond a certain threshold. If such features were to be triggered, the counterparties could request immediate settlement of open contracts at current fair value. As of March 31, 2011, there were no Funds that held derivative positions subject to credit-risk-related contingent features that were in a net liability position (unrealized depreciation) by counterparty.
Forward foreign currency contracts are subject to the risk that the counterparty will be unwilling or unable to meet its obligations under the contracts. The Funds have mitigated this risk by entering into master netting agreements with counterparties that allow the Fund and the counterparty to net amounts owed by each related to derivative contracts to one net amount payable by either the Fund or the counterparty. As of March 31, 2011, the maximum amount of loss that Global Bond Fund would incur if counterparties failed to meet their obligations, based on the value of derivative positions in an unrealized gain position as of period end, is $4,130,446 and the amount of loss that Global Bond Fund would incur after taking into account master netting arrangements is $1,723,027.
Counterparty risk is managed through the posting of collateral and, as a result, the risk of loss to a Fund from counterparty default should be limited to the extent a Fund is under collateralized. In addition to collateral requirements, the Funds also require counterparties to meet minimum credit quality requirements.
The following is a summary of derivative instruments for Global Bond Fund as of March 31, 2011:
| | | | | | | | |
Statements of Assets and Liabilities Caption | | Foreign
Exchange
Contracts | | | Interest
Rate
Contracts | |
Assets | | | | | | | | |
Unrealized appreciation on forward foreign currency contracts | | $ | 4,130,446 | | | $ | — | |
Unrealized appreciation on futures contracts* | | | — | | | | 34,522 | |
Liabilities | | | | | | | | |
Unrealized depreciation on forward foreign currency contracts | | | (2,407,419 | ) | | | — | |
* Represents cumulative unrealized appreciation (depreciation) on futures contracts. Only the current day’s variation margin on futures contracts is reported within the Statements of Assets and Liabilities as receivable or payable for variation margin, as applicable. Variation margin as of Mach 31, 2011 was $0.
Transactions in derivative instruments for Global Bond Fund during the six months ended March 31, 2011 were as follows:
| | | | | | | | |
Statements of Operations Caption | | Foreign
Exchange
Contracts | | | Interest
Rate
Contracts | |
Net Realized Gain (Loss) on: | | | | | | | | |
Foreign currency transactions* | | $ | 2,446,506 | | | $ | — | |
Futures contracts | | | — | | | | 4,296,316 | |
Net Change in Unrealized Appreciation (Depreciation) on: | | | | | | | | |
Foreign currency translations* | | | 867,057 | | | | — | |
Futures contracts | | | — | | | | 555,658 | |
* Represents realized gain and change in unrealized appreciation (depreciation), respectively, for forward foreign currency contracts during the period.
| 106
Notes to Financial Statements – continued
March 31, 2011 (Unaudited)
Transactions in derivative instruments for Intermediate Duration Bond Fund during the six months ended March 31, 2011 were as follows:
| | | | |
Statements of Operations Caption | | Interest
Rate
Contracts | |
Net Realized Gain (Loss) on: | | | | |
Futures contracts | | $ | (11,130 | ) |
As the Funds value their derivatives at fair value and recognize changes in fair value through the Statements of Operations, they do not qualify for hedge accounting under authoritative guidance for derivative instruments. The Funds’ investments in derivatives may represent an economic hedge; however, they are considered to be non-hedge transactions for the purpose of these disclosures.
Volume of forwards and futures activity, as a percentage of net assets, for Global Bond Fund, based on month-end notional amounts outstanding during the period, at absolute value, was as follows for the six months ended March 31, 2011:
| | | | | | | | |
Global Bond Fund | | Forwards | | | Futures | |
Average Notional Amount Outstanding | | | 15.17% | | | | 2.55% | |
Highest Notional Amount Outstanding | | | 22.31% | | | | 2.93% | |
Lowest Notional Amount Outstanding | | | 12.98% | | | | 2.40% | |
Notional Amount Outstanding as of March 31, 2011 | | | 15.39% | | | | 2.93% | |
Volume of futures activity, as a percentage of net assets, for Intermediate Duration Bond Fund, based on daily notional amounts outstanding during the period, at absolute value, was as follows for the six months ended March 31, 2011:
| | | | |
Intermediate Duration Bond Fund | | Futures | |
Average Notional Amount Outstanding | | | 0.20% | |
Highest Notional Amount Outstanding | | | 2.02% | |
Lowest Notional Amount Outstanding | | | 0.00% | |
Notional Amount Outstanding as of March 31, 2011 | | | 0.00% | |
Notional amounts outstanding at the end of the prior period are included in the average notional amount outstanding.
5. Purchases and Sales of Securities. For the six months ended March 31, 2011, purchases and sales of securities (excluding short-term investments and including paydowns) were as follows:
| | | | | | | | | | | | | | | | |
| | | U.S. Government/Agency
Securities | | | Other Securities | |
Fund | | Purchases | | | Sales | | | Purchases | | | Sales | |
Bond Fund | | $ | 462,689,167 | | | $ | 50,554 | | | $ | 1,487,211,224 | | | $ | 3,206,594,440 | |
Fixed Income Fund | | | 22,210,673 | | | | — | | | | 79,700,780 | | | | 121,795,260 | |
Global Bond Fund | | | 172,630,935 | | | | 214,891,326 | | | | 759,716,102 | | | | 696,999,378 | |
Inflation Protected Securities Fund | | | 3,222,066 | | | | 775,881 | | | | 270,358 | | | | 218,547 | |
Institutional High Income Fund | | | — | | | | — | | | | 69,153,308 | | | | 53,087,650 | |
Intermediate Duration Bond Fund | | | 14,770,080 | | | | 14,138,015 | | | | 25,109,064 | | | | 4,261,738 | |
Investment Grade Fixed Income Fund | | | — | | | | 71,788 | | | | 30,349,601 | | | | 105,262,683 | |
6. Management Fees and Other Transactions with Affiliates.
a. Management Fees. Loomis, Sayles & Company, L.P. (“Loomis Sayles”) serves as investment adviser to each Fund. Separate management agreements for each Fund in effect for the six months ended March 31, 2011, provided for fees at the following annual percentage rates of each Fund’s average daily net assets:
| | | | | | | | | | | | | | | | | | | | |
| | | Percentage of Average Daily Net Assets | |
Fund | | First
$1 billion | | | Next
$1 billion | | | Next
$1 billion | | | Next
$12 billion | | | Over
$15 billion | |
Bond Fund | | | 0.60% | | | | 0.60% | | | | 0.60% | | | | 0.50% | | | | 0.49% | |
Fixed Income Fund | | | 0.50% | | | | 0.50% | | | | 0.50% | | | | 0.50% | | | | 0.50% | |
Global Bond Fund | | | 0.60% | | | | 0.50% | | | | 0.48% | | | | 0.48% | | | | 0.48% | |
Inflation Protected Securities Fund | | | 0.25% | | | | 0.25% | | | | 0.25% | | | | 0.25% | | | | 0.25% | |
Institutional High Income Fund | | | 0.60% | | | | 0.60% | | | | 0.60% | | | | 0.60% | | | | 0.60% | |
Intermediate Duration Bond Fund | | | 0.25% | | | | 0.25% | | | | 0.25% | | | | 0.25% | | | | 0.25% | |
Investment Grade Fixed Income Fund | | | 0.40% | | | | 0.40% | | | | 0.40% | | | | 0.40% | | | | 0.40% | |
107 |
Notes to Financial Statements – continued
March 31, 2011 (Unaudited)
Loomis Sayles has given binding undertakings to the Funds to waive management fees and/or reimburse certain expenses to limit the Funds’ operating expenses, exclusive of acquired fund fees and expenses, brokerage expenses, interest expense, taxes and extraordinary expense. These undertakings are in effect until January 31, 2012 and are reevaluated on an annual basis. Management fees payable, as reflected on the Statements of Assets and Liabilities, is net of waivers and/or expense reimbursements, if any, pursuant to these undertakings. Waivers/reimbursements that exceed management fees payable are reflected on the Statements of Assets and Liabilities as receivable from investment adviser.
For the six months ended March 31, 2011, the expense limits as a percentage of average daily net assets under the expense limitation agreements were as follows:
| | | | | | | | | | | | |
| | | Expense Limit as a Percentage of
Average Daily Net Assets | |
Fund | | Institutional
Class | | | Retail
Class | | | Admin
Class | |
Bond Fund | | | 0.70% | | | | 0.95% | | | | 1.20% | |
Fixed Income Fund | | | 0.65% | | | | — | | | | — | |
Global Bond Fund | | | 0.75% | | | | 1.00% | | | | — | |
Inflation Protected Securities Fund | | | 0.40% | | | | 0.65% | | | | — | |
Institutional High Income Fund | | | 0.75% | | | | — | | | | — | |
Intermediate Duration Bond Fund | | | 0.40% | | | | 0.65% | | | | — | |
Investment Grade Fixed Income Fund | | | 0.55% | | | | — | | | | — | |
Loomis Sayles shall be permitted to recover expenses it has borne under the expense limitation agreements (whether through waiver of its management fees or otherwise) on a class by class basis in later periods to the extent the expenses of a class fall below a class’ expense limits, provided, however, that a class is not obligated to pay such waived/reimbursed fees or expenses more than one year after the end of the fiscal year in which the fees or expenses were waived/reimbursed.
For the six months ended March 31, 2011, the management fees and waivers of management fees for each Fund were as follows:
| | | | | | | | | | | | | | | | | | | | |
Fund | | Gross
Management
Fees | | | Waivers of
Management
Fees1 | | | Net
Management
Fees | | | Percentage of
Average Daily
Net Assets | |
| | | | | Gross | | | Net | |
Bond Fund | | $ | 50,428,026 | | | $ | — | | | $ | 50,428,026 | | | | 0.51% | | | | 0.51% | |
Fixed Income Fund | | | 2,065,773 | | | | — | | | | 2,065,773 | | | | 0.50% | | | | 0.50% | |
Global Bond Fund | | | 6,140,270 | | | | — | | | | 6,140,270 | | | | 0.54% | | | | 0.54% | |
Inflation Protected Securities Fund | | | 17,343 | | | | 17,343 | | | | — | | | | 0.25% | | | | 0.00% | |
Institutional High Income Fund | | | 1,230,100 | | | | — | | | | 1,230,100 | | | | 0.60% | | | | 0.60% | |
Intermediate Duration Bond Fund | | | 64,962 | | | | 46,500 | | | | 18,462 | | | | 0.25% | | | | 0.07% | |
Investment Grade Fixed Income Fund | | | 864,970 | | | | — | | | | 864,970 | | | | 0.40% | | | | 0.40% | |
1Management fee waivers are subject to possible recovery until September 30, 2012.
For the six months ended March 31, 2011, class-specific expenses have been reimbursed as follows:
| | | | | | | | | | | | | | | | |
| | | Reimbursement2 | |
Fund | | Institutional
Class | | | Retail
Class | | | Admin
Class | | | Total | |
Inflation Protected Securities Fund | | $ | 3,751 | | | $ | 129 | | | $ | — | | | $ | 3,880 | |
Intermediate Duration Bond Fund | | | 753 | | | | 309 | | | | — | | | | 1,062 | |
In addition, the investment adviser reimbursed non-class-specific expenses of Inflation Protected Securities Fund in the amount of $46,434 for the six months ended March 31, 20112.
2Expense reimbursements are subject to possible recovery until September 30, 2012.
For the six months ended March 31, 2011, expense reimbursements related to the prior fiscal year were recovered as follows:
| | | | | | | | | | | | | | | | |
| | | Recovered Expenses | |
Fund | | Institutional
Class | | | Retail
Class | | | Admin
Class | | | Total | |
Bond Fund | | $ | — | | | $ | — | | | $ | 6,942 | | | $ | 6,942 | |
| 108
Notes to Financial Statements – continued
March 31, 2011 (Unaudited)
Certain officers and employees of Loomis Sayles are also officers or Trustees of the Trust. Loomis Sayles’ general partner is indirectly owned by Natixis Global Asset Management, L.P. (“Natixis US”), which is part of Natixis Global Asset Management, an international asset management group based in Paris, France.
b. Service and Distribution Fees. Natixis Distributors, L.P. (“Natixis Distributors”), a wholly-owned subsidiary of Natixis US, has entered into a distribution agreement with the Trust. Pursuant to this agreement, Natixis Distributors serves as principal underwriter of the Funds of the Trust.
Pursuant to Rule 12b-1 under the 1940 Act, Bond Fund, Global Bond Fund, Inflation Protected Securities Fund and Intermediate Duration Bond Fund have adopted a Distribution Plan relating to each Fund’s Retail Class shares (the “Retail Class Plan”), and the Bond Fund has adopted a Distribution Plan relating to its Admin Class shares (the “Admin Class Plan”).
Under the Retail Class Plan, each Fund pays Natixis Distributors a monthly distribution fee at an annual rate not to exceed 0.25% of the average daily net assets attributable to the Funds’ Retail Class shares, as compensation for services provided by Natixis Distributors in connection with the marketing or sale of Retail Class shares or for payments made by Natixis Distributors to securities dealers or other financial intermediaries as commissions, asset-based sales charges or other compensation with respect to the sale of Retail Class shares, or for providing personal services to investors and/or the maintenance of shareholder accounts.
Under the Admin Class Plan, Bond Fund pays Natixis Distributors a monthly distribution fee at an annual rate not to exceed 0.25% of the average daily net assets attributable to the Fund’s Admin Class shares, as compensation for services provided by Natixis Distributors in connection with the marketing or sale of Admin Class shares or for payments made by Natixis Distributors to securities dealers or other financial intermediaries as commissions, asset-based sales charges or other compensation with respect to the sales of Admin Class shares, or for providing personal services to investors and/or the maintenance of shareholder accounts.
In addition, the Admin Class shares of the Bond Fund may pay Natixis Distributors an administrative service fee, at an annual rate not to exceed 0.25% of the average daily net assets attributable to Admin Class shares. These fees are subsequently paid to securities dealers or financial intermediaries for providing personal services and/or account maintenance for their customers who hold such shares.
For the six months ended March 31, 2011, the Funds paid the following service and distribution fees:
| | | | | | | | | | | | | | | | |
| | | Service Fees | | | Distribution Fees | |
Fund | | Retail Class | | | Admin Class | | | Retail Class | | | Admin Class | |
Bond Fund | | $ | — | | | $ | 332,220 | | | $ | 10,214,799 | | | $ | 332,220 | |
Global Bond Fund | | | — | | | | — | | | | 1,223,515 | | | | — | |
Inflation Protected Securities Fund | | | — | | | | — | | | | 244 | | | | — | |
Intermediate Duration Bond Fund | | | — | | | | — | | | | 1,483 | | | | — | |
c. Administrative Fees. Natixis Asset Management Advisors, L.P. (“Natixis Advisors”) provides certain administrative services for the Funds and contracts with State Street Bank to serve as sub-administrator. Natixis Advisors is a wholly-owned subsidiary of Natixis US. Pursuant to an agreement among Natixis Funds Trust I, Natixis Funds Trust II, Natixis Funds Trust IV, Natixis Cash Management Trust, Gateway Trust (“Natixis Funds Trusts”), Loomis Sayles Funds I, Loomis Sayles Funds II (“Loomis Sayles Funds Trusts”), Hansberger International Series and Natixis Advisors, each Fund pays Natixis Advisors monthly its pro rata portion of fees equal to an annual rate of 0.0575% of the first $15 billion of the average daily net assets of the Natixis Funds Trusts, Loomis Sayles Funds Trusts and Hansberger International Series, 0.0500% of the next $15 billion, 0.0400% of the next $30 billion and 0.0350% of such assets in excess of $60 billion, subject to an annual aggregate minimum fee for the Natixis Funds Trusts, Loomis Sayles Funds Trusts and Hansberger International Series of $10 million, which is reevaluated on an annual basis. New funds are subject to a fee for the first twelve months of operations of $75,000 plus $12,500 per additional class and an additional $75,000 if managed by multiple subadvisers.
For the six months ended March 31, 2011, each Fund paid the following administrative fees to Natixis Advisors:
| | | | |
Fund | | Administrative
Fees | |
Bond Fund | | $ | 4,594,562 | |
Fixed Income Fund | | | 193,034 | |
Global Bond Fund | | | 529,760 | |
Inflation Protected Securities Fund | | | 3,241 | |
Institutional High Income Fund | | | 95,786 | |
Intermediate Duration Bond Fund | | | 12,139 | |
Investment Grade Fixed Income Fund | | | 101,040 | |
109 |
Notes to Financial Statements – continued
March 31, 2011 (Unaudited)
d. Sub-Transfer Agent Fees. Natixis Distributors has entered into agreements with financial intermediaries to provide certain recordkeeping, processing, shareholder communications and other services to customers of the intermediaries and has agreed to compensate the intermediaries for providing those services. Certain services would be provided by the Funds if the shares of those customers were registered directly with the Funds’ transfer agent. Accordingly, the Funds agreed to pay a portion of the intermediary fees attributable to shares of the Fund held by the intermediaries (which generally is a percentage of the value of shares held) not to exceed what the Funds would have paid their transfer agent had each customer’s shares been registered directly with the transfer agent instead of held through the intermediaries. Natixis Distributors pays the remainder of the fees.
For the six months ended March 31, 2011, the Funds paid the following sub-transfer agent fees, which are reflected in transfer agent fees and expenses in the Statements of Operations.
| | | | | | | | | | | | |
| | | Sub-Transfer Agent Fees | |
Fund | | Institutional
Class | | | Retail
Class | | | Admin
Class | |
Bond Fund | | $ | 2,411,946 | | | $ | 3,164,315 | | | $ | 142,914 | |
Global Bond Fund | | | 241,895 | | | | 440,788 | | | | — | |
Inflation Protected Securities Fund | | | 2,654 | | | | 13 | | | | — | |
Institutional High Income Fund | | | 2,572 | | | | — | | | | — | |
Intermediate Duration Bond Fund | | | 438 | | | | 22 | | | | — | |
Investment Grade Fixed Income Fund | | | 20 | | | | — | | | | — | |
e. Trustees Fees and Expenses. The Trust does not pay any compensation directly to its officers or Trustees who are directors, officers or employees of Natixis Advisors, Natixis Distributors, Natixis US or their affiliates. The Chairperson of the Board receives a retainer fee at the annual rate of $250,000. The Chairperson does not receive any meeting attendance fees for Board of Trustees meetings or committee meetings that she attends. Each Independent Trustee (other than the Chairperson) receives, in the aggregate, a retainer fee at the annual rate of $80,000. Each Independent Trustee also receives a meeting attendance fee of $10,000 for each meeting of the Board of Trustees that he or she attends in person and $5,000 for each meeting of the Board of Trustees that he or she attends telephonically. In addition, each committee chairman receives an additional retainer fee at the annual rate of $15,000. Each Contract Review and Governance Committee member is compensated $6,000 for each Committee meeting that he or she attends in person and $3,000 for each meeting that he or she attends telephonically. Each Audit Committee member is compensated $7,500 for each Committee meeting that he or she attends in person and $3,750 for each meeting that he or she attends telephonically. These fees are allocated among the funds in the Natixis Funds Trusts, Loomis Sayles Funds Trusts and Hansberger International Series based on a formula that takes into account, among other factors, the relative net assets of each fund. Trustees are reimbursed for travel expenses in connection with attendance at meetings.
A deferred compensation plan (the “Plan”) is available to the Trustees on a voluntary basis. Deferred amounts remain in the Funds until distributed in accordance with the provisions of the Plan. The value of a participating Trustee’s deferral account is based on theoretical investments of deferred amounts, on the normal payment dates, in certain funds of the Natixis Funds Trusts, Loomis Sayles Funds Trusts and Hansberger International Series as designated by the participating Trustees. Changes in the value of participants’ deferral accounts are allocated pro rata among the funds in the Natixis Funds Trusts, Loomis Sayles Funds Trusts, and Hansberger International Series, and are normally reflected as Trustees’ fees and expenses in the Statements of Operations. The portions of the accrued obligations allocated to the Funds under the Plan are reflected as Deferred Trustees’ fees in the Statements of Assets and Liabilities.
7. Class Specific Expenses. For the six months ended March 31, 2011, the Funds paid the following class-specific transfer agent fees and expenses (including sub-transfer agent fees):
| | | | | | | | | | | | |
| | | Transfer Agent Fees and Expenses | |
Fund | | Institutional
Class | | | Retail
Class | | | Admin
Class | |
Bond Fund | | $ | 2,669,154 | | | $ | 3,731,387 | | | $ | 148,527 | |
Fixed Income Fund | | | 1,577 | | | | — | | | | — | |
Global Bond Fund | | | 246,912 | | | | 524,161 | | | | — | |
Inflation Protected Securities Fund | | | 3,750 | | | | 140 | | | | — | |
Institutional High Income Fund | | | 4,479 | | | | — | | | | — | |
Intermediate Duration Bond Fund | | | 753 | | | | 309 | | | | — | |
Investment Grade Fixed Income Fund | | | 965 | | | | — | | | | — | |
8. Line of Credit. Each Fund, together with certain other funds of Natixis Funds Trusts, Loomis Sayles Funds Trusts and Hansberger International Series, participates in a $200,000,000 committed unsecured line of credit provided by State Street Bank, with an individual limit of $125,000,000 for each fund that participates in the line of credit. Interest is charged to each participating fund based on its
| 110
Notes to Financial Statements – continued
March 31, 2011 (Unaudited)
borrowings at a rate per annum equal to the greater of the Federal Funds rate or overnight LIBOR, plus 1.25%. In addition, a commitment fee of 0.15% per annum, payable at the end of each calendar quarter, is accrued and apportioned among the participating funds based on their average daily unused portion of the line of credit.
Effective April 21, 2011, each Fund, together with certain other funds of Natixis Funds Trusts, Loomis Sayles Funds Trusts and Hansberger International Series, will participate in a $200,000,000 committed unsecured line of credit provided by State Street Bank, with an individual limit of $125,000,000 for each fund that will participate in the line of credit. Interest will be charged to each participating fund based on its borrowings at a rate per annum equal to the greater of the Federal Funds rate or overnight LIBOR, plus 1.25%. In addition, a commitment fee of 0.125% per annum, payable at the end of each calendar quarter, will be accrued and apportioned among the participating funds based on their average daily unused portion of the line of credit.
For the six months ended March 31, 2011, none of the Funds had borrowings under these agreements.
9. Concentration of Risk. Each Fund’s investments in foreign securities are subject to foreign currency fluctuations, higher volatility than U.S. securities, varying degrees of regulation and limited liquidity. Greater political, economic, credit and information risks are also associated with foreign securities.
10. Concentration of Ownership. At March 31, 2011, Loomis Sayles Distributors, L.P. and Loomis Sayles Trust Co. LLC owned 262,588 shares, equal to 16.73% of Inflation Protected Securities Fund’s shares outstanding. At March 31, 2011, the Loomis Sayles Funded Pension Plan and Trust (“Pension Plan”) and the Loomis Sayles Employees’ Profit Sharing Retirement Plan (“Retirement Plan”) held shares of beneficial interest in the Funds as follows:
| | | | | | | | |
Fund | | Pension Plan | | | Retirement Plan | |
Bond Fund | | | 959,011 | | | | 2,124,312 | |
Global Bond Fund | | | — | | | | 483,918 | |
Inflation Protected Securities Fund | | | — | | | | 273,472 | |
Institutional High Income Fund | | | — | | | | 1,454,868 | |
Intermediate Duration Bond Fund | | | — | | | | 88,153 | |
From time to time, the Funds may have a concentration of several shareholders having a significant percentage of shares outstanding. Investment activities of these shareholders could have material impacts on the Funds. As of March 31, 2011, certain Funds had shareholders that held greater than 5% of the fund’s outstanding shares. Such ownership may be beneficially held by multiple individuals or entities other than the owner of record. The number of greater than 5% shareholders and the aggregate percentage of net assets represented by such ownership was as follows:
| | | | |
Fund | | Number of Greater
Than 5% Shareholders | | Percentage of
Ownership |
Fixed Income Fund | | 3 | | 19.07% |
Global Bond Fund | | 1 | | 11.45% |
Inflation Protected Securities Fund | | 3 | | 22.33% |
Intermediate Duration Bond Fund | | 4 | | 72.89% |
Investment Grade Fixed Income Fund | | 3 | | 22.40% |
11. Capital Shares. Each Fund may issue an unlimited number of shares of beneficial interest, without par value. Transactions in capital shares were as follows:
| | | | | | | | | | | | | | | | |
| | | Bond Fund | |
| | |
| | | Six Months Ended March 31, 2011 | | | Year Ended September 30, 2010 | |
| | | | |
| Institutional Class | | Shares | | | Amount | | | Shares | | | Amount | |
Issued from the sale of shares | | | 107,155,867 | | | $ | 1,540,731,183 | | | | 225,791,097 | | | $ | 3,060,935,314 | |
Issued in connection with the reinvestment of distributions | | | 20,106,126 | | | | 287,909,548 | | | | 41,506,088 | | | | 563,071,668 | |
Redeemed | | | (130,531,629 | ) | | | (1,872,543,205 | ) | | | (314,876,391 | ) | | | (4,250,749,039 | ) |
| | | | | | | | | | | | | | | | |
Net change | | | (3,269,636 | ) | | $ | (43,902,474 | ) | | | (47,579,206 | ) | | $ | (626,742,057 | ) |
| | | | | | | | | | | | | | | | |
111 |
Notes to Financial Statements – continued
March 31, 2011 (Unaudited)
11. Capital Shares (continued)
| | | | | | | | | | | | | | | | |
| | | Bond Fund | |
| | |
| | | Six Months Ended March 31, 2011 | | | Year Ended September 30, 2010 | |
| | | | |
| Retail Class | | Shares | | | Amount | | | Shares | | | Amount | |
Issued from the sale of shares | | | 74,049,850 | | | $ | 1,061,407,101 | | | | 155,856,734 | | | $ | 2,110,792,790 | |
Issued in connection with the reinvestment of distributions | | | 14,985,923 | | | | 213,776,926 | | | | 31,177,594 | | | | 421,514,998 | |
Redeemed | | | (98,454,014 | ) | | | (1,407,060,404 | ) | | | (195,407,565 | ) | | | (2,642,018,934 | ) |
| | | | | | | | | | | | | | | | |
Net change | | | (9,418,241 | ) | | $ | (131,876,377 | ) | | | (8,373,237 | ) | | $ | (109,711,146 | ) |
| | | | | | | | | | | | | | | | |
| | | | |
| Admin Class | | Shares | | | Amount | | | Shares | | | Amount | |
Issued from the sale of shares | | | 2,787,794 | | | $ | 39,864,678 | | | | 6,876,197 | | | $ | 92,742,622 | |
Issued in connection with the reinvestment of distributions | | | 449,852 | | | | 6,401,579 | | | | 878,950 | | | | 11,862,601 | |
Redeemed | | | (3,620,107 | ) | | | (51,675,318 | ) | | | (6,397,886 | ) | | | (86,086,907 | ) |
| | | | | | | | | | | | | | | | |
Net change | | | (382,461 | ) | | $ | (5,409,061 | ) | | | 1,357,261 | | | $ | 18,518,316 | |
| | | | | | | | | | | | | | | | |
Increase (decrease) from capital share transactions | | | (13,070,338 | ) | | $ | (181,187,912 | ) | | | (54,595,182 | ) | | $ | (717,934,887 | ) |
| | | | | | | | | | | | | | | | |
| |
| | | Fixed Income Fund | |
| | |
| | | Six Months Ended March 31, 2011 | | | Year Ended September 30, 2010 | |
| | | | |
| Institutional Class | | Shares | | | Amount | | | Shares | | | Amount | |
Issued from the sale of shares | | | 6,634,769 | | | $ | 92,923,979 | | | | 5,773,068 | | | $ | 76,057,230 | |
Issued in connection with the reinvestment of distributions | | | 3,122,786 | | | | 41,814,110 | | | | 2,880,044 | | | | 36,461,361 | |
Redeemed | | | (5,563,615 | ) | | | (77,265,800 | ) | | | (10,449,999 | ) | | | (137,737,563 | ) |
| | | | | | | | | | | | | | | | |
Increase (decrease) from capital share transactions | | | 4,193,940 | | | $ | 57,472,289 | | | | (1,796,887 | ) | | $ | (25,218,972 | ) |
| | | | | | | | | | | | | | | | |
| |
| | | Global Bond Fund | |
| | |
| | | Six Months Ended March 31, 2011 | | | Year Ended September 30, 2010 | |
| | | | |
| Institutional Class | | Shares | | | Amount | | | Shares | | | Amount | |
Issued from the sale of shares | | | 13,110,838 | | | $ | 220,505,206 | | | | 26,748,125 | | | $ | 431,989,257 | |
Issued in connection with the reinvestment of distributions | | | 1,795,450 | | | | 29,831,598 | | | | 2,225,990 | | | | 35,769,761 | |
Redeemed | | | (11,578,919 | ) | | | (194,200,018 | ) | | | (17,516,539 | ) | | | (281,002,249 | ) |
| | | | | | | | | | | | | | | | |
Net change | | | 3,327,369 | | | $ | 56,136,786 | | | | 11,457,576 | | | $ | 186,756,769 | |
| | | | | | | | | | | | | | | | |
| | | | |
| Retail Class | | Shares | | | Amount | | | Shares | | | Amount | |
Issued from the sale of shares | | | 8,598,931 | | | $ | 142,857,572 | | | | 23,865,070 | | | $ | 381,825,710 | |
Issued in connection with the reinvestment of distributions | | | 1,346,128 | | | | 22,168,892 | | | | 1,915,462 | | | | 30,512,388 | |
Redeemed | | | (12,756,366 | ) | | | (211,628,356 | ) | | | (22,406,075 | ) | | | (355,736,901 | ) |
| | | | | | | | | | | | | | | | |
Net change | | | (2,811,307 | ) | | $ | (46,601,892 | ) | | | 3,374,457 | | | $ | 56,601,197 | |
| | | | | | | | | | | | | | | | |
Increase (decrease) from capital share transactions | | | 516,062 | | | $ | 9,534,894 | | | | 14,832,033 | | | $ | 243,357,966 | |
| | | | | | | | | | | | | | | | |
| 112
Notes to Financial Statements – continued
March 31, 2011 (Unaudited)
11. Capital Shares (continued)
| | | | | | | | | | | | | | | | |
| | | Inflation Protected Securities Fund | |
| | |
| | | Six Months Ended March 31, 2011 | | | Year Ended September 30, 2010* | |
| | | | |
| Institutional Class | | Shares | | | Amount | | | Shares | | | Amount | |
Issued from the sale of shares | | | 493,393 | | | $ | 5,469,025 | | | | 791,178 | | | $ | 8,469,372 | |
Issued in connection with the reinvestment of
distributions | | | 20,830 | | | | 229,454 | | | | 39,383 | | | | 421,149 | |
Redeemed | | | (178,307 | ) | | | (1,959,085 | ) | | | (973,654 | ) | | | (10,475,324 | ) |
| | | | | | | | | | | | | | | | |
Net change | | | 335,916 | | | $ | 3,739,394 | | | | (143,093 | ) | | $ | (1,584,803 | ) |
| | | | | | | | | | | | | | | | |
| | | | |
| Retail Class | | Shares | | | Amount | | | Shares | | | Amount | |
Issued from the sale of shares | | | 36,272 | | | $ | 398,991 | | | | 6,779 | | | $ | 73,519 | |
Issued in connection with the reinvestment
of distributions | | | 353 | | | | 3,907 | | | | 20 | | | | 221 | |
Redeemed | | | (2,342 | ) | | | (25,685 | ) | | | — | | | | — | |
| | | | | | | | | | | | | | | | |
Net change | | | 34,283 | | | $ | 377,213 | | | | 6,799 | | | $ | 73,740 | |
| | | | | | | | | | | | | | | | |
Increase (decrease) from capital share transactions | | | 370,199 | | | $ | 4,116,607 | | | | (136,294 | ) | | $ | (1,511,063 | ) |
| | | | | | | | | | | | | | | | |
|
* From commencement of operations on May 28, 2010 through September 30, 2010 for Retail Class shares. | |
| | | Institutional High Income Fund | |
| | |
| | | Six Months Ended March 31, 2011 | | | Year Ended September 30, 2010 | |
| | | | |
| Institutional Class | | Shares | | | Amount | | | Shares | | | Amount | |
Issued from the sale of shares | | | 6,945,368 | | | $ | 53,455,060 | | | | 8,849,076 | | | $ | 67,432,762 | |
Issued in connection with the reinvestment of distributions | | | 5,108,875 | | | | 37,652,413 | | | | 3,532,180 | | | | 25,502,337 | |
Redeemed | | | (4,973,878 | ) | | | (38,563,773 | ) | | | (26,865,854 | ) | | | (202,621,617 | ) |
| | | | | | | | | | | | | | | | |
Increase (decrease) from capital share transactions | | | 7,080,365 | | | $ | 52,543,700 | | | | (14,484,598 | ) | | $ | (109,686,518 | ) |
| | | | | | | | | | | | | | | | |
| |
| | | Intermediate Duration Bond Fund | |
| | |
| | | Six Months Ended March 31, 2011 | | | Year Ended September 30, 2010* | |
| | | | |
| Institutional Class | | Shares | | | Amount | | | Shares | | | Amount | |
Issued from the sale of shares | | | 2,879,316 | | | $ | 30,139,721 | | | | 763,776 | | | $ | 7,876,084 | |
Issued in connection with the reinvestment of distributions | | | 79,486 | | | | 826,522 | | | | 110,093 | | | | 1,123,452 | |
Redeemed | | | (1,102,995 | ) | | | (11,467,799 | ) | | | (196,295 | ) | | | (2,008,973 | ) |
| | | | | | | | | | | | | | | | |
Net change | | | 1,855,807 | | | $ | 19,498,444 | | | | 677,574 | | | $ | 6,990,563 | |
| | | | | | | | | | | | | | | | |
| | | | |
| Retail Class | | Shares | | | Amount | | | Shares | | | Amount | |
Issued from the sale of shares | | | 179,353 | | | $ | 1,880,268 | | | | 11,573 | | | $ | 120,851 | |
Issued in connection with the reinvestment of distributions | | | 306 | | | | 3,190 | | | | 38 | | | | 401 | |
Redeemed | | | (54,242 | ) | | | (562,811 | ) | | | (3,835 | ) | | | (40,575 | ) |
| | | | | | | | | | | | | | | | |
Net change | | | 125,417 | | | $ | 1,320,647 | | | | 7,776 | | | $ | 80,677 | |
| | | | | | | | | | | | | | | | |
Increase (decrease) from capital share transactions | | | 1,981,224 | | | $ | 20,819,091 | | | | 685,350 | | | $ | 7,071,240 | |
| | | | | | | | | | | | | | | | |
| * | From commencement of operations on May 28, 2010 through September 30, 2010 for Retail Class shares. |
| | | | | | | | | | | | | | | | |
| | | Investment Grade Fixed Income Fund | |
| | |
| | | Six Months Ended March 31, 2011 | | | Year Ended September 30, 2010 | |
| | | | |
| Institutional Class | | Shares | | | Amount | | | Shares | | | Amount | |
Issued from the sale of shares | | | 5,032,366 | | | $ | 64,440,706 | | | | 3,726,576 | | | $ | 47,540,397 | |
Issued in connection with the reinvestment of distributions | | | 2,391,916 | | | | 30,123,366 | | | | 1,587,990 | | | | 20,286,002 | |
Redeemed | | | (7,010,231 | ) | | | (92,714,443 | ) | | | (12,508,551 | ) | | | (159,771,890 | ) |
| | | | | | | | | | | | | | | | |
Increase (decrease) from capital share transactions | | | 414,051 | | | $ | 1,849,629 | | | | (7,193,985 | ) | | $ | (91,945,491 | ) |
| | | | | | | | | | | | | | | | |
113 |
Item 2. Code of Ethics.
Not applicable.
Item 3. Audit Committee Financial Expert.
Not applicable.
Item 4. Principal Accountant Fees and Services.
Not applicable.
Item 5. Audit Committee of Listed Registrants.
Not applicable.
Item 6. Schedule of Investments.
Included as part of the Report to Shareholders filed as Item 1 herewith.
Item 7. Disclosure of Proxy Voting Policies and Procedures for Closed-End Management Investment Companies.
Not applicable.
Item 8. Portfolio Managers of Closed-End Management Investment Companies.
Not applicable.
Item 9. Purchases of Equity Securities by Closed-End Management Investment Companies and Affiliated Purchasers.
Not applicable.
Item 10. Submission of Matters to a Vote of Securities Holders.
There were no material changes to the procedures by which shareholders may recommend nominees to the Trust’s Board of Trustees.
Item 11. Controls and Procedures.
The Registrant’s principal executive officer and principal financial officer have concluded that the Registrant’s disclosure controls and procedures are sufficient to ensure that information required to be disclosed by the Registrant in this Form N-CSR was recorded, processed, summarized and reported within the time periods specified in the Securities and Exchange Commission’s rules and forms, based upon such officers’ evaluation of these controls and procedures as of a date within 90 days of the filing date of the report.
There was no change in the Registrant’s internal control over financial reporting that occurred during the Registrant’s last fiscal quarter of the period covered by the report that has materially affected, or is reasonably likely to materially affect, the Registrant’s internal control over financial reporting.
Item 12. Exhibits.
| | | | |
(a) | | (1) | | Not applicable. |
| | |
(a) | | (2) | | Certifications of Principal Executive Officer and Principal Financial Officer pursuant to Rule 30a-2(a) under the Investment Company Act of 1940 (17 CFR 270.30a-2(a)), filed herewith as Exhibits (a)(2)(1) and (a)(2)(2), respectively. |
| | |
(a) | | (3) | | Not applicable. |
| | |
(b) | | | | Certifications of Principal Executive Officer and Principal Financial Officer pursuant to Section 906 of Sarbanes-Oxley Act of 2002 are filed herewith as Exhibit (b). |
SIGNATURES
Pursuant to the requirements of the Securities Exchange Act of 1934 and the Investment Company Act of 1940, the Registrant has duly caused this report to be signed on its behalf by the undersigned, thereunto duly authorized.
| | |
| Loomis Sayles Funds I |
| |
| By: | | /s/ ROBERT J. BLANDING |
| Name: | | Robert J. Blanding |
| Title: | | President and Chief Executive Officer |
| |
| Date: | | May 20, 2011 |
Pursuant to the requirements of the Securities Exchange Act of 1934 and the Investment Company Act of 1940, this report has been signed by the following persons on behalf of the Registrant and in the capacities and on the dates indicated.
| | |
| By: | | /s/ ROBERT J. BLANDING |
| Name: | | Robert J. Blanding |
| Title: | | President and Chief Executive Officer |
| |
| Date: | | May 20, 2011 |
| |
| By: | | /s/ MICHAEL C. KARDOK |
| Name: | | Michael C. Kardok |
| Title: | | Treasurer |
| |
| Date: | | May 20, 2011 |